Budget Review 2020 National Treasury Republic of South Africa 26 February 2020
SECURITIES AND EXCHANGE COMMISSION
Washington, D.C. 20549
FORM 18-K
For Foreign Governments and Political Subdivisions Thereof
ANNUAL REPORT
OF
REPUBLIC OF SOUTH AFRICA
(Name of Registrant)
Date of end of last fiscal year: March 31, 2019
SECURITIES REGISTERED*
(As of the close of the fiscal year)
|
Title of Issue |
|
Amounts as to |
|
Names of |
|
N/A |
|
N/A |
|
N/A |
Name and address of person authorized to receive notices
and communications from the Securities and Exchange Commission:
Ambassador of the Republic of South Africa
Embassy of the Republic of South Africa
3051 Massachusetts Avenue, N.W.
Washington, D.C. 20008
Copies to:
Sachin Davé, Esq.
Allen & Overy LLP
One Bishops Square
London E1 6AD
United Kingdom
* The Registrant is filing this annual report on a voluntary basis.
(1) In respect of each issue of securities of the registrant registered, a brief statement as to:
(a) The general effect of any material modifications, not previously reported, of the rights of the holders of such securities.
There have been no such modifications.
(b) The title and the material provisions of any law, decree or administrative action, not previously reported, by reason of which the security is not being serviced in accordance with the terms thereof.
There has been no such law, decree or administrative action.
(c) The circumstances of any other failure, not previously reported, to pay principal, interest or any sinking fund or amortization installment.
There has been no such failure.
(2) A statement as of the close of the last fiscal year of the registrant, giving the total outstanding of:
(a) Internal funded debt of the registrant. (Total to be stated in the currency of the registrant. If any internal funded debt is payable in a foreign currency, it should not be included under this paragraph (a), but under paragraph (b) of this item.)
See “Tables and Supplementary Information,” pages 82-91 of Exhibit 99.E.
(b) External funded debt of the registrant. (Totals to be stated in the respective currencies in which payable. No statement need be furnished as to intergovernmental debt.)
See “Tables and Supplementary Information,” pages 91-93 of Exhibit 99.E.
(3) A statement giving the title, date of issue, date of maturity, interest rate and amount outstanding, together with the currency or currencies in which payable, of each issue of funded debt of the registrant outstanding as of the close of the last fiscal year of the registrant.
See “Tables and Supplementary Information,” pages 88 and 91-93 of Exhibit 99.E.
(4) (a) As to each issue of securities of the registrant which is registered, there should be furnished a breakdown of the total amount outstanding, as shown in Item (3), into the following:
(1) Total amount held by or for the account of the registrant.
Not applicable.
(2) Total estimated amount held by nationals of the registrant.
Not applicable.
(3) Total amount otherwise outstanding.
Not applicable.
(b) If a substantial amount is set forth in answer to paragraph (a)(1) above, describe briefly the method employed by the registrant to reacquire such securities.
Not applicable.
(5) A statement as of the close of the last fiscal year of the registrant giving the estimated total of:
(a) Internal floating indebtedness of the registrant. (Total to be stated in the currency of the registrant.)
See “Tables and Supplementary Information,” pages 88-91 of Exhibit 99.E.
(b) External floating indebtedness of the registrant. (Total to be stated in the respective currencies in which payable.)
The registrant has no external floating indebtedness.
(6) Statements of the receipts, classified by source, and of the expenditures, classified by purpose, of the registrant for each fiscal year of the registrant ended since the close of the latest fiscal year for which such information was previously reported. These statements should be so itemized as to be reasonably informative and should cover both ordinary and extraordinary receipts and expenditures; there should be
indicated separately, if practicable, the amount of receipts pledged or otherwise specifically allocated to any issue registered, indicating the issue.
See “Public Finance—2019-2020 National Budget and Consolidated Government Budgets” and “Public Finance—Consolidated Government Revenue,” pages 76-78 and pages 81-82, respectively, of Exhibit 99.E.
(7) (a) If any foreign exchange control, not previously reported, has been established by the registrant, briefly describe the effect of any such action, not previously reported.
See “Monetary and Financial System—Exchange Controls,” pages 52-54 of Exhibit 99.E. No foreign exchange control not previously reported was established by the registrant during fiscal year 2019.
(a) If any foreign exchange control previously reported has been discontinued or materially modified, briefly describe the effect of any such action, not previously reported.
See “Monetary and Financial System—Exchange Controls,” pages 52-54 of Exhibit 99.E.
(8) Brief statements as of a date reasonably close to the date of the filing of this report (indicating such date), in respect of the note issue and gold reserves of the central bank of issue of the registrant, and of any further gold stocks held by the registrant.
See “Monetary and Financial System—Gold and Foreign Exchange Contingency Reserve Account (GFECRA),” page 54 of Exhibit 99.E.
(9) Statements of imports and exports of merchandise for each year ended since the close of the latest year for which such information was previously reported. Such statements should be reasonably itemized so far as practicable as to commodities and as to countries. They should be set forth in terms of value and of weight or quantity; if statistics have been established only in terms of value, such will suffice.
See “The External Sector of the Economy—Foreign Trade,” pages 54-56 of Exhibit 99.E.
(10) The balances of international payments of the registrant for each fiscal year ended since the close of the latest fiscal year for which such information was previously reported. The statements for such balances should conform, if possible, to the nomenclature and form used in the “Statistical Handbook of the League of Nations.” (These statements need be furnished only if the registrant has published balances of international payments.)
See “The External Sector of the Economy—Balance of Payments,” pages 56-60 of Exhibit 99.E.
This annual report comprises:
(1) Pages numbered i to v consecutively.
(2) The following exhibits:
Exhibit A — None.
Exhibit B — None.
Exhibit 24 — Power of Attorney, dated February 14, 2020.
Exhibit 99.C — Republic of South Africa Budget Review 2020.
Exhibit 99.D — Republic of South Africa Medium Term Budget Policy Statement 2019.
Exhibit 99.E — Description of the Republic of South Africa dated March 19, 2020.
Exhibit 99.F — Quarterly Bulletin No. 294 dated December 2019, published by the South African Reserve Bank.
This annual report is filed subject to the Instructions for Form 18-K for Foreign Governments and Political Subdivisions thereof.
SIGNATURE
Pursuant to the requirements of the Securities Exchange Act of 1934, the Registrant, Republic of South Africa, has duly caused this annual report to be signed on its behalf by the undersigned, thereunto duly authorized, in Pretoria, South Africa, on March 19, 2020.
|
REPUBLIC OF SOUTH AFRICA |
| |
|
|
| |
|
By: |
/s/ Siyabonga Shange |
|
|
|
Attorney-in-fact for |
|
|
|
TT Mboweni |
|
|
|
Minister of Finance |
|
|
|
Republic of South Africa |
|
EXHIBIT INDEX
POWER OF ATTORNEY
KNOW ALL PERSONS BY THESE PRESENTS, that the undersigned Minister of Finance of the Republic of South Africa (the “Republic”), by his execution hereof, does hereby constitute and appoint Dondo Mogajane, Tshepiso Moahloli and Siyabonga Shange or any of them acting individually as his true and lawful attorney-in-fact and agent, for him and in his name, place and stead, to execute and deliver the Republic’s Annual Report on Form 18-K (the “Form 18-K”) for the fiscal year ended March 31, 2019 and all amendments thereto, as fully to all intents and purposes as the undersigned might or could do in person, hereby ratifying and confirming all the acts of said attorney-in-fact and agent which he may lawfully do or cause to be done by virtue hereof;
PROVIDED THAT, this Power of Attorney shall not constitute a delegation of the Minister of Finance’s powers to borrow money on behalf of the Republic in terms of section 72 of the Public Finance Management Act, 1999, as amended.
|
Dated: 14 February 2020 |
By: |
/s/ TT Mboweni |
|
|
|
TT Mboweni |
|
|
|
Minister of Finance |
|
|
|
Republic of South Africa |
ISBN: RP: 9780621481013 19/2020 The Budget Review is compiled using the latest available information from departmental and other sources. Some of this information is unaudited or subject to revision. To obtain additional copies of this document, please contact: Communications Directorate National Treasury Private Bag X115 Pretoria 0001 South Africa Tel: +27 12 315 5944 Fax: +27 12 407 9055 The document is also available on the internet at: www.treasury.gov.za. ii
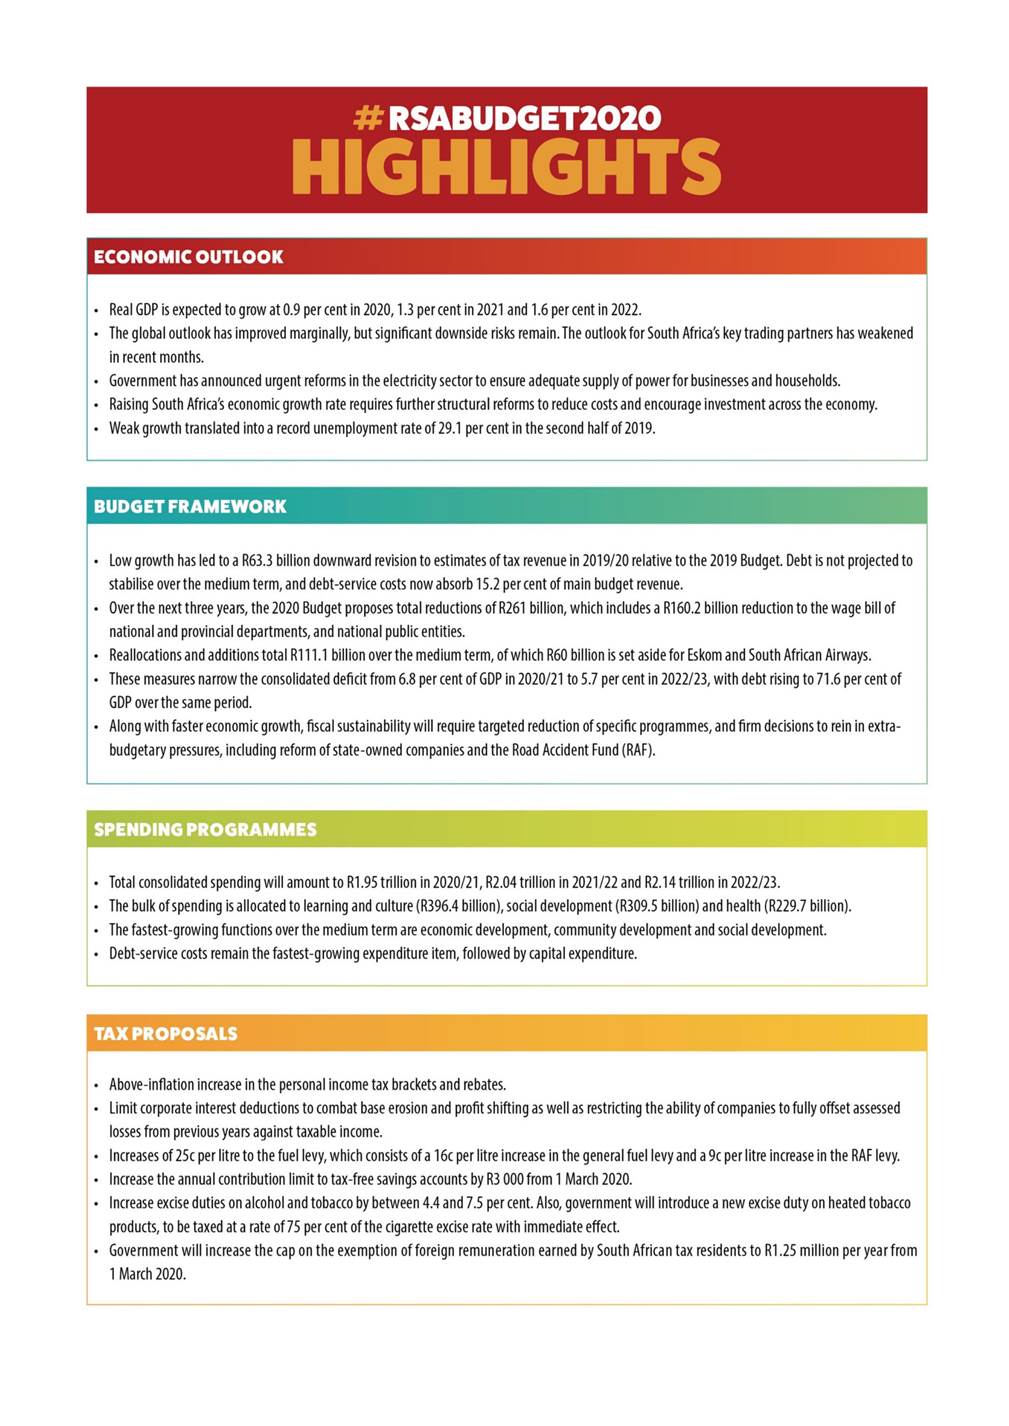
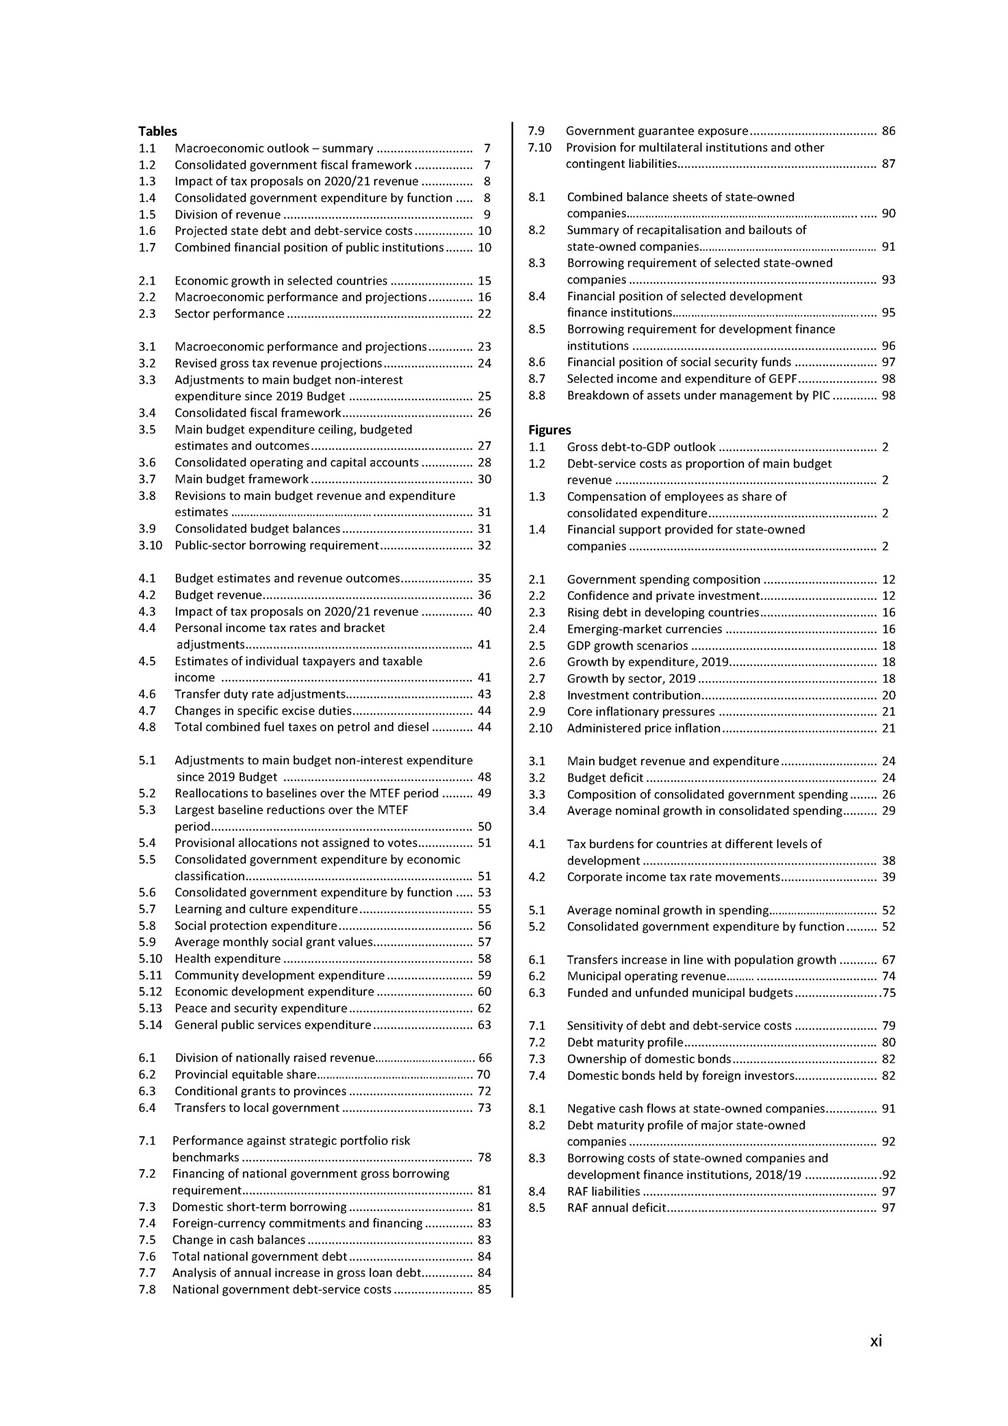
# HIGHLIGHTS Total consolidated spending willamount to R1.95 trillion in 2020/21,R2.04 trillion in 2021/22 and R2.14 trillion in 2022/23. The bulk of spending is allocated to learning and culture (R396.4 billion),socialdevelopment (R309.5 billion) and health (R229.7 billion). The fastest-growing functions over the medium term are economic development,community development and socialdevelopment. Debt-service costs remain the fastest-growing expenditure item,followed by capitalexpenditure. • • Above-inflation increase in the personalincome tax brackets and rebates. Limit corporate interest deductions to combat base erosion and profit shifting as well as restricting the ability of companies to fully offset assessed losses from previous years against taxable income. Increases of 25c per litre to the fuellevy,which consists of a 16c per litre increase in the generalfuel levy and a 9c per litre increase in the RAF levy. Increase the annualcontribution limit to tax-free savings accounts by R3 000 from 1 March 2020. Increase excise duties on alcoholand tobacco by between 4.4 and 7.5 per cent. Also,government will introduce a new excise duty on heated tobacco products,to be taxed at a rate of75 per cent of the cigarette excise rate with immediate effect. Government will increase the cap on the exemption of foreign remuneration earned by South African tax residents to R1.25 million per year from 1 March 2020. • • TAX PROPOSALS SPENDING PROGRAMMES • Low growth has led to a R63.3 billion downward revision to estimates of tax revenue in 2019/20 relative to the 2019 Budget. Debt is not projected to stabilise over the medium term,and debt-service costs now absorb 15.2 per cent of main budget revenue. Over the next three years,the 2020 Budget proposes total reductions of R261 billion,which includes a R160.2 billion reduction to the wage bill of nationaland provincialdepartments,and nationalpublic entities. Reallocations and additions totalR111.1 billion over the medium term,of which R60 billion is set aside for Eskom and South African Airways. • These measures narrow the consolidated deficit from 6.8 per cent of GOP in 2020/21 to 5.7 per cent in 2022/23, with debt rising to 71.6 per cent of GOP over the same period. • Along with faster economic growth,fiscalsustainability will require targeted reduction of specific programmes,and firm decisions to rein in extra budgetary pressures,including reform of state-owned companies and the Road Accident Fund (RAF). BUDGET FRAMEWORK • RealGOP is expected to grow at 0.9 per cent in 2020,1.3 per cent in 2021 and 1.6 per cent in 2022. The global outlook has improved marginally,but significant downside risks remain.The outlook for South Africa's key trading partners has weakened in recent months. Government has announced urgent reforms in the electricity sector to ensure adequate supply of power for businesses and households. • Raising South Africa's economic growth rate requires further structuralreforms to reduce costs and encourage investment across the economy. • Weak growth translated into a record unemployment rate of 29.1 per cent in the second half of 2019. ECONOMIC OUTLOOK RSABUDGET2020
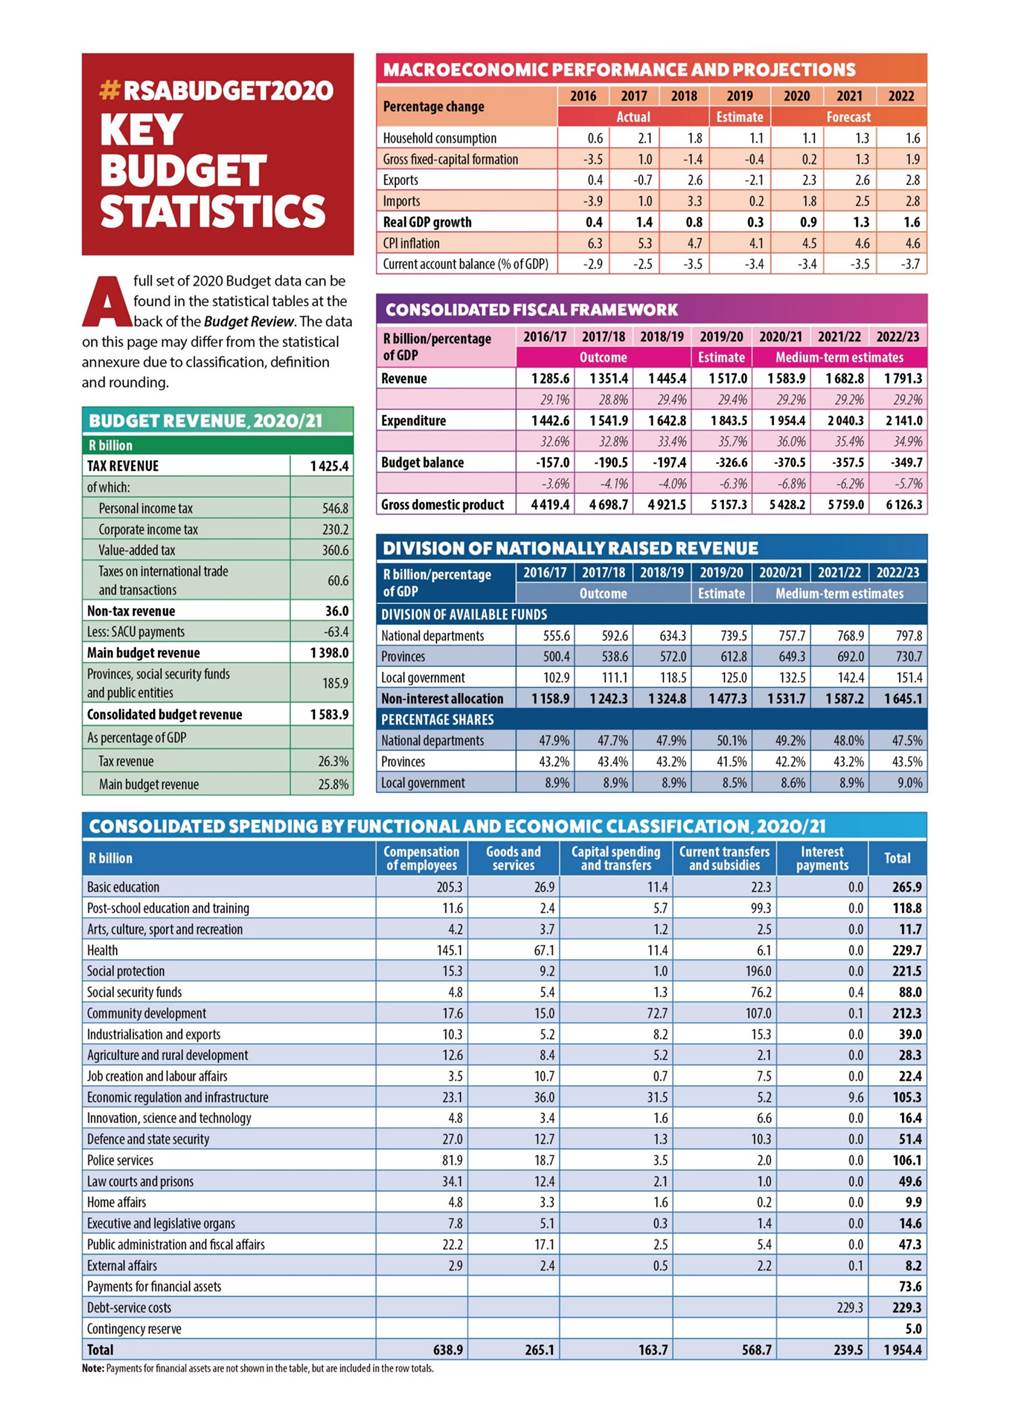
KEY Afull set of 2020 Budget data can be found in the statisticaltables at the back of the Budget Review.The data on this page may differ from the statistical annexure due to classification,definition and rounding. J2ill Note: Paymentsfor financial assets are not shown in the table, but a re included in the row totals. Non-interestallocation 1158.91242.3 1324.8 1477.31531.71587.21645.1 PERCENTAGE SHARES National departments 47.9% 47.7% 47.9% 50.1% 49.2% 48.0% 47.5% Provinces 43.2% 43.4% 43.2% 41.5% 42.2% 43.2% 43.5% Local government 8.9% 8.9% 8.9% 8.5% 8.6% 8.9% 9.0% BUDG ETREV ENUE.2020 R billion TAX REVENUE 1425.4 of which: Personalincome tax 546.8 Corporate income tax 230.2 Value-added tax 360.6 Taxes on international trade and transactions 60.6 Non-tax revenue 36.0 Less:SACU payments -63.4 Main budget revenue 1398.0 Provinces,socialsecurity funds and public entities 185.9 Consolidated budget revenue 1583.9 As percentage of GDP Tax revenue 26.3% Main budget revenue 25.8% # RSABUDGETZOZO BUDGET STATISTICS
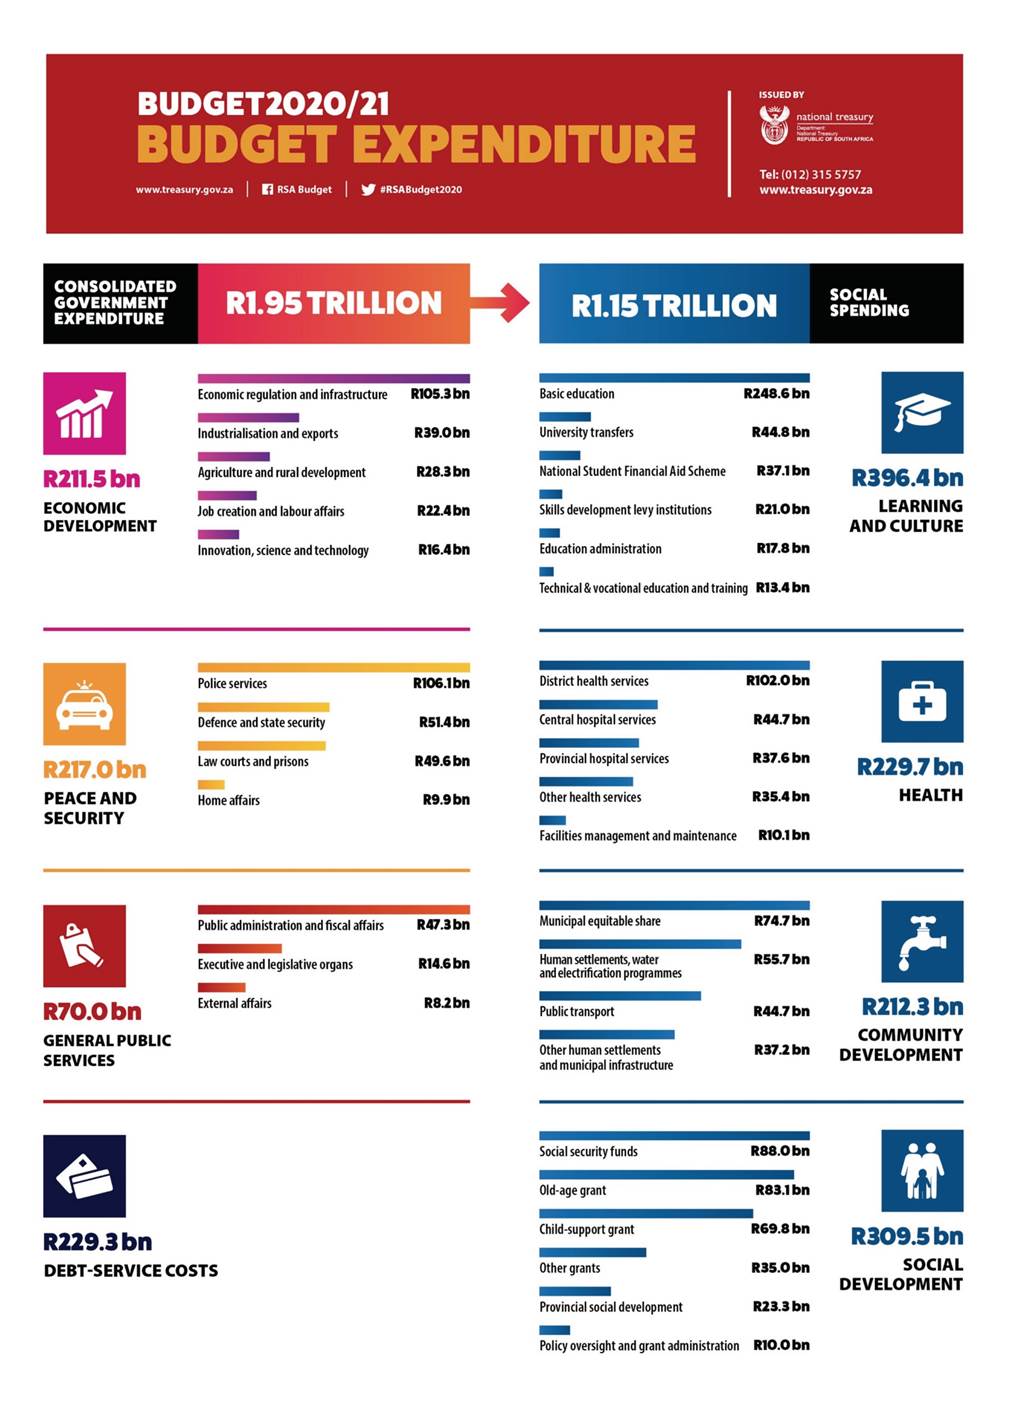
ISSUED BY u national treasur =-r__, BUDGET EXPENDITURE • RE IIUCOFSOUTHMRICA I I ON NG a m -Basic education Economic regulation and infrastructure R105.3bn -University transfers R248.6bn Industrialisation and exports R39.0bn R44.8bn -National Student Financial Aid Scheme Agriculture and rural development R37.1bn R28.3bn RZ11.5bn ECONOMIC DEVELOPMENT R396.4bn LEARNING AND CULTURE - - Skills development levy institutions R21.0bn Job creation and labour affairs R22.4bn -Education administration Innovation, science and technology R17.8bn R16.4bn Technical & vocational education and training R13.4bn m B District health services R102.0bn Police services R106.1bn • Central hospital services R44.7bn Defence and state security R51.4bn Provincial hospital services R37.6bn law courts and prisons - R49.6bn RZZ9.7bn RZ17.0bn PEACE AND SECURITY HEALTH Other health services R35.4bn Home affairs R9.9bn Facilities management and maintenanceR10.1bn Municipal equitable share R74.7bn Public administration and fiscal affairs R47.3bn - Humansettlements,water and electrification programmes RSS.7bn Executive and legislative organs R14.6bn External affairs R8.2bn RZ12.3bn COMMUNITY DEVELOPMENT R70.0bn GENERAL PUBLIC SERVICES Public transport R44.7bn Other human settlements and municipal infrastructure R37.2bn 13 I! Social security funds R88.0bn Old-age grant R83.1bn Child-support grant R69.8bn R309.5bn SOCIAL DEVELOPMENT RZZ9.3bn DEBT-SERVICE COSTS Other grants R3S.Obn -Provincial social development R23.3bn Policy oversight and grant administration RlO.Obn R1.15TRILLION R1.95 TRILI CONSOLIDATED GOVERNMENT EXPENDITURE www.treasury.gov.za W #RSABudget2020 11 RSA Budget Tel:(012) 315 5757 www.treasury.gov.za BUDGET2020/21
[LOGO]

Foreword Budgets are complex, but the numbers we face are straightforward. Without faster economic growth rates, South Africa cannot raise the revenue we need to fund our ambitious social and economic development agenda. Without sustainable public finances, revenue will increasingly be used to pay interest on debt, which now absorbs 15 cents of every rand government collects. Without financially selfsustaining stateowned companies, taxpayers will be paying for their losses for many years to come. Over the past year, economic growth has been weaker than forecast and is only expected to reach 0.9 per cent in 2020. Electricity shortages have put the economy under great strain, and demands from Eskom and other financially distressed stateowned companies drain public resources. In 2019/20, revenue collected is expected to be R63.3 billion lower than forecast in the 2019 Budget Review. By 2022/23, gross government debt is expected to rise to 71.6 per cent of GDP. Addressing this difficult situation requires two complementary approaches: determined action to reverse the deterioration of the public finances by narrowing the budget deficit and containing debt, and structural reforms to return the economy to faster, sustainable growth. The 2020 Budget proposals mark an important step on the road to fiscal consolidation. In comparison with the 2019 Budget, government proposes to reduce its expenditure by R156.1 billion – primarily through a decrease in its compensation bill. Publicservice employees should be fairly remunerated, but government is obligated to balance its wage bill with the broader needs of society. Other reductions are being applied, wherever possible, to poorly performing or underspending programmes. Reductions of this magnitude will inevitably have negative consequences for the economy and social services. But these shortterm costs are necessary to put the country onto a more sustainable footing. Rapid and sustained economic growth is the central requirement to build a prosperous and equitable South Africa. This remains our core policy objective. Achieving this requires decisive steps to build confidence, promote investment and job creation, reduce anticompetitive practices and eliminate regulatory blockages. The most immediate and crucial reform is to ensure adequate electricity supply for businesses and households. The President has announced the first steps to enable greater privatesector participation in electricity generation. A series of regulatory adjustments will follow. I would like to thank Cabinet, the Minister and Deputy Minister of Finance, Parliament’s Portfolio Committee on Finance, the Standing Committee on Appropriations, the Technical Committee on Finance, the Budget Council and my colleagues across government for their contributions to the 2020 Budget. National and provincial departments deserve much credit for their disciplined budget execution over the past several years. Finally, I want to acknowledge the diligent and dedicated team at the National Treasury, who continue to fulfil their constitutional responsibilities in challenging circumstances. Dondo Mogajane DirectorGeneral: National Treasury vii
viii

Contents Overview…………………………………………………………………………………………………………………………………. Stabilising the public finances…………………………….…………………………………………………………………… Structural reforms for investment and growth….……………………………………………………………….……. Improving spending efficiency and reducing waste….……………………………………………………………… Summary of the budget…….…………………………………………………………………………………………………….. Budget documentation……………………………………………………………………………………………………………. Chapter 1 Consolidation, reform and growth………………………………………………………………………………………. 1 1 3 4 6 6 10 Chapter 2 Economic outlook……………………………………………………………………………………………………………….. Overview…..……………………………………………………………………………………………………………………………. Reforms to boost confidence and investment..………….…………………………………………………………... Global outlook…..……………………………………………………………………………………………………………………. Domestic outlook……………………………………………………………………………………………………………………. Forecast trends…….……………………………………………………………………………………………………………….… Conclusion………………………………………………………………………………………………………………………………. 11 11 12 15 16 18 22 Chapter 3 Fiscal policy………………………………………………………………………………………………………………………… Overview………………………………………………………………………………………………………………………….…….. Changes in tax revenue and expenditure………….……………………………………….……….………………..… Achieving fiscal sustainability…………..…..………………………………………………………………………………… Fiscal framework……………………………..……………………………………………………………………………………… Elements of the consolidated budget……………………………………………………………………………………… Publicsector borrowing requirement…………………………………………………………………………………….. Risks to the fiscal outlook……………………………………………………………………………………………………….. Conclusion………………………………………………………………………………………………………………………………. 23 23 24 26 27 29 31 32 32 Chapter 4 Revenue trends and tax proposals….…………………………………………………………………………………… Overview………………………………………………………………………………………………………………………………… Revenue collection and outlook…………..…………………………………………………………………………………. Tax policy………………………………..……….…………………………………………………………………………………….. Tax proposals……………………………………………….…………………………………………………………………………. Tax policy reviews and research………………………………………………………………………………………………. Measures to enhance tax administration…………………..…………………………………………………………… Conclusion…………………………………………….…………………..……………………………………………………………. 33 33 34 37 40 46 46 46 Chapter 5 Consolidated spending plans………………………………………………………………………………………………. Overview…………………………………………………………………………………………………………………………………. Revisions to main budget spending plans………………………………………………………………………………… Provisional allocations………………………..…………………………………………………………………………………… Consolidated government expenditure………………………………………………………………………………...... Spending priorities by function……………………………………………………………………………………………….. Conclusion………………………………………………………………………………………………………………………………. 47 47 48 50 51 52 63 Chapter 6 Division of revenue and spending by provinces and municipalities……………………………………… Overview…………………………………………………………………………………………………………………………………. Division of revenue…………………………………………………………………………………………………………………. Provincial revenue and spending…………………………………………………………………………………………….. Municipal revenue and spending…………………………………………………………………………………………….. Conclusion………………………………………………………………………………………………………………………………. 65 65 66 69 72 76 Chapter 7 Government debt and contingent liabilities………………………………………………………………………… Overview………………………………………………………………………………………………………………………………… Financing strategy…………………………………………………………………………………………………………………… Borrowing performance and projections…….…………………………………………………………………………… Government debt and debtservice costs…….…………………………………………………………………………. Contingent liabilities……………………………..…….………………………………………………………………………….. Conclusion………………………………………………………………………………………………………………………………. 77 77 78 79 84 85 87 ix
Chapter 8 Financial position of publicsector institutions…………………………………………………………………….. Overview…………………………………………………………………………………………………………………………………. Stateowned companies ………………..………………………………………………………………………….……………. Development finance institutions………………………….…………………………………………………..…………… Social security funds…………………………………………………..…………………………………………………………… Government Employees Pension Fund……………………………………………………………………………………. 89 89 90 95 96 98 Annexure A Annexure B Annexure C Annexure D Annexure E Annexure F Report of the Minister of Finance to Parliament………………………………………………………………….. Tax expenditure statement…………….…………………………………………………………………………………… Additional tax policy and administrative adjustments…………………………………………………………. Publicsector infrastructure update…..………………………………………………………………………………… Financial sector update…....……………………………………………………………………………………………….. Summary of the budget …………………………………………………………..…….………………………………….. 101 119 125 143 153 157 161 177 Glossary………………………………………………………………………………………………………………………………………………………… Statistical annexure………………………………………………………………………………………………………………………………………. Two annexures are available on the National Treasury website (www.treasury.gov.za): W1 W2 Explanatory memorandum to the division of revenue Structure of the government accounts x
Tables 7.9 7.10 Government guarantee exposure ..................................... 86 Provision for multilateral institutions and other contingent liabilities.......................................................... 87 1.1 1.2 1.3 1.4 1.5 1.6 1.7 Macroeconomic outlook – summary ............................ Consolidated government fiscal framework ................. Impact of tax proposals on 2020/21 revenue ............... Consolidated government expenditure by function ..... Division of revenue ....................................................... 7 7 8 8 9 8.1 Combined balance sheets of state owned companies……………………………………………………………….. ..... 90 Summary of recapitalisation and bailouts of state owned companies………………………………………………… 91 Borrowing requirement of selected state owned companies ........................................................................ 93 Financial position of selected development finance institutions…………………………………………………… ..... 95 Borrowing requirement for development finance institutions ....................................................................... 96 Financial position of social security funds ........................ 97 Selected income and expenditure of GEPF ....................... 98 Breakdown of assets under management by PIC ............. 98 8.2 Projected state debt and debt service costs ................. 10 Combined financial position of public institutions ........ 10 8.3 2.1 2.2 2.3 Economic growth in selected countries ........................ 15 Macroeconomic performance and projections ............. 16 Sector performance ...................................................... 22 8.4 8.5 3.1 3.2 3.3 Macroeconomic performance and projections ............. 23 Revised gross tax revenue projections .......................... 24 Adjustments to main budget non interest expenditure since 2019 Budget .................................... 25 Consolidated fiscal framework...................................... 26 Main budget expenditure ceiling, budgeted estimates and outcomes ............................................... 27 Consolidated operating and capital accounts ............... 28 Main budget framework ............................................... 30 Revisions to main budget revenue and expenditure estimates ……………………………………… ............................. 31 Consolidated budget balances ...................................... 31 Public sector borrowing requirement ........................... 32 8.6 8.7 8.8 3.4 3.5 Figures 1.1 1.2 Gross debt to GDP outlook .............................................. 2 Debt service costs as proportion of main budget revenue ............................................................................ 2 Compensation of employees as share of consolidated expenditure................................................. 2 Financial support provided for state owned companies ........................................................................ 2 3.6 3.7 3.8 1.3 3.9 3.10 1.4 4.1 4.2 4.3 4.4 Budget estimates and revenue outcomes..................... 35 Budget revenue............................................................. 36 Impact of tax proposals on 2020/21 revenue ............... 40 Personal income tax rates and bracket adjustments.................................................................. 41 Estimates of individual taxpayers and taxable income ......................................................................... 41 Transfer duty rate adjustments..................................... 43 Changes in specific excise duties................................... 44 Total combined fuel taxes on petrol and diesel ............ 44 2.1 2.2 2.3 2.4 2.5 2.6 2.7 2.8 2.9 2.10 Government spending composition ................................. 12 Confidence and private investment.................................. 12 Rising debt in developing countries.................................. 16 Emerging market currencies ............................................ 16 GDP growth scenarios ...................................................... 18 Growth by expenditure, 2019........................................... 18 Growth by sector, 2019 .................................................... 18 Investment contribution................................................... 20 Core inflationary pressures .............................................. 21 Administered price inflation ............................................. 21 4.5 4.6 4.7 4.8 5.1 Adjustments to main budget non interest expenditure since 2019 Budget ....................................................... 48 Reallocations to baselines over the MTEF period ......... 49 Largest baseline reductions over the MTEF period............................................................................ 50 Provisional allocations not assigned to votes................ 51 Consolidated government expenditure by economic classification.................................................................. 51 Consolidated government expenditure by function ..... 53 Learning and culture expenditure ................................. 55 Social protection expenditure ....................................... 56 Average monthly social grant values............................. 57 Health expenditure ....................................................... 58 Community development expenditure ......................... 59 Economic development expenditure ............................ 60 Peace and security expenditure .................................... 62 General public services expenditure ............................. 63 3.1 3.2 3.3 3.4 Main budget revenue and expenditure ............................ 24 Budget deficit ................................................................... 24 Composition of consolidated government spending ........ 26 Average nominal growth in consolidated spending.......... 29 5.2 5.3 5.4 5.5 4.1 Tax burdens for countries at different levels of development .................................................................... 38 Corporate income tax rate movements............................ 39 4.2 5.6 5.7 5.8 5.9 5.10 5.11 5.12 5.13 5.14 5.1 5.2 Average nominal growth in spending………………………....... 52 Consolidated government expenditure by function ......... 52 6.1 6.2 6.3 Transfers increase in line with population growth ........... 67 Municipal operating revenue……… ................................... 74 Funded and unfunded municipal budgets ........................ .75 7.1 7.2 7.3 7.4 Sensitivity of debt and debt service costs ........................ 79 Debt maturity profile........................................................ 80 Ownership of domestic bonds .......................................... 82 Domestic bonds held by foreign investors........................ 82 6.1 6.2 6.3 6.4 Division of nationally raised revenue………………….………. 66 Provincial equitable share………………………………………….. 70 Conditional grants to provinces .................................... 72 Transfers to local government ...................................... 73 8.1 8.2 Negative cash flows at state owned companies............... 91 Debt maturity profile of major state owned companies ........................................................................ 92 Borrowing costs of state owned companies and development finance institutions, 2018/19 ..................... .92 RAF liabilities .................................................................... 97 RAF annual deficit............................................................. 97 7.1 Performance against strategic portfolio risk benchmarks ................................................................... 78 Financing of national government gross borrowing requirement................................................................... 81 Domestic short term borrowing .................................... 81 Foreign currency commitments and financing .............. 83 Change in cash balances ................................................ 83 Total national government debt .................................... 84 Analysis of annual increase in gross loan debt............... 84 National government debt service costs ....................... 85 8.3 7.2 8.4 8.5 7.3 7.4 7.5 7.6 7.7 7.8 xi
xii

1 Consolidation, reform and growth Overview Iof the economy, spending plans based on an assumption of economic n 2019, consolidated government spending reached a historic high of Government spending has reached a historic high of 36 per cent of GDP 36 per cent of GDP. This increase reflects downward revisions to the size growth that has not materialised, and increased demands from financially distressed state-owned companies. While government makes a significant contribution to development, this level of spending is unsustainable, and results in continued high deficits and debt accumulation. A year ago, the Budget Review projected real economic growth of 1.5 per cent in 2019 and 1.7 per cent in 2020. We now expect real growth of only 0.3 per cent in 2019 and 0.9 per cent in 2020. The impact of low growth on revenue collection has been considerable. Government expects to collect R63.3 billion less revenue than projected at the time of the 2019 Budget. The state is borrowing at an increased rate to The state is borrowing at an increased rate – not to build infrastructure, but to fund operations 1 In brief •The 2020 Budget proposes total consolidated spending of R1.95 trillion in 2020/21, with the largest allocations going to learning and culture (R396.4 billion), health (R229.7 billion) and social development (R309.5 billion). •The economic outlook is weak. Real GDP is expected to grow at 0.9 per cent in 2020, 1.3 per cent in 2021 and 1.6 per cent in 2022. Achieving faster economic growth requires far-reaching structural reforms. •The public finances continue to deteriorate. Low growth has led to a R63.3 billion downward revision to estimates of tax revenue in 2019/20 relative to the 2019 Budget. Debt is not projected to stabilise over the medium term, and debt-service costs now absorb 15.2 per cent of main budget revenue. •Halting the fiscal deterioration requires a combination of continued spending restraint, faster economic growth, and measures to contain financial demands from distressed state-owned companies. •As a first step, the 2020 Budget makes net non-interest spending reductions of R156.1 billion in total over the next three years compared with last year’s budget projections. This includes large reductions to the public-service wage bill.
2020 BUDGET REVIEW fund operations, with the deficit projected at 6.3 per cent of GDP this year. Debt-service costs now absorb 15 cents of every rand government collects. By 2022/23, interest payments will exceed health spending. As a major step towards fiscal sustainability, government has reduced the main budget expenditure baseline by R156.1 billion over the next three years in comparison with 2019 Budget projections. This is approximately 1 per cent of GDP per year. The net reduction is mainly the result of the following changes over the medium term: • Reductions to baselines of R261 billion, which includes a R160.2 billion reduction to the wage bill of national and provincial departments, and national public entities. • Reallocations and additions totalling R111.1 billion, of which R60.1 billion is set aside for Eskom and South African Airways (SAA). Non-interest expenditure is forecast to grow at 3.8 per cent over the next three years, down from an average of 8.4 per cent over the past three years. Despite slower growth in spending, the deficit is forecast to remain in excess of 6 per cent of GDP next year, as a result of lower economic growth and tax revenue projections. The scale of the challenge requires fundamental changes to support economic growth, continued restraint in spending growth and improved spending efficiency. Baseline expenditure reductions of R261 billion partially offset by R60 billion set aside for Eskom and SAA 2019 Budget 2020 Budget 20 69. 14 12 61.6 59.7 56.7 58.9 56.2 53.0 55.6 6 4 48.9 36.5 36 35.6 60 35.5 2 Per cent Per cent of GDP 2005/06 2006/07 2007/08 2008/09 2009/10 2010/11 2011/12 2012/13 2013/14 2014/15 2015/16 2016/17 2017/18 2018/19 2015/16 2016/17 2017/18 2018/19 2019/20 2020/21 2021/22 2022/23 R billion Per cent 2008/09 2009/10 2010/11 2011/12 2012/13 2013/14 2014/15 2015/16 2016/17 2017/18 2018/19 2019/20 2020/21 2021/22 2022/23 2010/11 2011/12 2012/13 2013/14 2014/15 2015/16 2016/17 2017/18 2018/19 2019/20 2020/21 2021/22 2022/23 Figure 1.1 Gross debt-to-GDP outlookFigure 1.2 Debt-service costs as proportion of main budget revenue 72 71.6 18 16 65.6 64 10 56 57.8 8 50.5 48 2 0 Figure 1.3 Compensation of employees as share ofFigure 1.4 Financial support provided for consolidated expenditurestate-owned companies 37 80 South African Broadcasting Corporation 70 South African Express 35.7 35 35.2 50 34.6 40 34 30 33 32.9 33.2 20 32.6 32.7 10 32 0 Source: National Treasury Denel South African Airways Eskom 1
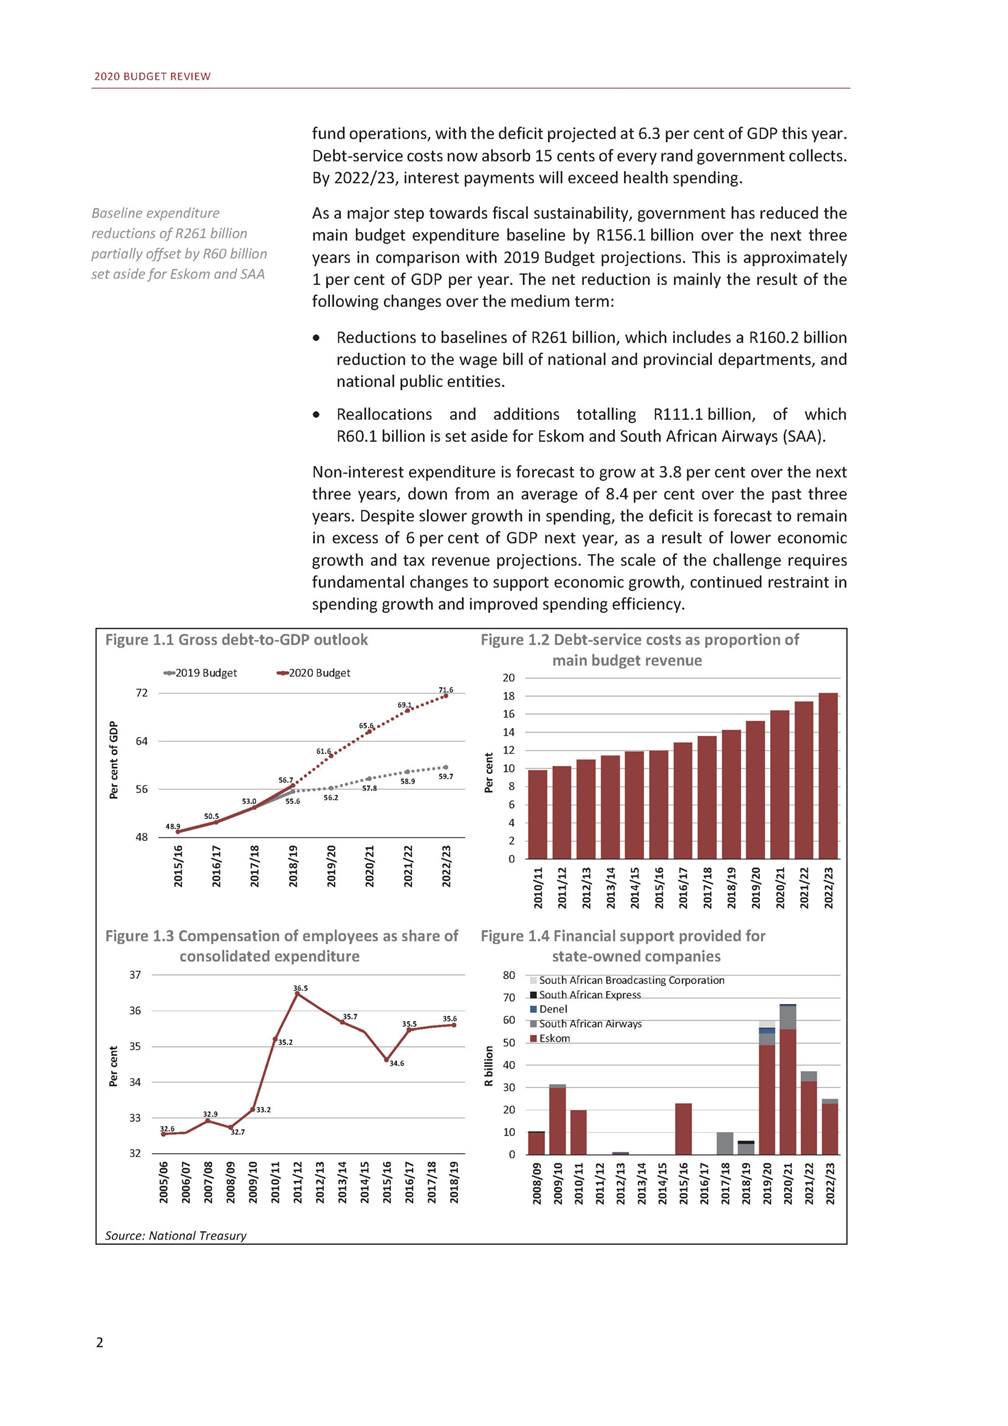
CHAPTER 1: CONSOLIDATION, REFORM AND GROWTH To achieve faster economic growth, South Africa requires structural reforms in a number of areas. Most urgently, the regulatory path should be cleared to enable the private sector to generate electricity, contributing both financial and technical capacity to the country’s energy needs. In other areas, cumbersome and unpredictable regulatory frameworks are undermining private investment. The President’s State of the Nation Address made several announcements in this regard, and more decisive steps will be required in the months ahead. Most urgent structural reform is to clear path for private-sector electricity generation Stabilising the public finances Achieving fiscal sustainability requires a combination of continued spending restraint, faster economic growth and measures to contain extra-budgetary pressures – including reform of state-owned companies. Since 2012/13, government has taken steps to reduce spending growth and raise tax revenue. As a result of lower nominal GDP and revenue growth, however, these interventions have not stabilised debt. Revenue and expenditure are near or at historic highs as a share of GDP. Over the same period, the composition of spending has deteriorated. Debt-service costs have been the fastest-growing area of spending, rising from 9.8 per cent of main budget revenue in 2010/11 to 15.2 per cent in 2019/20. The wage bill has grown strongly over this period, averaging 35.4 per cent of total consolidated expenditure. Over the past five years, the majority of efforts to reduce the deficit have come through tax increases. The 2020 Budget centres the consolidation effort on expenditure, by reducing compensation growth. The aim is to reduce spending as a share of GDP, and improve the composition of spending. Government will not raise additional revenue from tax proposals for 2020/21. Debt-service costs have been fastest-growing category of expenditure Towards a sustainable wage bill Government recognises that public-service employees should be fairly remunerated, but is obligated to balance compensation demands with the broader needs of society as reflected in the budget. Civil servants’ salaries have grown by about 40 per cent in real terms over the past 12 years, without equivalent increases in productivity. Growth in the wage bill has begun crowding out spending on capital projects for future growth and items that are critical for service delivery. The 2020 Budget Review includes R160.2 billion in medium-term reductions to the wage bill. This will affect national and provincial departments, and national public entities that receive transfers from government. Government has tabled an agenda item on the management of the public-service wage bill at the Public Service Co-ordinating Bargaining Council, and will discuss with unions options for achieving the required reduction. This target can be achieved through a combination of modifications to cost-of-living adjustments, pay progression and other benefits. The proposed wage reductions will see consolidated compensation spending contract by 1 per cent in real terms over the medium term. Goods and services and capital budgets will continue to grow in real terms. Government is obligated to balance fair compensation with needs of broader society 3
2020 BUDGET REVIEW Revenue considerations In preparing the 2020 Budget, government considered but decided against proposing tax increases. The main factors in this decision were the weakness of the economy and, in the context of the muted growth outlook, the elevated tax-to-GDP ratio of 26.3 per cent. Government’s short-term focus is to rebuild the capacity of the South African Revenue Service (SARS) and public trust in the institution. No overall tax increase proposed for 2020/21 State-owned companies Over the past 12 years, government has allocated R162 billion to financially distressed state-owned companies, of which Eskom accounts for 82 per cent. Fiscal support for Eskom, as outlined in Annexure C of the 2019 Medium Term Budget Policy Statement (MTBPS), remains unchanged. The roadmap on Eskom, published by the Minister of Public Enterprises, outlines the reform process. Eskom has begun the process of separating its three operating activities – generation, transmission and distribution – each of which will soon have its own board and management structure. These are the first steps in the necessary restructuring of South Africa’s electricity sector for the 21st century. SAA’s board placed the airline into voluntary business rescue in December 2019 as a result of its inability to meet financial obligations. Since 2008/09, SAA has incurred net losses of over R32 billion. Government has set aside R16.4 billion for SAA over the medium term to repay the airline’s guaranteed debt and to cover debt-service costs. The costs of this adjustment are still being finalised, and will be financed from existing provisional allocations for state-owned companies. R16.4 billion set aside for SAA to repay guaranteed debt and cover debt-service costs Structural reforms for investment and growth South Africa needs much faster economic growth to promote investment, create jobs, and enable the state to sustainably grow the revenue that pays for social and developmental programmes. These objectives underpin Economic Transformation, Inclusive Growth, and Competitiveness: Towards an Economic Strategy for South Africa – a discussion document released by the National Treasury in August 2019. The barriers to economic growth are complex and require structural reforms. In other words, the cost of doing business, the cost of finding or conducting work, and the cost of living must be meaningfully reduced. Such reforms will help to transform the economy by improving the profitability of existing businesses, encouraging the start-up of new enterprises, boosting private-sector investment, creating jobs and reducing unemployment, and improving the purchasing power of all households. South Africa’s macroeconomic policy provides a sound platform for the success of structural reforms. Government is committed to low and stable inflation, a flexible exchange rate and a sustainable fiscal framework. These policy commitments in turn reduce uncertainty and risk in investment decisions, and support business and consumer confidence. The Constitution entrenches the rule of law, and commits South Africa to transparent public finances, accompanied by expenditure controls, and a central bank that executes its functions independently. Reforms needed to promote investment, create jobs and enable state to sustainably grow revenue Low and stable inflation, flexible exchange rate, rule of law and transparent public finances promote certainty 4
CHAPTER 1: CONSOLIDATION, REFORM AND GROWTH Government is committed to building partnerships with the private sector to provide infrastructure. The Infrastructure Fund has a project pipeline with potential investments of more than R700 billion over the next 10 years, including both government and non-government contributions. Urgent attention is required to implement structural reforms to South Africa’s network industries. Alongside implementation of the reform agenda outlined in the discussion document, these efforts will help to lay the foundation for higher confidence and growth. Government is committed to partnerships with private sector to provide infrastructure Electricity The most pressing reform is to ensure that all businesses and households have sufficient and dependable electricity supply. Government can expand private-sector power generation by rapidly implementing the commitments made in the President’s State of the Nation Address. These include acquiring additional electricity from existing independent power producers, opening bid window 5, procuring an additional 2 000 to 3 000 megawatts (MW) of emergency power for the national grid within three to 12 months from approval, and allowing municipalities to procure power from the private sector. The speed with which the related procurement processes are undertaken is critical. Regulatory processes need to be simplified to meet deadlines for responses to licensing applications. Self-generation could reduce demand pressures and boost overall supply. Accordingly, government should implement previously announced commitments to make changes to schedule 2 of the Electricity Regulation Act (2006). All businesses and households must have sufficient and dependable electricity supply Ports Urgent regulatory reforms are needed in the ports sector to reduce the cost of trading. The corporatisation of the National Ports Authority should be accelerated. The authority, which regulates port operators and undertakes infrastructure investment, currently operates as a division within Transnet. Corporatising the authority would allow for better independent regulation of South Africa’s ports and increased competition in terminal operations. It would also support greater investment in ports from operating profits, free from Transnet group considerations. Corporatisation of National Ports Authority, provided for in law, should be accelerated Telecommunications The issuance of rapid deployment guidelines would enable the private sector to invest more quickly in telecommunications infrastructure. Enforcement of existing open-access conditions would avoid duplication of infrastructure. Digital migration should be accelerated and work to release spectrum through the auction process should continue. Freight rail The Economic Regulation of Transport Bill, which was approved by Cabinet for submission to Parliament, will improve third-party access to freight rail. This, in turn, can generate efficiencies in the rail sector. Regulatory reforms that promote freight rail efficiency should be complemented by the removal of implicit subsidies in road freight transport, ensuring a level playing field for competition. Reforms needed to level the playing field for competition in land-based freight transport 5
2020 BUDGET REVIEW Improving spending efficiency and reducing waste Government’s contribution to the economy is not matched by adequate spending efficiency. Reports by the Auditor-General have consistently highlighted patterns of wasteful expenditure. Reforms under way include: Reforms under way to improve procurement, strengthen provincial grants, reduce claims against the state • Procurement – The state maintains a complex and often ineffective procurement system. Some measures have had the unintended effect of severely hampering government’s ability to efficiently contract for goods and services. Many of these regulations can be reformed to make legitimate procurement easier without undermining the necessary anti-corruption safeguards. As a first step, the draft Public Procurement Bill has been gazetted for public comment. • Provincial unfunded municipal grants – Government has made progress in reducing municipal budgets and is piloting initiatives to improve revenue collection. Following a review, government is introducing several changes to the provincial grant system. Medico-legal claims – Medical malpractice claims and litigation against the state have increased rapidly in recent years. Although in many cases the quality of care is insufficient, the increase in claims is inconsistent with certain indicators of health outcomes in the public sector. Work has begun to limit unreasonable claims against the state. Public office bearers – There will be no increase in the salaries of public office bearers in 2020/21. This follows a reduction in benefits stemming from changes to the Ministerial Handbook. • • Over the period ahead, the following interventions will be undertaken: Tax incentives to be reviewed and expenditure to be assessed to improve efficiency • South Africa’s tax incentive system favours incumbents and those able to afford specialist tax advice. Over the medium term, government will conduct a review of such incentives, repealing or redesigning those that are redundant, inefficient or inequitable. The National Treasury and the Department of Planning, Monitoring and Evaluation will undertake a new round of expenditure reviews to identify cost savings and improve efficiency. Government will publish a new law this year introducing a remuneration framework for public entities and state-owned companies. One goal of this legislation is to eliminate excessive salaries and bonuses being awarded to executives and managers. • • Over the next year, the National Treasury and the Department of Public Service and Administration will improve the wage-setting mechanism; report on the causes of unauthorised and wasteful expenditure; and examine ways to reduce state litigation, accommodation and information technology costs. Summary of the budget Economic outlook The economic growth outlook has weakened since the 2019 MTBPS, following lower-than-expected growth in the second half of the year. 6
CHAPTER 1: CONSOLIDATION, REFORM AND GROWTH Electricity shortages are expected to constrain growth over the next few years. GDP is estimated to have grown by only 0.3 per cent in 2019. Over the medium term, economic growth projections have been revised down to 0.9 per cent in 2020, rising to 1.6 per cent in 2022. In 2020, the global economy is expected to recover moderately from its recent slowdown, supported by low interest rates and reduced trade tensions between the United States and China. Electricity shortages expected to constrain growth over medium term Table 1.1 Macroeconomic outlook – summary Across all tables in the Budget Review, the use of "0" refers to a value of small magnitude that is rounded up or down to zero. If a value is exactly zero, it will be denoted by "–". If data is not available, it is denoted by "N/A" Source: National Treasury Fiscal policy The consolidated budget deficit is estimated at 6.3 per cent in 2019/20. A key driver of the widening deficit has been a sharp decline in nominal GDP since 2018/19 and associated tax revenues. Nominal GDP is projected to fall below the 2019 MTBPS estimates by an average of R131 billion per year over the medium term. As a result, tax revenue is expected to be significantly lower. Requests for support from financially distressed state-owned companies have continued to mount. The 2020 Budget proposes measures to reduce public spending as a share of GDP and improve the composition of spending by reducing growth in the wage bill. Over the medium term, spending baselines will be reduced by R261 billion. The consolidated budget deficit is expected to narrow from 6.8 per cent in 2020/21 to 5.7 per cent of GDP in 2022/23. Table 1.2 Consolidated government fiscal framework Sharp decline in nominal GDP and associated tax revenues has widened consolidated budget deficit Source: National Treasury Revenue trends and tax proposals Government expects to collect tax revenue of R1.43 trillion (26.3 per cent of GDP) in 2020/21. Given the weak economic outlook, no overall tax increase is proposed for next year. Tax revenue is projected to grow by No overall tax increase is proposed for 2020/21 7 2019/20 Revised R billion/percentage of GDPestimate 2020/212021/222022/23 Medium-term estimates Revenue1 517.0 29.4% Expenditure1 843.5 35.7% 1 583.91 682.81 791.3 29.2%29.2%29.2% 1 954.42 040.32 141.0 36.0%35.4%34.9% Budget balance-326.6 -6.3% -370.5-357.5-349.7 -6.8%-6.2%-5.7% 2019 Real percentage growthEstimate 202020212022 Forecast Household consumption1.1 Gross fixed-capital formation-0.4 Exports-2.1 Imports0.2 Real GDP growth0.3 1.11.31.6 0.21.31.9 2.32.62.8 1.82.52.8 0.91.31.6 Consumer price index (CPI) inflation4.1 Current account balance (% of GDP)-3.4 4.54.64.6 -3.4-3.5-3.7
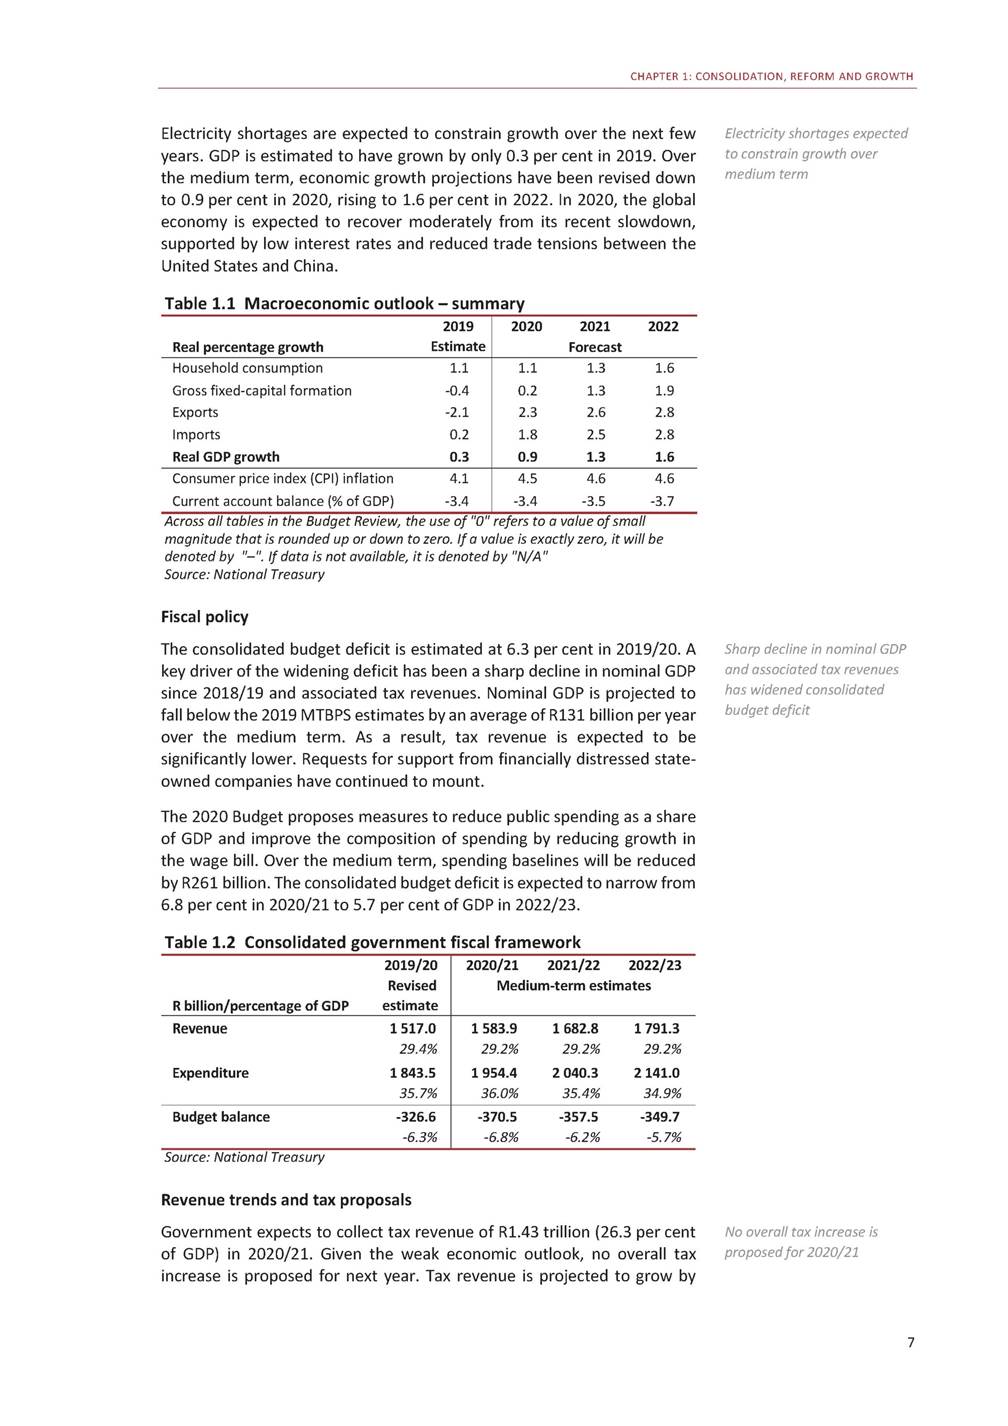
2020 BUDGET REVIEW 4.9 per cent. Reflecting the weak economic environment and reductions in state compensation, gross tax buoyancy is expected to fall to 0.93. The main tax proposals include personal income tax relief through inflation adjustments in all brackets, along with inflation-adjusted increases in the fuel and Road Accident Fund (RAF) levies. The revitalisation of SARS is expected to contribute to increased tax revenue over the medium term. Table 1.3 Impact of tax proposals on 2020/21 revenue1 Personal income tax relief through inflation adjustments in all brackets, and increases in fuel and RAF levies R million Gross tax revenue (before tax proposals) 1 425 418 Budget 2020/21 proposals – Direct taxes Taxes on individuals and companies Personal income tax Increasing brackets by more than inflation Revenue if no adjustment is made Higher-than-inflation increase in brackets and rebates Indirect taxes Carbon tax Plastic bag levy -2 000 -2 000 -2 000 12 000 -14 000 2 000 1 750 250 Gross tax revenue (after tax proposals) 1 425 418 1. Revenue changes are in relation to thresholds that have been fully adjusted for inflation Source: National Treasury Medium-term spending plans Total consolidated spending amounts to R1.84 trillion in the current year, rising to R2.14 trillion by 2022/23. Largest spending areas are learning and culture, health and social development Table 1.4 Consolidated government expenditure by function 1. Consisting of national, provincial, social security funds and selected public entities See Annexure W2 on the National Treasury website for a full list of entities included Source: National Treasury In 2020/21, the largest areas of spending by function are learning and culture (R396.4 billion), health (R229.7 billion) and social development (R309.5 billion). Over the medium term, aside from debt-service costs, the 8 2019/202020/21 RevisedBudget R billionestimateestimate Average growth 2019/20 – 2022/23 Learning and culture385.6396.4 Health222.0229.7 Social development284.5309.5 Community development201.7212.3 Economic development198.9211.5 Peace and security214.4217.0 General public services66.370.0 Payments for financial assets65.273.6 4.0% 5.1% 6.2% 6.3% 6.6% 2.2% 3.7% Allocated expenditure1 638.51 720.2 Debt-service costs205.0229.3 Contingency reserve–5.0 12.3% Consolidated expenditure11 843.51 954.4 5.1%
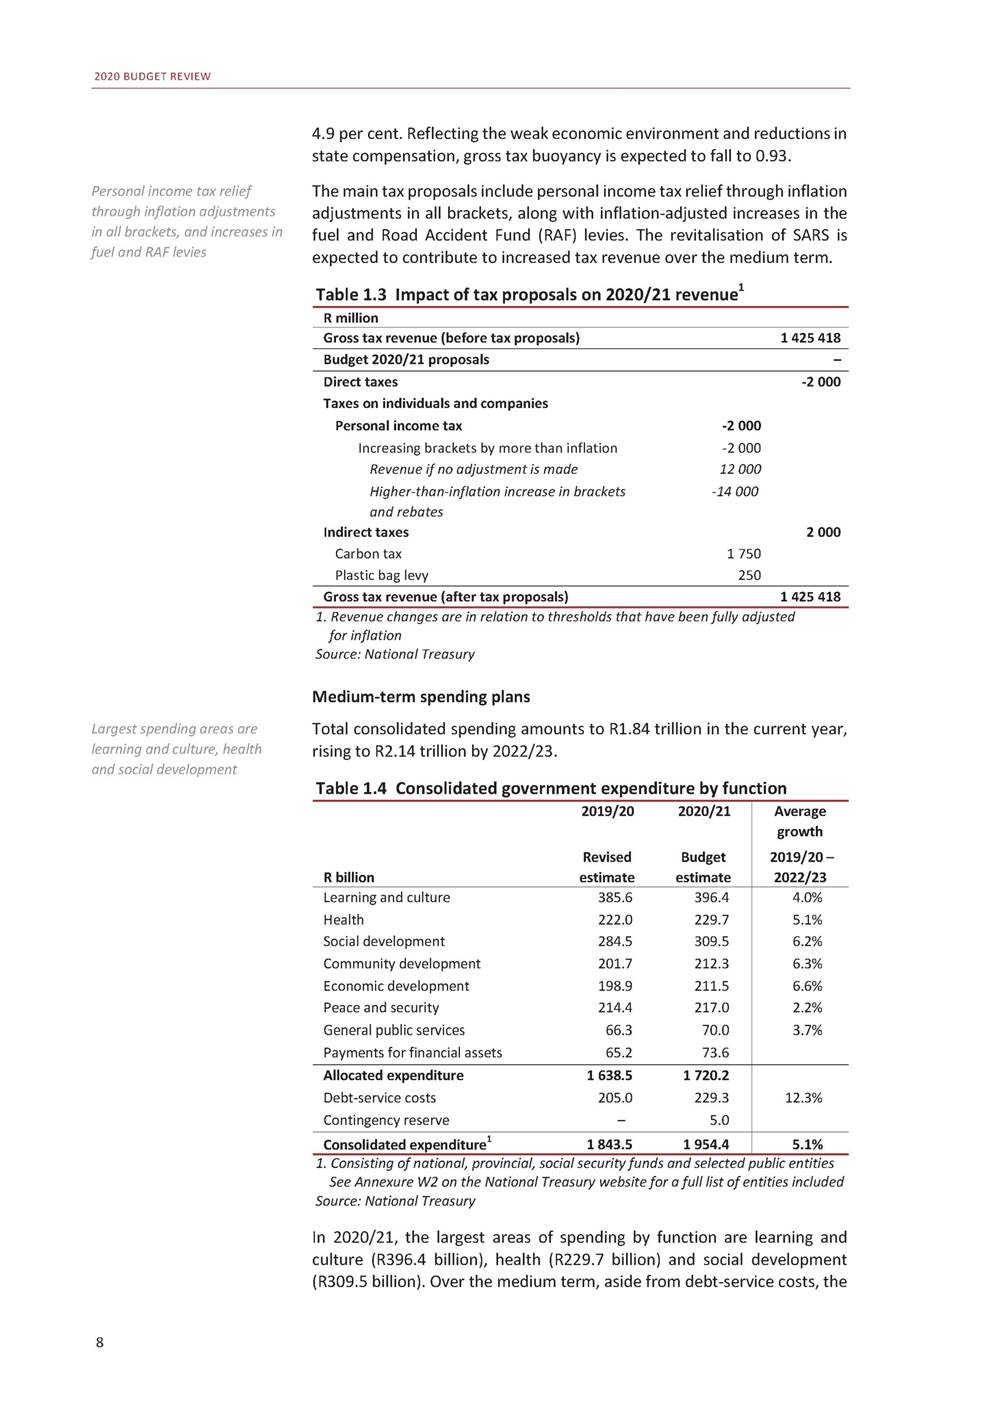
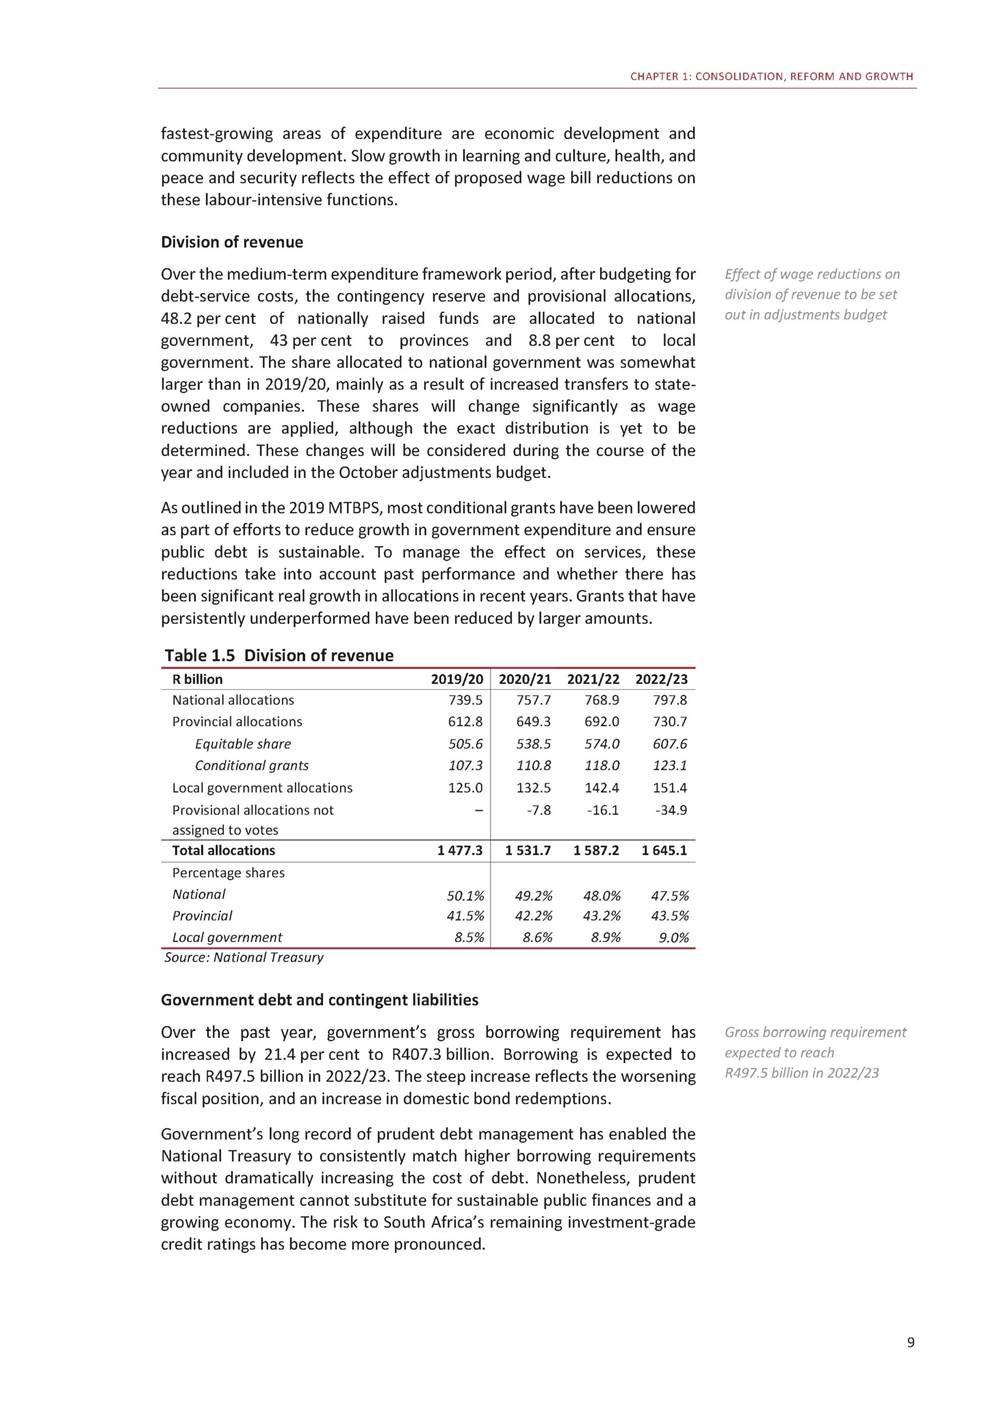
CHAPTER 1: CONSOLIDATION, REFORM AND GROWTH fastest-growing areas of expenditure are economic development and community development. Slow growth in learning and culture, health, and peace and security reflects the effect of proposed wage bill reductions on these labour-intensive functions. Division of revenue Over the medium-term expenditure framework period, after budgeting for debt-service costs, the contingency reserve and provisional allocations, 48.2 per cent of nationally raised funds are allocated to national government, 43 per cent to provinces and 8.8 per cent to local government. The share allocated to national government was somewhat larger than in 2019/20, mainly as a result of increased transfers to state-owned companies. These shares will change significantly as wage reductions are applied, although the exact distribution is yet to be determined. These changes will be considered during the course of the year and included in the October adjustments budget. As outlined in the 2019 MTBPS, most conditional grants have been lowered as part of efforts to reduce growth in government expenditure and ensure public debt is sustainable. To manage the effect on services, these reductions take into account past performance and whether there has been significant real growth in allocations in recent years. Grants that have persistently underperformed have been reduced by larger amounts. Effect of wage reductions on division of revenue to be set out in adjustments budget Table 1.5 Division of revenue Source: National Treasury Government debt and contingent liabilities Over the past year, government’s gross borrowing requirement has increased by 21.4 per cent to R407.3 billion. Borrowing is expected to reach R497.5 billion in 2022/23. The steep increase reflects the worsening fiscal position, and an increase in domestic bond redemptions. Government’s long record of prudent debt management has enabled the National Treasury to consistently match higher borrowing requirements without dramatically increasing the cost of debt. Nonetheless, prudent debt management cannot substitute for sustainable public finances and a growing economy. The risk to South Africa’s remaining investment-grade credit ratings has become more pronounced. Gross borrowing requirement expected to reach R497.5 billion in 2022/23 9 R billion2019/20 2020/21 2021/22 2022/23 National allocations739.5 Provincial allocations612.8 Equitable share505.6 Conditional grants107.3 Local government allocations125.0 Provisional allocations not– assigned to votes 757.7768.9797.8 649.3692.0730.7 538.5574.0607.6 110.8118.0123.1 132.5142.4151.4 -7.8-16.1-34.9 Total allocations1 477.3 1 531.71 587.21 645.1 Percentage shares National 50.1% Provincial 41.5% Local government 8.5% 49.2%48.0%47.5% 42.2%43.2%43.5% 8.6%8.9%9.0%
2020 BUDGET REVIEW Table 1.6 Projected state debt and debt-service costs Source: National Treasury Financial position of public-sector institutions The financial performance of state-owned companies has deteriorated sharply. Liability growth has outpaced that of assets, with a consequent decline in net asset value. This erosion of financial value is largely a result of weak revenue growth, high compensation costs and rapidly growing debt-service costs. The net asset value of the three largest development finance institutions – the Development Bank of Southern Africa, the Industrial Development Corporation and the Land Bank – increased by 4.7 per cent in 2018/19 to R139.4 billion. With the exception of the RAF, the financial positions of the social security funds and the Government Employees Pension Fund are strong. They are able to meet their long-term obligations. Net asset value of state-owned companies has declined sharply in recent years Table 1.7 Combined financial position of public institutions R billion/net asset value 2016/17 2017/18 2018/19 State-owned companies Development finance institutions1 Social security funds Other public entities2 354.0 126.8 1.0 674.9 362.1 133.1 -27.0 719.0 342.0 139.4 -90.2 751.7 1. Institutions listed in schedule 2 of the PFMA 2. State-owned institutions without a commercial mandate and listed in either schedule 1 or 3 of the PFMA such as the National Library of South Africa Source: National Treasury Budget documentation The 2020 Budget Review accompanies several other documents and submissions tabled in Parliament on Budget Day. These include: • • • • The Budget Speech The Division of Revenue Bill The Appropriation Bill The Estimates of National Expenditure. These and other fiscal and financial publications, including the People’s Guide to the Budget, are available at www.treasury.gov.za. 10 R billion/percentage of GDP2019/20 2020/212021/222022/23 Gross loan debt3 176.1 61.6% Debt-service costs205.0 4.0% 3 561.73 978.14 383.6 65.6%69.1%71.6% 229.3258.5290.1 4.2%4.5%4.7%

2 Economic outlook Overview MThis remains government’s core policy objective. Higher growth ore rapid and sustained economic growth is the central Decisions required that build confidence and boost investment to create jobs and raise growth requirement to build a prosperous and equitable South Africa. would also reduce pressure on the public finances. Achieving this requires decisive steps to build confidence, promote investment and employment, reduce anti-competitive practices and eliminate regulatory blockages. The economic outlook has weakened since the 2019 MTBPS, following lower-than-expected growth in the second half of the year. Real GDP is estimated to have grown by only 0.3 per cent in 2019, partly as a result of electricity supply failures. Weak growth translated into a record unemployment rate of 29.1 per cent in the second half of 2019. Economic growth projections have been revised down to 0.9 per cent in 2020, rising to just 1.6 per cent in 2022. Electricity shortages are expected to constrain the economy over the forecast period. Global growth is expected to rise moderately over the forecast period, but considerable downside risks remain. The outlook for South Africa’s key trading partners has weakened in recent months. 11 In brief •Since the 2019 Medium Term Budget Policy Statement (MTBPS), economic growth has been revised lower, in part due to electricity supply shortages. Real GDP is expected to grow at 0.9 per cent in 2020. •Global growth is expected to rise moderately over the forecast period, but considerable downside risks remain. The outlook for South Africa’s key trading partners has weakened in recent months. •Government has announced urgent reforms in the electricity sector to ensure adequate supply of power for businesses and households. •Raising South Africa’s economic growth rate requires structural reforms, including substantial changes in the network industries, to reduce costs and encourage investment across the economy.
2020 BUDGET REVIEW To jump-start growth, South Africa requires stronger investment by, and partnerships with, the private sector. Recent network industry failures – in particular in electricity, but also in ports – have increased the cost of doing business. Yet these failures also offer opportunities to draw in private-sector skills and investment, reduce operating costs and build confidence. The 2019 MTBPS noted that policy certainty and a conducive business environment are critical to support the confidence of business and households. South Africa’s monetary policy framework has provided certainty. Enhancing the state’s contribution to the economy requires greater spending efficiency and a shift in the composition of spending from consumption towards capital infrastructure. It also requires a clear vision for the role of state-owned companies within a robust framework for financial and operational management. The macroeconomic framework needs to be complemented by a range of reforms that are within government’s control, many of which do not require significant funding. The overriding priority is to enact structural reforms that enable the economy to break from the spiral of low growth and deteriorating public finances. Private-sector skills and investment can expand electricity generation and improve ports’ performance 60 15 Reforms to boost confidence and investment The foundations for economic growth include prudent and credible fiscal and monetary policy, reliable electricity supply, a well-functioning financial system and respect for the rule of law. The speed at which an economy can grow will then be determined by factors affecting the costs of doing business, including the regulatory environment, support for innovation and competition, and the quality and cost of infrastructure. As highlighted in the 2019 MTBPS, government is focused on structural reforms to support competitiveness, investment and employment, by: Structural reforms needed that lower costs of living and of doing business • Reducing costs for households and businesses by modernising and reforming network industries, restructuring inefficient state-owned companies and inviting private-sector participation. Increasing exports through evidence-based, export-orientated industrial policy, and supporting labour-intensive sectors such as agriculture and tourism. Promoting competition and supporting small business. • • 12 Index level 2009 2010 2011 2012 2013 2014 2015 2016 2017 2018 2019 Annual growth (per cent) Figure 2.1 Government spending compositionFigure 2.2 Confidence and private investment RMB/BER Business Confidence Index Private investment (RHS) 50 10 5 40 0 30 -5 20 -10 -15 10 -20 0 -25 Source: Statistics South Africa and National Treasury calculationsSource: Global Insight

CHAPTER 2: ECONOMIC OUTLOOK Initial steps to expand electricity supply Facilitating faster private-sector involvement in the power sector will catalyse confidence and growth more broadly. The President announced a set of urgent reforms to address the Eskom crisis in his February 2020 State of the Nation Address. To facilitate large-scale additional power production, the Department of Mineral Resources and Energy is assessing information to procure 2 000 to 3 000 megawatts of power through its risk mitigation programme. This power will be connected to the national grid within three to 12 months from approval. Efforts are under way to acquire additional electricity from existing independent power producers (IPPs). Government has committed to open bid window 5 and make it possible for municipalities in good financial standing to buy electricity from IPPs. These efforts will be supported by operational changes announced by the new Eskom CEO, which include separating the utility into three divisions, resuming scheduled maintenance practices, fixing defects at Medupi and Kusile, and buying energy from entities with excess supply. Eskom will also reinstate its demand management strategy, with a clear schedule that allows users to mitigate the most disruptive effects of unplanned outages. Awareness campaigns will help to reduce pressure on the national grid. A commitment to minimum response times by the National Energy Regulator of South Africa would be supported by introducing simpler, standardised and more transparent licensing requirements for connecting to the grid. This in turn would support the emergence of smaller electricity providers. Efforts are under way to acquire additional electricity from existing IPPs Simpler and more transparent licensing arrangements needed from energy regulator Clearing blockages in transport, logistics and communications In other network industries, work continues to expand access, draw in private investment and reduce the costs of doing business. These include: • Rail transport reforms – In November 2019, Cabinet approved the Economic Regulation of Transport Bill for submission to Parliament. The bill – which consolidates economic regulations for the aviation, marine, rail and road transport sectors – will improve third-party access to rail. • Spectrum licensing – The broadband spectrum licensing plan was released in November 2019. Government is acting to make additional spectrum available from analogue television users. 13 The economic impact of Eskom supply disruptions Eskom, which has a near monopoly on South Africa’s electricity supply, is taking a large toll on the economy. Industry estimated that power cuts caused losses of about 0.1 per cent of GDP in the fourth quarter of 2019. However, without intervention, the impact of supply disruptions on growth will be greater in 2020. Power cuts – even scheduled ones – restrict production and investment, lower trade, increase the cost of doing business and put pressure on profits and employment. This in turn tends to reduce technology uptake and modernisation, particularly in small businesses. An uncertain and declining supply of electricity also contributes to low levels of confidence and investment, as well as lost capacity due to damage from power surges. The size of Eskom’s balance sheet and its dominance in the energy sector affect the cost of borrowing for government, which in turn affects the cost of borrowing for the entire economy. Taken together, these factors structurally lower South Africa’s competitiveness, employment and exports.

2020 BUDGET REVIEW Supporting competition, trade and policy certainty Actions to boost investment, trade and policy certainty include: • Reforms to benefit small business – The Companies and Intellectual Property Commission website now includes a single platform for company registration, including registering with social security funds and the South African Revenue Service. In addition, the Competition Commission made rulings in December 2019 that imply a decrease in data costs. Investment promotion – In support of the President’s initiative, R664 billion of investment commitments have been made. South Africa’s foreign-exchange control system will be modernised over the next year to support investment and the country’s position as a hub on the continent, as outlined in Annexure E. The Upstream Petroleum Development Bill, which will guide oil and gas exploration and production, was released for public comment in December 2019. • • Industrial policy – Government and industry continue to work master plans to raise growth and exports in 15 key sectors. on Maximising the long-term growth impact of the fiscal framework Government is exploring ways to maximise the long-term growth impact of the fiscal framework. This includes: • Improving the composition of spending, by rebalancing spending towards capital expenditure rather than compensation. 14 A just transition: Avoiding short-term policy responses that harm long-term growth South Africa’s low growth levels and high unemployment reinforce the desire to protect existing industries and jobs. All governments consider a range of trade-offs in such matters. However, policy decisions should not lock the economy into production patterns that will limit long-term growth. To achieve higher living standards, South Africa needs to adjust to global market demand. Climate change is starting to shape the manner in which the largest markets regulate imported and domestic products. Support for industries with high carbon emissions is likely to threaten long-term export demand and growth, and could lock South Africa into a position of a low-value exporter. Climate challenges also represent opportunities to generate new economic activity. Jobs and investment can be created by drawing on private-sector skills and capital, while demand for carbon-intensive products can be managed with incentives and penalties. Industrial policy should support businesses that can respond to these challenges – including producing new food technologies, electric cars, renewable-energy equipment, or energy-and water-saving devices. Targeted social interventions, including re-skilling and financial support, should be directed to workers in sunset industries, rather than providing support to affected companies. Future-focused policy that takes cognisance of climate change would support efforts to raise youth employment, as announced in the State of the Nation Address, in sectors such as business-process outsourcing, tourism and technology. Swift regulatory action to clear backlogs and modernise ports Commercial ports’ efficiency has declined sharply over the past year. This is the combined result of poor management, inadequate maintenance and resulting equipment failures, and industrial action at container terminals. Delays in modernising ports and digitising operations have compounded these problems. Backlogs for those importing and exporting container cargo have increased sharply, raising costs and damaging export competitiveness. South Africa needs a modern and efficient ports system to reduce the costs of living and of doing business, and to maintain its position as one of Africa’s main trading hubs. Swift and decisive regulatory action is needed. The corporatisation of the National Ports Authority, provided for in the National Ports Act (2005), should be accelerated. The authority, which regulates ports operators and undertakes infrastructure investment, currently operates as a division of Transnet. Corporatising the authority should allow for better regulation of all port operators, including Transnet Port Terminals. It would also support greater reinvestment of operating profits back into ports, free from Transnet group considerations.
CHAPTER 2: ECONOMIC OUTLOOK • Initiating a review of departmental spending to maximise the impact of existing programmes. Reforming procurement regulations to remove unnecessary complexity that delays infrastructure spending and discourages small firms from doing business with government. Reviewing tax incentives and other non-cash disbursements, with the aim of repealing redundant, inefficient or inequitable incentives. • • Global outlook In 2020, the global economy is expected to recover moderately from its recent slowdown, supported by low interest rates and reduced trade tensions between the United States (US) and China. Although improved growth in developing countries is expected to support the recovery over the long term, the aggregate growth forecast for South Africa’s main trading partners has been revised down over the next three years. Table 2.1 Economic growth in selected countries Moderate improvement in global economic growth outlook, but forecast for main trading partners is down 1. National Treasury forecast. Note: final numbers are for 2022, not an average 2. Average based on IMF World Economic Outlook database, October 2019 Source: IMF World Economic Outlook, January 2020 and IMF World Economic Outlook database Over the medium term, global growth is expected to average 3.4 per cent, below average growth of 3.8 per cent between 2010 and 2018. Inflation is expected to remain subdued, with advanced-economy inflation rising from a forecast 1.4 per cent in 2019 to 1.9 per cent in 2021, and developing-economy inflation declining from 5.1 to 4.5 per cent over the same period. In 2019, global trade slowed, growing by just 1 per cent, in response to rising trade policy uncertainty and tariffs. Trade growth is expected to rise to 2.9 per cent in 2020 and 3.7 per cent in 2021 as trade relations normalise, although serious risks remain to global supply chains. Trading under the African Continental Free Trade Agreement is due to begin on 1 July 2020, marking an important offset to increased protectionism. Low interest rates, particularly in Europe, have supported asset prices in financial markets. Since September 2019, bond yields in advanced economies have started to rise gradually, but remain below 2018 levels. As a result, the impact on developing economies has been muted. African Continental Free Trade Agreement, which will boost intra-African trade, to take effect on 1 July 2020 15 Region/country2010-2018 PercentagePost-crisis 2019202020212022-20242 GDP forecast World3.8 Advanced economies2.0 United States2.3 Euro area1.4 United Kingdom1.9 Japan1.4 Developing countries5.2 Brazil1.4 Russia2.0 India7.4 China7.8 Sub-Saharan Africa4.2 South Africa11.8 2.93.33.43.6 1.71.61.61.6 2.32.01.71.6 1.21.31.41.4 1.31.41.51.5 1.00.70.50.5 3.74.44.64.8 1.22.22.32.3 1.11.92.01.9 4.85.86.57.4 6.16.05.85.6 3.33.53.54.1 0.30.91.31.6
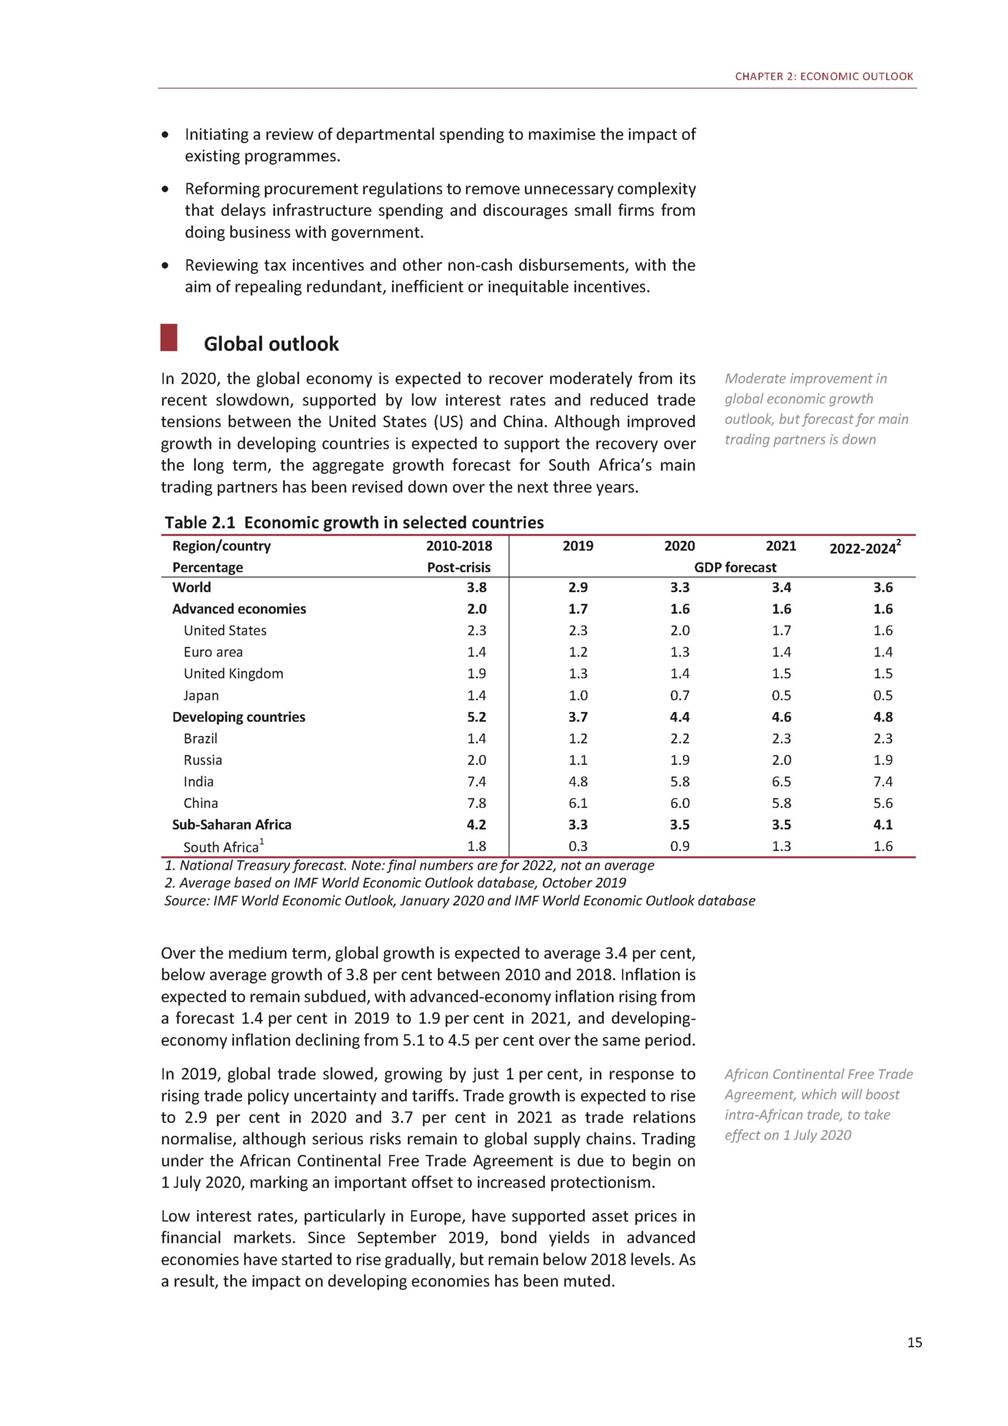
2020 BUDGET REVIEW Rand/dollar exchange rate In 2019, developing-country risk premiums and bond yields continued to fall. In aggregate, developing-country currencies remained largely stable against the US dollar. Countries with high levels of debt and policy uncertainty, such as South Africa, faced considerably more volatility. On average in 2019, the rand’s nominal exchange value fell 5.4 per cent in trade-weighted terms and 1.9 per cent in real terms. Near-term global risks have moderated since the 2019 MTBPS, but the risk of lower growth remains elevated due to trade tensions, in particular between the US and its major trading partners. Debt levels in developing countries have risen sharply since the global financial crisis, and are projected to grow. Debt levels in advanced economies also remain elevated. High levels of government debt will limit fiscal and monetary policy responses to economic shocks. Global trade tensions remain a risk to growth Domestic outlook Real GDP growth slowed from 0.8 per cent in 2018 to a projected 0.3 per cent in 2019. The National Treasury forecasts economic growth of 0.9 per cent in 2020, 1.3 per cent in 2021 and 1.6 per cent in 2022. Table 2.2 Macroeconomic performance and projections Sources: National Treasury, Reserve Bank and Statistics South Africa 16 Rands per dollar Jan 2016 Apr 2016 Jul 2016 Oct 2016 Jan 2017 Apr 2017 Jul 2017 Oct 2017 Jan 2018 Apr 2018 Jul 2018 Oct 2018 Jan 2019 Apr 2019 Jul 2019 Oct 2019 Jan 2020 Indexed (Jan 2016=100) 201620172018 Percentage changeActual 2019 Estimate 202020212022 Forecast Final household consumption0.62.11.8 Final government consumption2.20.21.9 Gross fixed-capital formation-3.51.0-1.4 Gross domestic expenditure-0.91.91.0 Exports0.4-0.72.6 Imports-3.91.03.3 1.1 2.0 -0.4 1.0 -2.1 0.2 1.11.31.6 1.6-0.61.2 0.21.31.9 0.71.31.6 2.32.62.8 1.82.52.8 Real GDP growth0.41.40.8 0.3 0.91.31.6 GDP inflation7.25.33.9 GDP at current prices (R billion)4 359.14 653.64 873.9 CPI inflation6.35.34.7 Current account balance (% of GDP)-2.9-2.5-3.5 4.0 5 086.4 4.1 -3.4 4.54.54.6 5 359.35 676.46 035.1 4.54.64.6 -3.4-3.5-3.7 Figure 2.3 Rising debt in developing countriesFigure 2.4 Emerging-market currencies 18110 EM currency index (RHS) 16 100 14 90 12 Currency weakness against the dollar 1080 Source: Bloomberg and National TreasurySource: Bloomberg
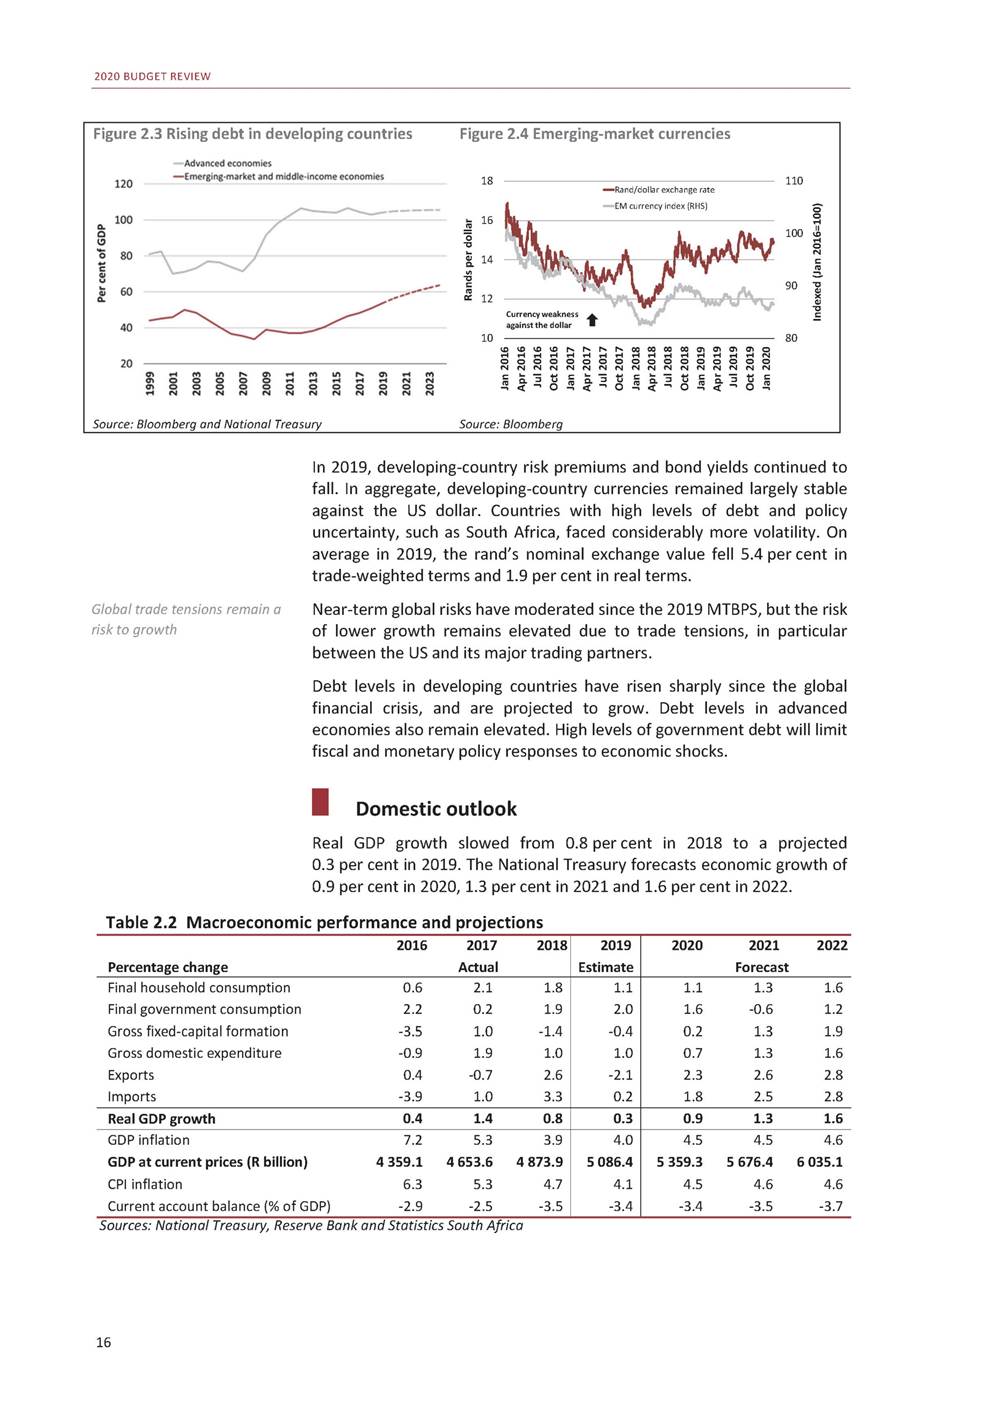
CHAPTER 2: ECONOMIC OUTLOOK Downward revisions to domestic and global demand mean that average growth is projected at 1.3 per cent over the next three years, well below the 1.8 per cent average from 2010 to 2018. With the population growing at 1.4 per cent over the next three years, per capita GDP is set to decline. Serious risks to the forecast include further deterioration in the financial condition of state-owned companies, with attendant demands on the Per capita GDP set to decline over next several years fiscus;unreliablepowersupply; implementation of structural reforms. and policy inertia and slow Scenarios The National Treasury has modelled two economic growth scenarios. • In scenario A, mounting distress at state-owned companies erodes the fiscal position further, raising borrowing costs and reducing confidence and investment. This is coupled with worsening global growth due to deteriorating international trade relations and less favourable bilateral trade conditions. In scenario B, reforms outlined in the discussion document Economic Transformation, Inclusive Growth, and Competitiveness: Towards an Economic Strategy for South Africa are implemented at a moderate pace and help to raise growth. However, weak levels of confidence and continued load-shedding reduce the impact of these reforms. Faster implementation of electricity-sector reforms could result in even higher growth. • 17 Macroeconomic assumptions The assumptions outlined below are incorporated in the forecast. Since the 2019 MTBPS, metals prices have been revised higher across the forecast period, while energy prices have been revised slightly lower, other than for 2020. Food inflation has been revised lower given continued subdued price pressures globally and locally. Public-sector investment in 2019 was lower than forecast, creating base effects that have resulted in a rise in 2020 growth. Deterioration in the public finances and state-owned company balance sheets will constrain growth over the forecast period. South Africa’s sovereign risk premium is now assumed to remain elevated in 2020 and 2021. Assumptions used in the economic forecast 20172018 Percentage changeActual 2019 Estimate 202020212022 Forecast Global demand14.84.4 International commodity prices2 Brent crude oil (US$ per barrel)54.871.0 Gold (US$ per ounce)1 257.71 269.3 Platinum (US$ per ounce)950.4880.7 Coal (US$ per ton)84.1103.7 Iron ore (US$ per ton)71.267.0 3.4 64.1 1 392.8 863.7 80.0 91.6 4.14.14.0 59.456.155.1 1 571.61 599.31 618.6 990.01 012.61 037.0 73.470.971.8 83.573.567.2 Food inflation6.93.6 3.4 4.24.14.5 Sovereign risk premium3 (percentage2.73.1 point) Real public corporation investment-11.7-12.5 3.2 -2.3 3.43.13.0 1.71.32.1 1. Combined growth index of South Africa's top 15 trading partners (IMF World Economic Outlook, January 2020) 2. Bloomberg futures prices at 5 February 2020 3. The JP Morgan EMBI South African Global Spread is used as an estimate of the risk premium. It is calculated as the difference between the yield on the US dollar-denominated South African debt, and an interpolated US Treasury curve Source: National Treasury, Bloomberg, Statistics South Africa

2020 BUDGET REVIEW Figure 2.5 GDP growth scenarios Source: National Treasury Forecast trends Real GDP growth declined by 0.6 per cent in the third quarter of 2019, with six of the 10 production sectors contracting sharply. Drought, subdued global and domestic demand, high production costs and unreliable power supply contributed to the decline. Annual electricity sector production declined by 1.4 per cent in 2019. Eskom’s energy availability factor, which measures the ratio of available power to the maximum amount that could be produced on a scale of 100, fell from an average of 71.8 in 2018 to 67 in 2019 – and below 60 in December 2019. A range of factors contributed to the decline, including operational failures at Medupi and Kusile, unreliable coal and diesel supply, and weather-related problems. Six of 10 production sectors contracted in the third quarter of 2019 Scheduled power cuts are expected to persist over the next 18 months as Eskom conducts urgent maintenance. 12 to Household consumption Imports Gross fixed-capital formation Exports Per cent Per cent 18 Figure 2.6 Growth by expenditure, 2019*Figure 2.7 Growth by sector, 2019* Finance, real estate and business services General governmentGeneral government services Personal services1.1 Transport, storage and communication Trade, catering and accommodation Manufacturing Electricity, gas and water Mining and quarrying Construction Agriculture, forestry and fishing -1.5 -1.0 -0.5 0.0 0.5 1.0 1.5 2.0 -10 -8 -6 -4 -2 0 2 4 *First three quarters of 2019 Source: Reserve Bank and National Treasury 1.5 1.1 0.0 -0.7 -1.2 -0.1 2.6 1.5 0.8 0.1 -1.4 -2.2 -2.6 -9.1
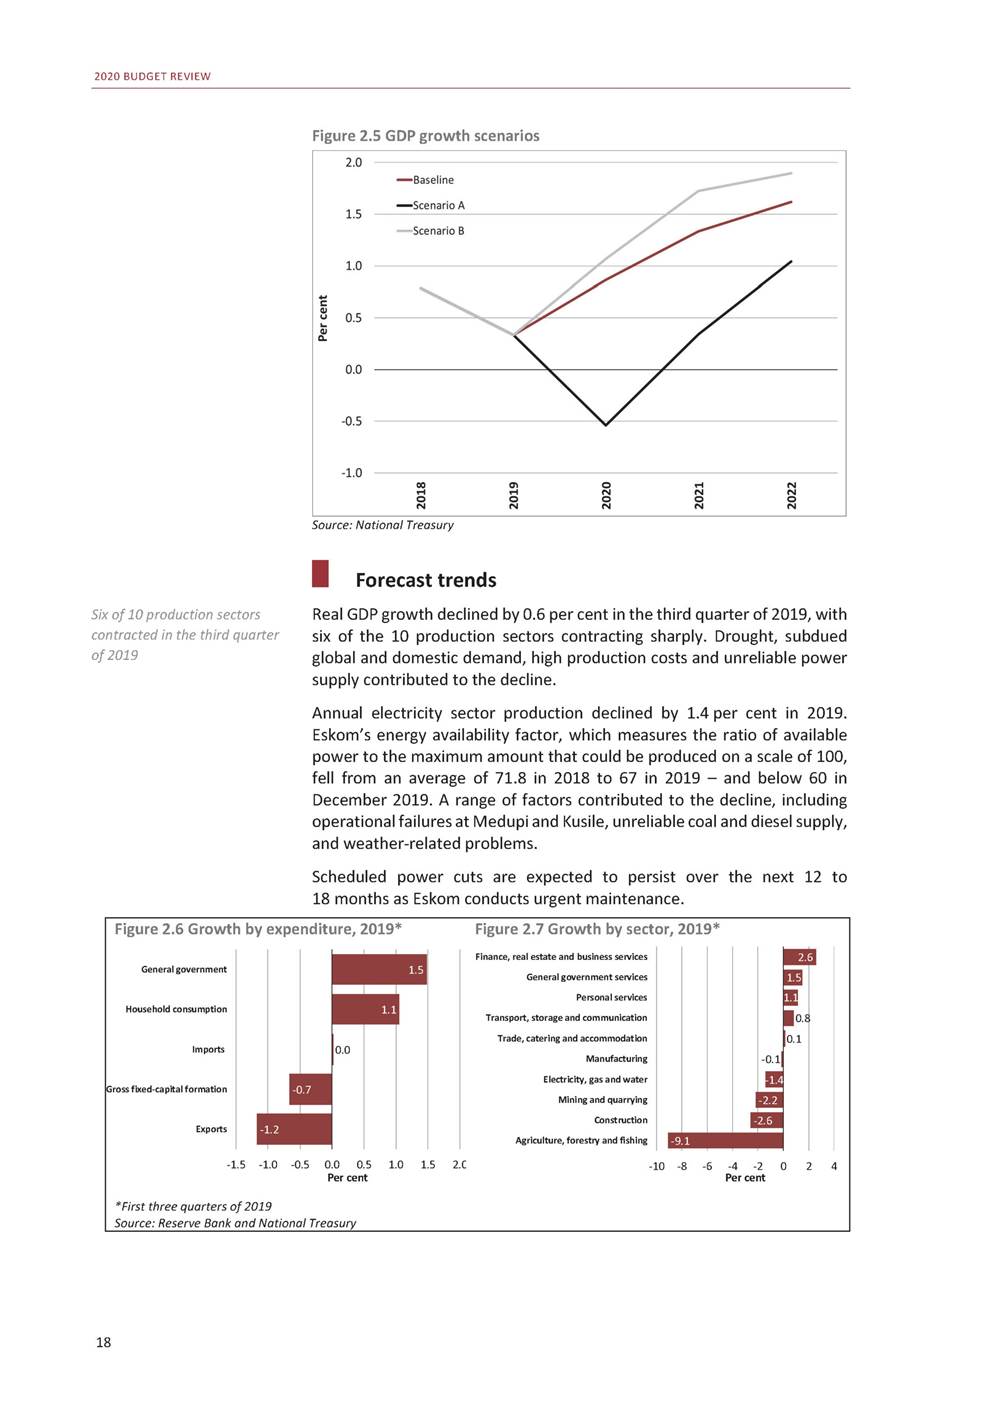
CHAPTER 2: ECONOMIC OUTLOOK Consumption Household consumption growth averaged 1.1 per cent in the first nine months of 2019, down from 2.1 per cent in the same period of 2018. This was a result of weaker employment, low growth in disposable income, fragile consumer confidence and high administered prices. The consumer confidence index remained at -7 index points in the second half of 2019, its lowest level since late 2017. Real disposable income growth decelerated sharply in the third quarter to 0.1 per cent as nominal compensation growth slowed in line with moderating inflation. Annual growth in credit extended to households, which averaged 6.4 per cent in 2019 compared to 4.6 per cent in 2018, continued to support consumption. Reductions in the prime lending rate have not been fully matched by declining debt-service costs. This is likely driven by debt growth outpacing growth in disposable income, and by rapid growth in costly unsecured credit (10.2 per cent), compared with growth in secured credit (5.3 per cent). Over the next three years, household consumption is expected to recover gradually. A sustained increase in consumption requires faster growth in economic activity, employment and net wealth, and a reduction in household debt. Household consumption growth averaged 1.1 per cent in first nine months of 2019 Credit supporting household consumption as income growth remains low Employment Job creation and wage growth are not easily achievable in the context of low economic growth. In 2019, formal non-agricultural employment fell 0.7 per cent, bringing total employment to 11.3 million people. Annual private-sector wage growth per worker was just 2.4 per cent in the first nine months of 2019, compared with public-sector wage growth of 7.2 per cent. Total wage growth has outpaced profit growth since 2008. Just 11.3 million people had formal, non-agricultural jobs in 2019 Investment Investment contracted by 0.7 per cent in the first nine months of 2019, due to slowing private-sector investment growth and continued contractions in public investment. Weak balance sheets have contributed to pervasive capital underspending, and the winding down of construction activity at Medupi and Kusile has also reduced investment. Growth in private-sector capital spending is expected to have declined from 2.1 per cent in 2018 to 1.7 per cent in 2019. Private-sector investment, which is expected to average 12.6 per cent of GDP in 2019, is forecast to recover moderately, reaching 12.8 per cent of GDP in 2022. This pattern will be supported by improved global growth, the need to replace capital stock and an uptick in confidence over the forecast period. Large investment projects, such as the renewable energy bid window 4 projects, provide further support. Although investment in state-owned companies is expected to remain constrained, initiatives such as the Infrastructure Fund are expected to crowd in private and public investment towards the end of the forecast period. Renewable energy projects and need to replenish capital stock expected to support private-sector investment 19
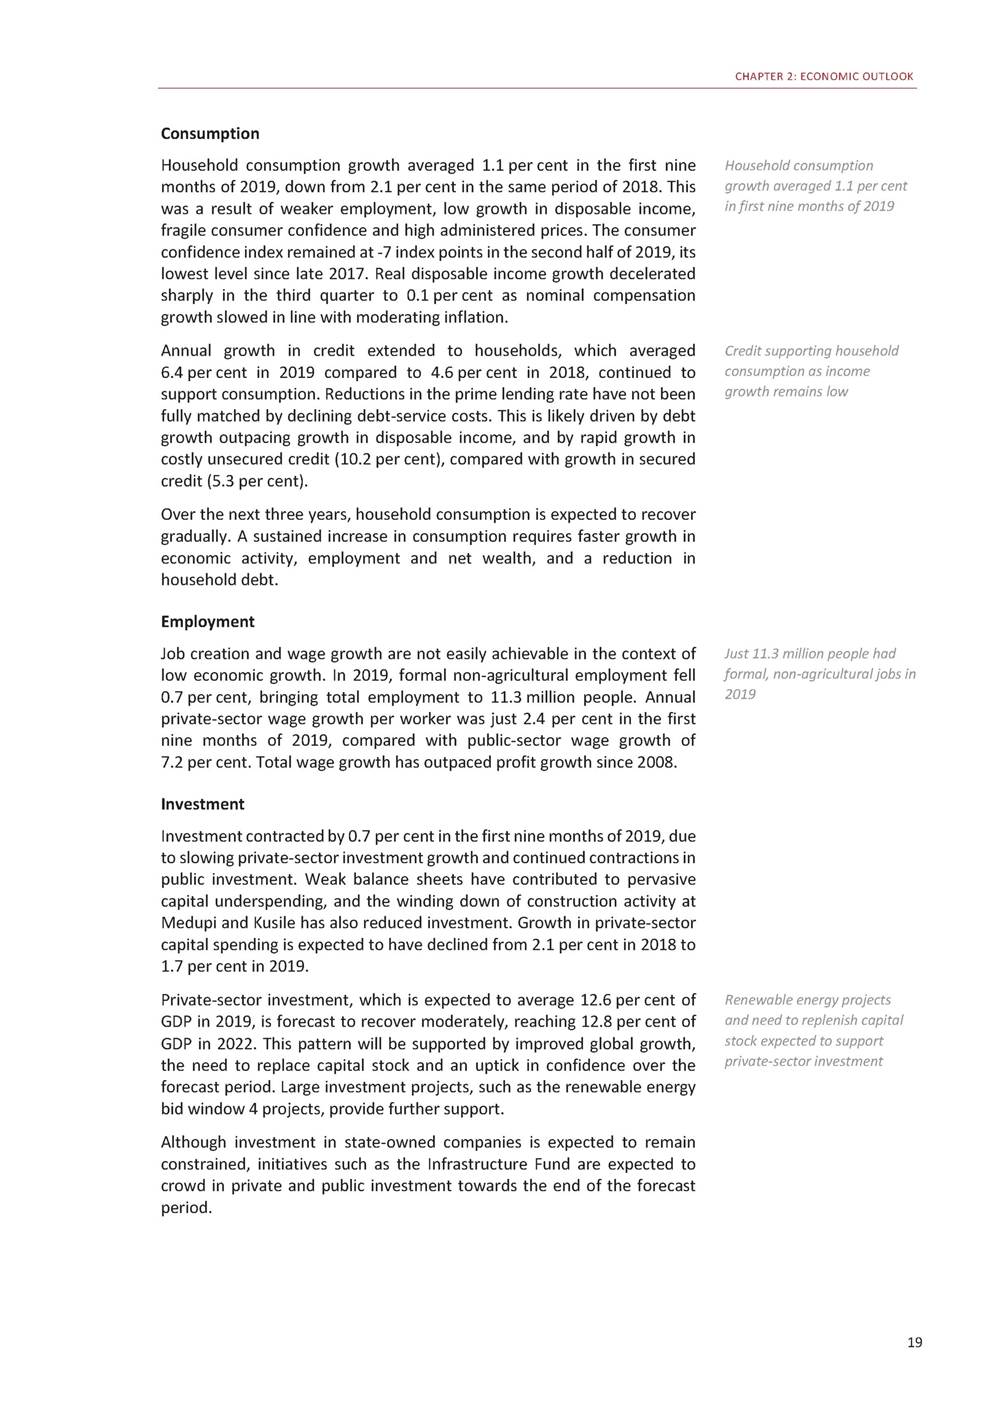
2020 BUDGET REVIEW Figure 2.8 Investment contribution Public corporations investment *Year to date Source: Statistics South Africa and National Treasury Balance of payments The current account deficit averaged 3.6 per cent of GDP in the first three quarters of 2019, as rising export prices offset the impact of declining export volumes. Net trade subtracted 0.3 percentage points from growth over the period, as exports contracted due to unreliable electricity supply and weak business conditions, while import growth slowed alongside domestic activity. The current account deficit is expected to average 3.5 per cent of GDP over the forecast period. Over the next three years, imports and exports are expected to grow gradually, in line with investment and consumption trends. Portfolio inflows are expected to fund the majority of the current account deficit over the medium term, although the President’s investment drive should help to raise direct investment. To some extent, low interest rates in the US and Europe are expected to encourage savers in these countries to invest in South Africa, which offers comparatively higher interest rates. Current account deficit forecast to average 3.5 per cent of GDP Inflation Weak domestic demand continues to limit firms’ ability to pass higher prices on to consumers – a trend reinforced by low global inflation. Consumer price index (CPI) inflation and core inflation averaged 4.1 per cent in 2019. CPI inflation is expected to rise to 4.5 per cent in 2020, mainly due to rising meat and electricity prices, and is forecast to remain about 4.6 per cent over the medium term. Inflation expectations remain well-anchored. There is a risk that higher administered prices and exchange-rate depreciation could put upward pressure on inflation. Downward pressure could emanate from weaker-than-expected global inflation and continued pressure on retailer margins. Low domestic inflation reinforced by weak demand and low global inflation 20 Percentage points contribution to investment 2008 2009 2010 2011 2012 2013 2014 2015 2016 2017 2018 *2019 Per cent of GDP 1525 10 520 0 -515 -10 Total investment as a share of GDP (RHS) -1510 Pr ivate investment General government investment
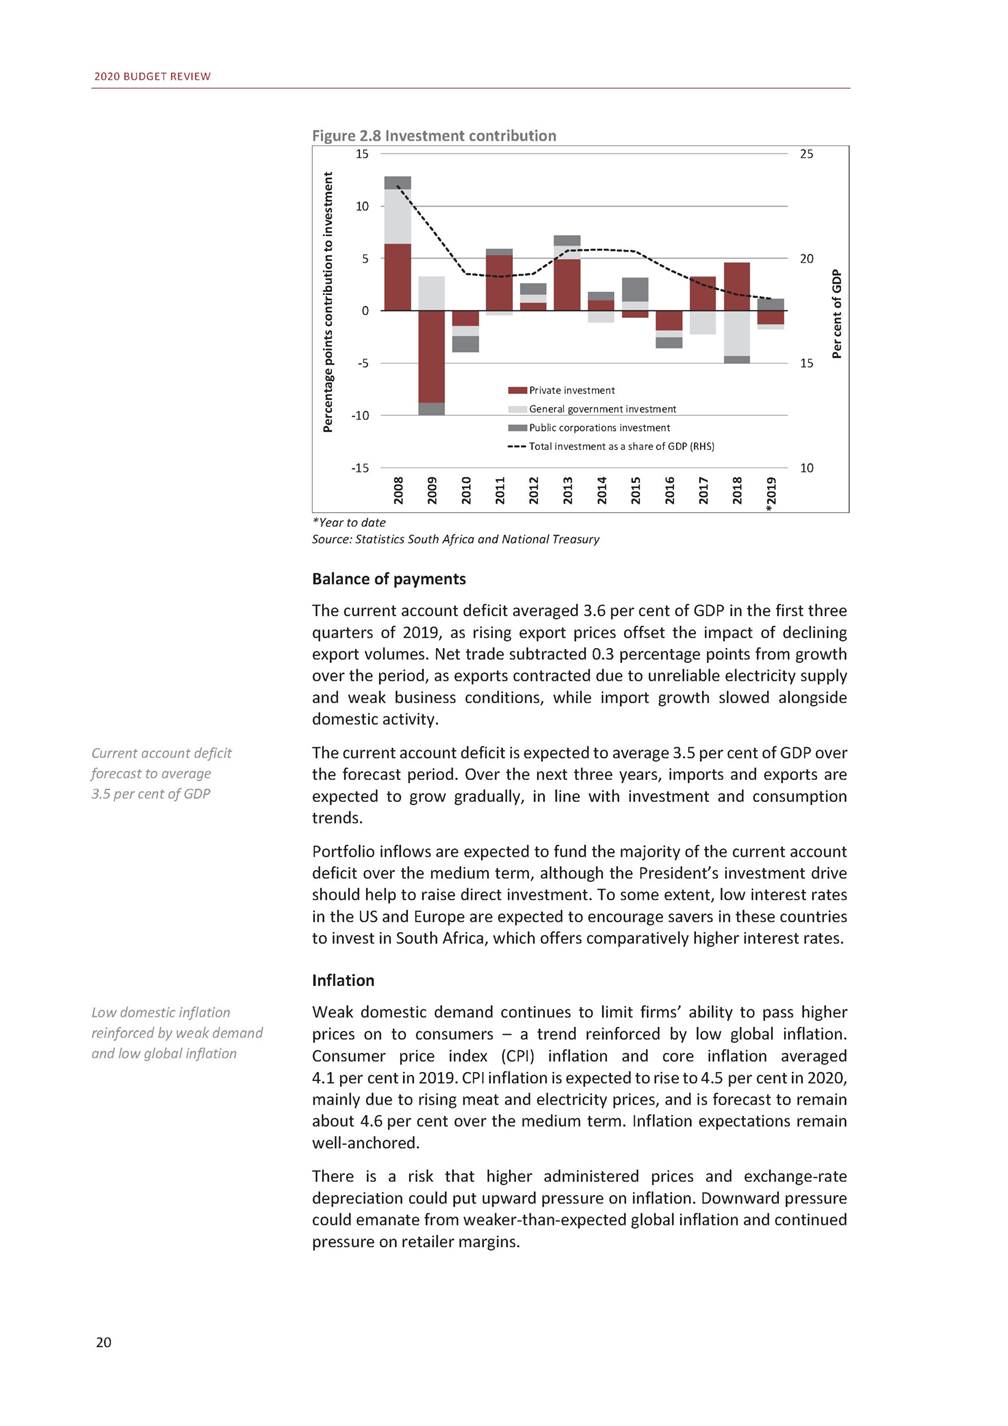
CHAPTER 2: ECONOMIC OUTLOOK Water supply Assessment rates Core goods Core services 12 lnflation target - upper band lnflation target - lower band Sector performance Mining Mining production contracted by 2.2 per cent in the first three quarters of 2019 compared with the same period a year earlier. Strikes, electricity shortages and weaker Chinese and Indian growth mean the sector is likely to contract for a second consecutive year. Production is likely to remain constrained over the medium term amid low confidence, insufficient demand, difficulties securing water for operations and electricity supply cuts. Strikes, electricity shortages and lower Chinese demand may result in mining contraction Agriculture Agricultural production is expected to contract for the second consecutive year in 2019 as a result of drought conditions and outbreaks of foot-and-mouth disease. Production fell by 9.1 per cent in the first three quarters of 2019 compared with the same period in 2018. Weather conditions in late 2019 suggest higher crop output in 2020, although non-tariff barriers and policy uncertainty remain challenges over the medium term. Agricultural production expected to contract again in 2019 due to drought and disease Manufacturing Manufacturing production contracted by 0.1 per cent in the first three quarters of 2019 compared with the same period in 2018. Food and beverages, and vehicles were the only components to raise output. Manufacturing exports grew by 6.8 per cent over the same period. Manufacturing performance is likely to remain subdued over the next few years as high operating costs and electricity shortages weigh on demand. Financial and business services Over the first three quarters of 2019, real value added in financial and business services grew by 2.6 per cent relative to the same period in 2018, in line with its long-term average. However, this sector has been losing momentum as activity continues to slow across the economy. Financial and business services still growing, but losing momentum Construction Real value added in construction contracted 2.6 per cent in the first three quarters of 2019. Moderate government spending and weak economic conditions will continue to act as a drag on construction activity, although 21 Per cent 2014 2015 2016 2017 2018 2019 Per cent 2014 2015 2016 2017 2018 2019 Figure 2.9 Core inflationary pressuresFigure 2.10 Administered price inflation 18 9 15 Core inflation 6 9 3 6 3 0 0 Source: Statistics South Africa Electricity Inflation target upper bound
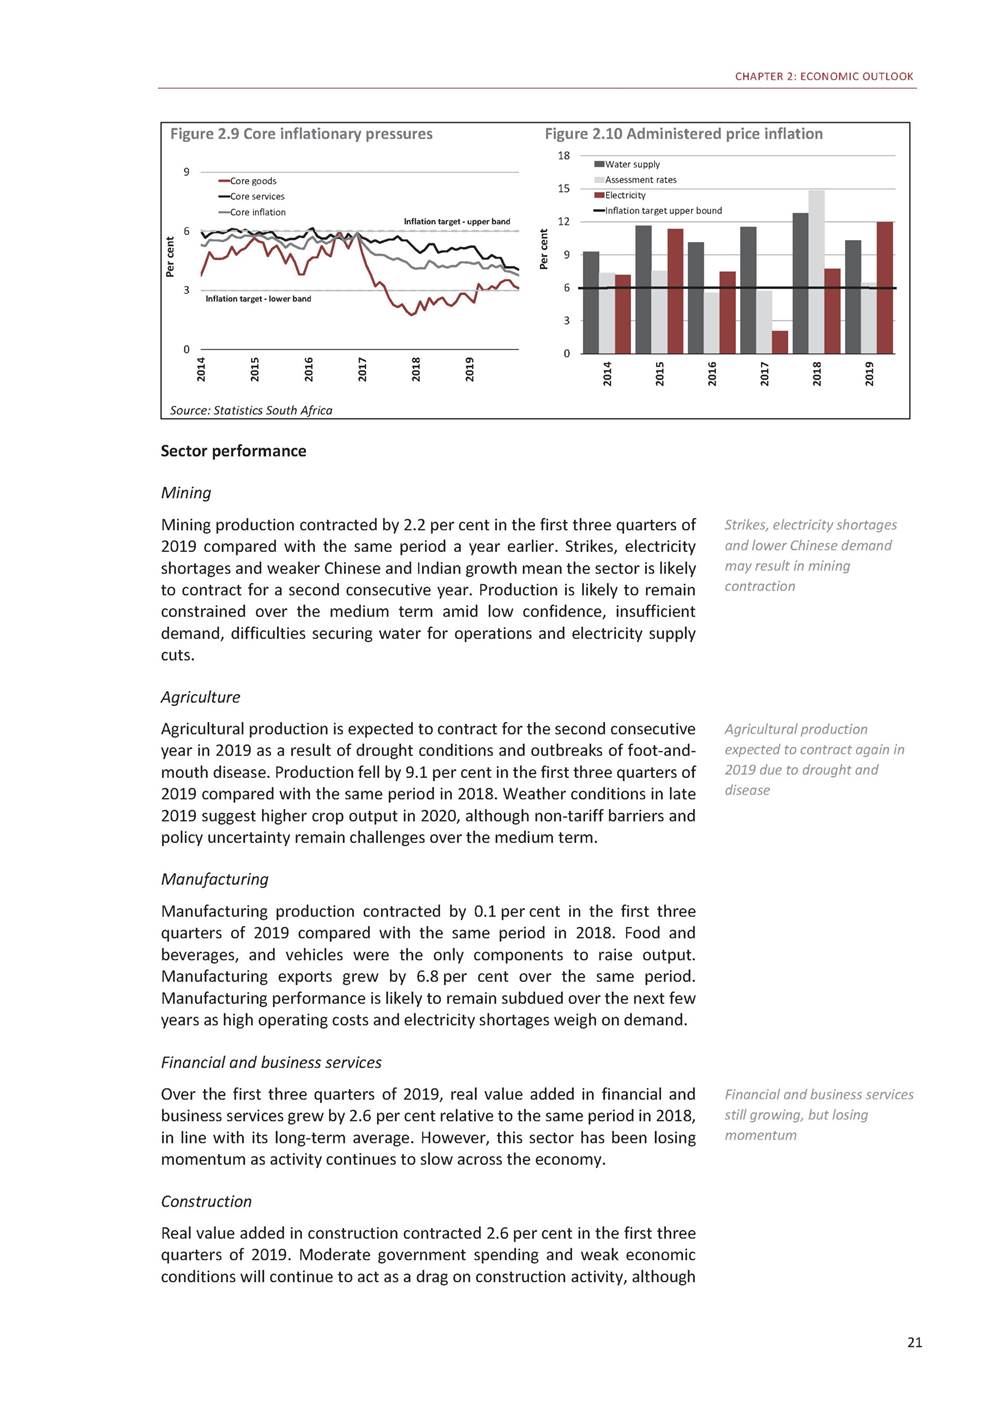
2020 BUDGET REVIEW the Infrastructure Fund project pipeline, which is valued at over R700 billion, should support activity over the longer term. Transport and telecommunications In the first three quarters of 2019, real value added in the transport and telecommunications sector increased by 0.8 per cent compared to the same period in 2018. Over the next few years, the sector is expected to grow more quickly due to the expansion of spectrum allocation, although load-shedding may negatively affect existing infrastructure. Spectrum allocation expected to benefit transport and telecommunications Table 2.3 Sector performance 20191 Percentage change 2014 2015 2016 2017 2018 Agriculture, forestry and fishing Mining and quarrying Manufacturing Electricity, gas and water Construction Trade, catering and accommodation Transport, storage and communication Finance, real estate and business services General government services Personal services Gross domestic product 6.8 -1.7 0.3 -1.0 3.5 1.4 3.5 2.7 3.2 1.8 1.8 -5.9 3.3 -0.4 -1.9 1.8 2.1 1.4 2.1 0.8 0.9 1.2 -10.1 -3.9 0.8 -2.1 1.2 1.7 1.1 1.9 0.6 1.8 0.4 21.1 4.2 -0.2 0.6 0.6 -0.3 1.4 2.1 0.3 1.3 1.4 -4.8 -1.7 1.0 0.9 -1.2 -0.6 1.6 1.8 1.3 1.0 0.8 -9.1 -2.2 -0.1 -1.4 -2.6 0.1 0.8 2.6 1.5 1.1 0.3 1. First three quarters Source: Statistics South Africa Conclusion Low levels of economic growth are forecast over the medium term. Efforts to reform the electricity sector and draw in private investment, alongside reforms in other network industries, should improve the growth outlook. 22
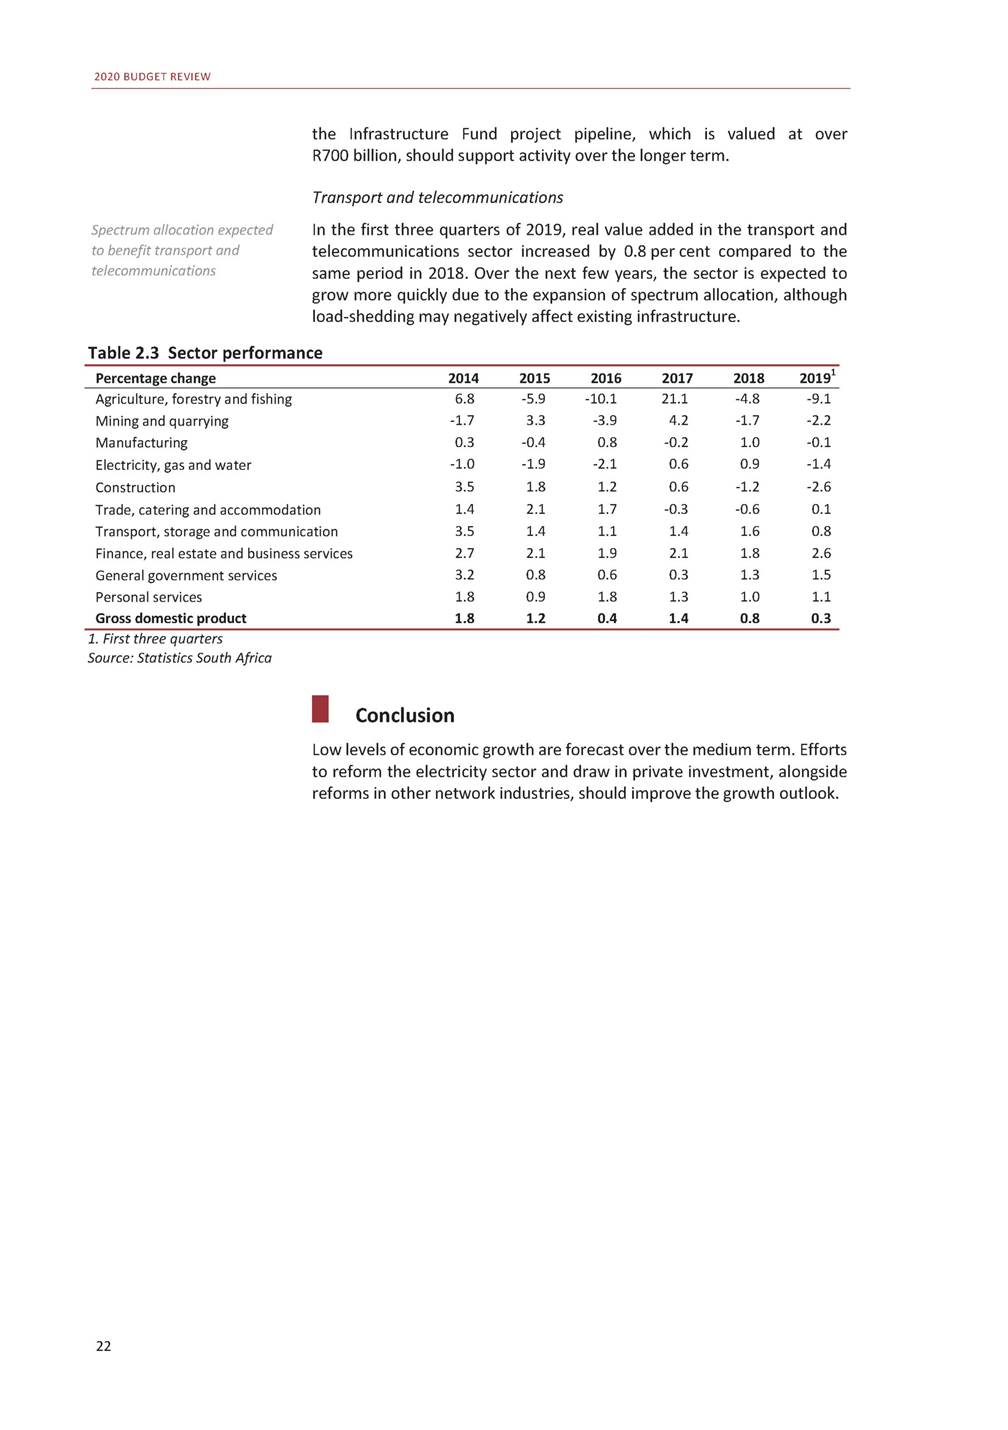
3 Fiscal policy Overview Iestimates. Adding to fiscal pressures, requests for support from n recent months, economic growth has continued to decline. As a result, tax revenue is expected to be significantly lower than the 2019 MTBPS financially distressed state-owned companies have increased. The 2019 MTBPS proposed achieving a main budget primary balance, excluding financial support to Eskom, by 2022/23. This target is now out of reach, and debt is not expected to stabilise over the medium term. Table 3.1 Macroeconomic performance and projections Source: National Treasury 23 2016/172017/182018/19 Percentage changeActual 2019/20 Estimate 2020/212021/222022/23 Forecast Real GDP growth0.81.30.6 Nominal GDP growth7.16.34.7 CPI inflation6.34.74.6 0.6 4.8 4.2 0.91.41.7 5.36.16.4 4.44.64.6 GDP at current prices (R billion)4 419.44 698.74 921.5 5 157.3 5 428.25 759.06 126.3 In brief •The economic and revenue outlook has deteriorated since the 2019 Medium Term Budget Policy Statement (MTBPS). As a result, gross national debt is expected to increase to 71.6 per cent of GDP by 2022/23. •Government remains committed to achieving fiscal sustainability, measured as stabilisation of the debt-to-GDP ratio, by moderating spending as a share of GDP and reducing the wage bill as a share of overall spending. •Relative to last year’s Budget, the 2020 Budget proposes net non-interest spending reductions totalling R156.1 billion over the medium-term expenditure framework (MTEF) period. •These measures narrow the consolidated deficit from 6.8 per cent of GDP in 2020/21 to 5.7 per cent in 2022/23. •Departments remain within published spending limits, showing budget discipline. But slowing growth and extra-budgetary pressures from state-owned companies in particular have widened the budget deficit.
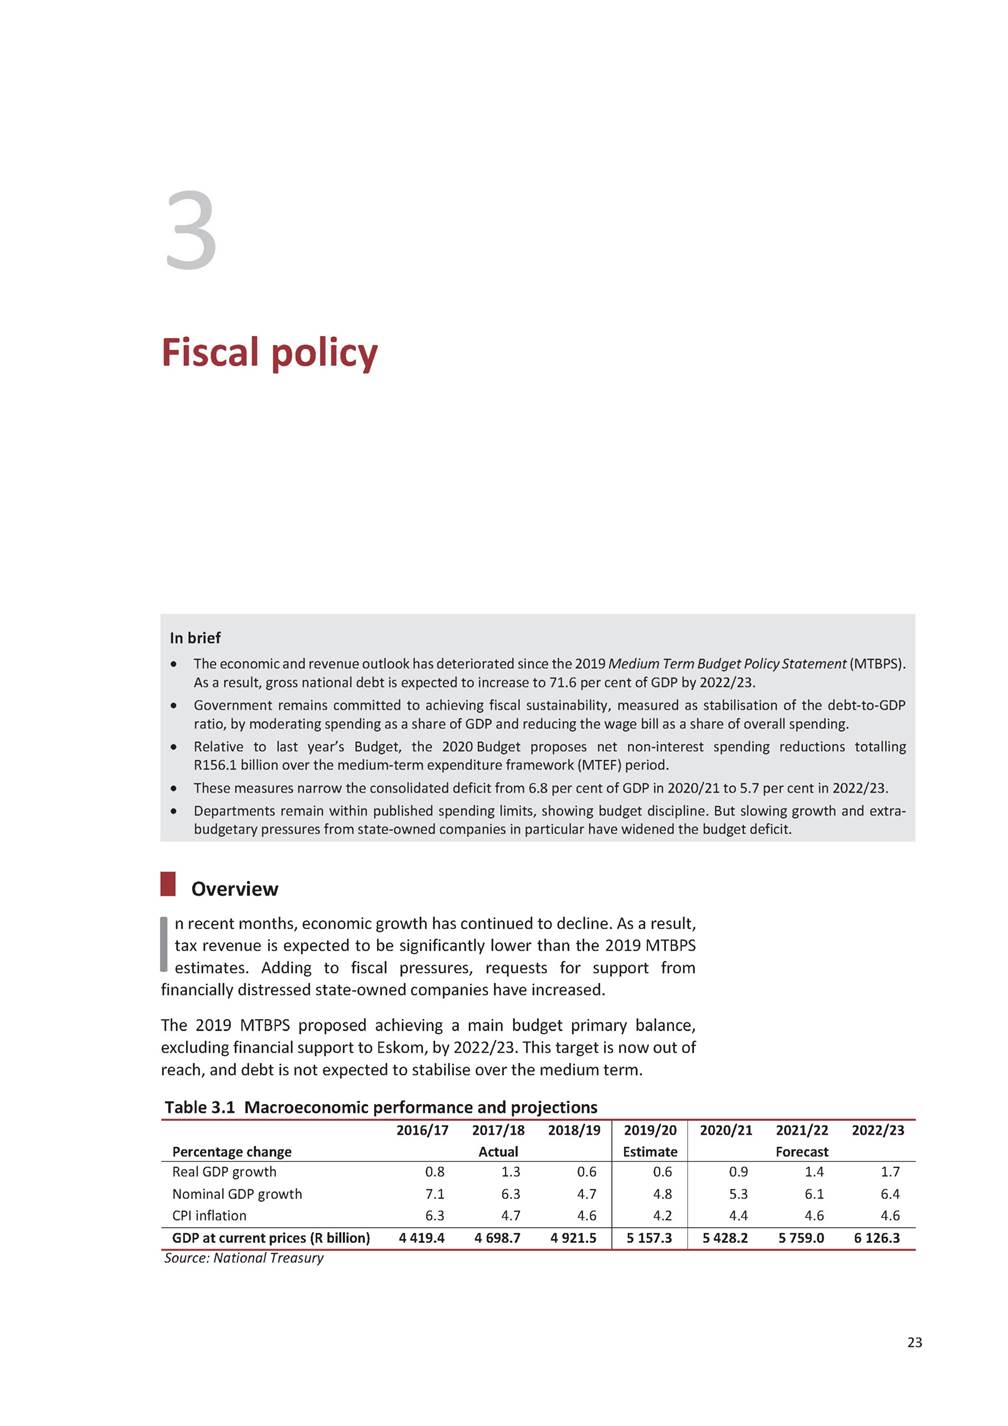
2020 BUDGET REVIEW Large downward revision of nominal GDP plays a central role in fiscal outlook The fiscal challenge – a widening gap between revenue and expenditure – is clearly indicated in Figure 3.1. Revenue remains broadly stable at about 26 per cent of GDP. Expenditure has grown as a share of GDP since 2007/08. The spike in the ratio in 2019/20 reflects lower economic growth, a significant increase in support to state-owned companies and a downward revision to nominal GDP. To contain the budget deficit and move towards debt stabilisation, the 2020 Budget proposes a significant reduction in government expenditure growth, mainly as a result of lower growth in the public-service wage bill. These steps will moderate spending as a share of GDP and improve the composition of expenditure, but will not stabilise debt. Options to increase taxes are limited in the current economic environment. Along with faster economic growth, fiscal sustainability requires targeted reduction of specific programmes, and firm decisions to rein in extra-budgetary pressures, including reform of state-owned companies and the Road Accident Fund. Further across-the-board spending cuts that affect core government programmes would severely harm service delivery. Firm decisions required to reform state-owned companies and Road Accident Fund Changes in tax revenue and expenditure Tax revenue Tax revenue estimates for the current year have been revised down by R10.7 billion compared with 2019 MTBPS estimates. In addition, government has chosen not to apply additional revenue measures of R10 billion for next year that were projected in last year’s budget. Lower revenue collection has a knock-on effect, reducing projections over the three-year spending period ahead. Table 3.2 Revised gross tax revenue projections R billion 2019/20 2020/21 2021/22 2022/23 2019 MTBPS Revised estimate Deviation against 2019 MTBPS 1 369.7 1 358.9 -10.7 1 460.9 1 425.4 -35.4 1 555.7 1 512.2 -43.5 1 658.2 1 609.7 -48.5 Source: National Treasury 24 Figure 3.1 Main budget revenue and expenditureFigure 3.2 Main budget deficit* *Figures may differ from Table 3.7 due to rounding Source: National Treasury

CHAPTER 3: FISCAL POLICY No further changes to tax rates are assumed in revenue projections, except annual adjustments in personal income tax brackets, levies and excise duties in line with inflation. These assumptions result in tax revenue projections that are lower than the 2019 MTBPS estimates by R35.4 billion in 2020/21, R43.5 billion in 2021/22 and R48.5 billion in 2022/23. Main budget non-interest expenditure adjustments After the 2019 Budget, two additional spending pressures emerged. First, government increased support to financially distressed state-owned companies by R60.1 billion over the MTEF period. Over the next three years, government will transfer R112 billion to Eskom to enable the utility to meet its short-term financial obligations. An amount of R16.4 billion has been set aside for South African Airways (SAA) to repay guaranteed debt and interest costs. Second, government largely reversed the savings from early retirement and other interventions. The 2019 MTBPS proposed to reduce goods and services, current transfers and capital baselines, and reprioritise funds towards critical priorities. The 2020 Budget takes the additional step of reducing the wage bill by R160.2 billion over the next three years. Net reductions to main budget non-interest spending from the 2019 Budget to the 2020 Budget total R156.1 billion over the MTEF period. Since 2019 Budget, government has agreed to large increases in transfers to Eskom and SAA Table 3.3 Adjustments to main budget non-interest expenditure since 2019 Budget 1. Includes reversal of savings from wage bill measures and national macro-reorganisation of government, adjustments due to lower CPI and early retirement savings in police Source: National Treasury In aggregate, these measures are expected to narrow the consolidated budget deficit from 6.8 per cent of GDP in 2020/21 to 5.7 per cent of GDP in 2022/23. Gross national debt is estimated to increase from 65.6 per cent of GDP in 2020/21 to 71.6 per cent of GDP in 2022/23. 25 R million2020/212021/222022/23 MTEF total 2019 Budget non-interest expenditure1 545 5001 653 0771 736 538 Skills development levy adjustments-1 025-1 722-500 Change in contingency reserve-1 000-1 000-1 000 Baseline reductions and reallocations-66 045-88 149-106 801 Programme baseline reductions-28 238-33 219-39 341 Wage bill reductions-37 807-54 929-67 460 Baseline allocations59 29329 98121 843 Financial support for state-owned companies44 04214 3091 777 Net change in adjustments announced in 20197 7537 62011 953 Budget1 Programme allocations7 4998 0518 113 4 935 115 -3 246 -3 000 -260 995 -100 798 -160 196 111 117 60 128 27 326 23 663 2020 Budget non-interest expenditure1 536 7241 592 1861 650 080 4 778 991 Change in non-interest expenditure since 2019 Budget-8 776-60 890-86 458 -156 124
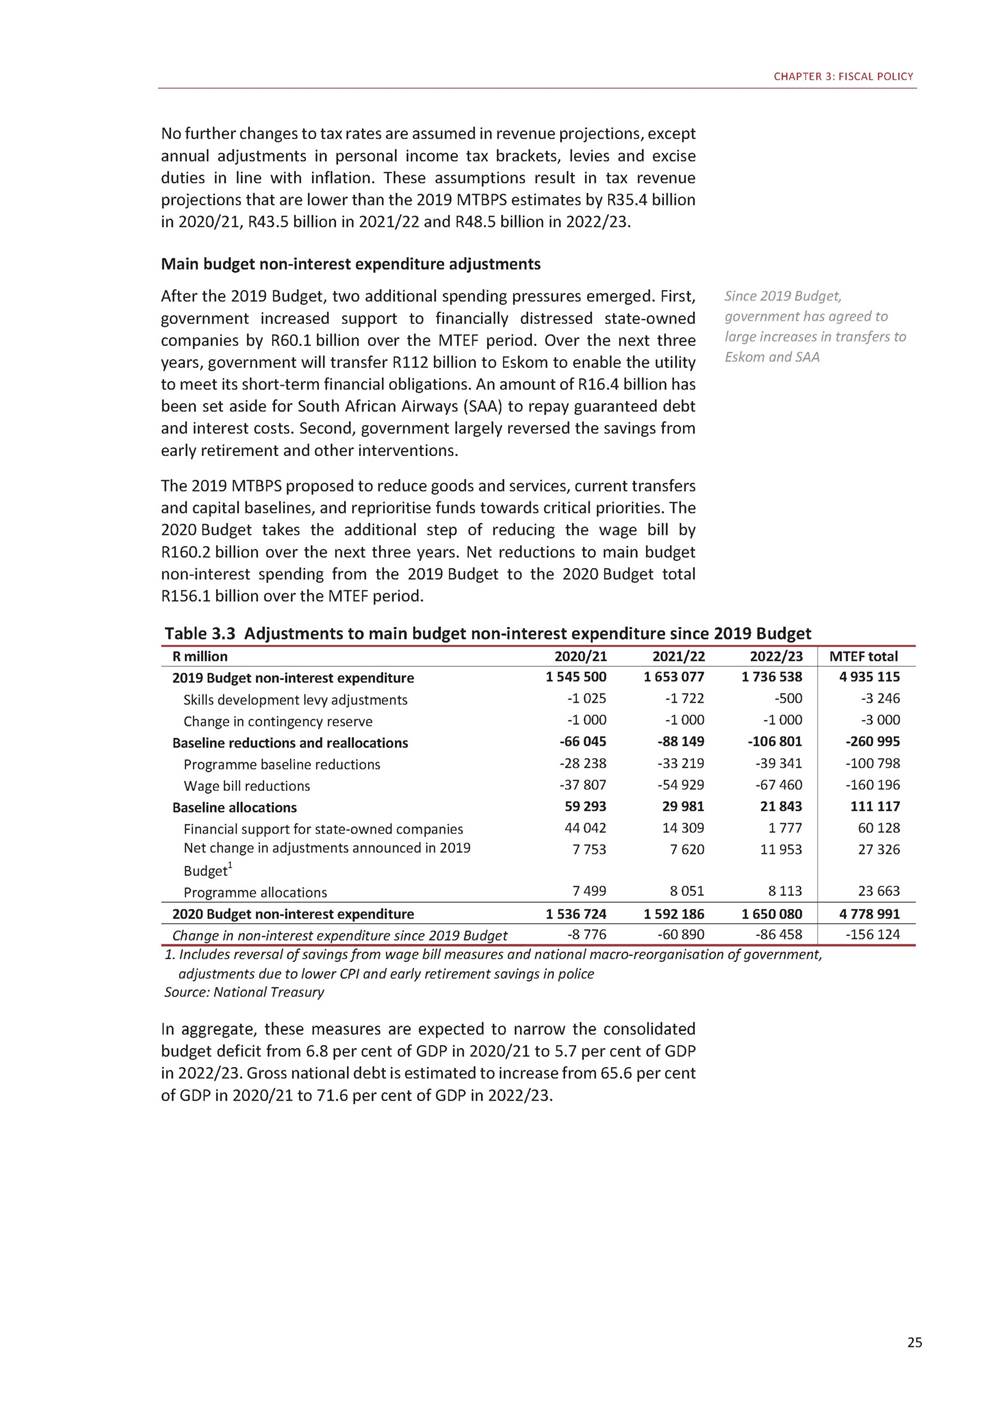
2020 BUDGET REVIEW Table 3.4 Consolidated fiscal framework Source: National Treasury Achieving fiscal sustainability Achieving fiscal sustainability requires public spending levels to be closely aligned with the revenue-raising potential of the economy. In 2012, government introduced the main budget expenditure ceiling, with the goal of controlling spending growth and stabilising debt. Between 2013/14 and 2018/19, in response to lower economic and revenue growth, government repeatedly reduced the expenditure ceiling. Most of the reductions were applied to goods and services and capital budgets, while leaving the wage bill relatively unchanged. Current transfers have grown as a result of increased support for higher education and larger Unemployment Insurance Fund payments. As a result, the composition of spending has moved away from capital towards consumption. Spending discipline within national and provincial departments introduced by the expenditure ceiling has not translated into debt stabilisation. Figure 3.3 Composition of consolidated government spending* Composition of spending has moved away from capital towards consumption *For selected years Source: National Treasury In recent years, financial demands from state-owned companies – especially Eskom – have mounted, even as economic growth and revenues 26 2016/172017/182018/19 Outcome R billion/percentage of GDP 2019/20 Revised estimate 2020/212021/222022/23 Medium-term estimates Revenue1 285.61 351.41 445.4 29.1%28.8%29.4% 1 517.0 29.4% 1 583.91 682.81 791.3 29.2%29.2%29.2% Expenditure1 442.61 541.91 642.8 32.6% 32.8%33.4% Non-interest expenditure1 286.01 368.91 450.6 29.1%29.1%29.5% 1 843.5 35.7% 1 628.5 31.6% 1 954.42 040.32 141.0 36.0%35.4%34.9% 1 715.01 771.61 840.3 31.6%30.8%30.0% Budget balance-157.0-190.5-197.4 -3.6%-4.1%-4.0% -326.6 -6.3% -370.5-357.5-349.7 -6.8%-6.2%-5.7%
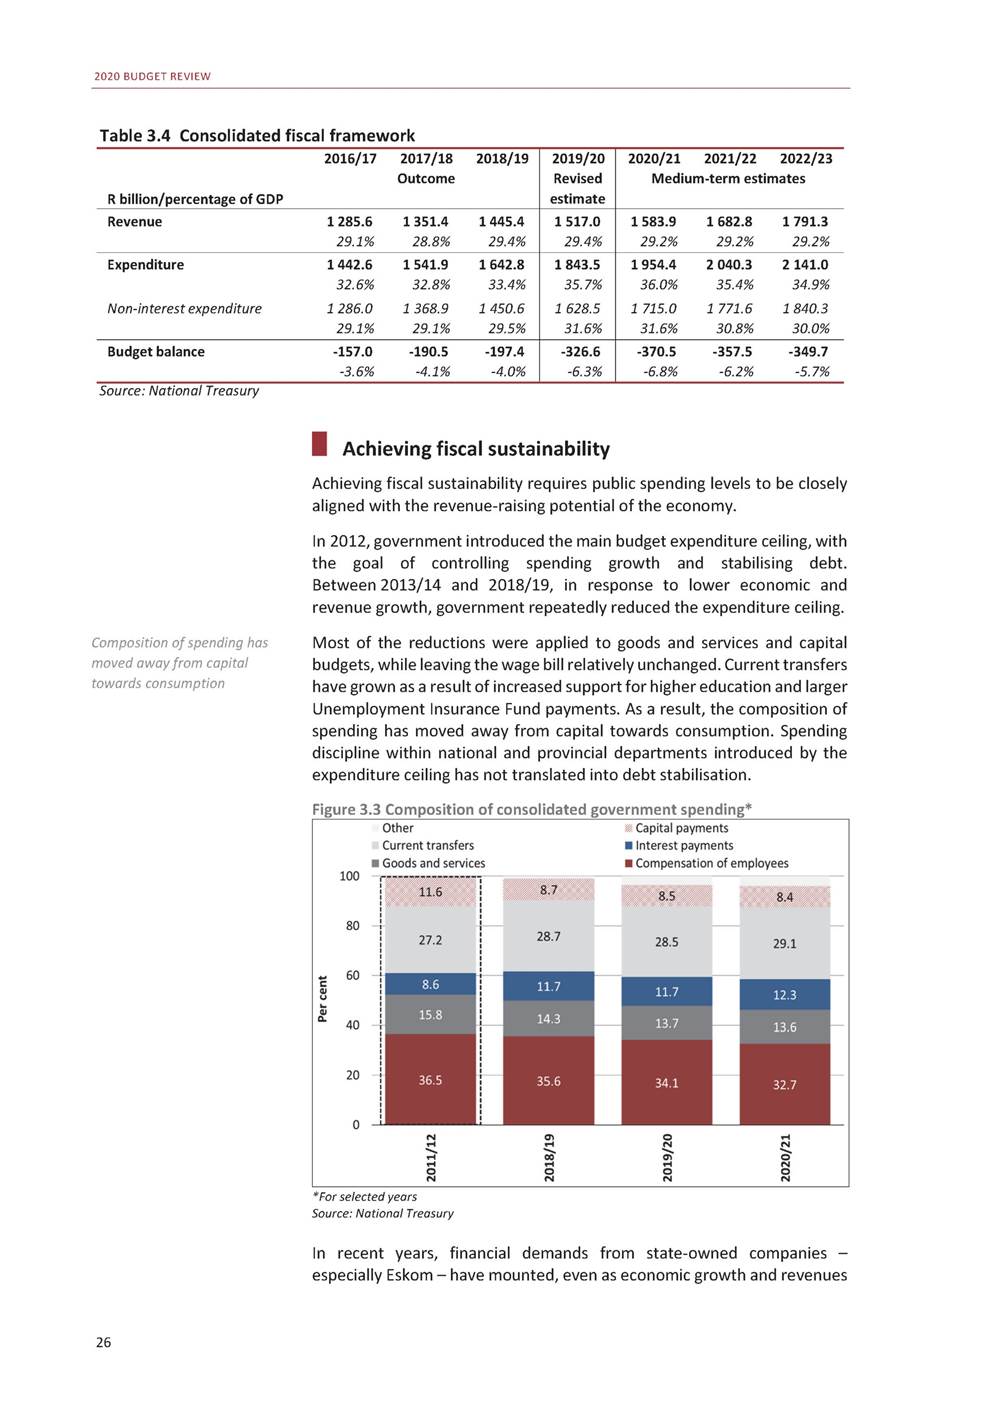
CHAPTER 3: FISCAL POLICY have fallen short of projections. As a result, the deficit has increased and additional resources have been prioritised away from national and provincial departments towards state-owned companies. Table 3.5 Main budget expenditure ceiling, budgeted estimates and outcomes 1. Outer year baselines announced in MTBPS 2014 to MTBPS 2018 Source: National Treasury Reducing wage bill growth From the mid-2000s, a series of wage policy reforms and generous wage settlements increased compensation spending as a share of consolidated spending. Public-service compensation has grown by about 40 per cent in real terms over the past 12 years, and remuneration growth is increasingly out of line with the rest of the economy. The wage bill remains the largest component of spending by economic classification. The 2019 Budget announced wage-bill measures amounting to R27 billion over the 2019 MTEF period. These included provision for early retirement and savings from the national macro-reorganisation of government. Take-up of the early retirement initiative has been slower than anticipated, and only the Department of Police has finalised implementation during 2019/20. Other departments have submitted proposals, which are being processed and may result in further adjustments to baselines. At this stage, the anticipated savings have been largely reversed. The 2020 Budget proposes a reduction in the compensation budgets of national and provincial departments, and entities that receive transfers directly from national government. These reductions amount to R37.8 billion in 2020/21, R54.9 billion in 2021/22 and R67.5 billion in 2022/23. The revised amounts will guide government in forthcoming talks in the Public Service Co-ordinating Bargaining Council. These reductions can be achieved through a combination of modifications to cost-of-living adjustments, pay progression and other benefits. Wage bill growth outside the public service is also contributing to fiscal pressure. During 2020, government will legislate a remuneration framework for public entities and state-owned companies. The framework will improve alignment of pay scales with the public service, and contain excessive salaries and other payments. Take-up of early retirement initiative has been slower than anticipated Excessive salaries at public entities to be addressed in new remuneration framework Fiscal framework The consolidated operating and capital accounts are summarised in Table 3.6. The consolidated deficit in 2019/20 has risen relative to the 2019 Budget estimate. This is mainly due to a larger main budget deficit, reflecting lower revenue and higher projected spending, and the estimated Consolidated deficit projected to narrow from 6.8 per cent of GDP in 2020/21 to 5.7 per cent in 2022/23 27 R billion2015/16 2016/17 2017/18 2018/19 2019/20 2020/21 2021/22 2022/23 Baselines announced in previous1 0911 1681 2501 354 budgets1 2019 Budget Review1 0751 1421 2251 310 2019 MTBPS1 1421 2251 307 2020 Budget Review1 0751 1421 2251 307 1 435 1 408 1 405 1 409 1 5241 630 1 5021 608 1 4931 5911 674 1 4581 5391 605 Outcomes / estimates compared-16-26-25-47 to original baselines -26 -66-91-69
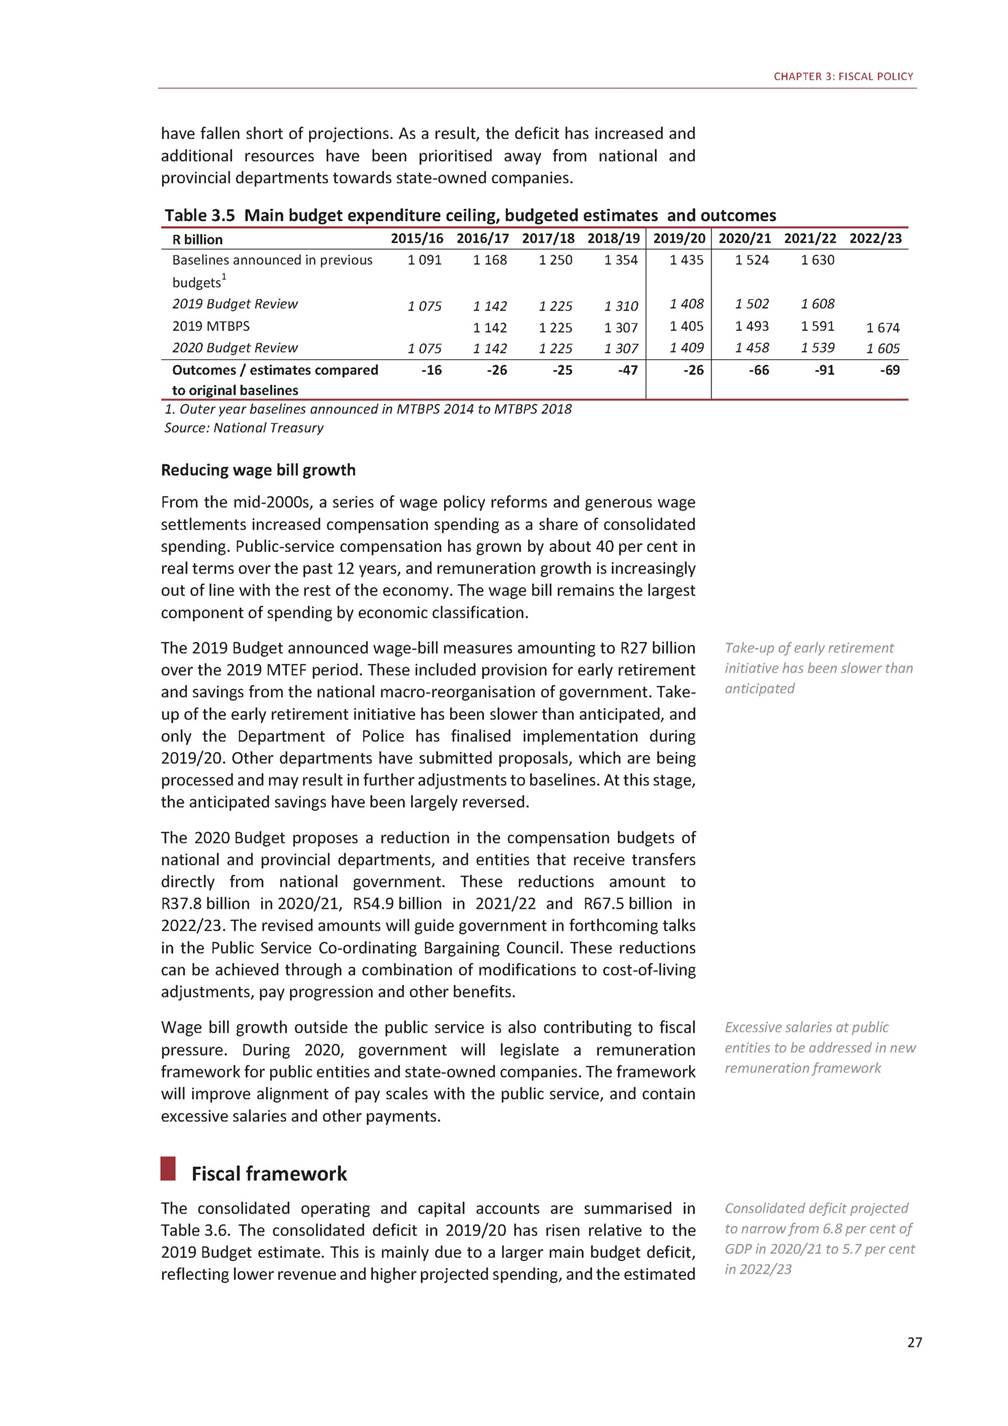
2020 BUDGET REVIEW deficit for social security funds. These deficits are partially offset by higher surpluses of public entities. Compared with the 2019 Budget, the consolidated deficit estimates for 2020/21 and 2021/22 are larger by an average of two percentage points. The consolidated deficit is projected to narrow from 6.8 per cent of GDP in 2020/21 to 5.7 per cent in 2022/23. Over the next three years, consolidated non-interest expenditure will contract at an annual real average rate of 0.4 per cent. This is largely the result of proposed reductions to the wage bill and other baseline spending. The consolidated wage bill is projected to grow largely in line with inflation in the two outer years of the MTEF period. While the share of the wage bill and of goods and services to total expenditure is projected to decline over the MTEF period, the share of current transfers will increase. Beginning in 2020/21, the composition of spending will improve over the medium term as capital budget reforms boost infrastructure spending and new projects are rolled out. Consolidated non-interest expenditure contracts at annual real average rate of 0.4 per cent over medium term Table 3.6 Consolidated operating and capital accounts 1. Balance of transactions in financial assets and liabilities Source: National Treasury The capital financing requirement, which is the sum of capital payments, transfers and receipts, is expected to remain in deficit at about 3 per cent of GDP over the MTEF period. Capital payments and transfers grow by a nominal annual average of 7.4 per cent over the next three years. The current deficit – the gap between revenue and current spending – is projected to narrow from 2.6 per cent of GDP in 2020/21 to 2.2 per cent of GDP in 2022/23. Financial transactions amount to R52.1 billion in 2019/20 and R61 billion in 2020/21. The majority of these amounts reflect financial support for Eskom and SAA. 28 2016/172017/182018/19 Outcome R billion/percentage of GDP 2019/20 Revised estimate 2020/212021/222022/23 Medium-term estimates OPERATING ACCOUNT Current revenue1 266.91 331.71 429.8 Current payments1 285.21 371.81 483.8 Compensation of employees511.7548.1584.8 Goods and services217.6221.3235.0 Interest payments156.5172.9192.2 Current transfers and subsidies399.4429.5471.9 1 503.6 1 622.0 629.2 251.7 215.0 526.1 1 571.01 674.41 782.0 1 712.11 811.11 915.0 638.9667.8697.1 265.1281.5288.5 239.5268.7300.7 568.7593.1628.7 Current balance-18.3-40.1-54.0 -0.4%-0.9%-1.1% -118.5 -2.3% -141.2-136.8-133.0 -2.6%-2.4%-2.2% CAPITAL ACCOUNT Capital receipts0.50.50.4 Capital payments79.177.469.9 Capital transfers69.872.373.4 0.3 82.8 73.5 0.30.30.3 92.1101.4109.0 71.578.784.7 Capital financing requirement-148.3-149.2-142.8 -3.4%-3.2%-2.9% -156.0 -3.0% -163.4-179.8-193.4 -3.0%-3.1%-3.2% Financial transactions19.7-1.1-0.5 Contingency reserve––– -52.1 – -61.0-36.0-18.3 5.05.05.0 Budget balance-157.0-190.5-197.4 -3.6%-4.1%-4.0% -326.6 -6.3% -370.5-357.5-349.7 -6.8%-6.2%-5.7%
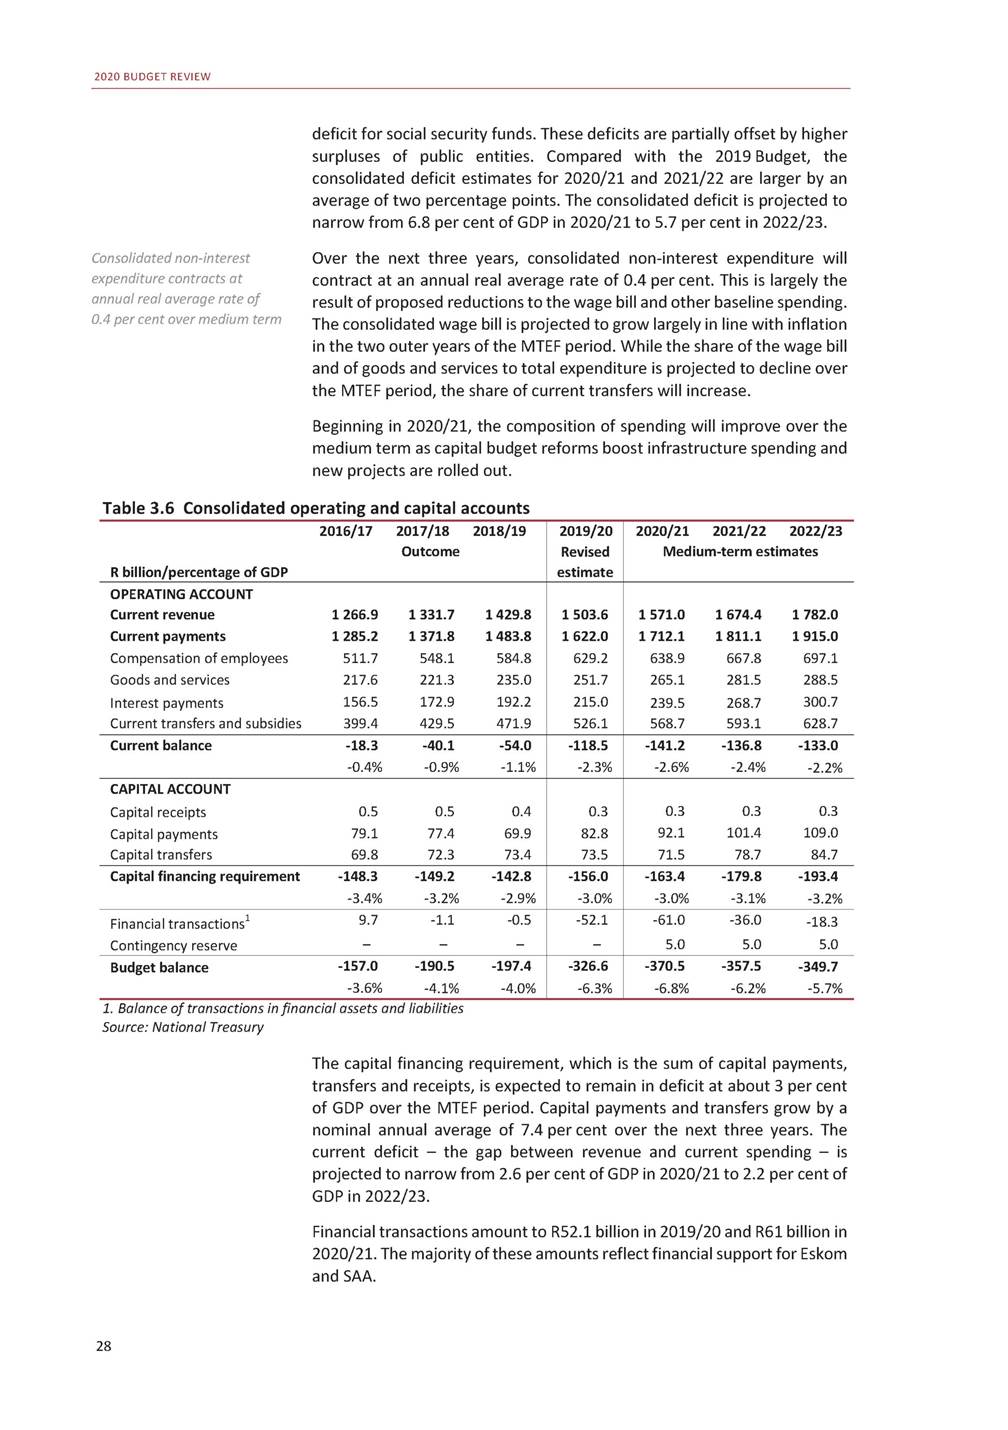
CHAPTER 3: FISCAL POLICY Figure 3.4 Average nominal growth in consolidated spending1 1. 2020/21 – 2022/23 Source: National Treasury Elements of the consolidated budget The consolidated budget includes the main budget framework and spending by provinces, social security funds and public entities financed from their own revenue sources. Main budget framework Spending financed from the National Revenue Fund is summarised in Table 3.7. The main budget deficit, forecast at 4.7 per cent in the 2019 Budget, reached 6.5 per cent of GDP in 2019/20. The deficit is expected to reach 6.8 per cent of GDP in 2020/21 before narrowing to 5.9 per cent of GDP in the outer year. Since the 2019 MTBPS, non-tax revenue has been revised upwards over the medium term, mainly due to higher projected interest on investments and the R3.5 billion in expected revenue from the sale of assets in 2020/21. The R7 billion projected revenue from the sale of non-core assets in 2019/20 has been reversed. Projections of National Revenue Fund receipts for the two outer years have declined significantly compared with 2019 MTBPS estimates due to lower revaluation profits on foreign currency transactions. Payments to the Southern African Customs Union are projected to decrease between 2020/21 and 2021/22, mainly due to estimated error adjustment of overpayments in 2019/20. Main budget non-interest expenditure is projected to increase in real terms by 7 per cent in 2019/20, from 1.9 per cent in the prior year, largely due to financial support for Eskom. In total, real main budget non-interest expenditure contracts by an annual average of 0.8 per cent over the medium term, largely due to compensation and other spending reductions. Main budget deficit to reach 6.8 per cent of GDP in 2020/21, narrowing to 5.9 per cent in outer year Real main budget non-interest expenditure contracts by annual average of 0.8 per cent 29
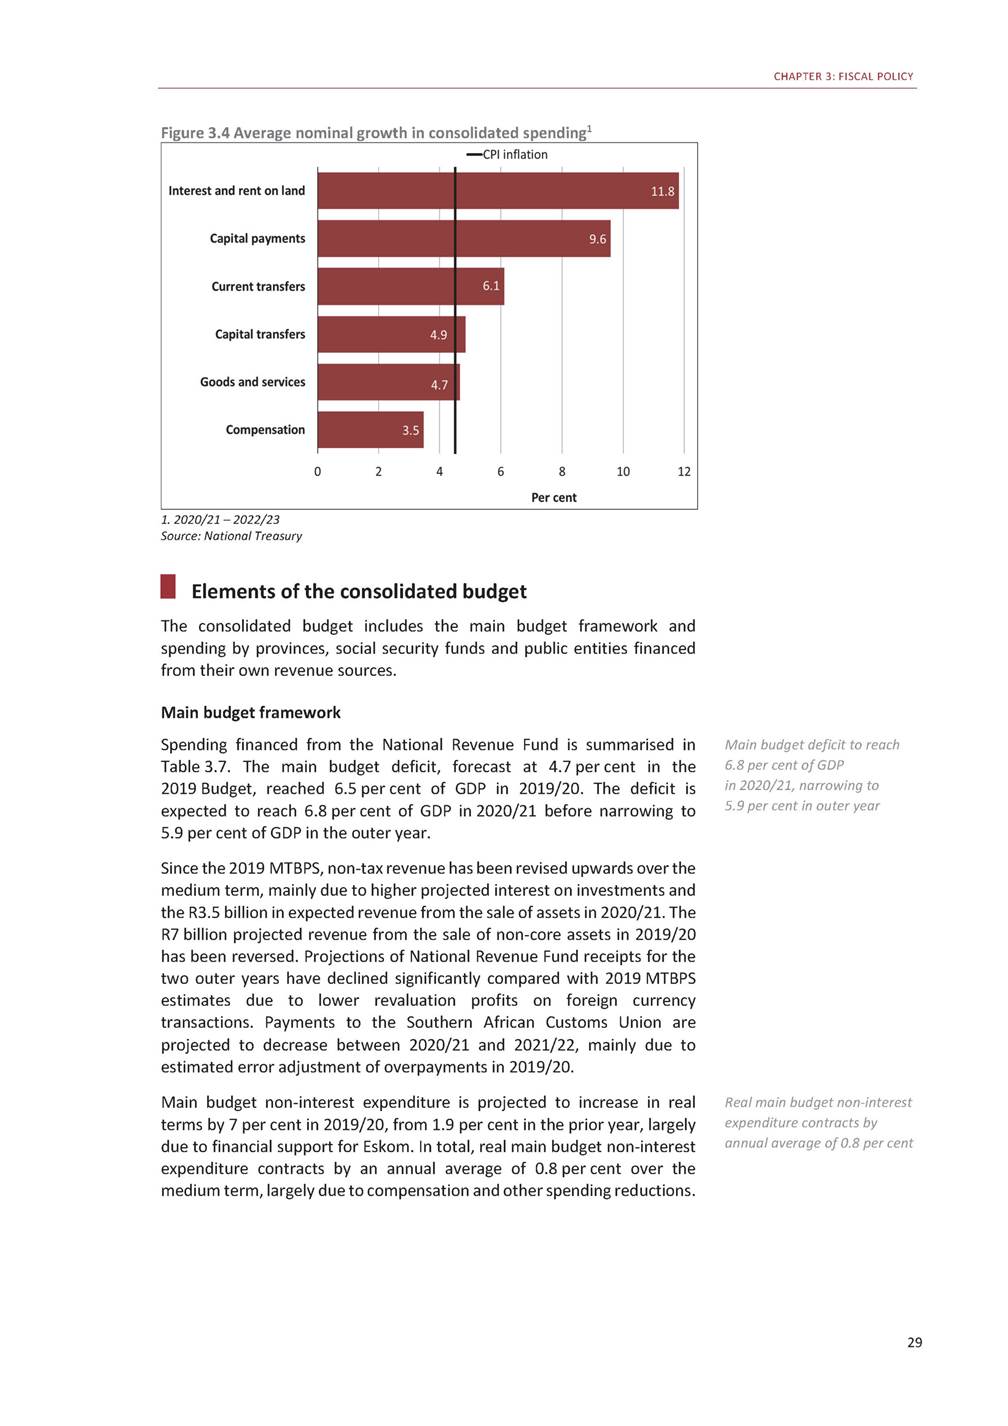
2020 BUDGET REVIEW Table 3.7 Main budget framework 1. Southern African Customs Union. Amounts made up of payments and other adjustments. The estimates for the outer two years include projected forecast error adjustments for 2019/20 and 2020/21, respectively Source: National Treasury Table 3.8 shows revisions to the main budget revenue and expenditure estimates since the 2019 Budget. Debt-service costs are higher than the 2019 Budget estimates by R2.8 billion in 2019/20, R5.2 billion 2020/21 and R11.1 billion in 2021/22. This is mainly driven by the higher budget deficit alongside fluctuations in interest, inflation and exchange rates. Social security funds, public entities and provincial balances Public entities and provinces are projected to have a combined cash surplus in the current year and over the medium term, partially offsetting the deficits of the main budget and social security funds. Higher projected spending by the Unemployment Insurance Fund, especially in 2020/21, is the main driver of the deficits at this level. This higher projected spending is the result of retrospective payments to claimants who were assessed and paid at a rate based on the old legislation, when they were meant to be paid based on higher rates in the amended act. Public entities and provinces expect a combined cash surplus over medium term 30 2016/17 2017/18 2018/19 Outcome R billion/percentage of GDP 2019/20 Revised estimate 2020/21 2021/22 2022/23 Medium-term estimates Revenue Gross tax revenue after proposals1 144.11 216.51 287.7 Non-tax revenue19.019.223.9 SACU1-39.4-56.0-48.3 National Revenue Fund receipts14.216.612.0 1 358.9 26.1 -50.3 10.0 1 425.41 512.21 609.7 30.027.929.3 -63.4-60.6-63.4 6.04.85.3 Main budget revenue1 137.91 196.41 275.3 25.7%25.5%25.9% 1 344.8 26.1% 1 398.01 484.31 580.9 25.8%25.8%25.8% Expenditure National departments 555.6 592.6 634.3 Provinces 500.4 538.6 572.0 Local government 102.9 111.1 118.5 Contingency reserve – – – Provisional allocation not – – – assigned to votes 739.5 612.8 125.0 – – 757.7768.9797.8 649.3692.0730.7 132.5142.4151.4 5.05.05.0 -7.8-16.1-34.9 Non-interest expenditure1 158.91 242.31 324.8 Debt-service costs146.5162.6181.8 1 477.3 205.0 1 536.71 592.21 650.1 229.3258.5290.1 Main budget expenditure1 305.41 404.91 506.6 29.5%29.9%30.6% 1 682.3 32.6% 1 766.01 850.71 940.2 32.5%32.1%31.7% Main budget balance-167.5-208.6-231.3 -3.8%-4.4%-4.7% Primary balance-21.0-45.9-49.5 -0.5%-1.0%-1.0% -337.5 -6.5% -132.5 -2.6% -368.0-366.4-359.3 -6.8%-6.4%-5.9% -138.7-107.9-69.2 -2.6%-1.9%-1.1%
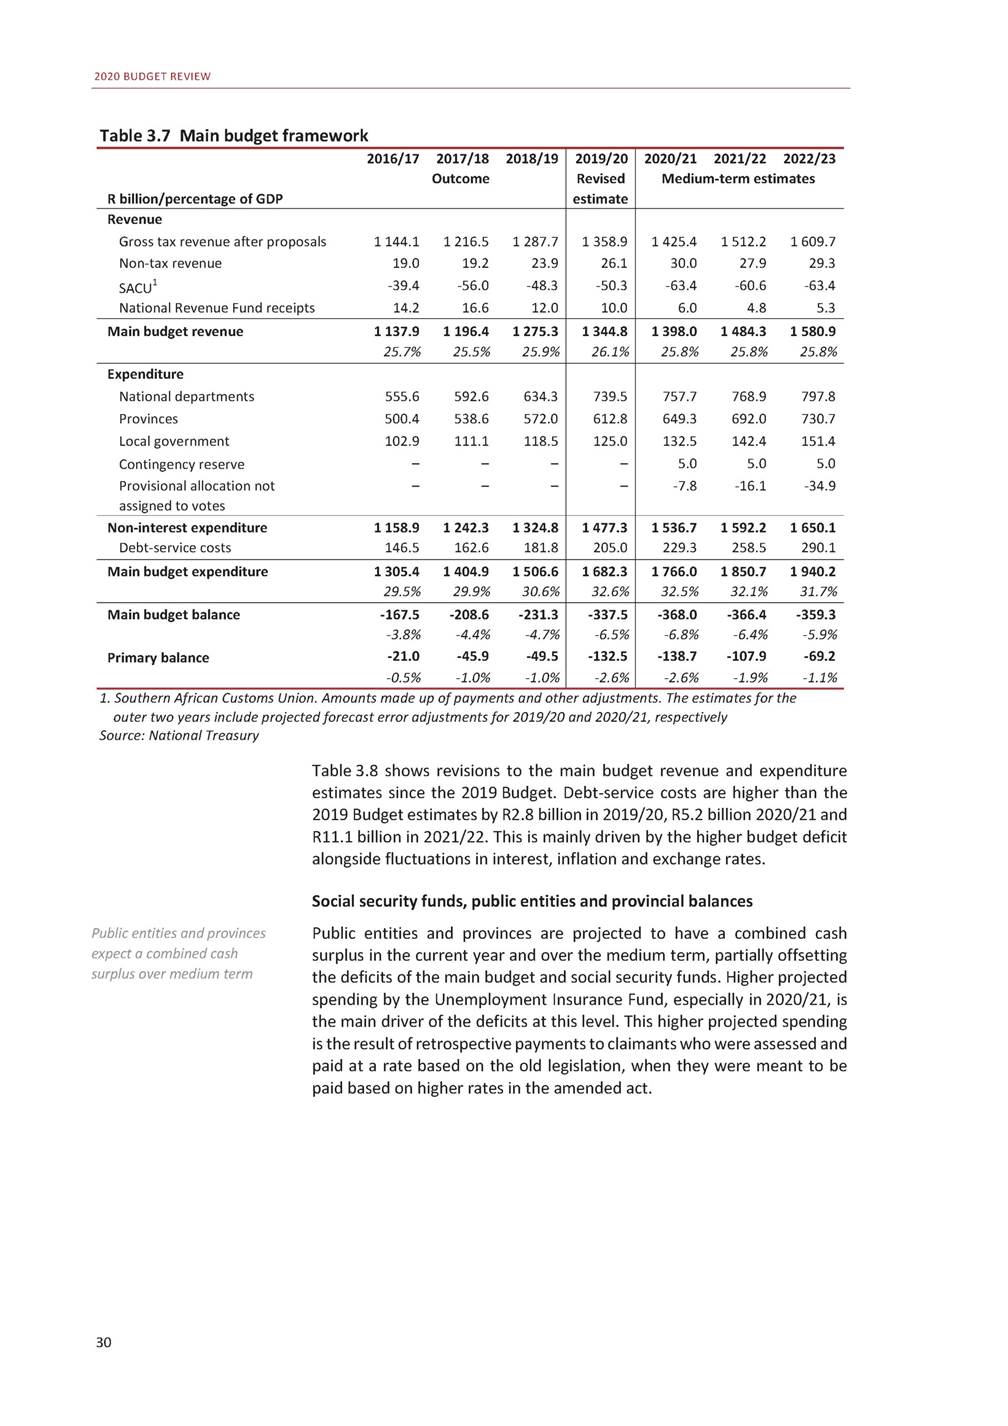
CHAPTER 3: FISCAL POLICY Table 3.8 Revisions to main budget revenue and expenditure estimates 1. Southern African Customs Union. Amounts made up of payments and other adjustments Source: National Treasury Public entities registered a high cash surplus of R26.3 billion in 2018/19 mainly due to lower spending on capital projects in the water and transport sectors. Underspending on capital projects by entities partly reflects unforeseen delays, supply chain management problems and suspension of projects. The Water Services Trading Entity, Passenger Rail Agency of South Africa and South African National Roads Agency Limited are projected to run significant cash surpluses in the current year. Table 3.9 Consolidated budget balances 1. Reconstruction and Development Programme Fund Source: National Treasury Public-sector borrowing requirement The public-sector borrowing requirement includes the borrowing needs of government as a whole, and those of state-owned companies, but excludes development finance institutions. In 2019/20, the requirement is estimated at R410 billion, or 7.9 per cent of GDP. Estimates for the current year and the next two years have been revised upwards compared with 31 R billion2016/17 2017/18 2018/19 2019/20 2020/21 2021/22 2022/23 Main budget-167.5-208.6-231.3 Social security funds8.29.36.8 Provinces-2.50.81.0 Public entities5.08.326.3 RDP Fund1-0.2-0.3-0.2 Consolidated budget balance-157.0-190.5-197.4 -337.5 -3.3 1.2 13.4 -0.2 -326.6 -368.0-366.4-359.3 -9.1-1.0-2.4 -0.42.52.5 7.17.59.5 -0.1-0.1-0.0 -370.5-357.5-349.7 2019/20 20192020 R billion/percentage of GDPBudgetBudget 2020/21 20192020 BudgetBudget 2021/22 20192020 BudgetBudget Revenue Gross tax revenue1 422.21 358.9 Non-tax revenue27.026.1 SACU1-50.3-50.3 National Revenue Fund receipts4.510.0 1 544.91 425.4 21.130.0 -65.8-63.4 5.06.0 1 670.41 512.2 22.327.9 -65.4-60.6 5.64.8 Main budget revenue1 403.51 344.8 25.9%26.1% 1 505.11 398.0 25.9%25.8% 1 632.91 484.3 26.1%25.8% Expenditure Current payments452.9455.6 of which: Compensation of employees175.6175.0 Goods and services74.975.5 Debt-service costs202.2205.0 Transfers and subsidies1 153.41 149.1 Payments for capital assets15.413.6 Payments for financial assets4.864.0 Provisional allocation not19.2– assigned to votes Contingency reserve13.0– 492.2495.0 188.5187.7 79.577.9 224.1229.3 1 238.81 215.9 16.215.3 4.942.6 11.4-7.8 6.05.0 534.6542.4 200.9200.1 86.183.6 247.4258.5 1 318.41 294.0 17.415.8 5.29.5 18.9-16.1 6.05.0 Total expenditure1 658.71 682.3 30.6%32.6% 1 769.61 766.0 30.4%32.5% 1 900.51 850.7 30.4%32.1%
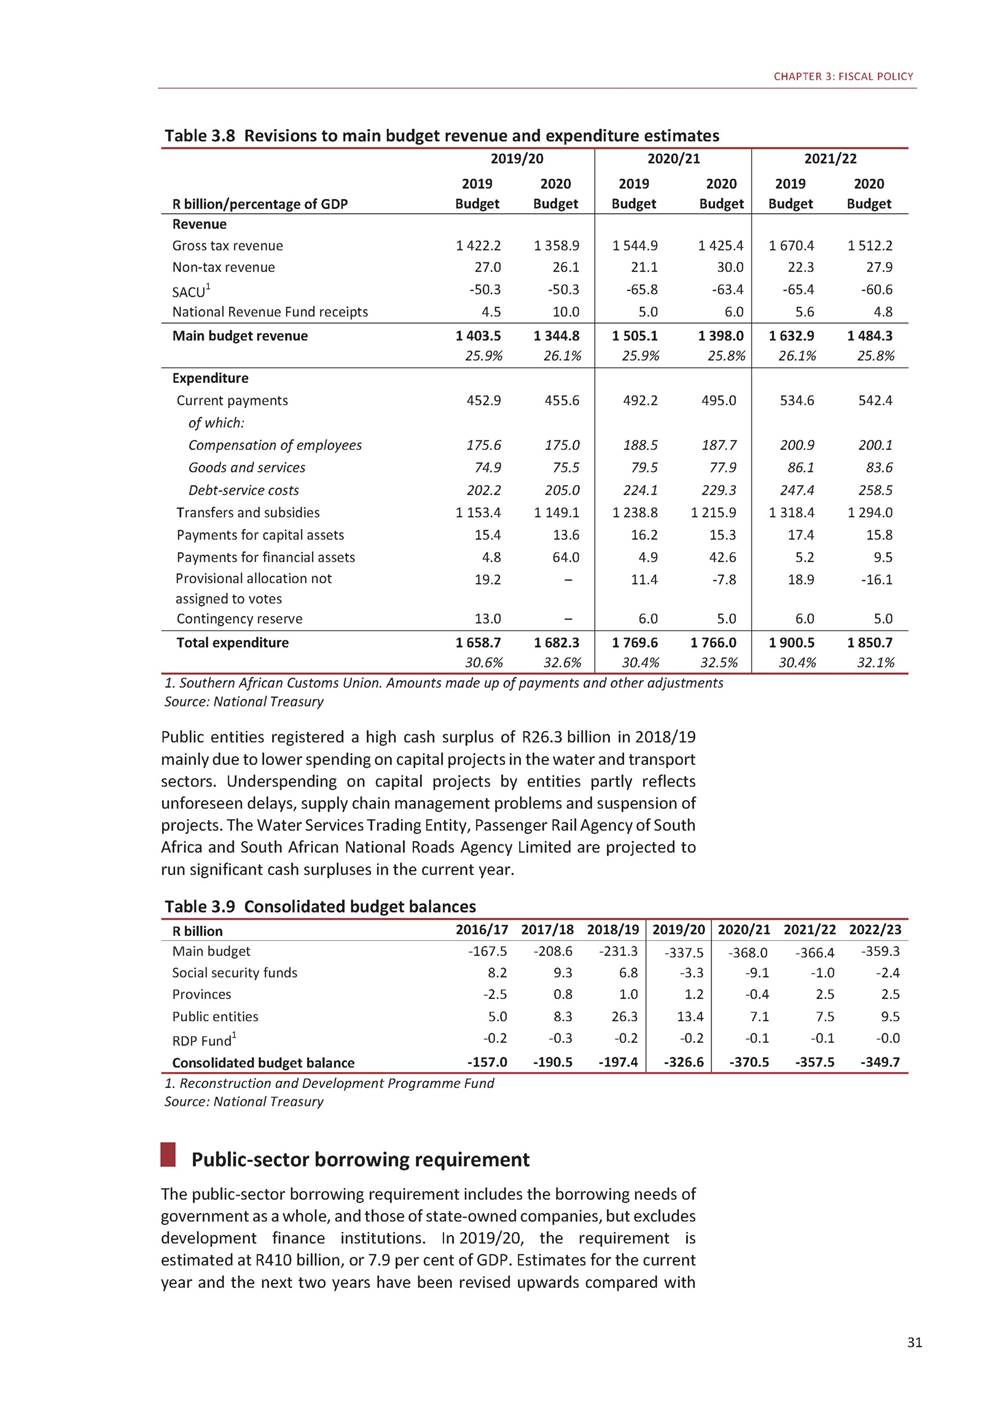
2020 BUDGET REVIEW 2019 Budget estimates, mainly due to a larger main budget deficit. Local government borrowing is projected to increase this year, reflecting municipal infrastructure investment plans. The borrowing requirement for state-owned companies has been lowered because these institutions are finding it more difficult to source financing. Table 3.10 Public-sector borrowing requirement1 1. A negative number reflects a surplus and a positive number a deficit 2. 2018/19 is a pre-audit outcome as at 30 June 2019. 2019/20-2021/22 figures are budgeted estimates adjusted in line with historical borrowing outcomes 3. Includes Eskom, South African Airways, Transnet, Airports Company South Africa and Denel Source: National Treasury Risks to the fiscal outlook Persistently weak economic growth is the central factor limiting improved public finances. Over the period ahead, other risks that could widen the budget deficit and raise debt-service costs include: Persistent low economic growth remains largest risk • Insufficient progress on Eskom reforms and its financial position, and demands from other financially distressed state-owned companies. Outcomes of the renegotiation of the existing wage agreement and the following round of wage talks. The Road Accident Fund is government’s second-largest contingent liability after Eskom. A decision on the Road Accident Benefit Scheme Bill is required to pave the way for a more affordable system. Clarity on government’s position on the user-pay principle as it relates to e-tolls. Declining e-toll revenue will have to be offset by other measures to repay South African National Roads Agency Limited debt. It could also affect funding for other investment projects. • • • Conclusion line with government’s commitment to fiscal sustainability, the In Although debt does not stabilise over medium term, budget deficit narrows 2020 Budget proposes a set of measures to reduce public spending as a share of GDP, improve the composition of spending by reducing growth in the wage bill, and maintain good budget execution. 32 2016/172017/182018/19 Outcome R billion/percentage of GDP 2019/20 BudgetBudget 20192020 2020/212021/222022/23 Medium-term estimates Main budget167.5208.6231.3 Social security funds-8.2-9.3-6.8 Provinces2.5-0.8-1.0 Public entities-5.0-8.3-26.3 RDP Fund0.20.30.2 255.2337.5 -8.03.3 -1.0-1.2 -3.6-13.4 0.10.2 368.0366.4359.3 9.11.02.4 0.4-2.5-2.5 -7.1-7.5-9.5 0.10.10.0 Consolidated government157.0190.5197.4 3.6%4.1%4.0% Local authorities28.36.26.0 0.2%0.1%0.1% State-owned companies388.599.477.1 2.0%2.1%1.6% 242.7326.6 4.5%6.3% 16.19.7 0.3%0.2% 74.773.7 1.4%1.4% 370.5357.5349.7 6.8%6.2%5.7% 10.410.010.2 0.2%0.2%0.2% 73.266.564.2 1.3%1.2%1.0% Borrowing requirement253.8296.1280.5 5.7%6.3%5.7% 333.5410.0 6.2%7.9% 454.1434.0424.1 8.4%7.5%6.9%
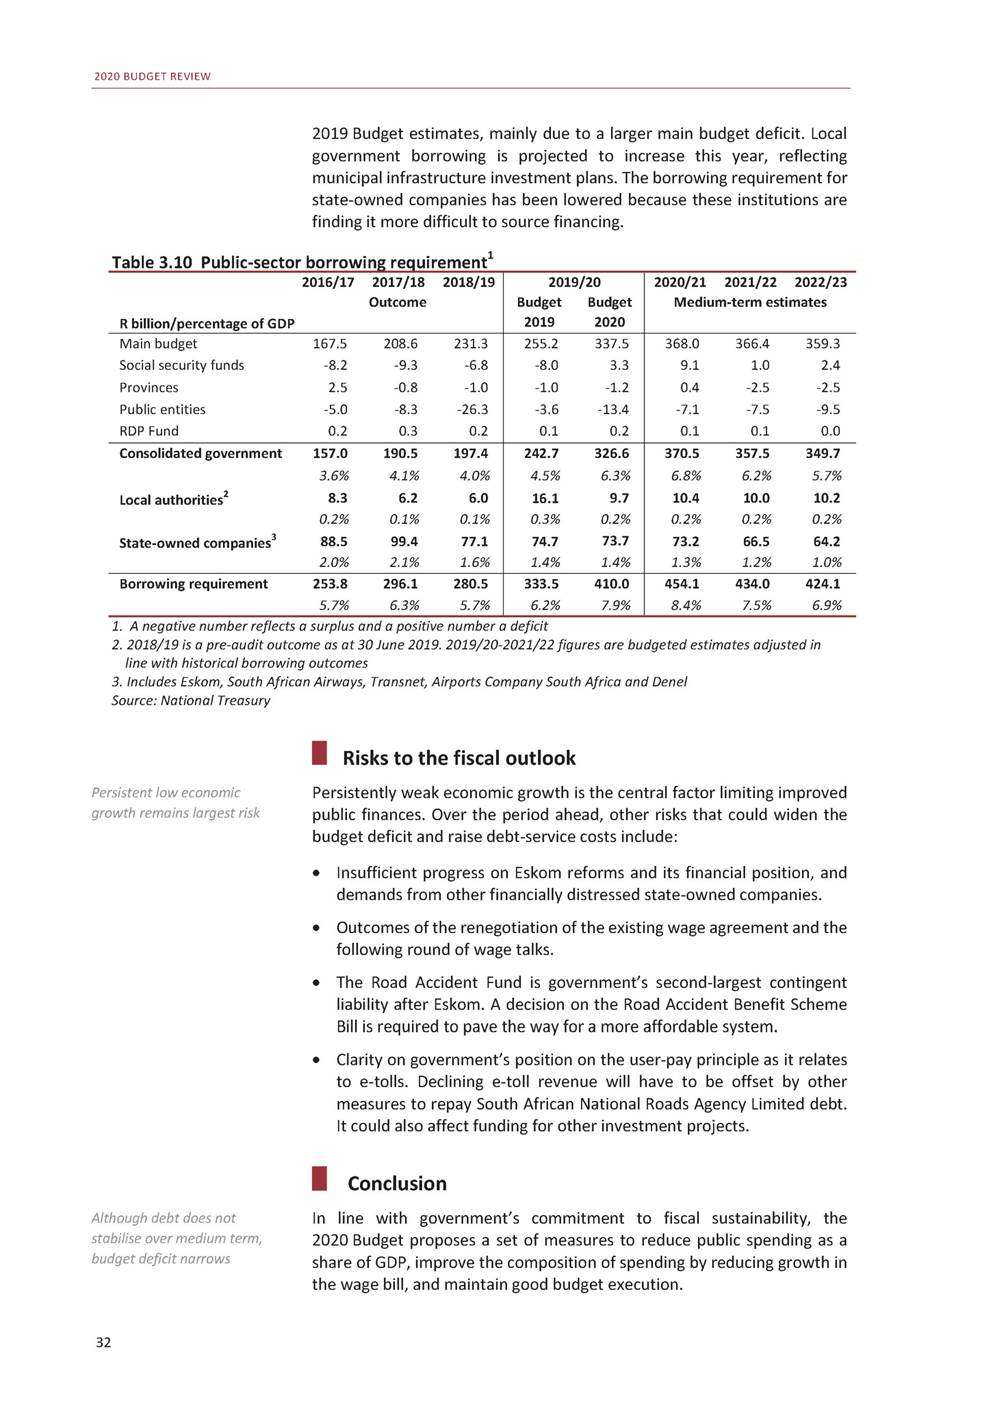
4 Revenue trends and tax proposals Overview Pexceeds that of 2009/10, in the immediate aftermath of the global rojected revenue for 2019/20 is now R63.3 billion lower than the Large revenue under-collection generally matches difference in GDP forecast and outcome estimate at the time of the 2019 Budget. This under-collection financial crisis. The shortfall is a consequence of weakening economic growth, and largely matches the lower GDP growth forecast. For example, the 2019 Budget forecast real economic growth in 2019 at 1.5 per cent; the revised forecast is 0.3 per cent. Over the past five years, government has implemented large tax increases. But the difference between projected and collected revenue has grown progressively larger in the face of a persistent slowdown in economic growth and a weakened SARS. In the last 12 months, the new SARS leadership has taken steps to revive the institution, and tax administration has started to recover – but the economy has not. Growth in wages, consumption and business profitability has stagnated in recent years, lowering tax receipts for personal income tax, value-added 33 In brief •Given the weak economic outlook, government will not raise additional revenue from tax proposals in 2020/21. •Tax revenue is projected to grow by 4.9 per cent in 2020/21. •The main tax proposals include personal income tax relief through above-inflation adjustments in all brackets, along with increases in the fuel and Road Accident Fund (RAF) levies to adjust for inflation. Corporate interest deductions will be limited to combat base erosion and profit shifting. •The revitalisation of the South African Revenue Service (SARS) is under way, and this is expected to contribute to increased tax revenue over the medium term. •South Africa aims to strengthen its progressive tax system, while broadening the tax base and removing exemptions. In line with this approach, government will review tax incentives over the medium term, and repeal or redesign those that are inefficient or inequitable.

2020 BUDGET REVIEW tax (VAT) and corporate income tax, which make up more than 80 per cent of total tax revenue. In this context, substantial tax increases are unlikely to be effective. South Africa already has a relatively high tax-to-GDP ratio compared with other countries at a similar level of development. New tax increases at this time could harm the economy’s ability to recover. Consequently, government will not raise additional revenue from tax proposals for 2020/21. Additional revenue from indirect taxes will be offset by personal income tax relief. The main tax proposals for 2020/21 are: Government proposes no overall increase in taxes for 2020/21 • Providing personal income tax relief through an above-inflation increase in the brackets and rebates. Further limiting corporate interest deductions to combat base erosion and profit shifting. Restricting the ability of companies to fully offset assessed losses from previous years against taxable income. Increasing the fuel levy by 25c/litre, consisting of a 16c/litre increase in the general fuel levy and a 9c/litre increase in the RAF levy, to adjust for inflation. Increasing the annual contribution limit to tax-free savings accounts by R3 000 from 1 March 2020. Increasing excise duties on alcohol and tobacco by between 4.4 and 7.5 per cent. • • • • • Revenue collection and outlook Compared with the 2019 Budget estimate, the projected revenue shortfall for 2019/20 is R63.3 billion – significantly higher than the revised estimate of R52.5 billion published in the 2019 Medium Term Budget Policy Statement. The main reason for reductions in projected revenue collection over the past two years has been weaker-than-expected economic growth. Personal income tax collection has been affected by sluggish employment and wage growth. Following the recession in the first half of 2018, the dividends tax has not yielded the expected results, and corporate income tax collection continued to underperform. Growth in VAT collection has moderated following the one percentage point rate increase in 2018/19. Strong growth in VAT refunds also played a role in the lower year-to-date performance. Following the acceleration of VAT refund payments in the past year, SARS reports that the number of fraudulent claims has been increasing. VAT refunds for the last quarter of the fiscal year are expected to moderate as SARS refers more cases for audit or criminal investigation. Tax collections related to trade have slowed in the second half of 2019/20 in line with contracting imports, resulting in lower estimated revenue from customs duties and import VAT. Tax buoyancy – a ratio of tax revenue growth to economic growth – is a useful measure to determine whether revenue collections are performing as expected. For example, gross tax buoyancy was particularly low in Projected revenue shortfall of R63.3 billion stems from weak economic growth Growth in fraudulent VAT claims to be referred for audit or criminal investigation 34
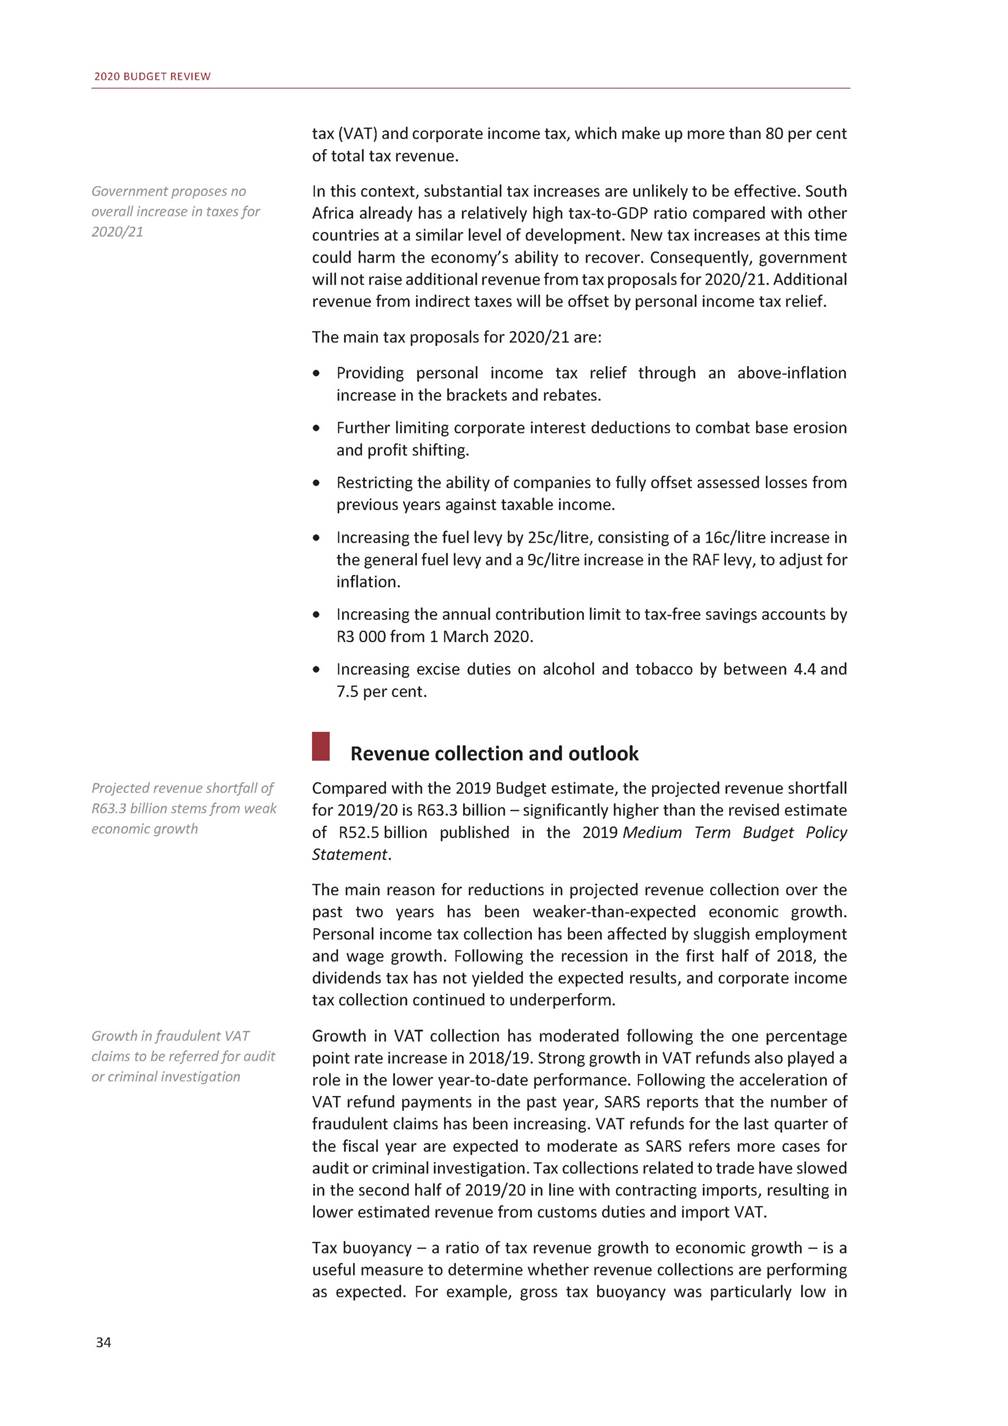
CHAPTER 4: REVENUE TRENDS AND TAX PROPOSALS 2016/17 and 2017/18, a period in which SARS was severely weakened. Tax increases in those years should have caused revenue to grow faster than nominal GDP, but buoyancy was at or below one. Table 4.1 Budget estimates and revenue outcomes1 1. A more disaggregated view is presented in Tables 2 and 3 of the statistical annexure 2. 2019 Budget Review estimates 3. Percentage change between outcome in 2018/19 and revised estimate in 2019/20 4. Includes interest on overdue income tax and interest withholding tax 5. Includes turnover tax for micro businesses, air departure tax, plastic bag levy, electricity levy, CO tax on motor vehicle emissions, incandescent light bulb levy, Universal Service Fund, tyre levy and International Oil Pollution Compensation Fund 6. Includes mineral and petroleum royalties, mining leases, departmental revenue and sales of capital assets 7. Southern African Customs Union. Amounts made up of payments and other adjustments Source: National Treasury Analysis of the main components of tax revenue shows that although 2019/20 personal income tax collections are not expected to meet the 2019 Budget forecast, their decline is in line with moderating real wage growth in the economy. Similarly, domestic VAT collections and trade-related taxes are in line with expected outcomes for consumption and imports. Corporate income tax, which is particularly volatile, is expected to significantly underperform. 35 2018/19 R million Budget2 Outcome Deviation 2019/20 Budget2 Revised Deviation Percentage change3 Taxes on income and profits 751 846 738 741 -13 105 Personal income tax 497 451 492 083 -5 368 Corporate income tax 218 436 212 046 -6 390 Dividends tax 30 341 29 898 -443 Other taxes on income and 5 618 4 714 -904 profits4 Skills development levy 17 312 17 439 127 Taxes on property 16 035 15 252 -783 Domestic taxes on goods and services 460 287 460 545 257 Value-added tax 325 917 324 766 -1 151 Specific excise duties 40 276 40 830 553 Health promotion levy 2 396 3 195 799 Ad valorem excise duties 4 163 4 192 29 Fuel levy 75 374 75 372 -1 Other domestic taxes 12 161 12 190 28 on goods and services5 Taxes on international 56 722 55 723 -999 trade and transactions Customs duties 55 638 54 968 -670 Health promotion levy on imports 78 53 -25 Diamond export levy 87 78 -9 Miscellaneous customs 918 624 -295 and excise receipts 820 342 778 280 -42 062 552 877 527 584 -25 293 229 608 216 718 -12 890 31 893 29 144 -2 748 5 964 4 833 -1 131 18 759 18 576 - 182 17 159 16 038 -1 121 504 649 488 711 -15 938 360 471 344 202 -16 269 42 354 46 765 4 411 1 986 2 590 604 4 454 4 112 - 342 82 958 79 277 -3 680 12 426 11 764 - 661 61 300 57 330 -3 971 60 029 56 325 -3 704 245 54 -191 93 90 -3 932 860 -73 5.4% 7.2% 2.2% -2.5% 2.5% 6.5% 5.2% 6.1% 6.0% 14.5% -18.9% -1.9% 5.2% -3.5% 2.9% 2.5% 2.4% 15.9% 37.8% Gross tax revenue 1 302 201 1 287 690 -14 511 Non-tax revenue6 31 473 35 869 4 395 of which: Mineral and petroleum 8 340 8 612 272 royalties Less: SACU7 payments -48 289 -48 289 – 1 422 208 1 358 935 -63 273 31 537 36 142 4 605 8 766 11 952 3 186 -50 280 -50 280 – 5.5% 0.8% 38.8% 4.1% Main budget revenue 1 285 386 1 275 270 -10 116 Provinces, social security 169 831 170 154 323 funds and selected public entities 1 403 464 1 344 796 -58 668 180 347 172 192 -8 155 5.5% 1.2% Consolidated budget revenue 1 455 217 1 445 424 -9 793 1 583 811 1 516 988 -66 823 5.0%
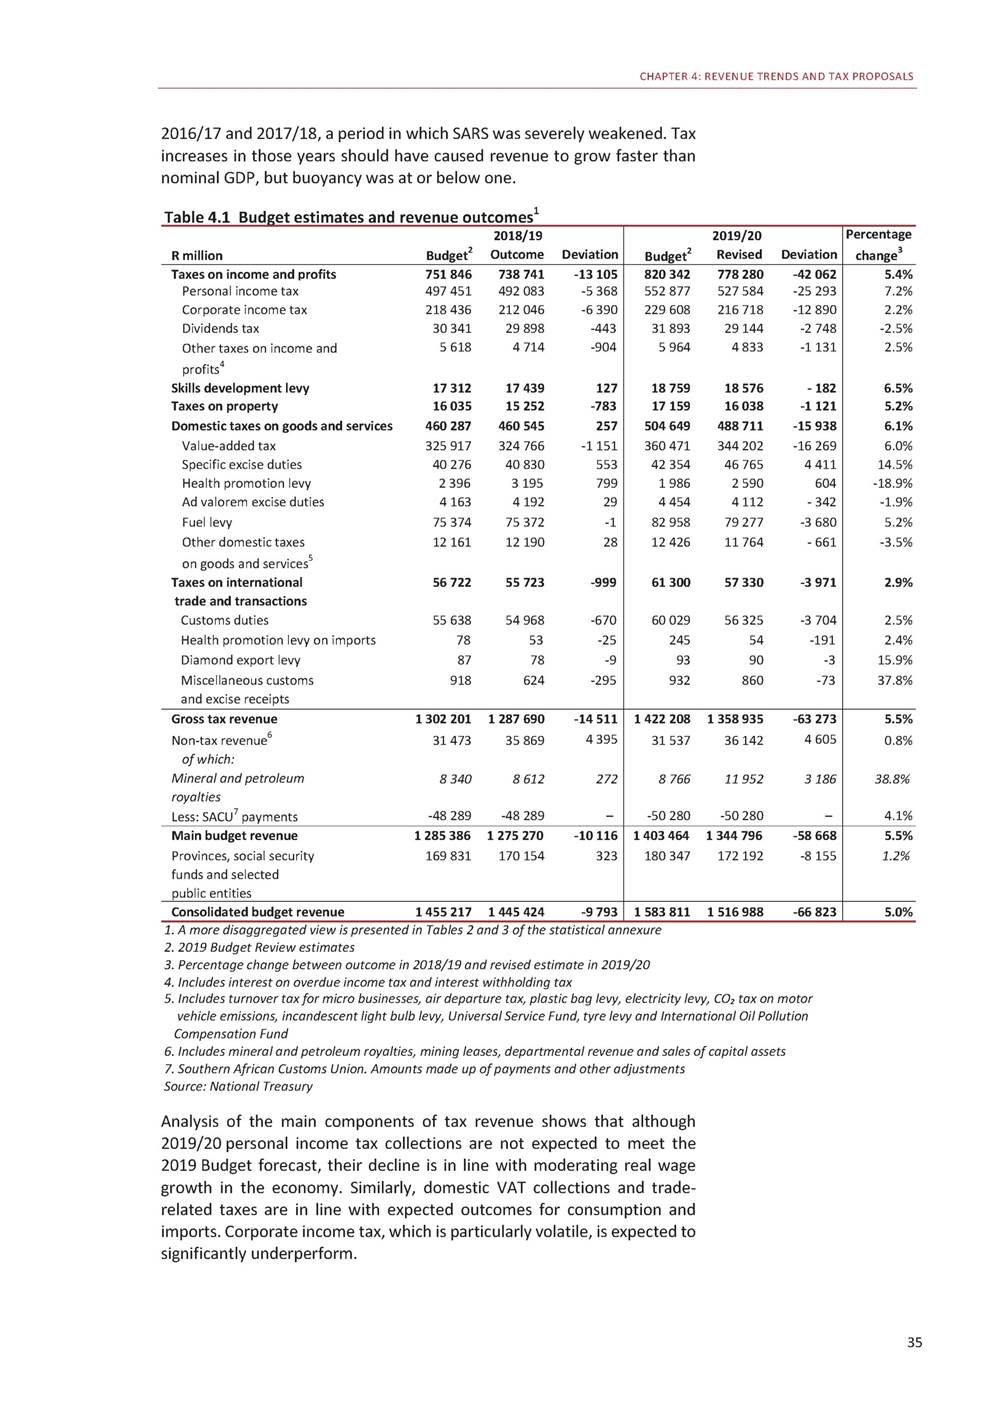
2020 BUDGET REVIEW Table 4.2 Budget revenue1 1. A more disaggregated view is presented in Tables 2 and 3 of the statistical annexure 2. Includes secondary tax on companies/dividends tax, interest withholding tax and interest on overdue income tax 3. As announced in the 2018 Budget, medical tax credits were adjusted below inflation over the MTEF to fund additional expenditure for national health insurance. The additional amount for 2020/21 is R0.58 billion. This is the last year of that MTEF, and therefore such an amount is not included in the two outer-year estimates for personal income taxes 4. Relative to the estimates published in Table D.4 of the 2019 MTBPS, the forecasts for corporate income tax assume a buoyancy of 0.9, 0.95 and 1 over the next three years 5. Includes mineral and petroleum royalties, mining leases, departmental revenue and sales of capital assets 6. Southern African Customs Union. Amounts made up of payments and other adjustments Source: National Treasury and SARS Tax revenue is projected to grow by 4.9 per cent in 2020/21. Gross tax buoyancy is expected to decrease to 0.93, primarily due to lower personal income tax receipts following the anticipated reduction in the public-service wage bill. After contractions in four of the past seven quarters, economic growth and profitability are expected to remain weak, putting greater pressure on corporate income tax collections. Revenue should improve over the medium term as growth recovers. Efficiency improvements at SARS may bolster revenue further, but such potential gains are not included in the current projections. Strengthening the South African Revenue Service Building a capable state that serves South Africa is integrally linked to the success of SARS. The new Commissioner is focusing on stabilising the organisation, re-establishing integrity and compliance functions, and restoring employee confidence and public trust. Revenue recovery plans include assistance from the re-established Davis Tax Committee to address SARS to renew its focus on illicit and criminal activity 36 2016/172017/182018/19 R millionOutcome 2019/20 Revised 2020/212021/222022/23 Medium-term estimates Taxes on income and664 526711 703738 741 profits2 of which: Personal income tax 3 424 545460 953492 083 Corporate income tax 4 204 432217 412212 046 Skills development levy15 31516 01217 439 Taxes on property15 66116 58515 252 Domestic taxes on goods402 464422 248460 545 and services of which: VAT289 167297 998324 766 Taxes on international46 10249 93955 723 trade and transactions 778 280 527 584 216 718 18 576 16 038 488 711 344 202 57 330 813 588863 888921 375 546 771581 146621 602 230 226243 686258 357 19 41320 58521 970 17 51018 95620 165 514 267543 916576 525 360 555381 859405 598 60 64064 84969 622 Gross tax revenue1 144 081 1 216 464 1 287 690 1 358 935 1 425 418 1 512 194 1 609 657 Non-tax revenue5 33 27235 84935 869 of which: Mineral and petroleum royalties5 8027 6178 612 Less: SACU6 payments-39 448-55 951-48 289 36 142 11 952 -50 280 35 97332 66334 586 12 69713 43914 248 -63 395-60 563-63 366 Main budget revenue1 137 904 1 196 362 1 275 270 Provinces, social security147 700155 015170 154 funds and selected public entities 1 344 796 172 192 1 397 996 1 484 294 1 580 877 185 910198 545210 442 Consolidated budget revenue1 285 605 1 351 378 1 445 424 1 516 988 1 583 905 1 682 839 1 791 319 As percentage of GDP Tax revenue25.9%25.9%26.2% Main budget revenue25.7%25.5%25.9% 26.3% 26.1% 26.3%26.3%26.3% 25.8%25.8%25.8% GDP (R billion)4 419.44 698.74 921.5 Tax buoyancy0.971.001.23 5 157.3 1.15 5 428.25 759.06 126.3 0.931.001.01

CHAPTER 4: REVENUE TRENDS AND TAX PROPOSALS tax leakages, customs fraud, trade mispricing and harmful tax practices; setting up a new centre focused on wealthy individuals who have complex tax arrangements; and renewing the focus on illicit and criminal activity, including non-compliance of religious public-benefit organisations. SARS is reviewing its procurement processes. Contracts that did not represent value for money have not been renewed. A number of senior officials implicated by the Nugent Commission have left, and experienced staff returned to roles from which they had been displaced. Strengthening SARS will take time, but will result in improved revenue collections in the years ahead. Some experienced SARS staff have returned to roles from which they had been displaced Tax policy Over the past five years, government has increased rates of personal income tax, dividends tax, capital gains tax and VAT, while raising the fuel levy and excise duties on alcohol and tobacco. The tax-to-GDP ratio has steadily increased over this period, reaching 26.2 per cent, which is close to its democratic-era peak of 26.4 per cent in 2007/08. The 2019 Budget announced that an additional R10 billion in tax revenue would be raised in 2020/21 to support fiscal consolidation. At the time, real GDP growth was expected to be 1.5 per cent for 2019 and 1.7 per cent for 2020. Since then, the economy has faltered and growth estimates have been revised down to 0.3 per cent for 2019 and 0.9 per cent for 2020. Substantial tax increases may obstruct short-term recovery. As a result, government will not raise any taxes to collect the additional R10 billion in 2020/21. Even without additional tax increases this year, the projected tax-to-GDP ratio is expected to equal 26.3 per cent over the next three years. South Africa has a relatively high level of tax to GDP compared with other upper-middle-income countries, as shown in Figure 4.1. Higher levels of economic South Africa’s tax-to-GDP ratio is nearing its democratic-era peak South Africa has relatively high level of tax to GDP compared with other upper-middle-income countries 37 Rebuilding governance at SARS The Commission of Inquiry into Tax Administration and Governance by SARS (the Nugent Commission) found a “massive failure of governance and integrity” at SARS under the former Commissioner. The Commission made 27 recommendations. The SARS Commissioner is responsible for implementing non-legislative and organisational recommendations from the report, and the Minister of Finance for policy recommendations. This is in keeping with two guiding principles: • SARS should implement tax laws fairly, without bias and without political interference. • SARS is autonomous but accountable to the Minister of Finance, who determines tax policy. Accordingly, government plans to publish a discussion document by June 2020 setting out proposed legislative amendments to strengthen governance at SARS. These will include an improved appointment and removal process for the Commissioner by the President, and an appointment and removal process for Deputy Commissioners. The Office of the Tax Ombud has proved effective in ensuring that taxpayers are not prejudiced by SARS. Government will strengthen the ombud and separate it financially and operationally from SARS. In addition, government recognises the need for an independent office to oversee governance and conduct within SARS. Accordingly, government will propose an inspector-general to: • Monitor and report conduct and performance metrics to government and the public. • Safeguard whistleblowing by SARS officials in a way that keeps tax information secret. • Empower senior SARS officials to disclose any lapses or findings by the internal audit function. • Provide independent assurance that internal processes are sound and unbiased.
2020 BUDGET REVIEW growth are required for further tax increases to be effective in consolidating the public finances or financing additional expenditure. Figure 4.1 Tax burdens for countries at different levels of development Source: OECD, International Monetary Fund The way in which tax revenue is raised has important implications for fairness and economic growth. South Africa aims to strengthen its progressive tax system by broadening the tax base and eliminating exemptions or deductions where possible. The system should make it easy for individuals and firms to comply, and minimise distortions so that they do not base their decisions on tax. Crucially, the system should continue to generate tax revenue throughout the business cycle. Government seeks to broaden tax base, and eliminate exemptions and deductions where possible Corporate income tax To promote economic growth, government intends to restructure the corporate income tax system over the medium term by broadening the base and reducing the rate. Broadening the base will involve minimising tax incentives, and introducing new interest deduction and assessed loss limitations. Rate reductions will be implemented in a revenue-neutral manner. Government has broadened the corporate income tax base since the early 2000s by taxing foreign dividends, imposing capital gains tax and introducing the controlled foreign company regime. In contrast with many other countries, however, South Africa’s corporate income tax rate has remained unchanged at 28 per cent for more than a decade. As the gap with our trading and investment partners grows, the country’s relative competitiveness declines. India, the United States and the United Kingdom have all recently reduced their corporate income tax rates below 28 per cent. Reducing the corporate income tax rate will encourage businesses to invest and expand production, improve the country’s competitiveness as an investment destination, and reduce the appeal of base erosion and profit shifting. As trading partners reduce their corporate tax rates, South Africa’s relative competitiveness declines 38
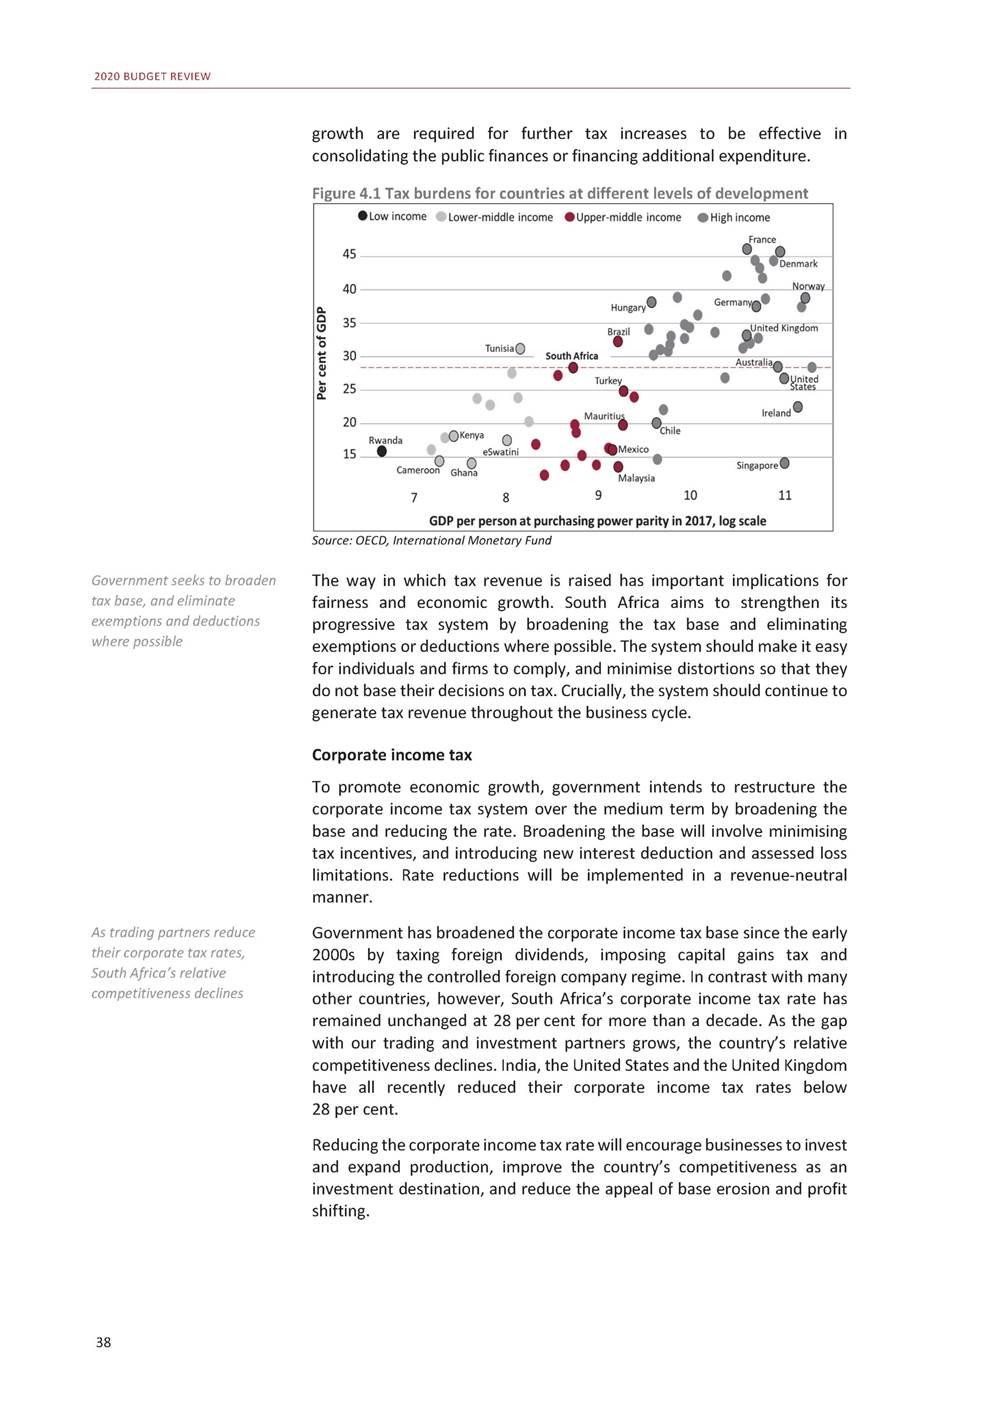
CHAPTER 4: REVENUE TRENDS AND TAX PROPOSALS Figure 4.2 Corporate income tax rate movements Source: OECD Do tax incentives work? Tax incentives are subsidies that provide favourable tax treatment to individuals and businesses to encourage specific behaviour or activities. They can compromise the principles of a good tax system by creating complexity and inequities between individuals, sectors and activities. They also reduce the tax base, requiring higher tax rates for the rest of the economy and opening up avenues for aggressive tax avoidance. In many cases, the incentivised investment or action would have taken place anyway, causing a direct loss of revenue with no additional benefit. In addition, tax incentives result in: Tax incentives can undermine the tax system by creating complexity and inequity • Increasingly complicated governing legislation to isolate the specific activity that is being promoted without an undue loss of tax revenue. Greater benefits to larger firms and those who are able to afford specialist tax advice. Additional SARS resources to monitor and audit incentives. • • The 1994 Katz Commission stated that tax incentives “are a form of special pleading, a preferential treatment to a particular group” and as such they should be treated as a subsidy provided by government. It noted that incentives often lead to lobbying by particular groups whose aim is to retain their vested interest. These subsidies do not form part of the annual budget process and are not subject to the same level of annual oversight as government expenditure, although the estimated costs of most tax expenditures are published in Annexure B of the Budget Review. The Katz Commission stated that “the range of incentives should be narrowed as far as possible”. The Davis Tax Committee has proposed a detailed review of corporate tax incentives and the removal of inefficient subsidies. The 2020 Budget applies sunset clauses to several incentives, as described in the tax proposals section. Over the medium term, government will systematically review tax incentives and repeal or redesign those found to be redundant, inefficient or inequitable. This will create a more Katz: tax incentives are ‘a form of special pleading, a preferential treatment to a particular group’ Government to launch systematic review of tax incentives 39 Per cent France Portugal Mexico Australia Germany Japan Belgium Italy Greece New Zealand South Africa Korea Canada United States India Netherlands Spain Chile Turkey Denmark Norway Switzerland Czech Republic Poland United Kingdom Ireland Hungary 5520002019 45 35 25 15 5
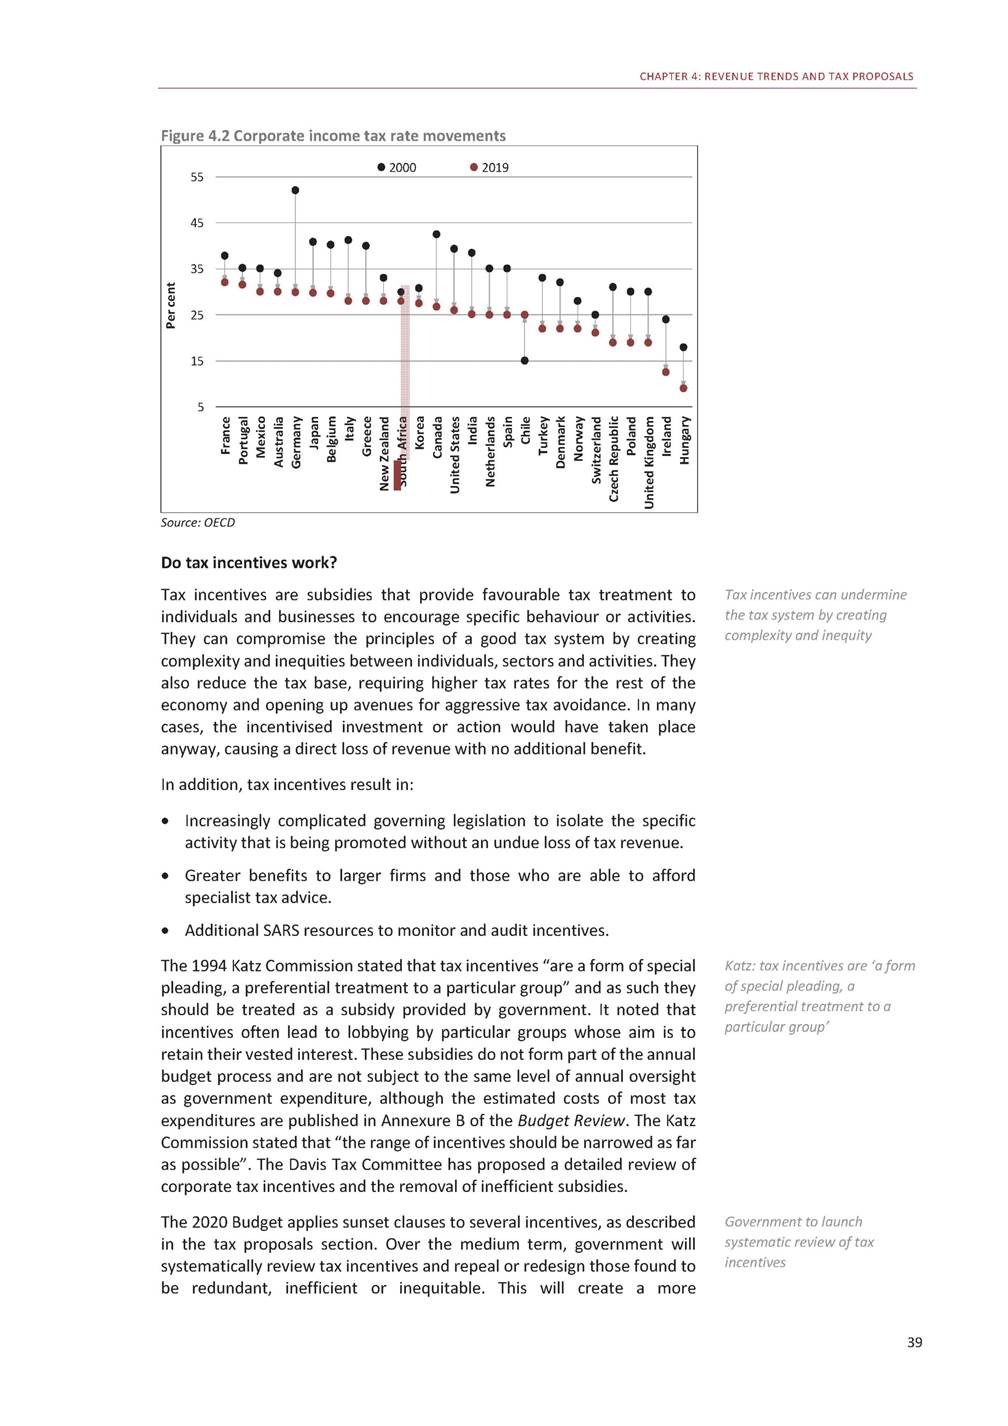
2020 BUDGET REVIEW standardised tax treatment of different sectors and individuals, and could allow for lower tax rates. In addition, government will consider publishing information on which companies benefit from tax incentives, and the amount of those incentives, to improve transparency. Tax proposals The tax proposals for the 2020 Budget aim to support a recovery in economic growth, with some relief at the level of personal income tax. They result in no overall change to tax revenue in 2020/21. Table 4.3 Impact of tax proposals on 2020/21 revenue1 Some relief is provided for personal income tax R million Gross tax revenue (before tax proposals) 1 425 418 Budget 2020/21 proposals - Direct taxes Taxes on individuals and companies Personal income tax Increasing brackets by more than inflation Revenue if no adjustment is made Higher-than-inflation increase in brackets and rebates Indirect taxes Carbon tax Plastic bag levy -2 000 -2 000 -2 000 12 000 -14 000 2 000 1 750 250 Gross tax revenue (after tax proposals) 1 425 418 1. Revenue changes are in relation to thresholds that have been fully adjusted for inflation Source: National Treasury Personal income tax The personal income tax brackets and the primary, secondary and tertiary rebates will be increased by 5.2 per cent for 2020/21, which is above expected inflation of 4.4 per cent (Table 4.4). This adjustment provides R2 billion in tax relief. The change in the primary rebate increases the tax-free threshold from R79 000 to R83 100. Medical tax credits Government proposes an increase in the value of medical tax credits in 2020/21 from R310 to R319 per month for the first two beneficiaries, and from R209 to R215 per month for the remaining beneficiaries. This increases the value of the tax credit by 2.8 per cent. It is in line with the announcement in the 2018 Budget Review that the credit would be adjusted by less than inflation to help fund the rollout of national health insurance over the medium term. Medical tax credit adjustment less than inflation to help fund rollout of national health insurance Tax-free savings accounts The annual limit on contributions to tax-free savings accounts will be increased from R33 000 to R36 000 from 1 March 2020. 40
CHAPTER 4: REVENUE TRENDS AND TAX PROPOSALS Table 4.4 Personal income tax rates and bracket adjustments Source: National Treasury Table 4.5 provides a distributional breakdown of the effects of changes to the rebates and personal income tax brackets. Lower-income individuals will receive most of the income tax relief from these inflation adjustments. Table 4.5 Estimates of individual taxpayers and taxable income, 2020/21 proposals 1. Registered individuals with taxable income below the income-tax threshold Source: National Treasury 41 Taxable bracket R thousand Registered individuals Number% Taxable income R billion% Income tax payable before relief R billion% Income tax relief after proposals R billion% Income tax payable after R billion% R0 - R801 6 822 326– 218.8– –– –– –– R80 - R150 R150 - R250 R250 - R350 R350 - R500 R500 - R750 R750 - R1 000 R1 000 - R1 500 R1 500 + 2 084 68329.2 1 771 58224.8 1 071 40215.0 1 029 50914.4 615 1778.6 266 1693.7 182 8832.6 125 0291.7 235.39.3 354.314.1 318.312.6 424.116.8 368.214.6 225.79.0 217.28.6 376.414.9 23.84.2 30.95.5 47.28.4 81.014.4 90.416.1 65.911.8 71.012.7 150.626.8 -1.410.2 -2.114.8 -2.014.0 -2.820.0 -2.517.6 -1.39.6 -0.96.6 -1.07.2 22.44.1 28.85.3 45.38.3 78.214.3 87.916.1 64.511.8 70.112.8 149.627.4 Total 7 146 434 100.0 2 519.5 100.0 560.8 100.0 -14.0100.0 546.8 100.0 Grand total 13 968 760 2 738.3 560.8 -14.0 546.8 2019/20 Taxable income (R)Rates of tax 2020/21 Taxable income (R)Rates of tax R0 - R195 85018% of each R1 R0 - R205 90018% of each R1 R195 851 - R305 850R35 253 + 26% of the amount above R195 850 R205 901 - R321 600R37 062 + 26% of the amount above R205 900 R305 851 - R423 300R63 853 + 31% of the amount above R305 850 R321 601 - R445 100R67 144 + 31% of the amount above R321 600 R423 301 - R555 600R100 263 + 36% of the amount above R423 300 R445 101 - R584 200R105 429 + 36% of the amount above R445 100 R555 601 - R708 310R147 891 + 39% of the amount above R555 600 R584 201 - R744 800R155 505 + 39% of the amount above R584 200 R708 311 - R1 500 000R207 448 + 41% of the amount above R708 310 R744 801 - R1 577 300R218 139 + 41% of the amount above R744 800 R1 500 001 and aboveR532 041 + 45% of the amount above R1 500 000 R1 577 301 and aboveR559 464 + 45% of the amount above R1 577 300 Rebates PrimaryR14 220 SecondaryR7 794 TertiaryR2 601 Tax threshold Below age 65R79 000 Age 65 and overR122 300 Age 75 and overR136 750 Rebates PrimaryR14 958 SecondaryR8 199 TertiaryR2 736 Tax threshold Below age 65R83 100 Age 65 and overR128 650 Age 75 and overR143 850
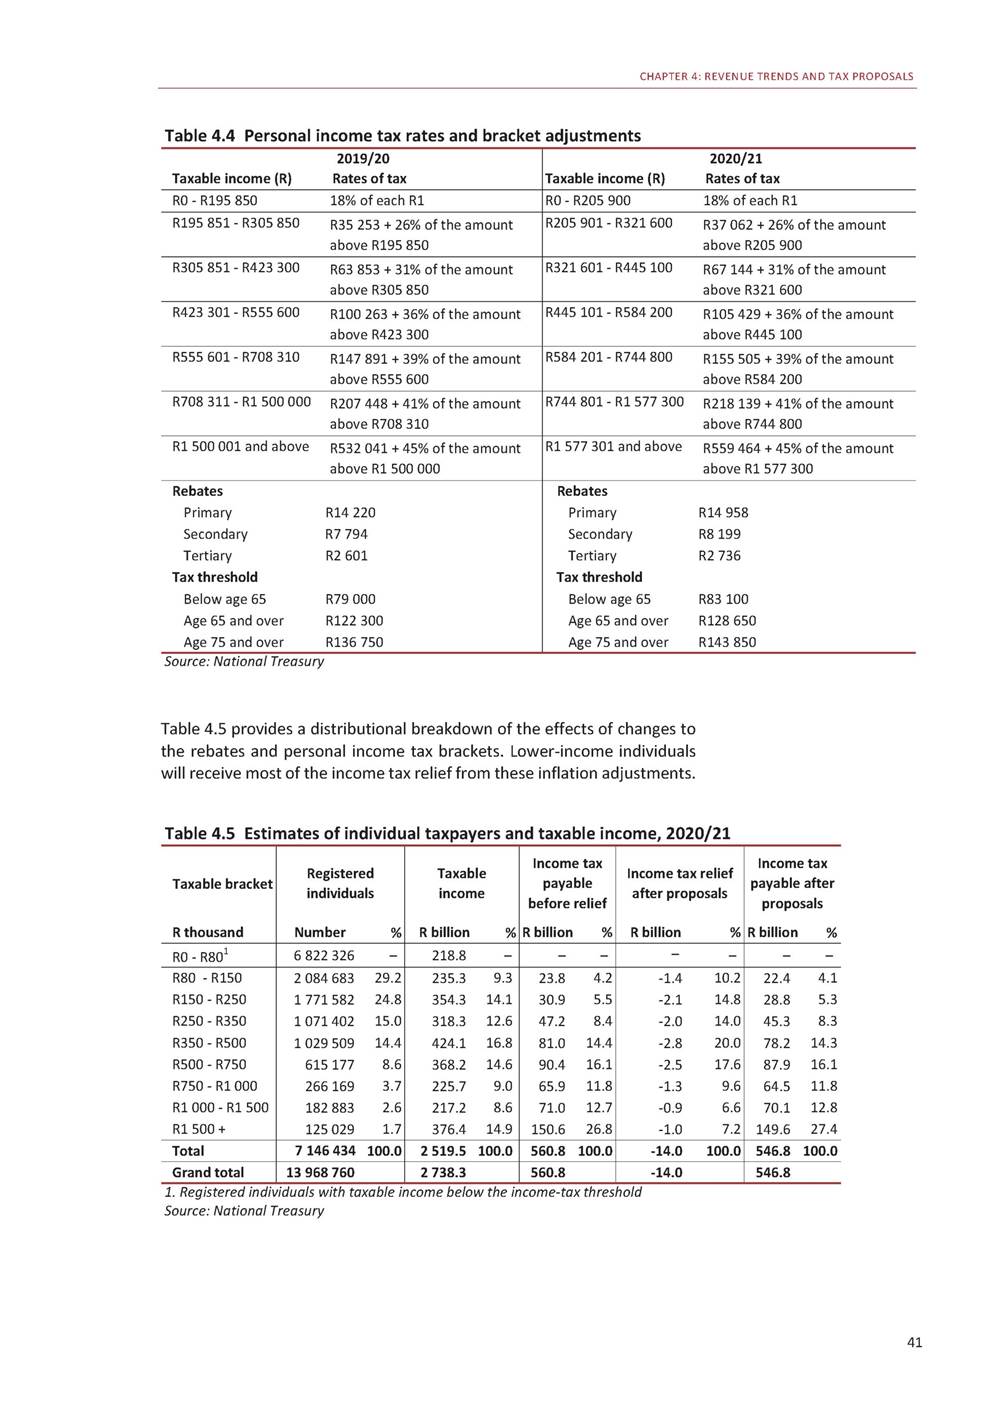
2020 BUDGET REVIEW Curtailing excessive corporate interest deductions Government proposes to restrict net interest expense deductions to 30 per cent of earnings for years of assessment commencing on or after 1 January 2021. This measure will address a typical form of base erosion and profit shifting by multinational corporations. This practice involves artificially inflating company debt and/or the interest rate on that debt to a related party in another jurisdiction with a lower corporate income tax rate. The resulting interest payments are deducted in South Africa, reducing the domestic tax base and effectively shifting profits to be taxed at a lower rate offshore. Consultation on the design of this limitation begins today. A discussion document is available on the National Treasury website and the closing date for comments is 17 April 2020. Proposal to restrict net interest expense deductions to curb base erosion and profit shifting Sunset dates for corporate tax incentives The National Treasury proposes introducing a 28 February 2022 sunset date for tax incentives dealing with airport and port assets, rolling stock, and loans for residential units. Government will review each of these incentives before the sunset date to determine whether they should be extended. Details are provided in Annexure B. The section 12I tax incentive relating to industrial policy projects will not be renewed beyond 31 March 2020. The urban development zone incentive will be extended for one year while a review of the incentive is completed. Government intends to insert sunset dates in additional tax incentives where they do not currently exist to avoid benefits continuing indefinitely without adequate oversight. More details are provided in Annexure B. Given the fiscal position, government does not intend to extend the tax incentives for special economic zones beyond the six zones already approved by the Minister of Finance. Limiting the use of assessed losses to reduce taxable income When a company’s tax-deductible expenses exceed its income, it records an assessed loss. Often, the loss is carried forward to the next year and is offset against taxable income in that year. Over the past few years, there has been an international trend to restrict this practice. Government proposes broadening the corporate income tax base by restricting the offset of assessed losses carried forward to 80 per cent of taxable income, for years of assessment commencing on or after 1 January 2021. This is viewed as a reasonable approach that affects all businesses equally, rather than restricting the number of years for carrying forward assessed losses, which would disproportionately hurt businesses with large initial investments or long lead times to profitability. Growing international trend to restrict use of assessed losses carried forward 42 Taxing the digital economy In today’s digital economy, many businesses are able to generate significant profits in a country, without a physical presence. The Organisation for Economic Co-operation and Development (OECD) secretariat has proposed a unified approach to taxing multinational firms. This approach considers multinationals as a whole, and recognises that consumers and intangible assets contribute to global profits. Under the proposal, multinationals would be required to report a portion of their global profits in all countries where they have a sustained and material market presence. The proposal forms the basis for negotiations and a hoped-for consensus in 2020. South Africa participates in these discussions as a member of the OECD’s inclusive framework steering group.
CHAPTER 4: REVENUE TRENDS AND TAX PROPOSALS Export taxes Export taxes are limited by trade agreements, and lead to winners and losers in the economy. Given these considerations, South Africa has generally avoided such taxes. Government is aware, however, that unfair trade practices have put some key industries under pressure. Government will consult with affected industries on the introduction of export taxes on scrap metal, which could replace the current price preference system. Proposed export taxes will apply to ferrous metals at the rate of R1 000 per tonne, aluminium at R3 000 per tonne, red metals at R8 426 per tonne, and other waste and scrap metals at R1 000 per tonne. This reform aims to improve the availability of better-quality scrap metal at affordable prices for domestic foundries and mills. Consultation will begin today, to be concluded by the end of May 2020, for consideration in the annual tax bills. Given their negative impact on trade, South Africa has generally not used export taxes Transfer duties The brackets to calculate transfer duties on the sale of property, last adjusted in 2017, will be adjusted for inflation from 1 March 2020. No transfer duty will be liable on the purchase of property with a value below R1 million. Table 4.6 Transfer duty rate adjustments Source: National Treasury Taxation of heated tobacco products Heated tobacco products produce aerosols containing addictive substances and other chemicals that are inhaled by users. These products are not currently subject to excise duty. Government will introduce a new category or tariff subheading for heated tobacco products in the schedule of excise duties, to be taxed at a rate of 75 per cent of the cigarette excise rate with immediate effect. Electronic cigarettes Electronic cigarettes are different to heated tobacco products: they do not contain tobacco, but they do contain nicotine or other chemicals. Currently, electronic cigarettes are not taxed. Globally, policymakers are looking at regulating and taxing these products due to concerns about their health effects. Government intends to tax electronic cigarettes in 2021. Government intends to tax electronic cigarettes due to concerns about health effects 43 2019/20 Property value (R) Rates of tax 2020/21 Property value (R) Rates of tax R0 - R900 000 0% of property value R0 - R1 000 000 0% of property value R900 001 - R1 250 000 3% of property value above R900 000 R1 000 001 - R1 375 000 3% of property value above R1 000 000 R1 250 001 - R1 750 000 R10 500 + 6% of property value above R1 250 000 R1 375 001 - R1 925 000 R11 250 + 6% of property value above R1 375 000 R1 750 001 - R2 250 000 R40 500 + 8% of property value above R1 750 000 R1 925 001 - R2 475 000 R44 250 + 8% of property value above R1 925 000 R2 250 001 - R10 000 000 R80 500 + 11% of property value above R2 250 000 R2 475 001 - R11 000 000 R88 250 + 11% of property value above R2 475 000 R10 000 001 and above R933 000 + 13% of property value above R10 000 000 R11 000 001 and above R1 026 000 + 13% of property value above R11 000 000
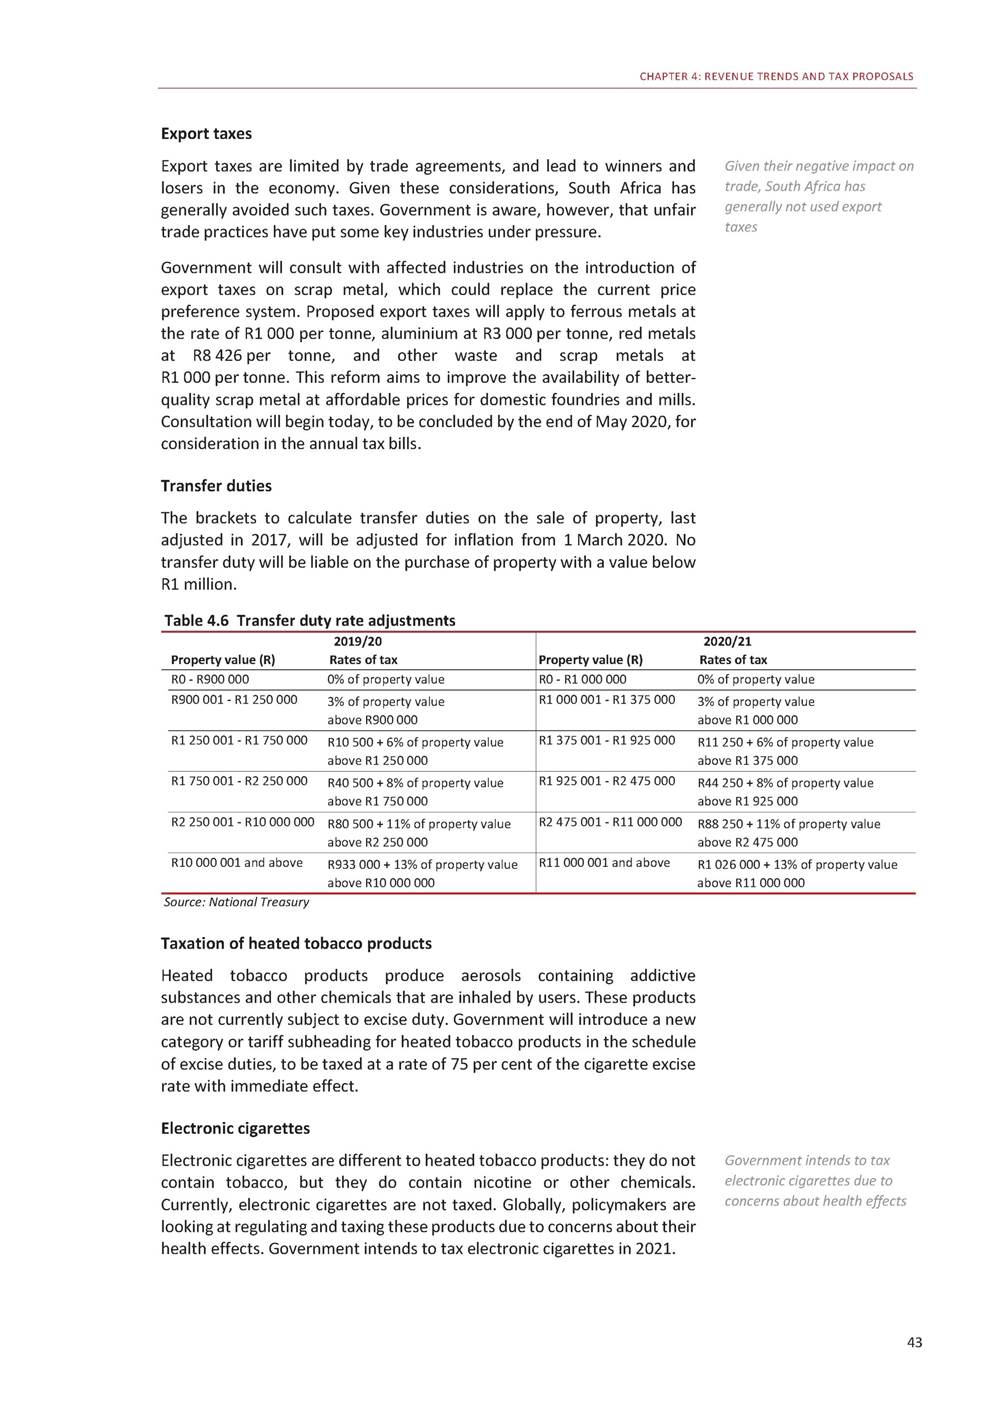
2020 BUDGET REVIEW Excise duties on alcohol and tobacco Taxes on alcohol and tobacco are determined within a policy framework that targets the excise duty burden. The excise burdens for most types of alcoholic beverages and tobacco products currently exceed the targeted level as a result of above-inflation increases and price fluctuations. Government will increase most excise duties by an amount that matches expected inflation of 4.4 per cent for 2020/21, and by 6 per cent in the case of sparkling wine and 7.5 per cent for pipe tobacco and cigars. Excise duties on alcohol and tobacco increase in line with inflation Table 4.7 Changes in specific excise duties, 2020/21 Source: National Treasury Levies on fuel To adjust for inflation, government proposes to increase the general fuel levy by 16c/litre and the RAF levy by 9c/litre from 1 April 2020. Table 4.8 Total combined fuel taxes on petrol and diesel 1. The carbon tax on fuel became effective from 5 June 2019 2. Average Gauteng pump price for the 2018/19 and 2019/20 years. The 2020/21 figure is the Gauteng pump price in February 2020. Diesel (0.05% sulphur) wholesale price (retail price not regulated) Source: National Treasury 44 2018/19 93 octaneDiesel Rands/litrepetrol 2019/20 93 octaneDiesel petrol 2020/21 93 octaneDiesel petrol General fuel levy3.373.22 Road Accident Fund levy1.931.93 Customs and excise levy0.040.04 Carbon tax1–– 3.543.39 1.981.98 0.040.04 0.070.08 3.703.55 2.072.07 0.040.04 0.070.08 Total5.345.19 Pump price215.3014.20 5.635.49 13.8613.14 5.885.74 15.7114.57 Taxes as percentage of34.9%36.5% pump price 40.6%41.8% 37.4%39.4% Current excise Productduty rate Proposed excise duty rate Percentage change NominalReal Malt beerR102.07/ litre of absolute alcohol (173,51c / average 340ml can) R106.56/ litre of absolute alcohol (181,15c / average 340ml can) 4.4– Traditional African beer7,82c / litre 7,82c / litre –-4.4 Traditional African beer34,70c / kg powder 34,70c / kg –-4.4 Unfortified wineR4.20 / litre R4.39 / litre 4.4– Fortified wineR7.03 / litre R7.34 / litre 4.4– Sparkling wineR13.55 / litre R14.36 / litre 6.01.6 Ciders and alcoholic fruit R102.07/ litre of absolute beveragesalcohol (173,51c / average 340ml can) R106.56/ litre of absolute alcohol (181,15c / average 340ml can) 4.4– SpiritsR204.15 / litre of absolute alcohol (R65.84 / 750ml bottle) R213.13 / litre of absolute alcohol (R68.73 / 750ml bottle) 4.4– CigarettesR16.66 / 20 cigarettes R17.40 / 20 cigarettes 4.4– Cigarette tobaccoR18.73 / 50g R19.55 / 50g 4.4– Pipe tobaccoR5.39 / 25g R5.79 / 25g 7.53.1 CigarsR89.72 / 23g R96.45 / 23g 7.53.1
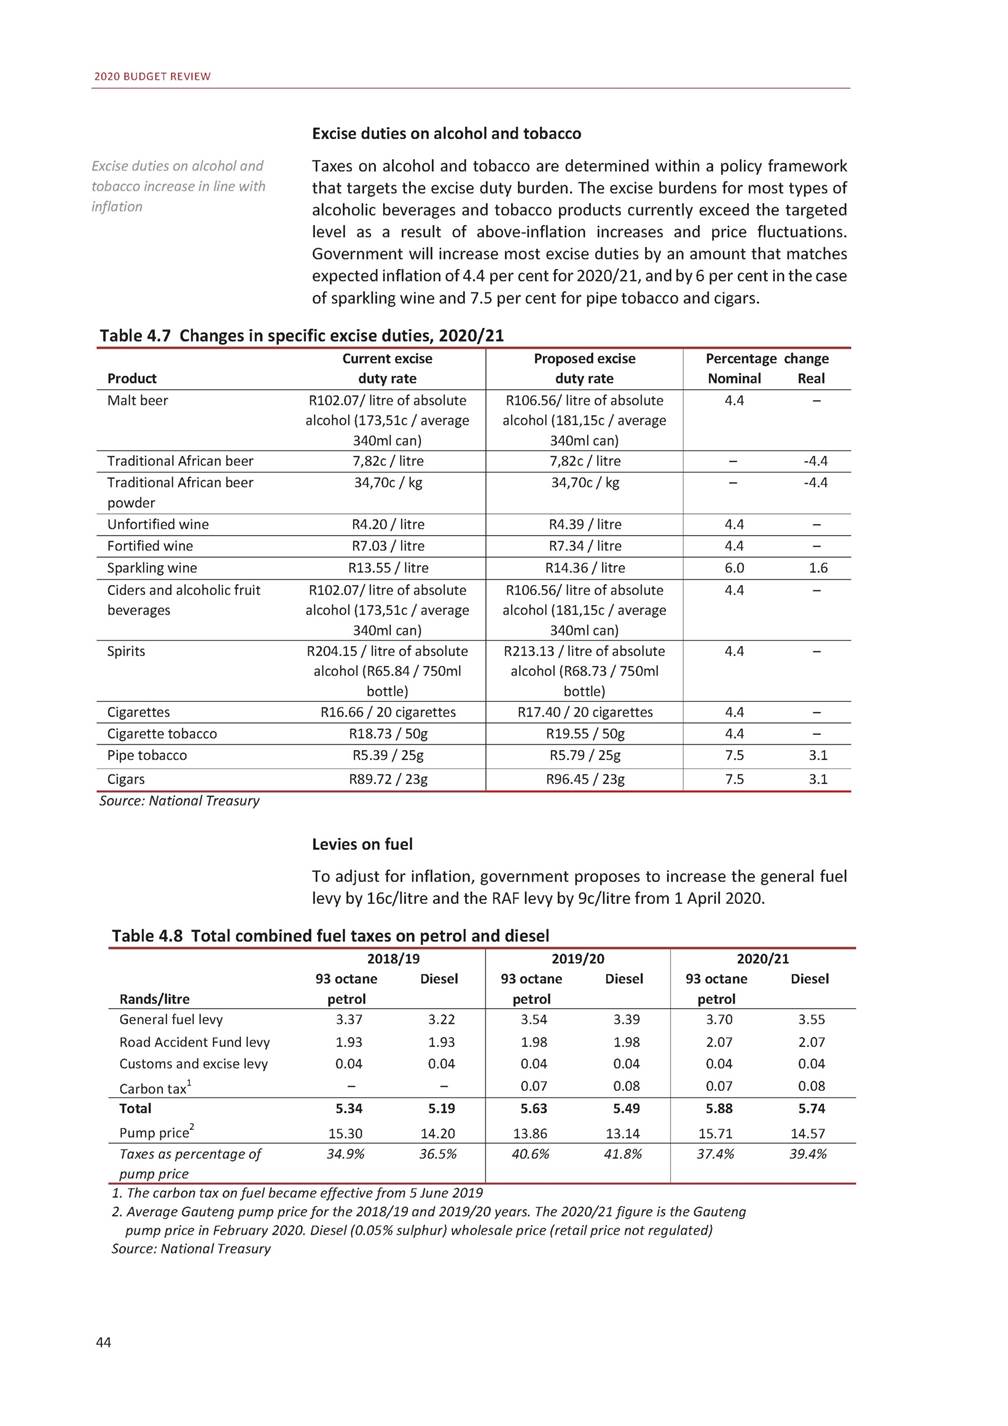
CHAPTER 4: REVENUE TRENDS AND TAX PROPOSALS Carbon tax The carbon tax rate will increase by 5.6 per cent for the 2020 calendar year. This increase includes an annual inflation rate of 3.6 per cent plus two percentage points in line with the Carbon Tax Act (2019). Accordingly, the carbon tax rate will increase from R120 per tonne of carbon dioxide equivalent to R127 per tonne of carbon dioxide equivalent. Purchase tax on motor vehicle emissions and incandescent globe tax In line with global vehicle emission standards and the shift to low-carbon, fuel-efficient vehicles, government proposes to increase the vehicle emissions tax rate for passenger cars to R120 per gram of carbon dioxide emissions per kilometre (gCO2/km) and R160 gCO2/km for double cabs. The threshold will be adjusted from 120 gCO2/km to 95 gCO2/km for passenger vehicles to align with the Euro 6 emission standards. These amendments will take effect from 1 April 2020. Government proposes to increase the incandescent light bulb levy by R2 from R8 to R10, effective 1 April 2020, to encourage the uptake of more energy-efficient light bulbs. Vehicle emission tax to increase in line with global standards and shift to fuel-efficient cars Levies on plastic An estimated 12.7 million tonnes of plastic litters the world’s oceans. While progress has been made in the domestic environment, plastic pollution remains a significant problem, particularly for marine life. The National Treasury will consult on extending the current levy on plastic bags to all single-use plastics used for retail consumption, including plastic straws, utensils and packaging. Changes will be implemented in 2021. Government proposes to raise the plastic bag levy from 12 to 25 cents per bag effective 1 April 2020. A review of the current levy, including a clarification of the tax treatment of compostable bags, will be undertaken. 45 Carbon pricing and environmental taxation Increasingly, governments and businesses recognise that the world faces a climate crisis, and acknowledge the need for partnerships to limit global warming to below 1.5 degrees Celsius. As the Paris Agreement becomes operational in 2020, signatories will submit revised nationally determined contribution commitments to mitigate climate change. A range of legislation and policies is being developed to meet South Africa’s commitments in this regard. South Africa introduced a carbon tax in June 2019 as part of government’s broader climate change mitigation policy. The National Treasury and the Department of Environment, Forestry and Fisheries will jointly consult stakeholders on future mitigation policies, including the integration of the carbon tax and mandatory carbon budgeting for the private sector to provide policy certainty and promote transparency. Government will also continue to monitor developments under Article 6 of the Paris Agreement and their implications for the design and implementation of the domestic carbon offset scheme under the carbon tax. Government will review the design of the carbon tax after it has been in operation for at least three years to ensure that the measure is contributing appropriately to cost-effective emissions reduction. Government is preparing to publish an environmental fiscal reform review paper. It will explore the potential for new environmental taxes and reforms to existing instruments, such as: • Restructuring the general fuel levy to include a local air pollution emissions component. •Alleviating traffic congestion through road pricing charges and design options for an annual carbon dioxide tax on vehicles, in collaboration with the Department of Transport and provincial governments. • Reviewing inefficient fossil fuel subsidies, including the VAT zero-rating of transport fuels. • Considering product taxes on electrical and electronic waste. • Reviewing the tax treatment of company cars to incentivise use of more fuel-efficient vehicles.

2020 BUDGET REVIEW Foreign remuneration exemption Government will increase the cap on the exemption of foreign remuneration earned by South African tax residents to R1.25 million per year from 1 March 2020. Some advisors have recommended emigration, as recognised by the Reserve Bank, as a way to break tax residency. However, this is only one factor considered by SARS. Government wants to encourage all South Africans working abroad to maintain their ties to the country. Consequently, this concept of emigration will be phased out by 1 March 2021. Details appear in Annexure E. Government wants to encourage all South Africans working abroad to maintain their ties to the country Tax policy reviews and research The fiscal treatment of the upstream petroleum sector The draft Upstream Petroleum Resources Development Bill was recently published for public comment. The National Treasury notes the current public discussion on the bill and will consult with the relevant stakeholders as to the most appropriate fiscal regime for South Africa. Other projects The National Treasury will undertake or complete the following projects during 2020/21: • Examining the regulation and tax treatment of unlisted real estate investment trusts, in line with the announcements in the 2013 and 2019 Budget Review. • Reviewing the tax treatment of amounts received by portfolios of collective investment schemes in line with the announcement in the 2019 Budget Review. Measures to enhance tax administration Pay-as-you-earn and personal income tax administration reform The legal framework and administration of pay-as-you-earn (PAYE) will be reviewed with a view to implementing a more modern, automated process for employers that is easy to understand, access and maintain. The reform is intended to promote accurate and timely withholding from employees and payments to SARS. It is expected to reduce the administrative burden for employers, payroll administrators and SARS. In addition, employees will be able to monitor their tax obligations during the course of the year, and the annual return process for employers will be simplified. Over time, this reform is likely to mean that most individual salaried taxpayers will not have to file personal tax returns. Reforms expected to lead to automated PAYE system that could reduce filing burden Conclusion Revenue collection continues to perform below expectations, driven by a weak economy. The 2020 Budget aims to support economic recovery in the short term by not raising additional taxes. Over time, the strengthening of SARS is expected to lead to increased revenue collection. 46
5 Consolidated spending plans Overview Tsince the 2019 Budget, and spending priorities for each function. his chapter outlines government’s consolidated spending plans over the next three years. It shows changes to medium-term allocations Government spending remains highly redistributive, with 55.4 per cent of the budget allocated to learning and culture, health and social development. Total consolidated government spending is expected to be R6.14 trillion over the medium term. Main budget non-interest expenditure will grow from R1.54 trillion in 2020/21 to R1.65 trillion in 2022/23. Relative to the 2019 Budget, main budget non-interest spending is reduced by R156.1 billion over the medium term. This is largely due to proposed measures, amounting to R160.2 billion, to reduce growth in the public-service wage bill. As discussed in Chapter 6, the way in which compensation reductions affect individual department baselines will only be finalised in 2020/21. Consolidated government spending amounts to R6.14 trillion over the MTEF period 47 In brief •Total consolidated spending will amount to R1.95 trillion in 2020/21, R2.04 trillion in 2021/22 and R2.14 trillion in 2022/23. •Relative to the 2019 Budget, main budget non-interest expenditure will be reduced by R156.1 billion over the medium-term expenditure framework (MTEF) period. As a result, it will grow from R1.54 trillion in 2020/21 to R1.65 trillion in 2022/23. •Funding for new and urgent priorities is provided through reprioritising existing baselines. •To reduce growth in the public-service wage bill, the 2020 Budget proposes reductions to compensation spending totalling R160.2 billion over the MTEF period. •In addition, baseline reductions of R28.2 billion in 2020/21, R33.2 billion in 2021/22 and R39.3 billion in 2022/23, mainly on non-compensation spending, have been implemented. These were partially offset by reallocations to baselines and additional allocations to state-owned companies.
2020 BUDGET REVIEW As noted in the 2019 Medium Term Budget Policy Statement (MTBPS), weak economic performance, revenue outcomes and balance sheets of several state-owned companies have necessitated reductions in government spending over the MTEF period. The 2020 Budget includes baseline reductions of R66 billion in 2020/21, R88.1 billion in 2021/22 and R106.8 billion in 2022/23. These include reductions to compensation ceilings and government programmes. Cost pressures, including new and urgent priorities, have been funded through a combination of reallocations and reprioritisations over the MTEF period. Despite these fiscal measures, government debt as a share of GDP continues to increase. Debt-service costs remain the fastest-growing expenditure item at an annual average rate of 12.3 per cent, and will increase to R290.1 billion in 2022/23. Baselines reduced by R66 billion in 2020/21, R88.1 billion in 2021/22 and R106.8 billion in 2022/23 Revisions to main budget spending plans The 2020 Budget proposes total baseline reductions of R261 billion over the medium term, as shown in Table 5.1. The reductions were partially offset by baseline reallocations and additional allocations to state-owned companies, mainly Eskom. Table 5.1 Adjustments to main budget non-interest expenditure since 2019 Budget 1. Includes reversal of savings from wage bill measures and national macro-reorganisation of government, adjustments due to lower CPI, and early retirement savings in police Source: National Treasury Non-compensation baseline reductions mainly affect conditional grants to provinces and municipalities, and national and provincial programme spending. As far as possible, reductions were made in underperforming or underspending programmes. The largest reductions are made to the human settlements and public transport sectors. Reductions in government programmes imply the need to review programmes, possibly resulting in closure or downscaling over the medium term, and to use allocated budgets more efficiently. In addition, reductions on goods and services may negatively affect maintenance of government facilities and information communications technology infrastructure, and lead to increased accruals. 48 R million2020/212021/222022/23 MTEF total 2019 Budget non-interest expenditure1 545 5001 653 0771 736 538 Less: Contingency reserve6 0006 0006 000 4 935 115 18 000 Allocated expenditure (2019 Budget)1 539 5001 647 0771 730 538 Skills development levy adjustments-1 025-1 722-500 Baseline reductions and reallocations-66 045-88 149-106 801 Programme baseline reductions-28 238-33 219-39 341 Wage bill reductions-37 807-54 929-67 460 Baseline allocations59 29329 98121 843 Financial support for state-owned companies44 04214 3091 777 Net change in adjustments announced in 2019 Budget17 7537 62011 953 Programme allocations7 4998 0518 113 4 917 115 -3 246 -260 995 -100 798 -160 196 111 117 60 128 27 326 23 663 Allocated in 2020 Budget1 531 7241 587 1861 645 080 Plus: Contingency reserve5 0005 0005 000 4 763 991 15 000 2020 Budget non-interest expenditure1 536 7241 592 1861 650 080 4 778 991 Change in non-interest expenditure since 2019 Budget-8 776-60 890-86 458 -156 124
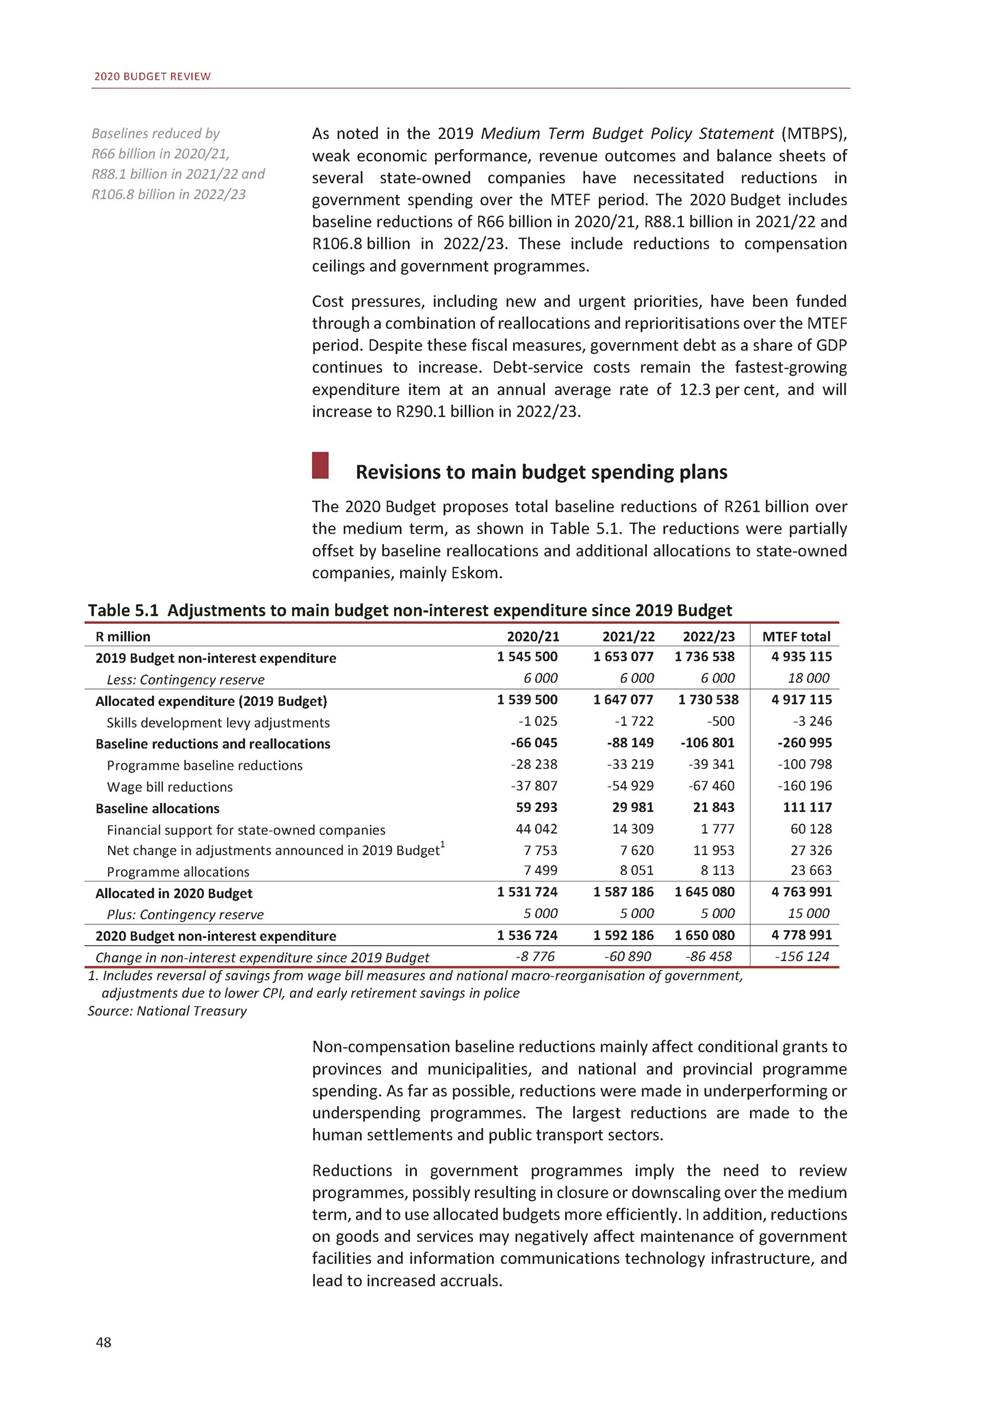
CHAPTER 5: CONSOLIDATED SPENDING PLANS Table 5.2 Reallocations to baselines over the MTEF period 1. Details of other baseline reallocations provided in the Estimates of National Expenditure Source: National Treasury Allocations to the human settlements sector are reduced by R14.6 billion over the MTEF period, implying fewer subsidy houses, serviced sites and related bulk and connector infrastructure. The municipal infrastructure grant is reduced by R2.8 billion over the same period, slowing provision of infrastructure such as water and electricity connections to poor households. Public transport spending is reduced by R13.2 billion over the next three years, mainly on allocations to the Passenger Rail Agency of South Africa and the public transport network grant. The reduced allocation to the agency is mainly due to underspending in previous years, which resulted in huge cash surpluses. The agency is expected to ensure that critical investments are made to stabilise Metrorail. Planning and implementation of integrated public transport networks will be suspended in Buffalo City, Mbombela and Msunduzi as these three cities have progressed the least in launching public transport systems. Accordingly, there will be no allocations to these cities in the 2020 MTEF period. Reductions in basic and higher education infrastructure allocations amount to R5.2 billion over the medium term. These reductions are expected to cause revisions to infrastructure plans and delays in project completion. Spending in the national Department of Health is reduced by R3.9 billion over the MTEF period. This implies that some activities related to national health insurance will be phased in over a longer timeframe. Public transport spending reduced by R13.2 billion over MTEF period 49 R million2020/212021/222022/23 MTEF total 2020 Budget additions to baseline7 4998 0518 113 Post-retirement medical assistance8041 5652 028 Common Monetary Area Compensation340390490 Municipal Revenue Management Improvement Programme330433454 Township Entrepreneurship Fund–500500 Universal Service and Access Fund: New model for broadcasting522604– digital migration Innovation Fund200500500 South African Revenue Service: Infrastructure-related projects400300300 Provincial conditional grants362473582 Other allocations14 5413 2863 259 23 663 4 397 1 220 1 216 1 000 1 126 1 200 1 000 1 418 11 086
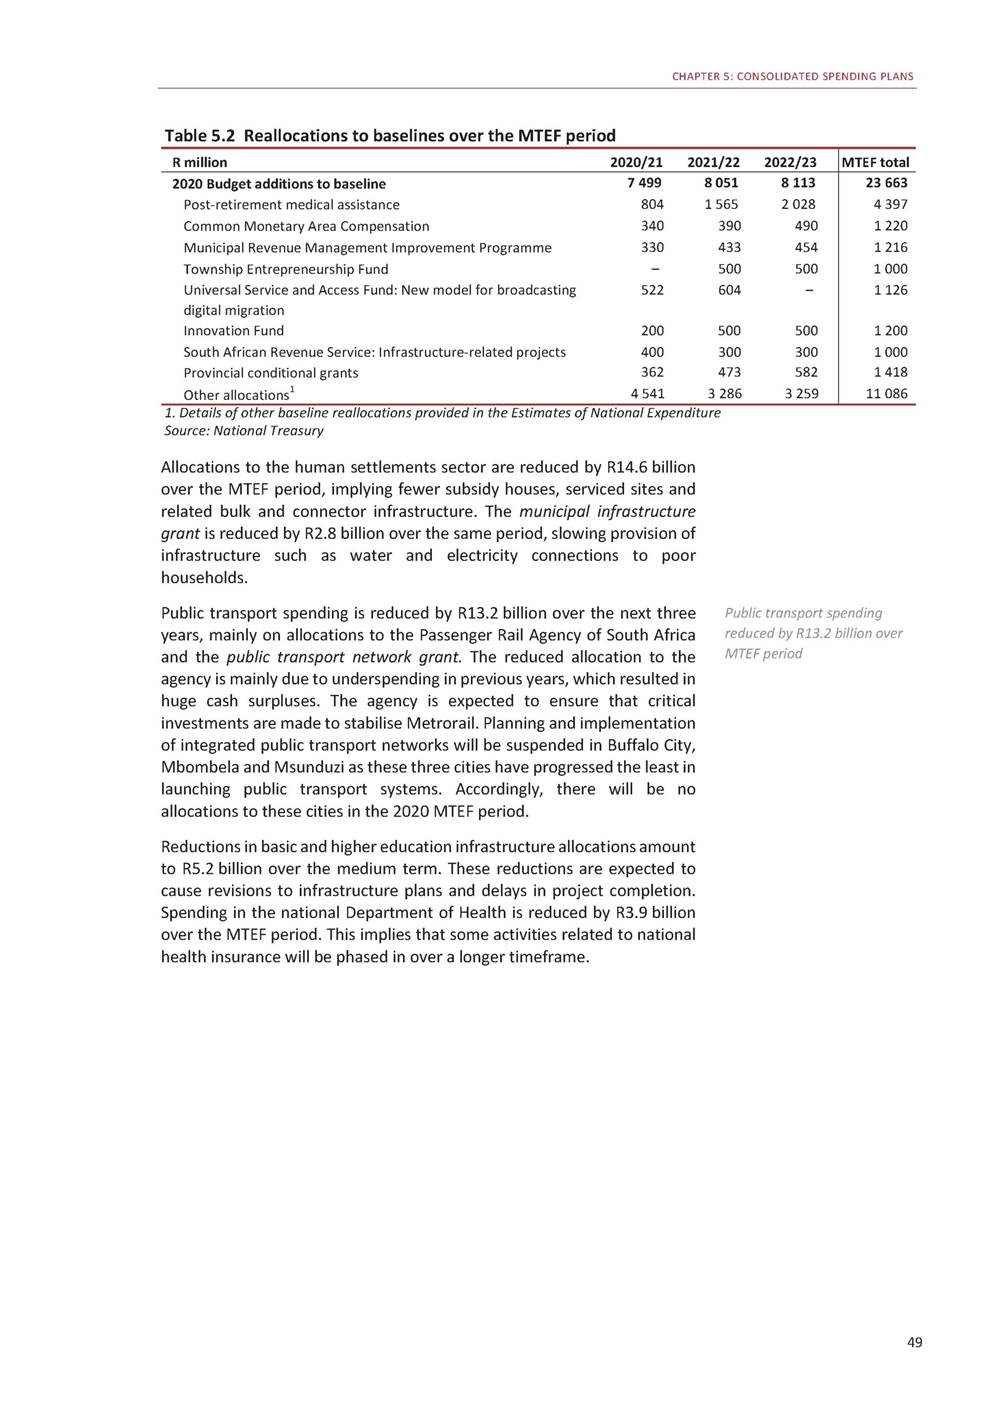
2020 BUDGET REVIEW Largest baseline reductions over the MTEF period1 Table 5.3 1. Selected information on large baseline reductions over the MTEF period, details provided in the Estimates of National Expenditure 2. Technical and vocational education and training 3. Mainly includes goods and services reductions in national departments and public entities Source: National Treasury Provisional allocations Provisional allocations are only confirmed once certain requirements have been met. In addition to provisional allocations to Eskom, the 2020 Budget includes provisional allocations of R7 billion in 2020/21, R1.9 billion in 2021/22 and R3.6 billion in 2022/23. These allocations are mainly for financial support to South African Airways and road asset management for the secondary and strategic road network. 50 R million2020/212021/222022/23 MTEF total 2020 Budget baseline adjustments-28 238-33 219-39 341 Programme specific reductions-10 666-10 596-15 742 of which: Passenger Rail Agency of South Africa-4 469-2 780-1 351 New Development Bank––-4 730 Social grants-1 438-1 521-1 245 Public entity transfers-528-1 185-1 367 Police: Reallocation to implement the integrated-824-940-997 criminal justice strategy TVET 2 college: Infrastructure and efficiency grant-688-819-826 South African Social Security Agency-406-517-626 South African National Roads Agency Limited––-1 391 Provincial equitable share-2 349-2 452-2 524 Provincial conditional grants-4 893-5 940-7 202 of which: Human settlements development grant-2 331-1 984-2 402 Provincial roads maintenance grant-500-1 084-1 258 Health conditional grants-446-698-732 Education infrastructure grant-459-616-775 Local equitable share-1 000-1 100-1 100 Local conditional grants-4 622-6 457-7 425 of which: Public transport network grant-1 049-1 570-1 727 Urban settlements development grant-1 420-1 968-2 554 Municipal infrastructure grant-989-894-939 Water services infrastructure grant-426-541-698 Cross-cutting reductions3-4 708-6 674-5 348 -100 798 -37 004 -8 599 -4 730 -4 204 -3 080 -2 761 -2 333 -1 550 -1 391 -7 325 -18 036 -6 717 -2 841 -1 875 -1 850 -3 200 -18 504 -4 347 -5 943 -2 822 -1 665 -16 729
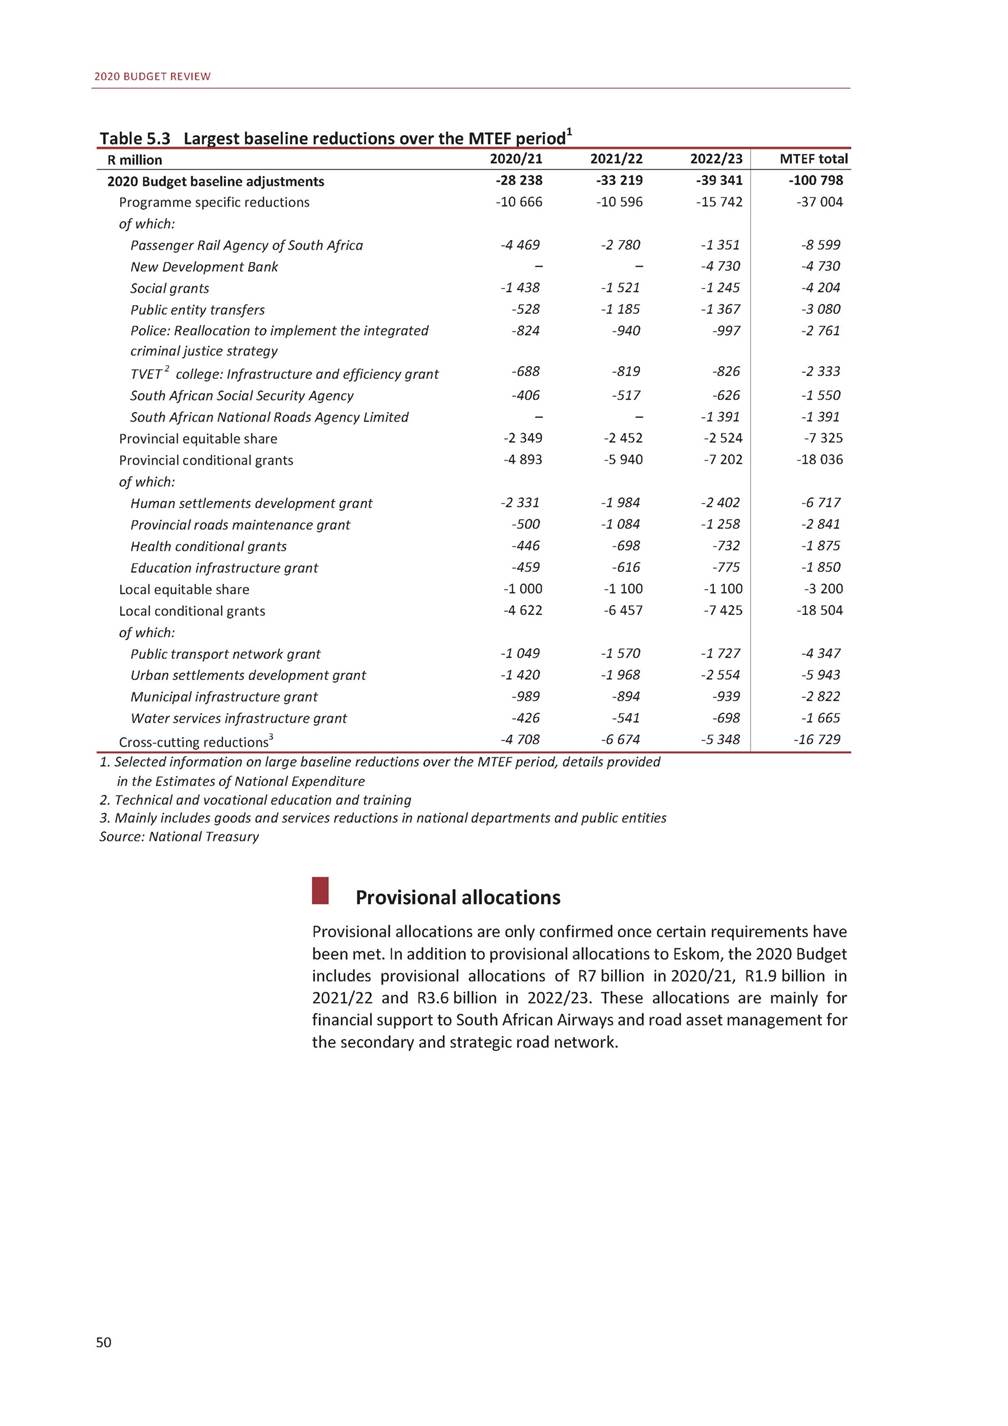
CHAPTER 5: CONSOLIDATED SPENDING PLANS Table 5.4 Provisional allocations not assigned to votes 1. Includes provisional allocation for the Municipal Demarcation Board Source: National Treasury Consolidated government expenditure Total consolidated government spending is expected to grow at an average annual growth rate of 5.1 per cent, from R1.84 trillion in 2019/20 to R2.14 trillion in 2022/23. Consolidated government expenditure by economic classification1 Table 5.5 1. The main budget and spending by provinces, public entities and social security funds financed from own revenue Source: National Treasury 51 2019/20 Revised estimate R million 2020/212021/222022/23 Medium-term estimates Percentage of total MTEF allocation Average annual MTEF growth Economic classification Current payments1 095 868 Compensation of employees629 200 Goods and services251 656 Interest and rent on land215 012 of which: Debt-service costs205 005 Transfers and subsidies599 650 Municipalities137 654 Departmental agencies and accounts26 591 Higher education institutions46 555 Foreign governments and international2 589 organisations Public corporations and private35 361 enterprises Non-profit institutions37 089 Households313 810 Payments for capital assets82 804 Buildings and other capital assets63 727 Machinery and equipment19 077 Payments for financial assets65 223 1 143 4271 218 0081 286 331 638 865667 815697 113 265 078281 465288 525 239 484268 728300 693 229 270258 482290 145 640 225671 805713 436 145 339155 518165 464 28 63927 01228 492 48 27850 34151 873 2 8802 8383 029 35 54039 86543 227 41 02343 69645 849 338 528352 534375 503 92 147101 411108 975 71 52779 61285 692 20 62021 79923 284 73 64644 11627 298 59.6% 32.7% 13.6% 13.2% 12.7% 33.1% 7.6% 1.4% 2.5% 0.1% 1.9% 2.1% 17.4% 4.9% 3.9% 1.1% 5.5% 3.5% 4.7% 11.8% 12.3% 6.0% 6.3% 2.3% 3.7% 5.4% 6.9% 7.3% 6.2% 9.6% 10.4% 6.9% Total1 843 546 Contingency reserve– 1 949 4452 035 3392 136 040 5 0005 0005 000 100.0% 5.0% Consolidated expenditure1 843 546 1 954 4452 040 3392 141 040 5.1% R million2020/212021/222022/23 MTEF total Public entity: South African Social Security Agency – 500 524 South African Airways 6 502 – – Provision for disaster recovery efforts 500 – – Competition Commission – 125 131 Broadband (SA Connect Phase 2) – – 1 289 Roads asset management for the secondary and – 800 1 048 strategic road network Construction of the Tygerberg hospital – 180 235 Construction of the Klipfontein hospital – 130 200 Other1 19 118 147 1 024 6 502 500 256 1 289 1 848 415 330 283 Total7 0211 8533 573 12 447
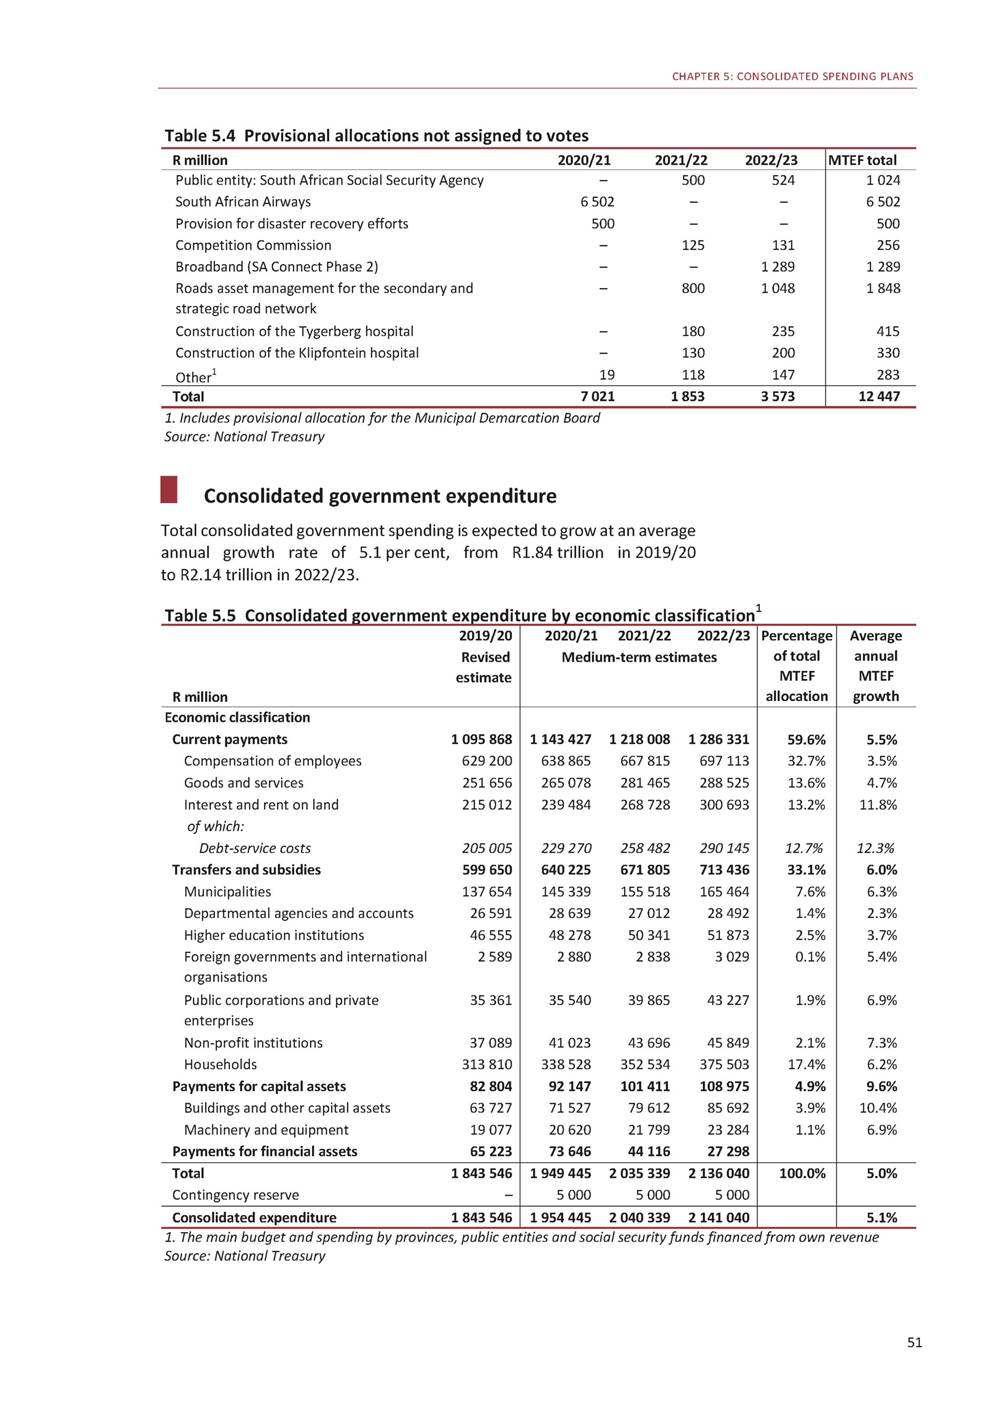
2020 BUDGET REVIEW Debt-service costs are the fastest-growing expenditure item over the medium term, rising at an annual average rate of 12.3 per cent – more than double the average growth rate for total expenditure. Despite proposed reductions in compensation ceilings, compensation of employees continues to account for the largest portion of total spending, at 32.7 per cent over the medium term. Transfers and subsidies, including transfers to local government and public entities, account for 33.1 per cent of total spending. Public-sector infrastructure spending remains proportionately low, as capital spending continues to be crowded out by rising consumption spending pressures, including the public-service wage bill, and debt-service costs. Social development Health Economic development Spending priorities by function To the degree possible with limited resources, spending across functions supports the implementation of the seven priorities outlined in government’s 2019-2024 medium-term strategic framework. New and urgent government priorities have been funded through the reallocation of budgets within and across functions. Improving efficiency – meaning that government will have to do more with less – is a key theme across all function groups. Government remains committed to improving education and health outcomes, and reducing poverty, as shown by the size of allocations to the learning and culture, health and social development functions over the medium term. 52 Figure 5.1 Average nominal growth in spending,Figure 5.2 Consolidated government expenditure 2020/21 — 2022/23by function, 2020/21 — 2022/23 Debt-service costs Learning and culture Economic development Social development Community development Debt-service costs Health Community development Learning and culturePeace and security General public services General public services Peace and securityContingency reserve 0 2 4 6 8 10 12 0 400 800 1 200 Per cent R billion Source: National Treasury 1 248 970 778 731 683 681 667 217 15 12.3 6.6 6.3 6.2 5.1 4.0 3.7 2.2
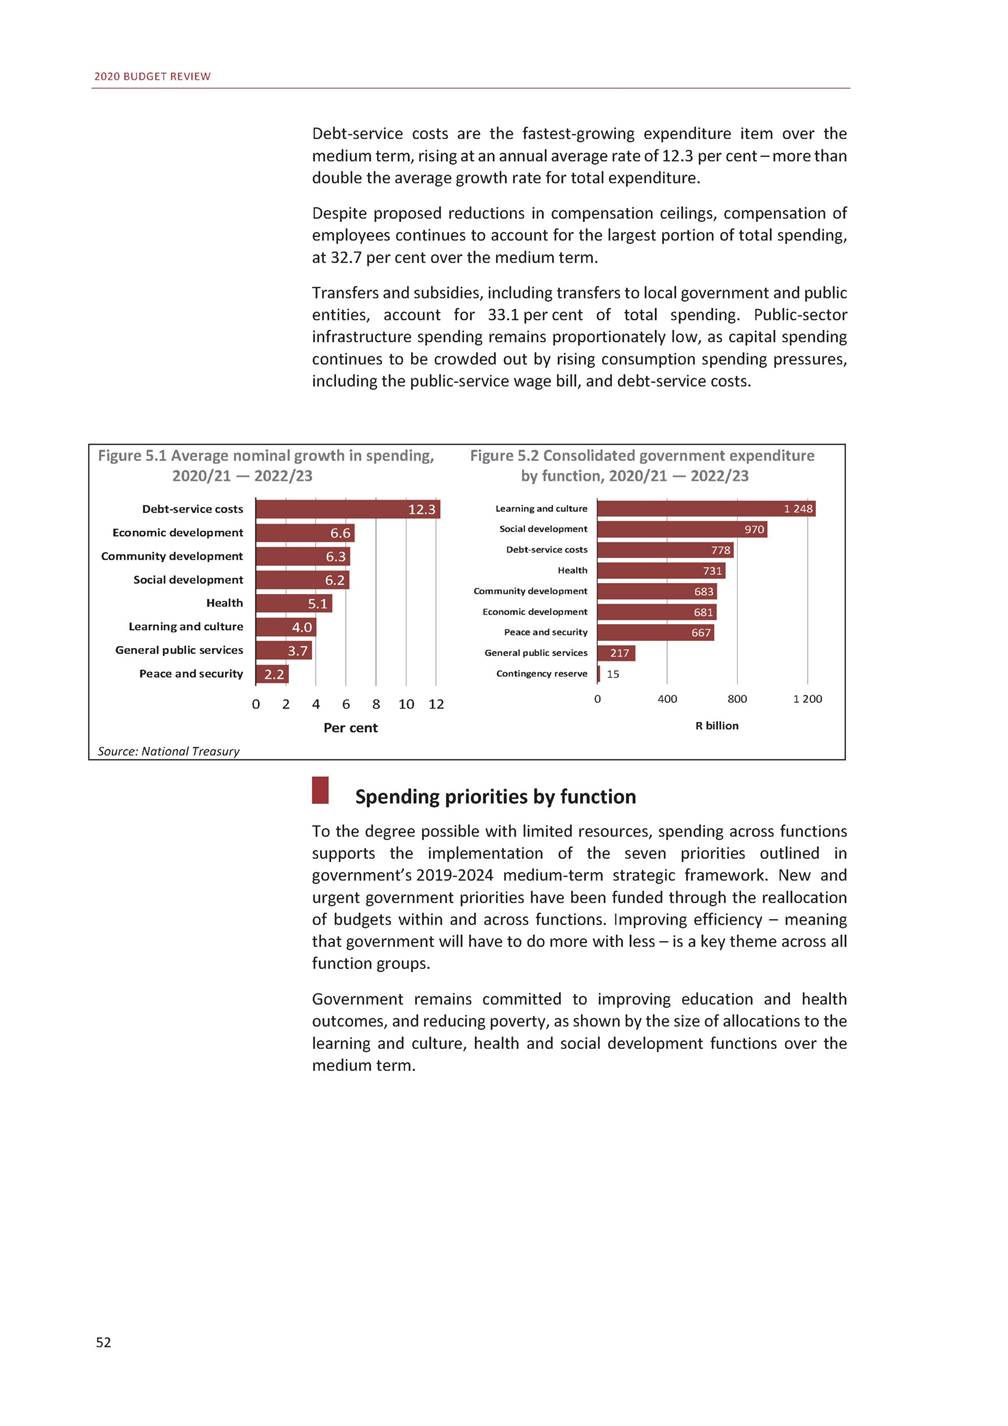
CHAPTER 5: CONSOLIDATED SPENDING PLANS Consolidated government expenditure by function1 Table 5.6 1. The main budget and spending by provinces, public entities and social security funds financed from own revenue Source: National Treasury Learning and culture Over the medium term, the learning and culture function aims to develop the capabilities of citizens from early childhood by providing access to education, training and skills development, and to strengthen social cohesion. The function will continue to receive the largest share of government spending over the MTEF period, rising from R385.6 billion in 2019/20 to R434.2 billion in 2022/23. Learning and culture continues to receive largest share of spending Basic education Basic education accounts for the largest share of expenditure in the function. The sector will focus on improving early literacy and numeracy of learners, introducing subjects like coding, data analytics and robotics, and improving school sanitation and the quality of teaching. 53 2019/20 Revised estimate R million 2020/212021/222022/23 Medium-term estimates Percentage of total MTEF allocation Average annual MTEF growth Learning and culture385 593 Basic education262 458 Post-school education and training112 087 Arts, culture, sport and recreation11 049 Health221 962 Social development284 479 Social protection207 528 Social security funds76 951 Community development201 675 Economic development198 906 Industrialisation and exports37 393 Agriculture and rural development29 608 Job creation and labour affairs21 742 Economic regulation94 467 and infrastructure Innovation, science and technology15 697 Peace and security214 365 Defence and state security50 766 Police services105 163 Law courts and prisons48 448 Home affairs9 988 General public services66 337 Executive and legislative organs14 202 Public administration44 342 and fiscal affairs External affairs7 793 Payments for financial assets65 223 396 422417 767434 166 265 881281 433293 211 118 847124 209128 386 11 69412 12512 569 229 707243 970257 559 309 512320 056340 924 221 483236 319252 037 88 02983 73888 887 212 347228 194242 169 211 531228 224240 911 39 01643 67245 664 28 34229 63730 658 22 43725 15826 555 105 311112 566120 258 16 42517 19117 776 217 001221 291228 804 51 37848 93250 439 106 127110 758114 186 49 60451 99253 641 9 8919 60910 538 70 00973 23874 064 14 57114 44315 028 47 27750 41450 279 8 1618 3818 758 73 64644 11627 298 23.4% 15.7% 7.0% 0.7% 13.7% 18.2% 13.3% 4.9% 12.8% 12.7% 2.4% 1.7% 1.4% 6.3% 1.0% 12.5% 2.8% 6.2% 2.9% 0.6% 4.1% 0.8% 2.8% 0.5% 4.0% 3.8% 4.6% 4.4% 5.1% 6.2% 6.7% 4.9% 6.3% 6.6% 6.9% 1.2% 6.9% 8.4% 4.2% 2.2% -0.2% 2.8% 3.5% 1.8% 3.7% 1.9% 4.3% 4.0% Allocated by function1 638 541 Debt-service costs205 005 Contingency reserve– 1 720 1751 776 8571 845 895 229 270258 482290 145 5 0005 0005 000 100.0% 4.1% 12.3% Consolidated expenditure1 843 546 1 954 4452 040 3392 141 040 5.1%
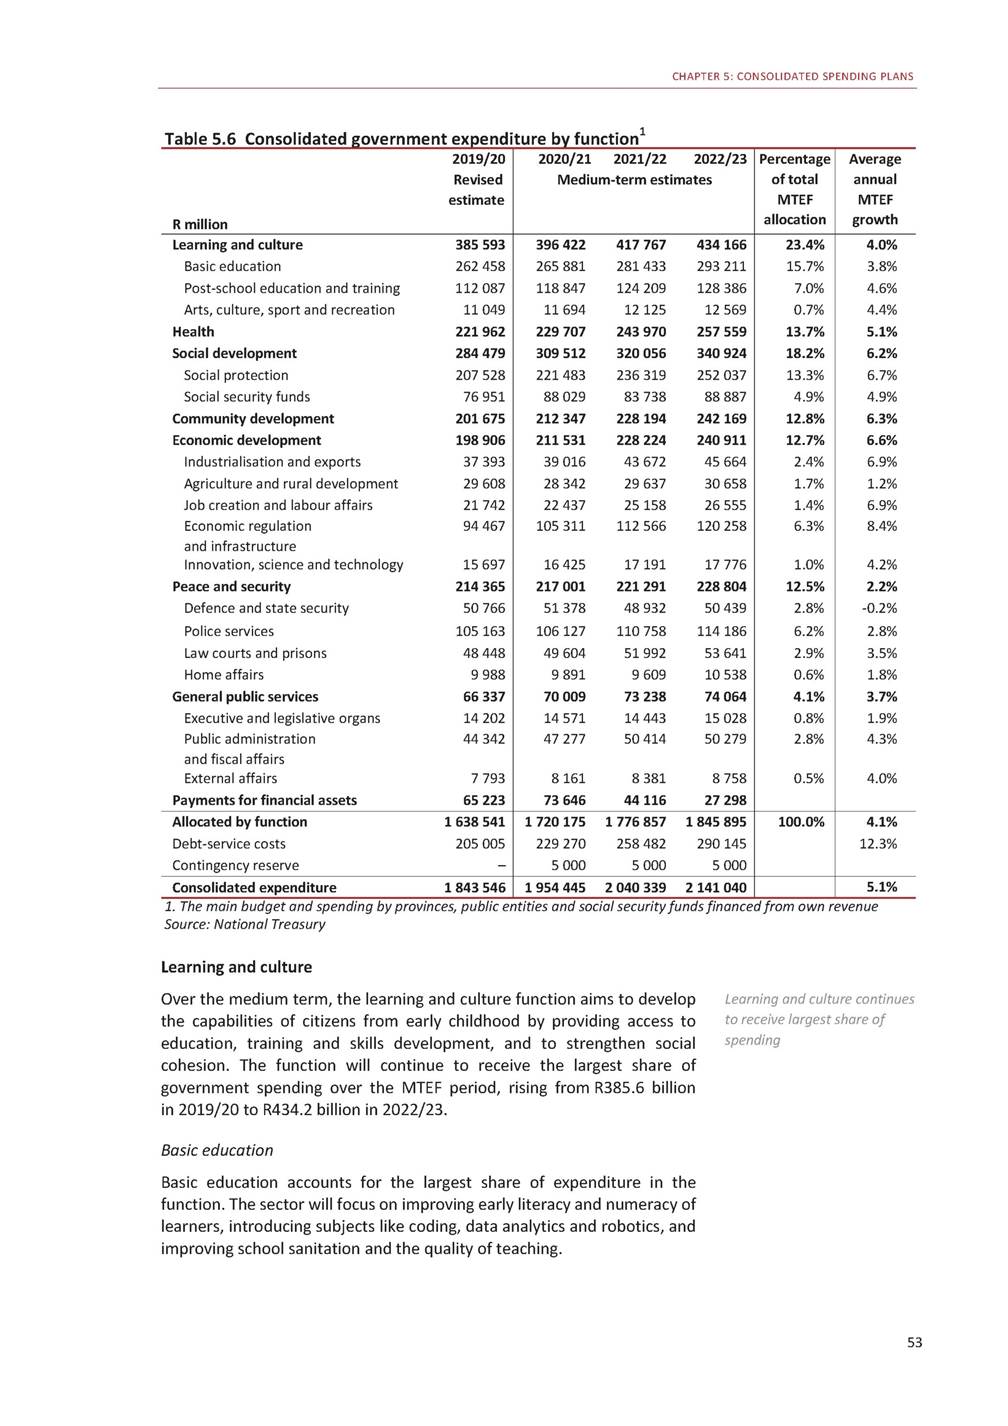
2020 BUDGET REVIEW Early childhood development is the foundation for success in school. Over the medium term, the Department of Basic Education will work with the Department of Social Development and other partners to shift responsibility for early childhood development from the social development sector to the basic education sector. They will also introduce two years of compulsory pre-schooling before all children enter Grade 1. Provincial expenditure on personnel dominates spending in the sector and function at 76.5 per cent and 51.4 per cent, respectively. Over the medium term, the education infrastructure grant is allocated R35 billion to construct, maintain and upgrade schooling infrastructure. The school infrastructure backlogs grant is allocated R5.6 billion to provide water, sanitation facilities and electricity to schools, and replace schools constructed with inappropriate materials. Of this allocation, R2.8 billion is set aside to provide appropriate sanitation facilities, which accounts for the 15.3 per cent annual average growth rate over the spending period. The national school nutrition programme grant is allocated R24.3 billion over the next three years to provide meals to 9 million learners in almost 20 000 poor schools (quintiles 1 to 3), and identified special schools. Responsibility for early childhood development to shift to basic education sector R35 billion allocated to build, maintain and upgrade schooling infrastructure Post-school education and training The medium-term focus in this sector will be to expand access to universities and technical and vocational education and training (TVET) colleges, improve their performance, develop artisans, support work-based learning, and strengthen the management and governance of community education and training colleges. Expenditure for the National Student Financial Aid Scheme increases at an average annual rate of 7.3 per cent from R33 billion in 2019/20 to R40.8 billion in 2022/23. The institution expects to fund more than 1 million students at universities and more than 870 000 students at TVET colleges over the period. NSFAS expects to fund 1 million university and 870 000 TVET students Arts, sports, recreation and culture This sector will focus on growing cultural and creative industries to create job opportunities and improve social cohesion. Existing infrastructure in the sector will be integrated where possible and new facilities will be constructed to ensure community access. The sector is allocated R36.4 billion over the MTEF period. 54
CHAPTER 5: CONSOLIDATED SPENDING PLANS Table 5.7 Learning and culture expenditure 1. Learner and teacher support material 2. Includes some provision for LTSM and property payments for schools that manage their own budgets 3. Total payments made from all income sources, including Funza Lushaka teacher bursaries and debt repayments from students 4. Spending of the 21 SETAs and the National Skills Fund Source: National Treasury Social development This function aims to reduce poverty and inequality by providing social welfare services and grants, and to empower women, youth and persons with disabilities. 55 2019/20 Revised estimate R million 2020/212021/222022/23 Medium-term estimates Percentage of total MTEF allocation Average annual MTEF growth Basic education262 458 Compensation of employees204 162 of which: Provincial compensation of203 460 employees Goods and services27 187 of which: Property payments3 596 Workbooks and LTSM 15 304 National school nutrition7 186 programme Transfers and subsidies20 058 of which: Subsidies to schools 216 730 Education infrastructure10 514 grant School infrastructure1 330 backlogs grant Post-school education and training112 087 of which: University subsidies42 359 of which: University infrastructure2 489 National Student Financial Aid32 987 Scheme 3 Technical and vocational12 555 education and training of which: Compensation of employees6 987 Subsidies5 205 Community education and2 058 training of which: Compensation of employees1 905 Skills development levy21 986 institutions 4 Arts and culture, sport and11 049 recreation 265 881281 433293 211 205 265214 754224 160 204 559214 018223 400 26 86128 04129 331 3 7243 9284 061 5 3865 4885 825 7 6668 1258 516 22 41925 20125 585 19 07220 40021 441 11 00811 71012 255 1 4912 0372 038 118 847124 209128 386 44 79647 18949 437 2 8412 9213 045 37 09739 11540 777 13 38414 02614 525 6 8647 1457 356 6 0366 3706 639 2 3862 4892 541 2 2242 3192 365 20 98821 20720 930 11 69412 12512 569 67.3% 51.6% 51.4% 6.7% 0.9% 1.3% 1.9% 5.9% 4.9% 2.8% 0.4% 29.8% 11.3% 0.7% 9.4% 3.4% 1.7% 1.5% 0.6% 0.6% 5.1% 2.9% 3.8% 3.2% 3.2% 2.6% 4.1% 3.2% 5.8% 8.5% 8.6% 5.2% 15.3% 4.6% 5.3% 7.0% 7.3% 5.0% 1.7% 8.5% 7.3% 7.5% -1.6% 4.4% Total385 593 396 422417 767434 166 100.0% 4.0%
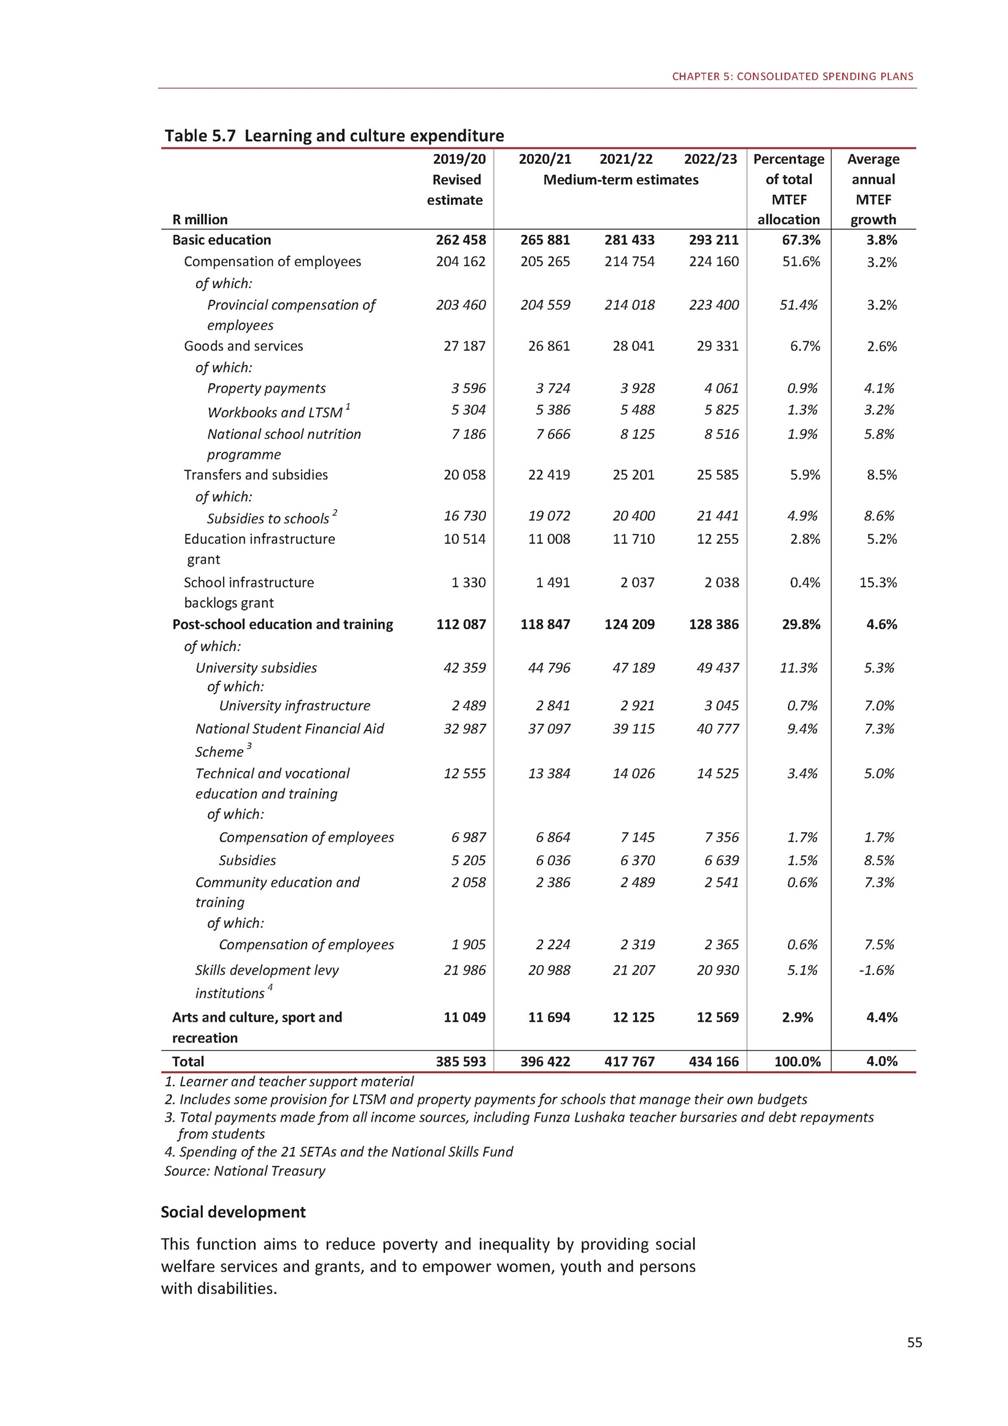
2020 BUDGET REVIEW Table 5.8 Social protection expenditure 3.1% 1. Includes war veterans Source: National Treasury Social grants The 2020 Budget continues to increase social grants in line with inflation. Due to lower expected inflation over the period, allocations have been reduced as shown in Table 5.3. Over the medium term, the total number of beneficiaries is expected to increase by almost 1 million to approximately 19 million by 2022/23. Over the MTEF period, funds amounting to R714 million are reprioritised from the Department of Social Development to its provincial counterparts for programmes to prevent HIV and AIDS infections, substance abuse, gender-based violence and femicide. Additional funds are reprioritised from the social worker scholarship programme grant, which will end in 2020/21, to provinces to employ 200 social worker graduates. Funds amounting to R406.2 million in 2020/21, R517.3 million in 2021/22 and R626 million in 2022/23 are reprioritised, mainly to the early childhood development conditional grant. As a result, the subsidy rate per child will increase by 23.8 per cent from R15 in 2019/20 to R18.57 in 2022/23. By 56 2019/20 Revised estimate R million 2020/212021/222022/23 Medium-term estimates Percentage of total MTEF allocation Average annual MTEF growth Social protection expenditure207 528 of which: Social grants175 156 of which: Child support64 967 Old age 176 951 Disability23 078 Foster care5 081 Care dependency3 430 Grant-in-aid1 238 Social Relief of Distress410 Provincial social development22 292 Women, youth and persons with791 disabilities of which: Women156 Youth523 Persons with disabilities19 221 483236 319252 037 187 836201 347216 027 69 76574 78080 735 83 10690 05397 068 24 39025 48826 522 4 9654 8294 795 3 5693 8094 077 1 6321 9782 421 407407407 23 26424 52525 661 832875915 174184192 551578605 202222 100.0% 85.3% 31.7% 38.1% 10.8% 2.1% 1.6% 0.8% 0.2% 10.3% 0.4% 0.1% 0.2% 0.0% 6.7% 7.2% 7.5% 8.0% 4.7% -1.9% 5.9% 25.1% -0.2% 4.8% 5.0% 7.1% 5.0% 6.2% Total207 528 221 483236 319252 037 100.0% 6.7% Social grants as percentage of GDP3.4% Social grant beneficiary numbers by grant type (thousands) Child support12 777 Old age13 655 Disability1 058 Foster care350 Care dependency155 3.5%3.5%3.5% 12 99113 21013 434 3 7693 8864 003 1 0511 0451 039 326304285 158161164 71.0% 20.9% 5.6% 1.6% 0.9% 1.7% -0.6% -6.7% 1.9% Total17 996 18 29618 60618 926 100.0% 1.7%
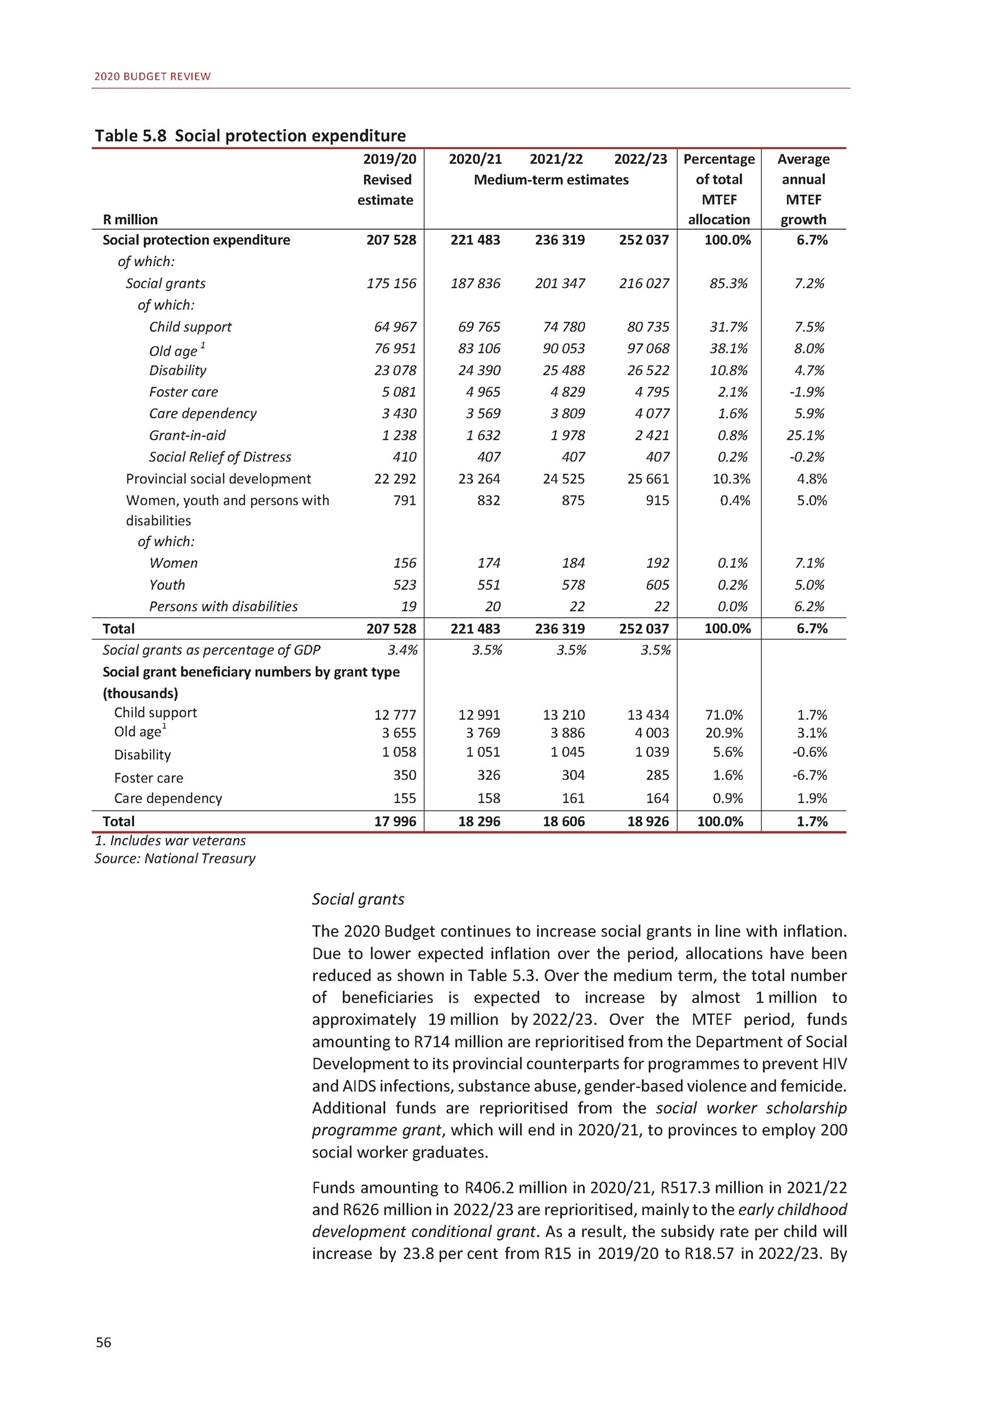
CHAPTER 5: CONSOLIDATED SPENDING PLANS 2022/23, government estimates it will provide access to early childhood development services to almost 700 000 children under the age of four. Table 5.9 Average monthly social grant values Source: National Treasury Women, youth and persons with disabilities Over the next three years, this department is allocated an additional R15 million to establish a national council to combat gender-based violence and femicide. Its budget will increase to R853 million in 2022/23, with a focus on strengthening interventions for women’s economic empowerment; promoting the rights of people with disabilities; and supporting youth development. An amount of R651.9 million is allocated through the provincial equitable share over the same period to provide sanitary products to more than half of all female learners in grades 7 to 12 in the country’s poorest schools (quintiles 1, 2 and 3). R15 million allocated to establish a national council to combat gender-based violence and femicide Health The health function aims to ensure access to high-quality healthcare services for all residents. Parliament is considering the National Health Insurance (NHI) Bill. Its enactment is expected to trigger large-scale reforms. Over the medium term, R55.6 million is reprioritised to the Department of Health to strengthen its capacity to phase in NHI. This allocation will be reviewed as NHI is implemented. From 2020/21, the human resource capacitation grant will be merged with the health professions training and development grant to form components of the new statutory human resource and training and development grant. This component is allocated R3.3 billion over the medium term to ensure sufficient medical internships and community service posts for medical students to complete their training. A team convened by the Presidency has developed a National Quality Health Improvement Plan, which aims to improve the quality of healthcare facilities to ensure that they can be accredited for NHI. For this purpose, R25 million is reprioritised in 2020/21 towards the non-personal services component of the NHI indirect grant. Subsequent allocations will be based on progress demonstrated in 2020/21. From 2021/22, allocations for mental health and oncology will also be added as components to the HIV, TB, malaria and community outreach grant, shifting from the NHI indirect grant due to underspending. To address funding shortfalls in the community outreach services component of the grant, R800 million is reprioritised from the HIV/AIDS component in 2020/21. NHI expected to result in large-scale reforms 57 2019/202020/21 Rand Percentage increase Old age1 7801 860 Old age, over 751 8001 880 War veterans1 8001 880 Disability1 7801 860 Foster care1 0001 040 Care dependency1 7801 860 Child support425445 4.5% 4.4% 4.4% 4.5% 4.0% 4.5% 4.7%
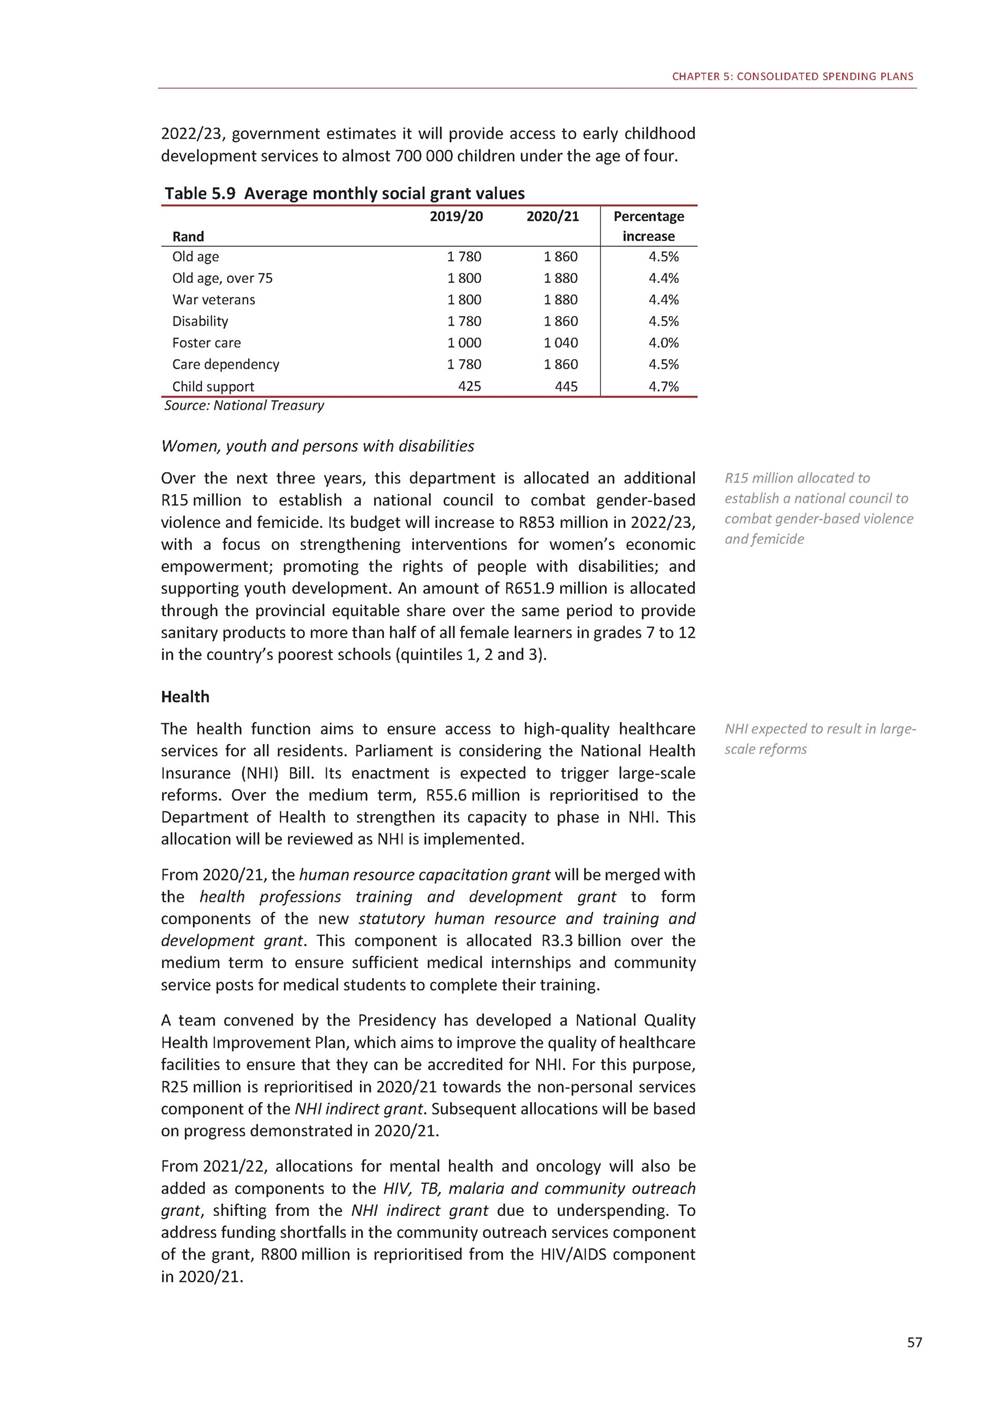
2020 BUDGET REVIEW Table 5.10 Health expenditure 1. Excludes grants and transfers reflected as expenditure in appropriate sub-functional areas Source: National Treasury 58 Progress in dealing with medico-legal claims In recent years, medical malpractice claims and litigation have increased rapidly. Although in many cases the quality of care is insufficient, the increase in claims is inconsistent with certain indicators of health outcomes in the public sector. For example, the overall death rate in public hospitals declined from 5.4 per cent in 2013/14 to 4.6 per cent in 2018/19, while maternal mortality in facilities decreased by 20.5 per cent over the same period. Since 2014, contingent liabilities and payments of medico-legal claims in the public sector have increased at an average annual growth rate of 30 per cent and 23 per cent respectively. In 2018/19, medico-legal contingent liabilities reached R99.2 billion, while medico-legal claim payments reached R2 billion. These payments are affecting the budgets of public facilities and, in turn, the delivery of services. Due to large lump-sum payments often awarded in malpractice cases, the effects are unplanned. This is a multifaceted problem, caused by inadequate quality of care, weak capacity in provincial medico-legal teams, poor administration of medical records, and high profitability for law firms specialising in this area. Government aims to stabilise its liability through a range of interventions and has made progress in the following areas: • Funding has been reprioritised in the Department of Health’s budget to pilot the National Quality Health Improvement Plan in 2020/21. •The department has contracted law firms with medico-legal expertise to support claim management and provide legal services in some provinces. • Several provinces are strengthening provincial medico-legal teams, including by contracting external legal capacity. •Parliament is considering the State Liability Amendment Bill, which would introduce periodic payments and provide for compensation in kind, in the form of future medical care in public facilities. • The Special Investigating Unit is probing potential fraud in this area, which has resulted in several arrests. The effect of these interventions on state contingent liabilities still needs to be evaluated. Long-term solutions may require wider legal reform, which the South African Law Reform Commission is exploring. 2019/20 Revised estimate R million 2020/212021/222022/23 Medium-term estimates Percentage of total MTEF allocation Average annual MTEF growth Health expenditure221 962 of which: Central hospital services44 129 Provincial hospital services36 385 District health services98 491 of which: HIV, TB, malaria and22 039 community outreach Emergency medical services8 249 Facilities management and9 340 maintenance Health science and training5 401 National Health Laboratory Service7 465 National Department of Health 15 171 229 707243 970257 559 44 70646 63349 207 37 63439 39441 539 101 958108 560113 788 24 38727 93129 405 8 5068 8439 283 10 05810 36310 979 5 7576 4746 918 8 6389 2719 913 6 0746 4686 641 100.0% 19.2% 16.2% 44.4% 11.2% 3.6% 4.3% 2.6% 3.8% 2.6% 5.1% 3.7% 4.5% 4.9% 10.1% 4.0% 5.5% 8.6% 9.9% 8.7% Total221 962 229 707243 970257 559 100.0% 5.1% of which: Compensation of employees141 320 Goods and services62 486 Transfers and subsidies7 071 Buildings and other fixed structures5 668 Machinery and equipment5 350 145 126152 008160 906 67 14271 56174 466 6 0597 4778 692 6 0877 4797 845 5 2645 4215 630 62.6% 29.2% 3.0% 2.9% 2.2% 4.4% 6.0% 7.1% 11.4% 1.7%
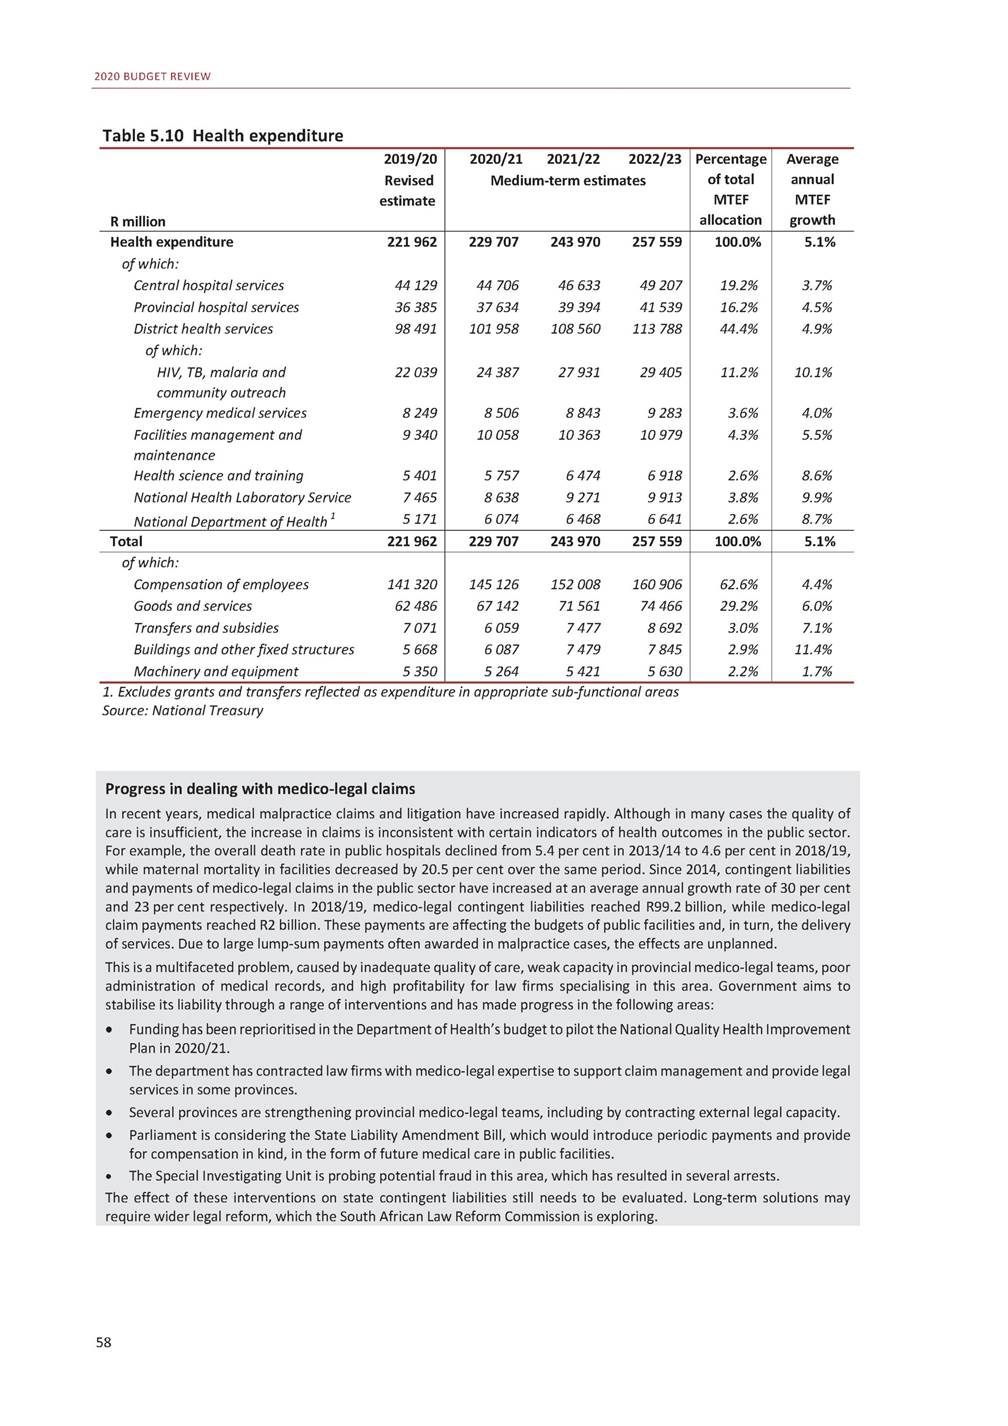
CHAPTER 5: CONSOLIDATED SPENDING PLANS Community development This function funds access to affordable housing, basic services and public transport, and facilitates spatial transformation and urban development. Expenditure in the function will rise from R201.7 billion in 2019/20 to R242.2 billion in 2022/23. Table 5.11 Community development expenditure Source: National Treasury Municipalities, provinces and public entities deliver water, sanitation, electricity, housing and public transport. As a result, transfers and subsidies to these entities make up 78.8 per cent of expenditure in this function. The local government equitable share remains the fastest-growing expenditure item at 9.2 per cent over the medium term. The Department of Human Settlements will continue to deliver subsidised housing over the medium term. The introduction of new conditional grants for upgrading informal settlements is postponed until 2021/22 and R20.1 billion is allocated in 2021/22 and 2022/23 for this grant. Economic development This function promotes faster and sustained inclusive economic growth to address the challenges of unemployment, poverty and inequality. Over the medium term, government has allocated R495.1 million to the Department of Agriculture, Land Reform and Rural Development to respond to biosecurity threats, and revitalise laboratories and quarantine stations to strengthen inspection services at ports of entry. This will improve compliance with international standards, and support exports. An additional R500 million is reprioritised over the medium term for the department to finalise outstanding land restitution claims. R500 million reprioritised over the MTEF to finalise land restitution claims 59 2019/20 Revised estimate R million 2020/212021/222022/23 Medium-term estimates Percentage of total MTEF allocation Average annual MTEF growth Community development201 675 of which: Human settlements41 140 Public transport, including41 442 commuter rail Local government equitable share66 973 Municipal infrastructure grant14 816 Regional and local water and10 361 sanitation services Electrification programmes5 086 212 347228 194242 169 39 68240 66142 214 44 71849 00852 181 74 68381 06287 213 14 67115 93716 852 11 15311 05211 512 5 1165 2576 074 100.0% 18.0% 21.4% 35.6% 7.0% 4.9% 2.4% 6.3% 0.9% 8.0% 9.2% 4.4% 3.6% 6.1% Total201 675 212 347228 194242 169 100.0% 6.3% of which: Compensation of employees17 822 Goods and services13 647 Transfers and subsidies160 827 Buildings and other fixed structures5 992 Machinery and equipment3 155 17 56018 27819 004 14 96914 58215 525 167 413179 619190 697 8 0859 33210 409 4 0926 1136 267 8.0% 6.6% 78.8% 4.1% 2.4% 2.2% 4.4% 5.8% 20.2% 25.7%
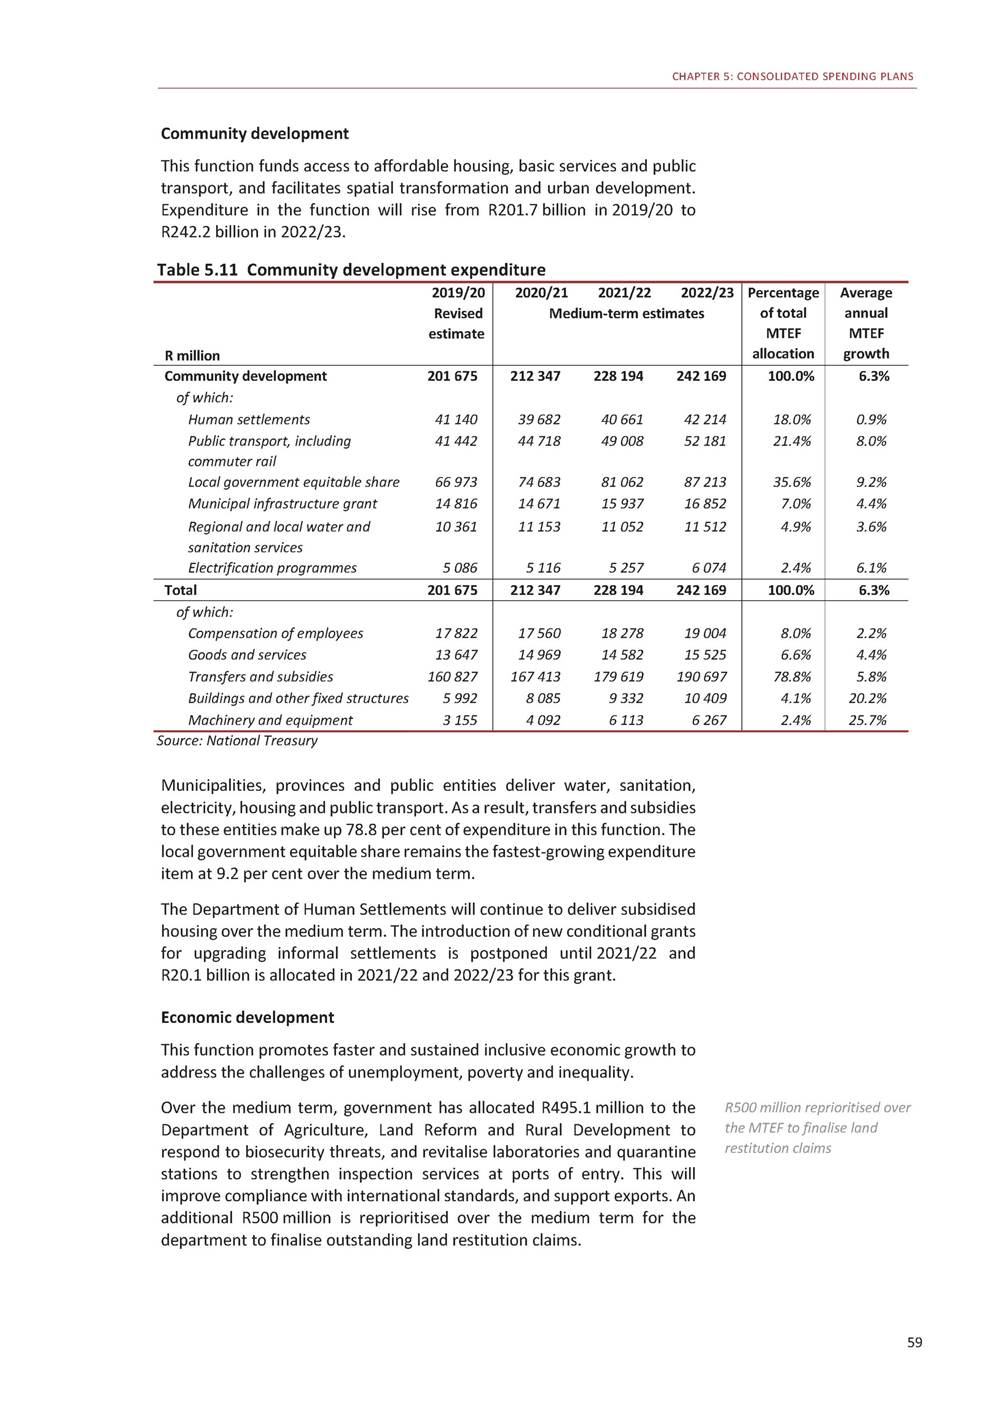
2020 BUDGET REVIEW The Black Business Supplier Development Programme, Cooperatives Incentive Schemes and the National Informal Business Upliftment Scheme are allocated R1.4 billion over the medium term to support small businesses and cooperatives. The Small Enterprise Finance Agency will collaborate with government and the private sector through a blended-finance model involving loans and grants to small and medium enterprises over the medium term. The Small Enterprise Development Agency is allocated R2.8 billion to provide support to small and medium enterprises, including increasing the incubation network in rural areas and townships. An additional R60 million is reprioritised to the Competition Commission over the medium term to implement the Competition Amendment Act (2018). Over the same period, R107.1 million is reprioritised to refurbish 27 industrial parks in various townships. Small Enterprise Finance Agency to support smaller businesses through grants Table 5.12 Economic development expenditure 1. Includes the Expanded Public Works Programme, the Community Works Programme and the Jobs Fund Source: National Treasury To support industry, R18.5 billion is allocated to the Department of Trade, Industry and Competition for business incentives including manufacturing and services sector development, and infrastructure investment. In addition, R1.4 billion is set aside to support the commercialisation of technological innovation and upgrade infrastructure to strengthen the 60 2019/20 Revised estimate R million 2020/212021/222022/23 Medium-term estimates Percentage of total MTEF allocation Average annual MTEF growth Economic regulation and infrastructure94 467 of which: Water resource and bulk27 182 infrastructure Road infrastructure46 038 Environmental programmes6 998 Job creation and labour affairs21 742 of which: Employment programmes 120 231 Industrialisation and exports37 393 of which: Economic development and incentive16 106 programmes Innovation, science and technology15 697 Agriculture and rural development29 608 of which: Land reform2 108 Agricultural land holding account2 136 Restitution3 593 Farmer support and development3 853 105 311112 566120 258 31 38336 17739 173 49 50651 62054 593 6 9507 2477 137 22 43725 15826 555 20 75323 38424 754 39 01643 67245 664 16 66815 92916 165 16 42517 19117 776 28 34229 63730 658 1 7081 8651 717 9891 0831 092 3 4063 6103 939 4 0714 3224 504 49.7% 15.7% 22.9% 3.1% 10.9% 10.1% 18.9% 7.2% 7.6% 13.0% 0.8% 0.5% 1.6% 1.9% 8.4% 13.0% 5.8% 0.7% 6.9% 7.0% 6.9% 0.1% 4.2% 1.2% -6.6% -20.0% 3.1% 5.3% Total198 906 211 531228 224240 911 100.0% 6.6% of which: Compensation of employees52 620 Goods and services59 266 Transfers and subsidies40 999 Buildings and other fixed structures31 339 Machinery and equipment3 929 54 33457 20859 879 63 62369 16870 573 42 40845 91350 494 36 06041 04144 935 4 0433 8903 497 25.2% 29.9% 20.4% 17.9% 1.7% 4.4% 6.0% 7.2% 12.8% -3.8%

CHAPTER 5: CONSOLIDATED SPENDING PLANS research and innovation capabilities of the Council for Scientific and Industrial Research and the South African National Space Agency. Economic regulation and infrastructure Over the medium term, the South African National Roads Agency Limited will maintain 22 214 kilometres of roads, and provinces plan to reseal 16 226 kilometres of roads through the provincial roads maintenance grant. To unlock spectrum for high-speed internet, R1.9 billion is reprioritised to subsidise devices that allow analogue televisions to receive digital signals for 2.8 million low-income households, and to compensate the South African Post Office for associated administration costs. A further R100 million signals. is allocated for Sentech to operate analogue and digital Peace and security The peace and security function aims to ensure the safety of the country, in particular through an efficient and effective criminal justice system. Over the medium term, funds have been reprioritised from the South African Police Service – the largest component of this function – to other departments and entities within the function to implement the integrated criminal justice strategy. The Department of Justice and Constitutional Development will receive R1.8 billion, mainly to enhance prosecution capacity in the National Prosecuting Authority (NPA), including the sexual offences and community affairs unit established to address gender-based violence against women and children. These funds will also help to operationalise the Investigative Directorate, capacitate various anti-corruption units and establish five additional specialised commercial crimes courts to ensure their presence in each province. In addition, R985 million is reprioritised to the Directorate for Priority Crime Funds reallocated to enhance capacity at NPA, and investigate and prosecute corruption 61 Responding to climate change and natural disasters Extreme weather events are becoming more frequent as a result of climate change. While parts of South Africa continue to grapple with a years-long drought, severe floods and storms in KwaZulu-Natal during 2019 damaged infrastructure and resulted in the deaths of 50 people. According to the World Economic Forum, extreme weather, natural disasters and climate action failure are three of the top five global risks in 2020. Since 2016, government has allocated R6.3 billion for drought relief projects and R660 million for flood relief. Yet reactive responses to disasters are inefficient and costly. The National Treasury is exploring ways to improve the immediate fiscal response to disasters and the fiscal management of government’s response to the long-term effects of climate change. Government provides funding for disaster response and recovery mainly through conditional grants. Funds are available for emergency housing and temporary infrastructure repairs, while social development departments provide assistance such as food parcels. Ring-fenced allocations in conditional grants then fund rebuilding of damaged infrastructure, including subsidised houses. However, the release of funds is often slow, and these are not always spent as planned. The National Treasury and the National Disaster Management Centre will review the funding system during 2020. Infrastructure design and construction can become more resilient to extreme weather. Submission guidelines for funding requests from the Budget Facility for Infrastructure will be adjusted to incorporate climate resilience. Government is also considering making ecological infrastructure, such as wetlands that can reduce flood damage, eligible for infrastructure grant funding. Projects with positive climate impacts are eligible for grant and concessional loan financing through international green financing initiatives. The energy efficiency demand side management grant is already using this funding to roll out renewable-energy projects in municipal buildings. South Africa has joined the Network of Central Banks and Supervisors for Greening the Financial System, which focuses on initiatives in sustainable finance. During 2020, the National Treasury will publish a paper on financing a sustainable economy, and the process to establish minimum practice and standards for emerging environmental risks. The National Treasury is also exploring tools to assess and anticipate the effects of climate change across budget-related areas.
2020 BUDGET REVIEW Investigation to appoint additional investigators, primarily to address the backlog of corruption cases. Table 5.13 Peace and security expenditure Source: National Treasury To safeguard the country’s borders, R831 million is reprioritised from the police to the departments of Defence and Home Affairs. These allocations will pay for equipment and technology to enable the military to broaden coverage of the borders, and the Department of Home Affairs to profile passengers before they reach ports of entry and minimise security risks. In addition, R255 million is reprioritised to the Independent Electoral Commission in 2020/21 to procure 38 000 voter registration devices. R831 million reprioritised for border security General public services This function aims to build a capable, ethical and developmental state. This requires professional and responsive public servants, as well as engaged citizens. Public administration and fiscal affairs grows fastest over the medium term as R3.1 billion was reprioritised to Statistics South Africa over the MTEF period to conduct the population census in 2021/22. In addition, R1 billion is allocated to the South African Revenue Service to improve its information communications technology capacity and operations. To fund critical priorities over the medium term, R74.5 million is reprioritised within the function. The Auditor-General of South Africa receives R374 million as a direct charge against the National Revenue Fund to support audits in financially distressed municipalities and entities. Funds reprioritised for census and allocated to South African Revenue Service 62 2019/20 Revised estimate R million 2020/212021/222022/23 Medium-term estimates Percentage of total MTEF allocation Average annual MTEF growth Defence and state security50 766 Police services105 163 Law courts and prisons48 448 Home affairs9 988 51 37848 93250 439 106 127110 758114 186 49 60451 99253 641 9 8919 60910 538 22.6% 49.6% 23.3% 13.8% -0.2% 2.8% 3.5% 1.8% Total214 365 217 001221 291228 804 100.0% 2.2% of which: Compensation of employees146 536 Goods and services47 742 Transfers and subsidies13 013 Buildings and other fixed structures2 674 Machinery and equipment4 135 147 850154 231158 667 47 11849 78251 002 13 8399 95110 269 3 1613 2853 411 4 9143 9755 382 69.1% 22.2% 5.1% 1.5% 2.1% 2.7% 2.2% -7.6% 8.4% 9.2%
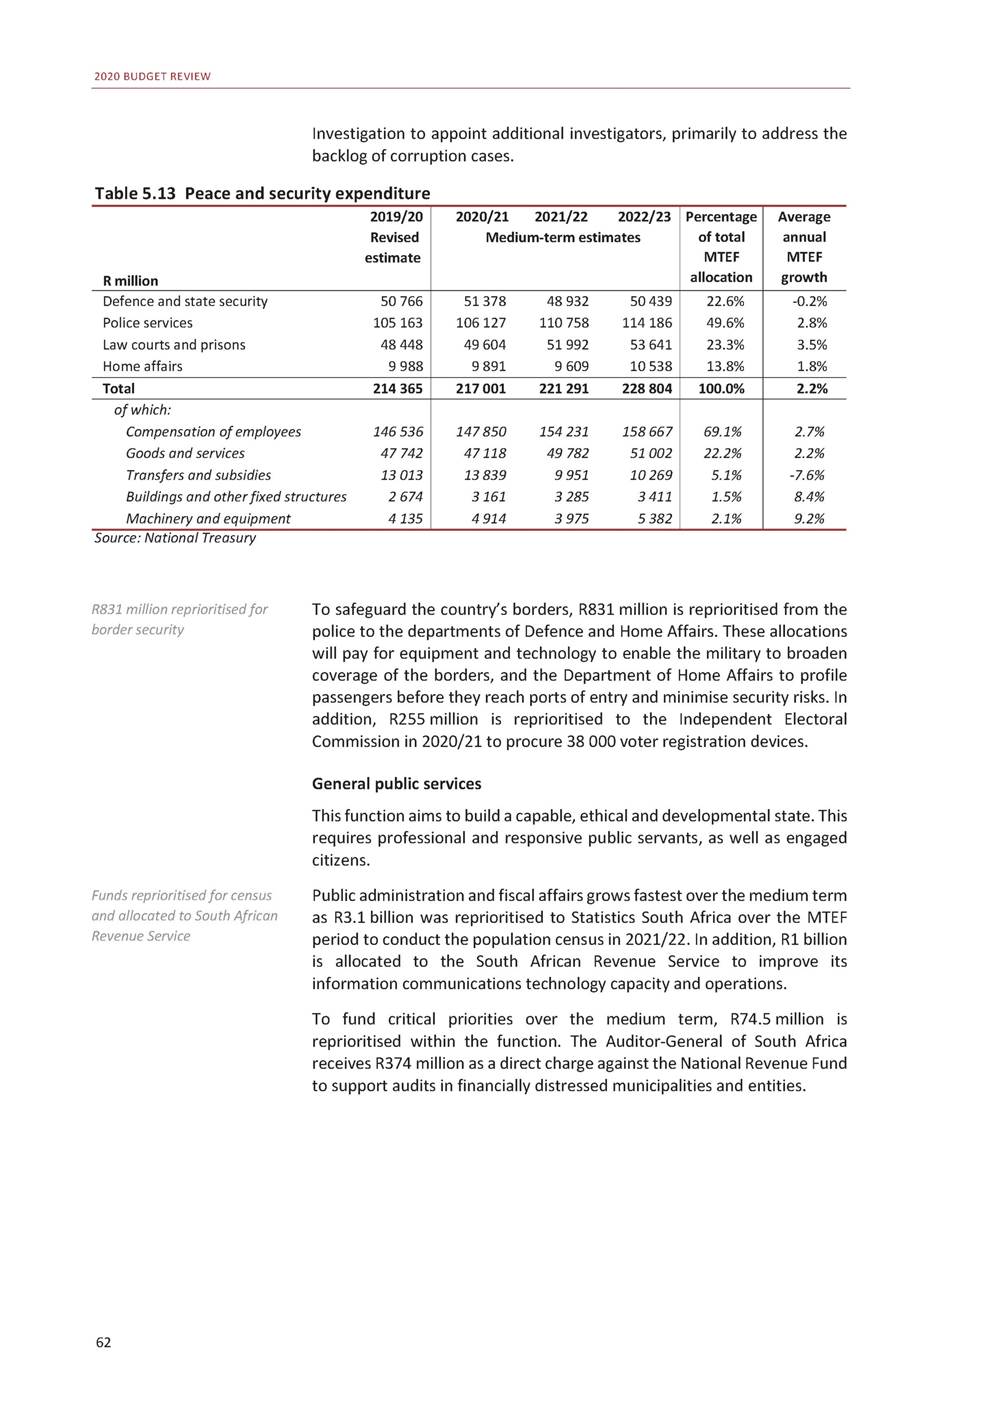
CHAPTER 5: CONSOLIDATED SPENDING PLANS Table 5.14 General public services expenditure Source: National Treasury Conclusion The 2020 Budget includes significant expenditure reductions. Cost pressures, including new and urgent priorities, are funded through a combination of reallocations and reprioritisations over the MTEF period. Despite these fiscal measures, government debt as a share of GDP continues to increase. Debt-service costs remain the fastest-growing expenditure item at an annual average rate of 12.3 per cent, and will increase to R290.1 billion in 2022/23. 63 2019/20 Revised estimate R million 2020/212021/222022/23 Medium-term estimates Percentage of total MTEF allocations Average annual MTEF growth Executive and legislative organs14 202 Public administration and44 342 fiscal affairs External affairs7 793 14 57114 44315 028 47 27750 41450 279 8 1618 3818 758 20.3% 68.1% 11.6% 1.9% 4.3% 4.0% Total66 337 70 00973 23874 064 100.0% 3.7% of which: Compensation of employees32 022 Goods and services21 621 Transfers and subsidies8 861 Buildings and other fixed structures2 129 Machinery and equipment1 051 32 84933 93535 460 24 63826 88125 779 9 2019 3299 819 1 6831 5691 517 863925936 47.0% 35.6% 13.0% 2.2% 1.3% 3.5% 6.0% 3.5% -10.7% -3.8%
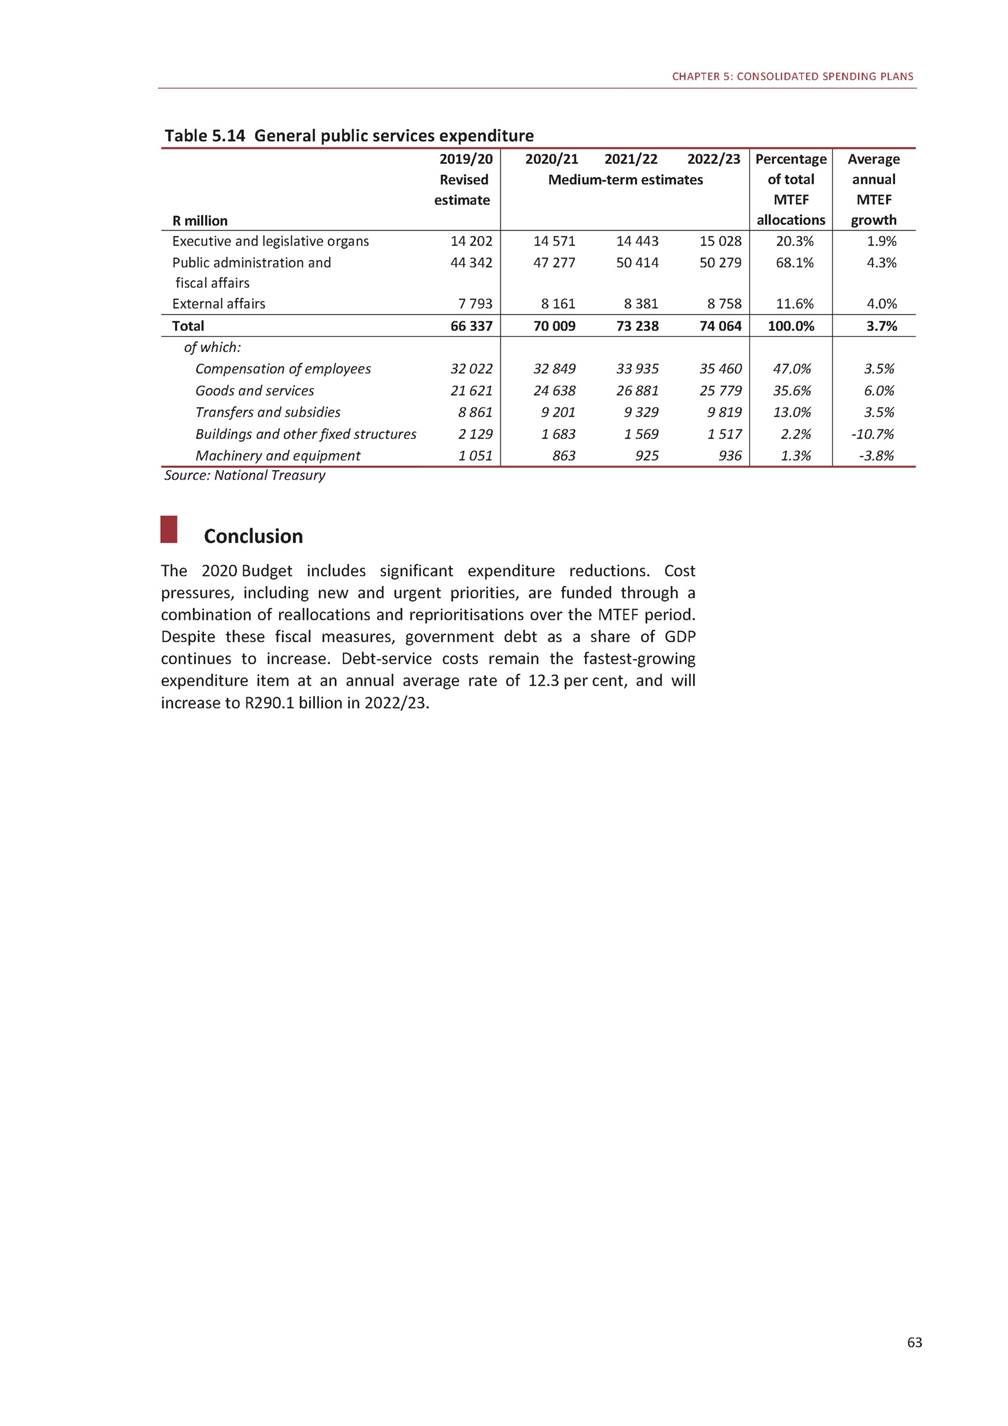
2020 BUDGET REVIEW This page was left blank intentionally. 64
6 Division of revenue and spending provinces and municipalities by Overview Pdeliver on its developmental mandate therefore requires provinces rovinces and municipalities account for the majority of public A capable state requires provinces and municipalities that can spend efficiently spending in South Africa. Building a capable state that is able to and municipalities to have the capacity to spend efficiently. It is also important to ensure problems are addressed timeously. Over the past few years, a number of programmes have been implemented to strengthen provincial and municipal capacity. Government investment can stimulate demand in the economy and create a foundation for future growth, provided that it is well spent. But wasteful spending and corruption undermine the ability of governments to translate budgeted resources into delivery of services. The resulting collapse of basic functions like water reticulation, sewage treatment and safe roads in some parts of the country imposes hardships on communities and increases the 65 In brief •Over the next three years, after providing for debt-service costs, the contingency reserve and provisional allocations, 48.2 per cent of nationally raised funds are allocated to national government, 43 per cent to provincial government and 8.8 per cent to local government. •The division of revenue redistributes revenue based on need, with taxes raised mainly in wealthier areas funding poorer provinces and municipalities. •The budget supports the development of a more capable state at sub-national level. Incentive programmes reward good performance and a range of capacity-building measures are in place. To improve infrastructure delivery, a new approach to project preparation in cities is introduced. •Where provinces and municipalities fail to meet basic standards, national government is prepared to impose consequences, including by intervening and withholding transfers. These measures have led to a significant increase in the number of municipalities with funded budgets in 2020/21.

2020 BUDGET REVIEW cost of doing business. For public spending to achieve value for money, the fundamentals of governance need to be fixed at all levels. The 2020 Budget protects the transfers that deliver the greatest value, while reducing those spent less effectively. Improving spending efficiency requires greater accountability from provinces and municipalities – especially to the residents who are entitled to these services. Over the period ahead, national government will continue to fund provinces and municipalities, work with them to build capacity, and ensure that underperforming sub-national governments face consequences. Provinces and municipalities need to become more accountable to residents for how they spend public money Division of revenue Over the medium-term expenditure framework (MTEF) period, after budgeting for debt-service costs, the contingency reserve and provisional allocations, 48.2 per cent of nationally raised funds are allocated to national government, 43 per cent to provinces and 8.8 per cent to local government. Table 6.1 Division of nationally raised revenue 1. Includes proposed compensation reductions, support to Eskom, amounts for Budget Facility for Infrastructure projects and other provisional allocations Source: National Treasury 66 2016/172017/182018/19 Outcome R billion 2019/20 Revised estimate 2020/212021/222022/23 Medium-term estimates Average annual MTEF growth Division of available funds National departments555.6592.6634.3 of which: Indirect transfers to3.63.83.9 provinces Indirect transfers to8.17.87.8 local government Provinces500.4538.6572.0 Equitable share410.7441.3470.3 Conditional grants89.797.2101.7 Local government102.9111.1118.5 Equitable share50.755.660.8 Conditional grants40.943.745.3 General fuel levy11.211.812.5 sharing with metros 739.5 3.9 7.0 612.8 505.6 107.3 125.0 67.0 44.9 13.2 757.7768.9797.8 4.14.85.1 7.67.28.2 649.3692.0730.7 538.5574.0607.6 110.8118.0123.1 132.5142.4151.4 74.781.187.2 43.846.248.1 14.015.216.1 2.6% 8.8% 5.1% 6.0% 6.3% 4.7% 6.6% 9.2% 2.4% 6.9% Provisional allocation––– not assigned to votes1 – -7.8-16.1-34.9 Non-interest allocations1 158.91 242.31 324.8 Percentage increase3.9%7.2%6.6% 1 477.3 11.5% 1 531.71 587.21 645.1 3.7%3.6%3.6% 3.7% Debt-service costs146.5162.6181.8 Contingency reserve––– 205.0 – 229.3258.5290.1 5.05.05.0 12.3% Main budget expenditure1 305.41 404.91 506.6 Percentage increase4.9%7.6%7.2% 1 682.3 11.7% 1 766.01 850.71 940.2 5.0%4.8%4.8% 4.9% Percentage shares National departments 47.9% 47.7% 47.9% Provinces 43.2% 43.4% 43.2% Local government 8.9% 8.9% 8.9% 50.1% 41.5% 8.5% 49.2%48.0%47.5% 42.2%43.2%43.5% 8.6%8.9%9.0%
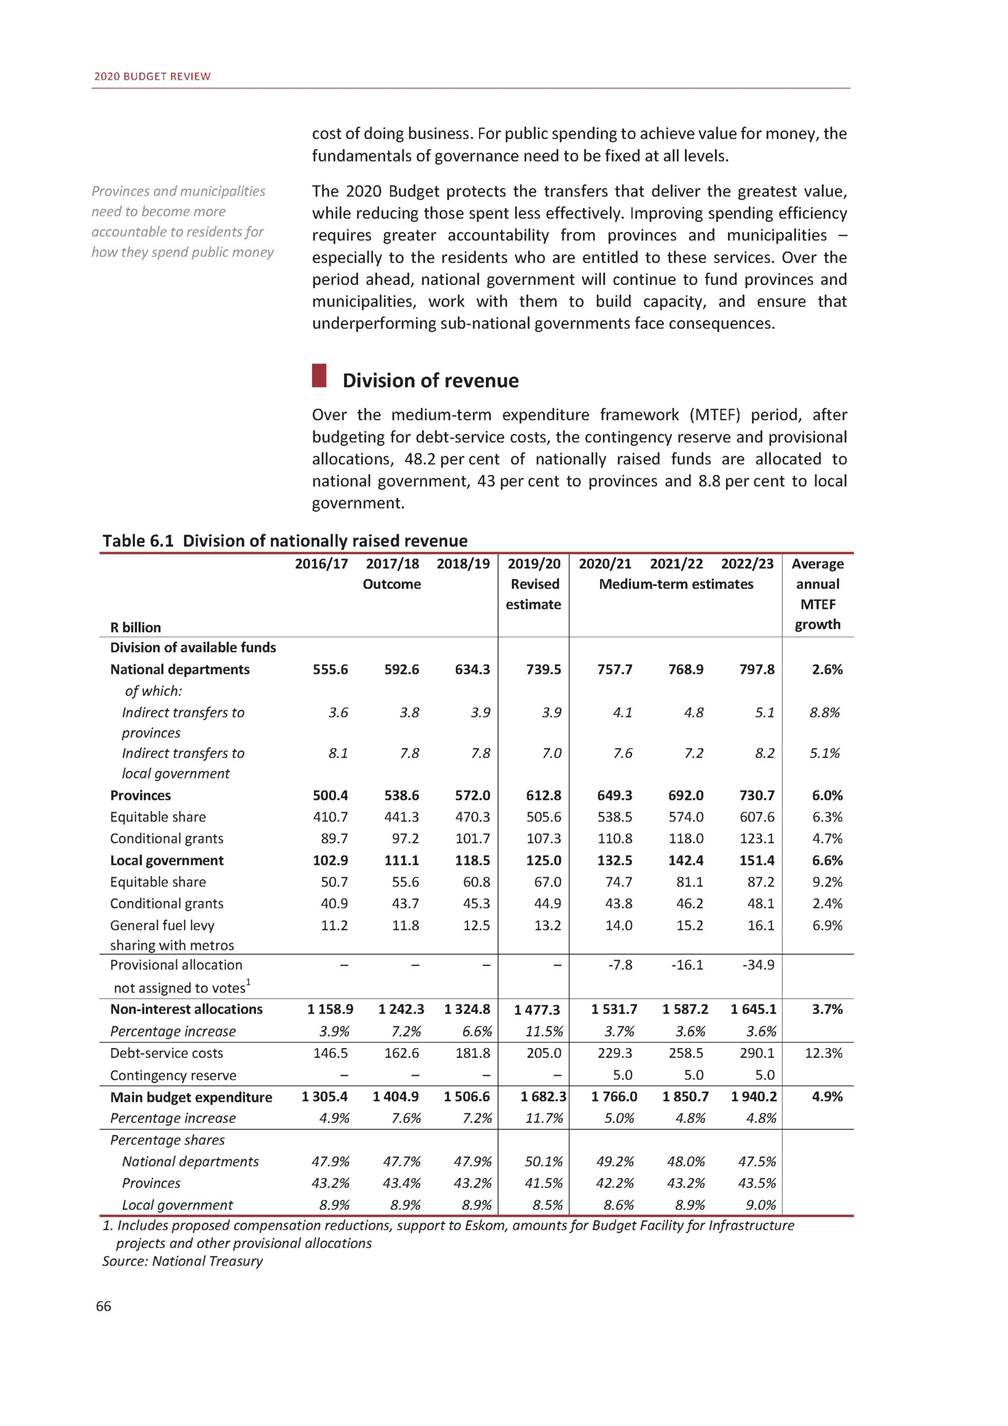
CHAPTER 6: DIVISION OF REVENUE AND SPENDING BY PROVINCES AND MUNICIPALITIES The proposed changes to the wage bill discussed in Chapters 3 and 5 are not yet reflected in the allocations to national and provincial departments shown in Table 6.1, or in the equitable share allocations in the Division of Revenue Bill. Once these changes are agreed in the Public Service Co-ordinating Bargaining Council, they will be implemented in the 2020/21 adjustment budget. This will reduce the national and provincial shares of the division of revenue and increase that of local government in relative terms. Shares in the division of revenue are also sensitive to increased support to public entities, which is provided at national level. This explains national government’s somewhat larger share in 2019/20. The division of revenue is redistributive, based on need. Most tax revenues come from urban centres: for example, per capita revenues from personal income tax are three times higher in Gauteng than in the Eastern Cape. However, the allocations made through the division of revenue are based on the demand for public services in each province and municipality, not its contribution to national revenues. Allocations also consider poverty rates. As a result, transfers per capita to the Eastern Cape are about 40 per cent higher than to Gauteng. Proposed adjustments to wage bill, when effected, will change shares in division of revenue The Explanatory Memorandum to the Division of Revenue, published on the National Treasury website as Annexure W1 to the Budget Review, sets out the provincial and municipal allocations, details the equitable share formulas, and explains how the division incorporates the recommendations of the Financial and Fiscal Commission. 67 R thousand 2013/14 2014/15 2015/16 2016/17 2017/18 2018/19 2019/20 2020/21 2021/22 2022/23 Percentage change Keeping the equitable share stable in line with population growth and demand for services South Africa’s population grew by just over 1 million people between 2018 and 2019, while the number of households grew by nearly 500 000. Equitable share transfers to provinces and municipalities need to keep pace with population growth and demand for services. After accounting for inflation, the division of revenue has maintained stable allocations over the decade between 2013/14 and 2022/23. This is true on a per person basis through the provincial equitable share (PES), and on a per household basis through the local government equitable share (LGES). Figure 6.1 Transfers increase in line with population growth 12 1 Source: National Treasury While annual growth rates fluctuate and there have been several rounds of fiscal consolidation over this period, the allocations per person and per household for the provision of basic services are remarkably consistent. Over the 2020 MTEF period, the provincial equitable share grows by an average of 6.3 per cent a year, while the local government equitable share grows at an average of 9.2 per cent a year. By contrast, transfers to national departments grow at 2.6 per cent a year. Debt-service costs are growing at a much faster rate, averaging 12.3 per cent a year. LGES per household PES per person PES growth rate (RHS) LGES growth rate (RHS) 10 14 9 8 7 10 6 8 5 4 6 3 4 2 2 0 0
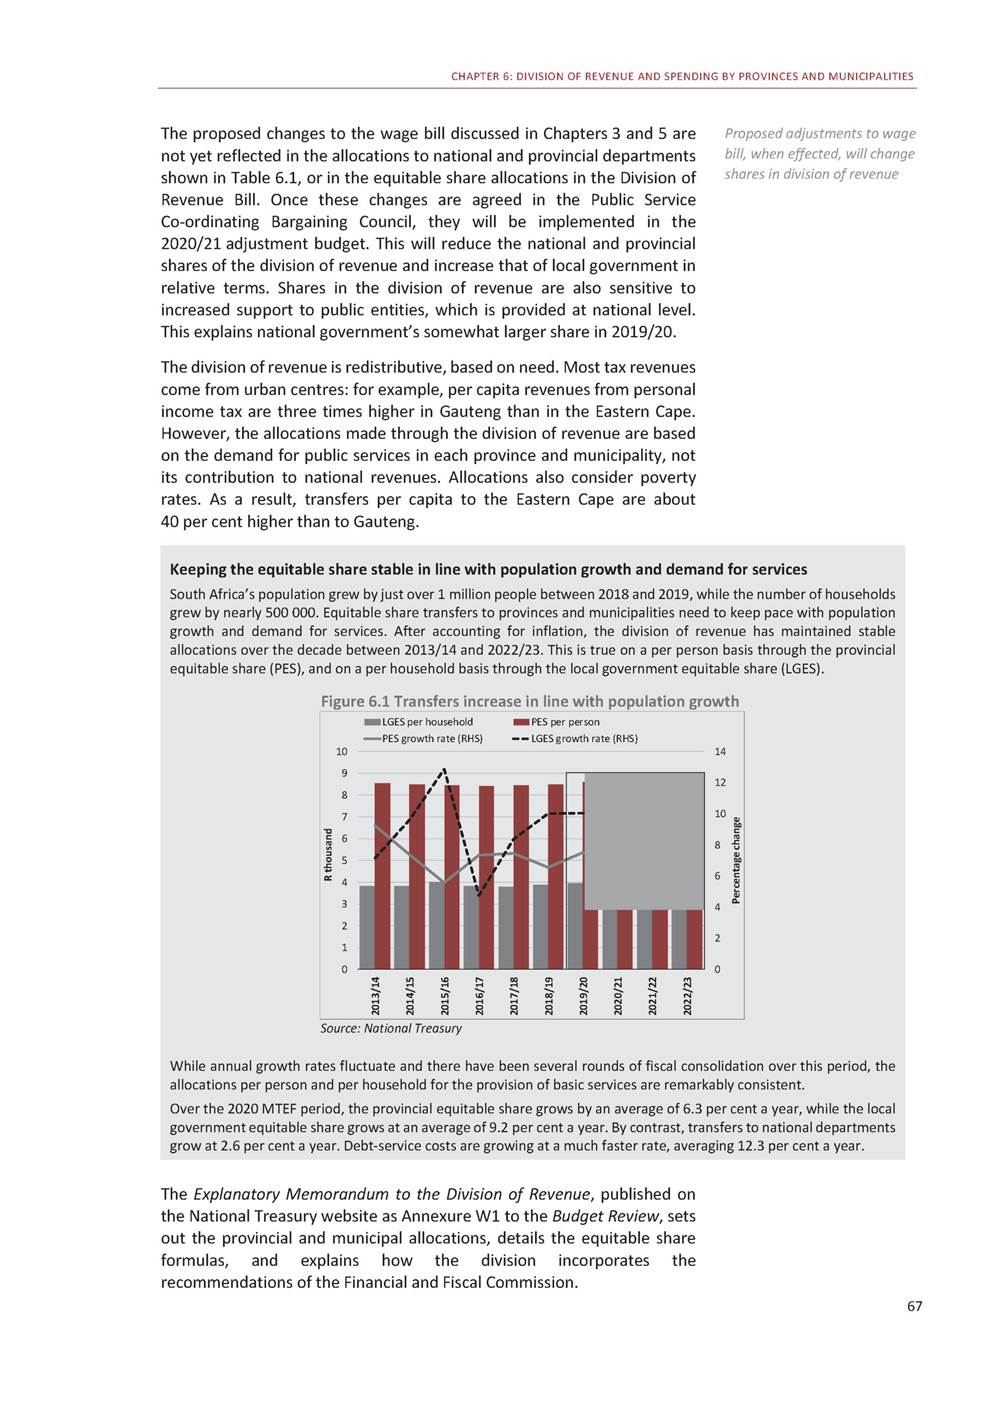
2020 BUDGET REVIEW Reductions to transfers As outlined in the 2019 Medium Term Budget Policy Statement (MTBPS), most conditional grants have been reduced as part of efforts to limit growth in government expenditure and ensure public debt is sustainable. To manage the effect on services, these reductions take into account: Most conditional grants have been reduced, taking into account past performance • • • Past spending and performance Whether the grant funds salaries, medicines and food Whether there has been significant real growth in allocations in recent years. Where possible, the National Treasury has reduced transfers that are more likely to go unspent or to be spent less effectively. Accordingly, grants that have persistently underperformed have been reduced by larger amounts. The largest proportional reduction to local government grants in 2020/21 has been made in the public transport network grant, because only six of the 13 cities receiving the grant have successfully launched public transport systems. The three cities that have shown the least progress – Buffalo City, Msunduzi and Mbombela – have been suspended from the grant and will not receive allocations in the 2020 MTEF period. Larger reductions are also made to grants to urban municipalities, which have more capacity to offset cuts by increasing their own-revenue investments. Proposed changes to the wage bill, once effected, will result in reductions to the provincial equitable share in the 2020/21 adjustment budget. These reductions will be fully offset by the lower compensation spending by provinces as a result of the revised wage agreement. Building capability for infrastructure delivery The National Treasury continues to expand the tools available for provinces and municipalities to improve spending. Weaknesses in preparing and authorising projects and programmes are one of the main causes of poor performance on infrastructure transfers. The Infrastructure Delivery Management System has helped provinces build infrastructure units with qualified staff and institutionalise best practices. In the 2020 Budget, cities will receive grant funding through the integrated city development grant to institutionalise an effective system for preparing programmes and projects. Metros will only be eligible for this funding if they: Conditions attached to integrated city development grant funding • Have not had an adverse or disclaimed audit opinion in the last two financial years Have formally adopted the Cities’ Infrastructure Delivery and Management System guidelines Establish a programme and project approval committee to authorise work Commit to co-financing contributions and budget management arrangements. • • • National government provides a broad range of capacity-support grants and programmes for local government. This system is under review; 68
CHAPTER 6: DIVISION OF REVENUE AND SPENDING BY PROVINCES AND MUNICIPALITIES reforms to improve its effectiveness are likely to be implemented from 2021/22. Past performance Underspending has stabilised across national and provincial government. In 2018/19, national expenditure, excluding direct charges to the National Revenue Fund, amounted to R820.9 billion out of a total adjusted appropriation of R831.6 billion. This amounted to underspending of 1.3 per cent. Provincial government underspent its adjusted budget of R598.6 billion for 2018/19 by R7.7 billion (1.3 per cent), compared with Underspending has stabilised at just above 1 per cent across national and provincial government R5.8 billion (1 per cent) in conditional grants declined 96.6 per cent in 2018/19. the prior year. Spending on provincial slightly, from 97.7 per cent in 2017/18 to About 38 per cent (R1.2 billion) of the R3.2 billion in unspent grant funds was returned to the National Revenue Fund because the funds were not committed to identifiable projects. Spending outcomes for 2018/19 varied across the 257 municipalities. Many local governments adopted unrealistic spending plans. As a result, Spending outcomes varied considerably in local government, with significant underspending 211 municipalitiesunderspent their operating budgetsand 214 municipalities underspent their capital budgets. This was a slight improvement from the previous year. Of the R33.6 billion in specific purpose conditional grants transferred to municipalities in 2018/19, R27.2 billion (80.1 per cent) was spent – down from the 93 per cent spent in 2017/18. This decline was partly due to underspending on drought relief funds allocated in the middle of the financial year. Spending outcomes also varied across grants. The spending rate among infrastructure grants was highest in the municipal infrastructure grant, which spent 92.7 per cent of transferred funds. This was achieved by closely monitoring municipal spending, and stopping transfers and reallocating funds in-year when the Department of Cooperative Governance identified that a municipality was not performing. Municipalities applied to roll over R4.4 billion of the unspent grant funds to 2019/20, but only R1.9 billion was found to meet the requirements. Provincial revenue and spending Provinces are responsible for providing social services. This includes public basic education for 12.5 million learners and healthcare for 49.1 million South Africans who do not have private insurance. Most recipients access these services free of charge or for low fees. Provinces do not have significant taxation powers, so the division of revenue compensates them for the cost of the services they provide through transfers. These account for an average of 95 per cent of provincial revenues. More than 80 per cent of transfers to provinces are allocated through the equitable share, which is based on a formula incorporating the demographic factors that affect demand for services, such as the school-age population and the population without medical aid. These factors are updated annually. Further improvements to the formula are expected to be announced in the 2020 MTBPS. Provinces are responsible for drawing Transfers to cover the cost of providing social services account for 95 per cent of provincial revenues 69
2020 BUDGET REVIEW up their own budgets and prioritising the use of these funds to meet their mandates. Table 6.2 Provincial equitable share Source: National Treasury Although wages account for a growing share of provincial budgets, provinces generally manage to remain within their planned spending for compensation. Over the past three financial years, provinces have on aggregate spent less than they budgeted to on wages, and in 2018/19 only one province exceeded its compensation budget. Without changes to the provincial wage bill, however, slower growth in transfers implies that spending on compensation of employees is likely to rise from 60 per cent of provincial budgets in 2019/20 to 63 per cent by the end of the 2020 MTEF period. To limit the effect of this compositional change on services, provinces are finding ways to reduce costs. These include merging provincial public entities, improving integrated planning to avoid duplication of services, enhancing contract management to avoid overpricing of projects, centralising the approval process for appointing new employees, curbing overtime and exploring new revenue sources. The guidelines for the budget process this year included a call for all departments to identify savings of between 5 and 7 per cent of their budgets in each year of the MTEF period. Some provinces struggled to achieve these savings. Others used the opportunity to make reductions and reprioritise savings for other priorities. Some provinces set aside unallocated amounts to reduce pressure in functions like health, roads and scholar transport; to settle unpaid bills and medico-legal claims; and to respond to disasters. Despite the constrained fiscal environment, government continues to increase funding for early education. An additional R1.4 billion is allocated to the early childhood development grant over the medium term. Provinces have also prioritised early-grade reading. Their budgets for the 2020 MTEF period are expected to provide funds for upskilling teachers and subject advisors, assessing students’ reading ability and providing additional reading material. Some provinces have found ways to achieve cost savings and reduce pressure in core social functions 70 2019/20 R million 2020/212021/222022/23 Medium-term estimates Average annual MTEF growth Eastern Cape68 824 Free State28 187 Gauteng102 448 KwaZulu-Natal106 014 Limpopo58 965 Mpumalanga41 428 Northern Cape13 424 North West34 973 Western Cape51 291 71 41575 30678 841 30 01731 89733 657 112 118121 121129 908 111 442117 755123 544 62 32966 25669 935 44 10546 99649 724 14 29015 20716 068 37 54840 17442 682 55 20859 27663 194 4.6% 6.1% 8.2% 5.2% 5.9% 6.3% 6.2% 6.9% 7.2% Total505 554 538 472573 990607 554 6.3%
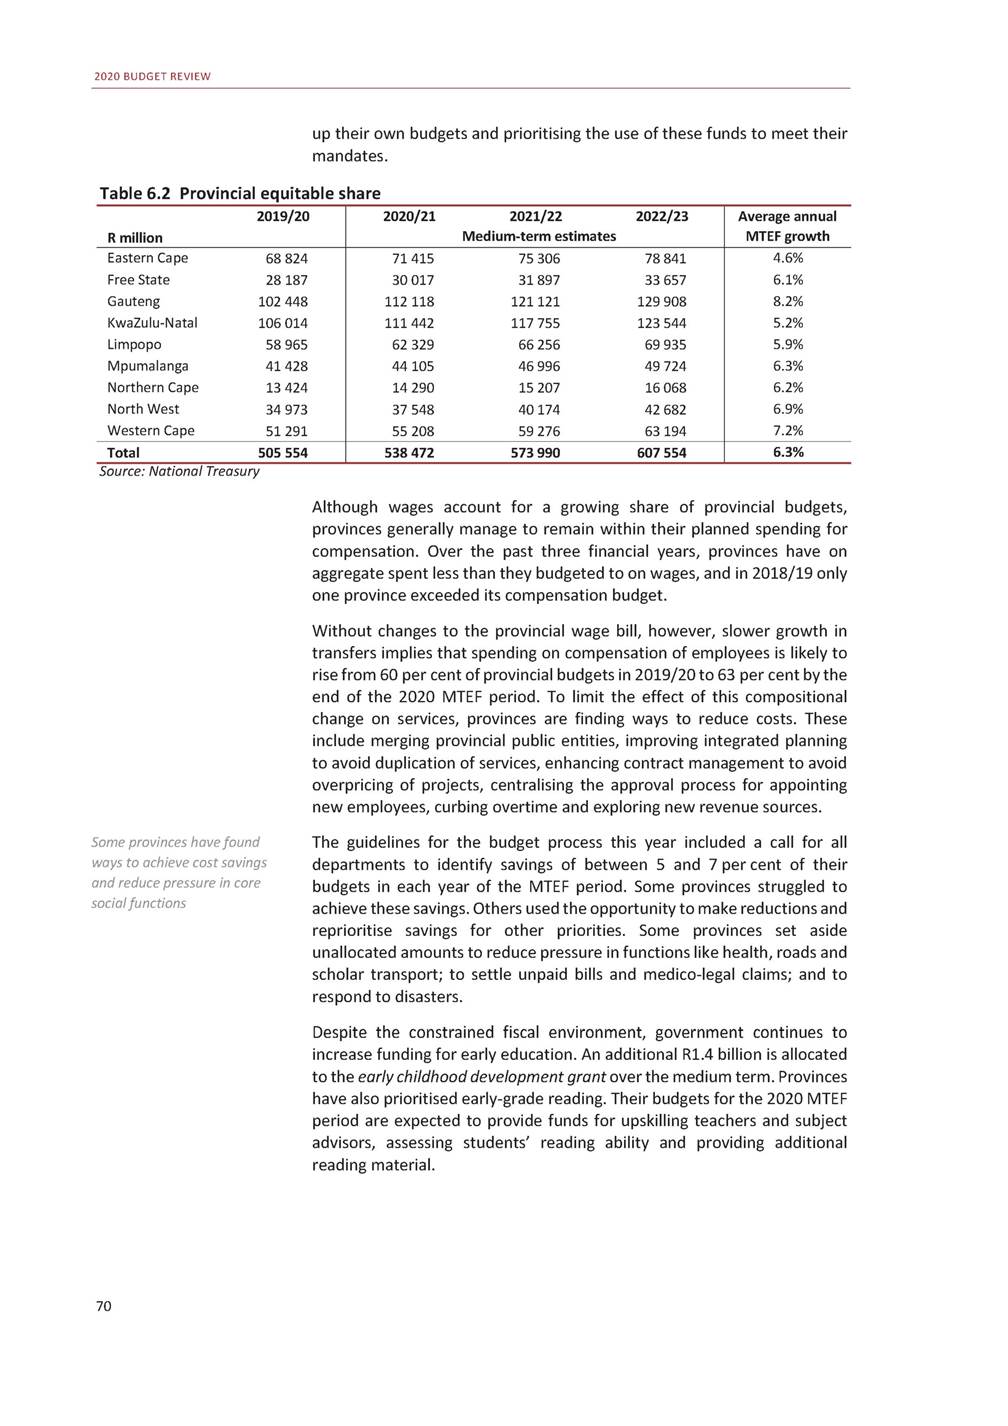
CHAPTER 6: DIVISION OF REVENUE AND SPENDING BY PROVINCES AND MUNICIPALITIES Changes in conditional grants Changes are made to the structure of conditional grants to better align them with government’s evolving policy objectives. In 2020, the National Treasury will work with the Department of Health to develop a strategy to align changes to health conditional grants with national health insurance reforms. These changes include accelerating the delivery of improved infrastructure for hospitals and clinics. In 2020/21 a development component will be reintroduced in the national tertiary services grant. This component will fund the development of specialised services in historically underserved provinces. Grants funding the training and development of health professionals have also been merged to form a new statutory human resources, training and development grant. Government has shifted the emphasis of housing policy from building costly subsidised units to providing serviced sites where residents can invest in improvements. Funding for this purpose is ring-fenced in the informal settlements upgrading components of the human settlements development grant and the urban settlements development grant. Other changes aim to improve the effectiveness of conditional grant spending. The 2020 Division of Revenue Bill will enhance requirements for information sharing where provincial conditional grants are transferred to public entities or municipalities to implement projects. These measures will improve coordination between different parts of government working on projects in the same area, in line with the district development model being led by the Department of Cooperative Governance. If a municipality or province does not adhere to grant conditions or is not spending its allocated funds, then further transfers can be withheld or reallocated to another recipient. The bill will require grant recipients to report the reasons why funds were withheld or reallocated in their annual Grant to be expanded to develop specialist health services in underserviced areas A shift from building costly subsidised housing to providing serviced sites where people can build and invest 71 Progress in turning around financial management in North West province In April 2018, following extensive protests by residents over the poor quality of public services in North West, national government placed the provincial government under intervention, as authorised by the Constitution. National departments are responsible for managing the interventions in their provincial counterparts. Five national departments took responsibility for delivering the mandates of their North West counterparts. Another five departments, including the National Treasury, issued directives to their provincial counterparts, which outlined the provincial department’s failure to meet its obligations and the corrective steps required. The National Treasury’s intervention in the provincial treasury involves three phases. The first phase, to stabilise provincial finances, has been completed, with 72 per cent of the National Treasury’s directives implemented. These included a financial and governance review of the North West Development Corporation, which revealed serious maladministration after oversight of this entity was shifted to the Office of the Premier. To improve governance, oversight responsibility has been returned to the Department of Economic Development, Environment, Conservation and Tourism. Irregular contracts across a wide range of activities, from project management offices to scholar transport, have been identified and terminated. The provincial treasury has initiated a project to develop contract registers and identify irregular expenditure in municipalities. The North West treasury was tasked with ensuring that all the province’s departments are appropriately funded for the services they have to deliver. Health has been a particular focus. As a result, the budget of the provincial health department was increased by 10.5 per cent between 2018/19 and 2019/20. Between March 2016 and December 2019, the province filled 235 critical positions for medical practitioners and specialists, and 1 064 nursing posts. The second phase of the intervention, from September 2019 to August 2020, aims to strengthen supply chain management. It will focus on improving audit outcomes, investigating irregular and wasteful expenditure, and intensifying forensic investigations. The third phase, beginning in September 2020, will monitor ongoing implementation.
2020 BUDGET REVIEW financial statements, occurring in future. and the measures they are taking to avoid this Table 6.3 Conditional grants to provinces Source: National Treasury Municipal revenue and spending Unlike provinces, municipalities have significant revenue-raising powers. Municipal property rate collections, for example, amount to more than 1 per cent of GDP, roughly equivalent to national customs duties. Most municipal revenue is generated from the sale of services such as water and electricity, so collecting fees owed for these services is foundational to sustainable municipal services. Yet South Africa’s 257 municipalities are also diverse, ranging from cities with large revenue-raising potential from property rates and the sale of services, to rural municipalities where most residents are very poor and the municipal budget is primarily funded from transfers. While own revenues account for the majority of municipal resources, transfers through the division of revenue make up about 30 per cent of aggregate municipal budgets and can account for more than 80 per cent of budgets in rural municipalities. The largest of these transfers is the local government equitable share, which is allocated through a formula that incorporates the number of poor households in each municipality and the cost of free basic services. The formula provides additional support to municipalitieswith lower revenue-raising capacity and includes R5.4 billion for maintenance. Diverse range of municipalities includes cities that can raise substantial revenue and poor rural municipalities 72 2019/20 Adjusted R millionbudget 2020/212021/222022/23 Medium-term estimates MTEF total Direct conditional grants Comprehensive agricultural support programme1 538 Ilima/Letsema projects538 Community library services1 501 Education infrastructure10 514 National school nutrition programme7 186 HIV, TB, malaria and community outreach22 039 Health facility revitalisation6 007 Statutory human resources, training and development3 846 National tertiary services13 186 Human settlements development18 780 Informal settlements upgrading partnership– Provincial roads maintenance11 442 Public transport operations6 326 Other direct grants4 360 1 5221 6201 672 549614632 1 4791 5841 667 11 00811 71012 255 7 6668 1258 516 24 38727 93129 405 6 3686 6587 034 4 1554 3334 494 14 06914 69415 294 16 62113 41413 871 –3 8904 121 11 59311 93812 507 6 7507 1217 090 4 6194 3304 580 4 814 1 795 4 730 34 973 24 308 81 723 20 060 12 982 44 057 43 905 8 011 36 037 20 961 13 529 Total direct conditional grants107 263 110 785117 962123 137 351 883 Indirect transfers3 941 School infrastructure backlogs1 987 National health insurance indirect1 909 Ilima/Letsema projects45 4 0604 8245 076 1 7362 2952 424 2 2882 5292 652 36–– 13 961 6 456 7 469 36
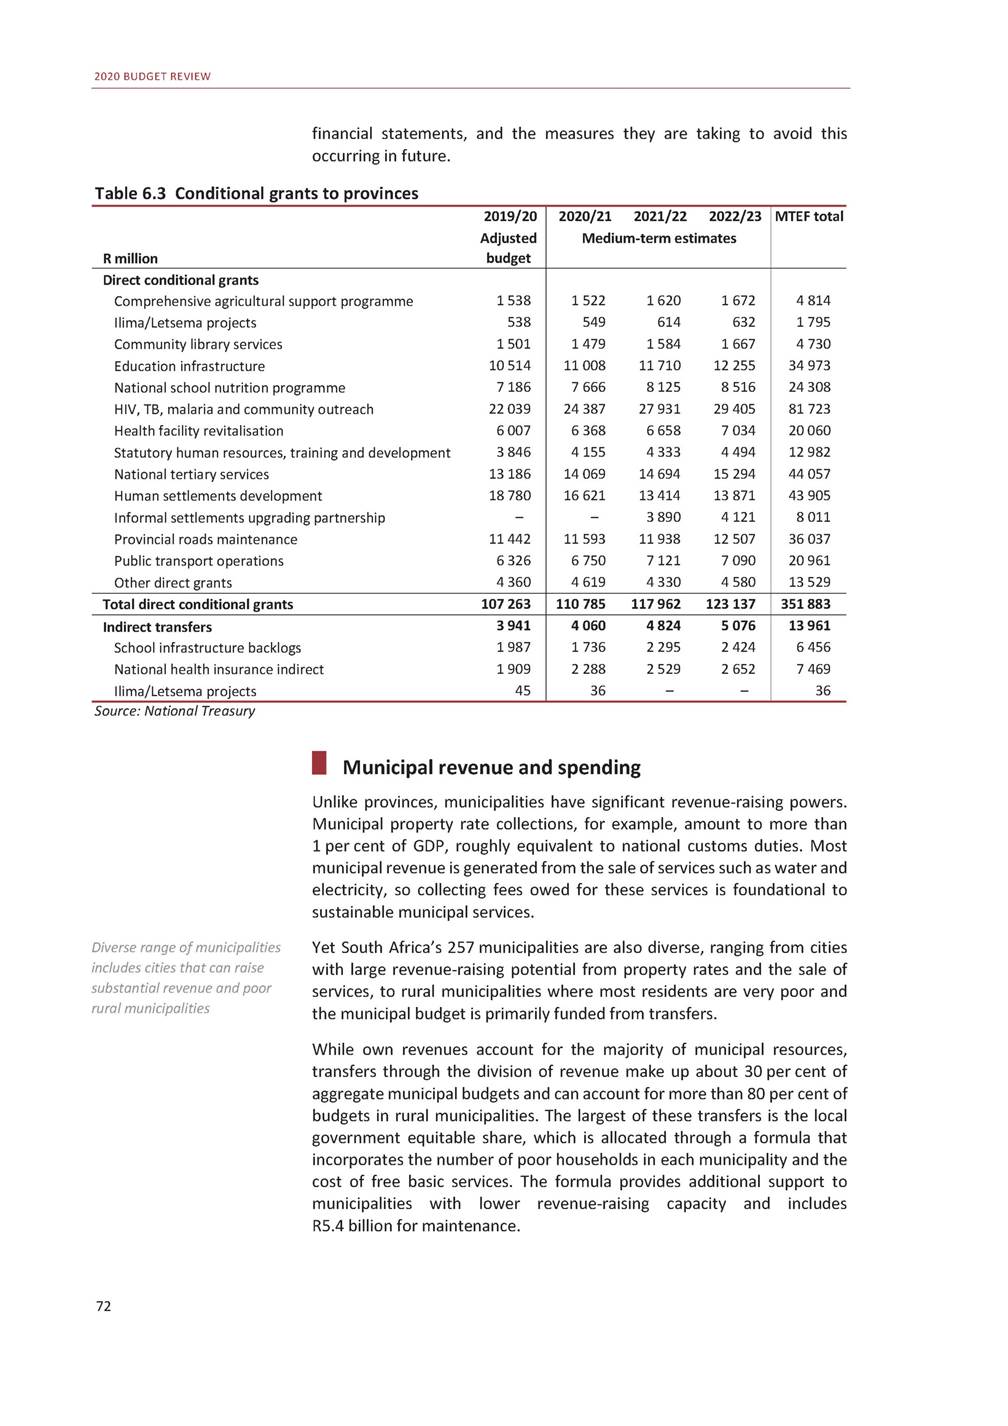
CHAPTER 6: DIVISION OF REVENUE AND SPENDING BY PROVINCES AND MUNICIPALITIES Municipalities also earn revenue from levying charges on developers to connect new developments to municipal services. The draft Municipal Fiscal Powers and Functions Amendment Bill proposes new, uniform regulations for these development charges, strengthening the revenue-raising framework for municipalities. This bill, which was published for public comment in January 2020, can be found on the National Treasury website. The 2020 Budget includes funding to support pilot initiatives to improve municipal revenue collection. The National Treasury will work with selected municipalities that have large outstanding debts to bulk suppliers, including Eskom, as a result of customer non-payment. Smart meters will be retrofitted in these municipalities to test whether revenue collections increase sufficiently to pay for the meters and recover associated costs. If so, further rollout of smart meters may be funded by borrowing against future revenue increases. The Department of Cooperative Governance has also been funded to run a payment culture campaign. Improving regulation of development charges will increase municipal revenue Table 6.4 Transfers to local government Source: National Treasury Government continues to reform the system of conditional grant transfers to local government based on the principles set out in the 2019 Budget Review. In 2020, the scope of the municipal infrastructure grant will be expanded to allow the purchase of specialised waste management vehicles and broaden waste collection services to more poor households. The structure of the fiscal framework for local government is refined in each budget. In 2020, the Minister of Finance will host a special lekgotla of the Budget Forum – the intergovernmental structure established to facilitate formal consultation on local government finances – to review the Minister of Finance to host special Budget Forum in 2020 to review municipal funding model 73 2019/20 Adjusted R millionbudget 2020/212021/222022/23 Medium-term estimates MTEF total Equitable share and related68 973 General fuel levy sharing with metros13 167 Direct conditional grants45 068 Municipal infrastructure14 816 Integrated urban development857 Urban settlements development12 045 Informal settlements– upgrading partnership Integrated national electrification1 863 programme (municipal) Public transport network6 468 Water services infrastructure3 669 Regional bulk infrastructure2 066 Other direct grants3 283 74 68381 06287 213 14 02715 18216 085 43 81946 19848 147 14 67115 93716 852 9481 0151 075 11 2827 4057 352 –3 9454 181 1 8592 0032 119 6 4466 7977 119 3 4453 6203 701 2 0062 1562 281 3 1623 3203 467 242 958 45 294 138 163 47 460 3 038 26 039 8 126 5 981 20 362 10 767 6 442 9 949 Total direct transfers127 209 132 529142 442151 445 426 416 Indirect transfers7 024 Integrated national electrification3 124 programme (Eskom) Regional bulk infrastructure3 094 Other indirect grants806 7 6287 2298 161 3 0012 9943 688 3 8573 2753 455 7709591 017 23 017 9 684 10 587 2 747
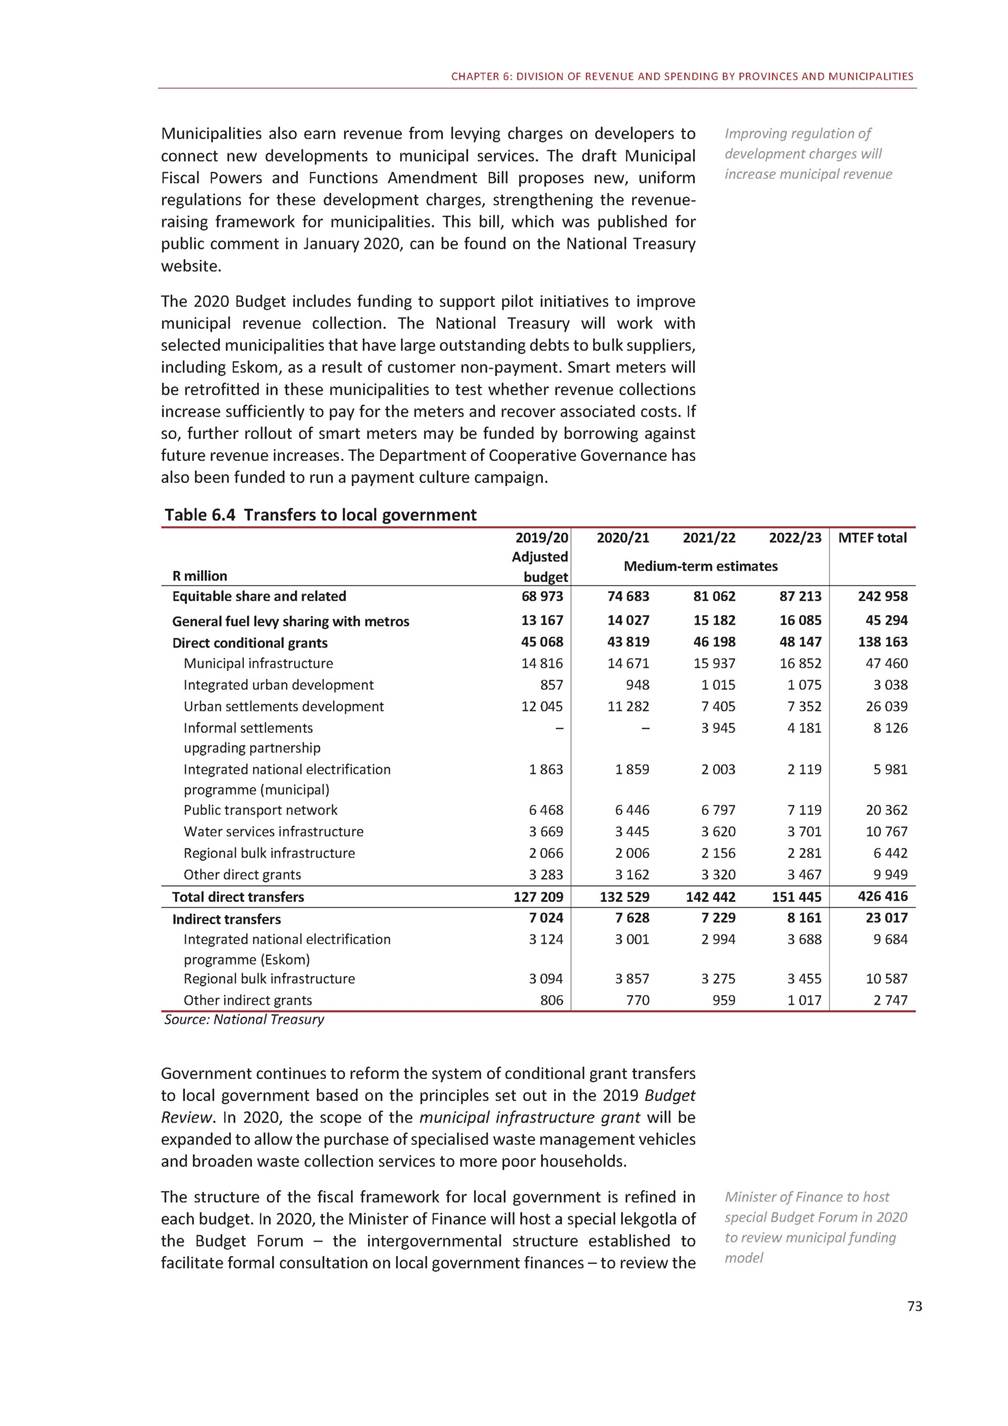
2020 BUDGET REVIEW municipal funding model broadly. The National Treasury is working with the Department of Cooperative Governance, the South African Local Government Association, the Financial provinces to prepare for this lekgotla. and Fiscal Commission and Progress in addressing unfunded budgets Over the past several years, a growing number of municipal councils have adopted unfunded budgets, in which realistically anticipated revenue is insufficient to meet planned spending sustainably. The National Treasury engages with these municipalities and is implementing more serious consequences for councils that continue to adopt unfunded budgets. At the time of the 2019 MTBPS, the National Treasury had written to 127 municipalities that had adopted unfunded budgets for 2019/20 and advised them to table adjusted budgets to balance planned expenditure with credible revenue projections. Sixty-one municipalities were able to do this. As a result, nearly three-quarters of all municipalities now have funded budgets – the highest proportion since the National Treasury began assessing the sustainability of all municipal budgets in 2013/14. After National Treasury intervention, nearly three-quarters of municipalities now have funded budgets 74 R billion Trends in municipal revenues Municipal revenues from service charges and property rates continue to grow rapidly, averaging about 8 per cent per year in nominal terms over the period 2013/14 to 2017/18. Cost increases for services such as electricity, water, sanitation and refuse collection are largely driven by growth in bulk costs, which municipalities must pass on to their consumers. Growth in property rates has been slightly faster, averaging about 9 per cent a year over this period. Figure 6.2 Municipal operating revenue 350 Source: National Treasury There is a noticeable difference between budgeted revenue and actual cash collected by municipalities. Over the five-year period shown in Figure 6.2, cash collections average about 11 per cent less than the expected revenue in municipalities’ adjusted budgets. Most of this difference is because of write-offs – in 2017/18, for example, municipalities wrote off R24.9 billion in unrecoverable debts. Municipalities use accrual accounting, which recognises revenues, taxes, fees and charges when bills are issued, not when payments are received. If revenues are billed but not paid, this will lead to cash-flow problems, and the municipality may be unable to meet its obligations. To avoid this, municipalities should budget for expected revenues as the amount that will likely be collected, taking into account historical experience with revenue and write-offs. This is part of the test that is applied when the National Treasury determines whether a municipality’s budget is funded or not. Adjusted budgetActual cash collectedDebt impairment 300 250 200 150 100 50 0 2013/142014/152015/162016/172017/18
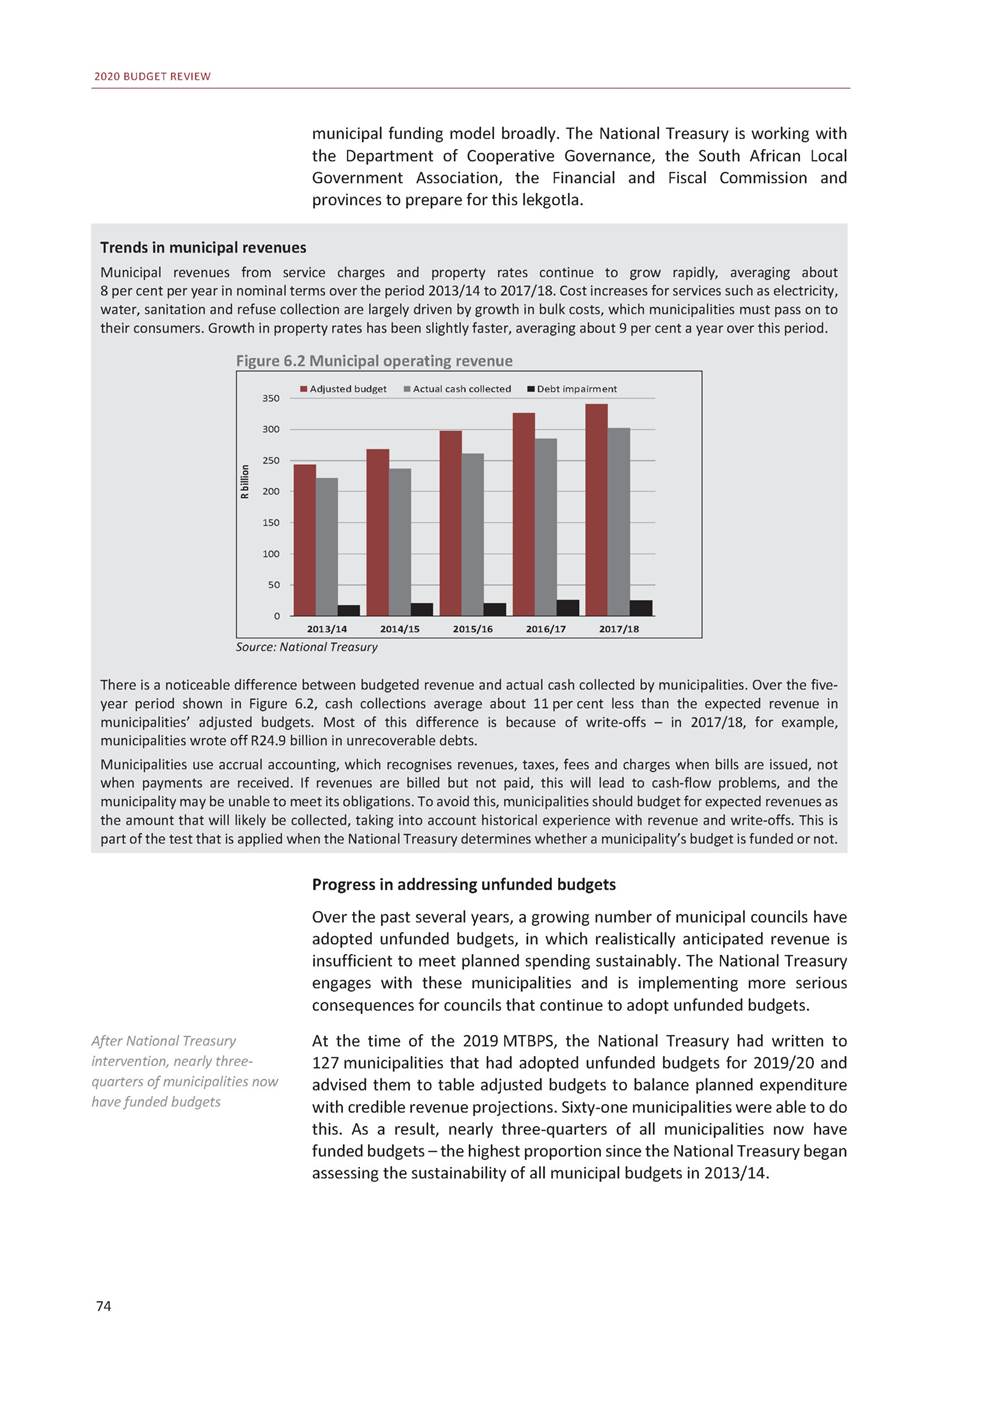
CHAPTER 6: DIVISION OF REVENUE AND SPENDING BY PROVINCES AND MUNICIPALITIES Figure 6.3 Funded and unfunded municipal budgets Source: National Treasury The remaining 66 municipalities were unable to revise their budgets despite support from national and provincial treasuries, mainly due to their large arrear obligations to creditors such as Eskom and water boards. These municipalities were then asked to revise their budgets to ensure adequate cash flows to cover their commitments in this financial year. When 36 municipalities did not comply with this and other requirements, the National Treasury withheld their equitable share payments. Funds were released as municipalities met the revised conditions. The National Treasury and provincial treasuries will closely monitor these municipalities, which are expected to continue improving their budget management and move towards fully funded budgets in future. Equitable shares withheld from municipalities until they fulfil budgetary responsibilities Promoting local accountability While national and provincial treasuries can monitor the financial health of local government, only local residents can hold municipalities accountable for their full range of functions. Frustration with the decline in services has led community organisations in several towns to approach the courts to require municipalities to be placed under intervention by the provincial government and for municipal councils to be dissolved – a measure of last resort included in the Constitution. Municipal administrations are the sphere of government closest to communities, and should be the most responsive to their day-to-day needs. The use of courts to compel municipalities to meet their mandates reflects a profound breakdown in this relationship and in governance. Rebuilding trust in these municipalities will require greater accountability among councillors and officials. In addition to supporting capacity building in sub-national government, the National Treasury publishes extensive municipal financial data that can assist residents to engage with their local council. Recent efforts have focused on making this data more user-friendly to members of the public by improving the portal, www.municipalmoney.gov.za. Residents need to hold municipalities accountable for their full range of functions 75 Number of municipalities 2013/14 2014/15 2015/16 2016/17 2017/18 2018/19 2019/20 Revised 2019/20 Funded Unfunded Undetermined Funded with risk 280 240 200 160 120 80 40 0 103 84 82 123 113 66 81 69 188 189 174 153 145 130 134 191
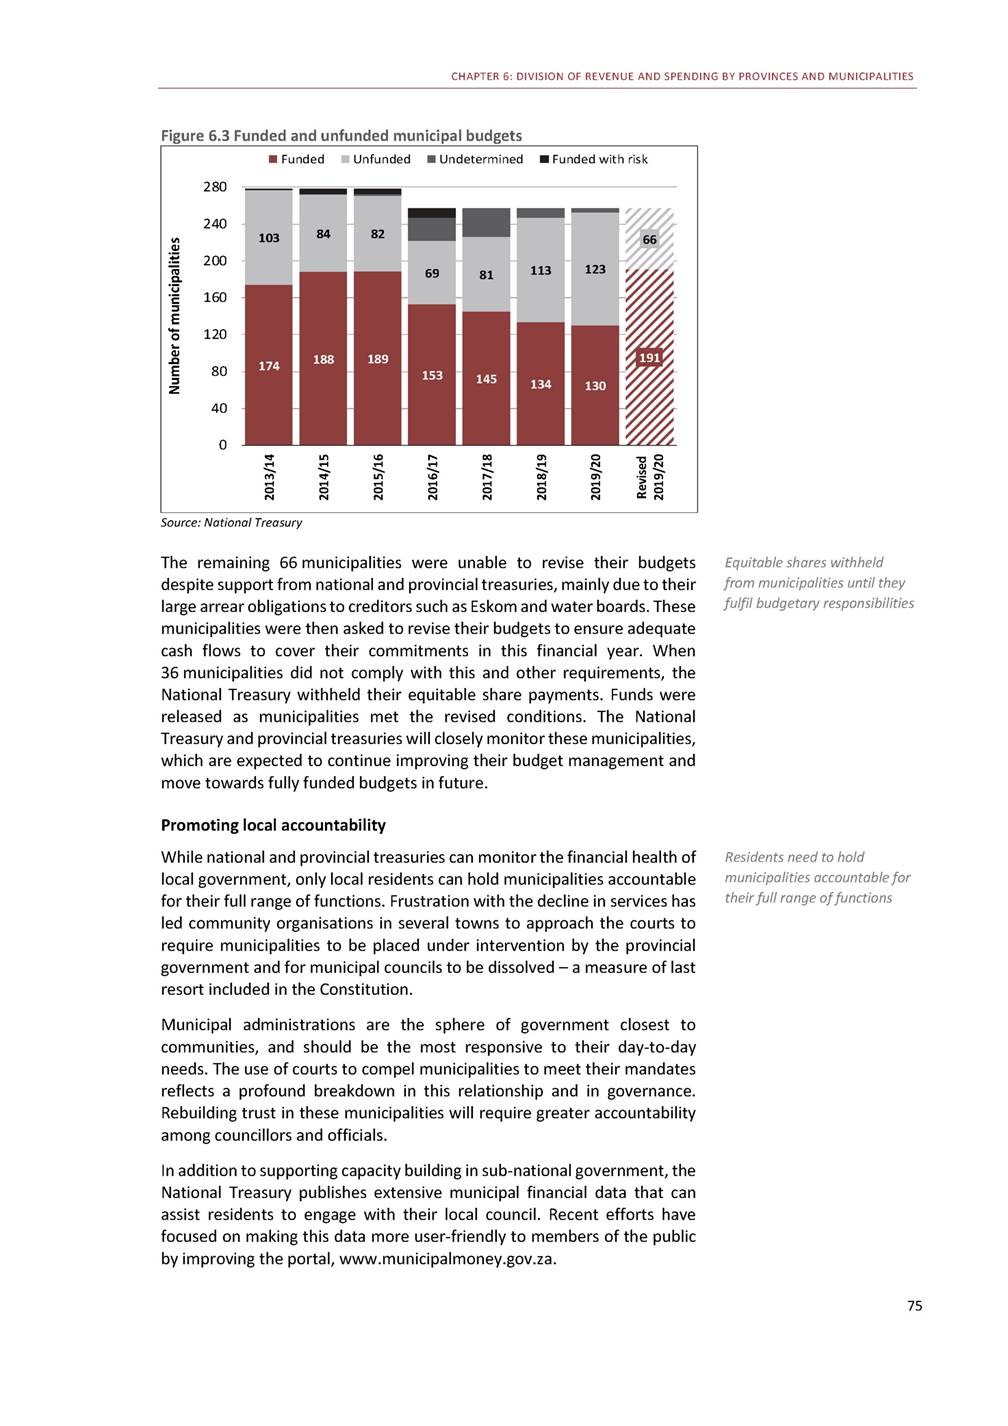
2020 BUDGET REVIEW Conclusion National government continues to support provinces and municipalities to deliver their mandates, but will impose governments violate public finance laws. consequences where local 76 Collaborations to promote local economic development Although local economic development projects often focus on small areas, they usually require collaboration among stakeholders across government, the private sector and community organisations to succeed. Several examples of recent collaborative initiatives are highlighted below. •Purpose-built coalitions that serve to build partnerships can bring different stakeholders together to drive local projects. In Nelson Mandela Bay, the Real Baakens Group was formed in 2017 by social activists, business people, municipal officials and spatial development experts to restore a river valley running through the city. The group engaged with the municipality to unblock stalled projects and mobilise resources to clean sewage spills and stormwater litter traps, and fix water leaks. The renewed Baakens Valley has the potential to be a well-used park, event space and tourist attraction. •The Department of Trade, Industry and Competition is implementing the Industrial Park Revitalisation Programme, which aims to attract investment by improving infrastructure in existing industrial parks, many of which are located in low-income areas. The department is working with municipalities that are responsible for many of the services needed. The National Treasury’s Cities Support Programme is also supporting Ekurhuleni, eThekwini, Tshwane and Mangaung to revitalise targeted parks, some of which are not operating optimally because of erratic electricity supply or protests by local residents. Cities will be supported to resolve these constraints. •Although township economic development initiatives have helped to improve quality of life through investment in public infrastructure and privately owned shopping centres, they have been insufficient to address the broader legacy of dislocation. The Cities Support Programme is promoting an approach to township economic development that recognises that many factors affect township economies, and that more participatory and collaborative approaches are required. Taking lessons from Gauteng’s Tshepo 1 Million Programme, a three-year programme to pilot this approach was launched in five metros in December 2019.
7 Government debt and contingent liabilities Overview O21.4 per cent to R407.3 billion. Borrowing is expected to reach ver the past year, government’s gross borrowing requirement – the Government’s gross borrowing requirement grew by 21.4 per cent over the past year budget balance plus maturing loans – has increased by R497.5 billion in 2022/23. The steep increase is the result of weak economic growth, the deteriorating fiscal position, an increase in domestic bond redemptions and large-scale support to distressed state-owned companies. About 90 per cent of government debt is rand-denominated, shielding government from some volatility in debt costs due to fluctuations in the exchange rate. However, higher yields, especially on longer-dated domestic bonds, have increased borrowing costs. Debt and debt-service costs will continue to rise over the medium term. Gross loan debt is estimated to increase from R3.18 trillion (61.6 per cent of GDP) in 2019/20 to R4.38 trillion (71.6 per cent of GDP) in 2022/23. Net loan debt is estimated to increase from R2.94 trillion (57 per cent of GDP) 77 In brief •Over the past year, government’s gross borrowing requirement has risen by R71.9 billion to R407.3 billion. •Government has financed this steep increase in a responsible manner, despite a deteriorating fiscal position resulting from weak economic growth and the precarious finances of state-owned companies. •Deep and liquid domestic capital markets remain the primary source of financing over the next three years. •Gross loan debt is expected to increase to R4.38 trillion, or 71.6 per cent of GDP, by 2022/23, with foreign debt averaging 9.6 per cent of gross debt over the medium term. Net loan debt is expected to reach R4.15 trillion, or 67.8 per cent of GDP, by 2022/23. •Contingent liabilities are expected to increase from R979.9 billion in 2019/20 to R1.16 trillion by 2022/23. •The risk to South Africa’s credit ratings became more pronounced in 2019. Only Moody’s and Ratings and Investment Information (R&I) rate the country’s debt at investment grade.

2020 BUDGET REVIEW in 2019/20 to R4.15 trillion (67.8 per cent of GDP) in 2022/23. Contingent liabilities – mainly guarantees to state-owned companies – are projected to reach R979.9 billion on 31 March 2020. Government’s long record of prudent debt management has enabled the National Treasury to consistently match higher borrowing requirements without dramatically increasing the cost of debt. Nonetheless, prudent debt management cannot substitute for sustainable public finances, or for a growing economy. Debt is not expected to stabilise over the medium term. The risk to South Africa’s remaining investment-grade credit ratings has become more pronounced. As discussed in Chapter 3, urgent interventions are required to stabilise the public finances. Prudent debt management strategies allow government to finance higher borrowing requirements Financing strategy Despite the challenging economic environment, government has continued to implement an efficient and cost-effective financing strategy. Global and domestic economic trends are considered when establishing the mix of funding instruments and maturities, as well as risk and debt management plans. The strategy prioritises funding liquidity – that is, the ability to make agreed-upon payments in a timely manner – while minimising refinancing and currency risk, without compromising the efficient functioning of the domestic bond market. In 2020/21, the borrowing requirement will be R432.7 billion. To ensure a diversified debt portfolio that spreads risk, the requirement will be met from short-and long-term borrowing in the domestic market, and from foreign-currency loans. Short-term borrowing consists of Treasury bills with maturities of 12 months or less and bridging finance from the Corporation for Public Deposits. Long-term loans include fixed-rate, inflation-linked and retail savings bonds. Foreign-currency loans will be in the form of foreign bonds. Government is preparing to issue a domestic Islamic bond in 2020/21. In addition, government is considering borrowing from multilateral institutions to finance infrastructure projects, with the benefit of additional technical expertise. Government’s strategic portfolio risk benchmarks help to ensure that the debt structure is configured to minimise risk. The debt portfolio is expected to remain within the current benchmarks during 2020/21. Government’s financing strategy remains efficient and cost-effective, and minimises risk Table 7.1 Performance against strategic portfolio risk benchmarks 1. Excludes borrowing from the Corporation for Public Deposits and retail savings bonds Source: National Treasury 78 Benchmark Descriptionrange or limit 2019/202020/21 Estimates Treasury bills as % of domestic debt115 Long-term debt maturing in 5 years as % of bonds25 Inflation-linked bonds as % of domestic debt20-25 Foreign debt as % of total debt15 Weighted term-to-maturity of fixed-rate bonds and Treasury bills (years)10-14 Weighted term-to-maturity of inflation-linked bonds (years)14-17 Other indicators (weighted average) Term-to-maturity of total debt (years) Term-to-maturity of foreign debt (years) 11.812.0 11.314.6 22.923.3 10.19.5 12.811.8 13.812.6 13.011.8 13.111.5
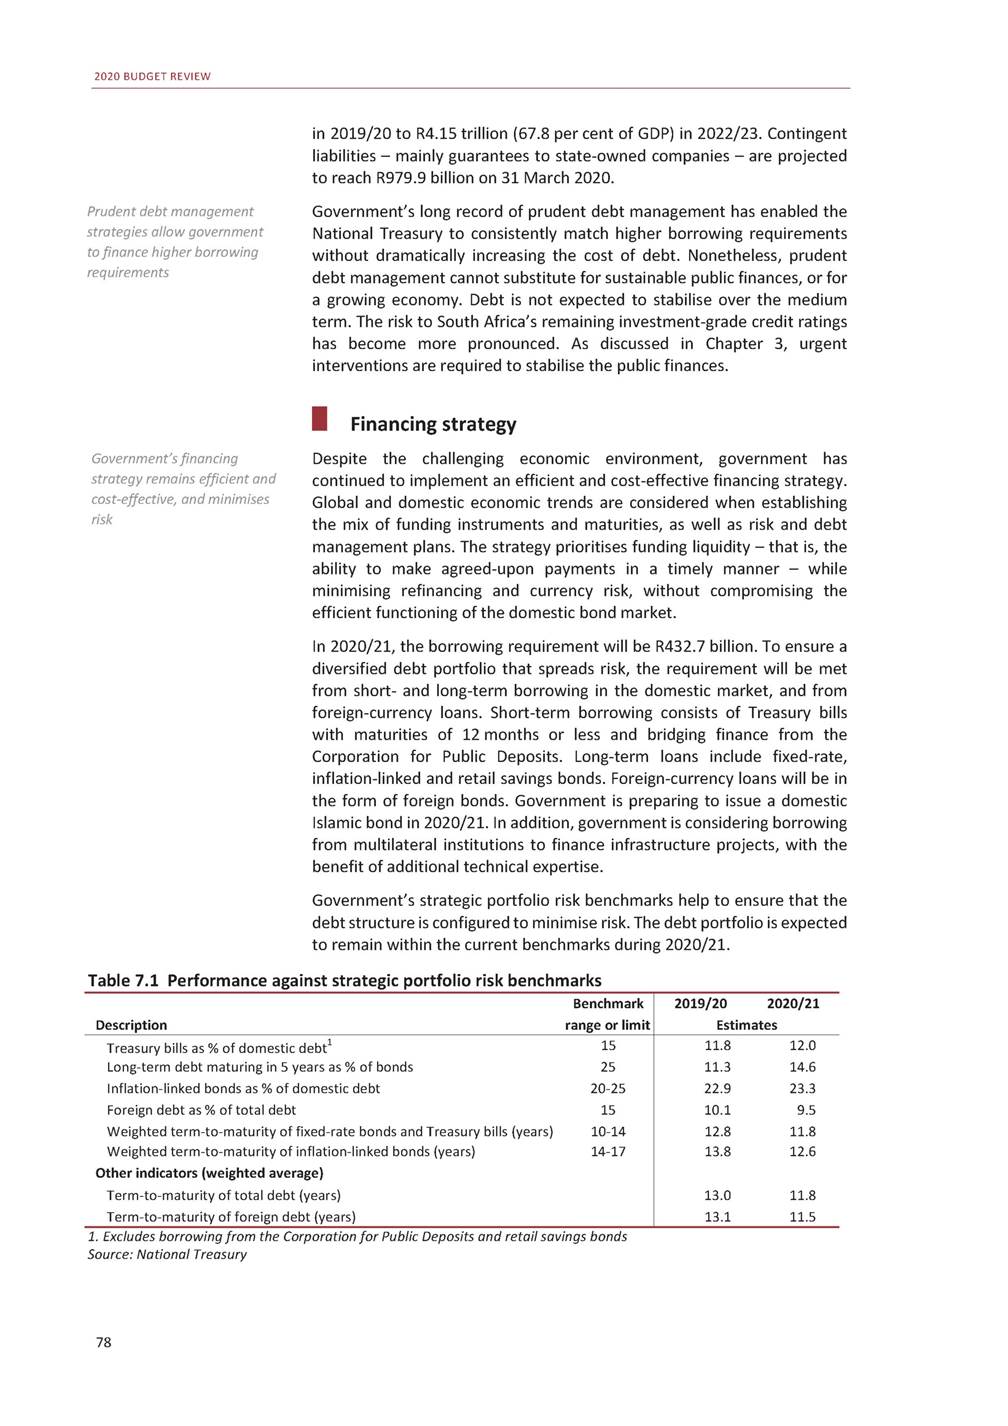
CHAPTER 7: GOVERNMENT DEBT AND CONTINGENT LIABILITIES Risks to the financing strategy The main risks to the financing strategy are: Budget deficit, inflation and exchange-rate fluctuations, and credit rating downgrades are risks to financing strategy • A widening budget deficit. If GDP growth contracts or spending increases – for example, through additional support to state-owned companies – debt and borrowing costs would increase. Inflation and exchange-rate risks. Unanticipated increases in inflation or depreciation in the rand exchange rate would increase the cost of outstanding inflation-linked or foreign-currency debt. Sovereign credit ratings. Further downgrades of South Africa’s credit ratings could lead to higher costs of borrowing. • • Borrowing performance and projections 2019/20, the budget deficit increased by R82.3 billion In relative to Borrowing requirement set to reach R497.5 billion in 2022/23 as result of higher budget deficit, redemptions projections in the 2019 Budget, partially offset by lower domestic bond redemptions of R11.1 billion. As a result, the gross borrowing requirement rose from a projected R335.3 billion to R407.3 billion for 2019/20, or from 6.2 to 7.9 per cent of GDP. Over the medium term, the gross borrowing requirement will increase from R407.3 billion to R497.5 billion as a result 79 Sovereign credit ratings and the borrowing requirement South Africa’s credit ratings from Moody’s, Standard & Poor’s and Fitch carry a negative outlook. Moody’s and R&I maintain an investment-grade rating. A downgrade by Moody’s would trigger exclusion from indices such as the FTSE World Government Bond Index, and would prevent some institutions from holding the country’s debt. Such an event could lead to short-term volatility in financial markets, including an increase in borrowing costs and exchange-rate depreciation. Given the country’s highly developed and liquid financial markets, however, it would be unlikely to affect government’s ability to finance its medium-term borrowing requirements. Figure 7.1 illustrates the sensitivity of debt and debt-service costs to changes in selected macroeconomic variables, such as interest, inflation and exchange rates. A further deterioration in sovereign credit ratings, for example, would result in adverse movements in exchange and interest rates, resulting in higher debt and borrowing costs. Figure 7.1 Sensitivity of debt and debt-service costs* *Assuming all other variables remain unchanged Source: National Treasury Rating agencies are concerned about the country’s low economic growth, rising fiscal deficit, growing debt and high contingent liabilities. Nonetheless, South Africa is supported by strong core institutions such as the judiciary and Reserve Bank, deep domestic financial markets and a well-capitalised financial sector. Change in debt-service costs Change in gross loan debt 1 percentage point change in headline inflation R1 change in the rand/US dollar exchange rate 1 percentage point change in short-and long-term interest rates 0 10 20 R billion 0.2 6 2 24 6.6 18
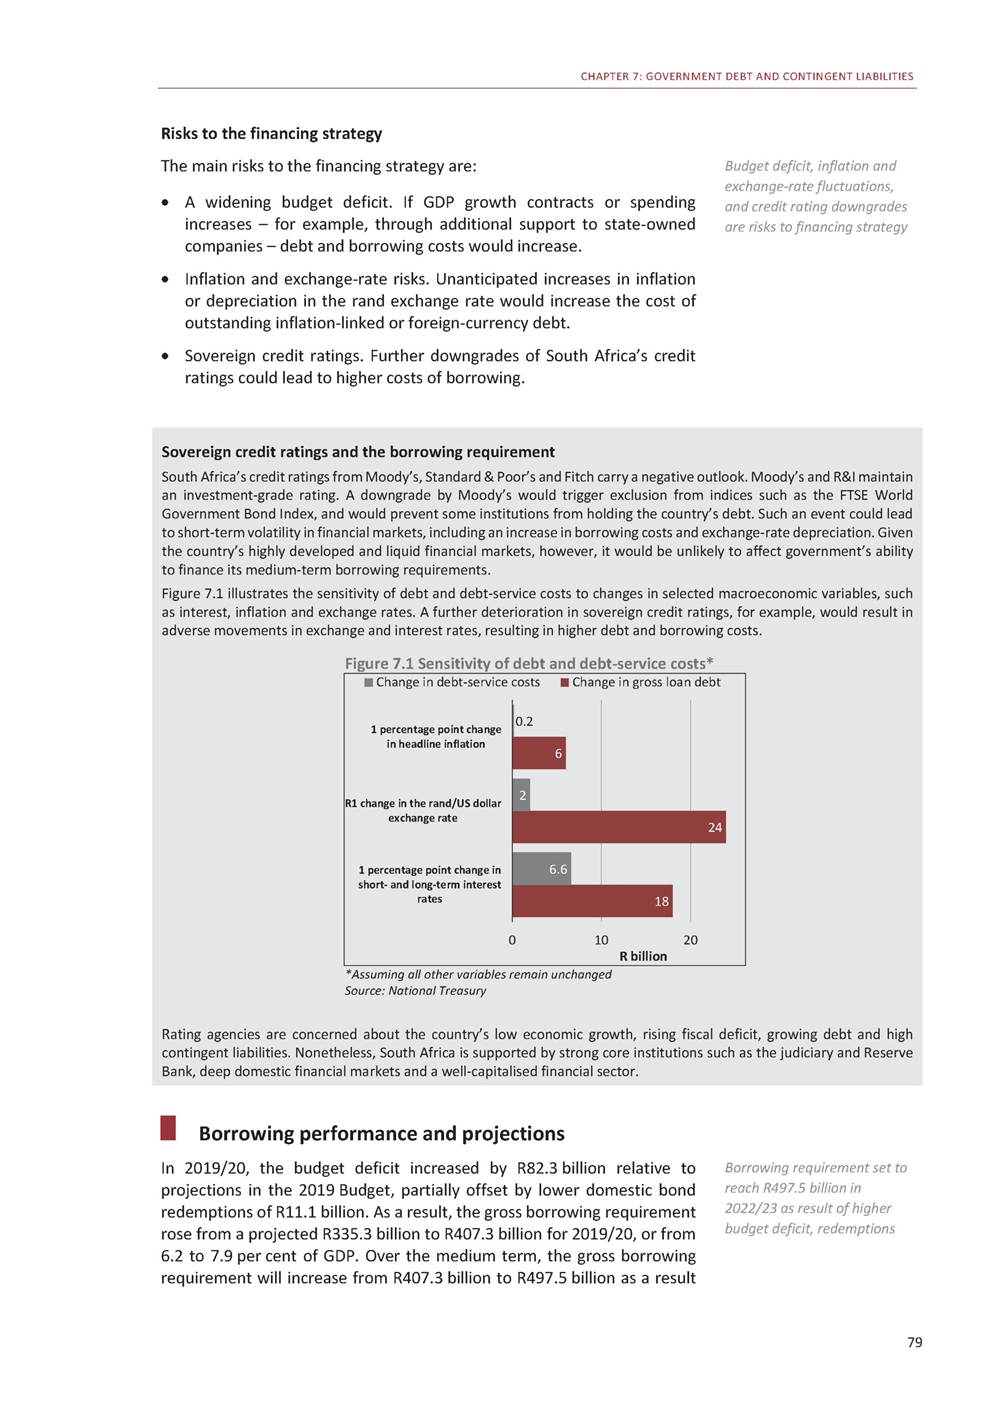
2020 BUDGET REVIEW of higher budget deficits and loan redemptions. Over the next three years, R266.4 billion of debt is scheduled for redemption, of which domestic debt accounts for 88.1 per cent. The high redemption levels will be addressed by exchanging shorter-for longer-dated bonds and using cash balances. Table 7.2 shows how the gross borrowing requirement will be financed over the next three years. As a percentage of GDP, the borrowing requirement reaches 8 per cent in 2020/21, increasing to 8.1 per cent in the outer year. 80 Managing refinancing risk through the bond switch programme The bond switch programme has succeeded in managing government’s refinancing risk – the risk that the state will not be able to raise money to repay debt at a scheduled point, or that it will have to do so at higher cost. The programme exchanges short-for longer-dated debt. Since 2015, R247 billion has been switched out of shorter-term bonds. The programme will be enhanced in 2020/21. The revised structure will increase transparency, in line with other government funding instruments, and reduce speculation about the timing and size of switch auctions. A calendar for switch auctions that use Dutch auction pricing – where bonds are allotted at a single price – will be introduced. To further manage bond market volatility, a maximum amount will be set for each switch auction. A detailed description of the enhanced programme will be published on the National Treasury’s investor relations portal. Figure 7.2 Debt maturity profile Source: National Treasury
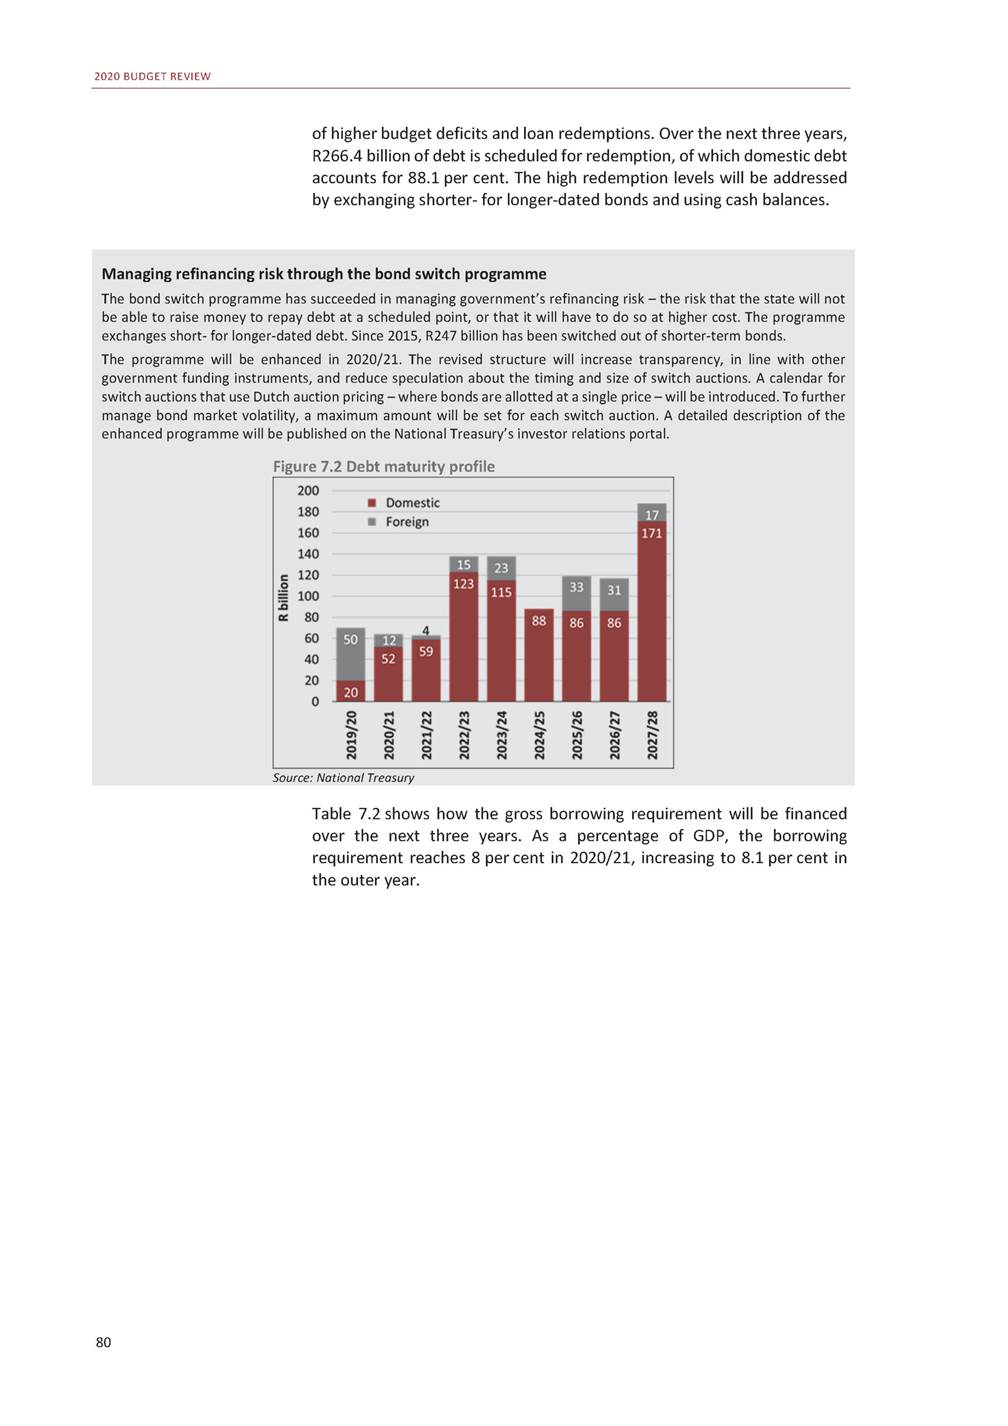
CHAPTER 7: GOVERNMENT DEBT AND CONTINGENT LIABILITIES Financing of national government gross borrowing requirement1 Table 7.2 1. A longer time series is presented in Table 1 of the statistical annexure at the back of the Budget Review 2. A positive value indicates that cash is used to finance part of the borrowing requirement 3. Differences between funds requested and actual cash flows of national departments Source: National Treasury Domestic short-term borrowing Short-term loans are made up of a highly liquid Corporation for Public Deposits borrowing facility and Treasury bills. During 2019/20, government issued an additional R11 billion in Treasury bills (relative to 2019 Budget projections) to partly finance the higher gross borrowing requirement. Loans from the Corporation for Public Deposits increased from R17.3 billion to R27.3 billion. Over the medium term, Treasury bill issuance will amount to 12.4 per cent of total domestic borrowing. In 2020/21, net Treasury bill issuance will amount to R48 billion, while borrowing from the Corporation for Public Deposits will remain unchanged at R27.3 billion. Treasury bill issuance will amount to 12.4 per cent of total domestic borrowing over medium term Table 7.3 Domestic short-term borrowing Source: National Treasury 81 2019/20 2020/21 2019/202020/21 OpeningNetClosing R millionbalancechangebalance Net Closing changebalance Weekly auction estimates Corporation for17 27810 00027 278 Public Deposits Treasury bills307 36026 000333 360 91-days17 000-4 72912 271 182-days59 818-2 60457 214 273-days98 5049 840108 344 364-days132 03823 493155 531 –27 278 48 000381 360 3 32915 600 11 55668 770 16 066124 410 17 049172 580 7 93010 375 1 0001 200 2 0552 645 2 3703 190 2 5053 340 Total324 63836 000360 638 48 000408 638 2018/19 R millionOutcome 2019/20 BudgetRevised 2020/212021/222022/23 Medium-term estimates Main budget balance-231 342 Redemptions-15 570 Domestic long-term loans-13 529 Foreign loans-2 041 -255 243-337 508 -80 088-69 743 -30 596-19 535 -49 492-50 208 -367 999-366 374-359 348 -64 699-63 531-138 137 -52 465-59 239-122 937 -12 234-4 292-15 200 Total-246 912 -335 331-407 251 -432 698-429 905-497 485 Financing Domestic short-term loans14 061 Treasury bills (net)14 039 Corporation for Public Deposits22 Domestic long-term loans183 003 Market loans183 503 Loans issued for switches-500 Foreign loans25 258 Market loans25 258 Loans issued for switches– Change in cash and other balances224 590 Cash balances-2 274 Other balances326 864 25 00036 000 15 00026 000 10 00010 000 216 000298 900 216 000299 189 –-289 28 52076 052 28 52076 052 –– 65 811-3 701 71 644-724 -5 833-2 977 48 00048 00055 000 48 00048 00055 000 ––– 337 700337 400385 800 337 700337 400385 800 ––– 29 26044 79053 200 29 26044 79053 200 ––– 17 738-2853 485 12 596-5 321-1 647 5 1425 0365 132 Total246 912 Percentage of GDP5.0% 335 331407 251 6.2%7.9% 432 698429 905497 485 8.0%7.5%8.1%
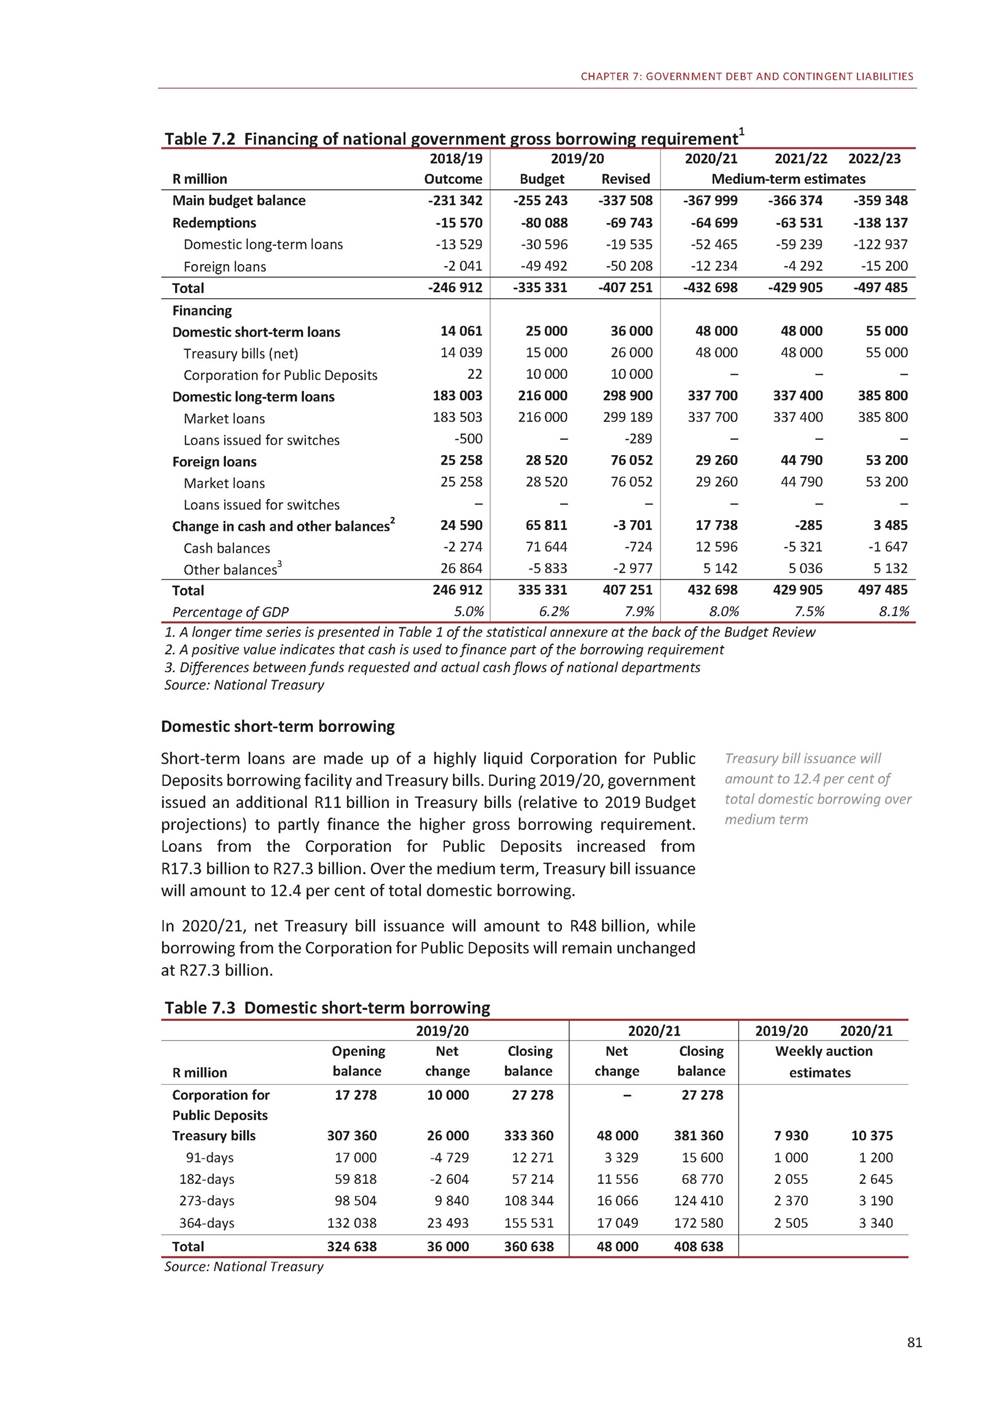
2020 BUDGET REVIEW Domestic long-term borrowing Domestic long-term borrowing consists of fixed-rate, inflation-linked and retail savings bonds. Between April 2019 and January 2020, government raised R250.6 billion by issuing domestic long-term debt. Fixed-rate bonds accounted for 82.6 per cent of bond issuances, with inflation-linked instruments making up the remainder. Fixed-rate bonds were issued across a range of maturities. About half were issued for between four and 15 years, as the bond exchange programme created space to issue more bonds in the short-to-medium term. In 2019/20, interest rates on long-term bonds increased compared with the previous year. Government was able to issue more bonds in the short-to-medium term, lowering its average borrowing costs. For instance, in 2018/19, fixed-rate bonds were funded at an average interest rate of 9.3 per cent, while in 2019/20, they were funded at an average interest rate of 9.1 per cent. Over the medium term, domestic long-term borrowing will increase from R298.9 billion in 2019/20 to R385.8 billion in 2022/23. Average cost of borrowing of 9.1 per cent for fixed-rate bonds Non-resident holdings As a category, international investors remain the largest holders of domestic government bonds, with 37.1 per cent of the portfolio. Moreover, foreign holdings increased by R95 billion in 2019, relative to an increase of R8 billion in 2018, showing global investors remain positive about South African assets despite concern about sovereign credit risk. Foreign holdings of government bonds increased by R95 billion in 2019 International borrowing Government’s foreign-currency bonds – mainly denominated in dollars and euros – are issued to meet foreign-currency commitments. In 2019/20, favourable pricing and continued investor interest allowed government to raise US$5 billion in 10-year and 30-year bonds, compared with the US$4 billion required for the year. Over the medium term, an additional US$8.5 billion will be raised in global capital markets. 82 R billion Dec 2014 Dec 2015 Dec 2016 Dec 2017 Dec 2018 Dec 2019 Figure 7.3 Ownership of domestic bondsFigure 7.4 Domestic bonds held by foreign investors 800 700 600 500 400 300 200 100 0 Source: Share Transactions Totally Electronic 808 705 713 558 449 451
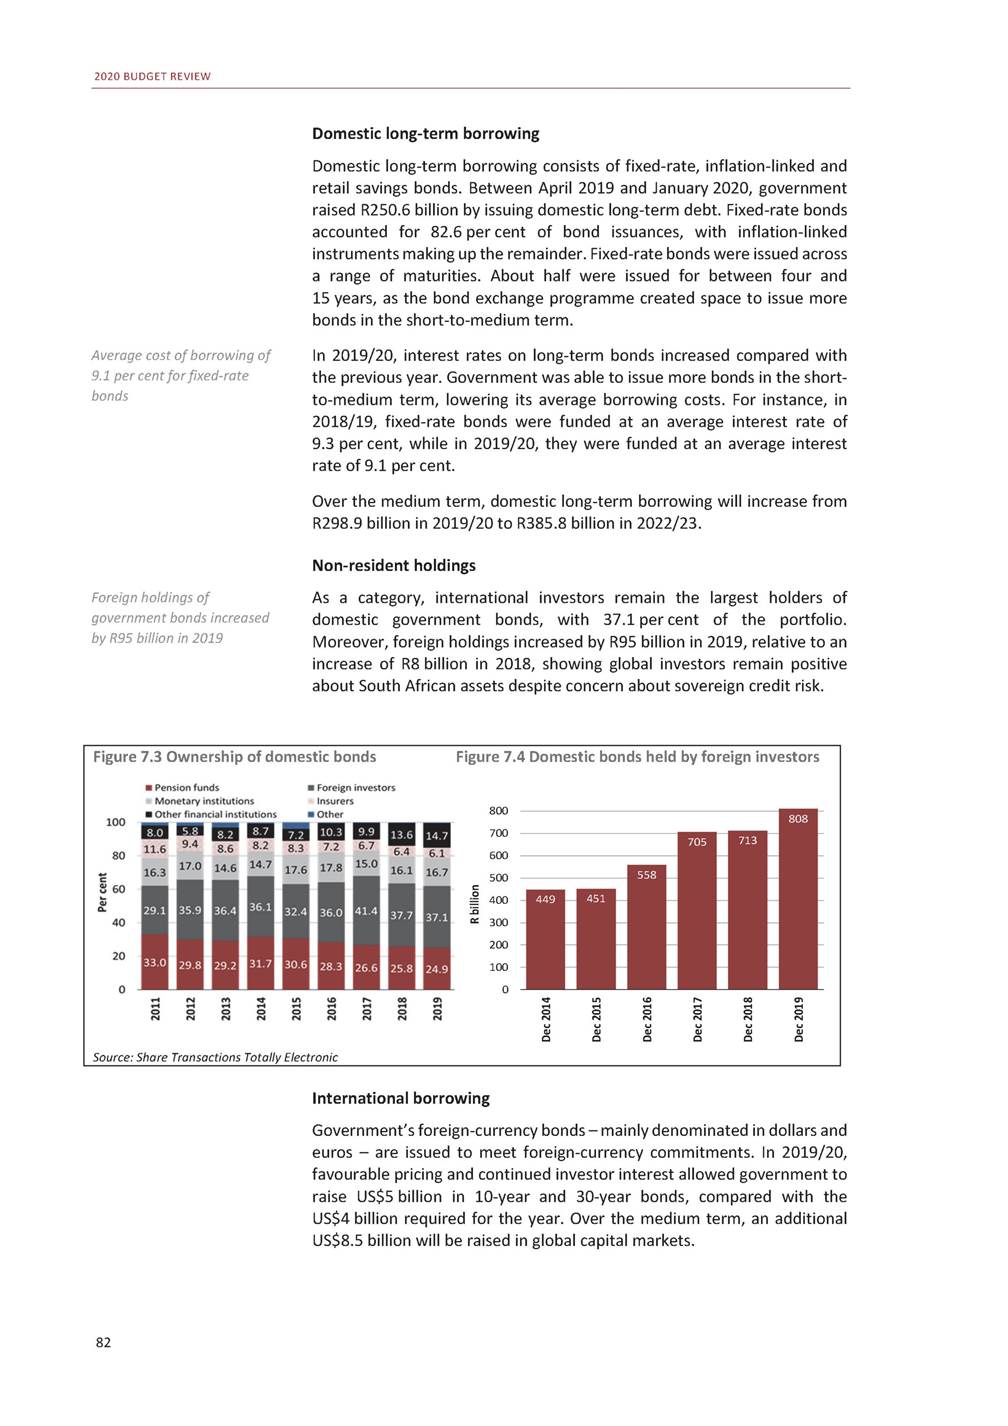
CHAPTER 7: GOVERNMENT DEBT AND CONTINGENT LIABILITIES Table 7.4 Foreign-currency commitments and financing Source: National Treasury Cash balances Government’s total cash holdings consist of deposits held at the commercial banks and the Reserve Bank. At the end of 2019/20, these balances stood at R238.8 billion. About 74.2 per cent, or R177.2 billion, of these holdings constitutes official foreign exchange reserve deposits made with the central bank, which is available as bridging finance. Over the medium term, foreign-currency deposits will remain slightly below US$7.5 billion, in line with government’s commitment to the Reserve Bank. Government’s total cash balances stand at R238.8 billion Table 7.5 Change in cash balances 1. A positive value indicates that cash is used to finance part of borrowing requirement 2. Rand values at which foreign currency was purchased or borrowed 3. Deposits in rands and US dollars to meet government’s commitments 4. Deposits in rands and US dollars made with Reserve Bank to increase official foreign exchange reserves Source: National Treasury 83 2018/19 R millionOutcome 2019/20 BudgetRevised 2020/212021/222022/23 Medium-term estimates Rand currency Opening balance123 241 Closing balance120 575 of which: Tax and loan accounts63 418 Change in rand cash balance12 666 (opening less closing balance) 138 657120 575 117 157117 157 50 00050 000 21 5003 418 117 157117 157117 157 117 157117 157117 157 50 00050 00050 000 ––– Foreign currency2 Opening balance112 546 Closing balance117 486 US$ equivalent8 722 Change in foreign currency-4 940 cash balance1 (opening less closing balance) 144 628117 486 94 484121 628 6 7868 285 50 144-4 142 121 628109 032114 353 109 032114 353116 000 7 1427 3257 435 12 596-5 321-1 647 Total change in cash balances1-2 274 71 644-724 12 596-5 321-1 647 Total closing cash balance238 061 of which: Operational cash 379 878 Official reserves 4158 183 211 641238 785 40 05961 537 171 582177 248 226 189231 510233 157 44 55147 28449 002 181 638184 226184 155 2018/19 US$ millionOutcome 2019/20 Estimate 2020/212021/222022/23 Medium-term estimates Opening balance8 942 Commitments-2 479 Redemptions-154 Interest-1 025 Departments-1 300 Financing2 259 Loans2 000 Purchases– Interest259 Closing balance8 722 8 722 -5 717 -3 456 -1 147 -1 114 5 280 5 000 – 280 8 285 8 2857 1427 325 -3 382-3 051-3 620 -836-287-1 000 -1 296-1 454-1 600 -1 250-1 310-1 020 2 2393 2343 730 2 0003 0003 500 ––– 239234230 7 1427 3257 435
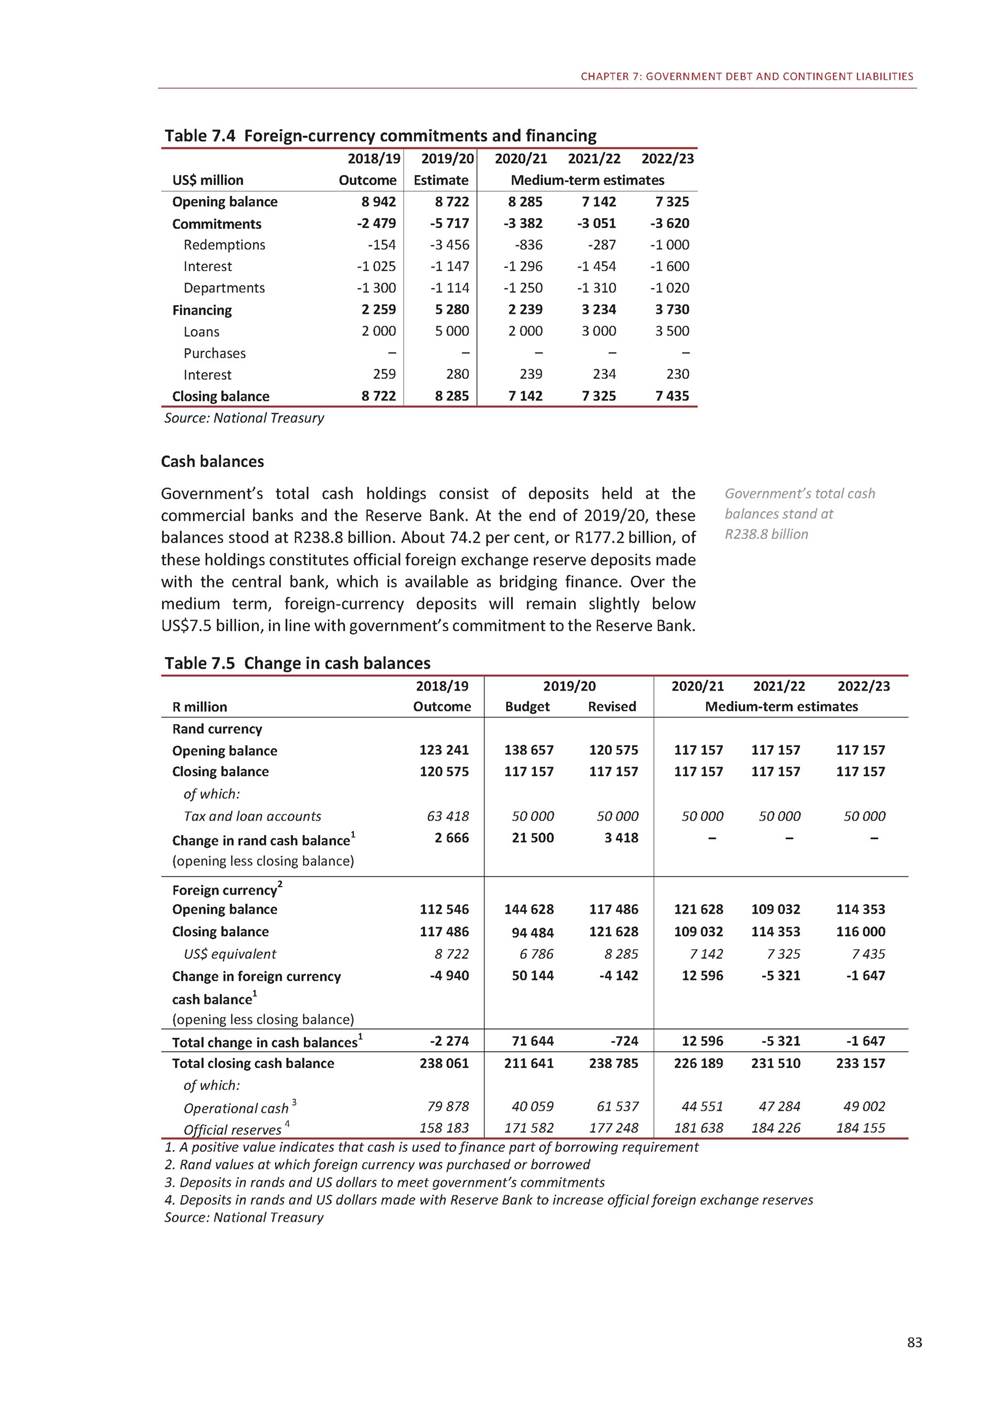
2020 BUDGET REVIEW Government debt and debt-service costs National government debt Table 7.6 summarises the distribution and stock of national government debt. Table 7.6 Total national government debt1 1. A longer time series is given in Table 10 of the statistical annexure at the back of the Budget Review 2. Estimates include revaluation based on National Treasury's projections of inflation and exchange rates Source: National Treasury Debt is not expected to stabilise over the medium term. Gross loan debt is expected to increase to R4.38 trillion, or 71.6 per cent of GDP, by 2022/23, with net debt reaching 67.8 per cent of GDP over the same period. Government debt levels are affected by changes in inflation and exchange rates. For example, rand appreciation decreases the value of outstanding Debt is not expected to stabilise over the medium term foreign debt.Foreign-currency-denominated debtwill average R381 billion, or 9.6 per cent, of gross debt over the medium term. Government’s foreign-currency exposure is partly offset by foreign-currency investments, which in 2019/20 amount to US$8.3 billion. In 2019/20, the stock of debt increased by R388 billion. The main budget deficit accounted for 87 per cent of this increase, while interest and inflation rate changes explain much of the rest. Table 7.7 Analysis of annual increase in gross loan debt 1. Revaluation based on National Treasury projections of inflation and exchange rates 2. A negative value indicates that cash is used to finance part of the borrowing requirement Source: National Treasury 84 2018/19 R millionOutcome 2019/20 Estimate 2020/212021/222022/23 Medium-term estimates Budget deficit231 342 Discount on loan transactions18 165 Revaluation of inflation-linked bonds123 440 Revaluation of foreign-currency debt150 225 Change in cash and other balances2-24 590 337 508 22 473 24 531 -450 3 701 367 999366 374359 348 5 9468 1706 443 28 67734 42736 248 7157 1836 930 -17 738285-3 485 Total298 582 387 763 385 600416 439405 484 End of period2018/19 R billionOutcome 2019/20 Estimate 2020/212021/222022/23 Medium-term estimates Domestic loans22 497 Short-term325 Long-term2 173 Fixed-rate1 605 Inflation-linked568 Foreign loans2291 2 859 361 2 498 1 851 647 317 3 2283 5973 957 409457512 2 8193 1403 445 2 0752 3502 542 744790903 334382427 Gross loan debt2 788 Less: National Revenue Fund-243 bank balances2 3 176 -238 3 5623 9794 384 -222-227-230 Net loan debt2 545 2 938 3 3403 7524 154 As percentage of GDP: Gross loan debt56.7 Net loan debt51.7 61.6 57.0 65.669.171.6 61.565.167.8
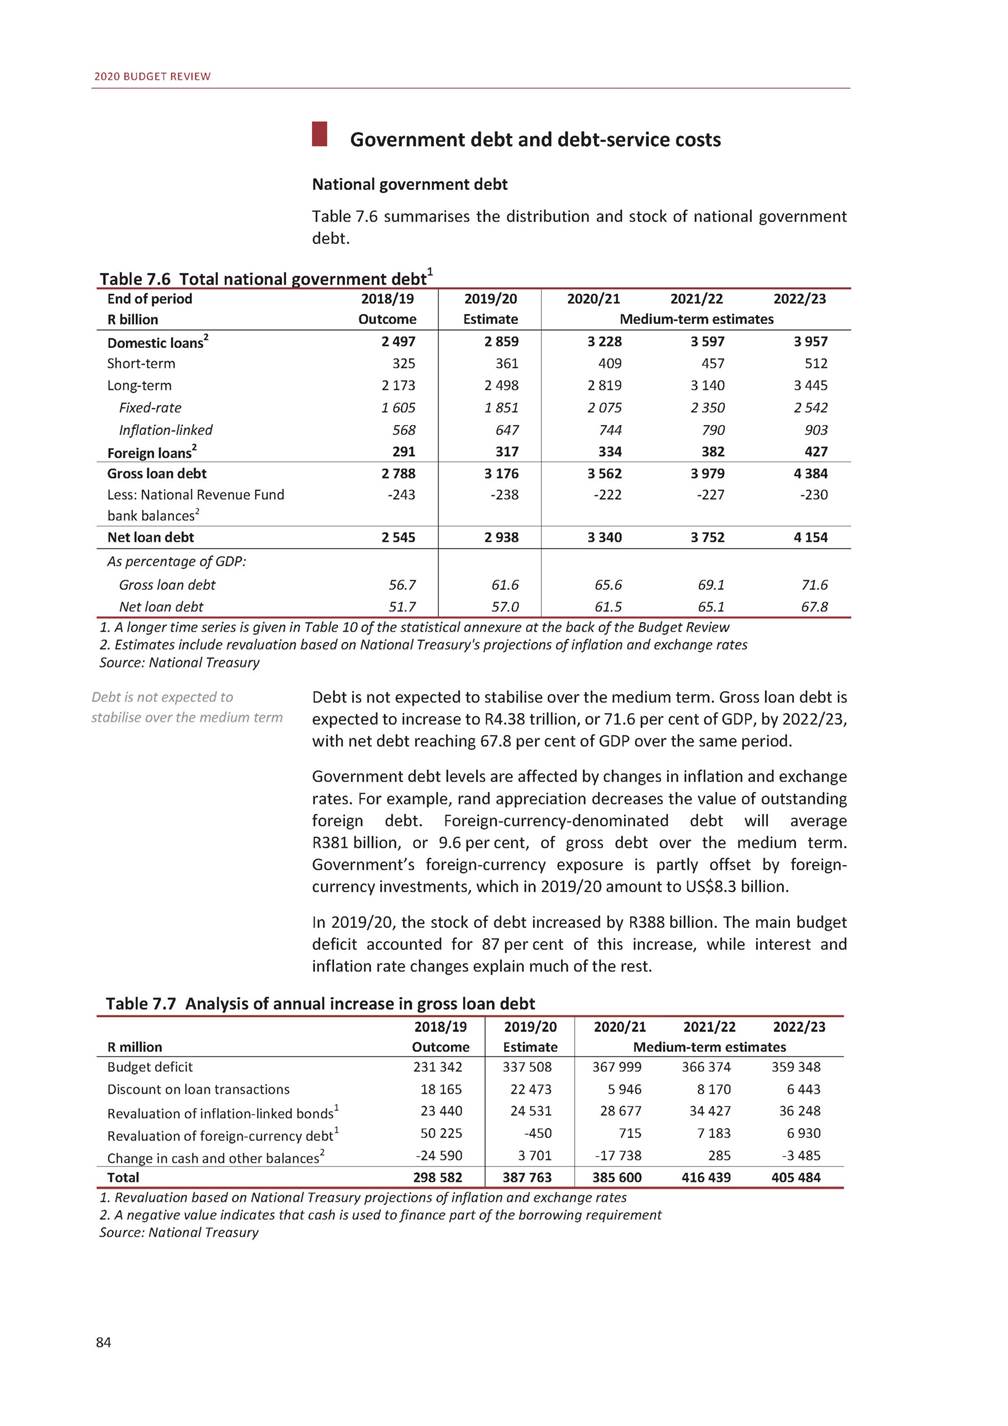
CHAPTER 7: GOVERNMENT DEBT AND CONTINGENT LIABILITIES National government debt-service costs Government debt-service costs are determined by debt stock, new borrowing and macroeconomic variables such as interest, inflation and exchange rates. In 2019/20, debt-service costs were revised upwards by R2.8 billion due to the higher borrowing requirement. In addition, increased Treasury bill issuance and greater bridging finance increased short-term borrowing costs. As a share of GDP, debt-service costs are projected to average 4.5 per cent over the medium term. Table 7.8 National government debt-service costs Source: National Treasury Contingent liabilities Contingent liabilities are state obligations that will only result in expenditure if a specific event occurs. Government closely monitors the status of its contingent liabilities and other fiscal obligations. These include guarantees to state-owned companies, independent power producers, public-private partnerships and provisions for multilateral institutions. The financial position of state-owned companies is discussed in Chapter 8. Details of contingent liabilities and other obligations are shown in Table 11 of the statistical annexure. Government guarantees and other liabilities Government is committed to reducing guarantees as part of its efforts to maintain prudent levels of debt and contingent liabilities. Guarantees to state-owned companies In 2019/20, government issued guarantee reporting guidelines for national departments and state-owned companies. The guidelines state that exposure from a guarantee consists of the sum of the outstanding value of a loan, accrued interest and adjustments to inflation-linked bonds as a result of changes in the inflation rate. The approved guarantee amount, however, reflects only the capital value of the loan. As a result, the exposure amount may exceed the approved guarantee amount. The total amount for approved guarantees is expected to decrease by R3.3 billion to R484.4 billion by the end of March 2020, with associated exposure estimated to increase by R17.2 billion to R385.3 billion. Eskom constitutes the largest exposure, at 77.2 per cent of guarantees. Guidelines issued to improve guarantee reporting 85 2018/19 R millionOutcome 2019/20 BudgetRevised 2020/212021/222022/23 Medium-term estimates Domestic loans167 438 Short-term29 601 Long-term137 837 Foreign loans14 411 184 240188 202 25 34528 039 158 895160 163 17 96816 803 211 144237 614266 238 25 44128 26031 255 185 703209 354234 983 18 12620 86823 907 Total181 849 202 208205 005 229 270258 482290 145 As percentage of: GDP3.7 Expenditure12.1 Revenue14.3 3.74.0 12.212.2 14.415.2 4.24.54.7 13.014.015.0 16.417.418.4
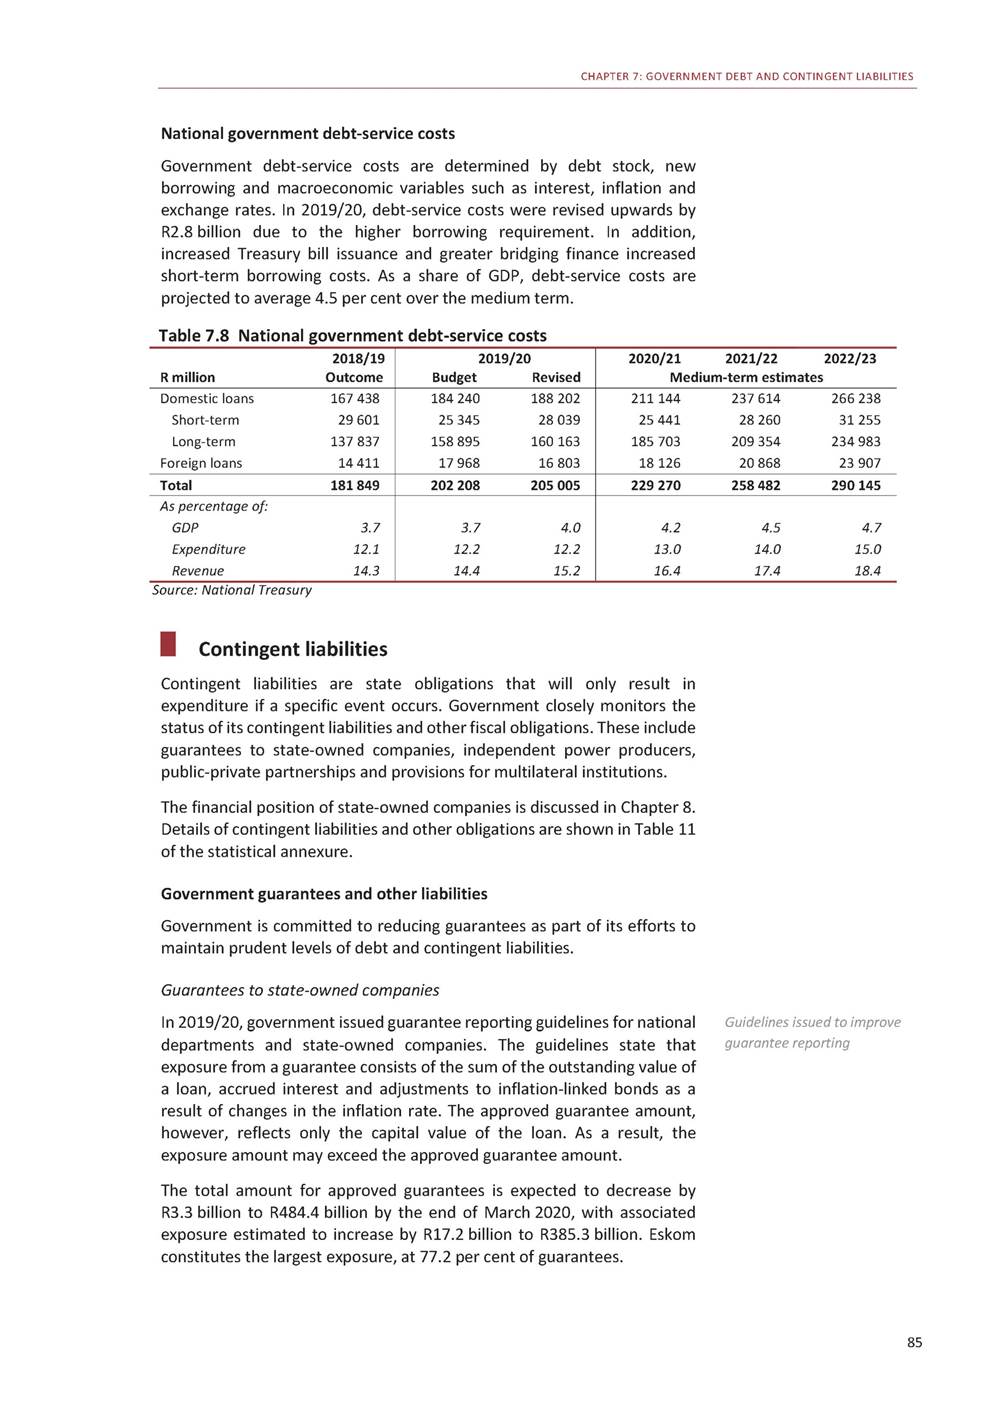
2020 BUDGET REVIEW Table 7.9 Government guarantee exposure1 1. A full list of guarantees is given in Table 11 of the statistical annexure in the Budget Review 2. Total amount of borrowing, adjustments to inflation-linked bonds as a result of inflation rate changes and accrued interest 3. The exposure in 2017/18 excludes adjustments to inflation-linked bonds as a result of inflation rate changes 4. These amounts only include national and provincial PPP agreements Source: National Treasury In 2019/20, there were four significant changes to the guarantee profile: • • • Eskom used an additional R12 billion of its guarantee. Denel was granted guarantees of R3.5 billion. Government recapitalised the South African Post Office and South African Express to allow the airline to settle guaranteed debt. The Development Bank of Southern Africa and the South African National Roads Agency Limited repaid some of their guaranteed debt. • Other guarantees Contingent liability risks for independent power producers (IPPs) are very low. Government has committed to procure up to R200 billion in renewable energy from IPPs. The value of signed projects, which represents government’s exposure, is expected to amount to R161.4 billion by March 2020. This exposure is expected to decrease to R141.9 billion in 2022/23. During 2019/20, government’s exposure to public-private partnerships decreased by about R1.8 billion to R8.7 billion, as a number of projects reached maturity. Total exposure is expected to reach R7 billion in 2022/23. Contingent liability risks for IPPs are very low Exposure to PPPs declined by R1.8 billion as a number of projects reached maturity 86 2017/18 R billionGuaranteeExposure2 2018/19 GuaranteeExposure2 2019/20 GuaranteeExposure2 Public institutions469.8327.3 of which: Eskom350.0250.6 SANRAL 338.930.4 Trans-Caledon Tunnel Authority25.718.9 South African Airways19.111.1 Land and Agricultural Bank of9.63.8 South Africa Development Bank of Southern12.24.1 Africa South African Post Office4.20.4 Transnet3.53.8 Denel2.42.4 South African Express1.10.9 Industrial Development0.40.1 Corporation South African Reserve Bank–– Independent power producers200.2122.2 Public-private partnerships49.69.6 487.7368.1 350.0285.6 38.939.5 43.014.3 19.115.3 9.61.0 11.44.3 2.9– 3.53.8 3.43.4 2.80.2 0.50.1 0.3– 200.2146.9 10.510.5 484.4385.3 350.0297.4 37.939.9 43.013.5 19.117.3 9.60.9 10.04.6 –– 3.53.8 6.96.9 1.90.2 0.50.1 –– 200.2161.4 8.78.7

CHAPTER 7: GOVERNMENT DEBT AND CONTINGENT LIABILITIES Other contingent liabilities Table 7.10 shows government’s exposure to multilateral institutions and other implicit contingent liabilities. South Africa subscribes to shares in these institutions but does not pay the full amount. Government’s commitments represent the unpaid portion of the share subscribed to in the unlikely event these institutions run into financial difficulty. Table 7.10 Provision for multilateral institutions and other contingent liabilities Source: National Treasury Net valuation profits and losses Government’s largest contingent asset is the Gold and Foreign Exchange Contingency Reserve Account. This account reflects profits and losses on gold and foreign exchange reserves, held by the Reserve Bank, to meet foreign exchange obligations and to maintain liquidity in the presence of external shocks. The balance on this account is split into transactions with cash flow and non-cash flow valuations. Due to the appreciation of the rand, unrealised gains are expected to amount to R278.1 billion by end-March 2020, a decrease of R7.6 billion compared with 2018/19. In 2019/20, government settled a realised loss of R131.7 million. Losses of R97.9 million are projected for 2020/21. Conclusion A prudent debt management strategy, alongside deep and liquid domestic capital markets, has enabled government to finance the higher borrowing requirement. The current debt trajectory is not sustainable, however, and will have to be addressed by reducing expenditure, improving the financial positions of state-owned companies and increasing revenue collection through higher economic growth. Debt management strategy has enabled government to finance borrowing, but debt trajectory is not sustainable 87 R billion2017/18 2018/19 2019/20 Multilateral institutions211.5 of which: New Development Bank33.2 African Development Bank44.1 International Monetary Fund76.4 Other contingent liabilities277.4 of which: Export Credit Insurance Corporation of South Africa18.2 Post-retirement medical assistance69.9 Road Accident Fund139.2 260.7 57.9 53.9 85.9 326.2 20.5 69.9 173.6 280.0 76.0 54.4 86.2 424.6 18.2 69.9 273.1
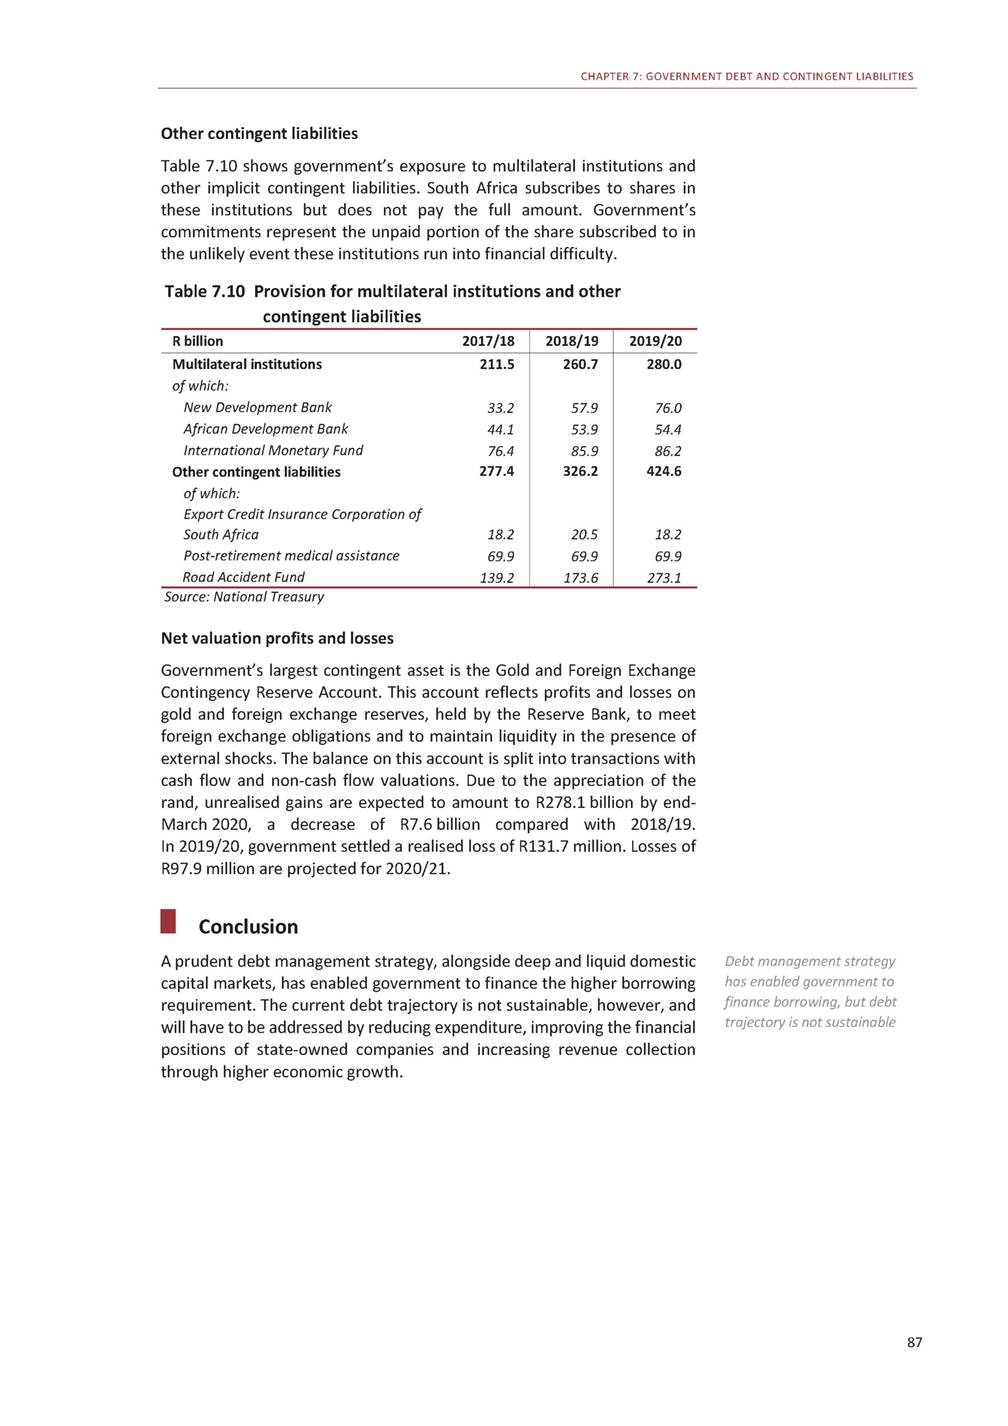
2020 BUDGET REVIEW This page was left blank intentionally. 88

8 Financial position of public-sector institutions Overview Tfunds. Their mandates include building and operating infrastructure, his chapter discusses the financial position of state-owned Public-sector institutions need to be well governed, operationally sound and financially sustainable companies, development finance institutions and social security financing social and economic development, and augmenting the country’s social security system. To meet their objectives, these institutions need to be well governed, operationally sound and financially sustainable. The 2019 Budget Review outlined a set of urgent reforms for Eskom, acknowledging that it was the largest state-owned company in need of significant restructuring – but not the only one. Since then, there has been some progress. The Department of Public Enterprises has published a roadmap for Eskom’s reform, outlining the utility’s role as part of a 89 In brief •The financial performance of several large state-owned companies continued to deteriorate sharply over the past year, leading to an increasing drain on public resources. •The Public Finance Management Act (1999) requires major state-owned companies to generate sufficient financial resources from their operations to meet their obligations to employees, the public and debt holders. Few are meeting these requirements: liabilities are growing faster than assets, with a consequent decline in aggregate net asset value of 5.6 per cent in 2018/19. •The combined net asset value of the three large development finance institutions – the Development Bank of Southern Africa (DBSA), the Industrial Development Corporation (IDC) and the Land Bank – increased to R139.4 billion in 2018/19. •The social security funds will pay out R211 billion in benefits and collect R238 billion in contributions over the medium term. Large surpluses in the Unemployment Insurance Fund and the Compensation Fund, however, are more than offset by Road Accident Fund liabilities, which are expected to reach R605 billion by 2022/23. •In 2018/19, the Government Employees Pension Fund paid out R102.5 billion in benefits funded by investment income of R84.2 billion and contributions of R75.6 billion.
2020 BUDGET REVIEW reformed electricity supply industry, and will report on progress at key milestones. South African Airways (SAA) has been placed in voluntary business rescue. The business rescue practitioners are expected to publish their plan within a matter of weeks. With the exception of the Road Accident Fund, the financial positions of the social security funds are sound. They are able to meet their long-term obligations, as is the Government Employees Pension Fund. Over the past year, government has taken steps to strengthen governance and transparency at the Public Investment Corporation. Apart from Road Accident Fund, financial position of social security funds remains sound State-owned companies Unlike their private counterparts, most state-owned companies hold developmental rather than profit-driven mandates. Nonetheless, these entities need to be financially self-sustaining. In recent years, a pattern of mismanagement and poor governance at major state-owned companies has led to operational failures, financial distress and increased demands for taxpayer support through the national budget. This problem is compounded by broad, sometimes unfunded mandates and, in some cases, outdated business models. The financial performance of state-owned companies continues to deteriorate. Liability growth has outpaced that of assets, with a consequent decline in net asset value, eroding the ability of these entities to meet their financial obligations and deliver on their mandates. Average return on equity, a measure of how effectively net assets are used to create value, fell sharply in 2018/19 – the most recent year for which data is available. This decline is largely the result of weak revenue growth, high compensation costs and rapidly growing debt-service costs. Average return on equity at state-owned companies has fallen sharply Table 8.1 Combined balance sheets of state-owned companies1 2016/172 2017/182 R billion/per cent growth 2014/15 2015/16 2018/19 Total assets 1 037.5 13.9% 739.2 16.2% 298.3 8.6% -2.5% 1 178.6 13.6% 818.2 10.7% 360.4 20.8% 0.6% 1 224.3 3.9% 870.3 6.4% 354.0 -1.8% 0.7% 1 263.2 3.2% 901.1 3.5% 362.1 2.3% -0.8% 1 269.0 0.5% 927.0 2.9% 342.0 -5.6% -8.2% Total liabilities Net asset value Return on equity (average) 1. State-owned companies listed in schedule 2 of the PFMA, excluding development finance institutions 2. Numbers may differ from earlier publications due to restatement or error Source: National Treasury As the scale of financial challenges in state-owned companies has become apparent, many have struggled to access capital markets. In combination with weak cash flows (Figure 8.1), this has reduced their capital spending, resulting in delayed delivery of much-needed social and economic infrastructure. It has also affected their ability to meet debt commitments. The Public Finance Management Act requires state-owned companies listed in schedule 2 to generate sufficient financial resources from their operations to meet obligations to employees, the public, creditors and debt holders. Increasingly, however, these entities rely on external funding, government-guaranteed debt and bailouts to sustain operations. 90
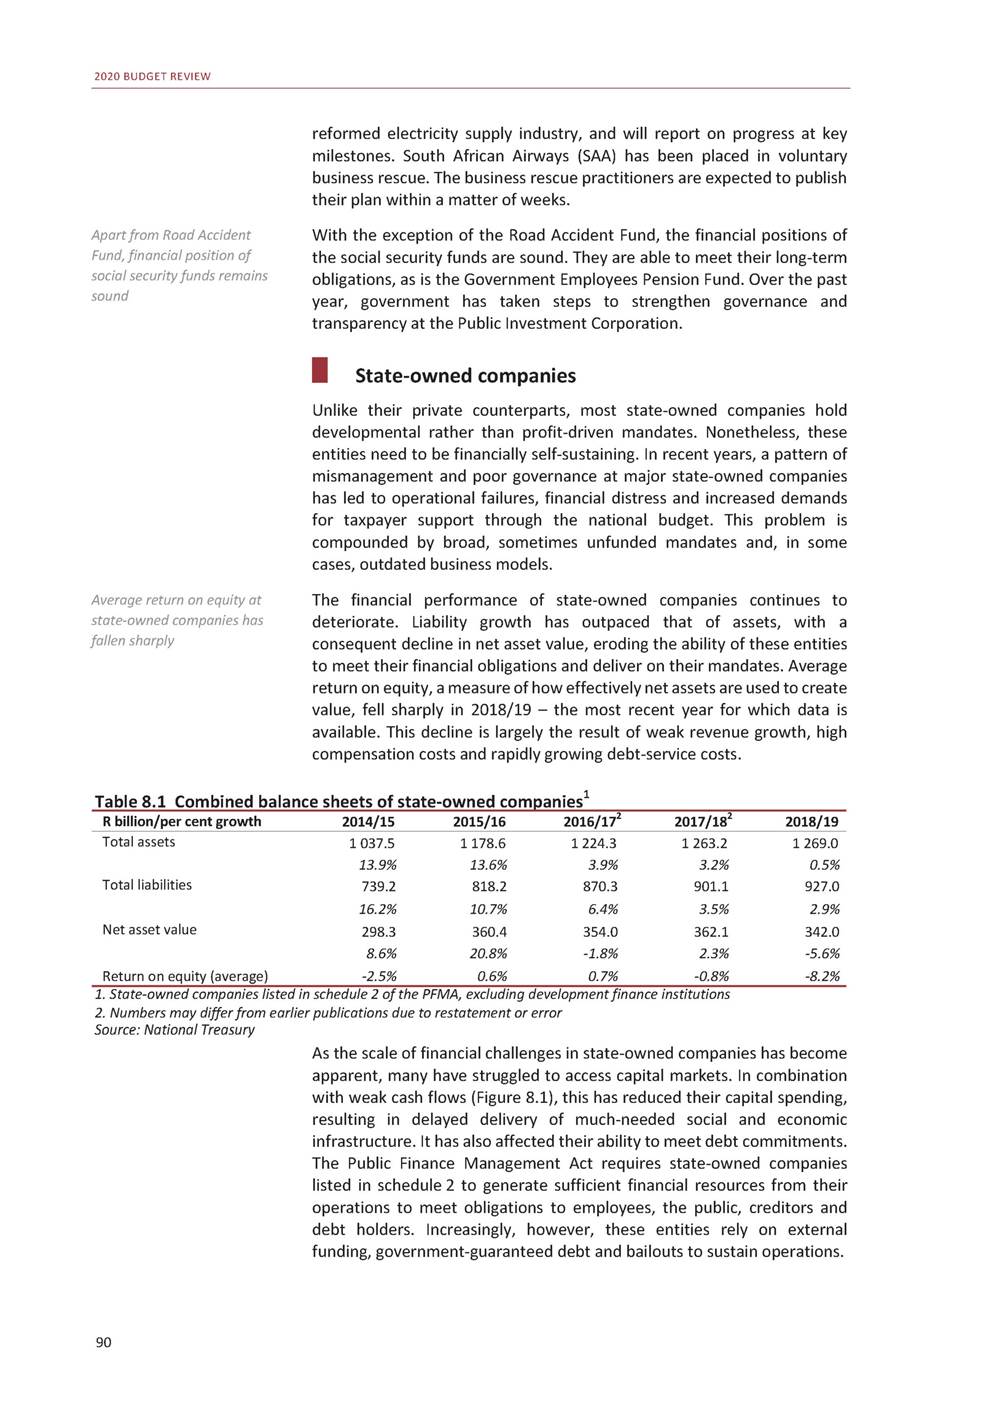
CHAPTER 8: FINANCIAL POSITION OF PUBLIC-SECTOR INSTITUTIONS Figure 8.1 Negative cash flows at state-owned companies* *Companies listed in schedule 2 of the PFMA, excluding development finance institutions **Numbers may differ from earlier publications due to restatement or error Source: National Treasury Over the past 12 years, government has allocated R162 billion to the financially distressed state-owned companies shown in Table 8.2. These allocations generally provide short-term support, but cannot substitute for the far-reaching structural reforms needed to return them to operational and financial stability. Of the total allocations, Eskom accounts for 82 per cent. In 2019/20, government allocated R49 billion to Eskom and committed R112 billion in medium-term funding. Eskom accounts for 82 per cent of fiscal support to state-owned companies over past 12 years Table 8.2 Summary of recapitalisations and bailouts of state-owned companies Source: National Treasury 91 R billion EskomSouth AfricanDenelSouth African South African AirwaysExpressBroadcasting R billionCorporation Total 2008/0910.0––0.4– 2009/1030.01.5––– 2010/1120.0–––– 2011/12––––– 2012/130.7–0.4–– 2013/14––––– 2014/15––––– 2015/1623.0–––– 2016/17––––– 2017/18–10.0––– 2018/19–5.0–1.2– 2019/2049.05.51.80.33.2 10.4 31.5 20.0 – 1.1 – – 23.0 – 10.0 6.2 59.8 2008/09-2019/20 (history)132.722.02.21.93.2 162.0 2020/2156.010.30.60.2– 2021/2233.04.3––– 2022/2323.01.8––– 67.1 37.3 24.8 2020/21-2022/23 (MTEF)112.016.40.60.2– 129.2 Total244.738.42.82.13.2 291.2 100 50 0 -50 -100 -150 -200 Debt principal repayments Interest payments Capital expenditure Net cash from operations Net cash flow after interest, debt service and capital expenditure 85 89 80 67 64 -103 -98 -86 -79 -57 -51 -47 -43 -34 -49 -28 -69 -35 -38 -44 2014/152015/162016/17**2017/18**2018/19
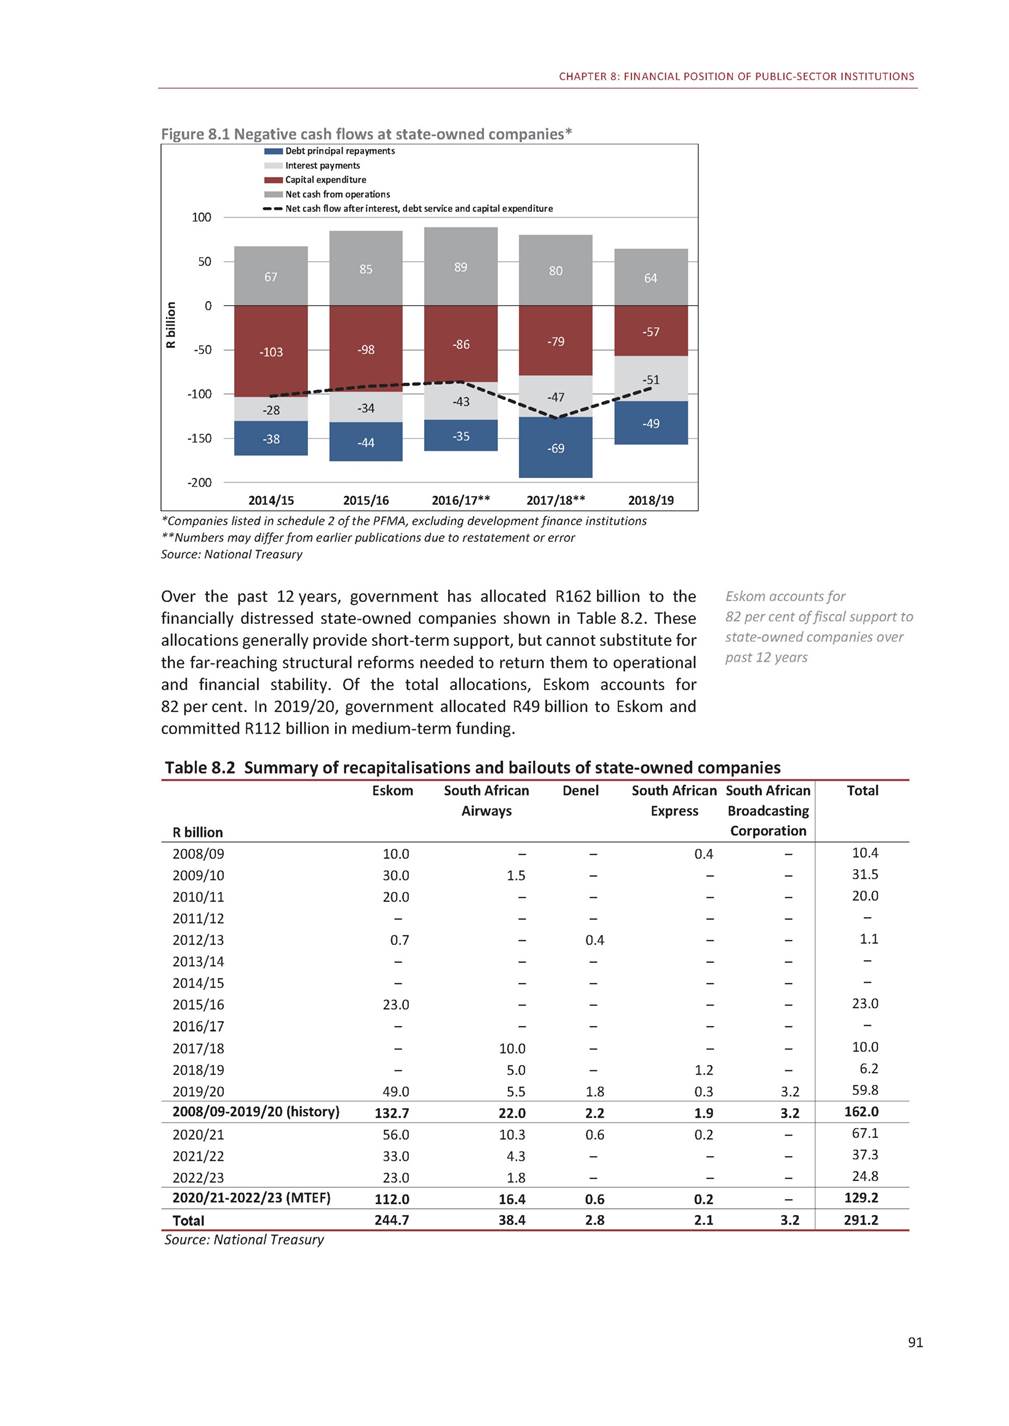
2020 BUDGET REVIEW Debt obligations Figure 8.2 shows the long-term debt maturity profile for the seven largest borrowers. Total debt amounts to R759.9 billion, of which 62 per cent is guaranteed by government. Over the next three years, debt repayments total R178.1 billion, of which R103.5 billion is held by Eskom. Debt repayments over next three years total R178.1 billion, of which Eskom holds R103.5 billion Figure 8.2 Debt maturity profile of major state-owned companies* *Airports Company South Africa, Denel, Eskom, South African National Roads Agency Limited, SAA, Transnet and Trans-Caledon Tunnel Authority Source: National Treasury Rising interest costs reflect market doubts about state-owned companies’ ability to repay debt In recent years, the ability of state-owned companies to access funding and generate sufficient cash flows to repay maturing debt has declined. Rising interest costs reflect market doubts about their ability to repay debt. Increasingly, these entities require state guarantees to borrow. Furthermore, much of the debt that has been raised is in short-term instruments, and is used for refinancing and operations rather than capital investment. Figure 8.3 Borrowing costs for state-owned companies and development finance institutions, 2018/19 *Effective cost of debt for the 10 largest borrowers Source: National Treasury 92 R billion 2020/21 2021/22 2022/23 2023/24 2024/25 2025/26 2026/27 2027/28 2028/29 2029/30 2030/31 2031/32 2032/33 2033/34 2034/35 2035/36 2036/37 2037/38 2038/39 2039/40 2040/41 2041/42 2042/43 2043/44 Effective government borrowing cost Minimum* Maximum* Unguaranteed Guaranteed 7.7 13.5 0 4 8 12 16 Per cent 11.4 6.9 7. 6 6.9 Domestic capital repayments 60 50 40 30 20 10 0 Foreign capital repayments Government-guaranteed capital portion
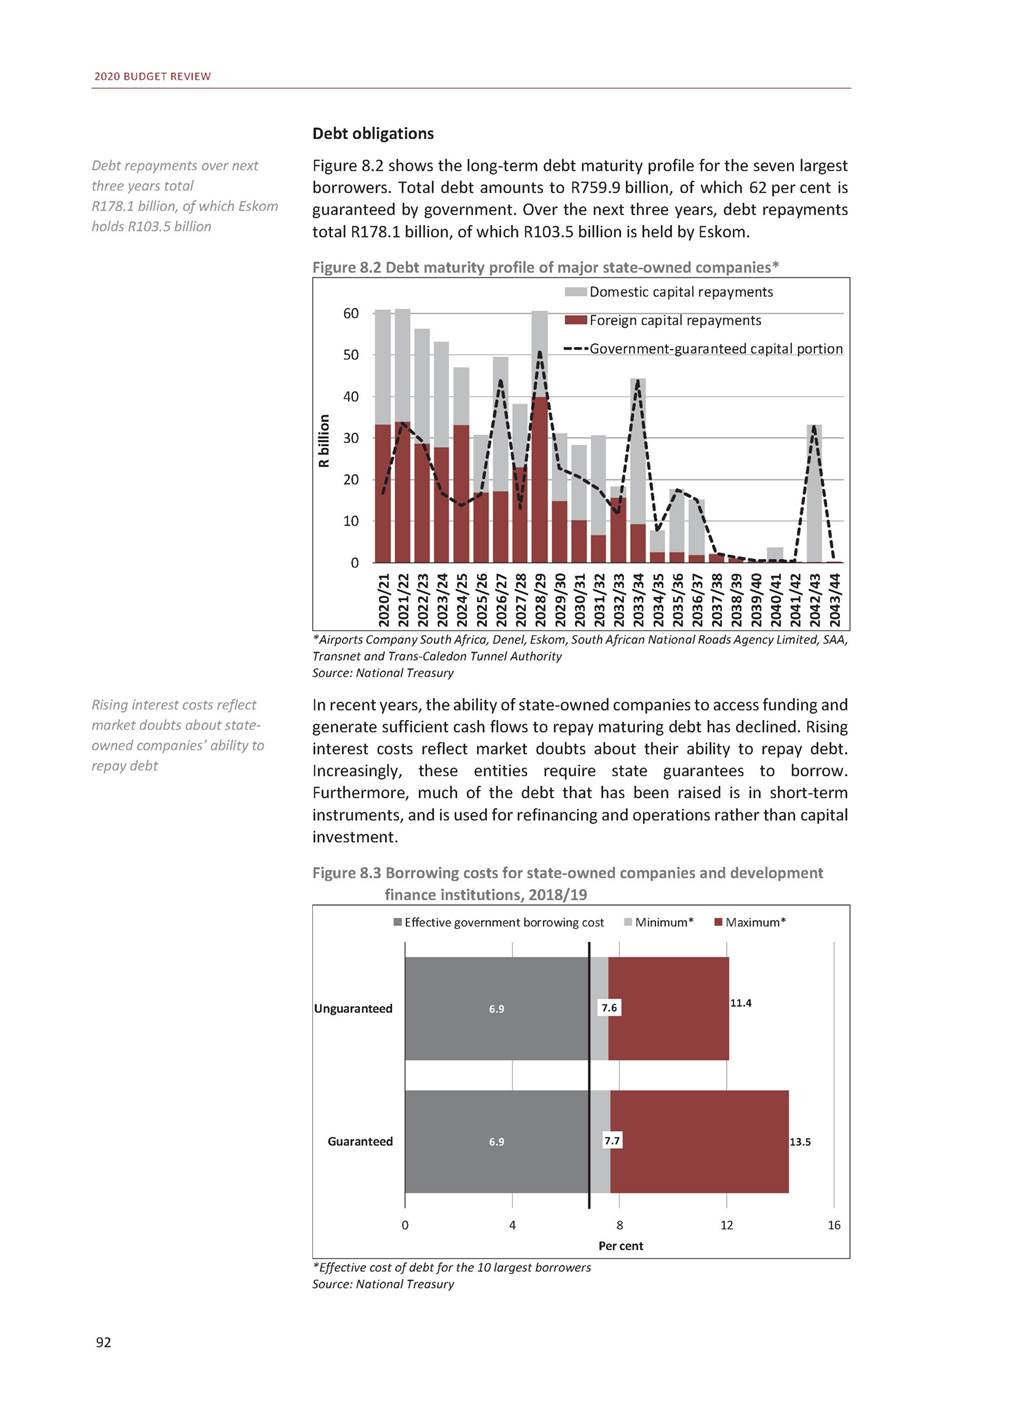
CHAPTER 8: FINANCIAL POSITION OF PUBLIC-SECTOR INSTITUTIONS Figure 8.3 shows the difference between borrowing costs for government and state-owned companies, indicating the level of risk that the market attaches to the latter. Government’s average effective borrowing cost is 6.9 per cent. State-owned companies are paying substantially more to borrow – and the highest cost is for guaranteed debt. SAA’s borrowing incurs nearly twice the interest rate of government. Table 8.3 shows that in 2018/19, as in the previous year, state-owned companies could only raise 75.4 per cent of planned borrowing. The decline in borrowing plans has reduced or delayed capital expenditure. In 2018/19, in contrast to previous years, about 70 per cent of state-owned companies’ domestic borrowing was in long-term instruments. Nonetheless, this debt continued to be used for refinancing maturing debt. State-owned companies borrow at higher rates than government Table 8.3 Borrowing requirement of selected state-owned companies1 1. Airports Company South Africa, Eskom, SANRAL, SAA, Transnet and Trans-Caledon Tunnel Authority 2. ACSA and TCTA not included, as no forecast was provided Source: National Treasury Overall, these trends reflect the deteriorating financial state of major state-owned companies. Without effective structural reforms, this cycle of lower funding access and higher reliance on government is set to continue. Eskom Eskom relies on state support to operate. The utility reported a net profit of R1.3 billion at 30 September 2019, but it is not generating enough cash to cover debt and finance costs. This is partly a result of non-payment by municipalities and other consumers. Government is working with municipalities to strengthen governance and financial management. Eskom’s immediate priority is to stabilise its operational and financial position, as discussed in Annexure C of the 2019 Medium Term Budget Policy Statement. Government has provided significant financial support to Eskom since 2008. This includes R105 billion in 2019/20 and 2020/21, which is conditional, to improve accountability and address inefficiencies. The conditions include reducing primary energy costs, containing other costs and making progress on restructuring. Eskom provides regular updates on these conditions, and government reviews its cash flows on a daily basis. Eskom has begun the process of separating its three operating activities – generation, transmission and distribution – each of which will soon have its own board and management structure. Eskom, which does not generate sufficient cash to cover debt and finance costs, is reliant on state support 93 2017/18 R billionBudgetOutcome 2018/19 BudgetOutcome 2019/20 Revised 2020/212021/22 2022/232 Medium-term estimates Domestic loans (gross)70.154.4 Short-term17.929.4 Long-term52.225.0 Foreign loans (gross)65.048.8 Long-term65.048.8 61.846.1 20.113.9 41.732.2 52.039.7 52.039.7 46.6 13.2 33.4 37.7 37.7 51.232.327.1 14.210.67.0 37.021.720.1 37.438.639.9 37.438.639.9 Total135.1103.2 113.885.8 84.3 88.670.967.0 Percentage of total: Domestic loans51.9%52.7% Foreign loans48.1%47.3% 54.3%53.7% 45.7%46.3% 55.3% 44.7% 57.8%45.6%40.4% 42.2%54.4%59.6%
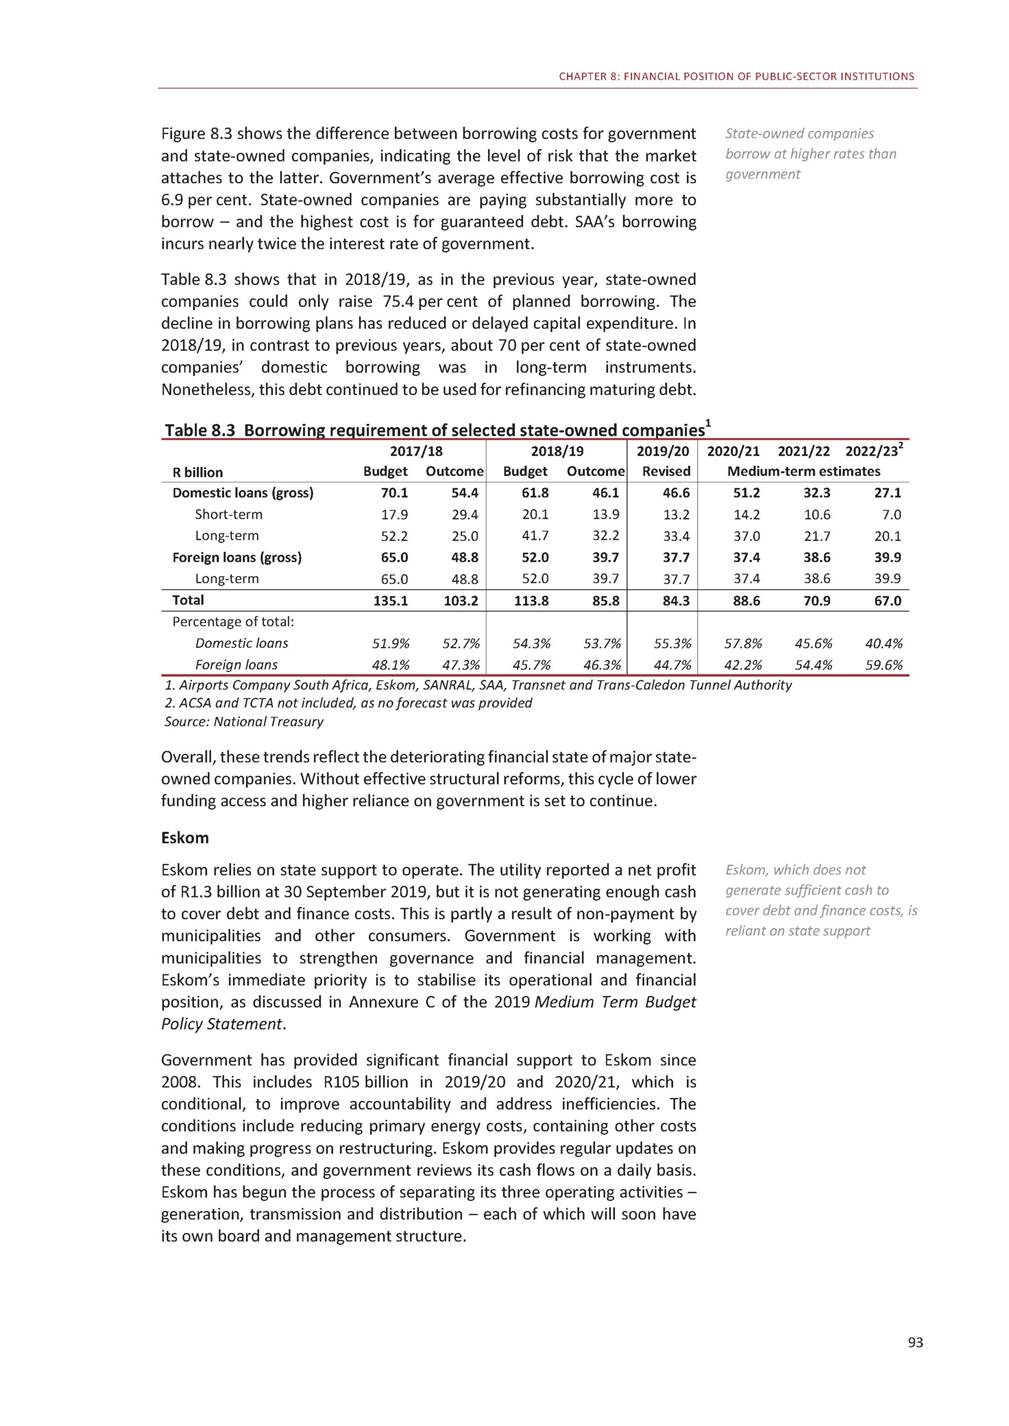
2020 BUDGET REVIEW Transnet Transnet operates South Africa’s port, freight rail and pipeline infrastructure. The group’s net profit increased from R4.9 billion in 2017/18 to R6 billion in 2018/19, supported by fair-value adjustments on leased investment properties. Transnet, which borrows on the strength of its own balance sheet, raised R6.7 billion through commercial paper, bank loans and development finance institutions in 2018/19. It invested R14.7 billion to maintain rail and port capacity, and R3.2 billion to expand infrastructure and equipment. Rating agencies downgraded Transnet’s credit rating, citing increased liquidity risk as a result of loan covenants triggered by an audit qualification on the 2018/19 annual financial statements. Transnet borrows on the strength of its own balance sheet South African Airways SAA’s board placed the airline into voluntary business rescue in December 2019 as a result of its inability to meet financial obligations. Since 2008/09, SAA has incurred net losses of over R32 billion. Government has set aside R16.4 billion over the medium term for SAA to repay its guaranteed debt, and cover debt-service costs. Government anticipates that additional funding will be required to cover restructuring costs in line with the business rescue plan. R16.4 billion set aside over medium term for SAA to repay guaranteed debt and cover debt-service costs South African Express SA Express, illiquid and insolvent, is unable to settle either short-or long-term obligations as they become due. Cumulative losses amount to R1.2 billion over the past 10 years. The airline was recently placed under involuntary business rescue, which it intends to appeal. Government will need to assess its appetite for continued ownership of the carrier, given that it has a limited role in the local aviation market. Government needs to assess its appetite for continued ownership of SA Express Denel Denel, the state-owned military and aerospace equipment manufacturer, faces serious liquidity problems. In response, government provided Denel with R1.8 billion in 2019/20. State guarantees granted to the entity amount to R6.9 billion. Additional funding of R576 million is allocated for 2020/21. This support is allocated with conditions that emphasise the need for Denel to speedily implement its turnaround plan. The plan includes exploring private-sector participation, optimising its property and plant, and developing an appropriate funding model. It is critical for government to define Denel’s role in a modern defence industry. South African Broadcasting Corporation Government allocated R3.2 billion to the SABC in 2019/20, of which R2.1 billion has been transferred, to enable the broadcaster to pay its bills. The conditions included reviewing broadcasting sector policies to respond to advances in technology, costing the developmental mandate and evaluating opportunities for private-sector participation. The remaining R1.1 billion is expected to be transferred to the SABC by 31 March 2020. Denel’s role in a modern defence industry needs to be defined Government allocated R3.2 billion to SABC in 2019/20 to enable it to pay its bills 94
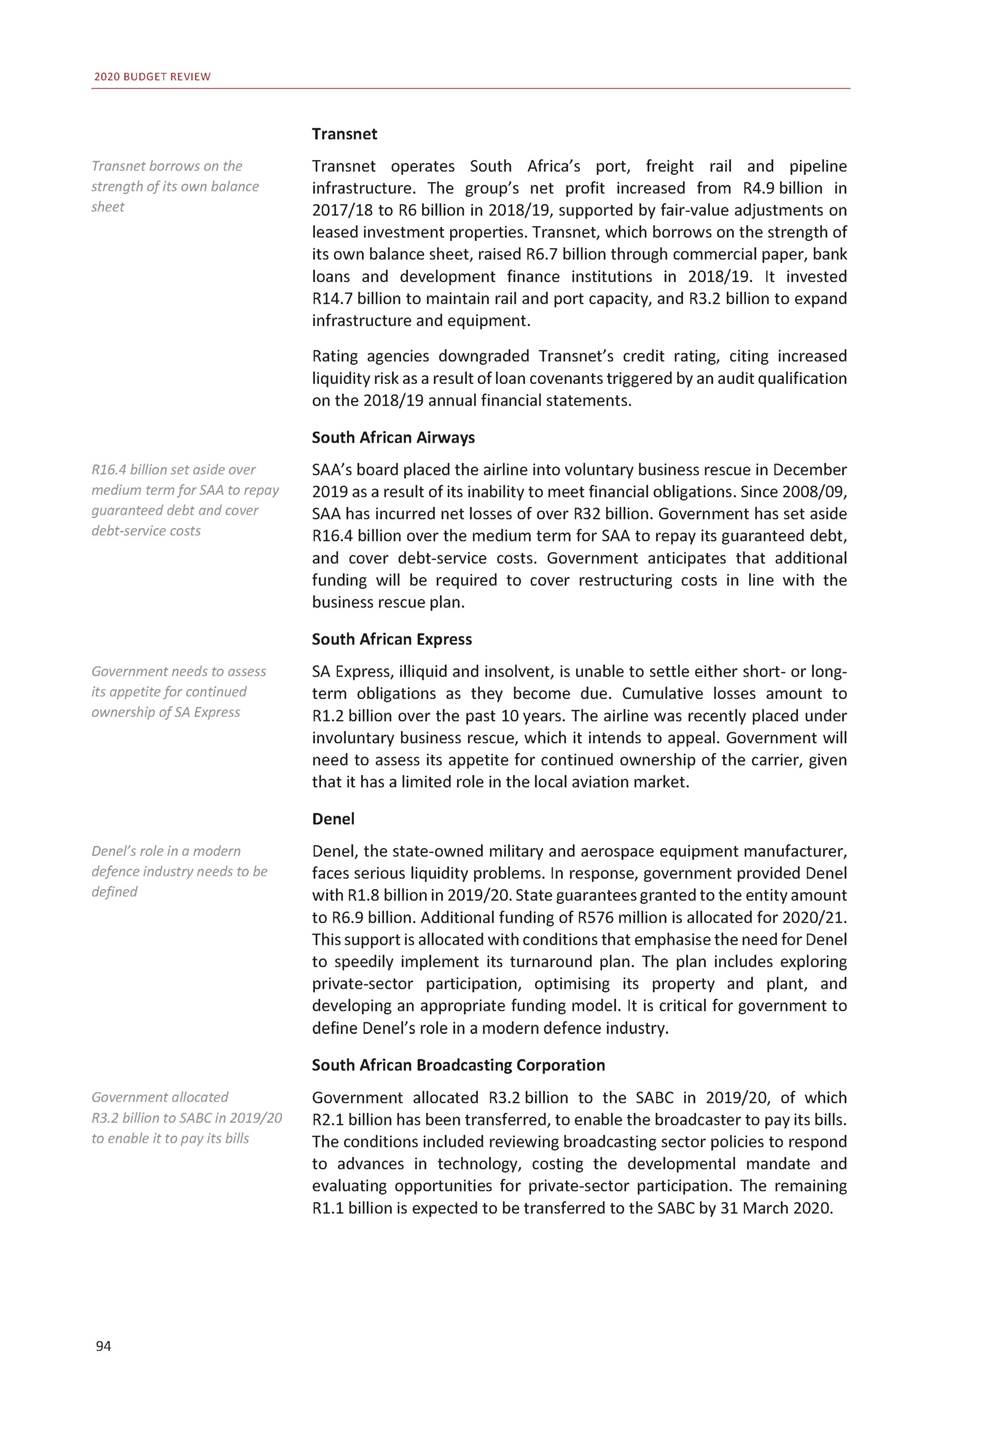
CHAPTER 8: FINANCIAL POSITION OF PUBLIC-SECTOR INSTITUTIONS Development finance institutions To support government in achieving inclusive growth and the objectives of the National Development Plan, development finance institutions require supportive governance structures, financial sustainability and developmental impact. They also require strong capacity. The net asset value of the three largest development finance institutions – the DBSA, IDC and Land Bank – increased by 4.7 per cent in 2018/19 to R139.4 billion. The institutions transitioned to the International Financial Reporting Standard 9 during the period, which resulted in higher impairments, causing a slight decrease in net loan books. Combined net asset value of DBSA, IDC and Land Bank increased by 4.7 per cent in 2018/19 Table 8.4 Financial position of selected development finance institutions 2016/17 2017/18 2018/19 R billion IDC Total assets Loan book Equity and other investments Total liabilities Net asset value 129.8 26.7 103.1 41.5 88.3 137.0 30.7 106.3 44.9 92.1 144.6 25.9 118.7 49.3 95.3 DBSA Total assets Loan book Equity and other investments Total liabilities Net asset value 83.7 76.6 7.1 51.6 32.1 89.2 75.0 14.2 54.9 34.3 89.5 75.8 13.7 52.3 37.2 Land Bank Total assets Loan book Equity and other investments Total liabilities Net asset value 45.4 41.0 4.4 39.0 6.4 49.5 43.4 6.1 42.8 6.7 52.4 44.5 7.9 45.5 6.9 Source: National Treasury Land Bank The Land Bank supports development and transformation of the agricultural sector. In 2018/19, it disbursed R5.1 billion of developmental and transformational loans, significantly up from R1.6 billion in 2017/18. The bank is refocusing on the development of smallholder farmers and aims to adopt financially and economically sustainable practices. During 2018/19, the Land Bank used R377.4 million of the R400 million joint Land Bank/IDC drought relief fund to provide low-interest loans to affected areas. In addition, it agreed with the Jobs Fund to provide concessional credit and support to small-and medium-scale emerging farmers. Industrial Development Corporation The IDC finances industrial development across Africa. Over the medium term, it will focus on financing and facilitating the adoption of emerging technologies and creating new industries. In 2018/19, the IDC approved funds totalling R13.1 billion, compared with R16.7 billion in 2017/18, and disbursed funds of R11.8 billion, compared with R15.4 billion in 2017/18. The corporation’s profits decreased by 78 per cent from R3.2 billion in IDC approved R13.1 billion in financing in 2018/19, down from R16.7 billion a year earlier 95
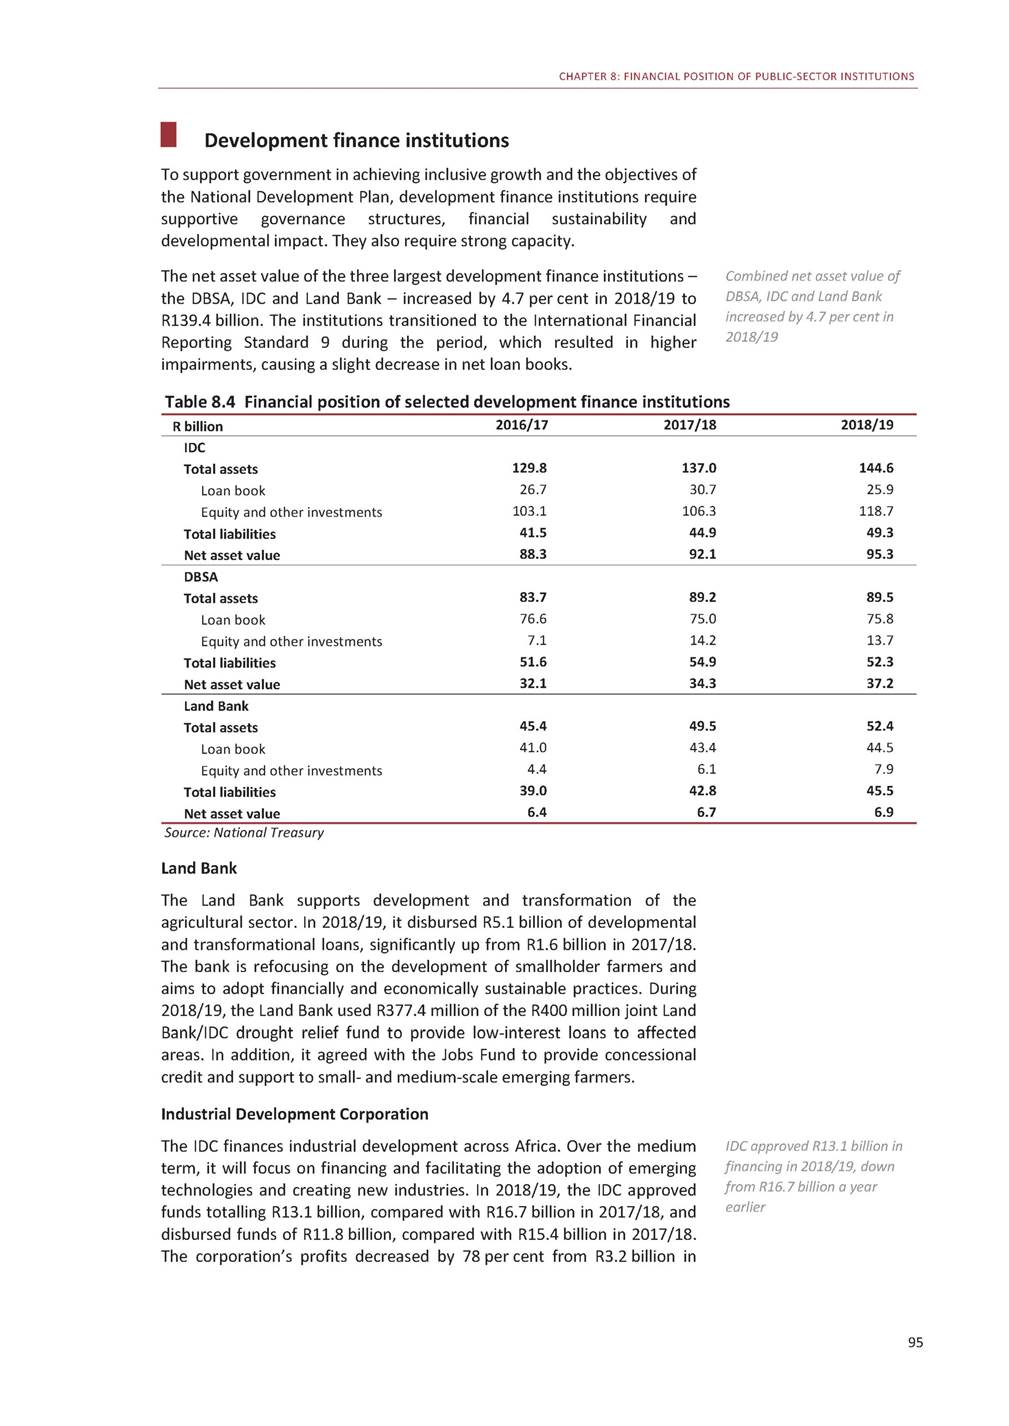
2020 BUDGET REVIEW 2017/18 to R720 million in 2018/19, mainly due to higher once-off capital gains recorded in 2017/18. In 2015/16, the IDC set a five-year target to approve R23 billion for black industrialists; by 2018/19, it had approved R21.4 billion for such projects. This programme is expected to create about 22 600 jobs. Development Bank of Southern Africa The DBSA finances infrastructure projects in water, sanitation, communication, energy and school infrastructure across southern Africa. It also assists with project preparation and implementation. The DBSA’s profit increased from R2.3 billion in 2017/18 to R3.1 billion in 2018/19, mainly due to interest income, and gains from foreign exchange and financial instruments. During the year, its developmental loan book rose marginally from R75 billion to R75.8 billion. DBSA’s developmental loan book rose marginally to R75.8 billion Development finance borrowing requirement In 2018/19, the three development finance institutions borrowed R56.3 billion, significantly more than the budgeted R45.4 billion. The difference is attributable to a steep increase in borrowing by the Land Bank, which was used to support its lending activities. The Land Bank and the DBSA account for 82.4 per cent of development finance borrowing. Over the medium term, borrowing plans total R90.7 billion. In 2018/19, nearly 90 per cent of borrowing was in domestic debt. Development finance borrowing rose significantly in 2018/19, largely as result of Land Bank lending Table 8.5 Borrowing requirement for development finance institutions1 1. Land Bank, DBSA and IDC 2. Land Bank and DBSA not included, as no forecast was provided Source: National Treasury Social security funds Social security funds, financed through levies and taxes, provide insurance for unemployed workers and those injured in road or workplace accidents. Over the medium term, these funds expect to collect R238 billion in contributions and pay R211 billion in benefits. The scale of Road Accident Fund (RAF) liabilities, however, means that the combined financial position of the social security funds is deeply negative. In 2018/19, the funds had a combined cash surplus of R6.8 billion. Over the medium term, however, the funds will have an average combined cash deficit of R3.3 billion, as benefits paid out by the Unemployment Insurance Fund (UIF) increase following legislative amendments. Combined R3.3 billion cash deficit over medium term is a result of RAF liabilities 96 2017/18 R billionBudget Outcome 2018/19 BudgetOutcome 2019/20 Revised 2020/212021/22 2022/232 Medium-term estimates Domestic loans (gross)51.154.0 Short-term36.239.0 Long-term14.915.0 Foreign loans (gross)9.35.6 Long-term9.35.6 36.250.6 23.923.1 12.327.5 9.25.7 9.25.7 39.8 20.3 19.5 18.0 18.0 26.831.16.0 20.920.81.0 5.910.35.0 14.49.62.8 14.49.62.8 Total60.459.6 45.456.3 57.8 41.240.78.8 Percentage of total: Domestic loans84.6%90.6% Foreign loans15.4%9.4% 79.7%89.9% 20.3%10.1% 68.9% 31.1% 65.0%76.4%68.2% 35.0%23.6%31.8%
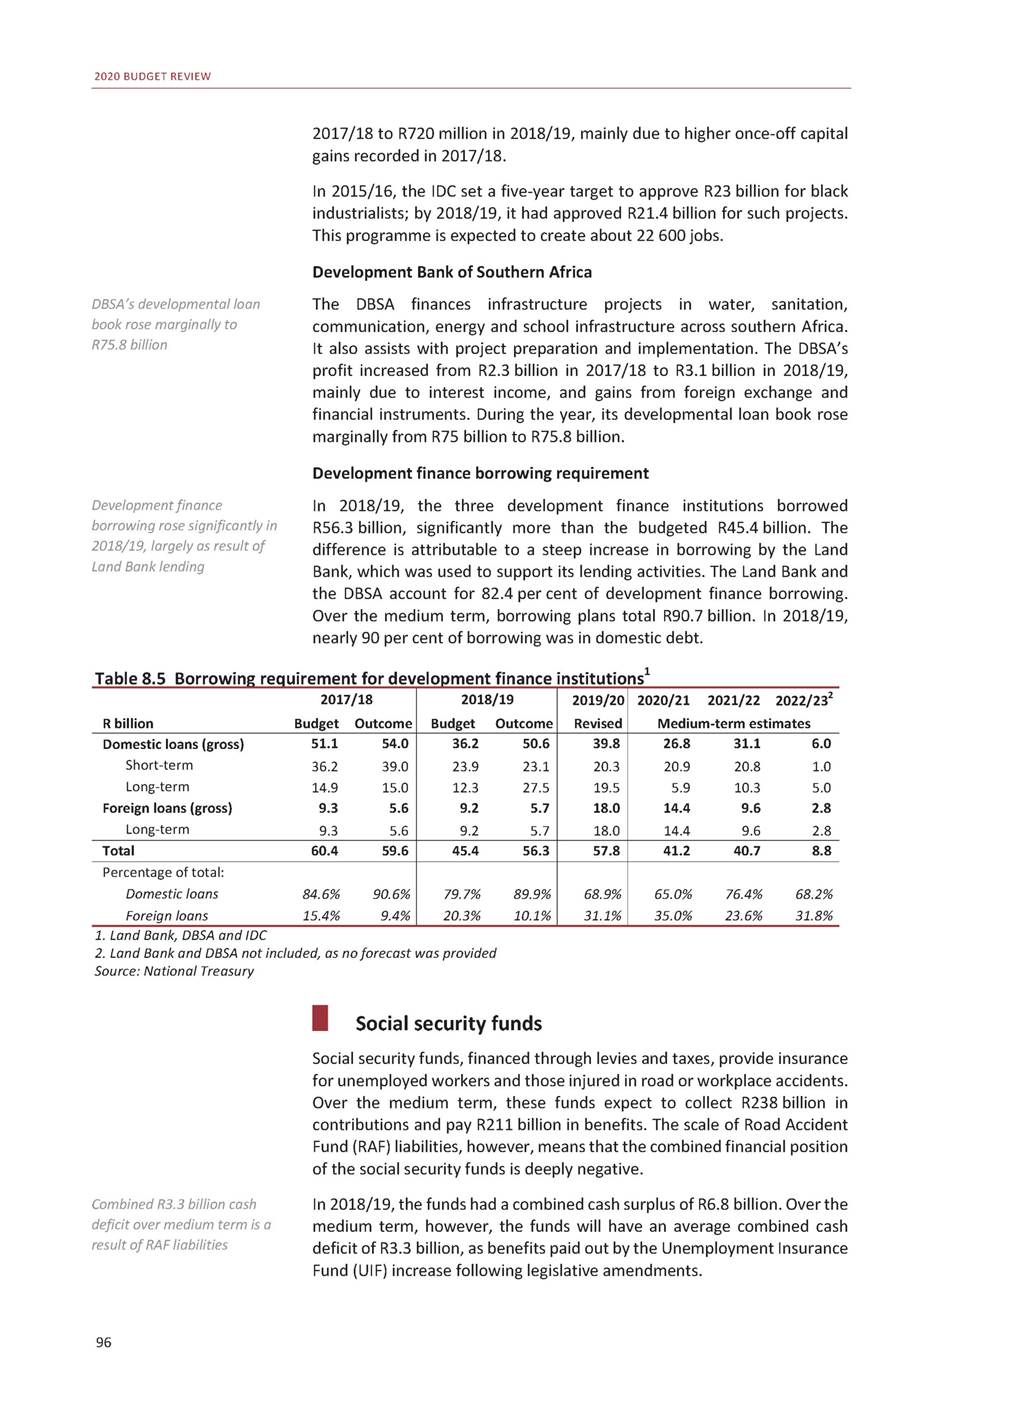
CHAPTER 8: FINANCIAL POSITION OF PUBLIC-SECTOR INSTITUTIONS Table 8.6 Financial position of social security funds 1. Compensation Commissioner for Occupational Diseases in Mines and Works Source: National Treasury Unemployment Insurance Fund The UIF pays benefits to those who are out of work due to retrenchment, illness or maternity leave. Benefit payments are expected to grow from R11 billion in 2018/19 to R22 billion in 2022/23. Over this period, the fund will run an average surplus of R3.6 billion on an accrual basis and a cash deficit. The latter is the result of retrospective payments to claimants who were assessed and paid at a rate based on the old legislation, when they were meant to be paid based on higher rates in the amended act. The additional benefits are expected to cost R12.7 billion. The fund plans to finalise these claims by 2020/21. The UIF’s net asset value is set to increase from R144.3 billion in 2018/19 to R175 billion in 2022/23. UIF maintains surplus, but higher benefits will see it run cash deficit over medium term Road Accident Fund The RAF provides compensation for the loss of earnings, along with general damages, and medical and funeral costs to victims of road accidents. Claims against the fund are expected to increase from R96.4 billion in 2018/19 to R145.6 billion in 2022/23. The RAF’s revenues are insufficient to meet its liabilities. Consequently, the accumulated deficit is forecast to increase from R262.1 billion in 2018/19 to R593 billion in 2022/23. Over the past 20 years, increases in the RAF levy have typically exceeded 97 Figure 8.4 RAF liabilitiesFigure 8.5 RAF annual deficit Source: National Treasury 2016/172017/182018/19 R billionOutcome 2019/20 Estimate 2020/212021/222022/23 Medium-term estimates Unemployment Insurance Fund Total assets139.5159.3165.5 Total liabilities6.413.421.2 Net asset value133.1145.9144.3 174.1 22.3 151.8 182.8191.5200.7 23.424.525.7 159.4167.0175.0 Compensation Fund1 Total assets66.472.075.4 Total liabilities18.538.547.8 Net asset value47.933.527.6 79.1 49.8 29.3 82.887.091.1 51.854.256.6 31.032.834.5 Road Accident Fund Total assets9.29.811.2 Total liabilities189.2216.1273.3 Net asset value-180.0-206.3-262.1 11.5 341.1 -329.6 11.711.811.9 413.1500.4604.9 -401.4-488.6-593.0
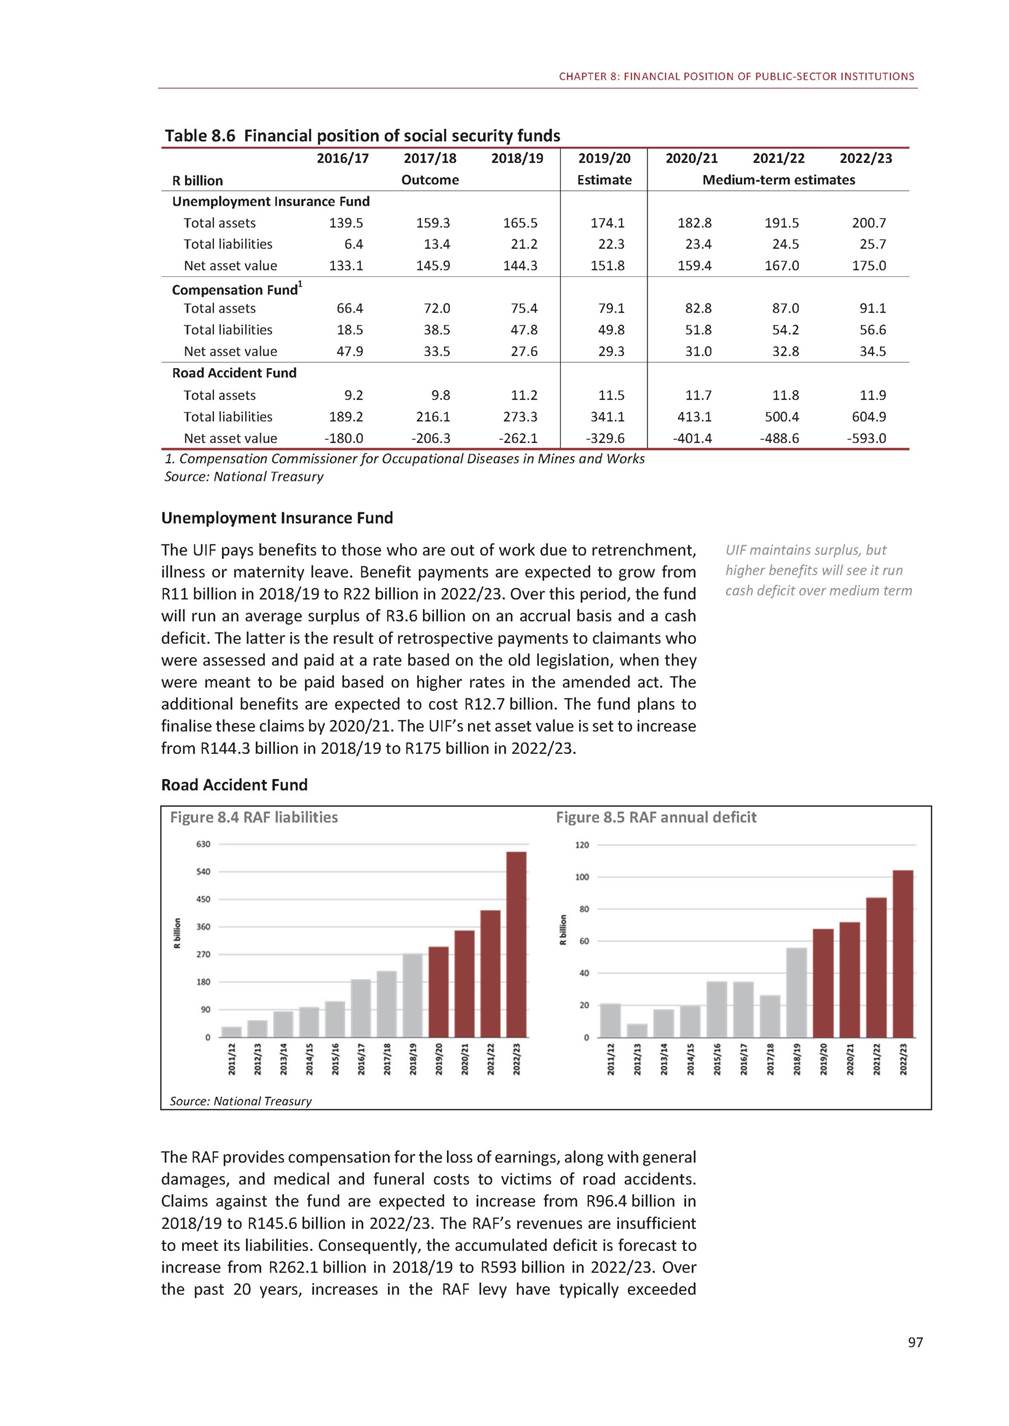
2020 BUDGET REVIEW inflation, yet the liabilities of the fund have grown at a faster pace. The RAF fuel levy increases by 9c/litre on 1 April 2020. Compensation Fund The Compensation Fund provides compensation for disability, illness and death resulting from occupational injuries and diseases. In 2018/19, the fund paid out R3.9 billion in benefits and ran a surplus of R1.7 billion. Over the medium term, the surplus is expected to average R2.5 billion due to higher returns on investments. This will increase the fund’s net asset value. Government Employees Pension Fund In 2018/19, the GEPF provided retirement security to about 1.3 million employees and 460 000 beneficiaries. Active membership has declined slightly, reflecting government’s efforts to stabilise headcounts, while the number of pensioners has remained relatively constant. The fund paid out benefits totalling R103 billion in 2018/19. Contributions received increased from R70.4 billion in 2017/18 to R75.6 billion in 2018/19, largely due to members’ annual salary increases. The cash revenue that the fund received from its investments grew by 17 per cent in 2018/19 to R84.2 billion. Table 8.7 Selected income and expenditure of GEPF 2012/13 2013/14 2014/15 2015/16 2016/17 2017/18 2018/19 R billion Revenue Employer contributions Employee contributions Investment income1 Expenditure Benefits paid 30.8 17.1 49.9 33.5 18.7 54.0 36.1 20.3 68.5 38.6 21.7 69.0 42.1 23.4 69.5 45.3 25.1 72.0 48.7 26.9 84.2 43.2 57.9 85.8 83.1 88.3 94.9 102.5 1. Dividends on listed equities, interest on bonds and money market instruments and income from unlisted properties and unlisted investments excludes adjustments for value of financial assets Source: Government Pensions Administration Agency The Public Investment Corporation invests the excess funds accumulated by the GEPF and the social security funds. At end-March 2019, it had R2.13 trillion in assets under management. A commission of inquiry was appointed to investigate allegations of impropriety in 2018. The commission has submitted its final report to the President. In the interim, the Minister of Finance has reconstituted the corporation’s board. Table 8.8 Breakdown of assets under management by PIC, 2018/19 Compensation Unemployment Employees Pension Fund R billion 1. Includes the Compensation Pension Fund Source: Public Investment Corporation and National Treasury 98 Government Insurance FundFund1Other Total Asset class Equity1 032.440.016.2– Bonds 574.989.541.513.1 Money market75.118.48.534.0 Property95.44.80.11.4 Unlisted investments70.913.61.9– 1 088.7 719.1 136.0 101.6 86.4 Total1 848.7166.368.248.5 2 131.7
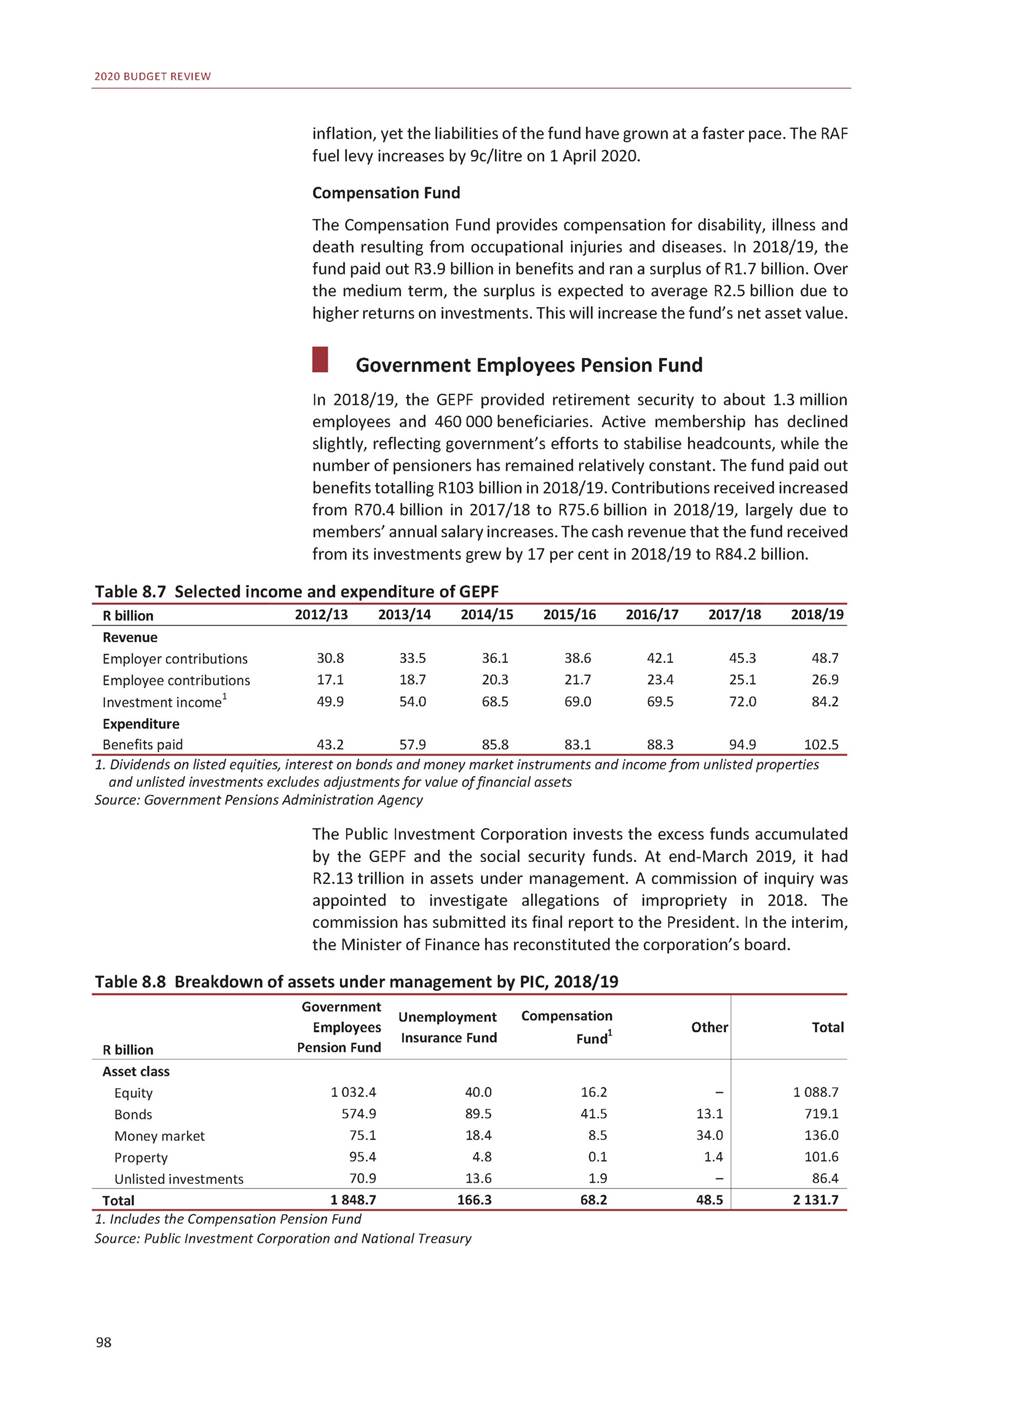
ANNEXURES Two annexures are available on the National Treasury website (www.treasury.gov.za): • Annexure W1: Explanatory memorandum to the division of revenue • Annexure W2: Structure of the government accounts 99
2020 BUDGET REVIEW 100

A Report of the Minister of Finance to Parliament Introduction This annexure fulfils the requirement of section 7(4) of the Money Bills Amendment Procedure and Related Matters Act (2009), which prescribes that the Minister of Finance submit a report to Parliament at the time of the budget explaining how the Division of Revenue Bill and the national budget give effect to, or the reasons for not taking into account, the recommendations contained in: • Budgetary review and recommendation reports submitted by committees of the National Assembly in terms of section 5 of the act. Reports on the fiscal framework proposed in the Medium Term Budget Policy Statement (MTBPS) submitted by the finance committees in terms of section 6 of the act. Reports on the proposed division of revenue and the conditional grant allocations to provinces and local governments set out in the MTBPS submitted by the appropriations committees in terms of section 6 of the act. • • Budgetary review and recommendation reports Section 5 of the act sets out the procedure that the National Assembly committees must follow when assessing the performance of each national department before the budget is introduced. This procedure provides for committees to prepare budgetary review and recommendation reports, which: • Must provide an assessment of the department’s service delivery performance given available resources. Must provide an assessment of the effectiveness and efficiency of the department’s use of available resources. May include recommendations on the future use of resources. • • 101
2020 BUDGET REVIEW This annexure provides responses to the portfolio committees’ recommendations where they relate to the National Treasury. A number of committees recommended making additional budget allocations available for certain programmes, sub-programmes or other budget items. Due to the constrained fiscal outlook, there is limited scope to do so. Departments, public entities and constitutional institutions are required to reprioritise existing funds for emerging priorities. Should the fiscal outlook improve, recommendations for additional funding may be considered in future budget processes. Portfolio Committee on Basic Education Together with relevant authorities, the department should fast-track the implementation of plans to allocate ring-fenced funds for learner transport. The committee made a similar recommendation in the 2019 Budget. The National Treasury is part of the task team on this issue. Funds can only be ring-fenced after government decides whether the function lies with the Department of Basic Education or the Department of Transport. Consideration should be made to increase the budget of Umalusi due to its expanded mandate. As noted at the beginning of this section, there is little scope to provide additional funding at this time. Portfolio Committee on Employment and Labour The committee recommends that the Minister of Finance take steps to ensure that the budget allocation of the Department of Employment and Labour is adjusted to accommodate its expanded mandate, thus enabling the capacitation of its inspectorate. The National Treasury recognises the Department of Employment and Labour’s contribution to creating jobs. The department has a budget allocation of R3.6 billion in 2020/21, R3.9 billion in 2021/22 and R4 billion in 2022/23. As noted at the beginning of this section, there is little scope to provide additional funding at this time. Portfolio Committee on Higher Education, Science and Technology The committee recommends that the Minister of Higher Education, Science and Technology and the Minister of Finance consider the following: The Ministry should expedite the process of filling the three Deputy Director-General positions in the Planning, Policy and Strategy; Technical and Vocational Education and Training (TVET); and Community Education and Training (CET) programmes as the process started in November 2017 for the Deputy Director-General of CET and June 2018 for both the Deputy Director-General of Planning, Policy and Strategy and TVET. The National Treasury has previously raised the issue of filling these posts with the department. The committee notes that notwithstanding the significant progress made by the department in securing additional funding to expand student accommodation in higher education, the private sector should be pursued to invest more resources towards the expansion of student housing in higher education. Since 2018, the Student Housing Infrastructure Programme has received additional funding through the Budget Facility on Infrastructure. The programme is estimated to cost R96 billion over the next 10 years 102
ANNEXURE A: REPORT OF THE MINISTER OF FINANCE TO PARLIAMENT to build about 300 000 beds. Construction of residences is under way at Fort Hare and Nelson Mandela University, funded by government, development finance institutions and private finance. The Development Bank of Southern Africa, together with the Department of Higher Education and Training, is facilitating the programme. Moreover, the current public-private partnership (PPP) regulations are being reviewed to address the shortcomings of the current framework and increase the PPP pipeline. Most universities continue to establish partnerships and elicit sponsorships to fund infrastructure projects. The committee notes that notwithstanding the current fiscal constraints, the National Treasury should increase the baseline funding for the CET sector so that the mandate of the sector and its policy priorities can be realised. The Department of Higher Education and Training should investigate whether funds from its baseline can be redirected to this sector. In the 2019 Adjusted Estimates of National Expenditure, the department declared underspending of R129.6 million for compensation of employees due to vacant posts. The ability to spend additional allocations is relevant in determining whether to provide more funding. The committee recommends that the filling of vacant funded posts by the Quality Council for Trades and Occupations (QCTO) should be prioritised as a matter of urgency to improve the overall performance of the entity, which was at 59 per cent during the year under review. The National Treasury agrees with the recommendation. The QCTO has underspent on the compensation of employees budget by an average of R16.5 million over the past three financial years, indicating that it has funds to fill critical posts. The entity is in the process of filling the posts. The committee recommends that the QCTO expedite the process of purchasing its own premises given the high rental fee amounting to R8 million per annum. The National Treasury agrees with the committee’s recommendation that the QCTO should expedite the purchase of its own premises. It should be noted that R12 million from the reserve fund was approved and earmarked to procure the QCTO’s premises in 2018/19. The committee recommends that mechanisms to increase the budget allocation to the Department of Science and Innovation be explored and pursued by the Minister of Higher Education, Science and Technology. The committee will support all efforts to secure additional funding for the science and innovation portfolio. There is little scope to provide additional funding at this time. The National Treasury will continue to work closely with the Department of Science and Innovation on developing and strengthening existing mechanisms to better account for public-led research and development spending to support the policy priorities outlined in the 2019 White Paper, and the draft Science and Innovation Decadal Plan. Portfolio Committee on Health The National Treasury and the Department of Health should allocate part of the 2018/19 Medium Term Expenditure Framework (MTEF) health infrastructure allocations to gradually offset expenditure accruals that have arisen from unavoidable demands for which allocated budgets were depleted. The National Treasury should ensure that the framework for health infrastructure conditional grants accommodates flexibility during periods of protracted fiscal constraint so that provinces can be allowed to re-orientate their package of available capital allocations towards maintenance. Accruals incurred by provincial health departments have increased significantly in recent years, exceeding R13.3 billion as at 31 March 2019. Of this, R6.7 billion is older than 30 days. This partly reflects financial 103
2020 BUDGET REVIEW pressures in provinces, but it also reflects weak financial management. Provincial departments require a more systematic and sustainable way of addressing rising accruals. The National Treasury, together with the national Department of Health, has developed a Health Action Plan that includes developing accruals intervention strategies and aligning procurement and cash-flow plans. Infrastructure is partly funded through the provincial equitable share, which provinces use at their discretion. The conditional grant framework does not limit redirecting capital allocations to maintenance. Provinces will, however, need to resubmit annual implementation plans showing changes to the infrastructure project list for approval by the national Department of Health. When redirecting funds to maintenance, it is important to consider the stages and cash flows of currently funded projects to ensure there are funds for contractually committed infrastructure projects. The national Department of Health and the National Treasury should provide adequate funding to the Office of the Health Ombud in line with the recently approved structure for better reporting and functionality. The National Treasury will support reprioritisation requests from areas that will not negatively affect service delivery. Portfolio Committee on Women, Youth and Persons with Disabilities The Commission for Gender Equality’s funding model should be aligned with the rest of the Chapter 9 institutions, in particular the Public Protector, to enable it to optimally give effect to its mandate. The National Treasury has taken note of this recommendation. The commission’s funding model is similar to that of the Public Protector of South Africa: both are funded through transfer payments in the votes of the Department of Women, Youth and Persons with Disabilities and the Department of Justice and Constitutional Development, respectively. The Commission for Gender Equality should be provided with additional funds in order to retain existing staff and attract new staff. Specific emphasis should be placed on the funding of staff for legal clinics, public education and information, communication and legal support. To this end, provinces with the largest case load should be prioritised where offices require additional support. Departments, public entities and constitutional institutions are encouraged to reprioritise existing funds for emerging priorities. The National Treasury will continue to engage the Commission for Gender Equality as part of the budget process, specifically in relation to the issues highlighted by the committee. Portfolio Committee on Agriculture, Land Reform and Rural Development Agriculture has been highlighted by the President in his economic stimulus package, including the National Treasury’s discussion paper entitled “Economic Transformation, Inclusive Growth, and Competitiveness: Towards an Economic Strategy for South Africa”, as one of the sectors with massive job creation potential. However, the sector is constrained by challenges which include climate change in the form of frequent and prolonged droughts, floods and veld fires; disease outbreaks; technological advances; and international trade standards and regulations. To give effect to the department’s mandate and some of the proposals in the Treasury discussion document, including the plans to reprioritise funding towards investments in agriculture, a significant increase in the budget allocation to the Department of Agriculture, Land Reform and Rural Development for the medium term is proposed. The National Treasury agrees with the committee’s recommendation. Over the 2020 MTEF period, an allocation of R495.1 million has been reprioritised within the existing budget baseline to boost agriculture production; improve health and food safety programmes; develop capacity to respond to biosecurity 104
ANNEXURE A: REPORT OF THE MINISTER OF FINANCE TO PARLIAMENT threats; revitalise laboratories; revitalise quarantine stations and strengthen inspection services at ports of entry; and strengthen animal and plant health, inspection and laboratory services. Over the medium term, a further R500 million will be allocated to the sector to fast-track the process of restoring land rights, supporting inclusive economic transformation as envisaged in the National Treasury’s discussion paper. Onderstepoort Biological Products (OBP) plays a vital role in the prevention and management of livestock diseases and, therefore, food and human safety. Notwithstanding the once-off allocation of R492 million that was made to OBP in 2012/13 for the refurbishment and modernisation of the vaccine manufacturing facility, and that over the years, the entity managed to raise additional funding to continue with the refurbishment project, which cost an estimated R1.2 billion, an additional funding allocation for operational activities is proposed from 2020/21 onwards. The funds will be used to establish a vaccine reserve to ensure that vaccines are available in sufficient quantities to address animal disease outbreaks (e.g. Anthrax, African Horse Sickness, Rift Valley Fever, Brucellosis, etc.), and to manufacture public good vaccines (orphan vaccines), which are unprofitable for OBP to produce but are of national importance in animal disease prevention and management. While the modernisation project is in progress, the aging infrastructure that does not meet good manufacturing practice standards is limiting OBP’s production efficiency and competitiveness. The National Treasury agrees with the committee’s recommendation. Over the medium term, the reprioritised allocation of R495.1 million to the Department of Agriculture, Land Reform and Rural Development for the Agricultural Production, Health, Food Safety, Natural Resources and Disaster Management Programme will indirectly reduce OBP’s burden of producing and distributing vaccines. The budget allocated to the department includes a component for preventing and managing animal and livestock disease. There is little scope for additional allocations. The department will have to collaborate with OBP to prevent and manage livestock diseases. The National Treasury will continue to engage with the department and OBP to ensure that funding is available. Portfolio Committee on Mineral Resources and Energy The National Treasury should restore MTEF funding of the Council for Geoscience in the short term, while securing R300 million baseline funding for the medium to long term in order to ensure that the entity is able to meet its mandate, which is long term in nature and scope, including the funding model that accommodates the National Key Point designation of the entity, in order to ensure compliance. The National Treasury agrees with the committee’s recommendation. Over the 2020 MTEF period, an additional allocation of R345.8 million has been reprioritised within the existing budget baselines for geological mapping to assess on-shore and off-shore mineral, agricultural, energy and groundwater resources to catalyse their exploration. Portfolio Committee on Small Business Development The committee should be updated on the Small Business Innovation Fund after commitments by the National Treasury have been formalised. The Department of Small Business Development has already begun to operationalise the fund through the Small Enterprise Agency. Over the 2020 MTEF period, the fund has been allocated R2.8 billion. 105
2020 BUDGET REVIEW Portfolio Committee on Tourism The committee recommends that the Minister of Finance work with the Department of Tourism to reprioritise budget for the Tourism vote in line with the committee’s new oversight approach with a focus on villages, townships and small towns. The National Treasury and the Department of Tourism will hold further discussions to realign budget and spending priorities over the medium term. The committee recommends that the Minister of Finance, notwithstanding the constrained national fiscus, consider the contribution of the tourism sector to the gross domestic product (GDP) of the country and the labour-intensive nature of the tourism sector and find innovative ways of increasing the budget appropriated for the Tourism vote. The National Treasury recognises tourism’s important contribution to GDP growth, but there is little scope to provide additional funding at this time. The National Treasury discussion paper, Economic Transformation, Inclusive Growth, and Competitiveness: Towards an Economic Strategy for South Africa, identifies the tourism sector as one of the labour-intensive sectors that could create jobs for semi-skilled and unskilled workers in the short to long term. The National Treasury supports the implementation of microeconomic reforms in the paper that could stimulate growth, investment and job creation in tourism. Portfolio Committee on Defence and Military Veterans The committee recommends that the National Treasury should not lower the Department of Defence’s baseline budget allocation in nominal terms over the MTEF period. This relates to all outlying years of the MTEF and specifically to 2021/22 where the budget is set to decrease from R52.5 billion in 2020/21 to R50.9 billion in 2021/22. The Department of Defence has an allocation of R52.4 billion in 2020/21, R50.8 billion in 2021/22 and R53 billion in 2022/23. In nominal terms, the 2020 MTEF allocations of the department are comparable to the 2019 MTEF allocations. The committee urges the National Treasury to provide additional funds specifically for the purpose of border safeguarding. The committee recommends that the number of sub-units be increased incrementally over the MTEF period with the aim of having 22 sub-units deployed for landward borderline duties by the end of the MTEF period. Additional funds should also include an allocation for the use of technology as a force multiplier for border safeguarding purposes. Border security remains a priority for government. The National Treasury has allocated an additional R225 million to the Department of Defence over the medium term to procure equipment and technology to support military units deployed to safeguard our borders. The committee urges immediate engagement between the Minister of Defence, the Minister of Finance and the Commander in Chief of the South African National Defence Force, to finalise a funding plan that will arrest the current decline of the military. This recommendation is derived from the dire financial and resource situation shared with the committee by especially the South African Army, the South African Air Force and the South African Navy during its recent oversight engagements. The finalised plan should be presented to the committee no later than the end of the first quarter of 2020/21. The National Treasury agrees that the funding challenges of the Department of Defence should be discussed. The department is arranging a meeting with the President, the Minister of Finance, the Minister of Public Service and Administration, and the Minister of Defence and Military Veterans to address the funding challenges. 106
ANNEXURE A: REPORT OF THE MINISTER OF FINANCE TO PARLIAMENT The committee noted comments by the Department of Defence that savings to compensation of employees can be made through a process of force rejuvenation. The committee therefore recommends a joint approach to force rejuvenation that would see the Department of Defence develop and roll out a rejuvenation plan and the National Treasury provide funding for an exit mechanism to speed up rejuvenation. The National Treasury should, as soon as possible, release funds to facilitate an interim exit mechanism for the remainder of 2019/20. The Department of Defence should finalise rejuvenation plans for full implementation from 2020/21. The National Treasury agrees that the Department of Defence should develop a rejuvenation strategy. At a ministerial meeting, it was resolved that the department would develop and submit a rejuvenation strategy to the National Treasury by May 2019. The department has not yet submitted the strategy, but is engaging with the National Treasury on a draft. The Department of Defence has yet to implement early retirement without penalties, which was introduced in the 2019 Budget Review as one of the measures to reduce spending on compensation of employees. Portfolio Committee on Justice and Correctional Services In addition to recommending that zero budget reductions be applied in the case of the South African Human Rights Commission and the Public Protector of South Africa, the committee recommends that additional funding be provided to: • The National Prosecuting Authority to address the shortfall in its compensation of employees budget; fill critical post vacancies; create capacity in the asset forfeiture, specialised commercial crimes, and witness protection units; and resume its aspirant prosecutor programme. Legal Aid South Africa to prevent it from having to cut posts with adverse consequences for service delivery, and to ensure that it is able to maintain its civil work and assist in land claims matters. The South African Human Rights Commission to fulfil its coordinating role in respect of the National Preventative Mechanism established in terms of the Optional Protocol to the Convention Against Torture and Other Cruel, Inhumane or Degrading Treatment or Punishment. The Public Protector of South Africa to fill vacancies, employ professional services, and improve security. • • • The 2020 Budget provides additional funding of R1.2 billion to the National Prosecuting Authority to improve prosecutorial capacity, rejuvenate the aspirant prosecutor programme and operationalise the new Investigative Directorate. Over the medium term, Legal Aid South Africa will receive additional funding of R75 million for increased capacity. The National Treasury has not reduced the baselines of the South African Human Rights Commission or the Public Protector of South Africa over the medium term. Portfolio Committee on International Relations and Cooperation The committee recommends to the Minister of Finance that investigations be undertaken, and a report submitted, around the role played by the National Treasury in the procurement processes of the New York Pilot project. Consequence management should be undertaken where wrongdoing has been established. The National Treasury is assisting the Department of International Relations and Cooperation with its investigation into the New York Pilot project, which aims to develop a multi-use area of offices and residential accommodation for diplomats and foreign-service staff in New York. It has given the department information pertaining to the procurement of a building through the PPP process, and will continue to provide any assistance required for the department to complete its investigation. 107
2020 BUDGET REVIEW Portfolio Committee on Public Service and Administration The Minister in the Presidency for Planning, Monitoring and Evaluation and the Minister of Finance should urgently resolve the budget shortfall on compensation of employees and critical surveys at Statistics South Africa (Stats SA) so that crucial and quality statistics get generated to the country and government’s benefit; if an ideal resolution cannot be found, the Minister for Planning, Monitoring and Evaluation is requested to escalate the matter to the Presidency. The department has been allocated R154.4 million over the MTEF period to address funding shortfalls in employee compensation and R150 million in 2020/21 to conduct the Income and Expenditure Survey. There is little scope for additional funding. The National Treasury will continue to engage with Statistics South Africa to find solutions for the funding shortfall on compensation of employees, and has asked the department to present the following information to justify its budget programme structure: • Explain the structure of its provincial and regional offices, considering the staff complement and budget allocation of these offices as a proportion of the department’s total staff complement and budget. • Calculate how much the department will save by transitioning from paper-assisted personal interviewing to computer-assisted personal interviewing. The savings could be reprioritised or used to reskill staff for other critical areas in the department. Recommendations of the Standing Committee on Appropriations on the 2019 MTBPS The National Treasury and the Department of Employment and Labour should conduct a comprehensive study on the public-sector wage bill at all levels of government, including state-owned companies and municipalities, in order to determine the exact impact of aggregate wages in government. This assessment should also consider the wider implication of reducing the public service on tax revenue, unemployment, service delivery and skills leakages within the public sector. The National Treasury should report to the committee before the tabling of the 2020 MTBPS. The National Treasury welcomes the committee’s recommendation. The National Treasury and the Department of Public Service and Administration have undertaken an extensive review of remuneration trends in the public sector over the past decade. Some of this work is reflected in Annexure B of the 2019 MTBPS. This collaboration will be extended to include the Department of Employment and Labour and the increased scope recommended by the committee will be factored into future work. Findings will be reported in the 2020 MTBPS. The National Treasury, in consultation with relevant stakeholders, should develop more effective supply chain management and procurement mechanisms to ensure value for money is obtained, especially regarding the overpricing of goods and services. The National Treasury has finalised a revised supply chain management regulatory framework. Compliance monitoring has been strengthened to maximise value for money, eliminate waste and prevent abuse of the procurement system. Other steps to improve procurement capacity and service delivery include reducing fragmentation and strengthening the national procurement architecture; strengthening the tax clearance system to ensure that those who have defrauded the state cannot do business with it; and introducing measures to improve institutions’ ability to set up bid committee structures for the invitation, evaluation and adjudication of tenders. 108
ANNEXURE A: REPORT OF THE MINISTER OF FINANCE TO PARLIAMENT To intensify compliance monitoring and expenditure containment, institutions are required to submit tender programmes to relevant treasuries. Demand-management procurement plans are scrutinised against the tender programmes. In addition to the focus on reducing the public-sector wage bill, the National Treasury should focus on other measures that will boost the performance of the South African economy. The National Treasury supports this recommendation. It has released a discussion paper, Economic Transformation, Inclusive Growth, and Competitiveness: Towards an Economic Strategy for South Africa. In it, government has outlined short-and medium-term reforms that can boost economic growth, many of which do not require significant state resources. Interventions to improve the quality of infrastructure planning, including the Budget Facility for Infrastructure, are beginning to show results. Government continues to work with the private sector through the Infrastructure Fund and other initiatives. Report of the Standing and Select Committees on Finance on the 2019 Revised Fiscal Framework The committee appreciates the global and domestic economic and political uncertainties and volatilities that make it difficult to accurately forecast GDP growth figures but recommends that the National Treasury draw in more independent expertise in its forecasting process to improve the credibility of the fiscal framework and better manage the economic and fiscal risks associated with its forecasts. The National Treasury uses various models to generate economic forecasts, including inflation, terms of trade, sector and business cycle models. They supplement the main macroeconomic forecast model, which is a large semi-structural econometric model similar to those used by the Reserve Bank and the Bureau for Economic Research. The assumptions that are used in the main model are sourced from global institutions or determined internally through a rigorous assumptions process. The model is regularly updated to capture changes in the South African and global economy. The Economic Policy division is engaging with the Bureau for Economic Research to assess and improve the model. Other models that are used for policy analysis and research are also maintained and updated. These are less appropriate for forecasting, but are still used to analyse trade-offs of policy and other shocks to the economy to better inform the forecast process. Since 2014, forecast errors from the National Treasury and market analysts have been decreasing. Independent studies show that National Treasury forecasts are on par with, or better than, market projections. It should also be noted that no institution has had consistently accurate forecasts over time.1 The Minister of Finance agreed that high debt now will burden future generations if it is not managed properly and the situation is unsustainable. We therefore require the National Treasury to report quarterly on the effectiveness of its debt management strategies, that would ensure that the level of debt stabilises over the medium term as the current situation is not sustainable. Rising fiscal deficits over the past decade have increased government’s borrowing requirements and debt-to-GDP ratio. Accordingly, the only way to lower the debt-to-GDP ratio is through consistently higher economic growth or lower spending. Government’s prudent debt management strategy enables it to manage the risks associated with elevated borrowing. Debt management is guided by strategic risk benchmarks for refinancing, interest, inflation and currency risks. 1 See for example: Bhoola, F., Rossouw, J. and Giannaros, M. 2018. Comparing Macroeconomic Forecasts for South Africa from 2001 to 2017: Do We Need Official Forecasts? Studies in Economics and Econometrics, 42(3): 35-69. 109
2020 BUDGET REVIEW The committee supports the new approach to project planning, budgeting, preparation and implementation and welcomes the progress of the Budget Facility for Infrastructure technical team. It believes that government needs to do much more to reduce corruption and wasteful and unnecessary expenditure and significantly improve the efficiency and quality of spending also in light of the Auditor-General’s announcement of continued increases in wasteful, fruitless and irregular expenditure, which stood at a total of R63.4 billion in 2018/19. Irregular expenditure increased from R52.7 billion in 2017/18 to R61.4 billion in 2018/19. The National Treasury should report progress made to the Committees on Appropriations in both the Houses of Parliament. Reducing corruption and wasteful, fruitless and irregular expenditure is the responsibility of every government department and entity, all of which have their own accounting officers. The National Treasury provides support to departments and entities in line with its mandate. Under the Public Finance Management Act (1999), the accounting officer and authorities of departments and public entities must: • Report irregular expenditure and fruitless and wasteful expenditure to the relevant treasury. • Take disciplinary steps against officials who make or permit irregular expenditure and fruitless and wasteful expenditure. In 2018, the National Treasury issued an irregular expenditure framework as an instruction, which was revised in May 2019. It sets out procedures for disciplining officials accused of financial misconduct and, where applicable, recovering funds and laying criminal charges. These disciplinary steps are required before such expenditure may be condoned. Amendments to the Public Audit Act (2004), which took effect on 1 April 2019, empower the Auditor-General to refer any suspected material irregularities for investigation. They also empower the Auditor-General to take appropriate remedial action and to issue a certificate of debt where an accounting officer or accounting authority has failed to comply with remedial action. The South African Revenue Service (SARS) needs to develop its policies and capacity to tax the digital economy more effectively and is required to report on this to the committee at the first quarterly briefing of 2020. The National Treasury agrees with the recommendation and will report as requested. Officials from both the National Treasury and SARS have been engaging with other countries to find global consensus on how to ensure that profit from digitised business models is taxed appropriately. The aim of the Organisation for Economic Co-operation and Development committee responsible for making recommendations in this area is to reach consensus on a new international tax architecture in 2020. South Africa is represented on the committee. SARS needs to work together with the relevant stakeholders to address the root causes of fiscal leakages emanating from, but not limited to, Road Accident Fund claims, medico legal claims and police litigations, particularly those resulting mainly from negligence. SARS will continue to engage with stakeholders on limiting the fiscal leakages cited by the committee. For example, SARS participates in an inter-agency working group with the Department of Trade and Industry and the National Treasury that focuses on tackling illicit trade, particularly in the clothing and textile industry. The committee notes with concern the direct impacts of incorrect economic growth forecasts on tax revenue collection by SARS. We are concerned that the revenue shortfall increases from a projected R14.5 billion in 2018/19 to R52.5 billion in 2019/20 and R84 billion in 2020/21 and that the scope for further tax increases has also narrowed. The National Treasury should support SARS more actively, 110
ANNEXURE A: REPORT OF THE MINISTER OF FINANCE TO PARLIAMENT including financially and in rebuilding the organisation without interfering in its operational matters. SARS, the National Treasury and law enforcement agencies need to work far more effectively in processing cases against any staff members legitimately accused of financial misconduct and corruption. The final revenue shortfall for 2018/19 was R57.3 billion compared to 2018 Budget estimates, and based on the audited revenue outcomes for 2018/19. The significant downward revisions to the economic and revenue outlook since the 2019 Budget are mainly the result of weaker economic performance. Tax revenue collection estimates published in the Budget Review and MTBPS are projections, rather than targets. If assumptions are not realised or economic performance is different than projected, these revenue estimates are subsequently revised. In the 2019 MTBPS, the National Treasury proposed additional allocations of R1 billion over three years for SARS to rebuild capacity, improve operations, and implement critical projects and recommendations from the Nugent Commission. Investigations into financial misconduct and corruption are ongoing. The National Treasury and SARS presented a progress report to the Standing Committee on Finance about implementing the recommendations of the Commission of Inquiry into Tax Administration and Governance by SARS. The committee is concerned about a constantly increasing gross debt-to-GDP ratio, a projected increase from R3.2 trillion in 2019/20 reaching R4.5 trillion in 2022/23 (71 per cent by 2023) as this is likely to burden future generations if concerted efforts are not made to sustainably reduce it. The persistently widening budget deficit, expected to peak at 6.5 per cent in 2019/20, a level last experienced during the 2009 recession, is a cause for concern, since there does not appear to be a point of stabilisation over the medium term. The committee also notes that debt service costs have become the fastest-growing expenditure item, costing the national fiscus R203.7 billion per annum (13.7 per cent) in 2019/20 and are expected to reach almost R300 billion in 2022/23. These funds could be utilised for other competing economic and social needs. The committee recommends that the National Treasury do far more to incrementally reduce the debt-to-GDP ratio and report on progress on this at its quarterly briefings. In the 2019 MTBPS, government proposed achieving a main budget primary balance by 2022/23. Achieving the fiscal target requires making large additional adjustments to the fiscal framework exceeding R150 billion in total over the medium term. These adjustments would need to address growth in the public-service wage bill and include a sustainable plan for state-owned companies in order to reduce future transfers. Given the size of the required adjustment, additional tax measures were considered. These measures require making difficult decisions that will affect the economy and the distribution of public resources. The committee notes that the 2019 MTBPS budgeted contingency reserves amount to R18 billion over the medium term, or R6 billion each year. These amounts are not adequate and are likely to leave South Africa susceptible to external and internal shocks in an event of unforeseen circumstances such as imminent dangers of food insecurity and water scarcity, including through potential floods and drought. The committee urges the National Treasury to quantify and factor in these potential risks in the economic growth forecasts and the overall fiscal framework. The National Treasury assesses fiscal risks to identify and plan for unexpected and uncertain events. This process informs the formulation of the fiscal framework and culminates in the publication of an annual fiscal risk statement. The contingency reserve is part of the expenditure ceiling and is determined within this overall limit. Its size depends on available resources and the level of uncertainty and is revised during the budget process. Analysis in the 2013 Budget Review showed that unforeseen and unavoidable expenditure adjustments, for which the contingency reserve was budgeted, averaged R4 billion per year over five years. This was much lower than the contingency reserve amounts, which were then lowered. In addition to the contingency reserve, there are disaster relief grants for local and provincial government. In the past, the combination of the contingency reserve, the disaster relief grants and other 111
2020 BUDGET REVIEW ring-fenced funds within infrastructure grants has proven sufficient to meet the costs associated with natural disasters. Recommendations of the Standing Committee on Appropriations on the Adjustments Appropriation Bill The Minister of Finance should ensure that the National Treasury carefully scrutinises government departments’ ability to spend allocated funds before submitting budget proposals to Parliament in order to prevent continued underspending on allocated funds as it has implications for government debt and the interest payments. Over the past 25 years the National Treasury has developed a rigorous budget process that imposes the highest level of scrutiny to ensure that departments have the ability to spend allocated funds. The Constitution mandates the National Treasury to manage public finances, and the Public Finance Management Act makes the National Treasury responsible for managing the budget preparation process. To support this, the National Treasury provides an overall fiscal framework based on the macroeconomic forecast. It also proposes the division of revenue between the three spheres of government and provides technical guidelines for budget submissions to ensure that they reflect the priorities set out by the President. These processes are subject to a lengthy period of consultation and modification throughout government, including the Ministers’ Committee on the Budget, before they are considered by Cabinet and ultimately Parliament. The National Treasury recognises that ultimate authority for the nation’s finances rests with Parliament, which debates and votes on the Budget in a range of public forums. The Money Bills Amendment Procedure and Related Matters Act also gives Parliament the opportunity to amend the Budget. The National Treasury conducts a wide range of stakeholder engagements, and encourages all South Africans to comment on the allocation of public funds. The Minister of Finance should, within 60 days after the adoption of this report by the House, submit to Parliament a report on all outstanding conditions attached to the bailouts of state-owned entities; while conditions for the 2020/21 Budget allocation to Eskom should be included in the primary legislation, to improve oversight and accountability. Eskom met conditions for the initial transfer of funds in December 2019 and continues to meet conditions for the remaining tranches of the Special Appropriation in 2019/20. Denel, South African Airways, South African Express and the South African Broadcasting Corporation have partially complied with the conditions attached for drawdowns in 2019/20 from the contingency reserve. These entities are being monitored to ensure compliance is achieved by the end of 2019/20. The National Treasury will separately provide a comprehensive analysis of the status of the conditions for all five entities to the committee. All departments that requested virements from compensation of employees to other economic classifications due to unfilled vacancies should, together with the National Treasury, and within 60 days after the adoption of this report by the House, provide a report detailing why budgeted vacancies were not filled on time, particularly the critical ones and those on the frontline service delivery points. The National Treasury will investigate the causes of these vacancies with the Department of Public Service and Administration, and provide a detailed report to Parliament within the 60 days. With regards to the R157 million declared unspent allocation for the Jobs Fund by the National Treasury, the committee recommends that the Minister of Finance should, within 60 days after the adoption of this report by the House, submit to Parliament a report on the reasons for this underspending and how it will be avoided in future. The National Treasury should also brief the committee on how the Jobs Fund is being administered in order to broaden its understanding. 112
ANNEXURE A: REPORT OF THE MINISTER OF FINANCE TO PARLIAMENT The National Treasury has briefed the committee. As outlined in the report, the funds have already been committed to projects and have not been declared unspent. Approved projects are funded through the budget processes, with the Jobs Fund’s allocations being ring-fenced or earmarked. Projects are required to provide budgets over three years even though their expenditure is projected to go beyond the MTEF period. This usually results in benchmarking rather than bottom-up budgeting or rescheduling. External factors affecting projects include the following: • The Jobs Fund only releases grant funding when projects reach contracted milestones, and the weak economy has negatively affected these plans. Before the Jobs Fund releases grant funding, project partners are required to contribute funding. Where project funds have not been provided timeously, grant funding has been delayed. A significant portion of the Jobs Fund portfolio consists of projects in the agricultural sector. Severe drought has delayed planned activities such as planting, with consequences for the release of grant funding. • • These factors have resulted in revised project implementation plans and related annual budgets. The Jobs Fund requested that the R157 million be released at a later stage when funds are required by implementing projects in order to roll out project activities and achieve the planned job creation targets. The Jobs Fund will continue to implement prudent fiscal discipline. Although funds have been committed to projects, grant funding will not be released unless performance and matched funding targets have been met. Recommendations of the Standing Committee on Appropriations on the Division of Revenue Amendment Bill (2019) The Minister of Finance should ensure that the National Treasury gazettes the following corrections to the Conditional Grant Frameworks as well as the New Conditional Grant Frameworks as set out in annexures 2 and 3 of the bill, in accordance with section 16(4) of the Division of Revenue Act (2019): Corrections to Conditional Grant Frameworks: • • • • • • • • Ilima/Letsema grant framework School infrastructure backlogs grant National health insurance direct grant Human papillomavirus vaccine grant Human resources capacitation grant National health insurance indirect grant: Health facility revitalisation component Provincial roads maintenance grant Integrated urban development grant. The corrected frameworks have been gazetted together with the details of the revised allocations, which were provided through the Division of Revenue Amendment Act (2019). The Minister of Finance should ensure that there is a consequence management framework and that actions are taken against government institutions that continuously underspend on their appropriated budgets. The National Treasury agrees that there should be consequences for institutions that underspend or underperform. 113
2020 BUDGET REVIEW Provinces and municipalities that underspend face consequences set out in the Division of Revenue Act. In terms of sections 18 to 20, if a recipient is anticipated to underspend, further transfers can be withheld, stopped or reallocated to another institution. If transferred funds are not spent by the end of the financial year, and no rollover is approved, provinces and municipalities must transfer the remaining funds back to the National Revenue Fund, or the funds owed will be offset against future transfers. Additional discussion is provided in Chapter 6 of the Budget Review. Recommendations of the Select Committee on Appropriations on the Division of Revenue Amendment Bill (2019) The Minister of Finance must ensure that the National Treasury gazettes the corrections to the Conditional Grant Frameworks as well as the New Conditional Grant Frameworks as set out in annexures 2 and 3 of the bill, in accordance with section 16(4) of the Division of Revenue Act (2019) as soon as possible. The following are the affected grants: • • • • • • • • • • Ilima/Letsema grant School infrastructure backlogs grant National health insurance direct grant Human papillomavirus vaccine grant Human resources capacitation grant National health insurance indirect grant: Health facility revitalisation component Provincial roads maintenance grant Integrated urban development grant Municipal disaster recovery grant Municipal infrastructure grant. The corrected frameworks have been gazetted together with the details of the revised allocations, which were provided through the Division of Revenue Amendment Act. While the committee notes the technical issues behind the school infrastructure backlogs grant adjustment and adjustments to infrastructure grants as a whole, the committee recommends that all procedural and technical issues be swiftly and effectively dealt with to ensure that the financial support for the removal of these backlogs is given, and that government does everything in its power to ensure the speedy completion of these projects. The National Treasury agrees that all procedural and technical issues need to be dealt with swiftly and effectively and has engaged the Department of Basic Education on these issues. The National Treasury can also confirm that provinces that had their allocations reduced in the 2019 adjustment budget due to technical challenges have received their full allocation in the 2020 Budget. In order to prevent fiscal dumping and fruitless and wasteful expenditure, the Minister of Finance, together with the Ministers of Agriculture, Health and Basic Education and the affected provincial treasuries, should ensure that concrete steps are taken to build and demonstrate capacity to spend, including developing clear plans to monitor expenditure for proposed additional allocations. Further, the ministers need to ensure that the proposed additional allocations are effectively and efficiently spent according to the approved plans before the end of this financial year, and provide a progress report to the committee in the first quarter of the 2020/21 financial year. The proposed additional allocations include the following conditional grants: • The ring-fenced R60.7 million, which was shifted to the Eastern Cape Provincial Department of Transport for roads damaged by floods. • The new indirect component of the Ilima/Letsema grant, amounting to R45.3 million, to fund the National Food and Nutrition Survey. 114
ANNEXURE A: REPORT OF THE MINISTER OF FINANCE TO PARLIAMENT • The human resources capacitation grant, amounting to R300 million, which is allocated to cater for the shortage of funding towards the carry-through costs of filling vacancies in the health sector. The direct component of the national health insurance grant, which will allow provinces to make payments directly to contracted health professionals. Additional funding of R700 million to the school infrastructure backlogs grant, which was added to the 2019/20 allocation. The municipal disaster recovery grant amount of R133.2 million, earmarked for eThekwini Metropolitan Municipality and Ugu District Municipality. • • • The National Treasury agrees with this recommendation and will monitor the spending of all transferred funds and provide the progress report as requested. The Minister of Finance should ensure that the National Treasury timeously approves the roll-overs contained in the bill for all projects near completion for the receiving municipalities (for regional bulk infrastructure to be used for emergency Vaal River pollution remediation) and provinces (for medical equipment in Limpopo hospital), and provides a progress report to the committee in the first quarter of 2020/21. The roll-overs have been approved and the funds are available to be spent. The National Treasury will provide the progress report as requested. The committee appeals to the National Treasury, the Department of Cooperative Governance and Traditional Affairs and the South African Local Government Association (SALGA) to continue to support municipalities until the Eskom and water boards’ debt issues are resolved; and to ensure that the issues around provincial and national departments owing municipalities are also expeditiously addressed to bolster municipal finances. They must further ensure that municipalities create credible credit control measures, debt management policies and effective revenue collection strategies; and provide a progress report in this regard to the committee in the first quarter of 2020/21. The National Treasury agrees with this recommendation and continues to work with the Department of Cooperative Governance and SALGA to support municipalities. The revised municipal budgets, described in Chapter 6 of the Budget Review, take account of the need to make payments to Eskom and water boards. The smart meter pilot, also described in Chapter 6, could make revenue collection and payments more sustainable. The National Treasury will provide the progress report as requested. The committee requests that the National Treasury consider allocating a budget for the development of the Moloto Rail Corridor even if it is spread over a period of five years. The argument that a feasibility study found the project to be too expensive was not accepted by the committee, which argued that high cost of a project cannot be elevated above the lives of voters who had been promised a better service. The Minister of Finance agrees that the loss of life on this road, and all roads in the country, is unacceptable. Improving safety on this route is a priority and work is already under way to improve road capacity and safety through infrastructure upgrades. This will be complemented by improving the safety of government-subsidised buses operating along the Moloto Corridor and running road safety campaigns. The option of building a new railway line along the Moloto Corridor was explored in a feasibility study undertaken by the Department of Transport in 2015. The National Treasury’s evaluation of this study concluded that it did not justify investment in a new railway link through the Moloto Corridor route, but that it does provide good grounds for improvements to the road infrastructure and transport services along the route. These upgrades will be carried out by the South African National Roads Agency Limited (SANRAL). 115
2020 BUDGET REVIEW SANRAL is upgrading roads across five municipalities in three provinces to accommodate the large volumes of daily traffic along this route. SANRAL is allocated R4.2 billion to upgrade these roads between 2019/20 and 2022/23. The buses that operate along the Moloto Corridor are subsidised by the Gauteng Provincial Government, including through funds transferred to the province in the public transport operations grant. The grant rules provide for the possibility that the national Department of Transport could take over responsibility for managing the contract for this route. This would allow the national department to issue a new contract for the route to improve the service. The bus operator on this route has recently implemented additional safety measures, including providing advanced driving courses for bus drivers and introducing new buses with cameras and GPS systems. Human settlement and economic development options for this region also need to be considered. A large number of residents in this region commute long distances daily to work in Tshwane – a legacy of apartheid spatial development policies. The National Development Plan calls for reducing the commuting burden and developing in ways that account for the unique needs and potential of different urban and rural areas. Future economic development in the Moloto region could alter commuting patterns, as would the decision by some households to take advantage of new housing opportunities closer to their places of work. All of these options must be kept open. A bus transport system will be much more flexible than a rail-based system to meet future changes in commuting patterns. The Minister of Finance and the Minister of Transport should report progress to Parliament, within three months after the adoption of this report, on what has been done since the pronouncement by President Jacob Zuma – in September 2017 – that the Moloto Rail Development Corridor was a government priority and one of the infrastructure development initiatives. An update is provided in the response to the previous recommendation. Recommendations of the Select Committee on Appropriations on the proposed division of revenue and the conditional grant allocations to provincial and local spheres of government Given the current state of the country’s fiscus presented in the 2019 MTPBS, including proposed budget reductions at provincial and local governments levels, which are at the coalface of service delivery, the committee recommends that the National Treasury, together with the Department of Cooperative Governance and Traditional Affairs, alongside provincial treasuries and provincial cooperative governance departments, ensure that provinces and municipalities use all the available resources in line with the public financial management prescripts in a manner that reduces waste, eradicates opportunities for corruption, and promotes quality service delivery as envisaged in the National Development Plan. The Minister of Finance agrees with this recommendation and appreciates the call to action for all parts of government to redouble their efforts to ensure sound management of public funds. Given the levels of under-investment in infrastructure projects by larger urban municipalities, the committee recommends that the National Treasury and the Department of Cooperative Governance fast-track the following initiatives and provide a progress report to the committee in the first quarter of the 2020/21 financial year: • Table the Municipal Fiscal Powers and Functions Amendment Bill to standardise the regulation of development charges in order for municipalities to recover their capital costs of connecting new developments to infrastructure. 116
ANNEXURE A: REPORT OF THE MINISTER OF FINANCE TO PARLIAMENT •Introduce the dedicated grant funding for large urban municipalities, whereby eligible municipalities will receive co-financing on a declining basis over three years. • Ensure that capacity-building and improvement of municipal systems allocations, such as the local government financial management grant and the municipal systems improvement grant, are effectively and efficiently utilised for their intended purposes. The National Treasury agrees with the recommendations and can report the following updates on each item: • The draft Municipal Fiscal Powers and Functions Amendment Bill was published for public comment in January 2020. Comments are invited until the end of March, after which they will be processed before the revised draft will go to Cabinet before being tabled in Parliament. The grant funding for project preparation recommended by the committee is being provided through the integrated city development grant, which forms part of the Division of Revenue Bill (2020). Grants like the financial management grant and the municipal systems improvement grant must be used for their intended purpose, as required by the Division of Revenue Act. The effectiveness of the capacity-building system for local government is also being reviewed by the National Treasury, with initial results likely to influence improvements to the system from 2021. • • While the committee understands the need to restructure certain conditional grants, it is of the view that grant restructuring, termination or merging must not affect service delivery objectives and proper assessment or analysis of grant performance ought to be conducted before any restructuring can happen. These include the following affected conditional grants: the human papillomavirus vaccination grant, which will be merged with the HIV, TB, malaria and community outreach grant; and the fact that from 2021/22, two new components, mental health and oncology, will be added to the HIV, TB, malaria and community outreach grant. The National Treasury agrees that grant restructuring should not harm but improve service delivery. Only small changes are being made to the structure of conditional grants in 2020/21. The Department of Health and the National Treasury will work together to develop a broader strategy that will inform future changes to health grants and ensure their alignment to national health insurance reforms. With regards to the Moloto Corridor, the committee believes that the loss of many lives in that area must come to an end. The committee recommends that the National Treasury consider allocating resources for the development of a Moloto Corridor Rail Project over the 2020/21 MTEF period and make use of all revenue-sourcing avenues at its disposal. The argument that a feasibility study found the project to be too expensive is not acceptable given the high levels of road fatalities there, affecting not only the Department of Transport, but also the Department of Health, due to the overcrowding in the hospital near the high accident zone. The National Treasury should provide a progress report on this during the tabling of the 2020 Budget. This issue has been responded to under an earlier recommendation of the Select Committee on Appropriations, recommendations on the Division of Revenue Amendment Bill. With regards to the municipalities adopting unfunded budgets, the committee recommends that the National Treasury, together with the Department of Cooperative Governance and Traditional Affairs, as well as the affected provincial treasuries, expedite the implementation of the revised strategy to address municipal financial performance failures, which has been endorsed by the Budget Council and Budget Forum, the respective intergovernmental forums for provincial and local government finances. A progress report hereon should be submitted to the committee in the first quarter of the 2020/21 financial year. The National Treasury agrees with this recommendation and is already implementing the strategy. Chapter 6 of the Budget Review reports on the results of efforts to get municipalities with unfunded 117
2020 BUDGET REVIEW budgets to revise their spending plans in line with credible revenue expectations. The National Treasury will provide further reports to the committee as requested. The committee recommends that the National Treasury, together with the Department of Cooperative Governance and Traditional Affairs and affected treasuries, expedite the pilot project of the district models, which will be implemented in Oliver Reginald Tambo District Municipality and eThekwini Metropolitan Municipality, and ensure that resources allocated to this project are effectively and efficiently utilised and value for money is achieved. On completion of the pilot project, the committee expects a report identifying lessons learnt during the pilot phase, how resources allocated have been utilised and clear recommendations to improve the programme before it is implemented. The National Treasury agrees with this recommendation. The national Department of Cooperative Governance is coordinating the implementation of the pilots of the district development model. The National Treasury will support the department in identifying lessons learnt for the report requested. The National Treasury should review the vertical division of nationally raised revenue, in order to ascertain whether the 9 per cent allocation to local government is sufficient for the sector to perform its mandate. The Minister of Finance has proposed holding a special local government Budget Forum lekgotla to discuss the structure of the local government fiscal framework, including the size and structure of transfers. The National Treasury should engage more extensively with the Financial and Fiscal Commission (FFC) and respond more comprehensively to its recommendations, as a constitutional body. Government, and specifically the Department of Planning, Monitoring and Evaluation, should provide detailed implementation plans, including deadlines, for the recommendations that it does agree with. Section 214 of the Constitution requires that the FFC’s recommendations be considered before tabling the division of revenue. Government’s responses to the FFC’s recommendations related to the division of revenue are provided in part 3 of Annexure W1 of the Budget Review. Other FFC recommendations have been referred to the relevant ministers, who will respond directly to the FFC. The Minister of Finance and the Chairperson of the FFC have corresponded to clarify how interactions between the staff of the commission and the National Treasury should be structured to facilitate a productive working relationship. In order to have more effective consultation on budgetary matters, the National Treasury and SALGA should engage more extensively during the budget planning cycle and not only at the Budget Forum meetings. The National Treasury agrees that ongoing engagements with stakeholders, including SALGA, are important to resolving problems in the intergovernmental system. SALGA officials are invited to participate in a range of meetings and processes with the National Treasury and others, such as the local government equitable share working group and conditional grant framework meetings. The National Treasury has proposed collaborating with SALGA and the Department of Cooperative Governance to produce papers and presentations for the local government Budget Forum lekgotla in 2020. 118
B Tax expenditure statement Introduction The primary aim of the tax system is to raise sufficient revenue for government spending. It can also promote socioeconomic objectives through targeted tax exemptions, deductions or credits. Tax expenditures are estimates of the total revenue foregone as a result of this preferential tax treatment. This annexure presents government’s latest estimates of the fiscal cost of tax expenditures, as well as the methodology used to produce these estimates. In 2017/18 – the latest year for which data is available – tax expenditures were estimated at R210 billion or 4.5 per cent of GDP. For that year, 35 tax expenditures were calculated compared to 34 in 2014/15, and the largest four expenditures accounted for more than half of the total. These relate to deductions for pension contributions by employers, vehicle manufacturer incentives, value-added tax (VAT) relief for basic food items and medical tax credits on contributions to medical schemes. The effectiveness of tax incentives in meeting their stated objectives is questionable, particularly in developing countries. For example, incentives to promote investment may not materially affect decisions on whether to invest or not. Tax expenditures can also undermine the tax principles of equity and simplicity, with unintended negative consequences for the efficiency of the tax system and the broader economy. Government will continue to monitor and evaluate tax expenditures, and repeal incentives that are redundant, inefficient or inequitable. Tax expenditure estimates The estimates presented in Table B.2 are calculated using the “revenue foregone” method. This entails comparing actual revenue collections with revenue that would have been collected without the incentive in place. Most of the personal income tax and corporate income tax estimates are calculated using administrative data from the South African Revenue Service (SARS), which allows expenditure estimates to be accounted for on an accrual basis. Changes to estimation methods since the 2019 Budget The most significant change to the tax expenditure methodology since the 2019 Budget relates to the calculation of expenditure estimates for VAT zero-rated municipal property rates. Previously, the reported municipal property rates estimates were based on data in vendors’ VAT returns submitted to SARS. In addition to zero-rated property rates, these returns include other zero-rated supplies to municipalities, as the design of the VAT return form does not distinguish between each category. This resulted in overstated tax expenditure estimates. Going forward, the tax expenditure on these property rates will be based on the audited financial statements of municipalities published on the National Treasury website. The tax expenditure estimates on VAT zero-rated municipal property rates have been recalculated for the reporting period and are now more accurately reflected in Table B.2. 119
2020 BUDGET REVIEW The diesel refund tax expenditure estimates were understated in the 2019 Budget because they did not include the diesel refund previously offset against domestic VAT. This has been updated and estimates in the 2020 Budget are correctly reflected over the reporting period. More accurate data and estimation methodologies have prompted revisions to the historical tax expenditure estimates in Table B.2. For the first time, tax expenditure estimates are published for the participation exemption for foreign dividends and the sale of equity shares, which has been effective since March 2012 through section 10B of the Income Tax Act (1962). Medical tax credit expenditures now distinguish between credits on contributions to medical schemes and for out-of-pocket expenditure. Participation exemption in terms of foreign dividends and share sales In line with the move from a source-based to a residence-based tax system, foreign dividends became taxable in South Africa in 2000. This shift aimed to bring South Africa closer to internationally accepted tax principles and to neutralise tax avoidance schemes. In 2012, with the move from secondary tax on companies to dividends tax, the participation exemption was introduced. To qualify for the exemption, a resident company (or group of companies) must hold at least 10 per cent of the total equity shares and voting rights of the company declaring the foreign dividend. The exemption is intended to encourage the repatriation of dividends and prevent economic double taxation – for example, if dividend withholding tax is due in the foreign country. Qualifying companies are also exempt from capital gains tax on the sale of shares. Foreign dividends are taxable as ordinary revenue unless they qualify for the participation exemption. In 2012, a ratio was introduced to bring the effective tax rate on foreign dividends in line with taxation of local dividends. Companies that do not qualify for the participation exemption will have their foreign dividend income effectively taxed at 20 per cent (15 per cent prior to 1 March 2017), in line with local dividends. Figure B.1 Foreign dividend participation exemption tax expenditures 200 6 160 Source: National Treasury Administrative data from SARS reveals the number of companies using this exemption for foreign dividends and the rand value of the exemption (Figure B.1). Multiplying the dividend withholding tax rate by the aggregate value of the exemption provides an estimate of the revenue foregone. It is difficult to estimate the revenue that could be generated from removing the participation exemption as behaviour might change in response. Companies may be less inclined to repatriate foreign dividends without the exemption. Moreover, if the dividend was taxed at source, South Africa might not receive the full amount of dividend tax and would have to provide a credit for the amount already paid. To avoid an overestimate, the tax expenditure estimates have been adjusted downwards by one quarter over the reporting period. 120 R billion Companies Estimated tax r evenue foregone 5180 4 3 140 2 1120 0100 2012/1 32013/1 42014/1 52015/1 62016/1 72017/1 8 Number of companies (RHS)
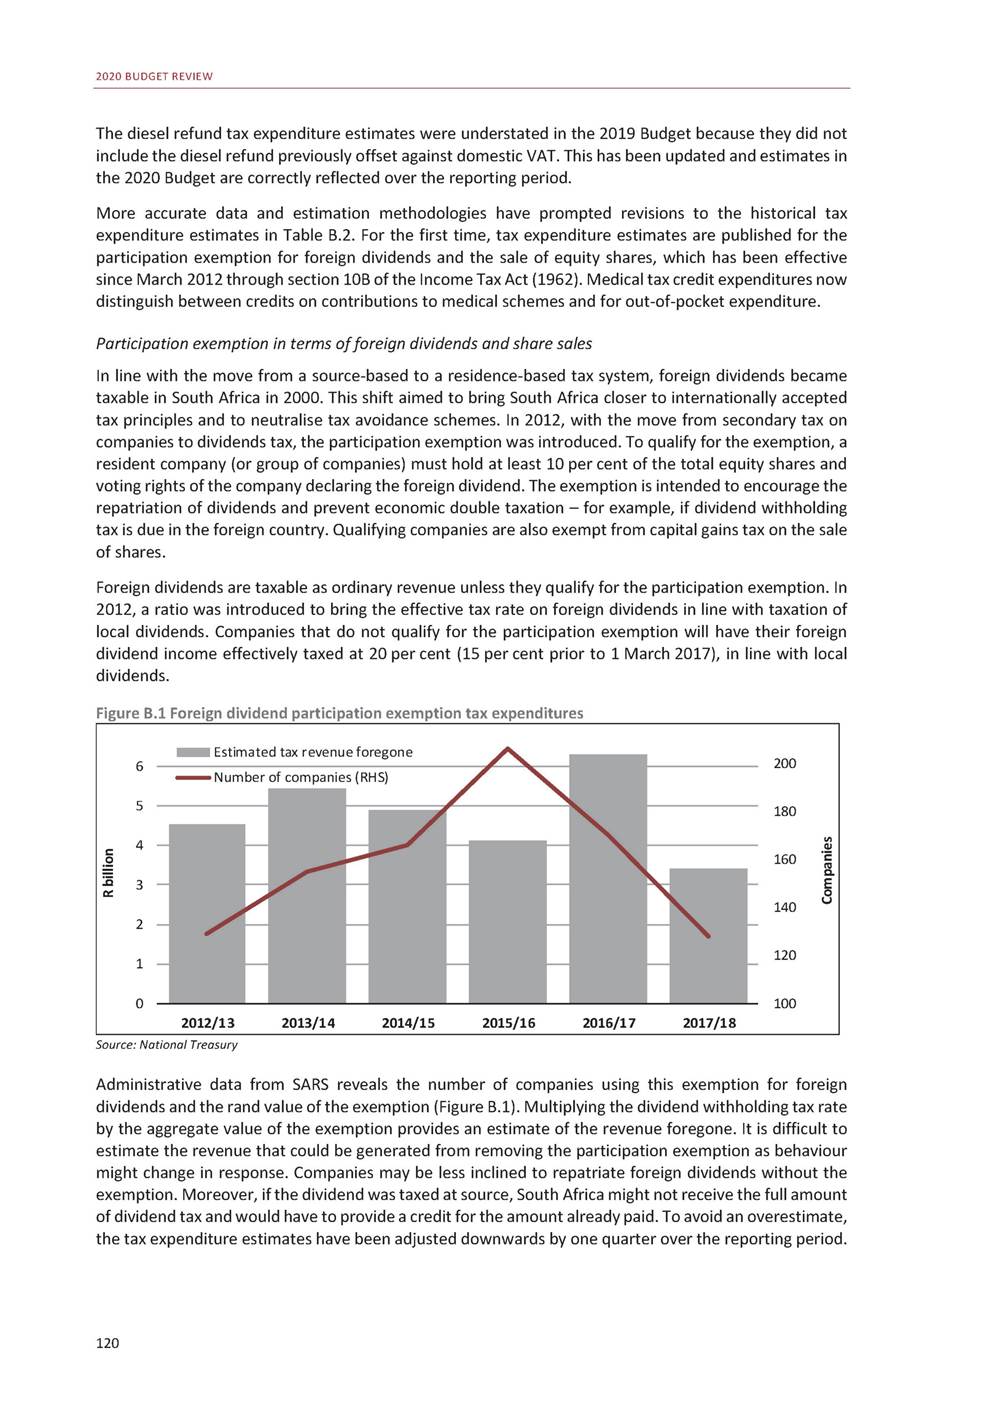
ANNEXURE B: TAX EXPENDITURE STATEMENT The National Treasury is not yet able to calculate the capital gains tax forgone as a result of the participation exemption. Trends in tax expenditure: 2014/15 – 2017/18 This section uses historical data to analyse trends in tax expenditure between 2014/15 and 2017/18. Including the new estimates for the participation exemption, 35 tax expenditures were estimated for 2017/18. Figure B.2 Share of total tax expenditure per tax type Source: National Treasury The share of personal income tax expenditures increased to more than half of the total in 2017/18. This was the result of the significant downward adjustment to the expenditure estimates for VAT zero-rated municipal property rates, which was partially offset by the inclusion of the participation exemption expenditures for corporates. Relative to the 2019 Budget estimates, corporate income tax expenditures increased significantly between 2014/15 and 2017/18 due to the inclusion of estimates for the participation exemption. In addition, over the same period, about 20 per cent of medical tax credit expenditures were the result of eligible out-of-pocket expenditures by individuals (R4.8 billion in 2017/18). Evaluation of tax expenditures Government views the monitoring and evaluation of tax expenditures as an important component of ensuring transparency and accountability. As recommended by the Davis Tax Committee, government will systematically review all business tax incentives with the aim of repealing those that are redundant, inefficient or inequitable. Furthermore, government will enhance the transparency of tax expenditure reporting by investigating whether to publish a greater number of the corporate beneficiaries of incentives and the related amounts. The 2020 Budget proposes the review of several tax incentives in 2020/21, as shown in Table B.1, to determine whether to amend or repeal them. These incentives will initially be amended by inserting sunset clauses, where none exist, indicating that they will lapse within two years. This will allow the review of these incentives to be completed before making a final decision on their future. The repeal of ineffective or distortionary incentives will expand the corporate tax base and enhance equity and efficiency in the tax system. Besides those listed in Table B.1, other incentives without sunset clauses have been identified for future review. These incentives will be amended by inserting sunset clauses to allow for a second phase of reviews to be completed after the initial phase targeted to begin in 2020/21. This process will continue 121 Value-added taxCorpo rat e income taxPersonal income taxCu stoms an d excise d uties 2017/1 8 2014/1 5 0102030405060708090100 Per cent 26 6 52 16 28 7 47 18
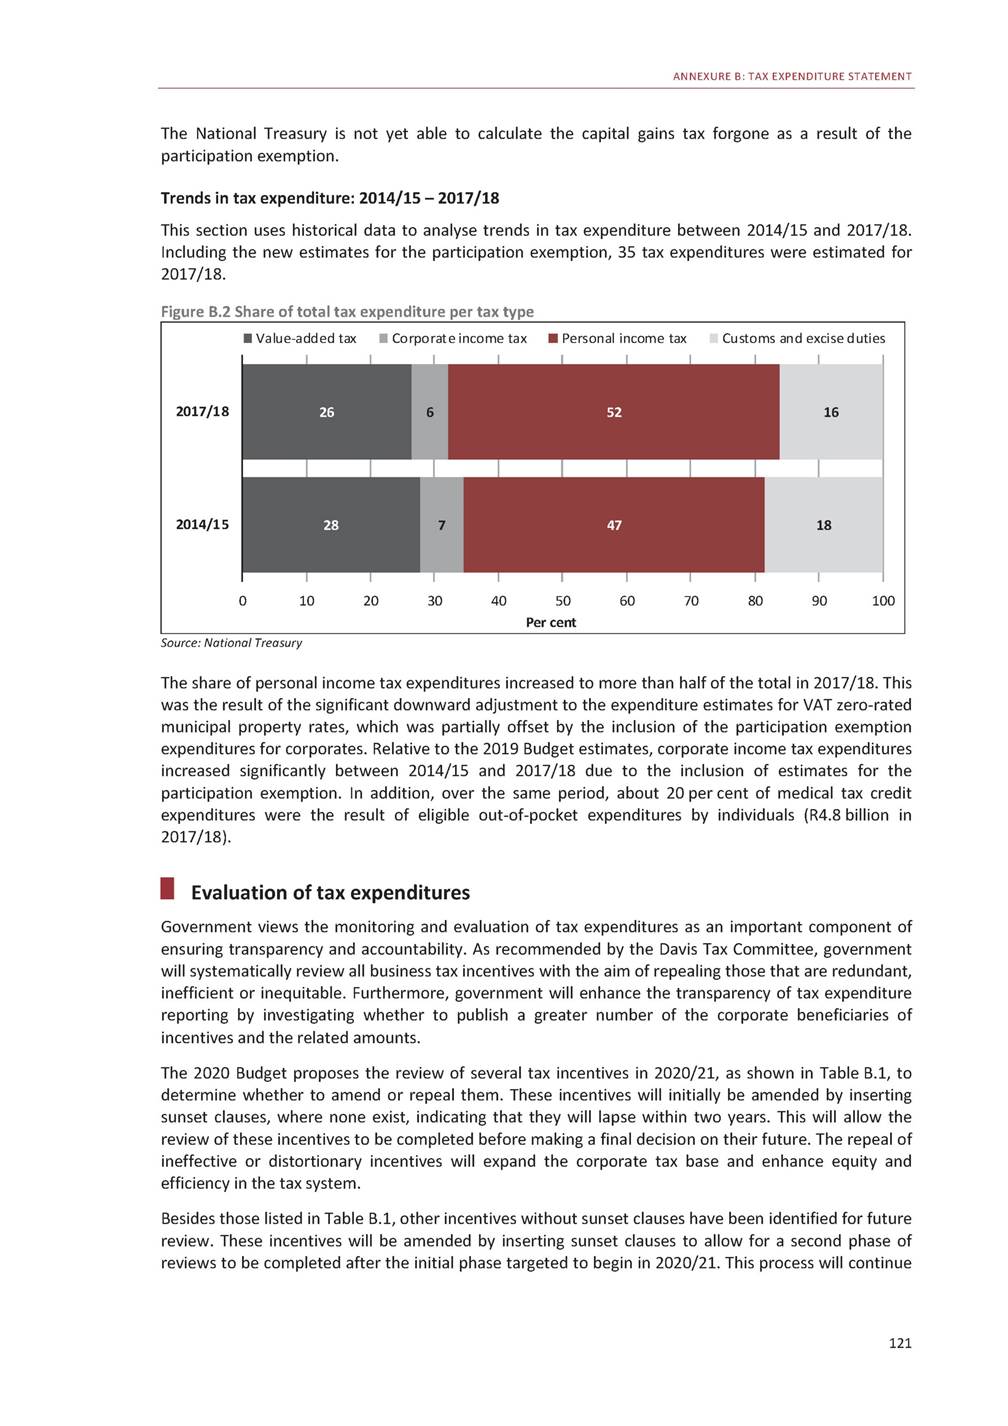
2020 BUDGET REVIEW beyond the 2020 medium-term expenditure framework period until all business tax incentives have been reviewed. Table B.1 Tax expenditures proposed for review Source: National Treasury The broad criteria used to assess whether a particular incentive is justified include: • • • • • • Has it ever been reviewed? Does it have a sunset clause? Is it in line with current government objectives? Does it support job creation? How many taxpayers are claiming the incentive? Does its provision create unintended consequences or distortions? It is unclear whether section 12F, which provides for a deduction for airport and port assets, is meeting its objectives. It was introduced in 2001 to promote private investment in public infrastructure. Uptake has been slow with only a few taxpayers claiming the incentive. About R600 million is claimed each year. Slow uptake may indicate that industry dynamics, beyond the scope of tax incentives, are deterring new entrants. To date, the incentive has not been reviewed and has no sunset clause. Section 12DA provides for a deduction for rolling stock and was introduced to correct the imbalance between the capacity of the transportation network and the infrastructure demands of the growing economy. One dominant taxpayer claimed almost R10 billion in each of the 2017 and 2018 tax years, raising concerns about the equity of the corporate tax system. Section 13sept provides for a deduction for the sale of low-cost residential units by an employer to its employee through an interest-free loan. It was introduced to address challenges in providing low-cost residential houses to employees by means of lease agreements. Between 2013/14 and 2017/18, few taxpayers claimed the incentive. The low tax expenditure values and number of beneficiaries implies that this incentive may not be an appropriate mechanism to achieve its objective. Section 12O was introduced to encourage a profit-driven rather than expenses-driven approach in the filmmaking industry, after the accelerated write-off (section 24F of the Income Tax Act) was exploited. The film industry receives separate on-budget support to promote its growth and development, calling into question the need for the tax incentive, which has few claimants and is subject to lobbying for increased benefits. 122 Income Tax Act Effective date Current deduction Number of beneficiaries and tax expenditure (R million) 2013/142014/152015/162016/172017/18 Sunset clause Se cti on 12F 01/01/01 5% for 20 ye a rs < 10< 10< 10< 10< 10 179.3146.4157.3172.5209.9 Non e Se cti on 12DA 01/01/08 20% for 5 ye a rs < 5< 10< 5< 5< 10 1.09.60.12 726.12 756.1 Non e Se cti on 13sept 21/10/08 10% fo r 10 ye a rs < 10< 10< 10< 5< 10 1.00.80.60.41.3 Non e Se cti on 12O 01/01/12 Exe mpti o n < 10< 10< 10< 10< 10 26.413.913.216.23.1 01/01/22
ANNEXURE B: TAX EXPENDITURE STATEMENT Table B.2 Tax expenditure estimates R million 2014/15 2015/16 2016/17 2017/18 Personal income tax Re ti re me nt fund contri bu ti on s 1 Pension contributions – employees Pension contributions – employers Provident contributions – employees Provident contributions – employers Retirement annuity Me di ca l Medical tax credits on contributions 2 Medical tax credits on out-of-pocket expenditure I nte re s t e xe mpti o ns Se co nd a ry re ba te (65 ye a rs a nd o l de r) Te rtia ry re bate (75 ye a rs and o l de r) Dona ti on s Ca pi ta l ga i ns ta x (a nn ua l e xcl us i o n) 53 707 13 019 23 882 – 10 087 6 718 22 004 17 852 4 152 2 478 1 868 160 951 482 58 980 14 363 26 348 – 11 129 7 141 22 595 18 477 4 118 2 814 1 922 179 707 529 73 547 15 014 29 064 3 285 12 303 13 881 25 381 20 289 5 092 3 173 2 173 190 807 679 77 375 17 008 31 987 3 947 13 249 11 184 24 111 19 297 4 814 3 257 1 941 170 809 601 Ve nture ca p i ta l co mpa ni e s 26 207 213 201 Total personal income tax 81 676 87 934 106 163 108 465 Corporate income tax Sma l l b usi n e ss co rpo ra ti o n ta x sa vi n gs Reduced headline rate Section 12E depreciation allowance Re s e a rch a n d de ve l op me n t Le a rne rs hi p a l l owa n ce s Stra te gi c i n du s tri a l pro je cts (12I ) Film i nce n ti ve 3 Urba n d e ve l o pme nt zo ne s Empl oyme n t ta x i nce n ti ve Energy-e ffi ci en cy s a vi n gs 2 641 2 607 33 207 952 423 15 232 2 420 135 2 839 2 795 44 277 1 068 479 13 257 4 063 1 057 2 880 2 838 42 232 1 070 690 16 273 4 656 1 192 2 549 2 510 39 150 568 418 3 295 4 317 456 Pa rticipation e xe mp tion 4 4 907 4 122 6 294 3 421 Total corporate income tax 11 932 14 175 17 304 12 176 123
2020 BUDGET REVIEW Table B.2 Tax expenditure estimates (continued) R million 2014/15 2015/16 2016/17 2017/18 Value-added tax Ze ro-ra te d s u pp l i e s 19 basic food items 5 Petrol 6 Diesel 6 Paraffin 6 Municipal property rates Reduced inclusion rate for commercial accommodation 47 002 21 503 16 065 2 146 659 6 402 228 47 941 22 793 15 901 1 911 536 6 567 233 50 521 24 411 16 150 1 842 569 7 285 263 54 254 26 023 17 080 2 049 665 8 130 307 Exe mpt s uppli e s (publ i c tra ns port a nd e duca ti on) 1 256 1 332 1 426 1 520 Total value-added tax 48 259 49 273 51 947 55 774 Customs duties and excise Motor ve hi cl e s (MI DP/APDP, i ncl ud i ng I RCCs )7 Te xtile a nd cloth ing (du ty cre dits – DCCs )7 Furni ture a n d fi xture s Othe r cu s toms 8 23 467 539 180 911 26 936 788 217 1 040 28 362 725 181 963 28 754 712 198 875 Di esel refu nd 9 6 900 9 283 5 037 3 025 Total customs and excise 31 997 38 264 35 268 33 564 Total tax expenditure 173 863 189 646 210 682 209 979 Tax expenditure as % of total gross tax revenue 17.6% 17.7% 18.4% 17.3% Total gross tax revenue 986 295 1 069 983 1 144 081 1 216 464 Tax expenditure as % of GDP 4.5% 4.6% 4.8% 4.5% 1. Some of this tax expenditure is recouped when amounts are withdrawn as either a lump sum or an annuity. From 2016/17 onwards provident fund employee contributions became deductible and a higher percentage contribution for all retirement funds was allowed, alongside a monetary cap of R350 000. The estimate for the tax expenditure of provident fund employer contributions (for all years) was included for the first time in the 2019 Budget 2. Medical credits were introduced in 2012/13 to replace income tax deductions for medical scheme contributions 3.Tax expenditure for all years is attributable to allowances under section 24F and exemptions under section 12O 4. Tax expenditure only attributable to foreign dividends. Capital gains tax on share sales not included 5. VAT relief in respect of basic food items based on 2010/11 Income and Expenditure Survey data 6. Based on fuel volumes and average retail selling prices 7. Motor Industry Development Programme (MIDP), replaced in 2013 by the Automotive Production Development Programme (APDP); import rebate credit certificate (IRCC); duty credit certificates (DCC) 8. Goods manufactured exclusively for exports, television monitors and agricultural goods exempted 9. Diesel refund previously offset against domestic VAT has been added Source: National Treasury 124
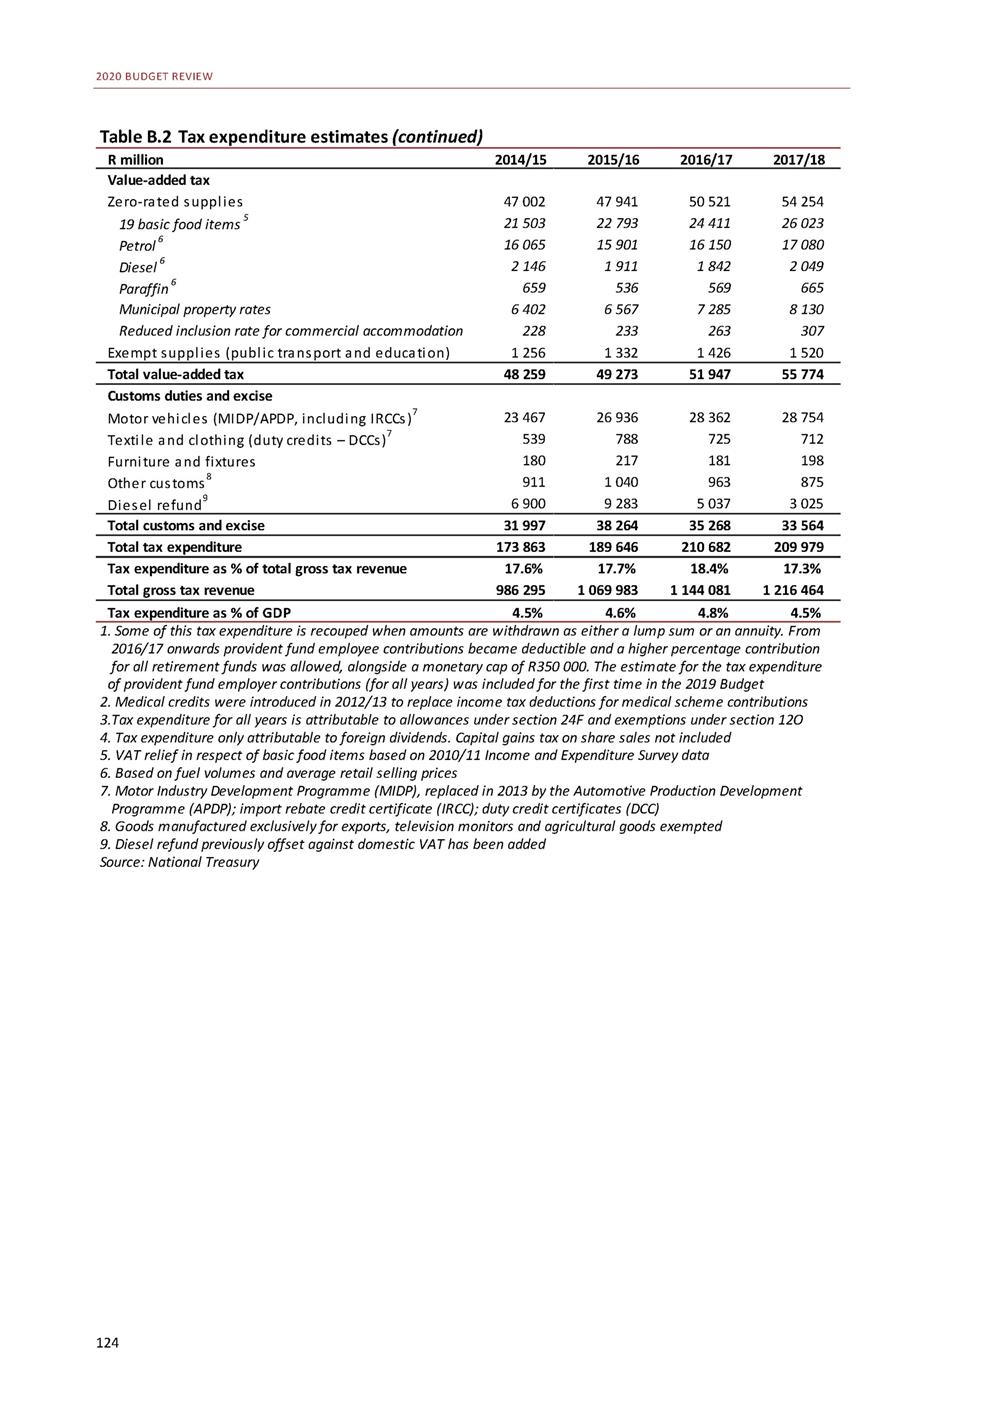
C Additional tax policy and administrative adjustments This annexure should be read with Chapter 4 of the Budget Review. It elaborates on some of the proposals contained in the chapter, clarifies certain matters and presents additional technical proposals arising from the annual tax policy process. Personal income tax The proposed tax schedule in Table 4.4 in Chapter 4 more than compensates individuals for the effect of inflation. The effects of these proposals are set out in tables C.1, C.2 and C.3. Table C.1 Annual income tax payable and average tax rates, 2020/21 (taxpayers below 65) Source: National Treasury 125 Taxable income (R) 2019/20 rates (R) Proposed 2020/21 rates (R) Tax change (R) % change Average tax rates Old ratesNew rates 85 000 90 000 100 000 120 000 150 000 200 000 250 000 300 000 400 000 500 000 750 000 1 000 000 1 500 000 2 000 000 1 080 1 980 3 780 7 380 12 780 22 112 35 112 48 112 78 819 113 654 210 320 312 820 517 820 742 820 342 1 242 3 042 6 642 12 042 21 042 33 570 46 570 76 490 110 235 205 313 307 813 512 813 734 721 -738 -738 -738 -738 -738 -1 070 -1 542 -1 542 -2 330 -3 420 -5 007 -5 007 -5 007 -8 099 -68.3% -37.3% -19.5% -10.0% -5.8% -4.8% -4.4% -3.2% -3.0% -3.0% -2.4% -1.6% -1.0% -1.1% 1.3%0.4% 2.2%1.4% 3.8%3.0% 6.2%5.5% 8.5%8.0% 11.1%10.5% 14.0%13.4% 16.0%15.5% 19.7%19.1% 22.7%22.0% 28.0%27.4% 31.3%30.8% 34.5%34.2% 37.1%36.7%
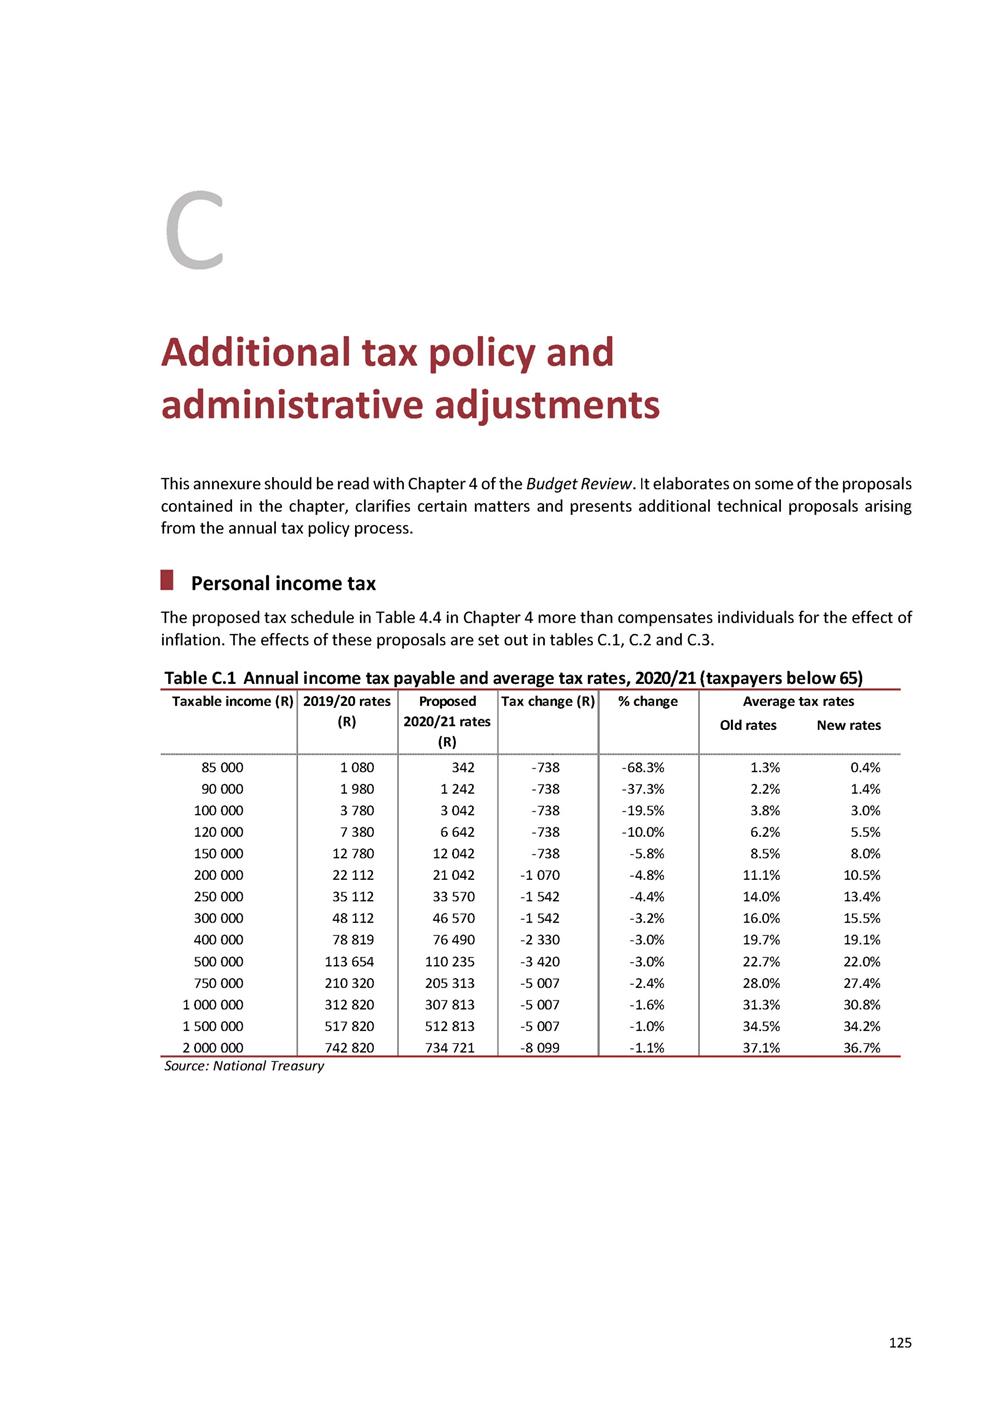
2020 BUDGET REVIEW Table C.2 Annual income tax payable and average tax rates, 2020/21 (taxpayers aged 65 to 74) Source: National Treasury Table C.3 Annual income tax payable and average tax rates, 2020/21 (taxpayers aged 75 and over) Source: National Treasury Customs and excise duty Government proposes that the customs and excise duties in the Customs and Excise Act (1964, section A of part 2 of schedule 1) be amended with effect from 26 February 2020 to the extent shown in Table C.4. 126 Taxable income (R) 2019/20 rates (R) Proposed 2020/21 rates (R) Tax change (R) % change Average tax rates Old rates New rates 150 000 200 000 250 000 300 000 400 000 500 000 750 000 1 000 000 1 500 000 2 000 000 2 385 11 717 24 717 37 717 68 424 103 259 199 925 302 425 507 425 732 425 1 107 10 107 22 635 35 635 65 555 99 300 194 378 296 878 501 878 723 786 -1 278 -1 610 -2 082 -2 082 -2 870 -3 960 -5 547 -5 547 -5 547 -8 639 -53.6% -13.7% -8.4% -5.5% -4.2% -3.8% -2.8% -1.8% -1.1% -1.2% 1.6% 0.7% 5.9% 5.1% 9.9% 9.1% 12.6% 11.9% 17.1% 16.4% 20.7% 19.9% 26.7% 25.9% 30.2% 29.7% 33.8% 33.5% 36.6% 36.2% Taxable income (R) 2019/20 rates (R) Proposed 2020/21 rates (R) Tax change (R) % change Average tax rates Old ratesNew rates 120 000 150 000 200 000 250 000 300 000 400 000 500 000 750 000 1 000 000 1 500 000 2 000 000 – 4 986 14 318 27 318 40 318 71 025 105 860 202 526 305 026 510 026 735 026 – 3 843 12 843 25 371 38 371 68 291 102 036 197 114 299 614 504 614 726 522 – -1 143 -1 475 -1 947 -1 947 -2 735 -3 825 -5 412 -5 412 -5 412 -8 504 – -22.9% -10.3% -7.1% -4.8% -3.9% -3.6% -2.7% -1.8% -1.1% -1.2% 0.0%0.0% 3.3%2.6% 7.2%6.4% 10.9%10.1% 13.4%12.8% 17.8%17.1% 21.2%20.4% 27.0%26.3% 30.5%30.0% 34.0%33.6% 36.8%36.3%
ANNEXURE C: ADDITIONAL TAX POLICY AND ADMINISTRATIVE ADJUSTMENTS Table C.4 Specific excise duties, 2019/20 – 2020/211 127 Tariff item Tariff subheading Article description 2019/20 Rate of excise duty 2020/21 Rate of excise duty 104.00 PREPARED FOODSTUFFS; BEVERAGES, SPIRITS AND VINEGAR; TOBACCO 104.01 19.01 Malt extract; food preparations of flour, groats, meal, starch or malt extract, not containing cocoa or containing less than 40 per cent by mass of cocoa calculated on a totally defatted basis, not elsewhere specified or included; food preparations of goods of headings 04.01 to 04.04, not containing cocoa or containing less than 5 per cent by mass of cocoa calculated on a totally defatted basis not elsewhere specified or included: 104.01.10 1901.90.20 Tra d i ti o n a l Afri ca n b e e r po wd e r a s d e fi n e d i n Add i ti o n a l No te 1 to Ch a pte r 19 34,7c/kg 34,7c/kg 104.10 22.03 Beer made from malt: 104.10.10 104.10.20 2203.00.05 2203.00.90 Tra d i ti o n a l Afri ca n b e e r a s d e fi n e d i n Ad d i tio n a l No te 1 to Cha pte r 22 Othe r 7,82c/l i R102.07/l i a a 7,82c/l i R106.56/l i a a 104.15 22.04 Wine of fresh grapes, including fortified wines; grape must (excluding that of heading 20.09): 104.15.01 2204.10 Sp a rkl i n g wi n e R13.55/l i R14.36/l i 104.15 2204.21 In containers holding 2 li or less: 104.15 2204.21.4 Unfortified wine: 104.15.03 104.15.04 2204.21.41 2204.21.42 Wi th a n a l co h ol i c s tre n gth o f a t l e a s t 4.5 p er cen t b y vo l u me b u t n ot e xce e d i n g 16.5 p e r ce nt b y vo l . Othe r R4.20/l i R204.15/l i a a R4.39/l i R213.13/l i a a 104.15 2204.21.5 Fortified wine: 104.15.05 104.15.06 2204.21.51 2204.21.52 Wi th a n a l co h ol i c s tre n gth o f a t l e a s t 15 p e r ce n t b y vo l u me but n ot e xce e d i n g 22 pe r ce nt b y vo l . Othe r R7.03/l i R204.15/l i a a R7.34/l i R213.13/l i a a 104.15 2204.22 In containers holding more than 2 li but not more than 10 li: 104.15 2204.22.4 Unfortified wine: 104.15.13 104.15.15 2204.22.41 2204.22.42 Wi th a n a l co h ol i c s tre n gth o f a t l e a s t 4.5 p er cen t b y vo l u me b u t n ot e xce e d i n g 16.5 p e r ce nt b y vo l . Othe r R4.20/l i R204.15/l i a a R4.39/l i R213.13/l i a a 104.15 2204.22.5 Fortified wine: 104.15.17 104.15.19 2204.22.51 2204.22.52 Wi th a n a l co h ol i c s tre n gth o f a t l e a s t 15 p e r ce n t b y vo l u me but n ot e xce e d i n g 22 pe r ce nt b y vo l . Othe r R7.03/l i R204.15/l i a a R7.34/l i R213.13/l i a a 104.15 2204.29 Other: 104.15 2204.29.4 Unfortified wine: 104.15.21 104.15.23 2204.29.41 2204.29.42 Wi th a n a l co h ol i c s tre n gth o f a t l e a s t 4.5 p er cen t b y vo l u me b u t n ot e xce e d i n g 16.5 p e r ce nt b y vo l . Othe r R4.20/l i R204.15/l i a a R4.39/l i R213.13/l i a a 104.15 2204.29.5 Fortified wine: 104.15.25 104.15.27 2204.29.51 2204.29.52 Wi th a n a l co h ol i c s tre n gth o f a t l e a s t 15 p e r ce n t b y vo l u me but n ot e xce e d i n g 22 pe r ce nt b y vo l . Othe r R7.03/l i R204.15/l i a a R7.34/l i R213.13/l i a a 104.16 22.05 Vermouth and other wine of fresh grapes flavoured with plants or aromatic substances: 104.16 2205.10 In containers holding 2 li or less: 104.16.01 2205.10.10 Sp a rklin g R13.55/l i R14.36/l i 104.16 2205.10.2 Unfortified: 104.16.03 104.16.04 2205.10.21 2205.10.22 Wi th a n a l co h ol i c s tre n gth o f a t l e a s t 4.5 p er cen t b y vo l u me but n ot e xce e d i n g 15 pe r ce nt b y vo l . Othe r R4.20/l i R204.15/l i a a R4.39/l i R213.13/l i a a
2020 BUDGET REVIEW Table C.4 Specific excise duties, 2019/20 – 2020/21 (continued) 128 Tariff item Tariff subheading Article description 2019/20 Rate of excise duty 2020/21 Rate of excise duty 104.16 2205.10.3 Fortified: 104.16.05 104.16.06 2205.10.31 2205.10.32 Wi th a n a l co h o l i c s tre n gth o f a t l e a s t 15 pe r ce n t b y vo l u me b ut n o t e xce e d i n g 22 p e r ce n t b y vol . Oth e r R7.03/l i R204.15/l i a a R7.34/l i R213.13/l i a a 104.16 2205.90 Other: 104.16 2205.90.2 Unfortified: 104.16.09 104.16.10 2205.90.21 2205.90.22 Wi th a n a l co h o l i c s tre n gth o f a t l e a s t 4.5 per cen t b y vo l u me b ut n o t e xce e d i n g 15 p e r ce n t b y vol . Oth e r R4.20/l i R204.15/l i a a R4.39/l i R213.13/l i a a 104.16 2205.90.3 Fortified: 104.16.11 104.16.12 2205.90.31 2205.90.32 Wi th a n a l co h o l i c s tre n gth o f a t l e a s t 15 pe r ce n t b y vo l u me b ut n o t e xce e d i n g 22 p e r ce n t b y vol . Oth e r R7.03/l i R204.15/l i a a R7.34/l i R213.13/l i a a 104.17 22.06 Other fermented beverages (for example, cider, perry, mead, saké); mixtures of fermented beverages and mixtures of fermented beverages and non-alcoholic beverages, not elsewhere specified or included: 104.17.03 104.17.05 104.17.07 104.17.09 104.17.11 104.17.15 104.17.16 104.17.17 104.17.21 104.17.22 2206.00.05 2206.00.15 2206.00.17 2206.00.19 2206.00.21 2206.00.81 2206.00.82 2206.00.83 2206.00.84 2206.00.85 Sp a rkl i n g fe rme n te d fru i t o r me a d b e ve ra ge s ; mi xtu re s of s pa rkl i ng fe rme n te d be ve ra ge s de ri ve d from the fe rme n ta ti o n o f fru i t o r h o n e y; mi xtu re s o f s p a rkl i n g fe rme n te d frui t or me a d be ve ra ge s a nd non-a l co hol i c be ve ra ge s Tra d i ti o na l Afri ca n be e r a s de fi ne d i n Addi ti o na l Note 1 to Cha pte r 22 Oth e r fe rme n te d b e ve ra ge s , u nfo rti fi e d , wi th a n a l co h o l i c s tre n gth o f l e s s th a n 2.5 p e r ce nt b y vo l u me Oth e r fe rme n te d b e ve ra ge s o f no n -ma l te d ce re al gra in s, unforti fi e d, wi th a n a l co hol i c s tre n gth of a t l e a s t 2.5 pe r ce nt b y vo l u me but not e xce e d i ng 9 pe r ce nt b y vo l . Oth e r mi xtu re s o f fe rme n te d b e ve ra ge s o f n o n -ma l te d ce re a l gra i n s a nd non-a l co hol i c b e ve ra ge s , unforti fi e d , wi th a n a l co hol i c s tre n gth of a t l e a s t 2.5 pe r ce nt b y vo l u me b ut n o t e xce e d i n g 9 p e r ce n t b y vol . Oth e r fe rme n te d a p pl e o r p e a r b e ve ra ge s , u n forti fi e d , wi th a n a l co hol i c s tre n gth of a t l e a s t 2.5 pe r ce nt b y vo l u me b ut n o t e xce e d i n g 15 p e r ce n t b y vol . Oth e r fe rme n te d fru i t b e ve ra ge s a n d me a d b e vera ge s , i n cl u d i n g mi xtu re s o f ferme n ted b e vera ge s d eri ved fro m th e fe rme nta ti o n o f fru i t o r h o ne y, u n fo rti fi e d , wi th a n a l co hol i c s tre n gth of a t l e a s t 2.5 pe r ce nt by vo l u me but not e xce e di n g 15 pe r ce nt b y vo l . Oth e r fe rme n te d a p pl e o r p e a r b e ve ra ge s , fo rti fi e d , wi th a n a l co h o l i c s tre n gth o f a t l e a s t 15 p e r ce nt b y vo l u me b u t n o t e xce e d i n g 23 p e r ce n t by vo l . Oth e r fe rme n te d fru i t b e ve ra ge s a n d me a d b e vera ge s i n cl u d i n g mi xtu re s o f ferme n ted b e vera ge s d eri ved fro m th e fe rme nta ti o n o f fru i t o r h o ne y, fo rti fi e d , wi th a n a l co h o l i c s tre n gth o f a t l e a s t 15 p e r ce n t by vo l u me bu t not e xce e di n g 23 pe r ce nt b y vo l . Oth e r mi xtu re s o f fe rme n te d frui t o r me a d b e ve ra ge s a nd non-a l co hol i c b e ve ra ge s , un fo rti fi e d, wi th a n a l co hol i c s tre n gth of a t l e a s t 2.5 pe r ce nt by vo l u me but not e xce e di n g 15 pe r ce nt b y vo l . R13.55/l i 7,82c/l i R102.07/l i a a R102.07/l i a a R102.07/l i a a R102.07/l i a a R102.07/l i a a R81.71/l i a a R81.71/l i a a R102.07/l i a a R14.36/l i 7,82c/l i R106.56/l i a a R106.56/l i a a R106.56/l i a a R106.56/l i a a R106.56/l i a a R85.25/l i a a R85.25/l i a a R106.56/l i a a
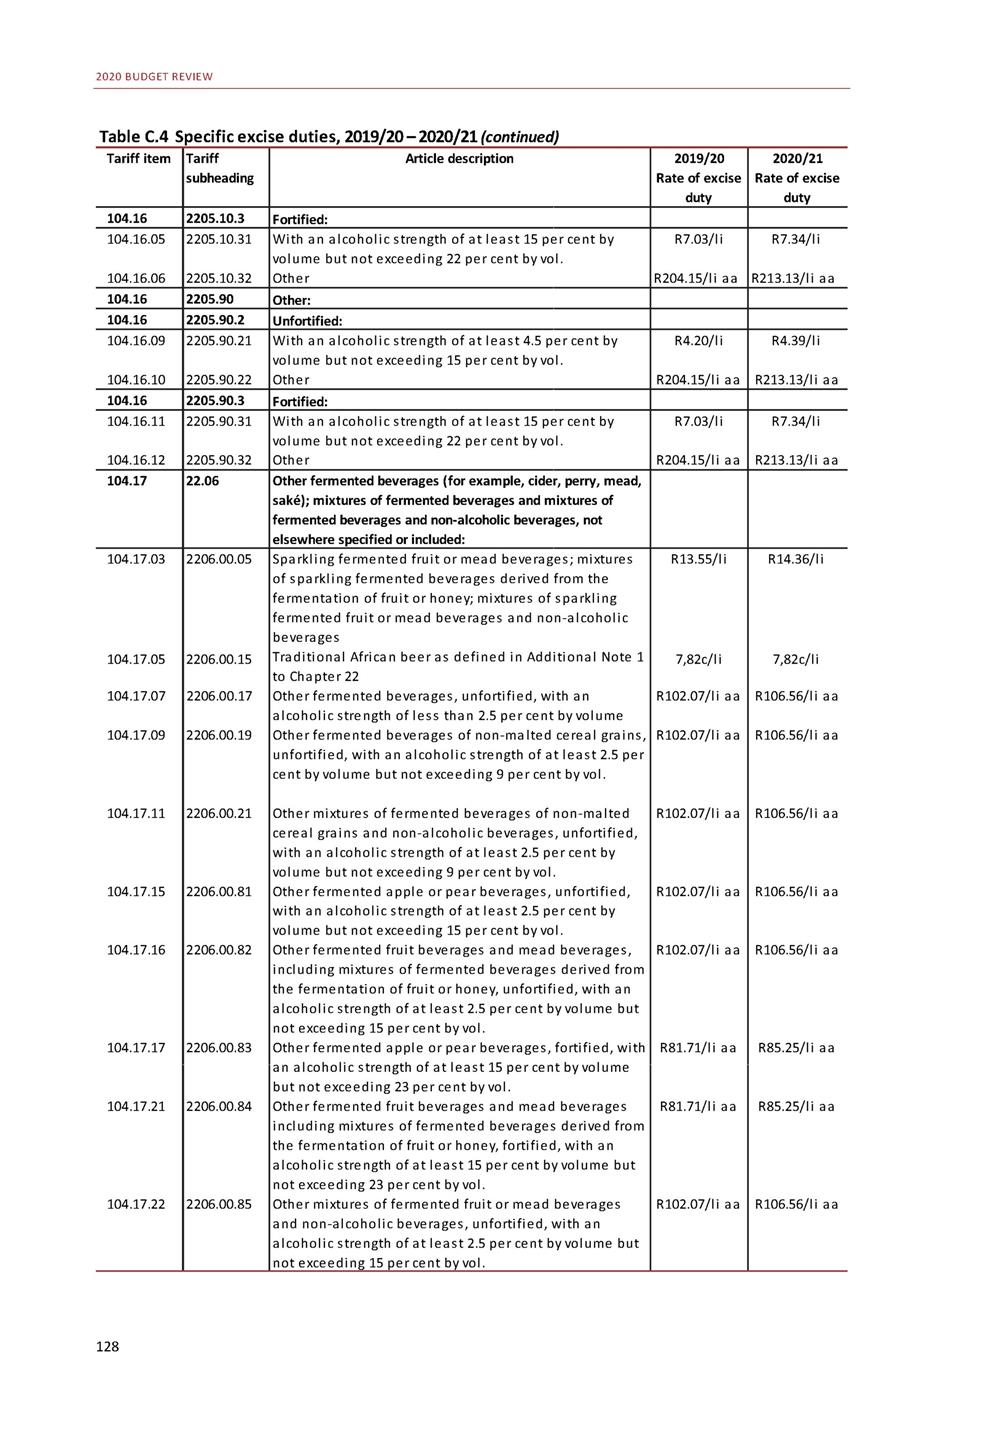
ANNEXURE C: ADDITIONAL TAX POLICY AND ADMINISTRATIVE ADJUSTMENTS Table C.4 Specific excise duties, 2019/20 – 2020/21 (continued) 129 Tariff item Tariff subheading Article description 2019/20 Rate of excise duty 2020/21 Rate of excise duty 104.17.25 104.17.90 2206.00.87 2206.00.90 Othe r mi xtu re s o f fe rme n te d fru i t o r me a d b e ve ra ge s a nd non-a l co ho l i c b e ve ra ge s , fo rti fi e d, wi th a n a l co hol i c s tre ngth of a t l e a s t 15 pe r ce nt b y vo l u me but not e xce e d i n g 23 pe r ce nt b y vo l . Othe r R81.71/l i a a R204.15/l i a a R85.25/l i a a R213.13/l i a a 104.21 22.07 Undenatured ethyl alcohol of an alcoholic strength by volume of 80 per cent vol. or higher; ethyl alcohol and other spirits, denatured, of any strength: 104.21.01 104.21.03 2207.10 2207.20 Und e n a tu re d e th yl a l co h ol o f a n a l coh o l i c s tre n gth by vo l u me o f 80 pe r ce n t vo l . o r h i gh e r Ethyl a l co h o l a n d o th e r s pi ri ts , d e n a tu re d , o f an y stre n gth R204.15/l i a a R204.15/l i a a R213.13/l i a a R213.13/l i a a 104.23 22.08 Undenatured ethyl alcohol of an alcoholic strength by volume of less than 80 per cent vol.; spirits, liqueurs and other spirituous beverages: 104.23 2208.20 Spirits obtained by distilling grape wine or grape marc: 104.23 2208.20.1 In containers holding 2 li or less: 104.23.01 104.23.02 2208.20.11 2208.20.19 Bra n d y a s d e fi n e d i n Ad d i ti o n a l No te 7 to Ch a p te r 22 Othe r R183.73/l i a a R204.15/l i a a R191.82/l i a a R213.13/l i a a 104.23 2208.20.9 Other: 104.23.03 104.23.04 2208.20.91 2208.20.99 Bra n d y a s d e fi n e d i n Ad d i ti o n a l No te 7 to Ch a p te r 22 Othe r R183.73/l i a a R204.15/l i a a R191.82/l i a a R213.13/l i a a 104.23 2208.30 Whiskies: 104.23.05 104.23.07 2208.30.10 2208.30.90 I n co n ta i n e rs ho l d i n g 2 l i o r l e s s Othe r R204.15/l i a a R204.15/l i a a R213.13/l i a a R213.13/l i a a 104.23 2208.40 Rum and other spirits obtained by distilling fermented sugarcane products: 104.23.09 104.23.11 2208.40.10 2208.40.90 I n co n ta i n e rs ho l d i n g 2 l i o r l e s s Othe r R204.15/l i a a R204.15/l i a a R213.13/l i a a R213.13/l i a a 104.23 2208.50 Gin and Geneva: 104.23.13 104.23.15 2208.50.10 2208.50.90 I n co n ta i n e rs ho l d i n g 2 l i o r l e s s Othe r R204.15/l i a a R204.15/l i a a R213.13/l i a a R213.13/l i a a 104.23 2208.60 Vodka: 104.23.17 104.23.19 2208.60.10 2208.60.90 I n co n ta i n e rs ho l d i n g 2 l i o r l e s s Othe r R204.15/l i a a R204.15/l i a a R213.13/l i a a R213.13/l i a a 104.23 2208.70 Liqueurs and cordials: 104.23 2208.70.2 In containers holding 2 li or less: 104.23.21 104.23.22 2208.70.21 2208.70.22 Wi th a n a l co h ol i c s tre n gth b y vo l u me e xce e d i ng 15 pe r ce nt b y vo l . b ut n o t e xce e di n g 23 p e r ce n t b y vo l . Othe r R81.71/l i a a R204.15/l i a a R85.25/l i a a R213.13/l i a a 104.23 2208.70.9 Other: 104.23.23 104.23.24 2208.70.91 2208.70.92 Wi th a n a l co h ol i c s tre n gth b y vo l u me e xce e d i ng 15 pe r ce nt b y vo l . b ut n o t e xce e di n g 23 p e r ce n t b y vo l . Othe r R81.71/l i a a R204.15/l i a a R85.25/l i a a R213.13/l i a a 104.23 2208.90 Other: 104.23 2208.90.2 In containers holding 2 li or less: 104.23.25 104.23.26 2208.90.21 2208.90.22 Wi th a n a l co h ol i c s tre n gth b y vo l u me e xce e d i ng 15 pe r ce nt b y vo l . b ut n o t e xce e di n g 23 p e r ce n t b y vo l . Othe r R81.71/l i a a R204.15/l i a a R85.25/l i a a R213.13/l i a a 104.23 2208.90.9 Other: 104.23.27 104.23.28 2208.90.91 2208.90.92 Wi th a n a l co h ol i c s tre n gth b y vo l u me e xce e d i ng 15 pe r ce nt b y vo l . b ut n o t e xce e di n g 23 p e r ce n t b y vo l . Othe r R81.71/l i a a R204.15/l i a a R85.25/l i a a R213.13/l i a a
2020 BUDGET REVIEW Table C.4 Specific excise duties, 2019/20 – 2020/21 (continued) 1. The chapter references in this table refer to chapters of the schedule to the Customs and Excise Act (1964) Source: National Treasury In terms of section 48 of the Customs and Excise Act, part 2A of schedule 1 is amended to the extent set out overleaf. 130 Tariff item Tariff subheading Article description 2019/20 Rate of excise duty 2020/21 Rate of excise duty 104.30 24.02 Cigars, cheroots, cigarillos and cigarettes, of tobacco or of tobacco substitutes: 104.30 2402.10 Cigars, cheroots and cigarillos containing tobacco: 104.30.01 104.30.03 2402.10.10 2402.10.90 I mp o rte d fro m Swi tze rl a n d Othe r R3901.04/kg ne t R3901.04/kg ne t R4193.62/kg ne t R4193.62/kg ne t 104.30 2402.20 Cigarettes containing tobacco: 104.30.05 104.30.07 2402.20.10 2402.20.90 I mp o rte d fro m Swi tze rl a n d Othe r R8.33/10 ci ga re tte s R8.33/10 ci ga re tte s R8.70/10 ci ga re tte s R8.70/10 ci ga re tte s 104.30 2402.90.1 Cigars, cheroots and cigarillos of tobacco substitutes: 104.30.09 104.30.11 2402.90.12 2402.90.14 I mp o rte d fro m Swi tze rl a n d Othe r R3901.04/kg ne t R3901.04/kg ne t R4193.62/kg ne t R4193.62/kg ne t 104.30 2402.90.2 Cigarettes of tobacco substitutes: 104.30.13 104.30.15 2402.90.22 2402.90.24 I mp o rte d fro m Swi tze rl a n d Othe r R8.33/10 ci ga re tte s R8.33/10 ci ga re tte s R8.70/10 ci ga re tte s R8.70/10 ci ga re tte s 104.35 24.03 Other manufactured tobacco and manufactured tobacco substitutes; “homogenised” or “reconstituted” tobacco; tobacco extracts and essences: 104.35 2403.1 Smoking tobacco, whether or not containing tobacco substitutes in any proportions: 104.35.01 2403.11 Wa te r p i p e to ba cco s p e ci fi e d i n Su b he a d i n g No te 1 to Ch a p te r 24 R215.52/kg ne t R231.69/kg ne t 104.35 2403.19 Other: 104.35.02 104.35.03 104.35.05 2403.19.10 2403.19.20 2403.19.30 Pi pe to b a cco i n i mme d i a te p a cki n gs of a co n ten t o f l es s th a n 5 kg Othe r p i p e to ba cco Ci ga re tte to b a cco R215.52/kg ne t R215.52/kg ne t R374.58/kg R231.69/kg ne t R231.69/kg ne t R391.06/kg 104.35 2403.91 "Homogenised" or "reconstituted" tobacco: 104.35.11 104.35.13 2403.91.10 2403.91.90 I mp o rte d fro m Swi tze rl a n d Othe r - - R815.63/kg R815.63/kg 104.35 2403.99 Other: 104.35.15 104.35.17 104.35.19 2403.99.30 2403.99.40 2403.99.90 Othe r ci ga re tte to b a cco s ub s ti tu te s Othe r p i p e to ba cco s u b s ti tu te s Othe r R374.58/kg R215.52/kg ne t - R391.06/kg R231.69/kg ne t R815.63/kg
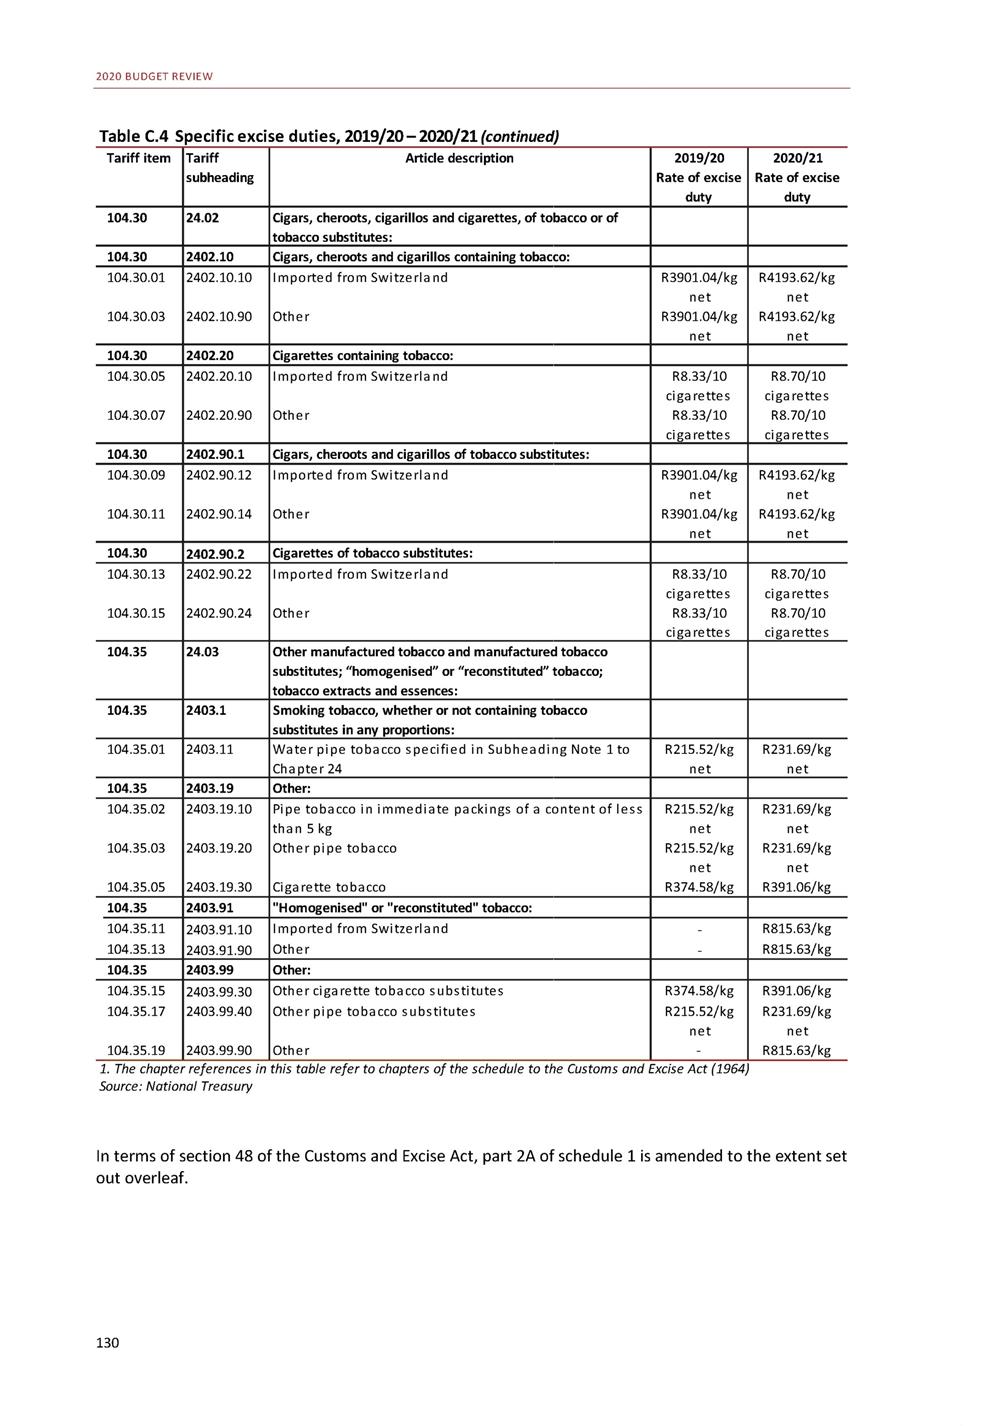
ANNEXURE C: ADDITIONAL TAX POLICY AND ADMINISTRATIVE ADJUSTMENTS Table C.5 Amendments to part 2A of Schedule No. 1 By deletion of the following: By the insertion of the following: Source: SARS In terms of section 75 of the Customs and Excise Act, schedule 6 is amended to the extent set out below. Table C.6 Amendments to Schedule No. 6 By deletion of the following: By insertion of the following: By insertion of the following: Source: SARS Additional tax amendments Additional tax amendments proposed for the upcoming legislative cycle are set out below. Individuals, employment and savings Reimbursing employees for business travel If an employee spends a night away from home for business purposes, an employer may reimburse the employee for meals and incidental costs. This reimbursement is not taxed, provided the amount does not exceed the amount published by the Commissioner of the South African Revenue Service (SARS) in the notice. If an employee is away from the office on a day trip, advances or reimbursements are not 131 Rebate item Tariff item Rebate code CD Description Extent of rebate Extent of refund 622.22 622.22 104.35.17 104.35.19 08.01 09.01 73 89 Oth e r p i p e to ba cco s u bs ti tu te s Oth e r As p ro vi d e d i n No te 4 to th i s Se cti o n As p ro vi d e d i n No te 4 to th i s Se cti o n Rebate item Tariff item Rebate code CD Description Extent of rebate Extent of refund 622.07 622.07 622.07 622.07 622.07 622.12 622.12 622.12 622.12 622.12 622.22 622.22 622.22 104.35.11 104.35.13 104.35.15 104.35.17 104.35.19 104.35.11 104.35.13 104.35.15 104.35.17 104.35.19 104.35.11 104.35.13 104.35.15 05.01 06.01 07.01 08.01 09.01 05.01 06.01 07.01 08.01 09.01 05.01 06.01 07.01 71 76 78 76 74 70 79 77 75 73 79 77 75 I mporte d fro m Swi tze rl a n d Othe r Othe r ci ga re tte toba cco s ub s ti tute s Othe r pi pe toba cco s ubs ti tute s Othe r I mporte d fro m Swi tze rl a n d Othe r Othe r ci ga re tte toba cco s ub s ti tute s Othe r pi pe toba cco s ubs ti tute s Othe r I mporte d fro m Swi tze rl a n d Othe r Othe r ci ga re tte toba cco s ub s ti tute s Ful l duty Ful l duty Fu l l duty Fu l l duty Ful l duty Ful l duty Ful l duty Fu l l duty Fu l l duty Ful l duty As provi d e d i n No te 4 to th i s Se cti o n As provi d e d i n No te 4 to th i s Se cti on As p ro vi de d i n Note 4 to thi s Se cti o n Rebate item Tariff item Rebate code CD Description Extent of rebate Extent of refund 622.07 622.07 622.12 622.12 622.22 622.22 104.35.07 104.35.09 104.35.07 104.35.09 104.35.07 104.35.09 05.01 06.01 05.01 06.01 05.01 06.01 74 72 73 71 71 75 Othe r ci ga re tte toba cco s ub s ti tute s Othe r pi pe toba cco s ubs ti tute s Othe r ci ga re tte toba cco s ub s ti tute s Othe r pi pe toba cco s ubs ti tute s Othe r ci ga re tte toba cco s ub s ti tute s Othe r pi pe toba cco s ubs ti tute s Fu l l duty Fu l l duty Fu l l duty Fu l l duty As p ro vi de d i n Note 4 to thi s Se cti o n As p ro vi de d i n Note 4 to thi s Se cti o n Tariff item Tariff subheading Article description Rate of excise duty 104.35 2403.91 "Homogenised" or "reconstituted" tobacco: 104.35.11 104.35.13 104.35.15 104.35.17 104.35.19 2403.91.10 2403.91.90 2403.99.30 2403.99.40 2403.99.90 I mpo rte d fro m Swi tze rl a n d Othe r Othe r ci ga re tte tob a cco s u bs ti tu te s Othe r p i pe to ba cco s ub s ti tute s Othe r R815.63/kg R815.63/kg R391.06/kg R231.69/kg ne t R815.63/kg Tariff item Tariff subheading Article description Rate of excise duty 104.35.07 104.35.09 2403.99.30 2403.99.40 Othe r ci ga re tte tob a cco s u bs ti tu te s Othe r p i pe to ba cco s ub s ti tute s R374.58/kg R215.52/kg ne t
2020 BUDGET REVIEW taxed if the employee can prove that they incurred these expenses on the instruction of the employer, in the furtherance of the employer’s trade. An anomaly arises when an employee purchases meals and incurs incidental costs during a day trip for work, but the employer has not explicitly instructed the employee to do so. To address this anomaly, it is proposed that the legislation be amended to exclude reimbursement expenses incurred by an employee for meals and incidental costs during a business day trip, provided the employer’s policy allows for such reimbursement. Clarifying deductions in respect of contributions to retirement funds Paragraphs 5(1)(a) and 6(1)(a) of the second schedule to the Income Tax Act (1962) make provision for a deduction of retirement fund contributions that did not qualify for a deduction in terms of section 11F of the act. These paragraphs refer to “own contributions”, which inadvertently prevents employer retirement fund contributions on behalf of employees (made on or after 1 March 2016) from qualifying for a deduction under either paragraph. It is proposed that the legislation be amended to remove this anomaly. Addressing the circumvention of anti-avoidance rules for trusts In 2016, anti-avoidance measures were introduced to curb the transfer of growth assets to trusts using low interest or interest-free loans, which was done to avoid estate duty on the asset’s subsequent growth in value. In 2017, these rules were strengthened to prevent the transfer of growth assets through low interest or interest-free loans made to companies owned by trusts. Certain taxpayers are undermining the adjusted rules by subscribing for preference shares in companies owned by trusts that are connected to the individuals. To curb this new form of abuse, it is proposed that the rules preventing tax avoidance through the use of trusts be amended. Addressing an anomaly in the rollover of amounts claimable under the employment tax incentive If the amount available to be claimed by a compliant employer in respect of the monthly employment tax incentive (ETI) is not claimed in that respective month, it can be claimed in the following month. Any unclaimed monthly ETI must be claimed by August or February, whichever is the last month of each reconciliation period. If the monthly ETI is not claimed by that time, the compliant employer forfeits that amount. However, if a non-compliant employer did not claim any ETI for an employee they were entitled to claim for, the employer is able to claim the ETI in any subsequent month when it becomes compliant. This creates an anomaly because non-compliant employers benefit more than compliant employers. It is proposed that the legislation be amended to address this anomaly. Addressing an anomaly in the tax exemption of employer-provided bursaries A number of employer bursary schemes seek to reclassify ordinary remuneration as a tax-exempt bursary granted to the dependants of an employee. Government proposes to close this loophole. These amendments will take effect on 1 March 2020. Business (general) Addressing anomalies on the acquisition of assets in exchange for debt issued The Income Tax Act sets out rules for the tax treatment of “share for share” and “asset for share” transactions, and for curbing value-shifting arrangements under these transactions. The act contains a rule to determine the base cost of assets acquired by a company in exchange for the issue of debt by that company. The interaction between the specific base cost rule for debt issued on the acquisition of assets and the act’s general provisions for determining the base cost creates unintended consequences. Some taxpayers are of the view that the specific rule overrides other anti-avoidance measures dealing with disposals between connected individuals. To address these concerns, it is proposed that the legislation be amended. 132
ANNEXURE C: ADDITIONAL TAX POLICY AND ADMINISTRATIVE ADJUSTMENTS Refining the corporate reorganisation rules Refining the interaction between the anti-avoidance provisions for intra-group transactions: Current corporate reorganisation rules allow for the tax-neutral transfer of assets between companies that are part of the same group. These provisions contain anti-avoidance measures to limit the abuse of these rules through: • • • • Early disinvestment in transferred assets External distribution of intra-group sale proceeds Transfers of assets and assumption of related debt De-grouping the group of companies that entered into an intra-group sale. In 2019, the legislation was amended to clarify the interaction between the anti-avoidance rules for de-grouping a group of companies and the anti-avoidance rules for the early disinvestment in transferred assets. However, the interaction between the anti-avoidance rules for de-grouping, and rules for the transfer of assets and the assumption of related debt may result in double taxation. It is proposed that the legislation be amended to address this anomaly. Clarifying rollover relief for unbundling transactions: The Income Tax Act makes provision for rollover relief where shares of a resident company (referred to as an unbundled company) that are held by another resident company (referred to as an unbundling company) are distributed to the shareholders of that unbundling company in accordance with the effective interest of those shareholders. However, these unbundling transactions are subject to an anti-avoidance rule that excludes the shareholders and the unbundling company from benefitting from the rollover relief if 20 per cent or more of the shares in the unbundled company are held by non-residents – either alone or together with individuals connected to those non-residents – after the transaction. This rule aims to limit the extent to which taxpayers can distribute tax-free shares in resident companies to non-residents. The current rule creates a loophole. To close this loophole, it is proposed that the legislation be amended to make provision for the 20 per cent rule to apply irrespective of whether non-resident shareholders are connected to each other. Business (financial sector) Taxation of insurance Tax treatment of deposit insurance scheme: Government is establishing a deposit insurance scheme to protect depositors in the event of a bank failure, which in turn will contribute to the stability of the South African financial system. It is envisaged that each bank will make stipulated contributions to the scheme. It is proposed that tax implications relating to the deposit insurance scheme be considered. Clarifying the meaning of “asset” for the taxation of long-term insurers: The rules in the Income Tax Act dealing with the taxation of long-term insurers make provision for assets to be allocated to the relevant fund and the profit to be taxed when annual transfers are made to the corporate fund. The transfer amounts are calculated by deducting the adjusted International Financial Reporting Standards (IFRS) value of liabilities from the market value of assets in the policyholder and risk policy funds. A problem arises with the treatment of assets that do not have an open market value, for example, prepayments. Prepayments are treated as assets for financial reporting purposes and they cannot be separately disposed of in the open market. To address these concerns, it is proposed that the legislation be amended to make provision for those assets that do not have a market value. Reviewing the interaction between rules for the taxation of benefits received by short-term insurance policyholders and the tax treatment of related expenses: 133
2020 BUDGET REVIEW The Income Tax Act allows short-term insurance premiums to be deductible provided they are disclosed as expenses for the purposes of financial reporting in line with IFRS 9. The act also makes provision for including short-term insurance policy benefits received or accrued during a year of assessment in gross income. However, another rule prohibits the deduction of any loss or expense, to the extent that it is recoverable under any contract of insurance, guarantee, security or indemnity. It is proposed that the interaction between the different rules for the taxation of benefits received by short-term insurance policyholders and the tax treatment of related expenses be reviewed. Refining the tax treatment of doubtful debt Clarifying the tax treatment of doubtful debt for non-bank taxpayers with security: The Income Tax Act sets out specific criteria for determining a doubtful debt allowance deduction for non-bank taxpayers that are not applying IFRS 9 to debt for financial reporting purposes. In this case, an age analysis of debt is used to determine a 25 per cent and 40 per cent deduction allowance for the doubtful debt. However, these deductions do not account for the taxpayer’s debt security. It is proposed that the determination of deductions in respect of secured debt arrears owed to non-bank taxpayers not applying IFRS 9 should be reviewed. Clarifying the tax treatment of doubtful debt in respect of certain impairments for banking regulated taxpayers: The Income Tax Act makes provision for the specific tax treatment of doubtful debt owed to taxpayers subject to prudential banking regulations. However, unlike the rules relating to non-banks, bank rules do not only restrict the allowance to be granted to a debt that would have been deductible if it had become a bad debt. As a result, certain impairments such as financial guarantee contracts that would otherwise not be deductible in terms of the act’s bad debt deduction provisions are deductible in terms of IFRS 9. This creates unintended consequences. To address these concerns, it is proposed that the determination of deductions in respect of impairments under IFRS 9 should be reviewed. Clarifying the tax treatment of doubtful debt in respect of taxpayers operating a leasing business: Taxpayers conducting a leasing business (lessors) and applying IFRS 9 for financial reporting purposes cannot claim a doubtful debt allowance because lease receivables are specifically excluded. This creates unintended consequences. To address these concerns, it is proposed that changes be made in the tax treatment of doubtful debts for both banking regulated and other taxpayers to exclude lease receivables that have not been received or accrued. Curbing potential tax avoidance caused by dividend deductions A bank or other “covered person” must, subject to exclusions, include in or deduct from their statement of comprehensive income all amounts from qualifying financial assets and financial liabilities that are recognised as profits or losses. One of the exclusions is a dividend or foreign dividend received by or accrued to a “covered person”. Some covered individuals are providing investment opportunities to investors by inserting a special purpose vehicle in a banking group between an investor and a “covered person”. This vehicle issues shares (a financial liability) to the investors that yield dividends while it receives interest or other income on its financial assets. The special purpose vehicle effectively converts income to dividends for the benefit of investors. To close this loophole, it is proposed that the exclusions from the rules for the taxation of covered individuals be extended to dividends declared. Refining the taxation of real estate investment trusts Clarifying the definition of real estate investment trusts (REITs): The current definition of REIT in the Income Tax Act refers to the approval of listing requirements by the appropriate authority under the Financial Markets Act (2012) in consultation with the Minister of Finance. This definition needs to be updated to be in line with the Financial Sector Regulation Act (2017). In 134
ANNEXURE C: ADDITIONAL TAX POLICY AND ADMINISTRATIVE ADJUSTMENTS addition, it is proposed that the consultation requirements regarding listing criteria in an approved exchange should be reviewed. Clarifying the meaning of a share in the definition of REITs: To qualify as a REIT for tax purposes, the entity must be a resident and the trust’s shares must be a listed on an exchange as defined in section 1 of the Financial Markets Act and licensed under section 9 of that act. However, it has come to government’s attention that some REITs wish to issue and list preference shares. It was never envisaged that holders of preference shares should benefit from the REIT tax dispensation because preference shares are mainly used for financing, and not to provide full equity exposure to investors. It is proposed that the legislation be clarified to exclude preference shares and non-equity shares from the shares that must be listed on an exchange to qualify as a REIT. Amending the anti-avoidance provision regarding taxation of foreign dividends received by REITs: A REIT holding shares in a non-resident property company qualifies for a participation exemption in terms of the Income Tax Act in respect of foreign dividends from that non-resident company. The REIT also gets a full deduction when it distributes profits from those foreign dividends. To address this mismatch, it is proposed that the legislation be amended so that the full dividend is subject to tax if the recipient company is a REIT. Refining the tax treatment of transfer of collateral in securities lending arrangements The Income Tax Act contains rules to address dividend tax avoidance transactions whereby listed shares are lent or transferred as collateral from a person that would be liable for the tax to a tax-exempt person. The borrower or recipient of the collateral receives the exempt dividend and pays a manufactured dividend to the lender or provider of the collateral. It is proposed that the anti-avoidance rules be extended to also cover situations where additional exempt parties are involved to facilitate the avoidance transactions. Business (incentives) Reviewing the special economic zone tax incentive regime The special economic zone (SEZ) tax incentive regime rules are contained in two separate provisions of the Income Tax Act. The first deals with the criteria for determining what constitutes a company, under the SEZ tax regime, that qualifies to be taxed at a rate of 15 per cent instead of 28 per cent. In addition, this provision includes a sunset clause. The clause originally stated that the provision will no longer apply for years of assessment starting on or after 1 January 2024. Following the late enactment of the Special Economic Zones Act (2014), the clause was amended to add that the provision will no longer apply for years of assessment after a 10-year period determined from the date when a qualifying company started trading in an SEZ. The second provision provides for an accelerated capital allowance for a building owned and used by a qualifying company in the production of its income within an SEZ. This provision has a sunset clause of the year of assessment starting on or after 1 January 2024. Government proposes to amend the sunset clauses for sections 12R and 12S to clearly stipulate an end date for these incentives. No company would be eligible for approval beyond these dates. The end date would also provide government with a natural point for reviewing these incentives to determine whether they should be continued. Reviewing the venture capital company tax incentive regime The venture capital company tax incentive regime has a sunset clause of 30 June 2021. Government will review the effectiveness, impact and role of this regime to ascertain whether the incentive should be discontinued. 135
2020 BUDGET REVIEW Clarifying anomalous provisions Over the past two years, changes were made in the venture capital company incentive tax regime to curb abuse and limit the regime’s revenue costs. There are potential unintended consequences within the current legislation that may affect the successful closure of legitimate venture capital companies. It is proposed that the legislation be amended to address these unintended consequences. Mining capital expenditure Addressing the tax treatment of allowable mining capital expenditure: The Income Tax Act makes provision for any taxpayer that derives income from mining operations to be allowed an accelerated capital expenditure deduction. At issue are the definitions of mining and mining operations for purposes of claiming the capital expenditure deductions, and whether a contract miner – who excavates for a fee – and the mineral rights holder – as principal – should both qualify for accelerated capital expenditure deductions. To address these concerns, it is proposed that the provisions dealing with allowable mining capital expenditure be reviewed. Removing the Minister of Finance’s discretion in ring-fencing capital expenditure per mine: The tax-deductible capital expenditure incurred on a mine may not be used to reduce the taxable income of another mine, unless the Minister of Finance, in consultation with the Minister of Mineral Resources and Energy and having considered the relevant fiscal, financial and technical implications, decides otherwise. The application of this discretion has proven problematic, so it is proposed that the discretion be reviewed with the aim of its removal or restructuring. Aligning immunity from taxation of international organisations South Africa is a member of many internationally recognised organisations. The international agreements underpinning these memberships make provision for these international organisations to be immune from taxation in South Africa. The Income Tax Act makes provision for such exemptions, but it is proposed that amendments be made to all tax acts to make provision for these exemptions and ensure South African legislation aligns with international agreements. Refining tax treatment of foreign donor-funded projects In 2006, changes were made to the Income Tax Act to make provision for the tax treatment of foreign donor-funded projects in terms of the Official Development Assistance Agreement. Given that some of these projects were entered into long ago, it has come to government’s attention that the interaction between the provisions of the act and the provisions of the Official Development Assistance Agreement creates unintended consequences. It is proposed that amendments be made to the legislation to address these concerns. Reviewing expenditure deductions incurred related to the National Key Points Act The National Key Points Act (1980) makes provision for deduction of expenditure incurred by taxpayers in respect of any national key point. The act will be repealed when the Critical Infrastructure Protection Act (2019) comes into effect. It is proposed that the current expenditure deduction for national key points be reviewed to ascertain whether this deduction should be discontinued or aligned with the Critical Infrastructure Protection Act, but with certain limitations. 136
ANNEXURE C: ADDITIONAL TAX POLICY AND ADMINISTRATIVE ADJUSTMENTS International Amending the anti-avoidance provision regarding change of residence Capital gains tax is levied when a person ceases to be a South African tax resident. When a company ceases to be a resident, there is a deemed disposal of its assets that triggers capital gains tax. Despite these rules, residents that hold shares in the company could subsequently dispose of the shares and qualify for a participation exemption for the sale of company shares. It is proposed that amendments be made to the legislation to close this loophole. Changing the anti-avoidance provision regarding taxation of foreign dividends received by residents The participation exemption rules for foreign dividends do not contain a similar limitation for general foreign dividends exemption rules (in the Income Tax Act). This limitation denies tax exemption for foreign dividends if there is a deductible expense or reduction that is determined directly or indirectly with reference to a dividend. For example, where a resident owns 20 per cent of the shares in an unlisted foreign company, no tax is imposed on the foreign dividends, even though these dividends arose from amounts that previously qualified for a tax deduction. To address this concern, it is proposed that changes be made to the legislation. Refining the definition of an “affected transaction” in the transfer pricing rules Transfer pricing rules apply if a taxpayer or a controlled foreign company enters into a transaction with a non-resident “connected person”, on terms and conditions that are not at arm’s length, and derives a tax benefit from that transaction. In the case of a transaction between a controlled foreign company and a non-resident “connected person”, a tax benefit may not be derived by the foreign company, but may be derived by a South African resident shareholder as a result of a lower inclusion of controlled foreign company net income for the resident. To address this situation, it is proposed that the legislation be amended to refer to a tax benefit that may be derived by a person, in relation to a controlled foreign company, that is a resident. Refining the tax treatment of capital flows Restricting the artificial reduction of dividends and capital gains tax: The current exchange control provisions restrict the use of loop structures, in part to protect the tax base. Tax legislation is a more appropriate tool to combat tax avoidance. For example, if a resident individual or trust holds at least 10 per cent of the total equity shares and voting rights in a foreign company, they qualify for a participation exemption and all foreign dividends received are exempt from tax. If the resident shareholding is more than 50 per cent, the foreign company is a controlled foreign company and all of the controlled foreign company’s dividend income is exempt from tax. If loop structures are no longer restricted, it would be possible to set up a structure where the controlled foreign company owns a South African company, and any dividends flowing from the resident company to the resident individual or trust through the controlled foreign company are exempt for the individual or trust. This would enable the resident individual or trust to reduce their dividend tax liability in respect of dividends declared by a resident company from 20 per cent to, in some instances, zero. A further loop structure risk exists if a resident disposes of shares in a controlled foreign company that owns South African assets. The unrealised gains attributable to the South African assets may not be taxed if the resident qualifies for the participation exemption for capital gains. Government proposes that the controlled foreign company legislation be amended to limit the dividend exemption available to a resident individual or trust relating to the accrual or receipt of dividends from a resident company to a controlled foreign company. As a result, such dividends would be taxed at an effective rate of 20 per cent, in line with cases where resident individuals receive dividends from resident companies. 137
2020 BUDGET REVIEW In addition, it is proposed that the participation exemption for capital gains on the disposal of shares in controlled foreign companies by residents should not apply to the extent that the value of those shares is derived from South African assets. Withdrawing retirement funds upon emigration: Individuals are currently able to withdraw funds from their pension preservation fund, provident preservation fund and retirement annuity fund upon emigrating for exchange control purposes through the Reserve Bank. As a result of the exchange control announcements in Annexure E, the concept of emigration as recognised by the Reserve Bank will be phased out. It is proposed that the trigger for individuals to withdraw these funds be reviewed. Any resulting amendments will come into effect on 1 March 2021. Transferring dual-listed shares abroad: A resident individual or company that owns a listed domestic security is not permitted to export that security without approval. This approval requirement is one of the exchange control provisions that will be phased out. As a result, government proposes that these events be deemed a disposal that would attract capital gains tax or normal tax. If the person or company remains a tax resident, they would be liable for tax on further gains when the security is sold in future. Value-added tax Revising the definition of “telecommunication services” for electronic services regulations With effect from April 2019, the regulations prescribing electronic services were changed to broaden the scope of electronic services that are subject to South African value-added tax (VAT). However, the definition of "telecommunication services" in the regulations currently contains an incorrect reference that creates unintended consequences. It is proposed that further changes be made to the regulations to address these consequences. Reviewing the VAT accounting basis option available for an intermediary In terms of section 54(2B) of the VAT Act (1991), certain supplies made by an underlying foreign electronic services supplier are deemed to be made by the intermediary, who is then required to levy and account for South African VAT on these supplies. Section 15(2)(a)(vii) of the VAT Act allows a vendor that is a foreign electronic services supplier to apply to the SARS Commissioner to account for VAT on a payment basis. However, it does not allow a vendor that is an intermediary to account for VAT on this basis. It is proposed that an intermediary vendor be allowed to account for VAT on a payment basis. Changing the VAT treatment of transactions under the corporate reorganisation rules Section 8(25) of the VAT Act ensures that transactions entered into between a group of companies have no VAT consequences. This is achieved by treating the supplier and the recipient of goods or services as the same person, provided the relevant rollover relief provisions of the Income Tax Act are met. The income tax relief provisions may not apply to the transfer of certain assets, which means that their transfer will also not qualify for the VAT relief, even though the assets form part of the entire transaction. This limitation of relief creates unintended consequences for VAT. The entire transaction could qualify for VAT relief under the going-concern provisions, but are excluded because the transaction falls within the ambit of the corporate reorganisation rules, which automatically require the provisions of section 8(25) of the VAT Act to apply. It is proposed that changes be made in the relief provisions in section 8(25) of the VAT Act to address these limitations. Reviewing section 72 arrangements and decisions In 2019, changes were made in section 72 of the VAT Act, which deals with the SARS Commissioner's discretion to make arrangements or decisions regarding the application of the VAT Act to specific 138
ANNEXURE C: ADDITIONAL TAX POLICY AND ADMINISTRATIVE ADJUSTMENTS situations where the manner in which a vendor or class of vendors conducts their business leads to difficulties, anomalies or incongruities. These changes have an impact on the arrangements and decisions made before 21 July 2019. To address these concerns, government will review the impact and the role of these arrangements and decisions to ascertain whether they should be discontinued or extended in accordance with the new provisions of section 72. Clarifying the VAT treatment of irrecoverable debts Where a vendor, who is required to account for VAT on an invoice basis, has made an input tax deduction for the VAT they were charged on a taxable supply and that vendor has not paid the full consideration within a 12-month period, that vendor will be required to account for output tax on the unpaid amount. The VAT Act provides clarity on the time of supply within which such output tax is to be declared. However, there is uncertainty regarding the value of supply rule that applies in certain circumstances. It is proposed that clarity be provided in the legislation to address the uncertainty. Introducing measures to address undue VAT refunds on gold Schemes and malpractice to claim undue VAT refunds have been detected in the value chain relating to gold exports. The schemes and malpractice generally involve the import of coins, purchase of Krugerrands and illicit gold. It is proposed that appropriate regulations be considered or legislation be amended to address this. Carbon tax Update on the Trade Exposure and Performance Allowance Regulations The Carbon Tax Act came into effect on 1 June 2019. Following an extensive five-year stakeholder consultation process on the design, scope and methodology, the National Treasury published draft regulations for trade exposure and performance allowances for public comment in December 2019. After taking into account the public comments received, the draft regulations will be revised and gazetted in March 2020. In that month, the National Treasury will also publish a notice for the renewable energy premium credit and, in April 2020, the Department of Environment, Forestry and Fisheries will publish the methodology and accounting framework for greenhouse gas emissions sequestration. Aligning the carbon fuel levy adjustment with Carbon Tax Act Non-stationary greenhouse gas emissions from petrol and diesel used for road transport are incorporated in the current fuel levy in terms of the Customs and Excise Act. Under section 5 of the Carbon Tax Act, the rate of the carbon tax must be increased annually based on the consumer price index inflation rate for the preceding tax period plus two percentage points for the first phase of the carbon tax up to December 2022. To provide clarity on the quantum of the annual carbon fuel levy rate adjustment, it is proposed that changes to the carbon fuel levy should be aligned with adjustments to the principal carbon tax rate under the Carbon Tax Act and become effective on the first Wednesday in January for a particular tax period. The rates of 7 cents and 8 cents per litre for petrol and diesel respectively will remain unchanged for the 2020 tax period. Government will also publish a technical note outlining the methodological approach and administrative process for future carbon fuel levy rate adjustments by June 2020. Allowing a carbon tax “pass-through” for the regulated liquid fuels sector Currently, stationary sources of greenhouse gas emissions from crude oil and synthetic coal-to-liquid and gas-to-liquid refining processes are covered by the carbon tax and qualify for tax-free allowances up to a maximum of 90 per cent and 95 per cent respectively. Due to the regulated nature of petrol and diesel fuel prices, refineries are unable to recover these carbon tax costs. The 2013 Carbon Tax Policy Paper recommended a limited, transparent and equitable “pass-through” mechanism for carbon tax costs. Taking into account the maximum tax-free allowances for fuel combustion and fugitive emissions, 139
2020 BUDGET REVIEW amendments are proposed to allow a limited recovery of the carbon tax costs for regulated fuels. It is proposed that the cost recovery mechanism applies as a deduction against the carbon tax liability of petroleum refineries and government will publish the applicable rates for specific regulated fuels in a notice in the gazette. Tax administration Income Tax Act Failure by public benefit organisations approved to receive tax-deductible donations to submit audit certificates If a public benefit organisation fails to comply with specific requirements for receiving tax-deductible donations, SARS may regard these donations as taxable income for the organisation. If the failure is not addressed within a reasonable period, the receipts issued by the organisation will no longer be valid for claiming tax deductions. The sanctions do not apply to the requirement that an organisation conducting mixed activities, some of which qualify for the issue of receipts and some of which do not, obtain an audit certificate for the use of the funds for which receipts have been issued. It is proposed that this be corrected. Refunds of withholding tax on royalties where the royalty becomes irrecoverable: The interest-withholding tax provisions provide for a refund of tax withheld when interest became due and payable if the interest subsequently becomes irrecoverable. It is proposed that the same principle should apply in cases where royalty-withholding tax was paid and the royalty becomes irrecoverable. Customs and Excise Act Exchanging information with the Department of International Relations and Cooperation: A review aimed at minimising abuse and risks associated with duty-free shops was announced in the 2019 Budget Review. The abuse of duty-free purchases by certain diplomats has become an increasing problem and disclosure of relevant information to the Department of International Relations and Cooperation will enable a response at a diplomatic level. It is proposed that SARS be permitted to disclose information regarding duty-free purchases by diplomats to the Director-General of the Department of International Relations and Cooperation. Providing for the publication of tariff determinations: The World Customs Organisation advocates capacity building, skills development and knowledge sharing by customs authorities to enhance compliance with customs and excise legislation. Publishing tariff classifications will be useful in this regard and will contribute to consistency and transparency in the classification of goods. It is proposed that the Customs and Excise Act be amended to provide for the publication of tariff determinations and rules prescribing the circumstances in which such publication may take place, the kind of information that may be published and the manner of publication. Liability for duty in respect of imported goods: The liability for import duties rests with the master, pilot or carrier and only ceases when the goods are lawfully delivered, after due entry, to the importer or agent of the importer. Complaints by stakeholders have highlighted certain difficulties relating to the cessation of liability of the master, pilot or carrier at that stage. These difficulties include high shipping line charges for landside operations and the transport of goods for scanning, the favouring of shipping line transport, and the removal of containers to certain container depots with which shipping lines have private agreements. It is proposed that the Customs and Excise Act be amended to address these challenges by providing for licensed removers of goods in bond to move containerised goods from container terminals before they are released. The liability of the master, pilot or carrier will cease on delivery of the goods to a licensed remover. Provision will also be made for the assumption of liability by the licensed remover on receipt of the goods until their delivery. 140
ANNEXURE C: ADDITIONAL TAX POLICY AND ADMINISTRATIVE ADJUSTMENTS Progress with the review of the diesel refund administration: SARS recently published draft diesel refund rules and notes to the Customs and Excise Act for public comment. The draft is the result of National Treasury and SARS consultations with affected industries, including the 2017 discussion paper, Review of the Diesel Fuel Tax Refund System, industry-specific workshops conducted in 2018 and further technical inputs received from stakeholders during 2019. The draft presents a provisional outline for the review of the diesel refund administration to facilitate further industry engagements during 2020. The reform proposals and legislative framework will be refined further based on the outcome of the engagements. Tax Administration Act Aligning the Mineral and Petroleum Resources Royalty (Administration) and the Tax Administration acts: Chapter 12 of the Tax Administration Act (2011) created a framework to support the modernisation of the SARS accounting system for interest. Due to the similarities in the interaction between provisional and income tax on the one hand and the estimation and final payment of royalties for mineral and petroleum resources on the other, it is proposed that the Mineral and Petroleum Resource Royalty (Administration) Act (2008) and Chapter 12 of the Tax Administration Act be amended to ensure they align. This includes aligning interest payable for royalties, for the first and second payment, with provisional tax interest under Chapter 12. Estimated assessments for non-compliance: SARS may issue an estimated assessment to a taxpayer who does not file a return. The assessment may only be disputed where the relevant return is filed and SARS has failed to revise the assessment in light of the return. This ensures that all the facts are available when the assessment is revisited and that the dispute resolution timelines that would otherwise apply may be relaxed in appropriate circumstances. It is proposed that this approach be extended to cases where specific relevant material was requested from a taxpayer on more than one occasion, without an adequate response. Withholding PAYE refunds where returns are outstanding: In terms of the Income Tax Act, SARS may refuse to authorise a refund until a taxpayer furnishes any outstanding returns. A similar but broader provision exists in the Employment Tax Incentive Act (2013). Given the tight integration between the PAYE, skills development levy, unemployment insurance contributions and employment tax incentive systems, it is proposed that this power also apply to the Skills Development Levies Act (1999) and the Unemployment Insurance Contributions Act (2002). It is also proposed that the similar provisions across tax legislation be reviewed to determine if they can be consolidated into a single provision applicable to all tax types under the Tax Administration Act. Withholding refunds where a matter is under criminal investigation: The Tax Administration Act provides that SARS may withhold a refund until such time that the refund is verified, inspected or audited. It is proposed that this provision be extended to include criminal investigations. Technical corrections In addition to the amendments described above, the 2020 tax legislation will make various technical corrections, which mainly cover inconsequential items – typing errors, grammar, punctuation, numbering, incorrect cross-references, updating and removing obsolete provisions, removing superfluous text, and incorporating regulations and commonly accepted interpretations into formal law. Technical corrections also include changes to effective dates and the proper coordination of transitional tax changes. 141
2020 BUDGET REVIEW A final set of technical corrections relate to modifications that account for practical implementation of the tax law. Although tax amendments go through an intensive comment and review process, new issues arise once the law is applied (including obvious omissions and ambiguities). These issues typically arise when tax returns are prepared for the first time after the tax legislation is applied. Technical corrections of this nature are limited to recent legislative amendments. 142
D Public-sector infrastructure update Introduction This annexure provides an update on the status of major infrastructure projects and reports on planned public infrastructure spending. In line with government priorities and the medium-term strategic framework, the 2020 Budget prioritises spending on social and economic infrastructure such as schools, health facilities, roads and transport, energy, and water and sanitation. It also continues to fund programmes to improve the quality of infrastructure spending, and the capacity of government to plan and implement capital projects. The budgeting provisions are complemented by reforms to improve the effectiveness of infrastructure spending. Trends in public infrastructure spending Between 1998/99 and 2018/19, the public sector spent R3.2 trillion on infrastructure (Figure D.1). Expenditure increased from R48.8 billion in 1998/99 to R216.2 billion in 2018/19. The average real growth in expenditure for the period 1998/99 to 2006/07 was 8 per cent. Spending then escalated on construction projects related to the 2010 FIFA World Cup, resulting in an average real growth of 50 per cent over 2007/08 and 2008/09. Since then, expenditure growth has been declining with an average real growth of 2 per cent. This declining trend is largely due to municipalities and state-owned companies substantially reducing their spending over the past few years. Several major state-owned companies have struggled to access capital markets to finance infrastructure programmes. Most municipalities have underspent on conditional grants and are not collecting sufficient revenue to finance their capital budgets. In addition, national government has reduced infrastructure conditional grants to provinces and municipalities as the budget deficit and debt have risen. The same trend is visible in infrastructure spending as a percentage of GDP. 143 Definitions of infrastructure spending The annexure presents estimates of infrastructure spending across the public sector, which includes national, provincial and local government, state-owned companies and other public entities, and public funds allocated to public-private partnerships. The data in this annexure may differ from infrastructure or capital expenditure estimates presented elsewhere in the 2020 Budget Review. Here, “infrastructure” is defined broadly, including spending on new assets; replacements; maintenance and repairs; upgrades and additions; and rehabilitation, renovation and refurbishment of assets. Capital and interest payments are also included in the definition. In contrast, “capital spending” typically excludes maintenance and finance charges. The annexure also includes expenditure on public housing as part of infrastructure spending. In accounting terms, housing subsidies are usually defined as transfers rather than capital spending.
2020 BUDGET REVIEW Figure D.1 Public-sector infrastructure spending Source: National Treasury Public-sector infrastructure spending highlights Table D.1 summarises government’s infrastructure spending plans for the next three years. The data combines infrastructure financed at national, provincial and local government level with spending estimates received from state-owned companies and other public entities. Table D.1 Public-sector infrastructure expenditure and estimates 1. Human settlements includes public housing and bulk infrastructure amounting to R43.9 billion over the MTEF period 2. Administration services include infrastructure spending by the departments of International Relations and Cooperation, Home Affairs, and Public Works and Infrastructure, Statistics South Africa and their entities 3. Public entities are financed by capital transfers from the fiscus and state-owned companies are financed from a combination of own revenue, borrowings and private funding Source: National Treasury 144 2016/17 2017/18 2018/19 Outcomes R billion 2019/20 Revised estimate 2020/21 2021/22 2022/23 Medium-term estimates MTEF total Ene rgy67.055.139.9 Wa te r a nd s a ni ta ti on30.826.827.1 Trans p ort an d logi s tics70.975.474.4 Othe r e con omi c s e rvi ce s14.317.113.5 He a l th10.49.711.3 Educa ti o n17.817.617.2 Huma n s e ttl e me nts 118.314.315.0 Othe r s oci a l s e rvi ce s10.311.210.1 Ad mi n i s tra ti o n s e rvi ce s 210.19.17.7 49.7 33.5 90.5 13.1 12.0 19.5 18.8 10.5 9.4 52.452.445.3 37.039.640.6 97.8105.4105.1 11.812.212.5 12.312.312.6 18.719.720.7 16.613.413.9 10.29.810.2 10.311.011.2 150.0 117.1 308.3 36.5 37.3 59.1 43.9 30.2 32.5 Total249.9236.3216.2 257.0 267.1275.9272.0 815.0 Na ti on a l de pa rtme n ts15.814.913.6 Provi n ci a l d e p a rtme nts62.662.359.5 Lo ca l gove rn me n t54.458.861.0 Public e ntitie s 317.113.29.6 Public-pri va te p a rtn e rs h ips4.84.84.9 Sta te -owne d comp a n i e s 395.282.267.5 15.8 60.8 61.7 18.7 5.6 94.2 16.116.917.3 59.957.159.9 62.365.768.7 19.019.620.6 5.76.15.9 104.0110.599.5 50.4 177.0 196.8 59.2 17.8 314.0 Total249.9236.2216.2 257.0 267.1275.9272.0 815.0
ANNEXURE D: PUBLIC-SECTOR INFRASTRUCTURE UPDATE Public-sector infrastructure spending over the medium-term expenditure framework (MTEF) period is estimated at R815 billion. State-owned companies continue to be the largest contributor to capital investment, spending a projected R314 billion over the next three years. Provinces are expected to spend R177 billion on infrastructure over the same period, while municipalities are forecast to spend R196.8 billion. Public housing and bulk infrastructure built through the human settlements development grant in provinces is expected to total R43.9 billion. Although these assets are transferred to homeowners, this spending is a substantial government contribution to the built environment. Spending on economic infrastructure, mainly by state-owned companies, accounts for 75.1 per cent of the medium-term estimate. These funds are used to expand power-generation capacity, upgrade and expand the transport network, and improve sanitation and water services. Social services infrastructure accounts for 20.9 per cent of the total, of which health and education account for 4.6 per cent and 7.2 per cent respectively. In 2019/20, the public sector is estimated to spend R257 billion on infrastructure, an increase of 19 per cent relative to 2018/19. This is mainly because of higher estimated spending by state-owned companies including the Passenger Rail Agency of South Africa, Eskom, Transnet and Rand Water, which are expected to resume or begin infrastructure projects that were deferred in previous years. The value of infrastructure budgets, however, is eroded by insufficient capacity and skills to build a sustainable pipeline of projects, as shown by infrastructure backlogs and the lack of business confidence. Government is therefore adopting a multi-faceted approach by resourcing project preparation facilities, reviewing regulations and policies, and introducing reforms. This approach is expected to improve the effectiveness of infrastructure spending and develop a project pipeline for funding by government and the private sector. Sectoral updates Energy Energy expenditure is expected to total R150 billion over the next three years, accounting for 18.4 per cent of total infrastructure spending. Eskom accounts for R128 billion, or 85.3 per cent, of this amount. The Department of Mineral Resources and Energy will focus on increasing household access to electricity over the medium term. A total of R16.4 billion has been allocated to support the Integrated National Electrification Programme. The programme will fund an estimated 560 000 new connections to the power grid over the MTEF period. An additional 15 000 households will be provided with non-grid (stand-alone power system) connections per year. Over the medium term, government will transfer R6 billion to municipalities and R9.7 billion to Eskom to fund this programme. To help municipalities replace and upgrade municipal infrastructure with more energy-efficient technology, R691.3 million has been allocated to the energy efficiency and demand-side management grant over the medium term. The Department of Mineral Resources and Energy continues to support the renewable energy market, in line with the national commitment to transition to a low-carbon economy. Government has committed to procuring 14 725 megawatts (MW) of power from renewable energy sources in terms of the Integrated Resource Plan 2010 to 2030. Up to 2019, 6 422 MW has been procured from 112 renewable energy independent power producer projects over seven bid windows, and 3 976 MW of electricity generation capacity from 64 projects has been added to the national grid. Private-sector investment in the programme amounts to R209.7 billion to date, of which R41.8 billion is from international investors and funders. 145
2020 BUDGET REVIEW Water and sanitation Government will spend R117.1 billion on water and sanitation over the next three years, accounting for 14.4 per cent of public-sector infrastructure expenditure. The Water Infrastructure Development Programme is allocated R41.6 billion over the medium term. The majority of this allocation, R24.5 billion, will be transferred to the Water Trading Entity, the regional bulk infrastructure grant and the water services infrastructure grant. The Water Trading Entity will receive transfers amounting to R6.6 billion over the medium term for new and existing projects such as the acid mine drainage operations in Gauteng, phase 2D of the Olifants River water resources development project, the Mokolo-Crocodile River water augmentation project, the raising of Tzaneen Dam, the Mdloti River development project, and the raising of Hazelmere Dam. Disbursements through the regional bulk infrastructure grant and the water services infrastructure grant will amount to R17.2 billion over the medium term. The funding will be used to implement regional bulk and water services infrastructure projects. Transport and logistics Public-sector infrastructure investment plans for transport and logistics total R308.3 billion over the medium term. This accounts for 37.8 per cent of total infrastructure expenditure during this period. These investments will improve the transport network, enhance the mobility of people and service provision, reduce transport costs, and facilitate regional trade. Revenue from services provided by state-owned companies will help fund infrastructure investment, complemented by national and provincial allocations for road construction and maintenance of the non-toll network. Over the MTEF period, major investments in roads and rail include the following: • The South African National Roads Agency Limited has been allocated R64.6 billion over the medium term. Of this amount, R35.4 billion will be used to improve and construct non-toll roads, R3.4 billion to construct the N2 Wild Coast highway, R2.5 billion to upgrade the R573 (Moloto Road) and R1.9 billion to compensate for reduced tariffs in the Gauteng Freeway Improvement Project. The provincial roads maintenance grant has been allocated R36 billion to maintain the provincial road network by resealing a targeted 16 226 lane kilometres, rehabilitating 6 199 lane kilometres, and patching 3.7 million square kilometres of potholes. The Passenger Rail Agency of South Africa has been allocated R32.4 billion in capital transfers to modernise the rail network. In addition, R20.4 billion has been allocated to the public transport network grant to fund the integrated public transport networks in 10 cities across the country. • • Human settlements The Department of Human Settlements has been allocated R95.9 billion over the medium term, which will support delivery of 226 906 housing subsidies. The department will facilitate the delivery of state-subsidised housing through implementing agents such as provinces, metropolitan municipalities and related departmental entities. These implementing agents are funded through the Housing Development Finance Programme in the form of conditional grants and transfers. The human settlements development grant has been allocated R43.9 billion over the medium term to fund housing and human settlements programmes at a provincial level. Over the same period, the urban settlements development grant has been allocated R26 billion to fund infrastructure provision for broader urban development in metropolitan municipalities. The National Housing Finance Corporation will increase access to affordable housing finance for low-to middle-income households by facilitating private-sector lending for housing. Over the medium term, the 146
ANNEXURE D: PUBLIC-SECTOR INFRASTRUCTURE UPDATE corporation will focus on incremental housing finance; developer and emerging contractor finance; affordable rental housing finance; and finance-linked individual subsidies for qualifying households. Over the medium term, the corporation will receive an additional allocation of R1.3 billion for its finance-linked individual subsidy programme. Health Over the medium term, the Department of Health plans to accelerate the delivery of infrastructure in the health sector for the implementation of national health insurance. The direct health facility revitalisation grant, which is transferred to provincial health departments, will receive R19.9 billion over the next three years. Over the same period, R4.6 billion will be allocated to the health facility revitalisation component of the national health insurance indirect grant. A portion of this allocation will fund the planning and building of the Limpopo Central Hospital in Polokwane, which is expected to be completed in 2025/26. Education Government plans to spend R59.1 billion on infrastructure for the education sector over the MTEF period. The Department of Basic Education plans to spend R41.4 billion on school infrastructure over the medium term. The education infrastructure grant has been allocated R35 billion over this period to accelerate the construction, maintenance, upgrading and rehabilitation of new and existing school infrastructure. The school infrastructure backlogs grant will receive R6.5 billion to provide water, sanitation and electricity to schools, and replace schools constructed with inappropriate materials. In 2020/21, R1.7 billion will be used to build 31 new schools and to provide water and sanitation facilities to 125 and 691 schools respectively. The Department of Higher Education and Training will focus on increasing student access and improving staff development in the university system by increasing allocations to universities with a high proportion of students and staff from historically disadvantaged population groups. In 2020/21, the University Capacity Development Programme will receive R1.1 billion, the Historically Disadvantaged Institutions Development Programme will receive R536.3 million and the Infrastructure and Efficiency Programme will receive R2.8 billion. Infrastructure reforms Infrastructure investments facilitate economic activities and thus enable economic growth, job creation and poverty alleviation. The National Development Plan targets infrastructure investment of 30 per cent as a percentage of GDP by 2030. Figure D.2 Public and private capital investment as a share of GDP, 1960–2018 30 Source: Reserve Bank 147 Per cent of GDP 1960 1964 1968 1972 1976 1980 1984 1988 1992 1996 2000 2004 2008 2012 2016 35 Public-sector investment 25 20 15 10 5 0 Private-sector investment NDP target
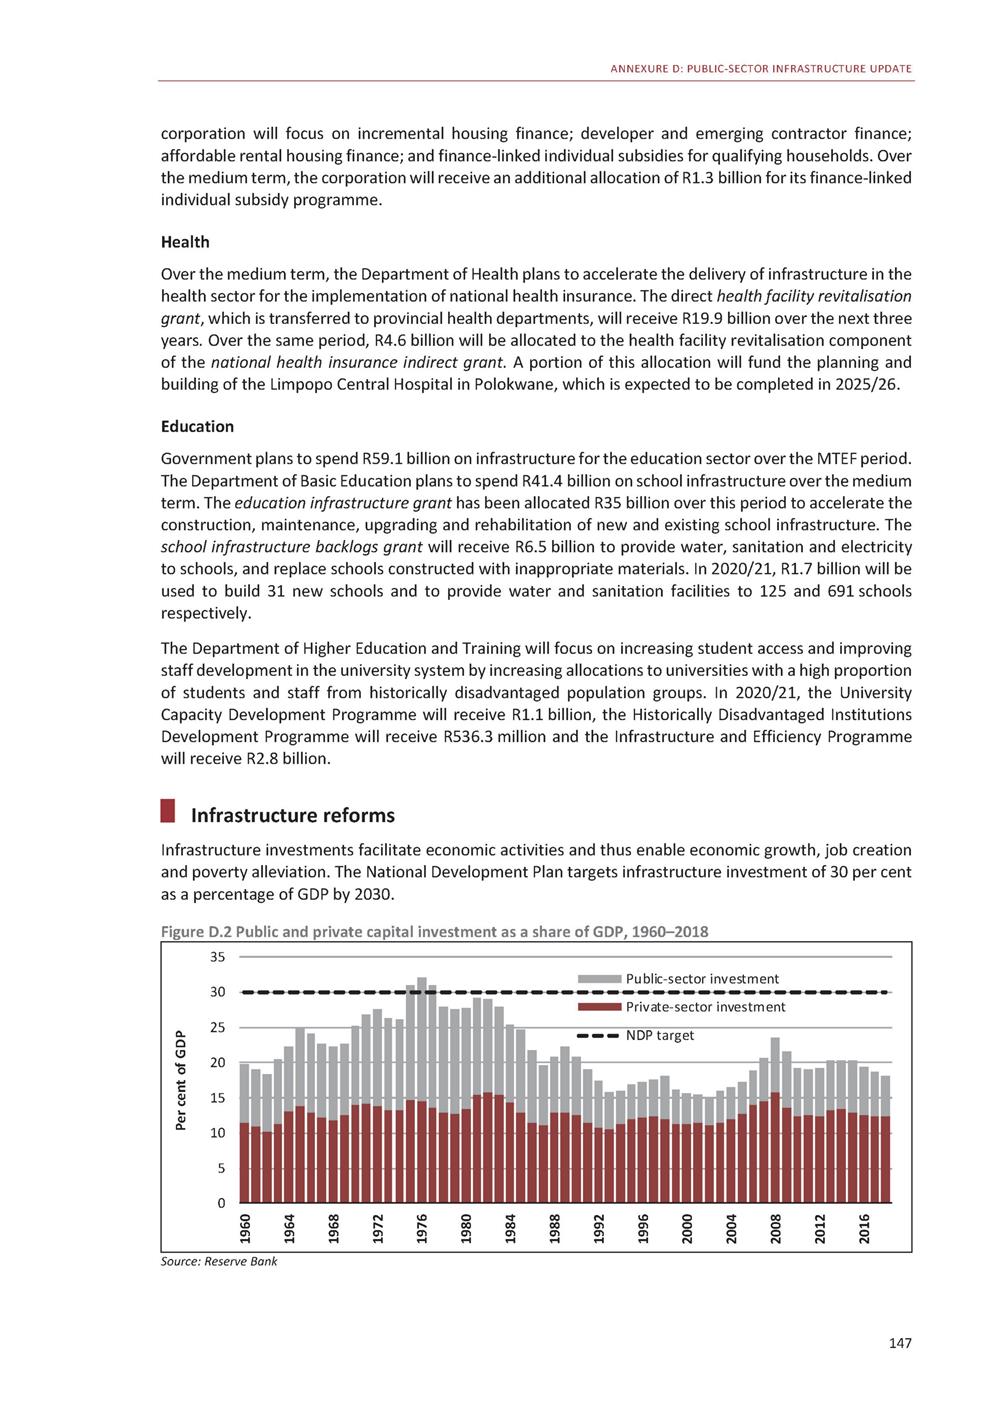
2020 BUDGET REVIEW Bridging the infrastructure investment gap requires developing innovative approaches to leverage private-sector finance, making the necessary regulatory changes and improving infrastructure planning across government to build a pipeline of projects. To unlock this potential, government has initiated broad reforms in infrastructure provision. The reforms will ensure that infrastructure is built faster and that costs are controlled, with appropriate sharing of risks between the private and public sector. In addition, government is integrating climate-change considerations into existing tools to strengthen the climate resilience of infrastructure. The components of these reforms are summarised below. The Budget Facility for Infrastructure The Budget Facility for Infrastructure (BFI) was launched in 2016 to support the planning and execution of priority infrastructure projects and programmes. The facility evaluates proposals before committing fiscal resources to avoid funding poorly planned and inadequately prepared large-scale projects. The BFI creates a window for annual submissions for budgets of large infrastructure projects and programmes, assesses the submissions, and makes recommendations to budget authorities and political decision makers. Since 2017, there have been three annual BFI windows. In total, submissions were received for 169 projects worth R374.5 billion, and 26 projects worth R37.1 billion were recommended for funding. Most proposals submitted through the BFI are poorly planned and packaged, mainly because of insufficient technical expertise and institutional capacity to develop good projects. Appraisal and evaluation guideline With funding from the World Bank, the National Treasury is developing a government-wide project appraisal and evaluation guideline. The guideline will provide simple, uniform methodologies and criteria that will apply to all new proposals. It will guide practitioners on how to package projects and enable decision makers to select projects that offer value for money and maximise economic benefits for government. The guideline is expected to be drafted within the next six months. Infrastructure Fund Government has committed R100 billion to the Infrastructure Fund, including R10 billion over the next three years. This includes new funding, new guarantees and repackaging of existing projects. The fund focuses on blended-finance projects, most of which will be funded primarily by the private sector. The Infrastructure Fund will increase private-sector investment in public infrastructure and contribute to higher economic growth, productivity and employment creation. The fund’s implementation unit, housed within the Development Bank of Southern Africa (DBSA), aims to facilitate and speed up the development of projects and programmes. The unit aims to build a pipeline of potential projects worth over 700 billion over the next 10 years. Stringent criteria are applied when deciding which projects should be included in the Infrastructure Fund pipeline. To be accepted, projects must: • Be large, as the preparation costs for blended-finance projects are prohibitive for small projects and large-scale investment is being targeted. Be suitable for blended financing, with clear and predictable cash flows, sufficiently attractive risk profiles for investors, and the need for some financial support from government. Mobilise private-sector skills and resources. Align with government’s infrastructure priorities. Be scalable and replicable. • • • • Over the next three years, the DBSA will identify, plan and package at least five blended-finance mega projects (valued at over R200 billion), using the funds committed by government to close funding gaps and reduce risks for the private sector. Results from the first set of projects will be used to adapt and 148
ANNEXURE D: PUBLIC-SECTOR INFRASTRUCTURE UPDATE strengthen the final design of the Infrastructure Fund. The DBSA is collaborating with private-sector investment associations, the Banking Association South Africa, the Association for Savings and Investment South Africa, and the Public Private Growth Initiative to build partnerships and attract private-sector funding. Project proposals will be evaluated through the BFI. Public-private partnership review In 2019, the National Treasury began reviewing the public-private partnership (PPP) regulations and guidelines. The review aims to identify and address challenges that have negatively affected PPP project readiness and private-sector participation. Improvements stemming from the review are also expected to enhance the Infrastructure Fund work on blended-finance projects. The review of the PPP framework is a key reform as most of the blended projects will be partnerships between the public and private sector. Key stakeholders in government and the private sector are providing input to the review. The recommendations are expected in September 2020. Feasible recommendations will be incrementally introduced to scale up the pipeline of PPP projects. Municipal Investment Programme Project Preparation Facility The Neighbourhood Development Programme helps municipalities improve the development and management of their built environment. To expedite spatial transformation in cities, the focus has been on planning well-located, mixed-use and mixed-income development programmes and projects as required by built environment performance plans. Metropolitan municipalities have growing infrastructure investment needs, established institutional capacity, autonomous borrowing authority and generally healthy balance sheets that can be used to leverage private finance. A dedicated grant will be created to support them to establish effective and efficient programme management and project preparation facilities for their capital investment programmes. They will be financed by reprioritising funds from the integrated city development grant and neighbourhood development partnership grant. From 2020/21, the Cities Preparation Support Fund will provide co-financing, which declines as these municipalities increase their capacity. Cities Support Programme’s work on climate change and infrastructure For many cities, strengthening the resilience of infrastructure and supporting low-carbon development of capital projects is a large-scale undertaking that requires strong partnerships and new sources of capital. Some cities lack technical expertise or access to the capital required. The National Treasury’s Cities Support Programme helps cities increase their capital investments in climate resilience and low-carbon development through targeted technical assistance to strengthen project design, packaging and preparation. The programme will also strengthen cities’ capability to manage climate-resilient assets by integrating climate-change considerations into their planning tools, including the Infrastructure Delivery Management System, guidelines for catalytic land development programmes and the BFI’s project appraisal and evaluation guideline. Support on applying these tools will be provided at the national and city level. Major infrastructure projects Table D.2 provides a pipeline of projects that are at various stages of development. Some projects are still in the early stages of project preparation while others are at advanced stages. These projects are not yet approved for funding. Large projects have to go through a number of approval gates involving successively more detailed planning before being considered for funding through the budgeting process. Most of the proposed projects and programmes will be financed in partnership with government, the private sector and development finance institutions. Health sector projects, however, are fully funded by government. 149
2020 BUDGET REVIEW Table D.2 Major infrastructure projects per sector Project name Implementing agent Project cost (R billion) Project description Current status Health Limpopo Central Hospital Limpopo Department of Health 4 Construction of a new 488-bed central hospital on a greenfield site donated by the Polokwane Local Municipality Procurement Tygerberg Hospital Western Cape Department of Health 4.3 Construction of a 550-bed regional hospital Feasibility completed Klipfontein Hospital Western Cape Department of Health 4.2 Construction of a 1 238-bed hospital to replace the GF Jooste Hospital Feasibility completed Education Student Housing Infrastructure Programme (SHIP) pilot phase Department of Higher Education and Training 96 Construction of student residences Various stages Gauteng Schools Programme Gauteng Provincial Government 4.7 Construction, expansion, refurbishment and facilities management of 64 schools in Gauteng Feasibility Housing Social Housing Programme Phase 1 Social Housing Regulatory Authority 10.3 Construction of social housing in well-located areas for low-to middle-income families Implementation Social Housing Programme Phase 2 Social Housing Regulatory Authority 18.5 Social Housing Programme Phase 2 Pre-feasibility Office accommodation Kopanong Precinct Gauteng Department of Infrastructure Development 16 Construction of Gauteng Provincial Government office to consolidate administration function of 19 buildings in the Johannesburg CBD Procurement Rural Development and Land Reform head office accommodation Department of Rural Development and Land Reform 4 Construction of the head office Procurement accommodation Bhisho Office Precinct Eastern Cape Department of Roads and Public Infrastructure 5 Construction of offices for seven Eastern Cape departments in a single location in Bhisho Procurement Telecommunications Broadband rollout (SA Connect) Department of Telecommunications and Postal Services 80 Broadband infrastructure in areas where pure private provision thereof is not commercially viable Feasibility 150
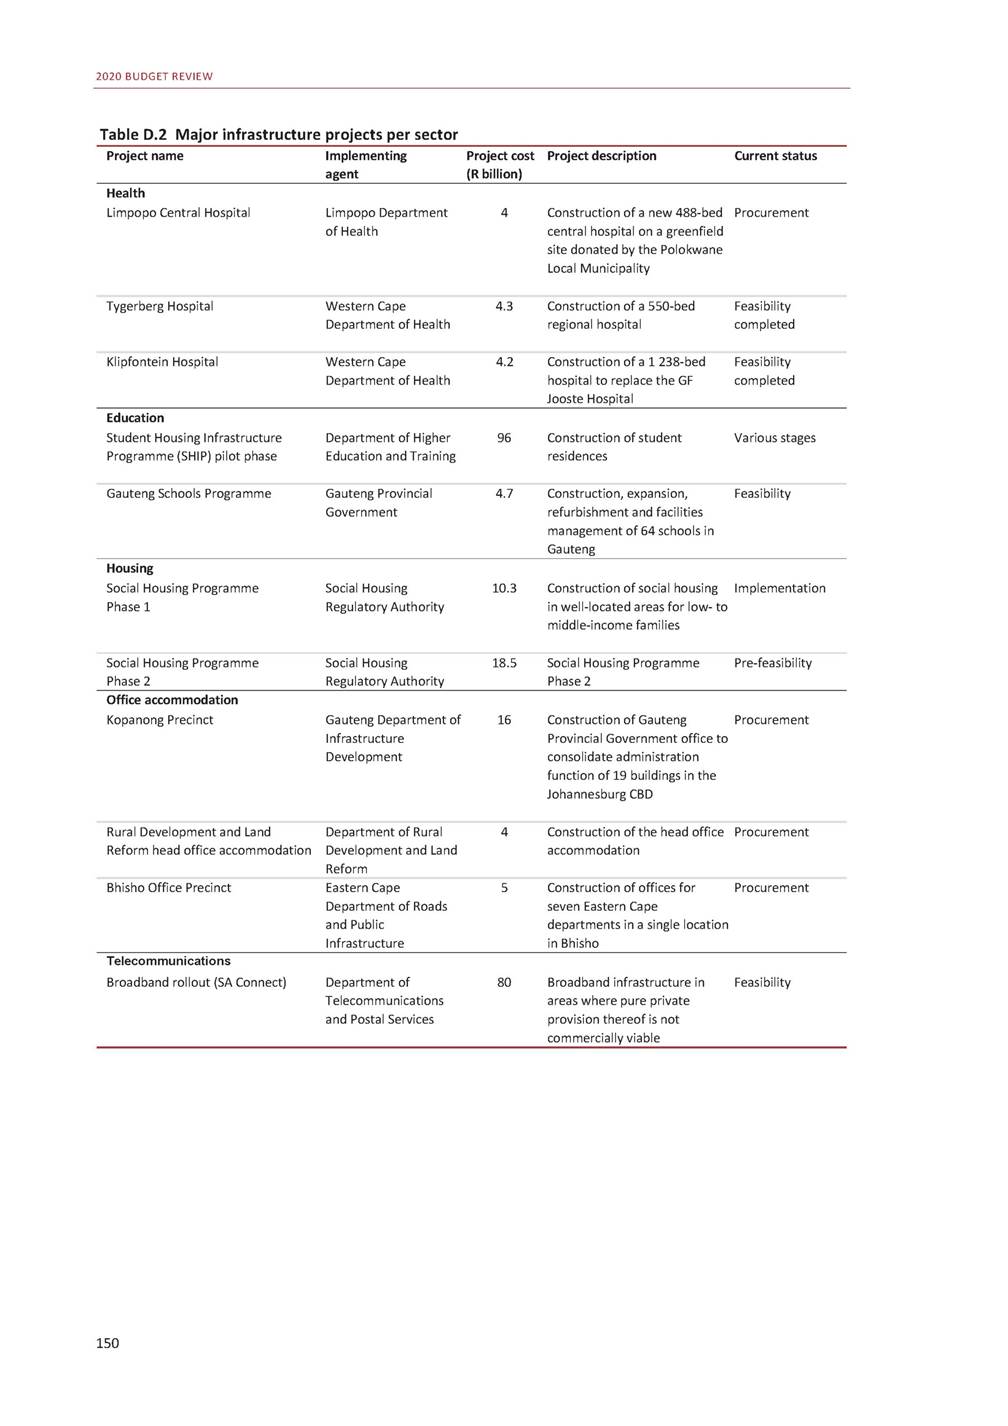
ANNEXURE D: PUBLIC-SECTOR INFRASTRUCTURE UPDATE Table D.2 Major infrastructure projects per sector (continued) Project name Implementing agent Project cost (R billion) Project description Current status Transport Gauteng Rapid Rail Network Extension Phase 1 and 2 Gauteng Department of Roads and Transport 112 A two-phase extension of the existing Gautrain rail system Feasibility Gautrain: Acquisition of additional rolling stock Gauteng Department of Roads and Transport 2 Procurement of 48 additional coaches and expansion of depot facility to accommodate increased demand Feasibility National Roads Programme – upgrades to existing non-concession national toll roads South African National Roads Agency 22 Major upgrades to various sections of the N1, N2 and N3 roads Pre-feasibility Provincial roads concessions Provincial roads and transport departments 45 Provincial roads infrastructure projects Pre-feasibility Expansion of the MyCiTi Bus Rapid Transport System in Cape Town City of Cape Town 7.5 Expansion of the current MyCiTi Procurement Bus Rapid Transport System network Small Harbours Programme Department of Public Works and Infrastructure 8.2 Upgrading and refurbishment Feasibility of 12 proclaimed fishing harbours in the Western Cape, and nodal-based refurbishment and development of new harbours in the Northern Cape, Eastern Cape and KwaZulu-Natal Transnet natural gas networks project Transnet 10 Develop, design, finance, construct and operate liquefied natural gas midstream infrastructure to enable gas import Pre-feasibility One-stop border posts Department of Home Affairs 11 Upgrade, refurbishments and Procurement facilities management for the six busiest border posts Energy Approach to Distribution Asset Management Department of Mineral Resources and Energy, Cooperative Governance and Municipal Infrastructure Support Agent 30 Maintenance, refurbishment Pre-feasibility and strengthening of municipal electricity distribution networks Research SA Isotope Facility National Research Foundation 1.4 Construction of the South African Isotope Facility Procurement Solid waste Mossel Bay regional landfill facility Garden Route District Municipality 0.8 Development of solid waste and landfill Procurement KwaDukuza waste services KwaDukuza Local Municipality 0.3 Collection and disposal of solid waste from households Procurement 151
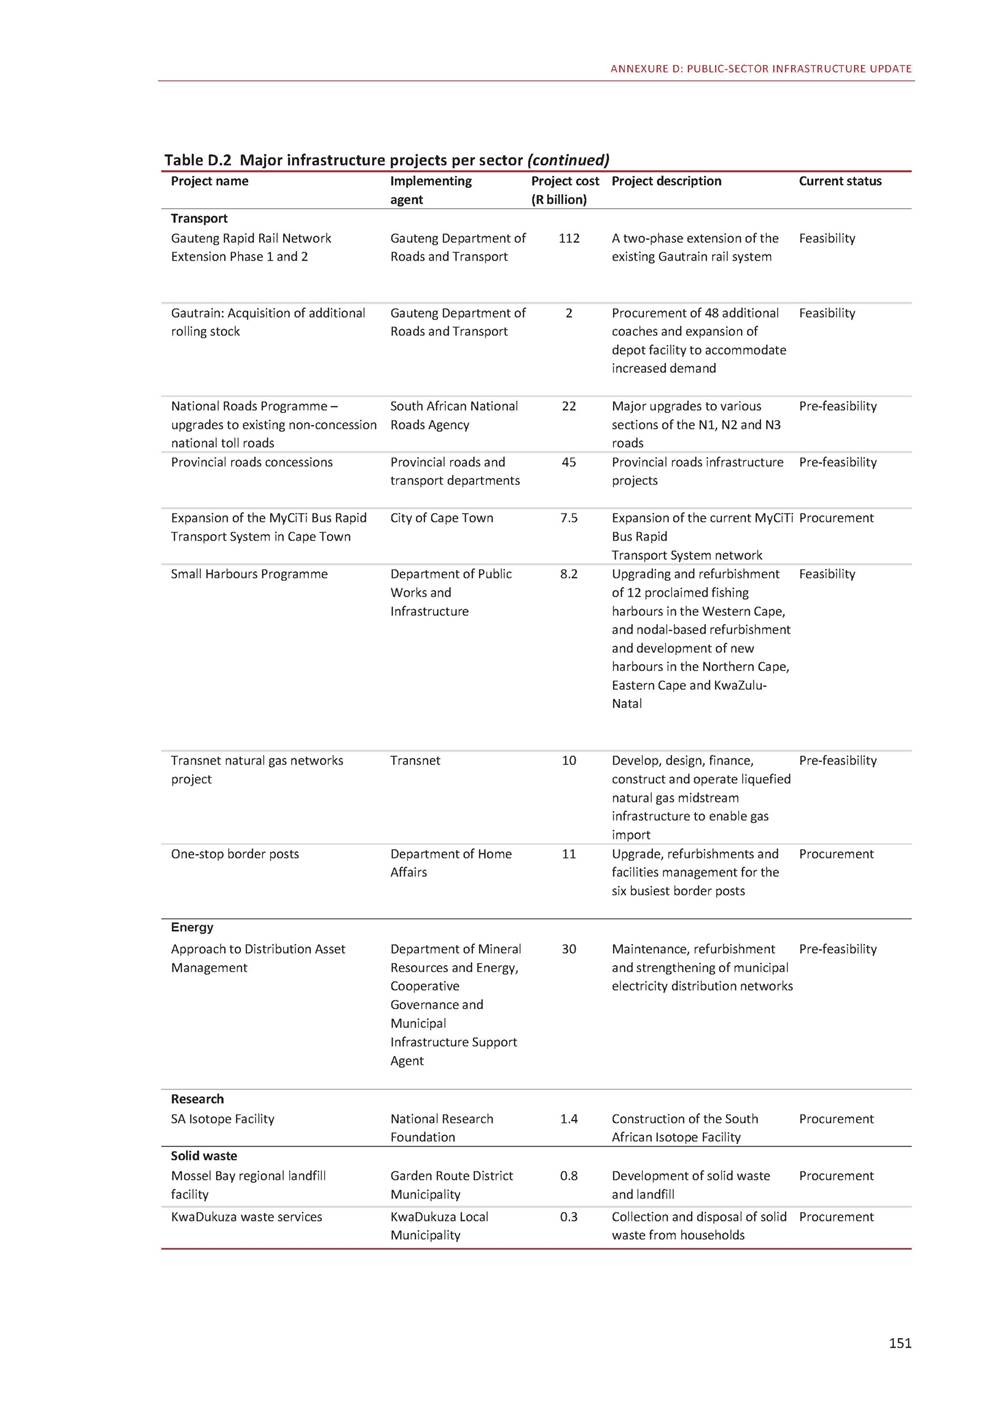
2020 BUDGET REVIEW Table D.2 Major infrastructure projects per sector (continued) Project name Implementing agent Project cost (R billion) Project description Current status Water and sanitation Water reuse Cooperative Governance and Municipal Infrastructure Support Agent 50-75 Increasing bulk water supply, through wastewater reuse or putting in place new sources of supply such as desalination Pre-feasibility Water and sanitation private-sector participation Cooperative Governance and Municipal Infrastructure Support Agent 100 Increasing private-sector participation in the provision of municipal water and sanitation services Pre-feasibility Non-revenue water (water conservation and water demand management) Cooperative Governance and Municipal Infrastructure Support Agent 35-50 Improving water infrastructure Pre-feasibility to reduce losses, and improving metering, billing and collection from non-indigent customers Olifants River Water Resources Development Project Trans-Caledon Tunnel Authority 20 Bulk water infrastructure development Pre-feasibility Bulk infrastructure Industrial Development Corporation (IDC) infrastructure for industrial projects programme Industrial Development Corporation 15 Industrial Development Corporation infrastructure for industrial projects Feasibility Vumela - municipal bulk infrastructure financing Cooperative Governance and Municipal Infrastructure Support Agent 50-60 Development of municipal bulk infrastructure Pre-feasibility Coega Special Economic Zone Return Effluent Scheme Coega Development Corporation 0.9 Construction of critical bulk infrastructure (water, return effluent and sanitation) around the development of a bulk return effluent scheme Feasibility completed The establishment of basic economic infrastructure in Zone 3, 5, 6 and 7 of the Coega Special Economic Zone to unlock gas-to-power, aquaculture development and bulk water demand Coega Development Corporation 0.5 The provision of bulk services, including water, sanitation, electrical and energy Feasibility completed Source: National Treasury 152
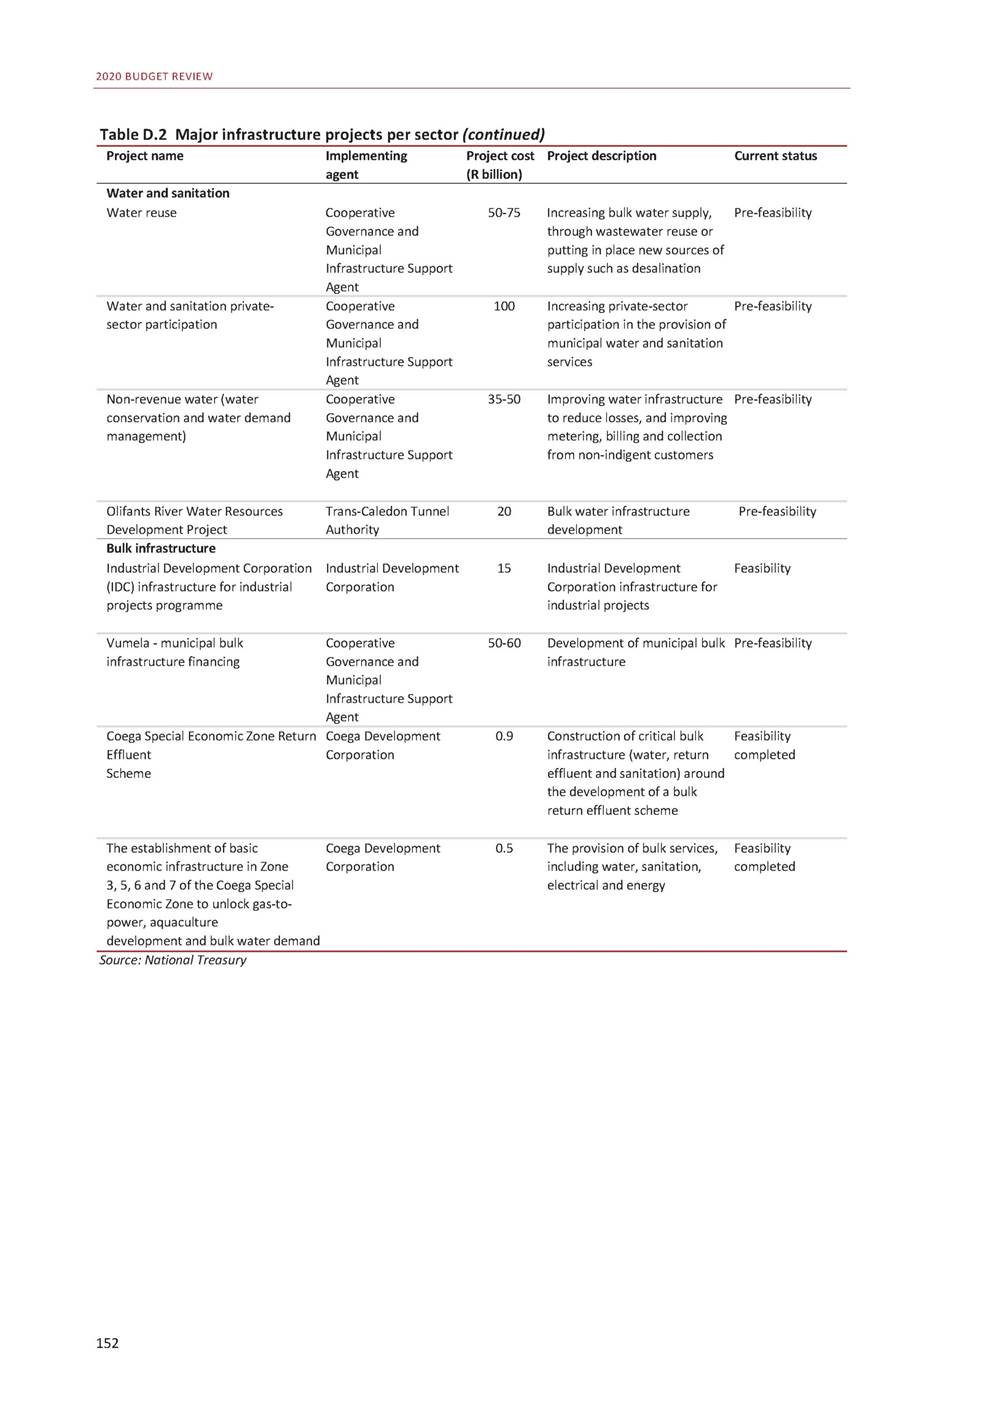
E Financial sector update This annexure provides an update on regulatory changes in the financial sector, including changes announced in the 2019 Medium Term Budget Policy Statement to promote investment and reduce burdensome regulation. Fighting financial crime and corruption South Africa’s financial intelligence system is undergoing a mutual evaluation by an assessment team from the Financial Action Task Force (FATF). This review, which takes place regularly in all FATF member countries, evaluates national systems to prevent money laundering, terror financing and financing of the proliferation of weapons of mass destruction. The review will conclude in September 2020, at which time the review team will provide an evaluation and recommendations to the South African authorities. Concurrently, government is preparing legislative and regulatory proposals to combat sophisticated financial crimes, unexplained wealth and suspicious financial flows. These may include expanding the scope of suspicious transaction reporting, facilitating greater cooperation and information sharing between relevant authorities, and expanding capacity in the areas of analysis, enforcement and investigation. These proposals will complement the recommendations emerging from the FATF review. Simplifying cross-border trade and financial flows In 2019, South Africa was one of 54 countries that signed up to an African free-trade area encompassing 1.2 billion people and more than US$3 trillion in output. African countries have agreed to cut tariffs to zero on 90 per cent of goods, which, alongside other trade-facilitating measures, is expected to increase intra-continental commerce by more than 50 per cent over four years, according to the United Nations Economic Commission for Africa. The free-trade area presents an opportunity to speed up development on the continent, and represents a potentially large market for South African goods and services. In this context, the National Treasury proposes modernising the foreign-exchange system. Since 1933, South Africa has operated a “negative list” system. By default, foreign-currency transactions are prohibited, except for those listed in the Currency and Exchanges Manual. As a result, even small individual transactions – such as for travel – require onerous approval processes. This regime constrains trade and cross-border flows, particularly in relation to fast-growing African economies. Over the next 12 months, a new capital flow management system will be put in place. All foreign-currency transactions will be allowed, except for a risk-based list of capital flow measures summarised in the box overleaf. This change will increase transparency, reduce burdensome and unnecessary administrative approvals, and promote certainty. The capital flow measures take account of the Organisation for Economic Co-operation and Development best-practice Code of Liberalisation of Capital Movements1 and 1 Available online at http://www.oecd.org/daf/inv/investment-policy/Code-capital-movements-EN.pdf 153
2020 BUDGET REVIEW are aligned with similar approaches in other developing countries. The detailed list of remaining capital flow measures will be published on the Reserve Bank website. Tax and exchange control treatment of individuals Following reforms to the income tax treatment of South African tax residents who receive remuneration outside the country, government proposes to remove the exchange control treatment for individuals, while strengthening the tax treatment. The intention is to allow individuals who work abroad more flexibility, provided funds are legitimately sourced and the individual is in good standing with the South African Revenue Service. Individuals who transfer more than R10 million offshore will be subjected to a more stringent verification process. Such transfers will also trigger a risk management test that will include certification of tax status and the source of funds, and assurance that the individual complies with anti-money laundering and countering terror financing requirements prescribed in the Financial Intelligence Centre Act (2001). This will be phased in by 1 March 2021. Under the new system, natural person emigrants and natural person residents will be treated identically. Additional restrictions on emigrants – such as the restrictions on emigrants being allowed to invest, and the requirement to only operate blocked accounts, have bank accounts and borrow in South Africa – have been repealed. The concept of emigration as recognised by the Reserve Bank will be phased out, to be replaced by a verification process based on the requirements above. Tax residency for individuals will continue to be determined by the ordinarily resident and physically present tests as set out in the Income Tax Act (1962). Under existing international standards, South Africa participates in the automatic sharing of information between tax authorities on individuals’ financial accounts and investments. These cooperative practices will remain in place to ensure that South African tax residents who have offshore income and investments pay the appropriate level of tax. Other reforms State bank In 2019, Parliament passed legislation to allow state-owned companies to apply for banking licences. Postbank is in the process of applying for such a licence. The decision to grant a licence is ultimately the 154 Remaining capital flow and macroprudential measures To ensure financial stability, some macroprudential and capital management measures will remain. These include: •South African corporates will not be allowed to shift their primary domicile, except under exceptional circumstances approved by the Minister of Finance. •Approval conditions granted by the Minister of Finance for corporates with a primary listing offshore, including dual-listed structures, will be aligned to the current foreign direct investment criteria and/or conditions to level the playing field. •Cross-border foreign-exchange activities will continue to be conducted through dealers authorised and regulated by the Reserve Bank. •Prudential limits on South African banks and institutional investors will remain, but the limits will be reviewed regularly. •Banks’ unhedged foreign-currency exposures will remain limited to 10 per cent of liabilities (known as the net open foreign exchange position) and will remain regulated by the Prudential Authority of the Reserve Bank. •The domestic treasury management company policy, which allows South African companies to establish one subsidiary as a holding company for African and offshore operations without being subject to exchange control restrictions, will remain in place, as will the international headquarter company regime. •The export of intellectual property for fair value to non-related parties will not be subject to approval. •The current policy of certain loop structures, which relates to the acquisition by private individuals of equity and/or voting rights in a foreign company, will remain until tax amendments are implemented to address the risks. The foreign-exchange treatment of individuals will be aligned to the tax treatment, which is discussed below and in Annexure C.
ANNEXURE E: FINANCIAL SECTOR UPDATE prerogative of the Prudential Authority, which will assess each applicant on its merits. The design of any state bank will protect the fiscus in the event of poor governance, non-performing loans or shortages in capital funding. Sovereign wealth fund The National Treasury is conducting a feasibility study for a sovereign wealth fund, possibly from the proceeds from the allocation of spectrum and the sale of non-core assets to capitalise such a fund. In addition, a fiscal rule that saves fiscal surpluses in the fund could help to manage volatile revenues. Alignment with Basel Committee on Banking Supervision principles In line with the Basel Committee on Banking Supervision’s core principles on corporate governance, South Africa has strengthened the regulatory framework by enforcing stricter independence requirements for directors on bank boards. In 2019, government updated banking regulations relating to a securitisation framework, total loss-absorbing capacity holdings, capital requirements for equity investments in funds, capital requirements for bank exposures to central counterparties and the standardised approach for measuring counterparty credit-risk exposures. In addition, consultation with the banking industry has started on the Fundamental Review of the Trading Book, a comprehensive set of capital rules applied to a bank’s wholesale trading activities. The economic effects of implementing these rules will be comprehensively assessed. Third-party cell captive insurance In December 2019, the Financial Sector Conduct Authority published a position paper2 to address concerns about third-party cell captive insurance, in which insurance is provided through cells, rather than directly to a client. Improving its regulation and supervision will protect consumers by ensuring that a financial advisor can no longer earn commission and share in the profits of the cell captive arrangement. Deposit insurance for financial institutions Following extensive consultation, the Minister of Finance has submitted final legislation to introduce a comprehensive deposit insurance scheme that protects depositors when banks fail. This safety net will also support the growth of smaller banks. In addition, systemically significant payment systems, as defined in the National Payment System Act (1998), will be considered. The Corporation for Deposit Insurance, which will be located at the Reserve Bank, is being created to manage and administer the deposit insurance fund. Further details of the tax treatment of this fund are contained in Annexure C. The Conduct of Financial Institutions Bill and retail distribution review In 2018, the Conduct of Financial Institutions Bill was published for public consultation. Public workshops were held during 2019. Over 800 pages of comments were received, including feedback on governance requirements, retirement funds, payment services, financial markets and wholesale banking. A revised draft of the bill will be published for public comment and tabled in Parliament in 2020. The Financial Sector Conduct Authority published an update of its retail distribution review in December 2019.3 The report indicates significant progress in implementation, which establishes requirements for product sales and ongoing support to the consumer, and ends “sign-on” bonuses. Financial markets legislation In the context of rapidly evolving financial markets, South Africa needs to update its legislative and regulatory framework. An extensive review of the Financial Markets Act (2012) highlighted gaps in the 2 Available at https://www.fsca.co.za/Regulatory%20Frameworks/Pages/Position%20Policy%20Papers.aspx 3 Available at https://www.fsca.co.za/Regulatory%20Frameworks/Temp/RDR%20General%20Status%20Update%20December%202019.pdf 155
2020 BUDGET REVIEW current framework and proposed changes. The National Treasury has consulted with market participants, the Prudential Authority and the Financial Sector Conduct Authority. A consultation paper will be published on the National Treasury website, and legislation will be drafted for public comment and tabled in Parliament by 2021. The framework for regulating over-the-counter derivative markets has been finalised, in line with South Africa’s commitment to the Group of Twenty. The final joint standard on margin requirements will take effect on 1 October 2020. Levies The Financial Sector Levies Bill, to be submitted to Parliament during 2020, will propose the collection of levies to ensure that the Prudential Authority, the Financial Sector Conduct Authority and ombuds are sufficiently resourced to carry out their duties and functions. Transformation and financial inclusion The Financial Sector Transformation Council has established eight subcommittees to review the targets in the Financial Sector Code to strengthen transformation of the financial sector. To date, the committees have developed targets for management control, skills development, socioeconomic development, consumer education and retirement funds. A paper to establish a policy framework for financial inclusion in South Africa will be published for public comment in 2020. Innovation hub The Intergovernmental Fintech Working Group is introducing an online fintech portal with an innovation hub, which will clarify the applicability of financial services regulation and support the testing of new products and services. Unclaimed benefits Retirement funds and the Guardian’s Fund are sometimes unable to trace beneficiaries, resulting in the money remaining unclaimed. The money is invested in government bonds and other instruments. These investments are being considered in the mobilisation of funding for infrastructure. Government will introduce legislation later this year to centralise such funds and establish a central registry of all members of retirement funds. Retirement fund reform Government and the National Economic Development and Labour Council have agreed to proceed with retirement reform related to the harmonisation of all retirement benefits, including provident funds. Government will take steps to ensure the development of annuity products more suitable for the low-income market. Further reforms will include improving oversight and governance of commercial umbrella funds, fund consolidation and auto-enrolment. 156
F Summary of the budget 157
2020 BUDGET REVIEW Summary of the national budget 1) Includes direct appropriations in respect of the salaries of the President, Deputy President, judges, magistrates, members of Parliament, National Revenue Fund payments (previously classified as extraordinary payments), and the International Oil Pollution Compensation Fund. Source: National Treasury 158 R million 2019/20 2020/21 2021/22 2022/23 Budget Revised estimate estimate Budget estimate Medium-term estimates REVENUE Estimate of revenue before tax proposals Budget 2020/21 proposals: Direct taxes Taxes on individuals and companies Personal income tax Increasing brackets by more than inflation Revenue if no adjustment is made Higher-than-inflation increase in brackets and rebates Indirect taxes Carbon tax Plastic bag levy 1 425 418 - -2 000 -2 000 -2 000 12 000 -14 000 2 000 1 750 250 Estimate of revenue after tax proposals Percentage change from previous year 1 403 464 1 344 796 1 397 996 4.0% 1 484 294 1 580 877 6.2% 6.5% EXPENDITURE Direct charges against the National Revenue Fund Debt-service costs Provincial equitable share General fuel levy sharing with metropolitan municipalities Skills levy and sector education and training authorities Other 1) Appropriated by vote Current payments Transfers and subsidies Payments for capital assets Payments for financial assets Provisional allocations Provisional allocation not assigned to votes Infrastructure fund not assigned to votes Provisional allocation for Eskom restructuring Compensation of employees adjustment 743 900 746 713 202 208 205 005 505 554 505 554 13 167 13 167 18 759 18 576 4 213 4 411 900 249 935 591 248 057 246 686 614 373 611 782 15 460 13 573 22 360 63 549 1 558 - 10 - 1 000 - 5 348 - -4 800 - 805 666 229 270 538 472 14 027 19 413 4 485 963 114 261 333 644 025 15 303 42 454 -7 786 7 021 - 23 000 -37 807 872 909 940 599 258 482 290 145 573 990 607 554 15 182 16 085 20 585 21 970 4 670 4 846 988 836 1 029 513 279 252 288 690 684 282 721 889 15 809 16 510 9 493 2 424 -16 077 -34 887 1 853 3 573 4 000 6 000 33 000 23 000 -54 929 -67 460 Total 1 645 707 1 682 304 1 760 994 1 845 668 1 935 225 Plus: Contingency reserve 13 000 - 5 000 5 000 5 000 Estimate of national expenditure Percentage change from previous year 1 658 707 1 682 304 1 765 994 5.0% 1 850 668 1 940 225 4.8% 4.8% 2019 Budget estimate of expenditure Increase / decrease (-) 1 658 707 23 597 1 769 566 -3 572 1 900 485 -49 817 Gross domestic product 5 413 825 5 157 347 5 428 212 5 758 993 6 126 302
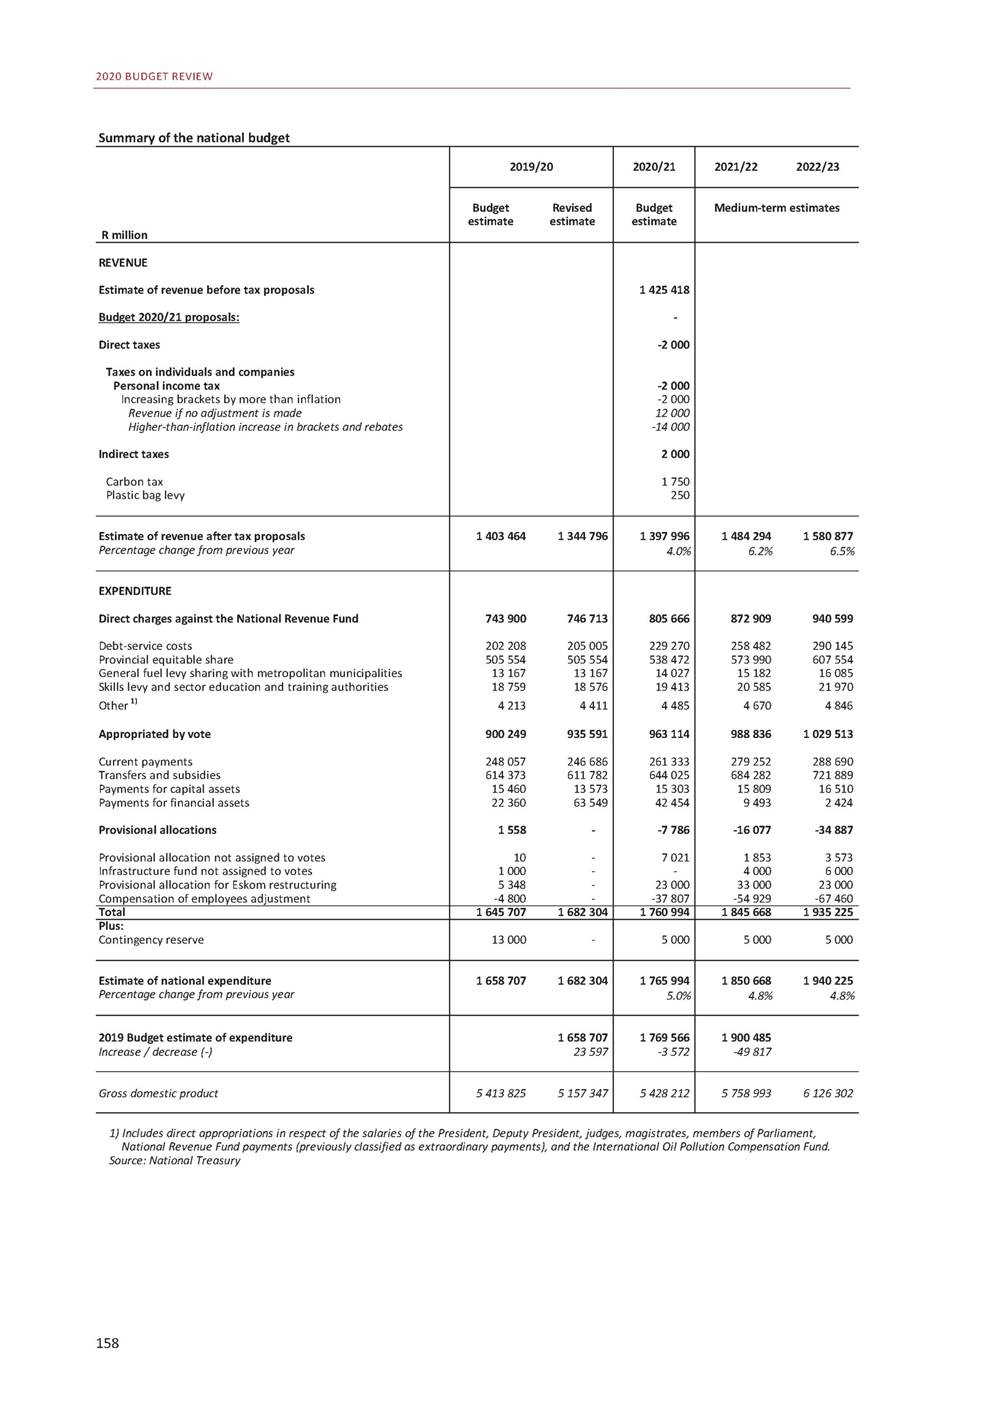
ANNEXURE F: SUMMARY OF BUDGET Summary of the consolidated budget 1) Transfers to provinces, social security funds and public entities presented as part of the national budget. 2) Flows between national, provincial, social security funds and public entities are netted out. Source: National Treasury 159 R million 2019/20 2020/21 2021/22 2022/23 Budget Revised estimate estimate Budget estimate Medium-term estimates National budget revenue 1) Revenue of provinces, social security funds and public entities Consolidated budget revenue 2) National budget expenditure 1) Expenditure of provinces, social security funds and public entities Consolidated budget expenditure 2) 1 403 464 1 344 796 180 347 172 192 1 397 996 185 910 1 484 294 1 580 877 198 545 210 442 1 583 811 1 516 988 1 583 905 1 682 839 1 791 319 1 658 707 1 682 304 167 845 161 241 1 765 994 188 450 1 850 668 1 940 225 189 671 200 815 1 826 553 1 843 546 1 954 445 2 040 339 2 141 040 Consolidated budget balance Percentage of GDP -242 741 -326 557 -4.5% -6.3% -370 539 -6.8% -357 500 -349 721 -6.2% -5.7% FINANCING Domestic loans (net) Foreign loans (net) Change in cash and other balances 209 992 312 736 -20 992 27 547 53 742 -13 726 332 286 18 815 19 438 325 913 317 484 41 763 40 760 -10 176 -8 523 Total financing (net) 242 741 326 557 370 539 357 500 349 721
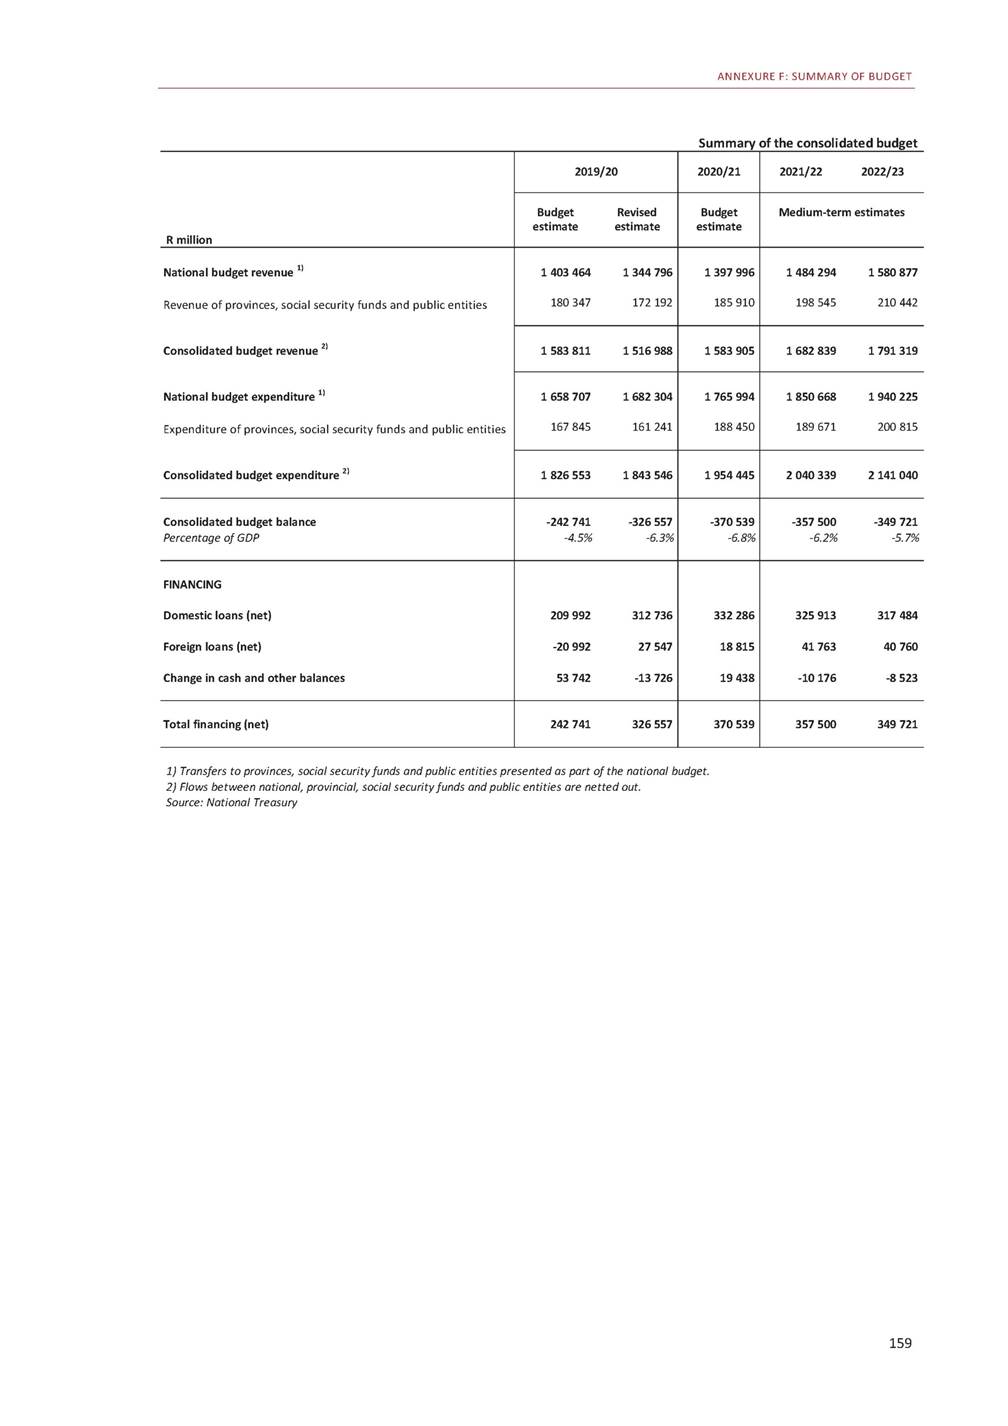
2020 BUDGET REVIEW This page was left blank intentionally. 160
Glossary Accounting officer The public servant who is accountable to Parliament for financial management of a government department, usually the director-general at the national level or head of the department at the provincial level. An accounting convention by which payments and receipts are recorded as they occur, even if no cash flow takes place. Debt used to buy shares or assets. Presentation to Parliament of the amendments to be made to the appropriations voted in the main budget for the year. Prices set outside ordinary market processes through administrative decisions by government, a public entity or a regulator. Taxes levied on commodities as a certain percentage of their value. Manufacturing activities that transform raw materials and intermediary goods derived from agriculture into intermediate or final goods. The part of the national budget that can be divided between the national, provincial and local spheres of government, after interest and the contingency reserve have been taken into account. The repayment of a loan by instalments over its duration. A fixed amount of money paid over a period of time as a return on an investment. A provision aimed at preventing tax avoidance. See principal purpose test. The approval by Parliament of spending from the National Revenue Fund, or by a provincial legislature from a provincial revenue fund. A condition occurring when prices for a category of assets rise above the level justified by economic fundamentals. A summary statement of all the international transactions of the residents of a country with the rest of the world over a particular period of time. Corporate tax-planning strategies that exploit the gaps and mismatches in tax laws between countries to shift taxable income to lower-or no-tax jurisdictions. See also tax evasion and profit shifting. Reforms developed by the Basel Committee on Banking Supervision to strengthen the regulation, supervision and risk management of the banking sector. The initial allocations used during the budget process, derived from the previous year’s forward estimates. One hundredth of one per cent. Manufacturing activities that transform raw minerals into higher-value products. A certificate of debt issued by a government or corporation guaranteeing payment of the original investment plus interest by a specified future date. Amount by which the purchase price of a bond is greater than its par value. The difference in yield between two bonds. An auction that aims to ease pressure on targeted areas of the redemption profile by exchanging shorter-dated debt for longer-term debt. See switch auction. Accrual Acquisition debt Adjustments estimate Administered prices Ad valorem duties Agro-processing Allocated expenditure Amortisation Annuity Anti-avoidance rule Appropriation Asset price bubble Balance of payments Base erosion and profit shifting Basel III Baseline Basis point Beneficiation Bond Bond premium Bond spread Bond-switch programme 161
2020 BUDGET REVIEW Bracket creep Increased real tax liability that arises when the personal income tax tables are not fully adjusted for inflation. The difference between budgeted expenditure and budgeted revenue. If expenditure exceeds revenue, the budget is in deficit. If the reverse is true, it is in surplus. A reform to the budget process that establishes specialised structures, procedures and criteria for committing fiscal resources to public infrastructure spending. Property of any kind, including assets that are movable or immovable, tangible or intangible, fixed or circulating, but excluding trading stock held to realise a financial or economic return. Spending on assets such as buildings, land, infrastructure and equipment. A flow of investments in or out of the country. A measure of the net increase in the country’s total stock of capital goods, after allowing for depreciation. Tax levied on the income realised from the disposal of a capital asset by a taxpayer. A capital gain is the excess of the selling price over the purchase price of the capital asset. Durable goods used over a period of time to produce other goods. See also intermediate goods. The cost of borrowing to construct a capital asset, which is then included in the cost of the asset. A financial market where individuals and institutions raise capital or funding in the form of debt or equities. The process of allocating a greenhouse gas emissions allowance to a company for a specific period of time. Municipal categories established by the Constitution: Category A, or metropolitan municipalities; Category B, or local municipalities; and Category C, or district municipalities. An asset placed as a guarantee for the repayment of debt, to be recouped in the case of a default. Debt issued by companies through short-term promissory notes. An expert panel established by the President to investigate a specific issue. Budget balance Budget Facility for Infrastructure Capital asset Capital expenditure Capital flow Capital formation Capital gains tax Capital goods Capitalised interest Capital market Carbon budgeting Category A, B and C municipalities Collateral Commercial paper issuances Commission of inquiry Conditional grants Allocations of money from one sphere of government to another, conditional on certain services being delivered or on compliance with specified requirements. Debt or credit granted by a person/entity to a connected person/entity. In the case of a holding company, for example, a subsidiary company would be a connected person. National, provincial and local government, as well as extra-budgetary government institutions and social security funds. Total expenditure by national and provincial government, social security funds and selected public entities, including transfers and subsidies to municipalities, businesses and other entities. The measure of inflation based on prices in a basket of goods and services. Expenditure on goods and services that are used within a short period of time, usually a year. Connected person debt/credit Consolidated general government Consolidated government expenditure Consumer price index Consumption expenditure 162
GLOSSARY Contingency reserve An amount set aside, but not allocated in advance, to accommodate changes to the economic environment and to meet unforeseeable spending pressures. A government obligation, such as a guarantee, that will only result in expenditure if a specific event occurs. See government guarantee. A foreign business in which South Africans hold a greater than 50 per cent interest, usually of the share capital of a company. The transformation of state-owned enterprises into commercial entities, subject to commercial legal requirements and governance structures, while the state retains ownership. Inflation that is caused by an increase in production costs, such as wages or oil prices. Policy that has the opposite effect on economic activity to that caused by the business cycle, such as slowing spending growth in a boom period and accelerating spending in a recession. The periodic interest payment made to bondholders during the life of the bond. The interest is usually paid twice a year. Stock brokers that do not trade as a treasury operation; the Reserve Bank; banks and their controlling companies; and companies or trusts that form part of a banking group, excluding short-and long-term insurers, and these insurers’ subsidiaries and companies in which they hold a controlling share. An indicator of the risk of default by a borrower or the riskiness of a financial instrument. The probability of financial loss resulting from failure to repay a loan or meet a contractual obligation. An increase in private investment through the income-raising effect of government spending financed by deficits. A fall in private investment or consumption as a result of increased government expenditure financed through borrowing, thereby competing for loanable funds and raising the interest rate, which curtails private investment and consumption spending. A digital medium of exchange that uses cryptography to secure its transactions, control the creation of additional units and verify the transfer of assets. The potential for a change in the price of a currency that would affect investors with assets, liabilities or operations denominated in other currencies. The difference between total imports and total exports, taking into account service payments and receipts, interest, dividends and transfers. The current account can be in deficit or surplus. See also trade balance. The difference between revenue and current expenditure, which consists of compensation of employees, goods and services, and interest and rent on land. Government expenditure on salaries and goods and services, such as rent, maintenance and interest payments. See also consumption expenditure. A tax levied on imported goods. An unsecured debt instrument backed by general creditworthiness of the issuer rather than by specific assets. The set of fixed repayment dates and amounts to which an issuer of debt, such as a preferred stock or bond, has committed to meeting. Contingent liability Controlled foreign company Corporatisation Cost-push inflation Countercyclical fiscal policy Coupon (bond) Covered person Credit rating Credit risk Crowding-in Crowding-out Cryptocurrency Currency risk Current account (of the balance of payments) Current balance Current expenditure Customs duties Debenture Debt redemption profile 163
2020 BUDGET REVIEW Debt-service costs The interest on government debt and other costs directly associated with borrowing. The ratio of cash from operating activities available to service debt payments. The total value of debt owed to all lenders. The removal or dismantling of a facility from service. Retirement funds’ trustee boards must offer a default in-fund preservation arrangement to members who leave the services of their employer before retirement, and a default investment portfolio to contributing members who do not or cannot choose how their savings should be invested. A consistent decrease in the price of goods and services. The reduction of debt previously used to increase the potential return of an investment. A reduction in the value of fixed capital as a result of wear and tear or redundancy. A reduction in the external value of a currency. A financial asset that derives its value from an underlying asset, which may be a physical asset such as gold or a financial asset such as a government bond. Foreign countries from which income may be exempt from South African tax under certain circumstances. See also double tax agreement. State agencies that aim to meet the credit needs of riskier but socially and economically desirable projects that are beyond the acceptance limits of commercial banks. An economy based on digital computing technologies – increasingly through internet-based markets. Taxes charged on taxable income or capital of individuals and legal entities. See unemployment. A trust where the executor has the choice of whether and how much of the trust’s income or capital is to be distributed to beneficiaries. The beneficiaries have only provisional rights to the income or capital of the trust. Total income less all taxes and employee contributions. An excess of current expenditure, including the depreciation of fixed capital, over current income. The distribution of a portion of a company’s earnings to a class of its shareholders. A tax on dividends that is subtracted and withheld by a company or intermediary before the net dividend is paid to the shareholder. See also withholding tax. The allocation of funds between spheres of government, as required by the Constitution. See also equitable share. The total level of spending in an economy, including imports but excluding exports. An agreement between two countries to prevent income that is taxed in one country from being taxed in the other as well. See also designated countries. A public offering auction where the price of the offering is set after taking in all bids to determine the highest price at which the total offering can be sold. The development of children from birth until the year they enter formal schooling. Debt-service coverage ratio Debt stock Decommissioning Default regulations Deflation Deleveraging Depreciation (capital) Depreciation (exchange rate) Derivative financial instrument Designated countries Development finance institutions Digital economy Direct taxes Discouraged work seekers Discretionary trust Disposable income Dissaving Dividend Dividend withholding tax Division of revenue Domestic demand Double tax agreement Dutch auction pricing Early childhood development 164
GLOSSARY Economically active population The part of the population that is of working age and is either employed or seeking work. The cost of an alternative that must be forgone to pursue a certain action. In other words, the benefits that could have been received by taking an alternative action. Also known as opportunity cost. An increase in the total amount of output, income and spending in the economy. The difference between the return made by a factor of production (capital or labour) and the return necessary to keep the factor in its current occupation. For example, a firm making excess profits is earning economic rent. Actual tax liability (or a reasonable estimate thereof) expressed as a percentage of a pre-tax income base rather than as a percentage of taxable income. In other words, tax rates that take into account not only the statutory or nominal tax rate, but also other aspects of the tax system (for example, allowable deductions) that determine the tax liability. A provision in a contract modifying its cash flows by making them dependent on an underlying measure – such as interest or exchange rates, or commodity prices – the value of which changes independently. A name given by international investors to middle-income economies. The ratio of employment growth to economic growth. The allocation of revenue to the national, provincial and local spheres of government as required by the Constitution. See also division of revenue. Raising money by selling shares of stock to investors, who receive an ownership interest in return. Rules that regulate the flow of currency out of South Africa, or restrict the amount of foreign assets held by South African individuals and companies. A foreign-currency amount relating to a debt, loan or foreign-exchange contract. Funds that track indices, commodities or baskets of assets, and trade like stocks. Taxes on the manufacture or sale of certain domestic or imported products. Excise duties are usually charged on products such as alcoholic beverages, tobacco and petroleum. The maximum allowable level of expenditure to which government has committed itself. Public entities not directly funded from the fiscus. A change in the value of an asset or liability resulting from the periodic reassessment of its expected future economic in-or outflows. A government policy on higher education and training that makes provision for full-cost-of-study bursaries to students below a specified household-income threshold, covering tuition fees, prescribed study material, meals, and a certain level of accommodation and/or travel allowances. A statement of all financial transactions between the nation and the rest of the world, including portfolio and fixed-investment flows and movements in foreign reserves. An independent body established by the Constitution to make recommendations to Parliament and provincial legislatures about financial issues affecting the three spheres of government. Economic cost Economic growth Economic rent Effective tax rate Embedded derivative Emerging economies Employment coefficient Equitable share Equity finance Exchange control Exchange item Exchange-traded funds Excise duties Expenditure ceiling Extra-budgetary institutions Fair-value adjustment Fee-free higher education and training Financial account Financial and Fiscal Commission 165
2020 BUDGET REVIEW Financial Sector Conduct Authority A body responsible for regulating and supervising the market conduct of financial institutions and market infrastructure. An independent institution established by statute that regulates insurers, intermediaries, retirement funds, friendly societies, unit trust schemes, management companies and financial markets. An international body made up of representatives of financial authorities and institutions, and central banks. It proposes regulatory, supervisory and other policies in the interest of financial stability. The 12 months according to which companies and organisations budget and account. See also fiscal year. An abbreviation of “financial technology”, which refers to new technologies and innovations that aim to compete with traditional methods to deliver financial services more efficiently. Policy aimed at reducing government deficits and debt accumulation. The arrangements, procedures, rules and institutions underlying the conduct of government’s budgetary policies. The combined overall economic impact that fiscal policy has on the economy. The outflow of revenue from an economy through tax evasion and avoidance. The process of marking a product with a prescribed identification (or chemical). Marking allows the South African Revenue Service to trace products back to the manufacturers in order to collect excise duties. Policy on taxation, public spending and borrowing by government. The ability of government’s budget to provide additional resources for a desired programme without jeopardising fiscal or debt sustainability. The 12 months on which government budgets are based, beginning 1 April and ending 31 March of the subsequent calendar year. Spending on buildings, machinery and equipment contributing to production capacity in the economy. See also gross fixed-capital formation. A bond that pays a specific interest rate over a specified period of time. A bond on which the interest rate is reset periodically in line with a money market reference rate. The exchange of principal and/or interest payments in one currency for those in another. The acquisition of a controlling interest by governments, institutions or individuals of a business in another country. The total amount of contracts for the future exchange of foreign currency entered into by the Reserve Bank at any given point in time. Transactions involving an agreed exchange rate at which foreign currency will be bought or sold at a future date. A geographical region in which a group of countries has signed an agreement and maintain few or no barriers to trade in the form of tariffs or quotas between them. A benefit supplementing an employee’s wages or salary, such as medical insurance, company cars, housing allowances and pension schemes. An excise tax on liquid fuels. Financial Services Board Financial Stability Board Financial year Fintech Fiscal consolidation Fiscal framework Fiscal incidence Fiscal leakage Fiscal marking Fiscal policy Fiscal space Fiscal year Fixed investment/capital formation Fixed-rate bond Floating rate notes Foreign currency swaps Foreign direct investment Forward book Forward cover Free-trade area Fringe benefit Fuel levy 166
GLOSSARY Fugitive emissions Emissions that are unintentionally released into the atmosphere through, for example, leaks from industrial plants and pipelines. The movement of a function from one departmental vote or sphere of government to another. A pension scheme in which expected future benefits are funded in advance and as entitlement accrues. The ratio of company debt to equity capital. Reserves held by the Reserve Bank to meet foreign-exchange obligations and to maintain liquidity in the presence of external shocks. The total amount of money owed by government as a consequence of its past borrowing. An assurance made by government to a lender that a financial obligation will be honoured, even if the borrowing government entity is unable to repay the debt. See contingent liability. A policy document intended for public discussion. The sum of the main budget balance, extraordinary receipts and payments (referred to as National Revenue Fund receipts and payments), and maturing debt. The amount is funded through domestic short-and long-term loans, foreign loans and changes in cash balances. A measure of the total national output, income and expenditure in the economy. GDP per head is the simplest overall measure of welfare, although it does not take account of the distribution of income, or goods and services that are produced outside the market economy, such as work within the household. A measure of the total increase in prices in the whole economy. Unlike CPI inflation, GDP inflation includes price increases in goods that are exported and intermediate goods such as machines, but excludes imported goods. The addition to a country’s fixed-capital stock during a specific period, before provision for depreciation. See government debt. Function shift Funded pension arrangements Gearing ratio Gold and foreign exchange reserves Government debt Government guarantee Green paper Gross borrowing requirement Gross domestic product Gross domestic product inflation Gross fixed-capital formation Gross loan debt Gross value added The value of output less intermediate consumption. It is also a measure of the contribution an industry or sector makes to the economy. An international forum made up of finance ministers and central bank governors from 20 of the world’s largest economies. An action taken by a buyer or seller to protect income against changes in prices, interest rates or exchange rates. A principle in taxation that holds that similarly situated taxpayers should face a similar tax treatment or tax burden. In other words, taxpayers with the same amount of income or capital should be accorded equal treatment. Loans or advances that may not be collected in full. A reduction in the recorded value of a long-lived asset arising from circumstances that prevent the asset from generating the future economic benefits previously expected and recorded. When a firm sells goods locally at the price customers would pay if they were to import the same goods from another country. The portion of the net capital gain derived from the disposal of an asset that will be taxed at the applicable rate. Group of Twenty (G20) Hedging Horizontal equity Impaired advances Impairment Import parity pricing Inclusion rate 167
2020 BUDGET REVIEW Independent power producer Industrial development zone A private-sector business that generates energy for the national grid. Export-oriented manufacturing sites linked to an international air or sea port, supported by incentives to encourage investment and job creation. An increase in the overall price level of goods and services in an economy over a specific period of time. A monetary policy framework intended to achieve price stability over a certain period of time. A fund that will provide government support for the co-financing of programmes and projects that blend public and private resources. The Department of Energy’s long-term plan for the country’s energy mix and generation expansion in order to meet electricity demand. A value based on ensuring that future generations do not have to repay debts taken on today, unless they also share in the benefits of assets. Goods produced to be used as inputs in the production of final goods. Money that different organs of state owe to each other. Stocks of goods held by firms. An increase in inventories reflects an excess of output relative to spending over a period of time. A credit rating indicating minimal risk to investors. A financial certificate that complies with Islamic religious law. It represents partial ownership of an asset. The issuer buys back the bond at a future date at par value. The relative amount of labour used to produce a unit of output. The estimated present value of the per-unit cost of electricity over the lifetime of a generating asset. The ease with which assets can be bought and sold. The amount of liquid or freely convertible assets that banks are required to hold relative to their liabilities for prudential and regulatory purposes. The risk that an asset might not easily and quickly be converted into cash through sale, or the risk to a debtor that it cannot meet its current debt obligations. A means of managing electricity supply when the power system is constrained by limiting the electricity supply to areas. A commitment, in a loan agreement, to certain activities. If violated, the covenant can trigger a default or penalties. Structures that arise when private individuals are permitted by the Reserve Bank to acquire up to 40 per cent equity or voting rights in a foreign company, which may in turn hold investments and/or make loans in a Common Monetary Area country (South Africa, eSwatini, Lesotho and Namibia). A one-time payment for the total or partial value of an asset, usually received in place of recurring smaller payments. The broadest definition of money supply in South Africa, including notes and coins, demand and fixed deposits, and credit. The branch of economics that deals with the whole economy – including issues such as growth, inflation, unemployment and the balance of payments. Rules that protect the stability of the financial sector and guard against systemic risk. Inflation Inflation targeting Infrastructure Fund Integrated Resource Plan Intergenerational equity Intermediate goods Intra-state debt Inventories Investment grade Islamic bond Labour intensity Levelised cost of electricity Liquidity Liquidity requirements Liquidity risk Load-shedding Loan covenant Loop structures Lump-sum benefit M3 Macroeconomics Macroprudential regulation 168
GLOSSARY Marginal income tax rate Marginal lending rate The rate of tax on an incremental unit of income. A penalty rate of interest charged by the Reserve Bank for lending to financial institutions in the money market in excess of the daily liquidity provided to the money market at the repurchase rate. See also repurchase agreements. Tradable financial securities listed with a securities exchange. A method for determining whether someone qualifies for state assistance. A civil claim of alleged wrongful medical treatment against a health provider. The technical committee responsible for evaluating the medium-term expenditure framework budget submissions of national departments and making recommendations to the Minister of Finance regarding allocations to national departments. The three-year spending plans of national and provincial governments, published at the time of the Budget. The branch of economics that deals with the behaviour of individual firms, consumers and sectors. The political committee that considers key policy and budgetary issues that pertain to the budget process before they are tabled in Cabinet. Policy concerning total money supply, exchange rates and the general level of interest rates. The total stock of money in an economy. The projected revenue and expenditures that flow through the National Revenue Fund. It does not include spending by provinces or local government from their own revenues. A planning framework prepared by the National Planning Commission that aims to eliminate poverty and reduce inequality by 2030. The authority that regulates electricity, piped-gas and petroleum pipelines industries in South Africa. The consolidated account of the national government into which all taxes, fees and charges collected by the South African Revenue Service and departmental revenue must be paid. Short-term deposit instruments issued by banks, at a variable interest rate, for a fixed period. The main budget balance. Exports less imports. Gross loan debt less government’s cash balances. Marketable securities Means test Medico-legal claims Medium Term Expenditure Committee Medium-term expenditure framework Microeconomics Ministers’ Committee on the Budget Monetary policy Money supply National budget National Development Plan National Energy Regulator of South Africa National Revenue Fund Negotiable certificate of deposit Net borrowing requirement Net exports Net loan debt Gold and foreign exchange reserves minus the oversold forward book. The figure is expressed in dollars. The difference between the value of exports and imports. A multilateral lending institution being established by Brazil, Russia, India, China and South Africa. The current rate of exchange between the rand and foreign currencies. The “effective” exchange rate is a trade-weighted average of the rates of exchange with other currencies. The return, or wage, to employees at the current price level. Net open foreign currency position Net trade New Development Bank Nominal exchange rates Nominal wage 169
2020 BUDGET REVIEW Non-competitive bid auction An auction in which an investor agrees to purchase a certain number of securities such as bonds at the average price of all competitive bids over a given period of time. Government-owned or controlled organisations that deliver goods and non-financial services, trading as business enterprises, such as Eskom or Transnet. Total expenditure by government less debt-service costs. Income received by government as a result of administrative charges, licences, fees, sales of goods and services, and so on. Revised salary structures unique to identified occupations in the public service, including doctors, nurses and teachers. The value of that which must be given up to achieve or acquire something. It is represented by the next highest valued alternative use of a resource. An organisation of 35 mainly industrialised member countries. South Africa is not a member. The pay-as-you-earn (PAYE) system of income tax withholding requires employers to deduct income tax, and in some cases, the employees’ portion of social benefit taxes, from each paycheque delivered to employees. Tax an employer withholds and/or pays on behalf of employees based on employee wages or salaries. A fixed place of business from which a company operates. When two countries have a tax treaty, the concept of “permanent establishment” is used to determine the right of one state to tax the profits of the business in the other state. See also anti-fragmentation rule. An environmental tax on certain types of plastic carrier and flat bags that is earmarked to establish recycling facilities. Additional money in the fiscus to fund new and crucial priorities. Investment in financial assets such as stocks and bonds. The fastest growth an economy can sustain without increasing inflation. A commission established by Cabinet to develop, review and coordinate a 20-year infrastructure plan. The process of determining the price level of a commodity or asset, based on supply and demand factors. The extent to which changes in price affect consumers’ purchasing behaviour. The issuance of new bonds in the primary market by means of an auction. The difference between total revenue and non-interest expenditure. When revenue exceeds non-interest expenditure there is a surplus. The market where new securities (bonds or equities) are issued or sold by a company or government in the capital markets for the first time. The agricultural, forestry, fishing, mining and quarrying sectors of the economy. A test where the benefits of a tax treaty are denied if it is reasonable to conclude that obtaining the benefit was one of the principal purposes behind the arrangement or transaction. Credit provided to the private sector. This includes all loans, credit cards and leases. Non-financial public enterprises Non-interest expenditure Non-tax revenue Occupation-specific salary dispensation Opportunity cost Organisation for Economic Co-operation and Development PAYE Payroll tax Permanent establishment Plastic bag levy Policy reserve Portfolio investment Potential growth Presidential Infrastructure Coordinating Commission Price discovery Price sensitivity Primary bond auctions Primary deficit/surplus Primary market Primary sector Principal purpose test Private-sector credit extension 170
GLOSSARY Privatisation The full or partial sale of state-owned enterprises to private individuals or companies. A measure of inflation based on the prices of production inputs as reported by producers across different sectors. A measure of the amount of output generated from every unit of input. Typically used to measure changes in labour efficiency. The allocation of income and expenses between related corporations or branches of the same legal entity to reduce overall tax liability. The authority responsible for the prudential regulation of banks, insurers, cooperative financial institutions, financial conglomerates and certain market infrastructure. Organisations that engage in social activities to meet the needs of the general public. They are mainly funded by donations from the public and other institutions. Companies, agencies, funds and accounts that are fully or partly owned by government or public authorities and are regulated by law. The act regulating financial management of national and provincial government, including the efficiency and effectiveness of public expenditure and the responsibilities of those engaging with government financial management. Goods and services that would not be fully provided in a pure free-market system and are largely provided by government. A government-owned investment management company that invests funds on behalf of public-sector entities. Its largest client is the Government Employees Pension Fund. A contractual arrangement in which a private party performs a government function and assumes the associated risks. In return, the private party receives a fee according to predefined performance criteria. See unitary payment. National government, provincial government, local government, extra-budgetary governmental institutions, social security funds and non-financial public enterprises. The consolidated cash borrowing requirement of general government and non-financial public enterprises. A composite index measuring the change in manufacturing activity. An index value of 50 indicates no change in activity, a value above 50 indicates increased activity and a value below 50 indicates decreased activity. An establishment-based survey conducted by Statistics South Africa to obtain information about the number of employees and gross salaries paid. A household-based survey conducted by Statistics South Africa to measure the dynamics of the labour market, producing indicators such as employment, unemployment and inactivity. A company that evaluates the ability of countries or other borrowers to honour their debt obligations. Credit ratings are used by international investors as indications of sovereign risk. See also credit rating. A measure of the rate of exchange of the rand relative to a trade-weighted average of South Africa’s trading partners’ currencies, adjusted for price trends in South Africa and the countries included. Expenditure measured in constant prices after taking account of inflation. Producer price index Productivity Profit shifting Prudential Authority Public-benefit organisations Public entities Public Finance Management Act Public goods Public Investment Corporation Public-private partnerships Public sector Public-sector borrowing requirement Purchasing managers’ index Quarterly Employment Statistics Quarterly Labour Force Survey Rating agency Real effective exchange rate Real expenditure 171
2020 BUDGET REVIEW Real interest rate Real wage Recapitalisation The level of interest after taking account of inflation. The return, or wage, to employees, measured at a constant price level. Injection of funds into a company or entity to aid liquidity, either as a loan or in return for equity. A period in which national output and income decline. A recession is usually defined as two consecutive quarters of negative growth. The return of an investor’s principal in a fixed-income security, such as a preferred stock or bond. The repayment of debt at a scheduled time with the proceeds of new loans. The risk that government will not be able to raise money to repay debt at any scheduled point, or that it will have to do so at a high cost. An economic policy intended to boost economic activity in a geographical area extending beyond one country. The costs of personnel, including salaries, housing allowances, car allowances and other benefits received by personnel. Short-term contracts between the Reserve Bank and private banks in the money market to sell specified amounts of money at an interest rate determined by daily auction. The rate at which the Reserve Bank lends to commercial banks. Holdings of foreign exchange, either by the Reserve Bank only or by the Reserve Bank and domestic banking institutions. A tax system in which the worldwide income accruing to a resident of a country is subject to the taxes of that country. The difference between the value of a foreign currency deposit from the original (historical) rate to execution of a trade based on the spot rate. A return that compensates for uncertainty. The difference between income and spending. The removal of seasonal volatility (monthly or quarterly) from a time series dataset. This provides a measure of the underlying trend in the data. A market where securities are bought and sold by participants in the capital market following primary market issuance. The price at which securities are bought and sold in the secondary market. A rebate from income tax, in addition to the primary rebate, that is available to taxpayers aged 65 years and older. The part of the economy concerned with the manufacture of goods. Tax on dividends declared by a company, calculated at the rate of 10 per cent of the net amount of dividends declared. This was discontinued in 2012 and replaced with a 15 per cent dividend withholding tax. Non-profit entities registered in terms of Section 21 of the Companies Act. Institutions funded through skills development levies, responsible for learnership programmes and implementing strategic sector skills plans. Debt backed or secured by collateral to reduce the risk of lending. The pooling of assets into a financial instrument to sell to different types of investors. Recession Redemption Refinancing Refinancing risk Regional integration Remuneration Repurchase agreements Repurchase (repo) rate Reserves (foreign exchange) Residence-based income tax system Revaluation gain/loss Risk premium Saving Seasonally adjusted Secondary market Secondary market pricing Secondary rebate Secondary sector Secondary tax on companies Section 21 company Sector education and training authorities Secured debt instruments Securitisation 172
GLOSSARY Service and transfer payments Services involve transactions of non-tangible commodities, while transfers are unrequited transactions that do not generate a counter-economic value (for example, gifts and grants). A person who directly or indirectly materially controls or influences the business or strategy of a financial institution. Significant owner Skills development levy A payroll tax designed to finance training initiatives in terms of the skills development strategy. Infrastructure that supports social services. Social benefits available to all individuals, funded wholly or partly by the state. A system in which income is taxed in the country where the income originates. An agreement between South Africa, Botswana, Namibia, Lesotho and eSwatini that allows for the unrestricted flow of goods and services, and the sharing of customs and excise revenue. A regional intergovernmental organisation that promotes collaboration, economic integration and technical cooperation throughout southern Africa. Debt issued by a government. An assessment of the likelihood that a government will default on its debt obligations. Planning to influence the geographic distribution of people and economic activity. A designated zone where business and trade laws incentivise trade, investment and employment. A tax on each unit of output or sale of a good, unrelated to the value of a good. Government’s expenditure obligations that do not require a vote or statutory provision, including contractual guarantees and international agreements. Amounts appropriated to be spent in terms of statutes and not requiring appropriation by vote. Action taken by the Reserve Bank to neutralise excess cash created in the money market when purchasing foreign currency. A representation of what government revenue and expenditure would be if output were at its potential level, with cyclical variations stripped out. Imbalances in the structure of the economy that hinder growth and development. Measures put in place to substantially change the economy, or the institutional and regulatory framework in which people and businesses operate. A clause in a public policy that allows for a law to cease being in effect after a specified date. An auction to exchange bonds to manage refinancing risk or improve tradability. A large loan in which a group of banks work together to provide funds, which they solicit from their clients for the borrower. A period allowed by tax authorities during which taxpayers who are outside the tax net, but should be registered for tax purposes, can register for tax without incurring penalties. When individuals or businesses legitimately use provisions in the tax law to reduce their tax liability. Social infrastructure Social wage Source-based income tax system Southern African Customs Union agreement Southern African Development Community Sovereign debt Sovereign debt rating Spatial planning Special economic zones Specific excise duty Standing appropriations Statutory appropriations Sterilisation Structural budget balance Structural constraints Structural reforms Sunset clause Switch auction Syndicated loan Tax amnesty Tax avoidance 173
2020 BUDGET REVIEW Tax base The aggregate value of income, sales or transactions on which particular taxes are levied. The relationship between total tax revenue collections and economic growth. This measure includes the effects of policy changes on revenue. A value above one means that revenues are growing faster than the economy and below one means they are growing below the rate of GDP growth. When individuals or businesses illegally reduce their tax liability. Government revenue forgone due to provisions that allow deductions, exclusions or exemptions from taxable income. The revenue can also be forgone through the deferral of tax liability or preferential tax rates. A measure of tax evasion that emerges from comparing the tax liability or tax base declared to the tax authorities with the tax liability or tax base calculated from other sources. Specific provisions in the tax code that provide favourable tax treatment to individuals and businesses to encourage specific behaviour or activities. The final distribution of the burden of tax. Statutory incidence defines where the law requires a tax to be levied. Economic incidence refers to those who experience a decrease in real income as a result of the imposition of a tax. Unintended weaknesses in the legal provisions of the tax system used by taxpayers to avoid paying tax liability. The willingness, or motivation, of citizens to pay tax. This is separate from the statutory obligation to pay taxes, but may influence tax compliance. The total tax payments for a particular fiscal year as a fraction or percentage of the GDP for that year. The time between issuance and expiry. An index measuring the ratio of a country’s export prices relative to its import prices. The part of the economy concerned with the provision of services. An index used to measure the efficiency of all inputs that contribute to the production process. The monetary record of a country’s net imports and exports of physical merchandise and services. See also current account. The system of tariffs, quotas and quantitative restrictions applied to protect domestic industries, together with subsidies and incentives used to promote international trade. The value of the rand pegged to or expressed relative to a market basket of selected foreign currencies. The setting of the price at which connected persons transfer goods or services between themselves. Short-term government debt instruments that yield no interest but are issued at a discount. Maturities vary from one day to 12 months. When related companies in different countries establish a third entity in another location to take advantage of a favourable tax arrangement. The theoretical level of GDP growth, where growth above the trend rate results in macroeconomic imbalances such as rising inflation or a weakening of the current account. Tax buoyancy Tax evasion Tax expenditure Tax gap Tax incentives Tax incidence Tax loopholes Tax morality Tax-to-GDP ratio Term-to-maturity Terms of trade Tertiary sector Total factor productivity Trade balance Trade regime Trade-weighted rand Transfer pricing Treasury bills Treaty shopping Trend GDP growth 174
GLOSSARY Unallocated reserves Potential expenditure provision not allocated to a particular use. It mainly consists of the contingency reserve and amounts of money left unallocated by provinces. All those of working age who are unemployed, including those actively seeking employment and discouraged work seekers. Those of working age who are unemployed and actively seeking work (excludes discouraged work seekers). The payment made to a private party for meeting its obligations in a public-private partnership. The cost of labour per unit of output, calculated by dividing average wages by productivity (output per worker per hour). An assessment by a registered auditing firm or the Auditor-General of South Africa asserting that the financial statements of a department, entity or company are free of material misstatement. Debt not backed or secured by collateral to reduce the risk of lending. A loan that is not backed or secured by any type of collateral to reduce the lender’s risk. The amount of value-added tax (VAT) repayable by the South African Revenue Service to a VAT vendor. In terms of South African regulation, a company whose sole objective is managing investments in qualifying companies (small businesses). Investments in venture capital companies are tax deductible. A principle in taxation that holds that differently situated taxpayers should be treated differently in terms of income tax provisions. In other words, taxpayers with more income and/or capital should pay more tax. The right to ownership of an asset that cannot be arbitrarily taken away by a third party. The transfer of resources from one programme to another within the same department during a financial year. An appropriation voted by Parliament. A departmental account that ring-fences revenue from the sale of bulk water and related services to secure funding to manage the sustainability of water resources and infrastructure. The average rate of return an organisation expects to pay to investors in its securities, such as bonds, debt and shares. Each category of security is accorded a proportionate weight in the calculation. Tax on income deducted at source. Withholding taxes are widely used for dividends, interest and royalties. A policy document used to present government policy preferences. A financial return or interest paid to buyers of government bonds. The yield/rate of return on bonds includes the total annual interest payments, the purchase price, the redemption value and the time remaining until maturity. A graph showing the relationship between the yield on bonds of the same credit quality but different years to maturity at a given point in time. Consumable goods that are exempt from the 15 per cent VAT rate. Unemployment (broad definition) Unemployment (official definition) Unitary payment Unit labour cost Unqualified audit Unsecured debt instruments Unsecured lending VAT refund Venture capital company Vertical equity Vested right Virement Vote Water trading account Weighted average cost of capital Withholding tax White paper Yield Yield curve Zero-rated tax items 175
2020 BUDGET REVIEW This page was left blank intentionally. 176
STATISTICAL ANNEXURE 177
2020 BUDGET REVIEW 178
STATISTICAL ANNEXURE Statistical annexure Explanatory notes The statistical tables present details of the main budget; consolidated national, provincial and social security funds expenditure; consolidated government revenue and expenditure; consolidated government revenue, expenditure and financing; total debt of government; and net loan debt, provisions and contingent liabilities. The tables are categorised according to government levels, from the main budget to the consolidated government account. The main budget consists of National Revenue Fund receipts, expenditure either voted by Parliament or allocated by statutory appropriation, and the financing of the deficit. This is the national budget, including transfers to other spheres of government. Consolidated national, provincial and social security funds expenditure consists of the main (national) budget, and the provincial and the social security funds’ budgets or expenditure. These budgets are aggregated and transfers between the three spheres of government are netted out to arrive at a total consolidated expenditure figure. The consolidated government revenue, expenditure and financing budget includes national, provincial and social security funds, the Reconstruction and Development Programme (RDP) Fund and national public entities. This is referred to as the consolidated budget. While government revenues are concentrated at national level, a large proportion of expenditure has shifted to the provinces since 1994. Equitable share transfers to the nine provinces are included as a government statutory commitment on the National Treasury vote, while the local government equitable share is appropriated on the vote of the Department of Cooperative Governance. The consolidated government account consists of all the activities of national and provincial government, and includes most of the listed public entities. The consolidation also includes several national government business enterprises. 179 1 Main budget: revenue, expenditure, budget balance and financing, 2013/14 to 2022/23 2 Main budget: estimates of national revenue – summary of revenue, 2002/03 to 2022/23 3 Main budget: estimates of national revenue – detailed classification of revenue, 2016/17 to 2020/21 4 Main budget: expenditure defrayed from the National Revenue Fund by vote, 2016/17 to 2022/23 5 Consolidated national, provincial and social security funds expenditure: economic classification, 2016/17 to 2022/23 6 Consolidated national, provincial and social security funds expenditure: functional classification, 2016/17 to 2022/23 7 Consolidated government revenue and expenditure: economic classification, 2016/17 to 2022/23 8 Consolidated government expenditure: functional classification, 2016/17 to 2022/23 9 Consolidated government revenue, expenditure and financing, 2016/17 to 2022/23 10 Total debt of government, 1995/96 to 2022/23 11 Net loan debt, provisions and contingent liabilities, 2009/10 to 2022/23
2020 BUDGET REVIEW Since more than 50 per cent of total national expenditure on the 2020/21 main budget consists of transfer payments to other levels of general government, economic and functional classifications of national budget expenditure are not comprehensive. For the purposes of analysis, it would be preferable to present economic and functional classifications of general government expenditure, but this would require information on expenditure at all levels of general government, its financing through revenue, balances brought forward and transfer payments (mainly from the national budget). This information is not readily available for local government. Historical data on general government finances is, however, published by the Reserve Bank in its Quarterly Bulletin and by Statistics South Africa. Change in recording of extraordinary receipts and payments in the budget tables Since 2014, the consolidated government account has been presented in a more transparent format in line with the International Monetary Fund’s Government Finance Statistics Manual (2014). This format provides details of operating activities, capital and infrastructure investment, as well as transactions in financial assets and liabilities. The calculation of the budget balance includes all government transactions. Previously, extraordinary receipts and payments were added to the budget deficit to calculate government’s net borrowing requirement. In the new format, there is no longer a difference between the budget balance and the net borrowing requirement. These transactions are now referred to as National Revenue Fund receipts and payments. Treatment of foreign grants to the RDP Fund All international technical assistance and other RDP-related grants are paid to the RDP Fund account, which is separated from government accounts. Departments incur expenditure on RDP-related projects through direct requisitions from this account. However, disbursements of foreign grants and technical assistance are included in the consolidated national and provincial expenditure estimates in Tables 5 and 6, and in the consolidated government expenditure in Table 7. Adjustments due to transactions in government debt As part of the state’s active management of its debt portfolio, government bonds are repurchased or switched into new bonds. In the process, government may make a capital profit, which is a book entry change in the bond discount. This capital profit does not represent actual cash flow and is regarded as a “book profit”, which lowers the outstanding debt. A premium may also be accrued, or payable, in managing the debt portfolio or when entering into new loans. Under the new format, premiums paid or received are included as National Revenue Fund receipts and payments, and no longer categorised as extraordinary receipts and payments. Sources of information The information in Tables 1 to 11 on national and provincial government and public entity finances is obtained from the following sources: • • • • • Reports of the Auditor-General on the Appropriation and Miscellaneous Accounts Printed estimates of revenue and expenditure for the national and provincial budgets The Reserve Bank The South African Revenue Service (SARS) Monthly press releases from the National Treasury, published in terms of section 32 of the Public Finance Management Act (1999). Main budget: revenue, expenditure, budget balance and financing (Table 1) Table 1 summarises the main budget balances since 2013/14 and medium-term estimates to 2022/23. In line with the economic reporting format introduced in 2009, the revenue classification shows departmental sales of capital assets separately. 180
STATISTICAL ANNEXURE Repayments of loans and advances, which were previously shown as negative expenditure, have been reclassified as revenue. The national budget deficit (negative budget balance) is due to a higher increase in expenditure relative to the revenue collected over the same period. Appropriations by vote are divided into current payments, transfers and subsidies, payments for capital assets and payments for financial assets. Both current and capital transfers are included in transfers and subsidies, in line with the economic reporting format’s requirements. The deficit figures presented in this table differ from those presented in budgets before 1995/96 because a number of items that were previously regarded as “below-the-line” expenditure have been included in total expenditure. In addition, revaluations of foreign loan obligations are excluded from expenditure, in keeping with international practice. Under the “financing” item, domestic short-term loans include net transactions in Treasury bills and borrowing from the Corporation for Public Deposits. Long-term loans include all transactions in domestic government bonds and foreign loans (new loan issues, repayments on maturity, buybacks, switches and reverse purchase transactions). Main budget: estimates of national revenue (Tables 2 and 3) Table 2 presents a summary of revenue and the details are set out in Table 3. Main budget revenue collections are recorded on an adjusted cash basis as the revenue is recorded in the SARS ledgers. Tax revenue is classified according to standard international categories and departmental receipts according to the economic reporting format’s requirements. In Table 3, a large amount of data cannot be reclassified to align with the economic reporting format because departments capture these transactions in their ledgers as miscellaneous receipts. Main budget: expenditure defrayed from the National Revenue Fund by vote (Table 4) Table 4 contains estimates of expenditure on national budget votes for the period 2016/17 to 2022/23. In 2019/20, amounts included in the budget estimate, the adjusted appropriation and the revised estimate on each vote are shown. Historical data has been adjusted to account for function shifts between departments. As a result, the figures presented for some departments may differ from their financial statements. Total expenditure, however, is not influenced by these changes. Consolidated national, provincial and social security funds expenditure (Tables 5 and 6) Tables 5 and 6 show the economic and functional classification of payments for consolidated national and provincial government and social security funds, including the Unemployment Insurance Fund, the Road Accident Fund and the Compensation Fund. Provincial expenditure estimates are preliminary because their budgets are tabled after the national budget. As such, these estimates are subject to change before being tabled in provincial legislatures. The functional classification The functional classification in this annexure is aligned with the classification of government functions set out in the Government Finance Statistics Manual. The historical data published in these tables has been reclassified accordingly. Chapter 5 of the Budget Review, which sets out the medium-term expenditure framework, outlines the budget allocations across these function groups. To support this approach, data at programme and entity level is aggregated into spending categories, which provides for a higher level of aggregation than in the functional classification. For example, functional classification tables include local development and social infrastructure as distinct functions. The fiscal statistics are an outcome of the budget process and can only be used as a guide to categorise expenditure for budgeting purposes. Some of the most important differences between the key spending categories presented in Chapter 5 and the more detailed functional classification presented in the statistical tables are as follows: 181
2020 BUDGET REVIEW • Learning and culture: Expenditure in this category includes spending related to school and tertiary education, as well as arts, culture, sport and recreation. In the statistical tables, this expenditure is included as part of either the education or recreation, culture and religion functions. Economic development: Expenditure related to innovation, science and technology is included in the economic development function group, while in the statistical tables it is classified as research and development according to the function to which it relates. Peace and security: This includes expenditure by defence, police, justice and home affairs. In the statistical tables, the bulk of this expenditure is included in the public order and safety function, with home affairs split between general public services and public order and safety. General public services: In the key spending categories, transfers made to international organisations are classified within the category of the paying department. In the statistical tables, they are classified under general public services. • • • Consolidated government revenue and expenditure (Tables 7 and 8) Tables 7 and 8 show the economic and functional classification of payments for the consolidated government budget. This consists of the consolidated national, provincial and social security figures presented in Tables 5 and 6, combined with general government entities, as well as some government business enterprises. The government budget consolidation includes all entities controlled and mainly financed by government revenue, where such revenue is defined as either taxes, levies and administrative or service fees prescribed by government, or direct budgetary support in the form of transfer payments. This consolidation also includes several government business enterprises, based on the principle that they either sell most of their goods and services to government institutions or departments at regulated prices, and are therefore not businesses in the true sense of the word, or they are directly involved in infrastructure financing and development. Accordingly, state-owned entities are broadly identified as one of the following: • Enterprises that sell mainly to government departments or institutions, have no clear competitors and whose prices are therefore not clearly market related. Science councils that conduct research or fulfil a regulatory or advisory function, with government-determined regulatory or administration fees. Government-regulated businesses that are primarily financed by a dedicated tax, administration fee or levy, (the level of which is dictated by government) or that are directly involved in the maintenance or extension of critical infrastructure. • • To present consolidated accounts, all units use the same accounting standards and policies. The format of the accounts, terminology used, classification, transaction coverage and accounting base (cash or accrual) must be the same. In this respect, the consolidated government budget is prepared on an adjusted cash basis of accounting. This is not strictly comparable to the financial information published in the consolidated financial statements, which has two components – a consolidation of departments using the modified cash basis of accounting and a separate consolidation of public entities that apply the accrual basis of accounting. All transactions that occur between units being consolidated are eliminated. A transaction of one unit is matched with the same transaction recorded for the second unit and both transactions are eliminated from the consolidation. For example, if a public entity sells a service to a government department and data for the two units is being consolidated, neither the sale nor the purchase of the service is reported. In this way, only transactions between government and non-government entities are recorded, without inflating total government revenue as a result of internal transactions. Not all intra-entity transactions are eliminated, however, because they are not always identifiable in the accounting systems of government and many of its agencies. Only those that can be identified have been eliminated. These broadly include: 182
STATISTICAL ANNEXURE • Transactions involving transfers from one government unit to another, including transfers made by national departments to public entities and transfers between public entities (such as Water Trading Entity transfers to water boards). • Purchases of goods and services from other government units included in the consolidation (such as transactions between the Trans-Caledon Tunnel Authority, water boards and the Water Trading Entity). As data collection and recording procedures for transactions improve, additional intra-entity transactions will be identified and removed from the consolidated government budget. A total of 162 national and provincial departments and 186 entities are included in the 2020 consolidated government budget. The National Treasury is committed to presenting a full consolidation of the whole of general government over time. Considerable work has been done to align the local government accounts with national and provincial accounts. A classification reporting framework has been developed for municipalities as a first step towards the consolidation of the financial information of all three spheres of government. Consolidated government revenue, expenditure and financing (Table 9) Table 9 presents the government account, which distinguishes between government's operating activities and its plans to invest in capital and infrastructure. The balance on the operating account shows the outcome of government’s operating activities, which is a measure of the cost of ongoing operations. It is calculated as the difference between current revenue and current expenditure, and the resulting balance shows how much government must borrow to run its operations. The current balance demonstrates the sustainability of government operations. Capital investment activities are presented in the capital account. Government’s capital financing requirement is the outcome of this account, which is calculated as the difference between capital revenue and capital expenditure. This account will mainly be in deficit due to continuous investment in infrastructure and substantial capital outlays. Total debt of government (Table 10) Table 10 shows the major components of government debt. Net loan debt consists of total domestic and foreign debt less the cash balances of the National Revenue Fund. The balances on the Gold and Foreign Exchange Reserve Account, which represent net revaluation profits and losses incurred on gold and foreign exchange transactions, are also disclosed. Net loan debt, provisions and contingent liabilities (Table 11) Provisions are liabilities with uncertain payment dates or amounts. The provisions for multilateral institutions are the unpaid portion of government’s subscriptions to these institutions, which are payable on request. Contingent liabilities are obligations that only result in expenditure when an uncertain future event occurs. Both explicit and implicit contingent liabilities are disclosed. Implicit contingent liabilities are mostly the actuarial deficits of social security funds, while explicit contingent liabilities are mostly guarantees for state-owned companies, public-private partnership projects and the Renewable Energy Independent Power Producer Programme. In the case of guarantees for state-owned companies, the exposure disclosed is the amount borrowed against a guarantee, any related revaluation adjustments on inflation-linked bonds and any related interest on this amount, if guaranteed. The National Treasury published detailed information on provisions and contingent liabilities in the annual consolidated financial statements of national departments. 183
2020 BUDGET REVIEW Table 1 Main budget: revenue, expenditure, budget balance and financing 1) 1) This table summarises revenue, expenditure and the main budget balance since 2013/14. As available data is incomplete, the estimates are not fully consistent with other sources, such as the Government Finance Statistics series of the Reserve Bank. 2) Mining leases and ownership has been reclassified as non-tax revenue (rent on land). Historical numbers have been adjusted for comparative purposes. 3) Payments in terms of Southern African Customs Union (SACU) agreements. 4) Excludes sales of capital assets, discount and revaluation of foreign loan repayments. Includes receipts for which a department serves as a conduit to deposit funds into the National Revenue Fund. 5) Includes National Revenue Fund receipts (previously classified as extraordinary receipts). 6) Includes interest, cost of raising loans and management cost but excludes discount on the issue of new government debt instruments and the revaluation of foreign loan repayments. Source: National Treasury 184 R million 2013/14 2014/15 2015/16 2016/17 2017/18 2018/19 Actual outcome Preliminary outcome Main budget revenue Current revenue Tax revenue (gross) 2) Less: SACU payments 3) Non-tax revenue (departmental and other receipts) 4) Financial transactions in assets and liabilities 5) Sales of capital assets Total revenue Main budget expenditure Direct charges against the National Revenue Fund Debt-service costs 6) Provincial equitable share General fuel levy sharing with metropolitan municipalities Skills levy and SETAs Other 7) Appropriated by vote Current payments 8) Transfers and subsidies 9) Payments for capital assets 10) Payments for financial assets 11) Provisional allocation not assigned to votes Infrastructure fund not assigned to votes Provisional allocation for Eskom restructuring Com pensation of em ployees adjustm ents Total Contingency reserve Total expenditure Main budget balance Percentage of GDP Financing Change in loan liabilities Domestic short-term loans (net) Domestic long-term loans (net) Market loans Loans issued for switches Redemptions Foreign loans (net) Market loans Loans issued for switches Arms procurement loan agreements Redemptions (including revaluation of loans) 12) Change in cash and other balances (-increase) Total financing (net) 871 371.8 900 014.7 -43 374.4 14 731.5 15 957.3 37.0 950 046.8 986 295.0 -51 737.7 15 489.4 15 332.7 77.4 1 032 727.7 1 069 982.6 -51 021.9 13 767.0 43 387.6 121.1 1 119 530.3 1 144 081.0 -39 448.3 14 897.7 18 224.9 149.2 1 176 623.8 1 216 463.9 -55 950.9 16 110.8 19 541.0 197.5 1 260 705.5 1 287 690.2 -48 288.6 21 303.9 14 452.9 111.9 887 366.2 462 603.0 101 184.7 336 495.3 9 613.4 12 090.2 3 219.4 585 155.6 176 398.4 391 285.2 14 002.7 3 469.4 – – – – 965 456.9 503 253.9 114 798.4 359 921.8 10 190.2 13 838.8 4 504.8 628 646.2 184 544.7 424 144.4 16 200.6 3 756.5 – – – – 1 076 236.4 544 848.0 128 795.6 386 500.0 10 658.9 15 156.4 3 737.0 699 774.9 196 320.3 455 984.7 18 276.3 29 193.5 – – – – 1 137 904.4 588 731.7 146 496.7 410 698.6 11 223.8 15 233.0 5 079.5 716 658.5 210 088.3 486 109.1 15 598.5 4 862.5 – – – – 1 196 362.3 636 337.0 162 644.6 441 331.1 11 785.0 16 293.6 4 282.7 768 602.9 218 947.5 516 020.0 15 232.9 18 402.5 – – – – 1 275 270.3 685 914.8 181 849.1 470 286.5 12 468.6 17 479.9 3 830.7 820 697.8 228 766.3 563 097.9 14 469.2 14 364.4 – – – – 1 047 758.6 1 131 900.1 1 244 622.9 1 305 390.1 1 404 939.9 1 506 612.5 – – – – – – 1 047 758.6 1 131 900.1 1 244 622.9 1 305 390.1 1 404 939.9 1 506 612.5 -160 392.4 -4.4% -166 443.2 -4.3% -168 386.4 -4.1% -167 485.7 -3.8% -208 577.7 -4.4% -231 342.2 -4.7% 23 048.0 149 414.4 172 112.5 -1 135.3 -21 562.8 378.4 19 619.1 – – -19 240.7 -12 448.4 9 569.0 157 014.0 192 414.0 -1 160.0 -34 240.0 8 361.0 22 952.0 – – -14 591.0 -8 500.8 13 075.0 146 172.0 176 795.0 -2 479.0 -28 144.0 -3 879.0 – – – -3 879.0 13 018.4 40 507.1 116 684.3 175 070.5 -1 036.4 -57 349.8 36 380.7 50 959.3 1 111.4 – -15 690.0 -26 086.4 33 407.0 174 438.0 200 200.0 -1 508.0 -24 254.0 29 774.0 33 895.0 – – -4 121.0 -29 041.3 14 061.0 169 474.0 183 503.0 -500.0 -13 529.0 23 217.0 25 258.0 – – -2 041.0 24 590.2 160 392.4 166 443.2 168 386.4 167 485.7 208 577.7 231 342.2 GDP 3 614 459 3 865 119 4 124 704 4 419 437 4 698 724 4 921 494 National Revenue Fund transactions 13) National Revenue Fund receipts National Revenue Fund payments 11 709.3 -516.3 12 647.0 -1 525.5 14 377.5 -681.7 14 240.6 -1 778.0 16 600.3 -587.1 11 999.4 -161.6 Net 11 193.0 11 121.5 13 695.8 12 462.6 16 013.2 11 837.8
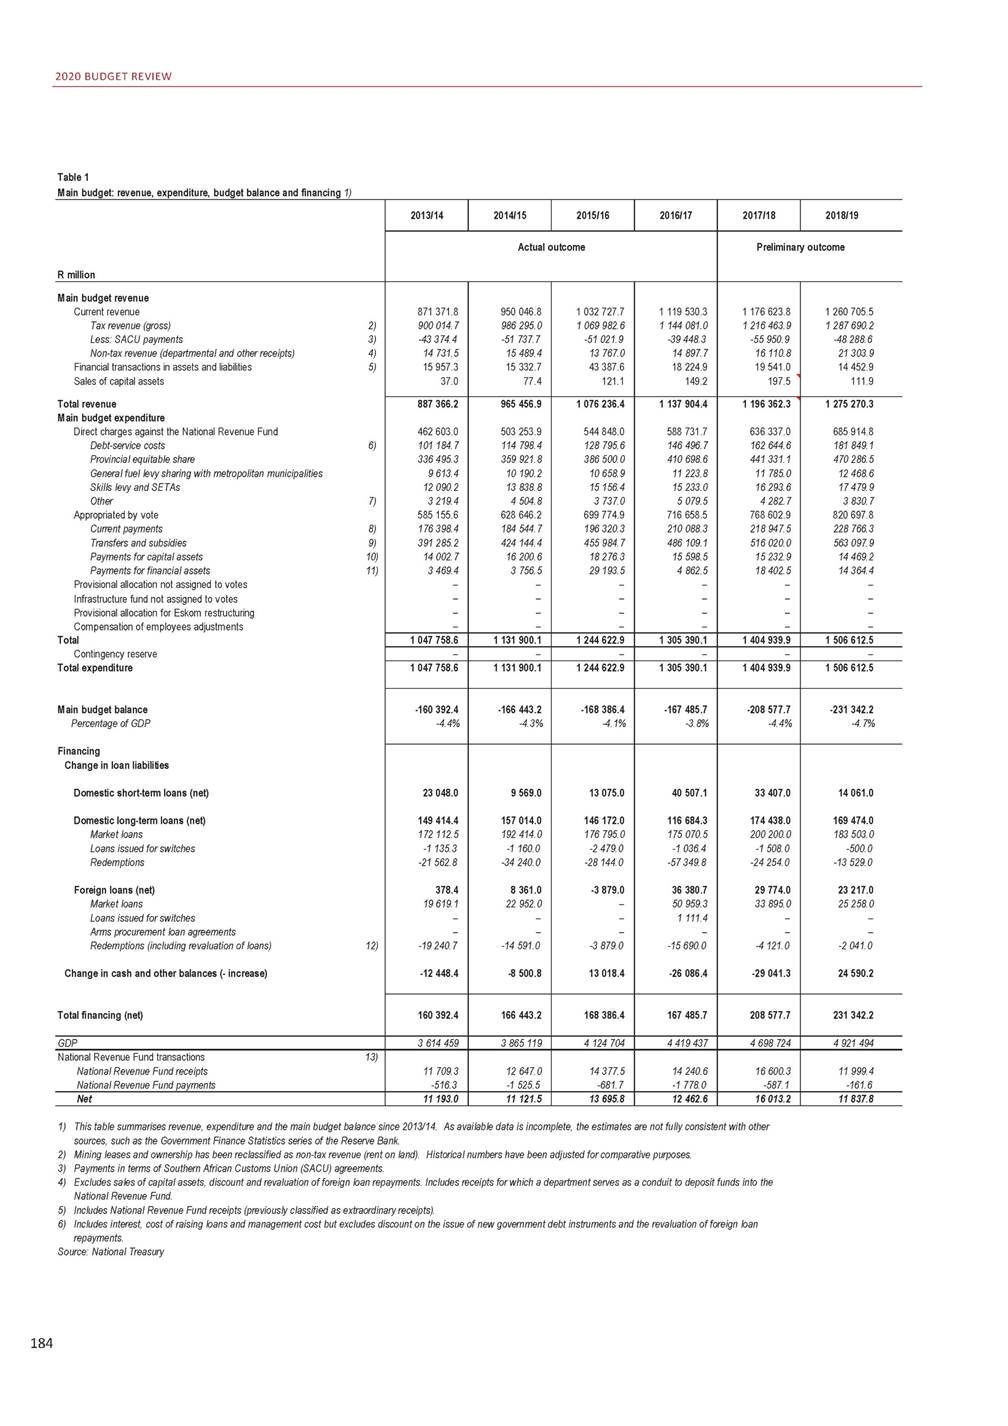
STATISTICAL ANNEXURE Table 1 Main budget: revenue, expenditure, budget balance and financing 1) 7) Includes direct appropriations in respect of the salaries of the President, Deputy President, judges, magistrates, members of Parliament, National Revenue Fund payments (previously classified as extraordinary payments) and the International Oil Pollution Compensation Funds. 8) Includes compensation of employees, payments for goods and services, interest and rent on land. Payment for medical benefits to former employees has been moved to transfers. 9) Includes current and capital transfers and subsidies to business, households, foreign countries and other levels and funds of general government. 10) Includes acquisition and own account construction of new assets and the cost of upgrading, improving and extending to existing capital assets. 11) Consists mainly of lending to public corporations or making equity investments in them for policy purposes. Previously included in transfers and subsidies. 12) Revaluation estimates are based on National Treasury's projection of exchange rates. 13) National Revenue Fund payments include premiums paid on loan transactions and revaluation adjustments when utilising foreign exchange deposits. National Revenue Fund receipts include proceeds from the sale of state assets, premiums received on loan transactions and revaluation adjustments when utilising foreign exchange deposits. 185 2019/20 2020/21 2021/22 2022/23 R million Budget Revised Deviation estimate estimate Medium-term estimates 1 389 607.8 1 332 098.9 -57 508.8 1 422 208.0 1 358 934.6 -63 273.4 -50 280.3 -50 280.3 – 17 680.1 23 444.7 5 764.6 13 727.0 12 583.8 -1 143.3 129.6 113.6 -16.0 1 385 864.0 1 425 417.6 -63 395.2 23 841.6 12 002.3 129.3 1 478 538.9 1 512 193.8 -60 563.0 26 908.1 5 622.8 132.4 1 574 534.5 1 609 656.6 -63 365.7 28 243.6 6 208.0 134.7 Main budget revenue Current revenue 2) Tax revenue (gross) 3) Less: SACU payments 4) Non-tax revenue (departmental and other receipts) 5) Financial transactions in assets and liabilities Sales of capital assets Total revenue Main budget expenditure Direct charges against the National Revenue Fund 6) Debt-service costs Provincial equitable share General fuel levy sharing with metropolitan municipalities Skills levy and SETAs 7) Other Appropriated by vote 8) Current payments 9) Transfers and subsidies 10) Payments for capital assets 11) Payments for financial assets Provisional allocation not assigned to votes Infrastructure fund not assigned to votes Provisional allocation for Eskom restructuring Com pensation of em ployees adjustm ents Contingency reserve Total expenditure Main budget balance Percentage of GDP Financing Change in loan liabilities Domestic short-term loans (net) Domestic long-term loans (net) Market loans Loans issued for switches Redemptions Foreign loans (net) Market loans Loans issued for switches Arms procurement loan agreements 12) Redemptions (including revaluation of loans) Change in cash and other balances (-increase) Total financing (net) 1 403 464.4 1 344 796.3 -58 668.1 743 900.1 746 713.2 2 813.2 202 207.8 205 005.0 2 797.1 505 553.8 505 553.8 – 13 166.8 13 166.8 – 18 758.5 18 576.3 -182.2 4 213.2 4 411.4 198.3 900 249.4 935 590.9 35 341.5 248 056.6 246 686.4 -1 370.2 614 372.7 611 782.0 -2 590.7 15 460.1 13 573.2 -1 886.9 22 359.9 63 549.3 41 189.4 10.0 – -10.0 1 000.0 – -1 000.0 5 348.0 – -5 348.0 -4 800.0 – 4 800.0 1 397 995.6 805 666.3 229 270.0 538 471.5 14 026.9 19 412.9 4 485.1 963 114.2 261 332.9 644 024.8 15 302.8 42 453.7 7 020.6 – 23 000.0 -37 806.7 1 484 294.1 872 909.4 258 482.1 573 989.5 15 182.5 20 585.0 4 670.3 988 835.6 279 252.0 684 281.7 15 809.0 9 493.0 1 852.6 4 000.0 33 000.0 -54 929.1 1 580 877.1 940 599.1 290 145.1 607 553.5 16 085.0 21 969.8 4 845.7 1 029 512.7 288 689.8 721 889.4 16 509.7 2 423.9 3 573.5 6 000.0 23 000.0 -67 460.4 1 645 707.4 1 682 304.1 36 596.7 1 760 994.4 1 845 668.5 1 935 224.9 13 000.0 – -13 000.0 5 000.0 5 000.0 5 000.0 1 658 707.4 1 682 304.1 23 596.7 1 765 994.4 1 850 668.5 1 940 224.9 -255 243.0 -337 507.8 -82 264.8 -4.7% -6.5% -1.8% -367 998.9 -6.8% -366 374.3 -6.4% -359 347.8 -5.9% 25 000.0 36 000.0 11 000.0 185 404.0 279 365.0 93 961.0 216 000.0 299 189.0 83 189.0 – -289.0 -289.0 -30 596.0 -19 535.0 11 061.0 -20 972.0 25 844.0 46 816.0 28 520.0 76 052.0 47 532.0 – – – – – – -49 492.0 -50 208.0 -716.0 65 811.0 -3 701.2 -69 512.2 48 000.0 285 235.0 337 700.0 – -52 465.0 17 026.0 29 260.0 – – -12 234.0 17 737.9 48 000.0 278 161.0 337 400.0 – -59 239.0 40 498.0 44 790.0 – – -4 292.0 -284.7 55 000.0 262 863.0 385 800.0 – -122 937.0 38 000.0 53 200.0 – – -15 200.0 3 484.8 255 243.0 337 507.8 82 264.8 367 998.9 366 374.3 359 347.8 5 413 825 5 157 347 -256 477 5 428 212 5 758 993 6 126 302 GDP 4 488.0 10 020.1 5 532.1 -135.3 -468.2 -332.8 6 005.0 -97.9 4 762.0 – 5 306.0 – 13) National Revenue Fund transactions National Revenue Fund receipts National Revenue Fund payments 4 352.7 9 551.9 5 199.3 5 907.1 4 762.0 5 306.0 Net
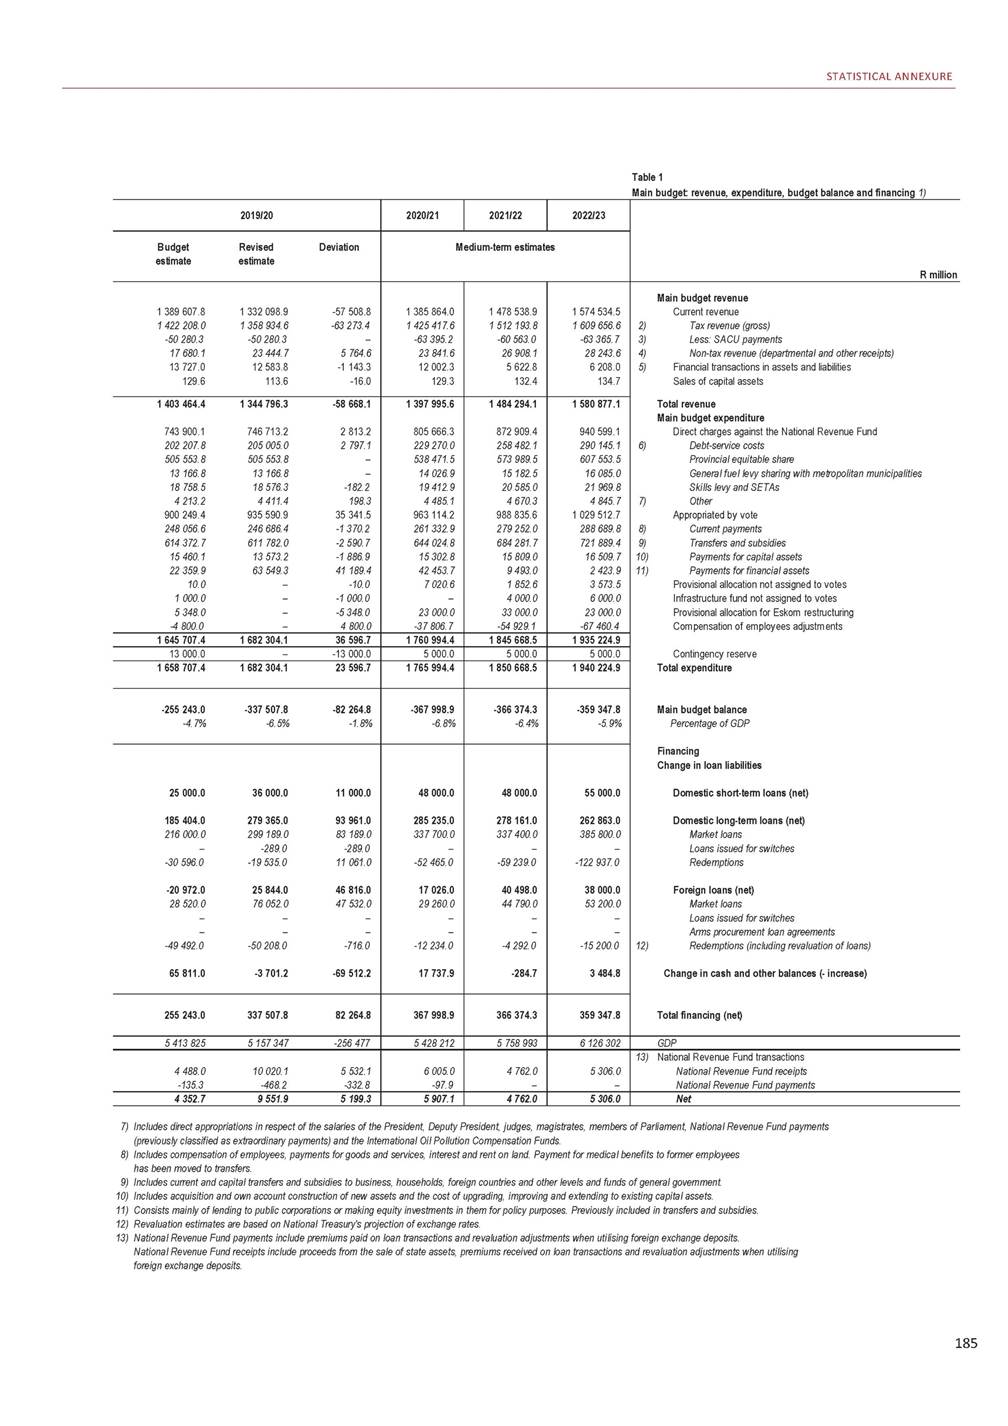
2020 BUDGET REVIEW Table 2 Main budget: estimates of national revenue Summary of revenue 1) 1) 2) 3) 4) 5) Includes interest on overdue income tax and small business tax amnesty (in 2006/07, 2007/08 and 2008/09). Levy on payroll dedicated to skills development. The securities transfer tax replaced the uncertificated securities tax from 1 July 2008. The value-added tax (VAT) replaced the general sales tax in September 1991. Includes plastic bag levy (from 2004/05), Universal Service Fund (from 1999/00), levies on financial services (up to 2004/05), CO 2 motor vehicle emissions (from 2010/11), incandescent light bulb levy (from 2009/10), turnover tax for micro businesses (from 2009/10), tyre levy and Interntional Oil Pollution Compensation Fund (from 2016/17). Mining leases and ownership have been reclassified as non-tax revenue. The historical years from 2000/01 have been adjusted for comparative purposes. Source: National Treasury 186 R million 2002/03 2003/04 2004/05 2005/06 2006/07 2007/08 2008/09 Taxes on income and profits Personal incom e tax Corporate incom e tax Secondary tax on com panies/dividends tax and interest withholding tax Tax on retirem ent funds Other 1) Taxes on payroll and workforce Skills developm ent levy 2) Taxes on property Donations tax Estate duty Securities transfer tax 3) Transfer duties Domestic taxes on goods and services Value-added tax 4) Specific excise duties Health prom otion levy Ad valorem excise duties Fuel levies Air departure tax Electricity levy Other 5) Taxes on international trade and transactions Custom s duties Health prom otion levy on im ports Im port surcharges Other 6) Stamp duties and fees State miscellaneous revenue 7) 164 565.9 94 336.7 55 745.1 6 325.6 6 989.7 1 169.0 3 352.1 3 352.1 5 084.6 17.7 432.7 1 205.2 3 429.0 97 311.5 70 149.9 10 422.6 1 050.2 15 333.8 324.8 – 30.3 9 619.8 9 330.7 – 0.0 289.1 1 572.4 433.0 171 962.8 98 495.1 60 880.8 6 132.9 4 897.7 1 556.3 3 896.4 3 896.4 6 707.5 17.1 417.1 1 101.1 5 172.1 110 108.6 80 681.8 11 364.6 1 016.2 16 652.4 367.2 – 26.5 8 414.3 8 479.4 – – -65.1 1 360.1 -7.1 195 219.1 110 981.9 70 781.9 7 487.1 4 406.1 1 562.2 4 443.3 4 443.3 9 012.6 25.2 506.9 1 365.9 7 114.6 131 980.6 98 157.9 13 066.7 1 015.2 19 190.4 412.2 – 138.3 13 286.5 12 888.4 – – 398.1 1 167.7 -130.9 230 803.6 125 645.3 86 160.8 12 277.6 4 783.1 1 936.7 4 872.0 4 872.0 11 137.5 29.5 624.7 1 973.4 8 510.0 151 223.7 114 351.6 14 546.5 1 157.3 20 506.7 458.2 – 203.4 18 201.9 18 303.5 – – -101.6 792.8 164.2 279 990.5 140 578.3 118 998.6 15 291.4 3 190.5 1 931.7 5 597.4 5 597.4 10 332.3 47.0 747.4 2 763.9 6 774.0 174 671.4 134 462.6 16 369.5 – 1 282.7 21 844.6 484.8 – 227.2 24 002.2 23 697.0 – – 305.2 615.7 339.2 332 058.3 168 774.4 140 119.8 20 585.4 285.4 2 293.3 6 330.9 6 330.9 11 883.9 27.6 691.0 3 757.1 7 408.2 194 690.3 150 442.8 18 218.4 – 1 480.5 23 740.5 540.6 – 267.5 27 081.9 26 469.9 – – 612.0 557.1 212.2 383 482.7 195 145.7 165 539.0 20 017.6 143.3 2 637.2 7 327.5 7 327.5 9 477.1 125.0 756.7 3 664.5 4 930.9 201 416.0 154 343.1 20 184.5 1 169.5 24 883.8 549.4 – 285.7 22 852.4 22 751.0 – – 101.4 571.8 -27.4 TOTAL TAX REVENUE (gross) Non-tax revenue 8) Less: SACU payments 9) Other adjustment 10) 281 939.3 12 995.7 -8 259.4 – 302 442.6 8 309.5 -9 722.7 – 354 978.8 8 695.4 -13 327.8 – 417 195.7 15 602.3 -14 144.9 – 495 548.6 14 281.4 -25 194.9 – 572 814.6 14 542.4 -24 712.6 – 625 100.2 20 819.6 -28 920.6 – TOTAL MAIN BUDGET REVENUE 286 675.6 301 029.4 350 346.5 418 653.1 484 635.1 562 644.4 616 999.2 Current revenue Direct taxes Indirect taxes State m iscellaneous revenue Non-tax revenue (excluding sales of capital assets) 11) Less: SACU paym ents Sales of capital assets 286 617.8 168 368.4 113 137.9 433.0 12 937.9 -8 259.4 57.8 301 012.9 176 293.5 126 156.1 -7.1 8 293.0 -9 722.7 16.5 350 316.3 200 194.5 154 915.3 -130.9 8 665.2 -13 327.8 30.2 418 573.8 236 329.7 180 701.8 164.2 15 523.0 -14 144.9 79.3 484 596.3 286 382.4 208 827.1 339.2 14 242.6 -25 194.9 38.8 562 414.2 339 107.8 233 494.6 212.2 14 312.2 -24 712.6 230.2 616 868.0 391 691.9 233 435.6 -27.4 20 688.4 -28 920.6 131.2 National Revenue Fund receipts 12) 8 167.9 1 598.2 2 492.0 6 905.2 3 438.1 1 849.8 8 203.4
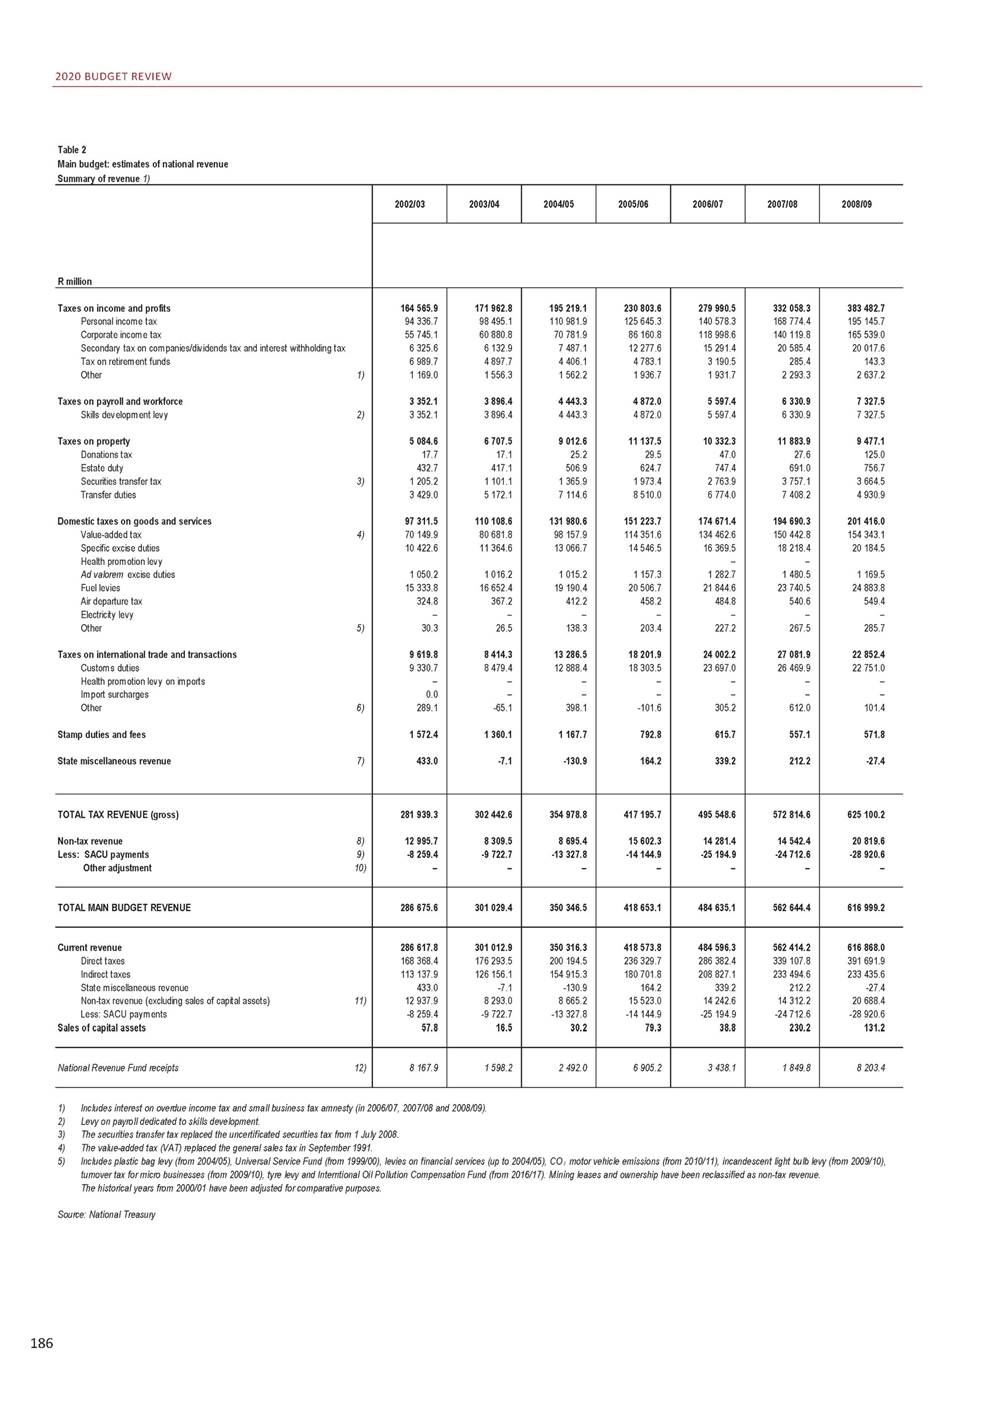
STATISTICAL ANNEXURE Table 2 Main budget: estimates of national revenue Summary of revenue 1) 6) Includes miscellaneous customs and excise receipts, ordinary levy (up to 2004/05) and diamond export duties. 7) Includes revenue received by SARS that could not be allocated to a specific revenue type. 8) Includes sales of goods and services, fines, penalties and forfeits, interest, dividends and rent on land (including mineral and petroleum royalties and mining leases and ownership), sales of capital assets as well as transactions in financial assets and liabilities. 9) Payments in terms of SACU agreements. 10) Payment to SACU partners in respect of a previous error in calculation of the 1969 agreement. 11) Excludes sales of capital assets. 12) Previously classified as extraordinary revenue, includes sales of strategic fuel stocks, proceeds from sales of state assets and certain other receipts are, by law, paid into the National Revenue Fund. 187 2009/10 2010/11 2011/12 2012/13 2013/14 2014/15 2015/16 R million Actual collections 359 044.8 205 145.0 134 883.4 15 467.8 42.7 3 505.9 7 804.8 7 804.8 8 826.4 60.1 759.3 3 324.0 4 683.0 203 666.8 147 941.3 21 289.3 – 1 275.9 28 832.5 580.3 3 341.7 405.7 19 318.9 19 577.1 – – -258.3 49.5 -5.7 379 941.2 226 925.0 132 901.7 17 178.2 2.8 2 933.6 8 652.3 8 652.3 9 102.3 64.6 782.3 2 932.9 5 322.5 249 490.4 183 571.4 22 967.6 – 1 596.2 34 417.6 647.8 4 996.4 1 293.3 26 977.1 26 637.4 – – 339.7 3.1 16.7 426 583.7 250 399.6 151 626.7 21 965.4 6.7 2 585.3 10 173.1 10 173.1 7 817.5 52.7 1 045.2 2 886.1 3 833.6 263 949.9 191 020.2 25 411.1 – 1 828.3 36 602.3 762.4 6 429.7 1 895.8 34 121.0 34 197.9 – – -76.9 -2.9 7.4 457 313.8 275 821.6 159 259.2 19 738.7 0.2 2 494.1 11 378.5 11 378.5 8 645.2 82.1 1 013.0 3 271.9 4 278.3 296 921.5 215 023.0 28 377.7 – 2 231.9 40 410.4 873.1 7 983.9 2 021.4 39 549.1 38 997.9 – – 551.2 0.5 17.2 507 759.2 309 834.1 177 324.3 17 308.8 – 3 292.0 12 475.6 12 475.6 10 487.1 112.8 1 101.5 3 784.3 5 488.5 324 548.2 237 666.6 29 039.5 – 2 363.3 43 684.7 878.7 8 818.9 2 096.5 44 732.2 44 178.7 – – 553.4 31.7 -19.1 561 789.8 352 950.4 184 925.4 21 247.3 – 2 666.7 14 032.1 14 032.1 12 471.5 167.0 1 488.6 4 150.1 6 665.8 356 554.4 261 294.8 32 333.6 – 2 962.3 48 466.5 906.6 8 648.2 1 942.5 41 462.9 40 678.8 – – 784.1 -1.2 -14.6 606 820.5 388 102.4 191 151.6 24 152.8 – 3 413.7 15 220.2 15 220.2 15 044.1 134.8 1 982.2 5 530.7 7 396.3 385 955.9 281 111.4 35 076.7 – 3 014.1 55 607.3 941.2 8 471.8 1 733.5 46 942.3 46 250.1 – – 692.2 0.4 -0.8 Taxes on income and profits Personal incom e tax Corporate incom e tax Secondary tax on com panies/dividends tax and interest w ithholding tax Tax on retirem ent funds 1) Other Taxes on payroll and workforce 2) Skills developm ent levy Taxes on property Donations tax Estate duty 3) Securities transfer tax Transfer duties Domestic taxes on goods and services 4) Value-added tax Specific excise duties Health prom otion levy Ad valorem excise duties Fuel levies Air departure tax Electricity levy 5) Other Taxes on international trade and transactions Custom s duties Health prom otion levy on im ports Im port surcharges 6) Other Stamp duties and fees 7) State miscellaneous revenue 598 705.4 15 323.1 -27 915.4 – 674 183.1 16 474.0 -14 991.3 -2 914.4 742 649.7 24 401.5 -21 760.0 – 813 825.8 28 467.7 -42 151.3 – 900 014.7 30 725.8 -43 374.4 – 986 295.0 30 899.6 -51 737.7 – 1 069 982.6 57 275.7 -51 021.9 – TOTAL TAX REVENUE (gross) 8) Non-tax revenue 9) Less: SACU payments 10) Other adjustment 586 113.1 672 751.5 745 291.3 800 142.2 887 366.2 965 456.9 1 076 236.4 TOTAL MAIN BUDGET REVENUE 586 076.8 367 669.0 231 042.1 -5.7 15 286.8 -27 915.4 36.3 672 716.0 389 440.5 284 726.0 16.7 16 438.5 -17 905.7 35.4 745 176.5 437 854.7 304 787.6 7.4 24 286.8 -21 760.0 114.7 800 047.9 469 787.4 344 021.2 17.2 28 373.4 -42 151.3 94.3 887 329.2 521 449.0 378 584.8 -19.1 30 688.8 -43 374.4 37.0 965 379.5 577 477.5 408 832.1 -14.6 30 822.1 -51 737.7 77.4 1 076 115.3 624 157.7 445 825.7 -0.8 57 154.6 -51 021.9 121.1 Current revenue Direct taxes Indirect taxes State m iscellaneous revenue 11) Non-tax revenue (excluding sales of capital assets) Less: SACU paym ents Sales of capital assets 6 428.6 3 013.9 5 209.2 12 302.8 11 709.3 12 647.0 14 377.5 12) National Revenue Fund receipts
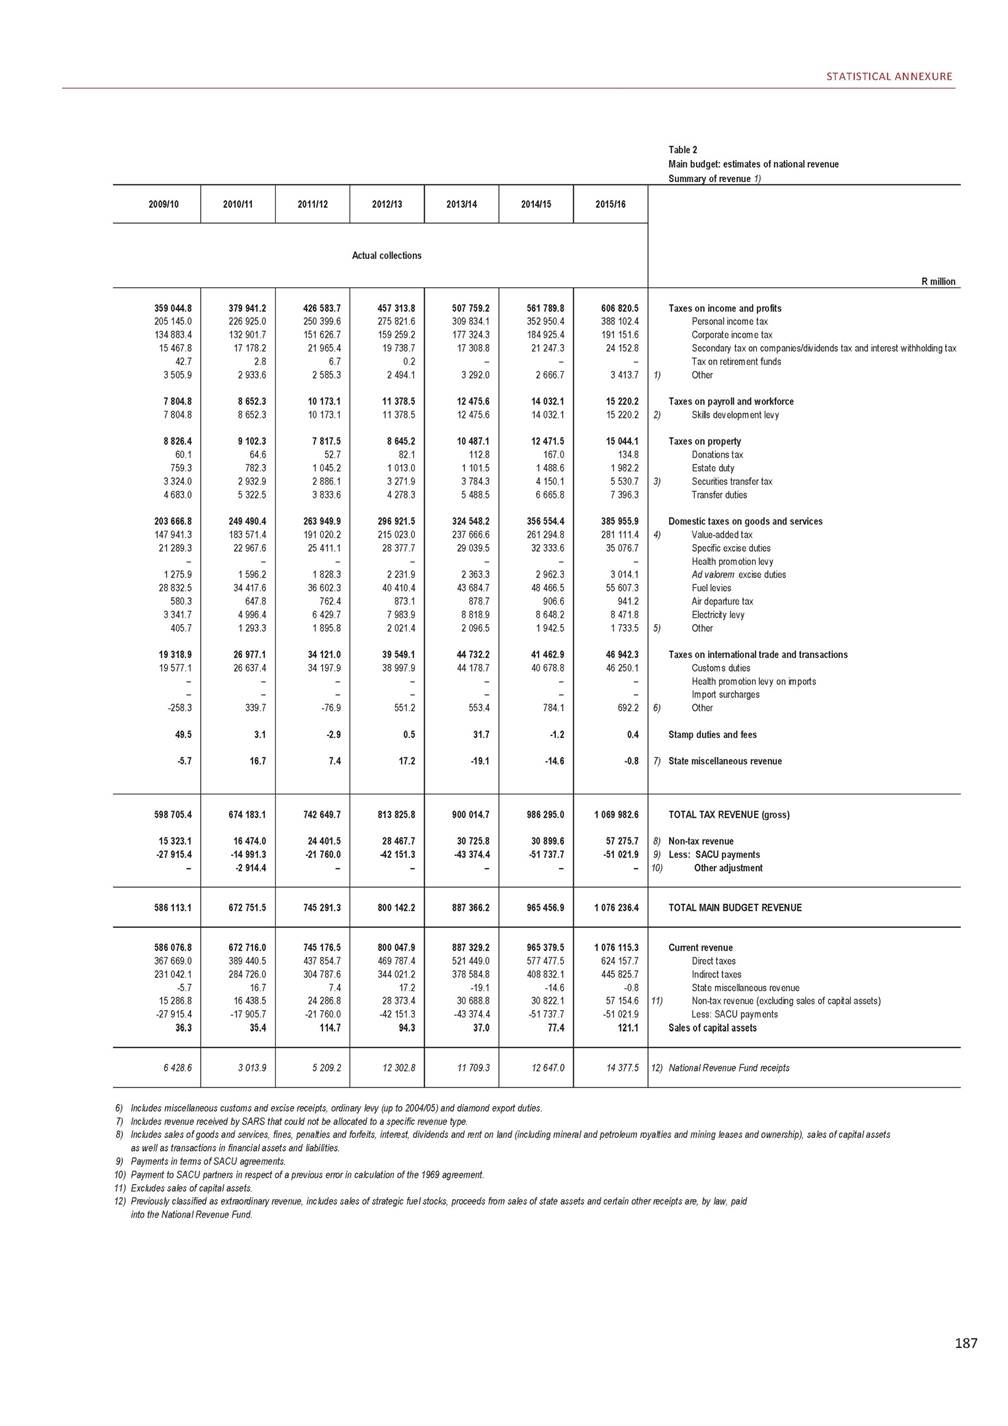
2020 BUDGET REVIEW Table 2 Main budget: estimates of national revenue Summary of revenue 1) 1) 2) 3) 4) 5) Includes interest on overdue income tax and small business tax amnesty (in 2006/07, 2007/08 and 2008/09). Levy on payroll dedicated to skills development. The securities transfer tax replaced the uncertificated securities tax from 1 July 2008. The value-added tax (VAT) replaced the general sales tax in September 1991. Includes plastic bag levy (from 2004/05), Universal Service Fund (from 1999/00), levies on financial services (up to 2004/05), CO 2 motor vehicle emissions (from 2010/11), incandescent light bulb levy (from 2009/10), turnover tax for micro businesses (from 2009/10), tyre levy and Interntional Oil Pollution Compensation Fund (from 2016/17). Mining leases and ownership have been reclassified as non-tax revenue. The historical years from 2000/01 have been adjusted for comparative purposes. Source: National Treasury 188 R million 2016/17 2017/18 2018/19 2019/20 2020/21 Actual collections % change Revised on actual estimates 2018/19 Budget estimates BeforeAfter tax proposals Taxes on income and profits Personal incom e tax Corporate incom e tax Secondary tax on com panies/dividends tax and interest w ithholding tax Tax on retirem ent funds Other 1) Taxes on payroll and workforce Skills developm ent levy 2) Taxes on property Donations tax Estate duty Securities transfer tax 3) Transfer duties Domestic taxes on goods and services Value-added tax 4) Specific excise duties Health prom otion levy Ad valorem excise duties Fuel levies Air departure tax Electricity levy Other 5) Taxes on international trade and transactions Custom s duties Health prom otion levy on im ports Im port surcharges Other 6) Stamp duties and fees State miscellaneous revenue 7) 664 526.4 424 545.2 204 431.8 31 575.7 – 3 973.8 15 314.8 15 314.8 15 661.2 280.3 1 619.5 5 553.2 8 208.3 402 463.9 289 166.7 35 773.8 – 3 396.2 62 778.8 1 003.9 8 457.7 1 886.8 46 102.5 45 579.1 – – 523.4 -0.1 12.2 711 703.0 460 952.8 217 412.0 28 559.6 – 4 778.6 16 012.4 16 012.4 16 584.6 732.1 2 292.0 5 837.5 7 723.0 422 248.3 297 997.6 37 355.9 – 3 780.9 70 948.6 1 086.0 8 501.0 2 578.3 49 939.4 49 151.7 – – 787.7 -0.3 -23.5 738 740.6 492 082.9 212 046.1 30 523.1 – 4 088.6 17 439.0 17 439.0 15 251.8 604.4 2 069.3 5 334.8 7 243.2 460 544.6 324 766.0 40 829.7 3 195.1 4 191.9 75 372.2 1 082.9 8 404.0 2 702.9 55 722.9 54 968.1 53.1 – 701.8 0.0 -8.7 778 280.1 5.4% 527 584.2 7.2% 216 718.1 2.2% 29 741.7 -2.6% – – 4 236.0 3.6% 18 576.3 6.5% 18 576.3 6.5% 16 037.8 5.2% 563.3 -6.8% 2 071.1 0.1% 6 163.0 15.5% 7 240.4 -0.0% 488 710.6 6.1% 344 201.9 6.0% 46 764.6 14.5% 2 590.0 -18.9% 4 112.5 -1.9% 79 277.5 5.2% 1 030.9 -4.8% 8 025.0 -4.5% 2 708.3 0.2% 57 329.7 2.9% 56 325.2 2.5% 54.3 2.4% – – 950.2 35.4% 0.1 46.7% – – 815 588.2 813 588.2 548 771.5 546 771.5 230 225.6 230 225.6 31 807.8 31 807.8 – – 4 783.3 4 783.3 19 412.9 19 412.9 19 412.9 19 412.9 17 509.8 17 509.8 702.7 702.7 2 320.5 2 320.5 6 865.9 6 865.9 7 620.7 7 620.7 512 266.8 514 266.8 360 554.6 360 554.6 48 836.1 48 836.1 2 860.4 2 860.4 4 328.5 4 328.5 83 441.2 83 441.2 1 150.5 1 150.5 8 100.3 8 100.3 2 995.3 4 995.3 60 639.8 60 639.8 59 500.2 59 500.2 74.6 74.6 – – 1 065.0 1 065.0 0.1 0.1 – – TOTAL TAX REVENUE (gross) Non-tax revenue 8) Less: SACU payments 9) Other adjustment 10) 1 144 081.0 33 271.8 -39 448.3 – 1 216 463.9 35 849.3 -55 950.9 – 1 287 690.2 35 868.7 -48 288.6 – 1 358 934.6 5.5% 36 142.0 0.8% -50 280.3 4.1% – – 1 425 417.6 1 425 417.6 35 973.2 35 973.2 -63 395.2 -63 395.2 – – TOTAL MAIN BUDGET REVENUE 1 137 904.4 1 196 362.3 1 275 270.3 1 344 796.3 5.5% 1 397 995.6 1 397 995.6 Current revenue Direct taxes Indirect taxes State m iscellaneous revenue Non-tax revenue (excluding sales of capital assets) 11) Less: SACU paym ents Sales of capital assets 1 137 755.2 681 741.0 462 327.8 12.2 33 122.6 -39 448.3 149.2 1 196 164.8 730 739.5 485 747.9 -23.5 35 651.8 -55 950.9 197.5 1 275 158.4 758 853.4 528 845.5 -8.7 35 756.8 -48 288.6 111.9 1 344 682.7 5.5% 799 490.8 5.4% 559 443.8 5.8% – – 36 028.4 0.8% -50 280.3 4.1% 113.6 1.5% 1 397 866.3 1 397 866.3 838 024.3 836 024.3 587 393.3 589 393.3 – – 35 843.9 35 843.9 -63 395.2 -63 395.2 129.3 129.3 National Revenue Fund receipts 12) 14 240.7 16 600.3 11 999.4 10 020.1 -16.5% 6 005.0 6 005.0
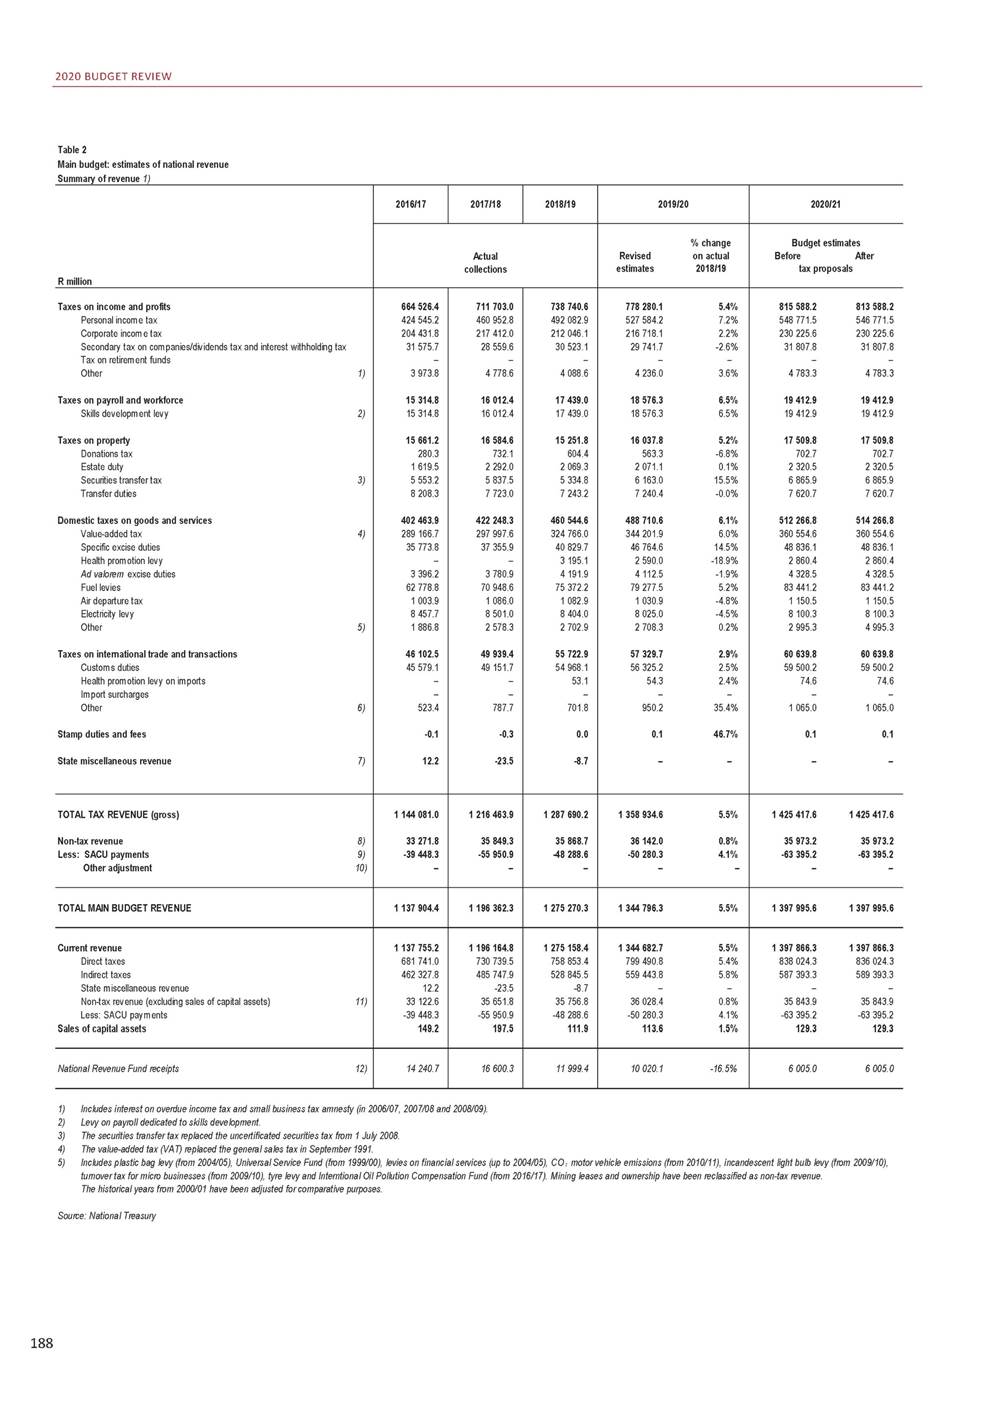
STATISTICAL ANNEXURE Table 2 Main budget: estimates of national revenue Summary of revenue 1) 6) 7) 8) Includes miscellaneous customs and excise receipts, ordinary levy (up to 2004/05) and diamond export duties. Includes revenue received by SARS that could not be allocated to a specific revenue type. Includes sales of goods and services, fines, penalties and forfeits, interest, dividends and rent on land (including mineral and petroleum royalties and mining leases and ownership), sales of capital assets as well as transactions in financial assets and liabilities. Payments in terms of SACU agreements. Payment to SACU partners in respect of a previous error in calculation of the 1969 agreement. Excludes sales of capital assets. Previously classified as extraordinary revenue, includes sales of strategic fuel stocks, proceeds from sales of state assets and certain other receipts are, by law, paid into the National Revenue Fund. 9) 10) 11) 12) 189 2020/21 2021/22 2022/23 R million % change % of on revised total budget 2019/20 revenue % change after tax proposals Estimates 2020/21 % change on Estimates 2021/22 4.5% 58.2% 3.6% 39.1% 6.2% 16.5% 6.9% 2.3% – – 12.9% 0.3% 4.5% 1.4% 4.5% 1.4% 9.2% 1.3% 24.7% 0.1% 12.0% 0.2% 11.4% 0.5% 5.3% 0.5% 5.2% 36.8% 4.8% 25.8% 4.4% 3.5% 10.4% 0.2% 5.3% 0.3% 5.3% 6.0% 11.6% 0.1% 0.9% 0.6% 84.4% 0.4% 5.8% 4.3% 5.6% 4.3% 37.4% 0.0% – – 12.1% 0.1% – 0.0% – – 863 888.2 6.2% 581 145.9 6.3% 243 685.7 5.8% 33 769.1 6.2% – – 5 287.5 10.5% 20 585.0 6.0% 20 585.0 6.0% 18 955.8 8.3% 778.3 10.8% 2 546.0 9.7% 7 546.4 9.9% 8 085.1 6.1% 543 916.1 5.8% 381 858.9 5.9% 51 097.3 4.6% 3 109.7 8.7% 4 592.2 6.1% 88 525.8 6.1% 1 247.1 8.4% 8 213.2 1.4% 5 271.9 5.5% 64 848.8 6.9% 63 606.6 6.9% 90.1 20.7% – – 1 152.1 8.2% 0.1 1.4% – – 921 375.1 6.7% 621 602.2 7.0% 258 356.8 6.0% 35 802.2 6.0% – – 5 614.0 6.2% 21 969.8 6.7% 21 969.8 6.7% 20 164.8 6.4% 827.9 6.4% 2 708.4 6.4% 8 027.7 6.4% 8 600.7 6.4% 576 525.0 6.0% 405 598.3 6.2% 53 440.7 4.6% 3 308.3 6.4% 4 885.1 6.4% 94 172.0 6.4% 1 304.3 4.6% 8 352.4 1.7% 5 463.9 3.6% 69 621.8 7.4% 68 347.0 7.5% 96.8 7.5% – – 1 178.0 2.2% 0.1 1.7% – – Taxes on income and profits Personal incom e tax Corporate incom e tax Secondary tax on com panies/dividends tax and interest w ithholding tax Tax on retirem ent funds 1) Other Taxes on payroll and workforce 2) Skills developm ent levy Taxes on property Donations tax Estate duty 3) Securities transfer tax Transfer duties Domestic taxes on goods and services 4) Value-added tax Specific excise duties Health prom otion levy Ad valorem excise duties Fuel levies Air departure tax Electricity levy 5) Other Taxes on international trade and transactions Custom s duties Health prom otion levy on im ports Im port surcharges 6) Other Stamp duties and fees 7) State miscellaneous revenue 4.9% 102.0% -0.5% 2.6% 26.1% -4.5% – – 1 512 193.8 6.1% 32 663.3 -9.2% -60 563.0 -4.5% – – 1 609 656.6 6.4% 34 586.3 5.9% -63 365.7 4.6% – – TOTAL TAX REVENUE (gross) 8) Non-tax revenue 9) Less: SACU payments 10) Other adjustment 4.0% 100.0% 1 484 294.1 6.2% 1 580 877.1 6.5% TOTAL MAIN BUDGET REVENUE 4.0% 100.0% 4.6% 59.8% 5.4% 42.2% – – -0.5% 2.6% 26.1% -4.5% 13.8% 0.0% 1 484 161.7 6.2% 887 797.5 6.2% 624 396.4 5.9% – – 32 530.9 -9.2% -60 563.0 -4.5% 132.4 2.4% 1 580 742.5 6.5% 946 881.3 6.7% 662 775.3 6.1% – – 34 451.6 5.9% -63 365.7 4.6% 134.7 1.7% Current revenue Direct taxes Indirect taxes State m iscellaneous revenue 11) Non-tax revenue (excluding sales of capital assets) Less: SACU paym ents Sales of capital assets -40.1% 0.4% 4 762.0 -20.7% 5 306.0 11.4% 12) National Revenue Fund receipts
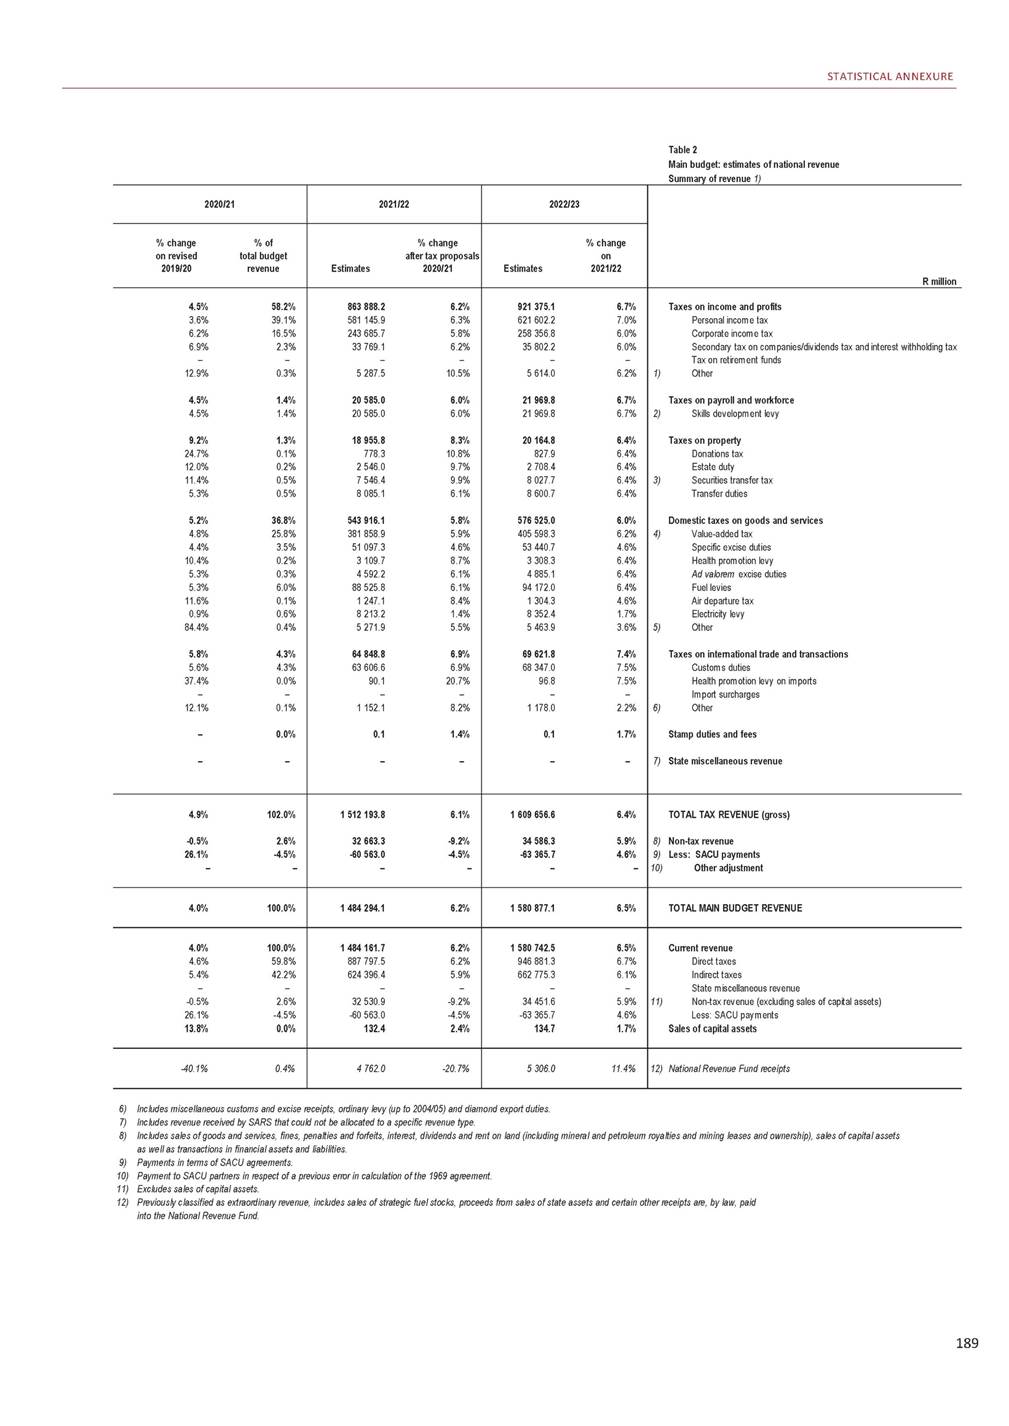
2020 BUDGET REVIEW Table 3 Main budget: estimates of national revenue Detailed classification of revenue 1) The securities transfer tax replaced the uncertificated securities tax from 1 July 2008. 2) Specific excise duties on petrol, distillate fuel, residual fuel and base oil. 190 Source: National Treasury R thousands 2016/17 2017/18 2018/19 Actual collections BeforeAfterRevisedActual tax proposalstax proposalsestimatecollection Taxes on income and profits Personal income tax Tax on corporate income Corporate income tax Secondary tax on companies/dividends tax Interest withholding tax Other Interest on overdue income tax Small business tax amnesty Taxes on payroll and workforce Skills development levy Taxes on property Estate, inheritance and gift taxes Donations tax Estate duty Taxes on financial and capital transactions Securities transfer tax1) Transfer duties Domestic taxes on goods and services Value-added tax Domestic VAT Import VAT Refunds Specific excise duties Beer Sorghum beer and sorghum flour Wine and other fermented beverages Spirits Cigarettes and cigarette tobacco Pipe tobacco and cigars Petroleum products2) Revenue from neighbouring countries3) Health promotion levy Ad valorem excise duties Fuel levy Taxes on use of goods or permission to use goods or to perform activities Air departure tax Plastic bag levy Electricity levy Incandescent light bulb levy CO2 tax - motor vehicle emissions Tyre levy International Oil Pollution Compensation Fund Carbon tax Turnover tax for micro businesses Other Universal Service Fund Taxes on international trade and transactions Import duties Customs duties Health promotion levy on imports Other Miscellaneous customs and excise receipts Diamond export levy Other taxes Stamp duties and fees State miscellaneous revenue4) 664 526 446 424 545 241 204 431 763 31 129 892 445 770 3 974 356 -575 15 314 761 15 314 761 15 661 246 280 264 1 619 492 5 553 233 8 208 257 402 463 950 321 475 499 149 265 484 -181 574 261 11 713 340 4 126 3 163 411 5 853 935 12 120 468 518 718 871 084 1 528 745 – 3 396 164 62 778 834 1 003 904 231 875 8 457 668 70 206 1 208 521 77 242 803 – 23 339 274 842 46 102 497 45 579 083 405 915 117 500 -125 -125 12 212 711 703 019 460 952 841 217 412 046 27 894 315 665 250 4 776 801 1 766 16 012 406 16 012 406 16 584 607 732 086 2 292 015 5 837 511 7 722 996 422 248 282 336 279 470 152 788 760 -191 070 644 13 172 996 3 918 3 771 583 6 442 619 11 067 422 429 271 829 790 1 638 277 – 3 780 887 70 948 576 1 086 040 241 295 8 500 970 55 359 1 336 818 715 997 3 019 – 33 504 192 357 49 939 408 49 151 743 700 809 86 856 -337 -337 -23 511 765 831 359772 991 359751 845 673738 740 597 498 334 638505 844 638497 451 304492 082 904 231 568 699231 218 699218 435 812212 046 052 30 828 96830 828 96830 340 67429 898 035 640 367640 367668 192625 055 4 413 8424 413 8424 949 2364 088 202 44 84444 844455349 16 929 38316 929 38317 312 16117 438 989 16 929 38316 929 38317 312 16117 438 989 17 160 66517 310 66516 034 76515 251 778 415 821415 821539 007604 447 2 573 4852 723 4851 895 8312 069 332 5 824 6445 824 6446 060 2715 334 752 8 346 7148 346 7147 539 6567 243 247 457 283 221484 825 979460 287 253460 544 575 363 016 755378 635 762379 887 172378 732 651 162 191 630169 472 624174 030 292175 184 585 -199 998 727-199 998 727-228 000 000-229 151 259 13 986 41314 576 41313 450 01013 781 537 4 3564 3564 4754 130 3 976 3754 086 3754 218 8464 452 995 6 828 1437 038 1437 466 9537 759 815 11 505 29811 915 29811 974 08112 090 765 484 930494 930423 477412 910 872 433872 433858 724838 362 1 664 2451 664 2451 879 8621 489 176 –1 684 7582 395 7583 195 110 4 059 7864 187 7864 162 6664 191 871 76 288 55077 508 55075 373 56775 372 226 1 154 2901 154 2901 102 3541 082 862 253 419363 419310 362300 395 8 621 0868 621 0868 434 4788 403 962 60 58590 58540 74040 719 1 435 2071 575 2071 236 0291 390 472 601 302601 302751 804730 204 3 0633 0635 9395 481 –––– 44 84444 84417 98012 938 229 236229 236261 682222 666 52 902 83054 050 07356 721 80555 722 906 51 698 81952 600 81955 638 27954 968 076 –245 24278 24253 052 1 103 3771 103 377918 427623 781 100 634100 63486 85677 997 -443-443-33948 -443-443-33948 -1 142 473-1 142 473–-8 651 TOTAL TAX REVENUE (gross) 1 144 080 987 1 216 463 874 1 308 964 5421 344 964 5421 302 201 3181 287 690 241 Less: SACU payments5) Payments in terms of Customs Union agreements (sec. 51(2) of Act 91 of 1964) -39 448 348 -39 448 348 -55 950 873 -55 950 873 -48 288 636-48 288 636-48 288 636-48 288 636 -48 288 636-48 288 636-48 288 636-48 288 636 TOTAL TAX REVENUE (net of SACU payments) 1 104 632 639 1 160 513 001 1 260 675 9051 296 675 9051 253 912 6821 239 401 605
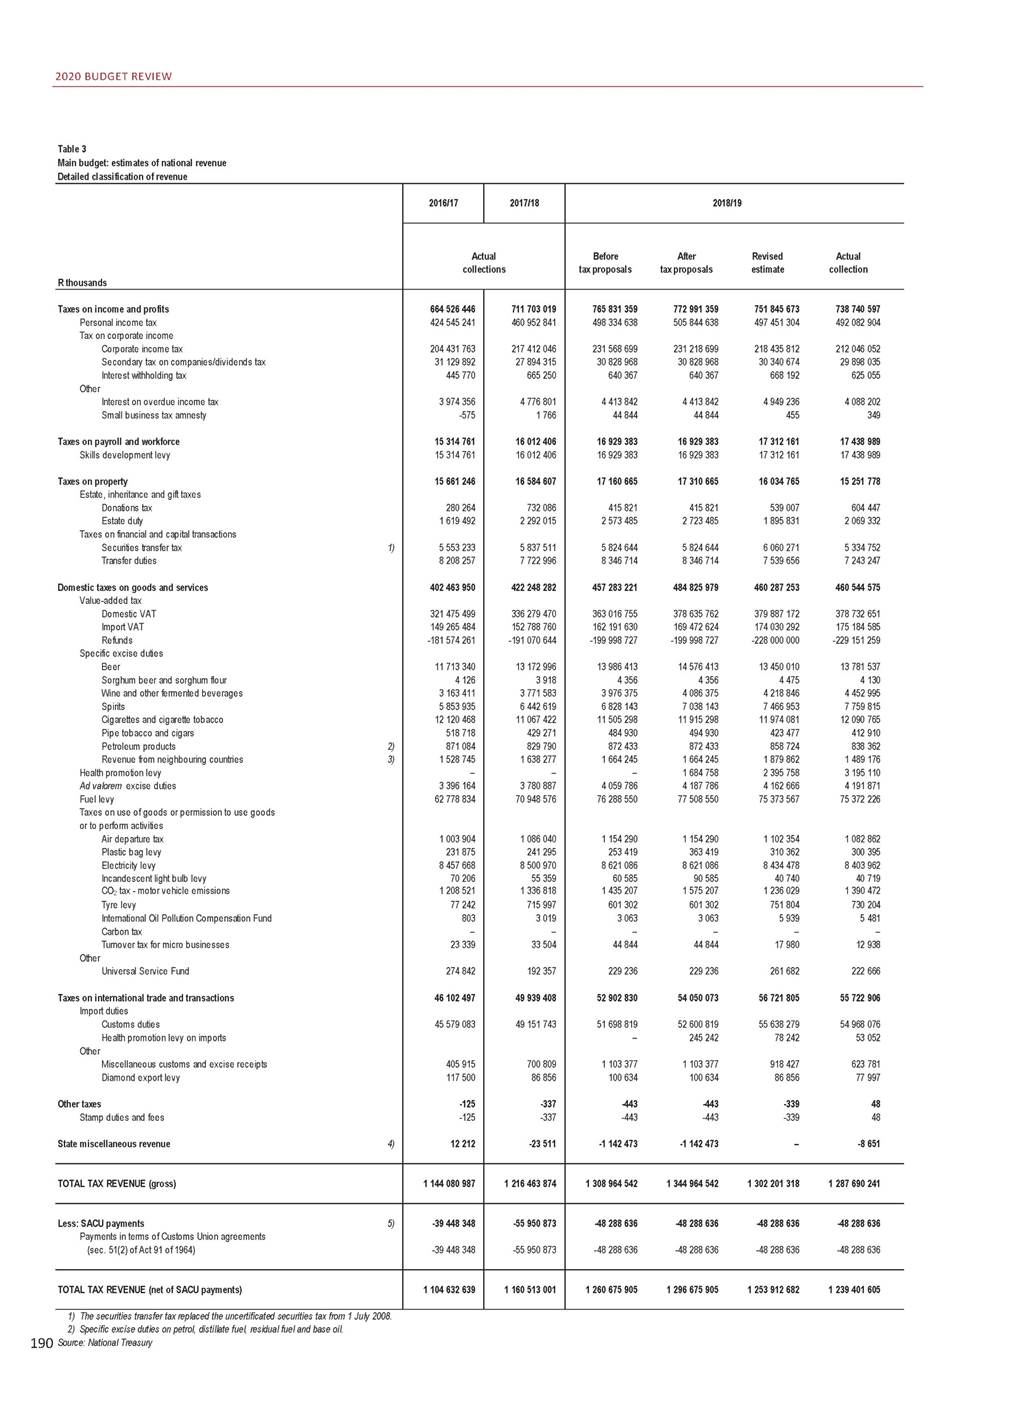
STATISTICAL ANNEXURE Table 3 Main budget: estimates of national revenue Detailed classification of revenue 3) 4) 5) Excise duties that are collected by Botswana, Lesotho, Namibia and Swatini. Revenue received by SARS in respect of taxation that could not be allocated to specific revenue types. Payments in terms of SACU agreements. 191 2019/20 2020/21 R thousands Budget estimates% change on BeforeAfterRevised2018/19 tax proposalsestimate actual BeforeAfter tax proposals 806 541 612820 341 612778 280 1055.4% 539 076 912552 876 912527 584 2167.2% 229 608 192229 608 192216 718 0972.2% 31 892 51531 892 51529 144 409-2.5% 702 368702 368597 334-4.4% 5 261 1405 261 1404 235 9003.6% 485485149-57.3% 18 758 51018 758 51018 576 3056.5% 18 758 51018 758 51018 576 3056.5% 17 158 87217 158 87216 037 7715.2% 576 793576 793563 283-6.8% 2 028 7372 028 7372 071 0760.1% 6 485 1226 485 1226 162 99015.5% 8 068 2198 068 2197 240 421-0.0% 503 448 985504 648 985488 710 6466.1% 406 966 584406 210 232399 432 7005.5% 187 765 494187 421 846182 666 0474.3% -233 160 795-233 160 795-237 896 8323.8% 14 582 85214 969 26915 420 22211.9% 4 3374 3374 2242.3% 4 175 2414 210 8804 452 108-0.0% 7 132 1487 310 0928 927 71315.1% 12 251 92612 627 46914 406 84319.2% 475 214499 671475 38215.1% 918 599918 599870 0383.8% 1 813 6151 813 6152 208 03648.3% 1 986 0671 986 0672 590 033-18.9% 4 454 4874 454 4874 112 466-1.9% 81 657 58382 957 58379 277 4915.2% 1 159 2151 159 2151 030 853-4.8% 326 371326 371325 9868.5% 8 562 4858 562 4858 025 000-4.5% 41 35941 35932 529-20.1% 1 254 7881 254 7881 300 225-6.5% 790 583790 583817 54212.0% 6 0306 0303 170-42.2% –––– 19 14919 14919 26748.9% 265 654265 654209 604-5.9% 61 300 36361 300 36357 329 6682.9% 60 029 48660 029 48656 325 2082.5% 245 242245 24254 3082.4% 932 366932 366859 74137.8% 93 26993 26990 41215.9% -344-3447146.7% -344-3447146.7% –––-100.0% 815 588 183 548 771 494 230 225 625 31 169 089 638 701 4 783 092 182 19 412 896 19 412 896 17 509 810 702 682 2 320 507 6 865 932 7 620 689 512 266 829 421 650 757 192 962 798 -254 058 947 16 484 000 4 939 5 326 196 9 281 460 14 461 679 493 879 1 002 759 1 781 193 2 860 369 4 328 453 83 441 153 1 150 545 360 782 8 100 339 37 477 1 394 995 951 353 3 548 – 26 263 220 839 60 639 807 59 500 218 74 619 963 645 101 324 71 71 – 813 588 183 546 771 494 230 225 625 31 169 089 638 701 4 783 092 182 19 412 896 19 412 896 17 509 810 702 682 2 320 507 6 865 932 7 620 689 514 266 829 421 650 757 192 962 798 -254 058 947 16 484 000 4 939 5 326 196 9 281 460 14 461 679 493 879 1 002 759 1 781 193 2 860 369 4 328 453 83 441 153 1 150 545 610 782 8 100 339 37 477 1 394 995 951 353 3 548 1 750 000 26 263 220 839 60 639 807 59 500 218 74 619 963 645 101 324 71 71 – Taxes on income and profits Personal income tax Tax on corporate income Corporate income tax Secondary tax on companies/dividends tax Interest withholding tax Other Interest on overdue income tax Small business tax amnesty Taxes on payroll and workforce Skills development levy Taxes on property Estate, inheritance and gift taxes Donations tax Estate duty Taxes on financial and capital transactions 1)Securities transfer tax Transfer duties Domestic taxes on goods and services Value-added tax Domestic VAT Import VAT Refunds Specific excise duties Beer Sorghum beer and sorghum flour Wine and other fermented beverages Spirits Cigarettes and cigarette tobacco Pipe tobacco and cigars 2)Petroleum products 3)Revenue from neighbouring countries Health promotion levy Ad valorem excise duties Fuel levy Taxes on use of goods or permission to use goods or to perform activities Air departure tax Plastic bag levy Electricity levy Incandescent light bulb levy CO2 tax - motor vehicle emissions Tyre levy International Oil Pollution Compensation Fund Carbon tax Turnover tax for micro businesses Other Universal Service Fund Taxes on international trade and transactions Import duties Customs duties Health promotion levy on imports Other Miscellaneous customs and excise receipts Diamond export levy Other taxes Stamp duties and fees 4) State miscellaneous revenue 1 407 207 9981 422 207 9981 358 934 5665.5% 1 425 417 596 1 425 417 596 TOTAL TAX REVENUE (gross) -50 280 313-50 280 313-50 280 3134.1% -50 280 313-50 280 313-50 280 3134.1% -63 395 241 -63 395 241 -63 395 241 -63 395 241 5) Less: SACU payments Payments in terms of Customs Union agreements (sec. 51(2) of Act 91 of 1964) 1 356 927 6851 371 927 6851 308 654 2545.6% 1 362 022 355 1 362 022 355 TOTAL TAX REVENUE (net of SACU payments)
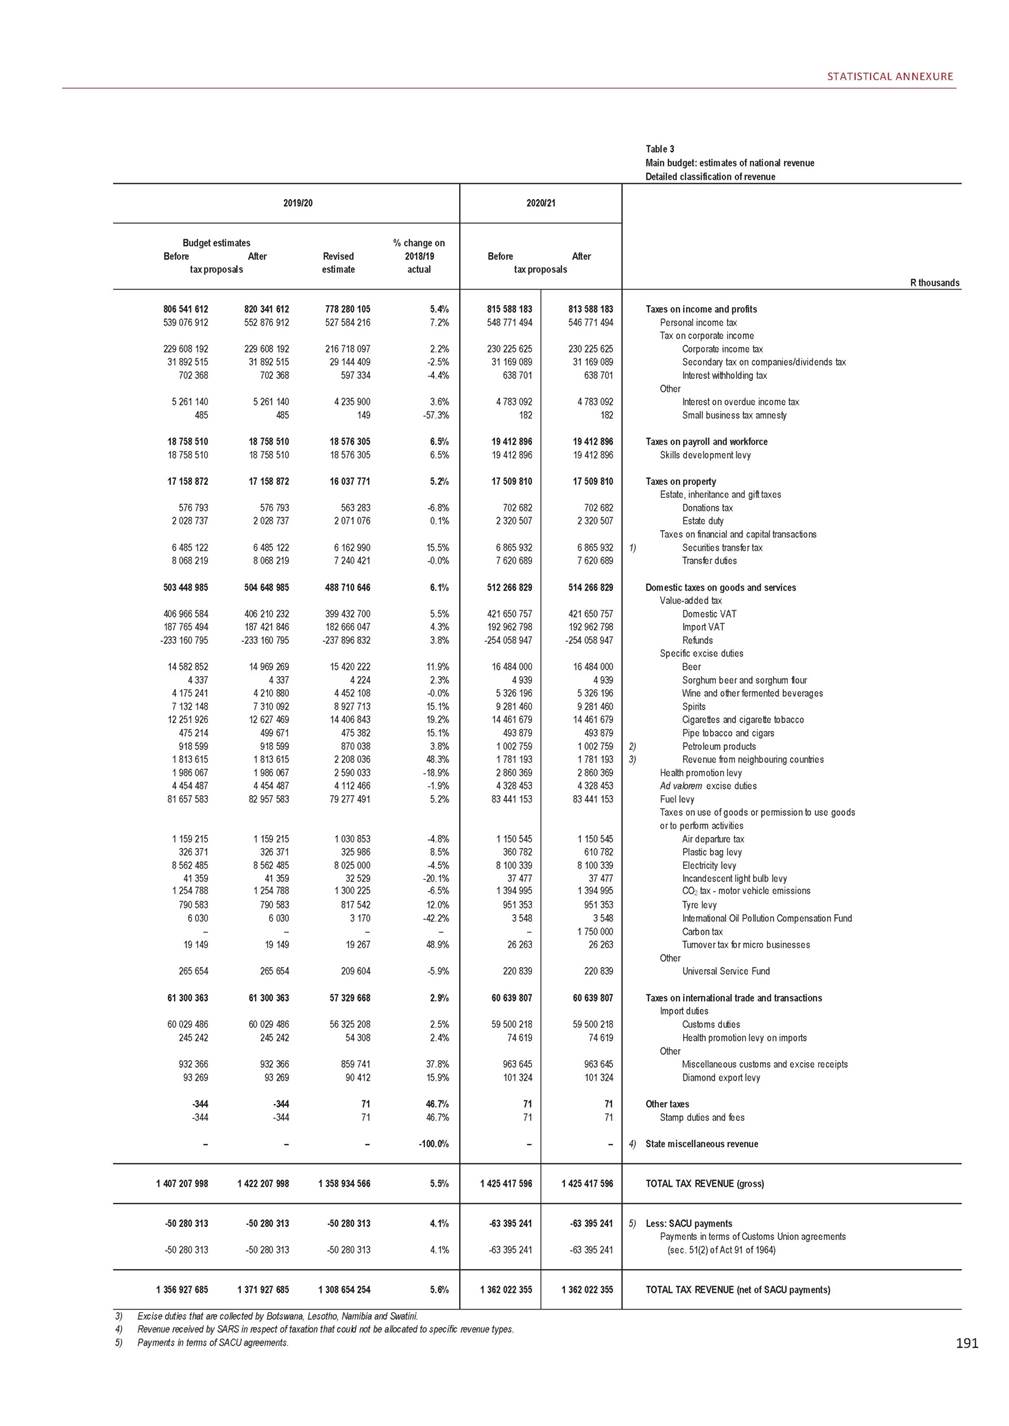
2020 BUDGET REVIEW Table 3 Main budget: estimates of national revenue Detailed classification of revenue 6) New item introduced on the standard chart of accounts from 2008/09. 7) Mineral royalties imposed on the transfer of mineral resources in terms of the Mineral and Petroleum Resources Royalty Act (2008), which came into operation on 1 May 2009. 8) Mining leases and ownership have been reclassified as non-tax revenue. 9) Royalties, prospecting fees and surface rental collected by the Department of Mineral resources. 10) Includes recoveries of loans and advances. 11) Includes National Revenue Fund receipts previously accounted for separately. Source: National Treasury 192 R thousands 2016/17 2017/18 2018/19 Actual collections BeforeAfterRevisedActual tax proposalstax proposals estimatecollection TOTAL TAX REVENUE (net of SACU payments) 1 104 632 639 1 160 513 001 1 260 675 9051 296 675 9051 253 912 6821 239 401 605 Sales of goods and services other than capital assets Sales of goods and services produced by departments Sales by market establishments6) Administrative fees Other sales Sales of scrap, waste, arms and other used current goods Transfers received Fines, penalties and forfeits Interest, dividends and rent on land Interest Cash and cash equivalents Dividends Airports Company South Africa South African Special Risks Insurance Association Vodacom Industrial Development Corporation Reserve Bank (National Treasury) Telkom Other Rent on land Mineral and petroleum royalties 7) Mining leases and ownership 8) Royalties, prospecting fees and surface rental 9) Land rent Sales of capital assets Financial transactions in assets and liabilities10) 2 546 176 56 205 1 342 255 1 098 748 48 968 495 915 666 963 11 188 619 3 981 450 255 671 151 200 – 20 000 – 830 813 1 218 5 801 670 111 696 23 616 11 285 149 200 18 224 915 2 588 718 55 913 1 438 136 1 082 556 12 113 330 504 466 043 12 725 550 3 484 812 266 854 242 979 – 50 000 – 846 603 – 7 617 251 179 777 23 387 13 887 197 491 19 540 965 2 298 7472 298 7472 381 5462 320 696 69 23469 23463 29759 164 1 368 3701 368 3701 352 6681 344 910 850 725850 725954 741902 116 10 41810 41810 84014 506 571 161571 161599 722386 234 610 725610 7251 161 5551 751 945 12 778 77012 778 77013 365 53816 845 028 3 490 3163 490 3163 575 1146 833 549 281 434281 434280 000109 989 160 261160 261160 26180 000 ––3232 20 00020 00050 00050 000 –––– 600 000600 000490 645722 859 1 0001 00046– 7 985 9957 985 9958 339 6278 611 781 193 905193 905440 537413 477 26 95626 95624 06319 000 18 90318 9035 2134 342 130 682130 682119 638111 917 8 080 1268 080 12613 845 40114 452 907 TOTAL NON-TAX REVENUE11) 33 271 788 35 849 271 24 470 21124 470 21131 473 40035 868 727 TOTAL MAIN BUDGET REVENUE 1 137 904 427 1 196 362 272 1 285 146 1171 321 146 1171 285 386 0821 275 270 332 National Revenue Fund receipts Revaluation profits on foreign currency transactions Premiums on loan transactions Premiums on debt portfolio restructuring (switches) Liquidation of South African Special Risks Insurance Association investment Other 14 240 651 10 710 440 2 594 049 – – 936 162 16 600 255 13 115 597 1 132 995 – – 2 351 663 6 185 0006 185 00011 685 23611 999 374 6 185 0006 185 00010 238 13810 390 835 ––1 000 0001 161 388 ––444 598– –––– ––2 500447 151
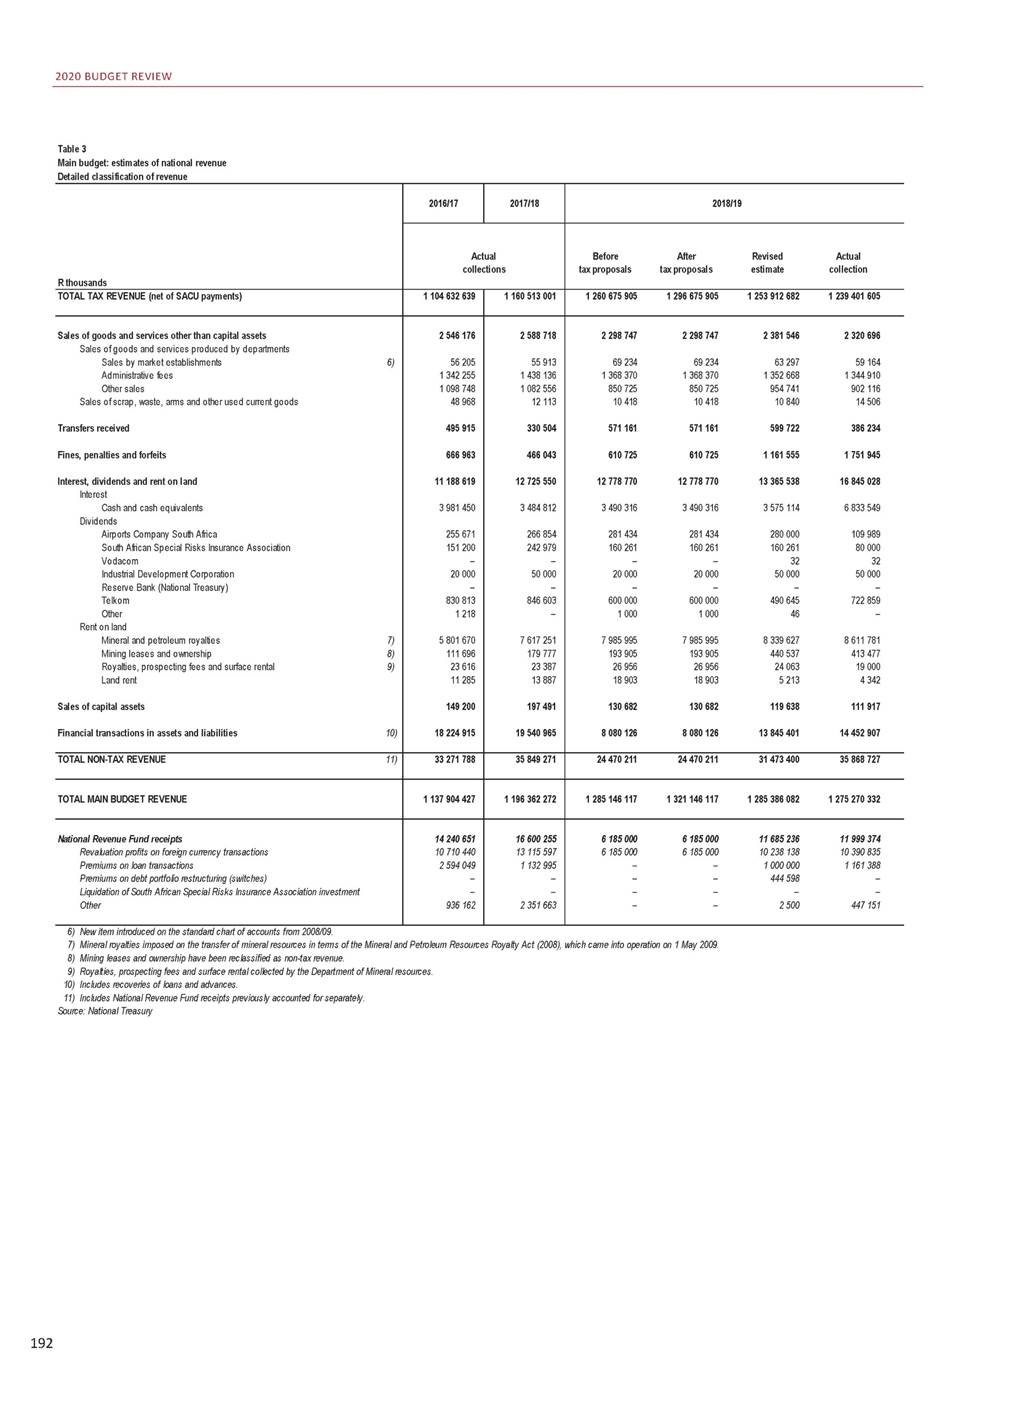
STATISTICAL ANNEXURE Table 3 Main budget: estimates of national revenue Detailed classification of revenue 193 2019/20 2020/21 R thousands Budget estimates% change on BeforeAfterRevised2018/19 tax proposalsestimate actual BeforeAfter tax proposals 1 356 927 6851 371 927 6851 308 654 2545.6% 1 362 022 355 1 362 022 355 TOTAL TAX REVENUE (net of SACU payments) 2 377 4052 377 4052 397 1013.3% 72 14672 14663 6787.6% 1 411 3711 411 3711 399 5324.1% 882 933882 933923 5442.4% 10 95510 95510 347-28.7% 602 202602 202660 34571.0% 788 825788 825711 989-59.4% 13 911 64413 911 64419 675 22616.8% 3 771 8363 771 8366 789 432-0.6% 297 194297 194100 000-9.1% 171 305171 305171 305114.1% 3232–-100.0% 50 00050 00050 000– –––– 600 000600 000600 000-17.0% 1 0461 0463 500– 8 766 1758 766 17511 951 92638.8% 217 547217 547-20 244-104.9% 24 67724 67724 67729.9% 11 83211 8324 6296.6% 129 597129 597113 5991.5% 13 727 01813 727 01812 583 757-12.9% 2 415 121 71 051 1 473 117 860 207 10 746 667 716 874 175 19 884 602 6 065 515 90 000 187 901 32 50 000 – 664 446 1 200 12 696 862 90 200 26 034 12 412 129 305 12 002 286 2 415 121 71 051 1 473 117 860 207 10 746 667 716 874 175 19 884 602 6 065 515 90 000 187 901 32 50 000 – 664 446 1 200 12 696 862 90 200 26 034 12 412 129 305 12 002 286 Sales of goods and services other than capital assets Sales of goods and services produced by departments 6)Sales by market establishments Administrative fees Other sales Sales of scrap, waste, arms and other used current goods Transfers received Fines, penalties and forfeits Interest, dividends and rent on land Interest Cash and cash equivalents Dividends Airports Company South Africa South African Special Risks Insurance Association Vodacom Industrial Development Corporation Reserve Bank (National Treasury) Telkom Other Rent on land 7)Mineral and petroleum royalties 8)Mining leases and ownership 9)Royalties, prospecting fees and surface rental Land rent Sales of capital assets 10) Financial transactions in assets and liabilities 31 536 69131 536 69136 142 0170.8% 35 973 205 35 973 205 11) TOTAL NON-TAX REVENUE 1 388 464 3761 403 464 3761 344 796 2705.5% 1 397 995 560 1 397 995 560 TOTAL MAIN BUDGET REVENUE 4 488 0004 488 00010 020 079-16.5% 4 488 0004 488 0007 156 956-31.1% ––2 483 353113.8% ––378 078– –––– ––1 692-99.6% 6 005 000 6 005 000 – – – – 6 005 000 6 005 000 – – – – National Revenue Fund receipts Revaluation profits on foreign currency transactions Premiums on loan transactions Premiums on debt portfolio restructuring (switches) Liquidation of South African Special Risks Insurance Association investment Other
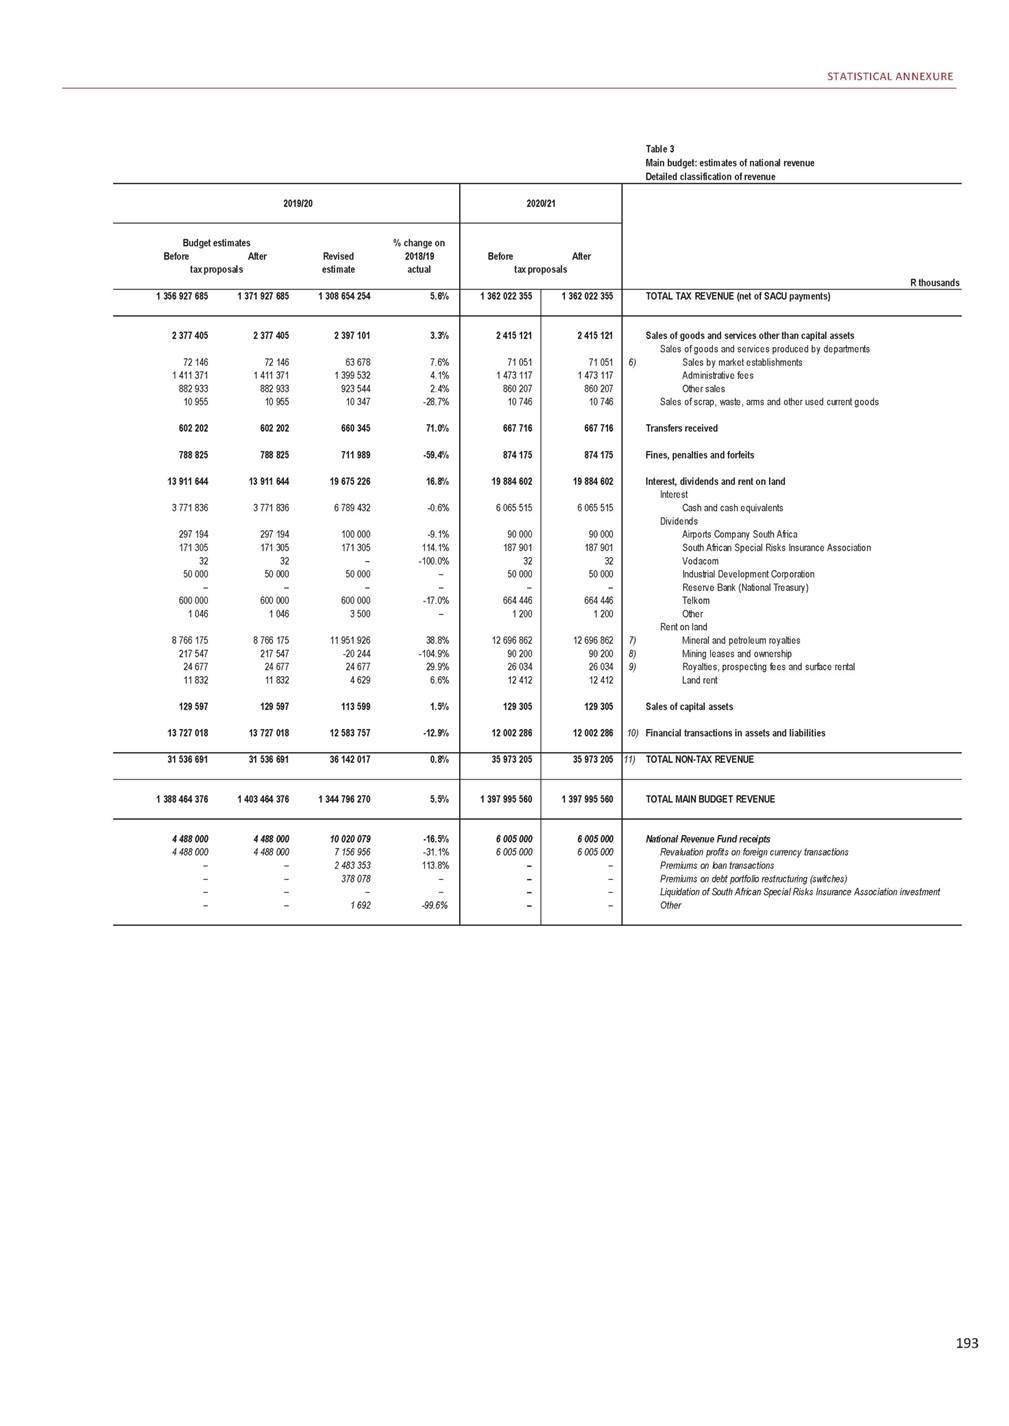
2020 BUDGET REVIEW Table 4 Main budget: expenditure defrayed from the National Revenue Fund by vote 1) Includes provincial equitable share and conditional grants allocated to provinces. 194 2) Includes local government equitable share and conditional grants allocated to local government, as well as general fuel levy sharing with metropolitan municipalities. 3) Budget estimate adjusted for function shifts. Source: National Treasury R million 2016/17 2017/18 Expenditure of which on budget transfers transfers vote to to local outcome provinces 1) government 2) Expenditure of which on budget transfers vote to outcome provinces 1) 1 The Presidency 2 Parliament 3 Cooperative Governance of which: local government equitable share 4 Government Communication and Information System 5 Home Affairs 6 International Relations and Cooperation 7 National School of Government 8 National Treasury 9 Planning, Monitoring and Evaluation 10 Public Enterprises 11 Public Service and Administration 12 Public Service Commission 13 Public Works and Infrastructure 14 Statistics South Africa 15 Traditional Affairs 16 Basic Education 17 Higher Education and Training 18 Health 19 Social Development 20 Women, Youth and Persons with Disabilities 21 Civilian Secretariat for the Police Service 22 Correctional Services 23 Defence 24 Independent Police Investigative Directorate 25 Justice and Constitutional Development 26 Military Veterans 27 Office of the Chief Justice 28 Police 29 Agriculture, Land Reform and Rural Development 30 Communications and Digital Technologies 31 Employment and Labour 32 Environment, Forestry and Fisheries 33 Human Settlements 34 Mineral Resources and Energy 35 Science and Innovation 36 Small Business Development 37 Sports, Arts and Culture 38 Tourism 39 Trade, Industry and Competition 40 Transport 478.1 – – 1 738.9 – – 69 718.2 – 66 178.5 – – 50 709.0 585.1 – – 8 143.5 – – 6 844.9 – – 87.7 – – 28 120.7 – 1 454.4 367.4 – – 253.8 – – 463.0 – – 229.1 – – 6 403.4 761.7 664.0 2 461.2 – – 130.7 – – 21 476.1 16 579.6 – 49 098.0 – – 38 496.2 33 981.0 – 147 325.0 85.5 – 623.5 – – 99.4 – – 21 542.2 – – 46 599.5 – – 241.7 – – 16 039.0 – – 504.6 – – 855.6 – – 80 874.2 – – 15 357.2 2 202.5 – 2 821.2 – – 2 761.6 – – 7 581.6 – – 30 587.2 18 284.0 10 839.5 9 173.9 – 2 131.9 7 423.2 – – 1 197.0 – – 4 981.6 1 912.5 – 1 919.6 – – 11 014.5 – – 56 403.7 15 878.5 5 694.2 485.2 – 1 711.9 – 76 209.5 82.3 – – 619.3 – 8 401.7 – 5 996.9 – 153.7 – 39 595.8 – 425.6 – 250.4 – 454.9 – 247.4 – 6 942.3 781.2 2 195.5 – 139.6 – 22 932.0 17 570.1 52 256.8 – 42 424.7 37 570.2 159 379.0 524.4 659.8 – 118.3 – 22 757.3 – 48 355.1 – 255.3 – 16 607.2 – 601.5 – 997.5 – 86 480.4 – 15 175.8 2 241.7 5 684.1 – 2 844.0 – 7 906.3 – 33 370.5 19 969.3 9 721.3 – 7 528.6 – 1 459.5 – 5 201.9 2 005.8 2 134.0 – 10 145.3 – 54 670.7 16 476.5 Total appropriation by vote Plus: Direct charges against the National Revenue Fund President and deputy president salaries (The Presidency) Members' remuneration (Parliament) Debt-service costs (National Treasury) Provincial equitable share (National Treasury) 4) General fuel levy sharing with metropolitan municipalities (National Treasury) National Revenue Fund payments (National Treasury) of which: Defrayal of the Gold and Foreign Exchange Contingency Reserve Account losses Revaluation losses on foreign currency transactions Premiums on loan transactions Òther Auditor-General of South Africa (National Treasury) Skills levy and sector education and training authorities (Higher Education and Training) Magistrates' salaries (Justice and Constitutional Development) Judges' salaries (Office of the Chief Justice and Judicial Administration) International Oil Pollution Compensation Fund (Transport) 716 658.5 89 685.2 91 643.2 5.7 – – 436.5 – – 146 496.7 – – 410 698.6 410 698.6 – 11 223.8 – 11 223.8 1 778.0 – – 187.2 – – 525.6 – – 1 065.2 – – 0.0 – – 79.1 – – 15 233.0 – – 1 845.7 – – 930.7 – – 3.8 – – 768 602.9 97 221.5 5.7 – 556.3 – 162 644.6 – 441 331.1 441 331.1 11 785.0 – 587.1 – 225.4 – – – 361.8 – -0.1 – 196.3 – 16 293.6 – 1 933.5 – 998.4 – 5.6 – Total direct charges against the National Revenue Fund Provisional allocation not assigned to votes Infrastructure fund not assigned to votes Provisional allocation for Eskom restructuring Compensation of employees adjustment 588 731.7 410 698.6 11 223.8 – – – – – – – – – – – – 636 337.0 441 331.1 – – – – – – – – Total 1 305 390.1 500 383.8 102 867.1 1 404 939.9 538 552.6 Contingency reserve National government projected underspending Local government repayment to the National Revenue Fund – – – – – – – – – – – – – – – Main budget expenditure 1 305 390.1 500 383.8 102 867.1 1 404 939.9 538 552.6
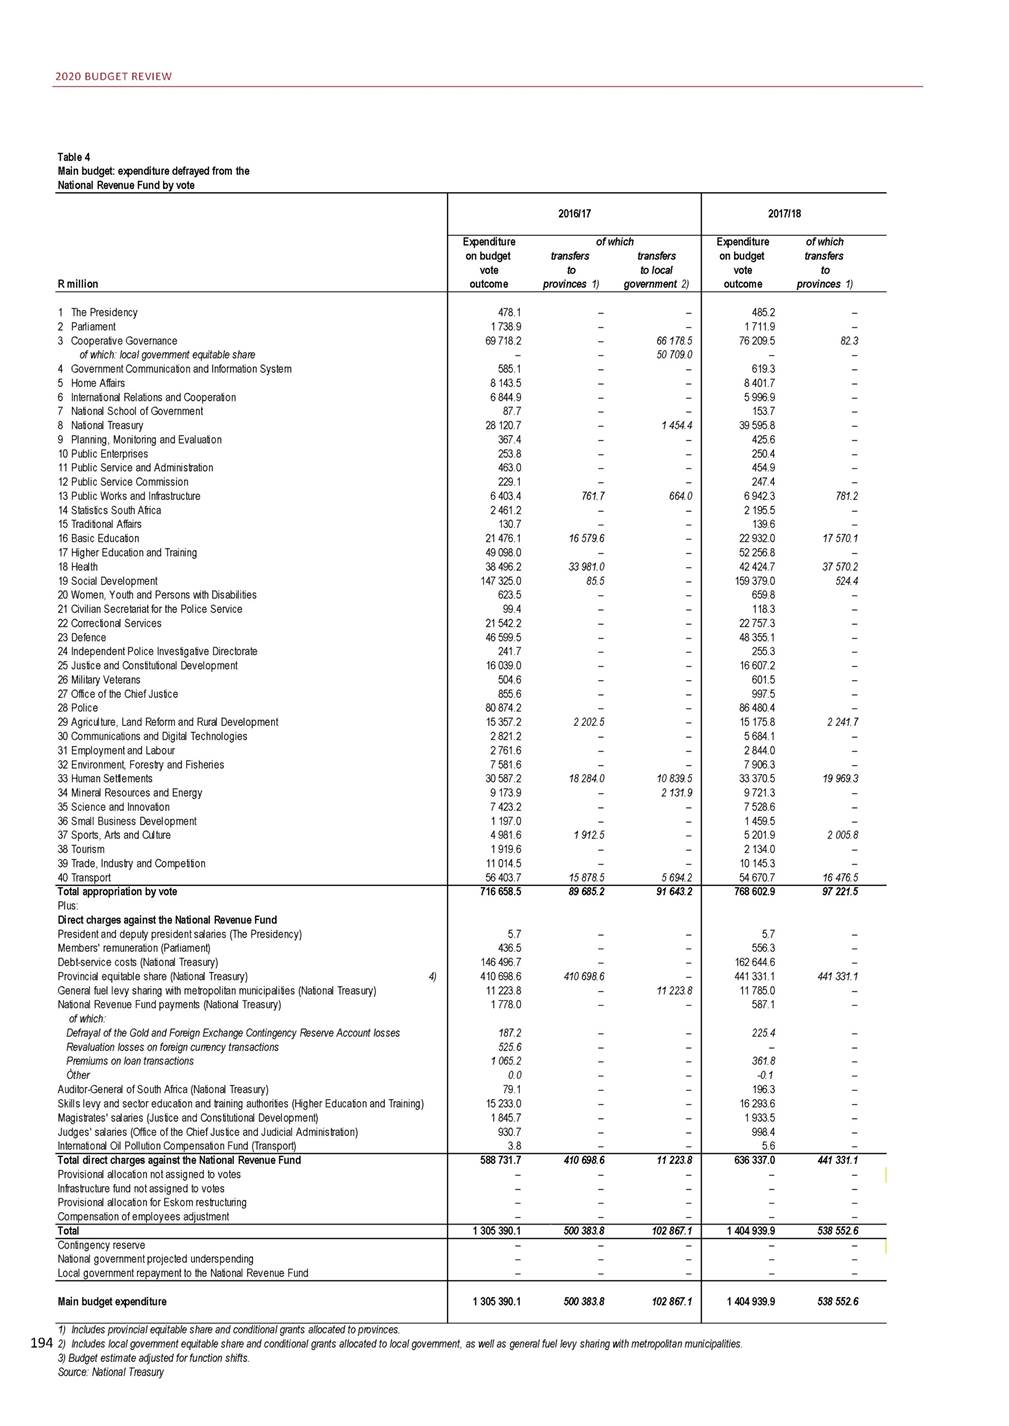
STATISTICAL ANNEXURE Table 4 Main budget: expenditure defrayed from the National Revenue Fund by vote 4) Provincial equitable share excluding conditional grants to provinces. 195 2017/18 2018/19 2019/20 R million of which transfers to local government 2) Expenditure of which on budget transfers transfers vote to to local outcome provinces 1) government 2) Adjusted Budget appro-estimate 3) priation – – 72 012.2 55 613.7 – – – – 1 592.7 – – – – 691.4 – – – – – – – – – – – – – – – – – – – 11 382.2 2 290.3 – – – – – 6 214.4 465.2 – – 1 872.7 – – 81 755.1 139.0 77 220.2 – – 60 757.9 643.7 – – 9 047.2 – – 6 370.2 – – 166.8 – – 28 554.6 – 1 508.8 384.6 – – 6 474.8 – – 492.7 – – 263.9 – – 7 463.5 824.0 692.9 2 311.1 – – 154.3 – – 23 414.8 17 690.2 – 72 866.3 – – 46 594.6 41 364.1 – 172 562.6 776.9 – 723.9 – – 123.9 – – 23 776.9 – – 47 865.0 – – 314.8 – – 17 182.1 – – 542.0 – – 1 092.0 – – 90 297.5 – – 16 600.2 2 845.9 – 4 826.6 – – 3 086.7 – – 7 992.0 – – 32 195.4 18 990.0 11 343.9 8 970.4 – 2 119.5 7 949.3 – – 1 419.5 – – 5 314.0 2 011.1 – 2 234.8 – – 10 519.3 – – 59 193.5 17 026.0 6 394.2 699.1 699.3 1 993.5 1 993.5 90 554.4 90 178.2 – – 688.7 683.6 8 339.7 9 527.7 6 508.5 6 508.5 187.9 187.9 30 720.7 30 628.9 478.4 479.5 17 945.0 56 883.0 536.0 527.2 278.2 278.2 7 869.0 7 967.0 2 514.4 2 514.4 163.4 168.4 24 504.5 24 464.5 89 454.5 89 013.6 51 460.7 51 195.2 184 767.8 184 697.8 739.3 738.0 146.7 143.1 25 407.6 25 316.9 49 850.4 50 235.6 336.7 336.7 18 717.1 18 781.5 662.6 652.6 1 197.7 1 197.7 97 448.6 96 684.2 17 398.7 17 228.9 2 572.0 5 774.1 3 435.1 3 433.2 8 742.1 8 695.7 33 879.2 33 861.9 9 445.2 9 185.8 8 194.6 8 172.3 2 568.6 2 268.6 5 771.1 5 723.1 2 392.7 2 392.7 11 044.4 11 014.4 64 194.2 64 205.1 1 The Presidency 2 Parliament 3 Cooperative Governance of which: local government equitable share 4 Government Communication and Information System 5 Home Affairs 6 International Relations and Cooperation 7 National School of Government 8 National Treasury 9 Planning, Monitoring and Evaluation 10 Public Enterprises 11 Public Service and Administration 12 Public Service Commission 13 Public Works and Infrastructure 14 Statistics South Africa 15 Traditional Affairs 16 Basic Education 17 Higher Education and Training 18 Health 19 Social Development 20 Women, Youth and Persons with Disabilities 21 Civilian Secretariat for the Police Service 22 Correctional Services 23 Defence 24 Independent Police Investigative Directorate 25 Justice and Constitutional Development 26 Military Veterans 27 Office of the Chief Justice 28 Police 29 Agriculture, Land Reform and Rural Development 30 Communications and Digital Technologies 31 Employment and Labour 32 Environment, Forestry and Fisheries 33 Human Settlements 34 Mineral Resources and Energy 35 Science and Innovation 36 Small Business Development 37 Sports, Arts and Culture 38 Tourism 39 Trade, Industry and Competition 40 Transport 99 317.5 – – – – 11 785.0 – – – – – – – – – – 820 697.8 101 667.1 106 019.7 5.7 – – 493.2 – – 181 849.1 – – 470 286.5 470 286.5 – 12 468.6 – 12 468.6 161.6 – – 142.0 – – – – – 18.8 – – 0.9 – – 97.7 – – 17 479.9 – – 2 047.4 – – 1 022.2 – – 3.0 – – 900 249.4 941 105.7 7.3 7.3 527.5 600.5 202 207.8 203 730.8 505 553.8 505 553.8 13 166.8 13 166.8 135.3 359.5 135.3 131.7 – 143.4 – 83.9 – 0.5 50.4 62.8 18 758.5 18 576.3 2 383.7 2 263.7 1 098.5 1 098.5 10.4 10.4 Total appropriation by vote Plus: Direct charges against the National Revenue Fund President and deputy president salaries (The Presidency) Members' remuneration (Parliament) Debt-service costs (National Treasury) 4) Provincial equitable share (National Treasury) General fuel levy sharing with metropolitan municipalities (National Treasury) National Revenue Fund payments (National Treasury) of which: Defrayal of the Gold and Foreign Exchange Contingency Reserve Account losses Revaluation losses on foreign currency transactions Premiums on loan transactions Òther Auditor-General of South Africa (National Treasury) Skills levy and sector education and training authorities (Higher Education and Training) Magistrates' salaries (Justice and Constitutional Development) Judges' salaries (Office of the Chief Justice and Judicial Administration) International Oil Pollution Compensation Fund (Transport) 11 785.0 – – – – 685 914.8 470 286.5 12 468.6 – – – – – – – – – – – – 743 900.1 745 430.4 10.0 - 1 000.0 - 5 348.0 - -4 800.0 - Total direct charges against the National Revenue Fund Provisional allocation not assigned to votes Infrastructure fund not assigned to votes Provisional allocation for Eskom restructuring Compensation of employees adjustment 111 102.6 1 506 612.5 571 953.6 118 488.3 1 645 707.4 1 686 536.1 Total – – – – – – – – – – – – 13 000.0 – - -1 183.8 - -2 000.0 Contingency reserve National government projected underspending Local government repayment to the National Revenue Fund 111 102.6 1 506 612.5 571 953.6 118 488.3 1 658 707.4 1 683 352.3 Main budget expenditure
2020 BUDGET REVIEW Table 4 Main budget: expenditure defrayed from the National Revenue Fund by vote 1) Includes provincial equitable share and conditional grants allocated to provinces. 196 2) Includes local government equitable share and conditional grants allocated to local government, as well as general fuel levy sharing with metropolitan municipalities. 3) Budget estimate adjusted for function shifts. Source: National Treasury R million 2019/20 2020/21 of which transfers transfers Revised to to local estimate provinces 1) government 2) of which transfers transfers Budget to to local estimate provinces 1) government 2) 1 The Presidency 2 Parliament 3 Cooperative Governance of which: local government equitable share 4 Government Communication and Information System 5 Home Affairs 6 International Relations and Cooperation 7 National School of Government 8 National Treasury 9 Planning, Monitoring and Evaluation 10 Public Enterprises 11 Public Service and Administration 12 Public Service Commission 13 Public Works and Infrastructure 14 Statistics South Africa 15 Traditional Affairs 16 Basic Education 17 Higher Education and Training 18 Health 19 Social Development 20 Women, Youth and Persons with Disabilities 21 Civilian Secretariat for the Police Service 22 Correctional Services 23 Defence 24 Independent Police Investigative Directorate 25 Justice and Constitutional Development 26 Military Veterans 27 Office of the Chief Justice 28 Police 29 Agriculture, Land Reform and Rural Development 30 Communications and Digital Technologies 31 Employment and Labour 32 Environment, Forestry and Fisheries 33 Human Settlements 34 Mineral Resources and Energy 35 Science and Innovation 36 Small Business Development 37 Sports, Arts and Culture 38 Tourism 39 Trade, Industry and Competition 40 Transport 699.3 – – 1 993.5 – – 88 168.2 130.9 83 115.2 – – 66 973.5 683.6 – – 9 527.7 – – 6 508.5 – – 187.9 – – 30 432.0 – 1 594.0 464.0 – – 56 883.0 – – 527.2 – – 278.2 – – 7 927.0 868.2 730.0 2 514.4 – – 166.2 – – 24 064.7 18 569.2 – 88 859.3 – – 50 695.0 45 524.1 – 184 697.8 518.2 – 738.0 – – 143.1 – – 25 316.9 – – 50 235.6 – – 336.7 – – 18 581.5 – – 652.6 – – 1 197.7 – – 96 684.2 – – 17 228.9 2 158.7 – 4 648.9 – – 3 381.7 – – 8 695.7 – – 33 861.9 19 604.4 12 194.5 9 036.7 – 2 090.4 8 172.3 – – 2 268.6 – – 5 687.1 2 121.2 – 2 392.7 – – 11 014.4 – – 63 976.1 17 768.2 6 393.1 611.6 – – 2 180.5 – – 96 234.0 138.5 90 656.4 – – 74 683.3 720.5 – – 9 029.6 – – 6 850.2 – – 206.6 – – 33 123.2 – 1 575.0 500.0 – – 37 849.4 – – 565.7 – – 297.6 – – 8 070.8 834.3 748.0 3 452.2 – – 173.4 – – 25 328.2 19 564.3 – 97 444.0 – – 55 516.0 49 267.2 – 197 718.3 915.1 – 778.5 – – 156.3 – – 26 800.0 – – 52 438.6 – – 355.7 – – 19 860.6 – – 683.1 – – 1 259.8 – – 101 711.0 – – 16 810.1 2 153.4 – 3 394.5 – – 3 637.7 – – 8 954.7 – – 31 324.9 17 493.5 11 440.7 9 337.0 – 2 076.7 8 797.4 – – 2 406.8 – – 5 720.2 2 075.7 – 2 481.0 – – 11 082.1 – – 62 036.3 18 342.8 6 554.3 Total appropriation by vote Plus: Direct charges against the National Revenue Fund President and deputy president salaries (The Presidency) Members' remuneration (Parliament) Debt-service costs (National Treasury) Provincial equitable share (National Treasury) 4) General fuel levy sharing with metropolitan municipalities (National Treasury) National Revenue Fund payments (National Treasury) of which: Defrayal of the Gold and Foreign Exchange Contingency Reserve Account losses Revaluation losses on foreign currency transactions Premiums on loan transactions Òther Auditor-General of South Africa (National Treasury) Skills levy and sector education and training authorities (Higher Education and Training) Magistrates' salaries (Justice and Constitutional Development) Judges' salaries (Office of the Chief Justice and Judicial Administration) International Oil Pollution Compensation Fund (Transport) 935 590.9 107 263.1 111 852.9 7.3 – – 600.5 – – 205 005.0 – – 505 553.8 505 553.8 – 13 166.8 – 13 166.8 468.1 – – 131.7 – – 252.3 – – 83.9 – – 0.2 – – 62.8 – – 18 576.3 – – 2 163.7 – – 1 098.5 – – 10.4 – – 963 114.2 110 784.8 118 501.9 7.8 – – 507.2 – – 229 270.0 – – 538 471.5 538 471.5 – 14 026.9 – 14 026.9 97.9 – – 97.9 – – – – – – – – – – – 120.0 – – 19 412.9 – – 2 550.2 – – 1 190.9 – – 11.0 – – Total direct charges against the National Revenue Fund Provisional allocation not assigned to votes Infrastructure fund not assigned to votes Provisional allocation for Eskom restructuring Compensation of employees adjustment 746 713.2 505 553.8 13 166.8 - – – - – – - – – - – – 805 666.3 538 471.5 14 026.9 7 020.6 – – - – – 23 000.0 – – -37 806.7 – – Total 1 682 304.1 612 816.8 125 019.7 1 760 994.4 649 256.3 132 528.8 Contingency reserve National government projected underspending Local government repayment to the National Revenue Fund – – – – – – – – – 5 000.0 – – - – – - – – Main budget expenditure 1 682 304.1 612 816.8 125 019.7 1 765 994.4 649 256.3 132 528.8
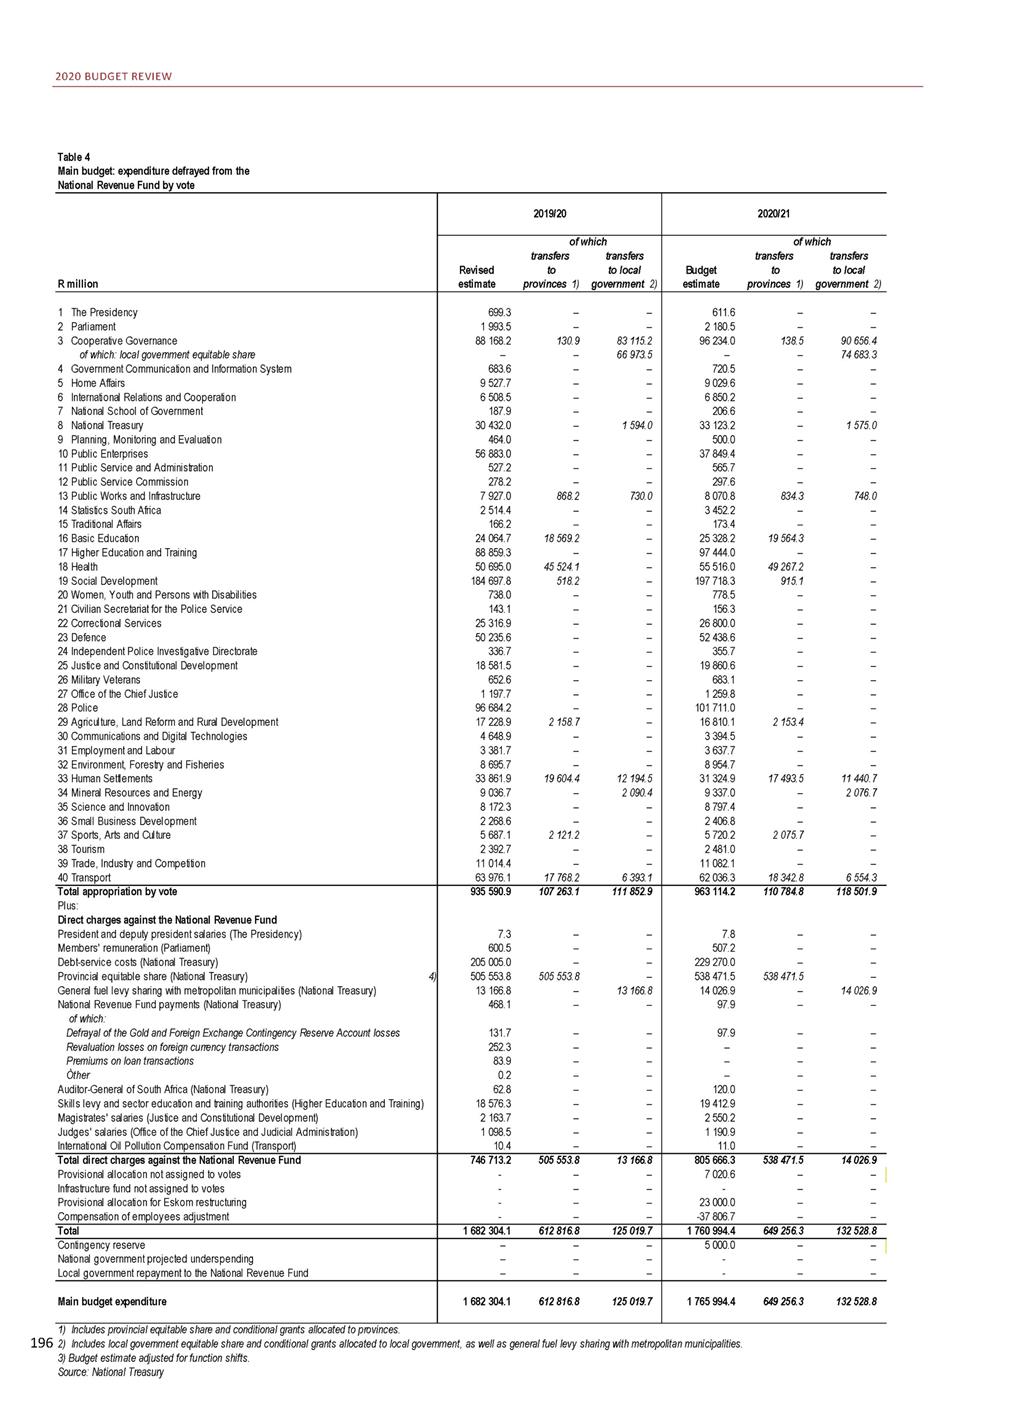
STATISTICAL ANNEXURE Table 4 Main budget: expenditure defrayed from the National Revenue Fund by vote 4) Provincial equitable share excluding conditional grants to provinces. 197 2021/22 2022/23 R million of which transfers transfers Budget to to local estimate provinces 1) government 2) of which transfers transfers Budget to to local estimate provinces 1) government 2) 648.8 – – 2 331.5 – – 104 262.1 146.1 98 387.0 – – 81 061.8 763.2 – – 9 659.9 – – 7 038.5 – – 227.3 – – 35 822.5 – 1 644.4 524.3 – – 4 637.4 – – 606.6 – – 316.3 – – 8 757.3 871.4 790.0 4 843.9 – – 184.7 – – 27 333.0 20 773.3 – 102 753.0 – – 60 638.3 53 916.6 – 211 810.9 1 056.7 – 821.5 – – 166.3 – – 28 565.6 – – 50 852.5 – – 377.7 – – 21 168.8 – – 711.0 – – 1 335.9 – – 108 208.8 – – 17 946.9 2 319.7 – 3 918.6 – – 3 857.2 – – 9 287.8 – – 31 788.6 17 614.4 11 517.7 9 570.0 – 2 233.1 9 377.8 – – 2 696.1 – – 6 035.5 2 204.9 – 2 586.2 – – 10 098.3 – – 69 034.6 19 058.3 6 911.0 676.0 – – 2 429.4 – – 111 656.6 153.0 105 531.1 – – 87 212.7 794.0 – – 10 041.5 – – 7 328.9 – – 236.3 – – 32 911.9 – 1 717.5 547.9 – – 2 119.1 – – 627.5 – – 328.2 – – 9 089.7 902.8 819.1 2 862.6 – – 192.3 – – 28 592.4 21 737.9 – 107 373.4 – – 63 491.0 56 537.0 – 226 890.8 1 191.9 – 853.0 – – 173.3 – – 29 779.2 – – 52 993.6 – – 393.4 – – 22 083.9 – – 735.0 – – 1 398.3 – – 112 683.6 – – 18 520.9 2 392.0 – 2 643.0 – – 4 009.8 – – 9 640.5 – – 32 790.8 18 317.4 11 708.2 10 583.4 – 2 362.0 9 681.5 – – 2 760.7 – – 6 269.6 2 307.5 – 2 687.7 – – 10 489.1 – – 72 228.0 19 597.2 7 240.2 1 The Presidency 2 Parliament 3 Cooperative Governance of which: local government equitable share 4 Government Communication and Information System 5 Home Affairs 6 International Relations and Cooperation 7 National School of Government 8 National Treasury 9 Planning, Monitoring and Evaluation 10 Public Enterprises 11 Public Service and Administration 12 Public Service Commission 13 Public Works and Infrastructure 14 Statistics South Africa 15 Traditional Affairs 16 Basic Education 17 Higher Education and Training 18 Health 19 Social Development 20 Women, Youth and Persons with Disabilities 21 Civilian Secretariat for the Police Service 22 Correctional Services 23 Defence 24 Independent Police Investigative Directorate 25 Justice and Constitutional Development 26 Military Veterans 27 Office of the Chief Justice 28 Police 29 Agriculture, Land Reform and Rural Development 30 Communications and Digital Technologies 31 Employment and Labour 32 Environment, Forestry and Fisheries 33 Human Settlements 34 Mineral Resources and Energy 35 Science and Innovation 36 Small Business Development 37 Sports, Arts and Culture 38 Tourism 39 Trade, Industry and Competition 40 Transport 988 835.6 117 961.5 127 259.5 8.3 – – 541.0 – – 258 482.1 – – 573 989.5 573 989.5 – 15 182.5 – 15 182.5 – – – – – – – – – – – – – – – 125.0 – – 20 585.0 – – 2 715.6 – – 1 268.7 – – 11.6 – – 1 029 512.7 123 136.7 135 359.8 8.6 – – 561.2 – – 290 145.1 – – 607 553.5 607 553.5 – 16 085.0 – 16 085.0 – – – – – – – – – – – – – – – 129.0 – – 21 969.8 – – 2 816.0 – – 1 318.9 – – 12.0 – – Total appropriation by vote Plus: Direct charges against the National Revenue Fund President and deputy president salaries (The Presidency) Members' remuneration (Parliament) Debt-service costs (National Treasury) 4) Provincial equitable share (National Treasury) General fuel levy sharing with metropolitan municipalities (National Treasury) National Revenue Fund payments (National Treasury) of which: Defrayal of the Gold and Foreign Exchange Contingency Reserve Account losses Revaluation losses on foreign currency transactions Premiums on loan transactions Òther Auditor-General of South Africa (National Treasury) Skills levy and sector education and training authorities (Higher Education and Training) Magistrates' salaries (Justice and Constitutional Development) Judges' salaries (Office of the Chief Justice and Judicial Administration) International Oil Pollution Compensation Fund (Transport) 872 909.4 573 989.5 15 182.5 1 852.6 – – 4 000.0 – – 33 000.0 – – -54 929.1 – – 940 599.1 607 553.5 16 085.0 3 573.5 – – 6 000.0 – – 23 000.0 – – -67 460.4 – – Total direct charges against the National Revenue Fund Provisional allocation not assigned to votes Infrastructure fund not assigned to votes Provisional allocation for Eskom restructuring Compensation of employees adjustment 1 845 668.5 691 951.1 142 442.0 1 935 224.9 730 690.2 151 444.8 Total 5 000.0 – – - – – - – – 5 000.0 – – - – – - – – Contingency reserve National government projected underspending Local government repayment to the National Revenue Fund 1 850 668.5 691 951.1 142 442.0 1 940 224.9 730 690.2 151 444.8 Main budget expenditure
2020 BUDGET REVIEW Table 5 Consolidated national, provincial and social security funds expenditure: economic classification 1) 1) These figures were estimated by the National Treasury and may differ from data published by Statistics South Africa and the Reserve Bank. The numbers in this table are not strictly comparable to those published in previous years due to the reclassification of expenditure items for previous years. Data for the previous years has been adjusted accordingly. 2) Includes equitable share and conditional grants to local government. Source: National Treasury 198 R million 2016/17 2017/18 2018/19 2019/20 % of Outcometotal % of Outcometotal % of Outcometotal Revised estimate Current payments Com pensation of em ployees Goods and services Interest and rent on land Transfers and subsidies M unicipalities of which: local government share2) Departm ental agencies and accounts Higher education institutions Foreign governm ents and international organisations Public corporations and private enterprises Public corporations Subsidies on products and production Other transfers Private enterprises Subsidies on products and production Other transfers Non-profit institutions Households Social benefits Other transfers to households Payments for capital assets Buildings and other fixed structures Buildings Other fixed structures M achinery and equipm ent Transport equipm ent Other m achinery and equipm ent Land and sub-soil assets Softw are and other intangible assets Other assets 3) Payments for financial assets 4) Subtotal: votes and direct charges Plus: Contingency reserve Total consolidated expenditure 779 534.456.5% 462 478.033.5% 170 193.112.3% 146 863.410.6% 543 121.539.4% 109 375.67.9% 4 680.80.3% 108 821.97.9% 28 262.92.0% 2 205.80.2% 45 635.83.3% 34 049.22.5% 26 741.61.9% 7 307.60.5% 11 586.60.8% 4 917.50.4% 6 669.10.5% 28 415.12.1% 220 404.416.0% 191 339.713.9% 29 064.72.1% 49 930.83.6% 39 199.32.8% 22 377.61.6% 16 821.71.2% 9 241.70.7% 3 622.00.3% 5 619.70.4% 139.70.0% 1 202.30.1% 147.70.0% 7 183.70.5% 838 697.956.7% 494 713.533.4% 180 857.512.2% 163 126.911.0% 570 707.038.6% 118 344.88.0% 5 134.20.3% 113 777.87.7% 32 021.02.2% 1 971.90.1% 41 115.22.8% 32 544.52.2% 22 605.71.5% 9 938.80.7% 8 570.70.6% 3 351.80.2% 5 218.90.4% 28 900.92.0% 234 575.315.9% 205 748.013.9% 28 827.31.9% 50 690.13.4% 39 388.62.7% 23 489.61.6% 15 899.01.1% 10 364.30.7% 4 446.40.3% 5 917.90.4% 180.10.0% 676.20.0% 80.90.0% 19 309.11.3% 902 037.056.7% 527 932.833.2% 191 667.512.0% 182 436.811.5% 625 823.839.3% 126 302.47.9% 6 740.30.4% 128 765.68.1% 37 530.32.4% 2 346.40.1% 42 047.22.6% 33 422.12.1% 23 641.01.5% 9 781.00.6% 8 625.20.5% 3 631.00.2% 4 994.10.3% 33 875.02.1% 254 956.816.0% 226 215.214.2% 28 741.61.8% 48 732.43.1% 37 908.12.4% 23 142.71.5% 14 765.40.9% 9 968.50.6% 4 145.10.3% 5 823.40.4% 102.50.0% 648.60.0% 104.80.0% 14 764.90.9% 983 613.8 567 426.3 210 660.5 205 527.0 684 098.2 133 286.0 5 735.7 146 329.9 42 614.4 2 542.0 44 822.9 34 760.9 24 077.6 10 683.4 10 062.0 4 218.4 5 843.6 35 631.2 278 871.8 248 953.7 29 918.1 49 499.9 36 651.7 21 075.9 15 575.7 11 983.1 4 238.4 7 744.7 106.1 532.8 226.3 64 036.1 1 379 770.4100.0% –– 1 479 404.1100.0% –– 1 591 358.1100.0% –– 1 781 248.0 – 1 379 770.4100.0% 1 479 404.1100.0% 1 591 358.1100.0% 1 781 248.0
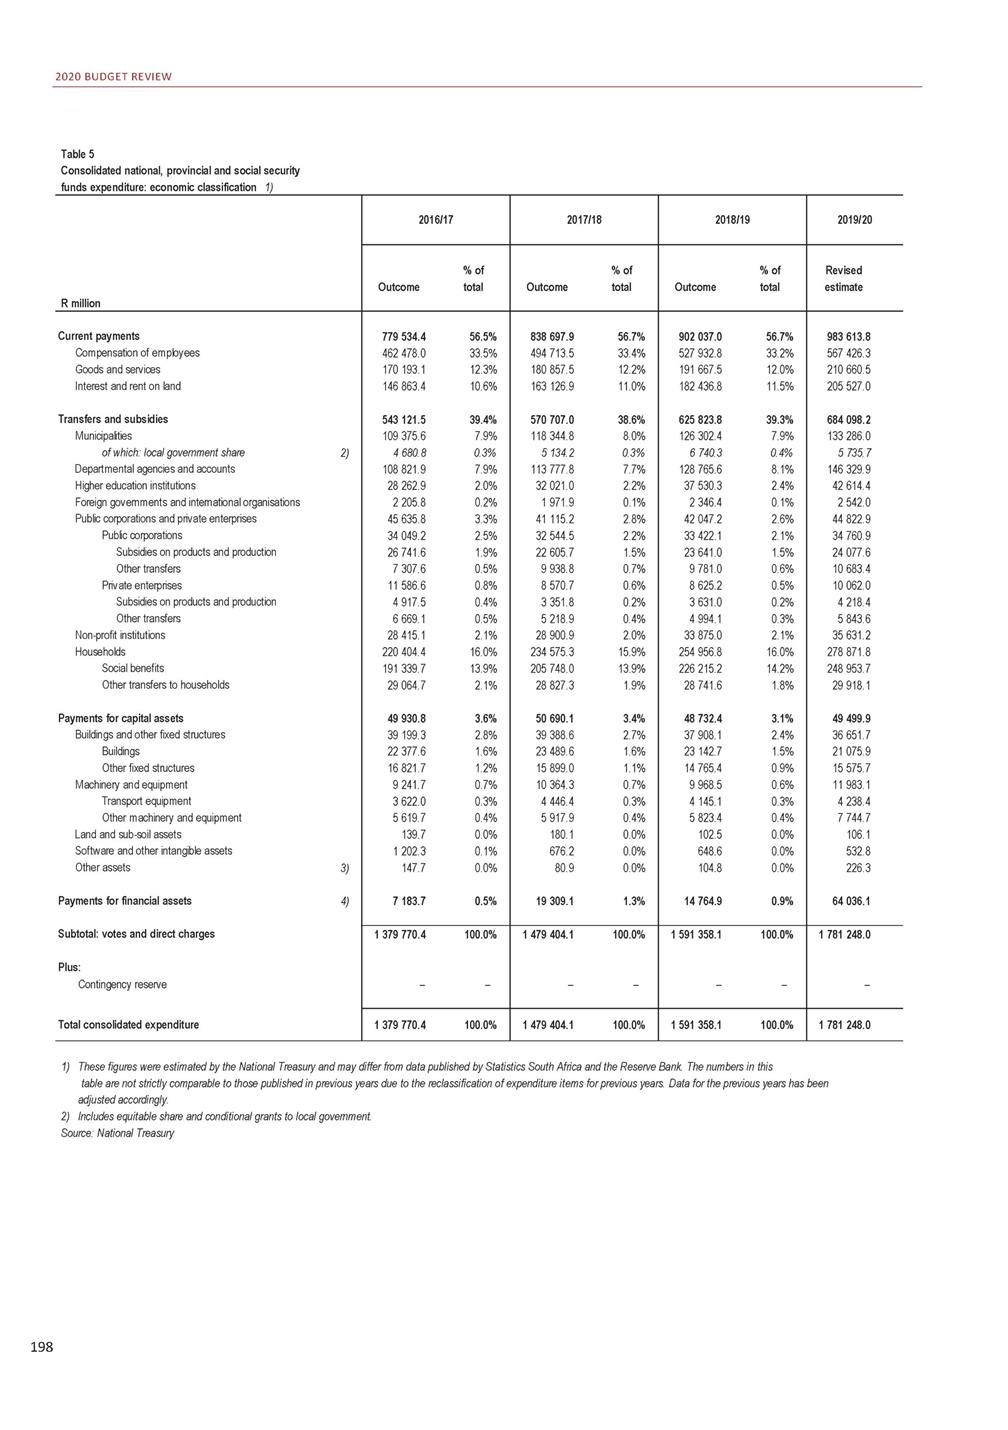
STATISTICAL ANNEXURE Table 5 Consolidated national, provincial and social security funds expenditure: economic classification 1) 3) Includes biological, heritage and specialised military assets. 4) Includes National Revenue Fund payments previously accounted for separately. 199 2020/21 2021/22 2022/23 R million % of total Budget % of estimatetotal Budget % of estimatetotal Budget % of estimatetotal 55.2% 31.9% 11.8% 11.5% 38.4% 7.5% 0.3% 8.2% 2.4% 0.1% 2.5% 2.0% 1.4% 0.6% 0.6% 0.2% 0.3% 2.0% 15.7% 14.0% 1.7% 2.8% 2.1% 1.2% 0.9% 0.7% 0.2% 0.4% 0.0% 0.0% 0.0% 3.6% 1 026 763.854.7% 576 814.830.7% 220 152.411.7% 229 796.612.2% 723 406.838.5% 140 767.77.5% 5 450.80.3% 153 808.88.2% 45 043.72.4% 2 829.70.2% 41 368.72.2% 30 806.61.6% 19 967.71.1% 10 839.00.6% 10 562.10.6% 4 248.10.2% 6 314.00.3% 39 438.62.1% 300 149.616.0% 271 079.614.4% 29 070.01.5% 51 470.62.7% 39 198.72.1% 22 347.11.2% 16 851.50.9% 11 500.90.6% 3 982.70.2% 7 518.20.4% 180.60.0% 336.90.0% 253.60.0% 72 060.73.8% 1 093 709.155.9% 603 481.330.8% 231 178.411.8% 259 049.413.2% 761 888.338.9% 150 650.57.7% 5 776.40.3% 156 353.88.0% 47 426.02.4% 2 785.20.1% 50 527.52.6% 41 125.72.1% 25 792.11.3% 15 333.60.8% 9 401.90.5% 2 901.10.1% 6 500.80.3% 42 268.22.2% 311 877.015.9% 281 587.714.4% 30 289.21.5% 53 857.32.8% 41 651.92.1% 24 744.51.3% 16 907.50.9% 11 649.80.6% 4 317.30.2% 7 332.50.4% 18.30.0% 277.90.0% 259.40.0% 42 500.62.2% 1 159 258.356.5% 630 065.930.7% 238 432.111.6% 290 760.314.2% 807 494.339.3% 160 267.27.8% 5 981.80.3% 160 859.97.8% 49 671.72.4% 2 974.60.1% 56 207.42.7% 46 363.72.3% 28 865.31.4% 17 498.40.9% 9 843.70.5% 3 012.40.1% 6 831.30.3% 44 322.62.2% 333 190.916.2% 301 377.314.7% 31 813.61.6% 55 278.82.7% 42 542.02.1% 25 820.11.3% 16 722.00.8% 12 194.70.6% 4 509.00.2% 7 685.70.4% 19.40.0% 273.50.0% 249.10.0% 25 431.91.2% Current payments Com pensation of em ployees Goods and services Interest and rent on land Transfers and subsidies M unicipalities 2)of which: local government share Departm ental agencies and accounts Higher education institutions Foreign governm ents and international organisations Public corporations and private enterprises Public corporations Subsidies on products and production Other transfers Private enterprises Subsidies on products and production Other transfers Non-profit institutions Households Social benefits Other transfers to households Payments for capital assets Buildings and other fixed structures Buildings Other fixed structures M achinery and equipm ent Transport equipm ent Other m achinery and equipm ent Land and sub-soil assets Softw are and other intangible assets 3)Other assets 4) Payments for financial assets Subtotal: votes and direct charges Plus: Contingency reserve Total consolidated expenditure 100.0% – 1 873 701.999.7% 5 000.00.3% 1 951 955.299.7% 5 000.00.3% 2 047 463.499.76% 5 000.00.2% 100.0% 1 878 701.9100.0% 1 956 955.2100.0% 2 052 463.4100.0%
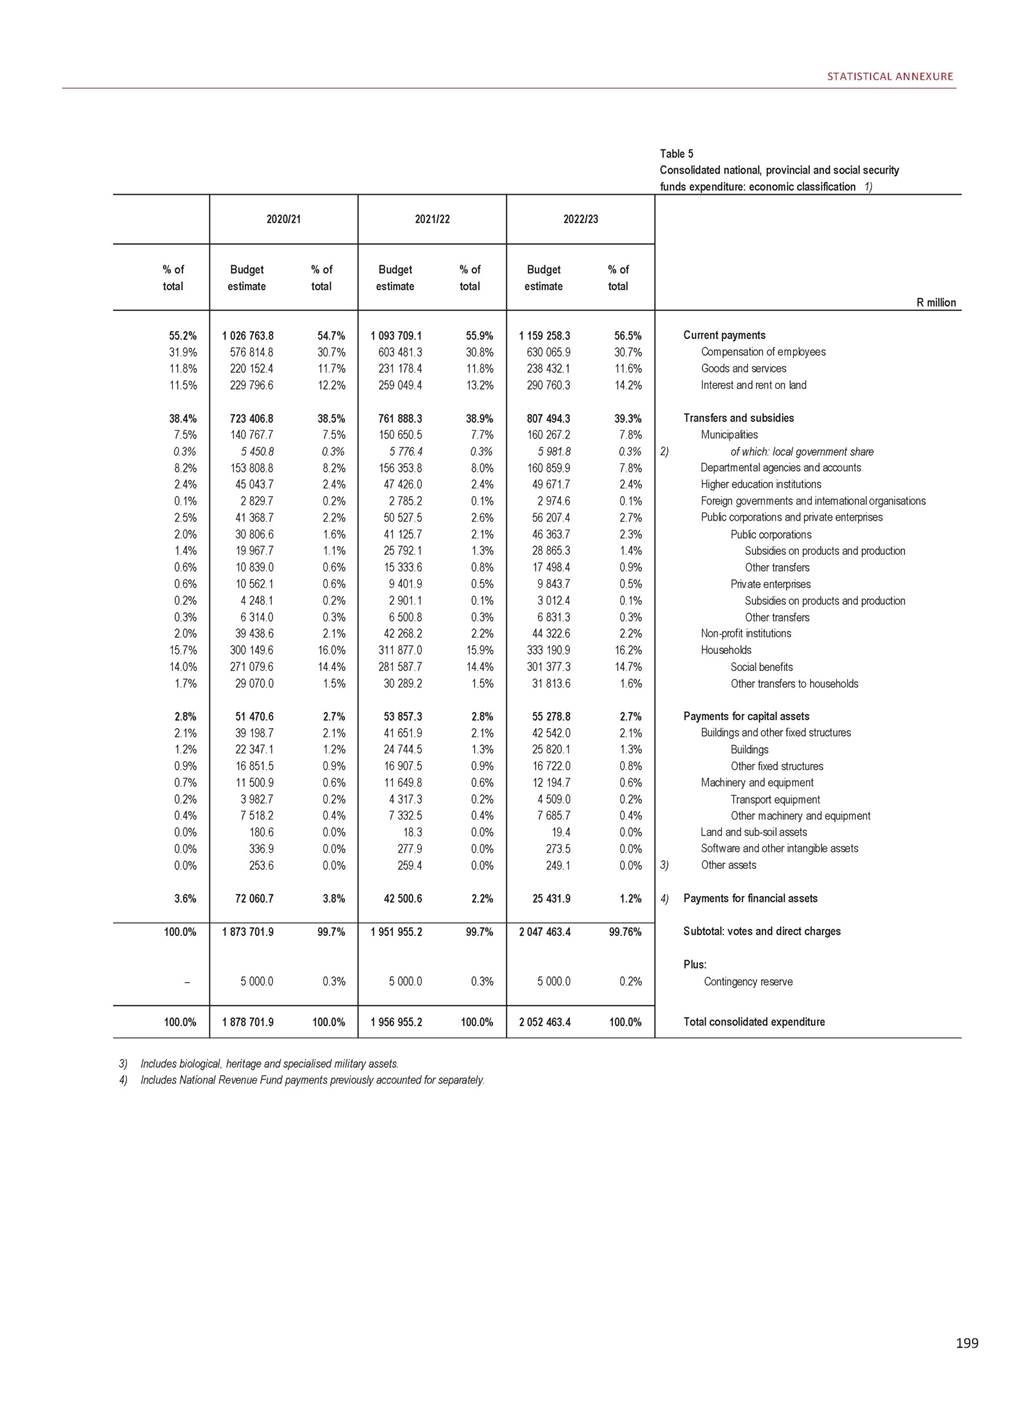
2020 BUDGET REVIEW Table 6 Consolidated national, provincial and social security funds expenditure: functional classification 1) 1) These figures were estimated by the National Treasury and may differ from data published by Statistics South Africa. The numbers in this table are not strictly comparable to those published in previous years due to the allocation of some of the unallocable expenditure for previous years. Data for the previous years has been adjusted accordingly. Source: National Treasury 200 R million 2016/17 2017/18 2018/19 2019/20 Estimated % of outcome total Estimated % of outcome total Estimated % of outcome total Revised estimate General public services 2) of which: debt-service costs Defence Public order and safety Police services Law courts Prisons Economic affairs General econom ic, com m ercial and labour affairs Agriculture, forestry, fishing and hunting Fuel and energy M ining, m anufacturing, and construction Transport Com m unication Other industries Econom ic affairs not elsew here classified Environmental protection Housing and community amenities Housing developm ent Com m unity developm ent Water supply Health Recreation and culture Education Social protection Subtotal: votes and direct charges Plus: Contingency reserve Total consolidated expenditure 236 570.4 17.1% 146 496.7 10.6% 47 211.5 3.4% 129 918.3 9.4% 88 044.7 6.4% 20 331.4 1.5% 21 542.2 1.6% 146 504.6 10.6% 23 763.1 1.7% 21 589.5 1.6% 7 816.6 0.6% 1 473.5 0.1% 77 320.3 5.6% 2 537.1 0.2% 3 507.6 0.3% 8 497.0 0.6% 9 054.2 0.7% 119 773.7 8.7% 34 248.1 2.5% 69 929.0 5.1% 15 596.6 1.1% 172 738.5 12.5% 11 777.8 0.9% 286 829.3 20.8% 219 392.2 15.9% 262 157.0 17.7% 162 644.6 11.0% 48 939.0 3.3% 137 532.8 9.3% 93 532.3 6.3% 21 243.2 1.4% 22 757.3 1.5% 152 781.1 10.3% 25 308.5 1.7% 21 787.8 1.5% 8 243.2 0.6% 1 511.6 0.1% 78 006.0 5.3% 5 713.5 0.4% 3 667.4 0.2% 8 543.1 0.6% 9 371.4 0.6% 128 312.3 8.7% 36 347.4 2.5% 76 896.3 5.2% 15 068.5 1.0% 188 158.1 12.7% 12 090.1 0.8% 304 786.7 20.6% 235 275.5 15.9% 272 644.4 17.1% 181 849.1 11.4% 47 796.7 3.0% 144 337.5 9.1% 98 458.0 6.2% 22 102.6 1.4% 23 776.9 1.5% 165 523.5 10.4% 25 627.9 1.6% 23 415.6 1.5% 7 259.5 0.5% 1 562.6 0.1% 89 491.2 5.6% 5 202.9 0.3% 3 894.6 0.2% 9 069.2 0.6% 9 669.0 0.6% 134 788.2 8.5% 35 671.6 2.2% 82 535.0 5.2% 16 581.7 1.0% 203 598.4 12.8% 12 219.8 0.8% 341 468.6 21.5% 259 312.2 16.3% 300 628.3 205 005.0 50 163.4 154 773.7 105 640.3 23 816.6 25 316.9 225 881.0 28 162.0 24 610.9 56 180.4 1 676.7 96 649.0 5 024.1 4 143.8 9 434.1 10 565.9 144 505.6 37 414.2 91 087.8 16 003.5 217 368.7 13 261.5 375 669.2 288 430.5 1 379 770.4 100.0% – – 1 479 404.1 100.0% – – 1 591 358.1 100.0% – – 1 781 248.0 – 1 379 770.4 100.0% 1 479 404.1 100.0% 1 591 358.1 100.0% 1 781 248.0
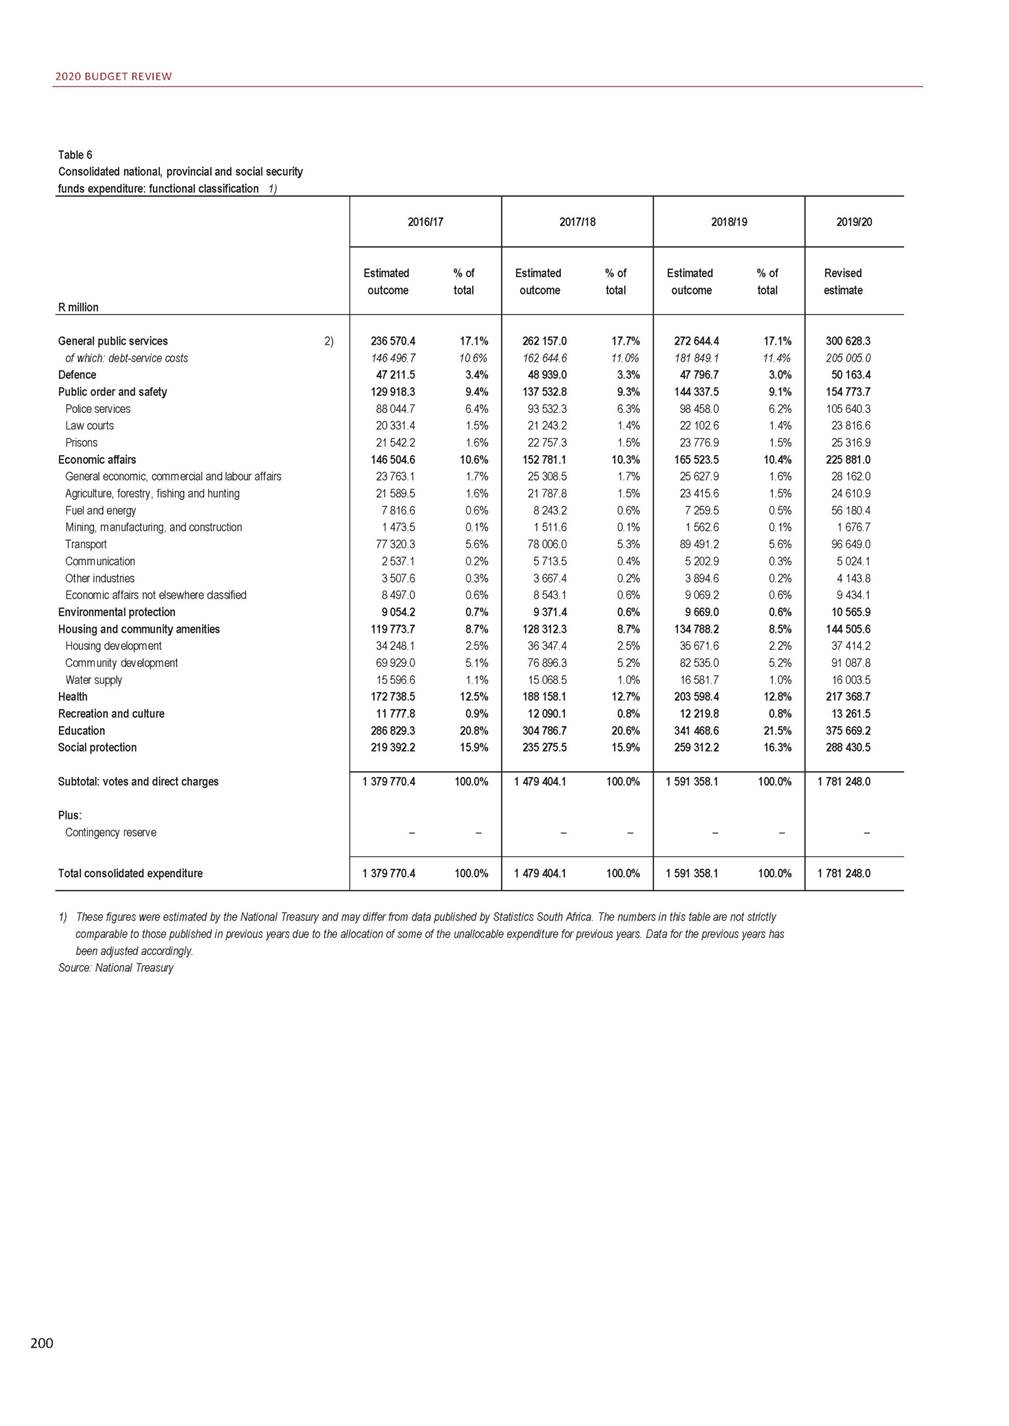
STATISTICAL ANNEXURE Table 6 Consolidated national, provincial and social security funds expenditure: functional classification 1) 2) Mainly general administration, cost of raising loans and unallocable capital expenditure, as well as National Revenue Fund payments previously accounted for separately. 201 2020/21 2021/22 2022/23 R million % of total Budget % of estimate total Budget % of estimate total Budget % of estimate total 16.9% 11.5% 2.8% 8.7% 5.9% 1.3% 1.4% 12.7% 1.6% 1.4% 3.2% 0.1% 5.4% 0.3% 0.2% 0.5% 0.6% 8.1% 2.1% 5.1% 0.9% 12.2% 0.7% 21.1% 16.2% 326 094.8 17.4% 229 270.0 12.2% 50 628.1 2.7% 157 631.4 8.4% 107 264.0 5.7% 24 628.9 1.3% 25 738.5 1.4% 236 399.6 12.6% 28 848.4 1.5% 24 224.3 1.3% 69 722.0 3.7% 1 774.5 0.1% 93 994.7 5.0% 3 110.9 0.2% 4 741.6 0.3% 9 983.2 0.5% 10 573.1 0.6% 152 549.2 8.1% 35 649.1 1.9% 100 010.4 5.3% 16 889.8 0.9% 224 661.8 12.0% 14 361.0 0.8% 388 113.1 20.7% 312 689.8 16.7% 360 245.6 18.5% 258 482.1 13.2% 48 237.8 2.5% 165 067.7 8.5% 112 232.4 5.7% 25 821.6 1.3% 27 013.7 1.4% 216 421.8 11.1% 30 458.6 1.6% 25 539.3 1.3% 40 432.6 2.1% 1 737.0 0.1% 99 683.5 5.1% 3 182.0 0.2% 4 823.0 0.2% 10 565.7 0.5% 10 798.9 0.6% 162 553.1 8.3% 37 678.6 1.9% 108 051.4 5.5% 16 823.0 0.9% 238 048.7 12.2% 15 303.1 0.8% 410 482.7 21.0% 324 795.9 16.6% 388 963.3 19.0% 290 145.1 14.2% 49 718.9 2.4% 170 343.1 8.3% 115 832.8 5.7% 26 628.2 1.3% 27 882.1 1.4% 215 383.4 10.5% 33 203.8 1.6% 26 590.4 1.3% 31 306.1 1.5% 1 812.6 0.1% 103 784.5 5.1% 3 199.6 0.2% 4 613.5 0.2% 10 872.9 0.5% 11 186.2 0.5% 171 431.2 8.4% 38 674.7 1.9% 115 382.7 5.6% 17 373.8 0.8% 250 886.3 12.3% 14 548.4 0.7% 428 459.4 20.9% 346 543.1 16.9% 2) General public services of which: debt-service costs Defence Public order and safety Police services Law courts Prisons Economic affairs General econom ic, com m ercial and labour affairs Agriculture, forestry, fishing and hunting Fuel and energy M ining, m anufacturing, and construction Transport Com m unication Other industries Econom ic affairs not elsew here classified Environmental protection Housing and community amenities Housing developm ent Com m unity developm ent Water supply Health Recreation and culture Education Social protection Subtotal: votes and direct charges Plus: Contingency reserve Total consolidated expenditure 100.0% – 1 873 701.9 99.7% 5 000.0 0.3% 1 951 955.2 99.7% 5 000.0 0.3% 2 047 463.4 99.8% 5 000.0 0.2% 100.0% 1 878 701.9 100.0% 1 956 955.2 100.0% 2 052 463.4 100.0%
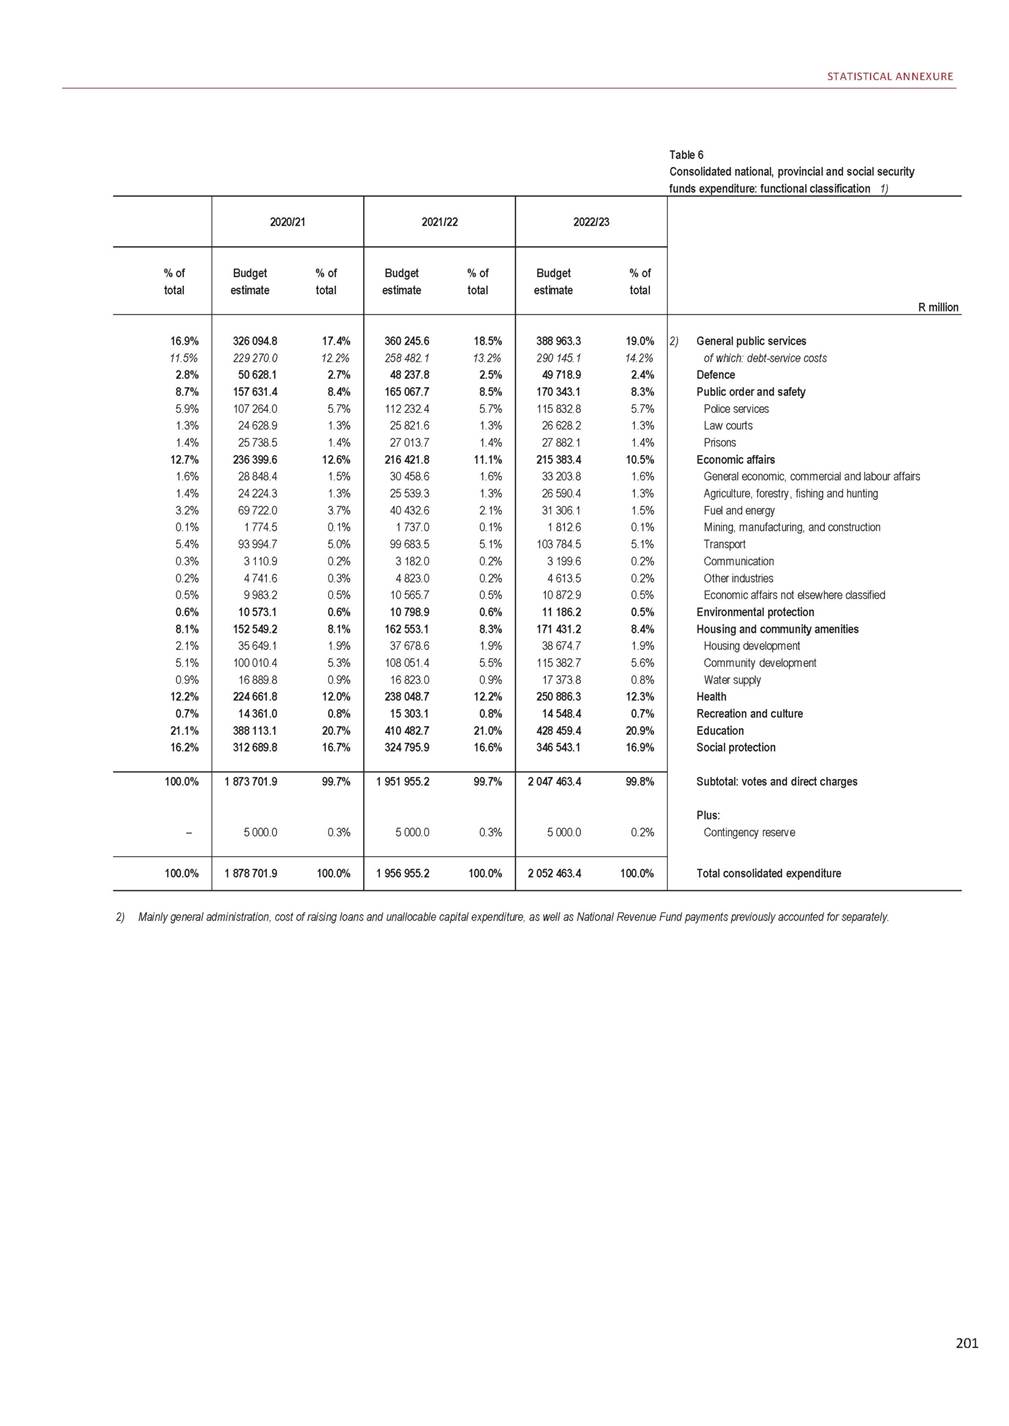
2020 BUDGET REVIEW Table 7 Consolidated government revenue and expenditure: economic classification 1) 1) Consisting of national and provincial government, social security funds and public entities. Refer to Annexure W2 for a detailed list of entities included. In some cases figures were estimated by the National Treasury and may differ from data published by Statistics South Africa and the Reserve Bank. 2) Includes National Revenue Fund receipts previously accounted for separately. Source: National Treasury 202 R million 2016/17 2017/18 2018/19 2019/20 % of Outcome total % of Outcome total % of Outcome total Revised estimate Revenue Current revenue Tax revenue (net of SACU) Non-tax revenue 2) Sales of capital assets Total revenue Expenditure Economic classification Current payments Compensation of employees Goods and services Interest and rent on land Transfers and subsidies Municipalities Departmental agencies and accounts Higher education institutions Foreign governments and international organisations Public corporations and private enterprises Non-profit institutions Households Payments for capital assets Buildings and other fixed structures Machinery and equipment Land and sub-soil assets Software and other intangible assets Other assets 3) Payments for financial assets 4) Subtotal: economic classification Contingency reserve Total consolidated expenditure Budget balance Percentage of GDP Financing Change in loan liabilities Domestic short-and long-term loans (net) Foreign loans (net) Change in cash and other balances (-increase) Borrowing requirement (net) GDP 1 285 061.0 100.0% 1 174 525.2 91.4% 110 535.8 8.6% 543.9 0.0% 1 350 837.5 100.0% 1 235 356.4 91.4% 115 481.1 8.5% 540.2 0.0% 1 445 027.5 100.0% 1 321 569.1 91.4% 123 458.4 8.5% 396.8 0.0% 1 516 681.6 1 395 383.0 121 298.7 306.7 1 285 604.9 100.0% 885 826.0 61.4% 511 665.9 35.5% 217 628.3 15.1% 156 531.7 10.9% 469 152.1 32.5% 112 738.1 7.8% 23 936.1 1.7% 31 981.2 2.2% 2 290.0 0.2% 32 172.2 2.2% 30 526.7 2.1% 235 507.8 16.3% 79 065.0 5.5% 58 900.6 4.1% 16 615.4 1.2% 790.2 0.1% 2 594.5 0.2% 164.3 0.0% 8 534.2 0.6% 1 351 377.7 100.0% 942 300.4 61.1% 548 057.6 35.5% 221 324.3 14.4% 172 918.5 11.2% 501 834.4 32.5% 121 803.8 7.9% 27 041.3 1.8% 36 790.6 2.4% 2 123.3 0.1% 31 886.7 2.1% 31 014.3 2.0% 251 174.4 16.3% 77 397.8 5.0% 58 384.7 3.8% 16 592.7 1.1% 847.8 0.1% 1 421.5 0.1% 151.1 0.0% 20 322.7 1.3% 1 445 424.3 100.0% 1 011 975.7 61.6% 584 841.1 35.6% 234 976.5 14.3% 192 158.1 11.7% 545 229.2 33.2% 129 455.6 7.9% 25 609.4 1.6% 38 898.3 2.4% 2 386.1 0.1% 31 389.7 1.9% 35 496.5 2.2% 281 993.6 17.2% 69 865.4 4.3% 52 717.3 3.2% 14 666.4 0.9% 738.6 0.0% 1 539.8 0.1% 203.4 0.0% 15 706.1 1.0% 1 516 988.3 1 095 868.3 629 200.4 251 656.1 215 011.8 599 650.1 137 653.6 26 590.8 46 555.4 2 589.5 35 361.4 37 089.3 313 810.1 82 804.1 60 807.8 19 077.0 605.4 1 831.9 481.9 65 223.1 1 442 577.2 100% – 1 541 855.3 100.0% – 1 642 776.4 100.0% – 1 843 545.6 – 1 442 577.2 1 541 855.3 1 642 776.4 1 843 545.6 -156 972.3 -3.6% -190 477.6 -4.1% -197 352.1 -4.0% -326 557.2 -6.3% 157 334.7 36 432.7 -36 795.0 156 972.3 4 419 437.0 204 163.7 29 811.0 -43 497.1 190 477.6 4 698 724.0 183 826.2 26 187.9 -12 662.0 197 352.1 4 921 494.0 312 736.0 27 546.9 -13 725.7 326 557.2 5 157 347.4
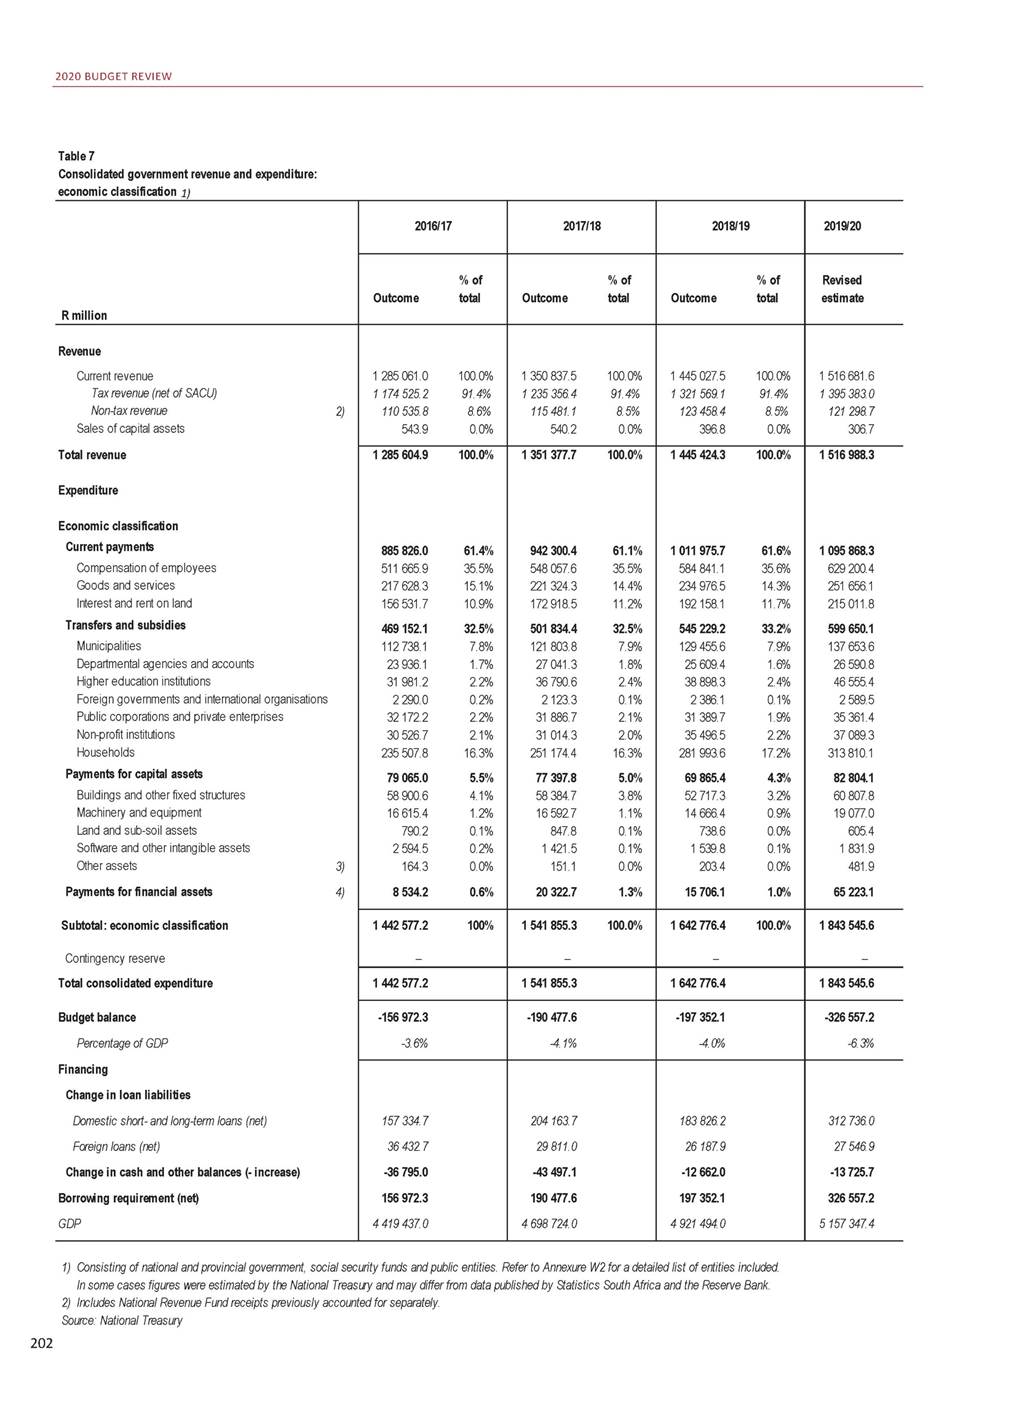
STATISTICAL ANNEXURE Table 7 Consolidated government revenue and expenditure: economic classification 1) 3) Includes biological, heritage and specialised military assets. 4) Includes extraordinary payments previously accounted for separately. 203 2019/20 2020/21 2021/22 2022/23 R million % of total Budget % of estimate total Budget % of estimate total Budget % of estimate total 100.0% 92.0% 8.0% 0.0% 1 583 599.2 100.0% 1 455 526.9 91.9% 128 072.3 8.1% 305.9 0.0% 1 682 503.8 100.0% 1 549 544.6 92.1% 132 959.2 7.9% 334.9 0.0% 1 791 044.2 100.0% 1 648 613.2 92.0% 142 430.9 8.0% 274.5 0.0% Revenue Current revenue Tax revenue (net of SACU) 2) Non-tax revenue Sales of capital assets Total revenue Expenditure Economic classification Current payments Compensation of employees Goods and services Interest and rent on land Transfers and subsidies Municipalities Departmental agencies and accounts Higher education institutions Foreign governments and international organisations Public corporations and private enterprises Non-profit institutions Households Payments for capital assets Buildings and other fixed structures Machinery and equipment Land and sub-soil assets Software and other intangible assets 3) Other assets 4) Payments for financial assets Subtotal: economic classification Contingency reserve Total consolidated expenditure Budget balance Percentage of GDP Financing Change in loan liabilities Domestic short-and long-term loans (net) Foreign loans (net) Change in cash and other balances (-increase) Borrowing requirement (net) GDP 100.0% 59.4% 34.1% 13.7% 11.7% 32.5% 7.5% 1.4% 2.5% 0.1% 1.9% 2.0% 17.0% 4.5% 3.3% 1.0% 0.0% 0.1% 0.0% 3.5% 1 583 905.1 100.0% 1 143 426.9 58.7% 638 864.8 32.8% 265 078.4 13.6% 239 483.7 12.3% 640 225.2 32.8% 145 339.0 7.5% 28 638.7 1.5% 48 277.7 2.5% 2 879.8 0.1% 35 539.6 1.8% 41 022.7 2.1% 338 527.7 17.4% 92 146.8 4.7% 68 383.5 3.5% 20 620.2 1.1% 439.5 0.0% 1 903.6 0.1% 800.1 0.0% 73 645.7 3.8% 1 682 838.7 100.0% 1 218 007.8 59.8% 667 815.5 32.8% 281 464.7 13.8% 268 727.5 13.2% 671 805.1 33.0% 155 518.4 7.6% 27 012.1 1.3% 50 341.5 2.5% 2 838.2 0.1% 39 864.8 2.0% 43 696.4 2.1% 352 533.8 17.3% 101 410.6 5.0% 76 880.6 3.8% 21 798.9 1.1% 422.9 0.0% 1 656.8 0.1% 651.4 0.0% 44 115.6 2.2% 1 791 318.7 100.0% 1 286 330.7 60.2% 697 113.3 32.6% 288 524.8 13.5% 300 692.6 14.1% 713 435.9 33.4% 165 463.8 7.7% 28 492.1 1.3% 51 872.7 2.4% 3 029.5 0.1% 43 226.6 2.0% 45 848.8 2.1% 375 502.5 17.6% 108 975.3 5.1% 82 745.4 3.9% 23 283.7 1.1% 768.3 0.0% 1 647.3 0.1% 530.6 0.0% 27 297.9 1.3% 100.0% 1 949 444.6 100.0% 5 000.0 2 035 339.1 100.0% 5 000.0 2 136 039.9 100.0% 5 000.0 1 954 444.6 2 040 339.1 2 141 039.9 -370 539.5 -6.8% -357 500.4 -6.2% -349 721.2 -5.7% 332 285.9 18 815.4 19 438.3 370 539.5 5 428 211.8 325 912.6 41 763.4 -10 175.6 357 500.4 5 758 993.4 317 484.1 40 760.4 -8 523.3 349 721.2 6 126 301.9
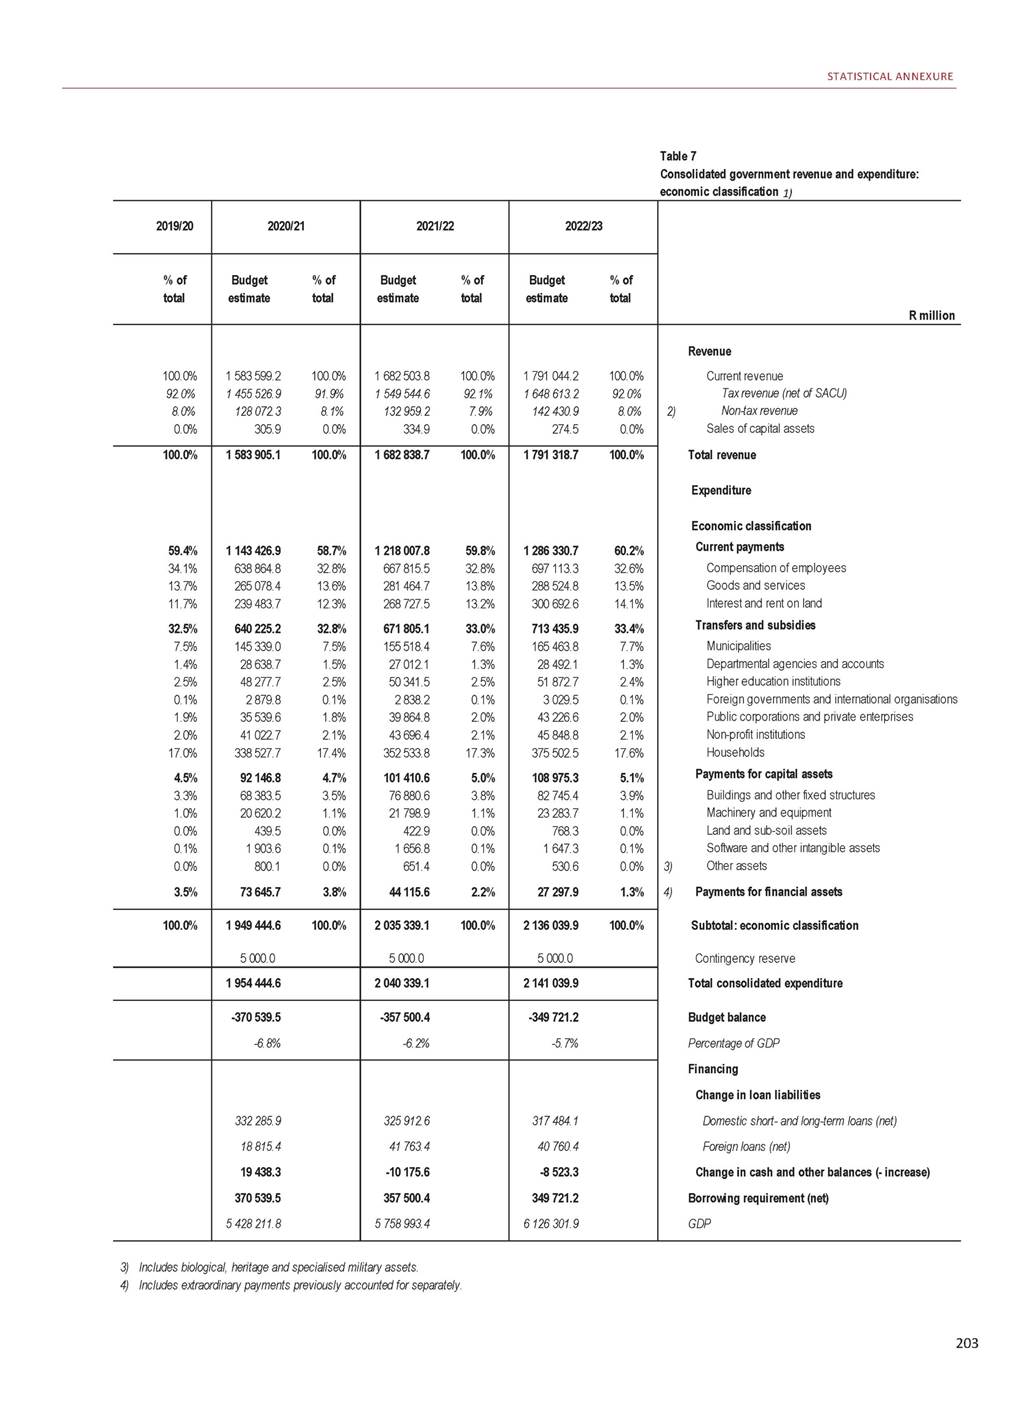
2020 BUDGET REVIEW Table 8 Consolidated government expenditure: functional classification 1) 1) Consisting of national and provincial government, social security funds and public entities. Refer to Annexure W2 for a detailed list of entities included. In some cases figures were estimated by the National Treasury and may differ from data published by Statistics South Africa and the Reserve Bank. Source: National Treasury 204 R million 2016/17 2017/18 2018/19 2019/20 % of Outcometotal % of Outcometotal % of Outcometotal Revised estimate General public services2) of which: debt-service costs Defence Public order and safety Police services Law courts Prisons Public order and safety not elsew here classified Economic affairs General econom ic, com m ercial and labour affairs Agriculture, forestry, fishing and hunting Fuel and energy M ining, m anufacturing and construction Transport Com m unication Other industries Econom ic affairs not elsew here classified Environmental protection Housing and community amenities Housing developm ent Com m unity developm ent Water supply Housing and com m unity am enities not elsew here classified Health Recreation and culture Education Social protection Subtotal: functional classification Plus: Contingency reserve Total consolidated expenditure 246 038.217.1% 146 496.710.2% 47 402.43.3% 131 470.59.1% 89 155.76.2% 20 570.01.4% 21 542.21.5% 202.6 167 088.611.6% 30 629.52.1% 22 114.21.5% 9 465.40.7% 2 411.70.2% 84 977.45.9% 4 487.60.3% 3 670.20.3% 9 332.60.6% 10 618.40.7% 144 913.910.0% 36 077.52.5% 70 867.04.9% 37 969.42.6% –– 173 789.812.0% 12 236.40.8% 288 368.420.0% 220 650.615.3% 269 752.517.5% 162 644.610.5% 49 158.93.2% 138 828.49.0% 94 617.66.1% 21 225.81.4% 22 757.31.5% 227.7 175 362.311.4% 31 964.62.1% 22 069.31.4% 9 462.60.6% 2 478.90.2% 87 228.35.7% 9 251.40.6% 3 878.70.3% 9 028.40.6% 11 449.10.7% 150 248.39.7% 37 828.32.5% 77 825.65.0% 34 594.42.2% –– 188 374.312.2% 12 449.30.8% 310 066.020.1% 236 166.315.3% 281 015.717.1% 181 849.111.1% 47 715.32.9% 146 001.78.9% 99 786.16.1% 22 196.71.4% 23 776.91.4% 242.0 179 583.010.9% 32 349.02.0% 23 855.21.5% 10 192.80.6% 2 425.70.1% 89 490.15.4% 8 564.90.5% 4 095.90.2% 8 609.40.5% 12 079.40.7% 158 880.29.7% 37 330.32.3% 83 596.15.1% 37 953.82.3% –– 203 665.112.4% 12 687.00.8% 342 634.020.9% 258 515.015.7% 308 574.5 205 005.0 50 408.9 156 969.7 107 086.9 24 275.0 25 316.9 290.9 240 959.9 35 629.5 26 458.3 58 568.8 2 597.1 97 622.5 6 452.6 4 379.1 9 251.9 13 458.7 171 342.5 39 814.0 92 274.3 39 254.3 – 217 664.5 13 736.5 380 341.9 290 088.5 1 442 577.2100% – 1 541 855.3100% – 1 642 776.4100% – 1 843 545.6 – 1 442 577.2 1 541 855.3 1 642 776.4 1 843 545.6
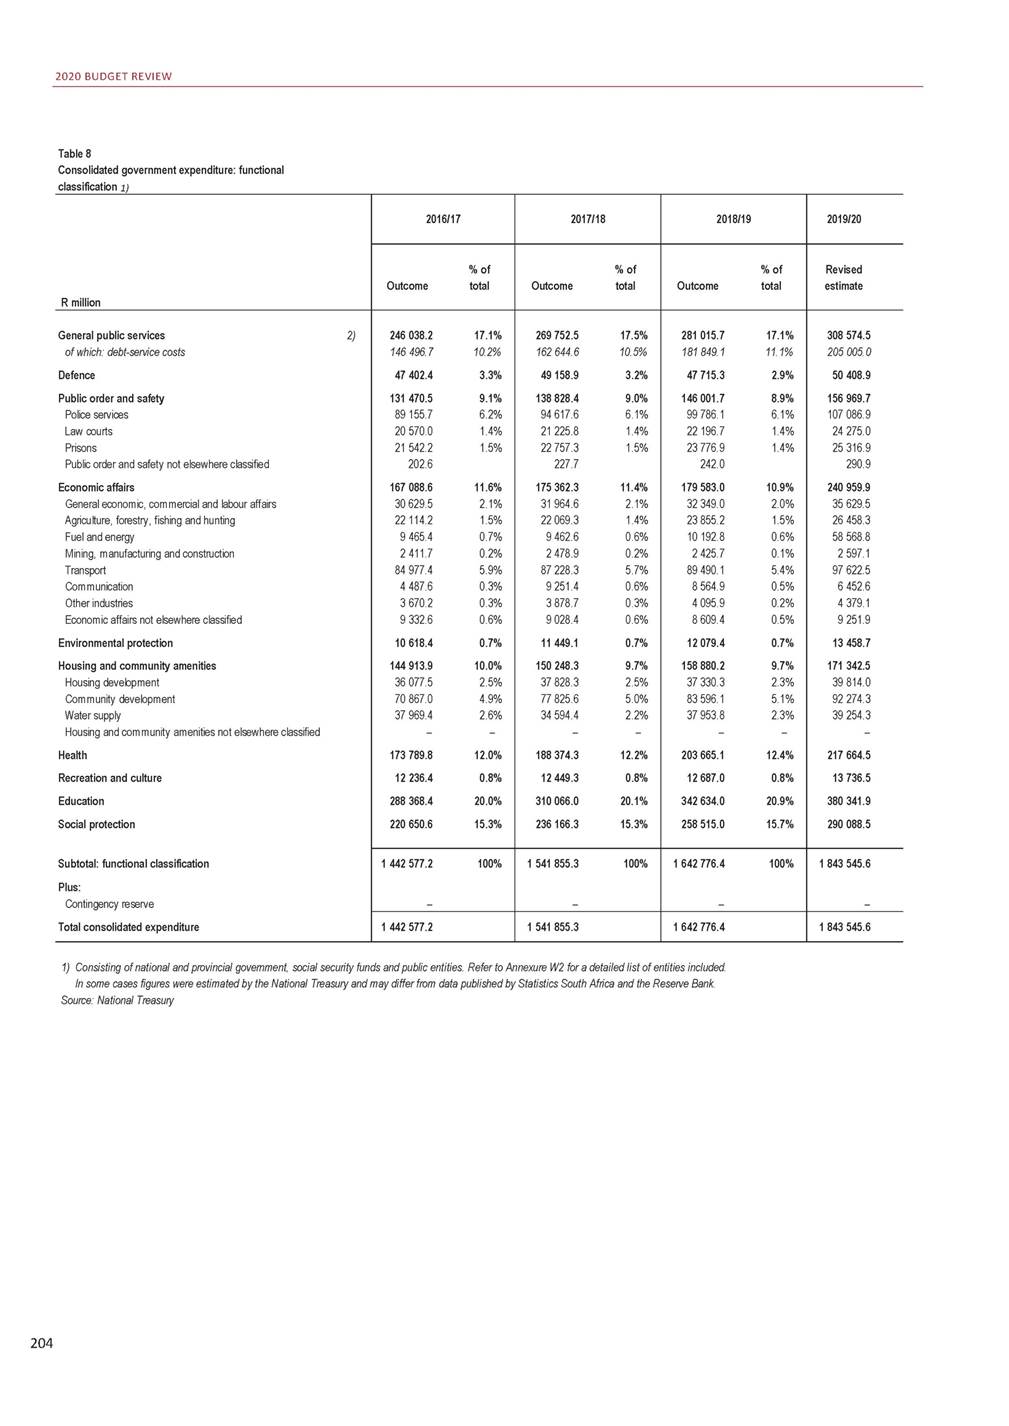
STATISTICAL ANNEXURE Table 8 Consolidated government expenditure: functional classification 1) 2) Mainly general administration, cost of raising loans and unallocable capital expenditure, as well as National Revenue Fund payments previously accounted for separately. 205 2019/20 2020/21 2021/22 2022/23 R million % of total Budget% of estimate total Budget% of estimate total Budget% of estimate total 16.7% 11.1% 2.7% 8.5% 5.8% 1.3% 1.4% 13.1% 1.9% 1.4% 3.2% 0.1% 5.3% 0.4% 0.2% 0.5% 0.7% 9.3% 2.2% 5.0% 2.1% – 11.8% 0.7% 20.6% 15.7% 335 903.617.2% 229 270.011.8% 50 965.02.6% 160 119.38.2% 109 041.85.6% 25 014.81.3% 25 738.51.3% 324.1 259 383.013.3% 36 702.21.9% 25 462.41.3% 72 283.33.7% 2 792.00.1% 103 055.85.3% 4 551.70.2% 4 988.20.3% 9 547.40.5% 13 330.90.7% 183 950.49.4% 38 646.52.0% 101 109.65.2% 44 194.32.3% –– 225 240.111.6% 14 811.30.8% 390 864.520.1% 314 876.416.2% 373 586.118.4% 258 482.112.7% 48 484.32.4% 167 662.38.2% 114 116.65.6% 26 190.31.3% 27 013.71.3% 341.6 238 933.511.7% 38 451.91.9% 26 607.61.3% 43 225.42.1% 2 583.00.1% 108 756.15.3% 4 242.30.2% 5 083.20.2% 9 983.90.5% 13 712.40.7% 199 037.09.8% 40 885.32.0% 109 221.25.4% 48 930.62.4% –– 238 841.911.7% 15 819.30.8% 412 485.720.3% 326 776.516.1% 403 011.118.9% 290 145.113.6% 49 975.52.3% 173 189.88.1% 117 945.45.5% 26 990.81.3% 27 882.11.3% 371.50.0% 240 395.711.3% 41 227.71.9% 27 663.71.3% 34 252.61.6% 2 672.80.1% 114 565.25.4% 4 596.20.2% 4 883.80.2% 10 533.60.5% 13 871.30.6% 211 157.59.9% 42 168.72.0% 116 608.15.5% 52 380.82.5% –– 252 079.111.8% 15 095.10.7% 428 906.420.1% 348 358.416.3% 2) General public services of which: debt-service costs Defence Public order and safety Police services Law courts Prisons Public order and safety not elsew here classified Economic affairs General econom ic, com m ercial and labour affairs Agriculture, forestry, fishing and hunting Fuel and energy M ining, m anufacturing and construction Transport Com m unication Other industries Econom ic affairs not elsew here classified Environmental protection Housing and community amenities Housing developm ent Com m unity developm ent Water supply Housing and com m unity am enities not elsew here classified Health Recreation and culture Education Social protection Subtotal: functional classification Plus: Contingency reserve Total consolidated expenditure 100% 1 949 444.6100% 5 000.0 2 035 339.1100% 5 000.0 2 136 039.9100% 5 000.0 1 954 444.6 2 040 339.1 2 141 039.9
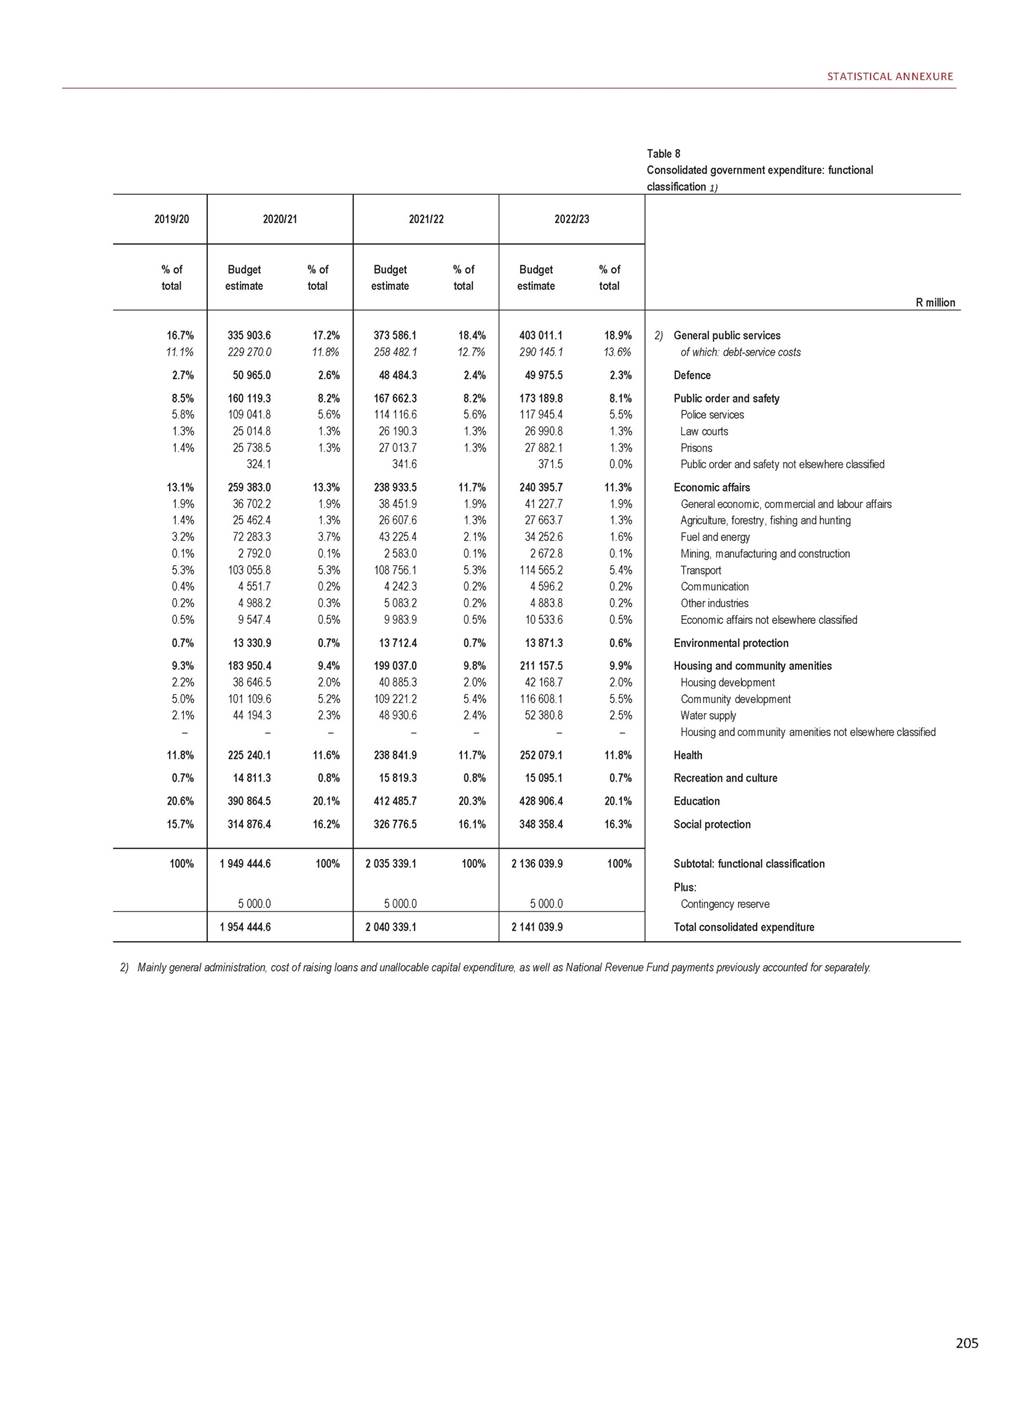
2020 BUDGET REVIEW Table 9 Consolidated government revenue, expenditure and financing Source: National Treasury 206 R million 2016/17 2017/18 2018/19 2019/20 Outcome Outcome Outcome Revised estimate Operating account Current receipts Tax receipts (net of SACU transfers) Non-tax receipts (including departmental receipts) Transfers received Current payments Compensation of employees Goods and services Interest and rent on land Transfers and subsidies Current balance Percentage of GDP Capital account Capital receipts Transfers and subsidies Payments for capital assets Capital financing requirement Percentage of GDP Transactions in financial assets and liabilities Contingency reserve Budget balance Percentage of GDP Primary balance Percentage of GDP Financing Change in loan liabilities Domestic short-and long-term loans (net) Foreign loans (net) Change in cash and other balances (-increase) Borrowing requirement (net) GDP 1 266 853.1 1 174 525.2 85 313.5 7 014.4 1 285 199.3 511 665.9 217 628.3 156 531.7 399 373.3 -18 346.1 -0.4% 543.9 69 778.8 79 065.0 -148 299.9 -3.4% 9 673.7 – -156 972.3 -3.6% -440.6 0.0% 157 334.7 36 432.7 -36 795.0 156 972.3 4 419 437.0 1 331 662.4 1 235 356.4 89 525.6 6 780.5 1 371 811.4 548 057.6 221 324.3 172 918.5 429 511.0 -40 149.0 -0.9% 540.2 72 323.4 77 397.8 -149 181.0 -3.2% -1 147.6 – -190 477.6 -4.1% -17 559.1 -0.4% 204 163.7 29 811.0 -43 497.1 190 477.6 4 698 724.0 1 429 845.5 1 321 569.1 101 560.3 6 716.1 1 483 839.8 584 841.1 234 976.5 192 158.1 471 864.1 -53 994.4 -1.1% 396.8 73 365.0 69 865.4 -142 833.6 -2.9% -524.1 – -197 352.1 -4.0% -5 194.0 -0.1% 183 826.2 26 187.9 -12 662.0 197 352.1 4 921 494.0 1 503 562.5 1 395 383.0 103 021.2 5 158.3 1 622 015.8 629 200.4 251 656.1 215 011.8 526 147.4 -118 453.2 -2.3% 306.7 73 502.6 82 804.1 -156 000.1 -3.0% -52 103.9 – -326 557.2 -6.3% -111 545.4 -2.2% 312 736.0 27 546.9 -13 725.7 326 557.2 5 157 347.4
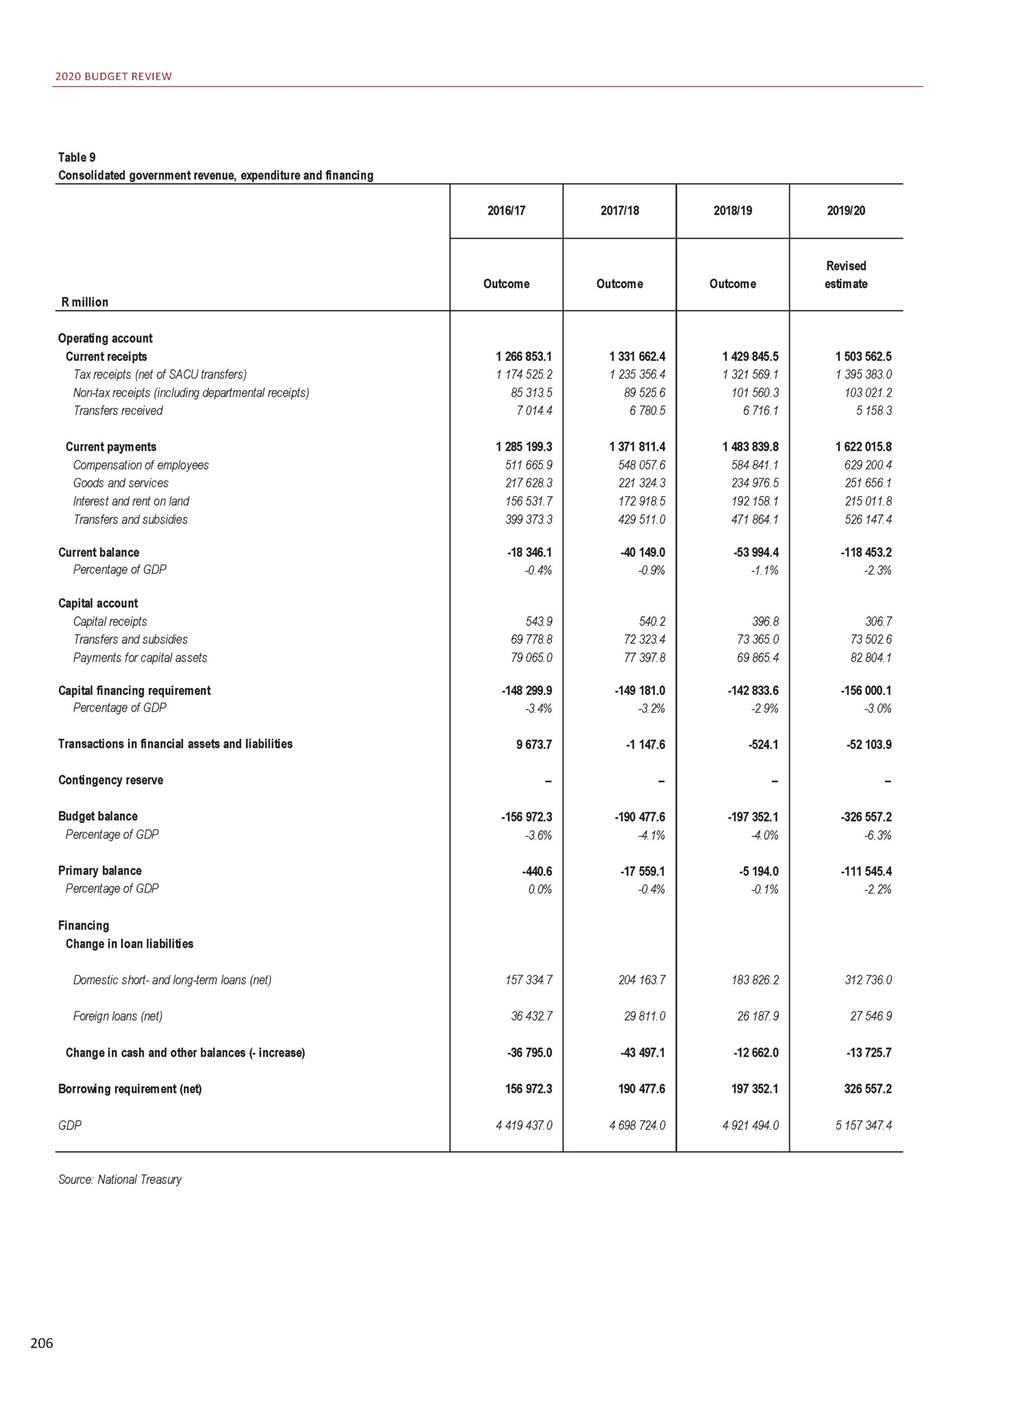
STATISTICAL ANNEXURE Table 9 Consolidated government revenue, expenditure and financing 207 2020/21 2021/22 2022/23 Budget estimate Budget estimate Budget estimate R million 1 570 968.4 1 455 526.9 110 264.5 5 177.0 1 712 133.5 638 864.8 265 078.4 239 483.7 568 706.6 -141 165.1 -2.6% 305.9 71 518.6 92 146.8 -163 359.5 -3.0% -61 014.9 5 000.0 -370 539.5 -6.8% -131 055.8 -2.4% 332 285.9 18 815.4 19 438.3 370 539.5 5 428 211.8 1 674 353.4 1 549 544.6 119 359.7 5 449.1 1 811 111.9 667 815.5 281 464.7 268 727.5 593 104.1 -136 758.5 -2.4% 334.9 78 701.0 101 410.6 -179 776.8 -3.1% -35 965.2 5 000.0 -357 500.4 -6.2% -88 772.8 -1.5% 325 912.6 41 763.4 -10 175.6 357 500.4 5 758 993.4 1 782 018.9 1 648 613.2 127 793.4 5 612.3 1 915 038.7 697 113.3 288 524.8 300 692.6 628 707.9 -133 019.8 -2.2% 274.5 84 728.0 108 975.3 -193 428.8 -3.2% -18 272.6 5 000.0 -349 721.2 -5.7% -49 028.6 -0.8% 317 484.1 40 760.4 -8 523.3 349 721.2 6 126 301.9 Operating account Current receipts Tax receipts (net of SACU transfers) Non-tax receipts (including departmental receipts) Transfers received Current payments Compensation of employees Goods and services Interest and rent on land Transfers and subsidies Current balance Percentage of GDP Capital account Capital receipts Transfers and subsidies Payments for capital assets Capital financing requirement Percentage of GDP Transactions in financial assets and liabilities Contingency reserve Budget balance Percentage of GDP Primary balance Percentage of GDP Financing Change in loan liabilities Domestic short-and long-term loans (net) Foreign loans (net) Change in cash and other balances (-increase) Borrowing requirement (net) GDP
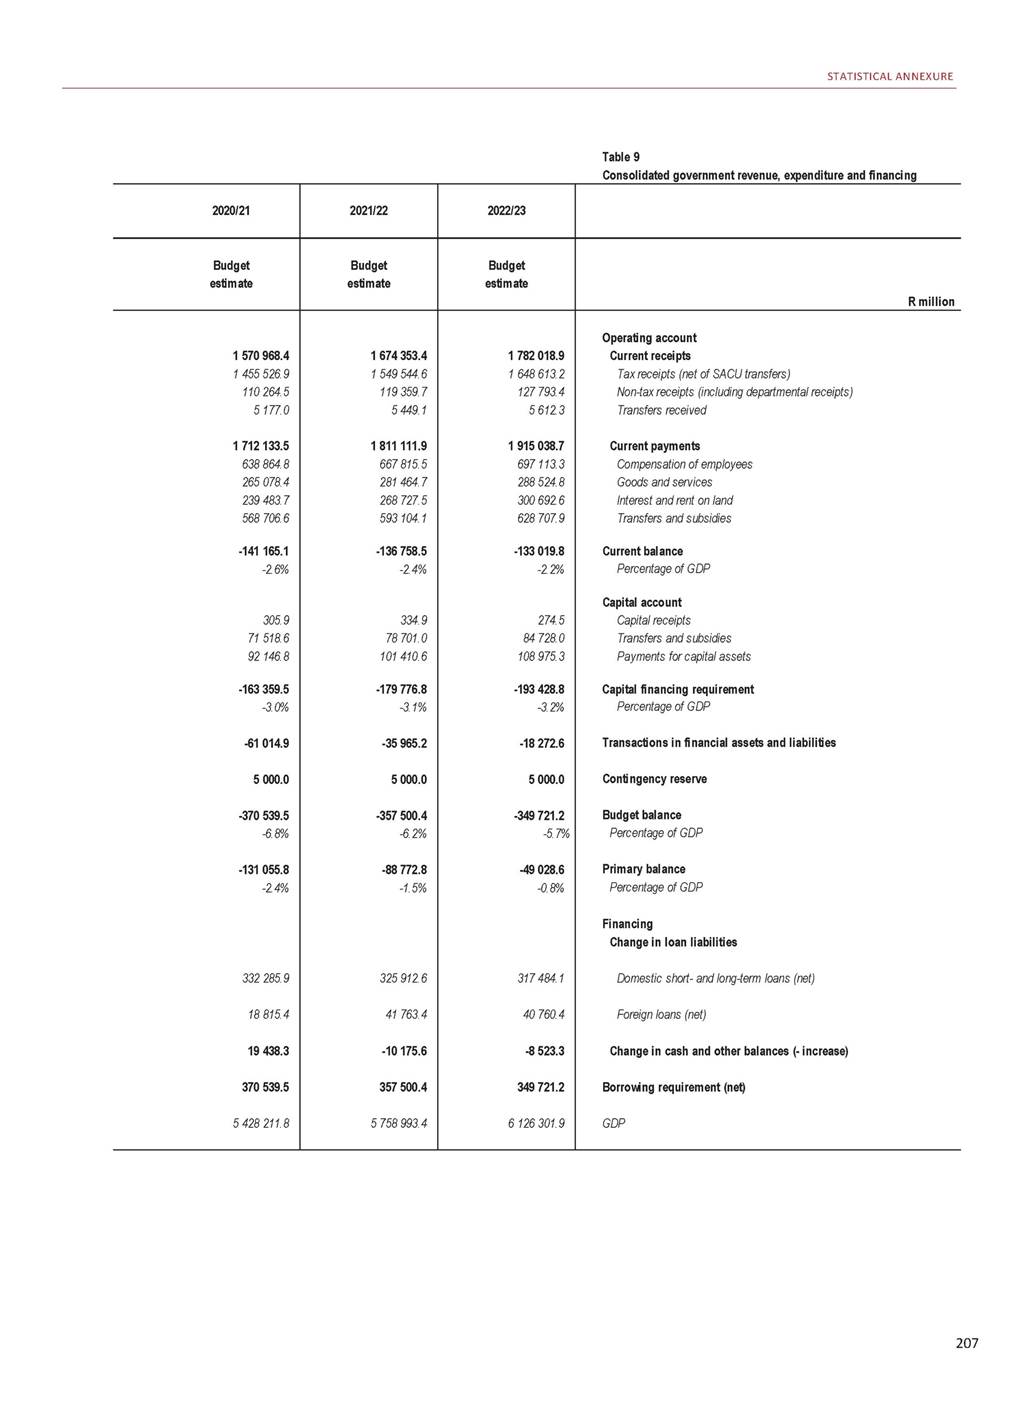
2020 BUDGET REVIEW Table 10 Total debt of government 1) 1) 2) 3) 4) Debt of the central government, excluding extra-budgetary institutions and social security funds. As projected at the end of January 2020. Includes non-marketable Treasury bills, retail bonds, loan levies, former regional authorities and Namibian loans. Bank balances of the National Revenue Fund (balances of government's accounts with the Reserve Bank and commercial banks). Bank balances in foreign currencies are revaluated using forward estimates of exchange rates. Source: National Treasury and Reserve Bank 208 R million 1995/96 1996/97 1997/98 1998/99 1999/00 2000/01 2001/02 Domestic debt Marketable Government bonds Treasury bills Bridging bonds Non-m arketable 3) Gross loan debt Cash balances 4) Net loan debt Foreign debt Gross loan debt 5) Cash balances 4) Net loan debt Gross loan debt Net loan debt Gold and Foreign Exchange Contingency Reserve Account 6) 263 844 248 877 10 700 4 267 4 700 268 544 -8 630 259 914 290 424 276 124 14 300 – 6 421 296 845 -2 757 294 088 318 773 301 488 17 285 – 2 778 321 551 -4 798 316 753 344 938 325 938 19 000 – 2 013 346 951 -5 166 341 785 354 706 332 706 22 000 – 998 355 704 -7 285 348 419 365 231 339 731 25 500 – 2 382 367 613 -2 650 364 963 349 415 331 505 17 910 – 2 030 351 445 -6 549 344 896 10 944 – 10 944 11 394 – 11 394 14 560 – 14 560 16 276 – 16 276 25 799 – 25 799 31 938 – 31 938 82 009 – 82 009 279 488 270 858 308 239 305 482 336 111 331 313 363 227 358 061 381 503 374 218 399 551 396 901 433 454 426 905 – 2 169 73 14 431 9 200 18 170 28 024 Composition of gross debt (excluding deduction of cash balances) M arketable dom estic debt Government bonds Treasury bills Bridging bonds Non-m arketable dom estic debt 3) Dom estic debt Foreign debt 5) 94.4% 89.0% 3.8% 1.5% 1.7% 94.2% 89.6% 4.6% 0.0% 2.1% 94.8% 89.7% 5.1% 0.0% 0.8% 95.0% 89.7% 5.2% 0.0% 0.6% 93.0% 87.2% 5.8% 0.0% 0.3% 91.4% 85.0% 6.4% 0.0% 0.6% 80.6% 76.5% 4.1% 0.0% 0.5% 96.1% 3.9% 96.3% 3.7% 95.7% 4.3% 95.5% 4.5% 93.2% 6.8% 92.0% 8.0% 81.1% 18.9% Total as percentage of GDP Gross dom estic debt Net dom estic debt Gross foreign debt Net foreign debt Gross loan debt Net loan debt 47.6% 46.1% 1.9% 1.9% 49.5% 48.0% 45.5% 45.1% 1.7% 1.7% 47.3% 46.8% 44.8% 44.1% 2.0% 2.0% 46.8% 46.2% 44.7% 44.0% 2.1% 2.1% 46.8% 46.1% 41.4% 40.6% 3.0% 3.0% 44.4% 43.6% 37.6% 37.4% 3.3% 3.3% 40.9% 40.6% 32.6% 31.9% 7.6% 7.6% 40.1% 39.5%
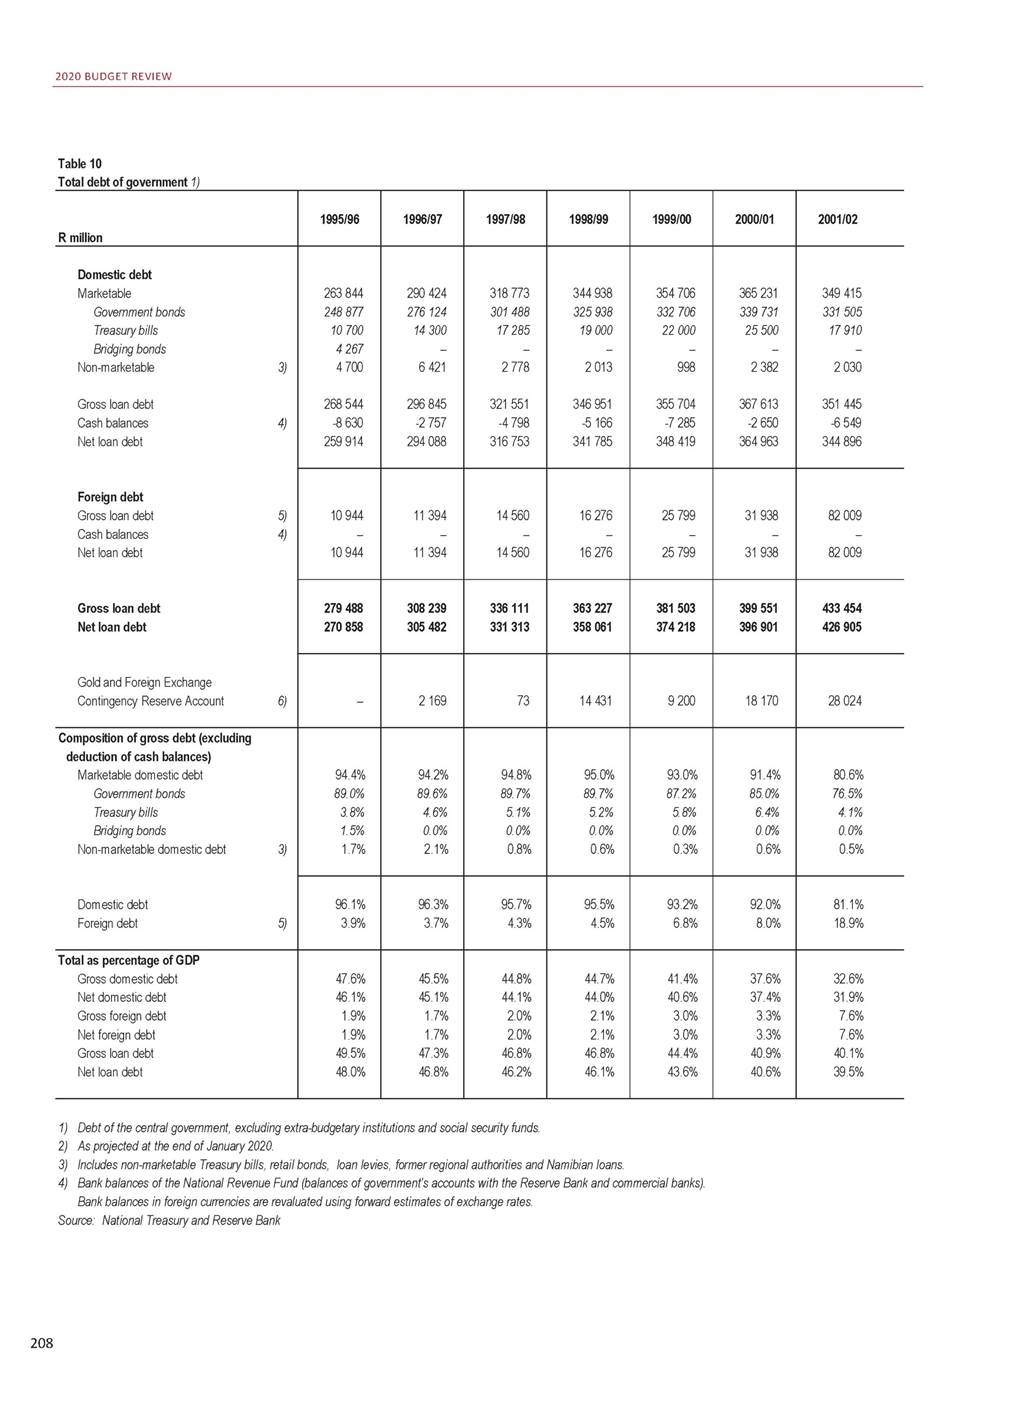
STATISTICAL ANNEXURE Table 10 Total debt of government 1) 5) Valued at appropriate foreign exchange rates up to 31 March 2019 as at the end of each period. Forward estimates are based on exchange rates prevailing at 31 January 2020, projected to depreciate in line with inflation differentials. 6) The balance on the Gold and Foreign Exchange Contingency Reserve Account on 31 March 2020 represents an estimated balance on the account. No provision for any profits or losses on this account has been made for subsequent years. A negative balance indicates a profit and a positive balance a loss. 209 2002/03 2003/04 2004/05 2005/06 2006/07 2007/08 2008/09 R million 350 870 328 820 22 050 – 1 910 352 780 -9 730 343 050 388 300 359 700 28 600 – 1 999 390 299 -12 669 377 630 428 593 394 143 34 450 – 3 498 432 091 -30 870 401 221 457 780 417 380 40 400 – 3 699 461 479 -58 187 403 292 467 864 422 064 45 800 – 3 238 471 102 -75 315 395 787 478 265 426 415 51 850 – 2 555 480 821 -93 809 387 012 527 751 462 751 65 000 – 1 956 529 707 -101 349 428 358 Domestic debt M arketable Government bonds Treasury bills Bridging bonds 3) Non-m arketable Gross loan debt 4) Cash balances Net loan debt Foreign debt 5) Gross loan debt 4) Cash balances Net loan debt Gross loan debt Net loan debt Gold and Foreign Exchange 6) Contingency Reserve Account 74 286 – 74 286 64 670 – 64 670 69 405 – 69 405 66 846 – 66 846 82 581 – 82 581 96 218 – 96 218 97 268 – 97 268 427 066 417 336 454 969 442 300 501 496 470 626 528 325 470 138 553 683 478 368 577 039 483 230 626 975 525 626 36 577 18 036 5 292 -1 751 -28 514 -72 189 -101 585 82.2% 77.0% 5.2% 0.0% 0.4% 85.3% 79.1% 6.3% 0.0% 0.4% 85.5% 78.6% 6.9% 0.0% 0.7% 86.6% 79.0% 7.6% 0.0% 0.7% 84.5% 76.2% 8.3% 0.0% 0.6% 82.9% 73.9% 9.0% 0.0% 0.4% 84.2% 73.8% 10.4% 0.0% 0.3% Composition of gross debt (excluding deduction of cash balances) M arketable dom estic debt Government bonds Treasury bills Bridging bonds 3) Non-m arketable dom estic debt Dom estic debt 5) Foreign debt 82.6% 17.4% 85.8% 14.2% 86.2% 13.8% 87.3% 12.7% 85.1% 14.9% 83.3% 16.7% 84.5% 15.5% 28.2% 27.4% 5.9% 5.9% 34.1% 33.4% 28.7% 27.8% 4.8% 4.8% 33.5% 32.6% 28.6% 26.6% 4.6% 4.6% 33.2% 31.2% 27.4% 24.0% 4.0% 4.0% 31.4% 27.9% 24.7% 20.7% 4.3% 4.3% 29.0% 25.0% 22.1% 17.8% 4.4% 4.4% 26.6% 22.3% 22.0% 17.8% 4.0% 4.0% 26.0% 21.8% Total as percentage of GDP Gross dom estic debt Net dom estic debt Gross foreign debt Net foreign debt Gross loan debt Net loan debt
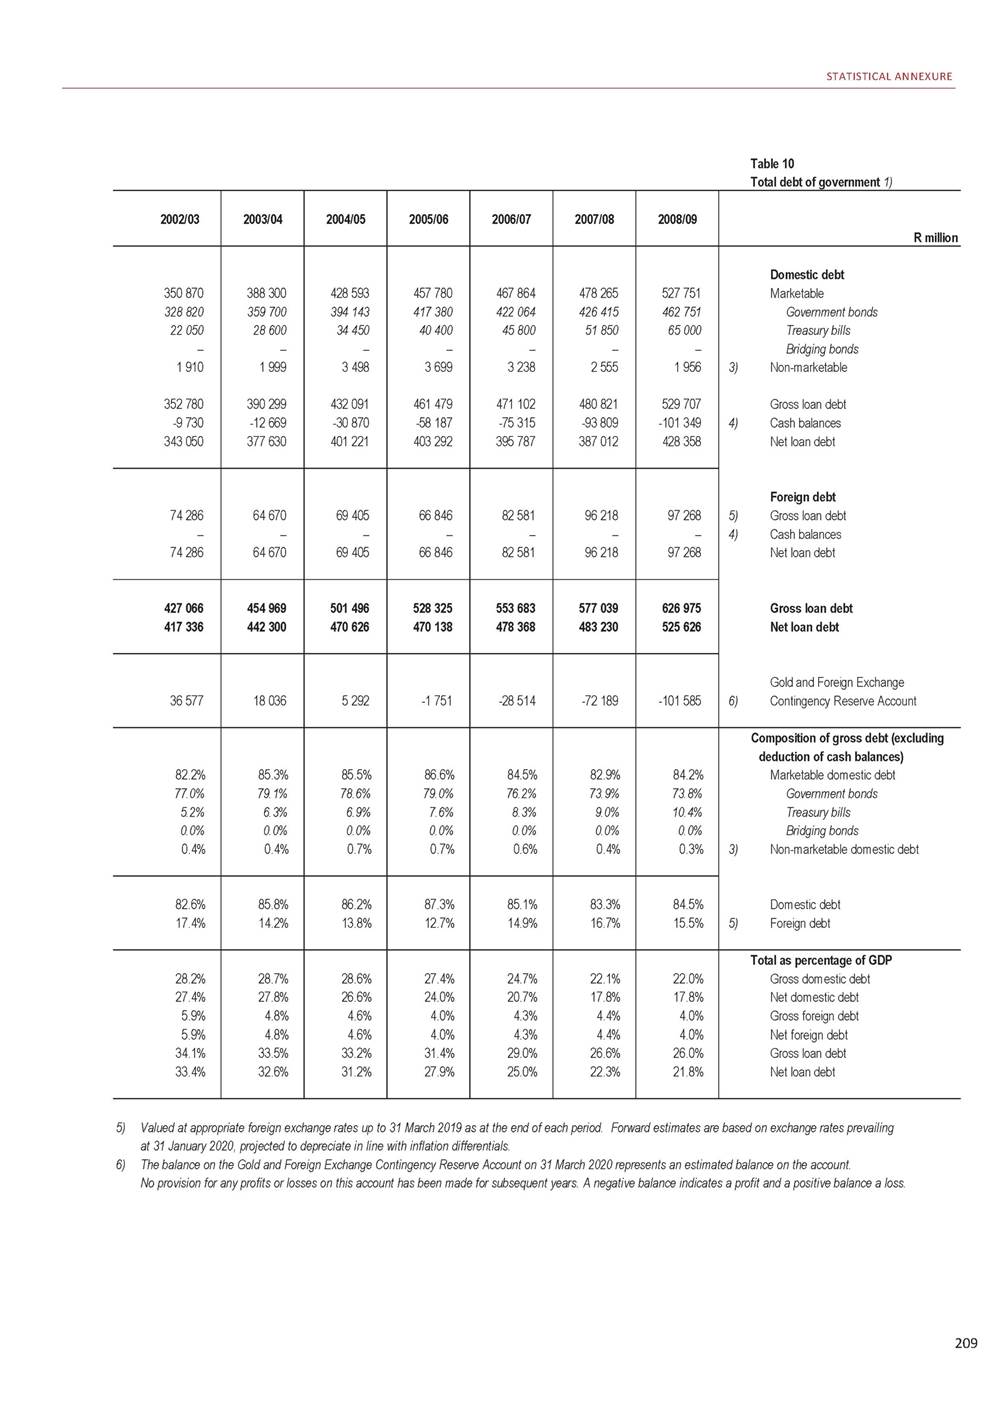
2020 BUDGET REVIEW Table 10 Total debt of government 1) 1) 2) 3) 4) Debt of the central government, excluding extra-budgetary institutions and social security funds. As projected at the end of January 2020. Includes non-marketable Treasury bills, retail bonds, loan levies, former regional authorities and Namibian loans. Bank balances of the National Revenue Fund (balances of government's accounts with the Reserve Bank and commercial banks). Bank balances in foreign currencies are revaluated using forward estimates of exchange rates. Source: National Treasury and Reserve Bank 210 R million 2009/10 2010/11 2011/12 2012/13 2013/14 2014/15 2015/16 Domestic debt Marketable Government bonds Treasury bills Bridging bonds Non-m arketable 3) Gross loan debt Cash balances 4) Net loan debt Foreign debt Gross loan debt 5) Cash balances 4) Net loan debt Gross loan debt Net loan debt Gold and Foreign Exchange Contingency Reserve Account 6) 700 532 585 992 114 540 – 4 943 705 475 -106 550 598 925 869 588 733 438 136 150 – 23 133 892 721 -111 413 781 308 1 045 415 890 256 155 159 – 25 524 1 070 939 -130 450 940 489 1 210 834 1 038 849 171 985 – 30 300 1 241 134 -103 774 1 137 360 1 409 718 1 217 512 192 206 – 31 381 1 441 099 -120 807 1 320 292 1 601 499 1 399 282 202 217 – 30 586 1 632 085 -120 304 1 511 781 1 782 042 1 572 574 209 468 – 37 322 1 819 364 -112 250 1 707 114 99 454 -25 339 74 115 97 851 -58 750 39 101 116 851 -67 609 49 242 124 555 -80 308 44 247 143 659 -84 497 59 162 166 830 -94 404 72 426 199 607 -102 083 97 524 804 929 673 040 990 572 820 409 1 187 790 989 731 1 365 689 1 181 607 1 584 758 1 379 454 1 798 915 1 584 207 2 018 971 1 804 638 -35 618 -28 283 -67 655 -125 552 -177 913 -203 396 -304 653 Composition of gross debt (excluding deduction of cash balances) M arketable dom estic debt Government bonds Treasury bills Bridging bonds Non-m arketable dom estic debt 3) Dom estic debt Foreign debt 5) 87.0% 72.8% 14.2% 0.0% 0.6% 87.8% 74.0% 13.7% 0.0% 2.3% 88.0% 75.0% 13.1% 0.0% 2.1% 88.7% 76.1% 12.6% 0.0% 2.2% 89.0% 76.8% 12.1% 0.0% 2.0% 89.0% 77.8% 11.2% 0.0% 1.7% 88.3% 77.9% 10.4% 0.0% 1.8% 87.6% 12.4% 90.1% 9.9% 90.2% 9.8% 90.9% 9.1% 90.9% 9.1% 90.7% 9.3% 90.1% 9.9% Total as percentage of GDP Gross dom estic debt Net dom estic debt Gross foreign debt Net foreign debt Gross loan debt Net loan debt 27.7% 23.5% 3.9% 2.9% 31.5% 26.4% 31.6% 27.7% 3.5% 1.4% 35.1% 29.0% 34.8% 30.6% 3.8% 1.6% 38.6% 32.2% 37.4% 34.3% 3.8% 1.3% 41.1% 35.6% 39.9% 36.5% 4.0% 1.6% 43.8% 38.2% 42.2% 39.1% 4.3% 1.9% 46.5% 41.0% 44.1% 41.4% 4.8% 2.4% 48.9% 43.8%
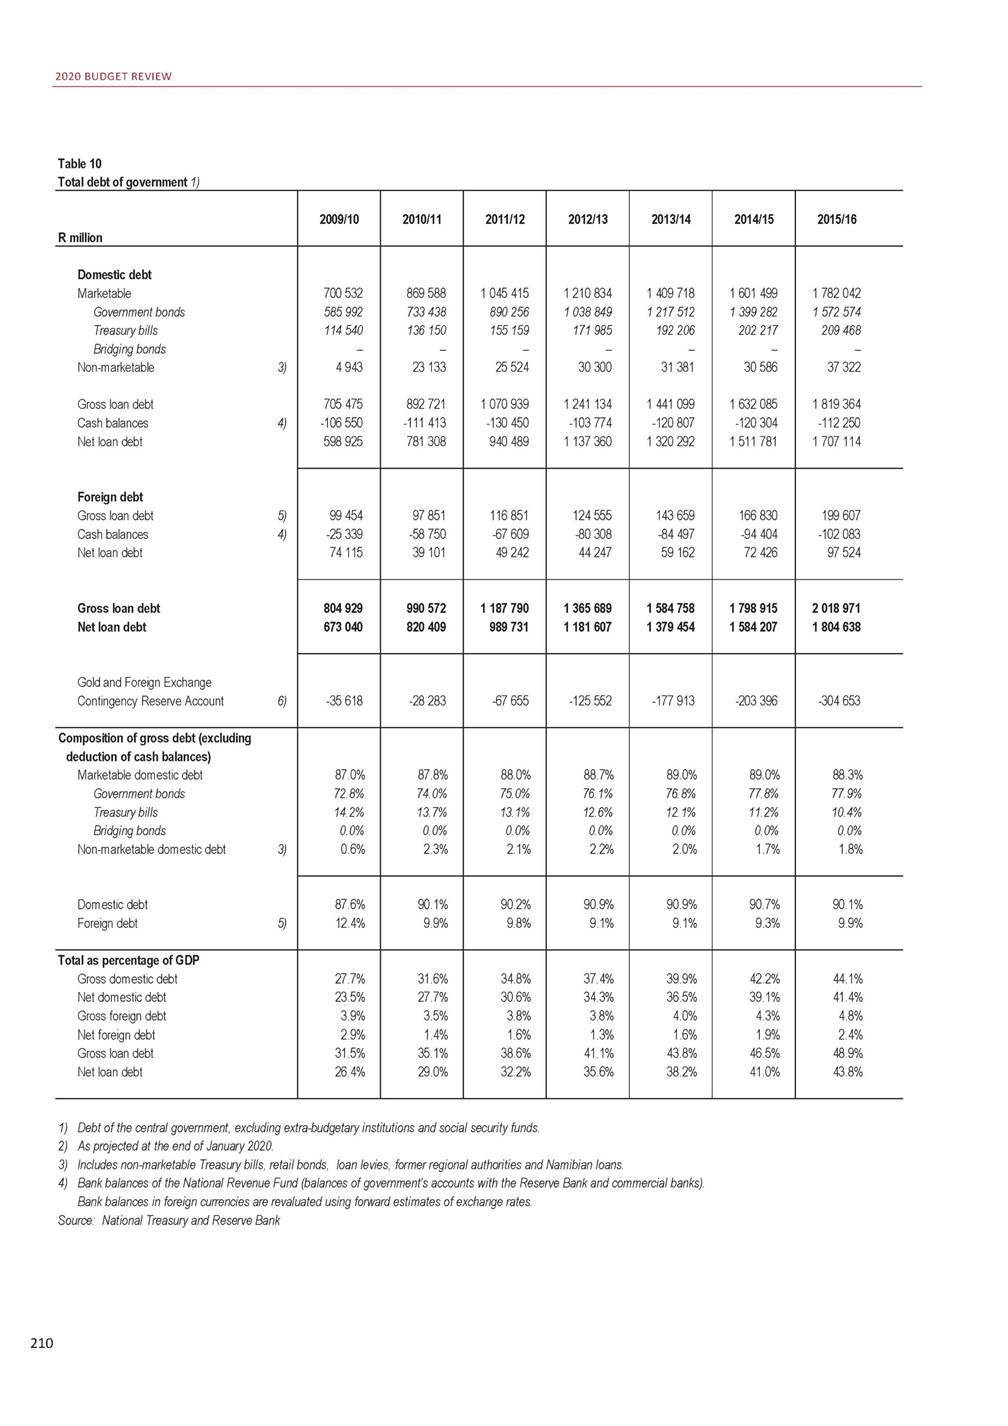
STATISTICAL ANNEXURE Table 10 Total debt of government 1) 5) Valued at appropriate foreign exchange rates up to 31 March 2019 as at the end of each period. Forward estimates are based on exchange rates prevailing at 31 January 2020, projected to depreciate in line with inflation differentials. 6) The balance on the Gold and Foreign Exchange Contingency Reserve Account on 31 March 2020 represents an estimated balance on the account. No provision for any profits or losses on this account has been made for subsequent years. A negative balance indicates a profit and a positive balance a loss. 211 2016/17 2017/18 2018/19 2) 2019/20 2020/21 2021/22 2022/23 R million 1 981 627 1 731 657 249 970 – 38 508 2 020 135 -110 262 1 909 873 2 242 894 1 949 573 293 321 – 29 013 2 271 907 -123 241 2 148 666 2 467 758 2 160 398 307 360 – 29 228 2 496 986 -120 575 2 376 411 2 820 128 2 486 768 333 360 – 39 228 2 859 356 -117 157 2 742 199 3 187 987 2 806 627 381 360 – 39 228 3 227 215 -117 157 3 110 058 3 556 745 3 127 385 429 360 – 39 228 3 595 973 -117 157 3 478 816 3 917 299 3 432 939 484 360 – 39 228 3 956 527 -117 157 3 839 370 Domestic debt M arketable Government bonds Treasury bills Bridging bonds 3) Non-m arketable Gross loan debt 4) Cash balances Net loan debt Foreign debt 5) Gross loan debt 4) Cash balances Net loan debt Gross loan debt Net loan debt Gold and Foreign Exchange 6) Contingency Reserve Account 212 754 -114 353 98 401 217 811 -106 110 111 701 291 314 -122 542 168 772 316 708 -121 141 195 567 334 449 -104 502 229 947 382 130 -109 377 272 753 427 060 -113 027 314 033 2 232 889 2 008 274 2 489 718 2 260 367 2 788 300 2 545 183 3 176 064 2 937 766 3 561 664 3 340 005 3 978 103 3 751 569 4 383 587 4 153 403 -231 158 -193 917 -285 829 -278 078 -278 078 -278 078 -278 078 88.7% 77.6% 11.2% 0.0% 1.7% 90.1% 78.3% 11.8% 0.0% 1.2% 88.5% 77.5% 11.0% 0.0% 1.0% 88.8% 78.3% 10.5% 0.0% 1.2% 89.5% 78.8% 10.7% 0.0% 1.1% 89.4% 78.6% 10.8% 0.0% 1.0% 89.4% 78.3% 11.0% 0.0% 0.9% Composition of gross debt (excluding deduction of cash balances) M arketable dom estic debt Government bonds Treasury bills Bridging bonds 3) Non-m arketable dom estic debt Dom estic debt 5) Foreign debt 90.5% 9.5% 91.3% 8.7% 89.6% 10.4% 90.0% 10.0% 90.6% 9.4% 90.4% 9.6% 90.3% 9.7% 45.7% 43.2% 4.8% 2.2% 50.5% 45.4% 48.4% 45.7% 4.6% 2.4% 53.0% 48.1% 50.7% 48.3% 5.9% 3.4% 56.7% 51.7% 55.4% 53.2% 6.1% 3.8% 61.6% 57.0% 59.5% 57.3% 6.2% 4.2% 65.6% 61.5% 62.4% 60.4% 6.6% 4.7% 69.1% 65.1% 64.6% 62.7% 7.0% 5.1% 71.6% 67.8% Total as percentage of GDP Gross dom estic debt Net dom estic debt Gross foreign debt Net foreign debt Gross loan debt Net loan debt
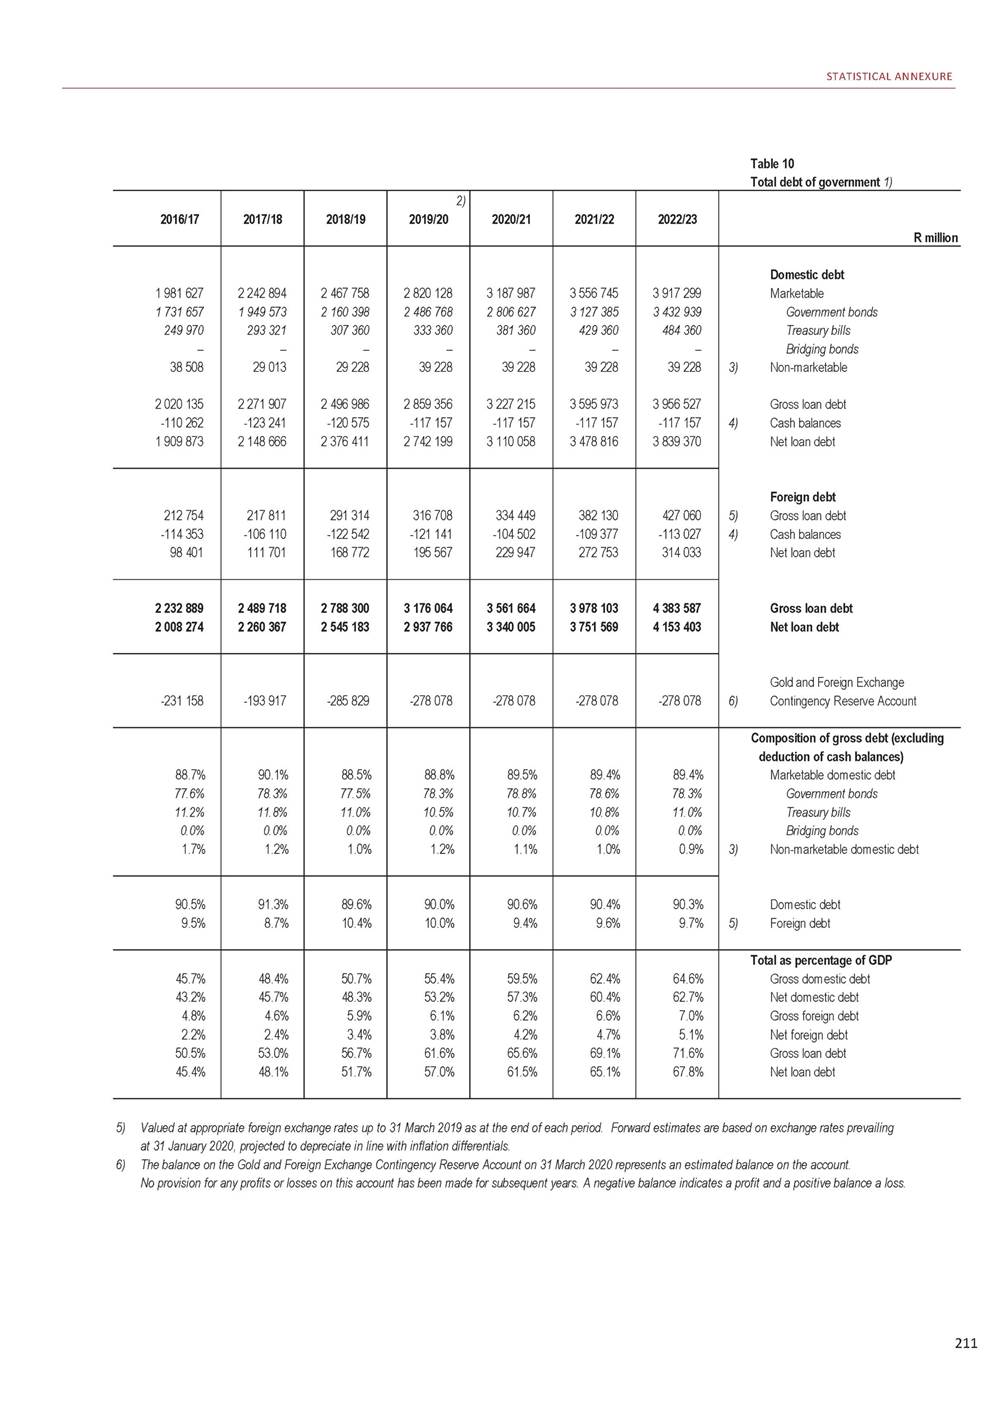
2020 BUDGET REVIEW Table 11 Net loan debt, provisions and contingent liabilities 1) 1) 2) 3) Medium-term forecasts of some figures are not available and are kept constant. Debt of the central government, excluding extra-budgetary institutions and socal security funds. Provisions are liabilities for which the payment date or amount is uncertain. The provisions for multilateral institutions are the unpaid portion of government's subscription to these institutions, payable on request. Source: National Treasury 212 R million 2009/10 2010/11 2011/12 2012/13 2013/14 2014/15 2015/16 Net loan debt2) Provisions3) African Development Bank Development Bank of Southern Africa Government employee leave credits International Bank for Reconstruction and Development International Monetary Fund Multilateral Investment Guarantee Agency New Development Bank Contingent liabilities Guarantees4) Agricultural cooperatives Central Energy Fund Denel Development Bank of Southern Africa Eskom5) Foreign central banks and governments Former regional authorities Guarantee scheme for housing loans to employees Guarantee scheme for motor vehicles – senior officials Industrial Development Corporation of South Africa Independent power producers Irrigation boards Kalahari East Water Board Komati Basin Water Authority Land Bank Lesotho Highlands Development Authority Nuclear Energy Corporation of South Africa Passenger Rail Agency of South Africa Public-private partnerships South African Airways South African Broadcasting Corporation South African Express South African National Roads Agency Limited South African Post Office Reserve Bank Telkom South Africa Trans-Caledon Tunnel Authority Transnet Universities and technikons Other contingent liabilities6) Claims against government departments Export Credit Insurance Corporation of SA Limited Government Employees Pension Fund Post-retirement medical assistance Road Accident Fund Unemployment Insurance Fund Other 673 040 81 051 8 091 4 800 9 762 11 187 47 104 107 – 279 137 139 395 94 19 1 850 26 370 46 678 25 190 154 3 952 – 46 16 1 406 2 500 401 20 1 217 10 296 1 351 1 000 – 12 287 – – 108 20 721 11 620 71 139 742 24 064 9 191 – 56 000 45 366 3 728 1 393 820 409 73 693 7 492 4 800 10 815 10 360 40 127 99 – 305 104 160 043 94 – 1 850 25 713 67 057 – 154 104 3 740 – 44 16 1 340 1 750 227 20 468 10 443 1 916 1 000 – 18 605 – – 90 18 489 9 887 33 145 061 31 310 9 614 – 65 348 33 547 3 315 1 927 989 731 98 593 27 300 4 800 11 266 11 703 43 412 112 – 345 865 164 338 94 – 1 850 25 554 77 230 – 138 64 2 646 – 48 15 1 247 1 000 171 20 264 10 414 1 300 889 – 19 426 – – 85 19 886 3 975 20 181 527 42 969 10 025 – 65 348 53 919 3 381 5 885 1 181 607 116 231 32 725 4 800 12 316 15 935 50 321 134 – 436 288 224 768 93 – 1 850 25 497 103 523 – 124 46 1 575 34 356 46 6 1 190 800 132 20 133 10 172 2 238 167 – 19 482 – – 90 20 460 3 757 10 211 520 43 628 12 482 – 65 348 82 838 3 241 3 983 1 379 454 134 045 38 063 4 800 12 924 19 407 58 697 154 – 494 114 288 041 93 – 1 850 25 635 125 125 – 112 26 1 504 68 345 44 – 1 148 1 004 113 20 92 10 127 5 010 – 539 23 866 – – 111 20 516 3 757 3 206 073 45 131 13 780 – 69 938 69 435 3 611 4 178 1 584 207 160 383 43 811 20 000 13 030 23 579 59 786 177 – 579 153 327 169 93 – 1 850 4 030 149 944 – 105 13 1 344 96 159 44 – 986 2 005 82 20 48 10 107 8 419 – 539 27 445 270 – 100 20 807 3 757 1 251 984 48 726 15 308 – 69 938 109 298 3 836 4 878 1 804 638 217 960 54 766 20 000 13 454 29 028 91 658 215 8 839 605 608 380 136 93 – 1 850 4 258 174 586 – 98 10 1 243 113 971 39 – 889 5 211 62 20 2 10 337 14 394 – 539 27 204 1 270 – 128 21 173 3 757 1 225 472 30 601 16 395 – 69 938 99 152 4 228 5 158
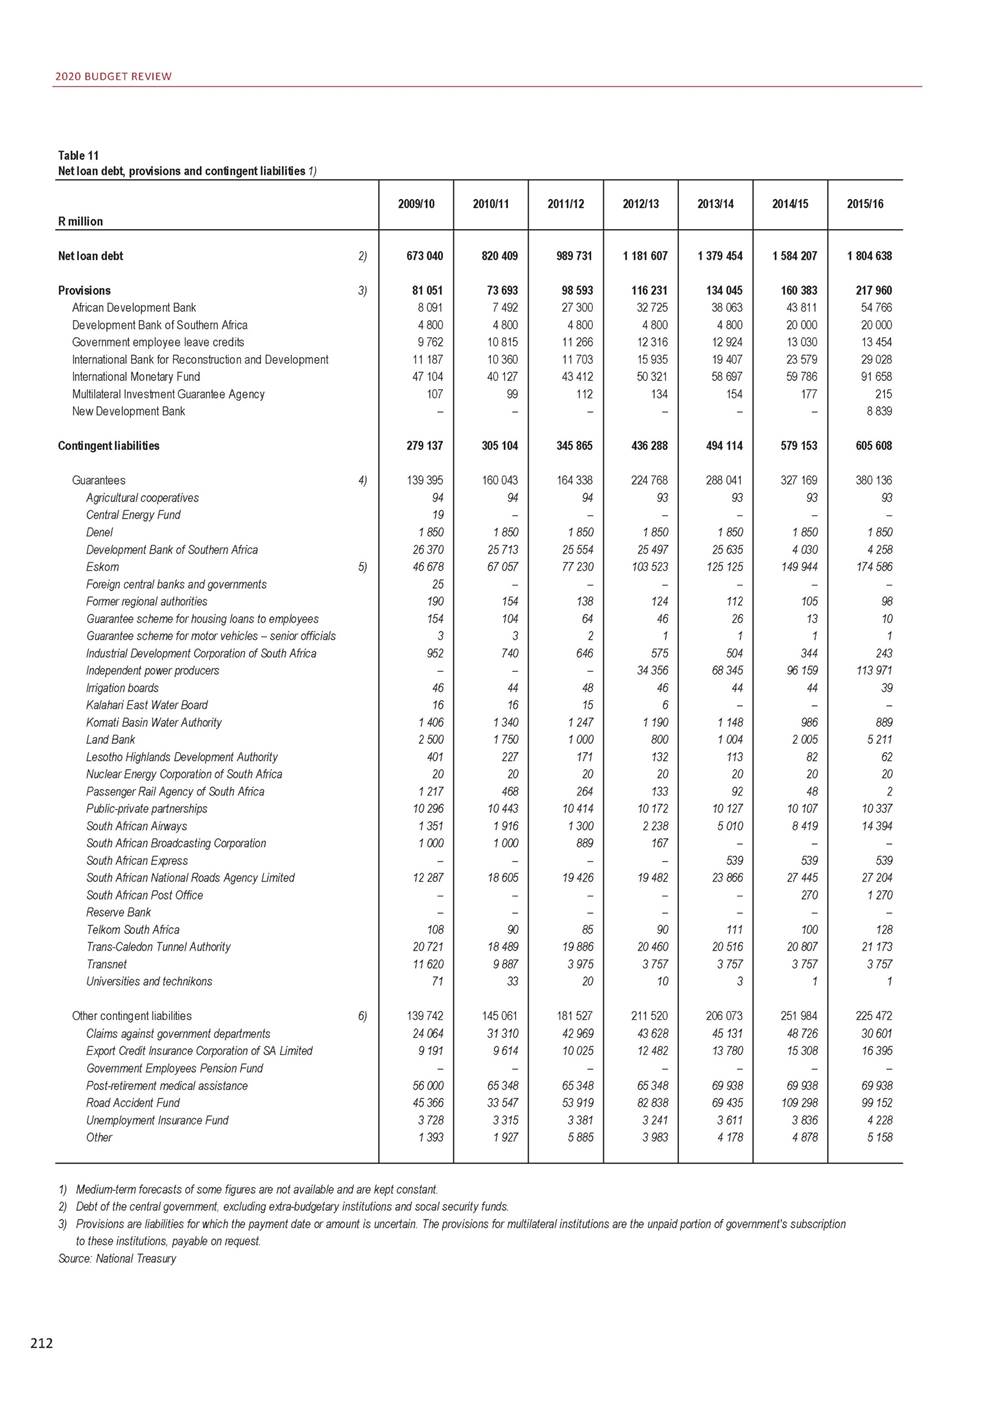
STATISTICAL ANNEXURE Table 11 Net loan debt, provisions and contingent liabilities 1) 4) Amounts drawn against financial guarantees, inclusive of revaluation adjustments on inflation-linked bonds and accrued interest. Numbers prior to 2018/19 exclude revaluation adjustment on inflation-linked bonds. These estimates are based on Eskom's current structure. Other contingent liabilities as disclosed in the consolidated financial statements of departments published annually by the National Treasury. 5) 6) 213 2016/17 2017/18 2018/19 2019/20 2020/21 2021/22 2022/23 R million 2 008 274 210 974 49 344 20 000 14 137 26 527 79 535 193 21 238 670 147 426 234 93 – 1 850 3 993 202 825 – 93 8 – 138 125 766 38 – 785 3 712 30 20 – 10 049 17 819 – 827 29 458 3 979 – 108 20 886 3 757 – 243 913 29 481 14 015 – 69 938 119 830 5 950 4 699 2 260 367 211 480 44 119 20 000 13 606 23 993 76 358 173 33 231 736 518 459 107 93 – 2 430 3 975 250 648 – 84 6 – 137 122 188 37 – 619 3 813 3 20 – 9 580 11 059 – 867 30 368 400 – 111 18 912 3 757 – 277 411 31 807 18 192 – 69 938 139 204 13 118 5 152 2 545 183 260 704 53 855 20 000 13 496 29 287 85 908 211 57 947 851 792 525 568 93 – 3 430 4 256 285 587 – 77 6 – 147 146 892 36 – 518 965 – 20 – 10 464 15 269 – 163 39 462 – – 124 14 302 3 757 – 326 224 36 001 20 454 – 69 938 173 559 20 656 5 616 2 937 766 279 962 54 350 20 000 14 373 28 807 86 195 213 76 024 979 988 555 430 93 – 6 930 4 481 297 432 – 56 6 – 144 161 427 36 – 427 873 – 20 – 8 654 17 328 – 163 39 919 – – 123 13 514 3 804 – 424 558 36 001 18 209 – 69 938 273 105 21 689 5 616 3 340 005 301 460 54 387 20 000 15 221 28 827 86 254 213 96 558 1 041 915 550 383 93 – 6 930 4 572 296 482 – 51 6 – 144 163 485 34 – 362 873 – 20 – 8 047 8 028 – 163 44 177 – – 128 12 984 3 804 – 491 532 36 001 14 088 – 69 938 343 116 22 773 5 616 3 751 569 328 749 55 502 20 000 16 149 29 418 88 022 218 119 440 1 097 499 535 820 93 – 5 930 4 663 295 142 – 46 6 – 146 155 574 32 – 297 873 – 20 – 7 494 4 228 – 163 45 922 – – 135 11 252 3 804 – 561 679 36 001 11 060 – 69 938 415 198 23 866 5 616 4 153 403 334 993 56 506 20 000 17 102 29 950 89 614 221 121 600 1 164 075 516 840 93 – 5 930 4 734 291 711 – 41 6 – 145 141 937 30 – 232 873 – 20 – 7 001 2 608 – 163 43 120 – – 138 14 254 3 804 – 647 235 36 001 8 168 – 69 938 502 500 25 012 5 616 2) Net loan debt 3) Provisions African Development Bank Development Bank of Southern Africa Government employee leave credits International Bank for Reconstruction and Development International Monetary Fund Multilateral Investment Guarantee Agency New Development Bank Contingent liabilities 4)Guarantees Agricultural cooperatives Central Energy Fund Denel Development Bank of Southern Africa 5)Eskom Foreign central banks and governments Former regional authorities Guarantee scheme for housing loans to employees Guarantee scheme for motor vehicles – senior officials Industrial Development Corporation of South Africa Independent power producers Irrigation boards Kalahari East Water Board Komati Basin Water Authority Land Bank Lesotho Highlands Development Authority Nuclear Energy Corporation of South Africa Passenger Rail Agency of South Africa Public-private partnerships South African Airways South African Broadcasting Corporation South African Express South African National Roads Agency Limited South African Post Office Reserve Bank Telkom South Africa Trans-Caledon Tunnel Authority Transnet Universities and technikons 6)Other contingent liabilities Claims against government departments Export Credit Insurance Corporation of SA Limited Government Employees Pension Fund Post-retirement medical assistance Road Accident Fund Unemployment Insurance Fund Other
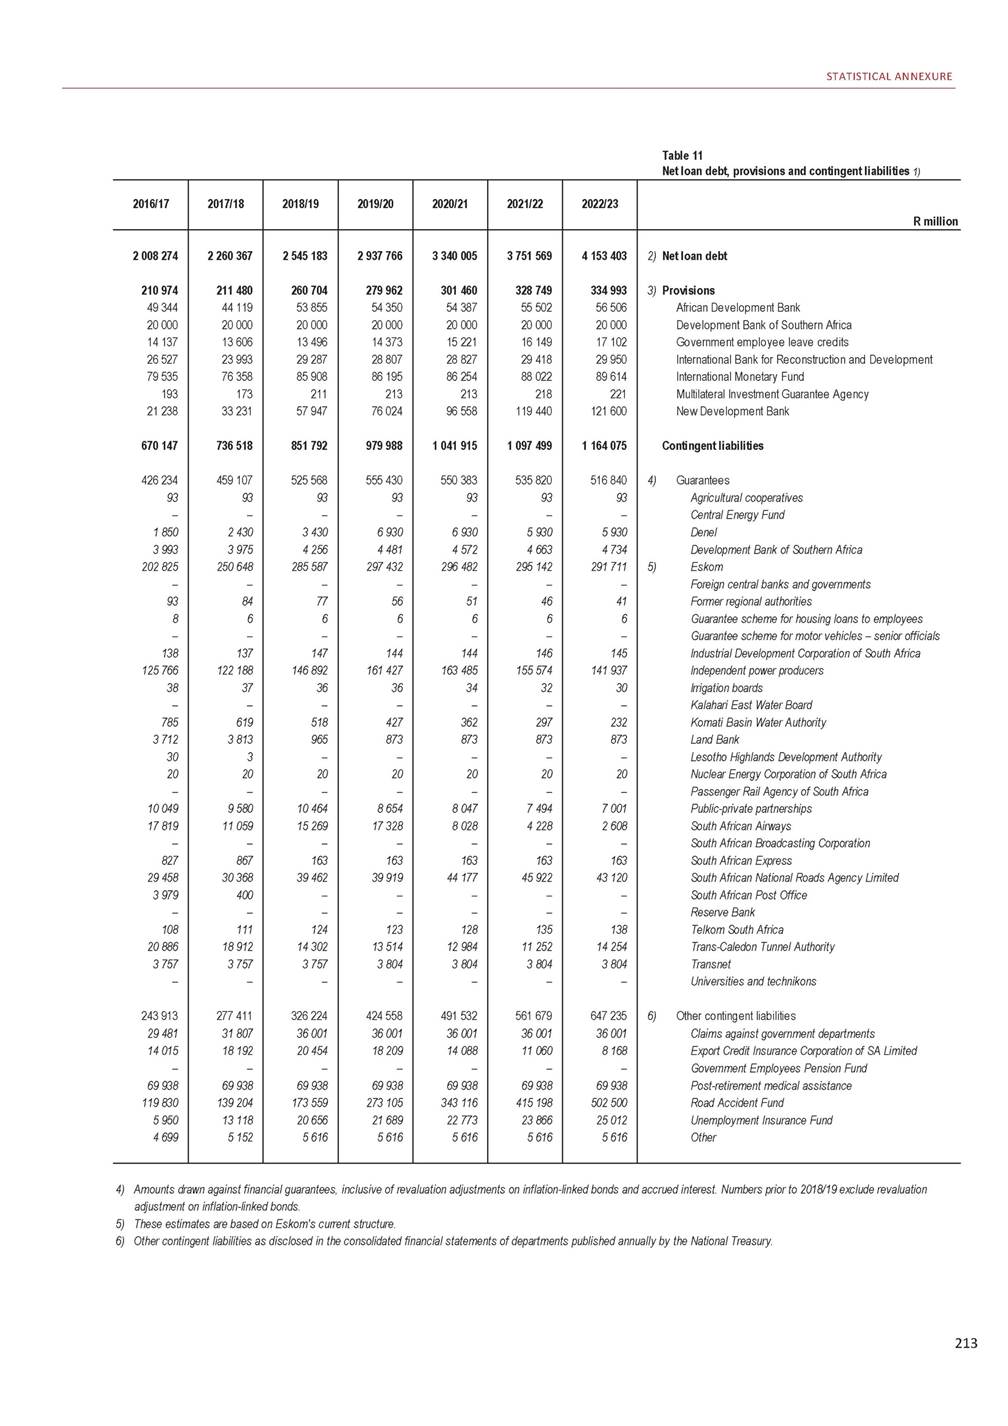
W1 Explanatory memorandum to the division of revenue Background Section 214(1) of the Constitution requires that every year a Division of Revenue Act determine the equitable division of nationally raised revenue between national government, the nine provinces and 257 municipalities. This process takes into account the powers and functions assigned to each sphere, fosters transparency and is at the heart of constitutional cooperative governance. The Intergovernmental Fiscal Relations Act (1997) prescribes the steps for determining the equitable sharing and allocation of nationally raised revenue. Sections 9 and 10(4) of the act set out the consultation process to be followed with the Financial and Fiscal Commission (FFC), including considering recommendations made regarding the division of revenue. This explanatory memorandum to the 2020 Division of Revenue Bill fulfils the requirement set out in section 10(5) of the Intergovernmental Fiscal Relations Act that the bill be accompanied by an explanatory memorandum detailing how it takes account of the matters listed in sections 214(2)(a) to (j) of the Constitution, government’s response to the FFC’s recommendations, and any assumptions and formulas used in arriving at the respective divisions among provinces and municipalities. This memorandum complements the discussion of the division of revenue in Chapter 6 of the Budget Review. It has six sections: Part 1 lists the factors that inform the division of resources between national, provincial and local government. Part 2 describes the 2020 division of revenue. Part 3 sets out how the FFC’s recommendations on the 2020 division of revenue have been taken into account. Part 4 explains the formula and criteria for dividing the provincial equitable share and conditional grants among provinces. Part 5 sets out the formula and criteria for dividing the local government equitable share and conditional grants among municipalities. Part 6 summarises issues that will form part of subsequent reviews of provincial and local government fiscal frameworks. The Division of Revenue Bill and its underlying allocations are the result of extensive consultation between national, provincial and local government. The Budget Council deliberated on the matters discussed in this memorandum at several meetings during the year. The approach to local government allocations was discussed with organised local government at technical meetings with the South African Local Government 1
2020 BUDGET REVIEW Association (SALGA), culminating in meetings of the Budget Forum (made up of the Budget Council and SALGA). The division of revenue, and the government priorities that underpin it, was agreed for the next three years at a Cabinet meeting in October 2019. Part 1: Constitutional considerations Section 214 of the Constitution requires that the annual Division of Revenue Act be enacted after factors in sub-sections (2)(a) to (j) are taken into account. The constitutional principles considered in the division of revenue are briefly noted below. National interest and the division of resources The national interest is captured in governance goals that benefit the nation. The National Development Plan sets out a long-term vision for the country’s development, including for economic development, environmental sustainability and building a capable and developmental state. It also sets goals for specific provincial and local government functions, including basic education, health, agriculture, human settlements, electricity, water and sanitation. In the June 2019 State of the Nation Address, the President set out the following seven priorities for this administration: 1. 2. 3. 4. 5. 6. 7. Economic transformation and job creation Education, skills and health Consolidating the social wage through reliable and quality basic services Spatial integration, human settlements and local government Social cohesion and safe communities Building a capable, ethical and developmental state A better Africa and world. These priorities have informed deliberations in the budget process on how resources will be allocated between the different spheres of government. They will also form the basis of the next five-year implementation plan for the National Development Plan, which is expected to be published by the Department of Planning, Monitoring and Evaluation in 2020. In the 2019 Medium Term Budget Policy Statement (MTBPS), the Minister of Finance outlined how the resources available to government over the 2020 medium-term expenditure framework (MTEF) period would be allocated to help achieve government’s goals in a difficult economic environment. Chapter 4 of the 2019 MTBPS and Chapters 5 and 6 of the 2020 Budget Review discuss how funds have been allocated across the three spheres of government based on these priorities. The framework for each conditional grant also notes how the grant is linked to the seven priorities. Provision for debt costs The resources shared between national, provincial and local government include proceeds from national government borrowing used to fund public spending. National government provides for the resulting debt costs to protect the country’s integrity and credit reputation. Chapter 7 of the 2020 Budget Review provides a more detailed discussion. National government’s needs and interests The Constitution assigns exclusive and concurrent powers and functions to each sphere of government. National government is solely responsible for functions that serve the national interest and are best centralised. National and provincial government have concurrent responsibility for a range of functions. Provincial and local government receive equitable shares and conditional grants to enable them to provide basic services and perform their functions. Functions may shift between spheres of government to better meet the country’s needs, which is then reflected in the division of revenue. Changes continue to be made to 2
ANNEXURE W1: EXPLANATORY MEMORANDUM TO THE DIVISION OF REVENUE various national transfers to provincial and local government to improve their efficiency, effectiveness and alignment with national strategic objectives. Provincial and local government basic services Provinces and municipalities are responsible for providing education, health, social development, housing, roads, electricity and water, and municipal infrastructure services. They have the autonomy to allocate resources to meet basic needs and respond to provincial and local priorities, while giving effect to national objectives. The division of revenue provides equitable shares to provinces and local government to enable them to meet their basic service obligations. In addition, conditional grants are provided to enable them to improve and expand services. Over half of non-interest spending is allocated to provinces and local government. These allocations also grow at a faster rate than those to national departments over the 2020 MTEF period, reflecting the priority placed on health, education and basic services, as well as the rising costs of these services as a result of population growth and higher bulk electricity and water costs. Fiscal capacity and efficiency National government has primary revenue-raising powers, with it collecting most of the largest taxes such as income taxes, value-added tax, fuel levies and customs and excise duties. The difference between the assignment of revenue-raising powers and spending responsibilities between the spheres of government is compensated for through the transfer of nationally raised revenue to provinces and local government. Provinces have limited tax-raising powers. Licences for vehicles and gambling are their largest sources of own tax revenue. Provincial functions such as basic education, public healthcare and social welfare do not lend themselves to self-funding or cost recovery. Due to their limited revenue-raising ability, and their responsibility to implement costly services at no or low fees to most recipients, provinces receive a larger share of nationally raised revenue than local government. Municipalities are assigned significant own revenue-raising powers, including the collection of property rates, which is a tax equivalent to more than 1 per cent of gross domestic product (GDP) and is worth slightly more than nationally collected revenue from customs duties. Municipalities also provide services such as electricity and water, the costs of which can be recovered through tariffs. As a result, local government finances most of its expenditure through property rates, user charges and fees. However, the ability of individual municipalities to raise revenue varies greatly – rural municipalities raise significantly less revenue than large urban and metropolitan municipalities. The design of the local government fiscal framework acknowledges that, as a result of their lower own revenue capacity, many rural municipalities will depend on transfers for most of their funding. The local government equitable share formula incorporates a revenue adjustment factor that considers the fiscal capacity of each recipient municipality (full details of the formula are provided in Part 5 of this annexure). The equitable share also provides funding to enable all municipalities to provide free basic water, electricity, sanitation and waste management services to poor households. To support the expansion of these services, local government’s share of nationally raised revenue has increased from 3 per cent in 2000/01 to 8.8 per cent over the 2020 MTEF period. The mechanisms for allocating funds to provinces and municipalities are regularly reviewed to improve their efficiency. To maximise the impact of allocations, many provincial and local government conditional grants consider the recipient’s efficiency in using previous allocations. The reductions in planned transfers over the 2020 MTEF period also took account of past performance of conditional grants, both in terms of their spending levels and their efficiency in meeting their objectives with the funds that were spent. Developmental needs Developmental needs are accounted for at two levels. First, in the determination of the division of revenue, which continues to grow the provincial and local government shares of nationally raised revenue faster than inflation, and second, in the formulas used to divide national transfers among municipalities and provinces. Developmental needs are built into the equitable share formulas for provincial and local government and 3
2020 BUDGET REVIEW included in specific conditional grants, such as the municipal infrastructure grant, which allocates funds according to the number of households in a municipality without access to basic services. Various infrastructure grants and the capital budgets of provinces and municipalities aim to boost economic and social development. Economic disparities The equitable share and infrastructure grant formulas redistribute funds towards poorer provinces and municipalities (parts 4 and 5 of this annexure provide statistics illustrating this). Through the division of revenue, government continues to invest in economic infrastructure (such as roads) and social infrastructure (such as schools, hospitals and clinics) to stimulate economic development, create jobs, and address economic and social disparities. Obligations in terms of national legislation The Constitution gives provincial governments and municipalities the power to determine priorities and allocate budgets. National government is responsible for developing policy, fulfilling national mandates, setting national norms and standards for provincial and municipal functions, and monitoring the implementation of concurrent functions. The 2020 MTEF, through the division of revenue, continues to fund the delivery of provincial, municipal and concurrent functions through a combination of conditional and unconditional grants. Predictability and stability Provincial and local government equitable share allocations are based on estimates of nationally raised revenue. If this revenue falls short of estimates within a given year, the equitable shares of provinces and local government will not be reduced. Allocations are assured (voted, legislated and guaranteed) for the first year and are transferred according to a payment schedule. To contribute to longer-term predictability and stability, estimates for a further two years are published with the annual proposal for appropriations. Adjusted estimates as a result of changes to data underpinning the equitable share formulas and revisions to the formulas themselves are phased in to ensure minimal disruption. Flexibility in responding to emergencies Government has a contingency reserve for emergencies and unforeseeable events. In addition, four conditional grants for disasters and housing emergencies allow government to swiftly allocate and transfer funds to affected provinces and municipalities in the immediate aftermath of a disaster. Sections 16 and 25 of the Public Finance Management Act (1999) provide for the allocation of funds to deal with emergency situations. Section 30(2) deals with adjustment allocations for unforeseeable and unavoidable expenditure. Section 29 of the Municipal Finance Management Act (2003) allows a municipal mayor to authorise unforeseeable and unavoidable expenditure in an emergency. Part 2: The 2020 division of revenue The central fiscal objectives over the MTEF period are to stabilise the growth of debt as a share of GDP and to strictly adhere to the planned expenditure ceiling (see Chapter 3 of the 2020 Budget Review). However, the most important public spending programmes that help poor South Africans, contribute to growth and create jobs have been protected from major reductions. The 2020 division of revenue reprioritises existing funds to ensure these objectives are met. Excluding debt-service costs and the contingency reserve, allocated expenditure shared across government amounts to R1.53 trillion in 2020/21, R1.59 trillion in 2021/22 and R1.65 trillion in 2022/23. The division of these funds between the three spheres takes into account government’s spending priorities, each sphere’s revenue-raising capacity and responsibilities, and input from various intergovernmental forums and the FFC. 4
ANNEXURE W1: EXPLANATORY MEMORANDUM TO THE DIVISION OF REVENUE The provincial and local equitable share formulas are designed to ensure fair, stable and predictable revenue shares, and to address economic and fiscal disparities. Reductions to transfers The fiscal objectives that determined the spending envelope are set out in Chapter 3 of the 2020 Budget Review. Reductions to previously announced spending levels were made across all three spheres of government to fit within the revised expenditure ceiling. The 2019 MTBPS announced that provincial transfers have been reduced by R20.3 billion over the MTEF period and transfers to local government have been reduced by R20.5 billion. Following the 2019 MTBPS, further changes were made. In total, the provincial equitable share has been reduced by R7.3 billion through a 2 per cent reduction in all non-compensation spending per year and a R5.2 billion reduction in compensation of employees. Direct conditional grants to provinces have been reduced by a net R13.3 billion, as the reduction of R16.2 billion is partly offset by reprioritisations of R2.9 billion. The local government reductions comprise R3.2 billion from the local government equitable share and R16.8 billion in reductions to direct conditional grants. All direct conditional grants have been lowered, except for the early childhood development grant and the learners with profound intellectual disabilities grant. To manage the impact on services, the amount reduced from each grant considers: Past spending and performance. Whether it funds salaries, medicines and food. Whether there has been significant real growth in allocations in recent years. Larger reductions are also made to grants to urban municipalities, which have more capacity to offset the effect of cuts by increasing their own revenue investments. Parts 4 and 5 of this annexure set out in more detail how the changes to the baseline affect provincial and local government transfers. The proposed changes to the wage bill discussed in Chapter 3 of the Budget Review are not yet reflected in the allocations to national and provincial departments shown in the Division of Revenue Bill. Once these changes are agreed in the Public Service Co-ordinating Bargaining Council, they will be implemented in the 2020/21 adjustment budget and 2020 MTBPS. This will reduce the national and provincial shares, and increase the local government share, of the division of revenue in relative terms. Reprioritisations To meet policy objectives while remaining within the revised expenditure ceiling, existing budgets need to be reprioritised to meet government’s policy goals. Priorities over the 2020 MTEF period that are funded through reprioritisations in the division of revenue include: Increasing the per-child subsidy for early childhood development services from R15 per day to R17 per day in 2020/21, rising to R18.57 per day by 2022/23. Addressing shortfalls in the funding of community outreach services in the health sector. Supporting the continued rollout of free sanitary products to learners from low-income households. Repairing wastewater treatment infrastructure in the Vaal River System. These reprioritisations complement baselines that provide R2.07 trillion to provinces and R426.4 billion to local government in transfers over the 2020 MTEF period. These transfers fund many core policy priorities, including basic education, health, social development, roads, housing and municipal services. The fiscal framework Table W1.1 presents the medium-term macroeconomic forecasts for the 2020 Budget. It sets out the growth assumptions and fiscal policy targets on which the fiscal framework is based. 5
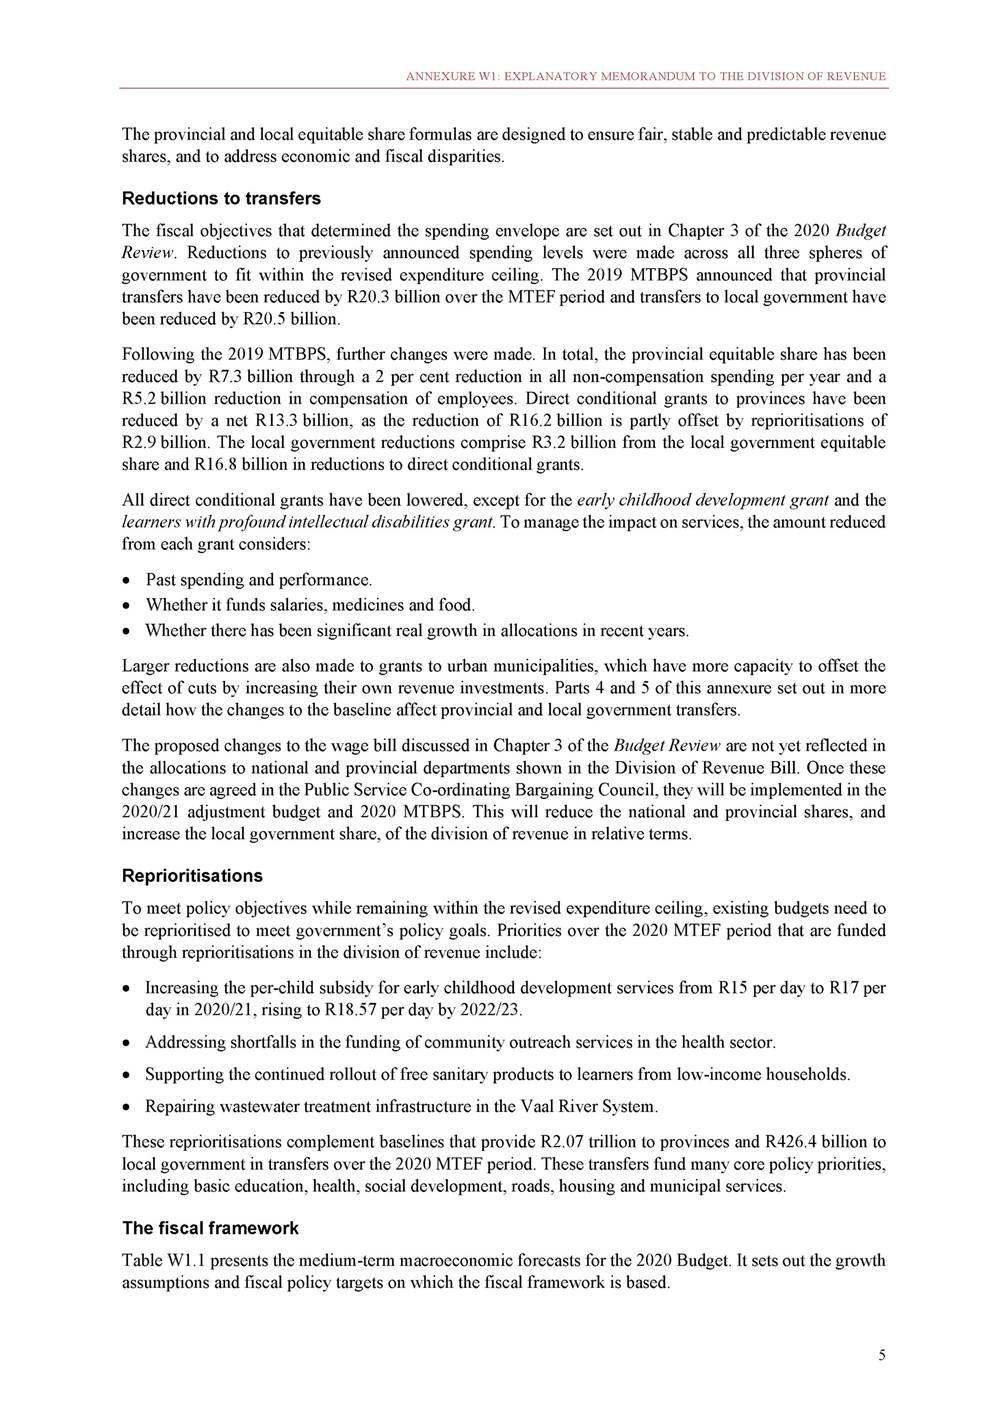
2020 BUDGET REVIEW Table W1.1 Medium-term macroeconomic assumptions 1. A positive number reflects a surplus and a negative number a deficit Source: National Treasury Table W1.2 sets out the division of revenue for the 2020 MTEF period after accounting for new policy priorities. Table W1.2 Division of nationally raised revenue 1. Includes proposed compensation reductions, support to Eskom, amounts for Budget Facility for Infrastructure projects and other provisional allocations Source: National Treasury Table W1.3 shows how changes to the baseline are spread across government. The new focus areas and baseline reductions are accommodated by shifting savings to priorities. 6 2016/17 2017/18 2018/19 Outcome R million 2019/20 Revised estimate 2020/21 2021/22 2022/23 Medium-term estimates Division of available funds National departments 555 643 592 640 634 322 of which: Indirect transfers to provinces 3 636 3 813 3 909 Indirect transfers to local 8 112 7 803 7 770 government Provinces 500 384 538 553 571 954 Equitable share 410 699 441 331 470 287 Conditional grants 89 685 97 222 101 667 Local government 102 867 111 103 118 488 Equitable share 50 709 55 614 60 758 Conditional grants 40 934 43 704 45 262 General fuel levy sharing with 11 224 11 785 12 469 metros 739 463 3 941 7 024 612 817 505 554 107 263 125 020 66 973 44 879 13 167 757 725 768 870 797 832 4 060 4 824 5 076 7 628 7 229 8 161 649 256 691 951 730 690 538 472 573 990 607 554 110 785 117 962 123 137 132 529 142 442 151 445 74 683 81 062 87 213 43 819 46 198 48 147 14 027 15 182 16 085 Provisional allocation – – – not assigned to votes1 – -7 786 -16 077 -34 887 Non-interest allocations 1 158 893 1 242 295 1 324 763 Percentage increase 3.9% 7.2% 6.6% 1 477 299 11.5% 1 531 724 1 587 186 1 645 080 3.7% 3.6% 3.6% Debt-service costs 146 497 162 645 181 849 Contingency reserves – – – 205 005 – 229 270 258 482 290 145 5 000 5 000 5 000 Main budget expenditure 1 305 390 1 404 940 1 506 613 Percentage increase 4.9% 7.6% 7.2% 1 682 304 11.7% 1 765 994 1 850 668 1 940 225 5.0% 4.8% 4.8% Percentage shares National departments 47.9% 47.7% 47.9% Provinces 43.2% 43.4% 43.2% Local government 8.9% 8.9% 8.9% 50.1% 41.5% 8.5% 49.2% 48.0% 47.5% 42.2% 43.2% 43.5% 8.6% 8.9% 9.0% 2019/20 20192020 R billion/percentage of GDPBudgetBudget 2020/21 20192020 BudgetBudget 2021/22 20192020 BudgetBudget 2022/23 2020 Budget Gross domestic product5 413.85 157.3 Real GDP growth1.5%0.6% GDP inflation5.4%4.2% 5 812.45 428.2 1.9%0.9% 5.4%4.3% 6 249.15 759.0 2.1%1.4% 5.3%4.6% 6 126.3 1.7% 4.6% National budget framework Revenue1 403.51 344.8 Percentage of GDP25.9%26.1% Expenditure1 658.71 682.3 Percentage of GDP30.6%32.6% Main budget balance1-255.2-337.5 Percentage of GDP-4.7%-6.5% 1 505.11 398.0 25.9%25.8% 1 769.61 766.0 30.4%32.5% -264.4-368.0 -4.5%-6.8% 1 632.91 484.3 26.1%25.8% 1 900.51 850.7 30.4%32.1% -267.6-366.4 -4.3%-6.4% 1 580.9 25.8% 1 940.2 31.7% -359.3 -5.9%
ANNEXURE W1: EXPLANATORY MEMORANDUM TO THE DIVISION OF REVENUE Table W1.3 Changes over baseline 2020/21 2021/22 R million 24 597 -7 858 -5 352 -8 804 -9 049 -7 056 National departments Provinces Local government Allocated expenditure 11 387 -24 910 Source: National Treasury Table W1.4 sets out schedule 1 of the Division of Revenue Bill, which reflects the legal division of revenue between national, provincial and local government. In this division, the national share includes all conditional grants to provinces and local government in line with section 214(1) of the Constitution, and the allocations for each sphere reflect equitable shares only. Table W1.4 Schedule 1 of the Division of Revenue Bill 1. National share includes conditional grants to provinces and local government, general fuel levy sharing with metropolitan municipalities, debt-service costs, the contingency reserve and provisional allocations Source: National Treasury The 2020 Budget Review sets out in detail how constitutional considerations and government’s priorities are taken into account in the division of revenue. It describes economic and fiscal policy considerations, revenue issues, debt and financing considerations, and expenditure plans. Chapter 6 focuses on provincial and local government financing. Part 3: Response to the FFC’s recommendations Section 9 of the Intergovernmental Fiscal Relations Act requires the FFC to make recommendations regarding: a) “An equitable division of revenue raised nationally, among the national, provincial and local spheres of government; b) the determination of each province’s equitable share in the provincial share of that revenue; and c) any other allocations to provinces, local government or municipalities from the national government’s share of that revenue, and any conditions on which those allocations should be made.” The act requires that the FFC table these recommendations at least 10 months before the start of each financial year. The FFC tabled its Submission for the Division of Revenue 2020/21 to Parliament in May 2019. This year’s theme is “reprioritising local government finances”. The 2020/21 recommendations cover the following areas: local government financing framework, municipal government capacity building, local government sustainability, infrastructure management and efficiency, investment and developmental challenges in the local government sector. Section 214 of the Constitution requires that the FFC’s recommendations be considered before tabling the division of revenue. Section 10 of the Intergovernmental Fiscal Relations Act requires that the Minister of Finance table a Division of Revenue Bill with the annual budget in the National Assembly. The bill must be accompanied by an explanatory memorandum setting out how government has taken into account the FFC’s 7 2020/21 R millionAllocation 2021/222022/23 Forward estimates National11 152 840 Provincial538 472 Local74 683 1 195 6171 245 459 573 990607 554 81 06287 213 Total1 765 994 1 850 6681 940 225
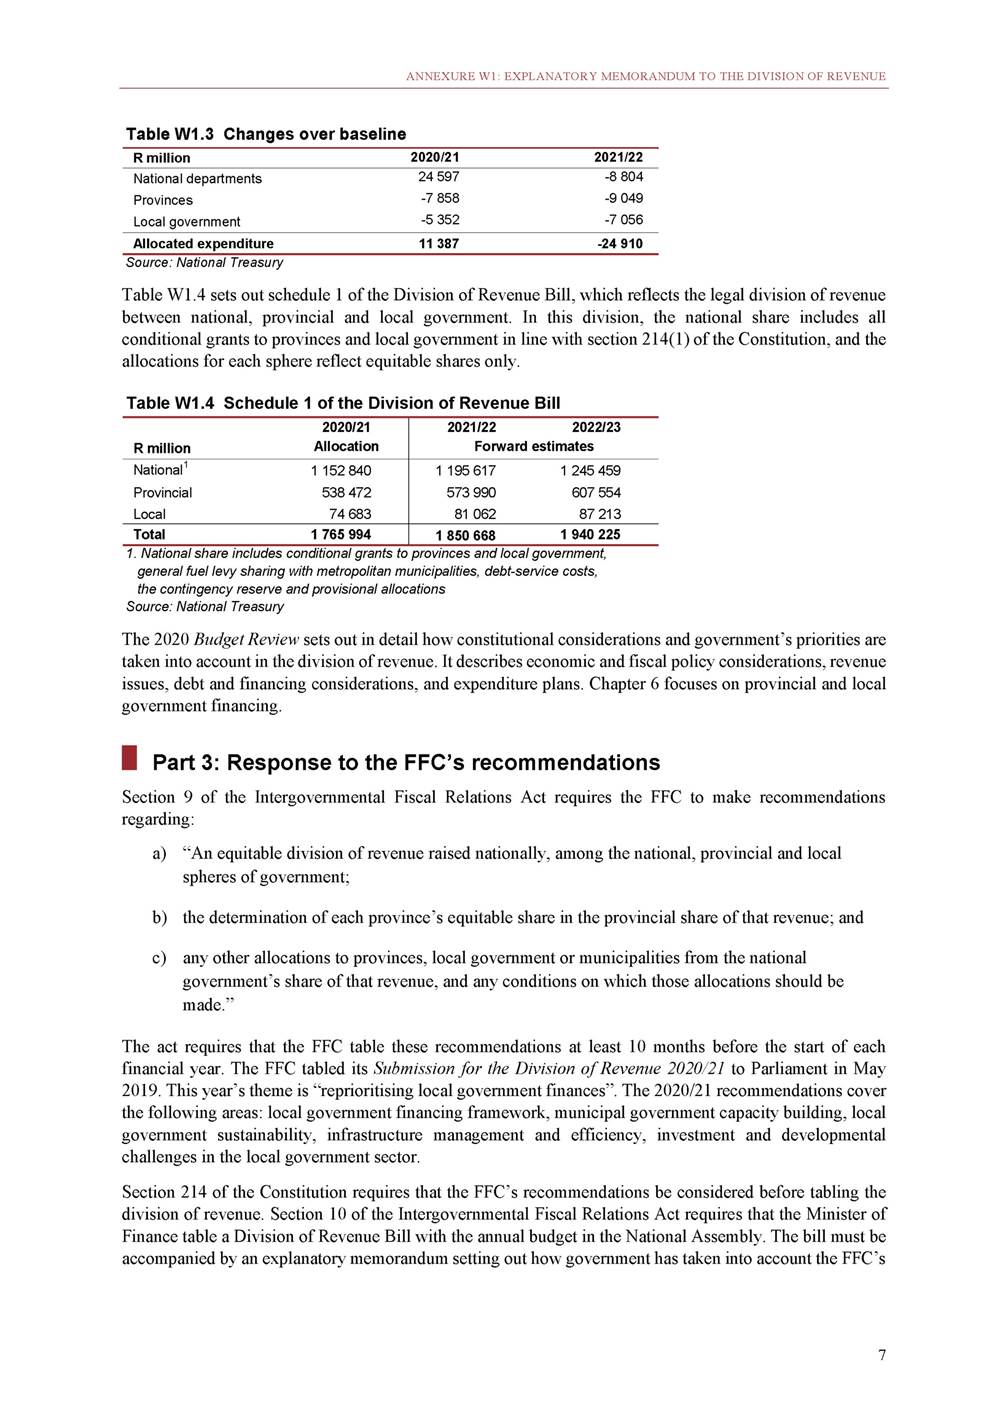
2020 BUDGET REVIEW recommendations when determining the division of revenue. This part of the explanatory memorandum complies with this requirement. The FFC’s recommendations can be divided into three categories: Recommendations that apply directly to the division of revenue Recommendations that indirectly apply to issues related to the division of revenue Recommendations that do not relate to the division of revenue. Government’s responses to the first and second categories are provided below. Recommendations that do not relate to the division of revenue have been referred to the officials to whom they were addressed – the Minister of Cooperative Governance and Traditional Affairs and the President of SALGA – and they will respond directly to the FFC. All the FFC recommendations can be accessed at www.ffc.co.za. Recommendations that apply directly and indirectly to the division of revenue Chapter 2: Reviewing the Local Government Fiscal Framework Supplementary revenue sources for local government The FFC recommends the following: “The Minister of Finance should take steps (including piloting) to add the following supplementary revenue sources to the list of allowable taxes for different types of municipalities in a differentiated manner that could include the development charges, tourism levies, land value capture mechanisms, tourism levies and fire levies. Fire service levies in particular should be considered for the municipalities that are to be authorised for this function. The greater potential for expansion of own revenue sources in urban areas should be compensated for by changes to the division of revenue to increase transfers to rural areas.” Government response Government supports this recommendation. Additional revenue sources to municipalities should be fully explored. Government has prioritised various reforms to supplement the revenue sources of municipalities. These include: Amending the Municipal Fiscal Powers and Functions Act (2007) to ensure development charges are uniformly regulated. Government acknowledges that, despite their potential scope to generate substantial revenue and support the provision of infrastructure to unlock growth, development charges have not been fully explored due to lack of clarity on how they should be levied. The legislative amendments contained in the draft Municipal Fiscal Powers and Functions Amendment Bill, published for comment in January 2020, address this challenge. Updating the municipal borrowing policy framework to clarify the funding instruments that municipalities are allowed to use to leverage their borrowing. These include, among others, land value capture mechanisms, tax increment financing, project finance and the use of public-private partnerships. Furthermore, the Municipal Fiscal Powers and Functions Act already allows municipalities to apply to the Minister of Finance to levy additional taxes such as the tourism levies and fire levies recommended by the FFC. The act also allows the Minister of Finance to introduce new municipal taxes on his own initiative. Applications from municipalities to implement new revenue sources provide a good mechanism for piloting new revenue sources like these as it ensures that the pilot municipalities are ready and willing to implement the new taxes. To be considered by the Minister of Finance, an application to introduce additional taxes must include the following: What the revenue from the proposed new municipal tax will be used for. 8
ANNEXURE W1: EXPLANATORY MEMORANDUM TO THE DIVISION OF REVENUE Its compliance with section 229(2)(a) of the Constitution, which requires that municipal taxes not prejudice national economic policy. The tax base, the desired tax rate, people liable for the tax and tax relief measures. The tax collecting authority. Particulars of any consultations conducted, including consultations with, where applicable, a provincial government, organised local government and municipalities, and the outcomes of the consultations. Government also agrees that future increases in own revenue collection in urban areas will create scope for government to reduce transfers to these municipalities and use those funds to increase transfers to rural municipalities that have less potential to increase their own revenues. This stance is reflected in the way reductions to transfers have been implemented in the 2020 MTEF, with larger reductions made to urban grants. Land value capture The FFC recommends that, “The Minister of Finance should proactively inform municipalities on various land value capture mechanisms that municipalities can take advantage of in order to supplement their current own revenue sources.” Government response Government views land value capture mechanisms as strategic funding tools for local government. These mechanisms should be used to augment municipal revenues to fund investment in infrastructure needed to support development. The National Treasury has called on municipalities to use all available options to increase their own revenues for several years in the Budget Review and the MTBPS. Municipalities, including the City of Johannesburg and the City of Cape Town, are already implementing land value capture mechanisms such as tax incremental financing and development rights. Government agrees that further information can enable more municipalities to take advantage of these mechanisms. It continues to research and analyse various land value capture mechanisms to better advise municipalities on their implementation. Chapter 3: Municipal Government Capacity Building Municipal functionality The FFC recommends that, “The Minister of COGTA, the Minister of Finance and the President of SALGA jointly lead the development of a government-wide accepted definition of ‘municipal functionality’. The definition should be based on the six factors put forward by the Commission: maintenance and performance of systems, processes and practices in governance, service delivery, financial management, leadership, political management, and human resources. Further, they should ensure that the accepted indices for measuring dysfunctionality should be explicit. Indicators of dysfunctionality should be chosen carefully and should exclude factors that are outside the current control of municipality. This definition can be used across government, including in targeting capacity support grants and further differentiating conditional grants.” Government response Government supports the proposal of a collaborative process to better understand and define municipal functionality. The Minister of Finance has proposed that a special local government Budget Forum lekgotla be held in May or June 2020 to discuss issues affecting the structure of the local government fiscal framework. The proposed agenda for this lekgotla includes a discussion on municipal functionality, and officials from the Department of Cooperative Governance, SALGA, the National Treasury and the FFC will work together to prepare options on how municipal viability should be understood and measured. 9
2020 BUDGET REVIEW Capacity building The FFC recommends that, “Based on an assessment of the specific needs of a municipality, the Minister of Finance and Minister of COGTA jointly, and in consultation with provincial governments, should prioritise technical support for new systems, innovative business process redesign and change management.” Government response Government agrees with the recommendation. When new systems, innovative business process redesign and change management are introduced, technical support to local government is necessary. The new municipal Standard Chart of Accounts (mSCOA) is an example of prioritising technical support in implementing new systems. mSCOA significantly changed municipal financial management as it introduced a standard chart of accounts for the first time. This required changes to the way municipalities recorded transactions, so that transactions would be comparable across all municipalities. To facilitate this change, government provided mSCOA training and training manuals, guidelines and an interactive multimedia learning webpage, which is on the National Treasury Municipal Financial Management Act website (mfma.treasury.gov.za). Government also invests more than R3 billion each year in capacity building and support to local government. In 2019/20, a review of the capacity building and support system of local government was announced. This review will identify overlaps, gaps and duplications and propose systematic measures to rectify them. The main work of the review is expected to be concluded during 2020. Minimum competency The FFC recommends that, “The Minister of Finance should conduct regular assessments of the minimum competency regulations to determine their impact and whether there are tangible improvements as a result of complying.” Government response Government agrees on the need to review the impact of its programmes and policies. Reviews should take place after an initiative has had sufficient time to have a measurable impact. The Municipal Regulations on Minimum Competency Levels were amended by the Minister of Finance, acting with the agreement of the Minister of Cooperative Governance and Traditional Affairs (COGTA), through a gazette published on 26 October 2018. As such, it is too soon to review the impact of the minimum competency regulations. Their impact will be reviewed in due course. Chapter 4: Local Government Infrastructure Management and Efficiency Local government infrastructure management and efficiency The FFC recommends that, “The Minister of COGTA and the Minister of Finance jointly should, as part of the ongoing local government infrastructure grant reforms, strengthen the linkage between technical project planning processes and budgeting and foster smooth intergovernmental infrastructure coordination, including the following: (i) Time-bound plans for consolidating all municipal infrastructure grants into the respective existing sector-specific grants and thereby provide the key sector department with the authority to carry out their infrastructure support mandate; (ii) Clarification of roles and responsibilities especially in the delivery of water and electricity services between local municipalities and district municipalities on the one hand, and public entities, including the water authorities and Eskom respectively. With respect to specific local geographic areas, these roles and responsibilities must receive further expression in a Memorandum of Understanding. This will enable more direct targeting of funding for services in the Division of Revenue Act.” 10
ANNEXURE W1: EXPLANATORY MEMORANDUM TO THE DIVISION OF REVENUE Government response Government acknowledges the need to consolidate municipal infrastructure grants and to strengthen the linkages between the technical project planning process and the budgeting. The review of local government infrastructure grants has identified consolidation and rationalisation in the number of grants received by each municipality as a key area for reforming the grant system. A number of reforms have been made to the infrastructure grant system in this regard. As early as 2015, two separate public transport grants to cities – one for capital and one for operational expenditures – were merged into a consolidated public transport network grant. This began the process of reducing duplication in the grant system. It also enhanced the link between capital investment and the sustainability of ongoing operational costs. This was followed by the rationalisation of four overlapping water and sanitation grants into two grants, each with direct and indirect components. The regional bulk infrastructure grant remains a stand-alone grant to fund large bulk-water and sanitation projects. The municipal water infrastructure grant, the water services operating subsidy grant and the rural households infrastructure grant were merged into one grant – the water services infrastructure grant – to fund construction and refurbishment of reticulation schemes and on-site services in rural municipalities. This responded to the concerns over duplication and fragmentation in water and sanitation grants. Most recently, the electrification funds for metropolitan municipalities from the Integrated National Electrification Programme (municipal) grant were shifted into the urban settlements development grant. This responds to several challenges noted by the Department of Mineral Resources and Energy with the grant, including problems in coordinating the timing of projects with the provision of other services and will help reduce the reporting burden for cities. As the various grants in the system serve different purposes, the consolidation and rationalisation process requires extensive consultation before grants can be merged. Grant consolidation must not adversely affect projects already being implemented through one of the affected grants (for example, as a result of changed conditions in the merged grant). It is therefore not appropriate to set definitive timelines on when grants will be consolidated, but government is committed to achieving the vision of a differentiated grant system that recognises the varying contexts faced by different types of municipalities while reducing the number of separate grants each municipality receives. Government also agrees that sector departments must carry out their infrastructure support and oversight mandates, whether this is for a sector-specific grant or as part of a consolidated grant that more holistically funds municipal infrastructure investment plans. The Division of Revenue Act (2019) includes new requirements that sector departments must be consulted on their responsibilities with respect to consolidated conditional grants before the draft frameworks are submitted to the National Treasury. This new requirement, which came into effect in preparing the 2020/21 conditional grant frameworks, should strengthen coordination between national departments. Government agrees that greater clarity on roles and responsibilities in the delivery of water and electricity is needed. Sections 29(2) and (3) of the Division of Revenue Act make provision for district and local municipalities to agree on their respective roles and responsibilities in providing services. Section 29(2) requires that district municipalities providing a service must, before implementing any capital project for water, electricity, roads or other municipal service, consult the local municipalities within whose area of jurisdiction the project will be implemented. Section 29(3) requires that district municipalities ensure they do not duplicate any function provided by a local municipality and must transfer funds for the provision of services to the relevant local municipality providing the service. Section 29(5) requires that district and local municipalities must agree to a payment schedule for funds that must be transferred from the district municipality to the local municipality for functions they perform on behalf of the district municipality. However, the Division of Revenue Act can only allocate transfers to the municipality formally assigned the responsibility for a function. The conclusion of an agreement between the district and local municipalities allows for smoother transfers between them, but would not allow national government to transfer funds directly to a municipality that is not assigned the relevant function. The Department of Mineral Resources and Energy is developing an electrification master plan, which will provide guidance on which areas should be electrified by Eskom and which by municipalities. However, the 11
2020 BUDGET REVIEW final decision on whether electricity distribution licences are granted to municipalities or Eskom is determined by the National Energy Regulator of South Africa. Infrastructure inspectorate The FFC recommends that, “The Minister of COGTA should establish an infrastructure inspectorate through the Municipal Infrastructure Support Agency (MISA) to assess management performance processes and capacity within municipalities to implement grant-funded and non-grant-funded infrastructure projects on a continuous basis.” The FFC also recommends that, “The MISA inspectorate should undertake infrastructure delivery management capability assessments, quality inspections of new and existing built infrastructure, project management and delivery audits and advise on alternative approaches, materials or technologies for infrastructure delivery through the development of infrastructure blueprints for various types of municipal facilities.” Finally, the FFC recommends that, “The Minister of COGTA should align inspectorate assessments to the Division of Revenue Bill conditions for allocation, reporting and the disbursement of grants. This must be in line with the recently established Budget Facility for Infrastructure Programme criteria for appraising and budgeting for infrastructure projects.” Government response Government acknowledges the need for improved oversight of the implementation of municipal infrastructure projects. The infrastructure inspectorate proposed by the FFC would require significant institutional capacity to implement successfully. As a result, the decision of whether an inspectorate is the best mechanism through which to improve oversight, and whether this capacity should be located in MISA or another institution, needs to be considered carefully. The National Treasury has recommended to MISA that it ask the Department of Planning, Monitoring and Evaluation to conduct a formal review of MISA’s operational efficiency. This independent assessment will identify which activities are improving municipal infrastructure delivery and which are not. This will help us to identify where there is scope to reprioritise resources within MISA to fund new activities such as the work of the proposed inspectorate. Developments in late 2019 are likely to affect MISA’s ability to implement significant new programmes in the short term. However, this recommendation will be considered further within government during 2020. In the meantime, government will continue to implement measures to review and strengthen municipal capacity building and to improve coordination and project management capacity, as described in the responses to other recommendations. Shared project management capacity in district municipalities The FFC recommends that, “The Minister of Finance, jointly with the Minister of COGTA, MECs for Finance and other provincial government departments, should within a district municipality area pull together the various project management resources present from GTAC, MISA, MIG administration and the respective municipal PMUs, to create a shared project management facility to improve the oversight capacity in respect of projects and to protect the financial interest of local government against contractor misconduct.” Government response Government agrees on the importance of improving the coordination of infrastructure delivery. President Ramaphosa launched pilots of the district development model in O.R. Tambo District Municipality, eThekwini Metropolitan Municipality and Waterberg District Municipality. The model aims to develop and implement One Plan for each district or metropolitan area that coordinates the efforts of different stakeholders within the respective municipality. This includes better coordination of project management capacity, as recommended by the FFC. 12
ANNEXURE W1: EXPLANATORY MEMORANDUM TO THE DIVISION OF REVENUE To complement efforts to improve project implementation, government is also investing in improved capacity to prepare projects. Sound project preparation will make implementation much smoother. Additional support and funding for project preparation is being made available through a new facility at the Development Bank of Southern Africa, established in support of the Infrastructure Fund. Government has also introduced dedicated grant funding for project preparation in metropolitan municipalities (this may be extended to other municipalities in future). From 2020/21, metropolitan municipalities will be funded for infrastructure project and programme preparation costs through the integrated city development grant, on condition that they meet certain requirements with respect to their project and programme preparation and authorisation processes and that they contribute funds from their own resources. Part 4: Provincial allocations Provincial government receives two forms of allocations from nationally raised revenue, the equitable share and conditional grants. Sections 214 and 227 of the Constitution require that an equitable share of nationally raised revenue be allocated to provincial government to provide basic services and perform its allocated functions. The equitable share is an unconditional transfer to provinces and constitutes their main source of revenue. Due to their limited revenue-raising abilities, provinces receive 43 per cent of nationally raised revenue. In addition, they receive conditional grants to help them fulfil their mandates. Transfers to provinces account for over 90 per cent of provincial revenue. This section outlines national transfers to provinces for the 2020 MTEF period, including the fiscal consolidation measures announced in the 2019 MTBPS, as well as other changes that were effected after it was tabled, both to the equitable share and conditional grants. Having taken the revisions to the provincial fiscal framework into account, national transfers to provinces increase from R612.2 billion in 2019/20 to R649.3 billion in 2020/21. Over the MTEF period, provincial transfers will grow at an average annual rate of 6 per cent to R730.7 billion in 2022/23. Table W1.5 sets out the transfers to provinces for 2020/21. A total of R538.5 billion is allocated to the provincial equitable share and R110.8 billion to conditional grants. Table W1.5 Total transfers to provinces, 2020/21 Source: National Treasury The provincial fiscal framework takes account of the different pressures facing each province and allocates larger per capita allocations to poorer provinces, and provinces with smaller populations. 13 EquitableConditional R millionsharegrants Total transfers Eastern Cape71 41512 488 Free State30 0178 239 Gauteng112 11823 935 KwaZulu-Natal111 44222 011 Limpopo62 3299 890 Mpumalanga44 1058 312 Northern Cape14 2904 542 North West37 5487 743 Western Cape55 20813 191 Unallocated–433 83 903 38 256 136 053 133 453 72 219 52 417 18 832 45 291 68 398 433 Total538 472110 785 649 256
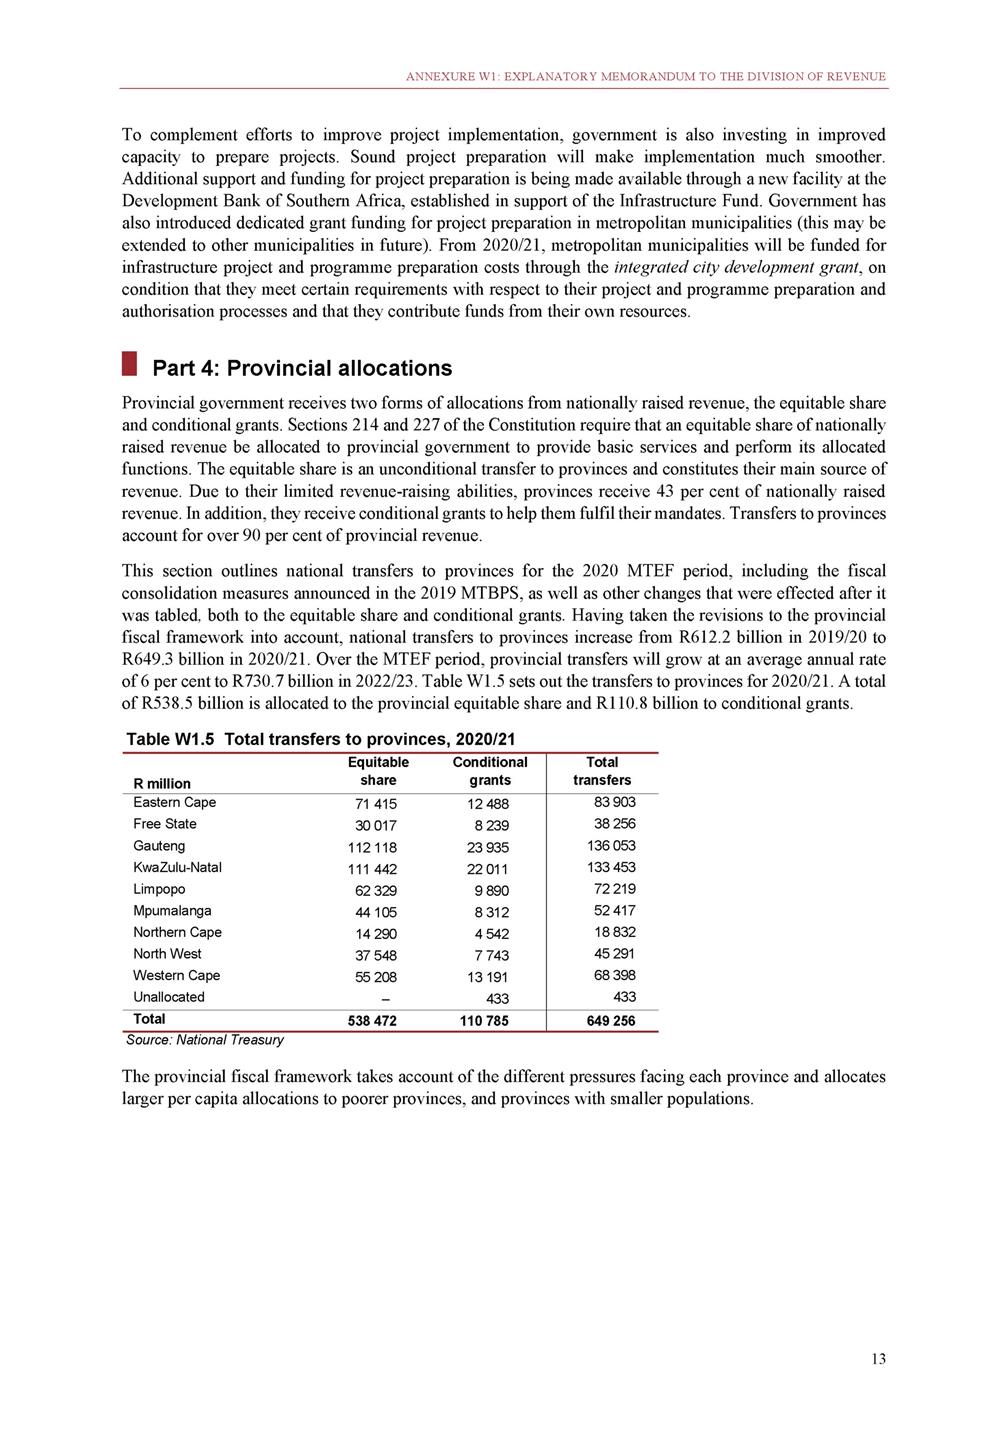
2020 BUDGET REVIEW Figure W1.1 Per capita allocations to provinces, 2020/21 8 4 Source: National Treasury Changes to provincial allocations For the 2020 MTEF, revisions to the provincial fiscal framework reflect a combination of fiscal consolidation reductions and reprioritisations in order to respond to the fiscal pressures faced by government while ensuring that provinces are able to deliver on their mandates. Table W1.6 provides a summary of the changes to the provincial fiscal framework. The proposed changes to the wage bill discussed in Chapter 3 of the Budget Review are not yet reflected in the allocations to provinces in this annexure. Once effected, they will result in reductions to the provincial equitable share in the 2020/21 adjustment budget. These reductions will compensation spending by provinces as a result of the revised wage agreement. be fully offset by lower 14 R thousands Eastern Cape Free State Gauteng KwaZulu-Nat al Limpopo Mpumalanga Nor ther n Cape Nor th West Western Cape Aver age equitable share per capita Aver age cond ition al grant per capita 14 12 10 6 2 0 3.6 2.9 1.9 1.9 1.7 1.8 11.3 1.9 10.6 10.4 9.9 10.4 9.6 1.9 9.3 1.6 8.1 7.4
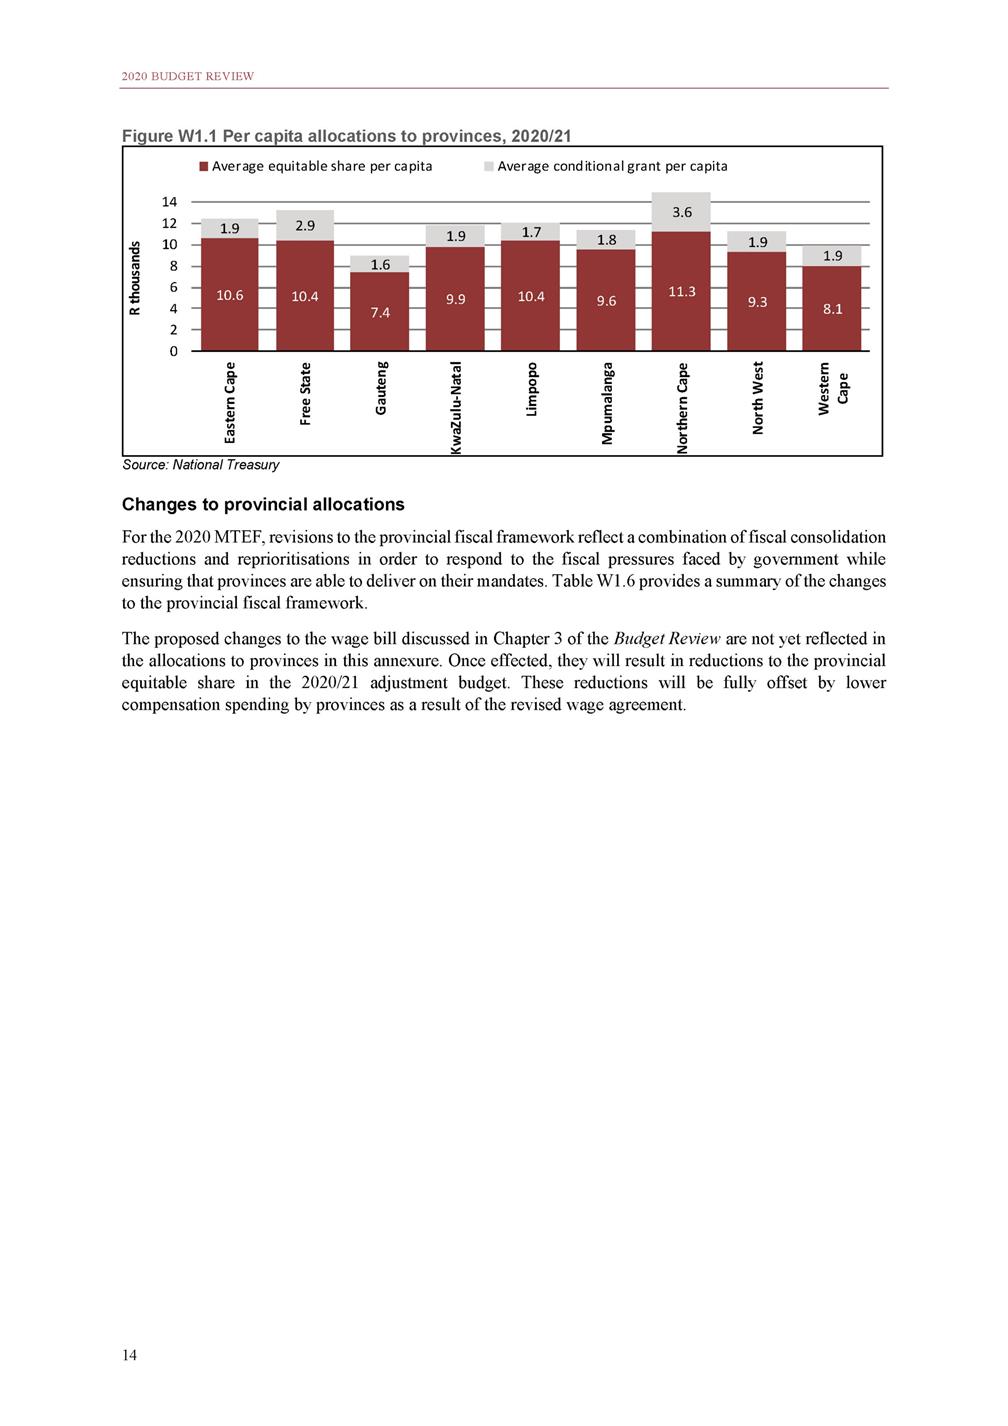
ANNEXURE W1: EXPLANATORY MEMORANDUM TO THE DIVISION OF REVENUE Table W1.6 Revisions to direct and indirect transfers to provincial government Source: National Treasury 15 2020/212021/222022/23 R million MTEF total revision Technical adjustments-2 503-2 669– Direct transfers-1 930-1 997666 Provincial equitable share: 121 145 123 grant reprioritisations Provincial equitable share: -2 503 -2 669 – CPI inflation adjustment Ilima/Letsema projects -36 – – Health facility revitalisation grant 199 6 – HIV, TB, malaria and community outreach 223 456 475 Human papillomavirus vaccine -223 -235 -244 National health insurance grant: health 289 300 311 professionals Human settlements development3 015– – Informal settlements upgrading partnership-3 015 –– Indirect transfers -573-672-666 Ilima/Letsema indirect 36 – – National health insurance indirect -609 -672 -666 -5 172 -3 261 390 -5 172 -36 205 1 154 -702 900 3 015 -3 015 -1 911 36 -1 947 Additions to baselines656794944 Direct transfers656794944 Provinicial equitable share293320362 Early childhood development362473582 2 393 2 393 976 1 418 Reductions to baselines-6 930-8 025-9 295 Direct transfers-6 584-7 846-9 087 Provinicial equitable share-2 349-2 452-2 524 Comprehensive agricultural support programme-154-194-233 Ilima/Letsema projects-31-39-48 Land care programme: poverty relief and-4-5-7 infrastructure development Community library services-105-95-83 Education infrastructure-459-616-775 HIV and AIDS (life skills education)-24-27-34 Maths, science and technology-12-13-14 National school nutrition programme-30-40-53 HIV, TB, malaria and community outreach-244-278-291 Health facility revitalisation-191-206-216 Statutory human resources, training and development-11-67-70 National tertiary services–-148-156 Human settlements development-2 331-1 984-2 402 Informal settlements upgrading partnership–-432-453 Expanded public works programme integrated-42-49-51 grants for provinces Social sector expanded public works programme incentive for provinces-41-48-50 Mass participation and sport development-57-69-75 Provinicial roads maintenance-500-1 084-1 258 Public transport operations––-295 Indirect transfers-346-179-208 School infrastructure backlogs-33-44-46 National health insurance indirect-314-135-162 -24 251 -23 517 -7 325 -581 -118 -17 -283 -1 850 -85 -39 -123 -812 -612 -147 -304 -6 717 -885 -142 -139 -201 -2 841 -295 -734 -123 -611 Total change to provincial government allocations Change to direct transfers-7 858-9 049-7 477 Change to indirect transfers-920-851-874 -24 385 -2 644 Net change to provincial government allocations-8 778-9 900-8 351 -27 029
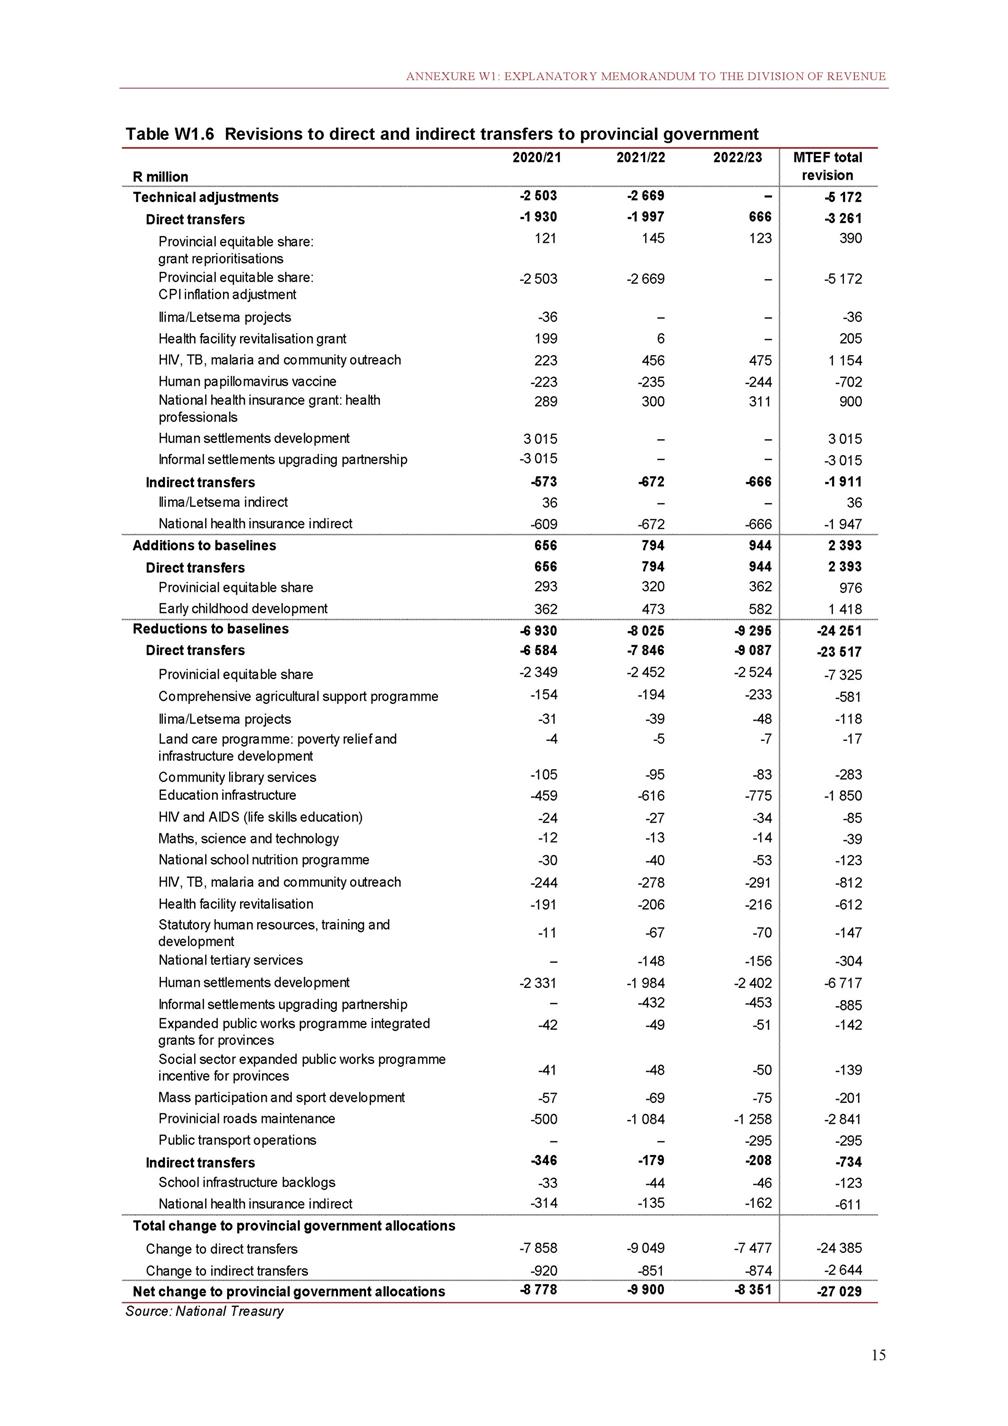
2020 BUDGET REVIEW Transfers to provincial governments are reduced by R27 billion over the 2020 MTEF period, of which direct transfers are reduced by R24.4 billion and indirect transfers are reduced by R2.6 billion. The 2019 MTBPS announced a reduction of R7.3 billion in the provincial equitable share over the MTEF period, which is equivalent to 2 per cent of non-compensation expenditure funded by the equitable share. More recently, the effect of lower estimates of consumer price index inflation on projected compensation spending have allowed a further reduction of R2.5 billion in 2020/21 and R2.7 billion in 2021/22 from the provincial equitable share. For the 2020 MTEF period, there are several increases to the provincial equitable share as a result of reprioritisations. To continue rolling out the Sanitary Dignity Programme, which was introduced in the 2019 MTEF period, R652 million has been added. A total of R398 million has been reprioritised from national government to provinces to continue to employ social workers in areas with high levels of gender-based violence, substance abuse and social problems affecting children, and an additional R315 million has been reprioritised to continue supporting non-profit organisations in implementing social behaviour change programmes to address social and structural drivers of HIV, TB and sexually transmitted infections. Further details of these allocations are contained in the provincial equitable share section, under the description of allocations made outside the formula. Where funds have been reprioritised from provincial conditional grants, these changes are reflected as technical adjustments in Table W1.6, while funds reprioritised from allocations to other spheres are shown as additions to the provincial fiscal framework. Several technical adjustments to conditional grants are shown in Table W1.6. In the 2019/20 adjustment budget, an indirect Ilima/Letsema grant was created to fund the National Food and Nutrition Survey, conducted by the Human Sciences Research Council, which will benefit provinces and national government. This survey will establish a baseline for poverty and food security that can be used to improve the targeting of poverty-relief programmes. This indirect grant will continue in 2020/21 and R36 million has been shifted from the direct Ilima/Letsema projects grant to the newly created indirect component to complete the survey. The 2019/20 adjustment budget announced that the contracting of health professionals to implement national health insurance would shift from being funded through the national health insurance indirect grant to being funded through the direct national health insurance grant. This shift continues over the 2020 MTEF period, and R900 million is allocated to this grant over the three years. Funds for the completion of a project in Limpopo have been shifted from the national health insurance indirect grant to the direct health facility revitalisation grant. The introduction of a separate informal settlements upgrading partnership grant has been delayed until 2021/22, so the indicative baseline for this grant in 2020/21 has been shifted back to the human settlements development grant. Over the 2020 MTEF period, R1.4 billion has been added to the early childhood development grant to increase the subsidy paid for children receiving early childhood development services and to provide for additional children to access these services. Several reprioritisations and technical changes to conditional grants that were announced in the 2019 MTBPS will be implemented over the 2020 MTEF period. These include a reprioritisation of R255 million over the MTEF period from the comprehensive agricultural support grant to the Department of Agriculture, Land Reform and Rural Development to support animal and plant health to sustain exports. The funds will be used to improve laboratory capacity, border control and inspections by the national department. Funds are also reprioritised out of the human settlements development grant to support efforts to address pollution in the Vaal River system. Reductions to provincial conditional grants, made as part of the fiscal consolidation announced in the 2019 MTBPS, were determined taking account of the factors described in Part 2 of this annexure. The details are discussed under individual grants. The provincial roads maintenance grant has been reduced by R500 million in 2020/21 and this amount has been set aside as a provisional allocation to fund disaster recovery projects. Including all of the additions, reductions and technical changes, the provincial equitable share grows at an average annual rate of 6.3 per cent over the MTEF period, while direct conditional grant allocations grow at an average annual rate of 4.7 per cent. 16

ANNEXURE W1: EXPLANATORY MEMORANDUM TO THE DIVISION OF REVENUE The provincial equitable share The equitable share is the main source of revenue through which provinces are able to meet their expenditure responsibilities. To ensure that allocations are fair, the equitable share is allocated through a formula using objective data to reflect the demand for services across all nine provinces. For each year of the 2020 MTEF period, the following amounts are allocated to the provincial equitable share respectively: R538.5 billion, R574 billion and R607.6 billion. The equitable share formula The equitable share formula consists of six components that account for the relative demand of services and take into consideration the change of demographics in each of the provinces. The structure of the two largest components, education and health, is based on the demand and the need for education and health services. The other four components enable provinces to perform their other functions, taking into consideration population size of each province, the proportion of poor residents in each province, the level of economic activity and the costs associated with running a provincial administration. For the 2020 MTEF, the formula has been updated with data from Statistics South Africa’s 2019 mid-year population estimates on population and age cohorts and the 2019 preliminary data published by the Department of Basic Education on school enrolment from the Learner Unit Record Information and Tracking System (LURITS) database. Data from the health sector, the 2018 General Household Survey for medical aid coverage and the Risk Equalisation Fund for the risk-adjusted capitation index is also used to update the formula. Allocation changes tend to mirror shifts in population across provinces, which result in changes in the relative demand for public services across these areas. The impact of these data updates on the provincial equitable shares will be phased in over three years (2020/21 – 2022/23). The provincial equitable share formula continues to be reviewed. Further details of this review are discussed in Part 6. Summary of the formula’s structure The formula’s six components, shown in Table W1.7, capture the relative demand for services across provinces and take into account specific provincial circumstances. The components are neither indicative budgets nor guidelines as to how much should be spent on functions. Rather, the education and health components are weighted broadly in line with historical expenditure patterns to indicate relative need. Provincial executive councils determine the departmental allocations for each function, taking into account the priorities that underpin the division of revenue. For the 2020 Budget, the formula components are set out as follows: An education component (48 per cent), based on the size of the school-age population (ages five to 17) and the number of learners (Grades R to 12) enrolled in public ordinary schools. A health component (27 per cent), based on each province’s risk profile and health system caseload. A basic component (16 per cent), derived from each province’s share of the national population. An institutional component (5 per cent), divided equally between the provinces. A poverty component (3 per cent), based on income data. This component reinforces the redistributive bias of the formula. An economic activity component (1 per cent), based on regional gross domestic product (GDP-R, measured by Statistics South Africa). 17
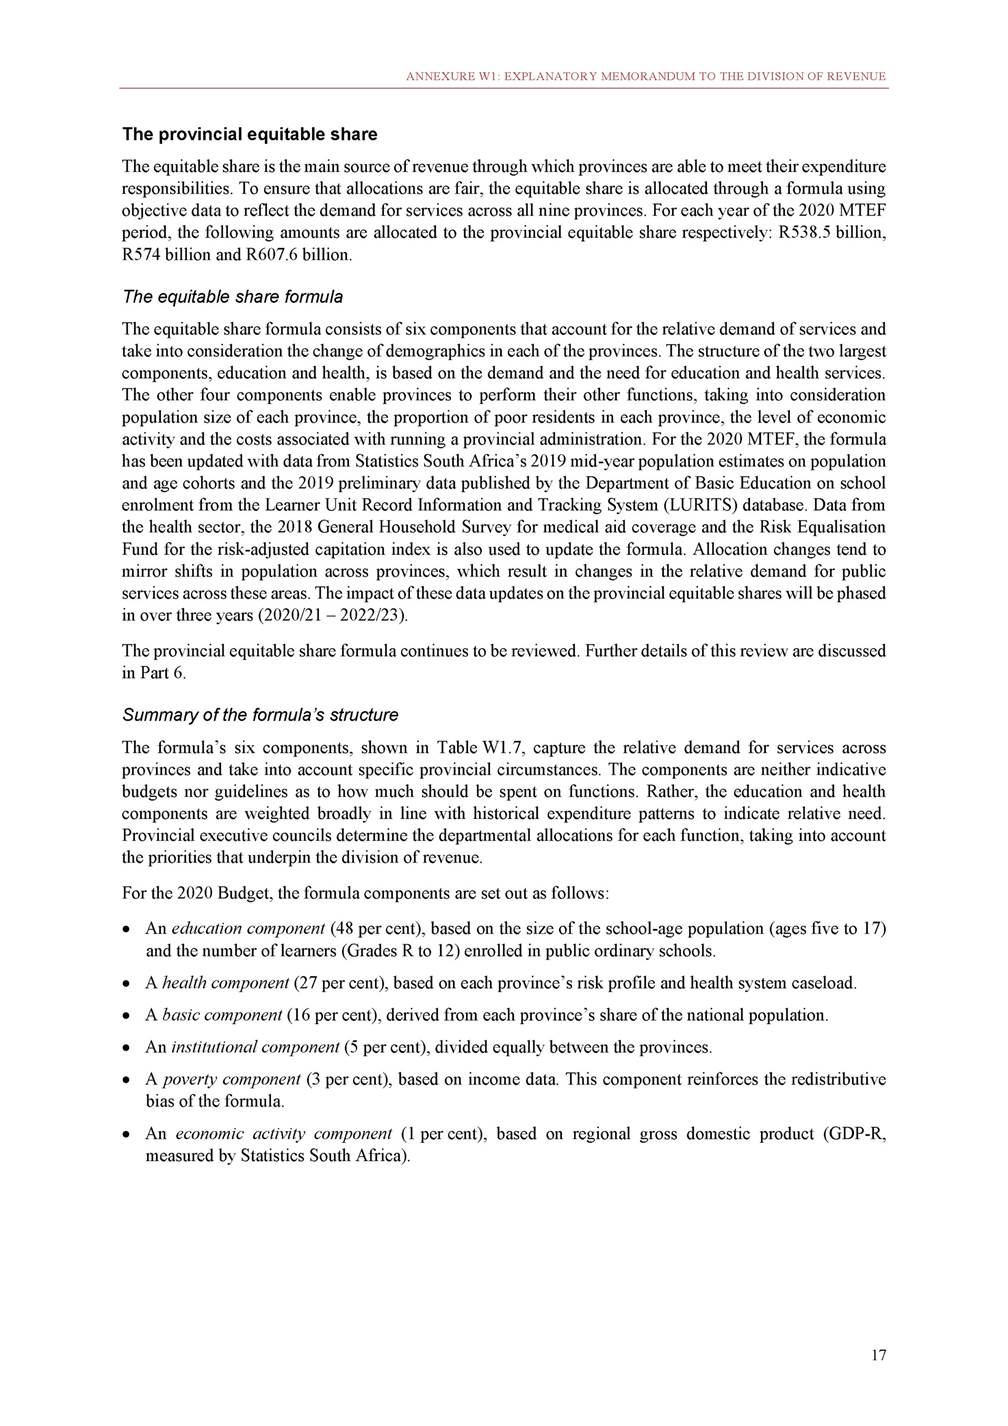
2020 BUDGET REVIEW Table W1.7 Distributing the equitable shares by province, 2020 MTEF Source: National Treasury Education component (48 per cent) The education component has two sub-components, accounting for school-age population (five to 17 years) and enrolment data. Each element is assigned a weight of 50 per cent. In 2018/19, the data source for enrolment numbers was changed as part of the review of the provincial equitable share, from the SNAP survey to the Department of Basic Education’s data collection system, LURITS. The LURITS system allows data to be verified and learners’ progress to be tracked throughout their school careers. It also allows for duplicates and repetitions to be detected, improving the integrity of the numbers that are reported. When the changes were implemented in the 2018 MTEF, the data was phased in over three years, with the 2018 MTEF and the 2019 MTEF enrolment numbers including data from the old SNAP survey. This phased approach is now complete, and from 2020/21 only the LURITS data is used to update learner enrolment numbers. As a result of the review of the formula, the data used for the school-age population sub-component has also changed. From 2019/20, the use of Statistics South Africa’s annual mid-year population estimates for the five-year-old to 17-year-old age cohort is being phased in. This data is updated yearly, unlike the 2011 Census data, which was used to update the school-age population previously. This will help limit the shocks of updating the sub-component after a lag between Census updates. This change is being phased in over three years, ending in 2021/22. In 2020/21, the data used to update the age cohort sub-component takes two thirds of its data from the mid-year population estimates and one third from the 2011 Census. From 2021/22, the data used comes only from the mid-year population estimates. Table W1.8 shows how this phase-in is calculated and the age cohort numbers used in the formula. 18 EducationHealthBasic sharePovertyEconomicInstitu-activity tional 48.0%27.0%16.0%3.0%1.0%5.0% Weighted average 100.0% Eastern Cape 14.0% 12.3% 11.4% 14.9% 7.7% 11.1% Free State 5.3% 5.3% 4.9% 5.1% 5.0% 11.1% Gauteng 19.4% 24.0% 25.8% 18.7% 34.3% 11.1% KwaZulu-Natal 21.6% 20.5% 19.2% 21.8% 16.0% 11.1% Limpopo 12.7% 10.2% 10.2% 13.5% 7.3% 11.1% Mpumalanga 8.4% 7.5% 7.8% 9.3% 7.5% 11.1% Northern Cape 2.3% 2.1% 2.2% 2.2% 2.1% 11.1% North West 6.8% 6.7% 6.9% 8.2% 6.5% 11.1% Western Cape 9.5% 11.4% 11.6% 6.4% 13.6% 11.1% 13.0% 5.5% 21.4% 20.3% 11.5% 8.2% 2.6% 7.0% 10.4% Total100.0%100.0%100.0%100.0%100.0%100.0% 100.0%
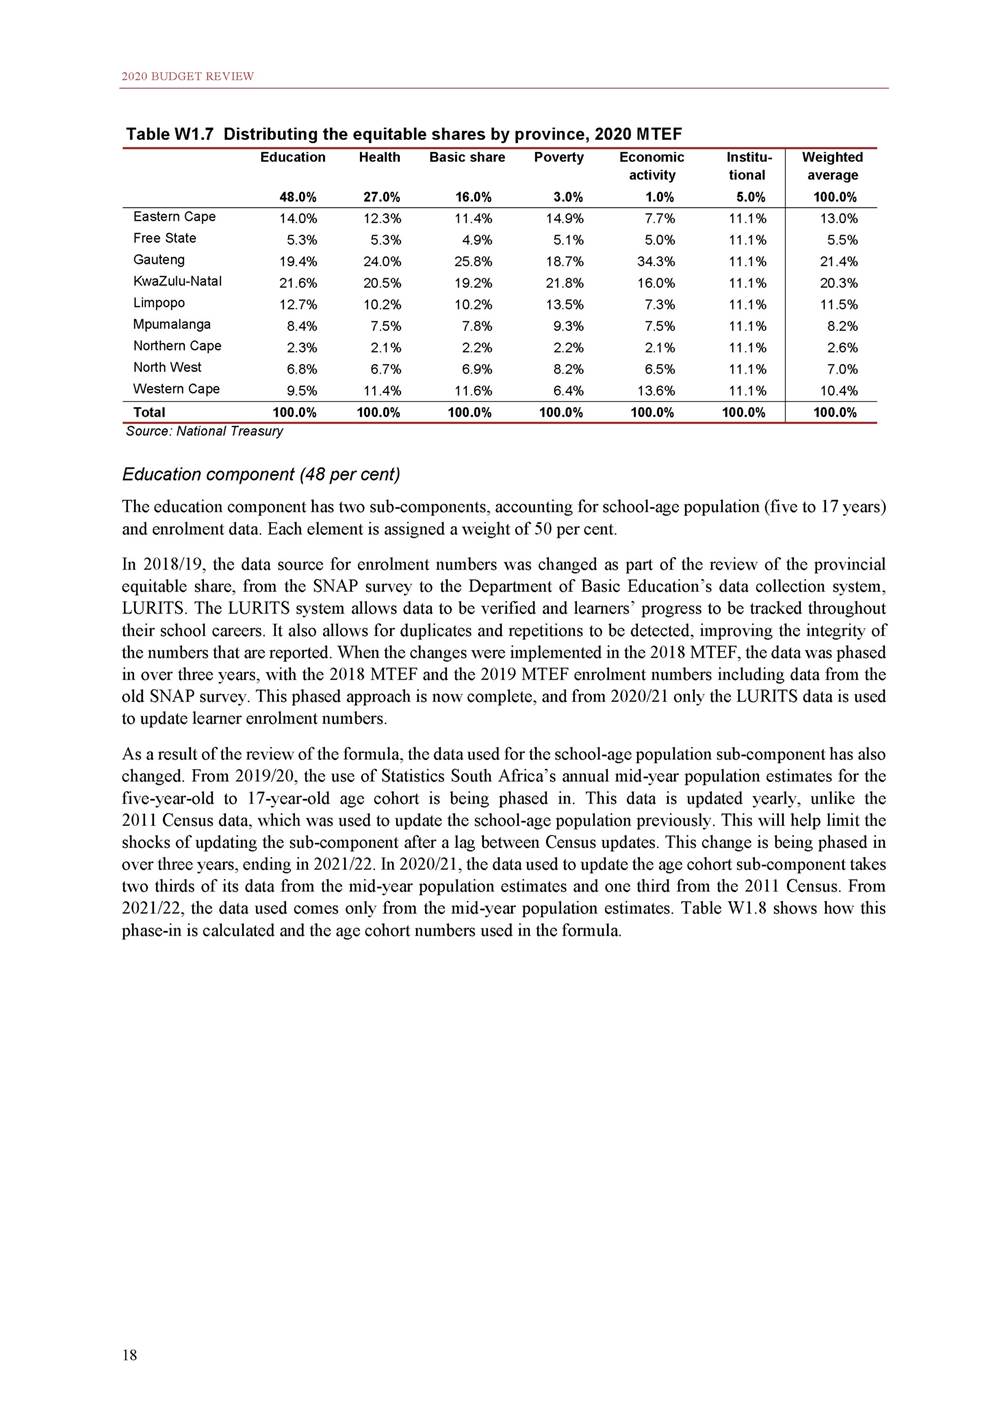
ANNEXURE W1: EXPLANATORY MEMORANDUM TO THE DIVISION OF REVENUE Table W1.8 Age-cohort sub-component, data phase-in, 2020 MTEF Source: National Treasury Table W1.9 shows the combined effect of updating the education component with new enrolment and age cohort data on the education component shares. Table W1.9 Impact of changes in school enrolment on the education component share Source: National Treasury Health component (27 per cent) The health component uses a risk-adjusted capitation index and output data from public hospitals to estimate each province’s share of the health component. These methods work together to balance needs (risk-adjusted capitation) and demands (output component). The health component is presented in three parts below. Table W1.10 shows the shares of the risk-adjusted component, which accounts for 75 per cent of the health component. 19 Age 5-17 Thousand School enrolmentChanges in 20182019enrolment (phased-in)LURITSdata Weighted average 2019 MTEF2020 MTEF Difference in weighted average Eastern Cape1 873 Free State695 Gauteng2 704 KwaZulu-Natal2 869 Limpopo1 608 Mpumalanga1 117 Northern Cape300 North West935 Western Cape1 341 1 8821 841-40 69671418 2 3602 44080 2 8522 841-11 1 7531 753-0 1 0691 09526 2932985 83285221 1 1251 18660 14.5% 5.3% 18.7% 22.0% 12.9% 8.4% 2.3% 6.6% 9.2% 14.0% 5.3% 19.4% 21.6% 12.7% 8.4% 2.3% 6.8% 9.5% -0.48% -0.01% 0.74% -0.46% -0.18% -0.01% -0.02% 0.11% 0.33% Total13 443 12 86213 021159 100.0% 100.0% – 2011 Census Ages 5-17 Thousand Mid-year population estimates (MPYE): Ages 5-17 Blended data used in provincial equitable share formula 2018 2019 Change 2020/21 2021/22 (1/3 Census, (MYPE data 2/3 MYPE) only) Eastern Cape 1 856 Free State 657 Gauteng 2 232 KwaZulu-Natal 2 759 Limpopo 1 536 Mpumalanga 1 054 Northern Cape 289 North West 825 Western Cape 1 175 1 865 1 881 16 725 714 -11 2 913 2 941 28 2 959 2 924 -35 1 626 1 644 18 1 156 1 149 -7 305 305 1 993 990 -2 1 405 1 425 20 1 873 695 2 704 2 869 1 608 1 117 300 935 1 341 1 881 714 2 941 2 924 1 644 1 149 305 990 1 425 Total 12 383 13 945 13 974 28 13 443 13 974
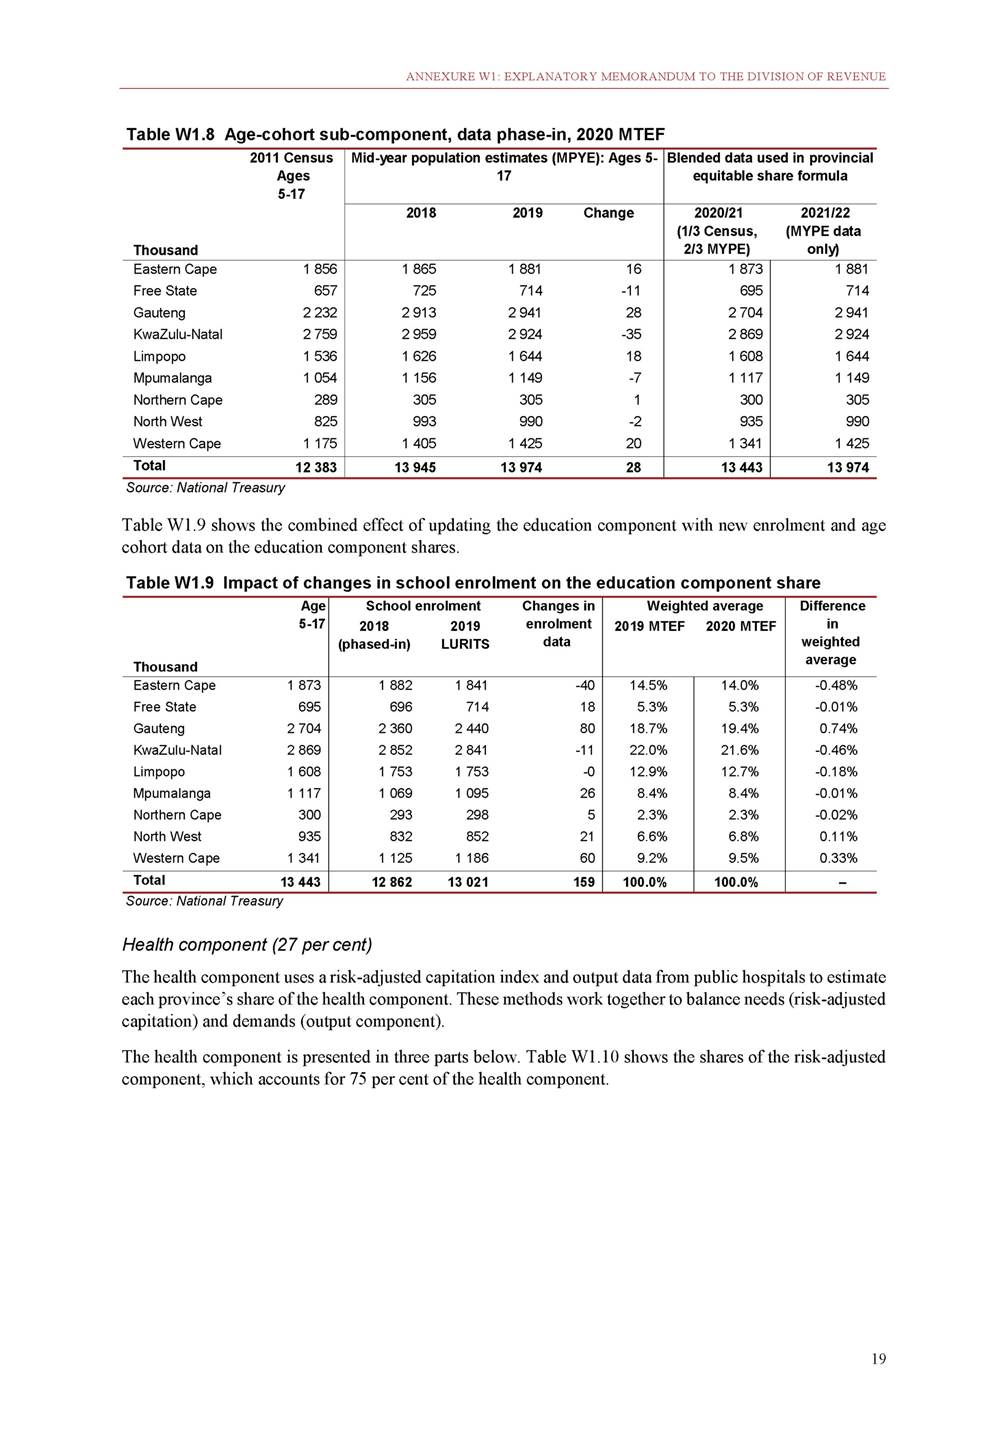
2020 BUDGET REVIEW Table W1.10 Risk-adjusted sub-component shares Source: National Treasury The risk-adjusted sub-component estimates a weighted population in each province using the risk-adjusted capitation index, which is calculated using data from the Council for Medical Schemes’ Risk Equalisation Fund. The percentage of the population with medical insurance, based on the 2018 General Household Survey, is deducted from the 2019 mid-year population estimates to estimate the uninsured population per province. The risk-adjusted index, which is an index of each province’s health risk profile, is applied to the uninsured population to estimate the weighted population. Each province’s share of this weighted population is used to estimate their share of the risk-adjusted sub-component. The column on the right in Table W1.10 shows the change in this sub-component between 2019 and 2020. Table W1.11 Output sub-component shares Source: National Treasury The output sub-component (shown in Table W1.11) uses patient load data from the District Health Information Services. The average number of visits to primary healthcare clinics in 2017/18 and 2018/19 is calculated to estimate each province’s share of this part of the output component, which makes up 5 per cent of the health component. For hospitals, each province’s share of the total patient-day equivalents at public hospitals in 2017/18 and 2018/19 is used to estimate their share of this part of the output sub-component, making up 20 per cent of the health component. In total, the output component is 25 per cent of the health component. Table W1.12 shows the updated health component shares for the 2020 MTEF period. 20 Primary healthcare visits Thousand 2017/18 2018/19 Average Share Hospital workload patient-day equivalents 2017/18 2018/19 Average Share Eastern Cape 16 418 16 606 16 512 13.8% Free State 5 462 5 299 5 381 4.5% Gauteng 21 132 20 905 21 019 17.6% KwaZulu-Natal 28 403 28 525 28 464 23.8% Limpopo 14 858 14 336 14 597 12.2% Mpumalanga 9 160 9 253 9 207 7.7% Northern Cape 2 689 2 719 2 704 2.3% North West 7 455 7 446 7 450 6.2% Western Cape 14 140 14 083 14 111 11.8% 4 328 4 388 4 358 13.5% 1 976 2 126 2 051 6.3% 7 315 7 467 7 391 22.9% 7 055 7 143 7 099 22.0% 3 014 3 010 3 012 9.3% 1 992 1 898 1 945 6.0% 563 573 568 1.8% 1 573 1 610 1 592 4.9% 4 344 4 297 4 321 13.4% Total 119 717 119 173 119 445 100.0% 32 161 32 512 32 336 100.0% Mid-year Insured Risk-Weighted population population adjusted population estimates index Thousand 2019 2018 Risk-adjusted shares 2019 2020 Change Eastern Cape 6 712 10.0% 96.9% 5 851 Free State 2 887 16.2% 103.3% 2 498 Gauteng 15 176 23.9% 105.4% 12 175 KwaZulu-Natal 11 289 12.4% 98.9% 9 781 Limpopo 5 983 8.2% 91.6% 5 033 Mpumalanga 4 592 12.6% 95.7% 3 841 Northern Cape 1 264 16.1% 100.7% 1 068 North West 4 027 13.5% 102.2% 3 561 Western Cape 6 844 25.1% 104.0% 5 333 11.9% 11.9% 5.4% 5.1% 24.2% 24.8% 20.5% 19.9% 10.1% 10.2% 7.8% 7.8% 2.2% 2.2% 7.2% 7.2% 10.8% 10.9% 0.05% -0.32% 0.54% -0.59% 0.10% 0.05% 0.02% 0.09% 0.06% Total 58 775 – – 49 141 100.0% 100.0% –
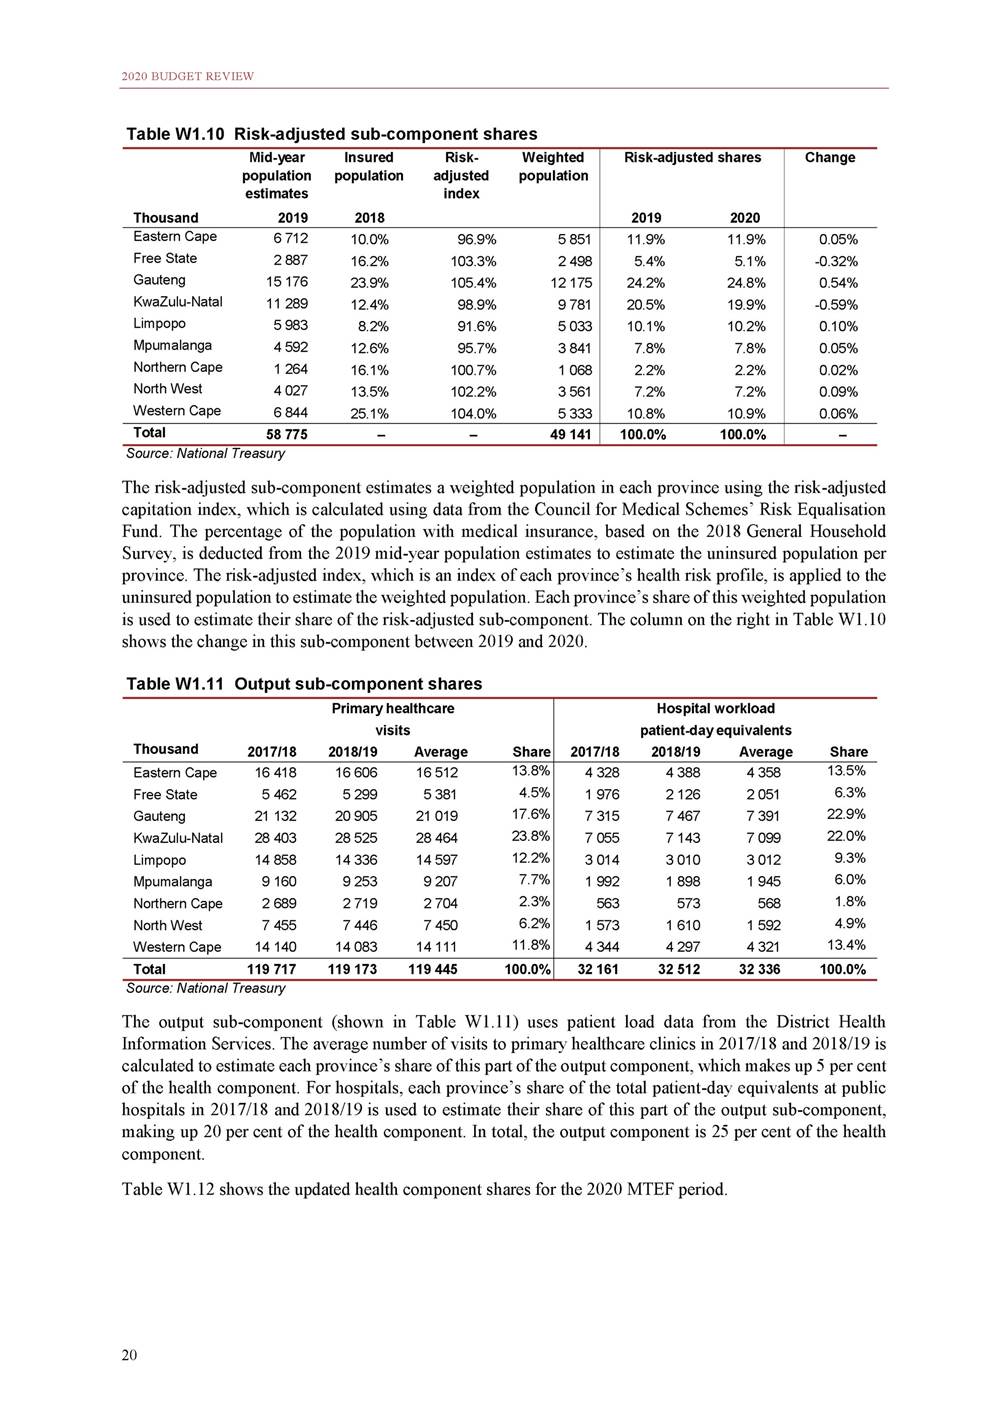
ANNEXURE W1: EXPLANATORY MEMORANDUM TO THE DIVISION OF REVENUE Table W1.12 Health component weighted shares Source: National Treasury Basic component (16 per cent) The basic component derives from each province’s share of the national population. This component constitutes 16 per cent of the total equitable share. For the 2020 MTEF, population data is drawn from the 2019 mid-year population estimates produced by Statistics South Africa. Table W1.13 shows how population changes have affected the basic component’s revised weighted shares. Table W1.13 Impact of the changes in population on the basic component shares Source: National Treasury Institutional component (5 per cent) The institutional component recognises that some costs associated with running a provincial government and providing services are not directly related to the size of a province’s population or factors included in other components. It is therefore distributed equally between provinces, constituting 5 per cent of the total equitable share, of which each province receives 11.1 per cent. This component benefits provinces with smaller populations, especially the Northern Cape, the Free State and the North West, because the allocation per person for these provinces is much higher in this component. Poverty component (3 per cent) The poverty component introduces a redistributive element to the formula and is assigned a weight of 3 per cent. For this component, the poor population is defined as people who fall into the lowest 40 per cent of household incomes in the 2010/11 Income and Expenditure Survey. The estimated size of the poor population in each province is calculated by multiplying the proportion of people in that province who fall 21 Mid-year population estimates Thousand20182019 Population% changepopulation change Basic component shares 2019 MTEF2020 MTEF Change Eastern Cape6 523 Free State2 954 Gauteng14 717 KwaZulu-Natal11 385 Limpopo5 797 Mpumalanga4 524 Northern Cape1 226 North West3 979 Western Cape6 621 6 712 2 887 15 176 11 289 5 983 4 592 1 264 4 027 6 844 1902.9% -67-2.3% 4593.1% -96-0.8% 1853.2% 681.5% 383.1% 481.2% 2233.4% 11.3%11.4% 5.1%4.9% 25.5%25.8% 19.7%19.2% 10.0%10.2% 7.8%7.8% 2.1%2.2% 6.9%6.9% 11.5%11.6% 0.12% -0.21% 0.33% -0.51% 0.14% -0.02% 0.03% -0.04% 0.17% Total57 726 58 775 1 049– 100.0%100.0% – Risk-adjustedPrimaryHospital healthcare compo-nent Weight75.0%5.0%20.0% Weighted shares 20192020 Change Eastern Cape 11.9% 13.8% 13.5% Free State 5.1% 4.5% 6.3% Gauteng 24.8% 17.6% 22.9% KwaZulu-Natal 19.9% 23.8% 22.0% Limpopo 10.2% 12.2% 9.3% Mpumalanga 7.8% 7.7% 6.0% Northern Cape 2.2% 2.3% 1.8% North West 7.2% 6.2% 4.9% Western Cape 10.9% 11.8% 13.4% 12.3%12.3% 5.4%5.3% 23.6%24.0% 21.0%20.5% 10.1%10.2% 7.4%7.5% 2.1%2.1% 6.7%6.7% 11.4%11.4% -0.02% -0.07% 0.47% -0.53% 0.08% 0.00% -0.00% 0.05% 0.02% Total100.0%100.0%100.0% 100.0%100.0% –
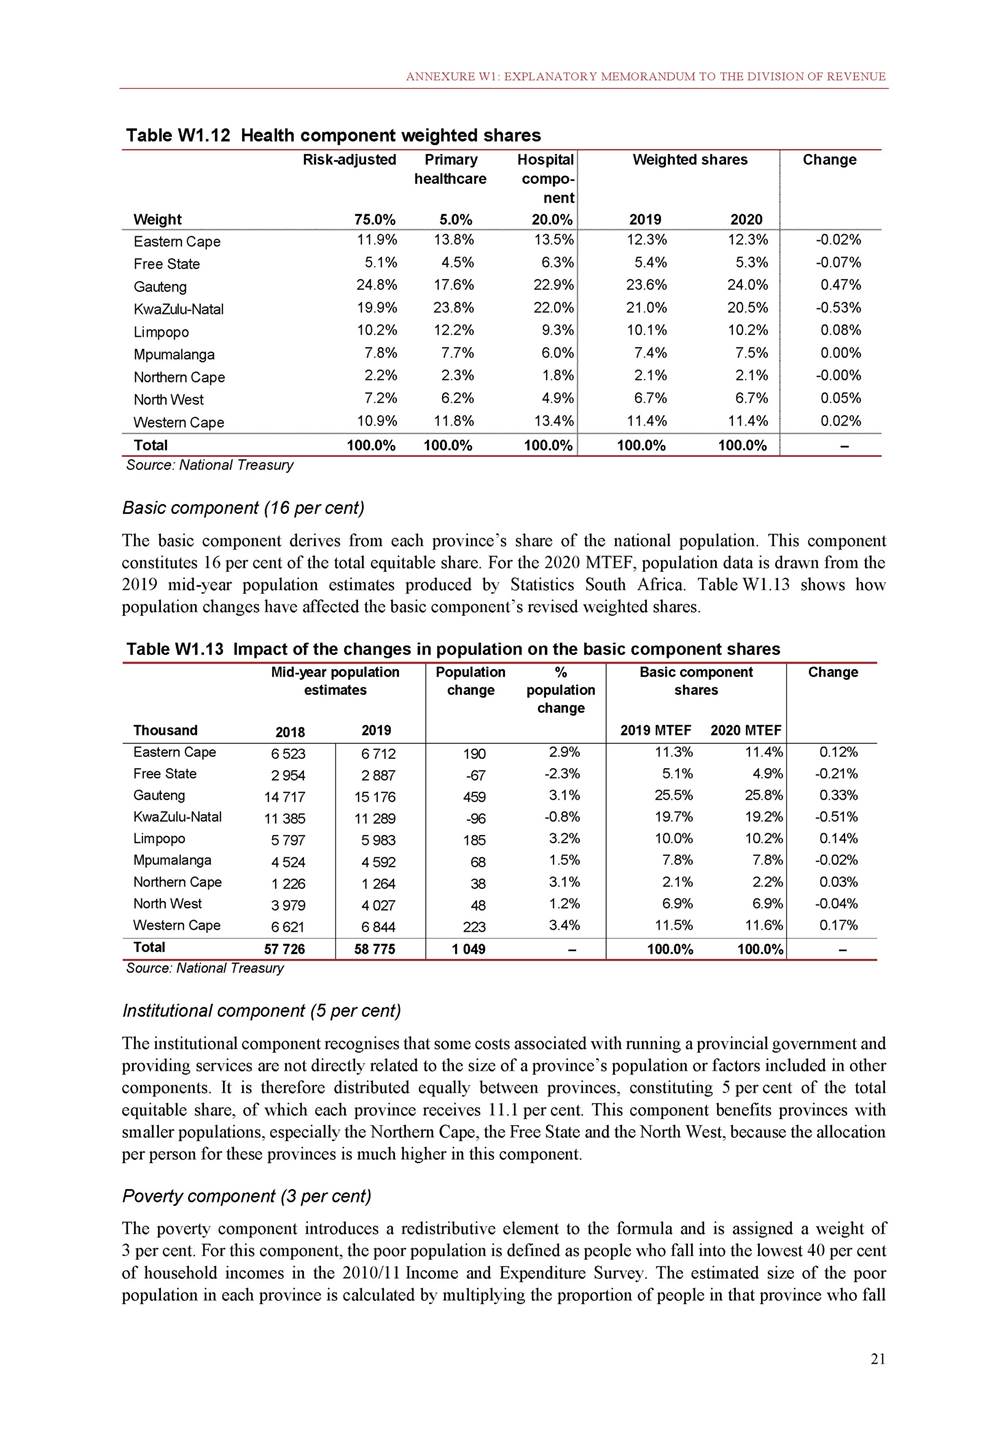
2020 BUDGET REVIEW into the poorest 40 per cent of South African households by the province’s population figure from the 2019 mid-year population estimates. Table W1.14 shows the proportion of the poor in each province from the Income and Expenditure Survey, the 2019 mid-year population estimates and the weighted share of the poverty component per province. Table W1.14 Comparison of current and new poverty component weighted shares in shares Source: National Treasury Economic activity component (1 per cent) The economic activity component is a proxy for provincial tax capacity and expenditure assignments. Given that these assignments are a relatively small proportion of provincial budgets, the component is assigned a weight of 1 per cent. For the 2020 MTEF, 2017 GDP-R data is used. Table W1.15 shows the weighted shares of the economic activity component. Table W1.15 Current and new economic activity component weighted shares Source: National Treasury Full impact of data updates on the provincial equitable share Table W1.16 shows the full impact of the data updates on the provincial equitable share per province, after the six updated components have been added together. It compares the target shares for the 2019 and 2020 MTEF periods. The size of each province’s share reflects the relative demand for provincial public services in that province, and the changes in shares from 2019 to 2020 respond to changes in that demand. The details of how the data updates affect each component of the formula are described in detail in the sub-sections above. 22 Current (2019 MTEF) GDP-R, 2016Weighted (R million) shares New (2020 MTEF) GDP-R, 2017Weighted (R million)shares Difference in weighted shares Eastern Cape Free State Gauteng KwaZulu-Natal Limpopo Mpumalanga Northern Cape North West Western Cape 331 0937.6% 217 8495.0% 1 507 08234.6% 692 22215.9% 311 6867.2% 323 7227.4% 90 8832.1% 279 7336.4% 596 04313.7% 358 6277.7% 234 5055.0% 1 593 87434.3% 746 36016.0% 340 2737.3% 348 9877.5% 96 4872.1% 301 4776.5% 632 99013.6% 0.1% 0.0% -0.4% 0.1% 0.1% 0.1% -0.0% 0.0% -0.1% Total 4 350 314100.0% 4 653 579100.0% 0.0% Income and Expendi-ture Survey Thousand2010/11 Current (2019 MTEF) Mid-yearPoorWeighted populationpopula-shares estimatestion 2018 New (2020 MTEF) Mid-yearPoorWeighted populationpopula-shares estimatestion 2019 Difference weighted Eastern Cape 52.0% Free State 41.4% Gauteng 28.9% KwaZulu-Natal 45.3% Limpopo 52.9% Mpumalanga 47.3% Northern Cape 40.8% North West 47.9% Western Cape 21.9% 6 5233 39414.7% 2 9541 2235.3% 14 7174 24918.4% 11 3855 15822.4% 5 7973 06413.3% 4 5242 1389.3% 1 2265002.2% 3 9791 9068.3% 6 6211 4486.3% 6 7123 49214.9% 2 8871 1955.1% 15 1764 38118.7% 11 2895 11521.8% 5 9833 16213.5% 4 5922 1709.3% 1 2645152.2% 4 0271 9298.2% 6 8441 4966.4% 0.2% -0.2% 0.3% -0.5% 0.2% -0.0% 0.0% -0.0% 0.1% Total 57 72623 079100.0% 58 77523 457100.0% –
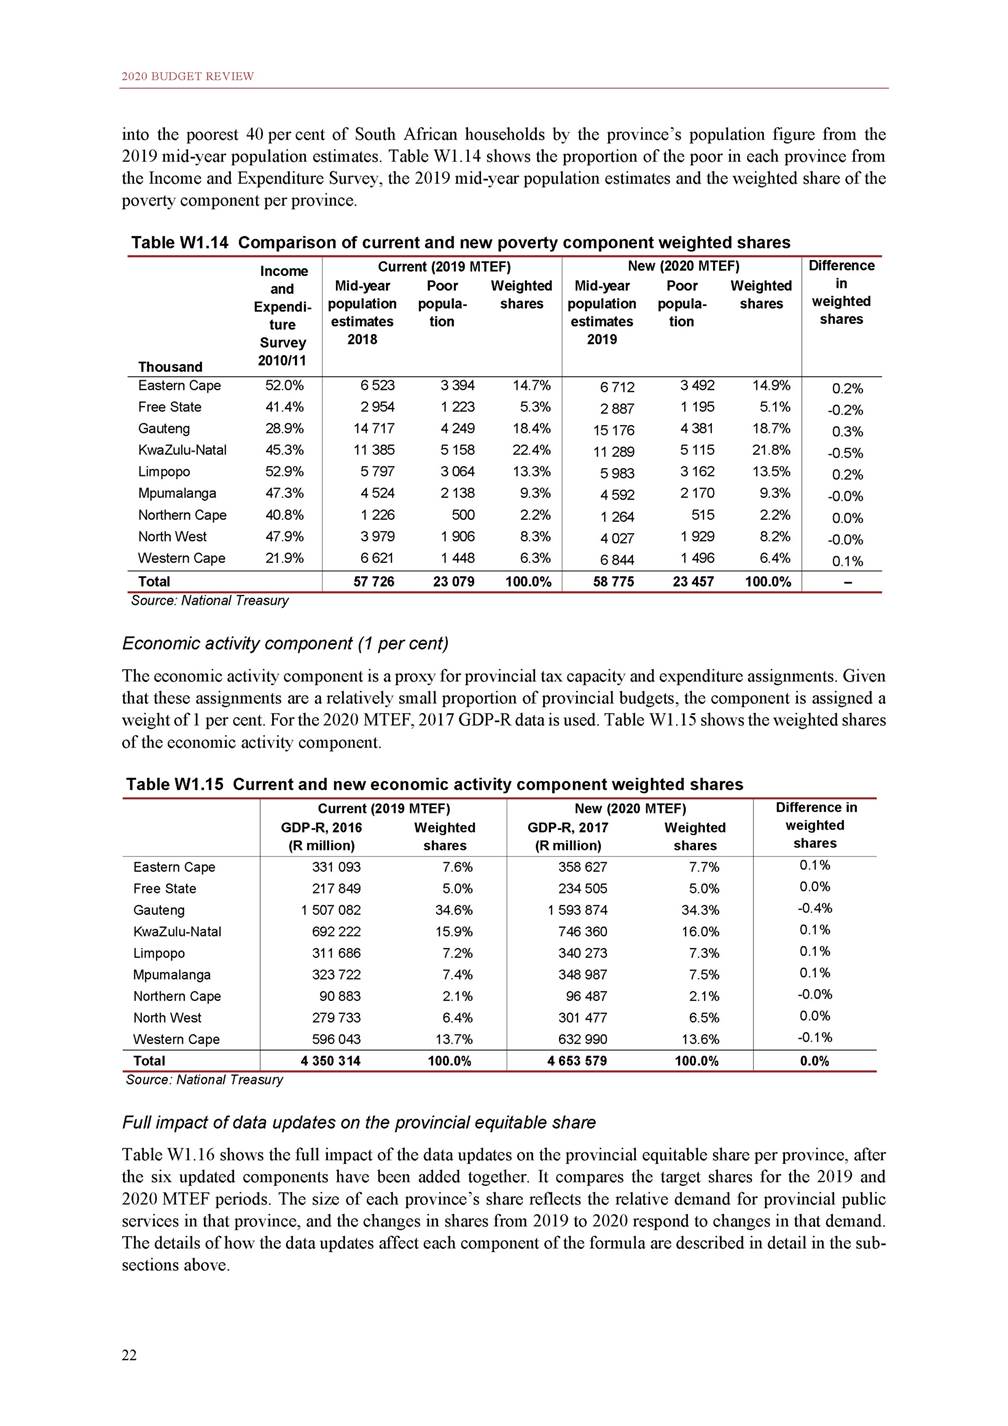
ANNEXURE W1: EXPLANATORY MEMORANDUM TO THE DIVISION OF REVENUE Table W1.16 Full impact of data updates on the equitable share Source: National Treasury Phasing in the formula The annual updates to the official data used to calculate the provincial equitable share formula result in changes to each province’s share of the available funds. These changes reflect the changing balance of service delivery demands among the provinces, and the annual data updates are vital to ensuring that allocations can respond to these changes. However, provinces need stable and predictable revenue streams to allow for sound planning. As such, the new shares calculated using the most recent data are phased in over the three-year MTEF period. The equitable share formula data is updated every year and a new target share for each province is calculated, as shown in Table W1.17. The phase-in mechanism provides a smooth path to achieving the new weighted shares by the third year of the MTEF period. It takes the difference between the target weighted share for each province at the end of the MTEF period and the indicative allocation for 2020/21 published in the 2019 MTEF, and closes the gap between these shares by a third in each year of the 2020 MTEF period. As a result, one third of the impact of the data updates is implemented in 2020/21 and two thirds in the indicative allocations for 2021/22. The updates are thus fully implemented in the indicative allocations for 2022/23. Table W1.17 Implementation of the equitable share weights Source: National Treasury Allocations calculated outside the equitable share formula In addition to allocations made through the formula, the provincial equitable share includes allocations that have been determined using other methodologies. These allocations are typically introduced when a new function or additional funding is transferred to provinces and national government indicates separately how 23 2020/21 Indicative weighted shares from Percentage 2019 MTEF 2020/21 2021/22 2022/23 2020 MTEF weighted shares 3-year phasing Eastern Cape 13.4% Free State 5.6% Gauteng 20.6% KwaZulu-Natal 20.9% Limpopo 11.6% Mpumalanga 8.2% Northern Cape 2.7% North West 6.9% Western Cape 10.2% 13.3% 5.6% 20.8% 20.7% 11.6% 8.2% 2.7% 7.0% 10.3% 13.1% 5.6% 21.1% 20.5% 11.5% 8.2% 2.6% 7.0% 10.3% 13.0% 5.5% 21.4% 20.3% 11.5% 8.2% 2.6% 7.0% 10.4% Total 100.0% 100.0% 100.0% 100.0% 2019 MTEF2020 MTEF weightedweighted averageaverage Difference Eastern Cape 13.2% 13.0% Free State 5.6% 5.5% Gauteng 20.9% 21.4% KwaZulu-Natal 20.8% 20.3% Limpopo 11.5% 11.5% Mpumalanga 8.2% 8.2% Northern Cape 2.6% 2.6% North West 7.0% 7.0% Western Cape 10.2% 10.4% -0.2% -0.1% 0.5% -0.5% -0.0% -0.0% -0.0% 0.1% 0.2% Total100.0%100.0% 0.0%
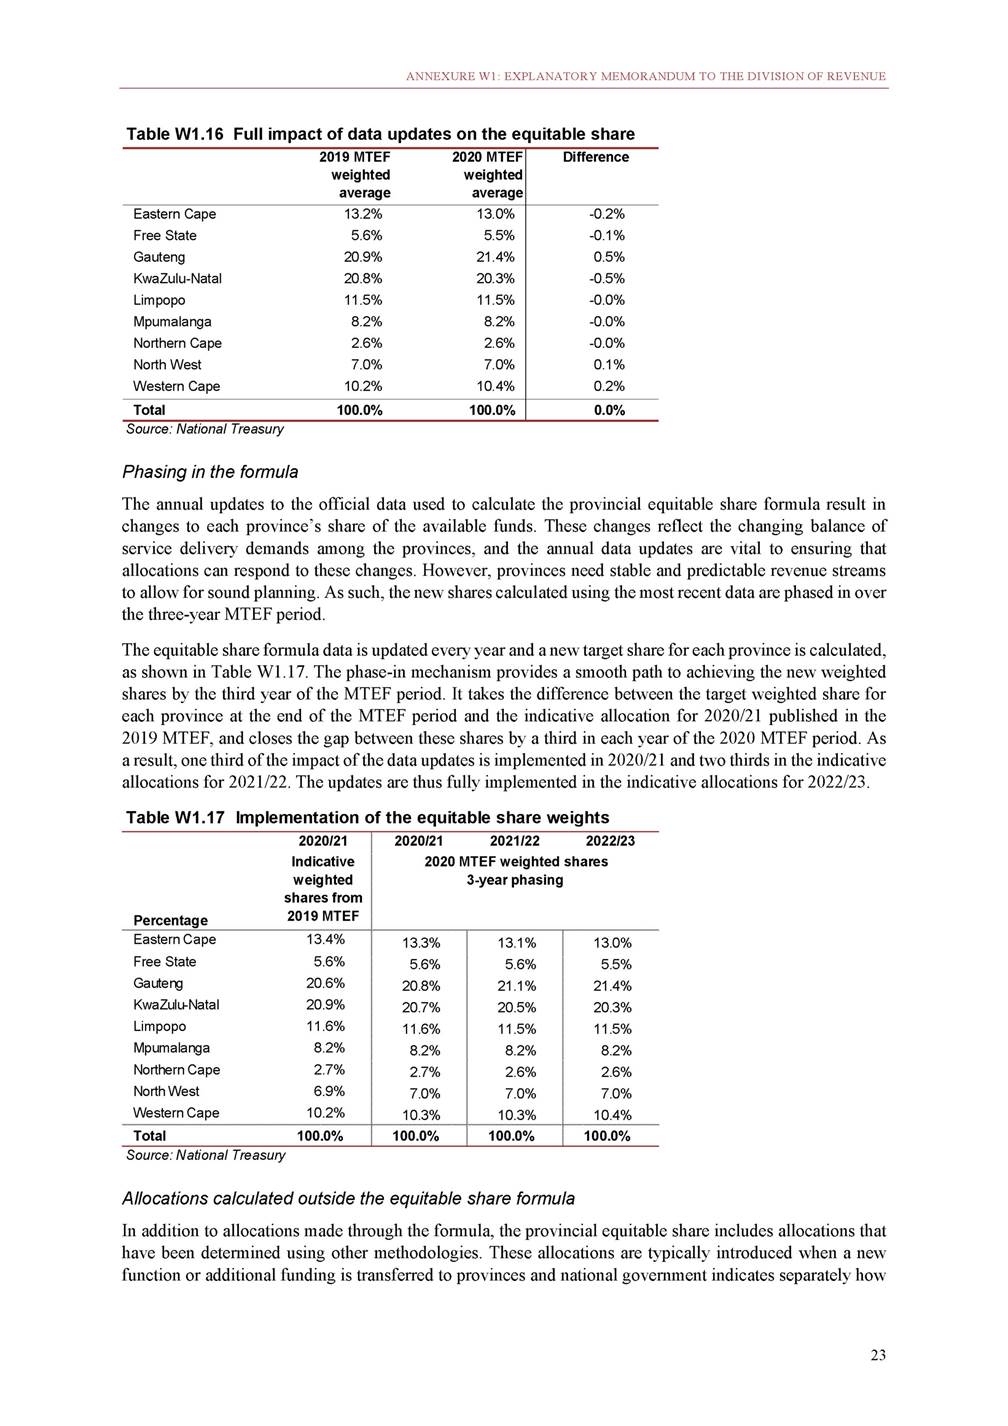
2020 BUDGET REVIEW much funding has been allocated to each province for this specific purpose. Funds are also added through this approach when a priority has been identified through the national budget process and provincial government performs the function or when a conditional grant is absorbed into the equitable share. For the 2020 MTEF, three new adjustments are allocated outside the provincial equitable share formula. In the social development sector, R398 million has been reprioritised from national government to continue to employ social workers in areas with a high prevalence of gender-based violence, substance abuse and issues affecting children. The allocations to the provinces are based on the prevalence of these problems, population and geographic size, and the number of sites offering social work services. In addition, R315 million has been reprioritised from the Department of Social Development for provinces to continue to help non-profit organisations implement Social Behaviour Change Programmes to address social and structural drivers of HIV, TB and sexually transmitted infections. To scale up the Sanitary Dignity Programme, which provides sanitary products to indigent girl learners, funds were added to the equitable share in 2019/20. To continue rolling out this programme, R652 million has been added to the provincial equitable share over the 2020 MTEF period. These funds are proportionally allocated to the provinces based on the number of girl learners in Grades 4 to 12 in the poorest schools (quintiles 1–3) in each province. Table W1.18 provides a summary of the allocations made outside the provincial equitable share in the 2020 MTEF period and a short description of how these amounts are allocated among provinces. Table W1.18 Allocations outside provincial equitable share formula Source: National Treasury Final provincial equitable share allocations The final equitable share allocations per province for the 2020 MTEF period are detailed in Table W1.19. These allocations include the full impact of the data updates, phased in over three years, and the allocations that are made separately from the formula. 24 2019/20 2020/212021/222022/23 Allocation criteria R million Adjusted Budget Medium-term estimates Food relief shift – 677175 Allocated equally among the provinces Social worker employment grant shift 213 227239251 Allocated in terms of what provinces would have received had the grant continued Substance abuse treatment grant shift 75 798387 Allocated in terms of what provinces would have received had the grant continued Municipal intervention support 87 899397 Allocated equally among the provinces Gender-based violence and sexually transmitted infections support shift – 93109114 Allocated based on the non-profit organisations located in the 27 priority districts Social worker additional support shift – 113139146 Allocated according to areas of high prevalence of gender-based violence, substance abuse and issues affecting children Sanitary Dignity Programme 157 209217226 Allocated proportionately based on the number of girl learners per province in quintiles 1 to 3 schools Infrastructure delivery improvement programme shift 45 454547 Allocated equally among the provinces Total 576 9219971 042
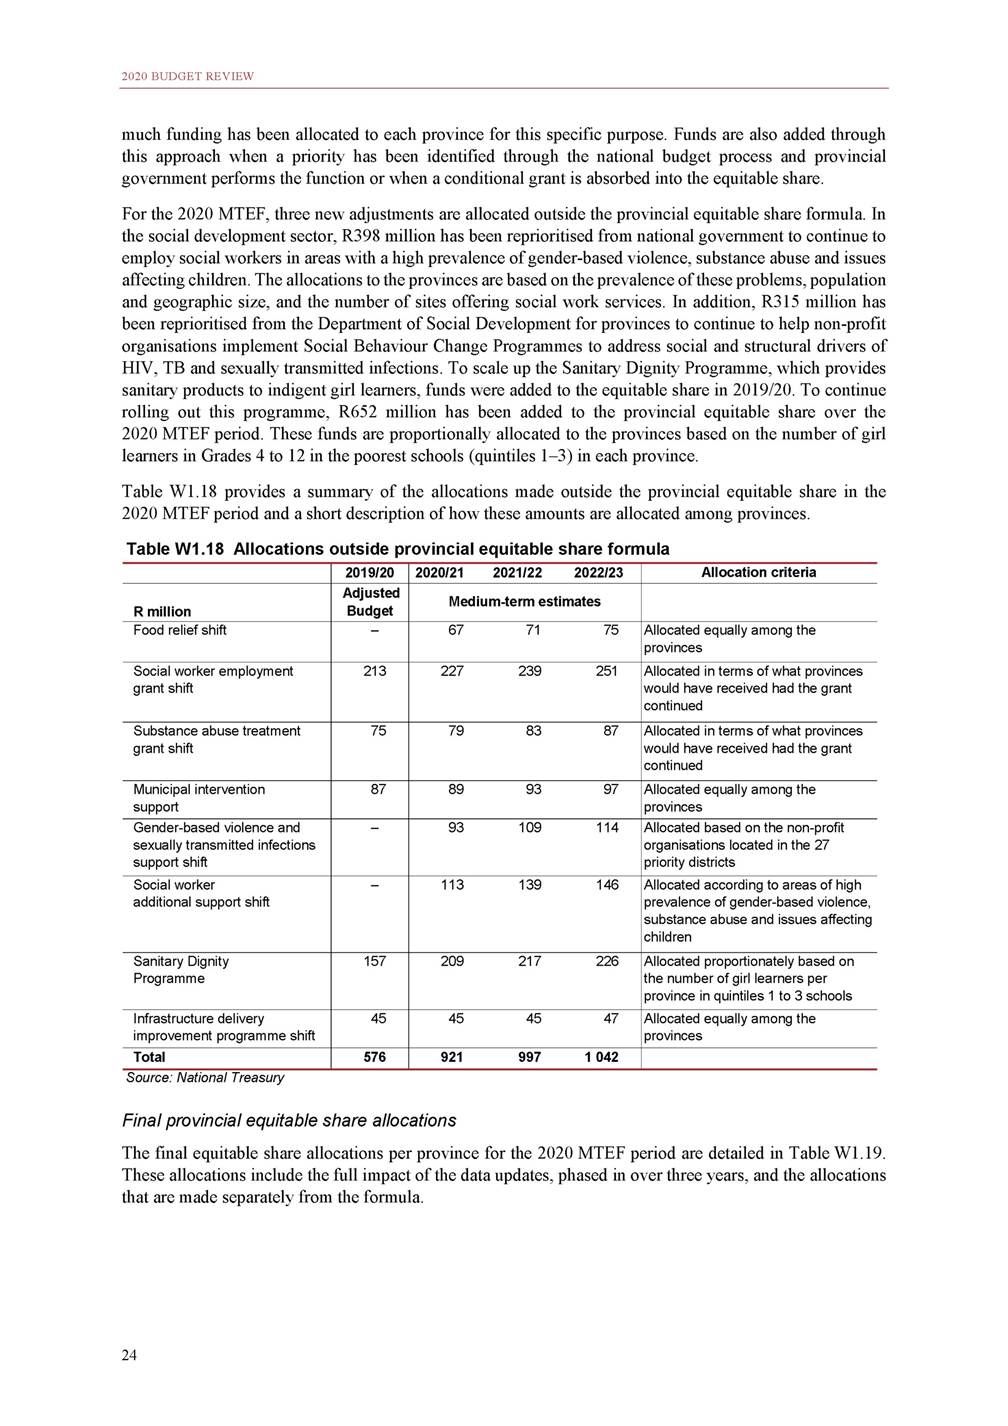
ANNEXURE W1: EXPLANATORY MEMORANDUM TO THE DIVISION OF REVENUE Table W1.19 Provincial equitable share 2020/21 2021/22 2022/23 R million Eastern Cape Free State Gauteng KwaZulu-Natal Limpopo Mpumalanga Northern Cape North West Western Cape 71 415 30 017 112 118 111 442 62 329 44 105 14 290 37 548 55 208 75 306 31 897 121 121 117 755 66 256 46 996 15 207 40 174 59 276 78 841 33 657 129 908 123 544 69 935 49 724 16 068 42 682 63 194 Total 538 472 573 990 607 554 Source: National Treasury Conditional grants to provinces There are four types of provincial conditional grants: Schedule 4, part A grants supplement various programmes partly funded by provinces. Schedule 5, part A grants fund specific responsibilities and programmes implemented by provinces. Schedule 6, part A grants provide in-kind allocations through which a national department implements projects in provinces. Schedule 7, part A grants provide for the swift allocation and transfer of funds to a province to help it deal with a disaster or housing emergency. Changes to conditional grants The overall growth in direct conditional transfers to provinces averages 4.7 per cent over the medium term. Direct conditional grant baselines total R111 billion in 2020/21, R118 billion in 2021/22 and R123 billion in 2022/23. Indirect conditional grants amount to R4.1 billion, R4.8 billion and R5.1 billion respectively for each year of the same period. Table W1.20 provides a summary of conditional grants by sector for the 2020 MTEF period. More detailed information, including the framework and allocation criteria for each grant, is provided in the 2020 Division of Revenue Bill. The frameworks provide the conditions for each grant, the outputs expected, the allocation criteria used for dividing each grant between provinces, and a summary of the grants’ audited outcomes for 2018/19. 25
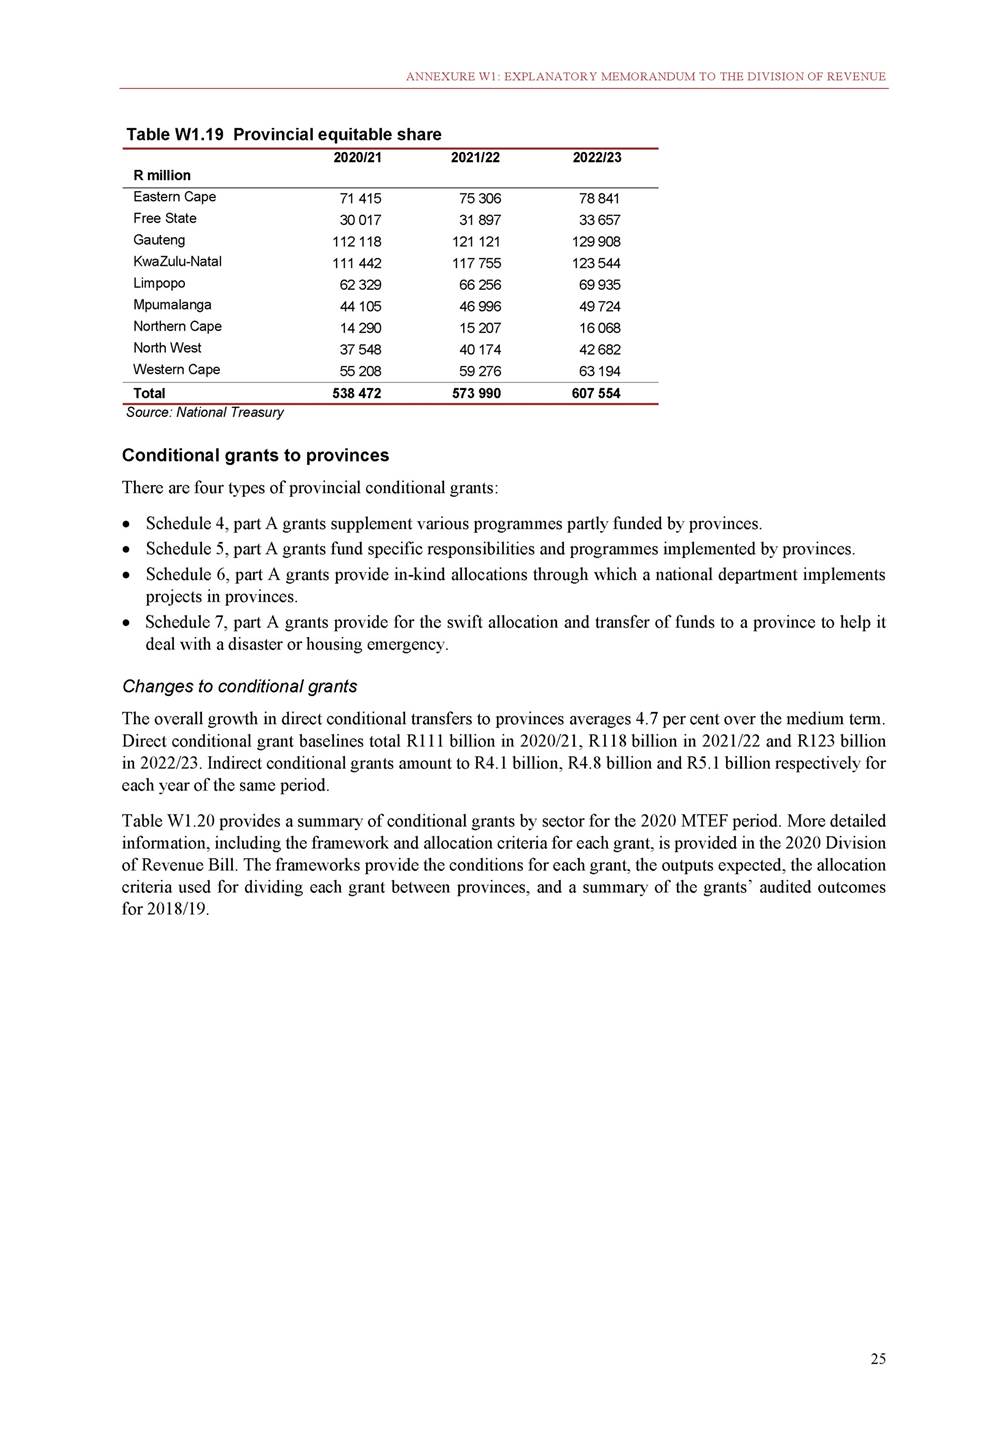
2020 BUDGET REVIEW Table W1.20 Conditional grants to provinces Source: National Treasury Agriculture, land reform and rural development grants The comprehensive agricultural support programme grant aims to support newly established and emerging farmers, particularly subsistence, smallholder and previously disadvantaged farmers. The grant funds a range of projects, including providing training, developing agro-processing infrastructure and directly supporting 26 2019/20 Adjusted R million budget 2020/21 2021/22 2022/23 MTEF total Agriculture, land reform and rural development 2 159 Comprehensive agricultural support programme 1 538 Ilima/Letsema projects 538 Land care programme: poverty relief 82 and infrastructure development Basic Education 18 569 Education infrastructure 10 514 HIV and AIDS (life skills education) 257 Learners with profound intellectual disabilities 221 Maths, science and technology 391 National school nutrition programme 7 186 Cooperative Governance 131 Provincial disaster relief 131 Health 45 524 HIV, TB, malaria and community outreach 22 039 Health facility revitalisation 6 007 Human papillomavirus vaccine 157 National tertiary services 13 186 National health insurance grant: health professionals 289 Statutory human resources, training and development 3 846 Human Settlements 19 604 Human settlements development 18 780 Title deeds restoration 548 Provincial emergency housing 277 Informal settlements upgrading partnership – Public Works and Infrastructure 868 Expanded public works programme 437 integrated grant for provinces Social sector expanded public works 431 programme incentive for provinces Social Development 518 Early childhood development 518 Sports arts and culture 2 121 Community library services 1 501 Mass participation and sport development 620 Transport 17 768 Provincial roads maintenance 11 442 Public transport operations 6 326 2 153 2 320 2 392 1 522 1 620 1 672 549 614 632 82 86 88 19 564 20 773 21 738 11 008 11 710 12 255 247 259 262 243 256 266 401 423 438 7 666 8 125 8 516 138 146 153 138 146 153 49 267 53 917 56 537 24 387 27 931 29 405 6 368 6 658 7 034 – – – 14 069 14 694 15 294 289 300 311 4 155 4 333 4 494 17 493 17 614 18 317 16 621 13 414 13 871 578 – – 295 311 326 – 3 890 4 121 834 871 903 421 440 456 414 432 447 915 1 057 1 192 915 1 057 1 192 2 076 2 205 2 307 1 479 1 584 1 667 597 621 640 18 343 19 058 19 597 11 593 11 938 12 507 6 750 7 121 7 090 6 865 4 814 1 795 257 62 076 34 973 767 765 1 262 24 308 438 438 159 721 81 723 20 060 – 44 057 900 12 982 53 425 43 905 578 932 8 011 2 609 1 316 1 292 3 164 3 164 6 588 4 730 1 858 56 998 36 037 20 961 Total direct conditional allocations 107 263 110 785 117 962 123 137 351 883 Indirect transfers 3 941 Agriculture, land reform and rural development 45 Ilima/Letsema indirect 45 Basic Education 1 987 School infrastructure backlogs 1 987 Health 1 909 National health insurance indirect 1 909 4 060 4 824 5 076 36 – – 36 – – 1 736 2 295 2 424 1 736 2 295 2 424 2 288 2 529 2 652 2 288 2 529 2 652 13 961 36 36 6 456 6 456 7 469 7 469
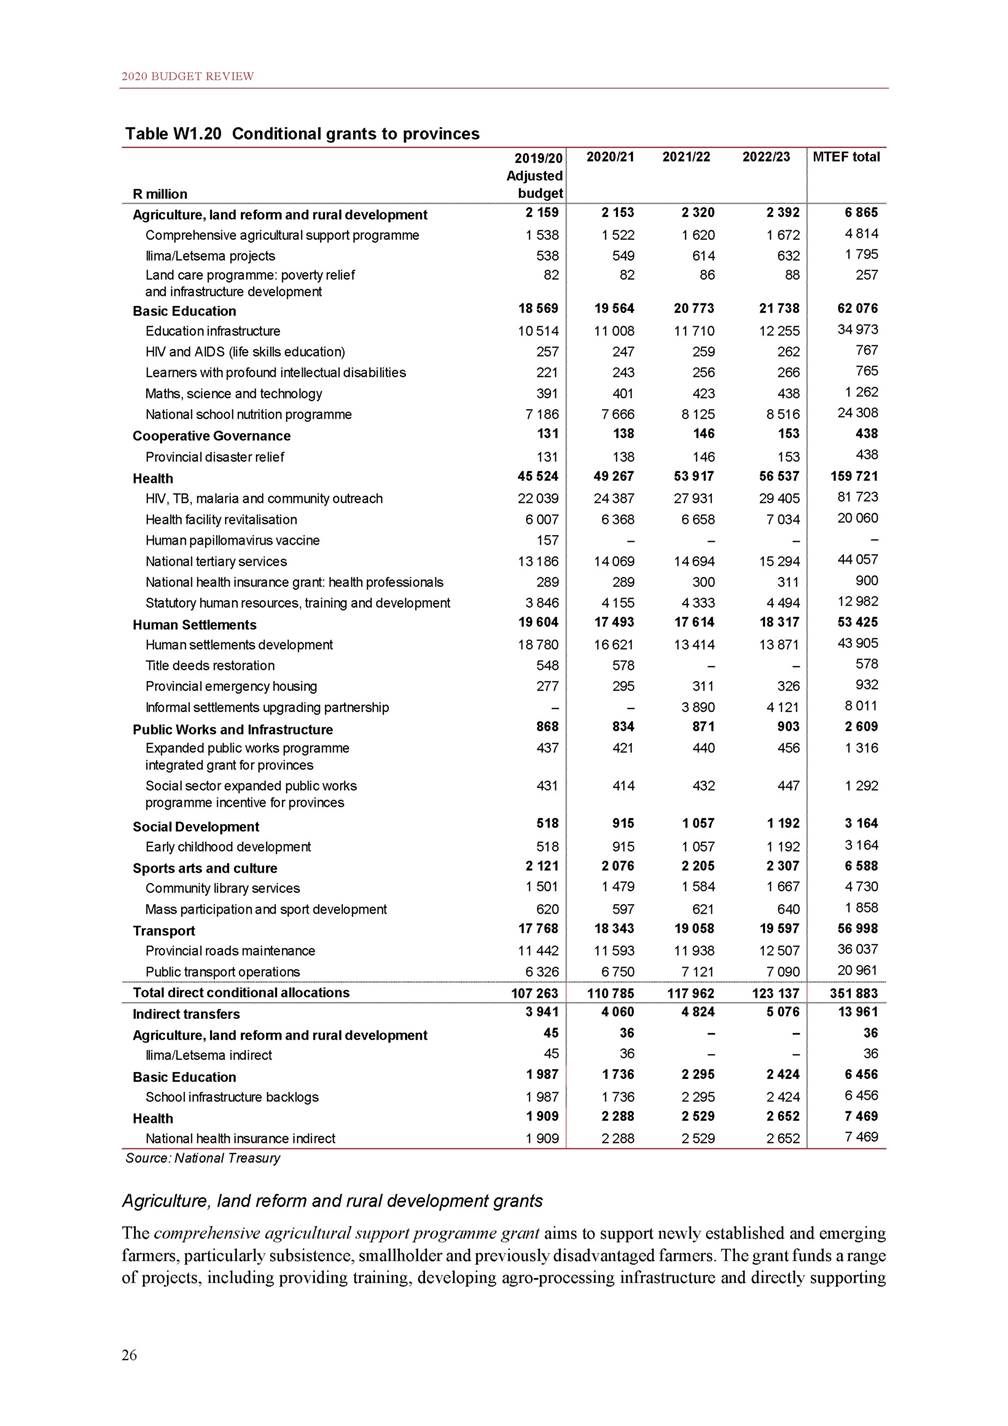
ANNEXURE W1: EXPLANATORY MEMORANDUM TO THE DIVISION OF REVENUE targeted farmers. Over the 2020 MTEF period, R255.1 million is reprioritised from the grant to the Department of Agriculture, Land Reform and Rural Development to fund improved laboratory capacity, border control and inspections. Although funds have been reprioritised from this grant, over the 2020 MTEF period R4.8 billion is allocated to this grant, and the baseline grows from R1.5 billion in 2020/21 to R1.7 billion in 2022/23. The fiscal consolidation reductions for this grant are equivalent to 5 per cent of the grant’s baseline in 2020/21, 6 per cent in 2022/23 and 7 per cent in 2022/23. The land care programme grant: poverty relief and infrastructure development aims to improve productivity and the sustainable use of natural resources. Provinces are also encouraged to use this grant to create jobs through the Expanded Public Works Programme. Over the medium term, R257 million is allocated to this grant. The fiscal consolidation reductions for this grant are equivalent to 5 per cent of the grant’s baseline in 2020/21, 6 per cent in 2022/23 and 7 per cent in 2022/23. The Ilima/Letsema projects grant aims to boost food production by helping previously disadvantaged farming communities. The grant’s baseline is R1.8 billion over the 2020 MTEF period. This includes R36 million in 2020/21, which is allocated through the Ilima/Letsema indirect grant to complete the National Food and Nutrition Survey. These funds were previously ring-fenced in the direct Ilima/Letsema projects grant, and this shift will allow the national Department of Agriculture, Land Reform and Rural Development to pay the Human Sciences Research Council directly for the survey. The fiscal consolidation reductions for this grant are equivalent to 5 per cent of the grant’s baseline in 2020/21, 6 per cent in 2021/22 and 7 per cent in 2022/23. Basic education grants The education infrastructure grant provides supplementary funding for ongoing infrastructure programmes in provinces. This includes maintaining existing infrastructure and building new infrastructure to ensure school buildings meet the required norms and standards. The grant’s total allocation for this period is R35 billion: R11 billion in 2020/21, R11.7 billion in 2021/22 and R12.3 billion in 2022/23. The fiscal consolidation reductions for this grant are equivalent to 4 per cent of the grant’s baseline in 2020/21, 5 per cent in 2022/23 and 5.9 per cent in 2022/23. Provincial education departments have to go through a two-year planning process to be eligible to receive incentive allocations for infrastructure projects. To receive the 2020/21 incentive, the departments had to meet certain prerequisites in 2018/19 and have their infrastructure plans approved in 2019/20. The national Department of Basic Education and the National Treasury assessed the provinces’ infrastructure plans. The national departments, provincial treasuries and provincial departments of basic education undertook a moderation process to agree on the final scores. Provinces needed to obtain a minimum score of 60 per cent to qualify for the incentive. Table W1.21 shows the final score and incentive allocation for each province. Table W1.21 Education infrastructure grant allocations Source: National Treasury 27 R thousand Planning assessment results from 2019 2020/21 Final allocation for 2020/21 Basic Incentive componentcomponent Eastern Cape Free State Gauteng KwaZulu-Natal Limpopo Mpumalanga Northern Cape North West Western Cape 77% 70% 90% 93% 75% 84% 80% 65% 91% 1 470 72873 386 767 04373 386 1 424 37173 386 1 922 79673 386 1 182 97873 386 1 021 29573 386 523 88273 386 1 016 62473 386 1 017 77673 386 1 544 114 840 429 1 497 757 1 996 182 1 256 364 1 094 681 597 268 1 090 010 1 091 162 Total 10 347 489660 478 11 007 967
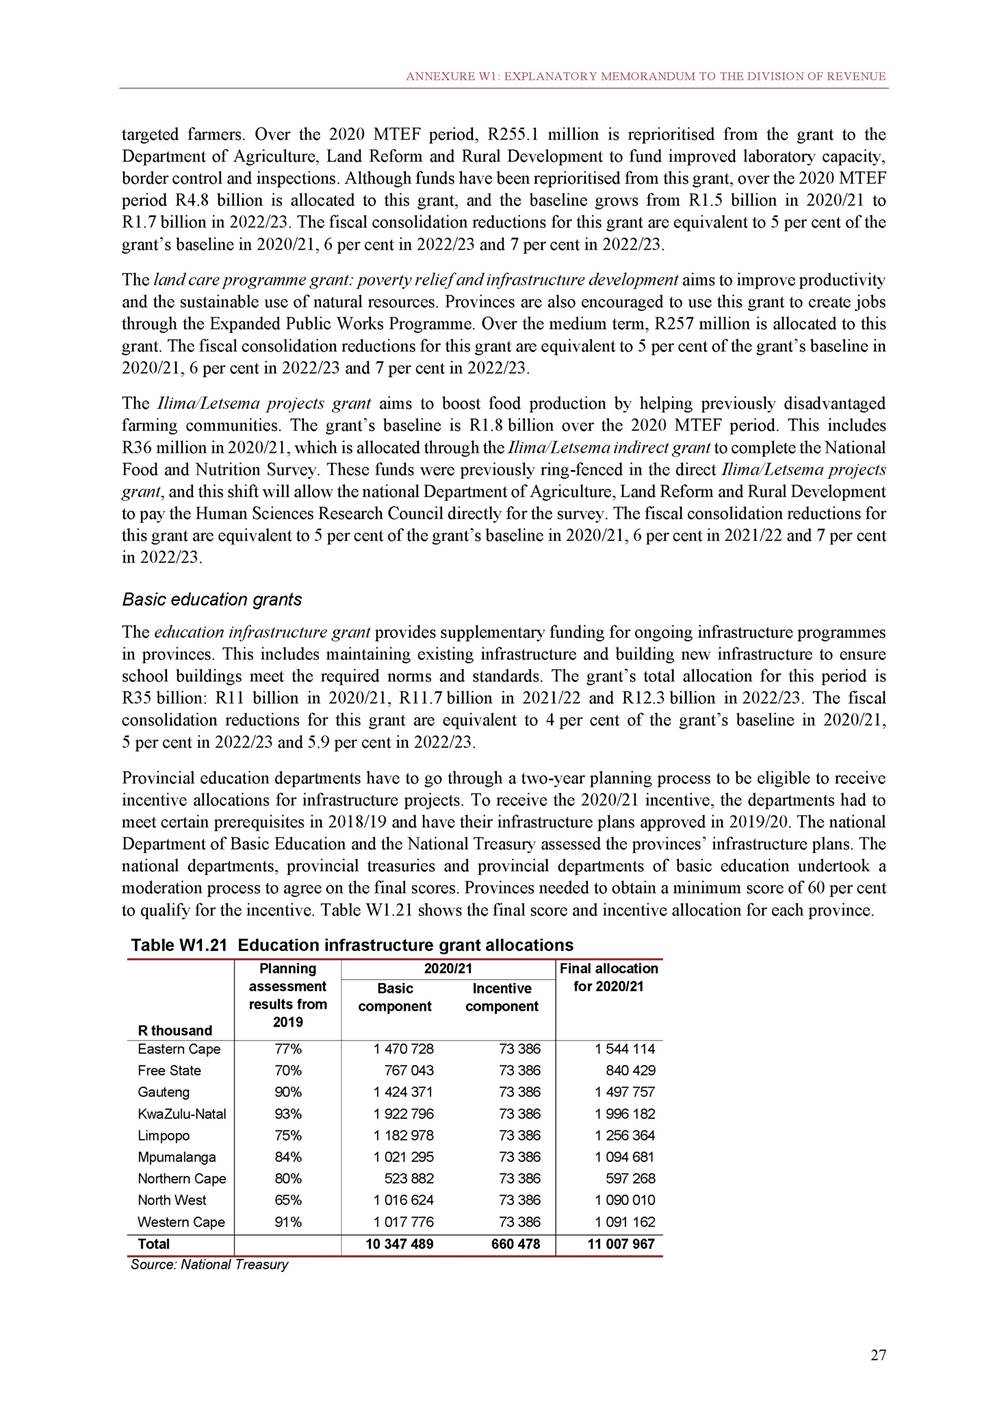
2020 BUDGET REVIEW The national Department of Basic Education uses the indirect school infrastructure backlogs grant to replace unsafe and inappropriate school structures and to provide water, sanitation services and electricity on behalf of provinces. This grant is allocated R6.5 billion over the medium term in the Planning, Information and Assessment Programme. An allocation of R1.7 billion in 2020/21 will be used to replace 40 inappropriate and unsafe schools with newly built ones, provide clean water to 432 schools and provide appropriate sanitation services to 1 033 schools. The national school nutrition programme grant aims to improve the nutrition of poor school children, enhance their capacity to learn and increase their attendance at school. The programme provides a free daily meal to learners in the poorest schools (quintiles 1 to 3). To provide meals to more children, while still providing quality food, growth in the grant’s allocations over the MTEF period averages 5.8 per cent, with a total allocation of R24.3 billion. The fiscal consolidation reductions to this grant are equivalent to 0.4 per cent of the grant’s baseline in 2020/21, 0.5 per cent in 2021/22 and 0.6 per cent in 2022/23. The maths, science and technology grant provides for ICT, workshop equipment and machinery to schools, which should lead to better outcomes in maths and science in the long term. The grant’s total allocation is R1.3 billion over the medium term. The fiscal consolidation reductions to this grant are equivalent to 3 per cent of the grant’s baseline in 2020/21, 3 per cent in 2021/22 and 3 per cent in 2022/23. The HIV and AIDS (life skills education) programme grant provides for life skills training, and sexuality and HIV/AIDS education in primary and secondary schools. The programme is fully integrated into the school system, with learner and teacher support materials provided for Grades 1 to 9. The grant’s total allocation is R767 million over the medium term. The fiscal consolidation reductions to this grant are equivalent to 8.8 per cent of the grant’s baseline in 2020/21, 9.5 per cent in 2021/22 and 11.5 per cent in 2022/23. The learners with profound intellectual disabilities grant aims to expand access to education for these learners. Over the MTEF period, the grant will provide access to quality, publicly funded education to such learners by recruiting outreach teams. This grant has been allocated R765 million over the 2020 MTEF period. Cooperative governance grant The provincial disaster relief grant is administered by the National Disaster Management Centre in the Department of Cooperative Governance. It is unallocated at the start of the financial year. The grant allows the National Disaster Management Centre to immediately release funds (in-year) after a disaster is declared, without the need for the transfers to be gazetted first. The reconstruction of infrastructure damaged by disasters is funded separately through ring-fenced allocations in sector grants. Strategies to mitigate the effects of the ongoing drought have, in part, been funded by this grant. To ensure that sufficient funds are available in the event of a disaster, section 21 of the 2019 Division of Revenue Bill allows for funds allocated to the municipal disaster relief grant to be transferred to provinces if funds in the provincial disaster relief grant have already been exhausted, and vice versa. The bill also allows for more than one transfer to be made to areas affected by disasters so that an initial payment for emergency aid can be made before a full assessment of damages and costs has been completed. Over the 2020 MTEF period, R438 million has been allocated to the provincial disaster relief grant. Health grants The national tertiary services grant provides strategic funding to enable provinces to plan, modernise and transform tertiary hospital service delivery in line with national policy objectives. The grant operates in 29 tertiary hospitals across the nine provinces and continues to fund medical specialists, equipment, and advanced medical investigation and treatment according to approved service specifications. Patient referral pathways often cross provincial borders and, as a result, many patients receive care in neighbouring provinces if the required services are unavailable in their home province. For the 2020 MTEF period, the national Department of Health has reprioritised R176 million within this conditional grant to develop and expand tertiary services in the Eastern Cape, Limpopo, Mpumalanga and the North West. The funds have 28
ANNEXURE W1: EXPLANATORY MEMORANDUM TO THE DIVISION OF REVENUE been ring-fenced in the 2020/21 allocations for these provinces and left unallocated for 2021/22 and 2022/23. These developmental allocations will allow the provinces to develop their capacity in offering tertiary services within their facilities. A similar approach to allocating developmental funds is taken in the statutory human resources component of the statutory human resources, training and development grant and further details on the amounts ring-fenced are discussed under this grant. The urban areas of Gauteng and the Western Cape continue to receive the largest share of the grant because they provide the largest proportion of high-level, sophisticated services. The national Department of Health has reviewed the allocation criteria under this grant and is working with provinces to develop a new allocation model to ensure continued fairness in allocations. The grant is allocated R44.1 billion over the medium term: R14.1 billion in 2020/21, R14.7 billion in 2021/22 and R15.3 billion in 2022/23. The fiscal consolidation reductions to this grant are equivalent to 1 per cent of the grant’s baseline in 2021/22 and 1 per cent in 2022/23. The health facility revitalisation grant funds the construction and maintenance of health infrastructure, including large projects to modernise hospital infrastructure and equipment, general maintenance and infrastructure projects at smaller hospitals, and the refurbishment and upgrading of nursing colleges and schools. A total of R199 million in 2020/21 and R5.7 million in 2021/22 has been shifted from the national health insurance indirect grant: health facility revitalisation component to this grant for upgrades to Pietersburg Hospital in Limpopo. These funds were initially part of the Limpopo allocations in the national health insurance indirect grant. The province will now undertake the upgrades, so the funds will be transferred directly to the province. Over the 2020 MTEF period, R20 billion has been allocated to this grant. The fiscal consolidation reductions to this grant are equivalent to 3 per cent of the grant’s baseline in 2020/21, 3 per cent in 2021/22 and 3 per cent in 2022/23. Like the education infrastructure grant discussed previously, a two-year planning process is also required for provinces to access this grant’s incentive component. The national Department of Health and the National Treasury assessed the provinces’ infrastructure plans. This was followed by a moderation process between the national departments, provincial treasuries and provincial departments of health to agree on the final scores. Provinces had to obtain a minimum score of 60 per cent to qualify for the incentive. Funds for the incentive component in the outer years are shown as unallocated. Table W1.22 sets out the final score and the incentive allocation per province. Table W1.22 Health facility revitalisation grant allocations Source: National Treasury The human resources capacitation grant and the health professions training and development grant have been merged to create a new statutory human resources, training and development grant from 2020/21. The conditional grant has two components and has been allocated R4.2 billion in 2020/21, R4.3 billion in 2021/22 and R4.5 billion in 2022/23. The health professions training and development component funds the training of health sciences professionals, including specialists, registrars and their supervisors (who were previously funded from the health professions training and development grant). The statutory human resources 29 R thousand Planning assessment results from 2019 2020/21 Final allocation for 2020/21 BasicIncentive componentcomponent Eastern Cape Free State Gauteng KwaZulu-Natal Limpopo Mpumalanga Northern Cape North West Western Cape 73% 62% 70% 80% 60% 69% 50% 73% 86% 610 773 527 985 909 450 1 212 654 683 713 365 162 409 404 538 398 640 033 58 760 58 760 58 760 58 760 58 760 58 760 – 58 760 58 760 669 533 586 745 968 210 1 271 414 742 473 423 922 409 404 597 158 698 793 Total 5 897 570 470 082 6 367 652
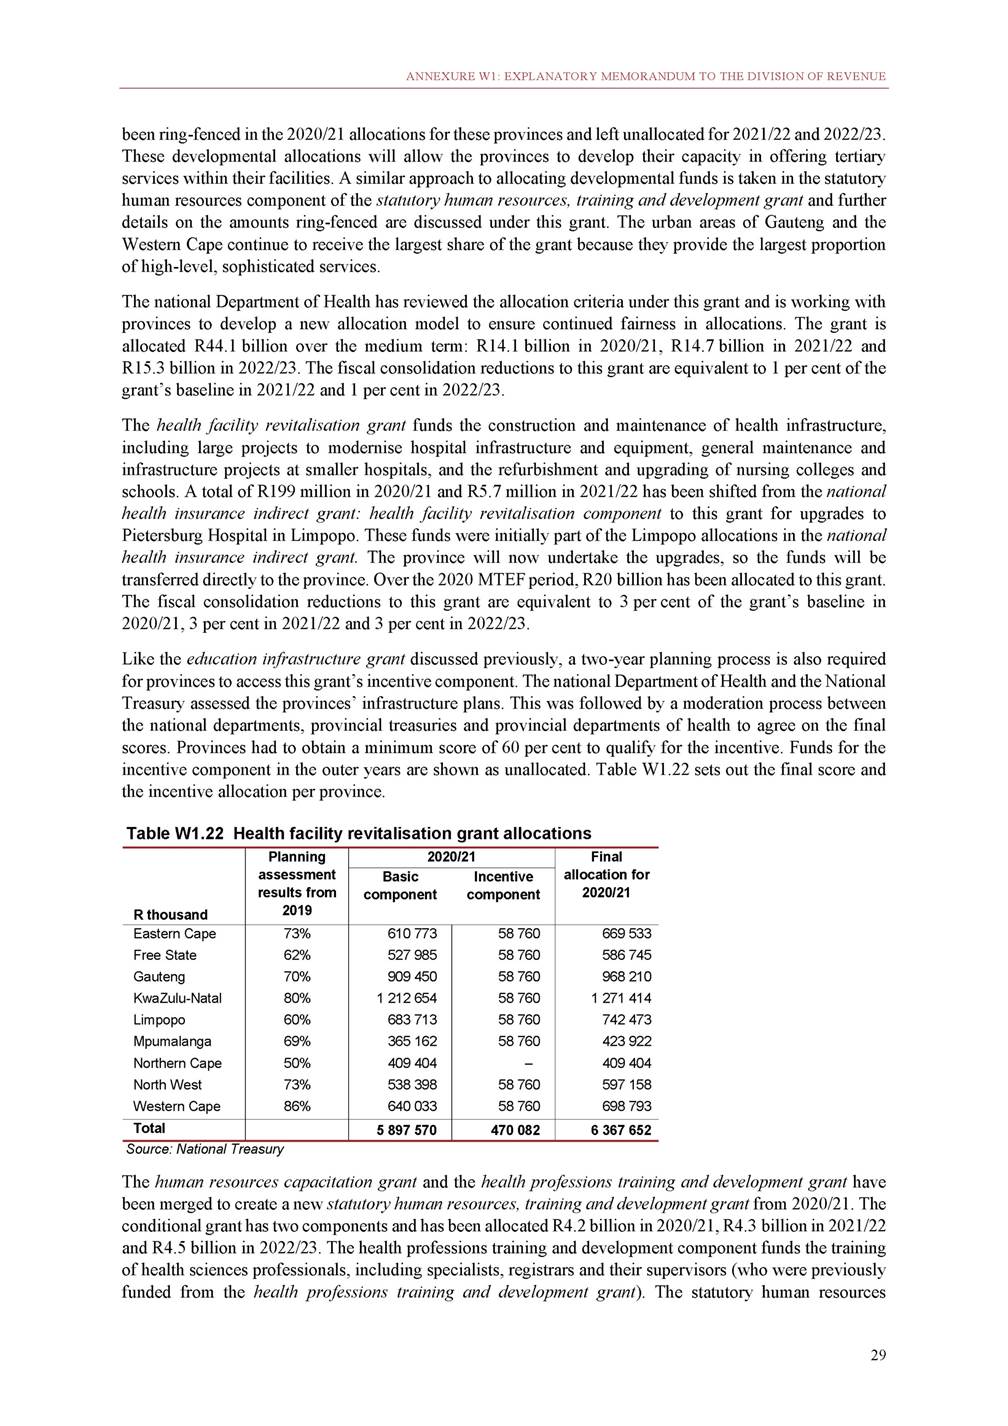
2020 BUDGET REVIEW component will fund intern and community service posts (which were previously funded from the human resources capacitation grant), as well as some posts previously funded from the equitable share. When the human resources capacitation grant was introduced, it was primarily meant to fund the shortfall in funding for interns and community service posts, but its scope expanded to include other vacant posts in the health sector. These non-statutory posts will now be funded through the provincial equitable share. Therefore, the grant will be able to fund some additional internship and community service posts that were previously funded from the equitable share. Over the 2020 MTEF period, similar to the national tertiary services grant, R65 million has been ring-fenced in the health professions training and development component of this grant for the development and expansion of tertiary services in the Eastern Cape, Limpopo, Mpumalanga, the Northern Cape and the North West. The funds have been allocated to these provinces for 2020/21, and are left unallocated for the outer two years of the MTEF period. The HIV, TB, malaria and community outreach grant supports HIV/AIDS prevention programmes and specific interventions, including voluntary counselling and testing, prevention of mother-to-child transmission, post-exposure prophylaxis, antiretroviral treatment and home-based care. In the 2016 MTEF, the grant’s scope was extended to include tuberculosis. In the 2018 Budget, a sub-component for community outreach services was introduced, so that funds used to support community health workers could be explicitly earmarked. This will help ensure that these workers are better integrated into national health services. In 2020/21, R800 million has been reprioritised to the community outreach services component from the HIV and AIDS component of the grant to cover a shortfall in the salaries of community health workers in that year. In 2019/20, two new components were added to the grant, to strengthen the continued fight against malaria in three provinces and to monitor the activities and outcomes of the TB portion of the grant. In the 2020 MTEF, the human papillomavirus vaccine grant has been merged into the HIV, TB, malaria, community outreach grant and a separate component will be created within the grant to continue funding human papillomavirus vaccinations. Two new components for mental health and oncology will be introduced in 2021/22, with funds of R452 million reprioritised from the national health insurance: personal services component for the two outer years of the 2020 MTEF period. The grant’s total baseline amounts to R82 billion over the medium term. The fiscal consolidation reductions to this grant are equivalent to 1 per cent of the grant’s baseline in 2020/21, 1 per cent in 2021/22 and 1 per cent in 2022/23. The national health insurance indirect grant continues to fund all preparatory work for universal health coverage, as announced in 2017/18. Over the 2020 MTEF period, this will be done through three components: health facility revitalisation and two integrated components (personal services and non-personal services). The personal services component funds priority services for national health insurance, which include: Expanding access to school health services, focusing on optometry and audiology. Contracting general practitioners based on a set annual amount per patient instead of fees per service provided. Providing community mental health services, maternal care for high-risk pregnancies, screening and treatment for breast and cervical cancer, hip and knee arthroplasty, cataract surgeries and wheelchairs. Non-personal services will test, and scale up when ready, the technology platforms and information systems needed to ensure a successful transition to national health insurance. In 2020/21, this component will also pilot new initiatives to improve the quality of health in preparation for accreditation to deliver national health insurance services. The non-personal services component is allocated R2.2 billion over the medium term to continue funding initiatives to strengthen health information systems, clinics, and the dispensing and distribution of centralised chronic medicines. This indirect grant is allocated a total of R7.5 billion over the 2020 MTEF period. The fiscal consolidation reductions to this grant are equivalent to 9.8 per cent of the grant’s baseline in 2020/21, 4 per cent in 2021/22 and 4.7 per cent in 2022/23. In the 2019/20 adjustment budget, funds for contracting health professionals were shifted from the personal services component of the indirect grant to create a new direct national health insurance grant. The contracting of health professionals in former national health insurance pilot sites was previously administered at national level, but the contracting was being carried out at provincial level with the 30
ANNEXURE W1: EXPLANATORY MEMORANDUM TO THE DIVISION OF REVENUE requirement that provinces submit claims for the costs they incurred. Transferring these funds to provinces allows them to pay contractors directly. The contracting of health professionals will continue to be funded in the direct national health insurance grant over the MTEF period through an allocation of R900 million. Human settlements grants The human settlements development grant seeks to establish habitable, stable and sustainable human settlements in which all citizens have access to social and economic amenities. Over the 2020 MTEF period, a total of R44 billion has been allocated to this grant. The fiscal consolidation reductions to this grant are equivalent to 13.1 per cent of the grant’s baseline in 2020/21, 12.9 per cent in 2021/22 and 14.8 per cent in 2022/23. This grant is allocated using a formula with three components: The first component shares 70 per cent of the total allocation between provinces in proportion to their share of the total number of households living in inadequate housing. Data from the 2011 Census is used for the number of households in each province living in informal settlements, shacks in backyards and traditional dwellings. Not all traditional dwellings are inadequate, which is why information from the 2010 General Household Survey on the proportion of traditional dwellings with damaged roofs and walls per province is used to adjust these totals so that only dwellings providing inadequate shelter are counted in the formula. The second component determines 20 per cent of the total allocation based on the share of poor households in each province. The number of households with an income of less than R1 500 per month is used to determine 80 per cent of the component and the share of households with an income of between R1 500 and R3 500 per month is used to determine the remaining 20 per cent. Data used in this component comes from the 2011 Census. The third component, which determines 10 per cent of the total allocation, is shared in proportion to the number of people in each province, as measured in the 2011 Census. Table W1.23 shows how the human settlements development grant formula calculates the shares for each province and the metropolitan municipalities within the provinces. Section 12(6) of the Division of Revenue Act requires provinces to gazette how much they will spend within each accredited municipality (including the amounts transferred to that municipality and the amounts spent by the province in that municipal area). Funds for mining towns and disaster recovery are allocated separately from the formula. 31
2020 BUDGET REVIEW Table W1.23 Human settlements development grant formula calculation Source: 2011 Census and General Household Survey In 2019/20, the structure of the human settlements development grant was changed to intensify efforts to upgrade informal settlements in partnership with communities. To promote this objective, a new component was introduced with specific conditions relating to such upgrades. The new component amounts to 15 per cent of the formula-based grant allocation to each province. The funds ring-fenced for each province are a minimum expenditure requirement, allowing them to invest more if necessary. The component requires the use of a partnership approach that promotes community ownership and participation in the upgrades. Provinces are required to work with municipalities to identify and prioritise informal settlements for upgrading and to submit a plan for each settlement to be upgraded, prepared in terms of the National Upgrading Support Programme’s methodology. This component will remain in place in 2020/21, serving as a planning and preparatory platform for the introduction of a new informal settlements upgrading grant in 2021/22. The new grant will be created by reprioritising funds from the human settlements development grant. A similar approach is being taken in the urban settlements development grant, discussed in Part 5, with an informal settlements upgrading component and the intention to introduce a separate grant for metropolitan municipalities in the outer years of the MTEF period. A total of R544 million is ring-fenced within the human settlements development grant in 2020/21 to upgrade human settlements in mining towns in six provinces. These allocations respond to areas with significant informal settlement challenges, with a high proportion of economic activity based on the natural resources sector. 32 Components Housing needs component Poverty component Population component Grant formula shares Description Weighted share of inadequate housing Share of poverty Share of population Weighted share of grant formula Component weight 70.0% 20.0% 10.0% Eastern Cape Nelson Mandela Bay Buffalo City Other Eastern Cape municipalities Free State Mangaung Other Free State municipalities Gauteng Ekurhuleni City of Johannesburg City of Tshwane Other Gauteng municipalities KwaZulu-Natal eThekwini Other KwaZulu-Natal municipalities Limpopo Mpumalanga Northern Cape North West Western Cape City of Cape Town Other Western Cape municipalities 10.1% 1.6% 2.2% 6.3% 5.9% 1.4% 4.4% 30.9% 9.1% 10.5% 6.8% 4.5% 18.0% 7.0% 11.0% 4.4% 6.2% 1.9% 10.0% 12.7% 9.3% 3.4% 13.7% 2.1% 1.6% 10.0% 6.2% 1.5% 4.6% 22.6% 6.2% 8.1% 4.8% 3.5% 18.9% 6.2% 12.7% 11.8% 7.9% 2.1% 7.8% 9.0% 5.6% 3.4% 12.7% 2.2% 1.5% 9.0% 5.3% 1.4% 3.9% 23.7% 6.1% 8.6% 5.6% 3.4% 19.8% 6.6% 13.2% 10.4% 7.8% 2.2% 6.8% 11.2% 7.2% 4.0% 11.1% 1.8% 2.0% 7.3% 5.9% 1.5% 4.4% 28.5% 8.2% 9.8% 6.3% 4.2% 18.3% 6.8% 11.6% 6.5% 6.7% 2.0% 9.2% 11.8% 8.3% 3.5% Total 100.0% 100.0% 100.0% 100.0%
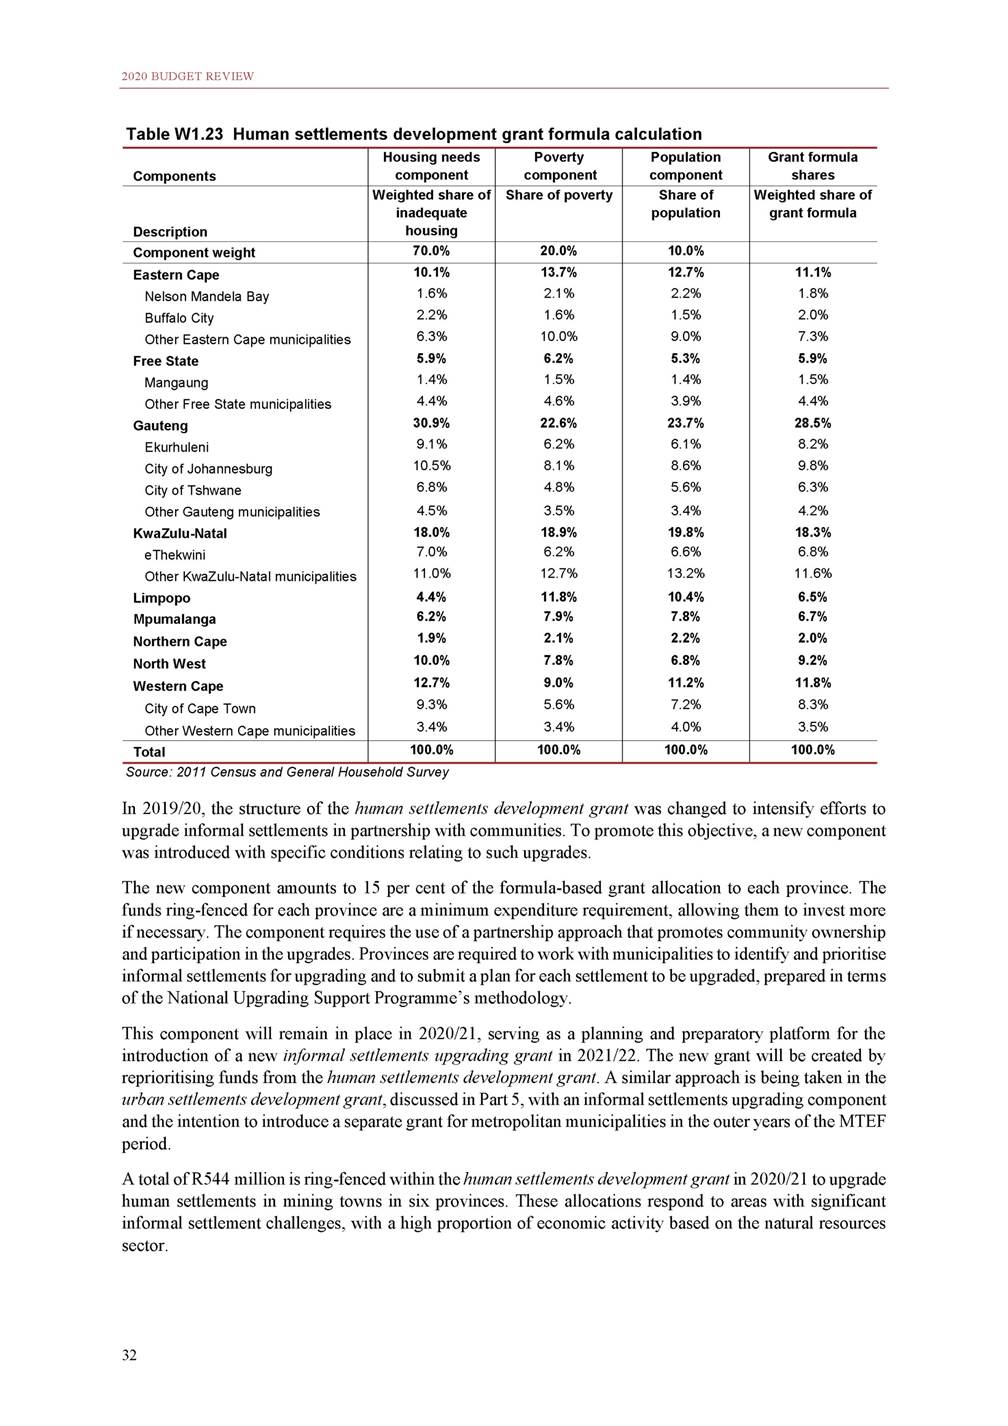
ANNEXURE W1: EXPLANATORY MEMORANDUM TO THE DIVISION OF REVENUE The human settlements development grant previously had funds ring-fenced for the eradication of the pre-2014 title deeds registration backlog. Given the slow progress to date, along with the impairment it had on the functioning of the property market, the title deeds restoration grant was introduced to accelerate the backlog eradication process. The grant was introduced in 2018/19 and comes to an end in 2020/21. It has an allocation of R578 million in 2021/22, which has been indicatively incorporated back into the human settlements development grant baseline in that year. A provincial emergency housing grant was also introduced in 2018/19 to enable the department to rapidly respond to emergencies by providing temporary housing in line with the Emergency Housing Programme. However, the grant is limited to funding emergency housing following the immediate aftermath of a disaster, and not the other emergency situations listed in the programme. In 2019/20, the grant’s purpose was expanded to fund the repair of houses damaged in disasters, if those repairs are cheaper than the grant’s funding of relocating households to temporary shelter. Over the 2020 MTEF period, a total of R932 million has been allocated to this grant. Public works and infrastructure grants The expanded public works programme (EPWP) integrated grant for provinces incentivises provincial departments to use labour-intensive methods in infrastructure, environmental and other projects. Grant allocations are determined upfront based on the performance of provincial departments in meeting job targets in the preceding financial year. The grant is allocated R1.3 billion over the MTEF period. The fiscal consolidation reductions to this grant are equivalent to 9 per cent of the grant’s baseline in 2020/21, 10 per cent in 2021/22 and 10.1 per cent in 2022/23. The social sector EPWP incentive grant for provinces rewards provinces for creating jobs in the preceding financial year in the areas of home-based care, early childhood development, adult literacy and numeracy, community safety and security, and sports programmes. The grant’s allocation model incentivises provincial departments to participate in the EPWP and measures the performance of each province relative to its peers, providing additional incentives to those that perform well. The grant is allocated R1.3 billion over the MTEF period. The fiscal consolidation reductions to this grant are equivalent to 9 per cent of the grant’s baseline in 2020/21, 10 per cent in 2021/22 and 10.1 per cent in 2022/23. Social development grants The early childhood development grant supports government’s prioritisation of early childhood development, as envisioned in the National Development Plan. The grant aims to improve poor children’s access to early childhood programmes and ensure that early childhood centres have adequate infrastructure. The grant baseline totals R3.2 billion over the 2020 MTEF period, which includes an additional R1.4 billion. For 2020/21, the additional allocations have been used to increase the per-child subsidy from R15 per day to R17 per day in 2020/21. The subsidy is then projected to increase in line with inflation to R17.77 in 2021/22 and R18.57 in 2022/23. The grant additions cover the cost of increasing the per-child subsidies funded from the provincial equitable share in 2020/21 as well as those funded directly from the grant. The additions also fund a small expansion in access to early childhood development services, which can be implemented by increasing the number of subsidies for centre-based early childhood development services or by providing subsidies for non-centre-based early childhood development services. The allocation of funds in the maintenance component of the grant, for the two outer years of the 2020 MTEF period, will be informed by the outcomes of the infrastructure assessments that need to be conducted in each province. As a result, 80 per cent of the allocations in this component remain unallocated in these two outer years. Sports, arts and culture grants The community library services grant, administered by the Department of Sports, Arts and Culture, aims to help South Africans access information to improve their socio-economic situation. The grant is allocated to the relevant provincial department and administered by that department or through a service-level agreement 33
2020 BUDGET REVIEW with municipalities. In collaboration with provincial departments of basic education, the grant also funds libraries that serve both schools and the general public. Funds from this grant may also be used to enable the shift of the libraries function between provinces and municipalities. The grant is allocated R4.7 billion over the next three years. The fiscal consolidation reductions to this grant are equivalent to 6.6 per cent of the grant’s baseline in 2020/21, 5.7 per cent in 2021/22 and 4.7 per cent in 2022/23. The mass participation and sport development grant aims to increase and sustain mass participation in sport and recreational activities in the provinces, with greater emphasis on provincial and district academies. Over the MTEF period, an amount of R90 million has been reprioritised within this grant to support the Netball World Cup, which will be hosted in the Western Cape in 2023. The grant is allocated R1.9 billion over the medium term. The fiscal consolidation reductions to this grant are equivalent to 8.8 per cent of the grant’s baseline in 2020/21, 10 per cent in 2021/22 and 10.5 per cent in 2022/23. Transport grants The public transport operations grant subsidises commuter bus services. It helps ensure that provinces meet their contractual obligations and provide services. Most of the contracts subsidised through this grant continue to operate on long-standing routes that link dormitory towns and suburbs established under apartheid to places of work. The grant allows provinces to renegotiate contracts and routes, and/or to devolve the function and funding to municipalities. This provides an opportunity for routes to be restructured in line with new settlement patterns and to promote more integrated urban development patterns in future. The grant is allocated R21 billion over the MTEF period. The fiscal consolidation reductions to this grant are equivalent to 4 per cent of the grant’s baseline in 2022/23. The provincial roads maintenance grant is a supplementary grant that supports the cost of maintaining provincial roads. Provinces are expected to fund the construction of new roads from their own budgets and supplement the cost of maintaining and upgrading existing roads. Grant allocations are determined using a formula based on provincial road networks, road traffic and weather conditions. These factors reflect the varying costs of maintaining road networks in each province. The grant requires provinces to follow best practices for planning, and to use and regularly update road asset management systems. The incentive portion of the grant is meant to be based on performance indicators relating to traffic loads, safety engineering and visual condition indicators. However, the Department of Transport was unable to provide updated data on the incentive calculation in time to determine incentive allocations for 2020/21. As a result, the full grant is allocated through the formula described above. The Department of Transport and the National Treasury agree that the grant should be used to incentivise improved performance in provincial roads departments and will work together in 2020 to revise the incentive component in time to determine allocations from the R1.6 billion unallocated incentive pool in 2021/22. The total allocation for the MTEF period is R36 billion. The fiscal consolidation reductions to this grant are equivalent to 8.3 per cent of the grant’s baseline in 2021/22 and 9.1 per cent in 2022/23. This grant has been reduced by R500 million in 2020/21 and this amount has been set aside as a provisional allocation to fund disaster recovery projects during the same year. Part 5: Local government fiscal framework and allocations This section outlines the transfers made to local government and how these funds are distributed between municipalities. Funds raised by national government are transferred to municipalities through conditional and unconditional grants. National transfers to municipalities are published to enable them to plan fully for their 2020/21 budgets, and to promote better accountability and transparency by ensuring that all national allocations are included in municipal budgets. Over the 2020 MTEF period, R426.4 billion will be transferred directly to local government and a further R23.4 billion has been allocated to indirect grants. Direct transfers to local government over the medium term account for 8.8 per cent of national government’s non-interest expenditure. When indirect transfers are 34
ANNEXURE W1: EXPLANATORY MEMORANDUM TO THE DIVISION OF REVENUE added to this, total spending on local government expenditure. increases to 9.3 per cent of national non-interest Table W1.24 Transfers to local government 1. Outcome figures for the equitable share reflect amounts transferred after funds have been withheld to offset underspending by municipalities on conditional grants. Roll-over funds are reflected in the year in which they were transferred Source: National Treasury The local government fiscal framework responds to the constitutional assignment of powers and functions to this sphere of government. The framework refers to all resources available to municipalities to meet their expenditure responsibilities. National transfers account for a relatively small proportion of the local government fiscal framework, with the majority of local government revenues being raised by municipalities themselves through their substantial revenue-raising powers. However, each municipality varies dramatically, with poor rural municipalities receiving most of their revenue from transfers, while urban municipalities raise the majority of their own revenues. This differentiation in the way municipalities are funded will continue in the period ahead. As a result, transfers per household to the most rural municipalities are more than twice as large as those to metropolitan municipalities. Figure W1.2 Per household allocations to municipalities, 2020/21* *Reflects funds allocated through Division of Revenue Bill. Allocations to district municipalities are reassigned to local municipalities where possible Source: National Treasury 35 R thousands Aver age equitable share per h ouseho ld Aver age cond ition al grant per hou seh old 10 8 6 4 2 0 Me tros (8) Secondary cities (19) Large towns (26) Small towns (99) Mostly r ural municipalities (61) 4.2 3.8 7.2 2.5 5.9 2.3 2.3 4.5 3.5 2.6 2016/172017/182018/19 Outcome R million 2019/20 Adjusted budget 2020/212021/222022/23 Medium-term estimates Direct transfers102 867111 103118 488 Equitable share and related50 70955 61460 758 Equitable share formula145 25949 92855 072 RSC levy replacement4 5674 7954 795 Support for councillor883891891 remuneration and ward committees General fuel levy sharing11 22411 78512 469 with metros Conditional grants40 93443 70445 262 Infrastructure39 25941 88843 862 Capacity building and other1 6751 8151 400 Indirect transfers8 1127 8037 770 Infrastructure8 0937 6997 699 Capacity building and other1910371 127 209 68 973 62 648 5 357 969 13 167 45 068 43 172 1 897 7 024 6 913 111 132 529142 442151 445 74 68381 06287 213 68 06374 09079 913 5 6525 9636 249 9691 0091 051 14 02715 18216 085 43 81946 19848 147 41 86044 13045 998 1 9592 0672 149 7 6287 2298 161 7 5007 0938 020 128135140 Total110 979118 905126 258 134 233 140 157149 671159 605
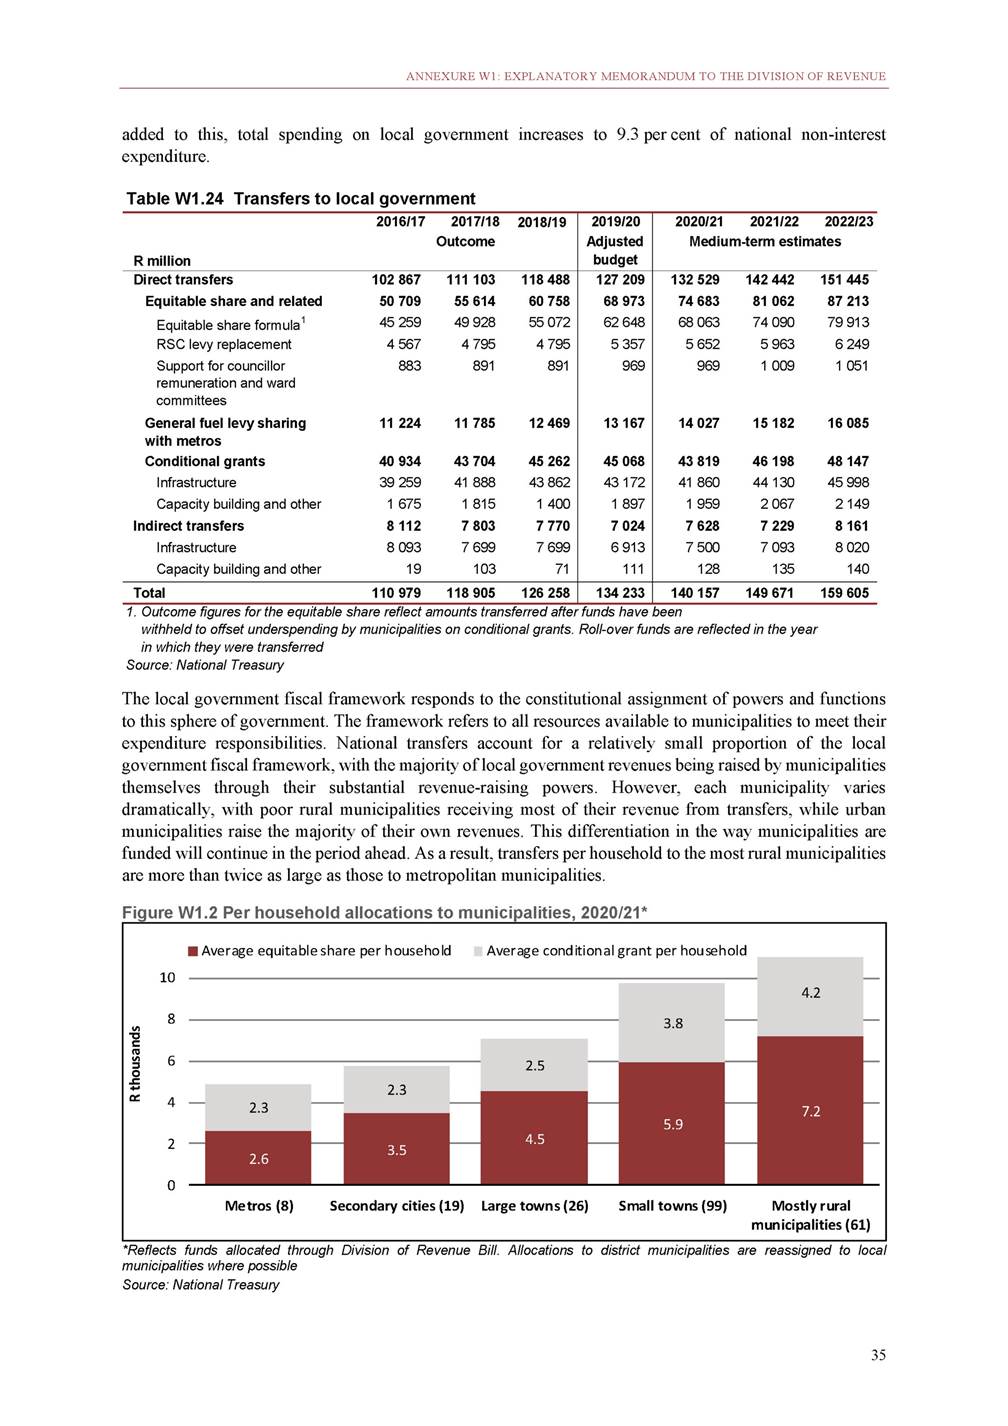
2020 BUDGET REVIEW Changes to local government allocations Over the next three years, above-inflation growth in allocations to the local government equitable share continues, while growth in conditional grants is slower as a result of reductions announced in the 2019 MTBPS. As a result, total direct allocations to local government grow at an annual average rate of 6.6 per cent over the MTEF period. The changes to each local government allocation are summarised in Table W1.25. Table W1.25 Revisions to direct and indirect transfers to local government Source: National Treasury 36 2020/212021/222022/23 R million 2020 MTEF Total revisions Technical adjustments––– Direct transfers-330-60-70 Municipal infrastructure-206-52-57 Urban settlements development2 835–– Integrated urban development565257 Neighbourhood development partnership-30-60-70 Informal settlements upgrading partnership-2 985–– Indirect transfers3306070 Neighbourhood development partnership306070 Regional bulk infrastructure400–– Water services infrastructure-100–– – -460 -316 2 835 166 -160 -2 985 460 160 400 -100 Additions to baselines250–– Indirect transfers250–– Regional bulk infrastructure250–– 250 250 250 Reductions to baselines-5 083-7 823-8 262 Direct transfers-5 022-6 996-7 982 Local government equitable share-1 000-1 100-1 100 Local government equitable share-1 000-1 100-1 100 Conditional grants-4 022-5 896-6 882 Municipal infrastructure-783-842-882 Water services infrastructure-426-541-698 Urban settlements development-1 270-1 968-2 554 Integrated national electrification programme-119-128-134 Integrated urban development-47-51-53 Public transport network-1 049-1 570-1 727 Neighbourhood development partnership-65-77-81 Integrated city development-10-11-11 Rural roads asset management systems-12-13-13 Informal settlements upgrading partnership–-438-459 Regional bulk infrastructure-174-187-196 Energy efficiency and demand-side management-22-23-24 Local government financial management-17-18-19 Expanded public works programme-23-24-26 Infrastructure skills development-5-5-5 Indirect transfers-61-826-279 Integrated national electrification programme-61-826-279 -21 168 -20 001 -3 200 -3 200 -16 801 -2 506 -1 665 -5 793 -380 -151 -4 347 -224 -31 -38 -898 -558 -68 -53 -73 -15 -1 167 -1 167 Total change to local government allocations Change to direct transfers-5 352-7 056-8 052 Change to indirect transfers519-766-209 -20 461 -457 Net change to local government allocations-4 833-7 823-8 262 -20 918
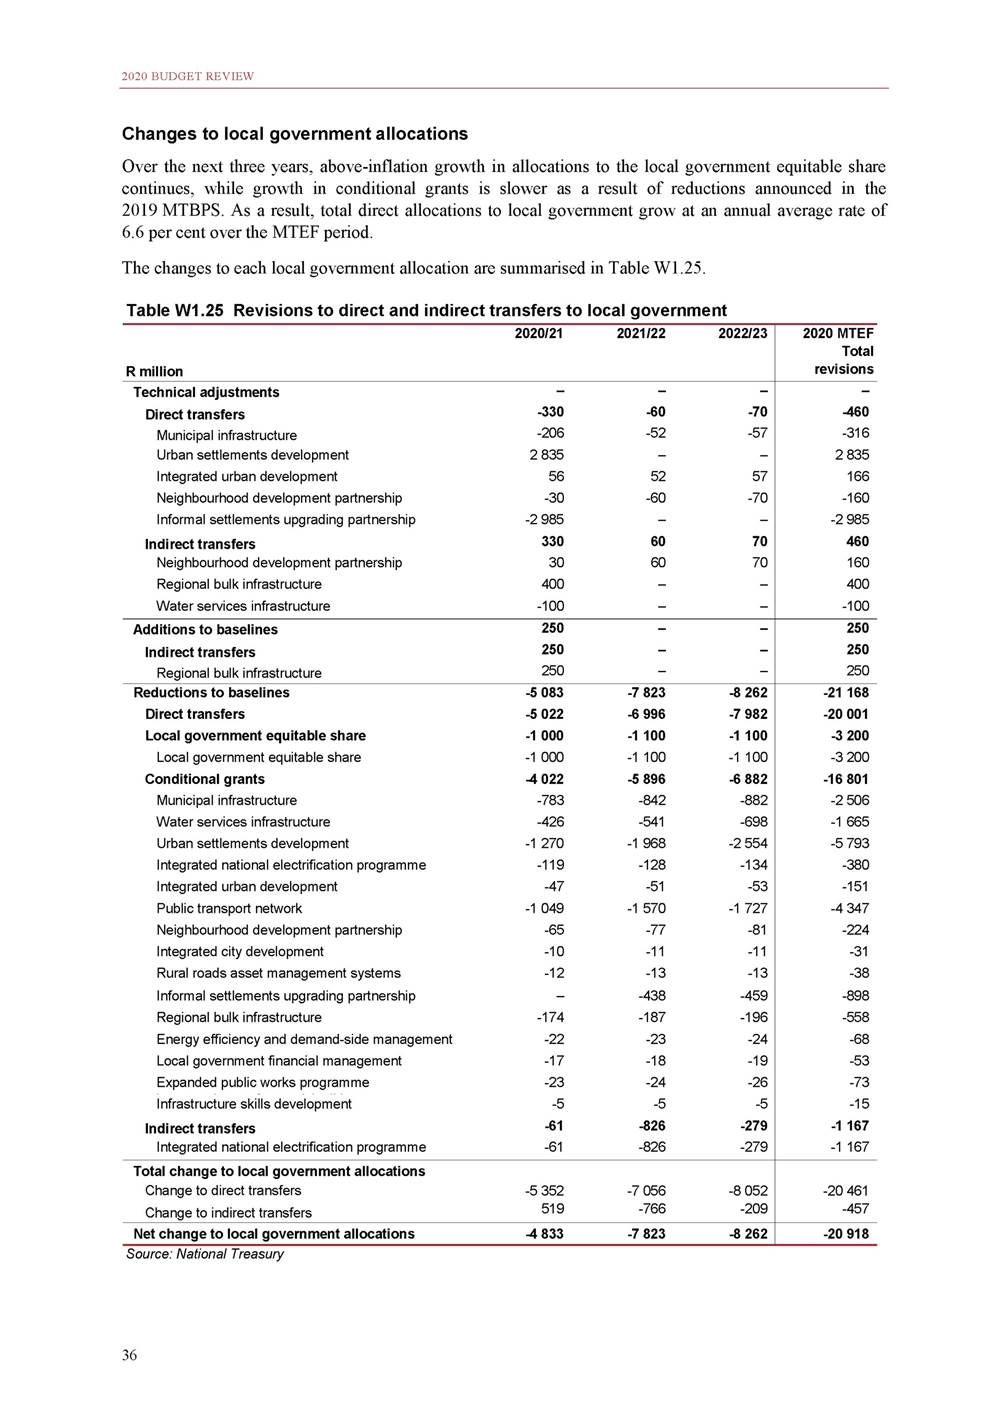
ANNEXURE W1: EXPLANATORY MEMORANDUM TO THE DIVISION OF REVENUE Technical adjustments in Table W1.25 summarise the shifting of funds between different local government allocations, but do not change the total amount allocated to local government. These changes to the grants include the shifting of: R400 million in 2020/21 from the municipal infrastructure grant, the water services infrastructure grant and the urban settlements development grant to the indirect regional bulk infrastructure grant to assist in funding the rehabilitation of wastewater treatment infrastructure in the Vaal River System. R160 million from the direct neighbourhood development partnership grant to the indirect component of the grant over the MTEF period. R3 billion that had been indicatively allocated to the new informal settlement upgrading partnership grant in 2020/21. This amount is shifted back to the urban settlements development grant following the decision to extend the informal settlements window within this grant for another year. R166 million over the 2020 MTEF period from the municipal infrastructure grant to the integrated urban development grant for the entry of one additional municipality into the grant. In addition to funds shifted from other local government grants, R250 million has been added to the indirect regional bulk infrastructure grant in 2020/21 to assist with addressing pollution in the Vaal River System. These funds were reprioritised from allocations in other spheres of government. The local government equitable share is reduced by R3.2 billion over the 2020 MTEF period as part of the fiscal consolidation measures announced in the 2019 MTBPS. The reductions in 2020/21 and 2021/22 eliminate the unallocated funds set aside in the equitable share to provide for possible higher increases in bulk costs. As a result, these reductions will not affect the indicative allocations for individual municipalities. Reductions to local government conditional grants, due to fiscal consolidation measures announced in the 2019 MTBPS, were determined taking account of the factors described in Part 2 of this annexure. These reductions to direct conditional grants to local government total R16.8 billion over the 2020 MTEF period. Indirect grants to local government have been reduced by R1.2 billion over the medium term, through a reduction to the indirect integrated national electrification programme grant. The details are discussed later under individual grants. The local government equitable share In terms of section 227 of the Constitution, local government is entitled to an equitable share of nationally raised revenue to enable it to provide basic services and perform its allocated functions. The local government equitable share is an unconditional transfer that supplements the revenue that municipalities can raise themselves (including revenue raised through property rates and service charges). The equitable share provides funding for municipalities to deliver free basic services to poor households and subsidises the cost of administration and other core services for those municipalities with the least potential to cover these costs from their own revenues. In the process of determining the baseline for the outer year (2022/23) of the 2020 MTEF period, the local government equitable share allocation has grown by 7.6 per cent, well above the standard 4.8 per cent baseline increase. The difference is equivalent to an amount of R2.2 billion in that year. This should cover the anticipated increase in the costs of providing free basic services to a growing number of households, and accounts for likely above-inflation increases in the costs of bulk water and electricity. It will also allow for above-inflation increases in allocations to poorer and rural municipalities through the redistributive components of the equitable share formula. Over the 2020 MTEF period, the local government equitable share, including the Regional Service Council/Joint Service Board (RSC/JSB) levies replacement grant and special support for councillor remuneration and ward committees grant, amounts to R243 billion (R74.7 billion in 2020/21, R81.1 billion in 2021/22 and R87.2 billion in 2022/23). Due to previous increases, as well as the revised baseline for 2022/23, the local government equitable share grows at an average annual rate of 8.1 per cent over the MTEF period. 37
2020 BUDGET REVIEW Formula for allocating the local government equitable share The portion of national revenue allocated to local government through the equitable share is determined in the national budget process and endorsed by Cabinet (the vertical division). Local government’s equitable share is divided among the country’s 257 municipalities, using a formula to ensure objectivity (the horizontal division). The principles and objectives of the formula are set out in detail in the Explanatory Memorandum to the 2013 Division of Revenue. Structure of the local government equitable share formula The formula uses demographic and other data to determine each municipality’s portion of the local government equitable share. It has three parts, made up of five components: The first part of the formula consists of the basic services component, which provides for the cost of free basic services for poor households. The second part enables municipalities with limited resources to afford basic administrative and governance capacity, and perform core municipal functions. It does this through three components: •The institutional component provides a subsidy for basic municipal administrative costs. •The community services component provides funds for other core municipal services not included under basic services. •The revenue adjustment factor ensures that funds from this part of the formula are only provided to municipalities with limited potential to raise their own revenue. Municipalities that are least able to fund these costs from their own revenues should receive the most funding. The third part of the formula provides predictability and stability through the correction and stabilisation factor, which ensures that all of the formula’s guarantees can be met. Each of these components is described in detail in the sub-sections that follow. The basic services component This component helps municipalities provide free basic water, sanitation, electricity and refuse removal services to households that fall below an affordability threshold. Following municipal consultation, the formula’s affordability measure (used to determine how many households need free basic services) is based on the level of two state old age pensions. When the 2011 Census was conducted, the state old age pension was worth R1 140 per month, which means that two pensions were worth R2 280 per month. A monthly household income of R2 300 per month in 2011 has therefore been used to define the formula’s affordability threshold. Statistics South Africa has calculated that 59 per cent of all households in South Africa fall below this income threshold. However, the proportion in each municipality varies widely. In 2020 terms, this monthly income is equivalent to about R3 700 per month. This threshold is not an official poverty line or a required level to be used by municipalities in their own indigence policies. If municipalities choose to provide fewer households with free basic services than they are funded for through the local government 38 Structure of the local government equitable share formula LGES = BS + (I + CS)xRA ± C where LGES is the local government equitable share BS is the basic services component I is the institutional component CS is the community services component RA is the revenue adjustment factor C is the correction and stabilisation factor
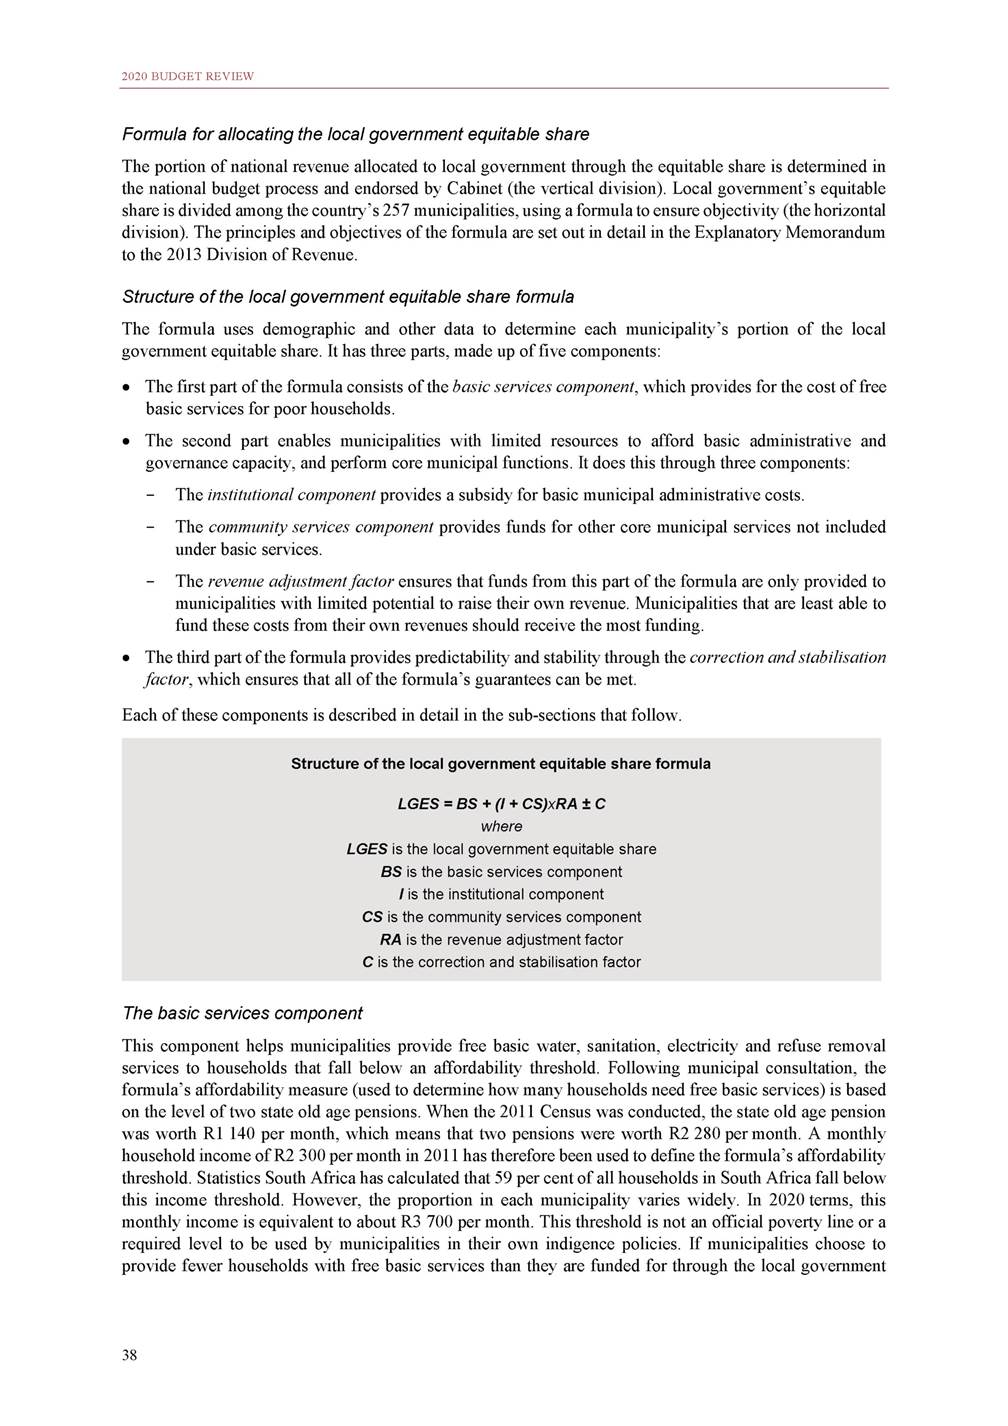
ANNEXURE W1: EXPLANATORY MEMORANDUM TO THE DIVISION OF REVENUE equitable share, then their budget documentation should clearly set out why they have made this choice and how they have consulted with their community during the budget process. The number of households per municipality, and the number below the poverty threshold, is updated annually. The number of households per municipality used to calculate indicative allocations for the outer years of the MTEF period is updated based on the growth experienced between the 2001 Census and the 2016 Community Survey. Provincial growth rates are then rebalanced to match the average annual provincial growth reported between 2002 and 2018 in the annual General Household Survey. Statistics South Africa has advised the National Treasury that, in the absence of official municipal household estimates, this is a credible method of estimating the household numbers per municipality needed for the formula. Statistics South Africa is researching methods for producing municipal-level data estimates, which may be used to inform equitable share allocations in future. The proportion of households below the affordability threshold in each municipality is still based on 2011 Census data. This is because the 2016 Community Survey did not publish data on household income. The total number of households in each municipality is adjusted every year to account for growth. Although the share of households subsidised for free basic services through the formula remains constant, the number of households subsidised increases annually in line with estimated household growth. The basic services subsidy is typically allocated to 100 per cent of households that fall below the poverty threshold. This is the case in 2020/21 and 2021/22. In 2022/23, the subsidy is allocated to 99.4 per cent of households below the poverty threshold to ensure that the effect of the reduction in that year is spread across all the components of the formula. The number of households that receive free basic services should not be affected because municipalities have not yet extended the provision of free basic services to reach all poor households. The basic services subsidy will fund: 10.4 million households in 2020/21. 10.6 million households in 2021/22. 10.8 million households in 2022/23. The basic services component provides a subsidy of R435.04 per month in 2020/21 for the cost of providing basic services to each of these households. The subsidy includes funding for the provision of free basic water (six kilolitres per poor household per month), energy (50 kilowatt-hours per month) and sanitation and refuse removal (based on service levels defined by national policy). The monthly amount provided for each service is detailed in Table W1.26 and includes an allocation of 10 per cent for service maintenance costs. Table W1.26 Amounts per basic service allocated through the local government equitable share, 2020/21 Source: National Treasury The formula uses the fairest estimates of the average costs of providing each service that could be derived from available information. More details of how the costs were estimated can be found in the discussion paper on the proposed structure of the new local government equitable share formula, available on the National Treasury website. The per-household allocation for each of the basic services in Table W1.26 is updated annually based on the following factors. The electricity cost estimate is made up of bulk and other costs. Bulk costs are updated based on the bulk price determination approved by the National Energy Regulator of South Africa. In March 2019, the 39 Allocation per household below affordability threshold (R per month) Total allocation per service (R million) Energy Water Sanitation Refuse removal Operations Maintenance Total 84.30 130.38 96.21 80.65 9.37 14.49 10.69 8.96 93.66 144.86 106.90 89.61 11 645 18 011 13 290 11 141 Total basic services 391.53 43.50 435.04 54 087
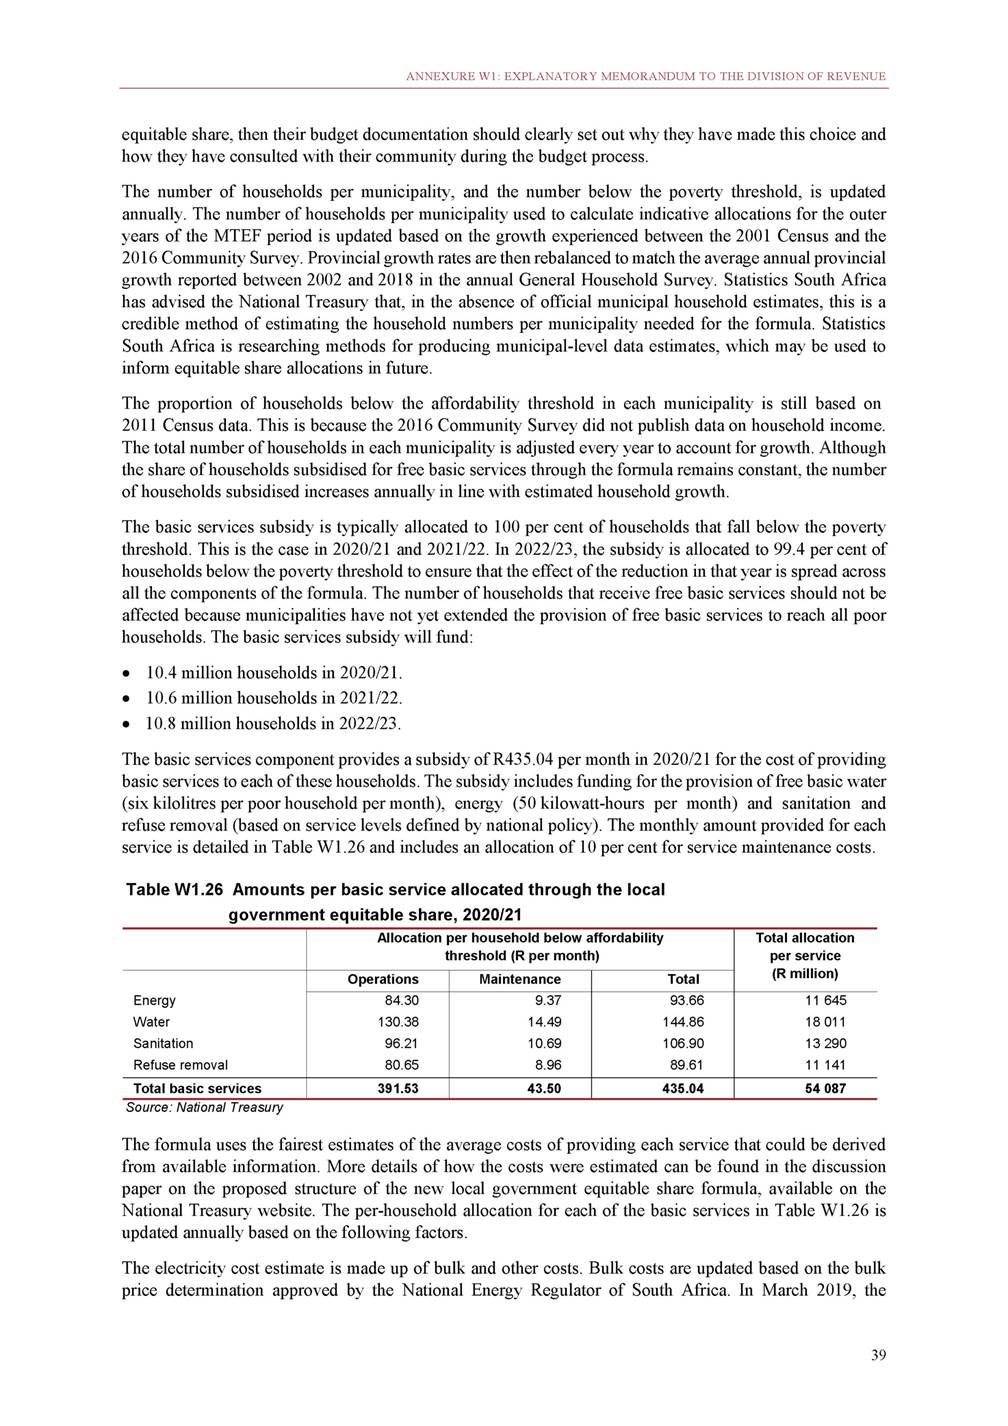
2020 BUDGET REVIEW regulator approved tariff increases of 9.4 per cent in 2019/20, 8.1 per cent in 2020/21 and 5.2 per cent in 2021/22. However, Eskom submitted an application to the court to increase the bulk tariffs. While the court has found merit in Eskom’s case, it has ruled that the matter is not urgent. The court will only rule on the merits of the case after the 2020 Budget has been tabled. Due to uncertainty about the exact tariffs for the municipal financial years (which are different to those for national financial years) and the pending court decision, the equitable share formula continues to use the 8 per cent bulk tariff increase in 2020/21 and 2021/22 that was used when the baselines for these years were calculated in the 2018 and 2019 MTEF periods. The electricity cost estimate for 2022/23 is calculated using an electricity price bulk increase of 8.9 per cent, which is the average annual tariff increase for the National Energy Regulator of South Africa’s multi-year price determination period of 1 April 2019 to 31 March 2022. Other (non-bulk) electricity costs are updated based on the National Treasury’s inflation projections in the 2019 MTBPS. The water cost estimate is also made up of bulk and other costs. Bulk costs are updated based on the average increase in bulk tariffs charged by water boards (although not all municipalities purchase bulk water from water boards, their price increases serve as a proxy for the cost increases for all municipalities). The average tariff increases for bulk water from water boards in 2019/20 was 10.4 per cent. Other costs are updated based on the National Treasury’s inflation projections in the 2019 MTBPS. The costs for sanitation and refuse removal are updated based on the National Treasury’s inflation projections in the 2019 MTBPS. The basic services component allocation to each municipality is calculated by multiplying the monthly subsidy per household by the updated number of households below the affordability threshold in each municipal area. Funding for each basic service is allocated to the municipality (metro, district or local) that is authorised to provide that service. If another municipality provides a service on behalf of the authorised municipality, it must transfer funds to the provider in terms of section 29 of the Division of Revenue Act. The basic services component is worth R54.1 billion in 2020/21 and accounts for 79.5 per cent of the value of the local government equitable share formula allocation. The institutional component To provide basic services to households, municipalities need to be able to run a basic administration. Most municipalities should be able to fund the majority of their administration costs with their own revenue. But, because poor households are not able to contribute in full, the equitable share includes an institutional support component to help meet some of these costs. To ensure that this component supports municipalities with limited revenue-raising abilities, a revenue adjustment factor is applied so that municipalities with less potential to raise their own revenue receive a larger proportion of the allocation. The revenue adjustment factor is described in more detail later in this annexure. In 2020/21, this component consists of a base allocation of R7.4 million, which goes to every municipality, and an additional amount that is based on the number of council seats in each municipality. This reflects the relative size of a municipality’s administration and is not intended to fund the costs of councillors only (the Minister of Cooperative Governance and Traditional Affairs determines the number of seats recognised for the formula). The base allocation acknowledges that there are some fixed costs that all municipalities face. 40 The basic services component BS = basic services subsidy x number of poor households
ANNEXURE W1: EXPLANATORY MEMORANDUM TO THE DIVISION OF REVENUE The institutional component accounts for 8.2 per cent of the equitable share formula and is worth R5.6 billion in 2020/21. This component is also complemented by special support for councillor remuneration in poor municipalities, which is not part of the equitable share formula. The community services component This component funds services that benefit communities rather than individual households (which are provided for in the basic services component). It includes funding for municipal health services, fire services, municipal roads, cemeteries, planning, storm water management, street lighting and parks. To ensure this component assists municipalities with limited revenue-raising abilities, a revenue adjustment factor is applied so that these municipalities receive a larger proportion of the allocation. The allocation for this component is split between district and local municipalities, which both provide community services. In 2020/21, the allocation to district and metropolitan municipalities for municipal health and other services is R10.39 per household per month. The component’s remaining funds are allocated to local and metropolitan municipalities based on the number of households in each municipality. The community services component accounts for 12.3 per cent of the equitable share formula and is worth R8.4 billion in 2020/21. The revenue adjustment factor The Constitution gives local government substantial revenue-raising powers (particularly through property rates and surcharges on services). Municipalities are expected to fund most of their own administrative costs and cross-subsidise some services for indigent residents. Given the varied levels of poverty across South Africa, the formula does not expect all municipalities to be able to generate similar amounts of own revenue. A revenue adjustment factor is applied to the institutional and community services components of the formula to ensure that the funds assist municipalities that are least likely to be able to fund these functions from their own revenue. To account for the varying fiscal capacities of municipalities, this component is based on a per capita index using the following factors from the 2011 Census: Total income of all individuals/households in a municipality (as a measure of economic activity and earning). Reported property values. Number of households on traditional land. Unemployment rate. Proportion of poor households as a percentage of the total number of households in the municipality. Based on this index, municipalities were ranked according to their per capita revenue-raising potential. The top 10 per cent of municipalities have a revenue adjustment factor of zero, which means that they do not receive an allocation from the institutional and community services components. The 25 per cent of municipalities with the lowest scores have a revenue adjustment factor of 100 per cent, which means that they receive their full allocation from the institutional and community services components. Municipalities between the bottom 25 per cent and top 10 per cent have a revenue adjustment factor applied on a sliding scale, so that those with higher per capita revenue-raising potential receive a lower revenue adjustment factor and those with less potential have a larger revenue adjustment factor. 41 The community services component CS = [municipal health and related services allocation x number of households] + [other services allocation x number of households] The institutional component I = base allocation + [allocation per councillor x number of council seats]
2020 BUDGET REVIEW The revenue adjustment factor is not based on the actual revenues municipalities collect, which ensures that this component does not create a perverse incentive for municipalities to under-collect revenue to receive a higher equitable share. Because district municipalities do not collect revenue from property rates, the revenue adjustment factor applied to these municipalities is based on the RSC/JSB levies replacement grant allocations. This grant replaces a source of own revenue previously collected by district municipalities and it is still treated as an own revenue source in many respects. Similar to the revenue adjustment factor for local and metropolitan municipalities, the factor applied to district municipalities is based on their per capita RSC/JSB levies replacement grant allocations. District municipalities are given revenue adjustment factors on a sliding scale – those with a higher per capita RSC/JSB levies replacement grant allocation receive a lower revenue adjustment factor, while those with lower allocations have a higher revenue adjustment factor. Correction and stabilisation factor Providing municipalities with predictable and stable equitable share allocations is one of the principles of the equitable share formula. Indicative allocations are published for the second and third years of the MTEF period to ensure predictability. To provide stability for municipal planning, while giving national government flexibility to account for overall budget constraints and amend the formula, municipalities are guaranteed to receive at least 90 per cent of the indicative allocation for the middle year of the MTEF period. Ensuring the formula balances The formula is structured so that all of the available funds are allocated. The basic services component is determined by the number of poor households per municipality and the estimated cost of free basic services, so it cannot be manipulated. This means that balancing the formula to the available resources must take place in the second part of the formula, which includes the institutional and community services components. The formula automatically determines the value of the allocation per council seat in the institutional component and the allocation per household for other services in the community services component to ensure that it balances. Increases in the cost of providing basic services can result in lower institutional and community services allocations. Details of new allocations In addition to the three-year formula allocations published in the Division of Revenue Bill, a copy of the formula, including the data used for each municipality and each component, is published online (http://mfma.treasury.gov.za/Media_Releases/LGESDiscussions/Pages/default.aspx). Other unconditional allocations RSC/JSB levies replacement grant Before 2006, district municipalities raised levies on local businesses through a Regional Services Council (RSC) or Joint Services Board (JSB) levy. This source of revenue was replaced in 2006/07 with the RSC/JSB levies replacement grant, which was allocated to all district and metropolitan municipalities based on the amounts they had previously collected through the levies. The RSC/JSB levies replacement grant for metropolitan municipalities has since been replaced by the sharing of the general fuel levy. The RSC/JSB levies replacement grant’s value increases every year. In 2020/21, the grant increases by 7.2 per cent for district municipalities authorised for water and sanitation and 2.4 per cent for unauthorised district municipalities. The different rates recognise the various service-delivery responsibilities of these district municipalities. Special support for councillor remuneration and ward committees Councillors’ salaries are subsidised in poor municipalities. The total value of the support provided in 2020/21 is R969 million, calculated separately to the local government equitable share and in addition to the funding 42
ANNEXURE W1: EXPLANATORY MEMORANDUM TO THE DIVISION OF REVENUE for governance costs provided in the institutional component. The level of support for each municipality is allocated based on a system gazetted by the Minister of Cooperative Governance and Traditional Affairs, which classifies municipal councils into six grades based on their total income and population size. Special support is provided to the lowest three grades of municipal councils (the smallest and poorest municipalities). The Minister of Cooperative Governance and Traditional Affairs last gazetted a notice on the determination of upper limits of salaries in December 2018. This is due to an ongoing review of wages which has resulted in a wage freeze for 2020/21. Using this last notice for maximum remuneration for part-time councillors, cost savings of R46 million are realised in 2020/21, with savings of R55 million carried through in 2021/22 and R63 million in 2022/23. A total of R164 million over the 2020 MTEF period is therefore shifted from support for councillor remuneration and ward committees to the local government equitable share formula. A subsidy of 90 per cent of the gazetted maximum remuneration for a part-time councillor is provided for every councillor in grade 1 municipalities, 80 per cent for grade 2 municipalities and 70 per cent for grade 3 municipalities. In addition to this support for councillor remuneration, each local municipality in grades 1 to 3 receives an allocation to provide stipends of R500 per month to 10 members of each ward committee in their municipality. Each municipality’s allocation for this special support is published in the Division of Revenue Bill appendices. Conditional grants to local government National government allocates funds to local government through a variety of conditional grants. These grants fall into two main groups: infrastructure and capacity building. The total value of conditional grants directly transferred to local government increases from R43.8 billion in 2020/21 to R46.2 billion in 2021/22 and R48.1 billion in 2022/23. There are four types of local government conditional grants: Schedule 4, part B sets out general grants that supplement various programmes partly funded by municipalities. Schedule 5, part B grants fund specific responsibilities and programmes implemented by municipalities. Schedule 6, part B grants provide in-kind allocations through which a national department implements projects in municipalities. Schedule 7, part B grants provide for the swift allocation and transfer of funds to a municipality to help it deal with a disaster or housing emergency. Infrastructure conditional grants to local government National transfers for infrastructure, including indirect or in-kind allocations to entities executing specific projects in municipalities, amount to R155 billion over the 2020 MTEF period. 43
2020 BUDGET REVIEW Table W1.27 Infrastructure grants to local government Source: National Treasury Municipal infrastructure grant The largest infrastructure transfer to municipalities is made through the municipal infrastructure grant, which supports government’s aim to expand service delivery and alleviate poverty. The grant funds the provision of infrastructure for basic services, roads and social infrastructure for poor households in all non-metropolitan municipalities. The grant’s baseline is reduced by R783 million in 2020/21, R842 million in 2021/22 and R882 million in 2022/23. The fiscal consolidation reductions to this grant are equivalent to 5 per cent of the grant’s baseline in 2020/21, 5 per cent in 2021/22 and 5 per cent in 2022/23. These reductions do not include an amount of R166 million shifted to the integrated urban development grant over the 2020 MTEF period, following approval for Steve Tshwete Local Municipality to participate in the programme from 2020/21. In 2020/21, R150 million is reprioritised from this grant to the indirect regional bulk infrastructure grant for the Vaal River system intervention. The total allocations for this grant amount to R47.5 billion over the 2020 MTEF period and grow at an average annual rate of 4.3 per cent. The municipal infrastructure grant is allocated through a formula with a vertical and horizontal division. The vertical division allocates resources between sectors and the horizontal division takes account of poverty, backlogs and municipal powers and functions in allocating funds to municipalities. The five main components of the formula are described in the box below. 44 2016/172017/182018/19 Outcome R million 2019/20 Adjusted budget 2020/212021/222022/23 Medium-term estimates Direct transfers39 25941 88843 862 Municipal infrastructure14 91415 89115 288 Integrated urban development––– Urban settlements development10 83911 38211 306 Informal settlements upgrading––– partnership Integrated city development267292294 Public transport network5 5936 1076 287 Neighbourhood development592658569 partnership Integrated national electrification1 9462 0871 904 programme Rural roads asset management102107108 systems Regional bulk infrastructure1 8501 8291 963 Water services infrastructure2 8313 3054 777 Municipal disaster recovery140261 151 Energy efficiency and demand-side186203215 management 43 172 14 816 857 12 045 – 310 6 468 602 1 863 114 2 066 3 669 133 227 41 86044 13045 998 14 67115 93716 852 9481 0151 075 11 2827 4057 352 –3 9454 181 317341361 6 4466 7977 119 559567593 1 8592 0032 119 108114121 2 0062 1562 281 3 4453 6203 701 ––– 218230243 Indirect transfers8 0937 6997 699 6 913 7 5007 0938 020 Integrated national electrification3 5263 8463 846 programme Neighbourhood development152828 partnership Water services infrastructure298852852 Regional bulk infrastructure3 4222 9742 974 Bucket eradication831–– 3 124 50 644 3 094 – 3 0012 9943 688 6395106 579730771 3 8573 2753 455 ––– Total47 35249 58851 561 50 085 49 36051 22454 018
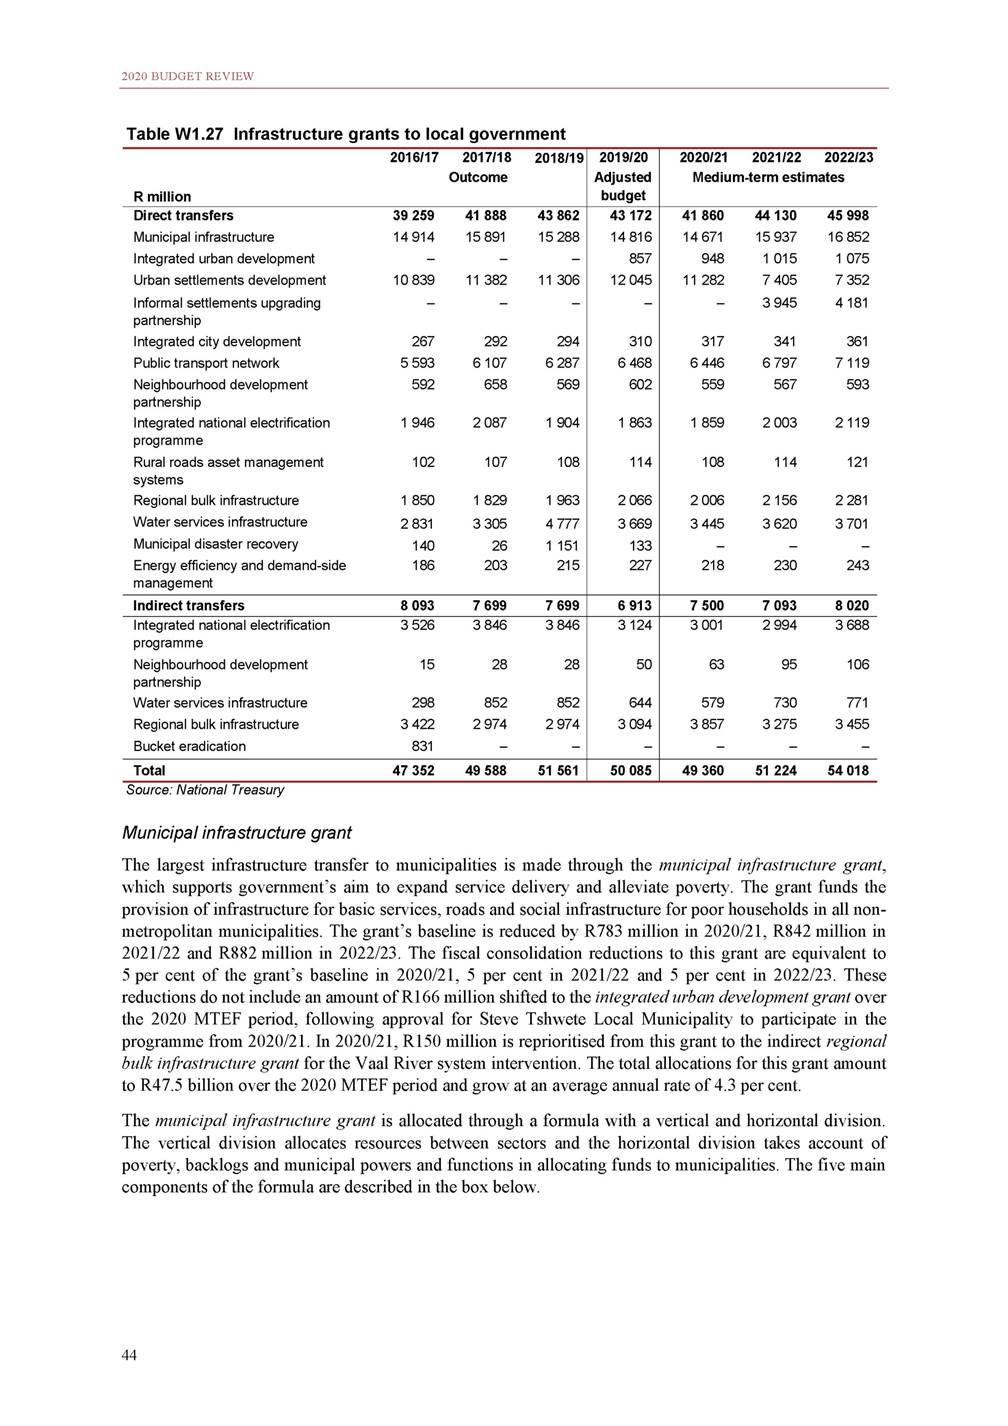
ANNEXURE W1: EXPLANATORY MEMORANDUM TO THE DIVISION OF REVENUE Allocations for the water and sanitation sub-components of the basic services component are based on the proportion of the national backlog for that service in each municipality. Other components are based on the proportion of the country’s poor households located in each municipality. The formula considers poor households without access to services that meet sector standards to be a backlog. Table W1.28 sets out the proportion of the grant accounted for by each component of the formula. The constant component provides a R5 million base to all municipalities receiving municipal infrastructure grant allocations. 45 Data used in the municipal infrastructure grant formula 1.Poor household defined as a monthly household income of less than R2 300 per month in 2011 Census data Component Indicator used in the formula Data used (all data is from the 2011 Census) B Number of water backlogs Number of poor households1 that do not have adequate access to water (adequate access defined as piped water either inside their dwelling, in the yard or within 200 metres of their dwelling) Number of sanitation backlogs Number of poor households that do not have adequate access to sanitation (adequate access defined as having a flush toilet, chemical toilet, pit toilet with ventilation or ecological toilet) Number of roads backlogs Number of poor households Number of other backlogs Number of poor households that do not have access to refuse disposal at Reconstruction and Development Programme levels of service P Number of poor households Number of poor households E Number of poor households Number of poor households N Number of households in nodal areas Allocated to the 27 priority districts identified by Cabinet as having large backlogs. Allocation is based on total households (not poor households) Municipal infrastructure grant = C + B + P + E + N C Constant to ensure a minimum allocation for small municipalities (this allocation is made to all municipalities) B Basic residential infrastructure (proportional allocations for water supply and sanitation, roads and other services such as street lighting and solid waste removal) P Public municipal service infrastructure (including sport infrastructure) E Allocation for social institutions and micro-enterprise infrastructure N Allocation to the 27 priority districts identified by government

2020 BUDGET REVIEW Table W1.28 Municipal infrastructure grant allocations per sector Source: National Treasury The municipal infrastructure grant includes an amount allocated outside of the grant formula and earmarked for specific sport infrastructure projects identified by the Department of Sports, Arts and Culture. These earmarked funds amount to R759 million over the MTEF period (R253 million in each year of the 2020 MTEF period). In addition, municipalities are required to spend a third of the P-component (equivalent to 4.5 per cent of the grant) on sport and recreation infrastructure identified in their own integrated development plans. Municipalities are also encouraged to increase their investment in other community infrastructure, including cemeteries, community centres, taxi ranks and marketplaces. Integrated urban development grant The integrated urban development grant is allocated to selected urban local municipalities in place of the municipal infrastructure grant. The grant recognises that municipalities differ in terms of their context and introduces a differentiated approach to encourage integrated development in cities. It is intended to: Support spatially aligned public infrastructure investment that will lead to functional and efficient urban spaces. Enable and incentivise municipalities to invest more non-grant funding in infrastructure projects in intermediate cities. The grant extends some of the fiscal reforms already implemented in metropolitan municipalities to non-metropolitan cities and is administered by the Department of Cooperative Governance. Municipalities must meet certain criteria and apply to receive the integrated urban development grant instead of the municipal infrastructure grant in terms of a process set out in section 27(5) of the Division of Revenue Act. The qualification criteria cover the following areas: Management stability (low vacancy rates among senior management). Audit findings. Unauthorised, irregular, fruitless and wasteful expenditure. Capital expenditure. Reporting in terms of the Municipal Finance Management Act. To remain in the grant, cities must continue to meet or exceed the entry criteria. If they do not do so, they will be placed on a performance improvement plan. If they still do not meet the criteria in the subsequent year, they will shift back to receiving grant transfers through the municipal infrastructure grant, which comes with closer oversight and support from national and provincial departments. The base allocations a 46 Municipal infrastructureComponent grant (formula) weights Value of component 2020/21 (R million) Proportion of municipal infrastructure grant per sector B-component 75.0% Water and sanitation 72.0% Roads 23.0% Other 5.0% P-component15.0% Sports33.0% E-component5.0% N-component5.0% 9 966 7 176 2 292 498 1 993 658 664 664 67.9% 48.9% 15.6% 3.4% 13.6% 4.5% 4.5% 4.5% Constant 1 130 7.7% Ring-fenced funding for sport infrastructure 253 1.7% Total 14 671 100.0%
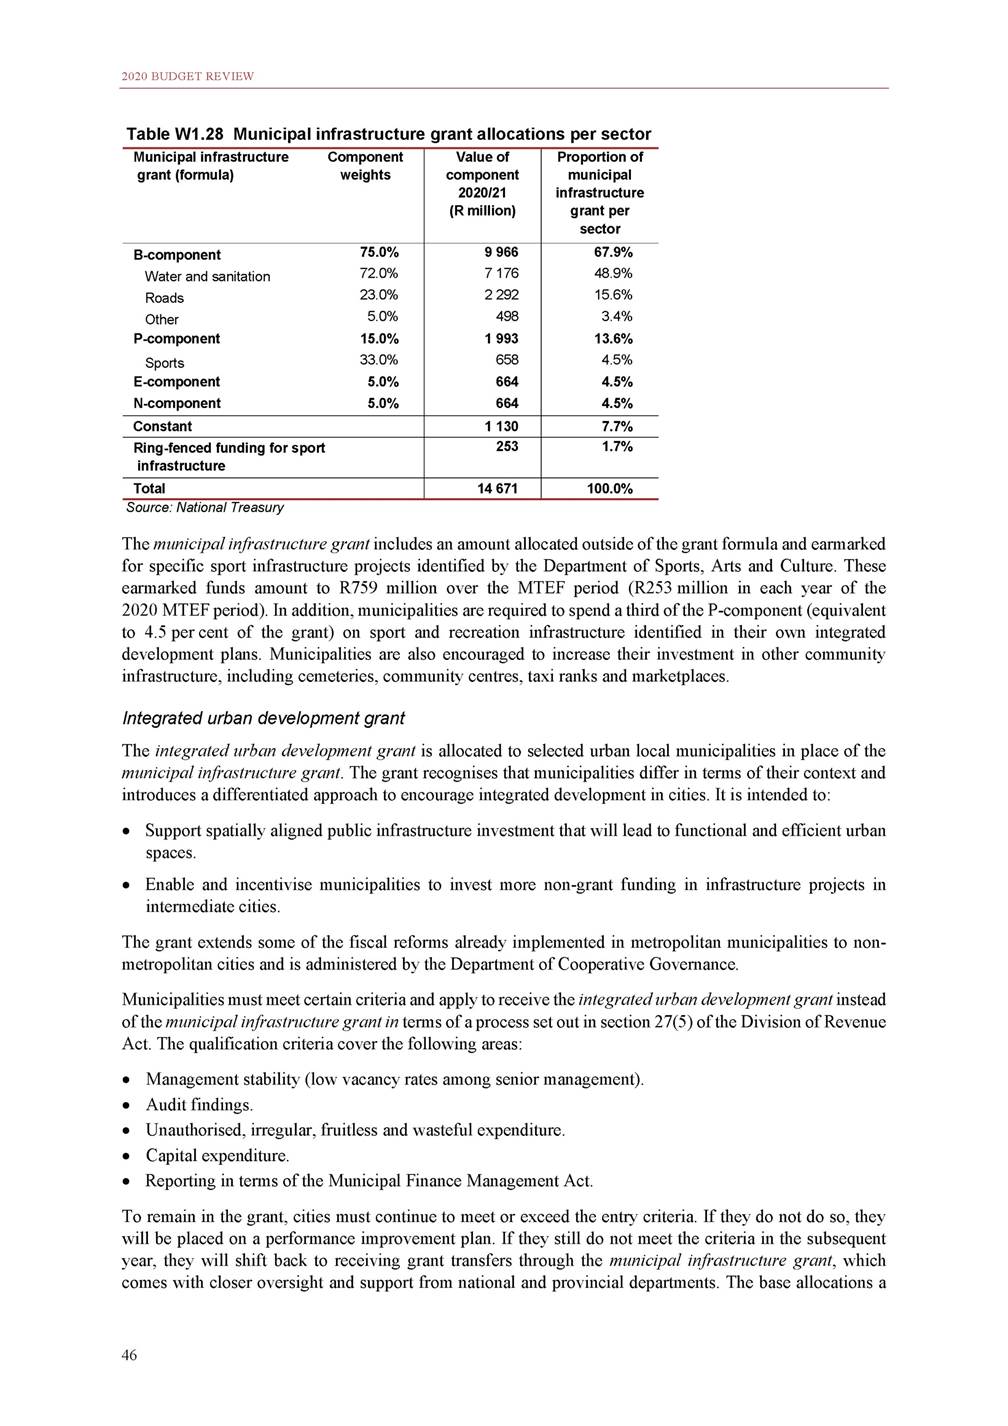
ANNEXURE W1: EXPLANATORY MEMORANDUM TO THE DIVISION OF REVENUE municipality receives through the municipal infrastructure grant and the integrated urban development grant will be the same and are determined in terms of the municipal infrastructure grant formula described above. In addition to the basic formula-based allocation, municipalities participating in the integrated urban development grant are also eligible to receive a performance-based incentive component, which is based on performance against the weighted indicators set out below. Linear scale in between dormant in 2020/21 The allocations for the integrated urban development grant are R948 million in 2020/21, R1 billion in 2021/22 and R1.1 billion in 2022/23. These allocations include additions of R56 million in 2020/21, R52 million in 2021/22 and R57 million in 2022/23, following the addition of Steve Tshwete Local Municipality to the pool of municipalities participating in the grant. The allocations for 2020/21 include R15 million in funds ring-fenced for sports infrastructure projects. These funds were shifted from the municipal infrastructure grant. The fiscal consolidation reductions to this grant are equivalent to 5 per cent of the grant’s baseline in 2020/21, 5 per cent in 2021/22 and 5 per cent in 2022/23. 47 Performance-based component weighted indicators for integrated urban development grant Indicator Purpose Weight Scores 1. Non-grant capital as a percentage of total capital expenditure Encourages cities to increase their capital investment funded through own revenue and borrowing 40% 1 if 70% or higher 0 if 30% or lower Linear scale in between 2. Repairs and maintenance expenditure as percentage of operating expenditure Rewards cities that take good care of their existing asset base 30% 1 if 8% or higher 3. Asset management plan Must have a plan in place, has been approved by municipal council and updated in the last three years 30% 1 if yes for all three 0 if no for any of the three 4. Land-use applications in priority areas 5. Building plan applications in priority areas Due to the lack of available data, these indicators, which are intended to reward spatial targeting of investment, remain 0% 1 if 50% or higher 0 if 10% or lower
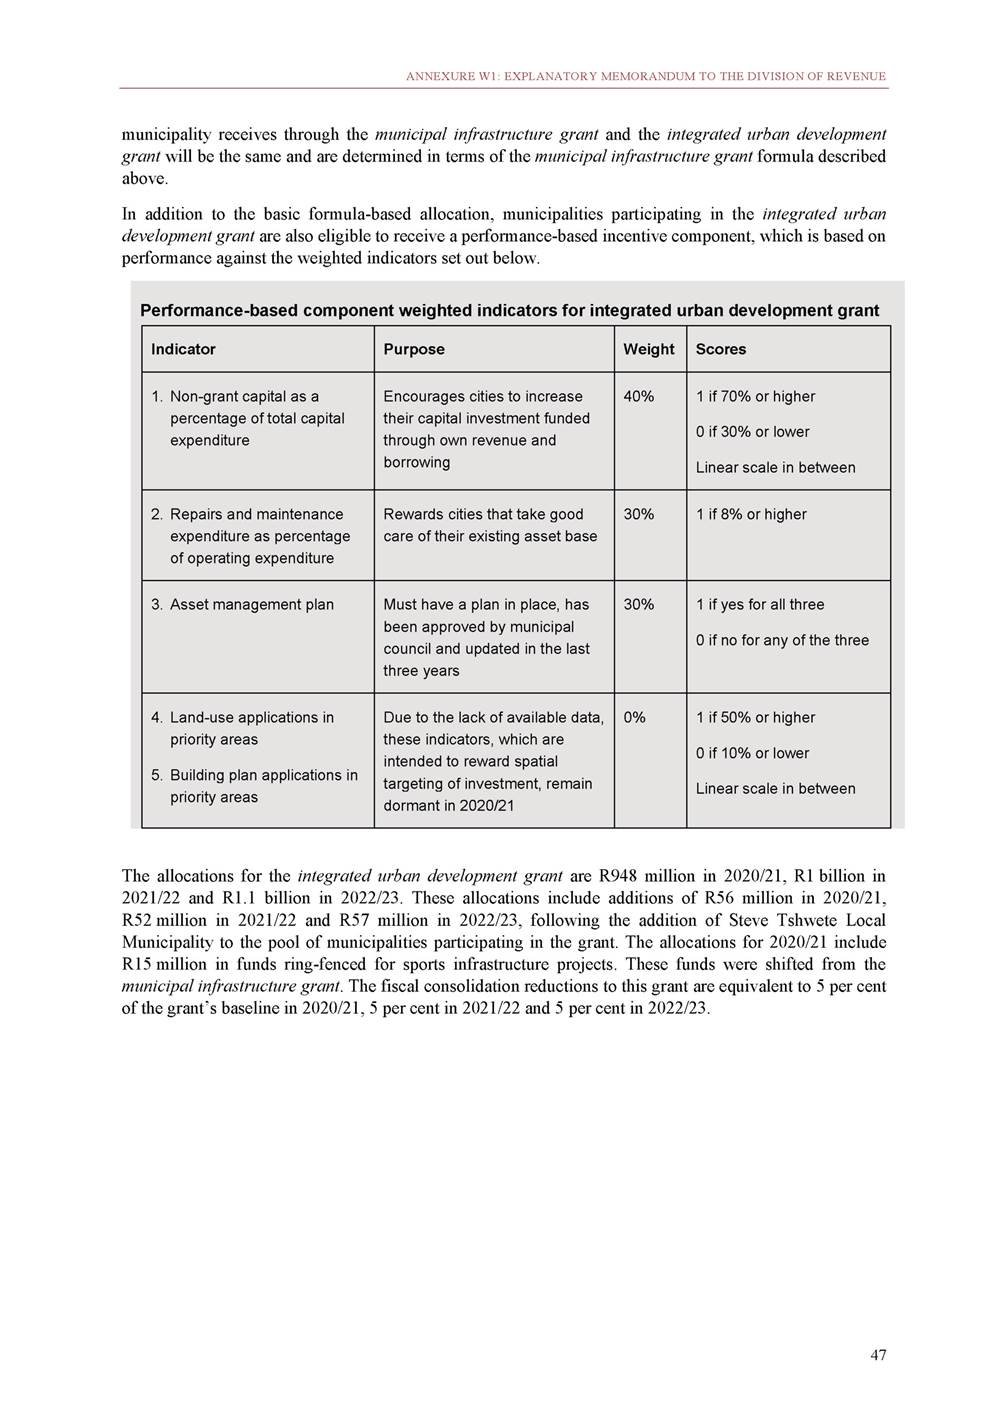
2020 BUDGET REVIEW Table W1.29 Formula for integrated urban development grant incentive component Source: Department of Cooperative Governance Urban settlements development grant The urban settlements development grant is an integrated source of funding for infrastructure for municipal services and upgrades to urban informal settlements in the eight metropolitan municipalities. It is allocated as a supplementary grant to cities (schedule 4, part B of the Division of Revenue Act), which means that municipalities are expected to use a combination of grant funds and their own revenue to develop urban infrastructure and integrated human settlements. Cities report their progress on these projects against the targets set in their service-delivery and budget implementation plans. Since 2019/20, cities have been required to report in line with the requirements of the Municipal Finance Management Act Circular 88. This is the result of a process led by the National Treasury to rationalise and streamline built environment reporting for the eight metropolitan municipalities. Cities report on one agreed set of indicators used by multiple stakeholders to monitor progress on the integrated and functional outcomes, rather than reporting separately to each department. These reforms will progressively be extended to non-metropolitan municipalities over the medium term. As discussed under the human settlements development grant in Part 4, a new component was introduced in 2019/20 for the upgrading of informal settlements. It sets a minimum amount each city must spend on informal settlement upgrades and requires cities to work in partnership with communities. The component has been extended for one more year, to 2020/21, and amounts to 20 per cent of the urban settlements development grant. The extension of this component serves as a planning and preparatory platform for a new informal settlements upgrading partnership grant, planned for 2021/22. Provided the component is a success, the new grant will be created through the reprioritisation of funds from the urban settlements development grant. Initial amounts of R3.9 billion in 2021/22 and R4.2 billion in 2022/23 have been set aside for this new grant in the outer years of the MTEF period. Further details on the new grant are discussed in Part 6. The urban settlements development grant, including allocations for the new informal settlements upgrading partnership grant, is allocated R34.2 billion over the medium term. The allocation per municipality is based on the municipal infrastructure grant formula. Up to 3 per cent of the grant may be used to fund municipal capacity in the built environment in line with the Department of Human Settlements’ capacity-building guideline. Because this grant has been previously reduced by a smaller proportion than the municipal infrastructure grant, the urban settlements development grant is reduced by R1.3 billion in 2020/21, R2 billion in 2021/22 and R2.7 billion in 2022/23 in order to fund other government priorities. The fiscal consolidation reductions to the urban settlements development grant are equivalent to 13.1 per cent of the grant’s baseline in 2020/21, 21 per cent in 2021/22 and 25.8 per cent in 2022/23. Reductions to the informal 48 Planning allocation (R 000) Perfomance incentive Total for incentive and planning (R 000) Non-grant Mainten-Asset Land use capital as ance manage-and percent-spend ment building age of plan plans in total priority capital areas spend Weighted score Total incentive (R 000) uMhlathuze Drakenstein Mogale City Polokwane Ray Nkonyeni Sol Plaatje Stellenbosch Steve Tshwete 3 183 1 048 3 488 10 222 1 834 1 484 1 067 1 782 80% 7% No 76% 5% Yes 14% 2% No 21% 2% No 22% 3% No 15% 2% No 79% 1% No 74% 1% Yes – – – – – – – – 65% 85% 0% 0% 5% 0% 40% 70% 52 680 22 678 – – 2 335 – 10 865 31 761 55 863 23 725 3 488 10 222 4 170 1 484 11 932 33 543 Total 24 108 120 319 144 428
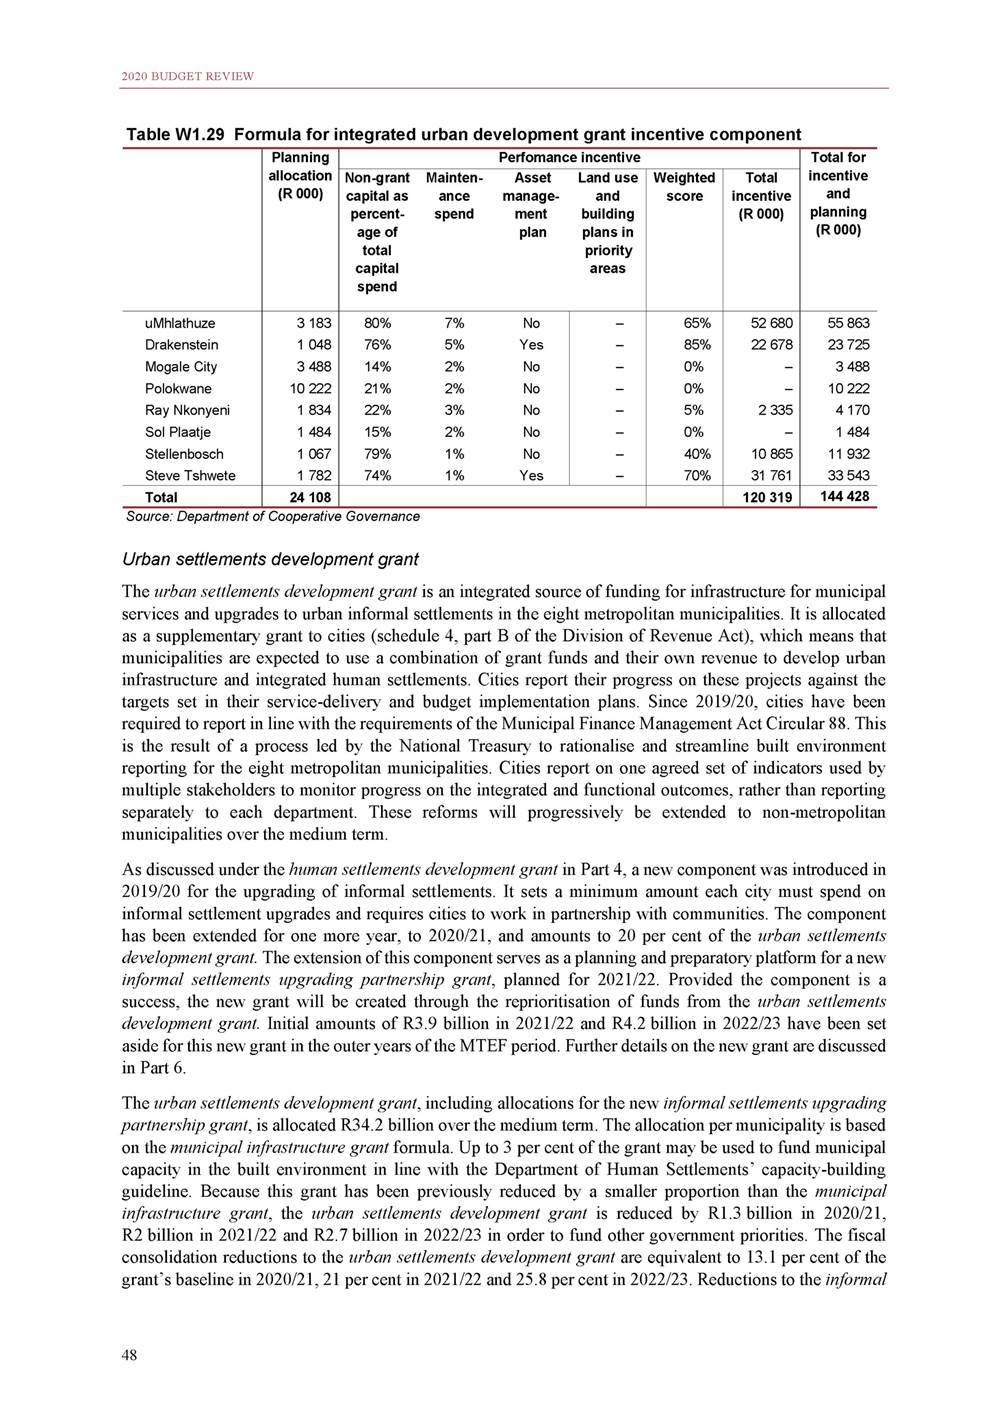
ANNEXURE W1: EXPLANATORY MEMORANDUM TO THE DIVISION OF REVENUE settlement upgrading partnership grant are equivalent to 10 per cent of the grant’s baseline in 2021/22, and 9.9 per cent in 2022/23. In 2020/21 R150 million is reprioritised from the urban settlements development grant to the indirect regional bulk infrastructure grant for the Vaal River system intervention. Integrated city development grant The 2019 MTBPS announced that, subject to certain conditions, programme and project preparation funding would be provided to metros through the grant system. Following consultations with cities, including through the City Budget Forum and a workshop, it has been agreed that cities will be able to use at least half of their integrated city development grant allocations for programme and project preparation activities in 2020/21. The remaining allocations from this grant can be used to complete planned investments funded from the grant, so that the full grant amount can be allocated to programme and project preparation activities from 2021/22. In order to be eligible to use these funds for project preparation costs, metros will need to: Submit a letter to the National Treasury indicating their commitment to establishing and institutionalising an effective system of programme and project preparation. Prove they have not had an adverse or disclaimed audit opinion in the last two financial years. Have formally adopted council resolutions on adopting the Cities Infrastructure Delivery and Management Systems guidelines, establishing a programme and project approval committee, and committing to co-financing contributions and budget management arrangements. Total allocations over the 2020 MTEF period amount to R1 billion and grow at an average annual rate of 5.2 per cent. The fiscal consolidation reductions to this grant are equivalent to 3 per cent of the grant’s baseline in 2020/21, 3 per cent in 2021/22 and 3 per cent in 2022/23. Public transport network grant The public transport network grant, administered by the Department of Transport, helps cities create or improve public transport systems in line with the National Land Transport Act (2009) and the Public Transport Strategy. This includes all integrated public transport network infrastructure, such as bus rapid transit systems, conventional bus services, and pedestrian and cycling infrastructure. The grant also subsidises the operation of these services. It is allocated R20.4 billion over the medium term. The grant has been reduced by R1 billion in 2020/21, R1.6 billion in 2021/22 and R1.7 billion in 2022/23. These fiscal consolidation reductions to this grant are equivalent to 14 per cent of the grant’s baseline in 2020/21, 18.8 per cent in 2021/22 and 19.5 per cent in 2022/23. Of the 13 cities that have been receiving the grant, three have been in the planning phase since the introduction of the grant in the 2006 MTEF period. These three cities have been suspended from the grant for the 2020 MTEF period, but this should have a minimal impact on service delivery because the cities were not transporting any passengers through this grant. The suspended cities are Buffalo City, Mbombela and Msunduzi. Despite support provided by the national Department of Transport, the cities of Cape Town, Johannesburg and eThekwini have not been able to scale up rollout to levels that justify their baseline allocations. As a result, the department proposed reductions to their allocations, based on performance and the ability of the cities to cover the shortfall from own revenue. The allocations for this grant are determined through a formula, which determines 95 per cent of the allocations, and a performance-based incentive component introduced in 2019/20, which accounts for the remaining 5 per cent. The formula increases certainty about the extent of national funding that municipalities can expect when planning their public transport networks, and encourages cities to make more sustainable public transport investments. 49
2020 BUDGET REVIEW To qualify for an allocation from the performance incentive, a city must have an operational municipal public transport system approved by the national Department of Transport and it must have spent more than 80 per cent of its grant allocation in the previous financial year. Incentive allocations are then calculated based on the coverage of costs from fares, passenger trips and the city’s own financial commitment to the system. Cities must exceed the minimum threshold in at least one of these three indicators. The calculation of the performance incentive allocations for 2020/21 is set out in Table W1.30 below. The raw scores for the cities are weighted using the sum of the base and formula components to account for the size of the city. Table W1.30 Public transport network grant incentive Source: National Treasury In the formula for the grant, a base component accounts for 20 per cent of total allocations and is divided equally among all participating cities – this ensures that smaller cities in particular have a significant base allocation to run their transport system regardless of their size. The bulk of the formula (75 per cent) is allocated based on three demand-driven factors, which account for the number of people in a city, the number of public transport users in a city (the weighting of train commuters is reduced as trains are subsidised separately through the Passenger Rail Authority of South Africa) and the size of a city’s economy. Table W1.31 sets out how the final allocation for each municipality is determined, taking account of both the formula and incentive components. 50 Oper-Grant Eligible ational spent in for public 2018/19 incentive transport system Coverage AverageCity's of direct weekday contri-costspassenger bution from trips (% of (% of farebox population) property rates) Raw scores for incentive Incentive allocation for 2020/21 (R 000) Minimum threshold Yes 80% 35.0% 1.00% 2% Buffalo City City of Cape Town City of Johannesburg City of Tshwane Ekurhuleni eThekwini George Mangaung Mbombela Msunduzi Nelson Mandela Bay Polokwane Rustenburg No 99% No Yes 89% Yes Yes 86% Yes Yes 100% Yes Yes 76% No No 63% No Yes 99% Yes No 75% No No 100% No No 100% No Yes 94% Yes No 69% No No 79% No 0.0% 0.00% 0.0% 41.6% 1.61% 6.3% 35.2% 1.13% 3.9% 29.9% 0.15% 1.6% 0.0% 0.00% 0.0% 0.0% 0.00% 0.0% 34.3% 6.20% 8.9% 0.0% 0.00% 0.0% 0.0% 0.00% 0.0% 0.0% 0.00% 0.0% 27.5% 0.80% 2.4% 0.0% 0.00% 0.0% 0.0% 0.00% 0.0% – 0.466 0.063 – – – 0.461 – – – 0.010 – – – 201 785 37 062 – – – 29 513 – – – 1 683 – – Total 1.000 270 043
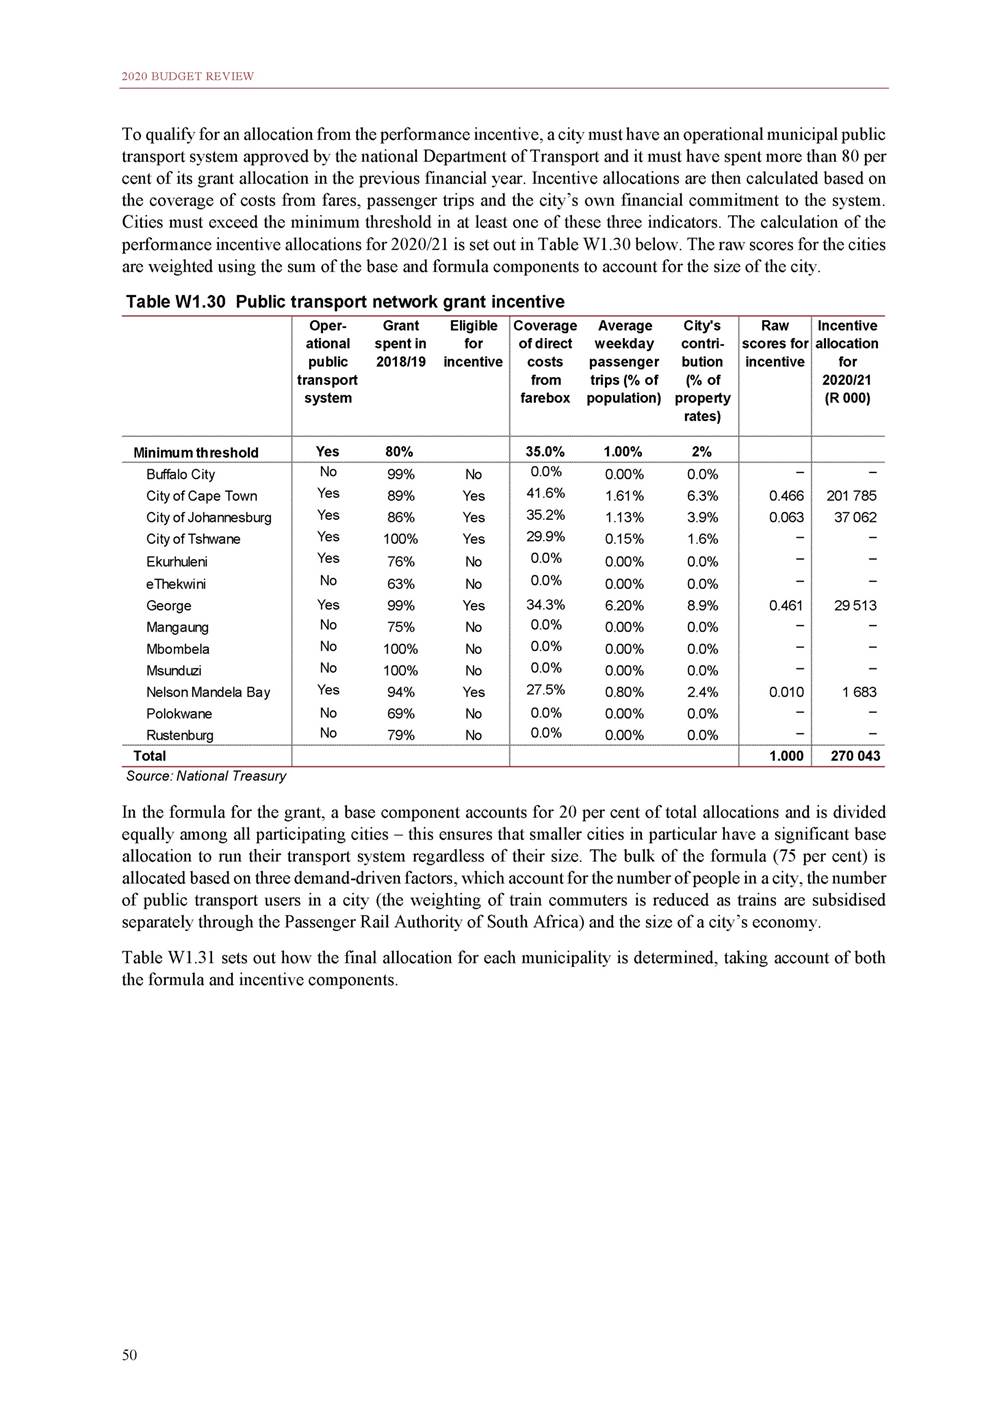
ANNEXURE W1: EXPLANATORY MEMORANDUM TO THE DIVISION OF REVENUE Table W1.31 Formula for the public transport network grant allocations 1. Excludes additional funds for Cape Town allocated through the Budget Facility for Infrastructure 2. These three cities are suspended from the grant Source: National Treasury In addition to the formula and performance incentive, R4 billion is allocated through the public transport network grant over the medium term for the City of Cape Town’s MyCiti public transport network, approved through the Budget Facility for Infrastructure. The facility seeks to support quality public investments through robust project appraisal, effective project development and execution, and sustainable financing arrangements. The process includes engaging with relevant stakeholders, the National Treasury and the Presidential Infrastructure Coordinating Commission. This additional amount will fund a new public transport corridor for the MyCiti network, linking the underserved areas of Khayelitsha and Mitchells Plain to the city centre. Neighbourhood development partnership grant The neighbourhood development partnership grant supports municipalities in developing and implementing urban network plans. The grant funds the upgrading of identified precincts in order to stimulate third-party public and private investment. In metropolitan municipalities, the focus is on upgrading urban hubs in townships. The National Treasury, in collaboration with other stakeholders, including the Department of Agriculture, Rural Development and Land Reform and the Department of Cooperative Governance, has identified a cohort of non-metropolitan municipalities to implement new projects as part of this grant. The National Treasury will be partnering with these municipalities to identify, plan and implement infrastructure upgrades in targeted urban hub precincts. The allocations for this grant in the 2020 MTEF period amount to R2 billion, made up of R1.7 billion for the direct capital component and R263 million for the indirect technical assistance component. An amount of R160 million, consisting of R30 million in 2020/21, R60 million in 2021/22 and R70 million in 2022/23, has been shifted from the direct component to the indirect component. The fiscal consolidation reductions to this grant are equivalent to 10 per cent of the grant’s baseline in 2020/21, 11 per cent in 2021/22 and 10.9 per cent in 2022/23. Water services infrastructure grant This grant, administered by the Department of Water and Sanitation, aims to accelerate the delivery of clean water and sanitation facilities to communities that do not have access to basic water services. It provides 51 Base 20% Demand-driven factors 75% Subtotal: base and demand driven factors Perfomance 5% Fiscal consolidation reductions 100% Equally shared Population Regional Public compo-gross transport nent shares value users addedcompo-compo-nent nent shares shares Incentive compo-nent (R 000) Grant 1 (R 000) Buffalo City2 City of Cape Town City of Johannesburg City of Tshwane Ekurhuleni eThekwini George Mangaung Mbombela2 Msunduzi2 Nelson Mandela Bay Polokwane Rustenburg Unallocated incentive 7.7% 7.7% 7.7% 7.7% 7.7% 7.7% 7.7% 7.7% 7.7% 7.7% 7.7% 7.7% 7.7% 3.3% 2.8% 3.1% 16.3% 15.8% 13.9% 19.3% 25.2% 20.5% 12.7% 15.0% 14.0% 13.8% 9.5% 14.9% 15.0% 15.8% 18.0% 0.8% 0.5% 0.2% 3.3% 2.4% 3.2% 2.6% 1.9% 2.4% 2.7% 1.5% 2.4% 5.0% 4.7% 3.6% 2.7% 1.5% 1.3% 2.4% 3.5% 2.3% 3.8% 13.0% 17.8% 12.0% 11.1% 13.7% 1.9% 3.8% 3.3% 3.2% 4.9% 2.9% 3.6% – 201 785 37 062 – – – 29 513 – – – 1 683 – – – -247 346 -97 766 -133 451 – – -103 087 – – -209 848 -205 360 – – – -52 466 – 944 974 1 051 518 771 954 716 466 783 643 153 645 242 210 – – 316 207 189 292 230 939 – Total 100.0% 100.0% 100.0% 100.0% 95.0% 270 043 -1 049 324 5 400 848
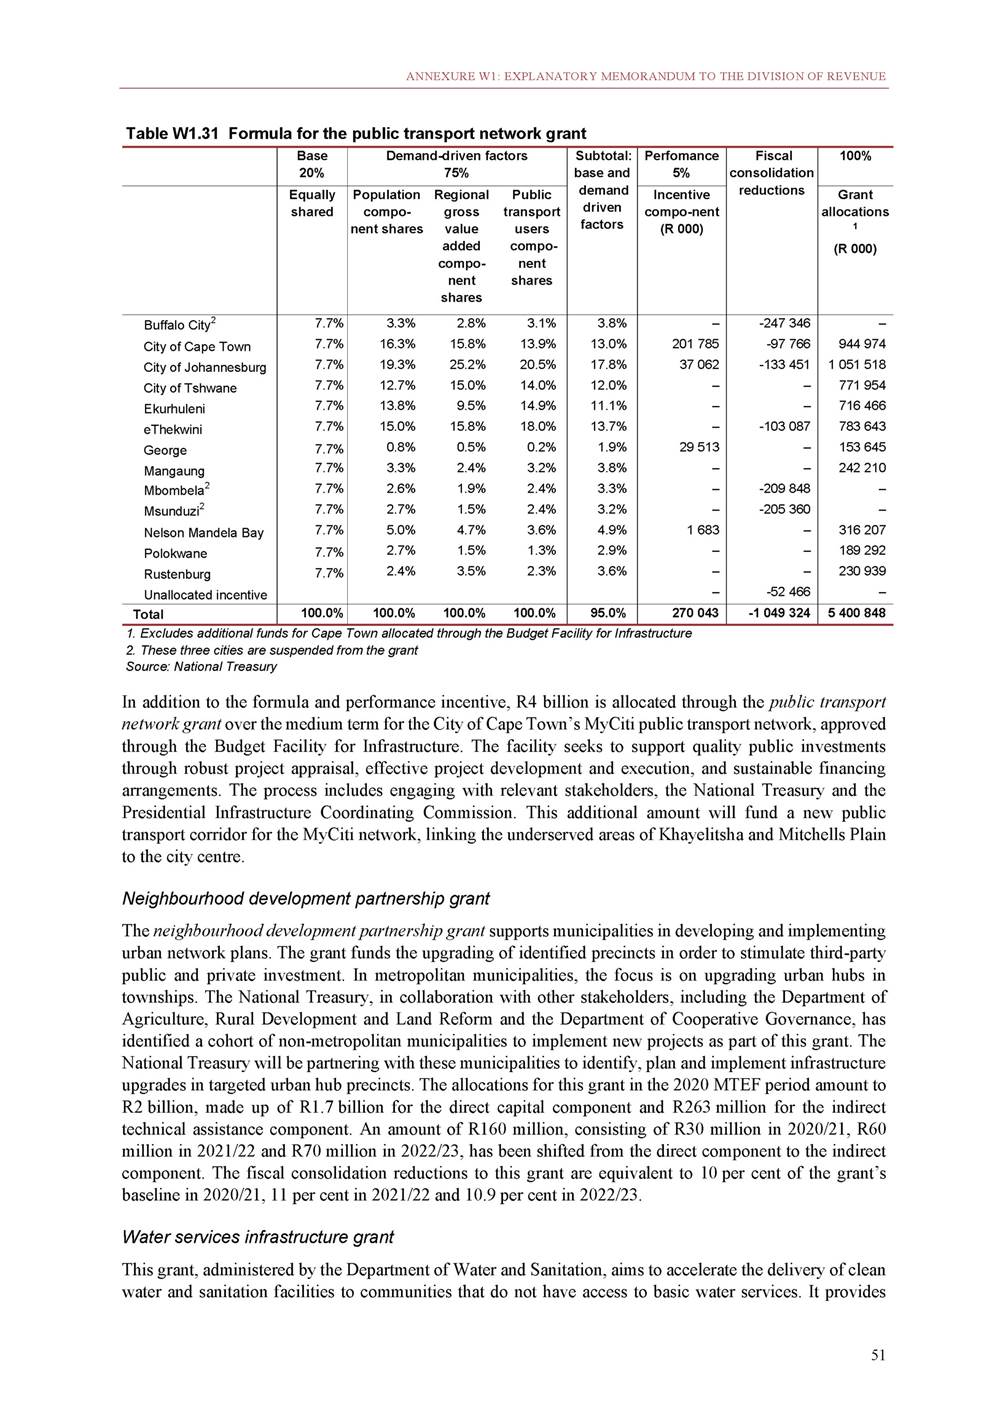
2020 BUDGET REVIEW funding for various projects, including the construction of new infrastructure and the refurbishment and extension of existing water schemes. It has both direct and indirect components. In areas where municipalities have the capacity to implement projects themselves, funds are transferred through a direct grant. In other areas, the Department of Water and Sanitation implements projects on behalf of municipalities through an indirect grant. The direct component of this grant is reduced by R426 million in 2020/21, R541 million in 2021/22 and R698 million in 2022/23. Although these reductions mean that the implementation of some projects will be delayed, they will not negatively impact water augmentation projects in drought-affected municipalities. This component of the grant has a total allocation of R10.8 billion over the 2020 MTEF period. The fiscal consolidation reductions to this grant are equivalent to 11 per cent of the grant’s baseline in 2020/21, 13 per cent in 2021/22 and 15.9 per cent in 2022/23. The indirect component of this grant is reduced by R100 million in 2020/21, with a total allocation of R2.1 billion over the medium term. Of this amount, R106 million is allocated to municipalities in the Free State and Northern Cape to complete outstanding bucket eradication projects and R181 million is allocated for drought relief projects. Regional bulk infrastructure grant This grant supplements the financing of the social component of regional bulk water and sanitation infrastructure. It targets projects that cut across several municipalities or large bulk projects within one municipality. The grant funds the bulk infrastructure needed to provide reticulated water and sanitation services to individual households. It may also be used to appoint service providers to carry out feasibility studies, related planning or management studies for infrastructure projects. It has both direct and indirect components. In areas where municipalities have the capacity to implement projects themselves, funds are transferred through a direct grant. In other areas, the Department of Water and Sanitation implements projects on behalf of municipalities through an indirect grant. A parallel programme, funded by the Department of Water and Sanitation, also funds water boards for the construction of bulk infrastructure. Though not part of the division of revenue, these projects still form part of the Department of Water and Sanitation’s larger programme of subsidising the construction of regional bulk infrastructure for water and sanitation. The direct component of this grant is reduced by R174 million in 2020/21, R187 million in 2021/22 and R196 million in 2022/23. An amount of R650 million is added to the indirect component of this grant to accelerate the implementation of repairs to the sewerage system in Emfuleni Local Municipality, which is currently spilling raw sewage into the Vaal River, and a further R100 million is reprioritised within the grant for the Vaal River intervention. This component also includes R241 million for the completion of bucket eradication projects. The fiscal consolidation reductions for this grant are equivalent to 8 per cent of the grant’s baseline in 2020/21, 8 per cent in 2021/22 and 7.9 per cent in 2022/23. The grant has a total allocation of R17 billion over the medium term, consisting of R6.4 billion and R10.6 billion for the direct and indirect components respectively. Integrated national electrification programme grants These grants aim to provide capital subsidies to municipalities to provide electricity to poor households and fund bulk infrastructure to ensure a constant supply of electricity. Allocations are based on the backlog of households without electricity and administered by the Department of Mineral Resources and Energy. The grant only funds bulk infrastructure that serves poor households. The national electrification programme has helped provide 91 per cent of all poor households with access to electricity, as reported in the 2016 Community Survey (up from the 85 per cent reported in the 2011 Census). To sustain this progress, government will spend R15.7 billion on the programme over the next three years. The integrated national electrification programme (municipal) grant is reduced by R119 million in 2020/21, R128 million in 2021/22 and R134 million in 2022/23. It has a total allocation of R6 billion over the medium 52
ANNEXURE W1: EXPLANATORY MEMORANDUM TO THE DIVISION OF REVENUE term and grows at an average annual rate of 4.4 per cent. The fiscal consolidation reductions to this grant are equivalent to 6 per cent of the grant’s baseline in 2020/21, 6 per cent in 2021/22 and 5.9 per cent in 2022/23. The integrated national electrification programme (Eskom) grant is allocated R9.7 billion over the medium term and grows at an average annual rate of 5.7 per cent. It is reduced by R61 million in 2020/21, R826 million in 2021/22 and R279 million in 2022/23 to fund other government priorities. The reductions to this grant are equivalent to 2 per cent of the grant’s baseline in 2020/21, 21.6 per cent in 2021/22 and 7 per cent in 2022/23. Energy efficiency and demand-side management grant The energy efficiency and demand-side management grant funds selected municipalities to implement projects with a focus on public lighting and energy-efficient municipal infrastructure. The grant continues to make provision for municipalities to use funding from the energy efficiency and demand-side management grant for planning and preparing for the Energy Efficiency in Public Infrastructure and Building Programme. The programme aims to create a market for private companies to invest in the large-scale retrofitting of municipal infrastructure, and then be paid back through the savings on energy costs achieved. This has the potential to unlock energy and cost savings on a much larger scale. Municipalities can use 15 per cent of their energy efficiency and demand-side management grant funding to develop a project pipeline and thereby strengthen the market for energy companies that offer this service. This scaling up of energy-efficiency retrofits is a key part of meeting the goals in the National Climate Change Response Strategy and the United Nations Framework Convention on Climate Change. This approach will also allow municipalities to benefit from donor financing. A Guarantee Fund from the Nationally Appropriated Mitigation Action Facility has been jointly established with funding from the German and United Kingdom governments to help private energy service companies obtain loans to implement the Energy Efficiency in Public Infrastructure and Building Programme. The programme will have significant long-term effects on energy savings, carbon emissions and the market for energy-efficient technologies. The grant is allocated R691 million over the medium term. The fiscal consolidation reductions to this grant are equivalent to 9 per cent of the grant’s baseline in 2020/21, 9 per cent in 2021/22 and 8.9 per cent in 2022/23. Rural roads asset management systems grant The Department of Transport administers the rural roads asset management systems grant to improve rural road infrastructure. The grant funds the collection of data on the condition and usage of rural roads in line with the Road Infrastructure Strategic Framework for South Africa. This information guides investments to maintain and improve these roads. District municipalities collect data on all the municipal roads in their area, ensuring that infrastructure spending (from the municipal infrastructure grant and elsewhere) can be properly planned to maximise impact. As data becomes available, incentives will be introduced to ensure that municipalities use this information to plan road maintenance appropriately. The municipal infrastructure grant stipulates that municipalities must use data from roads asset management systems to prioritise investment in roads projects. The Department of Transport will continue to work with the municipal infrastructure grant administrators to ensure that municipal roads projects are chosen, prioritised and approved using roads asset management systems data wherever possible. This grant is reduced by R12 million in 2020/21, R13 million in 2021/22 and R13 million in 2022/23 to fund other government priorities. The grant is allocated R108 million in 2020/21, R114 million in 2021/22 and R121 million in 2022/23. The fiscal consolidation reductions to this grant are equivalent to 10 per cent of the grant’s baseline in 2020/21, 10 per cent in 2021/22 and 9.9 per cent in 2022/23. Capacity-building grants and other current transfers Capacity-building grants help to develop municipalities’ management, planning, technical, budgeting and financial management skills. Other current transfers include the EPWP integrated grant for municipalities, 53
2020 BUDGET REVIEW which promotes increased labour intensity in municipalities, and the municipal disaster relief grant. A total of R6.6 billion is allocated to capacity-building grants and other current transfers to local government over the medium term. Table W1.32 Capacity building and other current grants to local government Source: National Treasury Local government financial management grant The local government financial management grant, managed by the National Treasury, funds the placement of financial management interns in municipalities and the modernisation of financial management systems. This includes building in-house municipal capacity to implement multi-year budgeting, linking integrated development plans to budgets, and producing quality and timely in-year and annual reports. The grant supports municipalities in the implementation of the Municipal Finance Management Act and provides funds for the implementation of the municipal standard chart of accounts. This grant is reduced by R17 million in 2020/21, R18 million in 2021/22 and R19 million in 2022/23 to fund other government priorities. Total allocations amount to R1.7 billion over the MTEF period and grow at an average annual rate of 3.8 per cent. The fiscal consolidation reductions to this grant are equivalent to 3 per cent of the grant’s baseline in 2020/21, 3 per cent in 2021/22 and 3 per cent in 2022/23. Infrastructure skills development grant The infrastructure skills development grant develops capacity within municipalities by creating a sustainable pool of young professionals with technical skills in areas such as water, electricity and town planning. The grant places interns in municipalities so they can complete the requirements of the relevant statutory council within their respective built environment fields. The interns can be hired by any municipality at the end of their internship. This grant is reduced by R5 million in each year of the 2020 MTEF period. The grant’s total allocations amount to R482 million over the 2020 MTEF period and grow at an average annual rate of 3.9 per cent. The fiscal consolidation reductions to this grant are equivalent to 3 per cent of the grant’s baseline in 2020/21, 3 per cent in 2021/22 and 3 per cent in 2022/23. Municipal systems improvement grant The municipal systems improvement grant funds a range of projects in municipalities in support of the Back to Basics strategy, including helping municipalities set up adequate record management systems, drawing up organograms for municipalities and reviewing their appropriateness relative to their assigned functions, implementing the Integrated Urban Development Framework, and assisting municipalities with revenue collection plans and the implementation of the municipal standard chart of accounts. The Department of 54 2016/17 2017/18 2018/19 Outcome R million 2019/20 Adjusted budget 2020/21 2021/22 2022/23 Medium-term estimates Direct transfers 1 675 1 815 1 400 Municipal disaster relief 118 341 – Municipal demarcation transition 297 140 – Municipal systems improvement – – 23 Municipal emergency housing – – 38 Infrastructure skills development 130 141 141 Local government financial 465 502 505 management Expanded public works programme 664 691 693 integrated grant for municipalities 1 897 335 – – 149 149 533 730 1 959 2 067 2 149 354 373 391 – – – – – – 159 168 175 153 162 168 545 575 596 748 790 819 Indirect transfers 19 103 71 111 128 135 140 Municipal systems improvement 19 103 71 111 128 135 140 Total 1 695 1 919 1 470 2 008 2 087 2 203 2 289
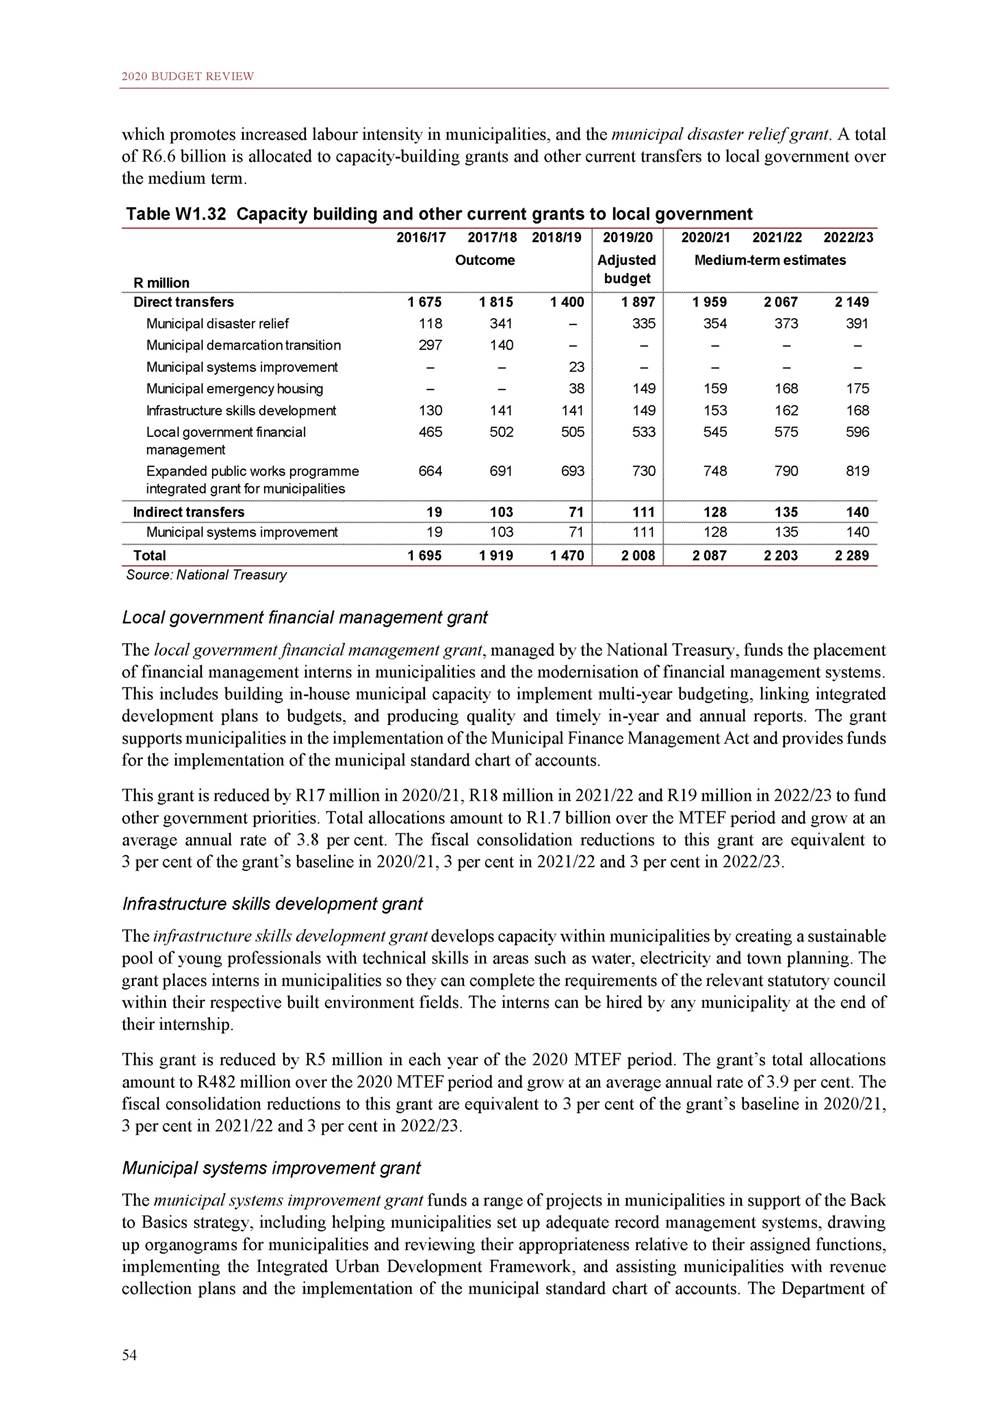
ANNEXURE W1: EXPLANATORY MEMORANDUM TO THE DIVISION OF REVENUE Cooperative Governance implements the indirect grant. The grant’s total allocations amount to R404 million over the 2020 MTEF period and grow at an average annual rate of 8.1 per cent. EPWP integrated grant for municipalities This grant promotes the use of labour-intensive methods in delivering municipal infrastructure and services. To determine eligibility for funding, municipalities must have reported performance on the EPWP, including performance in the infrastructure, social and environment and culture sectors and on the full-time equivalent jobs created in these sectors in the last 18 months. A formula then determines allocations on the basis of this performance as well as the labour intensity of the work opportunities created. The number of bands in which labour intensity are recorded in the formula have been expanded from seven to eight, providing an incentive for labour-intense projects to further increase their intensity. The formula is weighted to give larger allocations to rural municipalities. The grant’s baseline is reduced by R23 million in 2020/21, R24 million in 2021/22 and R26 million in 2022/23. The impact of these reductions will be spread across municipalities in line with the grant’s formula. The grant is allocated R2.4 billion over the MTEF period and grows at an average annual rate of 3.9 per cent. The fiscal consolidation reductions to this grant are equivalent to 3 per cent of the grant’s baseline in 2020/21, 3 per cent in 2021/22 and 3 per cent in 2022/23. Municipal disaster relief grant The municipal disaster relief grant is administered by the National Disaster Management Centre in the Department of Cooperative Governance as an unallocated grant to local government. The centre is able to disburse disaster-response funds immediately, without the need for the transfers to be gazetted first. The grant supplements the resources local government would have already used in responding to disasters. To ensure that sufficient funds are available in the event of disasters, section 21 of the Division of Revenue Bill allows for funds allocated to the provincial disaster relief grant to be transferred to municipalities if funds in the municipal grant have already been exhausted, and vice versa. The bill also allows for more than one transfer to be made to areas affected by disasters, so that initial emergency aid can be provided before a full assessment of damages and costs is conducted. Over the MTEF period, R1.1 billion is available for disbursement through this grant. To ensure that sufficient funds are available for disaster relief, clause 20(6) of the Division of Revenue Bill allows funds from other conditional grants to be reallocated for this purpose, subject to the National Treasury’s approval. Municipal emergency housing grant The municipal emergency housing grant is intended to enable the Department of Human Settlements to rapidly respond to emergencies by providing temporary housing and repairs in line with the Emergency Housing Programme. The grant is limited to funding emergency housing and repairs following the immediate aftermath of a disaster, and not the other emergency situations listed in the programme. Over the MTEF period, R502 million is available for disbursement through this grant. Part 6: Future work on provincial and municipal fiscal frameworks The fiscal frameworks for provincial and local government encompass all their revenue sources and expenditure responsibilities. As underlying social and economic trends evolve and the assignment of intergovernmental functions change, so must the fiscal frameworks. The National Treasury, together with relevant stakeholders, conducts reviews to ensure that provinces and municipalities have an appropriate balance of available revenues and expenditure responsibilities, while taking account of the resources available and the principles of predictability and stability. This part of the annexure describes the main areas of work to be undertaken during 2020/21 as part of the ongoing review and refinement of the intergovernmental fiscal framework. Provinces and municipalities will be consulted on all proposed changes. 55
2020 BUDGET REVIEW Review of the provincial equitable share formula The Constitution stipulates that provinces are entitled to a share of nationally raised revenue to deliver on their mandates. Provincial funds are allocated using a formula that considers the spread of the burden of service delivery across provinces. The provincial equitable share formula contains weighted elements that reflect government priorities and incorporates elements to redress inequality and poverty across provinces. The periodic review of the formula to assess its continued appropriateness and equity continues in 2020. During the year, the review will focus on: Refining options for a revised poverty component in the formula. Developing options for how the formula can account for costs associated with being in a rural location. Working with the Department of Health to revise and update the risk-adjusted factor as part of a broader overhaul of the health component. Working with the Department of Basic Education to develop options for how to account for the different funding needs of different types of schools and learners. The formula is being reviewed by a provincial equitable share task team made up of representatives from the National Treasury and provincial treasuries. The task team partners with sector departments, Statistics South Africa and the FFC on different components of the review. The task team reports to the Technical Committee on Finance, and the Budget Council considers and approves any proposed changes to the formula. Preparing for national health insurance implementation South Africa aims to make significant strides towards universal health coverage through the progressive implementation of national health insurance, as outlined in the National Health Insurance White Paper, which government adopted in 2017, and the National Health Insurance Bill, which was tabled in 2019 and is currently being considered in Parliament. Establishing the National Health Insurance Fund is likely to have significant implications for provincial finances, which are being discussed through consultative structures like the Technical Committee on Finance. In parallel, efforts to strengthen the health system in preparation for national health insurance will continue, including developing and piloting provider payment mechanisms, expanding the national insurance beneficiary registry, and purchasing and providing a prioritised set of health services. Government is also piloting a new quality improvement activity within the non-personal services component of the NHI indirect grant that will help facilities meet the envisaged standards required for NHI accreditation. The experience gained from this pilot will inform future efforts to improve quality. Two grants related to capacity development in the health sector have been merged in 2020/21, and the National Treasury and the Department of Health will work together during 2020 to develop a strategy for further reforms to the structure of all the health conditional grants to ensure that they are aligned to support NHI implementation. Shift of nursing and agricultural colleges to national government For nursing colleges and agricultural colleges to be accredited as higher education colleges in terms of the Higher Education Act (1997), the function for administering these colleges needs to move from provinces to national government. The Department of Higher Education and Training is coordinating with the departments of Health and Agriculture, Land Reform and Rural Development, as well as their provincial counterparts to prepare for this proposed function shift. The National Treasury will work with provincial treasuries and the FFC to assess the financial impacts of the proposed shift. The role of provinces in promoting economic development All three spheres of government must work with businesses and other relevant stakeholders to provide an enabling environment for faster and more inclusive economic growth. An Economic Development Coordination Forum has been established to improve the coordination of economic development initiatives between provincial and national governments. This forum is chaired jointly by the National Treasury and the Department of Trade, Industry and Competition, and includes participants from provincial treasuries and 56
ANNEXURE W1: EXPLANATORY MEMORANDUM TO THE DIVISION OF REVENUE sector departments, as well as the Department of Small Business Development, the Department of Cooperative Governance and SALGA. This year, the forum will establish work streams to examine data for economic development, policy and alignment issues, and township economic development (including industrial parks). Improving intergovernmental coordination on infrastructure investment Public infrastructure investments can play a major role in transforming South Africa’s spatial development patterns. This requires a significant improvement in intergovernmental coordination in planning and budgeting for infrastructure. The National Treasury is working with provinces to ensure that their investments in schools, roads, health facilities and housing are made in locations that align with the spatial development plans of municipalities. Municipalities must be consulted and agree on the location and bulk services requirements of all provincial infrastructure projects. Progress has been made in holding joint planning sessions between provinces and municipalities, and support in this area will continue in 2020. National departments will also be supported to participate in intergovernmental planning and to review sector policies and funding strategies to promote better alignment with spatial development frameworks. The National Treasury will review provincial infrastructure sector funding policies and propose how grants, incentives and other funding sources can best be structured to strengthen funding coordination to achieve spatial development objectives. Disaster funding The National Treasury will work with the National Disaster Management Centre to review the funding of disaster response and recovery activities. Climate change will make extreme weather events more common, and the disaster funding system needs to adapt to this new reality. The current system is designed to allow for the rapid release of funds immediately following the declaration of a disaster, and to fund the repair or reconstruction of infrastructure after an event. While there are problems and inefficiencies within the existing system that need to be addressed through this review, it must also consider how to place greater emphasis on being prepared before disasters occur. The system also needs to be adapted to respond better to long-running disasters such as drought conditions that may last for several years. New informal settlements upgrading grants for provinces and municipalities Informal settlement upgrades are a priority over the medium term. This is an inclusive process through which informal residential areas are incrementally improved, formalised and incorporated into the city or neighbourhood by extending land tenure security, infrastructure and services to residents of informal settlements. Following the introduction of dedicated components to fund informal settlement upgrades in the provincial human settlements development grant and the municipal urban settlements development grant in 2019/20, the Department of Human Settlements is leading the design of two new informal settlements upgrading grants for provinces and municipalities, which will be introduced in the 2021 MTEF period. These separate grants were intended to be introduced in 2020/21, but additional time is needed for provinces and municipalities to complete their informal settlements upgrading strategies. These strategies will guide how spending on the new grant will be prioritised. Having an additional year will allow the design of the new grants to draw on the lessons learnt from a full year of implementing the components within the existing grants. The design of the new grants will include consultations with provinces, municipalities, community organisations and other interested stakeholders. These consultations will also address the respective roles of provinces and municipalities in upgrading informal settlements. 57
2020 BUDGET REVIEW Review of the local government fiscal framework Budget Forum lekgotla The local government fiscal framework refers to all of the revenue sources that are available to local government and all the expenditure responsibilities that they have. A well-designed fiscal framework allows each municipality to balance its revenue sources against its expenditure responsibilities. Many stakeholders have expressed concern that elements of the current local government fiscal framework make it difficult for municipalities to balance their revenues with their expenditure responsibilities. The Minister of Finance has therefore proposed that the Budget Forum hold a special lekgotla in 2020 to review the structure of the framework and to agree on which issues in local government are attributable to the structure of the fiscal framework and which are related to other factors such as problems in governance, intergovernmental relations and the assignment of functions between spheres. This will help to resolve contentious issues and build consensus. The Budget Forum is chaired by the Minister of Finance and includes Members of the Executive Council (MEC) responsible for finance in each province and SALGA. In order to facilitate improved cooperation across sectors, the Minister and MECs responsible for cooperative governance are also invited to participate in meetings of the Budget Forum. The Chairs of Parliament’s Standing and Select Committee on Appropriations and Finance and as well as representatives of the FFC are invited to attend. Items for the lekgotla will be prepared in a collaborative process that includes inputs from officials from all of the participating organisations. The outcomes are expected to inform a reform agenda for the local government fiscal framework over the next five years that will complement the ongoing reforms discussed below. Refinements to the local government equitable share formula Government continues to work with stakeholders to improve the local government equitable share formula. Areas of work in the period ahead include: Improving the responsiveness of the formula to the different functions assigned to district and local municipalities. This work depends on the availability of credible official records of the functions assigned to each sphere of government. Policy and administrative work under way in the National Disaster Management Centre could help improve the targeting of funding for fire services. Reviewing and updating how the special support for councillor remuneration is calculated. This support is calculated separately from the rest of the equitable share formula, but transferred with equitable share allocations. Support is only provided to small and poor municipalities and the data used for determining eligibility needs to be updated. Working with Statistics South Africa to explore how new population estimates at municipal level can be incorporated into the formula updates. Review of local government infrastructure grants As part of the ongoing review of local government infrastructure grants, the National Treasury, the Department of Cooperative Governance, Department of Planning, Monitoring and Evaluation, SALGA and the FFC will work closely to implement the reform agenda agreed to through the review, including: Improving the administration of conditional grants by national departments. Further consolidating conditional grants. Increasing differentiation in the grant system, so that grants are well aligned to the different circumstances found across the country’s 257 municipalities. Reviewing grant formulas to ensure that allocations are equitable across the different types of municipalities that receive allocations from differentiated grants, such as the urban settlements 58
ANNEXURE W1: EXPLANATORY MEMORANDUM TO THE DIVISION OF REVENUE development grant (for metros), the integrated urban development grant (for intermediate cities) and the municipal infrastructure grant. Identifying ways to incorporate incentives for improved asset management into the grant system. Review of the municipal capacity support system Government is reviewing the system of capacity support provided to municipalities. It invests public funds of more than R3 billion in capacity support for municipalities every year through a broad range of grants and programmes. These various forms of capacity development and support tend to be planned and managed separately from one another. The National Treasury is managing the review, with the aim of identifying ways to improve the impact of this spending. Preliminary results may inform initial changes to the capacity-building system in the 2021 Budget. Reforms to local government own revenue sources Municipalities play a critical role in boosting economic growth and providing an enabling environment for job creation by providing well-maintained and functioning infrastructure services. However, municipalities are finding it increasingly difficult to build the infrastructure required for growth and meet the demands of rapid urbanisation. The National Treasury continues to explore how cities and other municipalities with a significant own revenue base can use a broader package of infrastructure financing sources to meet their developmental mandate. The National Treasury is implementing the reforms discussed below. Development charges Despite their potential as an alternative option for financing infrastructure, municipalities have not fully used development charges due to uncertainty surrounding the regulatory frameworks. These once-off charges are imposed by a municipality on a land owner applying for land development approval. The charges are based on the concept that urban growth and expanded land use creates the need for additional infrastructure services, so the developer should pay the incidence costs. To deal with the regulatory framework’s challenges, the National Treasury is amending the Municipal Fiscal Powers and Functions Act to incorporate the regulation of development charges. The draft amendment bill has been submitted to Cabinet and was published for public comment in January 2020. The due date for submitting comments is 31 March 2020. Parallel to the public participation process, the National Treasury intends to undertake provincial and national workshops to provide clarity on the technical provisions of the draft bill. The draft legislation can be accessed on the National Treasury website: http://www.treasury.gov.za/legislation/draft_bills. Municipal borrowing The 2017 update to the Policy Framework for Municipal Borrowing and Financial Emergencies will be submitted to Cabinet shortly. The updates aim to address the limitations of the original policy framework of 2000 and to respond to the changing needs and conditions in the municipal borrowing market by permitting the use of innovative infrastructure financing mechanisms. The updated policy framework makes specific recommendations on the role of development finance institutions in financing creditworthy municipalities. It proposes that these institutions should play a developmental, complementary and supportive role to transactions rather than competing directly with private financiers. It also suggests that development finance institutions should establish clear and measurable development impact indicators for their municipal operations in general, and for specific transactions. Each institution must, well in advance of any proposed lending to a municipality, obtain written agreement from the National Treasury that specifically outlines the development objectives and indicators of the loan, before entering into any transaction. The National Treasury continues to publish the Municipal Borrowing Bulletin on a quarterly basis. Copies can be obtained from www.mfma.treasury.gov.za. 59
2020 BUDGET REVIEW 60

Medium Term Budget Policy Statement 2019 National Treasury Republic of South Africa 30 October 2019
ISBN: RP: 978-0-621-47936-2 RP358/2019 The Medium Term Budget Policy Statement is compiled using the latest available information from departmental and other sources. Some of this information is unaudited or subject to revision. To obtain additional copies of this document, please contact: Communications Directorate National Treasury Private Bag X115 Pretoria 0001 South Africa Tel: +27 12 315 5944 Fax: +27 12 407 9055 The document is also available on the internet at: www.treasury.gov.za. ii
Foreword We are tabling the 2019 Medium Term Budget Policy Statement in a difficult global and domestic environment. The global growth forecast for 2019 is the lowest since the 2008 financial crisis, weighed down by mounting trade tensions and political uncertainty. Economic activity in two engines of the world economy, China and India, is slowing this year. Policy makers have taken a number of steps to support growth, but there is a risk that these measures will create new vulnerabilities, as interest rates in advanced economies decline. About a quarter of government bonds in these countries have negative yields. At home, economic growth has continued to stagnate and weaknesses in the world economy are likely to amplify our own shortcomings, which require structural reforms. The discussion paper released by the National Treasury has proposed a number of economic reforms that can boost GDP growth over the medium and longer term, and support increased investment and job creation. These measures have been broadly agreed within government. The next step is to implement them urgently. In addition to low growth, South Africa’s biggest economic risk is Eskom. Ongoing problems with the utility’s operations continue to disrupt the supply of electricity to households and businesses. Government has set aside significant resources for Eskom. With the immediate financial restraints lifted, the focus must be on operational problems and restructuring Eskom into three separate entities. Doing so will mark the beginning of a transition to a competitive, transparent and financially viable electricity sector. South Africa’s public finances deteriorated over the past decade, a trend that accelerated in recent years as low growth led to large revenue shortfalls. For 10 years, we have run large budget deficits. While this provided some support to the economy, it has put us deeply in debt, to the point where interest payments have begun crowding out social and economic spending programmes. This cannot be sustained. Government proposes a path to restore the public finances to a sustainable position. This will mainly involve a range of expenditure reductions, some of which are likely to be painful. We owe it to future generations to ensure that we are good stewards of our country’s resources and that they do not have to pay for our decisions. I would like to thank my Cabinet colleagues for their contributions to this challenging budget policy process. I would also like to acknowledge Deputy Minister David Masondo, as well as the Director- General and the entire staff of the National Treasury. They work diligently towards their constitutional duty to ensure transparent, sustainable finances for all South Africans. TT Mboweni Minister of Finance iii
Contents Chapter 1 Growth, sustainability and renewal…………..………..……..…..……..………. Introduction……………………………………………………..…………………………….… Stabilising the public finances…………………………………………………………... Promoting investment and economic growth..............................……... Stabilising state-owned companies…………………………….………………….... Improving spending efficiency and reducing waste ……………………….… Overview of the 2019 MTBPS ………………………………………………………..… Conclusion …………………………………………………………………………………..….. 1 1 3 4 5 7 8 9 Chapter 2 Economic overview………………………………………..………………………….……. Introduction…………………………………………………………………………………..…. The growth puzzle: why so weak for so long?……………………………….….. Economic reforms to implement without delay………………………………… Global outlook…………..……………………………………………………………………… Domestic outlook…………………….…………………………………………………….…. Sector performance and outlook……………………………………………….…….. Conclusion…………………..…………………………………………………………..………. 11 11 12 13 15 16 19 20 Chapter 3 Fiscal policy………………..………………………………..………………………………..… Introduction……………………………………………..………..…………..................... Options to stabilise the public finances…………………………………………….. Expenditure performance and outlook…………………………………………….. Revenue performance and outlook…………………………………………………… Fiscal framework.……………………………………………………………………………... Financing and debt management strategy.………………………………………. Risks to the fiscal outlook…………………………………………………………………. Conclusion……………………………………………………………………………………….. 21 21 22 24 26 28 29 31 31 Chapter 4 Expenditure priorities…………………………..…………………………………………. Introduction………………………………………………………………………….………….. Expenditure priorities and spending pressures.……………..……………….… In-year spending adjustments………………………..………………………………… Spending priorities by function group………………………………….…………… Division of revenue……….………………………………………………….…………….… 33 33 34 36 37 39 Annexure A Fiscal risk statement…………………………………..……………………………………. 47 Annexure B Compensation data……..…………………………………………………………………… 55 Annexure C Update on Eskom reforms…………………………..…………………..……………… 61 Annexure D Technical annexure……………………………………………………………..………….. 65 Annexure E Glossary……………………………………………………………………………………………. 73 iv
Tables 1.1 1.2 Figures Macroeconomic projections..……… Consolidated government fiscal framework….…………………………….... Consolidated government expenditure………………………………… Economic growth in selected countries………………………………….…. Macroeconomic performance and projections……………………………….…. Assumptions used in the economic forecast ....………………….. Revisions to non-interest expenditure…………….………………… Main budget expenditure ceiling…………………………………...….... Gross tax revenue……………………..… Revised revenue projections….……. Medium-term revenue framework Main budget framework ..………….. Main budget balances excluding financial support for Eskom.……….. Consolidated budget balance……... Total national government debt.… National government gross borrowing requirement and financing..…………………………………… Consolidated expenditure by function……………………..……………..… Consolidated expenditure by economic classification.………………. Division of revenue framework…… Provincial equitable share…………… 8 1.1 Ten-year change in debt-to-GDP ratio……………………….……………………. Real GDP growth……………………….… Main budget revenue and spending……………..………………………. Debt-to-GDP outlook…………..….…… Public-sector debt…………..…………… Long-term GDP growth....……………. Comparative per capita incomes Container export costs.……………….. Competitiveness and income….…… Developing-economy risk premiums……………………………………. Currency movements in peer economies…………………………………… Investment by asset type…………….. Main budget balance…………………… Gross debt-to-GDP outlook……….… Main budget primary balance……… Real main budget non-interest spending……………………………………... Breakdown of every R1 000 spent by economic classification…………... Average nominal growth in consolidated spending………………… Average nominal growth in spending……………………………………… Consolidated government expenditure by function………………. Provincial conditional grants……….. Local government conditional grants………………………………………….. 2 2 8 1.2 1.3 1.3 9 2 2 6 12 12 13 13 2.1 1.4 1.5 2.1 2.2 2.3 2.4 2.5 15 2.2 16 2.3 17 3.1 24 16 3.2 2.6 25 26 27 27 28 16 18 22 22 22 3.3 3.4 3.5 3.6 3.7 2.7 3.1 3.2 3.3 3.4 29 29 30 22 3.8 3.9 3.10 3.5 23 3.6 23 30 4.1 4.1 34 35 4.2 4.2 34 41 36 40 42 4.3 4.4 4.3 4.4 41 v
[LOGO]

1 Growth, sustainability and renewal Introduction Gyears, spending will total R6.3 trillion, with 48 per cent of this overnment allocates funds to its central policy objectives – reducing Almost half of budget is allocated to social grants, education and health poverty and inequality – through the budget. Over the next three amount going towards social grants, education and health. In the context of weak growth, however, revenue shortfalls and rising spending pressures are threatening government’s ability to maintain existing levels of service provision and infrastructure investment. South Africa’s long-run economic growth has been slowing alongside productivity and competitiveness. In the decade since the global financial crisis, government has run large budget deficits, raising its borrowing and making the increase in South Africa’s debt-to-GDP ratio among the highest of peer countries. 1 The Medium Term Budget Policy Statement (MTBPS) aims to communicate government’s policy stance, and to encourage Parliament and the public to debate options for the economy and the public finances. The 2019 MTBPS proposes an approach over the medium term that, effectively implemented, will restore the momentum of economic growth and stabilise the public finances. South Africa’s economic growth is now projected at 0.5 per cent for 2019, as long-term growth estimates have fallen. As a result, revenue projections have been sharply reduced. Spending pressures continue to mount, led by the public-service wage bill and state-owned companies in crisis. The combination of lower revenue and increased spending widens the budget deficit to an average of 6.2 per cent over the next three years. Debt and debt-service costs will continue to increase. Globally, a synchronised economic slowdown has caused downward revisions to growth in both developed and developing countries. South Africa’s macroeconomic framework remains broadly supportive of investment and growth. The flexible exchange rate acts as a shock absorber and monetary policy has kept inflation contained within the 3 to 6 per cent target band. But this framework cannot substitute for necessary economic reforms. Persistent growth in the wage bill has worsened the composition of spending, while spending outcomes continue to disappoint. As a result, fiscal deficits have not raised long-run growth, and have begun to undermine confidence, push up interest rates and reduce the space for new priorities. The MTBPS sets out measures to boost the economy, narrow the fiscal deficit and raise the quality of spending, particularly on large infrastructure projects. To mitigate the immediate risk that Eskom poses to the economy, the utility receives assistance to service its debt obligations. Addressing Eskom’s underlying problems requires reinvigorated governance, operational efficiencies and restructuring.
2019 MEDIUM TERM BUDGET POLICY STATEMENT Yet this spending has not translated into stronger economic growth. Revenue growth has also been lower than expected, despite tax measures. Without intervention, the persistent gap between revenue and expenditure now puts government debt on an upward trajectory over the next 10 years. 50 40 Expenditure Revenue 85 80 75 70 Revised without financial support for Eskom Revised with financial support for Eskom 79.5 30 73.7 75.8 71.8 28 68.0 64.9 26 60 56.7 57.8 58.9 59.3 24 50.5 48.9 This approach cannot be sustained. Main budget expenditure has been revised up since the 2019 Budget Review, primarily as a result of additional support for Eskom. In total, this support now amounts to R49 billion in 2019/20 and R56 billion in 2020/21. Excluding these amounts, debt-service costs is the fastest-growing area of spending and reaches R204 billion in the current year. Gross tax revenue is projected to fall short of the 2019 Budget estimates by R52.5 billion in 2019/20 and R84 billion in 2020/21, reflecting the weaker economic environment. The deficit is expected to widen substantially over the next three years relative to 2019 Budget estimates. Difficult decisions are now required to stabilise the public finances. The 2019 MTBPS proposes measures to narrow the fiscal deficit, boost the economy and improve the quality of spending, particularly on large infrastructure projects. Growth in debt and debt-service costs is unsustainable and requires difficult decisions 2 Per cent of GDP Per cent Guinea 2006/07 2007/08 2008/09 2009/10 2010/11 2011/12 2012/13 2013/14 2014/15 2015/16 2016/17 2017/18 2018/19 2019/20 2020/21 2021/22 2022/23 Côte d'Ivoire Philippines Turkey India Hungary Peru Indonesia Poland Thailand Uruguay Mexico Sri Lanka Pakistan Malaysia Mali Burkina Faso Colombia Morocco Chile China Egypt Brazil Belarus South Africa Argentina Croatia Ukraine Zambia Per cent of GDP Per cent 2000/01 2015/16 2016/17 2017/18 2018/19 2019/20 2020/21 2021/22 2022/23 2023/24 2024/25 2025/26 2026/27 2027/28 2002/03 2004/05 2006/07 2008/09 2010/11 2012/13 2014/15 2016/17 2018/19 Figure 1.1 Ten-year change in debt-to-GDP ratioFigure 1.2 Real GDP growth Average 6 30 30.2 5 20 4 10 3 0 2 -10 1 -20 0 -1 Figure 1.3 Main budget revenue and spendingFigure 1.4 Debt-to-GDP outlook 2019 Budget 32 80.9 77.8 75.8 71.3 73.4 74.7 68.5 70.1 65 65.7 60.8 62.8 59.7 60.2 60.1 59.9 55 53.0 55.6 56.2 50 22 45 Source: IMF World Economic Outlook, April 2019, and National Treasury
CHAPTER 1: GROWTH, SUSTAINABILITY AND RENEWAL As a first step, government is clawing back some of the revenue shortfall through reductions to departmental baselines and slower spending growth in the outer year of the medium-term expenditure framework (MTEF). Alone, these reductions are insufficient. Additional measures, particularly on the wage bill, will be required to narrow the deficit and improve the composition of spending. In August, the paper released by the National Treasury outlined short-and medium-term reforms that can boost economic growth, many of which do not require significant state resources. Interventions to improve the quality of infrastructure planning, including the Budget Facility for Infrastructure, are beginning to show results. Government continues to work with the private sector through the Infrastructure Fund and other initiatives. Further measures to reduce wasteful expenditure, including by limiting claims against the state, will be implemented in the coming year. Government is providing medium-term support to Eskom to secure energy supply and to honour the state’s contractual obligations. The National Treasury, in partnership with the Department of Public Enterprises, is instituting a series of measures to bring discipline to the utility’s finances, and to step up the timeline for restructuring. Departmental baselines reduced and slower spending in outer year Stabilising the public finances Relative to the 2019 Budget, the MTBPS shows an increase in main budget non-interest spending of R23 billion in 2020/21 and a reduction of R8.2 billion in 2021/22. These changes reflect the net impact of spending additions, mainly financial support for Eskom, and the baseline reductions made to goods and services, and transfers. In 2022/23, spending will be contained in line with consumer price index (CPI) inflation. Stabilising government’s debt-to-GDP ratio requires narrowing the gap between revenue and expenditure further. Accordingly, government proposes a fiscal target of achieving a main budget primary balance – in other words, revenue equal to non-interest expenditure – by 2022/23. This metric excludes financial support for Eskom, which will be addressed through separate operational and financial reforms. Achieving the fiscal target requires large additional adjustments exceeding R150 billion in total over the medium term. The following elements will be critical: Proposed fiscal target is a main budget primary balance by 2022/23 • Growth in the public-service wage bill needs to decline to reduce the pressure on goods and services and infrastructure. The wage bill accounts for 46 per cent of tax revenue in 2019/20, primarily because of above-inflation increases in average remuneration over the past decade. Significant tax increases over the past several years leave only moderate scope to boost tax revenue at this time. Given the size of the required adjustment, however, additional tax measures are under consideration. To reduce future transfers, a sustainable plan for state-owned companies is required. It should include the disposal of non-core assets and options for private-sector participation. • • 3
2019 MEDIUM TERM BUDGET POLICY STATEMENT The final adjustments will be announced in the 2020 Budget. These measures require difficult decisions that will affect the economy and the distribution of public resources. The short-term costs, however, are outweighed by the need to ensure sustainable public finances for decades to come, ensuring intergenerational fairness. Near-term costs of fiscal adjustment outweighed by need to ensure sustainable public finances Promoting investment and economic growth Government’s economic policy priority is to enact reforms that will enable South Africa to break from the spiral of anaemic growth, promoting investment and job creation. Policy certainty and a conducive business environment are critical to support the confidence of businesses and households. A robust monetary policy framework has provided certainty but needs to be complemented with a range of reforms that are within government’s control and do not require significant funding. These would help to raise long-term growth. The paper titled Economic Transformation, Inclusive Growth, and Competitiveness: Towards an Economic Strategy for South Africa, which the National Treasury released in 2019, has begun a vigorous national debate on the reforms required to raise growth. The interventions consider strengthening network industries, such as road and rail; enhancing South Africa’s export competitiveness to boost exports, employment and innovation; and promoting greater competition within the economy, enabling small firms to grow and compete with dominant players. Many of these overlap with the package of measures announced in the 2018 MTBPS. Several reforms do not require significant state resources. These include: Some short-term growth reforms do not require significant resources • Supporting tourism by reducing the cost of traveling to South Africa, and cutting red tape for small businesses in the tourism sector. Diversifying power generation by granting licences for small-scale power generation projects approved by the Minister of Energy. Expanding telecommunications services by allowing for the rapid expansion of fibre infrastructure. Lowering the cost of doing business by automating various registration and filing processes. • • • Medium-term reforms also need to begin immediately in transport, water, telecommunications, and industrial and trade policy, although they will likely only be completed over the next three years. Government continues to work with the private sector to strengthen infrastructure investment. Efforts are focused on raising the efficiency of spending and crowding in private-sector investment. The National Treasury has begun a review of public-private partnership regulation aimed at merging approval processes and reducing implementation timeframes. This project is already under way and its findings will be published by September 2020. Reforms should be enacted now in transport, water, telecommunications and industrial and trade policy 4
CHAPTER 1: GROWTH, SUSTAINABILITY AND RENEWAL Public-sector infrastructure projects are plagued by poor planning and implementation. This is reflected in continued underspending, which reached 20 per cent of capital budgets in 2018/19. The Budget Facility for Infrastructure, a technical entity that reviews complex capital projects, has strengthened state capacity to consider and budget for large infrastructure projects and programmes. These interventions have begun to yield results, such as an improvement in the quality of budget bids and an associated reduction in rejection rates. The 2019 MTBPS proposes allocations of R3.4 billion over the next three years for these projects, including student housing at three universities, school facilities and health infrastructure. Marked progress in quality of infrastructure proposals, with associated reduction in rejection rates Stabilising state-owned companies Several large state-owned companies are in crisis as a result of governance failures, poor operational performance and resultant unsustainable debt burdens. Figure 1.5 shows how these debts have grown alongside government debt. Government has increased spending to meet its obligations for guaranteed debt, but decisions are required to manage the ongoing impact of these entities on the fiscus. A programme of reforms is being enacted to strengthen governance and operations at these entities, and to stabilise those in financial distress. 5 Improving the pipeline of infrastructure projects with the Infrastructure Fund Over the past year, government has made progress in setting up a blended-finance Infrastructure Fund. The fund’s implementation unit has been established and is housed within the Development Bank of Southern Africa (DBSA). Its aim is to fast-track the development of projects and programmes by drawing on existing capacity in the Presidential Infrastructure Coordinating Commission, the National Treasury, the Government Technical Advisory Centre (GTAC) and the Independent Power Producers Office. The unit is also identifying policy and regulatory hurdles in the public sector that hamper private and public investment. It is collaborating with the private sector through associations such as the Banking Association South Africa, the Association for Savings and Investment South Africa, and the Public Private Growth Initiative. Government set aside R100 billion over a decade to co-finance programmes and projects that blend public and private resources, with R10 billion in the baseline for the next three years. Pilot projects, including the Student Housing Infrastructure Programme and Small Harbours Programme, receive R529.8 million in the current year. The implementation unit is developing a pipeline of projects for funding that includes proposals from government, the private sector and the DBSA. To date, the implementation unit for the Infrastructure Fund has identified possible projects and programmes amounting to more than R500 billion.
2019 MEDIUM TERM BUDGET POLICY STATEMENT Figure 1.5 Public-sector debt Gross loan debt Source: Reserve Bank Managing the Eskom risk Over the medium term and beyond, government will manage the massive risk to the economy and the fiscus associated with Eskom. This requires addressing the utility’s operational viability, which has a significant impact on its debt profile. The National Treasury and the Department of Public Enterprises are working with the utility to implement the plan, announced in the February 2019 State of the Nation Address, to separate Eskom into three distinct entities (generation, transmission, distribution) and conduct wide-ranging reforms to achieve operational efficiency. The Ministers of Finance and Public Enterprises have appointed independent experts to conduct rigorous assessments at Eskom. These include analysing the utility’s daily cash-flow management and assessing the implementation of operational efficiencies, which include considering whether capital expenditure can be stopped or deferred. The short-term priority is to stabilise Eskom’s cash-flow management, while undertaking the separation. Government has made provisional support of R49 billion available in 2019/20, R56 billion in 2020/21 and R33 billion in 2021/22. Should Eskom be unable to issue debt, government may be called upon to provide further support to enable the company to meet its obligations. Additional reforms to reduce Eskom’s debt burden will only be considered once the utility reduces costs and makes progress in the unbundling process. Government is committed to the separation of the three functions in conjunction with the necessary organisational reforms. Implementing this major reform successfully and timeously will require focus from Eskom management and the Board, and work across government to resolve structural issues that affect Eskom’s financial viability. Faster progress needed to effect separation of Eskom into three entities Reduction of Eskom’s debt burden will only be considered after it cuts costs and starts unbundling 6 R billion 2008/09 2009/10 2010/11 2011/12 2012/13 2013/14 2014/15 2015/16 2016/17 2017/18 2018/19 3 500 3 000 2 500 2 000 1 500 1 000 500 0 Non-financial public-sector entities Local government Financial public-sector entities
CHAPTER 1: GROWTH, SUSTAINABILITY AND RENEWAL This separation will mark the beginning of a transition in the electricity sector from the dominance of an inefficient, vertically integrated monopoly to a competitive sector that includes a financially viable utility with clear lines of accountability. Annexure C reviews the status of the Eskom restructuring, discusses government interventions to date and outlines projections for medium-term fiscal support. Reforms support creation of financially viable and accountable electricity utility Other state-owned companies Other state-owned companies are also adding to spending pressures on government. Funding for South African Airways (SAA), the South African Broadcasting Corporation, Denel and South African Express amounts to R10.8 billion in the current year, almost the entire contingency reserve for 2019/20. In its current configuration, SAA is unlikely to generate sufficient cash flow to sustain operations. It is unable to repay outstanding government guaranteed debt of R9.2 billion. Government will repay this debt over the next three years to honour its contractual obligation. Operational changes at SAA are required urgently. Improving spending efficiency and reducing waste Unsustainable fiscal finances harm South Africans by raising real spending on interest costs. Inefficient and ineffective spending harms South Africans by wasting limited public resources. Given South Africa’s progressive budgetary spending, the poor are most severely affected by these challenges. Where possible given budgetary constraints, government is shifting resources to areas that urgently need to strengthen capacity. Through reprioritisation, the National Prosecuting Authority receives an additional R1.3 billion, and the South African Revenue Service receives an additional R1 billion for the period 2019/20 to 2022/23. These funding shifts will bolster efforts to combat corruption and improve revenue collection. Over the coming year, as part of its effort to improve efficiency and reduce wasteful expenditure, government will: Overlapping agencies to be merged, unused land to be sold, new road accident scheme to be accelerated • Merge and consolidate entities and regulatory agencies, as well as consider salary controls at a wider range of public entities. Dispose of unused land and other assets. Initiate work to limit claims against the state, including through a review of medico-legal claims and accelerated implementation of the Road Accident Benefit Scheme. Implement recommendations from expenditure reviews to identify cost savings and improve efficiency. Manage the benefits received by political office bearers, through reforms to the Ministerial Handbook. Review the existing procurement regulatory framework, through the Public Procurement Bill, to simplify procurement processes and governance. The bill will be gazetted for public comment once Cabinet grants approval to do so. • • • • • 7
2019 MEDIUM TERM BUDGET POLICY STATEMENT Overview of the 2019 MTBPS Economic overview Chapter 2 sets out the medium-term economic forecast, alongside proposals to accelerate economic growth. The GDP growth forecast for 2019 has been revised down from 1.5 per cent in the 2019 Budget to 0.5 per cent, with growth expected to reach 1.7 per cent in 2022. Inflation is expected to remain within the 3 to 6 per cent target band over the medium term. Weakening global growth, associated with rising trade conflicts alongside low levels of competitiveness, moderate growth in the forecast. A gradual recovery in confidence and investment is expected over the medium term. Gradual recovery in confidence and investment expected over medium term Table 1.1 Macroeconomic projections Source: Reserve Bank and National Treasury Fiscal policy Chapter 3 provides an overview of fiscal policy, including proposals to reduce expenditure growth and manage the wage bill in order to achieve the fiscal target. The expenditure ceiling – which excludes support to Eskom – is revised down for this year and the next two years, relative to the 2019 Budget. The consolidated deficit, which includes national and provincial government, public entities and social security funds, is projected to narrow from 6.5 per cent of GDP in 2020/21 to 5.9 per cent of GDP in 2022/23. Table 1.2 Consolidated government fiscal framework Source: National Treasury Expenditure priorities Chapter 4 outlines government’s three-year spending priorities and explains how nationally raised funding is divided between national, provincial and local government. The budget continues to prioritise 8 2018/19 R billion/percentage of GDPOutcome 2019/20 Revised 2020/212021/222022/23 Medium-term estimates Revenue1 445.4 29.4% Expenditure1 652.8 33.6% Budget balance-207.5 -4.2% 1 537.8 29.5% 1 844.1 35.4% -306.2 -5.9% 1 618.51 729.61 841.2 29.3%29.4%29.3% 1 978.72 097.52 214.9 35.8%35.6%35.3% -360.2-367.9-373.7 -6.5%-6.2%-5.9% Total gross loan debt2 788.4 56.7% 3 167.6 60.8% 3 590.84 035.74 477.7 64.9%68.5%71.3% 2018 Calendar yearActual 2019 Estimate 202020212022 Forecast Percentage change unless otherwise indicated Household consumption1.8 Gross fixed-capital formation-1.4 1.3 -0.8 1.31.51.7 0.81.31.8 Real GDP growth0.8 GDP at current prices (R billion)4 874.0 0.5 5 131.7 1.21.61.7 5 448.95 804.46 187.4 CPI inflation4.7 Current account balance (% of GDP)-3.5 4.3 -3.4 4.94.84.8 -3.5-3.5-3.5
CHAPTER 1: GROWTH, SUSTAINABILITY AND RENEWAL education, health and social assistance. Despite baseline reductions, consolidated non-interest spending grows by 0.5 per cent in real terms over the medium term. Excluding support for Eskom and other payments for financial assets, real non-interest spending growth averages 1.4 per cent over the next three years. Financial payments (mostly support for state-owned companies), debt-service costs and wages are the fastest-growing areas of expenditure. Table 1.3 Consolidated government expenditure Source: National Treasury Additional information The MTBPS includes five annexures: • Annexure A contains the fiscal risk statement, which outlines events that could affect baseline projections for economic growth, revenue and spending. Annexure B presents data on the compensation of public-service employees. Annexure C discusses the status of Eskom’s restructuring and government support to stabilise the utility. Annexure D presents technical information and data. Annexure E is the glossary. • • • • Conclusion The 2019 MTBPS proposals are intended to promote economic growth and fiscal sustainability. Doing both will require difficult decisions that can no longer be postponed. 9 2019/20 Revised R billion 2020/212021/222022/23 Medium-term estimates Average annual growth 2019/20 – 2022/23 Learning and culture386.0 Health222.7 Social development277.1 Community development200.2 Economic development205.8 Peace and security214.3 General public services67.0 Payments for financial assets67.1 411.0437.6457.8 238.5257.2272.9 295.6312.9331.3 213.3230.2245.1 217.5235.5251.1 224.9233.5243.8 71.375.577.5 67.944.630.0 5.9% 7.0% 6.1% 7.0% 6.9% 4.4% 5.0% – Total expenditure by function1 640.3 Debt-service costs203.7 Contingency reserve– 1 740.01 827.01 909.8 232.8264.6299.1 6.06.06.0 5.2% 13.7% – Total expenditure1 844.1 1 978.72 097.52 214.9 6.3%
2019 MEDIUM TERM BUDGET POLICY STATEMENT This page was left blank intentionally. 10

2 Economic overview Introduction Sexpected to grow by just 0.5 per cent in 2019, compared with outh Africa’s economic growth continues to fall well short of what is Growth falls far short of what is needed to create jobs and boost living standards needed to create jobs and raise living standards. The economy is now 1.5 per cent forecast at the time of the 2019 Budget. Per capita gross domestic product (GDP) is expected to stagnate over the medium term. Since 2013, as the global economy and most of our developing-country peers experienced a rebound in economic activity, South Africa’s GDP growth trend has continued to decline. Failure to implement structural reforms and improve the composition and quality of spending meant that potential gains from persistent fiscal support were not realised. In turn, weak economic growth resulted in repeated revenue shortfalls, higher budget deficits and mounting government debt. Government’s overriding economic policy priority is to enact reforms that will enable South Africa to break from the spiral of anaemic growth and deteriorating public finances. At the same time, government is working to reverse the impact of state capture, rebuild the capacity of the public service and improve spending efficiency. These initiatives will take time to yield results. Government’s economic reform agenda has been enhanced bydebate around the discussion document titled Economic Transformation, Inclusive Growth, and Competitiveness: Towards an Some short-term economic reforms do not require significant state capacity or legislative changes 11 In brief •Economic growth is forecast to reach only 0.5 per cent in 2019, rising gradually to 1.7 per cent by 2022. This level of growth is far too low to support meaningful increases in employment and welfare. •World economic growth is slowing – largely in response to mounting trade conflict – in both developed and developing economies. Global economic growth is the lowest it has been since the 2008 financial crisis. •Inflation is expected to remain within the target band of 3 to 6 per cent over the medium term, while the current account deficit remains at 3.5 per cent. Investment is expected to recover gradually. •Short-and medium-term reforms are urgently required to improve economic performance over the next several years. The discussion document released by the National Treasury in August 2019 put forward an approach to restore growth momentum.
2019 MEDIUM TERM BUDGET POLICY STATEMENT Economic Strategy for South Africa, which the National Treasury released in August 2019. A series of short-and medium-term reforms are required to promote investment and job creation. The growth puzzle: why so weak for so long? South Africa faces a number of structural problems that are well understood and are identified in the National Development Plan. These include high levels of inequality, spatial disparities, low levels of education, the uneven quality of public services and inadequate state capacity. Although a wide range of policies aim to address these problems, progress has been limited. Since 2013, global growth has risen steadily and global interest rates remained low. The exchange rate has depreciated – making South African exports cheaper – and bond yields have remained contained, signalling investor interest and confidence in South Africa. The Reserve Bank’s anchoring of inflation expectations has helped to support competitiveness. But economic growth has remained subdued. South Africa is experiencing its longest business cycle downturn since 1945. Business and consumer confidence remain near historical lows, and manufacturing capital stocks have fallen to decade lows. In this environment, there is little chance of the country’s 9.4 million unemployed adults finding a job. As a result, per capita incomes continue to stagnate in comparison with our peers. Poor growth performance results from structural challenges, economic shocks and uncertainty South Africa Algeria 2000s 3.6% 1980s 2.2% 1970s 3.3% 20 000 Brazil Costa Rica 1990s 0 1.8% Thailand Mauritius 5 000 Policy and political uncertainty have weighed on confidence, compounded by drought and electricity supply shocks. Inefficient and ineffective investment spending by Eskom and other state-owned companies has weighed on productivity growth and confidence. Poor outcomes in education have left young workers vulnerable. Relative competitiveness has declined because South Africa has not moved as rapidly as its peers, for example in reducing exporting costs (Figure 2.3). As Figure 2.4 shows, citizens in more competitive countries enjoy higher per capita income. 12 Percentage change 1960 1964 1968 1972 1976 1980 1984 1988 1992 1996 2000 2004 2008 2012 2016 Per capita GDP (PPP US$) Figure 2.1 Long-term GDP growthFigure 2.2 Comparative per capita incomes* 8 6 25 000 1960s 5.5% 4 2 1.4% 2010s 15 000 Botswana -2 10 000 -4 2007 2014 2019 2024 *Countries selected on basis of similar 2007 GDP per capita incomes to South Africa Source: National Treasury and Reserve BankSource: IMF World Economic Outlook, October 2019
CHAPTER 2: ECONOMIC OVERVIEW The current slowdown is particularly concerning because it is associated with a sharp decline in expected long-term average economic growth, from nearly 4 per cent before the global financial crisis to between 1 and 1.5 per cent most recently. Reversing these trends requires urgent action. Short-term boosts to economic activity will not resolve the fundamental problems underlying weak long-run growth. Long-term average growth has declined from nearly 4 per cent to between 1 and 1.5 per cent East Asia and Pacific Europe and North America 11 2 000 7 500 Raising expected long-run growth requires an increase in state capacity and economic competitiveness. Government has two main levers to raise competitiveness: • Macroeconomic policy supports higher long-term growth by ensuring low inflation and clarifying long-term fiscal choices, which serve to reduce the cost of borrowing and support investment. Sustainable fiscal policy is intended to address risk perceptions, lower borrowing costs and create room to respond to unforeseen shocks. Monetary policy has focused on ensuring low inflation and reducing long-term inflation expectations. The flexible exchange rate has been an important shock absorber for volatility. • Microeconomic policy supports higher long-term growth by ensuring a well-regulated, efficient business environment that encourages innovation and the creation of new businesses. Such reforms have been highlighted repeatedly in the medium-term strategic framework and forums such as the Jobs Summit, but remain mostly unrealised. Economic reforms to implement without delay Government has made progress on the measures that the President announced in September 2018. To support tourism, the Minister of Home Affairs has withdrawn the requirement for unabridged birth certificates for foreign minors. The electronic visa platform will be piloted in November 2019 and four more countries have been granted visa waivers, bringing the total to 82 of 193 United Nations members. Cabinet has approved a revised Integrated Resources Plan for energy, which provides certainty around government’s preferred energy mix. In addition, the final 13 Cost to export container (US$) Gross national income per capita (US$ 2018) Figure 2.3 Container export costs*Figure 2.4 Competitiveness and income 2 500 South AfricaSub-Saharan Africa Middle East and North Africa ColombiaSouth Africa Algeria 10 1 500 Brazil9 8 1 000 Costa Rica Serbia6 Dominican5 Republic30 40 50 60 70 80 90 0 ThailandGlobal Competitiveness Index 2009 2011 2015 (score 0-100)* *Countries selected on basis of similar 2007 GDP per capita incomes to South Africa*A score of 100 is most competitive Source: World Bank Ease of Doing BusinessSource: Global Competitiveness Report, 2018
2019 MEDIUM TERM BUDGET POLICY STATEMENT telecommunications policy directive for spectrum licensing was released in July 2019, providing a framework to enable the regulator to issue licences. While encouraging, further progress is required. The discussion document titled Economic Transformation, Inclusive Growth, and Competitiveness: Towards an Economic Strategy for South Africa, released in August 2019 by the National Treasury, presents an approach to boost potential growth. It focuses on areas which address our largest microeconomic binding constraints: Treasury’s economic reform proposals aim to boost competitiveness and job creation • Network industries, such as road, rail and telecommunications, need to be modernised and reformed so that lower costs and increased efficiency can improve business competitiveness. Export-focused reforms are needed to boost exports, employment and innovation, and enhance regional growth. Focused and flexible industrial and trade policy can support such reforms, alongside promoting labour-intensive sectors such as tourism and agriculture. Raising competition in the economy will make it easier for businesses – particularly small firms – to compete against large, dominant players. • • Ideally, these structural reforms would have been implemented during a period of strong cyclical growth, and with ample fiscal space. The country, however, cannot wait any longer. It typically takes between two and four years for reforms to bolster growth. The following reforms should be implemented without delay. They do not require significant state capacity, and should boost economic growth over the next two years: • Tourism: Accelerate progress on the Yamoussoukro open skies agreement to reduce the cost of flying to South Africa, and support tourism by cutting red tape and the regulatory burden for entrepreneurs and small businesses. Electricity: Finalise the granting of licences for small-scale power generation projects approved by the Minister of Energy. The fifth round of the Independent Power Producer (IPP) programme for renewable energy should begin, with estimated revenue gains of between R40 billion and R50 billion two to four years after the bid window is opened. Telecommunications: Issue guidelines and enforce open-access conditions to support the rapid expansion of fibre infrastructure. Costs of doing business: Develop a single platform to register a business and automate the deeds registry. • • • Other reforms also need to begin immediately, although they will likely only be completed over the medium term. These include reforms in modernising ports and rail; in water, rehabilitating municipal infrastructure linked to industrial activity; and in telecommunications, releasing spectrum to facilitate a licensing process over the next two years. Industrial policy should actively promote an export orientation, broadening the focus from state-led demand programmes such as local procurement. In trade policy, government should establish, alongside the private sector, Medium-term reforms may be completed in next three years if begun immediately 14
CHAPTER 2: ECONOMIC OVERVIEW an automated licensing system for export documentation and improved border control procedures to meet global standards. Enhanced reciprocity can strengthen African market access and counter the impact of intensified overseas competition in manufactured goods markets. Global outlook Economic growth has weakened in both developed and developing countries. The International Monetary Fund (IMF) estimates that trade tensions will reduce growth by 0.8 percentage points in 2020, offset by supportive monetary policy. Expected growth in the euro area, which accounts for 23 per cent of all South African exports, has been revised down since January by 0.4 and 0.3 percentage points in 2019 and 2020 respectively, as uncertainty about the direction of Italy’s finances and lower external demand in Germany reduced growth more than previously forecast. China’s trend growth continues to slow, with important implications for resource exporters such as South Africa. Marked slowdown in global growth has tangible consequences for South Africa Table 2.1 Economic growth in selected countries 1. National Treasury forecasts. Note: Final numbers are for 2022 Source: IMF World Economic Outlook, October 2019, and IMF World Economic Outlook database In response to the deteriorating growth outlook, central banks have either begun to reduce interest rates from already low levels, or to communicate they are less likely to raise rates. In Europe and Japan, long-term bonds are trading at negative interest rates. The extremely low interest-rate environment in developed economies has supported a “hunt for yield” that has supported investment in developing-country government bonds and contained their borrowing costs. South Africa has benefited from this interest rate differential, although our performance compares unfavourably to peer countries. Compared to average 2018 levels, South Africa’s risk premium – the additional amount that investors demand to compensate for perceived risk in the economy – has risen by about 0.3 percentage points, compared to an average decline of 0.3 percentage points in peer countries. Currency movements have been relatively subdued. Developing-country currencies have strengthened by 0.4 per cent since the start of the year. “Hunt for yield” has contained borrowing costs, but South Africa’s risk premium has risen Rand is 3.2 per cent lower against US dollar in 2019 15 Region/country2018 PercentageActual 2019202020212022-2024 Average GDP (forecast) World3.6 Advanced economies2.3 United States2.9 Euro area1.9 United Kingdom1.4 Japan0.8 Developing countries4.5 China6.6 India6.8 Brazil1.1 Russia2.3 Mexico2.0 Sub-Saharan Africa3.2 South Africa10.8 3.03.43.63.6 1.71.71.61.6 2.42.11.71.6 1.21.41.41.3 1.21.41.51.5 0.90.50.50.5 3.94.64.84.8 6.15.85.95.6 6.17.07.47.4 0.92.02.42.4 1.11.92.01.9 0.41.31.92.3 3.23.63.74.1 0.51.21.61.7
2019 MEDIUM TERM BUDGET POLICY STATEMENT The rand is 3.2 per cent lower compared to the US dollar, as domestic risks have weighed on investor sentiment. Weak global growth has favoured precious metals prices as investors seek a safe haven, with strong purchases supporting gold and, to a lesser extent, platinum. Palladium prices have risen. Coal prices have fallen 33.8 per cent since January, while oil prices have risen 7 per cent. 6.0 100 Domestic outlook South Africa’s growth outlook has declined significantly since the 2019 Budget was tabled in Parliament. Growth in the first half of the year was flat, as the rebound in the second quarter offset the contractionary effects of power outages and prolonged strike action in the first quarter. The National Treasury forecasts that growth will now be 0.5 per cent in 2019 and only 1.2 per cent in 2020. Given the fiscal deficit, borrowing costs are expected to remain elevated. Government projects a very gradual recovery in confidence. Replacement investment in key sectors will support modest employment, wage and investment gains over the medium term. The current account deficit is expected to remain at 3.5 per cent of GDP over the next three years, given low investment and import growth. Treasury forecasts growth of 0.5 per cent in 2019, rising to 1.7 per cent in 2022 Table 2.2 Macroeconomic performance and projections Source: National Treasury, Reserve Bank and Statistics South Africa 16 Percentage points Jan 2019 Feb 2019 Mar 2019 Apr 2019 May 2019 Jun 2019 Jul 2019 Aug 2019 Sep 2019 Index (100=January 2018) Jan 2018 Mar 2018 May 2018 Jul 2018 Sep 2018 Nov 2018 Jan 2019 Mar 2019 May 2019 Jul 2019 Sep 2019 Calendar year20172018 Percentage changeActual 2019 Estimate 202020212022 Forecast Final household consumption2.11.8 Final government consumption0.21.9 Gross fixed-capital formation1.0-1.4 Gross domestic expenditure1.91.0 Exports-0.72.6 Imports1.03.3 1.3 1.8 -0.8 1.4 -1.7 1.1 1.31.51.7 1.81.10.6 0.81.31.8 1.11.51.7 2.52.83.1 1.92.63.0 Real GDP growth1.40.8 0.5 1.21.61.7 GDP inflation5.33.9 GDP at current prices (R billion)4 6544 874 CPI inflation5.34.7 Current account balance (% of GDP)-2.5-3.5 4.8 5 132 4.3 -3.4 4.94.94.8 5 4495 8046 187 4.94.84.8 -3.5-3.5-3.5 Figure 2.5 Developing-economy risk premiumsFigure 2.6 Currency movements in peer economies EMs* SA Turkey Brazil Mexico 110 EMs* currency indexUSD/ZAR 5.5 105 5.0 4.5 4.0 95 3.5 90 3.0 2.5 85 2.0 80 *Emerging markets Source: Bloomberg
CHAPTER 2: ECONOMIC OVERVIEW Macroeconomic assumptions The forecast incorporates assumptions outlined in Table 2.3. The main changes since the 2019 Budget include upward revisions to the sovereign risk premium and iron ore, gold and platinum prices. Downward revisions were made to global growth, coal, oil and metals prices and real investment by public corporations. Table 2.3 Assumptions used in the economic forecast 1. Combined growth index of South Africa's top 15 trading partners (IMF World Economic Outlook, October 2019) 2. Source: Bloomberg futures prices as at 2 October 2019 Source: National Treasury Risks to the growth outlook Risks to the growth outlook remain skewed to the downside. Domestically, a prolonged under-recovery in investment and disruptions to electricity supply, as well as renewed labour unrest, could threaten activity. Operational underperformance and resultant bailout risks in state-owned companies, as well as concerns about an unsustainable fiscal trajectory, could further weaken the currency and raise the cost of borrowing. Global risks include a larger than currently projected slowdown in growth due to intensified US-China trade tensions, prolonged Brexit uncertainty and a disorderly unwinding of monetary policy in advanced economies. Household consumption Consumption expenditure grew by 1 per cent in the first half of 2019 compared with the corresponding period of 2018. Although household 17 20172018 Percentage changeActual 2019 Estimate 202020212022 Forecast Global demand14.84.4 International commodity prices2 3.6 4.04.24.0 Brent crude oil (US$ per barrel)54.871.0 Gold (US$ per ounce)1 257.71 269.3 Platinum (US$ per ounce)950.4880.7 Coal (US$ per ton)77.393.1 Iron ore (US$ per ton)70.666.4 63.8 1 397.8 861.7 71.4 90.7 57.856.256.1 1 523.91 545.51 564.8 919.2939.5960.2 69.873.175.8 74.268.666.3 Food inflation6.93.6 Electricity inflation4.75.2 3.5 9.8 5.34.75.0 10.37.57.0 Sovereign risk premium2.73.1 (percentage point) Real public corporation investment-11.7-12.5 3.2 -1.7 3.33.23.1 0.51.62.0 Alternative scenarios The National Treasury has modelled two alternative scenarios to the baseline economic forecast. In Scenario A, if government proves unable to undertake sustainable reforms to the operations of state-owned companies, the resultant sharp rise in borrowing costs would reduce private investment, dampen confidence and employment, and lower household consumption. This in turn would result in a widening budget deficit and mounting debt. Growth would eventually recover to 1.4 per cent in 2022 as the economy adjusts to higher costs, but there would be a substantial loss of welfare and GDP per capita would decline. Scenario B envisions successful implementation of a meaningful set of structural policy reforms. This would boost confidence, and lower the costs of living and doing business. In turn, this would generate incentives for business to invest and hire workers. Growth would rise to 2.4 per cent in 2022. A well-structured fiscal consolidation strategy could raise long-term growth further. As is the case internationally, the full benefits of growth-enhancing reforms would emerge over five to seven years, moving South Africa to a new trend growth level.
2019 MEDIUM TERM BUDGET POLICY STATEMENT spending remains the main support for growth, spending on non-essential items has fallen dramatically due to rising unemployment, successive fuel price hikes and tax increases. Retailers are responding by keeping prices low and margins tight. A mild acceleration in consumption is forecast over the medium term as employment and income growth are expected to recover only gradually. Mild pickup in consumption expected Investment Investment contracted by 1.6 per cent in the first half of 2019, offset by a 15.2 per cent recovery in private-sector investment in the second quarter, partly linked to the fourth bid window of the IPP programme. Spending by government and state-owned companies continued to contract in the first half of 2019. Investment by state-owned companies has been constrained by lack of access to markets for borrowing, as well as processes to contain illegal and wasteful expenditure. Low confidence and growth have weighed heavily on private investment activity. The forecast assumes a gradual improvement in confidence as well as the need to rebuild eroded capital stock. Investment from IPPs is likely to support private investment, particularly in the two outer years of the Gradual improvement in business confidence will support higher levels of investment medium-term expenditure framework period. Commitments Investment Summit continue to be implemented. from the Figure 2.7 Investment by asset type *2019 figures reflect the first six months of the year Source: Reserve Bank and National Treasury calculations Employment The labour market remains extremely weak. The number of people employed has risen by 25 000 compared to a year ago. Although informal employment is 219 000 higher than a year ago, the trend towards informality in the context of low growth is of concern. Weak job growth and an expanding labour force have seen the official unemployment rate increase from 27.2 per cent in June 2018 to 29 per cent in June 2019. The proportion of people unemployed for more Official unemployment rate has increased to 29 per cent, up from 27 per cent a year ago 18 Per cent 1999 2000 2001 2002 2003 2004 2005 2006 2007 2008 2009 2010 2011 2012 2013 2014 2015 2016 2017 2018 *2019 Building Construction works Machinery and equipment Other 0.15 0.10 0.05 0.00 -0.05 -0.10 -0.15
CHAPTER 2: ECONOMIC OVERVIEW than a year has risen to 71.5 per cent in the second quarter, up from 60.8 per cent in the second quarter of 2009. Average annual wage growth per worker in the private sector was 2.1 per cent in the first half of 2019, compared to 10.4 per cent in the public sector. Inflation Inflation pressures have been subdued in 2019, with inflation averaging 4.3 per cent from January to August, mainly due to weak demand. Within its flexible inflation-targeting mandate, the Reserve Bank is focused on anchoring inflation expectations at the midpoint of the 3 to 6 per cent target band. The repurchase (repo) rate stands at 6.5 per cent, after a 0.25 percentage point cut in July to support growth. Reserve Bank modelling suggests a further 0.25 percentage point cut in rates before the end of 2019. The Reserve Bank has expressed concerns about risks of global financial market disruptions, as well as the effect that a loss of confidence could have on the rand and inflation. Inflation is forecast to increase gradually as a result of electricity tariff hikes, and higher meat and grain prices. Administered price inflation remains high, with electricity and water producer price inflation reaching 14.6 per cent in July 2019. Reserve Bank is anchoring inflation expectations at midpoint of 3 to 6 per cent target band Sector performance and outlook Mining Despite second-quarter growth of 14.4 per cent, mining output in the first half of the year was still 3.3 per cent lower than in the first half of 2018. Production is expected to decline again in 2019, despite higher precious metals prices, as weak global demand and strikes weigh on production. The medium-term production outlook is constrained by lingering domestic regulatory uncertainty and slowing global economic growth, particularly in China, which is a large commodity importer. Lingering regulatory uncertainty and slower global growth constrain outlook for mining Agriculture Real agricultural output was 9.2 per cent lower in the first half of 2019 than in the corresponding period of 2018. Late plantings and patchy rainfall are expected to negatively affect grains, while herds recover following the outbreak of foot-and-mouth disease. Agricultural production is expected to receive a short-term boost from higher global prices in 2020, but the Growth in citrus and high-value produce expected to remain strong 19 The relationship between the repo rate and other interest rates Concerns about the cost of borrowing have led to a focus on the repo rate, which is set by the Reserve Bank. The repo rate is the “policy rate” that affects how interest rates are set across the economy. However, borrowing costs are influenced by a range of factors, including the creditworthiness of the borrower, inflation expectations, and the willingness of savers to place deposits in bank accounts or in the money market. As a result, the actual rates paid by consumers vary. Mortgages and vehicle loans tend to move alongside changes in the repo rate; unsecured loans by contrast tend to be linked to the policy rate only at the time of the loan being extended, thereafter the interest rate is fixed. If the repo rate moves down but the risks of lending have risen, for example with higher inflation or higher risk of default, lending rates will not decline. Government provides concessionary finance to improve access to finance through development finance institutions such as the Land Bank, the Development Bank of Southern Africa and the Small Enterprise Finance Agency.
2019 MEDIUM TERM BUDGET POLICY STATEMENT need to rebuild herds is likely to constrain total output over the medium term. Growth in citrus and other high-value produce such as macadamia nuts and avocados is forecast to remain strong over the period. Manufacturing Real manufacturing output in the first half of 2019 was 0.5 per cent higher than in the corresponding period of 2018. However, monthly production contracted in May and June 2019, and the seasonally adjusted Absa Purchasing Managers’ Index declined to 45.7 index points in August 2019. All sub-indices in the index are below the neutral 50 mark, including business conditions expected in six months. Weaker growth in Sub-Saharan Africa and Europe, together with rising competition and limited improvements in domestic competitiveness, are expected to weigh on demand over the medium term. Despite uptick in manufacturing output in first half, competitiveness concerns weigh on outlook Electricity Electricity sector output rose 3.2 per cent in the second quarter, suggesting some recovery, but is 0.9 per cent lower than a year ago. The energy availability factor from coal-fired power stations has continued to decline from 70.2 in September 2018 to 67.3 in September 2019. Looking ahead, continued maintenance problems, cost overruns and delays at Eskom pose risks to the outlook for electricity generation. Other sources of generation continue to grow: of the 91 active renewable energy IPP projects, 64 were in operation as at March 2019, adding 3 976 megawatts of power to the national grid. Once completed, the 27 IPP projects that are currently under construction are expected to add nearly 2.4 gigawatts to the grid. 27 IPP projects under construction expected to add nearly 2.4 gigawatts to national grid Financial and business services The financial and business services sector grew by 2.7 per cent in the first half of 2019, a major contributor to faster growth. The sector has been buoyed by banking activity and a rebound in equity market activity in the second quarter, which offset first-quarter declines. Conclusion The growth outlook is weak. Promoting faster, job-creating growth remains government’s central economic policy priority. A series of short-and medium-term interventions, if enacted now with speed and determination, can promote higher growth outcomes over the next several years. Promoting faster, job-creating growth remains government’s central economic policy priority 20
3 Fiscal policy Introduction Sreductions in revenue projections, while fiscal pressures to stabilise outhAfrica’spublicfinanceshavedeterioratedsincethe 2019 Budget. Lower economic growth has resulted in sharp Eskom and other state-owned companies in financial crisis have mounted. The 2019 Medium Term Budget Policy Statement proposes a number of measures to respond to these shocks. Spending reductions amounting to R49.5 billion over the next two years have been identified, and non-interest expenditure growth is limited to CPI inflation in the outer year. Nevertheless, total spending increases in the current year and in 2020/21, mainly due to financial support for Eskom. The consolidated budget deficit averages 6.2 per cent of GDP over the next three years, while the debt-to-GDP ratio continues to rise. To return the public finances to a sustainable position over the longer term requires large additional adjustments. Government proposes a fiscal target: achieve a main budget primary balance, excluding Eskom funding 21 In brief •The public finances have deteriorated since the 2019 Budget mainly due to lower growth and tax revenue, as well as increased support to state-owned companies. The consolidated deficit averages 6.2 per cent over the next three years, with debt projected to reach 71.3 per cent of GDP by 2022/23. •Relative to the 2019 Budget, the MTBPS shows an increase in main budget non-interest spending of R23 billion in 2020/21 and a reduction of R8.2 billion in 2021/22. These net changes incorporate increased financial support to Eskom, the reversal of anticipated savings on compensation and reductions in other spending. •To stabilise the debt-to-GDP ratio over the coming decade, large additional measures are needed. Government is proposing a fiscal target: a main budget primary balance, excluding financial support for Eskom, by 2022/23. This will require reductions to wage bill growth. Tax measures are also being considered. •Eskom remains the major risk to the economy and public finances. To ensure its continued operation, Eskom receives R49 billion in the current year, and an expected R112 billion over the medium-term expenditure framework (MTEF) period. Additional support may be required, depending on progress in cost savings and institutional reform.
2019 MEDIUM TERM BUDGET POLICY STATEMENT provisions, by 2022/23. This target is expected to result in debt stabilising by 2025/26. Stabilisation involves difficult decisions that imply short-term costs for the economy and the fiscus. Growth in government’s compensation bill will need to be reduced and additional revenue measures may be needed. The final shape of the adjustment will be announced at the time of the 2020 Budget. The consequences of not taking action, however, would be profound for South Africa. Over time, the country would likely face mounting debt-service costs and escalating interest rates that raise the cost of borrowing and squeeze out government’s ability to provide services. Flagging confidence would translate into lower investment and still-weaker economic growth, worsening the employment crisis, reducing tax revenue and causing government debt to balloon. There is no status quo option: difficult decisions must be taken Gross loan debt without financial support for Eskom 85 79.5 75.8 74.7 75.8 71.3 4 68.5 70.1 68.0 65 3 2 59.7 58.9 57.8 55 53.0 56.2 55.6 48.9 Non-interest spending Revenue 8.4 8.3 27 7 24 2.4 2.0 2.0 2.1 1 -0.2 Options to stabilise the public finances Despite large fiscal deficits over the past decade, in which South Africa’s debt-to-GDP ratio has risen sharply, economic growth has not rebounded. These deficits, which had provided some short-term support to the economy, are increasingly harmful to economic growth, leading to rising interest rates and uncertainty. As debt has mounted, a growing share of Deficit spending has failed to accelerate economic growth 22 Per cent of GDP Per cent of GDP 2006/07 2007/08 2008/09 2009/10 2010/11 2011/12 2012/13 2013/14 2014/15 2015/16 2016/17 2017/18 2018/19 2019/20 2020/21 2021/22 2022/23 2009/10 2010/11 2011/12 2012/13 2013/14 2014/15 2015/16 2016/17 2017/18 2018/19 Per cent of GDP Percentage change 2006/07 2007/08 2008/09 2009/10 2010/11 2011/12 2012/13 2013/14 2014/15 2015/16 2016/17 2017/18 2018/19 2019/20 2020/21 2021/22 2022/23 2015/16 2016/17 2017/18 2018/19 2019/20 2020/21 2021/22 2022/23 2023/24 2024/25 2025/26 2026/27 2027/28 Figure 3.1 Main budget balanceFigure 3.2 Gross debt-to-GDP outlook** 7 Interest payments Primary deficit 2019 Budget 6 Gross loan debt with financial support for Eskom 80.9 77.8 5 75 73.7 71.8 73.4 64.9 65.7 60.8 62.8 56.7 59.8 60.2 60.1 59.9 59.3 1 50.5 0 45 Figure 3.3 Main budget primary balance*Figure 3.4 Real main budget non-interest spending* 28 9 8 26 6 5 25 4 3 2 1.6 23 0 22 -1 *Excluding Eskom financial support and transactions in financial assets and liabilities **The assumptions underlying the long-term projections appear in Annexure D Source: National Treasury 7.0 7.2 6.3 4.9 3.3 1.7 1.4 0.8 1.4 4.1 2.3 1.0 2.4 2.2 1.6 1.3 1.0 1.0 3.7 0.5 3.5 3.3 3.0 3.1 2.7 2.8 2.5 2.2 2.3
CHAPTER 3: FISCAL POLICY limited public resources has been absorbed by interest payments, which increasingly crowd out spending on social and economic investment. Options to stabilise the fiscus are becoming increasingly limited. Government’s economic reform agenda will boost confidence and investment. However, these reforms are only expected to begin yielding results over the next several years, implying continued weakness in revenue collection over the period ahead. Moreover, following several years of tax increases, revenue options are constrained. The tax-to-GDP ratio is close to its 2007/08 peak of 26.4 per cent. The 2019 Budget included R10 billion in tax increases for 2020/21. The tax policy measures to raise this amount will be announced in the 2020 Budget. Past reductions to spending growth have fallen primarily on goods and services – a category that includes things like school books, and medical and food supplies – and capital budgets, which finance the construction of roads, dams, hospitals and water treatment plants. The space to reduce these budgets further is shrinking. Economic reform agenda can be implemented immediately CPI inflation expenditure Compensation of employees Debt-service costs Transfers and subsidies training Transfers to Compensation of employees oods and R135 companies support and costs R54 0 4 8 12 municipalities Relative to the 2019 Budget, main budget non-interest spending increases by R23 billion in 2020/21 and decreases by R8.2 billion in 2021/22. Spending additions include financial support for Eskom and the reversal of estimated savings from compensation measures and the reorganisation of government, which were announced in the 2019 Budget. In addition to the amounts allocated through the Special Appropriation Bill, R10 billion is provisionally allocated to Eskom in 2021/22. The main reductions made have been to goods and services and transfers, while wage growth is revised down marginally due to lower projected CPI inflation. Narrowing the deficit and improving the composition of spending requires reductions in the growth of the wage bill, which accounts for 35 per cent of the consolidated budget. Salaries for civil servants have grown by about 40 per cent in real terms over the past decade. Options to be considered include pegging cost-of-living adjustments at or below CPI inflation, halting To improve spending composition and achieve reductions, lower growth in wage bill required automatic pay progression and reviewing occupation-specific 23 Figure 3.5 Breakdown of every R1 000 spent byFigure 3.6 Average nominal growth in consolidated economic classification, 2019/20*spending, 2011/12 — 2018/19 Other R39 Post-school R education and transfers households R42 Payments for capital assets R53 Goods and services State-owned services Debt-service Payments for capital assets investments Transfers to R115 R74 Per cent *Spending at consolidated national and provincial government level Source: National Treasury 13.5 8.8 8.3 7 5.3
2019 MEDIUM TERM BUDGET POLICY STATEMENT dispensations for wages. Government has to discuss these matters with labour, and progress will be announced in the 2020 Budget. Expenditure performance and outlook In-year spending adjustments Non-interest spending has increased by R23 billion in the current year, mainly due to a Special Appropriation Bill that allocates R26 billion to Eskom. Government has accommodated all other expenditure pressures within budget baselines. As shown in Table 3.1, additions to spending are offset by the use of the contingency reserve, provisional allocations, projected underspending and declared unspent funds. Additional funds include support to South African Airways (R5.5 billion) and the South African Broadcasting Corporation Largest in-year spending adjustments are for Eskom, South African Airways and SABC (SABC, R3.2 billion). Denel and South African Express amounting to R1.8 billion and R300 million, respectively. receive funding Table 3.1 Revisions to non-interest expenditure for 2019/20 R million Non-interest expenditure (2019 Budget Review) 1 456 500 Upward expenditure adjustments Budget Facility for Infrastructure projects and project preparation Financial support to state-owned companies: Eskom Special Appropriation Bill South African Airways South African Broadcasting Corporation Denel South African Express Self-financing1 Provisional downward adjustment not effected on compensation Roll-overs National Revenue Fund payments adjustment Revision to members of Parliament remuneration Downward expenditure adjustments Declared unspent funds and revision to magistrates' salaries Contingency reserve Skills development levy Provisional allocation not assigned to votes National government projected underspending Local government repayment to the National Revenue Fund 44 527 630 26 000 5 500 3 200 1 800 300 1 655 4 800 345 224 73 (21 405) (4 029) (13 000) (182) (1 010) (1 184) (2 000) Revised non-interest expenditure (2019 MTBPS) Change in non-interest expenditure from 2019 Budget Change in non-interest expenditure excluding Eskom 1 479 622 23 122 (2 878) 1. Spending financed from revenue derived from departments' specific activities Source: National Treasury Medium-term expenditure outlook Government proposes adjustments to main budget spending plans over the next two years. Relative to the 2019 Budget, total main budget non-interest expenditure increases by R23 billion in 2020/21, and decreases by R8.2 billion in 2021/22. These net changes include: 24
CHAPTER 3: FISCAL POLICY • Increases in non-interest spending of R45 billion and R22 billion over the next two years, mainly as a result of additional support to Eskom. • Reductions of R21 billion in 2020/21 and R28.5 billion in 2021/22, mostly falling on goods and services, and current and capital transfers. Compensation is revised down marginally in line with lower CPI projections. The expected savings on compensation announced in the 2019 Budget have been reversed. Compensation measures, which include early retirement without penalties, were anticipated to generate savings of R12 billion per year in 2020/21 and 2021/22. These measures will be included in a broader discussion between government and labour on future adjustments to wage bill growth. In total, real main budget non-interest spending grows at 1.2 per cent in 2020/21, and 0.1 per cent in 2021/22. Government is constraining non-interest expenditure in the outer year to grow largely in line with CPI inflation. As a share of GDP, non-interest expenditure moderates from 28.4 per cent in 2020/21 to 27.4 per cent by 2022/23. This includes a contingency reserve amounting to R6 billion per year over the medium term. Due to a wider deficit, weaker currency and higher interest rates, the cost of servicing government debt is expected to exceed 2019 Budget estimates by R1.5 billion in 2019/20, R8.7 billion in 2020/21 and R17.2 billion in 2021/22. An estimated 18.4 per cent of main budget revenue will be used to service debt in 2022/23 compared with 15 per cent in 2019/20. Real non-interest spending grows by 1.2 per cent in 2020/21 and 0.1 per cent in 2021/22 Debt-service costs increase to 18.4 per cent of main budget revenue in 2022/23 Expenditure ceiling The main budget expenditure ceiling provides an upper limit within which departments prepare their medium-term budgets. The ceiling has anchored fiscal policy since the 2012 Budget. In 2018/19, the expenditure ceiling was maintained. Compared with the 2019 Budget, the ceiling is lower by R2.9 billion in 2019/20, R9 billion in 2020/21 and R16.5 billion in 2021/22. Eskom financial support in-year and over the MTEF period is classified as payments for financial assets and is excluded from the expenditure ceiling. Funding for other state-owned companies is included. Annexure D explains the technical adjustments in calculating the difference between non-interest spending and the expenditure ceiling. Expenditure ceiling, which excludes Eskom, revised lower in medium term Table 3.2 Main budget expenditure ceiling1 1. The expenditure ceiling differs from main budget non-interest expenditure The precise definition and calculation of the expenditure ceiling is contained in Annexure D Source: National Treasury 25 R million2016/172017/182018/19 2019/20 2020/212021/222022/23 2017 MTBPS1 141 9781 233 7221 316 553 2018 Budget Review1 232 6781 315 002 2018 MTBPS1 225 4551 314 865 2019 Budget Review1 310 156 2019 MTBPS1 307 235 1 420 408 1 416 597 1 416 597 1 407 595 1 404 675 1 524 222 1 523 762 1 523 7621 630 026 1 502 0521 607 758 1 493 0291 591 2871 673 601
2019 MEDIUM TERM BUDGET POLICY STATEMENT Revenue performance and outlook Revenue estimates have been revised down steadily since 2014/15 as economic growth was lower than expected and inefficiencies and structural weaknesses at SARS affected collections. Measures to increase tax revenue have offset some of this decline, but the expected increase in collections has disappointed. Sustained higher economic growth, and a revitalised and effective SARS, are key to improved revenue outcomes over the medium term. Higher economic growth and improved performance by SARS are needed to improve revenue outcomes Table 3.3 Gross tax revenue 1. 2019 Budget figures 2. Includes secondary tax on companies Source: National Treasury Factors contributing to poor revenue performance In 2018/19, government collected R57.3 billion less than projected in the 2018 Budget, and R14.5 billion less than set out in the 2019 Budget. This was the largest undercollection since 2009/10, following the global financial crisis. It was partly driven by large and unexpected once-off payments of VAT refunds in line with commitments in the 2018 MTBPS. The bulk of the 2018/19 shortfall resulted from weaker-than-expected economic growth in 2019. Large shortfalls in a single year have a knock-on effect, widening the gap between forecasts and outcomes in subsequent years. Gross tax revenue needed to grow at 10.4 per cent this year to reach the 2019 Budget estimate. Due to the weak economy and base effects from unusually low VAT refund payments in the first half of 2018/19, revenue growth has been 3.7 per cent in the first half of 2019/20. The National Treasury expects revenue growth to accelerate to 6.4 per cent for the fiscal year. Along with weaker economic growth, high and consistent VAT refund payments will result in a downward revision to the in-year revenue projection, which is now estimated at R52.5 billion lower than the 2019 Budget estimate. Revenue growth is weaker for a number of reasons, including: Revenue shortfalls have a knock-on effect, widening gap between forecasts and outcomes in later years • A poor employment outlook, with job losses, lower wage settlements and smaller bonuses reducing personal income tax collection. • Reduced profitability in a difficult trading environment, resulting in lower-than-expected corporate income tax collections. 26 2018/19 R billionBudget1Outcome Deviations 2019/20 Budget1RevisedDeviations Persons and individuals497.5492.1-5.4 Companies218.4212.0-6.4 Value-added tax325.9324.8-1.2 Dividend withholding tax230.329.9-0.4 Specific excise duties40.340.80.6 Fuel levy75.475.4-0.0 Customs duties55.655.0-0.7 Ad-valorem excise duties4.24.20.0 Other54.653.5-1.1 552.9527.6-25.3 229.6219.0-10.6 360.5348.4-12.1 31.932.00.1 42.446.54.2 83.078.4-4.6 60.058.4-1.7 4.54.3-0.1 57.655.1-2.4 Gross tax revenue1 302.21 287.7-14.5 1 422.21 369.7-52.5
CHAPTER 3: FISCAL POLICY • Weak household consumption, which moderates the increase in domestic VAT collection. The Nugent Commission of Inquiry into SARS highlighted significant governance failures, the dismantling of critical organisational arrangements and the loss of experienced staff, which contributed to poor revenue collection in recent years. Under the new SARS Commissioner, the revenue authority is revitalising its operations, and performance is expected to improve significantly over the medium term. The SARS Large Business Centre, which focuses on major firms and high net-worth individuals, was officially reopened in October. The National Treasury will release a discussion document that reviews and proposes options to improve tax administration oversight by the 2020 Budget. New SARS Commissioner appointed and turnaround strategy expected to yield results over medium term Medium-term revenue outlook The 2018/19 revenue outcomes, persistently weak economic growth and downward revisions to expected growth in major tax bases all contribute to lower projected revenue growth over the medium term. As Table 3.4 shows, these assumptions produce gross tax revenue projections that fall short of the 2019 Budget estimates by R52.5 billion in 2019/20, R84 billion in 2020/21 and R114.7 billion in 2021/22. Tax revenue shortfall of R52.5 billion in current year Table 3.4 Revised revenue projections R billion 2019/20 2020/21 2021/22 2022/23 1 422.2 1.31 1 369.7 1.08 1 544.9 1.17 1 460.9 1.09 1 670.4 1.08 1 555.7 0.99 2019 Budget Buoyancy Revised estimates Buoyancy 1 658.2 1.00 Change since 2019 Budget -52.5 -84.0 -114.7 Source: National Treasury Details on tax revenue and tax bases are in Table D.4 of Annexure D. No changes have been made to the anticipated buoyancies – which relate growth in tax revenue to growth in the underlying tax bases – for the major tax instruments. Table 3.5 Medium-term revenue framework 1. Amount made up of payments and other adjustments 2. Mainly revaluation profits on foreign-currency transactions and premiums on loan transactions Source: National Treasury 27 2016/172017/182018/19 R billionOutcome 2019/20 Revised 2020/212021/222022/23 Medium-term estimates Gross tax revenue 1 144.1 1 216.5 1 287.7 Gross tax revenue growth 6.9% 6.3% 5.9% Nominal GDP growth 7.1% 6.3% 4.7% Buoyancy 0.97 1.00 1.23 1 369.7 6.4% 5.9% 1.08 1 460.91 555.71 658.2 6.7%6.5%6.6% 6.1%6.6%6.6% 1.090.991.00 Non-tax revenue19.019.323.3 Southern African-39.4-56.0-48.3 Customs Union1 National Revenue Fund14.216.612.0 receipts2 29.8 -50.3 9.9 23.825.026.7 -63.4-62.2-64.6 4.77.07.6 Main budget revenue1 137.91 196.41 274.7 1 359.1 1 425.91 525.61 627.9
2019 MEDIUM TERM BUDGET POLICY STATEMENT The Southern African Customs Union (SACU) common revenue pool forms part of the National Revenue Fund and main budget calculations. Payments to SACU partners have been revised down by R2.4 billion in 2020/21 and R3.2 billion in 2021/22 compared with the 2019 Budget estimates. Details appear in Annexure D. The 2019 Budget included R7 billion from the sale of non-core assets in 2019/20. There is a risk these sales will not be completed by the end of the financial year. Payments to SACU partners revised down by R5.6 billion over next two years Fiscal framework Main budget framework The main budget framework summarises spending financed from the National Revenue Fund. Main budget revenue is projected to remain around 26 per cent of GDP in the current year and over the MTEF period. Main budget expenditure is estimated to moderate to 32.1 per cent of GDP by 2022/23. Main budget revenue projected around 26 per cent of GDP over MTEF period Table 3.6 Main budget framework Source: National Treasury In 2019/20, the main budget deficit is estimated to widen to 6.2 per cent of GDP compared with the 2019 Budget estimate of 4.7 per cent, mainly due to lower nominal GDP, tax revenue shortfalls and financial support for Eskom. Over the next two years, lower revenue, additional financial support for Eskom and higher debt-service costs widen the main budget deficit by an average of 2.2 percentage points. The primary balance narrows over time, reaching 1.4 per cent of GDP in 2022/23. Provision for financial support for Eskom in the current year and over the medium term amounts to R161 billion. Excluding these provisions for Eskom, the main budget primary deficit improves by 0.9 percentage points to 1.4 per cent of GDP in 2019/20, and narrows to 1.1 per cent of GDP in 2022/23. Provision for Eskom support in the current year and over the MTEF period amounts to R161 billion 28 2016/172017/182018/19 R billion/percentage of GDPOutcome 2019/20 Revised 2020/21 2021/222022/23 Medium-term estimates Main budget revenue1 137.91 196.41 274.7 25.7%25.5%25.9% 1 359.1 26.1% 1 425.91 525.61 627.9 25.8%25.9%25.9% Main budget expenditure1 305.51 405.01 506.7 29.5%29.9%30.6% Non-interest expenditure1 159.01 242.31 324.9 26.2%26.4%26.9% Debt-service costs146.5162.6181.8 3.3%3.5%3.7% 1 683.4 32.3% 1 479.6 28.4% 203.7 3.9% 1 801.21 909.52 017.7 32.6%32.4%32.1% 1 568.51 644.91 718.6 28.4%27.9%27.4% 232.8264.6299.1 4.2%4.5%4.8% Main budget balance-167.6-208.6-232.0 -3.8%-4.4%-4.7% Primary balance-21.1-46.0-50.1 -0.5%-1.0%-1.0% -324.3 -6.2% -120.5 -2.3% -375.3-383.9-389.8 -6.8%-6.5%-6.2% -142.5-119.3-90.7 -2.6%-2.0%-1.4%
CHAPTER 3: FISCAL POLICY Table 3.7 Main budget balances excluding financial support for Eskom Source: National Treasury Consolidated budget framework The consolidated budget includes the main budget and spending financed from revenues raised by provinces, social security funds and public entities. Table 3.8 Consolidated budget balance Source: National Treasury Estimates for social security funds for the period 2019/20 to 2021/22 will be updated in the 2020 Budget. Data for provinces has been revised in line with tabled provincial budgets and annual financial statements. Estimates for public entities have been updated compared to the 2019 Budget. Public entities, social security funds and provinces are projected to have a combined cash surplus in the current year and over the medium term, partially offsetting the main budget deficit. The in-year estimate for the consolidated budget deficit is now at 5.9 per cent of GDP compared with 4.5 per cent of GDP in the 2019 Budget. Over the next two years, the consolidated budget deficit is projected to be 2.2 percentage points wider than the 2019 Budget estimates. Financing and debt management strategy Weak economic growth and the deteriorating fiscal position have affected government’s borrowing strategy. South Africa’s sovereign credit rating has also come under pressure. Interest rate changes and exchange rate depreciation have increased borrowing costs. Government’s debt portfolio is structured to accommodate changes in the fiscal stance, and minimise debt-service costs and refinancing risk. Debt management is informed by strategic portfolio risk benchmarks for interest, inflation, currency and refinancing. Despite rising debt, government remains within all its strategic portfolio risk benchmarks. Borrowing costs have increased, but debt portfolio remains within strategic benchmarks 29 2016/172017/182018/19 R billionOutcome 2019/20 Revised 2020/212021/222022/23 Medium-term estimates Main budget-167.6-208.6-232.0 Social security funds8.29.35.8 Public entities6.411.517.1 Provinces-2.50.81.9 RDP Fund-0.2-0.3-0.2 -324.3 8.7 9.8 – -0.4 -375.3-383.9-389.8 5.35.45.6 8.08.48.4 1.92.32.0 -0.1-0.1– Consolidated budget balance-155.7-187.3-207.5 Percentage of GDP-3.5%-4.0%-4.2% -306.2 -5.9% -360.2-367.9-373.7 -6.5%-6.2%-5.9% 2016/172017/182018/19 R billion/percentage of GDPOutcome 2019/20 Revised 2020/212021/222022/23 Medium-term estimates Main budget balance-167.6-208.6-232.0 -3.8%-4.4%-4.7% Primary balance-21.1-46.0-50.1 -0.5%-1.0%-1.0% -274.0 -5.3% -71.5 -1.4% -313.0-340.3-353.0 -5.7%-5.8%-5.6% -86.5-86.3-67.7 -1.6%-1.5%-1.1%
2019 MEDIUM TERM BUDGET POLICY STATEMENT Table 3.9 Total national government debt 1. Estimates include revaluations based on National Treasury's projections of inflation and exchange rates 2. Net loan debt is gross loan debt minus the bank balances of the National Revenue Fund Source: National Treasury Gross loan debt is expected to increase from R3.2 trillion or 60.8 per cent of GDP in 2019/20 to R4.5 trillion or 71.3 per cent of GDP in 2022/23, mainly to finance the budget deficit. The key drivers of this increase remain the budget balance and fluctuations in the interest, inflation and exchange rates. Gross loan debt to increase from 60.8 per cent of GDP in 2019/20 to 71.3 per cent in 2022/23 Table 3.10 National government gross borrowing requirement and financing Source: National Treasury Government’s gross borrowing requirement — consisting of the budget deficit and maturing debt — is expected to increase from 7.6 per cent of GDP in 2019/20 to 8.2 per cent of GDP in 2022/23. It will be financed by raising funds in both the domestic and international capital markets. Domestic debt issuances will remain the major source of financing. During 2019, government increased auction levels and borrowing from the Corporation for Public Deposits to cover cash flow pressures, provide financial support for Eskom – as announced in the 2019 Budget and in the Special Appropriation Bill – and provide for anticipated revenue shortfalls. 30 2018/19 R billionOutcome 2019/20 Revised 2020/212021/222022/23 Medium-term estimates Gross borrowing Main budget balance-232.0 Redemptions-15.5 Domestic long-term loans-13.5 Foreign loans-2.0 -324.3 -69.9 -19.5 -50.4 -375.3-383.9-389.8 -65.2-64.1-128.2 -52.5-59.7-112.7 -12.7-4.4-15.5 Total-247.5 -394.2 -440.5-448.0-518.0 Financing Domestic short-term loans (net)14.1 Domestic long-term loans183.0 Foreign loans25.3 Change in cash and other balances25.1 46.0 284.1 76.1 -12.0 37.050.058.0 343.0353.9407.4 45.546.454.2 15.0-2.3-1.6 Total247.5 394.2 440.5448.0518.0 End of period2018/19 R billionOutcome 2019/20 Revised 2020/212021/222022/23 Medium-term estimates Domestic loans12 497.1 Short-term324.6 Long-term2 172.5 Fixed-rate1 604.8 Inflation-linked567.7 Foreign loans1291.3 2 849.2 370.6 2 478.6 1 833.1 645.5 318.4 3 229.03 624.14 026.3 407.6457.6515.6 2 821.43 166.53 510.7 2 076.32 370.92 596.0 745.1795.6914.7 361.8411.6451.4 Gross loan debt2 788.4 Less: National Revenue Fund-243.1 bank balances 3 167.6 -243.6 3 590.84 035.74 477.7 -232.7-235.4-234.7 Net loan debt22 545.3 2 924.0 3 358.13 800.34 243.0 As percentage of GDP: Gross loan debt56.7% Net loan debt51.7% 60.8% 56.1% 64.9%68.5%71.3% 60.7%64.5%67.5%
CHAPTER 3: FISCAL POLICY As a result, no further adjustments to domestic bond auction levels were needed to provide for the higher MTBPS gross borrowing requirements. Risks to the fiscal outlook There are three main risks to the fiscal outlook: Economic growth, failure to achieve spending reductions and contingent liabilities are main risks • A continued deterioration in the economic outlook would have negative consequences for revenue collection, putting pressure on fiscal plans. A failure to achieve the required spending reductions and revenue increases from measures announced in the 2019 Budget would widen the budget deficit and lead to still-higher levels of government debt. A worsening of Eskom’s financial and operational position. Annexure C discusses the restructuring of the utility. Government is working to stabilise the finances of financially distressed state-owned companies, improve their operations and eliminate continuous calls for additional public resources. • • Annexure A contains the fiscal risk statement, which examines factors that could cause deviations from the baseline fiscal forecast, as well as the sustainability of longer-term commitments. Conclusion Government remains committed to fiscal sustainability, but there has been significant fiscal deterioration since the tabling of the 2019 Budget. This requires substantial spending reductions to stabilise debt. Measures to manage and reduce public-sector pressures and risks will be implemented over the medium term. Fiscal policy and the debt management strategy will work to mitigate risks to the outlook. 31
2019 MEDIUM TERM BUDGET POLICY STATEMENT This page was left blank intentionally. 32

4 Expenditure priorities Introduction Mdiscussed in Chapter 3, higher debt and debt-service costs limit edium-term spending plans have been developed in the context of slow growth, rising public debt and large revenue shortfalls. As the availability of funds to implement policy priorities. Critical obligations, cost pressures and policy priorities have been met through a combination of reallocations and reprioritisation within and across function groups. Relative to the 2019 Budget, total main budget non-interest expenditure increases by R23 billion in 2020/21, and decreases by R8.2 billion in 2021/22. These net changes mainly reflect: • Non-interest spending increases of R45 billion and R22 billion over the next two years, mainly as a result of additional support for Eskom. Reductions of R21 billion in 2020/21 and R28.5 billion in 2021/22, mostly falling on goods and services, and current and capital transfers. Compensation of employees is revised down marginally in line with lower CPI projections. 2022/23, baselines are constrained to grow marginally below CPI • In inflation. 33 In brief •Consolidated government spending is expected to total R6.3 trillion over the medium term expenditure framework (MTEF) period, growing from R1.8 trillion in 2019/20 to R2.2 trillion in 2022/23 at an average annual growth rate of 6.3 per cent. •Since the 2019 Budget, upward revisions to main budget non-interest spending amount to R45 billion in 2020/21 and R22 billion in 2021/22, mainly reflecting additional support for Eskom. Downward revisions amount to R21 billion in 2020/21 and R28.5 billion in 2021/22. In 2022/23, baselines are constrained to grow marginally below consumer price index (CPI) inflation. •Learning and culture, social development and health receive the largest allocations, amounting to R3 trillion over the next three years. Without further fiscal measures, spending on debt-service costs is expected to outpace spending in areas such as health and community development by 2022/23.
2019 MEDIUM TERM BUDGET POLICY STATEMENT Excluding Eskom support, national and provincial spending on goods, services and infrastructure is reduced by 2 per cent per year over the next two years. The same rate of reduction is proposed for transfers to most public entities. Conditional grants account for about half of the total reductions. Further reductions, focused on compensation budgets, will be required to stabilise government’s finances. Details will be announced in the 2020 Budget Review. The worsening fiscal situation requires spending reductions in every department, including public entities. These reductions may affect operations, commitments, programme outcomes, capital investment and services. Departments, provinces and municipalities are encouraged to offset lower budgets with greater efficiency and adhere to cost-containment measures. Excluding debt-service costs, the largest allocations are to learning and culture, health and social development over the MTEF period. The poverty-reducing effects of government spending will be threatened without efforts to manage interest costs, the pressure on goods and services and financial challenges in state-owned companies. Baseline spending, excluding Eskom, reduced by 2 per cent per year in national and provincial departments Learning and culture, health and social development receive largest share of non-interest spending Expenditure priorities and spending pressures Consolidated government spending is expected to increase from R1.8 trillion in 2019/20 to R2.2 trillion in 2022/23, at an average annual growth rate of 6.3 per cent. Non-interest expenditure is expected to grow at the same rate as inflation in 2022/23. Consolidated spending rises from R1.8 trillion in 2019/20 to R2.2 trillion in 2022/23 Economic development Social development The learning and culture function will receive the largest allocation of funds over the MTEF period, mainly for basic and post-school education and training. More than 60 per cent of the funds allocated to the social development function are allocated for social grant payments. By 2022/23, spending on debt-service costs is expected to exceed spending in areas such as health and economic development. 34 Figure 4.1 Average nominal growth in spending,Figure 4.2 Consolidated government expenditure 2020/21 – 2022/23by function, 2020/21 – 2022/23 Debt-service costs Learning and culture Health Social development Community development Debt-service costs Health Economic development Peace and security Learning and culture Community development General public services General public services Peace and security Contingency reserve 0 2 4 6 8 10 12 14 0 300 600 900 1 200 Per cent R billion Source: National Treasury 1 306 940 796 769 704 702 689 224 18 13.7 7.0 7.0 6.9 6.1 5.9 5.0 4.4
CHAPTER 4: EXPENDITURE PRIORITIES Consolidated expenditure by function1 Table 4.1 1. Consisting of national and provincial departments, social security funds and public entities Source: National Treasury 35 Combating gender-based violence and femicide Government is stepping up its efforts to combat high rates of gender-based violence and femicide in South Africa. Following a joint sitting of Parliament, the departments of justice and constitutional development, basic education, police, higher education and training, sports, arts and culture, and social development are integrating their interventions to promote awareness and education, support victims and increase access to justice. In 2019/20, funded government programmes such as life-skills education, subsidies for shelters, Thuthuzela care centres and sexual offences courts support these goals. Over the three-year spending period ahead, funds are added to the provincial equitable share to combat gender-based violence. Over the medium term, improved and broadened access to services, and greater cooperation between departments and those responsible for service delivery, would assist. Departments will continue to engage with the Interim Steering Committee on Gender-Based Violence and Femicide to implement responses quickly and prioritise resources effectively. 2018/19 Outcome R billion 2019/20 Revised 2020/212021/222022/23 Medium-term estimates Average annual growth 2019/20 – 2022/23 Learning and culture348.7 Basic education246.1 Post-school education and training92.4 Arts, culture, sport and recreation10.2 Health209.7 Peace and security198.2 Defence and state security47.8 Police services97.0 Law courts and prisons44.9 Home affairs8.5 Community development187.7 Economic development192.3 Industrialisation and exports32.5 Agriculture and rural development29.6 Job creation and labour affairs20.4 Economic regulation and infrastructure95.0 Innovation, science and technology14.9 General public services64.4 Executive and legislative organs13.9 Public administration and fiscal affairs42.6 External affairs7.9 Social development254.1 Social protection189.8 Social security funds64.3 Payments for financial assets15.9 386.0 262.8 111.9 11.4 222.7 214.3 50.9 104.8 48.7 10.0 200.2 205.8 36.8 30.3 22.7 99.0 17.0 67.0 16.0 43.4 7.6 277.1 206.8 70.3 67.1 411.0437.6457.8 279.5300.1315.7 120.0125.5129.5 11.512.012.7 238.5257.2272.9 224.9233.5243.8 52.250.552.7 111.3117.9123.6 52.155.257.7 9.49.99.9 213.3230.2245.1 217.5235.5251.1 39.144.046.2 30.932.434.4 24.826.928.4 105.0113.9123.1 17.718.319.0 71.375.577.5 16.517.218.1 46.850.150.8 8.08.28.6 295.6312.9331.3 219.9235.3252.1 75.677.579.3 67.944.630.0 5.9% 6.3% 5.0% 3.8% 7.0% 4.4% 1.2% 5.7% 5.8% -0.3% 7.0% 6.9% 7.9% 4.3% 7.7% 7.5% 3.9% 5.0% 4.2% 5.4% 4.2% 6.1% 6.8% 4.1% – Allocated by function1 471.0 Debt-service costs181.8 Contingency reserve– 1 640.3 203.7 – 1 740.01 827.01 909.8 232.8264.6299.1 6.06.06.0 5.2% 13.7% – Consolidated expenditure1 652.8 1 844.1 1 978.72 097.52 214.9 6.3%
2019 MEDIUM TERM BUDGET POLICY STATEMENT Consolidated expenditure by economic classification1 Table 4.2 1. Consisting of national and provincial departments, social security funds and public entities Source: National Treasury In-year spending adjustments The Public Finance Management Act (1999) allows in-year changes to the main budget through the adjustments budget. Relative to the 2019 Budget, total main budget non-interest expenditure for 2019/20 increases by a net amount of R23.1 billion. This includes in-year additions to spending amounting to R44.5 billion, partially offset by downward adjustments of R21.4 billion. Additions to spending include: In-year spending additions amount to R44.5 billion, including R26 billion allocated to Eskom • • • • • R26 billion in the Special Appropriation Bill for Eskom R5.5 billion for South African Airways R3.2 billion for the South African Broadcasting Corporation R1.8 billion for Denel R429.8 million approved through the Budget Facility for Infrastructure for student housing R300 million for South African Express Airways. • Excluding financial support for Eskom, main budget non-interest spending is reduced by R2.9 billion in 2019/20, mainly due to declared savings by national departments. The adjustments to in-year spending for national departments are set out in the 2019 Adjusted Estimates of National Expenditure. Changes to 36 2018/19 Outcome R billion 2019/20 Revised 2020/212021/222022/23 Medium-term estimates Average annual growth 2019/20 – 2022/23 Current payments1 006.6 Compensation of employees584.7 Goods and services233.4 Interest and rent on land188.5 of which: debt-service costs181.8 Transfers and subsidies548.8 Provinces and municipalities129.5 Departmental agencies and accounts26.0 Higher education institutions38.9 Foreign governments and2.4 international organisations Public corporations and private32.5 enterprises Non-profit institutions35.1 Households284.4 Payments for capital assets81.5 Buildings and other capital assets65.3 Machinery and equipment16.2 Payments for financial assets15.9 1 093.8 630.7 252.2 211.0 203.7 593.0 136.3 27.9 46.4 2.4 35.0 38.0 307.0 90.1 70.1 20.0 67.1 1 181.01 275.61 363.9 675.2717.6758.5 264.3284.9297.3 241.4273.1308.0 232.8264.6299.1 626.3665.5700.3 144.2155.3165.2 29.130.429.8 47.649.450.8 2.52.52.5 34.639.041.7 40.843.345.4 327.6345.7364.8 97.6105.8114.7 75.182.689.6 22.523.325.1 67.944.630.0 7.6% 6.3% 5.6% 13.5% 13.7% 5.7% 6.6% 2.2% 3.1% 2.3% 6.1% 6.1% 5.9% 8.4% 8.5% 7.8% – Total1 652.8 Contingency reserve– 1 844.1 – 1 972.72 091.52 208.9 6.06.06.0 6.2% – Consolidated expenditure1 652.8 1 844.1 1 978.72 097.52 214.9 6.3%
CHAPTER 4: EXPENDITURE PRIORITIES conditional grants are included in the 2019 Division of Revenue Amendment Bill. Revised provincial appropriations will be tabled in provincial legislatures before the end of the current financial year. Spending priorities by function group Learning and culture Over the medium term, spending in the basic education sector will continue to focus on eradicating pit latrines and unsafe school structures, providing learner and teacher support materials, and improving early-grade reading and mathematics. Coding and robotics will be introduced into the basic education curriculum. The Department of Higher Education and Training bursary programme for poor and working-class students dominates spending in the post-school education and training sector. The department is developing a student funding framework that will clarify food, book, transport and accommodation allowances. Over the MTEF period, the sector will focus on improving throughput rates at universities and technical and vocational education and training (TVET) colleges by expanding student support services, improving lecturer qualifications through new hiring and training, and testing new approaches to contact and online learning. In 2019/20, the Student Housing Infrastructure Programme receives funds to construct student housing at the universities of Limpopo and North West, and King Hintsa TVET college. This is part of a larger project, funded by the Department of Higher Education and Training, and public universities and TVET colleges, to provide 300 000 new beds at these institutions over the next 10 years. Bursary programme for poor and working-class students dominates spending Health The health function priority is to improve the efficiency of service delivery. Measures being undertaken include improving the management of patient records, for example by rolling out the health patient registration system to streamline management processes in health facilities. Following the introduction of the National Health Insurance (NHI) Bill in Parliament earlier this year, the Department of Health reprioritised funds within its 2019/20 budget to establish an NHI Office. Over the medium term, this office will receive increasing allocations for its operational costs. Department of Health reprioritised funds to establish NHI Office 37 Updated cost estimates for national health insurance The NHI policy aims to provide healthcare more equitably in South Africa. Originally, NHI costs were projected to increase public health spending from about 4 per cent to 6 per cent of GDP over 15 years. However, given the macroeconomic and fiscal outlook, the estimates to roll out NHI that were published in the NHI Green Paper in 2011 and White Paper in 2017 are no longer affordable. The National Treasury assisted the Department of Health to develop an actuarial model with updated fiscal costs and limited policy reforms to strengthen the current healthcare system. The revised model estimates that rolling out NHI would require an additional R33 billion annually from 2025/26. These amounts are not budget commitments but indicative cost estimates.
2019 MEDIUM TERM BUDGET POLICY STATEMENT Social development This function is responsible for critical programmes aimed at reducing poverty, such as social grants. Over the medium term, work on early childhood development is a priority. Higher allocations to the early childhood development grant in provinces will increase the per-child subsidy and broaden access. This increase will be financed through funds reprioritised from the transfer payment to the South African Social Security Agency (SASSA). Funds will be reprioritised to the provincial equitable share to continue rolling out sanitary towels to learners from low-income households in the poorest (quintiles 1, 2 and 3) schools. Increased allocations to early childhood development to broaden access and raise per-child subsidy Community development This function funds access to water, sanitation, electricity and shelter for households, and subsidises the cost of public transport. Its largest component, the local government equitable share, will increase over the medium term to fund free basic services and some administrative costs in municipalities. The Vaal River System is a strategic water asset for industrial, commercial, agricultural and domestic use. Over the medium term, funds will be reprioritised from the human settlements development grant, the urban settlements development grant, the municipal infrastructure grant, the regional bulk infrastructure grant and the water services infrastructure grant to protect water quality by restoring and upgrading wastewater infrastructure at Emfuleni municipality. Providing quality, affordable and accessible public transport for poor and working-class commuters remains a priority. Transfers to the Passenger Rail Agency of South Africa will continue to fund rail modernisation. In May 2019, the President announced changes to the organisation of government to improve coordination and efficiency. These changes mainly entailed establishing new departments by merging or splitting existing departments, and transferring functions between departments. Work is under way to implement all the changes by 1 April 2020. Economic development This function group aims to create jobs and increase inclusive and sustainable economic growth. Over the medium term, it focuses on agriculture, land reform, innovation and industrial development. Government will reprioritise funding over the medium term, including from the comprehensive agricultural support programme grant, to increase compliance with biosecurity, animal and plant health, and phyto-sanitary and sanitary standards to improve trade in agricultural exports. Since 1994, government has spent about R41 billion on the Land Restitution Programme to return about 3.5 million hectares of land to rightful owners. Over the medium term, funds will be allocated to improve post-settlement support in collaboration with agricultural commodity organisations. 38
CHAPTER 4: EXPENDITURE PRIORITIES As announced in the June 2019 State of the Nation Address, government will strengthen the Industrial Parks Revitalisation Programme with reprioritised funds to develop local economies through industrial parks. Furthermore, the Department of Small Business Development will implement a new operational model to improve its support to small and medium-sized enterprises. Funds reprioritised to develop local economies through industrial parks Peace and security This function aims to fight crime and ensure territorial integrity. Over the medium term, its priorities are to improve efficiency and integrate interventions across different departments and entities within the justice, crime prevention and security cluster. From the 2020 MTEF period onwards, funding will be reallocated from the South African Police Service to other departments and entities within this function to implement the Integrated Criminal Justice Strategy. Some of these funds will be used to improve prosecution capacity, including for the sexual offences and community affairs unit that focuses on gender-based violence. In addition, funds will be used to finance various corruption-fighting units and to combat cybercrime. Funds will also be reallocated to the Directorate for Priority Crime Investigation to appoint additional investigators to address the backlog of corruption cases, and to the departments of defence and home affairs to enhance border security. Funds reallocated to improve prosecution capacity, fight corruption and combat cybercrime General public services This function group aims to build a professional state to transform and develop South Africa. Over the medium term, additional allocations are proposed for the South African Revenue Service to rebuild capacity, improve operations, and implement critical projects and recommendations from the Nugent Commission. Additional funding is also proposed for the Auditor-General of South Africa to support audits in financially distressed municipalities and entities. Further support is recommended in 2020/21 for Statistics South Africa to conduct a survey to update the CPI basket of goods and services in line with international standards. Additional funding proposed to support audits for financially distressed municipalities and entities Division of revenue Provincial and municipal governments face multiple pressures over the period ahead. Provinces are expected to provide schooling for growing learner populations and improve health services before NHI is implemented. Local government is expected to continue to expand access to free basic services for poor households, while ensuring that those who can afford to pay for services do so, even in a difficult economic environment. Although transfers from national government will grow more slowly than in the past, planned reforms to the transfer system aim to improve efficiency in the use of these resources. Over the medium term, government proposes to allocate 48.1 per cent of available non-interest expenditure to national departments, 43 per cent to provinces and 8.9 per cent to local governments. Over this period, national 39
2019 MEDIUM TERM BUDGET POLICY STATEMENT government resources grow at an annual average of 2.3 per cent, provincial resources by 6.1 per cent and local government resources by 6.2 per cent. Managing the impact of reductions in planned expenditure The 2020 MTEF includes large reductions in planned transfers to provinces and municipalities relative to the 2019 MTEF. Provincial transfers will be reduced by R20.3 billion over the MTEF period. The provincial equitable share is reduced by R7.3 billion through a 2 per cent reduction on all non-compensation spending per year. Reductions in compensation, based on the outcome of discussions with labour, are expected to be implemented in future. Direct conditional grants are reduced by a net R13 billion, as the reduction of R15.2 billion is partly offset by reprioritisations of R2.2 billion. 2 per cent reduction per year in non-compensation spending in provincial equitable share Table 4.3 Division of revenue framework Source: National Treasury Transfers to local government will be reduced by R20.5 billion, including R3.2 billion from the local government equitable share and R17.3 billion in direct conditional grants. These reductions are likely to affect service delivery, particularly through delays in building infrastructure. Reductions in the local government equitable share will be absorbed through amounts of R1 billion in 2020/21 and R1.1 billion in 2021/22 set aside as unallocated funds in the 2019 Budget for further increases in bulk electricity costs. All direct conditional grants have been lowered, except for the early childhood development grant and the learners with profound intellectual disabilities grant. To manage the impact on services, the amount reduced from each grant considers: • • • Past spending and performance Whether it funds salaries, medicines and food Whether there has been significant real growth in allocations in recent years. 40 2016/17 2017/18 2018/19 R billionOutcome 2019/20 Revised 2020/21 2021/22 2022/23 Medium-term estimates Division of available funds National departments555.7592.7634.4 Provinces500.4538.6572.0 Equitable share410.7441.3470.3 Conditional grants89.797.2101.7 Local government102.9111.1118.5 Equitable share50.755.660.8 General fuel levy sharing11.211.812.5 with metropolitan municipalities Conditional grants40.943.745.3 742.8 612.8 505.6 107.3 127.2 69.0 13.2 45.1 757.4766.2796.2 651.5694.8731.1 541.0576.7607.6 110.5118.2123.5 132.4143.0152.2 74.781.187.2 14.015.216.1 43.746.849.0 Provisional allocations not assigned to––– votes Projected underspending––– – -3.2 21.234.933.1 ––– Total1 159.01 242.31 324.9 1 479.6 1 562.51 638.91 712.6 Percentage shares National departments 48.0% 47.7% 47.9% Provinces 43.2% 43.3% 43.2% Local government 8.9% 8.9% 8.9% 50.1% 41.3% 8.6% 49.1%47.8%47.4% 42.3%43.3%43.5% 8.6%8.9%9.1%
CHAPTER 4: EXPENDITURE PRIORITIES Larger reductions are also made to grants to urban municipalities, which have more capacity to offset the effect of cuts by increasing their own-revenue investments. The implications of these reductions will be set out in more detail in the 2020 Budget. In some cases, programmes funded through grants will have to be revised to fit within the available resources. For example, the public transport network grant has been funding the development of integrated public transport networks in 13 cities for over a decade, yet only six cities have launched operations. At least three non-operational cities will be suspended from this grant and the remaining cities will be required to reduce their costs and demonstrate their effectiveness to remain funded. 100 20 5 Changes to the structure of provincial allocations Several changes are proposed to the structure of conditional grants for health over the medium term. The human papillomavirus vaccination grant will be merged into the HIV, TB, malaria and community outreach grant from 2020/21, and from 2021/22 new components will be added to the grant for mental health and oncology (funded from a shift from an indirect grant). From 2020/21, funds for internship and community service posts will be shifted from the human resources capacitation grant to the health professionals training and development grant, while the remaining funds will be incorporated into the provincial equitable share. Provinces will receive a direct grant to contract health professionals in pilot NHI districts, which is currently funded through the NHI indirect grant. In addition, the National Treasury and the Department of Health will develop a strategy to reform health grants prior to implementing NHI. The 2019 Budget introduced new funding mechanisms for informal settlements upgrading in the human settlements development grant and Grant funding for oncology and mental health to be introduced Direct grant to provinces to contract health professionals in NHI pilot districts 41 R billion (real values in 2018 Rand) 2007/08 2008/09 2009/10 2010/11 2011/12 2012/13 2013/14 2014/15 2015/16 2016/17 2017/18 2018/19 2019/20 2020/21 2021/22 2022/23 R billion (real values in 2018 Rand) 2007/08 2008/09 2009/10 2010/11 2011/12 2012/13 2013/14 2014/15 2015/16 2016/17 2017/18 2018/19 2019/20 2020/21 2021/22 2022/23 Reductions in conditional grants Government increased investment in grant-funded programmes during a period of robust economic growth. As a result, conditional grant allocations to provinces and local government grew rapidly in inflation-adjusted (real) terms prior to 2010/11. Since then, real allocations have remained relatively stable, even during the period of fiscal consolidation. Although 39 per cent of the total spending reductions over the 2020 MTEF period comes from these grants, provincial grants will still grow over the period and total local government grant allocations remain above the levels of a decade ago. In addition, the equitable shares for both provincial and local government are projected to continue growing in real terms over the 2020 MTEF period. Figure 4.3 Provincial conditional grantsFigure 4.4 Local government conditional grants 120 45 40 35 80 30 60 25 40 15 20 10 0 0 Reduction proposed in 2019 MTBPS Reduction proposed in 2019 MTBPS Provincial direct conditional grant allocation Local government direct conditional grant allocations Level of 2022/23 grants after proposed reduction Level of 2022/23 grants after proposed reduction Source: National Treasury
2019 MEDIUM TERM BUDGET POLICY STATEMENT the urban settlements development grant. Before upgrading grants can be introduced, progress is required in two areas. New requirements to develop province-and city-wide informal settlement upgrading strategies need to be embedded. And work on planning individual upgrading projects with communities needs to be strengthened. The planned launch of these separate grants has therefore been pushed back from 2020/21 to 2021/22. In addition, funds will be reallocated from the social worker scholarship fund to provinces for the employment of social workers, and funds planned for transfer to HIV/AIDS organisations and the South African National AIDS Council will be shifted to the provincial equitable share. This shift supports the continued implementation of the Social Behaviour Change Programme and other initiatives that address gender-based violence. To ensure fair funding allocations to each province, the provincial equitable share formula is updated annually to reflect demographic changes related to the demand for services provided by provinces. This formula is under review, in collaboration with provincial treasuries, although no changes are proposed this year. Funds shifted to support initiatives addressing gender-based violence Table 4.4 Provincial equitable share Source: National Treasury Changes to the structure of local government allocations The local government equitable share formula has been updated to account for projected household growth, inflation and estimated increases in bulk water and electricity costs over the MTEF period. Large urban municipalities continue to underinvest in infrastructure, primarily because of poor programme and project preparation practices, leading to long delays, higher costs and breakdowns in service delivery. While public and private capital funding is available, these weaknesses translate into low levels of effective demand from the municipalities. To address these problems, from 2020/21 government will introduce dedicated grant funding for large urban municipalities. Eligible municipalities will receive co-financing on a declining basis over three years. Financing will be conditional on establishing a municipal project preparation fund and an infrastructure delivery management system, and achieving targets for programmes and projects under preparation. Funding for this new facility will be reprioritised from existing allocations to municipalities. Equitable share formula updated to account for demographic and economic changes 42 2019/20 R million 2020/212021/222022/23 Eastern Cape68 824 Free State28 187 Gauteng102 448 KwaZulu-Natal106 014 Limpopo58 965 Mpumalanga41 428 Northern Cape13 424 North West34 973 Western Cape51 291 71 74775 65678 841 30 15732 04633 657 112 640121 685129 908 111 960118 302123 544 62 61966 56469 935 44 31047 21549 724 14 35615 27816 068 37 72240 36142 682 55 46459 55263 194 Total505 554 540 975576 658607 554
CHAPTER 4: EXPENDITURE PRIORITIES Government is also working with municipalities to increase their revenue-raising potential. The Municipal Fiscal Powers and Functions Amendment Bill, which will be tabled shortly, will standardise the regulation of development charges. Development charges are the mechanism by which municipalities recover the capital costs of connecting new developments to infrastructure for water, roads, electricity and other services. Currently, these charges are frequently below cost, so municipalities effectively subsidise the provision of infrastructure to businesses and other developments, reducing their ability to subsidise infrastructure directly for lower-income residents. The change could increase municipal revenues for capital spending by an estimated R20 billion a year. Several efforts are also under way to improve the effectiveness of transfers to rural municipalities. The possibility of using municipal infrastructure grant funds to buy waste management vehicles, which must be purchased through a contract facilitated by the National Treasury to minimise costs, is being investigated to expand services in rural areas. Funds may be reprioritised between water and sanitation grants to accelerate the completion of regional bulk water schemes. The Department of Energy will complete an electrification master plan to guide the future allocation of funds between the Eskom, municipal, and non-grid components of the Integrated National Electrification Programme. The Department of Transport will establish a national database for all road traffic and condition data to inform the prioritisation and monitoring of road maintenance across all roads. Standardising regulation of development charges expected to raise municipal revenues Addressing unfunded budgets in local government A revised strategy to address municipal financial performance failures has been endorsed by the Budget Council and Budget Forum – the respective intergovernmental forums for provincial and local government finances. This strategy is based on an analysis of performance failures in governance, financial management, institutional capabilities and service delivery. As part of this strategy, the National Treasury is helping municipalities to ensure their spending plans are adequately funded. The number of councils adopting unfunded budgets, where realistically anticipated revenue is insufficient to cover planned spending sustainably, increased from 74 in 2016/17 to 126 in 2019/20. The National Treasury, alongside provincial treasuries, has provided extensive advice and support to ensure that municipalities plan affordable expenditure and collect all the revenue owed to them. All municipalities are able to table a funded budget – in some ways, this is easier for transfer-dependent municipalities as they have more predictable revenue and can plan their spending accordingly. The National Treasury has now written to these 126 municipalities to approve their tabling of special adjustment budgets to align their spending plans with projected revenues and ensure they have plans in place to pay their creditors (including Eskom and the water boards). National and provincial treasuries are available to assist municipalities to reprioritise their budgets accordingly. If these municipalities do not table funded adjustments budgets by 15 November 2019, the National Treasury will take steps to enforce compliance, which may include withholding future transfers of the local government equitable share. Revised strategy to address municipal financial performance failures Municipalities with unfunded budgets required to table adjustments by November 2019 43
2019 MEDIUM TERM BUDGET POLICY STATEMENT 44 A new district development model to improve service delivery To arrest the decline in state capacity and restructure service delivery to best serve citizens, government has introduced a new district development model, with pilots in the OR Tambo District Municipality in the Eastern Cape and eThekwini in KwaZulu-Natal. The model aims to integrate planning and actions across all spheres of government, and make planning more responsive to community needs and inputs. The National Treasury’s Cities Support Programme is supporting the piloting of this model in metropolitan municipalities, based on the experience of implementing built environment performance plans that have helped cities direct their infrastructure investments in targeted integration zones.
ANNEXURES 45
2019 MEDIUM TERM BUDGET POLICY STATEMENT This page was left blank intentionally. 46
A Fiscal risk statement Introduction This statement sets out the main fiscal risks to the baseline assessment of the public finances outlined in Chapter 3 of the Medium Term Budget Policy Statement. Fiscal risks are developments that may cause public finance outcomes to deviate from forecasts if they materialise. Over the medium term there are three primary concerns. The first is a sustained economic contraction in 2020, leading to larger revenue shortfalls with far-reaching effects on service delivery. High contingent liabilities pose a second risk, as failing to implement extensive governance and operational reforms at Eskom and other major state-owned companies would further drain public resources. The third is increased pressure on subnational government budgets, which could spur growth in unpaid liabilities and other accruals in provinces and municipalities. The main long-term risk to fiscal sustainability is that the recent trend of slow economic growth continues. In this context, the fiscal risk statement analyses several major expenditure commitments over the next two decades. This statement categorises fiscal risks in the four areas shown in Figure A.1. Figure A.1 Fiscal risks framework 47
2019 MEDIUM TERM BUDGET POLICY STATEMENT Macroeconomic risks Figure A.2 shows that, over the past nine budget cycles, government has overestimated GDP growth in its forecasts. The deviations are not unique to the National Treasury, and reflect both domestic risks that materialised and technical revisions to historical growth outcomes. As economic growth projections have been revised down over time, the gap between forecasts and outcomes has decreased, reducing (but not eliminating) the risk of a large, unanticipated variance. Figure A.2 Revisions to real GDP growth forecast 6 Source: National Treasury Fiscal scenarios around the baseline economic forecast Chapter 2 presents the National Treasury’s baseline economic forecast. Three scenarios have been modelled around this forecast, as set out below. Given the complex nature of long-term modelling, any moderate deviation from the assumptions could result in substantially different outcomes. Scenario A – Insufficient reforms results in the primary balance widening by between 1 and 2.7 percentage points of GDP over the medium term. Debt-service costs as a share of revenue will increase from 15.1 per cent in 2019/20 to 22.5 per cent in 2027/28. In this scenario, the primary balance remains in deficit even over the long term and, as a result, the debt-to-GDP ratio does not stabilise. Scenario B – Stronger domestic growth results in the primary balance closing more quickly than the baseline forecast. Debt stabilises at 69.8 per cent of GDP in 2025/26. 2.5 48 Per cent Per cent 2014/15 2015/16 2016/17 2017/18 2018/19 2019/20 2020/21 2021/22 2022/23 2023/24 2024/25 2025/26 2026/27 2027/28 2007 2008 2009 2010 2011 2012 2013 Per cent 2014 2015 2014/15 2015/16 2016/17 2017/18 2018/19 2019/20 2020/21 2021/22 2022/23 2023/24 2024/25 2025/26 2026/27 2027/28 2016 2017 2018 2019 2020 2021 Figure A.3 GDP growth scenariosFigure A.4 Gross debt-to-GDP scenarios 3.5 90 3.0 85 80 75 2.0 70 1.5 65 1.0 60 55 0.5 50 0.0 45 2019 MTBPS 2019 Budget Scenario A Scenario B Source: National Treasury 2017 Budget2016 Budget2015 Budget2014 Budget2013 Budget 2012 Budget2011 BudgetActual2018 Budget2019 Budget 4 2 0 -2
ANNEXURE A: FISCAL RISK STATEMENT Debt management risks Since the tabling of the 2019 Budget, the risk of a sovereign credit downgrade has increased as low economic growth and high government debt, exacerbated by support for state-owned companies, persisted. A downgrade by Moody’s to sub-investment grade would increase borrowing costs and reduce the range of institutions that can invest in South African government bonds. Government has a prudent debt management strategy in place that enables it to manage the risks associated with elevated borrowing. Long-dated fixed-rate instruments finance the bulk of the borrowing requirement. Although short-term bonds are cheaper, using these long-dated bonds protects the public finances from sudden changes in interest and exchange rates. In addition, most of government’s borrowing requirement is financed in domestic markets, which reduces exchange rate risk. Non-resident holdings of South African bonds peaked at 42.8 per cent in March 2018 and have since declined to 36.9 per cent in September 2019. Table A.1 shows the sensitivity of the debt portfolio to changes in interest-rate, exchange-rate and inflation assumptions. In the case of a 10 per cent change in any category, government would continue to finance its borrowing requirement, but at greater cost. State-owned companies, however, would likely struggle to refinance existing debt or issue new debt. Table A.1 Sensitivity in debt stock and debt-service costs, 2020/21 1. Sensitivities are positive in the case of a variable rise or currency depreciation and negative in the reverse case Source: National Treasury Repayments of the principal portion of government debt – known as redemptions – are set to increase sharply in coming years. Long-term debt redemptions will increase to an annual average of R97.5 billion over the next decade. If government rolls over maturing debt, the scale of debt redemptions would place substantial pressure on domestic capital markets, raising borrowing costs across the economy. Figure A.5 Long-term government debt redemptions 180 Source: National Treasury, as at 30 September 2019 49 R billion 2019/2 0 2020/2 1 2021/2 2 2022/2 3 2023/2 4 2024/2 5 2025/2 6 2026/2 7 2027/2 8 2028/2 9 2029/3 0 2030/3 1 2031/3 2 2032/3 3 2033/3 4 2034/3 5 200 160 140 120 100 80 60 40 20 0 Foreign bond sDo mestic bonds R billion Debt-service costs1 Gross loan debt1 Effect of a 10 per cent change in: Interest rates Rand/US dollar exchange rate Headline inflation 5.2 2.5 0.1 18.9 36.3 3.1
2019 MEDIUM TERM BUDGET POLICY STATEMENT Expenditure risks Unpaid bills or accrued debts from provincial and local governments remain a significant risk to sustainable public finances. Mounting accruals reflect several factors: poor financial management, employee compensation crowding out other spending and severe weaknesses in supply chain management. Medical legal claims against provincial health departments continue to increase, from R80 billion in 2017/18 to R99 billion in 2018/19. Payments against these claims amounted to R2 billion in 2018/19, compared with R1.5 billion paid out in 2017/18. In 2018/19, the financial position of local government deteriorated significantly. Uncollected revenues grew by 17 per cent to R147.8 billion, while overdue amounts owed by municipalities grew by 52.5 per cent from R23 billion in 2017/18 to R36 billion. Half of this amount is owed to Eskom. A revised strategy to address municipal financial performance failures, which has been endorsed by the Budget Council and Budget Forum, is expected to address these failures. This strategy is discussed in Chapter 4. In 2020/21, negotiations will begin for a new public-service wage agreement. Another agreement that is above consumer price index inflation, as occurred in the previous three rounds of wage negotiations, would put additional pressure on the public finances. It would continue the trend of compensation crowding out other areas of spending, widen the structural deficit and limit government’s ability to respond to any new fiscal pressures and risks. Annexure B discusses compensation trends. Contingent liabilities This section describes the risks posed by commitments that may result in future financial obligations (contingent liabilities) and by expenses that have been recorded but not yet paid (accrual liabilities). The financial condition of South Africa’s major state-owned companies account for the vast majority of these risks to the fiscal framework, and these risks have already begun to materialise. By 2021/22, contingent liabilities are expected to exceed R1 trillion. These liabilities consist of government guarantees and Road Accident Fund obligations. Government’s guarantee portfolio has increased from R670 billion in March 2018 to R683.3 billion in March 2019, of which the largest facility has been granted to Eskom (R350 billion). By end-March 2019, R372.4 billion of these government guarantees had been used, bringing government’s exposure from guarantees to 7 per cent of GDP. Over the next three financial years, guaranteed debt redemptions are expected to average R27.5 billion, up from R26 billion reported last year. 50
ANNEXURE A: FISCAL RISK STATEMENT Figure A.6 Debt maturity profile of largest state-owned companies based on borrowings* * Airports Company of South Africa, Denel, Development Bank of Southern Africa, Eskom, Industrial Development Corporation, Land Bank, South African Airways, South African National Roads Agency, Trans-Caledon Tunnel Authority and Transnet Source: National Treasury as at 30 June 2019 The interest-bearing debt of the 10 largest borrowers has grown from R266.7 billion in 2009/10 to R738.3 billion in 2017/18 – an increase of 177 per cent in eight years. The National Treasury estimates that this collective debt is likely to exceed R750 billion in 2018/19. In addition, the effective cost of debt for these entities, taking non-interest costs into account, has risen from 8.7 per cent in 2009/10 to 9.4 per cent in 2017/18. Total debt redemptions for these companies are estimated to average R82.4 billion annually over the 2020 MTEF period. Of this, 41 per cent consists of foreign debt. It has become increasingly difficult for state-owned companies to access funding in capital markets, due to poor financial performance as a result of weak revenue growth, poor operating performance and unsustainable debt-service costs. Rising interest rates and increasingly unfavourable loan terms and conditions raise the risks associated with borrowing. As a result, many companies are repeatedly requesting guaranteed lines of credit from government. Eskom Eskom remains the most serious risk to the fiscus, as it has a significantly high debt burden and has made limited progress with the necessary reforms announced in February. Eskom had used R289 billion of its R350 billion government guarantee facility by 31 August 2019, with another R43 billion committed to specific funding instruments but not yet used. The utility relies on government support, borrowing from existing facilities and securing new debt to maintain a positive cash balance. In the current financial year, government has provisionally allocated appropriations totalling R49 billion for Eskom. Annexure C discusses Eskom in more detail. Denel Government has guaranteed R4.4 billion to military equipment manufacturer Denel to enable it to obtain financing. In August 2019, government granted Denel an additional R1.8 billion in funding through the contingency reserve to pay creditors, implement a turnaround plan, restart stalled operations and meet its existing orders for equipment. During 2019/20, the Department of Public Enterprises is expected to appoint a chief restructuring officer to oversee and execute the company’s turnaround plan. South African Airways Over the past 13 years, South African Airways (SAA) has incurred over R28 billion in cumulative losses. The airline is insolvent and, in its current configuration, unlikely to ever generate sufficient cash flow to sustain its operations. 51
2019 MEDIUM TERM BUDGET POLICY STATEMENT Government has transferred R5.5 billion to SAA in the current year to enable the carrier to extend maturities on outstanding debt obligations, giving it time to develop an affordable repayment plan with creditors. However, without a debt repayment plan supported by government, the airline’s lenders are unlikely to extend outstanding government guaranteed debt of R9.2 billion beyond the end of the fiscal year, or to provide additional facilities needed for SAA to remain liquid. If this happens, government is contractually required to step in and repay this debt. South African Broadcasting Corporation Government allocated R3.2 billion to the South African Broadcasting Corporation (SABC) through the contingency reserve in the current year. The funds are intended to help the SABC pay its bills, acquire new content and conduct maintenance. To date, government has released R2.1 billion of these funds based on the SABC’s progress in meeting associated conditions. The National Treasury is working with the Department of Communications and Digital Technologies to ensure that the SABC progresses towards meeting the rest of the conditions before releasing the remaining R1.1 billion. A chief restructuring officer will be appointed to implement a revised turnaround plan. South African National Roads Agency Limited Since 2014/15, the South African National Roads Agency Limited (SANRAL) has incurred annual average losses of R1 billion. The agency is not generating sufficient cash from its toll portfolio to settle operational costs and debt redemptions falling due over the next three years. Government has extended a total guarantee facility of R38.9 billion to the agency, of which R30.3 billion had been used by 31 March 2019. Over the medium term, SANRAL is expected to repay R10.7 billion of maturing debt obligations and R10.8 billion worth of interest payments. To enable SANRAL to pay these obligations, government will implement direct user charges as outlined in the White Paper on National Transport Policy. Road Accident Fund The Road Accident Fund (RAF) is projected to become government’s largest contingent liability by 2021/22, despite receiving an ever-increasing share of combined fuel tax revenues. 80 180 In 2004/05, RAF levy collections accounted for 22 per cent of combined fuel taxes; by 2018/19, they had risen to 36 per cent. Claims against the fund have grown much faster than the increases in the RAF fuel levy, resulting in insufficient revenue growth to offset growth in liabilities. RAF liabilities are expected to grow from R341 billion in 2019/20 to R605 billion in 2022/23. Addressing the growing gap between revenue and liabilities requires a transition to the Road Accident Benefit Scheme, which would provide more equitable and sustainable support to accident victims. 52 R billion 2004/05 2005/06 2006/07 2007/08 2008/09 2009/10 2010/11 2011/12 2012/13 2013/14 2014/15 2015/16 2016/17 2017/18 2018/19 R billion 2011/12 2012/13 2013/14 2014/15 2015/16 2016/17 2017/18 2018/19 2019/20 2020/21 2021/22 2022/23 Figure A.7 Collections on combined fuel taxesFigure A.8 Road Accident Fund liabilities 120 630 100 540 450 360 60 270 40 20 90 0 0 Source: National Treasury General fuel levy Road Accident Fund levy
ANNEXURE A: FISCAL RISK STATEMENT Long-term fiscal sustainability of social spending The National Treasury maintains a long-term fiscal model that it uses to cost new policy initiatives and determine the sustainability of current expenditure commitments under certain assumptions of economic and demographic growth. There are three major changes to the assumptions in this update: lower long-run economic growth, lower inflation expectations and a demographic scenario that projects higher population growth. Long-term results are highly sensitive to changes in assumptions, as the effect of even a small change in an assumption is compounded over decades. The results in this section depend on the assumptions discussed above, as well as sector-specific cost trend and policy assumptions. In the baseline scenario, social spending on grants, education and health is broadly sustainable over the long term, as lower long-run growth is largely offset by lower inflation. The baseline scenario assumes that GDP growth will average between 2 and 2.3 per cent, which is lower than previously assumed. Chapter 2 discusses the reasons behind lower long-term growth. The baseline demographic scenario produced by Statistics South Africa projects that population growth will continue to decelerate, from 1.6 per cent in 2018 to 1 per cent in 2040. The population is expected to grow from 58 million currently to 76 million by 2040. As a result, real output per capita is forecast to grow by an average of 0.7 per cent between 2020/21 and 2030/31, and by 1.2 per cent between 2030/31 and 2040/41. Figure A.9 Long-run growth scenarios Source: National Treasury In the low-growth scenario, investment and job creation remains muted. In this case, maintaining government’s current policy commitments will be difficult and will require repeated adjustments to either revenue or expenditure. The high-growth scenario assumes long-run growth of 3.1 per cent, which would ease fiscal pressures from social spending. This is based on the expectation that government will undertake the reforms outlined in Chapter 2. Social assistance The baseline scenario projects that beneficiary numbers will grow from 17.9 million in the 2019/20 to 22.5 million in 2040/41. The uptake rate of grants is expected to stabilise at current levels. Given these trends, spending on social assistance is expected to remain relatively stable at 3 per cent of GDP. Basic education Spending on basic education has averaged about 5 per cent of GDP over the past decade. Expenditure has largely been driven by rising teacher wages, which grew by an average of 9 per cent annually over the past five years. At the same time, teacher headcount growth has remained relatively flat. As a result, 53 Per cent 2007/0 8 2010/1 1 2013/1 4 2016/1 7 2019/2 0 2022/2 3 2025/2 6 2028/2 9 2031/3 2 2034/3 5 2037/3 8 2040/4 1 High-growth scenar ioLow-growth scenarioBaseline-growth scenario 5 4 3 2 1 0 -1
2019 MEDIUM TERM BUDGET POLICY STATEMENT spending has been relatively stable. Assuming wage trends continue, spending on basic education would increase to between 5 and 6 per cent of GDP by 2040 to avoid significant growth in class sizes. Health South Africa spends about 8.5 per cent of GDP on health services, about half of which goes to the public health sector. Over the last 13 years, public and private spending on healthcare has grown by an annual average of 10 per cent. In the public sector, above-inflation wage increases for public-sector healthcare workers account for a disproportionate amount of this growth. The National Health Insurance Bill was tabled in Parliament earlier this year. Assuming this bill is adopted, public health spending is expected to rise from about 4 per cent currently to between 5 and 6 per cent of GDP over the long term. Higher education The 2018 Budget expanded spending allocations for higher education and training to cover students from poor and working-class families. Once this policy is fully implemented, between 50 and 60 per cent of undergraduate university students and all students in technical and vocational education and training (TVET) colleges are expected to be fully subsidised. Historically, higher education and training costs have outpaced inflation, largely because of above-inflation wage increases and some purchases in foreign currency. Assuming this trend continues, then the costs of university education would grow from 1.4 per cent of GDP in 2019/20 to 2 per cent of GDP in 2040. In this context it would be difficult to sustain the current policy of fully subsidised higher education training. A more sustainable fees policy, closely aligned with CPI inflation, would result in a more gradual increase in spending on university education to 1.5 per cent of GDP by 2040. The Department of Higher Education and Training is developing such a policy with higher education institutions. Staffing costs, driven by enrolment rates, dominate costs in TVET colleges. If enrolment remains stable at around 700 000 students per year, spending in the TVET sector will decline over the long term from 0.3 to 0.2 per cent of GDP. However, enrolment growth in line with the 2013 White Paper on post-school education and training would raise the costs of subsidising TVET colleges to 0.6 per cent of GDP by 2040. This level of subsidy would be difficult to sustain over the long term. Conclusion The outlook for fiscal risks has deteriorated sharply over the past year. The public finances are highly vulnerable to the three principal risks covered in this statement. Achieving the economic and fiscal objectives set out in this Medium Term Budget Policy Statement will require a significant effort across the entire public sector to prevent these risks from materialising – and, where that is not possible, to mitigate and manage their consequences. 54
B Compensation data Introduction In 2018/19, spending on compensation of state employees accounted for 35.4 per cent of consolidated national expenditure. Compensation is one of the largest components of public spending and, since 2006/07, has grown faster than any category except payments for financial assets. This trend has become a source of spending pressure across government, squeezing out spending on other inputs and capital equipment (Table B.1). Rapid growth in compensation spending has been driven by real increases in wages and benefits rather than higher employment levels. In addition, the rate of growth of compensation has diverged between the public and private sectors over the past eight years, as average remuneration growth has moderated in the private sector. Table B.1 Compensation spending as a percentage of total spending Change1 2006/07 2018/19 36% 56% 79% 54% 70% 46% 17% 1% 4% 0% 8% 10% 4% 4% National government Provincial government Basic education Health Police Land and rural development Roads and transport 37% 61% 79% 62% 80% 50% 21% 1. May not balance due to rounding Source: National Treasury Drivers of compensation spending Compensation spending1 is driven by two factors: changes in the number of public servants and changes in their remuneration. Within the budget for compensation, there is a trade-off between the two: the faster average remuneration rises, the slower the rate of increase in the number of public servants. This dynamic is always present, but it becomes critical in an era of slow revenue growth. 1 Unless otherwise noted, this section considers compensation spending on the main budget, which is administered through a common payroll system (PERSAL), and does not include spending on compensation by public entities included in the consolidated budget. 55
2019 MEDIUM TERM BUDGET POLICY STATEMENT Between 2006/07 and 2018/19 – a period that includes the introduction of occupation-specific dispensations for wages – total compensation spending on the main budget more than tripled, from R154 billion to R518 billion. Above-inflation remuneration increases account for the largest proportion of this spending, as shown in Figure B.1. Figure B.1 The drivers of increased compensation spending Source: National Treasury (PERSAL data) Personnel numbers Between 2006/07 and 2018/19 (the latest year for which full payroll data is available), personnel numbers, measured using full-time equivalents,2 rose by 170 000 from 1.2 million to 1.3 million. This translates to average annual growth of 1.2 per cent. In 2015, about 20 000 personnel employed at technical vocational education and training colleges were transferred from provincial departments to the Department of Higher Education and Training. Excluding the effect of this change, provincial personnel grew by 16 per cent and national personnel grew by 12 per cent between 2006/07 and 2018/19. The number of personnel has increased across all major sectors of government. A quarter of this increase has occurred in the health sector, followed by justice and education. Personnel numbers peaked in 2012/13 and have since declined by about 1.4 per cent. On average, between 2006/07 and 2011/12, every public-service employee who left was replaced with 1.6 employees. In comparison, since 2012/13, more people have left the public service than have been hired. 2 All statistics are reported as full-time equivalent employees, so that individuals are included in proportion to the time spent in government’s employ in each financial year. The South African National Defence Force (SANDF) uses a separate payroll system that does not have all the fields used in PERSAL, so where the relevant data is unavailable, the SANDF has been excluded from the analysis. 56 R billion 500 400 300 200 100 0 CompensationInflationIncrease inIncrease in r ealCompensation (2006/07)adjustmentper sonnelremuneration(2018/19) 159 518 46 158 154
ANNEXURE B: COMPENSATION DATA Figure B.2 Appointments and terminations (excluding SANDF) 200 Source: National Treasury (PERSAL data) Average remuneration and equity in the public sector After adjusting for inflation, average remuneration in the public service rose 66 per cent between 2006/07 and 2018/19 (Figure B.3). Much of this increase was concentrated in 2009/10 and 2010/11, where the fastest rise in wages was recorded in high-skill professions, including medical doctors, teachers and lawyers, where occupation-specific dispensations were introduced. Real growth in average remuneration has created significant spending pressures in all government departments, especially where compensation is a large portion of total spending, such as in the security sector (police) and education (teachers). Because this spending cannot be adjusted in the short term, it tends to crowd out other spending in departments if budgets have to be reduced. Figure B.3 Real average remuneration growth and levels (2018/19 rands) Source: National Treasury (PERSAL data) Average remuneration in the public sector is higher than average remuneration in the rest of the economy. Data from Statistics South Africa’s Quarterly Employment Survey (QES) show that average remuneration across 110 non-agricultural sectors and sub-sectors in 2018/19 was just under R273 000, compared with an estimated average remuneration of R352 000 for employees of national and provincial government. According to the National Treasury’s calculations, the actual level of average remuneration 57 R thousand Full-time equivalent personnel (thousand) 2006/0 7 2007/0 8 2007/0 8 2008/0 9 2008/0 9 2009/1 0 2009/1 0 2010/1 1 2010/1 1 2011/1 2 2011/1 2 2012/1 3 2012/1 3 2013/1 4 2014/1 5 2013/1 4 2015/1 6 2014/1 5 2016/1 7 2015/1 6 2017/1 8 2016/1 7 2018/1 9 2017/1 8 Per cent 4008 3507 3006 2505 2004 1503 1002 501 00 Annual per centage change (r ight axis) Real average remuner ation EntryExitCumulative change 150 100 50 0 -50 -100
2019 MEDIUM TERM BUDGET POLICY STATEMENT for these employees is even higher, around R393 000.3 We estimate that public servants in national and provincial government earn about 20 per cent of all wages earned in the non-agricultural formal sector. Average public-sector remuneration is higher in part because a larger proportion of public servants have tertiary qualifications. In addition, public servants have also tended to receive higher increases in average remuneration. Since 2010/11, the QES shows that average remuneration in the public sector has risen by an annual average of 8 per cent, a figure that may be understated because of the effect of temporary workers such as those employed by the Expanded Public Works Programme, compared with an annual average increase of 7.2 per cent in the rest of the economy. The gap between public-and private-sector remuneration growth has widened over the past few years. Figure B.4 Average remuneration growth in the public service and rest of the economy Source: Statistics South Africa Public-service remuneration is distributed more equitably than in the economy as a whole: the public-service Gini coefficient is 0.38, compared to a whole-economy Gini coefficient of over 0.6.4 The distribution of earnings is particularly compressed among teachers, who make up almost a third of the public service. Within more specialised groups, including middle and senior managers, remuneration is higher and the distribution is larger. In total, however, these groups make up about 6 per cent of the public service. Doctors, for example, account for only 2 per cent of the public service, but earn more than most other public servants within a wide range. The median doctor earns R781 000, while doctors at the 10th and 90th percentiles earn R472 000 and R1.2 million, respectively. 3 The QES records a larger number of public-service employees than appear in this analysis. There are two reasons for this. The first is that this analysis is premised on full-time equivalent employees, which is generally a smaller figure than the absolute number of employees. The second is that this analysis excludes low-wage temporary workers such as those employed through the Expanded Public Works Programme and the Community Works Programme. 4 The Gini coefficient measures inequality. A higher coefficient implies a more unequal distribution of income. 58 Percentage change (year-on-year) 10 9 8 7 6 5 Main budgetRest of the econo my 4 2011/1 22012/1 32013/1 42014/1 52015/1 62016/1 72017/1 82018/1 9
ANNEXURE B: COMPENSATION DATA Figure B.5 Distribution of annual remuneration for different occupations in 2018/19 1 200 Source: National Treasury (PERSAL data) Remuneration in the public service has been compressed because incomes in the lower salary bands have risen more quickly than incomes in higher salary bands (Table B.2) and there has been a consistent upward drift in the distribution of personnel across the grades (Figure B.6). Table B.2 Average salary by grade across government1 1. Excludes SANDF Source: National Treasury (PERSAL data) 59 R thousand Grade 2006/07 (nominal) 2006/07 (in 2018 rand) 2018/19 Compound annual growth rate (nominal) Compound annual growth rate (real) 1 2 3 4 5 6 7 8 9 10 11 12 13 14 15 16 R44 253 R58 812 R69 747 R83 124 R101 200 R120 002 R151 147 R181 134 R221 102 R280 757 R346 959 R440 097 R548 380 R642 820 R792 154 R992 563 R89 705 R119 217 R141 385 R168 501 R205 143 R243 256 R306 389 R367 177 R448 197 R569 124 R703 320 R892 121 R1 111 620 R1 303 061 R1 605 776 R2 012 025 R130 379 R159 827 R194 845 R237 818 R258 312 R317 240 R375 960 R448 039 R539 935 R687 120 R887 808 R964 954 R1 212 238 R1 442 967 R1 765 435 R2 169 585 9.4% 8.7% 8.9% 9.2% 8.1% 8.4% 7.9% 7.8% 7.7% 7.7% 8.1% 6.8% 6.8% 7.0% 6.9% 6.7% 3.2% 2.5% 2.7% 2.9% 1.9% 2.2% 1.7% 1.7% 1.6% 1.6% 2.0% 0.7% 0.7% 0.9% 0.8% 0.6% 10th per centile25th per centileMedian90th p er centile 1 000 800 600 400 200 0 All publicEducator sNon-O SDSAPSDoctors servants
2019 MEDIUM TERM BUDGET POLICY STATEMENT Figure B.6 Distribution of personnel by salary grade (excluding SANDF) Source: National Treasury (PERSAL data) Figure B.7 focuses on the effect of this movement of more personnel into the highest-earning categories. Between 2006/07 and 2018/19, the number of public servants earning R1 million a year increased from 9 600 to 29 000, primarily because of a growing number of high-skilled professionals. Average income for this group increased by about 8 per cent over the period, rising from R1.2 million to R1.3 million. Nonetheless, the increase in the number of employees in this category has driven the rise in total spending on this group from R5.8 billion to R38 billion, or from 4 per cent to 7.4 per cent of total compensation spending, between 2006/07 and 2018/19. Figure B.7 Public servants receiving annual salaries in excess of R1 million in 2018/19 rand* 30 *Excludes South African National Defence Force Source: National Treasury (PERSAL data) 60 Full-time equivalent personnel (thousand) Full-time equivalent personnel (thousand) 2006/0 7 2006/0 7 2007/0 8 2007/0 8 2008/0 9 2008/0 9 2009/1 0 2009/1 0 2010/1 1 2010/1 1 2011/1 2 2011/1 2 2012/1 3 2012/1 3 2013/1 4 2013/1 4 2014/1 5 2014/1 5 2015/1 6 2015/1 6 2016/1 7 2016/1 7 2017/1 8 2017/1 8 2018/1 9 2018/1 9 Non-OSDDo ctorsJudges an d lawyersPolice and DCSNursesOther 25 20 15 10 5 0 1-45-89-1213-16 1 200 1 000 800 600 400 200 0
C Update on Eskom reforms Overview Government’s strategic approach to resolve the financial and operational crisis at Eskom requires structural reform of the utility and the electricity sector. In February 2019, the President announced that Eskom would be separated into three entities corresponding with its electricity generation, transmission and distribution functions. The primary objective of this restructuring is to facilitate cost efficiencies, optimal investment in infrastructure, improved operational performance and reliability of supply. The separation of the entity will begin a far-reaching transition in the electricity sector, from dominance by a vertically integrated and inefficient monopoly to a competitive and financially sustainable sector. This annexure summarises the underlying principles that will inform the transition. There has been limited progress in implementing the legal separation of the utility. In addition, Eskom faces periodic cash flow crises, necessitating support to the value of R49 billion in 2019/20, of which R13.5 billion has been transferred to date.1 Further requests for short-term financial support in the current financial year are limited to the remaining balance of R35.5 billion, which will be transferred in accordance with Eskom’s cash flow requirements, pending the enactment of the appropriation bills. Short-term stabilisation measures The immediate priority is to stabilise Eskom’s financial position. The 2019 Budget included provisional government support of R230 billion over 10 years to support Eskom’s balance sheet and restructuring. Table C.1 shows the revised allocations to Eskom over the medium-term expenditure framework. Table C.1 Revised medium-term allocations to Eskom Source: National Treasury 1 The amount of R49 billion in the current year includes R23 billion announced by the Minister of Finance in his 2019 Budget Speech – an amount set aside for each of the next 10 years – and R26 billion tabled in a Special Appropriation Bill in July 2019. The R17.7 billion approved for disbursement under section 16 of the Public Finance Management Act (1999) in April 2019, forms part of the R23 billion, of which R13.5 billion has been transferred to Eskom to date. 61 R million2019/20 2020/21 2021/22 2022/23 2019 Budget baseline23 000 Proposed changes26 000 23 000 33 000 23 000 10 000 23 000 – Revised 2019 MTBPS allocation49 000 56 000 33 000 23 000
2019 MEDIUM TERM BUDGET POLICY STATEMENT The proposed additions to the amounts identified in the 2019 Budget are intended to help Eskom maintain its going-concern status, which requires the utility to meet its financial obligations as they become due. If Eskom is unable to issue debt in the financial markets, or the cost of doing so becomes prohibitively expensive, government may be called upon to provide further support to enable financial obligations to be met. The total cost of Eskom’s annual debt and interest payments averages R85 billion over the next three years. Assessment and timeline for restructuring The Ministers of Finance and Public Enterprises have appointed independent financial experts to: • • Assess Eskom’s daily cash flow management to eliminate continual requests for government support. Determine the degree to which operational efficiencies are being implemented across the business. This includes considering whether capital expenditure should be halted or deferred given Eskom’s weak financial position.2 Monitor implementation of the operational turnaround plan, particularly the performance of the generation division. • To date, following discussions with Eskom’s chief restructuring officer, government has agreed to the following proposals: • The primary objective of separating Eskom’s corporate structure into three transparent business units is to facilitate cost efficiencies, optimal investment in infrastructure, and improved operational performance and reliability of supply. • The capital structure will be modified to reduce and ultimately end Eskom’s reliance on government support. Debt relief will only be considered once operational efficiencies have been achieved. Government has set a two-phase timetable for Eskom’s restructuring: • Phase 1: Functionally separate the generation, transmission and distribution functions into separate, wholly owned subsidiaries with independent Boards by 31 March 2020. • Phase 2: Complete the legal separation of distribution and generation functions by 31 December 2021. This timetable requires an urgent and focused response from Eskom management and the Board, as well as focused work across government to resolve a number of structural issues that impact Eskom’s financial viability. Debt relief considerations and conditions Eskom’s R441 billion debt portfolio at 31 March 2019 is well beyond what it can afford to hold without government support. While this level of unsustainable debt must be reduced, the underlying causes must also be addressed. Eskom is plagued by operational inefficiencies. It has suffered cash losses as municipalities and other entities have not paid their bills. And it has received tariff determinations from the National Electricity Regulator of South Africa that do not allow the utility to recover its costs. Any proposed resolution must address these fundamental concerns. The National Treasury has considered various options for reducing Eskom’s debt burden. Without major operational and governance reforms, however, debt relief will only provide a temporary reprieve for the loss-making utility. Consequently, the National Treasury, in consultation with the Department of Public Enterprises, has set a number of preconditions before debt relief will be considered. 2 These decisions will have to be balanced against implications for electricity supply, and potential penalties and preservation costs. 62
ANNEXURE C: UPDATE ON ESKOM REFORMS The Eskom Board is required to: • Demonstrate measurable progress in instilling rigorous cash management discipline, and in achieving operational efficiencies in the business. Show that all business units are managing operations within their means. Create the three new functional entities, with the separation of the transmission function being the priority. Appoint new Boards and CEOs with the requisite skills for the three entities, who are accountable for the independent operation of each entity. • • • The National Treasury anticipates that some debt relief will be provided to Eskom over time, as operational and financial performance improve. Most operational changes are expected to be implemented before the end of 2021. This approach will support an efficient debt relief arrangement and strengthen the finances of the newly created entities relative to Eskom in its current form. The debt relief process will be managed to ensure that: • • • • • • The integrity of the budget process is maintained. The credibility of the fiscal framework remains intact. The state’s contingent liabilities are reduced. Any default and cross-default on total Eskom debt is contained. Creditors are treated equitably. Confidence returns to the capital market and bilateral funders about Eskom’s borrowing capacity. Eskom, with government support, will consult with its funders on detailed plans for debt reorganisation in due course. 63
2019 MEDIUM TERM BUDGET POLICY STATEMENT This page was left blank intentionally. 64
D Technical annexure Main budget expenditure ceiling Table D.1 Expenditure ceiling calculations 1. Gold and Foreign Exchange Contingency Reserve Account (GFECRA) Source: National Treasury Table D.1 shows technical adjustments made to main budget non-interest expenditure to calculate the expenditure ceiling. The ceiling excludes payments that are directly financed by dedicated revenue sources, and others not subject to policy oversight. These include: • Payments for financial assets financed by asset sales in the same financial year: Revenue from the sale of assets, particularly for equity investments, generally offsets the increases in associated spending levels, so these increases do not require adjustments to departmental allocations. For instance, in the current year, non-core asset sales are expected to generate R7 billion in revenue, which will offset funding allocations of the same amount requested by smaller state-owned companies. Financial support for Eskom is not included in the expenditure ceiling. This support is viewed as a balance sheet transaction, which could take the form of a loan agreement or large equity investment. Such transactions are excluded from the spending ceiling. • Payment transactions linked to the management of debt: This includes premiums paid on new loan issues, bond switches and buy-back transactions, revaluation profits or losses on government’s foreign-exchange deposits at the Reserve Bank when used to meet government’s foreign-currency position commitments, and realised profits and losses on the Gold and Foreign Exchange Contingency Reserve Account. These items relate to debt and currency transactions that are not financed through main budget appropriations. 65 R million2016/172017/182018/19 2019/20 2020/212021/222022/23 Non-interest expenditure1 158 9901 242 3441 324 880 Technical adjustments Skills development levy-15 233-16 294-17 480 Equity contribution from––– state -owned companies Eskom financial support Debt management and-1 778-587-162 GFECRA1 transactions International Oil–-6-3 Pollution Compensation Fund 1 479 622 -18 576 -7 000 -49 000 -360 -10 1 568 4531 644 8841 718 583 -19 413-20 585-21 970 ––– -56 000-33 000-23 000 ––– -11-12-12 Expenditure ceiling1 141 9791 225 4581 307 235 1 404 675 1 493 0291 591 2871 673 601
2019 MEDIUM TERM BUDGET POLICY STATEMENT • Direct charges that relate to specific payments made in terms of legislation that provides for the collection and transfer of such receipts outside of the main budget: These include skills development levy contributions and the International Oil Pollution Compensation Fund. Skills development levy contributions are paid to the National Skills Fund and the sector education and training authorities. The payment schedule to the National Skills Funds is generally revised to align it directly with anticipated receipts from the levy. Table D.2 Main budget framework and financing requirements MACROECONOMIC PROJECTIONS MAIN BUDGET FRAMEWORK Other non-interest expenditure BORROWING REQUIREMENT GOVERNMENT DEBT 1. Mainly revaluation profits on foreign-currency transactions and premiums on loan transactions 2. Technical adjustments explained in Table D.1 Source: National Treasury 66 Gross loan debt2 232.92 489.72 788.4 50.5%53.0%56.7% Net loan debt2 008.32 260.42 545.3 45.4%48.1%51.7% 3 167.6 60.8% 2 924.0 56.1% 3 590.84 035.74 477.7 64.9%68.5%71.3% 3 358.13 800.34 243.0 60.7%64.5%67.5% Main budget balance-167.6-208.6-232.0 Redemptions-73.0-28.4-15.5 -324.3 -69.9 -375.3-383.9-389.8 -65.2-64.1-128.2 Gross borrowing requirement-240.6-237.0-247.5 -5.4%-5.0%-5.0% -394.2 -7.6% -440.5-448.0-518.0 -8.0%-7.6%-8.2% R billion/percentage of GDP2016/17 2017/18 2018/19 2019/20 2020/21 2021/22 2022/23 Revenue Personal income tax424.5461.0492.1 Corporate income tax204.4217.4212.0 Value-added tax289.2298.0324.8 Other tax revenue141.2149.8158.8 Customs and excise duties84.790.3100.0 SACU transfers-39.4-56.0-48.3 Non-tax revenue19.019.323.3 National Revenue Fund receipts114.216.612.0 527.6 219.0 348.4 165.5 557.8596.1637.5 234.4249.2265.6 367.7390.2415.1 186.5198.9211.4 114.4121.3128.6 109.2 -50.3 29.8 9.9 -63.4-62.2-64.6 23.825.026.7 4.77.07.6 Main budget revenue1 137.91 196.41 274.7 25.7%25.5%25.9% 1 359.1 26.1% 1 425.91 525.61 627.9 25.8%25.9%25.9% Expenditure Expenditure ceiling1 142.01 225.51 307.2 Baseline allocations1 142.01 225.51 307.2 Contingency reserve––– 2 17.016.917.6 1 404.7 1 404.7 – 74.9 1 493.01 591.31 673.6 1 487.01 585.31 667.6 6.06.06.0 75.453.645.0 Non-interest expenditure1 159.01 242.31 324.9 Debt-service costs146.5162.6181.8 1 479.6 203.7 1 568.51 644.91 718.6 232.8264.6299.1 Main budget expenditure1 305.51 405.01 506.7 29.5%29.9%30.6% 1 683.4 32.3% 1 801.21 909.52 017.7 32.6%32.4%32.1% Main budget balance-167.6-208.6-232.0 -3.8%-4.4%-4.7% Primary balance-21.1-46.0-50.1 -0.5%-1.0%-1.0% -324.3 -6.2% -120.5 -2.3% -375.3-383.9-389.8 -6.8%-6.5%-6.2% -142.5-119.3-90.7 -2.6%-2.0%-1.4% R billion/percentage change2016/17 2017/18 2018/19 2019/20 2020/21 2021/22 2022/23 Real GDP growth 0.8% 1.3% 0.6% Nominal GDP growth 7.1% 6.3% 4.7% CPI inflation 6.3% 4.7% 4.6% 0.9% 5.9% 4.5% 1.2%1.6%1.8% 6.1%6.6%6.6% 4.8%4.8%4.7% GDP at current prices (R billion)4 419.44 698.74 921.5 5 210.8 5 530.35 893.16 283.0
ANNEXURE D: TECHNICAL ANNEXURE Southern African Customs Union revenue pool Payments to the Southern African Customs Union (SACU) have been revised downwards by R2.4 billion in 2020/21 and R3.2 billion in 2021/22 compared with the 2019 Budget estimates. The revisions reflect higher specific excise duties in line with above-expected performance in the first half of 2019/20, lower customs duties and adjustments to member states’ estimates of GDP, population and intra-SACU trade. The SACU revenue-sharing formula adjusts for forecast errors with a two-year lag. As a result, the projected 2020/21 SACU payments include the forecast error adjustment for 2018/19. Table D.3 Change to SACU common revenue pool since 2019 Budget Source: National Treasury Fiscal framework assumptions for long-term main budget baseline The long-term main budget fiscal framework assumptions underpin the long-term debt outlook. These assumptions include the following: • • Unit tax elasticity in each year, which implies that revenue grows in line with nominal GDP growth. In real terms, non-interest expenditure grows by 1.5 per cent, which is lower than the assumption of 2 per cent in the 2019 Budget. The assumption was changed to ensure non-interest expenditure grows at a slower pace than revenue. Beyond the medium term, average real GDP growth is assumed to be 2.2 per cent. • 67 2019 Budget estimates R million2019/202020/21 Revised estimates 2019/202020/21 Deviations 2019/202020/21 Customs duties60 02964 622 Specific excise duties42 35444 674 Ad-valorem excise duties4 4544 783 58 36561 064 46 51148 742 4 3374 603 -1 664-3 558 4 1574 068 -118-180 Common revenue pool106 838114 079 109 213114 409 2 375330
2019 MEDIUM TERM BUDGET POLICY STATEMENT Table D.4 Tax revenue and tax bases 1. Total remuneration in the formal non-agriculture sector 2. Other includes dividend withholding tax, interest on overdue income tax, taxes on property, stamp duties and fees, air departure tax, electricity levy, plastic bag levy and all other minor taxes 3. Unspecified tax policy measures announced in the 2019 Budget. The details will be announced in the 2020 Budget. The initial tax increase in 2020/21 is carried through into the following two years at the same rate as nominal GDP growth. Source: National Treasury 68 2016/172017/182018/19 R million/percentage changeOutcome 2019/20 Estimate 2020/212021/222022/23 Projections Personal income tax424 545460 953492 083 Wage bill 18.0%6.7%4.2% Buoyancy 1.17 1.28 1.60 527 606 5.2% 1.38 557 777596 090637 486 5.1%6.2%6.3% 1.121.101.10 Corporate income tax204 432217 412212 046 Net operating surplus6.1%7.5%1.6% Buoyancy1.15 0.85-1.59 218 984 7.5% 0.43 234 393249 250265 596 7.0%6.3%6.6% 1.001.001.00 Net value-added tax289 167297 998324 766 Household consumption6.9%6.6%5.4% Buoyancy 0.41 0.46 1.65 Domestic VAT321 475336 279378 733 Household consumption6.9%6.6%5.4% Buoyancy 1.17 0.70 2.32 Import VAT149 265152 789175 185 Nominal imports1.0%2.6%9.0% Buoyancy-0.970.89 1.63 VAT refunds-181 574-191 071-229 151 Nominal exports8.4%2.5%7.5% Buoyancy 1.032.07 2.64 348 388 5.5% 1.31 399 191 5.5% 0.97 190 449 6.0% 1.46 -241 253 3.9% 1.36 367 741390 240415 063 6.1%6.4%6.5% 0.920.960.97 423 374450 470479 875 6.1%6.4%6.5% 1.001.001.00 199 255212 945228 092 4.6%6.9%7.1% 1.001.001.00 -254 888-273 174-292 903 5.7%7.2%7.2% 1.001.001.00 Customs duties45 57949 15254 968 Nominal imports1.0%2.6%9.0% Buoyancy-1.432.97 1.31 58 365 6.0% 1.04 61 06465 26069 901 4.6%6.9%7.1% 1.001.001.00 Specific excise duties35 77437 35640 830 CPI inflation6.3%4.7%4.6% Buoyancy 0.32 0.94 2.00 46 511 4.5% 3.09 48 74251 08953 504 4.8%4.8%4.7% 1.001.001.00 Skills development levy15 31516 01217 439 Private sector wage bill8.1%6.3%3.2% Buoyancy 0.08 0.72 2.81 18 576 4.1% 1.61 19 41320 58521 970 4.5%6.0%6.7% 1.001.001.00 Fuel levy62 77970 94975 372 Nominal GDP7.1%6.3%4.7% Buoyancy 1.802.06 1.32 78 354 5.9% 0.67 83 16088 61594 478 6.1%6.6%6.6% 1.001.001.00 Ad-valorem excise duties3 3963 7814 192 Nominal GDP7.1%6.3%4.7% Buoyancy 1.771.79 2.29 4 337 5.9% 0.59 4 6034 9055 229 6.1%6.6%6.6% 1.001.001.00 Other263 09562 85265 994 Nominal GDP7.1% 6.3%4.7% Buoyancy 2.22-0.06 1.05 68 557 5.9% 0.66 73 97279 01483 584 6.1%6.6%6.6% 1.291.040.87 Gross tax (pre-proposals)1 144 081 1 216 464 1 287 690 Nominal GDP7.1%6.3%4.7% Buoyancy 0.971.00 1.23 Announced tax policy measures 3––– 1 369 678 5.9% 1.08 – 1 450 864 1 545 047 1 646 811 6.1%6.6%6.6% 0.970.991.00 10 00010 65611 361 Gross tax1 144 081 1 216 464 1 287 690 Nominal GDP7.1%6.3%4.7% Buoyancy 0.971.00 1.23 1 369 678 5.9% 1.08 1 460 864 1 555 703 1 658 172 6.1%6.6%6.6% 1.090.991.00
ANNEXURE D: TECHNICAL ANNEXURE 2018/19 outcomes and 2019/20 mid-year estimates Table D.5 summarises national and provincial appropriated expenditure outcomes for 2018/19 and estimates for the first half of 2019/20. Tables D.6 and D.7 present additional details. National expenditure measured R1.5 trillion in 2018/19, which was R6.7 billion lower than the adjusted budget estimate. The underspending was mainly driven by lower spending on goods and services, transfers and subsidies, and capital assets. The lower-than-estimated expenditure was partly offset by higher spending on employee compensation, debt-service costs and payments for financial assets. Provincial expenditure amounted to R590.9 billion in 2018/19, which was R7.8 billion below adjusted estimates. For the first six months of 2019/20, provinces spent R303.2 billion or 48 per cent of their original budget for the year. Provinces are primarily responsible for delivering social services including basic education and health. Compensation of employees is the largest spending item in provincial budgets, accounting for 62.7 per cent of spending in the first six months of 2019/20. Table D.5 National and provincial expenditure outcomes and mid-year estimates 1. Provinces will table adjusted estimates during November 2019 Source: National Treasury 69 2018/19 2019/20 OriginalAdjustedAuditedOver(-)/ budgetestimateoutcomeunder(+) R billion OriginalAdjustedActual budget estimate1 spending April to September National appropriation814.5831.6820.910.7 Direct charges683.7685.1685.8-0.8 Debt-service costs180.1181.1181.8-0.8 Provincial equitable share470.3470.3470.3– Other direct charges 33.333.7 33.7– 900.3941.2448.7 743.8745.4367.4 202.2203.799.5 505.6505.6252.8 36.136.115.1 National votes1 498.21 516.61 506.79.9 of which: Compensation of employees163.6163.6164.8-1.2 Goods and services69.372.866.16.6 Transfers and subsidies1 066.11 069.01 064.94.2 Payments for capital assets14.316.314.41.8 Payments for financial assets4.613.814.5-0.7 Provisional allocation for6.0––– contingencies not assigned to votes Contingency reserve8.0––– Projected underspending –-3.2–-3.2 1 644.11 686.5816.1 175.6174.785.6 74.975.428.9 1 153.41 152.7576.5 15.414.73.9 22.565.221.6 1.6–– 13.0–– –-3.2– Main budget expenditure1 512.21 513.41 506.76.7 1 658.71 683.4816.1 Provincial expenditure591.6598.6590.97.8 of which: Compensation of employees361.2361.1358.22.9 Transfers and subsidies71.777.378.9-1.6 Payments for capital assets39.735.433.02.4 632.3n/a303.2 389.6190.2 79.239.3 36.012.9
2019 MEDIUM TERM BUDGET POLICY STATEMENT Table D.6 Expenditure by vote 70 R million 2018/19 2019/20 MainAdjustedAuditedOver(-)/ budgetbudgetoutcomeUnder(+) MainAdjusted Actual budget budgetspending April to September 1 The Presidency50650645946 2 Parliament1 8731 8731 873– 3 Communications1 5131 5161 48828 4 Cooperative Governance and Traditional Affairs83 65285 03781 9183 119 5 Home Affairs7 9159 0479 0470 6 International Relations and Cooperation6 5536 5536 370183 7 National Treasury29 35829 71028 6521 058 8 Planning, Monitoring and Evaluation92795887583 9 Public Enterprises2746 5236 47548 10 Public Service and Administration95795192625 11 Public Works7 4537 4837 44935 12 Statistics South Africa2 2722 2722 311-39 13 Women2302302228 14 Basic Education22 72223 70023 415285 15 Higher Education and Training73 02173 12472 924200 16 Health47 14347 50846 595914 17 Social Development172 902172 822172 580242 18 Correctional Services23 84923 84923 77772 19 Defence and Military Veterans47 95048 49648 4924 20 Independent Police Investigative Directorate3153153150 21 Justice and Constitutional Development17 04917 45917 182277 22 Office of the Chief Justice and Judicial1 1201 1201 09228 Administration 23 Police91 83491 68490 4291 255 24 Agriculture, Forestry and Fisheries7 1657 7337 574159 25 Economic Development1 0731 0731 04429 26 Energy7 0457 1647 09073 27 Environmental Affairs7 1137 4316 737694 28 Labour3 2953 2833 087196 29 Mineral Resources1 8911 8911 88011 30 Science and Technology7 7907 9587 89266 31 Small Business Development1 4881 4881 42069 32 Telecommunications and Postal Services9234 0073 99413 33 Tourism2 2622 2622 23527 34 Trade and Industry9 4639 5329 49042 35 Transport59 79859 83159 193638 36 Water and Sanitation15 57216 87416 619254 37 Arts and Culture4 3724 3394 238101 38 Human Settlements32 35632 45632 195260 39 Rural Development and Land Reform10 42510 42510 281144 40 Sport and Recreation South Africa1 0911 0911 07615 691691264 1 9931 993– 1 5764 773698 90 71890 34735 384 8 3409 5284 728 6 5096 5093 383 30 77130 69211 529 957957442 17 94556 88321 215 1 002993449 7 8097 9073 778 2 5142 5141 141 244244119 24 50524 46514 317 89 49889 04063 507 51 46151 19524 997 184 792184 72291 077 25 40825 31711 384 50 51350 88824 274 337337145 18 71718 7828 349 1 1981 198517 97 59596 82746 396 7 6657 6123 879 1 045990550 7 4407 1843 096 7 5307 4842 711 3 4353 4331 537 2 0052 0021 115 8 1518 1464 098 2 5692 269907 1 6851 685762 2 3932 3931 485 10 05910 0854 357 64 19464 20530 073 16 44016 4676 121 4 6174 5722 032 33 87933 86212 958 10 94610 8294 384 1 1541 151503 Total appropriation by vote814 509831 572820 91210 660 900 300941 169448 659
ANNEXURE D: TECHNICAL ANNEXURE Table D.6 Expenditure by vote (continued) 1. National Revenue Fund payments previously classified as extraordinary payments Source: National Treasury 71 R million 2018/19 2019/20 MainAdjustedAuditedOver(-)/ budgetbudgetoutcomeUnder(+) MainAdjusted Actual budget budgetspending April to September Total appropriation by vote814 509831 572820 91210 660 Plus: Direct charges against the National Revenue Fund President and Deputy President's salaries (The7761 Presidency) Members' remuneration (Parliament)493493493– Debt-service costs (National Treasury)180 124181 099181 849-750 Provincial equitable share (National Treasury)470 287470 287470 287– General fuel levy sharing with metropolitan12 46912 46912 469– municipalities (National Treasury) National Revenue Fund payments (National135150162-12 Treasury)1 Skills levy and sector education and training16 92917 31217 480-168 authorities (Higher Education and Training) Magistrates' salaries (Justice and Constitutional2 2162 2162 047168 Development) Judges' salaries (Office of the Chief Justice and1 0221 0221 022-0 Judicial Administration) International Oil Pollution Compensation Fund101037 (Transport) 900 300941 169448 659 773 528601– 202 208203 73199 517 505 554505 554252 777 13 16713 1674 389 135360359 18 75918 5768 806 2 3842 2641 026 1 0991 099528 1010– Total direct charges against the National Revenue 683 691 685 064 685 817 -753 Fund Provisional allocation not assigned to votes 6 000 – – – Infrastructure fund not assigned to votes – – – – Provisional allocation for Eskom restructuring – – – – Compensation of employees and other baseline – – – – adjustments Contingency reserve 8 000 – – – National government projected underspending – -2 700 – -2 700 Local government repayment to the National – -500 – -500 Revenue Fund 743 850745 368367 404 10–– 1 000–– 5 348–– -4 800–– 13 000–– –-1 184– –-2 000– Total 1 512 200 1 513 436 1 506 7296 707 1 658 707 1 683 352816 063
2019 MEDIUM TERM BUDGET POLICY STATEMENT Table D.7 Expenditure by province Source: National Treasury 72 R million 2018/19 2019/20 MainAdjusted Audited Over(-)/Deviation budget budgetoutcomeUnder(+) from adjusted budget MainActual budgetspending April to September Eastern Cape 78 434 79 352 79 047 306 0.4% Education 34 772 35 128 35 032 97 0.3% Health 23 700 24 026 24 472 -447 -1.9% Social Development 2 837 2 858 2 721 137 4.8% Other functions 17 126 17 341 16 822 519 3.0% Free State 34 877 35 128 34 963 165 0.5% Education13 57913 62313 719 -96-0.7% Health10 40310 38010 239142 1.4% Social Development 1 266 1 3161 247 69 5.2% Other functions 9 629 9 8089 758 51 0.5% Gauteng 121 359 122 649 119 4863 163 2.6% Education45 22145 71244 724988 2.2% Health46 42946 76246 011752 1.6% Social Development 4 983 4 6614 242419 9.0% Other functions24 72625 51324 5091 004 3.9% KwaZulu-Natal 122 492 123 707 122 0951 612 1.3% Education50 90450 98450 344640 1.3% Health42 34842 54742 550 -3-0.0% Social Development 3 288 3 3113 297 14 0.4% Other functions25 95226 86525 904961 3.6% Limpopo 65 373 66 495 65 917 577 0.9% Education30 60830 83530 679155 0.5% Health19 51119 80219 720 82 0.4% Social Development 1 987 2 0652 035 30 1.4% Other functions13 26813 79313 483310 2.3% Mpumalanga 48 107 48 483 48 008 476 1.0% Education20 97320 92220 734188 0.9% Health13 27813 12013 056 64 0.5% Social Development 1 552 1 5381 524 15 0.9% Other functions12 30412 90412 694210 1.6% Northern Cape 17 150 17 625 17 511 114 0.6% Education 6 417 6 4386 456 -18-0.3% Health 4 735 4 8544 837 17 0.3% Social Development871868 859 9 1.0% Other functions 5 127 5 4655 358107 2.0% North West 41 072 41 903 40 8691 034 2.5% Education16 18416 13715 841296 1.8% Health11 15411 54311 508 35 0.3% Social Development 1 609 1 6381 636 1 0.1% Other functions12 12612 58511 884701 5.6% Western Cape 62 748 63 295 62 980 315 0.5% Education22 19322 15022 112 37 0.2% Health23 06423 10023 044 56 0.2% Social Development 2 242 2 2472 231 15 0.7% Other functions15 25015 79915 592206 1.3% 82 19842 589 36 32919 408 25 19013 846 3 0211 425 17 6597 909 37 27418 000 14 7337 479 11 1425 459 1 375652 10 0234 410 132 44361 189 49 81022 577 50 76725 036 5 5172 280 26 34911 297 130 47461 561 54 02226 599 45 03721 918 3 5191 688 27 89711 355 69 50133 408 32 29115 505 20 77710 361 2 1811 067 14 2526 475 50 98124 840 21 86211 005 14 3876 716 1 657797 13 0756 321 18 2559 021 6 9063 543 5 1972 636 921437 5 2322 405 44 02920 438 17 2547 888 12 2746 154 1 762825 12 7395 571 67 19132 185 23 66911 322 24 75711 695 2 4641 276 16 3017 893 Total 591 614 598 637 590 875 7 762 1.3% Education 240 851 241 927 239 641 2 286 0.9% Health 194 622 196 135 195 437 698 0.4% Social Development 20 634 20 503 19 794 709 3.5% Other functions 135 507 140 072 136 003 4 069 2.9% 632 346303 231 256 875125 326 209 529103 821 22 41610 447 143 52763 637
Glossary Accrued liability A liability that is not paid in the fiscal year in which it is incurred, and so continues to be owed in the next fiscal year. Presentation to Parliament of the amendments to be made to the appropriations voted in the main budget for the year. Prices set outside ordinary market processes through administrative decisions by government, a public entity or a regulator. The approval by Parliament of spending from the National Revenue Fund, or by a provincial legislature from the Provincial Revenue Fund. An increase in the overall price of assets over a specific period of time. A summary statement of all the transactions of the residents of a country with the rest of the world over a particular time period. Reforms developed by the Basel Committee on Banking Supervision to strengthen the regulation, supervision and risk management of the banking sector. The initial allocations used during the budget process, derived from the previous year’s forward estimates. The combination of public, private, development and multilateral sources of financing to leverage funding for infrastructure projects. An auction that aims to ease pressure on targeted areas of the redemption profile by exchanging shorter-dated debt for longer-term debt. The difference between expenditure and revenue. If expenditure exceeds revenue, the budget is in deficit. If the reverse is true, it is in surplus. A reform to the budget process that establishes specialised structures, procedures and criteria for committing fiscal resources to public infrastructure spending. A transaction where government buys debt instruments from investors before their redemption date. The deterioration of capital due to the lack of investment in the economy. A large outflow of investments from a country in response to heightened economic, political or policy risk. A flow of investments in or out of the country. Financing or loans that are extended on terms that are more generous than market loans, for example through lower interest rates or grace periods where there is no repayment. Adjustment estimates Administered prices Appropriation Asset price inflation Balance of payments Basel III Baseline Blended finance Bond-switch programme Budget balance Budget Facility for Infrastructure Buy-back transaction Capital erosion Capital flight Capital flow Concessionary financing 73
2019 MEDIUM TERM BUDGET POLICY STATEMENT Allocations of money from one sphere of government to another, conditional on certain services being delivered or on compliance with specified requirements. Total expenditure by national and provincial government, social security funds and selected public entities, including transfers to municipalities or other entities. See also main budget expenditure. The main measure of inflation, charting changes in the price movements of a basket of consumer goods and services. Expenditure on goods and services, including salaries, which are consumed within a short period of time – usually a year. An amount set aside, but not allocated in advance, to accommodate changes in the economic environment and to meet unforeseen spending pressures. A government obligation, such as a guarantee, that will only result in expenditure if a specific event occurs. See also government guarantee. A measure of the change in consumer price levels that excludes temporary shocks and represents the long-run trend of changes in the price level. See also headline inflation. Policy that has the opposite effect on economic activity to that caused by the business cycle, such as slowing spending growth in a boom period and accelerating spending in a recession. An indicator of the risk of default by a borrower or the riskiness of a financial instrument. Ratings agencies assign grades signifying the borrower’s capacity to meet its financial obligations or the probability that the value of the financial instrument will be realised. See also rating agency. An increase in private investment or consumption as a result of government spending. A fall in private investment or consumption as a result of increased government spending. The difference between total exports and imports, including service payments and receipts, interest, dividends and transfers. This account can be in deficit or surplus. See also trade balance. The difference between revenue and current expenditure, which consists of compensation of employees, goods and services, and interest and rent on land. Repayment of the principal and any outstanding interest on a bond. The cost of interest on government debt. Conditional grants Consolidated government expenditure Consumer price index (CPI) Consumption expenditure Contingency reserve Contingent liability Core inflation Countercyclical fiscal policy Credit rating Crowding-in Crowding-out Current account (of the balance of payments) Current balance Debt redemption Debt-service cost 74
GLOSSARY Depreciation (capital) A reduction in the value of fixed capital as a result of wear and tear or redundancy. A reduction in the external value of a currency. Total income less all taxes and employee contributions. The allocation of funds between national, provincial and local government as required by the Constitution. An increase in the total amount of output, income and spending in the economy. A measure of the cost of debt that includes non-interest costs, such as penalties and upfront payments, which are often applied to distressed borrowers. A name given by international investors to middle-income economies. An incentive to encourage the creation of jobs for youth by allowing employers to claim a reduction in employees’ tax. The allocation of revenue to national, provincial and local government as required by the Constitution. An overall limit on expenditure that enables government to manage departmental spending levels. An excessively positive or negative current account balance, reflecting an excess or deficit of domestic investment over domestic savings. The murder of women on the basis of their gender. A statement of all financial transactions between a country and the rest of the world, including portfolio and fixed investment flows, and movements in foreign reserves. An independent body established in terms of the Constitution to make recommendations to Parliament and provincial legislatures about financial issues affecting the three spheres of government. The 12 months according to which companies and organisations budget and account. Government’s financial year runs from 1 April to 31 March. Measures to stabilise a government’s debt-to-GDP ratio and narrow its budget deficit. Policy on taxation, spending and borrowing by government. Government’s ability to provide additional resources in the budget without jeopardising fiscal sustainability. Determination of currency exchange rates by market forces. An exchange rate regime in which the exchange rate of a country can fluctuate in response to movements in the foreign exchange market. The acquisition of long-term business interests in another country, usually involving management, technology and financial participation. Depreciation (exchange rate) Disposable income Division of revenue Economic growth Effective cost of debt Emerging economies Employment tax incentive Equitable share Expenditure ceiling External imbalance Femicide Financial account (of the balance of payments) Financial and Fiscal Commission Financial year Fiscal consolidation Fiscal policy Fiscal space Flexible exchange rate Floating exchange rate Foreign direct investment 75
2019 MEDIUM TERM BUDGET POLICY STATEMENT An indicator measuring the proportion of time for which an employee receives a salary. It enables government to estimate annual personnel costs by aggregating the amount of part-time work to calculate the full-time equivalents. For example, two people working full-time for six months of the year would count as one full-time equivalent. A measure of the total increase in prices in the whole economy. Unlike CPI inflation, GDP inflation includes price increases in goods that are exported and intermediate goods such as machines, but excludes imported goods. A Reserve Bank account that reflects its losses and profits on holdings of foreign currency and gold reserves, driven by changes in the exchange rate of the rand to the US dollar and the gold price. An assurance made by government to a lender that a financial obligation will be honoured, even if the borrowing government institution is unable to repay the debt. See also contingent liability. A measure of total national output, income and expenditure in the economy. The addition to a country’s fixed capital stock over a specific period, before providing for depreciation. A measure that illustrates inequality in the distribution of income. It is expressed as a number between 0 and 1, with 0 representing perfect equality in income and 1 representing perfect inequality. A measure of the change in the CPI level that includes temporary price shocks to the economy, such as once-off price changes. See also core inflation. A project to review, upgrade and integrate government’s financial management information technology systems. Full-time equivalent GDP inflation Gold and foreign exchange account Government guarantee Gross domestic product (GDP) Gross fixed capital formation Gini coefficient Headline inflation Integrated financial management system (IFMS) project Independent power producer A private-sector business that generates energy for the national grid. A grant allowing a national department to perform a function on behalf of a province or municipality. No funds are transferred, but the end-product of the grant, such as infrastructure, is generally transferred to the province or municipality. An increase in the general level of prices. A monetary policy framework intended to achieve price stability over a certain period of time. The Reserve Bank and government agree on a target rate or range of inflation to be maintained. A value based on ensuring that future generations do not have to repay debts taken on today, unless they also share in the benefits of assets. A credit rating which is regarded as carrying minimal risk to the investors. Indirect grant Inflation Inflation targeting Intergenerational equity Investment grade 76
GLOSSARY The ratio of employed and unemployed workers (the labour force) relative to the working-age population. The ease with which assets can be bought and sold. National government expenditure and transfers to provincial and local government financed from the National Revenue Fund, excluding revenues and spending related to social security funds, extra-budgetary institutions and provincial own revenue. See also consolidated government expenditure. The technical committee responsible for evaluating the medium term expenditure framework budget submissions of national departments and making recommendations to the Minister of Finance regarding allocations to national departments. The three-year spending plans of national and provincial governments published at the time of the Budget. The five-year strategy of government coinciding with the electoral term. The actions taken by a country’s monetary authority (e.g. the Reserve Bank), usually focused on money supply and interest rates. The total stock of money in an economy. The projected revenue and expenditure flowing through the National Revenue Fund. It does not include spending by provinces or local government from their own revenues. A national strategy to eliminate poverty and reduce inequality. Labour force participation Liquidity Main budget expenditure Medium Term Expenditure Committee (MTEC) Medium-term expenditure framework (MTEF) Medium-term strategic framework Monetary policy Money supply National budget National Development Plan (NDP) National health insurance (NHI) A policy relating to healthcare that aims to provide access to quality and affordable health services to all South Africans . The consolidated account of national government into which all taxes, fees and charges collected by the South African Revenue Service, and departmental revenue must be paid. The total value of a company’s assets minus its liabilities. The current rate of exchange between the rand and foreign currencies. The return, or wage, to employees at the current price level. Total expenditure by government less debt-service costs. A public-sector initiative aimed at improving government's ability to attract and retain skilled employees in targeted occupations through increased remuneration. National Revenue Fund Net asset position Nominal exchange rate Nominal wage Non-interest expenditure Occupation-specific dispensation (OSD) 77
2019 MEDIUM TERM BUDGET POLICY STATEMENT The cost of an alternative forgone to pursue a certain action. The difference between total revenue and non-interest expenditure. When revenue exceeds non-interest expenditure, there is a surplus. Non-interest expenditure by government. The agricultural and mining sectors of the economy. Credit provided to the private sector by banks. This includes all loans, credit card balances and leases. A measure of the amount of output generated from every unit of input over a period of time. Typically used to measure changes in labour efficiency. When a country restricts international trade to protect domestic industries. Tax an employer withholds and/or pays on behalf of employees based on employee wages or salaries. The fastest growth that an economy can sustain without increasing inflation. Companies, agencies, funds and accounts that are fully or partly owned by government or public authorities and regulated by law. The consolidated cash borrowing requirement of general government and non-financial public enterprises. A composite index measuring the change in manufacturing activity compared with the previous month. A company that evaluates the ability of countries or other borrowers to honour their debt obligations. Credit ratings are used by international investors as indications of risk. See also credit rating. A measure of the rate of exchange of the rand relative to a trade-weighted average of South Africa’s trading partners’ currencies, adjusted for inflation. Expenditure measured in constant prices, in other words, adjusted to remove the effects of inflation. The level of interest after removing the effects of inflation. Injection of funds into a company or entity to aid liquidity, either as a loan or in return for equity. The return of an investor’s principal in a fixed-income security, such as a preferred stock or bond. Opportunity cost Primary deficit/surplus Primary expenditure Primary sector Private-sector credit extension Productivity Protectionism Payroll tax Potential growth Public entities Public-sector borrowing requirement Purchasing managers’ index (PMI) Rating agency Real effective exchange rate Real expenditure Real interest rate Recapitalisation Redemption 78
GLOSSARY The repayment of debt at a scheduled time with the proceeds of new loans. The difference in value of an asset, liability or transaction from its original (historical) rate to its current rate. The interest rate at which the Reserve Bank lends to commercial banks. Holdings of foreign exchange, either by the Reserve Bank only, or by the Reserve Bank and domestic banking institutions. A return that compensates for uncertainty. Funds not spent during a given financial year that flow into the following year’s budget. The process of removing the seasonal volatility (monthly or quarterly) from a time series. This provides a measure of the underlying trend in the data. Once the rate is annualised, it is expressed as if it were applied over one year. Social benefits available to qualifying individuals, funded wholly or partly by the state. An agreement that allows for the unrestricted flow of goods and services, and the sharing of customs and excise revenue, between South Africa, Botswana, eSwatini, Lesotho and Namibia. A regional intergovernmental organisation that promotes collaboration, economic integration and technical cooperation throughout Southern Africa. Debt issued by a government. A designated area where infrastructure and incentives are provided to clusters of businesses to encourage private investment and employment growth. Measures that are put in place with the aim of substantially changing the economy, or the institutional and regulatory framework in which people and businesses operate. A situation where a country’s productive capacity cannot keep up with rising demand. Auctions to exchange bonds to manage refinancing risk or improve tradability. When individuals or businesses legitimately use provisions in the tax law to reduce their tax liability. Describes the relationship between total tax revenue collections and economic growth. This measure includes the effects of policy changes on revenue. A value above one means that revenues are growing faster than the economy and below one means they are growing below the rate of GDP growth. Refinancing Revaluation gain/loss Repurchase (repo) rate Reserves (foreign exchange) Risk premium Rollover Seasonally adjusted and annualised Social grants Southern African Customs Union (SACU) agreement Southern African Development Community (SADC) Sovereign debt Special economic zone Structural reforms Supply-side constraints Switch (auction) Tax avoidance Tax buoyancy 79
2019 MEDIUM TERM BUDGET POLICY STATEMENT When individuals or businesses illegally reduce their tax liability. For public finance comparison purposes, a country’s tax burden, or tax-to-GDP ratio, is calculated by taking the total tax payments for a particular fiscal year as a fraction or percentage of the GDP for that year. An index measuring the ratio of export prices to import prices. The monetary record of a country’s net imports and exports of physical merchandise. See also current account. A fixed-term contract to procure goods or services needed by more than one government department. Short-term government debt instruments that yield no interest but are issued at a discount. Maturities vary from one day to 12 months. The combination of deficits on the budget and the current account. An approach to organising financial sector regulation and supervision involving two regulators. One is responsible for ensuring financial services firms sell their products in an appropriate way. The other is responsible for ensuring financial firms remain financially sound and are generally prudent. Lack of sufficient funds (capital) to conduct day-to-day operations. The cost of labour per unit of output, calculated by dividing average wages by productivity (output per worker per hour). A loan that is not backed or secured by any type of collateral to reduce the lender’s risk. A financial return or interest paid to buyers of government bonds. The yield/rate of return on bonds includes the total annual interest payments, the purchase price, the redemption value and the time remaining until maturity. Tax evasion Tax-to-GDP ratio Terms of trade Trade balance Transversal term contract Treasury bills Twin deficit Twin peaks Undercapitalisation Unit labour costs Unsecured lending Yield 80
DESCRIPTION OF THE REPUBLIC OF SOUTH AFRICA
DATED MARCH 19, 2020
INCORPORATION OF DOCUMENTS BY REFERENCE
This document is an exhibit to the Republic of South Africa’s Annual Report on Form 18-K under the Securities Exchange Act of 1934 for the fiscal year ended March 31, 2019. All amendments to such Annual Report on Form 18-K/A filed by South Africa following the date hereof shall be incorporated by reference into this document. Any statement contained in a document, all or a portion of which is incorporated or deemed to be incorporated by reference herein, shall be deemed to be modified or superseded for purposes of this document to the extent that a statement contained herein or in any other subsequently filed document that also is or is deemed to be incorporated by reference herein modifies or supersedes such statement. Any statement so modified or superseded shall not be deemed, except as so modified or superseded, to constitute a part of this document.
TABLE OF CONTENTS
|
SUMMARY INFORMATION |
|
3 |
|
|
|
|
|
REPUBLIC OF SOUTH AFRICA |
|
5 |
|
Area and Population |
|
5 |
|
Government and Political Parties |
|
5 |
|
Legal System |
|
7 |
|
International Relations |
|
11 |
|
Public Health |
|
13 |
|
|
|
|
|
THE SOUTH AFRICAN ECONOMY |
|
15 |
|
Overview |
|
15 |
|
Gross Domestic Product (GDP) |
|
17 |
|
Gross Domestic Expenditure (GDE) |
|
20 |
|
Principal Sectors of the Economy |
|
21 |
|
Public Sector Enterprises |
|
29 |
|
Development Finance Institutions (DFIs) |
|
38 |
|
Informal Sector of the Economy |
|
38 |
|
Employment and Trade Unions |
|
39 |
|
Inflation and Wages |
|
42 |
|
|
|
|
|
MONETARY AND FINANCIAL SYSTEM |
|
43 |
|
The South African Reserve Bank (SARB) |
|
43 |
|
Monetary Policy |
|
44 |
|
Financial System Stability |
|
47 |
|
Regulation of the Financial Sector |
|
47 |
|
Structure of the Banking Industry |
|
49 |
|
Capital Markets |
|
52 |
|
Exchange Controls |
|
52 |
|
Gold and Foreign Exchange Contingency Reserve Account (GFECRA) |
|
54 |
|
|
|
|
|
THE EXTERNAL SECTOR OF THE ECONOMY |
|
54 |
|
Foreign Trade |
|
54 |
|
Financial Account |
|
58 |
|
Reserves and Exchange Rates |
|
60 |
|
|
|
|
|
PUBLIC FINANCE |
|
62 |
|
Background |
|
62 |
|
The Budget Process |
|
66 |
|
Medium Term Budget Policy Statement (MTBPS) |
|
67 |
|
2020 MTEF |
|
69 |
|
2020-2021 National Budget and Consolidated Government Budgets |
|
69 |
|
2019-2020 National Budget and Consolidated Government Budgets |
|
75 |
|
Financing |
|
82 |
|
|
|
|
|
NATIONAL GOVERNMENT DEBT |
|
82 |
|
General |
|
82 |
|
Summary of Internal National Government Debt |
|
83 |
|
Summary of External National Government Debt |
|
84 |
|
Financing |
|
85 |
|
Financing of the Net Borrowing Requirement of the National Government |
|
85 |
|
Guaranteed Debt |
|
86 |
|
Debt-Service Costs |
|
86 |
|
Debt Record |
|
87 |
|
|
|
|
|
TABLES AND SUPPLEMENTARY INFORMATION |
|
88 |
In this document, the government of the Republic of South Africa is referred to as the “National Government,” “the Government” or the “South African Government”. The currency of the Republic of South Africa (South Africa) is the South African Rand. In this document, all amounts are expressed in South African Rand (R or Rand) or US Dollars (US$, $ or Dollars), except as otherwise specified. See “The External Sector of the Economy—Reserves and Exchange Rates” for the average rates for the Rand against the Dollar for each of the years 2016 through March 19, 2020. On March 19, 2020, the exchange rate, as reported by the South African Reserve Bank (SARB), was R17.3757 per Dollar (or 5.7552 US cents per Rand).
The Republic’s fiscal year begins on April 1 and ends on March 31. For example, the 2019 fiscal year refers to the fiscal year beginning April 1, 2018 and ending March 31, 2019. Economic data presented in this description is presented on a calendar year basis unless reference is made to the relevant fiscal year or the fiscal year is otherwise indicated by the context. For example, fiscal data referring to the “first quarter” of 2019 refers to data as at, or for the three months ended, June 30, 2019. Economic data referring to the “first quarter” of 2019, by contrast, refers to data as at, or for the three months ended, March 31, 2019.
Unless otherwise indicated, references to gross domestic product (GDP) are to real GDP, calculated using constant prices in order to adjust for inflation (with 2010 as a base year), and % changes in GDP refer to changes as compared to the previous year or the same quarter of the previous year, unless otherwise indicated.
Unless otherwise stated herein, references in this description to the 2019-2020 Budget are to the 2019-2020 National Budget as released on February 20, 2019 and not as amended by the Medium-Term Budget Policy Statement (MTBPS) released on October 30, 2019. References to the 2019-2020 Consolidated Government Budget, which includes the 2019-2020 National Budget as part thereof, shall be construed accordingly.
Some figures included in this document have been subject to rounding adjustments. As a result, sum totals of data presented in this document may not precisely equate to the arithmetic sum of the data being totaled.
A NOTE ON SEASONALLY ADJUSTED AND ANNUALIZED INFORMATION
Some of the figures included in this document have been subject to seasonal adjustment and/or annualization.
Seasonal adjustment is a method to account for and eliminate the estimated effects of normal seasonal variation from a series of data, so that the effects of other influences on the series can be more clearly recognized and defined. Depending on the nature of the seasonal pattern, seasonal adjustment is accomplished either by the multiplicative method (i.e., each value of a time series is adjusted by dividing by a seasonal index that represents the percentage of the normal value typically observed in that season) or the additive method (i.e., each value of a time series is adjusted by adding or subtracting a quantity that represents the absolute amount by which the value in that season of the year tends to be below or above normal, as estimated from past data).
The aim of annualization is to reflect what the real growth rate would be if the prevailing growth rate were to be sustained for a year. Annualized information is calculated as the quarterly data multiplied by four, while the annualized growth rates are derived by raising the change in a given quarter from the previous quarter to the power of four.
SUMMARY INFORMATION
The following summary tables do not purport to be complete and are qualified in their entirety by the more detailed information appearing elsewhere in this document.
The following tables set forth certain summary statistics about the economy of South Africa, public finance and debt of the National Government for the periods indicated.
Selected Economic Indicators
|
|
|
As of and for the year ended December 31, |
|
As of and for |
| ||||||||
|
|
|
2014 |
|
2015 |
|
2016 |
|
2017 |
|
2018 |
|
2019 |
|
|
|
|
Rand (million) (except percentages) |
| ||||||||||
|
The Economy |
|
|
|
|
|
|
|
|
|
|
|
|
|
|
Gross Domestic Product (GDP) |
|
|
|
|
|
|
|
|
|
|
|
|
|
|
Nominal GDP(2) |
|
3,805,350 |
|
4,049,884 |
|
4,359,061 |
|
4,653,579 |
|
4,873,899 |
|
5,036,312 |
* |
|
Real GDP(3) |
|
3,028,090 |
|
3,064,236 |
|
3,076,466 |
|
3,119,984 |
|
3,144,539 |
|
3,152,205 |
* |
|
Real % change from prior year |
|
1.8 |
|
1.2 |
|
0.4 |
|
1.4 |
|
0.8 |
|
0.3 |
|
|
Unemployment rate (%) |
|
25.1 |
% |
25.4 |
% |
26.7 |
% |
27.5 |
% |
27.1 |
% |
29.1 |
% |
|
|
|
|
|
|
|
|
|
|
|
|
|
|
|
|
Balance of payments |
|
|
|
|
|
|
|
|
|
|
|
|
|
|
Current account |
|
(192,966 |
) |
(187,006 |
) |
(125,102 |
) |
(118,234 |
) |
(172,962 |
) |
(149,837 |
)** |
|
Financial account |
|
248,263 |
|
209,344 |
|
131,432 |
|
109,961 |
|
142,051 |
|
111,286 |
** |
|
Change in gross gold and other foreign reserves |
|
48,335 |
|
145,369 |
|
(66,069 |
) |
(23,047 |
) |
117,556 |
|
91,886 |
** |
|
Rand/Dollar exchange rate (average) |
|
10.84 |
|
12.76 |
|
14.71 |
|
13.31 |
|
13.23 |
|
14.36 |
|
|
Consumer prices (2016/12=100) |
|
88.0 |
|
92.0 |
|
97.8 |
|
103.0 |
|
107.8 |
|
111.7 |
|
|
Producer prices (2016/12=100) |
|
88.1 |
|
91.3 |
|
97.8 |
|
102.5 |
|
108.1 |
|
112.7 |
|
* Estimate based on the nine months ended September 30, 2019, seasonally adjusted and annualized.
** Cumulative numbers up to September 30, 2019, not seasonally adjusted.
|
|
|
As of and for the fiscal year ended March 31, |
| ||||||||
|
|
|
2015 |
|
2016 |
|
2017 |
|
2018(5) |
|
2019(6) |
|
|
|
|
|
|
|
|
|
|
|
|
|
|
|
Main Government Revenue |
|
965,456.9 |
|
1,076,234.4 |
|
1,137,896.4 |
|
1,196,399.1 |
|
1,359,084.4 |
|
|
% of GDP(2) |
|
25.0 |
% |
26.1 |
% |
25.8 |
% |
25.34 |
% |
25.91 |
% |
|
Main Government Expenditure |
|
1,131,900.1 |
|
1,244,622.9 |
|
1,305,486.2 |
|
1,404,985.9 |
|
1,506,729.0 |
|
|
% of GDP(2) |
|
29.3 |
% |
30.2 |
% |
29.6 |
% |
29.76 |
% |
30.62 |
% |
|
Main Budget Deficit |
|
(166,443.2 |
) |
(168,388.5 |
) |
(167,589.80 |
) |
(208,587 |
) |
(231,484 |
) |
|
% of GDP(2) |
|
(4.31 |
)% |
(4.08 |
)% |
(3.80 |
)% |
(4.4 |
)% |
(4.7 |
)% |
|
Net borrowing requirement |
|
166,443.2 |
|
168,388.5 |
|
167,589.80 |
|
208,586.8 |
|
231,483.7 |
|
|
Change in cash and other balances(4) |
|
(8,500.8 |
) |
13,020.5 |
|
(25,982.30 |
) |
(29,032.2 |
) |
24,732.3 |
|
Notes:
N/A = not available
(1) First half of 2019, seasonally adjusted and annualized.
(2) At market prices.
(3) At constant 2010 prices.
(4) The total debt of National Government (net) is calculated with due account of the bank balances of the National Revenue Fund (balances of National Government’s accounts with the SARB and the Tax and Loans Accounts with commercial banks).
(5) Final outcome for fiscal year 2018, as reflected in the MTBPS (October 2019).
(6) Estimates as revised and reflected in the MTBPS (October 2019).
Source: National Treasury, SARB and Statistics SA (Stats SA).
The estimates included in this Annual Report are based on the 1993 System of National Accounts (SNA) published by the United Nations in cooperation with other international organizations. This means that the methodology, concepts and classifications are in accordance with the latest guidelines of an internationally agreed system of national accounts. The estimates of real GDP are expressed in terms of a 2010 base year. Revision of the estimates for all components of the national accounts is done from time to time based on the availability of data.
MAP OF THE REPUBLIC OF SOUTH AFRICA
REPUBLIC OF SOUTH AFRICA
Area and Population
South Africa is situated on the southern tip of the African continent, with the Atlantic Ocean to the west and the Indian Ocean to the east. The north of the country shares common borders with Namibia, Botswana and Zimbabwe and, to the north east, the country shares a border with Mozambique. South Africa also shares common borders with the kingdoms of Lesotho and Swaziland. The total surface area of South Africa is approximately 1,219,090 square kilometers, with over 3,000 kilometers of coastline.
South Africa comprises of nine provinces, which are the Eastern Cape, Free State, Gauteng, KwaZulu-Natal, Limpopo, Mpumalanga, Northern Cape, North West and Western Cape Provinces.
According to the racial classifications that formed the basis for the apartheid system, “Black” referred to persons of original African indigenous origin, “Asian” to persons of Asian origin, “White” to persons of Caucasian ethnic origin and “Coloured” to persons of mixed race. While the National Government no longer makes any unfair discrimination based on race, the country’s history of racial division and racial and ethnic differences continues to have social and economic significance. This is because social and economic policies are judged partly by their ability to address disparities and discrimination and to equalize opportunities. Therefore, in this document, reference to such racially classified statistics is made occasionally to illustrate those disparities.
South Africa’s population is approximately 58.78 million as at June 30, 2019, of which 30 million, representing 51.2% of the population, are female. Approximately 80.8% are Black African, 8.8% are Coloured, 2.4% are Indian/Asian and 7.9% are White. The most densely populated parts of South Africa are the four major industrialized areas: the Pretoria/Witwatersrand/Vereeniging area of Gauteng (which includes Johannesburg), the Durban/Pinetown/Pietermaritzburg area of KwaZulu-Natal, the Cape Peninsula area of the Western Cape (which includes Cape Town) and the Port Elizabeth/Uitenhage area of the Eastern Cape.
South Africa has a diverse population consisting of Afrikaans and English-speaking Whites, Asians (including Indians), Coloureds, Khoi, Nguni, San, Sotho-Tswana, Tsonga, Venda and persons that have immigrated to South Africa from across the globe. By virtue of the country’s diversity, South Africa has 11 official languages, namely Afrikaans, English, isiNdebele, isiXhosa, isiZulu, Sepedi, Sesotho, Setswana, siSwati, Tshivenda and Xitsonga. According to the results of the census conducted in 2011, isiZulu is the mother tongue of 22.6% of the population, followed by isiXhosa at 15.9%, Sepedi at 9.1%, Afrikaans at 7.9%, and English and Setswana at 8.2% each. IsiNdebele is the least spoken language in South Africa, at 1.5%.
Government and Political Parties
Following the repeal of apartheid legislation, South Africa held its first fully democratic national election on April 27, 1994.
On May 10, 1994, Mr. Nelson Mandela, who had previously been elected as president of the ANC, was inaugurated as South Africa’s first black president. Mr. Mandela served until his deputy, Mr. Thabo Mbeki succeeded him on June 14, 1999. Mr. Mbeki resigned from the presidency on September 24, 2008, and Mr. Kgalema Motlanthe served as interim President between September 25, 2008 and May 9, 2009.
On May 24, 2009, following the ANC’s victory in the elections, Mr. Jacob Zuma was inaugurated as the fourth democratically elected President of the Republic, while Mr. Cyril Ramaphosa was elected as Deputy President.
In October 2017, the Supreme Court of Appeals ruled that former President Zuma had to face 18 counts of corruption, fraud, racketeering and money laundering. On February 14, 2018, former President Zuma resigned as President of the Republic of South Africa. On March 16, 2018, the National Prosecuting Authority announced the decision to prosecute former President Zuma on 16 charges of corruption, racketeering and money laundering. In November 2018, former President Zuma submitted a court application for a permanent stay of his prosecution. On October 11, 2019, the Kwa Zulu-Natal High Court: Pietermaritzburg, dismissed the application for permanent stay of prosecution. In December 2019, former President Zuma petitioned the Supreme Court of Appeal of South Africa to challenge the dismissal of his application for a permanent stay of prosecution. It is unclear whether the Supreme Court of Appeal of South Africa will agree to hear his appeal. In February 2020, an arrest warrant was issued for former President Zuma.
Following former President Zuma’s resignation, Mr. Cyril Ramaphosa ran unopposed and was elected on February 15, 2018 as the president of South Africa by the National Assembly. On October 9, 2018, the President
appointed Mr. Tito Titus Mboweni as Minister of Finance to replace Mr. Nhlanhla Nene who resigned. Mr. Mboweni previously served as a Governor of the South African Reserve Bank.
President Ramaphosa was inaugurated on May 29, 2019 for his first full-term as President of the Republic of South Africa following the ANC’s victory in the 2019 National and Provincial election. President Ramaphosa appointed Mr. David Mabuza as the Deputy-President and reduced his cabinet from 36 Ministers to 28 with the amalgamation of several portfolios.
Constitution
The current Constitution was adopted in 1996 and was phased in between 1997 and 1999. The Constitution provides for elections every five years as well as for the separation of powers among the legislative, executive and judicial branches of the National Government. Under the Constitution, the bicameral Parliament, in which the legislative authority of the National Government is vested, is comprised of a National Assembly and a National Council of Provinces (NCOP).
The National Assembly consists of no fewer than 350 and no more than 400 members elected on the basis of proportional representation pursuant to which political parties receive seats in proportion to the votes cast for the parties concerned.
The National Assembly is mandated by the Constitution to choose the President, provide a national forum for public consideration of issues, pass legislation, scrutinize and oversee executive action, maintain oversight of the bodies and institutions established by Chapter 9 of the Constitution, and ensure that Members of Cabinet are accountable collectively and individually to Parliament for the exercise of theirs powers and the performance of their functions.
The NCOP is one of the two Houses of Parliament and is constitutionally mandated to ensure that provincial interests are taken into account in the national sphere of government. This is done through participation in the national legislative process and by providing a national forum for consideration of issues affecting provinces. The NCOP also plays a unique role in the promotion of the principles of Cooperative Government and Intergovernmental Relations. It ensures that the three spheres of government work together in performing their unique functions in terms of the Constitution and that in doing so they do not encroach in each other’s area of competence. The NCOP consists of 90 members (namely 54 permanent members and 36 special delegates). Each of the nine provincial legislatures elects ten representatives.
Each province has its own executive authority, the premier. The premiers are elected by each Provincial legislature from among its members. The powers of the premier are exercised in consultation with a provincial executive council, which is constituted in a manner similar to the Cabinet in the National Government. The provinces exercise limited power on a national level, principally through their representatives in the NCOP, as well as through their power to block Parliamentary action affecting the constitutional position and status of the provinces. When deciding on bills that amend the constitution, the provincial delegations vote in accordance with the mandate conferred on them by their respective provincial legislature. Each province has one vote and at least six provinces have to vote in favor of the bill for it to be passed. Similarly, when deciding on bills that affect the provinces, the provincial delegations vote in accordance with the mandate conferred on them by their respective provincial legislatures. Each province has one vote and at least five provinces need to vote in favor of the bill for it to be approved.
Political Parties
The ANC is the ruling party in eight of the nine South African provinces. Founded in 1912, the ANC led the struggle against apartheid and is the most influential party in South Africa in terms of the size of its electoral constituency support. Following the May 2019 elections, the ANC occupies 230 of the National Assembly’s 400 seats. Every five years the ANC holds a National Conference where the ANC adopts proposed constitutional amendments and elects the National Executive Committee. The 54th ANC National Conference took place in Johannesburg, Gauteng Province, from December 16 to December 20, 2017, where Mr. Cyril Ramaphosa was elected president of the ANC.
2019 National and Provincial Elections
The official general election results were announced on May 11, 2019. The ruling ANC won the elections, receiving 57.50% of the votes cast in respect of the national elections. The DA remained the official opposition of the ANC, with 20.77% of the votes, and the EFF came in third with 10.80% of the votes.
The table below sets out the National and Provincial Assembly seats secured by political parties following the May 2019 general elections.
|
Political Party |
|
Number of seats in |
| ||
|
|
|
|
|
|
|
|
ANC |
|
230 |
|
57.50 |
% |
|
DA |
|
84 |
|
20.77 |
% |
|
EFF |
|
44 |
|
10.80 |
% |
|
IFP |
|
14 |
|
3.38 |
% |
|
VF PLUS |
|
10 |
|
2.28 |
% |
|
ACDP |
|
4 |
|
0.84 |
% |
|
UDM |
|
2 |
|
0.45 |
% |
|
NFP |
|
2 |
|
0.35 |
% |
|
ATM |
|
2 |
|
0.44 |
% |
|
GOOD |
|
2 |
|
0.40 |
% |
|
AIC |
|
2 |
|
0.281 |
% |
|
COPE |
|
2 |
|
0.27 |
% |
|
PAC |
|
1 |
|
0.19 |
% |
|
ALJAMA |
|
1 |
|
0.18 |
% |
|
Total |
|
400 |
|
100.0 |
% |
Source: IEC.
The table below sets out the NCOP seats secured by political parties following the May 2019 general elections.
|
Political Party |
|
Permanent |
|
Special |
|
|
|
|
|
|
|
|
|
ANC |
|
29 |
|
25 |
|
|
DA |
|
13 |
|
7 |
|
|
EFF |
|
9 |
|
2 |
|
|
VP |
|
2 |
|
1 |
|
|
IFP |
|
1 |
|
1 |
|
|
Total |
|
54 |
|
36 |
|
Source: Parliament of the Republic of South Africa
2016 Municipal Elections
Municipal elections are held every five years. Municipal elections were held on August 3, 2016. The shares of the votes for the major parties were as follows: ANC — 53.9%, DA — 26.9%, EFF — 8.2%, IFP — 4.23%, and COPE — 0.42%. The NFP failed to pay the registration fee to the Independent Electoral Commission and thus did not participate in the elections. The next municipal elections are scheduled to take place in 2021.
Recent Developments
In August 2018, the President established the Judicial Commission of Inquiry into State Capture, Corruption, Fraud and other allegations in the Public Sector to investigate allegations of state capture, corruption, fraud and other allegations in the public sector including organs of state in South Africa. The Committee has been granted a final extension until March 2021 to conclude its investigation. Once the Committee has concluded its investigations, it will issue its findings.
Legal System
The South African legal system is based on Roman-Dutch law and incorporates certain elements of English law, subject to the Bill of Rights contained in the Constitution. Judicial authority in South Africa is vested in the courts, which are established pursuant to the Constitution. The Constitution is the supreme law of the land and no other law can supersede the provisions of the Constitution. The Constitutional Court is the supreme court of the land and has jurisdiction as the court of final instance over all matters relating to the interpretation, protection and enforcement of the terms of the Constitution. It is also the court of first instance on matters such as those concerning the constitutionality of an Act of Parliament referred to it by a member of the National Assembly. Decisions of the Constitutional Court are binding upon all persons and upon all legislative, executive and judicial organs of state. Matters not falling within the jurisdiction of the Constitutional Court fall within the jurisdiction of the Supreme Court, which consists of the Supreme Court of Appeal and various High Courts. Judgments of the Supreme Court of Appeal are binding on all courts of a lower order, including the High Courts, and judgments of the High Courts are binding on the lower courts within their respective areas of jurisdiction.
The Chief Justice, currently Justice Mogoeng Mogoeng who was appointed on September 8, 2011, and the Deputy Chief Justice of the Constitutional Court are appointed by the President in consultation with the Judicial Service Commission (JSC) and the leaders of parties represented in the National Assembly. The Judge President and Deputy President of the Supreme Court of Appeal are appointed by the President after consulting with the JSC only. The remaining judges of the Constitutional Court, the Supreme Court of Appeal and the High Courts are appointed by the President on the advice of the JSC.
Key Reforms and Legislative Initiatives
Land Reform
Land reform in South Africa is a complex issue, due to both the apartheid era legacy of dispossessing black South Africans of their land and the current development challenges. Through the judicial process and the Constitution’s protection of private property rights, the National Government seeks to facilitate the equitable transfer of land to South Africans who lost their land as a result of the land dispossession policies of the previous regime in South Africa.
The Department of Rural Development and Land Reform had previously set 2014 as the deadline for achieving land reform in South Africa through the redistribution of 30% of white-owned commercial agricultural land to those previously dispossessed of such land. According to the Department of Rural Development and Land Reform, as of March 31, 2018 approximately 8.4 million hectares of land have been transferred to previously disadvantaged South Africans under the restitution and redistribution programs; the initial 30% target was 24.6 million hectares.
The implementation of the land restitution and land reform programs are supported through allocations to the Department. Expenditure grew from R8.9 billion in 2002 to R9.5 billion in 2014, mainly due to the increase in land reform and restitution grants, and remained at R9.5 billion in 2015 due to the tight fiscal environment. Expenditures decreased to R9.1 billion in 2016, increased to R10.1 billion in 2017, decreased to R9.7 billion in 2018 and increased to R10.2 billion in 2019. Expenditures, however, are expected to increase to R11 billion by 2020.
The government is committed to pursuing a comprehensive approach to land and agrarian reform that is supportive of inclusive growth and balances the need for transformation with the need for policy certainty to allow increased agricultural output, growth and food security. To this end, a Presidential Expert Advisory Panel on Land Reform and Agriculture (the Panel) was appointed and it included sector experts such as: farmers, policy makers, academics and lawyers to provide concrete measures to achieve a more effective land reform program. The Panel released its report on July 28, 2019. One of the report’s findings, which relates to land expropriation without compensation, is that the current framing of Section 25 does not inhibit the State from expropriating land. Through the Department of Rural Development and Land Reform, the Commission on Restitution of Land Rights has also embarked on a parliamentary process to evaluate the constitutionality of land expropriation without compensation. As part of the parliamentary process currently underway to evaluate the constitutionality of land expropriation without compensation, a parliamentary Joint Constitutional Committee adopted a resolution calling for the amendment of Section 25 of the constitution to allow for the expropriation of land without compensation in the public interest. The Committee recommended that it be made explicit that this is one of the means by which inequitable land ownership patterns in South Africa can be addressed. The Committee’s final report and recommendations were tabled in the National Assembly for debate and subsequently forwarded to the NCOP for concurrence.
The parliamentary Ad Hoc Committee, which has been mandated by the National Assembly to initiate and introduce legislation to amend the Section 25 of the Constitution, has also made recommendations which are contained in the reports of both the Constitutional Review Committee. The Ad Hoc Committee intends to complete its mandate by March 31, 2020. The outcomes of these processes have to be ratified by the Constitutional Court. Collectively, the outcomes of these processes will assist government in mapping a way forward with regard to answering South Africa’s land question.
Broad-Based Black Economic Empowerment
Broad-Based Black Economic Empowerment (B-BBEE) continues to be a core tenet of the National Government’s initiative to address the economic exclusion of historically disadvantaged South Africans. As part of this initiative, the National Government enacted the Broad-Based Black Economic Empowerment Act, 2003 (Act No. 53 of 2003) (B-BBEE Act), which came into effect in April 2004. For purposes of the B-BBEE Act, “black people” is a generic term which means Africans, Coloureds and Indians who are South African citizens. The B-BBEE Act aims to facilitate B-BBEE and promote economic transformation by: incentivizing meaningful
participation by black people in the economy; changing the racial composition of ownership and management structures in enterprises; promoting investment programs that lead to B-BBEE; enabling access to economic activities, infrastructure and skills for black women and rural and local communities; increasing the extent to which workers, communities and cooperatives own and manage enterprises; and promoting access to finance for black economic empowerment (BEE).
The Department of Trade and Industry (DTI) has issued the B-BBEE Codes of Good Practice on Black Economic Empowerment (the Codes). The Codes, which were promulgated in February 2007 and amended in October 2013, set out general principles for measuring ownership, management control, skills development, enterprise and supplier development and socio-economic development, including special guidance for qualifying small enterprises. The Codes also provide guidance on B-BBEE verification, the recognition of contributions toward BEE of multinationals and the treatment of public entities and other enterprises wholly owned by organs of state.
The B-BBEE Act requires that every organ of national and local government and every public entity apply B-BBEE the relevant Codes in issuing licenses, implement procurement policies, determine qualification criteria for the sale of state-owned enterprises and develop criteria for entering into public private partnerships.
Multinational Companies
The Codes give multinational companies flexibility in the manner in which they implement the Codes. A multinational company can retain sole ownership of its South African subsidiary, provided that alternative measures to broaden economic participation by black people, in terms of the Codes, are exercised. So called “equity equivalent” programs focus on skills transfer, empowerment of small-medium-micro-enterprises (SMME) and broader socio-economic empowerment projects.
Public Entities and State Agencies
The B-BBEE Act places a legal obligation on state agencies to contribute to B-BBEE, including when developing and implementing their preferential procurement policies. The Preferential Procurement Policy Framework Act, 2000 (Act No. 5 of 2000) (PPPF Act) states that all spheres of government must have a mechanism in place that brings about categories of preference in allocation of contracts when procuring goods and services to advance historically disadvantaged individuals (HDIs). Tenders above R50 Million, a total of 10%, will be contributed to the B-BBEE Status Level. A dispensation has been made for an organ of state and public entities to apply pre-qualifying criteria to advance certain designated groups.
Private Sector
A business’s B-BBEE Status Level is an important factor affecting its ability to tender successfully for Government and public entity tenders and to obtain licenses in certain sectors like mining and gaming, as well as trading with other firms in the private sector. The amendments, introduced by the DTI and approved by Parliament in 2013, impose penalties in certain circumstances such as fronting or circumvention of the legislation. These amendments became effective as of October 24, 2014. Private sector clients increasingly require their suppliers to have a minimum B-BBEE rating in order to boost their own B-BBEE ratings. B-BBEE is accordingly an important factor to be taken into account by any firm conducting business in South Africa.
The B-BBEE Act provides for the DTI to publish and promote any transformation charter (for later development into industry codes) for a particular sector of the economy, provided that charter (or code) is developed by the major stakeholders in that sector and advances the objectives of the B-BBEE Act. These charters or codes set out a blueprint and timeline for the transformation of the relevant economic sectors, including such sectors as tourism, financial services, forestry and construction.
Some of the biggest challenges facing the National Government in relation to the implementation of B-BBEE include educating the South African public on the objectives, opportunities and perceptions relating to B-BBEE, providing certainty as to the requirements of B-BBEE, ensuring that the objectives of B-BBEE are properly adhered to and encouraging investment in South Africa that advances B-BBEE and promotes economic and social transformation.
Mining Industry Reform
Mining in South Africa has historically been undertaken largely by the private sector. As of December 31, 2018 there were approximately 1,700 operating mines and quarries in South Africa. The most important mining houses in South Africa include Anglo American plc, De Beers Corporation, African Mineral Limited, BHP Billiton SA, Gold Fields Limited, Impala Platinum Holdings Limited, Lonmin plc, Kumba Iron Ore Limited, Exxaro Limited,
Xstrata plc and Harmony Gold Limited. These corporations, together with their affiliates, are responsible for the majority of the gold, diamond, uranium, zinc, lead, platinum, chrome, iron ore, coal and silver mining in South Africa.
The Minister of Mineral Resources is the competent authority for granting prospecting and mining licenses. The objective of the Department of Mineral Resources (DMR) for fiscal year 2019 is to grant 120 licenses to HDIs, 97 of which have been granted as of 30 September 2019.
The South African Mineral Resources Administration System (SAMRAD) was launched in April 2011 to process mining license applications, which enables the monitoring of the status and improves overall quality of license applications. Through SAMRAD, the general public can view the locality of applications, rights and permits made or held.
The DMR is also responsible for managing environmental impacts from mining-related activities, and by the end of September 2019, had conducted 760 environmental verification inspections out of a target of 1,275 inspections. The Department of Environmental Affairs has transferred some of the functions of the National Environmental Management Act related to mining activities to the DMR, which means the DMR would be the competent authority for environmental impact assessments for the mines and would also be responsible for developing tools and systems for mine environmental management and reporting.
Mining Charter
Subsequent to an extensive consultation with mining stakeholders the Mining Charter, 2018 was gazetted for implementation on September 27, 2018. This Charter represents the interest of all stakeholders and it is the Department of Mineral Resources’ view that it will meaningfully transform the industry while ensuring its growth and competitiveness. The Charter Regulations will be finalized before the 2018/19 financial year for ease and standardized implementation by all stakeholders.
The Department of Mineral Resources, while proceeding with implementation of the Mining Charter in 2019/20, will undertake advocacy sessions and engagements with investors and stakeholders on the Charter and its Regulations.
Mining and Petroleum Resources Development Act (MPRDA) Bill
The Cabinet has supported the withdrawal of the MPRDA Bill from Parliament in order to provide for regulatory certainty. The withdrawal of the Bill will not create a regulatory vacuum, as the Principal Act as amended by Act 49 of 2008 will be applied in its current form until workable amendment proposals are developed and finalized.
The department is in the process of amending the MPRDA to remove petroleum provisions and develop a Petroleum Resources Development Bill. Therefore, two separate bills, one on mineral resources and one on petroleum resources will be finalized in 2019/20. During the MTEF period, a total of nine legislative instruments will be completed and these include the Mining Company of South Africa (MINCOSA) Bill, the Petroleum Agency of South Africa (PASA) Bill, the review of the Mine Health and Safety Act (MHSA) Bill and the related Regulations.
With regards to shale gas, the department will continue working together with its state-owned enterprises, the Council for Geoscience (CGS) and PASA, to evaluate shale gas and conduct new research initiatives, including an investigation into the occurrence of near-surface hydrocarbon.
Other Mining Industry Initiatives and Legislation
Health and safety standards within the industry are governed by the Mine Health and Safety Act of 1996 (MHSA). From January to October 2019, 40 mining accident fatalities were registered, a decreased compared to 76 fatalities during the same period in 2018. These fatalities are mainly caused by a lack of effective health and safety management systems at the mines. Fall of ground accidents remain the largest cause of fatalities, followed by transportation and machinery accidents. In September 2012, the Cabinet approved the moratorium on the acceptance and processing of applications to explore shale gas, allowing normal exploration (excluding the actual hydraulic fracturing) to proceed under the existing regulatory framework.
The CGS has undertaken a shale gas research project that is aimed at unlocking the unknowns and assumptions about shale gas exploration in the country. The project is also aimed at building scientific skills in the area of shale gas exploration as this is a new concept to the country at large.
The program is funded by the DMR and will assist the government in making well informed decision about shale gas in South Africa.
The objectives of the program are to collect and review new geological information of the Karoo Basin, to define an environmental baseline, to assess the amount of recoverable gas mainly from the Whitehill and Prince Albert
Formations, to cover various geo-environmental impacts like ground water dynamics with possible contamination, and monitor potential seismic interferences.
The CGS Shale gas project will serve as a baseline study for future shale gas research work and play a vital role in review of Petroleum Exploration and Exploitation Regulations. National Environmental Management Act (NEMA) regulations will be utilized as a framework in identifying shortfalls of the environmental impacts of the shale gas
Department of Justice and Constitutional Development
The Prevention of Organized Crime Act (1998) (the POC Act) introduces measures to combat organized crime, money laundering and criminal gang activities and prohibits certain activities relating to racketeering activities. The POC Act also criminalizes certain activities associated with gangs and provides for the recovery of the proceeds of an unlawful activity, the civil forfeiture of criminal assets that have been used to commit an offence or assets that are the proceeds of an unlawful activity. Recoveries under the POC Act were valued at R3.05 billion in 2018/19, exceeding the set target of R3 billion by 2% and represented an increase of 907% when compared to the R302.8 million achieved in 2017/18.
With regards to convictions, the National Prosecuting Authority (NPA) has convicted 210 government officials in the period ending March 31, 2019 (115 from national departments, 46 from local authority, 27 from provincial departments, 18 from government agencies and 4 from the NPA) and 143 persons from private sector for corruption or offences related to corruption. 17 persons were convicted of corruption or offences related to corruption where the amount involved is more than R5 million. The conviction rate increased in the prosecution of complex commercial crime (i.e. corruption, cybercrime and money laundering) with a Specialized Commercial Crime Unit obtaining a conviction rate of 95% (against a target of 93%) in in the year ended March 31, 2019, from 94.1% in in the year ended March 31, 2018. There were 800 verdict cases that were finalized, including 760 convictions in the year ended March 31, 2019. With regards to organized crime cases relating to illegal precious metal (including copper), rhino related offences, drug dealings, illicit mining and tax matters, 310 cases were finalized with 294 convictions in the period from April 1, 2018 to March 31, 2019. This translates into 94.8% conviction rate as at the year ended March 31, 2019. This is a slight increase in performance when compared to the conviction rate of 93.8% achieved in the year ended March 31, 2018.
International Relations
South Africa maintains diplomatic relations with 123 countries. South African representation abroad includes 104 embassies, 16 consulates, 97, honorary consulates, 2 liaison offices, 68 non-resident accreditations and 12 representations in international organizations. South Africa hosts 123 embassies, 53 consulates, 79 honorary consulates, 1 liaison office, 18 non-resident accreditations and 35 international organizations.
United Nations
South Africa is one of the 51 founding members of the United Nations (UN) in 1945. South Africa has served as a member of the UN Security Council, the UN Human Rights Council and is a member of the UN General Assembly and the Economic and Social Council of the United Nations.
African Union (AU)
The Organization of African Unity (OAU) was established on May 25, 1963 in Addis Ababa, Ethiopia with the signing of the OAU Charter by representatives of 32 governments. South Africa joined the AOU in 1994, becoming the 53rd member of the continental body. In July 2000, the AOU was revitalized and the Constitutive Act of the African Union (the Act) opened for signatures, South Africa’s parliament ratified the Act in February 2001 and ascended to membership of the AU and some of the AU bodies as articulated in the Act. South Africa has served as the chair of the AU Commission and as chair of the Union.
International Monetary Fund (IMF)
South Africa is a founding member of the IMF and is one of 40 participants that have ratified the IMF’s expanded and amended New Arrangements to Borrow (NAB). South Africa committed a maximum of 340 million Special Drawing Rights (SDRs) to NAB during the five-year period from 2012 to 2017 and was called upon to lend a total of 90.2 million SDRs (R1.4 billion). South Africa has renewed its membership as a participant in the NAB for the five-year period from 2017 to 2022 and has renewed its commitment of 340 million SDRs. As of December 31, 2019, South Africa’s quota at the IMF was 3.1 billion SDRs.
South Africa is one of the 35 participants with commitments to the IMF’s 2012 Bilateral Borrowing Agreements (BBAs). South Africa committed US$2 billion to the 2012 BBAs. In October 2017, South Africa migrated to the IMF’s 2016 BBAs, to which it again committed US$2 billion (2.8 billion SDRs).
South Africa also contributes funds to the Poverty Reduction and Growth Trust (PGRT), the IMF’s instrument for financial support to low-income countries (LICs).
World Bank
South Africa is a founding member of the World Bank Group, which comprises the International Bank for Reconstruction and Development (IBRD), the International Development Association (IDA), the International Finance Corporation (IFC) and the Multilateral Investment Guarantee Agency (MIGA).
General Agreement on Tariffs and Trade
South Africa is a founding member of the General Agreement on Tariffs and Trade (GATT), participated in the Uruguay Round of Multilateral Trade Negotiations and acceded to the Marrakesh Agreement that established the World Trade Organization (WTO) in 1994. It is also part of the generalized system of preferences of Canada, the European Union (EU), Japan, Norway, Russia, Switzerland, Turkey and the United States.
South Africa is party to the Economic Partnership Agreement with the European Union, the Southern Africa Customs Union, the Southern African Development Community, the African Continental Free Trade Area, the Trade, Development and Cooperation Agreement; the EFTA-SACU Free Trade Agreement, the Southern Common Market (Mercosur) PTA and the Trade and Investment Framework Agreement.
Organization for Economic Cooperation and Development
South Africa enjoys a strong partnership with the Organization for Economic Cooperation and Development (OECD) and participates in numerous programs and committees. South Africa is a signatory to the Convention on Combating Bribery of Foreign Public Officials in International Business Transactions, and part of the Mutual Acceptance of Data system and has played a key role in the establishment of the African Tax Administrators Forum.
Group of 20 (G20)
South Africa is a member of the Group of 20 and is also a member of the Financial Stability Board (FSB), a structure responsible for setting standards and monitoring the progress of financial regulation globally.
BRICS
South Africa became a member of BRICS in 2010 and has participated in all subsequent Leaders Summits. BRICS is a group composed of five major emerging market economies; namely, Brazil, Russia, India, China and South Africa
New Development Bank
During the sixth BRICS Summit, which took place in Fortaleza on 15 July 2014, leaders of the BRICS countries signed the Agreement Establishing the New Development Bank (NDB), thus making South Africa a founding member of the bank, with equal shareholding among all founding members.
Commonwealth
In 1994, South Africa re-joined the Commonwealth. South Africa’s participation is limited to promoting economic, social and cultural cooperation and enhancing democracy through the Commonwealth Heads of States and Ministers’ meetings.
African Continental Free Trade Agreement (AfCFTA)
South Africa is a signatory to and a member of the AfCFTA, which came into force on May 30, 2019. The AfCFTA aims to promote the economic integration of Africa’s small and fragmented markets to create a single continental market for goods and services with the free movement of people and capital. The AfCFTA will bring together 55 members of the African Union, representing a population of more than 1.2 billion people and a combined gross domestic product of over US$3.4 trillion.
Public Health
South Africa has a well-established health sector which comprises 9.1% of GDP (including private sector expenditure). There are over 4,000 public health facilities, including approximately 400 hospitals throughout the Republic. Public health spending was approximately R222.8 billion in the 2018/19 fiscal year (including the school nutrition program and training of medical professionals), slightly less than private health spending which is R234.4 billion.
Over the past decade several achievements have been realized in the health sector, including among others, improved life expectancy and reduction in child and maternal mortality. Life expectancy has increased from an estimated 55.4 years to 64.7 years between 2009 and 2019. The under-five mortality rate declined from 79 to 28.5 per 1000 live births between 2002 and 2019 and the infant mortality rate has declined from 55.9 to 22.1 over the same period. Contributing to this is increased access to anti-retroviral treatment through universal test and treat, new child vaccines (rotavirus and pneumococcal) and an effective prevention of mother-to-child HIV transmission which had been reduced to below 1%.
HIV, AIDS and TB
Stats SA estimates the average life expectancy in South Africa for females to be 67.7 years, and 61.5 years for males. However, it should be noted that life expectation estimates vary, primarily due to differences in assumptions about the rapidity with which the HIV epidemic will spread and the morbidity and mortality of the disease.
· The socio-economic impact of the HIV and AIDS epidemic on South Africa is significant and the National Government has made the curtailment and treatment of this disease a high priority. This, along with the treatment and prevention of TB, is part of a multi-pronged strategy to improve public health services which also includes hospital revitalization, increasing the number of health professionals in the public sector, the introduction of new generation child vaccines, and improved infectious and non-communicable disease control programs.
· A multi-sectoral approach aims to improve prevention programs and mitigate the impact of AIDS-related morbidity and mortality. The National Strategic Plan for HIV, TB and STIs 2017-2022 (launched on March 31, 2017, by the then Deputy President Cyril Ramaphosa) aims to build on achievements made in HIV, TB and STI prevention, treatment and care and address social and structural barriers that increase vulnerability to HIV, TB and STI infection and increase protection of human rights. Some of the key objectives of this plan include:
· reducing new HIV infections from 270,000 to less than 100,000 per year;
· reducing new TB infections from 450,000 to less than 315,000 per year; and
· reaching the 90—90—90 targets by 2020, whereby 90% of people living with HIV know their HIV status, 90% of people who know their HIV positive status are accessing treatment and 90% of people on treatment have suppressed viral loads.
Spending on HIV and AIDS has grown rapidly to approximately R36 billion per annum (including foreign donor contributions) in 2018/19, of which R19.7 billion came from the HIV and AIDS conditional grant to provincial departments of health. There is evidence that access to ART treatment has extended the lifespan of many South Africans. According to StatSA’s 2019 mid-year population estimates, the number of people living with HIV has increased over the past decade from 6.4 million in 2009 to 8.0 million in 2019, while the number of HIV related deaths has been on a constant decline from 204,120 to 126,805 over the same period.
Quality of care
Although health outcomes in the country are improving, the public health sector nevertheless faces many challenges and the quality of care provided in public health facilities is often regarded as inadequate. Increased focus has been placed on improving the quality of the public health sector through the establishment of Office of Health Standards and Compliance (OHSC). OHSC is mandated to monitor and enforce compliance with health establishments with norms and standards prescribed by the Minister of Health. The Office is also mandated to consider and investigate complaints relating to the quality of the public sector. Initiatives such as the Ideal Clinic program and the recently announced National Quality Health Improvement Plan aim to raise the standard of primary healthcare facilities and hospitals in the country, and address gaps identified by OHSC.
National Health Insurance (NHI)
NHI is the South African government’s chosen path towards achieving universal health coverage, equitable access and improved quality of health care for all. Substantial changes are envisaged in both the public and private health sectors, particularly in terms of the way these are financed. Key to this reform is establishing an NHI Fund, which will pool funding for healthcare and purchase services from both public and private providers on behalf of the whole population. In 2019 the NHI Bill was introduced to parliament establishing the legal foundation of the NHI Fund. Parliament’s Portfolio Committee on Health has received a large amount of comments as part of its public consultation and is also conducting hearings in all nine provinces. Reforms can be expected in the wake of its enactment.
In keeping with the 2017 NHI White Paper, the reform is being implemented in phases, where the first phase involved piloting and health system strengthening initiatives, such as the ideal clinic program, investments in information systems and an expanded program of hospital construction and revitalization. Many of these activities continue in the current second phase, stretching from 2017 to 2022, focuses inter alia on establishing the legislative and institutional foundations of NHI; developing patient and provider registries; accrediting providers and developing provider payment mechanisms. Given the country’s constrained fiscal environment, the timeframe for full implementation of NHI will likely need to be stretched out over a longer time period.
Internal Security
South African Police Services (SAPS)
In response to the rise in Gender Based Violence, an Indaba (a conference or consultation between or with native communities of South Africa) on Gender Based Violence and Vulnerable Groups was convened with the sole purpose of reducing barriers to the reporting of sexual offences and domestic violence. Furthermore, given the rising number of police murders in custody, the Police Safety Strategy was reviewed to ensure befitting, relevant and proactive measures for the safety of all SAPS members. Both the political leadership and SAPS management recognized the centrality of partnerships between the various stakeholders, mainly the community, in the fight against crime, as well as mitigating risks associated with depleting scarce resources in the public sector. In this regard, various strategies were developed, including the Community Policing Strategy, Youth Crime Prevention Strategy, Gender-Based Violence Strategy, and Rural Safety Strategy.
Correctional Services
In the previous financial year and in line with sentence plans, the Department of Correctional Services has provided correctional programs to 90% of offenders. In addition, through the assistance rendered by student psychologists, community services psychologists and the marketing of person care services, the Correctional Services Department has exceeded the planned targets in this regard. Skills development programs, which form an integral part of the rehabilitation process, were provided to offenders through the support of external stakeholders. A total of 4,127 offenders participated in long skills training, 10,044 offenders participated in short skills training and a further 3,174 were trained at Technical and Vocational Education and Training (TVET) colleges. The Correctional Services Department has contributed to the matric pass rate (the Grade 12 pass rate) through the implementation of the Grade 12 program where 77% of offenders successfully completed the national Grade 12 examination. The implementation of the Universal Test and Treat (UTT) policy guidelines and support from Global Fund Partners (Aurum, TB/ HIV care and right to care) has assisted in improving performance for Antiretroviral Treatment (ART) and tuberculosis (TB) during the 2018/19 financial year.
The Correctional Services Department continues to ensure that parolees and probationers comply with their set conditions through continuous monitoring. During the financial year of 2018/19, a total of 201 service points were established through partnerships with external stakeholders to ensure that parolees and probationers have easy access to community corrections offices. As part of the continuous restorative justice processes, the Department increased the number of social auxiliary workers to encourage victims to attend dialogues with offenders for the successful reintegration of offenders into communities. Furthermore, a total of 218 incidents of fraud and corruption were reported to the Department investigation unit during the period under review, while a total 209 cases and 342 inquiries where brought forward from the previous financial year(s). The Correctional Services Department finalized 177 investigations of which 34 that had prima facie evidence of misconduct where disciplinary proceedings were initiated.
THE SOUTH AFRICAN ECONOMY
Overview
South Africa has the second largest economy in Sub-Saharan Africa in terms of total GDP, accounting for over 20% of the aggregate GDP of Sub-Saharan Africa during 2018. However, South Africa continues to confront a challenging domestic and international economic environment. Following the financial crisis, which induced a 1.5% contraction in real GDP growth in 2009, real GDP growth rebounded to rates above 3% in 2010 and 2011. Growth subsequently declined to 1.8% in 2014, 1.3% in 2015, 0.6% in 2016 and 1.3% in 2017 as a result of lower commodity prices, higher borrowing costs, diminished business and consumer confidence, and drought. The economy fell into technical recession in the first half of 2018, as a result of production losses in the agriculture and mining sectors, while investment growth remained subdued and imports accelerated. Growth rebounded in the second half of 2018, primarily driven by a recovery in the manufacturing, transport, finance and business services sectors, which resulted in real GDP growth of 0.8% in 2018. In 2019, real GDP growth slowed to a projected 0.3%, partly as a result of electricity supply failures. Weak growth has translated into a record unemployment rate of 29.1% in the second half of 2019. Economic growth projections have been revised down to 0.9% in 2020, rising to 1.6% in 2022. Electricity shortages are expected to constrain the economy over the medium term.
In spite of the economic downturn of recent years, South Africa has maintained a stable and transparent macroeconomic framework, a well-developed financial sector, and resilient institutions, all of which have underpinned long-term economic stability.
South Africa has a robust regulatory environment, openness to trade, a floating exchange rate, a credible inflation targeting regime and sound institutions, strong investor protection and an independent judiciary, which maintains the rule of law.
South Africa is resource rich. It is the world’s largest producer of platinum and chromium and holds the world’s largest known reserves of manganese, platinum group metals, chromium, vanadium and alumino-silicates. The economy includes a sophisticated finance, wholesale and retail trade, logistics, catering and accommodation sectors, as well as a developed manufacturing sector. Financial markets are liquid and both equities and government bonds are actively traded by domestic and international investors.
The World Economic Forum Global Competitiveness Report ranks South Africa as the second most competitive country in sub-Saharan Africa. Having lost competitiveness in 2018 due to changes in the political landscape, South Africa gained momentum in 2019, improving to 60th out of 140 countries, up from 67th in 2018. South Africa continues to rank favorably for financial market development, large market size and good infrastructure, with one of the most advanced transport infrastructure in the region. South Africa has a sophisticated banking sector with a major footprint in Africa. It is the continent’s financial hub, with the Johannesburg Stock Exchange (JSE) as Africa’s largest stock exchange by market capitalization.
With the most developed industrial and financial capabilities on the African continent, South Africa plays an important role in regional policies, markets, finance and infrastructure, and has an attractive position as the gateway into Africa. Outwardly oriented South African companies are among the largest sources of foreign direct investment (FDI) in Africa and the country’s development finance institutions are playing an increasing role in the funding of regional infrastructure investments. According to the United Nations Conference on Trade and Development’s (UNCTAD) World Investment Report 2018, outward FDI by South African firms increased by 64% to US$7.4 billion in 2017 as retailers expanded to Namibia and one of South Africa’s largest banks opened additional branches across the continent.
In addition, South Africa may be adversely affected by the effects of the recent COVID-19 outbreak. Although the impact is inherently unpredictable, any decrease in global GDP growth or prolonged disruption of financial markets may constrain growth in South Africa, particularly if South Africa suffers a large outbreak or is required to impose substantial restrictions.
Income Inequality; Labor and Employment
The legacy of apartheid era politics and economics is still felt today. South Africa aims to achieve higher levels of inclusive growth to raise employment and reduce inequality. The Inequality Trends in South Africa report, released by Statistics South Africa in 2019, shows that South Africa has improved on measures of social access such as education, and some basic services between 2002 and 2017. School attendance rose from 91.3% to 96.0% over the same period. Since the end of apartheid, poverty rates have declined, and the depth of poverty has become less severe (measured by the gap between average consumption expenditure of each household and the poverty line), suggesting that the welfare of those below the poverty line is improving.
The Government’s far-reaching social spending has been a significant contributor to poverty reduction. Almost 2.3 million South Africans were lifted out of poverty between 2006 and 2015. However, some of these gains were eroded between 2011 and 2015 with a decrease in poverty reduction. The medium-term expenditure framework (MTEF) has committed public resources of R6.3 trillion between 2019 and 2023. The largest allocations, excluding debt-servicing costs, are to learning and culture, health and social development. The
learning and culture function will receive the largest allocation of funds over the MTEF period, mainly for basic and post-school education and training. More than 60 per cent of the funds allocated to the social development function are allocated for social grant payments.
However, economic inequality remains high even after progressive fiscal policy, due in large part to high unemployment and weak economic growth. The Gini coefficient is a measure of economic inequality where 0 indicates no inequality and 1 absolute inequality. South Africa’s national Gini coefficient has only dropped slightly from 0.67 in 2006 to 0.65 in 2009, where it has remained between 2009 and 2015, among the highest in the world.
Reigniting job-enabling growth remains fundamental to the Government’s job creating efforts. As at the time of the 2020 Budget, the Government expected real GDP growth to recover only slowly from 0.9% in 2020 to 1.6% in 2022. Since the release of this forecast, downside risks to growth have increased in both the near and medium term, primarily as a result of domestic electricity supply and global trade tensions. Growth prospects in the mining and manufacturing sectors remain constrained in the short term, particularly given inconsistent electricity supply, while business and consumer confidence are expected to improve only gradually in the medium term. Though global growth is expected to rebound, risks remain tilted to the downside, dampening domestic growth prospects.
The trend of rising unemployment is a pressing concern for South Africa and remains an obstacle to poverty and inequality reduction. Since 2009, the unemployment rate has risen from 24.5% to 29.1% as of September 2019, now at the highest level in over a decade. Although the number of employed people has been growing, such growth has not been fast enough to absorb the expanding labor force. With 16.4 million people now in employment, only 42% of the adult population (ages 15 to 64) is employed, either in the formal or informal sector. Most of those without work have been without a job for more than a year. The proportion of those in long-term unemployment increased from 60.3% in 2009 to 70.9% as of September 2019. Unemployment is even more pronounced amongst the youth. As of September 2019, the unemployment rate for 15-24 year olds was 58.2%. The unemployment rate for those aged 25-34 (36.1%) is more than double that for those aged of the 45-54 (17.2%).
Patterns of unemployment reflect the legacy effects of the apartheid system on income, settlements and education. As of September 30, 2019, black females are the most vulnerable to unemployment, with an unemployment rate of 34.5%. The unemployment rate for black males, by contrast, is 31.3%, whereas the unemployment rate among white males stands at 6.8%. The impact of slowing economic growth on employment has been particularly large for vulnerable groups. Unemployment is higher for the less educated, women and individuals from more rural provinces.
The October 2018 Jobs Summit resulted in a major framework agreement setting out 20 action plans aimed at boosting job creation, the retention of jobs and economic growth. The action plans were discussed and agreed to collectively by social partners, underscoring the importance of effective partnerships between the public and private sectors and civil society. The primary aim of the agreement is to create an estimated 275,000 jobs annually. The principle strategies underpinning the process include investment promotion, upgrading industrial capacity, upgrading skills and education, and developing infrastructure. A monthly Presidential Working Committee on Jobs receives progress reports on the plans, which by early December 2019 included the piloting of eVisas, acceleration of water licensing, moving towards spectrum allocation, developing a practical approach to attracting critical skills to the country, and land reform, all of which are intended to boost employment numbers.
Accelerating investment is required to raise growth sustainably. Over the next three years, general government infrastructure investment plans amount to R526 billion. Work is underway to support existing projects and programs with blended finance. The Government will seek out private-sector skills in the design, construction and operation of key projects. The Government further intends to commit at least R100 billion to the fund over the coming decade to leverage private-sector and development finance funding for well-planned capital projects. The support will take different forms, including blended co-funding, capital subsidies, and long-term interest rate subsidies and guarantees.
The Government is stepping up its infrastructure build program by partnering with the private sector, development finance institutions and multilateral development banks to create an infrastructure fund. The fund will increase the number of blended-finance projects to enhance oversight, improve the speed and quality of spending, and reduce costs in public infrastructure. The fund will draw on global expertise to strengthen project preparation and implementation.
To support greater private sector investments, in addition to the ease-of-doing-business projects undertaken with the World Bank, the President has hosted two Investment Summits. The first, held in October 2018, sourced
investment commitments of approximately R300 billion as part of the plan to attract R1.2 trillion in new investment over five years to boost the country’s economy. The second summit held in 2019 sourced investment commitments in excess of R363 billion. The President has also appointed a team of investment envoys, including bankers, business people, economists and former ministers, to attract new investors from the world’s financial capitals.
Gross Domestic Product (GDP)
|
|
|
As of and for the year ended December 31, |
|
As of and for |
| ||||||||
|
|
|
2014 |
|
2015 |
|
2016 |
|
2017 |
|
2018 |
|
2019(1) |
|
|
Nominal GDP (millions of Rand) at market prices |
|
3,805,350 |
|
4,049,884 |
|
4,359,061 |
|
4,653,579 |
|
4,873,899 |
|
5,036,312 |
|
|
Real GDP (millions of Rand) at 2010 prices |
|
3,028,090 |
|
3,064,236 |
|
3,076,466 |
|
3,119,984 |
|
3,144,539 |
|
3,152,205 |
|
|
Real GDP Growth (percentages) |
|
1.8 |
|
1.2 |
|
0.4 |
|
1.4 |
|
0.8 |
|
0.3 |
|
|
Population (million) |
|
54.6 |
|
55.4 |
|
56.3 |
|
57.1 |
|
58 |
|
59 |
|
|
Per Capita GDP (nominal) |
|
71,064 |
|
74,635 |
|
79,225 |
|
83,422 |
|
86,170 |
|
n/a |
|
|
Per Capita GDP (real) |
|
56,549 |
|
56,470 |
|
55,914 |
|
55,930 |
|
55,595 |
|
n/a |
|
Note:
(1) First nine months of 2019, seasonally adjusted and annualized.
Sources: SARB and Stats SA
In the first three quarters of 2019, year-on-year GDP growth eased to 0.3% compared with 0.7% in the corresponding period in 2018. Quarter-on-quarter growth has been volatile in 2019. Electricity supply constraints and strikes in the mining sector saw the economy contract sharply in the first quarter by 3.1% on a seasonally adjusted, annualized basis. Economic growth subsequently rebounded in the second quarter, growing 3.2% primarily due to a strong recovery in the mining sector and the low base effect of the first quarter. However, the third quarter saw quarterly growth contract once more, by 0.6%, with weak demand contributing to declining activity in the mining, manufacturing, and transport sectors. Although a seasonal slowdown in activity is typically anticipated at the end of the year due to summer holidays, renewed electricity supply cuts in the final quarter of 2019 likely exerted additional downward pressure on growth.
The primary sector contracted by 4.0% year-on-year in the first three quarters of 2019, following a 2.3% contraction in the comparable period in 2018. The decline in the sector was driven by contracting production in both the agricultural and mining sectors. Growth in the agricultural sector contracted by 9.1% in the three quarters of 2019 compared to a contraction of 5.4% in the first three quarters of 2018. The sector is beset by lingering drought conditions and irregular rainfall patterns and is set for its second consecutive full year contraction. The outbreak of disease in early 2019 also adversely impacted livestock exports.
Growth in mining sector output in the first three quarters of 2019 contracted by 2.2% compared to a contraction of 1.1% in the corresponding period in 2018. The decline was led by falling output of platinum group metals (PGMs), gold, iron ore and diamonds, weighed down by electricity supply disruptions, industrial action and waning global demand. Domestic factors such as regulatory uncertainty, high costs, and sub-optimal investment also continue to weigh on the sector’s performance.
Likewise, the real gross value added by the secondary sector contracted by 0.8% in the first three quarters of 2019 following muted growth of 0.4% the corresponding period in 2018. The decline in the sector was driven by contractions across manufacturing, construction and utilities sectors. Electricity supply challenges and weak domestic and global demand contributed to the manufacturing sector contracting 0.1% in the first three quarters of 2019, after having grown 0.8% in the corresponding period in 2018. The decline in manufacturing was broad-based, but mainly driven by contractions in output of petrochemicals, metal products and wood and paper.
The construction sector is set for a third consecutive full year contraction, having contracted 2.6% in the first three quarters of 2019 amid faltering investment in both the public and private sectors. Real gross value added by the utilities sector contracted 1.4% in the first three quarters of 2019, after having grown 0.8% in the corresponding period in 2018. Electricity production has been hampered by poor plant performance, both as a result of challenges with the new build program and unplanned outages at older generation plants, as well as broad operational challenges at state electricity provider Eskom Limited (Eskom).
In contrast, growth in the tertiary sector has held up comparatively well, contributing positively to GDP growth in the three quarters of 2019. Output in the financial and business services sector, the largest sector in the economy, was 2.6% higher in the three quarters to September 2019, after growing 1.4 % the corresponding period in 2018. This improvement was supported by resilient activity in the banking and insurance sectors. However, this resilience was not uniform across tertiary industries. Trade, catering and accommodation, the third largest sector in the economy, only grew 0.1% in the first three quarters of 2019 following 0.7% growth in the corresponding period in 2018. The sector has been slow to recover from the sharp first quarter contraction, weighed down by weak confidence, employment and wage growth.
On the expenditure side, real GDP growth slowed in the first three quarters of 2019 following slower or contracting growth in most components. Household spending growth moderated to 1.1% in the first three quarters of 2019, compared to 2.1% in the corresponding period in 2018. Only expenditure in non-durable goods accelerated in the first three quarters of 2019, with spending growth in durable goods, semi-durable goods, and services decelerating over the same period. Real consumption expenditure by the government grew 1.5% in the first three quarters of 2019, from 1.9% in the corresponding period in 2018, as government continues to emphasize expenditure constraints given limited fiscal space.
Gross fixed capital formation in the first three quarters of 2019 contracted 0.7%, matching the contraction of the corresponding period in 2018. Growth in private sector investment continued to expand, albeit at a slower pace, by 1.6% compared to a 3.2% expansion in the first three quarters of 2018, supported by large investments in ICT equipment by Amazon and some renewable energy projects for Bid Window 4. Business confidence remains weak, with the Rand Merchant Bank/Bureau of Economic Research (RMB/BER) Business Confidence Index falling to historical lows of 22 points in the third quarter of 2019 as low growth has affected activity, growth and profitability.
The contraction in real fixed investment by general government deepened in the first three quarters of 2019 to 7.8%, following a 3.2% contraction in the corresponding period in 2018. Public corporation investment also continued to contract, albeit to a lesser degree of 3.4% in the first three quarters in 2019, compared to the 13.5% contraction in the corresponding period in 2018 due to funding and operational challenges. Continued weakness in investment and productivity growth have reduced potential GDP growth to an estimated range of between 1.0% and 1.4% in 2019, from 3% at the start of the previous decade.
Overall, net exports contributed negatively to GDP growth in the first three quarters of 2019, as export growth contracted while imports were largely flat. Real growth in imports was 0.0% in the first three months of 2019 compared to 4.0% growth over the same period last year. The drop in the growth rate of imports was on the back of lower imports of machinery and electrical equipment, as well as chemical products. Export growth was down 1.2% in the first three quarters of 2019, after rising by 1.7% in the same period in 2018, as a result of weaker exports in mineral products and base metals.
In the 2020 Budget Review, the National Treasury projected GDP growth to slow from 0.8% in 2018 to 0.3% in 2019. For 2020, GDP growth was expected to recover to 0.9%, a downwardly-revised estimate from the 0.2% at the time of the 2019 Medium-Term Budget Policy Statement. GDP growth was forecast to subsequently improve only moderately, reaching 1.6% by 2022.
Household consumption expenditure was expected to grow by 1.1% in 2020 and 1.3% in 2021, compared to 1.1% in 2019. Over the medium term, growth in household spending is expected to strengthen to 1.6% by 2022 on the back of a very gradual recovery in confidence, employment and wages.
In the 2020 Budget Review, growth in gross fixed capital formation was revised substantially lower from the 2019 Budget, from a forecast of 1.5% to -0.4% in 2019 as public investment declined sharply. For 2020, growth is expected to be 0.2% compared to the 2019 Budget forecast of 2.1%. Investment by state-owned companies has been constrained by lack of access to markets for borrowing, as well as processes to contain illegal and wasteful expenditure. Low confidence and growth have weighed heavily on private investment activity. Over the medium term, growth in gross fixed capital formation is expected to reach to 1.9% by 2022. The forecast assumes a gradual improvement in confidence as well as the need to rebuild eroded capital stock.
Elevated policy uncertainty, the financial positions of state-owned enterprises, power outages and the volatility of the rand exchange rate are key domestic downside risks to the economic outlook. However, sustained improvements in confidence, particularly related to the implementation and finalization of outstanding policy issues, may reduce barriers to investment and improve sentiment. External risks to the growth outlook include rising trade and geopolitical tensions, which may prompt capital outflows and exacerbate volatility in financial markets and the exchange rate.
|
|
|
As of and for the year ended December 31, |
|
As of and for the nine-month |
| ||||||||
|
|
|
2014 |
|
2015 |
|
2016 |
|
2017 |
|
2018 |
|
2019 |
|
|
Rand (million) |
|
|
|
|
|
|
|
|
|
|
|
|
|
|
Real GDP at market prices |
|
3,028,090 |
|
3,064,237 |
|
3,076,464 |
|
3,119,984 |
|
3,144,539 |
|
3,152,205 |
|
|
Add: Imports of goods and services |
|
916,156 |
|
966,025 |
|
928,729 |
|
937,740 |
|
968,651 |
|
970,673 |
|
|
Total supply of goods and services |
|
3,944,246 |
|
4,030,262 |
|
4,005,193 |
|
4,057,724 |
|
4,113,190 |
|
4,122,878 |
|
|
Less: Exports of goods and services |
|
883,501 |
|
909,345 |
|
912,546 |
|
905,898 |
|
929,792 |
|
903,911 |
|
|
Total goods and services available for domestic expenditure |
|
3,060,745 |
|
3,120,917 |
|
3,092,647 |
|
3,151,826 |
|
3,183,398 |
|
3,218,967 |
|
|
Domestic Expenditure |
|
|
|
|
|
|
|
|
|
|
|
|
|
|
Final consumption expenditure by households |
|
1,818,511 |
|
1,853,657 |
|
1,864,436 |
|
1,902,852 |
|
1,937,396 |
|
1,956,220 |
|
|
Final consumption expenditure by general government(1) |
|
619,681 |
|
614,957 |
|
628,434 |
|
629,711 |
|
641,512 |
|
650,347 |
|
|
|
|
As of and for the year ended December 31, |
|
As of and for the nine-month |
| ||||||||
|
|
|
2014 |
|
2015 |
|
2016 |
|
2017 |
|
2018 |
|
2019(3) |
|
|
Total Final consumption expenditure(1) |
|
2,438,192 |
|
2,468,614 |
|
2,492,870 |
|
2,532,563 |
|
2,578,908 |
|
2,606,567 |
|
|
Gross fixed capital formation |
|
618,786 |
|
634,540 |
|
612,111 |
|
618,516 |
|
609,613 |
|
606,285 |
|
|
Change in inventories |
|
6,180 |
|
20,918 |
|
(9,654 |
) |
3,189 |
|
(5,440 |
) |
1,393 |
|
|
Residual item(2) |
|
(2,415 |
) |
(3,154 |
) |
(2,680 |
) |
(2,442 |
) |
316 |
|
4,723 |
|
|
Total gross domestic expenditure |
|
3,063,158 |
|
3,124,071 |
|
3,095,329 |
|
3,154,269 |
|
3,183,082 |
|
3,214,245 |
|
|
Real GDP (at 2010 prices) |
|
3,028,090 |
|
3,064,236 |
|
3,076,466 |
|
3,119,984 |
|
3,144,539 |
|
3,152,205 |
|
Notes:
(1) Consumption expenditure by general government includes current expenditure on salaries and wages and on goods and other services of a non-capital nature of the general departments (not business enterprises) of the National Government authorities, provincial government authorities, local government authorities and extra-budgetary institutions.
(2) Represents the difference between the calculation of GDP according to the expenditure and production method.
(3) First nine months of 2019, seasonally adjusted and annualized. Source: SARB and Stats SA.
GDP and Expenditures as Percentage of Real GDP (at constant 2010 prices)
|
|
|
As of and for the year ended December 31, |
|
As of and for the nine-month period |
| ||||||||
|
|
|
2014 |
|
2015 |
|
2016 |
|
2017 |
|
2018 |
|
2019(3) |
|
|
Real GDP at market prices |
|
100 |
|
100 |
|
100 |
|
100 |
|
100 |
|
100 |
|
|
Add: Imports of goods and services |
|
30.3 |
|
31.5 |
|
30.2 |
|
30.1 |
|
30.8 |
|
30.8 |
|
|
Total supply of goods and services |
|
130.3 |
|
131.5 |
|
130.2 |
|
130.1 |
|
130.8 |
|
130.8 |
|
|
Less: Exports of goods and services |
|
29.2 |
|
29.7 |
|
29.7 |
|
29.0 |
|
29.6 |
|
28.7 |
|
|
Total goods and services available for domestic expenditure |
|
101.1 |
|
101.8 |
|
100.5 |
|
101.0 |
|
101.2 |
|
102.1 |
|
|
Domestic Expenditure |
|
|
|
|
|
|
|
|
|
|
|
|
|
|
Final consumption expenditure by households |
|
60.1 |
|
60.5 |
|
60.6 |
|
61.0 |
|
61.6 |
|
62.1 |
|
|
Final consumption expenditure by general government(1) |
|
20.5 |
|
20.1 |
|
20.4 |
|
20.2 |
|
20.4 |
|
20.6 |
|
|
Total Final consumption expenditure |
|
80.5 |
|
80.6 |
|
81.0 |
|
81.2 |
|
82.0 |
|
82.7 |
|
|
Gross fixed capital formation |
|
20.4 |
|
20.7 |
|
19.9 |
|
19.8 |
|
19.4 |
|
19.2 |
|
|
Change in inventories |
|
0.2 |
|
0.7 |
|
(0.3 |
) |
0.1 |
|
(0.2 |
) |
0.0 |
|
|
Residual item(2) |
|
(0.1 |
) |
(0.1 |
) |
(0.1 |
) |
(0.1 |
) |
0.0 |
|
0.1 |
|
|
Total gross domestic expenditure |
|
101.2 |
|
102.0 |
|
100.6 |
|
101.1 |
|
101.2 |
|
102.0 |
|
Notes:
(1) Consumption expenditure by general government includes current expenditure on salaries and wages and on goods and other services of a non-capital nature of the general departments (not business enterprises) of public authorities. Public authorities include National Government authorities, provincial government authorities, local government authorities and extra-budgetary institutions.
(2) Represents the difference between the calculation of GDP according to the expenditure and production methods.
(3) First nine months of 2019, seasonally adjusted and annualized.
Sources: SARB and Stats SA
Gross Domestic Expenditure (GDE)
Real growth in gross domestic expenditure slowed to 0.6% year-on-year in the first three quarters of 2019, following slower consumption growth and contracting gross fixed capital formation.
Real growth in household consumption expenditure increased by 1.1% year-on-year in the first three quarters of 2019, after rising by 2.1% in the corresponding period in 2018. Credit extended to households augmented household income and supported spending in an environment of slow economic growth, higher fuel prices and rising unemployment. The ratio of household debt to nominal disposable decreased slightly to 72.6% in the third quarter of 2019. Gross household saving as a proportion of GDP has remained fairly constant at 1.4% in the third quarter of 2019, from 1.4% in the corresponding period in 2018. Household net worth as a proportion of disposable income continues to fall, reaching 361% in the third quarter of 2019 from 369% in the corresponding period in 2018 amid softer housing and equity markets. Nominal wages per worker grew by 4.4% in the first half of 2019, while consumer price inflation averaged 4.3%.
Weaker growth in household demand reflected a broad-based weakening in nearly all sub-components. For the first three quarters of 2019, real spending growth in durable goods weakened to 0.4% compared to 5.8% in the corresponding period in 2018, mainly reflecting weak demand in the first half of 2019. Semi-durable goods grew
by 1.2% during the first three quarters of 2019 compared to 3.8% during the first three quarters of 2018, while growth in non-durables improved to 1.2% higher in the first three quarters of 2019 compared to 0.7% during the corresponding period in 2018. Non-durables consumption growth was supported by spending on alcoholic beverages, tobacco and narcotics, and food and non-alcohol beverages. Real spending by households on services moderated to 1.0% in the first three quarters of 2019, after rising by 2.0% in the corresponding period in 2018.
Real consumption by the general government grew 1.5% in the first three quarters of 2019, following 1.9% growth in the corresponding period in 2018, mainly driven by an increase compensation of employees. Spending on goods and services in the first and second quarters of 2019 grew at an average of 1.3% quarter-on-quarter before contracting by 1.3% in the third quarter of 2019. Overall, consumption growth by the general government consistently contributed positively to overall GDP growth in the first three quarters of 2019.
South Africa has experienced an extended period of weak investment as a result of low levels of demand and prolonged policy uncertainty. Investment in manufacturing and other equipment grew 2.3% in the first three quarters of 2019, but most other categories of investment declined. Residential building contracted by 3.7% in the first three quarters of 2019, compared to a 2.0% rise in the corresponding period in 2018. The contraction in non-residential building worsened to 9.9% in the first three quarters of 2019, following a contraction of 3.4% in the corresponding period in 2018. Growth in transport equipment contracted by 4.1% in the first three quarters of 2019.
Principal Sectors of the Economy
The following two tables set forth real gross value added and the percentage increase in gross value added for the periods indicated.
Real Gross Value Added by Sector (at constant 2010 prices)
|
|
|
As of and for the year ended December 31(1) |
|
Growth percentage |
| ||||||||||
|
|
|
2014 |
|
2015 |
|
2016 |
|
2017 |
|
2018 |
|
2019(2) |
|
2019(1) |
|
|
Agriculture, forestry and fishing |
|
75,982 |
|
71,515 |
|
64,305 |
|
77,857 |
|
74,157 |
|
57,574 |
|
(0.2 |
) |
|
Mining and quarrying |
|
226,791 |
|
234,247 |
|
225,035 |
|
234,522 |
|
230,514 |
|
168,255 |
|
(0.1 |
) |
|
Manufacturing |
|
382,498 |
|
380,781 |
|
383,903 |
|
383,189 |
|
386,884 |
|
284,554 |
|
0.0 |
|
|
Electricity, gas and water |
|
67,622 |
|
66,364 |
|
64,957 |
|
65,329 |
|
65,932 |
|
48,172 |
|
0.0 |
|
|
Construction |
|
106,403 |
|
108,361 |
|
108,361 |
|
109,640 |
|
109,008 |
|
78,340 |
|
(0.1 |
) |
|
Trade, catering and accommodation |
|
414,826 |
|
423,365 |
|
430,406 |
|
429,223 |
|
431,669 |
|
308,567 |
|
0.0 |
|
|
Transport, storage and communication |
|
258,906 |
|
262,458 |
|
265,363 |
|
268,994 |
|
273,193 |
|
202,710 |
|
0.1 |
|
|
Finance, insurance, real estate and business services |
|
592,352 |
|
604,767 |
|
616,301 |
|
628,972 |
|
640,368 |
|
489,531 |
|
0.5 |
|
|
General government services |
|
627,030 |
|
632,188 |
|
637,818 |
|
641,330 |
|
649,223 |
|
363,816 |
|
0,2 |
|
|
Personal services |
|
162,367 |
|
163,791 |
|
166,659 |
|
168,834 |
|
170,530 |
|
130,484 |
|
0.1 |
|
|
Gross value added at basic prices |
|
2,752,410 |
|
2,784,045 |
|
2,797,727 |
|
2,838,426 |
|
2,859,605 |
|
2,132,003 |
|
0.3 |
|
Note:
(1) Millions of Rand.
(2) The seasonally unadjusted nine months of 2019 compared to the first nine months of 2018.
Source: Stats SA.
Percentage Growth in Real Gross Value Added by Sector (at constant 2010 prices)
|
|
|
For the year ended December 31, |
|
As of and for the nine- |
| ||||||||
|
|
|
2014 |
|
2015 |
|
2016 |
|
2017 |
|
2018 |
|
2019(1) |
|
|
Agriculture, forestry and fishing |
|
6.8 |
|
(5.9 |
) |
(10.1 |
) |
21.1 |
|
(4.8 |
) |
(9.1 |
) |
|
Mining and quarrying |
|
(1.7 |
) |
3.3 |
|
(3.9 |
) |
4.2 |
|
(1.7 |
) |
(2.2 |
) |
|
Manufacturing |
|
0.3 |
|
(0.4 |
) |
0.8 |
|
(0.2 |
) |
1.0 |
|
(0.1 |
) |
|
Electricity, gas and water |
|
(1.0 |
) |
(1.9 |
) |
(2.1 |
) |
0.6 |
|
0.9 |
|
(1.4 |
) |
|
Construction |
|
3.5 |
|
1.8 |
|
1.2 |
|
(0.6 |
) |
(1.2 |
) |
(2.6 |
) |
|
Trade, catering and accommodation |
|
1.4 |
|
2.1 |
|
1.7 |
|
(0.3 |
) |
(0.6 |
) |
0.1 |
|
|
Transport, storage and communication |
|
3.5 |
|
1.4 |
|
1.1 |
|
1.4 |
|
1.6 |
|
0.8 |
|
|
Finance, insurance, real estate and business services |
|
2.7 |
|
2.1 |
|
1.9 |
|
2.1 |
|
1.8 |
|
2.6 |
|
|
General government services |
|
3.2 |
|
0.8 |
|
0.6 |
|
0.3 |
|
1.3 |
|
1.5 |
|
|
Personal services |
|
1.8 |
|
0.9 |
|
1.8 |
|
1.3 |
|
1.0 |
|
1.1 |
|
|
Gross value added at basic prices |
|
1.9 |
|
1.1 |
|
0.5 |
|
1.5 |
|
0.7 |
|
0.4 |
|
Note:
(1) The seasonally unadjusted first nine months of 2019 compared to the first nine months of 2018.
Source: Stats SA.
Finance, Insurance, Real Estate and Business Services
Growth in real Gross Value Added (GVA) by the finance, insurance, real estate and business services sector in the first three quarters of 2019 was 2.6% in comparison to 1.4% recorded in the corresponding period in 2018. The sector found support from resilient banking and equity markets, supported by expectations of prolonged accommodative monetary policy in advanced economies. The sector also benefited from positive, albeit muted, consumer spending growth.
The sector continues to record positive growth, and remains the largest sector in the South African economy by GVA, accounting for approximately 19% of the total economy. The contribution to growth by the sector increased slightly from 0.9 percentage points during the first nine months of 2018 to 1.4 percentage points in the corresponding period in 2019.
The sector employed 2,343,000 people in the quarter ended September 2019 and 2,315,000 people in the corresponding period in 2018, comprising roughly 23% of all formal sector workers according to the QES surveys published by Statistics SA. The sector recorded an annual increase in jobs of 1.2% in first three quarters of 2019 compared to the corresponding period in 2018.
Despite declining bank profitability, which may reduce the ability of banks to raise capital and extend credit in future stress periods, they generally remain resilient, with diverse and strong asset growth. Private credit extension remains positive but volatile, particularly with the current challenging economic environment and recent National Credit Act 34 of 2005 (NCA) amendments. Specifically, the NCA amendments seek to allow broader market access to all income levels and provide debt relief for consumers who earn R7 500 per month or less and have unsecured debt amounting to R50,000 by suspending the debt in part or in full. The NCA allows certain applicants to have their debt suspended in part or in full for up to 24 months and this debt may be expunged altogether if the financial circumstances of the applicant have not improved.The Banking Association South Africa has raised concerns surrounding the potential level of debt relief and the National Treasury has estimated that it could result in the write-off of R13.2 billion to R20 billion of debt. The retailers, which could also be hard hit, have not ruled out taking legal action over the NCA.
Bank loans are being issued with tight lending criteria. Annual growth in the number of credit applications increased to 5.8% in the third quarter of 2019 from 2.1% in the corresponding period in 2018, with an increase in the number of household applications for unsecured and revolving credit products. This will likely persist going forward, as cost of living continues to rise and affordability for households remain squeezed. The number of rejected credit applications increased to 10% from 9.4% over the same period, indicative of banks’ increasingly stringent lending standards. Factors that have been cited as affecting household credit standing include affordability, tight disposable income (due to food and fuel inflation), increases in electricity tariffs, persistent unemployment and generally difficult macroeconomic conditions (including low GDP growth).
On August 19, 2019, the National Credit Amendment Act 7 of 2019 (the Amendment Act) amended certain provisions in the NCA. The Amendment Act provides for a capped debt intervention framework in particular for
vulnerable consumers. The impact will be extensively felt by credit providers (i.e. retailers with high proportion of customers who use credit, while banks would typically raise credit impairments which make provisions for the expected bad debt). Furthermore, the Minister of Trade and Industry, in consultation with the Minister of Finance, may prescribe requirements for credit providers to require the consumer to acquire and maintain credit life insurance. This additional provision makes available mandatory credit life insurance on all credit agreements that are longer than six months, but are of no more than R50 000 in value. The intention for the mandatory credit life insurance, cited in the latest Financial Stability Review (FSR) by the South African Reserve Bank, is to protect low-income consumers from becoming over-indebted due to changes in their financial circumstances.
Trade, Catering and Accommodation
The trade, catering and accommodation sector is the third largest sector in the South African economy by GVA, accounting for approximately 15% of total GVA for the period ended September 30, 2019. Over the past 10 years, the sector’s contribution to GVA has been relatively stable, averaging 15.1%. This sector comprises wholesale and retail trade and allied services, catering and accommodation services and motor trade and repair services. Activities include the resale of new and used goods and the rendering of repair services.
Real value added growth in the sector amounted to 0.1% for the first three quarters of 2019, following 0.7% growth over the corresponding period in 2018. Growth was supported by improvements in the accommodation industry of 5.0%, due to an expansion in income generated by hotels, guest houses and others.
Despite the challenging trading conditions for the sector, owing to weak local and international demand, formal employment in the sector has remained relatively resilient, constituting 22% of total employment. According to the latest QES, employment in the trade, catering and accommodation sector grew by 2.4% for the period ended September 30, 2019 compared to the corresponding period in 2018.
Tourism
In recent years, given the slowdown in domestic consumption, the growth of catering and accommodation services has become closely linked to the growth of the tourism sector. The nominal gross direct value added of the tourism industries for South Africa amounted to R118.4 billion (or 2.7% of total GVA generated) in 2018, an increase of 9.3% on the R108.4 million (or 2.6% of total GVA generated) in 2017.
The tourism sector directly employed 739,657 people in 2018, an increase of 8.5% or 58,038 people compared with 2017. This saw the tourism share of total employment rise from 4.2% in 2017 to 4.5% in 2018. Despite the recent improvements, the sector has shrunk in relative size over the last few years. In 2014, the sector contributed 3.0% of total GVA generated, while the share of employment has remained stable at around 4.5% since 2014.
The direct contribution of the tourism sector underestimates its importance to the South African economy; once the indirect and induced effects are included, the sector accounts for nearly 10% of GDP. The significantly large contribution of the indirect and induced effects highlights the fact that the tourism sector is currently linked to 12 industries in the South African economy, counting key labor-absorbing industries such as manufacturing and agriculture among them.
The Government views the tourism sector as one of the key sectors that can deliver inclusive growth through its labor absorption potential. Tourism is characterized by low barriers to entry, and unlike mining, manufacturing and financial services, tourism is not clustered in specific development nodes. This makes it an important economic driver of rural economies and a mechanism to create sustainable employment opportunities outside urban and industrial areas. This is especially important given South Africa’s historically uneven spatial development patterns. The tourism sector is also an important vehicle through which other socioeconomic aims such as skills development, B-BBEE, youth and women empowerment can be achieved as it employs a high proportion of women (70% of tourism employees) and youth (up to 60% of tourism employees are under 35).
In terms of the updated National Tourism Sector Strategy, the Department of Tourism aims to increase the sector’s total contribution to GDP to R9.5 billion and increase the number of direct and indirect jobs supported by the sector to 2.2 million by 2026.
Arrivals from key source markets such as the UK (South Africa’s largest overseas market, comprising a 19.6% share of the total market as of November 2019), China and India have declined in recent years. However, there was an increase in tourist arrivals in 2018 (15,004,384 non-resident visitors to South Africa) compared with 14,975,675 non-resident visitors in 2017. Preliminary estimates show a slight decline in tourist arrivals in 2019, which declined by 2.3% for the first eleven months of 2019, compared to the corresponding period in 2018.
A recent relaxation in visa requirements for tourists, in particular the amendments to the requirements for travelling with minors and measures to facilitate travel such as the launch of the eVisa platform in November
2019, could see an improvement in tourist arrivals. This, coupled with renewed marketing efforts aimed at stimulating domestic tourism, is expected to boost growth in the catering and accommodation services sector.
Manufacturing
The manufacturing sector accounted for 12.3% of GVA in 2018. Real value added in the manufacturing sector grew 1.0% during 2018, contributing 0.1 percentage points to overall GDP growth. The sector is a substantial job creator, providing employment for 1,194,568 persons or 11.8% of total employment as of the third quarter of 2019.
The manufacturing sector accounted for 13.3% of GVA in the third quarter of 2019. Manufacturing production contracted by 0.1% in in the first nine months of 2019 compared to the corresponding period in 2018. The decline was broad-based, but mainly driven by declining output of petrochemicals, metal products and wood and paper. Food and beverages and motor vehicles and parts were the only manufacturing subsectors with higher production in the first nine months of 2019 compared to the corresponding period in 2018. Real value added in the third quarter of 2019 alone contracted by 3.9% quarter to quarter (seasonally adjusted and annualized).
Manufacturing exports increased 6.8% in the first nine months of 2019 compared to the corresponding period in 2018. The improvement in export performance can mainly be attributed to vehicles and transport equipment, machinery and food and beverages. Imports increased 8.1% over the same period.
Manufacturing capacity utilization remained low at 80.3% in the third quarter, remaining close to the low ten-year average of 80.9%. The erosion of capital stock since 2009 continues, and is likely to constrain the long-term growth of the sector. The seasonally adjusted ABSA Purchasing Managers’ Index (PMI) moderated to 47.7 index points in November 2019, with expected business conditions in six months at 47.4 index points. Both the PMI and expected business conditions remain below the neutral 50-point mark, indicating a deterioration in sentiment and reflecting that the manufacturing sector remains under pressure. Given prevailing electricity supply constraints, coupled with weak global growth, depressed domestic demand, low capacity utilization and the erosion of capital stock, the performance of the manufacturing sector is likely to remain subdued over the short and medium term.
Composition of Manufacturing Sector Growth
|
|
|
|
|
For the nine months |
| ||
|
|
|
Weights |
|
2018 |
|
2019 |
|
|
Food and beverages |
|
25.2 |
% |
4.6 |
|
3.9 |
|
|
Petrochemicals |
|
24.0 |
% |
(0.6 |
) |
(1.4 |
) |
|
Metals products |
|
18.7 |
% |
0.9 |
|
(1.5 |
) |
|
Wood and paper |
|
11.6 |
% |
(1.5 |
) |
(3.7 |
) |
|
Motor vehicles and parts |
|
6.9 |
% |
3.1 |
|
2.3 |
|
|
Glass and non-metallic |
|
3.9 |
% |
2.1 |
|
(5.4 |
) |
|
Clothing and textiles |
|
3.3 |
% |
(3.4 |
) |
(4.7 |
) |
|
Furniture and other manufacturing |
|
3.2 |
% |
1.7 |
|
(0.7 |
) |
|
Electrical machinery |
|
1.7 |
% |
(6.9 |
) |
(2.7 |
) |
|
Radio and TV |
|
1.6 |
% |
(10.5 |
) |
(4.8 |
) |
|
Total |
|
100.0 |
% |
1.0 |
|
(0.2 |
) |
Source: Stats SA.
Transport, Storage and Communications
The transport, storage and communications sector grew by 0.8% during the first three quarters of 2019 and contributed 0.1 percentage points to GDP growth during that period. The sector represented 8.7% of GVA for the first three quarters of 2019.
Transport and Storage
South Africa’s modern and extensive transport and logistics system, which is coordinated by the Department of Transport, plays an important role in the national and regional economies, transporting freight for export and domestic use, as well as enabling movement of people within and between cities and rural areas. The transport system comprises airports, sea ports, roads, rail and public transport networks.
Transnet, the horizontally integrated state-owned company, plays a central role in freight transportation through its rail, port and pipeline operations. Transnet National Ports Authority (National Ports Authority) operates as a
landlord port authority, managing, controlling and administering the South African port system on behalf of the state. The National Ports Authority owns and manages the eight ports within South Africa and its tariffs are regulated by the National Ports Regulator. Approximately 98% of South Africa’s exports are conveyed by sea. Transnet Port Terminals, along with some private sector players, is responsible for the operations at ports.
South Africa’s pipeline network is responsible for the transport of more than 85% of refined fuel and gas products. The business is regulated by the National Energy Regulator of South Africa (Nersa). The Passenger Rail Agency of South Africa (PRASA) provides both intercity and intra-city rail services. The South African National Roads Agency Limited (SANRAL) is responsible for the upgrading and expansion of the national road system while provincial and municipal governments are responsible for secondary roads.
The South African road network and national road network comprise approximately 750,000 km of roads and 21,403 km of roads, respectively. The national and local railway network consists of approximately 20,824 km of track and is divided into ten geographical areas under the control of Transnet Freight Rail (TFR). PRASA is planning to invest R173 billion in new infrastructure between 2019 and 2029. A total of 580 of related trains will be manufactured in South Africa.
The commercial airport infrastructure in South Africa consists primarily of nine airports which are owned and operated on a commercial basis by the Airports Company of South Africa Limited (ACSA). South Africa’s three major international airports are Johannesburg’s OR Tambo, Cape Town International and Durban’s King Shaka.
The submission of the Economic Regulation of Transport Bill was approved by Cabinet in November 2019. The bill will contribute to competitive pricing, third-party access in rail and improved service quality in the transport sector.
Communications
The communications sub-sector consists of postal services and telecommunications services. Growth in the real output of the telecommunications subsector continued to benefit from technological innovations and attractive data promotions.
As reported by the International Telecommunication Union (ITU), in 2018 there were 88,566,977 mobile cellular subscriptions in South Africa, an increase from 82,412,880 in 2016. There were 1,386,841 fixed broadband subscriptions, an increase from 1,123,189 in 2017. As at 2018, it is estimated that approximately 56% of individuals use the internet in South Africa. In addition, the ITU estimates that 99% of the population is within range of a 3G signal, and three quarters within an LTE signal.
Fixed-line services are dominated by Telkom SA Limited (Telkom). Telkom’s largest shareholders are the National Government, with a direct holding of 40.5%, and the Public Investment Corporation, with a direct holding of 12.4%. It is one of the largest companies in South Africa, and together with its subsidiaries and joint ventures, forms one of the largest communications services providers on the African continent. The second largest national fixed-line operator is Neotel. There are five licensed mobile operators: Vodacom, MTN, Cell-C, Virgin Mobile and Telkom Mobile. The telecoms sector has seen quite a few developments in 2019, with many firms attempting to invest in new technologies and become more cost competitive in terms of the cost of data.
In July 2019, the Department of Communications issued its Policy on High Demand Spectrum and Policy Direction on the Licensing or Wireless Open Access Network, outlining plans for the allocation of high demand spectrum for 4G networks. Recognizing the need for a shared approach to spectrum, the department has proposed deployment of a wholesale open access network (WOAN) for the roll-out of high demand spectrum. Spectrum assignment to the WOAN is to be determined by the regulator, Independent Communications Authority of South Africa (ICASA), whilst the department has recognized the Council for Scientific and Industrial Research’ recommendations of a market share of 20 per cent to ensure sustainability of the WOAN.
The remaining high demand spectrum is to be allocated to incumbent operators under certain obligations in relation to facilities leasing, minimum capacity procurement from the WOAN, universal access and universal service obligations, and compliance with empowerment requirements. The WOAN will be a consortium of persons, at least 70 per cent South African owned, and compliant with empowerment provisions outlined in the policy directive. In respect of a 5G network, ICASA has been directed by the Minister to investigate the relevant spectrum requirements and has since included auctioning 5G in its planned auction.
The move from analogue to digital television has also been fast-tracked. The latest position is that the government will embark on a retail-driven approach, giving vouchers to indigent households to buy set top boxes from commercial providers rather than continuing with a plan to run the project itself.
Mining and Quarrying
While South Africa’s economy is now well-diversified, the mining industry continues to play a significant role in the country’s economy despite the longer-term decline in the sector’s relative contribution to GDP and revenue collections. The mining sector made up 8.1% of total GVA in 2018, down from 8.3% in 2017. Over the past 10 years, the sector’s contribution to GVA has averaged 8.6%.
In the first three quarters of 2019, real value added in the mining sector contracted by 2.2% compared with the corresponding period in 2018. Production remains highly volatile. On a seasonally adjusted and annualized quarterly basis, the sector contracted 6.1% in the third quarter of 2019, following an expansion of 14.4% in the second quarter. Mineral sales increased 13.3% in nominal terms in the first three quarters of 2019 compared to the corresponding period in 2018, with gold, PGMs and iron ore sales particularly strong, increasing by 4.9%, 29.8% and 55.2% respectively. By contrast, coal and copper sales declined 0.4% and 6.1%, respectively, over the same period, weighed down by weaker demand from China.
According to the QES, the mining sector saw a 6,000 job rise to reach 462 000 in the four quarters to September 2019. However, the gold mining sector, in particular, consistently shed jobs in five of the last six quarters ending September 2019. Employment in the sector will remain under severe pressure as several companies have announced the restructuring or closure of their mining operations.
Of the pressures that weigh on the industry, policy and regulatory uncertainty has been highlighted as the main challenge, contributing significantly to the sector’s underperformance in recent years. The lack of policy direction has in turn frustrated investment in the sector, which has leveled off since 2011.
Progress has been made in reducing uncertainty, as some of the main contributors to policy uncertainty have been resolved. The Government issued a new Mining Charter and has withdrawn controversial amendments to the Mineral and Petroleum Resources Development Act (2002). The Cabinet has granted approval to publish the draft Upstream Petroleum Resources Development Bill for public comment. However, the Minerals Council SA has filed an application for a judicial review of the recently gazetted Mining Charter, citing problems with certain clauses that mean past deals were not sufficiently recognized.
The following table sets forth mineral production and sales for the periods indicated.
Mineral Production
|
|
|
Index of |
|
Index of |
|
Total Value of |
|
Total Value of |
|
|
Year |
|
Gold(1) |
|
Gold(1) |
|
Including Gold |
|
Excluding Gold |
|
|
2014 |
|
98.9 |
|
89.7 |
|
397,677.90 |
|
327,691.00 |
|
|
2015 |
|
96.9 |
|
91.6 |
|
396,277.60 |
|
332,928.80 |
|
|
2016 |
|
100.0 |
|
92.2 |
|
387,646.70 |
|
324,946.70 |
|
|
2017 |
|
96.3 |
|
83.3 |
|
437,589.50 |
|
348,506.10 |
|
|
2018 |
|
100.7 |
|
86.5 |
|
473,885,20 |
|
391,697,30 |
|
|
2019(2) |
|
98.7 |
|
90.1 |
|
403,421,70 |
|
392,025,30 |
|
Notes:
(1) Base: 2015 = 100.
(2) Rand million, through September 30, 2019.
Source: Stats SA.
Construction
The construction sector made up 3.8% of total GVA in both 2017 and 2018. Over the past 10 years, the sector’s contribution to GVA has not changed much, averaging 3.8%. Real value added in the sector contracted by 2.6% in the period ended September 30, 2019. The weakness in the sector prompted declines in employment growth. According to the third quarter QES, construction sector employment declined by 4.7% over the first three quarters of 2019 following a 1.0% increase for the corresponding period in 2018.
Confidence in the sector has deteriorated since the first quarter of 2019. The First National Bank/Bureau of Economic Research (FNB/BER) Building Survey recorded a 20-year low building confidence index of 22 (also reported in the first quarter of 2019) in the third quarter of 2019. This signaled a deterioration in building activity amid low levels of non-residential activity and a significant slowdown in residential activity. A lack of new building demand was cited as a business constraint by builders, with an overall building index reading of 79 for
insufficient demand. Investment within the sector also declined, with year-to-date contractions in the third quarter of 2019 reported in residential buildings, non-residential buildings and construction works.
The prevailing economic environment has unfavorably impacted the residential property segment. While the December 2019 SARB Quarterly Bulletin shows an improvement in the growth of credit demand by the real estate sector in the third quarter of 2019 (up 10%), growth in mortgage advances on residential property has remained just above 4% in the first ten months of 2019, broadly unchanged from 2018. Construction sector bank credit moderated to 2.3% in the third quarter of 2019 from 5.9% in the corresponding period in 2018 and a high of 17.7% in the first quarter of 2019.
Civil Engineering
Investment growth in construction works declined by 0.4% year-to-date for the first three quarters of 2019 following a decrease of 0.5% for the corresponding period in 2018. The FNB/BER Civil Confidence Index remained at a low level, registering 15 points in Q3 2019, marking the ninth straight month of an index level below 20 points. Approximately 90% of the respondents cited insufficient demand for new construction work as a business constraint. The difficult conditions in the civil construction sector are likely to persist as both public sector infrastructure expenditure and private sector investment remain constrained.
Agriculture, Forestry and Fishing
The agriculture, forestry and fishing sector made up 2.4% of total GVA in 2018, moderating from 2.6% in 2017. This was a result of less favorable weather conditions and a normalization in agricultural production following record summer field crop production in 2017.
Over the past 20 years, the sector has on average constituted 2.4% of total GDP. Despite the sector’s small direct contribution, strong linkages to the informal economy, rural areas and upstream (i.e. agricultural inputs) and downstream (i.e. food processing, paper and pulp production) activities means it has high output and employment multipliers which increase its overall value to the economy. The top ten employment multipliers for the South African economy include commodities from the services and agriculture sectors only. Extending this to the top twenty, there are another six commodities from manufacturing sub-sectors with strong links to the agriculture sector (i.e. leather products, furniture, sugar, animal feeding, bakery products and wood products).
The sector is set for a second consecutive annual decline in 2019. In the period ended September 2019, real value added in the agriculture, forestry and fishing sector contracted by 9.1% compared with the corresponding period in 2018. On a seasonally adjusted and annualized quarterly basis, the sector contracted by 3.6% in the third quarter of 2019, following a decline of 4.2% in the second quarter. Drought conditions that started in October 2018 and continued into early 2019 in some parts of the country, led to weaker summer field crops and horticulture production in 2019. The outbreak of foot-and-mouth disease in January 2019 led to a temporary ban of South Africa’s livestock exports, weighing on export values, while lower wheat production is expected in 2019 due to irregular rainfall during the growing season. Although production is weaker in 2019, average employment in the sector during the first three quarters of the year was almost unchanged in relation to the same period in 2018, expanding by 8,000 jobs (+0.9%) year-on-year.
Despite difficult conditions in recent years, some subsectors have performed exceptionally well, with both reinvestment and greenfield investment maintaining and growing output and employment. As a share of global trade, South African exports of citrus, grapes and pome fruit, for example, have increased over the past decade. Citrus’ global trade market share has risen from 4% in 2001 to more than 10% in 2018, followed by table grapes (5% to 7%) and pome fruits (3% to 6%). Agricultural exports hold significant potential, particularly in light of growing demand in Asia for higher value food products and the trade opportunities expected to arise from the African Continental Free Trade Agreement (AfCFTA).
However, a lack of adequate resources and skills to enhance biosecurity measures, inadequate port infrastructure and service delivery constraints pose a significant threat to sustainable export growth in agriculture. Trade promotion, market access, water interventions and certainty on land policy are crucial to unlock further investment in key crops such as apples, table grapes, citrus, wine, avocados, macadamia nuts, pecan nuts and beef. These products hold significant potential to increase agricultural exports and in many cases can contribute significantly toward increasing employment in the sector given their high labor intensity. However, in many growing markets, particularly in Asia, South Africa has less preferential trade access than competitors such as Chile, Peru and Australia.
Industry and the Department of Agriculture, Forestry and Fisheries (DAFF) have been collaborating to expand access to existing and new export markets. For example, DAFF collaborated with the wine industry to create an online system that issues export and import certificates for wine producers. The fruit and nut industry have a
trade working group within the Fruit Industry Value Chain Round Table which coordinates and resolves issues related to market access and export protocols on behalf of fruit exporters. Collaboration between DAFF and the local citrus industry to open up market access in China is bearing success as the value of citrus exports reached record levels in 2018 following significant growth in 2017. More of these kinds of partnerships are required to address trade access and market constraints hindering export growth. In general, better coordination and engagement between government and the farming industry to address these constraints is needed.
Electricity, Gas and Water
The electricity, gas and water sector made up 2.3% of total GVA in both 2017 and 2018. Over the past 10 years, the share in GVA has averaged 2.5%. The sector declined 1.4% over the first three quarters of 2019, primarily driven by a contraction in electricity generation and distribution. This poor performance has been matched by adverse sector employment developments. According to the latest QES, electricity, gas and water sector employment declined by 4.4% on a year-to-date basis as of Q3 2019, from a 2.1% year-on-year decline in the corresponding period in 2018.
Electricity
South Africa generates two-thirds of Africa’s electricity. More than 83% of South Africa’s electricity is coal generated. Koeberg, a large nuclear station near Cape Town, provides about 4% of capacity. A further 7% is provided by hydro-electric and pumped storage schemes.
Generation of electricity in South Africa is currently dominated by Eskom, the wholly state-owned utility, which also owns and operates the national electricity grid. The company supplies about 95% of South Africa’s electricity. It is regulated by Nersa, which is also mandated to regulate electricity departments of local authorities as well as the piped-gas and petroleum pipeline sectors.
Energy supply has deteriorated with the energy availability factor declining to 67.8% for the 2019/20 financial year from 71.8% in the previous financial year. The final unit of the Medupi power station was synchronized to the grid in late August 2019 to the tune of 190 MW. Completion is expected for November 2020. Kusile power station’s Unit 3 was synchronized to the grid for the first time in April 2019 (400 MW). All six units of Medupi and Kusile are expected to be commercially operational by 2020 and 2023 respectively.
The Renewable Energy Independent Power Producer (REIPP) Program has procured 112 projects (6,422MW) and R209.7 billion has been invested since the program was established in 2010. An updated Integrated Resource Plan was published in October 2019 which gradually increases the allocations of renewables (around 33% for wind and solar) and lessens the energy sector’s reliance on coal (43%) by 2030, facilitated through a “just transition” in the sector.
While Eskom’s intermediate financial results suggested an improvement in the first half of the 2019/20 financial year, a substantial loss is expected in the second half of the financial year due to lower sales in summer months, unplanned breakdowns, increased employee benefits kicking in in the second half of the year, higher maintenance costs in summer and higher debt service costs over the following six months. Longer term impacts on demand are likely to be negative given the steepness of energy price increases and the lack of reliability of supply.
Given the precarious financial position of Eskom, the Department of Public Enterprises has published a Roadmap for Eskom which details Eskom’s planned unbundling to improve transparency, encourage operational efficiencies and competitiveness. The paper suggests that there will be functional separation of a transmission entity and then separation of generation, transmission and distribution by 2021 under “Eskom Holdings.”
For further information, see “Public Sector Enterprises — Eskom” below.
Oil and Gas
The wholesale and retail markets for petroleum products in South Africa are subject to a set of government controls. The government regulates wholesale margins and controls the retail price of petrol. The petrol retail price is fixed on a monthly basis, but varies each month with respect to global crude oil prices, the Rand/Dollar exchange rate and taxes. The administration of the pricing regulation is undertaken by the Central Energy Fund on behalf of the Department of Energy (DOE). On November 23, 2018, the DOE published its Discussion Document on the Review of Basic Fuel Prices (BFP) structures. The department has taken an initial view that the import parity principle be maintained where petroleum products are imported and removed where products are not imported to reflect the actual cost of landing products in South Africa.
South Africa has very limited oil reserves. Approximately 60% of its crude oil requirements are met by imports from the Middle East and Africa. Over the past 5 years, the development of the South African upstream petroleum industry has functioned under regulatory uncertainty as finalization of the Minerals and Petroleum Resources Development Act (MPRDA) was never realized. The DOE elected to withdraw the MPRDA for regulation of oil and gas (minerals) industries, and instead the Upstream Petroleum Resources Development Bill was approved by the Cabinet and gazetted for public comment in December 2019. The bill will provide regulatory certainty and unlock the industry’s exploration, production and beneficiation potential.
Natural gas supply is comprised largely of imports via the pipeline from Temane and Pande gas fields in Mozambique. More recently in 2019, Total South Africa announced their discovery of a potential 1 million barrels of gas condensate on the Brulpadda off Mossel Bay in the Western Cape. To supplement and ensure reliability of natural gas supply, Transnet National Port Authority (TNPA) has commissioned the construction of a liquid petroleum gas (LPG) import and storage terminal for operation in 2020 in the port of Richards Bay in Kwa-Zulu Natal. Furthermore, in terms of regulation for gas, the department is in the process of finalizing the Draft Gas Amendment Bill to form part of the legislation governing the gas sector.
Water
South Africa is largely a semi-arid and water scarce country with a mean annual rainfall of 465 mm, almost half the world average. South Africa’s inland water resources include 22 major rivers, 165 large dams, more than 4,000 medium and small dams on public and private land and hundreds of small rivers. South Africa’s per capita consumption of approximately 237 liters remains above the world average of 173 liters. On the basis of current demand levels, the country is likely to face a water deficit of 17% by 2030.
The South African government has launched a wide ranging ten-year program to address water supply and sanitation backlogs affecting under-serviced households. Improvement to bulk water infrastructure has been prioritized. Initiatives are expected to fast-track the issuing of water licenses, expand the water system capacity, speed up construction programs, address backlogged projects and rehabilitate and upgrade existing water and sanitation infrastructure across the country. The Department of Water and Sanitation is also in the process of establishing an independent water regulator by 2023.
The Western Cape faced an unprecedented drought in 2017, but the situation subsequently improved and as of November 2019, collective metropolitan dam levels were recorded at 83.1% compared to 34% in 2017. Much of the improvement was due to improved demand management, rather than above-average rainfalls, which have remained below average for the fifth consecutive year. However, the country is once again faced with severe droughts affecting parts of the Eastern Cape, North West and Limpopo provinces, with average dam levels falling below 50% in November 2019 and below 6% at two of Limpopo’s major dams. The Department of Water and Sanitation announced a drought relief strategy, informed by its recently published (late November 2019) National Water and Sanitation Master Plan, which set out key immediate, short-term and future-thinking action steps, aimed at addressing systemic and infrastructural challenges to secure water supply. Drought relief measures include borehole drilling, water tankering from available resources and rainwater and fog harvesting to restore and ensure security of supply.
Public Sector Enterprises
The National Government owns a number of public enterprises (otherwise known as state-owned entities). The ministers under whose departments these enterprises fall act as the “Executive Authority” over these entities, taking up the role of shareholder on behalf of government. The ministers that act as the Executive Authority include the Minister of Public Enterprises, the Minister of Communications, the Minister of Energy, the Minister of Transport and various other ministers of the National Government.
The Executive Authority oversees the operations of the public enterprise, including the appointment of board members, the entering into of shareholder compacts with the public enterprise, approving major transactions, and the monitoring of performance. The National Treasury is responsible for financial oversight over all the public enterprises, including the review of major transactions, funding requests and applications for guarantees.
Parliament plays a significant role in the oversight of public enterprises through a number of committees that have been assigned responsibility for oversight over public enterprises. These committees include the Parliamentary Portfolio Committee on Public Enterprises, which is responsible for oversight over the Department of Public Enterprises and the key public enterprises that report to the department, the Parliamentary Portfolio Committees responsible for oversight of the various sectors in which public enterprises operate, and the Select Committee on Public Accounts, which is responsible for financial oversight.
The public sector is estimated to spend R257 billion on infrastructure in 2019/20, an increase of 19% compared to 2018/19. This is mainly because of higher estimated spending by state-owned companies including the Passenger Rail Agency of South Africa, Eskom, Transnet and Rand Water, which are expected to resume or begin infrastructure projects that were deferred in previous years.
The National Government has issued formal contractual guarantees in respect of certain indebtedness of the public enterprises, inter alia, to support the capital investment program/programs of the public enterprises. Such guarantees are issued in accordance with the Public Finance Management Act (PFMA). All guarantees are issued jointly by the Minister of Finance and the Executive Authority for the relevant public enterprise in terms of the PFMA. The National Government’s aim is for public enterprises to borrow on the strength of their own balance sheets without explicit recourse from the National Government. However, if a clear need for shareholder support is identified, a guarantee for a public enterprise may be provided on application. In such applications, the public enterprise is required to provide a sound business case, ensuring long-term financial sustainability. In extending guarantees, the National Government remains mindful of the fiscal risks that are posed by these guarantees and is vigilant in trying to ensure that the exposure from these contingent liabilities remains sustainable. State support and the financial condition of public sector enterprises remains a fundamental policy concern, particularly with respect to Eskom as discussed in more detail below.
A significant volume of guarantees has been issued to a number of public enterprises, with Eskom, SANRAL, Trans-Caledon Tunnel Authority (TCTA) and South African Airways (SAA) representing the largest exposure. The table below outlines the guarantees that are issued to public enterprises over the past four financial years.
Guarantees of Public Enterprises
|
|
|
2016/17 |
|
2017/18 |
|
2018/19 |
|
As of September 30, 2019 |
| ||||||||
|
|
|
Total |
|
Total |
|
Total |
|
Total |
|
Total |
|
Total |
|
Total |
|
Total |
|
|
|
|
Rand (million) |
| ||||||||||||||
|
Eskom |
|
350,000 |
|
202,825 |
|
350,000 |
|
244,678 |
|
350,000 |
|
285,587 |
|
350,000 |
|
304,986 |
|
|
SANRAL |
|
37,910 |
|
29,458 |
|
38,947 |
|
30,368 |
|
38,947 |
|
39,462 |
|
37,910 |
|
38,218 |
|
|
TCTA |
|
25,638 |
|
20,886 |
|
25,658 |
|
18,912 |
|
43,000 |
|
14,302 |
|
43,000 |
|
13,711 |
|
|
SAA |
|
19,114 |
|
17,819 |
|
19,114 |
|
11,059 |
|
19,114 |
|
15,269 |
|
19,114 |
|
11,804 |
|
|
DBSA |
|
12,324 |
|
3,993 |
|
12,038 |
|
3,975 |
|
11,268 |
|
4,256 |
|
9,843 |
|
4,460 |
|
|
LandBank |
|
11,100 |
|
3,805 |
|
9,600 |
|
3,806 |
|
9,600 |
|
965 |
|
9,600 |
|
921 |
|
|
Transnet |
|
3,500 |
|
3,757 |
|
3,500 |
|
3,757 |
|
3,500 |
|
3,757 |
|
3,500 |
|
3,698 |
|
|
Denel |
|
1,850 |
|
1,850 |
|
2,430 |
|
2,430 |
|
3,430 |
|
3,430 |
|
4,430 |
|
4,430 |
|
|
SA Express |
|
1,106 |
|
827 |
|
1,106 |
|
867 |
|
2,846 |
|
163 |
|
1,903 |
|
163 |
|
|
IDC |
|
435 |
|
138 |
|
448 |
|
137 |
|
499 |
|
147 |
|
508 |
|
147 |
|
|
SAPO |
|
3,970 |
|
3,989 |
|
4,170 |
|
400 |
|
2,947 |
|
0 |
|
0 |
|
0 |
|
|
Telkom |
|
245 |
|
108 |
|
253 |
|
111 |
|
281 |
|
124 |
|
287 |
|
126 |
|
|
PRASA |
|
1,217 |
|
— |
|
— |
|
— |
|
0 |
|
0 |
|
0 |
|
0 |
|
|
Other Entities |
|
5,739 |
|
902 |
|
2,574 |
|
771 |
|
1,948 |
|
658 |
|
1,784 |
|
593 |
|
|
Total |
|
474,148 |
|
290,357 |
|
469,838 |
|
321,271 |
|
487,380 |
|
368,120 |
|
481,879 |
|
383,257 |
|
Source: National Treasury.
Eskom
Eskom is a state-owned company responsible for electricity generation, transmission and distribution in South Africa. Eskom generates approximately 90% of electricity used in South Africa and approximately 40% of the electricity used in Africa. Eskom directly provides electricity to about 45% of all end users in South Africa. The other 55% is resold by redistributors (including municipalities).
While most of Eskom’s business is within South Africa, the company also buys and sells electricity in the Southern African Development Community (SADC) region. Eskom’s involvement in African markets beyond South Africa is currently limited to projects that have a direct impact on securing supply of electricity for South Africa. Eskom is investigating additional opportunities in the SADC region. The financial viability of Eskom and its on-going operational challenges remain a key vulnerability of the South African economy.
Eskom will continue to be reliant on Government support through the R350 billion Government Guarantee facility that was made available to support the construction of its capital expenditure (capex) program as well as additional budget support. Eskom’s current guarantee exposure, including interest to the Government, amounts to R305 billion as at 30 September 2019. Of the R350 billion Government guarantee facility, R334 billion has been committed, while R16 billion remains unallocated for future funding. Eskom is expected to remain highly leveraged mainly due to its historically weak balance sheet and its continued reliance on external sources of funds to match its capex program spend requirements.
As at March 31, 2019, 64 projects under the Renewable Energy Independent Power Procurement Purchase Programme (REIPPPP) totaling 3975.7MW of power have reached commercial operation, while 91 projects totaling 6306.2 were signed. The Independent Power Producers (IPPs) have significant government contingent liability exposure with R208 billion in guarantees provided towards the program since 2012. However, the maximum exposure, as at March 31, 2019, amounted to R156 billion and is anticipated to increase to R161 billion by March 31, 2020 due to additional IPPs coming online during the latest bid windows to acquire additional electricity from these IPPs. Thus, the risk associated with the guarantees provided to the IPPs is lower than the overall risk of the guarantees provided to Eskom due to the pass through cost provisions in the regulatory framework. Moreover, the government has control over the termination risk arising from government expropriation. There are ongoing re-negotiations between the Government and the IPPs to reduce the cost of electricity with regards to certain bid windows.
Eskom’s Annual Financial Statements for the year ended March 31, 2019 reported a net loss of R20.7 billion and the external auditors expressed a qualified audit opinion on these financials. The qualification was based on the non-compliance with the PFMA due to the inability of the external auditors to confirm the understatement of irregular expenditure of R25.65 billion (2018: R21.04 billion) and fruitless and wasteful expenditure of R641 million (2018: R603 million) as not enough audit evidence was provided.
Eskom’s revenue increased by R2.5 billion to R179.9 billion for the year ended March 31, 2019 (2018: R177.4 billion). While Eskom received a 5.23% Nersa price increase, the amount was reduced by revenue of R6.4 billion (2018: R3.3 billion) not being recognized as it did not meet the collectability criteria as well as a decline in sales volume. The decline in sales volume is attributable to a decline in sales to mining customers of 4.2% due to economic downturn leading to a closure of mines and shafts. International sales decreased by 18.4% due to SADC countries relying more on their own generations due to improved dam levels.
Primary energy cost increased significantly by R14.3 billion to R99.5 billion in the year ended March 31, 2019 (2018: R85.2 billion) due higher utilization of open-cycle gas turbine plants (OCGTs), an increase in coal coats per GW and an increase in oil and gas needed to start up coal fired units due to increased unit trips. Commissioning of new renewable IPPS added 11,344 GWh in the current financial year (9,584 GWh), increasing expenditure on IPPs by R5.7 billion to R25.0 billion for the year ended March 31, 2019 (2018: 19.3 billion).
Earnings before interest, tax, depreciation and amortization (EBITDA) for the year ended March 31, 2019 deteriorated to R31.5 billion (2018: R45.4 billion), with the Eskom Group experiencing a net loss of before tax of R29.1 billion in the year ended March 31, 2019 (20.7 billion after tax). The EBITDA margin decreased to 17.51% in the year ended March 31, 2019 (2018: 25.57%), mainly due to increased primary energy and employee benefits expenditure together with stagnant revenue growth. Crucial to the improvement of Eskom’s financial position is increasing the EBITDA margin, through a combination of delivering on cost savings initiatives and efficiencies, stimulating demand to increase sales and attaining a cost-reflective price of electricity.
Eskom plans to save R77.0 billion over the next four years comprising of R44.3 billion in operating expenditure, R19.9 billion in capital expenditure and R12.8 billion in working capital. For the 2018/2019 financial year Eskom saved R9.9 billion against a target of R10.6 billion. Cash and cash equivalents at year-end declined by R13.8 billion to R2.0 billion (March 2018: R15.8 billion). This was mainly attributable to poor operational cash flows and increased finance costs. This is a clear indication that Eskom will continue to rely on external funding in order to maintain a good liquidity position to be able to settle its debt obligations.
The Government recognizes the need to implement major changes to Eskom’s business model as part of the broader transformation of the electricity sector in line with industry changes. Failure to undertake these changes will result in the entity being unable to meet its financial obligations and continuously relying on the financial assistance being provided by the Government. Therefore, the Government is urgently working on stabilizing the utility, while developing a broad strategy for its future given the high risks to the economy of a systemic failure if Eskom were to collapse.
The immediate priority is to stabilize Eskom’s operations and financial position. Eskom has a very considerable level of debt, beyond what it can afford to hold without Government support; however the issues giving rise to this situation are not solved by merely reducing debt. The business has a number of key inefficiencies that must be addressed as a priority, it has suffered cash losses as a result of the failure of municipalities and others to honor their obligations, and it has received tariff determinations from Nersa that do not allow Eskom to recover relevant costs.
Therefore, the nature and scale of any debt relief will be based upon the financial performance of an improved Eskom, as well as fundamental progress on key operational improvement projects. Consequently, the Government will only consider debt relief once the Eskom Board has met the following preconditions:
· the Board must demonstrate measurable progress in instilling rigorous cash management discipline, and in achieving operational efficiencies in the business;
· the Board must show that all business units are managing operations within their means;
· the three new functional businesses must be created, with the separation of the transmission function being the priority; and
· new boards and CEOs with the requisite skills for the three entities must be appointed, and must be accountable for the independent operation of each business.
Furthermore, progress in developing a financial turnaround of Eskom, which will be vital in the development of a sustainable turnaround strategy for Eskom, has been made by the office of the Chief Restructuring Officer.
Moreover, the Government is working on providing additional financial support to Eskom through the Special Appropriation amounting to R26 billion and R33 billion in 2019/20 and 2020/21 respectively in addition to what was allocated in the 2019 Budget bringing the total government support to R49 billion and R56 billion in 2020/21. This additional financial support, which is intended to help Eskom maintain its going-concern status, and enable the utility to also meet its financial obligations as they become due. This allocation is based on stabilizing the company in the transition while the Government implements the restructuring of Eskom. Therefore, the Government does not anticipate that Eskom will come back with further requests for additional support during this period. That said, it must be noted that the Government has committed R230 billion (which includes government allocations to Eskom of R49 billion in 19/20, R56 billion in 20/21 and R33 billion in 21/22) over ten years towards supporting Eskom.
The Government remains committed to supporting and strengthening Eskom in order to ensure that the entity achieves business and financial sustainability and maintains adequate liquidity levels to continue operating as a going concern and ensure the security of electricity supply. However, this additional support is accompanied by conditions, outlined in the Special Appropriation Act, that Eskom must comply with but if Eskom fails to comply, the funds will not be transferred.
In addition to financial support, National Treasury and the Department of Public Enterprises continue to work closely with Eskom to manage its daily cash flow requirements to ensure that (i) the entity’s financial position does not negatively impact Government cash management, (ii) the entity implements an orderly separation of the business into three entities and (iii) the entity undertakes a path of just transition (i.e. move from coal to clean energy generation and mitigating the socio-economic impact on workers and communities).
Hence, the Minister of Public Enterprises recently announced a Special paper on Eskom which outlines the roadmap for restructuring Eskom and identifies the key strategic actions that must be implemented and presents timelines for these actions. The roadmap outlines the process to be undertaken for reforming the sector as well as presents a commitment to South Africa of the Government’s determination to act responsibly and with speed. The Government is acutely aware that Eskom’s deep crisis is a significant risk to the country’s economy and it has to act urgently to reform the electricity supply industry and Eskom. However, the timing and scope of implementation and any changes remain subject to political and other conditions.
In addition, the Government has recognize the responsibility that is given to the Board to deliver on this mandate and is currently working on capacitating the Board and the executive management with individuals who will bring in the skills required to address the challenges facing Eskom.
Transnet SOC Limited (Transnet)
Transnet is a public company, wholly-owned by the South African Government, and is the custodian of rail, ports and pipelines infrastructure in South Africa. Transnet is responsible for enabling the competitiveness, growth and development of the South African economy through delivering reliable freight transport and handling services. Transnet has five operating divisions:
· Freight Rail, the largest of the five operating divisions, operates more than 30,400 kilometers of rail network across South Africa which transports bulk, break-bulk and containerized freight. The rail network and rail services provide strategic links between the mines, production hubs, distribution centers and ports, and connect with the cross-border railways of the region.
· Transnet Engineering provides refurbishment, maintenance, upgrades and manufacturing services of rolling stock and specialized equipment for the other operating divisions of Transnet as well as external clients. It also houses the company’s research and development unit to capture opportunities for technology innovation.
· Transnet National Ports Authority provides port infrastructure and marine services at the eight commercial seaports in South Africa. The division’s core functions include the planning, provision, maintenance and improvement of port infrastructure.
· Transnet Port Terminals provides cargo-handling services at the ports which is critical in supporting the South African Government’s export-led growth strategy.
· Transnet Pipelines is the custodian of the country’s strategic pipeline assets and is currently servicing the fuel and gas industries by transporting petroleum and gas products.
In addition, Transnet has operations in Lesotho, Namibia, Swaziland and Mozambique and it plans to expand further into the rest of Africa. The tariffs charged by the National Ports Authority and Pipelines are determined by independent regulators, namely the Port Regulator and the National Energy Regulator of South Africa.
In recent years, Transnet has focused on addressing identified freight system challenges and has prepared the foundation for long-term competitiveness of the freight system.
Transnet is currently transitioning from the Market Demand Strategy (MDS) that was first implemented in 2012 to a new Transnet 4.0 Strategy (Transnet 4.0). The MDS was aimed at creating capacity ahead of demand with the capital investment program. Transnet 4.0 provides a framework for Transnet’s growth and diversification within the context of the 4th Industrial Revolution. The main growth thrusts of Transnet 4.0 include:
· extending Transnet’s footprint in Africa, the Middle East and South Asia;
· product and service innovation; and
· expanding Transnet’s advanced manufacturing business, with leading technologies to enhance new and existing products, and improve business processes.
In the short to medium term, Transnet is shifting its emphasis towards capital expenditure based on validating demand, and prioritizing spend on sustaining capital rather than capital expansion.
Transnet’s net profit increased significantly to R6 billion in 2018/19 compared to R4.9 billion in the prior year, on the back of fair value adjustment on investment properties leased out and supported by their favorable cashflow forecasts. The entity continued to access the markets without a government guarantee. The entity raised R6.7 billion through commercial paper, bank loans and Development Financial Institutions. The entity continued to execute infrastructure investment, spending R17.9 billion, R3.2 billion was invested in the expansion of infrastructure and equipment, whilst R14.7 billion was invested to maintain capacity in the rail and ports divisions. This takes the total investment spend to R183.5 billion over the past seven years.
Rating agencies downgraded Transnet’s credit rating, citing increased liquidity risk as a result of loan covenants triggered by the audit qualification on the 2018/19 Annual Financial Statements and credit rating downgrades for the sovereign. Transnet has since negotiated waivers on these non-financial covenants.
PetroSA
Petroleum, Oil and Gas Corporation of South Africa (Pty) Limited (PetroSA) is a wholly-owned subsidiary of the Central Energy Fund (CEF), which in turn is wholly-owned by the State. The Department of Energy acts as PetroSA’s executive authority. PetroSA was formed in 2002 upon the merger of Soekor E and P (Pty) Limited, Mossgas (Pty) Limited and parts of the Strategic Fuel Fund. PetroSA plays a role in the development of the energy sector in South Africa in support of the broader CEF mandate of ensuring security of energy supply.
PetroSA’s core activities include:
· exploration and production of oil and natural gas;
· participation in and acquisition of local as well as international upstream petroleum ventures;
· production of synthetic fuels from offshore gas at the Gas-To-Liquids (GTL) refinery in Mossel Bay;
· development of domestic refining and liquid fuels logistical infrastructure; and
· marketing and trade of oil petrochemicals.
Moreover, PetroSA operates the FA-EM, South Coast gas fields as well as the Oribi and Oryx oil fields. The producing gas fields provide feedstock to the Mossel Bay GTL refinery. PetroSA is also exploring alternative feedstock supply given the depletion of its gas reserves in the FA-EM field. Outside South Africa, the company has exploration acreage in Equatorial Guinea and Namibia. PetroSA’s GTL refinery produces ultra clean, low-sulphur, low-aromatic synthetic fuels and high-value products converted from natural methane rich gas and condensate using a unique GTL Fischer Tröpsch technology. Key commodities produced include unleaded petrol, kerosene (paraffin), diesel, propane, liquid oxygen and nitrogen, distillates, eco-fuels and alcohols. Its world-class synthetic fuels and petrochemicals are marketed internationally.
PetroSA operates the following main divisions:
· Products and Sales: The Trade, Supply and Logistics (TS&L) division is responsible for marketing and selling products and services to customers in South Africa and abroad.
· Petrochemicals: PetroSA produces several chemicals at its GTL plant in Mossel Bay. These synthetic chemicals fall into two main groups: alcohols and low-aromatic distillates. These products are placed locally and internationally.
· Crude Oil: PetroSA produces crude from its Oribi and Oryx oil fields, located in Block 9, off the coast of South Africa. It is estimated that the fields produce 1,800 barrels of oil per day.
· Commercial Business: In 2006, PetroSA established its Commercial Business in order to facilitate opportunities for players within the petroleum industry from a previously disadvantaged background. Initially, the unit focused on black economic empowerment wholesalers and later expanded its focus to include liquid petroleum gas.
The CEF group has been faced with sustainability pressures since the 2013/2014 financial year mainly as a result of the feedstock shortages (gas feedstock) which is extremely necessary in the sustainable operation of its GTL refinery. As an interim measure, PetroSA has started processing crude oil producing 18,000bpd. With additional capital expenditure, the entity will be able to scale up its production. The final turnaround strategy of PetroSA is however under discussion with the Minister of Energy and Mineral Resources.
PetroSA also faces a rehabilitation liability associated with the GTL refinery. The regulations issued under the National Environmental Management Act (NEMA) require that companies provide fully for the liability in a ring-fenced account. At the year ending March 31, 2019, the rehabilitation liability was valued at R9.8 billion. PetroSA has provided for R2.4 billion of that liability, leaving a shortfall of R7.3 billion. According to the entity, it is required to assess, review and adjust its financial provision and associated plans by February 2024.
In addition, CEF is seeking to mitigate against the Group’s worsening financial position through the implementation of a number of cost reduction strategies, including adoption of a consolidated shared service model and divesture from non-performing projects. Most importantly, CEF is engaged in a strategy review process aimed at refocusing its mandate. The strategic review process will, among other objectives, serve as a platform for the Government and CEF to work together in addressing CEF’s very wide mandate, which has thus far been costly for the entity to maintain.
The CEF Group’s revenue increased by 12.8% to R13.2 billion in 2018/19 from R11.7 billion in 2017/18. The increase was mainly attributable to PetroSA revenue increase of 17% to R12.1 billion in 2018/19 (2017/18: R10.4 billion), which was due to an increase in product prices as a of result increases in crude oil prices. Revenues from the African Exploration Mining and Finance Corporation (AEMFC) also increased by 38.5% to R635 million in 2018/19 (2017/18: R458 million) due to increased sales volumes to Eskom. Strategic Fuel Fund (SFF) however, recorded 61.2% decrease in revenue to R246 million in 2018/19 from R635 million 2017/18. This was due to a decrease in rental income from the storage facilities as the rising oil prices dissuaded crude oil traders from holding more crude oil to sell when the price is high.
Net loss for the 2018/19 financial year amounted to R471 million, a significant decrease from the previous year’s net profit of R354 million. This was mainly due PetroSA, which had a net loss of R2.1 billion, slightly offset by profits from SFF of R920 million, iGas of R360 million and AEMFC of R106 million. PetroSA’s losses were attributable to low production volumes and the weakening rand which increased rehabilitation provisions and production assets impairment.
Borrowings by the CEF Group constitute a reserve-based lending facility amounting to R968.3 million on March 31, 2019 (2018: R769.3 million). The facility is secured against the producing asset of PetroSA Ghana. In addition, CEF entered into finance leases through both AEMFC and PetroSA Ghana, with the present value of minimum lease payments amounting to R1.1 billion on March 31, 2019. During the current year ended March
31, 2019, borrowings increased by R475.8 million in aggregate. R199 million of the increase was attributable to the reserve-based lending facility, whereas R276.8 million was attributable to the finance lease obligation.
Airports Company South Africa (ACSA)
ACSA is a state-owned company (74.6% owned by the South African Government through the Department of Transport, 20.0 % owned by the Public Investment Corporation SOC Ltd, 4.21% owned by Empowerment Investors, and the remaining 1.19% owned by Staff through the Employee Share Option Scheme). The company is legally and financially autonomous and operates under commercial law. ACSA is mandated to own and operate South Africa’s nine principal airports, including the three major international airports at Johannesburg, Cape Town and Durban (King Shaka). As a result, ACSA is responsible for processing approximately 90.0% of all passengers departing on commercial airlines from airports within South Africa. ACSA has a 30-year concession and a 20-year concession to develop, operate and maintain the Mumbai (India) and Guarulhos International (Sao Paulo, Brazil) Airports respectively. ACSA earns consultancy fees and return on equity from these investments.
The ACSA Group derives revenue from two streams, aeronautical and non-aeronautical revenue. The former is derived from regulated charges, which consist of aircraft landing and parking charges, and passenger service charges. The non-aeronautical income is derived from commercial undertakings including retail operations, car rental concessions, property leases, car parking, hotel operations and advertising. Another component of non-aeronautical revenue is generated from international operations. ACSA’s non-aeronautical revenue accounted for 49% of total revenue in 2018/19 compared to 37% in 2017/2018 and 37% in 2016/17. The non-aeronautical revenue grew by 4.6% to R3.3 billion, largely reflecting a weak domestic economy and difficult operating environment for ACSA’s retail, car rental, advertising and property rental activities. ACSA’s performance in terms of non-aeronautical revenue is marginally below its target of 50%, but compares favorably with the global picture of modern airport operations, which sees an even split of revenue streams. Aeronautical revenue for 2018/19 grew by 6.3% to R3.8 billion compared to R3.2 billion in 2017/18. The lower growth was attributed to lower airport charges.
ACSA made steady progress in the expansion of airport service activities in 2018/19. The company secured contracts from the following foreign and domestic airports to provide advisory and consultancy services:
· Oribi Airport in Pietermaritzburg;
· Roberts International Airport in Monrovia, Liberia;
· Kenneth Kaunda International Airport in Lusaka, Zambia; and
· Bugesera International Airport in Kigali, Rwanda.
SANRAL
SANRAL is responsible for the financing, controlling, planning, construction, rehabilitation and maintenance of South Africa’s national road network to support socio-economic development. The national road system connects all the major centers in the country to each other and to neighboring countries. The South African road network comprises approximately 754,600 kilometers of roads, of which 22,214 kilometers is the national road network. The national highway network currently consists of 16,170 kilometers, which is expected to grow to 25,000 kilometers. South Africa has the longest road network of any country in Africa.
In accordance with the SANRAL Act (1998), the agency is responsible for toll and non-toll roads. These operations are funded separately. Non-toll roads are funded by government allocations, and are not allowed to be cross-subsidized from toll road income, and vice versa. Toll operations can be divided into two types — those funded by SANRAL itself and operated on its behalf, and roads concessioned to private parties under public private partnerships. Hence SANRAL’s revenue comes from two primary sources: grants from the National Government for all non-toll roads, and the tolling revenue received from toll roads.
During 2018/19 SANRAL undertook a total of 258 projects to build new roads, improve existing roads, and rehabilitate roads in a sub-optimal condition. These projects are predominately in the non-toll road network with only 34 projects undertaken in toll portfolio. SANRAL awarded new contracts worth R5.2 billion to black-owned companies and contracts worth R3.3 billion to white-owned companies for construction and maintenance of national roads during the year ended March 31, 2019.
In 2018/19, SANRAL recorded total revenue of R16.6 billion (2017/18: R16.2 billion). An annual Government grant of R18.6 billion was provided. Of this grant, an amount of R505 million was earmarked for the Gauteng Freeway Improvement Project (GFIP), to off-set the loss of income resulting from lower toll fees under the
dispensation announced by Government in 2015. A further R5.75 billion was also transferred to toll operations in 2018/19. The balance was transferred to non-toll roads and R5.74 billion of this was apportioned to capital projects.
Trans-Caledon Tunnel Authority (TCTA)
The TCTA is a specialized liability management body established in 1986 to give effect to the Treaty on the Lesotho Highlands Water Project between the Government of South Africa and the Government of Lesotho. TCTA was originally established to finance and implement the South African component of the Lesotho Highlands Water Project (LHWP) Phase 1. The entity’s notice of establishment was later amended in March 2000 and expanded to include the funding and implementation of bulk raw water infrastructure on behalf of the Minister of Water Affairs (now Minister of Water and Sanitation) in terms of the National Water Act. The scope of TCTA’s activities has expanded considerably in scale and complexity from a single project, to the management of the current portfolio of 13 major infrastructure projects at varying stages in the project life cycle as well as extensive advisory services. To date, the following directives have been received:
· Lesotho Highlands Water Project (LHWP): Delivery tunnel and subsequently fulfillment of the Republic’s financial obligations arising from its treaty with Lesotho signed in 1986 (includes both Phase 1 and Phase 2);
· advisory services to Umgeni Water, Water Management Institutions, Water Boards and the Department of Water and Sanitation (DWS);
· Berg Water Project (BWP);
· Vaal River Eastern Subsystem Project (VRESAP);
· refurbishment of Mooi-Mgeni Transfer Scheme Phase 1* (MMTS1) and implementation of Phase 2* (MMTS2);
· Olifants River Water Resources Development Project Phase 2C and subsequently, all the remaining phases* (ORWRDP);
· Komati Water Scheme Augmentation Project (KWSAP);
· Mokolo-Crocodile Water Augmentation Project Phases 1 and 2 * (MCWAP 1 and MCWAP 2);
· Metsi Bophelo Borehole Project;
· short term solution to Acid Mine Drainage* (AMD);
· coordination of Strategic Infrastructure Projects 3 and 18* (SIP3 and 18);
· Mzimvubu Water Project; and
· off-take to the town of Kriel from the Komati Water Supply Augmentation Project.
Implementation of these projects is still on-going.
In 2014, the initial R25 billion guarantees provided for LHWP Phase 1 were extended to cover the activities of LHWP Phase 2 and the short-term solution to Acid Mine Drainage (AMD) in the Vaal River area. Commercial funding for the rest of the projects is secured on the basis of income agreements between TCTA and DWS and these agreements determine how costs may be recovered on each project.
Lesotho Highlands Water Project (LHWP): in the past year, TCTA activities included the ongoing management of debt relating to the LHWP, as well as fulfillment of the associated financial obligations of the Government of the Republic of South Africa to the Kingdom of Lesotho. Loan negotiations for the raising of R4.5 billion for Phase 2 of the LHWP with development finance institutions commenced in the second quarter of 2019. TCTA was also in the process of finalizing arrangements for the listing of a R35 billion domestic medium term note program.
Mokolo-Crocodile Water Augmentation Project (MCWAP): The first phase of this project, MCWAP-1 was declared to be fully operational in September 2016, and TCTA is now making preparations for the implementation of the second phase, MCWAP-2 which will supply water meet Eskom’s environmental requirements which are part of the World Bank loan for Medupi. TCTA commenced and is currently addressing appeals received during the Environmental Impact Assessment (EIA) process. A combined guarantee for MCWAP 1 and MCWAP 2 was approved in the current financial year.
TCTA’s total debt decreased by R4.4 billion from R27.1 billion (the year ended March 31, 2018) to R22.7 billion (the year ended March 31, 2019) mainly due to the redemption of the WSP3 bond and the buyback of the WSP5 bond, the repayment of facilities from Absa and Standard Bank.
As a non-profit organization, TCTA’s aggregate net cash inflows and outflows are expected to balance to nil at the end of each project, once all debt has been extinguished. Cash inflows from operating activities for the year ended March 31, 2019 were higher than for the year ended March 31, 2018, due to higher receipts of revenues and netted off by lower recoveries on fiscally funded projects. The higher receipts were partly due to the repayment of the outstanding balance for the financial year. The total receipts for the 2017/18 financial year amounted to R6 218 million. The tariff billing for the current financial year was higher than the previous financial year due to increased volumes.
The liquidity position across all projects improved in the preceding year mainly due to an improvement in payment of the tariff receivable by the Department of Water and Sanitation.
South African Post Office (SAPO)
SAPO is mandated to provide postal services in accordance with the Postal Services Act of 1998. This Act provides for the regulation of postal services including its Universal Service Obligations. The Postal Services Act of 1998 sets out the licensing requirements of SAPO as prescribed by the relevant regulatory body, ICASA. In terms of the licensing framework developed by ICASA, SAPO is the only operator licensed within the reserved market, which covers all mail under 1kg. SAPO’s license is valid for a period of 25 years and is reviewed every three years in relation to SAPO’s performance in rolling out universal service obligations (USO) which include the rollout of postal addresses, points of presence and adherence to delivery targets. In the unreserved market, operators are required to register with ICASA, but there is no licensing framework. SAPO operates in both the reserved and unreserved market. SAPO’s license was issued in 2001.
Lastly, the South African Postbank Limited Act, provides for the corporatization of the Postbank, which is currently a division of SAPO. The Act allows for the transfer of the Postbank division to the Postbank Company. The Act further provides for the governance and functions of the Postbank once established as a company. SAPO operates an expansive network of more than 2,000 service points, through which its services are extended to the general public.
For a number of years, SAPO struggled with defining its strategic role as a commercial enterprise, operating within a rapidly changing ICT environment, whilst balancing its distinct developmental mandate. A number of reforms were implemented and SAPO’s mandate was strengthened through an amendment of the Postal Services Act.
Although the reforms provide the basis for the turnaround of SAPO, the entity is struggling to drive its commercial revenues.
For the year ended March 31, 2019, SAPO recorded a net loss after tax of R 1.099 billion. Revenue for the year ending March 2019 was increased to R5.4 billion (R4.4 billion in 2018), whilst expenditure totaled R6.9 billion (R5.2 billion in 2018). The increase in revenue and costs was primarily attributable to the South African Social Security Agency contract for the payment of social grants. In January 2019, government recapitalized SAPO with R2.9 billion which was utilized to settle all long term loans, pay critical suppliers to enhance the operational environment and to fund future capital expenditure. Government has also reinstated funding of R1.5 billion over the Medium-Term Expenditure Framework (MTEF) period for the public service mandate of SAPO.
Denel
Denel is a state-owned aerospace and defense company (100% owned by the South African Government through the Department of Public Enterprises). Denel operates through several business units that have diverse capabilities in the defense industry, ranging from designing, developing, integrating and supporting artillery, munitions, missiles, aerostructures, aircraft maintenance, unmanned aerial vehicles system and optical payloads based on high technology.
The Group’s revenue declined by 36% from R5.8 billion in 2017/18 to R3.7 billion in 2018/19. The decline in the Group’s net profit is mainly attributed to a slowdown in operational activities as a result of liquidity challenges. Revenue composition was 51% export revenue and 49% domestic revenue. Export revenue decreased from 75% of revenue in 2017/18 to 51% in 2018/19. The decline in domestic markets is mainly attributed to decreased local demand as the South African Government continues to focus on fiscal consolidation. To counter this, the Group has intensified its efforts to grow export market sales.
The entity realized a net loss amounting to R1.75 billion in the year ended March 31, 2019 compared to a net loss of R1 billion reported the previous financial year. The net loss includes a R389 million provision for the exit of the Denel Aerostructures manufacturing contract, and a net interest expense of R340 million. Interest bearing debt increased by 3% in the year ended March 31, 2019 to R3.4 billion from R3.3 billion the previous financial year. The Group debts are backed by a government guarantee which was issued during September 2018 for a period of five years. The Group increased its Domestic Medium Term Note (DMTN) Program from R3 billion to R4 billion in order to enable the entity to source additional funding under the program.
In order to resolve its financial challenges, Denel has developed a turnaround plan. The turnaround plan initiatives amongst others have focused on improving governance structures within the Group, reducing cost structures, improving program delivery and the generation of cash as well as the sale of non-core assets. In support of Denel’s turnaround plan, the government, in addition to the guarantees provided under the DMTN program, allocated Denel with a recapitalization amounting to R1.8 billion, through the contingency reserve in the 2019/20 financial year.
SA Express
SA Express is a state-owned regional airline (100.0% owned by the South African Government through the Department of Public Enterprises). The company is legally and financially autonomous and operates under commercial law. SA Express operates short- and medium-haul routes connecting primary and secondary domestic and regional destinations in South Africa and neighboring countries.
As of the latest available financial statements, SA Express derives revenue from passenger ticket sales and cargo transport services. SA Express’ revenue decreased by 67% to R707 million for the 2018/19 fiscal year (2017/18: R2.14 billion), this was driven by a decline in passenger revenue due to the reduction in the airline’s fight schedule. SA Express’ net loss for the 2018/19 year amounted to R59 million, a decline from the prior year loss of R162 million.
As of the latest available financial statements, the airline’s net equity improved from a negative R231 million as 1 April 2018 to a positive R426 million following a shareholder recapitalization of R1.249 billion as at 31 March 2019. SA Express’ liquidity position improved to 0.62 times in the 2018/19 financial year from 0.32 times in 2017/18 as a result of a decrease in current liabilities following the recapitalization by the shareholders.
As of the latest available financial statements, the capital expenditure of 2018/19 amounted to R30 million from R13 million in 2017/18.
Development Finance Institutions (DFIs)
South Africa has seven national Development Finance Institutions (DFIs) operating in sectors ranging from infrastructure, agriculture, industrial development and human settlements. These national DFIs are fully state-owned and report to their respective National Government shareholder departments. As of March 31, 2019, the South African DFIs, namely, the Land and Agricultural Development Bank of Southern Africa (Land Bank), Development Bank of Southern Africa (DBSA), the Industrial Development Corporation (IDC), National Housing Finance Corporation (NHFC), National Empowerment Fund (NEF), Rural Housing Loan Fund (RHLF) and national Urban Housing Reconstruction Agency (NURCHA) had a total asset base amounting to R298.16 billion, funding liabilities amounted to R148 billion and capital amounted to R149 billion. Currently the government is in the process of integrating the three DFIs i.e. NHFC, NURCHA and RLHF led by the Minister of Human Settlements.
Where necessary, DFIs continue to be supported by the National Government through a combination of financial instruments, such as grants and guarantees and recapitalization. The government has also allowed some/certain DFIs (DBSA, Land Bank, IDC and NHFC) to obtain external loan funding which consists of loans obtained from capital market funding as well as concessionary funding from multilateral development finance institutions. Currently only two DFIs, the Development Bank of Southern Africa (DBSA) and the Industrial Development Corporation (IDC) are permitted through their Acts to operate and invest outside the borders of South Africa.
Informal Sector of the Economy
The informal sector employs 2.9 million people (excluding agriculture and domestic service) and, as of December 31, 2019, accounted for 17.8% of total employment.
Informal enterprises encompass a very wide range of activities, such as the production of marketable products, the distribution of merchandise and the provision of services. Informal enterprises also mobilize capital at a grass-roots level for the provision of dwellings and community-based services. The businesses in this sector typically operate at a low level of organization and on a small scale, with little or no division between labor and
capital. Since the informal sector operates outside the legislated labor environment, employment tends to be casual, based on kinship or personal and social relations rather than on contractual arrangements with formal guarantees.
Employment and Trade Unions
Employment
Employment remains one of the key challenges for the South African economy. Faster growth is required over an extended period of time to significantly increase labor absorption, reduce high unemployment and achieve a more equitable distribution of income.
The Quarterly Labor Force Survey (QLFS) for the fourth quarter of 2019 showed that the official unemployment rate remained unchanged at 29.1% relative to the third quarter of 2019 (a 22% increase from 2010). The number of employed people in the non-agricultural formal sector has increased by 1,611,252 million since 2010 and the number in the informal sector has increased by 600,821 during the same period. The agriculture sector has seen an increase of employed people by 236,249 since 2010.
The labor force participation rate increased by 8.7% from the fourth quarter of 2010 to 59.8% in the fourth quarter of 2019. South Africans who are not economically active increased by 663,053 during the same period, while that of discouraged work seekers increased by 678,757.
The number of South Africans with tertiary education and who are not economically active increased by 265,220 from December 2010 to 688,591 in December 2019. Discourage work seekers rose to 678,757 since December 2010.
The table below denotes disaggregated formal employment levels.
|
Total non-agriculture |
|
Total employed |
|
As a percentage of |
|
Change since |
|
Average growth per |
|
|
Mining |
|
462 |
|
4.6 |
% |
(42.7 |
) |
(1.0 |
)% |
|
Manufacturing |
|
1,194 |
|
11.8 |
% |
27.1 |
|
0.3 |
% |
|
Utilities |
|
59 |
|
0.6 |
% |
2.7 |
|
0.5 |
% |
|
Construction |
|
599 |
|
5.9 |
% |
163.0 |
|
3.6 |
% |
|
Trade |
|
2,265 |
|
22.3 |
% |
563.7 |
|
3.2 |
% |
|
Transport |
|
482 |
|
4.8 |
% |
102.8 |
|
2.7 |
% |
|
Financial Real Estate and Business Services |
|
2,343 |
|
23.1 |
% |
502.6 |
|
2.7 |
% |
|
Community social and personal services |
|
2,738 |
|
27.0 |
% |
477.9 |
|
2.2 |
% |
|
Total |
|
10,142 |
|
100 |
% |
1,797.1 |
|
2.2 |
% |
Source: Quarterly Labor Force Survey (QLFS), Stats SA.
The following table sets forth the change in formal, non-agricultural, formal employment and the percentage of registered unemployed people for the periods indicated.
|
|
|
For the year ended December 31, |
| ||||||||||
|
|
|
2014 |
|
2015 |
|
2016 |
|
2017 |
|
2018 |
|
2019 |
|
|
Employment (% change on prior year)(1) |
|
|
|
|
|
|
|
|
|
|
|
|
|
|
Public Sector(1) |
|
4.4 |
|
(1.9 |
) |
1.4 |
|
(2.8 |
) |
1.1 |
|
n/a |
|
|
Private Sector(1) |
|
(0.7 |
) |
0.3 |
|
0.3 |
|
0.6 |
|
0.5 |
|
n/a |
|
|
Total |
|
0.4 |
|
-0.2 |
|
0.5 |
|
(0.2 |
) |
0.6 |
|
n/a |
|
|
Official Unemployment(2) (%) |
|
25.1 |
|
25.3 |
|
26.7 |
|
27.5 |
|
27.1 |
|
28.7 |
|
Notes:
(1) Employment in the formal non-agricultural sectors.
(2) QLFS as at December 31, 2019. Starting in January 2015, the estimates are based on a new master sample, which impacts comparability with previous periods.
Source: QES, QLFS, Stats SA.
The national government has placed job creation and skills development at the heart of its policies, by promoting an environment that is conducive to private sector growth and investment, with future legislation and regulation
being subject to a socio-economic impact assessment before being passed, and microeconomic reform as well as by directly impacting employment levels through public sector hiring and targeted job-creation programs. Some of these interventions include the following:
· The Employment Tax Incentive aims to incentivize firms to employ young inexperienced workers, and at the same time providing younger workers with work experience to improve the probability of later employment. Initial impact analyses suggest a modest but positive impact. A 10-year extension was agreed by social partners in September 2018. Within the current legislative cycle, the Incentive has been extended to February 2024, with a further extension to February 2029 to be put forward with the legislative amendments in the 2019 legislative cycle.
· The Expanded Public Works Program (EPWP) is one of government’s short-to-medium term programs aimed at providing short-term jobs and training for the unemployed. It is a national program covering all spheres of government and state-owned enterprises.
· The National Skills Development Strategy (NSDS) guides skills development in South Africa and seeks to ensure that the labor market is better able to cope with developmental challenges such as poverty, inequality and unemployment through responsive education and training.
· The Jobs Summit convened in October 2018 followed extensive consultation with government and its social partners, who have collectively arrived at a number of agreements on interventions to drive job creation and job retention, thus boosting the inclusivity of economic growth. These include in areas such as public employment programs, new sector-specific labor intensive initiatives, and enhanced policy and regulatory certainty that works to unlock inclusive growth and employment. Post-Summit monitoring and evaluation will be conducted by two oversight bodies, including a Presidential Committee.
Education, skills, employment and unemployment
There is a positive correlation between skills levels (using educational attainment as a proxy) and employment. Individuals with lower skills levels represent the majority of the unemployed. As at September 30, 2018, narrow unemployment stood at 31.8% for workers with less than complete secondary education, while it falls to 29.4% for workers with completed secondary education and 12.7% for workers with technical or academic qualifications beyond secondary education.
Education
Education is one of the National Government’s priority areas. This prioritization is reflected in the total government expenditure on education. Education will continue to receive the largest share of government spending over the MTEF period, rising from R385.6 billion in 2019/20 to R434.2 billion in 2022/23. South Africa’s total expenditure is above the 15% to 20% threshold as set by the UNESCO Education for All initiative in 2008.
According to Education Statistics 2019, published in January 2020 by the Department of Basic Education, the South African basic education system had 13.0 million students, 440,857 educators and 24,998 schools, of which 1,922 were independent schools. There were more males learners relative to the females (49.3%) in the schooling systems. Improving learner performance in literacy and numeracy is central to the overall improvement in education outcomes at all levels. South Africa’s performance within basic education is substandard, pupil to teacher ratio in primary education ranked 109 out of 141 countries as per the most recent World Economic Forum’s Global Competitiveness Report.
The National School Nutrition Program (NSNP) grant aims to improve the nutrition of poor school children, enhance their capacity to learn and increase their attendance at school and provides daily meals to approximately 9 million learners at 20,000 schools. The NSNP is funded by means of a conditional grant The program provides a free daily meal to learners in the poorest schools (quintiles 1 to 3). To provide meals to more children, while still providing quality food, growth in the grant’s allocations over the MTEF period averages 5.8 per cent, with a total allocation of R24.3 billion.
A safe and secure learning environment is a critical element to improving the quality of learning and teaching. The national Department of Basic Education uses the indirect school infrastructure backlogs grant to replace unsafe and inappropriate school structures and to provide water, sanitation services and electricity on behalf of provinces. This grant is allocated R6.5 billion over the medium term in the Planning, Information and Assessment Program. An allocation of R1.7 billion in 2020/21 will be used to replace 40 inappropriate and
unsafe schools with newly built ones, provide clean water to 432 schools and provide appropriate sanitation services to 1,033 schools.
The math, science and technology grant provides for ICT, workshop equipment and machinery to schools aims to better outcomes in math and science in the long term. The grant’s total allocation is R1.3 billion over the medium term. The fiscal consolidation reductions to this grant are equivalent to 3% of the grant’s baseline in 2020/21, 3% in 2021/22 and 3% in 2022/23. The HIV and AIDS (life skills education) program grant provides for life skills training and sexuality and HIV/AIDS education in primary and secondary schools. The program is fully integrated into the school system, with learner and teacher support materials provided for Grades 1 to 9. The grant’s total allocation is R767 million over the medium term. The fiscal consolidation reductions to this grant are equivalent to 8.8% of the grant’s baseline in 2020/21, 9.5% in 2021/22 and 11.5% in 2022/23.
The learners with profound intellectual disabilities grant aims to expand access to education for these learners. Over the MTEF period, the grant will provide access to quality, publicly funded education to such learners by recruiting outreach teams. This grant has been allocated R765 million over the 2020 MTEF period
Higher education
The Department of Higher Education and Training will focus on increasing student access and improving staff development in the university system by increasing allocations to universities with a high proportion of students and staff from historically disadvantaged population groups. In 2020/21, the University Capacity Development Program will receive R1.1 billion, the Historically Disadvantaged Institutions Development Program will receive R536.3 million and the Infrastructure and Efficiency Program will receive R2.8 billion.
Access to university education has steadily increased, with enrolment in public universities up from 892,936 in 2010 to 975,837 in the 2016 academic year. One of the key outputs identified under this priority outcome is to increase the number of science, engineering and technology graduates because of the contribution that these graduates can make to the economic growth that the country seeks. Additional grant funding is provided to those universities that are able to increase enrolment and graduation numbers in these key areas.
Expenditure for the National Student Financial Aid Scheme increases at an average annual rate of 7.3% from R33 billion in 2019/20 to R40.8 billion in 2022/23. The institution expects to fund more than 1 million students at universities and more than 870,000 students at Technical and Vocational Education and Training TVET colleges over the period.
The 2020 Budget Review noted that in the medium-term the focus for higher education will be to expand access to universities and technical and vocational education and training (TVET) colleges, improve their performance, develop artisans, support workbased learning, and strengthen the management and governance of community education and training colleges.
Expenditure for the National Student Financial Aid Scheme increased in the 2020 Budget Review at an average annual rate of 7.3% from R33 billion in 2019/20 to R40.8 billion in 2022/23. The institution expects to fund more than 1 million students at universities and more than 870 000 students at TVET colleges over the period.
Trade Unions and Labor Disputes
The Labor Relations Act promotes collective bargaining through, among other things, protecting organizational rights for unions and the right to strike. Trade union representation is an accepted fact of industrial practice in South Africa. Almost all sectors of the economy, including the public service, have representative unions which engage employers over issues affecting their workforce.
Union density serves as an indication of the strength and potential influence of unions in the economy. South Africa’s union density is quite high. As at March 2019, the number of registered trade unions was 207.
Most trade unions in South Africa are organized in federations, of which there are 24 registered with the Department of Labor as of April 2017. The largest federation is the Congress of South African Trade Unions (COSATU), which had approximately 1.8 million members as of 2019. COSATU includes the National Union of Mineworkers, the South African Clothing and Textile Workers Union, the Food and Allied Workers Union and the National Education, Health and Allied Workers Union. Other significant federations include the Federation of Unions of South Africa (with a membership of over 515,000 members) and the National Council of Trade Unions (with a membership of approximately 400,000 members).
The Labor Relations Act of 1995 (Labor Relations Act) promotes collective bargaining through, among other things, protecting organizational rights for unions and the right to strike as well as setting out the procedures for instituting legal strikes, introducing special requirements for the use of secondary strikes, picketing, protest action and replacement labor and protecting an employer’s right to have recourse to lockout. The right to strike is
contingent on the exhaustion of dispute procedures and on the condition that the industry does not provide essential services. The Labor Relations Act also establishes a framework for the formation of bargaining councils to determine matters within the public sector and each industrial sector, the criteria for which are to be established by the National Economic Development and Labor Council. When employers and employees cannot agree on the formation of a bargaining council, a statutory council may be formed.
The Labor Relations Act permits the use of privately negotiated dispute resolution procedures and also encourages a centralized dispute resolution mechanism. The Commission for Conciliation, Mediation and Arbitration (CCMA) is responsible for attempting to resolve industrial disputes through conciliation and mediation. If these attempts fail, the CCMA may determine the dispute by arbitration or the parties may refer the dispute to the Labor Court unless it falls into the categories that must be resolved finally by arbitration and may not be referred to the Labor Court. The Labor Court is comprised of both trial and appellate divisions and, together with the High Court of South Africa and Supreme Court of Appeals, has jurisdiction over all matters referred to it under the Labor Relations Act.
The Labor Relations Amendment Act in 2014 gave legal power to the Commission for Conciliation, Mediation and Arbitration (CCMA) to approach negotiation parties to assist in resolving issues. It is expected that this will help avoid disruptions to the economy. The CCMA has already demonstrated success in this regard, and has cut the duration of arbitration proceedings by more than 75% since 2003. The CCMA was heavily involved in the private security sector negotiations since violent strikes in 2005/06, which has avoided industrial action in its wage negotiations this year.
Labor Legislation
In November 2018 President Cyril Ramaphosa assented to the National Minimum Wage Bill, the Basic Conditions of Employment Amendment Bill and Labour Relations Amendment Bill, that together introduce a national minimum wage (NMW) of R20 an hour, effective January, 1 2019. Further, the legislation provides for the technical arrangements needed to support implementation of the NMW. In addition, an agreement on codes of good practice should help to normalize employer/ employee relations, build trust and increase propensity to hire. The codes set out practical guidelines for standard behavior during collective bargaining, industrial action and picketing.
Benefits
Although the National Government has not established a comprehensive welfare system of the type found in many industrialized countries, it does maintain a variety of social benefit schemes relating to, among other things, compensation for occupational injuries and diseases, occupational health and safety, unemployment insurance, old age, disability and survivor benefits, child support grants, unemployment, sickness and maternity benefits, worker injury benefits and various health care benefits targeted to certain persons. Other programs provide for a developmental social welfare program to ensure, among other things, delivery of benefits to the poorest South Africans and improved social insurance. These programs are funded largely from budgetary allocations and through improved efficiency of delivery of services, subsidies or payments. South Africa is considering the introduction of a comprehensive social security system.
Inflation and Wages
|
Prices and Wages |
|
For the year ended December 31, |
|
As of |
| ||||||||
|
|
2014 |
|
2015 |
|
2016 |
|
2017 |
|
2018 |
|
2019(3) |
| |
|
Consumer Prices(1) |
|
87.98 |
|
92.0 |
|
97.83 |
|
102.99 |
|
107.75 |
|
112.20 |
|
|
Percentage change from prior year |
|
6.05 |
% |
4.58 |
% |
6.33 |
% |
5.28 |
% |
4.62 |
|
4.14 |
|
|
Production Prices(4) |
|
88.1 |
|
91.31 |
|
97.78 |
|
102.54 |
|
108.13 |
|
113.13 |
|
|
Percentage change from prior year |
|
7.41 |
% |
3.61 |
% |
7.09 |
% |
4.88 |
% |
5.44 |
|
4.65 |
|
|
Remuneration per worker |
|
|
|
|
|
|
|
|
|
|
|
|
|
|
At current prices |
|
6.7 |
% |
7.0 |
% |
5.8 |
% |
6.4 |
% |
4.8 |
|
4.0 |
* |
|
At constant prices |
|
1.4 |
% |
2.1 |
% |
(0.5 |
)% |
0.3 |
% |
1.5 |
|
(0.3 |
)* |
* Average for the first three quarters of 2019.
Notes:
(1) December 2016 = 100.
(2) Year on year change Q1 2017 to Q1 2018.
(3) The average values over the first eleven months.
(4) 2016 = 100.
Source: SARB, Stats SA.
Annual consumer price inflation moderated to an average of 4.1% in 2019 compared to 4.7% in 2018. The moderation in headline inflation was mainly driven by a marked slowdown in fuel price inflation, and to a lesser extent moderating food price inflation.
Food inflation averaged 3.1% in 2019, down from 3.3% in 2018, as the prices of especially meat declined sharply.
Fuel price inflation slowed throughout 2019, amounting to an annual average of 2.5% compared with an annual average of 12.5% in 2018, underpinned by lower petrol and diesel prices. Petrol price inflation moderated to an annual average of 2.1% in 2019 from 13.4% the previous year, while diesel price inflation slowed sharply to 3.4% in 2019 from 17.4% in 2018, driven by lower global oil prices and the appreciation in the exchange value of the rand.
Core inflation, which represents the long-run trend of the price level and excludes more volatile items, moderated from an annual average of 4.3% in 2018 to 4.1% in 2019. The downward pressure in core inflation was generated by, among others, housing rentals, as domestic demand remain subdued.
The Government forecasts CPI inflation will remain within the 3-6% target range in the medium-term, although it is expected to accelerate somewhat to 4.6% in 2021 and 2020, as food inflation in particular accelerates. Other upside risks to inflation include a weaker exchange rate, higher wage growth, oil prices and rising electricity and water tariffs.
Growth in average nominal remuneration per worker in the formal non-agricultural sectors of the economy amounted to 3.0% in the third quarter of 2019, compared to 5.5% in the corresponding period in 2018. Average remuneration per worker decelerated to 3.3% in the private sector, but slowed notably to 1.7% in the public sector in the third quarter of 2019. Above-inflation public sector wage increases are likely to put pressure on wage inflation, which is an important driver of services price inflation.
Nominal remuneration increases were below the upper limit of the inflation target range in the first three quarters of 2019 in: manufacturing (4.8%), construction (0.8%), wholesale and retail trade (4.0%), utilities (5.9%), financial services (0.0%), and the non-government sector (4.7%). Remuneration growth was above the target range in the government sector (7.1%), mining (6.5%) and transport (6.3%).
Producer price inflation for final manufactured goods slowed moderately from an annual average of 5.4% in 2018 to an average of 4.6% in 2019, largely due to lower petroleum and chemical product price inflation.
MONETARY AND FINANCIAL SYSTEM
The South African financial system consists of banks and non-bank financial institutions such as investment funds, portfolio management companies, securities investment firms, insurance companies, development funding institutions and pension funds.
The South African Reserve Bank (SARB)
The SARB is the central bank of South Africa, with its head office in Pretoria and cash center branches in Cape Town, Durban and Johannesburg. The Constitution of the Republic of South Africa established the SARB as an independent central bank, subject only to acts of Parliament and to regular consultation with the Minister of Finance. The principal responsibilities of the SARB include, among others: formulating and implementing monetary policy; issuing banknotes and coin; acting as banker to the National Government; regulating banks licensed under the Banks Act of 1990; providing facilities for the clearing and settlement of claims between banks; acting as custodian of the country’s gold and other foreign reserves; acting as a lender of last resort; conducting open-market operations for purposes of the implementation of monetary policy; supervising large primary, secondary and tertiary co-operatives; collecting, processing and interpreting economic statistics and related information; and formulating and implementing exchange control policies in cooperation with the Minister of Finance and the National Treasury. Following the enactment of the Financial Sector Regulation Act 9 of 2017 (FSR Act) on 22 August 2017, the SARB was given an explicit financial stability mandate and the Prudential Authority (PA) was formally established on 1 April 2018. The PA is a legal entity operating within the administration of the SARB. The objective of the PA is to: promote and enhance the safety and soundness of financial institutions that provide financial products and securities services; promote and enhance the safety and soundness of market infrastructures; protect financial customers against the risk that those financial institutions may fail to meet their obligations; and assist in maintaining financial stability.
Unlike many other central banks, shares in the SARB are held by private shareholders, with no shares held by the National Government. The SARB was listed on the JSE from its inception in 1921 until May 2002, when it was de-listed. Currently, approximately 758 shareholders, including companies, institutions and individuals, hold SARB shares. No single shareholder may hold more than 10,000 shares. Dividends are paid to shareholders out of net profits at a rate of 10.0% per annum of the nominal value of the shares. After certain provisions, 10.0% of the SARB’s surplus in any year is paid into a statutory reserve fund, and the balance is paid to the National Government.
The SARB’s Board of Directors has 15 members, who hold office for a period of three years, which can be renewed for a further two terms of three years each. The Governor and three Deputy Governors of the SARB are appointed by the President for an initial five-year term and subsequent terms of five years or less. Mr. Lesetja Kganyago was appointed Governor of the SARB with effect from November 9, 2014. On July 10, 2019 President Ramaphosa announced that Governor Kganyago’s term would be extended for another five years to end in November 2024. Of the remaining 11 directors, four are appointed by the President, with the remaining seven elected by the SARB’s shareholders.
The South African Reserve Bank Act was amended in 2010 (through Amendment Act No. 4 of 2010) to provide mechanisms to ensure that shareholders contribute to the functioning of the SARB without adversely influencing the SARB’s decision-making capabilities through group or block formations.
Monetary Policy
The main objective of the SARB’s monetary policy has been the pursuit of price stability. This policy contributes to the broader macroeconomic policies of the National Government by creating a stable financial environment and improving the standard of living of all inhabitants of the country. The SARB does not have fixed exchange rate targets and allows the Rand to float freely against international currencies.
The current inflation-targeting framework is a broad-based strategy for achieving price stability, centered on an analysis of price developments, and is characterized by a publicly announced inflation target range. In recent years, the SARB has been clear that the 3.0-6.0% target should not be interpreted as a 6.0% target and that policymakers would prefer to have inflation expectations be anchored around the 4.5% mid-point. Monetary policy decisions are guided by the deviation of the expected rate of increase in headline CPI from that target. An important factor in determining monetary policy is the forecast generated by the SARB’s macroeconomic models. The framework includes a degree of flexibility, permitting temporary departures of inflation from the target in the event of shocks (such as oil price movements). From 2000 onwards, the Core Model of the SARB served as the frontline model responsible for headline growth and inflation forecasts. However, since September 2017, the Monetary Policy Committee (MPC) introduced the Quarterly Projections Model (QPM) as the frontline model, while retaining the Core Model in a supporting role. The SARB’s QPM is used to forecast not just future inflation but also the optimal policy rate path required to bring headline inflation to the mid-point of the target range. That said, the MPC does not mechanically follow the QPM’s prescriptions, which are one of many indicators and analyses used to decide on monetary policy action.
Headline consumer price inflation remained at levels below or at the 4.5% midpoint of the inflation target range for 11 successive months up to October 2019. In July 2019, the MPC decided to reduce the repo rate by 25 basis points to 6.50% against a backdrop of an improved inflation forecast, which showed a sustained moderation in inflation over the forecast period, and a reduction in earlier risks as well as a sustained downtrend in longer-term inflation expectations.
In its role of implementing monetary policy, the SARB monitors and influences conditions in the South African money and credit markets and affects interest rates, growth in lending and growth of deposits. The SARB uses open market operations to manage the amount of liquidity available to banks on a weekly basis in repurchase transactions. The interest rate for such repurchase transactions is set by the SARB’s MPC and has a significant impact on all short-term interest rates in the economy. The monetary policy stance is decided at the bi-monthly meetings of the MPC. There exists, however, a continuous process of review that takes new information and developments into consideration.
Open market operations entail the buying and selling of securities by the SARB in the open market in order to regulate the conditions in the money market or the level and pattern of interest rates. The SARB utilizes a market liquidity shortage mechanism to implement monetary policy and the level is currently set at R56 billion. Through its refinancing system, the SARB provides liquidity to banks with one week (t+7) maturity to enable banks meet their daily liquidity requirements. The SARB does not provide unsecured loans and as such participating banks pledge securities in the form of High Quality Liquid Assets (HQLA) in the main repurchase auction for the funds received. By injecting or absorbing funds through purchases and sales of securities, the SARB may increase or decrease liquidity in the banking system. Although these transactions are primarily undertaken to achieve long-term monetary objectives, a further objective may be to stabilize temporary money-market fluctuations.
The SARB may purchase and sell National Government securities for the SARB’s own account, providing it with an effective means of influencing money market liquidity. Other techniques used by the SARB to influence liquidity include purchasing securities outright, allocating National Government deposits between the SARB and private banks, issuing SARB debentures and entering into foreign exchange swaps with banks.
Currently, nine primary dealers make markets in government paper, five of which are domestic banks and four of which are international banks. Since its appointment of primary dealers in 1998, the SARB no longer acts as an agent for the National Government in buying or selling its securities. During 2004 the SARB conducted a review of its money-market operations. As a result, on May 25, 2005, following extensive consultations with market participants, the SARB implemented several changes to its refinancing operations with three aims: to streamline the SARB’s refinancing operations to make them simpler and more transparent; to encourage banks to take more responsibility for managing their own individual liquidity needs in the market; and to promote a more active money market in South Africa. These changes include, among other things, the announcement on the Wednesday morning prior to the main weekly repurchase auction, of an estimate of the average daily market liquidity requirement by the SARB and the estimated range within which the daily requirement is expected to fluctuate in the coming week (this announcement has since fallen away due to the fixed liquidity shortage mechanism of R56 billion). The introduction of standing facilities (previously referred to as final clearing or reverse repurchase tenders) at a spread (initially 50 basis points and currently 100 basis points) above or below the prevailing repurchase rate to was accommodate banks with short or long liquidity positions.
However, the central feature of the SARB’s operational arrangements — the conduct of repurchase auctions on Wednesdays, with one-week maturity at a repurchase rate fixed at the level announced by the MPC — remains unchanged.
Before the introduction of the changes to the SARB’s refinancing operations, the accommodation amount provided at the main weekly repurchase auction was stable at around R13 billion, which was also the approximate level of the average daily liquidity requirement of the private sector banks. Thereafter, the amounts on offer at the weekly main refinancing auctions varied, with generally higher levels around month end and lower levels towards the middle of the month. In order to even out the banks’ end-of-day positions, standing facilities and cash reserve accounts were utilized. This level increased over the years and was fixed at R56 billion since September 2016.
Following the evening-out of the oversold forward foreign exchange book in February 2004, the SARB continued to increase its foreign exchange reserves through the measured buying of foreign exchange from the market, thereby creating Rand liquidity. The banks’ required cash reserve balances with the SARB rose considerably in September 2004, as vault cash was no longer allowed as part of qualifying cash reserves due to the phase-out of vault cash concessions, which started in September 2001.
The outstanding amount and composition of interest-bearing instruments utilized by the SARB were changed to drain liquidity from the money market. Debentures with a 56-day maturity were first issued on December 1, 2004, and 56-day reverse repurchase transactions were first conducted on March 24, 2005. Debentures are currently offered on a weekly basis with 7-day, 14-day, 28-day and 56-day maturities. However, demand for debentures has sharply decreased in recent years as yield on these debentures have been capped at repurchase rate (currently 6.25%).
The outstanding amount of South African Government bonds in the SARB’s monetary policy portfolio amounted to R7.90 billion nominal loans as at November 2019. This followed an agreement between the National Treasury and the SARB on October 20, 2003, which allowed the SARB to restructure and shorten the average maturity of interest-bearing government bonds held in its monetary policy portfolio by conducting cash-neutral switch auctions.
The following table sets forth the rate at which the SARB provided liquidity to banks as of each month-end indicated.
Repurchase Transaction Rate
|
|
|
2018 |
|
2019 |
|
|
|
|
(%) |
| ||
|
January |
|
6.75 |
|
6.75 |
|
|
February |
|
6.75 |
|
6.75 |
|
|
March |
|
6.50 |
|
6.75 |
|
|
April |
|
6.50 |
|
6.75 |
|
|
May |
|
6.50 |
|
6.75 |
|
|
June |
|
6.50 |
|
6.50 |
|
|
July |
|
6.50 |
|
6.50 |
|
|
August |
|
6.50 |
|
6.50 |
|
|
September |
|
6.50 |
|
6.50 |
|
|
|
|
2018 |
|
2019 |
|
|
October |
|
6.50 |
|
6.50 |
|
|
November |
|
6.75 |
|
6.50 |
|
|
December |
|
6.75 |
|
6.75 |
|
Source: SARB.
The following table sets forth the money supply (M1A, M1, M2 and M3) of South Africa during the periods indicated.
Money Supply
|
|
|
As of December 31, |
|
As of |
| ||||||||
|
|
|
2014 |
|
2015 |
|
2016 |
|
2017 |
|
2018 |
|
2019 |
|
|
|
|
Rand (million) |
| ||||||||||
|
Coin and banknotes in circulation |
|
94,193 |
|
101,053 |
|
107,573 |
|
114,430 |
|
124,946 |
|
130,944 |
|
|
Check and transmission deposits |
|
589,602 |
|
657,190 |
|
702,822 |
|
748,084 |
|
764,219 |
|
789,892 |
|
|
Total: M1A(1) |
|
683,795 |
|
758,243 |
|
810,395 |
|
862,515 |
|
889,165 |
|
920,835 |
|
|
Other demand deposits(2) |
|
557,477 |
|
670,265 |
|
796,516 |
|
838,451 |
|
888,922 |
|
911,307 |
|
|
Total: M1(3) |
|
1,241,272 |
|
1,428,508 |
|
1,606,911 |
|
1,700,966 |
|
1,778,087 |
|
1,832,143 |
|
|
Other short- and medium-term deposits(4) |
|
985,272 |
|
1,013,017 |
|
994,290 |
|
1,105,067 |
|
1,116,998 |
|
1,193,874 |
|
|
Total: M2(5) |
|
2,226,544 |
|
2,441,525 |
|
2,601,201 |
|
2,806,033 |
|
2,895,085 |
|
3,026,017 |
|
|
Long-term deposits(6) |
|
467,355 |
|
534,382 |
|
555,346 |
|
553,098 |
|
650,685 |
|
778,597 |
|
|
Total: M3(7) |
|
2,693,899 |
|
2,975,907 |
|
3,156,546 |
|
3,359,131 |
|
3,545,770 |
|
3,804,614 |
|
Notes:
(1) Notes and coins in circulation plus check and transmission deposits of the domestic private sector with monetary institutions.
(2) Demand deposits (other than check and transmission deposits) of the domestic private sector with monetary institutions.
(3) M1A plus other demand deposits held by the domestic private sector.
(4) Short-term deposits (other than demand deposits) and medium-term deposits (including all savings deposits) of the domestic private sector with monetary institutions, including savings deposits with, and savings bank certificates issued by the Postbank (a division of the SAPO).
(5) M1 plus other short-term and medium-term deposits held by the domestic private sector.
(6) Long-term deposits of the domestic private sector with monetary institutions, including national saving certificates issued by the Postbank.
(7) M2 plus long-term deposits held by the domestic private sector.
Source: SARB.
Since the introduction of an inflation-targeting monetary framework, growth in the most broadly defined money supply (M3) has not been used as an intermediate target for monetary policy purposes. Nevertheless, money supply and credit may provide useful information about prospective spending plans and inflationary pressures.
From late 2010 to early 2014 the M3 growth rate fluctuated around an average of 7.0%, displaying a sideways trend in the subsequent years before increasing from 5.9% in February 2014 to a high of 10.5% in December 2015. During the four years to June 2014, year-on-year growth in M3 generally fell below that of nominal GDP, but this trend reversed in 2014 and 2015 as sluggish economic activity and lower commodity prices weighed on the level of nominal value added in the economy. The firmer growth in M3 deposits was underpinned by growth in deposits of both the household and corporate sectors and can partly be ascribed to rising interest rates, accelerating inflation and moderately rising real final demand, combined with a build-up in precautionary balances by asset managers in the wake of renewed financial market volatility. The depreciation of the Rand from 2013 also resulted in an upward revaluation of foreign-currency deposits included in M3. Growth in M3 slowed significantly in 2016 following a gradual year-on-year increase over the preceding two years. This reflected, among other things, a methodological change to the monetary statistics which partly affected the value of deposits reported by banks from January 2016. In their surveys, reporting banks were requested to move certain short-term debt instruments, such as structured and credit-linked notes, from deposits to debt securities as they fall outside the definition of money. Growth in M3 then trended moderately higher from mid-2016 and once again exceeded the weak expansion in nominal GDP in 2018 and 2019. The upward momentum in money supply growth reflected a notable recovery in the growth of deposit holdings of financial companies from the second half of 2016, followed by a similar improvement in deposit holdings of non-financial companies a year later, while being supported by sustained growth in household deposits over the period. Factors that contributed to the
higher growth in M3 during 2017 included institutional investor receipts of proceeds from the redemption of the R203 government bond in September, which shifted deposits from government to deposit holders, being included in the calculation of money supply; and banks’ drive, in the context of Basel III liquidity requirements, to attract and maintain stable longer-term deposits, especially of the household sector. In 2018, the increase in the deposit holdings of the corporate sector occurred amidst uncertain financial market conditions, while growth in household sector deposits slowed marginally in the wake of the increase in the value-added tax (VAT) rate and rising fuel prices. Growth in M3 outpaced that in nominal GDP by a wider margin during 2018, despite slowing markedly from a quarter-to-quarter seasonally adjusted and annualized rate of 9.3% in the third quarter to 4.4% in the fourth quarter. The deceleration in overall deposit growth was driven by moderate growth in the deposit holdings of both the corporate and the household sector during 2018. Growth in M3 outpaced that in nominal GDP by a wider margin during 2019, despite slowing markedly from a quarter-to-quarter seasonally adjusted and annualized rate of 14.9% in the second quarter to 5.9% in the third quarter. The deceleration in overall deposit growth was driven by slower growth in the deposit holdings of the corporate sector from July 2019, while the expansion in household deposits remained slightly more upbeat but range-bound alongside moderate wage growth
Growth in long-term deposits accelerated from a low of 0.3% in March 2018 to a high of 17.6% at the end of 2018 as preferences shifted to long term deposits. Growth in short- and medium-term deposits moderated gradually from a high of 12.5% in January 2018 to 1.1% in December. Growth in cash, cheque and other demand deposits accelerated from 3.4% in January 2018 to 6.3% in September before moderating again to 4.1% in October. Growth in long-term deposits has notably exceeded that of the other deposit categories since late 2018, and expanded at double-digit rates throughout 2019 to reach a recent high of 19.3% in November. Growth in short- and medium-term deposits accelerated notably from a low of 0.6% in January 2019 to 7.4% in May, after which it moderated to 5.6% in November. After fluctuating around an average of 4.5% in 2018, the rate of increase in the more liquid cash, cheque and other demand deposits accelerated from 4.0% in February 2019 to 9.0% in June before slowing again to 4.0% in October. The contribution of long-term deposits to total deposit balances remained at around 20% for most of 2019, with cash, check and other demand deposits accounting for 48%.
Financial System Stability
The SARB regards the achievement and maintenance of price stability as its primary goal. A necessary parallel objective to this is financial system stability, without which monetary policy cannot be effectively implemented. To pursue the maintenance of financially stable conditions and mitigate systemic risk, the SARB, with the help of the Financial Stability Committee and the Financial Stability Department continuously assesses the stability and efficiency of the key components of the financial system and, formulates and reviews policies for intervention and crisis resolution. In 1999, the SARB established a Financial Stability Committee with the specific mandate to strive to enhance financial stability by continuously assessing the stability and efficiency of the financial system, formulating and reviewing appropriate policies for intervention and crisis resolution, and strengthening the key components of the financial system. Central to the SARB’s increased focus on, and contribution to, the financial stability discourse, a semi-annual Financial Stability Review is published that covers both a quantitative and qualitative assessment of the strength and weakness of the South African financial system.
The Financial Sector Regulation Act (FSR Act) came into effect on 1 April 2018 and assigned the financial stability mandate to the SARB. The Act also established statutory structures for the coordination and cooperation on financial stability issues among financial sector regulators through the Financial Stability Oversight Committee (FSOC). As set out in the FSR Act, the FSOC is composed of representatives from the Financial Sector Conduct Authority, Prudential Authority, Financial Intelligence Centre, National Credit Regulator as well as the SARB. Its primary objective is to support the SARB in promoting financial stability, through co-operation and collaboration, and co-ordination of action, among the financial sector regulators and the SARB.
The FSR Act also established the Financial Sector Contingency Forum (FSCF), with broad representation from the financial industry. Its primary objective is to assist the FSOC with the identification of potential risks and to coordinating of plans and actions to mitigate such risks.
Regulation of the Financial Sector
South Africa has committed to implementing legislative and regulatory frameworks in line with the G20 recommendations. The FSR Act introduced a Twin Peaks model of financial regulation, establishing the Prudential Authority (PA) under the administration of the SARB and the Financial Sector Conduct Authority (FSCA) as the primary Authorities in the regulation of financial sector. However, the SARB retains the mandate for financial stability. The objectives of the PA include the promotion and enhancement of the safety and soundness of financial institutions and of market infrastructures, protection of financial customers from risks of those regulated financial institutions emanating from their failure to meet obligations and in addition assisting the SARB in maintaining financial stability. The FSCA has a market conduct focus, with objectives to enhance and support the efficiency and integrity of financial markets, the protection of financial customers by promoting fair treatment of financial customers, provision of financial education programs in addition to assisting in maintaining financial stability. The authorities have various regulatory instruments including prudential and conduct standards, in line with their respective roles.
Domestic regulation and supervision requirements incorporate international standards. For instance, South African financial institutions must comply with all relevant Basel capital adequacy and liquidity standards. South Africa is already in compliance with the capital requirements of Basel III and will continue to endeavor to comply with all the other related requirements within the stipulated timelines. South African financial institutions must also comply with the financial reporting and disclosure standards incorporated in the international accounting standards. The various financial markets, financial institutions and financial instruments are regulated by a series of general, specific and enabling legislation.
Legislation enacted in 1998 provides for an independent competition authority, comprising an investigative division and an adjudicative division with broad powers to, among other things, issue compliance orders and interdicts, levy fines, impose structural remedies such as divestitures and prohibit mergers. The legislation also provides for a right of appeal to a specially-constituted judicial authority. In the majority of cases, the adjudicative divisions have sole jurisdiction over competition matters. Amendments to the legislation enacted in 1999 require pre-merger notification in particular cases.
Recent legislative and regulatory initiatives coming into force since 2017 include the following:
· The Financial Sector Regulation (FSR) Act (No.9 of 2017), came into effect on 1 April 2018 and the PA and FSCA were established on the same date. The FSR Act has as its objective to enhance financial stability and mandates the SARB as the key player, with contributions from the PA and the FSCA. In addition, the FSR Act promotes, among other things, financial stability, the fair treatment and protection of financial customers, the efficiency and integrity of the financial system, the prevention of financial crime and transformation in the financial sector.
· In August 2015 the National Treasury, in cooperation with the SARB, published a paper on “Strengthening South Africa’s resolution framework for financial institutions”. The Financial Sector Laws Amendment Bill, 2018, was published in September 2018 and incorporates the proposals set out in the 2015 paper, including the designation of the SARB as Resolution Authority. In July 2019 the SARB published a discussion paper on its intended approach to resolution when it becomes the Resolution Authority.
· In December 2016, Parliament’s Standing Committee on Finance (SCOF) invited the public to make written submissions on the Insurance Bill, 2016, which was tabled by National Treasury in Parliament on January 28, 2016. The Bill provides a consolidated legal framework for the prudential supervision of the insurance sector in line with the international standards for insurance regulation and supervision. After public consultation and approval by both houses of Parliament, the Insurance Act No. 18 of 2017 was promulgated on 1 July 2018. Forty-two insurance prudential standards applicable to the different types of insurance entities were also published on 1 July 2018 to provide for the regulatory framework for insurers.
· In February 2018, National Treasury published the final Ministerial Regulations issued in terms of the Financial Markets Act. These regulations cover the OTC derivatives markets and mark a significant achievement in terms of meeting the G20 obligations to implement legislative and regulatory reforms for safer financial markets. In Addition, the Financial Sector Conduct Authority and the Prudential Authority have issued accompanying conduct and joint standards for the authorization of OTC derivatives providers, additional trade repository licensing requirements, conduct standards for providers, and trade-reporting obligations. In addition, the draft Margin Requirements for non-centrally cleared derivatives have been tabled before Parliament, with a proposed implementation date of 1 October 2020. The Margin Requirements will provide a framework for the exchange of initial and variation margin for non-centrally cleared OTC derivative transactions. Additionally, amendments to the Insolvency Act were effected, and in relevant part, the amendments provide for a process for when a creditor realises security in terms of a master agreement and to empower the Master to deal with disputes raised by the trustee/ creditors regarding the preference of the secured creditor (pursuant to the master agreement). This is to ensure that collateral exchanged as initial margin could be easily and readily realisable in the event of a counterparty default due to the insolvency of a counterparty in an OTC derivative transactions. In 2019, the PA and the FSCA commenced considering the applications for OTC derivatives providers.
· In 2016, the FSB (now FSCA) granted two new exchange licenses in terms of the Financial Markets Act, to ZARX (Pty) Ltd (ZAR X) and 4 Africa Exchange (Pty) Ltd (4AX). In 2017, the licensing of A2X markets, and Equities Express Securities Exchange (EESE) increased the number of local exchanges to four, excluding the JSE. In May 2017, the FSB (now FSCA) licensed a second central
securities depository, Granite CSD (Pty) Ltd in terms of the Financial Markets Act. The two licensed CSDs in the market are thus Granite and Strate.
· The National Treasury is exploring options to promote entry into the banking sector as South Africa’s highly concentrated banking sector may compromise the level of competition needed to bring about efficiency improvements and greater access to financial services.
· On 23 May 2019, the Banks Act 1990 was amended to regard national state-owned companies as public companies for purposes of the application of the Banks Act and to determine prerequisites for these companies and their holding companies to qualify to apply for establishment as a bank.
· South Africa has initiated a process of establishing an explicit deposit insurance scheme, in terms of the Financial Sector Laws Amendment Bill, 2018. It is expected that such a scheme will contribute to the development of a less concentrated banking sector and support financial inclusion.
· In April 2017, the Financial Intelligence Amendment Bill was signed into law. The Financial Intelligence Amendment Act seeks to strengthen the commitment to combatting financial crimes and address the gaps identified in the Financial Action Task Force and the IMF’s Financial Sector Assessment Program Technical Note on AML/CFT for South Africa in December 2014. During October and November 2019, the Prudential Authority was subjected to the on-site portion of a Mutual Evaluation. The results of the Mutual Evaluation will be finalized in 2020
· On January 16, 2019, the Crypto Assets Regulatory Working Group released a consultation paper on policy proposals for crypto assets. The paper discusses issues relating to the classification of crypto assets, the risks and benefits of crypto assets and tentative proposals on how to regulate crypto assets in South Africa.
· After public consultation and approval by both houses of Parliament, the National Credit Amendment Act, 2019 (Act No. 9 of 2019 — the NCAA) was promulgated on 19 August 2019. The NCAA intends to provide debt intervention relief under specified criteria. The aim is to promote a change in lending and borrowing practices and behavior in relation to over-indebted customers.
· In line with the SARB’s mandate to protect and enhance financial stability, section 29 of the FSR Act provides the Governor of the SARB with the power to designate a financial institution as a systemically important financial institution (SIFI). On 20 August 2019 the Governor gave formal notice to six identified institutions of his intention to designate them as SIFIs. In line with FSR Act requirements the names of these SIFIs, being Absa Bank Limited, The Standard Bank of South Africa Limited, FirstRand Bank Limited, Nedbank Bank Limited, Investec Bank Limited and Capitec Bank Limited was publically disclosed in the Financial Stability Review 2nd Edition ( November 2019).
· In May 2019, the SARB concluded its 10-month consultative process on the reform of selected interest rate benchmarks for South Africa. This resulted in the classification of two categories of risk free rates. The first relates to alternative reference rates and falls within the ambit of the Market Practitioners Group (MPG). The second relates to benchmark interest rates and remains the responsibility of the SARB. With regard to alternative reference rates, and in particular Johannesburg Interbank Average Rate (Jibar) reform, the SARB recommended that the current Jibar methodology be phased out and be replaced as soon as reasonably practicable.
· In July 2019, the PA and the FSCA published a joint standard on the fitness and propriety of significant owners of financial institutions for public consultation. It is anticipated that the final standard will be published in early 2020.
Structure of the Banking Industry
At the end of October 2019, 19 banks, four mutual banks and 16 local branches of foreign banks were registered with the Prudential Authority. In addition, 30 foreign banks had authorized representative offices in South Africa.
The four largest banking groups dominated the South African banking sector. ABSA Bank Limited, the Standard Bank of South Africa Limited, FirstRand Bank Limited and Nedbank Limited accounted for 82.3% of total banking-sector assets at the end of October 2019. The four largest banks offer a wide range of services to both individual and corporate customers at branches across all nine provinces.
Total banking-sector assets increased by 8.3% to R5,926 billion at the end of October 2019 (October 2018: R5,472 billion). The increase in total banking-sector assets is largely attributed to increases in loans and
advances and investment and trading securities. Gross loans and advances increased by 8.0% to R4,342 billion at the end of October 2019 (October 2018: R4,020 billion).
The South African banking system remained profitable and adequately capitalized throughout 2018 and into 2019. The capital adequacy ratio for the banking sector was 16.5% in October 2019, exceeding the 11.5% minimum capital adequacy requirement and therefore reflecting adequate systemic capitalization. The banking sector’s capital consists mainly of share capital and reserves (the highest loss-absorbing capital types). Impaired advances to gross loans and advances, a key indicator of credit risk, increased slightly from 3.7% in October 2018 to 3.8% in October 2019.
Financial Sector Charter
In August 2002, the financial sector voluntarily committed itself to developing a charter to address historical sector imbalances, particularly with reference to human resource development, broadening economic participation and access to financial services. Thereafter, key industry stakeholders came together to develop the Financial Sector Charter, which was launched by the industry and the Minister of Finance in October 2003. The Financial Sector Charter was built around a central vision of promoting a transformed, vibrant and globally-competitive financial sector that reflects the socioeconomic demographics of South Africa and contributes to the establishment of an equitable society by effectively providing accessible financial services to all South Africans and directing investment into targeted areas in the economy.
The Financial Sector Charter established sector transformation goals, emphasizing targets for human resource development, procurement and enterprise development, access to financial services and ownership transfer. In order to provide access to financial services, the country’s four major retail banks — ABSA, FirstRand, Nedbank and Standard Bank — as well as the Postbank, launched the Mzansi account in October 2004. Mzansi is a low cost national bank account aimed at ensuring that those falling within the lower socio-economic groups have access to first-order retail banking products that would provide them with entry-level banking services. There have been approximately six million Mzansi accounts opened, 4.5 million of which were opened by South Africa’s four major commercial banks. It is estimated that 72.0% of these were first-time accounts. Major banks have since de-emphasized Mzansi and are promoting their own branded low-income accounts. The percentage of adult South Africans who use banking services has improved from 51.0% as at June 30, 2006 to 75.0% as at June 30, 2013.
In addition, the financial sector committed to ensuring that 80.0% of the population in lower income groups has access to full-service banking points of presence within at least 15 kilometers of every poor South African and cash-withdrawal points of presence such as automatic teller machines within at least ten kilometers. By December 2010, 91.6% of poor households had access to points of presence of banks and Postbank within ten kilometers of their home. This percentage was 84.7% if only the big four banks are considered.
In December 2017, the amended financial sector code was published. The financial sector code provides the financial sector with a roadmap to build on existing achievements in economic transformation. It is also the framework against which the empowerment progress of the financial sector is measured. The weighting points and targets on the scorecards were increased to prioritize transformation. One of the significant changes in the amended financial sector code is the introduction of the Black Business Growth Funding. The initiative will be driven by the financial sector and deals with a capital investment of between R25 billion and R100 billion in black-owned and black-women owned businesses over five years.
Credit Allocation
Growth in bank credit extended to the domestic private sector declined steadily to an annual average of 6.8% in 2016 and 5.5% in 2017, following four consecutive years of average growth of approximately 8.0%. The decline in credit growth reflected the depressed state of domestic economic activity. Year-on-year growth in total loans and advances reached a post-recession low of 3.8% in January 2018 — its lowest rate since August 2010. However, growth in credit extension was impacted by the implementation of International Financial Reporting Standard 9 from January 2018. Banks’ calculation of the provision for credit losses (impairments) changed fundamentally, which affected outstanding credit balances. The impairment requirements in the new IFRS 9 standard are based on an expected credit loss model and replace the International Accounting Standard (IAS) 39 Financial Instruments: Recognition and Measurement incurred loss model. Subsequently, growth over 12 months in credit extension to both the household and corporate sectors increased moderately as total loans and advances extended by monetary institutions to the domestic private sector increased from 3.9% in January 2018 to 7.5% in April 2019. Nonetheless, persistent low business confidence and high unemployment continued to weigh on credit demand. Subsequently, growth in total loans and advances extended to the domestic private sector moderated from May 2019, as a deceleration in loans to companies countered the slight acceleration in loans to
households. Growth in credit extension to companies was likely suppressed by reduced corporate investment amid protracted weak domestic demand and low business confidence. Domestic demand for goods and services was affected by reduced household spending as a result of uncertain employment prospects, which contributed to weak household demand for bank credit. The quarter-to-quarter seasonally adjusted and annualized growth in total loans and advances to the private sector decreased from a high of 10.3% in the fourth quarter of 2015, to 2.9% in the first quarter of 2018, reflecting not only a loss of momentum, but also the technical adjustment mentioned above. The quarterly growth rate then accelerated to 9.2% in the second quarter of 2019, with some moderation to 5.3% in the third quarter. The moderate acceleration of growth in credit extension relative to the weak expansion in nominal GDP resulted in an increase in the ratio of credit to GDP, from 71.8% in the fourth quarter of 2017 to 74.7% in the third quarter of 2019.
Growth in mortgage advances on commercial property has slowed significantly from a high of 16.1% in September 2015 to 4.3% in April 2019, before rebounding to 9.0% in October 2019. Growth in mortgage advances on residential property was more subdued as it maintained a modest pace of expansion from 3.2% in January 2018 to 4.9% in November 2019. Installment sale credit and leasing finance, mostly used for the financing of new and second-hand vehicles, increased moderately from 2.4% in May 2016 to 7.6% in November 2019, although new vehicle sales remained fairly volatile and at historically low levels.
The following table sets out the distribution of gross credit exposure at the end of September 2019.
Percentage distribution of total credit extended (as of September 30, 2019)
|
|
|
Percentage distribution of total gross credit exposure of |
|
|
Corporate exposure |
|
39.0 |
|
|
Public sector entities |
|
2.0 |
|
|
Local government and municipalities |
|
0.4 |
|
|
Sovereign (including central government and central bank) |
|
9.8 |
|
|
Banks |
|
11.5 |
|
|
Securities firms |
|
3.4 |
|
|
Retail exposure |
|
34.0 |
|
|
Securitization exposure |
|
0.6 |
|
Source: SARB
The following table sets out the distribution of gross credit exposure by economic sector at the end of September 2019.
Credit extension by economic sector as of September 30, 2019
|
Sectorial distribution of credit |
|
Rand (billion) |
|
As a percentage of total |
|
|
Agriculture, hunting, forestry and fishing |
|
116.5 |
|
1.8 |
|
|
Mining and quarrying |
|
210.7 |
|
3.2 |
|
|
Manufacturing |
|
344.0 |
|
5.2 |
|
|
Electricity |
|
168.7 |
|
2.6 |
|
|
Construction |
|
61.5 |
|
0.9 |
|
|
Wholesale, retail trade and accommodation |
|
369.4 |
|
5.6 |
|
|
Transport and communication |
|
219.4 |
|
3.3 |
|
|
Financial intermediation and insurance |
|
1,586.3 |
|
24.1 |
|
|
Real estate |
|
600.4 |
|
9.1 |
|
|
Business services |
|
229.7 |
|
3.5 |
|
|
Community, social and personal services |
|
551.3 |
|
8.4 |
|
|
Private households |
|
1,992.0 |
|
30.3 |
|
|
Other |
|
139.7 |
|
2.1 |
|
|
Total |
|
6,589.6 |
|
100.00 |
|
Source: SARB
The following table sets out the geographical distribution of gross credit exposure as of September 30, 2019.
|
Geographical distribution of credit |
|
Rand (billion) |
|
As a percentage of total |
|
|
South Africa |
|
5,891.8 |
|
88.2 |
|
|
Other African countries |
|
186.0 |
|
2.8 |
|
|
Europe |
|
462.5 |
|
6.9 |
|
|
Asia |
|
66.2 |
|
1.0 |
|
|
North America |
|
56.8 |
|
0.9 |
|
|
South America |
|
7.1 |
|
0.1 |
|
|
Other |
|
25.9 |
|
0.4 |
|
|
Total |
|
6,696.1 |
|
100.0 |
|
Source: SARB
Capital Markets
The JSE was established in 1887 and is a licensed exchange for all securities. The JSE is governed externally by South African legislation and internally by its own rules and regulations. The JSE was listed on itself on June 5, 2006. The listing included a proposal regarding the implementation of a B-BBEE initiative. In February 2011, the JSE launched the Black Economic Empowerment (BEE) Segment, offering a facility for BEE-compliant parties to list and trade BEE scheme shares. Subsequent to the Financial Sector Conduct Authority’s (FSCA) change in policy in relation to the regulation of all providers of over-the-counter (OTC) share trading platforms, the JSE made amendments to the JSE Listings Requirements in July 2015 to allow trading in BEE securities on the BEE Segment via the use of a verification agent, in addition to the current BEE contract route. Consequently, some companies moved from OTC trading to a listing on the JSE’s BEE Segment. At the end of September 2019, a total of two companies were listed on the JSE’s BEE Segment.
In June 2003, the JSE announced the first alternative “exchange” in Africa that would list small- and medium-sized companies, specifically targeting B-BBEE and junior mining companies. The Alternative Exchange (AltX) opened in October 2003 and runs parallel to the main board, with separate listings requirements and reduced fees. As of September 30, 2019, 42 companies were listed on AltX with a market capitalization of R18.5 billion.
The FSCA has granted four new stock exchange licenses in recent years. ZAR X started trading in February 2017, followed by 4 Africa Exchange (4AX) in September 2017 and A2X Markets (A2X) in October 2017. The fourth new exchange, Equity Express Securities Exchange (EESE), started trading in December 2017.Together with the JSE, South Africa now has five licensed stock exchanges.
Derivative instruments are traded either on an OTC basis or on an exchange. The Equity and Commodity Derivatives Markets of the JSE, together with the Interest Rate and Currency Derivatives Markets are responsible for trading in all futures contracts and options on futures. JSE Clear, previously known as SAFEX Clearing Company (Pty) Limited (Safcom) is the clearing house for all the derivatives markets operated by the JSE and also provides compliance, surveillance and other exchange services.
In July 2018 the JSE launched a new Electronic Trading Platform (ETP) in conjunction with the National Treasury for primary dealers in government bonds. The new platform facilitates electronic trading in the Inter-Bank Market Primary dealers are mandated to make prices on the platform in order to maintain their primary dealer status.
While Share Transactions Totally Electronic (Strate) has been the only central securities depository since its inception in 1999, the former FSB (now FSCA) granted Granite Central Securities Depository a financial market infrastructure license to operate as such a depository in 2017. The license mandate is for bonds and money-market instruments.
The main index charting the performance of the JSE is the FTSE/JSE All-Share Price Index. At September 30, 2019, the FTSE/JSE All-Share Price Index included 160 companies and accounted for approximately 83.8% (on a gross market capitalization basis) of the market capitalization of the JSE. As at November 30, 2019, the ten largest companies by market capitalization represented approximately 53.4% of total market capitalization.
Exchange Controls
South African law provides for exchange controls, which, among other things, restrict the outward flow of capital from South Africa, the Kingdoms of Lesotho and Eswatini and the Republic of Namibia, known as the common monetary area (CMA). The Exchange Control Regulations are applied throughout the CMA and regulate transactions involving South African residents, including companies and institutional investors. The basic purpose of the Exchange Control Regulations is to mitigate the negative effects caused by a decline of foreign capital reserves in South Africa, which could result in the devaluation of the Rand. The National Government has, however, committed itself to gradually relaxing exchange controls.
The SARB, on behalf of the Minister of Finance, administers South Africa’s exchange control regulations.
Since the abolition of the Financial Rand System in 1995, South Africa has had a unitary exchange rate that applies to both current and capital transactions between residents and non-residents. No capital controls are applied to non-residents, who may freely invest in and disinvest from South Africa (this applies to portfolio investment as well as foreign direct investment into South Africa). As discussed below, South African residents still face certain restrictions. However, these restrictions have gradually been eased to foster macroeconomic stability, a stronger balance of payments and financial sector development. The proposed strategy going forward is characterized by a fundamental shift from a system where a substantial fraction of cross-border transactions
are subject to restrictions, approvals and administrative requirements to a more open regime where transactions are generally permitted with a narrow set of regulations targeted at specific national interests, macroeconomic and financial risks. The broad principles for exchange control reforms are as follows:
· supporting macroeconomic and financial stability through the macro-prudential regulation of cross border capital flows;
· encouraging the growth of South African companies in domestic, regional and international markets;
· supporting cross-border trade and higher levels of foreign direct investment in South Africa;
· support the overarching strategy for increasing investment and growth;
· reflect a fundamental shift in the approach to regulation;
· recognize the different objectives that are supported by exchange controls (e.g., contributing to systemic stability; supporting prudential regulation of financial institutions; protecting the tax base; and supporting the prevention of financial crime (including money laundering));
· address the distortions created by exchange controls;
· holistic approach taking into account interactions between institutions and individuals, residents and non-residents; and
· proportionate reporting requirements.
The present exchange control system in South Africa is used primarily to control movements of capital by South African residents. In order to ensure that capital transfers are not disguised as current payments, controls and limits are placed on transfers of a current nature. South African residents may avail of a single discretionary allowance of up to R1 million per calendar year, without the requirement to obtain a Tax Clearance Certificate, that may be used for any legal purpose abroad without any documentary evidence having to be produced, except for travel purposes outside the CMA, where certain prescribed documentation is required. In addition, private individuals may invest up to R10 million per calendar year for any purpose outside the CMA, provided that the individual is over the age of 18 years and subject to obtaining a Tax Clearance Certificate, which is issued by SARS.
South African companies are generally permitted to undertake international expansion and the policy stance is to encourage growth into the rest of Africa. There are no limits on the use of domestic capital for funding investment, although administrative and reporting conditions remain in place and investments above R1 billion per year require approval. The holding company dispensation (HoldCo) (renamed “Domestic Treasury Management Company” (DTMC) dispensation on December 13, 2019) was introduced in 2013 and provides local companies with a structure for managing their multinational operations without restrictions. With effect from February 21, 2018, listed companies may transfer up to R3 billion per calendar year into approved DTMCs and unlisted companies may transfer up to R2 billion per calendar year, subject to transparency requirements. Listed companies can further apply to the SARB to transfer additional amounts of up to 25% of the company’s market capitalization, subject to demonstrated benefits for South Africa. Unlisted companies may also apply for additional funding. With effect from December 13, 2019 the DTMC regime has been extended to companies operating in the financial sector. Financial sector companies may also apply for additional funding. Additional amounts of up to 25% of the listed company’s market capitalization will not apply.
In the 2010 MTBPS, the Minister of Finance announced measures to encourage global diversification from a domestic base by using South Africa as a gateway to Africa. In this regard, from January 1, 2010, qualifying internationally headquartered companies are allowed to raise and deploy capital offshore without the need to obtain exchange control approval, subject to reporting requirements. With effect from November 2012, the shares and/or debt of a headquarter company may be listed on regulated South African exchanges or be held directly or indirectly by a shareholder with shares or debt listed on regulated South African exchanges.
Foreign entities are permitted to list equity, debt and derivative instruments on regulated South African exchanges. Foreign entities, local Authorized Dealers and regulated South African exchanges are allowed to
issue inward listed instruments referencing foreign assets on regulated South African exchanges, subject to prior approval. Furthermore, South African private individuals, corporates, trusts, partnerships and emigrants are permitted to invest without restrictions in approved inward-listed instruments on regulated South African exchanges. Foreign companies may be allowed to use their shares as acquisition currency, subject to prior approval from the SARB’s Financial Surveillance Department.
Furthermore, companies listed on regulated South African exchanges may secondary list and/or list depository receipt programs on foreign exchanges to facilitate both local and offshore foreign direct investment expansions.
In the 2019 Medium Term Budget Policy Statement, the Minister announced that, in order to promote investment and reduce unnecessary burdensome approvals, by February 2020, the SARB would propose a more modern, transparent and risk-based approvals framework for cross-border flows. The SARB would also take stronger measures to fight illegitimate cross-border flows and tax evasion. The approach to money laundering would be reviewed by the Financial Action Task Force. Steps are also being taken to strengthen co-operation between the FIC, SARB and SARS.
Gold and Foreign Exchange Contingency Reserve Account (GFECRA)
GFECRA in the books of the SARB reflects the Rand valuation profits and losses on all the gold, SDRs and foreign exchange that form part of the official gross foreign exchange reserves of the country. It also includes the Rand value of the foreign exchange forward transactions conducted by the SARB as well as liabilities of the SARB denominated in foreign currencies.
The GFECRA comprises credit and debit balances on three different sub-accounts: a gold price adjustment account (GPAA); a foreign exchange adjustment account (FEAA); and a forward exchange contracts adjustment account (FECAA).
The GPAA reflects any valuation profit or loss on the gold held by the SARB. The volume of the gold holdings has been fairly static over the past decade at around four million fine ounces. The FEAA account reflects any profit or loss on the Rand valuation of the foreign currencies held due to the depreciation or appreciation of the Rand against these currencies. In terms of the SARB Act, the SARB can calculate an exchange commission on all foreign exchange transactions conducted on behalf of the National Treasury. This commission or exchange margin is also reflected in the FEAA and settled annually by the National Treasury.
The FECAA reflects profits or losses on any forward exchange contract entered into by the SARB, valuation profits and losses on foreign exchange liabilities of the SARB, and any profit or loss due to changes in the value of the Rand against the currency of the United States on certain agreements for the reinsurance of export contracts. Since early 1997, the SARB has terminated the extension of forward cover with respect to future external commitments. The SARB, however, conduct sizeable amounts of foreign exchange swaps for liquidity management in the money market.
As at March 31, 2018, the GFECRA showed a positive balance of R193.9 billion, which represents net valuation gains of approximately the same amount and cash flow losses of R14.1million. These cash flow losses were settled on April 20, 2018. As at March 31, 2019, the GFECRA balance had increased to R285.8 billion, mainly due to the depreciation of the exchange rate of the Rand over the period. Cash flow losses to be settled by the NT amounted to R121 million for the year to March 31, 2019. This balance was settled on April 26, 2019. As at September 30, 2019 the GFECRA balance increased to R317,8 billion, including cash flow losses of R55 million to be settled by NT. The increase in the GFECRA balance was mainly due to the further depreciation of the exchange rate of the Rand over the period.
The SARB does not intervene in the foreign exchange market with a view to influence the value of the Rand exchange rate. However, the SARB purchases foreign exchange from the Authorized Dealers to accumulate reserves when market conditions allow.
THE EXTERNAL SECTOR OF THE ECONOMY
Foreign Trade
The following table sets forth South Africa’s balance of trade for the periods indicated.
Balance of Trade
|
Year |
|
Balance of Trade |
|
|
2014 |
|
(54.9 |
) |
|
2015 |
|
(47.1 |
) |
|
2016 |
|
30.8 |
|
|
2017 |
|
64.9 |
|
|
2018 |
|
24.3 |
|
|
2019(1) |
|
12.0 |
|
Note:
(1) To September 30, 2019.
Exports
In the first three quarters of 2017, the value of exports improved by 3.6% compared with the same period in 2016, driven primarily by mineral products (34%), and cereals (42%). These were, however, off-set to some extent by significant declines in machinery (-11%), and vehicles, aircraft and vessels (-7%).
Real exports increased by 2.7% in the fourth quarter of 2018 as growth in the exports of merchandise and net gold decelerated alongside a contraction in the exports of services. In the fourth quarter of 2018, a slight contraction in the export volumes of base metals and articles as well as a moderation in foreign demand for precious metals (including gold, platinum group metals and stones) weighed on real mining exports while the exports of mineral products accelerated. Slower growth in the export volumes of most manufactured goods more than offset the turnaround in that of chemical products. A decline in vegetable exports adversely affected agricultural exports.
In the third quarter of 2019, real exports of goods and services increased by 0.9% compared with the same period in 2018, following a contraction of 0.4% in the second quarter. An increase in foreign demand for vehicles and transport equipment as well as machinery and electrical equipment boosted manufacturing exports, while vegetable products contributed to a substantial rise in agricultural exports. The decrease in overall mining exports reflected lower export volumes of mineral products and base metal articles.
Imports
Imports dropped by 1.2% in the first nine months of 2017 compared to the same period in 2015 reflecting weaker domestic demand. Imports for all categories, except for vehicles and mineral products increased. The effects of the drought were seen in the 40% increase in agricultural product, particularly vegetables which increased by 60%.
Real imports of goods and services contracted in the fourth quarter of 2018 as the import volumes of all the major goods and services components declined. Weaker domestic demand for mining products was broad-based, in particular for precious metals (including gold, platinum group metals and stones). Contractions in the real import volumes of vehicles and transport equipment, machinery and equipment, as well as prepared foodstuffs, beverages and tobacco weighed the real value of manufactured imports down. Agricultural imports also decreased.
The real imports of goods and services receded by 1.8% in the third quarter of 2019, following an increase in the second quarter of 2019. The contraction was driven by lower volumes of mining imports, mainly mineral products as well as base metals and articles thereof. Strong growth in the imports of vehicles and transport equipment as well as machinery and electrical equipment outweighed lower import volumes of chemical products as well as prepared foodstuffs, beverages and tobacco. The real value of agricultural imports rose marginally due to an increase in domestic demand for imported vegetable products.
Current Account Deficit
South Africa’s current account deficit deteriorated from 2.5% of GDP in 2017 to 3.5% in 2018. The deterioration reflects a narrowing of the trade surplus as a result of a rise in the value of imported goods which rose at a much faster pace than merchandise exports. Over the same period, the shortfall on the services, income and current transfer account widened. The current account deteriorated slightly to 3.6% of GDP in the first nine months of 2019, as a result of a slight narrowing in the trade surplus.
South Africa’s Commitment to the WTO
South Africa is a founding member of the General Agreement of Trade and Tariffs (GATT) and has been an active participant for decades in the various GATT rounds of multilateral trade negotiations. In line with the need to open up the economy and increase competition in the economy, South Africa has liberalized most sectors of the economy since the 1990s.
South Africa has phased out support measures and subsidies inconsistent with the principles expressed in the GATT. This encourages South African industries to improve their competitiveness in domestic and foreign markets, while at the same time benefiting from cost reductions, supply side support measures and reduced
import duties of trading partner countries that were negotiated in the Uruguay Round, as well as from certain market access preferences that have been granted to South Africa by Canada, the EU, Japan, Norway, Russia, Switzerland and the US.
South Africa enjoys beneficial trade agreements with a number of countries, both multilateral and bilateral. It enjoys preferential treatment under the African Growth and Opportunity Act when trading with the United States.
In Africa, South Africa has a number of free trade agreements with African countries. These include Botswana, Lesotho and Namibia, under the auspices of the Southern African Customs Union. South Africa is also an important member of the SADC, which, among other things, allows for preferential trading access to Zimbabwe. It is anticipated that the Tripartite Free Trade Agreement between SADC, the Common Market for Eastern and Southern Africa (COMESA) and East African Community (EAC) will help to facilitate market access and increased trade within the continent.
South Africa also has an agreement with the EU to export most of its goods duty free under the Trade Development and Cooperation Agreement and is in the process of negotiating a new trade agreement and a new economic partnership agreement. China, India and Brazil are also important markets for South Africa. Thus South Africa has strengthened diplomatic ties and trade cooperation with these countries.
Balance of Payments (1)
The following table sets forth the balance of payments for South Africa for the periods indicated.
|
|
|
For the year ended December 31 |
|
For the |
| ||||||||
|
|
|
2014 |
|
2015 |
|
2016 |
|
2017 |
|
2018 |
|
2019 |
|
|
|
|
(Rand millions) |
| ||||||||||
|
Current account |
|
|
|
|
|
|
|
|
|
|
|
|
|
|
Merchandise exports (f.o.b.)(2) |
|
942,825 |
|
970,623 |
|
1,058,032 |
|
1,108,322 |
|
1,175,547 |
|
916,762 |
|
|
Net gold exports(3) |
|
71,942 |
|
59,521 |
|
66,762 |
|
66,411 |
|
71,678 |
|
43,980 |
|
|
Service receipts |
|
182,725 |
|
191,605 |
|
210,865 |
|
210,238 |
|
210,415 |
|
155,971 |
|
|
Income receipts |
|
82,235 |
|
98,016 |
|
87,773 |
|
81,637 |
|
96,507 |
|
92,522 |
|
|
Less: Merchandise imports (f.o.b)(2) |
|
1,069,638 |
|
1,076,290 |
|
1,090,089 |
|
1,102,055 |
|
1,222,944 |
|
948,710 |
|
|
Less: Payments for services |
|
184,828 |
|
197,643 |
|
218,830 |
|
215,544 |
|
217,939 |
|
167,671 |
|
|
Less: Income payments |
|
183,779 |
|
198,382 |
|
208,243 |
|
221,201 |
|
250,552 |
|
216,047 |
|
|
Current transfers (net receipts (+))(4) |
|
(34,448 |
) |
(33,533 |
) |
(27,458 |
) |
(38,303 |
) |
(35,674 |
) |
(26,644 |
) |
|
Balance on current account |
|
(192,966 |
) |
(186,084 |
) |
(121,188 |
) |
(110,495 |
) |
(172,962 |
) |
(149,837 |
) |
|
Capital transfer account (net receipts (+)) |
|
236 |
|
243 |
|
241 |
|
246 |
|
236 |
|
182 |
|
|
|
|
|
|
|
|
|
|
|
|
|
|
For the |
|
|
|
|
2014 |
|
2015 |
|
2016 |
|
2017 |
|
2018 |
|
2019 |
|
|
Financial account |
|
|
|
|
|
|
|
|
|
|
|
|
|
|
Net direct investment (Inflow (+)/outflow (-))(4) |
|
(20,607 |
) |
(51,217 |
) |
(32,942 |
) |
(80,472 |
) |
10,360 |
|
23,314 |
|
|
Net incurrence of liabilities(5) |
|
62,627 |
|
22,065 |
|
32,876 |
|
17,663 |
|
70,627 |
|
55,058 |
|
|
Net acquisition of financial assets(6) |
|
(83,234 |
) |
(73,282 |
) |
(65,818 |
) |
(98,135 |
) |
(60,267 |
) |
(31,744 |
) |
|
Net portfolio investment (Inflow (+)/outflow (-)) |
|
145,774 |
|
122,622 |
|
240,559 |
|
220,371 |
|
33,224 |
|
113,683 |
|
|
Net incurrence of liabilities |
|
146,944 |
|
121,290 |
|
139,866 |
|
278,828 |
|
90,009 |
|
79,334 |
|
|
Equity and investment fund shares |
|
100,384 |
|
105,101 |
|
25,399 |
|
102,269 |
|
32,242 |
|
(30,133 |
) |
|
Debt securities |
|
46,560 |
|
16,189 |
|
114,467 |
|
176,559 |
|
57,767 |
|
109,467 |
|
|
Net acquisition of financial assets |
|
(1,170 |
) |
1,332 |
|
100,693 |
|
(58,457 |
) |
(56,785 |
) |
34,349 |
|
|
Equity and investment fund shares |
|
8,363 |
|
20,009 |
|
109,279 |
|
(27,213 |
) |
(35,484 |
) |
48,043 |
|
|
Debt securities |
|
(9,533 |
) |
(18,677 |
) |
(8,586 |
) |
(31,244 |
) |
(21,301 |
) |
(13,694 |
) |
|
Net financial derivatives (Inflow (+)/outflow (-)) |
|
16,409 |
|
4,882 |
|
(13,757 |
) |
(4,247 |
) |
7,209 |
|
(5,603 |
) |
|
Net incurrence of liabilities |
|
(194,842 |
) |
(320,856 |
) |
(499,330 |
) |
(227,481 |
) |
(218,327 |
) |
(112,394 |
) |
|
Net acquisition of financial assets |
|
211,251 |
|
325,738 |
|
485,573 |
|
223,234 |
|
225,536 |
|
106,791 |
|
|
Net other investment (Inflow (+)/outflow (-)) |
|
121,821 |
|
119,042 |
|
(22,235 |
) |
(9,002 |
) |
102,595 |
|
15,138 |
|
|
Liabilities |
|
148,133 |
|
72,273 |
|
(3,747 |
) |
60,675 |
|
118,803 |
|
32,175 |
|
|
Assets |
|
-26,312 |
|
46,769 |
|
(18,488 |
) |
(69,677 |
) |
(16,208 |
) |
(17,037 |
) |
|
Reserve assets (Increase (-)/decrease (+))(7) |
|
(15,134 |
) |
14,015 |
|
(40,193 |
) |
(25,525 |
) |
(11,337 |
) |
(35,246 |
) |
|
|
|
|
|
|
|
|
|
|
|
|
|
For the |
|
|
|
|
2014 |
|
2015 |
|
2016 |
|
2017 |
|
2018 |
|
2019 |
|
|
Balance on financial account |
|
248,263 |
|
209,344 |
|
131,432 |
|
101,125 |
|
142,051 |
|
111,286 |
|
|
Memo item: Balance on financial account excluding reserve assets |
|
263,397 |
|
195,329 |
|
171,625 |
|
126,650 |
|
153,388 |
|
146,532 |
|
|
Unrecorded transactions(8) |
|
(55,533 |
) |
(23,503 |
) |
(10,485 |
) |
9,124 |
|
30,674 |
|
38,369 |
|
|
Memo item: Balance on financial account excluding reserve assets including unrecorded transactions |
|
207,864 |
|
171,826 |
|
161,140 |
|
135,774 |
|
184,062 |
|
184,901 |
|
Notes:
(1) Data for 2016, 2017, 2018 and 2019 figures are preliminary and subject to revision.
(2) Published customs figures adjusted for balance-of-payments purposes.
(3) Commodity gold. Before 1981 net gold exports comprised net foreign sales of gold plus changes in gold holdings of the South African Reserve Bank and other banking institutions.
(4) A net incurrence of liabilities (inflow of capital) is indicated by a positive (+) sign. A net disposal of liabilities (outflow of capital) is indicated by a negative (-) sign. A net acquisition of assets (outflow of capital) is indicated by a negative (-) sign. A net disposal of assets (inflow of capital) is indicated by a positive (+) sign.
(5) Investment by foreigners in undertakings in South Africa in which they have individually or collectively in the case of affiliated organizations or persons at least 10.0% of the voting rights.
(6) Investment by South African residents in undertakings abroad in which they have at least 10.0% of the voting rights.
(7) Foreign-currency liabilities of the Reserve Bank with non-resident institutions and loans from the IMF are included in the calculation of reserve assets. An increase in reserve assets is indicated by a negative (-) sign and a decrease is indicated by a positive (+) sign.
(8) Transactions on the current, capital transfer and financial accounts.
Source: SARB.
Current Account
South Africa’s trade patterns and volumes changed notably during the past decade. These changes were brought about by, among other factors, uneven growth performance of the country’s most important trading partner countries in the aftermath of the 2008 global recession, substantial infrastructure development projects and a number of trade agreements concluded to promote international trade.
Notwithstanding various policy measures to enhance external competitiveness, to promote trade, and to raise the country’s growth performance, the South African economy has become more dependent on surplus saving from the rest of the world to finance the much-needed increase in gross fixed capital formation. The country’s import penetration ratio (i.e., the extent to which the country relies on merchandise imports to satisfy domestic expenditure) reached a peak in 2015. This was followed by a decrease in 2016 and 2017 but rose again in 2018 to almost the same level as in 2015 before declining marginally in the first nine months of 2019.
Owing to growth in imports surpassing that of merchandise exports, the trade balance has been in a deficit from 2012 to 2015. This deficit decreased from 2013 to 2015 at which time weak terms of trade began to improve. This contributed to a trade surplus in 2016, rising further in 2017 before declining again in 2018 as merchandise imports increased faster than merchandise exports. This trend continued into 2019.
Following an increase of 4.4% in 2017, the value of merchandise exports increased further by 6.7% in 2018 supported by both increases in prices and volumes in 2018. In the first nine months of 2019 the value of merchandise exports increased further supported by higher prices that more than countered the decline in volumes over the period. The value of net gold exports rose by almost 8% in 2018 as the increase in the volume of net gold exports more than offset the lower realized price. In the first nine months of 2019 the value of net gold exports declined as the volume of gold exported fell, countering the effect of the depreciation of the exchange value of the rand on the rand price of net gold exports.
After rising by 1.1% in 2017, the value of merchandise imports increased further by a substantial 10.8% in 2018 as both volumes and prices increased. The upward trend continued into the first nine months of 2019 as higher prices supported the rise in the value. Even though the value of manufactured goods has declined over the years it remained the largest component of merchandise imports, constituting more than two thirds of total merchandise imports.
Following a widening of 17.5% in 2017, the deficit on the services, income and current transfer account of the balance of payments increased by 7.7% in 2018. The decelerated pace of increase in the deficit during 2018 can largely be attributed to a slower increase of the deficit on the income account and a smaller deficit on the current transfer account. Expressed as percentage of GDP, the deficit on the services, income and current transfer account has therefore increased only marginally from 3.9% in 2017 to 4.0% in 2018. When the first three quarters of 2019 are compared with the corresponding quarters of 2018, the deficit on the services, income and current transfer account came to 3.9% of GDP — slightly lower than that for 2018 as a whole. The deficit on the income account reflected a steep widening in the third quarter of 2019. This can be attributed to a noticeable rise in gross dividend payments which originated from companies with a direct investment relationship with non-resident shareholders.
Due to the developments as outlined above, the deficit on the current account as percentage of GDP deteriorated from 2.5% in 2017 to 3.5% in 2018. The larger deficit is mainly attributable to a smaller trade surplus in 2018. The current account deficit came to 3.6% of GDP during the first three quarters of 2019 as both the surplus on the trade account and the deficit on the services, income and current transfer account remained broadly the same over the period.
Financial Account
The overall net capital inflow of the financial account of the balance of payments (including reserve assets but excluding unrecorded transactions) amounted to R142.1 billion in 2018, compared to the R110.0 billion in 2017. For the first nine months of 2019, the overall net capital inflow of the financial account of the balance of payments (including reserve assets but excluding unrecorded transactions) amounted to R111.3 billion. All functional categories, except reserve assets, recorded inflows in 2018. For the first nine months of 2019, all functional categories, except financial derivatives and reserve assets, recorded inflows. For 2018 as a whole, financial account inflows represented 2.9% of GDP compared to 2.4% in 2017. For the first nine months of 2019, financial account inflows represented 3.0% of GDP.
South Africa’s direct investment liabilities recorded a smaller inflow of R17.0 billion in the third quarter of 2019 following an inflow of R26.3 billion in the second quarter. The third-quarter inflow reflected foreign parent companies’ funding of South African subsidiaries through debt and equity.
Portfolio investment liabilities recorded a much larger inflow of R40.2 billion in the third quarter of 2019 following an inflow of R10.0 billion in the previous quarter. This inflow mainly reflected national government’s issuance of international bonds of US$5.0 billion. This more than offset both net sales of domestic debt securities by non-residents and the switch from non-residents’ net purchases of domestic equities in the second quarter of 2019 to net sales of R32.3 billion in the third quarter.
Other investment liabilities reverted from an outflow of R4.5 billion in the second quarter of 2019 to an inflow of R0.9 billion in the third quarter as non-residents’ foreign-currency deposits with the domestic private banking sector increased. This was partly countered by the repayment of short-term loans by the domestic private banking sector.
South Africa’s direct investment assets abroad reverted from an inflow of R5.1 billion in the second quarter of 2019 to an outflow of R21.6 billion in the third quarter. This mainly reflected an increase in the equity holdings of South African parent companies in subsidiaries abroad, especially in the petro-chemical industry.
South African residents sold foreign portfolio assets of R34.7 billion in the third quarter of 2019, following net sales of R17.5 billion in the second quarter. The inflow occurred as the domestic private non-banking sector’s sales of foreign equity securities outweighed South African residents’ purchases of foreign debt securities.
Other investment assets reverted from an outflow of R48.4 billion in the second quarter of 2019 to a substantial inflow of R82.9 billion in the third quarter. This was due to the domestic private banking sector’s repatriation of foreign-currency deposits and the repayment of short-term loans under repurchase agreements by non-residents.
The following table sets forth capital movements into and out of South Africa for the periods indicated.
Financial account(1)
|
|
|
|
|
|
|
|
|
|
|
|
|
For the |
|
|
Rand (million) |
|
2014 |
|
2015 |
|
2016 |
|
2017 |
|
2018 |
|
2019 |
|
|
Net incurrence of liabilities(2) |
|
|
|
|
|
|
|
|
|
|
|
|
|
|
Direct investment(3) |
|
62,627 |
|
22,065 |
|
32,876 |
|
26,759 |
|
70,627 |
|
55,058 |
|
|
Public corporations |
|
0 |
|
0 |
|
0 |
|
0 |
|
0 |
|
0 |
|
|
Banking sector |
|
1,121 |
|
3,257 |
|
(9,844 |
) |
(21,922 |
) |
3,035 |
|
(796 |
) |
|
Private sector |
|
61,506 |
|
18,808 |
|
(42,720 |
) |
48,681 |
|
67,592 |
|
55,854 |
|
|
Portfolio investment |
|
146,944 |
|
121,290 |
|
139,866 |
|
278,828 |
|
90,009 |
|
79,333 |
|
|
Monetary authorities |
|
0 |
|
0 |
|
0 |
|
0 |
|
0 |
|
0 |
|
|
Public authorities |
|
51,563 |
|
3,287 |
|
141,112 |
|
171,650 |
|
28,363 |
|
101,455 |
|
|
Public corporations |
|
2,613 |
|
16,262 |
|
(11,316 |
) |
(1,804 |
) |
20,551 |
|
8,036 |
|
|
Banking sector |
|
16,545 |
|
3,169 |
|
11,239 |
|
37,909 |
|
8,150 |
|
(573 |
) |
|
Private sector |
|
76,223 |
|
98,572 |
|
(1,169 |
) |
71,073 |
|
32,945 |
|
(29,584 |
) |
|
Financial derivatives |
|
(194,842 |
) |
(320,856 |
) |
(499,330 |
) |
(227,590 |
) |
(218,327 |
) |
(112,394 |
) |
|
Banking sector |
|
(194,842 |
) |
(320,856 |
) |
(499,330 |
) |
(227,590 |
) |
(218,327 |
) |
(112,394 |
) |
|
Other investment |
|
148,133 |
|
72,273 |
|
(3,747 |
) |
61,471 |
|
118,803 |
|
32,175 |
|
|
Monetary authorities(4) |
|
4,483 |
|
(1,606 |
) |
286 |
|
(1,059 |
) |
2,326 |
|
(5,937 |
) |
|
Public authorities |
|
(4,210 |
) |
(3,925 |
) |
(3,350 |
) |
(2,477 |
) |
(2,042 |
) |
(635 |
) |
|
Public corporations |
|
17,836 |
|
18,960 |
|
25,543 |
|
28,348 |
|
9,485 |
|
7,565 |
|
|
Banking sector |
|
123,106 |
|
33,443 |
|
(12,369 |
) |
(19,335 |
) |
77,953 |
|
(30,206 |
) |
|
Private sector |
|
6,918 |
|
25,401 |
|
(13,857 |
) |
55,994 |
|
31,081 |
|
61,388 |
|
|
Special Drawing Rights |
|
0 |
|
0 |
|
0 |
|
0 |
|
0 |
|
0 |
|
|
Net acquisition of financial assets(5) |
|
|
|
|
|
|
|
|
|
|
|
|
|
|
Direct investment(6) |
|
(83,234 |
) |
(73,282 |
) |
(65,818 |
) |
(98,212 |
) |
(60,267 |
) |
(31,744 |
) |
|
Public corporations |
|
0 |
|
0 |
|
0 |
|
0 |
|
0 |
|
0 |
|
|
Banking sector |
|
11 |
|
18 |
|
20 |
|
(498 |
) |
(3 |
) |
3 |
|
|
Private sector |
|
(83,245 |
) |
(73,300 |
) |
(65,838 |
) |
(97,714 |
) |
(60,264 |
) |
(31,747 |
) |
|
Portfolio investment |
|
(1,170 |
) |
1,332 |
|
100,693 |
|
(58,894 |
) |
(56,785 |
) |
34,349 |
|
|
Public corporations |
|
0 |
|
0 |
|
0 |
|
0 |
|
0 |
|
0 |
|
|
Banking sector |
|
3,491 |
|
(3,069 |
) |
19,901 |
|
(6,880 |
) |
(2,820 |
) |
3,146 |
|
|
Private sector |
|
(4,661 |
) |
4,401 |
|
80,792 |
|
(52,014 |
) |
(53,965 |
) |
31,203 |
|
|
Financial derivatives |
|
211,251 |
|
325,738 |
|
485,573 |
|
223,234 |
|
225,536 |
|
106,791 |
|
|
Banking sector |
|
211,251 |
|
325,738 |
|
485,573 |
|
223,234 |
|
225,536 |
|
106,791 |
|
|
Other investment |
|
(26,312 |
) |
46,769 |
|
(18,488 |
) |
(70,110 |
) |
(16,208 |
) |
(17,037 |
) |
|
Monetary authorities(7) |
|
0 |
|
0 |
|
0 |
|
0 |
|
0 |
|
0 |
|
|
Public authorities |
|
0 |
|
0 |
|
0 |
|
(3,431 |
) |
(4,088 |
) |
131 |
|
|
Public corporations |
|
1,802 |
|
(3,199 |
) |
(1,231 |
) |
(992 |
) |
(800 |
) |
(337 |
) |
|
Banking sector |
|
(15,850 |
) |
69,078 |
|
(15,659 |
) |
10,499 |
|
13,996 |
|
20,160 |
|
|
Private sector |
|
(12,264 |
) |
(19,110 |
) |
(1,598 |
) |
(76,186 |
) |
(25,316 |
) |
(36,991 |
) |
|
Reserve assets(8) |
|
(15,134 |
) |
14,015 |
|
(40,193 |
) |
(25,525 |
) |
(11,337 |
) |
(35,246 |
) |
Notes:
(1) Identified capital movements.
(2) A net incurrence of liabilities (inflow of capital) is indicated by a positive (+) sign. A net disposal of liabilities (outflow of capital) is indicated by a negative (-) sign.
(3) Investment by foreigners in undertakings in South Africa in which they have individually or collectively in the case of affiliated organizations or persons at least 10.0% of the voting rights.
(4) These transactions comprise the liabilities of the South African Reserve Bank and the Corporation for Public Deposits.
(5) A net acquisition of financial assets (outflow of capital) is indicated by a negative (-) sign. A net disposal of financial assets (inflow of capital) is indicated by a positive (+) sign.
(6) Investment by South African residents in undertakings abroad in which they individually or collectively in the case of affiliated organizations or persons have at least 10.0% of the voting rights.
(7) Including the long-term assets of the South African Reserve Bank and the Corporation for Public Deposits.
(8) Foreign-currency liabilities of the Reserve Bank with non-resident institutions and loans from the IMF are included in the calculation of reserve assets. An increase in reserve assets is indicated by a negative (-) sign and a decrease is indicated by a positive (+) sign.
Source: SARB.
The following table sets forth total foreign direct investment by South African entities and total foreign direct investment in South Africa by foreign entities for the periods indicated.
Foreign Direct Investment
|
|
|
2014 |
|
2015 |
|
2016 |
|
2017 |
|
2018 |
|
|
|
|
Rand (millions) |
| ||||||||
|
South African foreign direct investment |
|
|
|
|
|
|
|
|
|
|
|
|
Europe |
|
602,615 |
|
806,494 |
|
690,195 |
|
689,362 |
|
820,124 |
|
|
Africa |
|
298,255 |
|
347,669 |
|
333,466 |
|
338,145 |
|
510,892 |
|
|
Americas |
|
128,716 |
|
111,326 |
|
122,014 |
|
120,522 |
|
262,233 |
|
|
Asia |
|
590,681 |
|
1,050,253 |
|
1,177,362 |
|
2,119,401 |
|
1,828,565 |
|
|
Oceania |
|
70,804 |
|
88,807 |
|
80,407 |
|
93,664 |
|
120,199 |
|
|
Other |
|
18 |
|
5 |
|
39 |
|
787 |
|
957 |
|
|
Total |
|
1,691,089 |
|
2,404,554 |
|
2,403,483 |
|
3,361,882 |
|
3,542,970 |
|
|
Foreign direct investment in South Africa |
|
|
|
|
|
|
|
|
|
|
|
|
Europe |
|
1,246,913 |
|
1,542,225 |
|
1,366,366 |
|
1,403,586 |
|
1,404,217 |
|
|
Americas |
|
150,947 |
|
160,648 |
|
156,478 |
|
150,851 |
|
158,447 |
|
|
Asia |
|
137,954 |
|
162,986 |
|
206,175 |
|
227,041 |
|
268,032 |
|
|
Africa |
|
53,370 |
|
63,692 |
|
66,456 |
|
73,743 |
|
78,814 |
|
|
Oceania |
|
18,835 |
|
40,438 |
|
57,810 |
|
70,021 |
|
81,922 |
|
|
Other |
|
633 |
|
423 |
|
322 |
|
291 |
|
620 |
|
|
Total |
|
1,608,652 |
|
1,970,412 |
|
1,853,607 |
|
1,925,533 |
|
1,992,052 |
|
Source: SARB.
South Africa’s total external debt increased from US$176.0 billion at the end of March 2019 to US$180.6 billion at the end of June, mainly as a result of net purchases of domestic government bonds by non-residents. However, South Africa’s gross external debt, in rand terms, decreased from R2 569 billion to R2 555 billion over the same period.
Foreign currency-denominated external debt decreased from US$88.5 billion at the end of March 2019 to US$87.4 billion at the end of June, mainly due to the redemption of an international government bond. This was partially countered by increased private non-banking sector borrowing.
Rand-denominated external debt, in US dollars, increased from US$87.5 billion at the end of March 2019 to US$93.2 billion at the end of June. The increase was mainly driven by net purchases of domestically issued bonds by non-residents as well as an increase in the market values of non-resident holdings of such bonds, while loans to all sectors also increased.
South Africa’s total external debt as a ratio of GDP increased from 49.2% at the end of March 2019 to 51.5% at the end of June. Similarly, the ratio of external debt to export earnings increased from 152.7% to 158.2% over the same period.
Foreign Currency-Denominated Debt of South Africa(1)
|
|
|
As of December 31, |
|
As of June 30, |
| ||||||||
|
|
|
2014 |
|
2015 |
|
2016 |
|
2017 |
|
2018 |
|
2019 |
|
|
|
|
Rand (million)(2) |
| ||||||||||
|
Foreign-currency-denominated debt |
|
|
|
|
|
|
|
|
|
|
|
|
|
|
Public sector |
|
95,040 |
|
119,470 |
|
110,539 |
|
121,355 |
|
149,855 |
|
147,387 |
|
|
Monetary sector(3) |
|
212,425 |
|
310,550 |
|
261,621 |
|
210,597 |
|
268,354 |
|
254,918 |
|
|
Non-monetary private sector |
|
210,377 |
|
286,784 |
|
263,338 |
|
273,100 |
|
407,355 |
|
424,063 |
|
|
Bearer bonds and notes |
|
262,833 |
|
362,771 |
|
328,059 |
|
328,288 |
|
444,133 |
|
409,422 |
|
|
Long-term loans |
|
— |
|
— |
|
— |
|
— |
|
— |
|
— |
|
|
Total foreign-currency-denominated debt |
|
780,675 |
|
1,079,575 |
|
963,557 |
|
933,340 |
|
1,269,697 |
|
1,235,790 |
|
Notes:
(1) Excluding blocked Rand accounts, ordinary and non-redeemable preference shares, quoted domestic debentures and quoted domestic loan stock.
(2) Valued at middle-market exchange rates as of the end of period.
(3) Including lending to other sectors.
Source: SARB.
Reserves and Exchange Rates
Since the abolition of the Financial Rand System and the dual exchange rate in 1995, South Africa has had a unitary market-determined exchange rate that applies to both current and capital transactions between residents and non-residents.
The nominal effective exchange rate (NEER) of the rand declined, on balance, by 4.2% in the third quarter of 2019 following an increase of 3.1% in the second quarter. The exchange value of the rand remained volatile in the third quarter of 2019 with the NEER increasing marginally by 0.9% and 0.4% in July and September respectively while declining notably by 5.5% in August amid renewed global trade tensions. In October, the NEER declined by a further 0.7% before increasing by 3.4% in November.
The exchange value of the rand depreciated markedly against the US dollar from levels of around R14.00 in July 2019 to R15.50 in August, as the Chinese yuan’s depreciation weighed on emerging market currencies. Although the exchange value of the rand appreciated briefly in early September, it again weakened to almost R15.00 against the US dollar in early October. Amid persistent weak domestic economic outcomes and increased global risk aversion, the rand traded at an average of R14.70 against the US dollar in the third quarter of 2019, substantially weaker than in the first half of the year. However, this trend was also evident among other emerging market currencies, largely due to geopolitical factors. Despite adverse domestic idiosyncratic developments, the rand as well as other emerging market currencies were to a large extent influenced by global developments and risk aversion in the third quarter.
The exchange value of the rand depreciated sharply in late October after the release of the 2019 MTBPS, which reflected a marked deterioration in South Africa’s fiscal situation. This triggered renewed concerns regarding further credit rating downgrades as Moody’s Investor Services (Moody’s) revised South Africa’s sovereign rating outlook from stable to negative, followed by Standard and Poor’s on November 22, 2019. However, the exchange value of the rand stabilized towards the end of November.
The real effective exchange rate (REER) of the rand decreased by 0.3% from December 2018 to September 2019, reflecting an improvement in the external competitiveness of domestic producers in foreign markets.
The following table sets forth, for the periods indicated, the exchange rate of the Rand per Dollar.
Rand
(Against the US Dollar)
|
Year |
|
Low |
|
High |
|
Average |
|
Period End |
|
|
2012 |
|
7.4777 |
|
8.9432 |
|
8.2099 |
|
8.4838 |
|
|
2013 |
|
8.4478 |
|
10.4849 |
|
9.6502 |
|
10.4675 |
|
|
2014 |
|
10.2815 |
|
11.7415 |
|
10.8444 |
|
11.5719 |
|
|
2015 |
|
11.2955 |
|
15.5742 |
|
12.7507 |
|
15.5742 |
|
|
2016 |
|
13.2747 |
|
16.8927 |
|
14.7088 |
|
13.6282 |
|
|
2017 |
|
12.2566 |
|
14.4606 |
|
13.3129 |
|
12.2940 |
|
|
2018 |
|
11.5604 |
|
15.5487 |
|
13.2339 |
|
14.4506 |
|
|
January 2019 |
|
13.3249 |
|
14.4870 |
|
13.8615 |
|
13.3249 |
|
|
February 2019 |
|
13.2966 |
|
14.1863 |
|
13.7956 |
|
13.9532 |
|
|
March 2019 |
|
14.1054 |
|
14.6804 |
|
14.3831 |
|
14.5968 |
|
|
April 2019 |
|
13.9210 |
|
14.4946 |
|
14.1544 |
|
14.3319 |
|
|
May 2019 |
|
14.2010 |
|
14.8641 |
|
14.4370 |
|
14.7581 |
|
|
June 2019 |
|
14.1487 |
|
15.1165 |
|
14.5665 |
|
14.1487 |
|
|
July 2019 |
|
13.8574 |
|
14.2762 |
|
14.0466 |
|
14.1784 |
|
|
August 2019 |
|
14.4699 |
|
15.4120 |
|
15.1423 |
|
15.2324 |
|
|
September 2019 |
|
14.5560 |
|
15.2256 |
|
14.8485 |
|
15.1971 |
|
|
October 2019(2) |
|
14.5509 |
|
15.3802 |
|
14.9065 |
|
15.0823 |
|
|
November 2019(2) |
|
14.5949 |
|
15.0719 |
|
14.8036 |
|
14.6955 |
|
|
December 2019(2) |
|
13.970 |
|
14.750 |
|
14.4357 |
|
14.0418 |
|
|
January 2020 (2) |
|
13.992 |
|
14.845 |
|
14.3972 |
|
14.8455 |
|
|
February 2020(2) |
|
14.763 |
|
15.617 |
|
15.0153 |
|
15.6172 |
|
|
March 2020(1) (2) |
|
15.3336 |
|
17.3757 |
|
16.1128 |
|
17.3757 |
|
Source: SARB.
(1) Through March 19, 2020
(2) Source: U.S. Federal Reserve
Change in Reserves
South Africa’s international reserve assets increased significantly by R77.2 billion in the third quarter of 2019 following a decrease of R7.7 billion in the second quarter.
The US dollar value of South Africa’s gross gold and other foreign reserves (i.e. the international reserves of the SARB before accounting for reserves-related liabilities) increased from US$49.8 billion at the end of June 2019 to US$54.9 billion at the end of September. This primarily reflected the proceeds from two international bonds of US$5.0 billion issued by the South African government. Subsequently, the value of gross gold and other foreign reserves decreased to US$54.5 billion at the end of October 2019, and increased again to US$54.9 billion at the end of November. South Africa’s international liquidity position increased slightly from US$43.9 billion at the end of June 2019 to US$44.1 billion at the end of September, and further to US$44.4 billion at the end of November.
The level of import cover (i.e. the value of gross international reserves relative to the value of merchandise imports, as well as services and income payments) increased from 4.8 months at the end of June 2019 to 5.5 months at the end of September.
The following table sets forth the gold and foreign exchange reserves of South Africa in each of the periods indicated.
Foreign Exchange Reserves
|
|
|
For the year ended December 31, |
|
As of September 30, |
| ||||||||||
|
|
|
2014 |
|
2015 |
|
2016 |
|
2017 |
|
2018 |
|
2018 |
|
2019 |
|
|
|
|
Rand (million) |
| ||||||||||||
|
SARB gold reserves(1) |
|
55,890 |
|
66,696 |
|
63,817 |
|
64,335 |
|
74,313 |
|
67,663 |
|
90,873 |
|
|
Foreign exchange reserves |
|
— |
|
— |
|
— |
|
— |
|
668,020 |
|
— |
|
743,346 |
|
|
SDR holdings(2) |
|
29,995 |
|
38,736 |
|
32,777 |
|
31,373 |
|
46,070 |
|
35,399 |
|
49,857 |
|
|
Other(3) |
|
476,639 |
|
608,575 |
|
551,232 |
|
529,070 |
|
621,950 |
|
611,636 |
|
693,489 |
|
|
Gross gold and other foreign reserves |
|
562,524 |
|
714,007 |
|
647,825 |
|
624,778 |
|
742,333 |
|
714,698 |
|
834,219 |
|
Notes:
(1) Since March 6, 2005, gold reserves are valued at market price taken at 14:30 on each valuation date.
(2) SDRs.
(3) Non-gold reserves are valued at the middle market exchange rate applicable at end of period.
Source: SARB.
PUBLIC FINANCE
Background
South Africa’s public finances comprise all finances in the three spheres of government, namely, national, provincial, and local government. Finances in the national and provincial spheres of government consist of all transfer payments from the national government while those in the local government sphere of government consist of transfer payments from national government as well as own revenue.
The Division of Revenue Act (DORA) provides for the equitable division of revenue raised nationally among the national, provincial and local spheres of government and the responsibilities of all three spheres pursuant to such division, and addresses other matters connected therewith. The objectives of DORA are to: (a) provide for the equitable division of revenue raised nationally among the three spheres of government; (b) promote predictability and certainty in respect of all allocations to provinces and municipalities, in order that provinces and municipalities may plan their budgets over a multi-year period and thereby promote better coordination between policy, planning and budgeting; and (c) promote transparency and accountability in the resource allocation process by ensuring that all allocations are reflected in the budgets of provinces and municipalities, ensuring that the expenditure of conditional allocations is reported on by the receiving provincial and municipal departments. Government finances are presented in two ways, each highlighting key aspects of the budget. The main budget determines national government’s borrowing requirement. It has two elements. The first, appropriations by Parliament through budget votes, are mainly for national departments and including transfers to provinces, local government and public entities. The second, consists of direct charges against the National Revenue Fund, include the provincial equitable share and debt service costs, as well as the salaries of judges and public representatives. The Consolidated Budget provides a fuller picture of government’s contribution to the economy. It takes into account the main budget as well as spending of provinces, social security funds and public entities financed from their own revenue.
Provincial budgets are largely financed by the provincial equitable shares and conditional grants from the main budget. But provinces supplement these funds with their own revenues, such as gambling taxes, hospital fees and sales of goods and services. Also excluded from the consolidation is expenditures by the eight “category A” metropolitan municipalities as defined by the constitution and other large municipalities, which is financed from their own revenue, such as property rates and services charges. The Consolidated Government Budget includes 185 public entities. These include large entities such as South African National Roads Agency Limited, the Passenger Rail Agency, the South African Revenue Services and agencies that provide bulk water infrastructure. Public entities receive some transfers from the main budget but are also financed from own revenue. State-owned companies that function as standalone operations largely on a commercial basis, such as Eskom and Transnet, are not included in the consolidated accounts. Social security funds include Unemployment Insurance Fund, compensation funds and the Road Accident Fund. They are financed mainly by statutory levies or contributions but receive some transfers from the main budget.
National, provincial and local governments are responsible for delivering public services. Some of these services are the exclusive responsibility of one level of government, while others — known as concurrent functions — are shared. Nationally raised revenue is divided with the aim of providing for appropriate funding at each level of government — for example by taking into account their service delivery responsibilities and other sources of revenue available to them.
Over the medium-term expenditure framework period, after budgeting for debt-service cost, the contingency reserve and provincial allocations, 47.9% of nationally raised funds are allocated to national government, 43% to provinces and 9.1% to local government. The budget for national departments is dominated by four functions (Peace and Security, Social development, learning and culture and economic development) and account for 88% of allocations. In provinces, learning and culture and health account for 75% of the budget. 99% of the local government transferes are for community development, which includes water sanitation and electricity. Local governments receive the smallest share of the division of national raised revenue as they possess their own revenue-raising powers.
General government finances in South Africa represent a consolidation of the following: the National Budget; the budgets of the nine provincial governments; extra-budgetary accounts and funds; social security funds; and the budgets of local authorities. The National Government, provincial governments, social security funds, Reconstruction and Development Programs (RDP) accounts and extra-budgetary accounts are jointly referred to in this document as the “Consolidated Government Budget.” The Consolidated Government Budget includes transfer payments to local governments but does not constitute a consolidation of local government accounts. Municipalities, universities, polytechnics and various extra-budgetary funds derive substantial shares of their revenue from fees and charges or other sources. The Consolidated Government Budget presents a broader measure of government finances in South Africa. The public sector borrowing requirement shows the budget balance for the entire public sector, including general government and the non-financial public enterprises.
The borrowing powers of provincial and local governments are regulated by law. Provinces and municipalities generally may borrow for capital projects only. Under the Constitution, provinces have their own limited taxing powers and they are responsible for preparing their own budgets and for ensuring prudent financial management at the provincial level. Provinces receive agreed shares of nationally collected revenue and a framework for ensuring an equitable division to local government. The National Treasury has introduced generally recognized accounting practices and uniform treasury norms and standards, the prescription of measures to ensure transparency and expenditure control in all spheres of government, and operational procedures for borrowing, guarantees, procurement and oversight over various national and provincial revenue funds.
In terms of Section 230 of the Constitution, provinces are allowed to take out loans for either current expenditure, in the form of a bridging loan that must be repaid within a 12-month period, or capital projects. The Borrowing Powers of Provincial Governments Act of 1996 (Borrowing Powers Act) lists the conditions under which a province may take out loans for capital projects. The Act stipulates that loans must be approved by a loan coordinating committee, which is chaired by the Minister of Finance. Loans may be taken out as direct borrowing from the national government or from private banks and financial institutions. Provinces may not take out loans in foreign currency unless they are specifically authorized to do so by the Minister of Finance. As provinces are accountable in their own right, the National Government does not guarantee loans taken out by provincial governments and will not bail out any province that is unable to repay its loans.
The Public Finance Management Act (PFMA) regulates the National Government’s financial administration and outlines the various roles of the National Treasury, the Minister of Finance (as head of the National Treasury), the National Revenue Fund, accounting officers, auditors, executive authorities, public entities and other government officials. This legislation also addresses, among other things, regulation of loans, guarantees and other commitments as well as penalties for financial misconduct. Legislation aimed at regulating local government spending, known as the Municipal Finance Management Act of 2003 (MFMA), took effect in July 2004. The legislation seeks to secure sound and sustainable management of the financial affairs of municipalities and other institutions in the local sphere of government, and to establish treasury norms and standards for the local sphere of government.
Municipalities can borrow over the long term to finance capital projects, acquire capital assets or refinance existing debt pursuant to Section 46 of the MFMA. Short-term borrowing (not for more than 12 months) is also possible for operational purposes only. However, the debt needs to be repaid within the financial year in which the debt was incurred pursuant to Section 45 of the MFMA. Furthermore, the Regulatory Framework for Municipal Borrowing recommends that every municipality should adopt a written debt policy when planning to issue debt. The policy assists in determining borrowing limits that a municipality can cope with. The MFMA further requires that all municipalities seek written comments from the public, the relevant provincial treasury and National Treasury with respect to proposed debt.
As of June 30 2019, the total balance on long term borrowing for all municipalities was R69 billion as reported by lenders to municipalities. The total long term debt reported by municipalities is slightly higher at R70.6 billion. Of the amount reported by the lenders, long term loans represented R50.8 billion or 74.0% while the remaining 26.0% was made up of R18.2 billion in bonds. The majority of long-term municipal debt is held by private sector lenders (R35.8 billion or 52.0%) while the public sector holds a total of R33.2 billion or 48.0%. The Development Bank of Southern Africa with 38.2% is the largest lender to municipalities followed by the private commercial banks accounting for a total of 31.6%. The remaining 30.1% is held by International DFI’s, the Infrastructure Finance Corporation Limited (INCA), and other lenders (including pension funds and insurers). New long-term borrowing for the 2018/19 municipal financial year totaled R8.1 billion which was 65.0% of the budgeted borrowing.
The Constitution provides that the provincial and local governments are entitled to such percentages of nationally raised revenue as may be determined by Parliament (allocated among the provinces on an equitable basis). The largest allocation to municipalities is the “local government equitable share” (LGES) which is allocated through a formula that is primarily based on how many poor households a municipality provides services to. The budgets of the provincial governments are financed through such nationally collected revenue, together with other allocations or grants from the National Government, the provinces’ own revenue collections, unspent balances from previous fiscal years and proceeds from loans for capital outlays. The Constitution provides for the assignment of taxation powers to provinces within a national, regulated framework that is intended to ensure that all taxes are consistent with national economic policy. The Provincial Tax Regulation Process Act of 2001 provides a framework through which provinces can introduce and collect certain fees and taxes. These include automobile license and traffic fees, hospital fees, gambling fees and other user charges and levies. The Financial and Fiscal Commission, a constitutionally established body, has the responsibility of monitoring and overseeing intergovernmental fiscal relations. Additionally, the Intergovernmental Fiscal Relations Act of 1997 established the Budget Council and the Budget Forum to consider intergovernmental budget issues.
The 2016 Community Survey (the largest survey between censuses) confirmed that progress continues to be made in extending access to electricity, water, sanitation and refuse removal services. The Government’s aim is to ensure that all citizens receive at least a basic level of amenities. Drawing on international benchmarks, minimum standards of 50kWh of free electricity and 6,000 litters of free water per month per household have been adopted. However, the level of free services provided to poor households varies, depending on local circumstances and municipal capacity. The national budget contributes to the financing of household amenities through the local government equitable share, which is mainly allocated for provision of free basic services. There has been a significant growth in allocations to the local government equitable share in recent years, from R20 billion in 2009/10 to R57 billion in 2017/18. Over the Medium Term Expenditure Framework, allocations will increase to R62.7 billion in 2018/19, and R69.3 billion in 2019/20.
The new local government equitable share formula which was implemented in the 2013/14 financial year, also taking into account the 2011 census figures, provides a monthly subsidy of R359 in 2017/18 for every household with a monthly income less than the value of two state old age pensions, which is about 59.0% of all households. The previous formula for the local government equitable share targeted 47.0% of households. This threshold is not an official poverty line or a required level to be used by municipalities in their own indigence policies. If municipalities choose to provide fewer households with free basic services than they are funded for through the local government equitable share, then their budget documents should clearly state the reasons for that and whether they consulted with the community on that policy. The formula also makes provision for a contribution towards the administration and governance costs of running a municipality. Allocations also take account of the greater ability of some municipalities to cross subsidize services to their poor households and less funding is allocated to these (relatively wealthy) municipalities. While census and community survey data indicates steady progress towards universal access to electricity and clean water, achievement of free basic service standards still has some way to go.
According to a joint report by the World Health Organization (WHO) and UNICEF, as of 2015, 49.18 million people in South Africa had access to piped drinking water, an increase compared to 48.42 million in 2014. An additional 2.56 million had access to non-piped drinking water a decrease compared to 2.58 in 2014. In 2015, 25.48 million people had access to sewer sanitation, 1.48 million to septic sanitation and 12.88 million to latrine sanitation an increase compared to 24.88 million, 1.46 million and 12.67 million respectively in 2014.
According to the World Bank, 84.2% of the population in South Africa had access to electricity in 2016, a decrease compared to 85.5% in 2015.
Unemployment Insurance Fund (UIF)
In 2001, the Minister of Labor tabled legislation to strengthen the administration of the UIF, target benefits more effectively to the poor and extend the coverage of the fund. Since the UIF was given an estimated amount of R605 million in 2001 to address its outstanding financial debts, it has been experiencing positive financial performances. The UIF was able to meet its operational expenditure requirement and recorded an operating cash surplus of R4.5 billion in fiscal year 2019. The March 2019 actuarial evaluation indicated that the UIF is in a sound position to meet its cash-flow requirements through 2029 in a wide range of scenarios. The UIF had capital and reserves amounting to R144.3 billion as of March 31, 2019. It is estimated that the UIF’s financial performance surplus prior to reserving over the next three fiscal years will be R1.4 billion in fiscal year 2020, R1.5 billion in fiscal year 2021 and R1.6 billion in fiscal year 2022. The projected increase in the operational surplus is mainly attributable to as the salary increases of contributors and increased compliance with the Unemployment Contributions Act. However, the projected smaller operational surplus is as a result of the implementation of the amended benefits.
The Labour Laws Amendment Act also paved the way for the introduction of parental leave for working fathers to receive financial relief while looking after their children. The Fund is currently finalizing regulations and systems development in preparation for the implementation of Parental and Commissioning Parental benefits, as well as system changes to accommodate the amendments announced in terms of Adoption benefits. The adoption benefit will be paid at a flat rate to a maximum of 70 days compared to the previous maximum of 238 days, qualifying criteria will change and this benefit will be delinked from the normal unemployment benefits. The payment of parental benefits by the fund will be in line with the 10 leave days granted and will be subject to credit days accumulated and a 66 per cent flat rate is applicable.
The UIF continues to play a pivotal role in schemes designed to inject funding into job creation and retention. In contribution to enhancing economic growth, the fund will provide funding for the retention and re-entry of contributors into employment through funding interventions such as training and business development aimed at enabling retrenched workers to re-enter into employment, as employees or as self-employed. The fund has budgeted an estimated R8 billion over the medium term for its labor activation programs aimed at enhancing the employability of contributors and training programs that would benefit 160,000 people over the next few years to create jobs and entrepreneurs around the country. The learners are going to be trained in various programs including artisanship, skills programs, learnerships, and business venture creation.
The UIF will ramp up efforts to invest in socially responsible projects that will have high impact on job creation and job preservation. Currently SRIs accounts for 24 per cent of the UIF investment portfolio, and within this portfolio the UIF has launched the R2 billion Program Development Partnership Fund (PDP) and the High Social Impact investment (HSI) to assist with job creation and job preservation. Since the launch of the PDP in November 2018 about 48 applications have been received and of those, 23 are at various stages of the screening process. The PDP Fund is also used as a catalyst for development of black fund managers. To this end 6 black fund managers have been shortlisted and the successful fund managers will each receive an allocation of a minimum of R350 million for investment projects.
The UIF added 838,922 new employees to its database, raising the total to 10,475,759 registered employees as at fiscal year 2019. A total of 1,803,831 employers are registered with the UIF as at fiscal year 2019, an increase of 64,577 new employers compared to fiscal year 2018. These employers are categorized mainly as commercial, domestic and taxi employers, with the majority in the commercial sector.
Compensation Fund (CF)
The CF supports employees who experience loss of income as a result of injuries, death or disease in the course of employment. Funds are raised through assessed levies on companies.
The CF remains financially sound with an accumulated surplus of R25.3 billion as of March 31, 2019. The CF registered 156,233 claims and paid benefits valued at R1.3 billion and medical claims amounting to R2.5 billion in fiscal year 2019. The CF recorded a 66.8% increase in the number of registered employers at the end of fiscal year 2019 with a 19.6% increase in revenue in fiscal year 2019. The increase in revenue is attributed to increased compliance by employers with the payment of the assessment fee, and an increase in the number of employers registered with the fund. The Compensation for Occupational Injuries and Diseases Amendment Bill, 2018 has been tabled in Parliament. The amendments include the provision for rehabilitation, re-integration and return to work of occupationally injured and sick employees; extend the application of the Act to include domestic workers, regulate the use of health care services and regulate compliance and enforcement and provide for matters connected therewith. In response to the dissatisfaction expressed by the public regarding the unjustifiably long turnaround time in processing claims for occupational injuries and diseases, the CF is speeding up the process of restructuring the Fund and upgrading its information technology infrastructure. The Compensation
Board reviewed existing benefits in fiscal year 2019, increasing the salary ceiling by 6.4% from R430,944 to R458,520 per annum; all pensions payable from the Compensation Fund increased by 6%. The maximum monthly earnings level on which all types of disability is based increased by 6.4%, while the minimum monthly value in respect of free food and quarters increased by 6.3% and 6.7%, respectively.
Road Accident Fund (RAF)
The fund receives its revenue from the road accident fund fuel levy, in accordance with the Customs and Excise Act (1964). In 2018/19, the fund received revenue of R43.1billion from the fuel levy while claims against the Fund for the same period amounted to R96.4 billion. As the Fund operates on a pay-as-you-go model, it has had insufficient revenue to meet its liabilities, which has resulted in a growing accumulated deficit. In 2018/19, the accumulated deficit totalled R262.8 billion.
The Government set out on a reform path in 2002, including reform of the Fund and its guiding legislation from a liability insurance scheme to a social benefit scheme. In October 2019, the Road Accident Benefit Scheme Bill was revived in the National Assembly. The reform is expected to move the system to a more equitable and affordable compensation scheme.
South African Social Security Agency (SASSA)
The South African Social Security Agency Act (2004) provides for the establishment of the South African Social Security Agency, the objectives of which are to ensure the effective and efficient administration, management, and payment of social grants. The agency’s core business is to administer and pay social assistance transfers. It has a large network of centers where citizens can apply for social grants, and manages a large system for payment of grants
The South African Social Security Agency, provides social assistance to over 17 million poor South Africans through social grants. The majority of citizens benefitting are children. The child support grant represents two-thirds of the total number of grants administered by SASSA. This grant addresses poverty among children aged up to age 18 and has grown from 70,000 social grants in 1998 to over 12 million in 2019.
Social grant beneficiaries are projected to grow from 18.011 million in 2019/20 to 19.008 in 2022/23. The social grant budget is projected to increase from R175.2 billion in 2019/20 to R216 billion in 2022/23. These budgets will cover the increases in beneficiaries as a result of population growth and also cover increases in inflation. Despite the annual increases, social grant expenditure will remain stable at around 3% of GDP.
The Budget Process
The National Government’s fiscal year ends on March 31 of each year. The Minister of Finance and National Treasury prepare the Budget with the assistance of the Minister of Finance’s Committee on the Budget and approval of Cabinet. The National Treasury is responsible for the fiscal framework within which the budget is constructed and also coordinates the preparation of expenditure estimates. South Africa ranked third out of 102 countries in the 2015 release of the Open Budget Index by the International Budget Partnership. In the 2017 release of the Open Budget Index, South Africa ranked first, alongside New Zealand, out of 115 countries. The survey measures the quality of budget transparency, public participation in the budget processes and institutional oversight. South Africa was one of only four countries that performed solidly across all three categories. The Republic ranked in the top five on measures of transparency and oversight by the legislature and audit institutions, but placed sixth in public participation.
The Minister of Finance presents the National Budget to Parliament in February of each year, with provincial treasuries separately presenting their budgets shortly after the National Budget is proposed. Since the presentation of the 1998-1999 Budget, Parliament has been presented each year with a set of three-year spending plans, but is asked to vote only on the budget for the coming year. Each year’s National Budget is based on certain key macroeconomic assumptions regarding, among other things, GDP growth, inflation, employment growth, taxable income, private consumption expenditure, government consumption expenditure, import and export levels and investment.
In addition to presenting expenditure estimates to Parliament, the Minister of Finance is responsible for estimating the revenue that existing taxes and tax rates will rise and for proposing tax amendments, if any. The National Budget then takes the form of an appropriations bill authorizing National Government expenditures. The appropriations bill originates in the National Assembly and then goes to the Standing Committee on Appropriations of the National Assembly and the Select Committee on Appropriations of the NCOP before being debated and finally passed by both houses of Parliament towards the end of the Parliamentary session. Finally, the President has to sign the bill before it becomes a law.
In April 2009, Parliament assented to the Money Bills Amendment Procedure and Related Matters Act of 2009 (the Money Bills Act). The Money Bills Act reconciles Parliament’s legislative and oversight mandate provided for in the Constitution and provides for, among other things, a procedure to amend money bills before Parliament. In general, the new Money Bills Act is viewed as a legislative milestone that will afford Parliament powers to adjust the National Budget. In exercising its powers, Parliament must ensure that: (a) there is an appropriate balance between revenue, expenditure and borrowing; (b) levels of debt and debt interest cost are reasonable; (c) the cost of recurrent spending is not deferred to future generations; and (d) there is adequate provision for spending on infrastructure development, overall capital spending and maintenance. Also, Parliament must consider the short, medium and long-term implications of the fiscal framework, division of revenue and the long-term growth potential of the economy and the development of the country. Further, it must take into account cyclical factors that may impact on the prevailing fiscal position, public revenue and expenditure.
As in the case of the National Budget, the budgets of the provincial governments have been accompanied by three-year expenditure projections since 1999. The MTEF is intended to illustrate forward trends in expenditure priorities and to provide a firmer foundation for fiscal planning and review purposes.
The Minister of Finance is required to indicate each year how the expected deficit between consolidated government expenditure and revenue is to be financed or how any surplus is to be applied. The annual Consolidated Government Budget deficit financing requirement is principally met through the issue of long term fixed and non-fixed-rate National Government debt in the domestic capital market. The South African bond market is well-developed and highly liquid, and has attracted considerable foreign investor interest. The National Government also borrows from time to time in foreign capital markets, in which case the interest due and final repayment must be repaid in foreign currency.
During each fiscal year, government departments and other spending agencies are held to the spending plans approved in the National Budget by a system of expenditure controls under the direction of the National Treasury. Subsequently, audits of all government accounts provide Parliament and the public with verification of the uses to which public funds have been put. The Auditor-General, a constitutionally independent official, supervises this auditing process. Current Auditor-General, Thembekile Kimi Makwetu, was appointed by former president Zuma on December 1, 2013, for a term of seven years.
Accountability is further promoted by the breakdown of expenditures into “votes” for particular government departments, whose director-generals are the accounting officers responsible for these monies. Further breakdowns into departmental programs and so-called economic classification items (for example, employee compensation and payments for capital assets) serve to indicate in more detail the commitment of funds to defined purposes.
The Treasury Committee, comprising the President, Deputy President, the Minister of Finance, the Deputy Minister of Finance and other Cabinet members who have been assigned the task of assisting the Cabinet in evaluating additional expenditure requests that arise during a budget year, seeks to ensure prudent fiscal management. For the Treasury Committee to approve an additional expenditure request, the expenditure must be deemed to be unforeseeable and unavoidable, or to fall within another legally prescribed category to qualify for inclusion in the Adjustments Budget. A contingency reserve is set aside each year of the MTEF to deal with such requests. Such amendments to some elements of the current year’s budget and the consolidated budget (in departmental allocations) are made by Parliament in an Adjustments Budget towards the middle of the fiscal year.
Also, around the end of October of each year, the Minister of Finance presents the MTBPS. This policy statement outlines the priority policy proposals and the new MTEF that will underpin the next year’s budget.
Set forth below are summaries of the 2019 MTBPS presented on October 30, 2019, the 2020 Budget presented on February 26, 2020, and the 2019 Budget presented on February 20, 2019.
Medium Term Budget Policy Statement (MTBPS)
On October 30, 2019, the Minister of Finance presented the 2019 MTBPS.
The 2019 MTBPS sets out the macroeconomic, fiscal and public-expenditure priorities for the medium term. South Africa’s budget is strongly aligned with constitutional imperatives and is highly progressive. Over the past years, the government has followed a path of measured fiscal consolidation, aiming to stabilize the debt-to-GDP ratio by reducing spending and introducing tax increases. This strategy met with some success, reflected in a narrowing primary deficit, but debt has continued to rise as a share of GDP given that economic growth rates have declined.
The audited gross tax revenue outcome of R1.288 trillion for the fiscal year 2018 was R57.3 billion lower than the original budget estimate in February 2018 and R14.5 billion lower than the revised 2019 Budget Review estimate. These were the largest under-collections since 2009/10, following the global financial crisis. They were partly driven by large and unexpected once-off payments of value-added tax (VAT) refunds in line with
commitments made in the 2018 MTBPS of clearing the VAT refunds backlog. The bulk of the 2018 revenue shortfall resulted from weaker-than-expected economic growth in 2019. Compared with the 2019 Budget estimates, corporate income tax (CIT), personal income tax (PIT) and VAT were the worst-performing tax categories, recording under-collections of R6.4 billion, R5.4 billion and R1.2 billion. The under-collections were partially offset by over-collections in the health promotion levy and specific excise duties.
Significant shortfalls in a single year have a knock-on effect, widening the gap between forecasts and outcomes in subsequent years. Gross tax revenue needed to grow at 10.4 per cent this year to reach the 2019 Budget estimate. Due to the weak economy and base effects from unusually low VAT refund payments in the first half of 2018, revenue growth has been 3.7 per cent in the first half of 2019. The National Treasury expects revenue growth to accelerate to 6.4 per cent for the fiscal year.
Along with weaker economic growth, high and consistent VAT refund payments will result in a downward revision to the 2019 revenue projection, which is now estimated at R52.5 billion lower than the 2019 Budget estimate. Revenue growth is weaker for several reasons, including:
· A poor employment outlook, with job losses, lower-wage settlements and smaller bonuses reducing personal income tax collection.
· Reduced profitability in a challenging trading environment, resulting in lower-than-expected corporate income tax collections.
· Weak household consumption, which moderates the increase in domestic VAT collection.
The Nugent Commission of Inquiry into SARS highlighted significant governance failures, the dismantling of critical organizational arrangements and the loss of experienced staff, which contributed to poor revenue collection in recent years. Under the new SARS Commissioner, the revenue authority is revitalizing its operations, and performance is expected to improve significantly over the medium term. The SARS Large Business Centre, which focuses on major firms and high net-worth individuals, was officially reopened in October 2019. The National Treasury will release a discussion document that reviews and proposes options to improve tax administration oversight by the 2020 Budget.
In the 2019 MTBPS, consolidated government revenue is projected to increase from R1.618 trillion in 2020/21 to R1.841 trillion in 2022/23. Gross tax revenue is projected to fall short of the 2019 Budget estimates by R52.5 billion in 2019/20, R84 billion in 2020/21 and R114.7 billion in 2021/22. Gross tax revenue for 2019/20 has been revised downwards as a result of lower-than-expected 2018/19 revenue outcomes, persistently weak economic growth and downward revisions to expected growth in major tax bases. Lower revenue growth in 2019/20 feed-through to the years ahead. Besides, VAT refund payments are expected to remain at elevated levels in the current fiscal year.
Government’s three-year spending plans aim to reduce poverty and inequality, and to increase employment and inclusive growth. These priorities are set out in the NDP and the MTSF, which guide resource allocation. Healthcare, education, basic services and social grants continue to receive priority in allocations. Despite a constrained fiscal environment, these areas grow in real terms by 1-2% per year. Government projects total expenditure of R6.3 trillion over the 2019 MTEF period, growing from R1.8 trillion in 2019/20 to R2.2 trillion in 2022/23 at an average annual growth rate of 6.3 per cent. Despite moderate economic growth projections, spending growth will outpace inflation, with real non-interest expenditure growth expected to average 0.5% in real terms over the period. Debt-service costs as an expenditure category grow the fastest at 8.3% in real terms over the MTEF period.
The deficit is projected to reach 5.9% of GDP by 2022/23. Gross loan debt is expected to increase from R3.2 trillion or 60.8 per cent of GDP in 2019/20 to R4.5 trillion or 71.3 per cent of GDP in 2022/23, mainly to finance the budget deficit. The key drivers of this increase remain the budget balance and fluctuations in the interest, inflation and exchange rates. Government is acutely aware of the dangers of unchecked debt accumulation. To return the public finances to a sustainable position over the longer term requires large additional adjustments. Government proposes a fiscal target: achieve the main budget primary balance, excluding Eskom funding provisions, by 2022/23. This target is expected to result in debt stabilizing by 2025/26.
Non-interest spending has increased by R23 billion in the current year, mainly due to a Special Appropriation Bill that allocates R26 billion to Eskom. Additions to spending are offset by the use of the contingency reserve, provisional allocations, projected under spending and declared unspent funds. Government has accommodated all other expenditure pressures within budget baselines. The expected savings on compensation announced in the 2019 Budget have been reversed. Compensation measures, which include early retirement without penalties, were anticipated to generate savings of R12 billion per year in 2020/21 and 2021/22. These measures will be
included in a broader discussion between government and labor on future adjustments to wage bill growth. In total, the real main budget non-interest spending grows at 1.2% in 2020/21, and 0.1% in 2021/22. Government is constraining non-interest expenditure in the outer year to grow largely in line with CPI inflation. As a share of GDP, non-interest expenditure moderates from 28.4% in 2020/21 to 27.4% by 2022/23. This includes a contingency reserve amounting to R6 billion per year over the medium term. Due to a wider deficit, weaker currency and higher interest rates, the cost of servicing government debt is expected to exceed 2019 Budget estimates by R1.5 billion in 2019/20, R8.7 billion in 2020/21 and R17.2 billion in 2021/22. An estimated 18.4 per cent of main budget revenue will be used to service debt in 2022/23 compared with 15 per cent in 2019/20.
There is a resource allocation of R1.480 trillion across the three spheres of government in fiscal year 2019/20. This increases to R1.713 trillion by fiscal year 2022/23. The proposed division of revenue prioritizes large social spending programs that support basic education, health and social welfare services in provinces and water, sanitation and electricity services in municipalities. Provincial and municipal governments face multiple pressures over the period ahead. Provinces are expected to provide schooling for growing learner populations and improve health services before NHI is implemented. Local government is expected to continue to expand access to free basic services for poor households, while ensuring that those who can afford to pay for services do so, even in a challenging economic environment. Although transfers from the national government will grow more slowly than in the past, planned reforms to the transfer system aim to improve efficiency in the use of these resources. Over the medium term, government proposes to allocate 48.1% of available non-interest expenditure to national departments, 43% to provinces and 8.9% to local governments. Over this period, national government resources grow at an annual average of 2.3%, provincial resources by 6.1% and local government resources by 6.2%.
2020 MTEF
The 2019 MTBPS has announced the 2020 MTEF, which sets out the consolidated expenditure framework for fiscal year 2019/20 through to fiscal year 2022/23. The framework consists of revised baseline estimates reflecting the government’s current spending priorities, including community development, social development, economic development, health services, as well as learning and culture (which take up the largest of planned expenditure). Steady growth over the future spending period can be seen in health, community development, economic development, social protection and basic education.
2020-2021 National Budget and Consolidated Government Budgets
On February 26, 2020, the Minister of Finance presented the 2020 Budget.
2020-2021 National Budget
The 2020 Budget proposes total consolidated spending of R1.95 trillion in 2020/21, with the largest allocations going to learning and culture (R396.4 billion), health (R229.7 billion) and social development (R309.5 billion).
The 2020 Budget assumes that the economic outlook will continue to remain weak, with real GDP expected to grow at 0.9% in 2020, 1.3% in 2021 and 1.6% in 2022. To achieve faster economic growth, far-reaching structural reforms are required.
The 2020 Budget acknowledges that South Africa’s public finances have continued to deteriorate. Low growth has led to a downward revision of R63.3 billion to estimates of tax revenue in 2019/20 relative to the 2019 Budget. Debt is not projected to stabilize over the medium term, and debt-service costs now absorb 15.2% of main budget revenue.
A sharp decline in nominal GDP since 2018/19 and associated tax revenues resulted in an estimated consolidated budget deficit of 6.3% in 2019/20. The 2020 Budget proposes measures to reduce public spending as a share of GDP and improve the composition of spending by reducing growth in the wage bill. Over the medium term, spending baselines will be reduced by R261 billion according to the 2020 Budget. The consolidated budget deficit is expected to narrow from 6.8% in 2020/21 to 5.7% of GDP in 2022/23.
Consolidated government spending is expected to grow at an average annual growth rate of 5.1%, from R1.84 trillion in 2019/20 to R2.14 trillion in 2022/23. Debt-service costs are the fastest-growing expenditure item over the medium term, rising at an annual average rate of 12.3%, which is more than double the average growth rate for total expenditure, while compensation of employees continues to account for the largest portion of total spending, at 32.7% over the medium term. Transfers and subsidies, including transfers to local government and public entities, account for 33.1% of total spending.
In order to support fiscal sustainability, the 2020 Budget has reduced the main budget expenditure baseline by R156.1 billion over the next three years in comparison with 2019 Budget projections. This is approximately 1% of GDP per year. The net reduction is mainly the result of the following changes over the medium term:
· Reductions to spending baselines of R261 billion, which includes a R160.2 billion reduction to the wage bill of national and provincial departments, and national public entities; and
· Reallocations and additions totalling R111.1 billion, of which R60.1 billion is set aside for Eskom and SAA.
Consolidated government expenditure, 2019-2023
|
|
|
2019/20 |
|
2020/21 |
|
2021/22 |
|
2022/23 |
|
Percentage |
|
Average |
|
|
Fiscal year |
|
Revised |
|
Medium-term estimates |
|
|
|
|
| ||||
|
Economic Classification |
|
1,095,868 |
|
1,143,427 |
|
1,218,008 |
|
1,286,331 |
|
59.6 |
% |
5.5 |
% |
|
Current payments |
|
629,200 |
|
638,865 |
|
667,815 |
|
697,113 |
|
32.7 |
% |
3.5 |
% |
|
Compensation of employees |
|
251,656 |
|
265,078 |
|
281,465 |
|
288,525 |
|
13.6 |
% |
4.7 |
% |
|
Goods and services |
|
215,012 |
|
239,484 |
|
268,728 |
|
300,693 |
|
13.2 |
% |
11.8 |
% |
|
Interest and rent on land |
|
|
|
|
|
|
|
|
|
|
|
|
|
|
of which Debt-service costs |
|
205,005 |
|
229,270 |
|
258,482 |
|
290,145 |
|
12.7 |
% |
12.3 |
% |
|
Transfers and subsidies |
|
599,650 |
|
640,225 |
|
671,805 |
|
713,436 |
|
33.1 |
% |
6.0 |
% |
|
Municipalities |
|
137,654 |
|
145,339 |
|
155,518 |
|
165,464 |
|
7.6 |
% |
6.3 |
% |
|
Departmental agencies and accounts |
|
26,591 |
|
28,639 |
|
27,012 |
|
28,492 |
|
1.4 |
% |
2.3 |
% |
|
Higher education institutions |
|
46,555 |
|
48,278 |
|
50,341 |
|
51,873 |
|
2.5 |
% |
3.7 |
% |
|
Foreign governments and international organizations |
|
2,589 |
|
2,880 |
|
2,838 |
|
3,029 |
|
0.1 |
% |
5.4 |
% |
|
Public corporations and private enterprises |
|
35,361 |
|
35,540 |
|
39,865 |
|
43,227 |
|
1.9 |
% |
6.9 |
% |
|
Non-profit institutions |
|
37,089 |
|
41,023 |
|
43,696 |
|
45,849 |
|
2.1 |
% |
7.3 |
% |
|
Households |
|
313,810 |
|
338,528 |
|
352,534 |
|
375,503 |
|
17.4 |
% |
6.2 |
% |
|
Payments for capital assets |
|
82,804 |
|
92,147 |
|
101,411 |
|
108,975 |
|
4.9 |
% |
9.6 |
% |
|
Buildings and other capital assets |
|
63,727 |
|
71,527 |
|
79,612 |
|
85,692 |
|
3.9 |
% |
10.4 |
% |
|
Machinery and equipment |
|
19,077 |
|
20,620 |
|
21,799 |
|
23,284 |
|
1.1 |
% |
6.9 |
% |
|
Payments for financial assets |
|
65,223 |
|
73,646 |
|
44,116 |
|
27,298 |
|
|
|
|
|
|
Total |
|
1,843,546 |
|
1,949,445 |
|
2,035,339 |
|
2,136,040 |
|
100.0 |
% |
5.0 |
% |
|
Contingency reserve |
|
— |
|
5,000 |
|
5,000 |
|
5,000 |
|
|
|
|
|
|
Consolidated expenditure |
|
1,843,546 |
|
1,954,445 |
|
2,040,339 |
|
2,141,040 |
|
|
|
5.1 |
% |
Note:
(1) The main budget and spending by provinces, public entities and social security funds financed from own revenue.
Source: National Treasury.
Consolidated government expenditure by function, 2019-2023
|
|
|
2019/20 |
|
2020/21 |
|
2021/22 |
|
2022/23 |
|
Percentage |
|
Average |
|
|
Fiscal year |
|
Revised |
|
Medium-term estimates |
|
|
|
|
| ||||
|
Learning and Culture |
|
385,593 |
|
396,422 |
|
417,767 |
|
434,166 |
|
23.4 |
% |
4.0 |
% |
|
Basic Education |
|
262,458 |
|
265,881 |
|
281,433 |
|
293,211 |
|
15.7 |
% |
3.8 |
% |
|
Post-school education and training |
|
112,087 |
|
118,847 |
|
124,209 |
|
128,386 |
|
7.0 |
% |
4.6 |
% |
|
Arts, culture, sport and recreation |
|
11,049 |
|
11,694 |
|
12,125 |
|
12,569 |
|
0.7 |
% |
4.4 |
% |
|
Health |
|
221,962 |
|
229,707 |
|
243,970 |
|
257,559 |
|
13.7 |
% |
5.1 |
% |
|
Social Development |
|
284,479 |
|
309,512 |
|
320,056 |
|
340,924 |
|
18.2 |
% |
6.2 |
% |
|
Social protection |
|
207,528 |
|
221,483 |
|
236,319 |
|
252,037 |
|
13.3 |
% |
6.7 |
% |
|
Social security funds |
|
76,951 |
|
88,029 |
|
83,738 |
|
88,887 |
|
4.9 |
% |
4.9 |
% |
|
Community Development |
|
201,675 |
|
212,347 |
|
228,194 |
|
242,169 |
|
12.8 |
% |
6.3 |
% |
|
Economic Development |
|
198,906 |
|
211,531 |
|
228,224 |
|
240,911 |
|
12.7 |
% |
6.6 |
% |
|
Industrialzation and exports |
|
37,393 |
|
39,016 |
|
43,672 |
|
45,664 |
|
2.4 |
% |
6.9 |
% |
|
Agriculture and rural development |
|
29,608 |
|
28,342 |
|
29,637 |
|
30,658 |
|
1.7 |
% |
1.2 |
% |
|
Job creation and labor affairs |
|
21,742 |
|
22,437 |
|
25,158 |
|
26,555 |
|
1.4 |
% |
6.9 |
% |
|
Economic regulation and infrastructure |
|
94,467 |
|
105,311 |
|
112,566 |
|
120,258 |
|
6.3 |
% |
8.4 |
% |
|
Innovation, science and technology |
|
15,697 |
|
16,425 |
|
17,191 |
|
17,776 |
|
1.0 |
% |
4.2 |
% |
|
Peace and security |
|
214,365 |
|
217,001 |
|
221,291 |
|
228,804 |
|
12.5 |
% |
2.2 |
% |
|
Defence and state security |
|
50,766 |
|
51,378 |
|
48,932 |
|
50,439 |
|
2.8 |
% |
(0.2 |
)% |
|
Police Services |
|
105,163 |
|
106,127 |
|
110,758 |
|
114,186 |
|
6.2 |
% |
2.8 |
% |
|
Law courts and prisons |
|
48,448 |
|
49,604 |
|
51,992 |
|
53,641 |
|
2.9 |
% |
3.5 |
% |
|
Home Affairs |
|
9,988 |
|
9,891 |
|
9,609 |
|
10,538 |
|
0.6 |
% |
1.8 |
% |
|
General public services |
|
66,337 |
|
70,009 |
|
73,238 |
|
74,064 |
|
4.1 |
% |
3.7 |
% |
|
Executive and legislative organs |
|
14,202 |
|
14,571 |
|
14,443 |
|
15,028 |
|
0.8 |
% |
1.9 |
% |
|
Public administration and fiscal affairs |
|
44,342 |
|
47,277 |
|
50,414 |
|
50,279 |
|
2.8 |
% |
4.3 |
% |
|
External affairs |
|
7,793 |
|
8,161 |
|
8,381 |
|
8,758 |
|
0.5 |
% |
4.0 |
% |
|
Payments for financial assets |
|
65,223 |
|
73,646 |
|
44,116 |
|
27,298 |
|
|
|
|
|
|
Allocated by function |
|
1,638,541 |
|
1,720,175 |
|
1,776,857 |
|
1,845,895 |
|
100.0 |
% |
4.1 |
% |
|
Debt-service costs |
|
205,005 |
|
229,270 |
|
258,482 |
|
290,145 |
|
|
|
12.3 |
% |
|
Contingency reserve |
|
— |
|
5,000 |
|
5,000 |
|
5,000 |
|
|
|
|
|
|
Consolidated expenditure |
|
1,843,546 |
|
1,954,445 |
|
2,040,339 |
|
2,141,040 |
|
|
|
5.1 |
% |
Note:
(1) The main budget and spending by provinces, public entities and social security funds financed from own revenue.
Source: National Treasury.
Taxation
The 2020 Budget aims to follow a progressive tax system by broadening the tax base and eliminating exemptions or deductions where possible, while balancing considerations of fairness and economic growth. The Budget states that the goal of the tax system is to make it easy for individuals and firms to comply with the law and to minimize distortions so that they do not base their decisions on tax outcomes. Crucially, the system should continue to generate tax revenue throughout the business cycle.
The 2019 Budget announced an additional R10 billion in tax revenue would be raised in 2020/21 to support fiscal consolidation. At the time of the 2019 Budget, real GDP growth was expected to be 1.5% for 2019 and 1.7% for 2020. Since then, growth estimates have been revised downward to 0.3% for 2019 and 0.9% for 2020. Substantial tax increases may obstruct short-term recovery. As a result, the government has not planned to raise any taxes to collect the additional R10 billion in 2020/21. Key tax changes in the 2020 Budget include the following:
· personal income tax relief through an above-inflation increase in the brackets and rebates;
· further limits to corporate interest deductions to combat base erosion and profit shifting;
· restrictions concerning the ability of companies to fully offset assessed losses from previous years against taxable income;
· an increase of the fuel levy by 25c/liter, consisting of a 16c/liter increase in the general fuel levy and a 9c/liter increase in the RAF levy, to adjust for inflation;
· an increase in the annual contribution limit to tax-free savings accounts by R3,000 from March 1, 2020; and
· an increase in excise duties on alcohol and tobacco between 4.4% and 7.5%.
Revenue trends and tax proposals
The revenue projections assume annual adjustments in personal income tax brackets, levies and excise duties in line with inflation. No other changes to tax rates are assumed. These assumptions result in tax revenue projections that are lower than the 2019 MTBPS estimates by R35.4 billion in 2020/21, R43.5 billion in 2021/22 and R48.5 billion in 2022/23.
Personal income tax
The personal income tax brackets and the primary, secondary and tertiary rebates will be increased by 5.2% for 2020/21, which is above expected inflation of 4.4%. This adjustment provides R2 billion in tax relief. The change in the primary rebate increases the tax-free threshold from R79,000 to R83,100.
Medical tax credits
The 2020 Budget proposes an increase in the value of medical tax credits in 2020/21 by 2.8%. The credit is adjusted by less than inflation to help aid and fund the rollout of the national health insurance program over the medium term.
Tax-free savings accounts
The annual limit on contributions to tax-free savings accounts will be increased from R33,000 to R36,000 from March 1, 2020.
Export taxes
The Government has not generally used export taxes on the basis they would negatively impact trade. However, the Government has indicated that it will consult with affected industries on the introduction of export taxes on scrap metal, which could replace the current price preference system. Proposed export taxes will apply to ferrous metals at the rate of R1,000 per ton, aluminum at R3,000 per ton, red metals at R8,426 per ton, and other waste and scrap metals at R1,000 per ton. This reform aims to improve the availability of better-quality scrap metal at affordable prices for domestic foundries and mills. Consultation is expected to be concluded by the end of May 2020, for consideration in the annual tax bill.
Sin Tax
The 2020 Budget indicated that excise burdens for most types of alcoholic beverages and tobacco products have exceeded the targeted level as a result of above-inflation increases and price fluctuations. Accordingly, the 2020 Budget increases most excise duties by an amount that matches expected inflation of 4.4% cent for 2020/21, and by 6% in the case of sparkling wine and 7.5% for pipe tobacco and cigars.
Levies on fuel
To adjust for inflation, the government proposes to increase the general fuel levy by 16c/liter and the RAF levy by 9c/liter from April 1, 2020.
Carbon tax
The carbon tax rate will increase by 5.6% for the 2020 calendar year. This increase includes an annual inflation rate of 3.6% plus two percentage points in line with the Carbon Tax Act (2019). Accordingly, the carbon tax rate will increase from R120 per ton of carbon dioxide equivalent to R127 per ton of carbon dioxide equivalent.
Corporate income tax
To promote economic growth, the 2020 Budget indicates that the Government intends to restructure the corporate income tax system over the medium term by broadening the base and reducing the rate. Broadening the base will involve minimizing tax incentives and introducing new interest deduction and assessed loss limitations. Rate reductions will be implemented in a revenue-neutral basis. Since the early 2000s, the Government has sought to broaden the corporate income tax base by taxing foreign dividends, imposing capital gains tax and introducing the controlled foreign company regime. In contrast with many other countries, however, South Africa’s corporate income tax rate has remained unchanged at 28% for more than a decade, which is above the rate of many of South Africa’s trade and investment partners (e.g., India, the United States and the United Kingdom). The Government believes this has had a negative impact on competitiveness. The Government expects that reducing the corporate income tax rate will encourage businesses to invest and expand production,
improve the country’s competitiveness as an investment destination and reduce the appeal of base erosion and profit shifting.
State-owned companies
The 2020 Budget notes that in recent years, a pattern of mismanagement and poor governance at major state-owned companies has led to operational failures, financial distress and increased demands for taxpayer support through the national budget. This problem is compounded by broad, sometimes unfunded mandates and, in some cases, outdated business models.
Over the past 12 years, the Government has allocated R162 billion to financially distressed state-owned companies. These allocations generally provide short-term support, but cannot substitute for the far-reaching structural reforms needed to return each company to operational and financial stability. Of the total allocations, Eskom accounts for 82%. In 2019/20, the Government allocated R49 billion to Eskom and committed R112 billion in medium-term funding. The 2020 Budget notes the following issues and priorities:
· Eskom: Eskom does not generate sufficient cash to cover debt and finance costs and is reliant on state support. Since 2008, the Government has provided significant financial support to Eskom. This includes conditional funding totaling R105 billion in 2019/20 and 2020/21, to improve accountability and address inefficiencies. The conditions relating to this funding include reducing primary energy costs, containing other costs and making progress on restructuring.
· South African Airways: Since 2008/09, SAA has incurred net losses of over R32 billion. The Government has set aside R16.4 billion over the medium term for SAA to repay its guaranteed debt and cover debt-service costs. The Government anticipates that additional funding will be required to cover restructuring costs in line with the business rescue plan.
· South African Express: Cumulative losses of South African Express amount to R1.2 billion over the past 10 years. The airline was recently placed under involuntary business rescue, which it intends to appeal. The Government will need to assess its appetite for continued ownership of the carrier, given that it has a limited role in the local aviation market.
· Denel: In response to liquidity problems, the Government provided Denel with R1.8 billion in 2019/20. State guarantees granted to the entity amount to R6.9 billion. Additional funding of R576 million is allocated for 2020/21. This support is allocated with conditions that emphasize the need for Denel to speedily implement its turnaround plan. The plan includes exploring private-sector participation, optimizing its property and plant, and developing an appropriate funding model.
· South African Broadcasting Corporation: The Government allocated R3.2 billion to SABC in 2019/20 to enable it to pay its bills, of which R2.1 billion has been transferred. This support is allocated with conditions that include a review of broadcasting sector policies to respond to advances in technology, the developmental mandate and evaluating opportunities for private-sector participation. The remaining R1.1 billion is expected to be transferred to the SABC by March 31, 2020.
Growth reforms to lower the cost of doing business
The 2020 Budget includes the following reforms:
· Electricity: Acquire additional electricity from existing IPPs, open bid window 5, procure an additional 2,000-3,000MW of emergency power, allow municipalities to procure power from the private sector and make changes to electricity regulations to allow for self-generation.
· Ports: Accelerate corporatization of the National Ports Authority.
· Rail: Economic Regulation of Transport Bill to be put before Parliament; implicit subsidization of road freight should cease.
· Telecoms: Accelerate digital migration and continue work to release spectrum through an auction, enforcement of open-access conditions and issuance of rapid deployment guidelines.
· Support small business and enhance industrial policy by implementing:
· Competition Commission recommendations on retail and telecoms;
· Ease of Doing Business project proposals (i.e. launch of the Bizhub portal); and
· Sectoral Master Plans to boost investment and employment.
Social grants
Over the medium term, the total number of social grant beneficiaries is expected to increase by almost 1 million, to approximately 19 million by 2022/23. Over the MTEF period, funds amounting to R714 million are reprioritized from the Department of Social Development to its provincial counterparts for programs aimed at preventing HIV and AIDS infections, substance abuse, gender-based violence and femicide. Furthermore, funds amounting to R406.2 million in 2020/21, R517.3 million in 2021/22 and R626 million in 2022/23 are reprioritized, mainly to the early childhood development conditional grant. As a result, the subsidy rate per child will increase by 23.8%, from R15 in 2019/20 to R18.57 in 2022/23.
State bank
The 2020 Budget includes provisions for state banks. In 2019, Parliament passed legislation to allow state-owned companies to apply for banking licenses. Postbank is in the process of applying for such a license. The design of any state bank will protect the fiscus in the event of poor governance, non-performing loans or shortages in capital funding. The Minister of Finance indicated that the preferred options for the establishment of a bank are now ready, and include the architecture of a retail bank operation on commercial principals. The state bank will be subject to the Banks Act, will have an appropriate capital structure and performance parameters on investments and loan impairments. It will be regulated by the Prudential Authority.
Sovereign wealth fund
As part of the 2020 Budget speech, the Minister of Finance announced the formation of the South African Sovereign Wealth Fund with a target capital amount of about R30 billion, which converts to about US$2 billion. The Minister of Finance noted the legal, administrative and procedural issues involved, and that a relevant bill would be submitted to Parliament. Funding sources may include proceeds of spectrum allocation, petroleum, gas or minerals rights royalties, the sale of non-core state assets, future fiscal surpluses and money that the Government will set aside.
Government debt and borrowing plans
The Government’s gross borrowing requirement grew by 21.4% over the past year to R407.3 billion and is expected to reach R497.5 billion in 2022/23. About 90% of government debt is rand-denominated, which shields the Government from some volatility in debt costs due to fluctuations in the exchange rate. However, higher yields, especially on longer-dated domestic bonds, have increased borrowing costs.
To provide for a diversified debt portfolio that spreads risk, the Government expects that the requirement will be met from short- and long-term borrowing in the domestic market and from foreign-currency loans. Short-term borrowing consists of Treasury bills with maturities of 12 months or less and bridging finance from the Corporation for Public Deposits. Long-term loans include fixed-rate, inflation-linked and retail savings bonds. Foreign-currency loans will be in the form of foreign bonds. The Government is preparing to issue a domestic Islamic bond in 2020/21.
Gross loan debt is estimated to increase from R3.18 trillion (61.6% of GDP) in 2019/20 to R4.38 trillion (71.6% of GDP) in 2022/23. Net loan debt is estimated to increase from R2.94 trillion (57% of GDP) in 2019/20 to R4.15 trillion (67.8% of GDP) in 2022/23. Contingent liabilities, which mainly include guarantees to state-owned companies, are projected to reach R979.9 billion on March 31, 2020.
Risks to the financing strategy
The 2020 Budget noted the following key risks to the financing strategy:
· A widening budget deficit. If GDP growth contracts or spending increases, for example, through additional support to state-owned companies, debt and borrowing costs would increase.
· Inflation and exchange-rate risks. Unanticipated increases in inflation or depreciation in the rand exchange rate would increase the cost of outstanding inflation-linked or foreign-currency debt.
· Sovereign credit ratings. Further downgrades of South Africa’s credit ratings could lead to higher costs of borrowing.
Largest risks to the fiscal outlook
The 2020 Budget also noted that in terms of the fiscal outlook, persistently weak economic growth is the central factor limiting improved public finances. Over the period ahead, other risks that could widen the budget deficit and raise debt-service costs include:
· Insufficient progress on Eskom reforms and its financial position, as well as demands from other financially distressed state-owned companies.
· Outcomes of the renegotiation of the existing public-sector wage agreement and the following round of wage talks.
· The Road Accident Fund is the Government’s second-largest contingent liability after Eskom. A decision on the Road Accident Benefit Scheme Bill is required to pave the way for a more affordable system.
· Clarity on the Government’s position on the user-pay principle as it relates to e-tolls. Declining e-toll revenue will have to be offset by other measures to repay the debt of the South African National Roads Agency Limited. It could also affect funding for other investment project.
2019-2020 National Budget and Consolidated Government Budgets
On February 20, 2019, the Minister of Finance presented the 2019 Budget.
2019-2020 National Budget
In February 2019, the South African Minister of Finance submitted the 2019-2020 National Budget to Parliament. The 2019-2020 National Budget and the three-year MTEF estimates prioritized the following three areas:
· Narrowing the budget deficit and stabilizing the national debt-to-GDP ratio.
· Supporting restructuring of the electricity sector, and reducing the immediate risks Eskom poses to the economy and the public finances.
· Renewing economic growth by strengthening private-sector investment, improving the planning and implementation of infrastructure projects, and rebuilding state institutions.
The 2019 Budget proposed a series of tax and expenditure measures aimed at narrowing the deficit and stabilizing the debt-to-GDP ratio. Over the medium term, additions to spending amounted to R75.3 billion, consisting mainly of transfers to support the reconfiguration of Eskom. These additions were partially offset by reductions to baselines and proposed savings from compensation adjustments totaling R50.3 billion. Tax measures were aimed at raising an additional R15 billion in 2019/20 and R10 billion in 2020/21. In combination, these measures were expected to narrow the consolidated budget deficit from a projected 4.5% of GDP in 2019/20 to 4% of GDP in 2021/22. The gross national debt was projected to stabilize at 60.2% of GDP in 2023/24. Net loan debt (gross loan debt excluding government’s cash balances) was expected to stabilize at 57.3% of GDP in 2024/25.
Over the medium term, the composition of spending was projected to improve gradually. In line with the President’s economic stimulus and recovery plan, initiatives to boost infrastructure spending were announced. The capital financing requirement, which is the sum of capital payments, transfers and receipts, was expected to remain in deficit, at about 3% of GDP, over the medium term. Capital payments and transfers were estimated to grow by a nominal annual average of 8.3%. The current deficit — the gap between revenue and current spending — was projected to narrow over the MTEF period. Total consolidated government spending over the MTEF period was expected to be R5.87 trillion, with budgets amounting to R1.83 trillion in 2019/20, R1.95 trillion in 2020/21 and R2.09 trillion in 2021/22. The bulk of spending was allocated to learning and culture, social development, health and community development. The primary risks to the fiscal outlook stemmed from the macroeconomic forecast. A sharp rise in bond yields, exchange rate depreciation or lower economic growth could widen the deficit and delay debt stabilization. The main expenditure risk to the fiscus emanated from state-owned companies. Several major companies were in financial distress. If reforms to restore their financial sustainability are unsuccessful, risks from associated contingent liabilities, alongside requests for fiscal support, may materialize.
The 2019 National Budget estimated 2019/20 gross tax revenue (after the proposal) to amount to R1.422 trillion. Revenue measures were expected to raise R15 billion in 2019/20. Nearly all of the increase in revenue were effected through direct taxes, with no rate increases. Government proposed a small increase in personal income tax rebates, with no inflationary adjustments to the tax brackets, and no inflationary increase in medical tax credits. Indirect taxes made a smaller contribution through the increase in the general fuel levy, after the
substantial increase in indirect taxes as a result of the one percentage point increase in VAT announced in the 2018 National Budget.
The 2019-2020 National Budget estimated that total national revenues for the fiscal year 2019 would amount to R1.3 trillion. The national budget expenditures for the fiscal year 2019 were estimated at R1.659 trillion. Consequently, the main budget deficit, which is the government’s net borrowing requirement, was estimated at R255.2 billion, or 4.7% of GDP. As a result of fiscal measures, the primary deficit was projected to narrow to 0.3% by 2021/22, from 0.8% in 2018/19.
2019-2020 Consolidated Government Budget
The amounts reflected in the budget votes of the national departments whose functions are partially devolved to the provinces do not illustrate total allocations to such functions. By contrast, the Consolidated Government Budget presents a more relevant measure of trends and priorities in government finances in South Africa, particularly in the socio-economic field, and hence the tables and discussion below focus on this measure of government expenditure. See “Public Finance—Background.”
In the 2019 National Budget, the consolidated government expenditure was expected to increase from R1.665 trillion in 2018/19 to R2.089 trillion by 2021/22. This represents a real annual average growth of 2.4%. The consolidated government budget deficit was estimated to narrow from 4.2% of GDP in 2018/19 to 4% by 2021/22. The deficit on the Consolidated Government Budget is lower than that in the main National Budget due to surpluses in the provinces, public entities and the social security funds, primarily the Unemployment Insurance Fund.
The estimated 2019-2020 Consolidated Government Budget continues to build on policy priorities established in 2001, with a particular emphasis on growth-enhancing spending as well as spending programs that target the poor and vulnerable groups. Growth in all categories of social services spending reflects the National Government’s commitment to improving the social well-being of South Africans.
In 2018/19, learning and culture, mainly basic education, was the largest category of expenditure receiving 23.9% of total allocations, followed by social development, health, peace and security and economic affairs. The largest category of spending in terms of inputs required, however, remains compensation of employees which accounts for 35.1 of expenditures. Transfers to households also remained significant. Consolidation amid a prolonged low growth calls for more vigilance in budgeting, and steps are being taken across government to improve budget execution and the in-year monitoring of spending. National and provincial departments and municipalities submit monthly reports to the National Treasury. To strengthen oversight, a process has been initiated for all national public entities quarterly. This will improve transparency and provide early warnings of budget deviations.
The following table sets forth the Consolidated Government Expenditure as set out in the 2019 MTBPS for the periods indicated.
Consolidated government expenditure, 2016-2019
|
Fiscal year |
|
2016 |
|
2017 |
|
2019 |
| ||||||
|
R billion |
|
Outcome |
|
% of Total |
|
Outcome |
|
% of Total |
|
Outcome |
|
% of Total |
|
|
Current payments |
|
884.4 |
|
61.3 |
% |
943.2 |
|
61.2 |
% |
1006.6 |
|
60.9 |
% |
|
Compensation of employees |
|
510.8 |
|
35.4 |
% |
547.2 |
|
35.5 |
% |
584.7 |
|
35.4 |
% |
|
Goods and services |
|
219.2 |
|
15.2 |
% |
226.3 |
|
14.7 |
% |
233.4 |
|
14.1 |
% |
|
Interest and rent on land |
|
154.4 |
|
10.7 |
% |
169.8 |
|
11.0 |
% |
188.5 |
|
11.4 |
% |
|
of which Debt-service costs |
|
146.5 |
|
10.2 |
% |
162.6 |
|
10.5 |
% |
181.8 |
|
11.0 |
% |
|
Transfers and subsidies |
|
470.1 |
|
32.6 |
% |
503.9 |
|
32.7 |
% |
548.8 |
|
33.2 |
% |
|
Provinces and municipalities |
|
112.7 |
|
7.8 |
% |
121.8 |
|
7.9 |
% |
129.5 |
|
7.8 |
% |
|
Departmental agencies and accounts |
|
25.3 |
|
1.8 |
% |
28.8 |
|
1.9 |
% |
26.0 |
|
1.6 |
% |
|
Higher education institutions |
|
32.0 |
|
2.2 |
% |
36.8 |
|
2.4 |
% |
38.9 |
|
2.4 |
% |
|
Foreign governments and international organisations |
|
2.3 |
|
0.2 |
% |
2.1 |
|
0.1 |
% |
2.4 |
|
0.1 |
% |
|
Public corporations and private enterprises |
|
32.2 |
|
2.2 |
% |
31.8 |
|
2.1 |
% |
32.5 |
|
2.0 |
% |
|
Non-profit institutions |
|
30.5 |
|
2.1 |
% |
31.0 |
|
2.0 |
% |
35.1 |
|
2.1 |
% |
|
Households |
|
235.0 |
|
16.3 |
% |
251.6 |
|
16.3 |
% |
284.4 |
|
17.2 |
% |
|
Payments for capital assets |
|
79.0 |
|
5.5 |
% |
75.1 |
|
4.9 |
% |
81.5 |
|
4.9 |
% |
|
Buildings and other capital assets |
|
62.4 |
|
4.3 |
% |
59.2 |
|
3.8 |
% |
65.3 |
|
4.0 |
% |
|
Machinery and equipment |
|
16.6 |
|
1.2 |
% |
15.9 |
|
1.0 |
% |
16.2 |
|
1.0 |
% |
|
Payments for financial assets |
|
8.3 |
|
0.6 |
% |
20.1 |
|
1.3 |
% |
15.9 |
|
1.0 |
% |
|
Consolidated expenditure |
|
1441.7 |
|
100.0 |
% |
1542.4 |
|
100.0 |
% |
1 652.8 |
|
100.0 |
% |
Note:
(1) These figures were estimated by the National Treasury and may differ from data published by Stats SA and the SARB. The numbers in this table are not strictly comparable to those published in previous years due to the reclassification of expenditure items for previous years. Data for the history years have been adjusted accordingly.
Source: National Treasury.
The following table sets forth the Consolidated Government Expenditure as set out in the 2019 MTBPS.
Consolidated Government Expenditure by function & economic classification(1), 2016/17-2022/23
|
R billion |
|
2016/17 |
|
2017/18 |
|
2018/19 |
|
2019/20 |
|
2020/21 |
|
2021/22 |
|
2022/23 |
|
Average annual |
|
|
|
|
Outcome |
|
Revised |
|
Medium-term estimates |
|
|
| ||||||||
|
Functional Classification |
|
|
|
|
|
|
|
|
|
|
|
|
|
|
|
|
|
|
Learning and culture |
|
286.7 |
|
309.0 |
|
348.7 |
|
386.0 |
|
411.0 |
|
437.6 |
|
457.8 |
|
5.9 |
% |
|
Basic education |
|
216.7 |
|
230.7 |
|
246.1 |
|
262.8 |
|
279.5 |
|
300.1 |
|
315.7 |
|
6.3 |
% |
|
Post-school education and training |
|
60.5 |
|
68.6 |
|
92.4 |
|
111.9 |
|
120.0 |
|
125.5 |
|
129.5 |
|
5.0 |
% |
|
Arts, culture, sport and recreation |
|
9.5 |
|
9.8 |
|
10.2 |
|
11.4 |
|
11.5 |
|
12.0 |
|
12.7 |
|
3.8 |
% |
|
Health |
|
177.8 |
|
192.2 |
|
209.7 |
|
222.7 |
|
238.5 |
|
257.2 |
|
272.9 |
|
7.0 |
% |
|
Peace and security |
|
184.9 |
|
194.5 |
|
198.2 |
|
214.3 |
|
224.9 |
|
233.5 |
|
243.8 |
|
4.4 |
% |
|
Defense and state security |
|
47.7 |
|
49.2 |
|
47.8 |
|
50.9 |
|
52.2 |
|
50.5 |
|
52.7 |
|
1.2 |
% |
|
Police services |
|
87.6 |
|
93.8 |
|
97.0 |
|
104.8 |
|
111.3 |
|
117.9 |
|
123.6 |
|
5.7 |
% |
|
Law courts and prisons |
|
41.4 |
|
43.1 |
|
44.9 |
|
48.7 |
|
52.1 |
|
55.2 |
|
57.7 |
|
5.8 |
% |
|
Home affairs |
|
8.2 |
|
8.4 |
|
8.5 |
|
10.0 |
|
9.4 |
|
9.9 |
|
9.9 |
|
-0.3 |
% |
|
Community development |
|
176.2 |
|
183.4 |
|
187.7 |
|
200.2 |
|
213.3 |
|
230.2 |
|
245.1 |
|
7.0 |
% |
|
Economic development |
|
185.6 |
|
186.8 |
|
192.3 |
|
205.8 |
|
217.5 |
|
235.5 |
|
251.1 |
|
6.9 |
% |
|
Industrialization and exports |
|
33.5 |
|
33.4 |
|
32.5 |
|
36.8 |
|
39.1 |
|
44.0 |
|
46.2 |
|
7.9 |
% |
|
Agriculture and rural development |
|
26.1 |
|
25.8 |
|
29.6 |
|
30.3 |
|
30.9 |
|
32.4 |
|
34.4 |
|
4.3 |
% |
|
Job creation and labor affairs |
|
18.9 |
|
19.8 |
|
20.4 |
|
22.7 |
|
24.8 |
|
26.9 |
|
28.4 |
|
7.7 |
% |
|
Economic regulation and infrastructure |
|
91.8 |
|
92.8 |
|
95.0 |
|
99.0 |
|
105.0 |
|
113.9 |
|
123.1 |
|
7.5 |
% |
|
Innovation, science and technology |
|
15.4 |
|
15.0 |
|
14.9 |
|
17.0 |
|
17.7 |
|
18.3 |
|
19.0 |
|
3.9 |
% |
|
General public services |
|
59.4 |
|
62.1 |
|
64.4 |
|
67.0 |
|
71.3 |
|
75.5 |
|
77.5 |
|
5.0 |
% |
|
Executive and legislative organs |
|
13.2 |
|
13.9 |
|
13.9 |
|
16.0 |
|
16.5 |
|
17.2 |
|
18.1 |
|
4.2 |
% |
|
Public administration and fiscal affairs |
|
38.3 |
|
39.3 |
|
42.6 |
|
43.4 |
|
46.8 |
|
50.1 |
|
50.8 |
|
5.4 |
% |
|
External affairs |
|
7.9 |
|
8.9 |
|
7.9 |
|
7.6 |
|
8.0 |
|
8.2 |
|
8.6 |
|
4.2 |
% |
|
Social development |
|
216.3 |
|
231.6 |
|
254.1 |
|
277.1 |
|
295.6 |
|
312.9 |
|
331.3 |
|
6.1 |
% |
|
Social protection |
|
165.4 |
|
177.9 |
|
189.8 |
|
206.8 |
|
219.9 |
|
235.3 |
|
252.1 |
|
6.8 |
% |
|
Social security funds |
|
50.9 |
|
53.8 |
|
64.3 |
|
70.3 |
|
75.6 |
|
77.5 |
|
79.3 |
|
4.1 |
% |
|
Payments for financial assets |
|
8.3 |
|
20.1 |
|
15.9 |
|
67.1 |
|
67.9 |
|
44.6 |
|
30.0 |
|
-23.5 |
% |
|
Allocation by functional classification |
|
1295.2 |
|
1379.8 |
|
1471.0 |
|
1640.3 |
|
1740.0 |
|
1827.0 |
|
1909.8 |
|
5.2 |
% |
|
Contingency reserve |
|
0.0 |
|
0.0 |
|
0.0 |
|
0.0 |
|
6.0 |
|
6.0 |
|
6.0 |
|
|
|
|
Debt-service costs |
|
146.5 |
|
162.6 |
|
181.8 |
|
203.7 |
|
232.8 |
|
264.6 |
|
299.1 |
|
13.7 |
% |
|
Consolidated expenditure |
|
1441.7 |
|
1542.4 |
|
1 652.8 |
|
1844.1 |
|
1 978.7 |
|
2 097.5 |
|
2 214.9 |
|
6.3 |
% |
Consolidated Government Expenditure by functional & economic classification(1), 2016/17-2022/23 (continued)
|
R billion |
|
2016/17 |
|
2017/18 |
|
2018/19 |
|
2019/20 |
|
2020/21 |
|
2021/22 |
|
2022/23 |
|
Average |
|
|
|
|
Outcome |
|
Revised |
|
Medium-term estimates |
|
|
| ||||||||
|
Economic classification |
|
|
|
|
|
|
|
|
|
|
|
|
|
|
|
|
|
|
Current payments |
|
884.4 |
|
943.2 |
|
1006.6 |
|
1093.8 |
|
1181.0 |
|
1275.6 |
|
1363.9 |
|
7.6 |
% |
|
Compensation of employees |
|
510.8 |
|
547.2 |
|
584.7 |
|
630.7 |
|
675.2 |
|
717.6 |
|
758.5 |
|
6.3 |
% |
|
Goods and services |
|
219.2 |
|
226.3 |
|
233.4 |
|
252.2 |
|
264.3 |
|
284.9 |
|
297.3 |
|
5.6 |
% |
|
Interest and rent on land |
|
154.4 |
|
169.8 |
|
188.5 |
|
211.0 |
|
241.4 |
|
273.1 |
|
308.0 |
|
13.5 |
% |
|
of which Debt-service costs |
|
146.5 |
|
162.6 |
|
181.8 |
|
203.7 |
|
232.8 |
|
264.6 |
|
299.1 |
|
13.7 |
% |
|
Transfers and subsidies |
|
470.1 |
|
503.9 |
|
548.8 |
|
593.0 |
|
626.3 |
|
665.5 |
|
700.3 |
|
5.7 |
% |
|
Provinces and municipalities |
|
112.7 |
|
121.8 |
|
129.5 |
|
136.3 |
|
144.2 |
|
155.3 |
|
165.2 |
|
6.6 |
% |
|
Departmental agencies and accounts |
|
25.3 |
|
28.8 |
|
26.0 |
|
27.9 |
|
29.1 |
|
30.4 |
|
29.8 |
|
2.2 |
% |
|
Higher education institutions |
|
32.0 |
|
36.8 |
|
38.9 |
|
46.4 |
|
47.6 |
|
49.4 |
|
50.8 |
|
3.1 |
% |
|
Foreign governments and international organizations |
|
2.3 |
|
2.1 |
|
2.4 |
|
2.4 |
|
2.5 |
|
2.5 |
|
2.5 |
|
2.3 |
% |
|
Public corporations and private enterprises |
|
32.2 |
|
31.8 |
|
32.5 |
|
35.0 |
|
34.6 |
|
39.0 |
|
41.7 |
|
6.1 |
% |
|
Non-profit institutions |
|
30.5 |
|
31.0 |
|
35.1 |
|
38.0 |
|
40.8 |
|
43.3 |
|
45.4 |
|
6.1 |
% |
|
Households |
|
235.0 |
|
251.6 |
|
284.4 |
|
307.0 |
|
327.6 |
|
345.7 |
|
364.8 |
|
5.9 |
% |
|
Payments for capital assets |
|
79.0 |
|
75.1 |
|
81.5 |
|
90.1 |
|
97.6 |
|
105.8 |
|
114.7 |
|
8.4 |
% |
|
Buildings and other capital assets |
|
62.4 |
|
59.2 |
|
65.3 |
|
70.1 |
|
75.1 |
|
82.6 |
|
89.6 |
|
8.5 |
% |
|
Machinery and equipment |
|
16.6 |
|
15.9 |
|
16.2 |
|
20.0 |
|
22.5 |
|
23.3 |
|
25.1 |
|
7.8 |
% |
|
Payments for financial assets |
|
8.3 |
|
20.1 |
|
15.9 |
|
67.1 |
|
67.9 |
|
44.6 |
|
30.0 |
|
|
|
|
Allocation by economic classification |
|
1441.7 |
|
1542.4 |
|
1652.8 |
|
1844.1 |
|
1972.7 |
|
2091.5 |
|
2208.9 |
|
6.2 |
% |
|
Contingency reserve |
|
— |
|
— |
|
— |
|
— |
|
6 |
|
6 |
|
6 |
|
|
|
|
Consolidated expenditure |
|
1441.7 |
|
1542.4 |
|
1652.8 |
|
1844.1 |
|
1978.7 |
|
2097.5 |
|
2214.9 |
|
6.3 |
% |
Note:
(1) Consisting of national, provincial, social security funds and public entities.
Source: National Treasury.
Taxation
Taxation in South Africa is administered by South African Revenue Service (SARS), an autonomous body managed by a board of directors and established by legislation to collect revenue and ensure compliance with tax law. SARS’ vision is to be an innovative revenue and customs agency that enhances economic growth and social development and supports South Africa’s integration into the global economy in a way that benefits all South African citizens. Among others, SARS collects personal income tax, company tax, value added tax, customs duties on imports, excise duties on prescribed goods, fuel levies and various other taxes.
While most tax revenues are collected at the national level, municipalities impose and collect property taxes. In addition, the main sources of revenue (although limited in scope) for provinces are motor vehicle license fees and gambling taxes. Non-tax user charges are levied principally by municipalities and extra-budgetary institutions, such as universities, museums, statutory research councils and public entities.
The National Government aims to maintain and strengthen a tax system that is fair, efficient and internationally competitive, while meeting fiscal policy requirements. Recognizing that improving tax administration and collection are essential steps towards achieving meaningful tax reform in the future, the National Government seeks to narrow the tax compliance gap and broaden the tax base. It is the National Government’s policy to keep tax law as simple as possible in order to minimize collection and compliance costs and to monitor the tax system on a continuous basis.
Personal Income Tax
South Africa has a progressive personal income tax system whereby income categories in different brackets are taxed at different rates. As of 2019, for individuals earning between R0 and R195,850, a tax rate of 18.0% is levied. This is the lowest tax bracket, with four other brackets being applied to higher income earners. The top bracket has a tax rate of 45.0%, and it applies to individuals earning more than R1.5 million per annum. The tax system also provides primary rebates for all taxpayers, as well as secondary rebates for people aged 65 years and older, and a tertiary rebate for people 75 years or older. In practice, it means that people earning less than R79,000 will not pay any tax, while those aged 65 years and older will not pay tax if they earn less than R122,300. For those older than 75 years, the tax threshold is R136,750.
The National Government has, over the past ten years, adjusted income tax brackets to take account of the effects of inflation on income tax paid by individuals.
Tax deductions on personal income tax include deductions for pension contributions, while tax credits are provided for individuals belonging to medical aids. In addition, interest income of up to R23,800 is tax exempt for individuals younger than 65 years and R34,500 for those 65 years and older.
Company Tax
South Africa reduced the headline corporate income tax rate from 40% in 1994 to the current 28.0% rate. Mining companies are also subjected to a royalty regime, where they are liable to pay mineral royalties based on a schedule according to the types of minerals being produced. Mines also have different depreciation allowances
than non- mining companies. Dividends are taxed in the hands of investors at 20% on a withholding basis. Dividends distributed on a company to company basis are exempt from the tax
Small business corporations (SBCs) with an annual turnover of less than R20 million have certain special tax provisions. They are taxed on a graduated scale with the first R79,000 being tax free. There are also 7.0% and 21.0% brackets, with taxable income in excess of R550,000 taxed at 28.0%. In addition, SBCs may benefit from accelerated depreciation of assets. There is a turnover tax option for businesses with an annual turnover of less than R1 million, in an attempt to minimize their compliance burden, while investors are encouraged to fund small businesses through a Venture Capital Company regime. Investments in VCCs are tax deductible, provided that the investments meet the necessary requirements.
Capital gains tax is levied on any capital gains realized by individuals and companies. Individuals are taxed at their marginal income tax rate, with a 40.0% inclusion rate. Primary residences have an exemption of R2 million. Companies are taxed at the corporate income tax rate of 28.0%, with an 80.0% inclusion rate.
South African tax legislation contains certain corporate reorganization rollover rules. These rules are intended to facilitate the tax free transfer of assets in specified circumstances. Taxpayers may not generally deduct interest incurred in respect of loan funding used to acquire shares because shares generally only produce exempt income. However, taxpayers can indirectly obtain a deduction for interest when acquiring shares of a target company when the acquisition is associated with certain rollover reorganizations.
Distributions from collective investment schemes (CIS), follow the flow-through principle, meaning that the income (e.g. interest, dividends, etc.) received by the CIS in securities will retain its nature when distributed to the CIS unit holders. If the income is not distributed within 12 months it will be taxed at CIS level. Real estate investment trusts (REIT’s) have their own taxation regime, and although income is taxed at REIT level, the flow through principle applies for distributed income. Distributed income is tax deductible at REIT level, while REITs are not subject to capital gains tax on disposal of their real estate assets.
A withholding tax on interest took effect on January 1, 2015. As a result, all interest paid to non-residents is taxed at a final withholding tax rate of 15.0% and is payable within 14 days after the end of the month during which the interest is paid. However, the withholding charge is subject to some exemptions, including debt issued by government and debt listed on an exchange. The exemption of interest owed by domestic banks does not include back-to-back loan agreements designed to circumvent the 15.0% withholding tax (e.g., if the bank acts as an intermediary to facilitate the unlisted borrowing of funds by a domestic company from a foreign lender).
In addition to the exemption for mobile portfolio debt capital, cross-border interest withholding contains three additional exemptions which apply to: (a) trade finance; (b) certain foreign payers and foreign payees; and (c) certain forms of debt owed by a headquarter company.
In addition to withholding taxes on interest and dividends, offshore royalty payments are also subject to a 15.0% withholding tax. All withholding taxes are subject to double tax treaty provisions. South Africa has an extensive double tax treaty network with over 70 countries, which makes the country more attractive for foreign investors.
International transactions are subject to rules dealing with transfer pricing and controlled foreign companies. South Africa was part of the Base Erosion Profit Shifting (BEPS) project conducted by the Organization of Economic Cooperation and Development (OECD). Following the conclusion of the first part of the project, South Africa is in the process of aligning its relevant processes and legislation to OECD proposals. This includes subscribing to the country by country (CbC) reporting arrangement, whereby participating countries will be compelled to collect and share information on multinationals operating in their countries.
In addition, South Africa is also aligning several of its tax treaties with the proposed multilateral instrument as agreed at the OECD. Following the BEPS process, the G20 identified the tax challenges posed by the digitization of the global economy as a particular concern needing special focus. The OECD formed an Inclusive Framework and a Task Force for the Digital Economy (TFDE) of which South Africa is an active member. In addition, South Africa is also part of the Inclusive Framework, where it is also represented on the Steering Committee. The Inclusive Framework is expected to make final recommendations to G20 members by 2020.
A controlled foreign company includes a foreign company where more than 50.0% of the total participation rights in that foreign company is not only directly held, but also indirectly held by one or more persons that are South African residents other than persons that are headquarter companies. If one or more South African residents hold more than 50.0% of the participation rights in an offshore cell, the cell will be deemed to be a controlled foreign company without regard to ownership in the other cells. Controlled foreign companies are taxable in South Africa. The ownership threshold in respect of the dividend and capital gain participation exemptions in relation to foreign shares was reduced from 20.0% down to 10.0%. This lower threshold is
consistent with the global economic concept of direct foreign investment and that of the South African exchange control requirements.
Transfer pricing rules were modernized to be in line with the OECD guidelines. The amendment will shift the focus from goods and services to a broader category of “cross-border transactions, operations, schemes, agreements or understandings” that have been effected between, or undertaken for the benefit of connected persons. The new transfer pricing rules are closely aligned with the wording of the OECD and UN Model Tax Conventions and are in line with tax treaties and other international tax principles. Updates to the initial guidelines have been updated and implemented in South Africa. Further changes to transfer pricing guidelines can be expected as a result of the OECD process alluded to above, and South Africa will continue to align itself accordingly.
In relation to the thin-capitalization provisions, the amendments effectively took away the tax Commissioner’s discretion to determine whether or not financial assistance provided to a South African resident by a non-resident who is connected to the resident, is excessive in relation to the fixed capital of the recipient of the financial assistance. The taxpayer is obliged to ensure that all its transactions are done on an arm’s length basis. Further, the thin capitalization rules have been merged directly into the transfer pricing rules. The transfer pricing rules are used to deny deductions for interest that would not have existed had a South African entity not been thinly capitalized with excessive debt.
Investors in equity funds constituted as partnerships or trusts will be granted tax relief and will be regarded as having a permanent establishment in South Africa merely by virtue of their investment. This tax relief places limited partners of trust beneficiaries in the same position had these investors invested directly in the underlying assets of the partnership or trust. The investors will not be exposed to South African tax merely because of the portfolio management activities carried on in South Africa. However, management fees of the South African manager, general partner or trustee will remain taxable in South Africa. To qualify for this relief the investor must satisfy the following requirements: (a) the partner or trust beneficiary must have limited liability like a shareholder of a company; (b) the partner or trust beneficiary must not participate in the effective management of the business of the partnership or trust; (c) the partner or the trust beneficiary must not have the authority to act on behalf of the partnership or trust or on behalf of the members of the partnership or trust; and (d) the partner or trust beneficiary must not render any services to or on behalf of the partnership or trust.
A new definition of a “foreign partnership” was introduced into the Income Tax Act. The purpose of the new definition is to ensure that entities like limited liability partnerships or limited liability companies and similar hybrid entities are not treated as companies when they are in fact partnerships. The new definition therefore synchronizes the South African tax treatment of these entities with foreign tax practice. To qualify as a foreign partnership, an entity must be a partnership, association or body of persons established or formed under foreign law.
South Africa has introduced specific provisions in the various tax acts (Income tax Act, Value Added Tax and Securities Transfer Tax) to cater for Islamic finance. In 2014, the legislation was amended to also allow state owned enterprises to issue a Sukuk, following the successful issue of a Sukuk by the South African government. The changes were introduced to place the above mentioned products on an equal footing with conventional finance products.
South Africa levies a securities transfer tax (STT) on the transfer of both listed and unlisted shares at a rate of 0.25%. There are exemptions for securities backed lending transactions as well as brokerages, and the STT only applies to equity securities.
Depreciation allowances, including the increased depreciation relief for urban development zones, are available to taxpayers that invest in (by erecting or refurbishing) any commercial or residential building within specified urban development zones. The allowance is deductible in the year the erected building or the refurbished part of the building is brought into use by the taxpayer for purposes of trade, and this depreciation relief will benefit owners, users or lessors of such buildings.
There are also designated Special Economic Zones, where companies are subjected to a lower corporate tax rate of 15 percent. Special Economic Zones need to be approved by the Department of Trade and Industry as well as National Treasury and are situated in areas where economic development and job creation is most needed. SEZ’s will only accept companies that can demonstrate additionality, not merely a reallocation of existing activities.
In order to encourage research and development and make South African companies more competitive internationally, a Research and Development tax incentive is available for taxpayers. It allows for a tax deduction of up to 150 percent of research and development expenditure for approved projects. The projects must meet stringent requirements and are evaluated and adjudicated by a panel with representatives from all the relevant government departments and agencies.
Consolidated Government Revenue
Revenue Outcomes and revised estimates
Gross tax revenue collections for 2018/19 amounted to R1.29 trillion, a shortfall of R14.5 billion compared to the 2019 Budget estimates. The largest shortfalls against the 2019 Budget estimate were corporate income tax (CIT, R6.4 billion) and personal income tax (PIT, R5.4 billion). Further shortfalls were registered for Value-Added Tax (VAT, R1.2 billion), customs duties (R0.7 billion) and dividends tax (R0.5 billion). These shortfalls were offset by higher collections in domestic health promotion levy (R0.8 billion), as well as in specific excise duties (R0.6 billion).
For the first eight months of 2019/20, gross tax revenue collection grew by 5% compared to the same period last year. However, the effects of the GDP contraction in 2019 Q1 and 2019 Q3, as well as low growth in key sectors and subdued business and consumer confidence have led to deterioration in revenue collections throughout the first eight months of 2019/20. Value-added tax, as well as personal and corporate income taxes have been hit the hardest, both reflecting significant under-collections in the first eight months of 2019/20. Given weaker economic growth, alongside significant downward revisions in PIT, VAT, CIT, and net fuel levy, the National Treasury projects a tax revenue shortfall of R52.5 billion in 2019/20 compared with the 2019 Budget estimate.
Revenue weakness reflects a number of economic factors:
· GDP growth has been revised downwards in 2019 following a contraction in the first quarter of 2019 and the third quarter of 2019. This reflects lower production and growth by the agriculture, mining and manufacturing sectors, as well as a lack of new investment due to low levels of demand and economic uncertainty.
· Personal income tax collection has been negatively affected by continued job losses, low growth in both employment and wage settlements; and lower bonus payments, as well as high PIT refunds.
· Corporate income tax under collections in the eight months of 2019/20 were a result of weak CIT provisional payments in all sectors excluding mining, as well as slightly higher-than-expected CIT refund payments. Difficult trading conditions characterized by power outages, slower global growth and subdued demand have reduced profitability across key sectors.
· Household disposable income remains under pressure, constraining growth in household consumption and negatively affecting domestic VAT collections. For 2019/20, the tax base for domestic VAT, nominal household consumption expenditure, has been revised down by 1.6 percentage points compared to the 2019 Budget estimate giving a negative outlook for domestic VAT collections over the medium term. The estimate for VAT refunds in 2019/20 has been revised upwards by R8.1 billion compared to the 2019 Budget.
· Net fuel levy has been revised downwards by R4.6 billion following its underperformance in the first eight months of 2019/20. The underperformance is attributed to lower-than-expected collections on levies of domestically-produced fuel and significant diesel refunds which were slightly offset by payments on imported fuel.
Gross tax revenue performance and projections
|
R billion |
|
Budget(1) |
|
2018/19 |
|
Deviations |
|
Budget(1) |
|
2019/20 |
|
Deviations |
|
|
Persons and individuals |
|
497.5 |
|
492.1 |
|
-5.4 |
|
552.9 |
|
527.6 |
|
25.3 |
|
|
Companies |
|
218.4 |
|
212.0 |
|
-6.4 |
|
229.6 |
|
219.0 |
|
-10.6 |
|
|
Value-added tax |
|
325.9 |
|
324.8 |
|
-1.2 |
|
360.5 |
|
348.4 |
|
-12.1 |
|
|
Dividend withholding tax(2) |
|
30.3 |
|
29.9 |
|
-0.4 |
|
31.9 |
|
32.0 |
|
0.1 |
|
|
Specific excise duties |
|
40.3 |
|
40.8 |
|
0.6 |
|
42.4 |
|
46.5 |
|
4.2 |
|
|
Fuel levy |
|
75.4 |
|
75.4 |
|
0.0 |
|
83.0 |
|
78.4 |
|
-4.6 |
|
|
Customs duties |
|
55.6 |
|
55.0 |
|
-0.7 |
|
60.0 |
|
58.4 |
|
-1.7 |
|
|
Ad-valorem excise duties |
|
4.2 |
|
4.2 |
|
0.0 |
|
4.5 |
|
4.3 |
|
-0.1 |
|
|
Other |
|
54.6 |
|
53.5 |
|
-1.1 |
|
57.6 |
|
55.1 |
|
-2.4 |
|
|
Gross tax revenue |
|
1,302.2 |
|
1,287.7 |
|
-14.5 |
|
1,422.2 |
|
1,369.7 |
|
-52.5 |
|
(1) 2019 Budget figures
(2) Includes secondary tax on companies
Source: National Treasury
Financing
The following table sets forth the financing of the net borrowing requirement of the National Government for the five fiscal years ended March 31, 2018 and estimated amounts for the fiscal year ending March 31, 2019.
Financing of the Net Borrowing Requirement of the National Government
|
R Million |
|
2015 |
|
2016 |
|
2017 |
|
2018 |
|
2019 |
|
Revised |
|
|
Borrowing |
|
|
|
|
|
|
|
|
|
|
|
|
|
|
Revenue |
|
965,456.9 |
|
1,076,234.4 |
|
1,137,901.0 |
|
1,196,399.1 |
|
1,275,245.3 |
|
1,359,084.4 |
|
|
Expenditure |
|
1,131,900.1 |
|
1,244,622.9 |
|
1,305,486.0 |
|
1,404,985.9 |
|
1,506,729.0 |
|
1,683,352.4 |
|
|
Main Budget balance(1) |
|
(166,443.2 |
) |
(168,388.5 |
) |
(167,585.0 |
) |
(208,586.8 |
) |
(231,483.7 |
) |
(324,268.0 |
) |
|
% of GDP |
|
(4.3 |
)% |
(4.1 |
)% |
(3.8 |
)% |
(4.4 |
)% |
(4.7 |
)% |
(6.2 |
)% |
|
Financing |
|
|
|
|
|
|
|
|
|
|
|
|
|
|
Domestic short-term loans (net) |
|
(9,569.0 |
) |
13,075.0 |
|
40,507.1 |
|
33,407.0 |
|
14,060.6 |
|
46,000.0 |
|
|
Domestic long-term loans (net) |
|
157,014.0 |
|
146,172.0 |
|
116,684.3 |
|
174,438.0 |
|
169,474.4 |
|
264,565.0 |
|
|
Market loans |
|
192,414.0 |
|
176,795.0 |
|
175,070.5 |
|
200,249.7 |
|
183,453.9 |
|
284,389.3 |
|
|
Loans issues for switches |
|
(1,160.0 |
) |
(2,479.0 |
) |
(1,036.4 |
) |
(1,557.6 |
) |
(450.9 |
) |
(289.3 |
) |
|
Redemptions |
|
(34,240.0 |
) |
(28,144.0 |
) |
(57,349.8 |
) |
(24,254.1 |
) |
(13,528.7 |
) |
(19,535.0 |
) |
|
Foreign loans (net) |
|
8,361.0 |
|
(3,879.0 |
) |
36,380.7 |
|
29,774.0 |
|
23,216.4 |
|
25,660.0 |
|
|
Market loans |
|
22,952.0 |
|
— |
|
50,959.3 |
|
33,895.0 |
|
25,257.7 |
|
76,052.0 |
|
|
Loans issues for switches |
|
— |
|
— |
|
1,111.4 |
|
— |
|
— |
|
— |
|
|
Arms procurement loan agreements |
|
— |
|
— |
|
— |
|
— |
|
— |
|
— |
|
|
Redemptions (including revaluation of loans) |
|
(14,591.0 |
) |
(3,879.0 |
) |
(15,690.0 |
) |
(4,121.0 |
) |
(2,041.3 |
) |
(50,392.0 |
) |
|
Change in cash and other balances(2) |
|
(8,500.8 |
) |
13,020.5 |
|
(25,987.1 |
) |
(29,032.2 |
) |
24,732.3 |
|
(11,957.0 |
) |
|
|
|
|
|
|
|
|
|
|
|
|
|
|
|
|
Total |
|
166,443.2 |
|
168,388.5 |
|
167,585.0 |
|
208,586.8 |
|
231,483.7 |
|
324 268.0 |
|
Notes:
(1) A negative number reflects a deficit and a positive number a surplus.
(2) A positive change indicates a reduction in cash balances.
(3) Numbers as published during the October 2019 MTBPS.
Source: National Treasury.
In addition to transfers received from the National Budget and their own provinces’ revenue collections, Provincial Budgets are financed by means of opening balances and concessionary and non-concessionary funding such as loans by the DBSA. The deficit of the National Budget is financed mainly by domestic and foreign loans. The provinces are barred constitutionally from raising loans for current expenditure. Loans for bridging finance may be advanced, however, provided that the provinces redeem such loans within 12 months following the date on which they are obtained, and any special conditions be specified in an act of Parliament which is required to be recommended by the Financial and Fiscal Commission. In addition, the National Government may not guarantee any provincial or local government loans, unless the guarantee complies with the norms and conditions for such guarantee as set out in an act of Parliament. See “Public Finance—Background.”
NATIONAL GOVERNMENT DEBT
General
The legal authorization for the incurrence of debt by the National Government is set forth in the PFMA. The National Treasury administers the National Government debt of South Africa. In February of each year the annual budget is tabled in Parliament, including the government’s anticipated borrowing requirements and financing strategy for the current financial year and over the medium-term period (three years). Pursuant to Section 66 of the PFMA, the Minister of Finance needs to approve each issuance of debt. The PFMA also sets out for which purposes the Minister may borrow. There is no statutory cap on the stock of debt. In addition to its
direct indebtedness, the National Government is also a guarantor of certain third-party indebtedness. South Africa has issued formal contractual guarantees of certain indebtedness, primarily on behalf of partially or wholly state-owned entities. In this document, the National Government debt does not include debt that is guaranteed by the National Government. However, the guaranteed debt is summarized in the table entitled “Outstanding National Government Guaranteed Debt”. In addition, the National Government debt does not include debts incurred by the nine Provincial Governments. In this section, “external debt” means debt initially incurred or issued outside South Africa, regardless of the currency of denomination, and “internal debt” means debt initially incurred or issued in South Africa. “Floating debt” means debt that had a maturity at issuance of less than one year. “Funded debt” means debt that had a maturity at issuance of one year or more.
The following table summarizes the National Government debt as of March 31 in each of the years 2015 through 2019 and as of September 30, 2019.
|
|
|
As of March 31, |
|
As of |
| ||||||||
|
|
|
2015 |
|
2016 |
|
2017 |
|
2018 |
|
2019 |
|
2019 |
|
|
|
|
Rand (million) |
| ||||||||||
|
Government bonds |
|
1,399,282 |
|
1,572,574 |
|
1,731,657 |
|
1,949,573 |
|
2,160,399 |
|
2,431,526 |
|
|
Treasury bills |
|
202,217 |
|
209,468 |
|
249,970 |
|
293,321 |
|
307,360 |
|
357,659 |
|
|
Marketable internal debt |
|
1,601,499 |
|
1,782,042 |
|
1,981,627 |
|
2,242,894 |
|
2,467,759 |
|
2,789,185 |
|
|
Non-marketable internal debt |
|
30,586 |
|
37,322 |
|
38,508 |
|
29,013 |
|
29,227 |
|
40,138 |
|
|
Total internal debt |
|
1,632,085 |
|
1,819,364 |
|
2,020,135 |
|
2,271,907 |
|
2,496,986 |
|
2,829,323 |
|
|
Total external debt(1) |
|
166,830 |
|
199,607 |
|
212,754 |
|
217,811 |
|
291,314 |
|
326,493 |
|
|
Total gross loan debt |
|
1,798,915 |
|
2,018,971 |
|
2,232,889 |
|
2.489.718 |
|
2.788.300 |
|
3.155.816 |
|
|
Cash balances(2) |
|
(214,708 |
) |
(214,333 |
) |
(224,615 |
) |
(205,196 |
) |
(243,117 |
) |
(305,158 |
) |
|
Total net loan debt(3) |
|
1,584,207 |
|
1,804,638 |
|
2,008,274 |
|
2,284,522 |
|
2,545,183 |
|
2,850,658 |
|
|
GFECRA |
|
(203,396 |
) |
(304,653 |
) |
(231,158 |
) |
(209,375 |
) |
(285,829 |
) |
(285,829 |
) |
|
As percentages of nominal GDP: |
|
|
|
|
|
|
|
|
|
|
|
|
|
|
Net loan debt |
|
41.2 |
% |
44.2 |
% |
45.5 |
% |
48.4 |
% |
51.7 |
% |
54.7 |
% |
|
External debt |
|
4.3 |
% |
4.9 |
% |
4.8 |
% |
4.6 |
% |
5.9 |
% |
6.3 |
% |
|
As percentage of gross loan debt: |
|
|
|
|
|
|
|
|
|
|
|
|
|
|
External debt |
|
9.30 |
% |
9.90 |
% |
9.53 |
% |
8.75 |
% |
10.45 |
% |
10.35 |
% |
Notes:
(1) Valued using the applicable foreign exchange rates as at the end of each period.
(2) This represents surplus cash of the National Revenue Fund on deposit at the commercial banks and the SARB. Bank balances in foreign currencies are revaluated using the applicable exchange rates as at the end of each period.
(3) The total net loan debt is calculated with due account of the bank balances of the National Revenue Fund (balances of the National Government’s accounts with the SARB and with commercial banks).
(4) Represents the balance on the GFECRA on March 31, 2019. A negative balance indicates a profit and a positive balance reflects a loss.
Sources: South African National Treasury and the SARB.
Summary of Internal National Government Debt
Total internal National Government debt as of March 31, 2019 increased by 9.9 % to R2 497 billion from R2,272 billion as of March 31, 2018.
The following table sets forth the total internal National Government debt, divided into floating debt and funded debt, for the periods indicated.
Gross National Government Internal Debt
|
|
|
As of March 31, |
|
As of |
| ||||||||
|
|
|
2015 |
|
2016 |
|
2017 |
|
2018 |
|
2019 |
|
2019 |
|
|
|
|
Rand (million) |
| ||||||||||
|
Marketable securities |
|
|
|
|
|
|
|
|
|
|
|
|
|
|
Floating |
|
202,217 |
|
209,469 |
|
249,970 |
|
293,321 |
|
307,360 |
|
357,659 |
|
|
Funded |
|
1,399,409 |
|
1,572,573 |
|
1,731,657 |
|
1,949,573 |
|
2,160,399 |
|
2,431,526 |
|
|
Total(1) |
|
1,601,626 |
|
1,782,042 |
|
1,981,627 |
|
2,242,894 |
|
2,467,759 |
|
2,789,185 |
|
|
Non-marketable securities |
|
|
|
|
|
|
|
|
|
|
|
|
|
|
Floating |
|
21,370 |
|
27,194 |
|
27,199 |
|
17,256 |
|
17,277 |
|
28,163 |
|
|
Funded |
|
9,089 |
|
10,128 |
|
11,309 |
|
11,757 |
|
11,950 |
|
11,975 |
|
|
Total(2) |
|
30,459 |
|
37,322 |
|
38,508 |
|
29,013 |
|
29,227 |
|
40,138 |
|
|
Total internal National Government debt |
|
1,632,085 |
|
1,819,364 |
|
2,020,135 |
|
2,271,907 |
|
2,496,986 |
|
2,829,323 |
|
Notes:
(1) Treasury bills are classified as floating marketable securities. Government bonds are classified as funded marketable securities.
(2) Borrowings from the Corporation for Public Deposits are classified as floating non-marketable securities. Retail government bonds (since May 2004), together with debt and liabilities of the former TBVC states (which include Transkei, Bophuthatswana, Venda and Ciskei) and the Republic of Namibia that were assumed by the National Government in connection with South Africa’s transition to a constitutional democracy, are classified as funded non-marketable securities.
Sources: South African National Treasury and SARB.
Summary of External National Government Debt
The National Government borrows in the global market to finance its foreign currency commitments and partly to maintain a benchmark in major currencies. As part of these benchmarks, a limit of 15.0% is placed on the share of foreign currency debt as a percentage of total debt. South Africa’s external National Government debt as a percentage of total debt remains low. External debt as a percentage of total gross loan debt amounted to 9.82% as at December 31, 2019.
The following table sets forth a breakdown of National Government external debt by currency as of March 31 in each of the years 2015 through 2019 and as of December 31, 2019.
External Debt by Currency
|
|
|
As of March 31, |
|
As of |
| ||||||||
|
Currency in which debt is held |
|
2015 |
|
2016 |
|
2017 |
|
2018 |
|
2019 |
|
2019 |
|
|
|
|
(million) |
| ||||||||||
|
Euro |
|
1,488 |
|
1,383 |
|
572 |
|
538 |
|
513 |
|
505 |
|
|
Pound Sterling |
|
44 |
|
26 |
|
17 |
|
10 |
|
3 |
|
1 |
|
|
Swedish Kroner |
|
3,469 |
|
23,775 |
|
2,080 |
|
1,386 |
|
692 |
|
230 |
|
|
US Dollars |
|
11,125 |
|
11,055 |
|
14,622 |
|
16,942 |
|
18,903 |
|
12,139 |
|
|
Yen |
|
60,612 |
|
60,517 |
|
60,423 |
|
60,329 |
|
60,235 |
|
60,141 |
|
|
Total (in Rand)(1) |
|
166,831 |
|
166,831 |
|
212,753 |
|
217,811 |
|
291,313 |
|
326,492 |
|
Note:
(1) The conversion into Rand is calculated at the exchange rate published by the SARB on the last business day of the fiscal year.
Source: National Treasury.
The South African government remains committed to fiscal sustainability, however, due to low economic growth, high government debt that is exacerbated by the support for state-owned companies; the risk of sovereign credit down grade has increased since the tabling of the 2019 Budget. Substantial spending reductions to stabilize debt is required. Measures to manage and reduce public-sector pressures and risk will be implemented over the medium term.
The 2019 Budget Review made provision for US$2 billion equivalent to be raised in the international capital markets in 2019/20 to fund government’s foreign currency commitments. Of the US$4 billion planned for 2018/19, only US$2 billion was issued and the remaining US$2 billion was deferred to 2019/20, bringing the total foreign borrowing requirement for the year to US$4 billion. Due to favorable pricing and a sizeable order book, the Republic was able fund an additional US$1 billion over the planned US$4 billion, with US$2 billion and US$3 billion placed in the 2029(10-year) and 2049 (30-year) tranches respectively. Heightened risk of domestic policy uncertainty somewhat subsided following the outcome of national elections held in May 2019. The outcome of the elections was well received by the rating agencies. Subsequently, on May 24, 2019, S&P affirmed the country’s long-term foreign and local currency ratings at ‘BB’ and ‘BB+’ respectively, and maintained a stable outlook; Rating and Investment Information, Inc. (R&I) affirmed the country’s long-term foreign and local currency ratings at ‘BBB’ and ‘BBB+’ respectively, and maintained a stable outlook on the same day.
During the year, concerns regarding the deteriorating fiscal flexibility intensified following the tabling of the Special Appropriation Bill for Eskom by Minister of Finance on July 23, 2019, which aimed at providing additional financial support of R59 billion to the entity. One July 26, 2019, Fitch affirmed the sovereign’s long-
term foreign and local currency ratings at ‘BB+’ and changed the outlook to negative from stable. Fitch cited the widening budget deficit, low GDP growth and continued financial support SOCs as challenges to the government’s ability to stabilize debt to GDP over the medium term.
The 2019 MTBPS showed a bleak picture for the country’s debt trajectory, which was previously cited as negative by the rating agencies. Subsequently, on November 1, 2019, Moody’s affirmed the sovereign’s credit ratings at ‘Baa3’ and changed the outlook to negative from stable. On November 22, 2019, S&P followed suit and affirmed the country’s foreign and local currency ratings at ‘BB’ and ‘BB+’ respectively, and changed the outlook to negative from stable. On December 18, 2019, Fitch affirmed the sovereign’s credit ratings at ‘BB+’ and maintained a negative outlook. South Africa’s long-term foreign and local currency ratings by Moody’s and R&I remain investment grade, while S&P and Fitch ratings are non-investment grade. The three major rating agencies currently have the country’s rating outlook at negative.
|
Rating Agency |
|
Credit Rating Action |
|
Action |
|
LTFC(1) |
|
LTLC(2) |
|
Outlook |
|
Fitch |
|
18-Dec-19 |
|
Ratings affirmed |
|
BB+ |
|
BB+ |
|
negative |
|
S&P |
|
22-Nov-19 |
|
Ratings affirmed |
|
BB |
|
BB+ |
|
negative |
|
R&I |
|
24-May-19 |
|
Ratings affirmed |
|
BBB |
|
BBB+ |
|
negative |
|
Moody’s |
|
01-Nov -19 |
|
Ratings affirmed |
|
Baa3 |
|
Baa3 |
|
stable |
(1) Long Term Foreign Currency, (2) Long Term Local Currency
Financing
The following table sets forth the financing of the net borrowing requirement of the National Government for the five fiscal years ended March 31, 2019 and estimated amounts for the fiscal year ending March 31, 2020.
Financing of the Net Borrowing Requirement of the National Government
|
R Million |
|
2015 |
|
2016 |
|
2017 |
|
2018 |
|
2019 |
|
Revised |
|
|
Borrowing |
|
965,456.9 |
|
1,076,234.4 |
|
1,137,901.0 |
|
1,196,399.1 |
|
1,275,245.3 |
|
1,359,084.4 |
|
|
Revenue |
|
1,131,900.1 |
|
1,244,622.9 |
|
1,305,486.0 |
|
1,404,985.9 |
|
1,506,729.0 |
|
1,683,352.4 |
|
|
Expenditure |
|
(166,443.2 |
) |
(168,388.5 |
) |
(167,585.0 |
) |
(208,586.8 |
) |
(231,483.7 |
) |
(324,268.0 |
) |
|
Main Budget balance(1) |
|
(4.3 |
)% |
(4.1 |
)% |
(3.8 |
)% |
(4.4 |
)% |
(4.7 |
)% |
(6.2 |
)% |
|
% of GDP |
|
|
|
|
|
|
|
|
|
|
|
|
|
|
Financing |
|
9,569.0 |
|
13,075.0 |
|
40,507.1 |
|
33,407.0 |
|
14,060.6 |
|
46,000.0 |
|
|
Domestic short-term loans (net) |
|
157,014.0 |
|
146,172.0 |
|
116,684.3 |
|
174,438.0 |
|
169,474.4 |
|
264,565.0 |
|
|
Domestic long-term loans (net) |
|
192,414.0 |
|
176,795.0 |
|
175,070.5 |
|
200,249.7 |
|
183,453.9 |
|
284,389.3 |
|
|
Market loans |
|
(1,160.0 |
) |
(2,479.0 |
) |
(1,036.4 |
) |
(1,557.6 |
) |
(450.9 |
) |
(289.3 |
) |
|
Loans issues for switches |
|
(34,240.0 |
) |
(28,144.0 |
) |
(57,349.8 |
) |
(24,254.1 |
) |
(13,528.7 |
) |
(19,535.0 |
) |
|
Redemptions |
|
8,361.0 |
|
(3,879.0 |
) |
(36,380.7 |
) |
29,774.0 |
|
23,216.4 |
|
25,660.0 |
|
|
Foreign loans (net) |
|
22,952.0 |
|
— |
|
50,959.3 |
|
33,895.0 |
|
25,257.7 |
|
76,052.0 |
|
|
Market loans |
|
— |
|
— |
|
1,111.4 |
|
— |
|
— |
|
— |
|
|
Loans issues for switches |
|
— |
|
— |
|
— |
|
— |
|
— |
|
— |
|
|
Arms procurement loan agreements |
|
(14,591.0 |
) |
(3,879.0 |
) |
(15,690.0 |
) |
(4,121.0 |
) |
(2,041.3 |
) |
(50,392.0 |
) |
|
Redemptions (including revaluation of loans) |
|
(8,500.8 |
) |
13,020.5 |
|
(25,987.1 |
) |
29,032.2 |
|
24,732.3 |
|
(11,957.0 |
) |
|
Change in cash and other balances(2) |
|
965,456.9 |
|
1,076,234.4 |
|
1,137,901.0 |
|
1,196,399.1 |
|
1,275,245.3 |
|
1,359,084.4 |
|
|
Total |
|
166,443.2 |
|
168,388.5 |
|
167,585.0 |
|
208,586.8 |
|
231,483.7 |
|
324,268.0 |
|
Notes:
(1) A negative number reflects a deficit and a positive number a surplus.
(2) A positive change indicates a reduction in cash balances.
(3) Numbers as published during the October 2019 MTBPS.
Source: National Treasury.
In addition to transfers received from the National Budget and their own provinces’ revenue collections, Provincial Budgets are financed by means of opening balances and concessionary and non-concessionary funding such as loans by the DBSA. The deficit of the National Budget is financed mainly by domestic and foreign loans. The provinces are barred constitutionally from raising loans for current expenditure. Loans for bridging finance may be advanced, however, provided that the provinces redeem such loans within 12 months following the date on which they are obtained, and any special conditions be specified in an act of Parliament which is required to be recommended by the Financial and Fiscal Commission. In addition, the National Government may not guarantee any provincial or local government loans, unless the guarantee complies with the norms and conditions for such guarantee as set out in an act of Parliament. See “Public Finance—Background.”
Guaranteed Debt
In addition to its direct indebtedness, the National Government is also a guarantor of certain third-party indebtedness. The National Government has issued formal contractual guarantees in respect of certain indebtedness of wholly or partially state-owned companies.
The following table sets forth the debt guaranteed by the National Government outstanding in each of the years indicated:
Outstanding National Government Guaranteed Debt
|
|
|
As of March 31, |
| ||||||||
|
|
|
2015 |
|
2016 |
|
2017 |
|
2018 |
|
2019 |
|
|
|
|
Rand (million) |
| ||||||||
|
Internal |
|
169,211 |
|
187,009 |
|
191,894 |
|
208,102 |
|
208,842 |
|
|
External(1) |
|
56,682 |
|
76,972 |
|
98,525 |
|
113,169 |
|
159,279 |
|
|
Total |
|
225,893 |
|
263,981 |
|
290,419 |
|
321,271 |
|
368,121 |
|
Note:
(1) Excludes guarantees to the Independent Power Producers and Public-Private Partnerships.
Source: National Treasury.
The following table sets forth the National Government’s external guaranteed debt outstanding as of March 31, 2018.
Analysis of National Government External Guaranteed Debt
|
|
|
As of March 31, 2018 |
| ||||||
|
Guarantees Issued on Behalf of |
|
ZAR |
|
US Dollars |
|
Euro |
|
Equivalent |
|
|
|
|
Amount (million) |
| ||||||
|
Transnet |
|
3,500 |
|
— |
|
— |
|
3,500 |
|
|
Land bank |
|
817 |
|
— |
|
— |
|
817 |
|
|
Telkom |
|
— |
|
— |
|
8 |
|
126 |
|
|
IDC |
|
— |
|
— |
|
9 |
|
147 |
|
|
Lesotho Highlands Development Authority |
|
— |
|
— |
|
— |
|
— |
|
|
DBSA |
|
3,653 |
|
— |
|
44 |
|
4,378 |
|
|
Trans-Caledon Tunnel Authority |
|
— |
|
— |
|
— |
|
— |
|
|
ESKOM |
|
66,983 |
|
5,046 |
|
1,064 |
|
161,361 |
|
|
Total(2) |
|
74,953 |
|
5,046 |
|
1,125 |
|
170,329 |
|
Note:
(1) Conversion of amounts into Rand have been made at the following rates: US Dollar = R15.208950; Euro = R16.561026.
(2) Does not include guaranteed interest to the amount of R5.5 billion.
Source: National Treasury.
Debt-Service Costs
As a percentage of the National Government expenditure, debt-service costs increased from 10.1% during fiscal year 2015/16 to 12.1% in 2019/20. As a percentage of the National Government revenue, debt-service costs increased from 11.9% to 15.0% during the same period. In addition, as a percentage of GDP, debt-service costs increased from 3.0% during fiscal year 2015/16 to 3.9% in 2019/20. The following table sets forth such percentages for the periods indicated.
|
|
|
For the year ended March 31, |
| ||||||||
|
|
|
2015 |
|
2016 |
|
2017 |
|
2018 |
|
2019 |
|
|
Expenditure |
|
10.1 |
% |
10.3 |
% |
11.2 |
% |
11.6 |
% |
12.1 |
% |
|
Revenue |
|
11.9 |
% |
12.0 |
% |
12.9 |
% |
13.6 |
% |
15.0 |
% |
|
Debt Service Costs |
|
3.0 |
% |
3.1 |
% |
3.3 |
% |
3.4 |
% |
3.9 |
% |
Source: National Treasury.
The aggregate amount of scheduled repayments in respect of principal and interest on the funded National Government debt outstanding as of December 31, 2019, is set forth in the table below.
|
|
|
|
|
External Debt |
| ||||||||
|
Year(1) |
|
Rand |
|
US$ |
|
EURO |
|
YEN |
|
GBP |
|
SEK |
|
|
|
|
Amount (million) |
| ||||||||||
|
2019 |
|
156,514 |
|
1,018 |
|
41 |
|
2,381 |
|
7,646 |
|
756 |
|
|
2020 |
|
177,699 |
|
4,494 |
|
31 |
|
2,379 |
|
2,450 |
|
491 |
|
|
2021 |
|
192,485 |
|
1,588 |
|
24 |
|
31,807 |
|
1,182 |
|
236 |
|
|
2022 |
|
183,619 |
|
1,066 |
|
18 |
|
32,617 |
|
— |
|
— |
|
|
2023 |
|
213,991 |
|
2,037 |
|
18 |
|
— |
|
— |
|
— |
|
|
2024 |
|
215,295 |
|
2,507 |
|
18 |
|
— |
|
— |
|
— |
|
|
2025 |
|
174,373 |
|
937 |
|
18 |
|
— |
|
— |
|
— |
|
|
2026 |
|
193,158 |
|
2,879 |
|
18 |
|
— |
|
— |
|
— |
|
|
2027 |
|
234,416 |
|
2,039 |
|
518 |
|
— |
|
— |
|
— |
|
|
2028 |
|
117,285 |
|
1,735 |
|
1,735 |
|
— |
|
— |
|
— |
|
|
2029 |
|
217,739 |
|
2,710 |
|
— |
|
— |
|
— |
|
— |
|
|
2030 |
|
176,264 |
|
2,576 |
|
— |
|
— |
|
— |
|
— |
|
|
2031 |
|
100,725 |
|
1,886 |
|
— |
|
— |
|
— |
|
— |
|
|
2032 |
|
154,710 |
|
445 |
|
— |
|
— |
|
— |
|
— |
|
|
2033 |
|
151,800 |
|
445 |
|
— |
|
— |
|
— |
|
— |
|
|
2034 |
|
161,479 |
|
445 |
|
— |
|
— |
|
— |
|
— |
|
|
2035 |
|
171,064 |
|
445 |
|
— |
|
— |
|
— |
|
— |
|
|
2036 |
|
44,986 |
|
445 |
|
— |
|
— |
|
— |
|
— |
|
|
2037 |
|
126,489 |
|
445 |
|
— |
|
— |
|
— |
|
— |
|
|
2038 |
|
129,884 |
|
445 |
|
— |
|
— |
|
— |
|
— |
|
|
2039 |
|
74,402 |
|
445 |
|
— |
|
— |
|
— |
|
— |
|
|
2040 |
|
70,661 |
|
445 |
|
|
|
|
|
|
|
|
|
|
2041 |
|
66,921 |
|
1,195 |
|
— |
|
— |
|
— |
|
— |
|
|
2042 |
|
86,031 |
|
398 |
|
— |
|
— |
|
— |
|
— |
|
|
2043 |
|
80,188 |
|
398 |
|
— |
|
— |
|
— |
|
— |
|
|
2044 |
|
74,345 |
|
398 |
|
— |
|
— |
|
— |
|
— |
|
|
2045 |
|
24,154 |
|
1,371 |
|
— |
|
— |
|
— |
|
— |
|
|
2046 |
|
23,579 |
|
345 |
|
— |
|
— |
|
— |
|
— |
|
|
2047 |
|
156,514 |
|
345 |
|
— |
|
— |
|
— |
|
— |
|
|
2048 |
|
177,699 |
|
1,345 |
|
— |
|
— |
|
— |
|
— |
|
|
2049 |
|
192,485 |
|
1,752 |
|
— |
|
— |
|
— |
|
— |
|
|
2050 |
|
183,619 |
|
791 |
|
— |
|
— |
|
— |
|
— |
|
|
2051 |
|
213,991 |
|
3,086 |
|
— |
|
— |
|
— |
|
— |
|
|
2052 |
|
215,295 |
|
— |
|
— |
|
— |
|
— |
|
— |
|
|
Total |
|
4,398,583 |
|
42,901 |
|
2,439 |
|
67,994 |
|
11,278 |
|
1,483 |
|
|
Principal |
|
2,339,770 |
|
23,942 |
|
1,539 |
|
61,139 |
|
10,658 |
|
1,386 |
|
|
Interest |
|
2,058,813 |
|
18,959 |
|
900 |
|
6,855 |
|
620 |
|
97 |
|
Note:
(1) Fiscal years ending March 31.
Source: National Treasury.
Debt Record
South Africa has not defaulted in the payment of principal or interest on any of its internal or external indebtedness in the last twenty years.
TABLES AND SUPPLEMENTARY INFORMATION
Funded Internal Debt of the Republic of South Africa (Domestic Marketable Bonds — in Rand) as of September 30, 2019
|
Interest Rate |
|
Date of Issue |
|
Maturity Date |
|
Nominal Amount |
|
|
|
|
|
|
|
|
|
|
|
7.25% |
|
June 20, 2005 |
|
January 15, 2020 |
|
15,884,603,937 |
|
|
6.75% |
|
September 1, 2006 |
|
March 31, 2021 |
|
48,964,709,007 |
|
|
2.75% |
|
June 17, 2010 |
|
January 31, 2022 |
|
50,974,168,647 |
(1) |
|
7.75% |
|
June 22, 2012 |
|
February 28, 2023 |
|
119,437,352,549 |
|
|
5.50% |
|
May 30, 2001 |
|
December 7, 2023 |
|
92,969,301,366 |
(1) |
|
2.00% |
|
July 4, 2012 |
|
January 31, 2025 |
|
67,155,093,135 |
(1) |
|
10.50% |
|
May 22, 1998 |
|
December 21, 2025 |
|
81,793,650,266 |
|
|
10.50% |
|
May 22, 1998 |
|
December 21, 2026 |
|
81,793,650,266 |
|
|
10.50% |
|
May 22, 1998 |
|
December 21, 2027 |
|
81,793,650,266 |
|
|
2.60% |
|
September 27, 2007 |
|
March 31, 2028 |
|
59,194,190,467 |
(1) |
|
1.88% |
|
July 16, 2016 |
|
March 31, 2029 |
|
24,380,387,730 |
(1) |
|
8.00% |
|
October 4, 2013 |
|
January 31, 2030 |
|
176,191,024,973 |
|
|
7.00% |
|
May 28, 2010 |
|
February 28, 2031 |
|
110,792,390,244 |
|
|
8.25% |
|
June 13, 2014 |
|
March 31, 2032 |
|
122,150,123,098 |
|
|
3.45% |
|
August 15, 2003 |
|
December 7, 2033 |
|
88,245,972,808 |
(1) |
|
1.88% |
|
July 15, 2015 |
|
February 28, 2033 |
|
35,868,813,957 |
(1) |
|
8.88% |
|
July 17, 2015 |
|
February 28, 2035 |
|
126,680,589,197 |
|
|
6.25% |
|
July 21, 2006 |
|
March 31, 2036 |
|
104,262,552,145 |
|
|
8.50% |
|
July 19, 2013 |
|
January 31, 2037 |
|
138,030,792,164 |
|
|
2.25% |
|
July 4, 2012 |
|
January 31, 2038 |
|
65,073,613,902 |
(1) |
|
9.00% |
|
September 11, 2015 |
|
January 31, 2040 |
|
106,317,745,596 |
|
|
6.50% |
|
June 4, 2010 |
|
February 28, 2041 |
|
93,381,856,496 |
|
|
8.75% |
|
July 18, 2014 |
|
January 31, 2043 |
|
48,768,237,300 |
|
|
8.75% |
|
July 18, 2014 |
|
January 31, 2044 |
|
48,768,237,300 |
|
|
8.75% |
|
July 18, 2014 |
|
January 31, 2045 |
|
48,768,237,300 |
|
|
2.50% |
|
July 17, 2013 |
|
March 31, 2046 |
|
60,038,638,447 |
(1) |
|
8.75% |
|
June 29, 2012 |
|
February 28, 2047 |
|
81,538,381,358 |
|
|
8.75% |
|
June 29, 2012 |
|
February 28, 2048 |
|
81,538,381,358 |
|
|
8.75% |
|
June 29,2012 |
|
February 28, 2049 |
|
81,538,381,358 |
|
|
2.50% |
|
July 11, 2012 |
|
December 31, 2049 |
|
29,743,858,694 |
(1) |
|
2.50% |
|
July 11, 2012 |
|
December 31, 2050 |
|
29,743,858,694 |
(1) |
|
2.50% |
|
July 11, 2012 |
|
December 31, 2051 |
|
29,743,858,694 |
(1) |
|
4.50% |
|
December 1, 1986 |
|
Perpetual |
|
10,410 |
|
|
5.00% |
|
December 1, 1986 |
|
Perpetual |
|
57,935 |
|
|
7.25% |
|
June 20, 2005 |
|
January 15, 2020 |
|
2,443,455,207,610 |
|
|
6.75% |
|
September 1, 2006 |
|
March 31, 2021 |
|
15,884,603,937 |
|
|
Total Funded Internal Debt |
|
|
|
|
|
48,964,709,007 |
|
Note:
(1) Inflation-linked bonds have been revalued using the relevant “reference CPI”.
Source: National Treasury.
Floating Internal Debt of the Republic of South Africa (Treasury Bills — in Rand) As of September 30, 2019
|
Interest Rate |
|
Date of Issue |
|
Maturity Date |
|
Principal Amount |
|
|
|
|
|
|
|
|
(in Rand) |
|
|
8.04% |
|
October 3, 2018 |
|
October 3, 2019 |
|
2,735,000,000 |
|
|
8.15% |
|
October 10, 2018 |
|
October 10, 2019 |
|
2,650,000,000 |
|
|
8.05% |
|
October 17, 2018 |
|
October 17, 2019 |
|
3,000,000,000 |
|
|
8.07% |
|
October 24, 2018 |
|
October 24, 2019 |
|
2,735,000,000 |
|
|
8.10% |
|
October 31, 2018 |
|
October 31, 2019 |
|
2,735,000,000 |
|
|
8.09% |
|
November 7, 2018 |
|
November 7, 2019 |
|
2,735,000,000 |
|
|
8.13% |
|
November 14, 2018 |
|
November 14, 2019 |
|
2,735,000,000 |
|
|
8.14% |
|
November 21, 2018 |
|
November 21, 2019 |
|
2,735,000,000 |
|
|
8.17% |
|
November 28, 2018 |
|
November 28, 2019 |
|
2,735,000,000 |
|
|
8.21% |
|
December 5, 2018 |
|
December 4, 2019 |
|
2,475,000,000 |
|
|
8.24% |
|
December 12, 2018 |
|
December 11, 2019 |
|
2,881,000,000 |
|
|
8.34% |
|
December 19, 2018 |
|
December 18, 2019 |
|
2,262,000,000 |
|
|
8.44% |
|
December 27, 2018 |
|
December 27, 2019 |
|
2,460,000,000 |
|
|
8.37% |
|
January 2, 2019 |
|
January 2, 2020 |
|
2,735,000,000 |
|
|
8.30% |
|
January 2, 2019 |
|
October 3, 2019 |
|
2,595,000,000 |
|
|
8.26% |
|
January 9, 2019 |
|
January 8, 2020 |
|
2,735,000,000 |
|
|
8.16% |
|
January 9, 2019 |
|
October 10, 2019 |
|
2,595,000,000 |
|
|
8.16% |
|
January 16, 2019 |
|
January 15, 2020 |
|
2,735,000,000 |
|
|
8.07% |
|
January 16, 2019 |
|
October 17, 2019 |
|
2,595,000,000 |
|
|
8.06% |
|
January 23, 2019 |
|
January 22, 2020 |
|
2,735,000,000 |
|
|
7.99% |
|
January 23, 2019 |
|
October 24, 2019 |
|
2,595,000,000 |
|
|
8.00% |
|
January 30, 2019 |
|
January 29, 2020 |
|
2,735,000,000 |
|
|
7.93% |
|
January 30, 2019 |
|
October 31, 2019 |
|
2,595,000,000 |
|
|
7.91% |
|
February 6, 2019 |
|
February 5, 2020 |
|
2,735,000,000 |
|
|
7.85% |
|
February 6, 2019 |
|
November 7, 2019 |
|
2,395,000,000 |
|
|
7.85% |
|
February 13, 2019 |
|
February 12, 2020 |
|
2,735,000,000 |
|
|
7.82% |
|
February 13, 2019 |
|
November 14, 2019 |
|
2,395,000,000 |
|
|
7.88% |
|
February 20, 2019 |
|
February 19, 2020 |
|
2,735,000,000 |
|
|
7.85% |
|
February 20, 2019 |
|
November 21 2019 |
|
2,395,000,000 |
|
|
7.80% |
|
February 27, 2019 |
|
February 26, 2020 |
|
2,735,000,000 |
|
|
7.81% |
|
February 27, 2019 |
|
November 28, 2019 |
|
2,395,000,000 |
|
|
7.73% |
|
March 6, 2019 |
|
March 4, 2020 |
|
2,735,000,000 |
|
|
7.72% |
|
March 6, 2019 |
|
December 4, 2019 |
|
2,395,000,000 |
|
|
7.72% |
|
March 13, 2019 |
|
March 11, 2020 |
|
2,735,000,000 |
|
|
7.68% |
|
March 13, 2019 |
|
December 11, 2019 |
|
2,395,000,000 |
|
|
7.72% |
|
March 20, 2019 |
|
March 18, 2020 |
|
2,735,000,000 |
|
|
7.65% |
|
March 20, 2019 |
|
December 18, 2019 |
|
2,395,000,000 |
|
|
7.75% |
|
March 27, 2019 |
|
March 25, 2020 |
|
2,735,000,000 |
|
|
7.61% |
|
March 27, 2019 |
|
December 27, 2019 |
|
2,395,000,000 |
|
|
7.77% |
|
April 3, 2019 |
|
April 1, 2020 |
|
2,735,000,000 |
|
|
7.61% |
|
April 3, 2019 |
|
January 2, 2020 |
|
2,395,000,000 |
|
|
7.48% |
|
April 3, 2019 |
|
October 3, 2019 |
|
2,125,000,000 |
|
|
7.73% |
|
April 10, 2019 |
|
April 8, 2020 |
|
3,225,000,000 |
|
|
7.59% |
|
April 10, 2019 |
|
January 8, 2020 |
|
2,950,000,000 |
|
|
7.47% |
|
April 10, 2019 |
|
October 10, 2019 |
|
2,400,500,000 |
|
|
7.70% |
|
April 17, 2019 |
|
April 15, 2020 |
|
3,225,000,000 |
|
|
7.59% |
|
April 17, 2019 |
|
January 15, 2020 |
|
2,950,000,000 |
|
|
7.50% |
|
April 17, 2019 |
|
October 17, 2019 |
|
2,445,000,000 |
|
|
7.72% |
|
April 24, 2019 |
|
April 22, 2020 |
|
3,225,000,000 |
|
|
7.69% |
|
April 24, 2019 |
|
January 22, 2020 |
|
2,678,560,000 |
|
|
7.55% |
|
April 24, 2019 |
|
October 24, 2019 |
|
2,445,000,000 |
|
|
7.75% |
|
May 2, 2019 |
|
April 29, 2020 |
|
3,225,000,000 |
|
|
7.73% |
|
May 2, 2019 |
|
January 29, 2020 |
|
2,950,000,000 |
|
|
7.59% |
|
May 2, 2019 |
|
October 31, 2019 |
|
2,445,000,000 |
|
|
7.80% |
|
May 9, 2019 |
|
May 6, 2020 |
|
3,225,000,000 |
|
|
7.75% |
|
May 9, 2019 |
|
February 5, 2020 |
|
2,950,000,000 |
|
|
7.58% |
|
May 9, 2019 |
|
November 7, 2019 |
|
2,445,000,000 |
|
|
7.79% |
|
May 15, 2019 |
|
May 13, 2020 |
|
3,225,000,000 |
|
|
7.74% |
|
May 15, 2019 |
|
February 12, 2020 |
|
2,950,000,000 |
|
|
7.57% |
|
May 15, 2019 |
|
November 14, 2019 |
|
2,445,000,000 |
|
|
7.74% |
|
May 22, 2019 |
|
May 20, 2020 |
|
3,225,000,000 |
|
|
7.71% |
|
May 22, 2019 |
|
February 19, 2020 |
|
2,950,000,000 |
|
|
7.56% |
|
May 22, 2019 |
|
November 21, 2019 |
|
2,445,000,000 |
|
|
7.68% |
|
May 29, 2019 |
|
May 27, 2020 |
|
3,225,000,000 |
|
|
7.66% |
|
May 29, 2019 |
|
February 26, 2020 |
|
3,028,000,000 |
|
|
7.52% |
|
May 29, 2019 |
|
November 28, 2019 |
|
3,100,000,000 |
|
|
7.71% |
|
June 5, 2019 |
|
June 3, 2020 |
|
3,225,000,000 |
|
|
7.69% |
|
June 5, 2019 |
|
March 4, 2020 |
|
2,950,000,000 |
|
|
7.49% |
|
June 5, 2019 |
|
December 4, 2019 |
|
2,445,000,000 |
|
|
7.67% |
|
June 12, 2019 |
|
June 10, 2020 |
|
3,225,000,000 |
|
|
7.59% |
|
June 12, 2019 |
|
March 11, 2020 |
|
2,950,000,000 |
|
|
7.41% |
|
June 12, 2019 |
|
December 11, 2019 |
|
3,537,000,000 |
|
|
7.61% |
|
June 19, 2019 |
|
June 17, 2020 |
|
3,225,000,000 |
|
|
7.56% |
|
June 19, 2019 |
|
March 18, 2020 |
|
2,950,000,000 |
|
|
7.36% |
|
June 19, 2019 |
|
December 18, 2019 |
|
2,747,000,000 |
|
|
7.54% |
|
June 26, 2019 |
|
June 24, 2020 |
|
3,225,000,000 |
|
|
7.48% |
|
June 26, 2019 |
|
March 25, 2020 |
|
2,950,000,000 |
|
|
7.30% |
|
June 26, 2019 |
|
December 27, 2019 |
|
2,939,800,000 |
|
|
7.55% |
|
July 3, 2019 |
|
July 1, 2020 |
|
3,225,000,000 |
|
|
7.50% |
|
July 3, 2019 |
|
April 1, 2020 |
|
2,950,000,000 |
|
|
7.50% |
|
July 3, 2019 |
|
January 2, 2020 |
|
2,445,000,000 |
|
|
7.23% |
|
July 3, 2019 |
|
October 3, 2019 |
|
2,400,000,000 |
|
|
7.52% |
|
July 10, 2019 |
|
July 8, 2020 |
|
3,225,000,000 |
|
|
7.49% |
|
July 10, 2019 |
|
April 8, 2020 |
|
2,950,000,000 |
|
|
7.49% |
|
July 10, 2019 |
|
January 8, 2020 |
|
2,445,000,000 |
|
|
7.21% |
|
July 10, 2019 |
|
October 10, 2019 |
|
2,400,000,000 |
|
|
7.48% |
|
July 17, 2019 |
|
July 15, 2020 |
|
3,225,000,000 |
|
|
7.43% |
|
July 17, 2019 |
|
April 15, 2020 |
|
2,950,000,000 |
|
|
7.43% |
|
July 17, 2019 |
|
January 15, 2020 |
|
2,445,000,000 |
|
|
7.16% |
|
July 17, 2019 |
|
October 17, 2019 |
|
2,400,000,000 |
|
|
7.48% |
|
July 24, 2019 |
|
July 22, 2020 |
|
3,291,250,000 |
|
|
7.42% |
|
July 24, 2019 |
|
April 22, 2020 |
|
3,335,000,000 |
|
|
7.42% |
|
July 24, 2019 |
|
January 22, 2020 |
|
2,445,000,000 |
|
|
7.08% |
|
July 24, 2019 |
|
October 24, 2019 |
|
1,942,700,000 |
|
|
7.49% |
|
July 31, 2019 |
|
July 29, 2020 |
|
3,468,430,000 |
|
|
7.47% |
|
July 31, 2019 |
|
April 29, 2020 |
|
3,255,000,000 |
|
|
7.47% |
|
July 31, 2019 |
|
January 29, 2020 |
|
782,500,000 |
|
|
7.11% |
|
July 31, 2019 |
|
October 31, 2019 |
|
3,514,070,000 |
|
|
7.54% |
|
August 7, 2019 |
|
August 5, 2020 |
|
3,230,500,000 |
|
|
7.52% |
|
August 7, 2019 |
|
May 6, 2020 |
|
3,282,500,000 |
|
|
7.52% |
|
August 7, 2019 |
|
February 5, 2020 |
|
1,890,000,000 |
|
|
7.14% |
|
August 7, 2019 |
|
November 7, 2019 |
|
2,617,000,000 |
|
|
7.55% |
|
August 14, 2019 |
|
August 12, 2020 |
|
3,225,000,000 |
|
|
7.52% |
|
August 14, 2019 |
|
May 13, 2020 |
|
2,950,000,000 |
|
|
7.52% |
|
August 14, 2019 |
|
February 12, 2020 |
|
2,445,000,000 |
|
|
7.13% |
|
August 14, 2019 |
|
November 14, 2019 |
|
2,400,000,000 |
|
|
7.52% |
|
August 21, 2019 |
|
August 19, 2020 |
|
3,225,000,000 |
|
|
7.52% |
|
August 21, 2019 |
|
May 20, 2020 |
|
2,950,000,000 |
|
|
7.52% |
|
August 21, 2019 |
|
February 19, 2020 |
|
2,445,000,000 |
|
|
7.13% |
|
August 21, 2019 |
|
November 21, 2019 |
|
2,400,000,000 |
|
|
7.48% |
|
August 28, 2019 |
|
August 26, 2020 |
|
3,225,000,000 |
|
|
7.51% |
|
August 28, 2019 |
|
May 27, 2020 |
|
2,950,000,000 |
|
|
7.51% |
|
August 28, 2019 |
|
February 26, 2020 |
|
2,445,000,000 |
|
|
7.09% |
|
August 28, 2019 |
|
November 28, 2019 |
|
2,400,000,000 |
|
|
7.52% |
|
September 4, 2019 |
|
September 2, 2020 |
|
2,425,000,000 |
|
|
7.50% |
|
September 4, 2019 |
|
June 3, 2020 |
|
2,950,000,000 |
|
|
7.50% |
|
September 4, 2019 |
|
March 4, 2020 |
|
3,245,000,000 |
|
|
7.06% |
|
September 4, 2019 |
|
December 4, 2019 |
|
2,400,000,000 |
|
|
7.50% |
|
September 11, 2019 |
|
September 9, 2020 |
|
3,225,000,000 |
|
|
7.47% |
|
September 11, 2019 |
|
June 10, 2020 |
|
2,950,000,000 |
|
|
7.47% |
|
September 11, 2019 |
|
March 11, 2020 |
|
2,445,000,000 |
|
|
7.03% |
|
September 11, 2019 |
|
December 11, 2019 |
|
2,400,000,000 |
|
|
7.44% |
|
September 18, 2019 |
|
September 16, 2020 |
|
3,225,000,000 |
|
|
7.41% |
|
September 18, 2019 |
|
June 17, 2020 |
|
2,950,000,000 |
|
|
7.41% |
|
September 18, 2019 |
|
March 18, 2020 |
|
2,445,000,000 |
|
|
6.99% |
|
September 18, 2019 |
|
December 18, 2019 |
|
2,400,000,000 |
|
|
7.46% |
|
September 25, 2019 |
|
September 23, 2020 |
|
3,225,000,000 |
|
|
7.42% |
|
September 25, 2019 |
|
June 25, 2020 |
|
2,950,000,000 |
|
|
7.42% |
|
September 25, 2019 |
|
March 25, 2020 |
|
2,445,000,000 |
|
|
6.86% |
|
September 25, 2019 |
|
December 27, 2019 |
|
2,400,000,000 |
|
|
8.04% |
|
October 3, 2018 |
|
October 3, 2019 |
|
2,735,000,000 |
|
|
|
|
|
|
October 10, 2019 |
|
|
|
|
|
|
|
|
Total Floating Internal Debt |
|
358,817,810,000 |
|
Note:
(1) Excludes borrowing from the Corporation for Public Deposits to the amount of R58,075,323,689.06.
Source: National Treasury.
Funded External Debt of the Republic of South Africa as of March 31, 2019/December 31, 2019
|
Interest Rate |
|
Date of Issue |
|
Maturity Date |
|
Nominal Amount |
| |
|
Capital market loans |
|
|
|
|
|
|
| |
|
6.30% |
|
May 15, 2018 |
|
May 15, 2048 |
|
$ |
600,000,000 |
|
|
2.50% |
|
February 2, 1998 |
|
May 20, 2021 |
|
¥ |
141,120,000 |
|
|
3.80% |
|
June 1, 2000 |
|
June 1, 2020 |
|
¥ |
30,000,000,000 |
|
|
3.80% |
|
June 12, 2001 |
|
September 7, 2021 |
|
¥ |
30,000,000,000 |
|
|
4.875% |
|
April 14, 2016 |
|
April 14, 2026 |
|
$ |
1 250,000,000 |
|
|
5.875% |
|
May 30, 2007 |
|
May 30, 2022 |
|
$ |
1,000,000,000 |
|
|
5.50% |
|
March 5, 2010 |
|
September 3, 2020 |
|
$ |
1,619,112,000 |
|
|
6.25% |
|
March 8, 2011 |
|
March 8, 2041 |
|
$ |
750,000,000 |
|
|
4.665% |
|
January 17, 2012 |
|
January 17, 2024 |
|
$ |
1,500,000,000 |
|
|
5.875% |
|
September 16, 2013 |
|
September 16, 2025 |
|
$ |
2,000,000,000 |
|
|
5.375% |
|
July 24, 2014 |
|
July 24, 2044 |
|
$ |
1,000,000,000 |
|
|
3.750% |
|
July 24, 2014 |
|
July 24, 2026 |
|
€ |
500,000,000 |
|
|
5.0% |
|
October 12, 2016 |
|
October 12, 2046 |
|
$ |
1,000,000,000 |
|
|
4.30% |
|
October 12, 2016 |
|
October 12,2028 |
|
$ |
2,000,000,000 |
|
|
3.903% |
|
September 24, 2014 |
|
June 24, 2020 |
|
$ |
500,000,000 |
|
|
4.850% |
|
September 27, 2017 |
|
September 27, 2027 |
|
$ |
1000,000,000 |
|
|
Interest Rate |
|
Date of Issue |
|
Maturity Date |
|
Nominal Amount |
| |
|
5.650% |
|
September 27, 2017 |
|
September 27, 2047 |
|
$ |
1,500,000,000 |
|
|
5.875% |
|
May 15, 2018 |
|
May 15, 2030 |
|
$ |
1,400,000,000 |
|
|
4.850% |
|
September 30, 2019 |
|
September 30, 2029 |
|
$ |
2,000,000,000.00 |
|
|
5.750% |
|
September 30, 2019 |
|
September 30, 2029 |
|
$ |
3,000,000,000.00 |
|
|
4.92% Commercial Fixed |
|
April 6, 2010 |
|
April 15, 2011 - April 15, 2020 |
|
£ |
555,619.56 |
|
|
5.10% Commercial Fixed |
|
December 15, 2009 - October 15, 2010 |
|
April 15, 2011 - April 15, 2020 |
|
£ |
938,061.68 |
|
|
5.25% Commercial Fixed |
|
March 23, 2011 |
|
October 15, 2011 - April 15, 2020 |
|
£ |
831,188.33 |
|
|
6.77% MC CIRR |
|
July 22, 2005 |
|
April 15, 2009 - October 15, 2018 |
|
£ |
5,734.59 |
|
|
5.79% Commercial Fixed |
|
July 15, 2002 - April 15, 2004 |
|
April 15, 2009 - October 15, 2018 |
|
$ |
185,049.82 |
|
|
5.97% Commercial Fixed |
|
October 16, 2006 |
|
April 15, 2009 - October 15, 2018 |
|
$ |
80,300.36 |
|
|
5.55% Commercial Fixed |
|
October 15, 2003 - April 15, 2004 |
|
April 15, 2009 - October 15, 2018 |
|
$ |
1,837,157.28 |
|
|
5.315% Commercial Fixed |
|
April 15, 2009 |
|
April 15, 2011 - April 15, 2020 |
|
$ |
36,713.38 |
|
|
5.39% Commercial Fixed |
|
December 15, 2009 |
|
April 15, 2010 - October 15, 2018 |
|
$ |
9,432.99 |
|
|
5.40% Commercial Fixed |
|
June 22, 2007 - August 19, 2009 |
|
April 15, 2009 - October 15, 2018 |
|
$ |
529,644,00 |
|
|
5.16% Commercial Fixed |
|
June 6, 2008 - August 19, 2009 |
|
April 15, 2009 - October 15, 2018 |
|
$ |
812,578.64 |
|
|
5.61% Commercial Fixed |
|
December 15, 2009 |
|
April 15, 2010 - October 15, 2018 |
|
$ |
6,148.44 |
|
|
5.49% Commercial Fixed |
|
April 17, 2001 - July 15, 2003 |
|
April 15, 2009 - October 15, 2018 |
|
SEK |
21,863,050.48 |
|
|
3.90% Commercial Fixed |
|
April 15, 2005 - July 22, 2005 |
|
April 15, 2011 - April 15, 2020 |
|
SEK |
35,196,163.67 |
|
|
4.30% Commercial Fixed |
|
October 17, 2005 - January 17, 2006 |
|
April 15, 2011 - April 15, 2020 |
|
SEK |
83,684,084.10 |
|
|
3.81% Commercial Fixed |
|
October 26, 2004 - July 22, 2005 |
|
April 15, 2009 - October 15, 2018 |
|
SEK |
26,328,363.35 |
|
|
4.24% Commercial Fixed |
|
October 17, 2005 - January 16, 2006 |
|
April 15, 2009 - October 15, 2018 |
|
SEK |
8,986,613.06 |
|
|
4.57% Commercial Fixed |
|
April 18, 2006 - October 16, 2006 |
|
April 15, 2009 - October 15, 2018 |
|
SEK |
10,863,889.67 |
|
|
5.03% Commercial Fixed |
|
January 15, 2007 - April 16, 2007 |
|
April 15, 2009 - October 15, 2018 |
|
SEK |
2,860,440.01 |
|
|
4.60% Commercial Fixed |
|
April 18, 2006 - October 16, 2006 |
|
April 15, 2011 - April 15, 2020 |
|
SEK |
252,405,610.79 |
|
|
5.05% Commercial Fixed |
|
January 16, 2007 |
|
April 15, 2011 - April 15, 2020 |
|
SEK |
58,203,583.63 |
|
|
5.60% Commercial Fixed |
|
June 25, 2007 |
|
April 15, 2011 - April 15, 2020 |
|
SEK |
115,566,105.66 |
|
|
4.52% Commercial Fixed |
|
July 21, 2004 - October 17, 2005 |
|
April 15, 2009 - October 15, 2018 |
|
€ |
19,807.85 |
|
|
4.57% Commercial Fixed |
|
April 15, 2005 - January 17, 2006 |
|
April 15, 2011 - April 15, 2020 |
|
€ |
6,503,659.52 |
|
|
4.76% Commercial Fixed |
|
April 18, 2006 - July 17, 2006 |
|
April 15, 2011 - April 15, 2020 |
|
€ |
10,442,988.80 |
|
|
5.16% Commercial Fixed |
|
October 15, 2006 - April 16, 2007 |
|
April 15, 2009 - October 15, 2018 |
|
€ |
481,989.50 |
|
|
5.175% Commercial Fixed |
|
January 15, 2007 |
|
April 15, 2011 - April 15, 2020 |
|
€ |
3,250,381.08 |
|
|
6.28% Commercial Fixed |
|
October 16, 2006 - January 15, 2007 |
|
April 15, 2009 - October 15, 2018 |
|
£ |
1,125.28 |
|
|
6.42% Commercial Fixed |
|
December 15, 2008 |
|
April 15, 2011 - April 15, 2020 |
|
$ |
2,885,310.94 |
|
|
6.61% Commercial Fixed |
|
July 15, 2002 - April 15, 2004 |
|
April 15, 2009 - October 15, 2018 |
|
$ |
841,526.63 |
|
|
6.65% Commercial Fixed |
|
June 22, 2007 |
|
October 15, 2010 - April 15, 2020 |
|
$ |
11,710,221.53 |
|
|
5.89% Commercial Fixed |
|
October 23, 2009 - April 15, 2010 |
|
April 15, 2010 - October 15, 2018 |
|
$ |
425,062.02 |
|
|
5.98% Commercial Fixed |
|
October 16, 2006 |
|
October 15, 2010 - April 15, 2020 |
|
$ |
5,524,426. |
|
|
5.515% Commercial Fixed |
|
July 24, 2007 |
|
April 15, 2009 - October 15, 2018 |
|
€ |
264,403.58 |
|
|
4.93% Commercial Fixed |
|
April 16, 2007 |
|
April 15, 2009 - October 15, 2018 |
|
€ |
96,920.72 |
|
|
5.29% Commercial Fixed |
|
June 25, 2007 - July 24, 2007 |
|
April 15, 2009 - October 15, 2018 |
|
SEK |
3,580,533.42 |
|
|
5.09% Commercial Fixed |
|
April 15, 2009 |
|
April 15, 2011 - April 15, 2020 |
|
$ |
56,326.10 |
|
|
5.51% Commercial Fixed |
|
December 15, 2009 |
|
April 15, 2011 - April 15, 2020 |
|
$ |
67,160.64 |
|
|
5.70% Commercial Fixed |
|
December 15, 2009 - April 15, 2010 |
|
April 15, 2010 - October 15, 2018 |
|
$ |
613,700.38 |
|
|
5.70% Commercial Fixed |
|
September 15, 2009 |
|
April 15, 2011 - April 15, 2020 |
|
$ |
43,775.36 |
|
|
6.50% Commercial Fixed |
|
April 16, 2007 |
|
April 15, 2009 - October 15, 2018 |
|
£ |
1,682.51 |
|
|
5.35% Commercial Fixed |
|
October 17, 2011 |
|
April 15, 2012 - April 15, 2020 |
|
£ |
1,065,727.96 |
|
|
5.18% Commercial Fixed |
|
May 15, 2007 - October 15, 2007 |
|
April 15, 2011 - April 15, 2020 |
|
€ |
2,957,919.06 |
|
|
6.66% Commercial Fixed |
|
October 15, 2007 |
|
April 15, 2011 - April 15, 2020 |
|
$ |
4,085,152.65 |
|
|
6.75% Commercial Fixed |
|
July 31, 2008 |
|
April 15, 2011 - April 15, 2020 |
|
$ |
8,937,234.14 |
|
|
6.50% Commercial Fixed |
|
September 16, 2008 |
|
April 15, 2011 - April 15, 2020 |
|
$ |
5,819,166.44 |
|
|
7.89% Commercial Fixed |
|
December 15, 2009 |
|
April 15, 2011 - April 15, 2020 |
|
$ |
2,042,576.75 |
|
|
5.34% Commercial Fixed |
|
May 15, 2007 - October 15, 2007 |
|
April 15, 2011 - April 15, 2020 |
|
SEK |
44,650,820.86 |
|
|
5.64% Commercial Fixed |
|
October 15, 2007 |
|
April 15, 2011 - April 15, 2020 |
|
SEK |
41,670,139.55 |
|
|
6.06% Commercial Fixed |
|
July 31, 2008 |
|
April 15, 2011 - April 15, 2020 |
|
SEK |
85,826,425.44 |
|
|
5.79% Commercial Fixed |
|
September 16, 2008 |
|
April 15, 2011 - April 15, 2020 |
|
SEK |
73,751,313.85 |
|
|
5.45% Commercial Fixed |
|
December 15, 2008 |
|
April 15, 2011 - April 15, 2020 |
|
SEK |
31,041,897.39 |
|
|
5.50% Commercial Fixed |
|
July 31, 2008 - August 18, 2009 |
|
April 15, 2009 - October 15, 2018 |
|
SEK |
26,972,921.48 |
|
|
5.60% Commercial Fixed |
|
December 15, 2009 |
|
April 15, 2010 - October 15, 2018 |
|
SEK |
00.00 |
|
|
5.62% Commercial Fixed |
|
December 15, 2009 |
|
April 15, 2011 - April 15, 2020 |
|
SEK |
1,396,236.20 |
|
|
5.335% Commercial Fixed |
|
April 15, 2009 |
|
April 15, 2011 - April 15, 2020 |
|
SEK |
1,133,374.20 |
|
|
5.425% Commercial Fixed |
|
October 23, 2009 - April 15, 2010 |
|
April 15, 2011 - April 15, 2020 |
|
SEK |
11,869,625.12 |
|
|
5.80% Commercial Fixed |
|
October 23, 2009 - April 15, 2010 |
|
April 15, 2010 - October 15, 2018 |
|
SEK |
14,724,300.10 |
|
|
6.30% Commercial Fixed |
|
December 15, 2009 |
|
April 15, 2011 - April 15, 2020 |
|
SEK |
20,801,359.91 |
|
|
5.475% Commercial Fixed |
|
May 20, 2010 - October 15, 2010 |
|
April 15, 2011 - April 15, 2020 |
|
SEK |
15,977,301.87 |
|
|
5.525% Commercial Fixed |
|
December 13,2010 - April 16, 2012 |
|
October 15, 2011 - April 15, 2020 |
|
SEK |
18,348,639.14 |
|
|
5.565% Commercial Fixed |
|
October 17, 2011 |
|
April 15, 2012 - April 15, 2020 |
|
SEK |
23,608,344.12 |
|
|
5.595% Commercial Fixed |
|
December 7, 2011 - March 20, 2012 |
|
April 15, 2011 - April 15, 2020 |
|
SEK |
12,402,808.15 |
|
|
5.575% Commercial Fixed |
|
December 13, 2010 - April 16, 2012 |
|
October 15, 2011 - April 15, 2020 |
|
$ |
882,591.67 |
|
|
Interest Rate |
|
Date of Issue |
|
Maturity Date |
|
Nominal Amount |
| |
|
|
|
|
|
|
|
|
| |
|
5.355% Commercial Fixed |
|
April 6, 2010 |
|
April 15, 2011 - April 15, 2020 |
|
$ |
570,943.28 |
|
|
5.47% Commercial Fixed |
|
March 8, 2010 - October 15, 2010 |
|
April 15, 2011 - April 15, 2020 |
|
$ |
768,527.45 |
|
|
5.58% Commercial Fixed |
|
April 6, 2010 |
|
April 15, 2011 - April 15, 2020 |
|
$ |
372,141.13 |
|
|
5.695% Commercial Fixed |
|
March 8, 2010 - October 15, 2010 |
|
April 15, 2011 - April 15, 2020 |
|
$ |
500,926.56 |
|
|
5.80% Commercial Fixed |
|
December 13, 2010 - April 16, 2012 |
|
October 15, 2011 - April 15, 2020 |
|
$ |
575,273.66 |
|
|
5.905% Commercial Fixed |
|
October 17, 2011 |
|
April 15, 2012 - April 15, 2020 |
|
$ |
740,177.93 |
|
|
5.68% Commercial Fixed |
|
October 17, 2011 |
|
April 15, 2012 - April 15, 2020 |
|
$ |
1,135,589.79 |
|
|
5.775% Commercial Fixed |
|
December 7, 2011 - March 20, 2012 |
|
April 15, 2011 - April 15, 2020 |
|
$ |
596,590.06 |
|
|
6.00% Commercial Fixed |
|
December 7, 2011 - March 20, 2012 |
|
April 15, 2011 - April 15, 2020 |
|
$ |
388,872.87 |
|
|
5.43% Commercial Fixed |
|
December 7, 2011 - March 20, 2012 |
|
April 15, 2011 - April 15, 2020 |
|
£ |
876,635.46 |
|
|
1.750% Commercial Fixed |
|
April 15, 2009 - September 11, 2012 |
|
April 15, 2011 - April 15, 2020 |
|
$ |
578,784.59 |
|
|
1.158% Commercial Fixed |
|
April 16, 2012 |
|
October 15, 2012 - October 15, 2018 |
|
€ |
12,705.01 |
|
|
1.671% Commercial Fixed |
|
May 8, 2012 - September 11, 2012 |
|
October 15, 2012 - April 15, 2020 |
|
£ |
348,042.69 |
|
|
1.525% Commercial Fixed |
|
May 8, 2012 - September 11, 2012 |
|
April 15, 2011 - April 15, 2020 |
|
$ |
700,746.69 |
|
|
2.162% Commercial Fixed |
|
October 23, 2009 |
|
April 15, 2010 - October 15, 2018 |
|
SEK |
165,072.22 |
|
|
2.287% Commercial Fixed |
|
May 8, 2012 - September 11, 2012 |
|
October 15, 2012 - April 15, 2020 |
|
SEK |
10,242,342.71 |
|
Note:
Commercial Interest Reference Rate (CIRR). The CIRR is determined monthly by the OECD and published on the 14th day of each month. Each CIRR is fixed based on the previous 30-day treasury rate of each currency.
Source: National Treasury.
Total External Debt by Currency as of December 31, 2019
|
Euro |
|
€ |
505,788,736.89 |
| |
|
|
|
|
| ||
|
Pound Sterling |
|
£ |
1,153,819.07 |
| |
|
|
|
|
| ||
|
Swedish Krone |
|
SEK |
230,645,017.22 |
| |
|
|
|
|
| ||
|
U.S. Dollars |
|
$ |
22,131,366,809.18 |
| |
|
|
|
|
| ||
|
Yen |
|
¥ |
60,141,120,00.00 |
| |
Quarterly Bulletin December 2019 No. 294
© South African Reserve Bank All rights reserved. No part of this publication may be reproduced, stored in a retrieval system, or transmitted in any form or by any means, electronic, mechanical, photocopying, recording or otherwise, without fully acknowledging the Quarterly Bulletin of the South African Reserve Bank as the source. The contents of this publication are intended for general information only and are not intended to serve as financial or other advice. While every precaution is taken to ensure the accuracy of information, the South African Reserve Bank shall not be liable to any person for inaccurate information or opinions contained in this publication. Enquiries relating to this Bulletin should be addressed to: Head: Economic Statistics Department South African Reserve Bank P O Box 427 Pretoria 0001 Tel. +27 12 313 3668/3676 http://www.resbank.co.za ISSN 0038-2620 Android IOS Windows Printed by Publishing Section of South African Reserve Bank Quarterly Bulletin December 2019
Contents Quarterly Economic Review Introduction ............................................................................................................................... International economic developments ....................................................................................... Domestic economic developments ........................................................................................... Domestic output ............................................................................................................... Real gross domestic expenditure ...................................................................................... Gross nominal saving ........................................................................................................ Employment ...................................................................................................................... Labour cost and productivity ............................................................................................ Prices ................................................................................................................................ External economic accounts ..................................................................................................... Current account ................................................................................................................ Financial account .............................................................................................................. Foreign-owned assets in South Africa ............................................................................... South African-owned assets abroad ................................................................................. Foreign debt...................................................................................................................... International investment position ....................................................................................... International reserves and liquidity .................................................................................... Exchange rates ................................................................................................................. Turnover in the South African foreign exchange market..................................................... Monetary developments, interest rates and financial markets ................................................... Money supply.................................................................................................................... Credit extension ................................................................................................................ Interest rates and yields .................................................................................................... Money market ................................................................................................................... Bond market ..................................................................................................................... Share market..................................................................................................................... Market for exchange-traded derivatives ............................................................................ Real estate market ............................................................................................................ Non-bank financial intermediaries ..................................................................................... Flow of funds..................................................................................................................... Public finance............................................................................................................................ Non-financial public sector borrowing requirement ........................................................... Budget comparable analysis of national government finance ............................................ 1 4 7 7 13 21 24 29 31 37 37 45 46 46 47 48 49 50 52 54 54 56 60 64 65 67 68 70 71 72 74 74 79 Boxes Box 1 Methodology underlying the compilation of household saving and net lending/borrowing ............................................................................................ Methodology underlying South Africa’s merchandise trade statistics............................ Why the acceleration in general loans to households from 2018? ................................. The 2019 Medium Term Budget Policy Statement ........................................................ 21 40 59 75 Box 2 Box 3 Box 4 Note on the development of South Africa’s integrated economic accounts .......................... 85 Note on the recent sharp increase in the unemployment rate ................................................ 98 Notes to tables ......................................................................................................................... Abbreviations ........................................................................................................................... 111 112 Statistical tables Contents ..................................................................................................................................... S–0 Statistical tables .......................................................................................................................... S–2 Key information ....................................................................................................................... S–148 Quarterly Bulletin December 2019
.·.-: - :-.! - - -' ' I .. r 0, I I . '' . ., ' ; .. , - . . ' ' ·f. ' I I . ., . -' ' / - ' 'lo.,-. ,-' ·o ' .' ' ' . ' _) ' ' .. : -'. ' ' . .. - 0 .. : ----' ' .. .-. •' ' . .) •• -:.'.'.. ',_ ' ·/ - ' '' ' ' -:-.--\ .-I ' ' ' ·-'' . .-I• I• '· ' .''I ·' r : • ·'..,·"" ! :• : ! ,• •: . .' .··-1': ' - ' .. ,. ·-!.. • • ,. ---.,.. _,; .., - I• .'' ( .. /''· 7 .. ,>; . ) . ' -:. ·; .. - ·. ,--. . -·· ·.--· (• -'-.' '< •, .... -. ,._ .,... ' ' '• ' ' ,. -:) I ;; ,. -·-_ , ._ - . .,. --.._ ,. , <,. . ., .. ._. - ·-• , , 'i' -/. 1: ' --\ ... : -'-·- . ·---., '-.,, ·-. ;

Quarterly Economic Review Introduction Global economic growth remained subdued and slowed slightly further to 2.8% in the third quarter of 2019 as economic activity weakened in both the advanced and emerging market economies. Among the advanced economies, output growth decelerated notably in Japan while accelerating slightly in the Euro area, both expanding by less than one per cent. The moderation in the emerging markets was driven mainly by slower growth in Turkey and a likely further contraction in Argentina, while the gradual slowdown in China continued. World trade volumes contracted further, reflecting the slowdown in global economic growth and the impact of the ongoing trade tensions. Global inflation has remained subdued thus far in 2019. In the advanced economies, headline consumer price inflation continued to undershoot most central banks’ inflation targets. Inflationary pressures in the emerging market economies have also remained generally well contained, with only a few exceptions, such as Argentina and Turkey. The price of Brent crude oil receded notably in the three months up to early September 2019 amid concerns about slowing global economic growth. Attacks on Saudi Arabia’s oil facilities in mid-September caused oil prices to temporarily surge by around US$10 per barrel before declining again after production was restored in early October. Real economic growth in South Africa contracted once more by an annualised 0.6% in the third quarter of 2019 after rebounding by a slightly revised 3.2% in the second quarter. The weakness was broad-based as the real gross value added (GVA) by both the primary and the secondary sectors contracted, while output growth slowed markedly in the tertiary sector. Year-on-year growth in real gross domestic product (GDP) slowed markedly to only 0.1% in the third quarter. South Africa’s real GDP growth projections for 2019 have been lowered further in recent months, with estimates by the International Monetary Fund (IMF), National Treasury and the South African Reserve Bank (SARB) currently ranging between 0.5% and 0.7%, all below the 0.8% achieved in 2018. The contraction in the real output of the primary and secondary sectors in the third quarter of 2019 occurred in all of the subsectors. The real GVA by the agricultural sector contracted for a third successive quarter, albeit at a slightly slower pace, and that by the construction sector for a fifth consecutive quarter. The real output of the sector supplying electricity, gas and water was hampered by sluggish economic activity in the electricity-intensive mining and manufacturing sectors as well as the renewed implementation of electricity load shedding in October. Growth in the real GVA by the tertiary sector slowed sharply in the third quarter of 2019 as output increased at a slower pace in the commerce; finance, insurance, real estate and business services; and general government services sectors. In addition, real economic activity in the transport, storage and communication sector contracted for a third successive quarter. Real gross domestic expenditure (GDE) contracted by 3.6% in the third quarter of 2019 after having increased by 9.0% in the previous quarter. The contraction resulted primarily from inventory de-accumulation, while growth in all the components of real gross domestic final demand moderated. Real net exports made the largest positive contribution to growth in real GDP in the third quarter of 2019. Growth in the real final consumption expenditure by households moderated to only 0.2% in the third quarter of 2019. The pace of increase in real spending on services and, in particular, durable goods slowed, while purchases of semi-durable and non-durable goods decreased. This was consistent with the notably slower growth in households’ real disposable income and weaker consumer confidence. Household debt as a percentage of nominal disposable income decreased slightly in the third quarter of 2019. Households’ net wealth also decreased in the third quarter as the market value of assets was impacted by lower domestic share prices, with the FTSE/JSE All-Share 1 Quarterly Bulletin December 2019
Price Index (Alsi) recording its worst third-quarter performance since 2011. Furthermore, the lacklustre growth in nominal residential property prices persisted in the third quarter of 2019, with house prices continuing to decline in real terms. Real gross fixed capital formation expanded for a second consecutive quarter in the third quarter of 2019, driven largely by another sizable increase in capital expenditure by private business enterprises, particularly on machinery and other equipment as well as transport equipment. The increased capital outlays on machinery and equipment resulted from a marked increase in wind-powered generating sets for the ongoing construction of wind farms as well as automatic data-processing machines and units for a new data hub being established in Cape Town. By contrast, real fixed investment by general government decreased further and at a faster pace, while that by public corporations increased marginally following a substantial decrease in the second quarter. South Africa’s official unemployment rate increased marginally further to 29.1% in the third quarter of 2019 – the highest level since the inception of the Quarterly Labour Force Survey (QLFS) in 2008. The number of unemployed South Africans increased to an all-time high of 6.73 million in the third quarter, elevated by further significant increases in the number of job losers as well as long-term unemployed people entering the labour market and actively searching for jobs. The pace of increase in the nominal remuneration per worker in the formal non-agricultural sector accelerated somewhat to 5.6% in the second quarter of 2019, as both private and public sector (excluding temporary election-related jobs) wage growth accelerated. Private sector remuneration growth per worker rebounded from an all-time low in the first quarter, while public sector wage growth was elevated by the low base created a year earlier following the delayed implementation of the annual public sector wage increase. The acceleration in wage growth resulted in a quickening in formal non-agricultural nominal unit labour cost growth in the second quarter of 2019, although it remained within the inflation target range. The average nominal wage settlement rate in collective bargaining agreements decreased further to 6.8% in the first nine months of 2019 – its lowest level since the second quarter of 2007. Domestic inflationary pressures have remained fairly subdued, with headline consumer price inflation remaining at, or below, the 4.5% midpoint of the inflation target range thus far in 2019. Consumer goods price inflation has consistently been below the midpoint and followed the deceleration in producer price inflation over this period, while consumer services price inflation moderated further. Consumer food price inflation has accelerated steadily since April 2019, mainly on account of higher bread and cereals prices. However, domestic grain prices have moved broadly sideways thus far in 2019, resulting in the gradual dissipation of the low base of 2018. Core inflation slowed to 4.0% in September and October 2019, suggesting that underlying inflationary pressures remain well contained within an environment of subdued demand-side pressures. South Africa’s trade balance switched from a deficit in the second quarter of 2019 to a surplus in the third quarter. The turnaround resulted from an increase in the value of net gold and merchandise exports, alongside a contraction in merchandise imports. The value of merchandise exports was boosted by higher manufactured and agricultural exports which outweighed the contraction in non-gold mining exports. The lower value of merchandise imports reflected a sharp decline in the importation of mineral products, weighed down by fewer crude oil imports, while manufactured and agricultural imports increased. The shortfall on the services, income and current transfer account increased in the third quarter of 2019 due to a larger deficit on the income account as gross dividend payments increased markedly. However, the deficit on the current account of the balance of payments as a ratio of GDP narrowed from 4.1% in the second quarter of 2019 to 3.7% in the third quarter, as the switch to a trade surplus outweighed the wider deficit on the services, income and current transfer account. 2 Quarterly Bulletin December 2019
The net inflow of capital on the financial account of the balance of payments increased significantly in the third quarter of 2019. On a net basis, portfolio and, in particular, other investment registered inflows while direct investment, financial derivatives and reserve assets recorded outflows. South Africa’s positive net international investment position decreased notably from the end of March 2019 to the end of June. This reflected an increase in foreign liabilities and a decrease in foreign assets. The increase in the value of both direct and portfolio investment liabilities reflected higher domestic share prices. The market value of South Africa’s foreign assets decreased as direct and portfolio investment as well as reserve assets all decreased while only other investment and financial derivatives increased. The nominal effective exchange rate (NEER) of the rand declined, on balance, by 4.2% in the third quarter of 2019, largely reflecting a notable decline in August amid renewed global trade tensions. Despite adverse domestic idiosyncratic developments, the rand as well as other emerging market currencies was to a large extent influenced by global developments and risk aversion in the third quarter. In late October, the exchange value of the rand depreciated sharply after the release of the 2019 Medium Term Budget Policy Statement (2019 MTBPS), which presented a marked deterioration in South Africa’s fiscal position. This triggered renewed concerns of further credit-rating downgrades as two international rating agencies subsequently revised South Africa’s sovereign rating outlook from stable to negative. However, the exchange value of the rand stabilised towards the end of November. South African government bond yields increased from mid-July 2019 up to the end of November, reflecting continued global trade tensions, notable non-resident net sales of domestic bonds, government’s recapitalisation of Eskom, the depreciation in the exchange value of the rand, the larger government budget deficit, and increased debt levels depicted in the 2019 MTBPS. Growth in the broadly defined money supply (M3) slowed markedly in the third quarter of 2019 following an acceleration in the second quarter in the run-up to the national elections in May. The deceleration in the third quarter was driven by slower growth in the deposit holdings of the corporate sector as both financial and non-financial company deposit growth moderated, while that of households remained range-bound in recent months. Growth in total loans and advances extended by monetary institutions to the domestic private sector accelerated moderately in early 2019 but slowed in subsequent months. The recent moderation reflected slower growth in loans extended to companies while that to households continued its gradual upward trend. The acceleration in credit extension to the household sector reflected a further gradual acceleration in mortgage advances as well as a marked quickening in the extension of general loans. National government’s cash book deficit of R190 billion in the first half of fiscal 2019/20 was R62.1 billion more than in the same period of the previous fiscal year. The larger cash book deficit was brought about by a combination of significantly faster growth in expenditure and notably slower growth in revenue. The revenue shortfall reflected a marked increase in value-added tax (VAT) refunds and generally weak domestic economic activity along with weaker provisional tax payments. Higher government spending resulted mainly from increased transfers and subsidies, higher debt-service costs as well as additional allocations to some state-owned companies (SOCs). The larger cash deficit led to a larger non-financial public sector borrowing requirement in the first half of fiscal 2019/20 as the borrowing requirement of national government in particular increased notably. National government’s total gross loan debt increased significantly from 56.0% of GDP as at 30 September 2018 to 61.5% of GDP a year later, already surpassing the upwardly revised estimate of 60.8% for the end of fiscal 2019/20 in the 2019 MTBPS. 3 Quarterly Bulletin December 2019
International economic developments Global economic growth remained subdued and slowed slightly further from an annualised rate of 2.9% in the second quarter of 2019 to 2.8% in the third quarter. The slowdown reflected weaker economic activity in both advanced and emerging market economies. Among the advanced economies, Hong Kong and Japan underperformed, with the output of the former contracting by as much as 12.1%. The moderation in emerging markets was driven mainly by slower growth in Turkey and a likely further contraction in Argentina. Real global output growth and contributions from advanced and emerging market economies Percentage points Percentage change from quarter to quarter 5 5 owth (right-hand scale) 4 4 3 3 2 2 1 1 0 0 2014 2015 2016 2017 2018 2019 Seasonally adjusted annualised rates Sources: Barclays, Bloomberg, Haver Analytics, IMF, JPMorgan and SARB Real output growth in the United States (US) accelerated moderately from 2.0% in the second quarter of 2019 to 2.1% in the third quarter, reflecting an increase in private inventory investment, exports and residential fixed investment. Real output growth in selected advanced economies Quarter-to-quarter percentage change at seasonally adjusted annualised rates 2017 2018 2019 Country/region Q4 Year* Q1 Q2 Q3 Q4 Year* Q1 Q2 Q3 United States................. Japan ............................ Hong Kong.................... Euro area....................... United Kingdom ............ Canada ......................... Australia ........................ New Zealand ................. Advanced economies... 3.5 1.2 4.4 3.2 1.6 1.8 1.9 3.5 2.7 2.4 1.9 3.8 2.5 1.9 3.2 2.5 3.1 2.5 2.6 -0.6 7.8 1.1 0.2 2.2 3.8 2.1 1.9 3.5 2.2 -1.2 1.5 2.1 1.6 2.9 3.7 2.4 2.9 -2.0 0.4 0.8 2.5 2.5 1.2 1.4 1.5 1.1 1.5 -1.9 1.4 1.3 1.0 0.6 2.6 1.4 2.9 0.8 3.0 1.9 1.4 2.0 2.7 2.8 2.3 3.1 2.0 5.3 1.7 2.3 0.8 2.1 2.4 2.2 2.0 1.8 -1.9 0.8 -0.9 3.5 2.5 2.1 1.6 2.1 0.2 -12.1 0.9 1.2 1.3 1.8 2.8 1.3 * Percentage change over one year Underlined numbers indicate projections. Sources: Bloomberg, Haver Analytics, IMF, JPMorgan and SARB 4 Quarterly Bulletin December 2019 Advanced ec Emerging ma Global gr onomies rket economies
In the euro area, economic growth accelerated marginally to 0.9% in the third quarter of 2019 from 0.8% in the preceding quarter. The German economy avoided a technical recession with growth picking up to 0.3% from a contraction of 1.0% in the previous quarter. The German economy has been negatively impacted by slowing global demand, in part related to international trade tensions. Real output growth in the United Kingdom (UK) accelerated to 1.2% in the third quarter of 2019 following an unexpected contraction in the second quarter. The turnaround was mainly due to higher exports, which surged by 5.7%. However, the UK economy continued to experience widespread weakness as inventories, imports and gross fixed capital formation all contributed negatively to output growth. Japanese real output growth decelerated significantly from 1.8% in the second quarter of 2019 to only 0.2% in the third quarter, largely due to negative contributions from inventories and net exports. However, domestic demand remained relatively firm in the third quarter due to the frontloading of purchases ahead of the introduction of the consumption tax increase in the fourth quarter. Real economic growth in the emerging markets decelerated marginally to 4.1% in the third quarter of 2019 from 4.2% in the second quarter, largely due to slower growth in emerging Europe and Latin America. Growth in emerging Europe moderated slightly to 4.0% in the third quarter following a rebound in the previous quarter. The slowdown was mainly driven by weaker activity in Turkey, where real output growth decelerated sharply from 4.0% in the second quarter to 1.7% in the third quarter. By contrast, growth in Russia’s real gross domestic product (GDP) accelerated somewhat from 4.4% in the second quarter to 4.9% in the third quarter. Real output growth in selected emerging market economies Quarter-to-quarter percentage change at seasonally adjusted annualised rates 2017 2018 2019 Country/region Q4 Year* Q1 Q2 Q3 Q4 Year* Q1 Q2 Q3 China........................... 6.5 6.8 6.9 6.5 6.1 6.1 6.6 6.9 5.5 5.4 India ............................ 8.6 7.2 7.6 6.0 6.1 6.9 6.8 4.1 2.9 4.5 Indonesia..................... 5.3 5.1 4.7 5.8 4.9 5.3 5.2 4.4 5.7 4.8 Emerging Asia ............ 6.7 6.6 6.8 6.1 5.8 6.2 6.4 5.8 4.7 4.9 Russia ......................... -2.5 1.6 6.7 3.3 1.3 0.4 2.3 -2.8 4.4 4.9 Turkey ......................... 10.1 7.5 4.8 -0.3 -5.4 -10.0 2.8 7.0 4.0 1.7 Poland......................... 6.1 4.9 5.3 5.3 5.3 1.6 5.1 6.1 3.2 5.3 Emerging Europe........ 2.7 4.0 5.6 2.8 0.6 -1.9 3.3 1.7 4.1 4.0 Brazil ........................... 1.3 1.3 2.6 -0.1 2.1 0.4 1.3 0.0 1.9 2.5 Mexico ........................ 4.4 2.1 5.5 -0.9 1.5 -0.3 2.1 -0.4 -0.2 0.1 Argentina ..................... 3.7 2.7 0.0 -18.7 -0.6 -4.9 -2.5 -0.1 -1.3 -5.9 Latin America ............. Emerging economies.. 2.6 5.4 2.0 4.9 3.5 6.0 -1.2 4.5 1.2 4.3 0.4 4.1 1.8 4.7 0.0 4.3 1.4 4.2 0.9 4.1 * Percentage change over one year Underlined numbers indicate projections. Sources: Barclays, Bloomberg, Haver Analytics, IMF, JPMorgan and SARB 5 Quarterly Bulletin December 2019
In Latin America, real economic growth decelerated to 0.9% in the third quarter of 2019 from 1.4% in the second quarter. The slowdown was largely due to an expected sharp contraction of 5.9% in Argentina. By contrast, growth in Brazil accelerated from 1.9% in the second quarter to 2.5% in the third quarter. Real output growth across emerging Asia accelerated from 4.7% in the second quarter of 2019 to 4.9% in the third quarter. The improvement was largely due to a rebound in the Indian economy, as output expanded by 4.5% in the third quarter. In comparison, Chinese economic growth decelerated modestly further to 5.4% in the third quarter, reflecting continued pressure from weak domestic expenditure as well as trade tensions. Global inflation has remained subdued. In advanced economies, headline consumer price inflation has continued to undershoot most central banks’ inflation targets. Inflationary pressures in emerging market economies have generally remained well contained, with only a few exceptions, including Argentina and Turkey, where inflation is running in double digits. World trade volumes (using world exports as a proxy) contracted at a year-on-year rate (three-month moving average) of 1.0% in September 2019, reflecting the ongoing trade tensions. Export volumes in emerging markets fell even more (1.8%) over this period, mainly due to lower exports from Africa and the Middle East, China as well as the rest of emerging Asia. Meanwhile, exports from advanced economies contracted by a lesser 0.4% in September, largely due to lower exports from the euro area. After contracting for five consecutive months, US exports remained unchanged in September. The international prices of metals and minerals as well as agricultural products decreased modestly in the third quarter of 2019 while the decline in energy prices was more pronounced. The price of Brent crude oil fell from a high of US$74 per barrel in May 2019 to a trough of US$59 per barrel in early September amid concerns about slowing global economic growth. In mid-September, attacks on Saudi Arabia’s oil facilities caused oil prices to surge by around US$10 per barrel, but production was restored in early October, allowing prices to decline to levels prevailing before the attack. Oil prices have since trended somewhat higher, reaching US$61 per barrel in early December. International commodity prices in US dollars Index: 2010 = 100 150 130 110 90 70 50 30 2013 2014 2015 2016 2017 2018 2019 Sources: World Bank and SARB The international prices of agricultural products, in US dollar terms, decreased marginally by 1.9% in the third quarter of 2019 amid lower maize and wheat prices. Metals and minerals prices decreased by 1.8% over the same period due to pronounced declines in zinc and tin prices. 6 Quarterly Bulletin December 2019 Agriculture Metals and minerals Energy
Domestic economic developments Domestic output1 Real gross domestic product (GDP) in South Africa contracted by an annualised 0.6% in the third quarter of 2019, after rebounding by a slightly revised 3.2% in the second quarter. The real gross value added (GVA) by both the primary and the secondary sectors contracted anew in the third quarter of 2019, while output growth slowed in the tertiary sector. Year-on-year growth in real GDP slowed notably from 0.9% in the second quarter of 2019 to 0.1% in the third quarter, with the average level of real output only 0.3% higher in the first three quarters of 2019 than in the corresponding period in 2018. 1The quarter-to-quarter growth rates referred to in this section are based on seasonally adjusted data and are annualised. Real gross domestic product Quarter-to-quarter percentage change at seasonally adjusted annualised rates 2018 2019 Sector Q1 Q2 Q3 Q4 Year* Q1 Q2 Q3 Primary sector ................................. Agriculture ................................... Mining.......................................... Secondary sector ............................ Manufacturing.............................. Tertiary sector.................................. Non-primary sector** ....................... Non-agricultural sector*** ................ Total ................................................ -16.4 -33.7 -9.1 -6.2 -8.4 0.4 -7.3 -42.3 8.1 1.3 1.4 -0.1 -4.0 13.7 -8.9 4.9 7.5 2.9 -1.1 7.9 -3.8 3.0 4.5 1.7 -2.5 -4.8 -1.7 0.5 1.0 1.3 -12.3 -16.8 -10.8 -7.4 -8.8 -0.4 11.9 -4.2 17.4 1.5 2.1 2.9 -5.5 -3.6 -6.1 -3.8 -3.9 0.9 -1.1 -1.8 -2.7 0.2 0.8 -0.5 3.3 2.2 2.6 2.0 1.5 1.4 1.1 0.9 0.8 -2.0 -2.7 -3.1 2.6 3.7 3.2 -0.1 -0.6 -0.6 * Percentage change over one year ** The non-primary sector is total GVA excluding agriculture and mining. *** The non-agricultural sector is total GVA excluding agriculture. Source: Stats SA South Africa’s economic growth projection for 2019 was lowered to 0.7% in the International Monetary Fund’s (IMF) World Economic Outlook (WEO) in October. This growth rate was slightly higher than the estimate of 0.5% by National Treasury in the 2019 Medium Term Budget Policy Statement (2019 MTBPS). In November 2019, the South African Reserve Bank (SARB) also revised its growth projection for real GDP for 2019 lower to 0.5%. All of these projections are lower than the actual outcome of real GDP growth of 0.8% in 2018. When excluding the contribution of the generally more volatile primary sector, real output decreased by 0.1% in the third quarter of 2019, compared with a revised increase of 2.6% in the previous quarter. 7 Quarterly Bulletin December 2019
Real gross domestic product Percentage change from quarter to quarter 5 4 3 2 1 0 -1 -2 -3 -4 2014 2015 2016 2017 2018 2019 Source: Stats SA The real GVA by the primary sector contracted by 5.5% in the third quarter of 2019 after expanding by 11.9% in the second quarter as real output in both the agricultural and mining sectors decreased. Contributions to growth in real gross domestic product Primary sector Agriculture, forestry and fishing Mining and quarrying Secondary sector Manufacturing Electricity, gas and water Construction Tertiary sector Wholesale and retail trade, catering and accommodation Transport, storage and communication Finance, insurance, real estate and business services General government services Net taxes and subsidies on products -1.0 -0.5 0.0 0.5 1.0 1.5 2.0 2.5 Percentage points Source: Stats SA 8 Quarterly Bulletin December 2019 1.1 -0.5 -0.1 -0.1 1.2 -0.5 0.3 -0.7 0.3 -0.5 0.1 -0.1 0.0 -0.1 1.8 0.6 0.5 0.4 0.0 Second quarter 2019 Third quarter 2019 -0.5 0.9 0.3 0.5 0.4 0.0 0.1 Total Non-primary Seasonally adjusted and annualised
The real output of the agricultural sector shrank further in the third quarter of 2019 but at a slightly slower pace of 3.6%. This reflected lower field crop production, while the production of both horticultural and animal products increased slightly. The average level of real agricultural output was 9.1% lower in the first three quarters of 2019 than in the corresponding period of 2018. Commercial maize crop estimates Area planted (million hectares) 2018/19: final estimate ................................................................................................ 2.3 2019/20: intention to plant .......................................................................................... 2.5 Source: Crop Estimates Committee of the Department of Agriculture, Forestry and Fisheries The expected commercial maize crop of 11.2 million tons for the 2018/19 production season exceeds the estimated annual domestic consumption of about 10.8 million tons by a fair margin. Encouragingly, the area intended to be planted in the 2019/20 season is about 9% more than the previous season’s final area planted. Commercial maize crop Area planted Million hectares Production Million tons 5.0 18 4.5 16 4.0 14 3.5 12 3.0 2.5 10 8 2.0 6 1.5 1.0 4 0.5 2 0 0 1970 78 86 942002 10 2019 1970 78 86 94200210 2019 Average 1970-1990 Average 2015-2018 Calendar-year data, e.g. production season 2018/19 = 2019 Sources: Crop Estimates Committee of the Department of Agriculture, Forestry and Fisheries, and SAGIS South Africa’s maize industry has become much more productive over the past number of decades due to technological improvements in both the mechanical and biological area as well as improved farming skills. The average maize area planted almost halved from 4.2 million hectares between 1970 and 1990 to 2.4 million hectares between 2015 and 2018. However, the maize harvest increased to an average of about 12 million tons per annum from 8.4 million tons over the same period. 9 Quarterly Bulletin December 2019
Real gross domestic product Average level of the first three quarters of 2019 compared with the same period of 2018 Primary sector Agriculture, forestry and fishing Mining and quarrying Secondary sector Manufacturing Electricity, gas and water Construction Tertiary sector Wholesale and retail trade, catering and accommodation Transport, storage and communication Finance, insurance, real estate and business services General government services Total -10 -8 -6 -4 -2 0 2 4 Percentage change Seasonally adjusted and annualised Source: Stats SA The real GVA by the mining sector contracted by 6.1% in the third quarter of 2019 after having expanded by a revised 17.4% in the second quarter. Mining output subtracted 0.5 percentage points from real GDP growth in the third quarter, with platinum group metals (PGMs), iron ore, coal and other metallic minerals contributing the most to the decline. These declines were partially offset by increased production of gold, other non-metallic minerals and diamonds. The further pickup in gold production reflected the normalisation of operations following the end of the prolonged industrial action at a large gold mine. Activity in the mining sector was impeded by rising operating costs, in particular labour and electricity. Slowing global economic growth and declines in some commodity prices further constrained activity levels. The average level of real mining output in the first nine months of 2019 was 2.2% lower than in the corresponding period of 2018. Prospects for growth in mining output remain bleak given inconsistent electricity supply and expectations of a further moderation in global economic growth. Encouragingly, the protracted wage negotiations in the platinum sector have recently been concluded, with a three-year agreement having been reached without any industrial action. 10 Quarterly Bulletin December 2019 -4.0 -9.1 -2.2 -0.8 -0.1 -1.4 -2.6 1.4 0.1 0.8 2.6 1.5 0.3
Real gross value added by the mining sector Percentage change from quarter to quarter 20 10 0 -10 -20 -30 Physical volume of mining production: selected subsectors Index: first quarter of 2014 = 100 160 140 metals 120 100 80 Iron ore 60 40 2014 Source: Stats SA 2015 2016 2017 2018 2019 Real GVA by the secondary sector contracted by 3.8% in the third quarter of 2019 following an increase of 1.5% in the second quarter. The real output of all the secondary sectors – manufacturing, construction as well as electricity, gas and water – decreased in the third quarter. Contributions to growth in the real gross value added by the secondary sector Percentage points Percentage change from quarter to quarter 8 8 6 6 4 4 2 2 0 0 -2 -2 -4 -4 -6 -6 -8 -8 2014 Source: Stats SA 2015 2016 2017 2018 2019 11 Quarterly Bulletin December 2019 ConstructionElectricity, gas and water ManufacturingSecondary sector (right-hand scale) Seasonally adjusted and annualised Platinum group Coal Seasonally adjustedCopper Seasonally adjusted and annualised
The real output of the manufacturing sector decreased by 3.9% in the third quarter of 2019 and subtracted 0.5 percentage points from overall GDP growth as weak domestic demand, low business confidence and the slowdown in global manufacturing output suppressed activity. Durable goods production receded as activity shrank in all subsectors except for motor vehicles, parts and accessories and other transport equipment as well as furniture. Lower production of petroleum, chemical, rubber and plastic products as well as wood and wood products, paper, publishing and printing weighed on the manufacturing of non-durable goods. The average level of real manufacturing output essentially remained unchanged in the first three quarters of 2019 compared with that in the corresponding period of 2018. The seasonally adjusted utilisation of production capacity decreased notably from 81.7% in February 2019 to 80.4% in August, with insufficient demand the primary reason for under-utilisation. Real gross value added by the manufacturing sector Percentage change from quarter to quarter 10 5 0 -5 -10 2014 2015 2016 2017 2018 2019 Source: Stats SA Following an increase of 3.2% in the second quarter of 2019, real economic activity in the sector supplying electricity, gas and water contracted by 4.9% in the third quarter, subtracting 0.1 percentage points from overall GDP growth. Sluggish economic activity, particularly in the electricity-intensive mining and manufacturing sectors, contributed to the reduction in real output. The renewed implementation of electricity load shedding in October further aggravated the situation. Eskom experienced delays in the return to service of units that were on planned maintenance, while additional generation capacity at the Medupi Power Station was lost due to the failure of a coal-supplying conveyor belt. Limited diesel supplies also reduced the generation capacity of the utility. As a consequence, the average level of real output in the electricity, gas and water sector in the first three quarters of 2019 was 1.4% lower than in the corresponding period of 2018. The real GVA by the construction sector receded by 2.7% in the third quarter of 2019 – the fifth consecutive quarterly contraction. Activity levels declined in both the residential and non-residential building sector, while civil construction works also tapered off further. Growth in the real GVA by the tertiary sector slowed to 0.9% in the third quarter of 2019 from a revised 2.9% in the second quarter. Activity in the commerce; finance, insurance, real estate and business services; and general government services sectors moderated, while that in the transport, storage and communication sector contracted over the period. 12 Quarterly Bulletin December 2019 Seasonally adjusted and annualised
Real value added by the tertiary sector Index: first quarter of 2014 = 100 114 112 Transport, storage and communication General government services Wholesale and retail trade, catering and accommodation 110 108 106 104 102 100 98 2014 2015 2016 2017 2018 2019 Source: Stats SA In line with the marked deterioration in consumer confidence, growth in the real GVA by the commerce sector moderated to 2.6% in the third quarter of 2019 from a slightly revised 3.4% in the second quarter, contributing 0.4 percentage points to growth in overall real GDP. Strong growth in real wholesale trade was underpinned by improved sales of machinery and equipment; food, beverages and tobacco as well as solid, liquid and gaseous fuels. Growth in retail trade activity remained muted, reflecting weak consumer demand. In addition, the real GVA by the motor trade subsector increased at a slower pace, supported by a slight increase in new vehicle sales. Activity in the catering and accommodation services subsector was boosted by an increase in tourism. The real GVA by the transport, storage and communication sector decreased notably further by 5.4% in the third quarter of 2019, marking the third consecutive quarterly contraction. This reflected weaker activity in both land transportation and transport support services. Real output growth in the telecommunications subsector maintained its upward momentum in the third quarter. The real output of the finance, insurance, real estate and business services sector increased by 1.6% in the third quarter of 2019, following a more meaningful increase of 4.1% in the preceding quarter. Within the finance and insurance subsector, activity in the equity market gathered further pace while financial intermediation by the banking sector decreased. Economic activity also increased in the real estate and business services subsectors. The level of real output in this sector was 2.6% higher in the first nine months of 2019 compared with the same period of 2018. Growth in the real GVA by the general government services sector slowed from 3.2% in the second quarter of 2019 to 2.4% in the third quarter. The expansion in the third quarter reflects an increase in the number of employees in provincial government and at higher education institutions. Real gross domestic expenditure2 Real gross domestic expenditure (GDE) contracted by 3.6% in the third quarter of 2019, after having increased by as much as 9.0% in the second quarter. Growth in all components of real gross domestic final demand moderated alongside a decrease in inventory holdings. The average level of real GDE was 0.7% higher in the first three quarters of 2019 compared with the corresponding period of 2018. 2The quarter-to-quarter growth rates referred to in this section are based on seasonally adjusted data and are annualised. 13 Quarterly Bulletin December 2019 Finance, insurance, real estate and business services Total Seasonally adjusted
Real gross domestic expenditure Percentage change from quarter to quarter 10 5 0 -5 -10 Components of real gross domestic final demand Index: first quarter of 2014 = 100 110 105 100 95 2014 2015 2016 2017 2018 2019 Sources: Stats SA and SARB Real gross domestic expenditure Quarter-to-quarter percentage change at seasonally adjusted annualised rates 2018 2019 Component Q1 Q2 Q3 Q4 Year1 Q1 Q2 Q3 Final consumption expenditure Households..................................... General government........................ Gross fixed capital formation .............. Domestic final demand2 .................... Change in inventories (R billions)3 ....... Residual4 ............................................ Gross domestic expenditure5 ............ 1.1 4.6 -9.3 -0.3 13.1 0.0 1.2 0.1 2.1 -3.8 -0.2 4.6 0.0 -1.4 0.6 0.4 -0.7 0.3 14.5 0.1 2.1 3.2 0.6 -2.5 1.6 -53.9 0.0 -7.0 1.8 1.9 -1.4 1.2 -5.4 0.0 1.0 -0.6 2.0 -4.1 -0.7 -13.7 0.1 4.8 2.6 2.8 5.8 3.2 27.4 0.2 9.0 0.2 1.3 4.5 1.2 -9.5 0.1 -3.6 1 2 3 4 5 Percentage change over one year Comprises final consumption expenditure by households and general government as well as gross fixed capital formation At constant 2010 prices The residual as a percentage of GDP Including the residual Sources: Stats SA and SARB Net exports made the largest contribution to growth in real GDP in the third quarter of 2019 at 3.2 percentage points. Real gross fixed capital formation and final consumption expenditure by general government contributed a further 0.9 and 0.3 percentage points respectively. By contrast, the change in real inventory holdings subtracted 4.7 percentage points from overall economic growth over the period. 14 Quarterly Bulletin December 2019 Households General government Fixed capital formation Seasonally adjusted Seasonally adjusted and annualised
Contributions of expenditure components to growth in real gross domestic product Percentage points 2018 2019 Component Q1 Q2 Q3 Q4 Year Q1 Q2 Q3 Final consumption expenditure Households................................. General government.................... Gross fixed capital formation .......... Change in inventories ..................... Residual ......................................... Gross domestic expenditure ........ Net exports .................................... Gross domestic product ............... 0.7 0.9 -1.9 1.5 0.0 1.2 -3.9 -2.7 0.1 0.4 -0.8 -1.1 0.0 -1.4 0.9 -0.5 0.3 0.1 -0.1 1.3 0.5 2.1 0.5 2.6 2.0 0.1 -0.5 -8.7 -0.2 -7.3 8.7 1.4 1.1 0.4 -0.3 -0.3 0.1 1.0 -0.2 0.8 -0.4 0.4 -0.8 5.0 0.3 4.6 -7.7 -3.1 1.6 0.6 1.1 5.3 0.3 8.9 -5.7 3.2 0.1 0.3 0.9 -4.7 -0.3 -3.7 3.2 -0.6 Components may not add up to totals due to rounding off. Sources: Stats SA and SARB Real exports of goods and services increased by 0.9% (not annualised) in the third quarter of 2019, following a contraction of 0.4% in the second quarter. An increase in foreign demand for vehicles and transport equipment as well as machinery and electrical equipment boosted manufacturing exports, while vegetable products contributed to a substantial rise in agricultural exports. The decrease in overall mining exports reflected lower export volumes of mineral products and base metal articles. Real exports and imports of goods and services Quarter-to-quarter percentage change* 2019 Exports Imports Component Percentage of total** Percentage of total** Q2*** Q3*** Q2*** Q3*** Total ............................................................. 100.0 -0.4 0.9 100.0 4.3 -1.8 Mining.......................................................... Of which: Mineral products.................................. Precious metals, including gold, platinum group metals and stones ...... Base metals and articles ..................... 46.8 -3.0 -2.6 20.5 4.9 -14.1 18.9 -0.2 -4.3 15.0 7.7 -18.1 16.4 11.6 -12.2 2.4 7.2 -9.2 1.3 4.2 -22.3 3.3 0.5 -3.3 Manufacturing ............................................. Of which: Vehicles and transport equipment ....... Machinery and electrical equipment .... Chemical products .............................. Prepared foodstuffs, beverages and tobacco ........................................ 32.7 2.4 3.3 62.4 4.1 2.3 10.5 6.7 5.3 9.4 -0.7 -3.8 6.5 4.2 3.2 12.4 24.8 9.2 -4.0 7.8 7.0 7.7 3.6 -1.9 3.6 2.4 -0.4 2.5 13.1 -3.1 Agriculture ................................................... Of which: Vegetable products ............................. Services ....................................................... 5.7 -4.7 17.3 3.6 14.2 1.1 4.4 13.8 -9.2 1.4 27.9 -0.3 1.4 12.6 31.8 1.5 8.0 -2.9 * Based on seasonally adjusted and annualised data ** Expressed as a percentage of the total in 2018 *** Not annualised Components may not add up to totals due to rounding off and the exclusion of unclassified items. Sources: SARS, Stats SA and SARB 15 Quarterly Bulletin December 2019
The real imports of goods and services receded by 1.8% in the third quarter, following an increase in the second quarter of 2019. The contraction was driven by lower volumes of mining imports, mainly mineral products as well as base metals and articles thereof. Strong growth in the imports of vehicles and transport equipment as well as machinery and electrical equipment outweighed lower import volumes of chemical products as well as prepared foodstuffs, beverages and tobacco. The real value of agricultural imports rose marginally due to an increase in domestic demand for imported vegetable products. Contributions of real exports and imports, and net exports of goods and services to growth in real gross domestic product Percentage points 2019 Exports Imports* Net exports Component Q2 Q3 Q2 Q3 Q2 Q3 Total ............................................................... -0.5 1.0 5.3 -2.2 -5.7 3.2 Mining............................................................ Of which: Mineral products.................................... Precious metals, including gold, platinum group metals and stones......... Base metals and articles ....................... -1.6 -1.3 1.2 -3.6 -2.8 2.3 -0.1 -1.0 1.4 -3.4 -1.4 2.4 -1.9 0.3 0.9 -1.2 -0.3 0.2 0.0 -0.2 -1.8 0.1 0.9 -1.1 Manufacturing ............................................... Of which: Vehicles and transport equipment ......... Machinery and electrical equipment ...... Chemical products ................................ Prepared foodstuffs, beverages and tobacco .......................................... 1.0 1.3 3.2 1.8 -2.3 -0.5 1.3 -0.1 -0.2 0.9 0.3 0.2 -0.7 2.4 0.8 1.2 1.2 -0.2 1.9 -2.4 -1.0 -0.3 -0.8 0.4 0.1 0.0 0.4 -0.1 -0.3 1.0 Agriculture ..................................................... Of which: Vegetable products ............................... Services ......................................................... -0.3 1.0 0.6 0.0 -0.9 1.0 -0.4 0.2 1.2 -0.1 0.5 0.2 0.2 -0.4 -0.9 0.0 1.1 0.3 * A positive contribution by imports subtracts from growth and a negative contribution adds to growth. Components may not add up to totals due to rounding off and the exclusion of unclassified items. Sources: SARS, Stats SA and SARB Real net exports contributed 3.2 percentage points to real GDP growth in the third quarter of 2019 as the net exports of mining and agricultural products added 2.3 and 1.0 percentage points respectively. Within mining, the real net exports of mineral products contributed the most, at 2.4 percentage points. By contrast, real net manufacturing exports subtracted 0.5 percentage points from growth in real GDP, mainly due to reduced net exports of vehicles and transport equipment as well as machinery and electrical equipment. Growth in the real final consumption expenditure by households moderated from 2.6% in the second quarter of 2019 to only 0.2% in the third quarter. Consistent with notably slower growth in households’ real disposable income and weaker consumer confidence, the pace of increase in real spending on services and in particular durable goods slowed while less semi-durable and non-durable goods were purchased. The average level of real final consumption expenditure by households in the first three quarters of 2019 was only 1.1% higher than in the corresponding period of 2018 in an environment of slow economic growth, higher fuel prices and rising unemployment. 16 Quarterly Bulletin December 2019
Real final consumption expenditure by households Quarter-to-quarter percentage change at seasonally adjusted annualised rates 2018 2019 Category Q1 Q2 Q3 Q4 Year* Q1 Q2 Q3 Durable goods.................. Semi-durable goods ......... Non-durable goods .......... Services ........................... Total ................................. 2.8 -13.1 0.6 4.8 1.1 -3.7 1.2 -1.8 2.4 0.1 -3.7 9.0 2.7 -2.0 0.6 7.7 8.7 3.0 1.1 3.2 4.5 3.0 0.8 1.9 1.8 -6.7 -10.5 0.3 2.5 -0.6 9.0 4.2 2.2 1.2 2.6 2.1 -1.3 -0.3 0.5 0.2 * Percentage change over one year Source: Stats SA Growth in real consumer outlays on durable goods moderated to 2.1% in the third quarter of 2019, following strong growth of 9.0% in the previous quarter. Real expenditure on computers and related equipment decreased notably, while that on personal transport equipment, furniture and household appliances, and recreational and entertainment goods increased at a slower pace. The rate of increase in real spending on motor vehicles, the main contributor to the transport equipment category, slowed from 9.1% in the second quarter of 2019 to 4.2% in the third quarter. Real final consumption expenditure by households on durable goods Index: first quarter of 2014 = 100 175 160 Furniture, households appliances etc. Other durable goods Total 145 Personal transport equipment 130 115 100 85 70 2014 2015 2016 2017 2018 2019 Source: Stats SA Real household spending on semi-durable goods lost momentum and contracted by 1.3% in the third quarter of 2019, following an increase of 4.2% in the second quarter. A contraction in spending on clothing and footwear; motorcar tyres, parts and accessories; and household textiles, furnishings and glassware marginally outweighed the increased expenditure on recreational and entertainment goods as well as miscellaneous goods. Consumption expenditure on non-durable goods decreased marginally by 0.3% in the third quarter of 2019 after increasing by 2.2% in the previous quarter. Real outlays on food, beverages and tobacco, which represent the bulk of this category, rose at a slower pace. Conversely, spending on household fuel, power and water; petroleum products; household consumer goods; and recreational and entertainment goods contracted over the period. 17 Quarterly Bulletin December 2019 Recreational and entertainment goods Computers and related equipment Seasonally adjusted
Real household consumption expenditure on services increased by 0.5% in the third quarter of 2019 following an increase of 1.2% in the second quarter. Growth in consumer spending on household services as well as recreational, entertainment and educational services accelerated slightly. However, real spending on other services subcategories, including rent, medical services, and miscellaneous services increased at a slower pace, while that on transport and communication services decreased. Household debt increased at a slower pace in the third quarter of 2019, consistent with the modest increase in nominal spending. The pace of increase in overdrafts, credit cards as well as leasing finance and instalment sale loans moderated, while that in mortgage advances accelerated over the period. Household debt as a percentage of nominal disposable income decreased slightly to 72.6% in the third quarter of 2019 from 72.7% in the second quarter, as the quarter-to-quarter increase in nominal disposable income marginally exceeded that in household debt. On balance, households’ cost of servicing debt relative to disposable income decreased slightly to 9.4% in the third quarter of 2019 from 9.5% in the second quarter, following the 25 basis points reduction in the prime lending rate in July 2019 and the slower growth in household indebtedness in the third quarter. Household debt and debt-service cost as a ratio of disposable income Per cent 10.0 80 9.8 78 9.6 Debt-service cost (right-hand scale) 9.4 76 9.2 9.0 74 8.8 Debt 8.6 72 8.4 70 8.2 2014 Source: SARB 2015 2016 2017 2018 2019 Households’ net wealth decreased in the third quarter of 2019 as lower share prices impacted the value of equity holdings while liabilities increased at a slower pace. Consequently, the ratio of net wealth to nominal disposable income edged lower to 361.0% in the third quarter of 2019 from 367.2% in the second quarter. Growth in real final consumption expenditure by general government moderated from 2.8% in the second quarter of 2019 to 1.3% in the third quarter as growth in both the real compensation of employees and non-wage goods and services decelerated. The slowdown was in line with government’s effort to contain expenditure which remains constrained by limited fiscal space and the high public sector wage bill. The level of real spending by general government in the first three quarters of 2019 was 1.5% higher than in the corresponding period of 2018. 18 Quarterly Bulletin December 2019 Seasonally adjusted
Nominal final consumption expenditure by general government Percentage of gross domestic product 22.0 15.0 21.5 Long-term average consumption 14.5 Compensation of employees (right-hand scale) Henderson moving average (right-hand scale) 21.0 14.0 13.5 20.5 20.0 13.0 19.5 12.5 19.0 12.0 20102011 2012 2013 2014 2015 2016 2017 2018 2019 Source: Stats SA Nominal final consumption expenditure by general government as a ratio of nominal GDP trended higher from 2010 and has exceeded the long-term average3 of 20.6% since the third quarter of 2015. The upward trend was mainly driven by the compensation of employees, which constitute approximately 66% of government’s nominal final consumption expenditure. 3This is the average from the first quarter of 2010 to the third quarter of 2019. Real gross fixed capital formation expanded by 4.5% in the third quarter of 2019 after increasing by 5.8% in the second quarter. Capital outlays by private business enterprises expanded further, while that by public corporations increased marginally following a substantial decrease in the previous quarter. By contrast, real fixed investment by general government decreased further in the third quarter. Real gross fixed capital formation Quarter-to-quarter percentage change at seasonally adjusted annualised rates 2018 2019 Sector Q1 Q2 Q3 Q4 Year* Q1 Q2 Q3 Private business enterprises .... Public corporations................. General government ............... Total ....................................... -6.7 -15.5 -14.1 -9.3 -1.3 -13.8 -4.3 -3.8 2.9 -7.9 -9.0 -0.7 -1.4 -5.6 -4.1 -2.5 2.1 -12.5 -4.4 -1.4 -7.2 9.6 -2.1 -4.1 15.8 -11.9 -16.3 5.8 10.8 0.2 -17.8 4.5 * Percentage change over one year Source: Stats SA The substantial rebound in real gross fixed capital outlays by private business enterprises in the second quarter of 2019 was followed by a further strong increase of 10.8% in the third quarter. This reflected continued growth in capital expenditure on machinery and other equipment as well as transport equipment. The private sector’s share of gross fixed capital formation increased from 63.9% in 2015 to 70.9% in the third quarter of 2019, accentuated by a decline in gross fixed capital formation by public corporations over the period. The contraction in fixed investment by public corporations resulted from the winding down of construction activity at the Medupi and Kusile power plants and as the financial position of most of these institutions worsened. 19 Quarterly Bulletin December 2019 Total Henderson moving average Seasonally adjusted
Nominal gross fixed capital formation by type of organisation R billions 1 000 900 800 700 600 500 400 300 200 100 0 2000 2002 2004 2006 2008 2010 2012 2014 2016 2018 Seasonally adjusted Source: Stats SA Capital expenditure by the public sector, which accounts for about 30% of total gross fixed capital formation, contracted for a second consecutive quarter in the third quarter of 2019, with capital spending by general government contributing most to the decline. Growth in real gross fixed capital expenditure by public corporations increased marginally by 0.2% in the third quarter of 2019 after contracting by 11.9% in the second quarter, with a slight improvement in real fixed capital outlays on transport equipment as well as on machinery and equipment. Real capital expenditure by general government receded further by 17.8% in the third quarter of 2019, following a notable decrease of 16.3% in the second quarter. This marked the seventh consecutive quarterly contraction, with lower real capital spending by provincial and central government outweighing increases by local government. Total gross fixed capital formation in the third quarter of 2019 Contribution in percentage points 8 6 4 2 0 -2 -4 -6 -30 -20 -10 0 10 20 30 40 50 Percentage change from quarter to quarter Seasonally adjusted and annualised * Other assets include computer equipment, computer software, research and development, cultivated biological resources, and mineral exploration and evaluation. Source: Stats SA Construction-related gross fixed capital formation decreased markedly in the third quarter of 2019. Capital spending on both construction works and non-residential buildings contracted for a fourth and fifth consecutive quarter respectively, while that on residential buildings decreased anew. 20 Quarterly Bulletin December 2019 Transport equipment Machinery and other equipment Other assets* Non-residential buildings Residential buildings Transfer costs Construction works Private business enterprises Public corporations General government
Real capital outlays on transport equipment remained robust in the third quarter of 2019, increasing by 13.1%. Machinery and other equipment have contributed the most to growth in total fixed capital formation thus far in 2019. However, this was partly offset by reduced spending on construction-related assets. Real inventory holdings decreased by R9.5 billion on an annualised basis (at 2010 prices) in the third quarter, following an accumulation of R27.4 billion in the second quarter of 2019. The lower stock levels could mainly be attributed to a run-down of inventories in the manufacturing and transport sectors. Industrial and commercial inventories as a percentage of non-agricultural nominal GDP remained unchanged at 9.9% in the third quarter of 2019. Gross nominal saving The national saving rate (gross saving as a percentage of nominal GDP) for South Africa declined marginally from 14.8% in the second quarter of 2019 to 14.5% in the third quarter. The decline reflected dissaving by general government, whereas the saving rate of corporate business enterprises increased somewhat while that of households remained unchanged. The portion of total gross capital formation to be financed through foreign capital (the foreign financing ratio) decreased from 21.6% in the second quarter of 2019 to 20.5% in the third quarter. Gross saving as a percentage of gross domestic product Ratio in per cent at seasonally adjusted annualised rates 2018 2019 Sector Q1 Q2 Q3 Q4 Year Q1 Q2 Q3 Corporate......................... General government ....... Household ...................... Total ............................... 13.5 -0.5 1.3 14.3 11.8 0.9 1.6 14.3 13.5 -0.1 1.4 14.9 13.3 -0.4 1.2 14.0 13.0 0.0 1.4 14.4 13.9 -0.6 1.4 14.8 12.6 0.9 1.4 14.8 13.5 -0.4 1.4 14.5 Source: SARB Gross saving as a percentage of GDP for the corporate sector increased from 12.6% in the second quarter of 2019 to 13.5% in the third quarter, while that of general government reverted from 0.9% in the second quarter of 2019 to a dissaving of 0.4% in the third quarter. Government revenue decreased following lower corporate and personal income tax receipts, while the slower pace of increase in government’s nominal expenditure did not compensate for the reduction in revenue. Gross saving by the household sector as a percentage of GDP remained unchanged at 1.4% in the third quarter, as the increase in nominal disposable income was fully offset by that in nominal consumption expenditure. 21 Quarterly Bulletin December 2019 Box 1Methodology underlying the compilation of household saving and net lending/borrowing1 Household2 activity in the South African economy is captured in the analytical construct of the System of National Accounts (SNA).3 This box explains how households’ gross saving and net lending/borrowing position is derived. The link between these aggregates, as well as the nexus between real economic activity and financial intermediation, is also discussed. 1 This box relates to the statistics in the production, distribution and accumulation accounts of South Africa for households and non-profit institutions serving households on page S–134 of this Quarterly Bulletin and the National Financial Account statistics on page S–49 of the June 2019 Quarterly Bulletin. 2 Households consist of either one or a group of individuals, and include household unincorporated enterprises as well as non-profit institutions which are not government-controlled and render non-market services to households. 3 The compilation of South Africa’s national accounts adheres to the guidelines of the System of National Accounts 2008 (2008 SNA) as the international standard for the measurement of economic activity. See https://unstats.un.org/unsd/ nationalaccount/docs/SNA2008.pdf
distribution and redistribution of income, as well as the use of income for consumption and saving. occupied dwellings. Household production includes goods for own use but excludes services for own consumption, except gross and net saving is imputed consumption of fixed capital (depreciation). (other than inventories) or by relinquishing a financial claim, while the party receiving the transfer is obliged to acquire a non-financial retained in a bank deposit. account. 22 Quarterly Bulletin December 2019 termediation Firstly, the accompanying table provides a walk-through of how household gross saving is derived in the context of the current account, its subaccounts, and the balancing items within the SNA framework. Household saving and net lending/borrowing in the national accounts framework R millions22 at basic prices surplus/mixed income income12 entitlements13 by households 1. These are according to the accounting framework of the sequence of accounts in the SNA. 2. Balancing items are an accounting construct carried forward from one account to the next. 3. The current account records the production of goods and services, the generation of income by production, the subsequent 4. The capital account records the acquisition and disposal of non-financial assets and capital transfers. 5. The financial account records transactions in financial assets and liabilities. 6. This refers to the distribution of income between labour and capital. 7. The production account is the starting point and records the use of inputs to produce output and imputed rental of owner-paid domestic staff and own-account housing services by owner-occupiers. 8. Output at basic prices is the amount receivable for output minus tax payable and subsidies receivable. 9. This is the value of goods and services consumed as inputs, excluding depreciation. 10. This refers to the compensation of paid employees of household unincorporated enterprises. 11. This means the current transfer of goods or services without receiving anything in return. 12. Gross disposable income excludes holding gains and losses. 13. As individuals accrue pension entitlements, they become their assets. 14. Gross saving is the balancing item of the current account and is carried forward to the capital account. The difference between 15. Capital transfers are unrequired transfers where the party making the transfer realises the funds by disposing of a non-financial asset asset. 16. Gross fixed capital formation is the value of acquisitions less disposals of fixed assets (non-financial assets). 17. Net lending is the amount of resources available to lend to deficit units in the economy through the financial account, even if they are 18. Net borrowing is the amount of resources required from surplus units in the economy through incurring liabilities in the financial 19. Net lending/borrowing means that what is borrowed by one unit must be lent by another unit, and vice versa. 20 and 21. The statistics referred to here are published on page S–49 of the June 2019 Quarterly Bulletin. 22. The statistics referred to in this table are published on page S–134 of this Quarterly Bulletin. Real economic activity Accounts1 Balancing items2 High-level items 2018 Current3 Production7 Output at basic prices8 Intermediate consumption9 1 373 311 -560 156 813 155 -160 109 -32 253 620 793 2 317 919 286 097 3 224 809 -502 916 152 862 55 147 2 929 902 63 871 -2 920 994 Gross value added Generation of income Compensation of employees10 Net taxes on production Gross operating Distribution6 Allocation of primary income Compensation of employees Net property income received/paid Gross primary income Secondary distribution of income Current taxes on income and wealth Net social benefits/contributions Net current transfers received/paid11 Gross disposable Use of disposable income Adjustment for change in pension Final consumption expenditure Gross saving14 67 099 Capital4 Net capital transfers received/paid15 Gross fixed capital formation16 Change in inventories 15 053 -97 792 -227 Financial in-Net lending and borrowing17,18,19 -15 867 Financial5 Net acquisition of financial assets20 Net incurrence of financial liabilities21 101 363 117 229
2 000 2 000 20 2010 2012 2014 2016 2018 2015 2016 2017 2018 23 Quarterly Bulletin December 2019 The production of goods and services by unincorporated enterprises owned by households is recorded in the production account and includes imputed rental for owner-occupied dwellings minus intermediate consumption, inclusive of the maintenance of dwellings. This renders gross value added, from which both compensation paid to employees of household unincorporated enterprises and net taxes on production4 are deducted, to derive mixed income. Employed members of households earn income from other sectors in the economy, which, together with property income received/paid (interest, dividends and rent on land and subsoil assets), constitutes gross primary income. Households then pay tax on income received and make social contributions, such as those paid by employers on their behalf, while also receiving social benefits such as social security. This, combined with net current transfers received/paid (goods and services without quid pro quo), leaves households with gross disposable income, which is then adjusted for accrued pension entitlements. This income is then available to facilitate both final consumption expenditure and saving. For gross saving to be negative, households’ final consumption expenditure must be in excess of income received, or vice versa. The capital account records the change in non-financial assets and shows how to advance from household gross saving to net lending/borrowing. Gross saving is adjusted for unrequired capital transfers received/ paid, the disposal and acquisition of assets, as well as the change in inventories. Next, the implications of the nexus between real economic activity (as captured in the current and capital accounts) and financial intermediation (as recorded in the financial account) are discussed. Negative gross saving outcomes (dissaving) require financing through a combination of the disposal of non-financial assets (as recorded in the capital account) and net borrowing in the financial account through the depletion of financial assets and/or the incurrence of liabilities. In this instance, if net acquisitions of non-financial assets occurred, this would result in an even larger net borrowing requirement. Positive, but insufficient, gross saving to fund the net acquisition of non-financial assets results in a net borrowing requirement and the depletion of financial assets and/or the incurrence of liabilities. By contrast, positive and sufficient gross saving to fund the acquisition of non-financial assets results in a net lending position and the acquisition of financial assets and/or the repayment of liabilities. The compensation of employees dominates the composition of gross disposable income. Gross saving is positive when gross disposable income plus the adjustment for the change in pension entitlements exceeds final consumption expenditure, and vice versa. Composition of gross disposable From gross disposable income income to gross saving Per centR billions 120 3 000 3 000 100 2 500 2 500 80 60 1 500 1 500 40 1 000 1 000 0 500 500 -20 0 0 Current taxes on income and wealthGross disposable income Gross operating surplus/mixed incomeAdjustment for change in pension entitlements Compensation of employeesFinal consumption expenditure (right-hand scale) Net property income received/paidGross saving (right-hand scale) Net social benefits/contributions Net current transfers received/paid Source: SARB 4 Net taxes on production are derived as taxes less subsidies.
-10 30 -40 -90 Employment4 The prospects for meaningful employment creation and wage growth in the South African economy continue to be weighed down by sustained weak domestic economic activity and low business confidence. Enterprise-surveyed formal non-agricultural employment increased5 by only 17 100 (or 0.7% annualised) in the second quarter of 2019, raising the level of employment to an estimated 10.18 million. The public sector contributed the most to these employment gains, largely through the creation of temporary employment and training opportunities. When excluding the temporary election-related jobs created by the Electoral Commission of South Africa (IEC), formal non-agricultural employment remained almost unchanged in the second quarter of 2019. 4Unless stated to the contrary, the QES data reported in this section are seasonally adjusted. 5 This is according to Statistics South Africa’s (Stats SA) QES survey. 24 Quarterly Bulletin December 2019 Households were in a persistent net borrowing position as gross saving and net capital transfers received were insufficient to finance gross fixed capital formation. In 2018, only financial corporations recorded a surplus position and the South African economy required funding from the rest of the world to finance the deficit on the current account of the balance of payments.5 From gross saving to net lending/ Net lending/borrowing in 2018 borrowing R billionsR billions 120 0 90 60 -20 0 -30 -30 -60 -50 -120 -60 2010 2012 2014 2016 2018 -200 -100 0 100 200 Gross fixed capital formation and change in inventories Gross saving Net capital transfers received/paid Net lending (+)/borrowing (-) (right-hand scale) Source: SARB 5 See pages S–82 and S–131 to S–136 of this Quarterly Bulletin for the statistics underlying this analysis. Financial corporations Non-financial corporations General government Households and non-profit institutions serving households Total domestic economy Rest of the world
Formal non-agricultural employment Number (millions) 2.5 7.96 2.4 7.87 2.3 7.78 2.2 7.69 2.1 7.60 2014 2015 2016 2017 2018 2019 * Adjusted for election-related outliers Sources: Stats SA and SARB A composite forward-looking indicator of employment expectations6 in the retail, wholesale, manufacturing and building sectors points to a decrease in formal sector employment in the near term. 6This refers to the employment expectations indicator of Stellenbosch University’s Bureau for Economic Research (BER). Formal sector employment Number (millions) Net balance 4.5 40 4.3 20 0 4.1 3.9 -20 3.7 -40 3.5 -60 2000 2002 2004 2006 2008 2010 2012 2014 2016 2018 * Seasonally adjusted Sources: BER, Stats SA and SARB Growth in public sector employment accelerated to an annualised rate of 5.4% in the second quarter of 2019, buoyed by around 24 000 temporary election-related positions. However, public sector employment still expanded by 2.3% without these temporary jobs as employment increased at all tiers, with the exception of national departments as well as the public transport, storage and communication sector. Provinces increased their staff complement through the absorption of community health workers who had previously participated as volunteers or formed part of non-governmental organisations. In addition, local government employment was further boosted by work and training opportunities related to the Department of Public Works’ Expanded Public Works Programme (EPWP). 25 Quarterly Bulletin December 2019 Formal non-agricultural employment: trade, manufacturing and construction* Employment expectations (right-hand scale) Public sector Public sector* Private sector (right-hand scale) Seasonally adjusted
Private sector employment decreased at an annualised rate of 0.6% in the second quarter of 2019 following four successive quarterly increases. The goods-producing manufacturing, construction and gold-mining sectors collectively shed 17 400 jobs, while the services sectors created only 2 600 jobs, mostly in the community, social and personal services and in the transport, storage and communication services sectors. Enterprise-surveyed formal non-agricultural employment* Change over one Change over four quarter: Q2 2019quarters to Q2 2019 Sector Total number Per cent annualised Number Number Per cent Total mining ................................................................ 456 600 1 600 1.4 -900 -0.2 Gold mining............................................................. 92 900 -700 -3.2 -12 200 -11.6 Other mining ........................................................... 363 700 2 400 2.6 11 200 3.2 Manufacturing ............................................................ 1 212 800 -7 100 -2.3 -700 -0.1 Construction............................................................... 608 800 -9 600 -6.1 -29 600 -4.6 Total goods-producing ............................................... 2 278 200 -15 100 -2.6 -14 400 -1.4 Trade, catering and accommodation services............. 2 259 500 -4 500 -0.8 51 800 2.3 Transport, storage and communication services......... 382 700 2 500 2.6 8 300 2.2 Finance, insurance, real estate and business services 2 349 000 -4 300 -0.7 37 500 1.6 Community, social and personal services ................... 650 300 8 900 5.7 16 500 2.6 Total services.............................................................. 5 641 600 2 600 0.2 137 300 2.1 Private sector ............................................................ 7 919 800 -12 500 -0.6 82 800 1.1 National departments ................................................. 464 300 -1 800 -1.6 -2 900 -0.6 Provinces ................................................................... 1 060 100 11 900 4.6 22 400 2.2 Local governments ..................................................... 341 000 6 200 7.6 16 200 5.0 Transport, storage and communication services ........ Other public sector enterprises, including electricity and IEC**.................................................................... Public sector ............................................................. 104 000 -1 400 -5.1 -2 200 -2.1 295 800 2 265 300 14 700 29 600 22.7 5.4 6 800 40 200 2.3 1.8 Grand total ................................................................ 10 185 100 17 100 0.7 123 000 1.2 * Seasonally adjusted. Components may not add up to totals due to rounding off. ** Electoral Commission of South Africa Sources: Stats SA and SARB The increase in total mining sector employment in the second quarter of 2019 more than reversed the job losses in the previous quarter. In the non-gold-mining sector, an increase in employment in the second quarter of 2019 followed a marginal decrease in the first quarter. The cumulative 17 500 jobs created in the non-gold-mining sector since the fourth quarter of 2017 was consistent with this sector’s increased output over the period. This most probably reflected a lagged response to the earlier increase in international commodity prices and the depreciation in the exchange value of the rand, both of which have since become less supportive. In contrast, job losses in the gold-mining sector persisted, with employment decreasing for a fourth successive quarter in the second quarter of 2019. Job shedding has gathered renewed momentum in recent quarters, with a cumulative 24 300 gold-mining jobs lost in the 11 quarters up to the second quarter of 2019. This is also consistent with the decrease in this sector’s output, despite the higher rand price of gold. 26 Quarterly Bulletin December 2019
Employment and physical volume of production in the gold-mining sector Index: 2015 = 100 110 100 90 80 70 60 2014 2015 2016 2017 2018 2019 Sources: Stats SA and SARB Employment in the manufacturing sector decreased at a faster pace in the second quarter of 2019, consistent with the decline in business confidence among manufacturers for three successive quarters to a 20-year low of 16 index points in the third quarter of 2019. The Bureau for Economic Research (BER) noted in its Absa Manufacturing Survey that the decline in confidence was underpinned by sustained weakness in economic activity indicators. This was confirmed by demand indicators such as domestic sales volumes (which declined despite a further slowdown in domestic selling price inflation) and export sales volumes (which fell notwithstanding the depreciated exchange value of the rand). Both the insufficient demand and the political climate indicators as constraints on business conditions worsened to 2009 levels – at the height of the recession which was induced by the global financial crisis. This underscores the challenging operating environment currently confronting manufacturers. Discouragingly, the survey pointed to a limited recovery going forward, as the weak domestic economy, along with the slowdown in global economic growth and ongoing trade tensions, suggests no respite for the ailing manufacturing sector in the quarters ahead. Employment in the construction sector also decreased notably for a seventh successive quarter in the second quarter of 2019, with a cumulative 46 000 jobs lost. When measured over four quarters, labour paring in the construction sector occurred consistently for an uninterrupted period of almost three years up to the second quarter of 2019. In addition, the First National Bank (FNB)/BER Building Confidence Index fell to a 20-year low of 22 index points in the third quarter of 2019, weighed down by a deterioration in residential building activity in particular. Non-residential building activity remained stable, albeit at a low level. The FNB/BER Civil Confidence Index rose slightly by one index point to a still very low 11 over the same period. Construction firms continued to face difficult market conditions, with a total of 506 firms going into liquidation in 2014–2018 and a further 98 up to June 2019, according to Master Builders South Africa (MBSA). MBSA noted that the associated job losses also had a negative impact on training programmes, which could result in a perennial shortage of skilled and semi-skilled labour when construction activity recovers during the next upward phase of the business cycle. The private services sectors continued to create employment opportunities in the second quarter of 2019, albeit at a much slower pace. A mere 2 600 jobs were created during the quarter, mostly in the community, social and personal services and in the transport, storage and communication services sectors. By contrast, 8 800 jobs were shed in the trade, catering and accommodation services sector as well as in the finance, insurance, real estate and business services sector in the quarter. According to the BER’s Retail Survey, business confidence in the retail sector fell from 28 index points to 17 in the third quarter of 2019 – the lowest level since 1992. The BER noted that trading conditions remained extremely challenging as numerous 27 Quarterly Bulletin December 2019 Employment Production Seasonally adjusted
headwinds continued to weigh on consumers, including high and rising unemployment, slow wage growth, higher taxes, and rapidly rising electricity and water prices. In addition, the FNB/ BER Consumer Confidence Index receded sharply from 5 index points in the second quarter of 2019 to -7 in the third quarter. A meaningful and sustained acceleration in consumer spending over the coming quarters therefore seems unlikely. Employment and output in the private tertiary sectors Percentage change over four quarters 5 4 3 2 1 0 -1 -2 -3 -4 2010 2011 2012 2013 2014 2015 2016 2017 2018 2019 Sources: Stats SA and SARB Household-surveyed employment increased by 62 000 between the second and third quarter of 2019, but decreased slightly by 5 000 when measured over four quarters, bringing the level of total employment to approximately 16.38 million. Quarterly employment losses in both the formal non-agricultural sector (41 000) and the informal sector (22 000) were offset by job gains in agriculture (38 000) and private households (20 000). Job losses were registered in trade (103 000), manufacturing (41 000), mining (13 000) and community and social services (4 000) in the year to the third quarter of 2019. In contrast, employment growth occurred in construction (163 000), electricity (23 000), transport (21 000) and finance (10 000). Annual job losses were recorded in the categories for workers with unspecified duration contracts (110 000) and limited duration contracts (13 000), while 21 000 permanent jobs were created. Household-surveyed employment Number (thousands) 11 500 3 100 11 300 2 900 11 100 2 700 10 900 2 500 10 700 2 300 2014 2015 2016 2017 2018 2019 Sources: Stats SA and SARB 28 Quarterly Bulletin December 2019 Formal Informal (right-hand scale) Seasonally adjusted Employment Real gross value added
Following years of meaningful gains in household-surveyed formal non-agricultural employment, the pace of increase has lost momentum from the start of 2017 followed by employment losses from mid-2018. Since the most recent peak in formal non-agricultural employment in the second quarter of 2018, a cumulative 143 000 jobs were shed up to the third quarter of 2019. The bulk of these job losses occurred in the mining and construction sectors, while the services sectors continued to create employment opportunities. This was in line with the trend observed in enterprise-surveyed formal non-agricultural employment. Discouragingly, the pace of the consistent increase in informal sector employment over many years has moderated since the fourth quarter of 2018. Employment losses were mostly registered in the informal community and social services sector, while the goods-producing informal sectors as well as the trade, finance and transport services sectors have continued to create jobs. The number of unemployed South Africans increased further: by 78 000 in the third quarter of 2019 to an all-time high of 6.73 million, and by 524 000 (8.4%) from a year earlier. The number of discouraged work seekers also increased: by 60 000 (2.2%) to 2.79 million in the year to the third quarter of 2019, and by 44 000 from the second to the third quarter. Given these developments, the official unemployment rate increased further from 29.0% in the second quarter of 2019 (and 27.5% a year earlier) to 29.1% in the third quarter – the highest rate since the inception of the Quarterly Labour Force Survey (QLFS) in 2008. The unemployment rate was further elevated by a significant number of job losers as well as people in the ‘other’ category of the unemployed (i.e. the long-term unemployed) entering the labour market and actively searching for jobs. The seasonally adjusted unemployment rate also increased, from 28.7% in the second quarter of 2019 to 28.9% in the third quarter. Discouragingly, the youth unemployment rate (for people aged 15 to 24 years) increased notably from 56.4% in the second quarter of 2019 to a record-high 58.2% in the third quarter, significantly higher than the 52.8% recorded a year earlier. Unemployment rate Per cent 30 29 28 27 26 25 24 2014 2015 2016 2017 2018 2019 Sources: Stats SA and SARB Labour cost and productivity The pace of increase in the nominal remuneration per worker in the formal non-agricultural sector accelerated from a year-on-year rate of 3.3% in the first quarter of 2019 to 5.6% in the second quarter, as growth in both private and public (excluding the temporary election-related IEC jobs) sector remuneration per worker accelerated. In the private sector, remuneration growth per worker rebounded to 4.1% in the second quarter of 2019 from an all-time low of 1.1% in the first quarter, at that time weighed down by a large number of low-earning jobs created in the trade and business services sectors, a protracted 29 Quarterly Bulletin December 2019 Official Seasonally adjusted
no-work-no-pay strike at a large gold producer, significantly lower bonus and overtime payments in the finance sector, and a weak residential property market which reduced commissions earned. Remuneration growth per worker quickened in all of the private subsectors in the second quarter of 2019, with the exception of the community, social and personal services sector. Formal non-agricultural nominal remuneration per worker Percentage change over four quarters 12 9 6 3 0 2019 2014 2015 2016 2017 2018 * Adjusted for election-related outliers Sources: Stats SA and SARB Remuneration growth per public sector worker (excluding the temporary election-related IEC jobs) accelerated markedly from 7.2% in the first quarter of 2019 to 10.6% in the second quarter, largely due to a low base created a year earlier following the delayed implementation of the annual public sector wage increase. By contrast, remuneration growth per public sector worker inclusive of the temporary election-related IEC jobs moderated only slightly from 10.1% in the first quarter of 2019 to a still high 9.4% in the second quarter. Nominal wage growth per worker quickened at all tiers of the public sector, with the exception of the government transport, storage and communication sector and local government, where wage growth per worker was curtailed by the steady increase in low-earning EPWP job opportunities. According to Andrew Levy Employment Publications, the average wage settlement rate in collective bargaining agreements decreased further to 6.8% in the first nine months of 2019 – the lowest level since the second quarter of 2007. This was lower than the 7.2% recorded in the corresponding period of 2018 and the average of 7.2% for 2018 as a whole. However, the number of working days lost due to strike action increased to 1.2 million in the first nine months of 2019 from 970 000 in the corresponding period of 2018. Growth in labour productivity in the formal non-agricultural sector of the economy (adjusted for election-related outliers) changed from a year-on-year contraction of 1.0% in the first quarter of 2019 to a marginal expansion of 0.2% in the second quarter. However, on an unadjusted basis, the year-on-year rate of contraction slowed from 0.4% in the first quarter of 2019 to 0.1% in the second quarter, as output growth accelerated at a faster pace than employment. 30 Quarterly Bulletin December 2019 Public* Total* Private
Labour productivity and unit labour cost Percentage change over four quarters 15 Economy-wide unit labour cost Henderson moving average Labour productivity* (adjusted for election-related outliers) 12 9 6 3 0 -3 2014 2015 2016 2017 2018 2019 * Formal non-agricultural sector Sources: Stats SA and SARB Growth in nominal unit labour cost in the formal non-agricultural sector accelerated from a low of 3.8% in the first quarter of 2019 – impacted by the notable slowdown in private sector remuneration growth – to 5.7% in the second quarter, as growth in total remuneration quickened at a faster pace than output. Growth in economy-wide unit labour cost accelerated from 3.6% in the second quarter of 2019 to 3.9% in the third quarter, as growth in the compensation of employees moderated at a slower pace than output growth. 7Unless stated to the contrary, all rates mentioned in this section reflect year-on-year changes. Prices7 Headline consumer price inflation remained at levels below or at the 4.5% midpoint of the inflation target range for 11 successive months up to October 2019. The moderation in overall consumer price inflation in recent years, and the 3.7% recorded in October 2019, was assisted by the deceleration in services price inflation. Consumer price index Percentage change over 12 months 8 7 6 5 4 3 2 2014 2015 2016 2017 2018 2019 Midpoint of the inflation target range (4.5%) Source: Stats SA 31 Quarterly Bulletin December 2019 Headline Services Unit labour cost* Henderson moving average
The moderation in consumer goods price inflation in recent months followed the deceleration in producer price inflation. Producer price inflation for intermediate manufactured goods decelerated significantly from 6.7% in April 2019 to -0.6% in October, while producer price inflation for final manufactured goods moderated to a lesser extent, from 6.5% to 3.0% over the same period. Producer and consumer price inflation Percentage change over 12 months 12 9 6 3 0 -3 2014 2015 2016 2017 2018 2019 Midpoint of the inflation target range (4.5%) Source: Stats SA However, some measures of producer price inflation accelerated in recent months. Producer price inflation for mining products accelerated to 17.7% in October 2019 due to strong increases in the prices of gold and non-ferrous metal ores. Electricity and water producer price inflation accelerated to 17.1% in September 2019 as a result of notably higher electricity prices while water price inflation remained fairly elevated. In contrast, producer price changes in agriculture, forestry and fishing products remained in deflation and moderated further to -4.1% in September 2019, mainly as a consequence of the further decline in agricultural goods prices. Consumer goods price inflation has consistently been lower than consumer services price inflation thus far in 2019, with fluctuations driven almost entirely by non-durable goods price inflation due to changes in food and fuel price inflation. Both semi-durable and durable goods price inflation remained subdued at around the 2% level throughout, and probably reflected constraints to pass on cost increases within a weak economic environment. Consumer services price inflation moderated to 4.2% in September 2019 – its lowest rate in eight years – mainly due to lower rental price inflation, with landlords struggling to extract higher rentals, along with an increase in vacancy rates and as wage growth slowed. Rentals account for almost a third of the consumer services price basket. Both actual and owners’ equivalent8 rental price inflation have slowed to historically low levels in September 2019, with the slowdown being broad-based across all provinces. Lower transport services price inflation also assisted in containing services price pressures in October. 8Owners’ equivalent rent is the cost of consuming a housing service. It represents the opportunity cost incurred by owners who live in their own home rather than renting it out. When the more volatile food and non-alcoholic beverages, fuel and electricity prices are excluded, underlying consumer goods price inflation has remained below the midpoint of the inflation target range of 4.5% since March 2017. Subsequently, underlying consumer goods price inflation moderated to below the 3% lower limit of the inflation target range in August 2017 and remained there for 19 consecutive months. Underlying consumer goods price inflation only returned to within the inflation target range from March 2019 and amounted to 3.3% in October. 32 Quarterly Bulletin December 2019 Producer prices for final manufactured goods Consumer goods prices Producer prices for intermediate manufactured goods
Underlying consumer price inflation Percentage change over 12 months 8 7 6 5 4 3 2 Services Goods 1 0 2014 2015 2016 2017 2018 2019 Midpoint of the inflation target range (4.5%) Sources: Stats SA and SARB When the more persistently high administered services price inflation items are excluded, underlying consumer services price inflation receded to the midpoint of the inflation target range in July 2018. Subsequently, underlying consumer services price inflation moderated to 4.0% in September 2019 – its lowest level since the inception of the consumer price index (CPI) according to the classification of individual consumption by purpose (COICOP) in January 2008. Subdued rates of inflation in both the underlying consumer goods and services price measures are indicative of a lack of pricing power in an environment of weak economic activity. The year-on-year rate of increase in the US dollar-denominated international food price index of the Food and Agriculture Organization (FAO) of the United Nations accelerated from 0.3% in June 2019 to 9.0% in November. This reflected higher vegetable oils and meat prices which were partially offset by lower dairy prices. International sugar prices also fell sharply, especially in September 2019. In contrast, the 12-month increase in the rand-denominated FAO international food price index moderated from 9.9% to 3.3% over the same period as the exchange value of the rand against the US dollar appreciated up to July 2019. The year-on-year percentage change in the US dollar-denominated international cereals price index reverted from an increase of 4.0% in June 2019 to a decrease of 1.0% in November due to ample global supplies for export of both wheat and maize. The pace of increase in the rand-denominated cereals price index slowed significantly from 14.0% in June 2019 to 4.0% in November, reflecting the aforementioned appreciation in the exchange value of the rand. Domestic food price inflation moderated markedly from January 2017 to April 2019. The deceleration was primarily driven by lower meat; bread and cereals; milk, eggs and cheese; as well as vegetable prices – with a combined weight of 80% of the total consumer food price basket. Meat prices, which initially rose because of herd rebuilding after the drought, declined markedly following the outbreak of foot-and-mouth disease and greatly assisted in moderating overall food price inflation during that period. Lower bread and cereals price inflation also assisted in reducing overall consumer food price inflation but not as significantly as meat price inflation. More recently, consumer food price inflation accelerated gradually from 2.3% in April 2019 to 3.5% in October, largely due to a notable acceleration in bread and cereals price inflation and, to a lesser extent, the moderate reversal in meat as well as milk, cheese and egg price inflation. Conversely, vegetable price inflation slowed over this period. However, consumer food price inflation is not expected to accelerate significantly in the coming months given the continued decrease in agricultural producer prices. 33 Quarterly Bulletin December 2019
Contributions to consumer food price inflation Percentage points Percentage change over 12 months 14 14 12 12 10 10 8 8 6 6 4 4 2 2 0 0 -2 -2 2016 2017 2018 2019 Numbers in brackets indicate weights in the total consumer food basket. Source: Stats SA Underlying inflationary pressures have remained well contained within an environment of subdued demand-side pressures. Underlying inflation (headline consumer price inflation excluding food, non-alcoholic beverages and petrol prices) has nevertheless accelerated somewhat from 4.2% in April 2019 to 4.6% in August following higher utilities price inflation. Likewise, the South African Reserve Bank’s (SARB) preferred measure of core inflation, which also excludes electricity prices, accelerated slightly from 4.1% to 4.3% over the same period. This measure of inflation then moderated to 4.0% in September and October, mainly due to lower rental price inflation, and has now remained below the midpoint of the inflation target range for 18 consecutive months. The short-term pace of increase in core CPI, as indicated by the seasonally adjusted and annualised three-months-to-three-months percentage change in the index, has also remained below the midpoint of the inflation target range for nine successive months as from February 2019. At the current level of 4.0%, core inflation has slowed to below the average of 4.3% recorded for this inflation measure over the past two years, indicating weak underlying inflationary pressures in a generally sluggish domestic economy. Headline and underlying measures of consumer price inflation Percentage change over 12 months 8 7 6 5 4 3 Consumer price index excluding food* and fuel 2 1 2014 2015 2016 2017 2018 2019 * Food includes non-alcoholic beverages. Midpoint of the inflation target range (4.5%) Source: Stats SA 34 Quarterly Bulletin December 2019 Consumer price index Consumer price index excluding food*, fuel and electricity Meat (35%) Bread and cereals (21%) Milk, eggs and cheese (17%) Vegetables (8%) All other food products (19%) Total (100%) (right-hand scale)
Electricity price inflation accelerated from 6.8% in June 2019 to 12.0% in October, while fuel price inflation moderated from 7.4% to -4.9% over the same period. This lowered overall administered price inflation from 6.9% to 3.5%. Conversely, when excluding fuel prices, administered price inflation picked up from 6.8% to 7.4% over this period. However, when also excluding electricity prices, administered price inflation displayed a different trend, slowing from 6.7% to 5.3% during the period under review. Administered price inflation Percentage change over 12 months 15 150 12 120 9 90 6 60 3 30 0 0 -30 -3 -6 -60 2018 2019 2014 2015 2016 2017 Midpoint of the inflation target range (4.5%) Source: Stats SA Average annual headline CPI inflation expectations, as measured by the inflation expectations survey conducted by the Bureau for Economic Research (BER), declined for both 2019 and 2021 in the third quarter of 2019 relative to the previous quarter. The average inflation expectation for 2019 declined from 4.8% to 4.6%, that for 2020 remained unchanged at 5.0%, and that for 2021 is now expected to edge up slightly to 5.1% compared with 5.2% in the previous survey. In the third quarter of 2019, financial analysts revised their 2019 forecast downwards by a mere 0.1 percentage points and those for both 2020 and 2021 by 0.2 percentage points. Business representatives also lowered their 2019 expectations by 0.1 percentage points, but on average made no changes to their 2020 and 2021 expectations. By contrast, trade union officials on average lowered their expectations by 0.1 percentage points for all three forecast periods. Headline consumer price inflation expectations Per cent, as surveyed in the third quarter of 2019 Financial analysts Business representatives Trade union representatives All surveyed participants Average inflation expected for: 2019.......................................................... 2020.......................................................... 2021.......................................................... Five years ahead ....................................... 4.4 4.8 4.8 4.8 5.0 5.3 5.5 5.4 4.6 4.8 4.9 4.9 4.6 5.0 5.1 5.0 Source: BER Average five-year inflation expectations edged lower to 5.0% as financial analysts and trade union officials lowered their expectations slightly. By contrast, business representatives kept their five-year expectations unchanged at 5.4% in the third quarter of 2019. 35 Quarterly Bulletin December 2019 Administered price index Consumer fuel price index (right-hand scale)
Household inflation expectations and headline consumer price inflation Percentage points 8 7 6 5 4 3 2 1 2014 2015 2016 2017 2018 2019 Midpoint of the inflation target range (4.5%) Sources: BER and Stats SA Households’ inflation expectations moderated steadily from 6.6% in the second quarter of 2017 to 5.4% in the fourth quarter of 2018, alongside a general moderation in actual inflation outcomes. After surging temporarily to 6.0% in the first quarter of 2019, households lowered their inflation expectations again to 5.1% in the third quarter. 36 Quarterly Bulletin December 2019 Household inflation expectations Headline consumer price inflation
External economic accounts Current account9 South Africa’s trade balance switched to a surplus of R41.1 billion in the third quarter of 2019 from a deficit of R31.8 billion in the second quarter, which had marked only the second deficit since the second quarter of 2016. The turnaround to a trade surplus resulted from an increase in the value of net gold and merchandise exports, alongside a contraction in merchandise imports. The higher value of exports was boosted by both higher volumes and prices while the lower value of imports was driven by lower rand prices and volumes. 9Unless stated to the contrary, the current account transaction flows referred to in this section are all seasonally adjusted and annualised. Value of merchandise imports and exports R billions 1 500 1 400 1 300 1 200 1 100 1 000 900 800 2014 2015 2016 2017 2018 2019 Seasonally adjusted and annualised Sources: Stats SA and SARB Current account of the balance of payments R billions, seasonally adjusted and annualised 2018 2019 Q3 Q4 Year Q1 Q2 Q3 Merchandise exports ....................................................... 1 235 1 287 1 176 1 193 1 233 1 259 Net gold exports.............................................................. 73 67 72 56 50 70 Merchandise imports ....................................................... -1 298 -1 283 -1 223 -1 207 -1 315 -1 287 Trade balance ................................................................. 10 72 24 42 -32 41 Net service, income and current transfer payments......... -191 -182 -197 -185 -177 -231 Balance on current account ........................................... -180 -110 -173 -144 -209 -190 As a percentage of gross domestic product Trade balance.................................................................. 0.2 1.4 0.5 0.9 -0.6 0.8 Services balance ............................................................. -0.2 -0.2 -0.2 -0.3 -0.3 -0.2 Income balance ............................................................... -3.0 -2.8 -3.2 -2.8 -2.5 -3.6 Current transfer balance .................................................. Balance on current account ........................................... -0.6 -3.7 -0.7 -2.2 -0.7 -3.5 -0.7 -2.9 -0.7 -4.1 -0.7 -3.7 Components may not add up to totals due to rounding off. Sources: Stats SA and SARB 37 Quarterly Bulletin December 2019 Exports (including gold) Imports
The surplus in the trade balance was contrasted by a larger shortfall on the services, income and current transfer account in the third quarter of 2019. However, the deficit on the current account of the balance of payments narrowed from R209 billion in the second quarter of 2019 to R190 billion in the third quarter, as the effect of the switch to a trade surplus exceeded the surge in the shortfall on the services, income and current transfer account. These developments contributed to the decline in the deficit on the current account as a ratio of GDP, from 4.1% in the second quarter of 2019 to 3.7% in the third quarter. Current account of the balance of payments R billions 150 100 50 0 -50 -100 -150 -200 -250 Per cent 0 0 -50 -2 -100 -4 -150 -200 -6 -250 -8 -300 2014 2015 2016 2017 2018 2019 Seasonally adjusted and annualised Sources: Stats SA and SARB The value of merchandise exports increased by 2.1% in the third quarter of 2019 as a rise in manufactured and agricultural exports more than offset the contraction in non-gold-mining exports. Manufacturing exports were buoyed by machinery and electrical equipment as well as vehicles and transport equipment along with a continued increase in international demand for locally produced vehicles. The higher value of agricultural exports reflected a sharp rise in citrus exports – South Africa’s largest fruit export – mainly destined for Europe. The lower value of non-gold-mining exports reflected declines in base metals and articles of base metals, mineral products as well as platinum group metals. Mining exports were weighed down by lower production of ferro-alloys with the shutdown of some furnaces for planned maintenance and lower coal exports following the closure of a coal export railway line for scheduled maintenance. The international prices of South African export commodities diverged in the third quarter of 2019, with the prices of coal and copper decreasing and those of nickel, platinum and iron ore increasing. The prices of coal and copper decreased amid weak global demand prospects. By contrast, the price of nickel increased markedly after Indonesia, the world’s largest nickel ore producer, announced a ban on nickel exports from the beginning of 2020, two years ahead of schedule. The US dollar price of a basket of domestically produced non-gold export commodities nevertheless trended lower for a third consecutive quarter and decreased by 1.3% in the third quarter of 2019. 38 Quarterly Bulletin December 2019 Balance on current account Current account to GDP (right-hand scale) Trade balance Balance on services, income and current transfer account
International prices of selected South African export commodities US dollar index: 2010 = 100 120 100 Iron ore Coal Platinum 80 60 40 20 2014 2015 2016 2017 2018 2019 Sources: World Bank and SARB The rand price of merchandise exports rose by 1.8% in the third quarter of 2019 following a 3.5% increase in the second quarter. The volume of merchandise exports rose only marginally by 0.3% in the third quarter as the physical quantities of exported agricultural and manufactured goods increased. The average US dollar price of gold on the London market surged by 12.6% from US$1 310 per fine ounce in the second quarter of 2019 to US$1 474 per fine ounce in the third quarter. The price of gold was boosted by global demand for safe-haven assets as the US Federal Reserve (Fed) lowered interest rates during the third quarter. In addition, strong demand for gold by emerging market central banks, such as the central banks of China, Russia and Turkey, also contributed to the higher gold price. The average realised rand price of net gold exports also increased in the third quarter of 2019, which, together with the higher volume of net gold exports, resulted in a significant increase in the value of net gold exports over the period. The value of merchandise imports contracted by 2.1% in the third quarter of 2019 following an 8.9% increase in the second quarter. This reflected a sharp decline in the value of mineral products, which was weighed down by lower crude oil imports attributable to, among other things, base effects after the marked second-quarter build-up of stocks following a planned 20-day ‘single buoy mooring’ facility shutdown as well as the higher rand price of crude oil at the time. The shutdown of an oil refinery for maintenance also contributed to a decline in the value of crude oil imports in the third quarter. The value of manufactured imports increased in the third quarter of 2019 due to the importation of vehicles and transport equipment, machinery and electrical equipment as well as optical and professional equipment. The first-mentioned was buoyed by increased domestic demand for automotive components as some manufacturers ramped up production as well as the acquisition of aircraft. The notable rise in the value of imported machinery and electrical equipment resulted from a marked increase in domestic demand for wind-powered generating sets as well as automatic data-processing machines and units. The former is required for the ongoing construction of wind farms while the latter can largely be attributed to a new data hub being established in Cape Town. The value of agricultural imports also increased in the third quarter of 2019. The rand price of merchandise imports declined by 0.5% in the third quarter of 2019 and reflected, among other things, slowing inflation in many of South Africa’s trading partners as well as lower international crude oil prices. The volume of merchandise imports decreased by 1.6% 39 Quarterly Bulletin December 2019 SA export commodity basket (excluding gold) Copper Nickel
over this period, following an increase of 4.7% in the second quarter. The import penetration ratio – real merchandise imports as a ratio of real GDE – decreased slightly from 26.7% in the second quarter of 2019 to 26.5% in the third quarter. Import penetration ratio Per cent 28 27 26 25 24 23 2014 2015 2016 2017 2018 2019 Sources: Stats SA and SARB 40 Quarterly Bulletin December 2019 Box 2 Methodology underlying South Africa’s merchandise trade statistics1 Merchandise trade is an important part of the current account2 of the balance of payments.3 The South African Reserve Bank (SARB) is responsible for the compilation and publication of the current account of the balance of payments4 and numerous balance of payments statistical tables in the Quarterly Bulletin.5 The quarterly statistics in the current account press release and on page S–84 of this Quarterly Bulletin are seasonally adjusted and annualised, whereas those on page S–83 are not seasonally adjusted or annualised. The SARB sources merchandise trade data at current prices from the South African Revenue Service (SARS), while data on net gold exports are compiled by the SARB. The SARS customs data are compiled in accordance with the International Merchandise Trade Statistics: Concepts and Definitions (IMTS 2010) manual,6 and the monthly data releases incorporate vouchers of correction for the preceding months. 1 Merchandise trade statistics comprise both imports and exports of goods, including net gold exports, which render the trade balance. The goods traded are recorded at ‘free on board’ value, in other words excluding the cost of transportation and insurance services. These goods are physically visible produced items over which ownership rights can be established and where the economic ownership can be passed from one institutional unit to another by engaging in transactions. The trade balance is the value of merchandise and net gold exports minus the value of merchandise imports. 2 The current account of the balance of payments shows transactions of both goods and services as well as primary and secondary income. 3 The balance of payments is the statistical summary of transactions between residents and non-residents during a specific period. 4 See http://www.resbank.co.za/Publications/Detail-Item-View/Pages/Publications.aspx?sarbweb=3b6aa07d-92ab-441f-b7bf-bb7dfb1bedb4&sarblist=21b5222e-7125-4e55-bb65-56fd3333371e&sarbitem=9464 or http://www.resbank.co.za/Publications/QuarterlyBulletins/Pages/Current-Account-Release.aspx 5 See http://www.resbank.co.za/Publications/QuarterlyBulletins/Pages/QuarterlyBulletins-Home.aspx 6 See https://www.un.org/en/development/desa/publications/international-merchandise-trade-statistics-concepts-and-definitions-2010-imts-2010.html
41 Quarterly Bulletin December 2019 Merchandise trade statistics, second quarter of 2019 R millions SARB Quarterly Bulletin SARBpage S–84 and Quarterly Bulletinstatistical press SARSpage S–83Stats SArelease SARB-adjusted, SARB-adjusted, SARB-adjusted, seasonally but not seasonallyseasonallyadjusted and Customs adjusted or adjusted by annualised by data annualisedStats SA Stats SA Exports of goods..................... Merchandise exports (free on board) ....................309 339311 383308 2471 232 990 Net gold exports .................12 47612 47912 47949 918 Components may not add up to totals due to rounding off. Sources: SARS, Stats SA and SARB The SARS customs data are adjusted by the SARB to account for an important conceptual difference, namely that SARS records goods entering and exiting South Africa whereas the SARB’s trade statistics record the change of ownership between residents and non-residents in accordance with the guidelines of the Balance of Payments and International Investment Position Manual – Sixth Edition (BPM6).7 The conversion from customs data to balance of payments merchandise trade statistics requires adjustments for: coverage of goods that should be either included or excluded; timing, to ensure measurement when the goods changed ownership; valuation, to correct for goods not recorded at market value; and classification, when items in the customs data should be reflected elsewhere in the balance of payments. Most of the balance of payments adjustments are related to the coverage of crude oil, postal trade, electricity, and goods procured in ports. The role of statistical agencies in merchandise trade statistics Balance of payments Seasonal Customs data adjustments adjustment Constant (current prices)(current prices)(current prices)prices*Deflators SARSSARBStats SAStats SAStats SA * Including services. See page S–115 of this Quarterly Bulletin, available at http://www.resbank.co.za/Publications/QuarterlyBulletins/Pages/Quarterly-Bulletin.aspx 7 The methodology used to compile balance of payments statistics adheres to the guidelines of the Balance of Payments and International Investment Position Manual – Sixth Edition (BPM6) of the International Monetary Fund (IMF), available at www.imf.org/external/pubs/ft/bop/2007/pdf/bpm6.pdf Merchandise imports (free on board) ......................... 320 778319 698328 669 1 314 678 -31 770 Trade balance (goods) ............. 1 0374 164-7 942 321 816323 862320 727 1 282 908
-30 -10 2015 2016 2017 2018 2019 Sources: SARS, Stats SA and SARB Q2 Q3 Q1 Q2 42 Quarterly Bulletin December 2019 Following the SARB’s balance of payments adjustments, Statistics South Africa (Stats SA) seasonally adjusts8 the nominal values of exports and imports separately at a detailed disaggregated level and converts them to constant values9 (at 2010 prices) for inclusion in the compilation of expenditure on gross domestic product (GDP) (see pages S–114 and S–115 of this Quarterly Bulletin). The seasonal adjustment identifies and removes recurring seasonal fluctuations and calendar effects to reveal the underlying movements such as cyclical turning points, the trend cycle and the irregular component. An important and, at times, recurring observation is the difference in the sign of the trade balance at current prices of the SARS customs data compared to the official seasonally adjusted Stats SA statistics, as was the case in the second quarter of 2015, the third quarter of 2018, and again in both the first and the second quarter of 2019. The data in the dark grey area in the table reflect this phenomenon in the second quarter of 2019, when the SARS trade surplus of R1.0 billion switched to an official Stats SA seasonally adjusted trade deficit of R7.9 billion. The differences in the trade balance, as published by SARS and the SARB respectively, only reflect balance of payments adjustments. These had previously contributed to a switch in the sign on only one occasion during the period under review, namely in the third quarter of 2018. On balance, these adjustments are mostly small, and amounted to an average of 1.0% of exports, including gold, and an average of 0.8% of imports between the first quarter of 2015 and the third quarter of 2019. The few more material differences, such as those in the first quarter of 2016 and in the fourth quarter of 2017, mainly reflected adjustments to high-value items such as crude oil. The seasonal adjustment of exports and imports of goods also often explains most of the difference in the trade balance as measured by SARS and Stats SA. An analysis of the differences between Stats SA statistics (i.e. the trade balance, exports and imports) and SARS customs data shows that the difference in exports contributed significantly to the reversion of the SARS trade deficit in the first quarter of 2019, to a surplus in the official trade balance. Conversely, the difference in imports contributed most to the reversion of the SARS trade surplus in the second quarter of 2019, to a deficit in the official trade balance. Trade balanceDifference between Stats SA and SARS R billionsR billions 40 25 30 20 Exports 20 15 10 10 0 5 -10 0 -20 -5 SARB adjusted adjusted -40 -15 2015 2018 2019 8 See page 77 of Expenditure on Gross Domestic Product: Sources and Methods, available at http://www.statssa.gov.za/publications/P0441/Expenditure_on_GDP_Sources_and_Methods.pdf 9 See page 74 of Expenditure on Gross Domestic Product: Sources and Methods, available at http://www.statssa.gov.za/publications/P0441/Expenditure_on_GDP_Sources_and_Methods.pdf Trade balance Imports SARS customs Stats SA seasonally
2015 2016 2017 2018 2019 2015 2016 2017 2018 2019 340 340 2015 2016 2017 2018 2019 201520162017 20182019 43 Quarterly Bulletin December 2019 In the case of exports, the limited impact of the SARB adjustments is evident while the effect of the seasonal adjustment is more prominent, particularly in the first quarter of 2019. In the subsequent quarter, the seasonally adjusted export data are very similar to the unadjusted data. Value of exports R billionsR billions 360 360 340 340 320 320 300 300 280 280 260 260 240 240 220 220 Sources: SARS, Stats SA and SARB In the case of imports, the SARB’s adjustments generally also have a relatively small impact, while the effect of the seasonal adjustment is more prominent, particularly in the second quarter of 2019. Value of imports R billionsR billions 360360 Stats SA seasonally adjusted 320320 300300 280280 260260 240240 Sources: SARS, Stats SA and SARB The seasonally adjusted trade balance therefore reflects the combined effect of SARB adjustments and Stats SA’s seasonal adjustment on both exports and imports, with the seasonal adjustment generally impacting the trade statistics more. SARS customs SARS customs SARB adjusted SARS customs Stats SA seasonally adjusted SARS customs SARB adjusted
South Africa’s terms of trade improved in the third quarter of 2019 as the rand price of exports increased while that of imports decreased. Terms of trade* Index: 2010 = 100 115 110 105 100 95 2014 2015 2016 2017 2018 2019 * Including gold Sources: Stats SA and SARB The deficit on the services, income and current transfer account widened to an all-time high of R231 billion in the third quarter of 2019. Expressed as a percentage of GDP, the deficit increased from 3.5% in the second quarter of 2019 to 4.5% in the third quarter, almost similar to that in the first quarter of 2018. The larger shortfall could be attributed to a substantially larger deficit on the income account, while the deficit on the services account narrowed and that on the current transfer account remained broadly unchanged. Net service, income and current transfer payments R billions 20 0 -20 -40 -60 -80 -100 -120 -140 -160 -180 -200 -220 -240 Income 2014 2015 2016 2017 2018 2019 Seasonally adjusted and annualised Sources: Stats SA and SARB Net income payments increased noticeably in the third quarter of 2019 after having decreased for four consecutive quarters. The widening of the deficit on the income account mainly reflected a steep rise in gross dividend payments which originated from companies with a 44 Quarterly Bulletin December 2019 Services Current transfers
direct investment relationship with non-resident shareholders. The rapid surge in dividend payments caused the ratio of gross dividend payments to GDP to increase to 3.4% in the third quarter of 2019, compared with an average of 2.2% in the first half of the year. The marked increase in dividend payments could be attributed to non-resident parent companies’ need for liquidity. However, some of these dividend outflows returned as portfolio investment inflows in the financial account of the balance of payments. Following two consecutive quarterly increases to a recent high of 2.4% of GDP in the first and second quarter of 2019, gross interest payments contracted slightly in the third quarter to 2.3% of GDP, containing the deficit on the income account of the balance of payments somewhat. The shortfall on the services account narrowed in the third quarter of 2019 as payments decreased while receipts increased compared with the second quarter. Gross payments to non-residents for freight-related transportation declined marginally in the third quarter, mirroring the contraction in merchandise imports. Furthermore, payments for other services also declined in the third quarter. Gross travel receipts declined slightly from the second to the third quarter of 2019 following two consecutive quarterly increases. However, when the first three quarters of 2019 are compared with the corresponding period of the previous year, an increase of about 2.6% was recorded, up from 0.7% for 2018 as a whole. Net current transfer payments displayed almost no change in the third quarter of 2019 as both gross receipts and gross payments increased by similar amounts. Financial account The financial account of South Africa’s balance of payments (excluding unrecorded transactions) recorded a significantly larger inflow of capital of R73.9 billion in the third quarter of 2019 following an inflow of R13.2 billion in the second quarter. On a net basis, portfolio and other investment registered inflows while direct investment, financial derivatives and reserve assets recorded outflows. As a ratio of GDP, net financial account inflows increased significantly from 1.0% in the second quarter of 2019 to 5.7% in the third quarter. Net financial transactions R billions 2018 2019 Q3 Q4 Year Q1 Q2 Q3 Change in liabilities Direct investment ................................................ Portfolio investment ............................................ Financial derivatives............................................ Other investment ................................................ Change in assets Direct investment ................................................ Portfolio investment ............................................ Financial derivatives ............................................ Other investment ................................................ Reserve assets ................................................... Total identified financial transactions*................... As a percentage of gross domestic product ....... 28.7 17.9 -65.4 -8.7 -8.2 -33.9 -47.9 112.7 70.7 90.0 -218.4 118.8 11.7 29.2 -43.0 35.8 26.3 10.0 -31.5 -4.5 17.0 40.2 -37.9 0.9 -13.0 -2.8 69.9 -2.0 3.8 28.4 2.3 -23.3 -29.3 51.8 0.9 -6.2 16.6 1.3 -60.3 -56.7 225.4 -16.2 -11.3 142.0 2.9 -15.3 -17.9 40.9 -51.6 34.2 24.1 2.0 5.1 17.5 31.0 -48.4 7.7 13.2 1.0 -21.6 34.7 34.8 82.9 -77.2 73.9 5.7 * Excluding unrecorded transactions. Components may not add up to totals due to rounding off. Inflow (+) outflow (-) Source: SARB 45 Quarterly Bulletin December 2019
Foreign-owned assets in South Africa South Africa’s direct investment liabilities recorded a smaller inflow of R17.0 billion in the third quarter of 2019 following an inflow of R26.3 billion in the second quarter. The third-quarter inflow reflected foreign parent companies’ funding of South African subsidiaries through debt and equity. Portfolio investment liabilities recorded a much larger inflow of R40.2 billion in the third quarter of 2019 following an inflow of R10.0 billion in the previous quarter. This inflow mainly reflected national government’s issuance of international bonds of US$5.0 billion. This more than offset both net sales of domestic debt securities by non-residents and the switch from non-residents’ net purchases of domestic equities in the second quarter of 2019 to net sales of R32.3 billion in the third quarter. Other investment liabilities reverted from an outflow of R4.5 billion in the second quarter of 2019 to an inflow of R0.9 billion in the third quarter as non-residents’ foreign-currency deposits with the domestic private banking sector increased. This was partly countered by the repayment of short-term loans by the domestic private banking sector. Other investment flows R billions 140 120 100 80 60 40 20 0 -20 -40 -60 2014 2015 2016 2017 2018 2019 Source: SARB South African-owned assets abroad South Africa’s direct investment assets abroad reverted from an inflow of R5.1 billion in the second quarter of 2019 to an outflow of R21.6 billion in the third quarter. This mainly reflected an increase in the equity holdings of South African parent companies in subsidiaries abroad, especially in the petro-chemical industry. South African residents sold foreign portfolio assets of R34.7 billion in the third quarter of 2019, following net sales of R17.5 billion in the second quarter. The inflow occurred as the domestic private non-banking sector’s sales of foreign equity securities outweighed South African residents’ purchases of foreign debt securities. Other investment assets reverted from an outflow of R48.4 billion in the second quarter of 2019 to a substantial inflow of R82.9 billion in the third quarter. This was due to the domestic private banking sector’s repatriation of foreign-currency deposits and the repayment of short-term loans under repurchase agreements by non-residents. 46 Quarterly Bulletin December 2019 Liabilities Assets Net other investment
Foreign debt South Africa’s total external debt increased from US$176.0 billion at the end of March 2019 to US$180.6 billion at the end of June, mainly as a result of net purchases of domestic government bonds by non-residents. However, South Africa’s gross external debt, in rand terms, decreased from R2 569 billion to R2 555 billion over the same period. Foreign debt US$ billions 120 200 Rand-denominated 100 (right-hand scale) 180 80 60 160 40 140 20 0 120 Per cent 180 160 140 120 100 80 60 40 20 0 60 Debt to export earnings 50 40 30 20 10 0 2014 2015 2016 2017 2018 2019 Source: SARB Foreign currency-denominated external debt decreased from US$88.5 billion at the end of March 2019 to US$87.4 billion at the end of June, mainly due to the redemption of an international government bond. This was partially countered by increased private non-banking sector borrowing. Rand-denominated external debt, in US dollars, increased from US$87.5 billion at the end of March 2019 to US$93.2 billion at the end of June. The increase was mainly driven by net purchases of domestically issued bonds by non-residents as well as an increase in the market values of non-resident holdings of such bonds, while loans to all sectors also increased. South Africa’s total external debt as a ratio of GDP increased from 49.2% at the end of March 2019 to 51.5% at the end of June. Similarly, the ratio of external debt to export earnings increased from 152.7% to 158.2% over the same period. 47 Quarterly Bulletin December 2019 Debt to GDP (right-hand scale) Foreign currency-denominated Total
Foreign debt of South Africa US$ billions at end of period 2018 2019 Q1 Q2 Q3 Q4 Q1 Q2 Foreign currency-denominated debt.................. Debt securities .................................................... Other ................................................................... Public sector ................................................... Monetary sector .............................................. Non-monetary private sector ........................... Rand-denominated debt .................................... Debt securities................................................. Other ............................................................... Total foreign debt ............................................... As a percentage of gross domestic product .... As a percentage of total export earnings ......... 75.9 26.7 49.2 10.4 15.4 23.4 107.4 65.2 42.2 183.3 50.7 162.5 81.6 29.3 52.3 10.1 16.3 25.9 89.3 52.4 36.9 170.9 46.2 148.6 83.5 30.7 52.8 10.4 14.3 28.1 84.7 49.7 35.0 168.1 45.7 144.6 87.9 30.7 57.1 10.4 18.6 28.2 84.6 48.1 36.5 172.5 46.8 146.8 88.5 30.7 57.8 10.5 17.9 29.4 87.5 50.4 37.1 176.0 49.2 152.7 87.4 29.0 58.4 10.4 18.0 30.0 93.2 55.1 38.1 180.6 51.5 158.2 Source: SARB International investment position South Africa’s positive net international investment position (IIP) decreased from a revised R1 055 billion at the end of March 2019 to R760 billion at the end of June. This reflected an increase in foreign liabilities and a decrease in foreign assets. The increase in the weighted average exchange rate of the rand of 3.1% over the period also affected the valuation of foreign assets more than that of foreign liabilities. The market value of South Africa’s foreign assets (outward investment) decreased by 1.7% from a revised R7 699 billion at the end of March 2019 to R7 566 billion at the end of June, following an increase of 9.1% in the first quarter of 2019. The market value of direct and portfolio investment as well as reserve assets decreased in the second quarter of 2019, while that of other investment and financial derivatives increased. The decrease in direct investment mainly resulted from a valuation loss on a large foreign investment of a South African company, while the value of foreign portfolio assets decreased due to the repatriation of portfolio assets and the appreciation in the exchange value of the rand. These developments were partly countered by an increase of 3.8% in the US Standard & Poor’s (S&P) 500 Index in the second quarter of 2019. The increase in other investment assets reflected domestic banking sector loans to non-residents under resale agreements as well as short-term loans by the private non-banking sector to non-residents. The market value of South Africa’s foreign liabilities (inward investment) increased by 2.4% from a revised R6 644 billion at the end of March 2019 to R6 806 billion at the end of June, following an increase of 3.7% in the first quarter of 2019. The higher value of foreign liabilities reflected an increase in all functional categories, except other investment. The 3.1% increase in the FTSE/ JSE All-Share Price Index (Alsi) in the second quarter of 2019 was the main contributor to the higher value of both direct and portfolio investment liabilities. The redemption of an international government bond was countered by non-resident net purchases of domestic government bonds. The decrease in other investment liabilities resulted mainly from the repayment of short-term foreign loans by the domestic banking sector. 48 Quarterly Bulletin December 2019
South Africa’s international investment position R billions 8 000 1 200 7 600 Foreign assets 1 000 7 200 800 6 800 600 6 400 6 000 400 5 600 200 5 200 0 4 800 -200 4 400 4 000 -400 2014 2015 2016 2017 2018 2019 Source: SARB Foreign assets as a ratio of South Africa’s annual GDP decreased from 156.4% at the end of March 2019 to 152.1% in June, while foreign liabilities increased from 135.0% to 136.8% over the same period. This resulted in a significant decline in the positive net IIP from 21.4% of GDP at the end of March 2019 to 15.3% at the end of June. International reserves and liquidity South Africa’s international reserve assets increased significantly by R77.2 billion in the third quarter of 2019 following a decrease of R7.7 billion in the second quarter. The US dollar value of South Africa’s gross gold and other foreign reserves (i.e. the international reserves of the SARB before accounting for reserves-related liabilities) increased from US$49.8 billion at the end of June 2019 to US$54.9 billion at the end of September. This primarily reflected the proceeds from two international bonds of US$5.0 billion issued by the South African government. Subsequently, the value of gross gold and other foreign reserves decreased to US$54.5 billion at the end of October 2019, and increased again to US$54.9 billion at the end of November. South Africa’s international liquidity position10 increased slightly from US$43.9 billion at the end of June 2019 to US$44.1 billion at the end of September, and further to US$44.4 billion at the end of November. 10 This is calculated as the SARB’s gross gold and foreign reserves minus foreign currency-denominated liabilities against both domestic and foreign counterparties plus/minus the forward position in foreign currency. International reserves US$ billions Months 55 7.0 6.5 50 6.0 5.5 45 5.0 4.5 40 4.0 2014 Source: SARB 2015 2016 2017 2018 2019 49 Quarterly Bulletin December 2019 Gross reserves International liquidity position Import cover ratio (right-hand scale) Foreign liabilities Net international investment position (right-hand scale)
The level of import cover (i.e. the value of gross international reserves relative to the value of merchandise imports, as well as services and income payments) increased from 4.8 months at the end of June 2019 to 5.5 months at the end of September. Exchange rates11 The nominal effective exchange rate (NEER) of the rand declined, on balance, by 4.2% in the third quarter of 2019 following an increase of 3.1% in the second quarter. The exchange value of the rand remained volatile in the third quarter of 2019 with the NEER increasing marginally by 0.9% and 0.4% in July and September respectively while declining notably by 5.5% in August amid renewed global trade tensions. In October, the NEER declined by a further 0.7% before increasing by 3.4% in November. 11 Unless stated to the contrary, all percentage changes in this section are based on the end of the period. Exchange rates of the rand Percentage change 31 Dec 2018 to 29 Mar 2019 29 Mar 2019 to 28 Jun 2019 28 Jun 2019 to 30 Sep 2019 30 Sep 2019 to 29 Nov 2019 Weighted average* .............................. Euro ..................................................... US dollar .............................................. Chinese yuan........................................ British pound ........................................ Japanese yen ....................................... -0.8 0.9 -1.0 -3.0 -3.1 0.3 3.1 1.7 3.2 5.5 5.9 0.3 -4.2 -3.1 -6.9 -3.2 -4.1 -6.7 2.8 2.7 3.4 1.8 -1.4 5.0 * Trade-weighted exchange rate against a basket of 20 currencies (nominal effective exchange rate) Depreciation – appreciation + Source: SARB The exchange value of the rand depreciated markedly against the US dollar from levels of around R14.00 in July 2019 to R15.50 in August, as the Chinese yuan’s depreciation weighed on emerging market currencies. Although the exchange value of the rand appreciated briefly in early September, it again weakened to almost R15.00 against the US dollar in early October. Amid persistent weak domestic economic outcomes and increased global risk aversion, the rand traded at an average of R14.70 against the US dollar in the third quarter of 2019, substantially weaker than in the first half of the year. However, this trend was also evident among other emerging market currencies, largely due to geopolitical factors. Despite adverse domestic idiosyncratic developments, the rand as well as other emerging market currencies were to a large extent influenced by global developments and risk aversion in the third quarter. 50 Quarterly Bulletin December 2019
Exchange value of the rand against the US dollar Rand per US dollar Emerging market currencies and risk aversion Index Index 16.0 30 57 58 15.5 25 59 15.0 20 60 14.5 15 61 62 14.0 10 63 13.5 5 64 13.0 0 65 Jan Mar May 2019 Jul Sep Nov Jan Mar May Jul Sep Nov 2019 * The Volatility Index (VIX) is a real-time index that represents the market’s expectation of 30-day forward-looking volatility derived from the S&P 500 index options and was developed by the Chicago Board Options Exchange (CBOE). The VIX provides a measure of market risk and investor sentiment. ** JPMorgan emerging market currency index Sources: CBOE, JPMorgan and SARB The exchange value of the rand depreciated sharply in late October after the release of the 2019 MTBPS, which reflected a marked deterioration in South Africa’s fiscal situation. This triggered renewed concerns regarding further credit rating downgrades as Moody’s Investor Services (Moody’s) revised South Africa’s sovereign rating outlook from stable to negative, followed by Standard and Poor’s on 22 November. However, the exchange value of the rand stabilised towards the end of November. Effective exchange rates of the rand Index: 2010 = 100 100 Real effective exchange rate 90 80 70 Nominal effective exchange rate 60 50 2014 2015 2016 2017 2018 2019 Source: SARB The real effective exchange rate (REER) of the rand decreased by 0.3% from December 2018 to September 2019, reflecting an improvement in the external competitiveness of domestic producers in foreign markets. 51 Quarterly Bulletin December 2019 Stronger rand = higher South African rand Period average Volatility Index (VIX)* EM currency index** (inverse right-hand scale) Weaker EM currency = higher
Turnover in the South African foreign exchange market The net average daily turnover12 in the South African market for foreign exchange (FX) decreased by 3.7% from US$15.5 billion in the second quarter of 2019 to US$15.0 billion in the third quarter, as the value of transactions against both the rand and in third currencies declined. Transactions against the rand declined by 3.0% from US$11.2 billion in the second quarter of 2019 to US$10.9 billion in the third quarter, while transactions in third currencies declined by 5.8% from US$4.3 billion to US$4.1 billion over the same period. 12 This is calculated as the daily average of all new foreign exchange transactions concluded during a specified period, adjusted for local interbank double counting. Net average daily turnover in the South African foreign exchange market US$ billions 30 against the rand 25 20 15 10 5 0 2014 2015 2016 2017 2018 2019 Source: SARB Non-residents continued to dominate participation in the domestic FX market, although the value of their transactions against the rand declined from US$7.0 billion in the second quarter of 2019 to US$6.8 billion in the third quarter. The decline most probably resulted from reduced appetite for domestic bonds and shares amid disappointing domestic economic outcomes and increased risk aversion in global financial markets. Composition of turnover against the rand US$ billions 22 20 18 16 14 12 10 8 6 4 2 0 Monetary sector Other residents 2014 2015 2016 2017 2018 2019 Source: SARB 52 Quarterly Bulletin December 2019 Non -residents Total Trans Trans in thi actions actions rd currencies
The value of FX transactions against the rand within the monetary sector remained broadly unchanged at US$1.9 billion from the second to the third quarter of 2019. Similarly, the value of FX transactions against the rand with other resident counterparties remained unchanged at US$2.2 billion over the same period. Composition of turnover in third currencies US$ billions 8 7 6 5 4 3 2 1 0 2014 2015 2016 2017 2018 2019 Source: SARB Similarly to transactions against the rand, the decline in turnover for FX transactions in third currencies in the third quarter of 2019 was mainly driven by a third consecutive quarterly decline in non-resident participation, from US$3.9 billion in the second quarter to US$3.7 billion in the third quarter. FX transactions in third currencies within the monetary sector remained unchanged at US$0.1 billion in the third quarter of 2019, while FX transactions in third currencies with other resident counterparties declined marginally from US$0.4 billion in the second quarter of 2019 to US$0.3 billion in the third quarter. 53 Quarterly Bulletin December 2019 Monetary sector Other residents Non-residents
Monetary developments, interest rates and financial markets Money supply Growth in the broadly defined money supply (M3) outpaced that in nominal GDP by a narrower margin in the third quarter of 2019 despite slowing markedly from a quarter-to-quarter seasonally adjusted and annualised rate of 14.9% in the second quarter to 5.9% in the third quarter. The deceleration in overall deposit growth was driven by slower growth in the deposit holdings of the corporate sector from July 2019, while the expansion in household deposits remained slightly more upbeat but range-bound alongside moderate wage growth. The income velocity of circulation of M3 decreased from 1.38 in the second quarter of 2019 to 1.37 in the third quarter, as the quarterly expansion in M3 exceeded that in nominal GDP. Money supply and gross domestic product Year-on-year percentage change 12 10 8 6 4 2 0 2014 2015 2016 2017 2018 2019 Sources: Stats SA and SARB 13 The deposit holdings of the corporate sector include local government deposits. Year-on-year growth in M3 moderated from a high of 9.0% in May 2019 to 6.1% in September and 7.3% in October. Growth in the deposit holdings of the corporate sector initially accelerated from 3.7% in January 2019 to 9.3% in June amid risk aversion in the run-up to the national elections. The deposits of both financial and non-financial companies13 then decelerated to 6.5% in October, partly due to base effects as the balances of 12 months prior were boosted by valuation gains on foreign currency-denominated deposits when the exchange value of the rand depreciated. Growth in the deposit holdings of non-financial companies slowed from a recent high of 7.8% in April 2019 to 4.9% in August, with a moderate recovery to 6.4% in October. Similarly, the rate of increase in the deposit holdings of financial companies decelerated sharply from 12.1% in June to 5.3% in September and 6.5% in October. Nonetheless, this still exceeded the weak average growth of 2.8% recorded by this sector in 2018. Growth in the deposit holdings of households levelled off somewhat from a high of 9.0% in May 2019 to slightly more than 8% in the ensuing months to October. 54 Quarterly Bulletin December 2019 M3 Nominal GDP
Deposit holdings of households and companies Percentage change over 12 months 16 12 8 4 0 -4 2014 2015 2016 2017 2018 2019 Source: SARB Growth in long-term deposits has notably exceeded that of the other deposit categories since late 2018, and expanded at double-digit rates throughout the first 10 months of 2019, albeit with some moderation from 17.7% in March 2019 to 16.1% in October. Growth in short-and medium-term deposits accelerated notably from a low of 0.6% in January 2019 to 7.4% in May, after which it moderated to 4.2% in October. After fluctuating around an average of 4.5% in 2018, the rate of increase in the more liquid cash, cheque and other demand deposits accelerated from below 5.0% in February 2019 to 9.0% in June before slowing again to 5.8% in October. Deposits by maturity Percentage change over 12 months 20 15 10 5 0 -5 -10 2014 2015 2016 2017 2018 2019 Source: SARB Total M3 deposit holdings increased by R72.6 billion in the third quarter of 2019 compared with a marked increase of R158.6 billion in the same quarter a year earlier. The deposit holdings of the corporate sector as a whole increased by R38.9 billion in the third quarter of 2019, with non-financial companies contributing R29.8 billion and financial companies R9.1 billion. The moderate increase in financial company deposits compares to a very large increase in the third 55 Quarterly Bulletin December 2019 Cash, cheque and other demand Long term Short and medium term Financial companies Households Non-financial companies
quarter of 2018, which reflected valuation gains on foreign currency-denominated deposits at the time. The R33.7 billion increase in the deposit holdings of the household sector in the third quarter of 2019 almost equalled the increase of R35.0 billion in the same quarter a year earlier, but was less than the increase of R41.5 billion in the previous quarter. M3 holdings of households and companies * Expressed as a percentage of the total outstanding balance as at September 2019 Source: SARB In statistical terms, the difference between the increase in M3 of R72.6 billion and the increase in claims on the domestic private sector of R55.2 billion in the third quarter of 2019 is explained by the net effect of a R93.5 billion increase in net foreign assets of the monetary sector, a decline in net claims on the government sector of R31.9 billion, and a R44.2 billion decrease in net other assets (a contra-entry category absorbing the changes in foreign assets, among other factors). Credit extension14 Growth in total loans and advances extended by monetary institutions to the domestic private sector accelerated moderately in early 2019 but slowed in subsequent months. The recent moderation reflected slower growth in loans extended to companies while that to households continued its gradual upward trend. The household sector’s reliance on bank funding has consistently edged higher over the past two and a half years, amid a challenging economic environment. However, the rising debt levels of the household sector alongside weak job prospects, high unemployment and low consumer confidence may dampen credit growth over the short term. 14 Growth in credit extension was impacted by the implementation of International Financial Reporting Standard 9 from January 2018. Banks’ calculation of the provision for credit losses (impairments) changed fundamentally, which affected outstanding credit balances. For a more comprehensive analysis, see ‘Box 3: Impairments and credit statistics’ on page 52 of the June 2018 edition of the Quarterly Bulletin, also available at http://www.resbank.co.za/ Lists/News%20and%20 Publications/Attachments/ 8615/03Impairments%20 and%20credit%20 statistics.pdf The increase in total loans and advances of R47.2 billion in the third quarter of 2019 was more than the R30.6 billion in the second quarter but somewhat less than the increase of R51.0 billion in the third quarter of 2018. However, the quarter-to-quarter seasonally adjusted and annualised growth rate in total loans and advances to the domestic private sector decelerated from a recent high of 9.2% in the second quarter of 2019 to 5.3% in the third quarter. With the expansion in credit extension falling short of that in nominal GDP, the ratio of credit to GDP declined from 75.1% in the first quarter of 2019 to 74.7% in the third quarter. 56 Quarterly Bulletin December 2019 Households ........................................ Companies: Total................................ Of which: Financial ......................... Non-financial................... Total M3 deposits .............................. Quarter-to-quarter change R billions Percentage of total M3 deposit holdings* 20182019 Q2Q3Q4Q1Q2Q3 29.835.011.611.341.533.7 -36.8 123.6-14.8 75.520.338.9 -23.4 87.3-41.6 75.126.79.1 -13.4 36.326.90.4-6.4 29.8 -7.1 158.6-3.2 86.861.872.6 35.2 64.8 36.5 28.3 100.0
Bank loans and gross domestic product Year-on-year percentage change 20 16 12 8 4 0 Total loans and advances to the private sector Percentage change 15 10 5 0 2014 2015 2016 2017 2018 2019 * Growth rates impacted by the implementation of IFRS 9 from January 2018 Sources: Stats SA and SARB The 12-month growth in total loans and advances moderated from a recent high of 7.5% in April 2019 to 5.9% in September before rebounding to 7.1% in October. When adjusted for inflation, real credit growth exceeded the 2% level in January 2019 for the first time in 33 months after having fluctuated around zero per cent in the prior 12 months. Real credit growth accelerated further to a recent high of 3.3% in October 2019 as growth in nominal credit extension exceeded consumer price inflation by a wider margin. Total loans and advances Percentage change over 12 months 12 10 8 6 4 2 0 Real* -2 -4 2014 2015 2016 2017 2018 2019 * Deflated with the consumer price index Source: SARB 57 Quarterly Bulletin December 2019 Nominal Over 12 months Quarterly at seasonally adjusted annualised rates * Loans to companies Loans to households Nominal GDP *
Growth in credit extension to the corporate sector accelerated from 5.4% in February 2019 to 8.5% in April, only to recede again to 5.2% in September and rebound to 7.5% in October. These fluctuations were mostly driven by variations in credit to financial companies. By contrast, credit to non-financial companies maintained a relatively steady pace of expansion as the demand for credit by companies involved in, among other things, energy, mining, consumer goods and property development increased. The increase in bank loans to the corporate sector of R23.1 billion in the quarter ending September 2019 exceeded the increase of R10.6 billion in the previous quarter but was less than the increase of R31.0 billion in the third quarter of 2018. The increase in the third quarter of 2019 was mainly concentrated in mortgage advances and instalment sale credit, while growth in general loans (normally acquired for working capital purposes) moderated. Corporates also made significant repayments on overdraft facilities over this period. Selected loans and advances Corporate sector Percentage change over 12 months Household sector Percentage change over 12 months 14 20 18 16 14 12 10 8 6 4 2 0 -2 12 10 8 6 4 2 0 -2 2017 2018 2019 2017 2018 2019 Mortgages General loans Credit cards Instalment sale credit and leasing finance Overdrafts Source: SARB Year-on-year growth in credit extension to the household sector continued its rising trend, from 6.1% in January 2019 to a six-year high of 6.7% in October. Growth in mortgage advances, which account for 58% of household loans, has been accelerating gradually from an average of 3.1% in 2017 to an average of 3.6% in 2018, and further to 5.1% in October 2019. Households’ utilisation of overdrafts decreased during 2019, while growth in instalment sale credit and leasing finance also slowed from a recent high of 8.2% in April 2019 to 6.1% in October. By contrast, general loans and credit card advances maintained a steady pace of acceleration in 2019, with growth in both exceeding 11% in October. Despite the increased usage of credit card advances, it accounts for only about 7% of total loans to households, whereas general loans are somewhat more significant at around 14.5%. 58 Quarterly Bulletin December 2019
Growth in total mortgage advances edged moderately higher from 4.6% in January 2019 to 6.0% in October, benefitting from an increase in loans for both residential and commercial property. Mortgage advances on residential property continued to accelerate gradually from 4.0% in December 2018 to 4.9% in October 2019. Growth in advances on commercial property was more lively and quickened from 4.8% in January 2019 to 9.0% in October. Mortgage advances Percentage change over 12 months 18 16 14 12 10 8 6 4 2 0 2014 2015 2016 2017 2018 2019 Source: SARB The general weakness in credit growth was fairly pervasive across the domestic economic sectors in the second and third quarter of 2019. The significant deceleration in growth in credit extension to the construction sector from a recent high in the first quarter of 2019 coincided with slow growth in property prices as well as weak building confidence and activity. This contrasted credit to the real estate sector, which remained fairly upbeat during the course of 2019. Resilient growth in credit extension to the wholesale and retail trade sector in 2018 slowed noticeably in 2019 along with sluggish consumer spending. The mining sector’s credit demand, which is only a small portion of its source of funding, also dwindled during 2019. The moderate increase in bank credit to manufacturers in 2019 probably indicated headwinds related to weak consumer demand and confidence as domestic economic activity remained sluggish. The same reasons probably also contributed to the contractions in credit extension to the finance and insurance sector as well as the business services sector in some quarters of 2018 and 2019. 59 Quarterly Bulletin December 2019 Commercial property Residential property Total Box 3 Why the acceleration in general loans to households from 2018? Growth in general loans to households by private sector banks has accelerated steadily from a recent low of 2.7% in December 2017 to 11.8% in October 2019, and reflected various developments. More conservative and generally risk-averse credit underwriting criteria, together with an increase in the maximum value of loans offered, have typically resulted in fewer loans but with a longer term being granted to existing clients with relatively good credit risk profiles. As banks targeted higher-income clients with a lower probability of default, the unsecured credit became more competitively priced. Banks’ attempts to lure back clients through an improved customer experience, better processes and more convenient ways of opening loan accounts through new channels are also rendering results. Banks reported success with direct sales and web-based loan origination along with improved efficiencies from simplified online origination and digitised branch processes. However, the recent increase in unsecured loans is also partly technical. International Financial Reporting Standard 9 (IFRS 9), effective since 2018, requires that loans be kept on the balance sheet for a longer period of time before being written off. Previously, under International Accounting Standard 39 (IAS 39), loans under default would have been written off sooner. The change in balance sheet composition due to the extension of the write-off period for unsecured loans partly boosted growth rates during the changeover period.
Growth in bank credit by economic sector Percentage change over four quarters 2018 2019 Percentage of total credit extension* Economic sector Q3 Q4 Q1 Q2 Q3 Households .......................................................................... Finance and insurance ......................................................... Real estate ........................................................................... Wholesale and retail trade .................................................... Manufacturing ...................................................................... Business services ................................................................. Transport, storage and communication ................................ Electricity, gas and water...................................................... Agriculture, forestry and fishing............................................. Mining and quarrying ............................................................ Construction......................................................................... Community, social, personal services and other ................... Total ..................................................................................... 4.6 -7.9 10.1 16.6 1.0 -1.0 -1.3 4.2 6.0 16.1 5.9 17.0 4.3 5.8 -0.5 10.5 17.7 2.5 6.4 10.8 -0.4 4.8 24.2 9.9 8.2 6.2 6.2 0.8 5.6 6.7 9.5 7.0 10.2 1.2 5.4 29.3 17.7 10.5 6.3 6.8 -1.2 6.5 2.9 6.3 1.9 10.0 -1.3 7.9 0.2 5.9 -0.5 3.8 7.8 -5.4 10.9 0.3 5.2 -1.9 4.8 9.8 -4.4 1.0 2.3 -3.1 3.0 36.2 16.6 11.6 5.1 4.4 3.2 3.1 2.5 2.0 1.7 0.9 12.7 100.0 * Expressed as a percentage of the total outstanding balance for June 2019 Source: SARB Interest rates and yields The Monetary Policy Committee (MPC) of the SARB decided to keep the repurchase rate (repo rate) unchanged at the September and November 2019 meetings, having assessed the overall risks to the inflation outlook in the near term to be balanced. Nonetheless, the MPC noted that uncertainty about inflation risks is unusually high, driven mainly by supply-side factors. Domestic short-term money market interest rates generally declined during the course of the third quarter of 2019 following the decrease in the repo rate in July 2019 and periods of appreciation in the exchange value of the rand. Since then, money market conditions have been impacted by the release of a larger-than-expected fiscal budget deficit in the 2019 Medium Term Budget Policy Statement (2019 MTBPS) and the subsequent review of the international ratings outlook of South Africa’s sovereign debt instruments from stable to negative. The concomitant depreciation in the exchange value of the rand also placed upward pressure on interest rates. However, the favourable inflation outcomes of recent months moderated the increase in short-term interest rates. The 3-month Johannesburg Interbank Average Rate (Jibar) declined from 7.00% before the decrease in the repo rate on 19 July 2019 to 6.78% on 2 October and has since fluctuated between 6.78% and 6.81% up to the end of November. The 6-month Jibar fluctuated lower from 7.35% on 16 July 2019 to 7.22% in late October but then increased moderately to 7.30% on 29 November after the 2019 MTBPS. The 12-month Jibar followed a similar trajectory, initially decreasing by 20 basis points from 7.75% on 1 July 2019 to a low of 7.55% on 12 September before increasing to 7.77% at the end of November. The 12-month Jibar averaged 7.65% in the third quarter of 2019, down from an average of 8.02% in the second quarter. The tender rate on 91-day Treasury bills (TBs) decreased by 36 basis points from 7.10% on 2 July 2019 to 6.74% on 20 September before increasing to 6.97% in early November alongside a larger projected fiscal deficit. The tender rate maintained a moderate upward bias during the rest of the month, increasing to 7.06% on 29 November. 60 Quarterly Bulletin December 2019
Money market rates Per cent 9.0 8.5 8.0 7.5 7.0 6.5 6.0 Jun Sep Dec MarJun Sep Dec MarJun Sep Dec MarJun Sep Dec 2016 2017 2018 2019 Source: SARB Funding conditions in the market for interbank lending have been fairly stable in 2019 thus far, with interest rates exceeding the standing facility limits only on one occasion since the start of the year. The South African Benchmark Overnight Rate on Deposits (Sabor) remained closely aligned to the repo rate, averaging 6.51% since the lowering of the policy rate in July. By contrast, the overnight foreign exchange (FX) rate displayed somewhat more volatility, initially increasing by 73 basis points from 6.88% on 2 July 2019 to 7.61% on 31 August and exceeding the upper limit of the standing facility range due to generally high demand for liquidity towards month-end. Subsequently, the overnight FX rate fluctuated widely, albeit with a downward trajectory to 6.40% on 7 November, before increasing to 7.08% by month-end. The overnight FX rate averaged about 6.86% in the second and third quarter of 2019, up from 6.66% in the first quarter. Benchmark overnight rates Per cent 11 10 Standing facility 9 Overnight FX rate 8 7 6 5 4 2016 2017 2018 2019 Source: SARB 61 Quarterly Bulletin December 2019 Sabor upper band Standing facility lower band 12-month Jibar 6-month Jibar 3-month Jibar Repurchase rate 91-day Treasury bills
Rates on forward rate agreements (FRAs) generally decreased after the July 2019 reduction in the repo rate but remained sensitive to fluctuations in the exchange value of the rand. FRA rates across the maturity spectrum reacted positively to the recent benign inflation outcomes and reflected market expectations of a possible further reduction in the policy rate in the coming months. The 9x12-month FRA declined by 25 basis points from 6.58% on 1 July 2019 to 6.33% by mid-September but then fluctuated higher to 6.66% on 29 November after the 2019 MTBPS in October. Similarly, the 3x6-month FRA decreased by 24 basis points from 6.82% on 5 August 2019 to 6.58% on 22 October before increasing to 6.75% at the end of November as the exchange value of the rand depreciated after the 2019 MTBPS and the policy stance was kept unchanged at the November MPC meeting. Forward rate agreements Per cent 8.5 8.0 7.5 7.0 6.5 6.0 Jun SepDec MarJun Sep Dec Mar Jun Sep 2018 Dec MarJun Sep 2019 Dec 2016 2017 Source: SARB Private sector banks have kept deposit and lending rates relatively stable since the end of July 2019 alongside the unchanged repo rate. The prime lending rate was maintained at 10.00%, while the weighted-average flexible rate charged by banks on mortgage advances decreased from 9.77% in June to 9.51% in October. The interest rates offered on one-month notice deposits also decreased, from 6.54% in June to 6.37% in October. The yield on 10-year South African rand-denominated government bonds issued and traded in the domestic market generally declined from the end of October 2018 to mid-July 2019 along with a fair degree of volatility. Subsequently, this yield increased from 8.48% on 18 July 2019 to 9.12% on 29 November, reflecting continued global trade tensions between the US and China as well as notable non-resident net sales of domestic bonds, government’s recapitalisation of Eskom, and the depreciation in the exchange value of the rand. The larger government budget deficit and increased debt levels in the 2019 MTBPS also raised concerns of a possible sovereign credit rating downgrade. 62 Quarterly Bulletin December 2019 3x6 months 6x9 months 9x12 months 18x21 months
Government bond yield, inflation and the exchange rate Per cent Rand per US dollar 12 18 10 16 8 6 14 4 12 2 10 0 2014 2015 2016 2017 2018 2019 Consumer price inflation Exchange rate (right-hand scale) South African 10-year yield Sources: IRESS, JSE, Stats SA and SARB The level of the yield curve moved lower, beyond the short end, from the end of October 2018 to 18 July 2019. Thereafter, the curve shifted higher and the slope steepened as bond yields across the maturity spectrum increased except for the extreme short end, which declined along with the lower repo rate in July 2019. The overall increase in yields since July 2019, which was briefly interrupted from mid-August to mid-September, reflected the depreciation in the exchange value of the rand, among other factors. The yield gap15 widened markedly from 283 basis points on 18 July 2019 to 374 basis points on 29 November. 15 The yield gap is measured as the difference between yields at the extreme long and short ends of the yield curve. Yield curve Per cent 11 10 9 8 7 6 0 5 10 15 20 25 30 Unexpired maturity in years 25 October 2018 18 July 2019 29 November 2019 Sources: IRESS and JSE 63 Quarterly Bulletin December 2019
The yield spread of emerging market US dollar-denominated bonds relative to US government bonds, as measured by the JPMorgan Emerging Markets Bond Index Plus (EMBI+),16 narrowed significantly from 442 basis points in May 2019 to 340 basis points in November, amid some volatility. The narrowing reflected improved investor confidence towards emerging market bonds. Similarly, South Africa’s sovereign risk premium17 on government’s US dollar-denominated bonds in the six-year maturity range narrowed from an average of 260 basis points in May 2019 to 241 basis points in November. 16 The EMBI+ measures the total returns on US dollar-denominated debt instruments of emerging market economies. 17This is the differential between the yield on South African government US dollar-denomi-nated bonds and that on US dollar-denominated bonds of the US government. Money market Private sector banks’ average actual daily liquidity requirement of R56.5 billion in the third quarter of 2019 fluctuated between a low of R52.8 billion and a high of R60.9 billion, and was aligned to the average actual daily liquidity requirement of R56 billion of the SARB. In October and November 2019, the actual daily liquidity requirement averaged R55.6 billion and R56.2 billion respectively. The net effect of the factors influencing money market conditions expanded liquidity by R5.7 billion in the third quarter of 2019 compared with a contraction of R1.4 billion in the second quarter. Although an increase in notes and coin in circulation outside of the SARB of R4.9 billion tightened liquidity in the third quarter of 2019, the SARB’s money market operations injected R9.3 billion on a net basis. This included FX swaps to the value of R7.1 billion, which were allowed to mature, as well as the placement of R2.1 billion in deposits of the Corporation for Public Deposits (CPD) at private sector banks. FX transactions in the spot market by the SARB, which contracted liquidity by R0.1 billion, were countered by maturing SARB debentures, which expanded liquidity by R0.1 billion. In October and November 2019, money market liquidity contracted by R5.5 billion, mostly on account of increases in notes and coin in circulation and in the required cash reserve deposits of banks. Factors influencing money market liquidity conditions Notes and coin in circulation Change in cash reserve accounts Spot foreign exchange transactions Government deposits with SARB Reverse repurchase transactions SARB debentures Forward position (swaps) CPD call deposits Other Liquidity provided to the banking system -20 R billions -15 -10 -5 0 5 10 July–September 2019 October–November 2019 Source: SARB 64 Quarterly Bulletin December 2019 -4.9 -8.5 0.9 -5.1 -0.1 -0.1 Tightening (draining) 0.1 Easing (injecting) 7.1 -1.1 2.1 8.4 0.5 0.9 5.7 -5.5
From January to September 2019, capital redemptions and scheduled coupon interest payments on various government bonds amounting to R107.7 billion were effected from the government tax and loan accounts. Of this, the SARB’s portfolio of government bonds accrued only R296 million. Bond market The value of the public sector’s18 net issuance of listed bonds in the domestic primary bond market increased by 40.5% year on year to R309 billion in the first 11 months of 2019. The larger fiscal deficit of national government and the borrowing needs of some public corporations due to financial challenges increased funding pressures. Funding activity by private sector companies also increased markedly in 2019, with net issuances increasing almost seven-fold from only R10.6 billion in the 11 months to November 2018 to R71.3 billion in the same period of 2019. These issuances brought the total outstanding nominal amount of all JSE-listed bonds to R3.4 trillion at the end of November 2019 – 12.8% more than a year earlier. 18The public sector includes national and local governments as well as public corporations. Net issuances of listed bonds in the primary market R billions 50 40 30 20 10 0 -10 -20 2014 2015 2016 2017 2018 2019 Private sector Public sector Source: JSE National Treasury successfully raised US$5 billion through two bond issues in the international markets in September 2019, after announcing its intention to return to international markets to raise funding. The US$2 billion 10-year bond maturing in 2029 was priced at a coupon rate of 4.85% and the US$3 billion bond maturing in 2049 at a coupon rate of 5.75%. National government’s foreign currency-denominated debt as a percentage of total debt was 11.3% as at 31 October 2019, still well within the limit of 15% which was set to manage exchange rate risk. The daily average value of turnover in the domestic secondary bond market increased by 21.5% to R150 billion in the first 11 months of 2019 compared with the corresponding period of 2018, supported by higher volumes traded. Issuances of rand-denominated bonds in the European and Japanese bond markets gained some momentum in the 11 months to November 2019, with the outstanding amount of rand-denominated bonds in issue in international markets increasing by R7.3 billion to R273 billion in November. This followed net redemptions in the past two years. Despite several government bonds yielding negative returns globally compared with South Africa’s positive yields, investment in rand-denominated bonds is affected by concerns regarding the country’s sovereign credit rating. 65 Quarterly Bulletin December 2019
International primary markets for rand-denominated bonds R billions 10 0 -10 -20 -30 2014 2015 2016 2017 Redemptions 2018 2019 Issues Source: Bloomberg Non-resident investor interest in the domestic secondary bond market has faded of late, with notable net sales of R57.4 billion in the second and third quarter of 2019 combined, following net purchases of R16.0 billion in the first quarter, as reported by the JSE. Further net sales of domestic bonds by non-residents of R4.5 billion in October and November contributed to cumulative net sales of R45.8 billion in the first 11 months of 2019, which was less than the R84.0 billion over the same period in 2018. Non-residents’ negative sentiment towards domestic bonds in the latter part of 2019 was influenced by, among other factors, the depreciation in the exchange value of the rand, the uncertain political landscape, the larger budget deficit, and the rising debt of national government over the next three years, as projected in the 2019 MTBPS. Non-resident net transactions in JSE-listed shares and bonds R billions 40 30 20 10 0 -10 -20 -30 -40 Net sales -50 -60 2014 2015 2016 2017 2018 2019 Shares Bonds Source: JSE 66 Quarterly Bulletin December 2019 Net purchases
Share market Equity capital raised by companies listed on the JSE in the domestic and international primary share markets waned in the third quarter of 2019 amid a decline in share prices in a weak global and domestic economic environment. The value of shares issued on the JSE declined by 39.1% to R32.9 billion in the 11 months to November 2019 compared with the corresponding period in 2018. Thus far in 2019, companies in the financial sector contributed the most to the total value of shares issued, at 52.9%. Equity capital raised on the JSE by sector Per cent 9.5 30.2 Source: JSE The value of turnover in the secondary share market of the JSE was subdued in the first 11 months of 2019, with a daily average of R20.7 billion, which was 8.2% less than in the same period in 2018. The decline occurred alongside lower volumes, which also coincided with a decline in volatility. The market capitalisation of all shares listed on the JSE increased from a recent low of R12.5 trillion in November 2018 to an all-time high of R17.5 trillion in September 2019, reflecting higher share prices, before declining to R17.0 trillion in November. Non-residents’ net sales of JSE-listed shares of R29.3 billion in the first half of 2019 were followed by net sales of R44.5 billion in the third quarter and R38.4 billion in October and November, as reported by the JSE. The persistent sell-off by non-residents in 2019 was primarily driven by continued investor concerns over the domestic and global economic growth outlook, uncertainties over the US-China trade tensions, Brexit negotiations, and concerns that South Africa might lose its investment-grade credit rating. The cumulative net sales of shares by non-residents of R112 billion in the first 11 months of 2019 were nearly three times the R40.6 billion in the corresponding period of 2018. The share prices of JSE-listed companies trended lower in the third quarter of 2019 following increases in the first two quarters. In the third quarter of 2019, the South African share market was affected by the prolonged US-China trade tensions which added to market uncertainty, together with the weak domestic economic growth outlook and lack of business confidence amid the longest officially dated downward phase in the business cycle. The FTSE/JSE All-Share Price Index (Alsi) decreased by 5.8% in the third quarter of 2019, marking the worst third-quarter performance since 2011. Subsequently, the Alsi increased by 1.0% to 55 349 index points on 29 November. Domestic share prices also underperformed their global counterparts, with a decrease of 8.4% in US dollar terms, while the MSCI Emerging Markets Index declined by only 1.4% and the MSCI World Index gained 5.2% in the five months to November 2019. 67 Quarterly Bulletin December 2019 January–November 2018January–November 2019 1.9 7.8 40.8 52.9 40.09.1 FinancialsIndustrials ResourcesBEE AltX
Share prices Percentage change over one quarter 15 10 5 0 -5 -10 2011 2012 2013 2014 2015 2016 2017 20182019 FTSE/JSE All-Share (in rand terms) Index in US dollar: 2 January 2014 = 100 150 125 100 75 50 2014 MSCI World 2015 2016 2017 2018 2019 MSCI Emerging Markets FTSE/JSE All-Share Sources: Bloomberg, IRESS and JSE The overall historical price-earnings ratio of ordinary shares listed on the JSE receded from a recent high of 21.5 in June 2019 to 18.4 in November, as total earnings increased and share prices declined. Market for exchange-traded derivatives Domestic maize prices have moved broadly sideways thus far in 2019, amid some volatility. The spot prices of white and yellow maize contracts listed on the JSE Commodity Derivatives Market increased from mid-May 2019 to mid-August, along with the depreciated exchange value of the rand and some spillover from higher international maize prices which was partly driven by wet weather conditions in the US. Subsequently, the spot prices of domestic white and yellow maize declined to R2 841 per ton and R2 745 per ton respectively on 29 November. Encouragingly, the latest data released by the Department of Agriculture, Forestry and Fisheries’ Crop Estimates Committee indicate that the intention of maize farmers to plant in the 2019/20 production season has increased by 9.5% from the previous season. Despite lower international wheat prices, the spot price of domestic wheat increased by 11.8% from a low of R4 336 per ton on 26 February 2019 to R4 847 per ton on 19 September, along with the depreciation in the exchange value of the rand. Subsequently, domestic wheat prices declined to R4 395 per ton on 29 November. In October 2019, the domestic wheat import tariff was raised markedly from R664.70 per ton to R1 008.60 per ton to stave off cheap wheat imports, which could destabilise the domestic wheat market. 68 Quarterly Bulletin December 2019
Grain prices South Africa Rand per ton 5 500 4 500 3 500 2 500 1 500 International US dollar per ton 400 350 300 250 200 150 100 2014 2015 2016 2017 2018 2019 Sources: International Grains Council and JSE Turnover in equity derivatives on the JSE increased slightly in the first 11 months of 2019 compared to the corresponding period of 2018, while turnover in interest rate derivatives declined over the same period. By contrast, turnover in currency derivatives increased significantly by 48.7% over the same period, reflecting increased hedging activity against adverse movements in the exchange value of the rand. However, the value of equity derivatives turnover continued to dominate overall derivatives turnover on the JSE. Derivatives turnover on the JSE, January to November 2019 Change over one year (per cent) Type of derivative Value (R billions) Equity ............................................................................................................ Warrant ......................................................................................................... Commodity.................................................................................................... Interest rate ................................................................................................... Currency........................................................................................................ 5 457 1 761 1 243 1 444 2 37 24 -6 49 Source: JSE 69 Quarterly Bulletin December 2019 Wheat Maize Wheat White maize
Real estate market The lacklustre growth in nominal residential property prices has continued thus far in 2019. The year-on-year rates of increase in house prices varied between 2.4% and 4.0% across the different indicators in October 2019, mostly still less than consumer price inflation, implying that house prices continued to decline in real terms. The muted growth in nominal house prices continued to be a reflection of the prevailing macroeconomic fundamentals such as subdued domestic economic growth, the high unemployment rate, depressed property demand, low consumer confidence, and slow growth in households’ disposable income. Nominal house prices and consumer price inflation Percentage change over 12 months 12 10 8 6 4 2 2014 2015 2016 2017 2018 2019 First National Bank Standard Bank Lightstone Headline consumer price index Sources: First National Bank, Lightstone, Standard Bank and Stats SA The weak demand for residential property was observed in the average time that residential properties remained on the market, which increased from 14.1 weeks in the second quarter of 2019 to 16.0 weeks in the third quarter, as measured by First National Bank (FNB). In addition, sellers were forced to reduce their initial asking prices to a greater extent, with the average percentage reduction in the asking price increasing to 10.0% in the third quarter of 2019 from 8.6% a year earlier. The real value of residential building plans passed also declined markedly in recent months, reflecting falling demand for new residential property. Average reduction in initial residential property asking prices Per cent 0 -2 -4 -6 -8 -10 -12 2014 2015 2016 2017 2018 2019 Source: First National Bank 70 Quarterly Bulletin December 2019
Non-bank financial intermediaries19 19These consist of unit trusts, the Public Investment Corporation, long-and short-term insurance companies, public and private pension funds, participation bond schemes, finance companies and non-monetary public financial corporations. The consolidated assets of non-bank financial institutions increased by 0.4% from the second quarter of 2019 to R9.9 trillion in the third quarter. The total assets of unit trusts and long-term insurers increased by 2.2% and 0.7% respectively, while that of the Public Investment Corporation (PIC) declined by 1.8%. Year-on-year growth in the balance sheet of non-bank financial institutions has slowed from a recent high of 9.4% in the fourth quarter of 2017 to 3.3% in the third quarter of 2019. The change in asset allocation of these institutions mirrored financial market conditions in the third quarter of 2019. Total assets of non-bank financial institutions Percentage of total assets R billions 10 000 60 50 8 000 40 6 000 30 4 000 20 2 000 10 0 0 2014 2015 2016 2017 2018 2019 Shares Cash and deposits Total assets (right-hand scale) Interest-bearing securities Other assets Source: SARB Consistent with the decline in share prices in the third quarter of 2019, these institutions’ shareholding decreased by 0.5 percentage points from the second quarter of 2019 to 54.4% of total assets in the third quarter – the lowest since the second quarter of 2013. Shareholding declined by a cumulative 0.5 percentage points in the first three quarters of 2019, despite a 4.0% increase in domestic share prices over the same period. Non-bank financial institutions’ holdings of interest-bearing securities increased by 0.6 percentage points from the second quarter of 2019 to 31.4% of total assets in the third quarter. The holdings of cash and deposits by these institutions increased slightly by 0.2 percentage points from the second quarter of 2019 to 6.1% of total assets in the third quarter. In particular, unit trusts and long-term insurers increased cash and deposits by 3.9% and 3.6% respectively. The reallocation of funds to cash and deposits in the third quarter of 2019 was in line with increased risk aversion. The value of loans extended by non-bank financial institutions increased slightly from the second quarter of 2019 to 4.8% of total assets in the third quarter. The weak economic environment appears to be having an effect on credit extended by non-bank finance companies, especially on instalment sale finance to households. Quarter-to-quarter growth in credit extension by these companies slowed somewhat from 1.1% in the second quarter of 2019 to 0.6% in the third quarter. 71 Quarterly Bulletin December 2019
Flow of funds Non-resident investors’ net acquisition of domestic financial assets decreased from R66.6 billion in the first quarter of 2019 to R16.2 billion in the second quarter. This resulted from net outflows of financial derivatives of R31.5 billion and net sales of R7.0 billion of long-term government bonds (including the redemption of a foreign bond). Non-residents’ net sales could be attributed to concerns about escalating trade tensions, the possible downgrade of South Africa’s sovereign credit rating, and the additional recapitalisation costs of some state-owned companies (SOCs). In the second quarter of 2019, non-residents recorded net purchases of domestic shares of R14.4 billion following three consecutive quarters of negative sentiment towards domestic shares. Foreign investors reduced their deposits with domestic banks by R2.3 billion in the second quarter of 2019 while extending loans of R31.8 billion compared with R74.0 billion in the first quarter. The total funds intermediated in the economy moderated in the second quarter of 2019 despite a rebound in economic growth. Deposits with monetary institutions acted as a safe haven for risk-averse investors and increased notably by R98.6 billion compared with R37.8 billion in the first quarter, with the main deposit holders being general government and the household sector. Financial institutions intermediated funds through net purchases of fixed-interest securities of R95.9 billion and much lower net purchases of shares of R18.7 billion in the second quarter of 2019. Over the same period, the demand for bank funding through loans and advances amounted to R41.4 billion while total credit extended amounted to R164 billion, mainly to non-financial corporate business enterprises and general government. Financial intermediation by main asset class R billions 400 300 200 100 0 -100 2014 2015 2016 2017 2018 2019 Shares Fixed-interest securities Loans Total intermediation Source: SARB The general government sector’s net borrowing requirement increased marginally from R54.8 billion in the first quarter of 2019 to R56.1 billion in the second quarter. General government sourced funds through net issues of long-term government bonds of R87.8 billion together with R32.6 billion of TBs, while net redemptions of R12.1 billion were recorded in short-term government bonds. Domestic banks and non-bank financial institutions were the main net purchasers of long-term government bonds. General government also obtained loans of R33.8 billion in the second quarter of 2019, while deposit holdings increased by R64.6 billion compared with a decrease of R59.2 billion in the first quarter. The public and private non-financial corporate business enterprises’ net lending position of R26.1 billion in the first quarter of 2019 changed to a net borrowing position of R26.8 billion in the second quarter, as capital spending increased from R128 billion to R175 billion over the 72 Quarterly Bulletin December 2019
same period. The marked turnaround resulted from private non-financial corporate business enterprises increasing outlays on machinery and other equipment after lengthy delays in construction projects, which recently resumed under the fourth bid window of the Independent Power Producer (IPP) programme. The shortfall of non-financial public and private corporate business enterprises was financed through loans of R44.1 billion, the net issuance of fixed-interest securities of R33.7 billion, and shares of R31.1 billion. With regard to the net acquisition of financial assets, cash and deposit holdings increased by R22.3 billion and funds placed with other financial institutions (known as collective investment schemes) amounted to R18.4 billion during the period under review. Non-financial corporate business enterprises’ sources of funding R billions 300 200 100 0 -100 -200 2014 2015 2016 2017 2018 2019 Loans Shares Fixed-interest securities Net lending (+)/net borrowing (-) Source: SARB The increase in disposable income contributed to increased savings by the household sector in the second quarter of 2019, and a reversion from a deficit position of R46.2 billion in the first quarter to a net lending position of R31.4 billion in the second quarter. Some of these funds were channelled to deposits of R38.8 billion compared with R13.1 billion in the first quarter. Households’ interest in retirement and life funds was also higher at R36.7 billion. By contrast, households’ sourcing of credit through bank loans and advances was lower at R6.8 billion along with trade credit and short-term loans of R2.5 billion as well as mortgage loans of R10.6 billion in the second quarter of 2019. Prospects for consumer spending remain muted due to, among other factors, high unemployment and escalating administered prices, especially of electricity and water. 73 Quarterly Bulletin December 2019
Public finance20 Non-financial public sector borrowing requirement21 The preliminary non-financial public sector borrowing requirement of R144 billion in the first half of fiscal 2019/20 (April–September 2019) was R56.0 billion more than in the same period of the previous fiscal year. The cash deficits of both consolidated general government and the non-financial public enterprises and corporations, or state-owned companies (SOCs), increased over this period. The increase in the cash deficit of consolidated general government could be attributed to national government, while all the other sub-sectors of general government recorded cash surpluses. The non-financial public sector borrowing requirement as a percentage of GDP increased to 5.6% in the first six months of fiscal 2019/20 compared with 3.6% in the same period of the previous fiscal year. 20 Unless stated to the contrary, the year-on-year rates of increase in this section compare April–September 2019 to April–September 2018. Data for both periods are unaudited and preliminary. 21 The non-financial public sector borrowing requirement is calculated as the cash deficit/surplus of the consolidated general government as well as non-financial public enterprises and corporations. Non-financial public sector borrowing requirement R billions Level of government Apr–Sep 2018* Apr–Sep 2019* Consolidated general government ......................................................... National government.......................................................................... Extra-budgetary institutions ............................................................... Social security funds.......................................................................... Provincial governments...................................................................... Local governments ............................................................................ Non-financial public enterprises and corporations ................................. Total** ................................................................................................... As a percentage of gross domestic product ...................................... 78.5 116.5 -13.1 -8.4 -10.7 -5.7 9.7 88.2 3.6 133.5 188.4 -20.4 -15.0 -15.5 -4.0 10.6 144.1 5.6 * Deficit + surplus – ** Components may not add up to totals due to rounding off. Sources: National Treasury, Stats SA and SARB Non-financial public sector borrowing requirement R billions Per cent 10 100 80 8 60 6 40 4 20 2 0 0 -2 -20 -40 -4 2014/15 Fiscal years 2015/16 2016/17 2017/18 2018/19 2019/20* * April–September 2019 Sources: National Treasury, Stats SA and SARB 74 Quarterly Bulletin December 2019 Non-financial public enterprises and corporations Consolidated general government Deficit Percentage of GDP (right-hand scale) Surplus
The preliminary cash deficit of SOCs increased marginally by R0.9 billion year on year to R10.6 billion in the first half of fiscal 2019/20. The larger cash deficit could mainly be associated with slightly slower growth in cash receipts from operating activities. Total cash receipts from operating activities were R246 billion in April–September 2019, or 5.2% more than in the same period a year earlier. Financial activities of non-financial public enterprises and corporations R billions 160 140 120 100 eceipts 80 60 40 20 0 2014/15 Fiscal years 2015/16 2016/17 2017/18 2018/19 2019/20* * April–September 2019 ** Including both operating cash payments and net investment in non-financial assets Source: SARB 22 Total expenditure refers to the sum of operational expenses and net investment in non-financial assets. The total expenditure22 by non-financial SOCs increased by 5.4% year on year to R257 billion in the first half of fiscal 2019/20. The increase was driven by a 10.8% year-on-year increase in operating expenses to R224 billion, while net investment spending declined by R8.6 billion. The continued contraction in capital expenditure reflected the financial distress among the major SOCs which are funding-constrained and continue to rely on national government for financial assistance. 75 Quarterly Bulletin December 2019 Box 4 The 2019 Medium Term Budget Policy Statement1 The 2019 Medium Term Budget Policy Statement (2019 MTBPS), which was tabled in an environment of challenging global and domestic economic conditions, paves the way to stabilising South Africa’s fiscal position. Since the February 2019 Budget, world economic growth has moderated further and is expected to slow to its lowest level since the 2007/08 global financial crisis in 2019, while weak domestic economic activity has persisted alongside an increasingly constrained fiscal environment. This was reflected by a marked upward revision of the budget deficit and debt levels in the 2019 MTBPS. South Africa’s economic outlook has deteriorated since the 2019 Budget. Weaker-than-expected economic growth has led to lower-than-projected tax revenue collections. In addition, state-owned companies’ (SOCs) need for support from government have also increased. The 2019 MTBPS revised the annual growth in real gross domestic product (GDP) for the current year significantly lower from the 1.5% in the 2019 Budget to only 0.5% in an environment of lower expected global economic growth and weak domestic economic activity, together with rising unemployment and constrained growth in household and government consumption as well as investment expenditure. As far as price pressures in the economy are concerned, consumer price inflation is expected to remain within the 3–6% target range, with lower annual average estimates over the full medium-term horizon. 1 The 2019 Medium Term Budget Policy Statement (2019 MTBPS) was presented to Parliament by the Minister of Finance on 30 October 2019. Total expenditure** Total operating r Net investment in n on-financial assets
76 Quarterly Bulletin December 2019 Macroeconomic projections* Percentage * Calendar years ** 2018 Budget Review and 2018 MTBPS *** 2019 Budget Review and 2019 MTBPS Source: National Treasury The revised macroeconomic projections informed the review of the fiscal framework. The framework is at risk from further revenue shortfalls amid persistent slow domestic economic growth and higher expenditure due to demands for financial support from distressed SOCs, especially Eskom. To mitigate the major and immediate risk that Eskom poses to the economy and public finances, the utility received additional assistance from government to ensure its continued operation and to service its debt obligations. Under these circumstances, the budget deficit and debt levels are expected to increase. It is projected that national government’s stock of outstanding debt will increase by R1.3 trillion over the medium term. The original and revised fiscal projections are summarised in the accompanying table. Fiscal framework* R billions/percentage of GDP * Fiscal years ** 2018 Budget Review and 2018 MTBPS *** 2019 Budget Review and 2019 MTBPS Source: National Treasury Total consolidated revenue ......................... Total consolidated expenditure ................... Of which: debt service cost ................... Consolidated budget deficit (fiscal balance)..... Percentage of GDP ....... Gross loan debt (national government) .... Percentage of GDP ....... 2018/19** 2019/20 2020/21 2021/22 2022/23 Budget MTBPS Outcome Medium-term estimates*** Budget MTBPS Budget MTBPS Budget MTBPS MTBPS 1 455 1 4671 455 1 665 1 6691 653 180.1 181.1181.8 -181 -202 -208 -3.6 -4.0 -4.2 2 771 2 8182 788 55.155.856.7 1 584 1 538 1 827 1 844 202.2 203.7 -243 -306 -4.5 -5.9 3 043 3 168 56.260.8 1 696 1 619 1 949 1 979 224.1 232.8 -253 -360 -4.3 -6.5 3 358 3 591 57.764.9 1 837 1 730 2 089 2 098 247.4 246.6 -252 -368 -4.0 -6.2 3 683 4 036 58.968.5 1 841 2 215 299.1 -374 -5.9 4 478 71.3 Real GDP growth .......... CPI ................................ Current account balance (as a percentage of GDP) ......................... GDP at current prices (R billions) ...................... 2018** 2019202020212022 Budget MTBPS Outcome Medium-term estimates*** Budget MTBPS Budget MTBPS Budget MTBPS MTBPS 1.50.70.8 5.34.94.7 -2.3 -3.2 -3.5 4 941 4 9494 874 1.50.5 5.24.3 -3.4 -3.4 5 323 5 132 1.71.2 5.44.9 -3.8 -3.5 5 708 5 449 2.11.6 5.44.8 -4.0 -3.5 6 136 5 804 1.7 4.8 -3.5 6 187
77 Quarterly Bulletin December 2019 The deterioration in the revenue outlook is reflected by the 2019 MTBPS which revised consolidated government revenue lower by a cumulative R231 billion over the medium term (R46.0 billion for fiscal 2019/20) compared with the 2019 Budget. This reflects both the downward revision in GDP growth as well as inefficiencies and structural weaknesses in revenue collection. Revisions to consolidated government revenue and expenditure* R billions 60 40 20 0 -20 -40 -60 -80 -100 -120 2014/15 2015/16 2016/17 2017/18 2018/19 2019/20 2020/21 2021/22 Fiscal years * Budget Review to MTBPS Revenue Expenditure Source: National Treasury Despite the deterioration in revenue estimates, consolidated government expenditure is expected to grow at an average annual rate of 6.3% over the medium term. The upward adjustments in expenditure of R17.5 billion in fiscal 2019/20 mainly reflect additional support of R26 billion to Eskom and R11 billion to several other SOCs in financial distress, such as Denel, South African Airways, the South African Broadcasting Corporation and South African Express Airways. Eskom was allocated a total amount of R49 billion in the current fiscal year, R56 billion in fiscal 2020/21 and R33 billion in fiscal 2021/22. The higher expenditure is partly offset by using contingency reserves, provisional allocations, projected underspending and declared unspent funds, amounting to R21.4 billion in fiscal 2019/20. With the compensation of employees accounting for 34.2% of total government expenditure in fiscal 2019/20, growth in compensation should preferably not be above inflation as in the past, when the current three-year wage agreement, which is now in its second year, is renegotiated. With the much wider budget deficits, the cost of servicing government debt is expected to exceed the 2019 Budget estimates by R1.5 billion in fiscal 2019/20, R8.7 billion in fiscal 2020/21 and R17.2 billion in fiscal 2021/22. An estimated 18.4% of the main budget revenue will be allocated to service debt in fiscal 2022/23 compared with 15.0% in fiscal 2019/20. The 2019 MTBPS consolidated government budget deficit of 5.9% of GDP for fiscal 2019/20 represents a significant upward revision from the original 4.5% in the 2019 Budget. The consolidated government budget deficit as a ratio of GDP is expected to increase even further to 6.5% in fiscal 2020/21 before narrowing to 5.9% in fiscal 2022/23. Robust and consistently tight fiscal measures are required to stabilise the budget deficit at a more sustainable level. Revised upward (+)Medium-term estimates Revised downward (-)
500 7 6 50 5 000 80 60 78 Quarterly Bulletin December 2019 Consolidated government budget deficit Percentage of GDPR billions 450 400 5 350 4 300 250 3 200 2 150 100 1 0 0 2014/15 2016/17 2018/19 2020/21 2022/23 Fiscal years Actual: budget deficit ratio to GDP 2018 MTBPS 2018 Budget Review 2019 MTBPS 2019 Budget ReviewBudget deficit (right-hand scale) Source: National Treasury National government’s debt-to-GDP trajectory is not expected to stabilise over the medium term, with the 2019 MTBPS projecting gross loan debt (domestic and foreign currency-denominated) of R3.2 trillion (60.8% of GDP) for fiscal 2019/20. This was a significant upward revision from the R2.8 trillion (56.7% of GDP) estimated in the 2019 Budget. Gross loan debt is expected to increase further to 71.3% of GDP in fiscal 2022/23, and requires a meaningful containment of government expenditure and the implementation of structural reforms. National government gross loan debt R billionsPercentage of GDP 4 500 70 4 000 3 500 3 000 50 2 500 40 2 000 30 1 500 20 1 000 500 10 0 0 2014/15 2016/17 2018/19 2020/21 2022/23 As at 31 March of each fiscal year Total gross loan debt 2019 Budget Review Actual: ratio to GDP (right-hand scale) 2019 MTBPS Source: National Treasury ActualMedium-term estimates ActualMedium-term estimates
Budget comparable analysis of national government finance National government’s cash book deficit of R190 billion in the first half of fiscal 2019/20 (April– September 2019) was R62.1 billion more than in the same period of the previous fiscal year. The larger cash book deficit was brought about by a combination of significantly faster growth in expenditure and notably slower growth in revenue. Gross loan debt increased by R387 billion in the year to September 2019 as the cash book deficit was mostly financed through the issuance of Treasury bills (TBs) and government bonds in the domestic financial markets. National government finances Originally budgeted1 Fiscal 2019/20 Actual April–September 2018 Actual April–September 2019 Percentage change2 Percentage change2 Percentage change2 R billions R billions R billions Revenue ................................ Expenditure ........................... Cash book balance3 .............. Primary balance3 ................... Gross loan debt4................... 601 729 -128 -40.7 2 700 11.2 6.0 627 817 -190 -90.6 3 087 4.5 12.2 1 403 1 659 -255 -53.0 3 043 10.3 10.2 11.6 14.3 9.1 1 2 3 4 2019 Budget Review Year-on-year percentage change Cash book deficit (-)/surplus (+) excluding interest payments As at 30 September for rand values Sources: National Treasury and SARS National government revenue increased by only 4.5% year on year to R627 billion in the first half of fiscal 2019/20. The resultant revenue shortfall of R15.3 billion relative to the cumulative monthly budgeted estimates reflected, among other factors, a marked increase in value-added tax (VAT) refunds and generally weak domestic economic activity along with weaker provisional tax payments. Revenue as a ratio of GDP was 24.5% in the first half of fiscal 2019/20 compared with the 24.4% recorded in the same period a year earlier. The 2019 Budget projected an annual increase of 10.3% in revenue to R1 403 billion for fiscal 2019/20 as a whole, which was revised lower to R1 359 billion in the 2019 Medium Term Budget Policy Statement (2019 MTBPS). In the first seven months of the fiscal year, revenue collection increased by only 4.7% to R711 billion. Revenue from taxes on income, profits and capital gains of R366 billion (58.3% of total revenue) in April–September 2019 was only 5.5% more than in the same period of the previous year. This reflected a 7.4% year-on-year increase in personal income tax (PIT) collections, which was less than original expectations. Corporate income tax (CIT) collections increased by a mere 1.1% over the same period. Revenue from taxes on goods and services of R228 billion (36.4% of total revenue) in the first half of fiscal 2019/20 was only 1.0% more compared with the corresponding period of the previous fiscal year. This reflected an increase of only 5.6% in domestic VAT collections and a decrease of 0.9% in net VAT collections due to the marked increase of 19.9% in VAT refunds. Taxes on international trade and transactions increased by 5.8% year on year to R25.4 billion in the first half of fiscal 2019/20 due to the increased importation of vehicles, electrical machinery and footwear. 79 Quarterly Bulletin December 2019
National government revenue in fiscal 2019/201 Originally budgeted Fiscal 2019/20 Actual April–September 2019 Revenue source Percentage change2 Percentage change2 R billions R billions Taxes on income, profits and capital gains ......... Of which: Income tax on individuals.................. Income tax on companies................. Payroll taxes ....................................................... Taxes on property............................................... Taxes on goods and services ............................. Of which: Value-added tax (VAT) net ................ Domestic ................................... Import ........................................ Refunds ...................................... General fuel levy................................ Excise duties..................................... Taxes on international trade and transactions ..... Of which: Import duties .................................... Other revenue³ ................................................... Less: SACU4 payments ...................................... Total revenue 820.3 552.9 229.6 18.8 17.2 504.4 360.5 406.2 187.4 -233.2 83.0 48.8 61.3 60.0 31.8 50.3 1 403.5 11.0 12.0 7.1 7.6 12.5 9.6 11.0 7.2 7.0 1.7 10.1 -12.2 10.0 9.1 -3.8 4.1 10.3 365.5 249.1 102.3 8.8 7.4 228.5 160.4 195.2 83.2 -118.0 38.5 23.6 25.4 25.0 16.9 25.1 627.4 5.5 7.4 1.1 5.8 -2.1 1.0 -0.9 5.6 10.5 19.9 2.5 13.2 5.8 5.7 40.5 4.1 4.5 1 2 3 4 Components may not add up to totals due to rounding off and the exclusion of unclassified items. Year-on-year percentage change Including non-tax revenue and extraordinary receipts Southern African Customs Union Sources: National Treasury and SARS Composition of national government tax revenue Per cent 4.6 3.9 3.7 16.1 Other revenue (which includes non-tax revenue and extraordinary receipts) of R16.9 billion in the first six months of fiscal 2019/20 was R4.9 billion more compared with the same period a year earlier, mainly due to receipts by the National Revenue Fund of R8.0 billion and higher rent on 80 Quarterly Bulletin December 2019 April–September 2018April–September 2019 4.6 3.43.9 6.16.1 37.939.2 26.425.2 16.5 1.21.2 Personal income taxCorporate income taxTaxes on property Value-added tax (net)General fuel levyExcise duties Import dutiesOther tax revenue (including payroll taxes) Source: SARS
land of R5.4 billion. The February 2019 Budget earmarked R50.3 billion to the Southern African Customs Union (SACU) for fiscal 2019/20 as a whole, with R25.1 billion transferred in the first six months of the fiscal year. National government expenditure of R817 billion in the first half of fiscal 2019/20 increased notably by 12.2% year on year. Higher government spending was mainly due to increased transfers and subsidies, higher debt-service costs, as well as additional allocations to some state-owned companies (SOCs). As a ratio of GDP, expenditure was 32.0% in the first half of fiscal 2019/20, more than the 29.7% recorded in the same period of the previous fiscal year. The 2019 Budget Review estimated expenditure of R1 659 billion for fiscal 2019/20 as a whole. This was revised higher to R1 683 billion in the 2019 MTBPS, largely due to additional financial support for Eskom and higher debt-service costs. National government expenditure in fiscal 2019/20* Originally budgeted Fiscal 2019/20 Actual April–September 2019 Expenditure item Percentage change** Percentage change** R billions R billions Voted expenditure .............................................. Of which: Transfers and subsidies ................... Current payments ........................... Payments for capital assets ............ Payments for financial assets.......... Statutory amounts*** ......................................... Of which: Provincial equitable shares .............. Interest on debt .............................. General fuel levy ............................. Total expenditure ............................................... 882.6 615.7 246.8 15.4 4.7 776.1 505.6 202.1 13.2 1 658.7 7.7 8.8 9.4 13.1 … 13.2 7.5 11.2 5.6 10.2 449.7 310.7 113.8 3.9 21.2 367.8 252.8 99.5 4.4 817.4 14.8 11.0 6.8 -22.0 … … 9.2 7.5 14.0 12.2 * Components may not add up to totals due to rounding off and the exclusion of unclassified items. ** Year-on-year percentage change *** Including extraordinary payments Source: National Treasury Voted expenditure by national government departments (55.0% of total expenditure), which comprises of transfers and subsidies, current payments as well as payments for capital and financial assets, increased sharply by 14.8% year on year to R450 billion in the first six months of fiscal 2019/20. Transfers and subsidies of R311 billion and current payments of R114 billion together accounted for 94.4% of total voted expenditure, and increased by 11.0% and 6.8% respectively. The marked increase in transfers and subsidies reflected transfers to the Departments of Social Development, Education, Transport as well as Cooperative Governance and Traditional Affairs. The higher payments for financial assets of R21.2 billion included the R13.5 billion recapitalisation of Eskom in April 2019 and the R7.6 billion appropriated to South African Airways, Denel and SA Express Airways in August and September 2019 in terms of section 6(1)(b) of the Appropriation Act 24 of 2019. Interest on national government debt (debt-service costs) increased notably by 14.0% year on year to R99.5 billion in the first half of fiscal 2019/20. The February 2019 Budget projected debt-service costs of R202 billion for fiscal 2019/20 – an increase of 11.2% year on year, in line with the rising stock of national government debt. Equitable share transfers to provinces – the main source of provincial government revenue – increased by 7.5% year on year to R253 billion in the first half of fiscal 2019/20. The February 2019 Budget earmarked a total allocation of R506 billion as equitable share transfers to provinces and R13.2 billion as a share of the general fuel levy to metropolitan municipalities for fiscal 2019/20. In August 2019, metropolitan municipalities received a first tranche of R4.4 billion of the general fuel levy. 81 Quarterly Bulletin December 2019
The February 2019 Budget projected national government expenditure to increase by 10.2% to R1 659 billion in fiscal 2019/20. In the first seven months of this fiscal year, expenditure has already increased by 12.4% to R944 billion. Cumulative deficit of national government R billions 350 325 300 275 250 225 200 175 150 125 100 75 50 25 0 Actual 2018/19 Actual 2019/20 A M J J A S O N D J FM Fiscal years Originally budgeted deficit of R255 billion for fiscal 2019/20, in the 2019 Budget Review Revised budget deficit of R324 billion for fiscal 2019/20, in the 2019 MTBPS Sources: National Treasury, SARS and SARB Fiscal developments resulted in an increase in the cash book deficit of R62.1 billion to R190 billion in the first half of fiscal 2019/20. This cash book deficit was R16.2 billion more than the original cumulative monthly budgeted estimates up to September 2019, and resulted from the notable increase in expenditure which far exceeded the subdued increase in revenue. The projected cash book deficit of R255 billion for fiscal 2019/20 in the February 2019 Budget was revised higher to R324 billion in the 2019 MTBPS, in line with higher expected expenditure and the continued revenue shortfall. 23The primary deficit is the cash book deficit excluding interest payments. National government’s primary deficit23 of R90.6 billion in April–September 2019, at 3.5% of GDP, was more than double the R40.7 billion (1.7% of GDP) recorded in the corresponding period of the preceding fiscal year, and also much higher than the R53.0 billion projected for the full fiscal year in the February 2019 Budget. This projection was revised significantly higher to R121 billion in the 2019 MTBPS. National government’s cash flow deficit of R207 billion in the first half of fiscal 2019/20 was R45.1 billion more than in the same period a year earlier. Over this period, total net financing, or the net borrowing requirement,24 almost doubled from R100 billion to R192 billion. 24 The net borrowing requirement is calculated as the cash flow deficit after accounting for the revaluation of foreign debt at redemption and accrual adjustments. The higher net borrowing requirement in the first half of fiscal 2019/20 was financed mostly in the domestic financial and capital markets through the net issuance of bonds as well as TBs and short-term loans. Government also financed its borrowing requirement in the foreign capital markets through the net issuance of marketable bonds, albeit to a much lesser extent. The net issuance of domestic bonds of R123 billion in April–September 2019 was up sharply from the R69.3 billion a year earlier. Financing through TBs and short-term loans from the Corporation for Public Deposits (CPD) increased to R63.8 billion from R32.3 billion in April–September 2018. Over the same period, the net issuance of foreign bonds and loans of R61.5 billion was R36.9 billion more than in the same period of the previous year. National government’s funding activities increased its overall available cash balances by R57.0 billion in the period under review. 82 Quarterly Bulletin December 2019
National government financing R billions Originally budgeted1 Fiscal 2019/20 Item or instrument Actual Apr–Sep 2018 Actual Apr–Sep 2019 Cash book deficit .................................................................. 128.0 190.1 255.2 Cash flow deficit2 .................................................................. Plus: Cost/profit on revaluation of foreign debt at redemption3 ....................................................... 162.0 207.1 ... 0.3 11.4 22.5 Accrual adjustments ...................................................... Net borrowing requirement ................................................... Treasury bills and short-term loans4 ........................................ Domestic bonds4 .................................................................... Foreign bonds and loans4 ....................................................... Change in available cash balances5 ........................................ Total net financing6 ................................................................ 62.0 100.3 32.3 69.3 24.6 -26.0 100.3 26.7 191.8 63.8 123.5 61.5 -57.0 191.8 … 277.8 25.0 185.4 1.6 65.8 277.8 1 2 3 4 5 6 2019 Budget Review The cash flow deficit includes extraordinary receipts and payments, and differs from the cash book deficit. Cost + profit – Net issuance + net redemption – Increase – decrease + Components may not add up to totals due to rounding off. ... Not available Sources: National Treasury and SARB National government’s gross loan debt increased by R387 billion to R3 087 billion in the year to 30 September 2019, with domestic and foreign currency-denominated debt accounting for 88.5% and 11.5% respectively. Foreign currency-denominated debt increased with the bond issuance of US$5 billion in September 2019. As a ratio of GDP, gross loan debt increased from 56.0% as at 30 September 2018 to 61.5% as at 30 September 2019. The debt-to-GDP ratio of 56.2% as at the end of fiscal 2019/20 originally projected in the February 2019 Budget was revised higher to 60.8% in the 2019 MTBPS. National government’s gross domestic debt, both marketable and non-marketable, increased by R319 billion in the first half of fiscal 2019/20 to R2 732 billion as at 30 September 2019. Notwithstanding this increase, government redeemed the last of its series of zero-coupon bonds (Z083) to the value of R150 million in September 2019. Total non-marketable debt, which comprises bonds, short-term loans from the CPD and other debt, decreased from R58.2 billion as at 30 September 2018 to R41.6 billion as at 30 September 2019. The decrease resulted largely from a decline in short-term loans from the CPD to R46.5 billion as at 30 September 2019. National government’s foreign currency-denominated debt (marketable and non-marketable) increased significantly by R68.1 billion in the year to 30 September 2019. This increase reflected both exchange rate revaluation effects and the issuance, in September 2019, of a 10-year US$2 billion bond maturing in 2029 and a 30-year US$3 billion bond maturing in 2049. Relative to the original projection in the 2019 Budget Review, foreign currency-denominated debt was revised higher by R23.0 billion to R318 billion as at the end of March 2020 in the 2019 MTBPS. 83 Quarterly Bulletin December 2019
Domestic debt of national government R billions 3 000 2 500 2 000 1 500 1 000 500 0 2014/15 2015/16 2016/17 2017/18 2018/19 2019/20 As at 31 March of each fiscal year Originally budgeted Actual * As at 30 September 2019 Source: National Treasury National government’s foreign currency-denominated debt before accounting for revaluation effects was R281 billion as at 30 September 2019 and R354 billion after adjusting for exchange rate revaluation (a revaluation of about R73.6 billion). The bulk of the foreign currency-denominated debt was denominated in US dollars (95.0%), with the balance shared between the euro, the Japanese yen, the British pound and the Swedish krona. The average outstanding maturity of foreign marketable bonds increased from 134 months as at 30 September 2018 to 163 months a year later. Foreign currency-denominated debt of national government R billions 420 360 300 240 180 120 60 0 420 360 300 240 180 120 60 0 Japanese yen 2014/15 2015/16 2016/17 2017/18 2018/19 2019/20* As at 31 March of each fiscal year * As at 30 September 2019 Sources: National Treasury and SARB 84 Quarterly Bulletin December 2019 US dollar Euro Other Adjusted for revaluation Before revaluation *
Note on the development of South Africa’s integrated economic accounts1 By W Boonzaaier, E Botes, B de Beer, J Mokoena, C Monyela, B Stemmet and R Willemse2 1This note is the fourth in a series highlighting the development of South Africa’s integrated economic accounts (IEA). The statistics published and discussed in this note should be treated as experimental and subject to further adjustment. 2The views expressed are those of the authors and do not necessarily reflect those of the SARB. Introduction The development of an integrated economic accounts (IEA) framework for the South African economy, which started in 2015, has progressed further. When completed, the IEA framework will extend the range of macroeconomic statistics available for policy formulation and contribute to the fulfilment of the Group of Twenty (G20)3 Data Gaps Initiatives (DGI) commitments, although some data gaps will remain. 3The Group of Twenty (G20) is an international forum for ministers of finance and central bank governors of the 19 largest advanced and emerging economies as well as the European Union. Methodology The methodology underlying the compilation of the IEA is guided by the System of National Accounts 2008 (SNA 2008)4 and the statistical framework is illustrated in Figure 1. In the IEA, the current and capital (non-financial assets) accounts reflect real economic activity, the financial accounts show financial intermediation, and transactions, revaluations and other volume changes are reflected in the accumulation accounts for the five main institutional sectors.5 4The compilation methodology is based on the guidelines of the System of National Accounts 2008 (SNA 2008), available at https://unstats.un.org/ unsd/nationalaccount/ docs/SNA2008.pdf Figure 1 Integrated economic accounts* 5The main institutional sectors are non-financial corporations, financial corporations, general government, households (including non-profit institutions serving households), and the rest of the world. 85 Quarterly Bulletin December 2019 sheet liabilities * The green block represents the components of the current account. The blue dotted area includes the transactional accounts, from the production account through to the financial account. The yellow block represents the non-financial balance sheet and accumulation accounts, while the red block represents the financial balance sheet and accumulation accounts. Source: SNA 2008 Current account Opening balance sheet Closing balance Non-financial assets Capital account Net lending(+)/ borrowing(-) Other volume changes for non-financial assets Revaluation of non-financial assets Non-financial assets changes account Net financial worth Financial account Net lending(+)/ borrowing(-) Other volume changes for financial assets and Revaluation of financial assets and liabilities Net financial worth Net worth Accumulation accounts Net worth Other volume Revaluation account The use of disposable income account Saving The use of adjusted disposable income account Saving Redistribution of income in kind account Adjusted disposable income Secondary distribution of income accounts Disposable income Allocation of primary income account Balance of primary incomes Generation of income account Operating surplus/ mixed income Production account Value added
Current and capital accounts The current and capital accounts record transactions related to real economic activity in the process of production, the generation and distribution of income, consumption and saving as well as capital formation that renders an institutional sector’s net lending/borrowing position. The sub-accounts of the current and capital accounts, their purpose and the balancing items among the accounts which articulate the type of economic activities recorded, are shown in Table 1. Table 1 Sub-accounts of the current and capital account Main accounts Sub-accounts Purpose Balancing items income as income from property received 6The market value of fixed assets is calculated as the sum of gross fixed capital formation (i.e. expenditure on fixed assets) less the consumption of fixed capital (i.e. depreciation) revalued to market prices. The market value of total inventory holdings in the domestic economy is derived from inventory holdings at constant prices adjusted for end-of-period prices. 7Fixed assets consist of dwellings, buildings other than dwellings, other structures, machinery and equipment, cultivated biological resources and intellectual property. Intellectual property includes, among other things, research and development as well as computer software. Source: SNA 2008 Annual current and capital accounts for the five main institutional sectors are currently published in the South African Reserve Bank’s (SARB) Quarterly Bulletin on pages S–131 to S–136. On completion of the IEA, these accounts will be available in more detail at a quarterly frequency. Non-financial assets Transactions in non-financial assets are recorded in the capital account and related accumulation accounts. Non-financial assets consist of produced and non-produced assets, and are valued at end-of-period market prices6 which, in some instances, are calculated as the replacement value minus the consumption of fixed capital. The produced assets consist of fixed assets7 used in production and inventories as well as valuables, with the latter not currently measured due to data constraints. The non-produced assets consist of natural resources8 and those created through legal agreement9 from which the owners can extract economic benefits. Currently, only the annual abridged household sector balance sheet, with residential buildings and other non-financial assets, is published in the Quarterly Bulletin on page S–136. On completion of the IEA, these accounts will produce detailed non-financial statistics for the five main institutional sectors which will be available on a quarterly basis, with the lack of source data impeding the comprehensive compilation of non-produced assets. 8Natural resources include land, minerals and energy, non-cultivated biological and other natural resources as well as radio spectra. 9 Leases, licences and permits are created through legal agreements. 86 Quarterly Bulletin December 2019 Current ProductionTransactions related to economicGross value added for institutional production activitiessectors GDP for the total economy after adjusting for taxes and subsidies on products GenerationDistribution of value added/GDPGross operating surplus for of incomebetween labour and capital asinstitutional sectors factors of productionMixed income for households AllocationPrimary income derived fromGross balance of primary income of primarythe production process as well for the use of land, financial resources or other assets SecondaryRedistribution of the primaryGross disposable income distributionincome through current taxes, of incomesocial contributions and benefits, and other current transfers Use ofSpending of gross disposableNet saving disposableincome on final consumption incomeexpenditure Capital Spending on non-financial assetsNet lending(+)/borrowing(-)
Financial account and related accumulation accounts Transactions in financial assets and liabilities are recorded in the financial and related accumulation accounts. Currently, balance sheets are published for selected financial intermediaries on a quarterly basis from page S–2 to S–27 in the Quarterly Bulletin for the monetary sector, from page S–36 to S–47 for non-bank financial intermediaries, as well as for components of the general government and public sector from page S–78 to S–81, and also the annual abridged household sector balance sheet on page S–136. A quarterly national financial account, or flow of funds, is also published on pages S–48 to S–49. The IEA will integrate all the data sets into a consistent, coherent and balanced framework. On completion, the financial balance sheets, with inter-institutional sector balanced financial asset and liability stock positions as well as transactions, revaluations and other volume changes, will be available on a quarterly basis for the five main institutional sectors. In the IEA, the quarterly stock positions are balanced based on a hierarchy-of-sources matrix according to the quality of input data. The matrix includes financial assets and liabilities by type of instrument for each institutional sector vis-à-vis each counterparty sector. Each sector-by-sector financial asset and liability position is evaluated at an instrument level before the balanced outcome is generated. The financial asset and liability source data for the accumulation account (transactions, revaluations and other volume changes) are not obtained directly, but estimated indirectly by applying a revaluation model which was developed internally according to best international statistical practice. Analysis of preliminary sectoral balance sheet results10 An overview of South Africa’s macroeconomic balance sheet by main domestic institutional sector as well as the rest of the world (ROW), broken down into non-financial assets as well as financial assets and liabilities as at 31 December 2018, is provided in Table 2. 10These are experimental results and are subject to future revisions. Table 2 Summary balance sheet at market value, as at 31 December 2018* R trillions Total domestic economy Non-financial Financial General Rest of the world3 corporations1 corporations government Households2 A L A L A L A L A L A L Non-financial assets4........... Financial assets and liabilities ......................... Net worth5 ............................ Total assets and liabilities ... 7.9 0.2 3.7 4.8 16.6 5.1 10.4 2.6 13.0 18.1 19.0 -0.7 18.3 2.7 3.1 3.3 6.4 9.4 2.3 11.9 14.2 35.3 34.8 17.1 51.9 6.4 6.9 -0.5 6.4 13.0 18.3 6.4 14.2 51.9 6.4 Memo item: Net financial worth6 ............. -5.3 -0.9 -0.4 7.2 0.5 A = assets L = liabilities The balance sheet shows the market value of non-financial assets as well as financial assets and liabilities as at a specific * point in time. 1 Private non-financial corporations’ data are not directly sourced, but derived from counterparty positions. It should therefore be treated as preliminary and will be revised when administrative data sources are incorporated. 2 Including non-profit institutions serving households 3 In the IEA, the rest of the world is shown as a separate sector. 4 Total produced assets, including underlying land 5 Total assets minus total liabilities 6 Financial assets minus liabilities Components may not add up due to rounding off. Source: SARB 87 Quarterly Bulletin December 2019
At the end of 2018, the total assets of the domestic economy amounted to R51.9 trillion and comprised financial assets of R35.3 trillion and non-financial assets of R16.6 trillion, resulting in a total net worth of R17.1 trillion and a net financial worth of R0.5 trillion. Non-financial corporations held just less than half of all non-financial assets at 48% and financial corporations held just more than half of all financial assets at 51%. The household sector was the only sector with a positive net financial worth position while the non-financial corporations had the largest negative net financial worth position. Current and capital accounts The balancing items of the sub-accounts render analytically useful indicators of net flows and culminate in institutional sector net lending and borrowing positions. An analysis of the quarterly net lending and borrowing positions of the main institutional sectors shows that the financial corporations sector was a persistent net lender from 2010 to 2015. In contrast, general government and the non-financial corporations were mostly net borrowers over the period reviewed, except on occasion in 2010 and 2011. The size of general government’s borrowing requirement indicates the revenue-versus-expenditure shortfall experienced. The aggregate of the domestic institutional sectors’ net lending and borrowing positions reflects South Africa’s funding gap and dependency on the ROW to fund the balance on the current account of the balance of payments. Figure 2 Sectoral net lending and borrowing positions R billions 60 30 0 -30 -60 -90 -120 2010 2011 2012 2013 2014 2015 Non-financial corporations General government Total domestic economy Financial corporations Households* * Including non-profit institutions serving households Source: SARB Non-financial assets South Africa’s balance sheet of non-financial assets shows institutional sector holdings by type of asset. The market value of capital stock almost doubled to R16.6 trillion from 2010 to 2018. In the fourth quarter of 2018, non-financial corporations (both private and public) accounted for almost half of total non-financial assets and households for almost a third, mainly in the form of dwellings. 88 Quarterly Bulletin December 2019 Net lending Net borrowing
Table 3 Stock of non-financial assets at market value R trillions Non-financial Total domestic economy Financial General House-holds* corporations corporations government Opening stock: first quarter 2010 ....... Closing stock: fourth quarter 2018 ..... Change in stock over period .............. Contribution in per cent to change in holdings over period ....................... Institutional sector's holdings as a per cent of total non-financial assets in 2018 ............................................... 3.6 7.9 4.3 0.1 0.2 0.1 2.0 3.7 1.7 2.8 4.8 2.0 8.5 16.6 8.1 52.5 1.8 21.3 24.4 47.7 1.5 22.2 28.7 * Including non-profit institutions serving households Source: SARB The market value of non-financial corporations’ stock of non-financial assets increased by R4.3 trillion from 2010 to 2018, and contributed more than half of the total increase. This reflects the net outcome of gross fixed capital formation, the consumption of fixed capital as well as revaluations. The increase in financial corporations’ stock of non-financial assets accounted for only 1.8% of the total increase. Institutional sector ownership changed somewhat over the period, with the contribution of households decreasing from 32.7% to 28.7% and that of non-financial corporations increasing from 43.0% to 47.7%. Institutional sector non-financial asset holdings by type of asset differ significantly, as shown in Figure 3. As at the end of 2018, households held 83% of dwellings and the non-financial corporations held 63% of buildings other than dwellings. The non-financial corporations and general government had the largest share of other structures such as roads, bridges and harbours. Machinery and equipment as well as other produced assets were largely held by the non-financial corporations. Non-produced assets, currently only the value of land, were fairly evenly distributed among households, non-financial corporations and general government. The non-financial balance sheet statistics presented are subject to revisions.11, 12 11 Statistics South Africa (Stats SA) will publish benchmarked and rebased national accounts statistics in September 2020. 12 The SARB will introduce a new method for calculating the consumption of fixed capital, moving from straight line to geometric, where assets are assumed to lose value at a constant rate over their service life. The geometric method for calculating the consumption of fixed capital is empirically supported and will open up a larger suite of analytical possibilities. Figure 3 Institutional sector of non-financial asset holdings by type, as at December 2018 Per cent 100 90 80 70 60 50 40 30 20 10 0 assets Households* Financial corporations Non-financial corporations General government * Including non-profit institutions serving households Source: SARB 89 Quarterly Bulletin December 2019 Other structures Machinery and equipment Total produced Dwellings Buildings other than dwellings Other produced assets Non-produced assets
Financial assets and liabilities The distributional characteristics of unbalanced and balanced financial assets and liabilities are shown in Figure 4. The logarithmically transformed data cover the period from the first quarter of 2010 to the fourth quarter of 2018. Despite minor discrepancies, the respective distributional outcomes of financial assets and liabilities prior to being balanced are fairly similar. The distribution obtained after applying a balancing exercise is skewed to the left. A basic implication of this outcome is that more observations are concentrated on the right-hand side of the distribution, meaning that relatively large values are observed more frequently compared to smaller values. It is also generally the case that the mean of the distribution will then be less than the median. Figure 4 Distribution of balanced and unbalanced financial assets and liabilities Density Density 0.15 0.15 0.12 0.12 0.09 0.09 0.06 0.06 0.03 0.03 0.00 0.00 -20 -15 -10 -5 0 Log 5 10 15 20 -20 -15 -10 -5 0510 15 20 Log Financial assets Liabilities Source: SARB The market value of financial assets held by all the domestic institutional sectors increased from R16.8 trillion in the first quarter of 2010 to R35.3 trillion in the fourth quarter of 2018, as shown in Figure 5. The financial corporations contributed the most to this R18.5 trillion increase at 48%, followed by households at 24% and the non-financial corporations and general government at 20% and 8% respectively. The financial assets of the ROW vis-à-vis the domestic institutional sectors increased from R2.4 trillion in the first quarter of 2010 to R6.4 trillion in the fourth quarter of 2018. 90 Quarterly Bulletin December 2019 Unbalanced Balanced
Figure 5 Market value of total financial assets by institutional sector R trillions 45 40 35 30 25 20 15 10 5 0 2010 2011 2012 2013 2014 2015 2016 2017 2018 Non-financial corporations General government Rest of the world Financial corporations Households* Total domestic economy * Including non-profit institutions serving households Source: SARB In the harmonised IEA, financial assets equal liabilities in aggregate, but the institutional sector counterpart holdings differ significantly, as shown in Figure 6. The financial corporations’ large contribution to the increase in financial assets from the first quarter of 2010 to the fourth quarter of 2018 was also mirrored in their share in the increase in liabilities of 55% over the period. The liabilities of the ROW vis-à-vis the domestic institutional sectors increased from R2.0 trillion in the first quarter of 2010 to R6.9 trillion in the fourth quarter of 2018. Figure 6 Market value of total liabilities by institutional sector R trillions 45 40 35 30 25 20 15 10 5 0 2010 2011 2012 2013 2014 2015 2016 2017 2018 Non-financial corporations General government Rest of the world Financial corporations Households* Total domestic economy * Including non-profit institutions serving households Source: SARB 91 Quarterly Bulletin December 2019
The breakdown of total financial assets and liabilities by institutional sector and by type of financial instrument as at 31 December 2018 is shown in Figure 7. Equity and investment fund shares, or units, as well as insurance, pension and standardised guarantee schemes had a combined share of 55% in the domestic economy’s financial assets and liabilities. Asset holdings of equity and investment fund shares, or units, were concentrated in the financial and non-financial corporations sectors followed by households, with the non-financial corporations having the largest liability exposure. The ROW showed strong preference for equity and investment fund shares, or units, as these comprised 57% and 76% of their financial assets and liabilities respectively. Insurance, pension and standardised guarantee schemes account for most of households’ financial assets, with the liability against financial corporations. General government mostly funds through the issuance of debt securities and households through loans. Figure 7 Market value of total financial assets and liabilities by institutional sector and financial instrument, as at 31 December 2018 R trillions 20 15 10 5 0 Monetary gold and special drawing rights Debt securities Equity and investment fund shares or units Financial derivatives and employee stock options Currency and deposits Loans Insurance, pension and standardised guarantee schemes Other accounts receivable and/or payable * Including non-profit institutions serving households Source: SARB The evolution of financial corporations’ financial assets and liabilities by financial instrument, as shown in Figures 8 and 9, reveals that equity and investment fund shares, or units, recorded the highest average annual growth rate of about 10% from the first quarter of 2010 to the fourth quarter of 2018. Equity and investment fund shares, or units, as a share of total financial assets increased from 29% in 2010 to 33% in 2018, while that of currency and deposits, loans as well as financial derivatives and employee stock options decreased. Similarly, the share of equity and investment fund shares, or units, to total liabilities also increased from 22% to 25% over the same period, as shown in Figure 9, while that of currency and deposits, debt securities as well as financial derivatives and employee stock options decreased marginally. 92 Quarterly Bulletin December 2019 Assets Liabilities Non-financial corporations Assets Liabilities Financial corporations Assets Liabilities General government Assets Liabilities Households* Assets Liabilities Rest of the world
Figure 8 Market value of total financial assets of financial corporations by financial instrument R trillions 20 18 16 14 12 10 8 6 4 2 0 2010 2011 2012 2013 2014 2015 2016 2017 2018 Monetary gold and special drawing rights Debt securities Equity and investment fund shares or units Financial derivatives and employee stock options Currency and deposits Loans Insurance, pension and standardised guarantee schemes Other accounts receivable Source: SARB Figure 9 Market value of total liabilities of financial corporations by financial instrument R trillions 20 18 16 14 12 10 8 6 4 2 0 2010 2011 2012 2013 2014 2015 2016 2017 2018 Monetary gold and special drawing rights Debt securities Equity and investment fund shares or units Financial derivatives and employee stock options Currency and deposits Loans Insurance, pension and standardised guarantee schemes Other accounts payable Source: SARB 93 Quarterly Bulletin December 2019
The composition of households’ financial assets and liabilities remained broadly unchanged from the first quarter of 2010 to the fourth quarter of 2018, as shown in Figures 10 and 11. The average annual growth rate in households’ equity and investment fund shares, or units, currency and deposits as well as insurance, pension and standardised guarantee schemes instrument assets was between 8% and 10% over this period. Households’ loan liabilities and other accounts payable increased by, on average, 6% and 7% respectively over the same period. Figure 10 Market value of total financial assets of households* by financial instrument R trillions 10 8 6 4 2 0 2010 2011 2012 2013 2014 2015 2016 2017 2018 Equity and investment fund shares or units Financial derivatives and employee stock options Currency and deposits Insurance, pension and standardised guarantee schemes Other accounts receivable * Including non-profit institutions serving households Source: SARB Figure 11 Market value of total liabilities of households* by financial instrument R trillions 3 2 1 0 20102011 2012 2013 20142015 2016 2017 2018 Loans Other accounts payable * Including non-profit institutions serving households Source: SARB 94 Quarterly Bulletin December 2019
Transactions and revaluations in the accumulation account The change in the market value of financial assets and liabilities between opening and closing balances is explained by transactions, revaluations and other volume changes. Figure 12 Attribution of change in currency and deposit balances R billions 200 150 100 50 0 -50 -100 2010 2011 2012 2013 20142015 Revaluations 2016 2017 2018 Transactions Source: SARB The attribution of the change between the stock positions for currency and deposits13 as well as loans14 is shown in Figures 12 and 13. For both of these financial instruments, the changes from the first quarter of 2010 to the fourth quarter of 2015 mainly originated from transactions. From the first quarter of 2016 to the fourth quarter of 2018, revaluations had a larger effect due to the appreciation in the exchange value of the rand between the first quarter of 2016 and the first quarter of 2018, and its depreciation between the second and fourth quarter of 2018. 13 Currency and deposits consist of currency, transferable deposits and other deposits. 14 Loans include both short-and long-term loans. Figure 13 Attribution of change in loan balances R billions 200 150 100 50 0 -50 -100 2010 2011 2012 2013 20142015 Revaluations 2016 2017 2018 Transactions Source: SARB 95 Quarterly Bulletin December 2019
From-whom-to-whom positions An institutional sector’s financial assets and liabilities vis-à-vis a counterparty institutional sector reveal financial linkages within the economy as well as vis-à-vis the ROW. The from-whom-to-whom balanced financial asset and liability stock positions of the four domestic institutional sectors and the ROW, as at 31 December 2018, are shown in Table 4. The horizontal view (rows) shows the total financial assets of each institutional sector vis-à-vis the institutional sector against which claims are held. Similarly, the vertical view (columns) shows the counterparty breakdown of an institutional sector’s total liabilities. For example, households’ financial assets of R7.3 trillion represent a claim against financial corporations. Table 4 From-whom-to-whom market value positions of financial assets and liabilities between resident institutional sectors and the rest of the world, as at 31 December 2018 R billions Liabilities by institutional sector (vertical) 41 589 74*** * Including non-profit institutions serving households ** This value is equal to the net international investment position, excluding monetary gold, which has no counterparty classification in the financial balance sheets. *** This is the value of the monetary gold held by the SARB as at 31 December 2018; it equates to the difference between the balanced assets and liabilities, because monetary gold has no counterparty classification in the financial balance sheets. Source: SARB The net stock positions between domestic institutional sectors and the ROW derived from an analysis of the from-whom-to-whom market value positions of financial assets and liabilities depicted in Table 4, are shown in Table 5 and Figure 14. The areas of the circles in Figure 14 are proportional to the net asset and liability positions of each institutional sector, with green indicating a positive position and red a negative position. The arrows show inter-sectoral flows, with the width of the arrow proportional to the magnitude of the flow. Households were the only sector with a net asset position in the fourth quarter of 2018, while the non-financial corporations had the largest net liability position. 96 Quarterly Bulletin December 2019 Institutional sectors Non-financial corporations FinancialGeneralHouse-Rest of Total corporations government holds* the world assets Financial assets by institutional sector (horizontal) Non-financial corporations Financial corporations General government Households* Rest of the world 1371 35187743 467 4 0087 0491 7491 9893 276 9781 421801860 1 9197 2641042145 3 4041 8961 07800 5 115 18 070 2 665 9 434 6 378 41 663 Total liabilities10 44518 9823 0982 2506 888 552**
Table 5 From-whom-to-whom net stock positions between resident institutional sectors and the rest of the world, as at 31 December 2018 R billions Debtor sectors * Including non-profit institutions serving households Source: SARB Figure 14 Network analysis of net stock positions between resident institutional sectors and the rest of the world, as at 31 December 2018 FC NFC HH ROW GG NFC FC GG HH ROW = = = = = non-financial corporations financial corporations general government households* rest of the world * Including non-profit institutions serving households Source: SARB Conclusion The preliminary and experimental statistics analysed in this note reflect progress made with the further development of the current and capital account, the non-financial assets, and the financial account of South Africa’s IEA. Future work on the establishment of the IEA will focus on closing the remaining data gaps and on the refinement of financial instrument and institutional sector measurement as well as the vertical balancing of these accounts. 97 Quarterly Bulletin December 2019 Institutional sectors Non-financial corporations FinancialGeneralHouse-Rest of corporations government holds* the world Total Credit sectors Non-financial corporations Financial corporations General government Households* Rest of the world 0-2 656-892 -1 84563 2 6560328-5 2751 380 892-328 082-1 078 1 8455 275-82 0145 -63 -1 3801 078-145 0 -5 330 -911 -432 7 184 -510
Note on the recent sharp increase in the unemployment rate1 By A Bosch and J C Venter2 1Unless stated to the contrary, all the statistics analysed in this note have been sourced from Statistics South Africa’s Quarterly Labour Force Survey, available at http:// www.statssa.gov.za/ publications/P0211/ P02113rdQuarter2019.pdf Introduction South Africa’s official unemployment rate increased notably to 29.0% in the second quarter of 2019 and further to 29.1% in the third quarter. These all-time highs since the inception of the Quarterly Labour Force Survey (QLFS) by Statistics South Africa (Stats SA) in 2008 attracted attention due to their magnitude and also because significant increases historically have tended to be a first-quarter phenomenon, such as in 2009, 2015 and 2016. First-quarter increases in the unemployment rate are not unusual, as many school leavers enter the labour market (i.e. start looking for employment for the first time) at the beginning of the year, unlike in the second quarter when less seasonality is present. 2The views expressed in this note are those of the authors and do not necessarily reflect those of the SARB. In the case of the three previous first-quarter examples and in the second quarter of 2019, the notable increase in the number of unemployed people was accompanied by a decrease in the not economically active population. However, the composition of the recent second-quarter decrease in the not economically active population differs as the decreases in the previous periods resulted mostly from a decline in the student category while the decrease in the second quarter of 2019 was mostly due to a decline in the number of discouraged work seekers. In the third quarter of 2019, the number of unemployed persons increased further while the number of discouraged work seekers increased only slightly, leading to a further marginal increase in the unemployment rate. This analysis will show that this anomaly could be ascribed to various developments. In the case of possible data and sampling methodology issues, an analysis of the QLFS micro-data shows that the characteristics of the sampled survey participants remained stable and, together with Stats SA’s rotating panel methodology, ruled out obvious sampling or methodological changes. A plausible explanation for the sudden and sharp increase in the unemployment rate could also be the national elections that took place in the second quarter of 2019 (8 May). Temporary jobs at the Electoral Commission of South Africa (IEC), together with election campaign-related promises of job creation, could have created optimism which enticed discouraged work seekers to actively search for work. Should this have been the case, the unemployment rate might recede somewhat during the remainder of 2019 when the unemployed again become discouraged work seekers. However, it could also be that the substantial increase in the unemployment rate, as surveyed in the second quarter of 2019, reflects the continuation of an upward trajectory over the past few years consistent with weak economic growth, subdued fixed investment and employment creation, as well as the prolonged downward phase of the business cycle. The accuracy of the official unemployment rate is corroborated by the absence of material differences when it is compared with a counterfactual unemployment rate that hypothetically assumed no increases in the new entrants, re-entrants or ‘other’ unemployed categories while retaining the observed increases in the job losers and job leavers categories in the second and third quarters of 2019. Labour market movements Labour market movements between the economically active and the not economically active populations are illustrated in the accompanying diagram. The economically active population consists of the employed and unemployed, while the not economically active population consists of those who were neither employed nor unemployed in the reference week (Stats SA, 2019). The not economically active population includes students, homemakers, those with an 98 Quarterly Bulletin December 2019
illness or disability, those too old or too young to work, discouraged work seekers and ‘other’. The unemployed category consists of those who have lost their job (job losers), job leavers, new entrants, re-entrants and ‘other’ (Stats SA, 2019). The official definition of ‘unemployed persons’ is: … those (aged 15–64 years) who: a) Were not employed in the reference week; and b) Actively looked for work or tried to start a business in the four weeks preceding the survey interview; and c) Were available for work, i.e. would have been able to start work or a business in the reference week; or d) Had not actively looked for work in the past four weeks, but had a job or business to start at a definite date in the future and were available. (Stats SA, 2019) The unemployment rate increases when people either lose or leave their jobs, or when people move from being discouraged or not economically active to being unemployed when starting to actively search for work. This note attempts to explain the loss of jobs and the sudden increase in discouraged people searching for work in the second quarter of 2019, with the situation only partially reversing in the third quarter. Discouraged work seekers, or other not economically active persons, become employed when they find a job or unemployed (according to the official definition) if they actively start searching for work in the four weeks preceding the survey interview, and are categorised as new entrants, re-entrants or ‘other’. Figure 1 Economically active versus not economically active population* + Job loser Other Re-entrant Job leaver New entrant * The arrows illustrate the directional change in the second quarter of 2019, but the flows can also occur in the opposite direction. ** These are persons aged 15–64 years who are neither employed nor unemployed in the reference week. *** A discouraged work seeker is a person who was not employed during the reference period, wanted to work, was available to work/start a business but did not take active steps to find work during the last four weeks, provided that the main reason given for not seeking work was any of the following: no jobs available in the area; unable to find work requiring his/her skills; lost hope of finding any kind of work. Source: Stats SA 99 Quarterly Bulletin December 2019 Discouraged work-seekers*** Other not economically active Employed + Unemployed Not economically active** Economically active
Data and sampling methodology issues The QLFS micro-data analysis showed that the characteristics of the survey participants had remained in the same range (both weighted and unweighted) over time, without any sudden changes in the characteristics of those sampled. Furthermore, Stats SA uses a rotating panel where, for each successive quarter of the QLFS, a quarter of the sampled dwellings is rotated out of the sample (Stats SA, 2019). Therefore, for example, between the second and third quarter of 2019, about 75% of the people interviewed remained unchanged. This suggests the likely absence of data or sampling methodology changes. Unpacking the increase in the number of unemployed people The official unemployment rate increased from 27.6% in the first quarter of 2019 to 29.0% in the second quarter, and further to 29.1% in the third quarter (not seasonally adjusted).3 This reflected an increase in the total number of unemployed people in South Africa of 455 000 between the first and the second quarter of 2019 to 6.6 million and a further 78 000 in the third quarter. Simultaneously, the number of discouraged work seekers declined markedly by 248 000 from the first to the second quarter of 2019 while increasing by only 44 000 from the second to the third quarter. 3On a seasonally adjusted basis, the unemployment rate rose from 27.4% to 28.8% and further to 28.9% over the same period. From the first to the second quarter of 2019, the unemployed category ‘other’ increased the most (181 000),4 followed by new entrants (138 000) and job losers (105 000), as shown in Figure 2. From the second to the third quarter of 2019, the unemployed category ‘other’ again showed the largest increase (72 000), followed by job losers (57 000), while new entrants decreased by 63 000. The drivers of these unemployment categories and the underlying dynamics are very different. 4This was the largest increase recorded in the ‘other’ category since 2008. Job losers are people who were previously employed (at any time during the past five years) and are captured in this survey round as having lost their job at some point during this period. This is not an ideal measure as it does not give a clear indication of exactly when these jobs were lost. New entrants are people who are entering the unemployed category for the first time, while ‘other’ comprises people who last worked more than five years ago. The total number of unemployed people according to unemployment status in the first three quarters of 2018 and 2019 is shown in Figure 2. In the third quarter of 2019, 67.0% of new entrants into the labour market that were classified as unemployed had not worked before because they were students or scholars. Re-entrants into the unemployment category were mostly those who had not worked because they were managing a home or going to school. Those in the ‘other’ category were either employed at some point (more than five years ago) or managing a home. The focus now shifts to an analysis of job losers, new entrants and ‘other’, who together were the main drivers of the increase in the number of unemployed people in the second and third quarter of 2019, with the exception of the new entrants category which declined marginally in the third quarter of 2019. The categories are profiled in terms of age group, province, education level, when last they were employed, in which industry and occupation they were last employed, as well as the duration of their unemployment. 100 Quarterly Bulletin December 2019
Figure 2 The unemployed Total unemployed Number, thousands Job losers Number, thousands 6 800 2 150 6 600 2 100 6 400 2 050 6 200 2 000 6 000 1 950 5 800 1 900 5 600 1 850 Q1Q2 2018 Job leavers Q3 Q1 Q2 2019 Q3 Q1Q2Q3 2018 New entrants Number, thousands Q1 Q2 2019 Q3 Number, thousands 320 2 650 2 600 2 550 2 500 2 450 2 400 2 350 2 300 2 250 2 200 2 150 2 100 310 300 290 280 270 260 250 Q1Q2 2018 Re-entrants Q3 Q1 Q2 2019 Q3 Q1Q2Q3 2018 Other Number, thousands Q1 Q2 2019 Q3 Number, thousands 400 1 500 1 450 350 1 400 300 1 350 250 1 300 200 1 250 150 1 200 100 1 150 50 1 100 0 1 050 Q1Q2Q3 2018 Q1 Q2 2019 Q3 Q1Q2Q3 2018 Q1 Q2 2019 Q3 Source: Stats SA 101 Quarterly Bulletin December 2019 +7 +22 +72 +181 +5 +9 +138 -63 +78 +455 +57 +105
Job losers The profile of job losers during the first three quarters of 2018 and 2019 is shown in Figure 3. Figure 3 Job losers Change by age Number, thousands 120 100 35–49 years 25–34 years 15–24 years 80 60 40 20 0 -20 -40 -60 Q1 to Q2 Q2 to Q3 Q1 to Q2 Q2 to Q3 2018 2019 Job losers Number, thousands Change by education level Number, thousands 120 100 80 60 40 20 0 -20 -40 -60 -80 2 150 Seconday completed Secondary not 2 100 Primary completed Less than primary No schooling 2 050 2 000 1 950 1 900 1 850 Q1Q2Q3 2018 Q1 Q2 2019 Q3 Q1 to Q2 Q2 to Q3 Q1 to Q2 Q2 to Q3 2018 2019 Change by time since last searching for work Number, thousands 250 200 150 100 50 0 -50 -100 -150 Q1 to Q2 Q2 to Q3 Q1 to Q2 Q2 to Q3 2018 More than 5 years 1 year–less than 3 years 6 months–less than 9 months Less than 3 months 2019 3–5 years 9 months–less than 1 year 3 months–less than 6 months Source: Stats SA 102 Quarterly Bulletin December 2019 +57 +105 Tertiary completed 50–64 years
The number of job losers increased by 105 000 between the first and the second quarter of 2019, and by a further 57 000 between the second and the third quarter. In terms of age group, the increases in both quarters were driven by the age group of 15–34 years. This suggests that more young people lost their jobs in the second and third quarter of 2019, which added to the already high youth unemployment rate in both quarters. Between the first and second quarter, there was also a sizable increase in job losers in the age group of 35–64 years (although the 35–49 years category decreased marginally again between the second and the third quarter). Across provinces, the number of job losers increased the most in KwaZulu-Natal in the second quarter of 2019 (66 000), followed by Gauteng (26 700) and the Western Cape (12 000). Further job losses were recorded in KwaZulu-Natal (30 800) and the Western Cape (19 900) in the third quarter of 2019, while the number of job losers also increased in the Eastern Cape (36 000) but decreased in Gauteng (-41 800). In terms of education level, the increase in job losers in both the second and the third quarter of 2019 was driven by job losers with less than a secondary education, a secondary education completed and, to a lesser extent, a tertiary education. In terms of time since last searching for work, more people who were interviewed in the second quarter of 2019 relative to the first quarter reported that they last searched for work three to nine months ago (increasing by 69 500), as well as those last searching between one and three years ago (increasing by 41 900). In addition, a sharp increase of 91 500 occurred among people who had lost their jobs and last searched for work between three and five years ago (long-term unemployment). This category remained at this high level in the third quarter of 2019, increasing marginally further to 284 000 from 282 900 in the second quarter. These are usually the people less likely to find employment as they have been out of the labour market for an extended period of time (Anand, Kothari and Kumar, 2016; Nonyana and Njuho, 2018). The large number of people who have not worked for between one and five years, and have now suddenly been enticed to start searching for a job, could be related to either the May 2019 elections or the impact of the prolonged period of weak economic activity on household income. Figure 4 Job losers by previous industry and occupation Industry Number, thousands Occupation* Number, thousands 500 450 400 350 300 250 200 150 800 700 600 500 400 300 200 100 50 0 100 0 2018 Q1 2018 Q2 2018 Q3 2019 Q1 2019 Q2 2019 Q3 * The category Skilled agricultural and fishery worker, was excluded due to too small values. Source: Stats SA 103 Quarterly Bulletin December 2019 Agriculture Mining Manufacturing Electricity Construction Wholesale and retail trade Transport Finance and business services Community Private household Legislature Professionals Techical, associate professionals Clerks Service workers Craft and related trades Plant and machine operators Elementary Occupation Domestic workers
Among the job losers, most reported that their previous industry of employment was wholesale and retail trade, followed by construction. In addition, increased job losses were recorded in manufacturing (especially in the second quarter of 2019), finance and business services (especially in the third quarter of 2019), and the community and personal services industry (in both the second and third quarter of 2019). In terms of previous occupations, most job losses in 2019 were recorded in the elementary occupation category, which mostly comprises semi-skilled and unskilled workers (see Festus et al. (2015) for a breakdown of skills by occupation level), followed by craft and related trade workers and services workers. Increased job losses also occurred in the category for technical and associate professionals in the second and third quarter of 2019. New entrants New entrants usually comprise those that were scholars or students before entering the labour force and, more specifically, the unemployed. There was a sharp increase of new entrants who were scholars or students into the unemployed category between the first and the second quarter of 2019, although it was similar in magnitude to 2018. However, unlike in 2018, there was also a sharp increase in those who reported that they were managing a home before starting to look for work. Figure 5 Changes in new entrants by age group and education level Highest educational level Number, thousands Age group Number, thousands 80 60 40 60 40 20 20 0 -20 0 -40 -20 -40 -60 Change between 2019 Q1 and Q2 Change between 2019 Q2 and Q3 Source: Stats SA By age group, the increase in the number of new entrants in the second quarter of 2019 was largely driven by those aged 20–34 years old (youth) and, somewhat surprisingly, also by those that are 40–49 years old. The number of new entrants in these age groups fell back slightly in the third quarter, suggesting either that these people found jobs or that their optimism waned in the third quarter, resulting in them becoming discouraged or not economically active again. According to educational attainment, the increase in the number of new entrants into unemployment was mostly driven by increases in the groups who had less than a secondary education and those who had completed a secondary education, followed by those with a tertiary education. These groups all receded again in the third quarter. 104 Quarterly Bulletin December 2019 15–19 Years 20–24 Years 25–29 Years 30–34 Years 35–39 Years 40–44 Years 45–49 Years 50–54 Years 55–59 Years 60–64 Years No Schooling Less than primary completed Primary completed Secondary not completed Secondary completed Tertiary
Figure 6 Change in new entrants by province Number, thousands 100 80 60 40 20 0 -20 -40 -60 Western Eastern NorthernFree KwaZulu-North Gauteng Mpuma-Limpopo CapeCapeCapeStateNatalWest langa Source: Stats SA The increase in the number of new entrants in the second quarter of 2019 was driven by Gauteng (82 600), the North West province (55 900), Limpopo (32 900) and Mpumalanga (25 200). This suggests that new entrants thought they could find work in these provinces. The subsequent decrease in the number of new entrants in these provinces in the third quarter suggests either that they found work (which is unlikely in the current economic environment) or that they realised that their optimism around the time of the election was misplaced and they became discouraged or not economically active again. The ‘other’ unemployment category The category ‘other’ under unemployment only consists of people who have been unemployed for five years or longer. In the second quarter of 2019, large increases occurred in almost all the age groups, especially for those 35–44 years old. In the third quarter of 2019, there was also a large increase in the number of unemployed in this category for those 45–49 years old. Figure 7 ‘Other’ unemployment by age group and eduction level Age group Number, thousands Highest eduction level Number, thousands 800 350 700 300 600 250 500 200 400 150 300 100 200 50 100 0 0 2019 Q1 2019 Q2 2019 Q3 Source: Stats SA 105 Quarterly Bulletin December 2019 15–19 Years 20–24 Years 25–29 Years 30–34 Years 35–39 Years 40–44 Years 45–49 Years 50–54 Years 55–59 Years 60–64 Years No Schooling Less than primary completed Primary completed Secondary not completed Secondary completed Tertiary Change between 2019 Q1 and Q2 Change between 2019 Q1 and Q3
The increase in the ‘other’ category in the second quarter of 2019 occurred mostly among those with less than a secondary education, a secondary education completed and, to some extent, a tertiary education. In the third quarter, the number of those who were unemployed in these education categories either remained at these high levels or increased further. The increase in the number of ‘other’ unemployed was fairly widespread across the different provinces but most pronounced in Gauteng. Figure 8 ‘Other’ unemployment by province Number, thousands 700 2019 Q1 600 500 400 300 200 100 0 Western Eastern NorthernFree KwaZulu-North CapeCapeCapeStateNatalWest Gauteng Mpuma-Limpopo langa Source: Stats SA Discouraged work seekers The number of discouraged work seekers declined sharply by 248 000 from the first to the second quarter of 2019 – the largest quarterly decrease since the inception of the QLFS in 2008. A large part of this drop in discouraged work seekers can possibly be ascribed to optimism linked to the May 2019 elections. However, in the aftermath of the elections, the number of discouraged work seekers increased by only 44 000 in the third quarter of 2019. Figure 9 Number of discouraged work seekers Number, thousands 3 050 3 000 2 950 2 900 2 850 2 800 2 750 2 700 2 650 2 600 Q1 Q2 2018 Q3 Q1 Q2 2019 Q3 Source: Stats SA 106 Quarterly Bulletin December 2019 2019 Q2 2019 Q3
The decrease in the number of discouraged work seekers in the second quarter of 2019 occurred across most of the age groups, but primarily among the 20–24-year-olds who thought it was an opportune time to start searching for work. In the third quarter, the number of discouraged work seekers either remained unchanged or increased in most of the age groups (except for those aged 15–19 years and 40–49 years). Figure 10 Discouraged work seekers by age group and education level Age group Number, thousands Highest education level Number, thousands 800 1 600 700 1 400 600 1 200 500 1 000 800 400 600 300 200 400 100 200 0 0 2019 Q1 2019 Q2 2019 Q3 Source: Stats SA The decrease in the number of discouraged work seekers in the second quarter of 2019 was most pronounced for those with an uncompleted secondary education, followed by a marginal increase in the third quarter. Figure 11 Discouraged work seekers by province Number, thousands 900 2019 Q1 800 2019 Q2 2019 Q3 700 600 500 400 300 200 100 0 Western Eastern CapeCape NorthernFree KwaZulu-North CapeStateNatalWest Gauteng Mpuma-Limpopo langa Source: Stats SA 107 Quarterly Bulletin December 2019 15–19 Years 20–24 Years 25–29 Years 30–34 Years 35–39 Years 40–44 Years 45–49 Years 50–54 Years 55–59 Years 60–64 Years No Schooling Less than primary completed Primary completed Secondary not completed Secondary completed Tertiary
The second-quarter decline in the number of discouraged work seekers was predominantly in Limpopo, the North West, KwaZulu-Natal and Gauteng, followed by a marginal increase in the same provinces in the third quarter of 2019. In the second quarter of 2019, there was also a decrease in the number of people who had not searched for work previously because they had believed that there were no jobs available in their area. This category subsequently increased again somewhat in the third quarter. This suggests that there was an increase in the number of people actively searching for work in the second quarter of 2019 (who joined the unemployed from the discouraged) who had not searched for a job previously because they had been of the opinion that there were no jobs available in their area. Counterfactual unemployment rate A hypothetical unemployment rate was calculated based on the official definition of unemployment to assess whether the second quarter’s official unemployment rate was a true reflection of unemployment. The counterfactual unemployment rate assumed that the new entrants, re-entrants and ‘other’ categories of unemployment remained unchanged from the first to the second quarter of 2019, while the increase in the number of both job losers and job leavers in the second and third quarters of 2019 was retained. The counterfactual unemployment rate in the second quarter of 2019 would have been 27.9% (compared with the official rate of 29.0%) – at the time still the highest rate since the inception of the QLFS in 2008. The same methodology for the third quarter of 2019 rendered a counterfactual unemployment rate that was the same as the official unemployment rate of 29.1%, as there were further job losses and job leavers, and slightly more people who had become discouraged again. The accuracy of the official unemployment rate is corroborated by the absence of material differences when it is compared with the counterfactual unemployment rate. Figure 12 Official and counterfactual unemployment rate Per cent 30 29 28 27 26 Q1 Q2 Q3 Q4 Q1 Q2 2019 Q3 2018 Sources: Stats SA and SARB 108 Quarterly Bulletin December 2019 Official Counterfactual
Conclusion Recently, South Africa’s official unemployment rate increased significantly from 27.6% in the first quarter of 2019 to an all-time high of 29.0% in the second quarter, and further to 29.1% in the third quarter. This was mostly driven by increases in the number of job losers, new entrants and the ‘other’ category of unemployed people as well as a marked decrease in the number of discouraged work seekers as people started to actively search for work, which increased the number of unemployed. Considering the soundness of the methodology underlying the QLFS and the related micro-data ruling out obvious sampling or methodological changes, and with the counterfactual unemployment rate also confirming the accuracy of the official unemployment rate in the second and third quarter of 2019, other explanations were sought. A partial plausible explanation for the sudden increase in the unemployment rate could be related to people searching for work given the possibility of obtaining temporary IEC jobs, together with election-related expectations of job creation. Nevertheless, the high level of unemployment in South Africa requires urgent economic and labour market policy reforms. 109 Quarterly Bulletin December 2019
References Anand, R, Kothari, S and Kumar, N. 2016. ‘South Africa: labor market dynamics and inequality’. International Monetary Fund Working Paper No. 16/137, July: International Monetary Fund. Festus, L, Kasongo, A, Moses, M and Yu, D. 2015. ‘The South African labour market, 1995–2013’ Working Paper No. 493, February: Economic Research Southern Africa. Nonyana, J Z and Njuho, P M. 2018. ‘Modelling the length of time spent in unemployment state in South Africa’. South African Journal of Science 114(11/12), article 4313: 1–7. Statistics South Africa. 2019a. Quarterly Labour Force Survey. Quarter 2: 2019. P0211. Pretoria: Statistics South Africa. Statistics South Africa. 2019b. Quarterly Labour Force Survey. Quarter 3: 2019. P0211. Pretoria: Statistics South Africa. 110 Quarterly Bulletin December 2019
Notes to tables Money market and related interest rates – Table S–30 The interest rates for South African Reserve Bank (SARB) debentures of 7 days and 3x6-month forward rate agreements are now included in the statistical table KB130 for other money market interest rates on page S–30 and those on SARB debentures of 28 days and 56 days discontinued following a long period of inactivity. 111 Quarterly Bulletin December 2019
Abbreviations Alsi BER BPM6 All-Share Price Index Bureau for Economic Research Balance of Payments and International Investment Position Manual – Sixth Edition (BMP6) Chicago Board Options Exchange corporate income tax classification of individual consumption by purpose Corporation for Public Deposits consumer price index Emerging Markets Bond Index Plus Expanded Public Works Programme Food and Agriculture Organization United States Federal Reserve First National Bank forward rate agreement foreign exchange gross domestic expenditure gross domestic product gross value added International Accounting Standard integrated economic accounts Electoral Commission of South Africa International Financial Reporting Standard international investment position International Monetary Fund Independent Power Producer Johannesburg Interbank Average Rate JSE Limited Master Builders South Africa Moody’s Investor Services Monetary Policy Committee Medium Term Budget Policy Statement nominal effective exchange rate platinum group metals Public Investment Corporation personal income tax Quarterly Employment Statistics Quarterly Labour Force Survey CBOE CIT COICOP CPD CPI EMBI+ EPWP FAO Fed FNB FRA FX GDE GDP GVA IAS IEA IEC IFRS IIP IMF IPP Jibar JSE MBSA Moody’s MPC MTBPS NEER PGMs PIC PIT QES QLFS 112 Quarterly Bulletin December 2019
REER ROW S&P Sabor SACU SAGIS SNA SOC Stats SA TB UK US VAT VIX WEO real effective exchange rate rest of the world Standard & Poor’s South African Benchmark Overnight Rate South African Customs Union South African Grain Information Service System of National Accounts state-owned company Statistics South Africa Treasury bill United Kingdom United States value-added tax Volatility Index World Economic Outlook 113 Quarterly Bulletin December 2019