UNITED STATES
SECURITIES AND EXCHANGE COMMISSION
Washington, D.C. 20549
FORM 1−K
ANNUAL REPORT PURSUANT TO REGULATION A
OF THE SECURITIES ACT OF 1933
For the fiscal year ended December 31, 2022
Forge Group, Inc.
(Exact name of registrant as specified in its charter)
|
Pennsylvania |
85-4184821 |
|
(State or other incorporation) |
(I.R.S. Employer Identification No.) |
P.O. Box 15033
Worcester, MA 01615
(Full mailing address of principal executive offices)
(202) 547-8700
(Issuer’s telephone number, including area code)
Common Stock
(Title of each class of securities issued pursuant to Regulation A)
PART II
Use of Terms
Unless the context otherwise requires, as used in this report:
|
● |
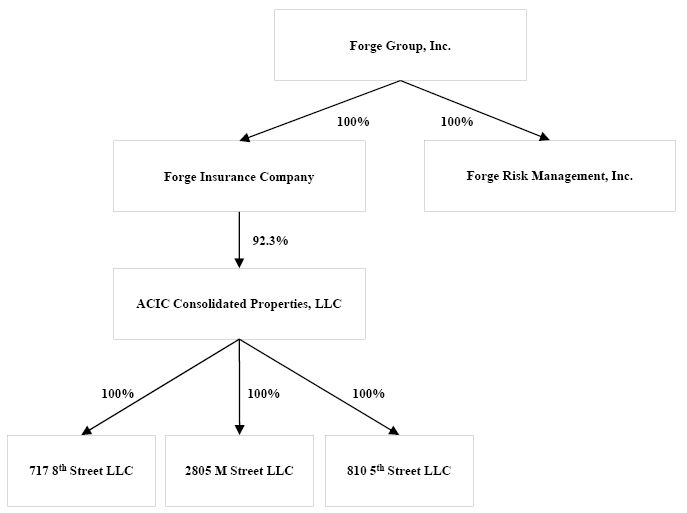
“ACIC Properties” refers to ACIC Consolidated Properties, LLC, a majority-owned subsidiary of FIC and the intermediate holding company for (i) 717 8th Street, LLC, (ii) 2805 M Street, LLC, and (iii) 810 5th Street, LLC, each of which directly own commercial real estate in the District of Columbia; |
|
● |
“the Company,” “we,” “us,” and “our” refer to Forge Insurance Company and its consolidated subsidiaries prior to March 11, 2022, and to Forge Group, Inc. and its consolidated subsidiaries after March 11, 2022; |
|
● |
“conversion” refers to a series of transactions by which FIC converted from mutual form to stock form and became a subsidiary of Forge Group, Inc. Given that the conversion did not occur until March 11, 2022, some of the information presented in this report is shown on a pre-conversion basis; |
|
● |
“Department” means the District of Columbia Department of Insurance, Securities and Banking; |
|
● |
“eligible member” refers to a person who was an owner of an insurance policy issued by FIC and in-force on February 3, 2021, the date the plan of conversion was adopted by the board of trustees of FIC; |
|
● |
“ESOP” means our employee stock ownership plan; |
|
● |
“FIC” refers to Forge Insurance Company, a licensed property and casualty insurer which was previously named Amalgamated Casualty Insurance Company, and its consolidated subsidiaries. Effective on March 18, 2022, Amalgamated Casualty Insurance Company changed its name to Forge Insurance Company; |
|
● |
“FRM” refers to Forge Risk Management, Inc., a licensed property and casualty insurance producer which was previously named American Risk Management, Inc. Effective on February 10, 2022, American Risk Management, Inc. changed its name to Forge Risk Management, Inc.; |
|
● |
“mutual form” refers to an insurance company organized as a mutual company, which is a form of organization in which the policyholders or members have certain membership rights in the mutual company, such as the right to vote with respect to the election of directors and approval of certain fundamental transactions, including the conversion from mutual to stock form; however, unlike shares held by shareholders, membership rights are not transferable and do not exist separately from the related insurance policy; |
|
● |
“offering” refers to the subscription offering and the public offering taken together; |
|
● |
“public offering” refers to the offering of up to 2,300,000 shares of our common stock to the general public under the plan of conversion; |
|
● |
“stock form” is a form of organization in which the only rights that policyholders have are contractual rights under their insurance policies and in which voting rights reside with shareholders under state corporate law; and |
|
● |
“subscription offering” refers to the offering of up to 2,300,000 shares of our common stock under the plan of conversion to eligible members, the ESOP, and trustees, officers, and employees of FIC. |
Special Note Regarding Forward Looking Statements
Certain information contained in this report includes forward-looking statements. The statements herein which are not historical reflect our current expectations and projections about our company’s future results, performance, liquidity, financial condition, prospects and opportunities and are based upon information currently available to our company and our management and our interpretation of what is believed to be significant factors affecting the businesses, including many assumptions regarding future events.
Forward-looking statements are generally identifiable by use of the words “may,” “should,” “expect,” “anticipate,” “estimate,” “believe,” “intend,” or “project” or the negative of these words or other variations on these words or comparable terminology. Actual results, performance, liquidity, financial condition, prospects and opportunities could differ materially from those expressed in, or implied by, these forward-looking statements as a result of various risks, uncertainties and other factors. Actual events or results may differ materially from those discussed in forward-looking statements as a result of various factors, including matters described in this report generally. In light of these risks and uncertainties, there can be no assurance that the forward-looking statements contained in this report will in fact occur.
Undue reliance should not be placed on any forward-looking statements. Except as expressly required by the federal securities laws, there is no undertaking to publicly update or revise any forward-looking statements, whether as a result of new information, future events, changed circumstances or any other reason.
ITEM 1. BUSINESS
Overview
Forge Group, Inc. (the “Company”) is a Pennsylvania corporation that was organized in 2021. The Company was formed so that it could (i) acquire all of the capital stock of Forge Insurance Company (“FIC”) in a mutual to stock conversion and (ii) acquire FIC’s affiliated insurance agency, Forge Risk Management, Inc. (“FRM”). Prior to the conversion, the Company did not engage in any operations. After the conversion, the Company’s primary assets consisted of (i) the outstanding capital stock of FIC, (ii) the outstanding capital stock of FRM, and (iii) a portion of the net proceeds from the offering completed in connection with the conversion of FIC. ACIC Consolidated Properties, LLC (“ACIC Properties”) is a majority-owned subsidiary of FIC and the intermediate holding company for (i) 717 8th Street, LLC, (ii) 2805 M Street, LLC, and (iii) 810 5th Street, LLC, each of which directly own commercial real estate in the District of Columbia. The Company’s initial public offering, and the concurrent acquisition of FRM, were completed on March 11, 2022. Please see Item 1. Business — Completion of Offering, Conversion and Agency Acquisition for more information. References to the Company’s financial information in this report is to the financial information for Forge Group, Inc., FIC, and FRM on a consolidated basis after March 11, 2022. References to the Company’s financial information in this report is to the financial information for FIC on a consolidated basis prior to March 11, 2022. Our current corporate structure is as shown in the following chart:
Through our wholly owned subsidiaries, we operate as a specialist commercial automobile insurance business. FIC was incorporated in the District of Columbia in 1938 and is rated B++ by A.M. Best. As of December 31, 2022, FIC was licensed as a property and casualty insurer in 34 states and the District of Columbia. FIC’s insurance products are marketed and distributed through FRM, its appointed insurance producer. FRM solicits business directly from customers and works with insurance agency sub-producers, referred to as “distribution partners”. As of December 31, 2022, FRM was licensed as a property and casualty insurance producer in 34 states and the District of Columbia. Through our wholly owned subsidiaries, we market and underwrite commercial automobile insurance products. We are focused on delivering these commercial automobile insurance products to small business owners and operators that operate in (i) certain business class segments and (ii) in certain geographic markets in the U.S. Historically, we have focused on the public automobile business class segment (“public auto segment”) within the commercial automobile insurance line. In the public auto segment, vehicles are used to transport passengers from one location to another. Specifically, we have historically focused on the following public auto sub-segments: taxi cabs, passenger sedans, golf carts, school vans, and other light transportation vehicles. Recently, we have developed commercial auto insurance products targeting additional business class segments, namely trade and service providers such as electricians, plumbers, and carpenters (collectively, the “small business segment”).
Our executive offices are located at 7910 Woodmont Avenue, Suite 925, Bethesda, Maryland, 20814. Our mailing address is P.O. Box 15033, Worcester, Massachusetts, 01615. Our phone number is (202) 547-8700 and our website address is www.forgeinsurance.com.
Completion of Offering, Conversion and Agency Acquisition
On March 11, 2022, the Company completed the sale of 2,050,000 shares of common stock at $10.00 per share for a total gross offering of $20.5 million, thereby completing the conversion of Forge Insurance Company, previously named Amalgamated Casualty Insurance Company, from mutual form to stock form. Following the conversion, FIC became a wholly owned subsidiary of the Company. Pursuant to the amended and restated plan of conversion, upon completion of the conversion and the offering, FIC distributed $4,594 in cash to each of the eligible members, which totaled $7.3 million, and which was recorded as a dividend. In addition, on March 11, 2022, pursuant to a stock purchase agreement with MCW Holdings, Inc., the Company completed the acquisition of all the outstanding capital stock of FIC’s affiliated agency, FRM, previously named American Risk Management, Inc. Pursuant to the stock purchase agreement, the Company assumed $1.4 million of FRM’s outstanding debt and issued to MCW Holdings, Inc. 550,000 shares of the Company’s Series A 8.5% cumulative convertible preferred stock.
Market for Registrant’s Common Equity
“Buy” and “Sell” quotes for shares of the Company’s common stock are reported on the “OTC Pink” market under the symbol “FIGP”.
Business Segments
We manage our business through two segments: insurance and commercial real estate investments. Through our wholly owned subsidiaries, namely FIC and FRM, the Company engages in the principal business line of insurance. See Item 2. Management Discussion and Analysis of Financial Condition and Results of Operations — Real Estate Held for the Production of Income for more detailed information concerning our commercial real estate investment segment.
Our Market and Opportunities
We principally operate within the commercial automobile insurance line of business. We estimate that the U.S. commercial automobile insurance line of business is approximately $60 billion of annual premium written.
Historically, we have focused on the public auto segment within the commercial automobile insurance line. In the public auto segment, vehicles are used to transport passengers from one location to another. In this business class segment, operation of the commercial vehicle is generally the primary source of business revenue. Specifically, we have historically focused on the following public auto sub-segments: taxi cabs, passenger sedans, golf carts, school vans, and other light transportation vehicles. We estimate that the public auto segment in our target geographic markets is approximately $200 million of annual premium written.
Recently, we have developed commercial auto insurance products targeting additional business class segments, namely trade and service providers such as electricians, plumbers, and carpenters (collectively, the “small business segment”) that our research has indicated present lower loss risk and other favorable business characteristics. In the small business segment, operation of the commercial vehicle is generally not the primary source of business revenue; rather, the commercial vehicle is used as a tool in the overall business. We estimate that the small business segment in our target geographic markets is approximately $12 billion of annual premium written.
Our Competitive Strengths
We believe that we are strategically positioned to take advantage of the following competitive strengths:
|
● |
Experienced management team. Our management team, led by Patrick Bracewell and Richard Hutchinson, has considerable experience operating in the commercial automobile insurance line of business. |
|
● |
Rich history and strong reputation for service. We have been in business since 1938 and are recognized in the specialty commercial automobile insurance markets in which we operate for our strong customer service. |
|
● |
Scalable platform. We believe that we will be able to significantly increase our policy volume without a significant increase in administrative expense. We are currently making investments in our technology infrastructure and product design. We believe these investments will enable us to process and service additional policy volumes without a significant increase in personnel. |
Our Growth Strategies
We intend to use our competitive strengths to grow our business through the following strategies:
|
● |
Expand our product offerings. We have developed commercial auto insurance products that we will introduce to the small business segment, a segment that our research has indicated presents lower loss risk and other favorable business characteristics. In this market, the vehicle is a tool used in the overall business and is typically driven significantly fewer miles than in the public auto segment, where the operation of the commercial vehicle is generally the primary source of business revenue. |
|
● |
Grow our distribution capacity. We intend to continue to expand our relatively small force of distribution partners by recruiting a substantial number of additional distribution partners in the coming years. We also intend to explore relationships with agency networks, insurers, and other strategic partners that currently offer insurance products to the small business segment but do not have a commercial auto product. |
|
● |
Pursue acquisitions of insurance companies and related businesses. Over time, we intend to explore possible acquisitions of other insurance companies or related businesses to grow our business and leverage our existing available administrative capacity. |
|
● |
Focus on profitability and operating efficiency. We are committed to improving our profitability by remaining focused on our target segment within the commercial auto insurance line and continuously seeking efficiencies within our operations. We believe that the investments we are making in our technology infrastructure and product design will allow us to improve our processes, response times, and scalability. |
Our Challenges and Risks
Our Company and our business are subject to numerous challenges and risks, including:
|
● |
History of losses. We have experienced losses in the last two years primarily due to our elevated expenses. Our expenses have been elevated as we have been investing in our business in anticipation of future growth. We have added additional personnel and have invested in our technology platform. During the last two years we have also incurred additional costs related to supporting our ongoing reporting obligations as an SEC-registrant. |
|
● |
Lack of marketing resources. We are small in relation to many of the insurance companies with which we compete. Larger insurance companies have a substantial advantage with respect to the resources that they can devote to advertising, marketing, and agent recruitment. Furthermore, their larger surplus permits them to maintain a larger book of business and spread their administrative expenses over a larger revenue base. Our small size could inhibit our ability to devote adequate resources to advertising, marketing, and agent recruitment, which could have a material and adverse effect on our ability to grow our business. |
|
● |
Lack of multiple distribution channels. We rely primarily on FRM and FRM’s limited number of distribution partners to distribute our insurance products. Growth in our written premiums will depend on our ability to recruit new distribution partners to distribute our insurance products. Much of the competition for talent involves agent recruitment. If our competitors have higher A.M. Best ratings, provide the agents with better technology, or pay higher commissions, our ability to attract and retain agents may be impaired, which could have a material and adverse effect on our ability to profitably grow our business. |
|
● |
Intense competition for policyholders. We face intense competition for policyholders and compete with much larger insurance companies, many of which seek to sell commercial automobile insurance products to the same markets that we target. Most of these companies devote substantial resources to advertising and marketing to potential policyholders as well as to agent recruitment. Many of these companies have multiple distribution channels for their products and some employ in-house agents, which reduces their commission expense. In addition, several of these companies have well established Internet sales capabilities. If we are unable to effectively compete with larger insurance companies, we may be unable to attract additional policyholders, which could have a material and adverse effect on our ability to profitably grow our business. |
|
● |
Inability to manage growth effectively. We intend to continue to grow our business, which could require additional capital, systems development, and skilled personnel. We may be unable to locate profitable business opportunities, meet our capital needs, expand our systems and our internal controls effectively, allocate our human resources optimally, or identify qualified employees. The failure to manage our growth effectively and maintain underwriting discipline could have a material adverse effect on our business, financial condition and results of operations. |
|
● |
Inability to obtain reinsurance coverage at reasonable prices or on terms that provide us adequate protection. We purchase reinsurance to help manage our exposure to insurance risks that we underwrite and to reduce volatility in our results. The availability and cost of reinsurance are subject to prevailing market conditions, both in terms of price and available capacity, each of which can affect our business volume and profitability. The availability of reasonably affordable reinsurance is a critical element of our business plan. One important way we utilize reinsurance is to reduce volatility in claims payments by limiting our exposure to losses from large risks. As a result, our ability to manage volatility and avoid significant losses may be limited by the unavailability of reasonably priced reinsurance. We may not be able to obtain reinsurance on acceptable terms or from entities with satisfactory creditworthiness. Under such circumstances, we may have to reduce the level of our underwriting commitments, which would reduce our revenues. |
|
● |
Inability to retain key management and employees or recruit other qualified personnel. We believe that our future success depends, in large part, on our ability to retain our experienced management team and key employees. There can be no assurance that we can attract and retain the necessary employees to conduct our business activities on a timely basis or at all. Our competitors may offer more favorable compensation arrangements to our key management or employees to incentivize them to leave our Company. The loss of any of our executive officers or other key personnel, or our inability to recruit and retain additional qualified personnel as we grow, could materially and adversely affect our business and results of operations, and could prevent us from fully implementing our growth strategies. |
|
● |
Interruptions to third-party technology systems. Our business is highly dependent upon our ability to perform necessary business functions in an efficient and uninterrupted manner. The shut-down, disruption, degradation or unavailability of one or more of our systems or facilities, or the inability of our employees to communicate in a largely work-from-home environment, for any reason could significantly impair our ability to perform critical business functions on a timely basis. In addition, many of our critical business systems interface with and depend on third-party systems. An interruption or degradation of service from a third-party system for any reason, or a determination by a vendor to abandon or terminate support for a system, product, obligation, or service that is significant to our business, could significantly impair our ability to perform critical business functions, including, but not limited to, impeding customer interactions, preventing access to company or customer data, and interfering with our ability to send or accept electronic payments through credit card or debit card networks and the Automated Clearing House, among other payment systems. If sustained or repeated, and if an alternate system, process, or vendor is not immediately available to us, such events could result in a deterioration of our ability to write and process policies, provide high quality customer service, resolve claims in a timely manner, make payments when required, or perform other necessary business functions. Also, system redundancy and other continuity measures may be ineffective or inadequate, and our business continuity and disaster recovery planning may not be sufficient for all eventualities. Any such event could have a material adverse effect on our financial results and business prospects, as well as cause damage to our reputation, brand and customer goodwill. |
|
● |
Capital markets volatility and credit deterioration. Our results of operations depend, in part, on the performance of our investment portfolio. Our investments are subject to general economic conditions and market risks as well as risks inherent to particular securities. The value of our investment portfolio is subject to the risk that certain investments may default or become impaired due to deterioration in the financial condition of one or more issuers of the securities held, or due to deterioration in the financial condition of an entity that guarantees an issuer’s payments of such investments. Such defaults and impairments could reduce our net investment income and result in realized investment losses. A severe economic downturn could cause us to incur substantial realized and unrealized investment losses in future periods, which would have an adverse impact on our financial condition, results of operations, and financial strength ratings. In addition, losses in our investment portfolio may occur at the same time as underwriting losses and, therefore, exacerbate the adverse effect of the losses on us. |
|
● |
Decline in our financial strength rating. Participants in the insurance industry use ratings from independent ratings agencies, such as A.M. Best Company, Inc. (“A.M. Best”) as an important means of assessing the financial strength and quality of insurers. In setting their ratings, A.M. Best utilize a quantitative and qualitative analysis of a company’s balance sheet strength, operating performance and business profile. These analyses include comparisons to peers and industry standards as well as assessments of operating plans, philosophy and management. A.M. Best assigns ratings that are intended to provide an independent opinion of an insurance company’s ability to meet its financial obligations to policyholders and such ratings are not evaluations directed to investors. A.M. Best periodically reviews FIC’s rating and may revise its rating downward or revoke it at their sole discretion based primarily on their analyses of FIC’s balance sheet strength (including capital adequacy and loss and loss adjustment expense reserve adequacy), operating performance and business profile. A downgrade of FIC’s rating could cause our current and future distribution partners to choose other, more highly‑rated competitors. A downgrade of FIC’s rating could also increase the cost or reduce the availability of reinsurance to us. A downgrade or withdrawal of FIC’s rating could severely limit or prevent us from writing new and renewal insurance contracts and would have a material adverse effect on our financial condition and results of operations. |
|
● |
Inability to underwrite and price risks accurately and to charge adequate rates to policyholders. Our financial condition, cash flows, and results of operations depend on our ability to underwrite and set rates accurately for a full spectrum of risks. A primary role of the pricing function is to ensure that rates are adequate to generate sufficient premiums to pay losses, loss adjustment expenses, and underwriting expenses, and to earn a profit. Pricing involves the acquisition and analysis of historical data regarding vehicle accidents, other insured events, and associated losses, and the projection of future trends for such accidents and events, loss costs, expenses, and inflation, among other factors, for each of our products in different markets. Our ability to price accurately is subject to a number of risks and uncertainties which could result in our pricing being based on inadequate or inaccurate data or inappropriate analyses, assumptions, or methodologies, and may cause us to estimate incorrectly future changes in the frequency or severity of claims. As a result, we could underprice risks, which would negatively affect our underwriting profit margins, or we could overprice risks, which could reduce our competitiveness and growth prospects. In either event, our financial condition, cash flows, and results of operations could be materially adversely affected. In addition, underpricing insurance policies over time could erode the capital position, thereby constraining our ability to write new business. |
Business Operations – Insurance Segment
Our insurance segment engages in the principal business line of commercial automobile insurance. In our insurance segment, we market and underwrite commercial automobile insurance products targeted to small business owners and operators. Historically, we have focused on the public auto segment within the commercial automobile insurance line. We currently offer our commercial auto insurance products in the District of Columbia and 14 states. In 2021, we began developing commercial auto insurance products targeting the small business segment.
Products
Our product language is based on Insurance Services Offices (“ISO”) forms, which is an industry standard, but tailored to the specific needs of our customers. In 2021, we began developing commercial auto insurance products targeting additional business class segments, namely trade and service providers such as electricians, plumbers, and carpenters (collectively, the “small business class segment”).
Marketing and Distribution
Our products are marketed and distributed through FRM. FRM solicits business directly from customers and also works with insurance agency sub-producers, referred to as “distribution partners”. Our distribution partners access multiple insurance companies and are typically established businesses in the communities in which they operate. We view our distribution partners as our primary customers because they are in a position to recommend either our insurance products or those of a competitor to their customers. We consider our relationships with our distribution partners to be a core strength of the Company. Our distribution partners are generally compensated through a fixed commission specified in their agency agreement, generally 10% of premiums collected on business they generate. For the year ended December 31, 2022, 3 of our distribution partners were responsible for approximately 30.4% of our gross premiums written and our top 10 distribution partners accounted for approximately 69.8% of gross premiums written. We intend to significantly expand our force of active distribution partners (i.e., those distribution partners with which we write business). In 2022, we had 54 active distribution partners, compared to 39 active distribution partners in 2021, or an increase in the number of active distribution partners of 38%.
Underwriting, Risk Assessment and Pricing
Our underwriting philosophy is aimed at consistently generating acceptable loss ratios through sound risk selection, stringent loss control, and pricing discipline. One key element in sound risk selection is our use of data and analytics. We rely on both internal data, developed over years of operation, and external data. The use of data allows us to more effectively price risks, thereby improving our profitability and allowing us to compete favorably with other insurance carriers. Our philosophy is to understand our industry and be disciplined in our underwriting efforts. We will not compromise profitability for top line growth. Our competitive strategy in underwriting is:
|
● |
Maximize the use of available information acquired through a wide variety of industry resources; |
|
● |
Allow our internal metrics and rating to establish risk pricing and use sound underwriting judgment for risk selection and pricing modification; |
|
● |
Utilize our risk grading system, which combines both objective and subjective inputs, to quantify desirability of risks and improve our overall risk profile; and |
|
● |
Provide very high-quality service to our distribution partners and insureds by responding quickly and effectively to information requests and policy submissions. Treat our distribution partners as partners and have the same expectation of them. |
|
● |
We underwrite our accounts by evaluating each risk with consistently applied standards. Each policy undergoes a thorough evaluation process prior to every renewal. |
We strive to be disciplined in our pricing by pursuing targeted rate changes to continually improve our underwriting profitability while still being able to attract and retain profitable customers. Our pricing reviews involve evaluating our claims experience, loss trends, data acquired from inspections, applications and other data sources to identify characteristics that drive the frequency and severity of our claims. These results drive changes to rates and rating metrics as well as understanding what portions of our business are most profitable. This knowledge and analysis enables us to price risks accurately, improve account retention, and drive profitable new business.
Claims and Litigation Management
Our claims team supports our underwriting strategy by working to provide a timely, good faith claims handling response to our policyholders. Claims excellence is achieved by timely investigation and handling of claims, settlement of meritorious claims for equitable amounts, maintenance of adequate case reserves, and control of claims loss adjustment expenses. Claims on insurance policies are received directly from the insured or through our distribution partners. Our claims department supports our distribution partner relationship strategy by working to provide a consistently responsive level of claim service to our policyholders.
Technology
We utilize a third-party, cloud-based policy administration system that includes policy issuance, claims processing, accounting, loss payment, and document management. This cloud-based system provides online access to electronic copies of policies, quotes, inspections, and any other correspondence enabling our associates to quickly and efficiently underwrite policies and adjust claims as well as respond to our producers’ inquiries. Since the system integrates all aspects of the policy life cycle, from underwriting to billing to claims, we are able to better automate internal workflows through electronic routing thus lowering costs and providing better service to our customers. This system allows us to leverage loss control data for predictive analytics in both the claims and underwriting areas. This third-party system permits us to limit each employee’s access by functional area and managerial level to protect confidential data. Our third-party vendor implements virus and malware protections while still enabling our employees to work from any location. The system is tested on a periodic basis for vulnerability to outside penetration to ensure the system’s protections are sufficient. We have the ability to scale since we are almost entirely a paperless organization. This allows us to integrate off-site employees just as if they are in the office. We intend to remain a leader in the industry by utilizing technology and data analysis to price our coverage based on the risk assumed and to both reduce accidents and provide a prompt response to claims. Our third-party vendor maintains an off-site co-location facility with real-time, redundant data replication as part of its disaster recovery program. If our offices are affected by a natural disaster or other disruption, we can access this cloud-based system to continue our business operations with minimal interruption.
Reinsurance
In accordance with insurance industry practice, we reinsure a portion of our exposure and pay to the reinsurers a portion of the premiums received on all policies reinsured. Insurance policies written by us are reinsured with other insurance companies principally to:
|
● |
reduce net liability on individual risks; |
|
● |
mitigate the effect of individual loss occurrences (including catastrophic losses); |
|
● |
stabilize underwriting results; |
|
● |
decrease leverage; and |
|
● |
increase our underwriting capacity. |
Reinsurance can be facultative reinsurance or treaty reinsurance. Under facultative reinsurance, each policy or portion of a risk is reinsured individually. Under treaty reinsurance, an agreed-upon portion of a class of business is automatically reinsured. Reinsurance also can be classified as quota share reinsurance, pro rata reinsurance or excess of loss reinsurance. Under quota share reinsurance and pro rata reinsurance, the insurance company issuing the policy cedes a percentage of its insurance liability to the reinsurer in exchange for a like percentage of premiums, less a ceding commission. The company issuing the policy in turn recovers from the reinsurer the reinsurer’s share of all losses and loss adjustment expenses incurred on those risks. Under excess of loss reinsurance, an insurer limits its liability to all or a particular portion of the amount in excess of a predetermined deductible or retention. Regardless of type, reinsurance does not legally discharge the insurance company issuing the policy from primary liability for the full amount due under the reinsured policies. However, the assuming reinsurer is obligated to reimburse the company issuing the policy to the extent of the coverage ceded. We determine the amount and scope of reinsurance coverage to purchase each year based on a number of factors. These factors include the evaluation of the risks accepted, consultations with reinsurance intermediates and a review of market conditions, including the availability and pricing of reinsurance. A primary factor in the selection of reinsurers from whom we purchase reinsurance is their financial strength. Our reinsurance arrangements are generally renegotiated annually. For the year ended December 31, 2022, we ceded to reinsurers $625 thousand of premiums written, compared to $469 thousand of premiums written for the year ended December 31, 2021. Ceded premiums written as a percentage of gross premiums written were 5.1% in 2022, and 5.0% in 2021. The increase is primarily a result of a hardening reinsurance pricing environment. We expect the recent dislocation in the capital markets, which has reduced overall capital capacity in the reinsurance marketplace, and dislocation in certain segments of the insurance marketplace, to lead to further hardening of reinsurance pricing. We expect the cost of our reinsurance to increase over the next 12 months.
Losses and LAE Reserves
We are required by applicable insurance laws and regulations to maintain reserves for payment of losses and loss adjustment expenses (“LAE”). These reserves are established for both reported claims and for claims incurred but not reported (“IBNR”), arising from the policies we have issued. The laws and regulations require that provision be made for the ultimate cost of those claims without regard to how long it takes to settle them or the time value of money. The determination of reserves involves actuarial and statistical projections of what we expect to be the cost of the ultimate settlement and administration of such claims. The reserves are set based on facts and circumstances then known, estimates of future trends in claims severity, and other variable factors such as inflation and changing judicial theories of liability.
Estimating the ultimate liability for losses and LAE is an inherently uncertain process. Therefore, the reserve for losses and LAE does not represent an exact calculation of that liability. Our reserve policy recognizes this uncertainty by maintaining reserves at a level providing for the possibility of adverse development relative to the estimation process. We do not discount our reserves to recognize the time value of money.
When a claim is reported to us, our claims personnel establish a “case reserve” for the estimated amount of the ultimate payment. This estimate reflects an informed judgment based upon general insurance reserving practices and on the experience and knowledge of our claims staff. In estimating the appropriate reserve, our claims staff considers the nature and value of the specific claim, the severity of injury or damage, and the policy provisions relating to the type of loss. Case reserves are adjusted by our claims staff as more information becomes available. It is our policy to resolve each claim as expeditiously as possible. These estimates are reported net of amounts estimated to be recoverable from salvage and subrogation.
We maintain IBNR reserves to provide for already incurred claims that have not yet been reported and developments on reported claims. The IBNR reserve is determined by estimating our ultimate net liability for both reported and IBNR claims and then subtracting the case reserves and paid losses and LAE for reported claims.
Each quarter, we compute our estimated ultimate liability using principles and procedures applicable to the lines of business written. However, because the establishment of loss reserves is an inherently uncertain process, we cannot assure you that ultimate losses will not exceed the established loss reserves. Adjustments in aggregate reserves, if any, are reflected in the operating results of the period during which such adjustments are made.
The following table provides information about open claims, reserves, and paid losses and LAE as of December 31, 2022 and December 31, 2021, with dollars in thousands.
|
As of and for the year ending December 31, 2022 |
||||||||||||||||||||
|
Open |
Total |
Case |
IBNR |
Paid Losses |
||||||||||||||||
|
(dollars in thousands) |
Claims |
Reserves |
Reserves |
Reserves |
and LAE |
|||||||||||||||
|
Commercial auto liability |
314 | $ | 7,423 | $ | 4,984 | $ | 2,439 | $ | 5,129 | |||||||||||
|
Commercial auto physical damage |
8 | (13 | ) | (23 | ) | 10 | 727 | |||||||||||||
|
Total net amount |
322 | $ | 7,410 | $ | 4,961 | $ | 2,449 | $ | 5,856 | |||||||||||
|
Reinsurance ceded |
1,070 | 157 | 913 | 895 | ||||||||||||||||
|
Total gross amounts |
$ | 8,480 | $ | 5,118 | $ | 3,362 | $ | 6,751 | ||||||||||||
|
As of and for the year ending December 31, 2021 |
||||||||||||||||||||
|
Open |
Total |
Case |
IBNR |
Paid Losses |
||||||||||||||||
|
(dollars in thousands) |
Claims |
Reserves |
Reserves |
Reserves |
and LAE |
|||||||||||||||
|
Commercial auto liability |
340 | $ | 8,704 | $ | 6,014 | $ | 2,690 | $ | 4,477 | |||||||||||
|
Commercial auto physical damage |
11 | 50 | 25 | 25 | 597 | |||||||||||||||
|
Total net amount |
351 | $ | 8,754 | $ | 6,039 | $ | 2,715 | $ | 5,074 | |||||||||||
|
Reinsurance ceded |
924 | 319 | 605 | 345 | ||||||||||||||||
|
Total gross amounts |
$ | 9,678 | $ | 6,358 | $ | 3,320 | $ | 5,419 | ||||||||||||
The following tables provide a reconciliation of beginning and ending unpaid losses and LAE reserve balances for the years ended December 31, 2022 and 2021, prepared in accordance with GAAP with dollars in thousands.
|
(dollars in thousands) |
December 31, |
|||||||
|
2022 |
2021 |
|||||||
|
Unpaid losses and LAE at beginning of year: |
||||||||
|
Gross |
$ | 9,678 | $ | 9,861 | ||||
|
Ceded |
924 | 1,200 | ||||||
|
Net |
8,754 | 8,661 | ||||||
|
Increase (decrease) in incurred losses and LAE: |
||||||||
|
Current year |
5,933 | 6,070 | ||||||
|
Prior years |
(1,422 | ) | (903 | ) | ||||
|
Total incurred |
4,511 | 5,167 | ||||||
|
Loss and LAE payments for claims incurred: |
||||||||
|
Current year |
2,805 | 1,898 | ||||||
|
Prior years |
3,050 | 3,176 | ||||||
|
Total paid |
5,855 | 5,074 | ||||||
|
Net unpaid losses and LAE at end of year |
$ | 7,410 | $ | 8,754 | ||||
The estimation process for determining the liability for unpaid losses and LAE inherently results in adjustments each year for claims incurred (but not paid) in preceding years. Negative amounts reported for claims incurred related to prior years are a result of claims being settled for amounts less than originally estimated (favorable development). Positive amounts reported for claims incurred related to prior years are a result of claims being settled for amounts greater than originally estimated (unfavorable or adverse development).
Reconciliation of Reserve for Losses and Loss Adjustment Expenses
The following table shows the development of our reserves for unpaid losses and LAE from 2013 through 2022 on a GAAP basis. The top line of the table shows the liabilities at the balance sheet date, including losses incurred but not yet reported. The upper portion of the table shows the cumulative amounts subsequently paid as of successive years with respect to the liability. The lower portion of the table shows the re-estimated amount of the previously recorded liability based on experience as of the end of each succeeding year. The estimates change as more information becomes known about the frequency and severity of claims for individual years. The redundancy (deficiency) exists when the re-estimated liability for each reporting period is less (greater) than the prior liability estimate. The “cumulative redundancy (deficiency)” depicted in the table, for any particular calendar year, represents the aggregate change in the initial estimates over all subsequent calendar years. Gross deficiencies and redundancies may be significantly more or less than net deficiencies and redundancies due to the nature and extent of applicable reinsurance. As noted in the table below, since 2013 the Company has consistently selected initial ultimate loss picks that have proven to be redundant over time (dollars in thousands).
|
Year Ended December 31, |
||||||||||||||||||||||||||||||||||||||||
|
(dollars in thousands) |
2013 |
2014 |
2015 |
2016 |
2017 |
2018 |
2019 |
2020 |
2021 |
2022 |
||||||||||||||||||||||||||||||
|
Liability for unpaid loss and LAE, net of reinsurance recoverables |
$ | 6,193 | $ | 5,678 | $ | 5,828 | $ | 6,230 | $ | 8,106 | $ | 11,877 | $ | 11,582 | $ | 8,661 | $ | 8,754 | $ | 7,410 | ||||||||||||||||||||
|
Cumulative amount of liability paid through: |
||||||||||||||||||||||||||||||||||||||||
|
One year later |
1,938 | 2,508 | 2,954 | 4,624 | 5,921 | 5,854 | 4,239 | 3,174 | 3,054 | |||||||||||||||||||||||||||||||
|
Two years later |
3,027 | 3,541 | 4,735 | 6,271 | 8,607 | 7,969 | 6,747 | 4,711 | ||||||||||||||||||||||||||||||||
|
Three years later |
3,414 | 3,905 | 5,241 | 6,923 | 8,909 | 8,858 | 7,894 | |||||||||||||||||||||||||||||||||
|
Four years later |
3,499 | 4,078 | 5,356 | 7,034 | 8,963 | 9,449 | ||||||||||||||||||||||||||||||||||
|
Five years later |
3,514 | 4,080 | 5,432 | 7,074 | 9,047 | |||||||||||||||||||||||||||||||||||
|
Six years later |
3,514 | 4,084 | 5,432 | 7,153 | ||||||||||||||||||||||||||||||||||||
|
Seven years later |
3,514 | 4,084 | 5,438 | |||||||||||||||||||||||||||||||||||||
|
Eight years later |
3,514 | 4,084 | ||||||||||||||||||||||||||||||||||||||
|
Nine years later |
3,514 | |||||||||||||||||||||||||||||||||||||||
|
Ten years later |
||||||||||||||||||||||||||||||||||||||||
|
Liability estimated after: |
||||||||||||||||||||||||||||||||||||||||
|
One year later |
5,729 | 5,408 | 5,873 | 7,264 | 9,959 | 10,882 | 9,066 | 7,758 | 7,336 | |||||||||||||||||||||||||||||||
|
Two years later |
4,498 | 4,323 | 5,717 | 7,242 | 9,671 | 10,226 | 9,489 | 6,842 | ||||||||||||||||||||||||||||||||
|
Three years later |
3,590 | 4,345 | 5,466 | 7,247 | 9,656 | 10,249 | 9,217 | |||||||||||||||||||||||||||||||||
|
Four years later |
3,594 | 4,110 | 5,484 | 7,246 | 9,470 | 10,140 | ||||||||||||||||||||||||||||||||||
|
Five years later |
3,514 | 4,128 | 5,473 | 7,263 | 9,349 | |||||||||||||||||||||||||||||||||||
|
Six years later |
3,514 | 4,117 | 5,482 | 7,199 | ||||||||||||||||||||||||||||||||||||
|
Seven years later |
3,514 | 4,117 | 5,444 | |||||||||||||||||||||||||||||||||||||
|
Eight years later |
3,514 | 4,086 | ||||||||||||||||||||||||||||||||||||||
|
Nine years later |
3,514 | |||||||||||||||||||||||||||||||||||||||
|
Ten years later |
||||||||||||||||||||||||||||||||||||||||
|
Cumulative total redundancy (deficiency) |
||||||||||||||||||||||||||||||||||||||||
|
Gross liability — end of year |
6,193 | 5,678 | 5,828 | 6,230 | 8,468 | 12,580 | 12,415 | 9,861 | 9,677 | 8,480 | ||||||||||||||||||||||||||||||
|
Reinsurance recoverable |
- | - | - | - | 362 | 703 | 833 | 1,200 | 923 | 1,070 | ||||||||||||||||||||||||||||||
|
Net liability — end of year |
6,193 | 5,678 | 5,828 | 6,230 | 8,106 | 11,877 | 11,582 | 8,661 | 8,754 | 7,410 | ||||||||||||||||||||||||||||||
|
Gross re-estimated liability — latest |
3,514 | 4,086 | 5,444 | 7,199 | 10,247 | 11,494 | 10,354 | 7,672 | 8,179 | 8,480 | ||||||||||||||||||||||||||||||
|
Re-estimated reinsurance recoverables — latest |
- | - | - | - | 898 | 1,354 | 1,137 | 830 | 843 | 1,070 | ||||||||||||||||||||||||||||||
|
Net re-estimated liability — latest |
3,514 | 4,086 | 5,444 | 7,199 | 9,349 | 10,140 | 9,217 | 6,842 | 7,336 | 7,410 | ||||||||||||||||||||||||||||||
|
Gross cumulative redundancy (deficiency) |
$ | 2,679 | $ | 1,592 | $ | 384 | $ | (969 | ) | $ | (1,779 | ) | $ | 1,086 | $ | 2,061 | $ | 2,189 | $ | 1,498 | $ | - | ||||||||||||||||||
Investments
Our investments in debt and equity securities are classified as available for sale and are carried at fair value with unrealized gains and losses reflected as a component of equity net of taxes. The goal of our investment activities is to complement and support our overall mission. As such, the investment portfolio’s goal is to maximize after-tax investment income and price appreciation while maintaining the portfolio’s target risk profile. An important component of our operating results has been the return on invested assets. Our investment objectives are (i) to preserve and grow capital and surplus, in order to improve our competitive position and allow for expansion of insurance operations; (ii) to ensure sufficient cash flow and liquidity to fund expected liability payments and otherwise support our underwriting strategy; (iii) to provide a reasonable and stable level of income; and (iv) to maintain a portfolio which will assist in attaining the highest possible rating from A.M. Best. See Item 2. Management’s Discussion and Analysis of Financial Condition and Results of Operations — Quantitative and Qualitative Information about Market Risk. In addition to any investments prohibited by the insurance laws and regulations of District of Columbia and any other applicable states, our investment policy prohibits the following investments and investing activities:
|
● |
short sales; |
|
● |
purchase of securities on margin; |
|
● |
derivatives; |
|
● |
investment in commodities; |
|
● |
mortgage derivatives such as inverse floaters, interest only strips and principal only strips; |
|
● |
options, puts and futures contracts; and |
|
● |
any security that would not be in compliance with the regulations of the Department. |
Our board of directors developed our investment policy and reviews the policy periodically. Exceptions to prohibitions discussed above are allowed with express written authority of the investment committee of our board of directors, but under no circumstance may such exception exceed 10% of our invested assets. Our investment portfolio is managed internally. The following table sets forth information concerning our available for sale, fixed maturity investments (dollars in thousands).
|
At December 31, |
||||||||||||||||
|
2022 |
2021 |
|||||||||||||||
|
Cost or |
Cost or |
|||||||||||||||
|
Amortized |
Estimated |
Amortized |
Estimated |
|||||||||||||
|
(dollars in thousands) |
Cost |
Fair Value |
Cost |
Fair Value |
||||||||||||
|
U.S. government |
$ | 964 | $ | 920 | $ | - | $ | - | ||||||||
|
States, territories and possessions |
40 | 40 | 41 | 43 | ||||||||||||
|
Political subdivisions |
4,458 | 4,297 | 5,453 | 5,670 | ||||||||||||
|
Special revenue |
8,167 | 7,786 | 10,386 | 10,873 | ||||||||||||
|
Industrial and miscellaneous |
13,071 | 12,258 | 4,311 | 4,467 | ||||||||||||
|
Asset backed |
1,201 | 898 | 1,213 | 1,120 | ||||||||||||
|
Total rated securities |
27,901 | 26,199 | 21,404 | 22,173 | ||||||||||||
|
Redeemable preferred |
1,454 | 1,351 | 1,268 | 1,320 | ||||||||||||
|
Total available for sale securities |
$ | 29,355 | $ | 27,550 | $ | 22,672 | $ | 23,493 | ||||||||
The following table summarizes the distribution of our portfolio of fixed maturity investments as a percentage of total estimated fair value based on credit ratings assigned by Standard & Poor’s Financial Services, LLC (“S&P”) at December 31, 2022 and December 31, 2021 (dollars in thousands).
|
(dollars in thousands) |
December 31, 2022 |
December 31, 2021 |
||||||||||||||
|
Estimated |
Percent of |
Estimated |
Percent of |
|||||||||||||
|
Rating (1) |
Fair Value |
Total (2) |
Fair Value |
Total (2) |
||||||||||||
|
AAA |
$ | 618 | 2.4 | % | $ | 404 | 1.8 | % | ||||||||
|
AA |
12,132 | 46.3 | % | 12,337 | 55.6 | % | ||||||||||
|
A |
2,202 | 8.4 | % | 5,063 | 22.8 | % | ||||||||||
|
BBB |
8,204 | 31.3 | % | 1,940 | 8.7 | % | ||||||||||
|
BB |
2,848 | 10.9 | % | 2,429 | 11.0 | % | ||||||||||
|
B |
195 | 0.7 | % | - | 0.0 | % | ||||||||||
|
Total |
$ | 26,199 | 100.0 | % | $ | 22,173 | 100.0 | % | ||||||||
|
(1) |
The ratings set forth in this table are based on the ratings assigned by S&P. If S&P’s ratings were unavailable, the equivalent ratings supplied by Moody’s Investors Service, Inc., Fitch Ratings, Inc. or the Securities Valuation Office of the National Association of Insurance Commissioners were used, where available. |
|
(2) |
Represents percent of fair value for classification as a percent of the total portfolio. |
The table below sets forth the maturity profile of our investments in available for sale, fixed maturity securities by contractual maturities as of December 31, 2022. Expected maturities could differ from contractual maturities because borrowers may have the right to call or prepay obligations, with or without call or prepayment penalties (dollars in thousands).
|
December 31, 2022 |
||||||||
|
Amortized |
Estimated |
|||||||
|
(dollars in thousands) |
Cost |
Fair Value (1) |
||||||
|
Less than one year |
$ | 975 | $ | 965 | ||||
|
One through five years |
14,570 | 13,842 | ||||||
|
Five through ten years |
7,297 | 6,950 | ||||||
|
Greater than ten years |
3,858 | 3,543 | ||||||
|
MBS/ABS |
1,201 | 899 | ||||||
|
Total debt securities |
$ | 27,901 | $ | 26,199 | ||||
|
(1) |
Debt securities are carried at fair value in our financial statements. |
Other invested assets consist of (i) non-controlling interests in unaffiliated limited partnerships that invest primarily in small-cap public equities, (ii) an equity interest in Trustar Bank, a related entity, (iii) an investment in a limited liability company, and (iv) a non-controlling equity interest in a private company. The following table shows the cost and estimated fair values of such assets at December 31, 2022 and 2021 (dollars in thousands).
|
December 31, 2022 |
||||||||||||||||
|
Carrying |
Gross Unrealized |
|||||||||||||||
|
(dollars in thousands) |
Cost |
Value |
Gains |
Losses |
||||||||||||
|
Limited partnership investments |
$ | 3,701 | $ | 3,608 | $ | 336 | $ | (430 | ) | |||||||
|
Equity interest in Trustar Bank |
250 | 238 | - | (12 | ) | |||||||||||
|
Equity interest in CSE Opportunity Fund II, LLC |
55 | 55 | - | - | ||||||||||||
|
Equity interest in Stream-IT.app |
500 | 500 | - | - | ||||||||||||
|
Total other invested assets |
$ | 4,506 | $ | 4,401 | $ | 336 | $ | (442 | ) | |||||||
|
December 31, 2021 |
||||||||||||||||
|
Carrying |
Gross Unrealized |
|||||||||||||||
|
(dollars in thousands) |
Cost |
Value |
Gains |
Losses |
||||||||||||
|
Limited partnership investments |
$ | 3,701 | $ | 4,929 | $ | 1,246 | $ | (18 | ) | |||||||
|
Equity interest in Trustar Bank |
250 | 216 | - | (34 | ) | |||||||||||
|
Equity interest in CSE Opportunity Fund II, LLC |
128 | 128 | - | - | ||||||||||||
|
Equity interest in Stream-IT.app |
500 | 500 | - | - | ||||||||||||
|
Total other invested assets |
$ | 4,579 | $ | 5,773 | $ | 1,246 | $ | (52 | ) | |||||||
At December 31, 2022, the average maturity of our fixed maturity investment portfolio was 4.7 years and the average duration was 4.1 years. As a result, the fair value of our investments may fluctuate significantly in response to changes in interest rates. In addition, we may experience investment losses to the extent our liquidity needs require the disposition of fixed maturity securities in unfavorable interest rate environments.
We use quoted values and other data provided by independent pricing services as inputs in our process for determining fair values of our investments. The pricing services cover substantially all of the securities in our portfolio for which publicly quoted values are not available. The pricing services’ evaluations represent an exit price, a good faith opinion as to what a buyer in the marketplace would pay for a security in a current sale. The pricing is based on observable inputs either directly or indirectly, such as quoted prices in markets that are active, quoted prices for similar securities at the measurement date, or other inputs that are observable.
Our independent third-party investment management technology provider delivers to us pricing information that they obtain from independent pricing services to determine the fair value of our fixed maturity securities. After performing a detailed review of the information obtained from the pricing service, limited adjustments may be made by management to the values provided.
Our average cash and invested assets, net investment income, and return on average cash and invested assets for the years ended December 31, 2022 and 2021 were as follows (dollars in thousands):
|
(dollars in thousands) |
2022 |
2021 |
||||||
|
Average cash and invested assets (1) |
$ | 40,914 | $ | 41,559 | ||||
|
Net investment income |
$ | 1,157 | $ | 1,171 | ||||
|
Return on average cash and invested assets |
2.8 | % | 2.8 | % | ||||
|
(1) |
Average cash and invested assets does not include real estate held for the production of income. |
A.M. Best Rating
A.M. Best Company, Inc. (“A.M. Best”) rates insurance companies based on factors of concern to policyholders. The latest rating evaluation by A.M. Best was published on April 12, 2022. In its latest evaluation, A.M. Best affirmed FIC’s Financial Strength Rating of “B++” (Good). According to the A.M. Best guidelines, companies rated “B++” are considered by A.M. Best to have “a good ability to meet their ongoing insurance obligations.” In addition, in its most recent evaluation, A.M. Best upgraded FIC’s Long-Term Issuer Credit Rating to “bbb+” (Good) from “bbb” (Good). According to the A.M. Best guidelines, companies rated “bbb+” are considered by A.M. Best to have “a good ability to meet their ongoing senior financial obligations.” The outlook assigned to both the Financial Strength Rating and the Long-Term Issuer Credit Rating is stable. These ratings evaluate the claims paying ability and financial strength of a company and are not an investment recommendation. In evaluating a company’s financial and operating performance, A.M. Best reviews:
|
● |
the company’s profitability, leverage and liquidity; |
|
● |
its book of business; |
|
● |
the adequacy and soundness of its reinsurance; |
|
● |
the quality and estimated fair value of its assets; |
|
● |
the adequacy of its reserves and surplus; |
|
● |
its capital structure; |
|
● |
the experience and competence of its management; and |
|
● |
its marketing presence. |
In its ratings report on FIC, A.M. Best recognized FIC’s strong balance sheet position, noting its “Strongest” level of risk-adjusted capitalization, as measured by Best’s Capital Adequacy Ratio (“BCAR”). A.M. Best noted that FIC had experienced underwriting losses during the most recent five (5) years, primarily related to (i) discontinued operations (including coverage for non-emergency medical transportation vehicles and certain higher-severity states) and (ii) elevated fixed costs in 2021 as it has invested in its business ahead of anticipated premium growth. A.M. Best also noted FIC’s limited business profile as it is concentrated in the commercial auto segment. Finally, A.M. Best noted FIC’s enterprise risk management (“ERM”) as being appropriate for its business, citing improvements made in the ERM function since its prior rating evaluation. Specifically, A.M. Best noted that FIC had created a formal ERM committee, with representation across each department. A.M Best noted that the ERM committee held regular meetings, with documented meeting minutes and progress reports.
Competition
Given our focus on certain business class segments within the commercial automobile insurance line of business, the market conditions for our business varies geographically. The level of competition we face in each of our target geographies is based upon the number and nature of the other market participants that are also actively seeking to write business for the business class segments that we target. In states that have less competition, our primary competitors are Progressive and National Indemnity. In states with a high degree of competition such as Ohio, Wisconsin, and Maryland, we compete with the competitors listed above, in addition to other specialty carriers such as Philadelphia Insurance Company, Lancer Insurance Company, and New York Marine & General, as well as competition from other regional mutual carriers, excess and surplus lines companies, and risk retention groups. Despite significant competition, our management team believes the Company can continue to maintain and grow its market share.
Enterprise Risk Management
The enterprise risk management (“ERM”) function is the responsibility of our management team, the board of directors, and certain board committees. We have established ERM policies and procedures which have been approved by our board of directors. To ensure that the organization is operating in a manner consistent with these policies and procedures, we have established an ERM committee that consists of certain members of our senior management team, with each member representing a core functional area within the organization. The functional areas include: (i) strategic, (ii) investments, (iii) digital commerce and technology, (iv) finance, (v) business development, (vi) insurance operations, and (vii) product. Each member of the ERM committee is responsible for identifying and defining key risks and risk events for their respective functional area, prioritizing risks based on estimated impact and likelihood, establishing root cause analysis (“RCA”) maps, and developing risk mitigation action plans for each of the identified risks and risk events. The ERM committee meets on a regular basis and periodically reports to the board of directors and certain board committees throughout the year. To limit its exposure in the event of a lawsuit, the Company maintains a full line of insurance coverages, including errors and omissions, directors’ and officers’ liability, employment practices liability, and cyber liability insurance.
Legal Proceedings
We are, from time to time, involved in various legal proceedings in the ordinary course of business. While it is not possible to forecast the outcome of such legal proceedings, in light of existing insurance, reinsurance, and established reserves, we believe that there is no individual case pending that is likely to have a material adverse effect on our financial condition or results of operations.
Properties
We lease approximately 9,544 square feet of office space at 8401 Connecticut Avenue, Chevy Chase, Maryland. As of December 31, 2022, we subleased all of such space to three tenants. We have adopted a hybrid work-from-home employment model and anticipate needing less leased office than we have had historically. We entered into a new lease for one office suite, totaling 1,579 square feet, in Bethesda, Maryland under an operating lease that commenced September 1, 2022, and has a term expiring 41 months after commencement. We believe this office space will be adequate to accommodate the Company’s existing needs and any increase in workforce for the foreseeable future.
Employees
As of December 31, 2022 the Company had 19 employees, all of which are full-time. We provide health, dental, disability, vision, and life insurance to our full-time employees who have completed 90 days of full-time employment. Full-time employees are also eligible for paid vacation and to participate in the FIC 401(k) plan, which features a safe harbor contribution by FIC equal to 3% of the employee’s eligible compensation. We have the option to make an additional profit-sharing contribution to the plan. The Company’s Employee Stock Ownership Plan (“ESOP”) is an integral component of long-term compensation and is also a valuable employee retention tool. The Company’s ESOP is a qualified retirement plan that grants shares of the Company’s stock to eligible employees. The ESOP provides a mechanism whereby employees can actively participate in building long-term value in alignment with the interests of other shareholders. None of our employees are covered by a collective bargaining agreement. We believe that relations with our employees are good.
Federal Income Tax
We file a U.S. federal income tax return that includes the pass-through income or loss of majority owned direct and indirect subsidiaries. State tax returns are filed depending on applicable laws. We record adjustments related to prior years’ taxes during the period in which they are identified, generally when the tax returns are filed. The effect of these adjustments on the current and prior periods (during which the differences originated) is evaluated based upon quantitative and qualitative factors and are considered in relation to the consolidated financial statements taken as a whole for the respective years. The provision for income taxes for the years ended December 31, 2022 and 2021, is comprised of the following (dollars in thousands):
|
Years ended December 31, |
||||||||
|
(dollars in thousands) |
2022 |
2021 |
||||||
|
Current federal income tax expense |
$ | - | $ | - | ||||
|
Current state income tax expense |
42 | - | ||||||
|
Deferred federal and state income tax expense |
594 | 104 | ||||||
|
Income tax expense (benefit) |
$ | 636 | $ | 104 | ||||
A reconciliation of the expected income tax expense to the actual income tax expense and the reconciliation of the federal statutory rate to our effective tax rate for the periods ended December 31, 2022 and 2021 is presented below (dollars in thousands):
|
December 31, |
% of Pre-Tax |
|||||||
|
(dollars in thousands) |
2022 |
Income |
||||||
|
Provision for income taxes at the statutory federal rate |
$ | (2,412 | ) | 21.0 | % | |||
|
Increase (reduction) in taxes resulting from: |
||||||||
|
Permanent differences: |
||||||||
|
Dividends received deduction |
(6 | ) | 0.1 | % | ||||
|
Tax exempt interest |
(18 | ) | 0.2 | % | ||||
|
Gain on extinguishment of related party loan |
84 | -0.7 | % | |||||
|
Policyholder dividends |
1,534 | -13.4 | % | |||||
|
Pass-through entity income |
(32 | ) | 0.3 | % | ||||
|
Temporary differences: |
||||||||
|
Valuation allowance adjustment |
1,127 | -9.8 | % | |||||
|
Prior year true-ups and other |
359 | -3.2 | % | |||||
|
Actual income tax, as provided in the consolidated financial statements |
$ | 636 | -5.5 | % | ||||
|
December 31, |
% of Pre-Tax |
|||||||
|
(dollars in thousands) |
2021 |
Income |
||||||
|
Provision for income taxes at the statutory federal rate |
$ | (131 | ) | 21.0 | % | |||
|
Increase (reduction) in taxes resulting from: |
||||||||
|
Permanent differences: |
||||||||
|
Dividends received deduction |
(24 | ) | 3.8 | % | ||||
|
Tax exempt interest |
(26 | ) | 4.2 | % | ||||
|
Gain on extinguishment of related party loan |
- | 0.0 | % | |||||
|
Pass-through entity income |
(81 | ) | 13.0 | % | ||||
|
Temporary differences: |
||||||||
|
Valuation allowance adjustment |
145 | -4.9 | % | |||||
|
Prior year true-ups and other |
221 | -43.1 | % | |||||
|
Actual income tax, as provided in the consolidated financial statements |
$ | 104 | -6.0 | % | ||||
Significant components of our deferred tax assets and liabilities at December 31, 2022 and 2021 were as follows (dollars in thousands):
|
December 31, |
December 31, |
|||||||
|
(dollars in thousands) |
2022 |
2021 |
||||||
|
Deferred tax assets: |
||||||||
|
Unearned premiums |
$ | 265 | $ | 176 | ||||
|
Loss discounting |
64 | 119 | ||||||
|
Net operating loss carryforward |
2,526 | 2,479 | ||||||
|
Net unrealized loss on investments |
379 | - | ||||||
|
Lease liability |
152 | 191 | ||||||
|
Defined benefit plan |
101 | 58 | ||||||
|
Other |
202 | 201 | ||||||
|
Valuation allowance adjustment |
(1,493 | ) | (366 | ) | ||||
|
Total deferred tax assets |
2,196 | 2,858 | ||||||
|
Deferred tax liabilities: |
||||||||
|
Deferred policy acquisition costs |
290 | 155 | ||||||
|
Unrealized gains on investments |
- | 161 | ||||||
|
Deferred gain -- 1031 exchange |
1,879 | 1,879 | ||||||
|
Other |
27 | 663 | ||||||
|
Total deferred tax liabilities |
2,196 | 2,858 | ||||||
|
Net deferred tax liability |
$ | - | $ | - | ||||
At December 31, 2022, we had net operating loss (“NOL”) carry forwards available for tax purposes of $12.0 million that will begin to expire in 2037, and foreign tax credit carry-forwards of $1.0 thousand. In 2015, ACIC Consolidated Properties, LLC sold a building, placed the proceeds in trust and then reinvested the proceeds in similar use (like-kind) property, availing itself of the ability (pursuant to Section 1031 of the tax code) to defer the taxes that would otherwise have been due on the gain. As a result, we established a deferred tax liability of $1.9 million (as shown above). In assessing the valuation of deferred tax assets, we consider whether it is more likely than not that some portion or all of the deferred tax assets will not be realized. The ultimate realization of deferred tax assets is dependent upon the generation of future taxable income during the periods in which those temporary differences become deductible. A valuation allowance against deferred tax assets has been established, as we believe it is more likely than not the deferred tax assets will not be realized based on its historical taxable income, or be offset to deferred tax liabilities. We had no material unrecognized tax benefits and no adjustments to liabilities or operations were required. There were no interest or penalties related to income taxes that have been accrued or recognized as of and for the years ended December 31, 2022 and 2021. If any had been recognized, these would have been reported in income tax expense. Generally, taxing authorities may examine our tax returns for the three years from the date of filing. Our tax returns for the years ended December 31, 2020 through December 31, 2022 remain subject to examination.
Regulation
Our businesses are subject to a number of federal and state laws and regulations. These laws and regulations apply to FIC’s operations as an insurance company and FRM’s operations as a licensed insurance producer. Our operations are subject to extensive laws and governmental regulations, including administrative determinations, court decisions, and similar constraints. The purpose of the laws and regulations affecting our operations is primarily to protect our policyholders and not our shareholders. Many of the laws and regulations to which we are subject are regularly re-examined, and existing or future laws and regulations may become more restrictive or otherwise adversely affect our operations. State insurance laws regulate most aspects of our insurance business, and we are regulated by the insurance departments of the states in which we sell insurance policies. The NAIC assists the various state insurance regulators in the development, review, and implementation of a wide range of financial and other regulations over the insurance industry.
Insurance Regulation
FIC is licensed as a property and casualty insurer in 34 states and the District of Columbia. State insurance laws regulate many aspects of our business. Such regulation is vested primarily in state agencies having broad administrative and in some instances discretionary power dealing with many aspects of our business, which may include, among other things, required reserve liability levels, permitted classes of investments, transactions among affiliates, marketing practices, advertising, privacy, policy forms, reinsurance reserve requirements, acquisitions, mergers, and capital adequacy, and is concerned primarily with the protection of policyholders and other consumers rather than shareholders. We are subject to financial and market conduct examinations by insurance regulators from our domiciliary states and from other states in which we do business. State laws and regulations governing the financial condition of insurers apply to FIC, including standards of solvency, risk-based capital requirements, types, quality and concentration of investments, establishment and maintenance of reserves, required methods of accounting, reinsurance and minimum capital and surplus requirements, and the business conduct of insurers, including sales and marketing practices, claim procedures and practices, and policy form content. In addition, state insurance laws require licensing of insurers and their agents. State insurance regulators have the power to grant, suspend, and revoke licenses to transact business and to impose substantial fines and other penalties.
Agent Licensing
FIC sells its insurance products through FRM, its appointed insurance producer. FRM in turn also works with other independent distributors and independent agents. The states in which insurance agents operate require agents to obtain and maintain licenses to sell insurance products. In order to sell insurance products, the agents must be licensed by their resident state and by any other state in which they do business and must comply with regulations regarding licensing, sales and marketing practices, premium collection and safeguarding, and other market conduct practices. Consistent with various federal and state legal requirements, FRM monitors all of the agents that sell FIC policies, and FRM monitors the agencies with which the independent distributors and independent agents work in order to understand and evaluate the agencies’ training and general supervision programs relevant to regulatory compliance.
Financial Review
FIC is required to file detailed annual and quarterly financial reports with the insurance departments in the states in which we do business, and its business and accounts are subject to examination by such agencies at any time. These examinations generally are conducted under NAIC guidelines. Under the rules of these jurisdictions, insurance companies are examined periodically (generally every three to five years) by one or more of the supervisory agencies on behalf of the states in which they do business.
Market Conduct Regulation
The laws and regulations governing our insurance businesses include numerous provisions governing the marketplace activities of insurers, such as FIC, including regulations governing the form and content of disclosures to consumers, advertising, product replacement, sales and underwriting practices, complaint handling, and claims handling. State insurance regulators enforce compliance, in part, through periodic market conduct examinations.
Insurance Holding Company Regulation
All states in which FIC conducts insurance business have enacted legislation that requires each insurance company in a holding company system to register with the insurance regulatory authority of its state of domicile and to furnish that regulatory authority financial and other information concerning the operations of, and the interrelationships and transactions among, companies within its holding company system that may materially affect the operations, management, or financial condition of the insurers within the system. These laws and regulations also regulate transactions between insurance companies and their parents and affiliates. Generally, these laws and regulations require that all transactions within a holding company system between an insurer and its affiliates be fair and reasonable and that the insurer’s statutory surplus following any transaction with an affiliate be both reasonable in relation to its outstanding liabilities and adequate to its financial needs. Statutory surplus is the excess of admitted assets over statutory liabilities. For certain types of agreements and transactions between an insurer and its affiliates, these laws and regulations require prior notification to, and non-disapproval or approval by, the insurance regulatory authority of the insurer’s state of domicile. These laws and regulations also require the holding company system to file an annual report identifying certain risks (“enterprise risks”) that, if not remedied, are likely to have a material adverse effect upon the financial condition of the insurer or its holding company system as a whole.
Dividend Limitations
As a holding company with no significant business operations of its own, the Company will depend on intercompany dividends or other distributions from its subsidiaries as the principal source of cash to meet its obligations. FIC’s ability to pay dividends is subject to restrictions contained in the insurance laws of District of Columbia, which require that dividends be approved by the District of Columbia Department of Insurance, Securities and Banking prior to their payment. Insurance regulators have broad powers to prevent the reduction of statutory surplus to inadequate levels, and there is no assurance that dividend payments will be permitted. See Item 2. Management’s Discussion and Analysis of Financial Condition and Results of Operations – Liquidity and capital resources for additional information regarding on the restrictions on FIC’s ability to pay dividends with the prior approval of the Department.
Change of Control
District of Columbia law requires advance approval by the Commissioner of Insurance of any direct or indirect change of control of a District of Columbia domiciled insurer, such as FIC. In considering an application to acquire control of an insurer, the Commissioner generally will consider such factors as experience, competence, and the financial strength of the applicant, the integrity of the applicant’s board of directors and officers, the acquirer’s plans for the management and operation of the insurer, and any anti-competitive effects that may result from the acquisition. Under District of Columbia law, there exists a presumption of “control” when an acquiring party acquires 10% or more of the voting securities of an insurance company or of a company which itself controls an insurance company. Therefore, any person acquiring, directly or indirectly, 10% or more of our common stock would need the prior approval of the District of Columbia Commissioner of Insurance, or a determination from the Commissioner that “control” has not been acquired. Under Section 31-906(l) of the D.C. Official Code, no person, together with such purchaser’s associates or a group acting in concert, may acquire, directly or indirectly, more than 5% of the capital stock of the Company for a period of five years from the effective date of the conversion without the approval of the District of Columbia Commissioner of Insurance. In addition, a person seeking to acquire, directly or indirectly, control of an insurance company is required in some states to make filings prior to completing an acquisition if the acquirer and the target insurance company and their affiliates have sufficiently large market shares in particular lines of insurance in those states. Approval of an acquisition may not be required in these states, but the state insurance departments could take action to impose conditions on an acquisition that could delay or prevent its consummation.
Risk Based Capital (RBC) Requirements
The NAIC has established a standard for assessing the solvency of insurance companies using a formula for determining each insurer’s RBC. The RBC model act provides that insurance companies must submit an annual RBC report to state regulators reporting their RBC based upon four categories of risk: asset risk, insurance risk, interest rate risk, and business risk. For each category, the capital requirement is determined by applying factors to various asset, premium, and reserve items, with the factor being higher for those items with greater underlying risk and lower for less risky items. The formula is intended to be used by insurance regulators as an early warning tool to identify possible weakly capitalized companies for purposes of initiating further regulatory action. If an insurer’s Total Adjusted Capital (“TAC”) falls below specified levels in relation to its RBC, the insurer would be subject to different degrees of regulatory action depending upon the relationship of its TAC to its RBC. These actions range from requiring the insurer to propose actions to correct the capital deficiency to placing the insurer under regulatory control. For example, if FIC’s TAC is equal to or less than its “company action level RBC,” then FIC could be subject to a wide range of regulatory oversight, including a requirement to submit a written plan for capital strengthening to the District of Columbia Commissioner of Insurance. A company’s “company action level RBC” is equal to two times its “authorized control level RBC,” which is the product of the RBC formula as described above. FIC’s “authorized control level RBC” was $4.0 million, which results in a “company action level RBC” of $8.0 million. At December 31, 2022, FIC’s TAC was significantly in excess of its “company action level RBC” by $29.4 million. Our other operating subsidiaries and the Company are not subject to RBC requirements.
NAIC Ratios
The NAIC is a voluntary association of state insurance commissioners formed to discuss issues and formulate policy with respect to regulation, reporting, and accounting of insurance companies. Although the NAIC has no legislative authority and insurance companies are at all times subject to the laws of their respective domiciliary states, and to a lesser extent, other states in which they conduct business, the NAIC is influential in determining the form in which such laws are enacted. Model insurance laws, regulations, and guidelines have been promulgated by the NAIC as minimum standards by which state regulatory systems and regulations are measured. The NAIC also has established a set of 13 financial ratios to assess the financial strength of insurance companies. The key financial ratios of the NAIC’s Insurance Regulatory Information System, or IRIS, which were developed to assist insurance departments in overseeing the financial condition of insurance companies, are reviewed by experienced financial examiners of the NAIC and state insurance departments to select those companies that merit highest priority in the allocation of the regulators’ resources. IRIS identifies these key financial ratios and specifies a range of “unusual values” for each ratio. The NAIC suggests that insurance companies that fall outside the “usual” range in four or more financial ratios are those most likely to require analysis by state regulators. However, according to the NAIC, it may not be unusual for a financially sound company to have several ratios outside the “usual” range. For the year ended December 31, 2022, FIC was within the “usual” range for all but two ratios. The two ratios outside the “usual” range were the two-year operating ratio and change in adjusted policyholders’ surplus. Both ratios were adversely affected by the $7.3 million policyholder dividend made in connection with the conversion and offering.
Statutory Accounting Principles (SAP)
SAP is a basis of accounting developed by U.S. insurance regulators to monitor and regulate the solvency of insurance companies. In developing SAP, insurance regulators were primarily concerned with evaluating an insurer’s ability to pay all its current and future obligations to policyholders. As a result, statutory accounting focuses on conservatively valuing the assets and liabilities of insurers, generally in accordance with standards specified by the insurer’s domiciliary jurisdiction. Uniform statutory accounting practices are established by the NAIC and generally adopted by regulators in the various U.S. jurisdictions. These accounting principles differ somewhat from GAAP, which are designed to measure a business on a going concern basis. GAAP gives consideration to matching of revenue and expenses and, as a result, certain insurer expenses are capitalized when incurred and then amortized over the life of the associated policies. The valuation of assets and liabilities under GAAP is based in part upon best estimate assumptions made by the insurer. Shareholders’ equity under GAAP represents both amounts currently available and amounts expected to emerge over the life of the business. As a result, the values for assets, liabilities, and equity reflected in financial statements prepared in accordance with GAAP may be different from those reflected in financial statements prepared under SAP. State insurance laws and regulations require FIC to file with state insurance departments publicly available quarterly and annual financial statements, prepared in accordance with statutory guidelines that generally follow NAIC uniform standards. State insurance laws require that the annual statutory financial statements be audited by an independent public accountant and that the audited statements be filed with the insurance departments in states where the insurer transacts business.
State Insurance Guaranty Funds Laws
In most states, there is a requirement that property and casualty insurers doing business within the state participate in a guaranty association, which is organized to pay contractual benefits owed pursuant to insurance policies issued by impaired, insolvent, or failed insurers. These associations levy assessments, up to prescribed limits, on all member insurers in a particular state on the basis of the proportionate share of the written premium in the state by member insurers in the lines of business in which the impaired, insolvent, or failed insurer is engaged. Some states permit member insurers to recover such paid assessments through full or partial premium tax offsets. Property and casualty insurance company insolvencies or failures may result in additional guaranty association assessments against FIC in the future. At this time, we are not aware of any material liabilities for guaranty fund assessments that apply to FIC with respect to impaired or insolvent insurers that are currently subject to insolvency proceedings.
Regulation of Investments
FIC is subject to state laws and regulations that require diversification of its investment portfolio and limit the amount of investments in certain asset categories, such as below investment grade fixed income securities, equity real estate, mortgages, other equity investments, foreign investments, and derivatives. Failure to comply with these laws and regulations would cause investments exceeding regulatory limitations to be treated as non-admitted assets for purposes of measuring statutory surplus, and, in most instances, require divestiture.
Federal and State Legislative and Regulatory Changes
From time to time, various regulatory and legislative changes have been proposed for the insurance industry. Among the proposals that have in the past been or are at present being considered are the possible introduction of federal regulation in addition to, or in lieu of, the current system of state regulation of insurers and proposals in various state legislatures (some of which proposals have been enacted) to conform portions of their insurance laws and regulations to various model acts adopted by the NAIC. We are unable to predict whether any of these proposed laws and regulations will be adopted, the form in which any such laws and regulations would be adopted or the effect, if any, these developments would have on our business, financial condition, and results of operations.
Other Laws and Regulations
USA Patriot Act and similar regulations
The USA Patriot Act of 2001, enacted in response to the terrorist attacks on September 11, 2001, contains anti money laundering and financial transparency laws and mandates the implementation of various regulations applicable to broker dealers and other financial services companies, including insurance companies. The Patriot Act seeks to promote cooperation among financial institutions, regulators, and law enforcement entities in identifying parties that may be involved in terrorism or money laundering. The increased obligations of financial institutions to identify their customers, watch for and report suspicious transactions, respond to requests for information by regulatory authorities and law enforcement agencies, and share information with other financial institutions, require the implementation and maintenance of internal practices, procedures, and controls.
Privacy of consumer information
U.S. federal and state laws and regulations require financial institutions, including insurance companies, to protect the security and confidentiality of consumer financial information and to notify consumers about their policies and practices relating to their collection and disclosure of consumer information and their policies relating to protecting the security and confidentiality of that information. Similarly, federal and state laws and regulations also govern the disclosure and security of consumer health information. In particular, regulations promulgated by the U.S. Department of Health and Human Services regulate the disclosure and use of protected health information by health insurers and others, the physical and procedural safeguards employed to protect the security of that information, and the electronic transmission of such information.
ITEM 2. MANAGEMENT’S DISCUSSION AND ANALYSIS OF FINANCIAL CONDITION AND RESULTS OF OPERATIONS
The following discussion and analysis of our financial condition and results of operations should be read in conjunction with the financial statements and accompanying notes included elsewhere in this Form 1-K. Some of the information contained in this discussion and analysis or set forth elsewhere in this Form 1-K constitutes forward-looking information that involves risks and uncertainties. Please see Forward-Looking Information for more information.
Overview
As described in this report, the Company was organized in 2021 so that it could (i) acquire all of the capital stock of FIC in a mutual to stock conversion and (ii) acquire FIC’s affiliated insurance agency, FRM. Prior to the conversion, the Company did not engage in any operations. After the conversion, the Company’s primary assets consisted of (i) the outstanding capital stock of FIC, (ii) the outstanding capital stock of FRM, and (iii) a portion of the net proceeds from the offering completed in connection with the conversion of FIC. ACIC Properties is a majority-owned subsidiary of FIC and the intermediate holding company for (i) 717 8th Street, LLC, (ii) 2805 M Street, LLC, and (iii) 810 5th Street, LLC, each of which directly own commercial real estate in the District of Columbia. The Company’s initial public offering, and the concurrent acquisition of FRM, were completed on March 11, 2022. Please see Item 1. Business — Completion of Offering, Conversion and Agency Acquisition for more information. References to the Company’s financial information in this report is to the financial information for Forge Group, Inc., FIC, and FRM on a consolidated basis after March 11, 2022. References to the Company’s financial information in this report is to the financial information for FIC on a consolidated basis prior to March 11, 2022.
Through our wholly owned subsidiaries, we operate as a specialist commercial automobile insurance business. FIC was incorporated in the District of Columbia in 1938 and is rated B++ by A.M. Best. As of December 31, 2022, FIC was licensed as a property and casualty insurer in 34 states and the District of Columbia. FIC’s insurance products are marketed and distributed through FRM, its appointed insurance producer. FRM solicits business directly from customers and works with insurance agency sub-producers, referred to as “distribution partners”. As of December 31, 2022, FRM was licensed as a property and casualty insurance producer in 34 states and the District of Columbia. Through our wholly owned subsidiaries, we market and underwrite commercial automobile insurance products. We are focused on delivering these commercial automobile insurance products to small business owners and operators that operate in (i) certain business class segments and (ii) in certain geographic markets in the U.S. Historically, we have focused on the public automobile business class segment (“public auto segment”) within the commercial automobile insurance line. In the public auto segment, vehicles are used to transport passengers from one location to another. Specifically, we have historically focused on the following public auto sub-segments: taxi cabs, passenger sedans, golf carts, school vans, and other light transportation vehicles. Recently, we have developed commercial auto insurance products targeting additional business class segments, namely trade and service providers such as electricians, plumbers, and carpenters (collectively, the “small business segment”).
For the year ended December 31, 2022, we had net premiums written of $11.5 million, net premiums earned of $9.4 million, and net loss attributable to the Company of $12.5 million. For the year ended December 31, 2021, we had net premiums written of $8.9 million, net premiums earned of $7.9 million, and a net loss attributable to the Company of $0.7 million.
Principal Revenue and Expense Items
We derive our revenue primarily from premiums earned, net investment income and net realized gains (losses) from investments.
Gross and net premiums written
Gross premiums written is equal to direct and assumed premiums before the effect of ceded reinsurance. Net premiums written is the difference between gross premiums written and premiums ceded or paid to reinsurers (ceded premiums written).
Premiums earned
Premiums earned is the earned portion of our net premiums written. Gross premiums written include all premiums recorded by an insurance company during a specified policy period. Insurance premiums on property and casualty insurance contracts are recognized in proportion to the underlying risk insured and are earned ratably over the duration of the policies. At the end of each accounting period, the portion of the premiums that is not yet earned is included in unearned premiums and is realized as revenue in subsequent periods over the remaining term of the policy. Our policies typically have a term of twelve months. Thus, for example, for a policy that is written on July 1, 2022, one-half of the premiums would be earned in 2022 and the other half would be earned in 2023.
Net investment income and net realized gains (losses) on investments
We invest our surplus and the funds supporting our insurance liabilities (including unearned premiums and unpaid losses and loss adjustment expenses) in cash, cash equivalents, equities, fixed maturity securities and real estate. Investment income includes interest and dividends earned on invested assets. Net realized gains and losses on invested assets are reported separately from net investment income. We recognize realized gains when invested assets are sold for an amount greater than their cost or amortized cost (in the case of fixed maturity securities) and recognize realized losses when investment securities are written down as a result of an other than temporary impairment (“OTTI”) or sold for an amount less than their cost or amortized cost, as applicable. Our portfolio of investment securities is managed internally.
Loss and loss adjustment expense
Loss and loss adjustment expenses represent the largest expense item and include: (1) claim payments made, (2) estimates for future claim payments and changes in those estimates for prior periods, and (3) costs associated with investigating, defending and adjusting claims.
Amortization of deferred policy acquisition costs and underwriting and administrative expenses
Expenses incurred to underwrite risks are referred to as policy acquisition expenses. Variable policy acquisition costs consist of commission expenses, premium taxes and certain other underwriting expenses that vary with, and are primarily related to, the writing and acquisition of new and renewal business. These policy acquisition costs are deferred and amortized over the effective period of the related insurance policies. Fixed policy acquisition costs, referred to herein as underwriting and administrative expenses, are expensed as incurred. These costs include salaries, rent, office supplies, depreciation and all other operating expenses not otherwise classified separately.
Income taxes
We use the asset and liability method of accounting for income taxes. Deferred income taxes arise from the recognition of temporary differences between financial statement carrying amounts and the tax basis of our assets and liabilities. A valuation allowance is provided when it is more likely than not that some or all of the deferred tax asset will not be realized. The effect of a change in tax rates is recognized in the period of the enactment date.
Key Financial Measures
We evaluate our insurance operations by monitoring certain key measures of growth and profitability. In addition to reviewing our financial performance based on results determined in accordance with generally accepted accounting principles in the United States (GAAP), we utilize certain non-GAAP financial measures that we believe are valuable in managing our business and for comparison to our peers. These non-GAAP measures are written premium, loss and loss adjustment expense ratio, expense ratio, GAAP combined ratio, net premiums written to statutory surplus ratio, underwriting income (loss), net income (loss) and return on average equity.
We measure growth by monitoring changes in gross premiums written and net premiums written. We measure underwriting profitability by examining loss and loss adjustment expense, underwriting expense, loss and loss adjustment expense ratio, expense ratio, GAAP combined ratio, and underwriting income (loss). We measure consolidated profitability by examining net income (loss).
Premiums written
Gross premiums written represents the premiums from policies written during the period, before taking into account any premiums ceded to reinsurers. Ceded premiums written represents the premiums ceded to reinsurers during the period. Net premiums written represent the premiums from policies written during the period, less any premiums ceded to reinsurers.
Loss and loss adjustment expense ratio
The loss and loss adjustment expense ratio is the ratio (expressed as a percentage) of losses and loss adjustment expenses incurred to premiums earned. We measure the loss ratio on an accident year and calendar year loss basis to measure underwriting profitability. An accident year loss ratio measures losses and loss adjustment expenses for insured events occurring in a particular year, regardless of when they are reported, as a percentage of premiums earned during that year. A calendar year loss ratio measures losses and loss adjustment expense for insured events occurring during a particular year and the change in loss reserves from prior accident years as a percentage of premiums earned during that year.
Expense ratio
The expense ratio is the ratio (expressed as a percentage) of underwriting expenses to premiums earned. As described in this report, we define underwriting expenses as policy acquisition costs and other operating expenses attributable to our insurance segment (net of service fee and other income). In calculating our underwriting expenses, we also include the following items: (i) related party commissions, (ii) depreciation and amortization expenses attributable to our insurance segment and (iii) rent expense (net of sublease income). The expense ratio measures our operational efficiency in producing, underwriting and administering our insurance business.
GAAP combined ratio
Our GAAP combined ratio is the sum of the loss and loss adjustment expense ratio and the expense ratio and measures our overall underwriting profit. If the GAAP combined ratio is below 100%, we are making an underwriting profit. If the GAAP combined ratio is at or above 100%, we are not profitable without investment income and may not be profitable if investment income is insufficient.
Net premiums written to statutory surplus ratio
The net premiums written to statutory surplus ratio represents the ratio of net premiums written, after reinsurance ceded, to statutory surplus. This ratio measures our exposure to pricing errors in our current book of business. The higher the ratio, the greater the impact on surplus should pricing prove inadequate.
Underwriting income (loss)
Underwriting income (loss) measures the pre-tax profitability of our insurance operations. It is derived by subtracting loss and loss adjustment expense and underwriting expenses from earned premiums.
Net income (loss) and return on average equity
We use net income (loss) to measure our profit and return on average equity to measure our effectiveness in utilizing equity to generate net income. In determining return on average equity for a given year, net income (loss) is divided by the average of the beginning and ending equity for that year.
Critical Accounting Policies
General
The preparation of financial statements in accordance with GAAP requires both the use of estimates and judgment relative to the application of appropriate accounting policies. We are required to make estimates and assumptions in certain circumstances that affect amounts reported in our financial statements and related footnotes. We evaluate these estimates and assumptions on an on-going basis based on historical developments, market conditions, industry trends and other information that we believe to be reasonable under the circumstances. There can be no assurance that actual results will conform to our estimates and assumptions and that reported results of operations will not be materially adversely affected by the need to make accounting adjustments to reflect changes in these estimates and assumptions from time to time. We believe the following policies are the most sensitive to estimates and judgments.
Investments
We classify our investments in all debt and equity securities as available-for-sale.
Available-for-sale securities
Debt and equity securities are classified as available-for-sale and reported at fair value. Unrealized gains and losses on debt securities are excluded from net earnings but are recorded as a separate component of comprehensive earnings and shareholders’ equity, net of deferred income taxes. Changes in the fair value of equity securities are recognized as a component of net earnings.
Other than temporary impairment
Under current accounting standards, an OTTI write-down of debt securities, where fair value is below amortized cost, is triggered by circumstances where (1) an entity has the intent to sell a security, (2) it is more likely than not that the entity will be required to sell the security before recovery of its amortized cost basis or (3) the entity does not expect to recover the entire amortized cost basis of the security. If an entity intends to sell a security or if it is more likely than not the entity will be required to sell the security before recovery, an OTTI write-down is recognized in earnings equal to the difference between the security’s amortized cost and its fair value. If an entity does not intend to sell the security or it is not more likely than not that it will be required to sell the security before recovery, the OTTI write-down is separated into an amount representing the credit loss, which is recognized in earnings, and the amount related to all other factors, which is recognized in other comprehensive income. Impairment losses result in a reduction of the underlying investment’s cost basis.
We regularly evaluates its fixed income securities using both quantitative and qualitative criteria to determine impairment losses for other-than-temporary declines in the fair value of the investments. The following are the key factors for determining if a security is other-than-temporarily impaired:
|
● |
The extent to which the fair value is less than cost; |
|
● |
The assessment of significant adverse changes to the cash flows on a fixed income investment; |
|
● |
The occurrence of a discrete credit event resulting in the issuer defaulting on a material obligation, the issuer seeking protection from creditors under the bankruptcy laws, the issuer proposing a voluntary reorganization under which creditors are asked to exchange their claims for cash or securities having a fair value substantially lower than par value; |
|
● |
The probability that FIC will recover the entire amortized cost basis of the fixed income securities prior to maturity; or |
|
● |
The ability and intent to hold fixed income securities until maturity. |
Quantitative and qualitative criteria are considered during this process to varying degrees depending on the sector the analysis is being performed.
Corporate securities
We perform a qualitative evaluation of holdings that fall below the price threshold. The analysis begins with an opinion of industry and competitive position. This includes an assessment of factors that enable the profit structure of the business (e.g., reserve profile for exploration and production companies), competitive advantage (e.g., distribution system), management strategy, and an analysis of trends in return on invested capital. We may also review other factors to determine whether an impairment exists including liquidity, asset value cash flow generation, and industry multiples.
Municipal securities
We analyze the screened impairment candidates on a quantitative and qualitative basis. This includes an assessment of the factors that may be contributing to the unrealized loss and whether the recovery value is greater or less than current market value.
Structured securities
The “stated assumptions” analytic approach relies on actual 6-month average collateral performance measures (voluntary prepayment rate, gross default rate, and loss severity) sourced through third party data providers or remittance reports. The analysis applies the stated assumptions throughout the remaining term of the transaction using forecasted cash flows, which are then applied through the transaction structure (reflecting the priority of payments and performance triggers) to determine whether there is a loss to the security (“Loss to Tranche”). For securities or sectors for which no actual loss or minimal loss has been observed (certain Prime Residential Mortgage-Backed Securities (“RMBS”) and Commercial Mortgage-Backed Securities (“CMBS”), for example), sector-based assumptions are applied or an alternative quantitative or qualitative analysis is performed.
Property and equipment
Property and equipment (including major renewals, replacements and betterments) with a cost of $5,000 or greater are capitalized and stated at cost. Expenditures for ordinary maintenance and repair items are charged to operations as incurred. Upon the sale or other disposition of property, the cost and related accumulated depreciation are eliminated from the accounts and any resulting gain or loss is reflected in the results of operations.
Other invested assets
Other invested assets consist of (i) non-controlling interests in unaffiliated limited partnerships that invest primarily in small-cap public equities, (ii) an equity interest in Trustar Bank, a related entity, (iii) an investment in a limited liability company, and (iv) a non-controlling equity interest in a private company. For our interest in unaffiliated limited partnerships, our pro rata share of the audited GAAP equity of the partnership is the fair value equivalent. For the other investments, we have used internal estimates of fair market value.
Investment income
Interest on fixed maturities and short-term investments is credited to earnings on an accrual basis. Premiums and discounts are amortized or accreted over the lives of the related fixed maturities. Dividends on equity securities are credited to earnings on the ex-dividend date. Realized gains and losses on disposition of investments are based on specific identification of the investments sold on the settlement date, which does not differ significantly from trade date accounting.
Cash and cash equivalents
Cash consists of uninvested balances in bank accounts. Cash equivalents consist of investments with original maturities of 90 days or less, primarily AAA-rated prime and government money market funds. Cash equivalents are carried at cost, which approximates fair value. The Company has not experienced losses on these instruments.
Unpaid losses and loss adjustment expense reserves
We maintain reserves for the payment of claims (incurred losses) and expenses related to adjusting those claims (loss adjustment expenses or “LAE”). Our loss reserves consist of case reserves, which are reserves for claims that have been reported to us; defense and cost containment expense (“DCC”) reserve, which includes all defense and litigation-related expenses, whether internal or external to us; Adjusting and Other reserves (“A&O”), which includes internal claims adjustment expenses; and reserves for claims that have been incurred but have not yet been reported or for case reserve deficiencies or redundancies (“IBNR”).
When a claim is reported to us, our claims personnel establish a case reserve for the estimated amount of the ultimate payment. The amount of the loss reserve for the reported claim is based primarily upon a claim-by-claim evaluation of coverage, liability, injury severity or scope of property damage, and any other information considered pertinent to estimating the exposure presented by the claim. Each claim is settled individually based upon its merits, and some claims may take years to settle, especially if legal action is involved. Case reserves are reviewed on a regular basis and are updated as new data becomes available.
In addition to case reserves, we maintain an estimate of reserves for losses and loss adjustment expenses incurred but not reported. Some claims may not be reported for several years. As a result, the liability for unpaid losses and loss adjustment reserves includes significant estimates for IBNR.
We utilize an independent actuary to assist with the estimation of our loss and LAE reserves on an annual basis. This actuary prepares estimates of the ultimate liability for unpaid losses and LAE based on established actuarial methods described below. Our management reviews these estimates and supplements the actuarial analysis with information not fully incorporated into the actuarially based estimate, such as changes in the external business environment and changes in internal company processes and strategy. We may adjust the actuarial estimates based on this supplemental information in order to arrive at the amount recorded in the financial statements.
We accrue liabilities for unpaid losses and loss adjustment expenses based upon estimates of the ultimate amount payable.
Policy acquisition costs
We defer commissions, premium taxes, and certain other costs that are incrementally or directly related to the successful acquisition of new or renewal insurance contracts. Acquisition-related costs may be deemed ineligible for deferral when they are based on contingent or performance criteria beyond the basic acquisition of the insurance contract or when efforts to obtain or renew the insurance contract are unsuccessful. All eligible costs are capitalized and charged to expense in proportion to premium revenue recognized. The method followed in computing deferred policy acquisition costs limits the amount of such deferred costs to their estimated realizable value. This deferral methodology applies to both gross and ceded premiums and acquisition costs.
Premiums
Premiums are recorded and billed and recognized as income ratably over the term of the contracts, net of ceded reinsurance. Unearned premiums represent the portion of premiums written relative to the unexpired terms of coverage. Unearned premiums are calculated on a daily pro rata basis. A premium deficiency reserve is recognized if the sum of expected claim costs and claim adjustment expenses, unamortized acquisition costs, and maintenance costs exceed related unearned premiums. We anticipate investment income, if applicable, as a factor in the premium deficiency calculation.
Reinsurance
Ceded unearned premiums and reinsurance balances recoverable on paid and unpaid losses and settlement expenses are reported separately as assets instead of being netted with the related liabilities, since reinsurance does not relieve us of our legal liability to our policyholders. Amounts recoverable from reinsurers are estimated in a manner consistent with the claim liability associated with the reinsured policy and in accordance with the terms of the reinsurance agreement.
Quarterly, we monitor the financial condition of our reinsurers. Our monitoring efforts include, but are not limited to, the review of annual summarized financial data and analysis of the credit risk associated with reinsurance balances recoverable by monitoring the A.M. Best and Standard & Poor’s (“S&P”) ratings. If necessary, our policy is to charge to earnings, in the form of an allowance, an estimate of unrecoverable amounts from reinsurers.
Real estate held for the production of income
Real estate leases are recognized in accordance with GAAP, which often requires significant judgment due to complex provisions. The two primary criteria that are used to classify transactions as sales-type or operating leases are (i) review of the lease term to determine if it is equal to or greater than 75% of the economic life of the building and (ii) review of the present value of the minimum lease payments to determine if they are equal to or greater than 90% of the fair market value of the equipment at lease inception. Operating lease income is recognized on a straight-line basis over the life of the lease.
Income taxes
Federal income taxes are accounted for using the asset and liability method under which deferred income taxes are recognized for the tax consequences of “temporary differences” by applying enacted statutory tax rates applicable to future years to differences between the financial statement carrying amounts and the tax bases of existing assets and liabilities, operating losses and tax credit carry forwards. Deferred income tax assets and liabilities are established for temporary differences between the financial reporting basis and tax basis of assets and liabilities at enacted tax rates expected to be in effect when such amounts are realized or settled. The effect on deferred taxes for a change in tax rates is recognized in income in the period that includes the enactment date. Deferred tax assets are reduced by a valuation allowance if it is more likely than not all or some of the deferred tax assets will not be realized.
We consider uncertainties in income taxes and recognizes those in its financial statements as required. As it relates to uncertainties in income taxes, unrecognized tax benefits, including interest and penalty accruals, are not considered material to the consolidated financial statements. Also, no tax uncertainties are expected to result in significant increases or decreases to unrecognized tax benefits within the next 12-month period. Penalties and interest related to income tax uncertainties, should they occur, would be included in income tax expense in the period in which they are incurred.
As an insurance company, FIC is subject to minimal state income tax liabilities. On a state basis, since the majority of income is from insurance operations, FIC pays premium taxes in lieu of state income tax. Premium taxes are a component of policy acquisition costs and calculated as a percentage of gross premiums written.
Comprehensive earnings
Comprehensive earnings include net earnings plus unrealized gains/losses on available-for-sale debt securities, net of tax. In reporting the components of comprehensive earnings on a net basis in the statement of earnings, we used a 21% percent tax rate.
Reserving methods
In developing our losses and DCC reserve estimates, we relied upon several widely used and accepted loss reserving methods (described below). Based on the deemed predictive qualities of each of the applied methods, we selected estimated ultimates by year in order to determine our reserve estimates.
|
● |
Paid Loss Development – historical patterns of paid loss development are used to project future paid loss emergence in order to estimate required reserves. |
|
● |
Incurred Loss Development – historical patterns of incurred loss development, reflecting both paid losses and changes in case reserves, are used to project future incurred loss emergence in order to estimate required reserves. |
|
● |
Paid Bornhuetter-Ferguson (“BF”) – an estimated loss ratio for a particular accident year is determined and is weighted against the portion of the accident year claims that have been paid, based on historical paid loss development patterns. The estimate of required reserves assumes that the remaining unpaid portion of a particular accident year will pay out at a rate consistent with the estimated loss ratio for that year. This method can be useful for situations where an unusually high or low amount of paid losses exists at the early stages of the claims development process. |
|
● |
Incurred Bornhuetter-Ferguson (“BF”) - an estimated loss ratio for a particular accident year is determined and is weighted against the portion of the accident year claims that have been reported, based on historical incurred loss development patterns. The estimate of required reserves assumes that the remaining unreported portion of a particular accident year will pay out at a rate consistent with the estimated loss ratio for that year. This method can be useful for situations where an unusually high or low amount of reported losses exists at the early stages of the claims development process. |
|
● |
Incremental Claim-Based Methods – historical patterns of incremental incurred losses and paid LAE during various stages of development are reviewed and assumptions are made regarding average losses and LAE development applied to remaining claims inventory. Such methods more properly reflect changes in the speed of claims closure and the relative adequacy of case reserve levels at various stages of development. These methods may provide a more accurate estimate of IBNR for lines of business with relatively few remaining open claims but for which significant recent settlement activity has occurred. |
|
● |
Frequency / Severity Based Methods – historical measurements of claim frequency and average paid claim size (severity) are reviewed for more mature accident years where a majority of claims have been reported and/or closed. These historical averages are trended forward to more recent periods in order to estimate ultimate losses for newer accident years that are not yet fully developed. These methods are useful for lines of business with slow and/or volatile loss development patterns, such as liability lines where information pertaining to individual cases may not be completely known for many years. The claim frequency and severity information for older periods can then be used as reasonable measures for developing a range of estimates for more recent immature periods. |
Range of estimates
In addition to our actuarial reported estimate, we have also developed a range of estimates. This range is not designed to represent minimum or maximum possible outcomes. It is developed to represent low and high ends for a reasonable range of expected outcomes given the selection of alternative, but reasonable assumptions. Actual results may fall outside of this range.
High and low net reserve estimates were developed by stressing our expected loss ratio and loss development factor selections. By applying a factor to increase (and decrease) these assumptions, we developed high (and low) ultimate losses and DCC estimates. These estimates, along with paid and incurred loss information, result in a range of reserves. The gross reserve range is based on selected percentages which produce a range which is slightly wider than the net range.
We estimate IBNR reserves by first deriving an actuarially based estimate of the ultimate cost of total losses and loss adjustment expenses incurred by line of business as of the financial statement date. We then reduce the estimated ultimate losses and loss adjustment expenses by losses and loss adjustment expense payments and case reserves carried as of the financial statement date. The actuarially determined estimate is based upon indications from one of the above actuarial methodologies or uses a weighted average of these results. The specific method used to estimate the ultimate losses for individual lines of business, or individual accident years within a line of business, will vary depending on the judgment of the actuary as to what is the most appropriate method for a line of business’ unique characteristics. Finally, we consider other factors that impact reserves that are not fully incorporated in the actuarially based estimate, such as changes in the external business environment and changes in internal company processes and strategy.
The process of estimating loss reserves involves a high degree of judgment and is subject to a number of variables. These variables can be affected by both internal and external events, such as changes in claims handling procedures, economic inflation, legal trends, and legislative changes, among others. The impact of many of these items on ultimate costs for claims and claim adjustment expenses is difficult to estimate. Loss reserve estimation difficulties also differ significantly by line of business due to differences in claim complexity, the volume of claims, the potential severity of individual claims, the determination of occurrence date for a claim, and reporting lags (the time between the occurrence of the policyholder event and when it is actually reported to the insurer). Informed judgment is applied throughout the process, including the application of various individual experiences and expertise to multiple sets of data and analyses. We continually refine our loss reserve estimates in a regular ongoing process as historical loss experience develops and additional claims are reported and settled. We consider all significant facts and circumstances known at the time loss reserves are established.
Due to the inherent uncertainty underlying loss reserve estimates, final resolution of the estimated liability for losses and loss adjustment expenses may be higher or lower than the related loss reserves at the reporting date. Therefore, actual paid losses, as claims are settled in the future, may be materially higher or lower in amount than current loss reserves. We reflect adjustments to loss reserves in the results of operations in the period the
estimates are changed.
Results of Operations
Our results of operations are influenced by factors affecting the commercial auto insurance industry in general. The operating results of the United States commercial auto insurance industry are subject to significant variations due to competition, weather, catastrophic events, regulation, general economic conditions, judicial trends, fluctuations in interest rates and other changes in the investment environment.
Our premium growth and underwriting results have been, and continue to be, influenced by market conditions. Pricing in the commercial auto insurance industry historically has been cyclical. During a soft market cycle, price competition is more significant than during a hard market cycle and makes it difficult to attract and retain properly priced commercial business. A hard market typically has a positive effect on premium growth.
The major components of operating revenues and net (loss) income for the years ended December 31, 2022 and 2021 are as follows (dollars in thousands):
|
For the year ended |
||||||||
|
December 31, |
||||||||
|
(dollars in thousands) |
2022 |
2021 |
||||||
|
Revenues |
||||||||
|
Net premiums earned |
$ | 9,402 | $ | 7,909 | ||||
|
Income from real estate held for investment |
2,336 | 2,159 | ||||||
|
Investment income, net of investment expense |
1,157 | 1,171 | ||||||
|
Realized investment gains (losses), net |
218 | 379 | ||||||
|
Unrealized gains (losses) on equity securities, net |
(2,191 | ) | 862 | |||||
|
Other income |
506 | 52 | ||||||
|
Total revenues |
11,428 | 12,532 | ||||||
|
Expenses |
||||||||
|
Loss and loss adjusting expense |
4,511 | 5,167 | ||||||
|
Policy acquisition costs and other operating expenses |
7,760 | 3,592 | ||||||
|
Related party commissions |
410 | 1,670 | ||||||
|
Depreciation and amortization |
1,336 | 1,086 | ||||||
|
Interest expense |
1,291 | 1,312 | ||||||
|
Policyholder dividend |
7,305 | - | ||||||
|
Other expenses |
300 | 329 | ||||||
|
Total expenses |
22,913 | 13,156 | ||||||
|
Income (loss) before income taxes |
(11,485 | ) | (624 | ) | ||||
|
Income tax expense |
(636 | ) | (104 | ) | ||||
|
Net loss attributable to noncontrolling interest |
13 | 26 | ||||||
|
Net income (loss) |
(12,108 | ) | (702 | ) | ||||
|
Total other comprehensive earnings (loss) |
(2,234 | ) | (392 | ) | ||||
|
Comprehensive income (loss) |
$ | (14,355 | ) | $ | (1,120 | ) | ||
Year Ended December 31, 2022 Compared to Year Ended December 31, 2021
Premiums
For the year ended December 31, 2022, gross premiums written were $12.2 million, compared to $9.3 million for the year ended December 31, 2021. Gross premiums written increased by $2.8 million, or 30%, in 2022 primarily due to an increase in the number of active distribution partners, which grew from 39 in 2021 to 54 in 2022. For the year ended December 31, 2022, net premiums written were $11.5 million, compared to $8.9 million for the year ended December 31, 2021. Net premiums written increased by $2.6 million, or 30%, and net premiums earned increased by $1.5 million, or 19%, in 2022.
For the year ended December 31, 2022, we ceded to reinsurers $625 thousand of premiums written, compared to $469 thousand of premiums written for the year ended December 31, 2021. Ceded premiums written as a percentage of gross premiums written were 5.1% in 2022, and 5.0% in 2021. The increase is primarily a result of a hardening reinsurance pricing environment.
Premiums are earned ratably over the term of the policy whereas written premiums are reflected on the effective date of the policy.
Income from real estate held for investment
Real estate assets held for the production of income, which were $30.2 million and $30.9 million at December 31, 2022 and 2021, respectively, generated income of $2.3 million during 2022, an increase of $178 thousand over the prior year, principally due to an $84 thousand increase in percentage rent, which is rent that is tied to tenant sales, and incremental increases in base rents.
Investment income and realized gains (losses)
Our investment portfolio, excluding real estate assets held for the production of income, is generally highly liquid and 85.0% and 89.1% of the fixed income portfolio consisted of readily marketable, investment-grade fixed-income securities as of December 31, 2022 and 2021, respectively. The remainder of the portfolio is generally comprised of unrated fixed income securities, preferred stocks, common stocks, and limited partnership interests in funds which primarily invest in small-capitalization public equities. Net investment income is primarily comprised of interest earned and dividends paid on these securities, net of related investment expenses, and excludes realized gains and losses.
Net investment income decreased by $15 thousand for the year ended December 31, 2022 as compared to 2021. Excluding real estate held for the production of income, average cash and invested assets were $40.9 million in 2022, which were comparable to $41.6 million in 2021. For additional information, see Item 1. Business — Investments.
Unrealized gains (losses) on equity securities, net
For the year ended December 31, 2022, net unrealized (losses) gains on equity securities were $(2.2) million, compared to $0.9 million in 2021. This represents a decrease of $3.1 million versus 2021. This decrease is primarily due to the downturn experienced in the equity markets during 2022.
Other income
Other income includes additional charges to policyholders for services outside of the premium charge, such as installment billing or policy endorsement costs, and other miscellaneous sources of revenue. For the year ended December 31, 2022, other income was $506 thousand compared to $52 thousand in 2021. This represents an increase of $454 thousand compared to 2021. The increase is primarily due to a $401 thousand gain on extinguishment of related party debt related to the Paycheck Protection Program.
Loss and loss adjusting expense
The table below details our unpaid losses and settlement expenses (“LAE”) and loss reserves for the years ended December 31, 2022 and 2021.
|
December 31, |
||||||||
|
(dollars in thousands) |
2022 |
2021 |
||||||
|
Unpaid losses and LAE at beginning of year: |
||||||||
|
Gross |
$ | 9,678 | $ | 9,861 | ||||
|
Ceded |
924 | 1,200 | ||||||
|
Net |
8,754 | 8,661 | ||||||
|
Increase (decrease) in incurred losses and LAE: |
||||||||
|
Current year |
5,933 | 6,070 | ||||||
|
Prior years |
(1,422 | ) | (903 | ) | ||||
|
Total incurred |
4,511 | 5,167 | ||||||
|
Loss and LAE payments for claims incurred: |
||||||||
|
Current year |
2,805 | 1,898 | ||||||
|
Prior years |
3,050 | 3,176 | ||||||
|
Total paid |
5,855 | 5,074 | ||||||
|
Net unpaid losses and LAE at end of year |
7,410 | 8,754 | ||||||
|
Unpaid losses and LAE at end of year: |
||||||||
|
Gross |
8,480 | 9,678 | ||||||
|
Ceded |
1,070 | 924 | ||||||
|
Net |
$ | 7,410 | $ | 8,754 | ||||
Differences from the initial reserve estimates emerged as changes in the ultimate loss estimates as those estimates were updated through the reserve analysis process. The recognition of the changes in initial reserve estimates occurred over time as claims were reported, initial case reserves were established, initial reserves were reviewed in light of additional information and ultimate payments were made on the collective set of claims incurred as of that evaluation date. The new information on the ultimate settlement value of claims is updated until all claims in a defined set are settled. As a small specialty insurer with a niche product portfolio, our experience will ordinarily exhibit fluctuations from period to period. While management attempts to identify and react to systematic changes in the loss environment, management must also consider the volume of experience directly available to us and interpret any particular period’s indications with a realistic technical understanding of the reliability of those observations.
For the year ended December 31, 2022, net losses and LAE incurred were $4.5 million, compared to $5.2 million in 2021. The calendar year loss and loss adjustment expense ratios were 48.0% and 65.3% for the years ended December 31, 2022 and 2021, respectively. We experienced favorable development in 2022 relative to the December 31, 2021, reserve estimates primarily from the 2021 and 2020 accident years.
Policy acquisition costs and other operating expenses and related party commissions
For the year ended December 31, 2022, our policy acquisition costs and other operating expenses and related party commissions totaled $8.2 million. Included in this amount is the net impact of the settlement loss recorded upon the Company’s acquisition of FRM, which totaled $749 thousand. This settlement loss is a one-time item and was recorded to eliminate the deferred acquisition costs FIC had recorded related to commissions incurred with FRM. Excluding the net impact of the settlement loss of $749 thousand, our policy acquisition costs and other operating expenses and related party commissions totaled $7.4 million, compared to $5.3 million in 2021. This represents an increase of $2.2 million compared to 2021. The increase was the result of higher commission expenses associated with higher premium revenue, additional personnel and technology costs related to the Company’s long-term business plan, and expenses related to stock-based compensation, including expenses related to our ESOP and grants of restricted stock and stock options.
Expense ratio
For the year ended December 31, 2022, our underwriting expenses were $7.7 million, comprised of (i) $7.4 million of policy acquisition costs and other operating expenses and related party commissions (excluding the net impact of the settlement loss of $749 thousand), (ii) $273 thousand of depreciation and amortization expenses attributable to our insurance segment (which primarily relates to amortization of intangible assets related to our acquisition of FRM), (iii) $142 thousand of net lease expenses (lease expense net of sublease income), and (iv) $106 thousand of service fee and other income (presented as an offsetting amount). For the year ended December 31, 2022, our expense ratio was 82.2%. For the year ended December 31, 2021, our underwriting expenses were $5.4 million, comprised of (i) $5.3 million of policy acquisition costs and other operating expenses and related party commissions, (ii) $22 thousand of depreciation and amortization expenses attributable to our insurance segment, (iii) $184 thousand of net lease expenses (lease expense net of sublease income), and (iv) $53 thousand of service fee and other income (presented as an offsetting amount). For the year ended December 31, 2021, our expense ratio was 68.5%.
Underwriting results
The table below details our underwriting results for the years ended December 31, 2022 and 2021.
|
For the year ended |
||||||||
|
December 31, |
||||||||
|
(dollars in thousands) |
2022 |
2021 |
||||||
|
Net premiums earned |
$ | 9,402 | $ | 7,909 | ||||
|
Loss and loss adjusting expense |
(4,511 | ) | (5,167 | ) | ||||
|
Underwriting expense |
(7,731 | ) | (5,415 | ) | ||||
|
Underwriting loss |
$ | (2,840 | ) | $ | (2,673 | ) | ||
|
Loss and loss adjustment expense ratio |
48.0 | % | 65.3 | % | ||||
|
Expense ratio |
82.2 | % | 68.5 | % | ||||
|
Combined ratio |
130.2 | % | 133.8 | % | ||||
Policyholder dividend
Upon the completion of the offering, pursuant to the plan of conversion, FIC distributed $4,594 to each eligible member, which totaled $7.3 million. This distribution was recorded as a dividend in our financial statements for the year ended December 31, 2022. Please see Item 1. Business — Completion of Offering, Conversion and Agency Acquisition for additional information.
Income tax expense (benefit)
The table below details our income tax expense for 2022 and 2021.
|
(dollars in thousands) |
2022 |
2021 |
||||||
|
Current federal income tax expense |
$ | - | $ | - | ||||
|
Current state income tax expense |
42 | - | ||||||
|
Deferred federal and state income tax expense |
594 | 104 | ||||||
|
Income tax expense |
$ | 636 | $ | 104 | ||||
The Company has federal net operating loss carryforwards of $12.0 million as of December 31, 2022 and has a full valuation allowance equal to the net deferred tax assets as of December 31, 2022 and 2021. FRM incurred $42 thousand of state income tax in 2022. The deferred federal and state income tax expense resulted from recording other comprehensive income net of tax.
Financial Position
The major components of our assets and liabilities as of December 31, 2022 and 2021 are as follows (dollars in thousands):
|
As of |
||||||||
|
December 31, |
December 31, |
|||||||
|
(dollars in thousands) |
2022 |
2021 |
||||||
|
Assets |
||||||||
|
Investments and cash: |
||||||||
|
Fixed maturity, at fair value (amortized cost - $27,901 at December 31, 2022 and $21,404 at December 31, 2021) |
$ | 26,199 | $ | 22,173 | ||||
|
Common stock, at fair value |
2,174 | 1,747 | ||||||
|
Preferred securities, at fair value |
2,203 | 2,469 | ||||||
|
Other invested assets |
4,401 | 5,773 | ||||||
|
Real estate held for the production of income |
30,181 | 30,921 | ||||||
|
Cash and cash equivalents |
6,568 | 8,121 | ||||||
|
Total investments and cash |
71,726 | 71,204 | ||||||
|
Accrued investment income |
267 | 216 | ||||||
|
Premiums and reinsurance balances receivable |
5,458 | 4,637 | ||||||
|
Ceded unearned premiums |
43 | 244 | ||||||
|
Reinsurance balances recoverable on unpaid losses |
1,070 | 924 | ||||||
|
Deferred policy acquisition costs |
214 | 739 | ||||||
|
Deferred rent |
2,215 | 2,011 | ||||||
|
Leases in place |
2,767 | 3,065 | ||||||
|
Right of use asset |
149 | 1,769 | ||||||
|
Goodwill and other intangibles |
6,343 | - | ||||||
|
Prepaid expenses and other assets |
808 | 3,091 | ||||||
|
Total assets |
$ | 91,060 | $ | 87,900 | ||||
|
Liabilities and Equity |
||||||||
|
Liabilities: |
||||||||
|
Unpaid losses and loss adjusting expenses |
$ | 8,480 | $ | 9,678 | ||||
|
Unearned premiums |
6,315 | 4,393 | ||||||
|
Reinsurance balances payable |
49 | 3 | ||||||
|
Commissions payable to related party |
- | 862 | ||||||
|
Notes payable |
26,961 | 27,524 | ||||||
|
Defined benefit plan |
479 | 275 | ||||||
|
Accrued expenses |
1,471 | 870 | ||||||
|
Related party loan |
- | 398 | ||||||
|
Operating lease liability |
870 | 2,567 | ||||||
|
Other liabilities |
503 | 256 | ||||||
|
Total liabilities |
45,128 | 46,826 | ||||||
|
Mezzanine equity: |
||||||||
|
Preferred stock |
- | - | ||||||
|
Additional paid-in capital |
5,227 | - | ||||||
|
Shareholders' equity: |
||||||||
|
Common stock |
21 | - | ||||||
|
Additional paid-in capital |
16,171 | - | ||||||
|
Unearned employee stock ownership plan shares |
(1,827 | ) | - | |||||
|
Retained earnings |
28,443 | 40,930 | ||||||
|
Accumulated other comprehensive income (loss), net of tax |
(2,810 | ) | (576 | ) | ||||
|
Noncontrolling interest |
707 | 720 | ||||||
|
Total equity |
45,932 | 41,074 | ||||||
|
Total liabilities and equity |
$ | 91,060 | $ | 87,900 | ||||
Unpaid losses and LAE
Our reserves for unpaid losses and LAE are summarized below (dollars in thousands):
|
As of December 31, |
||||||||
|
(dollars in thousands) |
2022 |
2021 |
||||||
|
Case reserves |
$ | 4,961 | $ | 6,039 | ||||
|
IBNR reserves |
2,449 | 2,715 | ||||||
|
Net unpaid losses and LAE |
7,410 | 8,754 | ||||||
|
Reinsurance recoverable on unpaid losses and LAE |
1,070 | 924 | ||||||
|
Gross reserves for unpaid losses and LAE |
$ | 8,480 | $ | 9,678 | ||||
Actuarial ranges
The selection of the ultimate loss is based on information unique to each line of business and accident year and the judgment and expertise of our actuary and management.
The following table provides case and IBNR reserves for losses and loss adjustment expenses as of December 31, 2022 and 2021.
|
As of December 31, 2022 |
||||||||||||||||||||
|
Actuarially Determined |
||||||||||||||||||||
|
Range of Estimates |
||||||||||||||||||||
|
Case |
IBNR |
Total |
||||||||||||||||||
|
(dollars in thousands) |
Reserves |
Reserves |
Reserves |
Low |
High |
|||||||||||||||
|
Commercial auto liability |
$ | 4,984 | $ | 2,439 | $ | 7,423 | $ | 6,777 | $ | 7,516 | ||||||||||
|
Commercial auto physical damage |
(23 | ) | 10 | (13 | ) | (49 | ) | (17 | ) | |||||||||||
|
Total net amount |
4,961 | 2,449 | 7,410 | 6,728 | 7,499 | |||||||||||||||
|
Reinsurance recoverables |
157 | 913 | 1,070 | 583 | 1,158 | |||||||||||||||
|
Total gross amounts |
$ | 5,118 | $ | 3,362 | $ | 8,480 | $ | 7,311 | $ | 8,657 | ||||||||||
|
As of December 31, 2021 |
||||||||||||||||||||
|
Actuarially Determined |
||||||||||||||||||||
|
Range of Estimates |
||||||||||||||||||||
|
Case |
IBNR |
Total |
||||||||||||||||||
|
(dollars in thousands) |
Reserves |
Reserves |
Reserves |
Low |
High |
|||||||||||||||
|
Commercial auto liability |
$ | 6,014 | $ | 2,690 | $ | 8,704 | $ | 7,605 | $ | 8,737 | ||||||||||
|
Commercial auto physical damage |
25 | 25 | 50 | 13 | 35 | |||||||||||||||
|
Total net amount |
6,039 | 2,715 | 8,754 | 7,618 | 8,772 | |||||||||||||||
|
Reinsurance recoverables |
319 | 605 | 924 | 744 | 1,119 | |||||||||||||||
|
Total gross amounts |
$ | 6,358 | $ | 3,320 | $ | 9,678 | $ | 8,362 | $ | 9,891 | ||||||||||
Our actuary determined a range of reasonable reserve estimates which reflect the uncertainty inherent in the loss reserve process. This range does not represent the range of all possible outcomes. We believe that the actuarially-determined ranges represent reasonably likely changes in the losses and LAE estimates, however actual results could differ significantly from these estimates. The range was determined by line of business and accident year after a review of the output generated by the various actuarial methods utilized. The actuary reviewed the variance around the select loss reserve estimates for each of the actuarial methods and selected reasonable low and high estimates based on his knowledge and judgment. In making these judgments the actuary typically assumed, based on his experience, that the larger the reserve the less volatility and that property reserves would exhibit less volatility than casualty reserves. In addition, when selecting these low and high estimates, the actuary considered:
|
● |
historical industry development experience in our business line; |
|
● |
historical company development experience; |
|
● |
the impact of court decisions on insurance coverage issues, which can impact the ultimate cost of settling claims; |
|
● |
changes in our internal claims processing policies and procedures; and |
|
● |
trends and risks in claim costs, such as risk that medical cost inflation could increase. |
Our actuary is required to exercise a considerable degree of judgment in the evaluation of all of these and other factors in the analysis of our losses and LAE reserves, and related range of anticipated losses. Because of the level of uncertainty impacting the estimation process, it is reasonably possible that different actuaries would arrive at different conclusions. The method of determining the reserve range has not changed and the reserve range generated by our actuary is consistent with the observed development of our loss reserves over the last few years.
The width of the range in reserves arises primarily because specific losses may not be known and reported for some period and the ultimate losses paid and loss adjustment expenses incurred with respect to known losses may be larger than currently estimated. The ultimate frequency or severity of these claims can be very different than the assumptions we used in our estimation of ultimate reserves for these exposures.
Specifically, the following factors could impact the frequency and severity of claims, and therefore, the ultimate amount of losses and LAE paid:
|
● |
the rate of increase in labor costs, medical costs, and material costs that underlie insured risks; |
|
● |
development of risk associated with our expanding producer relationships and our growth in new states or states where we currently have small market share; and |
|
● |
impact of changes in laws or regulations. |
The estimation process for determining the liability for unpaid losses and LAE inherently results in adjustments each year for claims incurred (but not paid) in preceding years. Negative amounts reported for claims incurred related to prior years are a result of claims being settled for amounts less than originally estimated (favorable development). Positive amounts reported for claims incurred related to prior years are a result of claims being settled for amounts greater than originally estimated (unfavorable development). For the years ended December 31, 2022 and 2021, we experienced favorable development on prior year reserves of $1.4 million and $0.9 million, respectively.
As discussed earlier, the estimation of our reserves is based on several actuarial methods, each of which incorporates many quantitative assumptions. The judgment of the actuary plays an important role in selecting among various loss development factors and selecting the appropriate method, or combination of methods, to use for a given accident year. The ranges presented above represent reasonable variability around the actuarially determined central estimate. The total variability around the midpoint of our actuarially determined range at December 31, 2022 was +/- 8.4%. As shown in the table below, since 2018, the variance in our originally estimated accident year loss reserves has ranged from 12.1% to 51.4% redundant.
|
Recent Variabilities of the Liability for Unpaid Losses and LAE, Net of Reinsurance Recoverables |
||||||||||||||||||||
|
(dollars in thousands) |
2018 |
2019 |
2020 |
2021 |
2022 |
|||||||||||||||
|
As originally estimated |
$ | 7,839 | $ | 6,553 | $ | 3,836 | $ | 4,172 | $ | 3,128 | ||||||||||
|
As estimated at December 31, 2022 |
6,712 | 4,931 | 1,864 | 3,668 | 3,128 | |||||||||||||||
|
Net cumulative redundancy (deficiency) |
$ | 1,127 | $ | 1,622 | $ | 1,972 | $ | 504 | $ | - | ||||||||||
|
% redundancy (deficiency) |
14.4 | % | 24.8 | % | 51.4 | % | 12.1 | % | n/a | |||||||||||
The table below summarizes the impact on equity from changes in estimates of unpaid losses and LAE reserves as of December 31, 2022 and 2021 (dollars in thousands):
|
(dollars in thousands) |
Aggregate |
Percentage |
||||||
|
Losses and LAE |
Change in |
|||||||
|
Reserve Range for Unpaid Losses and LAE |
Reserve |
Equity |
||||||
|
As of December 31, 2022 |
||||||||
|
Low End |
$ | 6,728 | 1.5 | % | ||||
|
Recorded |
$ | 7,410 | 0.0 | % | ||||
|
High End |
$ | 7,499 | -0.2 | % | ||||
|
As of December 31, 2021 |
||||||||
|
Low End |
$ | 7,618 | 2.8 | % | ||||
|
Recorded |
$ | 8,754 | 0.0 | % | ||||
|
High End |
$ | 8,772 | 0.0 | % | ||||
If the losses and LAE reserves were recorded at the high end of the actuarially-determined range as of December 31, 2022, the losses and LAE reserves would increase by $89 thousand before taxes. This increase in reserves would have the effect of decreasing comprehensive income and equity as of December 31, 2022 by $89 thousand. If the losses and LAE reserves were recorded at the low end of the actuarially-determined range, the losses and LAE reserves at December 31, 2022 would be reduced by $0.7 million with corresponding increases in comprehensive income and equity of $0.7 million.
If the losses and LAE reserves were to adversely develop to the high end of the range, approximately $89 thousand of anticipated future payments for the losses and LAE expenses would be required to be paid, thereby affecting cash flows in future periods, as the payments for losses are made.
Investments
Our fixed maturity and equity securities investments are classified as available-for-sale and carried at estimated fair value as determined by management based upon quoted market prices or a recognized pricing service at the reporting date for those or similar investments. Changes in unrealized investment gains or losses on our fixed maturity investments, net of applicable income taxes, are reflected directly in equity as a component of comprehensive income (loss) and, accordingly, have no effect on net income (loss). Changes in fair value of equity securities are recognized as a component of current earnings. Investment income is recognized when earned, and capital gains and losses are recognized when investments are sold, or other-than-temporarily impaired.
Fair values of interest rate sensitive instruments may be affected by increases and decreases in prevailing interest rates which generally translate, respectively, into decreases and increases in fair values of fixed maturity investments. The fair values of interest rate sensitive instruments also may be affected by the credit worthiness of the issuer, prepayment options, relative values of other investments, the liquidity of the instrument, and other general market conditions.
At December 31, 2022, our fixed maturity portfolio had net unrealized losses of $1.7 million compared to net unrealized gains of $0.8 million at December 31, 2021. The decrease in fair value in our fixed maturity portfolio was the result of increases in prevailing interest rates during 2022.
The Company monitors the credit quality of its fixed income investments to assess if it is probable that the Company will receive its contractual or estimated cash flows in the form of principal and interest, in accordance with their terms.
The available for sale portfolio contained 82 securities in an unrealized loss position as of December 31, 2022, 2 of which had been in an unrealized loss position for 12 consecutive months or longer and represent $368 thousand in unrealized losses. The available for sale portfolio contained 4 securities in an unrealized loss position as of December 31, 2021, 2 of which had been in an unrealized loss position for 12 consecutive months or longer and represent $94 thousand in unrealized losses. All fixed income securities in the investment portfolio continue to pay the expected coupon payments in accordance with the contractual terms of the securities. Credit-related impairments on fixed income securities that the Company does not plan to sell, and for which the Company is not more likely than not to be required to sell, are recognized in income before income taxes. Any non-credit related impairment is recognized in comprehensive income. Based on the Company’s analysis, the fixed income portfolio is of high credit quality and it is believed it will recover the amortized cost basis of the fixed income securities.
In order to diversify its investment portfolio and improve expected returns, the Company has made non-controlling (typically less than 5%) investments in a number of unaffiliated, specialized equity investment vehicles (limited partnerships and one limited liability company), which are included in other invested assets. Such investments are broadly diversified and in the aggregate are less than 5% of the Company’s investment portfolio. The limited partnerships generally limit or preclude redemptions within a period of time (the “lock-up” period, usually between one and three years) from the date of the investment. Subsequent to the expiry of any applicable lock-up periods, withdrawals or redemptions generally require between 30 to 90 days’ advance notice, with redemptions being permitted on dates varying from month-end to annually, but typically quarter end. The Company also holds an equity investment in Trustar Bank, a related entity.
Since, amongst other qualifying criteria, these other invested assets do not have a readily determined fair value, the Company values them applying the guidance of Accounting Standards Update Subtopic 820-10, Fair Value Measurements and Disclosures — Overall, which, as a practical expedient, permits the fair value of investments within its scope to be measured on the basis of net asset value per share (or its equivalent).
The Company had $2.5 million unfunded commitment to Mutual Capital Investment fund, LP as of December 31, 2022
Under current accounting standards, an Other-Than-Temporary-Impairment (“OTTI”) write-down of fixed maturity securities, where fair value is below amortized cost, is triggered by circumstances where (1) an entity has the intent to sell the security, (2) it is more likely than not that the entity will be required to sell the security before recovery of its amortized cost basis, or (3) the entity does not expect to recover the entire amortized cost basis of the security. If an entity intends to sell the security before the recovery, an OTTI write-down is recognized in earnings equal to the difference between the security’s amortized cost and its fair value. If an entity does not intend to sell the security or it is more likely than not that it will be required to sell the security before recovery, the OTTI write-down is separated into an amount representing the credit loss, that is recognized in income before income taxes, and the amount related to all other factors, which is recognized in other comprehensive income. Impairment losses result in a reduction of the underlying investment’s cost basis.
The Company regularly evaluates its fixed maturity securities using both quantitative and qualitative criteria to determine impairment losses for other-than-temporary declines in the fair value of the investments. The following are the key factors used to determine whether a security is other-than-temporarily impaired:
|
● |
The extent to which the fair value is less than cost, |
|
● |
The assessment of significant adverse changes to the cash flows on a fixed maturity investment, |
|
● |
The occurrence of a discrete credit event resulting in the issuer defaulting on a material obligation, the issuer seeking protection from creditors under the bankruptcy laws, the issuer proposing a voluntary reorganization under which creditors are asked to exchange their claims for cash or securities having a fair value substantially lower than par value, |
|
● |
The probability that the Company will recover the entire amortized cost basis of the fixed income securities prior to maturity, or |
|
● |
The ability and intent to hold fixed maturities until maturity. |
Quantitative and qualitative criteria are considered to varying degrees depending on the sector for which the analysis is being performed. The sectors are as follows:
Corporate securities
The Company performs a qualitative evaluation of holdings that fall below the price threshold. The analysis begins with an opinion of industry and competitive position. This includes an assessment of factors that enable the profit structure of the business (e.g., reserve profile for exploration and production companies), competitive advantage (e.g., distribution system), management strategy, and an analysis of trends in return on invested capital. Analysts may also review other factors to determine whether an impairment exists, including liquidity and asset value cash flow generation.
Municipal securities
The Company analyzes the screened impairment candidates on a quantitative and qualitative basis. This includes an assessment of the factors that may be contributing to an unrealized loss and whether the recovery value is greater or less than current market value.
Asset backed securities
The Company uses the “stated assumptions” analytic approach which relies on actual 6-month average collateral performance measures (voluntary prepayment rate, gross default rate, and loss severity) sourced through third party data providers or remittance reports. The analysis applies the stated assumptions throughout the remaining term of the transaction using forecasted cash flows, which are then applied through the transaction structure (reflecting the priority of payments and performance triggers) to determine whether there is a loss to the security (“Loss to Tranche”).
For all fixed income securities in a loss position on December 31, 2022 and 2021, the Company believes it is probable that it will receive all contractual payments in the form of principal and interest. In addition, the Company is not required to, nor does it intend to sell these investments prior to recovering the entire amortized cost basis for each security, which may be maturity. Accordingly, the fixed income securities in an unrealized loss position were not other-than-temporarily impaired on December 31, 2022 and 2021.
Fair value is defined as the price in the principal market that would be received for an asset to facilitate an orderly transaction between market participants on the measurement date. The Company determined the fair value of certain financial instruments based on their underlying characteristics and relevant transactions in the marketplace. GAAP guidance requires an entity to maximize the use of observable inputs and minimize the use of unobservable inputs when measuring fair value. The guidance also describes three levels defined by the type of inputs used to measure fair value. The following are the levels of the fair value hierarchy and a brief description of the type of valuation inputs that are used to establish each level:
|
● |
Level 1: is applied to valuations based on readily available, unadjusted quoted prices in active markets for identical assets. |
|
● |
Level 2: is applied to valuations based upon quoted prices for similar assets in active markets, quoted prices for identical or similar assets in inactive markets; or valuations based on models where the significant inputs are observable (e.g. interest rates, yield curves, prepayment speeds, default rates, loss severities) or can be corroborated by observable market data. |
|
● |
Level 3: is applied to valuations that are derived from techniques in which one or more of the significant inputs are unobservable. Financial assets are classified based upon the lowest level of significant input that is used to determine fair value. |
As a part of the process to determine fair value, the Company utilizes widely recognized, third-party pricing sources to determine fair values. The Company has obtained an understanding of the third-party pricing sources’ valuation methodologies and inputs. The following is a description of the valuation techniques used for financial assets that are measured at fair value, including the general classification of such assets pursuant to the fair value hierarchy.
|
● |
U.S. Treasury Bonds, Common Stocks, and Exchange Traded Funds: U.S. treasury bonds and exchange traded equities have readily observable price levels and are classified as Level 1 (fair value based on quoted market prices). All common stock holdings are deemed Level 1. |
|
● |
Corporate, Agencies, and Municipal Bonds: The pricing source employs a anti-dimensional model that uses standard inputs including (listed in order of priority for use) benchmark yields, reported trades, broker/dealer quotes, issuer spreads, two-sided markets, benchmark securities, market bids/offers and other reference data. The pricing source also monitors market indicators, as well as industry and economic events. All bonds valued using these techniques are classified as Level 2. All Corporate, Agencies, and Municipal securities are deemed Level 2. |
|
● |
Collateralized Mortgage Obligations (“CMO”) and Asset-backed Securities (“ABS”): The pricing source evaluation methodology includes principally interest rate movements and new issue data. Evaluation of the tranches (non-volatile, volatile, or credit sensitivity) is based on the pricing vendors’ interpretation of accepted modeling and pricing conventions. This information is then used to determine the cash flows for each tranche, benchmark yields, pre-payment assumptions and to incorporate collateral. |
To evaluate CMO volatility, an option-adjusted spread model is used in combination with models that simulate interest rate paths to determine market price information. This process allows the pricing vendor to obtain evaluations of a broad universe of securities in a way that reflects changes in yield curve, index rates, implied volatility, mortgage rates, and recent trade activity. CMO and ABS with corroborate and observable inputs are classified as Level 2. With the exception of one ABS classified as Level 3, all CMO and ABS holdings are deemed to be Level 2.
|
● |
Preferred Stock: Preferred stocks do not have readily observable prices but do have quoted prices for similar assets or liabilities in active markets; quoted prices for identical or similar assets in markets that are not active; and inputs other than quoted prices are classified as Level 2. All preferred stock holdings are deemed Level 2. |
Deferred policy acquisition costs
Certain direct acquisition costs consisting of commissions, premium taxes and certain other direct underwriting expenses that vary with and are primarily related to the production of business are deferred and amortized over the effective period of the related insurance policies as the underlying policy premiums are earned. At December 31, 2022 and 2021, deferred acquisition costs and the related unearned premium reserves, which does not include ceded unearned premiums, were as follows (dollars in thousands):
|
December 31, |
||||||||
|
(dollars in thousands) |
2022 |
2021 |
||||||
|
Deferred policy acquisition costs, net |
$ | 214 | $ | 739 | ||||
|
Unearned premium reserves |
$ | 6,315 | $ | 4,393 | ||||
The method followed in computing deferred acquisition costs limits the amount of deferred costs to their estimated realizable value, which gives effect to the premium to be earned, related investment income, losses and loss adjustment expenses, and certain other costs expected to be incurred as the premium is earned. Future changes in estimates, the most significant of which is expected losses and loss adjustment expenses, may require adjustments to deferred policy acquisition costs. If the estimation of net realizable value indicates that the deferred acquisition costs are not recoverable, they would be written off.
Income taxes
We use the asset and liability method of accounting for income taxes. Deferred income taxes arise from the recognition of temporary differences between financial statement carrying amounts and the tax bases of our assets and liabilities. A valuation allowance is provided when it is more likely than not that some portion of the deferred tax asset will not be realized. The effect of a change in tax rates is recognized in the period of the enactment date.
We had deferred tax assets of $3.7 million as of December 31, 2022 and $3.2 million as of December 31, 2021, which includes the Company’s net operating loss carry forward of $12.0 million. A valuation allowance is required to be established for any portion of the deferred tax asset for which we believe it is more likely than not that it will not be realized. At December 31, 2022 and at December 31, 2021, we had a valuation allowance of $1.5 million and $0.4 million, respectively, offsetting the full amount of the net deferred tax asset.
We exercise significant judgment in evaluating the amount and timing of recognition of the resulting tax liabilities and assets. These judgments require us to make projections of future taxable income. The judgments and estimates we make in determining our deferred tax assets, which are inherently subjective, are reviewed on a continual basis as regulatory and business factors change. Any reduction in estimated future taxable income may require us to record an additional valuation allowance against our deferred tax assets.
As of December 31, 2022, and December 31, 2021, we had no material unrecognized tax benefits or accrued interest and penalties. Federal tax years 2020 through 2022 are open for examination.
Other assets
As of December 31, 2022 and 2021, other assets totaled $808 thousand and $512 thousand, respectively. Deferred stock offering and conversion expenses were $0 as of December 31, 2022 and $2.6 million at December 31, 2021.
Right-of-use asset and operating lease liability
We lease three office suites, totaling 9,544 square feet, in Chevy Chase, Maryland under an operating lease that commenced July 1, 2016, and has an initial term expiring 15 years after commencement. The lease provides for a 2.5% annual increase in the base rent on the anniversary of the lease commencement date. The operating lease may be terminated, subject to penalties, effective June 30, 2025. We have an option to extend the lease for one 5-year renewal term at the fair market rent as of the date of the renewal term commencement. However, we believe it is unlikely that we will exercise our renewal option. In accordance with Topic 842, we have recorded an operating lease liability, representing the discounted present value of future lease payments and a right-of-use asset.
In 2017, we signed a sublease agreement to sublease 1,961 square feet of our office space in Chevy Chase, Maryland to another company. The sublease commenced on October 1, 2017, expires September 30, 2024, and provides for 4.0% annual escalation in the base rent. Sublease income is recorded on a straight-line basis over the life of the lease. The cumulative difference between lease expense and lease payments is recorded as an adjustment to the right-of-use asset.
In 2021, we signed a sublease agreement to sublease 2,048 square feet of our office space in Chevy Chase, Maryland to another company. The sublease commenced on August 1, 2021, expires July 31, 2024, and provides for 4.5% annual escalation in the base rent. Sublease income is recorded on a straight-line basis over the life of the lease. The cumulative difference between lease expense and lease payments is recorded as an adjustment to the right-of-use asset.
On February 28, 2022, we entered into an agreement to sublease the remaining 5,535 square feet of space in Chevy Chase, Maryland. The sublease commenced on June 1, 2022, expires on May 31, 2025, and provides for 3.0% annual escalation in the base rent. Sublease income is recorded on a straight-line basis over the life of the lease. The cumulative difference between lease expense and lease payments is recorded as an adjustment to the right-of-use asset. Upon agreeing to this additional sublease, we determined that it was probable that we will exercise our early lease termination option, thereby reducing the term of the lease to June 30, 2025. We have reduced the amount of the operating lease liability to the net present value of contractually committed future lease income. In addition, we have reduced the net value of our right-of-use asset to $0, as we are not anticipating occupying the office space for the remainder of the lease term. The reduced lease term decreased the net operating lease liability by $1.4 million.
In 2022, we entered into a lease for one office suite, totaling 1,579 square feet, in Bethesda, Maryland. The operating lease commenced September 1, 2022, expires on January 31, 2026. The lease provides for a 3.25% annual increase in base rent on the anniversary of the lease commencement date.
The following summarizes the line items in the balance sheet which include amounts for operating leases as of December 31, 2022 and 2021 (dollars in thousands):
|
2022 |
||||||||||||
|
Operating |
||||||||||||
|
(dollars in thousands) |
Lease |
Sublease |
Net |
|||||||||
|
Right-of-use asset |
$ | 2,451 | $ | (628 | ) | $ | 1,823 | |||||
|
Accumulatied amortization |
(1,420 | ) | 287 | (1,133 | ) | |||||||
|
Impairment of RoU |
(541 | ) | - | (541 | ) | |||||||
|
Right-of-use asset, net |
$ | 490 | $ | (341 | ) | $ | 149 | |||||
|
Operating lease liability |
$ | 1,269 | $ | (399 | ) | $ | 870 | |||||
|
2021 |
||||||||||||
|
Operating |
||||||||||||
|
(dollars in thousands) |
Lease |
Sublease |
Net |
|||||||||
|
Right-of-use asset |
$ | 3,472 | $ | (373 | ) | $ | 3,099 | |||||
|
Accumulatied amortization |
(1,021 | ) | 151 | (870 | ) | |||||||
|
Impairment of RoU |
(460 | ) | - | (460 | ) | |||||||
|
Right-of-use asset, net |
$ | 1,991 | $ | (222 | ) | $ | 1,769 | |||||
|
Operating lease liability |
$ | 2,805 | $ | (238 | ) | $ | 2,567 | |||||
We had lease expense of $282 thousand and $264 thousand for the years ended December 31, 2022 and 2021, respectively. In addition, we had sublease income of $140 thousand and $80 thousand for the years ended December 31, 2022 and 2021, respectively.
The components of lease expense and supplemental cash flow information related to leases for the years ended December 31, 2022 and 2021 are as follows (dollars in thousands):
|
December 31, |
December 31, |
|||||||
|
(dollars in thousands) |
2022 |
2021 |
||||||
|
Cash paid for leases |
$ | - | $ | - | ||||
|
Remaining lease term (years) |
3.50 | 9.50 | ||||||
|
Weighted average annual discount rate |
3.50 | % | 3.50 | % | ||||
|
December 31, |
December 31, |
|||||||
|
(dollars in thousands) |
2022 |
2021 |
||||||
|
Sum of remaining payments |
$ | 1,349 | $ | 3,323 | ||||
|
Less: imputed interest |
(81 | ) | (518 | ) | ||||
|
Net present value of remaining payments |
1,268 | 2,805 | ||||||
|
Less: net present value of sublease rent |
(398 | ) | (238 | ) | ||||
|
Operating lease liability, net |
$ | 870 | $ | 2,567 | ||||
Future minimum lease payments for the lease outlined above at December 31, 2022 are as follows (dollars in thousands):
|
Minimum |
Sublease |
Net |
||||||||||
|
(dollars in thousands) |
Commitments |
Commitments |
Commitments |
|||||||||
|
2023 |
373 | 197 | 176 | |||||||||
|
2024 |
567 | 172 | 395 | |||||||||
|
2025 |
405 | 46 | 359 | |||||||||
|
2026 |
5 | - | 5 | |||||||||
|
Thereafter |
- | - | - | |||||||||
| $ | 1,350 | $ | 415 | $ | 935 | |||||||
Liquidity and Capital Resources
We generate sufficient funds from our operations and maintain a high degree of liquidity in our investment portfolio to meet the demands of claim settlements and operating expenses. The primary sources of funds are premium collections, investment earnings and maturing investments.
We maintain investment and reinsurance programs that are intended to provide sufficient funds to meet our obligations without forced sales of investments. We maintain a portion of our investment portfolio in relatively short-term and highly liquid assets to ensure the availability of funds.
Cash flows from continuing operations for the years ended December 31, 2022 and 2021 were as follows (dollars in thousands):
|
For the year ended |
||||||||
|
December 31, |
||||||||
|
(dollars in thousands) |
2022 |
2021 |
||||||
|
Cash flows provided by (used in) operating activities |
$ | (7,653 | ) | $ | (3,080 | ) | ||
|
Cash flows provided by (used in) in investing activities |
$ | (7,355 | ) | $ | 6,943 | |||
|
Cash flows provided by (used in) financing activities |
$ | 13,456 | $ | (97 | ) | |||
|
Net increase (decrease) in cash and cash equivalents |
$ | (1,552 | ) | $ | 3,766 | |||
For the year ended December 31, 2022, cash flows used in operating activities totaled $7.7 million compared to $3.1 million for the year ended December 31, 2021. This decrease in cash flows from operating activities was primarily due to the $7.3 million dividend paid to eligible members in connection with the conversion and offering. Please see Item 1. Business — Completion of Offering, Conversion and Agency Acquisition for more information. Cash flows used in investing activities totaled $7.4 million for the year ended December 31, 2022, compared to cash flows provided by investing activities of $6.9 million in 2021, primarily resulting from the purchase of investment securities during 2022.
Our principal source of liquidity will be dividend payments and other fees received from FIC and FRM. FIC is restricted by the insurance laws of District of Columbia as to the amount of dividends or other distributions it may pay to us. Under District of Columbia law, there is a maximum amount that may be paid by FIC during any twelve-month period. FIC may pay dividends to us after notice to, but without prior approval of the District of Columbia Department of Insurance, Insurance and Banking in an amount “not to exceed” the lesser of (i) 10% of the surplus as regards policyholders of FIC as reported on its most recent annual statement filed with the Department, or (ii) the statutory net income of FIC for the period covered by such annual statement. Dividends in excess of this amount are considered “extraordinary” and are subject to the approval of the Department.
FIC’s ability to pay dividends is subject to restrictions contained in the insurance laws of District of Columbia, which require that dividends be approved by the District of Columbia Department of Insurance prior to their payment. Prior to its payment of any dividend, FIC is required to provide notice of the dividend to the Department. This notice must be provided to the Department 30 days prior to the payment of an extraordinary dividend and 10 days prior to the payment of an ordinary dividend. The Department has the power to limit or prohibit dividend payments if FIC is in violation of any law or regulation. These restrictions or any subsequently imposed restrictions may affect our future liquidity. See “Dividends” for additional information on the limitation on FIC’s ability to pay dividends.
The following table summarizes, as of December 31, 2022, our future payments under contractual obligations and estimated claims and claims related payments for continuing operations.
|
As of December 31, 2022 |
||||||||||||||||||||
|
(dollars in thousands) |
Payments due by period |
|||||||||||||||||||
|
Less than |
More than |
|||||||||||||||||||
|
Contractual Obligations |
Total |
1 Year |
1-3 Years |
3-5 Years |
5 Years |
|||||||||||||||
|
Estimated gross loss & loss adjustment expense payments |
$ | 8,479 | $ | 5,379 | $ | 2,910 | $ | 190 | $ | - | ||||||||||
|
Notes payable |
28,129 | 733 | 6,251 | 1,587 | 19,558 | |||||||||||||||
|
Minimum lease obligations |
1,350 | 373 | 972 | 5 | - | |||||||||||||||
|
Total |
$ | 37,958 | $ | 6,485 | $ | 10,133 | $ | 1,782 | $ | 19,558 | ||||||||||
The timing of the amounts of the gross loss and loss adjustment expense payments is an estimate based on historical experience and the expectations of future payment patterns. However, the timing of these payments may vary from the amounts stated above.
Off-Balance Sheet Arrangements
We have no off-balance sheet arrangements that have or are reasonably likely to have a current or future effect on our financial condition, changes in financial condition, revenues or expenses, results of operations, liquidity, capital expenditures, or capital reserves.
Quantitative and Qualitative Information about Market Risk
Market Risk
Market risk is the risk that we will incur losses due to adverse changes in the fair value of financial instruments. We have exposure to three principal types of market risk through our investment activities: (i) interest rate risk, (ii) credit risk and (iii) equity risk. Our primary market risk exposure is to changes in interest rates. We have not entered, and do not plan to enter, into any derivative financial instruments for hedging, trading or speculative purposes.
Interest Rate Risk
Interest rate risk is the risk that we will incur economic losses due to adverse changes in interest rates. Our exposure to interest rate changes primarily results from our significant holdings of fixed rate investments. Fluctuations in interest rates have a direct impact on the fair value of these securities.
The average maturity of the debt securities in our investment portfolio at December 31, 2022, was 4.7 years. Our debt securities investments include U.S. government bonds, securities issued by government agencies, obligations of state and local governments and governmental authorities, and corporate bonds, most of which are exposed to changes in prevailing interest rates and which may experience moderate fluctuations in fair value resulting from changes in interest rates. We carry these investments as available for sale. This allows us to manage our exposure to risks associated with interest rate fluctuations through active review of our investment portfolio by our management and board of directors.
Fluctuations in near-term interest rates could have an impact on our results of operations and cash flows. Certain of these securities may have call features. In a declining interest rate environment these securities may be called by their issuer and replaced with securities bearing lower interest rates. If we are required to sell these securities in a rising interest rate environment, we may recognize losses.
As a general matter, we attempt to match the durations of our assets with the durations of our liabilities. Our investment objectives include maintaining adequate liquidity to meet our operational needs, optimizing our after-tax investment income, and our after-tax total return, all of which are subject to our tolerance for risk.
The table below shows the interest rate sensitivity of our fixed maturity investments measured in terms of fair value (which is equal to the carrying value for all of our investment securities that are subject to interest rate changes) at December 31, 2022:
|
(dollars in thousands) |
As of December 31, 2022 |
|||||||
|
Estimated |
||||||||
|
Change in |
Fair |
|||||||
|
Hypothetical Change in Interest Rates |
Fair Value |
Value |
||||||
|
200 basis point increase |
$ | (1,975 | ) | $ | 24,224 | |||
|
100 basis point increase |
$ | (988 | ) | $ | 25,211 | |||
|
No change |
$ | - | $ | 26,199 | ||||
|
100 basis point decrease |
$ | 987 | $ | 27,186 | ||||
|
200 basis point decrease |
$ | 1,974 | $ | 28,173 | ||||
Impact of Inflation
Inflation increases our customers’ needs for property and casualty insurance coverage due to the increase in the value of the property covered and any potential liability exposure. Inflation also increases claims incurred by property and casualty insurers as property repairs, replacements and medical expenses increase. These cost increases reduce profit margins to the extent that rate increases are not implemented on an adequate and timely basis. We establish property and casualty insurance premiums levels before the amount of losses and loss expenses, or the extent to which inflation may impact these expenses, are known. Therefore, we attempt to anticipate the potential impact of inflation when establishing rates. Because inflation has remained relatively low in recent years, financial results have not been significantly affected by it.
Real Estate Held for the Production of Income
FIC owns 92.3% of ACIC Consolidated Properties, LLC (“ACIC Properties”), the intermediate holding company for 717 8th Street, LLC, 2805 M Street, LLC, and 810 5th Street, LLC. Through its wholly owned subsidiaries, ACIC Properties owns and leases three commercial real estate properties located in the District of Columbia. The properties are leased to tenants and the leases are primarily triple net with 10 to 20-year terms. The operations of ACIC Properties may be considered a separate business segment.
FIC has determined that ACIC Properties’ commercial leases should be treated as “operating leases” for purposes of GAAP, and operating lease income and expense is recognized on a straight-line basis over the life of the leases.
The properties are comprised of the following as of December 31, 2022 and 2021 (dollars in thousands).
|
For the year ended |
||||||||||||
|
December 31, |
||||||||||||
|
Depreciable |
||||||||||||
|
(dollars in thousands) |
2022 |
2021 |
lives (in years) |
|||||||||
|
Land |
$ | 12,000 | $ | 12,000 | ||||||||
|
Building and improvements |
21,457 | 21,457 | 39 | |||||||||
|
Leasehold/tenant improvements |
931 | 906 | 15 | |||||||||
|
Furniture, fixtures & equipment |
1,081 | 1,081 | 7 | |||||||||
|
Real estate held for the production of income |
35,469 | 35,444 | ||||||||||
|
Accumulated depreciation |
(5,288 | ) | (4,523 | ) | ||||||||
|
Real estate held for the production of income, net |
$ | 30,181 | $ | 30,921 | ||||||||
Depreciation expense for the years ended December 31, 2022 and 2021 was $765 thousand and $765 thousand, respectively.
810 5th Street, LLC, a wholly owned subsidiary of ACIC Properties, has a mortgage with a financial institution that matures in February 2036 and has a fixed interest rate of 4.15% per annum. A balloon payment of $9.1 million is due at maturity. The loan is secured by the property, held by 810 5th Street, LLC, and a replacement reserve of $84 thousand, which is held in escrow, and is not guaranteed by FIC. The replacement reserve is included in other receivables. The property held by 810 5th Street, LLC is leased to a single tenant, the District of Columbia, on a triple-net basis. The initial term of the lease expires in February 2036, at which time the tenant has an option to extend the term of the lease for an additional five years. Debt service payments equal to 95% of 810 5th Street, LLC’s net rental proceeds are due monthly. As of December 31, 2022, and 2021, monthly debt service payments were $121 thousand and $117 thousand, respectively. The mortgage balance outstanding at 810 5th Street, LLC as of December 31, 2022 and 2021 was $23.0 million and $23.4 million, respectively, before netting unamortized finance costs of $1.1 million and $1.2 million, respectively.
In addition to the mortgage at 810 5th Street, LLC, ACIC Properties, through its wholly owned subsidiaries 717 8th Street, LLC and 2805 M Street, LLC, has two commercial lines of credit with the same financial institution that mature in November 2025. The commercial lines of credit are secured by the properties held by 717 8th Street, LLC and 2805 M Street, LLC and are not guaranteed by FIC. The properties held by 717 8th Street, LLC and 2805 M Street, LLC are leased to a commercial tenants on a triple-net basis. As of December 31, 2022 and 2021, the interest rate for both commercial lines of credit was 4.25% per annum. The interest rate for both commercial lines of credit is fixed at 4.25% until November 2025. As of December 31, 2022 and 2021, monthly debt service payments for these commercial lines of credit were $33 thousand. The outstanding balance on the commercial lines of credit as of December 31, 2022 and 2021 was $5.2 million and $5.4 million, respectively, before netting unamortized finance costs of $21 thousand and $28 thousand, respectively. Finance costs incurred are being amortized over the terms of the commercial lines of credit. Interest expense included $94 thousand of amortized finance costs in each of the years ended December 31, 2022 and 2021.
Deferred rent (on real estate held for the production of income)
Deferred rent on leased assets represents the cumulative difference between the actual cash receipts for rent and the rental income recorded in the financial statements, which is calculated on a straight-line basis. Deferred rent as of December 31, 2022 and December 31, 2021 was $2.2 million and $2.0 million, respectively.
Long-term debt maturity is summarized as follows (dollars in thousands):
|
December 31, |
||||||||
|
(dollars in thousands) |
2022 |
2021 |
||||||
|
Notes payable |
28,129 | 28,787 | ||||||
|
Unamortized finance costs |
(1,168 | ) | (1,263 | ) | ||||
|
Notes payable, net of unamortized finance costs |
26,961 | 27,524 | ||||||
Long-term debt maturities at December 31, 2022 were as follows (dollars in thousands):
|
(dollars in thousands) |
2022 |
|||
|
2023 |
$ | 733 | ||
|
2024 |
810 | |||
|
2025 |
5,441 | |||
|
2026 |
752 | |||
|
2027 |
834 | |||
|
Thereafter |
19,559 | |||
|
Total notes payable |
28,129 | |||
|
Unamortized finance costs |
(1,168 | ) | ||
|
Notes payable, net of unamortized finance costs |
$ | 26,961 | ||
Future rental income from non-cancelable operating leases for the year ended December 31, 2022 was as follows (dollars in thousands):
|
(dollars in thousands) |
2022 |
|||
|
2023 |
$ | 1,912 | ||
|
2024 |
2,126 | |||
|
2025 |
2,182 | |||
|
2026 |
2,242 | |||
|
2027 |
2,298 | |||
|
Thereafter |
16,931 | |||
|
Future rental income from non-cancellable operating leases |
$ | 27,691 | ||
In conjunction with the acquisition of the real estate, the following lease assets and liabilities were acquired and are being amortized throughout the remaining terms of the lease as follows (dollars in thousands):
|
December 31, |
||||||||
|
(dollars in thousands) |
2022 |
2021 |
||||||
|
Acquired leases |
$ | 4,831 | $ | 4,831 | ||||
|
Accumulated amortization, acquired leases |
(2,064 | ) | (1,766 | ) | ||||
|
Acquired leases, net of accumulated amortization |
$ | 2,767 | $ | 3,065 | ||||
Amortization expense for the years ended December 31, 2022 and 2021 was $299 thousand and $299 thousand, respectively.
In conjunction with the acquisition of the real estate, the following below market leases were acquired and are being offset by rent during the remaining terms of the lease as follows:
|
December 31, |
||||||||
|
(dollars in thousands) |
2022 |
2021 |
||||||
|
Below market lease |
$ | (134 | ) | $ | (134 | ) | ||
|
Rent offset |
120 | 103 | ||||||
| $ | (14 | ) | $ | (31 | ) | |||
ITEM 3. DIRECTORS AND OFFICERS
Overview
Our board of directors is divided into three classes, with approximately one-third of the directors being elected at each annual meeting of shareholders. Mr. Brewer and Mr. Wolfe have terms of office expiring at the annual meeting to be held in 2023. Mr. Patrick Bracewell, Mr. Roumell, and Mr. Hampton have terms of office expiring at the annual meeting to be held in 2024. Ms. Andersen and Mr. Joseph Bracewell have terms of office expiring at the annual meeting to be held in 2025. The current standing committees of our board of directors are: the audit committee; the human capital and compensation committee; the finance and investment committee; the nominating and corporate governance committee; and the strategy and risk committee.
Our executive officers are elected annually by the board of directors and, subject to their respective employment agreements, hold office until their respective successors have been elected or until death, resignation, or termination. Annually, the director nominees are reviewed and proposed by the nominating and governance committee and are selected by the board of directors.
Except for Patrick and Joseph Bracewell, there are no family relationships among any of our directors or executive officers. Joseph Bracewell is Patrick Bracewell’s father.
The table below provides certain information about our current directors and executive officers.
|
Term of Office |
|||||||
|
Name |
Position |
Age (1) |
Start Date (2), (3) |
End Date |
|||
|
Patrick J. Bracewell |
Chairman, President and Chief Executive Officer |
43 |
Oct-2011 |
Present |
|||
|
Richard A. Hutchinson |
President and Chief Operating Officer of FIC |
63 |
Jan-2021 |
Present |
|||
|
Michael C. Henke |
Treasurer and Vice President — Finance |
38 |
Oct-2021 |
Present |
|||
|
Brian T. Mancino |
Secretary and Vice President — Distribution & Product of FIC |
41 |
Mar-2013 |
Present |
|||
|
Michael A. McColley |
Vice President — Insurance Operations of FIC |
56 |
Jun-2017 |
Present |
|||
|
Joseph R. Niemer |
Vice President — Digital Commerce & Technology of FIC |
52 |
Jan-2021 |
Present |
|||
|
Shaza L. Andersen |
Director |
56 |
Oct-2011 |
Present |
|||
|
Joseph S. Bracewell, III |
Director |
75 |
Mar-2013 |
Present |
|||
|
Fred L. Brewer |
Director |
74 |
Mar-1984 |
Present |
|||
|
Thomas E. Hampton |
Director |
64 |
May-2021 |
Present |
|||
|
James C. Roumell |
Director |
61 |
Sep-2017 |
Present |
|||
|
Jason K. Wolfe |
Director |
46 |
Oct-2011 |
Present |
|||
|
(1) |
Age is as of December 31, 2022. |
|
(2) |
For executive officers, year in which individual became an employee of FIC. |
|
(3) |
For directors, year in which individual became a director of FIC. All directors of FIC also became directors of Forge Group, Inc. upon its formation in January 2021. |
Directors
We believe our board of directors should be composed of individuals with sophistication and experience in many substantive areas that impact our business. In this regard, we believe experience, qualifications or skills in the following areas are the most important: the insurance industry; insurance company operations; financial reporting and investment expertise; legal/regulatory matters relating to insurance companies; marketing; direct distribution and technology. We seek to select individuals who possess the personal and professional qualifications necessary for service on our board. Set forth below is biographical information for each of our directors:
Patrick J. Bracewell is the Chairman, President, and Chief Executive Officer, a position he has held since Forge Group, Inc. was organized in January 2021. Mr. Bracewell joined FIC in October 2011 and was elected as Chairman and Chief Executive Officer in 2011. Mr. Bracewell has also served as Chairman and President of FRM since 2011. Mr. Bracewell also serves as a director of Trustar Bank. Prior to joining FIC, Mr. Bracewell served as a Vice President in the Insurance Investment Banking Group at FBR Capital Markets, a middle-market investment banking firm. Mr. Bracewell holds an A.B. degree from Bowdoin College and has extensive experience with U.S. and Bermuda insurance and reinsurance companies. Mr. Bracewell was selected to serve on our board of directors because of his business, executive, operational and financial experience with property and casualty insurance companies.
Shaza L. Andersen has been a director of Forge Group, Inc. since its organization in January 2021 and has served as a director of FIC since October 2011. Ms. Andersen serves as the founder and Chief Executive Officer of Trustar Bank, the first Virginia based bank to be chartered in over a decade. Previously, Ms. Andersen served as the Vice Chair of the Board of Sandy Spring Bank. Prior thereto, Ms. Andersen founded and served as Chief Executive Officer of WashingtonFirst Bank, a wholly owned subsidiary of WashingtonFirst Bankshares, Inc. Ms. Andersen serves on the FDIC Advisory Committee on Community Banking. She is also a past member of the Federal Home Loan Bank of Atlanta, where she was the Vice Chair of the Corporate Governance Committee and a member of the Housing Committee and also served on the Treasury Board of the Commonwealth of Virginia.
Joseph S. Bracewell, III has been a director of Forge Group, Inc. since its organization in January 2021 and has served as a director of FIC since March 2013. Mr. Bracewell is Chairman of Trustar Bank and previously served as chairman of WashingtonFirst Bank from its inception in 2004 until its merger with Sandy Spring Bank in 2018. From 2002 through 2012, he was a partner in the law firm of McKee Nelson LLP and its successor firm of Bingham McCutchen LLP. Mr. Bracewell is a former director and vice chairman of the Federal Home Loan Bank of Atlanta, and a former director of the Independent Bankers Association of America. Mr. Bracewell graduated from Harvard University with an A.B. in applied mathematics and holds an M.B.A. from Stanford University, a JD from American University, and is a Chartered Financial Analyst.
Fred L. Brewer has been a director of Forge Group, Inc. since its organization in January 2021 and has served as a director of FIC since March 1984. Mr. Brewer previously served as Chairman of FIC until 2011 and was President of FIC until November 2014. Mr. Brewer has significant experience in underwriting, legal, claims, and insurance company operations. Mr. Brewer was also the Chairman and President of FRM until 2011. Before joining FIC, Mr. Brewer served as Deputy Superintendent and Actuary of the District of Columbia Department of Insurance, Securities and Banking where he was responsible for the regulation of property and casualty insurance rates, rules and policy forms, assigned risk plans, statistical bureaus, and insurance consumer complaints. Mr. Brewer received his B.S. from Southeast Missouri State University and is a licensed insurance producer.
Thomas E. Hampton has served as a director of Forge Group, Inc. and a director of FIC since May 2021. Mr. Hampton is currently a Principal with TE Hampton Consulting, an insurance regulatory consulting firm. Previously, Mr. Hampton was a Senior Advisor at Dentons LLP, a multi-national law firm, in the firm’s insurance practice. Mr. Hampton advises insurance companies, as well as financial services companies, on general regulatory matters, insurance product filings, as well as market conducts issues and financial regulatory matters, including examination, insurance statutory accounting standards and financial reporting procedures. Mr. Hampton also provides information and advice on insurance regulatory concerns to non-insurance company clients operating in the insurance industry. Mr. Hampton has advised clients on regulatory requirements related to insurance agency, insurance company, captive insurance, and risk retention group licensing issues. Mr. Hampton has also advised clients with life and health policy form filings. Mr. Hampton previously held the position of Commissioner for the District of Columbia Department of Insurance, Securities and Banking, a role in which, most recently, he was responsible for providing oversight and direction of the agency that regulates all financial services industries in the District of Columbia. Mr. Hampton also managed the captives and risk retention group division and assisted in the development of the regulatory procedures for these entities in the District of Columbia. Mr. Hampton participated in several leadership positions at the NAIC and NASAA committees and working groups dealing with financial regulatory issues, life insurance, as well as suitability and supervision of broker-dealer firms and their representatives. Mr. Hampton has his BBA in Accounting from North Carolina Central University and his M.B.A. from St. John’s University in New York.
James C. Roumell has been a director of Forge Group, Inc. since its organization in January 2021 and has served as a director of FIC since September 2017. Mr. Roumell is a Founder, Partner, and Portfolio Manager of Roumell Asset Management, LLC (“RAM”), an investment adviser. RAM serves as the investment advisor for Roumell Opportunistic Value Fund (RAMSX). Before founding Roumell Asset Management, Inc. in 1998, he was a Registered Principal at Raymond James Financial Services, Inc. Mr. Roumell is a graduate of Wayne State University in Detroit, MI.
Jason K. Wolfe has been a director of Forge Group, Inc. since its organization in January 2021 and has served as a director of FIC since October 2011. Mr. Wolfe is the President and Chief Executive Officer of Mutual Capital Investment Advisors, LLC (“MCIA”), which serves as the investment adviser for Mutual Capital Investment Fund, LP (“MCIF”), an investment fund that is focused principally on providing capital to mutual insurance companies in the U.S. property and casualty insurance segment. Mr. Wolfe is also a founder and Managing Member at Arbor Hills Asset Management, LLC (“Arbor Hills”), a private investment firm. Prior to founding Arbor Hills, Mr. Wolfe served as a Managing Director at Paragon Capital Group, LLC (“Paragon”), a merchant banking firm that advises and provides growth capital to middle-market businesses in various industries including financial institutions, insurance, real estate, and diversified industrials. Mr. Wolfe joined Paragon in 2010 and specialized in providing merger and acquisition advisory and capital raising services for insurance companies and other financial services businesses. During his career, Mr. Wolfe has advised numerous publicly traded and privately held stock companies as well as mutual insurance companies and reciprocal exchanges. Mr. Wolfe has a B.S. in chemical engineering from Case Western Reserve University. Mr. Wolfe has significant experience advising leading insurance businesses on such matters as capital raising, mergers, acquisitions, and growth initiatives.
Executive Officers
We believe that our executive officers and senior staff play a critical role in the success of our business. A brief description of each of our executive officers, other than Patrick J. Bracewell, and his or her business experience is set forth below.
Richard A. Hutchinson is the President and Chief Operating Officer of FIC. Mr. Hutchinson joined FIC in January 2021. Prior to joining FIC, Mr. Hutchinson was President of Hagerty Insurance Agency, a specialty insurance business focused on classic cars. Prior to serving as President of Hagerty, Mr. Hutchinson spent 29 years at Progressive, where he served in various leadership positions. Mr. Hutchinson holds an M.B.A. from University of Chicago and a B.A. from Yale University.
Michael C. Henke is the Treasurer and Vice President – Finance. Mr. Henke was appointed to this position on December 8, 2022, after serving as Interim Principal Financial and Accounting Officer since May 25, 2022. Prior to joining FIC in October 2021, Mr. Henke was a Manager at Strohm Ballweg, LLP, a public accounting firm providing accounting, audit, and tax services to the insurance industry. Mr. Henke is a licensed Certified Public Accountant and is a graduate of the University of Wisconsin-Whitewater with a B.B.A. in Accounting and Finance.
Brian T. Mancino is the Secretary and the Vice President — Distribution & Product of FIC. Mr. Mancino joined FIC in March 2013 and was appointed to Vice President in May 2019. Prior to joining FIC, Mr. Mancino was an Analyst at Ramsey Asset Management, LLC, an institutional alternative investment firm. Mr. Mancino holds both a B.S. degree and a M.S. degree of Accountancy from Miami University (Ohio) and is a Chartered Financial Analyst and was a former licensed Certified Public Accountant.
Michael A. McColley is the Vice President — Insurance Operations of FIC. Mr. McColley joined FIC in June 2017 and was appointed to Vice President in May 2019. Prior to such appointment, Mr. McColley served as Director of Claims. Prior to joining FIC, Mr. McColley served as Associate Director — Claims for Nationwide Mutual Insurance Company. Mr. McColley has 29 years of claims experience in the insurance industry. Mr. McColley has a B.A. in History from Virginia Commonwealth University.
Joseph R. Niemer is the Vice President — Digital Commerce & Technology of FIC. Mr. Niemer joined FIC in January 2021. Prior to joining FIC, Mr. Niemer was Vice President of Digital Commerce & Valuation at Hagerty Insurance Agency from 2009 to 2019 and was Manager — Business Analysis at Blue Cross Blue Shield of Michigan from 2002 to 2009. Mr. Niemer holds a B.A. from the University of Michigan.
Executive Compensation
Summary compensation table
The following table shows the annual compensation information for the three most highly compensated persons who were executive officers or directors of the Company during the year ended December 31, 2022.
|
Capacities in which compensation was received |
Cash |
Other |
Total |
|||||||||||
|
Name |
(e.g., Chief Executive Officer, directors, etc.) |
Compensation (1) |
Compensation (2) |
Compensation |
||||||||||
|
Patrick J. Bracewell |
Chairman, President and Chief Executive Officer |
$ | 415,814 | $ | 51,315 | $ | 467,129 | |||||||
|
Richard A. Hutchinson |
President and Chief Operating Officer of FIC |
$ | 447,692 | $ | 59,864 | $ | 507,556 | |||||||
|
Joseph R. Niemer |
Vice President — Digital Commerce & Technology of FIC |
$ | 213,385 | $ | 42,178 | $ | 255,563 | |||||||
|
(1) |
Includes salary, bonus and other cash incentive payments. |
|
(2) |
All other compensation consists of the following: (i) company portion of health, dental, life, disability and vision insurance premiums, (ii) 401(k) company matching contributions, and (iii) ESOP contributions. |
Employment agreements
In connection with the conversion and the offerings, we entered into an employment agreement with Patrick Bracewell. The employment agreement provides for a base salary of not less than $400,000, subject to annual increases as determined each year by the Board of Directors. Pursuant to the employment agreement, Mr. Bracewell is eligible to participate in all employee benefit programs of the Company as then in effect. The employment agreement extends for a term of three years that automatically renews for an additional year at each anniversary of the completion of the conversion and the offering unless notice of non-extension is given by the Board of Directors or Mr. Bracewell at least 90 days prior to each such anniversary.
In the event Patrick Bracewell is terminated by the Company without just cause or terminates his employment voluntarily for good reason, he will be entitled to continuation of his then current base salary (payable in monthly installments) for the greater of (i) twenty-four months, or (ii) the remaining term of the employment agreement. Mr. Bracewell would also be entitled to a pro rata payment of the current year’s annual incentive payment (based on the portion of the year completed) and a lump sum payment equal to two times the average of the two most recent annual incentive payments received by Mr. Bracewell. If Mr. Bracewell elects health continuation coverage under COBRA, the Company will pay or reimburse Mr. Bracewell for the monthly premium paid by Mr. Bracewell for himself and his enrolled spouse and dependents, less any amount he would be required to contribute if he were still an active employee of the Company. Such payment or reimbursement will continue until the earliest of (x) the eighteen-month anniversary of his termination date, (y) the date on which he is no longer eligible to receive COBRA continuation coverage, and (z) the date on which he receives substantially similar coverage from another employer or other source. In the event of the death of Patrick Bracewell, his legal representative is entitled to receive his current base salary paid though the end of the month of the date of his death. In the event of disability of Patrick Bracewell (as defined in the employment agreement), the Company shall continue to pay his then current base salary and any annual compensation until the earlier of (i) the termination of his employment by the Company or (ii) the end of the term of the employment agreement. If Mr. Bracewell is receiving disability payments, then the Company may offset for any disability income payments Mr. Bracewell is receiving.
Pursuant to the employment agreement, Mr. Bracewell is subject to noncompetition provisions during the term of employment and during a 24-month period thereafter.
The employment agreement requires the Company to cover and insure the executive under the insurance maintained to indemnify directors or officers of the Company. In the event of a dispute regarding a termination of employment and payment of severance, the Company shall pay reasonable costs, including attorney’s fees, of Mr. Bracewell, providing he prevails in such action.
Equity Compensation
In connection with the offering, on March 11, 2022, we granted options to purchase shares of our common stock to certain of our executive officers. As of December 31, 2022, there were options to purchase 180,000 shares outstanding. The following table sets forth the number of options to purchase shares of our common stock that were awarded upon the closing of the offering and were outstanding as of December 31, 2022:
|
Name |
Title |
Equity Award |
||
|
Patrick J. Bracewell |
Chairman and Chief Executive Officer |
Options to purchase 50,000 shares (1) |
||
|
Richard A. Hutchinson |
President and Chief Operating Officer of FIC |
Options to purchase 100,000 shares (2) |
||
|
Joseph R. Niemer |
Vice President — Digital Commerce & Technology of FIC |
Options to purchase 10,000 shares (3) |
||
|
Michael A. McColley |
Vice President — Insurance Operations of FIC |
Options to purchase 10,000 shares (3) |
||
|
Brian T. Mancino |
Vice President — Distribution & Product of FIC |
Options to purchase 10,000 shares (3) |
|
(1) |
The options have an exercise price equal to $10.00 and vest in equal annual installments over a seven-year period on March 11 of each year. |
|
(2) |
The options have an exercise price equal to $10.00. 50,000 options vest in equal annual installments over a five-year period on March 11 of each year. The remaining 50,000 options vest pursuant to reaching performance milestones that are based on growth in our book value per share and FIC achieving an A- financial strength rating from A.M. Best. |
|
(3) |
The options have an exercise price equal to $10.00 and vest in equal annual installments over a seven-year period on March 11 of each year. |
In addition, in connection with the offering, on March 11, 2022, we granted 15,000 shares of restricted stock to our non-employee directors. We awarded each non-employee director 1,000 shares of restricted stock, except our lead director, Jason Wolfe, who was awarded 10,000 shares of restricted stock. All of such shares of restricted stock will vest one year from the date of grant, or March 11, 2023, except the shares of restricted stock granted to Jason Wolfe, which will vest in equal installments over a five-year period.
Employee stock ownership plan (“ESOP”)
In connection with the offering, the ESOP purchased 202,950 shares, or 9.9% of the common stock issued in the offering. The ESOP borrowed $2.0 million at an interest rate of 2.14% from the Company to fund the purchase of these shares and will make annual contributions to the ESOP sufficient to repay that loan. It is anticipated that FIC will reimburse the Company for annual contributions to the ESOP.
Director compensation
In 2022, the total compensation paid to our directors as a group was $200,000. Each of the non-employee directors receives an annual retainer of $30,000 and our lead director, Jason Wolfe, receives an annual retainer of $50,000. Commencing in 2023, each director will be granted 1,000 shares of restricted stock annually, except our lead director, who will be granted 1,500 shares of restricted stock annually.
ITEM 4. SECURITY OWNERSHIP OF MANAGEMENT AND CERTAIN SECURITYHOLDERS
The following table sets forth, as of December 31, 2022, certain information with respect to the beneficial ownership of shares of our Common Stock by (i) each of our directors, (ii) each of our executive officers, (iii) our directors and executive officers as a group, and (iv) each stockholder known by us to be the beneficial owner of more than 5% of our outstanding Common Stock.
|
Common Stock |
Series A Preferred Stock |
As-Converted Basis |
||||||||||||||||||||||||||
|
Name of Beneficial Owner (1) |
Shares Beneficially Owned |
% of Class (2) |
Shares Beneficially Owned |
% of Class (3) |
Shares of Common Stock Beneficially Owned Upon Conversion (4) |
Shares of Common Stock Beneficially Owned |
% of Total (5) |
|||||||||||||||||||||
|
Directors and Officers |
||||||||||||||||||||||||||||
|
Patrick J. Bracewell (6) |
146,100 | 7.1 | % | 550,000 | 100.0 | % | 458,333 | 604,433 | 24.0 | % | ||||||||||||||||||
|
Richard A. Hutchinson (7) |
50,025 | 2.4 | % | - | 0.0 | % | - | 50,025 | 2.0 | % | ||||||||||||||||||
|
Joseph S. Bracewell, III (8) |
30,400 | 1.5 | % | - | 0.0 | % | - | 30,400 | 1.2 | % | ||||||||||||||||||
|
Fred L. Brewer (9) |
26,000 | 1.3 | % | - | 0.0 | % | - | 26,000 | 1.0 | % | ||||||||||||||||||
|
Jason K. Wolfe (10) |
25,000 | 1.2 | % | - | 0.0 | % | - | 25,000 | 1.0 | % | ||||||||||||||||||
|
Shaza L. Andersen (11) |
20,975 | 1.0 | % | - | 0.0 | % | - | 20,975 | 0.8 | % | ||||||||||||||||||
|
Brian T. Mancino (12) |
10,000 | 0.5 | % | - | 0.0 | % | - | 10,000 | 0.4 | % | ||||||||||||||||||
|
James C. Roumell (13) |
8,500 | 0.4 | % | - | 0.0 | % | - | 8,500 | 0.3 | % | ||||||||||||||||||
|
Joseph R. Niemer (14) |
6,500 | 0.3 | % | - | 0.0 | % | - | 6,500 | 0.3 | % | ||||||||||||||||||
|
Thomas E. Hampton (15) |
3,500 | 0.2 | % | - | 0.0 | % | - | 3,500 | 0.1 | % | ||||||||||||||||||
|
Michael C. Henke (16) |
2,000 | 0.1 | % | - | 0.0 | % | - | 2,000 | 0.1 | % | ||||||||||||||||||
|
Michael A. McColley (17) |
500 | 0.0 | % | - | 0.0 | % | - | 500 | 0.0 | % | ||||||||||||||||||
|
Directors and Officers as a Group |
329,500 | 16.0 | % | 550,000 | 100.0 | % | 458,333 | 787,833 | 31.2 | % | ||||||||||||||||||
|
Five Percent (5%) Shareholders |
||||||||||||||||||||||||||||
|
Mutual Capital Investment Fund, LP (18) |
675,685 | 32.7 | % | - | 0.0 | % | - | 675,685 | 26.8 | % | ||||||||||||||||||
|
Forge Group, Inc. Employee Stock Ownership Trust (19) |
202,950 | 9.8 | % | - | 0.0 | % | - | 202,950 | 8.0 | % | ||||||||||||||||||
|
(1) |
Under Rule 13d-3, a beneficial owner of a security includes any person who, directly or indirectly, through any contract, arrangement, understanding, relationship, or otherwise has or shares: (i) voting power, which includes the power to vote, or to direct the voting of shares; and (ii) investment power, which includes the power to dispose or direct the disposition of shares. Certain shares may be deemed to be beneficially owned by more than one person (if, for example, persons share the power to vote or the power to dispose of the shares). In addition, shares are deemed to be beneficially owned by a person if the person has the right to acquire the shares (for example, upon exercise of an option) within 60 days of the date as of which the information is provided. In computing the percentage ownership of any person, the amount of shares outstanding is deemed to include the amount of shares beneficially owned by such person (and only such person) by reason of these acquisition rights. As a result, the percentage of outstanding shares of any person as shown in this table does not necessarily reflect the person’s actual ownership or voting power with respect to the number of shares of common stock actually outstanding. |
|
(2) |
Based upon 2,065,000 shares of common stock issued and outstanding as of the date referenced and includes: (i) 2,050,000 shares of common stock issued and outstanding and (ii) 15,000 shares of restricted common stock (15,000 of which remained subject to restrictions within 60 days of the date referenced but which have voting rights). There were no stock options held for the purchase of common stock which were exercisable within 60 days of the date referenced. |
|
(3) |
Based upon 550,000 shares of Series A Preferred Stock outstanding as of the date referenced. |
|
(4) |
Based upon 458,333 shares of common stock issuable upon conversion of 550,000 shares of Series A Preferred Stock. |
|
(5) |
Based upon 2,523,333 shares of common stock issued and outstanding, including shares of common stock issuable upon conversion of Series A Preferred Stock, as of the date referenced and includes: (i) 2,065,000 shares of common stock issued and outstanding and (ii) 458,333 shares of common stock issuable upon conversion of 550,000 shares of Series A Preferred Stock. |
|
(6) |
Includes (i) 28,000 shares of common stock held by Patrick J. Bracewell, (ii) 74,800 shares of common stock held by MCW Holdings, Inc., of which Patrick J. Bracewell is the Chairman and President, (iii) 550,000 shares of Series A Preferred Stock held by MCW Holdings, Inc., of which Patrick J. Bracewell is the Chairman and President, and (iv) 42,500 shares of common stock held by Bracewell Trustar Investment Partnership, of which Patrick J. Bracewell is the Managing Partner. |
|
(7) |
Includes (i) 37,878 shares of common stock held by Midland Trust Company Custodian FBO Richard Hutchinson Roth IRA, (ii) 8,749 shares of common stock held by Midland Trust Company Custodian FBO Richard Hutchinson Traditional IRA, and (iii) 3,398 shares of common stock held by Richard A. Hutchinson. |
|
(8) |
Includes (i) 29,400 shares of common stock held by Midland Trust Company Custodian FBO Joseph Bracewell IRA and (ii) 1,000 shares of restricted common stock held by Joseph S. Bracewell, III (1,000 of which remained subject to restrictions within 60 days of the date referenced but which had voting rights). |
|
(9) |
Includes (i) 25,000 shares of common stock held by Fred Lewis Brewer Living Trust and (ii) 1,000 shares of restricted common stock held by Fred L. Brewer (1,000 of which remained subject to restrictions within 60 days of the date referenced but which had voting rights). |
|
(10) |
Includes (i) 15,000 shares of common stock held by Jason K. Wolfe and (ii) 10,000 shares of restricted common stock held by Jason K. Wolfe (10,000 of which remained subject to restrictions within 60 days of the date referenced but which had voting rights). |
|
(11) |
Includes (i) 19,975 shares of common stock held by Midland Trust Company Custodian FBO Shaza Andersen and (ii) 1,000 shares of restricted common stock held by Shaza L. Andersen (1,000 of which remained subject to restrictions within 60 days of the date referenced but which had voting rights). |
|
(12) |
Includes 10,000 shares of common stock held by Brian T. Mancino. |
|
(13) |
Includes (i) 7,500 shares of common stock held by James C. Roumell and Deborah Billet Roumell Joint Tenants and (ii) 1,000 shares of restricted common stock held by James C. Roumell (1,000 of which remained subject to restrictions within 60 days of the date referenced but which had voting rights). |
|
(14) |
Includes 6,500 shares of common stock held by Midland Trust Company Custodian FBO Joseph Niemer. |
|
(15) |
Includes (i) 2,500 shares of common stock held by Thomas E. Hampton and (ii) 1,000 shares of restricted common stock held by Thomas E. Hampton (1,000 of which remained subject to restrictions within 60 days of the date referenced but which had voting rights). |
|
(16) |
Includes 2,000 shares of common stock held by Michael C. Henke. |
|
(17) |
Includes 500 shares of common stock held by Michael A. McColley. |
|
(18) |
Includes 675,685 shares of common stock held by Mutual Capital Investment Fund, LP (“MCIF”), an investment fund managed by Mutual Capital Investment Advisors, LLC (“MCIA”), of which Jason K. Wolfe is the Chief Executive Officer. Although MCIA is the manager of MCIF, the power to direct the purchase, sale, or voting of the shares of common stock of the Company is held by Mutual Capital Group, Inc. (“MCG”), which is the parent and controlling person of MCIA. |
|
(19) |
Includes 202,950 shares of common stock held by Forge Group, Inc. Employee Stock Ownership Trust. |
ITEM 5. INTERESTS OF MANAGEMENT AND OTHERS IN CERTAIN TRANSACTIONS
Forge Risk Management, Inc.
As of December 31, 2021, American Risk Management, Inc., which has been renamed Forge Risk Management, Inc. (“FRM”), was a wholly owned subsidiary of MCW Holdings, Inc. Patrick Bracewell and Joseph Bracewell own 94% of the outstanding capital stock of MCW Holdings, Inc. Pursuant to a nonexclusive agency agreement between FIC and FRM, FRM receives a commission of 18.3% of substantially all premiums collected by FIC that are produced by FRM or FRM’s independent insurance agent sub-producers. FRM and FIC have a cost-sharing agreement whereby FRM utilizes a portion of FIC’s office space and has the use of one of FIC’s employees to assist in performing its insurance agency functions. FRM reimburses FIC for 10% of certain shared resources, office expenses, and shared personnel. On March 11, 2022, pursuant to a stock purchase agreement with MCW Holdings, Inc., the Company completed the acquisition of all the outstanding capital stock of FRM. Pursuant to the stock purchase agreement, the Company assumed $1.4 million of FRM’s outstanding debt and issued to MCW Holdings, Inc. 550,000 shares of the Company’s Series A 8.5% cumulative convertible preferred stock. See Item 1. Business — Completion of Offering, Conversion and Agency Acquisition for more detailed information.
Trustar Bank
In March 2019, FIC invested $250 thousand in the ownership units, consisting of common stock and warrants, of Trustar Bank (“Trustar”), a newly formed Virginia bank. Joseph S. Bracewell, III serves as Chairman of Trustar, Shaza L. Andersen serves as a director and Chief Executive Officer of Trustar, and Patrick J. Bracewell serves as a director of Trustar. Mr. Joseph Bracewell, Ms. Andersen, and Mr. Patrick Bracewell are members of the board of directors of the Company.
Limitations of Liability and Indemnification Matters
Our articles of incorporation and bylaws, as they will be in effect upon the closing of this offering, will limit the liability of our directors to the fullest extent permitted by the PBCL and provide that we will indemnify our officers and directors to the fullest extent permitted by the PBCL.
We also maintain director and officer liability insurance.
ITEM 6. OTHER INFORMATION
None.
ITEM 7. FINANCIAL STATEMENTS
Audited Consolidated Financial Statements of Forge Group, Inc. and Subsidiaries
Report of Independent Registered Public Accounting Firm
Consolidated Balance Sheets (As of December 31, 2022 and 2021)
Consolidated Statements of Earnings and Comprehensive Earnings (Years ended December 31, 2022 and 2021)
Consolidated Statements of Stockholders’ Equity (Years ended December 31, 2022 and 2021)
Consolidated Statements of Cash Flows (Years ended December 31, 2022 and 2021)
Notes to Consolidated Financial Statements (As of December 31, 2022 and for the two years ended December 31, 2022)
ITEM 8. EXHIBITS
|
Exhibit No. |
Description of Exhibit |
|
|
2.1 |
Amended and Restated Articles of Incorporation of Forge Group, Inc.** |
|
|
2.2 |
||
|
3.1 |
||
|
3.2 |
||
|
3.3 |
||
|
4.1 |
||
|
6.1 |
||
|
6.2 |
||
|
6.3 |
||
|
6.4 |
Form of Restricted Stock Award Agreement under the Forge Group, Inc. 2021 Stock Incentive Plan** |
|
|
6.5 |
||
|
6.6 |
||
|
6.7 |
||
|
6.8 |
||
|
7.1 |
||
|
8.1 |
||
|
11.1 |
** Previously filed.
SIGNATURES
Pursuant to the requirements of Regulation A, the issuer has duly caused this report to be signed on its behalf by the undersigned, thereunto duly authorized.
(Exact name of issuer as specified in its charter): Forge Group, Inc.
This report has been signed by the following persons in the capacities and on the dates indicated.
By: /s/ Patrick J. Bracewell
Name: Patrick J. Bracewell
Title: Chief Executive Officer
(Principal Executive Officer)
(Date): April 28, 2023
By: /s/ Michael Henke
Name: Michael C. Henke
Title: Treasurer and Vice President – Finance
(Principal Financial Officer, Principal Accounting Officer)
(Date): April 28, 2023
Pursuant to the requirements of Regulation A, this report has been signed below by the following persons on behalf of the issuer and in the capacities and on the dates indicated.
|
Signature |
Title |
Date |
|
|
/s/Patrick J. Bracewell |
Chairman, President and Chief Executive Officer |
April 28, 2023 |
|
| Patrick J. Bracewell | |||
|
/s/ Shaza L. Andersen |
Director |
April 28, 2023 |
|
| Shaza L. Andersen | |||
|
/s/ Fred L. Brewer |
Director |
April 28, 2023 |
|
| Fred L. Brewer | |||
|
/s/ Jason K. Wolfe |
Director |
April 28, 2023 |
|
| Jason K. Wolfe |
 |
Crowe LLP Independent Member Crowe Global |
INDEPENDENT AUDITOR'S REPORT
Board of Directors and Stockholders
Forge Group, Inc. and Subsidiaries
Opinion
We have audited the consolidated financial statements of Forge Group, Inc. and Subsidiaries (the Company), which comprise the consolidated balance sheets as of December 31, 2022 and 2021, and the related statements of operations and comprehensive earnings, shareholders’ equity, and cash flows for the years then ended, and the related notes to the consolidated financial statements.
In our opinion, the accompanying consolidated financial statements present fairly, in all material respects, the financial position of the Company as of December 31, 2022 and 2021, and the results of its operations and its cash flows for the years then ended in accordance with accounting principles generally accepted in the United States of America.
Basis for Opinion
We conducted our audits in accordance with auditing standards generally accepted in the United States of America (GAAS). Our responsibilities under those standards are further described in the Auditor’s Responsibilities for the Audit of the Financial Statements section of our report. We are required to be independent of the Company and to meet our other ethical responsibilities, in accordance with the relevant ethical requirements relating to our audit. We believe that the audit evidence we have obtained is sufficient and appropriate to provide a basis for our audit opinion.
Responsibilities of Management for the Consolidated Financial Statements
Management is responsible for the preparation and fair presentation of the consolidated financial statements in accordance with accounting principles generally accepted in the United States of America, and for the design, implementation, and maintenance of internal control relevant to the preparation and fair presentation of consolidated financial statements that are free from material misstatement, whether due to fraud or error.
In preparing the consolidated financial statements, management is required to evaluate whether there are conditions or events, considered in the aggregate, that raise substantial doubt about the Company’s ability to continue as a going concern for one year from the date the consolidated financial statements are available to be issued.
Auditor’s Responsibilities for the Audit of the Consolidated Financial Statements
Our objectives are to obtain reasonable assurance about whether the consolidated financial statements as a whole are free from material misstatement, whether due to fraud or error, and to issue an auditor’s report that includes our opinion. Reasonable assurance is a high level of assurance but is not absolute assurance and therefore is not a guarantee that an audit conducted in accordance with GAAS will always detect a material misstatement when it exists. The risk of not detecting a material misstatement resulting from fraud is higher than for one resulting from error, as fraud may involve collusion, forgery, intentional omissions, misrepresentations, or the override of internal control. Misstatements are considered material if there is a substantial likelihood that, individually or in the aggregate, they would influence the judgment made by a reasonable user based on the consolidated financial statements.
(continued)
In performing an audit in accordance with GAAS, we:
|
● |
Exercise professional judgment and maintain professional skepticism throughout the audit. |
|
● |
Identify and assess the risks of material misstatement of the consolidated financial statements, whether due to fraud or error, and design and perform audit procedures responsive to those risks. Such procedures include examining, on a test basis, evidence regarding the amounts and disclosures in the consolidated financial statements. |
|
● |
Obtain an understanding of internal control relevant to the audit in order to design audit procedures that are appropriate in the circumstances, but not for the purpose of expressing an opinion on the effectiveness of the Company’s internal control. Accordingly, no such opinion is expressed. |
|
● |
Evaluate the appropriateness of accounting policies used and the reasonableness of significant accounting estimates made by management, as well as evaluate the overall presentation of the consolidated financial statements. |
|
● |
Conclude whether, in our judgment, there are conditions or events, considered in the aggregate, that raise substantial doubt about the Company’s ability to continue as a going concern for a reasonable period of time. |
We are required to communicate with those charged with governance regarding, among other matters, the planned scope and timing of the audit, significant audit findings, and certain internal control–related matters that we identified during the audit.
Required Supplementary Information
Accounting principles generally accepted in the United States of America require that the incurred and paid claims development information for the periods ended December 31, 2013 through December 31, 2021 on pages 33-34 and the average annual claims payout as of December 31, 2022 on page 35 be presented to supplement the basic consolidated financial statements. Such information is the responsibility of management and, although not part of the basic consolidated financial statements, is required by the Financial Accounting Standards Board, who considers it to be an essential part of financial reporting for placing the basic consolidated financial statements in an appropriate operational, economic, or historical context. We have applied certain limited procedures to the required supplemental information in accordance with auditing standards generally accepted in the United States of America, which consisted of inquiries of management about the methods of preparing the information and comparing the information for consistency with management’s responses to our inquiries, the basic consolidated financial statements, and other knowledge we obtained during our audit of the basic consolidated financial statements. We do not express an opinion or provide any assurance on the information because the limited procedures do not provide us with sufficient evidence to express an opinion or provide any assurance.
 Crowe LLP |
Fort Lauderdale, Florida
April 28, 2022
Forge Group, Inc. and Subsidiaries
Consolidated Balance Sheets
December 31, 2022 and 2021
|
|
2022 |
2021 |
||||||
| Assets | ||||||||
|
Investments and cash: |
||||||||
|
Fixed maturity securities, at fair value (amortized cost - $27,901,027 and $21,403,981, at December 31, 2022 and 2021, respectively) |
$ | 26,199,198 | $ | 22,173,342 | ||||
|
Redeemable preferred stock, at fair value |
1,351,429 | 1,320,173 | ||||||
|
Perpetual preferred stock, at fair value |
851,519 | 1,148,790 | ||||||
|
Common stock, at fair value |
2,173,764 | 1,747,168 | ||||||
|
Other invested assets |
4,400,901 | 5,773,405 | ||||||
|
Real estate held for the production of income, net |
30,181,082 | 30,921,206 | ||||||
|
Cash and cash equivalents |
6,357,638 | 7,925,721 | ||||||
|
Restricted cash |
210,318 | 194,348 | ||||||
|
Total investments and cash |
71,725,849 | 71,204,153 | ||||||
|
Accrued investment income |
267,496 | 216,215 | ||||||
|
Premium and reinsurance balances receivable |
5,457,886 | 4,637,294 | ||||||
|
Ceded unearned premiums |
42,950 | 243,799 | ||||||
|
Reinsurance balances recoverable on unpaid losses |
1,070,452 | 923,240 | ||||||
|
Deferred policy acquisition costs, net of premium deficiency reserve |
214,021 | 739,254 | ||||||
|
Deferred rent |
2,215,270 | 2,011,088 | ||||||
|
Leases in place |
2,767,162 | 3,065,397 | ||||||
|
Right-of-use asset, net |
148,597 | 1,768,894 | ||||||
|
Goodwill and other intangibles |
6,343,292 | - | ||||||
|
Prepaid expenses and other assets |
807,466 | 3,090,410 | ||||||
|
Total assets |
$ | 91,060,441 | $ | 87,899,744 | ||||
|
Liabilities and Equity |
||||||||
|
Liabilities: |
||||||||
|
Unpaid losses and loss adjustment expenses |
$ | 8,479,990 | $ | 9,677,705 | ||||
|
Unearned premium |
6,315,045 | 4,392,781 | ||||||
|
Reinsurance balances payable |
49,122 | 2,654 | ||||||
|
Accrued expenses |
1,470,542 | 869,802 | ||||||
|
Commissions payable to related party |
- | 862,327 | ||||||
|
Notes payable |
26,960,687 | 27,524,112 | ||||||
|
Defined benefit plan unfunded liability |
478,682 | 275,203 | ||||||
|
Related party loan |
- | 397,810 | ||||||
|
Operating lease liability, net |
870,091 | 2,566,718 | ||||||
|
Other liabilities |
504,350 | 256,307 | ||||||
|
Total liabilities |
45,128,509 | 46,825,419 | ||||||
|
Mezzanine equity: |
||||||||
|
Preferred stock, without par value, authorized 1,000,000 shares, 550,000 shares outstanding at December 31, 2022 and none at December 31, 2021 |
- | - | ||||||
|
Additional paid-in capital |
5,227,000 | - | ||||||
|
Shareholders' equity |
||||||||
|
Common stock, $0.01 par value, authorized 10,000,000 shares, issued and outstanding 2,050,000 shares at December 31, 2022 and none at December 31, 2021 |
20,500 | - | ||||||
|
Additional paid-in capital |
16,170,962 | - | ||||||
|
Unearned employee stock ownership plan shares |
(1,826,550 | ) | - | |||||
|
Retained earnings |
28,442,689 | 40,929,755 | ||||||
|
Accumulated other comprehensive loss, net of tax |
(2,810,215 | ) | (575,721 | ) | ||||
|
Non-controlling interest |
707,546 | 720,291 | ||||||
|
Total equity |
45,931,932 | 41,074,325 | ||||||
|
Total liabilities and equity |
$ | 91,060,441 | $ | 87,899,744 | ||||
See notes to consolidated financial statements.
Forge Group, Inc. and Subsidiaries
Consolidated Statements of Operations and Comprehensive Earnings
Years Ended December 31, 2022 and 2021
|
2022 |
2021 |
|||||||
|
Revenues |
||||||||
|
Net premiums earned |
$ | 9,402,147 | $ | 7,908,743 | ||||
|
Income from real estate held for investment |
2,336,241 | 2,158,585 | ||||||
|
Net investment income |
1,156,902 | 1,171,449 | ||||||
|
Net realized investment gains |
217,899 | 378,893 | ||||||
|
Net unrealized gains (losses) on equity securities |
(2,191,322 | ) | 862,127 | |||||
|
Gain on extinguishment of related party loan |
400,698 | - | ||||||
|
Service fee and other income |
105,553 | 52,623 | ||||||
|
Total revenues |
11,428,118 | 12,532,420 | ||||||
|
Expenses |
||||||||
|
Losses and loss adjustment expenses |
4,510,580 | 5,167,137 | ||||||
|
Policy acquisition costs and other operating expenses |
7,760,143 | 3,592,479 | ||||||
|
Related party commissions incurred |
410,227 | 1,670,095 | ||||||
|
Depreciation and amortization |
1,336,042 | 1,085,769 | ||||||
|
Real estate operating expense |
158,515 | 168,370 | ||||||
|
Interest expense on debt |
1,290,879 | 1,312,081 | ||||||
|
Lease expense |
282,287 | 264,098 | ||||||
|
Sublease income |
(140,145 | ) | (79,908 | ) | ||||
|
Policyholder dividend |
7,304,587 | - | ||||||
|
Other expenses |
- | (23,396 | ) | |||||
|
Total expenses |
22,913,115 | 13,156,725 | ||||||
|
Loss before income taxes |
(11,484,997 | ) | (624,305 | ) | ||||
|
Income tax expense |
635,644 | 104,091 | ||||||
|
Net loss |
(12,120,641 | ) | (728,396 | ) | ||||
|
Net loss attributable to non-controlling interest |
12,745 | 26,499 | ||||||
|
Net loss attributable to Forge Group Inc. common shareholders |
(12,107,896 | ) | (701,897 | ) | ||||
|
Other comprehensive income (loss), net of tax |
||||||||
|
Unrealized gains and losses on investments: |
||||||||
|
Unrealized holding (losses) gains on AFS securities arising during the year, net of income tax benefit of $589,616 and $100,546, respectively |
(1,962,821 | ) | (400,816 | ) | ||||
|
Reclassification adjustment for losses (gains) included in net income, net of income tax benefit of $4,364 and $5,433, respectively |
(16,416 | ) | (20,439 | ) | ||||
|
Defined benefit plan, net of income tax expense (benefit) of $(67,853) and $7,888, respectively |
(255,257 | ) | 29,676 | |||||
|
Total other comprehensive loss |
(2,234,494 | ) | (391,579 | ) | ||||
|
Comprehensive loss |
$ | (14,355,135 | ) | $ | (1,119,975 | ) | ||
|
Earnings per share: |
||||||||
|
Basic: |
||||||||
|
Basic net (loss) earnings per share |
$ | (5.91 | ) | $ | (0.34 | ) | ||
|
Diluted: |
||||||||
|
Diluted net (loss) earnings per share |
$ | (4.48 | ) | $ | (0.26 | ) | ||
|
Weighted average number of common shares outstanding: |
||||||||
|
Basic |
2,050,000 | 2,050,000 | ||||||
|
Diluted |
2,703,333 | 2,703,333 | ||||||
See notes to consolidated financial statements.
Forge Group, Inc. and Subsidiaries
Consolidated Statements of Shareholders' Equity
Years Ended December 31, 2022 and 2021
| Preferred stock | Common Stock | Unearned |
Accumulated |
|||||||||||||||||||||||||||||||||
|
Additional |
Additional |
employee |
other |
|||||||||||||||||||||||||||||||||
|
Preferred |
paid-in |
Common |
paid-in |
stock ownership |
Retained |
comprehensive |
Non-controlling |
|||||||||||||||||||||||||||||
|
stock |
capital |
stock |
capital |
plan shares |
earnings |
(loss) income |
interest |
Total equity |
||||||||||||||||||||||||||||
|
Balance January 1, 2021 |
$ | - | $ | - | $ | - | $ | - | $ | - | $ | 41,631,652 | $ | (184,142 | ) | $ | 746,790 | $ | 42,194,300 | |||||||||||||||||
|
Net loss attributable to Forge Group, Inc. |
- | - | - | - | - | (701,897 | ) | - | - | (701,897 | ) | |||||||||||||||||||||||||
|
Unrealized holding gains on AFS securities arising during the period, net |
- | - | - | - | - | - | (400,816 | ) | - | (400,816 | ) | |||||||||||||||||||||||||
|
Reclassification adjustment for losses included in net income |
- | - | - | - | - | - | (20,439 | ) | - | (20,439 | ) | |||||||||||||||||||||||||
|
Defined benefit plan, net of income tax expense |
- | - | - | - | - | - | 29,676 | 29,676 | ||||||||||||||||||||||||||||
|
Net loss attributable to non-controlling interest |
- | - | - | - | - | - | - | (26,499 | ) | (26,499 | ) | |||||||||||||||||||||||||
|
Balance December 31, 2021 |
$ | - | $ | - | $ | - | $ | - | $ | - | $ | 40,929,755 | $ | (575,721 | ) | $ | 720,291 | $ | 41,074,325 | |||||||||||||||||
|
Net loss attributable to Forge Group, Inc. |
- | - | - | - | - | (12,107,896 | ) | - | - | (12,107,896 | ) | |||||||||||||||||||||||||
|
Unrealized holding losses on AFS securities arising during the period, net |
- | - | - | - | - | - | (1,962,821 | ) | - | (1,962,821 | ) | |||||||||||||||||||||||||
|
Reclassification adjustment for gains included in net income |
- | - | - | - | - | - | (16,416 | ) | - | (16,416 | ) | |||||||||||||||||||||||||
|
Defined benefit plan, net of income tax expense |
- | - | - | - | - | - | (255,257 | ) | - | (255,257 | ) | |||||||||||||||||||||||||
|
Issuance of shares, net of expenses |
- | 5,227,000 | 20,500 | 16,088,020 | (2,029,500 | ) | - | - | - | 19,306,020 | ||||||||||||||||||||||||||
|
Employee stock ownership plan compensation expense |
- | - | - | 30,442 | 202,950 | - | - | - | 233,392 | |||||||||||||||||||||||||||
|
Share-based compensation |
- | - | - | 52,500 | - | - | - | - | 52,500 | |||||||||||||||||||||||||||
|
Dividends incurred on preferred stock |
- | - | - | - | - | (379,170 | ) | - | - | (379,170 | ) | |||||||||||||||||||||||||
|
Net loss attributable to non-controlling interest |
- | - | - | - | - | - | - | (12,745 | ) | (12,745 | ) | |||||||||||||||||||||||||
|
Balance December 31, 2022 |
$ | - | $ | 5,227,000 | $ | 20,500 | $ | 16,170,962 | $ | (1,826,550 | ) | $ | 28,442,689 | $ | (2,810,215 | ) | $ | 707,546 | $ | 45,931,932 | ||||||||||||||||
See notes to consolidated financial statements.
Forge Group, Inc. and Subsidiaries
Consolidated Statements of Cash Flows
Years Ended December 31, 2022 and 2021
|
2022 |
2021 |
|||||||
|
Cash flows from operating activities: |
||||||||
|
Net (loss) gain attributable to Forge Group, Inc. |
$ | (12,107,896 | ) | $ | (701,897 | ) | ||
|
Adjustments to reconcile net (loss) gain to net cash provided by operating activities: |
||||||||
|
Net realized capital (gain) loss on investments |
(217,899 | ) | (378,893 | ) | ||||
|
Gain on extinguishment of related party loan |
(400,698 | ) | - | |||||
|
Net unrealized losses (gains) on equity securities |
2,191,322 | (862,127 | ) | |||||
|
Depreciation of property and equipment |
765,105 | 764,965 | ||||||
|
Amortization of intangibles |
272,708 | - | ||||||
|
Deferred income taxes, net |
593,979 | 104,091 | ||||||
|
Net amortization of premiums and discounts on investments |
1,360 | 81,987 | ||||||
|
Amortization on acquired leases and finance costs |
392,588 | 298,234 | ||||||
|
Interest expense |
(649 | ) | (2,978 | ) | ||||
|
Non-controlling interest |
12,745 | (26,499 | ) | |||||
|
Changes in assets and liabilities which provided (used) cash: |
||||||||
|
Premiums and agents' balances receivable |
(820,592 | ) | (1,092,443 | ) | ||||
|
Deferred policy acquisition costs, net of premium deficiency reserve |
1,273,941 | (361,029 | ) | |||||
|
Ceded unearned premiums |
200,849 | (119,129 | ) | |||||
|
Reinsurance balances payable |
46,468 | (1,535 | ) | |||||
|
Reinsurance balances recoverable on unpaid losses |
(147,212 | ) | 276,489 | |||||
|
Accrued investment income |
(51,281 | ) | 39,279 | |||||
|
Deferred rent |
(204,182 | ) | (320,952 | ) | ||||
|
Leases in place |
298,235 | 298,234 | ||||||
|
Right-of-use asset, net |
1,620,297 | 204,993 | ||||||
|
Prepaid stock offering expenses |
- | (1,868,893 | ) | |||||
|
Other assets |
(296,042 | ) | 19,577 | |||||
|
Unpaid losses and loss expenses |
(1,197,715 | ) | (183,057 | ) | ||||
|
Unearned premiums |
1,922,264 | 1,089,041 | ||||||
|
Accrued expenses and other liabilities |
554,785 | (160,466 | ) | |||||
|
Commissions payable to related parties |
(862,327 | ) | 215,791 | |||||
|
Operating lease liability |
(1,696,627 | ) | (261,811 | ) | ||||
|
Defined benefit plan |
203,479 | (131,280 | ) | |||||
|
Net cash used in operating activities |
(7,652,995 | ) | (3,080,308 | ) | ||||
|
Cash flows from investing activities: |
||||||||
|
Purchases of: |
||||||||
|
Fixed maturity securities and redeemable preferred stock, available for sale |
(10,572,062 | ) | (1,996,787 | ) | ||||
|
Common stock and perpetual preferred stock |
(2,439,581 | ) | (831,344 | ) | ||||
|
Real estate held for the production of income |
(24,981 | ) | - | |||||
|
Other invested assets |
- | (1,988,905 | ) | |||||
|
Proceeds from sales, maturities and calls of: |
||||||||
|
Fixed maturity securities and redeemable preferred stock, available for sale |
4,112,908 | 10,829,185 | ||||||
|
Common stock and perpetual preferred stock |
1,531,637 | 265,050 | ||||||
|
Other invested assets |
36,711 | 665,549 | ||||||
|
Net cash provided by (used in) investing activities |
(7,355,368 | ) | 6,942,748 | |||||
|
Cash flows from financing activities: |
||||||||
|
Proceeds from issuance of common stock, net |
16,108,520 | - | ||||||
|
Loan to employee stock ownership plan, net of repayment |
(1,826,550 | ) | - | |||||
|
Dividends paid to preferred stock owners |
(262,295 | ) | - | |||||
|
Proceeds from related party loan |
- | 397,810 | ||||||
|
Repayments of borrowed funds |
(563,425 | ) | (495,112 | ) | ||||
|
Net cash provided by (used in) financing activities |
13,456,250 | (97,302 | ) | |||||
|
Net change in cash and cash equivalents |
(1,552,113 | ) | 3,765,138 | |||||
|
Cash and cash equivalents at beginning of year |
8,120,069 | 4,354,931 | ||||||
|
Cash and cash equivalents at end of period |
$ | 6,567,956 | $ | 8,120,069 | ||||
|
Cash and cash equivalents |
$ | 6,357,638 | $ | 7,925,721 | ||||
|
Restricted cash |
210,318 | 194,348 | ||||||
|
Cash, cash equivalents and restricted cash |
$ | 6,567,956 | $ | 8,120,069 | ||||
|
Supplemental information: |
||||||||
|
Federal income tax paid |
$ | - | $ | - | ||||
|
Interest paid |
$ | 1,196,520 | $ | 1,312,081 | ||||
See notes to consolidated financial statements.
Note 1 – Description of Business
Forge Group, Inc. is a Pennsylvania corporation that was organized in 2021. References to the “Company”, “we”, “us”, and “our” refer to the consolidated group. On a stand-alone basis Forge Group, Inc. is referred to as the “Parent Company”. The consolidated group consists of the holding company, Forge Risk Management, Inc. (“FRM”), an insurance agency, and Forge Insurance Company (“FIC”), an insurance company that is the majority owner (92.3%) of ACIC Consolidated Properties, LLC (“ACP”), a real estate holding company that has three wholly owned subsidiaries, 717 8th Street LLC, 2805 M Street LLC, and 810 5th Street LLC.
Forge Group, Inc. was formed so that it could acquire all of the capital stock of FIC in a mutual-to stock conversion. The plan of conversion was approved by FIC policyholders at a special meeting on March 7, 2022. Prior to the conversion on March 11, 2022, Forge Group, Inc. did not engage in any operations. After the conversion, Forge Group, Inc’s primary assets are the outstanding capital stock of FIC and a portion of the net proceeds from the stock offering completed in connection with the mutual-to-stock conversion. On the effective date of the conversion, FIC became a wholly owned subsidiary of Forge Group, Inc. The mutual to stock conversion was accounted for as a change in corporate form with the historic basis of FIC’s assets, liabilities and equity unchanged as a result. The consolidated financial statements as of and for the twelve months ended December 31, 2022, include Forge Group, Inc. and subsidiaries. The financial statements as of and for the twelve months ended December 31, 2021, represent the financial position and results of operations of FIC and its subsidiaries only, as the conversion to stock form was completed March 11, 2022.
The Company operates as a specialist property and casualty insurance business. FIC was incorporated in the District of Columbia in 1938. As of December 31, 2022, FIC is licensed as a property and casualty insurer in 35 states and the District of Columbia. FIC’s principal business consists of underwriting commercial automobile insurance products targeted to small business owners and operators. Historically, FIC has focused on the public automobile business class segment within the commercial automobile insurance line. Vehicles within the public automobile business class segment are used to transport passengers from one location to another. In this business class segment, operation of the commercial vehicle is generally the primary source of business revenue. Specifically, FIC has historically underwritten insurance for the following public automobile business classes: taxi cabs, passenger sedans, golf carts, school vans, and other light transportation vehicles. FIC has begun developing commercial auto insurance products targeting additional business class segments, namely trade and service providers such as electricians, plumbers, and carpenters (collectively, the “small business class segment”). FIC’s products are marketed and distributed through FRM, its appointed insurance producer. FRM solicits business directly from customers and works with insurance agency sub-producers, referred to as “distribution partners”. As of December 31, 2022, FRM is licensed as a property and casualty insurance producer in 35 states and the District of Columbia.
Note 2 – Basis of Presentation and Accounting Policies
Basis of Presentation
The accompanying Consolidated Financial Statements have been prepared in accordance with accounting principles generally accepted in the United States of America (“GAAP”).
Principles of Consolidation
The consolidated financial statements consist of Forge Group, Inc. and its wholly owned subsidiaries: FRM and FIC as well as FIC’s majority owned subsidiary, ACP. All significant intercompany transactions and account balances have been eliminated in consolidation.
Revenue Recognition
Net Premiums Earned
Insurance policies issued by the Company are short-duration contracts. Accordingly, premium revenues, net of premiums ceded to reinsurers, are recognized as earned in proportion to the amount of insurance protection provided, on a daily pro rata basis over the terms of the underlying policies. Unearned premiums represent premiums applicable to the unexpired portions of in-force insurance contracts at the end of the year.
The Company recognizes a premium deficiency reserve when the sum of expected claim costs and claim adjustment expenses, unamortized acquisition costs and maintenance costs exceed related unearned premiums. Accordingly, there was no premium deficiency reserve required as of December 31, 2022. The Company recorded $157,605 liability as of December 31, 2021.The Company anticipates investment income, if applicable, as a factor in the premium deficiency reserve evaluation.
Income from real estate held for investment
The Company accounts for leases in accordance with GAAP, which often requires significant judgment due to complex provisions. The two primary criteria that are used to classify transactions as sales-type or operating leases are (1) whether the lease term is equal to or greater than 75% of the economic life of the building and (2) whether the present value of the minimum lease payments is equal to or greater than 90% of the fair market value of the equipment at lease inception. Properties’ leases are all considered to be “operating leases.” Operating lease income and expense is recognized on a straight-line basis over the life of the lease.
Note 2 – Basis of Presentation and Accounting Policies, continued
Unpaid Losses and Loss Adjustment Expenses (“LAE”)
Unpaid losses and LAE represent the Company’s best estimates of the ultimate cost of all reported and unreported losses that are unpaid as of the balance sheet dates. The unpaid losses and LAE are estimated on an undiscounted basis, using individual case-basis valuations, statistical analyses, and various actuarial reserving methodologies. The projection of future claim payment and reporting is based on an analysis of the Company’s historical experience, supplemented by an analysis of industry loss data. Unpaid losses and LAE include the net amount for claims, after deducting anticipated salvage and subrogation, which have been reported and are unpaid at statement date, as well as a provision for claims incurred but not reported at statement date. The Company believes that the unpaid losses and LAE are adequate to cover the ultimate cost of losses and claims to date; however, because of inherent uncertainty, including changes in reporting patterns, claims settlement patterns, judicial decisions, legislation, and economic conditions, actual loss experience may not conform to the assumptions used in determining the estimated amounts for such liability at the balance sheet date. Adjustments for these estimates are reflected in expense for the period in which the estimates are changed. Because of the nature of the business historically written, the Company believes that it has no exposure to environmental claim liabilities.
Reinsurance
In the ordinary course of business, the Company seeks to limit its exposure to losses on individual claims and the cumulative effect of adverse loss experience by entering reinsurance contracts with reinsurance companies.
Reinsurance balances receivable represent the Company’s best estimate of paid and unpaid losses and LAE recoverable from reinsurers, and ceded losses receivable and unearned ceded premiums under reinsurance agreements. Ceded losses receivables are estimated using techniques and assumptions consistent with those used in estimating the liability for unpaid losses and LAE, in accordance with the terms of the reinsurance agreement. The Company believes that reinsurance receivables as recorded represent its best estimate of such amounts; however, as changes in the estimated ultimate liability for losses and LAE are determined, the estimated ultimate amount receivable from reinsurers will also change. Accordingly, the ultimate receivable could be significantly in excess of, or less than, the amount recorded in the consolidated financial statements. Adjustments in these estimates are reflected in the period in which the estimates are changed. As presented in the Consolidated Statements of Operations and Comprehensive Income, losses and LAE incurred are net of reinsurance recoveries.
The Company has evaluated its reinsurance arrangements and determined that significant insurance risk is transferred to its reinsurers. Reinsurance agreements have been determined to be short-duration prospective contracts and, accordingly, the costs of the reinsurance are recognized over the life of the contract in a manner consistent with the earning of premiums on the underlying policies subject to the reinsurance contract.
Note 2 – Basis of Presentation and Accounting Policies, continued
The Company estimates uncollectible amounts receivable from reinsurers based on an assessment of factors including the creditworthiness of the reinsurers and the adequacy of collateral obtained, where applicable. There was no allowance for uncollectible reinsurance as of December 31, 2021 or 2020, nor did the Company expense any uncollectible reinsurance for the years then ended. Significant uncertainties are inherent in the assessment of the creditworthiness of reinsurers and estimates of any uncollectible amounts due from reinsurers. Any change in the ability of the Company’s reinsurers to meet their contractual obligations could have a material adverse effect on the consolidated financial statements.
Cash and Cash Equivalents
The Company considers cash at banks in checking and savings accounts, as well as, all highly liquid investments with maturities of three months or less to be cash equivalents. For purposes of reporting cash flows, cash and cash equivalents include cash in bank accounts and short‑term investments, which when purchased were due to mature in three months or less.
Investments
Fixed maturity securities and redeemable preferred stock are classified as available for sale (“AFS”) and valued at fair value. Unrealized gains and losses on these securities are excluded from net earnings but are recorded as a separate component of comprehensive income and equity, net of related deferred income taxes.
Equity securities include common stock and perpetual preferred stock. Equity securities are carried at fair value, with changes in fair value recorded in net gain (loss).
Interest on fixed maturity securities and short-term investments is credited to earnings on an accrual basis. Premiums and discounts are amortized or accreted over the lives of the related securities. Dividends on equity securities are credited to earnings on the ex-dividend date. Realized investment gains and losses are reported based upon the specific-identification method of investments sold to minimize taxable gains. Declines in the fair value of AFS investments below cost that are deemed other than temporary are charged to earnings resulting in the establishment of a new cost basis.
Premiums Receivable
Premiums receivable include balances due currently or installment premiums contractually due in the future and are presented net of an allowance for doubtful accounts, if any. The allowance for uncollectible amounts is based on an analysis of amounts receivable giving consideration to historical loss experience and current economic conditions and reflects an amount that, in the Company’s judgment, is adequate.
Note 2 – Basis of Presentation and Accounting Policies, continued
Deferred Policy Acquisition Costs
Policy acquisition costs, consisting primarily of commissions, premium taxes, and certain other costs that vary directly with the production of premium revenue, are deferred and amortized over the period in which premiums are earned. Anticipated losses and LAE, expenses for maintenance of policies in force and investment income are considered in the determination of the recoverability of deferred policy acquisition costs. Deferred acquisition costs relate directly to the successful acquisition of a new or renewal insurance contract to qualify for deferral.
Deferred Rent on Real Estate Held for the Production of Income
Deferred rent on leased assets represents the cumulative difference between the actual cash receipts for rent and the rental income recorded in the financial statements, which is calculated on a straight-line basis.
Leases in Place
The acquisition of real estate held for the production of income includes various other assets. These other assets, leases in place, are recorded at cost and are being amortized over the life of the acquired lease terms. Upon the early termination of a lease, the cost and related accumulated amortization is eliminated from the accounts and any resulting gain or loss is reflected in the results of operations. Amortization is provided for under the straight-line method.
Properties leases are all considered to be operating leases. Income from real estate held for investment and real estate operating expense are reflected as separate line items in the Consolidated Statements of Operations.
Right-of-use Asset
The Company’s lease on its main office is considered to be an operating lease. In accordance with GAAP, the Company’s lease is reflected in the consolidated balance sheets as a right-of-use asset, with a corresponding operating lease liability. Lease expense and associated sublease income are reflected as separate line items in the Consolidated Statements of Operations.
Property and Equipment
Property and equipment (including major renewals, replacements, and betterments) with a cost of $5,000 or greater are capitalized and stated at cost. Expenditures for ordinary maintenance and repair items are charged to operations as incurred, while expenditures which substantially increase the useful life of the asset are capitalized. Depreciation is provided for using straight-line and accelerated methods for both financial reporting and income tax purposes over the estimated useful lives of the assets. Upon the sale or other disposition of property, the cost and related accumulated depreciation are eliminated from the accounts and any resulting gain or loss is reflected in the results of operations.
Note 2 – Basis of Presentation and Accounting Policies, continued
Restricted Cash
Restricted cash represents required replacement reserves of certain deposits required by a lender. The restricted cash is in a separate account with a financial institution.
Above and Below Market Leases
Above-market and below-market in-place lease values for acquired properties are recorded based on the present value (using a discount rate that reflects the risks associated with the property acquired and the respective tenants) of the difference between (i) the contractual amounts to be paid pursuant to the in-place leases and (ii) management’s estimates of fair market lease rates for the comparable in-place leases, measured over a period equal to the remaining non-cancelable term of the lease. The value of above-market lease values is amortized as a reduction of rental income over the remaining terms of the respective leases. The value of below-market lease values is amortized as an increase to rental income over the remaining terms of the respective leases. The net above-market leases are presented within leases in place on the consolidated balance sheets.
Income Taxes
Deferred income tax assets and liabilities are established for temporary differences between the financial reporting basis and tax basis of assets and liabilities at enacted tax rates expected to be in effect when such amounts are realized or settled. Properties is a limited liability company that files a partnership return. In lieu of entity level corporate taxes, its members are taxed on their respective shares of Properties’ taxable income.
Goodwill and Other Intangibles:
Goodwill arising from the acquisition of FRM in March 2022 represents the excess of the purchase price over the fair value of the net assets acquired. Other intangible assets arising from the acquisition of FRM represents the estimated fair values of certain intangible assets, including the value of FRM’s distribution network, the value of the FRM trade name and state insurance licenses. The distribution networks asset, trade name and state insurance license are being amortized over eight years, five years and one year, respectively, from the March 11, 2022 acquisition/valuation date.
Goodwill represents the excess of the purchase price over the underlying fair value of acquired entities. When completing acquisitions, we seek to identify separately identifiable intangible assets that we have acquired. We assess goodwill and other intangibles with an indefinite useful life for impairment annually. We also assess goodwill and other intangibles for impairment upon the occurrence of certain events. In making our assessment, we consider several factors including operating results, business plans, economic projections, anticipated future cash flows, and current market data. Inherent uncertainties exist with respect to these factors and to our judgment in applying them when we make our assessment. Impairment of goodwill and other intangibles could result from changes in economic and operating conditions in future periods. We did not record any impairments of goodwill or other intangibles during the year ended December 31, 2022.
Note 2 – Basis of Presentation and Accounting Policies, continued
Employee Stock Ownership Plan
The Company recognizes employee stock ownership plan (ESOP) compensation expense ratably during each year for the shares committed to be allocated to participants that year. This expense is determined by the fair market value of our stock at the time the commitment to allocate the shares is accrued and recognized. For purposes of balance sheet disclosures of shares outstanding, the Company includes only the number of ESOP shares that have been committed to be released for the period. For purposes of calculating earnings per share, the Company includes the weighted average ESOP shares committed to be released for the period. The ESOP covers all employees who have worked a minimum of 1,000 hours in the plan year.
Earnings Per Share
Basic and diluted earnings per share (EPS) are calculated by dividing earnings available to common shareholders by the weighted average number of common shares outstanding during the period. The denominator for basic and diluted EPS includes ESOP shares committed to be released. Dilutive earnings per share includes the effect of all potentially dilutive instruments, such as restricted stock units and stock options, outstanding during the period.
Assessments
The Company is subject to a variety of assessments including insurance related assessments, which are accrued in the period in which they have been incurred and charged to expense.
Concentration, Credit Risk and Market Risk
Financial instruments that potentially expose the Company to concentrations of credit risk consist primarily of debt securities other than U.S. government debt and agency securities, cash and cash equivalents, accounts receivable, reinsurance receivable and accrued investment income.
Non-U.S. government debt securities are diversified, and no one investment accounts for a significant portion of the Company’s invested assets.
The Company maintains cash deposits in a financial institution that are insured through the Federal Deposit Insurance Corporation as well as cash deposits and securities at various brokerage firms that are insured with the Securities Investor Protection Corporation. Cash deposits and securities may exceed insured limits. The Company has not experienced any losses in such accounts and believes it is not exposed to any significant risk on cash and cash equivalents.
Note 2 – Basis of Presentation and Accounting Policies, continued
Stressed conditions, volatility and disruptions in capital markets or financial asset classes could have an adverse effect on the Company, in part because the Company has a large investment portfolio supporting its insurance liabilities, which are sensitive to changing market factors. These market factors, which include interest rates, credit spreads, equity prices, and the volatility and strength of the capital markets, all affect the business and economic environment and, ultimately, the profitability of the Company’s business. The Company manages its investments to limit credit and other market risks by diversifying its portfolio among various security types and industry sectors based on the Company’s investment committee guidelines, which employ a variety of investment strategies.
Use of Estimates
In preparing the consolidated financial statements, the Company is required to make estimates and assumptions that affect the reported amounts of assets and liabilities as of the balance sheet dates, revenues and expenses for the years then ended, and the accompanying notes to the consolidated financial statements. Such estimates and assumptions could change in the future which could impact the amounts reported and disclosed herein. The most significant of these amounts is the liability for unpaid losses and LAE, stock based compensation and the pension benefit obligation and the asset for goodwill and intangible assets. Other estimates include investment valuation, the collectability of reinsurance balances, recoverability of deferred tax assets, and deferred policy acquisition costs. These estimates and assumptions are based on the Company’s best estimates and judgment. The Company evaluates its estimates and assumptions on an ongoing basis using historical experience and other factors, which the Company believes to be reasonable under the circumstances. The Company adjusts such estimates and assumptions when facts and circumstances dictate. Although recorded estimates are supported by actuarial computations and other supportive data, the estimates are ultimately based on expectations of future events. As future events and their effects cannot be determined with precision, actual results could differ significantly from these estimates. Changes in those estimates resulting from continuing changes in the economic environment will be reflected in the consolidated financial statements in future periods.
Other Comprehensive Income
Other comprehensive income refers to revenues, expenses, gains and losses that are included in comprehensive income but are excluded from net gain (loss) as these amounts are recorded directly as an adjustment to equity; such items primarily arise from changes in unrealized gains and losses on available-for-sale securities, net pension liability and related income taxes.
Note 3 – Acquisition of Forge Risk Management, Inc.
On March 11, 2022, the Company completed the acquisition of 100 percent of the common stock of FRM and became a consolidated subsidiary of the Company. FRM is a licensed insurance producer focused on commercial auto. Prior to the acquisition, over 99% of FRM’s revenue was generated from one agency contract between FRM and FIC and all of FIC’s premiums were written through the agency contract with FRM.
Note 3 – Acquisition of Forge Risk Management, Inc., continued
We account for business acquisitions in accordance with the acquisition method of accounting, which requires that most assets acquired, liabilities assumed and contingent consideration be recognized at their fair values as of the acquisition date, which is the closing date. During the measurement period, adjustments to provisional purchase price allocations are recognized if new information is obtained about the facts and circumstances that existed as of the acquisition date that, if known, would have resulted in the recognition of those assets and liabilities as of that date. The measurement period ends as soon as it is determined that no more information is obtainable, but in no case shall the measurement period exceed one year from the acquisition date. The measurement period for the FRM acquisition ended June 30, 2022.
The Company issued 550,000 shares of the Class A preferred stock to the private shareholder of FRM as of the closing date. The acquisition of FRM did not include any contingent consideration.
The following table summarizes the consideration transferred to acquire FRM and the amounts of identified assets acquired and liabilities assumed at the acquisition date:
|
Fair Value of Consideration |
||||
|
Series A Preferred stock issued |
$ | 5,227,000 | ||
|
Fair Value of Identifiable Assets Acquired and Liabilities Assumed: |
||||
|
Identifiable net assets: |
||||
|
Cash and cash equivalents |
512,861 | |||
|
Other assets |
23,006 | |||
|
Agency relationships |
1,930,000 | |||
|
Trade name |
130,000 | |||
|
Licenses |
50,000 | |||
|
Loan payable |
(1,395,820 | ) | ||
|
Accrued expenses |
(52,767 | ) | ||
|
Accrued subproducer commissions |
(459,987 | ) | ||
|
Net balance due to FIC |
(26,293 | ) | ||
|
Total identifiable net assets |
$ | 711,000 | ||
|
Goodwill |
$ | 4,516,000 | ||
Note 4 – Investments
Available-for-Sale (“AFS”) Fixed Maturity Securities and Redeemable Preferred Stock
Following is a schedule of the cost, estimated fair values, and gross gains and losses of investments in securities classified as AFS fixed-maturity securities and redeemable preferred equities at December 31, 2022 and 2021.
|
Amortized |
Gross Unrealized |
|||||||||||||||
|
2022 |
cost |
Fair value |
Gains |
Losses |
||||||||||||
|
Fixed maturity securities: |
||||||||||||||||
|
U.S. government |
$ | 963,993 | $ | 919,611 | $ | 137 | $ | (44,519 | ) | |||||||
|
States, territories and possessions |
40,259 | 40,502 | 243 | - | ||||||||||||
|
Political subdivisions |
4,458,266 | 4,296,786 | 589 | (162,069 | ) | |||||||||||
|
Special revenue |
8,166,877 | 7,785,880 | 46,380 | (427,377 | ) | |||||||||||
|
Industrial and miscellaneous |
13,070,613 | 12,257,827 | 67,113 | (879,899 | ) | |||||||||||
|
Asset backed securities |
1,201,019 | 898,592 | - | (302,427 | ) | |||||||||||
|
Total fixed maturity securities |
27,901,027 | 26,199,198 | 114,462 | (1,816,291 | ) | |||||||||||
|
Redeemable preferred stock |
1,454,137 | 1,351,429 | 980 | (103,688 | ) | |||||||||||
|
Total AFS securities |
$ | 29,355,164 | $ | 27,550,627 | $ | 115,442 | $ | (1,919,979 | ) | |||||||
|
Amortized |
Gross Unrealized |
|||||||||||||||
|
2021 |
cost |
Fair value |
Gains |
Losses |
||||||||||||
|
Fixed maturity securities: |
||||||||||||||||
|
States, territories and possessions |
$ | 40,690 | $ | 42,936 | $ | 2,246 | $ | - | ||||||||
|
Political subdivisions |
5,453,260 | 5,670,487 | 217,228 | - | ||||||||||||
|
Special revenue |
10,386,411 | 10,873,053 | 488,259 | (1,617 | ) | |||||||||||
|
Industrial and miscellaneous |
4,310,483 | 4,466,602 | 229,518 | (73,400 | ) | |||||||||||
|
Asset backed securities |
1,213,137 | 1,120,264 | 250 | (93,124 | ) | |||||||||||
|
Total fixed maturity securities |
21,403,981 | 22,173,342 | 937,501 | (168,141 | ) | |||||||||||
|
Redeemable preferred stock |
1,268,115 | 1,320,173 | 52,058 | - | ||||||||||||
|
Total AFS securities |
$ | 22,672,096 | $ | 23,493,515 | $ | 989,559 | $ | (168,141 | ) | |||||||
As required by insurance regulations, certain fixed maturity investments amounting to $3,663,372 and $1,680,094 at December 31, 2022 and December 31, 2021, respectively, were on deposit with either regulatory authorities or banks.
Note 4 – Investments, continued
The amortized cost and fair values of the Company’s investments in AFS fixed maturity securities by contractual maturity as of December 31, 2022 are shown below. Expected maturities may differ from contractual maturities where borrowers may have the right to call or prepay obligations with or without call or prepayment penalties.
|
Amortized |
||||||||
|
Cost |
Fair Value |
|||||||
|
Due in one year or less |
$ | 975,271 | $ | 965,033 | ||||
|
Due after one year through five years |
14,569,554 | 13,842,156 | ||||||
|
Due after five years through ten years |
7,297,413 | 6,949,964 | ||||||
|
Due after ten years |
3,857,770 | 3,543,453 | ||||||
|
Asset backed securities |
1,201,019 | 898,592 | ||||||
|
Total fixed maturity securities |
27,901,027 | 26,199,198 | ||||||
|
Redeemable preferred stock |
1,454,137 | 1,351,429 | ||||||
|
Total AFS securities |
$ | 29,355,164 | $ | 27,550,627 | ||||
The schedule below summarizes the fair values of those fixed maturity securities and redeemable preferred stock in an unrealized loss position at December 31, 2022 and 2021. The schedule further classifies the securities based on the length of time they have been in an unrealized loss position.
|
Less than 12 months |
12 months or more |
Total |
||||||||||||||||||||||
|
Fair |
Unrealized |
Fair |
Unrealized |
Fair |
Unrealized |
|||||||||||||||||||
|
2022 |
value |
losses |
value |
losses |
value |
losses |
||||||||||||||||||
|
Fixed maturity securities: |
||||||||||||||||||||||||
|
U.S. government |
$ | 817,920 | $ | (44,519 | ) | $ | - | $ | - | $ | - | $ | (44,519 | ) | ||||||||||
|
Political subdivisions |
3,382,387 | (162,069 | ) | - | - | 3,382,387 | (162,069 | ) | ||||||||||||||||
|
Special revenue |
6,306,908 | (427,377 | ) | - | - | 6,306,908 | (427,377 | ) | ||||||||||||||||
|
Industrial and miscellaneous |
9,569,323 | (806,499 | ) | 426,600 | (73,400 | ) | 9,995,923 | (879,899 | ) | |||||||||||||||
|
Asset backed securities |
1,016 | (3 | ) | 897,576 | (302,424 | ) | 898,592 | (302,427 | ) | |||||||||||||||
|
Total fixed maturity securities |
20,077,554 | (1,440,467 | ) | 1,324,176 | (375,824 | ) | 20,583,810 | (1,816,291 | ) | |||||||||||||||
|
Redeemable preferred stock |
1,000,449 | (103,688 | ) | - | - | 1,000,449 | (103,688 | ) | ||||||||||||||||
|
Total AFS securities |
$ | 21,078,003 | $ | (1,544,155 | ) | $ | 1,324,176 | $ | (375,824 | ) | $ | 21,584,259 | $ | (1,919,979 | ) | |||||||||
|
Less than 12 months |
12 months or more |
Total |
||||||||||||||||||||||
|
Fair |
Unrealized |
Fair |
Unrealized |
Fair |
Unrealized |
|||||||||||||||||||
|
2021 |
value |
losses |
value |
losses |
value |
losses |
||||||||||||||||||
|
Fixed maturity securities: |
||||||||||||||||||||||||
|
Special revenue |
$ | 531,620 | $ | (868 | ) | $ | 30,686 | $ | (749 | ) | $ | 562,306 | $ | (1,617 | ) | |||||||||
|
Industrial and miscellaneous |
426,600 | (73,400 | ) | - | - | 426,600 | (73,400 | ) | ||||||||||||||||
|
Asset backed securities |
- | - | 1,106,876 | (93,124 | ) | 1,106,876 | (93,124 | ) | ||||||||||||||||
|
Total fixed maturity securities |
958,220 | (74,268 | ) | 1,137,562 | (93,873 | ) | 2,095,782 | (168,141 | ) | |||||||||||||||
|
Redeemable preferred stock |
- | - | - | - | - | - | ||||||||||||||||||
|
Total AFS securities |
$ | 958,220 | $ | (74,268 | ) | $ | 1,137,562 | $ | (93,873 | ) | $ | 2,095,782 | $ | (168,141 | ) | |||||||||
The Company monitors the credit quality of its fixed income investments to assess if it is probable that the Company will receive its contractual or estimated cash flows in the form of principal and interest, in accordance with their terms.
Note 4 – Investments, continued
The AFS portfolio contained 65 securities in an unrealized loss position as of December 31, 2022, two of which had been in an unrealized loss position for 12 consecutive months or longer and represent $375,824 in unrealized losses. All fixed income securities in the investment portfolio continue to pay the expected coupon payments in accordance with the contractual terms of the securities. Credit-related impairments on fixed income securities that the Company does not plan to sell, and for which the Company is not more likely than not to be required to sell, are recognized in income before income taxes. Any non-credit related impairment is recognized in comprehensive income. Based on the Company’s analysis, the fixed income portfolio is of high credit quality and it is believed it will recover the amortized cost basis of the fixed income securities.
Other invested assets
In order to diversify its investment portfolio and improve expected returns, the Company has made non-controlling (typically less than 5%) investments in a number of unaffiliated, specialized equity investment vehicles (limited partnerships and one limited liability company), which are included in other invested assets. Such investments are broadly diversified and in the aggregate are less than 5% of the Company’s investment portfolio. The limited partnerships generally limit or preclude redemptions within a period of time (the "lock-up" period, usually between one and three years) from the date of the investment. Subsequent to the expiry of any applicable lock-up periods, withdrawals or redemptions generally require between 30 to 90 days' advance notice, with redemptions being permitted on dates varying from month-end to annually, but typically quarter end. The Company also holds an equity investment in Trustar Bank, a related entity, which is a community bank serving the D.C. area; and an investment in CSE Opportunity Fund II, LLC, which makes short-term loans to finance the development of convenience stores in the mid-Atlantic region, each of which is valued at GAAP equity.
Since, amongst other qualifying criteria, these investments do not have a readily determined fair value, the Company values them applying the guidance of Accounting Standards Update Subtopic 820-10, Fair Value Measurements and Disclosures - Overall, which, as a practical expedient, permits the fair value of investments within its scope to be measured on the basis of net asset value per share (or its equivalent).
Note 4 – Investments, continued
The following table is a schedule of the cost and estimated fair values of the Company’s other invested assets at December 31, 2022 and 2021.
|
Carrying |
Gross Unrealized |
|||||||||||||||
|
2022 |
Cost |
Value |
Gains |
Losses |
||||||||||||
|
Limited partnership investments |
$ | 3,701,405 | $ | 3,608,231 | $ | 336,402 | $ | (429,576 | ) | |||||||
|
Equity interest in Trustar Bank |
250,000 | 237,637 | - | (12,363 | ) | |||||||||||
|
Equity interest in Stream-IT.app Inc. |
500,000 | 500,000 | - | - | ||||||||||||
|
Equity interest in CSE Opportunity Fund II, LLC |
55,033 | 55,033 | - | - | ||||||||||||
|
Total other invested assets |
$ | 4,506,438 | $ | 4,400,901 | $ | 336,402 | $ | (441,939 | ) | |||||||
|
Carrying |
Gross Unrealized |
|||||||||||||||
|
2021 |
Cost |
Value |
Gains |
Losses |
||||||||||||
|
Limited partnership investments |
$ | 3,701,405 | $ | 4,929,126 | $ | 1,245,805 | $ | (18,084 | ) | |||||||
|
Equity interest in Trustar Bank |
250,000 | 216,228 | - | (33,772 | ) | |||||||||||
|
Equity interest in Stream-IT.app Inc. |
500,000 | 500,000 | - | - | ||||||||||||
|
Equity interest in CSE Opportunity Fund II, LLC |
128,052 | 128,051 | - | - | ||||||||||||
|
Total other invested assets |
$ | 4,579,457 | 5,773,405 | $ | 1,245,805 | $ | (51,856 | ) | ||||||||
Other invested assets contained 7 investments in an unrealized loss position as of December 31, 2022, two of which had been in an unrealized loss position for 12 months or more.
The Company had $2,500,000 unfunded commitment to Mutual Capital Investment Fund, LP as of December 31, 2022.
Unrealized gains on equity securities, net
The portion of unrealized gains as of December 31, 2022 and 2021 that relates to equity securities held as of the respective year end were $90,219 and $862,127.
Note 4 – Investments, continued
Net Investment Income
A summary of net investment income for the years ended December 31, 2022 and 2021 is as follows:
|
2022 |
2021 |
|||||||
|
AFS, fixed maturity securities |
$ | 1,073,445 | $ | 1,022,054 | ||||
|
AFS, redeemable preferred stock |
115,685 | 58,358 | ||||||
|
Perpetual preferred stock |
83,795 | 32,452 | ||||||
|
Common stock |
83,619 | 111,716 | ||||||
|
Other invested assets |
(20,913 | ) | 48,891 | |||||
|
Cash and short-term investments |
35,796 | 570 | ||||||
|
Investment income |
1,371,427 | 1,274,041 | ||||||
|
Less investment expenses |
(214,525 | ) | (208,059 | ) | ||||
|
Net investment income |
$ | 1,156,902 | $ | 1,065,982 | ||||
Investment related gains (losses)
The following summarizes of the proceeds from sales, maturities and calls of invested securities and the related gross realized gains and losses for the years ended December 31, 2022 and 2021.
|
Net Realized |
||||||||||||||||
|
2022 |
Proceeds |
Gains |
Losses |
Gains |
||||||||||||
|
AFS, fixed maturity securities |
$ | 4,066,180 | $ | 38,242 | $ | (17,463 | ) | $ | 20,779 | |||||||
|
AFS, redeemable preferred stock |
46,728 | 4,494 | - | 4,494 | ||||||||||||
|
Perpetual preferred stock |
442,492 | - | (27,998 | ) | (27,998 | ) | ||||||||||
|
Common stock |
1,089,145 | 272,501 | (51,877 | ) | 220,624 | |||||||||||
|
Other invested assets |
36,711 | - | - | - | ||||||||||||
|
Total |
$ | 5,681,256 | $ | 315,237 | $ | (97,338 | ) | $ | 217,899 | |||||||
|
Net Realized |
||||||||||||||||
|
2021 |
Proceeds |
Gains |
Losses |
Gains/(Losses) |
||||||||||||
|
AFS, fixed maturity securities |
$ | 10,254,185 | $ | 166,218 | $ | (158,699 | ) | $ | 7,519 | |||||||
|
AFS, redeemable preferred stock |
575,000 | 18,353 | - | 18,353 | ||||||||||||
|
Perpetual preferred stock |
265,050 | 28,817 | - | 28,817 | ||||||||||||
|
Other invested assets |
665,549 | 324,204 | - | 324,204 | ||||||||||||
|
Total |
$ | 11,759,784 | $ | 537,592 | $ | (158,699 | ) | $ | 378,893 | |||||||
Note 4 – Investments, continued
Impairment Review
Under current accounting standards, an Other-Than-Temporary-Impairment (“OTTI”) write-down of fixed maturity securities, where fair value is below amortized cost, is triggered by circumstances where (1) an entity has the intent to sell the security, (2) it is more likely than not that the entity will be required to sell the security before recovery of its amortized cost basis, or (3) the entity does not expect to recover the entire amortized cost basis of the security. If an entity intends to sell the security before the recovery, an OTTI write-down is recognized in earnings equal to the difference between the security’s amortized cost and its fair value. If an entity does not intend to sell the security or it is more likely than not that it will be required to sell the security before recovery, the OTTI write-down is separated into an amount representing the credit loss, that is recognized in income before income taxes, and the amount related to all other factors, which is recognized in other comprehensive income. Impairment losses result in a reduction of the underlying investment’s cost basis.
The Company regularly evaluates its fixed maturity securities using both quantitative and qualitative criteria to determine impairment losses for other-than-temporary declines in the fair value of the investments. The following are the key factors used to determine whether a security is other-than-temporarily impaired:
|
● |
The extent to which the fair value is less than cost, |
|
● |
The assessment of significant adverse changes to the cash flows on a fixed maturity investment, |
|
● |
The occurrence of a discrete credit event resulting in the issuer defaulting on a material obligation, the issuer seeking protection from creditors under the bankruptcy laws, the issuer proposing a voluntary reorganization under which creditors are asked to exchange their claims for cash or securities having a fair value substantially lower than par value, |
|
● |
The probability that the Company will recover the entire amortized cost basis of the fixed income securities prior to maturity, or |
|
● |
The ability and intent to hold fixed maturities until maturity. |
Quantitative and qualitative criteria are considered to varying degrees depending on the sector for which the analysis is being performed. The sectors are as follows:
Industrial and Miscellaneous Securities
The Company performs a qualitative evaluation of holdings that fall below the price threshold. The analysis begins with an opinion of industry and competitive position. This includes an assessment of factors that enable the profit structure of the business (e.g., reserve profile for exploration and production companies), competitive advantage (e.g., distribution system), management strategy, and an analysis of trends in return on invested capital. Analysts may also review other factors to determine whether an impairment exists, including liquidity and asset value cash flow generation.
Note 4 – Investments, continued
Political Subdivisions and Special Revenue Securities
The Company analyzes the screened impairment candidates on a quantitative and qualitative basis. This includes an assessment of the factors that may be contributing to an unrealized loss and whether the recovery value is greater or less than current market value.
Asset Backed Securities
The Company uses the “stated assumptions” analytic approach which relies on actual 6-month average collateral performance measures (voluntary prepayment rate, gross default rate, and loss severity) sourced through third party data providers or remittance reports. The analysis applies the stated assumptions throughout the remaining term of the transaction using forecasted cashflows, which are then applied through the transaction structure (reflecting the priority of payments and performance triggers) to determine whether there is a loss to the security (“Loss to Tranche”).
Redeemable Preferred Stock Securities
The Company performs a qualitative evaluation of holdings that fall below the price threshold. The analysis begins with an opinion of industry and competitive position. This includes an assessment of factors that enable the profit structure of the business (e.g., reserve profile for exploration and production companies), competitive advantage (e.g., distribution system), management strategy, and an analysis of trends in return on invested capital. Analysts may also review other factors to determine whether an impairment exists, including liquidity and asset value cash flow generation.
For all fixed income and redeemable preferred stock securities in a loss position on December 31, 2022 and 2021 the Company believes it is probable that it will receive all contractual payments in the form of principal and interest. In addition, the Company is not required to, nor does it intend to sell these investments prior to recovering the entire amortized cost basis for each security, which may be maturity. Accordingly, the fixed income securities in an unrealized loss position were not other-than-temporarily impaired at December 31, 2022 or 2021.
Note 5 – Fair Value Measurements
Fair value is defined as the price in the principal market that would be received for an asset to facilitate an orderly transaction between market participants on the measurement date. The Company determined the fair value of certain financial instruments based on their underlying characteristics and relevant transactions in the marketplace. GAAP guidance requires an entity to maximize the use of observable inputs and minimize the use of unobservable inputs when measuring fair value. The guidance also describes three levels defined by the type of inputs used to measure fair value. The following are the levels of the fair value hierarchy and a brief description of the type of valuation inputs that are used to establish each level:
Level 1: is applied to valuations based on readily available, unadjusted quoted prices in active markets for identical assets.
Level 2: is applied to valuations based upon quoted prices for similar assets in active markets, quoted prices for identical or similar assets in inactive markets; or valuations based on models where the significant inputs are observable (e.g. interest rates, yield curves, prepayment speeds, default rates, loss severities) or can be corroborated by observable market data.
Level 3: is applied to valuations that are derived from techniques in which one or more of the significant inputs are unobservable. Financial assets are classified based upon the lowest level of significant input that is used to determine fair value.
Note 5 – Fair Value Measurements, continued
As a part of the process to determine fair value, the Company utilizes widely recognized, third-party pricing sources to determine fair values. The Company has obtained an understanding of the third-party pricing sources’ valuation methodologies and inputs. The following is a description of the valuation techniques used for financial assets that are measured at fair value, including the general classification of such assets pursuant to the fair value hierarchy.
U.S. Government Fixed Maturity Securities and Common Stock: U.S. government fixed maturity securities and common stock traded equities have readily observable price levels and are classified as Level 1 (fair value based on quoted market prices). All common stock holdings are deemed Level 1.
States, Territories and Possessions, Political Subdivisions, Special Revenue and Industrial and Miscellaneous Fixed Income Securities: The pricing source employs a multi-dimensional model that uses standard inputs including (listed in order of priority for use) benchmark yields, reported trades, broker/dealer quotes, issuer spreads, two-sided markets, benchmark securities, market bids/offers and other reference data. The pricing source also monitors market indicators, as well as industry and economic events. All bonds valued using these techniques are classified as Level 2. All Corporate, Agencies, and Municipal securities are deemed Level 2.
Asset-backed Securities (“ABS”): The pricing source evaluation methodology includes principally interest rate movements and new issue data. Evaluation of the tranches (non-volatile, volatile, or credit sensitivity) is based on the pricing vendors’ interpretation of accepted modeling and pricing conventions. This information is then used to determine the cash flows for each tranche, benchmark yields, pre-payment assumptions and to incorporate collateral performance. ABS with corroborate and observable inputs are classified as Level 2. With the exception of one ABS classified as Level 3, ABS holdings are deemed to be Level 2.
Redeemable Preferred Stock and Perpetual Preferred Stock: Preferred stocks do not have readily observable prices but do have quoted prices for similar assets or liabilities in active markets; quoted prices for identical or similar assets in markets that are not active; and inputs other than quoted prices are classified as Level 2. All preferred stock holdings are deemed Level 2.
Note 5 – Fair Value Measurements, continued
Assets measured at fair value on a recurring basis as of December 31, 2022 and 2021, were as summarized below.
|
Significant |
||||||||||||||||
|
Quoted in active |
Other |
Significant |
||||||||||||||
|
Markets for |
Observable |
Unobservable |
||||||||||||||
|
Identical Assets |
Inputs |
Inputs |
||||||||||||||
|
2022 |
(Level 1) |
(Level 2) |
(Level 3) |
Total |
||||||||||||
|
Fixed maturity securities: |
||||||||||||||||
|
U.S. government |
$ | - | $ | 919,611 | $ | - | $ | 919,611 | ||||||||
|
States, territories and possessions |
- | 40,502 | - | 40,502 | ||||||||||||
|
Political subdivisions |
- | 4,296,786 | - | 4,296,786 | ||||||||||||
|
Special revenue |
- | 7,785,880 | - | 7,785,880 | ||||||||||||
|
Industrial and miscellaneous |
- | 12,257,827 | - | 12,257,827 | ||||||||||||
|
Asset backed securities |
- | 1,016 | 897,576 | 898,592 | ||||||||||||
|
Total fixed maturity securities |
- | 25,301,622 | 897,576 | 26,199,198 | ||||||||||||
|
Redeemable preferred stock |
- | 1,351,429 | - | 1,351,429 | ||||||||||||
|
Total AFS securities |
- | 26,653,051 | 897,576 | 27,550,627 | ||||||||||||
|
Common stock |
2,173,764 | - | - | 2,173,764 | ||||||||||||
|
Perpetual preferred stock |
- | 851,519 | - | 851,519 | ||||||||||||
|
Total marketable investments measured at fair value |
$ | 2,173,764 | $ | 27,504,570 | $ | 897,576 | $ | 30,575,910 | ||||||||
|
Significant |
||||||||||||||||
|
Quoted in active |
Other |
Significant |
||||||||||||||
|
Markets for |
Observable |
Unobservable |
||||||||||||||
|
Identical Assets |
Inputs |
Inputs |
||||||||||||||
|
2021 |
(Level 1) |
(Level 2) |
(Level 3) |
Total |
||||||||||||
|
Fixed maturity securities: |
||||||||||||||||
|
States, territories and possessions |
$ | - | $ | 42,936 | $ | - | $ | 42,936 | ||||||||
|
Political subdivisions |
- | 5,670,487 | - | 5,670,487 | ||||||||||||
|
Special revenue |
- | 10,873,053 | - | 10,873,053 | ||||||||||||
|
Industrial and miscellaneous |
- | 4,466,602 | - | 4,466,602 | ||||||||||||
|
Asset backed securities |
- | 13,388 | 1,106,876 | 1,120,264 | ||||||||||||
|
Total fixed maturity securities |
- | 21,066,466 | 1,106,876 | 22,173,342 | ||||||||||||
|
Redeemable preferred stock |
- | 1,320,173 | - | 1,320,173 | ||||||||||||
|
Total AFS securities |
- | 22,386,639 | 1,106,876 | 23,493,515 | ||||||||||||
|
Common stock |
1,747,168 | - | - | 1,747,168 | ||||||||||||
|
Perpetual preferred stock |
- | 1,148,790 | - | 1,148,790 | ||||||||||||
|
Total marketable investments measured at fair value |
$ | 1,747,168 | $ | 23,535,429 | $ | 1,106,876 | $ | 26,389,473 | ||||||||
Note 5 – Fair Value Measurements, continued
As of December 31, 2022 and 2021, the reported fair value of the Company’s investment in Level 3 AFS asset backed security was $897,576 and $1,106,876, respectively. Fair value was determined by discounting the expected contractual cash-flows using two significant inputs: the interpolated treasury rate, corresponding to the weighted average life of the certificates, and an appropriate credit spread which was determined by considering the market spread for commercial mortgage-backed securities with similar characteristics (eg maturity, underlying assets and credit worthiness.)
|
Beginning |
Transfers |
Transfers |
Total gains |
Total (losses) |
Ending |
|||||||||||||||||||||||||||
|
Balance at |
into |
out of |
included in |
gains included |
Balance at |
|||||||||||||||||||||||||||
|
2022 |
1/1/2022 |
Level 3 |
Level 3 |
Net Income |
in Equity |
Purchases |
Sales |
12/31/2022 |
||||||||||||||||||||||||
|
AFS securities: |
||||||||||||||||||||||||||||||||
|
Asset backed securities |
$ | 1,106,876 | $ | - | $ | - | $ | - | $ | (209,300 | ) | $ | - | $ | - | $ | 897,576 | |||||||||||||||
|
Total AFS securities |
$ | 1,106,876 | $ | - | $ | - | $ | - | $ | (209,300 | ) | $ | - | $ | - | $ | 897,576 | |||||||||||||||
|
Beginning |
Transfers |
Transfers |
Total gains |
Total (losses) |
Ending |
|||||||||||||||||||||||||||
|
Balance at |
into |
out of |
included in |
gains included |
Balance at |
|||||||||||||||||||||||||||
|
2021 |
1/1/2021 |
Level 3 |
Level 3 |
Net Income |
in Equity |
Purchases |
Sales |
12/31/2021 |
||||||||||||||||||||||||
|
AFS securities: |
||||||||||||||||||||||||||||||||
|
Asset backed securities |
$ | 1,188,156 | $ | - | $ | - | $ | - | $ | (81,280 | ) | $ | - | $ | - | $ | 1,106,876 | |||||||||||||||
|
Total AFS securities |
$ | 1,188,156 | $ | - | $ | - | $ | - | $ | (81,280 | ) | $ | - | $ | - | $ | 1,106,876 | |||||||||||||||
There were no transfers in or out of level 3 either period. Additionally, no securities were transferred in or out of levels 1 or 2 during either period.
Note 6 – Real Estate Held for the Production of Income
As of December 31, 2022 and 2021, Properties owned two commercial buildings and one building leased to the District of Columbia. One building is multi-tenant and the other two buildings are leased to single tenants. The leases are primarily triple net with 10 to 20-year terms. The properties comprised the following as of December 31, 2022 and 2021:
|
Depreciable |
||||||||||||
|
2022 |
2021 |
lives (in years) |
||||||||||
|
Land |
$ | 11,999,958 | $ | 11,999,958 | ||||||||
|
Building and improvements |
21,457,097 | 21,457,097 | 39 | |||||||||
|
Leasehold/tenant improvements |
931,318 | 906,337 | 15 | |||||||||
|
Furniture, fixtures & equipment |
1,080,522 | 1,080,522 | 7 | |||||||||
|
Real estate held for the production of income |
35,468,895 | 35,443,914 | ||||||||||
|
Accumulated depreciation |
(5,287,813 | ) | (4,522,708 | ) | ||||||||
|
Real estate held for the production of income, net |
$ | 30,181,082 | $ | 30,921,206 | ||||||||
Note 6 – Real Estate Held for the Production of Income, continued
Depreciation expense for the years ended December 31, 2022 and 2021 was $765,105 and 764,965, respectively.
Properties future annual rental income from non-cancelable operating leases as of December 31, 2022 was as follows:
|
2023 |
$ | 1,911,820 | ||
|
2024 |
2,125,537 | |||
|
2025 |
2,181,901 | |||
|
2026 |
2,241,755 | |||
|
2027 |
2,298,017 | |||
|
Thereafter |
16,932,062 | |||
|
Future rental income from non-cancelable operating leases |
$ | 27,691,092 |
In conjunction with the acquisition of the real estate, the following lease assets were acquired and are being amortized throughout the remaining terms of the lease as of December 31, 2022 and 2021 are as follows:
|
2022 |
2021 |
|||||||
|
Leases in place |
$ | 4,831,335 | $ | 4,831,335 | ||||
|
Accumulated amortizaton, leases in place |
(2,064,173 | ) | (1,765,938 | ) | ||||
|
Leases in place, net of accumulated amortization |
$ | 2,767,162 | $ | 3,065,397 | ||||
Amortization expense for the years ended December 31, 2022 and 2021 was $298,235.
In conjunction with the acquisition of the real estate, the following below market leases were acquired and are being offset by rent during the remaining terms of the lease as follows:
|
2022 |
2021 |
|||||||
|
Below-market lease |
$ | (133,703 | ) | $ | (133,703 | ) | ||
|
Rent offset |
119,776 | 103,063 | ||||||
|
Below-market lease, net of rent offset |
$ | (13,927 | ) | $ | (30,640 | ) | ||
Note 7 – Deferred Policy Acquisition Costs
Changes in deferred policy acquisition costs for the years ended December 31, 2022 and 2021 were follows:
|
2022 |
2021 |
|||||||
|
Balance, January 1, |
$ | 896,859 | $ | 684,604 | ||||
|
Premium deficiency reserve |
157,605 | 306,379 | ||||||
|
Net balance January 1, |
739,254 | 378,225 | ||||||
|
Acquisition costs deferred, during the period |
838,543 | 1,908,505 | ||||||
|
Settlement loss from FRM acquisition |
937,956 | - | ||||||
|
Amortization charged to earnings |
583,425 | 1,696,250 | ||||||
|
Balance, December 31, |
214,021 | 896,859 | ||||||
|
Premium deficiency reserve |
- | 157,605 | ||||||
|
Net balance, December 31, |
$ | 214,021 | $ | 739,254 | ||||
Note 8 – Right-of-Use Asset and Operating Lease Liability
The Company leases three office suites in Chevy Chase, Maryland under an operating lease that commenced July 1, 2016 has an initial term expiring 15 years after commencement. The lease provides for a 2.5% annual increase in the base rent on the anniversary of the lease commencement date. The Company has an option to extend the lease for one 5-year renewal term at the fair market rent as of the date of the renewal term commencement. However, it is unlikely that the Company will exercise the renewal option. In accordance with Topic 842, the Company recorded an operating lease liability, representing the discounted present value of future lease payments and a right-of-use asset.
In 2017, the Company signed a sublease agreement to sublease 2,048 square feet of its office space in Chevy Chase to another company. The sublease commenced on October 1, 2017 and expires September 30, 2024 and provides for 4.0% annual escalation in the base rent. Sublease income is recorded on a straight-line basis over the life of the lease. The cumulative difference between lease expense and lease payments is recorded as an adjustment to the right-of-use asset.
In 2021, the Company signed a sublease agreement to sublease 2,048 square feet of our office space in Chevy Chase, Maryland to another company. The sublease commenced on August 1, 2021, expires July 31, 2024, and provides for 4.5% annual escalation in the base rent. Sublease income is recorded on a straight-line basis over the life of the lease. The cumulative difference between lease expense and lease payments is recorded as an adjustment to the right-of-use asset.
Note 8 – Right-of-Use Asset and Operating Lease Liability, continued
On February 28, 2022, the Company entered into an agreement to sublease the remaining 5,535 square feet of space in Chevy Chase, Maryland. The sublease commenced on June 1, 2022, expires on May 31, 2025, and provides for 3.0% annual escalation in the base rent. Sublease income is recorded on a straight-line basis over the life of the lease. The cumulative difference between lease expense and lease payments is recorded as an adjustment to the right-of-use asset. Upon agreeing to this additional sublease, the Company determined that it was probable that will exercise our early lease termination option, thereby reducing the term of the lease to June 30, 2025. The Company has reduced the amount of the operating lease liability to the net present value of contractually committed future lease income. In addition, The Company has reduced the net value of our right-of-use asset to $0, as we are not anticipating occupying the office space for the remainder of the lease term.
The following summarizes the line items in the consolidated balance sheet which include amounts for operating leases as of December 31, 2022 and 2021:
|
2022 |
||||||||||||
|
Operating |
Sublease |
Net of |
||||||||||
|
Lease |
Agreement |
Sublease |
||||||||||
|
Operating lease right-of-use office space |
$ | 2,451,004 | $ | (628,156 | ) | $ | 1,822,848 | |||||
|
Accumulated amortization |
(1,420,379 | ) | 286,754 | (1,133,625 | ) | |||||||
|
Impairment of right-of-use asset |
(540,626 | ) | - | (540,626 | ) | |||||||
|
Operating lease right-of-use asset |
$ | 489,999 | $ | (341,402 | ) | $ | 148,597 | |||||
|
Operating lease liability |
$ | 1,268,537 | $ | (398,446 | ) | $ | 870,091 | |||||
|
2021 |
||||||||||||
|
Operating |
Sublease |
Net of |
||||||||||
|
Lease |
Agreement |
Sublease |
||||||||||
|
Operating lease right-of-use office space |
$ | 3,472,570 | $ | (373,767 | ) | $ | 3,098,803 | |||||
|
Accumulated amortization |
(1,021,347 | ) | 151,361 | (869,986 | ) | |||||||
|
Impairment of right-of-use asset |
(459,923 | ) | - | (459,923 | ) | |||||||
|
Operating lease right-of-use asset |
$ | 1,991,300 | $ | (222,406 | ) | $ | 1,768,894 | |||||
|
Operating lease liability |
$ | 2,805,207 | $ | (238,489 | ) | $ | 2,566,718 | |||||
The Company had lease expense of $282,287 and $264,098 for the years ended December 31, 2022 and 2021, respectively. In addition, the Company had sublease income of $140,145 and $79,908 for each of the years then ended.
Note 8 – Right-of-Use Asset and Operating Lease Liability, continued
The components of lease expense and supplemental cash flow information related to leases for the periods ended December 31, 2022 and 2021 are as follows:
|
2022 |
2021 |
|||||||
|
Cash paid for leases |
$ | - | $ | - | ||||
|
Remaining lease term (in years) |
3.50 | 9.50 | ||||||
|
Weighted average annual discount rate |
3.50 | % | 3.50 | % | ||||
|
2022 |
2021 |
|||||||
|
Sum of remaining payments |
$ | 1,349,499 | $ | 3,322,837 | ||||
|
Less: imputed interest |
(80,962 | ) | (517,630 | ) | ||||
|
Net present value of remaining payments |
1,268,537 | 2,805,207 | ||||||
|
Less: net present value of sublease rent |
398,446 | 238,489 | ||||||
|
Operating lease liability, net |
$ | 870,091 | $ | 2,566,718 | ||||
Annual future minimum lease payments for the lease outlined above as of December 31 of the respective years are as follows:
|
Minimum |
Sublease |
Net |
||||||||||
|
Commitments |
Commitments |
Commitments |
||||||||||
|
2023 |
$ | 372,712 | $ | 196,959 | $ | 175,753 | ||||||
|
2024 |
566,512 | 171,512 | 395,000 | |||||||||
|
2025 |
405,278 | 45,876 | 359,402 | |||||||||
|
2026 |
4,997 | - | 4,997 | |||||||||
|
Future minimum lease payments |
$ | 1,349,499 | $ | 414,347 | $ | 935,152 | ||||||
Note 9 – Unpaid Losses and LAE
Activity in the liability for unpaid losses and LAE for the years ended December 31, 2022 and 2021 was as follows:
|
2022 |
2021 |
|||||||
|
Balance, January 1, |
$ | 9,677,705 | $ | 9,860,762 | ||||
|
Less reinsurance receivable |
(923,240 | ) | (1,199,729 | ) | ||||
|
Net balance, January 1, |
8,754,465 | 8,661,033 | ||||||
|
Incurred losses and LAE related to: |
||||||||
|
Current year |
5,933,369 | 6,069,665 | ||||||
|
Prior years |
(1,422,789 | ) | (902,528 | ) | ||||
|
Total incurred losses and LAE |
4,510,580 | 5,167,137 | ||||||
|
Paid losses and LAE related to: |
||||||||
|
Current year |
2,804,758 | 1,898,340 | ||||||
|
Prior years |
3,050,749 | 3,175,365 | ||||||
|
Total paid losses and LAE |
5,855,507 | 5,073,705 | ||||||
|
Net balance, December 31, |
7,409,538 | 8,754,465 | ||||||
|
Plus reinsurance receivable |
1,070,452 | 923,240 | ||||||
|
Balance, December 31, |
$ | 8,479,990 | $ | 9,677,705 | ||||
As a result of changes in estimates for unpaid losses and LAE related to insured events of prior years, the liability for losses and LAE decreased by $1,422,789 and $902,528 in 2022 and 2021, respectively. The favorable development in 2022 and 2021 was primarily attributable to re-estimation of unpaid losses and LAE, specifically in the commercial automobile liability line of business related to the two most prior accident years.
The Company made no significant changes in its reserving philosophy, key reserving assumptions or claims management personnel, and has made no significant offsetting changes in estimates that increased or decreased losses and LAE reserves in 2022 or 2021.
The Company determines incurred but not reported (“IBNR”) reserves by subtracting the cumulative losses and LAE amounts the Company has paid and the case reserves the Company has established at the balance sheet date from an actuarial estimate of the ultimate cost of losses and LAE. Accordingly, IBNR reserves include actuarial projections of the cost of unreported claims, as well as actuarial projected development of case reserves on known claims and reopened claims. The Company’s methodology for estimating IBNR reserves has been in place for many years, and the Company made no significant changes to that methodology during 2022 or 2021.
Note 9 – Unpaid Losses and LAE, continued
The Company generally prepares an initial estimate of ultimate losses and LAE for the current accident year by multiplying earned premium by an expected loss ratio for each line of business the Company writes. Expected loss ratios represent the Company’s expectation of losses at the time the Company prices and writes policies before the emergence of any actual claims experience. The Company determines an expected loss ratio by analyzing historical experience and adjusting for loss cost trends, loss frequency and severity trends, premium rate-level changes, reported and paid loss emergence patterns and other known or observed factors.
The Company and its independent actuary utilized several generally accepted actuarial methodologies to estimate the ultimate cost of losses and LAE, including:
Paid Loss Development – historical patterns of paid loss development are used to project future paid loss emergence in order to estimate required reserves.
Incurred Loss Development – historical patterns of incurred loss development, reflecting both paid losses and changes in case reserves, are used to project future incurred loss emergence in order to estimate required reserves.
Paid Bornhuetter-Ferguson (“BF”) – an estimated loss ratio for a particular accident year is determined and is weighted against the portion of the accident year claims that have been paid, based on historical paid loss development patterns. The estimate of required reserves assumes that the remaining unpaid portion of a particular accident year will pay out at a rate consistent with the estimated loss ratio for that year. This method can be useful for situations where an unusually high or low amount of paid losses exists at the early stages of the claims development process.
Incurred Bornhuetter-Ferguson (“BF”) - an estimated loss ratio for a particular accident year is determined and is weighted against the portion of the accident year claims that have been reported, based on historical incurred loss development patterns. The estimate of required reserves assumes that the remaining unreported portion of a particular accident year will pay out at a rate consistent with the estimated loss ratio for that year. This method can be useful for situations where an unusually high or low amount of reported losses exists at the early stages of the claims development process.
Incremental Claim-Based Methods – historical patterns of incremental incurred losses and paid LAE during various stages of development are reviewed and assumptions are made regarding average loss and LAE development applied to remaining claims inventory. Such methods more properly reflect changes in the speed of claims closure and the relative adequacy of case reserve levels at various stages of development. These methods may provide a more accurate estimate of IBNR for lines of business with relatively few remaining open claims but for which significant recent settlement activity has occurred.
Frequency / Severity Based Methods – historical measurements of claim frequency and average paid claim size (severity) are reviewed for more mature accident years where a majority of claims have been reported and/or closed. These historical averages are trended forward to more recent periods in order to estimate ultimate losses for newer accident years that are not yet fully developed.
Note Note 9 – Unpaid Losses and LAE, continued
These methods are useful for lines of business with slow and/or volatile loss development patterns, such as liability lines where information pertaining to individual cases may not be completely known for many years. The claim frequency and severity information for older periods can then be used as reasonable measures for developing a range of estimates for more recent immature periods.
Estimates of indicated Adjusting and Other (“A&O”) reserves were developed based on the Company’s historical average costs incurred to settle unpaid losses applied to case and IBNR reserves at December 31, 2022 and 2021.
The Company considers loss frequency and severity trends when developing expected loss ratios. Loss frequency is a measure of the number of claims per unit of insured exposure, and loss severity is a measure of the average size of claims. Factors that affect loss frequency include changes in operator experience, traffic density, miles driven, safety advances, weather patterns or geographic mix of business. Factors that affect loss severity include changes in policy limits, reinsurance retentions, inflation rates and judicial interpretations.
The Company creates a claim file when it receives notice of a claim (first notice of loss), in most cases that is a telephone call from the insured, claimant, attorney or another insurance company. Some claims are submitted by a fax from the insurance agent, on behalf of the insured. A claims adjuster is assigned immediately upon receipt of the first notice of loss based on customer need and including, but not limited to complexity, severity, geography, and availability. All claims, regardless of active coverage, are assigned for immediate review and investigation.
The Company generally creates a claim file for a policy at the policy level. If there is more than one type of claim (such as collision, medical and property damage) resulting from an accident, there will be separate features set under the same claim. A claim number is automatically assigned once a claim is entered into the administrative system. The Company accumulates the claim counts and report them by line of business. For purposes of the claim development tables presented below, the Company counts claims on policies issued even if such claims are eventually closed without making a loss payment, as claims the Company closes without making a loss payment typically generate loss expenses. The methods used to summarize claim counts have not changed significantly over the time periods reported in the tables below.
The Company is not aware of any claim trends that have emerged or that would cause future adverse development that have not already been contemplated in setting current carried reserves levels.
The tables below present incurred and paid claims development, as well as cumulative claim frequency and the total of IBNR as of December 31, 2022 for all lines of business. Information related to incurred and paid claims and allocated claim adjustment expenses, IBNR reserves and cumulative number of reported claims for the year ended December 31, 2022 are audited. All prior years are considered required supplementary information and are unaudited.
Note 9 – Unpaid Losses and LAE, continued
|
All lines |
||||||||||||||||||||||||||||||||||||||||||||||||
|
Incurred Claims and Allocated Claim Adjustment Expenses, Net of Reinsurance (Unaudited) |
||||||||||||||||||||||||||||||||||||||||||||||||
|
For the Year Ended December 31, |
||||||||||||||||||||||||||||||||||||||||||||||||
|
Accident Year |
2013 |
2014 |
2015 |
2016 |
2017 |
2018 |
2019 |
2020 |
2021 |
2022 |
Total IBNR Plus Expected Development on Reported Claims |
Cumulative Number of Reported Claims |
||||||||||||||||||||||||||||||||||||
|
Unaudited |
||||||||||||||||||||||||||||||||||||||||||||||||
|
(in thousands) |
||||||||||||||||||||||||||||||||||||||||||||||||
|
2013 |
3,928 | 4,330 | 4,568 | 3,850 | 3,826 | 3,752 | 3,752 | 3,752 | 3,752 | $ | 3,752 | - | 1,012 | |||||||||||||||||||||||||||||||||||
|
2014 |
4,088 | 5,048 | 4,871 | 4,889 | 4,734 | 4,752 | 4,741 | 4,741 | 4,710 | - | 1,111 | |||||||||||||||||||||||||||||||||||||
|
2015 |
6,419 | 7,549 | 7,371 | 7,355 | 7,355 | 7,354 | 7,363 | 7,356 | 5 | 1,473 | ||||||||||||||||||||||||||||||||||||||
|
2016 |
6,690 | 7,880 | 8,109 | 8,097 | 8,106 | 8,114 | 8,088 | 16 | 1,590 | |||||||||||||||||||||||||||||||||||||||
|
2017 |
10,397 | 12,271 | 11,978 | 11,964 | 11,761 | 11,704 | 73 | 1,527 | ||||||||||||||||||||||||||||||||||||||||
|
2018 |
12,397 | 11,690 | 11,048 | 11,259 | 11,270 | 94 | 1,496 | |||||||||||||||||||||||||||||||||||||||||
|
2019 |
9,823 | 7,964 | 8,364 | 8,201 | 156 | 948 | ||||||||||||||||||||||||||||||||||||||||||
|
2020 |
5,201 | 3,873 | 3,229 | 181 | 377 | |||||||||||||||||||||||||||||||||||||||||||
|
2021 |
6,070 | 5,566 | 591 | 493 | ||||||||||||||||||||||||||||||||||||||||||||
|
2022 |
5,932 | 1,333 | 585 | |||||||||||||||||||||||||||||||||||||||||||||
|
Incurred claims and allocated claims adjustment expense, net of reinsurance |
$ | 69,808 | ||||||||||||||||||||||||||||||||||||||||||||||
Note 9 - Unpaid Losses and LAE, continued
|
All lines |
||||||||||||||||||||||||||||||||||||||||
|
Cumulative Paid Claims and Allocated Claim Adjustment Expenses, Net of Reinsurance (Unaudited) |
||||||||||||||||||||||||||||||||||||||||
|
For the Year Ended December 31, |
||||||||||||||||||||||||||||||||||||||||
|
Accident Year |
2013 |
2014 |
2015 |
2016 |
2017 |
2018 |
2019 |
2020 |
2021 |
2022 |
||||||||||||||||||||||||||||||
|
Unaudited |
||||||||||||||||||||||||||||||||||||||||
|
(in thousands) |
||||||||||||||||||||||||||||||||||||||||
|
2013 |
1,783 | 2,946 | 3,496 | 3,722 | 3,747 | 3,752 | 3,752 | 3,752 | 3,752 | $ | 3,752 | |||||||||||||||||||||||||||||
|
2014 |
2,200 | 3,619 | 4,265 | 4,544 | 4,702 | 4,704 | 4,708 | 4,708 | 4,710 | |||||||||||||||||||||||||||||||
|
2015 |
3,491 | 5,412 | 6,829 | 7,162 | 7,275 | 7,347 | 7,347 | 7,351 | ||||||||||||||||||||||||||||||||
|
2016 |
3,379 | 6,222 | 7,363 | 7,900 | 7,935 | 7,975 | 8,048 | |||||||||||||||||||||||||||||||||
|
2017 |
4,930 | 9,204 | 11,238 | 11,429 | 11,443 | 11,448 | ||||||||||||||||||||||||||||||||||
|
2018 |
4,558 | 7,726 | 9,539 | 10,374 | 10,881 | |||||||||||||||||||||||||||||||||||
|
2019 |
3,270 | 5,394 | 7,013 | 7,569 | ||||||||||||||||||||||||||||||||||||
|
2020 |
1,365 | 2,032 | 2,421 | |||||||||||||||||||||||||||||||||||||
|
2021 |
1,899 | 3,415 | ||||||||||||||||||||||||||||||||||||||
|
2022 |
2,803 | |||||||||||||||||||||||||||||||||||||||
|
Paid claims and allocated claim adjustment expenses, net of reinsurance |
62,398 | |||||||||||||||||||||||||||||||||||||||
|
All outstanding liabilities before 2013, net of reinsurance |
- | |||||||||||||||||||||||||||||||||||||||
|
Liabilities for claims and claims adjustment expenses, net of reinsurance |
$ | 7,410 | ||||||||||||||||||||||||||||||||||||||
Note 9 - Unpaid Losses and LAE, continued
The following table presents a reconciliation of the net incurred and paid claims development tables to the liability for unpaid losses and loss expenses in the consolidated balance sheet:
|
2022 |
2021 |
|||||||
|
Unpaid loss and defense and cost containment expenses, net of reinsurance |
$ | 6,360,464 | $ | 7,536,172 | ||||
|
Unallocated A&O Reserves |
1,049,074 | 1,218,293 | ||||||
|
Net unpaid loss and LAE |
7,409,538 | 8,754,465 | ||||||
|
Reinsurance recoverable on unpaid loss and LAE |
1,070,452 | 923,240 | ||||||
|
Total gross unpaid losses and LAE |
$ | 8,479,990 | $ | 9,677,705 | ||||
The following table presents unaudited supplementary information about average historical claims duration as of December 31, 2022:
|
Average annual percentage payout of incurred claims by age, net of reinsurance (Unaudited) |
||||||||||||||||||||||||||||||||||||||||
|
Year 1 |
Year 2 |
Year 3 |
Year 4 |
Year 5 |
Year 6 |
Year 7 |
Year 8 |
Year 9 |
Year 10 |
|||||||||||||||||||||||||||||||
|
All product lines |
43.0 |
% |
29.0 |
% |
15.9 |
% |
5.6 |
% |
1.8 |
% |
0.3 |
% |
0.2 |
% |
0.0 |
% |
0.0 |
% |
0.0 |
% |
||||||||||||||||||||
The percentages in the above table do not add up to 100% because they represent averages across all accident years at each development stage.
Note 10 - Reinsurance
The Company entered into an excess of loss reinsurance contract which provides the Company with excess of loss reinsurance coverage for commercial automobile liability losses, including 100 percent of losses in excess of policy limits and 100 percent of extra contractual obligations, occurring on or after June 1, 2019. Under the agreement coverage is provided for 100 percent of losses in excess of $400,000 up to $1.6 million per occurrence per policy. Aggregate limits under the reinsurance treaties are $6.6 million for losses under $1.0 million and $2.0 million for losses in excess $1.0 million.
Effective June 1, 2022, the Company’s reinsurance treaties provide the Company with excess of loss reinsurance coverage for commercial automobile liability losses. Under the agreement coverage is provided for 97.5 percent of losses in excess of $400,000 up to $1.6 million per occurrence per policy, including 97.5 percent of losses in excess of policy limits and 97.5 percent of extra contractual obligations. Aggregate limits under the reinsurance treaties are $6.6 million for losses under $1.0 million and $2.0 million for losses in excess $1.0 million. Subject to the terms of the contract, the Company has retained, a 2.5 percent share of the $1.6 million liability in excess of $400,000, which is not reinsured.
Note 10 – Reinsurance, continued
On December 31, 2022 and 2021, the Company had reinsurance recoverable paid losses and LAE and ceded premiums totaling $253,126 and $163,986, respectively. All reinsurance amounts recoverable are due from companies with financial strength ratings of “A” or better by A.M. Best.
The effect of reinsurance on premiums written, premiums earned and loss and LAE incurred for the years ended was December 31, 2022 and 2021 is as follows:
|
2022 |
2021 |
|||||||||||||||||||||||
|
Premium |
Premium |
Losses & LAE |
Premium |
Premium |
Losses & LAE |
|||||||||||||||||||
|
Written |
Earned |
Incurred |
Written |
Earned |
Incurred |
|||||||||||||||||||
|
Direct |
$ | 12,150,342 | $ | 10,228,078 | $ | 5,553,678 | $ | 9,347,787 | $ | 8,258,746 | $ | 5,342,138 | ||||||||||||
|
Ceded |
(625,082 | ) | (825,931 | ) | (1,043,098 | ) | (469,132 | ) | (350,003 | ) | (175,001 | ) | ||||||||||||
|
Net |
$ | 11,525,260 | $ | 9,402,147 | $ | 4,510,580 | $ | 8,878,655 | $ | 7,908,743 | $ | 5,167,137 | ||||||||||||
Note 11 – Goodwill and Other Intangibles
Goodwill
The carrying amount of the Company’s goodwill was $4,506,000 and $0 as of December 31, 2022 and 2021, respectively.
Other Intangible Assets
The following table presents the carrying amount of the Company’s other intangible assets as of December 31, 2022:
|
Gross Carrying |
Accumulated |
|||||||||||
|
Amount |
Amortization |
Net |
||||||||||
|
Agency Relationships |
$ | 1,930,000 | $ | 201,040 | $ | 1,728,960 | ||||||
|
Trade Name |
130,000 | 21,668 | 108,332 | |||||||||
|
Licenses |
50,000 | 50,000 | - | |||||||||
|
Total |
$ | 2,110,000 | $ | 272,708 | $ | 1,837,292 | ||||||
Amortization expense was $272,708 and $0 for the years ended December 31, 2022 and 2021, respectively.
Note 11 – Goodwill and Other Intangibles, continued
Other intangible assets that have finite lives, including agency relationships, trade names and licenses, are amortized over their useful lives. As of December 31, 2022, the estimated amortization of other intangible assets with finite lives for the next five years and thereafter is as follows:
|
Year ending December 31, |
Amount |
|||
|
2023 |
$ | 267,250 | ||
|
2024 |
267,250 | |||
|
2025 |
267,250 | |||
|
2026 |
267,250 | |||
|
2027 |
245,583 | |||
|
Thereafter |
522,709 | |||
| $ | 1,837,292 | |||
Note 12 – Notes Payable
Properties has a mortgage with a financial institution that matures in February 2036 and has a fixed interest rate of 4.15% per annum. A balloon payment of the remaining mortgage is due at maturity. Installments of 95% of 810 5th Street LLC’s net rental proceeds, less $1,546 in replacement reserves and fees, are due monthly. Replacement reserves are included in other receivables. The mortgage outstanding balance as of December 31, 2022 and 2021 was $21,809,430 and $22,192,434, net of $1,147,390 and $1,262,794 of unamortized finance costs, respectively. The loan is secured by the property, held by 810 5th Street LLC, and a replacement reserve held in escrow.
In addition to the mortgage, Properties has two commercial lines of credit with the same financial institution with monthly payments totaling $34,576, maturing November 2025. Interest was calculated using a floating rate based off the 5-year treasury rate, subject to a floor of 4.25%. Effective November 2020, interest became fixed at 4.25%. The outstanding balances on the lines of credit as of December 31, 2022 and 2021 was $5,151,257 and $5,331,678, net of $21,045 and $28,261 in unamortized finance costs, respectively. The lines of credit are secured by the property held by 717 8th Street LLC and 2805 M Street LLC. In order to obtain the loans, finance costs were incurred and are being amortized over the loans’ terms. Interest expense included $94,359 of amortized finance costs in each of the years ended December 31, 2022 and 2021.
Note 12 – Notes Payable, continued
Under the terms of each of the credit facilities, each of the borrowers has granted the bank a right of set-off so that, in the event of a default, the bank may set-off the balance in the defaulting borrower's account against amounts owed to the bank. At December 31, 2022 and 2021, amounts included in cash and cash equivalents that were subject to the right of set-off were as follows:
|
Borrower |
2022 |
2021 |
||||||
|
717 8th Street LLC |
$ | 206,331 | $ | 189,577 | ||||
|
2805 M Street LLC |
128,361 | 84,522 | ||||||
|
Total |
$ | 334,692 | $ | 274,099 | ||||
Current and long-term debt maturity at December 31, 2022 and 2021 were as follows:
|
2022 |
2021 |
|||||||
|
Notes payable |
28,129,122 | 28,786,906 | ||||||
|
Unamortized finance costs |
(1,168,435 | ) | (1,262,794 | ) | ||||
|
Long-term maturity, net of unamortized finance costs |
$ | 26,960,687 | $ | 27,524,112 | ||||
Annual long-term debt maturities at December 31, 2022 were as follows:
|
2023 |
$ | 733,341 | ||
|
2024 |
810,269 | |||
|
2025 |
5,441,095 | |||
|
2026 |
752,333 | |||
|
2027 |
834,098 | |||
|
Thereafter |
19,557,986 | |||
|
Total notes payable |
28,129,122 | |||
|
Unamortized finance costs |
(1,168,435 | ) | ||
|
Notes payable, net of unamortized finance costs |
$ | 26,960,687 |
Note 13 – Employee Benefits
401(k) Plan
In 2007, the Company introduced a Safe Harbor 401(k) plan for its employees. Contributions of 3% of each employee’s compensation are made each year. The Company’s contributions for the plan years ending December 31, 2022 and 2021 were $93,196 and $82,404, respectively.
The Company has a non-contributory defined benefit pension plan (the “Plan”). The Plan benefits are based on years of service and the employee’s compensation. The Plan covered all employees of FIC who had completed one year of service and attained age 21 before June 20, 2006. As of June 20, 2006, the Company decided to freeze the accrual of the future benefits for the Plan. Accordingly, there have been nor will there be additional benefits credited to plan participants after June 20, 2006.
The normal retirement benefit is 2.5% of average monthly compensation multiplied by total years of service, limited to 35 years, but in no event less than $12.00 per month multiplied by total years of service, limited to 35 years. On June 20, 2006, the plan was amended to cease the accrual of future benefits. Upon reaching the plan's normal retirement date, participants are entitled to receive their accrued benefit as of June 20, 2006.
There were no new benefit provisions or plan amendments during the plan years ended December 31, 2022 and 2021.
The plan sponsor's funding policy is based on actuarially determined contributions that take into consideration the amount deductible for income tax purposes and the minimum required contributions under the Employee Retirement Income Security Act of 1974, as amended. The Company does not expect to make any required payments in 2022.
Estimated future benefit payments are as follows:
|
2023 |
$ | 321,092 | |||
|
2024 |
316,860 | ||||
|
2025 |
308,887 | ||||
|
2026 |
304,244 | ||||
|
2027 |
296,835 | ||||
| 2027 to 2032 | $ | 1,450,035 |
Note 13 – Employee Benefits, continued
The benefit obligations, funded status and net periodic benefit costs related to the pension plan were as follows:
|
2022 |
2021 |
|||||||
|
Benefit obligations |
$ | 4,068,955 | $ | 5,063,692 | ||||
|
Estimated fair value of plan assets |
3,590,273 | 4,788,489 | ||||||
|
Underfunded status |
$ | 478,682 | $ | 275,203 | ||||
|
Net periodic benefit costs |
$ | (119,630 | ) | $ | (131,280 | ) | ||
A summary of assets, benefit obligations and funded status was as follows at December 31, 2022 and 2021:
|
2022 |
2021 |
|||||||
|
Change in benefit obligation: |
||||||||
|
Benefit obligation at January 1, |
$ | 5,063,692 | $ | 5,330,835 | ||||
|
Interest costs |
139,046 | 130,609 | ||||||
|
Net actuarial loss (gain) during year |
(858,998 | ) | (122,967 | ) | ||||
|
Benefits paid |
(274,785 | ) | (274,785 | ) | ||||
|
Benefit obligation at December 31, |
$ | 4,068,955 | $ | 5,063,692 | ||||
|
Change in plan assets: |
||||||||
|
Estimated fair value of plan assets at January 1, |
$ | 4,788,489 | $ | 4,886,788 | ||||
|
Actual return on plan assets |
(923,431 | ) | 176,486 | |||||
|
Employer contributions |
- | - | ||||||
|
Benefits paid |
(274,785 | ) | (274,785 | ) | ||||
|
Fair value of plan assets at December 31, |
$ | 3,590,273 | $ | 4,788,489 | ||||
|
Funded status at December 31, |
$ | (478,682 | ) | $ | (275,203 | ) | ||
|
Amounts recognized in the balance sheets consist of: |
||||||||
|
Defined benefit plan - liability |
$ | (478,682 | ) | $ | (275,203 | ) | ||
|
AOCI, before income tax |
||||||||
|
Net actuarial loss |
$ | (1,873,288 | ) | $ | (1,550,179 | ) | ||
Note 13 – Employee Benefits, continued
Employer contributions are included in Other Expenses in the Consolidated Statements of Operations and Comprehensive Earnings for the years ended December 31, 2022 and 2021. The components of net periodic benefit costs and other changes in plan assets and benefit obligations recognized in OCI were as follows:
|
2022 |
2021 |
|||||||
|
Net periodic benefit costs: |
||||||||
|
Interest costs |
$ | 139,046 | $ | 130,609 | ||||
|
Expected return on plan assets |
(301,475 | ) | (308,024 | ) | ||||
|
Amortization of actuarial loss |
42,799 | 46,135 | ||||||
|
Total net periodic benefit costs |
$ | (119,630 | ) | $ | (131,280 | ) | ||
The weighted average assumptions used in determining benefit obligations for the Plan were as follows as of December 31, 2022 and 2021:
|
2022 |
2021 |
|||||||
|
Weighted average discount rate |
5.02 | % | 2.83 | % | ||||
|
Weighted average interest crediting rate |
0.00 | % | 0.00 | % | ||||
|
Rate of compensation increase |
0.00 | % | 0.00 | % | ||||
Weighted average assumptions used to determine net periodic benefit costs were as follows as of December 31, 2022 and 2021:
|
2022 |
2021 |
|||||||
|
Weighted average discount rate |
2.83 | % | 2.52 | % | ||||
|
Expected long-term return on plan assets |
6.50 | % | 6.50 | % | ||||
|
Rate of compensation increase |
- | - | ||||||
As of December 31, 2022, a discount rate of 5.02% and the RP-2014 mortality table MP-2021 Improvement Scale projected generationally (2.83% , RP-2014 mortality table and MP-2020 Improvement Scale for 2021) are used to determine the liability. There is no salary progression assumption used in the measurement of the plan, since there are no future benefit accruals. These assumptions were chosen by the Company.
Note 13 – Employee Benefits, continued
The Plan invests in a diversified mix of traditional asset classes, including investments in U.S. and foreign equity securities, fixed income securities and cash. The defined benefit pension plan asset allocation as of December 31, 2022 and 2021, and the measurement date presented as a percentage of total plan assets are as follows:
|
Target |
||||||||||||
|
2022 |
2021 |
Allocation |
||||||||||
|
Equity securities |
63 | % | 64 | % | 35 to 90 | % | ||||||
|
Debt securities |
37 | % | 36 | % | 5 to 55 | % | ||||||
| 100 | % | 100 | % | |||||||||
The Plan investments are made to maximize long-term returns, while recognizing the need for adequate liquidity to meet on-going benefit and administrative obligations. Risk tolerance of unexpected investment and actuarial outcomes is continually evaluated by understanding the Plan’s liability characteristics.
Asset allocations and investment performance are formally reviewed quarterly by the Plan’s trustees. More thorough analysis of assets and liabilities is also performed periodically. Investment goals include a return objective designed to satisfy the actuarial return objectives of the Plan. All investment practices are expected to be consistent with the Uniform Prudent Investor’s Act.
Plan assets measured at fair value on a recurring basis as of December 31, 2022 and 2021, were as summarized below.
|
2022 |
||||||||||||||||
|
Significant |
||||||||||||||||
|
Quoted in active |
Other |
Significant |
||||||||||||||
|
Markets for |
Observable |
Unobservable |
||||||||||||||
|
Identical Assets |
Inputs |
Inputs |
||||||||||||||
|
(Level 1) |
(Level 2) |
(Level 3) |
Total |
|||||||||||||
|
Fixed maturity securities: |
||||||||||||||||
|
U.S. government |
$ | 272,106 | $ | - | $ | - | $ | 272,106 | ||||||||
|
Industrial and miscellaneous |
- | 919,498 | - | 919,498 | ||||||||||||
|
Asset backed securities |
- | 152,186 | - | 152,186 | ||||||||||||
|
Total fixed maturity securities |
272,106 | 1,071,684 | - | 1,343,790 | ||||||||||||
|
Common stocks |
2,246,483 | - | - | 2,246,483 | ||||||||||||
|
Total marketable investments measured at fair value |
$ | 2,518,589 | $ | 1,071,684 | $ | - | $ | 3,590,273 | ||||||||
Note 13 – Employee Benefits, continued
|
2021 |
||||||||||||||||
|
Significant |
||||||||||||||||
|
Quoted in active |
Other |
Significant |
||||||||||||||
|
Markets for |
Observable |
Unobservable |
||||||||||||||
|
Identical Assets |
Inputs |
Inputs |
||||||||||||||
|
(Level 1) |
(Level 2) |
(Level 3) |
Total |
|||||||||||||
|
Fixed maturity securities: |
||||||||||||||||
|
U.S. government |
$ | 269,733 | $ | - | $ | - | $ | 269,733 | ||||||||
|
Industrial and miscellaneous |
- | 1,285,503 | - | 1,285,503 | ||||||||||||
|
Asset backed securities |
- | 192,004 | - | 192,004 | ||||||||||||
|
Total fixed maturity securities |
269,733 | 1,477,507 | - | 1,747,240 | ||||||||||||
|
Common stocks |
3,041,249 | - | - | 3,041,249 | ||||||||||||
|
Total marketable investments measured at fair value |
$ | 3,310,982 | $ | 1,477,507 | $ | - | $ | 4,788,489 | ||||||||
ESOP
In connection with our conversion and public offering, the Company established an ESOP. The ESOP borrowed from the Company to purchase 202,950 shares in the offering. The issuance of the shares to the ESOP resulted in a contra account established in the equity section of the balance sheet for the unallocated shares at an amount equal to their $10.00 per share purchase price.
The Company may make discretionary contributions to the ESOP and pay dividends on unallocated shares to the ESOP. The Company makes annual contributions to the ESOP sufficient to repay the loan. When loan payments are made, ESOP shares are allocated to participants based on relative compensation. The Company repurchases shares from participants that have left our employment. The Company contributed $226,772 to the ESOP for the year ended December 31, 2022.
A compensation expense charge is booked monthly during each year for the shares committed to be allocated to participants that year, determined with reference to the fair market value of our stock at the time the commitment to allocate the shares is accrued and recognized. For the year ended December 31, 2022, the Company recognized compensation expense of $233,392 related to 20,295 shares of our common stock that are committed to be released to participants’ accounts at December 31, 2022. For the year ended December 31, 2021, the Company recognized no compensation expense as there were no shares released in 2021.
Share-based Compensation
The Forge Group, Inc. 2021 Stock and Incentive Plan (the “Plan”) was approved by the Company’s Board of directors. The purpose of the Plan is to promote the interests of the Company and its shareholders by aiding the Company in attracting, retaining, and motivating employees and non-employee directors. The Plan provides for the grant of restricted stock awards, restricted stock unit awards, qualified stock options and nonqualified stock options.
Note 13 – Employee Benefits, continued
The total aggregate number of shares of common stock that may be issued under the Plan shall not exceed 287,000 shares, subject to adjustments as provided in the Plan. No eligible participant may be granted any awards for more than 100,000 shares in the aggregate in any calendar year, subject to adjustment in accordance with the Plan.
The Board of Directors has awarded restricted stock awards to non-employee directors on March 11, 2022. The restricted stock awards vest over a period of one-year or 20% over a five-year period following the grant date. Dividend equivalents on restricted stock awards are accrued during the vesting period and paid in cash at the end of the vesting period, but are subject to forfeiture until the underlying shares become vested. Participants do not have voting rights with respect to unvested restricted stock grants. The Company recognizes stock-based compensation costs for restricted stock awards based on the grant date fair value. The compensation costs are expensed over the vesting periods to each vesting date. Estimated forfeitures are included in the determination of compensation costs. No forfeitures are currently estimated.
A summary of the Company’s outstanding and unearned restricted stock awards is presented below:
|
Weighted-Average |
||||||||
|
Grant Date |
||||||||
|
Fair Value |
||||||||
|
Shares |
Per Share |
|||||||
|
Shares outstanding and unearned at January 1, 2021 |
- | $ | - | |||||
|
Shares granted during 2021 |
- | - | ||||||
|
Shares earned during 2021 |
- | - | ||||||
|
Shares outstanding and unearned at December 31, 2021 |
- | - | ||||||
|
Shares granted during 2022 |
15,000 | 10.00 | ||||||
|
Shares earned during 2022 |
- | - | ||||||
|
Shares outstanding and unearned at December 31, 2022 |
15,000 | $ | 10.00 | |||||
The Board of Directors has awarded qualified and nonqualified stock options on March 11, 2022. The options vest over various periods or performance objectives. The Company recognizes stock-based compensation costs for stock options based on the grant date fair value. The compensation costs are normally expensed over the actual or estimated vesting periods to each vesting date. Estimated forfeitures are included in the determination of compensation costs. No forfeitures are currently estimated.
Note 13 – Employee Benefits, continued
A summary of the Company’s outstanding and unearned restricted stock options is presented below:
|
Weighted-Average |
||||||||
|
Number of Shares |
Exercise Price | |||||||
|
Options outstanding and unearned at January 1, 2021 |
- | $ | - | |||||
|
Options granted during 2021 |
- | - | ||||||
|
Options earned during 2021 |
- | - | ||||||
|
Options outstanding and unearned at December 31, 2021 |
- | - | ||||||
|
Options granted during 2022 |
190,000 | 10.00 | ||||||
|
Options forfeited during 2022 |
(10,000 | ) | 10.00 | |||||
|
Options earned during 2022 |
- | - | ||||||
|
Options outstanding and unearned at December 31, 2022 |
180,000 | $ | 10.00 | |||||
Note 14 – Other Comprehensive Income
The following tables summarize the net change in after-tax accumulated other comprehensive income for the years ending December 31, 2022 and 2021 and significant amounts reclassified out of accumulated other comprehensive income for the years ending December 31, 2022 and 2021.
|
Unrealized |
Accumulated other |
|||||||||||
|
appreciation on |
Defined |
comprehensive |
||||||||||
|
investments, net |
Benefit Plan |
income (loss) |
||||||||||
|
Balance at December 31, 2020 |
$ | 1,070,175 | $ | (1,254,317 | ) | $ | (184,142 | ) | ||||
|
Other Comprehensive income before reclassifications |
(400,816 | ) | 29,676 | (371,140 | ) | |||||||
| Reclassifications from accumulated other comprehensive income | (20,439 | ) | - | (20,439 | ) | |||||||
|
Balance at December 31, 2021 |
$ | 648,920 | $ | (1,224,641 | ) | $ | (575,721 | ) | ||||
|
Other Comprehensive income before reclassifications |
- | - | - | |||||||||
|
Reclassifications from accumulated other comprehensive income |
(2,234,494 | ) | - | (2,234,494 | ) | |||||||
|
Balance at December 31, 2022 |
$ | (1,585,574 | ) | $ | (1,224,641 | ) | $ | (2,810,215 | ) | |||
Note 15 – Related Parties
In 2019, the Company made an investment in Trustar Bank (“Trustar”), a newly formed financial institution. Certain members of the Board of Trustees of the Company maintain board of directors’, advisory director, and executive management positions at Trustar. Accordingly, Trustar is considered a related party. The carrying value, which approximated fair value, of the investment in Trustar was $237,637 and $216,228 on December 31, 2022 and 2021, respectively.
On March 27, 2020, the United States of America passed the COVID-19 Aid, Relief, and Economic Security Act (“CARES Act”), which includes various programs to aid businesses that have been adversely impacted by the COVID-19. The Paycheck Protection Program (“PPP”) is a component of the CARES Act and is being administered by the Small Business Administration (“SBA”), an Agency of the United States of America SBA as part of their 7(a) loan program. Pursuant to the CARES Act, loans made under the PPP will be forgiven as long as the loan proceeds are used to cover payroll costs, mortgage interest, rent, and utility costs over the eight (8) week period after the loan is made, as long as employee and compensation levels are maintained.
On April 17, 2020, the Company closed on the PPP loan from Trustar, an authorized lender for the SBA, and received funds in the amount of $397,810. The Company utilized the PPP loan proceeds for eligible expenses and on December 3, 2020 the Company’s application for loan forgiveness was approved by the SBA and the loan and accrued interest was retired by Trustar. The Company recognized a gain on the forgiveness of the loan and accrued interest of $400,306 in 2020.
In January 2021, the SBA opened a second draw opportunity for PPP loans. The Company submitted its loan application under the program and was subsequently approved for a PPP loan through Trustar Bank. On February 9, 2021, the Company closed on the PPP loan from Trustar and received funds in the amount of $397,810. The Company utilized the PPP loan proceeds for eligible expenses and on March 9, 2022 the Company’s application for loan forgiveness was approved by the SBA and the loan and accrued interest was retired by Trustar. The Company recognized a gain on the forgiveness of the loan and accrued interest of $400,698 in 2022.
Note 16 – Commitments and Contingencies
Litigation
The Company is party to numerous claims, losses, and litigation matters that arise in the normal course of business. Many of such claims, losses, or litigation matters involve claims under policies that the Company underwrites as an insurer. The Company believes that the resolution of these claims and any resulting losses will not have a material adverse effect on the Company’s financial condition, results of operations, or cash flows.
Note 17 – Income Taxes
The Company files a U.S. federal income tax return that includes the pass-through income or loss of majority owned direct and indirect subsidiaries. State tax returns are filed depending on applicable laws. The Company records adjustments related to prior years’ taxes during the period in which they are identified, generally when the tax returns are filed. The effect of these adjustments on the current and prior periods (during which the differences originated) is evaluated based upon quantitative and qualitative factors and are considered in relation to the consolidated financial statements taken as a whole for the respective years.
The provision for income taxes for the year ending December 31, 2022 and 2021, is comprised of the following:
|
2022 |
2021 |
|||||||
|
Current federal income tax expense |
$ | - | $ | - | ||||
|
Current state income tax expense |
41,665 | - | ||||||
|
Deferred federal and state income tax expense |
593,979 | 104,091 | ||||||
|
Income tax expense |
$ | 635,644 | $ | 104,091 | ||||
A reconciliation of the expected income tax expense to the actual income tax expense and the reconciliation of the federal statutory rate to the Company’s effective tax rate for the period ended December 31, 2022 and 2021 is presented below:
|
% of Pre-Tax |
||||||||
|
2022 |
Income |
|||||||
|
Provision for income taxes at the statutory federal rate |
$ | (2,411,849 | ) | 21.0 | % | |||
|
Increase (reduction) in taxes resulting from: |
||||||||
|
Permanent differences: |
||||||||
|
Dividends received deduction |
(6,099 | ) | 0.1 | % | ||||
|
Tax exempt interest income |
(18,490 | ) | 0.2 | % | ||||
|
Gain on extinguishment of related party loan |
84,147 | -0.7 | % | |||||
|
Policyholder dividends |
1,533,963 | -13.4 | % | |||||
|
Pass-through entity income |
(31,904 | ) | 0.3 | % | ||||
|
Temporary differences: |
||||||||
|
Valuation allowance adjustment |
1,126,785 | -9.8 | % | |||||
|
Prior year true-ups and other adjustments |
359,091 | -3.1 | % | |||||
|
Actual income tax, as provided in the consolidated financial statements |
$ | 635,644 | -5.5 | % | ||||
Note 17 – Income Taxes, continued
|
% of Pre-Tax |
||||||||
|
2021 |
Income |
|||||||
|
Provision for income taxes at the statutory federal rate |
$ | (131,104 | ) | 21.0 | % | |||
|
Increase (reduction) in taxes resulting from: |
||||||||
|
Permanent differences: |
||||||||
|
Dividends received deduction |
(23,606 | ) | 3.8 | % | ||||
|
Tax exempt interest income |
(26,352 | ) | 4.2 | % | ||||
|
Pass-through entity income |
(80,975 | ) | 13.0 | % | ||||
|
Temporary differences: |
||||||||
|
Valuation allowance adjustment |
145,278 | -23.3 | % | |||||
|
Prior year true-ups |
220,850 | -35.4 | % | |||||
|
Actual income tax, as provided in the consolidated financial statements |
$ | 104,091 | -16.7 | % | ||||
Significant components of the Company’s deferred tax assets and liabilities at December 31, 2022 and 2021 were as follows:
|
2022 |
2021 |
|||||||
|
Deferred tax assets: |
||||||||
|
Unearned premiums |
$ | 265,099 | $ | 176,294 | ||||
|
Loss discounting |
64,071 | 119,309 | ||||||
|
Net operating loss carryforward |
2,526,015 | 2,478,635 | ||||||
|
Net unrealized loss on investment securities |
378,953 | - | ||||||
|
Lease liability |
151,720 | 191,407 | ||||||
|
Defined benefit plan |
100,523 | 57,793 | ||||||
|
Other |
202,680 | 201,413 | ||||||
|
Valuation allowance adjustment |
(1,493,256 | ) | (366,471 | ) | ||||
|
Total deferred tax assets |
2,195,805 | 2,858,380 | ||||||
|
Deferred tax liabilities: |
||||||||
|
Deferred policy acquisition costs |
290,005 | 155,243 | ||||||
|
Unrealized gains on investments |
- | 161,565 | ||||||
|
Deferred gain - 1031 exchange |
1,878,987 | 1,878,987 | ||||||
|
Other |
26,813 | 662,585 | ||||||
|
Total deferred tax liabilities |
2,195,805 | 2,858,380 | ||||||
|
Net deferred tax liability |
$ | - | $ | - | ||||
Note 17 – Income Taxes, continued
At December 31, 2022, the Company had net operating loss “NOL” carry forwards available for tax purposes of $12,028,643 that will begin to expire in 2037.
In 2015, the Company sold a building, placed the proceeds in trust and then reinvested the proceeds in similar use (like-kind) property, availing itself of the ability (pursuant to Section 1031 of the tax code) to defer the taxes that would otherwise have been due on the gain. As a result, the Company established has a deferred tax liability of $1,878,987 (as shown above). The gain will become taxable when the like-kind property is sold if the Company elects to sell the property.
In assessing the valuation of deferred tax assets, the Company considers whether it is more likely than not that some portion or all of the deferred tax assets will not be realized. The ultimate realization of deferred tax assets is dependent upon the generation of future taxable income during the periods in which those temporary differences become deductible. A valuation allowance against deferred tax assets has been established as the Company believes it is more likely than not the deferred tax assets will not be realized based on the historical taxable income of the Company, or by offset to deferred tax liabilities.
The Company had no material unrecognized tax benefits and no adjustments to liabilities or operations were required. There were no interest or penalties related to income taxes that have been accrued or recognized as of and for the years ended December 31, 2022 and 2021. If any had been recognized these would have been reported in income tax expense.
Generally, taxing authorities may examine the Company’s tax returns for the three years from the date of filing. The Company’s tax returns for the years ended December 31, 2020 through December 31, 2022 remain subject to examination.
Note 18 - Demutualization
Until March 11, 2022, FIC was a District of Columbia mutual insurance company. The board of trustees of FIC adopted a plan of conversion on February 3, 2021, under which FIC would convert from a mutual insurance company to a stock insurance company. In response to comments received from the Department, the board of trustees of FIC adopted an amended and restated plan of conversion on November 9, 2021. A special meeting of the members of FIC eligible to vote (those persons who were members of FIC as of the close of business on February 3, 2021) was held on March 7, 2022, to approve the plan of conversion. At the special meeting, the plan of conversion was approved by the affirmative vote of a majority of the votes cast at the special meeting. On March 11, 2022, the Company completed the sale of 2,050,000 shares of common stock at $10.00 per share for a total gross offering of $20,500,000, thereby completing the conversion of FIC from mutual to stock form. Following the conversion, FIC became a wholly owned subsidiary of the Company. Pursuant to the amended and restated plan of conversion, upon completion of the conversion and the offering, FIC distributed $4,594 in cash to each of the eligible policyholders. These distributions totaled $7,304,587 and are reflected as policyholder dividends on the consolidated statement of operations and comprehensive earnings.
Note 19 – Subsequent Events
The Company has evaluated events that occurred subsequent to December 31, 2022 through April 28, 2023, the date on which the unaudited consolidated financial statements were issued for matters that required disclosure or adjustment to these consolidated financial statements.
Exhibit 11.1
|
|
Crowe LLP Independent Member Crowe Global |
Board of Directors and Management of Forge Group, Inc.
Chevy Chase, Maryland
We consent to the use in this Annual Report on Form 1-K of Forge Group, Inc. of our report dated April 28, 2023, relating to our audit of the consolidated financial statements of Forge Group, Inc. as of December 31, 2022 and for the year ended December 31, 2022.
 |
|
| Crowe LLP |
Fort Lauderdale, Florida
April 28, 2023