UNITED STATES SECURITIES AND EXCHANGE COMMISSION
Washington, D.C. 20549
____________________
Form 10-K
[X] | ANNUAL REPORT PURSUANT TO SECTION 13 OR 15(d) OF THE SECURITIES EXCHANGE ACT OF 1934 | |
For the fiscal year ended December 31, 2019 | ||
[ ] | TRANSITION REPORT PURSUANT TO SECTION 13 OR 15(d) OF THE SECURITIES EXCHANGE ACT OF 1934 | |
For the transition period from to | ||
Commission File No. 001-12079
______________________

Calpine Corporation
(A Delaware Corporation)
I.R.S. Employer Identification No. 77-0212977
717 Texas Avenue, Suite 1000, Houston, Texas 77002
Telephone: (713) 830-2000
Not Applicable
(Former Address)
Securities registered pursuant to Section 12(b) or 12(g) of the Act:
None
Indicate by check mark if the registrant is a well-known seasoned issuer, as defined in Rule 405 of the Securities Act. Yes [ ] No [X]
Indicate by check mark if the registrant is not required to file reports pursuant to Section 13 or Section 15(d) of the Act. Yes [X] No [ ]
Indicate by check mark whether the registrant (1) has filed all reports required to be filed by Section 13 or 15(d) of the Securities Exchange Act of 1934 during the preceding 12 months (or for such shorter period that the registrant was required to file such reports), and (2) has been subject to such filing requirements for the past 90 days. Yes [ ] No [X]
Indicate by check mark whether the registrant has submitted electronically every Interactive Data File required to be submitted and posted pursuant to Rule 405 of Regulation S-T during the preceding 12 months (or for such shorter period that the registrant was required to submit and post such files). Yes [X] No [ ]
Indicate by check mark whether the registrant is a large accelerated filer, an accelerated filer, a non-accelerated filer, or a smaller reporting company. See definitions of “large accelerated filer, “accelerated filer,” and “smaller reporting company” in Rule 12b-2 of the Exchange Act. (Check one):
Large accelerated filer [ ] | Accelerated filer [ ] | |
Non-accelerated filer [X] | Smaller reporting company [ ] | |
(Do not check if a smaller reporting company) | Emerging growth company [ ] | |
If an emerging growth company, indicate by check mark if the registrant has elected not to use the extended transition period for complying with any new or revised financial accounting standards provided pursuant to Section 13(a) of the Exchange Act. [ ]
Indicate by check mark whether the registrant is a shell company (as defined in Rule 12b-2 of the Act). Yes [ ] No [X]
State the aggregate market value of the voting and non-voting common equity held by non-affiliates of the registrant as of June 30, 2019, the last business day of the registrant’s most recently completed second fiscal quarter: $0.
Indicate the number of shares outstanding of each of the registrant’s classes of common stock, as of the latest practicable date: Calpine Corporation: 105.2 shares of common stock, par value $0.001, were outstanding as of February 24, 2020.
DOCUMENTS INCORPORATED BY REFERENCE
CALPINE CORPORATION AND SUBSIDIARIES
FORM 10-K
ANNUAL REPORT
For the Year Ended December 31, 2019
TABLE OF CONTENTS
Page | ||
Item 1. | ||
Item 1A. | ||
Item 1B. | ||
Item 2. | ||
Item 3. | ||
Item 4. | ||
Item 5. | ||
Item 6. | ||
Item 7. | ||
Item 7A. | ||
Item 8. | ||
Item 9. | ||
Item 9A. | ||
Item 9B. | ||
Item 10. | ||
Item 11. | ||
Item 12. | ||
Item 13. | ||
Item 14. | ||
Item 15. | ||
Item 16. | ||
i
DEFINITIONS
As used in this annual report for the year ended December 31, 2019, the following abbreviations and terms have the meanings as listed below. Additionally, the terms “Calpine,” “we,” “us” and “our” refer to Calpine Corporation and its consolidated subsidiaries, unless the context clearly indicates otherwise. The term “Calpine Corporation” refers only to Calpine Corporation and not to any of its subsidiaries. Unless and as otherwise stated, any references in this Report to any agreement means such agreement and all schedules, exhibits and attachments in each case as amended, restated, supplemented or otherwise modified to the date of filing this Report.
ABBREVIATION | DEFINITION | |
2019 First Lien Term Loan | The $400 million first lien senior secured term loan, dated February 3, 2017, among Calpine Corporation, as borrower, the lenders party thereto, Morgan Stanley Senior Funding, Inc., as administrative agent and MUFG Union Bank, N.A., as collateral agent, repaid on April 5, 2019 | |
2022 First Lien Notes | The $750 million aggregate principal amount of 6.0% senior secured notes due 2022, issued October 31, 2013, repaid on December 20, 2019 and January 21, 2020 | |
2023 First Lien Term Loans | The $550 million first lien senior secured term loan, dated December 15, 2015, among Calpine Corporation, as borrower, the lenders party thereto, Morgan Stanley Senior Funding, Inc., as administrative agent and Goldman Sachs Credit Partners L.P., as collateral agent, repaid on April 5, 2019, and the $562 million first lien senior secured term loan, dated May 31, 2016, among Calpine Corporation, as borrower, the lenders party thereto, Citibank, N.A., as administrative agent and MUFG Union Bank, N.A., as collateral agent, repaid on August 12, 2019 | |
2023 Senior Unsecured Notes | The $1.25 billion aggregate principal amount of 5.375% senior unsecured notes due 2023, issued July 22, 2014, repaid on December 27, 2019 and January 21, 2020 | |
2024 First Lien Notes | The $490 million aggregate principal amount of 5.875% senior secured notes due 2024, issued October 31, 2013, repaid on December 20, 2019 and January 21, 2020 | |
2024 First Lien Term Loan | The $1.6 billion first lien senior secured term loan, dated May 28, 2015 (as amended December 21, 2016), among Calpine Corporation, as borrower, the lenders party thereto, Morgan Stanley Senior Funding, Inc., as administrative agent and Goldman Sachs Credit Partners L.P., as collateral agent | |
2024 Senior Unsecured Notes | The $650 million aggregate principal amount of 5.5% senior unsecured notes due 2024, issued February 3, 2015 | |
2025 Senior Unsecured Notes | The $1.55 billion aggregate principal amount of 5.75% senior unsecured notes due 2025, issued July 22, 2014 | |
2026 First Lien Notes | Collectively, the $625 million aggregate principal amount of 5.25% senior secured notes due 2026, issued May 31, 2016, and the $560 million aggregate principal amount of 5.25% senior secured notes due 2026, issued on December 15, 2017 | |
2026 First Lien Term Loans | Collectively, the $950 million first lien senior secured term loan, dated April 5, 2019, among Calpine Corporation, as borrower, the lenders party thereto, Morgan Stanley Senior Funding, Inc., as administrative agent and MUFG Union Bank, N.A., as collateral agent and the $750 million first lien senior secured term loan, dated August 12, 2019, among Calpine Corporation, as borrower, the lending party thereto, Credit Suisse AG, Cayman Islands Branch, as administrative agent and MUFG Union Bank, N.A., as collateral agent | |
2028 First Lien Notes | The $1.25 billion aggregate principal amount of 4.5% senior secured notes due 2028, issued December 20, 2019 | |
2028 Senior Unsecured Notes | The $1.4 billion aggregate principal amount of 5.125% senior unsecured notes due 2028, issued December 27, 2019 | |
AB 32 | California Assembly Bill 32 | |
ii
ABBREVIATION | DEFINITION | |
Accounts Receivable Sales Program | Receivables purchase agreement between Calpine Solutions and Calpine Receivables and the purchase and sale agreement between Calpine Receivables and an unaffiliated financial institution, both which allows for the revolving sale of up to $250 million in certain trade accounts receivables to third parties | |
AOCI | Accumulated Other Comprehensive Income | |
Average availability | Represents the total hours during the period that our plants were in-service or available for service as a percentage of the total hours in the period | |
Average capacity factor, excluding peakers | A measure of total actual power generation as a percent of total potential power generation. It is calculated by dividing (a) total MWh generated by our power plants, excluding peakers, by (b) the product of multiplying (i) the average total MW in operation, excluding peakers, during the period by (ii) the total hours in the period | |
Board of Directors | Calpine Corporation Board of Directors | |
Btu | British thermal unit(s), a measure of heat content | |
CAA | Federal Clean Air Act, U.S. Code Title 42, Chapter 85 | |
CAISO | California Independent System Operator which is an entity that manages the power grid and operates the competitive power market in California | |
CARB | California Air Resources Board | |
Calpine Equity Incentive Plans | Calpine’s equity plans in place prior to the Merger, which provided for grants of equity awards to Calpine non-union employees and non-employee members of our Board of Directors | |
Calpine Receivables | Calpine Receivables, LLC, an indirect, wholly-owned subsidiary of Calpine, which was established as bankruptcy remote, special purpose subsidiary and is responsible for administering the Accounts Receivable Sales Program | |
Calpine Solutions | Calpine Energy Solutions, LLC, an indirect, wholly-owned subsidiary of Calpine, which is a supplier of power to commercial and industrial retail customers in the United States with customers in 20 states, including presence in California, Texas, the Mid-Atlantic and the Northeast | |
Cap-and-Trade | A government imposed emissions reduction program that would place a cap on the amount of emissions that can be emitted from certain sources, such as power plants. In its simplest form, the cap amount is set as a reduction from the total emissions during a base year and for each year over a period of years the cap amount would be reduced to achieve the targeted overall reduction by the end of the period. Allowances or credits for emissions in an amount equal to the cap would be issued or auctioned to companies with facilities, permitting them to emit up to a certain amount of emissions during each applicable period. After allowances have been distributed or auctioned, they can be transferred or traded | |
CCA | Community Choice Aggregators which are local governments that procure power on behalf of their residents, businesses and municipal accounts from an alternative supplier while still receiving transmission and distribution service from their existing utility | |
CCFC | Calpine Construction Finance Company, L.P., an indirect, wholly-owned subsidiary of Calpine | |
CCFC Term Loan | The $1.0 billion first lien senior secured term loan entered into on December 15, 2017 among CCFC as borrower, the lenders party thereto, and Credit Suisse AG, Cayman Islands Branch, as administrative agent and collateral agent | |
iii
ABBREVIATION | DEFINITION | |
CCFC Term Loans | Collectively, the $900 million first lien senior secured term loan and the $300 million first lien senior secured term loan entered into on May 3, 2013, and the $425 million first lien senior secured term loan entered into on February 26, 2014, between CCFC, as borrower, and Goldman Sachs Lending Partners, LLC, as administrative agent and as collateral agent, and the lenders party thereto, repaid on December 15, 2017 | |
CDHI | Calpine Development Holdings, Inc., an indirect, wholly-owned subsidiary of Calpine | |
CFTC | Commodities Futures Trading Commission | |
Champion Energy | Champion Energy Marketing, LLC, an indirect, wholly owned subsidiary of Calpine, which owns a retail electric provider that serves residential, governmental, commercial and industrial customers in deregulated electricity markets in 14 states and the District of Columbia, including presence in California, Texas, the Mid-Atlantic and Northeast | |
Chapter 11 | Chapter 11 of the U.S. Bankruptcy Code | |
Class B Interests | Partnership interests in CPN Management having the rights and obligations with respect to Class B Interests as set forth in the Second Amended and Restated Limited Partnership Agreement of CPN Management dated August 29, 2018 | |
CO2 | Carbon dioxide | |
Cogeneration | Using a portion or all of the steam generated in the power generating process to supply a customer with steam for use in the customer’s operations | |
Commodity expense | The sum of our expenses from fuel and purchased energy expense, commodity transmission and transportation expense, environmental compliance expenses, ancillary retail expense and realized settlements from our marketing, hedging and optimization activities including natural gas and fuel oil transactions hedging future power sales | |
Commodity Margin | Measure of profit that includes revenue recognized on our wholesale and retail power sales activity, electric capacity sales, REC sales, steam sales, realized settlements associated with our marketing, hedging, optimization and trading activities, fuel and purchased energy expenses, commodity transmission and transportation expenses, environmental compliance expenses and ancillary retail expense. Commodity Margin is a measure of segment profit or loss under FASB Accounting Standards Codification 280 used by our chief operating decision maker to make decisions about allocating resources to the relevant segments and assessing their performance | |
Commodity revenue | The sum of our revenues recognized on our wholesale and retail power sales activity, electric capacity sales, REC sales, steam sales and realized settlements from our marketing, hedging, optimization and trading activities | |
Company | Calpine Corporation, a Delaware corporation, and its subsidiaries | |
Corporate Revolving Facility | The approximately $2.0 billion aggregate amount revolving credit facility credit agreement, dated as of December 10, 2010, as amended on June 27, 2013, July 30, 2014, February 8, 2016, December 1, 2016, September 15, 2017, October 20, 2017, March 8, 2018, May 18, 2018, April 5, 2019 and August 12, 2019 among Calpine Corporation, the Bank of Tokyo-Mitsubishi UFJ, Ltd., as successor administrative agent, MUFG Union Bank, N.A., as successor collateral agent, the lenders party thereto and the other parties thereto | |
CPN Management | CPN Management, LP, which owns 100% of the common stock of Calpine Corporation | |
CSAPR | Cross-State Air Pollution Rule | |
EIA | Energy Information Administration of the U.S. Department of Energy | |
EPA | U.S. Environmental Protection Agency | |
iv
ABBREVIATION | DEFINITION | |
ERCOT | Electric Reliability Council of Texas which is an entity that manages the flow of electric power to Texas customers representing approximately 90 percent of the state’s electric load | |
Exchange Act | U.S. Securities Exchange Act of 1934, as amended | |
FASB | Financial Accounting Standards Board | |
FDIC | U.S. Federal Deposit Insurance Corporation | |
FERC | U.S. Federal Energy Regulatory Commission | |
First Lien Notes | Collectively, the 2022 First Lien Notes, the 2024 First Lien Notes, the 2026 First Lien Notes and the 2028 First Lien Notes | |
First Lien Term Loans | Collectively, the 2019 First Lien Term Loan, the 2023 First Lien Term Loans, the 2024 First Lien Term Loan and the 2026 First Lien Term Loans | |
GE | General Electric International, Inc. | |
Geysers Assets | Our geothermal power plant assets, including our steam extraction and gathering assets, located in northern California consisting of 13 operating power plants | |
GHG(s) | Greenhouse gas(es), primarily carbon dioxide (CO2), and including methane (CH4), nitrous oxide (N2O), sulfur hexafluoride (SF6), hydrofluorocarbons (HFCs) and perfluorocarbons (PFCs) | |
Greenfield LP | Greenfield Energy Centre LP, a 50% partnership interest between certain of our subsidiaries and a third party which operates the Greenfield Energy Centre, a 1,038 MW natural gas-fired, combined-cycle power plant in Ontario, Canada | |
Heat Rate(s) | A measure of the amount of fuel required to produce a unit of power | |
IRC | Internal Revenue Code | |
IRS | U.S. Internal Revenue Service | |
ISO(s) | Independent System Operator(s) which is an entity that coordinates, controls and monitors the operation of an electric power system | |
ISO-NE | ISO New England Inc., an independent nonprofit RTO serving states in the New England area, including Connecticut, Maine, Massachusetts, New Hampshire, Rhode Island and Vermont | |
KWh | Kilowatt hour(s), a measure of power produced, purchased or sold | |
LIBOR | London Inter-Bank Offered Rate | |
LTSA(s) | Long-Term Service Agreement(s) | |
Lyondell | LyondellBasell Industries N.V. | |
Market Heat Rate(s) | The regional power price divided by the corresponding regional natural gas price | |
Merger | Merger of Volt Merger Sub, Inc. with and into Calpine pursuant to the terms of the Merger Agreement, which was consummated on March 8, 2018 | |
v
ABBREVIATION | DEFINITION | |
Merger Agreement | Agreement and Plan of Merger, dated August 17, 2017, by and among Calpine Corporation, Volt Parent, LP and Volt Merger Sub, Inc. | |
MMBtu | Million Btu | |
MRO | Midwest Reliability Organization | |
MW | Megawatt(s), a measure of plant capacity | |
MWh | Megawatt hour(s), a measure of power produced, purchased or sold | |
NAAQS | National Ambient Air Quality Standards | |
NERC | North American Electric Reliability Council | |
NOL(s) | Net operating loss(es) | |
North American Power | North American Power & Gas, LLC, an indirect, wholly-owned subsidiary of Calpine, which was acquired on January 17, 2017 and is a retail energy supplier for homes and small businesses primarily concentrated in the Northeast U.S. | |
NOx | Nitrogen oxides | |
NPCC | Northeast Power Coordinating Council | |
NYISO | New York ISO which operates competitive wholesale markets to manage the flow of electricity across New York | |
NYMEX | New York Mercantile Exchange | |
OCI | Other Comprehensive Income | |
OMEC | Otay Mesa Energy Center, LLC, an indirect, wholly-owned subsidiary that owns the Otay Mesa Energy Center, a 608 MW power plant located in San Diego County, California | |
OTC | Over-the-Counter | |
PG&E | Pacific Gas & Electric Company | |
PJM | PJM Interconnection is a RTO that coordinates the movement of wholesale electricity in all or parts of Delaware, Illinois, Indiana, Kentucky, Maryland, Michigan, New Jersey, North Carolina, Ohio, Pennsylvania, Tennessee, Virginia, West Virginia and the District of Columbia | |
PPA(s) | Any term power purchase agreement or other contract for a physically settled sale (as distinguished from a financially settled future, option or other derivative or hedge transaction) of any power product, including power, capacity and/or ancillary services, in the form of a bilateral agreement or a written or oral confirmation of a transaction between two parties to a master agreement, including sales related to a tolling transaction in which the purchaser provides the fuel required by us to generate such power and we receive a variable payment to convert the fuel into power and steam | |
PSD | Prevention of Significant Deterioration | |
PUCT | Public Utility Commission of Texas | |
PUHCA 2005 | U.S. Public Utility Holding Company Act of 2005 | |
PURPA | U.S. Public Utility Regulatory Policies Act of 1978 | |
vi
ABBREVIATION | DEFINITION | |
QF(s) | Qualifying facility(ies), which are cogeneration facilities and certain small power production facilities eligible to be “qualifying facilities” under PURPA, provided that they meet certain power and thermal energy production requirements and efficiency standards. QF status provides an exemption from the books and records requirement of PUHCA 2005 and grants certain other benefits to the QF | |
REC(s) | Renewable energy credit(s) | |
Report | This Annual Report on Form 10-K for the year ended December 31, 2019, filed with the SEC on February 24, 2020 | |
Reserve margin(s) | The measure of how much the total generating capacity installed in a region exceeds the peak demand for power in that region | |
RFC | Reliability First Corporation | |
RGGI | Regional Greenhouse Gas Initiative | |
Risk Management Policy | Calpine’s policy applicable to all employees, contractors, representatives and agents, which defines the risk management framework and corporate governance structure for commodity risk, interest rate risk, currency risk and other risks | |
RMR Contract(s) | Reliability Must Run contract(s) | |
RPS | Renewable Portfolio Standard | |
RTO(s) | Regional Transmission Organization which is an entity that coordinates, controls and monitors the operation of an electric power system and administers the transmission grid on a regional basis | |
SDG&E | San Diego Gas & Electric Company | |
SEC | U.S. Securities and Exchange Commission | |
Securities Act | U.S. Securities Act of 1933, as amended | |
Senior Unsecured Notes | Collectively, the 2023 Senior Unsecured Notes, the 2024 Senior Unsecured Notes, the 2025 Senior Unsecured Notes and the 2028 Senior Unsecured Notes | |
SERC | Southeastern Electric Reliability Council | |
SO2 | Sulfur dioxide | |
Spark Spread(s) | The difference between the sales price of power per MWh and the cost of natural gas to produce it | |
Steam Adjusted Heat Rate | The adjusted Heat Rate for our natural gas-fired power plants, excluding peakers, calculated by dividing (a) the fuel consumed in Btu reduced by the net equivalent Btu in steam exported to a third party by (b) the KWh generated. Steam Adjusted Heat Rate is a measure of fuel efficiency, so the lower our Steam Adjusted Heat Rate, the lower our cost of generation | |
Stockholders Agreement | Stockholders Agreement, dated March 8, 2018, by and between Calpine Corporation and CPN Management | |
TRE | Texas Reliability Entity, Inc. | |
U.S. GAAP | Generally accepted accounting principles in the U.S. | |
VAR | Value-at-risk | |
vii
ABBREVIATION | DEFINITION | |
VIE(s) | Variable interest entity(ies) | |
WECC | Western Electricity Coordinating Council | |
Whitby | Whitby Cogeneration Limited Partnership, a 50% partnership interest, which we sold on November 20, 2019, between certain of our subsidiaries and a third party which operates Whitby, a 50 MW natural gas-fired, simple-cycle cogeneration power plant located in Ontario, Canada | |
viii
Forward-Looking Statements
This Report contains “forward-looking statements” within the meaning of the Private Securities Litigation Reform Act of 1995, Section 27A of the Securities Act, and Section 21E of the Exchange Act. Forward-looking statements may appear throughout this Report, including without limitation, the “Management’s Discussion and Analysis” section. We use words such as “believe,” “intend,” “expect,” “anticipate,” “plan,” “may,” “will,” “should,” “estimate,” “potential,” “project” and similar expressions to identify forward-looking statements. Such statements include, among others, those concerning our expected financial performance and strategic and operational plans, as well as all assumptions, expectations, predictions, intentions or beliefs about future events. We believe that the forward-looking statements are based upon reasonable assumptions and expectations. However, you are cautioned that any such forward-looking statements are not guarantees of future performance and that a number of risks and uncertainties could cause actual results to differ materially from those anticipated in the forward-looking statements. Such risks and uncertainties include, but are not limited to:
• | Financial results that may be volatile and may not reflect historical trends due to, among other things, seasonality of demand, fluctuations in prices for commodities such as natural gas and power, changes in U.S. macroeconomic conditions, fluctuations in liquidity and volatility in the energy commodities markets and our ability and extent to which we hedge risks; |
• | Laws, regulations and market rules in the wholesale and retail markets in which we participate and our ability to effectively respond to changes in laws, regulations or market rules or the interpretation thereof including those related to the environment, derivative transactions and market design in the regions in which we operate; |
• | Our ability to manage our liquidity needs, access the capital markets when necessary and comply with covenants under our Senior Unsecured Notes, First Lien Term Loans, First Lien Notes, Corporate Revolving Facility, CCFC Term Loan and other existing financing obligations; |
• | Risks associated with the operation, construction and development of power plants, including unscheduled outages or delays and plant efficiencies; |
• | Risks related to our geothermal resources, including the adequacy of our steam reserves, unusual or unexpected steam field well and pipeline maintenance requirements, variables associated with the injection of water to the steam reservoir and potential regulations or other requirements related to seismicity concerns that may delay or increase the cost of developing or operating geothermal resources; |
• | Extensive competition in our wholesale and retail businesses, including from renewable sources of power, interference by states in competitive power markets through subsidies or similar support for new or existing power plants, lower prices and other incentives offered by retail competitors, and other risks associated with marketing and selling power in the evolving energy markets; |
• | Structural changes in the supply and demand of power, resulting from the development of new fuels or technologies and demand-side management tools (such as distributed generation, power storage and other technologies); |
• | The expiration or early termination of our PPAs and the related results on revenues; |
• | Future capacity revenue may not occur at expected levels; |
• | Natural disasters, such as hurricanes, earthquakes, droughts and floods, acts of terrorism, cyber attacks or wildfires that may affect our power plants or the markets our power plants or retail operations serve and our corporate offices; |
• | Disruptions in or limitations on the transportation of natural gas or fuel oil and the transmission of power; |
• | Our ability to manage our counterparty and customer exposure and credit risk, including our commodity positions or if a significant customer were to seek bankruptcy protection under Chapter 11; |
• | Our ability to attract, motivate and retain key employees; |
• | Present and possible future claims, litigation and enforcement actions that may arise from noncompliance with market rules promulgated by the SEC, CFTC, FERC and other regulatory bodies; and |
• | Other risks identified in this Report. |
Given the risks and uncertainties surrounding forward-looking statements, you should not place undue reliance on these statements. Many of these factors are beyond our ability to control or predict. Our forward-looking statements speak only as of the date of this Report. Other than as required by law, we undertake no obligation to update or revise forward-looking statements, whether as a result of new information, future events, or otherwise.
1
Where You Can Find Other Information
Our website is www.calpine.com. Information contained on our website is not part of this Report. Information that we furnish or file with the SEC, including our annual reports on Form 10-K, quarterly reports on Form 10-Q, current reports on Form 8-K and any amendments to, or exhibits included in, these reports are available for download, free of charge, through our website. Our SEC filings, including exhibits filed therewith, are also available directly on the SEC’s website at www.sec.gov.
2
PART I
Item 1. | Business |
BUSINESS AND STRATEGY
We are a premier competitive power company with 77 power plants, including one under construction, primarily in the U.S. We sell power and related services to our wholesale customers who include commercial and industrial end-users, state and regional wholesale market operators, and our retail customers. We measure our success by delivering long-term value. We accomplish this through our focus on operational excellence at our power plants and in our customer and commercial activity, as well as through our disciplined approach to capital allocation.
Our capital allocation philosophy seeks to maximize levered cash returns to equity while maintaining a strong balance sheet. We seek to enhance value through a diverse and balanced capital allocation approach that includes portfolio management including select asset sales, organic or acquisitive growth, returning capital to owners and debt reduction. The mix of this activity shifts over time given the external market environment and the opportunity set. During the year ended December 31, 2019, we paid cash distributions to our parent, CPN Management, totaling $1.15 billion. Since the beginning of 2017 through the end of January 2020, we have reduced our total debt by approximately $1.6 billion and funded approximately $350 million of expansion/growth projects. We further optimized our capital structure by refinancing, redeeming, repricing or amending several of our debt instruments during the year ended December 31, 2019 achieving substantial annual interest savings.
We are one of the largest power generators in the U.S. measured by power produced. We own and operate primarily natural gas-fired and geothermal power plants in North America and have a significant presence in major competitive wholesale and retail power markets in California, Texas and the Northeast and Mid-Atlantic regions of the U.S. Since our inception in 1984, we have been a leader in environmental stewardship. We have invested in clean power generation to become a recognized leader in developing, constructing, owning and operating an environmentally responsible portfolio of flexible and reliable power plants. Our portfolio is primarily comprised of two types of power generation technologies: efficient combined-cycle power plants, which use natural gas-fired combustion turbines, and renewable geothermal conventional steam turbines. We are among the world’s largest owners and operators of industrial gas turbines as well as cogeneration power plants. Our Geysers Assets located in northern California represent the largest geothermal power generation portfolio in the U.S. as well as the largest single producing power generation asset of all renewable energy in the state of California.
We sell power, steam, capacity, renewable energy credits and ancillary services to our customers, which include utilities, independent electric system operators and industrial companies, retail power providers, municipalities, CCAs and other governmental entities, power marketers as well as retail commercial, industrial, governmental and residential customers. We continue to focus on providing products and services that are beneficial to our wholesale and retail customers. We purchase primarily natural gas and some fuel oil as fuel for our power plants and engage in related natural gas transportation and storage transactions. We also purchase power and related products for sale to our customers and purchase electric transmission rights to deliver power to our customers. Additionally, consistent with our Risk Management Policy, we enter into natural gas, power, environmental product, fuel oil and other physical and financial commodity contracts to hedge certain business risks and optimize our portfolio of power plants. Seasonality and weather can have a significant effect on our results of operations and are also considered in our hedging and optimization activities.
We assess our wholesale business on a regional basis due to the effect on our financial performance of the differing characteristics of these regions, particularly with respect to competition, regulation and other factors affecting supply and demand. Our geographic reportable segments for our wholesale business are West (including geothermal), Texas and East (including Canada) and we have a separate reportable segment for our retail business.
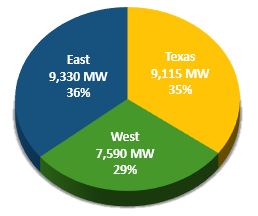
Our wholesale power plant portfolio, including partnership interests, consists of 77 power plants, including one under construction, with an aggregate current generation capacity of 26,035 MW and 361 MW under construction. In March 2019, our York 2 Energy Center commenced commercial operations, bringing online approximately 828 MW of combined cycle, natural gas-fired capacity with dual-fuel capability. Our fleet consists of 62 natural gas-fired combustion turbine-based plants, one natural gas and fuel oil-fired steam-based plant, 13 geothermal steam turbine-based plants and one photovoltaic solar plant. Our wholesale geographic segments have an aggregate generation capacity of 7,590 MW in the West, 9,115 MW in Texas and 9,330 MW with an additional 361 MW under construction in the East. Inclusive of our power generation portfolio and our retail sales platforms, we serve customers in 23 states in the U.S. and in Canada and Mexico.
3
Our goal is to be recognized as the premier competitive power company in the U.S. as viewed by our employees, owners, customers and policy-makers as well as the communities in which our facilities are located. We seek to deliver long-term value through operational excellence at our power plants and in our customer and commercial activity, as well as through our disciplined approach to capital allocation.
THE MARKET FOR POWER
Our Power Markets and Market Fundamentals
The power industry represents one of the largest industries in the U.S. and affects nearly every aspect of our economy, with an estimated end-user market of approximately $398 billion in power sales in 2019 according to the EIA. Although different regions of the country have very different models and rules for competition, the markets in which we operate have some form of wholesale or retail market competition. California (included in our West segment), Texas (included in our Texas segment) and the Northeast and Mid-Atlantic regions (included in our East segment), which are the markets in which we have our largest presence, have emerged as among the most competitive wholesale and retail power markets in the U.S. We also operate, to a lesser extent, in competitive wholesale power markets in the Southeast. In addition to our sales of electrical power to wholesale and retail customers, our power plants produce and our customers require several other products. A description of the products we provide to our customers is below:
• | First, we provide power to utilities, independent electric system operators and industrial companies, retail power providers, municipalities, CCAs and other governmental entities, power marketers as well as retail commercial, industrial, governmental and residential customers. Our power sales occur in several different product categories including baseload (around the clock generation), intermediate (generation typically more expensive than baseload and utilized during higher demand periods to meet shifting demand needs), and peaking energy (most expensive variable cost and utilized during the highest demand periods), for which the latter is provided by some of our stand-alone peaking power plants/units and from our combined-cycle power plants by using technologies such as steam injection or duct firing additional burners in the heat recovery steam generators. |
• | Second, we provide capacity for sale to utilities, independent electric system operators and retail power providers. In various markets, retail power providers, including our affiliates, (or independent electric system operators on their behalf) are required to demonstrate adequate resources to meet their power sales commitments. To meet this obligation, they procure a market product known as capacity from power plant owners or resellers. Capacity auctions are held in the Northeast, Mid-Atlantic and certain Midcontinent regional markets. California has a bilateral capacity program. Texas does not presently have a capacity market or a requirement for retailers to ensure adequate resources. |
• | Third, we produce RECs primarily from our Geysers Assets in northern California. California has an RPS that requires load serving entities to have RECs for a certain percentage of their demand for the purpose of guaranteeing a certain level of renewable generation in the state or in neighboring areas. Because geothermal is a renewable source of energy, we receive a REC for each MWh we produce and are able to sell our RECs to load serving entities. We also purchase RECs from other sources for resale to our customers. |
• | Fourth, our cogeneration power plants produce steam, in addition to electricity, for sale to industrial customers for use in their manufacturing processes or heating, ventilation and air conditioning operations. |
• | Fifth, we provide ancillary service products to wholesale power markets. These products include the right for the purchaser to call on our generation to provide flexibility to the market and support operation of the electric grid. |
• | Of the five products above, we are active not only in production but also in the procurement of four of the five (excluding steam) on behalf of our retail customers. |
We also buy and sell emission allowances and credits, including those under California’s AB 32 GHG reduction program, Massachusetts’ CO2 reduction program, RGGI, the federal Acid Rain and CSAPR programs, and emission reduction credits under the federal Nonattainment New Source Review program.
Although all of the products mentioned above contribute to our financial performance and are the primary components of our Commodity Margin, the most important are our sales of wholesale power and capacity. We utilize long-term customer contracts for our power and steam sales where possible. For power and capacity that are not sold under customer contracts or longer-dated capacity auctions, we use our hedging program and retail channels and sell power into shorter term markets throughout the regions in which we participate.
4
The Price and Supply of Natural Gas
Approximately 96%, or 24,915 MW, of our generating capability’s fuel requirements are met with natural gas. We have approximately 725 MW of baseload capacity from our Geysers Assets and our expectation is that the steam reservoir at our Geysers Assets will be able to supply economic quantities of steam for the foreseeable future as our steam flow decline rates have become very small over the past several years. We also have approximately 391 MW of capacity from power plants where we purchase fuel oil to meet generation requirements, but generally do not expect fuel oil requirements to be material to our portfolio of power plants. In our East segment, where the supply of natural gas can be constrained under some weather circumstances, we have approximately 6,100 MW of dual-fueled capable power plants. Additionally, we have 4 MW of capacity from solar power generation technology with no fuel requirement.
We procure natural gas from multiple suppliers and transportation and storage sources. Although availability is generally not an issue, localized shortages (especially in extreme weather conditions in and around population centers), transportation availability and supplier financial stability issues can and do occur. When natural gas supply is constrained, some of our power plants benefit from the ability to operate on fuel oil instead of natural gas.
The price of natural gas, economic growth and environmental regulations affect our Commodity Margin and liquidity. The effect of changes in natural gas prices differs according to the time horizon and regional market conditions and depends on our hedge levels and other factors discussed below.
Much of our generating capacity is located in California (included in our West segment), Texas (included in our Texas segment) and the Northeast and Mid-Atlantic (included in our East segment) where natural gas-fired units set power prices during many hours. When natural gas is the price-setting fuel (i.e., when electricity demand exceeds available renewable generation and natural gas prices exceed the cost of available coal generation), increases in natural gas prices may increase our unhedged Commodity Margin because our combined-cycle power plants in those markets are more fuel-efficient than conventional natural gas-fired technologies and peaking power plants. Conversely, decreases in natural gas prices may decrease our unhedged Commodity Margin. In these instances, our cost of production advantage relative to less efficient natural gas-fired generation is diminished on an absolute basis until the point we are cheaper than any available coal on marginal economics. Additionally, in the Northeast and Mid-Atlantic regions, we have generating units capable of burning either natural gas or fuel oil. For these units, on the rare occasions when the cost of consuming natural gas is excessively high relative to fuel oil, our unhedged Commodity Margin may increase as a result of our ability to use the lower cost fuel.
Where we operate under long-term contracts, changes in natural gas prices can have a neutral effect on us in the short-term. This tends to be the case where we have entered into tolling agreements under which the customer provides the natural gas and we convert it to power for a fee, or where we enter into indexed-based agreements with a contractual Heat Rate at or near our actual Heat Rate for a monthly payment.
Changes in natural gas prices or power prices may also affect our liquidity. During periods of high or volatile natural gas or power prices, we could be required to post additional cash collateral or letters of credit.
Weather Patterns and Natural Events
Weather generally has a significant short-term effect on supply and demand for power and natural gas. Historically, demand for and the price of power is higher in the summer and winter seasons when temperatures are more extreme, and therefore, our unhedged revenues and Commodity Margin could be negatively affected by relatively cool summers or mild winters. However, our geographically diverse portfolio mitigates the effect on our Commodity Margin of weather in specific regions of the U.S. Additionally, a disproportionate amount of our total revenue is usually realized during the summer months of our third fiscal quarter. We expect this trend to continue in the future as U.S. demand for power generally peaks during this time.
Operating Heat Rate and Availability
Our fleet is modern and more efficient than the average generation fleet; accordingly, we run more and earn incremental margin in markets where less efficient natural gas units frequently set the power price. In such cases, our unhedged Commodity Margin is positively correlated with how much more efficient our fleet is than our competitors’ fleets and with higher natural gas prices. Efficient operation of our fleet creates the opportunity to capture Commodity Margin in a cost effective manner. However, unplanned outages during periods when Commodity Margin is positive could result in a loss of that opportunity. We generally measure our fleet performance based on our availability factors, operating Heat Rate and operating and maintenance expense. The higher our availability factor, the better positioned we are to capture Commodity Margin. The lower our operating Heat Rate compared to the Market Heat Rate, the more favorable the effect on our Commodity Margin.
5
Regulatory and Environmental Trends
For a discussion of federal, state and regional legislative and regulatory initiatives and how they might affect us, see “— Governmental and Regulatory Matters.” It is very difficult to predict the continued evolution of our markets due to the uncertainty of various risk factors which could affect our business. A description of these risk factors is included under Item 1A. “Risk Factors.”
Competition
Wholesale power generation is a capital-intensive, commodity-driven business with numerous industry participants. We compete against other independent power producers, power marketers and trading companies, including those owned by financial institutions, retail load aggregators, municipalities, retail power providers, cooperatives and regulated utilities to supply power and power-related products to our customers in major markets in the U.S. and Canada. In addition, in some markets, we compete against some of our customers.
In markets with centralized ISOs, such as California, Texas, the Northeast and Mid-Atlantic, our natural gas-fired power plants compete directly with all other sources of power. The EIA estimates that in 2019, 38% of the power generated in the U.S. was fueled by natural gas, 24% by coal, 20% by nuclear facilities and the remaining 18% of power generated by hydroelectric, fuel oil, geothermal and other energy sources. We are subject to complex and stringent energy, environmental and other governmental laws and regulations at the federal, state and local levels in connection with the development, ownership and operation of our power plants. For a further discussion of the environmental and other governmental regulations that affect us, see “— Governmental and Regulatory Matters.”
Competition from renewable generation and energy storage is likely to continue to increase in the future. Federal and state financial incentives and RPS requirements continue to foster renewables development.
Retail electricity and natural gas is similarly a commodity-driven business with numerous industry participants. We compete against other integrated power companies, regulated utilities, other retail power providers, brokers, trading companies including those owned by financial institutions, retail load aggregators, municipalities and cooperatives to supply power and power-related products to our customers in major markets in the U.S. and Canada.
MARKETING, HEDGING AND OPTIMIZATION ACTIVITIES
Our commercial hedging and optimization strategies are designed to maximize our risk-adjusted Commodity Margin by leveraging our knowledge, experience and fundamental views on natural gas and power. Additionally, we seek strong bilateral relationships with load serving entities that can benefit us and our customers. Our retail portfolio has been established to provide an additional source of liquidity for our generation fleet as we hedge retail load from our wholesale generation assets as appropriate.
The majority of our risk exposures arise from our ownership and operation of power plants. Our primary risk exposures are Spark Spread, power prices, natural gas prices, capacity prices, locational price differences in power and in natural gas, natural gas transportation, electric transmission, REC prices, carbon allowance prices in California and the Northeast and other emissions credit prices. In addition to the direct risk exposure to commodity prices, we also have general market risks such as risk related to performance of our counterparties and customers and plant operating performance risk.
Our operations are commodity intensive. We produced approximately 103 billion KWh of electricity in 2019 across North America and consumed approximately 790 Bcf of natural gas, making us one of the largest producers of electricity and consumers of natural gas in North America. Additionally, our retail affiliates provided approximately 60 billion KWh to customers in 2019. We actively manage our commodity risk exposures with a variety of physical and financial instruments with varying time horizons. These instruments include PPAs, tolling arrangements, Heat Rate swaps and options, retail power sales including through our retail subsidiaries, steam sales, buying and selling standard physical power and natural gas products, buying and selling exchange traded instruments, buying and selling environmental and capacity products, natural gas transportation and storage arrangements, electric transmission service and other contracts for the sale and purchase of power products. We utilize these instruments to maximize the risk-adjusted returns for our Commodity Margin.
At any point in time, the relative quantity of our products hedged or sold under longer-term contracts is determined by the availability of forward product sales opportunities and our view of the attractiveness of the pricing available for forward sales. We have economically hedged a portion of our expected generation and natural gas portfolio as well as retail load supply obligations, where appropriate, mostly through power and natural gas forward physical and financial transactions including retail power sales; however, we currently remain susceptible to significant price movements for 2020 and beyond. When we elect to enter into these transactions, we are able to economically hedge a portion of our Spark Spread at pre-determined generation and price levels.
We conduct our hedging and optimization activities within a structured risk management framework based on controls, policies and procedures. We monitor these activities through active and ongoing management and oversight, defined roles and
6
responsibilities, and daily risk estimates and reporting. Additionally, we seek to manage the associated risks through diversification, by controlling position sizes, by using portfolio position limits, and by actively managing hedge positions to lock in margin. We are exposed to commodity price movements (both profits and losses) in connection with these transactions. These positions are included in and subject to our consolidated risk management portfolio position limits and controls structure. Our future hedged status and marketing and optimization activities are subject to change as determined by our commercial operations group, Chief Risk Officer, senior management and Board of Directors. For control purposes, we have VAR limits that govern the overall risk of our portfolio of power plants, energy contracts, financial hedging transactions and other contracts. Our VAR limits, transaction approval limits and other risk related controls are dictated by our Risk Management Policy which is approved by our Board of Directors and by a committee comprised of members of our senior management and administered by our Chief Risk Officer’s organization. The Chief Risk Officer’s organization is segregated from the commercial operations and retail units and reports directly to our Audit Committee and Chief Financial Officer. Our Risk Management Policy is primarily designed to provide us with a degree of protection from significant downside commodity price risk exposure to our cash flows.
We have historically used interest rate hedging instruments to adjust the mix between our fixed and variable rate debt. To the extent eligible, our interest rate hedging instruments have been designated as cash flow hedges, and changes in fair value are recorded in OCI with gains and losses reclassified into earnings in the same period during which the hedged forecasted transaction affects earnings.
SEGMENT AND SIGNIFICANT CUSTOMER INFORMATION
See Note 18 of the Notes to Consolidated Financial Statements for a discussion of financial information by reportable segment and geographic area and significant customer information for the years ended December 31, 2019, 2018 and 2017.
7
DESCRIPTION OF OUR OPERATIONS
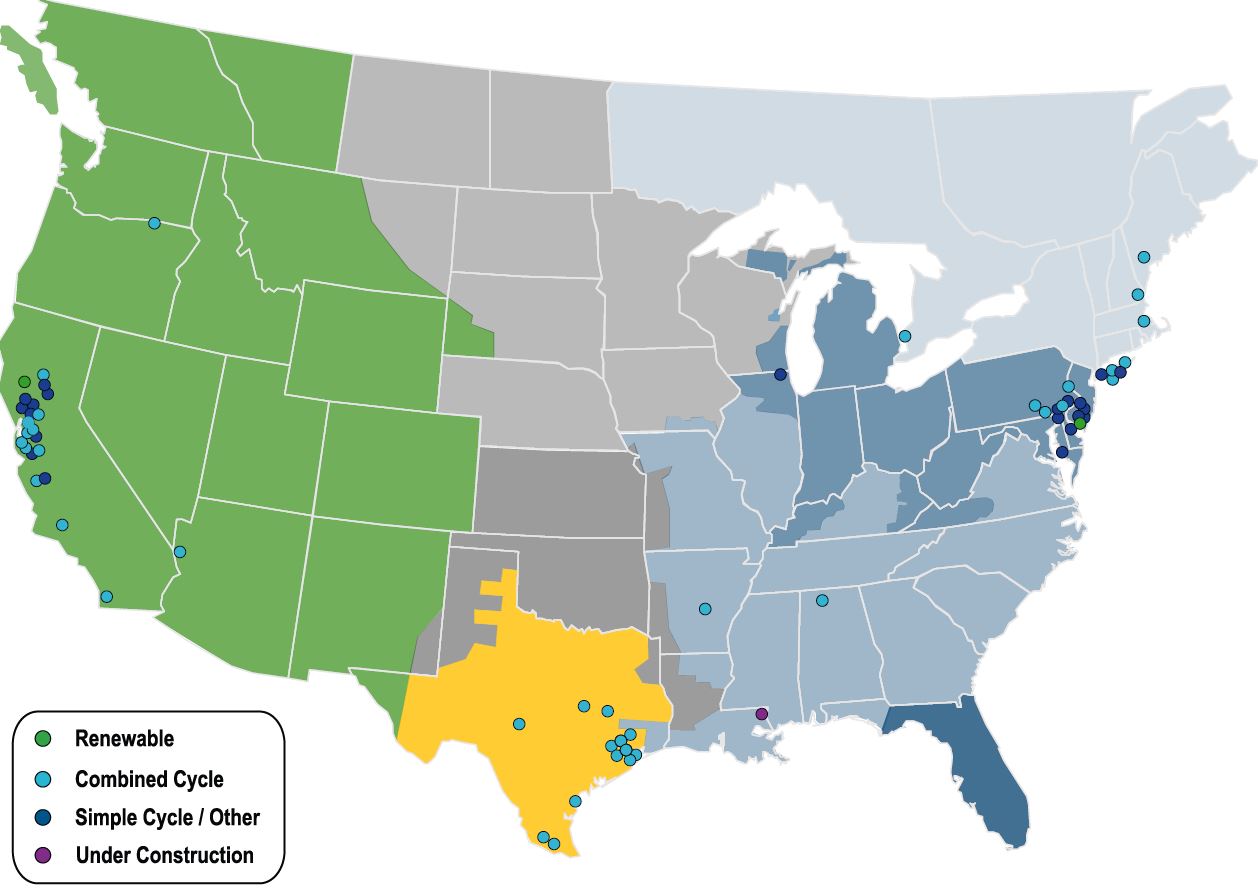
Geographic Diversity | Dispatch Technology |
 | |
 | |
8
Power Plants in Operation
We own 77 power plants, including one under construction, with an aggregate generation capacity of 26,035 MW and 361 MW under construction.
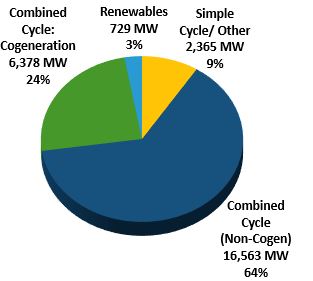
Natural Gas-Fired Fleet
Our natural gas-fired power plants primarily utilize two types of designs: 1,640 MW of simple-cycle combustion turbines and 22,941 MW of combined-cycle combustion turbines and a small portion from conventional natural gas/oil-fired boilers with steam turbines. Simple-cycle combustion turbines burn natural gas or fuel oil to spin an electric generator to produce power. A combined-cycle unit combusts fuel like a simple-cycle combustion turbine and the exhaust heat is captured by a heat recovery boiler to create steam which can then spin a steam turbine. Simple-cycle turbines are easier to maintain, but combined-cycle turbines operate with much higher efficiency. Each of our power plants currently in operation is capable of producing power for sale to a utility, another third-party end user, our retail customers or an intermediary such as a marketing company. At 12 of our power plants, we also produce thermal energy (primarily steam and chilled water), which can be sold to industrial and governmental users. These plants are called combined heat and power facilities.
Our Steam Adjusted Heat Rate for 2019 for the power plants we operate was 7,326 Btu/KWh which results in a power conversion efficiency of approximately 47%. The power conversion efficiency is a measure of how efficiently a fossil fuel power plant converts thermal energy to electrical energy. Our Steam Adjusted Heat Rate includes all fuel required to dispatch our power plants including “start-up” and “shut-down” fuel, as well as all non-steady state operations. Once our power plants achieve steady state operations, our combined-cycle power plants achieve an average power conversion efficiency of approximately 50%. Additionally, we also sell steam from our combined heat and power plants, which improves our power conversion efficiency in steady state operations from these power plants to an average of approximately 53%. Due to our modern combustion turbine fleet, our power conversion efficiency is significantly better than that of older technology natural gas-fired power plants and coal-fired power plants, which typically have power conversion efficiencies that range from 28% to 36%.
Our natural gas fleet is relatively young with a weighted average age, based upon MW capacities in operation, of approximately 19 years.
Geothermal Fleet
Our Geysers Assets are a 725 MW fleet of 13 operating power plants in northern California. Geothermal power is considered renewable energy because the steam harnessed to power our turbines is produced inside the Earth and does not require burning fuel. The steam is produced below the Earth’s surface from reservoirs of hot water, both naturally occurring and injected. The steam is piped directly from the underground production wells to the power plants and used to spin turbines to generate power. Unlike other renewable resources such as wind or sunlight, which depend on intermittent sources to generate power, geothermal power provides a consistent source of energy as evidenced by our Geysers Assets’ availability of approximately 86% in 2019, which reflects the impact of a third-party transmission outage at our Geysers Assets associated with a wildfire during the fourth quarter of 2019. The sale of RECs to customers is an important separate income stream for our Geysers Assets.
We inject water back into the steam reservoir, which extends the useful life of the resource and helps to maintain the output of our Geysers Assets. The water we inject comes from the condensate associated with the steam extracted to generate power, wells and creeks, as well as water purchase agreements for reclaimed water. We receive and inject an average of approximately 15 million gallons of reclaimed water per day into the geothermal steam reservoir at The Geysers where the water is naturally heated by the Earth, creating additional steam to fuel our Geysers Assets. Approximately 12 million gallons per day are received from the Santa Rosa Geysers Recharge Project, which we developed jointly with the City of Santa Rosa, and we receive, on average, approximately three million gallons a day from The Lake County Recharge Project from Lake County. As a result of these recharge projects, MWh production has been relatively constant. We expect that, as a result of the water injection program, the reservoir at our Geysers Assets will be able to supply economic quantities of steam for the foreseeable future.
We periodically review our geothermal studies to help us assess the economic life of our geothermal reserves. Our most recent geothermal reserve study was conducted in 2019. Our evaluation of our geothermal reserves, including our review of any applicable independent studies conducted, indicated that our Geysers Assets should continue to supply sufficient steam to generate positive cash flows at least through 2079. In reaching this conclusion, our evaluation, consistent with the due diligence study of 2019, assumes that defined “proved reserves” are those quantities of geothermal energy which, by analysis of geological and engineering data, can be estimated with reasonable certainty to be commercially recoverable, from a given date forward, from known reservoirs and under current economic conditions, operating methods and government regulations.
We lease the geothermal steam fields from which we extract steam for our Geysers Assets. We have leasehold mineral interests in 105 leases comprising approximately 28,000 acres of federal, state and private geothermal resource lands in The
9
Geysers region of northern California. Our leases cover one contiguous area of property that comprises approximately 45 square miles in the northwest corner of Sonoma County and southeast corner of Lake County. The approximate breakout by volume of steam removed under the above leases for the year ended 2019 is:
• | 26% related to leases with the federal government via the Office of Natural Resources Revenue, |
• | 31% related to leases with the California State Lands Commission and |
• | 43% related to leases with private landowners/leaseholders. |
In general, our geothermal leases grant us the exclusive right to drill for, produce and sell geothermal resources from these properties and the right to use the surface for all related purposes. Each lease requires the payment of annual rent until commercial quantities of geothermal resources are established. After such time, the leases require the payment of minimum advance royalties or other payments until production commences, at which time production royalties are payable on a monthly basis from 10 to 31 days (depending upon the lease terms) following the close of the production month. Such royalties and other payments are payable to landowners, state and federal agencies and others, and vary widely as to the particular lease. In general, royalties payable are calculated based upon a percentage of total gross revenue received by us associated with our geothermal leases. Each lease’s royalty calculation is based upon its percentage of revenue as calculated by its steam generated relative to the total steam generated by our Geysers Assets as a whole.
Our geothermal leases are generally for initial terms varying from five to 20 years and for so long thereafter as geothermal resources are produced and sold. Most of our geothermal leases were signed in excess of 30 years ago. Our federal leases are, in general, for an initial 10-year period with renewal clauses for an additional 40 years for a maximum of 50 years. The 50-year term expires in 2024 for four of our federal leases. However, our federal leases allow for a preferential right to renewal for a second 40-year term on such terms and conditions as the lessor deems appropriate if, at the end of the initial 40-year term, geothermal steam is being produced or utilized in commercial quantities. The majority of our other leases run through the economic life of our Geysers Assets and provide for renewals so long as geothermal resources are being produced or utilized, or are capable of being produced or utilized, in commercial quantities from the leased land or from land unitized with the leased land. Although we believe that we will be able to renew our leases through the economic life of our Geysers Assets on terms that are acceptable to us, it is possible that certain of our leases may not be renewed, or may be renewable only on less favorable terms.
In addition, we hold 40 geothermal leases comprising approximately 43,840 acres of federal geothermal resource lands in the Glass Mountain area in northern California, which is separate from The Geysers region. Four test production wells were drilled prior to our acquisition of these leases and we have drilled one test well since their acquisition, which produced commercial quantities of steam during flow tests. However, the properties subject to these leases have not been developed and there can be no assurance that these leases will ultimately be developed.
Other Power Generation Technologies
We also have 725 MW of older, less efficient technology at our Edge Moor Energy Center which has conventional steam turbine technology and 4 MW of capacity from solar power generation technology at our Vineland Solar Energy Center in New Jersey.
Retail Operations
Our retail segment provides energy and related services to commercial, industrial, governmental and residential customers through our retail subsidiaries which consist of Calpine Solutions and Champion Energy (including North American Power). Our retail operations have an overlapping presence with our wholesale business in California, Texas and the Northeast and Mid-Atlantic regions of the U.S and provided approximately 60 billion KWh to customers in 2019 consisting of approximately 6 million annualized residential customer equivalents. Thus, our retail segment geographically and strategically complements our wholesale generation fleet providing access to forward market liquidity through both direct and mass market retail sales channels.
10
Table of Operating Power Plants and Project Under Construction
Set forth below is certain information regarding our operating power plants and project under construction at January 28, 2020.
SEGMENT / Power Plant | NERC Region | U.S. State or Canadian Province | Technology | Calpine Interest Percentage | Calpine Net Interest Baseload (MW)(1)(3) | Calpine Net Interest With Peaking (MW)(2)(3) | 2019 Total MWh Generated(4) | |||||||||||
WEST | ||||||||||||||||||
Geothermal | ||||||||||||||||||
McCabe #5 & #6 | WECC | CA | Renewable | 100 | % | 84 | 84 | 635,462 | ||||||||||
Ridge Line #7 & #8 | WECC | CA | Renewable | 100 | % | 76 | 76 | 546,804 | ||||||||||
Calistoga | WECC | CA | Renewable | 100 | % | 69 | 69 | 400,526 | ||||||||||
Eagle Rock | WECC | CA | Renewable | 100 | % | 68 | 68 | 606,753 | ||||||||||
Big Geysers | WECC | CA | Renewable | 100 | % | 61 | 61 | 351,745 | ||||||||||
Lake View | WECC | CA | Renewable | 100 | % | 54 | 54 | 491,695 | ||||||||||
Quicksilver | WECC | CA | Renewable | 100 | % | 53 | 53 | 368,140 | ||||||||||
Sonoma | WECC | CA | Renewable | 100 | % | 53 | 53 | 350,221 | ||||||||||
Cobb Creek | WECC | CA | Renewable | 100 | % | 51 | 51 | 350,775 | ||||||||||
Socrates | WECC | CA | Renewable | 100 | % | 50 | 50 | 299,620 | ||||||||||
Sulphur Springs | WECC | CA | Renewable | 100 | % | 47 | 47 | 456,099 | ||||||||||
Grant | WECC | CA | Renewable | 100 | % | 41 | 41 | 244,322 | ||||||||||
Aidlin | WECC | CA | Renewable | 100 | % | 18 | 18 | 106,159 | ||||||||||
Natural Gas-Fired | ||||||||||||||||||
Delta Energy Center | WECC | CA | Combined Cycle | 100 | % | 835 | 857 | 3,540,562 | ||||||||||
Pastoria Energy Center | WECC | CA | Combined Cycle | 100 | % | 780 | 759 | 4,061,160 | ||||||||||
Hermiston Power Project | WECC | OR | Combined Cycle | 100 | % | 566 | 635 | 4,303,231 | ||||||||||
Russell City Energy Center(5) | WECC | CA | Combined Cycle | 100 | % | 572 | 619 | 662,160 | ||||||||||
Otay Mesa Energy Center | WECC | CA | Combined Cycle | 100 | % | 513 | 608 | 751,810 | ||||||||||
Metcalf Energy Center | WECC | CA | Combined Cycle | 100 | % | 564 | 605 | 2,566,516 | ||||||||||
Sutter Energy Center | WECC | CA | Combined Cycle | 100 | % | 542 | 578 | 653,076 | ||||||||||
Los Medanos Energy Center | WECC | CA | Cogen | 100 | % | 518 | 572 | 2,707,147 | ||||||||||
South Point Energy Center | WECC | AZ | Combined Cycle | 100 | % | 520 | 530 | 1,883,597 | ||||||||||
Los Esteros Critical Energy Facility | WECC | CA | Combined Cycle | 100 | % | 243 | 309 | 216,237 | ||||||||||
Gilroy Energy Center | WECC | CA | Simple Cycle | 100 | % | — | 141 | 26,680 | ||||||||||
Gilroy Cogeneration Plant | WECC | CA | Cogen | 100 | % | 109 | 130 | 89,536 | ||||||||||
King City Cogeneration Plant | WECC | CA | Cogen | 100 | % | 120 | 120 | 161,388 | ||||||||||
Wolfskill Energy Center | WECC | CA | Simple Cycle | 100 | % | — | 48 | 7,008 | ||||||||||
Yuba City Energy Center | WECC | CA | Simple Cycle | 100 | % | — | 47 | 28,995 | ||||||||||
Feather River Energy Center | WECC | CA | Simple Cycle | 100 | % | — | 47 | 12,321 | ||||||||||
Creed Energy Center | WECC | CA | Simple Cycle | 100 | % | — | 47 | 11,763 | ||||||||||
Lambie Energy Center | WECC | CA | Simple Cycle | 100 | % | — | 47 | 12,245 | ||||||||||
Goose Haven Energy Center | WECC | CA | Simple Cycle | 100 | % | — | 47 | 11,509 | ||||||||||
Riverview Energy Center | WECC | CA | Simple Cycle | 100 | % | — | 47 | 20,042 | ||||||||||
King City Peaking Energy Center | WECC | CA | Simple Cycle | 100 | % | — | 44 | 6,038 | ||||||||||
Agnews Power Plant | WECC | CA | Combined Cycle | 100 | % | 28 | 28 | 6,613 | ||||||||||
Subtotal | 6,635 | 7,590 | 26,947,955 | |||||||||||||||
11
SEGMENT / Power Plant | NERC Region | U.S. State or Canadian Province | Technology | Calpine Interest Percentage | Calpine Net Interest Baseload (MW)(1)(3) | Calpine Net Interest With Peaking (MW)(2)(3) | 2019 Total MWh Generated(4) | |||||||||||
TEXAS | ||||||||||||||||||
Deer Park Energy Center | TRE | TX | Cogen | 100 | % | 1,103 | 1,204 | 6,775,720 | ||||||||||
Guadalupe Energy Center | TRE | TX | Combined Cycle | 100 | % | 1,009 | 1,000 | 5,481,210 | ||||||||||
Baytown Energy Center | TRE | TX | Cogen | 100 | % | 810 | 896 | 4,746,868 | ||||||||||
Channel Energy Center | TRE | TX | Cogen | 100 | % | 732 | 817 | 4,172,535 | ||||||||||
Pasadena Power Plant(6) | TRE | TX | Cogen/Combined Cycle | 100 | % | 763 | 781 | 4,266,517 | ||||||||||
Bosque Energy Center | TRE | TX | Combined Cycle | 100 | % | 760 | 782 | 4,257,071 | ||||||||||
Freestone Energy Center | TRE | TX | Combined Cycle | 75 | % | 779 | 746 | 5,536,148 | ||||||||||
Magic Valley Generating Station | TRE | TX | Combined Cycle | 100 | % | 682 | 712 | 2,865,506 | ||||||||||
Jack A. Fusco Energy Center(7) | TRE | TX | Combined Cycle | 100 | % | 523 | 609 | 2,343,664 | ||||||||||
Corpus Christi Energy Center | TRE | TX | Cogen | 100 | % | 426 | 500 | 2,047,276 | ||||||||||
Texas City Power Plant | TRE | TX | Cogen | 100 | % | 400 | 453 | 1,743,106 | ||||||||||
Hidalgo Energy Center | TRE | TX | Combined Cycle | 78.5 | % | 397 | 379 | 2,136,301 | ||||||||||
Freeport Energy Center(8) | TRE | TX | Cogen | 100 | % | 210 | 236 | 1,092,978 | ||||||||||
Subtotal | 8,594 | 9,115 | 47,464,900 | |||||||||||||||
EAST | ||||||||||||||||||
Bethlehem Energy Center | RFC | PA | Combined Cycle | 100 | % | 960 | 1,130 | 4,721,711 | ||||||||||
Hay Road Energy Center | RFC | DE | Combined Cycle | 100 | % | 931 | 1,130 | 1,473,514 | ||||||||||
York 2 Energy Center | RFC | PA | Combined Cycle | 100 | % | 668 | 828 | 4,073,106 | ||||||||||
Morgan Energy Center | SERC | AL | Cogen | 100 | % | 720 | 807 | 3,121,040 | ||||||||||
Fore River Energy Center | NPCC | MA | Combined Cycle | 100 | % | 750 | 731 | 4,403,186 | ||||||||||
Edge Moor Energy Center | RFC | DE | Steam Cycle | 100 | % | — | 725 | 146,670 | ||||||||||
Granite Ridge Energy Center | NPCC | NH | Combined Cycle | 100 | % | 745 | 695 | 3,025,593 | ||||||||||
York Energy Center | RFC | PA | Combined Cycle | 100 | % | 464 | 565 | 1,379,992 | ||||||||||
Westbrook Energy Center | NPCC | ME | Combined Cycle | 100 | % | 552 | 552 | 958,466 | ||||||||||
Greenfield Energy Centre(9) | NPCC | ON | Combined Cycle | 50 | % | 422 | 519 | 1,075,167 | ||||||||||
Zion Energy Center | RFC | IL | Simple Cycle | 100 | % | — | 503 | 663,766 | ||||||||||
Pine Bluff Energy Center | SERC | AR | Cogen | 100 | % | 184 | 215 | 1,169,631 | ||||||||||
Cumberland Energy Center | RFC | NJ | Simple Cycle | 100 | % | — | 191 | 95,697 | ||||||||||
Kennedy International Airport Power Plant | NPCC | NY | Cogen | 100 | % | 110 | 121 | 483,081 | ||||||||||
Sherman Avenue Energy Center | RFC | NJ | Simple Cycle | 100 | % | — | 92 | 24,265 | ||||||||||
Bethpage Energy Center 3 | NPCC | NY | Combined Cycle | 100 | % | 60 | 80 | 111,104 | ||||||||||
Carll’s Corner Energy Center | RFC | NJ | Simple Cycle | 100 | % | — | 73 | 5,911 | ||||||||||
Mickleton Energy Center | RFC | NJ | Simple Cycle | 100 | % | — | 67 | 60 | ||||||||||
Bethpage Power Plant | NPCC | NY | Combined Cycle | 100 | % | 55 | 56 | 195,701 | ||||||||||
Christiana Energy Center | RFC | DE | Simple Cycle | 100 | % | — | 53 | 189 | ||||||||||
Bethpage Peaker | NPCC | NY | Simple Cycle | 100 | % | — | 48 | 45,293 | ||||||||||
Stony Brook Power Plant | NPCC | NY | Cogen | 100 | % | 45 | 47 | 288,650 | ||||||||||
Tasley Energy Center | RFC | VA | Simple Cycle | 100 | % | — | 33 | 657 | ||||||||||
Delaware City Energy Center | RFC | DE | Simple Cycle | 100 | % | — | 23 | 157 | ||||||||||
West Energy Center | RFC | DE | Simple Cycle | 100 | % | — | 20 | 78 | ||||||||||
12
SEGMENT / Power Plant | NERC Region | U.S. State or Canadian Province | Technology | Calpine Interest Percentage | Calpine Net Interest Baseload (MW)(1)(3) | Calpine Net Interest With Peaking (MW)(2)(3) | 2019 Total MWh Generated(4) | |||||||||||
Bayview Energy Center | RFC | VA | Simple Cycle | 100 | % | — | 12 | 2,585 | ||||||||||
Crisfield Energy Center | RFC | MD | Simple Cycle | 100 | % | — | 10 | 657 | ||||||||||
Vineland Solar Energy Center | RFC | NJ | Renewable | 100 | % | — | 4 | 5,348 | ||||||||||
Subtotal | 6,666 | 9,330 | 27,471,275 | |||||||||||||||
Total operating power plants | 76 | 21,895 | 26,035 | 101,884,130 | ||||||||||||||
Power plants sold during 2019 | ||||||||||||||||||
RockGen Energy Center | MRO | WI | Simple Cycle | 100 | % | n/a | n/a | 152,712 | ||||||||||
Garrison Energy Center | RFC | DE | Combined Cycle | 100 | % | n/a | n/a | 976,547 | ||||||||||
Whitby Cogeneration(10) | NPCC | ON | Cogen | 50 | % | n/a | n/a | 75,260 | ||||||||||
Subtotal | 1,204,519 | |||||||||||||||||
Total operating and sold power plants | 103,088,649 | |||||||||||||||||
Project Under Construction | ||||||||||||||||||
Washington Parish Energy Center(11) | SERC | LA | Simple Cycle | 100 | % | — | 361 | n/a | ||||||||||
Total operating power plants and project under construction | 21,895 | 26,396 | ||||||||||||||||
___________
(1) | Natural gas-fired fleet capacities are generally derived on as-built as-designed outputs, including upgrades, based on site specific annual average temperatures and average process steam flows for cogeneration power plants, as applicable. Geothermal capacities are derived from historical generation output and steam reservoir modeling under average ambient conditions (temperatures and rainfall). |
(2) | Natural gas-fired fleet peaking capacities are primarily derived on as-built as-designed peaking outputs based on site specific average summer temperatures and include power enhancement features such as heat recovery steam generator duct-firing, gas turbine power augmentation, and/or other power augmentation features. For certain power plants with definitive contracts, capacities at contract conditions have been included. Oil-fired capacities reflect capacity test results. |
(3) | These outputs do not factor in the typical MW loss and recovery profiles over time, which natural gas-fired turbine power plants display associated with their planned major maintenance schedules. |
(4) | MWh generation is shown here as our net operating interest. |
(5) | On January 28, 2020 we purchased the 25% interest in Russell City Energy Center owned by a third party. MWh generation for 2019 reflects our net interest at the time of generation. Subsequent to the acquisition, we will reflect 100% of the results of our 619 MW Russell City Energy Center in our earnings. |
(6) | Pasadena is comprised of 260 MW of cogen technology and 521 MW of combined cycle (non-cogen) technology. |
(7) | Formerly our Brazos Valley Power Plant, which was renamed in December 2017. |
(8) | Freeport Energy Center is owned by Calpine; however, it is contracted and operated by The Dow Chemical Company. |
(9) | Calpine holds a 50% partnership interest in Greenfield LP through its subsidiaries; however, it is operated by a third party. |
(10) | On November 20, 2019, we sold our 50% partnership interest in Whitby Cogeneration. |
(11) | A third party will purchase a 100% ownership interest in this power plant upon achieving commercial operation. |
Substantially all of the power plants in which we have an interest are located on sites which we either own or lease on a long-term basis.
GOVERNMENTAL AND REGULATORY MATTERS
We are subject to complex and stringent energy, environmental and other laws and regulations at the federal, state and local levels as well as within the RTO and ISO markets in which we participate in connection with the development, ownership and operation of our power plants. Federal and state legislative and regulatory actions, including those by ISO/RTOs, continue to have an effect on our business. Some of the more significant governmental and regulatory matters that affect our business are discussed below.
13
Power and Natural Gas Matters
Federal Regulation of Power
FERC Jurisdiction
The Federal Power Act (“FPA”) grants the federal government broad authority over electric utilities and independent power producers, and vests its authority in the FERC. Unless otherwise exempt, any person that owns or operates facilities used for the wholesale sale or transmission of power in interstate commerce is a public utility subject to FERC’s jurisdiction. The FERC governs, among other things, the disposition of certain utility property, the issuance of securities by public utilities, the rates, the terms and conditions for the transmission or wholesale sale of power in interstate commerce, the interlocking directorates, and the uniform system of accounts and reporting requirements for public utilities.
Our power plants, outside of ERCOT, are subject to FERC’s jurisdiction as either exempt wholesale generators (“EWGs”) under the FPA or QFs under PURPA. Most of our affiliates have been granted authority to sell power at market-based rates and have been granted certain waivers of FERC reporting and accounting regulations. However, we cannot assure that such authorities or waivers will not be revoked in the future for these affiliates.
The FERC has civil penalty authority over violations of any provision of Part II of the FPA, as well as any rule or order issued thereunder. The FERC is authorized to assess a maximum civil penalty of approximately $1.29 million per violation for each day that the violation continues. The FPA also provides for the assessment of criminal fines and imprisonment for violations under Part II of the FPA. This penalty authority was enhanced in the Energy Policy Act of 2005 (“EPAct 2005”).
Pursuant to EPAct 2005, NERC has been certified by the FERC as the Electric Reliability Organization to develop and enforce reliability standards and critical infrastructure protection standards, which protect the bulk power system against potential disruptions from cyber and physical security breaches. The NERC standards are applicable throughout the U.S. and are subject to FERC review and approval. FERC-approved reliability standards may be enforced by the FERC independently, or, alternatively, by the NERC and the regional reliability organizations with frontline responsibility for auditing, investigating and otherwise ensuring compliance with reliability standards, subject to the FERC’s oversight. The critical infrastructure protection standards focus on controlling access to critical physical and cybersecurity assets, including supervisory control and data acquisition systems for the electric grid. Compliance with these standards is mandatory. Monetary penalties of approximately $1.29 million per day per violation may be assessed for violations of the reliability and critical infrastructure protection standards.
State Regulation of Power
State Public Utility Commissions, or PUC(s), have historically had broad authority to regulate both the rates charged by, and the financial activities of, electric utilities operating in their states and to promulgate regulation for implementation of PURPA. Since all of our generation affiliates are either QFs or EWGs, none of them are currently subject to direct rate regulation by a state PUC. However, states may assert jurisdiction over the siting and construction of power generating facilities including QFs and EWGs and, with the exception of QFs, over the issuance of securities and the sale or other transfer of assets by these facilities. State PUCs also maintain extensive control over the procurement of wholesale power by the utilities that they regulate. Many of these utilities are our customers, and agreements between us and these counterparties often require approval by state PUCs.
With regard to our retail sales affiliates, state PUCs have the ability to set policies that either enhance or limit customer choice. Each state that has adopted retail electric choice creates its own laws, regulations and compliance requirements which evolve over time and could impact our ability to maintain or expand retail operations.
Power Regions
The following is a brief overview of our core power regions – CAISO, ERCOT, PJM, ISO-NE and NYISO. The CAISO market is in our West segment. The ERCOT market is in our Texas segment. The PJM, ISO-NE and NYISO markets are in our East segment. These markets are constantly evolving in response to external factors that may disrupt the competitive balance within the wholesale markets.
Recently, several initiatives at the state and regional levels to provide out-of-market financial subsidies to certain generation resources in states and power regions with competitive wholesale markets threaten to undermine the operation of these power markets. Some of these initiatives have been enacted while others are currently being developed for future implementation. If these anticompetitive actions are ultimately upheld and implemented, they could adversely affect capacity and energy prices in the deregulated electricity markets which in turn could have a material adverse effect on our business prospects and financial results.
14
CAISO
The majority of our power plants in our West segment are located in California, in the CAISO region. We also own one power plant in Arizona and one in Oregon. CAISO is responsible for ensuring the safe and reliable operation of the transmission grid within the bulk of California and providing open, nondiscriminatory transmission services. CAISO maintains various markets for wholesale sales of power, differentiated by time and type of electrical service, into which our subsidiaries may sell power from time to time. These markets are subject to various controls, such as price caps and mitigation of bids when transmission constraints arise. The controls and the markets themselves are subject to regulatory change at any time.
The CPUC determines Resource Adequacy (“RA”) requirements for load serving entities (“LSEs”) and for specified local areas utilizing inputs from the CAISO in order to ensure the reliability of electric service in California. CPUC rules require LSEs to contract for capacity with sufficient generation resources in order to ensure capacity is available when and where it is needed. To the extent LSE’s have not procured sufficient capacity through the CPUC administered process, the CAISO will implement a backstop procurement process called the Capacity Procurement Mechanism (“CPM”) to meet its reliability needs. Currently, there are active proceedings at both the CAISO and CPUC which could entail changes to both the RA and CPM constructs. We do not know at this point whether these changes will be impactful to our business.
ERCOT
ERCOT is the ISO that manages approximately 90% of Texas’ load and an electric grid covering about 75% of the state, overseeing transactions associated with Texas’ competitive wholesale and retail power markets. FERC does not regulate wholesale sales of power in ERCOT. The PUCT exercises regulatory jurisdiction over the rates and services of any electric utility conducting business within Texas. Our subsidiaries that own power plants in Texas have power generation company status at the PUCT, and are either EWGs or QFs and are exempt from PUCT rate regulation. ERCOT ensures resource adequacy through an energy-only model. In ERCOT, there is a market offer price cap for energy and capacity services purchased by ERCOT. Under certain market conditions, the offer cap could be lower. Our subsidiaries are subject to the offer cap rules, but only for sales of power and capacity services to ERCOT.
In early 2018, the PUCT approved changes to energy price formation and scarcity pricing. These changes affect the shape of the Operating Reserve Demand Curve (“ORDC”), which produces a price “adder” to the clearing price of energy that increases as reserve capacity declines. The effect of these changes to the ORDC is to produce a more robust price signal than previously existed as reserve capacity declines.
PJM
PJM operates wholesale power markets, a locationally based energy market, a forward capacity market and ancillary service markets. PJM also performs transmission planning and operation for the region. The rules and regulations affecting PJM power markets and transmission are subject to change over time.
On June 29, 2018, the FERC issued a decision finding PJM’s current tariff to be unjust and unreasonable due to the price-suppressive effects of out-of-market compensation provided to certain generation resources by states within the PJM market. The FERC rejected both replacement proposals submitted by PJM to address the issue and instead opted for a paper hearing to identify a reasonable replacement mechanism. PJM’s annual capacity auction, which was scheduled to be held in May 2019, has been postponed pending the issuance of a FERC decision in this proceeding.
On December 19, 2019, the FERC issued an order in the paper hearing docket, directing PJM to expand its minimum offer price rule (“MOPR”) to apply to most generators receiving a state subsidy, although certain existing resources are exempted from the MOPR requirement. For non-exempt resources receiving a state subsidy, the MOPR will be set at the net Cost of New Entry for new resources and the Net Avoidable Cost Rate for existing resources. PJM is directed to submit a compliance filing by March 18, 2020. PJM must also propose dates in this filing for when the postponed May 2019 auction will be held. PJM has indicated that several future auctions will be delayed. Multiple parties have sought rehearing of the FERC’s order. The FERC has not ruled on those rehearing requests.
In addition, subsequent to the December 19, 2019 order, several states in the PJM region have expressed interest in using the “Fixed Resource Requirement” (FRR) provisions of the PJM tariff to bilaterally contract for capacity instead of participating in PJM’s market. It is unknown at this time whether or not states will pursue this approach, and what the resulting impact on our business will be.
The Independent Market Monitor (“IMM”) for PJM filed a complaint with the FERC on February 21, 2019 alleging that a component of PJM’s Reliability Pricing Model (“RPM”) allows sellers of the Capacity Performance product (“CP”) to offer CP at prices above the competitive level, thereby potentially allowing them to exercise market power. The IMM argues that this
15
provision of the tariff is unjust and unreasonable because the tariff does not provide a mechanism for the IMM to review these offers. Additionally, the IMM argues that the tariff should be revised to lower the Market Seller Offer Cap. This change would require nearly all competitive suppliers to submit their offers to the IMM for review prior to bidding in the RPM. In response to the IMM’s complaint, Calpine joined with many other competitive suppliers to urge the FERC to reject the IMM’s proposed resolution as inconsistent with CP and, alternatively, to enhance the penalty provisions of CP. This course of action would address the IMM’s concerns and would also be more consistent with the CP design. FERC action on the IMM’s complaint is pending.
ISO-NE
We have three power plants in our East segment located in Massachusetts, Maine and New Hampshire, all of which participate in the regional wholesale market in which ISO-NE is the RTO. ISO-NE has broad authority over the day-to-day operation of the transmission system and, among other responsibilities, operates a day-ahead and real-time wholesale energy market, a forward capacity market and an ancillary services market.
In response to reliability concerns related to fuel security in the New England region, ISO-NE filed a proposal with the FERC in mid-2018 that would allow it to retain certain generators under cost-of-service RMR Contracts that it believes are necessary to ensure fuel security on the system. The only units ISO-NE has contracted with to date are Mystic Units 8 and 9 (the “Mystic Units”). Included in ISO-NE’s proposal is a requirement that the cost-of-service units participate in ISO-NE’s forward capacity auction (“FCA”) as price takers. Calpine and many other generators opposed ISO-NE’s proposal, arguing that having these generators act as price takers will suppress capacity market clearing prices. The FERC rejected the price suppression concerns and accepted ISO-NE’s filing on December 3, 2018. Several companies have sought rehearing of the FERC’s decision. The Mystic Units were price takers in the FCA 13 and 14 auctions held in February 2019 and 2020, respectively, which likely contributed to lower capacity market clearing prices.
ISO-NE concedes that treating the cost-of-service units (i.e., the Mystic Units) as price takers in the FCA suppresses clearing prices. As a result, ISO-NE filed with the FERC an interim, administrative mechanism, referred to as the Energy Inventory Program, to provide additional compensation to all generators that provide fuel security to the system during the winter months of 2023-2024 and 2024-2025. The FERC was unable to issue an order on the proposal due to a lack of quorum. Consequently, on May 28, 2019, the Energy Inventory Program became effective by operation of law. Certain stakeholders have appealed the FERC’s decision to the U.S. Court of Appeals for the District of Columbia Circuit. Briefing has not yet commenced.
Additionally, ISO-NE has committed to the FERC to develop a long-term market-based solution to incent and retain fuel secure resources and is conducting stakeholder meetings to develop a solution. ISO-NE intends to submit this long-term solution to the FERC by April 15, 2020. Stakeholder meetings are continuing.
NYISO
We have five power plants in our East segment located in New York where NYISO is the RTO which manages the transmission system in New York and operates the state’s wholesale power markets. NYISO manages both day-ahead and real-time energy markets using a locationally based marginal pricing mechanism that pays each generator the zonal marginally accepted bid price for the energy it produces. NYISO also manages a forward capacity market where capacity prices are determined through auctions.
Regulation of Transportation and Sale of Natural Gas
Since the majority of our power generating capacity is derived from natural gas-fired power plants, we are broadly affected by federal regulation of natural gas transportation and sales. We own two pipelines in Texas that are subject to the Texas Railroad Commission regulation as Texas gas utilities.
We also operate a proprietary pipeline system in California, which is regulated by the U.S. Department of Transportation and the Pipeline and Hazardous Materials Safety Administration with regard to safety matters. Additionally, some of our power plants own and operate short pipeline laterals that connect the natural gas-fired power plants to the North American natural gas grid. Some of these laterals are subject to state and/or federal safety regulations.
The FERC has civil penalty authority for violations of the Natural Gas Act (“NGA”) and Natural Gas Policy Act (“NGPA”), as well as any rule or order issued thereunder. The FERC’s regulations specifically prohibit the manipulation of the natural gas markets by making it unlawful for any entity in connection with the purchase or sale of natural gas, or the purchase or sale of transportation service under the FERC’s jurisdiction, to engage in fraudulent or deceptive practices. Similar to its penalty authority under the FPA described above, the FERC is authorized to assess a maximum civil penalty of approximately $1.29 million per violation for each day that the violation continues. The NGA and NGPA also provide for the assessment of criminal fines and imprisonment time for violations.
16
Federal Regulation of Futures and Other Derivatives
CFTC Regulation of Futures Transactions
The CFTC has regulatory oversight of the futures markets, including trading on NYMEX for energy, and licensed futures professionals such as brokers, clearing members and large traders. In connection with its oversight of the futures markets and NYMEX, the CFTC regularly investigates market irregularities and potential manipulation of those markets. Recent laws also give the CFTC certain powers with respect to broker-type markets referred to as “exempt commercial markets” or ECMs, including the Intercontinental Exchange. The CFTC monitors activities in the OTC, ECM and physical markets that may be undertaken for the purpose of influencing futures prices. With respect to ECMs, the CFTC exercises only light-handed regulation primarily related to trade reporting, price dissemination and record retention (including retention of fraudulent claims and allegations).
Environmental Matters
Federal Air Emissions Regulations
CAA
The CAA provides for the regulation of air quality and air emissions, largely through state implementation of federal requirements. We believe that all of our operating power plants comply with existing federal and state performance standards mandated under the CAA. In addition to regulation of air emissions at the federal level, a number of states in which we do business have implemented regulations that go beyond current federal environmental requirements. We continue to monitor and actively participate in federal and state initiatives which further our environmental and business objectives and where we anticipate an effect on our business.
The CAA requires the EPA to regulate emissions of pollutants considered harmful to public health and the environment. The EPA has set NAAQS for six “criteria” pollutants: carbon monoxide, lead, NO2, particulate matter, ozone and SO2. In addition, the CAA regulates a large number of air pollutants that are known to cause or may reasonably be anticipated to cause adverse effects to human health or adverse environmental effects, known as hazardous air pollutants (“HAPs”). The EPA is required to issue technology-based national emissions standards for hazardous air pollutants (“NESHAPs”) to limit the release of specified HAPs from specific industrial sectors. The EPA also regulates emissions of certain pollutants that affect visibility in national parks and wilderness areas (“Regional Haze”). Finally, the EPA has begun regulating GHG emissions from various industries, including the power sector.
CAA regulations primarily affect higher-emitting units in the national power generating fleet. Our commitment to environmental stewardship is reflected in our history of investing in low-emitting power plant technologies. As a result, these regulations generally do not have a meaningful, direct adverse effect on our generating fleet, although they may impose significant costs on the power industry overall.
NAAQS — Ozone
As part of its ongoing CAA obligation to periodically review NAAQS to ensure that air quality is protective of human health and the environment, on October 1, 2015, the EPA set a new standard for ground-level of ozone of 70 parts per billion, down from the standard set in 2008 of 75 parts per billion. This is significant to the power sector because ground-level ozone is a product of complex chemical reactions contributed to by NOx, which are one of the primary emissions of concern from power plants.
Air quality in the Houston area, where six of our power plants are located, has improved over the last two decades. As a result, the Houston area was determined by the EPA to be attaining the 1-hour ozone standard, effective November 19, 2015, and the 1997 8-hour ozone standard, effective January 29, 2016. The Houston area remains in nonattainment relative to the 2008 ozone standard, and in fact, was downgraded in overall status relative to that standard effective September 23, 2019. The area’s status is also in nonattainment under the 2015 ozone standard, which could lead to further, more stringent regulation of NOx emissions from mobile sources and a number of industry sources, particularly the power industry.
Pursuant to authority granted under the CAA, the Texas Commission on Environmental Quality adopted regulations to attain the earlier NAAQS for ozone including the establishment of a Cap-and-Trade program for NOx emitted by industrial sources in the Houston-Galveston-Brazoria ozone nonattainment area, including power plants. We own and operate six power plants that participate in this program, all of which received free NOx allowances based on historical operating profiles. At this time, our Houston-area power plants have sufficient NOx allowances to meet forecasted obligations under the program. Due to the ongoing noncompliance of the Houston-Galveston-Brazoria area with the 2008 and 2015 standards, allowable NOx emissions under this program could be reduced at some point in the future, which could cause us to incur additional compliance costs. However, we cannot estimate such costs until such program changes are proposed and finalized.
17
Regional Haze
The EPA first issued the Regional Haze rule in 1999, with a focus on emissions of SO2, NOx, and particulate matter, particularly PM2.5. The Regional Haze program includes two major components: demonstration of Reasonable Further Progress, and installation of Best Achievable Retrofit Technology (“BART”). States submit State Implementation Plans (“SIP”) to the EPA for approval. These SIPs delineate all of the relevant emission controls programs in the state, and demonstrate that the state is making reasonable progress toward the Regional Haze program visibility goals. In addition, states must require the installation of a minimum level of controls that are considered cost-effective on coal- and oil-fired power plants within the state. In the eastern U.S., regional NOx and SO2 programs are relied upon in Regional Haze SIPs to achieve much of the required emission reductions, and are also allowed by EPA policy to substitute for the installation of BART. If the EPA does not approve a SIP, it may instead issue a Federal Implementation Plan, which will specify the control requirements for sources in a state.
GHG Emissions
Over the past several years, the EPA has proposed and issued rules related to GHG emissions within the power sector. The current presidential administration, however, has not indicated support for some of these rules, including, most notably, the Clean Power Plan.
The EPA’s regulation of GHG in response to the 2007 decision of the U.S. Supreme Court in Massachusetts v. EPA has been controversial and heavily litigated at every step of the regulatory process. Within the power industry, the EPA first proposed to regulate GHG emissions through the PSD and Title V programs, the two major permitting programs of the CAA.
These permitting rules were the subject of more than 60 petitions for review by industry and the states. The U.S. Supreme Court ultimately heard the case, and on June 23, 2014, rejected the PSD and Title V permitting rules in part but upheld the EPA’s authority to impose GHG limits on large new or modified sources if such sources were required to obtain permits for other pollutants. Our clean portfolio and additions thereto generally meet the technology that would be required if they triggered PSD permitting requirements. Therefore, we believe we are well-positioned to benefit from this regulatory development.
On October 23, 2015, the EPA finalized the New Source Performance Standard (“NSPS”) for GHG emissions from new, modified and reconstructed power plants and the Clean Power Plan. On June 19, 2019, the EPA issued the Affordable Clean Energy (“ACE”) rule which replaced the Clean Power Plan. The ACE rule regulates GHG emissions from existing coal-fired power plants and establishes a “best system of emission reduction” for reducing carbon emissions. Litigation challenging the ACE rule is ongoing.
State Air Emissions Regulations
In addition to federal GHG rules, several states and regional organizations have developed state-specific or regional initiatives to reduce GHG emissions through mandatory programs. The most advanced programs include California’s suite of GHG policies promulgated pursuant to AB 32, including its Cap-and-Trade program, Massachusetts’ CO2 reduction program and RGGI in the Northeast. The evolution of these programs could have a material effect on our business.
In these programs, a cap is established defining the maximum allowable emissions of GHGs emitted by sources subject to the program. Affected sources are required to hold one allowance for each ton of CO2 emitted (and, in the case of California’s program, other GHGs) during the applicable compliance period. Both programs also contain provisions for the use of qualified offsets in lieu of allowances. Allowances are distributed through auctions or through allocations to affected companies. In addition, there are functional secondary markets for allowances. We obtain allowances in a variety of ways, including through bilateral or exchange transactions and pursuant to the terms of PPAs.
California: GHG - Cap-and-Trade Regulation
California’s climate policies and GHG reduction targets are among the most ambitious and aggressive in the world. Assembly Bill (“AB”) 32, as amended by Senate Bill (“SB”) 32 in 2016, requires California to reduce statewide GHG emissions to 1990 levels by 2020 and to at least 40% below 1990 levels by 2030. To meet this mandate, the CARB has promulgated a suite of complementary regulatory measures, including the Cap-and-Trade Regulation and Mandatory Reporting Regulation. Covered entities, such as our power plants, must surrender compliance instruments, which include both allowances and offset credits, in an amount equivalent to their GHG emissions. AB 398, enacted in 2017, authorized extension of the Cap-and-Trade Regulation through 2030.
AB 398 required several changes in the post-2020 Cap-and-Trade Regulation, including a requirement that CARB impose a price ceiling and two reserve tiers to control the pace of price increases, as well as limitations on the percentage of offset credits that covered entities can surrender to meet their compliance obligation. In subsequently adopting regulatory amendments to implement AB 398’s mandates, the CARB adopted an initial price ceiling value for 2021 at $65, which will increase each year by
18
five percent plus the rate of inflation. Assuming an annual inflation rate of two percent, the 2030 price ceiling will approach $119, above which an unlimited number of additional metric tons will be available to covered entities if needed for compliance.
In October 2019, the United States sued California in the U.S. Court for the Eastern District of California, alleging that California’s linkage of its Cap-and-Trade program with a cap-and-trade system implemented by the Canadian province of Québec, as well as the California Cap-and-Trade Regulation’s linkage authority and regulations, violate several provisions of the U.S. Constitution relating to foreign affairs. In addition, the Utah Legislature has appropriated funding for the State of Utah to sue California in federal court challenging the California Cap-and-Trade Regulation’s treatment of imported electricity as a violation of the dormant Commerce Clause and an intrusion into FERC’s exclusive jurisdiction over the sale of electricity at wholesale in interstate commerce.
Several of our natural gas-fired power plants in California will likely remain subject to the Cap-and-Trade Regulation through 2030 as a result of passage of AB 398. If the United States’ pending challenge to the Cap-and-Trade Program were to succeed, we do not anticipate it would have any material impact on us. If the State of Utah should file a lawsuit challenging the Cap-and-Trade Regulation’s imported power provisions and, as a consequence, the CARB should be enjoined from further implementation of those provisions, it is possible that the CARB would continue applying the program’s compliance obligation to in-state electricity generation, but not to imported electricity, in which case in-state natural gas-fired power plants could be competitively disadvantaged relative to out-of-state fossil generation.
Northeast GHG Regulation: RGGI
Ten states in the Northeast participate in RGGI, a Cap-and-Trade program, which affects our power plants in Maine, Massachusetts, New Hampshire, New Jersey, New York and Delaware (together emitting about 5.1 million tons of CO2 annually). The governors of Pennsylvania and Virginia are currently taking actions to have their state join RGGI.
We receive annual allocations from New York’s long-term contract set-aside pool to cover some of the CO2 emissions attributable to our PPA at our Stony Brook Power Plant. We do not anticipate any significant business or financial effect from RGGI, given the efficiency of our power plants in RGGI states.
Massachusetts: Global Warming Solutions Act
On December 16, 2016, the Massachusetts Department of Environmental Protection proposed regulations that would impose new GHG limits on power plants and other sources. These regulations are notable because they are structured as annually-declining hard caps on CO2 emissions from regulated facilities. The Massachusetts Department of Environmental Protection issued a final rule on August 11, 2017, which became effective on January 1, 2018. The rule establishes an allowance trading system and auction platform. Although we view the regulations as likely to result in market distortions impeding the efficient operation of both power and emissions markets, we believe that we will be able to comply with its provisions.
Other Environmental Regulations
RPS
We are subject to an RPS in multiple states in which we do business. Generally, an RPS requires each retail seller of electricity to include in its resource portfolio (the resources procured by the retail seller to supply its retail customers) a certain amount of power generated from renewable or clean energy resources by a certain date.
California RPS
California’s RPS requires retail power providers to generate or procure 33% and 60% of the power they sell to retail customers from renewable resources by 2020 and 2030, respectively, with intermediate targets leading up to 2020 and 2030. Behind-the-meter solar generally does not count towards California’s RPS requirements. Under California’s RPS, there are limits on different “buckets” of procurement that can be used to satisfy the RPS. Load-serving entities must satisfy a growing fraction of their compliance obligations with renewable power from resources located in California or delivered into California within the hour, such as our Geysers Assets. Beginning in 2021, load-serving entities are required to meet 65% of their compliance obligations with contracts with terms of ten years or longer. The law that increased the 2030 RPS target to 60%, SB 100, also sets a state policy that eligible renewable energy and zero-carbon resources supply 100% of all retail sales of electricity in California by 2045. While this goal is aspirational and the legislation does not establish an enforceable framework or mechanism by which it will be achieved, it will nevertheless guide procurement and planning decisions. In addition, a recently signed executive order articulates a carbon neutrality goal for the entire state, not just the electricity sector, by 2045, which is five years earlier than the existing target of reducing greenhouse gas emissions to 80% below 1990 levels. While the RPS generally depresses wholesale energy prices, the intermittency of many renewable resources raises operational flexibility challenges that present opportunities for natural
19
gas-fired generation to provide capacity and ancillary services products. Additionally, the RPS could result in the retirement of non-renewable generating units creating opportunities for our fleet.
Other States
A number of additional states have an RPS in place. Existing state-specific RPS requirements may change due to regulatory and/or legislative initiatives, and other states may consider implementing an enforceable RPS in the future. Our retail subsidiaries operate in states that have an RPS in place and are required to procure a certain amount of power from renewable sources or purchase renewable energy credits in order to comply with the RPS requirements.
Miscellaneous
In addition to controls on air emissions, our power plants and the equipment necessary to support them are subject to other extensive federal, state and local laws and regulations adopted for the protection of the environment and to regulate land use. The laws and regulations applicable to us primarily involve the discharge of wastewater and the use of water, but can also include wetlands protection and preservation, protection of endangered species, hazardous materials handling and disposal, waste disposal and noise regulations. Noncompliance with environmental laws and regulations can result in the imposition of civil or criminal fines or penalties. In some instances, environmental laws may also impose clean-up or other remedial obligations in the event of a release of pollutants or contaminants into the environment. The following federal laws are among the more significant environmental laws that apply to us. In most cases, analogous state laws also exist that may impose similar and, in some cases, more stringent requirements on us than those discussed below. In general, our relatively clean portfolio as compared to our competitors affords us some advantage in complying with these laws.
Clean Water Act
The federal Clean Water Act establishes requirements relating to the discharge of pollutants into waters of the U.S., including from cooling water intake structures. Section 316(b) of the Clean Water Act requires that the location, design, construction and capacity of cooling water intake structures reflect the best technology available for minimizing adverse effects on the environment. We are required to obtain wastewater and storm water discharge permits for wastewater and runoff, respectively, for some of our power plants. We are subject to the requirements for cooling water intake structures at many of our power plants. In addition, we are required to maintain spill prevention control and countermeasure plans for some of our power plants. We do not use once-through cooling technology at any of the power plants in our fleet. We believe that our facilities that are subject to the Clean Water Act are in compliance with applicable discharge requirements of the Clean Water Act.
Safe Drinking Water Act
Part C of the Safe Drinking Water Act establishes the underground injection control program that regulates the disposal of wastes by means of deep well injection. Although geothermal production wells, which are wells that bring steam to the surface, are exempt under EPAct 2005, we use geothermal re-injection wells to inject reclaimed wastewater back into the steam reservoir, which are subject to the underground injection control program. We believe that we are in compliance with Part C of the Safe Drinking Water Act.
Comprehensive Environmental Response, Compensation and Liability Act
The Comprehensive Environmental Response, Compensation and Liability Act (“CERCLA”), also referred to as the Superfund, requires cleanup of sites from which there has been a release or threatened release of hazardous substances, and authorizes the EPA to take any necessary response action at Superfund sites, including ordering potentially responsible parties liable for the release to pay for such actions. Potentially responsible parties are broadly defined under CERCLA to include past and present owners and operators of, as well as generators of, wastes sent to a site. As of the filing of this Report, we are not subject to any material liability for any Superfund matters. However, we generate certain wastes, including hazardous wastes, and send these to third party waste disposal sites. As a result, there can be no assurance that we will not incur a liability under CERCLA in the future.
EMPLOYEES
At December 31, 2019, we employed 2,256 full-time employees, of whom 179 were represented by collective bargaining agreements. Two collective bargaining agreements, representing a total of 28 employees, will expire within one year. We have never experienced a work stoppage or a strike.
20
Item 1A. | Risk Factors |
Commercial Operations
Our financial performance is affected by commodity price fluctuations in the wholesale and retail power and natural gas markets and other market factors that are beyond our control.
Market prices for power, generation capacity, ancillary services, natural gas and fuel oil are unpredictable. Depending upon price risk management activity undertaken by us, a decline in market prices for power, generation capacity, and ancillary services may adversely affect our financial performance. Long- and short-term power and natural gas prices may also fluctuate substantially due to other factors outside of our control, including:
• | increases and decreases in generation capacity in our markets; |
• | changes in power transmission or fuel transportation capacity constraints or inefficiencies; |
• | volatile weather conditions, particularly unusually hot or mild summers or unusually cold or warm winters in our market areas; |
• | an economic downturn which could negatively affect demand for power; |
• | changes in the supply of commodities utilized as fuel sources for power generation, including but not limited to coal, natural gas and fuel oil; |
• | technological shifts resulting in changes in the demand for power or in patterns of power usage, including the potential development of demand-side management tools, expansion and technological advancements in power storage capability and the development of new fuels or new technologies for the production or storage of power; |
• | federal and state power, market and environmental regulation and legislation, including mandating an RPS or creating financial incentives, each resulting in new renewable energy generation capacity creating oversupply; |
• | changes in prices related to RECs and other environmental allowance products; and |
• | changes in capacity prices and capacity markets. |
These factors have caused our operating results to fluctuate in the past and will continue to cause them to do so in the future.
Our revenues and results of operations depend on market rules, regulation and other forces beyond our control.
Our revenues and results of operations are influenced by factors that are beyond our control, including:
• | rate caps, price limitations and bidding rules imposed by ISOs, RTOs and other market regulators that may impair our ability to recover our costs and limit our return on our capital investments; |
• | regulations promulgated by the FERC, the CFTC and state public utility commissions; |
• | sufficient liquidity in the forward commodity markets to conduct our hedging activities; |
• | some of our competitors (mainly utilities) receive entitlement-guaranteed rates of return on their capital investments, with returns that exceed market returns and may affect our ability to sell our power at economical rates; |
• | structure and operating characteristics of our capacity markets such as the PJM and ISO-NE capacity auctions and the NYISO and California markets; and |
• | regulations and market rules related to our RECs. |
Accounting for derivative hedging activities may increase the volatility in our quarterly and annual financial results.
We engage in commodity-related marketing and price-risk management activities in order to economically hedge our forward commodity market price risk exposure utilizing both physical and financial commodity purchases and sales commitments. Some of these contracts are accounted for as derivatives under U.S. GAAP, which requires us to record the fair value of the commitment on the balance sheet with changes in the fair value of all derivatives reflected within current period earnings. As current period earnings are impacted by non-cash mark-to-market gains/losses associated with price risk management hedges of future period activity that are accounted for as derivatives, we are unable to accurately predict the effect that our risk management decisions may have on our quarterly and annual financial results prepared in accordance with U.S. GAAP.
21
The use of hedging agreements may not work as planned or fully protect us and could result in financial losses.
In accordance with internal policies and procedures designed to monitor hedging activities and positions, we enter into hedging agreements, including contracts to purchase or sell commodities at future dates and at fixed prices, in order to manage our commodity price risks. These activities, although intended to mitigate price volatility, expose us to risks related to commodity price movements, deviations in weather and other risks. When we sell power forward, we may be required to post significant amounts of cash collateral or other credit support to our counterparties, and we give up the opportunity to sell power at higher prices if spot prices are higher in the future. Further, if the values of the financial contracts change in a manner that we do not anticipate, or if a counterparty or customer fails to perform under a contract, it could harm our financial condition, results of operations and cash flows.
We do not typically hedge the entire exposure of our operations against commodity price volatility. To the extent we do not hedge against commodity price volatility, our financial condition, results of operations and cash flows may be diminished based upon adverse movement in commodity prices.
Our ability to enter into hedging agreements and manage our counterparty and customer credit risk could adversely affect us.
Our wholesale counterparties, retail customers and suppliers may experience deteriorating credit. These conditions could cause counterparties in the natural gas and power markets, particularly in the energy commodity derivative markets that we rely on for our hedging activities, to withdraw from participation in those markets. If multiple parties withdraw from those markets, market liquidity may be threatened, which in turn could adversely affect our business and create more volatility in our earnings. Additionally, these conditions may cause our counterparties or customers to seek bankruptcy protection under Chapter 11 or liquidation under Chapter 7 of the U.S. Bankruptcy Code. Our credit risk may be exacerbated to the extent collateral held by us cannot be realized or is liquidated at prices not sufficient to recover the full amount of the exposure due to us. There can be no assurance that any such losses or impairments to the carrying value of our financial assets would not materially and adversely affect our financial condition, results of operations and cash flows.
Extensive competition in our wholesale and retail businesses could adversely affect our performance.
The power generation industry is characterized by intense competition, and we encounter competition from utilities, industrial companies, marketing and trading companies and other independent power producers. This competition has put pressure on power utilities to lower their costs, including the cost of purchased power, and increasing competition in the supply of power in the future could increase this pressure. In addition, construction during the last decade has created excess power supply and higher reserve margins in the power trading markets, putting downward pressure on prices.
Other companies we compete with may have greater liquidity, greater access to credit and other financial resources, lower cost structures, greater ability to incur losses, longer-standing relationships with customers, greater potential for profitability from ancillary services or greater flexibility in the timing of their sale of generation capacity and ancillary services than we do.
Additionally, there is extensive competition in the retail power markets in which our retail subsidiaries operate. Competitors may offer lower prices or other incentives which may attract customers away from our retail subsidiaries. We may also face competition from a number of other energy service providers, other energy industry participants, or nationally branded providers of consumer products and services who may develop businesses that will compete with our retail subsidiaries.
In certain situations, our PPAs and other contractual arrangements, including construction agreements, commodity contracts, maintenance agreements and other arrangements, may be terminated by the counterparty or customer and/or may allow the counterparty or customer to seek liquidated damages.
The situations that could allow a counterparty or customer to terminate the contract and/or seek liquidated damages include:
• | the cessation or abandonment of the development, construction, maintenance or operation of a power plant; |
• | failure of a power plant to achieve construction milestones or commercial operation by agreed-upon deadlines; |
• | failure of a power plant to achieve certain output or efficiency minimums; |
• | our failure to make any of the payments owed to the counterparty or to establish, maintain, restore, extend the term of or increase any required collateral; |
• | failure of a power plant to obtain material permits and regulatory approvals by agreed-upon deadlines; |
22
• | a material breach of a representation or warranty or our failure to observe, comply with or perform any other material obligation under the contract; or |
• | events of liquidation, dissolution, insolvency or bankruptcy. |
Revenue may be reduced significantly upon expiration or termination of our PPAs.
Some of the capacity from our existing portfolio is sold under long-term PPAs that expire at various times. We seek to extend contracts or sell any capacity not sold under long-term PPAs, on a short-term basis as market opportunities arise. Our non-contracted capacity is generally sold on the spot market at current market prices as merchant energy. When the terms of each of our various PPAs expire, it is possible that the price paid to us for the generation of power under subsequent arrangements or in short-term markets may be significantly less than the price that had been paid to us under the PPA. Without the benefit of long-term PPAs, we may not be able to sell any or all of the capacity from these power plants at commercially attractive rates and these power plants may not be able to operate profitably. Certain of our PPAs have values in excess of current market prices. If a counterparty to a PPA were to seek bankruptcy protection under Chapter 11 or liquidation under Chapter 7 of the U.S. Bankruptcy Code, they may be able to terminate the PPA. We are at risk of loss of margins to the extent that these contracts expire or are terminated and we are unable to replace them on comparable terms.
For example, our wholesale business currently has contracts with investor owned California utilities which could be affected should they be found liable for recent wildfires in California and, accordingly, incur substantial costs associated with the wildfires.
On January 29, 2019, PG&E and PG&E Corporation each filed voluntary petitions for relief under Chapter 11. We currently have several power plants that provide energy and energy-related products to PG&E under PPAs, many of which have PG&E collateral posting requirements. Since the bankruptcy filing, we have received all material payments under the PPAs, either directly or through the application of collateral. We also currently have numerous other agreements with PG&E related to the operation of our power plants in Northern California, under which PG&E has continued to provide service since its bankruptcy filing. We cannot predict the ultimate outcome of this matter and continue to monitor the bankruptcy proceedings. However, should the outcome in the matter be unfavorable, our business may be adversely affected.
The introduction or expansion of competing technologies for power generation and demand-side management tools could adversely affect our performance.
The power generation business has seen a substantial change in the technologies used to produce power. With federal and state incentives for the development and production of renewable sources of power, we have seen market penetration of competing technologies, such as wind, solar, and commercial-sized power storage. Additionally, the development of demand-side management tools and practices can effect peak demand requirements for some of our markets at certain times during the year. The continued development of subsidized, competing power generation technologies and significant development of demand-side management tools and practices could alter the market and price structure for power and negatively affect our financial condition, results of operations and cash flows.
Power Operations
Our power generating operations performance involves significant risks and hazards and may be below expected levels of output or efficiency.
The operation of power plants involves risks, including the breakdown or failure of power generation equipment, transmission lines, pipelines or other equipment or processes, performance below expected levels of output or efficiency and risks related to the creditworthiness of our contract counterparties and the creditworthiness of our counterparties’ customers or other parties, such as steam hosts, with whom our counterparties have contracted. From time to time our power plants have experienced unplanned outages, including extensions of scheduled outages due to equipment breakdowns, failures or other problems which are an inherent risk of our business. Unplanned outages typically can result in lost revenues, inability to perform and potential recognition of liquidated damages owed and/or termination of existing long-term PPAs, increase our maintenance expenses and may reduce our profitability, which could have a material adverse effect on our financial condition, results of operations and cash flows.
We may be subject to future claims, litigation and enforcement.
Our power generating operations are inherently hazardous and may lead to catastrophic events, including loss of life, personal injury and destruction of property, and subject us to litigation. Natural gas is highly explosive and power generation involves hazardous activities, including acquiring, transporting and delivering fuel, operating large pieces of rotating equipment
23
and delivering power to transmission and distribution systems. These and other hazards including, but not limited to, the risk of events such as wildfires that may affect the ability for our power plants to operate can cause severe damage to and destruction of property, plant and equipment and suspension of operations. In the worst circumstances, catastrophic events can cause significant personal injury or loss of life. Further, the occurrence of any one of these events may result in us being named as a defendant in lawsuits asserting claims for substantial damages. We maintain an amount of insurance protection that we consider adequate; however, we cannot provide any assurance that the insurance will be sufficient or effective under all circumstances and against all hazards or liabilities to which we are subject.
Additionally, we are party to various litigation matters, including regulatory and administrative proceedings arising out of the normal course of business. We review our litigation activities and determine if an unfavorable outcome to us is considered “remote,” “reasonably possible” or “probable” as defined by U.S. GAAP. Where we have determined an unfavorable outcome is probable and is reasonably estimable, we accrue for potential litigation losses. A successful claim against us that is not fully insured could be material. The liability we may ultimately incur with respect to such litigation matters, in the event of a negative outcome, may be in excess of amounts currently accrued, if any. Where we determine an unfavorable outcome is not probable or reasonably estimable, we do not accrue for any potential litigation loss. The ultimate outcome of these litigation matters cannot presently be determined, nor can the liability that could potentially result from a negative outcome be reasonably estimated. As a result, we give no assurance that such litigation matters would, individually or in the aggregate, not have a material adverse effect on our financial condition, results of operations or cash flows. See Note 16 of the Notes to Consolidated Financial Statements for a description of our more significant litigation matters.
We rely on power transmission and fuel distribution facilities owned and operated by other companies.
We depend on facilities and assets that we do not own or control for the transmission to our customers of the power produced by our power plants and the distribution of natural gas or fuel oil to our power plants. If these transmission and distribution systems are disrupted or capacity on those systems is inadequate, our ability to sell and deliver power products or obtain fuel may be hindered. ISOs that oversee transmission systems in regional power markets have imposed price limitations and other mechanisms to address volatility in their power markets. Existing congestion, as well as expansion of transmission systems, could affect our performance, which in turn could adversely affect our business.
Our power project development and construction activities involve risk and may not be successful.
We are currently constructing one natural gas-fired power plant and may construct other facilities in the future, including battery storage facilities. The development and construction of power plants is subject to substantial risks. In connection with the development of a power plant, we must generally obtain:
• | necessary power generation or storage equipment; |
• | governmental permits and approvals including environmental permits and approvals; |
• | fuel supply and transportation agreements; |
• | sufficient equity capital and debt financing; |
• | power transmission agreements; |
• | water supply and wastewater discharge agreements or permits; and |
• | site agreements and construction contracts. |
To the extent that our development and construction activities continue or expand, we may be unsuccessful on a timely and profitable basis. Although we may attempt to minimize the financial risks of these activities by securing a favorable PPA and arranging adequate financing prior to the commencement of construction, the development of a power project may require us to expend significant cash sums for preliminary engineering, permitting, legal and other expenses before we can determine whether a project is feasible, economically attractive or financeable. The process for obtaining governmental permits and approvals is complicated and lengthy, often taking more than one year, and is subject to significant uncertainties. We may be unable to obtain all necessary licenses, permits, approvals and certificates for proposed projects, and completed power plants may not comply with all applicable permit conditions, statutes or regulations. In addition, regulatory compliance for the construction and operation of our power plants can be a costly and time-consuming process. Intricate and changing environmental and other regulatory requirements may necessitate substantial expenditures to obtain and maintain permits. If a project is unable to function as planned due to changing requirements, loss of required permits or regulatory status or local opposition, it may create expensive delays, extended periods of non-operation or significant loss of value in a project resulting in potential impairments.
24
We may be unable to obtain an adequate supply of fuel in the future.
We obtain substantially all of our physical natural gas and fuel oil supply from third parties pursuant to arrangements that vary in term, pricing structure, firmness and delivery flexibility. Our physical natural gas and fuel oil supply arrangements must be coordinated with transportation agreements, balancing agreements, storage services, financial hedging transactions and other contracts so that the natural gas and fuel oil is delivered to our power plants at the times, in the quantities and otherwise in a manner that meets the needs of our generation portfolio and our customers. We must also comply with laws and regulations governing natural gas transportation.
Additionally, the PJM and ISO-NE power markets have recently experienced an increase in natural gas-fired generation assets that supply electricity to the area. As a result, there has been a corresponding increase in the need for natural gas transmission assets to supply the generation assets with fuel to generate power. When extreme cold temperatures rapidly increase the demand for natural gas used for residential heating, it can also create constraints on natural gas pipelines that serve power generation assets. When these conditions exist, it could interrupt the fuel supply to our natural gas-fired power plants in these power markets, although some of our natural gas-fired power plants in this region are dual-fuel and benefit from the ability to operate on both natural gas and fuel oil.
While adequate supplies of natural gas and fuel oil are currently available to us at prices we believe are reasonable for each of our power plants, we are exposed to increases in the price of natural gas and fuel oil, and it is possible that sufficient supplies to operate our portfolio profitably may not continue to be available to us. In addition, we face risks with regard to the delivery to and the use of natural gas and fuel oil by our power plants including the following:
• | transportation may be unavailable if pipeline infrastructure is damaged or disabled; |
• | pipeline tariff changes may adversely affect our ability to, or cost to, deliver natural gas and fuel oil supply; |
• | new pipelines and pipeline expansions may not be permitted in a timely manner due to environmental concerns or prolonged regulatory processes; |
• | third-party suppliers may default on natural gas supply obligations, and we may be unable to replace supplies currently under contract; |
• | market liquidity for physical natural gas and fuel oil or availability of natural gas and fuel oil services (e.g. storage) may be insufficient or available only at prices that are not acceptable to us; |
• | natural gas and fuel oil quality variation may adversely affect our power plant operations; |
• | our natural gas and fuel oil operations capability may be compromised due to various events such as natural disaster, loss of key personnel or loss of critical infrastructure; |
• | fuel supplies diverted to residential heating for humanitarian reasons; and |
• | any other reasons. |
Our power plants and construction projects are subject to impairments.
If we were to experience a significant reduction in our expected revenues and operating cash flows for an extended period of time from a prolonged economic downturn or from advances or changes in technologies, we could experience future impairments of our power plant assets as a result. There can be no assurance that any such losses or impairments to the carrying value of our financial assets would not have a material adverse effect on our financial condition, results of operations and cash flows.
Our geothermal power reserves may be inadequate for our operations.
In connection with each geothermal power plant, we estimate the productivity of the geothermal resource and the expected decline in productivity. The productivity of a geothermal resource may decline more than anticipated, resulting in insufficient reserves being available for sustained generation of the power capacity desired. In addition, we may not be able to successfully manage the development and operation of our geothermal reservoirs or accurately estimate the quantity or productivity of our steam reserves. An incorrect estimate or inability to manage our geothermal reserves or a decline in productivity could adversely affect our results of operations or financial condition. In addition, the development and operation of geothermal power resources are subject to substantial risks and uncertainties. The successful exploitation of a geothermal power resource ultimately depends upon many factors including the following:
• | the heat content of the extractable steam or fluids; |
• | the geology of the reservoir; |
25
• | the total amount of recoverable reserves; |
• | operating expenses relating to the extraction of steam or fluids; |
• | price levels relating to the extraction of steam, fluids or power generated; and |
• | capital expenditure requirements relating primarily to the drilling of new wells. |
Significant events beyond our control, such as natural disasters, including weather-related events, or acts of terrorism, could damage our power plants or our corporate offices or cause a loss of system load and may affect us in unpredictable ways.
Certain of our geothermal and natural gas-fired power plants, particularly in the West, have been in the past and remain subject to frequent low-level seismic disturbances. More significant seismic disturbances are possible. In addition, other areas in which we operate, particularly in Texas and the Southeast, routinely experience tornados and hurricanes. Operations at our corporate offices in Houston, Texas could be substantially affected by a hurricane. Any significant loss of system load resulting from a weather-related event could negatively affect our wholesale business and retail subsidiaries. Such events could damage or shut down our power plants, power transmission or the fuel supply facilities upon which our wholesale business and retail subsidiaries are dependent. Our existing power plants are built to withstand relatively significant levels of seismic and other disturbances, and we believe we maintain adequate insurance protection, earthquake, property damage or business interruption insurance may be inadequate to cover all potential losses sustained in the event of extensive damages to our power plants or disruptions to our wholesale and retail operations due to natural disasters.
Periodic wildfires in the West, particularly California, could damage our power plants or cause a loss of system load and may affect us in unpredictable ways.
Our geothermal and natural gas-fired power plants in the West have been in the past and remain subject to an ongoing risk of wildfires. Severe drought conditions, unseasonably warm temperatures and stronger winds have increased the severity and prevalence of wildfires in California. Although such wildfires have not resulted in material damages to us in the past, we cannot be certain that any such events would not materially and adversely affect our operations in the future. Such events could damage or shut down our power plants, power transmission or the fuel supply facilities upon which our power plants are dependent or cause serious injuries, fatalities, property damage or service interruptions, which could expose us to liabilities that could be material. Although we believe we maintain adequate insurance protection, property damage liability or business interruption insurance may be inadequate to cover all potential losses sustained in the event of extensive damages to our power plants or disruptions to our operations due to wildfires. The recent wildfires in California may exacerbate these insurance risks by leading to adverse changes in insurance deductibles, premiums, coverage and/or limits. If we incur a substantial liability and the damages are above our estimates for self-insured claims, or such damages are not covered by our insurance policies or are in excess of policy limits, or if we incur liability at a time when we do not have liability insurance, our results of operations and cash flows could be materially and adversely affected.
In addition, electric utilities in California are authorized to shut down power for public safety reasons, such as during periods of extreme fire hazard, if the utility reasonably believes that there is an imminent and significant risk that strong winds may topple power lines or cause vegetation to come into contact with power lines leading to increased risk of fire. Any shut down of power for public safety reasons may reduce our revenues.
Our business, financial condition and results of operations could be adversely affected by strikes or work stoppages by unionized employees or by our inability to replace key employees.
Approximately 8% of our employees are subject to collective bargaining agreements. In the event that our union employees participate in a strike, work stoppage or engage in other forms of labor disruption, we would be responsible for procuring replacement labor and could experience reduced power generation or outages.
In addition, our success is largely dependent on the skills, experience and efforts of our people. The loss of the services of one or more members of our senior management or of numerous employees with critical skills could have a negative effect on our business, financial condition and results of operations and future growth if we were unable to replace them.
Failures in our systems or a cyber attack or breach of our information technology systems or technology could significantly disrupt our business operations or result in sensitive customer information being compromised, which would negatively affect our reputation and/or results of operations.
Our information technology systems contain personal, financial and other information that is entrusted to us by our customers and employees as well as financial, proprietary and other confidential information related to our business, which makes us a target of cyber attacks on our systems. We rely on electronic networks, computers, systems, including our gateways, programs
26
to run our business and operations, our employees and third party technology and information technology infrastructure providers and, as a result, are potentially exposed to the risk of security breaches, computer or other malware, viruses, social engineering or general hacking, industrial espionage, employee or third party error or malfeasance, or other irregularities or compromises on our systems or those to third parties, which could result in the loss or misappropriation of sensitive data or other disruption to our operations.
We depend on computer and telecommunications systems we do not own or control. We have entered into agreements with third parties for hardware, software, telecommunications and other information technology services in connection with the operation of our power plants. In addition, we have developed proprietary software systems, management techniques and other information technologies incorporating software licensed from third parties. We also rely on software systems owned and operated by third parties, such as ISOs and RTOs, to be functioning in order to be able to transmit the electricity produced by our power plants to our customers. It is possible that we, or a third party that we rely on, could incur interruptions from a loss of communications, hardware or software failures, a cyber attack or a breach of our information technology systems or technology, computer viruses or malware. We believe that we have positive relations with our vendors and maintain adequate anti-virus and malware software and controls; however, any interruptions to our arrangements with third parties, to our computing and communications infrastructure, or to our information systems or any of those operated by a third party that we rely on could significantly disrupt our business operations.
A cyber attack on our systems or networks that impairs our information technology systems could disrupt our business operations and result in loss of service to customers. We have a comprehensive cybersecurity program designed to protect and preserve the integrity of our information technology systems. We have experienced and expect to continue to experience actual or attempted cyber attacks on our information technology systems or networks; however, none of these actual or attempted cyber attacks has had a material effect on our operations or financial condition. Even when a security breach is detected, the full extent of the breach may not be determined for some time. The risk of a security breach or disruption, particularly through a cyber attack or a cyber intrusion, including by computer hackers, foreign governments and cyber terrorists, has magnified as the number, intensity and sophistication of attempted attacks and intrusions from around the world has increased. An increasing number of companies have disclosed security breaches of their information technology systems and networks, some of which have involved sophisticated and highly targeted attacks. We believe such incidents are likely to continue, and we are unable to predict the direct or indirect effect of any future attacks on our business.
Additionally, our retail subsidiaries require access to sensitive customer information in the ordinary course of business. If a significant data breach occurred, the reputation of our retail subsidiaries may be adversely affected, customer confidence may be diminished, and our retail subsidiaries may become subject to legal claims, any of which may contribute to the loss of customers and have a material adverse effect on our retail subsidiaries.
Capital Resources; Liquidity
We have substantial liquidity needs and could face liquidity pressure.
As of December 31, 2019, our consolidated debt outstanding was $11.7 billion, of which approximately $9.7 billion was outstanding under our Senior Unsecured Notes, First Lien Term Loans and First Lien Notes. In addition, we had $1,085 million issued in letters of credit and our pro rata share of unconsolidated subsidiary debt was approximately $150 million. Although we significantly extended our maturities during the last several years, we could face liquidity challenges as we continue to have substantial debt and substantial liquidity needs in the operation of our business. Our ability to make payments on our indebtedness, to meet margin requirements and to fund planned capital expenditures and development efforts will depend on our ability to generate cash in the future from our operations and our ability to access the capital markets. This, to a certain extent, is dependent upon industry conditions, as well as general economic, financial, competitive, legislative, regulatory and other factors that are beyond our control, as discussed further in “— Commercial Operations” above.
27
We also have exposure to many different financial institutions and counterparties including those under our Senior Unsecured Notes, First Lien Term Loans, First Lien Notes, Corporate Revolving Facility and other credit and financing arrangements as we routinely execute transactions in connection with our hedging and optimization activities, including brokers and dealers, commercial banks, investment banks and other institutions and industry participants. Many of these transactions expose us to credit risk in the event that any of our lenders or counterparties are unable to honor their commitments or otherwise default under a financing agreement. See additional discussion regarding our capital resources and liquidity in Item 7. “Management’s Discussion and Analysis of Financial Condition and Results of Operations — Liquidity and Capital Resources.”
Our indebtedness could adversely affect our financial health and limit our operations.
Our indebtedness has important consequences, including:
• | limiting our ability to borrow additional amounts for working capital, capital expenditures, debt service requirements, potential growth or other purposes; |
• | limiting our ability to use operating cash flows in other areas of our business because we must dedicate a substantial portion of these funds to service our debt; |
• | increasing our vulnerability to general adverse economic and industry conditions; |
• | limiting our ability to capitalize on business opportunities and to react to competitive pressures and adverse changes in governmental regulation; |
• | limiting our ability or increasing the costs to refinance indebtedness; and |
• | limiting our ability to enter into marketing, hedging and optimization activities by reducing the number of counterparties with whom we can transact as well as the volume and type of those transactions. |
We may be unable to obtain additional financing or access the credit and capital markets in the future at prices that are beneficial to us or at all.
If our available cash, including future cash flows generated from operations, is not sufficient in the near term to finance our operations, post collateral or satisfy our obligations as they become due, we may need to access the capital and credit markets. Our ability to arrange financing (including any extension or refinancing) and the cost of the financing is dependent upon numerous factors, including general economic and capital market conditions. Market disruptions such as those experienced in the U.S. and abroad in recent years, may increase our cost of borrowing or adversely affect our ability to access capital. Other factors include:
• | low credit ratings may prevent us from obtaining any material amount of additional debt financing; |
• | conditions in energy commodity markets; |
• | regulatory developments; |
• | credit availability from banks or other lenders for us and our industry peers; |
• | investor confidence in the industry and in us; |
• | the continued reliable operation of our current power plants; and |
• | provisions of tax, regulatory and securities laws that are conducive to raising capital. |
While we have utilized non-recourse or lease financing when appropriate, market conditions and other factors may prevent us from completing similar financings in the future. It is possible that we may be unable to obtain the financing required to develop, construct, acquire or expand power plants on terms satisfactory to us. We have financed our existing power plants using a variety of leveraged financing structures, including senior secured and unsecured indebtedness, construction financing, project financing, term loans and lease obligations. In the event of a default under a financing agreement which we do not cure, the lenders or lessors would generally have rights to the power plant and any related assets. In the event of foreclosure after a default, we may not be able to retain any interest in the power plant or other collateral supporting such financing. In addition, any such default or foreclosure may trigger cross default provisions in our other financing agreements.
Our Senior Unsecured Notes, First Lien Term Loans, First Lien Notes, Corporate Revolving Facility, CCFC Term Loan and our other debt instruments impose restrictions on us and any failure to comply with these restrictions could have a material adverse effect on our liquidity and our operations.
The restrictions under our Senior Unsecured Notes, First Lien Term Loans, First Lien Notes, Corporate Revolving Facility, CCFC Term Loan and other debt instruments could adversely affect us by limiting our ability to plan for or react to market
28
conditions or to meet our capital needs and, if we were unable to comply with these restrictions, could result in an event of default under these debt instruments. These restrictions require us to meet certain financial performance tests on a quarterly basis and limit or prohibit our ability, subject to certain exceptions to, among other things:
• | incur or guarantee additional first lien indebtedness up to certain consolidated net tangible asset ratios; |
• | enter into certain types of commodity hedge agreements that can be secured by first lien collateral; |
• | enter into sale and leaseback transactions; |
• | make certain investments; |
• | create or incur liens; |
• | consolidate or merge with or transfer all or substantially all of our assets to another entity, or allow substantially all of our subsidiaries to do so; |
• | lease, transfer or sell assets and use proceeds of permitted asset leases, transfers or sales; |
• | engage in certain business activities; and |
• | enter into certain transactions with our affiliates. |
Our Senior Unsecured Notes, First Lien Term Loans, First Lien Notes, Corporate Revolving Facility, CCFC Term Loan and our other debt instruments contain events of default customary for financings of their type, including a cross default to debt other than non-recourse project financing debt, a cross-acceleration to non-recourse project financing debt and certain change of control events. If we fail to comply with the covenants and are unable to obtain a waiver or amendment, or a default exists and is continuing under such debt, the lenders or the holders or trustee, as applicable, could give notice and declare outstanding borrowings and other obligations under such debt immediately due and payable.
Our ability to comply with these covenants may be affected by events beyond our control, and any material deviations from our forecasts could require us to seek waivers or amendments of covenants or alternative sources of financing or to reduce expenditures. We may not be able to obtain such waivers, amendments or alternative financing, or if obtainable, it could be on terms that are not acceptable to us. If we are unable to comply with the terms of our Senior Unsecured Notes, First Lien Term Loans, First Lien Notes, Corporate Revolving Facility, CCFC Term Loan and our other debt instruments, or if we fail to generate sufficient cash flows from operations, or if it becomes necessary to obtain such waivers, amendments or alternative financing, it could adversely affect our financial condition, results of operations and cash flows.
Our credit status is below investment grade, which may restrict our operations, increase our liquidity requirements and restrict financing opportunities.
There are a number of factors that rating agencies evaluate to arrive at credit ratings for us and our subsidiaries, including regulatory framework, ability to recover costs and earn returns, diversification, financial strength and liquidity. If one or more rating agencies downgrade us, borrowing costs would increase, the potential pool of investors and funding sources would likely decrease, and cash or letter of credit collateral demands may be triggered by the terms of a number of commodity contracts, leases and other agreements.
Our corporate and debt credit ratings are below investment grade. There is no assurance that our credit ratings will improve in the future, which may restrict the financing opportunities available to us or may increase the cost of any available financing. Our current credit rating has resulted in the requirement that we provide additional collateral in the form of letters of credit or cash for credit support obligations and may adversely affect our subsidiaries’ and our financial position and results of operations.
Certain of our obligations are required to be secured by letters of credit or cash, which increase our costs; if we are unable to provide such security it may restrict our ability to conduct our business.
Companies using derivatives, which include many commodity contracts, are subject to the inherent risks of such transactions. Consequently, many such companies, including us, may be required to post cash collateral for certain commodity transactions; and, the level of collateral will increase as a company increases its hedging activities. We use margin deposits, prepayments and letters of credit as credit support for commodity procurement and risk management activities. Future cash collateral requirements may increase based on the extent of our involvement in standard contracts and movements in commodity prices, and also based on our credit ratings and general perception of creditworthiness in this market. Certain of our financing arrangements for our power plants have required us to post letters of credit which are at risk of being drawn down in the event we, or the applicable subsidiary, default on our obligations.
29
Many of our collateral agreements require that letters of credit posted as collateral must be issued by a financial institution with a minimum credit rating of “A”. Currently the financial institutions that issue letters of credit under our Corporate Revolving Facility and other letter of credit facilities meet or exceed the minimum credit rating criteria. However, if one or more of these financial institutions is no longer able to meet the minimum credit rating criteria, then we could be required to post collateral funding from our cash and cash equivalents which could negatively affect our liquidity.
These letter of credit and cash collateral requirements increase our cost of doing business and could have an adverse effect on our overall liquidity, particularly if there was a call for a large amount of additional cash or letter of credit collateral due to an unexpectedly large movement in the market price of a commodity. As of December 31, 2019, we had $1,085 million issued in letters of credit under our Corporate Revolving Facility and other facilities, with $1,392 million remaining available for borrowing or for letter of credit support under our Corporate Revolving Facility. In addition, we have ratably secured our obligations under certain of our power and natural gas agreements that qualify as eligible commodity hedge agreements with the assets subject to liens under our First Lien Notes, First Lien Term Loans and Corporate Revolving Facility.
Additionally, changes in market regulations can increase the use of credit support and collateral.
We may not have sufficient liquidity to hedge market risks effectively.
We are exposed to market risks through our purchase and sale of power, capacity and related products, fuel, transmission services and emission allowances. These market risks include, among other risks, volatility arising from location and timing differences that may be associated with buying and transporting fuel, converting fuel into power and delivering the power to a buyer.
We undertake these activities through agreements with various counterparties, many of which require us to provide guarantees, offset or netting arrangements, letters of credit, a second lien on assets and/or cash collateral to protect the counterparties against the risk of our default or insolvency. The amount of such credit support that must be provided typically is based on the difference between the price of the commodity in a given contract and the market price of the commodity. Significant movements in market prices can result in our being required to provide cash collateral and letters of credit in very large amounts. The effectiveness of our strategy may be dependent on the amount of collateral available to enter into or maintain these contracts, and liquidity requirements may be greater than we anticipate or will be able to meet. Without a sufficient amount of working capital to post as collateral in support of performance guarantees or as a cash margin, we may not be able to manage price volatility effectively or to implement our strategy. An increase in the amount of letters of credit or cash collateral required to be provided to our counterparties may negatively affect our liquidity and financial condition.
Further, if any of our power plants experience unplanned outages, we may be required to procure replacement power at spot market prices in order to fulfill contractual commitments. Without adequate liquidity to meet margin and collateral requirements, we may be exposed to significant losses, may miss significant opportunities and may have increased exposure to the volatility of spot markets.
Our ability to receive future cash flows generated from the operation of our subsidiaries may be limited.
Almost all of our operations are conducted through our subsidiaries and other affiliates. As a result, we depend almost entirely upon their earnings and cash flows to service our indebtedness, post collateral and finance our ongoing operations. Certain of our project debt and other agreements restrict our ability to receive dividends and other distributions from our subsidiaries. Some of these limitations are subject to a number of significant exceptions (including exceptions permitting such restrictions in connection with certain subsidiary financings). Accordingly, the financing agreements of certain of our subsidiaries and other affiliates generally restrict their ability to pay dividends, make distributions or otherwise transfer funds to us prior to the payment of their other obligations, including their outstanding debt, operating expenses, lease payments and reserves or during the existence of a default.
We may utilize project financing, preferred equity and other types of subsidiary financing transactions when appropriate in the future, which could increase our debt and may be structurally senior to other debt such as our First Lien Term Loans, First Lien Notes and Corporate Revolving Facility.
Our ability and the ability of our subsidiaries to incur additional indebtedness are limited in some cases by existing indentures, debt instruments or other agreements. Our subsidiaries may incur additional construction/project financing indebtedness, issue preferred equity to finance the acquisition and development of new power plants and engage in certain types of non-recourse financings to the extent permitted by existing agreements, and may continue to do so in order to fund our ongoing operations. Any such newly incurred subsidiary preferred equity would be added to our current consolidated debt levels and would likely be structurally senior to our debt, which could also intensify the risks associated with our already existing leverage.
30
Our First Lien Term Loans, First Lien Notes and Corporate Revolving Facility are effectively subordinated to certain project indebtedness.
Certain of our subsidiaries and other affiliates are separate and distinct legal entities and, except in limited circumstances, have no obligation to pay any amounts due with respect to our indebtedness or indebtedness of other subsidiaries or affiliates, and do not guarantee the payment of interest on or principal of such indebtedness. In the event of our bankruptcy, liquidation or reorganization (or the bankruptcy, liquidation or reorganization of a subsidiary or affiliate), such subsidiaries’ or other affiliates’ creditors, including trade creditors and holders of debt issued by such subsidiaries or affiliates, will generally be entitled to payment of their claims from the assets of those subsidiaries or affiliates before any assets are made available for distribution to us or the holders of our indebtedness. As a result, holders of our indebtedness will be effectively subordinated to all present and future debts and other liabilities (including trade payables) of certain of our subsidiaries. As of December 31, 2019, our subsidiaries had approximately $967 million in debt from our CCFC subsidiary and approximately $1.0 billion in secured project financing from other subsidiaries, which are effectively senior to our First Lien Term Loans, First Lien Notes and Corporate Revolving Facility. We may incur additional project financing indebtedness in the future, which will be effectively senior to our other secured and unsecured debt.
Governmental Regulation
Federal tax incentives and regulations, existing and proposed state RPS and energy efficiency standards, as well as economic support for renewable sources of power under federal or state legislation could adversely affect our operations.
Renewables have the ability to take market share from us and to lower overall wholesale power prices which could negatively affect us. In December 2015, the Consolidated Appropriations Act extended the production tax credit for wind through the end of 2016 with gradual decreases thereafter until the tax credit was to expire completely in 2019 and extended the 30% investment tax credit for solar through the end of 2019 with gradual decreases through 2021 after which the investment tax credit declines to 10%. On December 20, 2019, President Trump signed the federal government budget appropriation bill which included a one year extension of the production tax credit for wind, allowing wind facilities that begin construction in 2020 to be eligible for a 60% production tax credit. California has a RPS in effect and recently enacted legislation requiring implementation of a 100% CO2-free electricity requirement by 2045. A number of additional states, including Maine, New York, Texas and Wisconsin, have an array of different RPS in place. Existing state-specific RPS requirements may change due to regulatory and/or legislative initiatives, and other states may consider implementing enforceable RPS in the future. A more robust RPS in states in which we are active, coupled with federal tax incentives, would likely initially drive up the number of wind and solar resources, increasing power supply to various markets which could negatively affect the dispatch of our natural gas-fired power plants, primarily in Texas and California.
Similarly, several states have energy efficiency initiatives in place while others are considering imposing them. Improved energy efficiency when mandated by law or promoted by government sponsored incentives can decrease demand for power which could negatively affect the dispatch of our natural gas-fired power plants.
Increased oversight and investigation by the CFTC relating to derivative transactions, as well as certain financial institutions, could have an adverse effect on our ability to hedge risks associated with our business.
The CFTC has regulatory oversight of the futures markets, including trading on NYMEX for energy, and licensed futures professionals such as brokers, clearing members and large traders. In connection with its oversight of the futures markets and NYMEX, the CFTC regularly investigates market irregularities and potential manipulation of those markets. Recent laws also give the CFTC certain powers with respect to broker-type markets referred to as “exempt commercial markets” or ECMs, including the Intercontinental Exchange. The CFTC monitors activities in the OTC, ECM and physical markets that may be undertaken for the purpose of influencing futures prices. With respect to ECMs, the CFTC exercises only light-handed regulation primarily related to trade reporting, price dissemination and record retention (including retention of fraudulent claims and allegations).
Changes in the regulation of the power markets in which we operate could negatively affect us.
We have a significant presence in the major competitive power markets of California, Texas and the Northeast and Mid-Atlantic regions of the U.S. While these markets are largely deregulated, they continue to evolve. Existing regulations within the markets in which we operate may be revised or reinterpreted and new laws or regulations may be issued. We cannot predict the future development of regulation or legislation nor the ultimate effect such changes in these markets could have on our business; however, we could be negatively affected.
31
Additionally, state PUCs have the ability to set policies that either enhance or limit customer choice. Each state that has adopted retail electric choice creates its own laws, regulations and compliance requirements which evolve over time and could impact our ability to maintain or expand retail operations and negatively affect our retail business.
State legislative and regulatory action could adversely affect our competitive position and business.
Certain states have taken or are considering taking anticompetitive actions by subsidizing or otherwise providing economic support to existing, uneconomic power plants in a manner that could have an adverse effect on the deregulated power markets. In addition, certain states in which we have retail operations are taking actions which we believe limit customer choice as well as other actions that we believe are anticompetitive and could negatively affect our retail operations. We are actively participating in many of the legislative, regulatory and judicial processes challenging these actions at the state and federal levels. If these anticompetitive actions are ultimately upheld and implemented, they could adversely affect capacity and energy prices in the deregulated electricity markets or impede our ability to maintain or expand our retail operations which in turn could have a material adverse effect on our business prospects and financial results.
Existing and future anticipated GHG/Carbon and other environmental regulations could cause us to incur significant costs and adversely affect our operations generally or in a particular quarter when such costs are incurred.
Environmental laws and regulations have generally become more stringent over time, and this trend is likely to continue. In particular, there is a potential that carbon taxes or limits on carbon, CO2 and other GHG emissions could be implemented at the federal or expanded at the state or regional levels. We continue to monitor and actively participate in initiatives where we anticipate a material effect on our business.
Currently, ten states in the Northeast are required to comply with a Cap-and-Trade program, RGGI, to regulate CO2 emissions from power plants. California has implemented AB 32 which places a statewide cap on GHG emissions and requires the state to return to 1990 emission levels by 2020. In December 2010, the CARB adopted a regulation establishing a GHG Cap-and- Trade program which is in effect for electric utilities and other “major industrial sources,” and in 2015 for certain other GHG sources including transportation fuels and natural gas distribution. The Massachusetts Department of Environmental Protection issued a final rule in August 2017 that imposes new GHG limits on power plants and other sources.
Environmental regulations could also affect the availability and price of natural gas used in our generation facilities. Permitting of new natural gas transportation pipelines has become more difficult in some regions such as the Northeast, and restrictions on natural gas production have been implemented or proposed in some locations.
We are subject to other complex governmental regulation which could adversely affect our operations.
Generally, in the U.S., we are subject to regulation by the FERC regarding the terms and conditions of wholesale service and the sale and transportation of natural gas, as well as by state agencies regarding physical aspects of the power plants. The majority of our generation is sold at market prices under the market-based rate authority granted by the FERC. If certain conditions are not met, FERC has the authority to withhold or rescind market-based rate authority and require sales to be made based on cost-of-service rates. A loss of our market-based rate authority could have a materially negative effect on our generation business. FERC could also impose fines or other restrictions or requirements on us under certain circumstances.
The construction and operation of power plants require numerous permits, approvals and certificates from the appropriate foreign, federal, state and local governmental agencies, as well as compliance with numerous environmental laws and regulations of federal, state and local authorities. We could also be required to install expensive pollution control measures or limit or cease activities, including the retirement of certain generating plants, based on these regulations. Should we fail to comply with any environmental requirements that apply to power plant construction or operations, we could be subject to administrative, civil and/or criminal liability and fines, and regulatory agencies could take other actions to curtail our operations.
Furthermore, certain environmental laws impose strict, joint and several liability for costs required to clean up and restore sites where hazardous substances have been disposed or otherwise released. We are generally responsible for all liabilities associated with the environmental condition of our power plants, including any soil or groundwater contamination that may be present, regardless of when the liabilities arose and whether the liabilities are known or unknown, or arose from the activities of predecessors or third parties.
32
If we were deemed to have market power in certain markets as a result of common ownership by certain significant investors, we could lose FERC authorization to sell power at wholesale at market-based rates in such markets or be required to engage in mitigation in those markets.
Certain of our significant ownership groups own power generating assets, or own significant equity interests in entities with power generating assets, in markets where we currently own power plants. We could be determined to have market power if these existing significant owners acquire additional significant ownership or equity interest in other entities with power generating assets in the same markets where we generate and sell power.
If the FERC makes the determination that we have market power, the FERC could, among other things, revoke market-based rate authority for the affected market-based companies or order them to mitigate that market power. If market-based rate authority was revoked for any of our market-based rate companies, those companies would be required to make wholesale sales of power based on cost-of-service rates, which could negatively affect their revenues. If we are required to mitigate market power, we could be required to sell certain power plants in regions where we are determined to have market power. A loss of our market-based rate authority or required sales of power plants, particularly if it affected several of our power plants or was in a significant market, could have a material negative effect on our financial condition, results of operations and cash flows.
Item 1B. | Unresolved Staff Comments |
None.
Item 2. | Properties |
Our principal offices are located in Houston, Texas with the principal offices of our retail affiliates located in Houston, Texas and San Diego, California.
We either lease or own the land upon which our power plants are built. We believe that our properties are adequate for our current operations. A description of our power plants is included under Item 1. “Business — Description of Our Power Plants.”
Item 3. | Legal Proceedings |
See Note 16 of the Notes to Consolidated Financial Statements for a description of our legal proceedings.
Item 4. | Mine Safety Disclosures |
Not applicable.
33
PART II
Item 5. | Market for Registrant’s Common Equity, Related Stockholder Matters and Issuer Purchases of Equity Securities |
At December 31, 2019, all of the outstanding shares of Calpine Corporation common stock are held by our parent, CPN Management.
Item 6. Selected Financial Data
SELECTED CONSOLIDATED FINANCIAL DATA
Years Ended December 31, | |||||||||||||||||||
2019 | 2018 | 2017 | 2016 | 2015 | |||||||||||||||
(in millions) | |||||||||||||||||||
Statement of Operations data: | |||||||||||||||||||
Operating revenues | $ | 10,072 | $ | 9,512 | $ | 8,752 | $ | 6,716 | $ | 6,472 | |||||||||
Net income (loss) attributable to Calpine | $ | 770 | $ | 10 | $ | (339 | ) | $ | 92 | $ | 235 | ||||||||
Balance Sheet data: | |||||||||||||||||||
Total assets | $ | 16,649 | $ | 16,062 | $ | 16,453 | $ | 17,493 | $ | 16,849 | |||||||||
Short-term debt and finance lease obligations | $ | 1,268 | $ | 637 | $ | 225 | $ | 748 | $ | 221 | |||||||||
Long-term debt and finance lease obligations | $ | 10,438 | $ | 10,148 | $ | 11,180 | $ | 11,431 | $ | 11,716 | |||||||||
34
Item 7. | Management’s Discussion and Analysis of Financial Condition and Results of Operations |
Forward-Looking Information
This Management’s Discussion and Analysis of Financial Condition and Results of Operations should be read in conjunction with our accompanying Consolidated Financial Statements and related Notes. See the cautionary statement regarding forward-looking statements at the beginning of this Report for a description of important factors that could cause actual results to differ from expected results. See also Item 1A. “Risk Factors.”
INTRODUCTION AND OVERVIEW
We are a power generation company engaged in the ownership and operation of primarily natural gas-fired and geothermal power plants in North America. We have a significant presence in major competitive wholesale and retail power markets in California, Texas and the Northeast and Mid-Atlantic regions of the U.S. We sell power, steam, capacity, renewable energy credits and ancillary services to our customers, which include utilities, independent electric system operators and industrial companies, retail power providers, municipalities, CCAs and other governmental entities, power marketers as well as retail commercial, industrial, governmental and residential customers. We continue to focus on providing products and services that are beneficial to our wholesale and retail customers. We purchase primarily natural gas and some fuel oil as fuel for our power plants and engage in related natural gas transportation and storage transactions. We also purchase power and related products for sale to our customers and purchase electric transmission rights to deliver power to our customers. Additionally, consistent with our Risk Management Policy, we enter into natural gas, power, environmental product, fuel oil and other physical and financial commodity contracts to hedge certain business risks and optimize our portfolio of power plants.
We assess our wholesale business on a regional basis due to the effect on our financial performance of the differing characteristics of these regions, particularly with respect to competition, regulation and other factors affecting supply and demand. Our geographic reportable segments for our wholesale business are West (including geothermal), Texas and East (including Canada) and we have a separate reportable segment for our retail business.
35
RESULTS OF OPERATIONS FOR THE YEARS ENDED DECEMBER 31, 2019 AND 2018
Below are our results of operations for the year ended December 31, 2019, as compared to the same period in 2018 (in millions, except for percentages and operating performance metrics). A discussion regarding our results of operations for the year ended December 31, 2018, as compared to the same period in 2017 can be found under Item 7 of Part II “Management’s Discussion and Analysis — Results of Operations for the Years Ended December 31, 2018 and 2017” in our Annual Report on Form 10-K for the fiscal year ended December 31, 2018, filed with the SEC on March 28, 2019, which is available on our website at www.calpine.com and on the SEC’s website at www.sec.gov. In the comparative tables below, increases in revenue/income or decreases in expense (favorable variances) are shown without brackets while decreases in revenue/income or increases in expense (unfavorable variances) are shown with brackets.
2019 | 2018 | Change | % Change | |||||||||||
Operating revenues: | ||||||||||||||
Commodity revenue | $ | 9,437 | $ | 9,865 | $ | (428 | ) | (4 | ) | |||||
Mark-to-market gain (loss) | 618 | (373 | ) | 991 | # | |||||||||
Other revenue | 17 | 20 | (3 | ) | (15 | ) | ||||||||
Operating revenues | 10,072 | 9,512 | 560 | 6 | ||||||||||
Operating expenses: | ||||||||||||||
Fuel and purchased energy expense: | ||||||||||||||
Commodity expense | 6,164 | 6,914 | 750 | 11 | ||||||||||
Mark-to-market (gain) loss | 340 | (165 | ) | (505 | ) | # | ||||||||
Fuel and purchased energy expense | 6,504 | 6,749 | 245 | 4 | ||||||||||
Operating and maintenance expense | 1,001 | 1,020 | 19 | 2 | ||||||||||
Depreciation and amortization expense | 694 | 739 | 45 | 6 | ||||||||||
General and other administrative expense | 150 | 158 | 8 | 5 | ||||||||||
Other operating expenses | 79 | 98 | 19 | 19 | ||||||||||
Total operating expenses | 8,428 | 8,764 | 336 | 4 | ||||||||||
Impairment losses | 84 | 10 | (74 | ) | # | |||||||||
(Gain) on sale of assets, net | (10 | ) | — | 10 | # | |||||||||
(Income) from unconsolidated subsidiaries | (22 | ) | (24 | ) | (2 | ) | (8 | ) | ||||||
Income from operations | 1,592 | 762 | 830 | # | ||||||||||
Interest expense | 609 | 617 | 8 | 1 | ||||||||||
(Gain) loss on extinguishment of debt | 58 | (28 | ) | (86 | ) | # | ||||||||
Other (income) expense, net | 37 | 81 | 44 | 54 | ||||||||||
Income before income taxes | 888 | 92 | 796 | # | ||||||||||
Income tax expense | 98 | 64 | (34 | ) | (53 | ) | ||||||||
Net income | 790 | 28 | 762 | # | ||||||||||
Net income attributable to the noncontrolling interest | (20 | ) | (18 | ) | (2 | ) | (11 | ) | ||||||
Net income attributable to Calpine | $ | 770 | $ | 10 | $ | 760 | # | |||||||
2019 | 2018 | Change | % Change | ||||||||
Operating Performance Metrics: | |||||||||||
MWh generated (in thousands)(1)(2) | 100,845 | 95,732 | 5,113 | 5 | |||||||
Average availability(2) | 86.7 | % | 87.6 | % | (0.9 | )% | (1 | ) | |||
Average total MW in operation(1) | 25,399 | 25,120 | 279 | 1 | |||||||
Average capacity factor, excluding peakers | 50.0 | % | 46.9 | % | 3.1 | % | 7 | ||||
Steam Adjusted Heat Rate(2) | 7,326 | 7,353 | 27 | — | |||||||
36
# | Variance of 100% or greater |
(1) | Represents generation and capacity from power plants that we both consolidate and operate. See “— Description of Our Power Plants – Table of Operating Power Plants and Project Under Construction” for our total equity generation and capacities. |
(2) | Generation, average availability and Steam Adjusted Heat Rate exclude power plants and units that are inactive. |
We evaluate our Commodity revenue and Commodity expense on a collective basis because the price of power and natural gas tend to move together as the price for power is generally determined by the variable operating cost of the next marginal generator to be dispatched to meet demand. The spread between our Commodity revenue and Commodity expense represents a significant portion of our Commodity Margin. Our financial performance is correlated to how we maximize our Commodity Margin through management of our portfolio of power plants, as well as our hedging and optimization activities. See additional segment discussion in “Commodity Margin by Segment.”
Commodity revenue, net of Commodity expense, increased $322 million for the year ended December 31, 2019, compared to the year ended December 31, 2018, primarily due to (favorable variances are shown without brackets while unfavorable variances are shown with brackets):
(in millions) | ||||
$ | 392 | Higher energy margins primarily associated with higher market Spark Spreads in Texas during the third quarter of 2019 compared to the same period in 2018, higher contribution from both wholesale and retail hedging activities and the commencement of commercial operations at our 828 MW York 2 Energy Center in March 2019. The increase was partially offset by the sale of our Garrison and RockGen Energy Centers on July 10, 2019 and a gain associated with the cancellation of a PPA recorded in the first quarter of 2018 with no similar activity in 2019 | ||
(80 | ) | Lower PJM and ISO-NE regulatory capacity revenue in our East segment | ||
(31 | ) | The sale of environmental credits in our Texas segment during the first quarter of 2018 with no similar activity in 2019 | ||
41 | Period-over-period change in contract amortization, lease levelization relating to tolling contracts and other(1) | |||
$ | 322 | |||
__________
(1) | Commodity Margin excludes amortization expense related to contracts recorded at fair value, non-cash GAAP-related adjustments to levelize revenues from tolling agreements, Commodity revenue and Commodity expense attributable to the noncontrolling interest and other unusual or non-recurring items. |
Mark-to-market gain/loss, net from hedging our future generation, fuel supply requirements and retail activities had a favorable variance of $486 million primarily driven by the effect of lower forward power prices and more favorable hedge levels in our Texas segment, partially offset by lower forward natural gas prices during the year ended December 31, 2019 compared to 2018.
Operating and maintenance expense decreased by $19 million for the year ended December 31, 2019 compared to the year ended December 31, 2018 primarily driven by a $32 million decrease associated with the acceleration of stock-based compensation expense during the first quarter of 2018 in connection with the consummation of the Merger. We no longer incur stock-based compensation expense subsequent to the consummation of the Merger. The decrease is partially offset by a $12 million year-over-year increase in normal, recurring operating and maintenance expense, after excluding the effect of power plant portfolio changes, primarily driven by higher performance-based compensation costs given our strong financial and operating results in 2019 and an increase in variable operating costs driven by a 5% year-over-year increase in generation.
Depreciation and amortization expense decreased by $45 million for the year ended December 31, 2019 compared to the year ended December 31, 2018 primarily due to the sale of our Garrison and RockGen Energy Centers during 2019 with no comparable sales in 2018 and the change in estimated useful lives for our componentized balance of plant parts and rotable parts initiated in 2018.
General and other administrative expense decreased by $8 million for the year ended December 31, 2019 compared to year ended December 31, 2018 primarily resulting from the acceleration of stock-based compensation expense during the first quarter of 2018 in connection with the consummation of the Merger. The decrease was partially offset primarily by higher employee-related costs resulting from higher performance-based compensation given our strong financial and operating results in 2019.
Other operating expenses decreased by $19 million for the year ended December 31, 2019 compared to the year ended December 31, 2018 primarily due to Merger-related costs associated with legal, investment banking and other professional fees
37
in 2018, partially offset by the write-off of unamortized balances associated with the termination of a PPA during the first quarter of 2018.
During the year ended December 31, 2019, we recorded impairment losses of approximately $84 million comprised of a $55 million impairment related to the sale of our Garrison and RockGen Energy Centers and $29 million in impairment losses to adjust the carrying value of spare turbine equipment and certain capitalized costs related to wind development projects to fair value. See Note 5 of the Notes to Consolidated Financial Statements for further information related to the sale of our Garrison and RockGen Energy Centers.
During the year ended December 31, 2019, we recorded a (gain) on sale of assets, net of $10 million primarily related to the sale of our 50% interest in Whitby with no comparable activity during 2018.
(Gain) loss on extinguishment of debt had an unfavorable variance of $86 million for the year ended December 31, 2019 compared to the year ended December 31, 2018. The unfavorable change is driven primarily by the recognition of $58 million in losses in connection with debt refinancing and repricing activities during 2019 compared to a gain of $35 million recognized during the year ended December 31, 2018 associated with the repurchase of a portion of our Senior Unsecured Notes during the fourth quarter of 2018.
Other (income) expense, net decreased by $44 million for the year ended December 31, 2019 compared to the year ended December 31, 2018 primarily due to shareholder settlement costs associated with the Merger recorded during the second quarter of 2018. The decrease was partially offset by the net effect of a settlement agreement with GE executed in February 2019 which, among other things, terminated our call option and GE’s put option related to the Inland Empire Energy Center. See Note 7 of the Notes to Consolidated Financial Statements for further information related to the Inland Empire Energy Center.
During the year ended December 31, 2019, we recorded an income tax expense of $98 million compared to $64 million for the year ended December 31, 2018. The unfavorable year-over-year change primarily resulted from an increase in state and foreign income taxes resulting from higher income in 2019 and higher income tax expense associated with an increase in our valuation allowance related to our deferred tax assets in 2019. The unfavorable year-over-year change was partially offset by the write-off of foreign NOLs as a result of the Merger in 2018.
38
COMMODITY MARGIN BY SEGMENT
We use Commodity Margin to assess reportable segment performance. Commodity Margin includes revenues recognized on our wholesale and retail power sales activity, electric capacity sales, REC sales, steam sales, realized settlements associated with our marketing, hedging, optimization and trading activity less costs from our fuel and purchased energy expenses, commodity transmission and transportation expenses, environmental compliance expenses and ancillary retail expense. We believe that Commodity Margin is a useful tool for assessing the performance of our core operations and is a key operational measure of profit reviewed by our chief operating decision maker. See Note 18 of the Notes to Consolidated Financial Statements for a reconciliation of Commodity Margin to income (loss) from operations by segment.
Commodity Margin by Segment for the Years Ended December 31, 2019 and 2018
The following tables show our Commodity Margin by segment and related operating performance metrics by regional segment for our wholesale business for the years ended December 31, 2019 and 2018 (exclusive of the noncontrolling interest). A discussion of our Commodity Margin by segment for the year ended December 31, 2018, as compared to the same period in 2017 can be found under Item 7 of Part II “Management’s Discussion and Analysis — Commodity Margin by Segment for the Years Ended December 31, 2018 and 2017” in our Annual Report on Form 10-K for the fiscal year ended December 31, 2018, filed with the SEC on March 28, 2019, which is available on our website at www.calpine.com and on the SEC’s website at www.sec.gov. In the comparative tables below, favorable variances are shown without brackets while unfavorable variances are shown with brackets. The MWh generated by regional segment below represent generation from power plants that we both consolidate and operate. Generation, average availability and Steam Adjusted Heat Rate exclude power plants and units that are inactive.
West: | 2019 | 2018 | Change | % Change | ||||||||||
Commodity Margin (in millions) | $ | 1,151 | $ | 1,060 | $ | 91 | 9 | |||||||
Commodity Margin per MWh generated | $ | 42.71 | $ | 41.99 | $ | 0.72 | 2 | |||||||
MWh generated (in thousands) | 26,948 | 25,247 | 1,701 | 7 | ||||||||||
Average availability | 87.5 | % | 88.5 | % | (1.0 | )% | (1 | ) | ||||||
Average total MW in operation | 7,431 | 7,425 | 6 | — | ||||||||||
Average capacity factor, excluding peakers | 44.3 | % | 41.4 | % | 2.9 | % | 7 | |||||||
Steam Adjusted Heat Rate | 7,364 | 7,347 | (17 | ) | — | |||||||||
West — Commodity Margin in our West segment increased by $91 million, or 9%, for the year ended December 31, 2019 compared to 2018, primarily due to higher resource adequacy revenues and higher contribution from hedging activities. These improvements were partially offset by lower revenue from reliability must run contracts in 2019 compared to 2018 and a third-party transmission outage at our Geysers Assets associated with a wildfire during the fourth quarter of 2019. Generation increased 7% primarily due to our South Point Energy Center operations during the second half of 2019 partially offset by lower generation resulting from the transmission outage at our Geysers Assets in the fourth quarter of 2019.
Texas: | 2019 | 2018 | Change | % Change | ||||||||||
Commodity Margin (in millions) | $ | 857 | $ | 646 | $ | 211 | 33 | |||||||
Commodity Margin per MWh generated | $ | 18.48 | $ | 14.46 | $ | 4.02 | 28 | |||||||
MWh generated (in thousands) | 46,372 | 44,661 | 1,711 | 4 | ||||||||||
Average availability | 84.1 | % | 88.8 | % | (4.7 | )% | (5 | ) | ||||||
Average total MW in operation | 8,856 | 8,850 | 6 | — | ||||||||||
Average capacity factor, excluding peakers | 59.8 | % | 57.6 | % | 2.2 | % | 4 | |||||||
Steam Adjusted Heat Rate | 7,156 | 7,152 | (4 | ) | — | |||||||||
Texas — Commodity Margin in our Texas segment increased by $211 million, or 33%, for the year ended December 31, 2019 compared to 2018, primarily due to higher market Spark Spreads during August and September 2019 compared to the same months in 2018. These improvements were partially offset by higher revenue in the first quarter of 2018 associated with the sale of environmental credits with no similar activity in 2019.
39
East: | 2019 | 2018 | Change | % Change | ||||||||||
Commodity Margin (in millions) | $ | 924 | $ | 970 | $ | (46 | ) | (5 | ) | |||||
Commodity Margin per MWh generated | $ | 33.57 | $ | 37.56 | $ | (3.99 | ) | (11 | ) | |||||
MWh generated (in thousands) | 27,525 | 25,824 | 1,701 | 7 | ||||||||||
Average availability | 88.6 | % | 85.5 | % | 3.1 | % | 4 | |||||||
Average total MW in operation | 9,112 | 8,845 | 267 | 3 | ||||||||||
Average capacity factor, excluding peakers | 43.2 | % | 42.5 | % | 0.7 | % | 2 | |||||||
Steam Adjusted Heat Rate | 7,592 | 7,708 | 116 | 2 | ||||||||||
East — Commodity Margin in our East segment decreased by $46 million, or 5%, for the year ended December 31, 2019 compared to 2018, primarily due to lower regulatory capacity revenue in PJM and ISO-NE, the sale of our Garrison and RockGen Energy Centers on July 10, 2019 and a gain associated with the cancellation of a PPA recorded during the first quarter of 2018 with no similar activity in 2019. These factors were partially offset by higher contribution from hedging activities and the commencement of commercial operations at our 828 MW York 2 Energy Center in March 2019.
Retail: | 2019 | 2018 | Change | % Change | ||||||||||
Commodity Margin (in millions) | $ | 382 | $ | 357 | $ | 25 | 7 | |||||||
Retail — Commodity Margin in our retail segment increased by $25 million, or 7%, for the year ended December 31, 2019 compared to 2018, primarily due to increased contribution from gas supply hedging activity associated with our retail gas business and lower costs.
40
LIQUIDITY AND CAPITAL RESOURCES
We maintain a strong focus on liquidity. We manage our liquidity to help provide access to sufficient funding to meet our business needs and financial obligations throughout business cycles.
Our business is capital intensive. Our ability to successfully implement our strategy is dependent on the continued availability of capital on attractive terms. In addition, our ability to successfully operate our business is dependent on maintaining sufficient liquidity. We believe that we have adequate resources from a combination of cash and cash equivalents on hand and cash expected to be generated from future operations to continue to meet our obligations as they become due.
Liquidity
The following table provides a summary of our liquidity position at December 31, 2019 and 2018 (in millions):
2019 | 2018 | ||||||
Cash and cash equivalents, corporate(1) | $ | 1,072 | $ | 141 | |||
Cash and cash equivalents, non-corporate(2) | 59 | 64 | |||||
Total cash and cash equivalents | 1,131 | 205 | |||||
Restricted cash(2) | 345 | 201 | |||||
Corporate Revolving Facility availability(3) | 1,392 | 966 | |||||
CDHI revolving facility availability(4) | 1 | 49 | |||||
Other facilities availability(5) | 3 | 7 | |||||
Total current liquidity availability(6) | $ | 2,872 | $ | 1,428 | |||
____________
(1) | Our ability to use corporate cash and cash equivalents is unrestricted. On January 21, 2020, we used the remaining cash on hand from the issuance of our 2028 First Lien Notes and 2028 Senior Unsecured Notes to redeem the remaining approximately $1,052 million aggregate principal amount of our 2022 and 2024 First Lien Notes and 2023 Senior Unsecured Notes. See Note 8 of the Notes to Consolidated Financial Statements for further information related to the redemption of our 2022 and 2024 First Lien Notes and 2023 Senior Unsecured Notes. |
(2) | See Note 2 of the Notes to Consolidated Financial Statements for a description of the restrictions on our use of non-corporate cash and cash equivalents and restricted cash. |
(3) | Our ability to use availability under our Corporate Revolving Facility is unrestricted. On April 5, 2019, we amended our Corporate Revolving Facility to increase the capacity by approximately $330 million from $1.69 billion to approximately $2.02 billion. On August 12, 2019, we amended our Corporate Revolving Facility to extend the maturity of $150 million in revolving commitments from June 27, 2020 to March 8, 2023, and to reduce the commitments outstanding by $20 million to approximately $2.0 billion. The entire Corporate Revolving Facility matures on March 8, 2023. See “Letter of Credit Facilities” below for amounts issued under letters of credit at December 31, 2019 associated with our Corporate Revolving Facility. |
(4) | Our CDHI revolving facility is restricted to support certain obligations under PPAs and power transmission and natural gas transportation agreements as well as fund the construction of our Washington Parish Energy Center. Pursuant to the terms and conditions of the CDHI credit agreement, the capacity under the CDHI revolving facility was reduced to $125 million on June 28, 2019. The decrease in capacity did not have a material effect on our liquidity as alternative sources of liquidity are available to us. |
(5) | We have three unsecured letter of credit facilities with two third-party financial institutions totaling approximately $300 million at December 31, 2019. |
(6) | Includes $127 million and $52 million of margin deposits posted with us by our counterparties at December 31, 2019 and 2018, respectively. See Note 11 of the Notes to Consolidated Financial Statements for further information related to our collateral. |
Our principal source for future liquidity is cash flows generated from our operations. We believe that cash on hand and expected future cash flows from operations will be sufficient to meet our liquidity needs for our operations, both in the near and longer term. See “Cash Flow Activities” below for a further discussion of our change in cash, cash equivalents and restricted cash.
Our principal uses of liquidity and capital resources, outside of those required for our operations, include, but are not limited to, collateral requirements to support our commercial hedging and optimization activities, debt service obligations, including principal and interest payments, capital expenditures for construction, project development and other growth initiatives and opportunistically repaying debt to manage our balance sheet.
41
Cash Management — We manage our cash in accordance with our cash management system subject to the requirements of our Corporate Revolving Facility and requirements under certain of our project debt and lease agreements or by regulatory agencies. Our cash and cash equivalents, as well as our restricted cash balances, are invested in money market funds that are not FDIC insured. We place our cash, cash equivalents and restricted cash in what we believe to be creditworthy financial institutions.
During the year ended December 31, 2019, our board of directors approved special cash dividends of $400 million and $750 million, which were paid to our parent, CPN Management, on July 18, 2019 and November 20, 2019, respectively.
Future cash dividends, if any, may be authorized at the discretion of our Board of Directors and will depend upon, among other things, our future operations and earnings, capital requirements, asset sales, general financial condition, contractual and financing restrictions and such other factors as our Board of Directors may deem relevant.
Liquidity Sensitivity
Significant changes in commodity prices and Market Heat Rates can affect our liquidity as we use margin deposits, cash prepayments and letters of credit as credit support (collateral) with and from our counterparties for commodity procurement and risk management activities. We estimate that as of December 31, 2019, a three standard deviation shift in collateral exposure based on commodity market price changes for the previous 12 months applied to our current portfolio of margined transactions would result in an increase in collateral posted of approximately $269 million. This amount is not necessarily indicative of the actual amounts that could be required, which may be higher or lower than the amounts estimated above, and also exclude any correlation between the changes in natural gas prices and Market Heat Rates that may occur concurrently. These sensitivities will change as new contracts or hedging activities are executed.
In order to effectively manage our future Commodity Margin, we have economically hedged a portion of our expected generation and natural gas portfolio as well as retail load supply obligations, where appropriate, mostly through power and natural gas forward physical and financial transactions including retail power sales; however, we currently remain susceptible to significant price movements for 2020 and beyond. In addition to the price of natural gas, our Commodity Margin is highly dependent on other factors such as:
• | the level of Market Heat Rates; |
• | our continued ability to successfully hedge our Commodity Margin; |
• | changes in U.S. macroeconomic conditions; |
• | maintaining acceptable availability levels for our fleet; |
• | the effect of current and pending environmental regulations in the markets in which we participate; |
• | improving the efficiency and profitability of our operations; |
• | increasing future contractual cash flows; and |
• | our significant counterparties performing under their contracts with us. |
Additionally, scheduled outages related to the life cycle of our power plant fleet in addition to unscheduled outages may result in maintenance expenditures that are disproportionate in differing periods. In order to manage such liquidity requirements, we maintain additional liquidity availability in the form of our Corporate Revolving Facility (noted in the table above), letters of credit and the ability to issue first priority liens for collateral support. It is difficult to predict future developments and the amount of credit support that we may need to provide should such conditions occur, we experience another economic recession or energy commodity prices increase significantly.
Letter of Credit Facilities
The table below represents amounts issued under our letter of credit facilities at December 31, 2019 and 2018 (in millions):
2019 | 2018 | ||||||
Corporate Revolving Facility(1) | $ | 604 | $ | 693 | |||
CDHI(2) | 3 | 251 | |||||
Various project financing facilities | 184 | 228 | |||||
Other corporate facilities(3) | 294 | 193 | |||||
Total | $ | 1,085 | $ | 1,365 | |||
____________
42
(1) | The Corporate Revolving Facility represents our primary revolving facility. On April 5, 2019, we amended our Corporate Revolving Facility to increase the capacity by approximately $330 million from $1.69 billion to approximately $2.02 billion. On August 12, 2019, we amended our Corporate Revolving Facility to extend the maturity of $150 million in revolving commitments from June 27, 2020 to March 8, 2023, and to reduce the commitments outstanding by $20 million to approximately $2.0 billion. The entire Corporate Revolving Facility matures on March 8, 2023. |
(2) | Pursuant to the terms and conditions of the CDHI credit agreement, the capacity under the CDHI revolving facility was reduced to $125 million on June 28, 2019. The decrease in capacity did not have a material effect on our liquidity as alternative sources of liquidity are available to us. |
(3) | We have three unsecured letter of credit facilities with two third-party financial institutions totaling approximately $300 million at December 31, 2019. One of the facilities, with commitments totaling $150 million, matures partially in June 2020 and fully by December 2020. The other two facilities, with commitments totaling $50 million and approximately $100 million, mature in December 2023 and December 2021, respectively. |
Major Maintenance and Capital Spending
Our major maintenance and capital spending remains an important part of our business. Our expected expenditures for 2020 are as follows (in millions):
2020 | |||
Major maintenance expense | $ | 140 | |
Capital maintenance expenditures | 330 | ||
Growth related capital expenditures | 130 | ||
Total major maintenance expense and capital spending | $ | 600 | |
California Wildfire
A wildfire known as the Kincade Fire began on October 23, 2019 in Sonoma County, California where our Geysers Assets are located and burned on parts of the 45 square miles that make up our Geysers Assets properties and leasehold. Operating equipment at our Geysers Assets sustained limited damage which we are in the process of repairing. The fire caused extensive damage to third-party property in the region. Transmission service owned and operated by PG&E was cut due to the fire and high wind conditions, forcing us to suspend operations. Approximately two-thirds of operations have resumed and, while some repairs continue at the Geysers Assets, we are ready to operate at full capacity. We expect to resume full operations as PG&E completes repairs to its transmission system over the next several weeks.
Prior to the fire, in response to forecasted severe wind conditions and PG&E’s Public Safety Power Shutoff (“PSPS”), personnel at our Geysers Assets followed fire prevention protocols, including de-energizing the local power system that supports our Geysers Assets operations. We do not believe our facilities caused or contributed to the start of the fire, nor do we believe we have any liability for damages caused by the fire. Notably, PG&E has filed a notice with the CPUC that it was notified by the California Department of Forestry and Fire Protection (“CALFIRE”) that equipment on one of its transmission towers was observed to be broken at the location that CALFIRE is investigating as the fire’s potential point of origin. The ultimate liability for the fire cannot presently be determined, nor can the liability for any parties that could potentially result from a negative outcome be reasonably estimated.
Our Geysers Assets remain a critical part of the California plan to achieve a low-carbon future. In our view, our investments and processes at our Geysers Assets assure the facilities are as fire resistant and resilient as possible, and we expect our Geysers Assets will remain ready to help California meet that challenge.
NOLs
We have significant NOLs that will provide future tax deductions when we generate sufficient taxable income during the applicable carryover periods. At December 31, 2019, our consolidated federal NOLs totaled approximately $7.1 billion. See Note 12 of the Notes to Consolidated Financial Statements for further discussion of our NOLs.
43
Cash Flow Activities
The following table summarizes our cash flow activities for the years ended December 31, 2019, 2018 and 2017 (in millions):
2019 | 2018 | 2017 | |||||||||
Beginning cash, cash equivalents and restricted cash | $ | 406 | $ | 443 | $ | 606 | |||||
Net cash provided by (used in): | |||||||||||
Operating activities | 1,556 | 1,101 | 949 | ||||||||
Investing activities | (258 | ) | (392 | ) | (211 | ) | |||||
Financing activities | (228 | ) | (746 | ) | (901 | ) | |||||
Net increase (decrease) in cash, cash equivalents and restricted cash | 1,070 | (37 | ) | (163 | ) | ||||||
Ending cash, cash equivalents and restricted cash | $ | 1,476 | $ | 406 | $ | 443 | |||||
2019 — 2018
Net Cash Provided By Operating Activities
Cash provided by operating activities was $1,556 million for the year ended December 31, 2019, compared to $1,101 million for the year ended December 31, 2018. The increase was primarily due to:
• | Income from operations — Income from operations, adjusted for non-cash items, increased by $325 million for the year ended December 31, 2019, compared to 2018. Non-cash items consist primarily of depreciation and amortization, impairment losses, gain on sale of assets and mark-to-market activity. The increase in income from operations was primarily driven by a $322 million increase in Commodity revenue, net of Commodity expense. See “Results of Operations for the Year Ended December 31, 2019 and 2018” above for further discussion of these changes. |
• | Working capital employed — Working capital employed decreased by $169 million for the year ended December 31, 2019, compared to the same period in 2018. This change was primarily due to margin posting activity on our commodity hedging activities as well as timing differences relating to procurement of environmental products for compliance purposes. |
Net Cash Used In Investing Activities
Cash used in investing activities was $258 million for the year ended December 31, 2019, compared to $392 million for the year ended December 31, 2018. The decrease was primarily due to:
• | Divestitures — During the year ended December 31, 2019, we closed on the sale of the Garrison and RockGen Energy Centers for approximately $303 million. |
• | Capital expenditures — We incurred higher capital expenditures on construction and growth projects during the year ended December 31, 2019, as compared to the year ended December 31, 2018. |
Net Cash Used In Financing Activities
Cash used in financing activities was $228 million for the year ended December 31, 2019, compared to $746 million for the year ended December 31, 2018. The decrease was primarily due to:
• | Debt transactions — During the year ended December 31, 2019, we refinanced $4.1 billion of our First Lien Term Loans, First Lien Notes and Senior Unsecured Notes resulting in a net borrowing of $1.3 billion for the year ended December 31, 2019. Approximately $1.1 billion of the net borrowing is attributable to a timing difference as call redemptions on our 2022 and 2024 First Lien Notes and 2023 Senior Unsecured Notes were issued during December 2019 and not funded until January 21, 2020. The remaining net borrowing is attributable to the repayment of our OMEC project debt facility with a portion of the proceeds from our 2026 First Lien Term Loans during the year ended December 31, 2019. During the year ended December 31, 2018, we repurchased $390 million in aggregate principal of our Senior Unsecured Notes for $355 million as compared to repurchases of $48 million in aggregate principal during 2019. |
• | Project financing, note payable and other — During the year ended December 31, 2019, project debt, notes payable and finance leases outstanding were reduced by $404 million as a result of standard amortization payments as well as the repayment of the project debt associated with OMEC in the amount of $220 million as noted above. During |
44
the year ended December 31, 2018, we refinanced and downsized the project debt associated with OMEC, utilizing the proceeds of $220 million, together with cash on hand, to repay the original project debt of $285 million.
• | Dividends Paid — During the year ended December 31, 2019, we paid dividends to our parent, CPN Management, of $1.15 billion from the proceeds of the sale of the Garrison Energy Center and RockGen Energy Center and from cash on hand. We paid a $20 million dividend to CPN Management during 2018. |
• | Stock Repurchases — During the year ended December 31, 2018, we repurchased $79 million of our equity classified share-based awards on the effective date of the Merger. There was no similar activity during the year ended December 31, 2019. |
• | Commodity liability — During the year ended December 31, 2019, we recognized a liability for the fair value of two financial commodity contracts that were executed at closing of the sale of the Garrison and RockGen Energy Centers. The proceeds, net of repayments, through December 31, 2019 were $50 million. There was no similar activity during the year ended December 31, 2018. |
2018 — 2017
A discussion of our cash flow activities for the year ended December 31, 2018, as compared to the same period in 2017 can be found under Item 7 of Part II “Management’s Discussion and Analysis — Liquidity and Capital Resources — Cash Flow Activities — 2018–2017” in our Annual Report on Form 10-K for the fiscal year ended December 31, 2018, filed with the SEC on March 28, 2019, which is available on our website at www.calpine.com and on the SEC’s website at www.sec.gov.
Credit Considerations
Our credit rating has, among other things, generally required us to post significant collateral with our hedging counterparties. Our collateral is generally in the form of cash deposits, letters of credit or first liens on our assets. See also Note 11 of the Notes to Consolidated Financial Statements for our use of collateral. Our credit rating reduces the number of hedging counterparties willing to extend credit to us and reduces our ability to negotiate more favorable terms with them. However, we believe that we will continue to be able to work with our hedging counterparties to execute beneficial hedging transactions and provide adequate collateral. At December 31, 2019, our First Lien Notes, First Lien Term Loans, Corporate Revolving Facility, Senior Unsecured Notes and our corporate rating had the following ratings and commentary from Standard and Poor’s and Moody’s Investors Service:
Standard and Poor’s | Moody’s Investors Service | ||
First Lien Notes, First Lien Term Loans and Corporate Revolving Facility rating | BB | Ba2 | |
Senior Unsecured Notes | B | B2 | |
Corporate rating | B+ | Ba3 | |
Commentary | Positive | Negative | |
Off Balance Sheet Arrangements
Our unconsolidated equity method investment has debt that is not reflected on our Consolidated Balance Sheets. As of December 31, 2019, our investment in Greenfield LP had aggregate debt outstanding of $299 million. Based on our pro rata share of our investment, our share of debt would be approximately $150 million. All such debt is non-recourse to us.
Guarantee Commitments — As part of our normal business operations, we enter into various agreements providing, or otherwise arranging, financial or performance assurance to third parties on behalf of our subsidiaries in the ordinary course of such subsidiaries’ respective business. Such arrangements include guarantees, standby letters of credit and surety bonds for power and natural gas purchase and sale arrangements, retail contracts, contracts associated with the development, construction, operation and maintenance of our fleet of power plants and our Accounts Receivable Sales Program. See Note 16 of the Notes to Consolidated Financial Statements for further information on our guarantee commitments.
45
Contractual Obligations — Our contractual obligations as of December 31, 2019, are as follows (in millions):
Total | Less than 1 Year | 1-3 Years | 3-5 Years | More than 5 Years | |||||||||||||||
Operating lease obligations(1) | $ | 285 | $ | 21 | $ | 42 | $ | 37 | $ | 185 | |||||||||
Purchase obligations: | |||||||||||||||||||
Commodity purchase obligations(2) | $ | 943 | $ | 402 | $ | 299 | $ | 139 | $ | 103 | |||||||||
LTSA(3) | 217 | 27 | 46 | 56 | 88 | ||||||||||||||
Water agreements(4) | 512 | 27 | 56 | 56 | 373 | ||||||||||||||
Other purchase obligations(5) | 293 | 147 | 68 | 23 | 55 | ||||||||||||||
Total purchase obligations | $ | 1,965 | $ | 603 | $ | 469 | $ | 274 | $ | 619 | |||||||||
Debt | $ | 11,845 | $ | 1,269 | $ | 577 | $ | 2,228 | $ | 7,771 | |||||||||
Other contractual obligations: | |||||||||||||||||||
Interest payments on debt(6) | $ | 3,023 | $ | 489 | $ | 983 | $ | 872 | $ | 679 | |||||||||
Liability for uncertain tax positions | 32 | — | 13 | 3 | 16 | ||||||||||||||
Interest rate hedging instruments(6) | 32 | 13 | 18 | 1 | — | ||||||||||||||
Total other contractual obligations | $ | 3,087 | $ | 502 | $ | 1,014 | $ | 876 | $ | 695 | |||||||||
Total contractual obligations | $ | 17,182 | $ | 2,395 | $ | 2,102 | $ | 3,415 | $ | 9,270 | |||||||||
___________
(1) | Included in the total are future minimum payments for office, land and other operating leases. See Note 4 of the Notes to Consolidated Financial Statements for more information. |
(2) | The amounts presented here include contractually obligated amounts for the purchase, transportation or storage of commodities accounted for as executory contracts and therefore not recognized on our Consolidated Balance Sheet. |
(3) | The amounts presented here are based on estimated payments in accordance with the stated payment terms in the contracts at the time of execution. |
(4) | The amounts presented here are based on contractually obligated amounts over the life of the contracts. |
(5) | The amounts presented here include costs to complete construction projects, parts supply agreements, maintenance agreements, information technology agreements and other purchase obligations. |
(6) | Amounts are projected based upon spot and forward interest rates at December 31, 2019. |
Special Purpose Subsidiaries
Pursuant to applicable transaction agreements, we have established certain of our entities separate from Calpine Corporation and our other subsidiaries. In accordance with applicable accounting standards, we consolidate one of these entities and do not consolidate Calpine Receivables (see Notes 7 and 17 of the Notes to Consolidated Financial Statements for further information related to Calpine Receivables). As of the date of filing of this Report, these entities included: Russell City Energy Company, LLC and Calpine Receivables.
Russell City Energy Company, LLC — On January 28, 2020, we completed the acquisition of the 25% of Russell City Energy Company, LLC that was previously owned by a third party for approximately $49 million.
46
RISK MANAGEMENT AND COMMODITY ACCOUNTING
Our commercial hedging and optimization strategies are designed to maximize our risk-adjusted Commodity Margin by leveraging our knowledge, experience and fundamental views on natural gas and power. A description of risk management activities is included under Item 1. “Business — Marketing, Hedging and Optimization Activities.” See Note 10 of the Notes to Consolidated Financial Statements for further discussion of our derivative instruments.
The primary factors affecting our market risk and the fair value of our derivatives at any point in time are the volume of open derivative positions (MMBtu, MWh and $ notional amounts); changing commodity market prices, primarily for power and natural gas; our credit standing and that of our counterparties for energy commodity derivatives; and prevailing interest rates for our interest rate hedging instruments. Since prices for power and natural gas and interest rates are volatile, there may be material changes in the fair value of our derivatives over time, driven both by price volatility and the changes in volume of open derivative transactions. Our derivative assets have increased to approximately $402 million at December 31, 2019, compared to approximately $302 million at December 31, 2018, and our derivative liabilities have decreased to approximately $288 million at December 31, 2019, compared to approximately $443 million at December 31, 2018. The fair value of our level 3 derivative assets and liabilities at December 31, 2019 represents approximately 23% and 36% of our total assets and liabilities measured at fair value, respectively. See Note 9 of the Notes to Consolidated Financial Statements for further information related to our level 3 derivative assets and liabilities.
The change in fair value of our outstanding commodity and interest rate hedging instruments from January 1, 2019, through December 31, 2019, is summarized in the table below (in millions):
Commodity Instruments | Interest Rate Hedging Instruments | Total | |||||||||
Fair value of contracts outstanding at January 1, 2019 | $ | (171 | ) | $ | 30 | $ | (141 | ) | |||
Items recognized or otherwise settled during the period(1)(2) | 179 | (25 | ) | 154 | |||||||
Fair value attributable to new contracts(3) | 88 | 12 | 100 | ||||||||
Changes in fair value attributable to price movements | 37 | (36 | ) | 1 | |||||||
Fair value of contracts outstanding at December 31, 2019(4) | $ | 133 | $ | (19 | ) | $ | 114 | ||||
__________
(1) | Commodity contract settlements consist of the realization of previously recognized losses on contracts not designated as hedging instruments of $(202) million (represents a portion of Commodity revenue and Commodity expense as reported on our Consolidated Statements of Operations) and $(23) million related to current period losses from other changes in derivative assets and liabilities not reflected in OCI or earnings. |
(2) | Interest rate settlements consist of $25 million related to realized gains from settlements of designated cash flow hedges and nil related to roll-off from settlements of undesignated interest rate hedging instruments (represents a portion of interest expense as reported on our Consolidated Statements of Operations). |
(3) | Fair value attributable to new contracts includes $(18) million and nil of fair value related to commodity contracts and interest rate hedging instruments, respectively, which are not reflected in OCI or earnings. |
(4) | We netted all amounts allowed under the derivative accounting guidance on the Consolidated Balance Sheet, which includes derivative transactions under enforceable master netting arrangements and related cash collateral. Net commodity and interest rate derivative assets and liabilities reported in Notes 9 and 10 of the Notes to Consolidated Financial Statements and are shown net of collateral paid to and received from counterparties under legally enforceable master netting arrangements. |
Commodity Price Risk — Commodity price risks result from exposure to changes in spot prices, forward prices, price volatilities and correlations between the price of power, steam and natural gas. We manage the commodity price risk and the variability in future cash flows from forecasted sales of power and purchases of natural gas of our entire portfolio of generating assets and contractual positions by entering into various derivative and non-derivative instruments.
47
The net fair value of outstanding derivative commodity instruments, net of allocated collateral, at December 31, 2019, based on price source and the period during which the instruments will mature, are summarized in the table below (in millions):
Fair Value Source | 2020 | 2021-2022 | 2023-2024 | After 2024 | Total | |||||||||||||||
Prices actively quoted | $ | — | $ | — | $ | — | $ | — | $ | — | ||||||||||
Prices provided by other external sources | (73 | ) | 33 | 2 | — | (38 | ) | |||||||||||||
Prices based on models and other valuation methods | 11 | 67 | 54 | 39 | 171 | |||||||||||||||
Total fair value | $ | (62 | ) | $ | 100 | $ | 56 | $ | 39 | $ | 133 | |||||||||
We measure the energy commodity price risk in our portfolio on a daily basis using a VAR model to estimate the potential one-day risk of loss based upon historical experience resulting from potential market movements. Our VAR is calculated for our entire portfolio comprising energy commodity derivatives, expected generation and natural gas consumption from our power plants, PPAs, and other physical and financial transactions. We measure VAR using a variance/covariance approach based on a confidence level of 95%, a one-day holding period and actual observed historical correlation. While we believe that our VAR assumptions and approximations are reasonable, different assumptions and/or approximations could produce materially different estimates.
The table below presents the high, low and average of our daily VAR for the years ended December 31, 2019 and 2018 (in millions):
2019 | 2018 | ||||||
Year ended December 31: | |||||||
High | $ | 68 | $ | 64 | |||
Low | $ | 22 | $ | 19 | |||
Average | $ | 35 | $ | 35 | |||
As of December 31 | $ | 22 | $ | 38 | |||
Due to the inherent limitations of statistical measures such as VAR, the VAR calculation may not capture the full extent of our commodity price exposure. As a result, actual changes in the value of our energy commodity portfolio could be different from the calculated VAR, and could have a material effect on our financial results. In order to evaluate the risks of our portfolio on a comprehensive basis and augment our VAR analysis, we also measure the risk of the energy commodity portfolio using several analytical methods including sensitivity analysis, non-statistical scenario analysis, including stress testing, and daily position report analysis.
We utilize the forward commodity markets to hedge price risk associated with our power plant portfolio. Our ability to hedge relies in part on market liquidity and the number of counterparties with which to transact. If the number of counterparties in these markets were to decrease, it could decrease our ability to hedge our forward commodity price risk and create incremental volatility in our earnings. The effects of declining liquidity in the forward commodity markets are also mitigated by our retail subsidiaries which provides us with an additional outlet to transact hedging activities related to our wholesale power plant portfolio.
Liquidity Risk — Liquidity risk arises from the general funding requirements needed to manage our activities and assets and liabilities. Fluctuating natural gas prices or Market Heat Rates can cause our collateral requirements for our wholesale and retail activities to increase or decrease. Our liquidity management framework is intended to maximize liquidity access and minimize funding costs during times of rising prices. See further discussion regarding our uses of collateral as they relate to our commodity procurement and risk management activities in Note 11 of the Notes to Consolidated Financial Statements.
Credit Risk — Credit risk relates to the risk of loss resulting from nonperformance or non-payment by our counterparties or customers related to their contractual obligations with us. Risks surrounding counterparty and customer performance and credit could ultimately affect the amount and timing of expected cash flows. We also have credit risk if counterparties or customers are unable to provide collateral or post margin. We monitor and manage our credit risk through credit policies that include:
• | credit approvals; |
• | routine monitoring of counterparties’ and customer’s credit limits and their overall credit ratings; |
• | limiting our marketing, hedging and optimization activities with high risk counterparties; |
• | margin, collateral, or prepayment arrangements; and |
• | payment netting arrangements, or master netting arrangements that allow for the netting of positive and negative exposures of various contracts associated with a single counterparty. |
48
We have concentrations of credit risk with a few of our wholesale counterparties and retail customers relating to our sales of power and steam and our hedging, optimization and trading activities. For example, our wholesale business currently has contracts with investor owned California utilities which could be affected should they be found liable for recent wildfires in California and, accordingly, incur substantial costs associated with the wildfires.
On January 29, 2019, PG&E and PG&E Corporation each filed voluntary petitions for relief under Chapter 11. We currently have several power plants that provide energy and energy-related products to PG&E under PPAs, many of which have PG&E collateral posting requirements. Since the bankruptcy filing, we have received all material payments under the PPAs, either directly or through the application of collateral. We also currently have numerous other agreements with PG&E related to the operation of our power plants in Northern California, under which PG&E has continued to provide service since its bankruptcy filing. We cannot predict the ultimate outcome of this matter and continue to monitor the bankruptcy proceedings. See Note 8 of the Notes to Consolidated Financial Statements for further information related to the event of default associated with our Russell City and Los Esteros project debt agreements in connection with the PG&E bankruptcy.
We believe that our credit policies and portfolio of transactions adequately monitor and diversify our credit risk, and currently our counterparties and customers are performing and financially settling timely according to their respective agreements. We monitor and manage our total comprehensive credit risk associated with all of our contracts irrespective of whether they are accounted for as an executory contract, a normal purchase normal sale or whether they are marked-to-market and included in our derivative assets and liabilities on our Consolidated Balance Sheets. Our counterparty and customer credit quality associated with the net fair value of outstanding derivative commodity instruments is included in our derivative assets and (liabilities), net of allocated collateral, at December 31, 2019, and the period during which the instruments will mature are summarized in the table below (in millions):
Credit Quality (Based on Standard & Poor’s Ratings as of December 31, 2019) | 2020 | 2021-2022 | 2023-2024 | After 2024 | Total | |||||||||||||||
Investment grade | $ | (128 | ) | $ | 33 | $ | 14 | $ | 16 | $ | (65 | ) | ||||||||
Non-investment grade | 6 | 4 | 7 | 6 | 23 | |||||||||||||||
No external ratings(1) | 60 | 63 | 35 | 17 | 175 | |||||||||||||||
Total fair value | $ | (62 | ) | $ | 100 | $ | 56 | $ | 39 | $ | 133 | |||||||||
____________
(1) | Primarily comprised of the fair value of derivative instruments held with customers that are not rated by third party credit agencies due to the nature and size of the customers. |
Interest Rate Risk — We are exposed to interest rate risk related to our variable rate debt. Interest rate risk represents the potential loss in earnings arising from adverse changes in market interest rates. Our variable rate financings are indexed to base rates, generally LIBOR. The following table summarizes the contract terms as well as the fair values of our debt instruments exposed to interest rate risk as of December 31, 2019. All outstanding balances and fair market values are shown gross of applicable premium or discount, if any (in millions):
2020 | 2021 | 2022 | 2023 | 2024 | Thereafter | Total | Fair Value December 31, 2019 | ||||||||||||||||||||||||
Debt by Maturity Date: | |||||||||||||||||||||||||||||||
Fixed Rate | $ | 1,060 | $ | 7 | $ | 8 | $ | 8 | $ | 490 | $ | 5,025 | $ | 6,598 | $ | 6,749 | |||||||||||||||
Average Interest Rate | 5.6 | % | 6.1 | % | 6.1 | % | 6.1 | % | 5.5 | % | 5.1 | % | |||||||||||||||||||
Variable Rate | $ | 182 | $ | 311 | $ | 196 | $ | 169 | $ | 1,528 | $ | 2,713 | $ | 5,099 | $ | 5,108 | |||||||||||||||
Average Interest Rate(1) | 3.7 | % | 3.9 | % | 3.6 | % | 3.7 | % | 4.1 | % | 4.4 | % | |||||||||||||||||||
____________
(1) | Projection based upon forward LIBOR rates inferred from spot rates at December 31, 2019. |
Interest rate risk represents the potential loss in earnings arising from adverse changes in market interest rates. Our interest rate hedging instruments are with counterparties we believe are primarily high quality institutions, and we do not believe that our interest rate hedging instruments expose us to any significant credit risk. Holding all other factors constant, we estimate that a 10% decrease in interest rates would result in a change in the fair value of our interest rate hedging instruments hedging our variable rate debt of approximately $(11) million at December 31, 2019.
49
APPLICATION OF CRITICAL ACCOUNTING POLICIES
The preparation of financial statements in accordance with U.S. GAAP requires management to make certain estimates and assumptions which are inherently imprecise and may differ significantly from actual results achieved. We believe the following are our more critical accounting policies due to the significance, subjectivity and judgment involved in determining our estimates used in preparing our Consolidated Financial Statements. See Note 3 of the Notes to Consolidated Financial Statements for a discussion of the application of these and other accounting policies. We evaluate our estimates and assumptions used in preparing our Consolidated Financial Statements on an ongoing basis utilizing historic experience, anticipated future events or trends, consultation with third party advisors or other methods that involve judgment as determined appropriate under the circumstances. The resulting effects of changes in our estimates are recorded in our Consolidated Financial Statements in the period in which the facts and circumstances that give rise to the change in estimate become known.
Revenue Recognition
We routinely enter into physical commodity contracts for sales of our generated power to manage risk and capture the value inherent in our generation. Determining the proper accounting for our power contracts can require significant judgment and affect how we recognize revenue. In addition, we determine whether the contract should be accounted for on a gross or net basis. Determining the proper accounting treatment involves the evaluation of quantitative, as well as qualitative factors, to determine if the contract should be accounted for as one of the following:
• | a contract that qualifies as a lease; |
• | a derivative; |
• | a contract that meets the definition of a derivative but is eligible for the normal purchase normal sale exemption; or |
• | a contract that is a physical or executory contract. |
On January 1, 2018, we adopted Accounting Standards Update 2014-09, “Revenue from Contracts with Customers” (“Topic 606”). The comprehensive new revenue recognition standard supersedes all pre-existing revenue recognition guidance. The core principle of Topic 606 is that a company will recognize revenue to depict the transfer of promised goods or services to customers in an amount that reflects the consideration to which the entity expects to be entitled in exchange for those goods or services. We adopted the new revenue recognition standards under Topic 606 using the modified retrospective method and applied Topic 606 to those contracts which were not completed as of January 1, 2018. Results for reporting periods beginning after December 31, 2017 are presented under Topic 606, while prior period amounts continue to be reported in accordance with historical accounting standards. Under the new standard, the majority of our operating revenue continues to be recognized as the underlying commodity or service is delivered to our customers.
Executory and Physical Contracts Exempt from Derivative Accounting — We generally recognize revenue from the sale of power or thermal energy for sale to our customers for use in industrial or other heating operations, upon transmission and delivery to the customer at the contractual price. For our power and steam contracts, we have elected the practical expedient under Topic 606 that allows us to recognize revenue in the amount to which we have the right to invoice to the extent we determine that we have a right to consideration in an amount that corresponds directly with the value provided to date. To the extent this practical expedient cannot be utilized, we will recognize revenue over time based on the quantity of the commodity delivered to the customer.
In addition to power and steam revenues related to generation, retail power and gas sales activities and RECs from our Geysers Assets, our operating revenues also include:
• | power revenues consisting of fixed and variable capacity payments, including capacity payments received from PJM and ISO-NE capacity auctions which are not related to generation; |
• | other revenues such as RMR Contracts, resource adequacy and certain ancillary service revenues; and |
• | sales of natural gas and other service revenues. |
Capacity revenues include fixed and variable capacity payments, which are based on generation volumes and include capacity payments received from RTO and ISO capacity auctions as well as contractual capacity under long-term PPAs. For these contracts and ancillary service contracts, we have elected the practical expedient under Topic 606 that allows us to recognize revenue in the amount to which we have the right to invoice to the extent we determine that we have a right to consideration in an amount that corresponds directly with the value provided to date. To the extent this practical expedient cannot be utilized, we will recognize revenue over time as the service is being provided to the customer.
Revenues from the sale of RECs are primarily related to credits that are generated upon generation of renewable power from our Geysers Assets and are recognized over a period of time similar to the timing of the related energy sale. Revenues from
50
sales of RECs or other environmental products that are not generated from our assets are recognized once all certifications have been completed and the credits are delivered to the customer at a point in time. Revenues from our natural gas sales are recognized at a point in time when delivery of the natural gas is provided. Revenues from natural gas and emission product sales are generally at the contracted transaction price, which may be fixed or index-based.
Revenues from sales of power to retail customers are recognized upon delivery under the accrual method, unless we apply derivative accounting treatment to the retail contract. Unbilled retail sales are based upon estimates of customer usage since the date of the last meter reading provided by the ISOs or electric distribution companies by applying the estimated revenue per KWh by customer class to the estimated number of KWhs delivered but not yet billed. Estimated amounts are adjusted when actual usage is known and billed.
See Note 3 of the Notes to Consolidated Financial Statements for further information related to our accounting policies for recognizing revenue from contracts with customers.
Gross vs. Net Accounting — We determine whether the financial statement presentation of revenues should be on a gross or net basis. Where we act as principal, we record settlement of our physical commodity contracts on a gross or net basis dependent upon whether the contract results in physical delivery of the underlying product. With respect to our physical executory contracts, where we do not take title to the commodities but receive a variable payment to convert natural gas into power and steam in a tolling operation, we record revenues on a net basis.
Lease Accounting — Revenue from contracts accounted for as operating leases, such as certain tolling agreements, with minimum lease rentals (capacity payments) which vary over time must be levelized. Generally, we levelize these contract revenues on a straight-line basis over the term of the contract. We apply lease accounting to contracts that meet the definition of a lease and accrual accounting treatment to those contracts that are either exempt from derivative accounting or do not meet the definition of a derivative instrument.
See “ — Accounting for Derivative Instruments” directly below for a discussion of the significant judgments and estimates related to accounting for derivative instruments.
Fair Value Measurements
We use fair value to measure certain of our assets, liabilities and expenses in our financial statements. Fair value is the amount that would be received to sell an asset or paid to transfer a liability in an orderly transaction between market participants at the measurement date (i.e., the exit price). Generally, the determination of fair value requires the use of significant judgment and different approaches and models under varying circumstances. Under a market based approach, we consider prices of similar assets, consult with brokers and experts or employ other valuation techniques. Under an income based approach, we generally estimate future cash flows and then discount them at a risk adjusted rate.
Accordingly, the determination of fair value represents a critical accounting policy. Our most significant fair value measurements represent the valuation of our derivative assets and liabilities, which are measured on a recurring basis (each reporting period) and measurements of impairments and acquired assets and liabilities on a nonrecurring basis. We primarily apply the market approach and income approach for recurring fair value measurements (primarily our derivative assets and liabilities) using the best available information. We primarily utilize the income approach for nonrecurring fair value measurements such as impairments of our assets as market prices for similar assets may not be readily available and may not incorporate the expected future returns from our assets. We utilize valuation techniques that seek to maximize the use of observable inputs and minimize the use of unobservable inputs. We classify fair value balances based on the observability of those inputs. U.S. GAAP establishes a fair value hierarchy which classifies fair value measurements from level 1 through level 3 based upon the inputs used to measure fair value:
Level 1 — Quoted prices (unadjusted) are available in active markets for identical assets or liabilities as of the reporting date. Active markets are those in which transactions for the asset or liability occur in sufficient frequency and volume to provide pricing information on an ongoing basis.
Level 2 — Pricing inputs include quoted prices for similar assets and liabilities in active markets, and inputs other than quoted prices that are observable for the asset or liability, either directly or indirectly, for substantially the full term of the financial instrument.
Level 3 — Pricing inputs include significant inputs that are generally less observable or from unobservable sources. These inputs may be used with internally developed methodologies that result in management’s best estimate of fair value.
51
Derivative Instruments and Valuation Techniques
The primary factors affecting the fair value of our derivative instruments at any point in time are the volume of open derivative positions (MMBtu, MWh and $ notional amounts); changing commodity market prices, primarily for power and natural gas; our credit standing and that of our counterparties and customers for energy commodity derivatives; and prevailing interest rates for our interest rate hedging instruments. Prices for power and natural gas and interest rates are volatile, which can result in material changes in the fair value measurements reported in our financial statements in the future. Derivative contracts can be exchange-traded or OTC. For OTC derivatives that trade in liquid markets, model inputs can generally be verified and model selection does not involve significant management judgment. Certain OTC derivatives trade in less liquid markets with limited pricing information, and the determination of fair value for these derivatives is inherently more difficult.
For our level 2 and level 3 derivative instruments, we may utilize models to measure fair value. Where models are used, the selection of a particular model to value an asset or liability depends upon the contractual terms and specific risks, as well as the availability of pricing information in the market. We generally use similar models to value similar instruments. Valuation models require a variety of inputs, including contractual terms, market prices, yield curves, credit curves and measures of volatility. These models are primarily industry-standard models, including the Black-Scholes option-pricing model. Substantially all of these assumptions are observable in the marketplace throughout the full term of the instrument, can be derived from observable data or are supported by observable levels at which transactions are executed in the marketplace. In cases where there is no corroborating market information available to support significant model inputs, we initially use the transaction price as the best estimate of fair value.
Our derivative instruments that are traded on the NYMEX or Intercontinental Exchange primarily consist of natural gas swaps, futures and options and are classified as level 1 fair value measurements.
Our derivative instruments that primarily consist of interest rate hedging instruments and OTC power and natural gas forwards for which market-based pricing inputs in the principal or most advantageous market are representative of executable prices for market participants are classified as level 2 fair value measurements. These inputs are observable at commonly quoted intervals for substantially the full term of the instruments.
Our OTC power and natural gas forwards and options where pricing inputs are unobservable, as well as other complex and structured transactions primarily for the sale of power to both wholesale counterparties and retail customers are classified as level 3 fair value measurements. Complex or structured transactions are tailored to our customers’ needs and can introduce the need for internally-developed model inputs which might not be observable in or corroborated by the market. When such inputs have a significant effect on the measurement of fair value, the instrument is categorized in level 3. At each balance sheet date, we perform an analysis of all instruments subject to fair value measurement and include in level 3 all of those whose fair value is based on significant unobservable inputs.
The determination of fair value of our derivatives also includes consideration of our credit standing, the credit standing of our counterparties and customers and the effect of credit enhancements, if any. We assess non-performance risk by adjusting the fair value of our derivatives based on our credit standing or the credit standing of our counterparties and customers involved and the effect of credit enhancements, if any. Such valuation adjustments represent the amount of probable loss due to default either by us or a third party. Our credit valuation methodology is based on a quantitative approach which allocates a credit adjustment to the fair value of derivative transactions based on the net exposure of each counterparty or customer. We develop our credit reserve based on our expectation of potential credit exposure. Our calculation of the credit reserve on net asset positions is based on available market information including credit default swap rates, credit ratings and historical default information. We also incorporate non-performance risk in net liability positions based on an assessment of our potential risk of default.
Impairments
When we determine that an impairment exists, we determine fair value using valuation techniques such as the present value of expected future cash flows. In order to estimate future cash flows, we consider historical cash flows, existing and future contracts and PPAs and changes in the market environment and other factors that may affect future cash flows. To the extent applicable, the assumptions we use are consistent with forecasts that we are otherwise required to make (for example, in preparing our other earnings forecasts). The use of this method involves inherent uncertainty. We use our best estimates in making these evaluations and consider various factors, including forward price curves for power and fuel costs and forecasted operating costs. However, actual future market prices and project costs could vary from the assumptions used in our estimates, and the effect of such variations could be material.
We also discount the estimated future cash flows associated with the asset using a single interest rate representative of the risk involved with such an investment including contract terms, tenor and credit risk of counterparts. We may also consider prices of similar assets, consult with brokers, or employ other valuation techniques. We use our best estimates in making these
52
evaluations; however, actual future market prices and project costs could vary from the assumptions used in our estimates, and the effect of such variations could be material.
Acquisitions of Assets and Liabilities
U.S. GAAP requires that the purchase price for an acquisition be assigned and allocated to the individual assets and liabilities based upon their fair value. Generally, the amount recorded in the financial statements for an acquisition is the purchase price (value of the consideration paid), but a purchase price that exceeds the fair value of the assets acquired can result in the recognition of goodwill. In addition to the potential for the recognition of goodwill, differing fair values will affect the allocations of the purchase price to the individual assets and liabilities and can affect the gross amount and classification of assets and liabilities recorded on our Consolidated Balance Sheet and can affect the timing and the amount of depreciation and amortization expense recorded in any given period. We utilize our best effort to make our determinations and review all information available including estimated future cash flows and prices of similar assets when making our best estimate. We also may hire independent appraisers to help us make this determination as we deem appropriate under the circumstances.
Accounting for Derivative Instruments
We recognize all derivative instruments that qualify for derivative accounting treatment as either assets or liabilities and measure those instruments at fair value unless they qualify for, and we elect, the normal purchase normal sale exemption. For transactions in which we elect the normal purchase normal sale exemption, gains and losses are not reflected on our Consolidated Statements of Operations until the period of delivery.
Hedge Accounting — Revenues and expenses derived from derivative instruments that qualify for hedge accounting are recorded in the period and same financial statement line item as the hedged item. Hedge accounting requires us to formally document, designate and assess the effectiveness of transactions that receive hedge accounting. We present the cash flows from hedging derivatives in the same category as the item being hedged within operating activities on our Consolidated Statements of Cash Flows unless they contain an other-than-insignificant financing element in which case their cash flows are classified within financing activities.
Cash Flow Hedges — We currently apply hedge accounting to certain of our interest rate hedging instruments. We report the mark-to-market gain or loss on our interest rate hedging instruments designated and qualifying as a cash flow hedging instrument as a component of OCI and reclassify such gains and losses into earnings in the same period during which the hedged forecasted transaction affects earnings. Prior to January 1, 2019, gains and losses due to ineffectiveness on interest rate hedging instruments were recognized in earnings as a component of interest expense. Upon the adoption of Accounting Standards Update 2017-12 on January 1, 2019, hedge ineffectiveness is no longer separately measured and recorded in earnings. If it is determined that the forecasted transaction is no longer probable of occurring, then hedge accounting will be discontinued prospectively and future changes in fair value will be recorded in earnings. If the hedging instrument is terminated or de-designated prior to the occurrence of the hedged forecasted transaction, the net accumulated gain or loss associated with the changes in fair value of the hedge instrument remains deferred in AOCI until such time as the forecasted transaction affects earnings or until it is determined that the forecasted transaction is probable of not occurring.
Derivatives Not Designated as Hedging Instruments — We enter into power, natural gas, interest rate, environmental product and fuel oil transactions that primarily act as economic hedges to our asset and interest rate portfolio, but either do not qualify as hedges under the hedge accounting guidelines or qualify under the hedge accounting guidelines and the hedge accounting designation has not been elected. Changes in fair value of commodity derivatives not designated as hedging instruments are recognized currently in earnings and are separately stated on our Consolidated Statements of Operations in mark-to-market gain/loss as a component of operating revenues (for physical and financial power and Heat Rate and commodity option activity) and fuel and purchased energy expense (for physical and financial natural gas, power, environmental product and fuel oil activity). Changes in fair value of interest rate derivatives not designated as hedging instruments are recognized currently in earnings as interest expense.
See Notes 9 and 10 of the Notes to Consolidated Financial Statements for further discussion of our derivative instruments.
Accounting for VIEs and Financial Statement Consolidation Criteria
We consolidate all VIEs where we determined that we have both the power to direct the activities of a VIE that most significantly affect the VIE’s economic performance and the obligation to absorb losses or receive benefits from the VIE. We have determined that we hold the obligation to absorb losses and receive benefits in all of our VIEs where we hold the majority equity interest. Therefore, our determination of whether to consolidate is based upon which variable interest holder has the power to direct the most significant activities of the VIE (the primary beneficiary). Our analysis includes consideration of the following primary activities which we believe to have a significant effect on a power plant’s financial performance: operations and
53
maintenance, plant dispatch, and fuel strategy as well as our ability to control or influence contracting and overall plant strategy. Our approach to determining which entity holds the powers and rights is based on powers held as of the balance sheet date. Contractual terms that may change the powers held in future periods, such as a purchase or sale option, are not considered in our analysis. Based on our analysis, we believe that we hold the power and rights to direct the most significant activities for most of our majority owned VIEs.
Under our consolidation policy and under U.S. GAAP we also:
• | perform an ongoing reassessment each reporting period of whether we are the primary beneficiary of our VIEs; and |
• | evaluate if an entity is a VIE and whether we are the primary beneficiary whenever any changes in facts and circumstances occur, such as contractual changes where the holders of the equity investment at risk, as a group, lose the power from voting rights or similar rights of those investments to direct the activities of a VIE that most significantly affect the VIE’s economic performance or when there are other changes in the powers held by individual variable interest holders. |
Because we are required to perform ongoing reassessments of whether we are the primary beneficiary, future changes in our assessments of whether we are the primary beneficiary could require us to consolidate our VIEs that are currently not consolidated or deconsolidate our VIEs that are currently consolidated based upon our reassessments in future periods. Making these determinations can require the use of significant judgment to determine which variable interest holder has the power to direct the most significant activities of the VIE (the primary beneficiary) and can directly affect amounts reported on our Consolidated Financial Statements. See Note 7 of the Notes to Consolidated Financial Statements for further information related to our VIEs.
Disclosure Requirements
U.S. GAAP requires separate disclosure on the face of our Consolidated Balance Sheets of the significant assets of a consolidated VIE that can be used only to settle obligations of the consolidated VIE and the significant liabilities of a consolidated VIE for which creditors (or beneficial interest holders) do not have recourse to the general credit of the primary beneficiary. In determining which assets of our VIEs meet the separate disclosure criteria, we consider that this separate disclosure requirement is met where Calpine Corporation is substantially limited or prohibited from access to assets (including cash and cash equivalents, restricted cash and property, plant and equipment), and where our VIEs have project financing that prohibits the VIE from providing guarantees on the debt of others. In determining which liabilities of our VIEs meet the separate disclosure criteria, we consider that this separate disclosure requirement is met where there are agreements that prohibit the debt holders of the VIEs from recourse to the general credit of Calpine Corporation.
Unconsolidated VIEs
We have a 50% partnership interest in Greenfield LP which is also a VIE; however, we do not have the power to direct the most significant activities of this entity and therefore do not consolidate it. We account for this entity under the equity method of accounting and include our net equity interest in investments in unconsolidated subsidiaries on our Consolidated Balance Sheets. Our equity interest in the net income from Greenfield LP for the years ended December 31, 2019, 2018 and 2017, is recorded in (income) from unconsolidated subsidiaries.
We have a 100% membership interest in Calpine Receivables, a bankruptcy remote entity created for the special purpose of purchasing trade accounts receivable from Calpine Solutions under the Accounts Receivable Sales Program. Calpine Receivables is a VIE as we have determined that we do not have the power to direct the activities of the VIE that most significantly affect the VIE’s economic performance nor the obligation to absorb losses or receive benefits from the VIE. Accordingly, we have determined that we are not the primary beneficiary of Calpine Receivables as we do not have the power to affect its financial performance as the unaffiliated financial institutions that purchase the receivables from Calpine Receivables control the selection criteria of the receivables sold and appoint the servicer of the receivables which controls management of default. Thus, we do not consolidate Calpine Receivables in our Consolidated Financial Statements and we use the equity method of accounting to record our net interest in Calpine Receivables.
54
Long-Lived Assets and Depreciation and Amortization Expense
Determination of the appropriate depreciation/amortization method, proper useful lives and salvage values involves significant judgment, estimates, assumptions and historical experience. Changes in our estimates and methods can result in a significant change in the amounts and timing of when we recognize depreciation and amortization expense and therefore significantly affect our financial condition and results of operations from period to period. Different depreciation and amortization methods can affect the timing and amount of depreciation and amortization expense affecting our results of operations and could result in different net book values of assets at a particular time during the useful life of the asset affecting our financial position. Estimates of useful lives also significantly affect the timing and amounts of depreciation and amortization expense and include significant estimates. If useful lives are too short, then the asset is depreciated/amortized too quickly and depreciation and amortization expense is overstated. Estimated useful lives can significantly decrease if routine maintenance or certain upgrades are not performed, premature mechanical failure of the asset occurs, significant increases in the planned level of usage occur, advances in technology make the asset obsolete, or if there are adverse changes in environmental regulations. Our depreciable cost basis of our assets is reduced by the assets’ estimated salvage values. Dependent upon our ability to accurately estimate salvage values and the timing of disposal, the salvage values actually realized for our assets could significantly increase or decrease resulting in additional gains or losses in the year of disposal.
We depreciate/amortize our assets under the straight-line method over the shorter of their estimated useful lives or lease term. For our natural gas-fired power plants, we assume an estimated salvage value which approximates 10% of the depreciable cost basis where we own the power plant or have a favorable option to purchase the power plant or take ownership of the power plant at conclusion of the lease term and a de minimis amount of the depreciable costs basis for componentized equipment. For our Geysers Assets, we typically assume no salvage values. We use the component depreciation method for our natural gas-fired power plant rotable parts, certain componentized balance of plant parts and our information technology equipment and the composite depreciation method for the other natural gas-fired power plant asset groups and Geysers Assets. We amortize intangible assets related to acquired retail and wholesale commodity contracts that were initially recorded under purchase accounting in business combination transactions based on the relative acquisition fair value of the commodity contract over the life of the contract.
Impairment Evaluation of Long-Lived Assets (Including Goodwill, Intangibles and Investments)
We evaluate our long-lived assets, such as property, plant and equipment, equity method investments, turbine equipment and specifically identified intangibles, on an annual basis or when events or changes in circumstances indicate that the carrying value of such assets may not be recoverable. Examples of such events or changes in circumstances are:
• | a significant decrease in the market price of a long-lived asset; |
• | a significant adverse change in the manner an asset is being used or its physical condition; |
• | an adverse action by a regulator or legislature or an adverse change in the business climate; |
• | an accumulation of costs significantly in excess of the amount originally expected for the construction or acquisition of an asset; |
• | a current-period loss combined with a history of losses or the projection of future losses; or |
• | a change in our intent about an asset from an intent to hold to a greater than 50% likelihood that an asset will be sold or disposed of before the end of its previously estimated useful life. |
When we believe an impairment condition on long-lived assets such as property, plant and equipment may have occurred, we are required to estimate the undiscounted future cash flows associated with a long-lived asset or group of long-lived assets at the lowest level for which identifiable cash flows are largely independent of the cash flows of other assets and liabilities for long-lived assets that are expected to be held and used. We use a fundamental long-term view of the power market which is based on long-term production volumes, price curves and operating costs together with the regulatory and environmental requirements within each individual market to prepare our multi-year forecast. Since we manage and market our power sales as a portfolio rather than at the individual power plant level or customer level within each designated market, pool or segment, we group our power plants based upon the corresponding market for valuation purposes. If we determine that the undiscounted cash flows from an asset or group of assets to be held and used are less than the associated carrying amount, or if we have classified an asset as held for sale, we must estimate fair value to determine the amount of any impairment loss.
When we believe an impairment condition may exist on specifically identifiable finite-lived intangibles or an investment, we must estimate their fair value to determine the amount of any impairment loss. Significant judgment is required in determining fair value as discussed above in “— Fair Value Measurements.”
We test goodwill and all intangible assets not subject to amortization for impairments at least annually, or more frequently whenever an event or change in circumstances occurs that would more likely than not reduce the fair value of a reporting unit
55
below its carrying amount. We test goodwill for impairment at the reporting unit level, which is identified one level below our operating segments for which discrete financial information is available and management regularly reviews the operating results. We perform an annual impairment assessment in the third quarter of each year, or more frequently if indicators of potential impairment exist, to determine whether it is more likely than not that the fair value of a reporting unit in which goodwill resides is less than its carrying value. For reporting units in which this assessment concludes that it is more likely than not that the fair value is more than its carrying value, goodwill is not considered impaired and we are not required to perform the goodwill impairment test. Qualitative factors considered in this assessment include industry and market considerations, overall financial performance, and other relevant events and factors affecting the reporting unit.
For reporting units in which the impairment assessment concludes that it is more likely than not that the fair value is less than its carrying value, we perform the goodwill impairment test, which compares the fair value of the reporting unit to its carrying value. If the fair value of the reporting unit exceeds the carrying value of the net assets assigned to that unit, goodwill is not considered impaired and we are not required to perform additional analysis. If the carrying value of the net assets assigned to the reporting unit exceeds the fair value of the reporting unit, then we record an impairment loss equal to the difference not to exceed the goodwill balance assigned to the reporting unit.
All construction and development projects are reviewed for impairment whenever there is an indication of potential reduction in fair value. If it is determined that it is no longer probable that the projects will be completed and all capitalized costs recovered through future operations, the carrying values of the projects would be written down to their fair value. When we determine that our assets meet the assets held-for-sale criteria, they are reported at the lower of the carrying amount or fair value less the cost to sell. We are also required to evaluate our equity method investments to determine whether or not they are impaired when the value is considered an “other than a temporary” decline in value.
See Note 2 of the Notes to Consolidated Financial Statements for further discussion of our impairment evaluation of long-lived assets.
Accounting for Income Taxes
To arrive at our consolidated income tax provision and other tax balances, significant judgment and estimates are required. Although we believe that our estimates are reasonable, no assurance can be given that the final tax outcome of these matters will not be different than that which is reflected in our historical tax provisions and accruals. Such differences could have a material effect on our income tax provision, other tax accounts and net income in the period in which such determination is made.
As of December 31, 2019, our NOL carryforwards consisted primarily of federal NOL carryforwards of approximately $7.1 billion, of which the majority expire between 2024 and 2037, and NOL carryforwards in 25 states and the District of Columbia totaling approximately $3.2 billion, which expire between 2020 and 2039. A substantial portion of our federal and state NOLs are offset with a valuation allowance. Certain of the state NOL carryforwards may be subject to limitations on their annual usage. As a result of the ownership change associated with the Merger, our ability to utilize the NOL carryforwards are subject to limitations. Additionally, our state NOLs available to offset future state income could materially decrease which would be offset by an equal and offsetting adjustment to the existing valuation allowance. Given the offsetting adjustments to the existing valuation allowance, the ownership change is not expected to have a material adverse effect on our Consolidated Financial Statements.
In the ordinary course of business, there are many transactions and calculations where the ultimate tax outcome is uncertain. Some of these uncertainties arise as a consequence of the treatment of capital assets, financing transactions, multistate taxation of operations and segregation of foreign and domestic income and expense to avoid double taxation. We recognize the financial statement effects of a tax position when it is more likely than not, based on the technical merits, that the position will be sustained upon examination. A tax position that meets the more-likely-than-not recognition threshold is measured as the largest amount of tax benefit that is greater than 50% likely of being realized upon ultimate settlement with a taxing authority. We reverse a previously recognized tax position in the first period in which it is no longer more likely than not that the tax position would be sustained upon examination. The determination and calculation of uncertain tax positions involves significant judgment in the application of complex tax laws. Resolution of these uncertainties in a manner inconsistent with our expectations could have a material effect on our financial condition or results of operations. As of December 31, 2019, we had $29 million of unrecognized tax benefits from uncertain tax positions.
See Note 12 of the Notes to Consolidated Financial Statements for further discussion of our accounting for income taxes.
56
New Accounting Standards and Disclosure Requirements
See Note 2 of the Notes to Consolidated Financial Statements for a discussion of new accounting standards and disclosure requirements.
Item 7A. | Quantitative and Qualitative Disclosures about Market Risk |
The information required hereunder is set forth under Item 7. “Management’s Discussion and Analysis of Financial Condition and Results of Operations — Risk Management and Commodity Accounting.”
Item 8. | Financial Statements and Supplementary Data |
The information required hereunder is set forth under “Report of Independent Registered Public Accounting Firm,” “Consolidated Statements of Operations,” “Consolidated Statements of Comprehensive Income,” “Consolidated Balance Sheets,” “Consolidated Statements of Stockholder’s Equity,” “Consolidated Statements of Cash Flows,” and “Notes to Consolidated Financial Statements” included in the Consolidated Financial Statements that are a part of this Report. Other financial information and schedules are included in the Consolidated Financial Statements that are a part of this Report.
Item 9. | Changes in and Disagreements with Accountants on Accounting and Financial Disclosure |
None.
Item 9A. | Controls and Procedures |
Disclosure Controls and Procedures
We maintain disclosure controls and procedures that are designed to ensure that information required to be disclosed in our Exchange Act reports is recorded, processed, summarized and reported within the time periods specified in the SEC’s rules and forms, and that such information is accumulated and communicated to our management, including our Chief Executive Officer and Chief Financial Officer, as appropriate, to allow timely decisions regarding required financial disclosure.
As of the end of the period covered by this Report, we carried out an evaluation, under the supervision and with the participation of our management, including our Chief Executive Officer and Chief Financial Officer, of the effectiveness of the design and operation of our disclosure controls and procedures as defined in Rule 13a-15(e) or Rule 15d-15(e) of the Exchange Act. Based upon, and as of the date of, this evaluation, the Chief Executive Officer and the Chief Financial Officer concluded that our disclosure controls and procedures were effective such that the information required to be disclosed in our SEC reports is recorded, processed, summarized and reported within the time periods specified in SEC rules and forms, and is accumulated and communicated to our management, including our Chief Executive Officer and Chief Financial Officer, as appropriate to allow timely decisions regarding required disclosure.
Management’s Report on Internal Control over Financial Reporting
Our management is responsible for establishing and maintaining adequate internal control over financial reporting (as defined in Rules 13a-15(f) and 15d-15(f) under the Exchange Act). Our internal control over financial reporting is a process designed to provide reasonable assurance regarding the reliability of financial reporting and the preparation of financial statements for external purposes in accordance with U.S. GAAP.
Our internal control over financial reporting includes those policies and procedures that:
• | pertain to the maintenance of records that, in reasonable detail, accurately and fairly reflect the transactions and dispositions of our assets; |
• | provide reasonable assurance that transactions are recorded as necessary to permit preparation of financial statements in accordance with U.S. GAAP, and that our receipts and expenditures are being made only in accordance with authorizations of our management and directors; and |
• | provide reasonable assurance regarding prevention or timely detection of unauthorized acquisition, use, or disposition of our assets that could have a material effect on our financial statements. |
Management has assessed the effectiveness of our internal control over financial reporting as of December 31, 2019. In making its assessment of internal control over financial reporting, management used the criteria described in Internal Control — Integrated Framework (2013) issued by the Committee of Sponsoring Organizations of the Treadway Commission.
57
Based on management’s assessment, management has concluded that our internal control over financial reporting was effective as of December 31, 2019 to provide reasonable assurance regarding the reliability of financial reporting and the preparation of consolidated financial statements for external reporting purposes in accordance with U.S. GAAP.
Changes in Internal Control Over Financial Reporting
During the fourth quarter of 2019, there were no changes in our internal control over financial reporting (as defined in Rules 13a-15(f) and 15d-15(f) under the Exchange Act) that materially affected, or are reasonably likely to materially affect, our internal control over financial reporting.
Item 9B. | Other Information |
None.
58
PART III
Item 10. | Directors, Executive Officers and Corporate Governance |
Directors
Set forth in the table below is a list of our directors, together with certain biographical information, including their ages as of February 24, 2020. The directors are selected in accordance with the Stockholders Agreement dated March 8, 2018, by and between Calpine Corporation and CPN Management.
Name | Age | Principal Occupation | ||
Waleed Elgohary | 43 | Senior Principal, Canada Pension Plan Investment Board | ||
Andrew Gilbert | 33 | Partner, Energy Capital Partners | ||
John B. (Thad) Hill III | 52 | President and Chief Executive Officer, Calpine Corporation | ||
Douglas W. Kimmelman | 59 | Senior Partner and Founder, Energy Capital Partners | ||
W. Thaddeus Miller | 69 | Executive Vice Chairman, Chief Legal Officer and Secretary, Calpine Corporation | ||
Tyler G. Reeder | 46 | Managing Partner, Energy Capital Partners | ||
Andrew D. Singer | 57 | Senior Legal Counsel, Energy Capital Partners | ||
Donald A. Wagner | 56 | Managing Director, Access Industries | ||
Waleed Elgohary became a director of the Company on February 12, 2020. Mr. Elgohary is a Senior Principal of the Canada Pension Plan Investment Board where he is a member of the Energy & Resources group, which focuses on investments in oil and gas, midstream, metal and mining and power and LNG. Prior to joining the Canada Pension Plan Investment Board in 2016, he was Senior Vice President, Asset Management at Capstone Infrastructure Corporation and, prior to that, Senior Vice President, Operations and Corporate Secretary at Enwave Energy Corporation, a portfolio company of Brookfield Infrastructure. Prior to Enwave, Mr Elgohary was a corporate and energy associate at McCarthy Tetrault, a leading Canadian Law Firm. Mr. Elgohary has a Juris Doctorate and Master of Business Administration degree from Western Law and the Ivey School of Business in London, Canada and a Bachelor of Science in Mechanical Engineering and Bachelor of Science from McMaster University in Hamilton, Canada. He was nominated to our Board of Directors by the Canada Pension Plan Investment Board in accordance with the terms of the Stockholders Agreement. Mr. Elgohary's more than 15 years of strategic energy asset management experience as well as his extensive experience in investment analysis in the global energy sector make him a valuable member of our Board of Directors and of our Compensation Committee.
Andrew Gilbert became a director of the Company on March 8, 2018. Mr. Gilbert is a Partner of Energy Capital Partners, a private equity firm focused on investments in the energy industry, and is involved in all areas of Energy Capital Partner’s investment activities, with a particular emphasis on fossil and renewable power generation and environmental services. Mr. Gilbert serves as a member of the firm’s Valuation Committee. Prior to joining Energy Capital Partners in 2010, Mr. Gilbert was a member of Citigroup’s Global Energy Investment Banking Group, where he focused on the midstream sector. Mr. Gilbert received a Bachelor of Science degree in Finance and Economics from New York University Stern School of Business and is a Chartered Financial Analyst. He was nominated to our Board of Directors by Energy Capital Partners in accordance with the terms of the Stockholders Agreement. Mr. Gilbert’s knowledge and expertise regarding financial and investment matters and the power generation industry make him a valuable member of our Board of Directors and of our Compensation Committee and Chairman of our Audit Committee.
John B. (Thad) Hill III became a director of the Company and has served as our President and Chief Executive Officer since May 14, 2014. He previously served as our President and Chief Operating Officer from December 2012, as our Executive Vice President and Chief Operating Officer from November 2010 to December 2012 and as our Executive Vice President and Chief Commercial Officer from September 2008 to November 2010. Prior to joining the Company, Mr. Hill served as Executive Vice President of NRG Energy, Inc. from February 2006 to September 2008 and President of NRG Texas LLC from December 2006 to September 2008. Prior to joining NRG Energy, Inc., Mr. Hill was Executive Vice President of Strategy and Business Development at Texas Genco LLC from 2005 to 2006. From 1995 to 2005, Mr. Hill was with Boston Consulting Group, Inc., where he rose to Partner and Managing Director and led the North American energy practice, serving companies in the power and natural gas sectors with a focus on commercial and strategic issues. Mr. Hill received his Bachelor of Arts degree from Vanderbilt University and a Master of Business Administration degree from the Amos Tuck School of Dartmouth College. He was nominated to our Board of Directors in accordance with the terms of the Stockholders Agreement. Mr. Hill’s expertise in the power sector,
59
power operations and energy commodities along with his knowledge of the Company’s day-to-day operations and overall strategic plan make him a valuable member of our Board of Directors.
Douglas W. Kimmelman became a director of the Company on March 8, 2018. Mr. Kimmelman founded Energy Capital Partners in April 2005 and serves as its Senior Partner. Mr. Kimmelman serves as a member of the firm’s Management Committee, Partnership Committee and Investment Committee. Prior to founding Energy Capital Partners, Mr. Kimmelman spent 22 years with Goldman Sachs, starting in 1983 in the firm’s Pipeline and Utilities Department within the Investment Banking Division. He remained exclusively focused on the energy and utility sectors in the Investment Banking Division until 2002, when he transferred to the firm’s J. Aron commodity group. He was named a General Partner of the firm in 1996. From 2002 to 2005, Mr. Kimmelman played a leadership role at Goldman Sachs in building a power generation asset portfolio through the J. Aron commodity group. Mr. Kimmelman currently serves on the board of Nesco Holdings, Inc. since July 2019, Sunnova Energy International, Inc. since June 2019, USD Partners, LP since October 2014 and also sits on the boards of numerous Energy Capital Partners portfolio companies and other private, charitable and nonprofit boards. Mr. Kimmelman received a Bachelor of Arts degree in Economics from Stanford University and a Masters in Business Administration degree from the Wharton School at the University of Pennsylvania. He was nominated to our Board of Directors by Energy Capital Partners in accordance with the terms of the Stockholders Agreement. Mr. Kimmelman’s approximately 35 years of experience in the power generation and energy industries provide him with strong leadership and insight, particularly with regard to power sector strategy and management matters and make him a valuable member of our Board of Directors.
W. Thaddeus Miller became a non-voting director of the Company and has served as our Executive Vice Chairman since March 8, 2018 and as Executive Vice President, Chief Legal Officer and Secretary since August 12, 2008. Prior to joining the Company, Mr. Miller served as Executive Vice President and Chief Legal Officer of Texas Genco LLC from December 2004 until February 2006. From 2002 to 2004, Mr. Miller was a consultant to Texas Pacific Group, a private equity firm. From 1999 to 2002, he served as Executive Vice President and Chief Legal Officer of Orion Power Holdings, Inc., an independent power producer. From 1994 to 1999, Mr. Miller was a Vice President of Goldman Sachs & Co., where he focused on wholesale electric and other energy commodity trading. Before joining Goldman Sachs & Co., Mr. Miller was a partner in a New York law firm. Mr. Miller currently serves on the board of RMG Acquisition Corp. since December 2019. Mr. Miller earned his Bachelor of Science degree from the U.S. Merchant Marine Academy and his Juris Doctor degree from St. John’s School of Law. In addition, Mr. Miller was an officer in the U.S. Coast Guard from 1973 through 1976. He was nominated to our Board of Directors as a non-voting director in accordance with the terms of the Stockholders Agreement. Mr. Miller’s extensive experience in legal, regulatory and governmental matters related to the power sector along with his breadth and knowledge of the Company’s legal matters make him a valuable member of the Board of Directors.
Tyler G. Reeder became a director of the Company on March 8, 2018. Mr. Reeder is a Managing Partner of Energy Capital Partners and is involved in all areas of Energy Capital Partner’s investment activities, with a particular emphasis on fossil power generation and environmental infrastructure and services. Mr. Reeder serves as a member of the firm’s Investment Committee, Valuation Committee and Strategy Committee. Prior to joining Energy Capital Partners in 2006, he was a member of the Texas Genco, LLC management team until the sale of the company to NRG Energy, Inc. in 2006. While at Texas Genco, LLC, Mr. Reeder was the head of the asset optimization desk and managed the generation portfolio’s power and fuel positions. From 1998 to 2002, he was a Director for Energy Markets and a Finance Manager at Orion Power Holdings, Inc., where he was responsible for power marketing, transaction analysis and execution. From 1996 to 1998, he worked at Goldman Sachs. Mr. Reeder currently serves on the board of Ramaco Resources, Inc. since December 2016 and serves on the boards of numerous Energy Capital Partners portfolio companies. He previously served as a director for Dynegy, Inc. from February to November 2017. Mr. Reeder received a Bachelor of Arts degree in Economics from Colgate University. He was nominated to our Board of Directors by Energy Capital Partners in accordance with the terms of the Stockholders Agreement. Mr. Reeder’s knowledge and expertise with power generation companies provide him with strong insight, particularly with regard to commercial and power operations, power sector strategy, regulatory compliance and capital allocation and make him a valuable member of our Board of Directors and of our Audit Committee and Chairman of our Compensation Committee.
Andrew D. Singer became a director of the Company on March 8, 2018. Mr. Singer is Senior Legal Counsel and, prior to January 1, 2020, a Partner and General Counsel of Energy Capital Partners and a member of the firm’s Investment Committee. As such, he was involved in all areas of the firm’s investment activities, with a particular emphasis on fossil and renewable power generation and environmental services. He also took a leadership role in structuring most of the firm’s debt financings and contractual obligations. Prior to joining Energy Capital Partners in 2005, Mr. Singer was a partner at the law firm of Latham & Watkins LLP and the Global Chair of Latham’s Project Development and Finance Group, with 18 years of experience in the energy industry. Mr. Singer received a Bachelor of Science degree in Electrical Engineering from Cornell University and a Juris Doctorate from Harvard University. He was nominated to our Board of Directors by Energy Capital Partners in accordance with the terms of the Stockholders Agreement. Mr. Singer’s significant experience in representing both lenders and borrowers in power
60
development, acquisition and financing transactions as well as his expertise in power sector capital transactions make him a valuable member of our Board of Directors and of our Compensation Committee and our Audit Committee.
Donald A. Wagner became a director of the Company on March 8, 2018. Mr. Wagner is a Managing Director of Access Industries, Inc. (“Access”) having been with Access since 2010. He is responsible for sourcing and executing new investment opportunities in North America, and he oversees Access’ current North American investments. From 2000 to 2009, Mr. Wagner was a Senior Managing Director of Ripplewood Holdings L.L.C., responsible for investments in several areas and heading the industry group focused on investments in basic industries. Previously, Mr. Wagner was a Managing Director of Lazard Freres & Co. LLC and had a 15-year career at that firm and its affiliates in New York and London. He is a board member of Access portfolio companies Warner Music Group since July 2011, EP Energy Corporation and predecessors since May 2012 and BMC Software since October 2018. He previously served on the board of NYSE-listed RSC Holdings from November 2006 until August 2009. Mr. Wagner graduated summa cum laude with a Bachelor of Arts degree in physics from Harvard College. He was nominated to our Board of Directors by Access in accordance with the terms of the Stockholders Agreement. Mr. Wagner’s knowledge and understanding of capital markets as a result of his over 25 years of experience in investing, banking and private equity, in addition to his experience as a director of public companies, make him a valuable member of our Board of Directors and of our Audit Committee.
Information about our Executive Officers
Set forth in the table below is a list of our executive officers, together with certain biographical information, including their ages as of February 24, 2020:
Name | Age | Position | |||
John B. (Thad) Hill III(1) | 52 | President and Chief Executive Officer | |||
Zamir Rauf | 60 | Executive Vice President and Chief Financial Officer | |||
W. Thaddeus Miller(1) | 69 | Executive Vice Chairman, Chief Legal Officer and Secretary | |||
Charles M. Gates | 68 | Executive Vice President, Power Operations | |||
___________
(1) | See “Directors” above for biographical information. |
Zamir Rauf has served as our Executive Vice President and Chief Financial Officer since December 17, 2008, after serving as Interim Chief Financial Officer from June 4, 2008. Previously, he served as our Senior Vice President, Finance and Treasurer from September 2007 until his appointment as Interim Chief Financial Officer. Since joining the Company in February 2000, Mr. Rauf has served as Manager, Finance from February 2000 to April 2001, Director, Finance from April 2001 to December 2002, Vice President, Finance from December 2002 to July 2005 and Senior Vice President, Finance from July 2005 to September 2007. Prior to joining the Company, Mr. Rauf held various accounting and finance roles with Enron North America and Dynegy Inc., as well as credit and lending roles with Comerica Bank. Mr. Rauf earned his Bachelor of Arts degree in Business and Commerce and Masters in Business Administration – Finance degree from the University of Houston.
Charles M. Gates joined Calpine as Executive Vice President of Power Operations in April 2016. Previously, Mr. Gates had served as Senior Vice President and Chief Fossil/Hydro Officer for Duke Energy Corporation (“Duke”) since August 2014. He had been Duke’s Senior Vice President of Power Generation Operations since July 2012, when Progress Energy, Inc. merged with Duke. Mr. Gates had served in a similar capacity for Progress Energy, Inc. since January 2012 after being promoted from Vice President of Fossil Generation for Progress Energy, Inc. for the Carolinas and Florida. He was previously General Manager of Progress Energy Florida from the time the company merged with Carolina Power & Light Company in 2001 to 2006. Mr. Gates began his power industry career with Carolina Power & Light in 1982 as an associate engineer and moved up through increasingly responsible positions to become General Manager of five fossil fuel plants in 2000. Mr. Gates’ other industry leadership roles include serving as Chairman of the Generation Council for the Electric Power Research Institute. He earned bachelor’s degrees in chemical engineering from North Carolina State University and in political science from the University of North Carolina.
Code of Conduct and Ethics
Our Code of Conduct applies to all directors, officers and employees and requires that each individual deal fairly, honestly and constructively with governmental and regulatory bodies, customers, suppliers and competitors. It prohibits any individual’s taking unfair advantage through manipulation, concealment, abuse of privileged information or misrepresentation of material facts. Further, it imposes an express duty to act in the best interests of the Company and to avoid influences, interests or relationships that could give rise to an actual or apparent conflict of interest. If any question as to a potential conflict of interest arises, employees are directed to notify their supervisors and the Chief Legal Officer and, in the case of directors and the Chief Executive Officer,
61
the Audit Committee of our Board of Directors. We require our executives to comply with our Code of Conduct as a condition of employment.
Our Code of Conduct also prohibits directors, officers and employees from competing with us, using Company property or information, or such employee’s position, for personal gain, and taking corporate opportunities for personal gain. Waivers of our Code of Conduct must be explicit. Any director, officer or employee seeking a waiver must provide his supervisor and the Chief Legal Officer with all pertinent information and, if the Chief Legal Officer recommends approval of a waiver, it shall present such information and the recommendation to the Audit Committee of our Board of Directors. A waiver may only be granted if (i) the Audit Committee is satisfied that all relevant information has been provided and (ii) adequate controls have been instituted to assure that the interests of the Company remain protected. In the case of our Chief Executive Officer and our directors, any waiver must also be approved by the Audit Committee. Any waiver that is granted, and the basis for granting the waiver, will be publicly communicated as appropriate, including posting on our website, as soon as practicable. We granted no waivers under our Code of Conduct in 2019. Our Code of Conduct is posted on our website at www.calpine.com/about-us/investor-information. We intend to post any amendments to and any waivers of our Code of Conduct on our website within four business days.
Audit Committee
Our Board of Directors has a separately designated audit committee established in accordance with Section 3(a)(58)(A) of the Exchange Act. The members of the Audit Committee are Andrew Gilbert, who serves as chair, Tyler G. Reeder, Andrew D. Singer and Donald A. Wagner. The Board of Directors has also determined that each member of the Audit Committee have sufficient knowledge and understanding of the Company’s financial statements to serve on the Audit Committee and that Messrs. Gilbert, Reeder and Wagner satisfy the definition of “audit committee financial expert” as defined under the federal securities laws. We currently do not have any outstanding stock listed on a national securities exchange; thus, there are no independence standards applicable to us associated with our Audit Committee members.
62
Item 11. | Executive Compensation |
COMPENSATION DISCUSSION AND ANALYSIS
This Compensation Discussion and Analysis section explains how our executive compensation programs are designed and operate with respect to the following officers identified in the “Summary Compensation Table” below (the “named executive officers”):
John B. (Thad) Hill III | President and Chief Executive Officer |
Zamir Rauf | Executive Vice President and Chief Financial Officer |
W. Thaddeus Miller | Executive Vice Chairman, Chief Legal Officer and Secretary |
Charles M. Gates | Executive Vice President, Power Operations |
Executive Summary
Our goal is to be recognized as the premier competitive power company in the United States and our Compensation Committee believes that our executive compensation program is instrumental in helping us achieve this goal. We maintain straightforward compensation programs pursuant to which our named executive officers’ compensation consists almost entirely of base salary, annual cash incentives and long-term incentives.
During 2019, we achieved strong operational and financial results while maintaining a steadfast commitment to safety. Our wholesale commercial operations positioned the Company to benefit from higher market prices in Texas during the summer while our power operations maintained our power plants to be available to operate when called upon to meet market demand. Additionally, our retail business exceeded expectations in residential sales in Texas and at Calpine Solutions. Our executive management team consists of individuals with extensive industry experience who remain focused on executing the Company’s strategic plan to create long-term value and our executive compensation program is designed to reward successful execution of short- and long-term Company goals.
The compensation decisions made in 2019 by the Compensation Committee continue to reflect a commitment to aligning executive compensation with the creation of long-term value for our owners and focus on incentivizing our executives to improve financial and operating performance.
Our Compensation Program Objectives and Guiding Principles
The Company’s executive compensation program is designed to promote long-term value creation and emphasize pay for performance. The compensation program for our named executive officers emphasizes at-risk, performance-based compensation and helps Calpine recruit, retain and motivate a highly talented team of executives with the requisite set of skills and experience to successfully lead the Company in creating value for our owners. In addition, the Compensation Committee believes that the mix and structure of compensation for our executives strikes an appropriate balance in promoting long-term returns without motivating or rewarding imprudent risk taking. The compensation objectives and principles that govern the Company’s compensation decisions include:
• | Alignment with Owners’ Interests. Our long-term incentive awards align our named executive officers’ interests with the interests of our owners by rewarding increases in the value of our business, incentivizing retention and optimizing long-term financial performance. |
• | Pay for Performance. A significant portion of compensation for our named executive officers is linked to the achievement of corporate operating and financial objectives that we believe drive long-term value. |
• | Emphasis on Performance Over Time. The compensation program for our named executive officers is designed to minimize excessive short-term decision making and imprudent risk taking. The potential value of long-term incentives could be substantially greater than the annual cash incentive bonus based upon the creation of long-term value. Additionally, our annual incentive plan limits the maximum cash incentive bonus that can be earned in a given year. The Compensation Committee also retains the discretionary power to reduce annual incentive awards below calculated values. |
• | Recruitment, Retention and Motivation of Key Leadership Talent. We provide an appropriate combination of fixed and variable compensation designed not only to attract and motivate the most talented executives for Calpine, |
63
but also to encourage retention by vesting Class B Interests (as described in “Details of Each Element of Compensation — Long-Term Incentives” below) over approximately five years.
Determining Executive Compensation
The Compensation Committee bases any adjustments to current pay levels on several factors, including the scope and complexity of the functions an executive officer oversees, the contribution of those functions to our overall performance, individual experience and capabilities, individual performance and competitive pay practices. Any variations in compensation among our executive officers reflect differences in these factors.
Compensation Consultant
The Compensation Committee has authority to retain compensation consulting firms to assist it in the evaluation of executive officer and employee compensation and benefit programs. The Compensation Committee elected not to retain a compensation consultant in 2019 to assist in determining or recommending the amount or form of executive compensation; however, the Compensation Committee may elect to retain a compensation consultant in the future.
Comparator Group
We believe it is appropriate to provide industry-competitive total compensation opportunities to our named executive officers in order to attract and retain top executive talent. The Company does not formally target compensation of its named executive officers against any specific comparator group but rather reviews market data generally to assess whether the Company’s compensation practices are competitive.
Role of Executive Officers in Executive Compensation Decisions
The Chief Executive Officer considers each other executive officer’s performance and makes a recommendation to the Compensation Committee on base salary, annual bonus and, subject to the approval of Volt Parent, the grant of Class B Interests for each named executive officer other than himself. The Chief Executive Officer participates in Compensation Committee meetings at the Compensation Committee’s request to provide background information regarding the Company’s strategic objectives and to evaluate the performance of and compensation recommendations for the other executive officers. The Committee considers the information provided by the Chief Executive Officer in making compensation decisions. Executive officers do not propose or seek approval for their own compensation. The Chairman of the Compensation Committee, with input from the Board of Directors, recommends the Chief Executive Officer’s compensation to the Compensation Committee in an executive session, not attended by the Chief Executive Officer.
Elements of Compensation
Compensation for the named executive officers primarily consists of:
Type | Purpose |
Base Salary | Provide a minimum, fixed level of cash compensation to compensate executives for services rendered during the fiscal year. |
Annual Cash Incentives | Drive achievement of annual corporate goals, including key financial and operating results and strategic goals that drive value for our owners. |
Long-Term Incentives | Align executive officers’ interests with the interests of owners by rewarding increases in the value of our business. |
Post-Employment Compensation | Assist executive officers and other eligible employees to prepare financially for retirement, to offer benefits that are competitive and tax-efficient, and to provide a benefits structure that allows for reasonable certainty of future costs. Help retain executive officers and certain other qualified employees, maintain a stable work environment and provide financial security in the event of a change in control or in the event of a termination of employment in connection with or without a change in control. |
Allocation and Distribution of Each Element of Compensation
The portion of total compensation delivered in the form of base salary and benefits is intended to provide a competitive foundation and fixed rate of pay for the work being performed by each named executive officer commensurate with such executive’s associated level of responsibility and contributions to Calpine. The compensation opportunity beyond those pay elements is “at risk” and must be earned through achievement of annual goals, which represent performance expectations of the Board of Directors and management and are designed to measure long-term value creation for our owners. In setting target compensation, the Compensation Committee focuses on the total compensation opportunity for the executive. The proportion of compensation
64
designed to be delivered in base salary versus variable pay depends on the executive’s position and the ability of that position to influence overall Company performance. The more senior the level of the executive, the greater is the percentage of total pay opportunity that is variable.
Details of Each Element of Compensation
Base Salary. The 2019 base salary of each of our named executive officers was set following an annual review, during which adjustments were made to reflect performance-based factors, as well as competitive considerations. During its annual review of base salaries, the Compensation Committee primarily considered:
• | our budget for annual merit increases; |
• | the appropriateness of each executive officer’s compensation, both individually and relative to the other executive officers; and |
• | the individual performance of each executive officer. |
We do not apply specific formulas to determine increases to base salary, which are granted to recognize individual performance and contributions to the improved strategy and operations of the Company. Adjustments to executive salaries are generally effective with the first payroll period after the adjustment is approved. Base salaries and percentage increases from the previous year’s base salary for our named executive officers are indicated below for 2019:
2019 | |||||||
Base Salary | Percentage increase from previous year | ||||||
John B. (Thad) Hill III | $ | 1,263,825 | 2.75 | % | |||
Zamir Rauf | $ | 674,146 | 2.75 | % | |||
W. Thaddeus Miller | $ | 917,561 | 2.75 | % | |||
Charles M. Gates | $ | 496,578 | 2.75 | % | |||
Annual Incentive — Calpine Incentive Plan. Our annual incentive program, the CIP, is designed to promote the achievement of annual corporate goals, including key financial, operating and strategic goals that, in turn, drive value for our owners. Most regular full-time, non-collective bargaining unit employees hired prior to October 1, 2019, were eligible to participate in the CIP, including all our named executive officers. The Compensation Committee assigned to each executive officer a target incentive opportunity, expressed as a percentage of eligible earnings (base salary amount paid in 2019), which is dependent on the level of the employee’s position and the scope of the employee’s responsibilities. Target annual incentive levels for each named executive officer are shown in a table below. The total target CIP incentive pool is the sum of all participants’ target annual incentive amounts.
CIP Funding. Funding of the CIP incentive pool is triggered only if we meet a minimum corporate performance target established by the Compensation Committee. For fiscal 2019, this minimum corporate performance target was $1,632 million of Adjusted EBITDA, which was 80% of our fiscal 2019 Adjusted EBITDA goal of $2,040 million. We use Adjusted EBITDA because it is a metric used by our Board of Directors and senior management in evaluating our financial performance. Our Adjusted EBITDA of $2,291 million exceeded our minimum corporate performance target for fiscal 2019. As a result, the 2019 CIP incentive was funded.
Adjusted EBITDA represents net income before interest, income taxes and depreciation and amortization adjusted for the effects of impairment losses, gains or losses on sales, dispositions or retirements of assets, any mark-to-market gains or losses from accounting for derivatives, adjustments to exclude the Adjusted EBITDA related to the noncontrolling interest, operating lease expense, non-cash gains and losses from foreign currency translations, major maintenance expense, gains or losses on the repurchase or extinguishment of debt, non-cash GAAP-related adjustments to levelize revenues from tolling agreements and any unusual or non-recurring items plus adjustments to reflect the Adjusted EBITDA from our unconsolidated investments.
Determination of CIP Bonus Pool. The size of the CIP incentive pool is based on the extent to which we achieve the corporate performance goals that are established annually by the Compensation Committee. The Compensation Committee selected these performance goals to reflect a balanced evaluation of annual financial and operating performance. Specific performance metrics include cash generation, cost containment, safety and achievement of key goals that drive the creation of long-term value. The 2019 performance goals and the actual results are shown in the following table and discussed in further detail below:
65
CIP Performance Score Calculation ($ in millions) for 2019
Performance Measure / Performance Score | Threshold(1) | Target | Maximum(1) | Results | Score | Weight | Weighted Score | |||||||||||||||||||||
Commodity Margin | $ | 2,785 | $ | 3,035 | $ | 3,235 | $ | 3,392 | 278.3 | % | 35.0 | % | 97.4 | % | ||||||||||||||
Expenses | $ | 1,194 | $ | 995 | $ | 750 | $ | 1,069 | 62.3 | % | 35.0 | % | 21.8 | % | ||||||||||||||
CAPEX/Maintenance | $ | 555 | $ | 494 | $ | 425 | $ | 523 | 55.0 | % | 10.0 | % | 5.5 | % | ||||||||||||||
TRIR | 2.23 | 0.80 | 0.40 | 0.58 | 128.0 | % | 10.0 | % | 12.8 | % | ||||||||||||||||||
Average EFOF | 8.50 | % | 3.6 | % | 1.71 | % | 4.37 | % | 84.0 | % | 5.0 | % | 4.2 | % | ||||||||||||||
Regulatory Compliance (Pass/Fail) | No material non-compliance events | PASS | 100.0 | % | 5.0 | % | 5.0 | % | ||||||||||||||||||||
Overall Performance Score | 100 | % | 146.7 | % | ||||||||||||||||||||||||
Board Discretionary Increase (Decrease) Factor | 1.0 | |||||||||||||||||||||||||||
Final Performance Score(2) | 146.7 | % | ||||||||||||||||||||||||||
_______________
(1) | Threshold and maximum incentive levels for each Performance Measure under the CIP are displayed as 0% and 200%, respectively, of the target incentive percentage for Commodity Margin, Expenses, CAPEX/Maintenance and Average EFOF. Actual results for these Performance Measures can exceed the maximum incentive level. TRIR has a maximum incentive level of 150% and Regulatory Compliance is Pass/Fail. |
(2) | Although the individual Performance Measures have no cap, the overall CIP payout (or Final Performance Score) is capped at 150%. |
Explanation of Performance Measures.
• | Commodity Margin, as used for purposes of determining our CIP goal, is a financial measure that includes power and steam revenues, sales of purchased power and physical natural gas, capacity revenues, REC revenue, sales of surplus emission allowances, transmission revenue and expenses, fuel and purchased energy expense, fuel transportation expense, environmental compliance expenses, ancillary retail expense and realized settlements from marketing, hedging, optimization and trading activities, but excludes mark-to-market activity. Commodity Margin is a key operational measure of profit used to assess the performance of our business. This amount differs from “Commodity Margin” as reported under FASB Accounting Standards Codification 280 in this Report as it also includes other revenue, as referenced in the CIP performance score calculation, Adjusted EBITDA from Calpine’s unconsolidated operations at Greenfield and Whitby (prior to the sale of our interest in Whitby), and certain other adjustments approved by the Compensation Committee. |
• | Expenses, as used solely for purposes of determining our CIP pool, are comprised of Operating and Maintenance Expense (excluding major maintenance, scrap and certain other items), Royalty Expense from Calpine’s geothermal operations, General & Other Administrative Expense (excluding certain other items), and Other Operating Expense (excluding amortization and Merger-related costs), in each case, as calculated in accordance with U.S. GAAP and included in the amounts reported on our Consolidated Statement of Operations for the year ended December 31, 2019 in this Report. We believe that Expenses are a useful tool for assessing the performance of our core operations and are a key operational measure reviewed by our management. |
• | CAPEX/Maintenance refers to Calpine’s Capital Expenditure and Major Maintenance Expense related to the refurbishment of major turbine generator equipment and other plant-related facilities inclusive of Calpine’s unconsolidated operations at Greenfield and Whitby (prior to the sale of our interest in Whitby). CAPEX is capitalized into Property, Plant and Equipment and Maintenance is recorded as a component of Operating and Maintenance Expense. We monitor these expenditures and establish targets as useful tools to measure our operating performance. We believe that monitoring our Capital Expenditure and Major Maintenance Expense allows us to ensure that planned capital projects are not experiencing cost overruns. |
• | Average EFOF refers to Equivalent Forced Outage Factor, which is a measure indicating the percent of time that our power plants are not capable of reaching full capacity due to forced outages and forced equipment limitations and is a key operating measure to assess plant availability. |
• | TRIR refers to Total Recordable Incident Rate, which is a measure of operational safety. We place a high priority on the safety of our employees. TRIR is calculated as the sum of our lost time, restricted duty and other recordable cases as well as any fatality incidents during the year multiplied by 200,000 and then divided by total hours worked during the year. |
66
• | Regulatory Compliance refers to the Compensation Committee evaluation of overall regulatory compliance based on consultation with the Chief Compliance Officer to ensure compliance with all applicable statutes in the operation of our business. |
• | Board Discretionary Increase/Decrease Factor represents the Board of Directors’ consideration of the quantitative outcomes of the Performance Measures and any additional factors taken into consideration which would result in the Board of Directors, in its discretion, adjusting the calculated outcomes. |
Determination of Individual Award Payouts. Based on the extent to which we achieved the previously established 2019 performance goals, as shown above, approximately $65 million was funded to the total CIP bonus pool for 2019 for allocation among the eligible plan participants. The following table shows the incentive eligible earnings and target and maximum incentive percentages and actual payout amounts for each named executive officer:
Name | Incentive Eligible Earnings | Target Incentive % | Maximum Incentive % | Incremental Incentive Rate(3) | Incentive Calculation Overall Performance Score(4) | Incentive %(5) | Incentive Amount | |||||||||||||||
John B. (Thad) Hill III(1) | $ | 1,257,320 | 110 | % | 220 | % | 2.0 | 146.7 | % | 212.7 | % | $ | 2,674,823 | |||||||||
Zamir Rauf(1) | $ | 670,676 | 90 | % | 200 | % | 2.22 | 146.7 | % | 183.4 | % | $ | 1,230,020 | |||||||||
W. Thaddeus Miller(1) | $ | 912,838 | 90 | % | 200 | % | 2.22 | 146.7 | % | 183.4 | % | $ | 1,674,145 | |||||||||
Charles M. Gates(2) | $ | 482,563 | 90 | % | 200 | % | 2.22 | 146.7 | % | 183.4 | % | $ | 885,020 | |||||||||
_______________
(1) | The maximum incentive as a percentage of base salary is set forth in the employment agreement for these named executive officers. |
(2) | Mr. Gates’ maximum incentive is consistent with the terms of the CIP. |
(3) | Incremental Incentive Rate equals the additional percentage of eligible earnings for each percent that Overall Performance Score exceeds 100%. Rate is calculated as the ratio of the difference between maximum and target incentive percentage and maximum and target Performance Score. |
(4) | From 2019 CIP performance score calculation shown above. |
(5) | Incentive % equals sum of Target Incentive plus product of excess of Overall Performance Score over 100% multiplied by Incremental Incentive Rate. |
Long-Term Incentives. In March 2018, following the entry into the Amended and Restated Limited Partnership Agreement of CPN Management (the “LPA”) dated March 8, 2018, as amended on August 29, 2018, CPN Management commenced an arrangement whereby certain Class B partnership interests in CPN Management will be available for grant to certain Calpine eligible employees and its subsidiaries, including our named executive officers.
CPN Management is the direct owner of 100% of Calpine. Thus, the time vested Class B Interests directly align our named executive officers’ interests with the interests of our owners by rewarding increases in the value of our business, incentivizing retention and optimizing long-term financial and operating performance.
Pursuant to the LPA, up to a total of 6% of the total partnership interests of CPN Management are eligible to be granted in the form of time vesting Class B Interests of which an aggregate percentage of approximately 5.5% was granted to senior management, including our named executive officers, in 2018. The allocation of the remaining 0.5% is reserved for allocation to new hires or for promotions. Additionally, Class B Interests with an aggregate percentage of 2.5% are eligible to be granted in the form of outsized performance vesting Class B Interests which only share in returns above 200% return of capital to the Class A interests (the “Performance Class B Interests”). There were no grants of Performance Class B Interests made in 2019.
At December 31, 2019, approximately 5.7% of the 6% time vested Class B Interests were allocated among individual members of senior management and all 2.5% of the Performance Class B Interests remain available for grant.
Each of the time vested Class B Interests will generally be entitled to participate in distributions from CPN Management only after holders of capital interests in CPN Management have received distributions in an aggregate amount equal to their capital contributed, and only with respect to appreciation in the value of CPN Management following the date of grant of such interest. On June 28, 2019, our Compensation Committee approved the grant of 0.11% time vested Class B Interests to Mr. Gates in connection with his commitment to extend his tenure with the Company by two years. One-fifth of the time vested Class B Interests will vest ratably on March 8th of each year over the service period and concludes on March 8, 2023, subject to the recipient’s continuous provision of services through the vesting date.
67
Additionally, in connection with Mr. Gates’ decision to extend his employment with the Company, on July 23, 2019, our Compensation Committee amended Mr. Gates’ Class B Interest Award Agreements dated March 8, 2018 and August 29, 2018 whereby the vesting terms of the time vested Class B Interests were modified to vest ratably over the extended service period of approximately five years as compared to the original service period of approximately three years. No other terms of the Class B Interest Award Agreements were affected by the amendments.
There were no Class B Interests granted to Messrs. Hill, Rauf and Miller in 2019; however, they did receive grants of Class B Interests in 2018.
The time vested Class B Interests become immediately vested upon the occurrence of certain events involving a change in control of Calpine or CPN Management (as defined in the relevant award agreement) as well as termination of employment due to death or disability. All unvested Class B Interests become forfeited upon any other termination of employment event.
The time vested Class B Interests are generally non-transferable without the prior written consent of the general partner of CPN Management and contain certain customary non-compete, non-solicitation, non-disparagement and confidentiality restrictions. In addition, CPN Management has the right under the LPA to redeem the vested Class B Interests following a termination of employment for fair market value. Following a termination of employment for cause (as defined in the relevant award agreement), the vested Class B Interests may be redeemed by CPN Management for zero (0) dollars.
The time vested Class B Interests are intended to be treated as “profits interest” for U.S. federal income tax purposes.
Perquisites and Other Personal Benefits. We offer a very limited amount of customary perquisites and other personal benefits to our named executive officers. The Compensation Committee believes that these perquisites are reasonable and consistent with prevailing market practice and the Company’s overall compensation program. Perquisites are not a material part of our compensation program. The Compensation Committee periodically reviews the levels of perquisites and other personal benefits provided to our named executive officers. See “— Summary Compensation Table — All Other Compensation.”
Post-Employment Compensation Arrangements
To promote retention and recruiting, we offer various arrangements that provide certain post-employment benefits in order to alleviate concerns that may arise in the event of an employee’s separation from service with us and enable employees to focus on Company duties while employed by us. These post-employment severance benefits are provided through employment agreements and letter agreements as described more fully below under “— Summary of Employment Agreements” and “— Potential Payments Upon Termination or Change in Control.”
Retirement Benefits. Our executive officers participate in retirement plan programs provided to all Calpine employees and do not receive special retirement plans or benefits. Our primary objectives for providing retirement benefits is to assist employees in preparing financially for retirement, to offer benefits that are competitive and to provide a benefits structure that allows for reasonable certainty of future costs. Except for certain employees represented by a collective bargaining agreement, Calpine does not have a defined benefit plan for employees, including our named executive officers.
Our primary retirement benefit is the Calpine Corporation Retirement Savings Plan (the “401(k) Plan”), a defined contribution plan. For our executive officers as well as all other non-bargaining unit employees, we match employee contributions 100% up to 5% of eligible earnings, subject to all applicable regulatory limits, and the match vests immediately. Our 401(k) Plan also has an enhanced feature to our defined contribution plan for non-union employees consisting of a non-elective contribution for certain eligible employees who are active employees as of December 31. In addition, if an employee leaves our employment due to retirement, the employee can use any money remaining in his or her health reimbursement account to pay for post-employment medical insurance.
Severance Benefits. We maintain the Severance Plan that provides certain severance benefits to our executive officers and other qualified employees. The purpose of the Severance Plan is to help retain our executive officers and other qualified employees, maintain a stable work environment and provide financial security to our executive officers and certain other employees of the Company in the event of a change in control or in the event of a termination of employment in connection with or without a change in control. The Severance Plan does not provide for the payment of an excise tax gross-up, but Mr. Gates is entitled to a tax-gross up for any excise taxes incurred under Section 4999 of the IRC pursuant to a separate letter agreement with the Company, dated August 29, 2018 (the “Gates Letter Agreement”).
For a further discussion of the Severance Plan, see “— Potential Payments Upon Termination or Change in Control” below. For a further discussion of the Employment Agreements, see “— Summary of Employment Agreements” below.
68
Report of the Compensation Committee
The Compensation Committee has reviewed and discussed the “Compensation Discussion and Analysis” section of this Report with the Company’s management. Based on this review and discussion, the Compensation Committee recommended to our Board of Directors that the “Compensation Discussion and Analysis” section be included in this Report.
Tyler G. Reeder (Chair)
Waleed Elgohary
Andrew Gilbert
Andrew D. Singer
69
EXECUTIVE COMPENSATION
Summary Compensation Table
The following table provides certain information concerning the compensation for services rendered to us during the years ended December 31, 2019, 2018 and 2017 by (i) each person serving as a principal executive officer during the year ended December 31, 2019, (ii) each person serving as a principal financial officer during the year ended December 31, 2019, (iii) each of the two other most highly-compensated individuals who were serving as executive officers as of December 31, 2019 (collectively, the “named executive officers”):
Non-Equity | ||||||||||||||||||||
Option | Stock | Incentive Plan | All Other | |||||||||||||||||
Salary | Awards | Awards | Compensation | Compensation | Total | |||||||||||||||
Name and Principal Position | Year | ($) | ($) | ($) | ($)(1) | ($)(2)(3) | ($) | |||||||||||||
John B. (Thad) Hill III | 2019 | 1,266,702 | — | — | 2,674,823 | 16,500 | 3,958,025 | |||||||||||||
President and Chief | 2018 | 1,233,279 | — | — | 1,847,609 | 10,272,030 | 13,352,918 | |||||||||||||
Executive Officer | 2017 | 1,182,486 | 1,663,591 | 2,631,318 | 1,284,741 | 13,500 | 6,775,636 | |||||||||||||
Zamir Rauf | 2019 | 683,615 | — | — | 1,230,020 | 16,500 | 1,930,135 | |||||||||||||
Executive Vice President and | 2018 | 658,490 | — | — | 830,649 | 4,266,125 | 5,755,264 | |||||||||||||
Chief Financial Officer | 2017 | 643,513 | 581,045 | 894,072 | 568,801 | 13,500 | 2,700,931 | |||||||||||||
W. Thaddeus Miller | 2019 | 937,931 | — | — | 1,674,145 | 16,500 | 2,628,576 | |||||||||||||
Executive Vice Chairman, | 2018 | 913,321 | — | — | 1,130,572 | 3,858,850 | 5,902,743 | |||||||||||||
Chief Legal Officer and | 2017 | 888,119 | 790,838 | 1,216,895 | 774,179 | 13,500 | 3,683,531 | |||||||||||||
Secretary | ||||||||||||||||||||
Charles M. Gates | 2019 | 510,035 | — | — | 885,020 | 16,500 | 1,411,555 | |||||||||||||
Executive Vice President, | 2018 | 496,188 | — | — | 597,672 | 1,974,503 | 3,068,363 | |||||||||||||
Power Operations | 2017 | 482,768 | 427,995 | 658,580 | 409,385 | 13,500 | 1,992,228 | |||||||||||||
______________
(1) | Bonus paid pursuant to the CIP and/or the named executive officer’s employment agreement or letter agreement, as applicable. |
(2) | For 2019, the amounts set forth under “All Other Compensation” for Messrs. Hill, Rauf, Miller and Gates represents $14,000 in employer contributions to the Company’s 401(k) Plan and $2,500 in non-discretionary employer contribution. |
(3) | The Class B Interests do not have a grant date fair value as these awards are accounted for as profit sharing arrangements under FASB Accounting Standards Codification Topic 710. For a further description of the Class B Interests, see “Compensation Discussion and Analysis — Elements of Compensation — Details of Each Element of Compensation — Long-Term Incentives.” The market value for the Class B Interests is not determinable as there is no public market for the Class B Interests. As such, the fair value of the Class B Interests is not included herein. We did not record any expense in our Consolidated Statement of Operations for the year ended December 31, 2019 associated with the Class B Interests. |
70
Grants of Plan-Based Awards
The following table sets forth the information concerning the grants of any plan-based compensation to each named executive officer during 2019. The non-equity awards described below were made under the CIP.
Estimated Future Payouts Under Non-Equity Incentive Plan Awards(1) | |||||||
Name | Grant Date | Threshold ($) | Target ($) | Maximum ($) | |||
John B. (Thad) Hill III | — | — | 1,383,052 | 2,766,104 | |||
Zamir Rauf | — | — | 603,608 | 1,348,292 | |||
W. Thaddeus Miller | — | — | 821,554 | 1,835,122 | |||
Charles M. Gates | — | — | 434,307 | 993,156 | |||
______________
(1) | Amounts represent estimated possible payments under the CIP. Actual amounts paid under the CIP for 2019 are shown in the “Non-Equity Incentive Plan Compensation” column of the “Summary Compensation Table.” For more information on the performance metrics applicable to these awards, see “Compensation Discussion and Analysis — Details of Each Element of Compensation — Annual Incentive — Calpine Incentive Plan.” |
Summary of Employment Agreements
Certain of the amounts shown in the “Summary Compensation Table” and the “Grants of Plan-Based Awards” table are provided for in employment or letter agreements, as the case may be. The material terms of those agreements are summarized below:
John B. (Thad) Hill III
President and Chief Executive Officer
On August 29, 2018, the Company entered into an amended and restated executive employment agreement with John B. (Thad) Hill III, the Company’s President and Chief Executive Officer (the “Hill Agreement”), effective from and after March 8, 2018 (the “Hill Effective Date”), which replaced the original employment agreement entered into between the Company and Mr. Hill, effective as of the Company’s 2014 annual meeting of shareholders and as amended by that amended and restated executive employment agreement, dated May 16, 2017. The Hill Agreement has a five-year term and is subject to automatic one-year renewals on the fifth anniversary of the Hill Effective Date and each annual anniversary thereafter unless either party provides 90 days’ prior notice of his or its intention to not extend the term of the Hill Agreement. Under the Hill Agreement, Mr. Hill is entitled to an annual base salary of at least $1,230,000 and an annual target cash performance bonus equal to 110% of annual base salary, with a maximum annual performance bonus opportunity of two times Mr. Hill’s target bonus. The Hill Agreement provides that on, or as soon as reasonably practicable after, the Hill Effective Date, CPN Management will grant to Mr. Hill an award of 1.39% of the issued and outstanding Class B Interests in CPN Management.
The Hill Agreement gives Mr. Hill the right to payments and benefits upon certain termination events of Mr. Hill’s employment, upon his death or disability, non-renewal of the Hill Agreement, and upon a change in control. Specifically, upon a termination of Mr. Hill’s employment by the Company without “cause” or by Mr. Hill for “good reason” (each as defined in the Hill Agreement) or due to non-renewal of the Hill Agreement by the Company, in each case, following March 8, 2020, other than in connection with a change in control, the Hill Agreement provides that Mr. Hill will be entitled to receive: (i) all accrued obligations; (ii) a lump-sum cash payment equal to 2.0 times the sum of (A) Mr. Hill’s highest base salary in the three years preceding the termination, plus (B) Mr. Hill’s highest target bonus for the year of termination; (iii) a pro-rata annual bonus calculated based on actual Company performance and the number of days in the year of termination that Mr. Hill was employed by the Company; (iv) reimbursement of outplacement benefits for 24 months; and (v) a monthly payment for a period of 24 months equal to the monthly premium paid by other former employees for continuation coverage under the Company’s health plans and such additional amounts as are necessary to ensure receipt of the full amount of such monthly premium after application of all federal income and employment taxes imposed thereon (the “Additional Payment”). In the event Mr. Hill’s employment is terminated by the Company without cause or by Mr. Hill for good reason, in each case, on or before March 8, 2020, other than in connection with a change in control, the Hill Agreement provides that he will be entitled to receive the same payments described immediately above, with the following exceptions: (i) the multiple for his lump-sum cash payment will be 3.0, (ii) the portion of such payment calculated based on his annual bonus will be calculated based on the higher of his target bonus for the year of termination or 2018,
71
and (iii) the Additional Payment will be for a period of 36 months. In the event Mr. Hill is terminated by the Company without cause or by Mr. Hill for good reason, or as a result of a non-renewal of the Hill Agreement, in each case, in connection with a change in control, Mr. Hill will be entitled to receive the same payments and benefits described in the immediately preceding sentence, with the exception that the portion of such payments calculated based on his annual bonus will be calculated based on the higher of his target bonus for the year of termination or the year of the change in control.
In the event Mr. Hill experiences a disability or death during the term of the Hill Agreement, the Company will pay him or his estate: (i) all accrued obligations; (ii) a full annual bonus calculated based on actual Company performance; and (iii) payment of the Additional Payment for a period of 18 months.
If Mr. Hill’s employment terminates for any reason following the fifth anniversary of the Hill Effective Date (an “Other Termination”), the Hill Agreement provides that he will be entitled to receive (i) all accrued obligations; (ii) the pro-rata annual bonus calculated based on actual Company performance and the number of days in the year of termination that Mr. Hill was employed by the Company; (iii) payment of the Additional Payment for a period of 24 months, and (iv) consent rights regarding certain redemption, repurchase, and / or call rights that may be applicable to vested Class B Interests.
The Hill Agreement contains an affirmation that the terms of the restrictive covenant agreement between the Company and Mr. Hill, dated September 1, 2008, are incorporated in the Hill Agreement by reference, except that the Hill Agreement provides that the provisions in such restrictive covenant agreement providing that certain provisions will not apply following a change in control-related termination, are deleted and will have no further force or effect.
Mr. Hill is generally required to sign a release of claims in order to receive the termination benefits described above but he will not be required to execute a release of claims as a condition of receiving any benefits upon his termination of employment in connection with a change in control.
In connection with a change in control of the Company where immediately before such change in control, Company stock was readily tradeable on an established securities market or otherwise, if it is determined that Mr. Hill will be subject to the excise tax imposed by IRC Section 4999 (the “Excise Tax”), the Company will pay to or for the benefit of Mr. Hill, an additional amount (the “Gross-Up Payment”), such that the net after-tax amount of the Gross-Up Payment retained by Mr. Hill, after deduction of any Excise Tax and any federal and state and local taxes imposed on the Gross-Up Payment itself, will be equal to the Excise Tax. Other than in the circumstances described in the immediately preceding sentence, if it is determined that any benefits payable to Mr. Hill are subject to the Excise Tax, then such payments will be reduced (the “Cut-Back”) until the payments are no longer subject to the Excise Tax; provided, however, that if the net amount of such payments after the Excise Tax is paid would be greater than the reduced amount, the Company will pay the full amount due to Mr. Hill without any reductions.
W. Thaddeus Miller
Executive Vice Chairman, Chief Legal Officer and Secretary
On August 29, 2018, the Company entered into an amended and restated executive employment agreement with Thaddeus Miller, the Company’s Executive Vice Chairman and Chief Legal Officer (the “Miller Agreement”), effective from and after March 8, 2018 (the “Miller Effective Date”), which replaced the original employment agreement entered into between the Company and Mr. Miller, dated as of August 11, 2008, and as amended on each of December 21, 2012, February 28, 2013 and December 18, 2015, and as further amended by the letter agreement on December 29, 2017. The Miller Agreement has a five-year term and is subject to automatic one-year renewals on the fifth anniversary of the Miller Effective Date and each annual anniversary thereafter unless either party provides 90 days’ prior notice of his or its intention to not extend the term of the Miller Agreement. Under the Miller Agreement, Mr. Miller is entitled to an annual base salary of at least $893,003 and an annual target cash performance bonus equal to 90% of annual base salary, with a maximum annual performance bonus opportunity of 200% of Mr. Miller’s annual base salary. The Miller Agreement provides that on, or as soon as reasonably practicable after, the Miller Effective Date, CPN Management will grant to Mr. Miller an award of 0.53% of the issued and outstanding Class B Interests.
The Miller Agreement gives Mr. Miller payments and benefits upon certain termination events of Mr. Miller’s employment, upon his death or disability, non-renewal of the Miller Agreement, and upon a change in control, which payments and benefits are substantially identical to those provided in the Hill Agreement with respect to Mr. Hill, with the following exceptions: (i) payment of the lump-sum cash payment will be based on Mr. Miller’s target bonus, (ii) upon a termination of Mr. Miller’s employment by the Company without cause or by Mr. Miller for good reason or due to non-renewal of the Miller Agreement by the Company, in each case, following March 8, 2020, other than in connection with a change in control, (A) the multiple for his lump-sum cash payment will be 1.5, (B) the Additional Payment will be for a period of 18 months following such termination, and (C) reimbursement of outplacement benefits will be for 18 months, (iii) the reimbursement for outplacement benefits will be for a period of 18 months following either a termination of Mr. Miller’s employment by the Company without cause or by Mr. Miller for good reason, in each case, on or before March 8, 2020 or a termination of Mr. Miller’s employment by the Company without cause or by Mr. Miller for good reason or due to a non-renewal of the Miller Agreement by the Company, in each case, in connection with a change
72
in control, (iv) the Additional Payment in the event Mr. Miller experiences a disability or death will be for the remainder of his employment term, and (v) the benefits triggered in connection with an Other Termination go into effect following the second anniversary of the Miller Effective Date, and provide for payment of the Additional Payment for 18 months following such termination.
The Miller Agreement includes 12-month post-termination non-solicitation and cooperation covenants, as well as post-termination mutual non-disparagement and confidentiality covenants.
Mr. Miller is generally required to sign a release of claims in order to receive the termination benefits described above but he will not be required to execute a release of claims as a condition of receiving any benefits upon his termination of employment due to an Other Termination or upon his death or disability.
The Miller Agreement contains substantially identical provisions regarding the Gross-Up Payment and the Cut-Back as the Hill Agreement.
Zamir Rauf
Executive Vice President and Chief Financial Officer
On August 29, 2018, the Company entered into an executive employment agreement with Zamir Rauf, the Company’s Executive Vice President and Chief Financial Officer (the “Rauf Agreement”), effective from and after March 8, 2018 (the “Rauf Effective Date”). The Rauf Agreement has a five-year term and is subject to automatic one-year renewals on the fifth anniversary of the Rauf Effective Date and each annual anniversary thereafter unless either party provides 90 days’ prior notice of his or its intention to not extend the term of the Rauf Agreement. Under the Rauf Agreement, Mr. Rauf is entitled to an annual base salary of at least $656,103.16 and an annual target cash performance bonus equal to 90% of annual base salary, with a maximum annual performance bonus opportunity of 200% of Mr. Rauf’s annual base salary. The Rauf Agreement provides that on, or as soon as reasonably practicable after the Rauf Effective Date, CPN Management will grant to Mr. Rauf an award of 0.40% of the issued and outstanding Class B Interests.
The Rauf Agreement gives payments and benefits upon certain terminations of Mr. Rauf’s employment, upon his death or disability, non-renewal of the Rauf Agreement, and upon a change in control, which payments and benefits are substantially identical to those provided in the Miller Agreement with respect to Mr. Miller, with the exception that the benefits triggered in connection with an Other Termination go into effect following the fifth anniversary of the Rauf Effective Date.
In entering into the Rauf Agreement, Mr. Rauf acknowledged and agreed that he is bound by those restrictions set forth in that certain Restrictive Covenant Agreement entered into between the Company and Mr. Rauf, dated as of August 29, 2018 (the “Rauf Restrictive Covenant Agreement”). The Rauf Restrictive Covenant Agreement includes 12-month post-termination non-competition and non-solicitation and cooperation covenants, as well as post-termination mutual non-disparagement and confidentiality covenants.
Mr. Rauf is generally required to sign a release of claims in order to receive the termination benefits described above but he will not be required to execute a release of claims as a condition of receiving any benefits upon his termination of employment due to an Other Termination or upon his death or disability.
The Rauf Agreement contains substantially identical provisions regarding the Gross-Up Payment and the Cut-Back as the Hill Agreement and the Miller Agreement.
Charles M. Gates
Executive Vice President, Power Operations
Charles Gates serves as the Company’s Executive Vice President, Power Operations pursuant to an offer letter between Mr. Gates and Calpine Corporation, dated February 23, 2016, as amended by the Gates Letter Agreement (the “Gates Offer Letter”). Mr. Gates’ annual base salary for 2019 was $496,578. Mr. Gates’ employment is terminable at will by either party. Under the Gates Offer Letter, Mr. Gates is eligible to participate in the Calpine Incentive Plan (“CIP”), which provides for an annual cash bonus with a target equal to 90% of his base salary and a maximum payout equal to 200% of his base salary. Payouts under the CIP will be based on achievement of corporate financial results as well as individual performance. Under the Gates Offer Letter, Mr. Gates received a sign-on equity award, 50% in the form of restricted stock awards and 50% in the form of performance share units, with a targeted value of $920,000 within two weeks of his start date. In consideration of the sign-on equity award, Mr. Gates signed a one-year non-compete agreement.
Mr. Gates participates in the Severance Plan as a Tier 3 Participant and any target bonus amount under the Severance Plan will be determined based on his participation in the CIP. Further, if Mr. Gates’s employment terminates for any reason
73
following the third anniversary of the date of the Gates Letter Agreement, he shall be entitled to the following benefits, without duplication of any other severance payments for which he may be eligible under the Severance Plan: (i) an amount equal to his pro-rated annual cash bonus in respect of the fiscal year in which the termination occurs, calculated based on Calpine’s actual performance and (ii) consent rights regarding certain redemption, repurchase, and / or call rights that may be applicable to vested Class B Interests.
Potential Payments Upon Termination or Change in Control
Effective January 31, 2008, we adopted our Severance Plan, which provides eligible employees, including executive officers, whose employment is involuntarily terminated by us without “cause”, by the employee with “good reason” (each as defined in the Severance Plan), or in connection with a change in control, with certain severance benefits, including a lump sum payment based upon (i) the employee’s position and (ii) base salary and target bonus, as further described below. In addition, Messrs. Hill, Rauf and Miller have agreements with us that provide for certain severance benefits as described below. The amount of compensation that would be payable to each named executive officer in the event of a termination of employment, or a change in control, on December 31, 2019, is described below under “— Quantification of Potential Payments Upon Termination or Change in Control.”
Change in Control and Severance Benefits Plan
Under the Severance Plan, amended and restated as of November 4, 2013, and further amended on November 10, 2016, employees who are Senior Vice Presidents with a pay grade at 19 or above, Vice Presidents with a pay grade at 19 or above, employees with a pay grade at 19 or above, and such other employees of subsidiaries of the Company that are designated as participants pursuant to a written employment agreement or by the Compensation Committee are eligible for certain post-employment benefits, which vary depending upon (i) the tier assigned to the employee and (ii) whether a change in control or termination of employment occurs. As of December 31, 2019, Mr. Gates participated as Tier 3 participant in the Severance Plan. In addition, pursuant to the Gates Letter Agreement, following the third anniversary of the date of the Gates Letter Agreement, if Mr. Gates’s employment terminates for any reason, he shall be entitled to the following benefits, without duplication of any other severance payments for which he may be eligible under the Severance Plan: (i) an amount equal to his pro-rated annual cash bonus in respect of the fiscal year in which the termination occurs, calculated based on Calpine’s actual performance and (ii) consent rights regarding certain redemption, repurchase, and / or call rights that may be applicable to vested Class B Interests. Any severance benefits for which Messrs. Hill, Rauf and Miller may be eligible would be provided under the Hill Agreement, Rauf Agreement and Miller Agreement, respectively, and not under the Severance Plan.
Severance Plan. With respect to each participant in the Severance Plan, including Mr. Gates, upon the occurrence of a change in control, notwithstanding the provisions of any other benefit plan or agreement:
In the event that a participant’s employment is terminated within 24 months following a change in control or within six months following a potential change in control (provided that a change in control occurs within nine months following such potential change in control) and upon the occurrence of a participant’s termination of employment by us without cause, or by such participant for good reason, then such participant (or his or her beneficiary) is entitled to receive, subject to certain conditions outlined in the Severance Plan:
• | a lump sum payment within 60 days following termination in an amount equal to 2.99 times (in the case of a Tier 1, Tier 2 or Tier 3 participant) or 1.99 times (in the case of a Tier 4 participant) the sum of (i) the participant’s highest annual salary in the three years preceding the termination and (ii) the participant’s target bonus for the year of termination or for the year in which the change in control occurred, whichever is larger; plus |
• | in the case of a Tier 1 participant only, a pro-rated annual bonus for the year of termination, to be paid at such time as we pay annual bonuses generally; plus |
• | a lump sum payment for all “accrued obligations,” defined as all unused vacation time and all accrued but unpaid compensation earned by such participant as of the termination date, to be paid as soon as practicable following the termination date; and |
• | continued coverage for the participant and his or her dependents under all health care, medical, dental and life insurance plans and programs (excluding disability) maintained by us under which the participant was covered immediately prior to his or her termination date, to be provided (concurrently with any health care benefit required under the Consolidated Omnibus Budget Reconciliation Act of 1985, as amended, “COBRA”), in the case of a Tier 1, Tier 2 or Tier 3 participant, for a period of 36 months following termination, at the same cost sharing between us and such participant as applies to a similarly situated active employee. |
74
Severance and Benefits Not in Connection with a Change in Control. In the event that a participant’s employment is terminated by the participant for good reason or by us without cause, and not in connection with a change in control, as described above, then such participant (or his or her beneficiary) is entitled to receive, subject to certain conditions outlined in the Severance Plan:
• | In the case of a Tier 1 participant, (i) a lump sum payment within 60 days following termination in an amount equal to 2.0 times the sum of (a) the participant’s highest annual salary in the three years preceding termination and (b) the participant’s highest target bonus for the year of termination; plus (ii) payment of all accrued obligations as soon as practicable following the termination date; plus (iii) a pro-rated annual bonus for the year of termination, to be paid at such time as we pay annual bonuses generally; |
• | In the case of a Tier 2 or Tier 3 participant, (i) a lump sum payment within 60 days following termination in an amount equal to 1.5 times the sum of (a) the participant’s highest annual salary in the three years preceding termination and (b) the participant’s highest target bonus for the year of termination; plus (ii) payment of all accrued obligations as soon as practicable following the termination date; and |
• | In the case of a Tier 4 participant, (i) a lump sum payment within 60 days following termination in an amount equal to the sum of (a) the participant’s highest annual salary in the three years preceding termination and (b) the participant’s highest target bonus for the year of termination; plus (ii) payment of all accrued obligations as soon as practicable following the termination date. |
In addition to the above, for a period of 24 months (Tier 1), 18 months (Tier 2 and Tier 3) or 12 months (Tier 4), following the termination date, the participant and his or her dependents shall receive continued health care benefits at the same cost sharing between us and such participant as a similarly situated active employee, to be provided concurrently with any health care benefit required under COBRA.
Provisions Applicable Whether or Not Termination is in Connection with a Change in Control. In addition, participants entitled to benefits in connection with a severance or change in control are also entitled to receive outplacement benefits at our expense beginning on such participant’s termination date for a period of 24 months (Tier 1), 18 months (Tier 2 and Tier 3) or 12 months (Tier 4).
As a condition to receiving benefits under the Severance Plan, participants will be subject to certain conditions, including entering into non-solicitation, non-disclosure, non-disparagement and release agreements with us.
Additional Considerations. Tier 1, Tier 2 and Tier 3 participants are not entitled to a gross-up payment in the event that any benefit or payment by the Company (whether paid or payable or distributed or distributable pursuant to the terms of the Severance Plan or otherwise, including any acceleration of vesting or payment) is determined to be subject to the excise tax imposed by IRC Section 4999, except that Mr. Gates is entitled to a gross-up payment for excise taxes incurred under Section 4999 of the IRC pursuant to the Gates Letter Agreement. If any amounts will become subject to the excise tax imposed by IRC Section 4999, then such amounts will be reduced so as not to become subject to such excise tax, but only if the net amount of such payments as so reduced is greater than or equal to the net amount of such payments without such reduction.
Termination Provisions of Employment Agreements
John B. (Thad) Hill III
Pursuant to the Hill Agreement, described further above under “— Summary of Employment Agreements,” if Mr. Hill’s employment is terminated by us without cause or by his resignation for good reason on or prior to March 8, 2020, other than in connection with a change in control, he will be entitled to certain severance payments and benefits, as follows:
• | a prorated bonus for the year in which such termination occurs; |
• | a lump sum cash severance payment equal to 3.0 times the sum of (i) his highest base salary in the three years preceding termination and (ii) his highest target bonus with respect to the year of termination or for 2018, whichever is larger; |
• | a monthly payment for a period of 36 months following the date of termination equal to the full monthly premium paid by other former employees for continuation coverage under the Company’s health plans, as well as a tax gross-up on such payments; and |
• | reimbursement for payment for outplacement services for a period of up to 24 months following such termination. |
In the event Mr. Hill’s employment is terminated by us without cause, by his resignation for good reason or the Hill Agreement is not renewed following March 8, 2020, other than in connection with a change in control, he will be entitled to certain severance payments and benefits, as follows:
75
• | a prorated bonus for the year in which such termination occurs calculated based on the Company’s actual performance; |
• | a lump sum cash severance payment equal to 2.0 times the sum of (i) his highest base salary in the three years preceding termination and (ii) his highest target bonus with respect to the year of termination; |
• | a monthly payment for a period of 24 months following the date of termination equal to the full monthly premium paid by other former employees for continuation coverage under the Company’s health plans, as well as a tax gross-up on such payments; and |
• | reimbursement for payment for outplacement services for a period of up to 24 months following such termination. |
In the event Mr. Hill’s employment terminates without cause or for good reason or the Hill Agreement is not renewed following a change in control, Mr. Hill generally will be entitled to the same payments and benefits as set forth above for a termination that takes place on or prior to March 8, 2020, with the exception that the portion of such payments calculated based on his annual bonus will be calculated based on the higher of his target bonus for the year of termination or the year of the change in control.
In the event Mr. Hill experiences a disability or death during the term of the Hill Agreement, the Company will pay him or his estate:
• | a full annual bonus for the year in which such termination occurs calculated based on actual Company performance; and |
• | a monthly payment for a period of 18 months following the date of termination equal to the full monthly premium paid by other former employees for continuation coverage under the Company’s health plans, as well as a tax gross-up on such payments. |
In the event Mr. Hill’s employment terminates for any reason following the fifth anniversary of the Hill Effective Date, he will be entitled to receive:
• | a prorated bonus for the year in which such termination occurs calculated based on actual Company performance and the number of days in the year of termination that Mr. Hill was employed by the Company; |
• | a monthly payment for a period of 24 months following the date of termination equal to the full monthly premium paid by other former employees for continuation coverage under the Company’s health plans, as well as a tax gross-up on such payments; and |
• | consent rights regarding certain redemption, repurchase, and / or call rights that may be applicable to vested Class B Interests. |
In addition, with respect to the Class B Interests granted to Mr. Hill pursuant to the Hill Agreement:
• | in the event of a change in control of the Company, the Class B Interests will become fully vested; and |
• | if Mr. Hill’s employment terminates by reason of disability or death, the Class B Interests will become fully vested. |
W. Thaddeus Miller
Pursuant to our agreement with Mr. Miller, described further above under “— Summary of Employment Agreements,” if Mr. Miller was terminated by us without cause or if he resigned for good reason on or prior to March 8, 2020, other than in connection with a change in control, he would be entitled to certain severance payments and benefits, as follows:
• | a prorated bonus for the year in which such termination would have occurred calculated based on actual Company performance; |
• | a lump sum cash severance payment equal to 3.0 times the sum of (i) his highest base salary in the three years preceding termination and (ii) his target bonus with respect to the year of termination or for 2018, if higher; |
• | a monthly payment for a period of 36 months following the date of termination equal to the full monthly premium paid by other former employees for continuation coverage under the Company’s health plans, as well as a tax gross-up on such payments; and |
• | outplacement services for a period of up to 18 months following such termination. |
In the event Mr. Miller’s employment is terminated by us without cause, by his resignation for good reason or the Miller Agreement is not renewed following March 8, 2020, other than in connection with a change in control, he will be entitled to certain severance payments and benefits, as follows:
76
• | a prorated bonus for the year in which such termination occurs calculated based on actual Company performance; |
• | a lump sum cash severance payment equal to 1.5 times the sum of (i) his highest base salary in the three years preceding termination and (ii) his target bonus with respect to the year of termination; |
• | a monthly payment for a period of 18 months following the date of termination equal to the full monthly premium paid by other former employees for continuation coverage under the Company’s health plans, as well as a tax gross-up on such payments; and |
• | reimbursement for payment for outplacement services for a period of up to 18 months following such termination. |
In the event Mr. Miller’s employment terminates without cause or for good reason or the Miller Agreement is not renewed following a change in control, Mr. Miller generally will be entitled to the same payments and benefits as set forth above for a termination that takes place on or prior to March 8, 2020, with the exception that the portion of such payments calculated based on his annual bonus will be calculated based on the higher of his target bonus for the year of termination or the year of the change in control.
In the event Mr. Miller experiences a disability or death during the term of the Miller Agreement, the Company will pay him or his estate:
• | a full annual bonus for the year in which such termination occurs calculated based on actual Company performance; and |
• | for the remainder of the employment term, a monthly payment equal to the full monthly premium paid by other former employees for continuation coverage under the Company’s health plans, as well as a tax gross-up on such payments. |
In the event Mr. Miller’s employment terminates for any reason following the second anniversary of the Miller Effective Date, he will be entitled to receive:
• | a prorated bonus for the year in which such termination occurs calculated based on actual Company performance; |
• | a monthly payment for a period of 18 months following the date of termination equal to the full monthly premium paid by other former employees for continuation coverage under the Company’s health plans, as well as a tax gross-up on such payments; and |
• | consent rights regarding certain redemption, repurchase, and / or call rights that may be applicable to vested Class B Interests. |
In addition, with respect to the Class B Interests granted to Mr. Miller pursuant to the Miller Agreement:
• | in the event of a change in control of the Company, the Class B Interests will become fully vested; and |
• | if Mr. Miller’s employment terminates by reason of disability or death, the Class B Interests will become fully vested. |
Zamir Rauf
Pursuant to our agreement with Mr. Rauf, described further above under “— Summary of Employment Agreements,” if Mr. Rauf was terminated by us without cause or if he resigned for good reason on or prior to March 8, 2020, other than in connection with a change in control, he would be entitled to certain severance payments and benefits, as follows:
• | a prorated bonus for the year in which such termination would have occurred; |
• | a lump sum cash severance payment equal to 3.0 times the sum of (i) his highest base salary in the three years preceding termination and (ii) his target bonus with respect to the year of termination or for 2018, whichever is larger; |
• | a monthly payment for a period of 36 months following the date of termination equal to the full monthly premium paid by other former employees for continuation coverage under the Company’s health plans, as well as a tax gross-up on such payments; and |
• | outplacement services for a period of up to 18 months following such termination. |
In the event Mr. Rauf’s employment is terminated by us without cause, by his resignation for good reason or the Rauf Agreement is not renewed following March 8, 2020, other than in connection with a change in control, he will be entitled to certain severance payments and benefits, as follows:
• | a prorated bonus for the year in which such termination occurs; |
77
• | a lump sum cash severance payment equal to 1.5 times the sum of (i) his highest base salary in the three years preceding termination and (ii) his target bonus with respect to the year of termination; |
• | a monthly payment for a period of 18 months following the date of termination equal to the full monthly premium paid by other former employees for continuation coverage under the Company’s health plans, as well as a tax gross-up on such payments; and |
• | reimbursement for payment for outplacement services for a period of up to 18 months following such termination. |
In the event Mr. Rauf’s employment was terminated without cause or for good reason following a change in control, Mr. Rauf generally will be entitled to the same payments and benefits as set forth above for a termination that takes place on or prior to March 8, 2020, with the exception that the portion of such payments calculated based on his annual bonus will be calculated based on the higher of his target bonus for the year of termination or the year of the change in control.
In the event Mr. Rauf experiences a disability or death during the term of the Rauf Agreement, the Company will pay him or his estate:
• | a full annual bonus for the year in which such termination occurs calculated based on actual Company performance; and |
• | for the remainder of the employment term, a monthly payment equal to the full monthly premium paid by other former employees for continuation coverage under the Company’s health plans, as well as a tax gross-up on such payments. |
In the event Mr. Rauf’s employment terminates for any reason following the fifth anniversary of the Rauf Effective Date, he will be entitled to receive:
• | a prorated bonus for the year in which such termination occurs calculated based on actual Company performance; |
• | a monthly payment for a period of 18 months following the date of termination equal to the full monthly premium paid by other former employees for continuation coverage under the Company’s health plans, as well as a tax gross-up on such payments; and |
• | consent rights regarding certain redemption, repurchase, and / or call rights that may be applicable to vested Class B Interests. |
In addition, with respect to the Class B Interests granted to Mr. Rauf pursuant to the Rauf Agreement:
• | in the event of a change in control of the Company, the Class B Interests will become fully vested; and |
• | if Mr. Rauf’s employment terminates by reason of disability or death, the Class B Interests will become fully vested. |
Quantification of Potential Payments Upon Termination or Change in Control
The following table sets forth potential benefits that each named executive officer would be entitled to receive in the event that the executive’s employment with us is terminated for any reason, including a termination for “cause”, resignation without “good reason” (each as defined in the Severance Plan, the Hill Agreement, Rauf Agreement, Miller Agreement and Gates Letter Agreement, as applicable), a termination without cause, resignation with good reason, termination without cause or resignation with good reason in each case in connection with a change in control, and death or disability. The amounts shown in the table are the amounts that would have been payable under existing plans and arrangements if the named executive officer’s employment had terminated, and/or a change in control occurred on December 31, 2019. “Cash Compensation” includes payments of salary, bonus, non-equity annual incentive plan compensation, severance or death benefit amounts payable in the applicable scenario.
78
The actual amounts that would be payable in these circumstances can only be determined at the time of the executive’s termination or a change in control and accordingly, may differ from the estimated amounts set forth in the table below:
Named Executive Officer | Termination by Company for Cause or Resignation by Executive Without Good Reason | Termination by Company Without Cause | Resignation by Executive with Good Reason | Termination by Company Without Cause, or Resignation by Executive With Good Reason, in Connection with Change in Control | Death or Disability | |||||||||||||||
John B. (Thad) Hill III | ||||||||||||||||||||
Cash Compensation(1) | $ | — | $ | 10,636,921 | $ | 10,636,921 | $ | 10,636,921 | $ | 2,674,823 | ||||||||||
Health and Welfare Benefits(2) | — | 103,104 | 103,104 | 103,104 | 51,552 | |||||||||||||||
Outplacement(2) | — | 50,000 | 50,000 | 50,000 | — | |||||||||||||||
Unvested Class B Interests(3) | — | — | — | — | — | |||||||||||||||
TOTAL | $ | — | $ | 10,790,025 | $ | 10,790,025 | $ | 10,790,025 | $ | 2,726,375 | ||||||||||
Zamir Rauf | ||||||||||||||||||||
Cash Compensation(1) | $ | 1,230,020 | $ | 5,072,652 | $ | 5,072,652 | $ | 5,072,652 | $ | 1,230,020 | ||||||||||
Health and Welfare Benefits(2) | — | 103,104 | 103,104 | 103,104 | 111,696 | |||||||||||||||
Outplacement(2) | — | 50,000 | 50,000 | 50,000 | — | |||||||||||||||
Unvested Class B Interests(3) | — | — | — | — | — | |||||||||||||||
TOTAL | $ | 1,230,020 | $ | 5,225,756 | $ | 5,225,756 | $ | 5,225,756 | $ | 1,341,716 | ||||||||||
W. Thaddeus Miller | ||||||||||||||||||||
Cash Compensation(1) | $ | 1,674,145 | $ | 6,904,243 | $ | 6,904,243 | $ | 6,904,243 | $ | 1,674,145 | ||||||||||
Health and Welfare Benefits(2) | — | 71,640 | 71,640 | 71,640 | 77,610 | |||||||||||||||
Outplacement(2) | — | 50,000 | 50,000 | 50,000 | — | |||||||||||||||
Unvested Class B Interests(3) | — | — | — | — | — | |||||||||||||||
TOTAL | $ | 1,674,145 | $ | 7,025,883 | $ | 7,025,883 | $ | 7,025,883 | $ | 1,751,755 | ||||||||||
Charles M. Gates | ||||||||||||||||||||
Cash Compensation(1) | $ | 885,020 | $ | 1,415,247 | $ | 1,415,247 | $ | 2,821,060 | $ | 885,020 | ||||||||||
Health and Welfare Benefits(2) | — | 35,820 | 35,820 | 71,640 | — | |||||||||||||||
Outplacement(2) | — | 50,000 | 50,000 | 50,000 | — | |||||||||||||||
Unvested Class B Interests(3) | — | — | — | — | — | |||||||||||||||
Tax Gross-Up(4) | — | — | — | 439,690 | — | |||||||||||||||
TOTAL | $ | 885,020 | $ | 1,501,067 | $ | 1,501,067 | $ | 3,382,390 | $ | 885,020 | ||||||||||
______________
(1) | Amounts disclosed in the table assume that no executive received any severance or termination benefit which would decrease the amount of the above payments, where applicable. These amounts would primarily be paid as a lump sum but have been calculated without any present-value discount and assuming that base pay would continue at 2019 rates. |
(2) | Using generally accepted accounting principles for purposes of the Company’s financial statements, continued health and welfare benefits were valued at the amount of $2,864 per month (for family coverage) which applied to Messrs. Hill and Rauf and $1,990 per month (for employee and spouse coverage) which applied to Messrs. Miller and Gates. Outplacement services were valued at $50,000 for 18 and 24 months of coverage. |
(3) | Class B Interests only entitle the holder to future distributions from CPN Management. Distributions from CPN Management are made at the discretion of the general partner. |
(4) | The gross-up payment is an additional amount that we are obligated to pay to Mr. Gates pursuant to the Gates Letter Agreement in order to make the executive whole for any federal excise tax imposed on the executive as a result of the executive’s receipt of any excess parachute payments that are contingent upon a change of control, as well as the payment of all federal and state income and excise taxes imposed on the gross-up payment. |
Compensation Committee Interlocks and Insider Participation
None of the current members of our Compensation Committee (whose names appear under “—Report of the Compensation Committee”) is, or has ever been, an officer or employee of the Company or any of its subsidiaries. In addition, during the last fiscal year, no executive officer of the Company served as a member of the board of directors or the compensation committee of any other entity that has one or more executive officers serving on our Board of Directors or our Compensation Committee.
79
Compensation and Risk
Our Compensation Committee regularly conducts risk assessments to determine the extent, if any, to which our compensation practices and programs may create incentives for excessive risk taking. Based on these reviews, we believe that for the substantial majority of our employees the incentive for risk taking is low, because their compensation consists largely of fixed cash salary and a cash bonus that has a capped payout. Furthermore, the majority of these employees do not have the authority to take action on our behalf that could expose us to significant business risks.
In 2019, as part of its assessment, the Compensation Committee reviewed the compensation program for employees that engage in certain hedging and optimization activities. While these employees have increased potential for risk taking because a part of their compensation is linked to the profitability of these activities, the Compensation Committee concluded that the business risk from these activities is not significant because these employees’ activities are subject to controls that limit excessive risk taking, such as VAR limits that are monitored and enforced on a daily basis by our Chief Risk Officer.
The Compensation Committee also reviewed the cash and long-term incentive programs for senior executives and concluded that certain aspects of the programs actually reduce the likelihood of excessive risk taking. These aspects include the use of long-term incentives for senior executives to contribute towards long-term growth of the Company, including limited claw-back provisions contained in employment agreements limiting the incentive to take excessive risk for short-term gains by imposing caps on CIP bonuses, requiring compliance with our Code of Conduct and giving the Compensation Committee the power to reduce discretionary bonuses.
For these reasons, we do not believe that our compensation policies and practices create risks that are reasonably likely to have a material adverse effect on us.
Pay Ratio Disclosure
At December 31, 2019, we had approximately 2,256 employees, with all of these individuals located in the United States. Our diverse employee population varies significantly in experience, education and specialized training. Regardless of the employee’s role in the organization or their location, the process for determining salaries is the same: local market competitive data is reviewed to set base pay rates. Individual salaries are then adjusted from these base pay rates to reflect the individual’s role and responsibilities as well as his or her experience, education, specialized training and overall performance.
We identified our median employee for the year ended December 31, 2019, by reviewing compensation data reflected in our payroll records consisting of:
• | base salary, |
• | compensation under the annual incentive program or equivalent (calculated assuming payouts at the target level for employees hired in 2019 who were not eligible for an incentive payment in 2019), and |
• | employer contributions to the Company’s 401(k) Plan. |
We identified our median employee using the above compensation data, which was consistently applied to all of our employees included in the calculation. We identified this payment information for all current full and part-time employees employed on December 31, 2019; thus, we used December 31, 2019 as the measurement date in determining our median employee. Since all of our employees, as well as our President and Chief Executive Officer, are located in the United States, we did not make any cost of living adjustments in identifying the median employee. These results were then ranked, excluding the President and Chief Executive Officer, from lowest to highest, and the median employee was identified. Once we identified our median employee, we combined all of the elements of such employee’s total annual compensation in a manner consistent with total compensation for our named executive officers, as presented in the “Summary Compensation Table”. With respect to total annual compensation for our President and Chief Executive Officer, we used the amount reported in the “Total” column of the “Summary Compensation Table”.
The total annual compensation for the year ended December 31, 2019 was $124,866 for our median employee and $3,958,025 for our President and Chief Executive Officer. The ratio of our President and Chief Executive Officer’s pay to that of our median employee for 2019 was approximately 32 times.
DIRECTOR COMPENSATION
Members of our Board of Directors do not receive compensation for their service. We reimburse directors for their reasonable out-of-pocket and travel expenses in connection with attendance at board and committee meetings.
80
Item 12. | Security Ownership of Certain Beneficial Owners and Management and Related Stockholder Matters |
The following table sets forth certain information known to the Company regarding the beneficial ownership of its common stock as of February 24, 2020, by (i) each person known by the Company to be the beneficial owner of more than 5% of the outstanding shares of its common stock, (ii) each of our directors, (iii) each of our named executive officers and (iv) all of our executive officers and directors serving as a group. Unless otherwise stated, the address of each named executive officer and director is c/o Calpine Corporation, 717 Texas Avenue, Suite 1000, Houston, Texas 77002.
Name | Common Shares Beneficially Owned(1) | Shares Individuals Have the Right to Acquire Within 60 Days | Total Number of Shares Beneficially Owned(1) | Percent of Class | |||||||
5% or Greater Owners | |||||||||||
CPN Management(1) | 105.2 | — | 105.2 | 100.0 | % | ||||||
Named Executive Officers and Directors | |||||||||||
John B. (Thad) Hill III | — | — | — | — | |||||||
Zamir Rauf | — | — | — | — | |||||||
W. Thaddeus Miller | — | — | — | — | |||||||
Charles M. Gates | — | — | — | — | |||||||
Waleed Elgohary | — | — | — | — | |||||||
Andrew Gilbert | — | — | — | — | |||||||
Douglas W. Kimmelman(2) | 105.2 | — | 105.2 | 100 | % | ||||||
Tyler G. Reeder(2) | 105.2 | — | 105.2 | 100 | % | ||||||
Andrew D. Singer(2) | 105.2 | — | 105.2 | 100 | % | ||||||
Donald A. Wagner | — | — | — | — | |||||||
All executive officers and directors as a group (10 persons) | 105.2 | — | 105.2 | 100 | % | ||||||
_____________
(1) | The principal business address of CPN Management, LP is 40 Beachwood Road, Summit, NJ 07901. |
(2) | ECP ControlCo, LLC is the sole managing member of Energy Capital Partners III, LLC, which is the sole managing member of Volt Parent GP, LLC, which is the general partner of each of Volt Parent, LP and CPN Management. Douglas Kimmelman, Andrew Singer, Peter Labbat, Tyler Reeder and Rahman D’Argenio are the managing members of ECP ControlCo, LLC and share the power to vote and dispose of the securities beneficially owned by ECP ControlCo, LLC. As such, each of ECP ControlCo, LLC, Energy Capital Partners III, LLC, Volt Parent GP, LLC, and Messrs. Kimmelman, Singer, Labbat, Reeder and D’Argenio may be deemed to have or share beneficial ownership of the common stock held directly by CPN Management. Each such entity or individual disclaims any such beneficial ownership. The principal business address of each of the entities and individuals listed in this footnote is 40 Beachwood Road, Summit, NJ 07901. |
Securities Authorized for Issuance under Equity Compensation Plans
At December 31, 2019, there were no securities authorized for issuance under any compensation plans of Calpine Corporation.
Item 13. | Certain Relationships and Related Transactions, and Director Independence |
Certain Relationships and Related Transactions
See “Executive Compensation — Summary of Employment Agreements” for a description of employment agreements between us and certain of the named executive officers.
Except as described below, since the beginning of 2019, there were no actual or proposed transactions to be disclosed in which we were a participant and the amount involved exceeded $120,000 and in which any related person, including our executives and directors, had or will have a direct or indirect material interest.
In April 2019, one of our subsidiaries, Johanna Energy Center, LLC, entered into a ground lease agreement with Orange County Energy Storage 2 LLC (“OCES2”), a subsidiary of Convergent Energy + Power (“Convergent”). Convergent is owned by
81
Energy Capital Partners, which is the sole managing member of Volt Parent GP, LLC, which is the general partner of each of Volt Parent, LP and CPN Management, our direct parent. The consideration associated with the ground lease is expected to be between approximately $5 million and $10 million over the term of the lease, which will be at least 20 years. In connection with the execution of the ground lease agreement, OCES2 is required to post and maintain a security deposit of $750,000 in the form of cash, letter of credit or other acceptable form of security to secure the ground lease. In June 2019, we agreed to return $375,000 of the cash security deposit to OCES2.
In October 2019, one of our subsidiaries, Pasadena Cogeneration L.P., entered into a steam contract with Pasadena Performance Products, LLC, a subsidiary of Next Wave Energy Partners, LP (“Next Wave”), to sell steam over an initial term of ten years. Next Wave is owned by Energy Capital Partners. The consideration associated with the steam contract will be a combination of fixed and variable based upon steam deliveries but is expected to be between $70 million and $90 million over the initial ten-year term.
In February 2020, Calpine Solutions entered into a renewable energy contract with TGP Energy Management, LLC (“TGP”) to purchase renewable energy over a term of 11 years. TGP is owned by Energy Capital Partners. Total payments associated with the renewable energy contract are expected to be between $15 million and $20 million over the 11 year term.
Business Relationships and Related Person Transactions Policy
We have adopted a written policy regarding approval requirements for related person transactions. Under our related person transactions policy, our Chief Legal Officer is primarily responsible for the development and implementation of processes and controls to obtain information from the directors and executive officers with respect to related person transactions and for then determining, based on the relevant facts and circumstances, whether a related person has a direct or indirect material interest in the transaction. Under our policy, transactions (i) that involve directors, director nominees, executive officers, significant owners or other “related persons” in which the Company is or will be a participant and (ii) of the type that must be disclosed under the SEC’s rules must be referred by the Chief Legal Officer to our Audit Committee for the purpose of determining whether such transactions are in the best interests of the Company. Under our policy, it is the responsibility of the individual directors, director nominees, executive officers and holders of five percent or more of the Company’s common stock to promptly report to our Chief Legal Officer all proposed or existing transactions in which the Company and they, or any related person of theirs, are parties or participants. The Chief Legal Officer (or the Chief Executive Officer, in the event the transaction in question involves the Chief Legal Officer or a related person of the Chief Legal Officer) is then required to furnish to the Chairman of the Audit Committee reports relating to any transaction that, in the Chief Legal Officer’s judgment, may require reporting pursuant to the SEC’s rules or may otherwise be the type of transaction that should be brought to the attention of the Audit Committee. The Audit Committee considers material facts and circumstances concerning the transaction in question, consults with counsel and other advisors as it deems advisable and makes a determination or recommendation to the Board of Directors and appropriate officers of the Company with respect to the transaction in question. In its review, the Audit Committee considers the nature of the related person’s interest in the transaction, the material terms of the transaction, the relative importance of the transaction to the related person, the relative importance of the transaction to the Company and any other matters deemed important or relevant. Upon receipt of the Audit Committee’s recommendation, the Board of Directors or officers take such action as deemed appropriate in light of their respective responsibilities under applicable laws and regulations.
Our Board of Directors approved guidelines to the related persons transaction policy for the approval of transactions with three entities (and their subsidiaries or affiliates) that have been determined to have the ability to control or significantly influence the management or operating policies of the Company. These entities are as follows:
• | ECP ControlCo, LLC |
• | CPPIB Calpine Canada, Inc. |
• | Access Industries, Inc. |
Ordinary course of business transactions between Calpine and any of the above entities or their subsidiaries or affiliates are approved and authorized provided that (a) transactions shall be executed at market-based prices/rates, (b) a list of existing transactions meeting the criteria under (a) will be provided to the Chair of the Audit Committee on a quarterly basis, and (c) transactions or amendments with a notional value in excess of $10 million or any individual transaction with a term of longer than five years will be presented to the Audit Committee for approval in accordance with the related person transaction policy described above.
Director Independence
Following the consummation of the Merger, we are no longer an issuer whose securities are listed on a national securities exchange or in an inter-dealer quotation system which has requirements that a majority of the Board of Directors be independent.
82
However, if we were a listed issuer whose securities were traded on the New York Stock Exchange (“NYSE”) and subject to such requirements, we would be entitled to rely on the controlled company exception contained in the NYSE Listing Manual, Section 303A.00 for the exception from the independence requirements related to the majority of our Board of Directors and for the independence requirements related to our Compensation Committee. Pursuant to NYSE Listing Manual, Section 303A.00, a company of which more than 50% of the voting power for the election of directors is held by an individual, a group or another company is exempt from the requirements that its board of directors consist of a majority of independent directors and that the compensation committee (and, if applicable, the nominating committee) of such company be comprised solely of independent directors. CPN Management beneficially owns 100% of the voting power of the Company, which would qualify the Company as a controlled company eligible for exemption under the rule.
Although the NYSE listing standards, including the independence requirements described above, no longer apply to us since we are a privately-held company, the Board of Directors has applied the NYSE independence standards to determine the independence of our directors for purposes of this Report. Under the NYSE independence standards, a director qualifies as independent if the Board of Directors affirmatively determines that the director has no material relationship with us. While the focus of the inquiry is independence from management, the Board of Directors is required to broadly consider all relevant facts and circumstances in making an independence determination.
Subsequent to the consummation of the Merger, our Board of Directors has determined that each member of the Board of Directors would not be considered “independent” under the NYSE listing standards. In making its independence determinations, the Board of Directors considered Messrs. Hill and Miller’s employment with the Company during 2019, Mr. Elgohary’s affiliation with the Canada Pension Plan Investment Board, Messrs. Gilbert, Kimmelman, Reeder and Singer’s affiliation with Energy Capital Partners, and Mr. Wagner’s affiliation with Access Industries, Inc.
Item 14. | Principal Accounting Fees and Services |
Audit Fees
The following table presents fees for professional services rendered by PwC for the years ended December 31, 2019 and 2018, respectively. PwC did not bill us for other services during those periods.
2019 | 2018 | ||||||
(in millions) | |||||||
Audit Fees(1)(2) | $ | 6.0 | $ | 5.4 | |||
_______________
(1) | Our Audit fees consisted of approximately $4.9 million and $4.4 million for the audits and quarterly reviews of our consolidated financial statements and other offerings for Calpine Corporation for 2019 and 2018, respectively, and fees of approximately $1.1 million and $1.0 million for 2019 and 2018, respectively, which were billed for performing audits and reviews of certain of our subsidiaries. |
(2) | PwC did not provide us with any material tax consulting services for the years ended December 31, 2019 and 2018. |
Audit Committee Pre-Approval Policies and Procedures
All audit and non-audit services provided by our independent registered public accounting firm must be pre-approved by our Audit Committee. Any service proposals submitted by our independent registered public accounting firm need to be discussed and approved by the Audit Committee during its meetings, which take place at least four times a year. Once a proposed service is approved, we or our subsidiaries formalize the engagement of the service. The approval of any audit and non-audit services to be provided by our independent registered public accounting firm is specified in the minutes of our Audit Committee meetings. In addition, the members of our Board of Directors are briefed on matters discussed by the different Committees of our Board of Directors.
83
PART IV
Item 15. | Exhibits, Financial Statement Schedule |
Page | |
(a)-1. Financial Statements and Other Information | |
Calpine Corporation and Subsidiaries | |
(a)-2. Financial Statement Schedule | |
Calpine Corporation and Subsidiaries | |
(b) Exhibits | |
84
Exhibit Number | Description | |
Debtors’ Sixth Amended Joint Plan of Reorganization Pursuant to Chapter 11 of the United States Bankruptcy Code (incorporated by reference to Exhibit 2.1 to Calpine’s Current Report on Form 8-K, filed with the SEC on December 27, 2007, File No. 001-12079). | ||
Findings of Fact, Conclusions of Law, and Order Confirming Sixth Amended Joint Plan of Reorganization Pursuant to Chapter 11 of the U.S. Bankruptcy Code (incorporated by reference to Exhibit 2.2 to Calpine’s Current Report on Form 8-K, filed with the SEC on December 27, 2007, File No. 001-12079). | ||
Agreement and Plan of Merger, dated as of August 17, 2017, by and among Calpine Corporation, Volt Parent, LP and Volt Merger Sub, Inc. (incorporated by reference to Exhibit 2.1 to Calpine’s Current Report on Form 8-K, filed with the SEC on August 22, 2017). | ||
Fourth Amended and Restated Certificate of Incorporation of Calpine Corporation (incorporated by reference to Exhibit 3.1 to the Company’s Current Report on From 8-K filed with the SEC on April 13, 2018). | ||
Third Amended and Restated By-Laws of Calpine Corporation (incorporated by reference to Exhibit 3.3 to the Company’s Current Report on From 8-K filed with the SEC on April 13, 2018). | ||
Indenture, dated July 8, 2014, between the Company and Wilmington Trust, National Association, as trustee (the “Trustee”) (incorporated by reference to Exhibit 4.1 to the Company’s Form S-3ASR filed with the SEC on July 8, 2014). | ||
Second Supplemental Indenture, dated as of July 22, 2014, between the Company and the Trustee, governing the 2025 Notes (incorporated by reference to Exhibit 4.5 to the Company’s Current Report on Form 8-K filed with the SEC on July 22, 2014). | ||
Form of 2025 Note (incorporated by reference to Exhibit 4.7 to the Company’s Current Report on Form 8-K filed with the SEC on July 22, 2014). | ||
Third Supplemental Indenture, dated as of February 3, 2015, between the Company and the Trustee, governing the 2024 Notes (incorporated by reference to Exhibit 4.2 to the Company’s Current Report on Form 8-K filed with the SEC on February 3, 2015). | ||
Form of 2024 Note (incorporated by reference to Exhibit 4.3 to the Company’s Current Report on Form 8-K filed with the SEC on February 3, 2015). | ||
Indenture, dated as of May 31, 2016, for the senior secured notes due 2026 among each of the Company, the guarantors party thereto and Wilmington Trust, National Association, as trustee (the “Trustee”) (incorporated by reference to Exhibit 4.1 to the Company’s Current Report on Form 8-K filed with the SEC on June 1, 2016). | ||
Indenture, dated as of December 20, 2019, for the senior secured notes due 2028 among each of Calpine Corporation, the guarantors party thereto and Wilmington Trust Company, National Association, as trustee (incorporated by reference to Exhibit 4.1 to Calpine’s Current Report on Form 8-K, filed with the SEC on December 23, 2019). | ||
Indenture, dated as of December 27, 2019, for the senior notes due 2028 among Calpine Corporation and Wilmington Trust, National Association, as trustee (incorporated by reference to Exhibit 4.1 to Calpine’s Current Report on Form 8-K, filed with the SEC on December 27, 2019). | ||
Stockholders Agreement, dated March 8, 2018, by and between Calpine Corporation and CPN Management, LP (incorporated by reference to Exhibit 4.1 to the Company’s Current Report on From 8-K filed with the SEC on March 8, 2018). | ||
10.1 | Financing Agreements. | |
Credit Agreement, dated as of December 10, 2010, among Calpine Corporation, Goldman Sachs Bank USA, as administrative agent, Goldman Sachs Credit Partners L.P., as collateral agent, the lenders party thereto and other parties thereto (incorporated by reference to Exhibit 10.1 to Calpine’s Current Report on Form 8-K, filed with the SEC on December 13, 2010, File No. 001-12079). | ||
Amended and Restated Guarantee and Collateral Agreement, dated as of December 10, 2010, made by the Company and certain of the Company's subsidiaries party thereto in favor of Goldman Sachs Credit Partners, L.P., as collateral agent (incorporated by reference to Exhibit 10.1 to Calpine’s Quarterly Report on Form 10-Q for the quarter ended June 30, 2011, filed with the SEC on July 29, 2011, File No. 001-12079). | ||
85
Exhibit Number | Description | |
Amendment No. 1 to the December 10, 2010 Credit Agreement, dated as of June 27, 2013, among Calpine Corporation, as borrower, Goldman Sachs Bank USA, as administrative agent, Goldman Sachs Credit Partners L.P., as collateral agent, and the lenders party thereto (incorporated by reference to Exhibit 10.1 to the Company’s Current Report on Form 8-K, filed with the SEC on July 1, 2013). | ||
Amendment No. 2 to the Credit Agreement, dated as of July 30, 2014, among Calpine Corporation, as borrower, Goldman Sachs Bank USA, as administrative agent, Goldman Sachs Credit Partners L.P., as collateral agent, and the lenders party thereto (incorporated by reference to Exhibit 10.1 to the Company’s Current Report on Form 8-K filed with the SEC on July 31, 2014). | ||
Credit Agreement, dated as of May 28, 2015 among Calpine Corporation, as borrower, the lenders party thereto, Morgan Stanley Senior Funding, Inc., as administrative agent, Goldman Sachs Credit Partners L.P., as collateral agent, and Goldman Sachs Bank USA, MUFG Union Bank, N.A., Barclays Bank Plc and Royal Bank of Canada, as co-documentation agents (incorporated by reference to Exhibit 10.1 to the Company’s Current Report on Form 8-K filed with the SEC on May 28, 2015). | ||
Amendment No. 3 to the Credit Agreement, dated as of February 8, 2016, among Calpine Corporation, as borrower, the guarantors party thereto, Goldman Sachs Bank USA, as administrative agent, Goldman Sachs Credit Partners L.P., as collateral agent, The Bank of Tokyo-Mitsubishi UFJ Ltd, as successor administrative agent, MUFG Union Bank, N.A., as successor collateral agent, and the lenders party thereto (incorporated by reference to Exhibit 10.1.19 to the Company’s Annual Report on Form 10-K for the year ended December 31, 2015, filed with the SEC on February 12, 2016). | ||
Amendment No. 4 to the Credit Agreement, dated as of December 1, 2016, among Calpine Corporation, as borrower, the guarantors party thereto, Goldman Sachs Bank USA, as administrative agent, Goldman Sachs Credit Partners L.P., as collateral agent, The Bank of Tokyo-Mitsubishi UFJ Ltd, as successor administrative agent, MUFG Union Bank, N.A., as successor collateral agent, and the lenders party thereto (incorporated by reference to Exhibit 10.2 to the Company’s Current Report on Form 8-K filed with the SEC on December 2, 2016). | ||
Amendment No. 1 to Credit Agreement, dated as of December 21, 2016, among Calpine Corporation, as borrower, the guarantors, Credit Suisse AG, as the initial new lender and Morgan Stanley Senior Funding, Inc., as administrative agent, and amends the Credit Agreement dated as of May 28, 2015 entered into among the borrower, the institutions from time to time party thereto as lenders, the administrative agent and MUFG Union Bank, N.A., as collateral agent (incorporated by reference to Exhibit 10.1.18 to the Calpine’s Annual Report on Form 10-K for the year ended December 31, 2016, filed with the SEC on February 10, 2017). | ||
Amendment No. 5 to the Credit Agreement, dated as of September 15, 2017, among Calpine Corporation, as borrower, the guarantors party thereto, The Bank of Tokyo-Mitsubishi UFJ Ltd, as administrative agent, MUFG Union Bank, N.A., as collateral agent, and the lenders party thereto (incorporated by reference to Exhibit 10.1 to Calpine’s Current Report on Form 8-K, filed with the SEC on September 20, 2017). | ||
Amendment No. 6 to the Credit Agreement, dated as of October 20, 2017, among the Company, as borrower, the guarantors party thereto, The Bank of Tokyo-Mitsubishi UFJ Ltd, as administrative agent, MUFG Union Bank, N.A., as collateral agent, and the lenders party thereto (incorporated by reference to Exhibit 10.1 to Calpine’s Current Report on Form 8-K, filed with the SEC on October 26, 2017). | ||
Credit Agreement, dated December 15, 2017 among CCFC as borrower, the lenders party hereto, and Credit Suisse AG, Cayman Islands Branch, as administrative agent and collateral agent (incorporated by reference to Exhibit 10.1 to Calpine’s Current Report on Form 8-K, filed with the SEC on December 18, 2017). | ||
Amendment No. 8 to the Credit Agreement, dated as of May 18, 2018, among Calpine Corporation, as borrower, the guarantors party thereto, The Bank of Tokyo-Mitsubishi UFJ Ltd, as administrative agent, MUFG Union Bank, N.A., as collateral agent, and the lenders party thereto (incorporated by reference to Exhibit 10.1 to the Company’s Current Report on From 8-K filed with the SEC on May 21, 2018). | ||
Amendment No. 9 to the Credit Agreement, dated as of April 5, 2019, among Calpine Corporation, as borrower, the guarantors party thereto, MUFG Bank, Ltd, as administrative agent, MUFG Union Bank, N.A., as collateral agent, and the lenders party thereto (incorporated by reference to Exhibit 10.1 to the Company’s Current Report on From 8-K filed with the SEC on April 5, 2019). | ||
Credit Agreement, dated April 5, 2019 among Calpine Corporation, as borrower, the lenders party thereto, Morgan Stanley Senior Funding, Inc., as administrative agent, and MUFG Union Bank, N.A., as collateral agent (incorporated by reference to Exhibit 10.2 to the Company’s Current Report on From 8-K filed with the SEC on April 5, 2019). | ||
86
Exhibit Number | Description | |
Amendment No. 10 to the Credit Agreement, dated as of August 12, 2019, among Calpine Corporation, as borrower, the guarantors party thereto, MUFG Bank, Ltd, as administrative agent, MUFG Union Bank, N.A., as collateral agent, and the lenders party thereto (incorporated by reference to Exhibit 10.1 to the Company’s Current Report on Form 8-K filed with the SEC on August 16, 2019). | ||
Credit Agreement, dated August 12, 2019 among Calpine Corporation, as borrower, the lenders party thereto, Credit Suisse AG, Cayman Islands Branch, as administrative agent, and MUFG Union Bank, N.A., as collateral agent (incorporated by reference to Exhibit 10.2 to the Company’s Current Report on Form 8-K filed with the SEC on August 16, 2019). | ||
10.2 | Management Contracts or Compensatory Plans, Contracts or Arrangements. | |
Letter Agreement, dated September 1, 2008, between the Company and John B. (Thad) Hill (incorporated by reference to Exhibit 10.1 to Calpine’s Current Report on Form 8-K, filed with the SEC on September 4, 2008).† | ||
Amended and Restated Executive Employment Agreement between the Company and John B. (Thad) Hill, dated August 29, 2018 (incorporated by reference to Exhibit 10.1 to the Company’s Current Report on From 8-K filed with the SEC on September 4, 2018).† | ||
Executive Employment Agreement between the Company and Zamir Rauf, dated August 29, 2018 (incorporated by reference to Exhibit 10.3 to the Company’s Current Report on From 8-K filed with the SEC on September 4, 2018).† | ||
Restrictive Covenant Agreement between the Company and Zamir Rauf, dated August 29, 2018 (incorporated by reference to Exhibit 10.4 to the Company’s Current Report on From 8-K filed with the SEC on September 4, 2018).† | ||
Amended and Restated Executive Employment Agreement between the Company and W. Thaddeus Miller, dated August 29, 2018 (incorporated by reference to Exhibit 10.2 to the Company’s Current Report on From 8-K filed with the SEC on September 4, 2018).† | ||
Letter Agreement, dated August 29, 2018, between the Company and Charles M. Gates (incorporated by reference to Exhibit 10.2.4.1 to Calpine’s Quarterly Report on Form 10-K for the year ended December 31, 2018, filed with the SEC on March 28, 2019).† | ||
Amendment to Award Agreement of Class B Interest in CPN Management, LP to Charles M. Gates dated April 26, 2019 (incorporated by reference to Exhibit 10.3 to Calpine’s Quarterly Report on Form 10-Q for the quarter ended June 30, 2019, filed with the SEC on August 8, 2019).† | ||
Second Amendment to Award Agreement of Class B Interest in CPN Management, LP to Charles M. Gates dated July 23, 2019 (incorporated by reference to Exhibit 10.4 to Calpine’s Quarterly Report on Form 10-Q for the quarter ended June 30, 2019, filed with the SEC on August 8, 2019).† | ||
Award Agreement of Class B Interest in CPN Management, LP to Charles M. Gates dated June 28, 2019 (incorporated by reference to Exhibit 10.5 to Calpine’s Quarterly Report on Form 10-Q for the quarter ended June 30, 2019, filed with the SEC on August 8, 2019).† | ||
Letter Agreement, dated August 7, 2019, between the Company and Charles M. Gates (incorporated by reference to Exhibit 10.6 to Calpine’s Quarterly Report on Form 10-Q for the quarter ended June 30, 2019, filed with the SEC on August 8, 2019).† | ||
Calpine Corporation Amended and Restated Change in Control and Severance Benefits Plan (incorporated by reference to Exhibit 10.2.8 to the Calpine’s Annual Report on Form 10-K for the year ended December 31, 2016, filed with the SEC on February 10, 2017).† | ||
Amended and Restated Limited Partnership Agreement of CPN Management, LP a Delaware Limited Partnership, dated March 8, 2018 (incorporated by reference to Exhibit 10.1 to the Calpine’s Quarterly Report on Form 10-Q for the quarter ended March 31, 2018, filed with the SEC on May 10, 2018).† | ||
Form of Award Agreement of Class B Interest in CPN Management, L.P (incorporated by reference to Exhibit 10.2.8 to Calpine’s Quarterly Report on Form 10-K for the year ended December 31, 2018, filed with the SEC on March 28, 2019).† | ||
87
Exhibit Number | Description | |
Second Amended and Restated Limited Partnership Agreement of CPN Management, LP a Delaware Limited Partnership, dated August 29, 2018 (incorporated by reference to Exhibit 10.1 to the Calpine’s Quarterly Report on Form 10-Q for the quarter ended September 30, 2018, filed with the SEC on November 8, 2018).† | ||
Subsidiaries of the Company.* | ||
Certification of the Chief Executive Officer Pursuant to Section 302 of the Sarbanes-Oxley Act of 2002.* | ||
Certification of the Chief Financial Officer Pursuant to Section 302 of the Sarbanes-Oxley Act of 2002.* | ||
Certification of Chief Executive Officer and Chief Financial Officer Pursuant to 18 U.S.C. Section 1350, as Adopted Pursuant to Section 906 of the Sarbanes-Oxley Act of 2002.‡ | ||
101.INS | XBRL Instance Document.* | |
101.SCH | XBRL Taxonomy Extension Schema.* | |
101.CAL | XBRL Taxonomy Extension Calculation Linkbase.* | |
101.DEF | XBRL Taxonomy Extension Definition Linkbase.* | |
101.LAB | XBRL Taxonomy Extension Label Linkbase.* | |
101.PRE | XBRL Taxonomy Extension Presentation Linkbase.* | |
______________________________
* | Filed herewith. |
‡ | Furnished herewith. |
† | Management contract or compensatory plan, contract or arrangement. |
Item 16. Form 10-K Summary
None.
88
SIGNATURES
Pursuant to the requirements of Section 13 or 15(d) of the Securities Exchange Act of 1934, the registrant has duly caused this Report to be signed on its behalf by the undersigned thereunto duly authorized.
CALPINE CORPORATION | ||
By: | /s/ ZAMIR RAUF | |
Zamir Rauf Executive Vice President and Chief Financial Officer (Principal Financial Officer) | ||
Date: February 24, 2020
Pursuant to the requirements of the Securities Exchange Act of 1934, this Report has been signed below by the following persons on behalf of the registrant and in the capacities and on the dates indicated.
Signature | Title | Date | ||
/s/ JOHN B. (Thad) HILL | President, Chief Executive Officer and Director (principal executive officer) | February 24, 2020 | ||
John B. (Thad) Hill | ||||
/s/ ZAMIR RAUF | Executive Vice President and Chief Financial Officer (principal financial officer) | February 24, 2020 | ||
Zamir Rauf | ||||
/s/ JEFF KOSHKIN | Chief Accounting Officer (principal accounting officer) | February 24, 2020 | ||
Jeff Koshkin | ||||
/s/ WALEED ELGOHARY | Director | February 24, 2020 | ||
Waleed Elgohary | ||||
/s/ ANDREW GILBERT | Director | February 24, 2020 | ||
Andrew Gilbert | ||||
/s/ DOUGLAS W. KIMMELMAN | Director | February 24, 2020 | ||
Douglas W. Kimmelman | ||||
/s/ W. THADDEUS MILLER | Executive Vice Chairman, Chief Legal Officer, Secretary and Director | February 24, 2020 | ||
W. Thaddeus Miller | ||||
/s/ TYLER G. REEDER | Director | February 24, 2020 | ||
Tyler G. Reeder | ||||
/s/ ANDREW D. SINGER | Director | February 24, 2020 | ||
Andrew D. Singer | ||||
/s/ DONALD A. WAGNER | Director | February 24, 2020 | ||
Donald A. Wagner | ||||
89
CALPINE CORPORATION AND SUBSIDIARIES
INDEX TO CONSOLIDATED FINANCIAL STATEMENTS
December 31, 2019
Page | |
90
Report of Independent Registered Public Accounting Firm
To the Board of Directors and Stockholder of Calpine Corporation
Opinion on the Financial Statements
We have audited the accompanying consolidated balance sheets of Calpine Corporation and its subsidiaries (the “Company”) as of December 31, 2019 and 2018, and the related consolidated statements of operations, of comprehensive income (loss), of stockholder’s equity and of cash flows for each of the three years in the period ended December 31, 2019, including the related notes and financial statement schedule listed in the index appearing under Item 15(a)(2) (collectively referred to as the “consolidated financial statements”). In our opinion, the consolidated financial statements present fairly, in all material respects, the financial position of the Company as of December 31, 2019 and 2018, and the results of its operations and its cash flows for each of the three years in the period ended December 31, 2019 in conformity with accounting principles generally accepted in the United States of America.
Basis for Opinion
These consolidated financial statements are the responsibility of the Company’s management. Our responsibility is to express an opinion on the Company’s consolidated financial statements based on our audits. We are a public accounting firm registered with the Public Company Accounting Oversight Board (United States) (PCAOB) and are required to be independent with respect to the Company in accordance with the U.S. federal securities laws and the applicable rules and regulations of the Securities and Exchange Commission and the PCAOB.
We conducted our audits of these consolidated financial statements in accordance with the standards of the PCAOB and in accordance with auditing standards generally accepted in the United States of America. Those standards require that we plan and perform the audit to obtain reasonable assurance about whether the consolidated financial statements are free of material misstatement, whether due to error or fraud. The Company is not required to have, nor were we engaged to perform, an audit of its internal control over financial reporting. As part of our audits we are required to obtain an understanding of internal control over financial reporting but not for the purpose of expressing an opinion on the effectiveness of the Company's internal control over financial reporting. Accordingly, we express no such opinion.
Our audits included performing procedures to assess the risks of material misstatement of the consolidated financial statements, whether due to error or fraud, and performing procedures that respond to those risks. Such procedures included examining, on a test basis, evidence regarding the amounts and disclosures in the consolidated financial statements. Our audits also included evaluating the accounting principles used and significant estimates made by management, as well as evaluating the overall presentation of the consolidated financial statements. We believe that our audits provide a reasonable basis for our opinion.
/s/ PricewaterhouseCoopers LLP
Houston, Texas
February 24, 2020
We have served as the Company's auditor since 2003.
91
CALPINE CORPORATION AND SUBSIDIARIES
CONSOLIDATED STATEMENTS OF OPERATIONS
For the Years Ended December 31, 2019, 2018 and 2017
(in millions)
2019 | 2018 | 2017 | |||||||||
Operating revenues: | |||||||||||
Commodity revenue | $ | 9,437 | $ | 9,865 | $ | 8,836 | |||||
Mark-to-market gain (loss) | 618 | (373 | ) | (101 | ) | ||||||
Other revenue | 17 | 20 | 17 | ||||||||
Operating revenues | 10,072 | 9,512 | 8,752 | ||||||||
Operating expenses: | |||||||||||
Fuel and purchased energy expense: | |||||||||||
Commodity expense | 6,164 | 6,914 | 6,268 | ||||||||
Mark-to-market (gain) loss | 340 | (165 | ) | 70 | |||||||
Fuel and purchased energy expense | 6,504 | 6,749 | 6,338 | ||||||||
Operating and maintenance expense | 1,001 | 1,020 | 1,080 | ||||||||
Depreciation and amortization expense | 694 | 739 | 724 | ||||||||
General and other administrative expense | 150 | 158 | 155 | ||||||||
Other operating expenses | 79 | 98 | 85 | ||||||||
Total operating expenses | 8,428 | 8,764 | 8,382 | ||||||||
Impairment losses | 84 | 10 | 41 | ||||||||
(Gain) on sale of assets, net | (10 | ) | — | (27 | ) | ||||||
(Income) from unconsolidated subsidiaries | (22 | ) | (24 | ) | (22 | ) | |||||
Income from operations | 1,592 | 762 | 378 | ||||||||
Interest expense | 609 | 617 | 621 | ||||||||
(Gain) loss on extinguishment of debt | 58 | (28 | ) | 38 | |||||||
Other (income) expense, net | 37 | 81 | 32 | ||||||||
Income (loss) before income taxes | 888 | 92 | (313 | ) | |||||||
Income tax expense | 98 | 64 | 8 | ||||||||
Net income (loss) | 790 | 28 | (321 | ) | |||||||
Net income attributable to the noncontrolling interest | (20 | ) | (18 | ) | (18 | ) | |||||
Net income (loss) attributable to Calpine | $ | 770 | $ | 10 | $ | (339 | ) | ||||
The accompanying notes are an integral part of these Consolidated Financial Statements.
92
CALPINE CORPORATION AND SUBSIDIARIES
CONSOLIDATED STATEMENTS OF COMPREHENSIVE INCOME (LOSS)
For the Years Ended December 31, 2019, 2018 and 2017
(in millions)
2019 | 2018 | 2017 | ||||||||||
Net income (loss) | $ | 790 | $ | 28 | $ | (321 | ) | |||||
Cash flow hedging activities: | ||||||||||||
Gain (loss) on cash flow hedges before reclassification adjustment for cash flow hedges realized in net income (loss) | (42 | ) | 40 | (22 | ) | |||||||
Reclassification adjustment for loss on cash flow hedges realized in net income (loss) | 2 | 6 | 48 | |||||||||
Unrealized actuarial gain (loss) arising during period | (2 | ) | 1 | — | ||||||||
Foreign currency translation gain (loss) | 3 | (10 | ) | 13 | ||||||||
Income tax benefit (expense) | 2 | (5 | ) | (6 | ) | |||||||
Other comprehensive income (loss) | (37 | ) | 32 | 33 | ||||||||
Comprehensive income (loss) | 753 | 60 | (288 | ) | ||||||||
Comprehensive (income) attributable to the noncontrolling interest | (20 | ) | (21 | ) | (20 | ) | ||||||
Comprehensive income (loss) attributable to Calpine | $ | 733 | $ | 39 | $ | (308 | ) | |||||
The accompanying notes are an integral part of these Consolidated Financial Statements.
93
CALPINE CORPORATION AND SUBSIDIARIES
CONSOLIDATED BALANCE SHEETS
December 31, 2019 and 2018
(in millions, except share and per share amounts)
2019 | 2018 | ||||||
ASSETS | |||||||
Current assets: | |||||||
Cash and cash equivalents ($33 and $43 attributable to VIEs) | $ | 1,131 | $ | 205 | |||
Accounts receivable, net of allowance of $9 and $9 | 757 | 1,022 | |||||
Inventories ($77 and $71 attributable to VIEs) | 543 | 525 | |||||
Margin deposits and other prepaid expense | 367 | 315 | |||||
Restricted cash, current ($206 and $90 attributable to VIEs) | 299 | 167 | |||||
Derivative assets, current | 156 | 142 | |||||
Other current assets | 49 | 43 | |||||
Total current assets | 3,302 | 2,419 | |||||
Property, plant and equipment, net ($3,454 and $3,919 attributable to VIEs) | 11,963 | 12,442 | |||||
Restricted cash, net of current portion ($15 and $33 attributable to VIEs) | 46 | 34 | |||||
Investments in unconsolidated subsidiaries | 70 | 76 | |||||
Long-term derivative assets | 246 | 160 | |||||
Goodwill | 242 | 242 | |||||
Intangible assets, net | 340 | 412 | |||||
Other assets ($53 and $30 attributable to VIEs) | 440 | 277 | |||||
Total assets | $ | 16,649 | $ | 16,062 | |||
LIABILITIES & STOCKHOLDER’S EQUITY | |||||||
Current liabilities: | |||||||
Accounts payable | $ | 714 | $ | 958 | |||
Accrued interest payable ($7 and $10 attributable to VIEs) | 61 | 96 | |||||
Debt, current portion ($161 and $201 attributable to VIEs) | 1,268 | 637 | |||||
Derivative liabilities, current | 225 | 303 | |||||
Other current liabilities ($122 and $36 attributable to VIEs) | 657 | 489 | |||||
Total current liabilities | 2,925 | 2,483 | |||||
Debt, net of current portion ($1,635 and $1,978 attributable to VIEs) | 10,438 | 10,148 | |||||
Long-term derivative liabilities ($8 and $6 attributable to VIEs) | 63 | 140 | |||||
Other long-term liabilities ($53 and $36 attributable to VIEs) | 565 | 235 | |||||
Total liabilities | 13,991 | 13,006 | |||||
Commitments and contingencies (see Note 16) | |||||||
Stockholder’s equity: | |||||||
Common stock, $0.001 par value per share; authorized 5,000 and 5,000 shares, respectively, 105.2 and 105.2 shares issued, respectively, and 105.2 and 105.2 shares outstanding, respectively | — | — | |||||
Additional paid-in capital | 9,584 | 9,582 | |||||
Accumulated deficit | (6,923 | ) | (6,542 | ) | |||
Accumulated other comprehensive loss | (114 | ) | (77 | ) | |||
Total Calpine stockholder’s equity | 2,547 | 2,963 | |||||
Noncontrolling interest | 111 | 93 | |||||
Total stockholder’s equity | 2,658 | 3,056 | |||||
Total liabilities and stockholder’s equity | $ | 16,649 | $ | 16,062 | |||
The accompanying notes are an integral part of these Consolidated Financial Statements.
94
CALPINE CORPORATION AND SUBSIDIARIES
CONSOLIDATED STATEMENTS OF
STOCKHOLDER’S EQUITY
For the Years Ended December 31, 2019, 2018 and 2017
(in millions)
Common Stock | Treasury Stock | Additional Paid-In Capital | Accumulated Deficit | Accumulated Other Comprehensive Loss | Noncontrolling Interest | Total Stockholder’s Equity | |||||||||||||||||||||
Balance, December 31, 2016 | $ | — | $ | (7 | ) | $ | 9,625 | $ | (6,213 | ) | $ | (137 | ) | $ | 71 | $ | 3,339 | ||||||||||
Treasury stock transactions | — | (8 | ) | — | — | — | — | (8 | ) | ||||||||||||||||||
Stock-based compensation expense | — | — | 36 | — | — | — | 36 | ||||||||||||||||||||
Distribution to the noncontrolling interest | — | — | — | — | — | (12 | ) | (12 | ) | ||||||||||||||||||
Net income (loss) | — | — | — | (339 | ) | — | 18 | (321 | ) | ||||||||||||||||||
Other comprehensive income | — | — | — | — | 31 | 2 | 33 | ||||||||||||||||||||
Balance, December 31, 2017 | $ | — | $ | (15 | ) | $ | 9,661 | $ | (6,552 | ) | $ | (106 | ) | $ | 79 | $ | 3,067 | ||||||||||
Treasury stock transactions | — | (7 | ) | — | — | — | — | (7 | ) | ||||||||||||||||||
Stock-based compensation expense | — | — | 41 | — | — | — | 41 | ||||||||||||||||||||
Effects of the Merger | — | 22 | (100 | ) | — | — | — | (78 | ) | ||||||||||||||||||
Dividends | — | — | (20 | ) | — | — | — | (20 | ) | ||||||||||||||||||
Contribution from the noncontrolling interest | — | — | — | — | — | 2 | 2 | ||||||||||||||||||||
Distribution to the noncontrolling interest | — | — | — | — | — | (9 | ) | (9 | ) | ||||||||||||||||||
Net income | — | — | — | 10 | — | 18 | 28 | ||||||||||||||||||||
Other comprehensive income | — | — | — | — | 29 | 3 | 32 | ||||||||||||||||||||
Balance, December 31, 2018 | $ | — | $ | — | $ | 9,582 | $ | (6,542 | ) | $ | (77 | ) | $ | 93 | $ | 3,056 | |||||||||||
Dividends | — | — | — | (1,151 | ) | — | — | (1,151 | ) | ||||||||||||||||||
Net income | — | — | — | 770 | — | 20 | 790 | ||||||||||||||||||||
Other comprehensive loss | — | — | — | — | (37 | ) | — | (37 | ) | ||||||||||||||||||
Other | — | — | 2 | — | — | (2 | ) | — | |||||||||||||||||||
Balance, December 31, 2019 | $ | — | $ | — | $ | 9,584 | $ | (6,923 | ) | $ | (114 | ) | $ | 111 | $ | 2,658 | |||||||||||
The accompanying notes are an integral part of these Consolidated Financial Statements.
95
CALPINE CORPORATION AND SUBSIDIARIES
CONSOLIDATED STATEMENTS OF CASH FLOWS
For the Years Ended December 31, 2019, 2018 and 2017
(in millions)
2019 | 2018 | 2017 | |||||||||
Cash flows from operating activities: | |||||||||||
Net income (loss) | $ | 790 | $ | 28 | $ | (321 | ) | ||||
Adjustments to reconcile net income (loss) to net cash provided by operating activities: | |||||||||||
Depreciation and amortization(1) | 781 | 848 | 921 | ||||||||
(Gain) loss on extinguishment of debt | 22 | (32 | ) | 38 | |||||||
Deferred income taxes | 95 | 47 | 14 | ||||||||
Impairment losses | 84 | 10 | 41 | ||||||||
(Gain) on sale of assets, net | (10 | ) | — | (27 | ) | ||||||
Mark-to-market activity, net | (275 | ) | 205 | 169 | |||||||
(Income) from unconsolidated subsidiaries | (22 | ) | (24 | ) | (22 | ) | |||||
Return on investments from unconsolidated subsidiaries | 21 | 35 | 28 | ||||||||
Stock-based compensation expense | — | 57 | 42 | ||||||||
Other | 3 | 29 | (5 | ) | |||||||
Change in operating assets and liabilities, net of effects of acquisitions: | |||||||||||
Accounts receivable | 265 | (101 | ) | (108 | ) | ||||||
Accounts payable | (271 | ) | 164 | 70 | |||||||
Margin deposits and other prepaid expense | (57 | ) | (134 | ) | 115 | ||||||
Other assets and liabilities, net | 144 | (82 | ) | (15 | ) | ||||||
Derivative instruments, net | (14 | ) | 51 | 9 | |||||||
Net cash provided by operating activities | 1,556 | 1,101 | 949 | ||||||||
Cash flows from investing activities: | |||||||||||
Purchases of property, plant and equipment | (584 | ) | (415 | ) | (305 | ) | |||||
Proceeds from sale of power plants and other | 322 | 11 | 162 | ||||||||
Purchases of North American Power, net of cash acquired | — | — | (111 | ) | |||||||
Return of investment from unconsolidated subsidiaries | 5 | 18 | — | ||||||||
Other | (1 | ) | (6 | ) | 43 | ||||||
Net cash used in investing activities | (258 | ) | (392 | ) | (211 | ) | |||||
Cash flows from financing activities: | |||||||||||
Borrowings under CCFC Term Loan and First Lien Term Loans | 1,687 | — | 1,395 | ||||||||
Repayments of CCFC Term Loans and First Lien Term Loans | (1,507 | ) | (41 | ) | (2,150 | ) | |||||
Borrowings under First Lien Notes | 1,250 | — | 560 | ||||||||
Repayments of First Lien Notes | (811 | ) | — | — | |||||||
Borrowings under Senior Unsecured Notes | 1,400 | — | — | ||||||||
Repayments of Senior Unsecured Notes | (768 | ) | (355 | ) | (453 | ) | |||||
Borrowings under revolving facilities | 342 | 525 | 440 | ||||||||
Repayments of revolving facilities | (250 | ) | (495 | ) | (440 | ) | |||||
Borrowings from project financing, notes payable and other | — | 220 | — | ||||||||
Repayments of project financing, notes payable and other | (404 | ) | (470 | ) | (174 | ) | |||||
Financing costs | (67 | ) | (18 | ) | (60 | ) | |||||
Stock repurchases | — | (79 | ) | — | |||||||
Dividends paid(2) | (1,151 | ) | (20 | ) | — | ||||||
Other | 51 | (13 | ) | (19 | ) | ||||||
Net cash used in financing activities | (228 | ) | (746 | ) | (901 | ) | |||||
Net increase (decrease) in cash, cash equivalents and restricted cash | 1,070 | (37 | ) | (163 | ) | ||||||
Cash, cash equivalents and restricted cash, beginning of period | 406 | 443 | 606 | ||||||||
Cash, cash equivalents and restricted cash, end of period(3) | $ | 1,476 | $ | 406 | $ | 443 | |||||
The accompanying notes are an integral part of these Consolidated Financial Statements.
96
CALPINE CORPORATION AND SUBSIDIARIES CONSOLIDATED STATEMENTS OF CASH FLOWS — (Continued) (in millions) | |||||||||||
2019 | 2018 | 2017 | |||||||||
Cash paid during the period for: | |||||||||||
Interest, net of amounts capitalized | $ | 598 | $ | 587 | $ | 575 | |||||
Income taxes | $ | 11 | $ | 23 | $ | 12 | |||||
Supplemental disclosure of non-cash investing and financing activities: | |||||||||||
Purchase of King City Cogeneration Plant Lease(4) | $ | — | $ | — | $ | 15 | |||||
Change in capital expenditures included in accounts payable | $ | 13 | $ | 19 | $ | 20 | |||||
Plant tax settlement offset in prepaid assets | $ | (4 | ) | $ | — | $ | — | ||||
Asset retirement obligation adjustment offset in operating activities | $ | (10 | ) | $ | — | $ | — | ||||
(1) | Includes amortization included in Commodity revenue and Commodity expense associated with intangible assets and amortization recorded in interest expense associated with debt issuance costs and discounts. |
(2) | Dividends paid during the years ended December 31, 2019 and 2018, includes approximately $1 million and $20 million, respectively, in certain Merger-related costs incurred by CPN Management, our parent. |
(3) | Our cash and cash equivalents, restricted cash, current and restricted cash, net of current portion are stated as separate line items on our Consolidated Balance Sheets. |
(4) | On April 3, 2017, we completed the purchase of the King City Cogeneration Plant lease in exchange for a three-year promissory note with a discounted value of $57 million. We recorded a net increase to property, plant and equipment, net on our Consolidated Balance Sheet of $15 million due to the increased value of the promissory note as compared to the carrying value of the lease. |
The accompanying notes are an integral part of these Consolidated Financial Statements.
97
CALPINE CORPORATION AND SUBSIDIARIES
NOTES TO CONSOLIDATED FINANCIAL STATEMENTS
For the Years Ended December 31, 2019, 2018 and 2017
1. | Organization and Operations |
We are a power generation company engaged in the ownership and operation of primarily natural gas-fired and geothermal power plants in North America. We have a significant presence in major competitive wholesale and retail power markets in California, Texas and the Northeast and Mid-Atlantic regions of the U.S. We sell power, steam, capacity, renewable energy credits and ancillary services to our customers, which include utilities, independent electric system operators and industrial companies, retail power providers, municipalities, CCAs and other governmental entities, power marketers as well as retail commercial, industrial, governmental and residential customers. We continue to focus on providing products and services that are beneficial to our wholesale and retail customers. We purchase primarily natural gas and some fuel oil as fuel for our power plants and engage in related natural gas transportation and storage transactions. We also purchase power and related products for sale to our customers and purchase electric transmission rights to deliver power to our customers. Additionally, consistent with our Risk Management Policy, we enter into natural gas, power, environmental product, fuel oil and other physical and financial commodity contracts to hedge certain business risks and optimize our portfolio of power plants.
Merger
On August 17, 2017, we entered into the Merger Agreement with Volt Parent, LP (“Volt Parent”) and Volt Merger Sub, Inc. (“Merger Sub”), a wholly-owned subsidiary of Volt Parent, pursuant to which Merger Sub merged with and into Calpine, with Calpine surviving the Merger as a subsidiary of Volt Parent. On March 8, 2018, we completed the Merger contemplated in the Merger Agreement.
At the effective time of the Merger, each share of Calpine common stock outstanding as of immediately prior to the effective time of the Merger (excluding certain shares as described in the Merger Agreement) ceased to be outstanding and was converted into the right to receive $15.25 per share in cash or approximately $5.6 billion in total. See Note 13 for a discussion of the treatment of the outstanding share-based awards to employees at the effective time of the Merger.
For the years ended December 31, 2019, 2018 and 2017, we recorded approximately nil, $33 million and $15 million, respectively, in Merger-related costs which was recorded in other operating expenses on our Consolidated Statements of Operations and primarily related to legal, investment banking and other professional fees associated with the Merger. We elected not to apply pushdown accounting in connection with the consummation of the Merger. As a result, our assets and liabilities are recorded at historical cost and do not reflect the fair value ascribed in the Merger.
2. | Summary of Significant Accounting Policies |
Basis of Presentation and Principles of Consolidation
Our Consolidated Financial Statements have been prepared in accordance with U.S. GAAP and include the accounts of all majority-owned subsidiaries that are not VIEs and all VIEs where we have determined we are the primary beneficiary. Intercompany transactions have been eliminated in consolidation.
Equity Method Investments — We use the equity method of accounting to record our net interests in VIEs where we have determined that we are not the primary beneficiary, which include Greenfield LP, a 50% partnership interest and Calpine Receivables, a 100% membership interest. Our share of net income (loss) is calculated according to our equity ownership percentage or according to the terms of the applicable partnership agreement or limited liability company operating agreement. See Note 7 for further discussion of our VIEs and unconsolidated investments.
Reclassifications — We have reclassified certain prior period amounts for comparative purposes. These reclassifications did not have a material effect on our financial condition, results of operations or cash flows.
98
Jointly-Owned Plants — Certain of our subsidiaries own undivided interests in jointly-owned plants. These plants are maintained and operated pursuant to their joint ownership participation and operating agreements. We are responsible for our subsidiaries’ share of operating costs and direct expenses and include our proportionate share of the facilities and related revenues and direct expenses in these jointly-owned plants in the corresponding balance sheet and income statement captions of our Consolidated Financial Statements. The following table summarizes our proportionate ownership interest in jointly-owned power plants:
As of December 31, 2019 | Ownership Interest | Property, Plant & Equipment | Accumulated Depreciation | Construction in Progress | |||||||||||
(in millions, except percentages) | |||||||||||||||
Freestone Energy Center | 75.0 | % | $ | 379 | $ | (177 | ) | $ | — | ||||||
Hidalgo Energy Center | 78.5 | % | $ | 250 | $ | (113 | ) | $ | — | ||||||
Use of Estimates in Preparation of Financial Statements
The preparation of financial statements in conformity with U.S. GAAP requires management to make estimates and assumptions that affect the reported amounts of assets, liabilities, revenues, expenses and related disclosures included in our Consolidated Financial Statements. Actual results could differ from those estimates.
Fair Value of Financial Instruments and Derivatives
See Note 8 for disclosures regarding the fair value of our debt instruments and Note 9 for disclosures regarding the fair values of our derivative instruments and related margin deposits and certain of our cash balances.
Concentrations of Credit Risk
Financial instruments that potentially subject us to credit risk consist of cash and cash equivalents, restricted cash, accounts and notes receivable and derivative financial instruments. Certain of our cash and cash equivalents, as well as our restricted cash balances, are invested in money market accounts with investment banks that are not FDIC insured. We place our cash and cash equivalents and restricted cash in what we believe to be creditworthy financial institutions and certain of our money market accounts invest in U.S. Treasury securities or other obligations issued or guaranteed by the U.S. Government, its agencies or instrumentalities. Additionally, we actively monitor the credit risk of our counterparties and customers, including our receivable, commodity and derivative transactions. Our accounts and notes receivable are concentrated within entities engaged in the energy industry, mainly within the U.S. We generally have not collected collateral for accounts receivable from utilities and end-user customers; however, we may require collateral in the future. For financial and commodity derivative counterparties and customers, we evaluate the net accounts receivable, accounts payable and fair value of commodity contracts and may require security deposits, cash margin or letters of credit to be posted if our exposure reaches a certain level or their credit rating declines.
Our counterparties and customers primarily consist of four categories of entities who participate in the energy markets:
• | financial institutions and trading companies; |
• | regulated utilities, municipalities, cooperatives, ISOs and other retail power suppliers; |
• | oil, natural gas, chemical and other energy-related industrial companies; and |
• | commercial, industrial and residential retail customers. |
We have concentrations of credit risk with a few of our wholesale counterparties and retail customers relating to our sales of power and steam and our hedging, optimization and trading activities. For example, our wholesale business currently has contracts with investor owned California utilities which could be affected should they be found liable for recent wildfires in California and, accordingly, incur substantial costs associated with the wildfires.
On January 29, 2019, PG&E and PG&E Corporation each filed voluntary petitions for relief under Chapter 11. We currently have several power plants that provide energy and energy-related products to PG&E under PPAs, many of which have PG&E collateral posting requirements. Since the bankruptcy filing, we have received all material payments under the PPAs, either directly or through the application of collateral. We also currently have numerous other agreements with PG&E related to the operation of our power plants in Northern California, under which PG&E has continued to provide service since its bankruptcy filing. We cannot predict the ultimate outcome of this matter and continue to monitor the bankruptcy proceedings.
99
We have exposure to trends within the energy industry, including declines in the creditworthiness of our counterparties and customers for our commodity and derivative transactions. Currently, certain of our counterparties and customers within the energy industry have below investment grade credit ratings. Our risk control group manages counterparty and customer credit risk and monitors our net exposure with each counterparty or customer on a daily basis. The analysis is performed on a mark-to-market basis using forward curves. The net exposure is compared against a credit risk threshold which is determined based on each counterparties’ and customer’s credit rating and evaluation of their financial statements. We utilize these thresholds to determine the need for additional collateral or restriction of activity with the counterparty or customer. We believe that our credit policies and portfolio of transactions adequately monitor and diversify our credit risk. Currently, our wholesale counterparties and retail customers are performing and financially settling timely according to their respective agreements with the exception of certain retail customers where our credit exposure is not material.
Cash and Cash Equivalents
We consider all highly liquid investments with an original maturity of three months or less to be cash equivalents. We have cash and cash equivalents held in non-corporate accounts relating to certain project finance facilities and lease agreements that require us to establish and maintain segregated cash accounts. These accounts have been pledged as security in favor of the lenders under such project finance facilities, and the use of certain cash balances on deposit in such accounts is limited, at least temporarily, to the operations of the respective projects.
Restricted Cash
Certain of our debt agreements, lease agreements or other operating agreements require us to establish and maintain segregated cash accounts, the use of which is restricted, making these cash funds unavailable for general use. These amounts are held by depository banks in order to comply with the contractual provisions requiring reserves for payments such as for debt service, rent and major maintenance or with applicable regulatory requirements. Funds that can be used to satisfy obligations due during the next 12 months are classified as current restricted cash, with the remainder classified as non-current restricted cash. Restricted cash is generally invested in accounts earning market rates; therefore, the carrying value approximates fair value. Such cash is excluded from cash and cash equivalents on our Consolidated Balance Sheets.
The table below represents the components of our restricted cash as of December 31, 2019 and 2018 (in millions):
2019 | 2018 | ||||||||||||||||||||||
Current | Non-Current | Total | Current | Non-Current | Total | ||||||||||||||||||
Debt service | $ | 58 | $ | 8 | $ | 66 | $ | 13 | $ | 8 | $ | 21 | |||||||||||
Construction/major maintenance | 28 | 6 | 34 | 23 | 24 | 47 | |||||||||||||||||
Security/project/insurance | 209 | 31 | 240 | 120 | — | 120 | |||||||||||||||||
Other | 4 | 1 | 5 | 11 | 2 | 13 | |||||||||||||||||
Total | $ | 299 | $ | 46 | $ | 345 | $ | 167 | $ | 34 | $ | 201 | |||||||||||
Business Interruption Proceeds
We record business interruption insurance proceeds when they are realizable and recorded approximately $11 million, $14 million and $27 million of business interruption proceeds in operating revenues for the years ended December 31, 2019, 2018, and 2017, respectively.
Accounts Receivable and Payable
Accounts receivable and payable represent amounts due from customers and owed to vendors, respectively. Accounts receivable are recorded at invoiced amounts, net of reserves and allowances, and do not bear interest. Receivable balances greater than 30 days past due are reviewed for collectability, depending upon the nature of the customer, and if deemed uncollectible, are charged off against the allowance account after all means of collection have been exhausted and the potential for recovery is considered remote. We use our best estimate to determine the required allowance for doubtful accounts based on a variety of factors, including the length of time receivables are past due, economic trends and conditions affecting our customer base, significant one-time events and historical write-off experience. Specific provisions are recorded for individual receivables when we become aware of a customer’s inability to meet its financial obligations.
The accounts receivable and payable balances also include settled but unpaid amounts relating to our marketing, hedging and optimization activities. Some of these receivables and payables with individual counterparties are subject to master netting
100
arrangements whereby we legally have a right of offset and settle the balances net. However, for balance sheet presentation purposes and to be consistent with the way we present the majority of amounts related to marketing, hedging and optimization activities on our Consolidated Statements of Operations, we present our receivables and payables on a gross basis. We do not have any significant off balance sheet credit exposure related to our customers.
Inventory
Inventory primarily consists of spare parts, stored natural gas and fuel oil, environmental products and natural gas exchange imbalances. Inventory, other than spare parts, is stated primarily at the lower of cost or net realizable value under the weighted average cost method. Spare parts inventory is valued at weighted average cost and is expensed to operating and maintenance expense or capitalized to property, plant and equipment as the parts are utilized and consumed.
Collateral
We use margin deposits, prepayments and letters of credit as credit support with and from our counterparties and customers for commodity procurement and risk management activities. In addition, we have granted additional first priority liens on the assets previously subject to first priority liens under our First Lien Notes, First Lien Term Loans and Corporate Revolving Facility as collateral under certain of our power and natural gas agreements. These agreements qualify as “eligible commodity hedge agreements” under our First Lien Notes, First Lien Term Loans and Corporate Revolving Facility. The first priority liens have been granted in order to reduce the cash collateral and letters of credit that we would otherwise be required to provide to our counterparties under such agreements. The counterparties under such agreements would share the benefits of the collateral subject to such first priority liens ratably with the lenders under our First Lien Notes, First Lien Term Loans and Corporate Revolving Facility. Certain of our interest rate hedging instruments relate to hedges of certain of our project financings collateralized by first priority liens on the underlying assets. See Note 11 for a further discussion on our amounts and use of collateral.
Property, Plant and Equipment, Net
Property, plant, and equipment items are recorded at cost. We capitalize costs incurred in connection with the construction of power plants, the development of geothermal properties and the refurbishment of major turbine generator equipment. When capital improvements to leased power plants meet our capitalization criteria, they are capitalized as leasehold improvements and amortized over the shorter of the term of the lease or the economic life of the capital improvement. We expense maintenance when the service is performed for work that does not meet our capitalization criteria. Our current capital expenditures at our Geysers Assets are those incurred for proven reserves and reservoir replenishment (primarily water injection), pipeline and power generation assets and drilling of “development wells” as all drilling activity has been performed within the known boundaries of the steam reservoir. We have capitalized costs incurred during ownership consisting of additions, certain replacements or repairs when the repairs appreciably extend the life, increase the capacity or improve the efficiency or safety of the property. Such costs are expensed when they do not meet the above criteria. We purchased our Geysers Assets as a proven steam reservoir and all well costs, except well workovers and routine repairs and maintenance, have been capitalized since our purchase date.
We depreciate our assets under the straight-line method over the shorter of their estimated useful lives or lease term. For our natural gas-fired power plants, we assume an estimated salvage value which approximates 10% of the depreciable cost basis where we own the power plant or have a favorable option to purchase the power plant or take ownership of the power plant at conclusion of the lease term and a de minimis amount of the depreciable costs basis for componentized equipment. For our Geysers Assets, we typically assume no salvage values. We use the component depreciation method for our natural gas-fired power plant rotable parts, certain componentized balance of plant parts and our information technology equipment and the composite depreciation method for the other natural gas-fired power plant asset groups and Geysers Assets.
Generally, upon normal retirement of assets under the composite depreciation method, the costs of such assets are retired against accumulated depreciation and no gain or loss is recorded. For the retirement of assets under the component depreciation method, generally, the costs and related accumulated depreciation of such assets are removed from our Consolidated Balance Sheets and any gain or loss is recorded as operating and maintenance expense.
Goodwill and Intangible Assets
Goodwill represents the excess of the purchase price over the fair value of the net assets acquired at the time of an acquisition. We assess the carrying amount of our goodwill annually for impairment during the third quarter and whenever the events or changes in circumstances indicate that the carrying value may not be recoverable.
101
Our goodwill resulted from the acquisition of our retail business. As such, our goodwill balance of $242 million was allocated to our Retail segment. We did not record any changes in the carrying amount of our goodwill during the years ended December 31, 2019 and 2018.
We record intangible assets, such as acquired contracts, customer relationships and trademark and trade name at their estimated fair values at acquisition. We use all information available to estimate fair values including quoted market prices, if available, and other widely accepted valuation techniques. Certain estimates and judgments are required in the application of the techniques used to measure fair value of our intangible assets, including estimates of future cash flows, selling prices, replacement costs, economic lives and the selection of a discount rate, which are not observable in the market and represent a level 3 measurement. All recognized intangible assets consist of rights and obligations with finite lives.
As of December 31, 2019 and 2018, the components of our intangible assets were as follows (in millions):
2019 | 2018 | Lives | |||||||
Acquired contracts | $ | 444 | $ | 458 | 0 – 9 Years | ||||
Customer relationships | 445 | 445 | 7 – 14 Years | ||||||
Trademark and trade name | 40 | 40 | 15 Years | ||||||
Other | 4 | 88 | 39 – 44 Years | ||||||
933 | 1,031 | ||||||||
Less: Accumulated amortization | 593 | 619 | |||||||
Intangible assets, net | $ | 340 | $ | 412 | |||||
Amortization expense related to our intangible assets for the years ended December 31, 2019, 2018 and 2017 was $72 million, $100 million and $175 million, respectively.
The estimated aggregate amortization expense of our intangible assets for the next five years is as follows (in millions):
2020 | $ | 44 | |
2021 | $ | 39 | |
2022 | $ | 36 | |
2023 | $ | 28 | |
2024 | $ | 28 | |
Impairment Evaluation of Long-Lived Assets (Including Goodwill, Intangibles and Investments)
We evaluate our long-lived assets, such as property, plant and equipment, equity method investments and definite-lived intangible assets for impairment, when events or changes in circumstances indicate that the carrying value of such assets may not be recoverable. Equipment assigned to each power plant is not evaluated for impairment separately; instead, we evaluate our operating power plants and related equipment as a whole unit. When we believe an impairment condition may have occurred, we are required to estimate the undiscounted future cash flows associated with a long-lived asset or group of long-lived assets at the lowest level for which identifiable cash flows are largely independent of the cash flows of other assets and liabilities for long-lived assets that are expected to be held and used. We use a fundamental long-term view of the power market which is based on long-term production volumes, price curves and operating costs together with the regulatory and environmental requirements within each individual market to prepare our multi-year forecast. Since we manage and market our power sales as a portfolio rather than at the individual power plant level or customer level within each designated market, pool or segment, we group our power plants based upon the corresponding market for valuation purposes. If we determine that the undiscounted cash flows from an asset or group of assets to be held and used are less than the associated carrying amount, or if we have classified an asset as held for sale, we must estimate fair value to determine the amount of any impairment loss.
We test goodwill and all intangible assets not subject to amortization for impairments at least annually, or more frequently whenever an event or change in circumstances occurs that would more likely than not reduce the fair value of a reporting unit below its carrying amount. We test goodwill for impairment at the reporting unit level, which is identified one level below the Company’s operating segments for which discrete financial information is available and management regularly reviews the operating results. We perform an annual impairment assessment in the third quarter of each year, or more frequently if indicators of potential impairment exist, to determine whether it is more likely than not that the fair value of a reporting unit in which goodwill resides is less than its carrying value. For reporting units in which this assessment concludes that it is more likely than not that
102
the fair value is more than its carrying value, goodwill is not considered impaired and we are not required to perform the goodwill impairment test. Qualitative factors considered in this assessment include industry and market considerations, overall financial performance, and other relevant events and factors affecting the reporting unit.
For reporting units in which the impairment assessment concludes that it is more likely than not that the fair value is less than its carrying value, we perform the goodwill impairment test, which compares the fair value of the reporting unit to its carrying value. If the fair value of the reporting unit exceeds the carrying value of the net assets assigned to that unit, goodwill is not considered impaired and we are not required to perform additional analysis. If the carrying value of the net assets assigned to the reporting unit exceeds the fair value of the reporting unit, then we record an impairment loss equal to the difference not to exceed the goodwill balance assigned to the reporting unit. We did not record an impairment of our goodwill during the years ended December 31, 2019, 2018 and 2017.
All construction and development projects are reviewed for impairment whenever there is an indication of potential reduction in fair value. If it is determined that a construction or development project is no longer probable of completion and the capitalized costs will not be recovered through future operations, the carrying value of the project will be written down to its fair value.
In order to estimate future cash flows, we consider historical cash flows, existing contracts, capacity prices and PPAs, changes in the market environment and other factors that may affect future cash flows. To the extent applicable, the assumptions we use are consistent with forecasts that we are otherwise required to make (for example, in preparing our earnings forecasts). The use of this method involves inherent uncertainty. We use our best estimates in making these evaluations and consider various factors, including forward price curves for power and fuel costs and forecasted operating costs. However, actual future market prices and project costs could vary from the assumptions used in our estimates, and the effect of such variations could be material.
When we determine that our assets meet the assets held-for-sale criteria, they are reported at the lower of their carrying amount or fair value less the cost to sell. We are also required to evaluate our equity method investments to determine whether or not they are impaired when the value is considered an “other than a temporary” decline in value.
Generally, fair value will be determined using valuation techniques such as the present value of expected future cash flows. We will also discount the estimated future cash flows associated with the asset using a single interest rate representative of the risk involved with such an investment including contract terms, tenor and credit risk of counterparties. We may also consider prices of similar assets, consult with brokers, or employ other valuation techniques. We use our best estimates in making these evaluations and consider various factors, including forward price curves for power and fuel costs and forecasted operating costs. However, actual future market prices and project costs could vary from the assumptions used in our estimates, and the effect of such variations could be material.
On January 29, 2019, PG&E and PG&E Corporation each filed voluntary petitions for relief under Chapter 11. Our power plants that sell energy and energy-related products to PG&E through PPAs, include Russell City Energy Center and Los Esteros Critical Energy Facility. Since the bankruptcy filing, we have received all material payments under the PPAs, either directly or through application of collateral. As of December 31, 2019, our Consolidated Balance Sheet included net long-lived assets at Russell City Energy Center and Los Esteros Critical Energy Facility of approximately $647 million and $427 million, respectively, and non-recourse project finance debt at Russell City Energy Center and Los Esteros Critical Energy Facility of approximately $272 million and $135 million, respectively. We cannot predict whether the PPAs will be assumed through the bankruptcy proceeding, however, we believe that even if the contracts were not to be assumed, the undiscounted future cash flows of the power plants would exceed the carrying values of each of the facilities. We continue to monitor the bankruptcy proceedings for any changes in circumstances that would impact the carrying value of either power plant.
We recorded impairment losses of $84 million during the year ended December 31, 2019 related to the sale of our Garrison and RockGen Energy Centers in our East segment, spare turbine equipment in our Texas segment and certain capitalized costs related to wind development projects in our Texas and East segments. We recorded impairment losses of $10 million during the year ended December 31, 2018 related to scrapped power plant equipment in our East segment. We recorded impairment losses of $41 million during the year ended December 31, 2017 related to our South Point Energy Center in our West segment and spare turbine equipment in our Texas segment.
103
Asset Retirement Obligation
We record all known asset retirement obligations for which the liability’s fair value can be reasonably estimated. Over time, the liability is accreted to its present value each period and the capitalized cost is depreciated over the useful life of the related asset. At December 31, 2019 and 2018, our asset retirement obligation liabilities were $68 million and $63 million, respectively, primarily relating to land leases upon which our power plants are built and the requirement that the property meet specific conditions upon its return.
Debt Issuance Costs
Costs incurred related to the issuance of debt instruments are deferred and amortized over the term of the related debt using a method that approximates the effective interest rate method. However, when the timing of debt transactions involve contemporaneous exchanges of cash between us and the same creditor(s) in connection with the issuance of a new debt obligation and satisfaction of an existing debt obligation, debt issuance costs are accounted for depending on whether the transaction qualifies as an extinguishment or modification, which requires us to either write-off the original debt issuance costs and capitalize the new issuance costs, or continue to amortize the original debt issuance costs and immediately expense the new issuance costs. Our debt issuance costs related to a recognized debt liability are presented as a direct deduction from the carrying amount of the related debt liability, which is consistent with the presentation of debt discounts.
Revenue Recognition
Our operating revenues are comprised of the following:
• | power and steam revenue consisting of variable payments related to generation, retail power and gas sales activities, power revenues consisting of fixed and variable capacity payments not related to generation including capacity payments received from RTO and ISO capacity auctions, host steam, REC revenue from our Geysers Assets, other revenues such as RMR Contracts, resource adequacy and certain ancillary service revenues and realized settlements from our marketing, hedging, optimization and trading activities; |
• | mark-to-market revenues from derivative instruments as a result of our marketing, hedging, optimization and trading activities; and |
• | sales of natural gas and other service revenues. |
See Note 3 for further information related to our accounting for revenue from contracts with customers.
Realized Settlements of Commodity Derivative Instruments — The realized value of power commodity sales and purchase contracts that are net settled or settled as gross sales and purchases, but could have been net settled, are reflected on a net basis and are included in Commodity revenue on our Consolidated Statements of Operations.
Mark-to-Market Gain (Loss) — The changes in the mark-to-market value of power-based commodity derivative instruments are reflected on a net basis as a separate component of operating revenues.
Gross vs. Net Accounting — We determine whether the financial statement presentation of revenues should be on a gross or net basis. Where we act as principal, we record settlement of our physical commodity contracts on a gross or net basis dependent upon whether the contract results in physical delivery of the underlying product. With respect to our physical executory contracts, where we do not take title to the commodities but receive a variable payment to convert natural gas into power and steam in a tolling operation, we record revenues on a net basis.
Accounting for Derivative Instruments
We enter into a variety of derivative instruments including both exchange traded and OTC power and natural gas forwards, options as well as instruments that settle on the power price to natural gas price relationships (Heat Rate swaps and options) and interest rate hedging instruments. We recognize all derivative instruments that qualify for derivative accounting treatment as either assets or liabilities and measure those instruments at fair value unless they qualify for and are designated under the normal purchase normal sale exemption. Accounting for derivatives at fair value requires us to make estimates about future prices during periods for which price quotes may not be available from sources external to us, in which case we rely on internally developed price estimates. See Note 10 for further discussion on our accounting for derivatives.
104
Fuel and Purchased Energy Expense
Fuel and purchased energy expense is comprised of the cost of natural gas and fuel oil purchased from third parties for the purposes of consumption in our power plants as fuel, the cost of power purchased from third parties for sale to retail customers, the cost of power and natural gas purchased from third parties for our marketing, hedging and optimization activities and realized settlements and mark-to-market gains and losses resulting from general market price movements against certain derivative natural gas and power contracts including financial natural gas transactions economically hedging anticipated future power sales that either do not qualify as hedges under the hedge accounting guidelines or qualify under the hedge accounting guidelines and the hedge accounting designation has not been elected.
Realized and Mark-to-Market Expenses from Commodity Derivative Instruments
Realized Settlements of Commodity Derivative Instruments — The realized value of natural gas commodity purchase and sales contracts that are net settled are reflected on a net basis and included in Commodity expense on our Consolidated Statements of Operations. Power purchase commodity contracts that result in the physical delivery of power, and that also supplement our power generation, are reflected on a gross basis and are included in Commodity expense on our Consolidated Statements of Operations.
Mark-to-Market (Gain) Loss — The changes in the mark-to-market value of natural gas-based and certain power-based commodity derivative instruments are reflected on a net basis as a separate component of fuel and purchased energy expense.
Operating and Maintenance Expense
Operating and maintenance expense primarily includes employee expenses, utilities, chemicals, repairs and maintenance (including equipment failure and major maintenance), insurance and property taxes. We recognize these expenses when the service is performed or in the period to which the expense relates.
Income Taxes
Income taxes are accounted for under the asset and liability method. Deferred tax assets and liabilities are recognized for the future tax consequences attributable to differences between the financial statement carrying values of existing assets and liabilities and their respective tax basis and tax credit and NOL carryforwards. Deferred tax assets and liabilities are measured using enacted tax rates expected to apply to taxable income in the years in which temporary differences are expected to be recovered or settled. The effect on deferred tax assets and liabilities due to a change in tax rates is recognized in income in the period that includes the enactment date.
We recognize the financial statement effects of a tax position when it is more-likely-than-not, based on the technical merits, that the position will be sustained upon examination. A tax position that meets the more-likely-than-not recognition threshold is measured as the largest amount of tax benefit that is greater than 50% likely of being realized upon ultimate settlement with a taxing authority. We reverse a previously recognized tax position in the first period in which it is no longer more-likely-than-not that the tax position would be sustained upon examination. See Note 12 for a further discussion on our income taxes.
New Accounting Standards and Disclosure Requirements
Leases — On January 1, 2019, we adopted Accounting Standards Update 2016-02, “Leases” (“Topic 842”). The comprehensive new lease standard superseded all existing lease guidance. The standard requires that a lessee should recognize a right-of-use asset and a lease liability for substantially all operating leases based on the present value of the minimum rental payments. For lessors, the accounting for leases under Topic 842 remained substantially unchanged. The standard also requires expanded disclosures surrounding leases. We adopted the standards under Topic 842 using the modified retrospective method and elected a number of the practical expedients in our implementation of Topic 842. The key change that affected us relates to our accounting for operating leases for which we are the lessee that were historically off-balance sheet. The impact of adopting the standards resulted in the recognition of a right-of-use asset and lease obligation liability of $191 million on our Consolidated Balance Sheet on January 1, 2019, exclusive of previously recognized lease balances. The implementation of Topic 842 did not have a material effect on our Consolidated Statement of Operations or Consolidated Statement of Cash Flows for the year ended December 31, 2019. See Note 4 for a discussion of the practical expedients we elected and additional disclosures required by Topic 842.
105
Derivatives and Hedging — In August 2017, the FASB issued Accounting Standards Update 2017-12, “Targeted Improvements to Accounting for Hedging Activities.” The standard better aligns an entity’s hedging activities and financial reporting for hedging relationships through changes to both the designation and measurement guidance for qualifying hedging relationships and the presentation of hedge results in the financial statements. The standard will prospectively make hedge accounting easier to apply to hedging activities and also enhances disclosure requirements for how hedge transactions are reflected in the financial statements when hedge accounting is elected. We adopted Accounting Standards Update 2017-12 in the first quarter of 2019 which did not have a material effect on our financial condition, results of operations or cash flows.
Fair Value Measurements — In August 2018, the FASB issued Accounting Standards Update 2018-13, “Disclosure Framework – Changes to the Disclosure Requirements for Fair Value Measurement.” The standard removes, modifies and adds disclosures about fair value measurements and is effective for fiscal years beginning after December 15, 2019. The changes required by this standard to remove or modify disclosures may be early adopted with adoption of the additional disclosures required by this standard delayed until their effective date. We do not anticipate a material effect on our financial condition, results of operations or cash flows as a result of adopting this standard.
Income Taxes — In December 2019, the FASB issued Accounting Standards Update 2019-12, “Simplifying the Accounting for Income Taxes.” The standard is intended to simplify the accounting for income taxes by removing certain exceptions and improve consistent application by clarifying guidance related to the accounting for income taxes. The standard is effective for fiscal years beginning after December 15, 2020. We do not anticipate a material effect on our financial condition, results of operations or cash flows as a result of adopting this standard.
3. | Revenue from Contracts with Customers |
Disaggregation of Revenues with Customers
The following tables represent a disaggregation of our revenue for the years ended December 31, 2019 and 2018 by reportable segment (in millions). See Note 18 for a description of our segments.
Year Ended December 31, 2019 | |||||||||||||||||||||||
Wholesale | |||||||||||||||||||||||
West | Texas | East | Retail | Elimination | Total | ||||||||||||||||||
Third Party: | |||||||||||||||||||||||
Energy & other products | $ | 948 | $ | 1,406 | $ | 609 | $ | 1,694 | $ | — | $ | 4,657 | |||||||||||
Capacity | 173 | 125 | 547 | — | — | 845 | |||||||||||||||||
Revenues relating to physical or executory contracts – third party | $ | 1,121 | $ | 1,531 | $ | 1,156 | $ | 1,694 | $ | — | $ | 5,502 | |||||||||||
Affiliate(1): | $ | 44 | $ | 55 | $ | 99 | $ | 9 | $ | (207 | ) | $ | — | ||||||||||
Revenues relating to leases and derivative instruments(2) | $ | 4,570 | |||||||||||||||||||||
Total operating revenues | $ | 10,072 | |||||||||||||||||||||
106
Year Ended December 31, 2018 | |||||||||||||||||||||||
Wholesale | |||||||||||||||||||||||
West | Texas | East | Retail | Elimination | Total | ||||||||||||||||||
Third Party: | |||||||||||||||||||||||
Energy & other products | $ | 1,070 | $ | 1,500 | $ | 621 | $ | 1,857 | $ | — | $ | 5,048 | |||||||||||
Capacity | 152 | 94 | 657 | — | — | 903 | |||||||||||||||||
Revenues relating to physical or executory contracts – third party | $ | 1,222 | $ | 1,594 | $ | 1,278 | $ | 1,857 | $ | — | $ | 5,951 | |||||||||||
Affiliate(1): | $ | 30 | $ | 34 | $ | 89 | $ | 4 | $ | (157 | ) | $ | — | ||||||||||
Revenues relating to leases and derivative instruments(2) | $ | 3,561 | |||||||||||||||||||||
Total operating revenues | $ | 9,512 | |||||||||||||||||||||
___________
(1) | Affiliate energy, other and capacity revenues reflect revenues on transactions between wholesale and retail affiliates excluding affiliate activity related to leases and derivative instruments. All such activity supports retail supply needs from the wholesale business and/or allows for collateral margin netting efficiencies at Calpine. |
(2) | Revenues relating to contracts accounted for as leases and derivatives include energy and capacity revenues relating to PPAs that we are required to account for as operating leases and physical and financial commodity derivative contracts, primarily relating to power, natural gas and environmental products. Revenue related to derivative instruments includes revenue recorded in Commodity revenue and mark-to-market gain (loss) within our operating revenues on our Consolidated Statements of Operations. |
For contracts that do not meet the requirements of a lease and either do not meet the definition of a derivative instrument or are exempt from derivative accounting, we have applied the new revenue recognition standard beginning in the first quarter of 2018. Under the new standard, the majority of our operating revenue continues to be recognized as the underlying commodity or service is delivered to our customers.
Energy and Other Products
Variable payments for power and steam that are based on generation, including retail sales of power, are recognized over time as the underlying commodity is generated or purchased and control is transferred to our customer upon transmission and delivery. Ancillary service revenues are also included within energy-related revenues and are recognized over time as the service is provided.
For our power, steam and ancillary service contracts, we have elected the practical expedient that allows us to recognize revenue in the amount to which we have the right to invoice to the extent we determine that we have a right to consideration in an amount that corresponds directly with the value provided to date. To the extent this practical expedient cannot be utilized, we will recognize revenue over time based on the quantity of the commodity delivered to the customer for power and steam sales and over time as the service is provided for our ancillary service sales.
Energy and other revenues also includes revenues generated from the sale of natural gas and environmental products, including RECs and are recognized at either a point in time or over time when control of the commodity has transferred. Revenues from the sale of RECs are primarily related to credits that are generated upon generation of renewable power from our Geysers Assets and are recognized over a period of time similar to the timing of the related energy sale. Revenues from sales of RECs or other environmental products that are not generated from our assets are recognized once all certifications have been completed and the credits are delivered to the customer at a point in time. Revenues from our natural gas sales are recognized at a point in time when delivery of the natural gas is provided. Revenues from natural gas and emission product sales are generally at the contracted transaction price, which may be fixed or index-based.
107
Capacity
Capacity revenues include fixed and variable capacity payments, which are based on generation volumes and include capacity payments received from RTO and ISO capacity auctions as well as contractual capacity under long-term PPAs. For these contracts, we have elected the practical expedient that allows us to recognize revenue in the amount to which we have the right to invoice to the extent we determine that we have a right to consideration in an amount that corresponds directly with the value provided to date. To the extent this practical expedient cannot be utilized, we will recognize revenue over time as the service is being provided to the customer.
Performance Obligations and Contract Balances
Certain of our contracts have multiple performance obligations. The revenues associated with each individual performance obligation is based on the relative stand-alone sales price of each good or service or, when not available, is based on a cost incurred plus margin approach. For a significant portion of our contracts with multiple performance obligations, management has applied the practical expedient that results in recognition of revenue commensurate with the invoiced amount and no allocation is required as all performance obligations are transferred over the same period of time.
Certain of our contracts include volumetric optionality based on our customer’s needs. The transaction price within these contracts are based on a stand-alone sale price of the good or service being provided and revenue is recognized based on our customer’s usage. On a monthly basis, revenue is recognized based on estimated or actual usage by our customer at the transaction price. To the extent estimated usage is used in the recognition of revenue, revenues are adjusted for actual usage once known; however, this adjustment is not material to the revenues recognized. Generally, we have applied the practical expedient that allows us to recognize revenue based on the invoiced amount for these contracts.
Changes in estimates for our contracts are not material and revisions to estimates are recognized when the amounts can be reasonably estimated. Unbilled retail sales are based upon estimates of customer usage since the date of the last meter reading provided by the ISOs or electric distribution companies by applying the estimated revenue per KWh by customer class to the estimated number of KWhs delivered but not yet billed. Estimated amounts are adjusted when actual usage is known and billed. During the years ended December 31, 2019 and 2018, there were no significant changes to revenue amounts recognized in prior periods as a result of a change in estimates. Sales and other taxes we collect concurrent with revenue-producing activities are excluded from our operating revenues.
Billing requirements for our wholesale customers generally result in billing customers on a monthly basis in the month following the delivery of the good or service. Once billed, payment is generally required within 20 days resulting in payment for the delivery of the good or service in the month following delivery of the good or service. Billing requirements for our retail customers are generally once every 30 days and may result in billed amounts relating to our retail customers extending up to 60 days. Based on the terms of our agreements, payment is generally received at or shortly after delivery of the good or service.
Changes in accounts receivable relating to our customers is primarily due to the timing difference between payment and when the good or service is provided. During the years ended December 31, 2019 and 2018, there were no significant changes in accounts receivable other than normal billing and collection transactions and there were no material credit or impairment losses recognized relating to accounts receivable balances associated with contracts with customers.
When we receive consideration from a customer prior to transferring goods or services to the customer under the terms of a contract, we record deferred revenue, which represents a contract liability. Such deferred revenue typically results from consideration received prior to the transfer of goods and services relating to our capacity contracts and the sale of RECs that are not generated from our power plants. Based on the nature of these contracts and the timing between when consideration is received and delivery of the good or service is provided, these contracts do not contain any material financing elements.
At December 31, 2019 and 2018, deferred revenue balances relating to contracts with our customers were included in other current liabilities on our Consolidated Balance Sheets and primarily relate to sales of environmental products and capacity. We classify deferred revenue as current or long-term based on the timing of when we expect to recognize revenue. The balance outstanding at December 31, 2019 and 2018, was $14 million and $14 million, respectively. The revenue recognized during the years ended December 31, 2019 and 2018, relating to the deferred revenue balance at the beginning of the period was $14 million and $15 million and resulted from our performance under the customer contracts. The change in the deferred revenue balance during the years ended December 31, 2019 and 2018 was primarily due to the timing difference of when consideration was received and when the related good or service was transferred.
108
Contract Costs
For certain retail contracts, we incur third party incremental broker costs that are capitalized on our Consolidated Balance Sheets. Capitalized contract costs are amortized on a straight line basis over the term of the underlying sales contract to the extent the term extends beyond one year. Contract costs associated with sales contracts that are less than one year are expensed as incurred under a practical expedient.
At December 31, 2019 and 2018, the capitalized contract cost balance was not material. There were no impairment losses or changes in amortization during the years ended December 31, 2019 and 2018 and amortization of contract costs during the years ended December 31, 2019 and 2018 was immaterial.
Performance Obligations not yet Satisfied
As of December 31, 2019, we have entered into certain contracts for fixed and determinable amounts with customers under which we have not yet completed our performance obligations which primarily includes agreements for which we are providing capacity from our generating facilities. We have revenues related to the sale of capacity through participation in various ISO capacity auctions estimated based upon cleared volumes and the sale of capacity to our customers of $639 million, $633 million, $408 million, $141 million and $49 million that will be recognized during the years ending December 31, 2020, 2021, 2022, 2023 and 2024, respectively, and $63 million thereafter. Revenues under these contracts will be recognized as we transfer control of the commodities to our customers.
4. | Leases |
Accounting for Leases – Lessee
We evaluate contracts for lease accounting at contract inception and assess lease classification at the lease commencement date. For our leases, we recognize a right-of-use asset and corresponding lease obligation liability at the lease commencement date where the lease obligation liability is measured at the present value of the minimum lease payments. For our operating leases, the amortization of the right-of-use asset and the accretion of our lease obligation liability result in a single straight-line expense recognized over the lease term.
We determine the discount rate associated with our operating and finance leases using our incremental borrowing rate at lease commencement. For our operating leases, we use an interest rate commensurate with the interest rate to borrow on a collateralized basis over a similar term with an amount equal to the lease payments. Factors management considers in the calculation of the discount rate include the amount of the borrowing, the lease term including options that are reasonably certain of exercise, the current interest rate environment and the credit rating of the entity. For our finance leases, we use the interest rate commensurate with the interest rate for a project finance borrowing arrangement with a similar collateral package, repayment terms, restrictive covenants and guarantees.
Our operating leases are primarily related to office space for our corporate and regional offices as well as land and operating related leases for our power plants. Additionally, one of our power plants is accounted for as an operating lease. Payments made by Calpine on this lease are recognized on a straight-line basis with capital improvements associated with our leased power plant deemed leasehold improvements that are amortized over the shorter of the term of the lease or the economic life of the capital improvement. Several of our leases contain renewal options held by us to extend the lease term. The inclusion of these renewal periods in the lease term and in the minimum lease payments included in our lease liabilities is dependent on specific facts and circumstances for each lease and whether it is determined to be reasonably certain that we will exercise our option to extend the term. Our office, land and other operating leases do not contain any material restrictive covenants or residual value guarantees.
We have entered into finance leases for certain power plants and related equipment with terms that range up to 30 years (including lease renewal options). The finance leases generally provide for the lessee to pay taxes, maintenance, insurance, and certain other operating costs of the leased property.
In connection with our adoption of Topic 842 on January 1, 2019, we elected certain practical expedients that were available under the new lease standards including:
• | we elected not to separate lease and non-lease components for our current classes of underlying leased assets as the lessee; |
• | we did not evaluate existing and expired land easements that were not previously accounted for as leases prior to January 1, 2019; and |
109
• | we did not reassess the classification of leases, the accounting for initial direct costs or whether contractual arrangements contained a lease for all contracts that expired or commenced prior to January 1, 2019. |
Further, upon the adoption of Topic 842, we made an accounting policy election to not recognize lease assets and liabilities for leases with a term of 12 months or less. We do not have any material subleases associated with our operating and finance leases.
The components of our operating and finance lease expense are as follows for the year ended December 31, 2019 (in millions):
December 31, 2019 | |||
Operating Leases | |||
Operating lease expense | $ | 46 | |
Finance Leases | |||
Amortization of the right-of-use assets | 8 | ||
Interest expense | 8 | ||
Finance lease expense | $ | 16 | |
Variable lease expense | 9 | ||
Total lease expense | $ | 71 | |
The following is a schedule by year of future minimum lease payments associated with our operating and finance leases together with the present value of the net minimum lease payments as of December 31, 2019 (in millions):
Operating Leases(1) | Finance Leases(2) | ||||||
2020 | $ | 21 | $ | 16 | |||
2021 | 22 | 16 | |||||
2022 | 20 | 15 | |||||
2023 | 19 | 19 | |||||
2024 | 18 | 8 | |||||
Thereafter | 185 | 26 | |||||
Total minimum lease payments | 285 | 100 | |||||
Less: Amount representing interest | 103 | 27 | |||||
Total lease obligation | 182 | 73 | |||||
Less: current lease obligation | 12 | 10 | |||||
Long-term lease obligation | $ | 170 | $ | 63 | |||
____________
(1) | The lease liabilities associated with our operating leases as of December 31, 2019 are included in other current liabilities and other long-term liabilities on our Consolidated Balance Sheet. |
(2) | The lease liabilities associated with our finance leases as of December 31, 2019 are included in debt, current portion and debt, net of current portion on our Consolidated Balance Sheet. |
110
Supplemental balance sheet information related to our operating and finance leases is as follows as of December 31, 2019 (in millions, except lease term and discount rate):
December 31, 2019 | ||||
Operating leases(1) | ||||
Right-of-use assets associated with operating leases | $ | 171 | ||
Finance leases(2) | ||||
Property, plant and equipment, gross | 212 | |||
Accumulated amortization | (105 | ) | ||
Property, plant and equipment, net | $ | 107 | ||
Weighted average remaining lease term (in years) | ||||
Operating leases | 17.5 | |||
Finance leases | 6.8 | |||
Weighted average discount rate | ||||
Operating leases | 5.1 | % | ||
Finance leases | 8.0 | % | ||
____________
(1) | The right-of-use assets associated with our operating leases as of December 31, 2019 are included in other assets on our Consolidated Balance Sheet. |
(2) | The right-of-use assets associated with our finance leases as of December 31, 2019 are included in property, plant and equipment, net on our Consolidated Balance Sheet. |
Supplemental cash flow information related to our operating and finance leases is as follows for the period presented (in millions):
December 31, 2019 | ||||
Cash paid for amounts included in the measurement of lease liabilities | ||||
Operating cash flows from operating leases | $ | 54 | ||
Operating cash flows from finance leases | $ | 8 | ||
Financing cash flows from finance leases | $ | 11 | ||
Right-of-use assets obtained in exchange for lease obligations: | ||||
Operating leases | $ | 14 | ||
Finance leases | $ | — | ||
Accounting for Leases – Lessor
We apply lease accounting to PPAs that meet the definition of a lease and determine lease classification treatment at commencement of the agreement. We currently do not have any contracts which are accounted for as sales-type leases or direct financing leases and all of our leases as the lessor are classified as operating leases. As part of the implementation of Topic 842, we elected the practical expedient to not reassess leases that have commenced prior to January 1, 2019.
Revenue from contracts accounted for as operating leases, such as certain tolling agreements, with minimum lease rentals (capacity payments) which vary over time must be levelized. Generally, we levelize these contract revenues on a straight-line basis over the term of the contract. Our operating leases that have commenced contain terms extending through May 2042. These contracts also generally contain variable payment components based on generation volumes or operating efficiency over a period of time. Revenues associated with the variable payments are recognized over time as the goods or services are provided to the lessee. Our operating leases generally do not contain renewal or purchase options or residual value guarantees. We have elected to not separate our lease and non-lease components as the lease components reflect the predominant characteristics of these agreements.
111
Revenue recognized related to fixed lease payments on our operating leases for the period presented is as follows (in millions):
2019 | |||
Operating Leases(1) | |||
Fixed lease payments | $ | 341 | |
____________
(1) | Revenues associated with our operating leases are included in Commodity revenue and other revenue on our Consolidated Statement of Operations. |
The total contractual future minimum lease rentals for our contracts that have commenced and are accounted for as operating leases at December 31, 2019, are as follows (in millions):
2020 | $ | 286 | |
2021 | 261 | ||
2022 | 226 | ||
2023 | 144 | ||
2024 | 50 | ||
Thereafter | 236 | ||
Total | $ | 1,203 | |
We do not recognize lease receivables associated with our operating leases as the long-lived assets subject to the lease contracts are recorded on our Consolidated Balance Sheet and are being depreciated over their estimated useful lives. Amounts recorded on our Consolidated Balance Sheet associated with the long-lived assets subject to our operating leases as of December 31, 2019 are as follows (in millions):
December 31, 2019 | |||
Assets subject to contracts accounted for as operating leases | |||
Property, plant and equipment, gross | $ | 2,561 | |
Accumulated depreciation | (770 | ) | |
Property, plant and equipment, net(1) | $ | 1,791 | |
____________
(1) | Our assets subject to contracts that are accounted for as operating leases primarily consist of our power plants subject to tolling contracts. |
We also record lease levelization assets and liabilities for any difference between the timing of the contractual payments made related to our operating lease contracts and revenue recognized on a straight-line basis. These balances are included in current and long-term assets and liabilities on our Consolidated Balance Sheet.
112
Disclosures for periods prior to the adoption of Topic 842
Lessee
The following is a schedule by year of future minimum lease payments under operating and capital leases as of December 31, 2018 (in millions):
Operating Leases(1) | Capital Leases(2) | ||||||
2019 | $ | 50 | $ | 40 | |||
2020 | 19 | 40 | |||||
2021 | 20 | 38 | |||||
2022 | 18 | 33 | |||||
2023 | 17 | 27 | |||||
Thereafter | 192 | 92 | |||||
Total minimum lease payments | $ | 316 | 270 | ||||
Less: Amount representing interest | 89 | ||||||
Present value of net minimum lease payments | $ | 181 | |||||
____________
(1) | During the years ended December 31, 2018 and 2017, expense for operating leases amounted to $53 million and $50 million, respectively. |
(2) | Includes a failed sale-leaseback transaction related to our Pasadena Power Plant. |
At December 31, 2018, the asset balance for our assets under capital leases totaled approximately $715 million with accumulated amortization of $353 million. Amortization of assets under capital leases is recorded in depreciation and amortization expense on our Consolidated Statements of Operations.
Lessor
The total contractual future minimum lease rentals for our contracts accounted for as operating leases at December 31, 2018, are as follows (in millions):
2019 | $ | 342 | |
2020 | 261 | ||
2021 | 257 | ||
2022 | 224 | ||
2023 | 141 | ||
Thereafter | 239 | ||
Total | $ | 1,464 | |
5. | Acquisitions and Divestitures |
Acquisition of North American Power
On January 17, 2017, we, through an indirect, wholly-owned subsidiary, completed the purchase of 100% of the outstanding limited liability company membership interests in North American Power for approximately $105 million, excluding working capital and other adjustments. North American Power is a retail energy supplier for homes and small businesses and is primarily concentrated in the Northeast U.S. where Calpine has a substantial power generation presence and where Champion Energy has a substantial retail sales footprint that is enhanced by the addition of North American Power, which has been integrated into our Champion Energy retail platform. We funded the acquisition with cash on hand and the purchase price is allocated to the net assets of the business including intangible assets for the value of customer relationships and goodwill. The goodwill recorded associated with our acquisition of North American Power is deductible for tax purposes. The purchase price allocation was finalized during the fourth quarter of 2017 which did not result in any material adjustments. The pro forma incremental effect of North American Power on our results of operations for the year ended December 31, 2017 is not material.
113
Sale of Garrison Energy Center and RockGen Energy Center
On July 10, 2019, we, through our indirect, wholly owned subsidiaries Calpine Holdings, LLC and Calpine Northbrook Project Holdings, LLC, completed the sale of 100% of our ownership interests in Garrison Energy Center LLC (“Garrison”) and RockGen Energy LLC (“RockGen”) to Cobalt Power, L.L.C. for approximately $360 million, subject to certain immaterial working capital adjustments and the execution of financial commodity contracts. Upon closing, we recognized a liability of $52 million for the fair value of the financial commodity contracts on our Consolidated Balance Sheet, and the related proceeds are reflected within the financing section on our Consolidated Statement of Cash Flows. Garrison owns the Garrison Energy Center, a 309 MW natural gas-fired, combined-cycle power plant located in Dover, Delaware, and RockGen owns the RockGen Energy Center, a 503 MW natural gas-fired, simple-cycle power plant located in Christiana, Wisconsin. We used the sale proceeds, together with cash on hand, to fund a dividend of $400 million to our parent, CPN Management.
We recorded an immaterial gain on the sale during the third quarter of 2019 and an impairment loss of $55 million for the year ended December 31, 2019, to adjust the carrying value of the assets to reflect fair value less cost to sell.
Sale of Osprey Energy Center
On January 3, 2017, we completed the sale of our Osprey Energy Center to Duke Energy Florida, Inc. for approximately $166 million, excluding working capital and other adjustments. This transaction supports our effort to divest non-core assets outside our strategic concentration. We recorded a gain on sale of assets, net of approximately $27 million during the year ended December 31, 2017 associated with the sale of the Osprey Energy Center.
6. | Property, Plant and Equipment, Net |
As of December 31, 2019 and 2018, the components of property, plant and equipment are stated at cost less accumulated depreciation as follows (in millions):
2019 | 2018 | Depreciable Lives | |||||||
Buildings, machinery and equipment | $ | 16,510 | $ | 16,400 | 1.5 – 50 Years | ||||
Geothermal properties | 1,553 | 1,501 | 13 – 58 Years | ||||||
Other | 291 | 286 | 3 – 50 Years | ||||||
18,354 | 18,187 | ||||||||
Less: Accumulated depreciation | 6,851 | 6,832 | |||||||
11,503 | 11,355 | ||||||||
Land | 128 | 121 | |||||||
Construction in progress | 332 | 966 | |||||||
Property, plant and equipment, net | $ | 11,963 | $ | 12,442 | |||||
Total depreciation expense, including amortization of finance lease assets, recorded for the years ended December 31, 2019, 2018 and 2017, was $627 million, $684 million and $638 million, respectively.
We have various debt instruments that are collateralized by our property, plant and equipment. See Note 8 for a discussion of such instruments.
Buildings, Machinery and Equipment
This component primarily includes power plants and related equipment. Included in buildings, machinery and equipment are assets under finance leases. See Note 4 for further information regarding these assets under finance leases.
Geothermal Properties
This component primarily includes power plants and related equipment associated with our Geysers Assets.
Other
This component primarily includes software and hardware as well as emission reduction credits that are power plant specific and not available to be sold.
114
Capitalized Interest
The total amount of interest capitalized was $12 million, $29 million and $26 million for the years ended December 31, 2019, 2018 and 2017, respectively.
7. | Variable Interest Entities and Unconsolidated Investments |
We consolidate all of our VIEs where we have determined that we are the primary beneficiary. There were no changes to our determination of whether we are the primary beneficiary of our VIEs for the year ended December 31, 2019. We have the following types of VIEs consolidated in our financial statements:
Subsidiaries with Project Debt — All of our subsidiaries with project debt not guaranteed by Calpine have PPAs that provide financial support and are thus considered VIEs. We retain ownership and absorb the full risk of loss and potential for reward once the project debt is paid in full. Actions by the lender to assume control of collateral can occur only under limited circumstances such as upon the occurrence of an event of default. See Note 8 for further information regarding our project debt and Note 2 for information regarding our restricted cash balances.
Subsidiaries with PPAs — Certain of our majority owned subsidiaries have PPAs that limit the risk and reward of our ownership and thus constitute a VIE.
VIE with a Purchase Option — OMEC had a ten-year tolling agreement with SDG&E which commenced on October 3, 2009 and expired on October 2, 2019. Under a ground lease agreement, OMEC held a put option to sell the Otay Mesa Energy Center for $280 million to SDG&E, pursuant to the terms and conditions of the agreement, which was exercisable until April 1, 2019 and SDG&E held a call option to purchase the Otay Mesa Energy Center for $377 million, which was exercisable through October 3, 2018. The call option held by SDG&E expired unexercised.
OMEC has executed a new 59-month Resource Adequacy (“RA”) contract with SDG&E. The RA contract received initial regulatory approval by the CPUC on February 21, 2019. This approval was subject to a 30 day appeal period from the date of the issuance of the CPUC decision. On March 27, 2019, an appeal of the CPUC decision was filed with the CPUC. Accordingly, on March 28, 2019, we provided notice of our exercise of the put option, which we subsequently rescinded by agreement following the CPUC’s denial of all appeals of the new RA contract on August 1, 2019. On October 3, 2019, the RA contract with SDG&E commenced. As a result, we retained the 608 MW Otay Mesa Energy Center, which plays an integral role in electric reliability in Southern California.
As the call and put options have terminated and the project debt has been fully repaid, we determined that OMEC no longer meets the definition of a VIE during the third quarter of 2019.
Consolidation of VIEs
We consolidate our VIEs where we determine that we have both the power to direct the activities of a VIE that most significantly affect the VIE’s economic performance and the obligation to absorb losses or receive benefits from the VIE. We have determined that we hold the obligation to absorb losses and receive benefits in almost all of our VIEs where we hold the majority equity interest. Therefore, our determination of whether to consolidate is based upon which variable interest holder has the power to direct the most significant activities of the VIE (the primary beneficiary). Our analysis includes consideration of the following primary activities which we believe to have a significant effect on a power plant’s financial performance: operations and maintenance, plant dispatch, and fuel strategy as well as our ability to control or influence contracting and overall plant strategy. Our approach to determining which entity holds the powers and rights is based on powers held as of the balance sheet date. Contractual terms that may change the powers held in future periods, such as a purchase or sale option, are not considered in our analysis. Based on our analysis, we believe that we hold the power and rights to direct the most significant activities for most of our majority-owned VIEs.
Under our consolidation policy and under U.S. GAAP we also:
• | perform an ongoing reassessment each reporting period of whether we are the primary beneficiary of our VIEs; and |
• | evaluate if an entity is a VIE and whether we are the primary beneficiary whenever any changes in facts and circumstances occur, such as contractual changes where the holders of the equity investment at risk, as a group, lose the power from voting rights or similar rights of those investments to direct the activities of a VIE that most significantly affect the VIE’s economic performance or when there are other changes in the powers held by individual variable interest holders. |
115
Noncontrolling Interest — At December 31, 2019, we owned a 75% interest in Russell City Energy Company, LLC, one of our VIEs, which was also 25% owned by a third party. On January 28, 2020, we completed the acquisition of the 25% noncontrolling interest of Russell City Energy Company, LLC for approximately $49 million. For the year ended December 31, 2019, we fully consolidated this entity in our Consolidated Financial Statements and accounted for the third party ownership interest as a noncontrolling interest.
VIE Disclosures
Our consolidated VIEs include natural gas-fired power plants with an aggregate capacity of 6,669 MW and 7,880 MW, at December 31, 2019 and 2018, respectively. For these VIEs, we may provide other operational and administrative support through various affiliate contractual arrangements among the VIEs, Calpine Corporation and its other wholly-owned subsidiaries whereby we support the VIE through the reimbursement of costs and/or the purchase and sale of energy. On August 14, 2019, we repaid the OMEC project debt outstanding balance utilizing a portion of the proceeds from our 2026 First Lien Term Loans and cash on hand. See above for further discussion of OMEC. Other than amounts contractually required, we provided no additional material support to our VIEs in the form of cash and other contributions during each of the years ended December 31, 2019, 2018 and 2017.
U.S. GAAP requires separate disclosure on the face of our Consolidated Balance Sheets of the significant assets of a consolidated VIE that can be used only to settle obligations of the consolidated VIE and the significant liabilities of a consolidated VIE for which creditors (or beneficial interest holders) do not have recourse to the general credit of the primary beneficiary. In determining which assets of our VIEs meet the separate disclosure criteria, we consider that this separate disclosure requirement is met where Calpine Corporation is substantially limited or prohibited from access to assets (including cash and cash equivalents, restricted cash and property, plant and equipment), and where our VIEs have project financing that prohibits the VIE from providing guarantees on the debt of others. In determining which liabilities of our VIEs meet the separate disclosure criteria, we consider that this separate disclosure requirement is met where there are agreements that prohibit the debt holders of the VIEs from recourse to the general credit of Calpine Corporation.
Unconsolidated VIEs and Investments in Unconsolidated Subsidiaries
We have a 50% partnership interest in Greenfield LP which is also a VIE; however, we do not have the power to direct the most significant activities of this entity and therefore do not consolidate it. Greenfield LP is a limited partnership between certain subsidiaries of ours and of Mitsui & Co., Ltd., which operates the Greenfield Energy Centre, a 1,038 MW natural gas-fired, combined-cycle power plant located in Ontario, Canada. We and Mitsui & Co., Ltd. each hold a 50% interest in Greenfield LP. On November 20, 2019, we sold our 50% interest in Whitby, a limited partnership, which operates the Whitby facility, a 50 MW natural gas-fired, simple-cycle cogeneration power plant located in Ontario, Canada.
Calpine Receivables is a VIE and a bankruptcy remote entity created for the special purpose of purchasing trade accounts receivable from Calpine Solutions under the Accounts Receivable Sales Program. We have determined that we do not have the power to direct the activities of the VIE that most significantly affect the VIE’s economic performance nor the obligation to absorb losses or receive benefits from the VIE. Accordingly, we have determined that we are not the primary beneficiary of Calpine Receivables because we do not have the power to affect its financial performance as the unaffiliated financial institutions that purchase the receivables from Calpine Receivables control the selection criteria of the receivables sold and appoint the servicer of the receivables which controls management of default. Thus, we do not consolidate Calpine Receivables in our Consolidated Financial Statements and use the equity method of accounting to record our net interest in Calpine Receivables.
We account for these entities under the equity method of accounting and include our net equity interest in investments in unconsolidated subsidiaries on our Consolidated Balance Sheets. At December 31, 2019 and 2018, our equity method investments included on our Consolidated Balance Sheets were comprised of the following (in millions):
Ownership Interest as of December 31, 2019 | 2019 | 2018 | |||||||
Greenfield LP(1) | 50% | $ | 66 | $ | 55 | ||||
Whitby(2) | —% | — | 15 | ||||||
Calpine Receivables | 100% | 4 | 6 | ||||||
Total investments in unconsolidated subsidiaries | $ | 70 | $ | 76 | |||||
____________
116
(1) | Includes our share of accumulated other comprehensive income/loss related to interest rate hedging instruments associated with our unconsolidated subsidiary Greenfield LP’s debt. |
(2) | On November 20, 2019, we sold our 50% interest in Whitby to a third party and recorded a gain on sale of assets, net of approximately $5 million. |
Our risk of loss related to our investment in Greenfield LP is limited to our investment balance. Our risk of loss related to our investment in Calpine Receivables is $48 million which consists of our notes receivable from Calpine Receivables at December 31, 2019, and our initial investment associated with Calpine Receivables. See Note 17 for further information associated with our related party activity with Calpine Receivables.
Holders of the debt of our unconsolidated investments do not have recourse to Calpine Corporation and its other subsidiaries; therefore, the debt of our unconsolidated investments is not reflected on our Consolidated Balance Sheets. At December 31, 2019 and 2018, Greenfield LP’s debt was approximately $299 million and $301 million, respectively, and based on our pro rata share of our investment in Greenfield LP, our share of such debt would be approximately $150 million and $151 million at December 31, 2019 and 2018, respectively.
Our equity interest in the net income from our investments in unconsolidated subsidiaries for the years ended December 31, 2019, 2018 and 2017, is recorded in (income) loss from unconsolidated subsidiaries. The following table sets forth details of our (income) loss from unconsolidated subsidiaries and distributions for the years indicated (in millions):
(Income) loss from Unconsolidated Subsidiaries | Distributions | ||||||||||||||||||||||
2019 | 2018 | 2017 | 2019 | 2018 | 2017 | ||||||||||||||||||
Greenfield LP | $ | (13 | ) | $ | (11 | ) | $ | (14 | ) | $ | — | $ | 48 | $ | 8 | ||||||||
Whitby(1) | (11 | ) | (15 | ) | (10 | ) | 26 | 5 | 20 | ||||||||||||||
Calpine Receivables | 2 | 2 | 2 | — | — | — | |||||||||||||||||
Total | $ | (22 | ) | $ | (24 | ) | $ | (22 | ) | $ | 26 | $ | 53 | $ | 28 | ||||||||
____________
(1) | On November 20, 2019, we sold our 50% interest in Whitby to a third party. |
Inland Empire Energy Center Put and Call Options — We held a call option to purchase the Inland Empire Energy Center (a 775 MW natural gas-fired power plant located in California) at predetermined prices from GE that could be exercised between years 2017 and 2024. GE held a put option whereby they could require us to purchase the power plant, if certain plant performance criteria were met by 2025. On February 1, 2019, we entered into an agreement with GE, which among other things, terminated our call option and GE’s put option related to the Inland Empire Energy Center. As per this agreement, we will take ownership of the facility site and certain remaining site infrastructure and equipment after closure and decommissioning of the facility at a future date, until such time GE continues to own, operate and maintain the power plant, including directing any closure activities. As GE continues to direct all such significant activities of the power plant, we have determined that we no longer hold any variable interests in the Inland Empire Energy Center and it is not a VIE to Calpine.
117
8. | Debt |
Our debt at December 31, 2019 and 2018, was as follows (in millions):
2019 | 2018 | ||||||
Senior Unsecured Notes | $ | 3,663 | $ | 3,036 | |||
First Lien Term Loans | 3,167 | 2,976 | |||||
First Lien Notes | 2,835 | 2,400 | |||||
Project financing, notes payable and other | 879 | 1,264 | |||||
CCFC Term Loan | 967 | 974 | |||||
Finance lease obligations | 73 | 105 | |||||
Revolving facilities | 122 | 30 | |||||
Subtotal | 11,706 | 10,785 | |||||
Less: Current maturities | 1,268 | 637 | |||||
Total long-term debt | $ | 10,438 | $ | 10,148 | |||
Our debt agreements contain covenants which could permit lenders to accelerate the repayment of our debt by providing notice, the lapse of time, or both, if certain events of default remain uncured after any applicable grace period. We were in compliance with all of the covenants in our debt agreements at December 31, 2019. Our effective interest rate on our consolidated debt, excluding the effects of capitalized interest and mark-to-market gains (losses) on interest rate hedging instruments, increased to 5.8% for the year ended December 31, 2019 from 5.7% for the year ended December 31, 2018.
Annual Debt Maturities
Contractual annual principal repayments or maturities of debt instruments as of December 31, 2019, are as follows (in millions):
2020 | $ | 1,269 | |
2021 | 347 | ||
2022 | 230 | ||
2023 | 198 | ||
2024 | 2,030 | ||
Thereafter | 7,771 | ||
Subtotal | 11,845 | ||
Less: Debt issuance costs | 114 | ||
Less: Discount | 25 | ||
Total debt | $ | 11,706 | |
Senior Unsecured Notes
Our Senior Unsecured Notes are summarized in the table below (in millions, except for interest rates):
Outstanding at December 31, | Weighted Average Effective Interest Rates(1) | ||||||||||||
2019 | 2018 | 2019 | 2018 | ||||||||||
2023 Senior Unsecured Notes(2) | $ | 623 | $ | 1,227 | 5.7 | % | 5.6 | % | |||||
2024 Senior Unsecured Notes | 479 | 599 | 5.7 | 5.7 | |||||||||
2025 Senior Unsecured Notes | 1,174 | 1,210 | 5.8 | 6.0 | |||||||||
2028 Senior Unsecured Notes(2) | 1,387 | — | 5.3 | — | |||||||||
Total Senior Unsecured Notes | $ | 3,663 | $ | 3,036 | |||||||||
____________
(1) | Our weighted average interest rate calculation includes the amortization of debt issuance costs. |
118
(2) | On December 27, 2019, we used the proceeds from the issuance of our 2028 Senior Unsecured Notes (discussed below) to redeem approximately $613 million in aggregate principal amount of our 2023 Senior Unsecured Notes, plus accrued and unpaid interest. On January 21, 2020, we redeemed the remaining $623 million in aggregate principal amount of our 2023 Senior Unsecured Notes, which was included in debt, current portion on our Consolidated Balance Sheet at December 31, 2019, with the proceeds from the 2028 Senior Unsecured Notes, which was included in cash and cash equivalents on our Consolidated Balance Sheet at December 31, 2019. We recorded approximately $24 million in loss on extinguishment of debt which is comprised of approximately $18 million of prepayment premiums and approximately $6 million associated with the write-off of unamortized debt issuance costs during the fourth quarter of 2019 associated with the redemption. |
During the year ended December 31, 2019, we repurchased $160 million in aggregate principal amount of our Senior Unsecured Notes for $158 million. In connection with the repurchases, we recorded approximately $2 million in gain on extinguishment of debt and recorded an immaterial amount in loss on extinguishment of debt associated with the write-off of debt issuance costs.
During the year ended December 31, 2018, we repurchased $390 million in aggregate principal of our Senior Unsecured Notes for $355 million. In connection with the repurchases, we recorded approximately $35 million in gain on extinguishment of debt and recorded approximately $3 million in loss on extinguishment of debt associated with the write-off of debt issuance costs.
Year Ended December 31, 2019 | Year Ended December 31, 2018 | |||||||||||||||||||||||
Principal Repurchased | Cash Paid | Gain (loss) on Extinguishment of Debt | Principal Repurchased | Cash Paid | Gain on Extinguishment of Debt | |||||||||||||||||||
(in million) | ||||||||||||||||||||||||
2023 Senior Unsecured Notes | $ | — | $ | — | $ | — | $ | 14 | $ | 13 | $ | 1 | ||||||||||||
2024 Senior Unsecured Notes | 122 | 123 | (1 | ) | 46 | 42 | 4 | |||||||||||||||||
2025 Senior Unsecured Notes | 38 | 35 | 3 | 330 | 300 | 30 | ||||||||||||||||||
Total | $ | 160 | $ | 158 | $ | 2 | $ | 390 | $ | 355 | $ | 35 | ||||||||||||
On December 27, 2019, we issued $1.4 billion in aggregate principal amount of 5.125% senior unsecured notes due 2028 in a private placement. The 2028 Senior Unsecured Notes bear interest at 5.125% per annum with interest payable semi-annually on March 15 and September 15 of each year, beginning on September 15, 2020. The 2028 Senior Unsecured Notes mature on March 15, 2028. We recorded approximately $13 million in debt issuance costs during the fourth quarter of 2019 in connection with the issuance of our 2028 Senior Unsecured Notes.
In February 2015, we issued $650 million in aggregate principal amount of 5.5% senior unsecured notes due 2024 in a public offering. The 2024 Senior Unsecured Notes bear interest at 5.5% per annum with interest payable semi-annually on February 1 and August 1 of each year, beginning on August 1, 2015. The 2024 Senior Unsecured Notes were issued at par, mature on February 1, 2024 and contain substantially similar covenant, qualifications, exceptions and limitations as our 2023 Senior Unsecured Notes and 2025 Senior Unsecured Notes.
On July 22, 2014, we issued $1.25 billion in aggregate principal amount of 5.375% senior unsecured notes due 2023 and $1.55 billion in aggregate principal amount of 5.75% senior unsecured notes due 2025 in a public offering. The 2023 Senior Unsecured Notes bear interest at 5.375% per annum and the 2025 Senior Unsecured Notes bear interest at 5.75% per annum, in each case payable semi-annually on April 15 and October 15 of each year, beginning on April 15, 2015. The 2023 Senior Unsecured Notes mature on January 15, 2023 and the 2025 Senior Unsecured Notes mature on January 15, 2025. Our Senior Unsecured Notes were issued at par.
Our Senior Unsecured Notes are:
• | general unsecured obligations of Calpine; |
• | rank equally in right of payment with all of Calpine’s existing and future senior indebtedness; |
• | effectively subordinated to Calpine’s secured indebtedness to the extent of the value of the collateral securing such indebtedness; |
• | structurally subordinated to any existing and future indebtedness and other liabilities of Calpine’s subsidiaries; and |
• | senior in right of payment to any of Calpine’s subordinated indebtedness. |
119
First Lien Term Loans
Our First Lien Term Loans are summarized in the table below (in millions, except for interest rates):
Outstanding at December 31, | Weighted Average Effective Interest Rates(1) | ||||||||||||
2019 | 2018 | 2019 | 2018 | ||||||||||
2019 First Lien Term Loan | $ | — | $ | 389 | — | % | 4.9 | % | |||||
2023 First Lien Term Loans | — | 1,059 | — | 5.4 | |||||||||
2024 First Lien Term Loan(2) | 1,514 | 1,528 | 5.3 | 5.0 | |||||||||
2026 First Lien Term Loans | 1,653 | — | 5.4 | — | |||||||||
Total First Lien Term Loans | $ | 3,167 | $ | 2,976 | |||||||||
____________
(1) | Our weighted average interest rate calculation includes the amortization of debt issuance costs and debt discount. |
(2) | Our 2024 First Lien Term Loan, which matures on January 15, 2024, carries substantially similar terms as our $950 million first lien senior secured term loan as discussed below. |
On August 12, 2019, we entered into a $750 million first lien senior secured term loan which bears interest, at our option, at either (i) the Base Rate, equal to the highest of (a) the Federal Funds Effective Rate plus 0.50% per annum, (b) the Prime Rate or (c) the Eurodollar Rate for a one month interest period plus 1.0% (in each case, as such terms are defined in the credit agreement), plus an applicable margin of 1.0%, or (ii) LIBOR plus 2.00% per annum, which reflects the lower rate resulting from the repricing on February 12, 2020, (with a 0% LIBOR floor) and matures on August 12, 2026. An aggregate amount equal to 0.25% of the aggregate principal amount is payable at the end of each quarter with the remaining balance payable on the maturity date. We paid an upfront fee of an amount equal to 0.50% of the aggregate principal amount, which is structured as original issue discount and recorded approximately $11 million in debt issuance costs during the third quarter of 2019 related to the issuance of our $750 million first lien senior secured term loan. The $750 million first lien senior secured term contains substantially similar covenants, qualifications, exceptions and limitations as our First Lien Term Loans and First Lien Notes. We used the proceeds, together with cash on hand, to repay the remaining 2023 First Lien Term Loans with a maturity date in May 2023 and to repay project debt associated with OMEC. We recorded approximately $12 million in loss on extinguishment of debt during the third quarter of 2019 associated with the repayment.
On April 5, 2019, we entered into a $950 million first lien senior secured term loan which bears interest, at our option, at either (i) the Base Rate, equal to the highest of (a) the Federal Funds Effective Rate plus 0.50% per annum, (b) the Prime Rate or (c) the Eurodollar Rate for a one month interest period plus 1.0% (in each case, as such terms are defined in the credit agreement), plus an applicable margin of 1.25%, or (ii) LIBOR plus 2.25% per annum, which reflects the lower rate resulting from the repricing on December 20, 2019, (with a 0% LIBOR floor) and matures on April 5, 2026. An aggregate amount equal to 0.25% of the aggregate principal amount is payable at the end of each quarter with the remaining balance payable on the maturity date. We paid an upfront fee of an amount equal to 1.0% of the aggregate principal amount, which is structured as original issue discount and recorded approximately $7 million in debt issuance costs during the second quarter of 2019 related to the issuance of our $950 million first lien senior secured term loan. The $950 million first lien senior secured term loan contains substantially similar covenants, qualifications, exceptions and limitations as our First Lien Term Loans and First Lien Notes. We used the proceeds to repay our 2019 First Lien Term Loan and a portion of our 2023 First Lien Term Loans with a maturity date in January 2023 and recorded approximately $3 million in loss on extinguishment of debt during the second quarter of 2019 associated with the repayment.
120
First Lien Notes
Our First Lien Notes are summarized in the table below (in millions, except for interest rates):
Outstanding at December 31, | Weighted Average Effective Interest Rates(1) | ||||||||||||
2019 | 2018 | 2019 | 2018 | ||||||||||
2022 First Lien Notes(2) | $ | 245 | $ | 743 | 6.4 | % | 6.4 | % | |||||
2024 First Lien Notes(3) | 184 | 486 | 6.1 | 6.1 | |||||||||
2026 First Lien Notes | 1,172 | 1,171 | 5.5 | 5.5 | |||||||||
2028 First Lien Notes(2)(3) | 1,234 | — | 4.7 | — | |||||||||
Total First Lien Notes | $ | 2,835 | $ | 2,400 | |||||||||
____________
(1) | Our weighted average interest rate calculation includes the amortization of debt issuance costs and debt discount. |
(2) | On December 20, 2019, we used the proceeds from the issuance of our 2028 First Lien Notes (discussed below) to redeem approximately $505 million in aggregate principal amount of our 2022 First Lien Notes, plus accrued and unpaid interest. On January 21, 2020, we redeemed the remaining $245 million in aggregate principal amount of our 2022 First Lien Notes, which was included in debt, current portion on our Consolidated Balance Sheet at December 31, 2019, with the proceeds from the 2028 First Lien Notes, which was included in cash and cash equivalents on our Consolidated Balance Sheet at December 31, 2019. We recorded approximately $6 million in loss on extinguishment of debt which is comprised of approximately $1 million of prepayment premiums and approximately $5 million associated with the write-off of unamortized discount and debt issuance costs during the fourth quarter of 2019 associated with the redemption. |
(3) | On December 20, 2019, we used the proceeds from the issuance of our 2028 First Lien Notes (discussed below) to redeem approximately $306 million of the total aggregate debt amount of 2024 First Lien Notes, plus accrued and unpaid interest. On January 21, 2020, we redeemed the remaining $184 million in aggregate principal amount of our 2024 First Lien Notes, which was included in debt, current portion on our Consolidated Balance Sheet at December 31, 2019, with the proceeds from the 2028 First Lien Notes which was included in cash and cash equivalents on our Consolidated Balance Sheet at December 31, 2019. We recorded approximately $14 million in loss on extinguishment of debt which is comprised of approximately $11 million of prepayment premiums and approximately $3 million associated with the write-off of unamortized debt issuance costs during the fourth quarter of 2019 associated with the redemption. |
On December 20, 2019, we issued $1.25 billion in aggregate principal amount of 4.50% senior secured notes due 2028 in a private placement. Our 2028 First Lien Notes bear interest at 4.50% payable semi-annually on February 15 and August 15 of each year, beginning on August 15, 2020. Our 2028 First Lien Notes mature on February 15, 2028 and contain substantially similar covenants, qualifications, exceptions and limitations as our First Lien Notes. We recorded approximately $16 million in debt issuance costs during the fourth quarter of 2019 related to the issuance of our 2028 First Lien Notes.
On December 15, 2017, we issued $560 million in aggregate principal amount of 5.25% senior secured notes due 2026 in a private placement. Additionally, on May 31, 2016, we issued $625 million in aggregate principal amount of 5.25% senior secured notes due 2026 in a private placement. Our 2026 First Lien Notes bear interest at 5.25% payable semi-annually on June 1 and December 1 of each year. Our 2026 First Lien Notes mature on June 1, 2026 and contain substantially similar covenants, qualifications, exceptions and limitations as our First Lien Notes. We recorded approximately $8 million in debt issuance costs during the fourth quarter of 2017 related to the issuance of a portion of our 2026 First Lien Notes and approximately $9 million in debt issuance costs during the second quarter of 2016 related to the issuance of a portion of our 2026 First Lien Notes.
Our First Lien Notes are secured equally and ratably with indebtedness incurred under our First Lien Term Loans and Corporate Revolving Facility, subject to certain exceptions and permitted liens, on substantially all of our and certain of the guarantors’ existing and future assets. Additionally, our First Lien Notes rank equally in right of payment with all of our and the guarantors’ other existing and future senior indebtedness, and will be effectively subordinated in right of payment to all existing and future liabilities of our subsidiaries that do not guarantee our First Lien Notes.
Subject to certain qualifications and exceptions, our First Lien Notes will, among other things, limit our ability and the ability of the guarantors to:
• | incur or guarantee additional first lien indebtedness; |
121
• | enter into certain types of commodity hedge agreements that can be secured by first lien collateral; |
• | enter into sale and leaseback transactions; |
• | create or incur liens; and |
• | consolidate, merge or transfer all or substantially all of our assets and the assets of our restricted subsidiaries on a combined basis. |
Project Financing, Notes Payable and Other
The components of our project financing, notes payable and other are (in millions, except for interest rates):
Outstanding at December 31, | Weighted Average Effective Interest Rates(1) | ||||||||||||
2019 | 2018 | 2019 | 2018 | ||||||||||
Russell City due 2023 | $ | 272 | $ | 341 | 6.6 | % | 6.5 | % | |||||
Steamboat due 2025 | 351 | 384 | 4.6 | 4.5 | |||||||||
OMEC due 2024(2) | — | 218 | — | 7.1 | |||||||||
Los Esteros due 2023 | 135 | 163 | 5.2 | 4.7 | |||||||||
Pasadena(3) | 62 | 76 | 8.9 | 8.9 | |||||||||
Bethpage Energy Center 3 due 2020-2025(4) | 45 | 53 | 7.0 | 7.1 | |||||||||
Other | 14 | 29 | — | — | |||||||||
Total | $ | 879 | $ | 1,264 | |||||||||
_____________
(1) | Our weighted average interest rate calculation includes the amortization of debt issuance costs and debt discount. |
(2) | On August 14, 2019, we repaid the project debt associated with OMEC from a portion of the proceeds received from the issuance of our 2026 First Lien Term Loans (as discussed above), together with cash on hand. |
(3) | Represents a failed sale-leaseback transaction that is accounted for as financing transaction under U.S. GAAP. |
(4) | Represents a weighted average of first and second lien loans for the weighted average effective interest rates. |
Our project financings are collateralized solely by the capital stock or partnership interests, physical assets, contracts and/or cash flows attributable to the entities that own the power plants. The lenders’ recourse under these project financings is limited to such collateral.
On January 29, 2019, PG&E and PG&E Corporation each filed voluntary petitions for relief under Chapter 11. Our power plants that sell energy and energy-related products to PG&E through PPAs, include Russell City Energy Center and Los Esteros Critical Energy Facility. Since the bankruptcy filing, we have received all material payments under the PPAs, either directly or through application of collateral. As a result of PG&E’s bankruptcy, we are currently unable to make distributions from our Russell City and Los Esteros projects in accordance with the terms of the project debt agreements associated with each related project. In July 2019, we executed forbearance agreements associated with the Russell City and Los Esteros project debt agreements, under which the lenders have agreed to forbear enforcement of their rights and remedies, including the ability to accelerate the repayment of borrowings outstanding, otherwise arising because PG&E did not assume our PPAs during the first 180 days of PG&E’s bankruptcy proceeding. The forbearance agreements are effective for rolling 90-day periods, so long as we continue to meet certain conditions, including that the PPAs have not been rejected and there are no other defaults under the project debt agreements or the forbearance agreements. We may be required to reclassify $304 million of Russell City and Los Esteros long-term project debt outstanding at December 31, 2019 to a current liability in a future period. We continue to monitor the bankruptcy proceedings and are assessing our options.
122
CCFC Term Loan
Our CCFC Term Loan is summarized in the table below (in millions, except for interest rates):
Outstanding at December 31, | Weighted Average Effective Interest Rates(1) | ||||||||||||
2019 | 2018 | 2019 | 2018 | ||||||||||
CCFC Term Loan | $ | 967 | $ | 974 | 5.2 | % | 4.9 | % | |||||
____________
(1) | Our weighted average interest rate calculation includes the amortization of debt issuance costs and debt discount. |
On December 15, 2017, CCFC entered into a credit agreement providing for a first lien senior secured term loan facility for $1.0 billion. The CCFC Term Loan bears interest, at CCFC’s option, at either (i) the Base Rate, equal to the higher of (a) the Federal Funds Effective Rate plus 0.5% per annum, (b) the Prime Rate or (c) the Eurodollar Rate (as such terms are defined in the Credit Agreement) plus 1.0% per annum, plus an applicable margin of 1.0% per annum, or (ii) LIBOR plus 2.0% per annum, which reflects the lower rate resulting from the repricing on January 29, 2020. The CCFC Term Loan was offered to investors at an issue price equal to 99.875% of face value.
An aggregate amount equal to 0.25% of the aggregate principal amount of the CCFC Term Loan will be payable at the end of each quarter commencing in March 2018, with the remaining balance payable on the maturity date (January 15, 2025). CCFC may elect from time to time to convert all or a portion of the CCFC Term Loan from LIBOR rate loans to Base Rate loans or vice versa. In addition, CCFC may at any time, and from time to time, prepay the CCFC Term Loan, in whole or in part, without premium or penalty, upon irrevocable notice to the Administrative Agent. Partial prepayments shall be in an aggregate minimum principal amount of $1 million, provided that any prepayment shall be first applied to any portion of the CCFC Term Loan that is designated as Base Rate loans and then LIBOR rate loans.
CCFC may also reprice the CCFC Term Loan, subject to approval from the Lenders (as defined in the Credit Agreement). CCFC may elect to extend the maturity of any CCFC Term Loan, in whole or in part, subject to approval from those lenders (as defined in the Credit Agreement) holding such CCFC Term Loan.
Subject to certain qualifications and exceptions, the Credit Agreement will, among other things, limit CCFC’s ability and the ability of the guarantors of the CCFC Term Loan to:
• | incur or guarantee additional first lien indebtedness; |
• | enter into sale and leaseback transactions; |
• | create liens; |
• | consummate certain asset sales; |
• | make certain non-cash restricted payments; and |
• | consolidate, merge or transfer all or substantially all of CCFC’s assets and the assets of CCFC’s restricted subsidiaries on a combined basis. |
We utilized the proceeds received from a portion of our 2026 First Lien Notes (discussed above) and the CCFC Term Loan, together with operating cash on hand, to fully repay the CCFC Term Loans and recorded approximately $13 million in debt issuance costs during the fourth quarter of 2017. We recorded approximately $12 million in loss on extinguishment of debt associated with the repayment of our CCFC Term Loans during the fourth quarter of 2017.
The CCFC Term Loan is secured by certain real and personal property of CCFC consisting primarily of six natural gas-fired power plants. The CCFC Term Loan is not guaranteed by Calpine Corporation and is without recourse to Calpine Corporation or any of our non-CCFC subsidiaries or assets; however, CCFC generates the majority of its cash flows from an intercompany tolling agreement with Calpine Energy Services, L.P. and has various service agreements in place with other subsidiaries of Calpine Corporation.
123
Finance Lease Obligations
See Note 4 for disclosures related to our finance lease obligations.
Corporate Revolving Facility and Other Letters of Credit Facilities
The table below represents amounts issued under our letter of credit facilities at December 31, 2019 and 2018 (in millions):
2019 | 2018 | ||||||
Corporate Revolving Facility | $ | 604 | $ | 693 | |||
CDHI | 3 | 251 | |||||
Various project financing facilities | 184 | 228 | |||||
Other corporate facilities | 294 | 193 | |||||
Total | $ | 1,085 | $ | 1,365 | |||
Corporate Revolving Facility
On April 5, 2019, we amended our Corporate Revolving Facility to increase the capacity by approximately $330 million from $1.69 billion to approximately $2.02 billion. On August 12, 2019, we amended our Corporate Revolving Facility to extend the maturity of $150 million in revolving commitments from June 27, 2020 to March 8, 2023, and to reduce the commitments outstanding by $20 million to approximately $2.0 billion. The entire Corporate Revolving Facility matures on March 8, 2023.
The Corporate Revolving Facility represents our primary revolving facility. Borrowings under the Corporate Revolving Facility bear interest, at our option, at either a base rate or LIBOR rate. Base rate borrowings shall be at the base rate, plus an applicable margin ranging from 1.00% to 1.25% as provided in the Corporate Revolving Facility credit agreement. Base rate is defined as the higher of (i) the Federal Funds Effective Rate, as published by the Federal Reserve Bank of New York, plus 0.50% and (ii) the rate the administrative agent announces from time to time as its prime per annum rate. LIBOR rate borrowings shall be at the British Bankers’ Association Interest Settlement Rates for the interest period as selected by us as a one, two, three, six or, if agreed by all relevant lenders, nine or twelve month interest period, plus an applicable margin ranging from 2.00% to 2.25%. Interest payments are due on the last business day of each calendar quarter for base rate loans and the earlier of (i) the last day of the interest period selected or (ii) each day that is three months (or a whole multiple thereof) after the first day for the interest period selected for LIBOR rate loans. Letter of credit fees for issuances of letters of credit include fronting fees equal to that percentage per annum as may be separately agreed upon between us and the issuing lenders and a participation fee for the lenders equal to the applicable interest margin for LIBOR rate borrowings. Drawings under letters of credit shall be repaid within two business days or be converted into borrowings as provided in the Corporate Revolving Facility credit agreement. We incur an unused commitment fee ranging from 0.25% to 0.50% on the unused amount of commitments under the Corporate Revolving Facility.
The Corporate Revolving Facility does not contain any requirements for mandatory prepayments. However, we may voluntarily repay, in whole or in part, the Corporate Revolving Facility, together with any accrued but unpaid interest, with prior notice and without premium or penalty. Amounts repaid may be reborrowed, and we may also voluntarily reduce the commitments under the Corporate Revolving Facility without premium or penalty.
The Corporate Revolving Facility is guaranteed and secured by certain of our current domestic subsidiaries and will also be additionally guaranteed by our future domestic subsidiaries that are required to provide such a guarantee in accordance with the terms of the Corporate Revolving Facility. The Corporate Revolving Facility ranks equally in right of payment with all of our and the guarantors’ other existing and future senior indebtedness and will be effectively subordinated in right of payment to all existing and future liabilities of our subsidiaries that do not guarantee the Corporate Revolving Facility. The Corporate Revolving Facility also requires compliance with financial covenants that include a minimum cash interest coverage ratio and a maximum net leverage ratio.
CDHI
We have a $300 million revolving facility related to CDHI which matures on October 2, 2021. Pursuant to the terms and conditions of the CDHI credit agreement, the capacity under the CDHI revolving facility was reduced to $125 million on June 28, 2019. The decrease in capacity did not have a material effect on our liquidity as alternative sources of liquidity are available to us. Our CDHI revolving facility is restricted to support certain obligations under PPAs and power transmission and natural gas transportation agreements as well as fund the construction of our Washington Parish Energy Center. Borrowings under the CDHI revolving facility were $122 million at December 31, 2019, and bear interest, at our option, at either a base rate or LIBOR rate.
124
Base rate borrowings shall be at the base rate, plus an applicable margin of 1.75% and LIBOR rate borrowings shall be at the LIBOR rate, plus an applicable margin of 2.75%.
Other corporate facilities
We have three unsecured letter of credit facilities with third party financial institutions totaling approximately $300 million. One of the facilities, with commitments totaling $150 million, matures partially in June 2020 and fully by December 2020. The other two facilities, with commitments totaling $50 million and approximately $100 million, mature in December 2023 and December 2021, respectively.
Fair Value of Debt
We record our debt instruments based on contractual terms, net of any applicable premium or discount and debt issuance costs. The following table details the fair values and carrying values of our debt instruments at December 31, 2019 and 2018 (in millions):
2019 | 2018 | ||||||||||||||
Fair Value | Carrying Value | Fair Value | Carrying Value | ||||||||||||
Senior Unsecured Notes | $ | 3,764 | $ | 3,663 | $ | 2,803 | $ | 3,036 | |||||||
First Lien Term Loans | 3,238 | 3,167 | 2,877 | 2,976 | |||||||||||
First Lien Notes | 2,929 | 2,835 | 2,299 | 2,400 | |||||||||||
Project financing, notes payable and other(1) | 822 | 817 | 1,209 | 1,188 | |||||||||||
CCFC Term Loan | 982 | 967 | 938 | 974 | |||||||||||
Revolving facilities | 122 | 122 | 30 | 30 | |||||||||||
Total | $ | 11,857 | $ | 11,571 | $ | 10,156 | $ | 10,604 | |||||||
____________
(1) | Excludes a lease that is accounted for as a failed sale-leaseback transaction under U.S. GAAP. |
Our Senior Unsecured Notes, First Lien Term Loans, First Lien Notes and CCFC Term Loan are categorized as level 2 within the fair value hierarchy. Our revolving facilities and project financing, notes payable and other debt instruments are categorized as level 3 within the fair value hierarchy. We do not have any debt instruments with fair value measurements categorized as level 1 within the fair value hierarchy.
9. | Assets and Liabilities with Recurring Fair Value Measurements |
Cash Equivalents — Highly liquid investments which meet the definition of cash equivalents, primarily investments in money market accounts and other interest-bearing accounts, are included in both our cash and cash equivalents and our restricted cash on our Consolidated Balance Sheets. Certain of our money market accounts invest in U.S. Treasury securities or other obligations issued or guaranteed by the U.S. Government, its agencies or instrumentalities. We do not have any cash equivalents invested in institutional prime money market funds which require use of a floating net asset value and are subject to liquidity fees and redemption restrictions. Certain of our cash equivalents are classified within level 1 of the fair value hierarchy.
Derivatives — The primary factors affecting the fair value of our derivative instruments at any point in time are the volume of open derivative positions (MMBtu, MWh and $ notional amounts); changing commodity market prices, primarily for power and natural gas; our credit standing and that of our counterparties and customers for energy commodity derivatives; and prevailing interest rates for our interest rate hedging instruments. Prices for power and natural gas and interest rates are volatile, which can result in material changes in the fair value measurements reported in our financial statements in the future.
We utilize market data, such as pricing services and broker quotes, and assumptions that we believe market participants would use in pricing our assets or liabilities including assumptions about the risks inherent to the inputs in the valuation technique. These inputs can be either readily observable, market corroborated or generally unobservable. The market data obtained from broker pricing services is evaluated to determine the nature of the quotes obtained and, where accepted as a reliable quote, used to validate our assessment of fair value. We use other qualitative assessments to determine the level of activity in any given market. We primarily apply the market approach and income approach for recurring fair value measurements and utilize what we believe to be the best available information. We utilize valuation techniques that seek to maximize the use of observable inputs and minimize the use of unobservable inputs. We classify fair value balances based on the observability of those inputs.
125
The fair value of our derivatives includes consideration of our credit standing, the credit standing of our counterparties and customers and the effect of credit enhancements, if any. We have also recorded credit reserves in the determination of fair value based on our expectation of how market participants would determine fair value. Such valuation adjustments are generally based on market evidence, if available, or our best estimate.
Our level 1 fair value derivative instruments primarily consist of power and natural gas swaps, futures and options traded on the NYMEX or Intercontinental Exchange.
Our level 2 fair value derivative instruments primarily consist of interest rate hedging instruments and OTC power and natural gas forwards for which market-based pricing inputs in the principal or most advantageous market are representative of executable prices for market participants. These inputs are observable at commonly quoted intervals for substantially the full term of the instruments. In certain instances, our level 2 derivative instruments may utilize models to measure fair value. These models are industry-standard models, including the Black-Scholes option-pricing model, that incorporate various assumptions, including quoted interest rates, correlation, volatility, as well as other relevant economic measures. Substantially all of these assumptions are observable in the marketplace throughout the full term of the instrument, can be derived from observable data or are supported by observable levels at which transactions are executed in the marketplace.
Our level 3 fair value derivative instruments may consist of OTC power and natural gas forwards and options where pricing inputs are unobservable, as well as other complex and structured transactions primarily for the sale and purchase of power and natural gas to both wholesale counterparties and retail customers. Complex or structured transactions are tailored to our customers’ needs and can introduce the need for internally-developed model inputs which might not be observable in or corroborated by the market. When such inputs have a significant effect on the measurement of fair value, the instrument is categorized in level 3. Our valuation models may incorporate historical correlation information and extrapolate available broker and other information to future periods.
Financial assets and liabilities are classified in their entirety based on the lowest level of input that is significant to the fair value measurement at period end. Our assessment of the significance of a particular input to the fair value measurement requires judgment and may affect our estimate of the fair value of our assets and liabilities and their placement within the fair value hierarchy levels. The following tables present our financial assets and liabilities that were accounted for at fair value on a recurring basis as of December 31, 2019 and 2018, by level within the fair value hierarchy:
Assets and Liabilities with Recurring Fair Value Measures as of December 31, 2019 | |||||||||||||||
Level 1 | Level 2 | Level 3 | Total | ||||||||||||
(in millions) | |||||||||||||||
Assets: | |||||||||||||||
Cash equivalents(1) | $ | 784 | $ | — | $ | — | $ | 784 | |||||||
Commodity instruments: | |||||||||||||||
Commodity exchange traded derivatives contracts | 872 | — | — | 872 | |||||||||||
Commodity forward contracts(2) | — | 245 | 294 | 539 | |||||||||||
Interest rate hedging instruments | — | 12 | — | 12 | |||||||||||
Effect of netting and allocation of collateral(3)(4) | (872 | ) | (131 | ) | (18 | ) | (1,021 | ) | |||||||
Total assets | $ | 784 | $ | 126 | $ | 276 | $ | 1,186 | |||||||
Liabilities: | |||||||||||||||
Commodity instruments: | |||||||||||||||
Commodity exchange traded derivatives contracts | 984 | — | — | 984 | |||||||||||
Commodity forward contracts(2) | — | 285 | 123 | 408 | |||||||||||
Interest rate hedging instruments | — | 31 | — | 31 | |||||||||||
Effect of netting and allocation of collateral(3)(4) | (984 | ) | (133 | ) | (18 | ) | (1,135 | ) | |||||||
Total liabilities | $ | — | $ | 183 | $ | 105 | $ | 288 | |||||||
126
Assets and Liabilities with Recurring Fair Value Measures as of December 31, 2018 | |||||||||||||||
Level 1 | Level 2 | Level 3 | Total | ||||||||||||
(in millions) | |||||||||||||||
Assets: | |||||||||||||||
Cash equivalents(1) | $ | 168 | $ | — | $ | — | $ | 168 | |||||||
Commodity instruments: | |||||||||||||||
Commodity exchange traded derivatives contracts | 933 | — | — | 933 | |||||||||||
Commodity forward contracts(2) | — | 338 | 212 | 550 | |||||||||||
Interest rate hedging instruments | — | 40 | — | 40 | |||||||||||
Effect of netting and allocation of collateral(3)(4) | (933 | ) | (262 | ) | (26 | ) | (1,221 | ) | |||||||
Total assets | $ | 168 | $ | 116 | $ | 186 | $ | 470 | |||||||
Liabilities: | |||||||||||||||
Commodity instruments: | |||||||||||||||
Commodity exchange traded derivatives contracts | 932 | — | — | 932 | |||||||||||
Commodity forward contracts(2) | — | 549 | 220 | 769 | |||||||||||
Interest rate hedging instruments | — | 10 | — | 10 | |||||||||||
Effect of netting and allocation of collateral(3)(4) | (932 | ) | (310 | ) | (26 | ) | (1,268 | ) | |||||||
Total liabilities | $ | — | $ | 249 | $ | 194 | $ | 443 | |||||||
___________
(1) | As of December 31, 2019 and 2018, we had cash equivalents of $573 million and $23 million included in cash and cash equivalents and $211 million and $145 million included in restricted cash, respectively. |
(2) | Includes OTC swaps and options. |
(3) | We offset fair value amounts recognized for derivative instruments executed with the same counterparty under a master netting arrangement for financial statement presentation; therefore, amounts recognized for the right to reclaim, or the obligation to return, cash collateral are presented net with the corresponding derivative instrument fair values. See Note 10 for further discussion of our derivative instruments subject to master netting arrangements. |
(4) | Cash collateral posted with (received from) counterparties allocated to level 1, level 2 and level 3 derivative instruments totaled $112 million, $2 million and nil, respectively, at December 31, 2019. Cash collateral posted with (received from) counterparties allocated to level 1, level 2 and level 3 derivative instruments totaled $(1) million, $48 million and nil, respectively, at December 31, 2018. |
At December 31, 2019 and 2018, the derivative instruments classified as level 3 primarily included commodity contracts, which are classified as level 3 because the contract terms relate to a delivery location or tenor for which observable market rate information is not available. The fair value of the net derivative position classified as level 3 is predominantly driven by market commodity prices. The following table presents quantitative information for the unobservable inputs used in our most significant level 3 fair value measurements at December 31, 2019 and 2018:
Quantitative Information about Level 3 Fair Value Measurements | ||||||||||
December 31, 2019 | ||||||||||
Fair Value, Net Asset | Significant Unobservable | |||||||||
(Liability) | Valuation Technique | Input | Range | |||||||
(in millions) | ||||||||||
Power Contracts(1) | $ | 158 | Discounted cash flow | Market price (per MWh) | $4.85 — $184.15/MWh | |||||
Power Congestion Products | $ | 17 | Discounted cash flow | Market price (per MWh) | $(10.32)— $20.00/MWh | |||||
Natural Gas Contracts | $ | (20 | ) | Discounted cash flow | Market price (per MMBtu) | $1.73 — $6.45/MMBtu | ||||
127
Quantitative Information about Level 3 Fair Value Measurements | ||||||||||
December 31, 2018 | ||||||||||
Fair Value, Net Asset | Significant Unobservable | |||||||||
(Liability) | Valuation Technique | Input | Range | |||||||
(in millions) | ||||||||||
Power Contracts(1) | $ | 36 | Discounted cash flow | Market price (per MWh) | $2.12 — $227.98/MWh | |||||
Power Congestion Products | $ | 26 | Discounted cash flow | Market price (per MWh) | $(11.71) — $11.88/MWh | |||||
Natural Gas Contracts | $ | (73 | ) | Discounted cash flow | Market price (per MMBtu) | $0.75 — $8.87/MMBtu | ||||
___________
(1) | Power contracts include power and heat rate instruments classified as level 3 in the fair value hierarchy. |
The following table sets forth a reconciliation of changes in the fair value of our net derivative assets (liabilities) classified as level 3 in the fair value hierarchy for the years ended December 31, 2019, 2018 and 2017 (in millions):
2019 | 2018 | 2017 | |||||||||
Balance, beginning of period | $ | (8 | ) | $ | 197 | $ | 416 | ||||
Realized and mark-to-market gains (losses): | |||||||||||
Included in net income (loss): | |||||||||||
Included in operating revenues(1) | 171 | (88 | ) | 32 | |||||||
Included in fuel and purchased energy expense(2) | (21 | ) | (45 | ) | 50 | ||||||
Change in collateral | — | — | (17 | ) | |||||||
Purchases, issuances and settlements: | |||||||||||
Purchases | 5 | 18 | 4 | ||||||||
Issuances | (3 | ) | (2 | ) | (1 | ) | |||||
Settlements | 56 | (86 | ) | (179 | ) | ||||||
Transfers in and/or out of level 3(3): | |||||||||||
Transfers into level 3(4) | 1 | — | (2 | ) | |||||||
Transfers out of level 3(5) | (30 | ) | (2 | ) | (106 | ) | |||||
Balance, end of period | $ | 171 | $ | (8 | ) | $ | 197 | ||||
Change in unrealized gains (losses) relating to instruments still held at end of period | $ | 150 | $ | (133 | ) | $ | 82 | ||||
___________
(1) | For power contracts and other power-related products, included on our Consolidated Statements of Operations. |
(2) | For natural gas and power contracts, swaps and options, included on our Consolidated Statements of Operations. |
(3) | We transfer amounts among levels of the fair value hierarchy as of the end of each period. There were no transfers into or out of level 1 during the years ended December 31, 2019, 2018 and 2017. |
(4) | We had $1 million in gains, nil and $(2) million in losses transferred out of level 2 into level 3 for the years ended December 31, 2019, 2018 and 2017, respectively. |
(5) | We had $30 million, $2 million and $104 million in gains transferred out of level 3 into level 2 during the years ended December 31, 2019, 2018 and 2017, respectively, due to changes in market liquidity in various power markets and $2 million in gains transferred out of level 3 during the years ended December 31, 2017, to other assets following the election of the normal purchase normal sales exemption and the discontinuance of derivative accounting treatment as of the date of this election for certain commodity contracts. |
128
10. | Derivative Instruments |
Types of Derivative Instruments and Volumetric Information
Commodity Instruments — We are exposed to changes in prices for the purchase and sale of power, natural gas, fuel oil, environmental products and other energy commodities. We use derivatives, which include physical commodity contracts and financial commodity instruments such as OTC and exchange traded swaps, futures, options, forward agreements and instruments that settle on the power price to natural gas price relationships (Heat Rate swaps and options) or instruments that settle on power or natural gas price relationships between delivery points for the purchase and sale of power and natural gas to attempt to maximize the risk-adjusted returns by economically hedging a portion of the commodity price risk associated with our assets. By entering into these transactions, we are able to economically hedge a portion of our Spark Spread at estimated generation and prevailing price levels.
We also engage in limited trading activities related to our commodity derivative portfolio as authorized by our Board of Directors and monitored by our Chief Risk Officer and Risk Management Committee of senior management. These transactions are executed primarily for the purpose of providing improved price and price volatility discovery, greater market access, and profiting from our market knowledge, all of which benefit our asset hedging activities. Our trading results were not material for the years ended December 31, 2019, 2018 and 2017.
Interest Rate Hedging Instruments — A portion of our debt is indexed to base rates, primarily LIBOR. We have historically used interest rate hedging instruments to adjust the mix between fixed and variable rate debt to hedge our interest rate risk for potential adverse changes in interest rates. As of December 31, 2019, the maximum length of time over which we were hedging using interest rate hedging instruments designated as cash flow hedges was 6 years.
As of December 31, 2019 and 2018, the net forward notional buy (sell) position of our outstanding commodity derivative instruments that did not qualify or were not designated under the normal purchase normal sale exemption and our interest rate hedging instruments were as follows (in millions):
Derivative Instruments | Notional Amounts | |||||||||
2019 | 2018 | Unit of Measure | ||||||||
Power (MWh) | (184 | ) | (161 | ) | Million MWh | |||||
Natural gas (MMBtu) | 1,063 | 1,045 | Million MMBtu | |||||||
Environmental credits (Tonnes) | 26 | 13 | Million Tonnes | |||||||
Interest rate hedging instruments | $ | 4.8 | $ | 4.5 | Billion U.S. dollars | |||||
Certain of our derivative instruments contain credit risk-related contingent provisions that require us to maintain collateral balances consistent with our credit ratings. If our credit rating were to be downgraded, it could require us to post additional collateral or could potentially allow our counterparty to request immediate, full settlement on certain derivative instruments in liability positions. The aggregate fair value of our derivative liabilities with credit risk-related contingent provisions as of December 31, 2019, was $153 million for which we have posted collateral of $93 million by posting margin deposits, letters of credit or granting additional first priority liens on the assets currently subject to first priority liens under our First Lien Notes, First Lien Term Loans and Corporate Revolving Facility. However, if our credit rating were downgraded by one notch from its current level, we estimate that additional collateral of $3 million related to our derivative liabilities would be required and that no counterparty could request immediate, full settlement.
Accounting for Derivative Instruments
We recognize all derivative instruments that qualify for derivative accounting treatment as either assets or liabilities and measure those instruments at fair value unless they qualify for, and we elect, the normal purchase normal sale exemption. For transactions in which we elect the normal purchase normal sale exemption, gains and losses are not reflected on our Consolidated Statements of Operations until the period of delivery. Revenues and expenses derived from instruments that qualified for hedge accounting or represent an economic hedge are recorded in the same financial statement line item as the item being hedged. Hedge accounting requires us to formally document, designate and assess the effectiveness of transactions that receive hedge accounting. We present the cash flows from our derivatives in the same category as the item being hedged (or economically hedged) within operating activities on our Consolidated Statements of Cash Flows unless they contain an other-than-insignificant financing element in which case their cash flows are classified within financing activities.
129
Cash Flow Hedges — We currently apply hedge accounting to our interest rate hedging instruments. We report the mark-to-market gain or loss on our interest rate hedging instruments designated and qualifying as a cash flow hedging instrument as a component of OCI and reclassify such gains and losses into earnings in the same period during which the hedged forecasted transaction affects earnings. Prior to January 1, 2019, gains and losses due to ineffectiveness on interest rate hedging instruments were recognized in earnings as a component of interest expense. Upon the adoption of Accounting Standards Update 2017-12 on January 1, 2019, hedge ineffectiveness is no longer separately measured and recorded in earnings. If it is determined that the forecasted transaction is no longer probable of occurring, then hedge accounting will be discontinued prospectively and future changes in fair value will be recorded in earnings. If the hedging instrument is terminated or de-designated prior to the occurrence of the hedged forecasted transaction, the net accumulated gain or loss associated with the changes in fair value of the hedge instrument remains deferred in AOCI until such time as the forecasted transaction affects earnings or until it is determined that the forecasted transaction is probable of not occurring.
Derivatives Not Designated as Hedging Instruments — We enter into power, natural gas, interest rate, environmental product and fuel oil transactions that primarily act as economic hedges to our asset and interest rate portfolio, but either do not qualify as hedges under the hedge accounting guidelines or qualify under the hedge accounting guidelines and the hedge accounting designation has not been elected. Changes in fair value of commodity derivatives not designated as hedging instruments are recognized currently in earnings and are separately stated on our Consolidated Statements of Operations in mark-to-market gain/loss as a component of operating revenues (for physical and financial power and Heat Rate and commodity option activity) and fuel and purchased energy expense (for physical and financial natural gas, power, environmental product and fuel oil activity). Changes in fair value of interest rate derivatives not designated as hedging instruments are recognized currently in earnings as interest expense.
Derivatives Included on Our Consolidated Balance Sheets
We offset fair value amounts associated with our derivative instruments and related cash collateral and margin deposits on our Consolidated Balance Sheets that are executed with the same counterparty under master netting arrangements. Our netting arrangements include a right to set off or net together purchases and sales of similar products in the margining or settlement process. In some instances, we have also negotiated cross commodity netting rights which allow for the net presentation of activity with a given counterparty regardless of product purchased or sold. We also post and/or receive cash collateral in support of our derivative instruments which may also be subject to a master netting arrangement with the same counterparty.
130
The following tables present the fair values of our derivative instruments and our net exposure after offsetting amounts subject to a master netting arrangement with the same counterparty to our derivative instruments recorded on our Consolidated Balance Sheets by location and hedge type at December 31, 2019 and 2018 (in millions):
December 31, 2019 | ||||||||||||
Gross Amounts of Assets and (Liabilities) | Gross Amounts Offset on the Consolidated Balance Sheets | Net Amount Presented on the Consolidated Balance Sheets(1) | ||||||||||
Derivative assets: | ||||||||||||
Commodity exchange traded derivatives contracts | $ | 727 | $ | (727 | ) | $ | — | |||||
Commodity forward contracts | 262 | (108 | ) | 154 | ||||||||
Interest rate hedging instruments | 2 | — | 2 | |||||||||
Total current derivative assets(2) | $ | 991 | $ | (835 | ) | $ | 156 | |||||
Commodity exchange traded derivatives contracts | 145 | (145 | ) | — | ||||||||
Commodity forward contracts | 277 | (41 | ) | 236 | ||||||||
Interest rate hedging instruments | 10 | — | 10 | |||||||||
Total long-term derivative assets(2) | $ | 432 | $ | (186 | ) | $ | 246 | |||||
Total derivative assets | $ | 1,423 | $ | (1,021 | ) | $ | 402 | |||||
Derivative (liabilities): | ||||||||||||
Commodity exchange traded derivatives contracts | $ | (830 | ) | $ | 830 | $ | — | |||||
Commodity forward contracts | (321 | ) | 109 | (212 | ) | |||||||
Interest rate hedging instruments | (13 | ) | — | (13 | ) | |||||||
Total current derivative (liabilities)(2) | $ | (1,164 | ) | $ | 939 | $ | (225 | ) | ||||
Commodity exchange traded derivatives contracts | (154 | ) | 154 | — | ||||||||
Commodity forward contracts | (87 | ) | 42 | (45 | ) | |||||||
Interest rate hedging instruments | (18 | ) | — | (18 | ) | |||||||
Total long-term derivative (liabilities)(2) | $ | (259 | ) | $ | 196 | $ | (63 | ) | ||||
Total derivative liabilities | $ | (1,423 | ) | $ | 1,135 | $ | (288 | ) | ||||
Net derivative assets (liabilities) | $ | — | $ | 114 | $ | 114 | ||||||
131
December 31, 2018 | ||||||||||||
Gross Amounts of Assets and (Liabilities) | Gross Amounts Offset on the Consolidated Balance Sheets | Net Amount Presented on the Consolidated Balance Sheets(1) | ||||||||||
Derivative assets: | ||||||||||||
Commodity exchange traded derivatives contracts | $ | 820 | $ | (820 | ) | $ | — | |||||
Commodity forward contracts | 341 | (229 | ) | 112 | ||||||||
Interest rate hedging instruments | 30 | — | 30 | |||||||||
Total current derivative assets(3) | $ | 1,191 | $ | (1,049 | ) | $ | 142 | |||||
Commodity exchange traded derivatives contracts | 113 | (113 | ) | — | ||||||||
Commodity forward contracts | 209 | (59 | ) | 150 | ||||||||
Interest rate hedging instruments | 10 | — | 10 | |||||||||
Total long-term derivative assets(3) | $ | 332 | $ | (172 | ) | $ | 160 | |||||
Total derivative assets | $ | 1,523 | $ | (1,221 | ) | $ | 302 | |||||
Derivative (liabilities): | ||||||||||||
Commodity exchange traded derivatives contracts | $ | (764 | ) | $ | 764 | $ | — | |||||
Commodity forward contracts | (576 | ) | 277 | (299 | ) | |||||||
Interest rate hedging instruments | (4 | ) | — | (4 | ) | |||||||
Total current derivative (liabilities)(3) | $ | (1,344 | ) | $ | 1,041 | $ | (303 | ) | ||||
Commodity exchange traded derivatives contracts | (168 | ) | 168 | — | ||||||||
Commodity forward contracts | (193 | ) | 59 | (134 | ) | |||||||
Interest rate hedging instruments | (6 | ) | — | (6 | ) | |||||||
Total long-term derivative (liabilities)(3) | $ | (367 | ) | $ | 227 | $ | (140 | ) | ||||
Total derivative liabilities | $ | (1,711 | ) | $ | 1,268 | $ | (443 | ) | ||||
Net derivative assets (liabilities) | $ | (188 | ) | $ | 47 | $ | (141 | ) | ||||
____________
(1) | At December 31, 2019 and 2018, we had $191 million and $244 million of collateral under master netting arrangements that were not offset against our derivative instruments on the Consolidated Balance Sheets primarily related to initial margin requirements. |
(2) | At December 31, 2019, current and long-term derivative assets are shown net of collateral of $(4) million and $(4) million, respectively, and current and long-term derivative liabilities are shown net of collateral of $108 million and $14 million, respectively. |
(3) | At December 31, 2018, current and long-term derivative assets are shown net of collateral of $(58) million and $(8) million, respectively, and current and long-term derivative liabilities are shown net of collateral of $49 million and $64 million, respectively. |
132
December 31, 2019 | December 31, 2018 | ||||||||||||||
Fair Value of Derivative Assets | Fair Value of Derivative Liabilities | Fair Value of Derivative Assets | Fair Value of Derivative Liabilities | ||||||||||||
Derivatives designated as cash flow hedging instruments: | |||||||||||||||
Interest rate hedging instruments | $ | 12 | $ | 29 | $ | 40 | $ | 10 | |||||||
Total derivatives designated as cash flow hedging instruments | $ | 12 | $ | 29 | $ | 40 | $ | 10 | |||||||
Derivatives not designated as hedging instruments: | |||||||||||||||
Commodity instruments | $ | 390 | $ | 257 | $ | 262 | $ | 433 | |||||||
Interest rate hedging instruments | — | 2 | — | — | |||||||||||
Total derivatives not designated as hedging instruments | $ | 390 | $ | 259 | $ | 262 | $ | 433 | |||||||
Total derivatives | $ | 402 | $ | 288 | $ | 302 | $ | 443 | |||||||
Derivatives Included on Our Consolidated Statements of Operations
Changes in the fair values of our derivative instruments are reflected either in cash for option premiums paid or collected, in OCI, net of tax, for derivative instruments which qualify for and we have elected cash flow hedge accounting treatment, or on our Consolidated Statements of Operations as a component of mark-to-market activity within our earnings.
The following tables detail the components of our total activity for both the net realized gain (loss) and the net mark-to-market gain (loss) recognized from our derivative instruments in earnings and where these components were recorded on our Consolidated Statements of Operations for the years ended December 31, 2019, 2018 and 2017 (in millions):
2019 | 2018 | 2017 | |||||||||
Realized gain (loss)(1)(2) | |||||||||||
Commodity derivative instruments | $ | 256 | $ | 193 | $ | 7 | |||||
Total realized gain | $ | 256 | $ | 193 | $ | 7 | |||||
Mark-to-market gain (loss)(3) | |||||||||||
Commodity derivative instruments | $ | 278 | $ | (208 | ) | $ | (171 | ) | |||
Interest rate hedging instruments | (3 | ) | 3 | 2 | |||||||
Total mark-to-market gain (loss) | $ | 275 | $ | (205 | ) | $ | (169 | ) | |||
Total activity, net | $ | 531 | $ | (12 | ) | $ | (162 | ) | |||
___________
(1) | Does not include the realized value associated with derivative instruments that settle through physical delivery. |
(2) | Includes amortization of acquisition date fair value of financial derivative activity related to the acquisition of Champion Energy and Calpine Solutions. |
(3) | In addition to changes in market value on derivatives not designated as hedges, changes in mark-to-market gain (loss) also includes adjustments to reflect changes in credit default risk exposure. |
2019 | 2018 | 2017 | |||||||||
Realized and mark-to-market gain (loss)(1) | |||||||||||
Derivatives contracts included in operating revenues(2)(3) | $ | 816 | $ | (369 | ) | $ | (69 | ) | |||
Derivatives contracts included in fuel and purchased energy expense(2)(3) | (282 | ) | 354 | (95 | ) | ||||||
Interest rate hedging instruments included in interest expense | (3 | ) | 3 | 2 | |||||||
Total activity, net | $ | 531 | $ | (12 | ) | $ | (162 | ) | |||
___________
(1) | In addition to changes in market value on derivatives not designated as hedges, changes in mark-to-market gain (loss) also includes adjustments to reflect changes in credit default risk exposure. |
(2) | Does not include the realized value associated with derivative instruments that settle through physical delivery. |
133
(3) | Includes amortization of acquisition date fair value of financial derivative activity related to the acquisition of Champion Energy and Calpine Solutions. |
Derivatives Included in OCI and AOCI
The following table details the effect of our net derivative instruments that qualified for hedge accounting treatment and are included in OCI and AOCI for the years ended December 31, 2019, 2018 and 2017 (in millions):
Gain (Loss) Recognized in OCI (Effective Portion) | Gain (Loss) Reclassified from AOCI into Income (Effective Portion)(3)(4) | ||||||||||||||||||||||||
2019 | 2018 | 2017 | 2019 | 2018 | 2017 | Affected Line Item on the Consolidated Statements of Operations | |||||||||||||||||||
Interest rate hedging instruments(1)(2) | $ | (41 | ) | $ | 45 | $ | 21 | $ | (1 | ) | $ | (5 | ) | $ | (43 | ) | Interest expense | ||||||||
Interest rate hedging instruments(1)(2) | 1 | 1 | 5 | (1 | ) | (1 | ) | (5 | ) | Depreciation expense | |||||||||||||||
Total | $ | (40 | ) | $ | 46 | $ | 26 | $ | (2 | ) | $ | (6 | ) | $ | (48 | ) | |||||||||
____________
(1) | We recorded a gain of $1 million on hedge ineffectiveness related to our interest rate hedging instruments designated as cash flow hedges during the years ended December 31, 2018 and 2017. Upon the adoption of Accounting Standards Update 2017-12 on January 1, 2019, hedge ineffectiveness is no longer separately measured and recorded in earnings. |
(2) | We recorded an income tax benefit of $2 million and income tax expense of $5 million and $6 million for the years ended December 31, 2019, 2018 and 2017, respectively, in AOCI related to our cash flow hedging activities. |
(3) | Cumulative cash flow hedge losses attributable to Calpine, net of tax, remaining in AOCI were $72 million, $34 million and $72 million at December 31, 2019, 2018 and 2017, respectively. Cumulative cash flow hedge losses attributable to the noncontrolling interest, net of tax, remaining in AOCI were $3 million, $3 million and $6 million at December 31, 2019, 2018 and 2017, respectively. |
(4) | Includes losses of $2 million, $1 million and nil that were reclassified from AOCI to interest expense for the years ended December 31, 2019, 2018 and 2017, respectively, where the hedged transactions became probable of not occurring. |
We estimate that pre-tax net losses of $26 million would be reclassified from AOCI into interest expense during the next 12 months as the hedged transactions settle; however, the actual amounts that will be reclassified will likely vary based on changes in interest rates. Therefore, we are unable to predict what the actual reclassification from AOCI into earnings (positive or negative) will be for the next 12 months.
11. | Use of Collateral |
We use margin deposits, prepayments and letters of credit as credit support with and from our counterparties for commodity procurement and risk management activities. In addition, we have granted additional first priority liens on the assets currently subject to first priority liens under various debt agreements as collateral under certain of our power and natural gas agreements and certain of our interest rate hedging instruments in order to reduce the cash collateral and letters of credit that we would otherwise be required to provide to the counterparties under such agreements. The counterparties under such agreements share the benefits of the collateral subject to such first priority liens pro rata with the lenders under our various debt agreements.
134
The table below summarizes the balances outstanding under margin deposits, natural gas and power prepayments, and exposure under letters of credit and first priority liens for commodity procurement and risk management activities as of December 31, 2019 and 2018 (in millions):
2019 | 2018 | ||||||
Margin deposits(1) | $ | 432 | $ | 343 | |||
Natural gas and power prepayments | 29 | 31 | |||||
Total margin deposits and natural gas and power prepayments with our counterparties(2) | $ | 461 | $ | 374 | |||
Letters of credit issued | $ | 906 | $ | 1,166 | |||
First priority liens under power and natural gas agreements | 42 | 92 | |||||
First priority liens under interest rate hedging instruments | 31 | 10 | |||||
Total letters of credit and first priority liens with our counterparties | $ | 979 | $ | 1,268 | |||
Margin deposits posted with us by our counterparties(1)(3) | $ | 127 | $ | 52 | |||
Letters of credit posted with us by our counterparties | 25 | 27 | |||||
Total margin deposits and letters of credit posted with us by our counterparties | $ | 152 | $ | 79 | |||
___________
(1) | We offset fair value amounts recognized for derivative instruments executed with the same counterparty under a master netting arrangement for financial statement presentation; therefore, amounts recognized for the right to reclaim, or the obligation to return, cash collateral are presented net with the corresponding derivative instrument fair values. See Note 10 for further discussion of our derivative instruments subject to master netting arrangements. |
(2) | At December 31, 2019 and 2018, $117 million and $79 million, respectively, were included in current and long-term derivative assets and liabilities, $336 million and $286 million, respectively, were included in margin deposits and other prepaid expense and $8 million and $9 million, respectively, were included in other assets on our Consolidated Balance Sheets. |
(3) | At December 31, 2019 and 2018, $3 million and $32 million, respectively, were included in current and long-term derivative assets and liabilities, $93 million and $20 million, respectively, were included in other current liabilities and $31 million and nil, respectively, were included in other long-term liabilities on our Consolidated Balance Sheets. |
Future collateral requirements for cash, first priority liens and letters of credit may increase or decrease based on the extent of our involvement in hedging and optimization contracts, movements in commodity prices, and also based on our credit ratings and general perception of creditworthiness in our market.
12. | Income Taxes |
Tax Cuts and Jobs Act (the “Act”)
On December 22, 2017, the Act was signed into law resulting in significant changes from previous tax law. Some of the more meaningful provisions which affected us are:
• | a reduction in the U.S. federal corporate tax rate from 35% to 21%; |
• | limitation on the deduction of certain interest expense; |
• | full expense deduction for certain business capital expenditures; |
• | limitation on the utilization of NOLs arising after December 31, 2017; and |
• | a system of taxing foreign-sourced income from multinational corporations. |
In December 2017, the SEC issued Staff Accounting Bulletin No. 118 “Income Tax Accounting Implications of the Tax Cuts and Jobs Act” which allows a company up to one year to finalize and record the tax effects of the Act. We finalized the tax effect of the transition tax as of December 31, 2017 which did not have a material effect on our financial condition, results of operations or cash flows. During the year ended December 31, 2018, we finalized and recorded the remaining tax effects of the Act which did not have a material effect on our financial condition, results of operations or cash flows.
135
Income Tax Expense (Benefit)
The jurisdictional components of income from continuing operations before income tax expense (benefit), attributable to Calpine, for the years ended December 31, 2019, 2018 and 2017, are as follows (in millions):
2019 | 2018 | 2017 | |||||||||
U.S. | $ | 836 | $ | 47 | $ | (358 | ) | ||||
International | 32 | 27 | 27 | ||||||||
Total | $ | 868 | $ | 74 | $ | (331 | ) | ||||
The components of income tax expense from continuing operations for the years ended December 31, 2019, 2018 and 2017, consisted of the following (in millions):
2019 | 2018 | 2017 | |||||||||
Current: | |||||||||||
Federal | $ | (2 | ) | $ | — | $ | (10 | ) | |||
State | 2 | 20 | 18 | ||||||||
Foreign | 3 | (3 | ) | (14 | ) | ||||||
Total current | 3 | 17 | (6 | ) | |||||||
Deferred: | |||||||||||
Federal | 66 | (1 | ) | 5 | |||||||
State | 28 | (6 | ) | 6 | |||||||
Foreign | 1 | 54 | 3 | ||||||||
Total deferred | 95 | 47 | 14 | ||||||||
Total income tax expense | $ | 98 | $ | 64 | $ | 8 | |||||
For the years ended December 31, 2019, 2018 and 2017, our income tax rates did not bear a customary relationship to statutory income tax rates, primarily as a result of the effect of our NOLs, valuation allowances and state income taxes. A reconciliation of the federal statutory rate of 21% and, prior to 2018, 35% to our effective rate from continuing operations for the years ended December 31, 2019, 2018 and 2017, is as follows:
2019 | 2018 | 2017 | ||||||
Federal statutory tax rate | 21.0 | % | 21.0 | % | 35.0 | % | ||
State tax expense, net of federal benefit | 2.8 | 17.0 | (6.0 | ) | ||||
Change in tax rate of net deferred tax asset | — | — | (168.8 | ) | ||||
Valuation allowances offsetting tax rate change | — | — | 168.8 | |||||
Valuation allowances against future tax benefits | (11.2 | ) | (31.7 | ) | (33.0 | ) | ||
Valuation allowance related to foreign taxes | — | (138.3 | ) | 0.5 | ||||
Decrease in foreign NOL due to change in ownership | — | 202.3 | — | |||||
Distributions from foreign affiliates and foreign taxes | 0.2 | 6.6 | (2.0 | ) | ||||
Change in unrecognized tax benefits | — | (8.0 | ) | 5.1 | ||||
Disallowed compensation | — | 7.7 | (0.6 | ) | ||||
Stock-based compensation | — | (1.5 | ) | (0.9 | ) | |||
Equity earnings | 0.1 | 1.4 | (0.8 | ) | ||||
Merger Related Fees/Expenses | — | 12.7 | — | |||||
Depletion in excess of basis | (0.3 | ) | (4.0 | ) | — | |||
Other differences | (1.3 | ) | 1.3 | 0.3 | ||||
Effective income tax rate | 11.3 | % | 86.5 | % | (2.4 | )% | ||
136
Deferred Tax Assets and Liabilities
The components of deferred income taxes as of December 31, 2019 and 2018, are as follows (in millions):
2019 | 2018 | ||||||
Deferred tax assets: | |||||||
NOL and credit carryforwards | $ | 1,731 | $ | 1,595 | |||
Taxes related to risk management activities and derivatives | 18 | 7 | |||||
Reorganization items and impairments | 73 | 166 | |||||
Other differences | 62 | 101 | |||||
Deferred tax assets before valuation allowance | 1,884 | 1,869 | |||||
Valuation allowance | (873 | ) | (1,000 | ) | |||
Total deferred tax assets | 1,011 | 869 | |||||
Deferred tax liabilities: | |||||||
Property, plant and equipment | (1,125 | ) | (890 | ) | |||
Total deferred tax liabilities | (1,125 | ) | (890 | ) | |||
Net deferred tax asset (liability) | (114 | ) | (21 | ) | |||
Less: Non-current deferred tax liability | (116 | ) | (22 | ) | |||
Deferred income tax asset, non-current | $ | 2 | $ | 1 | |||
Intraperiod Tax Allocation — In accordance with U.S. GAAP, intraperiod tax allocation provisions require allocation of a tax expense (benefit) to continuing operations due to current OCI gains (losses) with an offsetting amount recognized in OCI. The intraperiod tax allocation included in continuing operations is nil, $1 million and $6 million for the years ended December 31, 2019, 2018 and 2017.
NOL Carryforwards — As of December 31, 2019, our NOL carryforwards consisted primarily of federal NOL carryforwards of approximately $7.1 billion, of which the majority expire between 2024 and 2037, and NOL carryforwards in 25 states and the District of Columbia totaling approximately $3.2 billion, which expire between 2020 and 2039. A substantial portion of our federal and state NOLs are offset with a valuation allowance. Certain of the state NOL carryforwards may be subject to limitations on their annual usage. As a result of the ownership change associated with the Merger, our ability to utilize the NOL carryforwards are subject to limitations. Additionally, our state NOLs available to offset future state income could materially decrease which would be offset by an equal and offsetting adjustment to the existing valuation allowance. Given the offsetting adjustments to the existing valuation allowance, the ownership change is not expected to have a material adverse effect on our Consolidated Financial Statements.
As a result of the Merger, our Canadian NOLs, which comprised all of our foreign NOLs, are no longer available to us. This resulted in a decrease of approximately $58 million in the deferred tax asset and a related charge to deferred tax expense during the year ended December 31, 2018.
Income Tax Audits — We remain subject to periodic audits and reviews by taxing authorities; however, we do not expect these audits will have a material effect on our tax provision. Any NOLs we claim in future years to reduce taxable income could be subject to IRS examination regardless of when the NOLs were generated. Any adjustment of state or federal returns could result in a reduction of deferred tax assets rather than a cash payment of income taxes in tax jurisdictions where we have NOLs. We are currently under various state income tax audits for various periods.
Valuation Allowance — U.S. GAAP requires that we consider all available evidence, both positive and negative, and tax planning strategies to determine whether, based on the weight of that evidence, a valuation allowance is needed to reduce the value of deferred tax assets. Future realization of the tax benefit of an existing deductible temporary difference or carryforward ultimately depends on the existence of sufficient taxable income of the appropriate character within the carryback or carryforward periods available under the tax law. Due to our history of losses, we were unable to assume future profits; however, we are able to consider available tax planning strategies.
As of December 31, 2019, we have provided a valuation allowance of approximately $873 million on certain federal and state tax jurisdiction deferred tax assets to reduce the amount of these assets to the extent necessary to result in an amount that is more likely than not to be realized. The net change in our valuation allowance was a decrease of $127 million for the year ended December 31, 2019.
137
Limitation on Deductions of Net Business Interest Expense — On November 26, 2018, the U.S. Treasury Department released proposed regulations which would limit the current deductibility of net business interest expense. The proposed regulations would be applicable for taxable years ending after the date on which the regulations become final. Companies have the discretion to apply the proposed regulations, but must apply all such provisions of the proposed regulations on a consistent basis. As of December 31, 2019, we have not elected to apply the proposed regulations for the 2018 or 2019 tax years and we do not expect the application of the final regulations will have a material effect on our Consolidated Financial Statements.
Unrecognized Tax Benefits
At December 31, 2019, we had unrecognized tax benefits of $29 million. If recognized, $17 million of our unrecognized tax benefits could affect the annual effective tax rate and $12 million, related to deferred tax assets, could be offset against the recorded valuation allowance resulting in no effect to our effective tax rate. We had accrued interest and penalties of $3 million and $2 million for income tax matters at December 31, 2019 and 2018, respectively. We recognize interest and penalties related to unrecognized tax benefits in income tax expense (benefit) on our Consolidated Statements of Operations and recorded $1 million, $(2) million and $(8) million for the years ended December 31, 2019, 2018 and 2017, respectively.
A reconciliation of the beginning and ending amounts of our unrecognized tax benefits for the years ended December 31, 2019, 2018 and 2017, is as follows (in millions):
2019 | 2018 | 2017 | |||||||||
Balance, beginning of period | $ | (28 | ) | $ | (38 | ) | $ | (59 | ) | ||
Increases related to prior year tax positions | — | (7 | ) | — | |||||||
Decreases related to prior year tax positions | — | 17 | 11 | ||||||||
Increases related to current year tax positions | (1 | ) | — | (2 | ) | ||||||
Decreases related to change in tax rate of net deferred tax asset | — | — | 12 | ||||||||
Balance, end of period | $ | (29 | ) | $ | (28 | ) | $ | (38 | ) | ||
13. | Stock-Based Compensation |
Calpine Equity Incentive Plans
Prior to the effective date of the Merger on March 8, 2018, the Calpine Equity Incentive Plans provided for the issuance of equity awards to all non-union employees as well as the non-employee members of our Board of Directors. Subsequent to the merger, we do not issue share-based awards.
As a result of the Merger, the outstanding share-based awards were treated as follows during the first quarter of 2018:
• | all restricted stock and restricted stock units were vested and canceled and the holders received a cash payment equal to a share price of $15.25 per share less any applicable withholding taxes; |
• | all vested and unvested stock options were vested (in the case of unvested stock options) and canceled and the holders of the stock options received a cash payment equal to the intrinsic value based on a share price of $15.25 per share less any applicable withholding taxes; and |
• | all Performance Share Units (“PSUs”), including the PSUs awarded in 2015 for the measurement period of January 1, 2015 through December 31, 2017, were vested and canceled in exchange for a cash payment with the payout value based on the greater of target value or actual performance over the truncated period using a share price of $15.25 per share less any applicable withholding taxes. |
The amount of cash transferred to repurchase the share-based awards associated with our equity classified share-based awards totaled $79 million and was recorded to additional paid-in capital on our Consolidated Balance Sheet for the year ended December 31, 2018. The amount of unrecognized compensation related to our equity classified share-based awards that we recognized in connection with the shortened service period associated with the completion of the Merger was $35 million for the year ended December 31, 2018, which did not include any incremental compensation cost as the amount paid did not exceed the fair value of the equity classified share-based awards at the effective time of the Merger. The total stock-based compensation expense for our equity classified share-based awards was $41 million and $36 million for the years ended December 31, 2018 and 2017, respectively.
The amount of cash transferred to repurchase the share-based awards associated with our liability classified share-based awards totaled $25 million and was recorded to the associated liability in other long-term liabilities on our Consolidated Balance Sheet for the year ended December 31, 2018. The amount of unrecognized compensation related to our liability classified share-
138
based awards that we recognized in connection with the shortened implied service period associated with the completion of the Merger was $16 million for the year ended December 31, 2018. The total stock-based compensation expense for our liability classified share-based awards was $16 million and $6 million for the years ended December 31, 2018 and 2017, respectively.
The total intrinsic value of our employee stock options exercised was $11 million and nil for the years ended December 31, 2018 and 2017, respectively. The total cash proceeds received from our employee stock options exercised was nil for each of the years ended December 31, 2018 and 2017, respectively.
The total fair value of our restricted stock and restricted stock units that vested during the years ended December 31, 2018 and 2017 was approximately $88 million and $23 million, respectively.
14. | Defined Contribution and Defined Benefit Plans |
We maintain two defined contribution savings plans that are intended to be tax exempt under Sections 401(a) and 501(a) of the IRC. Our non-union plan generally covers employees who are not covered by a collective bargaining agreement, and our union plan covers employees who are covered by a collective bargaining agreement. In 2018, we added an enhanced feature to our defined contribution plan for non-union employees consisting of a non-elective contribution for certain eligible employees who are active employees as of December 31st. We recorded expenses for these plans of approximately $20 million, $20 million and $14 million for the years ended December 31, 2019, 2018 and 2017, respectively. Employer matching contributions are 100% of the first 5% of compensation a participant defers for the non-union plan. The employee deferral limit is 75% of eligible compensation under both plans.
We also maintain defined benefit pension plans whereby retirement benefits are primarily a function of age attained, years of participation, years of service, vesting and level of compensation. Only approximately 4% of our employees are eligible to participate in a defined benefit pension plan. As of December 31, 2019 and 2018, there were approximately $26 million and $19 million in plan assets and approximately $33 million and $27 million in pension liabilities, respectively. Our net pension liability recorded on our Consolidated Balance Sheets as of December 31, 2019 and 2018, was approximately $7 million and $8 million, respectively. For the years ended December 31, 2019, 2018 and 2017, we recognized net periodic benefit costs of approximately $1 million, $1 million and $1 million, respectively. Our net periodic benefit cost is included in operating and maintenance expense on our Consolidated Statements of Operations. As of December 31, 2019 and 2018, the total amount recognized in AOCI for actuarial losses related to pension obligation was approximately $6 million and $4 million, respectively.
In making our estimates of our pension obligation and related costs, we utilize discount rates, rates of compensation increases and rates of return on our assets that we believe are reasonable. Due to the relatively small size of our pension liability (which is not considered material), significant changes in these assumptions would not have a material effect on our pension liability. During 2019 and 2018, we made contributions of approximately $4 million and $1 million, respectively, and estimated contributions to the pension plan are expected to be approximately nil in 2020. Estimated future benefit payments to participants in each of the next five years are expected to be approximately $1 million in each year.
15. | Capital Structure |
On August 17, 2017, we entered into the Merger Agreement with Volt Parent, LP (“Volt Parent”) and Volt Merger Sub, Inc. (“Merger Sub”), a wholly-owned subsidiary of Volt Parent, pursuant to which Merger Sub merged with and into Calpine, with Calpine surviving the Merger as a subsidiary of Volt Parent. On March 8, 2018, we completed the Merger contemplated in the Merger Agreement.
At the effective time of the Merger, each share of Calpine common stock outstanding as of immediately prior to the effective time of the Merger (excluding certain shares as described in the Merger Agreement) ceased to be outstanding and was converted into the right to receive $15.25 per share in cash or approximately $5.6 billion in total. Also at the effective time of the Merger, the common stock of Merger Sub became the new common stock of Calpine Corporation.
Common Stock
Our authorized common stock consists of 5,000 shares of Calpine Corporation common stock as of December 31, 2019 and 2018. Common stock issued as of December 31, 2019 and 2018, was 105.2 shares, at a par value of $0.001 per share. Common stock outstanding as of December 31, 2019 and 2018, was 105.2 shares. The table below summarizes our common stock activity for the years ended December 31, 2019, 2018 and 2017.
Shares Issued | Shares Held in Treasury | Shares Outstanding | ||||||
Balance, December 31, 2016 | 359,627,113 | (565,349 | ) | 359,061,764 | ||||
Shares issued under Calpine Equity Incentive Plans | 2,050,778 | (596,451 | ) | 1,454,327 | ||||
Balance, December 31, 2017 | 361,677,891 | (1,161,800 | ) | 360,516,091 | ||||
Shares issued under Calpine Equity Incentive Plans | 355,805 | (477,711 | ) | (121,906 | ) | |||
Cancellation of Calpine Corporation common stock in accordance with the Merger Agreement | (362,033,696 | ) | 1,639,511 | (360,394,185 | ) | |||
Conversion of Merger Sub common stock to Calpine Corporation common stock in accordance with the Merger Agreement | 105.2 | — | 105.2 | |||||
Balance, December 31, 2018 | 105.2 | — | 105.2 | |||||
Shares issued under Calpine Equity Incentive Plans | — | — | — | |||||
Balance, December 31, 2019 | 105.2 | — | 105.2 | |||||
16. | Commitments and Contingencies |
Long-Term Service Agreements
As of December 31, 2019, the total estimated commitments for LTSAs associated with turbines were approximately $217 million. These commitments are payable over the remaining terms of the respective agreements, which range from 1 to 20 years. LTSA future commitment estimates are based on the stated payment terms in the contracts at the time of execution. Certain of these agreements have terms that allow us to cancel the contracts for a fee. If we cancel such contracts, the estimated commitments remaining for LTSAs would be reduced.
139
Production Royalties
We are obligated under numerous geothermal contracts and right-of-way, easement and surface agreements. The geothermal contracts generally provide for royalties based on production revenue with reductions for property taxes paid. The right-of-way, easement and surface agreements are based on flat rates or adjusted based on consumer price index changes and are not material. Under the terms of most geothermal contracts, the royalties accrue as a percentage of power revenues. Certain properties also have net profits and overriding royalty interests that are in addition to the land base contract royalties. Some contracts contain clauses providing for minimum payments if production temporarily ceases or if production falls below a specified level. Production royalties for geothermal power plants for the years ended December 31, 2019, 2018 and 2017, were $24 million, $26 million and $25 million, respectively.
Commodity Purchases
We enter into commodity purchase contracts of various terms with third parties to supply fuel to our natural gas-fired power plants and power to our retail customers. The majority of our purchases are made in the spot market or under index-priced contracts. These contracts are accounted for as executory contracts and therefore not recognized as liabilities on our Consolidated Balance Sheet. At December 31, 2019, we had future commitments for the purchase, transportation, or storage of commodities as detailed below (in millions):
2020 | $ | 402 | |
2021 | 178 | ||
2022 | 121 | ||
2023 | 98 | ||
2024 | 41 | ||
Thereafter | 103 | ||
Total | $ | 943 | |
Guarantees and Indemnifications
As part of our normal business operations, we enter into various agreements providing, or otherwise arranging, financial or performance assurance to third parties on behalf of our subsidiaries in the ordinary course of such subsidiaries’ respective business. Such arrangements include guarantees, standby letters of credit and surety bonds for power and natural gas purchase and sale arrangements, retail contracts, contracts associated with the development, construction, operation and maintenance of our fleet of power plants and our Accounts Receivable Sales Program. These arrangements are entered into primarily to support or enhance the creditworthiness otherwise attributed to a subsidiary on a stand-alone basis, thereby facilitating the extension of sufficient credit to accomplish the subsidiaries’ intended commercial purposes.
At December 31, 2019, guarantees of subsidiary debt, standby letters of credit and surety bonds to third parties and the guarantee under our Account Receivable Sales Program and their respective expiration dates were as follows (in millions):
Guarantee Commitments | 2020 | 2021 | 2022 | 2023 | 2024 | Thereafter | Total | |||||||||||||||||||||
Guarantee of subsidiary obligations(1) | $ | 30 | $ | 29 | $ | 24 | $ | 14 | $ | 13 | $ | 39 | $ | 149 | ||||||||||||||
Standby letters of credit(2)(3)(4) | 1,015 | 32 | — | 38 | — | — | 1,085 | |||||||||||||||||||||
Surety bonds(4)(5)(6) | 10 | 7 | — | — | — | 94 | 111 | |||||||||||||||||||||
Guarantee under Accounts Receivable Sales Program(7) | 222 | — | — | — | — | — | 222 | |||||||||||||||||||||
Total | $ | 1,277 | $ | 68 | $ | 24 | $ | 52 | $ | 13 | $ | 133 | $ | 1,567 | ||||||||||||||
____________
(1) | Represents Calpine Corporation guarantees of certain power plant leases and related interest. All guaranteed finance leases are recorded on our Consolidated Balance Sheets. |
(2) | The standby letters of credit disclosed above represent those disclosed in Note 8. |
140
(3) | Letters of credit are renewed annually and as such all amounts are reflected in the year of letter of credit expiration. The related commercial obligations extend for multiple years, therefore, renewal of the letter of credit will likely follow the term of the associated commercial obligation. |
(4) | These are contingent off balance sheet obligations. |
(5) | The majority of surety bonds do not have expiration or cancellation dates. |
(6) | As of December 31, 2019, no cash collateral is outstanding related to these bonds. |
(7) | Calpine has guaranteed the performance of Calpine Solutions under the Accounts Receivable Sales Program. The Accounts Receivable Sales Program expires on November 27, 2020. |
We routinely arrange for the issuance of letters of credit and various forms of surety bonds to third parties in support of our subsidiaries’ contractual arrangements of the types described above and may guarantee the operating performance of some of our partially-owned subsidiaries up to our ownership percentage. The letters of credit issued under various credit facilities support risk management and other operational and construction activities. In the event a subsidiary were to fail to perform its obligations under a contract supported by such a letter of credit or surety bond, and the issuing bank or surety were to make payment to the third party, we would be responsible for reimbursing the issuing bank or surety within an agreed timeframe, typically a period of one to five days. To the extent liabilities are incurred as a result of activities covered by letters of credit or the surety bonds, such liabilities are included on our Consolidated Balance Sheets.
Commercial Agreements — In connection with the purchase and sale of power, natural gas, environmental products and fuel oil to and from third parties with respect to the operation of our power plants and our retail subsidiaries, we may be required to guarantee a portion of the obligations of certain of our subsidiaries. We may also be required to guarantee performance obligations associated with our marketing, hedging, optimization and trading activities to manage our exposure to changes in prices for energy commodities. These guarantees may include future payment obligations and effectively guarantee our future performance under certain agreements.
Asset Acquisition and Disposition Agreements — In connection with our purchase and sale agreements, we have frequently provided for indemnification to the counterparty for liabilities incurred as a result of a breach of a representation, warranty or covenant by the indemnifying party. These indemnification obligations generally have a discrete term and are intended to protect the parties against risks that are difficult to predict or impossible to quantify at the time of the consummation of a particular transaction.
Other — Additionally, we and our subsidiaries from time to time assume other guarantee and indemnification obligations in conjunction with other transactions such as parts supply agreements, construction agreements, maintenance and service agreements and equipment lease agreements. These guarantee and indemnification obligations may include indemnification from personal injury or other claims by our employees as well as future payment obligations and effectively guarantee our future performance under certain agreements.
Our potential exposure under guarantee and indemnification obligations can range from a specified amount to an unlimited dollar amount, depending on the nature of the claim and the particular transaction. Our total maximum exposure under our guarantee and indemnification obligations is not estimable due to uncertainty as to whether claims will be made or how any potential claim will be resolved. As of December 31, 2019, there are no material outstanding claims related to our guarantee and indemnification obligations and we do not anticipate that we will be required to make any material payments under our guarantee and indemnification obligations.
Litigation
We are party to various litigation matters, including regulatory and administrative proceedings arising out of the normal course of business. At the present time, we do not expect that the outcome of any of these proceedings, individually or in the aggregate, will have a material adverse effect on our financial condition, results of operations or cash flows.
On a quarterly basis, we review our litigation activities and determine if an unfavorable outcome to us is considered “remote,” “reasonably possible” or “probable” as defined by U.S. GAAP. Where we determine an unfavorable outcome is probable and is reasonably estimable, we accrue for potential litigation losses. The liability we may ultimately incur with respect to such litigation matters, in the event of a negative outcome, may be in excess of amounts currently accrued, if any; however, we do not expect that the reasonably possible outcome of these litigation matters would, individually or in the aggregate, have a material adverse effect on our financial condition, results of operations or cash flows. Where we determine an unfavorable outcome is not probable or reasonably estimable, we do not accrue for any potential litigation loss. The ultimate outcome of these litigation matters cannot presently be determined, nor can the liability that could potentially result from a negative outcome be reasonably estimated.
141
As a result, we give no assurance that such litigation matters would, individually or in the aggregate, not have a material adverse effect on our financial condition, results of operations or cash flows.
Environmental Matters
We are subject to complex and stringent environmental laws and regulations related to the operation of our power plants. On occasion, we may incur environmental fees, penalties and fines associated with the operation of our power plants. At the present time, we do not have environmental violations or other matters that would have a material effect on our financial condition, results of operations or cash flows or that would significantly change our operations.
17. | Related Party Transactions |
We have entered into various agreements with related parties associated with the operation of our business. A description of these related party transactions is provided below:
Accounts Receivable Sales Program
On December 1, 2016, in conjunction with our acquisition of Calpine Solutions, we entered into the Accounts Receivable Sales Program which allows us to sell, at a discount, up to $250 million in certain trade accounts receivable, arising from the sale of power and natural gas, from Calpine Solutions to Calpine Receivables which in turn sells 100% of the receivables to an unaffiliated financial institution, subject to certain contractual limitations. The Accounts Receivable Sales Program expires on November 27, 2020. Calpine Solutions services the receivables sold in exchange for a servicing fee which was not material for the years ended December 31, 2019, 2018 and 2017. We are not the primary beneficiary of Calpine Receivables and, accordingly, do not consolidate this entity in our Consolidated Financial Statements. See Note 7 for a further discussion of our unconsolidated VIEs. Any portion of the purchase price for the sold receivables which is not paid in cash is recorded as a note receivable. The note receivable is recorded at fair value and does not materially differ from the carrying value of the trade accounts receivable held prior to sale due to the short-term nature of the receivables and high credit quality of the retail customers involved. Receivables sold under the Accounts Receivable Sales Program are accounted for as sales and excluded from accounts receivable on our Consolidated Balance Sheets and reflected as cash provided by operating activities on our Consolidated Statements of Cash Flows. Calpine has guaranteed the performance of Calpine Solutions under the Accounts Receivable Sales Program. See Note 16 for a further description of our guarantees.
Under the Accounts Receivable Sales Program, at December 31, 2019 and 2018, we had $222 million and $238 million, respectively, in trade accounts receivable outstanding that were sold under the Accounts Receivable Sales Program and $38 million and $34 million, respectively, in notes receivable which was recorded on our Consolidated Balance Sheets. We sold an aggregate of approximately $2.3 billion, $2.4 billion and $2.2 billion in trade accounts receivable and recorded proceeds of approximately $2.3 billion, $2.3 billion and $2.2 billion during the years ended December 31, 2019, 2018 and 2017, respectively. Any losses incurred on the sale of trade accounts receivable are recorded in other (income) expense, net on our Consolidated Statements of Operations which were not material during the years ended December 31, 2019, 2018 and 2017.
Lyondell — We have a ground lease agreement with Houston Refining LP (“Houston Refining”), a subsidiary of Lyondell, for our Channel Energy Center site from which we sell power, capacity and steam to Houston Refining under a PPA. We purchase refinery gas and raw water from Houston Refining under a facilities services agreement. One of the entities which obtained an ownership interest in Calpine through the Merger also has an ownership interest in Lyondell whereby they may significantly influence the management and operating policies of Lyondell. The terms of the PPA with Lyondell were negotiated prior to the Merger closing. During the year ended December 31, 2019 and 2018, we recorded $70 million and $76 million in operating revenues, respectively, and $14 million and $12 million in operating expenses, respectively, associated with Lyondell. At December 31, 2019 and 2018, the related party receivables and payables associated with this contract were immaterial.
Other — Following the Merger, we have identified other related party contracts for the sale of power, capacity, steam and RECs which are entered into in the ordinary course of our business. Most of these contracts relate to the sale of commodities and capacity for varying tenors. We have also entered into a long-term land lease agreement with a related party. As of December 31, 2019 and 2018, the related party revenues, expenses, receivables and payables associated with these transactions were immaterial.
18. | Segment and Significant Customer Information |
We assess our business on a regional basis due to the effect on our financial performance of the differing characteristics of these regions, particularly with respect to competition, regulation and other factors affecting supply and demand. At December 31, 2019, our geographic reportable segments for our wholesale business are West (including geothermal), Texas and East (including Canada) and we have a separate reportable segment for our retail business. We continue to evaluate the optimal manner in which we assess our performance including our segments and future changes may result in changes to the composition of our geographic segments.
142
Commodity Margin is a key operational measure of profit reviewed by our chief operating decision maker to assess the performance of our segments. The tables below show our financial data for our segments (including a reconciliation of our Commodity Margin to income (loss) from operations by segment) for the periods indicated (in millions).
Year Ended December 31, 2019 | |||||||||||||||||||||||
Wholesale | |||||||||||||||||||||||
West | Texas | East | Retail | Consolidation and Elimination | Total | ||||||||||||||||||
Total operating revenues(1) | $ | 2,743 | $ | 3,081 | $ | 2,164 | $ | 4,093 | $ | (2,009 | ) | $ | 10,072 | ||||||||||
Commodity Margin | $ | 1,151 | $ | 857 | $ | 924 | $ | 382 | $ | — | $ | 3,314 | |||||||||||
Add: Mark-to-market commodity activity, net and other(2) | 219 | 154 | 46 | (131 | ) | (34 | ) | 254 | |||||||||||||||
Less: | |||||||||||||||||||||||
Operating and maintenance expense | 340 | 269 | 278 | 148 | (34 | ) | 1,001 | ||||||||||||||||
Depreciation and amortization expense | 254 | 196 | 191 | 53 | — | 694 | |||||||||||||||||
General and other administrative expense | 35 | 53 | 45 | 17 | — | 150 | |||||||||||||||||
Other operating expenses | 31 | 6 | 42 | — | — | 79 | |||||||||||||||||
Impairment losses | — | 13 | 71 | — | — | 84 | |||||||||||||||||
(Gain) on sale of assets, net | (4 | ) | — | (6 | ) | — | — | (10 | ) | ||||||||||||||
(Income) from unconsolidated subsidiaries | — | — | (24 | ) | 2 | — | (22 | ) | |||||||||||||||
Income from operations | 714 | 474 | 373 | 31 | — | 1,592 | |||||||||||||||||
Interest expense | 609 | ||||||||||||||||||||||
(Gain) loss on extinguishment of debt and other (income) expense, net | 95 | ||||||||||||||||||||||
Income before income taxes | $ | 888 | |||||||||||||||||||||
Year Ended December 31, 2018 | |||||||||||||||||||||||
Wholesale | |||||||||||||||||||||||
West | Texas | East | Retail | Consolidation and Elimination | Total | ||||||||||||||||||
Total operating revenues(1) | $ | 1,988 | $ | 2,860 | $ | 1,987 | $ | 3,976 | $ | (1,299 | ) | $ | 9,512 | ||||||||||
Commodity Margin | $ | 1,060 | $ | 646 | $ | 970 | $ | 357 | $ | — | $ | 3,033 | |||||||||||
Add: Mark-to-market commodity activity, net and other(2) | (165 | ) | (197 | ) | 40 | 84 | (32 | ) | (270 | ) | |||||||||||||
Less: | |||||||||||||||||||||||
Operating and maintenance expense | 348 | 272 | 269 | 163 | (32 | ) | 1,020 | ||||||||||||||||
Depreciation and amortization expense | 269 | 237 | 180 | 53 | — | 739 | |||||||||||||||||
General and other administrative expense | 40 | 61 | 38 | 19 | — | 158 | |||||||||||||||||
Other operating expenses | 42 | 24 | 32 | — | — | 98 | |||||||||||||||||
Impairment losses | — | — | 10 | — | — | 10 | |||||||||||||||||
(Income) from unconsolidated subsidiaries | — | — | (26 | ) | 2 | — | (24 | ) | |||||||||||||||
Income (loss) from operations | 196 | (145 | ) | 507 | 204 | — | 762 | ||||||||||||||||
Interest expense | 617 | ||||||||||||||||||||||
(Gain) loss on extinguishment of debt and other (income) expense, net | 53 | ||||||||||||||||||||||
Income before income taxes | $ | 92 | |||||||||||||||||||||
143
Year Ended December 31, 2017 | |||||||||||||||||||||||
Wholesale | |||||||||||||||||||||||
West | Texas | East | Retail | Consolidation and Elimination | Total | ||||||||||||||||||
Total operating revenues(1) | $ | 1,881 | $ | 2,342 | $ | 1,658 | $ | 3,797 | $ | (926 | ) | $ | 8,752 | ||||||||||
Commodity Margin | $ | 970 | $ | 552 | $ | 790 | $ | 396 | $ | — | $ | 2,708 | |||||||||||
Add: Mark-to-market commodity activity, net and other(2) | (19 | ) | (174 | ) | (62 | ) | (10 | ) | (29 | ) | (294 | ) | |||||||||||
Less: | |||||||||||||||||||||||
Operating and maintenance expense | 361 | 308 | 302 | 138 | (29 | ) | 1,080 | ||||||||||||||||
Depreciation and amortization expense | 240 | 208 | 201 | 75 | — | 724 | |||||||||||||||||
General and other administrative expense | 45 | 66 | 27 | 17 | — | 155 | |||||||||||||||||
Other operating expenses | 38 | 14 | 33 | — | — | 85 | |||||||||||||||||
Impairment losses | 28 | 13 | — | — | — | 41 | |||||||||||||||||
(Gain) on sale of assets, net | — | — | (27 | ) | — | — | (27 | ) | |||||||||||||||
(Income) from unconsolidated subsidiaries | — | — | (24 | ) | 2 | — | (22 | ) | |||||||||||||||
Income (loss) from operations | 239 | (231 | ) | 216 | 154 | — | 378 | ||||||||||||||||
Interest expense | 621 | ||||||||||||||||||||||
Debt modification and extinguishment costs and other (income) expense, net | 70 | ||||||||||||||||||||||
Loss before income taxes | $ | (313 | ) | ||||||||||||||||||||
__________
(1) | Includes intersegment revenues of $530 million, $488 million and $324 million in the West, $946 million, $573 million and $361 million in Texas, $522 million, $234 million and $237 million in the East and $11 million, $4 million, $4 million in Retail for the years ended December 31, 2019, 2018 and 2017, respectively. |
(2) | Includes $1 million, nil and $(8) million of lease levelization and $78 million, $104 million and $178 million of amortization expense for the years ended December 31, 2019, 2018 and 2017, respectively. |
Significant Customers
For the years ended December 31, 2019, 2018 and 2017, we had no significant customer that individually accounted for more than 10% of our annual consolidated revenues.
19. | Quarterly Consolidated Financial Data (unaudited) |
Our quarterly operating results have fluctuated in the past and may continue to do so in the future as a result of a number of factors, including, but not limited to, our restructuring activities (including asset sales and dispositions), the completion of development projects, the timing and amount of curtailment of operations under the terms of certain PPAs, the degree of risk management and marketing, hedging, optimization and trading activities, energy commodity market prices and variations in levels of production. Furthermore, the majority of the dollar value of capacity payments under certain of our PPAs are received during the months of May through October.
144
Quarter Ended | |||||||||||||||
December 31 | September 30 | June 30 | March 31 | ||||||||||||
(in millions) | |||||||||||||||
2019 | |||||||||||||||
Operating revenues | $ | 2,082 | $ | 2,792 | $ | 2,599 | $ | 2,599 | |||||||
Income from operations | $ | 108 | $ | 682 | $ | 444 | $ | 358 | |||||||
Net income (loss) attributable to Calpine | $ | (156 | ) | $ | 485 | $ | 266 | $ | 175 | ||||||
2018 | |||||||||||||||
Operating revenues | $ | 2,354 | $ | 2,890 | $ | 2,259 | $ | 2,009 | |||||||
Income (loss) from operations | $ | 105 | $ | 568 | $ | 417 | $ | (328 | ) | ||||||
Net income (loss) attributable to Calpine | $ | (16 | ) | $ | 272 | $ | 352 | $ | (598 | ) | |||||
145
CALPINE CORPORATION AND SUBSIDIARIES
SCHEDULE II VALUATION AND QUALIFYING ACCOUNTS
Description | Balance at Beginning of Year | Charged to Expense | Charged to Other Accounts | Deductions(1) | Balance at End of Year | ||||||||||||||
(in millions) | |||||||||||||||||||
Year Ended December 31, 2019 | |||||||||||||||||||
Allowance for doubtful accounts | $ | 9 | $ | 6 | $ | (1 | ) | $ | (5 | ) | $ | 9 | |||||||
Deferred tax asset valuation allowance | 1,000 | (127 | ) | — | — | 873 | |||||||||||||
Year Ended December 31, 2018 | |||||||||||||||||||
Allowance for doubtful accounts | $ | 9 | $ | 5 | $ | 1 | $ | (6 | ) | $ | 9 | ||||||||
Deferred tax asset valuation allowance | 1,168 | (168 | ) | — | — | 1,000 | |||||||||||||
Year Ended December 31, 2017 | |||||||||||||||||||
Allowance for doubtful accounts | $ | 6 | $ | 4 | $ | 2 | $ | (3 | ) | $ | 9 | ||||||||
Deferred tax asset valuation allowance | 1,581 | (413 | ) | — | — | 1,168 | |||||||||||||
____________
(1) Represents write-offs of accounts considered to be uncollectible and previously reserved.
146