
UNITED STATES
SECURITIES AND EXCHANGE COMMISSION
Washington, D.C. 20549
FORM N-CSR
CERTIFIED SHAREHOLDER REPORT OF REGISTERED MANAGEMENT
INVESTMENT COMPANIES
Investment Company Act file number: 811-21656
| Name of Fund: | BlackRock Energy and Resources Trust (BGR) |
| Fund Address: | 100 Bellevue Parkway, Wilmington, DE 19809 |
Name and address of agent for service: John M. Perlowski, Chief Executive Officer, BlackRock Energy and Resources Trust, 50 Hudson Yards, New York, NY 10001
Registrant’s telephone number, including area code: (800) 882-0052, Option 4
Date of fiscal year end: 12/31/2023
Date of reporting period: 12/31/2023
Item 1 – Report to Stockholders
(a) The Report to Shareholders is attached herewith.
|
|
DECEMBER 31, 2023 |
| 2023 Annual Report | ||
BlackRock Energy and Resources Trust (BGR)
BlackRock Enhanced Capital and Income Fund, Inc. (CII)
BlackRock Enhanced Equity Dividend Trust (BDJ)
BlackRock Enhanced Global Dividend Trust (BOE)
BlackRock Enhanced International Dividend Trust (BGY)
BlackRock Health Sciences Term Trust (BMEZ)
BlackRock Health Sciences Trust (BME)
BlackRock Innovation and Growth Term Trust (BIGZ)
BlackRock Resources & Commodities Strategy Trust (BCX)
BlackRock Science and Technology Term Trust (BSTZ)
BlackRock Science and Technology Trust (BST)
BlackRock Utilities, Infrastructure & Power Opportunities Trust (BUI)
|
Not FDIC Insured • May Lose Value • No Bank Guarantee
|
|
|
| Supplemental Information (unaudited)
|
Section 19(a) Notices
BlackRock Energy and Resources Trust’s (BGR), BlackRock Enhanced Capital and Income Fund, Inc.’s (CII), BlackRock Enhanced Equity Dividend Trust’s (BDJ), BlackRock Enhanced Global Dividend Trust’s (BOE), BlackRock Enhanced International Dividend Trust’s (BGY), BlackRock Health Sciences Term Trust’s (BMEZ), BlackRock Health Sciences Trust’s (BME), BlackRock Innovation and Growth Term Trust’s (BIGZ), BlackRock Resources & Commodities Strategy Trust’s (BCX), BlackRock Science and Technology Term Trust’s (BSTZ), BlackRock Science and Technology Trust’s (BST) and BlackRock Utilities, Infrastructure & Power Opportunities Trust’s (BUI) (collectively, the “Trusts” or individually, a “Trust”) amounts and sources of distributions reported are estimates and are being provided pursuant to regulatory requirements and are not being provided for tax reporting purposes. The actual amounts and sources for tax reporting purposes will depend upon each Trust’s investment experience during its fiscal year and may be subject to changes based on tax regulations. Each Trust will provide a Form 1099-DIV each calendar year that will tell you how to report these distributions for U.S. federal income tax purposes.
December 31, 2023
|
|
||||||||||||||||||||||||||||||||||||||||
| Total Cumulative Distributions for the Fiscal Period |
% Breakdown of the Total Cumulative Distributions for the Fiscal Period |
|||||||||||||||||||||||||||||||||||||||
| Trust Name | |
Net Income |
|
|
Net Realized Capital Gains Short-Term |
|
|
Net Realized Capital Gains Long-Term |
|
|
Return of Capital |
(a) |
|
Total Per Common Share |
|
|
Net Income |
|
|
Net Realized Capital Gains Short-Term |
|
|
Net Realized Capital Gains Long-Term |
|
|
Return of Capital |
|
|
Total Per Common Share |
| ||||||||||
|
|
||||||||||||||||||||||||||||||||||||||||
| BGR |
$ | 0.386340 | $ | — | $ | — | $ | 0.387660 | $ | 0.774000 | 50 | % | — | % | — | % | 50 | % | 100% | |||||||||||||||||||||
| CII |
0.084620 | — | 1.109380 | — | 1.194000 | 7 | — | 93 | — | 100 | ||||||||||||||||||||||||||||||
| BDJ |
0.273080 | 0.049100 | 0.407220 | — | 0.729400 | 37 | 7 | 56 | — | 100 | ||||||||||||||||||||||||||||||
| BOE |
0.222930 | — | — | 0.533070 | 0.756000 | 29 | — | — | 71 | 100 | ||||||||||||||||||||||||||||||
| BGY |
0.088760 | — | 0.154160 | 0.162680 | 0.405600 | 22 | — | 38 | 40 | 100 | ||||||||||||||||||||||||||||||
| BMEZ |
— | — | — | 1.582470 | 1.582470 | — | — | — | 100 | 100 | ||||||||||||||||||||||||||||||
| BME |
0.146200 | — | 1.586760 | 0.823040 | 2.556000 | 6 | — | 62 | 32 | 100 | ||||||||||||||||||||||||||||||
| BIGZ |
— | — | — | 0.765770 | 0.765770 | — | — | — | 100 | 100 | ||||||||||||||||||||||||||||||
| BCX |
0.293280 | — | — | 0.328320 | 0.621600 | 47 | — | — | 53 | 100 | ||||||||||||||||||||||||||||||
| BSTZ |
— | — | 0.167000 | 1.654710 | 1.821710 | — | — | 9 | 91 | 100 | ||||||||||||||||||||||||||||||
| BST |
— | — | — | 3.000000 | 3.000000 | — | — | — | 100 | 100 | ||||||||||||||||||||||||||||||
| BUI |
0.360190 | 0.209850 | 0.606660 | 0.275300 | 1.452000 | 25 | 14 | 42 | 19 | 100 | ||||||||||||||||||||||||||||||
|
|
||||||||||||||||||||||||||||||||||||||||
| (a) | Each Trust estimates that it has distributed more than its net income and net realized capital gains; therefore, a portion of the distribution may be a return of capital. A return of capital may occur, for example, when some or all of the shareholder’s investment in a Trust is returned to the shareholder. A return of capital does not necessarily reflect a Trust’s investment performance and should not be confused with “yield” or “income.” When distributions exceed total return performance, the difference will reduce a Trust’s net asset value per share. |
Section 19(a) notices for the Trusts, as applicable, are available on the BlackRock website at blackrock.com.
Section 19(b) Disclosure
The Trusts, acting pursuant to a U.S. Securities and Exchange Commission (“SEC”) exemptive order and with the approval of each Trust’s Board of Trustees (the “Board”), each has adopted a managed distribution plan, consistent with its investment objectives and policies, to support a level distribution of income, capital gains and/or return of capital (the “Plan”). In accordance with the Plans, the Trusts currently distribute the following fixed amounts per share on a monthly basis:
| Trust Name | Amount Per Common Share |
|||
| BGR |
$ | 0.065700 | ||
| CII |
0.099500 | |||
| BDJ |
0.056200 | |||
| BOE |
0.063000 | |||
| BGY |
0.033800 | |||
| BMEZ |
0.091600 | |||
| BME |
0.213000 | |||
| BIGZ |
0.044870 | |||
| BCX |
0.051800 | |||
| BSTZ |
0.102540 | |||
| BST |
0.250000 | |||
| BUI |
0.121000 | |||
The fixed amounts distributed per share are subject to change at the discretion of each Trust’s Board. Under its Plan, each Trust will distribute all available net income to its shareholders as required by the Internal Revenue Code of 1986, as amended (the “Code”). If sufficient income (inclusive of net income and short-term capital gains) is not earned on a monthly basis, the Trusts will distribute long-term capital gains and/or return of capital to shareholders in order to maintain a level distribution. Each monthly distribution to shareholders is expected to be at the fixed amount established by the Board; however, each Trust may make additional distributions from time to time, including additional capital gain distributions at the end of the taxable year, if required to meet requirements imposed by the Code and/or the Investment Company Act of 1940, as amended (the “1940 Act”).
Shareholders should not draw any conclusions about a Trust’s investment performance from the amount of these distributions or from the terms of the Plan. Each Trust’s total return performance is presented in its financial highlights table.
| 2 | 2 0 2 3 B L A C K R O C K A N N U A L R E P O R T T O S H A R E H O L D E R S |
| Supplemental Information (unaudited) (continued)
|
The Board may amend, suspend or terminate a Trust’s Plan at any time without prior notice to the Trust’s shareholders if it deems such actions to be in the best interests of the Trust or its shareholders. The suspension or termination of the Plan could have the effect of creating a trading discount (if the Trust’s stock is trading at or above net asset value) or widening an existing trading discount. The Trusts are subject to risks that could have an adverse impact on their ability to maintain level distributions. Examples of potential risks include, but are not limited to, economic downturns impacting the markets, changes in interest rates, decreased market volatility, companies suspending or decreasing corporate dividend distributions and changes in the Code. Please refer to BDJ, BME, BST and BUI’s prospectuses for a more complete description of each Trust’s risks.
| S U P P L E M E N T A L I N F O R M A T I O N |
3 |
Dear Shareholder,
The combination of continued economic growth and cooling inflation provided a supportive backdrop for investors during the 12-month reporting period ended December 31, 2023. Significantly tighter monetary policy helped to rein in inflation, and the Consumer Price Index decelerated substantially in the first half of the year before stalling between 3% and 4% in the second half. A moderating labor market helped ease inflationary pressure, although wages continued to grow. Wage and job growth powered robust consumer spending, backstopping the economy. On October 7, 2023, Hamas launched a horrific attack on Israel. The ensuing war will have a significant humanitarian impact and could lead to heightened economic and market volatility. We see geopolitics as a structural market risk going forward. See our geopolitical risk dashboard at blackrock.com for more details.
Equity returns were robust during the period, as interest rates stabilized and the economy proved to be more resilient than many investors expected. The U.S. economy continued to show strength, and growth further accelerated in the third quarter of 2023. Large-capitalization U.S. stocks posted particularly substantial gains, supported by the performance of a few notable technology companies and small-capitalization U.S. stocks also advanced. Meanwhile, international developed market equities and emerging market stocks posted solid gains.
The 10-year U.S. Treasury yield ended 2023 where it began despite an eventful year that saw significant moves in bond markets. Overall, U.S. Treasuries gained as investors began to anticipate looser financial conditions. The corporate bond market benefited from improving economic sentiment, although high-yield corporate bond prices fared significantly better than investment-grade bonds as demand from yield-seeking investors remained strong.
The U.S. Federal Reserve (the “Fed”), attempting to manage persistent inflation, raised interest rates four times during the 12-month period, but paused its tightening in the second half of the period. The Fed also wound down its bond-buying programs and incrementally reduced its balance sheet by not replacing securities that reach maturity.
Supply constraints appear to have become an embedded feature of the new macroeconomic environment, making it difficult for developed economies to increase production without sparking higher inflation. Geopolitical fragmentation and an aging population risk further exacerbating these constraints, keeping the labor market tight and wage growth high. Although the Fed has stopped tightening for now, we believe that the new economic regime means that the Fed will need to maintain high rates for an extended period despite the market’s hopes for interest rate cuts, as reflected in the recent rally. In this new regime, we anticipate greater volatility and dispersion of returns, creating more opportunities for selective portfolio management.
We believe developed market equities have priced in an optimistic scenario for rate cuts, which we view as premature, so we prefer an underweight stance in the near term. Nevertheless, we are overweight on Japanese stocks as shareholder-friendly policies generate increased investor interest. We also believe that stocks with an AI tilt should benefit from an investment cycle that is set to support revenues and margins. In credit, there are selective opportunities in the near term despite tighter credit and financial conditions. For fixed income investing with a six- to twelve-month horizon, we see the most attractive investments in short-term U.S. Treasuries, U.S. mortgage-backed securities, and hard-currency emerging market bonds.
Overall, our view is that investors need to think globally, position themselves to be prepared for a decarbonizing economy, and be nimble as market conditions change. We encourage you to talk with your financial advisor and visit blackrock.com for further insight about investing in today’s markets.
Sincerely,

Rob Kapito
President, BlackRock Advisors, LLC

Rob Kapito
President, BlackRock Advisors, LLC
| Total Returns as of December 31, 2023
| ||||
|
6-Month
|
12-Month
| |||
|
U.S. large cap equities (S&P 500® Index)
|
8.04% |
26.29% | ||
|
U.S. small cap equities (Russell 2000® Index)
|
8.18 |
16.93 | ||
|
International equities (MSCI Europe, Australasia, Far East Index)
|
5.88 |
18.24 | ||
|
Emerging market equities (MSCI Emerging Markets Index)
|
4.71 |
9.83 | ||
|
3-month Treasury bills (ICE BofA 3-Month U.S. Treasury Bill Index)
|
2.70 |
5.02 | ||
|
U.S. Treasury securities (ICE BofA 10-Year U.S. Treasury Index)
|
1.11 |
2.83 | ||
|
U.S. investment grade bonds (Bloomberg U.S. Aggregate Bond Index)
|
3.37 |
5.53 | ||
|
Tax-exempt municipal bonds (Bloomberg Municipal Bond Index)
|
3.63 |
6.40 | ||
|
U.S. high yield bonds (Bloomberg U.S. Corporate High Yield 2% Issuer Capped Index) |
7.65 |
13.44 | ||
| Past performance is not an indication of future results. Index performance is shown for illustrative purposes only. You cannot invest directly in an index.
| ||||
| 4 | T H I S P A G E I S N O T P A R T O F Y O U R F U N D R E P O R T |
| Page | ||||
| 2 | ||||
| 4 | ||||
| 6 | ||||
| 6 | ||||
| Annual Report: |
||||
| 7 | ||||
| Financial Statements: |
||||
| 44 | ||||
| 133 | ||||
| 136 | ||||
| 139 | ||||
| 145 | ||||
| 151 | ||||
| 163 | ||||
| 178 | ||||
| 179 | ||||
| 181 | ||||
| 207 | ||||
| 217 | ||||
| 218 | ||||
| 222 | ||||
| 226 | ||||
| 5 |
Overview
In general, the goal of each of the Trusts is to provide total return through a combination of current income and realized and unrealized gains (capital appreciation). The Trusts seek to pursue these goals primarily by investing in a portfolio of equity securities and also by employing a strategy of writing (selling) call and put options in an effort to generate current gains from option premiums and to enhance each Trust’s risk-adjusted return. Each Trust’s objectives cannot be achieved in all market conditions.
Each Trust primarily writes single stock covered call options and may also from time to time write single stock put options. When writing (selling) a covered call option, a Trust holds an underlying equity security and enters into an option transaction which allows the counterparty to purchase the equity security at an agreed-upon price (“strike price”) within an agreed-upon time period. The Trust receives cash premiums from the counterparties upon writing (selling) the option, which along with net investment income and net realized gains, if any, are generally available to support current or future distributions paid by the Trust. During the option term, the counterparty may elect to exercise the option if the market value of the equity security rises above the strike price, and the Trust is obligated to sell the equity security to the counterparty at the strike price, realizing a gain or loss. Premiums received increase gains or reduce losses realized on the sale of the equity security. If the option remains unexercised upon its expiration, the Trust realizes gains equal to the premiums received. Alternatively, an option may be closed out by an offsetting purchase or sale of an option prior to expiration. The Trust realizes a capital gain from a closing purchase or sale transaction if the premium paid is less than the premium received from writing the option. The Trust realizes a capital loss from a closing purchase or sale transaction if the premium received is less than the premium paid to purchase the option.
Writing covered call options entails certain risks, which include, but are not limited to, the following: an increase in the value of the underlying equity security above the strike price can result in the exercise of a written option (sale by a Trust to the counterparty) when the Trust might not otherwise have sold the security; exercise of the option by the counterparty may result in a sale below the current market value and a gain or loss being realized by the Trust; and limiting the potential appreciation that could be realized on the underlying equity security to the extent of the strike price of the option. The premium that a Trust receives from writing a covered call option may not be sufficient to offset the potential appreciation on the underlying equity security above the strike price of the option that could have otherwise been realized by the Trust. As such, an option over-writing strategy may outperform the general equity market in flat or falling markets but underperform in rising markets.
Option Over-Writing Strategy Illustration
To illustrate these concepts, assume the following: (1) a common stock purchased at and currently trading at $37.15 per share; (2) a three-month call option is written by a Trust with a strike price of $40 (i.e., 7.7% higher than the current market price); and (3) the Trust receives $2.45, or 6.6% of the common stock’s value, as a premium. If the stock price remains unchanged, the option expires and there would be a 6.6% return for the three-month period. If the stock were to decline in price by 6.6% (i.e., decline to $34.70 per share), the option strategy would “break-even” from an economic perspective resulting in neither a gain nor a loss. If the stock were to climb to a price of $40 or above, the option would be exercised and the stock would return 7.7% coupled with the option premium received of 6.6% for a total return of 14.3%. Under this scenario, the Trust loses the benefit of any appreciation of the stock above $40, and thus is limited to a 14.3% total return. The premium from writing the call option serves to offset some of the unrealized loss on the stock in the event that the price of the stock declines, but if the stock were to decline more than 6.6% under this scenario, the Trust’s downside protection is eliminated and the stock could eventually become worthless.
Each Trust intends to write covered call and other options to varying degrees depending upon market conditions. Please refer to each Trust’s Schedule of Investments and the Notes to Financial Statements for details of written options.
Derivative Financial Instruments
The Trusts may invest in various derivative financial instruments. These instruments are used to obtain exposure to a security, commodity, index, market, and/or other assets without owning or taking physical custody of securities, commodities and/or other referenced assets or to manage market, equity, credit, interest rate, foreign currency exchange rate, commodity and/or other risks. Derivative financial instruments may give rise to a form of economic leverage and involve risks, including the imperfect correlation between the value of a derivative financial instrument and the underlying asset, possible default of the counterparty to the transaction or illiquidity of the instrument. Pursuant to Rule 18f-4 under the 1940 Act, among other things, the Trusts must either use derivative financial instruments with embedded leverage in a limited manner or comply with an outer limit on fund leverage risk based on value-at-risk. The Trusts’ successful use of a derivative financial instrument depends on the investment adviser’s ability to predict pertinent market movements accurately, which cannot be assured. The use of these instruments may result in losses greater than if they had not been used, may limit the amount of appreciation a Trust can realize on an investment and/or may result in lower distributions paid to shareholders. The Trusts’ investments in these instruments, if any, are discussed in detail in the Notes to Financial Statements.
| 6 | 2 0 2 3 B L A C K R O C K A N N U A L R E P O R T T O S H A R E H O L D E R S |
| Trust Summary as of December 31, 2023
|
BlackRock Energy and Resources Trust (BGR) |
Investment Objective
BlackRock Energy and Resources Trust’s (BGR) (the “Trust”) investment objective is to provide total return through a combination of current income and long-term capital appreciation. The Trust seeks to achieve its investment objective by investing, under normal market conditions, at least 80% of its total assets in equity securities of energy and natural resources companies and equity derivatives with exposure to the energy and natural resources industry. The Trust may invest directly in such securities or synthetically through the use of derivatives. The Trust seeks to pursue this goal primarily by investing in a portfolio of equity securities and also by employing a strategy of writing (selling) call and put options.
No assurance can be given that the Trust’s investment objective will be achieved.
Trust Information
| Symbol on New York Stock Exchange |
BGR | |
| Initial Offering Date |
December 29, 2004 | |
| Current Distribution Rate on Closing Market Price as of December 31, 2023 ($12.45)(a) |
6.33% | |
| Current Monthly Distribution per Common Share(b) |
$0.065700 | |
| Current Annualized Distribution per Common Share(b) |
$0.788400 |
| (a) | Current distribution rate on closing market price is calculated by dividing the current annualized distribution per share by the closing market price. The current distribution rate may consist of income, net realized gains and/or a return of capital. Past performance is not an indication of future results. |
| (b) | The distribution rate is not constant and is subject to change. A portion of the distribution may be deemed a return of capital or net realized gain. |
Market Price and Net Asset Value Per Share Summary
| 12/31/23 | 12/31/22 | Change | High | Low | ||||||||||||||||
| Closing Market Price |
$ | 12.45 | $ | 12.53 | (0.64 | )% | $ | 13.36 | $ | 11.23 | ||||||||||
| Net Asset Value |
14.13 | 14.21 | (0.56 | ) | 15.09 | 12.71 | ||||||||||||||
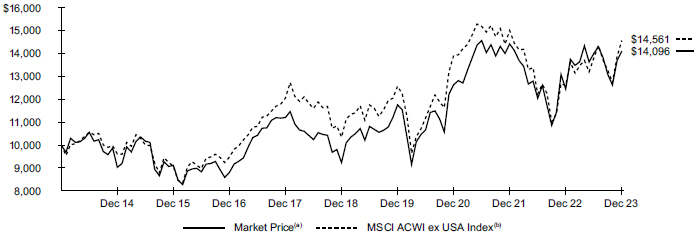
GROWTH OF $10,000 INVESTMENT
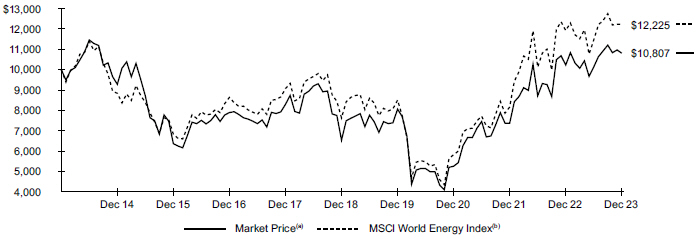
| (a) | Represents the Trust’s closing market price on the NYSE and reflects the reinvestment of dividends and/or distributions at actual reinvestment prices. |
| (b) | An index that is designed to capture the large- and mid-cap segments across developed markets countries. All securities in the index are classified in the energy sector as per the Global Industry Classification Standard. |
| T R U S T S U M M A R Y |
7 |
| Trust Summary as of December 31, 2023 (continued)
|
BlackRock Energy and Resources Trust (BGR) |
Performance
Returns for the period ended December 31, 2023 were as follows:
| Average Annual Total Returns | ||||||||||||
| 1 Year | 5 Years | 10 Years | ||||||||||
| Trust at NAV(a)(b) |
5.75 | % | 10.34 | % | 0.98 | % | ||||||
| Trust at Market Price(a)(b) |
5.66 | 10.57 | 0.78 | |||||||||
| MSCI World Energy Call Overwrite Index(c) |
5.18 | 7.71 | N/A | |||||||||
| MSCI World Energy Index |
2.54 | 9.88 | 2.03 | |||||||||
| (a) | All returns reflect reinvestment of dividends and/or distributions at actual reinvestment prices. |
| (b) | The Trust’s discount to NAV widened during the period, which accounts for the difference between performance based on market price and performance based on NAV. |
| (c) | An index that incorporates an option overlay component on the MSCI World Energy Index with a 33% overwrite level. The benchmark commenced on December 31, 2018 and therefore the benchmark does not have 10-year returns. |
Performance results may include adjustments made for financial reporting purposes in accordance with U.S. generally accepted accounting principles. Past performance is not an indication of future results.
The Trust is presenting the performance of one or more indices for informational purposes only. The Trust is actively managed and does not seek to track or replicate the performance of any index. The index performance shown is not intended to be indicative of the Trust’s investment strategies, portfolio components or past or future performance.
More information about the Trust’s historical performance can be found in the “Closed End Funds” section of blackrock.com.
The following discussion relates to the Trust’s relative performance based on NAV:
What factors influenced performance?
Natural resources stocks posted gains as a group in 2023, but they lagged the broader equity market due largely to weakness in commodity prices.
The Trust’s overweight positions in Canadian Natural Resources Ltd. and Diamondback Energy, Inc., which rose on the strength of robust production and positive earnings results, contributed to performance. Zero weightings in Devon Energy Corp. and Occidental Petroleum Corp. also contributed. Devon reported weaker-than-expected profits, and Occidental’s share price fell following the announcement of a debt-trusted acquisition. The U.S. liquified natural gas exporter Cheniere Energy, Inc., which reported strong results and upgraded its earnings guidance throughout the year, was another noteworthy contributor.
On the negative side, an underweight in the oilfield services sub-sector detracted from performance. At the stock level, an overweight position in Patterson-UTI Energy Inc. detracted in the first half of the year. A zero weighting in Baker Hughes, Inc. hurt performance, as well. Elsewhere in the portfolio, zero weightings in Cameco Inc., Neste oyj, and Phillips 66 pressured results. A position in BP PLC also detracted. Although the company reported robust earnings, investors reacted negatively to the company’s decision to reduce its pace of share buybacks.
The Trust used an options overlay strategy in which calls were written on a portion of the portfolio’s holdings. This strategy contributed to results in the annual period.
The Trust’s practice of maintaining a specified level of monthly distributions to shareholders did not have a material impact on the Trust’s investment strategy. The distribution policy resulted in return of capital for the period. Refer to the financial highlights and income tax information sections in this report for further information about the distributions.
Describe recent portfolio activity.
The investment adviser added to the Trust’s weighting in the oilfield services subsector, and it modestly reduced the allocation to integrated oil companies. The investment adviser also reduced the Trust’s position in U.S. shale exploration and production companies, and it rotated its holdings in the integrated subsector in an effort to capitalize on differences in relative performance.
Describe portfolio positioning at period end.
The investment adviser actively manages the Trust’s positioning to focus on areas where it sees compelling return opportunities and attractive valuations. It believed valuations were favorable at the end of the reporting period given energy companies’ ability to generate profits and deliver high free cash flows. The Trust was overweight in European integrated producers, where the investment advisor saw the most compelling valuations. The Trust maintained selective exposure within the U.S. shale space.
As of December 31, 2023, the Trust had in place an option overwriting program whereby 29.8% of the underlying equities were overwritten with call options on individual stocks. These call options were typically written at prices above the prevailing market prices (estimated to be 3.9% out of the money) and for maturities averaging 48 days.
The views expressed reflect the opinions of BlackRock as of the date of this report and are subject to change based on changes in market, economic or other conditions. These views are not intended to be a forecast of future events and are no guarantee of future results.
| 8 | 2 0 2 3 B L A C K R O C K A N N U A L R E P O R T T O S H A R E H O L D E R S |
| Trust Summary as of December 31, 2023 (continued)
|
BlackRock Energy and Resources Trust (BGR) |
Overview of the Trust’s Total Investments
TEN LARGEST HOLDINGS
| Security(a) | Percent of Total Investments |
|||
| Exxon Mobil Corp. |
16.3 | % | ||
| Shell PLC |
10.8 | |||
| Chevron Corp. |
8.8 | |||
| TotalEnergies SE |
8.2 | |||
| ConocoPhillips |
6.2 | |||
| BP PLC |
4.7 | |||
| Canadian Natural Resources Ltd. |
4.2 | |||
| EOG Resources, Inc. |
4.0 | |||
| Williams Cos., Inc. |
3.7 | |||
| Cheniere Energy, Inc. |
3.7 | |||
INDUSTRY ALLOCATION
| Industry(a)(b) | Percentage of Total Investments |
|||
| Oil, Gas & Consumable Fuels |
93.6 | % | ||
| Energy Equipment & Services |
6.4 | |||
| (a) | Excludes short-term securities. |
| (b) | For Trust compliance purposes, the Trust’s industry classifications refer to one or more of the industry sub-classifications used by one or more widely recognized market indexes or ratings group indexes, and/or as defined by the investment adviser. These definitions may not apply for purposes of this report, which may combine such industry sub-classifications for reporting ease. |
| T R U S T S U M M A R Y |
9 |
| Trust Summary as of December 31, 2023
|
BlackRock Enhanced Capital and Income Fund, Inc. (CII) |
Investment Objective
BlackRock Enhanced Capital and Income Fund, Inc.’s (CII) (the “Trust”) investment objective is to provide current income and capital appreciation. The Trust seeks to achieve its investment objective by investing in a portfolio of equity securities of U.S. and foreign issuers. The Trust may invest directly in such securities or synthetically through the use of derivatives. The Trust also seeks to achieve its investment objective by employing a strategy of writing (selling) call and put options.
No assurance can be given that the Trust’s investment objective will be achieved.
Trust Information
| Symbol on New York Stock Exchange |
CII | |
| Initial Offering Date |
April 30, 2004 | |
| Current Distribution Rate on Closing Market Price as of December 31, 2023 ($19.00)(a) |
6.28% | |
| Current Monthly Distribution per Common Share(b) |
$0.099500 | |
| Current Annualized Distribution per Common Share(b) |
$1.194000 |
| (a) | Current distribution rate on closing market price is calculated by dividing the current annualized distribution per share by the closing market price. The current distribution rate may consist of income, net realized gains and/or a return of capital. Past performance is not an indication of future results. |
| (b) | The distribution rate is not constant and is subject to change. A portion of the distribution may be deemed a return of capital or net realized gain. |
Market Price and Net Asset Value Per Share Summary
| 12/31/23 | 12/31/22 | Change | High | Low | ||||||||||||||||
| Closing Market Price |
$ | 19.00 | $ | 17.12 | 10.98 | % | $ | 19.32 | $ | 16.82 | ||||||||||
| Net Asset Value |
19.81 | 17.55 | 12.88 | 19.84 | 17.42 | |||||||||||||||
GROWTH OF $10,000 INVESTMENT
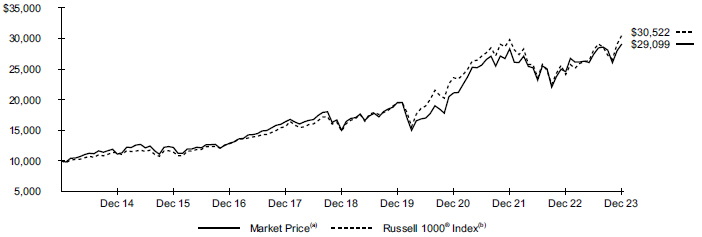
| (a) | Represents the Trust’s closing market price on the NYSE and reflects the reinvestment of dividends and/or distributions at actual reinvestment prices. |
| (b) | An index that measures the performance of the large-cap segment of the U.S. equity universe. It is a subset of the Russell 3000® Index and includes approximately 1,000 of the largest securities based on a combination of their market capitalization and current index membership. The Russell 1000® Index represents approximately 93% of the U.S. market. |
| 10 | 2 0 2 3 B L A C K R O C K A N N U A L R E P O R T T O S H A R E H O L D E R S |
| Trust Summary as of December 31, 2023 (continued)
|
BlackRock Enhanced Capital and Income Fund, Inc. (CII) |
Performance
Returns for the period ended December 31, 2023 were as follows:
| Average Annual Total Returns | ||||||||||||
| 1 Year | 5 Years | 10 Years | ||||||||||
| Trust at NAV(a)(b) |
20.45 | % | 13.27 | % | 10.25 | % | ||||||
| Trust at Market Price(a)(b) |
18.43 | 14.18 | 11.27 | |||||||||
| MSCI USA Call Overwrite Index(c) |
22.00 | 11.57 | N/A | |||||||||
| Russell 1000® Index |
26.53 | 15.52 | 11.80 | |||||||||
| (a) | All returns reflect reinvestment of dividends and/or distributions at actual reinvestment prices. |
| (b) | The Trust’s discount to NAV widened during the period, which accounts for the difference between performance based on market price and performance based on NAV. |
| (c) | An index that incorporates an option overlay component on the MSCI USA Index with a 55% overwrite level. The benchmark commenced on December 31, 2018 and therefore the benchmark does not have 10-year returns. |
Performance results may include adjustments made for financial reporting purposes in accordance with U.S. generally accepted accounting principles. Past performance is not an indication of future results.
The Trust is presenting the performance of one or more indices for informational purposes only. The Trust is actively managed and does not seek to track or replicate the performance of any index. The index performance shown is not intended to be indicative of the Trust’s investment strategies, portfolio components or past or future performance.
More information about the Trust’s historical performance can be found in the “Closed End Funds” section of blackrock.com.
The following discussion relates to the Trust’s relative performance based on NAV:
What factors influenced performance?
Stock selection within the healthcare sector was a leading contributor to relative performance, most notably within the pharmaceuticals industry. Investment decisions within communication services also proved additive, most notably an overweight allocation to the sector along with stock selection in interactive media and services. Finally, positioning within the energy sector and a lack of exposure to utilities was beneficial as well.
An underweight allocation to the information technology sector was the largest detractor during the period. Stock selection in materials also detracted, most notably an overweight allocation to and poor selection within the containers and packaging industry. Stock selection within consumer discretionary and industrials detracted as well.
The Trust utilized an options overlay strategy in which calls are written on a portion of the portfolio’s holdings. The Trust’s options overlay strategy detracted from relative performance for the 12-month period.
The Trust’s practice of maintaining a specified level of monthly distributions did not have a material impact on the Trust’s investment strategy. The distribution policy did not result in return of capital for the period. Refer to the financial highlights and income tax information sections in this report for further information about the distributions.
Describe recent portfolio activity.
During the reporting period, a combination of portfolio trading activity and market price changes resulted in the Trust adding exposure to the information technology and communication services sectors, while the Trust saw reduced exposure to industrials and materials.
Describe portfolio positioning at period end.
As of December 31, 2023, the Trust had an options overwriting program in place whereby 51% of the underlying equities were overwritten with call options. These call options were typically written at levels above prevailing market prices (estimated to be 6.0% out of the money) with an average time until expiration of 53 days.
At period end, the Trust’s largest absolute allocations were in IT, healthcare and financials. Relative to the benchmark, the Trust’s most significant overweight exposures were in communication services, health care and consumer discretionary. The Trust maintained its most significant relative underweight sector exposures to IT, real estate and utilities.
The views expressed reflect the opinions of BlackRock as of the date of this report and are subject to change based on changes in market, economic or other conditions. These views are not intended to be a forecast of future events and are no guarantee of future results.
| T R U S T S U M M A R Y |
11 |
| Trust Summary as of December 31, 2023 (continued)
|
BlackRock Enhanced Capital and Income Fund, Inc. (CII) |
Overview of the Trust’s Total Investments
TEN LARGEST HOLDINGS
| Security(a) | Percent of Total Investments |
|||
| Microsoft Corp. |
8.7 | % | ||
| Amazon.com, Inc. |
5.5 | |||
| Alphabet, Inc. |
5.4 | |||
| Apple, Inc. |
4.4 | |||
| Meta Platforms, Inc. |
3.1 | |||
| Berkshire Hathaway, Inc. |
2.6 | |||
| Advanced Micro Devices, Inc. |
2.3 | |||
| Comcast Corp. |
2.3 | |||
| Fortive Corp. |
2.3 | |||
| Sanofi SA |
2.2 | |||
SECTOR ALLOCATION
| Sector(a)(b) | Percent of Total Investments |
|||
| Information Technology |
25.2 | % | ||
| Health Care |
16.2 | |||
| Financials |
13.1 | |||
| Communication Services |
13.1 | |||
| Consumer Discretionary |
12.8 | |||
| Industrials |
6.9 | |||
| Consumer Staples |
5.5 | |||
| Energy |
4.2 | |||
| Materials |
3.0 | |||
| (a) | Excludes short-term securities. |
| (b) | For Trust compliance purposes, the Trust’s sector classifications refer to one or more of the sector sub-classifications used by one or more widely recognized market indexes or rating group indexes, and/or as defined by the investment adviser. These definitions may not apply for purposes of this report, which may combine such sector sub-classifications for reporting ease. |
| 12 | 2 0 2 3 B L A C K R O C K A N N U A L R E P O R T T O S H A R E H O L D E R S |
| Trust Summary as of December 31, 2023
|
BlackRock Enhanced Equity Dividend Trust (BDJ) |
Investment Objective
BlackRock Enhanced Equity Dividend Trust’s (BDJ) (the “Trust”) primary investment objective is to provide current income and current gains, with a secondary investment objective of long-term capital appreciation. The Trust seeks to achieve its investment objectives by investing in common stocks that pay dividends and have the potential for capital appreciation and by utilizing an option writing strategy to enhance distributions to its shareholders. The Trust invests, under normal market conditions, at least 80% of its total assets in dividend paying equities and may invest up to 20% of its total assets in equity securities of issuers that do not pay dividends. The Trust may invest directly in such securities or synthetically through the use of derivatives.
No assurance can be given that the Trust’s investment objectives will be achieved.
Trust Information
| Symbol on New York Stock Exchange |
BDJ | |
| Initial Offering Date |
August 31, 2005 | |
| Current Distribution Rate on Closing Market Price as of December 31, 2023 ($7.69)(a) |
8.77% | |
| Current Monthly Distribution per Common Share(b) |
$0.056200 | |
| Current Annualized Distribution per Common Share(b) |
$0.674400 |
| (a) | Current distribution rate on closing market price is calculated by dividing the current annualized distribution per share by the closing market price. The current distribution rate may consist of income, net realized gains and/or a return of capital. Past performance is not an indication of future results. |
| (b) | The distribution rate is not constant and is subject to change. A portion of the distribution may be deemed a return of capital or net realized gain. |
Market Price and Net Asset Value Per Share Summary
| 12/31/23 | 12/31/22 | Change | High | Low | ||||||||||||||||
| Closing Market Price |
$ | 7.69 | $ | 9.01 | (14.65 | )% | $ | 9.36 | $ | 6.92 | ||||||||||
| Net Asset Value |
8.82 | 8.74 | 0.92 | 9.15 | 8.05 | |||||||||||||||
GROWTH OF $10,000 INVESTMENT
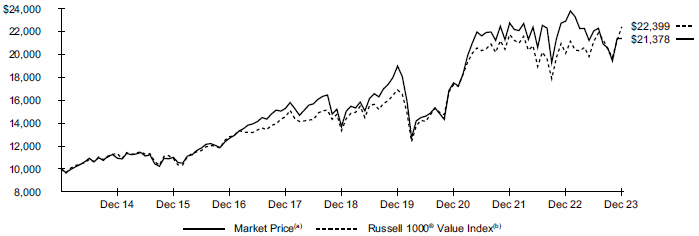
| (a) | Represents the Trust’s closing market price on the NYSE and reflects the reinvestment of dividends and/or distributions at actual reinvestment prices. |
| (b) | An index that measures the performance of the large-cap value segment of the U.S. equity universe. It includes those Russell 1000 companies with lower price-to-book ratios and lower expected growth values. |
| T R U S T S U M M A R Y |
13 |
| Trust Summary as of December 31, 2023 (continued)
|
BlackRock Enhanced Equity Dividend Trust (BDJ) |
Performance
Returns for the period ended December 31, 2023 were as follows:
| Average Annual Total Returns | ||||||||||||
| 1 Year | 5 Years | 10 Years | ||||||||||
| Trust at NAV(a)(b) |
10.37 | % | 9.76 | % | 7.88 | % | ||||||
| Trust at Market Price(a)(b) |
(6.65 | ) | 9.31 | 7.89 | ||||||||
| MSCI USA Value Call Overwrite Index(c) |
5.33 | 7.12 | N/A | |||||||||
| Russell 1000® Value Index |
11.46 | 10.91 | 8.40 | |||||||||
| (a) | All returns reflect reinvestment of dividends and/or distributions at actual reinvestment prices. |
| (b) | The Trust moved from a premium to NAV to a discount during the period, which accounts for the difference between performance based on market price and performance based on NAV. |
| (c) | An index that incorporates an option overlay component on the MSCI USA Value Index with a 55% overwrite level. The benchmark commenced on December 31, 2018 and therefore the benchmark does not have 10-year returns. |
Performance results may include adjustments made for financial reporting purposes in accordance with U.S. generally accepted accounting principles. Past performance is not an indication of future results.
The Trust is presenting the performance of one or more indices for informational purposes only. The Trust is actively managed and does not seek to track or replicate the performance of any index. The index performance shown is not intended to be indicative of the Trust’s investment strategies, portfolio components or past or future performance.
More information about the Trust’s historical performance can be found in the “Closed End Funds” section of blackrock.com.
The following discussion relates to the Trust’s relative performance based on NAV:
What factors influenced performance?
The global equity markets produced robust returns in 2023 thanks to stronger-than-expected economic growth and a more favorable outlook for central bank policy. Dividend-paying stocks, while posting gains, lagged the broader market at a time in which investors displayed a preference for faster-growing companies.
Stock selection in the financial sector made the largest contribution to the Fund’s relative performance. Selection in health care also boosted results, mainly due to positioning in pharmaceuticals. Stock selection in energy was an additional contributor, led by the oil, gas, and consumable fuels industry group. Positioning in utilities contributed as well.
On the other hand, an underweight in the information technology sector detracted from performance. Stock selection in materials further weighed on results, with the weakest showing in the containers and packaging industry. Positioning in the consumer discretionary and consumer staples sectors also detracted.
The Trust used an options overlay strategy in which calls were written on a portion of the portfolio’s holdings. The options overlay strategy detracted from relative performance.
The Trust’s practice of maintaining a specified level of monthly distributions to shareholders did not have a material impact on the Trust’s investment strategy. The distribution policy did not result in return of capital for the period. Refer to the financial highlights and income tax information sections in this report for further information about the distributions.
Describe recent portfolio activity.
The Trust’s allocations to the financials and industrials sectors increased due to a combination of portfolio trading activity and market price changes. The Trust’s weightings in information technology and healthcare sectors decreased.
Describe portfolio positioning at period end.
As of December 31, 2023, the Trust had in place an option overwriting program whereby 50.8% of the underlying equities were overwritten with call options on individual stocks. These call options were typically written at prices above the prevailing market prices (estimated to be 5.0% out of the money) and for maturities averaging 55 days.
At period end, the Trust’s largest absolute allocations were in financials, healthcare, and industrials. Relative to the benchmark, the Trust’s most significant overweight exposures were in financials, communication services and health care. The Trust maintained its most significant relative underweight sector exposures to IT, real estate and materials.
The views expressed reflect the opinions of BlackRock as of the date of this report and are subject to change based on changes in market, economic or other conditions. These views are not intended to be a forecast of future events and are no guarantee of future results.
| 14 | 2 0 2 3 B L A C K R O C K A N N U A L R E P O R T T O S H A R E H O L D E R S |
| Trust Summary as of December 31, 2023 (continued)
|
BlackRock Enhanced Equity Dividend Trust (BDJ) |
Overview of the Trust’s Total Investments
TEN LARGEST HOLDINGS
| Security(a) | Percent of Total Investments |
|||
| Wells Fargo & Co. |
3.2 | % | ||
| Citigroup, Inc. |
3.0 | |||
| American International Group, Inc. |
2.9 | |||
| Shell PLC |
2.6 | |||
| Kraft Heinz Co. |
2.4 | |||
| Leidos Holdings, Inc. |
2.3 | |||
| L3Harris Technologies, Inc. |
2.3 | |||
| General Motors Co. |
2.2 | |||
| SS&C Technologies Holdings, Inc. |
2.1 | |||
| BP PLC |
2.1 | |||
SECTOR ALLOCATION
| Sector(a)(b) | Percent of Total Investments |
|||
| Financials |
26.9 | % | ||
| Health Care |
18.2 | |||
| Industrials |
11.5 | |||
| Consumer Staples |
8.8 | |||
| Energy |
8.5 | |||
| Information Technology |
7.3 | |||
| Consumer Discretionary |
6.3 | |||
| Communication Services |
5.5 | |||
| Utilities |
4.1 | |||
| Materials |
2.1 | |||
| Real Estate |
0.8 | |||
| (a) | Excludes short-term securities. |
| (b) | For Trust compliance purposes, the Trust’s sector classifications refer to one or more of the sector sub-classifications used by one or more widely recognized market indexes or rating group indexes, and/or as defined by the investment adviser. These definitions may not apply for purposes of this report, which may combine such sector sub-classifications for reporting ease. |
| T R U S T S U M M A R Y |
15 |
| Trust Summary as of December 31, 2023
|
BlackRock Enhanced Global Dividend Trust (BOE) |
Investment Objective
BlackRock Enhanced Global Dividend Trust’s (BOE) (the “Trust”) primary investment objective is to provide current income and current gains, with a secondary investment objective of long-term capital appreciation. The Trust seeks to achieve its investment objectives by investing primarily in equity securities issued by companies located in countries throughout the world and by employing a strategy of writing (selling) call and put options. Under normal circumstances, the Trust invests at least 80% of its net assets in dividend-paying equity securities and at least 40% of its assets outside of the U.S. (unless market conditions are not deemed favorable by Trust management, in which case the Trust would invest at least 30% of its assets outside of the U.S.). The Trust may invest in securities of companies of any market capitalization, but intends to invest primarily in securities of large capitalization companies. The Trust may invest directly in such securities or synthetically through the use of derivatives.
No assurance can be given that the Trust’s investment objectives will be achieved.
Trust Information
| Symbol on New York Stock Exchange |
BOE | |
| Initial Offering Date |
May 31, 2005 | |
| Current Distribution Rate on Closing Market Price as of December 31, 2023 ($ 9.92)(a) |
7.62% | |
| Current Monthly Distribution per Common Share(b) |
$0.063000 | |
| Current Annualized Distribution per Common Share(b) |
$0.756000 |
| (a) | Current distribution rate on closing market price is calculated by dividing the current annualized distribution per share by the closing market price. The current distribution rate may consist of income, net realized gains and/or a return of capital. Past performance is not an indication of future results. |
| (b) | The distribution rate is not constant and is subject to change. A portion of the distribution may be deemed a return of capital or net realized gain. |
Market Price and Net Asset Value Per Share Summary
| 12/31/23 | 12/31/22 | Change | High | Low | ||||||||||||||||
| Closing Market Price |
$ | 9.92 | $ | 9.56 | 3.77 | % | $ | 10.59 | $ | 8.87 | ||||||||||
| Net Asset Value |
11.81 | 10.97 | 7.66 | 11.81 | 10.56 | |||||||||||||||
GROWTH OF $10,000 INVESTMENT
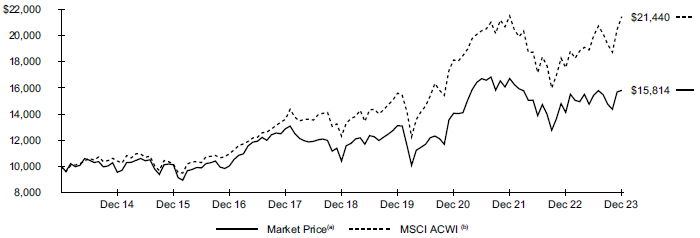
| (a) | Represents the Trust’s closing market price on the NYSE and reflects the reinvestment of dividends and/or distributions at actual reinvestment prices. |
| (b) | An index that captures large- and mid-cap representation across certain developed and emerging markets. |
| 16 | 2 0 2 3 B L A C K R O C K A N N U A L R E P O R T T O S H A R E H O L D E R S |
| Trust Summary as of December 31, 2023 (continued)
|
BlackRock Enhanced Global Dividend Trust (BOE) |
Performance
Returns for the period ended December 31, 2023 were as follows:
| Average Annual Total Returns | ||||||||||||
| 1 Year | 5 Years | 10 Years | ||||||||||
| Trust at NAV(a)(b) |
16.16 | % | 8.89 | % | 5.14 | % | ||||||
| Trust at Market Price(a)(b) |
11.95 | 8.72 | 4.69 | |||||||||
| MSCI ACWI Call Overwrite Index(c) |
18.00 | 8.97 | N/A | |||||||||
| MSCI ACWI |
22.20 | 11.72 | 7.93 | |||||||||
| (a) | All returns reflect reinvestment of dividends and/or distributions at actual reinvestment prices. |
| (b) | The Trust’s discount to NAV widened during the period, which accounts for the difference between performance based on market price and performance based on NAV. |
| (c) | An index that incorporates an option overlay component on the MSCI ACWI Index with a 45% overwrite level. The benchmark commenced on December 31, 2018 and therefore the benchmark does not have 10-year returns. |
Performance results may include adjustments made for financial reporting purposes in accordance with U.S. generally accepted accounting principles. Past performance is not an indication of future results.
The Trust is presenting the performance of one or more indices for informational purposes only. The Trust is actively managed and does not seek to track or replicate the performance of any index. The index performance shown is not intended to be indicative of the Trust’s investment strategies, portfolio components or past or future performance.
More information about the Trust’s historical performance can be found in the “Closed End Funds” section of blackrock.com.
The following discussion relates to the Trust’s relative performance based on NAV:
What factors influenced performance?
At the individual stock level, a lack of exposure to Nvidia Corp. and Meta Platforms, Inc., along with an underweight position in Apple, Inc. were among the top detractors given the outsized gains posted by these stocks over the year. The Trust’s focus on investing in high quality companies with sustainable growing cash flows that pay a dividend limits its ability to invest in much of the universe of technology-related companies given that these companies typically pay very low dividends or have no dividend policies. The Trust’s position in International Flavors & Fragrances, Inc. also detracted from performance. The company missed earnings estimates and guided lower on full year 2023 growth given an uncertain market environment that led to weaker volumes and industry-wide consumer destocking in the United States. The Fund exited the position in the third quarter of 2023.
In terms of individual holdings, positive contributions were led by MediaTek, Inc. (“MediaTek”), a Taiwanese semiconductor company that supplies chips for smartphones in China. MediaTek shares benefited as expectations for central bank rate cuts supported growth-oriented areas of the market. In addition, the company continued to beat earnings estimates and saw significant improvements in inventory levels and expectations for the recovery in China’s smartphone market where the investment adviser believed it was positioned to continue to gain market share. Holdings of U.K. home construction company Taylor Wimpey PLC also contributed to performance. The shares were supported by expectations for lower U.K. mortgage rates and a more robust U.K. housing market in 2024. The company’s strong balance sheet and attractive land bank along with the structural imbalance between supply and demand in the U.K. housing market continued to make it an attractive holding in the view of the investment adviser. Finally, Spanish clothing retailer Industria de Diseno Textil SA, curator of brands such as Zara, reported strong profits over the year thanks to robust in-store and online sales. The company has been able to maintain pricing strength in markets outside the Eurozone, which has boosted profitability.
The Trust utilized an options overlay strategy in which calls are written on a portion of the portfolio’s holdings. The Trust’s options overlay strategy contributed positively to relative performance.
The Trust’s practice of maintaining a specified level of monthly distributions to shareholders did not have a material impact on the Trust’s investment strategy. The distribution policy resulted in return of capital for the period. Refer to the financial highlights and income tax information sections in this report for further information about the distributions.
Describe recent portfolio activity.
During the reporting period, the Trust added exposure to the industrials, information technology and energy sectors. The Trust reduced exposure to the consumer discretionary sector, particularly in relation to the luxury segment, as well as to healthcare and utilities.
Describe portfolio positioning at period end.
At period end, the Trust’s largest sector overweights were in industrials, healthcare and consumer staples, while consumer discretionary was the largest underweight. Regionally, the Trust was overweight Europe and underweight the United States.
As of December 31, 2023, the Trust had an options overwriting program in place whereby 44% of the underlying equities were overwritten with call options. These call options were typically written at levels above prevailing market prices (estimated to be 2.3% out of the money) with an average time until expiration of 57 days.
The views expressed reflect the opinions of BlackRock as of the date of this report and are subject to change based on changes in market, economic or other conditions. These views are not intended to be a forecast of future events and are no guarantee of future results.
| T R U S T S U M M A R Y |
17 |
| Trust Summary as of December 31, 2023 (continued)
|
BlackRock Enhanced Global Dividend Trust (BOE) |
Overview of the Trust’s Total Investments
TEN LARGEST HOLDINGS
| Security(a) | Percent of Total Investments |
|||
| Microsoft Corp. |
4.8 | % | ||
| Apple, Inc. |
3.4 | |||
| Nestle SA |
3.0 | |||
| Mondelez International, Inc. |
2.9 | |||
| Taiwan Semiconductor Manufacturing Co. Ltd. |
2.8 | |||
| AstraZeneca PLC |
2.8 | |||
| Union Pacific Corp. |
2.7 | |||
| AbbVie, Inc. |
2.7 | |||
| Accenture PLC |
2.7 | |||
| RELX PLC |
2.6 | |||
GEOGRAPHIC ALLOCATION
| Country/Geographic Region | Percentage of Total Investments |
|||
| United States |
50.9 | % | ||
| United Kingdom |
11.1 | |||
| France |
9.4 | |||
| Switzerland |
6.7 | |||
| Taiwan |
4.9 | |||
| Netherlands |
4.1 | |||
| Ireland |
4.1 | |||
| Denmark |
2.2 | |||
| Mexico |
2.1 | |||
| Canada |
2.0 | |||
| Singapore |
1.4 | |||
| Indonesia |
1.1 | |||
| India |
— | (b) | ||
| (a) | Excludes short-term securities. |
| (b) | Rounds to less than 0.1%. |
| 18 | 2 0 2 3 B L A C K R O C K A N N U A L R E P O R T T O S H A R E H O L D E R S |
| Trust Summary as of December 31, 2023
|
BlackRock Enhanced International Dividend Trust (BGY) |
Investment Objective
BlackRock Enhanced International Dividend Trust’s (BGY) (the “Trust”) primary investment objective is to provide current income and current gains, with a secondary objective of long-term capital appreciation. The Trust seeks to achieve its investment objectives by investing primarily in equity securities issued by companies of any market capitalization located in countries throughout the world and by employing a strategy of writing (selling) call and put options. The Trust invests, under normal circumstances, at least 80% of its net assets in dividend-paying equity securities issued by non-U.S. companies of any market capitalization, but intends to invest primarily in securities of large capitalization companies. The Trust may invest directly in such securities or synthetically through the use of derivatives.
No assurance can be given that the Trust’s investment objectives will be achieved.
Trust Information
| Symbol on New York Stock Exchange |
BGY | |
| Initial Offering Date |
May 30, 2007 | |
| Current Distribution Rate on Closing Market Price as of December 31, 2023 ($ 5.27)(a) |
7.70% | |
| Current Monthly Distribution per Common Share(b) |
$0.033800 | |
| Current Annualized Distribution per Common Share(b) |
$0.405600 |
| (a) | Current distribution rate on closing market price is calculated by dividing the current annualized distribution per share by the closing market price. The current distribution rate may consist of income, net realized gains and/or a return of capital. Past performance is not an indication of future results. |
| (b) | The distribution rate is not constant and is subject to change. A portion of the distribution may be deemed a return of capital or net realized gain. |
Market Price and Net Asset Value Per Share Summary
| 12/31/23 | 12/31/22 | Change | High | Low | ||||||||||||||||
| Closing Market Price |
$ | 5.27 | $ | 5.02 | 4.98 | % | $ | 5.64 | $ | 4.68 | ||||||||||
| Net Asset Value |
6.21 | 5.78 | 7.44 | 6.40 | 5.54 | |||||||||||||||
GROWTH OF $10,000 INVESTMENT
| (a) | Represents the Trust’s closing market price on the NYSE and reflects the reinvestment of dividends and/or distributions at actual reinvestment prices. |
| (b) | An index that captures large- and mid-cap representation across certain developed markets countries (excluding the U.S.) and certain emerging markets countries. |
| T R U S T S U M M A R Y |
19 |
| Trust Summary as of December 31, 2023 (continued)
|
BlackRock Enhanced International Dividend Trust (BGY) |
Performance
Returns for the period ended December 31, 2023 were as follows:
| Average Annual Total Returns | ||||||||||||
| 1 Year | 5 Years | 10 Years | ||||||||||
| Trust at NAV(a)(b) |
15.94 | % | 9.12 | % | 3.93 | % | ||||||
| Trust at Market Price(a)(b) |
13.29 | 8.82 | 3.49 | |||||||||
| MSCI ACWI ex USA Call Overwrite Index(c) |
11.24 | 4.61 | N/A | |||||||||
| MSCI ACWI ex USA Index |
15.62 | 7.08 | 3.83 | |||||||||
| (a) | All returns reflect reinvestment of dividends and/or distributions at actual reinvestment prices. |
| (b) | The Trust’s discount to NAV widened during the period, which accounts for the difference between performance based on market price and performance based on NAV. |
| (c) | An index that incorporates an option overlay component on the MSCI ACWI ex USA Index with a 45% overwrite level. The benchmark commenced on December 31, 2018 and therefore the benchmark does not have 10-year returns. |
Performance results may include adjustments made for financial reporting purposes in accordance with U.S. generally accepted accounting principles. Past performance is not an indication of future results.
The Trust is presenting the performance of one or more indices for informational purposes only. The Trust is actively managed and does not seek to track or replicate the performance of any index. The index performance shown is not intended to be indicative of the Trust’s investment strategies, portfolio components or past or future performance.
More information about the Trust’s historical performance can be found in the “Closed End Funds” section of blackrock.com.
The following discussion relates to the Trust’s relative performance based on NAV:
What factors influenced performance?
Stock selection within and an overweight to industrials led positive contributions to the Trust’s relative performance during the reporting period. Stock selection within and underweights to materials and consumer discretionary also contributed.
In terms of individual holdings, positive contributions were led by MediaTek Inc.(“MediaTek”), a Taiwanese semiconductor company that supplies chips for smartphones in China. MediaTek shares benefited as expectations for central bank rate cuts supported growth-oriented areas of the market. In addition, the company continued to beat earnings estimates and is seeing significant improvements in inventory levels and expectations for the recovery in China’s smartphone market where it is positioned to continue to gain market share. Spanish clothing retailer Industria de Diseno Textil SA, curator of brands such as Zara, reported strong profits during the period thanks to robust sales both in-store and online. The company has been able to maintain pricing strength in markets outside the eurozone, aiding profitability. Novo Nordisk A/S, the Danish multinational pharmaceutical company, also contributed to returns. The stock reacted positively as Novo Nordisk A/S reported that its latest trial resulted in a 20% decrease in cardiovascular events in obese patients using Wegovy, – the GLP-1 weight-loss drug manufactured by the company. This result was expected to help unlock reimbursement of the product in commercial plans and potentially lead to Medicare reimbursement, while differentiating Wegovy from competing products.
Stock selection in financials was the main detractor from relative performance during the period. Stock selection within and an overweight to consumer staples and stock selection within communication services also detracted.
Lonza Group AG, the Swiss pharmaceutical and biotech company and largest biologics contract manufacturer in the world, was the top detractor from relative performance over the period. Following the unexpected departure of the CEO in September 2023, the company held its Capital Markets Day in October 2023 and downgraded 2024 guidance. The reduced guidance was centered on Lonza Group AG’s Biologics business that management had previously indicated was “sold out for the foreseeable future”. The Trust subsequently exited the position. Prudential PLC, the U.K.-based multinational insurance company and leading provider of insurance products and services in Asia, also detracted during the period as the shares came under pressure due to weaker sentiment in China. The company posted strong new business profits for the first half of 2023 and the new CEO announced plans for a $1 billion organic investment program through 2025 to drive an increase in new business premiums growth. Finally, brewer Budweiser Brewing Co. APAC Ltd. had significant exposure to the on-premise and nightlife channels in China and saw its shares come under pressure due to increasing concerns over the strength of China’s post-pandemic reopening.
The Trust utilized an options overlay strategy in which calls are written on a portion of the portfolio’s holdings. The Trust’s options overlay strategy contributed to relative performance for the reporting period.
The Trust’s practice of maintaining a specified level of monthly distributions did not have a material impact on the Trust’s investment strategy. The distribution policy resulted in return of capital for the period. Refer to the financial highlights and income tax information sections in this report for further information about the distributions.
Describe recent portfolio activity.
During the reporting period, the Trust reduced its exposure to the materials, energy and information technology sectors, while adding to consumer staples, consumer discretionary and industrials.
Describe portfolio positioning at period end.
At period end, the Trust’s largest sector overweights were in industrials, healthcare and information technology. Regionally, the majority of portfolio assets comprised securities listed in Europe, with particularly significant exposure in Europe excluding the United Kingdom.
| 20 | 2 0 2 3 B L A C K R O C K A N N U A L R E P O R T T O S H A R E H O L D E R S |
| Trust Summary as of December 31, 2023 (continued)
|
BlackRock Enhanced International Dividend Trust (BGY) |
As of December 31, 2023, the Trust had an options overwriting program in place whereby 43% of the underlying equities were overwritten with call options. These call options were typically written at levels above prevailing market prices (estimated to be 2.3% out of the money) with an average time until expiration of 60 days.
The views expressed reflect the opinions of BlackRock as of the date of this report and are subject to change based on changes in market, economic or other conditions. These views are not intended to be a forecast of future events and are no guarantee of future results.
Overview of the Trust’s Total Investments
TEN LARGEST HOLDINGS
| Security(a) | Percent of Total Investments |
|||
| Taiwan Semiconductor Manufacturing Co. Ltd. |
4.5 | % | ||
| Novo Nordisk A/S |
3.7 | |||
| RELX PLC |
3.6 | |||
| Baker Hughes Co. |
3.4 | |||
| Keyence Corp. |
3.3 | |||
| ASML Holding NV |
3.1 | |||
| Atlas Copco AB |
3.1 | |||
| Air Liquide SA |
3.0 | |||
| FinecoBank Banca Fineco SpA |
3.0 | |||
| Shell PLC |
3.0 | |||
GEOGRAPHIC ALLOCATION
| Country/Geographic Region | Percentage of Total Investments |
|||
| United Kingdom |
13.4 | % | ||
| Netherlands |
11.9 | |||
| France |
10.5 | |||
| United States |
10.3 | |||
| Japan |
7.6 | |||
| Taiwan |
7.1 | |||
| Sweden |
5.7 | |||
| Switzerland |
4.5 | |||
| Canada |
4.4 | |||
| Germany |
4.3 | |||
| Singapore |
4.1 | |||
| Denmark |
3.7 | |||
| Italy |
3.0 | |||
| Mexico |
2.9 | |||
| India |
2.6 | |||
| Indonesia |
1.5 | |||
| Brazil |
1.4 | |||
| China |
1.1 | |||
| (a) | Excludes short-term securities. |
| T R U S T S U M M A R Y |
21 |
| Trust Summary as of December 31, 2023
|
BlackRock Health Sciences Term Trust (BMEZ) |
Investment Objective
BlackRock Health Sciences Term Trust’s (BMEZ) (the “Trust”) (formerly known as BlackRock Health Sciences Trust II) investment objective is to provide total return and income through a combination of current income, current gains and long-term capital appreciation. Under normal market conditions, the Trust will invest at least 80% of its total assets in equity securities of companies principally engaged in the health sciences group of industries and equity derivatives with exposure to the health sciences group of industries. Equity derivatives in which the Trust invests include purchased and sold (written) call and put options on equity securities of companies in the health sciences group of industries.
On March 31, 2023 the Board approved a proposal to change the name of BlackRock Health Sciences Trust II, effective as of April 5, 2023, to BlackRock Health Sciences Term Trust. There were no changes to the Trust’s investment policies or strategies in conjunction with the name change.
No assurance can be given that the Trust’s investment objective will be achieved.
Trust Information
|
| ||
| Symbol on New York Stock Exchange |
BMEZ | |
| Initial Offering Date |
January 30, 2020 | |
| Current Distribution Rate on Closing Market Price as of December 31, 2023 ($14.65)(a) |
7.50% | |
| Current Monthly Distribution per Common Share(b) |
$0.091600 | |
| Current Annualized Distribution per Common Share(b) |
$1.099200 | |
|
| ||
| (a) | Current distribution rate on closing market price is calculated by dividing the current annualized distribution per share by the closing market price. The current distribution rate may consist of income, net realized gains and/or a return of capital. Past performance is not an indication of future results. |
| (b) | The monthly distribution per Common Share, declared on February 1, 2024, was decreased to $0.090440 per share. The current distribution rate on closing market price, current monthly distribution per Common Share, and current annualized distribution per Common Share do not reflect the new distribution rate. The new distribution rate is not constant and is subject to change in the future. A portion of the distribution may be deemed a return of capital or net realized gain. |
Market Price and Net Asset Value Per Share Summary
| 12/31/23 | 12/31/22 | Change | High | Low | ||||||||||||||||
| Closing Market Price |
$ | 14.65 | $ | 15.43 | (5.06 | )% | $ | 16.99 | $ | 13.02 | ||||||||||
| Net Asset Value |
17.91 | 18.76 | (4.53 | ) | 19.72 | 15.62 | ||||||||||||||
GROWTH OF $10,000 INVESTMENT
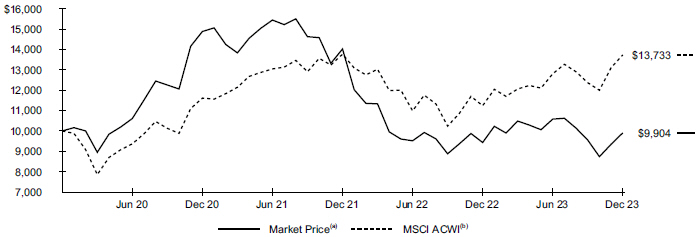
BMEZ commenced operations on January 30, 2020.
| (a) | Represents the Trust’s closing market price on the NYSE and reflects the reinvestment of dividends and/or distributions at actual reinvestment prices. |
| (b) | An index that captures large- and mid-cap representation across certain developed and emerging markets. |
| 22 | 2 0 2 3 B L A C K R O C K A N N U A L R E P O R T T O S H A R E H O L D E R S |
| Trust Summary as of December 31, 2023 (continued)
|
BlackRock Health Sciences Term Trust (BMEZ) |
Performance
Returns for the period ended December 31, 2023 were as follows:
| Average Annual Total Returns | ||||||||
| 1 Year | Since Inception(a) |
|||||||
| Trust at NAV(b)(c) |
5.60 | % | 5.00% | |||||
| Trust at Market Price(b)(c) |
5.02 | (0.24) | ||||||
| MSCI Custom ACWI SMID Growth HC Call Overwrite Index(d) |
4.08 | (6.87) | ||||||
| MSCI ACWI |
22.20 | 8.44 | ||||||
| (a) | BMEZ commenced operations on January 30, 2020. |
| (b) | All returns reflect reinvestment of dividends and/or distributions at actual reinvestment prices. |
| (c) | The Trust’s discount to NAV widened during the period, which accounts for the difference between performance based on market price and performance based on NAV. |
| (d) | An index representing the Health Care sector stocks within the MSCI ACWI SMID Cap Growth Index and incorporating an option overlay component with a 25% overwrite level. The MSCI ACWI SMID Cap Growth Index captures mid- and small-cap securities exhibiting overall growth style characteristics across certain developed and emerging markets countries. The index commenced on March 31, 2022 and therefore the since inception return presented is for the period March 31, 2022 through the current reporting period. |
Performance results may include adjustments made for financial reporting purposes in accordance with U.S. generally accepted accounting principles. Past performance is not an indication of future results.
The Trust is presenting the performance of one or more indices for informational purposes only. The Trust is actively managed and does not seek to track or replicate the performance of any index. The index performance shown is not intended to be indicative of the Trust’s investment strategies, portfolio components or past or future performance.
More information about the Trust’s historical performance can be found in the “Closed End Funds” section of blackrock.com.
The following discussion relates to the Trust’s relative performance based on NAV:
What factors influenced performance?
Selection in the biotechnology and pharmaceuticals sub-sectors contributed to the Fund’s relative performance in 2023.
At the individual security level, an out-of-benchmark position in Vertex Pharmaceuticals, Inc. was the largest contributor. The biotechnology company reported consistently strong earnings during the reporting period and released promising trial results for its non-opioid pain medicine. An overweight position in Reata Pharmaceuticals, Inc. (“Reata”) was another top contributor. The biotechnology giant Biogen, Inc. announced it would acquire the company for $7.3 billion to obtain Reata’s pipeline of rare disease treatments. An overweight in Blueprint Medicines also contributed positively. The precision therapy company reported increased sales of its hematological disorder treatment, Avyakit. Performance was further bolstered by a year-end rally in small- and mid-cap stocks after the Fed signaled it was likely to begin easing interest rates in 2024.
Security selection in the healthcare providers and services and medical devices and supplies sub-sectors detracted from relative performance.
An overweight in the oncology company Novocure, Ltd., which reported disappointing trial results for its ovarian cancer therapy, was the largest individual detractor from performance. Additionally, a separate trial caused market participants to question the commercial viability of the company’s experimental lung cancer treatment. An underweight in Align Technology, Inc. detracted, as well. The dental device company missed earnings expectations and provided negative future guidance, citing decreased orthodontic case starts and longer sales cycles for capital equipment purchases. An out-of-benchmark position in the Chinese medical devices company Adicon Holdings, Ltd., which declined due to the broader weakness in the nation’s stock market, also detracted.
The Trust used an options overlay strategy in which calls were written on a portion of the portfolio’s holdings. This strategy contributed to relative performance.
The Trust’s practice of maintaining a specified level of monthly distributions to shareholders did not have a material impact on the Trust’s investment strategy. The distribution policy resulted in return of capital for the period. Refer to the financial highlights and income tax information sections in this report for further information about the distributions.
Describe recent portfolio activity.
The Trust increased its allocations to the biotechnology, healthcare providers and services, and pharmaceuticals sub-sectors, while reducing its weighting in the medical devices and supplies sub-sector.
Describe portfolio positioning at period end.
At the end of the period, the Trust held 41% of net asset value in biotechnology, 36% in medical devices and supplies, 11% in healthcare providers and services, and 10% in pharmaceuticals. These industry weightings were the result of bottom-up stock selection.
As of December 31, 2023, the Trust had in place an option overwriting program whereby 25% of the underlying equities were overwritten with call options on individual stocks. These call options were typically written at prices above the prevailing market prices (estimated to be 6.8% out of the money) and for maturities averaging 57 days.
The views expressed reflect the opinions of BlackRock as of the date of this report and are subject to change based on changes in market, economic or other conditions. These views are not intended to be a forecast of future events and are no guarantee of future results.
| T R U S T S U M M A R Y |
23 |
| Trust Summary as of December 31, 2023 (continued)
|
BlackRock Health Sciences Term Trust (BMEZ) |
Overview of the Trust’s Total Investments
TEN LARGEST HOLDINGS
| Security(a) | Percent of Total Investments |
|||
| BioMarin Pharmaceutical, Inc. |
2.1 | % | ||
| Cencora, Inc. |
2.1 | |||
| Align Technology, Inc. |
2.0 | |||
| Amgen, Inc. |
2.0 | |||
| Cooper Cos., Inc. |
2.0 | |||
| Novo Nordisk A/S |
1.9 | |||
| STERIS PLC |
1.8 | |||
| Intuitive Surgical, Inc. |
1.8 | |||
| Bio-Techne Corp. |
1.7 | |||
| Blueprint Medicines Corp. |
1.6 | |||
INDUSTRY ALLOCATION
| Industry(a)(b) | Percentage of Total Investments |
|||
| Biotechnology |
41.3 | % | ||
| Health Care Equipment & Supplies |
20.9 | |||
| Life Sciences Tools & Services |
15.7 | |||
| Health Care Providers & Services |
10.6 | |||
| Pharmaceuticals |
9.6 | |||
| Other* |
1.9 | |||
| (a) | Excludes short-term securities. |
| (b) | For Trust compliance purposes, the Trust’s industry classifications refer to one or more of the industry sub-classifications used by one or more widely recognized market indexes or ratings group indexes, and/or as defined by the investment adviser. These definitions may not apply for purposes of this report, which may combine such industry sub-classifications for reporting ease. |
| * | Includes one or more investment categories that individually represents less than 1.0% of the Trust’s total investments. Please refer to the Schedule of Investments for details. |
| 24 | 2 0 2 3 B L A C K R O C K A N N U A L R E P O R T T O S H A R E H O L D E R S |
| Trust Summary as of December 31, 2023
|
BlackRock Health Sciences Trust (BME) |
Investment Objective
BlackRock Health Sciences Trust’s (BME) (the “Trust”) investment objective is to provide total return through a combination of current income, current gains and long-term capital appreciation. The Trust seeks to achieve its investment objective by investing, under normal market conditions, at least 80% of its total assets in equity securities of companies engaged in the health sciences and related industries and equity derivatives with exposure to the health sciences industry. The Trust seeks to pursue this goal primarily by investing in a portfolio of equity securities and by employing a strategy of writing (selling) call and put options.
No assurance can be given that the Trust’s investment objective will be achieved.
Trust Information
|
| ||
| Symbol on New York Stock Exchange |
BME | |
| Initial Offering Date |
March 31, 2005 | |
| Current Distribution Rate on Closing Market Price as of December 31, 2023 ($ 40.46)(a) |
6.32% | |
| Current Monthly Distribution per Common Share(b) |
$0.213000 | |
| Current Annualized Distribution per Common Share(b) |
$2.556000 | |
|
| ||
| (a) | Current distribution rate on closing market price is calculated by dividing the current annualized distribution per share by the closing market price. The current distribution rate may consist of income, net realized gains and/or a return of capital. Past performance is not an indication of future results. |
| (b) | The distribution rate is not constant and is subject to change. A portion of the distribution may be deemed a return of capital or net realized gain. |
Market Price and Net Asset Value Per Share Summary
| 12/31/23 | 12/31/22 | Change | High | Low | ||||||||||||||||
| Closing Market Price |
$ | 40.46 | $ | 43.58 | (7.16 | )% | $ | 43.68 | $ | 35.53 | ||||||||||
| Net Asset Value |
42.18 | 43.30 | (2.59 | ) | 43.30 | 39.01 | ||||||||||||||
GROWTH OF $10,000 INVESTMENT
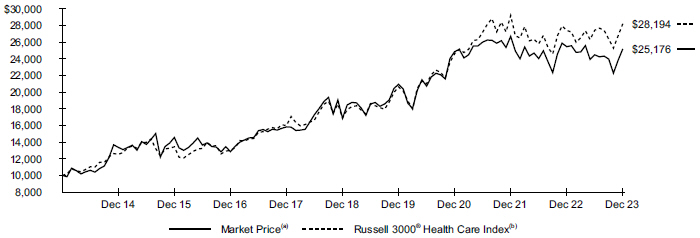
| (a) | Represents the Trust’s closing market price on the NYSE and reflects the reinvestment of dividends and/or distributions at actual reinvestment prices. |
| (b) | An unmanaged index that features companies involved in medical services or health care in the Russell 3000® Index, which includes the largest 3,000 U.S. companies as determined by total market capitalization. |
| T R U S T S U M M A R Y |
25 |
| Trust Summary as of December 31, 2023 (continued)
|
BlackRock Health Sciences Trust (BME) |
Performance
Returns for the period ended December 31, 2023 were as follows:
| Average Annual Total Returns | ||||||||||||
| 1 Year | 5 Years | 10 Years | ||||||||||
| Trust at NAV(a)(b) |
3.80 | % | 9.60 | % | 10.49 | % | ||||||
| Trust at Market Price(a)(b) |
(1.08 | ) | 8.34 | 9.67 | ||||||||
| MSCI USA Investable Market Index Health Care Call Overwrite Index(c) |
1.80 | 8.58 | N/A | |||||||||
| Russell 3000® Health Care Index |
2.87 | 10.79 | 10.92 | |||||||||
| (a) | All returns reflect reinvestment of dividends and/or distributions at actual reinvestment prices. |
| (b) | The Trust moved from a premium to NAV to a discount during the period, which accounts for the difference between performance based on market price and performance based on NAV. |
| (c) | An index that incorporates an option overlay component on the MSCI USA IMI Health Care Index with a 33% overwrite level. The benchmark commenced on December 31, 2018 and therefore the benchmark does not have 10-year returns. |
Performance results may include adjustments made for financial reporting purposes in accordance with U.S. generally accepted accounting principles. Past performance is not an indication of future results.
The Trust is presenting the performance of one or more indices for informational purposes only. The Trust is actively managed and does not seek to track or replicate the performance of any index. The index performance shown is not intended to be indicative of the Trust’s investment strategies, portfolio components or past or future performance.
More information about the Trust’s historical performance can be found in the “Closed End Funds” section of blackrock.com.
The following discussion relates to the Trust’s relative performance based on NAV:
What factors influenced performance?
Security selection in the pharmaceuticals sub-sector contributed to the Trust’s performance in 2023, as did an overweight allocation to the biotechnology sub-sector.
At the individual security level, an underweight position in the pharmaceutical giant Pfizer, Inc. was the largest contributor to relative performance. The company experienced decreased demand for its COVID-19 products, and it provided negative guidance for 2024. Additionally, it reported negative trial results for its oral obesity and diabetes treatment program, adding to uncertainty about its ability to compete in the weight loss market. An underweight in Bristol-Myers Squibb Co. was another top contributor to relative returns. The drugmaker reported disappointing earnings as impending patent expirations put pricing pressure on the company’s offerings. An overweight position in Boston Scientific Corp. further helped results. The medical device company reported strong earnings as elective surgical procedure volume continued to normalize following the pandemic. The company also achieved positive trial results for its Farapulse pulsed-field ablation system, which offers a faster treatment for atrial fibrillation than the current procedure and potentially expands the company’s market share in this area.
On the negative side, an underweight allocation to the healthcare providers and services sub-sector and an overweight in the medical devices and supplies sub-sector detracted from relative performance.
An overweight position in the oncology company Novocure, Ltd., which reported disappointing trial results for its ovarian cancer therapy, was the largest detractor from performance. Additionally, a separate trial caused market participants to question the commercial viability of the company’s experimental lung cancer treatment. An overweight in Biogen, Inc. detracted on concerns about the company’s ability to commercialize its new Alzheimer’s treatment, Leqembi. Obstacles, including limited health insurance reimbursement and testing prerequisites for patients, contributed to the drug’s slow uptake. An underweight in Thermo Fisher Scientific, Inc., was another detractor of note. The Trust moved from an overweight in Thermo Fisher to an underweight in the third quarter 2023 due to a weak biotechnology funding market and uncertainty about China. However, a year-end rally in the biotechnology sector lifted the stock as market participants responded positively to signals of easing interest rates.
The Trust made use of options, principally writing call options on individual stocks, to seek enhanced income returns while continuing to participate in the performance of the underlying equities. The option overlay strategy contributed to results.
The Trust’s practice of maintaining a specified level of monthly distributions to shareholders did not have a material impact on the Trust’s investment strategy. The distribution policy resulted in return of capital for the period. Refer to the financial highlights and income tax information sections in this report for further information about the distributions.
Describe recent portfolio activity.
The Trust increased its allocations to the biotechnology and healthcare providers and services sub-sectors and reduced its weightings in the pharmaceuticals and medical devices and supplies sub-sectors.
The Trust held a 5.3% cash position at the end of the period, reflecting the investment adviser’s decision to take some profits on select positions in pharmaceutical and medical device companies. The elevated cash balance did not have a material impact on performance, and the Trust was not in a defensive investment position.
Describe portfolio positioning at period end.
At the end of the period, the Trust held 31% of net asset value in medical devices and supplies, 25% in biotechnology, 21% in healthcare providers and services, and 19% in pharmaceuticals. These industry weightings were the result of bottom-up stock selection.
| 26 | 2 0 2 3 B L A C K R O C K A N N U A L R E P O R T T O S H A R E H O L D E R S |
| Trust Summary as of December 31, 2023 (continued)
|
BlackRock Health Sciences Trust (BME) |
As of December 31, 2023, the Trust had in place an option overwriting program whereby 34% of the underlying equities were overwritten with call options on individual stocks. These call options were typically written at prices above the prevailing market prices (estimated to be 5.3% out of the money) and for maturities averaging 55 days.
The views expressed reflect the opinions of BlackRock as of the date of this report and are subject to change based on changes in market, economic or other conditions. These views are not intended to be a forecast of future events and are no guarantee of future results.
Overview of the Trust’s Total Investments
TEN LARGEST HOLDINGS
| Security(a) | Percent of Total Investments |
|||
| UnitedHealth Group, Inc. |
9.5 | % | ||
| Eli Lilly & Co. |
8.4 | |||
| AbbVie, Inc. |
4.7 | |||
| Boston Scientific Corp. |
4.5 | |||
| Merck & Co., Inc. |
4.5 | |||
| Amgen, Inc. |
3.9 | |||
| Abbott Laboratories |
3.7 | |||
| Danaher Corp. |
3.2 | |||
| Stryker Corp. |
2.6 | |||
| Gilead Sciences, Inc. |
2.6 | |||
INDUSTRY ALLOCATION
| Industry(a)(b) | Percentage of Total Investments |
|||
| Biotechnology |
25.7 | % | ||
| Health Care Equipment & Supplies |
23.4 | |||
| Health Care Providers & Services |
22.1 | |||
| Pharmaceuticals |
20.1 | |||
| Life Sciences Tools & Services |
8.6 | |||
| Health Care Technology |
0.1 | |||
| (a) | Excludes short-term securities. |
| (b) | For Trust compliance purposes, the Trust’s industry classifications refer to one or more of the industry sub-classifications used by one or more widely recognized market indexes or ratings group indexes, and/or as defined by the investment adviser. These definitions may not apply for purposes of this report, which may combine such industry sub-classifications for reporting ease. |
| T R U S T S U M M A R Y |
27 |
| Trust Summary as of December 31, 2023
|
BlackRock Innovation and Growth Term Trust (BIGZ) |
Investment Objective
BlackRock Innovation and Growth Term Trust’s (BIGZ) (the “Trust”) (formerly known as BlackRock Innovation and Growth Trust) investment objective is to provide total return and income through a combination of current income, current gains and long-term capital appreciation. The Trust will invest primarily in equity securities issued by mid-and small-capitalization companies that the Trust’s adviser believes have above-average earnings growth potential. In selecting investments for the Trust, the Trust’s adviser focuses on mid- and small-capitalization growth companies that are “innovative.” These are companies that have introduced, or are seeking to introduce, a new product or service that potentially changes the marketplace. The Trust utilizes an option writing (selling) strategy in an effort to generate current gains from options premiums and to enhance the Trust’s risk-adjusted returns.
On March 31, 2023 the Board approved a proposal to change the name of BlackRock Innovation and Growth Trust, effective as of April 5, 2023, to BlackRock Innovation and Growth Term Trust. There were no changes to the Trust’s investment policies or strategies in conjunction with the name change.
No assurance can be given that the Trust’s investment objective will be achieved.
Trust Information
| Symbol on New York Stock Exchange |
BIGZ | |
| Initial Offering Date |
March 29, 2021 | |
| Current Distribution Rate on Closing Market Price as of December 31, 2023 ($7.33)(a) |
7.35% | |
| Current Monthly Distribution per Common Share(b) |
$0.044870 | |
| Current Annualized Distribution per Common Share(b) |
$0.538440 | |
| (a) | Current distribution rate on closing market price is calculated by dividing the current annualized distribution per share by the closing market price. The current distribution rate may consist of income, net realized gains and/or a return of capital. Past performance is not an indication of future results. |
| (b) | The monthly distribution per Common Share, declared on February 1, 2024, was decreased to $0.044660 per share. The current distribution rate on closing market price, current monthly distribution per Common Share, and current annualized distribution per Common Share do not reflect the new distribution rate. The new distribution rate is not constant and is subject to change in the future. A portion of the distribution may be deemed a return of capital or net realized gain. |
Market Price and Net Asset Value Per Share Summary
| 12/31/23 | 12/31/22 | Change | High | Low | ||||||||||||||||
| Closing Market Price |
$ | 7.33 | $ | 6.81 | 7.64 | % | $ | 8.35 | $ | 6.23 | ||||||||||
| Net Asset Value |
9.03 | 8.82 | 2.38 | 9.97 | 7.66 | |||||||||||||||
GROWTH OF $10,000 INVESTMENT
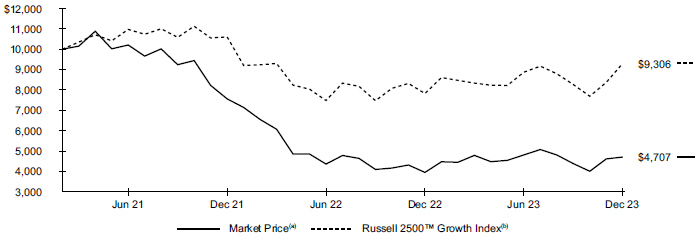
BIGZ commenced operations on March 29, 2021.
| (a) | Represents the Trust’s closing market price on the NYSE and reflects the reinvestment of dividends and/or distributions at actual reinvestment prices. |
| (b) | An index that measures the performance of the small to mid-cap growth segment of the U.S. equity universe. It includes those Russell 2500 companies with higher growth earning potential as defined by FTSE Russell’s leading style methodology. |
| 28 | 2 0 2 3 B L A C K R O C K A N N U A L R E P O R T T O S H A R E H O L D E R S |
| Trust Summary as of December 31, 2023 (continued)
|
BlackRock Innovation and Growth Term Trust (BIGZ) |
Performance
Returns for the period ended December 31, 2023 were as follows:
| Average Annual Total Returns | ||||||||
| 1 Year | |
Since Inception |
(a) | |||||
| Trust at NAV(b)(c) |
13.28 | % | (17.93 | )% | ||||
| Trust at Market Price(b)(c) |
19.09 | (23.90 | ) | |||||
| MSCI USA SMID Growth Call Overwrite Index(d) |
20.07 | 0.66 | ||||||
| Russell 2500™ Growth Index |
18.93 | (2.58 | ) | |||||
| (a) | BIGZ commenced operations on March 29, 2021. |
| (b) | All returns reflect reinvestment of dividends and/or distributions at actual reinvestment prices. |
| (c) | The Trust’s discount to NAV narrowed during the period, which accounts for the difference between performance based on market price and performance based on NAV. |
| (d) | A custom benchmark that is made up of the MSCI USA SMID Growth Index, MSCI USA SMID Growth 25% Call Overwrite Cash and MSCI USA SMID Growth 25% Call Overwrite Option. The MSCI USA SMID Growth Index captures mid and small cap representations of securities exhibiting overall growth style characteristics in the U.S. |
Performance results may include adjustments made for financial reporting purposes in accordance with U.S. generally accepted accounting principles. Past performance is not an indication of future results.
The Trust is presenting the performance of one or more indices for informational purposes only. The Trust is actively managed and does not seek to track or replicate the performance of any index. The index performance shown is not intended to be indicative of the Trust’s investment strategies, portfolio components or past or future performance.
More information about the Trust’s historical performance can be found in the “Closed End Funds” section of blackrock.com.
The following discussion relates to the Trust’s relative performance based on NAV:
What factors influenced performance?
Shares of smaller, innovative growth companies generally performed well in 2023, a time characterized by hearty investor risk appetites and outperformance for the growth style more broadly.
Stock selection in the industrials sector was the largest contributor to the Fund’s relative performance. An overweight position in Saia Inc., a U.S. trucking company that specializes in less-than-truckload (“LTL”) freight shipping methods, was a top contributor. Positioning in the aerospace and defense industry also added to relative performance, primarily as a result of an overweight in Axon Enterprise, Inc. Axon benefited from strong demand for its new products, as well as robust recurring revenues and positive customer retention metrics. In energy, the Fund’s zero weighting in the oil, gas and consumable fuels industry proved beneficial. Notably, the lack of a position in Texas Pacific Land Corp., a natural resource and real estate company, was a positive. Thirdly, avoidance of companies in the materials sector boosted relative return, including underweight allocations to the chemicals and containers and packaging industries.
Stock selection in the communication services sector was the largest detractor from relative performance, largely due to selection decisions among entertainment companies. Notably, an out-of-benchmark position in Under Canvas, Inc., an upscale camping experience provider, hurt results. In consumer discretionary, security selection in the hotels, restaurants and leisure industry proved costly. A key stock level detractor in the industry was the portfolio’s overweight position in Planet Fitness, Inc. Shares of the discount gym operator disappointed amid slowing new store growth, due in part to the impacts of higher interest rates on funding costs. Stock selection in the healthcare sector also dampened relative performance, with the largest adverse effect coming from an overweight in Phreesia, Inc., a software-as-a-service company in the healthcare technology sub-sector.
The Trust used an options overlay strategy in which calls were written on a portion of the portfolio’s holdings. The Trust’s options overlay strategy contributed to relative performance over the 12-month period.
The Trust’s practice of maintaining a specified level of monthly distributions to shareholders did not have a material impact on the Trust’s investment strategy. The distribution policy resulted in return of capital for the period. Refer to the financial highlights and income tax information sections in this report for further information about the distributions.
Describe recent portfolio activity.
Due to a combination of market changes and portfolio activity, the Trust’s allocations to information technology and real estate increased, while its weightings in communication services and consumer discretionary decreased. The Trust did not add any new private companies during the reporting period.
Describe portfolio positioning at period end.
On a sector basis, the portfolio’s largest overweight allocations were in the information technology and consumer discretionary sectors. The largest underweights were in industrials and energy.
As of December 31, 2023, the Trust had in place an option overwriting program whereby 13.04% of the underlying equities were overwritten with call options on individual stocks. These call options were typically written at prices above the prevailing market prices (estimated to be 6.2% out of the money) and for maturities averaging 60 days.
The views expressed reflect the opinions of BlackRock as of the date of this report and are subject to change based on changes in market, economic or other conditions. These views are not intended to be a forecast of future events and are no guarantee of future results.
| T R U S T S U M M A R Y |
29 |
| Trust Summary as of December 31, 2023 (continued)
|
BlackRock Innovation and Growth Term Trust (BIGZ) |
Overview of the Trust’s Total Investments
| TEN LARGEST HOLDINGS
|
| |||
| Security(a) | Percent of Total Investments |
|||
| Axon Enterprise, Inc. |
3.4 | % | ||
| ANSYS, Inc. |
2.8 | |||
| Monolithic Power Systems, Inc. |
2.8 | |||
| CoStar Group, Inc. |
2.7 | |||
| HubSpot, Inc. |
2.7 | |||
| Saia, Inc. |
2.6 | |||
| Entegris, Inc. |
2.6 | |||
| Align Technology, Inc. |
2.5 | |||
| Planet Fitness, Inc. |
2.4 | |||
| West Pharmaceutical Services, Inc. |
2.4 | |||
| INDUSTRY ALLOCATION
|
| |||
| Industry(a)(b) | Percentage of Total Investments |
|||
| Software |
23.6 | % | ||
| Semiconductors & Semiconductor Equipment |
11.6 | |||
| Life Sciences Tools & Services |
8.8 | |||
| IT Services |
8.0 | |||
| Capital Markets |
6.5 | |||
| Aerospace & Defense |
5.4 | |||
| Health Care Equipment & Supplies |
4.9 | |||
| Hotels, Restaurants & Leisure |
4.6 | |||
| Automobile Components |
3.3 | |||
| Diversified Consumer Services |
3.2 | |||
| Real Estate Management & Development |
2.7 | |||
| Ground Transportation |
2.6 | |||
| Entertainment |
2.2 | |||
| Specialty Retail |
2.0 | |||
| Building Products |
1.6 | |||
| Machinery |
1.3 | |||
| Construction & Engineering |
1.2 | |||
| Wireless Telecommunication Services |
1.1 | |||
| Textiles, Apparel & Luxury Goods |
1.0 | |||
| Health Care Providers & Services |
1.0 | |||
| Other* |
3.4 | |||
| (a) | Excludes short-term securities. |
| (b) | For Trust compliance purposes, the Trust’s industry classifications refer to one or more of the industry sub-classifications used by one or more widely recognized market indexes or ratings group indexes, and/or as defined by the investment adviser. These definitions may not apply for purposes of this report, which may combine such industry sub-classifications for reporting ease. |
| * | Includes one or more investment categories that individually represents less than 1.0% of the Trust’s total investments. Please refer to the Schedule of Investments for details. |
| 30 | 2 0 2 3 B L A C K R O C K A N N U A L R E P O R T T O S H A R E H O L D E R S |
| Trust Summary as of December 31, 2023
|
BlackRock Resources & Commodities Strategy Trust (BCX) |
Investment Objective
BlackRock Resources & Commodities Strategy Trust’s (BCX) (the “Trust”) primary investment objective is to seek high current income and current gains, with a secondary objective of capital appreciation. The Trust will seek to achieve its investment objectives, under normal market conditions, by investing at least 80% of its total assets in equity securities issued by commodity or natural resources companies, derivatives with exposure to commodity or natural resources companies or investments in securities and derivatives linked to the underlying price movement of commodities or natural resources. While permitted, the Trust does not currently expect to invest in securities and derivatives linked to the underlying price movement of commodities or natural resources. The Trust seeks to pursue this goal primarily by investing in a portfolio of equity securities and also by employing a strategy of writing (selling) call and put options.
No assurance can be given that the Trust’s investment objectives will be achieved.
Trust Information
| Symbol on New York Stock Exchange |
BCX | |
| Initial Offering Date |
March 30, 2011 | |
| Current Distribution Rate on Closing Market Price as of December 31, 2023 ($ 8.88)(a) |
7.00% | |
| Current Monthly Distribution per Common Share(b) |
$0.051800 | |
| Current Annualized Distribution per Common Share(b) |
$0.621600 |
| (a) | Current distribution rate on closing market price is calculated by dividing the current annualized distribution per share by the closing market price. The current distribution rate may consist of income, net realized gains and/or a return of capital. Past performance is not an indication of future results. |
| (b) | The distribution rate is not constant and is subject to change. A portion of the distribution may be deemed a return of capital or net realized gain. |
Market Price and Net Asset Value Per Share Summary
| 12/31/23 | 12/31/22 | Change | High | Low | ||||||||||||||||
| Closing Market Price |
$ | 8.88 | $ | 9.97 | (10.93 | )% | $ | 10.56 | $ | 8.43 | ||||||||||
| Net Asset Value |
10.57 | 11.23 | (5.88 | ) | 11.90 | 9.95 | ||||||||||||||
GROWTH OF $10,000 INVESTMENT
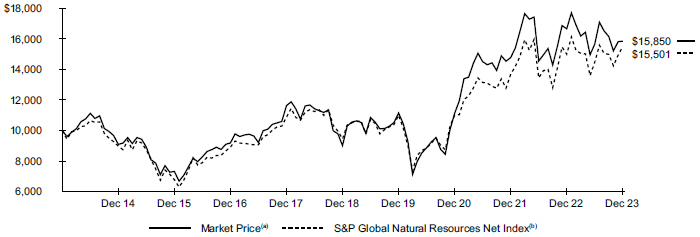
| (a) | Represents the Trust’s closing market price on the NYSE and reflects the reinvestment of dividends and/or distributions at actual reinvestment prices. |
| (b) | An index that includes approximately 90 of the largest publicly-traded companies in the natural resources and commodities businesses that meet specific investability requirements across three primary commodity-related sectors: agribusiness, energy, and metals and mining. |
| T R U S T S U M M A R Y |
31 |
| Trust Summary as of December 31, 2023 (continued)
|
BlackRock Resources & Commodities Strategy Trust (BCX) |
Performance
Returns for the period ended December 31, 2023 were as follows:
| Average Annual Total Returns | ||||||||||||
| 1 Year | 5 Years | 10 Years | ||||||||||
| Trust at NAV(a)(b) |
0.56 | % | 11.85 | % | 4.80 | % | ||||||
| Trust at Market Price(a)(b) |
(4.84 | ) | 11.95 | 4.71 | ||||||||
| MSCI ACWI Select Liquidity Natural Resources Call Overwrite Index(c) |
0.74 | 7.48 | N/A | |||||||||
| S&P Global Natural Resources Net Index |
3.38 | 10.40 | 4.48 | |||||||||
| (a) | All returns reflect reinvestment of dividends and/or distributions at actual reinvestment prices. |
| (b) | The Trust’s discount to NAV widened during the period, which accounts for the difference between performance based on market price and performance based on NAV. |
| (c) | An index that incorporates an option overlay component on the MSCI ACWI Select Liquidity Natural Resources Index with a 33% overwrite level. The benchmark commenced on December 31, 2018 and therefore the benchmark does not have 10-year returns. |
Performance results may include adjustments made for financial reporting purposes in accordance with U.S. generally accepted accounting principles. Past performance is not an indication of future results.
The Trust is presenting the performance of one or more indices for informational purposes only. The Trust is actively managed and does not seek to track or replicate the performance of any index. The index performance shown is not intended to be indicative of the Trust’s investment strategies, portfolio components or past or future performance.
More information about the Trust’s historical performance can be found in the “Closed End Funds” section of blackrock.com.
The following discussion relates to the Trust’s relative performance based on NAV:
What factors influenced performance?
Natural resources stocks posted gains as a group in 2023, but they trailed the broader equity market due largely to weakness in commodity prices.
The Trust’s underweight in Nutrien Ltd., which lagged due to a downturn in fertilizer prices, contributed to performance. An out-of-benchmark position in Cameco Corp. was also a strong contributor. Uranium prices rose on expectations for a revival in the nuclear energy industry, leading to a rally in the stock. The U.S. liquified natural gas exporter Cheniere Energy, Inc., which reported robust results and upgraded its earnings guidance throughout the year, was another noteworthy contributor.
First Quantum Minerals Ltd. (“First Quantum”) was a key detractor. In October 2023, the Panamanian government announced a referendum on whether to revoke the company’s mining license in the country. First Quantum’s Cobre Panama mine was subsequently closed in November 2023 after Panama’s Supreme Court ruled that the concession granted to the company was unconstitutional. Weakness in lithium prices impacted the Trust’s holdings in the industrial minerals sector, including Albemarle Corp. The agricultural chemical producer FMC Corp. was another key detractor. The stock came under pressure from the combination of weaker-than-expected earnings, reduced forward guidance, and a negative report from a short seller (an investor who expects the stock will fall).
The Trust used an options overlay strategy in which calls were written on a portion of the portfolio’s holdings. This strategy contributed to results in the annual period.
The Trust’s practice of maintaining a specified level of monthly distributions to shareholders did not have a material impact on the Trust’s investment strategy. The distribution policy resulted in return of capital for the period. Refer to the financial highlights and income tax information sections in this report for further information about the distributions.
Describe recent portfolio activity.
The investment adviser added to the energy sector in order to maintain an overweight position. It funded this move by reducing the Trust’s allocation to agricultural stocks. The investment adviser remained alert for investment ideas in undervalued energy stocks, companies that can benefit from the adoption of lower-carbon technologies, and longer-term growth opportunities in the nutrition area.
Describe portfolio positioning at period end.
At the end of the reporting period, 38.8% of the portfolio was invested in the energy sector, 38.5% in mining and 22.1% in agriculture. The remaining 0.6% was held in cash.
As of December 31, 2023, the Trust had in place an option overwriting program whereby 30.9% of the underlying equities were overwritten with call options on individual stocks. These call options were typically written at prices above the prevailing market prices (estimated to be 4.0% out of the money) and for maturities averaging 52 days.
The views expressed reflect the opinions of BlackRock as of the date of this report and are subject to change based on changes in market, economic or other conditions. These views are not intended to be a forecast of future events and are no guarantee of future results.
| 32 | 2 0 2 3 B L A C K R O C K A N N U A L R E P O R T T O S H A R E H O L D E R S |
| Trust Summary as of December 31, 2023 (continued)
|
BlackRock Resources & Commodities Strategy Trust (BCX) |
Overview of the Trust’s Total Investments
| TEN LARGEST HOLDINGS
|
| |||
| Security(a) | Percent of Total Investments |
|||
| Shell PLC |
7.7 | % | ||
| TotalEnergies SE |
6.4 | |||
| Exxon Mobil Corp. |
5.4 | |||
| BHP Group Ltd. |
4.9 | |||
| Glencore PLC |
4.8 | |||
| Chevron Corp. |
4.3 | |||
| Vale SA |
4.2 | |||
| BP PLC |
4.1 | |||
| Wheaton Precious Metals Corp. |
3.7 | |||
| Freeport-McMoRan, Inc. |
3.5 | |||
| INDUSTRY ALLOCATION
|
| |||
| Industry(a)(b) | Percentage of Total Investments |
|||
| Metals & Mining |
38.4 | % | ||
| Oil, Gas & Consumable Fuels |
37.6 | |||
| Containers & Packaging |
7.6 | |||
| Chemicals |
5.9 | |||
| Food Products |
4.9 | |||
| Paper & Forest Products |
2.3 | |||
| Machinery |
1.9 | |||
| Energy Equipment & Services |
1.4 | |||
| (a) | Excludes short-term securities. |
| (b) | For Trust compliance purposes, the Trust’s industry classifications refer to one or more of the industry sub-classifications used by one or more widely recognized market indexes or ratings group indexes, and/or as defined by the investment adviser. These definitions may not apply for purposes of this report, which may combine such industry sub-classifications for reporting ease. |
| T R U S T S U M M A R Y |
33 |
| Trust Summary as of December 31, 2023
|
BlackRock Science and Technology Term Trust (BSTZ) |
Investment Objective
BlackRock Science and Technology Term Trust’s (BSTZ) (the “Trust”) (formerly known as BlackRock Science and Technology Trust II) investment objective is to provide total return and income through a combination of current income, current gains and long-term capital appreciation. The Trust seeks to achieve its investment objective by investing, under normal market conditions, at least 80% of its total assets in equity securities issued by U.S. and non-U.S. science and technology companies in any market capitalization range, selected for their rapid and sustainable growth potential from the development, advancement and use of science and/or technology. The Trust seeks to pursue this goal primarily by investing in a portfolio of equity securities and also by employing a strategy of writing (selling) call and put options.
On March 31, 2023 the Board approved a proposal to change the name of BlackRock Science and Technology Trust II, effective as of April 5, 2023, to BlackRock Science and Technology Term Trust. There were no changes to the Trust’s investment policies or strategies in conjunction with the name change.
No assurance can be given that the Trust’s investment objective will be achieved.
Trust Information
| Symbol on New York Stock Exchange |
BSTZ | |
| Initial Offering Date |
June 27, 2019 | |
| Current Distribution Rate on Closing Market Price as of December 31, 2023 ($ 16.71)(a) |
7.36% | |
| Current Monthly Distribution per Common Share(b) |
$0.102540 | |
| Current Annualized Distribution per Common Share(b) |
$1.230480 |
| (a) | Current distribution rate on closing market price is calculated by dividing the current annualized distribution per share by the closing market price. The current distribution rate may consist of income, net realized gains and/or a return of capital. Past performance is not an indication of future results. |
| (b) | The monthly distribution per Common Share, declared on February 1, 2024, was increased to $0.103260 per share. The current distribution rate on closing market price, current monthly distribution per Common Share, and current annualized distribution per Common Share do not reflect the new distribution rate. The new distribution rate is not constant and is subject to change in the future. A portion of the distribution may be deemed a return of capital or net realized gain. |
Market Price and Net Asset Value Per Share Summary
| 12/31/23 | 12/31/22 | Change | High | Low | ||||||||||||||||
| Closing Market Price |
$ | 16.71 | $ | 15.64 | 6.84 | % | $ | 19.04 | $ | 14.16 | ||||||||||
| Net Asset Value |
21.43 | 19.53 | 9.73 | 22.14 | 19.00 | |||||||||||||||
GROWTH OF $10,000 INVESTMENT
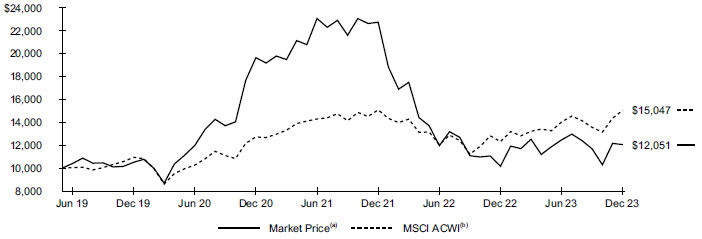
BSTZ commenced operations on June 27, 2019.
| (a) | Represents the Trust’s closing market price on the NYSE and reflects the reinvestment of dividends and/or distributions at actual reinvestment prices. |
| (b) | An index that captures large- and mid-cap representation across certain developed and emerging markets. |
| 34 | 2 0 2 3 B L A C K R O C K A N N U A L R E P O R T T O S H A R E H O L D E R S |
| Trust Summary as of December 31, 2023 (continued)
|
BlackRock Science and Technology Term Trust (BSTZ) |
Performance
Returns for the period ended December 31, 2023 were as follows:
|
Average Annual Total Returns |
||||||||
| 1 Year | Since Inception(a) |
|||||||
| Trust at NAV(b)(c)(d) |
21.74% | 10.13% | ||||||
| Trust at Market Price(b)(c)(d) |
18.54 | 4.22 | ||||||
| MSCI Custom ACWI SMID Growth IT Call Overwrite Index(e) |
31.60 | 2.34 | ||||||
| MSCI ACWI |
22.20 | 9.49 | ||||||
| (a) | BSTZ commenced operations on June 27, 2019. |
| (b) | All returns reflect reinvestment of dividends and/or distributions at actual reinvestment prices. |
| (c) | The Trust’s discount to NAV widened during the period, which accounts for the difference between performance based on market price and performance based on NAV. |
| (d) | For financial reporting purposes, the market value of certain investments were adjusted as of report date. Accordingly, the NAV per share and total return performance based on NAV presented herein are different than the information previously published on December 31, 2023. |
| (e) | An index representing the Information Technology sector stocks within the MSCI ACWI SMID Cap Growth Index and incorporating an option overlay component with a 25% overwrite level. An index that captures mid- and small-cap securities exhibiting overall growth style characteristics across certain developed and emerging markets. The index commenced on March 31, 2022 and therefore the since inception return presented is for the period March 31, 2022 through the current reporting period. |
Performance results may include adjustments made for financial reporting purposes in accordance with U.S. generally accepted accounting principles. Past performance is not an indication of future results.
The Trust is presenting the performance of one or more indices for informational purposes only. The Trust is actively managed and does not seek to track or replicate the performance of any index. The index performance shown is not intended to be indicative of the Trust’s investment strategies, portfolio components or past or future performance.
More information about the Trust’s historical performance can be found in the “Closed End Funds” section of blackrock.com.
The following discussion relates to the Trust’s relative performance based on NAV:
What factors influenced performance?
Technology stocks produced strong returns in 2023, as investors gravitated toward companies seen as having the most attractive growth characteristics.
At the sector level, an overweight allocation to the semiconductors sub-sector contributed to the Fund’s relative performance. Security selection in the hardware sub-sector added value, as well. Among individual holdings, the Trust’s out-of-benchmark position in the semiconductor designer NVIDIA Corp. was the largest contributor to relative performance. The stock jumped on optimism around surging demand for the company’s graphics processing units that enable artificial intelligence (“AI”). An out-of-benchmark position in Tesla, Inc., was an additional noteworthy contributor. The stock rallied after the company reported stable revenues and revealed that demand growth for its electric vehicles continued to outpace supply. The firm’s tiered pricing also emerged as an effective tool for supporting sales. A zero weighting in SolarEdge Technologies, Inc. (“SolarEdge”), an Israeli solar inverter company that primarily services residential markets, also contributed. SolarEdge experienced price competition in key regions such as China and Europe.
At the sector level, security selection in the software and new industries sub-sectors detracted from relative performance. An out-of-benchmark position in Farmers Business Network, a private company, was a key detractor among the Trust’s individual holdings. The agriculture network company raised an additional funding round in the third calendar quarter 2023 after the near-failure of the business. At the same time, governance challenges led to fundamental weakness that dragged on the company’s private-market valuation. Similarly, an out-of-benchmark private position in ByteDance detracted from active returns. The parent company of the social media app TikTok experienced a decrease in valuation in tandem with those of its Chinese internet peers. An out-of-benchmark private position in Think & Learn was a further detractor of note. The private company’s valuation declined due to weakness across the educational technology industry. Idiosyncratic governance and execution challenges at the firm weighed on its valuation, as well.
The Trust used an options overlay strategy in which calls were written on a portion of the portfolio’s holdings. The Trust’s options overlay strategy contributed to relative performance for the 12-month period.
The Trust’s practice of maintaining a specified level of monthly distributions did not have a material impact on the Trust’s investment strategy. The distribution policy did not result in return of capital for the period. The distribution policy resulted in return of capital for the period. Refer to the financial highlights and income tax information sections in this report for further information about the distributions.
Describe recent portfolio activity.
Throughout the reporting period, the Trust added to semiconductor and hardware companies positioned to benefit from the growth of AI. On the other hand, it trimmed select internet holdings where advertising demand remained muted.
From a regional perspective, the Trust reduced its weighting in China due to concerns about the slow pace of the economic recovery in the region. On the other hand, it added to Japanese equities where it identified both attractive fundamentals and near-term catalysts. The Trust did not make any additional investments in private technology companies.
| T R U S T S U M M A R Y |
35 |
| Trust Summary as of December 31, 2023 (continued)
|
BlackRock Science and Technology Term Trust (BSTZ) |
Describe portfolio positioning at period end.
The Trust’s investment adviser continued to perform due diligence on multiple new opportunities, although at year-end exposure to private assets was above the 25% target. As of December 31, 2023, the Trust held 22 private investments, comprising 33% of total assets for a commitment of approximately $540 million. The investment adviser continued to seek opportunities to harvest the illiquidity premium by taking advantage of the Trust’s “closed” structure and adding holdings in private investments as the Trust’s capacity increased.
At the end of the period, the Trust held 32% of its net asset value in the semiconductor industry, 31% in software, 13% in hardware, 11% in internet, 9% in services, 3% in content and infrastructure, and 3% in new industries. These industry weightings were a result of bottom-up stock selection.
As of December 31, 2023, the Trust had in place an option overwriting program whereby 25.3% of the underlying equities were overwritten with call options on individual stocks. These call options were typically written at prices above the prevailing market prices (estimated to be 5.2% out of the money) and for maturities averaging 56 days.
The views expressed reflect the opinions of BlackRock as of the date of this report and are subject to change based on changes in market, economic or other conditions. These views are not intended to be a forecast of future events and are no guarantee of future results.
| 36 | 2 0 2 3 B L A C K R O C K A N N U A L R E P O R T T O S H A R E H O L D E R S |
| Trust Summary as of December 31, 2023 (continued)
|
BlackRock Science and Technology Term Trust (BSTZ) |
Overview of the Trust’s Total Investments
| TEN LARGEST HOLDINGS
|
| |||
| Security(a) | Percent of Total Investments |
|||
| NVIDIA Corp. |
4.9 | % | ||
| Databricks, Inc. |
4.3 | |||
| Synopsys, Inc. |
3.6 | |||
| ByteDance Ltd. |
3.1 | |||
| PsiQuantum Corp. |
2.9 | |||
| SambaNova Systems, Inc. |
2.5 | |||
| GrubMarket, Inc. |
2.4 | |||
| Tesla, Inc. |
2.0 | |||
| SK Hynix, Inc. |
1.9 | |||
| Snyk Ltd. |
1.8 | |||
| INDUSTRY ALLOCATION
|
| |||
| Industry(a)(b) | Percentage of Total Investments |
|||
| Semiconductors & Semiconductor Equipment |
31.8 | % | ||
| Software |
25.6 | |||
| IT Services |
7.0 | |||
| Interactive Media & Services |
5.0 | |||
| Electronic Equipment, Instruments & Components |
4.9 | |||
| Entertainment |
4.0 | |||
| Technology Hardware, Storage & Peripherals |
3.5 | |||
| Professional Services |
2.6 | |||
| Consumer Staples Distribution & Retail |
2.4 | |||
| Communications Equipment |
2.1 | |||
| Automobiles |
2.0 | |||
| Financial Services |
1.8 | |||
| Diversified Consumer Services |
1.7 | |||
| Media |
1.6 | |||
| Broadline Retail |
1.6 | |||
| Other* |
2.4 | |||
| (a) | Excludes short-term securities. |
| (b) | For Trust compliance purposes, the Trust’s industry classifications refer to one or more of the industry sub-classifications used by one or more widely recognized market indexes or ratings group indexes, and/or as defined by the investment adviser. These definitions may not apply for purposes of this report, which may combine such industry sub-classifications for reporting ease. |
| * | Includes one or more investment categories that individually represents less than 1.0% of the Trust’s total investments. Please refer to the Consolidated Schedule of Investments for details. |
| T R U S T S U M M A R Y |
37 |
| Trust Summary as of December 31, 2023
|
BlackRock Science and Technology Trust (BST) |
Investment Objective
BlackRock Science and Technology Trust’s (BST) (the “Trust”) investment objective is to provide income and total return through a combination of current income, current gains and long-term capital appreciation. The Trust seeks to achieve its investment objective by investing, under normal market conditions, at least 80% of its total assets in equity securities of U.S. and non-U.S. science and technology companies in any market capitalization range, selected for their rapid and sustainable growth potential from the development, advancement and use of science and/or technology (high growth science and technology stocks), and/or potential to generate current income from advantageous dividend yields (cyclical science and technology stocks). The Trust seeks to pursue this goal primarily by investing in a portfolio of equity securities and also by employing a strategy of writing (selling) call and put options.
No assurance can be given that the Trust’s investment objective will be achieved.
Trust Information
| Symbol on New York Stock Exchange |
BST | |
| Initial Offering Date |
October 30, 2014 | |
| Current Distribution Rate on Closing Market Price as of December 31, 2023 ($33.66)(a) |
8.91% | |
| Current Monthly Distribution per Common Share(b) |
$0.250000 | |
| Current Annualized Distribution per Common Share(b) |
$3.000000 | |
| (a) | Current distribution rate on closing market price is calculated by dividing the current annualized distribution per share by the closing market price. The current distribution rate may consist of income, net realized gains and/or a return of capital. Past performance is not an indication of future results. |
| (b) | The distribution rate is not constant and is subject to change. A portion of the distribution may be deemed a return of capital or net realized gain. |
Market Price and Net Asset Value Per Share Summary
| 12/31/23 | 12/31/22 | Change | High | Low | ||||||||||||||||
| Closing Market Price |
$ | 33.66 | $ | 28.37 | 18.65 | % | $ | 35.25 | $ | 28.37 | ||||||||||
| Net Asset Value |
34.74 | 29.11 | 19.34 | 35.20 | 28.82 | |||||||||||||||
GROWTH OF $10,000 INVESTMENT
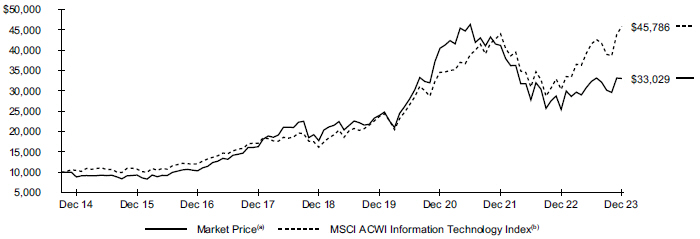
BST commenced operations on October 30, 2014.
| (a) | Represents the Trust’s closing market price on the NYSE and reflects the reinvestment of dividends and/or distributions at actual reinvestment prices. |
| (b) | An index that includes large- and mid-cap securities across certain developed markets countries and certain emerging markets countries. All securities in the index are classified in the Information Technology sector as per the Global Industry Classification Standard. |
| 38 | 2 0 2 3 B L A C K R O C K A N N U A L R E P O R T T O S H A R E H O L D E R S |
| Trust Summary as of December 31, 2023 (continued)
|
BlackRock Science and Technology Trust (BST) |
Performance
Returns for the period ended December 31, 2023 were as follows:
| Average Annual Total Returns | ||||||||||||
| 1 Year | 5 Years | |
Since Inception |
(a) | ||||||||
| Trust at NAV(b)(c)(d) |
30.78 | % | 15.01 | % | 14.88 | % | ||||||
| Trust at Market Price(b)(c)(d) |
30.03 | 13.21 | 13.92 | |||||||||
| MSCI ACWI Information Technology Call Overwrite Index(e) |
45.37 | 18.23 | N/A | |||||||||
| MSCI ACWI Information Technology Index |
51.02 | 23.18 | 18.05 | |||||||||
| (a) | BST commenced operations on October 30, 2014. |
| (b) | All returns reflect reinvestment of dividends and/or distributions at actual reinvestment prices. |
| (c) | The Trust’s discount to NAV widened during the period, which accounts for the difference between performance based on market price and performance based on NAV. |
| (d) | For financial reporting purposes, the market value of certain investments were adjusted as of report date. Accordingly, the NAV per share and total return performance based on NAV presented herein are different than the information previously published on December 31, 2023. |
| (e) | An index that incorporates an option overlay component on the MSCI ACWI IT Index with a 33% overwrite level. since inception. |
Performance results may include adjustments made for financial reporting purposes in accordance with U.S. generally accepted accounting principles. Past performance is not an indication of future results.
The Trust is presenting the performance of one or more indices for informational purposes only. The Trust is actively managed and does not seek to track or replicate the performance of any index. The index performance shown is not intended to be indicative of the Trust’s investment strategies, portfolio components or past or future performance.
More information about the Trust’s historical performance can be found in the “Closed End Funds” section of blackrock.com.
The following discussion relates to the Trust’s relative performance based on NAV:
What factors influenced performance?
Technology stocks produced strong returns in 2023, as investors gravitated toward companies seen as having the most attractive growth characteristics.
At the sector level, the Trust’s underweight allocation to the hardware sub-sector contributed to relative performance. Among individual holdings, an out-of-benchmark position in Meta Platforms, Inc. (“Meta”) (formerly Facebook) was the leading contributor. Companies that demonstrated a commitment to cost discipline by reducing headcount expenses were generally rewarded by investors in 2023. In addition, Meta reported improvements in the use of artificial intelligence (“AI”) to increase monetization across its social media platforms. The Trust also benefited from a zero weighting in Cisco Systems, Inc., which lagged at a time of muted spending among its enterprise customers. An out-of-benchmark position in Tesla, Inc., was an additional contributor of note. The stock rallied after the company reported stable revenues and revealed that demand growth for its electric vehicles continued to outpace supply. The firm’s tiered pricing also emerged as an effective tool for supporting sales.
At the sector level, security selection in the semiconductors and software sub-sectors detracted from relative performance. An underweight position in the semiconductor designer NVIDIA Corp. was the most notable individual detractor. The stock jumped on optimism around surging demand for the company’s graphics processing units that enable generative AI. An out-of-benchmark position in Farmers Business Network, a private company, was an additional detractor. The agriculture network company raised an additional funding round in the third calendar quarter 2023 after the near-failure of the business. At the same time, governance challenges led to fundamental weakness that dragged on the company’s private-market valuation. A position in Bolt Financial, another private company, also detracted. The financial software company’s valuation fell along with those of its publicly traded peers in the financial technology space amid softer industry demand.
The Trust used an options overlay strategy in which calls were written on a portion of the portfolio’s holdings. The Trust’s options overlay strategy contributed to relative performance for the 12-month period.
The Trust’s practice of maintaining a specified level of monthly distributions to shareholders did not have a material impact on the Trust’s investment strategy. The distribution policy resulted in return of capital for the period. Refer to the financial highlights and income tax information sections in this report for further information about the distributions.
Describe recent portfolio activity.
The Trust increased its allocations to the semiconductors and software sub-sectors and reduced its weighting in the services sub-sector. Its allocations to the internet and hardware sub-sectors were relatively unchanged.
From a regional perspective, the Trust’s allocation to the United States increased. Its position in China and other emerging markets decreased.
Describe portfolio positioning at period end.
At the end of the period, the Trust held 32% of its net asset value in the software industry, 29% in semiconductors, 15% in internet, 12% in hardware, 10% in services, 2% in new industries, and 2% in content & infrastructure. These industry weightings were the result of bottom-up stock selection.
As of December 31, 2023, the Trust had in place an option overwriting program whereby 28% of the underlying equities were overwritten with call options on individual stocks. These call options were typically written at prices above the prevailing market prices (estimated to be 3.8% out of the money) and for maturities averaging 50 days.
| T R U S T S U M M A R Y |
39 |
| Trust Summary as of December 31, 2023 (continued)
|
BlackRock Science and Technology Trust (BST) |
The views expressed reflect the opinions of BlackRock as of the date of this report and are subject to change based on changes in market, economic or other conditions. These views are not intended to be a forecast of future events and are no guarantee of future results.
Overview of the Trust’s Total Investments
| TEN LARGEST HOLDINGS
|
| |||
| Security(a) | Percent of Total Investments |
|||
| Microsoft Corp. |
9.2 | % | ||
| Apple, Inc. |
7.7 | |||
| NVIDIA Corp. |
7.1 | |||
| Broadcom, Inc. |
2.9 | |||
| Cadence Design Systems, Inc. |
2.8 | |||
| ASML Holding NV |
2.3 | |||
| Mastercard, Inc. |
2.3 | |||
| Amazon.com, Inc. |
2.2 | |||
| Meta Platforms, Inc. |
2.1 | |||
| Alphabet, Inc. |
1.9 | |||
| INDUSTRY ALLOCATION
|
| |||
| Industry(a)(b) | Percentage of Total Investments |
|||
| Semiconductors & Semiconductor Equipment |
28.2 | % | ||
| Software |
27.7 | |||
| Technology Hardware, Storage & Peripherals |
8.7 | |||
| IT Services |
7.9 | |||
| Financial Services |
5.4 | |||
| Interactive Media & Services |
5.2 | |||
| Broadline Retail |
3.7 | |||
| Diversified Consumer Services |
2.1 | |||
| Entertainment |
1.9 | |||
| Automobiles |
1.8 | |||
| Professional Services |
1.6 | |||
| Consumer Staples Distribution & Retail |
1.3 | |||
| Communications Equipment |
1.1 | |||
| Ground Transportation |
1.0 | |||
| Other* |
2.4 | |||
| (a) | Excludes short-term securities. |
| (b) | For Trust compliance purposes, the Trust’s industry classifications refer to one or more of the industry sub-classifications used by one or more widely recognized market indexes or ratings group indexes, and/or as defined by the investment adviser. These definitions may not apply for purposes of this report, which may combine such industry sub-classifications for reporting ease. |
| * | Includes one or more investment categories that individually represents less than 1.0% of the Trust’s total investments. Please refer to the Consolidated Schedule of Investments for details. |
| 40 | 2 0 2 3 B L A C K R O C K A N N U A L R E P O R T T O S H A R E H O L D E R S |
| Trust Summary as of December 31, 2023
|
BlackRock Utilities, Infrastructure & Power Opportunities Trust (BUI) |
Investment Objective
BlackRock Utilities, Infrastructure & Power Opportunities Trust’s (BUI) (the “Trust”) investment objective is to provide total return through a combination of current income, current gains and long-term capital appreciation. The Trust seeks to achieve its investment objective by investing, under normal market conditions, at least 80% of its total assets in equity securities issued by companies that are engaged in the Utilities, Infrastructure and Power Opportunities business segments anywhere in the world and by employing a strategy of writing (selling) call and put options. The Trust considers the “Utilities” business segment to include products, technologies and services connected to the management, ownership, operation, construction, development or financing of facilities used to generate, transmit or distribute electricity, water, natural resources or telecommunications, the “Infrastructure” business segment to include companies that own or operate infrastructure assets or that are involved in the development, construction, distribution or financing of infrastructure assets and the “Power Opportunities” business segment to include companies with a significant involvement in, supporting, or necessary to renewable energy technology and development, alternative fuels, energy efficiency, automotive and sustainable mobility and technologies that enable or support the growth and adoption of new power and energy sources. Under normal circumstances, the Trust invests a substantial amount of its total assets in foreign issuers, issuers that primarily trade in a market located outside the United States or issuers that do a substantial amount of business outside the United States. The Trust may invest directly in such securities or synthetically through the use of derivatives.
No assurance can be given that the Trust’s investment objective will be achieved.
Trust Information
| Symbol on New York Stock Exchange |
BUI | |
| Initial Offering Date |
November 25, 2011 | |
| Current Distribution Rate on Closing Market Price as of December 31, 2023 ($ 21.82)(a) |
6.65% | |
| Current Monthly Distribution per Common Share(b) |
$0.121000 | |
| Current Annualized Distribution per Common Share(b) |
$1.452000 |
| (a) | Current distribution rate on closing market price is calculated by dividing the current annualized distribution per share by the closing market price. The current distribution rate may consist of income, net realized gains and/or a return of capital. Past performance is not an indication of future results. |
| (b) | The distribution rate is not constant and is subject to change. A portion of the distribution may be deemed a return of capital or net realized gain. |
Market Price and Net Asset Value Per Share Summary
| 12/31/23 | 12/31/22 | Change | High | Low | ||||||||||||||||
| Closing Market Price |
$ | 21.82 | $ | 20.77 | 5.06 | % | $ | 23.98 | $ | 18.75 | ||||||||||
| Net Asset Value |
22.53 | 22.37 | 0.72 | 23.39 | 19.59 | |||||||||||||||
GROWTH OF $10,000 INVESTMENT
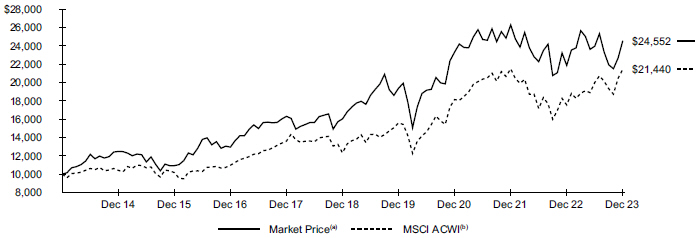
| (a) | Represents the Trust’s closing market price on the NYSE and reflects the reinvestment of dividends and/or distributions at actual reinvestment prices. |
| (b) | An index that captures large- and mid-cap representation across certain developed and emerging markets. |
| T R U S T S U M M A R Y |
41 |
| Trust Summary as of December 31, 2023 (continued)
|
BlackRock Utilities, Infrastructure & Power Opportunities Trust (BUI) |
Performance
Returns for the period ended December 31, 2023 were as follows:
| Average Annual Total Returns | ||||||||||||
| 1 Year | 5 Years | 10 Years | ||||||||||
| Trust at NAV(a)(b) |
7.66 | % | 10.73 | % | 8.15 | % | ||||||
| Trust at Market Price(a)(b) |
12.30 | 8.90 | 9.40 | |||||||||
| MSCI World Select Energy, Utilities and Industry Call Overwrite Index(c) |
13.07 | 6.64 | N/A | |||||||||
| MSCI ACWI |
22.20 | 11.72 | 7.93 | |||||||||
| (a) | All returns reflect reinvestment of dividends and/or distributions at actual reinvestment prices. |
| (b) | The Trust’s discount to NAV narrowed during the period, which accounts for the difference between performance based on market price and performance based on NAV. |
| (c) | An index that incorporates an option overlay component on the MSCI World Select Energy, Utilities and Industry Index with a 33% overwrite level. The benchmark commenced on December 31, 2018 and therefore the benchmark does not have 10-year returns. |
Performance results may include adjustments made for financial reporting purposes in accordance with U.S. generally accepted accounting principles. Past performance is not an indication of future results.
The Trust is presenting the performance of one or more indices for informational purposes only. The Trust is actively managed and does not seek to track or replicate the performance of any index. The index performance shown is not intended to be indicative of the Trust’s investment strategies, portfolio components or past or future performance.
More information about the Trust’s historical performance can be found in the “Closed End Funds” section of blackrock.com.
The following discussion relates to the Trust’s relative performance based on NAV:
What factors influenced performance?
Infrastructure stocks, as a group, gained ground in 2023 but struggled relative to the broader equity market in the rising-rate environment.
Holdings in the industrial energy efficiency companies Ingersoll Rand, Inc., Air Liquide SA and Kingspan Group PLC were top contributors to the Trust’s performance during the reporting period. The companies benefited from strong demand, supported by a significant increase in U.S. clean-technology manufacturing following the passage of the Inflation Reduction Act. This trend was highlighted by growing investment in areas such as electric vehicle (“EV”) battery manufacturing, semiconductor fabrication plants and solar panel production. Eaton Corp. PLC, which makes products used in data centers, also performed well as the breakthrough in generative artificial intelligence was seen as driver for increased investment in this area.
On the other hand, positions in clean power utility companies detracted as bond yields rose. This resulted in a pronounced decline in valuations across the sector, weighing on shares of NextEra Energy, Inc. (“Nextera”) and EDP Renováveis SA. Nextera also experienced a change in management that further contributed to uncertainty. The investment adviser maintained the positions, as the companies consistently reported quarterly earnings in line with or ahead of consensus expectations. The EV battery producer LG Chem Ltd., which was pressured by concerns about slowing EV demand and greater price competition, also detracted.
The Trust used an options overlay strategy in which calls were written on a portion of the portfolio’s holdings. The Trust’s options overlay strategy contributed to relative performance in the 12-month period.
The Trust’s practice of maintaining a specified level of monthly distributions to shareholders did not have a material impact on the Trust’s investment strategy. The distribution policy resulted in return of capital for the period. Refer to the financial highlights and income tax information sections in this report for further information about the distributions.
Describe recent portfolio activity.
The investment adviser adjusted the portfolio throughout the reporting period in an effort to capitalize on market volatility. Most notably, the investment adviser moved positioning around in clean power utilities. It maintained a steady overall allocation to the broader utilities sector on the belief that earnings prospects remained favorable and rising rates had been fully discounted into prices.
Describe portfolio positioning at period end.
At the end of the reporting period, 48.4% of the portfolio was invested in the utilities sector, 32.8% in industrials and 9.4% in energy. The remainder was invested in other infrastructure- and power-related sectors.
As of December 31, 2023, the Trust had in place an option overwriting program whereby 33.5% of the underlying equities were overwritten with call options on individual stocks. These call options were typically written at prices above the prevailing market prices (estimated to be 2.6% out of the money) and for maturities averaging 58 days.
The views expressed reflect the opinions of BlackRock as of the date of this report and are subject to change based on changes in market, economic or other conditions. These views are not intended to be a forecast of future events and are no guarantee of future results.
| 42 | 2 0 2 3 B L A C K R O C K A N N U A L R E P O R T T O S H A R E H O L D E R S |
| Trust Summary as of December 31, 2023 (continued)
|
BlackRock Utilities, Infrastructure & Power Opportunities Trust (BUI) |
Overview of the Trust’s Total Investments
| TEN LARGEST HOLDINGS
|
| |||
| Security(a) | Percent of Total Investments |
|||
| NextEra Energy, Inc. |
7.1 | % | ||
| RWE AG |
4.5 | |||
| Enel SpA |
4.3 | |||
| Vinci SA |
3.7 | |||
| Vestas Wind Systems A/S |
3.3 | |||
| Atlas Copco AB |
3.1 | |||
| Sempra |
2.9 | |||
| Trane Technologies PLC |
2.7 | |||
| Duke Energy Corp. |
2.7 | |||
| PG&E Corp. |
2.4 | |||
| INDUSTRY ALLOCATION
|
| |||
| Industry(a)(b) | Percentage of Total Investments |
|||
| Electric Utilities |
29.0 | % | ||
| Multi-Utilities |
10.6 | |||
| Oil, Gas & Consumable Fuels |
9.4 | |||
| Independent Power and Renewable Electricity Producers |
8.6 | |||
| Building Products |
8.0 | |||
| Electrical Equipment |
6.9 | |||
| Machinery |
6.2 | |||
| Construction & Engineering |
5.8 | |||
| Semiconductors & Semiconductor Equipment |
5.5 | |||
| Commercial Services & Supplies |
4.2 | |||
| Chemicals |
3.1 | |||
| Electronic Equipment, Instruments & Components |
1.5 | |||
| Ground Transportation |
1.2 | |||
| (a) | Excludes short-term securities. |
| (b) | For Trust compliance purposes, the Trust’s industry classifications refer to one or more of the industry sub-classifications used by one or more widely recognized market indexes or ratings group indexes, and/or as defined by the investment adviser. These definitions may not apply for purposes of this report, which may combine such industry sub-classifications for reporting ease. |
| T R U S T S U M M A R Y |
43 |
|
December 31, 2023
|
BlackRock Energy and Resources Trust (BGR) (Percentages shown are based on Net Assets) |
| Security | Shares | Value | ||||||
| Common Stocks |
||||||||
| Energy Equipment & Services — 6.4% | ||||||||
| NOV, Inc. |
91,550 | $ | 1,856,634 | |||||
| Patterson-UTI Energy, Inc. |
106,500 | 1,150,200 | ||||||
| Schlumberger NV |
226,731 | 11,799,081 | ||||||
| TechnipFMC PLC |
222,150 | 4,474,101 | ||||||
| Tenaris SA |
205,600 | 3,576,035 | ||||||
| Weatherford International PLC(a) |
17,750 | 1,736,483 | ||||||
|
|
|
|||||||
| 24,592,534 | ||||||||
| Oil, Gas & Consumable Fuels — 93.0% | ||||||||
| ARC Resources Ltd. |
341,430 | 5,068,434 | ||||||
| BP PLC |
3,042,155 | 18,034,101 | ||||||
| Canadian Natural Resources Ltd. |
249,592 | 16,351,897 | ||||||
| Cenovus Energy, Inc. |
452,787 | 7,545,026 | ||||||
| Cheniere Energy, Inc. |
82,918 | 14,154,932 | ||||||
| Chevron Corp. |
228,590 | 34,096,484 | ||||||
| ConocoPhillips(b) |
205,819 | 23,889,367 | ||||||
| Diamondback Energy, Inc. |
60,351 | 9,359,233 | ||||||
| EOG Resources, Inc. |
128,616 | 15,556,105 | ||||||
| Exxon Mobil Corp.(b)(c) |
628,030 | 62,790,440 | ||||||
| Galp Energia SGPS SA |
199,093 | 2,929,390 | ||||||
| Gazprom PJSC(a)(d) |
879,200 | 99 | ||||||
| Hess Corp.(b) |
77,303 | 11,144,001 | ||||||
| Kosmos Energy Ltd.(a) |
308,034 | 2,066,908 | ||||||
| Marathon Petroleum Corp. |
94,745 | 14,056,368 | ||||||
| Pembina Pipeline Corp. |
256,800 | 8,841,339 | ||||||
| Shell PLC, ADR(b) |
634,410 | 41,744,178 | ||||||
| TC Energy Corp. |
299,300 | 11,691,459 | ||||||
| TotalEnergies SE |
462,811 | 31,470,674 | ||||||
| Tourmaline Oil Corp. |
130,433 | 5,865,818 | ||||||
| Valero Energy Corp. |
76,611 | 9,959,430 | ||||||
| Williams Cos., Inc. |
411,581 | 14,335,366 | ||||||
|
|
|
|||||||
| 360,951,049 | ||||||||
|
|
|
|||||||
| Total Long-Term Investments — 99.4% |
385,543,583 | |||||||
|
|
|
|||||||
| Security | Shares | Value | ||||||
| Short-Term Securities |
||||||||
| Money Market Funds — 0.9% | ||||||||
| BlackRock Liquidity Funds, T-Fund, Institutional Class, 5.26%(e)(f) |
3,612,320 | $ | 3,612,320 | |||||
|
|
|
|||||||
| Total Short-Term Securities — 0.9% |
3,612,320 | |||||||
|
|
|
|||||||
| Total Investments Before Options Written — 100.3% |
|
389,155,903 | ||||||
|
|
|
|||||||
| Options Written — (0.4)% |
(1,725,858 | ) | ||||||
|
|
|
|||||||
| Total Investments, Net of Options Written — 99.9% |
|
387,430,045 | ||||||
| Other Assets Less Liabilities — 0.1% |
551,812 | |||||||
|
|
|
|||||||
| Net Assets — 100.0% |
$ | 387,981,857 | ||||||
|
|
|
|||||||
| (a) | Non-income producing security. |
| (b) | All or a portion of the security has been pledged and/or segregated as collateral in connection with outstanding exchange-traded options written. |
| (c) | All or a portion of the security has been pledged as collateral in connection with outstanding OTC derivatives. |
| (d) | Security is valued using significant unobservable inputs and is classified as Level 3 in the fair value hierarchy. |
| (e) | Affiliate of the Trust. |
| (f) | Annualized 7-day yield as of period end. |
For Trust compliance purposes, the Trust’s industry classifications refer to one or more of the industry sub-classifications used by one or more widely recognized market indexes or rating group indexes, and/or as defined by the investment adviser. These definitions may not apply for purposes of this report, which may combine such industry sub-classifications for reporting ease.
Affiliates
Investments in issuers considered to be affiliate(s) of the Trust during the year ended December 31, 2023 for purposes of Section 2(a)(3) of the Investment Company Act of 1940, as amended, were as follows:
| Affiliated Issuer | Value at 12/31/22 |
Purchases at Cost |
Proceeds from Sale |
Net Realized Gain (Loss) |
Change in Unrealized Appreciation (Depreciation) |
Value at 12/31/23 |
Shares Held at 12/31/23 |
Income | Capital Gain Distributions from Underlying Funds |
|||||||||||||||||||||||||||
| BlackRock Liquidity Funds, T-Fund, Institutional Class |
$ | 7,695,475 | $ | — | $ | (4,083,155 | )(a) | $ | — | $ | — | $ | 3,612,320 | 3,612,320 | $ | 298,320 | $ | — | ||||||||||||||||||
|
|
|
|
|
|
|
|
|
|
|
|||||||||||||||||||||||||||
| (a) | Represents net amount purchased (sold). |
| 44 | 2 0 2 3 B L A C K R O C K A N N U A L R E P O R T T O S H A R E H O L D E R S |
| Schedule of Investments (continued) December 31, 2023
|
BlackRock Energy and Resources Trust (BGR) |
Derivative Financial Instruments Outstanding as of Period End
Exchange-Traded Options Written
| Description | Number of Contracts |
Expiration Date |
Exercise Price | Notional Amount (000) |
Value | |||||||||||||||||||||||
| Call |
||||||||||||||||||||||||||||
| Diamondback Energy, Inc. |
107 | 01/05/24 | USD | 160.00 | USD | 1,659 | $ | (4,280 | ) | |||||||||||||||||||
| Exxon Mobil Corp. |
437 | 01/05/24 | USD | 107.00 | USD | 4,369 | (1,311 | ) | ||||||||||||||||||||
| Hess Corp. |
88 | 01/05/24 | USD | 150.00 | USD | 1,269 | (3,740 | ) | ||||||||||||||||||||
| Schlumberger NV |
168 | 01/05/24 | USD | 54.00 | USD | 874 | (2,100 | ) | ||||||||||||||||||||
| Valero Energy Corp. |
138 | 01/05/24 | USD | 131.00 | USD | 1,794 | (19,458 | ) | ||||||||||||||||||||
| Williams Cos., Inc. |
492 | 01/05/24 | USD | 37.00 | USD | 1,714 | (2,460 | ) | ||||||||||||||||||||
| Chevron Corp. |
313 | 01/12/24 | USD | 155.00 | USD | 4,669 | (17,372 | ) | ||||||||||||||||||||
| ConocoPhillips |
202 | 01/12/24 | USD | 119.00 | USD | 2,345 | (18,887 | ) | ||||||||||||||||||||
| EOG Resources, Inc. |
220 | 01/12/24 | USD | 124.50 | USD | 2,661 | (22,000 | ) | ||||||||||||||||||||
| Exxon Mobil Corp. |
437 | 01/12/24 | USD | 106.00 | USD | 4,369 | (9,614 | ) | ||||||||||||||||||||
| Hess Corp. |
25 | 01/12/24 | USD | 145.00 | USD | 360 | (7,750 | ) | ||||||||||||||||||||
| Marathon Petroleum Corp. |
134 | 01/12/24 | USD | 155.00 | USD | 1,988 | (13,065 | ) | ||||||||||||||||||||
| Schlumberger NV |
230 | 01/12/24 | USD | 51.00 | USD | 1,197 | (40,480 | ) | ||||||||||||||||||||
| Shell PLC, ADR |
549 | 01/12/24 | USD | 66.00 | USD | 3,612 | (48,037 | ) | ||||||||||||||||||||
| ARC Resources Ltd. |
602 | 01/19/24 | CAD | 22.00 | CAD | 1,184 | (1,817 | ) | ||||||||||||||||||||
| Canadian Natural Resources Ltd. |
120 | 01/19/24 | CAD | 94.00 | CAD | 1,042 | (1,540 | ) | ||||||||||||||||||||
| Chevron Corp. |
314 | 01/19/24 | USD | 150.00 | USD | 4,684 | (84,152 | ) | ||||||||||||||||||||
| ConocoPhillips |
190 | 01/19/24 | USD | 125.00 | USD | 2,205 | (5,225 | ) | ||||||||||||||||||||
| Diamondback Energy, Inc. |
92 | 01/19/24 | USD | 160.00 | USD | 1,427 | (15,640 | ) | ||||||||||||||||||||
| Exxon Mobil Corp. |
734 | 01/19/24 | USD | 100.00 | USD | 7,339 | (161,113 | ) | ||||||||||||||||||||
| Hess Corp. |
110 | 01/19/24 | USD | 150.00 | USD | 1,586 | (27,500 | ) | ||||||||||||||||||||
| NOV, Inc. |
261 | 01/19/24 | USD | 20.00 | USD | 529 | (20,880 | ) | ||||||||||||||||||||
| Patterson-UTI Energy, Inc. |
117 | 01/19/24 | USD | 13.00 | USD | 126 | (1,755 | ) | ||||||||||||||||||||
| Schlumberger NV |
144 | 01/19/24 | USD | 55.00 | USD | 749 | (7,704 | ) | ||||||||||||||||||||
| Shell PLC, ADR |
374 | 01/19/24 | USD | 65.00 | USD | 2,461 | (63,580 | ) | ||||||||||||||||||||
| TechnipFMC PLC |
666 | 01/19/24 | USD | 21.00 | USD | 1,341 | (23,310 | ) | ||||||||||||||||||||
| Tourmaline Oil Corp. |
335 | 01/19/24 | CAD | 66.00 | CAD | 1,996 | (1,264 | ) | ||||||||||||||||||||
| Valero Energy Corp. |
114 | 01/19/24 | USD | 130.00 | USD | 1,482 | (42,465 | ) | ||||||||||||||||||||
| Weatherford International PLC |
51 | 01/19/24 | USD | 90.00 | USD | 499 | (47,175 | ) | ||||||||||||||||||||
| Williams Cos., Inc. |
492 | 01/19/24 | USD | 37.00 | USD | 1,714 | (4,920 | ) | ||||||||||||||||||||
| Chevron Corp. |
127 | 01/26/24 | USD | 145.00 | USD | 1,894 | (81,597 | ) | ||||||||||||||||||||
| ConocoPhillips |
10 | 01/26/24 | USD | 116.00 | USD | 116 | (3,225 | ) | ||||||||||||||||||||
| EOG Resources, Inc. |
204 | 01/26/24 | USD | 121.50 | USD | 2,467 | (57,120 | ) | ||||||||||||||||||||
| Exxon Mobil Corp. |
464 | 01/26/24 | USD | 106.00 | USD | 4,639 | (30,160 | ) | ||||||||||||||||||||
| Hess Corp. |
32 | 01/26/24 | USD | 140.00 | USD | 461 | (27,520 | ) | ||||||||||||||||||||
| Marathon Petroleum Corp. |
178 | 01/26/24 | USD | 160.00 | USD | 2,641 | (18,868 | ) | ||||||||||||||||||||
| Schlumberger NV |
206 | 01/26/24 | USD | 56.00 | USD | 1,072 | (10,506 | ) | ||||||||||||||||||||
| Shell PLC, ADR |
434 | 01/26/24 | USD | 67.00 | USD | 2,856 | (39,060 | ) | ||||||||||||||||||||
| Williams Cos., Inc. |
393 | 01/26/24 | USD | 36.00 | USD | 1,369 | (11,790 | ) | ||||||||||||||||||||
| ConocoPhillips |
75 | 02/02/24 | USD | 121.00 | USD | 871 | (13,125 | ) | ||||||||||||||||||||
| ARC Resources Ltd. |
524 | 02/16/24 | CAD | 21.00 | CAD | 1,031 | (13,841 | ) | ||||||||||||||||||||
| Canadian Natural Resources Ltd. |
704 | 02/16/24 | CAD | 86.00 | CAD | 6,111 | (205,879 | ) | ||||||||||||||||||||
| Cenovus Energy, Inc. |
150 | 02/16/24 | CAD | 24.00 | CAD | 331 | (4,302 | ) | ||||||||||||||||||||
| ConocoPhillips |
202 | 02/16/24 | USD | 120.00 | USD | 2,345 | (57,368 | ) | ||||||||||||||||||||
| NOV, Inc. |
41 | 02/16/24 | USD | 22.00 | USD | 83 | (2,050 | ) | ||||||||||||||||||||
| Patterson-UTI Energy, Inc. |
234 | 02/16/24 | USD | 12.00 | USD | 253 | (7,605 | ) | ||||||||||||||||||||
| Shell PLC, ADR |
736 | 02/16/24 | USD | 67.50 | USD | 4,843 | (93,840 | ) | ||||||||||||||||||||
| TechnipFMC PLC |
67 | 02/16/24 | USD | 22.00 | USD | 135 | (3,183 | ) | ||||||||||||||||||||
| Tourmaline Oil Corp. |
95 | 02/16/24 | CAD | 64.00 | CAD | 566 | (3,692 | ) | ||||||||||||||||||||
| Weatherford International PLC |
7 | 02/16/24 | USD | 110.00 | USD | 68 | (1,680 | ) | ||||||||||||||||||||
|
|
|
|||||||||||||||||||||||||||
| $ | (1,407,005 | ) | ||||||||||||||||||||||||||
|
|
|
|||||||||||||||||||||||||||
OTC Options Written
| Description | Counterparty | Number of Contracts |
Expiration Date |
Exercise Price | Notional Amount (000) |
Value | ||||||||||||||||||||||||||
| Call |
||||||||||||||||||||||||||||||||
| Galp Energia SGPS SA |
Goldman Sachs International | 36,500 | 01/04/24 | EUR | 13.73 | EUR | 486 | $ | (1,148 | ) | ||||||||||||||||||||||
| TC Energy Corp. |
Royal Bank of Canada | 28,300 | 01/09/24 | CAD | 48.31 | CAD | 1,465 | (76,401 | ) | |||||||||||||||||||||||
| S C H E D U L E O F I N V E S T M E N T S |
45 |
| Schedule of Investments (continued) December 31, 2023
|
BlackRock Energy and Resources Trust (BGR) |
OTC Options Written (continued)
| Description | Counterparty | Number of Contracts |
Expiration Date |
Exercise Price | Notional Amount (000) |
Value | ||||||||||||||||||||||||||
| Call (continued) |
||||||||||||||||||||||||||||||||
| Tenaris SA |
UBS AG | 60,300 | 01/11/24 | EUR | 16.58 | EUR | 950 | $ | (2,813 | ) | ||||||||||||||||||||||
| TotalEnergies SE |
Bank of America N.A. | 124,900 | 01/18/24 | EUR | 62.70 | EUR | 7,693 | (49,244 | ) | |||||||||||||||||||||||
| TC Energy Corp. |
Royal Bank of Canada | 35,200 | 01/29/24 | CAD | 52.43 | CAD | 1,822 | (16,656 | ) | |||||||||||||||||||||||
| BP PLC |
Morgan Stanley & Co. International PLC | 562,900 | 01/30/24 | GBP | 4.87 | GBP | 2,618 | (36,715 | ) | |||||||||||||||||||||||
| TotalEnergies SE |
Morgan Stanley & Co. International PLC | 4,700 | 01/30/24 | EUR | 63.63 | EUR | 290 | (2,353 | ) | |||||||||||||||||||||||
| Galp Energia SGPS SA |
Bank of America N.A. | 35,400 | 02/01/24 | EUR | 13.66 | EUR | 472 | (8,821 | ) | |||||||||||||||||||||||
| BP PLC |
Bank of America N.A. | 447,000 | 02/08/24 | GBP | 4.68 | GBP | 2,079 | (82,485 | ) | |||||||||||||||||||||||
| TC Energy Corp. |
Royal Bank of Canada | 35,200 | 02/26/24 | CAD | 52.43 | CAD | 1,822 | (32,425 | ) | |||||||||||||||||||||||
| Pembina Pipeline Corp. |
Morgan Stanley & Co. International PLC | 17,400 | 02/27/24 | CAD | 46.91 | CAD | 794 | (9,792 | ) | |||||||||||||||||||||||
|
|
|
|||||||||||||||||||||||||||||||
| $ | (318,853 | ) | ||||||||||||||||||||||||||||||
|
|
|
|||||||||||||||||||||||||||||||
Balances Reported in the Statements of Assets and Liabilities for Options Written
| Description | Swap Premiums Paid |
Swap Premiums Received |
Unrealized Appreciation |
Unrealized Depreciation |
Value | |||||||||||||||
| Options Written |
$ | N/A | $ | N/A | $ | 994,621 | $ | (281,392 | ) | $ | (1,725,858) | |||||||||
Derivative Financial Instruments Categorized by Risk Exposure
As of period end, the fair values of derivative financial instruments located in the Statements of Assets and Liabilities were as follows:
| Commodity Contracts |
Credit Contracts |
Equity Contracts |
Foreign Currency Exchange Contracts |
Interest Rate Contracts |
Other Contracts |
Total | ||||||||||||||||||||||
| Liabilities — Derivative Financial Instruments |
||||||||||||||||||||||||||||
| Options written |
||||||||||||||||||||||||||||
| Options written at value |
$ | — | $ | — | $ | 1,725,858 | $ | — | $ | — | $ | — | $ | 1,725,858 | ||||||||||||||
|
|
|
|
|
|
|
|
|
|
|
|
|
|
|
|||||||||||||||
For the period ended December 31, 2023, the effect of derivative financial instruments in the Statements of Operations was as follows:
| Commodity Contracts |
Credit Contracts |
Equity Contracts |
Foreign Currency Exchange Contracts |
Interest Rate Contracts |
Other Contracts |
Total | ||||||||||||||||||||||
| Net Realized Gain (Loss) from: |
||||||||||||||||||||||||||||
| Options purchased(a) |
$ | — | $ | — | $ | (734,586 | ) | $ | — | $ | — | $ | — | $ | (734,586 | ) | ||||||||||||
| Options written |
— | — | 9,232,797 | — | — | — | 9,232,797 | |||||||||||||||||||||
|
|
|
|
|
|
|
|
|
|
|
|
|
|
|
|||||||||||||||
| $ | — | $ | — | $ | 8,498,211 | $ | — | $ | — | $ | — | $ | 8,498,211 | |||||||||||||||
|
|
|
|
|
|
|
|
|
|
|
|
|
|
|
|||||||||||||||
| Net Change in Unrealized Appreciation (Depreciation) on: |
||||||||||||||||||||||||||||
| Options written |
$ | — | $ | — | $ | (1,712,020 | ) | $ | — | $ | — | $ | — | $ | (1,712,020 | ) | ||||||||||||
|
|
|
|
|
|
|
|
|
|
|
|
|
|
|
|||||||||||||||
| (a) | Options purchased are included in net realized gain (loss) from investments — unaffiliated. |
Average Quarterly Balances of Outstanding Derivative Financial Instruments
| Options: |
||||
| Average value of option contracts purchased |
$ | — | (a) | |
| Average value of option contracts written |
$ | 2,743,846 |
| (a) | Derivative financial instrument not held at any quarter-end. The risk exposure table serves as an indicator of activity during the period. |
For more information about the Trust’s investment risks regarding derivative financial instruments, refer to the Notes to Financial Statements.
| 46 | 2 0 2 3 B L A C K R O C K A N N U A L R E P O R T T O S H A R E H O L D E R S |
| Schedule of Investments (continued) December 31, 2023
|
BlackRock Energy and Resources Trust (BGR) |
Derivative Financial Instruments — Offsetting as of Period End
The Trust’s derivative assets and liabilities (by type) were as follows:
| Assets | Liabilities | |||||||
| Derivative Financial Instruments |
||||||||
| Options |
$ | — | $ | 1,725,858 | ||||
|
|
|
|
|
|||||
| Total derivative assets and liabilities in the Statements of Assets and Liabilities |
— | 1,725,858 | ||||||
|
|
|
|
|
|||||
| Derivatives not subject to a Master Netting Agreement or similar agreement (“MNA”) |
— | (1,407,005 | ) | |||||
|
|
|
|
|
|||||
| Total derivative assets and liabilities subject to an MNA |
$ | — | $ | 318,853 | ||||
|
|
|
|
|
|||||
The following table presents the Trust’s derivative liabilities by counterparty net of amounts available for offset under an MNA and net of the related collateral pledged by the Trust:
| Counterparty | |
Derivative Liabilities Subject to an MNA by Counterparty |
|
|
Derivatives Available for Offset |
|
|
Non-Cash Collateral Pledged |
(a) |
|
Cash Collateral Pledged |
|
|
Net Amount of Derivative Liabilities |
(b) | |||||
| Bank of America N.A. |
$ | 140,550 | $ | — | $ | — | $ | — | $ | 140,550 | ||||||||||
| Goldman Sachs International |
1,148 | — | — | — | 1,148 | |||||||||||||||
| Morgan Stanley & Co. International PLC |
48,860 | — | (48,860 | ) | — | — | ||||||||||||||
| Royal Bank of Canada |
125,482 | — | — | — | 125,482 | |||||||||||||||
| UBS AG |
2,813 | — | — | — | 2,813 | |||||||||||||||
|
|
|
|
|
|
|
|
|
|
|
|||||||||||
| $ | 318,853 | $ | — | $ | (48,860 | ) | $ | — | $ | 269,993 | ||||||||||
|
|
|
|
|
|
|
|
|
|
|
|||||||||||
| (a) | Excess of collateral received/pledged, if any, from the individual counterparty is not shown for financial reporting purposes. |
| (b) | Net amount represents the net amount payable due to counterparty in the event of default. Net amount may be offset further by the options written receivable/payable on the Statements of Assets and Liabilities. |
Fair Value Hierarchy as of Period End
Various inputs are used in determining the fair value of financial instruments. For a description of the input levels and information about the Trust’s policy regarding valuation of financial instruments, refer to the Notes to Financial Statements.
The following table summarizes the Trust’s financial instruments categorized in the fair value hierarchy. The breakdown of the Trust’s financial instruments into major categories is disclosed in the Schedule of Investments above.
| Level 1 | Level 2 | Level 3 | Total | |||||||||||||
| Assets |
||||||||||||||||
| Investments |
||||||||||||||||
| Long-Term Investments |
||||||||||||||||
| Common Stocks |
||||||||||||||||
| Energy Equipment & Services |
$ | 21,016,499 | $ | 3,576,035 | $ | — | $ | 24,592,534 | ||||||||
| Oil, Gas & Consumable Fuels |
308,516,785 | 52,434,165 | 99 | 360,951,049 | ||||||||||||
| Short-Term Securities |
||||||||||||||||
| Money Market Funds |
3,612,320 | — | — | 3,612,320 | ||||||||||||
|
|
|
|
|
|
|
|
|
|||||||||
| $ | 333,145,604 | $ | 56,010,200 | $ | 99 | $ | 389,155,903 | |||||||||
|
|
|
|
|
|
|
|
|
|||||||||
| Derivative Financial Instruments(a) |
||||||||||||||||
| Liabilities |
||||||||||||||||
| Equity Contracts |
$ | (1,407,005 | ) | $ | (318,853 | ) | $ | — | $ | (1,725,858 | ) | |||||
|
|
|
|
|
|
|
|
|
|||||||||
| (a) | Derivative financial instruments are options written. Options written are shown at value. |
See notes to financial statements.
| S C H E D U L E O F I N V E S T M E N T S |
47 |
| Schedule of Investments December 31, 2023
|
BlackRock Enhanced Capital and Income Fund, Inc. (CII) (Percentages shown are based on Net Assets) |
| Security | Shares | Value | ||||||
| Common Stocks |
||||||||
| Automobile Components — 1.5% | ||||||||
| Aptiv PLC(a) |
147,551 | $ | 13,238,276 | |||||
|
|
|
|||||||
| Banks — 1.8% | ||||||||
| JPMorgan Chase & Co.(b) |
94,564 | 16,085,336 | ||||||
|
|
|
|||||||
| Beverages — 0.9% | ||||||||
| Monster Beverage Corp.(a) |
138,985 | 8,006,926 | ||||||
|
|
|
|||||||
| Broadline Retail — 5.5% | ||||||||
| Amazon.com, Inc.(a)(b) |
319,381 | 48,526,749 | ||||||
|
|
|
|||||||
| Building Products — 1.2% | ||||||||
| Allegion PLC |
80,992 | 10,260,877 | ||||||
|
|
|
|||||||
| Capital Markets — 3.4% | ||||||||
| Intercontinental Exchange, Inc.(b) |
151,536 | 19,461,768 | ||||||
| LPL Financial Holdings, Inc. |
45,624 | 10,384,935 | ||||||
|
|
|
|||||||
| 29,846,703 | ||||||||
| Chemicals — 3.1% | ||||||||
| Axalta Coating Systems Ltd.(a) |
355,562 | 12,078,441 | ||||||
| Corteva, Inc.(b) |
306,853 | 14,704,396 | ||||||
|
|
|
|||||||
| 26,782,837 | ||||||||
| Communications Equipment — 0.8% | ||||||||
| Ciena Corp.(a) |
155,832 | 7,013,998 | ||||||
|
|
|
|||||||
| Consumer Finance — 0.9% | ||||||||
| American Express Co. |
42,880 | 8,033,139 | ||||||
|
|
|
|||||||
| Consumer Staples Distribution & Retail(b) — 2.4% | ||||||||
| Dollar General Corp. |
76,260 | 10,367,547 | ||||||
| Dollar Tree, Inc.(a) |
72,274 | 10,266,522 | ||||||
|
|
|
|||||||
| 20,634,069 | ||||||||
| Diversified Telecommunication Services — 1.4% | ||||||||
| Verizon Communications, Inc. |
326,062 | 12,292,537 | ||||||
|
|
|
|||||||
| Electronic Equipment, Instruments & Components — 1.7% | ||||||||
| Zebra Technologies Corp., Class A(a) |
55,903 | 15,279,967 | ||||||
|
|
|
|||||||
| Entertainment — 1.0% | ||||||||
| TKO Group Holdings, Inc., Class A(b) |
107,011 | 8,729,957 | ||||||
|
|
|
|||||||
| Financial Services — 3.6% | ||||||||
| Berkshire Hathaway, Inc., Class B(a)(b) |
63,439 | 22,626,154 | ||||||
| Voya Financial, Inc. |
119,726 | 8,735,209 | ||||||
|
|
|
|||||||
| 31,361,363 | ||||||||
| Food Products — 1.2% | ||||||||
| Mondelez International, Inc., Class A(b) |
146,251 | 10,592,960 | ||||||
|
|
|
|||||||
| Health Care Equipment & Supplies — 1.8% | ||||||||
| Medtronic PLC |
193,236 | 15,918,782 | ||||||
|
|
|
|||||||
| Health Care Providers & Services — 6.5% | ||||||||
| Elevance Health, Inc. |
21,062 | 9,931,997 | ||||||
| Humana, Inc.(b) |
20,719 | 9,485,365 | ||||||
| Laboratory Corp. of America Holdings(b) |
37,688 | 8,566,106 | ||||||
| Tenet Healthcare Corp.(a) |
130,657 | 9,873,749 | ||||||
| UnitedHealth Group, Inc.(b) |
35,789 | 18,841,835 | ||||||
|
|
|
|||||||
| 56,699,052 | ||||||||
| Health Care Technology — 0.9% | ||||||||
| Veeva Systems, Inc., Class A(a)(b) |
39,050 | 7,517,906 | ||||||
|
|
|
|||||||
| Hotels, Restaurants & Leisure — 0.8% | ||||||||
| Las Vegas Sands Corp.(b) |
141,432 | 6,959,869 | ||||||
|
|
|
|||||||
| Security | Shares | Value | ||||||
| Household Durables — 2.2% | ||||||||
| Sony Group Corp., ADR(c) |
200,199 | $ | 18,956,843 | |||||
|
|
|
|||||||
| Insurance — 3.5% | ||||||||
| Fidelity National Financial, Inc., Class A |
228,435 | 11,654,754 | ||||||
| Progressive Corp. |
61,776 | 9,839,681 | ||||||
| Reinsurance Group of America, Inc.(b) |
53,822 | 8,707,323 | ||||||
|
|
|
|||||||
| 30,201,758 | ||||||||
| Interactive Media & Services(a) — 8.5% | ||||||||
| Alphabet, Inc., Class A |
337,582 | 47,156,830 | ||||||
| Meta Platforms, Inc., Class A(b) |
76,113 | 26,940,957 | ||||||
|
|
|
|||||||
| 74,097,787 | ||||||||
| IT Services — 2.0% | ||||||||
| Cognizant Technology Solutions Corp., Class A |
233,189 | 17,612,765 | ||||||
|
|
|
|||||||
| Life Sciences Tools & Services — 2.8% | ||||||||
| Avantor, Inc.(a) |
556,795 | 12,711,630 | ||||||
| Fortrea Holdings, Inc.(a)(b) |
187,843 | 6,555,720 | ||||||
| Thermo Fisher Scientific, Inc. |
10,253 | 5,442,190 | ||||||
|
|
|
|||||||
| 24,709,540 | ||||||||
| Machinery(b) — 4.6% | ||||||||
| Caterpillar, Inc. |
40,462 | 11,963,399 | ||||||
| Fortive Corp. |
269,413 | 19,836,879 | ||||||
| Otis Worldwide Corp. |
98,695 | 8,830,242 | ||||||
|
|
|
|||||||
| 40,630,520 | ||||||||
| Media — 2.3% | ||||||||
| Comcast Corp., Class A(b) |
459,529 | 20,150,347 | ||||||
|
|
|
|||||||
| Oil, Gas & Consumable Fuels — 4.3% | ||||||||
| BP PLC, ADR(c) |
316,478 | 11,203,321 | ||||||
| ConocoPhillips(b) |
130,814 | 15,183,581 | ||||||
| Shell PLC |
334,409 | 10,946,567 | ||||||
|
|
|
|||||||
| 37,333,469 | ||||||||
| Personal Care Products — 1.0% | ||||||||
| Unilever PLC, ADR(b) |
187,755 | 9,102,362 | ||||||
|
|
|
|||||||
| Pharmaceuticals — 4.3% | ||||||||
| Novo Nordisk A/S, ADR(b) |
170,760 | 17,665,122 | ||||||
| Sanofi SA, ADR |
396,772 | 19,731,472 | ||||||
|
|
|
|||||||
| 37,396,594 | ||||||||
| Professional Services — 1.1% | ||||||||
| Dun & Bradstreet Holdings, Inc. |
818,943 | 9,581,633 | ||||||
|
|
|
|||||||
| Semiconductors & Semiconductor Equipment — 7.7% | ||||||||
| Advanced Micro Devices, Inc.(a)(d) |
139,515 | 20,565,906 | ||||||
| Applied Materials, Inc.(b) |
105,417 | 17,084,933 | ||||||
| Marvell Technology, Inc. |
209,096 | 12,610,580 | ||||||
| Micron Technology, Inc. |
199,067 | 16,988,378 | ||||||
|
|
|
|||||||
| 67,249,797 | ||||||||
| Software — 8.8% | ||||||||
| Microsoft Corp.(b)(d) |
204,069 | 76,738,107 | ||||||
|
|
|
|||||||
| Specialty Retail — 1.8% | ||||||||
| Ross Stores, Inc.(b) |
113,388 | 15,691,765 | ||||||
|
|
|
|||||||
| Technology Hardware, Storage & Peripherals — 4.4% | ||||||||
| Apple, Inc.(b) |
198,730 | 38,261,487 | ||||||
|
|
|
|||||||
| 48 | 2 0 2 3 B L A C K R O C K A N N U A L R E P O R T T O S H A R E H O L D E R S |
| Schedule of Investments (continued) December 31, 2023
|
BlackRock Enhanced Capital and Income Fund, Inc. (CII) (Percentages shown are based on Net Assets) |
| Security | Shares | Value | ||||||
| Textiles, Apparel & Luxury Goods — 1.0% | ||||||||
| Skechers USA, Inc., Class A(a) |
142,987 | $ | 8,913,810 | |||||
|
|
|
|||||||
| Total Long-Term Investments — 100.7% |
|
880,409,887 | ||||||
|
|
|
|||||||
| Short-Term Securities |
||||||||
| Money Market Funds — 1.5% | ||||||||
| BlackRock Liquidity Funds, T-Fund, Institutional Class, 5.26%(e)(f) |
12,932,953 | 12,932,953 | ||||||
| SL Liquidity Series, LLC, Money Market Series, 5.58%(e)(f)(g) |
397,392 | 397,512 | ||||||
|
|
|
|||||||
| Total Short-Term Securities — 1.5% |
|
13,330,465 | ||||||
|
|
|
|||||||
| Total Investments Before Options Written — 102.2% |
|
893,740,352 | ||||||
|
|
|
|||||||
| Options Written — (2.1)% |
|
(18,548,876 | ) | |||||
|
|
|
|||||||
| Total Investments, Net of Options Written — 100.1% |
|
875,191,476 | ||||||
| Liabilities in Excess of Other Assets — (0.1)% |
|
(740,695 | ) | |||||
|
|
|
|||||||
| Net Assets — 100.0% |
|
$ | 874,450,781 | |||||
|
|
|
|||||||
| (a) | Non-income producing security. |
| (b) | All or a portion of the security has been pledged and/or segregated as collateral in connection with outstanding exchange-traded options written. |
| (c) | All or a portion of this security is on loan. |
| (d) | All or a portion of the security has been pledged as collateral in connection with outstanding OTC derivatives. |
| (e) | Affiliate of the Trust. |
| (f) | Annualized 7-day yield as of period end. |
| (g) | All or a portion of this security was purchased with the cash collateral from loaned securities. |
For Trust compliance purposes, the Trust’s industry classifications refer to one or more of the industry sub-classifications used by one or more widely recognized market indexes or rating group indexes, and/or as defined by the investment adviser. These definitions may not apply for purposes of this report, which may combine such industry sub-classifications for reporting ease.
Affiliates
Investments in issuers considered to be affiliate(s) of the Trust during the year ended December 31, 2023 for purposes of Section 2(a)(3) of the Investment Company Act of 1940, as amended, were as follows:
| Affiliated Issuer | Value at 12/31/22 |
Purchases at Cost |
Proceeds from Sale |
Net Realized Gain (Loss) |
Change in Unrealized Appreciation (Depreciation) |
Value at 12/31/23 |
Shares Held at 12/31/23 |
Income | Capital Gain Distributions from Underlying Funds |
|||||||||||||||||||||||||||
| BlackRock Liquidity Funds, T-Fund, Institutional Class |
$ | 14,661,156 | $ | — | $ | (1,728,203 | )(a) | $ | — | $ | — | $ | 12,932,953 | 12,932,953 | $ | 617,975 | $ | — | ||||||||||||||||||
| SL Liquidity Series, LLC, Money Market Series |
— | 398,038 | (a) | — | (486 | ) | (40 | ) | 397,512 | 397,392 | 6,751 | (b) | — | |||||||||||||||||||||||
|
|
|
|
|
|
|
|
|
|
|
|||||||||||||||||||||||||||
| $ | (486 | ) | $ | (40 | ) | $ | 13,330,465 | $ | 624,726 | $ | — | |||||||||||||||||||||||||
|
|
|
|
|
|
|
|
|
|
|
|||||||||||||||||||||||||||
| (a) | Represents net amount purchased (sold). |
| (b) | All or a portion represents securities lending income earned from the reinvestment of cash collateral from loaned securities, net of fees and collateral investment expenses, and other payments to and from borrowers of securities. |
Derivative Financial Instruments Outstanding as of Period End
Exchange-Traded Options Written
| Description | Number of Contracts |
Expiration Date |
Exercise Price | Notional Amount (000) |
Value | |||||||||||||||||||||||
| Call |
||||||||||||||||||||||||||||
| Advanced Micro Devices, Inc. |
135 | 01/05/24 | USD | 125.00 | USD | 1,990 | $ | (305,438 | ) | |||||||||||||||||||
| Amazon.com, Inc. |
358 | 01/05/24 | USD | 152.50 | USD | 5,439 | (54,237 | ) | ||||||||||||||||||||
| Apple, Inc. |
84 | 01/05/24 | USD | 195.00 | USD | 1,617 | (5,670 | ) | ||||||||||||||||||||
| Applied Materials, Inc. |
346 | 01/05/24 | USD | 155.00 | USD | 5,608 | (258,635 | ) | ||||||||||||||||||||
| Elevance Health, Inc. |
35 | 01/05/24 | USD | 485.00 | USD | 1,650 | (1,838 | ) | ||||||||||||||||||||
| JPMorgan Chase & Co. |
150 | 01/05/24 | USD | 155.00 | USD | 2,552 | (229,125 | ) | ||||||||||||||||||||
| Meta Platforms, Inc., Class A |
78 | 01/05/24 | USD | 340.00 | USD | 2,761 | (117,390 | ) | ||||||||||||||||||||
| Microsoft Corp. |
260 | 01/05/24 | USD | 370.00 | USD | 9,777 | (198,900 | ) | ||||||||||||||||||||
| S C H E D U L E O F I N V E S T M E N T S |
49 |
| Schedule of Investments (continued) December 31, 2023
|
BlackRock Enhanced Capital and Income Fund, Inc. (CII) |
Exchange-Traded Options Written (continued)
| Description | Number of Contracts |
Expiration Date |
Exercise Price | Notional Amount (000) |
Value | |||||||||||||||||||||||
| Call (continued) |
||||||||||||||||||||||||||||
| Mondelez International, Inc., Class A |
109 | 01/05/24 | USD | 72.00 | USD | 789 | $ | (8,720 | ) | |||||||||||||||||||
| Ross Stores, Inc. |
168 | 01/05/24 | USD | 132.00 | USD | 2,325 | (113,400 | ) | ||||||||||||||||||||
| UnitedHealth Group, Inc. |
94 | 01/05/24 | USD | 550.00 | USD | 4,949 | (658 | ) | ||||||||||||||||||||
| Advanced Micro Devices, Inc. |
50 | 01/12/24 | USD | 129.00 | USD | 737 | (94,375 | ) | ||||||||||||||||||||
| Alphabet, Inc., Class A |
776 | 01/12/24 | USD | 141.00 | USD | 10,840 | (136,964 | ) | ||||||||||||||||||||
| Amazon.com, Inc. |
332 | 01/12/24 | USD | 147.25 | USD | 5,044 | (207,572 | ) | ||||||||||||||||||||
| Apple, Inc. |
416 | 01/12/24 | USD | 200.00 | USD | 8,009 | (15,184 | ) | ||||||||||||||||||||
| Applied Materials, Inc. |
96 | 01/12/24 | USD | 150.00 | USD | 1,556 | (121,440 | ) | ||||||||||||||||||||
| Berkshire Hathaway, Inc., Class B |
195 | 01/12/24 | USD | 355.00 | USD | 6,955 | (97,500 | ) | ||||||||||||||||||||
| Comcast Corp., Class A |
345 | 01/12/24 | USD | 43.00 | USD | 1,513 | (37,950 | ) | ||||||||||||||||||||
| ConocoPhillips |
89 | 01/12/24 | USD | 119.00 | USD | 1,033 | (8,322 | ) | ||||||||||||||||||||
| Dollar General Corp. |
154 | 01/12/24 | USD | 139.00 | USD | 2,094 | (28,105 | ) | ||||||||||||||||||||
| Humana, Inc. |
31 | 01/12/24 | USD | 495.00 | USD | 1,419 | (2,170 | ) | ||||||||||||||||||||
| JPMorgan Chase & Co. |
149 | 01/12/24 | USD | 157.50 | USD | 2,534 | (191,837 | ) | ||||||||||||||||||||
| Las Vegas Sands Corp. |
195 | 01/12/24 | USD | 48.00 | USD | 960 | (36,563 | ) | ||||||||||||||||||||
| Marvell Technology, Inc. |
140 | 01/12/24 | USD | 55.00 | USD | 844 | (77,000 | ) | ||||||||||||||||||||
| Meta Platforms, Inc., Class A |
80 | 01/12/24 | USD | 325.00 | USD | 2,832 | (241,200 | ) | ||||||||||||||||||||
| Microsoft Corp. |
424 | 01/12/24 | USD | 375.00 | USD | 15,944 | (263,940 | ) | ||||||||||||||||||||
| Mondelez International, Inc., Class A |
371 | 01/12/24 | USD | 72.00 | USD | 2,687 | (43,592 | ) | ||||||||||||||||||||
| Novo Nordisk A/S, ADR |
360 | 01/12/24 | USD | 100.00 | USD | 3,724 | (160,200 | ) | ||||||||||||||||||||
| Ross Stores, Inc. |
118 | 01/12/24 | USD | 131.00 | USD | 1,633 | (89,680 | ) | ||||||||||||||||||||
| Ross Stores, Inc. |
199 | 01/12/24 | USD | 135.00 | USD | 2,754 | (85,570 | ) | ||||||||||||||||||||
| Thermo Fisher Scientific, Inc. |
33 | 01/12/24 | USD | 500.00 | USD | 1,752 | (110,055 | ) | ||||||||||||||||||||
| Allegion PLC |
195 | 01/19/24 | USD | 110.00 | USD | 2,470 | (332,475 | ) | ||||||||||||||||||||
| Alphabet, Inc., Class A |
530 | 01/19/24 | USD | 137.00 | USD | 7,404 | (249,100 | ) | ||||||||||||||||||||
| Amazon.com, Inc. |
295 | 01/19/24 | USD | 142.50 | USD | 4,482 | (309,750 | ) | ||||||||||||||||||||
| Apple, Inc. |
296 | 01/19/24 | USD | 190.00 | USD | 5,699 | (145,040 | ) | ||||||||||||||||||||
| Applied Materials, Inc. |
243 | 01/19/24 | USD | 165.00 | USD | 3,938 | (75,937 | ) | ||||||||||||||||||||
| Aptiv PLC |
430 | 01/19/24 | USD | 82.50 | USD | 3,858 | (337,550 | ) | ||||||||||||||||||||
| Avantor, Inc. |
940 | 01/19/24 | USD | 19.75 | USD | 2,146 | (391,570 | ) | ||||||||||||||||||||
| Axalta Coating Systems Ltd. |
1,224 | 01/19/24 | USD | 31.00 | USD | 4,158 | (400,860 | ) | ||||||||||||||||||||
| Berkshire Hathaway, Inc., Class B |
229 | 01/19/24 | USD | 360.00 | USD | 8,168 | (67,440 | ) | ||||||||||||||||||||
| BP PLC, ADR |
345 | 01/19/24 | USD | 38.00 | USD | 1,221 | (2,933 | ) | ||||||||||||||||||||
| Caterpillar, Inc. |
62 | 01/19/24 | USD | 250.00 | USD | 1,833 | (290,625 | ) | ||||||||||||||||||||
| Cognizant Technology Solutions Corp., Class A |
214 | 01/19/24 | USD | 70.00 | USD | 1,616 | (126,260 | ) | ||||||||||||||||||||
| Cognizant Technology Solutions Corp., Class A |
151 | 01/19/24 | USD | 72.50 | USD | 1,141 | (53,605 | ) | ||||||||||||||||||||
| Comcast Corp., Class A |
133 | 01/19/24 | USD | 45.00 | USD | 583 | (4,389 | ) | ||||||||||||||||||||
| ConocoPhillips |
107 | 01/19/24 | USD | 125.00 | USD | 1,242 | (2,943 | ) | ||||||||||||||||||||
| Corteva, Inc. |
738 | 01/19/24 | USD | 48.25 | USD | 3,536 | (72,866 | ) | ||||||||||||||||||||
| Dollar General Corp. |
156 | 01/19/24 | USD | 135.00 | USD | 2,121 | (64,740 | ) | ||||||||||||||||||||
| Dollar Tree, Inc. |
139 | 01/19/24 | USD | 120.00 | USD | 1,974 | (311,707 | ) | ||||||||||||||||||||
| Elevance Health, Inc. |
31 | 01/19/24 | USD | 480.00 | USD | 1,462 | (17,360 | ) | ||||||||||||||||||||
| Fortrea Holdings, Inc. |
199 | 01/19/24 | USD | 35.00 | USD | 695 | (35,820 | ) | ||||||||||||||||||||
| Humana, Inc. |
53 | 01/19/24 | USD | 505.00 | USD | 2,426 | (3,578 | ) | ||||||||||||||||||||
| Intercontinental Exchange, Inc. |
331 | 01/19/24 | USD | 115.00 | USD | 4,251 | (458,435 | ) | ||||||||||||||||||||
| Intercontinental Exchange, Inc. |
653 | 01/19/24 | USD | 120.00 | USD | 8,386 | (561,580 | ) | ||||||||||||||||||||
| JPMorgan Chase & Co. |
176 | 01/19/24 | USD | 155.00 | USD | 2,994 | (269,720 | ) | ||||||||||||||||||||
| Laboratory Corp. of America Holdings |
153 | 01/19/24 | USD | 213.22 | USD | 3,478 | (231,562 | ) | ||||||||||||||||||||
| Las Vegas Sands Corp. |
85 | 01/19/24 | USD | 52.50 | USD | 418 | (3,103 | ) | ||||||||||||||||||||
| LPL Financial Holdings, Inc. |
154 | 01/19/24 | USD | 240.00 | USD | 3,505 | (26,565 | ) | ||||||||||||||||||||
| Marvell Technology, Inc. |
140 | 01/19/24 | USD | 55.00 | USD | 844 | (80,850 | ) | ||||||||||||||||||||
| Meta Platforms, Inc., Class A |
81 | 01/19/24 | USD | 330.00 | USD | 2,867 | (215,865 | ) | ||||||||||||||||||||
| Micron Technology, Inc. |
370 | 01/19/24 | USD | 80.00 | USD | 3,158 | (224,775 | ) | ||||||||||||||||||||
| Microsoft Corp. |
316 | 01/19/24 | USD | 375.00 | USD | 11,883 | (240,160 | ) | ||||||||||||||||||||
| Mondelez International, Inc., Class A |
38 | 01/19/24 | USD | 72.50 | USD | 275 | (4,085 | ) | ||||||||||||||||||||
| Monster Beverage Corp. |
418 | 01/19/24 | USD | 57.50 | USD | 2,408 | (51,205 | ) | ||||||||||||||||||||
| Novo Nordisk A/S, ADR |
247 | 01/19/24 | USD | 104.00 | USD | 2,555 | (61,750 | ) | ||||||||||||||||||||
| Otis Worldwide Corp. |
196 | 01/19/24 | USD | 83.25 | USD | 1,754 | (135,243 | ) | ||||||||||||||||||||
| Progressive Corp. |
195 | 01/19/24 | USD | 165.00 | USD | 3,106 | (19,500 | ) | ||||||||||||||||||||
| Reinsurance Group of America, Inc. |
160 | 01/19/24 | USD | 165.00 | USD | 2,588 | (30,400 | ) | ||||||||||||||||||||
| Ross Stores, Inc. |
314 | 01/19/24 | USD | 135.00 | USD | 4,345 | (147,580 | ) | ||||||||||||||||||||
| Sanofi SA, ADR |
753 | 01/19/24 | USD | 47.60 | USD | 3,745 | (216,792 | ) | ||||||||||||||||||||
| 50 | 2 0 2 3 B L A C K R O C K A N N U A L R E P O R T T O S H A R E H O L D E R S |
| Schedule of Investments (continued) December 31, 2023
|
BlackRock Enhanced Capital and Income Fund, Inc. (CII) |
Exchange-Traded Options Written (continued)
| Description | Number of Contracts |
Expiration Date |
Exercise Price | Notional Amount (000) |
Value | |||||||||||||||||||||||
| Call (continued) |
||||||||||||||||||||||||||||
| Skechers USA, Inc., Class A |
120 | 01/19/24 | USD | 55.00 | USD | 748 | $ | (89,400 | ) | |||||||||||||||||||
| Sony Group Corp., ADR |
500 | 01/19/24 | USD | 90.00 | USD | 4,735 | (270,000 | ) | ||||||||||||||||||||
| Tenet Healthcare Corp. |
265 | 01/19/24 | USD | 80.00 | USD | 2,003 | (24,513 | ) | ||||||||||||||||||||
| Unilever PLC, ADR |
389 | 01/19/24 | USD | 50.00 | USD | 1,886 | (4,862 | ) | ||||||||||||||||||||
| UnitedHealth Group, Inc. |
94 | 01/19/24 | USD | 550.00 | USD | 4,949 | (26,743 | ) | ||||||||||||||||||||
| Verizon Communications, Inc. |
882 | 01/19/24 | USD | 38.00 | USD | 3,325 | (28,665 | ) | ||||||||||||||||||||
| Zebra Technologies Corp., Class A |
211 | 01/19/24 | USD | 250.00 | USD | 5,767 | (547,545 | ) | ||||||||||||||||||||
| Alphabet, Inc., Class A |
566 | 01/26/24 | USD | 146.00 | USD | 7,906 | (77,825 | ) | ||||||||||||||||||||
| Amazon.com, Inc. |
358 | 01/26/24 | USD | 150.00 | USD | 5,439 | (194,215 | ) | ||||||||||||||||||||
| Apple, Inc. |
274 | 01/26/24 | USD | 200.00 | USD | 5,275 | (29,044 | ) | ||||||||||||||||||||
| BP PLC, ADR |
920 | 01/26/24 | USD | 37.00 | USD | 3,257 | (26,220 | ) | ||||||||||||||||||||
| Caterpillar, Inc. |
201 | 01/26/24 | USD | 295.00 | USD | 5,943 | (151,252 | ) | ||||||||||||||||||||
| Comcast Corp., Class A |
1,564 | 01/26/24 | USD | 44.00 | USD | 6,858 | (185,334 | ) | ||||||||||||||||||||
| ConocoPhillips |
137 | 01/26/24 | USD | 116.00 | USD | 1,590 | (44,182 | ) | ||||||||||||||||||||
| Dollar Tree, Inc. |
122 | 01/26/24 | USD | 135.00 | USD | 1,733 | (106,140 | ) | ||||||||||||||||||||
| Fortive Corp. |
427 | 01/26/24 | USD | 68.25 | USD | 3,144 | (254,536 | ) | ||||||||||||||||||||
| JPMorgan Chase & Co. |
149 | 01/26/24 | USD | 165.00 | USD | 2,534 | (97,967 | ) | ||||||||||||||||||||
| Las Vegas Sands Corp. |
285 | 01/26/24 | USD | 51.00 | USD | 1,402 | (34,058 | ) | ||||||||||||||||||||
| Marvell Technology, Inc. |
139 | 01/26/24 | USD | 55.00 | USD | 838 | (83,400 | ) | ||||||||||||||||||||
| Medtronic PLC |
35 | 01/26/24 | USD | 83.34 | USD | 288 | (4,113 | ) | ||||||||||||||||||||
| Meta Platforms, Inc., Class A |
156 | 01/26/24 | USD | 340.00 | USD | 5,522 | (311,610 | ) | ||||||||||||||||||||
| Micron Technology, Inc. |
119 | 01/26/24 | USD | 87.00 | USD | 1,016 | (22,789 | ) | ||||||||||||||||||||
| Microsoft Corp. |
140 | 01/26/24 | USD | 385.00 | USD | 5,265 | (94,150 | ) | ||||||||||||||||||||
| Mondelez International, Inc., Class A |
184 | 01/26/24 | USD | 71.00 | USD | 1,333 | (44,160 | ) | ||||||||||||||||||||
| Sony Group Corp., ADR |
300 | 01/26/24 | USD | 92.00 | USD | 2,841 | (121,500 | ) | ||||||||||||||||||||
| Thermo Fisher Scientific, Inc. |
33 | 01/26/24 | USD | 500.00 | USD | 1,752 | (118,635 | ) | ||||||||||||||||||||
| Amazon.com, Inc. |
348 | 02/02/24 | USD | 157.40 | USD | 5,288 | (110,260 | ) | ||||||||||||||||||||
| Comcast Corp., Class A |
9 | 02/02/24 | USD | 46.05 | USD | 39 | (404 | ) | ||||||||||||||||||||
| ConocoPhillips |
101 | 02/02/24 | USD | 121.00 | USD | 1,172 | (17,675 | ) | ||||||||||||||||||||
| Medtronic PLC |
64 | 02/02/24 | USD | 83.05 | USD | 527 | (10,500 | ) | ||||||||||||||||||||
| Micron Technology, Inc. |
122 | 02/02/24 | USD | 87.00 | USD | 1,041 | (29,097 | ) | ||||||||||||||||||||
| Comcast Corp., Class A |
154 | 02/09/24 | USD | 44.00 | USD | 675 | (22,330 | ) | ||||||||||||||||||||
| Medtronic PLC |
111 | 02/09/24 | USD | 83.34 | USD | 914 | (19,040 | ) | ||||||||||||||||||||
| Micron Technology, Inc. |
62 | 02/09/24 | USD | 87.00 | USD | 529 | (17,205 | ) | ||||||||||||||||||||
| Advanced Micro Devices, Inc. |
94 | 02/16/24 | USD | 140.00 | USD | 1,386 | (131,130 | ) | ||||||||||||||||||||
| Alphabet, Inc., Class A |
322 | 02/16/24 | USD | 145.00 | USD | 4,498 | (123,970 | ) | ||||||||||||||||||||
| Amazon.com, Inc. |
384 | 02/16/24 | USD | 150.00 | USD | 5,834 | (339,840 | ) | ||||||||||||||||||||
| Apple, Inc. |
221 | 02/16/24 | USD | 195.00 | USD | 4,255 | (114,367 | ) | ||||||||||||||||||||
| Aptiv PLC |
351 | 02/16/24 | USD | 92.50 | USD | 3,149 | (133,380 | ) | ||||||||||||||||||||
| Avantor, Inc. |
588 | 02/16/24 | USD | 21.00 | USD | 1,342 | (142,590 | ) | ||||||||||||||||||||
| Ciena Corp. |
798 | 02/16/24 | USD | 45.10 | USD | 3,592 | (150,145 | ) | ||||||||||||||||||||
| Cognizant Technology Solutions Corp., Class A |
101 | 02/16/24 | USD | 77.50 | USD | 763 | (19,695 | ) | ||||||||||||||||||||
| ConocoPhillips |
89 | 02/16/24 | USD | 120.00 | USD | 1,033 | (25,276 | ) | ||||||||||||||||||||
| Dollar Tree, Inc. |
208 | 02/16/24 | USD | 135.00 | USD | 2,955 | (210,080 | ) | ||||||||||||||||||||
| Fidelity National Financial, Inc., Class A |
470 | 02/16/24 | USD | 47.79 | USD | 2,398 | (189,389 | ) | ||||||||||||||||||||
| Fortive Corp. |
1,234 | 02/16/24 | USD | 69.93 | USD | 9,086 | (638,829 | ) | ||||||||||||||||||||
| Fortrea Holdings, Inc. |
552 | 02/16/24 | USD | 32.50 | USD | 1,926 | (201,480 | ) | ||||||||||||||||||||
| Laboratory Corp. of America Holdings |
96 | 02/16/24 | USD | 220.00 | USD | 2,182 | (115,680 | ) | ||||||||||||||||||||
| Medtronic PLC |
111 | 02/16/24 | USD | 85.00 | USD | 914 | (12,654 | ) | ||||||||||||||||||||
| Micron Technology, Inc. |
62 | 02/16/24 | USD | 77.50 | USD | 529 | (58,125 | ) | ||||||||||||||||||||
| Microsoft Corp. |
186 | 02/16/24 | USD | 400.00 | USD | 6,994 | (100,905 | ) | ||||||||||||||||||||
| Progressive Corp. |
206 | 02/16/24 | USD | 160.00 | USD | 3,281 | (124,630 | ) | ||||||||||||||||||||
| Reinsurance Group of America, Inc. |
189 | 02/16/24 | USD | 165.00 | USD | 3,058 | (75,127 | ) | ||||||||||||||||||||
| Sanofi SA, ADR |
771 | 02/16/24 | USD | 49.00 | USD | 3,834 | (174,197 | ) | ||||||||||||||||||||
| TKO Group Holdings, Inc., Class A |
435 | 02/16/24 | USD | 80.00 | USD | 3,549 | (224,025 | ) | ||||||||||||||||||||
| Unilever PLC, ADR |
514 | 02/16/24 | USD | 50.00 | USD | 2,492 | (30,840 | ) | ||||||||||||||||||||
| Voya Financial, Inc. |
400 | 02/16/24 | USD | 77.50 | USD | 2,918 | (34,000 | ) | ||||||||||||||||||||
| Zebra Technologies Corp., Class A |
57 | 02/16/24 | USD | 230.00 | USD | 1,558 | (281,580 | ) | ||||||||||||||||||||
| Fidelity National Financial, Inc., Class A |
1,039 | 03/15/24 | USD | 47.31 | USD | 5,301 | (614,376 | ) | ||||||||||||||||||||
| Medtronic PLC |
64 | 03/15/24 | USD | 85.00 | USD | 527 | (12,992 | ) | ||||||||||||||||||||
| S C H E D U L E O F I N V E S T M E N T S |
51 |
| Schedule of Investments (continued) December 31, 2023
|
BlackRock Enhanced Capital and Income Fund, Inc. (CII) |
Exchange-Traded Options Written (continued)
| Description | Number of Contracts |
Expiration Date |
Exercise Price | Notional Amount (000) |
Value | |||||||||||||||||||||||
| Call (continued) |
||||||||||||||||||||||||||||
| Micron Technology, Inc. |
62 | 03/15/24 | USD | 87.50 | USD | 529 | $ | (25,420 | ) | |||||||||||||||||||
| Otis Worldwide Corp. |
271 | 03/15/24 | USD | 90.00 | USD | 2,425 | (84,010 | ) | ||||||||||||||||||||
|
|
|
|||||||||||||||||||||||||||
| $ | (17,227,049 | ) | ||||||||||||||||||||||||||
|
|
|
|||||||||||||||||||||||||||
OTC Options Written
| Description | Counterparty | Number of Contracts |
Expiration Date |
Exercise Price | Notional Amount (000) |
Value | ||||||||||||||||||||||||||
| Call |
||||||||||||||||||||||||||||||||
| Verizon Communications, Inc. |
Citibank N.A. | 35,500 | 01/03/24 | USD | 37.53 | USD | 1,338 | $ | (13,786 | ) | ||||||||||||||||||||||
| Otis Worldwide Corp. |
UBS AG | 18,500 | 01/04/24 | USD | 85.49 | USD | 1,655 | (77,025 | ) | |||||||||||||||||||||||
| Verizon Communications, Inc. |
Citibank N.A. | 35,500 | 01/10/24 | USD | 37.53 | USD | 1,338 | (8,812 | ) | |||||||||||||||||||||||
| Shell PLC |
Goldman Sachs International | 40,600 | 01/11/24 | GBP | 26.68 | GBP | 1,043 | (2,830 | ) | |||||||||||||||||||||||
| Dun & Bradstreet Holdings, Inc. |
Citibank N.A. | 120,800 | 01/16/24 | USD | 9.82 | USD | 1,413 | (265,220 | ) | |||||||||||||||||||||||
| Voya Financial, Inc. |
JPMorgan Chase Bank N.A. | 39,100 | 01/23/24 | USD | 71.55 | USD | 2,853 | (98,306 | ) | |||||||||||||||||||||||
| Shell PLC |
Goldman Sachs International | 25,400 | 01/24/24 | GBP | 25.83 | GBP | 652 | (15,746 | ) | |||||||||||||||||||||||
| Shell PLC |
Morgan Stanley & Co. International PLC | 70,000 | 01/30/24 | GBP | 26.54 | GBP | 1,798 | (24,658 | ) | |||||||||||||||||||||||
| LPL Financial Holdings, Inc. |
Citibank N.A. | 14,300 | 01/31/24 | USD | 216.19 | USD | 3,255 | (236,728 | ) | |||||||||||||||||||||||
| Meta Platforms, Inc., Class A |
Citibank N.A. | 9,900 | 01/31/24 | USD | 361.74 | USD | 3,504 | (140,823 | ) | |||||||||||||||||||||||
| Skechers USA, Inc., Class A |
Bank of America N.A. | 21,400 | 01/31/24 | USD | 64.63 | USD | 1,334 | (35,361 | ) | |||||||||||||||||||||||
| Dun & Bradstreet Holdings, Inc. |
UBS AG | 42,900 | 02/13/24 | USD | 11.84 | USD | 502 | (33,852 | ) | |||||||||||||||||||||||
| Monster Beverage Corp. |
Citibank N.A. | 50,000 | 02/16/24 | USD | 56.12 | USD | 2,881 | (141,506 | ) | |||||||||||||||||||||||
| Axalta Coating Systems Ltd. |
Citibank N.A. | 113,000 | 02/26/24 | USD | 33.10 | USD | 3,839 | (227,174 | ) | |||||||||||||||||||||||
|
|
|
|||||||||||||||||||||||||||||||
| $ | (1,321,827 | ) | ||||||||||||||||||||||||||||||
|
|
|
|||||||||||||||||||||||||||||||
Balances Reported in the Statements of Assets and Liabilities for Options Written
| Description | Swap Premiums Paid |
Swap Premiums Received |
Unrealized Appreciation |
Unrealized Depreciation |
Value | |||||||||||||||
| Options Written |
$ | N/A | $ | N/A | $ | 1,510,847 | $ | (9,793,053) | $ | (18,548,876) | ||||||||||
Derivative Financial Instruments Categorized by Risk Exposure
As of period end, the fair values of derivative financial instruments located in the Statements of Assets and Liabilities were as follows:
| Commodity Contracts |
Credit Contracts |
Equity Contracts |
Foreign Currency Exchange Contracts |
Interest Rate Contracts |
Other Contracts |
Total | ||||||||||||||||||||||
| Liabilities — Derivative Financial Instruments |
|
|||||||||||||||||||||||||||
| Options written |
||||||||||||||||||||||||||||
| Options written at value |
$ | — | $ | — | $ | 18,548,876 | $ | — | $ | — | $ | — | $ | 18,548,876 | ||||||||||||||
|
|
|
|
|
|
|
|
|
|
|
|
|
|
|
|||||||||||||||
For the period ended December 31, 2023, the effect of derivative financial instruments in the Statements of Operations was as follows:
| Commodity Contracts |
Credit Contracts |
Equity Contracts |
Foreign Currency Exchange Contracts |
Interest Rate Contracts |
Other Contracts |
Total | ||||||||||||||||||||||
| Net Realized Gain (Loss) from: |
|
|||||||||||||||||||||||||||
| Options written |
$ | — | $ | — | $ | (10,946,814 | ) | $ | — | $ | — | $ | — | $ | (10,946,814 | ) | ||||||||||||
|
|
|
|
|
|
|
|
|
|
|
|
|
|
|
|||||||||||||||
| Net Change in Unrealized Appreciation (Depreciation) on: |
||||||||||||||||||||||||||||
| Options written |
$ | — | $ | — | $ | (13,682,244 | ) | $ | — | $ | — | $ | — | $ | (13,682,244 | ) | ||||||||||||
|
|
|
|
|
|
|
|
|
|
|
|
|
|
|
|||||||||||||||
| 52 | 2 0 2 3 B L A C K R O C K A N N U A L R E P O R T T O S H A R E H O L D E R S |
| Schedule of Investments (continued) December 31, 2023
|
BlackRock Enhanced Capital and Income Fund, Inc. (CII) |
Average Quarterly Balances of Outstanding Derivative Financial Instruments
| Options: |
||||
| Average value of option contracts written |
$ | 14,431,983 |
For more information about the Trust’s investment risks regarding derivative financial instruments, refer to the Notes to Financial Statements.
Derivative Financial Instruments — Offsetting as of Period End
The Trust’s derivative assets and liabilities (by type) were as follows:
| Assets | Liabilities | |||||||
| Derivative Financial Instruments |
||||||||
| Options |
$ | — | $ | 18,548,876 | ||||
|
|
|
|
|
|||||
| Total derivative assets and liabilities in the Statements of Assets and Liabilities |
— | 18,548,876 | ||||||
|
|
|
|
|
|||||
| Derivatives not subject to a Master Netting Agreement or similar agreement (“MNA”) |
— | (17,227,049 | ) | |||||
|
|
|
|
|
|||||
| Total derivative assets and liabilities subject to an MNA |
$ | — | $ | 1,321,827 | ||||
|
|
|
|
|
|||||
The following table presents the Trust’s derivative liabilities by counterparty net of amounts available for offset under an MNA and net of the related collateral pledged by the Trust:
| Counterparty |
|
Derivative Liabilities Subject to an MNA by Counterparty |
|
|
Derivatives Available for Offset |
|
|
Non-Cash Collateral Pledged |
(a) |
|
Cash Collateral Pledged |
|
|
Net Amount of Derivative Liabilities |
(b) | |||||
| Bank of America N.A. |
$ | 35,361 | $ | — | $ | — | $ | — | $ | 35,361 | ||||||||||
| Citibank N.A. |
1,034,049 | — | (1,034,049 | ) | — | — | ||||||||||||||
| Goldman Sachs International |
18,576 | — | — | — | 18,576 | |||||||||||||||
| JPMorgan Chase Bank N.A. |
98,306 | — | — | — | 98,306 | |||||||||||||||
| Morgan Stanley & Co. International PLC |
24,658 | — | — | — | 24,658 | |||||||||||||||
| UBS AG |
110,877 | — | — | — | 110,877 | |||||||||||||||
|
|
|
|
|
|
|
|
|
|
|
|||||||||||
| $ | 1,321,827 | $ | — | $ | (1,034,049 | ) | $ | — | $ | 287,778 | ||||||||||
|
|
|
|
|
|
|
|
|
|
|
|||||||||||
| (a) | Excess of collateral received/pledged, if any, from the individual counterparty is not shown for financial reporting purposes. |
| (b) | Net amount represents the net amount payable due to counterparty in the event of default. Net amount may be offset further by the options written receivable/payable on the Statements of Assets and Liabilities. |
Fair Value Hierarchy as of Period End
Various inputs are used in determining the fair value of financial instruments. For a description of the input levels and information about the Trust’s policy regarding valuation of financial instruments, refer to the Notes to Financial Statements.
The following table summarizes the Trust’s financial instruments categorized in the fair value hierarchy. The breakdown of the Trust’s financial instruments into major categories is disclosed in the Schedule of Investments above.
| Level 1 | Level 2 | Level 3 | Total | |||||||||||||
| Assets |
||||||||||||||||
| Investments |
||||||||||||||||
| Long-Term Investments |
||||||||||||||||
| Common Stocks |
||||||||||||||||
| Automobile Components |
$ | 13,238,276 | $ | — | $ | — | $ | 13,238,276 | ||||||||
| Banks |
16,085,336 | — | — | 16,085,336 | ||||||||||||
| Beverages |
8,006,926 | — | — | 8,006,926 | ||||||||||||
| Broadline Retail |
48,526,749 | — | — | 48,526,749 | ||||||||||||
| Building Products |
10,260,877 | — | — | 10,260,877 | ||||||||||||
| Capital Markets |
29,846,703 | — | — | 29,846,703 | ||||||||||||
| Chemicals |
26,782,837 | — | — | 26,782,837 | ||||||||||||
| Communications Equipment |
7,013,998 | — | — | 7,013,998 | ||||||||||||
| Consumer Finance |
8,033,139 | — | — | 8,033,139 | ||||||||||||
| Consumer Staples Distribution & Retail |
20,634,069 | — | — | 20,634,069 | ||||||||||||
| Diversified Telecommunication Services |
12,292,537 | — | — | 12,292,537 | ||||||||||||
| Electronic Equipment, Instruments & Components |
15,279,967 | — | — | 15,279,967 | ||||||||||||
| Entertainment |
8,729,957 | — | — | 8,729,957 | ||||||||||||
| S C H E D U L E O F I N V E S T M E N T S |
53 |
| Schedule of Investments (continued) December 31, 2023
|
BlackRock Enhanced Capital and Income Fund, Inc. (CII) |
Fair Value Hierarchy as of Period End (continued)
| Level 1 | Level 2 | Level 3 | Total | |||||||||||||
| Common Stocks (continued) |
||||||||||||||||
| Financial Services |
$ | 31,361,363 | $ | — | $ | — | $ | 31,361,363 | ||||||||
| Food Products |
10,592,960 | — | — | 10,592,960 | ||||||||||||
| Health Care Equipment & Supplies |
15,918,782 | — | — | 15,918,782 | ||||||||||||
| Health Care Providers & Services |
56,699,052 | — | — | 56,699,052 | ||||||||||||
| Health Care Technology |
7,517,906 | — | — | 7,517,906 | ||||||||||||
| Hotels, Restaurants & Leisure |
6,959,869 | — | — | 6,959,869 | ||||||||||||
| Household Durables |
18,956,843 | — | — | 18,956,843 | ||||||||||||
| Insurance |
30,201,758 | — | — | 30,201,758 | ||||||||||||
| Interactive Media & Services |
74,097,787 | — | — | 74,097,787 | ||||||||||||
| IT Services |
17,612,765 | — | — | 17,612,765 | ||||||||||||
| Life Sciences Tools & Services |
24,709,540 | — | — | 24,709,540 | ||||||||||||
| Machinery |
40,630,520 | — | — | 40,630,520 | ||||||||||||
| Media |
20,150,347 | — | — | 20,150,347 | ||||||||||||
| Oil, Gas & Consumable Fuels |
26,386,902 | 10,946,567 | — | 37,333,469 | ||||||||||||
| Personal Care Products |
9,102,362 | — | — | 9,102,362 | ||||||||||||
| Pharmaceuticals |
37,396,594 | — | — | 37,396,594 | ||||||||||||
| Professional Services |
9,581,633 | — | — | 9,581,633 | ||||||||||||
| Semiconductors & Semiconductor Equipment |
67,249,797 | — | — | 67,249,797 | ||||||||||||
| Software |
76,738,107 | — | — | 76,738,107 | ||||||||||||
| Specialty Retail |
15,691,765 | — | — | 15,691,765 | ||||||||||||
| Technology Hardware, Storage & Peripherals |
38,261,487 | — | — | 38,261,487 | ||||||||||||
| Textiles, Apparel & Luxury Goods |
8,913,810 | — | — | 8,913,810 | ||||||||||||
| Short-Term Securities |
||||||||||||||||
| Money Market Funds |
12,932,953 | — | — | 12,932,953 | ||||||||||||
|
|
|
|
|
|
|
|
|
|||||||||
| $ | 882,396,273 | $ | 10,946,567 | $ | — | 893,342,840 | ||||||||||
|
|
|
|
|
|
|
|
|
|||||||||
| Investments Valued at NAV(a) |
397,512 | |||||||||||||||
|
|
|
|||||||||||||||
| $ | 893,740,352 | |||||||||||||||
|
|
|
|||||||||||||||
| Derivative Financial Instruments(b) |
||||||||||||||||
| Liabilities |
||||||||||||||||
| Equity Contracts |
$ | (13,805,655 | ) | $ | (4,743,221 | ) | $ | — | $ | (18,548,876 | ) | |||||
|
|
|
|
|
|
|
|
|
|||||||||
| (a) | Certain investments of the Trust were fair valued using NAV as a practical expedient as no quoted market value is available and therefore have been excluded from the fair value hierarchy. |
| (b) | Derivative financial instruments are options written. Options written are shown at value. |
See notes to financial statements.
| 54 | 2 0 2 3 B L A C K R O C K A N N U A L R E P O R T T O S H A R E H O L D E R S |
| Consolidated Schedule of Investments December 31, 2023
|
BlackRock Enhanced Equity Dividend Trust (BDJ) (Percentages shown are based on Net Assets) |
| Security | Shares | Value | ||||||
| Common Stocks |
||||||||
| Aerospace & Defense(a) — 3.7% | ||||||||
| L3Harris Technologies, Inc.(b) |
180,535 | $ | 38,024,282 | |||||
| RTX Corp. |
269,046 | 22,637,530 | ||||||
|
|
|
|||||||
| 60,661,812 | ||||||||
| Automobile Components — 0.4% | ||||||||
| Lear Corp. |
47,800 | 6,749,838 | ||||||
|
|
|
|||||||
| Automobiles — 2.2% | ||||||||
| General Motors Co.(a)(b) |
1,018,667 | 36,590,519 | ||||||
|
|
|
|||||||
| Banks — 11.0% | ||||||||
| Bank of America Corp. |
314,801 | 10,599,350 | ||||||
| Citigroup, Inc.(a) |
970,830 | 49,939,495 | ||||||
| Citizens Financial Group, Inc. |
352,124 | 11,669,389 | ||||||
| First Citizens BancShares, Inc., Class A |
23,527 | 33,384,107 | ||||||
| JPMorgan Chase & Co.(a) |
122,378 | 20,816,498 | ||||||
| Wells Fargo & Co.(a) |
1,098,968 | 54,091,205 | ||||||
|
|
|
|||||||
| 180,500,044 | ||||||||
| Beverages — 0.9% | ||||||||
| Constellation Brands, Inc., Class A(a) |
42,599 | 10,298,308 | ||||||
| Keurig Dr. Pepper, Inc. |
123,060 | 4,100,359 | ||||||
|
|
|
|||||||
| 14,398,667 | ||||||||
| Building Products — 0.8% | ||||||||
| Allegion PLC |
104,660 | 13,259,375 | ||||||
|
|
|
|||||||
| Capital Markets — 4.1% | ||||||||
| Carlyle Group, Inc. |
414,230 | 16,855,019 | ||||||
| Goldman Sachs Group, Inc. |
33,980 | 13,108,465 | ||||||
| Intercontinental Exchange, Inc. |
84,950 | 10,910,128 | ||||||
| Raymond James Financial, Inc. |
146,399 | 16,323,488 | ||||||
| UBS Group AG, Registered Shares |
319,280 | 9,917,335 | ||||||
|
|
|
|||||||
| 67,114,435 | ||||||||
| Chemicals — 0.6% | ||||||||
| International Flavors & Fragrances, Inc. |
127,520 | 10,325,294 | ||||||
|
|
|
|||||||
| Communications Equipment — 2.0% | ||||||||
| Cisco Systems, Inc.(a) |
632,570 | 31,957,436 | ||||||
|
|
|
|||||||
| Consumer Finance — 0.5% | ||||||||
| American Express Co. |
47,010 | 8,806,853 | ||||||
|
|
|
|||||||
| Consumer Staples Distribution & Retail — 2.0% | ||||||||
| Dollar General Corp. |
237,476 | 32,284,862 | ||||||
|
|
|
|||||||
| Containers & Packaging — 1.5% | ||||||||
| Sealed Air Corp.(b) |
688,332 | 25,137,885 | ||||||
|
|
|
|||||||
| Diversified Telecommunication Services — 2.4% | ||||||||
| AT&T, Inc. |
827,562 | 13,886,490 | ||||||
| Verizon Communications, Inc.(b) |
657,980 | 24,805,846 | ||||||
|
|
|
|||||||
| 38,692,336 | ||||||||
| Electric Utilities — 2.8% | ||||||||
| American Electric Power Co., Inc. |
224,679 | 18,248,428 | ||||||
| Exelon Corp. |
256,819 | 9,219,802 | ||||||
| NextEra Energy, Inc. |
80,460 | 4,887,141 | ||||||
| PG&E Corp.(c) |
763,531 | 13,766,464 | ||||||
|
|
|
|||||||
| 46,121,835 | ||||||||
| Entertainment — 0.1% | ||||||||
| Walt Disney Co.(c) |
19,020 | 1,717,316 | ||||||
|
|
|
|||||||
| Security | Shares | Value | ||||||
| Financial Services — 5.1% | ||||||||
| AP Arsenal Co. Invest LP(c)(d) |
15,830,106 | $ | 15,830,106 | |||||
| Equitable Holdings, Inc. |
227,446 | 7,573,952 | ||||||
| Fidelity National Information Services, Inc.(b) |
575,110 | 34,546,858 | ||||||
| Visa, Inc., Class A |
96,229 | 25,053,220 | ||||||
|
|
|
|||||||
| 83,004,136 | ||||||||
| Food Products — 2.4% | ||||||||
| Kraft Heinz Co.(a)(b) |
1,079,834 | 39,932,261 | ||||||
|
|
|
|||||||
| Ground Transportation — 0.6% | ||||||||
| Union Pacific Corp. |
37,481 | 9,206,083 | ||||||
|
|
|
|||||||
| Health Care Equipment & Supplies — 5.0% | ||||||||
| Baxter International, Inc.(a) |
830,532 | 32,108,367 | ||||||
| Koninklijke Philips NV(c) |
830,415 | 19,433,561 | ||||||
| Medtronic PLC |
374,970 | 30,890,029 | ||||||
|
|
|
|||||||
| 82,431,957 | ||||||||
| Health Care Providers & Services — 8.0% | ||||||||
| Cardinal Health, Inc. |
262,089 | 26,418,571 | ||||||
| Cencora, Inc. |
44,126 | 9,062,598 | ||||||
| Cigna Group |
74,674 | 22,361,129 | ||||||
| CVS Health Corp. |
63,370 | 5,003,695 | ||||||
| Elevance Health, Inc.(a) |
62,056 | 29,263,128 | ||||||
| Humana, Inc. |
19,428 | 8,894,333 | ||||||
| Laboratory Corp. of America Holdings(a) |
135,817 | 30,869,846 | ||||||
|
|
|
|||||||
| 131,873,300 | ||||||||
| Household Durables — 2.1% | ||||||||
| Newell Brands, Inc. |
747,674 | 6,489,810 | ||||||
| Panasonic Holdings Corp. |
1,179,300 | 11,613,243 | ||||||
| Sony Group Corp. |
179,600 | 16,996,060 | ||||||
|
|
|
|||||||
| 35,099,113 | ||||||||
| Industrial Conglomerates — 0.4% | ||||||||
| Siemens AG, Registered Shares |
36,162 | 6,784,327 | ||||||
|
|
|
|||||||
| Insurance — 6.7% | ||||||||
| American International Group, Inc.(a) |
703,484 | 47,661,041 | ||||||
| Fidelity National Financial, Inc., Class A |
496,525 | 25,332,706 | ||||||
| First American Financial Corp. |
29,750 | 1,917,090 | ||||||
| Prudential PLC |
576,635 | 6,505,990 | ||||||
| Willis Towers Watson PLC |
118,625 | 28,612,350 | ||||||
|
|
|
|||||||
| 110,029,177 | ||||||||
| IT Services — 1.3% | ||||||||
| Cognizant Technology Solutions Corp., |
282,568 | 21,342,361 | ||||||
|
|
|
|||||||
| Leisure Products — 0.3% | ||||||||
| Hasbro, Inc. |
102,660 | 5,241,820 | ||||||
|
|
|
|||||||
| Life Sciences Tools & Services — 0.7% | ||||||||
| Fortrea Holdings, Inc.(c) |
206,687 | 7,213,377 | ||||||
| Thermo Fisher Scientific, Inc. |
8,080 | 4,288,783 | ||||||
|
|
|
|||||||
| 11,502,160 | ||||||||
| Machinery — 1.3% | ||||||||
| CNH Industrial NV |
814,300 | 9,918,174 | ||||||
| Fortive Corp. |
74,754 | 5,504,137 | ||||||
| Komatsu Ltd. |
220,700 | 5,743,351 | ||||||
|
|
|
|||||||
| 21,165,662 | ||||||||
| S C H E D U L E O F I N V E S T M E N T S |
55 |
| Consolidated Schedule of Investments (continued) December 31, 2023
|
BlackRock Enhanced Equity Dividend Trust (BDJ) (Percentages shown are based on Net Assets) |
| Security | Shares | Value | ||||||
| Media — 2.7% |
||||||||
| Comcast Corp., Class A(a) | 751,887 | $ 32,970,245 | ||||||
| Fox Corp., Class A |
380,307 | 11,283,709 | ||||||
|
|
|
|||||||
| 44,253,954 | ||||||||
| Multi-Utilities — 1.4% | ||||||||
| Public Service Enterprise Group, Inc. |
115,778 | 7,079,825 | ||||||
| Sempra |
212,882 | 15,908,672 | ||||||
|
|
|
|||||||
| 22,988,497 | ||||||||
| Oil, Gas & Consumable Fuels — 8.6% | ||||||||
| BP PLC |
5,837,860 | 34,607,229 | ||||||
| Chevron Corp. |
64,390 | 9,604,413 | ||||||
| Enterprise Products Partners LP(a) |
1,007,778 | 26,554,950 | ||||||
| Formentera Partners Fund II LP(d)(e) |
— | (f) | 10,716,626 | |||||
| Shell PLC |
1,316,592 | 43,097,409 | ||||||
| Suncor Energy, Inc. |
521,730 | 16,716,229 | ||||||
|
|
|
|||||||
| 141,296,856 | ||||||||
| Personal Care Products — 1.8% | ||||||||
| Unilever PLC, ADR(a) |
610,738 | 29,608,578 | ||||||
|
|
|
|||||||
| Pharmaceuticals — 4.8% | ||||||||
| AstraZeneca PLC |
95,155 | 12,835,443 | ||||||
| Bayer AG, Registered Shares |
384,584 | 14,269,567 | ||||||
| Eli Lilly & Co. |
18,167 | 10,589,908 | ||||||
| Novo Nordisk A/S, ADR |
78,264 | 8,096,411 | ||||||
| Pfizer, Inc. |
140,670 | 4,049,889 | ||||||
| Sanofi SA |
286,792 | 28,499,317 | ||||||
|
|
|
|||||||
| 78,340,535 | ||||||||
| Professional Services — 4.9% | ||||||||
| Leidos Holdings, Inc.(a) |
361,660 | 39,146,079 | ||||||
| Robert Half, Inc. |
65,910 | 5,794,807 | ||||||
| SS&C Technologies Holdings, Inc. |
584,940 | 35,745,683 | ||||||
|
|
|
|||||||
| 80,686,569 | ||||||||
| Semiconductors & Semiconductor Equipment — 2.9% | ||||||||
| Intel Corp. |
122,570 | 6,159,142 | ||||||
| Micron Technology, Inc.(b) |
373,400 | 31,865,956 | ||||||
| Taiwan Semiconductor Manufacturing Co. Ltd., ADR |
92,084 | 9,576,736 | ||||||
|
|
|
|||||||
| 47,601,834 | ||||||||
| Software — 1.3% | ||||||||
| Microsoft Corp. |
57,206 | 21,511,744 | ||||||
|
|
|
|||||||
| Specialized REITs — 0.9% | ||||||||
| American Tower Corp. |
22,100 | 4,770,948 | ||||||
| Crown Castle, Inc. |
81,370 | 9,373,010 | ||||||
|
|
|
|||||||
| 14,143,958 | ||||||||
| Specialty Retail — 0.8% | ||||||||
| Ross Stores, Inc. |
88,225 | 12,209,458 | ||||||
|
|
|
|||||||
| Textiles, Apparel & Luxury Goods — 0.6% | ||||||||
| Ralph Lauren Corp., Class A |
52,173 | 7,523,347 | ||||||
| Tapestry, Inc. |
47,920 | 1,763,935 | ||||||
|
|
|
|||||||
| 9,287,282 | ||||||||
| Security | Shares | Value | ||||||
| Tobacco — 1.4% |
||||||||
| British American Tobacco PLC, ADR |
783,226 | $ | 22,940,690 | |||||
|
|
|
|||||||
| Wireless Telecommunication Services — 0.4% | ||||||||
| Rogers Communications, Inc., Class B |
152,562 | 7,141,935 | ||||||
|
|
|
|||||||
| Total Common Stocks — 101.4% |
1,663,942,754 | |||||||
|
|
|
|||||||
| Preferred Securities |
||||||||
| Preferred Stocks — 0.5% | ||||||||
| Household Products — 0.5% |
||||||||
| Henkel AG & Co. KGaA |
106,570 | 8,572,705 | ||||||
|
|
|
|||||||
| 8,572,705 | ||||||||
|
|
|
|||||||
| Total Preferred Securities — 0.5% |
8,572,705 | |||||||
|
|
|
|||||||
| Total Long-Term Investments — 101.9% |
1,672,515,459 | |||||||
|
|
|
|||||||
| Short-Term Securities |
||||||||
| Money Market Funds — 0.3% | ||||||||
| BlackRock Liquidity Funds, T-Fund, Institutional Class, 5.26%(g)(h) |
5,204,534 | 5,204,534 | ||||||
|
|
|
|||||||
| Total Short-Term Securities — 0.3% |
5,204,534 | |||||||
|
|
|
|||||||
| Total Investments Before Options Written — 102.2% |
|
1,677,719,993 | ||||||
|
|
|
|||||||
| Options Written — (2.2)% |
(36,487,628 | ) | ||||||
|
|
|
|||||||
| Total Investments, Net of Options Written — 100.0% |
|
1,641,232,365 | ||||||
| Other Assets Less Liabilities — 0.0% |
368,758 | |||||||
|
|
|
|||||||
| Net Assets — 100.0% |
$ | 1,641,601,123 | ||||||
|
|
|
|||||||
| (a) | All or a portion of the security has been pledged and/or segregated as collateral in connection with outstanding exchange-traded options written. |
| (b) | All or a portion of the security has been pledged as collateral in connection with outstanding OTC derivatives. |
| (c) | Non-income producing security. |
| (d) | Security is valued using significant unobservable inputs and is classified as Level 3 in the fair value hierarchy. |
| (e) | All or a portion of the security is held by a wholly-owned subsidiary. See Note 1 of the Notes to Consolidated Financial Statements for details on the wholly-owned subsidiary. |
| (f) | Investment does not issue shares. |
| (g) | Affiliate of the Trust. |
| (h) | Annualized 7-day yield as of period end. |
For Trust compliance purposes, the Trust’s industry classifications refer to one or more of the industry sub-classifications used by one or more widely recognized market indexes or rating group indexes, and/or as defined by the investment adviser. These definitions may not apply for purposes of this report, which may combine such industry sub-classifications for reporting ease.
| 56 | 2 0 2 3 B L A C K R O C K A N N U A L R E P O R T T O S H A R E H O L D E R S |
| Consolidated Schedule of Investments (continued) December 31, 2023 |
BlackRock Enhanced Equity Dividend Trust (BDJ) |
Affiliates
Investments in issuers considered to be affiliate(s) of the Trust during the year ended December 31, 2023 for purposes of Section 2(a)(3) of the Investment Company Act of 1940, as amended, were as follows:
| Affiliated Issuer | Value at 12/31/22 |
Purchases at Cost |
Proceeds from Sale |
Net Realized Gain (Loss) |
Change in Unrealized Appreciation (Depreciation) |
Value at 12/31/23 |
Shares Held at 12/31/23 |
Income | Capital Gain Distributions from Underlying Funds |
|||||||||||||||||||||||||||
| BlackRock Liquidity Funds, T-Fund, Institutional Class |
$ | 76,042,437 | $ | — | $ | (70,837,903 | )(a) | $ | — | $ | — | $ | 5,204,534 | 5,204,534 | $ | 2,734,658 | $ | — | ||||||||||||||||||
| SL Liquidity Series, LLC, Money Market Series(b) |
— | 331 | (a) | — | (331 | ) | — | — | — | 1,130 | (c) | — | ||||||||||||||||||||||||
|
|
|
|
|
|
|
|
|
|
|
|||||||||||||||||||||||||||
| $ | (331 | ) | $ | — | $ | 5,204,534 | $ | 2,735,788 | $ | — | ||||||||||||||||||||||||||
|
|
|
|
|
|
|
|
|
|
|
|||||||||||||||||||||||||||
| (a) | Represents net amount purchased (sold). |
| (b) | As of period end, the entity is no longer held. |
| (c) | All or a portion represents securities lending income earned from the reinvestment of cash collateral from loaned securities, net of fees and collateral investment expenses, and other payments to and from borrowers of securities. |
Derivative Financial Instruments Outstanding as of Period End
Exchange-Traded Options Written
| Description | Number of Contracts |
Expiration Date |
Exercise Price | Notional Amount (000) |
Value | |||||||||||||||||||||||
| Call |
||||||||||||||||||||||||||||
| American International Group, Inc. |
733 | 01/05/24 | USD | 67.00 | USD | 4,966 | $ | (67,802 | ) | |||||||||||||||||||
| AT&T, Inc. |
968 | 01/05/24 | USD | 16.50 | USD | 1,624 | (38,720 | ) | ||||||||||||||||||||
| Baxter International, Inc. |
1,458 | 01/05/24 | USD | 37.00 | USD | 5,637 | (247,860 | ) | ||||||||||||||||||||
| Cardinal Health, Inc. |
503 | 01/05/24 | USD | 106.00 | USD | 5,070 | (5,030 | ) | ||||||||||||||||||||
| Cigna Group |
216 | 01/05/24 | USD | 285.00 | USD | 6,468 | (329,400 | ) | ||||||||||||||||||||
| Cisco Systems, Inc. |
1,277 | 01/05/24 | USD | 49.00 | USD | 6,451 | (201,766 | ) | ||||||||||||||||||||
| Elevance Health, Inc. |
119 | 01/05/24 | USD | 485.00 | USD | 5,612 | (6,248 | ) | ||||||||||||||||||||
| Goldman Sachs Group, Inc. |
68 | 01/05/24 | USD | 340.00 | USD | 2,623 | (314,500 | ) | ||||||||||||||||||||
| JPMorgan Chase & Co. |
164 | 01/05/24 | USD | 155.00 | USD | 2,790 | (250,510 | ) | ||||||||||||||||||||
| Kraft Heinz Co. |
1,823 | 01/05/24 | USD | 35.00 | USD | 6,741 | (370,980 | ) | ||||||||||||||||||||
| Ross Stores, Inc. |
80 | 01/05/24 | USD | 132.00 | USD | 1,107 | (54,000 | ) | ||||||||||||||||||||
| RTX Corp. |
715 | 01/05/24 | USD | 85.00 | USD | 6,016 | (31,103 | ) | ||||||||||||||||||||
| Taiwan Semiconductor Manufacturing Co. Ltd. |
384 | 01/05/24 | USD | 98.00 | USD | 3,994 | (236,160 | ) | ||||||||||||||||||||
| AT&T, Inc. |
986 | 01/12/24 | USD | 17.50 | USD | 1,655 | (6,409 | ) | ||||||||||||||||||||
| Chevron Corp. |
188 | 01/12/24 | USD | 155.00 | USD | 2,804 | (10,434 | ) | ||||||||||||||||||||
| Cigna Group |
16 | 01/12/24 | USD | 265.00 | USD | 479 | (56,560 | ) | ||||||||||||||||||||
| Cisco Systems, Inc. |
1,126 | 01/12/24 | USD | 49.00 | USD | 5,689 | (173,967 | ) | ||||||||||||||||||||
| Citigroup, Inc. |
733 | 01/12/24 | USD | 48.00 | USD | 3,771 | (267,545 | ) | ||||||||||||||||||||
| Comcast Corp., Class A |
1,264 | 01/12/24 | USD | 43.00 | USD | 5,543 | (139,040 | ) | ||||||||||||||||||||
| Constellation Brands, Inc., Class A |
143 | 01/12/24 | USD | 240.00 | USD | 3,457 | (95,095 | ) | ||||||||||||||||||||
| CVS Health Corp. |
150 | 01/12/24 | USD | 76.00 | USD | 1,184 | (51,000 | ) | ||||||||||||||||||||
| Dollar General Corp. |
374 | 01/12/24 | USD | 139.00 | USD | 5,085 | (68,255 | ) | ||||||||||||||||||||
| Eli Lilly & Co. |
39 | 01/12/24 | USD | 615.00 | USD | 2,273 | (9,867 | ) | ||||||||||||||||||||
| Fox Corp., Class A |
414 | 01/12/24 | USD | 30.00 | USD | 1,228 | (16,560 | ) | ||||||||||||||||||||
| Humana, Inc. |
43 | 01/12/24 | USD | 495.00 | USD | 1,969 | (3,010 | ) | ||||||||||||||||||||
| Intel Corp. |
224 | 01/12/24 | USD | 44.00 | USD | 1,126 | (141,120 | ) | ||||||||||||||||||||
| JPMorgan Chase & Co. |
240 | 01/12/24 | USD | 157.50 | USD | 4,082 | (309,000 | ) | ||||||||||||||||||||
| Microsoft Corp. |
9 | 01/12/24 | USD | 375.00 | USD | 338 | (5,603 | ) | ||||||||||||||||||||
| Novo Nordisk A/S, ADR |
177 | 01/12/24 | USD | 100.00 | USD | 1,831 | (78,765 | ) | ||||||||||||||||||||
| PG&E Corp. |
1,076 | 01/12/24 | USD | 17.50 | USD | 1,940 | (78,548 | ) | ||||||||||||||||||||
| Ross Stores, Inc. |
135 | 01/12/24 | USD | 131.00 | USD | 1,868 | (102,600 | ) | ||||||||||||||||||||
| Ross Stores, Inc. |
67 | 01/12/24 | USD | 135.00 | USD | 927 | (28,810 | ) | ||||||||||||||||||||
| RTX Corp. |
764 | 01/12/24 | USD | 83.00 | USD | 6,428 | (149,362 | ) | ||||||||||||||||||||
| Suncor Energy, Inc. |
772 | 01/12/24 | USD | 35.00 | USD | 2,473 | (3,860 | ) | ||||||||||||||||||||
| Union Pacific Corp. |
26 | 01/12/24 | USD | 235.00 | USD | 639 | (30,030 | ) | ||||||||||||||||||||
| Union Pacific Corp. |
52 | 01/12/24 | USD | 240.00 | USD | 1,277 | (37,960 | ) | ||||||||||||||||||||
| Verizon Communications, Inc. |
509 | 01/12/24 | USD | 39.00 | USD | 1,919 | (4,327 | ) | ||||||||||||||||||||
| Visa, Inc., Class A |
89 | 01/12/24 | USD | 260.00 | USD | 2,317 | (29,593 | ) | ||||||||||||||||||||
| Allegion PLC |
365 | 01/19/24 | USD | 110.00 | USD | 4,624 | (622,325 | ) | ||||||||||||||||||||
| S C H E D U L E O F I N V E S T M E N T S |
57 |
| Consolidated Schedule of Investments (continued) December 31, 2023 |
BlackRock Enhanced Equity Dividend Trust (BDJ) |
Exchange-Traded Options Written (continued)
| Description | Number of Contracts |
Expiration Date |
Exercise Price | Notional Amount (000) |
Value | |||||||||||||||||||||||
| Call (continued) |
||||||||||||||||||||||||||||
| American Electric Power Co., Inc. |
442 | 01/19/24 | USD | 80.00 | USD | 3,590 | $ | (100,555 | ) | |||||||||||||||||||
| American International Group, Inc. |
775 | 01/19/24 | USD | 66.00 | USD | 5,251 | (179,107 | ) | ||||||||||||||||||||
| American Tower Corp. |
121 | 01/19/24 | USD | 220.00 | USD | 2,612 | (33,880 | ) | ||||||||||||||||||||
| AT&T, Inc. |
1,290 | 01/19/24 | USD | 16.00 | USD | 2,165 | (110,295 | ) | ||||||||||||||||||||
| Bank of America Corp. |
741 | 01/19/24 | USD | 28.00 | USD | 2,495 | (429,780 | ) | ||||||||||||||||||||
| Bank of America Corp. |
112 | 01/19/24 | USD | 31.00 | USD | 377 | (32,424 | ) | ||||||||||||||||||||
| Cardinal Health, Inc. |
436 | 01/19/24 | USD | 105.00 | USD | 4,395 | (19,620 | ) | ||||||||||||||||||||
| Carlyle Group, Inc. |
1,068 | 01/19/24 | USD | 31.10 | USD | 4,346 | (1,051,982 | ) | ||||||||||||||||||||
| Chevron Corp. |
83 | 01/19/24 | USD | 145.00 | USD | 1,238 | (48,555 | ) | ||||||||||||||||||||
| Citigroup, Inc. |
1,062 | 01/19/24 | USD | 42.50 | USD | 5,463 | (969,075 | ) | ||||||||||||||||||||
| Citizens Financial Group, Inc. |
1,004 | 01/19/24 | USD | 30.00 | USD | 3,327 | (331,320 | ) | ||||||||||||||||||||
| Cognizant Technology Solutions Corp., Class A |
959 | 01/19/24 | USD | 70.00 | USD | 7,243 | (565,810 | ) | ||||||||||||||||||||
| Comcast Corp., Class A |
611 | 01/19/24 | USD | 45.00 | USD | 2,679 | (20,163 | ) | ||||||||||||||||||||
| Constellation Brands, Inc., Class A |
91 | 01/19/24 | USD | 250.00 | USD | 2,200 | (26,163 | ) | ||||||||||||||||||||
| Crown Castle, Inc. |
133 | 01/19/24 | USD | 120.00 | USD | 1,532 | (9,643 | ) | ||||||||||||||||||||
| Dollar General Corp. |
375 | 01/19/24 | USD | 135.00 | USD | 5,098 | (155,625 | ) | ||||||||||||||||||||
| Elevance Health, Inc. |
109 | 01/19/24 | USD | 480.00 | USD | 5,140 | (61,040 | ) | ||||||||||||||||||||
| Eli Lilly & Co. |
29 | 01/19/24 | USD | 640.00 | USD | 1,690 | (3,886 | ) | ||||||||||||||||||||
| Enterprise Products Partners LP |
1,269 | 01/19/24 | USD | 27.51 | USD | 3,344 | (2,661 | ) | ||||||||||||||||||||
| Exelon Corp. |
556 | 01/19/24 | USD | 41.00 | USD | 1,996 | (2,780 | ) | ||||||||||||||||||||
| Fidelity National Information Services, Inc. |
855 | 01/19/24 | USD | 57.50 | USD | 5,136 | (273,600 | ) | ||||||||||||||||||||
| First American Financial Corp. |
81 | 01/19/24 | USD | 58.01 | USD | 522 | (55,166 | ) | ||||||||||||||||||||
| First Citizens BancShares, Inc., Class A |
39 | 01/19/24 | USD | 1,520.00 | USD | 5,534 | (25,545 | ) | ||||||||||||||||||||
| First Citizens BancShares, Inc., Class A |
90 | 01/19/24 | USD | 1,480.00 | USD | 12,771 | (118,350 | ) | ||||||||||||||||||||
| Fortrea Holdings, Inc. |
567 | 01/19/24 | USD | 35.00 | USD | 1,979 | (102,060 | ) | ||||||||||||||||||||
| Fox Corp., Class A |
413 | 01/19/24 | USD | 30.00 | USD | 1,225 | (20,650 | ) | ||||||||||||||||||||
| General Motors Co. |
1,815 | 01/19/24 | USD | 30.00 | USD | 6,519 | (1,102,612 | ) | ||||||||||||||||||||
| Goldman Sachs Group, Inc. |
118 | 01/19/24 | USD | 340.00 | USD | 4,552 | (563,155 | ) | ||||||||||||||||||||
| Intercontinental Exchange, Inc. |
132 | 01/19/24 | USD | 115.00 | USD | 1,695 | (182,820 | ) | ||||||||||||||||||||
| Intercontinental Exchange, Inc. |
335 | 01/19/24 | USD | 120.00 | USD | 4,302 | (288,100 | ) | ||||||||||||||||||||
| JPMorgan Chase & Co. |
29 | 01/19/24 | USD | 155.00 | USD | 493 | (44,443 | ) | ||||||||||||||||||||
| Kraft Heinz Co. |
2,294 | 01/19/24 | USD | 35.00 | USD | 8,483 | (495,504 | ) | ||||||||||||||||||||
| L3Harris Technologies, Inc. |
466 | 01/19/24 | USD | 190.00 | USD | 9,815 | (1,001,900 | ) | ||||||||||||||||||||
| Laboratory Corp. of America Holdings |
556 | 01/19/24 | USD | 213.22 | USD | 12,637 | (841,494 | ) | ||||||||||||||||||||
| Lear Corp. |
174 | 01/19/24 | USD | 140.00 | USD | 2,457 | (72,210 | ) | ||||||||||||||||||||
| Leidos Holdings, Inc. |
958 | 01/19/24 | USD | 105.00 | USD | 10,369 | (373,620 | ) | ||||||||||||||||||||
| Micron Technology, Inc. |
410 | 01/19/24 | USD | 80.00 | USD | 3,499 | (249,075 | ) | ||||||||||||||||||||
| Microsoft Corp. |
182 | 01/19/24 | USD | 375.00 | USD | 6,844 | (138,320 | ) | ||||||||||||||||||||
| Newell Brands, Inc. |
777 | 01/19/24 | USD | 8.00 | USD | 674 | (66,045 | ) | ||||||||||||||||||||
| Novo Nordisk A/S, ADR |
84 | 01/19/24 | USD | 104.00 | USD | 869 | (21,000 | ) | ||||||||||||||||||||
| PG&E Corp. |
1,563 | 01/19/24 | USD | 17.00 | USD | 2,818 | (195,375 | ) | ||||||||||||||||||||
| Raymond James Financial, Inc. |
318 | 01/19/24 | USD | 110.00 | USD | 3,546 | (101,760 | ) | ||||||||||||||||||||
| Robert Half, Inc. |
181 | 01/19/24 | USD | 77.41 | USD | 1,591 | (195,750 | ) | ||||||||||||||||||||
| Ross Stores, Inc. |
202 | 01/19/24 | USD | 135.00 | USD | 2,795 | (94,940 | ) | ||||||||||||||||||||
| Sealed Air Corp. |
593 | 01/19/24 | USD | 35.00 | USD | 2,166 | (124,530 | ) | ||||||||||||||||||||
| Sempra |
584 | 01/19/24 | USD | 75.00 | USD | 4,364 | (64,240 | ) | ||||||||||||||||||||
| SS&C Technologies Holdings, Inc. |
1,562 | 01/19/24 | USD | 56.13 | USD | 9,545 | (818,799 | ) | ||||||||||||||||||||
| Taiwan Semiconductor Manufacturing Co. Ltd. |
122 | 01/19/24 | USD | 105.00 | USD | 1,269 | (33,367 | ) | ||||||||||||||||||||
| Unilever PLC, ADR |
1,854 | 01/19/24 | USD | 50.00 | USD | 8,988 | (23,175 | ) | ||||||||||||||||||||
| Union Pacific Corp. |
102 | 01/19/24 | USD | 220.00 | USD | 2,505 | (267,750 | ) | ||||||||||||||||||||
| Union Pacific Corp. |
26 | 01/19/24 | USD | 235.00 | USD | 639 | (31,850 | ) | ||||||||||||||||||||
| Verizon Communications, Inc. |
1,731 | 01/19/24 | USD | 36.00 | USD | 6,526 | (307,252 | ) | ||||||||||||||||||||
| Visa, Inc., Class A |
335 | 01/19/24 | USD | 255.00 | USD | 8,722 | (261,300 | ) | ||||||||||||||||||||
| Wells Fargo & Co. |
2,281 | 01/19/24 | USD | 42.50 | USD | 11,227 | (1,585,295 | ) | ||||||||||||||||||||
| Willis Towers Watson PLC |
182 | 01/19/24 | USD | 250.00 | USD | 4,390 | (17,745 | ) | ||||||||||||||||||||
| Cencora, Inc. |
129 | 01/25/24 | USD | 204.00 | USD | 2,649 | (59,040 | ) | ||||||||||||||||||||
| American International Group, Inc. |
732 | 01/26/24 | USD | 66.00 | USD | 4,959 | (192,150 | ) | ||||||||||||||||||||
| American International Group, Inc. |
459 | 01/26/24 | USD | 68.00 | USD | 3,110 | (60,817 | ) | ||||||||||||||||||||
| AT&T, Inc. |
1,307 | 01/26/24 | USD | 17.00 | USD | 2,193 | (41,824 | ) | ||||||||||||||||||||
| Baxter International, Inc. |
678 | 01/26/24 | USD | 39.00 | USD | 2,621 | (62,715 | ) | ||||||||||||||||||||
| Cardinal Health, Inc. |
502 | 01/26/24 | USD | 108.00 | USD | 5,060 | (11,295 | ) | ||||||||||||||||||||
| Chevron Corp. |
83 | 01/26/24 | USD | 145.00 | USD | 1,238 | (53,328 | ) | ||||||||||||||||||||
| 58 | 2 0 2 3 B L A C K R O C K A N N U A L R E P O R T T O S H A R E H O L D E R S |
| Consolidated Schedule of Investments (continued) December 31, 2023 |
BlackRock Enhanced Equity Dividend Trust (BDJ) |
Exchange-Traded Options Written (continued)
| Description | Number of Contracts |
Expiration Date |
Exercise Price | Notional Amount (000) |
Value | |||||||||||||||||||||||
| Call (continued) |
||||||||||||||||||||||||||||
| Cigna Group |
89 | 01/26/24 | USD | 310.00 | USD | 2,665 | $ | (32,040 | ) | |||||||||||||||||||
| Cisco Systems, Inc. |
1,076 | 01/26/24 | USD | 51.00 | USD | 5,436 | (51,648 | ) | ||||||||||||||||||||
| Citigroup, Inc. |
897 | 01/26/24 | USD | 45.75 | USD | 4,614 | (532,578 | ) | ||||||||||||||||||||
| Comcast Corp., Class A |
637 | 01/26/24 | USD | 44.00 | USD | 2,793 | (75,484 | ) | ||||||||||||||||||||
| Eli Lilly & Co. |
31 | 01/26/24 | USD | 595.00 | USD | 1,807 | (36,580 | ) | ||||||||||||||||||||
| Enterprise Products Partners LP |
1,268 | 01/26/24 | USD | 26.27 | USD | 3,341 | (63,955 | ) | ||||||||||||||||||||
| Fortive Corp. |
56 | 01/26/24 | USD | 68.25 | USD | 412 | (33,382 | ) | ||||||||||||||||||||
| Fox Corp., Class A |
1,264 | 01/26/24 | USD | 31.00 | USD | 3,750 | (31,600 | ) | ||||||||||||||||||||
| Intel Corp. |
225 | 01/26/24 | USD | 49.00 | USD | 1,131 | (67,837 | ) | ||||||||||||||||||||
| JPMorgan Chase & Co. |
240 | 01/26/24 | USD | 165.00 | USD | 4,082 | (157,800 | ) | ||||||||||||||||||||
| Medtronic PLC |
284 | 01/26/24 | USD | 85.00 | USD | 2,340 | (16,330 | ) | ||||||||||||||||||||
| Medtronic PLC |
99 | 01/26/24 | USD | 83.34 | USD | 816 | (11,633 | ) | ||||||||||||||||||||
| Micron Technology, Inc. |
548 | 01/26/24 | USD | 87.00 | USD | 4,677 | (104,942 | ) | ||||||||||||||||||||
| Microsoft Corp. |
16 | 01/26/24 | USD | 385.00 | USD | 602 | (10,760 | ) | ||||||||||||||||||||
| PG&E Corp. |
755 | 01/26/24 | USD | 17.50 | USD | 1,361 | (64,930 | ) | ||||||||||||||||||||
| Suncor Energy, Inc. |
634 | 01/26/24 | USD | 32.00 | USD | 2,031 | (63,400 | ) | ||||||||||||||||||||
| Visa, Inc., Class A |
92 | 01/26/24 | USD | 260.00 | USD | 2,395 | (54,280 | ) | ||||||||||||||||||||
| Walt Disney Co. |
104 | 01/26/24 | USD | 96.00 | USD | 939 | (6,136 | ) | ||||||||||||||||||||
| Newell Brands, Inc. |
1,107 | 01/31/24 | USD | 9.50 | USD | 961 | (25,995 | ) | ||||||||||||||||||||
| Comcast Corp., Class A |
1,249 | 02/02/24 | USD | 46.05 | USD | 5,477 | (56,063 | ) | ||||||||||||||||||||
| Intel Corp. |
225 | 02/02/24 | USD | 51.00 | USD | 1,131 | (52,313 | ) | ||||||||||||||||||||
| Kraft Heinz Co. |
1,822 | 02/02/24 | USD | 37.00 | USD | 6,738 | (152,137 | ) | ||||||||||||||||||||
| Medtronic PLC |
522 | 02/02/24 | USD | 83.05 | USD | 4,300 | (85,638 | ) | ||||||||||||||||||||
| Micron Technology, Inc. |
547 | 02/02/24 | USD | 87.00 | USD | 4,668 | (130,459 | ) | ||||||||||||||||||||
| PG&E Corp. |
805 | 02/02/24 | USD | 18.00 | USD | 1,451 | (45,885 | ) | ||||||||||||||||||||
| Visa, Inc., Class A |
13 | 02/02/24 | USD | 260.68 | USD | 338 | (8,345 | ) | ||||||||||||||||||||
| Newell Brands, Inc. |
1,106 | 02/07/24 | USD | 9.75 | USD | 960 | (25,147 | ) | ||||||||||||||||||||
| Comcast Corp., Class A |
374 | 02/09/24 | USD | 44.00 | USD | 1,640 | (54,230 | ) | ||||||||||||||||||||
| Medtronic PLC |
317 | 02/09/24 | USD | 83.34 | USD | 2,611 | (54,376 | ) | ||||||||||||||||||||
| Micron Technology, Inc. |
274 | 02/09/24 | USD | 87.00 | USD | 2,338 | (76,035 | ) | ||||||||||||||||||||
| American Electric Power Co., Inc. |
793 | 02/16/24 | USD | 82.50 | USD | 6,441 | (136,792 | ) | ||||||||||||||||||||
| American International Group, Inc. |
1,169 | 02/16/24 | USD | 67.50 | USD | 7,920 | (289,327 | ) | ||||||||||||||||||||
| Bank of America Corp. |
878 | 02/16/24 | USD | 34.00 | USD | 2,956 | (100,092 | ) | ||||||||||||||||||||
| Baxter International, Inc. |
1,186 | 02/16/24 | USD | 40.00 | USD | 4,585 | (148,250 | ) | ||||||||||||||||||||
| British American Tobacco PLC, ADR |
1,031 | 02/16/24 | USD | 29.44 | USD | 3,020 | (91,141 | ) | ||||||||||||||||||||
| Carlyle Group, Inc. |
1,210 | 02/16/24 | USD | 35.50 | USD | 4,923 | (830,445 | ) | ||||||||||||||||||||
| Cencora, Inc. |
39 | 02/16/24 | USD | 204.00 | USD | 801 | (26,005 | ) | ||||||||||||||||||||
| Citigroup, Inc. |
518 | 02/16/24 | USD | 48.00 | USD | 2,665 | (213,675 | ) | ||||||||||||||||||||
| Cognizant Technology Solutions Corp., Class A |
595 | 02/16/24 | USD | 77.50 | USD | 4,494 | (116,025 | ) | ||||||||||||||||||||
| CVS Health Corp. |
195 | 02/16/24 | USD | 75.00 | USD | 1,540 | (100,912 | ) | ||||||||||||||||||||
| Dollar General Corp. |
260 | 02/16/24 | USD | 130.00 | USD | 3,535 | (256,100 | ) | ||||||||||||||||||||
| Enterprise Products Partners LP |
1,887 | 02/16/24 | USD | 26.14 | USD | 4,972 | (86,525 | ) | ||||||||||||||||||||
| Exelon Corp. |
300 | 02/16/24 | USD | 40.50 | USD | 1,077 | (3,070 | ) | ||||||||||||||||||||
| Exelon Corp. |
558 | 02/16/24 | USD | 37.00 | USD | 2,003 | (39,060 | ) | ||||||||||||||||||||
| Fidelity National Financial, Inc., Class A |
1,777 | 02/16/24 | USD | 47.79 | USD | 9,066 | (716,053 | ) | ||||||||||||||||||||
| Fidelity National Information Services, Inc. |
1,446 | 02/16/24 | USD | 62.50 | USD | 8,686 | (278,355 | ) | ||||||||||||||||||||
| First American Financial Corp. |
82 | 02/16/24 | USD | 65.00 | USD | 528 | (19,065 | ) | ||||||||||||||||||||
| Fortive Corp. |
355 | 02/16/24 | USD | 69.93 | USD | 2,614 | (183,780 | ) | ||||||||||||||||||||
| Fortrea Holdings, Inc. |
569 | 02/16/24 | USD | 32.50 | USD | 1,986 | (207,685 | ) | ||||||||||||||||||||
| General Motors Co. |
605 | 02/16/24 | USD | 34.00 | USD | 2,173 | (178,475 | ) | ||||||||||||||||||||
| Humana, Inc. |
63 | 02/16/24 | USD | 505.00 | USD | 2,884 | (27,405 | ) | ||||||||||||||||||||
| International Flavors & Fragrances, Inc. |
702 | 02/16/24 | USD | 82.50 | USD | 5,684 | (221,130 | ) | ||||||||||||||||||||
| L3Harris Technologies, Inc. |
526 | 02/16/24 | USD | 200.00 | USD | 11,079 | (762,700 | ) | ||||||||||||||||||||
| Laboratory Corp. of America Holdings |
190 | 02/16/24 | USD | 220.00 | USD | 4,319 | (228,950 | ) | ||||||||||||||||||||
| Leidos Holdings, Inc. |
1,031 | 02/16/24 | USD | 110.00 | USD | 11,160 | (306,722 | ) | ||||||||||||||||||||
| Medtronic PLC |
317 | 02/16/24 | USD | 85.00 | USD | 2,611 | (36,138 | ) | ||||||||||||||||||||
| Microsoft Corp. |
107 | 02/16/24 | USD | 400.00 | USD | 4,024 | (58,048 | ) | ||||||||||||||||||||
| Ralph Lauren Corp., Class A |
99 | 02/16/24 | USD | 150.00 | USD | 1,428 | (40,095 | ) | ||||||||||||||||||||
| Raymond James Financial, Inc. |
487 | 02/16/24 | USD | 110.00 | USD | 5,430 | (248,370 | ) | ||||||||||||||||||||
| Robert Half, Inc. |
181 | 02/16/24 | USD | 84.25 | USD | 1,591 | (111,588 | ) | ||||||||||||||||||||
| Rogers Communications, Inc., Class B |
459 | 02/16/24 | CAD | 64.00 | CAD | 2,847 | (37,931 | ) | ||||||||||||||||||||
| Sempra |
586 | 02/16/24 | USD | 76.48 | USD | 4,379 | (80,387 | ) | ||||||||||||||||||||
| S C H E D U L E O F I N V E S T M E N T S |
59 |
| Consolidated Schedule of Investments (continued) December 31, 2023 |
BlackRock Enhanced Equity Dividend Trust (BDJ) |
Exchange-Traded Options Written (continued)
| Description | Number of Contracts |
Expiration Date |
Exercise Price | Notional Amount (000) |
Value | |||||||||||||||||||||||
| Call (continued) |
||||||||||||||||||||||||||||
| SS&C Technologies Holdings, Inc. |
1,655 | 02/16/24 | USD | 58.00 | USD | 10,114 | $ | (702,874 | ) | |||||||||||||||||||
| Suncor Energy, Inc. |
648 | 02/16/24 | USD | 34.00 | USD | 2,076 | (42,120 | ) | ||||||||||||||||||||
| Unilever PLC, ADR |
1,505 | 02/16/24 | USD | 50.00 | USD | 7,296 | (90,300 | ) | ||||||||||||||||||||
| Wells Fargo & Co. |
2,114 | 02/16/24 | USD | 45.00 | USD | 10,405 | (1,009,435 | ) | ||||||||||||||||||||
| Ralph Lauren Corp., Class A |
187 | 02/26/24 | USD | 136.00 | USD | 2,697 | (235,492 | ) | ||||||||||||||||||||
| Equitable Holdings, Inc. |
626 | 02/28/24 | USD | 32.90 | USD | 2,085 | (111,455 | ) | ||||||||||||||||||||
| British American Tobacco PLC, ADR |
1,032 | 03/15/24 | USD | 30.00 | USD | 3,023 | (87,720 | ) | ||||||||||||||||||||
| Citigroup, Inc. |
673 | 03/15/24 | USD | 52.50 | USD | 3,462 | (126,860 | ) | ||||||||||||||||||||
| Enterprise Products Partners LP |
1,115 | 03/15/24 | USD | 27.00 | USD | 2,938 | (30,105 | ) | ||||||||||||||||||||
| Fidelity National Financial, Inc., Class A |
953 | 03/15/24 | USD | 47.31 | USD | 4,862 | (563,523 | ) | ||||||||||||||||||||
| General Motors Co. |
1,654 | 03/15/24 | USD | 36.00 | USD | 5,941 | (337,416 | ) | ||||||||||||||||||||
| Medtronic PLC |
522 | 03/15/24 | USD | 85.00 | USD | 4,300 | (105,966 | ) | ||||||||||||||||||||
| Micron Technology, Inc. |
274 | 03/15/24 | USD | 87.50 | USD | 2,338 | (112,340 | ) | ||||||||||||||||||||
| Rogers Communications, Inc., Class B |
380 | 03/15/24 | CAD | 64.00 | CAD | 2,357 | (43,304 | ) | ||||||||||||||||||||
|
|
|
|||||||||||||||||||||||||||
| $ | (31,429,198 | ) | ||||||||||||||||||||||||||
|
|
|
|||||||||||||||||||||||||||
OTC Options Written
| Description | Counterparty | Number of Contracts |
Expiration Date |
Exercise Price | Notional Amount (000) |
Value | ||||||||||||||||||||||||
| Call |
||||||||||||||||||||||||||||||
| Verizon Communications, Inc. |
Citibank N.A. | 66,500 | 01/03/24 | USD | 37.53 | USD | 2,507 | $ | (25,826 | ) | ||||||||||||||||||||
| Citizens Financial Group, Inc. |
Citibank N.A. | 33,200 | 01/04/24 | USD | 28.31 | USD | 1,100 | (161,538 | ) | |||||||||||||||||||||
| Prudential PLC |
Bank of America N.A. | 96,800 | 01/09/24 | GBP | 9.14 | GBP | 857 | (8,277 | ) | |||||||||||||||||||||
| Bayer AG, Registered Shares |
Morgan Stanley & Co. International PLC | 135,700 | 01/10/24 | EUR | 42.74 | EUR | 4,561 | (84 | ) | |||||||||||||||||||||
| Citizens Financial Group, Inc. |
Citibank N.A. | 33,700 | 01/10/24 | USD | 29.03 | USD | 1,117 | (140,281 | ) | |||||||||||||||||||||
| Koninklijke Philips NV |
Morgan Stanley & Co. International PLC | 130,500 | 01/10/24 | EUR | 19.04 | EUR | 2,766 | (300,018 | ) | |||||||||||||||||||||
| Panasonic Holdings Corp. |
BNP Paribas SA | 217,100 | 01/10/24 | JPY | 1,479.86 | JPY | 301,445 | (15,583 | ) | |||||||||||||||||||||
| Verizon Communications, Inc. |
Citibank N.A. | 66,600 | 01/10/24 | USD | 37.53 | USD | 2,511 | (16,532 | ) | |||||||||||||||||||||
| BP PLC |
UBS AG | 2,182,700 | 01/11/24 | GBP | 4.92 | GBP | 10,151 | (22,424 | ) | |||||||||||||||||||||
| Henkel AG & Co. KGaA, Preference Shares |
Morgan Stanley & Co. International PLC | 13,900 | 01/11/24 | EUR | 72.36 | EUR | 1,013 | (15,743 | ) | |||||||||||||||||||||
| Komatsu Ltd. |
Societe Generale | 18,400 | 01/11/24 | JPY | 3,785.05 | JPY | 67,515 | (4,089 | ) | |||||||||||||||||||||
| Komatsu Ltd. |
UBS AG | 42,300 | 01/11/24 | JPY | 3,861.20 | JPY | 155,211 | (5,987 | ) | |||||||||||||||||||||
| NextEra Energy, Inc. |
Barclays Bank PLC | 22,100 | 01/11/24 | USD | 57.37 | USD | 1,342 | (82,938 | ) | |||||||||||||||||||||
| Komatsu Ltd. |
UBS AG | 60,700 | 01/17/24 | JPY | 3,880.13 | JPY | 222,726 | (11,837 | ) | |||||||||||||||||||||
| Shell PLC |
Goldman Sachs International | 276,700 | 01/17/24 | GBP | 26.49 | GBP | 7,106 | (49,681 | ) | |||||||||||||||||||||
| Henkel AG & Co. KGaA, Preference Shares |
Morgan Stanley & Co. International PLC | 13,900 | 01/18/24 | EUR | 72.35 | EUR | 1,013 | (18,704 | ) | |||||||||||||||||||||
| Sanofi SA |
Morgan Stanley & Co. International PLC | 99,900 | 01/18/24 | EUR | 87.55 | EUR | 8,993 | (316,286 | ) | |||||||||||||||||||||
| Sony Group Corp. |
Bank of America N.A. | 24,300 | 01/18/24 | JPY | 13,535.12 | JPY | 324,241 | (46,206 | ) | |||||||||||||||||||||
| Public Service Enterprise Group, Inc. |
JPMorgan Chase Bank N.A. | 5,900 | 01/22/24 | USD | 64.49 | USD | 361 | (1,086 | ) | |||||||||||||||||||||
| AstraZeneca PLC |
Goldman Sachs International | 52,300 | 01/23/24 | GBP | 103.39 | GBP | 5,535 | (269,602 | ) | |||||||||||||||||||||
| Koninklijke Philips NV |
Goldman Sachs International | 217,800 | 01/23/24 | EUR | 19.22 | EUR | 4,617 | (484,300 | ) | |||||||||||||||||||||
| Panasonic Holdings Corp. |
Bank of America N.A. | 261,500 | 01/23/24 | JPY | 1,596.90 | JPY | 363,095 | (11,921 | ) | |||||||||||||||||||||
| Sanofi SA |
Morgan Stanley & Co. International PLC | 57,900 | 01/23/24 | EUR | 89.72 | EUR | 5,212 | (107,975 | ) | |||||||||||||||||||||
| Siemens AG, Registered Shares |
UBS AG | 19,900 | 01/23/24 | EUR | 163.50 | EUR | 3,382 | (177,910 | ) | |||||||||||||||||||||
| Shell PLC |
Goldman Sachs International | 356,700 | 01/24/24 | GBP | 25.83 | GBP | 9,160 | (221,123 | ) | |||||||||||||||||||||
| Prudential PLC |
Goldman Sachs International | 96,800 | 01/25/24 | GBP | 9.12 | GBP | 857 | (20,415 | ) | |||||||||||||||||||||
| UBS Group AG, Registered Shares |
Goldman Sachs International | 87,800 | 01/26/24 | CHF | 25.58 | CHF | 2,294 | (99,424 | ) | |||||||||||||||||||||
| BP PLC |
Morgan Stanley & Co. International PLC | 732,200 | 01/30/24 | GBP | 4.87 | GBP | 3,405 | (47,757 | ) | |||||||||||||||||||||
| Equitable Holdings, Inc. |
Bank of America N.A. | 62,400 | 01/30/24 | USD | 30.15 | USD | 2,078 | (215,838 | ) | |||||||||||||||||||||
| Prudential PLC |
Morgan Stanley & Co. International PLC | 222,200 | 01/30/24 | GBP | 9.04 | GBP | 1,967 | (64,732 | ) | |||||||||||||||||||||
| Shell PLC |
Morgan Stanley & Co. International PLC | 90,800 | 01/30/24 | GBP | 26.54 | GBP | 2,332 | (31,982 | ) | |||||||||||||||||||||
| Sony Group Corp. |
Bank of America N.A. | 44,200 | 01/30/24 | JPY | 13,438.59 | JPY | 589,771 | (123,148 | ) | |||||||||||||||||||||
| Cencora, Inc. |
Citibank N.A. | 7,400 | 01/31/24 | USD | 201.54 | USD | 1,520 | (51,186 | ) | |||||||||||||||||||||
| Public Service Enterprise Group, Inc. |
JPMorgan Chase Bank N.A. | 57,700 | 01/31/24 | USD | 63.86 | USD | 3,528 | (21,632 | ) | |||||||||||||||||||||
| Willis Towers Watson PLC |
Morgan Stanley & Co. International PLC | 47,000 | 01/31/24 | USD | 243.57 | USD | 11,336 | (301,828 | ) | |||||||||||||||||||||
| Bayer AG, Registered Shares |
Goldman Sachs International | 75,900 | 02/01/24 | EUR | 33.49 | EUR | 2,551 | (101,774 | ) | |||||||||||||||||||||
| Koninklijke Philips NV |
Goldman Sachs International | 108,500 | 02/01/24 | EUR | 18.88 | EUR | 2,300 | (288,155 | ) | |||||||||||||||||||||
| Panasonic Holdings Corp. |
BNP Paribas SA | 116,200 | 02/01/24 | JPY | 1,496.41 | JPY | 161,345 | (16,747 | ) | |||||||||||||||||||||
| Panasonic Holdings Corp. |
Societe Generale | 53,800 | 02/01/24 | JPY | 1,432.55 | JPY | 74,702 | (14,370 | ) | |||||||||||||||||||||
| NextEra Energy, Inc. |
Barclays Bank PLC | 22,100 | 02/02/24 | USD | 57.94 | USD | 1,342 | (90,525 | ) | |||||||||||||||||||||
| 60 | 2 0 2 3 B L A C K R O C K A N N U A L R E P O R T T O S H A R E H O L D E R S |
| Consolidated Schedule of Investments (continued) December 31, 2023 |
BlackRock Enhanced Equity Dividend Trust (BDJ) |
OTC Options Written (continued)
| Description | Counterparty | Number of Contracts |
Expiration Date |
Exercise Price | Notional Amount (000) |
Value | ||||||||||||||||||||||||
| Call (continued) |
||||||||||||||||||||||||||||||
| Sealed Air Corp. |
Goldman Sachs International | 61,300 | 02/02/24 | USD | 34.98 | USD | 2,239 | $ | (161,831 | ) | ||||||||||||||||||||
| Crown Castle, Inc. |
JPMorgan Chase Bank N.A. | 19,800 | 02/05/24 | USD | 117.74 | USD | 2,281 | (52,882 | ) | |||||||||||||||||||||
| BP PLC |
Bank of America N.A. | 296,000 | 02/08/24 | GBP | 4.68 | GBP | 1,377 | (54,621 | ) | |||||||||||||||||||||
| Sealed Air Corp. |
Citibank N.A. | 92,500 | 02/13/24 | USD | 35.44 | USD | 3,378 | (253,970 | ) | |||||||||||||||||||||
| Sealed Air Corp. |
UBS AG | 62,200 | 02/20/24 | USD | 33.27 | USD | 2,272 | (275,394 | ) | |||||||||||||||||||||
| Crown Castle, Inc. |
JPMorgan Chase Bank N.A. | 11,600 | 02/26/24 | USD | 113.50 | USD | 1,336 | (69,161 | ) | |||||||||||||||||||||
| Citizens Financial Group, Inc. |
Citibank N.A. | 26,500 | 02/27/24 | USD | 33.33 | USD | 878 | (45,383 | ) | |||||||||||||||||||||
| UBS Group AG, Registered Shares |
Goldman Sachs International | 87,800 | 02/27/24 | CHF | 25.70 | CHF | 2,294 | (139,724 | ) | |||||||||||||||||||||
|
|
|
|||||||||||||||||||||||||||||
| $ | (5,058,430 | ) | ||||||||||||||||||||||||||||
|
|
|
|||||||||||||||||||||||||||||
Balances Reported in the Consolidated Statements of Assets and Liabilities for Options Written
| Description | Swap Premiums Paid |
Swap Premiums Received |
Unrealized Appreciation |
Unrealized Depreciation |
Value | |||||||||||||||
| Options Written |
$ | N/A | $ | N/A | $ | 3,457,080 | $ | (19,331,182 | ) | $ | (36,487,628 | ) | ||||||||
Derivative Financial Instruments Categorized by Risk Exposure
As of period end, the fair values of derivative financial instruments located in the Consolidated Statements of Assets and Liabilities were as follows:
| Commodity Contracts |
Credit Contracts |
Equity Contracts |
Foreign Currency Exchange Contracts |
Interest Rate Contracts |
Other Contracts |
Total | ||||||||||||||||||||||
| Liabilities — Derivative Financial Instruments |
||||||||||||||||||||||||||||
| Options written |
||||||||||||||||||||||||||||
| Options written at value |
$ | — | $ | — | $ | 36,487,628 | $ | — | $ | — | $ | — | $ | 36,487,628 | ||||||||||||||
|
|
|
|
|
|
|
|
|
|
|
|
|
|
|
|||||||||||||||
For the period ended December 31, 2023, the effect of derivative financial instruments in the Consolidated Statements of Operations was as follows:
| Commodity Contracts |
Credit Contracts |
Equity Contracts |
Foreign Currency Exchange Contracts |
Interest Rate Contracts |
Other Contracts |
Total | ||||||||||||||||||||||
| Net Realized Gain (Loss) from: |
||||||||||||||||||||||||||||
| Options purchased(a) |
$ | — | $ | — | $ | (8,293,785 | ) | $ | — | $ | — | $ | — | $ | (8,293,785 | ) | ||||||||||||
| Options written |
— | — | (6,887,226 | ) | — | — | — | (6,887,226 | ) | |||||||||||||||||||
|
|
|
|
|
|
|
|
|
|
|
|
|
|
|
|||||||||||||||
| $ | — | $ | — | $ | (15,181,011 | ) | $ | — | $ | — | $ | — | $ | (15,181,011 | ) | |||||||||||||
|
|
|
|
|
|
|
|
|
|
|
|
|
|
|
|||||||||||||||
| Net Change in Unrealized Appreciation (Depreciation) on: |
||||||||||||||||||||||||||||
| Options written |
$ | — | $ | — | $ | (23,815,466 | ) | $ | — | $ | — | $ | — | $ | (23,815,466 | ) | ||||||||||||
|
|
|
|
|
|
|
|
|
|
|
|
|
|
|
|||||||||||||||
| (a) | Options purchased are included in net realized gain (loss) from investments — unaffiliated. |
Average Quarterly Balances of Outstanding Derivative Financial Instruments
| Options: |
||||
| Average value of option contracts purchased |
$ | — | (a) | |
| Average value of option contracts written |
$ | 24,853,085 |
| (a) | Derivative financial instrument not held at any quarter-end. The risk exposure table serves as an indicator of activity during the period. |
For more information about the Trust’s investment risks regarding derivative financial instruments, refer to the Notes to Consolidated Financial Statements.
| S C H E D U L E O F I N V E S T M E N T S |
61 |
| Consolidated Schedule of Investments (continued) December 31, 2023 |
BlackRock Enhanced Equity Dividend Trust (BDJ) |
Derivative Financial Instruments — Offsetting as of Period End
The Trust’s derivative assets and liabilities (by type) were as follows:
| Assets | Liabilities | |||||||
| Derivative Financial Instruments |
||||||||
| Options |
$ | — | $ | 36,487,628 | ||||
|
|
|
|
|
|||||
| Total derivative assets and liabilities in the Consolidated Statements of Assets and Liabilities |
— | 36,487,628 | ||||||
|
|
|
|
|
|||||
| Derivatives not subject to a Master Netting Agreement or similar agreement (“MNA”) |
— | (31,429,198 | ) | |||||
|
|
|
|
|
|||||
| Total derivative assets and liabilities subject to an MNA |
$ | — | $ | 5,058,430 | ||||
|
|
|
|
|
|||||
The following table presents the Trust’s derivative liabilities by counterparty net of amounts available for offset under an MNA and net of the related collateral pledged by the Trust:
| Counterparty | |
Derivative Liabilities Subject to an MNA by Counterparty |
|
|
Derivatives Available for Offset |
|
|
Non-Cash Collateral Pledged |
(a) |
|
Cash Collateral Pledged |
|
|
Net Amount of Derivative Liabilities |
(b) | |||||
| Bank of America N.A. |
$ | 460,011 | $ | — | $ | (460,011 | ) | $ | — | $ | — | |||||||||
| Barclays Bank PLC |
173,463 | — | (170,839 | ) | — | 2,624 | ||||||||||||||
| BNP Paribas SA |
32,330 | — | (32,330 | ) | — | — | ||||||||||||||
| Citibank N.A. |
694,716 | — | (694,716 | ) | — | — | ||||||||||||||
| Goldman Sachs International |
1,836,029 | — | (1,836,029 | ) | — | — | ||||||||||||||
| JPMorgan Chase Bank N.A. |
144,761 | — | (144,761 | ) | — | — | ||||||||||||||
| Morgan Stanley & Co. International PLC |
1,205,109 | — | (1,205,109 | ) | — | — | ||||||||||||||
| Societe Generale |
18,459 | — | (18,459 | ) | — | — | ||||||||||||||
| UBS AG |
493,552 | — | (493,552 | ) | — | — | ||||||||||||||
|
|
|
|
|
|
|
|
|
|
|
|||||||||||
| $ | 5,058,430 | $ | — | $ | (5,055,806 | ) | $ | — | $ | 2,624 | ||||||||||
|
|
|
|
|
|
|
|
|
|
|
|||||||||||
| (a) | Excess of collateral received/pledged, if any, from the individual counterparty is not shown for financial reporting purposes. |
| (b) | Net amount represents the net amount payable due to counterparty in the event of default. Net amount may be offset further by the options written receivable/payable on the Consolidated Statements of Assets and Liabilities. |
Fair Value Hierarchy as of Period End
Various inputs are used in determining the fair value of financial instruments. For a description of the input levels and information about the Trust’s policy regarding valuation of financial instruments, refer to the Notes to Consolidated Financial Statements.
The following table summarizes the Trust’s financial instruments categorized in the fair value hierarchy. The breakdown of the Trust’s financial instruments into major categories is disclosed in the Consolidated Schedule of Investments above.
| Level 1 | Level 2 | Level 3 | Total | |||||||||||||||||||||||||
| Assets |
||||||||||||||||||||||||||||
| Investments |
||||||||||||||||||||||||||||
| Long-Term Investments |
||||||||||||||||||||||||||||
| Common Stocks |
||||||||||||||||||||||||||||
| Aerospace & Defense |
$ | 60,661,812 | $ | — | $ | — | $ | 60,661,812 | ||||||||||||||||||||
| Automobile Components |
6,749,838 | — | — | 6,749,838 | ||||||||||||||||||||||||
| Automobiles |
36,590,519 | — | — | 36,590,519 | ||||||||||||||||||||||||
| Banks |
180,500,044 | — | — | 180,500,044 | ||||||||||||||||||||||||
| Beverages |
14,398,667 | — | — | 14,398,667 | ||||||||||||||||||||||||
| Building Products |
13,259,375 | — | — | 13,259,375 | ||||||||||||||||||||||||
| Capital Markets |
57,197,100 | 9,917,335 | — | 67,114,435 | ||||||||||||||||||||||||
| Chemicals |
10,325,294 | — | — | 10,325,294 | ||||||||||||||||||||||||
| Communications Equipment |
31,957,436 | — | — | 31,957,436 | ||||||||||||||||||||||||
| Consumer Finance |
8,806,853 | — | — | 8,806,853 | ||||||||||||||||||||||||
| Consumer Staples Distribution & Retail |
32,284,862 | — | — | 32,284,862 | ||||||||||||||||||||||||
| Containers & Packaging |
25,137,885 | — | — | 25,137,885 | ||||||||||||||||||||||||
| Diversified Telecommunication Services |
38,692,336 | — | — | 38,692,336 | ||||||||||||||||||||||||
| Electric Utilities |
46,121,835 | — | — | 46,121,835 | ||||||||||||||||||||||||
| Entertainment |
1,717,316 | — | — | 1,717,316 | ||||||||||||||||||||||||
| Financial Services |
67,174,030 | — | 15,830,106 | 83,004,136 | ||||||||||||||||||||||||
| Food Products |
39,932,261 | — | — | 39,932,261 | ||||||||||||||||||||||||
| 62 | 2 0 2 3 B L A C K R O C K A N N U A L R E P O R T T O S H A R E H O L D E R S |
| Consolidated Schedule of Investments (continued) December 31, 2023 |
BlackRock Enhanced Equity Dividend Trust (BDJ) |
Fair Value Hierarchy as of Period End (continued)
| Level 1 | Level 2 | Level 3 | Total | |||||||||||||||||||||||||
| Common Stocks (continued) |
||||||||||||||||||||||||||||
| Ground Transportation |
$ | 9,206,083 | $ | — | $ | — | $ | 9,206,083 | ||||||||||||||||||||
| Health Care Equipment & Supplies |
62,998,396 | 19,433,561 | — | 82,431,957 | ||||||||||||||||||||||||
| Health Care Providers & Services |
131,873,300 | — | — | 131,873,300 | ||||||||||||||||||||||||
| Household Durables |
6,489,810 | 28,609,303 | — | 35,099,113 | ||||||||||||||||||||||||
| Industrial Conglomerates |
— | 6,784,327 | — | 6,784,327 | ||||||||||||||||||||||||
| Insurance |
103,523,187 | 6,505,990 | — | 110,029,177 | ||||||||||||||||||||||||
| IT Services |
21,342,361 | — | — | 21,342,361 | ||||||||||||||||||||||||
| Leisure Products |
5,241,820 | — | — | 5,241,820 | ||||||||||||||||||||||||
| Life Sciences Tools & Services |
11,502,160 | — | — | 11,502,160 | ||||||||||||||||||||||||
| Machinery |
15,422,311 | 5,743,351 | — | 21,165,662 | ||||||||||||||||||||||||
| Media |
44,253,954 | — | — | 44,253,954 | ||||||||||||||||||||||||
| Multi-Utilities |
22,988,497 | — | — | 22,988,497 | ||||||||||||||||||||||||
| Oil, Gas & Consumable Fuels |
52,875,592 | 77,704,638 | 10,716,626 | 141,296,856 | ||||||||||||||||||||||||
| Personal Care Products |
29,608,578 | — | — | 29,608,578 | ||||||||||||||||||||||||
| Pharmaceuticals |
22,736,208 | 55,604,327 | — | 78,340,535 | ||||||||||||||||||||||||
| Professional Services |
80,686,569 | — | — | 80,686,569 | ||||||||||||||||||||||||
| Semiconductors & Semiconductor Equipment |
47,601,834 | — | — | 47,601,834 | ||||||||||||||||||||||||
| Software |
21,511,744 | — | — | 21,511,744 | ||||||||||||||||||||||||
| Specialized REITs |
14,143,958 | — | — | 14,143,958 | ||||||||||||||||||||||||
| Specialty Retail |
12,209,458 | — | — | 12,209,458 | ||||||||||||||||||||||||
| Textiles, Apparel & Luxury Goods |
9,287,282 | — | — | 9,287,282 | ||||||||||||||||||||||||
| Tobacco |
22,940,690 | — | — | 22,940,690 | ||||||||||||||||||||||||
| Wireless Telecommunication Services |
7,141,935 | — | — | 7,141,935 | ||||||||||||||||||||||||
| Preferred Securities |
||||||||||||||||||||||||||||
| Preferred Stocks |
— | 8,572,705 | — | 8,572,705 | ||||||||||||||||||||||||
| Short-Term Securities |
||||||||||||||||||||||||||||
| Money Market Funds |
5,204,534 | — | — | 5,204,534 | ||||||||||||||||||||||||
|
|
|
|
|
|
|
|
|
|||||||||||||||||||||
| $ | 1,432,297,724 | $ | 218,875,537 | $ | 26,546,732 | $ | 1,677,719,993 | |||||||||||||||||||||
|
|
|
|
|
|
|
|
|
|||||||||||||||||||||
| Derivative Financial Instruments(a) |
||||||||||||||||||||||||||||
| Liabilities |
||||||||||||||||||||||||||||
| Equity Contracts |
$ | (23,585,749 | ) | $ | (12,901,879 | ) | $ | — | $ | (36,487,628 | ) | |||||||||||||||||
|
|
|
|
|
|
|
|
|
|||||||||||||||||||||
| (a) | Derivative financial instruments are options written. Options written are shown at value. |
A reconciliation of Level 3 financial instruments is presented when the Trust had a significant amount of Level 3 investments and derivative financial instruments at the beginning and/or end of the year in relation to net assets. The following table is a reconciliation of Level 3 investments for which significant unobservable inputs were used in determining fair value:
|
|
||||
| Common Stocks |
||||
|
|
||||
| Assets |
||||
| Opening balance, as of December 31, 2022 |
$ | 11,435,463 | ||
| Transfers into Level 3 |
— | |||
| Transfers out of Level 3 |
— | |||
| Accrued discounts/premiums |
— | |||
| Net realized gain (loss) |
(106,982 | ) | ||
| Net change in unrealized appreciation (depreciation)(a)(b) |
(813,619 | ) | ||
| Purchases |
21,332,655 | |||
| Sales |
(5,300,785 | ) | ||
|
|
|
|||
| Closing balance, as of December 31, 2023 |
$ | 26,546,732 | ||
|
|
|
|||
| Net change in unrealized appreciation (depreciation) on investments still held at December 31, 2023(b) |
$ | (813,619 | ) | |
|
|
|
|||
| (a) | Included in the related net change in unrealized appreciation (depreciation) in the Consolidated Statements of Operations. |
| (b) | Any difference between net change in unrealized appreciation (depreciation) and net change in unrealized appreciation (depreciation) on investments still held at December 31, 2023 is generally due to investments no longer held or categorized as Level 3 at period end. |
| S C H E D U L E O F I N V E S T M E N T S |
63 |
| Consolidated Schedule of Investments (continued) December 31, 2023 |
BlackRock Enhanced Equity Dividend Trust (BDJ) |
The following table summarizes the valuation approaches used and unobservable inputs utilized by the BlackRock Valuation Committee (the “Valuation Committee”) to determine the value of certain of the Trust’s Level 3 financial instruments as of period end.
| Value | |
Valuation Approach |
|
|
Unobservable Inputs |
|
|
Range of Unobservable Inputs Utilized |
(a) |
|
Weighted Average of Unobservable Inputs Based on Fair Value |
| ||||||||
| Assets |
||||||||||||||||||||
| Common Stocks |
$ | 26,546,732 | Income | Discount Rate | 11% | — | ||||||||||||||
| Market | EBITDA Multiple | 7.71x | — | |||||||||||||||||
|
|
|
|||||||||||||||||||
| $ | 26,546,732 | |||||||||||||||||||
|
|
|
|||||||||||||||||||
| (a) | A significant change in unobservable input would have resulted in a correlated (inverse) significant change to value. |
See notes to financial statements.
| 64 | 2 0 2 3 B L A C K R O C K A N N U A L R E P O R T T O S H A R E H O L D E R S |
| Schedule of Investments December 31, 2023
|
BlackRock Enhanced Global Dividend Trust (BOE) (Percentages shown are based on Net Assets) |
| Security | Shares | Value | ||||||
| Common Stocks |
||||||||
| Canada — 2.0% | ||||||||
| TELUS Corp. |
820,022 | $ | 14,592,747 | |||||
|
|
|
|||||||
| Denmark — 2.2% | ||||||||
| Novo Nordisk A/S, Class B |
152,408 | 15,794,217 | ||||||
|
|
|
|||||||
| France — 9.6% | ||||||||
| Air Liquide SA |
89,151 | 17,357,292 | ||||||
| EssilorLuxottica SA |
93,763 | 18,827,490 | ||||||
| LVMH Moet Hennessy Louis Vuitton SE |
18,418 | 14,965,304 | ||||||
| Sanofi SA |
183,527 | 18,237,587 | ||||||
|
|
|
|||||||
| 69,387,673 | ||||||||
| India — 0.0% | ||||||||
| AceVector Limited, Series I, (Acquired 08/31/18, Cost: $2,637,143)(a)(b)(c) |
566,400 | 284,447 | ||||||
|
|
|
|||||||
| Indonesia — 1.1% | ||||||||
| Bank Rakyat Indonesia Persero Tbk PT |
22,422,100 | 8,333,569 | ||||||
|
|
|
|||||||
| Ireland — 4.1% | ||||||||
| Allegion PLC |
121,238 | 15,359,642 | ||||||
| Medtronic PLC(d) |
175,741 | 14,477,544 | ||||||
|
|
|
|||||||
| 29,837,186 | ||||||||
| Mexico — 2.1% | ||||||||
| Wal-Mart de Mexico SAB de CV |
3,624,607 | 15,276,669 | ||||||
|
|
|
|||||||
| Netherlands — 4.2% | ||||||||
| Koninklijke KPN NV |
4,200,135 | 14,470,004 | ||||||
| Shell PLC |
477,667 | 15,716,808 | ||||||
|
|
|
|||||||
| 30,186,812 | ||||||||
| Singapore — 1.4% | ||||||||
| DBS Group Holdings Ltd. |
405,168 | 10,246,220 | ||||||
|
|
|
|||||||
| Switzerland — 6.8% | ||||||||
| Nestle SA, Registered Shares |
190,916 | 22,130,956 | ||||||
| TE Connectivity Ltd. |
76,977 | 10,815,268 | ||||||
| Zurich Insurance Group AG, Class N |
31,721 | 16,584,591 | ||||||
|
|
|
|||||||
| 49,530,815 | ||||||||
| Taiwan — 5.0% | ||||||||
| MediaTek, Inc. |
477,000 | 15,750,493 | ||||||
| Taiwan Semiconductor Manufacturing Co. Ltd. |
1,076,000 | 20,628,575 | ||||||
|
|
|
|||||||
| 36,379,068 | ||||||||
| United Kingdom — 11.3% | ||||||||
| AstraZeneca PLC |
152,719 | 20,600,242 | ||||||
| BAE Systems PLC |
1,044,412 | 14,783,641 | ||||||
| Prudential PLC |
1,065,116 | 12,017,369 | ||||||
| RELX PLC |
487,507 | 19,315,727 | ||||||
| Taylor Wimpey PLC, Series L |
8,107,080 | 15,175,769 | ||||||
|
|
|
|||||||
| 81,892,748 | ||||||||
| United States — 51.2% | ||||||||
| AbbVie, Inc.(e) |
126,869 | 19,660,889 | ||||||
| Accenture PLC, Class A |
55,699 | 19,545,336 | ||||||
| American Express Co. |
58,216 | 10,906,197 | ||||||
| Security | Shares | Value | ||||||
| United States (continued) | ||||||||
| Apple, Inc.(d)(e) |
128,400 | $ | 24,720,852 | |||||
| Assurant, Inc.(d) |
63,722 | 10,736,520 | ||||||
| Baker Hughes Co., Class A(d)(e) |
442,901 | 15,138,356 | ||||||
| Carrier Global Corp. |
236,117 | 13,564,922 | ||||||
| Citizens Financial Group, Inc.(e) |
429,755 | 14,242,081 | ||||||
| Intercontinental Exchange, Inc.(d) |
145,616 | 18,701,463 | ||||||
| M&T Bank Corp. |
80,031 | 10,970,649 | ||||||
| Microsoft Corp.(d) |
93,741 | 35,250,366 | ||||||
| Mondelez International, Inc., Class A(d) |
294,985 | 21,365,764 | ||||||
| Oracle Corp.(e) |
153,421 | 16,175,176 | ||||||
| Otis Worldwide Corp.(e) |
211,801 | 18,949,835 | ||||||
| Paychex, Inc.(e) |
148,004 | 17,628,756 | ||||||
| Philip Morris International, Inc.(d)(e) |
194,950 | 18,340,896 | ||||||
| Republic Services, Inc.(e) |
87,104 | 14,364,321 | ||||||
| Synchrony Financial |
225,639 | 8,617,153 | ||||||
| Union Pacific Corp. |
80,294 | 19,721,812 | ||||||
| United Parcel Service, Inc., Class B(d) |
96,388 | 15,155,085 | ||||||
| UnitedHealth Group, Inc.(d) |
34,608 | 18,220,074 | ||||||
| Williams Cos., Inc.(d) |
290,496 | 10,117,976 | ||||||
|
|
|
|||||||
| 372,094,479 | ||||||||
|
|
|
|||||||
| Total Long-Term Investments — 101.0% (Cost: $605,816,932) |
733,836,650 | |||||||
|
|
|
|||||||
| Short-Term Securities | ||||||||
| Money Market Funds — 0.4% | ||||||||
| BlackRock Liquidity Funds, T-Fund, Institutional Class, 5.26%(f)(g) |
2,668,223 | 2,668,223 | ||||||
|
|
|
|||||||
| Total Short-Term Securities — 0.4% |
|
2,668,223 | ||||||
|
|
|
|||||||
| Total Investments Before Options Written — 101.4% |
|
736,504,873 | ||||||
|
|
|
|||||||
| Options Written — (1.5)% |
|
(10,846,451 | ) | |||||
|
|
|
|||||||
| Total Investments, Net of Options Written — 99.9% |
|
725,658,422 | ||||||
| Other Assets Less Liabilities — 0.1% |
830,765 | |||||||
|
|
|
|||||||
| Net Assets — 100.0% |
$ | 726,489,187 | ||||||
|
|
|
|||||||
| (a) | Security is valued using significant unobservable inputs and is classified as Level 3 in the fair value hierarchy. |
| (b) | Non-income producing security. |
| (c) | Restricted security as to resale, excluding 144A securities. The Trust held restricted securities with a current value of $284,447, representing less than 0.05% of its net assets as of period end, and an original cost of $2,637,143. |
| (d) | All or a portion of the security has been pledged and/or segregated as collateral in connection with outstanding exchange-traded options written. |
| (e) | All or a portion of the security has been pledged as collateral in connection with outstanding OTC derivatives. |
| (f) | Affiliate of the Trust. |
| (g) | Annualized 7-day yield as of period end. |
| S C H E D U L E O F I N V E S T M E N T S |
65 |
| Schedule of Investments (continued) December 31, 2023
|
BlackRock Enhanced Global Dividend Trust (BOE) |
Affiliates
Investments in issuers considered to be affiliate(s) of the Trust during the year ended December 31, 2023 for purposes of Section 2(a)(3) of the Investment Company Act of 1940, as amended, were as follows:
| Affiliated Issuer | Value at 12/31/22 |
Purchases at Cost |
Proceeds from Sale |
Net Realized Gain (Loss) |
Change in Unrealized Appreciation (Depreciation) |
Value at 12/31/23 |
Shares Held at 12/31/23 |
Income | Capital Gain Distributions from Underlying Funds |
|||||||||||||||||||||||||||
| BlackRock Liquidity Funds, T-Fund, Institutional Class |
$ | 6,643,752 | $ | — | $ | (3,975,529 | )(a) | $ | — | $ | — | $ | 2,668,223 | 2,668,223 | $ | 436,584 | $ | — | ||||||||||||||||||
| SL Liquidity Series, LLC, Money Market Series(b) |
— | — | (1,183 | )(a) | 1,183 | — | — | — | 2,641 | (c) | — | |||||||||||||||||||||||||
|
|
|
|
|
|
|
|
|
|
|
|||||||||||||||||||||||||||
| $ | 1,183 | $ | — | $ | 2,668,223 | $ | 439,225 | $ | — | |||||||||||||||||||||||||||
|
|
|
|
|
|
|
|
|
|
|
|||||||||||||||||||||||||||
| (a) | Represents net amount purchased (sold). |
| (b) | As of period end, the entity is no longer held. |
| (c) | All or a portion represents securities lending income earned from the reinvestment of cash collateral from loaned securities, net of fees and collateral investment expenses, and other payments to and from borrowers of securities. |
Derivative Financial Instruments Outstanding as of Period End
Exchange-Traded Options Written
| Description | Number of Contracts |
Expiration Date |
Exercise Price | Notional |
Value | |||||||||||||||||||||||
| Call |
||||||||||||||||||||||||||||
| American Express Co. |
134 | 01/05/24 | USD | 167.50 | USD | 2,510 | $ | (266,995 | ) | |||||||||||||||||||
| Microsoft Corp. |
209 | 01/05/24 | USD | 370.00 | USD | 7,859 | (159,885 | ) | ||||||||||||||||||||
| Mondelez International, Inc., Class A |
468 | 01/05/24 | USD | 72.00 | USD | 3,390 | (37,440 | ) | ||||||||||||||||||||
| UnitedHealth Group, Inc. |
47 | 01/05/24 | USD | 550.00 | USD | 2,474 | (329 | ) | ||||||||||||||||||||
| Williams Cos., Inc. |
280 | 01/05/24 | USD | 37.00 | USD | 975 | (1,400 | ) | ||||||||||||||||||||
| AbbVie, Inc. |
364 | 01/12/24 | USD | 146.00 | USD | 5,641 | (346,710 | ) | ||||||||||||||||||||
| American Express Co. |
181 | 01/12/24 | USD | 172.50 | USD | 3,391 | (270,595 | ) | ||||||||||||||||||||
| Apple, Inc. |
260 | 01/12/24 | USD | 200.00 | USD | 5,006 | (9,490 | ) | ||||||||||||||||||||
| M&T Bank Corp. |
196 | 01/12/24 | USD | 126.50 | USD | 2,687 | (220,808 | ) | ||||||||||||||||||||
| Mondelez International, Inc., Class A |
368 | 01/12/24 | USD | 72.00 | USD | 2,665 | (43,240 | ) | ||||||||||||||||||||
| Philip Morris International, Inc. |
292 | 01/12/24 | USD | 94.00 | USD | 2,747 | (35,770 | ) | ||||||||||||||||||||
| Union Pacific Corp. |
100 | 01/12/24 | USD | 235.00 | USD | 2,456 | (115,500 | ) | ||||||||||||||||||||
| Union Pacific Corp. |
160 | 01/12/24 | USD | 240.00 | USD | 3,930 | (116,800 | ) | ||||||||||||||||||||
| United Parcel Service, Inc., Class B |
167 | 01/12/24 | USD | 160.00 | USD | 2,626 | (22,545 | ) | ||||||||||||||||||||
| AbbVie, Inc. |
112 | 01/19/24 | USD | 145.00 | USD | 1,736 | (119,000 | ) | ||||||||||||||||||||
| Accenture PLC, Class A |
147 | 01/19/24 | USD | 347.50 | USD | 5,158 | (107,310 | ) | ||||||||||||||||||||
| Allegion PLC |
272 | 01/19/24 | USD | 125.00 | USD | 3,446 | (94,520 | ) | ||||||||||||||||||||
| Apple, Inc. |
129 | 01/19/24 | USD | 190.00 | USD | 2,484 | (63,210 | ) | ||||||||||||||||||||
| Assurant, Inc. |
168 | 01/19/24 | USD | 163.50 | USD | 2,831 | (117,263 | ) | ||||||||||||||||||||
| Baker Hughes Co., Class A |
336 | 01/19/24 | USD | 36.00 | USD | 1,148 | (7,560 | ) | ||||||||||||||||||||
| Carrier Global Corp. |
176 | 01/19/24 | USD | 57.50 | USD | 1,011 | (24,640 | ) | ||||||||||||||||||||
| Carrier Global Corp. |
355 | 01/19/24 | USD | 60.00 | USD | 2,039 | (17,750 | ) | ||||||||||||||||||||
| Citizens Financial Group, Inc. |
781 | 01/19/24 | USD | 30.00 | USD | 2,588 | (257,730 | ) | ||||||||||||||||||||
| Intercontinental Exchange, Inc. |
690 | 01/19/24 | USD | 115.00 | USD | 8,862 | (955,650 | ) | ||||||||||||||||||||
| Intercontinental Exchange, Inc. |
33 | 01/19/24 | USD | 120.00 | USD | 424 | (28,380 | ) | ||||||||||||||||||||
| Microsoft Corp. |
123 | 01/19/24 | USD | 375.00 | USD | 4,625 | (93,480 | ) | ||||||||||||||||||||
| Mondelez International, Inc., Class A |
468 | 01/19/24 | USD | 72.50 | USD | 3,390 | (50,310 | ) | ||||||||||||||||||||
| Otis Worldwide Corp. |
311 | 01/19/24 | USD | 83.25 | USD | 2,783 | (214,595 | ) | ||||||||||||||||||||
| Paychex, Inc. |
282 | 01/19/24 | USD | 120.00 | USD | 3,359 | (41,595 | ) | ||||||||||||||||||||
| Republic Services, Inc. |
37 | 01/19/24 | USD | 160.00 | USD | 610 | (21,645 | ) | ||||||||||||||||||||
| Republic Services, Inc. |
270 | 01/19/24 | USD | 165.00 | USD | 4,453 | (62,100 | ) | ||||||||||||||||||||
| Synchrony Financial |
499 | 01/19/24 | USD | 31.00 | USD | 1,906 | (366,765 | ) | ||||||||||||||||||||
| TE Connectivity Ltd. |
186 | 01/19/24 | USD | 135.00 | USD | 2,613 | (120,900 | ) | ||||||||||||||||||||
| Union Pacific Corp. |
100 | 01/19/24 | USD | 235.00 | USD | 2,456 | (122,500 | ) | ||||||||||||||||||||
| UnitedHealth Group, Inc. |
47 | 01/19/24 | USD | 550.00 | USD | 2,474 | (13,372 | ) | ||||||||||||||||||||
| Williams Cos., Inc. |
280 | 01/19/24 | USD | 37.00 | USD | 975 | (2,800 | ) | ||||||||||||||||||||
| Baker Hughes Co., Class A |
224 | 01/25/24 | USD | 32.30 | USD | 766 | (51,788 | ) | ||||||||||||||||||||
| AbbVie, Inc. |
94 | 01/26/24 | USD | 152.50 | USD | 1,457 | (37,130 | ) | ||||||||||||||||||||
| Accenture PLC, Class A |
103 | 01/26/24 | USD | 345.00 | USD | 3,614 | (107,120 | ) | ||||||||||||||||||||
| Apple, Inc. |
129 | 01/26/24 | USD | 200.00 | USD | 2,484 | (13,674 | ) | ||||||||||||||||||||
| 66 | 2 0 2 3 B L A C K R O C K A N N U A L R E P O R T T O S H A R E H O L D E R S |
| Schedule of Investments (continued) December 31, 2023
|
BlackRock Enhanced Global Dividend Trust (BOE) |
Exchange-Traded Options Written (continued)
| Description | Number of Contracts |
Expiration Date |
Exercise Price | Notional |
Value | |||||||||||||||||||||||
| Call (continued) |
||||||||||||||||||||||||||||
| Medtronic PLC |
48 | 01/26/24 | USD | 85.00 | USD | 395 | $ | (2,760 | ) | |||||||||||||||||||
| Medtronic PLC |
69 | 01/26/24 | USD | 83.34 | USD | 568 | (8,108 | ) | ||||||||||||||||||||
| Microsoft Corp. |
110 | 01/26/24 | USD | 385.00 | USD | 4,136 | (73,975 | ) | ||||||||||||||||||||
| Mondelez International, Inc., Class A |
23 | 01/26/24 | USD | 71.00 | USD | 167 | (5,520 | ) | ||||||||||||||||||||
| Oracle Corp. |
345 | 01/26/24 | USD | 104.00 | USD | 3,637 | (111,262 | ) | ||||||||||||||||||||
| Philip Morris International, Inc. |
315 | 01/26/24 | USD | 97.00 | USD | 2,964 | (17,325 | ) | ||||||||||||||||||||
| United Parcel Service, Inc., Class B |
170 | 01/26/24 | USD | 165.00 | USD | 2,673 | (15,555 | ) | ||||||||||||||||||||
| Williams Cos., Inc. |
456 | 01/26/24 | USD | 36.00 | USD | 1,588 | (13,680 | ) | ||||||||||||||||||||
| Medtronic PLC |
83 | 02/02/24 | USD | 83.05 | USD | 684 | (13,617 | ) | ||||||||||||||||||||
| Medtronic PLC |
221 | 02/09/24 | USD | 83.34 | USD | 1,821 | (37,909 | ) | ||||||||||||||||||||
| Oracle Corp. |
345 | 02/09/24 | USD | 110.00 | USD | 3,637 | (45,712 | ) | ||||||||||||||||||||
| Baker Hughes Co., Class A |
165 | 02/12/24 | USD | 34.75 | USD | 564 | (18,087 | ) | ||||||||||||||||||||
| Allegion PLC |
272 | 02/16/24 | USD | 125.00 | USD | 3,446 | (148,240 | ) | ||||||||||||||||||||
| Apple, Inc. |
59 | 02/16/24 | USD | 195.00 | USD | 1,136 | (30,533 | ) | ||||||||||||||||||||
| Assurant, Inc. |
120 | 02/16/24 | USD | 164.90 | USD | 2,022 | (105,099 | ) | ||||||||||||||||||||
| Carrier Global Corp. |
531 | 02/16/24 | USD | 60.00 | USD | 3,051 | (79,650 | ) | ||||||||||||||||||||
| Citizens Financial Group, Inc. |
782 | 02/16/24 | USD | 30.99 | USD | 2,592 | (227,698 | ) | ||||||||||||||||||||
| M&T Bank Corp. |
164 | 02/16/24 | USD | 145.00 | USD | 2,248 | (54,940 | ) | ||||||||||||||||||||
| Medtronic PLC |
221 | 02/16/24 | USD | 85.00 | USD | 1,821 | (25,194 | ) | ||||||||||||||||||||
| Microsoft Corp. |
73 | 02/16/24 | USD | 400.00 | USD | 2,745 | (39,603 | ) | ||||||||||||||||||||
| Otis Worldwide Corp. |
105 | 02/16/24 | USD | 85.10 | USD | 939 | (61,323 | ) | ||||||||||||||||||||
| Paychex, Inc. |
384 | 02/16/24 | USD | 130.00 | USD | 4,574 | (8,640 | ) | ||||||||||||||||||||
| Philip Morris International, Inc. |
270 | 02/16/24 | USD | 95.00 | USD | 2,540 | (61,425 | ) | ||||||||||||||||||||
| Republic Services, Inc. |
84 | 02/16/24 | USD | 164.96 | USD | 1,385 | (37,278 | ) | ||||||||||||||||||||
| Synchrony Financial |
516 | 02/16/24 | USD | 35.60 | USD | 1,971 | (177,661 | ) | ||||||||||||||||||||
| TE Connectivity Ltd. |
160 | 02/16/24 | USD | 140.00 | USD | 2,248 | (79,200 | ) | ||||||||||||||||||||
| TELUS Corp. |
1,534 | 02/16/24 | CAD | 26.00 | CAD | 3,617 | (6,946 | ) | ||||||||||||||||||||
| Baker Hughes Co., Class A |
224 | 02/22/24 | USD | 32.30 | USD | 766 | (61,073 | ) | ||||||||||||||||||||
| Baker Hughes Co., Class A |
376 | 02/26/24 | USD | 36.10 | USD | 1,285 | (30,762 | ) | ||||||||||||||||||||
| Baker Hughes Co., Class A |
224 | 03/07/24 | USD | 32.30 | USD | 766 | (65,494 | ) | ||||||||||||||||||||
| Medtronic PLC |
148 | 03/15/24 | USD | 85.00 | USD | 1,219 | (30,044 | ) | ||||||||||||||||||||
| Otis Worldwide Corp. |
269 | 03/15/24 | USD | 90.00 | USD | 2,407 | (83,390 | ) | ||||||||||||||||||||
| TELUS Corp. |
602 | 03/15/24 | CAD | 26.00 | CAD | 1,420 | (3,180 | ) | ||||||||||||||||||||
| TELUS Corp. |
602 | 04/19/24 | CAD | 26.00 | CAD | 1,420 | (5,906 | ) | ||||||||||||||||||||
|
|
|
|||||||||||||||||||||||||||
| $ | (6,547,083 | ) | ||||||||||||||||||||||||||
|
|
|
|||||||||||||||||||||||||||
OTC Options Written
| Description | Counterparty | Number of Contracts |
Expiration Date |
Exercise Price | Notional Amount (000) |
Value | ||||||||||||||||||||||||
| Call |
||||||||||||||||||||||||||||||
| Citizens Financial Group, Inc. |
Citibank N.A. | 25,800 | 01/04/24 | USD | 28.31 | USD | 855 | $ | (125,532 | ) | ||||||||||||||||||||
| Otis Worldwide Corp. |
UBS AG | 30,300 | 01/04/24 | USD | 85.49 | USD | 2,711 | (126,155 | ) | |||||||||||||||||||||
| Taiwan Semiconductor Manufacturing Co. Ltd. |
JPMorgan Chase Bank N.A. | 90,000 | 01/04/24 | TWD | 576.08 | TWD | 52,955 | (51,441 | ) | |||||||||||||||||||||
| MediaTek, Inc. |
Morgan Stanley & Co. International PLC | 119,700 | 01/09/24 | TWD | 936.85 | TWD | 121,304 | (210,705 | ) | |||||||||||||||||||||
| Novo Nordisk A/S, Class B |
Morgan Stanley & Co. International PLC | 7,500 | 01/09/24 | DKK | 703.28 | DKK | 5,248 | (12,207 | ) | |||||||||||||||||||||
| Prudential PLC |
Bank of America N.A. | 152,100 | 01/09/24 | GBP | 9.14 | GBP | 1,346 | (13,005 | ) | |||||||||||||||||||||
| Air Liquide SA |
Morgan Stanley & Co. International PLC | 40,100 | 01/10/24 | EUR | 168.61 | EUR | 7,072 | (357,536 | ) | |||||||||||||||||||||
| AstraZeneca PLC |
Morgan Stanley & Co. International PLC | 23,100 | 01/10/24 | GBP | 107.35 | GBP | 2,445 | (27,724 | ) | |||||||||||||||||||||
| Citizens Financial Group, Inc. |
Citibank N.A. | 26,200 | 01/10/24 | USD | 29.03 | USD | 868 | (109,061 | ) | |||||||||||||||||||||
| DBS Group Holdings Ltd. |
UBS AG | 110,800 | 01/10/24 | SGD | 33.42 | SGD | 3,698 | (31,255 | ) | |||||||||||||||||||||
| LVMH Moet Hennessy Louis Vuitton SE |
Morgan Stanley & Co. International PLC | 8,200 | 01/10/24 | EUR | 731.07 | EUR | 6,035 | (131,271 | ) | |||||||||||||||||||||
| Taiwan Semiconductor Manufacturing Co. Ltd. |
JPMorgan Chase Bank N.A. | 114,000 | 01/10/24 | TWD | 568.14 | TWD | 67,076 | (95,802 | ) | |||||||||||||||||||||
| Taylor Wimpey PLC |
UBS AG | 535,500 | 01/10/24 | GBP | 1.21 | GBP | 786 | (178,507 | ) | |||||||||||||||||||||
| Nestle SA, Registered Shares |
UBS AG | 26,700 | 01/11/24 | CHF | 100.25 | CHF | 2,603 | (3,767 | ) | |||||||||||||||||||||
| EssilorLuxottica SA |
Goldman Sachs International | 12,500 | 01/12/24 | EUR | 177.75 | EUR | 2,274 | (71,555 | ) | |||||||||||||||||||||
| Koninklijke KPN NV |
Morgan Stanley & Co. International PLC | 533,000 | 01/12/24 | EUR | 3.17 | EUR | 1,663 | (11,186 | ) | |||||||||||||||||||||
| RELX PLC |
Goldman Sachs International | 44,900 | 01/12/24 | EUR | 35.81 | EUR | 1,611 | (23,135 | ) | |||||||||||||||||||||
| DBS Group Holdings Ltd. |
JPMorgan Chase Bank N.A. | 71,500 | 01/17/24 | SGD | 32.18 | SGD | 2,386 | (75,090 | ) | |||||||||||||||||||||
| MediaTek, Inc. |
JPMorgan Chase Bank N.A. | 77,000 | 01/17/24 | TWD | 927.62 | TWD | 78,032 | (159,859 | ) | |||||||||||||||||||||
| Wal-Mart de Mexico SAB de CV |
Citibank N.A. | 415,700 | 01/17/24 | MXN | 68.08 | MXN | 29,752 | (100,851 | ) | |||||||||||||||||||||
| S C H E D U L E O F I N V E S T M E N T S |
67 |
| Schedule of Investments (continued) December 31, 2023
|
BlackRock Enhanced Global Dividend Trust (BOE) |
OTC Options Written (continued)
| Description | Counterparty | Number of Contracts |
Expiration Date |
Exercise Price | Notional Amount (000) |
Value | ||||||||||||||||||||||||
| Call (continued) |
||||||||||||||||||||||||||||||
| Koninklijke KPN NV |
UBS AG | 394,550 | 01/18/24 | EUR | 3.19 | EUR | 1,231 | $ | (10,676 | ) | ||||||||||||||||||||
| Novo Nordisk A/S, Class B |
Morgan Stanley & Co. International PLC | 7,500 | 01/18/24 | DKK | 703.28 | DKK | 5,248 | (17,509 | ) | |||||||||||||||||||||
| RELX PLC |
Goldman Sachs International | 33,750 | 01/18/24 | EUR | 34.28 | EUR | 1,211 | (65,178 | ) | |||||||||||||||||||||
| Sanofi SA |
Morgan Stanley & Co. International PLC | 29,000 | 01/18/24 | EUR | 87.55 | EUR | 2,610 | (91,815 | ) | |||||||||||||||||||||
| Taiwan Semiconductor Manufacturing Co. Ltd. |
Goldman Sachs International | 82,000 | 01/18/24 | TWD | 594.66 | TWD | 48,247 | (21,691 | ) | |||||||||||||||||||||
| Taylor Wimpey PLC |
UBS AG | 535,500 | 01/18/24 | GBP | 1.23 | GBP | 786 | (169,149 | ) | |||||||||||||||||||||
| Zurich Insurance Group AG, Class N |
Morgan Stanley & Co. International PLC | 6,700 | 01/18/24 | CHF | 432.35 | CHF | 2,946 | (79,358 | ) | |||||||||||||||||||||
| AstraZeneca PLC |
Goldman Sachs International | 60,200 | 01/23/24 | GBP | 103.39 | GBP | 6,371 | (310,326 | ) | |||||||||||||||||||||
| BAE Systems PLC |
UBS AG | 121,700 | 01/23/24 | GBP | 10.62 | GBP | 1,351 | (85,851 | ) | |||||||||||||||||||||
| Novo Nordisk A/S, Class B |
Goldman Sachs International | 6,600 | 01/23/24 | DKK | 711.62 | DKK | 4,619 | (14,469 | ) | |||||||||||||||||||||
| Prudential PLC |
UBS AG | 83,200 | 01/23/24 | GBP | 8.74 | GBP | 736 | (36,433 | ) | |||||||||||||||||||||
| RELX PLC |
Goldman Sachs International | 44,900 | 01/23/24 | EUR | 35.81 | EUR | 1,611 | (31,977 | ) | |||||||||||||||||||||
| Sanofi SA |
Morgan Stanley & Co. International PLC | 35,100 | 01/23/24 | EUR | 89.72 | EUR | 3,160 | (65,456 | ) | |||||||||||||||||||||
| Taylor Wimpey PLC |
Bank of America N.A. | 881,700 | 01/23/24 | GBP | 1.40 | GBP | 1,295 | (99,922 | ) | |||||||||||||||||||||
| Wal-Mart de Mexico SAB de CV |
JPMorgan Chase Bank N.A. | 799,700 | 01/23/24 | MXN | 68.95 | MXN | 57,235 | (174,601 | ) | |||||||||||||||||||||
| Koninklijke KPN NV |
Goldman Sachs International | 532,600 | 01/24/24 | EUR | 3.17 | EUR | 1,662 | (18,250 | ) | |||||||||||||||||||||
| Koninklijke KPN NV |
Goldman Sachs International | 394,550 | 01/24/24 | EUR | 3.18 | EUR | 1,231 | (13,311 | ) | |||||||||||||||||||||
| Prudential PLC |
Goldman Sachs International | 83,300 | 01/25/24 | GBP | 9.12 | GBP | 737 | (17,568 | ) | |||||||||||||||||||||
| Nestle SA, Registered Shares |
Morgan Stanley & Co. International PLC | 56,900 | 01/30/24 | CHF | 101.82 | CHF | 5,547 | (18,390 | ) | |||||||||||||||||||||
| Prudential PLC |
Morgan Stanley & Co. International PLC | 92,200 | 01/30/24 | GBP | 9.04 | GBP | 816 | (26,860 | ) | |||||||||||||||||||||
| Taylor Wimpey PLC, Series L |
UBS AG | 81,200 | 01/30/24 | GBP | 1.32 | GBP | 119 | (16,306 | ) | |||||||||||||||||||||
| Zurich Insurance Group AG, Class N |
Morgan Stanley & Co. International PLC | 7,600 | 01/30/24 | CHF | 444.21 | CHF | 3,342 | (32,249 | ) | |||||||||||||||||||||
| EssilorLuxottica SA |
UBS AG | 29,600 | 01/31/24 | EUR | 183.98 | EUR | 5,384 | (88,937 | ) | |||||||||||||||||||||
| RELX PLC |
Morgan Stanley & Co. International PLC | 52,000 | 02/01/24 | EUR | 36.80 | EUR | 1,866 | (22,850 | ) | |||||||||||||||||||||
| Shell PLC |
Bank of America N.A. | 105,100 | 02/01/24 | EUR | 30.26 | EUR | 3,133 | (53,843 | ) | |||||||||||||||||||||
| Wal-Mart de Mexico SAB de CV |
Citibank N.A. | 415,600 | 02/01/24 | MXN | 68.03 | MXN | 29,744 | (117,632 | ) | |||||||||||||||||||||
| Taiwan Semiconductor Manufacturing Co. Ltd. |
JPMorgan Chase Bank N.A. | 198,000 | 02/05/24 | TWD | 585.66 | TWD | 116,500 | (106,966 | ) | |||||||||||||||||||||
| BAE Systems PLC |
UBS AG | 172,400 | 02/06/24 | GBP | 10.80 | GBP | 1,915 | (103,623 | ) | |||||||||||||||||||||
| Prudential PLC |
Goldman Sachs International | 68,500 | 02/07/24 | GBP | 8.84 | GBP | 606 | (31,808 | ) | |||||||||||||||||||||
| RELX PLC |
Morgan Stanley & Co. International PLC | 43,900 | 02/07/24 | EUR | 36.02 | EUR | 1,576 | (38,026 | ) | |||||||||||||||||||||
| Shell PLC |
Morgan Stanley & Co. International PLC | 62,000 | 02/07/24 | EUR | 30.46 | EUR | 1,848 | (32,745 | ) | |||||||||||||||||||||
| Taylor Wimpey PLC |
Goldman Sachs International | 766,000 | 02/08/24 | GBP | 1.40 | GBP | 1,125 | (89,856 | ) | |||||||||||||||||||||
| BAE Systems PLC |
Goldman Sachs International | 172,400 | 02/13/24 | GBP | 10.88 | GBP | 1,915 | (100,160 | ) | |||||||||||||||||||||
| Novo Nordisk A/S, Class B |
Goldman Sachs International | 31,800 | 02/13/24 | DKK | 720.40 | DKK | 22,253 | (103,318 | ) | |||||||||||||||||||||
| Taylor Wimpey PLC |
Goldman Sachs International | 476,300 | 02/14/24 | GBP | 1.47 | GBP | 699 | (31,746 | ) | |||||||||||||||||||||
| Citizens Financial Group, Inc. |
Citibank N.A. | 26,200 | 02/27/24 | USD | 33.33 | USD | 868 | (44,869 | ) | |||||||||||||||||||||
|
|
|
|||||||||||||||||||||||||||||
| $ | (4,299,368 | ) | ||||||||||||||||||||||||||||
|
|
|
|||||||||||||||||||||||||||||
Balances Reported in the Statements of Assets and Liabilities for Options Written
|
|
||||||||||||||||||||
| Description | Swap Premiums Paid |
Swap Premiums Received |
Unrealized Appreciation |
Unrealized Depreciation |
Value | |||||||||||||||
|
|
||||||||||||||||||||
| Options Written |
$ | N/A | $ | N/A | $ | 1,243,098 | $ | (5,410,478 | ) | $ | (10,846,451 | ) | ||||||||
|
|
||||||||||||||||||||
Derivative Financial Instruments Categorized by Risk Exposure
As of period end, the fair values of derivative financial instruments located in the Statements of Assets and Liabilities were as follows:
|
|
||||||||||||||||||||||||||||
| Commodity Contracts |
Credit Contracts |
Equity Contracts |
Foreign Currency Exchange Contracts |
Interest Rate Contracts |
Other Contracts |
Total | ||||||||||||||||||||||
|
|
||||||||||||||||||||||||||||
| Liabilities — Derivative Financial Instruments |
|
|||||||||||||||||||||||||||
| Options written |
||||||||||||||||||||||||||||
| Options written at value |
$ | — | $ | — | $ | 10,846,451 | $ | — | $ | — | $ | — | $ | 10,846,451 | ||||||||||||||
|
|
|
|
|
|
|
|
|
|
|
|
|
|
|
|||||||||||||||
| 68 | 2 0 2 3 B L A C K R O C K A N N U A L R E P O R T T O S H A R E H O L D E R S |
| Schedule of Investments (continued) December 31, 2023
|
BlackRock Enhanced Global Dividend Trust (BOE) |
For the period ended December 31, 2023, the effect of derivative financial instruments in the Statements of Operations was as follows:
|
|
||||||||||||||||||||||||||||
| Commodity Contracts |
Credit Contracts |
Equity Contracts |
Foreign Currency Exchange Contracts |
Interest Rate Contracts |
Other Contracts |
Total | ||||||||||||||||||||||
|
|
||||||||||||||||||||||||||||
| Net Realized Gain (Loss) from: |
||||||||||||||||||||||||||||
| Options purchased(a) |
$ | — | $ | — | $ | (7,590,517 | ) | $ | — | $ | — | $ | — | $ | (7,590,517 | ) | ||||||||||||
| Options written |
— | — | 4,801,919 | — | — | — | 4,801,919 | |||||||||||||||||||||
|
|
|
|
|
|
|
|
|
|
|
|
|
|
|
|||||||||||||||
| $ | — | $ | — | $ | (2,788,598 | ) | $ | — | $ | — | $ | — | $ | (2,788,598 | ) | |||||||||||||
|
|
|
|
|
|
|
|
|
|
|
|
|
|
|
|||||||||||||||
| Net Change in Unrealized Appreciation (Depreciation) on: |
||||||||||||||||||||||||||||
| Options written |
$ | — | $ | — | $ | (7,553,097 | ) | $ | — | $ | — | $ | — | $ | (7,553,097 | ) | ||||||||||||
|
|
|
|
|
|
|
|
|
|
|
|
|
|
|
|||||||||||||||
| (a) | Options purchased are included in net realized gain (loss) from investments — unaffiliated. |
Average Quarterly Balances of Outstanding Derivative Financial Instruments
|
|
||||
| Options: |
||||
| Average value of option contracts purchased |
$ | —(a) | ||
| Average value of option contracts written |
$ | 7,695,249 | ||
|
|
||||
| (a) | Derivative financial instrument not held at any quarter-end. The risk exposure table serves as an indicator of activity during the period. |
For more information about the Trust’s investment risks regarding derivative financial instruments, refer to the Notes to Financial Statements.
Derivative Financial Instruments — Offsetting as of Period End
The Trust’s derivative assets and liabilities (by type) were as follows:
|
|
||||||||
| Assets | Liabilities | |||||||
|
|
||||||||
| Derivative Financial Instruments |
||||||||
| Options |
$ | — | $ | 10,846,451 | ||||
|
|
|
|
|
|||||
| Total derivative assets and liabilities in the Statements of Assets and Liabilities |
— | 10,846,451 | ||||||
|
|
|
|
|
|||||
| Derivatives not subject to a Master Netting Agreement or similar agreement (“MNA”) |
— | (6,547,083 | ) | |||||
|
|
|
|
|
|||||
| Total derivative assets and liabilities subject to an MNA |
$ | — | $ | 4,299,368 | ||||
|
|
|
|
|
|||||
The following table presents the Trust’s derivative liabilities by counterparty net of amounts available for offset under an MNA and net of the related collateral pledged by the Trust:
|
|
||||||||||||||||||||
| Counterparty | |
Derivative Liabilities Subject to an MNA by |
|
|
Derivatives Available for Offset |
|
|
Non-Cash Collateral Pledged |
(a) |
|
Cash Collateral Pledged |
|
|
Net Amount of Derivative Liabilities |
| |||||
|
|
||||||||||||||||||||
| Bank of America N.A. |
$ | 166,770 | $ | — | $ | (166,770 | ) | $ | — | $ | — | |||||||||
| Citibank N.A. |
497,945 | — | (497,945 | ) | — | — | ||||||||||||||
| Goldman Sachs International |
944,348 | — | (414,348 | ) | (530,000 | ) | — | |||||||||||||
| JPMorgan Chase Bank N.A. |
663,759 | — | (663,759 | ) | — | — | ||||||||||||||
| Morgan Stanley & Co. International PLC |
1,175,887 | — | (1,175,887 | ) | — | — | ||||||||||||||
| UBS AG |
850,659 | — | (850,659 | ) | — | — | ||||||||||||||
|
|
|
|
|
|
|
|
|
|
|
|||||||||||
| $ | 4,299,368 | $ | — | $ | (3,769,368) | $ | (530,000 | ) | $ | — | ||||||||||
|
|
|
|
|
|
|
|
|
|
|
|||||||||||
| (a) | Excess of collateral received/pledged, if any, from the individual counterparty is not shown for financial reporting purposes. |
| S C H E D U L E O F I N V E S T M E N T S |
69 |
| Schedule of Investments (continued) December 31, 2023
|
BlackRock Enhanced Global Dividend Trust (BOE) |
Fair Value Hierarchy as of Period End
Various inputs are used in determining the fair value of financial instruments. For a description of the input levels and information about the Trust’s policy regarding valuation of financial instruments, refer to the Notes to Financial Statements.
The following table summarizes the Trust’s financial instruments categorized in the fair value hierarchy. The breakdown of the Trust’s financial instruments into major categories is disclosed in the Schedule of Investments above.
| Level 1 | Level 2 | Level 3 | Total | |||||||||||||||||||||||||
| Assets |
||||||||||||||||||||||||||||
| Investments |
||||||||||||||||||||||||||||
| Long-Term Investments |
||||||||||||||||||||||||||||
| Common Stocks |
||||||||||||||||||||||||||||
| Canada |
$ | 14,592,747 | $ | — | $ | — | $ | 14,592,747 | ||||||||||||||||||||
| Denmark |
— | 15,794,217 | — | 15,794,217 | ||||||||||||||||||||||||
| France |
— | 69,387,673 | — | 69,387,673 | ||||||||||||||||||||||||
| India |
— | — | 284,447 | 284,447 | ||||||||||||||||||||||||
| Indonesia |
— | 8,333,569 | — | 8,333,569 | ||||||||||||||||||||||||
| Ireland |
29,837,186 | — | — | 29,837,186 | ||||||||||||||||||||||||
| Mexico |
15,276,669 | — | — | 15,276,669 | ||||||||||||||||||||||||
| Netherlands |
— | 30,186,812 | — | 30,186,812 | ||||||||||||||||||||||||
| Singapore |
— | 10,246,220 | — | 10,246,220 | ||||||||||||||||||||||||
| Switzerland |
10,815,268 | 38,715,547 | — | 49,530,815 | ||||||||||||||||||||||||
| Taiwan |
— | 36,379,068 | — | 36,379,068 | ||||||||||||||||||||||||
| United Kingdom |
14,783,641 | 67,109,107 | — | 81,892,748 | ||||||||||||||||||||||||
| United States |
372,094,479 | — | — | 372,094,479 | ||||||||||||||||||||||||
| Short-Term Securities |
||||||||||||||||||||||||||||
| Money Market Funds |
2,668,223 | — | — | 2,668,223 | ||||||||||||||||||||||||
|
|
|
|
|
|
|
|
|
|||||||||||||||||||||
| $ | 460,068,213 | $ | 276,152,213 | $ | 284,447 | $ | 736,504,873 | |||||||||||||||||||||
|
|
|
|
|
|
|
|
|
|||||||||||||||||||||
| Derivative Financial Instruments(a) |
||||||||||||||||||||||||||||
| Liabilities |
||||||||||||||||||||||||||||
| Equity Contracts |
$ | (5,098,520 | ) | $ | (5,747,931 | ) | $ | — | $ | (10,846,451 | ) | |||||||||||||||||
|
|
|
|
|
|
|
|
|
|||||||||||||||||||||
| (a) | Derivative financial instruments are options written. Options written are shown at value. |
See notes to financial statements.
| 70 | 2 0 2 3 B L A C K R O C K A N N U A L R E P O R T T O S H A R E H O L D E R S |
| Schedule of Investments December 31, 2023 |
BlackRock Enhanced International Dividend Trust (BGY) (Percentages shown are based on Net Assets) |
|
Security |
Shares | Value | ||||||
| Common Stocks |
||||||||
| Brazil — 1.5% | ||||||||
| B3 SA - Brasil Bolsa Balcao |
3,072,226 | $ | 9,192,006 | |||||
|
|
|
|||||||
| Canada — 4.5% | ||||||||
| Canadian National Railway Co. |
129,475 | 16,274,149 | ||||||
| TELUS Corp. |
661,770 | 11,776,564 | ||||||
|
|
|
|||||||
| 28,050,713 | ||||||||
| China — 1.1% | ||||||||
| Yum China Holdings, Inc. (a) |
159,098 | 6,750,528 | ||||||
|
|
|
|||||||
| Denmark — 3.7% | ||||||||
| Novo Nordisk A/S, Class B |
223,426 | 23,153,894 | ||||||
|
|
|
|||||||
| France — 10.7% | ||||||||
| Air Liquide SA |
97,316 | 18,946,980 | ||||||
| EssilorLuxottica SA |
65,768 | 13,206,130 | ||||||
| LVMH Moet Hennessy Louis Vuitton SE |
19,763 | 16,058,166 | ||||||
| Sanofi SA |
186,010 | 18,484,330 | ||||||
|
|
|
|||||||
| 66,695,606 | ||||||||
| Germany — 4.4% | ||||||||
| MTU Aero Engines AG, Class N |
59,338 | 12,784,112 | ||||||
| Symrise AG, Class A |
130,733 | 14,366,970 | ||||||
|
|
|
|||||||
| 27,151,082 | ||||||||
| India — 2.6% | ||||||||
| AceVector Limited, Series I, (Acquired 01/25/22, |
848,000 | 425,866 | ||||||
| HDFC Bank Ltd. |
782,464 | 16,021,748 | ||||||
|
|
|
|||||||
| 16,447,614 | ||||||||
| Indonesia — 1.6% | ||||||||
| Bank Rakyat Indonesia Persero Tbk PT |
26,413,700 | 9,817,118 | ||||||
|
|
|
|||||||
| Italy — 3.0% | ||||||||
| FinecoBank Banca Fineco SpA |
1,247,909 | 18,773,747 | ||||||
|
|
|
|||||||
| Japan — 7.7% | ||||||||
| KDDI Corp. |
321,100 | 10,184,811 | ||||||
| Keyence Corp. |
47,600 | 20,913,358 | ||||||
| Sony Group Corp. |
177,900 | 16,835,183 | ||||||
|
|
|
|||||||
| 47,933,352 | ||||||||
| Mexico — 2.9% | ||||||||
| Wal-Mart de Mexico SAB de CV |
4,298,658 | 18,117,599 | ||||||
|
|
|
|||||||
| Netherlands — 12.1% | ||||||||
| ASML Holding NV |
26,026 | 19,646,702 | ||||||
| Heineken NV |
183,267 | 18,619,833 | ||||||
| Koninklijke KPN NV |
5,283,115 | 18,201,008 | ||||||
| Shell PLC |
567,699 | 18,679,156 | ||||||
|
|
|
|||||||
| 75,146,699 | ||||||||
| Singapore — 4.2% | ||||||||
| DBS Group Holdings Ltd. |
477,400 | 12,072,882 | ||||||
| United Overseas Bank Ltd. |
653,100 | 14,095,986 | ||||||
|
|
|
|||||||
| 26,168,868 | ||||||||
| Sweden — 5.9% | ||||||||
| Assa Abloy AB, Class B |
599,526 | 17,277,842 | ||||||
| Atlas Copco AB, A Shares |
1,108,482 | 19,100,375 | ||||||
|
|
|
|||||||
| 36,378,217 | ||||||||
|
Security |
Shares | Value | ||||||
| Switzerland — 4.6% | ||||||||
| Nestle SA, Registered Shares |
129,067 | $ | 14,961,428 | |||||
| Zurich Insurance Group AG, Class N |
25,565 | 13,366,069 | ||||||
|
|
|
|||||||
| 28,327,497 | ||||||||
| Taiwan — 7.2% | ||||||||
| MediaTek, Inc. |
513,000 | 16,939,210 | ||||||
| Taiwan Semiconductor Manufacturing Co. Ltd. |
1,468,000 | 28,143,818 | ||||||
|
|
|
|||||||
| 45,083,028 | ||||||||
| United Kingdom — 13.6% | ||||||||
| AstraZeneca PLC |
132,185 | 17,830,414 | ||||||
| BAE Systems PLC |
891,229 | 12,615,337 | ||||||
| Prudential PLC |
1,363,945 | 15,388,963 | ||||||
| RELX PLC |
571,799 | 22,655,497 | ||||||
| Smith & Nephew PLC |
492,926 | 6,771,357 | ||||||
| Taylor Wimpey PLC, Series L |
5,105,774 | 9,557,577 | ||||||
|
|
|
|||||||
| 84,819,145 | ||||||||
| United States(a) — 9.1% | ||||||||
| Baker Hughes Co., Class A (e) |
628,896 | 21,495,665 | ||||||
| Freeport-McMoRan, Inc. |
145,401 | 6,189,721 | ||||||
| Otis Worldwide Corp. (e) |
142,255 | 12,727,555 | ||||||
| Visa, Inc., Class A (e) |
62,660 | 16,313,531 | ||||||
|
|
|
|||||||
| 56,726,472 | ||||||||
|
|
|
|||||||
| Total Long-Term Investments — 100.4% |
624,733,185 | |||||||
|
|
|
|||||||
| Short-Term Securities |
||||||||
| Money Market Funds — 1.3% | ||||||||
| BlackRock Liquidity Funds, T-Fund, Institutional Class, 5.26%(f)(g) |
8,260,103 | 8,260,103 | ||||||
|
|
|
|||||||
| Total Short-Term Securities — 1.3% |
8,260,103 | |||||||
|
|
|
|||||||
| Total Investments Before Options Written — 101.7% |
|
632,993,288 | ||||||
|
|
|
|||||||
| Options Written — (1.7)% |
(10,496,177 | ) | ||||||
|
|
|
|||||||
| Total Investments, Net of Options Written — 100.0% |
|
622,497,111 | ||||||
| Liabilities in Excess of Other Assets — 0.0% |
(15,261 | ) | ||||||
|
|
|
|||||||
| Net Assets — 100.0% | $622,481,850 | |||||||
|
|
|
|||||||
| (a) | All or a portion of the security has been pledged and/or segregated as collateral in connection with outstanding exchange-traded options written. |
| (b) | Security is valued using significant unobservable inputs and is classified as Level 3 in the fair value hierarchy. |
| (c) | Non-income producing security. |
| (d) | Restricted security as to resale, excluding 144A securities. The Trust held restricted securities with a current value of $425,866, representing 0.1% of its net assets as of period end, and an original cost of $3,948,600. |
| (e) | All or a portion of the security has been pledged as collateral in connection with outstanding OTC derivatives. |
| (f) | Affiliate of the Trust. |
| (g) | Annualized 7-day yield as of period end. |
| S C H E D U L E O F I N V E S T M E N T S |
71 |
| Schedule of Investments (continued) December 31, 2023
|
BlackRock Enhanced International Dividend Trust (BGY) |
Affiliates
Investments in issuers considered to be affiliate(s) of the Trust during the year ended December 31, 2023 for purposes of Section 2(a)(3) of the Investment Company Act of 1940, as amended, were as follows:
| Affiliated Issuer | Value at 12/31/22 |
Purchases at Cost |
Proceeds from Sale |
Net Realized Gain (Loss) |
Change in Unrealized Appreciation (Depreciation) |
Value at 12/31/23 |
Shares Held at 12/31/23 |
Income | Capital Gain Distributions from Underlying Funds |
|||||||||||||||||||||||||||
| BlackRock Liquidity Funds, T-Fund, Institutional Class |
$ | 5,622,321 | $ | 2,637,782 | (a) | $ | — | $ | — | $ | — | $ | 8,260,103 | 8,260,103 | $ | 518,836 | $ | — | ||||||||||||||||||
|
|
|
|
|
|
|
|
|
|
|
|||||||||||||||||||||||||||
| (a) | Represents net amount purchased (sold). |
Derivative Financial Instruments Outstanding as of Period End
Exchange-Traded Options Written
| Description |
Number of Contracts |
Expiration Date |
Exercise Price | Notional Amount (000) |
Value |
|||||||||||||||||||||||
| Call |
||||||||||||||||||||||||||||
| Freeport-McMoRan, Inc. |
370 | 01/05/24 | USD | 38.00 | USD | 1,575 | $ | (170,200 | ) | |||||||||||||||||||
| Visa, Inc., Class A |
37 | 01/12/24 | USD | 260.00 | USD | 963 | (12,302 | ) | ||||||||||||||||||||
| Baker Hughes Co., Class A |
268 | 01/19/24 | USD | 36.00 | USD | 916 | (6,030 | ) | ||||||||||||||||||||
| Canadian National Railway Co. |
241 | 01/19/24 | CAD | 155.00 | CAD | 4,014 | (221,439 | ) | ||||||||||||||||||||
| Otis Worldwide Corp. |
100 | 01/19/24 | USD | 83.25 | USD | 895 | (69,001 | ) | ||||||||||||||||||||
| Visa, Inc., Class A |
50 | 01/19/24 | USD | 255.00 | USD | 1,302 | (39,000 | ) | ||||||||||||||||||||
| Yum China Holdings, Inc. |
358 | 01/19/24 | USD | 47.50 | USD | 1,519 | (3,580 | ) | ||||||||||||||||||||
| Baker Hughes Co., Class A |
381 | 01/25/24 | USD | 32.30 | USD | 1,302 | (88,085 | ) | ||||||||||||||||||||
| Visa, Inc., Class A |
223 | 01/26/24 | USD | 260.00 | USD | 5,806 | (131,570 | ) | ||||||||||||||||||||
| Visa, Inc., Class A |
34 | 02/02/24 | USD | 260.68 | USD | 885 | (21,826 | ) | ||||||||||||||||||||
| Baker Hughes Co., Class A |
395 | 02/12/24 | USD | 34.75 | USD | 1,350 | (43,299 | ) | ||||||||||||||||||||
| Canadian National Railway Co. |
341 | 02/16/24 | CAD | 160.00 | CAD | 5,679 | (234,831 | ) | ||||||||||||||||||||
| Freeport-McMoRan, Inc. |
370 | 02/16/24 | USD | 39.00 | USD | 1,575 | (164,650 | ) | ||||||||||||||||||||
| Otis Worldwide Corp. |
437 | 02/16/24 | USD | 85.10 | USD | 3,910 | (255,221 | ) | ||||||||||||||||||||
| TELUS Corp. |
346 | 02/16/24 | CAD | 26.00 | CAD | 816 | (1,567 | ) | ||||||||||||||||||||
| Baker Hughes Co., Class A |
381 | 02/22/24 | USD | 32.30 | USD | 1,302 | (103,879 | ) | ||||||||||||||||||||
| Baker Hughes Co., Class A |
394 | 02/26/24 | USD | 36.10 | USD | 1,347 | (32,235 | ) | ||||||||||||||||||||
| Baker Hughes Co., Class A |
381 | 03/07/24 | USD | 32.30 | USD | 1,302 | (111,399 | ) | ||||||||||||||||||||
| Otis Worldwide Corp. |
103 | 03/15/24 | USD | 90.00 | USD | 922 | (31,930 | ) | ||||||||||||||||||||
| TELUS Corp. |
985 | 03/15/24 | CAD | 26.00 | CAD | 2,323 | (5,204 | ) | ||||||||||||||||||||
| TELUS Corp. |
985 | 04/19/24 | CAD | 26.00 | CAD | 2,323 | (9,664 | ) | ||||||||||||||||||||
|
|
|
|||||||||||||||||||||||||||
| $ | (1,756,912 | ) | ||||||||||||||||||||||||||
|
|
|
|||||||||||||||||||||||||||
OTC Options Written
| Description | Counterparty | Number of Contracts |
Expiration Date |
Exercise Price | Notional Amount (000) |
Value | ||||||||||||||||||||||||
| Call |
||||||||||||||||||||||||||||||
| Taiwan Semiconductor Manufacturing Co. Ltd. |
JPMorgan Chase Bank N.A. | 96,000 | 01/04/24 | TWD | 576.08 | TWD | 56,485 | $ | (54,871 | ) | ||||||||||||||||||||
| MediaTek, Inc. |
Morgan Stanley & Co. International PLC |
57,900 | 01/09/24 | TWD | 936.85 | TWD | 58,676 | (101,921 | ) | |||||||||||||||||||||
| MTU Aero Engines AG, Class N |
Bank of America N.A. | 6,900 | 01/09/24 | EUR | 187.87 | EUR | 1,347 | (58,421 | ) | |||||||||||||||||||||
| Prudential PLC |
Bank of America N.A. | 183,300 | 01/09/24 | GBP | 9.14 | GBP | 1,622 | (15,673 | ) | |||||||||||||||||||||
| Sony Group Corp. |
Societe Generale | 37,400 | 01/09/24 | JPY | 13,611.90 | JPY | 499,037 | (41,163 | ) | |||||||||||||||||||||
| Symrise AG, Class A |
Bank of America N.A. | 36,100 | 01/09/24 | EUR | 97.33 | EUR | 3,594 | (108,824 | ) | |||||||||||||||||||||
| Air Liquide SA |
Morgan Stanley & Co. International PLC |
57,800 | 01/10/24 | EUR | 168.61 | EUR | 10,194 | (515,351 | ) | |||||||||||||||||||||
| ASML Holding NV |
Morgan Stanley & Co. International PLC |
4,500 | 01/10/24 | EUR | 630.76 | EUR | 3,077 | (261,902 | ) | |||||||||||||||||||||
| DBS Group Holdings Ltd. |
UBS AG |
95,400 | 01/10/24 | SGD | 33.42 | SGD | 3,184 | (26,911 | ) | |||||||||||||||||||||
| FinecoBank Banca Fineco SpA |
Morgan Stanley & Co. International PLC |
210,400 | 01/10/24 | EUR | 12.13 | EUR | 2,867 | (342,762 | ) | |||||||||||||||||||||
| Heineken NV |
Goldman Sachs International |
34,300 | 01/10/24 | EUR | 87.82 | EUR | 3,157 | (164,427 | ) | |||||||||||||||||||||
| Keyence Corp. |
Societe Generale | 8,300 | 01/10/24 | JPY | 62,553.70 | JPY | 514,179 | (64,191 | ) | |||||||||||||||||||||
| LVMH Moet Hennessy Louis Vuitton SE |
Morgan Stanley & Co. International PLC |
7,000 | 01/10/24 | EUR | 731.07 | EUR | 5,152 | (112,060 | ) | |||||||||||||||||||||
| Taiwan Semiconductor Manufacturing Co. Ltd. |
JPMorgan Chase Bank N.A. |
172,000 | 01/10/24 | TWD | 568.14 | TWD | 101,202 | (144,544 | ) | |||||||||||||||||||||
| Taylor Wimpey PLC, Series L |
UBS AG |
1,290,000 | 01/10/24 | GBP | 1.32 | GBP | 1,894 | (249,226 | ) | |||||||||||||||||||||
| Atlas Copco AB, A Shares |
Goldman Sachs International |
68,800 | 01/11/24 | SEK | 159.29 | SEK | 11,957 | (99,868 | ) | |||||||||||||||||||||
| 72 | 2 0 2 3 B L A C K R O C K A N N U A L R E P O R T T O S H A R E H O L D E R S |
| Schedule of Investments (continued) December 31, 2023
|
BlackRock Enhanced International Dividend Trust (BGY) |
OTC Options Written (continued)
| Description | Counterparty | Number of Contracts |
Expiration Date |
Exercise Price | Notional Amount (000) |
Value | ||||||||||||||||||||||||
| Call (continued) |
||||||||||||||||||||||||||||||
| Nestle SA, Registered Shares |
UBS AG | 35,050 | 01/11/24 | CHF | 100.25 | CHF | 3,417 | $ | (4,945 | ) | ||||||||||||||||||||
| Shell PLC |
Goldman Sachs International | 64,600 | 01/11/24 | EUR | 30.62 | EUR | 1,925 | (6,438 | ) | |||||||||||||||||||||
| Assa Abloy AB, Class B |
Goldman Sachs International | 170,000 | 01/12/24 | SEK | 272.41 | SEK | 49,414 | (320,530 | ) | |||||||||||||||||||||
| Koninklijke KPN NV |
Morgan Stanley & Co. International PLC | 534,000 | 01/12/24 | EUR | 3.17 | EUR | 1,666 | (11,207 | ) | |||||||||||||||||||||
| RELX PLC |
Goldman Sachs International | 69,000 | 01/12/24 | EUR | 35.81 | EUR | 2,476 | (35,553 | ) | |||||||||||||||||||||
| Atlas Copco AB, A Shares |
Bank of America N.A. | 202,000 | 01/17/24 | SEK | 163.50 | SEK | 35,106 | (218,692 | ) | |||||||||||||||||||||
| DBS Group Holdings Ltd. |
JPMorgan Chase Bank N.A. | 119,400 | 01/17/24 | SGD | 32.18 | SGD | 3,985 | (125,395 | ) | |||||||||||||||||||||
| KDDI Corp. |
BNP Paribas SA | 88,300 | 01/17/24 | JPY | 4,666.97 | JPY | 394,905 | (13,135 | ) | |||||||||||||||||||||
| MediaTek, Inc. |
JPMorgan Chase Bank N.A. | 171,000 | 01/17/24 | TWD | 927.62 | TWD | 173,291 | (355,011 | ) | |||||||||||||||||||||
| MTU Aero Engines AG, Class N |
Bank of America N.A. | 23,700 | 01/17/24 | EUR | 188.90 | EUR | 4,625 | (202,863 | ) | |||||||||||||||||||||
| United Overseas Bank Ltd. |
JPMorgan Chase Bank N.A. | 156,600 | 01/17/24 | SGD | 27.46 | SGD | 4,461 | (142,313 | ) | |||||||||||||||||||||
| Wal-Mart de Mexico SAB de CV |
Citibank N.A. | 734,000 | 01/17/24 | MXN | 68.08 | MXN | 52,532 | (178,072 | ) | |||||||||||||||||||||
| FinecoBank Banca Fineco SpA |
Morgan Stanley & Co. International PLC | 210,400 | 01/18/24 | EUR | 12.70 | EUR | 2,867 | (225,714 | ) | |||||||||||||||||||||
| Koninklijke KPN NV |
UBS AG | 468,550 | 01/18/24 | EUR | 3.19 | EUR | 1,462 | (12,678 | ) | |||||||||||||||||||||
| Sanofi SA |
Morgan Stanley & Co. International PLC | 3,400 | 01/18/24 | EUR | 87.55 | EUR | 306 | (10,764 | ) | |||||||||||||||||||||
| Taiwan Semiconductor Manufacturing Co. Ltd. |
Goldman Sachs International | 198,000 | 01/18/24 | TWD | 594.66 | TWD | 116,500 | (52,375 | ) | |||||||||||||||||||||
| Taylor Wimpey PLC, Series L |
UBS AG | 1,290,000 | 01/18/24 | GBP | 1.32 | GBP | 1,894 | (252,910 | ) | |||||||||||||||||||||
| Zurich Insurance Group AG, Class N |
Morgan Stanley & Co. International PLC | 5,300 | 01/18/24 | CHF | 432.35 | CHF | 2,331 | (62,776 | ) | |||||||||||||||||||||
| Assa Abloy AB, Class B |
UBS AG | 170,000 | 01/23/24 | SEK | 272.46 | SEK | 49,414 | (342,265 | ) | |||||||||||||||||||||
| AstraZeneca PLC |
Goldman Sachs International | 72,800 | 01/23/24 | GBP | 103.39 | GBP | 7,704 | (375,278 | ) | |||||||||||||||||||||
| BAE Systems PLC |
UBS AG | 52,400 | 01/23/24 | GBP | 10.62 | GBP | 582 | (36,965 | ) | |||||||||||||||||||||
| FinecoBank Banca Fineco SpA |
Goldman Sachs International | 158,900 | 01/23/24 | EUR | 12.88 | EUR | 2,165 | (148,972 | ) | |||||||||||||||||||||
| Keyence Corp. |
Citibank N.A. | 13,100 | 01/23/24 | JPY | 64,933.75 | JPY | 811,535 | (83,098 | ) | |||||||||||||||||||||
| Novo Nordisk A/S, Class B |
Goldman Sachs International | 78,200 | 01/23/24 | DKK | 711.62 | DKK | 54,724 | (171,439 | ) | |||||||||||||||||||||
| Prudential PLC |
UBS AG | 90,300 | 01/23/24 | GBP | 8.74 | GBP | 799 | (39,542 | ) | |||||||||||||||||||||
| RELX PLC |
Goldman Sachs International | 69,000 | 01/23/24 | EUR | 35.81 | EUR | 2,476 | (49,141 | ) | |||||||||||||||||||||
| Sanofi SA |
Morgan Stanley & Co. International PLC | 61,800 | 01/23/24 | EUR | 89.72 | EUR | 5,563 | (115,248 | ) | |||||||||||||||||||||
| Smith & Nephew PLC |
Goldman Sachs International | 126,400 | 01/23/24 | GBP | 10.56 | GBP | 1,362 | (63,009 | ) | |||||||||||||||||||||
| Sony Group Corp. |
Bank of America N.A. | 42,700 | 01/23/24 | JPY | 12,954.17 | JPY | 569,756 | (200,286 | ) | |||||||||||||||||||||
| Symrise AG, Class A |
Bank of America N.A. | 30,200 | 01/23/24 | EUR | 105.31 | EUR | 3,006 | (11,530 | ) | |||||||||||||||||||||
| Wal-Mart de Mexico SAB de CV |
JPMorgan Chase Bank N.A. | 466,300 | 01/23/24 | MXN | 68.95 | MXN | 33,373 | (101,809 | ) | |||||||||||||||||||||
| Koninklijke KPN NV |
Goldman Sachs International | 533,400 | 01/24/24 | EUR | 3.17 | EUR | 1,665 | (18,278 | ) | |||||||||||||||||||||
| Koninklijke KPN NV |
Goldman Sachs International | 468,550 | 01/24/24 | EUR | 3.18 | EUR | 1,462 | (15,807 | ) | |||||||||||||||||||||
| United Overseas Bank Ltd. |
UBS AG | 63,000 | 01/24/24 | SGD | 27.74 | SGD | 1,795 | (47,617 | ) | |||||||||||||||||||||
| ASML Holding NV |
Bank of America N.A. | 9,000 | 01/25/24 | EUR | 650.68 | EUR | 6,154 | (394,599 | ) | |||||||||||||||||||||
| Prudential PLC |
Goldman Sachs International | 90,400 | 01/25/24 | GBP | 9.12 | GBP | 800 | (19,066 | ) | |||||||||||||||||||||
| Nestle SA, Registered Shares |
Morgan Stanley & Co. International PLC | 23,000 | 01/30/24 | CHF | 101.82 | CHF | 2,242 | (7,433 | ) | |||||||||||||||||||||
| Prudential PLC |
Morgan Stanley & Co. International PLC | 95,600 | 01/30/24 | GBP | 9.04 | GBP | 846 | (27,850 | ) | |||||||||||||||||||||
| Taylor Wimpey PLC, Series L |
UBS AG | 1,290,000 | 01/30/24 | GBP | 1.32 | GBP | 1,894 | (259,043 | ) | |||||||||||||||||||||
| Zurich Insurance Group AG, Class N |
Morgan Stanley & Co. International PLC | 6,300 | 01/30/24 | CHF | 444.21 | CHF | 2,770 | (26,733 | ) | |||||||||||||||||||||
| EssilorLuxottica SA |
UBS AG | 29,600 | 01/31/24 | EUR | 183.98 | EUR | 5,384 | (88,937 | ) | |||||||||||||||||||||
| B3 SA - Brasil Bolsa Balcao |
Citibank N.A. | 768,100 | 02/01/24 | BRL | 13.96 | BRL | 11,163 | (151,254 | ) | |||||||||||||||||||||
| KDDI Corp. |
BNP Paribas SA | 88,300 | 02/01/24 | JPY | 4,703.22 | JPY | 394,905 | (19,408 | ) | |||||||||||||||||||||
| RELX PLC |
Morgan Stanley & Co. International PLC | 29,400 | 02/01/24 | EUR | 36.80 | EUR | 1,055 | (12,919 | ) | |||||||||||||||||||||
| Shell PLC |
Bank of America N.A. | 82,500 | 02/01/24 | EUR | 30.26 | EUR | 2,459 | (42,265 | ) | |||||||||||||||||||||
| Wal-Mart de Mexico SAB de CV |
Citibank N.A. | 734,100 | 02/01/24 | MXN | 68.03 | MXN | 52,540 | (207,781 | ) | |||||||||||||||||||||
| Taiwan Semiconductor Manufacturing Co. Ltd. |
JPMorgan Chase Bank N.A. | 48,000 | 02/05/24 | TWD | 585.65 | TWD | 28,242 | (25,931 | ) | |||||||||||||||||||||
| BAE Systems PLC |
UBS AG | 246,300 | 02/06/24 | GBP | 10.80 | GBP | 2,735 | (148,041 | ) | |||||||||||||||||||||
| Koninklijke KPN NV |
Morgan Stanley & Co. International PLC | 372,900 | 02/06/24 | EUR | 3.20 | EUR | 1,164 | (15,470 | ) | |||||||||||||||||||||
| Smith & Nephew PLC |
Morgan Stanley & Co. International PLC | 95,400 | 02/06/24 | GBP | 10.97 | GBP | 1,028 | (33,417 | ) | |||||||||||||||||||||
| United Overseas Bank Ltd. |
Citibank N.A. | 74,200 | 02/06/24 | SGD | 28.52 | SGD | 2,114 | (30,727 | ) | |||||||||||||||||||||
| B3 SA - Brasil Bolsa Balcao |
Citibank N.A. | 768,100 | 02/07/24 | BRL | 13.69 | BRL | 11,163 | (190,988 | ) | |||||||||||||||||||||
| Prudential PLC |
Goldman Sachs International | 154,100 | 02/07/24 | GBP | 8.84 | GBP | 1,364 | (71,557 | ) | |||||||||||||||||||||
| RELX PLC |
Morgan Stanley & Co. International PLC | 90,000 | 02/07/24 | EUR | 36.02 | EUR | 3,230 | (77,957 | ) | |||||||||||||||||||||
| Shell PLC |
Morgan Stanley & Co. International PLC | 51,600 | 02/07/24 | EUR | 30.46 | EUR | 1,538 | (27,252 | ) | |||||||||||||||||||||
| Atlas Copco AB, A Shares |
Bank of America N.A. | 228,000 | 02/08/24 | SEK | 168.64 | SEK | 39,625 | (190,187 | ) | |||||||||||||||||||||
| Heineken NV |
Morgan Stanley & Co. International PLC | 37,000 | 02/08/24 | EUR | 90.09 | EUR | 3,405 | (148,691 | ) | |||||||||||||||||||||
| BAE Systems PLC |
Goldman Sachs International | 102,400 | 02/13/24 | GBP | 10.88 | GBP | 1,137 | (59,492 | ) | |||||||||||||||||||||
| Yum China Holdings, Inc. |
Morgan Stanley & Co. International PLC | 35,700 | 02/26/24 | USD | 45.19 | USD | 1,515 | (48,497 | ) | |||||||||||||||||||||
|
|
|
|||||||||||||||||||||||||||||
| $ | (8,739,265 | ) | ||||||||||||||||||||||||||||
|
|
|
|||||||||||||||||||||||||||||
| S C H E D U L E O F I N V E S T M E N T S |
73 |
| Schedule of Investments (continued) December 31, 2023
|
BlackRock Enhanced International Dividend Trust (BGY) |
Balances Reported in the Statements of Assets and Liabilities for Options Written
| Description | Swap Premiums Paid |
Swap Premiums Received |
Unrealized Appreciation |
Unrealized Depreciation |
Value | |||||||||||||||
| Options Written |
$ N/A | $ N/A | $ 823,460 | $ (5,271,664 | ) | $ (10,496,177 | ) | |||||||||||||
Derivative Financial Instruments Categorized by Risk Exposure
As of period end, the fair values of derivative financial instruments located in the Statements of Assets and Liabilities were as follows:
| Commodity Contracts |
Credit Contracts |
Equity Contracts |
Foreign Currency Exchange Contracts |
Interest Rate Contracts |
Other Contracts |
Total | ||||||||||||||||||||||
| Liabilities — Derivative Financial Instruments |
||||||||||||||||||||||||||||
| Options written |
||||||||||||||||||||||||||||
| Options written at value |
$ | — | $ | — | $ | 10,496,177 | $ | — | $ | — | $ | — | $ | 10,496,177 | ||||||||||||||
|
|
|
|
|
|
|
|
|
|
|
|
|
|
|
|||||||||||||||
For the period ended December 31, 2023, the effect of derivative financial instruments in the Statements of Operations was as follows:
| Commodity Contracts |
Credit Contracts |
Equity Contracts |
Foreign Currency |
Interest Rate Contracts |
Other Contracts |
Total | ||||||||||||||||||||||
| Net Realized Gain (Loss) from: |
||||||||||||||||||||||||||||
| Options purchased(a) |
$ | — | $ | — | $ | (11,196,135 | ) | $ | — | $ | — | $ | — | $ | (11,196,135 | ) | ||||||||||||
| Options written |
— | — | 13,525,844 | — | — | — | 13,525,844 | |||||||||||||||||||||
|
|
|
|
|
|
|
|
|
|
|
|
|
|
|
|||||||||||||||
| $ | — | $ | — | $ | 2,329,709 | $ | — | $ | — | $ | — | $ | 2,329,709 | |||||||||||||||
|
|
|
|
|
|
|
|
|
|
|
|
|
|
|
|||||||||||||||
| Net Change in Unrealized Appreciation (Depreciation) on: |
||||||||||||||||||||||||||||
| Options written |
$ | — | $ | — | $ | (5,754,650 | ) | $ | — | $ | — | $ | — | $ | (5,754,650 | ) | ||||||||||||
|
|
|
|
|
|
|
|
|
|
|
|
|
|
|
|||||||||||||||
| (a) | Options purchased are included in net realized gain (loss) from investments — unaffiliated. |
Average Quarterly Balances of Outstanding Derivative Financial Instruments
| Options: |
||||
| Average value of option contracts purchased |
$ | — | (a) | |
| Average value of option contracts written |
$ | 6,703,347 | ||
| (a) | Derivative financial instrument not held at any quarter-end. The risk exposure table serves as an indicator of activity during the period. |
For more information about the Trust’s investment risks regarding derivative financial instruments, refer to the Notes to Financial Statements.
Derivative Financial Instruments — Offsetting as of Period End
The Trust’s derivative assets and liabilities (by type) were as follows:
| Assets | Liabilities | |||||||
| Derivative Financial Instruments |
$ | — | $ | 10,496,177 | ||||
|
|
|
|
|
|||||
| Total derivative assets and liabilities in the Statements of Assets and Liabilities |
— | 10,496,177 | ||||||
|
|
|
|
|
|||||
| Derivatives not subject to a Master Netting Agreement or similar agreement (“MNA”) |
— | (1,756,912 | ) | |||||
|
|
|
|
|
|||||
| Total derivative assets and liabilities subject to an MNA |
$ | — | $ | 8,739,265 | ||||
|
|
|
|
|
|||||
| 74 | 2 0 2 3 B L A C K R O C K A N N U A L R E P O R T T O S H A R E H O L D E R S |
| Schedule of Investments (continued) December 31, 2023
|
BlackRock Enhanced International Dividend Trust (BGY) |
The following table presents the Trust’s derivative liabilities by counterparty net of amounts available for offset under an MNA and net of the related collateral pledged by the Trust:
| Counterparty | |
Derivative Liabilities Subject to an MNA by Counterparty |
|
|
Derivatives Available for Offset |
|
|
Non-Cash Collateral Pledged |
(a) |
|
Cash Collateral Pledged |
|
|
Net Amount of Derivative Liabilities |
(b) | |||||
| Bank of America N.A. |
$ | 1,443,340 | $ | — | $ | (1,443,340 | ) | $ | — | $ | — | |||||||||
| BNP Paribas SA |
32,543 | — | — | — | 32,543 | |||||||||||||||
| Citibank N.A. |
841,920 | — | (841,920 | ) | — | — | ||||||||||||||
| Goldman Sachs International |
1,671,230 | — | (1,671,230 | ) | — | — | ||||||||||||||
| JPMorgan Chase Bank N.A. |
949,874 | — | (949,874 | ) | — | — | ||||||||||||||
| Morgan Stanley & Co. International PLC |
2,185,924 | — | (2,185,924 | ) | — | — | ||||||||||||||
| Societe Generale |
105,354 | — | — | — | 105,354 | |||||||||||||||
| UBS AG |
1,509,080 | — | (1,509,080 | ) | — | — | ||||||||||||||
|
|
|
|
|
|
|
|
|
|
|
|||||||||||
| $ | 8,739,265 | $ | — | $ | (8,601,368 | ) | $ | — | $ | 137,897 | ||||||||||
|
|
|
|
|
|
|
|
|
|
|
|||||||||||
| (a) | Excess of collateral received/pledged, if any, from the individual counterparty is not shown for financial reporting purposes. |
| (b) | Net amount represents the net amount payable due to counterparty in the event of default. Net amount may be offset further by the options written receivable/payable on the Statements of Assets and Liabilities. |
Fair Value Hierarchy as of Period End
Various inputs are used in determining the fair value of financial instruments. For a description of the input levels and information about the Trust’s policy regarding valuation of financial instruments, refer to the Notes to Financial Statements.
The following table summarizes the Trust’s financial instruments categorized in the fair value hierarchy. The breakdown of the Trust’s financial instruments into major categories is disclosed in the Schedule of Investments above.
| Level 1 | Level 2 | Level 3 | Total | |||||||||||||
| Assets |
||||||||||||||||
| Investments |
||||||||||||||||
| Long-Term Investments |
||||||||||||||||
| Common Stocks |
||||||||||||||||
| Brazil |
$ | — | $ | 9,192,006 | $ | — | $ | 9,192,006 | ||||||||
| Canada |
28,050,713 | — | — | 28,050,713 | ||||||||||||
| China |
6,750,528 | — | — | 6,750,528 | ||||||||||||
| Denmark |
— | 23,153,894 | — | 23,153,894 | ||||||||||||
| France |
— | 66,695,606 | — | 66,695,606 | ||||||||||||
| Germany |
— | 27,151,082 | — | 27,151,082 | ||||||||||||
| India |
— | 16,021,748 | 425,866 | 16,447,614 | ||||||||||||
| Indonesia |
— | 9,817,118 | — | 9,817,118 | ||||||||||||
| Italy |
— | 18,773,747 | — | 18,773,747 | ||||||||||||
| Japan |
— | 47,933,352 | — | 47,933,352 | ||||||||||||
| Mexico |
18,117,599 | — | — | 18,117,599 | ||||||||||||
| Netherlands |
— | 75,146,699 | — | 75,146,699 | ||||||||||||
| Singapore |
— | 26,168,868 | — | 26,168,868 | ||||||||||||
| Sweden |
— | 36,378,217 | — | 36,378,217 | ||||||||||||
| Switzerland |
— | 28,327,497 | — | 28,327,497 | ||||||||||||
| Taiwan |
— | 45,083,028 | — | 45,083,028 | ||||||||||||
| United Kingdom |
12,615,337 | 72,203,808 | — | 84,819,145 | ||||||||||||
| United States |
56,726,472 | — | — | 56,726,472 | ||||||||||||
| Short-Term Securities |
||||||||||||||||
| Money Market Funds |
8,260,103 | — | — | 8,260,103 | ||||||||||||
|
|
|
|
|
|
|
|
|
|||||||||
| $ | 130,520,752 | $ | 502,046,670 | $ | 425,866 | $ | 632,993,288 | |||||||||
|
|
|
|
|
|
|
|
|
|||||||||
| Derivative Financial Instruments(a) |
||||||||||||||||
| Liabilities |
||||||||||||||||
| Equity Contracts |
$ | (1,031,967 | ) | $ | (9,464,210 | ) | $ | — | $ | (10,496,177 | ) | |||||
|
|
|
|
|
|
|
|
|
|||||||||
| (a) | Derivative financial instruments are options written. Options written are shown at value. |
See notes to financial statements.
| S C H E D U L E O F I N V E S T M E N T S |
75 |
| Schedule of Investments December 31, 2023 |
BlackRock Health Sciences Term Trust (BMEZ) (Percentages shown are based on Net Assets) |
|
Security |
Shares | Value | ||||||
| Common Stocks |
||||||||
| Biotechnology — 37.6% | ||||||||
| 4D Molecular Therapeutics, Inc.(a) |
95,330 | $ | 1,931,386 | |||||
| Abbisko Cayman Ltd. |
10,378,250 | 4,844,022 | ||||||
| AbbVie, Inc. |
149,565 | 23,178,088 | ||||||
| AC Immune SA(a) |
752,390 | 3,761,950 | ||||||
| Alkermes PLC(a) |
183,485 | 5,089,874 | ||||||
| Allakos, Inc.(a) |
136,405 | 372,386 | ||||||
| Alnylam Pharmaceuticals, Inc.(a)(b) |
102,967 | 19,708,913 | ||||||
| Amgen, Inc.(b)(c) |
132,690 | 38,217,374 | ||||||
| Annexon, Inc.(a) |
237,835 | 1,079,771 | ||||||
| Antengene Corp. Ltd.(a) |
5,019,274 | 1,285,592 | ||||||
| Apellis Pharmaceuticals, Inc.(a)(d) |
51,390 | 3,076,205 | ||||||
| Arcturus Therapeutics Holdings, Inc.(a) |
103,675 | 3,268,873 | ||||||
| Arcus Biosciences, Inc.(a) |
169,790 | 3,242,989 | ||||||
| Argenx SE, ADR(a) |
69,867 | 26,579,503 | ||||||
| Arrowhead Pharmaceuticals, Inc.(a) |
81,025 | 2,479,365 | ||||||
| Autolus Therapeutics PLC, ADR(a) |
462,111 | 2,975,995 | ||||||
| BeiGene Ltd., ADR(a) |
68,555 | 12,364,580 | ||||||
| Bicycle Therapeutics PLC, ADR(a)(d) |
278,270 | 5,031,122 | ||||||
| Biogen, Inc.(a) |
99,215 | 25,673,866 | ||||||
| Biohaven Ltd.(a) |
99,155 | 4,243,834 | ||||||
| BioMarin Pharmaceutical, Inc.(a)(c) |
420,758 | 40,569,486 | ||||||
| Biomea Fusion, Inc.(a) |
146,215 | 2,123,042 | ||||||
| Black Diamond Therapeutics, Inc.(a)(d) |
833,550 | 2,342,276 | ||||||
| Blueprint Medicines Corp.(a) |
322,440 | 29,741,866 | ||||||
| Bridgebio Pharma, Inc.(a) |
66,595 | 2,688,440 | ||||||
| Cabaletta Bio, Inc.(a) |
506,395 | 11,495,166 | ||||||
| Cerevel Therapeutics Holdings, Inc.(a) |
221,156 | 9,377,014 | ||||||
| Connect Biopharma Holdings Ltd., ADR(a) |
1,040,067 | 1,227,279 | ||||||
| CureVac NV(a)(d) |
320,123 | 1,347,718 | ||||||
| Everest Medicines Ltd. |
3,113,667 | 8,343,091 | ||||||
| Exact Sciences Corp.(a) |
83,290 | 6,161,794 | ||||||
| Exelixis, Inc.(a) |
599,320 | 14,377,687 | ||||||
| Galapagos NV, ADR(a) |
74,410 | 3,024,767 | ||||||
| Genmab A/S(a) |
34,827 | 11,104,694 | ||||||
| Genmab A/S, ADR(a)(d) |
114,086 | 3,632,498 | ||||||
| Gilead Sciences, Inc. |
168,195 | 13,625,477 | ||||||
| Halozyme Therapeutics, Inc.(a) |
158,300 | 5,850,768 | ||||||
| Immuneering Corp., Class A(a) |
335,561 | 2,466,373 | ||||||
| Immunocore Holdings PLC, ADR(a) |
59,868 | 4,090,182 | ||||||
| Immunocore Holdings PLC, Series C, ADR(a) |
321,900 | 21,992,208 | ||||||
| ImmunoGen, Inc.(a) |
207,169 | 6,142,561 | ||||||
| Incyte Corp.(a) |
227,420 | 14,279,702 | ||||||
| Ionis Pharmaceuticals, Inc.(a) |
405,860 | 20,532,457 | ||||||
| Iovance Biotherapeutics, Inc.(a) |
168,215 | 1,367,588 | ||||||
| Karuna Therapeutics, Inc.(a) |
21,350 | 6,757,489 | ||||||
| Keros Therapeutics, Inc.(a) |
124,317 | 4,942,844 | ||||||
| Kinnate Biopharma, Inc.(a) |
196,773 | 466,352 | ||||||
| Legend Biotech Corp., ADR(a)(d) |
316,032 | 19,015,645 | ||||||
| LianBio, Series A, ADR(a) |
615,188 | 2,749,890 | ||||||
| MacroGenics, Inc.(a) |
190,555 | 1,833,139 | ||||||
| Merus NV(a)(d) |
411,972 | 11,329,230 | ||||||
| Mirati Therapeutics, Inc.(a) |
180,175 | 10,585,281 | ||||||
| Monte Rosa Therapeutics, Inc.(a) |
266,168 | 1,503,849 | ||||||
| MoonLake Immunotherapeutics, Class A(a)(d) |
114,141 | 6,892,975 | ||||||
| Morphic Holding, Inc.(a) |
75,190 | 2,171,487 | ||||||
| Neurocrine Biosciences, Inc.(a) |
204,955 | 27,004,871 | ||||||
| Neurogene, Inc. |
372,050 | 7,210,329 | ||||||
| Nuvalent, Inc., Class A(a)(d) |
241,500 | 17,771,985 | ||||||
| Prime Medicine, Inc.(a)(d) |
412,139 | 3,651,552 | ||||||
| Protagonist Therapeutics, Inc.(a) |
421,725 | 9,670,154 | ||||||
|
Security |
Shares | Value | ||||||
| Biotechnology (continued) | ||||||||
| PTC Therapeutics, Inc.(a) |
225,815 | $ | 6,223,461 | |||||
| REVOLUTION Medicines, Inc.(a) |
181,447 | 5,203,900 | ||||||
| Rhythm Pharmaceuticals, Inc.(a)(d) |
580,575 | 26,689,033 | ||||||
| Rocket Pharmaceuticals, Inc.(a) |
252,097 | 7,555,347 | ||||||
| Roivant Sciences Ltd.(a) |
607,105 | 6,817,789 | ||||||
| Sarepta Therapeutics, Inc.(a)(b) |
237,759 | 22,927,100 | ||||||
| Tenaya Therapeutics, Inc.(a) |
165,729 | 536,962 | ||||||
| TScan Therapeutics, Inc.(a) |
1,045,767 | 6,096,822 | ||||||
| Twist Bioscience Corp.(a) |
130,265 | 4,801,568 | ||||||
| Ultragenyx Pharmaceutical, Inc.(a) |
118,142 | 5,649,550 | ||||||
| United Therapeutics Corp.(a)(b) |
55,704 | 12,248,753 | ||||||
| Vaxcyte, Inc.(a) |
277,670 | 17,437,676 | ||||||
| Vertex Pharmaceuticals, Inc.(a) |
25,510 | 10,379,764 | ||||||
| Viking Therapeutics, Inc.(a) |
235,245 | 4,377,909 | ||||||
| Voyager Therapeutics, Inc.(a)(d) |
164,865 | 1,391,461 | ||||||
| Xenon Pharmaceuticals, Inc.(a) |
420,084 | 19,349,069 | ||||||
|
|
|
|||||||
| 717,553,058 | ||||||||
| Electronic Equipment, Instruments & Components — 0.2% | ||||||||
| 908 Devices, Inc.(a) |
274,084 | 3,075,222 | ||||||
|
|
|
|||||||
| Health Care Equipment & Supplies — 20.0% |
|
|||||||
| Abbott Laboratories |
127,770 | 14,063,644 | ||||||
| Alcon, Inc. |
174,349 | 13,620,144 | ||||||
| Align Technology, Inc.(a)(c) |
139,485 | 38,218,890 | ||||||
| Becton Dickinson & Co. |
84,050 | 20,493,911 | ||||||
| Boston Scientific Corp.(a) |
455,830 | 26,351,532 | ||||||
| CONMED Corp. |
98,215 | 10,755,525 | ||||||
| ConvaTec Group PLC(e) |
4,411,215 | 13,727,210 | ||||||
| Cooper Cos., Inc. |
99,160 | 37,526,110 | ||||||
| Dexcom, Inc.(a) |
76,385 | 9,478,615 | ||||||
| Hologic, Inc.(a)(b) |
194,620 | 13,905,599 | ||||||
| Inspire Medical Systems, Inc.(a)(d) |
89,190 | 18,143,922 | ||||||
| Intuitive Surgical, Inc.(a)(b) |
100,308 | 33,839,907 | ||||||
| Masimo Corp.(a)(d) |
145,470 | 17,050,539 | ||||||
| Novocure Ltd.(a) |
213,335 | 3,185,092 | ||||||
| Nyxoah SA(a) |
648,041 | 3,006,910 | ||||||
| Orchestra BioMed Holdings, Inc.(a) |
233,344 | 2,130,431 | ||||||
| Penumbra, Inc.(a)(d) |
59,993 | 15,090,639 | ||||||
| Pulmonx Corp.(a) |
335,566 | 4,278,467 | ||||||
| Shockwave Medical, Inc.(a) |
63,915 | 12,179,642 | ||||||
| SI-BONE, Inc.(a) |
204,910 | 4,301,061 | ||||||
| STERIS PLC |
158,575 | 34,862,714 | ||||||
| Stryker Corp. |
44,605 | 13,357,413 | ||||||
| Tandem Diabetes Care, Inc.(a) |
129,700 | 3,836,526 | ||||||
| Zimmer Biomet Holdings, Inc. |
154,445 | 18,795,956 | ||||||
|
|
|
|||||||
| 382,200,399 | ||||||||
| Health Care Providers & Services — 9.6% | ||||||||
| Adicon Holdings Ltd., (Acquired 07/19/23, Cost: $17,840,000)(f) |
10,696,226 | 17,862,430 | ||||||
| Cencora, Inc.(b)(c) |
193,355 | 39,711,250 | ||||||
| Centene Corp.(a)(d) |
179,980 | 13,356,316 | ||||||
| Chemed Corp. |
10,662 | 6,234,604 | ||||||
| Elevance Health, Inc. |
28,805 | 13,583,286 | ||||||
| Encompass Health Corp.(b) |
82,323 | 5,492,591 | ||||||
| Guardant Health, Inc.(a) |
196,470 | 5,314,513 | ||||||
| Humana, Inc. |
18,270 | 8,364,189 | ||||||
| Kindstar Globalgene Technology, Inc.(a)(e) |
4,092,500 | 880,502 | ||||||
| McKesson Corp. |
38,905 | 18,012,237 | ||||||
| Molina Healthcare, Inc.(a) |
70,995 | 25,651,203 | ||||||
| UnitedHealth Group, Inc.(b) |
52,210 | 27,486,999 | ||||||
|
|
|
|||||||
| 181,950,120 | ||||||||
| 76 | 2 0 2 3 B L A C K R O C K A N N U A L R E P O R T T O S H A R E H O L D E R S |
| Schedule of Investments (continued) December 31, 2023 |
BlackRock Health Sciences Term Trust (BMEZ) (Percentages shown are based on Net Assets) |
|
Security |
Shares | Value | ||||||
| Health Care Technology — 0.1% | ||||||||
| Sophia Genetics SA(a)(d) |
291,485 | $ | 1,372,894 | |||||
|
|
|
|||||||
| Life Sciences Tools & Services — 14.7% | ||||||||
| 10X Genomics, Inc., Class A(a) |
231,935 | 12,979,083 | ||||||
| Avantor, Inc.(a)(b)(d) |
664,444 | 15,169,257 | ||||||
| Bio-Rad Laboratories, Inc., Class A(a) |
20,190 | 6,519,149 | ||||||
| Bio-Techne Corp. |
415,455 | 32,056,508 | ||||||
| Bruker Corp. |
185,257 | 13,612,684 | ||||||
| Charles River Laboratories International, Inc.(a) |
102,105 | 24,137,622 | ||||||
| Danaher Corp. |
82,550 | 19,097,117 | ||||||
| Gerresheimer AG |
243,305 | 25,312,387 | ||||||
| Lonza Group AG, Registered Shares |
23,365 | 9,850,361 | ||||||
| Mettler-Toledo International, Inc.(a) |
15,590 | 18,910,046 | ||||||
| QIAGEN NV(a) |
663,980 | 28,836,652 | ||||||
| Rapid Micro Biosystems, Inc., Class A(a) |
549,778 | 406,836 | ||||||
| Repligen Corp.(a)(d) |
95,255 | 17,126,849 | ||||||
| Waters Corp.(a) |
90,145 | 29,678,438 | ||||||
| West Pharmaceutical Services, Inc.(b)(c) |
77,325 | 27,227,679 | ||||||
|
|
|
|||||||
| 280,920,668 | ||||||||
| Pharmaceuticals — 8.6% | ||||||||
| Arvinas, Inc.(a) |
232,960 | 9,588,634 | ||||||
| Axsome Therapeutics, Inc.(a) |
38,160 | 3,037,154 | ||||||
| Catalent, Inc.(a) |
347,125 | 15,596,326 | ||||||
| Elanco Animal Health, Inc.(a) |
1,234,695 | 18,396,956 | ||||||
| Eli Lilly & Co.(b) |
43,825 | 25,546,469 | ||||||
| Merck & Co., Inc. |
200,730 | 21,883,585 | ||||||
| Novo Nordisk A/S, Class B |
339,190 | 35,150,651 | ||||||
| Nuvation Bio, Inc., Class A(a) |
200,496 | 302,749 | ||||||
| Sanofi SA, ADR |
496,860 | 24,708,848 | ||||||
| Structure Therapeutics, Inc., ADR(a)(d) |
258,475 | 10,535,441 | ||||||
|
|
|
|||||||
| 164,746,813 | ||||||||
|
|
|
|||||||
| Total Common Stocks — 90.8% |
1,731,819,174 | |||||||
|
|
|
|||||||
| Benefical Interest (000) |
||||||||
| Other Interests |
||||||||
| Biotechnology(f)(g)(h) — 0.2% |
||||||||
| Affinivax, Inc., (Acquired 08/18/22, |
$ | 183 | 2,458,061 | |||||
| Amunix Pharmaceuticals, Inc., (Acquired 02/08/22, Cost: $ —) |
5,657 | 2,206,257 | ||||||
|
|
|
|||||||
| Total Other Interests — 0.2% |
4,664,318 | |||||||
|
|
|
|||||||
| Shares | ||||||||
| Preferred Securities |
||||||||
| Preferred Stocks — 8.5% | ||||||||
| Biotechnology(a)(g) — 3.2% | ||||||||
| ABCURO, Series B |
1,092,954 | 6,011,247 | ||||||
| Bright Peak Therapeutics, Inc., Series B, (Acquired 05/14/21, Cost: $8,000,004)(f) |
2,048,132 | 3,236,049 | ||||||
| Cellarity, Inc., Series B, (Acquired 01/15/21, Cost: $14,584,998)(f) |
2,430,833 | 8,070,365 | ||||||
| Security |
Shares |
Value | ||||||
| Biotechnology (continued) | ||||||||
| Genesis Therapeutics, Series B, (Acquired 08/10/23, Cost: $6,999,996)(f) |
1,370,506 | $ | 7,003,286 | |||||
| Goldfinch Bio, Inc., Series B, (Acquired 06/26/20, Cost: $4,543,847)(f) |
3,850,718 | 1,309,244 | ||||||
| Kartos Therapeutics, Series C, (Acquired 08/22/23, Cost: $7,539,875)(f) |
1,333,783 | 7,562,550 | ||||||
| Laronde, Inc., Series B, (Acquired 07/28/21, Cost: $13,498,156)(f) |
482,077 | 13,498,156 | ||||||
| Mirvie, Inc., Series B, (Acquired 10/15/21, Cost: $6,250,000)(f) |
2,793,833 | 5,000,961 | ||||||
| NiKang Therapeutics, Inc., Series C, (Acquired 05/20/21, Cost: $7,999,996)(f) |
1,394,189 | 4,252,276 | ||||||
| OnKure, Inc., Series C, (Acquired 03/24/23, Cost: $7,022,595)(f) |
2,541,380 | 5,540,208 | ||||||
|
|
|
|||||||
| 61,484,342 | ||||||||
| Health Care Equipment & Supplies(a)(f)(g) — 0.8% |
|
|||||||
| Exo Imaging, Inc., Series C, (Acquired 06/24/21, Cost: $13,225,003) |
2,257,597 | 5,960,056 | ||||||
| Nucleix Ltd., Series AA, (Acquired 03/25/21, Cost: $6,929,998) |
2,379,480 | 6,448,391 | ||||||
| Swift Health Systems, Inc., Series D, (Acquired 08/27/21, Cost: $6,441,930) |
2,078,042 | 1,745,555 | ||||||
|
|
|
|||||||
| 14,154,002 | ||||||||
| Health Care Providers & Services(a)(f)(g) — 1.0% |
|
|||||||
| Everly Well, Inc., Series D, (Acquired 11/25/20, Cost: $9,999,986) |
382,775 | 3,789,473 | ||||||
| Numab Therapeutics AG, Series C, (Acquired 05/07/21, Cost: $7,770,441) |
815,851 | 7,508,099 | ||||||
| Quanta Dialysis Technologies Ltd., Series D, (Acquired 06/18/21, Cost: $14,071,890) |
115,766,240 | 7,820,757 | ||||||
|
|
|
|||||||
| 19,118,329 | ||||||||
| Health Care Technology — 0.8% |
|
|||||||
| Carbon Health Technologies, Inc., Series D2, (Acquired 02/02/23, |
1,694,781 | 14,931,020 | ||||||
|
|
|
|||||||
| Life Sciences Tools & Services — 0.9% | ||||||||
| Sartorius AG |
47,930 | 17,600,893 | ||||||
|
|
|
|||||||
| Pharmaceuticals(a)(f)(g) — 0.9% |
|
|||||||
| Adarx Pharamaceuticals, Series C, (Acquired 08/02/23, Cost: $7,160,001) |
860,577 | 7,168,607 | ||||||
| Insitro, Inc. |
|
|||||||
| Series B, (Acquired 05/21/20, Cost: $5,000,000) |
802,478 | 8,377,870 | ||||||
| Series C, (Acquired 03/10/21, Cost: $3,600,018) |
196,818 | 2,054,780 | ||||||
|
|
|
|||||||
| 17,601,257 | ||||||||
| Semiconductors & Semiconductor Equipment — 0.9% |
|
|||||||
| PsiQuantum Corp., Series D, (Acquired 05/21/21, |
571,947 | 16,254,734 | ||||||
|
|
|
|||||||
| 161,144,577 | ||||||||
|
|
|
|||||||
| Total Preferred Securities — 8.5% |
|
161,144,577 | ||||||
|
|
|
|||||||
| Rights |
|
|||||||
| Biotechnology — 0.0% | ||||||||
| Korro Bio, Inc., CVR |
231,775 | 3,152 | ||||||
|
|
|
|||||||
| S C H E D U L E O F I N V E S T M E N T S |
77 |
| Schedule of Investments (continued) December 31, 2023 |
BlackRock Health Sciences Term Trust (BMEZ) (Percentages shown are based on Net Assets) |
| Security |
Shares |
Value | ||||||
| Health Care Equipment & Supplies — 0.0% |
|
|||||||
| Abiomed, Inc., CVR(g) |
98,636 | $ | 268,290 | |||||
|
|
|
|||||||
| Total Rights — 0.0% |
|
271,442 | ||||||
|
|
|
|||||||
| Warrants | ||||||||
| Health Care Providers & Services — 0.0% | ||||||||
| CareMax, Inc., (Issued/Exercisable 09/15/20, 1 Share for 1 Warrant, Expires 08/06/26, Strike Price USD 11.50)(a) |
63,808 | 478 | ||||||
|
|
|
|||||||
| Pharmaceuticals — 0.0% | ||||||||
| Nuvation Bio, Inc., (Issued/Exercisable 08/17/20, 1 Share for 1 Warrant, Expires 07/07/27, Strike Price USD 11.50)(a) |
68,880 | 4,133 | ||||||
|
|
|
|||||||
| Total Warrants — 0.0% |
|
4,611 | ||||||
|
|
|
|||||||
| Total Long-Term Investments — 99.5% |
|
1,897,904,122 | ||||||
|
|
|
|||||||
| Short-Term Securities | ||||||||
| Money Market Funds — 2.8% | ||||||||
| BlackRock Liquidity Funds, T-Fund, Institutional Class, 5.26%(i)(j) |
40,473,813 | 40,473,813 | ||||||
| SL Liquidity Series, LLC, Money Market Series, 5.58%(i)(j)(k) |
12,304,554 | 12,308,246 | ||||||
|
|
|
|||||||
| Total Short-Term Securities — 2.8% |
|
52,782,059 | ||||||
|
|
|
|||||||
| Total Investments Before Options Written — 102.3% |
|
1,950,686,181 | ||||||
|
|
|
|||||||
| Options Written — (1.7)% |
|
(31,431,446 | ) | |||||
|
|
|
|||||||
| Total Investments, Net of Options Written — 100.6% |
|
1,919,254,735 | ||||||
| Liabilities in Excess of Other Assets — (0.6)% |
|
(11,883,803 | ) | |||||
|
|
|
|||||||
| Net Assets — 100.0% |
|
$ | 1,907,370,932 | |||||
|
|
|
|||||||
| (a) | Non-income producing security. |
| (b) | All or a portion of the security has been pledged and/or segregated as collateral in connection with outstanding exchange-traded options written. |
| (c) | All or a portion of the security has been pledged as collateral in connection with outstanding OTC derivatives. |
| (d) | All or a portion of this security is on loan. |
| (e) | Security exempt from registration pursuant to Rule 144A under the Securities Act of 1933, as amended. These securities may be resold in transactions exempt from registration to qualified institutional investors. |
| (f) | Restricted security as to resale, excluding 144A securities. The Trust held restricted securities with a current value of $160,059,185, representing 8.4% of its net assets as of period end, and an original cost of $200,578,730. |
| (g) | Security is valued using significant unobservable inputs and is classified as Level 3 in the fair value hierarchy. |
| (h) | Other interests represent beneficial interests in liquidation trusts and other reorganization or private entities. |
| (i) | Affiliate of the Trust. |
| (j) | Annualized 7-day yield as of period end. |
| (k) | All or a portion of this security was purchased with the cash collateral from loaned securities. |
For Trust compliance purposes, the Trust’s industry classifications refer to one or more of the industry sub-classifications used by one or more widely recognized market indexes or rating group indexes, and/or as defined by the investment adviser. These definitions may not apply for purposes of this report, which may combine such industry sub-classifications for reporting ease.
| 78 | 2 0 2 3 B L A C K R O C K A N N U A L R E P O R T T O S H A R E H O L D E R S |
| Schedule of Investments (continued) December 31, 2023 |
BlackRock Health Sciences Term Trust (BMEZ) |
Affiliates
Investments in issuers considered to be affiliate(s) of the Trust during the year ended December 31, 2023 for purposes of Section 2(a)(3) of the Investment Company Act of 1940, as amended, were as follows:
|
|
||||||||||||||||||||||||||||||||||||||||||
| Affiliated Issuer | Value at 12/31/22 |
Purchases at Cost |
Proceeds from Sale |
Net Realized Gain (Loss) |
Change in Unrealized Appreciation (Depreciation) |
Value at 12/31/23 |
Shares Held at 12/31/23 |
Income | Capital Gain Distributions from Underlying Funds |
|||||||||||||||||||||||||||||||||
|
|
||||||||||||||||||||||||||||||||||||||||||
| BlackRock Liquidity Funds, T-Fund, Institutional Class |
$ | 83,001,707 | $ | — | $ | (42,527,894 | )(a) | $ | — | $ | — | $ | 40,473,813 | 40,473,813 | $ | 2,845,610 | $ | — | ||||||||||||||||||||||||
| DA32 Life Science Tech Acquisition Corp., |
14,818,508 | — | (15,444,684 | ) | 476,495 | 149,681 | N/A | N/A | — | — | ||||||||||||||||||||||||||||||||
| SL Liquidity Series, LLC, Money Market Series |
1,828,050 | 10,470,673 | (a) | — | 10,301 | (778 | ) | 12,308,246 | 12,304,554 | 458,690 | (c) | — | ||||||||||||||||||||||||||||||
|
|
|
|
|
|
|
|
|
|
|
|||||||||||||||||||||||||||||||||
| $ | 486,796 | $ | 148,903 | $ | 52,782,059 | $ | 3,304,300 | $ | — | |||||||||||||||||||||||||||||||||
|
|
|
|
|
|
|
|
|
|
|
|||||||||||||||||||||||||||||||||
| (a) | Represents net amount purchased (sold). |
| (b) | As of period end, the entity is no longer held. |
| (c) | All or a portion represents securities lending income earned from the reinvestment of cash collateral from loaned securities, net of fees and collateral investment expenses, and other payments to and from borrowers of securities. |
Derivative Financial Instruments Outstanding as of Period End
Forward Foreign Currency Exchange Contracts
|
|
||||||||||||||||||||||||||||||||||
| Currency Purchased | Currency Sold | Counterparty | Settlement Date | Unrealized Appreciation (Depreciation) |
|
|||||||||||||||||||||||||||||
|
|
||||||||||||||||||||||||||||||||||
| JPY | 1,030,785,200 | USD | 7,206,933 | Barclays Bank PLC | 03/14/24 | $ | 182,850 | |||||||||||||||||||||||||||
| JPY | 7,025,754,800 | USD | 49,121,960 | Morgan Stanley & Co. International PLC | 03/14/24 | 1,246,245 | ||||||||||||||||||||||||||||
|
|
|
|||||||||||||||||||||||||||||||||
| $ | 1,429,095 | |||||||||||||||||||||||||||||||||
|
|
|
|||||||||||||||||||||||||||||||||
Exchange-Traded Options Written
|
|
||||||||||||||||||||||||||||||||||||||||||||||
| Description | Number of Contracts |
Expiration Date |
Exercise Price | Notional Amount (000) |
Value | |||||||||||||||||||||||||||||||||||||||||
|
|
||||||||||||||||||||||||||||||||||||||||||||||
| Call |
||||||||||||||||||||||||||||||||||||||||||||||
| Amgen, Inc. |
60 | 01/05/24 | USD | 275.00 | USD | 1,728 | $ | (80,250 | ) | |||||||||||||||||||||||||||||||||||||
| Centene Corp. |
78 | 01/05/24 | USD | 75.00 | USD | 579 | (3,705 | ) | ||||||||||||||||||||||||||||||||||||||
| Danaher Corp. |
91 | 01/05/24 | USD | 230.00 | USD | 2,105 | (30,940 | ) | ||||||||||||||||||||||||||||||||||||||
| Dexcom, Inc. |
265 | 01/05/24 | USD | 121.00 | USD | 3,288 | (106,000 | ) | ||||||||||||||||||||||||||||||||||||||
| Elevance Health, Inc. |
92 | 01/05/24 | USD | 485.00 | USD | 4,338 | (4,830 | ) | ||||||||||||||||||||||||||||||||||||||
| McKesson Corp. |
60 | 01/05/24 | USD | 470.00 | USD | 2,778 | (9,600 | ) | ||||||||||||||||||||||||||||||||||||||
| UnitedHealth Group, Inc. |
56 | 01/05/24 | USD | 550.00 | USD | 2,948 | (392 | ) | ||||||||||||||||||||||||||||||||||||||
| Alcon, Inc. |
797 | 01/09/24 | USD | 76.00 | USD | 6,226 | (206,442 | ) | ||||||||||||||||||||||||||||||||||||||
| AbbVie, Inc. |
151 | 01/12/24 | USD | 146.00 | USD | 2,340 | (143,827 | ) | ||||||||||||||||||||||||||||||||||||||
| Biogen, Inc. |
93 | 01/12/24 | USD | 245.00 | USD | 2,407 | (134,385 | ) | ||||||||||||||||||||||||||||||||||||||
| Centene Corp. |
194 | 01/12/24 | USD | 75.00 | USD | 1,440 | (21,340 | ) | ||||||||||||||||||||||||||||||||||||||
| Eli Lilly & Co. |
48 | 01/12/24 | USD | 615.00 | USD | 2,798 | (12,144 | ) | ||||||||||||||||||||||||||||||||||||||
| Gilead Sciences, Inc. |
204 | 01/12/24 | USD | 80.00 | USD | 1,653 | (38,046 | ) | ||||||||||||||||||||||||||||||||||||||
| Humana, Inc. |
29 | 01/12/24 | USD | 495.00 | USD | 1,328 | (2,030 | ) | ||||||||||||||||||||||||||||||||||||||
| Intuitive Surgical, Inc. |
75 | 01/12/24 | USD | 320.00 | USD | 2,530 | (157,500 | ) | ||||||||||||||||||||||||||||||||||||||
| McKesson Corp. |
4 | 01/12/24 | USD | 460.00 | USD | 185 | (3,900 | ) | ||||||||||||||||||||||||||||||||||||||
| Merck & Co., Inc. |
321 | 01/12/24 | USD | 102.01 | USD | 3,500 | (237,250 | ) | ||||||||||||||||||||||||||||||||||||||
| 10X Genomics, Inc., Class A |
396 | 01/19/24 | USD | 45.00 | USD | 2,216 | (457,380 | ) | ||||||||||||||||||||||||||||||||||||||
| AbbVie, Inc. |
151 | 01/19/24 | USD | 150.00 | USD | 2,340 | (89,090 | ) | ||||||||||||||||||||||||||||||||||||||
| Align Technology, Inc. |
133 | 01/19/24 | USD | 240.00 | USD | 3,644 | (501,410 | ) | ||||||||||||||||||||||||||||||||||||||
| Alnylam Pharmaceuticals, Inc. |
329 | 01/19/24 | USD | 200.00 | USD | 6,297 | (133,245 | ) | ||||||||||||||||||||||||||||||||||||||
| Amgen, Inc. |
60 | 01/19/24 | USD | 285.00 | USD | 1,728 | (44,700 | ) | ||||||||||||||||||||||||||||||||||||||
| Apellis Pharmaceuticals, Inc. |
164 | 01/19/24 | USD | 62.00 | USD | 982 | (96,760 | ) | ||||||||||||||||||||||||||||||||||||||
| Arcturus Therapeutics Holdings, Inc. |
331 | 01/19/24 | USD | 30.00 | USD | 1,044 | (96,817 | ) | ||||||||||||||||||||||||||||||||||||||
| Argenx SE, ADR |
71 | 01/19/24 | USD | 520.00 | USD | 2,701 | (33,370 | ) | ||||||||||||||||||||||||||||||||||||||
| Arrowhead Pharmaceuticals, Inc. |
129 | 01/19/24 | USD | 30.00 | USD | 395 | (24,833 | ) | ||||||||||||||||||||||||||||||||||||||
| Avantor, Inc. |
830 | 01/19/24 | USD | 19.75 | USD | 1,895 | (345,748 | ) | ||||||||||||||||||||||||||||||||||||||
| S C H E D U L E O F I N V E S T M E N T S |
79 |
| Schedule of Investments (continued) December 31, 2023 |
BlackRock Health Sciences Term Trust (BMEZ) |
Exchange-Traded Options Written (continued)
|
|
||||||||||||||||||||||||||||||||||||||||||||||
| Description | Number of Contracts |
Expiration Date |
Exercise Price | Notional Amount (000) |
Value | |||||||||||||||||||||||||||||||||||||||||
|
|
||||||||||||||||||||||||||||||||||||||||||||||
| Call (continued) |
||||||||||||||||||||||||||||||||||||||||||||||
| Becton Dickinson & Co. |
78 | 01/19/24 | USD | 245.00 | USD | 1,902 | $ | (28,080 | ) | |||||||||||||||||||||||||||||||||||||
| BeiGene Ltd., ADR |
219 | 01/19/24 | USD | 200.00 | USD | 3,950 | (61,867 | ) | ||||||||||||||||||||||||||||||||||||||
| Biogen, Inc. |
115 | 01/19/24 | USD | 245.00 | USD | 2,976 | (191,475 | ) | ||||||||||||||||||||||||||||||||||||||
| BioMarin Pharmaceutical, Inc. |
586 | 01/19/24 | USD | 90.00 | USD | 5,650 | (421,920 | ) | ||||||||||||||||||||||||||||||||||||||
| Bio-Techne Corp. |
517 | 01/19/24 | USD | 65.00 | USD | 3,989 | (612,645 | ) | ||||||||||||||||||||||||||||||||||||||
| Blueprint Medicines Corp. |
540 | 01/19/24 | USD | 65.00 | USD | 4,981 | (1,495,800 | ) | ||||||||||||||||||||||||||||||||||||||
| Blueprint Medicines Corp. |
491 | 01/19/24 | USD | 85.00 | USD | 4,529 | (491,000 | ) | ||||||||||||||||||||||||||||||||||||||
| Bridgebio Pharma, Inc. |
213 | 01/19/24 | USD | 35.00 | USD | 860 | (130,995 | ) | ||||||||||||||||||||||||||||||||||||||
| Bruker Corp. |
296 | 01/19/24 | USD | 70.00 | USD | 2,175 | (146,520 | ) | ||||||||||||||||||||||||||||||||||||||
| Cabaletta Bio, Inc. |
960 | 01/19/24 | USD | 22.50 | USD | 2,179 | (172,800 | ) | ||||||||||||||||||||||||||||||||||||||
| Catalent, Inc. |
277 | 01/19/24 | USD | 40.00 | USD | 1,245 | (149,580 | ) | ||||||||||||||||||||||||||||||||||||||
| Cencora, Inc. |
148 | 01/19/24 | USD | 200.00 | USD | 3,040 | (105,820 | ) | ||||||||||||||||||||||||||||||||||||||
| Centene Corp. |
109 | 01/19/24 | USD | 77.50 | USD | 809 | (5,995 | ) | ||||||||||||||||||||||||||||||||||||||
| Cerevel Therapeutics Holdings, Inc. |
398 | 01/19/24 | USD | 25.00 | USD | 1,688 | (698,490 | ) | ||||||||||||||||||||||||||||||||||||||
| Charles River Laboratories International, Inc. |
108 | 01/19/24 | USD | 230.00 | USD | 2,553 | (111,780 | ) | ||||||||||||||||||||||||||||||||||||||
| Chemed Corp. |
29 | 01/19/24 | USD | 590.00 | USD | 1,696 | (19,285 | ) | ||||||||||||||||||||||||||||||||||||||
| CONMED Corp. |
157 | 01/19/24 | USD | 115.00 | USD | 1,719 | (20,410 | ) | ||||||||||||||||||||||||||||||||||||||
| Cooper Cos., Inc. |
159 | 01/19/24 | USD | 360.00 | USD | 6,017 | (333,105 | ) | ||||||||||||||||||||||||||||||||||||||
| Danaher Corp. |
90 | 01/19/24 | USD | 230.00 | USD | 2,082 | (58,500 | ) | ||||||||||||||||||||||||||||||||||||||
| Dexcom, Inc. |
265 | 01/19/24 | USD | 122.50 | USD | 3,288 | (153,700 | ) | ||||||||||||||||||||||||||||||||||||||
| Elanco Animal Health, Inc. |
1,482 | 01/19/24 | USD | 12.00 | USD | 2,208 | (448,305 | ) | ||||||||||||||||||||||||||||||||||||||
| Encompass Health Corp. |
83 | 01/19/24 | USD | 65.00 | USD | 554 | (20,543 | ) | ||||||||||||||||||||||||||||||||||||||
| Encompass Health Corp. |
49 | 01/19/24 | USD | 68.80 | USD | 327 | (2,442 | ) | ||||||||||||||||||||||||||||||||||||||
| Exact Sciences Corp. |
81 | 01/19/24 | USD | 80.00 | USD | 599 | (13,973 | ) | ||||||||||||||||||||||||||||||||||||||
| Exelixis, Inc. |
959 | 01/19/24 | USD | 22.00 | USD | 2,301 | (239,750 | ) | ||||||||||||||||||||||||||||||||||||||
| Galapagos NV, ADR |
119 | 01/19/24 | USD | 37.50 | USD | 484 | (37,187 | ) | ||||||||||||||||||||||||||||||||||||||
| Gilead Sciences, Inc. |
407 | 01/19/24 | USD | 82.50 | USD | 3,297 | (35,206 | ) | ||||||||||||||||||||||||||||||||||||||
| Guardant Health, Inc. |
467 | 01/19/24 | USD | 25.00 | USD | 1,263 | (122,587 | ) | ||||||||||||||||||||||||||||||||||||||
| Halozyme Therapeutics, Inc. |
128 | 01/19/24 | USD | 43.50 | USD | 473 | (8,506 | ) | ||||||||||||||||||||||||||||||||||||||
| Hologic, Inc. |
311 | 01/19/24 | USD | 75.00 | USD | 2,222 | (10,108 | ) | ||||||||||||||||||||||||||||||||||||||
| Humana, Inc. |
29 | 01/19/24 | USD | 505.00 | USD | 1,328 | (1,958 | ) | ||||||||||||||||||||||||||||||||||||||
| Immunocore Holdings PLC, ADR |
95 | 01/19/24 | USD | 50.00 | USD | 649 | (176,700 | ) | ||||||||||||||||||||||||||||||||||||||
| Incyte Corp. |
411 | 01/19/24 | USD | 57.50 | USD | 2,581 | (242,490 | ) | ||||||||||||||||||||||||||||||||||||||
| Inspire Medical Systems, Inc. |
155 | 01/19/24 | USD | 165.00 | USD | 3,153 | (616,125 | ) | ||||||||||||||||||||||||||||||||||||||
| Intuitive Surgical, Inc. |
79 | 01/19/24 | USD | 340.00 | USD | 2,665 | (69,125 | ) | ||||||||||||||||||||||||||||||||||||||
| Ionis Pharmaceuticals, Inc. |
750 | 01/19/24 | USD | 52.50 | USD | 3,794 | (95,625 | ) | ||||||||||||||||||||||||||||||||||||||
| Karuna Therapeutics, Inc. |
31 | 01/19/24 | USD | 230.00 | USD | 981 | (270,320 | ) | ||||||||||||||||||||||||||||||||||||||
| Keros Therapeutics, Inc. |
198 | 01/19/24 | USD | 40.00 | USD | 787 | (63,360 | ) | ||||||||||||||||||||||||||||||||||||||
| Keros Therapeutics, Inc. |
199 | 01/19/24 | USD | 35.00 | USD | 791 | (119,400 | ) | ||||||||||||||||||||||||||||||||||||||
| Legend Biotech Corp., ADR |
496 | 01/19/24 | USD | 75.00 | USD | 2,984 | (9,920 | ) | ||||||||||||||||||||||||||||||||||||||
| Masimo Corp. |
295 | 01/19/24 | USD | 120.00 | USD | 3,458 | (116,525 | ) | ||||||||||||||||||||||||||||||||||||||
| Merck & Co., Inc. |
160 | 01/19/24 | USD | 110.00 | USD | 1,744 | (21,280 | ) | ||||||||||||||||||||||||||||||||||||||
| Mettler-Toledo International, Inc. |
49 | 01/19/24 | USD | 1,240.00 | USD | 5,944 | (103,390 | ) | ||||||||||||||||||||||||||||||||||||||
| Molina Healthcare, Inc. |
113 | 01/19/24 | USD | 380.00 | USD | 4,083 | (29,380 | ) | ||||||||||||||||||||||||||||||||||||||
| MoonLake Immunotherapeutics, Class A |
365 | 01/19/24 | USD | 80.00 | USD | 2,204 | (68,437 | ) | ||||||||||||||||||||||||||||||||||||||
| Neurocrine Biosciences, Inc. |
320 | 01/19/24 | USD | 115.00 | USD | 4,216 | (555,200 | ) | ||||||||||||||||||||||||||||||||||||||
| Neurocrine Biosciences, Inc. |
335 | 01/19/24 | USD | 125.00 | USD | 4,414 | (284,750 | ) | ||||||||||||||||||||||||||||||||||||||
| Nuvalent, Inc., Class A |
386 | 01/19/24 | USD | 70.00 | USD | 2,841 | (241,250 | ) | ||||||||||||||||||||||||||||||||||||||
| Repligen Corp. |
82 | 01/19/24 | USD | 160.00 | USD | 1,474 | (174,660 | ) | ||||||||||||||||||||||||||||||||||||||
| REVOLUTION Medicines, Inc. |
286 | 01/19/24 | USD | 22.50 | USD | 820 | (184,470 | ) | ||||||||||||||||||||||||||||||||||||||
| Rhythm Pharmaceuticals, Inc. |
1,206 | 01/19/24 | USD | 32.10 | USD | 5,544 | (1,740,315 | ) | ||||||||||||||||||||||||||||||||||||||
| Rocket Pharmaceuticals, Inc. |
403 | 01/19/24 | USD | 25.00 | USD | 1,208 | (207,545 | ) | ||||||||||||||||||||||||||||||||||||||
| Sanofi SA, ADR |
586 | 01/19/24 | USD | 47.60 | USD | 2,914 | (168,712 | ) | ||||||||||||||||||||||||||||||||||||||
| Seagen, Inc. |
78 | 01/19/24 | USD | 215.00 | USD | 1,784 | (109,980 | ) | ||||||||||||||||||||||||||||||||||||||
| Shockwave Medical, Inc. |
20 | 01/19/24 | USD | 185.00 | USD | 381 | (21,300 | ) | ||||||||||||||||||||||||||||||||||||||
| STERIS PLC |
252 | 01/19/24 | USD | 219.50 | USD | 5,540 | (138,934 | ) | ||||||||||||||||||||||||||||||||||||||
| Structure Therapeutics, Inc., ADR |
262 | 01/19/24 | USD | 70.00 | USD | 1,068 | (6,550 | ) | ||||||||||||||||||||||||||||||||||||||
| Stryker Corp. |
69 | 01/19/24 | USD | 300.00 | USD | 2,066 | (38,295 | ) | ||||||||||||||||||||||||||||||||||||||
| Tandem Diabetes Care, Inc. |
207 | 01/19/24 | USD | 32.50 | USD | 612 | (15,525 | ) | ||||||||||||||||||||||||||||||||||||||
| Twist Bioscience Corp. |
208 | 01/19/24 | USD | 35.00 | USD | 767 | (101,920 | ) | ||||||||||||||||||||||||||||||||||||||
| Ultragenyx Pharmaceutical, Inc. |
159 | 01/19/24 | USD | 40.00 | USD | 760 | (124,815 | ) | ||||||||||||||||||||||||||||||||||||||
| UnitedHealth Group, Inc. |
56 | 01/19/24 | USD | 550.00 | USD | 2,948 | (15,932 | ) | ||||||||||||||||||||||||||||||||||||||
| 80 | 2 0 2 3 B L A C K R O C K A N N U A L R E P O R T T O S H A R E H O L D E R S |
| Schedule of Investments (continued) December 31, 2023 |
BlackRock Health Sciences Term Trust (BMEZ) |
Exchange-Traded Options Written (continued)
|
|
||||||||||||||||||||||||||||||||||||||||||||||
| Description | Number of Contracts |
Expiration Date |
Exercise Price | Notional Amount (000) |
Value | |||||||||||||||||||||||||||||||||||||||||
|
|
||||||||||||||||||||||||||||||||||||||||||||||
| Call (continued) |
||||||||||||||||||||||||||||||||||||||||||||||
| Vaxcyte, Inc. |
325 | 01/19/24 | USD | 55.00 | USD | 2,041 | $ | (284,375 | ) | |||||||||||||||||||||||||||||||||||||
| Vertex Pharmaceuticals, Inc. |
67 | 01/19/24 | USD | 370.00 | USD | 2,726 | (261,300 | ) | ||||||||||||||||||||||||||||||||||||||
| Viking Therapeutics, Inc. |
376 | 01/19/24 | USD | 14.00 | USD | 700 | (182,360 | ) | ||||||||||||||||||||||||||||||||||||||
| Waters Corp. |
90 | 01/19/24 | USD | 320.00 | USD | 2,963 | (134,100 | ) | ||||||||||||||||||||||||||||||||||||||
| West Pharmaceutical Services, Inc. |
348 | 01/19/24 | USD | 380.00 | USD | 12,254 | (33,930 | ) | ||||||||||||||||||||||||||||||||||||||
| Xenon Pharmaceuticals, Inc. |
672 | 01/19/24 | USD | 45.00 | USD | 3,095 | (285,600 | ) | ||||||||||||||||||||||||||||||||||||||
| Zimmer Biomet Holdings, Inc. |
247 | 01/19/24 | USD | 120.00 | USD | 3,006 | (91,390 | ) | ||||||||||||||||||||||||||||||||||||||
| Cencora, Inc. |
80 | 01/25/24 | USD | 204.00 | USD | 1,643 | (36,614 | ) | ||||||||||||||||||||||||||||||||||||||
| Abbott Laboratories |
204 | 01/26/24 | USD | 109.00 | USD | 2,245 | (61,812 | ) | ||||||||||||||||||||||||||||||||||||||
| Align Technology, Inc. |
313 | 01/26/24 | USD | 280.00 | USD | 8,576 | (342,735 | ) | ||||||||||||||||||||||||||||||||||||||
| Amgen, Inc. |
304 | 01/26/24 | USD | 285.00 | USD | 8,756 | (258,400 | ) | ||||||||||||||||||||||||||||||||||||||
| Biogen, Inc. |
109 | 01/26/24 | USD | 265.00 | USD | 2,821 | (54,500 | ) | ||||||||||||||||||||||||||||||||||||||
| Danaher Corp. |
83 | 01/26/24 | USD | 235.00 | USD | 1,920 | (39,840 | ) | ||||||||||||||||||||||||||||||||||||||
| Intuitive Surgical, Inc. |
166 | 01/26/24 | USD | 330.00 | USD | 5,600 | (307,930 | ) | ||||||||||||||||||||||||||||||||||||||
| Merck & Co., Inc. |
161 | 01/26/24 | USD | 107.00 | USD | 1,755 | (56,350 | ) | ||||||||||||||||||||||||||||||||||||||
| Vertex Pharmaceuticals, Inc. |
14 | 01/26/24 | USD | 405.00 | USD | 570 | (17,360 | ) | ||||||||||||||||||||||||||||||||||||||
| Bio-Techne Corp. |
812 | 01/31/24 | USD | 77.00 | USD | 6,265 | (596,475 | ) | ||||||||||||||||||||||||||||||||||||||
| McKesson Corp. |
60 | 02/09/24 | USD | 475.00 | USD | 2,778 | (64,500 | ) | ||||||||||||||||||||||||||||||||||||||
| 10X Genomics, Inc., Class A |
188 | 02/16/24 | USD | 50.00 | USD | 1,052 | (141,000 | ) | ||||||||||||||||||||||||||||||||||||||
| 10X Genomics, Inc., Class A |
158 | 02/16/24 | USD | 55.00 | USD | 884 | (75,840 | ) | ||||||||||||||||||||||||||||||||||||||
| Abbott Laboratories |
204 | 02/16/24 | USD | 110.00 | USD | 2,245 | (67,320 | ) | ||||||||||||||||||||||||||||||||||||||
| AbbVie, Inc. |
170 | 02/16/24 | USD | 160.00 | USD | 2,634 | (37,485 | ) | ||||||||||||||||||||||||||||||||||||||
| Argenx SE, ADR |
54 | 02/16/24 | USD | 500.00 | USD | 2,054 | (27,000 | ) | ||||||||||||||||||||||||||||||||||||||
| Arrowhead Pharmaceuticals, Inc. |
130 | 02/16/24 | USD | 35.00 | USD | 398 | (15,925 | ) | ||||||||||||||||||||||||||||||||||||||
| Avantor, Inc. |
457 | 02/16/24 | USD | 21.00 | USD | 1,043 | (110,822 | ) | ||||||||||||||||||||||||||||||||||||||
| Becton Dickinson & Co. |
190 | 02/16/24 | USD | 240.00 | USD | 4,633 | (196,650 | ) | ||||||||||||||||||||||||||||||||||||||
| Biohaven Ltd. |
317 | 02/16/24 | USD | 40.00 | USD | 1,357 | (163,255 | ) | ||||||||||||||||||||||||||||||||||||||
| BioMarin Pharmaceutical, Inc. |
760 | 02/16/24 | USD | 100.00 | USD | 7,328 | (207,100 | ) | ||||||||||||||||||||||||||||||||||||||
| Bio-Rad Laboratories, Inc., Class A |
64 | 02/16/24 | USD | 350.00 | USD | 2,066 | (48,640 | ) | ||||||||||||||||||||||||||||||||||||||
| Boston Scientific Corp. |
1,458 | 02/16/24 | USD | 57.50 | USD | 8,429 | (335,340 | ) | ||||||||||||||||||||||||||||||||||||||
| Cabaletta Bio, Inc. |
660 | 02/16/24 | USD | 30.00 | USD | 1,498 | (46,200 | ) | ||||||||||||||||||||||||||||||||||||||
| Cencora, Inc. |
275 | 02/16/24 | USD | 204.00 | USD | 5,648 | (183,369 | ) | ||||||||||||||||||||||||||||||||||||||
| Centene Corp. |
194 | 02/16/24 | USD | 77.50 | USD | 1,440 | (31,040 | ) | ||||||||||||||||||||||||||||||||||||||
| Charles River Laboratories International, Inc. |
109 | 02/16/24 | USD | 240.00 | USD | 2,577 | (100,825 | ) | ||||||||||||||||||||||||||||||||||||||
| CONMED Corp. |
157 | 02/16/24 | USD | 120.00 | USD | 1,719 | (20,018 | ) | ||||||||||||||||||||||||||||||||||||||
| Cooper Cos., Inc. |
158 | 02/16/24 | USD | 350.00 | USD | 5,979 | (533,250 | ) | ||||||||||||||||||||||||||||||||||||||
| Elanco Animal Health, Inc. |
1,481 | 02/16/24 | USD | 13.00 | USD | 2,207 | (333,225 | ) | ||||||||||||||||||||||||||||||||||||||
| Eli Lilly & Co. |
92 | 02/16/24 | USD | 620.00 | USD | 5,363 | (147,660 | ) | ||||||||||||||||||||||||||||||||||||||
| Encompass Health Corp. |
131 | 02/16/24 | USD | 68.80 | USD | 874 | (18,935 | ) | ||||||||||||||||||||||||||||||||||||||
| Exact Sciences Corp. |
185 | 02/16/24 | USD | 75.00 | USD | 1,369 | (94,350 | ) | ||||||||||||||||||||||||||||||||||||||
| Exelixis, Inc. |
958 | 02/16/24 | USD | 23.00 | USD | 2,298 | (210,760 | ) | ||||||||||||||||||||||||||||||||||||||
| Galapagos NV, ADR |
119 | 02/16/24 | USD | 42.50 | USD | 484 | (10,710 | ) | ||||||||||||||||||||||||||||||||||||||
| Gilead Sciences, Inc. |
204 | 02/16/24 | USD | 77.50 | USD | 1,653 | (110,670 | ) | ||||||||||||||||||||||||||||||||||||||
| Halozyme Therapeutics, Inc. |
378 | 02/16/24 | USD | 45.00 | USD | 1,397 | (9,450 | ) | ||||||||||||||||||||||||||||||||||||||
| Hologic, Inc. |
311 | 02/16/24 | USD | 75.00 | USD | 2,222 | (36,542 | ) | ||||||||||||||||||||||||||||||||||||||
| Immunocore Holdings PLC, ADR |
96 | 02/16/24 | USD | 65.00 | USD | 656 | (63,360 | ) | ||||||||||||||||||||||||||||||||||||||
| Inspire Medical Systems, Inc. |
130 | 02/16/24 | USD | 175.00 | USD | 2,645 | (456,950 | ) | ||||||||||||||||||||||||||||||||||||||
| Ionis Pharmaceuticals, Inc. |
548 | 02/16/24 | USD | 55.00 | USD | 2,772 | (80,830 | ) | ||||||||||||||||||||||||||||||||||||||
| Karuna Therapeutics, Inc. |
35 | 02/16/24 | USD | 240.00 | USD | 1,108 | (275,275 | ) | ||||||||||||||||||||||||||||||||||||||
| Legend Biotech Corp., ADR |
515 | 02/16/24 | USD | 70.00 | USD | 3,099 | (77,250 | ) | ||||||||||||||||||||||||||||||||||||||
| Molina Healthcare, Inc. |
114 | 02/16/24 | USD | 400.00 | USD | 4,119 | (49,020 | ) | ||||||||||||||||||||||||||||||||||||||
| Nuvalent, Inc., Class A |
386 | 02/16/24 | USD | 80.00 | USD | 2,841 | (133,170 | ) | ||||||||||||||||||||||||||||||||||||||
| Penumbra, Inc. |
191 | 02/16/24 | USD | 260.00 | USD | 4,804 | (207,235 | ) | ||||||||||||||||||||||||||||||||||||||
| PTC Therapeutics, Inc. |
722 | 02/16/24 | USD | 31.00 | USD | 1,990 | (149,815 | ) | ||||||||||||||||||||||||||||||||||||||
| Repligen Corp. |
222 | 02/16/24 | USD | 185.00 | USD | 3,992 | (179,820 | ) | ||||||||||||||||||||||||||||||||||||||
| REVOLUTION Medicines, Inc. |
294 | 02/16/24 | USD | 28.00 | USD | 843 | (80,850 | ) | ||||||||||||||||||||||||||||||||||||||
| Rhythm Pharmaceuticals, Inc. |
651 | 02/16/24 | USD | 40.41 | USD | 2,993 | (479,126 | ) | ||||||||||||||||||||||||||||||||||||||
| Rocket Pharmaceuticals, Inc. |
403 | 02/16/24 | USD | 27.12 | USD | 1,208 | (165,105 | ) | ||||||||||||||||||||||||||||||||||||||
| Sanofi SA, ADR |
1,003 | 02/16/24 | USD | 49.00 | USD | 4,988 | (226,614 | ) | ||||||||||||||||||||||||||||||||||||||
| Shockwave Medical, Inc. |
184 | 02/16/24 | USD | 184.95 | USD | 3,506 | (335,382 | ) | ||||||||||||||||||||||||||||||||||||||
| STERIS PLC |
255 | 02/16/24 | USD | 202.97 | USD | 5,606 | (521,776 | ) | ||||||||||||||||||||||||||||||||||||||
| Structure Therapeutics, Inc., ADR |
262 | 02/16/24 | USD | 85.00 | USD | 1,068 | (19,650 | ) | ||||||||||||||||||||||||||||||||||||||
| S C H E D U L E O F I N V E S T M E N T S |
81 |
| Schedule of Investments (continued) December 31, 2023 |
BlackRock Health Sciences Term Trust (BMEZ) |
Exchange-Traded Options Written (continued)
|
|
||||||||||||||||||||||||||||||||||||||||||||||
| Description | Number of Contracts |
Expiration Date |
Exercise Price | Notional Amount (000) |
Value | |||||||||||||||||||||||||||||||||||||||||
|
|
||||||||||||||||||||||||||||||||||||||||||||||
| Call (continued) |
||||||||||||||||||||||||||||||||||||||||||||||
| Stryker Corp. |
73 | 02/16/24 | USD | 310.00 | USD | 2,186 | $ | (50,370 | ) | |||||||||||||||||||||||||||||||||||||
| Tandem Diabetes Care, Inc. |
208 | 02/16/24 | USD | 32.50 | USD | 615 | (35,880 | ) | ||||||||||||||||||||||||||||||||||||||
| Twist Bioscience Corp. |
208 | 02/16/24 | USD | 35.00 | USD | 767 | (130,000 | ) | ||||||||||||||||||||||||||||||||||||||
| Ultragenyx Pharmaceutical, Inc. |
219 | 02/16/24 | USD | 45.00 | USD | 1,047 | (97,455 | ) | ||||||||||||||||||||||||||||||||||||||
| United Therapeutics Corp. |
94 | 02/16/24 | USD | 260.00 | USD | 2,067 | (3,995 | ) | ||||||||||||||||||||||||||||||||||||||
| Vaxcyte, Inc. |
564 | 02/16/24 | USD | 60.00 | USD | 3,542 | (301,740 | ) | ||||||||||||||||||||||||||||||||||||||
| Viking Therapeutics, Inc. |
376 | 02/16/24 | USD | 18.00 | USD | 700 | (99,640 | ) | ||||||||||||||||||||||||||||||||||||||
| Xenon Pharmaceuticals, Inc. |
672 | 02/16/24 | USD | 47.50 | USD | 3,095 | (233,520 | ) | ||||||||||||||||||||||||||||||||||||||
| Bruker Corp. |
296 | 03/15/24 | USD | 72.50 | USD | 2,175 | (143,560 | ) | ||||||||||||||||||||||||||||||||||||||
| Incyte Corp. |
316 | 03/15/24 | USD | 65.00 | USD | 1,984 | (84,530 | ) | ||||||||||||||||||||||||||||||||||||||
|
|
|
|||||||||||||||||||||||||||||||||||||||||||||
| $ | (26,603,366 | ) | ||||||||||||||||||||||||||||||||||||||||||||
|
|
|
|||||||||||||||||||||||||||||||||||||||||||||
OTC Options Written
|
|
||||||||||||||||||||||||||||||||||||
| Description | Counterparty | Number of Contracts |
Expiration Date |
Exercise Price | Notional Amount (000) |
Value | ||||||||||||||||||||||||||||||
|
|
||||||||||||||||||||||||||||||||||||
| Call |
||||||||||||||||||||||||||||||||||||
| QIAGEN NV |
Morgan Stanley & Co. International PLC | 106,200 | 01/04/24 | USD | 39.91 | USD | 4,612 | $ | (381,140 | ) | ||||||||||||||||||||||||||
| United Therapeutics Corp. |
BNP Paribas SA | 8,400 | 01/04/24 | USD | 235.69 | USD | 1,847 | (487 | ) | |||||||||||||||||||||||||||
| Waters Corp. |
Morgan Stanley & Co. International PLC | 19,800 | 01/04/24 | USD | 273.35 | USD | 6,519 | (1,111,401 | ) | |||||||||||||||||||||||||||
| Elanco Animal Health, Inc. |
Goldman Sachs International | 98,800 | 01/08/24 | USD | 9.64 | USD | 1,472 | (521,540 | ) | |||||||||||||||||||||||||||
| Gerresheimer AG |
Morgan Stanley & Co. International PLC | 14,900 | 01/09/24 | EUR | 97.55 | EUR | 1,404 | (15,936 | ) | |||||||||||||||||||||||||||
| Masimo Corp. |
BNP Paribas SA | 17,000 | 01/09/24 | USD | 86.94 | USD | 1,993 | (517,067 | ) | |||||||||||||||||||||||||||
| Novo Nordisk A/S, Class B |
Goldman Sachs International | 19,700 | 01/09/24 | DKK | 736.76 | DKK | 13,786 | (6,431 | ) | |||||||||||||||||||||||||||
| ConvaTec Group PLC |
Morgan Stanley & Co. International PLC | 510,000 | 01/10/24 | GBP | 2.17 | GBP | 1,245 | (178,081 | ) | |||||||||||||||||||||||||||
| Zimmer Biomet Holdings, Inc. |
Barclays Bank PLC | 24,700 | 01/10/24 | USD | 117.91 | USD | 3,006 | (114,276 | ) | |||||||||||||||||||||||||||
| ConvaTec Group PLC |
UBS AG | 411,500 | 01/17/24 | GBP | 2.30 | GBP | 1,005 | (79,270 | ) | |||||||||||||||||||||||||||
| Gerresheimer AG |
Morgan Stanley & Co. International PLC | 28,000 | 01/17/24 | EUR | 99.47 | EUR | 2,639 | (31,259 | ) | |||||||||||||||||||||||||||
| Genmab A/S |
Morgan Stanley & Co. International PLC | 9,200 | 01/18/24 | DKK | 2,308.53 | DKK | 19,809 | (11,257 | ) | |||||||||||||||||||||||||||
| Novo Nordisk A/S, Class B |
Morgan Stanley & Co. International PLC | 19,600 | 01/18/24 | DKK | 703.28 | DKK | 13,716 | (45,757 | ) | |||||||||||||||||||||||||||
| ConvaTec Group PLC |
UBS AG | 490,000 | 01/23/24 | GBP | 2.30 | GBP | 1,196 | (98,652 | ) | |||||||||||||||||||||||||||
| Genmab A/S |
Morgan Stanley & Co. International PLC | 1,900 | 01/23/24 | DKK | 2,284.88 | DKK | 4,091 | (5,012 | ) | |||||||||||||||||||||||||||
| Gerresheimer AG |
UBS AG | 20,000 | 01/23/24 | EUR | 88.70 | EUR | 1,885 | (160,745 | ) | |||||||||||||||||||||||||||
| QIAGEN NV |
Morgan Stanley & Co. International PLC | 106,200 | 01/23/24 | USD | 40.29 | USD | 4,612 | (388,600 | ) | |||||||||||||||||||||||||||
| Cencora, Inc. |
Citibank N.A. | 11,500 | 01/31/24 | USD | 201.54 | USD | 2,362 | (79,546 | ) | |||||||||||||||||||||||||||
| Gerresheimer AG |
UBS AG | 14,900 | 02/01/24 | EUR | 88.60 | EUR | 1,404 | (130,320 | ) | |||||||||||||||||||||||||||
| Sartorius AG |
Bank of America N.A. | 15,300 | 02/01/24 | EUR | 306.80 | EUR | 5,089 | (607,225 | ) | |||||||||||||||||||||||||||
| Novo Nordisk A/S, Class B |
Morgan Stanley & Co. International PLC | 69,200 | 02/06/24 | DKK | 735.42 | DKK | 48,425 | (141,574 | ) | |||||||||||||||||||||||||||
| Genmab A/S |
Citibank N.A. | 36,500 | 02/26/24 | USD | 32.28 | USD | 1,162 | (66,022 | ) | |||||||||||||||||||||||||||
| Lonza Group AG, Registered Shares |
Goldman Sachs International | 7,400 | 02/27/24 | CHF | 359.38 | CHF | 2,624 | (136,482 | ) | |||||||||||||||||||||||||||
|
|
|
|||||||||||||||||||||||||||||||||||
| $ | (4,828,080 | ) | ||||||||||||||||||||||||||||||||||
|
|
|
|||||||||||||||||||||||||||||||||||
Balances Reported in the Statements of Assets and Liabilities for Options Written
|
|
||||||||||||||||||||||||||||||||||||||||||||||
| Description | Swap Premiums Paid |
Swap Premiums Received |
Unrealized Appreciation |
Unrealized Depreciation |
Value | |||||||||||||||||||||||||||||||||||||||||
|
|
||||||||||||||||||||||||||||||||||||||||||||||
| Options Written | $ | N/A | $ | N/A | $ | 2,395,662 | $ | (19,100,792 | ) | $ | (31,431,446) | |||||||||||||||||||||||||||||||||||
|
|
||||||||||||||||||||||||||||||||||||||||||||||
| 82 | 2 0 2 3 B L A C K R O C K A N N U A L R E P O R T T O S H A R E H O L D E R S |
| Schedule of Investments (continued) December 31, 2023
|
BlackRock Health Sciences Term Trust (BMEZ) |
Derivative Financial Instruments Categorized by Risk Exposure
As of period end, the fair values of derivative financial instruments located in the Statements of Assets and Liabilities were as follows:
| Commodity Contracts |
Credit Contracts |
Equity Contracts |
Foreign Currency Exchange Contracts |
Interest Rate Contracts |
Other Contracts |
Total | ||||||||||||||||||||||
| Assets — Derivative Financial Instruments |
||||||||||||||||||||||||||||
| Forward foreign currency exchange contracts |
||||||||||||||||||||||||||||
| Unrealized appreciation on forward foreign currency exchange contracts |
$ | — | $ | — | $ | — | $ | 1,429,095 | $ | — | $ | — | $ | 1,429,095 | ||||||||||||||
|
|
|
|
|
|
|
|
|
|
|
|
|
|
|
|||||||||||||||
| Liabilities — Derivative Financial Instruments |
||||||||||||||||||||||||||||
| Options written |
||||||||||||||||||||||||||||
| Options written at value |
$ | — | $ | — | $ | 31,431,446 | $ | — | $ | — | $ | — | $ | 31,431,446 | ||||||||||||||
|
|
|
|
|
|
|
|
|
|
|
|
|
|
|
|||||||||||||||
For the period ended December 31, 2023, the effect of derivative financial instruments in the Statements of Operations was as follows:
| Commodity Contracts |
Credit Contracts |
Equity Contracts |
Foreign Currency Exchange Contracts |
Interest Rate Contracts |
Other Contracts |
Total | ||||||||||||||||||||||
| Net Realized Gain (Loss) from: |
||||||||||||||||||||||||||||
| Forward foreign currency exchange contracts |
$ | — | $ | — | $ | — | $ | (57,158 | ) | $ | — | $ | — | $ | (57,158 | ) | ||||||||||||
| Options purchased(a) |
— | — | (2,939,621 | ) | — | — | — | (2,939,621 | ) | |||||||||||||||||||
| Options written |
— | — | 24,415,306 | — | — | — | 24,415,306 | |||||||||||||||||||||
|
|
|
|
|
|
|
|
|
|
|
|
|
|
|
|||||||||||||||
| $ | — | $ | — | $ | 21,475,685 | $ | (57,158 | ) | $ | — | $ | — | $ | 21,418,527 | ||||||||||||||
|
|
|
|
|
|
|
|
|
|
|
|
|
|
|
|||||||||||||||
| Net Change in Unrealized Appreciation (Depreciation) on: |
||||||||||||||||||||||||||||
| Forward foreign currency exchange contracts |
$ | — | $ | — | $ | — | $ | (3,535,460 | ) | $ | — | $ | — | $ | (3,535,460 | ) | ||||||||||||
| Options written |
— | — | (19,080,793 | ) | — | — | — | (19,080,793 | ) | |||||||||||||||||||
|
|
|
|
|
|
|
|
|
|
|
|
|
|
|
|||||||||||||||
| $ | — | $ | — | $ | (19,080,793 | ) | $ | (3,535,460 | ) | $ | — | $ | — | $ | (22,616,253 | ) | ||||||||||||
|
|
|
|
|
|
|
|
|
|
|
|
|
|
|
|||||||||||||||
| (a) | Options purchased are included in net realized gain (loss) from investments — unaffiliated. |
Average Quarterly Balances of Outstanding Derivative Financial Instruments
| Forward foreign currency exchange contracts: |
||||
| Average amounts purchased — in USD |
$ | 1,628,769 | ||
| Average amounts sold — in USD |
$ | 88,273,543 | ||
| Options: |
||||
| Average value of option contracts purchased |
$ | 38 | ||
| Average value of option contracts written |
$ | 19,905,286 | ||
For more information about the Trust’s investment risks regarding derivative financial instruments, refer to the Notes to Financial Statements.
Derivative Financial Instruments — Offsetting as of Period End
The Trust’s derivative assets and liabilities (by type) were as follows:
| Assets | Liabilities | |||||||
| Derivative Financial Instruments |
||||||||
| Forward foreign currency exchange contracts |
$ | 1,429,095 | $ | — | ||||
| Options |
— | 31,431,446 | ||||||
|
|
|
|
|
|||||
| Total derivative assets and liabilities in the Statements of Assets and Liabilities |
1,429,095 | 31,431,446 | ||||||
|
|
|
|
|
|||||
| Derivatives not subject to a Master Netting Agreement or similar agreement (“MNA”) |
— | (26,603,366 | ) | |||||
|
|
|
|
|
|||||
| Total derivative assets and liabilities subject to an MNA |
$ | 1,429,095 | $ | 4,828,080 | ||||
|
|
|
|
|
|||||
| S C H E D U L E O F I N V E S T M E N T S |
83 |
| Schedule of Investments (continued) December 31, 2023
|
BlackRock Health Sciences Term Trust (BMEZ) |
The following table presents the Trust’s derivative assets and liabilities by counterparty net of amounts available for offset under an MNA and net of the related collateral received and pledged by the Trust:
| Counterparty |
|
Derivative Assets Subject to an MNA by Counterparty |
|
|
Derivatives Available for Offset |
(a) |
|
Non-Cash Collateral Received |
|
|
Cash Collateral Received |
|
|
Net Amount of Derivative Assets |
(b)(c) | |||||
| Barclays Bank PLC |
$ | 182,850 | $ | (114,276 | ) | $ | — | $ | — | $ | 68,574 | |||||||||
| Morgan Stanley & Co. International PLC |
1,246,245 | (1,246,245 | ) | — | — | — | ||||||||||||||
|
|
|
|
|
|
|
|
|
|
|
|||||||||||
| $ | 1,429,095 | $ | (1,360,521 | ) | $ | — | $ | — | $ | 68,574 | ||||||||||
|
|
|
|
|
|
|
|
|
|
|
|||||||||||
| Counterparty |
|
Derivative Liabilities Subject to an MNA by Counterparty |
|
|
Derivatives Available for Offset |
(a) |
|
Non-Cash Collateral Pledged |
(d) |
|
Cash Collateral Pledged |
|
|
Net Amount of Derivative Liabilities |
(e) | |||||
| Bank of America N.A. |
$ | 607,225 | $ | — | $ | (607,225 | ) | $ | — | $ | — | |||||||||
| Barclays Bank PLC |
114,276 | (114,276 | ) | — | — | — | ||||||||||||||
| BNP Paribas SA |
517,554 | — | — | (440,000 | ) | 77,554 | ||||||||||||||
| Citibank N.A. |
145,568 | — | — | — | 145,568 | |||||||||||||||
| Goldman Sachs International |
664,453 | — | (664,453 | ) | — | — | ||||||||||||||
| Morgan Stanley & Co. International PLC |
2,310,017 | (1,246,245 | ) | (1,047,772 | ) | (16,000 | ) | — | ||||||||||||
| UBS AG |
468,987 | — | (468,987 | ) | — | — | ||||||||||||||
|
|
|
|
|
|
|
|
|
|
|
|||||||||||
| $ | 4,828,080 | $ | (1,360,521 | ) | $ | (2,788,437 | ) | $ | (456,000 | ) | $ | 223,122 | ||||||||
|
|
|
|
|
|
|
|
|
|
|
|||||||||||
| (a) | The amount of derivatives available for offset is limited to the amount of derivative asset and/or liabilities that are subject to an MNA. |
| (b) | Net amount may also include forward foreign currency exchange contracts that are not required to be collateralized. |
| (c) | Net amount represents the net amount receivable from the counterparty in the event of default. |
| (d) | Excess of collateral received/pledged, if any, from the individual counterparty is not shown for financial reporting purposes. |
| (e) | Net amount represents the net amount payable due to counterparty in the event of default. Net amount may be offset further by the options written receivable/payable on the Statements of Assets and Liabilities. |
Fair Value Hierarchy as of Period End
Various inputs are used in determining the fair value of financial instruments. For a description of the input levels and information about the Trust’s policy regarding valuation of financial instruments, refer to the Notes to Financial Statements.
The following table summarizes the Trust’s financial instruments categorized in the fair value hierarchy. The breakdown of the Trust’s financial instruments into major categories is disclosed in the Schedule of Investments above.
| Level 1 | Level 2 | Level 3 | Total | |||||||||||||
| Assets |
||||||||||||||||
| Investments |
||||||||||||||||
| Long-Term Investments |
||||||||||||||||
| Common Stocks |
||||||||||||||||
| Biotechnology |
$ | 686,050,922 | $ | 31,502,136 | $ | — | $ | 717,553,058 | ||||||||
| Electronic Equipment, Instruments & Components |
3,075,222 | — | — | 3,075,222 | ||||||||||||
| Health Care Equipment & Supplies |
368,473,189 | 13,727,210 | — | 382,200,399 | ||||||||||||
| Health Care Providers & Services |
164,087,690 | 17,862,430 | — | 181,950,120 | ||||||||||||
| Health Care Technology |
1,372,894 | — | — | 1,372,894 | ||||||||||||
| Life Sciences Tools & Services |
245,757,920 | 35,162,748 | — | 280,920,668 | ||||||||||||
| Pharmaceuticals |
129,596,162 | 35,150,651 | — | 164,746,813 | ||||||||||||
| Other Interests |
— | — | 4,664,318 | 4,664,318 | ||||||||||||
| Preferred Securities |
||||||||||||||||
| Preferred Stocks |
— | 17,600,893 | 143,543,684 | 161,144,577 | ||||||||||||
| Rights |
— | 3,152 | 268,290 | 271,442 | ||||||||||||
| Warrants |
4,611 | — | — | 4,611 | ||||||||||||
| 84 | 2 0 2 3 B L A C K R O C K A N N U A L R E P O R T T O S H A R E H O L D E R S |
| Schedule of Investments (continued) December 31, 2023
|
BlackRock Health Sciences Term Trust (BMEZ) |
Fair Value Hierarchy as of Period End (continued)
| Level 1 | Level 2 | Level 3 | Total | |||||||||||||
| Short-Term Securities |
||||||||||||||||
| Money Market Funds |
$ | 40,473,813 | $ | — | $ | — | $ | 40,473,813 | ||||||||
|
|
|
|
|
|
|
|
|
|||||||||
| $ | 1,638,892,423 | $ | 151,009,220 | $ | 148,476,292 | 1,938,377,935 | ||||||||||
|
|
|
|
|
|
|
|
|
|||||||||
| Investments Valued at NAV(a) |
12,308,246 | |||||||||||||||
|
|
|
|||||||||||||||
| $ | 1,950,686,181 | |||||||||||||||
|
|
|
|||||||||||||||
| Derivative Financial Instruments(b) |
||||||||||||||||
| Assets |
||||||||||||||||
| Foreign Currency Exchange Contracts |
$ | — | $ | 1,429,095 | $ | — | $ | 1,429,095 | ||||||||
| Liabilities |
||||||||||||||||
| Equity Contracts |
(21,191,621 | ) | (10,239,825 | ) | — | (31,431,446 | ) | |||||||||
|
|
|
|
|
|
|
|
|
|||||||||
| $ | (21,191,621 | ) | $ | (8,810,730 | ) | $ | — | $ | (30,002,351 | ) | ||||||
|
|
|
|
|
|
|
|
|
|||||||||
| (a) | Certain investments of the Trust were fair valued using NAV as a practical expedient as no quoted market value is available and therefore have been excluded from the fair value hierarchy. |
| (b) | Derivative financial instruments are forward foreign currency exchange contracts and options written. Forward foreign currency exchange contracts are valued at the unrealized appreciation (depreciation) on the instrument and options written are shown at value. |
A reconciliation of Level 3 financial instruments is presented when the Trust had a significant amount of Level 3 investments and derivative financial instruments at the beginning and/or end of the year in relation to net assets. The following table is a reconciliation of Level 3 investments for which significant unobservable inputs were used in determining fair value:
| Common Stocks |
Other Interests |
Preferred Stocks |
Rights | Total | ||||||||||||||||
| Assets |
||||||||||||||||||||
| Opening balance, as of December 31, 2022 |
$ | 12,093,187 | $ | 4,076,191 | $ | 158,791,702 | $ | — | $ | 174,961,080 | ||||||||||
| Transfers into Level 3 |
— | — | — | — | — | |||||||||||||||
| Transfers out of Level 3 |
— | — | — | — | — | |||||||||||||||
| Other(a) |
(12,093,187 | ) | 5,987,002 | 6,005,576 | 100,609 | — | ||||||||||||||
| Accrued discounts/premiums |
— | — | — | — | — | |||||||||||||||
| Net realized gain (loss) |
— | 1,973,468 | — | — | 1,973,468 | |||||||||||||||
| Net change in unrealized appreciation (depreciation)(b)(c) |
— | (5,398,876 | ) | (24,086,134 | ) | 167,681 | (29,317,329 | ) | ||||||||||||
| Purchases |
— | — | 51,822,457 | — | 51,822,457 | |||||||||||||||
| Sales |
— | (1,973,467 | ) | (48,989,917 | ) | — | (50,963,384 | ) | ||||||||||||
|
|
|
|
|
|
|
|
|
|
|
|||||||||||
| Closing balance, as of December 31, 2023 |
$ | — | $ | 4,664,318 | $ | 143,543,684 | $ | 268,290 | $ | 148,476,292 | ||||||||||
|
|
|
|
|
|
|
|
|
|
|
|||||||||||
| Net change in unrealized appreciation (depreciation) on investments still held at December 31, 2023(c) |
$ | — | $ | (1,322,685 | ) | $ | (18,668,933 | ) | $ | 167,681 | $ | (19,823,937 | ) | |||||||
|
|
|
|
|
|
|
|
|
|
|
|||||||||||
| (a) | Certain Level 3 investments were re-classified between Common Stocks, Preferred Stocks and Rights. |
| (b) | Included in the related net change in unrealized appreciation (depreciation) in the Statements of Operations. |
| (c) | Any difference between net change in unrealized appreciation (depreciation) and net change in unrealized appreciation (depreciation) on investments still held at December 31, 2023 is generally due to investments no longer held or categorized as Level 3 at period end. |
The following table summarizes the valuation approaches used and unobservable inputs utilized by the BlackRock Valuation Committee (the “Valuation Committee”) to determine the value of certain of the Trust’s Level 3 financial instruments as of period end.
| Value | |
Valuation Approach |
|
Unobservable Inputs |
|
Range of Unobservable Inputs Utilized |
(a) |
|
Weighted Average of Unobservable Inputs Based on Fair Value |
| ||||||||||||||||
| Assets |
||||||||||||||||||||||||||
| Preferred Stocks(b) |
143,543,684 | Market | Revenue Multiple | 2.25x - 5.75x | 3.51x | |||||||||||||||||||||
| Volatility | 50% - 100% | 74% | ||||||||||||||||||||||||
| Time to Exit | 1.5 - 4.0 years | 2.5 years | ||||||||||||||||||||||||
| Market Adjustment Multiple | 0.60x - 1.20x | 0.91x | ||||||||||||||||||||||||
| Income | Discount Rate | 6% | — | |||||||||||||||||||||||
| Other Interests |
4,664,318 | Income | Discount Rate | 5% - 6% | 6% | |||||||||||||||||||||
| S C H E D U L E O F I N V E S T M E N T S |
85 |
| Schedule of Investments (continued) December 31, 2023
|
BlackRock Health Sciences Term Trust (BMEZ) |
| Value | Valuation Approach |
Unobservable Inputs |
|
Range of Unobservable Inputs Utilized |
(a) |
|
Weighted Average of Unobservable Inputs Based on Fair Value |
| ||||||||||||||
| Rights |
268,290 | Income | Discount Rate | 5% | — | |||||||||||||||||
|
|
|
|||||||||||||||||||||
| $ | 148,476,292 | |||||||||||||||||||||
|
|
|
|||||||||||||||||||||
| (a) | A significant change in unobservable input would have resulted in a correlated (inverse) significant change to value. |
| (b) | For the period end December 31, 2023, the valuation technique for investments classified as Preferred Stocks amounting to $1,309,244 changed to a Discounted Cash Flow approach. The investments were previously valued utilizing a Option Pricing Model. The change was due to consideration of the information that was available at the time the investments were valued. |
See notes to financial statements.
| 86 | 2 0 2 3 B L A C K R O C K A N N U A L R E P O R T T O S H A R E H O L D E R S |
| Schedule of Investments December 31, 2023
|
BlackRock Health Sciences Trust (BME) (Percentages shown are based on Net Assets) |
| Security | Shares | Value | ||||||
| Common Stocks |
||||||||
| Biotechnology — 24.3% | ||||||||
| AbbVie, Inc. |
171,601 | $ | 26,593,007 | |||||
| AC Immune SA(a) |
78,180 | 390,900 | ||||||
| Alnylam Pharmaceuticals, Inc.(a) |
13,010 | 2,490,244 | ||||||
| Amgen, Inc.(b) |
75,441 | 21,728,517 | ||||||
| Argenx SE, ADR(a) |
16,353 | 6,221,172 | ||||||
| BeiGene Ltd., ADR(a) |
6,675 | 1,203,903 | ||||||
| Biogen, Inc.(a) |
42,571 | 11,016,098 | ||||||
| BioMarin Pharmaceutical, Inc.(a) |
45,161 | 4,354,424 | ||||||
| Biomea Fusion, Inc.(a) |
9,387 | 136,299 | ||||||
| Blueprint Medicines Corp.(a) |
26,672 | 2,460,225 | ||||||
| Cabaletta Bio, Inc.(a) |
29,605 | 672,033 | ||||||
| Cerevel Therapeutics Holdings, Inc.(a) |
16,659 | 706,342 | ||||||
| CureVac NV(a) |
29,850 | 125,668 | ||||||
| Exact Sciences Corp.(a) |
14,991 | 1,109,034 | ||||||
| Genmab A/S(a) |
2,927 | 933,283 | ||||||
| Genmab A/S, ADR(a) |
19,943 | 634,985 | ||||||
| Gilead Sciences, Inc. |
178,480 | 14,458,665 | ||||||
| Immuneering Corp., Class A(a) |
14,456 | 106,252 | ||||||
| Immunocore Holdings PLC, ADR(a) |
12,497 | 853,795 | ||||||
| Incyte Corp.(a) |
27,851 | 1,748,764 | ||||||
| Ionis Pharmaceuticals, Inc.(a) |
25,805 | 1,305,475 | ||||||
| Karuna Therapeutics, Inc.(a) |
2,227 | 704,868 | ||||||
| Legend Biotech Corp., ADR(a) |
32,098 | 1,931,337 | ||||||
| Merus NV(a) |
23,470 | 645,425 | ||||||
| Mirati Therapeutics, Inc.(a) |
15,747 | 925,136 | ||||||
| Moderna, Inc.(a) |
33,556 | 3,337,144 | ||||||
| MoonLake Immunotherapeutics, Class A(a) |
10,337 | 624,251 | ||||||
| Morphic Holding, Inc.(a) |
7,827 | 226,044 | ||||||
| Neurocrine Biosciences, Inc.(a) |
9,808 | 1,292,302 | ||||||
| Neurogene, Inc. |
19,342 | 374,848 | ||||||
| Nuvalent, Inc., Class A(a) |
13,886 | 1,021,871 | ||||||
| Prime Medicine, Inc.(a) |
22,929 | 203,151 | ||||||
| Protagonist Therapeutics, Inc.(a) |
27,836 | 638,279 | ||||||
| PTC Therapeutics, Inc.(a) |
19,817 | 546,156 | ||||||
| Regeneron Pharmaceuticals, Inc.(a) |
9,307 | 8,174,245 | ||||||
| REVOLUTION Medicines, Inc.(a) |
18,339 | 525,963 | ||||||
| Rhythm Pharmaceuticals, Inc.(a) |
49,466 | 2,273,952 | ||||||
| Rocket Pharmaceuticals, Inc.(a) |
18,343 | 549,740 | ||||||
| Roivant Sciences Ltd.(a) |
53,725 | 603,332 | ||||||
| Sarepta Therapeutics, Inc.(a) |
36,858 | 3,554,217 | ||||||
| Tenaya Therapeutics, Inc.(a) |
25,502 | 82,626 | ||||||
| Ultragenyx Pharmaceutical, Inc.(a) |
14,268 | 682,296 | ||||||
| Vaxcyte, Inc.(a) |
28,905 | 1,815,234 | ||||||
| Vertex Pharmaceuticals, Inc.(a) |
27,779 | 11,302,997 | ||||||
| Viking Therapeutics, Inc.(a) |
17,352 | 322,921 | ||||||
| Xenon Pharmaceuticals, Inc.(a) |
32,241 | 1,485,020 | ||||||
|
|
|
|||||||
| 143,092,440 | ||||||||
| Health Care Equipment & Supplies — 22.1% | ||||||||
| Abbott Laboratories(b) |
190,037 | 20,917,373 | ||||||
| Alcon, Inc. |
91,365 | 7,137,434 | ||||||
| Align Technology, Inc.(a) |
11,220 | 3,074,280 | ||||||
| Baxter International, Inc. |
60,439 | 2,336,572 | ||||||
| Becton Dickinson & Co. |
39,171 | 9,551,065 | ||||||
| Boston Scientific Corp.(a) |
441,434 | 25,519,300 | ||||||
| Cooper Cos., Inc. |
13,642 | 5,162,678 | ||||||
| Dexcom, Inc.(a) |
28,333 | 3,515,842 | ||||||
| Envista Holdings Corp.(a) |
22,246 | 535,239 | ||||||
| GE HealthCare, Inc.(a) |
42,353 | 3,274,734 | ||||||
| IDEXX Laboratories, Inc.(a) |
7,516 | 4,171,756 | ||||||
| Inspire Medical Systems, Inc.(a) |
5,782 | 1,176,232 | ||||||
| Security | Shares | Value | ||||||
| Health Care Equipment & Supplies (continued) | ||||||||
| Intuitive Surgical, Inc.(a) |
42,340 | $ | 14,283,822 | |||||
| Masimo Corp.(a) |
15,144 | 1,775,028 | ||||||
| Medtronic PLC |
79,846 | 6,577,713 | ||||||
| Novocure Ltd.(a) |
29,303 | 437,494 | ||||||
| Orchestra BioMed Holdings, Inc.(a) |
18,076 | 165,034 | ||||||
| Penumbra, Inc.(a) |
12,105 | 3,044,892 | ||||||
| Shockwave Medical, Inc.(a) |
3,150 | 600,264 | ||||||
| STERIS PLC |
9,997 | 2,197,840 | ||||||
| Stryker Corp. |
49,207 | 14,735,528 | ||||||
|
|
|
|||||||
| 130,190,120 | ||||||||
| Health Care Providers & Services — 21.1% | ||||||||
| Cencora, Inc. |
62,148 | 12,763,956 | ||||||
| Centene Corp.(a) |
77,624 | 5,760,477 | ||||||
| Cigna Group |
31,736 | 9,503,345 | ||||||
| Elevance Health, Inc.(b) |
28,967 | 13,659,678 | ||||||
| Guardant Health, Inc.(a) |
15,095 | 408,320 | ||||||
| HCA Healthcare, Inc. |
21,723 | 5,879,982 | ||||||
| Humana, Inc. |
15,630 | 7,155,570 | ||||||
| Laboratory Corp. of America Holdings |
6,745 | 1,533,071 | ||||||
| McKesson Corp. |
25,848 | 11,967,107 | ||||||
| Quest Diagnostics, Inc. |
11,479 | 1,582,725 | ||||||
| UnitedHealth Group, Inc.(b) |
102,008 | 53,704,152 | ||||||
|
|
|
|||||||
| 123,918,383 | ||||||||
| Life Sciences Tools & Services — 8.3% | ||||||||
| 10X Genomics, Inc., Class A(a) |
15,123 | 846,283 | ||||||
| Agilent Technologies, Inc. |
23,561 | 3,275,686 | ||||||
| Avantor, Inc.(a) |
88,349 | 2,017,008 | ||||||
| Bio-Techne Corp. |
16,718 | 1,289,961 | ||||||
| Danaher Corp. |
78,006 | 18,045,908 | ||||||
| IQVIA Holdings, Inc.(a) |
9,048 | 2,093,526 | ||||||
| Mettler-Toledo International, Inc.(a) |
1,010 | 1,225,090 | ||||||
| Nautilus Biotechnology, Inc.(a) |
16,560 | 49,515 | ||||||
| QIAGEN NV(a) |
36,163 | 1,570,559 | ||||||
| Rapid Micro Biosystems, Inc., Class A(a) |
20,561 | 15,215 | ||||||
| Repligen Corp.(a) |
8,125 | 1,460,875 | ||||||
| Thermo Fisher Scientific, Inc. |
24,009 | 12,743,737 | ||||||
| West Pharmaceutical Services, Inc. |
11,152 | 3,926,842 | ||||||
|
|
|
|||||||
| 48,560,205 | ||||||||
| Pharmaceuticals — 19.1% | ||||||||
| AstraZeneca PLC |
17,449 | 2,353,693 | ||||||
| Catalent, Inc.(a) |
20,853 | 936,925 | ||||||
| Daiichi Sankyo Co. Ltd. |
34,800 | 952,710 | ||||||
| Elanco Animal Health, Inc.(a) |
97,264 | 1,449,233 | ||||||
| Eli Lilly & Co. |
81,287 | 47,383,818 | ||||||
| Johnson & Johnson(b) |
70,368 | 11,029,480 | ||||||
| Merck & Co., Inc.(b) |
230,007 | 25,075,363 | ||||||
| Novo Nordisk A/S, Class B |
68,574 | 7,106,403 | ||||||
| Pfizer, Inc.(b) |
282,816 | 8,142,273 | ||||||
| Sanofi SA |
26,788 | 2,661,998 | ||||||
| Structure Therapeutics, Inc., ADR(a) |
26,914 | 1,097,015 | ||||||
| Zoetis, Inc., Class A |
20,979 | 4,140,625 | ||||||
|
|
|
|||||||
| 112,329,536 | ||||||||
|
|
|
|||||||
| Total Common Stocks — 94.9% |
|
558,090,684 | ||||||
|
|
|
|||||||
| S C H E D U L E O F I N V E S T M E N T S |
87 |
| Schedule of Investments (continued) December 31, 2023 |
BlackRock Health Sciences Trust (BME) (Percentages shown are based on Net Assets) |
| Security | Benefical Interest (000) |
Value | ||||||
| Other Interests |
||||||||
| Biotechnology — 0.0% | ||||||||
| Affinivax, Inc., (Acquired 08/18/22, |
$ | 6 | $ | 84,962 | ||||
|
|
|
|||||||
| Health Care Providers & Services — 0.0% | ||||||||
| Afferent Pharmaceuticals, Inc., (Acquired 09/30/15, Cost: $ —)(c)(d)(e) |
190 | 26,622 | ||||||
|
|
|
|||||||
| Total Other Interests — 0.0% |
|
111,584 | ||||||
|
|
|
|||||||
| Shares | ||||||||
| Preferred Securities |
||||||||
| Preferred Stocks — 0.8%(a)(c)(e) | ||||||||
| Biotechnology — 0.3% | ||||||||
| Cellarity, Inc., Series B, (Acquired 01/15/21, Cost: $265,002) |
44,167 | 146,635 | ||||||
| Genesis Therapeutics, Series B, (Acquired 08/10/23, Cost: $292,001) |
57,170 | 292,139 | ||||||
| Goldfinch Bio, Inc., Series B, (Acquired 06/26/20, Cost: $224,200) |
190,000 | 64,600 | ||||||
| Kartos Therapeutics, Series C, (Acquired 08/22/23, Cost: $485,124) |
85,817 | 486,582 | ||||||
| Laronde, Inc., Series B, (Acquired 07/28/21, Cost: $590,800) |
21,100 | 590,800 | ||||||
|
|
|
|||||||
| 1,580,756 | ||||||||
| Health Care Equipment & Supplies — 0.2% | ||||||||
| Exo Imaging, Inc., Series C, (Acquired 06/24/21, Cost: $595,999) |
101,741 | 268,596 | ||||||
| Nucleix Ltd., Series AA, (Acquired 03/25/21, Cost: $1,070,001) |
367,395 | 995,641 | ||||||
| Swift Health Systems, Inc., Series D, (Acquired 08/27/21, Cost: $286,998) |
92,580 | 77,767 | ||||||
|
|
|
|||||||
| 1,342,004 | ||||||||
| Health Care Providers & Services — 0.1% | ||||||||
| Quanta Dialysis Technologies Ltd., Series D, (Acquired 06/18/21, Cost: $515,759) |
4,243,029 | 286,644 | ||||||
|
|
|
|||||||
| Health Care Technology — 0.1% | ||||||||
| Carbon Health Technologies, Inc., Series D2, (Acquired 02/02/23, Cost: $907,000) |
89,892 | 791,948 | ||||||
|
|
|
|||||||
| Pharmaceuticals — 0.1% | ||||||||
| Adarx Pharamaceuticals, Series C, (Acquired 08/02/23, Cost: $440,003) |
52,885 | 440,532 | ||||||
| Insitro, Inc., Series C, (Acquired 03/10/21, Cost: $560,000) |
30,616 | 319,631 | ||||||
|
|
|
|||||||
| 760,163 | ||||||||
|
|
|
|||||||
| 4,761,515 | ||||||||
|
|
|
|||||||
| Total Preferred Securities — 0.8% |
|
4,761,515 | ||||||
|
|
|
|||||||
| Security |
Shares |
Value | ||||||
| Rights |
||||||||
| Biotechnology — 0.0% | ||||||||
| Korro Bio, Inc., CVR |
28,060 | $ | 382 | |||||
|
|
|
|||||||
| Health Care Equipment & Supplies — 0.0% | ||||||||
| Abiomed, Inc., CVR(c) |
14,359 | 39,056 | ||||||
|
|
|
|||||||
| Total Rights — 0.0% |
|
39,438 | ||||||
|
|
|
|||||||
| Warrants |
||||||||
| Health Care Providers & Services — 0.0% | ||||||||
| CareMax, Inc., (Issued/Exercisable 09/15/20, 1 Share for 1 Warrant, Expires 08/06/26, Strike Price USD 11.50)(a) |
4,201 | 32 | ||||||
|
|
|
|||||||
| Pharmaceuticals — 0.0% | ||||||||
| Nuvation Bio, Inc., (Issued/Exercisable 08/17/20, 1 Share for 1 Warrant, Expires 07/07/27, Strike Price USD 11.50)(a) |
4,050 | 243 | ||||||
|
|
|
|||||||
| Total Warrants — 0.0% |
275 | |||||||
|
|
|
|||||||
| Total Long-Term Investments — 95.7% |
|
563,003,496 | ||||||
|
|
|
|||||||
| Short-Term Securities |
||||||||
| Money Market Funds — 5.3% | ||||||||
| BlackRock Liquidity Funds, T-Fund, Institutional Class, 5.26%(f)(g) |
31,396,977 | 31,396,977 | ||||||
|
|
|
|||||||
| Total Short-Term Securities — 5.3% |
|
31,396,977 | ||||||
|
|
|
|||||||
| Total Investments Before Options Written — 101.0% |
|
594,400,473 | ||||||
|
|
|
|||||||
| Options Written — (1.2)% |
|
(7,272,745 | ) | |||||
|
|
|
|||||||
| Total Investments, Net of Options Written — 99.8% |
|
587,127,728 | ||||||
| Other Assets Less Liabilities — 0.2% | 1,007,702 | |||||||
|
|
|
|||||||
| Net Assets — 100.0% |
|
$ | 588,135,430 | |||||
|
|
|
|||||||
| (a) | Non-income producing security. |
| (b) | All or a portion of the security has been pledged and/or segregated as collateral in connection with outstanding exchange-traded options written. |
| (c) | Security is valued using significant unobservable inputs and is classified as Level 3 in the fair value hierarchy. |
| (d) | Other interests represent beneficial interests in liquidation trusts and other reorganization or private entities. |
| (e) | Restricted security as to resale, excluding 144A securities. The Trust held restricted securities with a current value of $4,873,099, representing 0.8% of its net assets as of period end, and an original cost of $6,232,887. |
| (f) | Affiliate of the Trust. |
| (g) | Annualized 7-day yield as of period end. |
For Trust compliance purposes, the Trust’s industry classifications refer to one or more of the industry sub-classifications used by one or more widely recognized market indexes or rating group indexes, and/or as defined by the investment adviser. These definitions may not apply for purposes of this report, which may combine such industry sub-classifications for reporting ease.
| 88 | 2 0 2 3 B L A C K R O C K A N N U A L R E P O R T T O S H A R E H O L D E R S |
| Schedule of Investments (continued) December 31, 2023
|
BlackRock Health Sciences Trust (BME) |
Affiliates
Investments in issuers considered to be affiliate(s) of the Trust during the year ended December 31, 2023 for purposes of Section 2(a)(3) of the Investment Company Act of 1940, as amended, were as follows:
| Affiliated Issuer | Value at 12/31/22 |
Purchases at Cost |
Proceeds from Sale |
Net Realized Gain (Loss) |
Change in Unrealized Appreciation (Depreciation) |
Value at 12/31/23 |
Shares Held at 12/31/23 |
Income | Capital Gain Distributions from Underlying Funds |
|||||||||||||||||||||||||||
| BlackRock Liquidity Funds, T-Fund, Institutional Class |
$ | 23,195,315 | $ | 8,201,662 | (a) | $ | — | $ | — | $ | — | $ | 31,396,977 | 31,396,977 | $ | 1,268,777 | $ | — | ||||||||||||||||||
| SL Liquidity Series, LLC, Money Market Series(b) |
675,980 | — | (676,809 | )(a) | 1,094 | (265 | ) | — | — | 25,650 | (c) | — | ||||||||||||||||||||||||
|
|
|
|
|
|
|
|
|
|
|
|||||||||||||||||||||||||||
| $ | 1,094 | $ | (265 | ) | $ | 31,396,977 | $ | 1,294,427 | $ | — | ||||||||||||||||||||||||||
|
|
|
|
|
|
|
|
|
|
|
|||||||||||||||||||||||||||
| (a) | Represents net amount purchased (sold). |
| (b) | As of period end, the entity is no longer held. |
| (c) | All or a portion represents securities lending income earned from the reinvestment of cash collateral from loaned securities, net of fees and collateral investment expenses, and other payments to and from borrowers of securities. |
Derivative Financial Instruments Outstanding as of Period End
Exchange-Traded Options Written
| Description | Number of Contracts |
Expiration Date |
Exercise Price | Notional Amount (000) |
Value | |||||||||||||||||||||||
| Call |
||||||||||||||||||||||||||||
| Abbott Laboratories |
410 | 01/05/24 | USD | 105.00 | USD | 4,513 | $ | (214,225 | ) | |||||||||||||||||||
| Amgen, Inc. |
110 | 01/05/24 | USD | 275.00 | USD | 3,168 | (147,125 | ) | ||||||||||||||||||||
| Centene Corp. |
62 | 01/05/24 | USD | 75.00 | USD | 460 | (2,945 | ) | ||||||||||||||||||||
| Cigna Group |
70 | 01/05/24 | USD | 285.00 | USD | 2,096 | (106,750 | ) | ||||||||||||||||||||
| Danaher Corp. |
76 | 01/05/24 | USD | 230.00 | USD | 1,758 | (25,840 | ) | ||||||||||||||||||||
| Elevance Health, Inc. |
24 | 01/05/24 | USD | 485.00 | USD | 1,132 | (1,260 | ) | ||||||||||||||||||||
| McKesson Corp. |
17 | 01/05/24 | USD | 470.00 | USD | 787 | (2,720 | ) | ||||||||||||||||||||
| Pfizer, Inc. |
154 | 01/05/24 | USD | 31.00 | USD | 443 | (308 | ) | ||||||||||||||||||||
| Thermo Fisher Scientific, Inc. |
36 | 01/05/24 | USD | 500.00 | USD | 1,911 | (114,120 | ) | ||||||||||||||||||||
| UnitedHealth Group, Inc. |
153 | 01/05/24 | USD | 550.00 | USD | 8,055 | (1,071 | ) | ||||||||||||||||||||
| Alcon, Inc. |
135 | 01/09/24 | USD | 76.00 | USD | 1,055 | (34,968 | ) | ||||||||||||||||||||
| AbbVie, Inc. |
165 | 01/12/24 | USD | 146.00 | USD | 2,557 | (157,162 | ) | ||||||||||||||||||||
| Biogen, Inc. |
67 | 01/12/24 | USD | 245.00 | USD | 1,734 | (96,815 | ) | ||||||||||||||||||||
| Centene Corp. |
95 | 01/12/24 | USD | 75.00 | USD | 705 | (10,450 | ) | ||||||||||||||||||||
| Cigna Group |
36 | 01/12/24 | USD | 265.00 | USD | 1,078 | (127,260 | ) | ||||||||||||||||||||
| Danaher Corp. |
63 | 01/12/24 | USD | 225.00 | USD | 1,457 | (57,960 | ) | ||||||||||||||||||||
| Eli Lilly & Co. |
126 | 01/12/24 | USD | 615.00 | USD | 7,345 | (31,878 | ) | ||||||||||||||||||||
| Gilead Sciences, Inc. |
226 | 01/12/24 | USD | 80.00 | USD | 1,831 | (42,149 | ) | ||||||||||||||||||||
| Humana, Inc. |
21 | 01/12/24 | USD | 495.00 | USD | 961 | (1,470 | ) | ||||||||||||||||||||
| Intuitive Surgical, Inc. |
58 | 01/12/24 | USD | 320.00 | USD | 1,957 | (121,800 | ) | ||||||||||||||||||||
| Johnson & Johnson |
61 | 01/12/24 | USD | 160.00 | USD | 956 | (4,057 | ) | ||||||||||||||||||||
| Johnson & Johnson |
60 | 01/12/24 | USD | 155.00 | USD | 940 | (19,320 | ) | ||||||||||||||||||||
| McKesson Corp. |
43 | 01/12/24 | USD | 460.00 | USD | 1,991 | (41,925 | ) | ||||||||||||||||||||
| Merck & Co., Inc. |
318 | 01/12/24 | USD | 102.01 | USD | 3,467 | (235,033 | ) | ||||||||||||||||||||
| Moderna, Inc. |
31 | 01/12/24 | USD | 85.00 | USD | 308 | (45,957 | ) | ||||||||||||||||||||
| Regeneron Pharmaceuticals, Inc. |
10 | 01/12/24 | USD | 860.00 | USD | 878 | (30,550 | ) | ||||||||||||||||||||
| 10X Genomics, Inc., Class A |
30 | 01/19/24 | USD | 45.00 | USD | 168 | (34,650 | ) | ||||||||||||||||||||
| AbbVie, Inc. |
118 | 01/19/24 | USD | 145.00 | USD | 1,829 | (125,375 | ) | ||||||||||||||||||||
| Alcon, Inc. |
69 | 01/19/24 | USD | 72.50 | USD | 539 | (41,745 | ) | ||||||||||||||||||||
| Align Technology, Inc. |
10 | 01/19/24 | USD | 240.00 | USD | 274 | (37,700 | ) | ||||||||||||||||||||
| Alnylam Pharmaceuticals, Inc. |
49 | 01/19/24 | USD | 200.00 | USD | 938 | (19,845 | ) | ||||||||||||||||||||
| Amgen, Inc. |
166 | 01/19/24 | USD | 285.00 | USD | 4,781 | (123,670 | ) | ||||||||||||||||||||
| Argenx SE, ADR |
31 | 01/19/24 | USD | 520.00 | USD | 1,179 | (14,570 | ) | ||||||||||||||||||||
| Avantor, Inc. |
130 | 01/19/24 | USD | 19.75 | USD | 297 | (54,153 | ) | ||||||||||||||||||||
| Becton Dickinson & Co. |
48 | 01/19/24 | USD | 245.00 | USD | 1,170 | (17,280 | ) | ||||||||||||||||||||
| BeiGene Ltd., ADR |
25 | 01/19/24 | USD | 200.00 | USD | 451 | (7,063 | ) | ||||||||||||||||||||
| Biogen, Inc. |
23 | 01/19/24 | USD | 245.00 | USD | 595 | (38,295 | ) | ||||||||||||||||||||
| BioMarin Pharmaceutical, Inc. |
41 | 01/19/24 | USD | 90.00 | USD | 395 | (29,520 | ) | ||||||||||||||||||||
| Bio-Techne Corp. |
23 | 01/19/24 | USD | 65.00 | USD | 177 | (27,255 | ) | ||||||||||||||||||||
| S C H E D U L E O F I N V E S T M E N T S |
89 |
| Schedule of Investments (continued) December 31, 2023
|
BlackRock Health Sciences Trust (BME) |
Exchange-Traded Options Written (continued)
| Description | Number of Contracts |
Expiration Date |
Exercise Price | Notional Amount (000) |
Value | |||||||||||||||||||||||
| Call (continued) |
||||||||||||||||||||||||||||
| Blueprint Medicines Corp. |
60 | 01/19/24 | USD | 65.00 | USD | 553 | $ | (166,200 | ) | |||||||||||||||||||
| Blueprint Medicines Corp. |
41 | 01/19/24 | USD | 85.00 | USD | 378 | (41,000 | ) | ||||||||||||||||||||
| Cabaletta Bio, Inc. |
50 | 01/19/24 | USD | 22.50 | USD | 114 | (9,000 | ) | ||||||||||||||||||||
| Catalent, Inc. |
31 | 01/19/24 | USD | 40.00 | USD | 139 | (16,740 | ) | ||||||||||||||||||||
| Cencora, Inc. |
97 | 01/19/24 | USD | 200.00 | USD | 1,992 | (69,355 | ) | ||||||||||||||||||||
| Centene Corp. |
41 | 01/19/24 | USD | 77.50 | USD | 304 | (2,255 | ) | ||||||||||||||||||||
| Cerevel Therapeutics Holdings, Inc. |
32 | 01/19/24 | USD | 25.00 | USD | 136 | (56,160 | ) | ||||||||||||||||||||
| Cooper Cos., Inc. |
26 | 01/19/24 | USD | 360.00 | USD | 984 | (54,470 | ) | ||||||||||||||||||||
| Danaher Corp. |
77 | 01/19/24 | USD | 230.00 | USD | 1,781 | (50,050 | ) | ||||||||||||||||||||
| Elanco Animal Health, Inc. |
138 | 01/19/24 | USD | 12.00 | USD | 206 | (41,745 | ) | ||||||||||||||||||||
| Elevance Health, Inc. |
10 | 01/19/24 | USD | 480.00 | USD | 472 | (5,600 | ) | ||||||||||||||||||||
| Eli Lilly & Co. |
74 | 01/19/24 | USD | 640.00 | USD | 4,314 | (9,916 | ) | ||||||||||||||||||||
| Exact Sciences Corp. |
37 | 01/19/24 | USD | 80.00 | USD | 274 | (6,383 | ) | ||||||||||||||||||||
| GE HealthCare, Inc. |
160 | 01/19/24 | USD | 75.00 | USD | 1,237 | (52,000 | ) | ||||||||||||||||||||
| Gilead Sciences, Inc. |
141 | 01/19/24 | USD | 82.50 | USD | 1,142 | (12,197 | ) | ||||||||||||||||||||
| Guardant Health, Inc. |
43 | 01/19/24 | USD | 25.00 | USD | 116 | (11,288 | ) | ||||||||||||||||||||
| HCA Healthcare, Inc. |
50 | 01/19/24 | USD | 245.00 | USD | 1,353 | (136,500 | ) | ||||||||||||||||||||
| HCA Healthcare, Inc. |
32 | 01/19/24 | USD | 265.00 | USD | 866 | (30,880 | ) | ||||||||||||||||||||
| Humana, Inc. |
7 | 01/19/24 | USD | 505.00 | USD | 320 | (473 | ) | ||||||||||||||||||||
| IDEXX Laboratories, Inc. |
28 | 01/19/24 | USD | 570.00 | USD | 1,554 | (20,020 | ) | ||||||||||||||||||||
| Immunocore Holdings PLC, ADR |
18 | 01/19/24 | USD | 50.00 | USD | 123 | (33,480 | ) | ||||||||||||||||||||
| Incyte Corp. |
61 | 01/19/24 | USD | 57.50 | USD | 383 | (35,990 | ) | ||||||||||||||||||||
| Inspire Medical Systems, Inc. |
21 | 01/19/24 | USD | 165.00 | USD | 427 | (83,475 | ) | ||||||||||||||||||||
| Intuitive Surgical, Inc. |
48 | 01/19/24 | USD | 340.00 | USD | 1,619 | (42,000 | ) | ||||||||||||||||||||
| Ionis Pharmaceuticals, Inc. |
79 | 01/19/24 | USD | 52.50 | USD | 400 | (10,073 | ) | ||||||||||||||||||||
| IQVIA Holdings, Inc. |
34 | 01/19/24 | USD | 240.00 | USD | 787 | (5,950 | ) | ||||||||||||||||||||
| Johnson & Johnson |
146 | 01/19/24 | USD | 160.00 | USD | 2,288 | (13,067 | ) | ||||||||||||||||||||
| Karuna Therapeutics, Inc. |
1 | 01/19/24 | USD | 230.00 | USD | 32 | (8,720 | ) | ||||||||||||||||||||
| Legend Biotech Corp., ADR |
54 | 01/19/24 | USD | 75.00 | USD | 325 | (1,080 | ) | ||||||||||||||||||||
| Masimo Corp. |
41 | 01/19/24 | USD | 120.00 | USD | 481 | (16,195 | ) | ||||||||||||||||||||
| Merck & Co., Inc. |
278 | 01/19/24 | USD | 110.00 | USD | 3,031 | (36,974 | ) | ||||||||||||||||||||
| Mettler-Toledo International, Inc. |
3 | 01/19/24 | USD | 1,240.00 | USD | 364 | (6,330 | ) | ||||||||||||||||||||
| Moderna, Inc. |
75 | 01/19/24 | USD | 80.00 | USD | 746 | (150,375 | ) | ||||||||||||||||||||
| MoonLake Immunotherapeutics, Class A |
39 | 01/19/24 | USD | 80.00 | USD | 236 | (7,313 | ) | ||||||||||||||||||||
| Neurocrine Biosciences, Inc. |
15 | 01/19/24 | USD | 115.00 | USD | 198 | (26,025 | ) | ||||||||||||||||||||
| Neurocrine Biosciences, Inc. |
22 | 01/19/24 | USD | 125.00 | USD | 290 | (18,700 | ) | ||||||||||||||||||||
| Nuvalent, Inc., Class A |
26 | 01/19/24 | USD | 70.00 | USD | 191 | (16,250 | ) | ||||||||||||||||||||
| Pfizer, Inc. |
340 | 01/19/24 | USD | 31.00 | USD | 979 | (3,740 | ) | ||||||||||||||||||||
| Quest Diagnostics, Inc. |
12 | 01/19/24 | USD | 135.00 | USD | 165 | (4,800 | ) | ||||||||||||||||||||
| Quest Diagnostics, Inc. |
32 | 01/19/24 | USD | 140.00 | USD | 441 | (4,160 | ) | ||||||||||||||||||||
| Regeneron Pharmaceuticals, Inc. |
25 | 01/19/24 | USD | 885.00 | USD | 2,196 | (46,375 | ) | ||||||||||||||||||||
| REVOLUTION Medicines, Inc. |
34 | 01/19/24 | USD | 22.50 | USD | 98 | (21,930 | ) | ||||||||||||||||||||
| Rhythm Pharmaceuticals, Inc. |
98 | 01/19/24 | USD | 32.10 | USD | 451 | (141,419 | ) | ||||||||||||||||||||
| Rocket Pharmaceuticals, Inc. |
32 | 01/19/24 | USD | 25.00 | USD | 96 | (16,480 | ) | ||||||||||||||||||||
| Shockwave Medical, Inc. |
6 | 01/19/24 | USD | 185.00 | USD | 114 | (6,390 | ) | ||||||||||||||||||||
| STERIS PLC |
18 | 01/19/24 | USD | 219.50 | USD | 396 | (9,924 | ) | ||||||||||||||||||||
| Structure Therapeutics, Inc., ADR |
32 | 01/19/24 | USD | 70.00 | USD | 130 | (800 | ) | ||||||||||||||||||||
| Stryker Corp. |
126 | 01/19/24 | USD | 300.00 | USD | 3,773 | (69,930 | ) | ||||||||||||||||||||
| Ultragenyx Pharmaceutical, Inc. |
12 | 01/19/24 | USD | 40.00 | USD | 57 | (9,420 | ) | ||||||||||||||||||||
| UnitedHealth Group, Inc. |
153 | 01/19/24 | USD | 550.00 | USD | 8,055 | (43,528 | ) | ||||||||||||||||||||
| Vaxcyte, Inc. |
23 | 01/19/24 | USD | 55.00 | USD | 144 | (20,125 | ) | ||||||||||||||||||||
| Vertex Pharmaceuticals, Inc. |
53 | 01/19/24 | USD | 370.00 | USD | 2,157 | (206,700 | ) | ||||||||||||||||||||
| Viking Therapeutics, Inc. |
33 | 01/19/24 | USD | 14.00 | USD | 61 | (16,005 | ) | ||||||||||||||||||||
| West Pharmaceutical Services, Inc. |
48 | 01/19/24 | USD | 380.00 | USD | 1,690 | (4,680 | ) | ||||||||||||||||||||
| Xenon Pharmaceuticals, Inc. |
61 | 01/19/24 | USD | 45.00 | USD | 281 | (25,925 | ) | ||||||||||||||||||||
| Zoetis, Inc., Class A |
79 | 01/19/24 | USD | 200.00 | USD | 1,559 | (20,737 | ) | ||||||||||||||||||||
| Cencora, Inc. |
23 | 01/25/24 | USD | 204.00 | USD | 472 | (10,527 | ) | ||||||||||||||||||||
| Abbott Laboratories |
156 | 01/26/24 | USD | 109.00 | USD | 1,717 | (47,268 | ) | ||||||||||||||||||||
| AbbVie, Inc. |
166 | 01/26/24 | USD | 152.50 | USD | 2,573 | (65,570 | ) | ||||||||||||||||||||
| Align Technology, Inc. |
32 | 01/26/24 | USD | 280.00 | USD | 877 | (35,040 | ) | ||||||||||||||||||||
| Amgen, Inc. |
10 | 01/26/24 | USD | 285.00 | USD | 288 | (8,500 | ) | ||||||||||||||||||||
| Baxter International, Inc. |
202 | 01/26/24 | USD | 39.00 | USD | 781 | (18,685 | ) | ||||||||||||||||||||
| 90 | 2 0 2 3 B L A C K R O C K A N N U A L R E P O R T T O S H A R E H O L D E R S |
| Schedule of Investments (continued) December 31, 2023
|
BlackRock Health Sciences Trust (BME) |
Exchange-Traded Options Written (continued)
| Description | Number of Contracts |
Expiration Date |
Exercise Price | Notional Amount (000) |
Value | |||||||||||||||||||||||
| Call (continued) |
||||||||||||||||||||||||||||
| Biogen, Inc. |
71 | 01/26/24 | USD | 265.00 | USD | 1,837 | $ | (35,500 | ) | |||||||||||||||||||
| Cigna Group |
7 | 01/26/24 | USD | 310.00 | USD | 210 | (2,520 | ) | ||||||||||||||||||||
| Danaher Corp. |
80 | 01/26/24 | USD | 235.00 | USD | 1,851 | (38,400 | ) | ||||||||||||||||||||
| Eli Lilly & Co. |
141 | 01/26/24 | USD | 595.00 | USD | 8,219 | (166,380 | ) | ||||||||||||||||||||
| Intuitive Surgical, Inc. |
54 | 01/26/24 | USD | 330.00 | USD | 1,822 | (100,170 | ) | ||||||||||||||||||||
| Medtronic PLC |
26 | 01/26/24 | USD | 85.00 | USD | 214 | (1,495 | ) | ||||||||||||||||||||
| Medtronic PLC |
23 | 01/26/24 | USD | 83.34 | USD | 189 | (2,703 | ) | ||||||||||||||||||||
| Merck & Co., Inc. |
278 | 01/26/24 | USD | 107.00 | USD | 3,031 | (97,300 | ) | ||||||||||||||||||||
| Moderna, Inc. |
21 | 01/26/24 | USD | 94.00 | USD | 209 | (19,320 | ) | ||||||||||||||||||||
| Vertex Pharmaceuticals, Inc. |
55 | 01/26/24 | USD | 405.00 | USD | 2,238 | (68,200 | ) | ||||||||||||||||||||
| Bio-Techne Corp. |
40 | 01/31/24 | USD | 77.00 | USD | 309 | (29,383 | ) | ||||||||||||||||||||
| Medtronic PLC |
59 | 02/02/24 | USD | 83.05 | USD | 486 | (9,679 | ) | ||||||||||||||||||||
| McKesson Corp. |
38 | 02/09/24 | USD | 475.00 | USD | 1,759 | (40,850 | ) | ||||||||||||||||||||
| Medtronic PLC |
68 | 02/09/24 | USD | 83.34 | USD | 560 | (11,664 | ) | ||||||||||||||||||||
| 10X Genomics, Inc., Class A |
18 | 02/16/24 | USD | 50.00 | USD | 101 | (13,500 | ) | ||||||||||||||||||||
| 10X Genomics, Inc., Class A |
9 | 02/16/24 | USD | 55.00 | USD | 50 | (4,320 | ) | ||||||||||||||||||||
| Abbott Laboratories |
156 | 02/16/24 | USD | 110.00 | USD | 1,717 | (51,480 | ) | ||||||||||||||||||||
| AbbVie, Inc. |
40 | 02/16/24 | USD | 160.00 | USD | 620 | (8,820 | ) | ||||||||||||||||||||
| AbbVie, Inc. |
163 | 02/16/24 | USD | 155.00 | USD | 2,526 | (69,275 | ) | ||||||||||||||||||||
| Agilent Technologies, Inc. |
90 | 02/16/24 | USD | 140.00 | USD | 1,251 | (43,650 | ) | ||||||||||||||||||||
| Alcon, Inc. |
143 | 02/16/24 | USD | 77.50 | USD | 1,117 | (41,470 | ) | ||||||||||||||||||||
| Argenx SE, ADR |
9 | 02/16/24 | USD | 500.00 | USD | 342 | (4,500 | ) | ||||||||||||||||||||
| Avantor, Inc. |
75 | 02/16/24 | USD | 21.00 | USD | 171 | (18,187 | ) | ||||||||||||||||||||
| Baxter International, Inc. |
27 | 02/16/24 | USD | 40.00 | USD | 104 | (3,375 | ) | ||||||||||||||||||||
| Becton Dickinson & Co. |
100 | 02/16/24 | USD | 240.00 | USD | 2,438 | (103,500 | ) | ||||||||||||||||||||
| BioMarin Pharmaceutical, Inc. |
130 | 02/16/24 | USD | 100.00 | USD | 1,253 | (35,425 | ) | ||||||||||||||||||||
| Boston Scientific Corp. |
1,677 | 02/16/24 | USD | 57.50 | USD | 9,695 | (385,710 | ) | ||||||||||||||||||||
| Cabaletta Bio, Inc. |
60 | 02/16/24 | USD | 30.00 | USD | 136 | (4,200 | ) | ||||||||||||||||||||
| Cencora, Inc. |
64 | 02/16/24 | USD | 204.00 | USD | 1,314 | (42,675 | ) | ||||||||||||||||||||
| Centene Corp. |
96 | 02/16/24 | USD | 77.50 | USD | 712 | (15,360 | ) | ||||||||||||||||||||
| Cooper Cos., Inc. |
25 | 02/16/24 | USD | 350.00 | USD | 946 | (84,375 | ) | ||||||||||||||||||||
| Dexcom, Inc. |
132 | 02/16/24 | USD | 120.00 | USD | 1,638 | (141,900 | ) | ||||||||||||||||||||
| Elanco Animal Health, Inc. |
139 | 02/16/24 | USD | 13.00 | USD | 207 | (31,275 | ) | ||||||||||||||||||||
| Exact Sciences Corp. |
19 | 02/16/24 | USD | 75.00 | USD | 141 | (9,690 | ) | ||||||||||||||||||||
| Gilead Sciences, Inc. |
358 | 02/16/24 | USD | 77.50 | USD | 2,900 | (194,215 | ) | ||||||||||||||||||||
| Humana, Inc. |
31 | 02/16/24 | USD | 505.00 | USD | 1,419 | (13,485 | ) | ||||||||||||||||||||
| Immunocore Holdings PLC, ADR |
29 | 02/16/24 | USD | 65.00 | USD | 198 | (19,140 | ) | ||||||||||||||||||||
| Ionis Pharmaceuticals, Inc. |
19 | 02/16/24 | USD | 55.00 | USD | 96 | (2,803 | ) | ||||||||||||||||||||
| Karuna Therapeutics, Inc. |
4 | 02/16/24 | USD | 240.00 | USD | 127 | (31,460 | ) | ||||||||||||||||||||
| Laboratory Corp. of America Holdings |
25 | 02/16/24 | USD | 220.00 | USD | 568 | (30,125 | ) | ||||||||||||||||||||
| Legend Biotech Corp., ADR |
67 | 02/16/24 | USD | 70.00 | USD | 403 | (10,050 | ) | ||||||||||||||||||||
| Medtronic PLC |
68 | 02/16/24 | USD | 85.00 | USD | 560 | (7,752 | ) | ||||||||||||||||||||
| Nuvalent, Inc., Class A |
26 | 02/16/24 | USD | 80.00 | USD | 191 | (8,970 | ) | ||||||||||||||||||||
| Penumbra, Inc. |
45 | 02/16/24 | USD | 260.00 | USD | 1,132 | (48,825 | ) | ||||||||||||||||||||
| PTC Therapeutics, Inc. |
75 | 02/16/24 | USD | 31.00 | USD | 207 | (15,562 | ) | ||||||||||||||||||||
| Repligen Corp. |
30 | 02/16/24 | USD | 185.00 | USD | 539 | (24,300 | ) | ||||||||||||||||||||
| REVOLUTION Medicines, Inc. |
35 | 02/16/24 | USD | 28.00 | USD | 100 | (9,625 | ) | ||||||||||||||||||||
| Rhythm Pharmaceuticals, Inc. |
89 | 02/16/24 | USD | 40.41 | USD | 409 | (65,503 | ) | ||||||||||||||||||||
| Rocket Pharmaceuticals, Inc. |
37 | 02/16/24 | USD | 27.12 | USD | 111 | (15,158 | ) | ||||||||||||||||||||
| Shockwave Medical, Inc. |
6 | 02/16/24 | USD | 184.95 | USD | 114 | (10,936 | ) | ||||||||||||||||||||
| STERIS PLC |
19 | 02/16/24 | USD | 202.97 | USD | 418 | (38,877 | ) | ||||||||||||||||||||
| Structure Therapeutics, Inc., ADR |
25 | 02/16/24 | USD | 85.00 | USD | 102 | (1,875 | ) | ||||||||||||||||||||
| Stryker Corp. |
60 | 02/16/24 | USD | 310.00 | USD | 1,797 | (41,400 | ) | ||||||||||||||||||||
| Thermo Fisher Scientific, Inc. |
36 | 02/16/24 | USD | 530.00 | USD | 1,911 | (81,360 | ) | ||||||||||||||||||||
| Ultragenyx Pharmaceutical, Inc. |
42 | 02/16/24 | USD | 45.00 | USD | 201 | (18,690 | ) | ||||||||||||||||||||
| Vaxcyte, Inc. |
86 | 02/16/24 | USD | 60.00 | USD | 540 | (46,010 | ) | ||||||||||||||||||||
| Viking Therapeutics, Inc. |
32 | 02/16/24 | USD | 18.00 | USD | 60 | (8,480 | ) | ||||||||||||||||||||
| West Pharmaceutical Services, Inc. |
6 | 02/16/24 | USD | 342.92 | USD | 211 | (13,076 | ) | ||||||||||||||||||||
| Xenon Pharmaceuticals, Inc. |
61 | 02/16/24 | USD | 47.50 | USD | 281 | (21,197 | ) | ||||||||||||||||||||
| Envista Holdings Corp. |
84 | 03/15/24 | USD | 25.00 | USD | 202 | (10,920 | ) | ||||||||||||||||||||
| S C H E D U L E O F I N V E S T M E N T S |
91 |
| Schedule of Investments (continued) December 31, 2023
|
BlackRock Health Sciences Trust (BME) |
Exchange-Traded Options Written (continued)
| Description | Number of Contracts |
Expiration Date |
Exercise Price | Notional Amount (000) |
Value | |||||||||||||||||||||||
| Call (continued) |
||||||||||||||||||||||||||||
| Incyte Corp. |
44 | 03/15/24 | USD | 65.00 | USD | 276 | $ | (11,770 | ) | |||||||||||||||||||
| Medtronic PLC |
59 | 03/15/24 | USD | 85.00 | USD | 486 | (11,977 | ) | ||||||||||||||||||||
|
|
|
|||||||||||||||||||||||||||
| $ | (6,958,918 | ) | ||||||||||||||||||||||||||
|
|
|
|||||||||||||||||||||||||||
OTC Options Written
| Description | Counterparty | Number of Contracts |
Expiration Date |
Exercise Price | Notional Amount (000) |
Value | ||||||||||||||||||||||||
| Call |
||||||||||||||||||||||||||||||
| QIAGEN NV |
Morgan Stanley & Co. International PLC | 6,800 | 01/04/24 | USD | 39.91 | USD | 295 | $ | (24,404 | ) | ||||||||||||||||||||
| Elanco Animal Health, Inc. |
Goldman Sachs International | 9,200 | 01/08/24 | USD | 9.64 | USD | 137 | (48,565 | ) | |||||||||||||||||||||
| Masimo Corp. |
BNP Paribas SA | 1,600 | 01/09/24 | USD | 86.94 | USD | 188 | (48,665 | ) | |||||||||||||||||||||
| Novo Nordisk A/S, Class B |
Goldman Sachs International | 1,900 | 01/09/24 | DKK | 736.76 | DKK | 1,330 | (620 | ) | |||||||||||||||||||||
| Daiichi Sankyo Co. Ltd. |
BNP Paribas SA | 13,200 | 01/17/24 | JPY | 4,310.70 | JPY | 50,954 | (2,682 | ) | |||||||||||||||||||||
| Genmab A/S |
Morgan Stanley & Co. International PLC | 1,100 | 01/18/24 | DKK | 2,308.53 | DKK | 2,368 | (1,346 | ) | |||||||||||||||||||||
| Novo Nordisk A/S, Class B |
Morgan Stanley & Co. International PLC | 1,100 | 01/18/24 | DKK | 703.28 | DKK | 770 | (2,568 | ) | |||||||||||||||||||||
| Sanofi SA |
Morgan Stanley & Co. International PLC | 5,400 | 01/18/24 | EUR | 87.55 | EUR | 486 | (17,097 | ) | |||||||||||||||||||||
| AstraZeneca PLC |
Goldman Sachs International | 6,700 | 01/23/24 | GBP | 103.39 | GBP | 709 | (34,538 | ) | |||||||||||||||||||||
| Novo Nordisk A/S, Class B |
Goldman Sachs International | 21,200 | 01/23/24 | DKK | 711.62 | DKK | 14,836 | (46,477 | ) | |||||||||||||||||||||
| QIAGEN NV |
Morgan Stanley & Co. International PLC | 6,800 | 01/23/24 | USD | 40.29 | USD | 295 | (24,882 | ) | |||||||||||||||||||||
| Sanofi SA |
Morgan Stanley & Co. International PLC | 4,700 | 01/23/24 | EUR | 89.72 | EUR | 423 | (8,765 | ) | |||||||||||||||||||||
| Cencora, Inc. |
Citibank N.A. | 5,200 | 01/31/24 | USD | 201.53 | USD | 1,068 | (35,969 | ) | |||||||||||||||||||||
| Novo Nordisk A/S, Class B |
Morgan Stanley & Co. International PLC | 1,800 | 02/06/24 | DKK | 735.42 | DKK | 1,260 | (3,683 | ) | |||||||||||||||||||||
| Genmab A/S |
Citibank N.A. | 7,500 | 02/26/24 | USD | 32.28 | USD | 239 | (13,566 | ) | |||||||||||||||||||||
|
|
|
|||||||||||||||||||||||||||||
| $ | (313,827 | ) | ||||||||||||||||||||||||||||
|
|
|
|||||||||||||||||||||||||||||
Balances Reported in the Statements of Assets and Liabilities for Options Written
| Description | Swap Premiums Paid |
Swap Premiums Received |
Unrealized Appreciation |
Unrealized Depreciation |
Value | |||||||||||||||
| Options Written |
$ | N/A | $ | N/A | $ | 1,134,305 | $ | (3,613,712 | ) | $ | (7,272,745 | ) | ||||||||
Derivative Financial Instruments Categorized by Risk Exposure
As of period end, the fair values of derivative financial instruments located in the Statements of Assets and Liabilities were as follows:
| Commodity Contracts |
Credit Contracts |
Equity Contracts |
Foreign Currency Exchange Contracts |
Interest Rate Contracts |
Other Contracts |
Total | ||||||||||||||||||||||
| Liabilities — Derivative Financial Instruments |
||||||||||||||||||||||||||||
| Options written |
||||||||||||||||||||||||||||
| Options written at value |
$ | — | $ | — | $ | 7,272,745 | $ | — | $ | — | $ | — | $ | 7,272,745 | ||||||||||||||
|
|
|
|
|
|
|
|
|
|
|
|
|
|
|
|||||||||||||||
| 92 | 2 0 2 3 B L A C K R O C K A N N U A L R E P O R T T O S H A R E H O L D E R S |
| Schedule of Investments (continued) December 31, 2023
|
BlackRock Health Sciences Trust (BME) |
For the period ended December 31, 2023, the effect of derivative financial instruments in the Statements of Operations was as follows:
| Commodity Contracts |
Credit Contracts |
Equity Contracts |
Foreign Currency Exchange Contracts |
Interest Rate Contracts |
Other Contracts |
Total | ||||||||||||||||||||||
| Net Realized Gain (Loss) from: |
||||||||||||||||||||||||||||
| Options purchased(a) |
$ | — | $ | — | $ | (209,469 | ) | $ | — | $ | — | $ | — | $ | (209,469 | ) | ||||||||||||
| Options written |
— | — | 5,205,429 | — | — | — | 5,205,429 | |||||||||||||||||||||
|
|
|
|
|
|
|
|
|
|
|
|
|
|
|
|||||||||||||||
| $ | — | $ | — | $ | 4,995,960 | $ | — | $ | — | $ | — | $ | 4,995,960 | |||||||||||||||
|
|
|
|
|
|
|
|
|
|
|
|
|
|
|
|||||||||||||||
| Net Change in Unrealized Appreciation (Depreciation) on: |
||||||||||||||||||||||||||||
| Options written |
$ | — | $ | — | $ | (4,658,396 | ) | $ | — | $ | — | $ | — | $ | (4,658,396 | ) | ||||||||||||
|
|
|
|
|
|
|
|
|
|
|
|
|
|
|
|||||||||||||||
| (a) | Options purchased are included in net realized gain (loss) from investments — unaffiliated. |
Average Quarterly Balances of Outstanding Derivative Financial Instruments
| Options: |
||||
| Average value of option contracts purchased |
$ | — | (a) | |
| Average value of option contracts written |
$ | 5,600,802 | ||
| (a) | Derivative financial instrument not held at any quarter-end. The risk exposure table serves as an indicator of activity during the period. |
For more information about the Trust’s investment risks regarding derivative financial instruments, refer to the Notes to Financial Statements.
Derivative Financial Instruments — Offsetting as of Period End
The Trust’s derivative assets and liabilities (by type) were as follows:
| Assets | Liabilities | |||||||
| Derivative Financial Instruments |
||||||||
| Options |
$ | — | $ | 7,272,745 | ||||
|
|
|
|
|
|||||
| Total derivative assets and liabilities in the Statements of Assets and Liabilities |
— | 7,272,745 | ||||||
|
|
|
|
|
|||||
| Derivatives not subject to a Master Netting Agreement or similar agreement (“MNA”) |
— | (6,958,918 | ) | |||||
|
|
|
|
|
|||||
| Total derivative assets and liabilities subject to an MNA |
$ | — | $ | 313,827 | ||||
|
|
|
|
|
|||||
The following table presents the Trust’s derivative liabilities by counterparty net of amounts available for offset under an MNA and net of the related collateral pledged by the Trust:
| Counterparty | |
Derivative Liabilities Subject to an MNA by |
|
|
Derivatives Available for Offset |
|
|
Non-Cash Collateral Pledged |
|
|
Cash Collateral Pledged |
|
|
Net Amount of |
| |||||
| BNP Paribas SA |
$ | 51,347 | $ | — | $ | — | $ | — | $ | 51,347 | ||||||||||
| Citibank N.A. |
49,535 | — | — | — | 49,535 | |||||||||||||||
| Goldman Sachs International |
130,200 | — | — | — | 130,200 | |||||||||||||||
| Morgan Stanley & Co. International PLC |
82,745 | — | — | — | 82,745 | |||||||||||||||
|
|
|
|
|
|
|
|
|
|
|
|||||||||||
| $ | 313,827 | $ | — | $ | — | $ | — | $ | 313,827 | |||||||||||
|
|
|
|
|
|
|
|
|
|
|
|||||||||||
| (a) | Net amount represents the net amount payable due to counterparty in the event of default. Net amount may be offset further by the options written receivable/payable on the Statements of Assets and Liabilities. |
| S C H E D U L E O F I N V E S T M E N T S |
93 |
| Schedule of Investments (continued) December 31, 2023
|
BlackRock Health Sciences Trust (BME) |
Fair Value Hierarchy as of Period End
Various inputs are used in determining the fair value of financial instruments. For a description of the input levels and information about the Trust’s policy regarding valuation of financial instruments, refer to the Notes to Financial Statements.
The following table summarizes the Trust’s financial instruments categorized in the fair value hierarchy. The breakdown of the Trust’s financial instruments into major categories is disclosed in the Schedule of Investments above.
| Level 1 | Level 2 | Level 3 | Total | |||||||||||||
| Assets |
||||||||||||||||
| Investments |
||||||||||||||||
| Long-Term Investments |
||||||||||||||||
| Common Stocks |
||||||||||||||||
| Biotechnology |
$ | 141,784,309 | $ | 1,308,131 | $ | — | $ | 143,092,440 | ||||||||
| Health Care Equipment & Supplies |
130,190,120 | — | — | 130,190,120 | ||||||||||||
| Health Care Providers & Services |
123,918,383 | — | — | 123,918,383 | ||||||||||||
| Life Sciences Tools & Services |
48,560,205 | — | — | 48,560,205 | ||||||||||||
| Pharmaceuticals |
99,254,732 | 13,074,804 | — | 112,329,536 | ||||||||||||
| Other Interests |
— | — | 111,584 | 111,584 | ||||||||||||
| Preferred Securities |
||||||||||||||||
| Preferred Stocks |
— | — | 4,761,515 | 4,761,515 | ||||||||||||
| Rights |
— | 382 | 39,056 | 39,438 | ||||||||||||
| Warrants |
275 | — | — | 275 | ||||||||||||
| Short-Term Securities |
||||||||||||||||
| Money Market Funds |
31,396,977 | — | — | 31,396,977 | ||||||||||||
|
|
|
|
|
|
|
|
|
|||||||||
| $ | 575,105,001 | $ | 14,383,317 | $ | 4,912,155 | $ | 594,400,473 | |||||||||
|
|
|
|
|
|
|
|
|
|||||||||
| Derivative Financial Instruments(a) |
||||||||||||||||
| Liabilities |
||||||||||||||||
| Equity Contracts |
$ | (6,233,240 | ) | $ | (1,039,505 | ) | $ | — | $ | (7,272,745 | ) | |||||
|
|
|
|
|
|
|
|
|
|||||||||
| (a) | Derivative financial instruments are options written. Options written are shown at value. |
See notes to financial statements.
| 94 | 2 0 2 3 B L A C K R O C K A N N U A L R E P O R T T O S H A R E H O L D E R S |
| Schedule of Investments December 31, 2023
|
BlackRock Innovation and Growth Term Trust (BIGZ) (Percentages shown are based on Net Assets) |
| Security | Shares | Value | ||||||
| Common Stocks |
| |||||||
| Aerospace & Defense — 5.4% | ||||||||
| Axon Enterprise, Inc.(a)(b) |
269,406 | $ | 69,595,652 | |||||
| HEICO Corp. |
222,346 | 39,771,029 | ||||||
|
|
|
|||||||
| 109,366,681 | ||||||||
| Air Freight & Logistics — 0.8% | ||||||||
| GXO Logistics, Inc.(b) |
273,731 | 16,741,388 | ||||||
|
|
|
|||||||
| Automobile Components — 1.2% | ||||||||
| Fox Factory Holding Corp.(b)(c) |
363,790 | 24,548,549 | ||||||
|
|
|
|||||||
| Biotechnology — 0.8% | ||||||||
| Halozyme Therapeutics, Inc.(b)(c) |
410,430 | 15,169,493 | ||||||
|
|
|
|||||||
| Building Products — 1.6% | ||||||||
| AZEK Co., Inc., Class A(b) |
830,411 | 31,763,221 | ||||||
|
|
|
|||||||
| Capital Markets — 4.2% | ||||||||
| TPG, Inc., Class A |
911,268 | 39,339,439 | ||||||
| Tradeweb Markets, Inc., Class A(d) |
496,893 | 45,157,636 | ||||||
|
|
|
|||||||
| 84,497,075 | ||||||||
| Construction & Engineering — 1.2% | ||||||||
| Comfort Systems USA, Inc. |
119,706 | 24,619,933 | ||||||
|
|
|
|||||||
| Diversified Consumer Services(b) — 2.9% | ||||||||
| Duolingo, Inc., Class A |
111,847 | 25,372,492 | ||||||
| Grammarly, Inc., (Acquired 11/17/21, |
1,001,454 | 17,174,936 | ||||||
| Ideal Image, Class A, (Acquired 05/05/21, |
6,224 | 16,239,254 | ||||||
|
|
|
|||||||
| 58,786,682 | ||||||||
| Entertainment — 1.3% | ||||||||
| Liberty Media Corp.-Liberty Formula One, Class C(b) |
409,685 | 25,863,414 | ||||||
|
|
|
|||||||
| Food Products — 0.3% | ||||||||
| Freshpet, Inc.(b) |
62,788 | 5,447,487 | ||||||
|
|
|
|||||||
| Ground Transportation — 2.6% | ||||||||
| Saia, Inc.(b)(c) |
122,155 | 53,530,764 | ||||||
|
|
|
|||||||
| Health Care Equipment & Supplies(b) — 5.0% | ||||||||
| Align Technology, Inc. |
187,295 | 51,318,830 | ||||||
| IDEXX Laboratories, Inc. |
69,304 | 38,467,185 | ||||||
| Inmode Ltd. |
70,065 | 1,558,246 | ||||||
| Inspire Medical Systems, Inc. |
44,833 | 9,120,377 | ||||||
|
|
|
|||||||
| 100,464,638 | ||||||||
| Health Care Providers & Services — 1.0% | ||||||||
| Surgery Partners, Inc.(b) |
651,580 | 20,844,044 | ||||||
|
|
|
|||||||
| Hotels, Restaurants & Leisure — 3.5% | ||||||||
| Planet Fitness, Inc., Class A(b)(d) |
675,050 | 49,278,650 | ||||||
| Vail Resorts, Inc. |
97,604 | 20,835,526 | ||||||
|
|
|
|||||||
| 70,114,176 | ||||||||
| Industrial REITs — 0.1% | ||||||||
| Innovative Industrial Properties, Inc. |
13,416 | 1,352,601 | ||||||
| Rexford Industrial Realty, Inc. |
13,893 | 779,397 | ||||||
|
|
|
|||||||
| 2,131,998 | ||||||||
| IT Services(b) — 5.7% | ||||||||
| DigitalOcean Holdings, Inc. |
333,354 | 12,230,758 | ||||||
| Globant SA |
165,042 | 39,276,695 | ||||||
| Security | Shares | Value | ||||||
| IT Services (continued) | ||||||||
| MongoDB, Inc., Class A(c) |
117,109 | $ | 47,880,015 | |||||
| Patreon, Inc., (Acquired 08/19/21, Cost: $11,732,736)(e)(f) |
208,333 | 5,874,991 | ||||||
| Teya Services Ltd., (Acquired 11/16/21, |
25,742 | 11,115,138 | ||||||
|
|
|
|||||||
| 116,377,597 | ||||||||
| Life Sciences Tools & Services — 8.8% | ||||||||
| Azenta, Inc.(b)(c) |
86,715 | 5,648,615 | ||||||
| Bio-Techne Corp |
615,651 | 47,503,631 | ||||||
| Charles River Laboratories International, Inc.(b) |
137,183 | 32,430,061 | ||||||
| Repligen Corp.(b) |
247,772 | 44,549,406 | ||||||
| West Pharmaceutical Services, Inc. |
139,329 | 49,060,528 | ||||||
|
|
|
|||||||
| 179,192,241 | ||||||||
| Machinery — 1.3% | ||||||||
| AutoStore Holdings Ltd.(b)(c)(g) |
13,757,639 | 27,030,178 | ||||||
|
|
|
|||||||
| Professional Services(b) — 0.3% | ||||||||
| Fiverr International Ltd. |
195,955 | 5,333,895 | ||||||
| Paylocity Holding Corp. |
6,588 | 1,086,032 | ||||||
|
|
|
|||||||
| 6,419,927 | ||||||||
| Real Estate Management & Development — 2.8% | ||||||||
| CoStar Group, Inc.(b) |
636,962 | 55,664,109 | ||||||
|
|
|
|||||||
| Semiconductors & Semiconductor Equipment — 9.2% | ||||||||
| ASM International NV |
81,580 | 42,460,310 | ||||||
| Entegris, Inc.(d) |
436,574 | 52,310,297 | ||||||
| Lattice Semiconductor Corp.(b) |
501,878 | 34,624,563 | ||||||
| Monolithic Power Systems, Inc.(a)(d) |
90,663 | 57,188,407 | ||||||
|
|
|
|||||||
| 186,583,577 | ||||||||
| Software — 16.7% | ||||||||
| ANSYS, Inc.(b) |
159,716 | 57,957,742 | ||||||
| Aspen Technology, Inc.(b)(c) |
164,760 | 36,271,914 | ||||||
| Bentley Systems, Inc., Class B |
798,964 | 41,689,941 | ||||||
| Confluent, Inc., Class A(b) |
1,444,548 | 33,802,423 | ||||||
| HubSpot, Inc.(b) |
94,841 | 55,058,994 | ||||||
| JFrog Ltd.(b) |
601,511 | 20,818,296 | ||||||
| PagerDuty, Inc.(b)(c) |
333,419 | 7,718,650 | ||||||
| SiteMinder Ltd.(b) |
5,400,709 | 18,874,399 | ||||||
| Snorkel AI, Inc., (Acquired 06/30/21, Cost: $2,999,997)(b)(e)(f) |
199,738 | 1,737,721 | ||||||
| Snyk Ltd., Ordinary Shares, (Acquired 09/02/21, Cost: $25,961,537)(b)(e)(f) |
1,809,860 | 19,763,671 | ||||||
| Zscaler, Inc.(b) |
204,319 | 45,268,918 | ||||||
|
|
|
|||||||
| 338,962,669 | ||||||||
| Specialty Retail — 1.4% | ||||||||
| Floor & Decor Holdings, Inc., Class A(b)(c) |
262,151 | 29,245,566 | ||||||
|
|
|
|||||||
| Textiles, Apparel & Luxury Goods — 1.1% | ||||||||
| On Holding AG, Class A(b) |
793,857 | 21,410,323 | ||||||
|
|
|
|||||||
| Total Common Stocks — 79.2% (Cost: $1,457,618,260) |
1,604,775,730 | |||||||
|
|
|
|||||||
| S C H E D U L E O F I N V E S T M E N T S |
95 |
| Schedule of Investments (continued) December 31, 2023
|
BlackRock Innovation and Growth Term Trust (BIGZ) (Percentages shown are based on Net Assets) |
| Security | Shares | Value | ||||||
| Preferred Securities | ||||||||
| Preferred Stocks — 21.8%(b)(e) | ||||||||
| Aerospace & Defense — 0.1% | ||||||||
| SkySafe, Inc., Series B, (Acquired 12/02/21, |
909,438 | $ | 1,045,854 | |||||
|
|
|
|||||||
| Automobile Components — 2.2% | ||||||||
| Relativity Space, Inc., Series E, (Acquired 05/27/21, Cost: $50,000,009)(f) |
2,189,612 | 43,836,032 | ||||||
|
|
|
|||||||
| Capital Markets(f) — 2.4% | ||||||||
| Anchor Labs, Inc., Series D, (Acquired 11/24/21, Cost: $9,999,995) |
428,785 | 2,752,800 | ||||||
| The Production Board LLC, Series A3, (Acquired 06/04/21, Cost: $50,000,001) |
16,666,667 | 30,500,000 | ||||||
| Varo Money, Inc., Series E, (Acquired 08/27/21, |
4,316,904 | 14,720,643 | ||||||
|
|
|
|||||||
| 47,973,443 | ||||||||
| Diversified Consumer Services — 0.3% | ||||||||
| Grammarly, Inc., Series 3, (Acquired 11/17/21, Cost: $8,750,004)(f) |
333,818 | 5,898,564 | ||||||
|
|
|
|||||||
| Diversified Telecommunication Services — 0.6% | ||||||||
| Discord, Inc., Series I, (Acquired 09/13/21, |
32,690 | 12,802,058 | ||||||
|
|
|
|||||||
| Entertainment — 0.9% | ||||||||
| Under Canvas, Inc., Class A, (Acquired 08/19/21, Cost: $49,999,983)(f) |
2,172,486 | 18,683,380 | ||||||
|
|
|
|||||||
| Food Products — 0.6% | ||||||||
| Motif Food Works, Inc., Series B, (Acquired 06/08/21, Cost: $39,999,986)(f) |
1,972,240 | 12,444,834 | ||||||
|
|
|
|||||||
| Hotels, Restaurants & Leisure(f) — 1.2% | ||||||||
| Dapper Labs, Inc., Series 7, (Acquired 07/20/21, Cost: $29,999,946) |
191,067 | 3,330,298 | ||||||
| Underdog Sports, Inc., Series B, (Acquired 01/11/22, Cost: $14,999,974) |
291,061 | 21,477,391 | ||||||
|
|
|
|||||||
| 24,807,689 | ||||||||
| IT Services(f) — 2.3% | ||||||||
| Patreon, Inc., Series D, (Acquired 07/14/21, |
416,667 | 11,750,009 | ||||||
| Via Transportation, Inc., Series G, (Acquired 11/05/21, Cost: $24,999,974) |
549,357 | 30,335,493 | ||||||
| Wagestream Holdings Ltd., Series C, (Acquired 02/11/22, Cost: $10,024,684) |
762,746 | 5,259,788 | ||||||
|
|
|
|||||||
| 47,345,290 | ||||||||
| Semiconductors & Semiconductor Equipment — 2.5% |
| |||||||
| PsiQuantum Corp., Series D, (Acquired 05/21/21, Cost: $39,999,990)(f) |
1,525,192 | 43,345,957 | ||||||
| Rivos, Inc., Series A1 |
2,997,684 | 6,534,951 | ||||||
|
|
|
|||||||
| 49,880,908 | ||||||||
| Software(f) — 7.1% | ||||||||
| AnyRoad, Inc., Series B, (Acquired 12/07/21, Cost: $14,999,995) |
2,745,894 | 11,917,180 | ||||||
| Bolt Financial, Inc., Series E, (Acquired 01/18/22, Cost: $44,999,983) |
898,024 | 19,145,872 | ||||||
| Deepgram, Inc., Series B, (Acquired 10/22/21, Cost: $11,999,997) |
2,165,400 | 13,273,902 | ||||||
| Dragos, Inc., Series D, (Acquired 09/28/21, Cost: $39,999,959) |
900,760 | 34,670,252 | ||||||
| Genesys Cloud Services, Inc., (Acquired 11/24/21, Cost: $30,000,101) |
4,651,163 | 16,883,722 | ||||||
| Security | Shares | Value | ||||||
| Software (continued) | ||||||||
| Open Space Labs, Inc., Series D, (Acquired 01/31/22, Cost: $15,000,003) |
1,687,916 | $ | 13,739,636 | |||||
| Snorkel AI, Inc., Series C, (Acquired 06/30/21, Cost: $10,999,993) |
732,373 | 6,371,645 | ||||||
| Snyk Ltd., Series F, (Acquired 09/02/21, Cost: $24,038,470) |
1,685,092 | 18,401,205 | ||||||
| Validere Technologies, Inc., Series B, (Acquired 10/21/21, Cost: $10,000,000) |
4,684,060 | 8,431,308 | ||||||
|
|
|
|||||||
| 142,834,722 | ||||||||
| Specialty Retail — 0.5% | ||||||||
| Super73, Inc., Series C-1, (Acquired 10/25/22, Cost: $12,000,000)(f) |
1,400,669 | 10,799,158 | ||||||
|
|
|
|||||||
| Wireless Telecommunication Services — 1.1% | ||||||||
| Loft Orbital Solutions, Inc., Series B, (Acquired 10/14/21, Cost: $24,999,992)(f) |
1,365,305 | 22,855,206 | ||||||
|
|
|
|||||||
| 441,207,138 | ||||||||
|
|
|
|||||||
| Total Preferred Securities — 21.8% |
|
441,207,138 | ||||||
|
|
|
|||||||
| Total Long-Term Investments — 101.0% |
|
2,045,982,868 | ||||||
|
|
|
|||||||
| Short-Term Securities |
| |||||||
| Money Market Funds — 1.0% | ||||||||
| BlackRock Liquidity Funds, T-Fund, Institutional Class, 5.26%(h)(i) |
326,227 | 326,227 | ||||||
| SL Liquidity Series, LLC, Money Market Series, 5.58%(h)(i)(j) |
20,498,856 | 20,505,005 | ||||||
|
|
|
|||||||
| Total Short-Term Securities — 1.0% |
|
20,831,232 | ||||||
|
|
|
|||||||
| Total Investments Before Options Written — 102.0% |
|
2,066,814,100 | ||||||
|
|
|
|||||||
| Options Written — (0.8)% |
| |||||||
| (Premiums Received: $(8,337,243)) |
|
(16,978,313 | ) | |||||
|
|
|
|||||||
| Total Investments, Net of Options Written — 101.2% |
|
2,049,835,787 | ||||||
| Liabilities in Excess of Other Assets — (1.2)% |
|
(23,365,949 | ) | |||||
|
|
|
|||||||
| Net Assets — 100.0% |
|
$ | 2,026,469,838 | |||||
|
|
|
|||||||
| (a) | All or a portion of the security has been pledged as collateral in connection with outstanding OTC derivatives. |
| (b) | Non-income producing security. |
| (c) | All or a portion of this security is on loan. |
| (d) | All or a portion of the security has been pledged and/or segregated as collateral in connection with outstanding exchange-traded options written. |
| (e) | Security is valued using significant unobservable inputs and is classified as Level 3 in the fair value hierarchy. |
| (f) | Restricted security as to resale, excluding 144A securities. The Trust held restricted securities with a current value of $506,577,898, representing 25.0% of its net assets as of period end, and an original cost of $821,090,559. |
| (g) | Security exempt from registration pursuant to Rule 144A under the Securities Act of 1933, as amended. These securities may be resold in transactions exempt from registration to qualified institutional investors. |
| (h) | Affiliate of the Trust. |
| (i) | Annualized 7-day yield as of period end. |
| (j) | All or a portion of this security was purchased with the cash collateral from loaned securities. |
| 96 | 2 0 2 3 B L A C K R O C K A N N U A L R E P O R T T O S H A R E H O L D E R S |
| Schedule of Investments (continued) December 31, 2023
|
BlackRock Innovation and Growth Term Trust (BIGZ) |
For Trust compliance purposes, the Trust’s industry classifications refer to one or more of the industry sub-classifications used by one or more widely recognized market indexes or rating group indexes, and/or as defined by the investment adviser. These definitions may not apply for purposes of this report, which may combine such industry sub-classifications for reporting ease.
Affiliates
Investments in issuers considered to be affiliate(s) of the Trust during the year ended December 31, 2023 for purposes of Section 2(a)(3) of the Investment Company Act of 1940, as amended, were as follows:
| Affiliated Issuer | Value at 12/31/22 |
Purchases at Cost |
Proceeds from Sale |
Net Realized Gain (Loss) |
Change in Unrealized Appreciation (Depreciation) |
Value at 12/31/23 |
Shares Held at 12/31/23 |
Income | Capital Gain Distributions from Underlying Funds |
|||||||||||||||||||||||||||
| BlackRock Liquidity Funds, T-Fund, Institutional Class |
$ | 20,778,628 | $ | — | $ | (20,452,401 | )(a) | $ | — | $ | — | $ | 326,227 | 326,227 | $ | 445,542 | $ | — | ||||||||||||||||||
| SL Liquidity Series, LLC, Money Market Series |
184,600 | 20,319,860 | (a) | — | (616 | ) | 1,161 | 20,505,005 | 20,498,856 | 63,099 | (b) | — | ||||||||||||||||||||||||
|
|
|
|
|
|
|
|
|
|
|
|||||||||||||||||||||||||||
| $ | (616 | ) | $ | 1,161 | $ | 20,831,232 | $ | 508,641 | $ | — | ||||||||||||||||||||||||||
|
|
|
|
|
|
|
|
|
|
|
|||||||||||||||||||||||||||
| (a) | Represents net amount purchased (sold). |
| (b) | All or a portion represents securities lending income earned from the reinvestment of cash collateral from loaned securities, net of fees and collateral investment expenses, and other payments to and from borrowers of securities. |
Derivative Financial Instruments Outstanding as of Period End
Exchange-Traded Options Written
| Description | Number of Contracts |
Expiration Date |
Exercise Price | Notional Amount (000) |
Value | |||||||||||||||||||||||
| Call |
||||||||||||||||||||||||||||
| MongoDB, Inc., Class A |
87 | 01/12/24 | USD | 430.00 | USD | 3,557 | $ | (39,150 | ) | |||||||||||||||||||
| On Holding AG, Class A |
252 | 01/12/24 | USD | 31.00 | USD | 680 | (3,150 | ) | ||||||||||||||||||||
| Rexford Industrial Realty, Inc. |
70 | 01/12/24 | USD | 47.00 | USD | 393 | (64,347 | ) | ||||||||||||||||||||
| Zscaler, Inc. |
161 | 01/12/24 | USD | 200.00 | USD | 3,567 | (356,615 | ) | ||||||||||||||||||||
| Align Technology, Inc. |
37 | 01/19/24 | USD | 240.00 | USD | 1,014 | (139,490 | ) | ||||||||||||||||||||
| ANSYS, Inc. |
75 | 01/19/24 | USD | 310.00 | USD | 2,722 | (415,125 | ) | ||||||||||||||||||||
| Aspen Technology, Inc. |
174 | 01/19/24 | USD | 220.00 | USD | 3,831 | (89,610 | ) | ||||||||||||||||||||
| Axon Enterprise, Inc. |
180 | 01/19/24 | USD | 230.00 | USD | 4,650 | (531,000 | ) | ||||||||||||||||||||
| AZEK Co., Inc., Class A |
617 | 01/19/24 | USD | 34.00 | USD | 2,360 | (280,874 | ) | ||||||||||||||||||||
| Azenta, Inc. |
140 | 01/19/24 | USD | 60.00 | USD | 912 | (90,300 | ) | ||||||||||||||||||||
| Bio-Techne Corp. |
360 | 01/19/24 | USD | 65.00 | USD | 2,778 | (426,600 | ) | ||||||||||||||||||||
| Charles River Laboratories International, Inc. |
117 | 01/19/24 | USD | 230.00 | USD | 2,766 | (121,095 | ) | ||||||||||||||||||||
| Comfort Systems USA, Inc. |
112 | 01/19/24 | USD | 200.00 | USD | 2,304 | (111,440 | ) | ||||||||||||||||||||
| Confluent, Inc., Class A |
835 | 01/19/24 | USD | 21.00 | USD | 1,954 | (231,712 | ) | ||||||||||||||||||||
| Confluent, Inc., Class A |
1,476 | 01/19/24 | USD | 25.00 | USD | 3,454 | (92,250 | ) | ||||||||||||||||||||
| CoStar Group, Inc. |
417 | 01/19/24 | USD | 85.00 | USD | 3,644 | (148,035 | ) | ||||||||||||||||||||
| DigitalOcean Holdings, Inc. |
109 | 01/19/24 | USD | 30.00 | USD | 400 | (75,210 | ) | ||||||||||||||||||||
| Duolingo, Inc., Class A |
67 | 01/19/24 | USD | 240.00 | USD | 1,520 | (33,500 | ) | ||||||||||||||||||||
| Entegris, Inc. |
280 | 01/19/24 | USD | 105.00 | USD | 3,355 | (453,600 | ) | ||||||||||||||||||||
| Fiverr International Ltd. |
313 | 01/19/24 | USD | 30.00 | USD | 852 | (14,085 | ) | ||||||||||||||||||||
| Floor & Decor Holdings, Inc., Class A |
293 | 01/19/24 | USD | 95.00 | USD | 3,269 | (506,890 | ) | ||||||||||||||||||||
| Fox Factory Holding Corp. |
270 | 01/19/24 | USD | 70.00 | USD | 1,822 | (47,925 | ) | ||||||||||||||||||||
| Freshpet, Inc. |
72 | 01/19/24 | USD | 75.00 | USD | 625 | (91,080 | ) | ||||||||||||||||||||
| Freshpet, Inc. |
30 | 01/19/24 | USD | 77.50 | USD | 260 | (30,300 | ) | ||||||||||||||||||||
| Globant SA |
170 | 01/19/24 | USD | 230.00 | USD | 4,046 | (205,700 | ) | ||||||||||||||||||||
| GXO Logistics, Inc. |
187 | 01/19/24 | USD | 60.00 | USD | 1,144 | (42,075 | ) | ||||||||||||||||||||
| Halozyme Therapeutics, Inc. |
292 | 01/19/24 | USD | 43.50 | USD | 1,079 | (19,404 | ) | ||||||||||||||||||||
| HEICO Corp. |
177 | 01/19/24 | USD | 190.00 | USD | 3,166 | (6,637 | ) | ||||||||||||||||||||
| HubSpot, Inc. |
77 | 01/19/24 | USD | 480.00 | USD | 4,470 | (787,710 | ) | ||||||||||||||||||||
| IDEXX Laboratories, Inc. |
110 | 01/19/24 | USD | 570.00 | USD | 6,106 | (78,650 | ) | ||||||||||||||||||||
| Inmode Ltd. |
119 | 01/19/24 | USD | 25.00 | USD | 265 | (4,760 | ) | ||||||||||||||||||||
| Inspire Medical Systems, Inc. |
79 | 01/19/24 | USD | 165.00 | USD | 1,607 | (314,025 | ) | ||||||||||||||||||||
| JFrog Ltd. |
263 | 01/19/24 | USD | 26.00 | USD | 910 | (231,743 | ) | ||||||||||||||||||||
| MongoDB, Inc., Class A |
40 | 01/19/24 | USD | 410.00 | USD | 1,635 | (57,000 | ) | ||||||||||||||||||||
| On Holding AG, Class A |
296 | 01/19/24 | USD | 30.00 | USD | 798 | (9,620 | ) | ||||||||||||||||||||
| S C H E D U L E O F I N V E S T M E N T S |
97 |
| Schedule of Investments (continued) December 31, 2023
|
BlackRock Innovation and Growth Term Trust (BIGZ) |
Exchange-Traded Options Written (continued)
| Description | Number of Contracts |
Expiration Date |
Exercise Price | Notional Amount (000) |
Value | |||||||||||||||||||||||
| Call (continued) |
||||||||||||||||||||||||||||
| PagerDuty, Inc. |
533 | 01/19/24 | USD | 25.00 | USD | 1,234 | $ | (10,660 | ) | |||||||||||||||||||
| Paylocity Holding Corp. |
29 | 01/19/24 | USD | 165.00 | USD | 478 | (15,225 | ) | ||||||||||||||||||||
| Planet Fitness, Inc., Class A |
540 | 01/19/24 | USD | 65.00 | USD | 3,942 | (437,400 | ) | ||||||||||||||||||||
| Repligen Corp. |
357 | 01/19/24 | USD | 160.00 | USD | 6,419 | (760,410 | ) | ||||||||||||||||||||
| Saia, Inc. |
115 | 01/19/24 | USD | 430.00 | USD | 5,040 | (235,750 | ) | ||||||||||||||||||||
| Surgery Partners, Inc. |
534 | 01/19/24 | USD | 35.00 | USD | 1,708 | (25,365 | ) | ||||||||||||||||||||
| Tradeweb Markets, Inc., Class A |
795 | 01/19/24 | USD | 95.00 | USD | 7,225 | (39,750 | ) | ||||||||||||||||||||
| Vail Resorts, Inc. |
92 | 01/19/24 | USD | 240.00 | USD | 1,964 | (2,760 | ) | ||||||||||||||||||||
| West Pharmaceutical Services, Inc. |
104 | 01/19/24 | USD | 380.00 | USD | 3,662 | (10,140 | ) | ||||||||||||||||||||
| Align Technology, Inc. |
262 | 01/26/24 | USD | 280.00 | USD | 7,179 | (286,890 | ) | ||||||||||||||||||||
| MongoDB, Inc., Class A |
18 | 01/26/24 | USD | 400.00 | USD | 736 | (41,625 | ) | ||||||||||||||||||||
| On Holding AG, Class A |
547 | 01/26/24 | USD | 29.00 | USD | 1,475 | (35,555 | ) | ||||||||||||||||||||
| Bio-Techne Corp. |
667 | 01/31/24 | USD | 77.00 | USD | 5,147 | (489,962 | ) | ||||||||||||||||||||
| ANSYS, Inc. |
180 | 02/16/24 | USD | 310.00 | USD | 6,532 | (1,054,800 | ) | ||||||||||||||||||||
| AZEK Co., Inc., Class A |
711 | 02/16/24 | USD | 35.25 | USD | 2,720 | (297,269 | ) | ||||||||||||||||||||
| Bentley Systems, Inc., Class B |
500 | 02/16/24 | USD | 55.00 | USD | 2,609 | (48,750 | ) | ||||||||||||||||||||
| Charles River Laboratories International, Inc. |
117 | 02/16/24 | USD | 240.00 | USD | 2,766 | (108,225 | ) | ||||||||||||||||||||
| Comfort Systems USA, Inc. |
79 | 02/16/24 | USD | 210.00 | USD | 1,625 | (60,435 | ) | ||||||||||||||||||||
| CoStar Group, Inc. |
600 | 02/16/24 | USD | 90.00 | USD | 5,243 | (127,500 | ) | ||||||||||||||||||||
| DigitalOcean Holdings, Inc. |
424 | 02/16/24 | USD | 32.50 | USD | 1,556 | (243,800 | ) | ||||||||||||||||||||
| Floor & Decor Holdings, Inc., Class A |
126 | 02/16/24 | USD | 115.00 | USD | 1,406 | (58,590 | ) | ||||||||||||||||||||
| Fox Factory Holding Corp. |
312 | 02/16/24 | USD | 70.00 | USD | 2,105 | (84,240 | ) | ||||||||||||||||||||
| Globant SA |
110 | 02/16/24 | USD | 230.00 | USD | 2,618 | (199,100 | ) | ||||||||||||||||||||
| GXO Logistics, Inc. |
250 | 02/16/24 | USD | 60.00 | USD | 1,529 | (91,250 | ) | ||||||||||||||||||||
| Halozyme Therapeutics, Inc. |
364 | 02/16/24 | USD | 45.00 | USD | 1,345 | (9,100 | ) | ||||||||||||||||||||
| HEICO Corp. |
178 | 02/16/24 | USD | 195.00 | USD | 3,184 | (16,020 | ) | ||||||||||||||||||||
| Innovative Industrial Properties, Inc. |
21 | 02/16/24 | USD | 105.00 | USD | 212 | (6,720 | ) | ||||||||||||||||||||
| MongoDB, Inc., Class A |
42 | 02/16/24 | USD | 480.00 | USD | 1,717 | (21,525 | ) | ||||||||||||||||||||
| Monolithic Power Systems, Inc. |
62 | 02/16/24 | USD | 630.00 | USD | 3,911 | (256,060 | ) | ||||||||||||||||||||
| On Holding AG, Class A |
175 | 02/16/24 | USD | 32.50 | USD | 472 | (6,125 | ) | ||||||||||||||||||||
| Planet Fitness, Inc., Class A |
540 | 02/16/24 | USD | 75.00 | USD | 3,942 | (122,850 | ) | ||||||||||||||||||||
| Repligen Corp. |
78 | 02/16/24 | USD | 185.00 | USD | 1,402 | (63,180 | ) | ||||||||||||||||||||
| Saia, Inc. |
80 | 02/16/24 | USD | 470.00 | USD | 3,506 | (126,000 | ) | ||||||||||||||||||||
| Surgery Partners, Inc. |
604 | 02/16/24 | USD | 36.20 | USD | 1,932 | (54,962 | ) | ||||||||||||||||||||
| TPG, Inc., Class A |
1,058 | 02/16/24 | USD | 35.00 | USD | 4,567 | (973,360 | ) | ||||||||||||||||||||
| Vail Resorts, Inc. |
64 | 02/16/24 | USD | 240.00 | USD | 1,366 | (5,600 | ) | ||||||||||||||||||||
| West Pharmaceutical Services, Inc. |
118 | 02/16/24 | USD | 342.92 | USD | 4,155 | (257,168 | ) | ||||||||||||||||||||
| Zscaler, Inc. |
180 | 02/16/24 | USD | 220.00 | USD | 3,988 | (240,300 | ) | ||||||||||||||||||||
| JFrog Ltd. |
230 | 02/23/24 | USD | 30.20 | USD | 796 | (125,027 | ) | ||||||||||||||||||||
| Monolithic Power Systems, Inc. |
93 | 03/15/24 | USD | 640.00 | USD | 5,866 | (418,035 | ) | ||||||||||||||||||||
|
|
|
|||||||||||||||||||||||||||
| $ | (13,618,190 | ) | ||||||||||||||||||||||||||
|
|
|
|||||||||||||||||||||||||||
OTC Options Written
| Description | Counterparty | Number of Contracts |
Expiration Date |
Exercise Price | Notional Amount (000) |
Value | ||||||||||||||||||||||||
| Call |
||||||||||||||||||||||||||||||
| SiteMinder Ltd. |
Goldman Sachs International | 41,400 | 01/04/24 | AUD | 4.61 | AUD | 212 | $ | (14,666 | ) | ||||||||||||||||||||
| Lattice Semiconductor Corp. |
JPMorgan Chase Bank N.A. | 5,100 | 01/08/24 | USD | 79.66 | USD | 352 | (167 | ) | |||||||||||||||||||||
| AutoStore Holdings Ltd. |
Goldman Sachs International | 250,000 | 01/09/24 | NOK | 14.69 | NOK | 4,990 | (130,804 | ) | |||||||||||||||||||||
| SiteMinder Ltd. |
UBS AG | 39,300 | 01/09/24 | AUD | 4.81 | AUD | 202 | (8,936 | ) | |||||||||||||||||||||
| ASM International NV |
Morgan Stanley & Co. International PLC | 8,000 | 01/11/24 | EUR | 472.18 | EUR | 3,772 | (86,654 | ) | |||||||||||||||||||||
| AutoStore Holdings Ltd. |
Goldman Sachs International | 259,700 | 01/11/24 | NOK | 17.90 | NOK | 5,184 | (56,480 | ) | |||||||||||||||||||||
| Aspen Technology, Inc. |
Morgan Stanley & Co. International PLC | 8,900 | 01/12/24 | USD | 190.81 | USD | 1,959 | (265,906 | ) | |||||||||||||||||||||
| SiteMinder Ltd. |
UBS AG | 67,000 | 01/12/24 | AUD | 5.14 | AUD | 344 | (5,394 | ) | |||||||||||||||||||||
| AutoStore Holdings Ltd. |
Barclays Bank PLC | 250,900 | 01/17/24 | NOK | 15.90 | NOK | 5,008 | (102,504 | ) | |||||||||||||||||||||
| AutoStore Holdings Ltd. |
Goldman Sachs International | 259,700 | 01/18/24 | NOK | 17.90 | NOK | 5,184 | (59,271 | ) | |||||||||||||||||||||
| ASM International NV |
Bank of America N.A. | 5,100 | 01/23/24 | EUR | 461.39 | EUR | 2,404 | (114,729 | ) | |||||||||||||||||||||
| AutoStore Holdings Ltd. |
Goldman Sachs International | 250,000 | 01/23/24 | NOK | 18.09 | NOK | 4,990 | (55,883 | ) | |||||||||||||||||||||
| Lattice Semiconductor Corp. |
Citibank N.A. | 56,000 | 01/23/24 | USD | 62.43 | USD | 3,863 | (424,202 | ) | |||||||||||||||||||||
| SiteMinder Ltd. |
UBS AG | 67,000 | 01/23/24 | AUD | 5.24 | AUD | 344 | (5,357 | ) | |||||||||||||||||||||
| 98 | 2 0 2 3 B L A C K R O C K A N N U A L R E P O R T T O S H A R E H O L D E R S |
| Schedule of Investments (continued) December 31, 2023
|
BlackRock Innovation and Growth Term Trust (BIGZ) |
OTC Options Written (continued)
| Description | Counterparty | Number of Contracts |
Expiration Date |
Exercise Price | Notional Amount (000) |
Value | ||||||||||||||||||||||||
| Call (continued) |
||||||||||||||||||||||||||||||
| AutoStore Holdings Ltd. |
Goldman Sachs International | 125,000 | 01/24/24 | NOK | 18.91 | NOK | 2,495 | $ | (20,783 | ) | ||||||||||||||||||||
| SiteMinder Ltd. |
UBS AG | 55,000 | 01/24/24 | AUD | 4.98 | AUD | 282 | (9,483 | ) | |||||||||||||||||||||
| Bentley Systems, Inc., Class B |
JPMorgan Chase Bank N.A. | 78,000 | 01/26/24 | USD | 53.50 | USD | 4,070 | (62,156 | ) | |||||||||||||||||||||
| Duolingo, Inc., Class A |
Barclays Bank PLC | 11,100 | 01/26/24 | USD | 222.00 | USD | 2,518 | (163,016 | ) | |||||||||||||||||||||
| JFrog Ltd. |
Citibank N.A. | 47,000 | 01/26/24 | USD | 27.98 | USD | 1,627 | (327,147 | ) | |||||||||||||||||||||
| TPG, Inc., Class A |
UBS AG | 40,000 | 01/29/24 | USD | 32.25 | USD | 1,727 | (452,433 | ) | |||||||||||||||||||||
| AutoStore Holdings Ltd. |
Goldman Sachs International | 267,000 | 01/30/24 | NOK | 18.38 | NOK | 5,330 | (58,407 | ) | |||||||||||||||||||||
| Axon Enterprise, Inc. |
Bank of America N.A. | 25,100 | 01/31/24 | USD | 254.10 | USD | 6,484 | (268,677 | ) | |||||||||||||||||||||
| Entegris, Inc. |
UBS AG | 44,500 | 01/31/24 | USD | 122.47 | USD | 5,332 | (165,740 | ) | |||||||||||||||||||||
| HubSpot, Inc. |
Barclays Bank PLC | 7,400 | 01/31/24 | USD | 569.59 | USD | 4,296 | (256,072 | ) | |||||||||||||||||||||
| AutoStore Holdings Ltd. |
Morgan Stanley & Co. International PLC | 260,000 | 02/06/24 | NOK | 19.74 | NOK | 5,190 | (39,966 | ) | |||||||||||||||||||||
| Lattice Semiconductor Corp. |
Goldman Sachs International | 10,700 | 02/06/24 | USD | 62.25 | USD | 738 | (92,315 | ) | |||||||||||||||||||||
| SiteMinder Ltd. |
Goldman Sachs International | 32,500 | 02/08/24 | AUD | 5.05 | AUD | 167 | (5,631 | ) | |||||||||||||||||||||
| AutoStore Holdings Ltd. |
Morgan Stanley & Co. International PLC | 260,000 | 02/13/24 | NOK | 19.74 | NOK | 5,190 | (45,355 | ) | |||||||||||||||||||||
| SiteMinder Ltd. |
Goldman Sachs International | 32,500 | 02/13/24 | AUD | 5.05 | AUD | 167 | (5,924 | ) | |||||||||||||||||||||
| AutoStore Holdings Ltd. |
Morgan Stanley & Co. International PLC | 260,000 | 02/21/24 | NOK | 19.74 | NOK | 5,190 | (49,699 | ) | |||||||||||||||||||||
| SiteMinder Ltd. |
JPMorgan Chase Bank N.A. | 32,500 | 02/21/24 | AUD | 5.05 | AUD | 167 | (6,366 | ) | |||||||||||||||||||||
|
|
|
|||||||||||||||||||||||||||||
| $ | (3,360,123 | ) | ||||||||||||||||||||||||||||
|
|
|
|||||||||||||||||||||||||||||
Balances Reported in the Statements of Assets and Liabilities for Options Written
| Description | Swap Premiums Paid |
Swap Premiums Received |
Unrealized Appreciation |
Unrealized Depreciation |
Value | |||||||||||||||
| Options Written |
$ | N/A | $ | N/A | $ | 1,369,510 | $ | (10,010,580 | ) | $ | (16,978,313 | ) | ||||||||
Derivative Financial Instruments Categorized by Risk Exposure
As of period end, the fair values of derivative financial instruments located in the Statements of Assets and Liabilities were as follows:
| Commodity Contracts |
Credit Contracts |
Equity Contracts |
Foreign Currency Exchange Contracts |
Interest Rate Contracts |
Other Contracts |
Total | ||||||||||||||||||||||
| Liabilities — Derivative Financial Instruments |
||||||||||||||||||||||||||||
| Options written |
||||||||||||||||||||||||||||
| Options written at value |
$ | — | $ | — | $ | 16,978,313 | $ | — | $ | — | $ | — | $ | 16,978,313 | ||||||||||||||
|
|
|
|
|
|
|
|
|
|
|
|
|
|
|
|||||||||||||||
For the period ended December 31, 2023, the effect of derivative financial instruments in the Statements of Operations was as follows:
| Commodity Contracts |
Credit Contracts |
Equity Contracts |
Foreign Currency Exchange Contracts |
Interest Rate Contracts |
Other Contracts |
Total | ||||||||||||||||||||||
| Net Realized Gain (Loss) from: |
||||||||||||||||||||||||||||
| Options purchased(a) |
$ | — | $ | — | $ | (1,549,151 | ) | $ | — | $ | — | $ | — | $ | (1,549,151 | ) | ||||||||||||
| Options written |
— | — | (1,695,478 | ) | — | — | — | (1,695,478 | ) | |||||||||||||||||||
|
|
|
|
|
|
|
|
|
|
|
|
|
|
|
|||||||||||||||
| $ | — | $ | — | $ | (3,244,629 | ) | $ | — | $ | — | $ | — | $ | (3,244,629 | ) | |||||||||||||
|
|
|
|
|
|
|
|
|
|
|
|
|
|
|
|||||||||||||||
| Net Change in Unrealized Appreciation (Depreciation) on: |
||||||||||||||||||||||||||||
| Options written |
$ | — | $ | — | $ | (14,212,806 | ) | $ | — | $ | — | $ | — | $ | (14,212,806 | ) | ||||||||||||
|
|
|
|
|
|
|
|
|
|
|
|
|
|
|
|||||||||||||||
| (a) | Options purchased are included in net realized gain (loss) from investments — unaffiliated. |
| S C H E D U L E O F I N V E S T M E N T S |
99 |
| Schedule of Investments (continued) December 31, 2023
|
BlackRock Innovation and Growth Term Trust (BIGZ) |
Average Quarterly Balances of Outstanding Derivative Financial Instruments
| Options: |
||||
| Average value of option contracts purchased |
$ | — | (a) | |
| Average value of option contracts written |
$ | 12,587,699 | ||
| (a) | Derivative financial instrument not held at any quarter-end. The risk exposure table serves as an indicator of activity during the period. |
For more information about the Trust’s investment risks regarding derivative financial instruments, refer to the Notes to Financial Statements.
Derivative Financial Instruments — Offsetting as of Period End
The Trust’s derivative assets and liabilities (by type) were as follows:
| Assets | Liabilities | |||||||
| Derivative Financial Instruments |
||||||||
| Options |
$ | — | $ | 16,978,313 | ||||
|
|
|
|
|
|||||
| Total derivative assets and liabilities in the Statements of Assets and Liabilities |
— | 16,978,313 | ||||||
|
|
|
|
|
|||||
| Derivatives not subject to a Master Netting Agreement or similar agreement (“MNA”) |
— | (13,618,190 | ) | |||||
|
|
|
|
|
|||||
| Total derivative assets and liabilities subject to an MNA |
$ | — | $ | 3,360,123 | ||||
|
|
|
|
|
|||||
The following table presents the Trust’s derivative liabilities by counterparty net of amounts available for offset under an MNA and net of the related collateral pledged by the Trust:
| Counterparty | |
Derivative Liabilities Subject to an MNA by Counterparty |
|
|
Derivatives Available for Offset |
|
|
Non-Cash Collateral Pledged |
(a) |
|
Cash Collateral Pledged |
|
|
Net Amount of Derivative Liabilities |
| |||||
| Bank of America N.A. |
$ | 383,406 | $ | — | $ | (383,406 | ) | $ | — | $ | — | |||||||||
| Barclays Bank PLC |
521,592 | — | (521,592 | ) | — | — | ||||||||||||||
| Citibank N.A. |
751,349 | — | (751,349 | ) | — | — | ||||||||||||||
| Goldman Sachs International |
500,164 | — | (500,164 | ) | — | — | ||||||||||||||
| JPMorgan Chase Bank N.A. |
68,689 | — | (68,689 | ) | — | — | ||||||||||||||
| Morgan Stanley & Co. International PLC |
487,580 | — | (487,580 | ) | — | — | ||||||||||||||
| UBS AG |
647,343 | — | (647,343 | ) | — | — | ||||||||||||||
|
|
|
|
|
|
|
|
|
|
|
|||||||||||
| $ | 3,360,123 | $ | — | $ | (3,360,123 | ) | $ | — | $ | — | ||||||||||
|
|
|
|
|
|
|
|
|
|
|
|||||||||||
| (a) | Excess of collateral received/pledged, if any, from the individual counterparty is not shown for financial reporting purposes. |
Fair Value Hierarchy as of Period End
Various inputs are used in determining the fair value of financial instruments. For a description of the input levels and information about the Trust’s policy regarding valuation of financial instruments, refer to the Notes to Financial Statements.
The following table summarizes the Trust’s financial instruments categorized in the fair value hierarchy. The breakdown of the Trust’s financial instruments into major categories is disclosed in the Schedule of Investments above.
| Level 1 | Level 2 | Level 3 | Total | |||||||||||||
| Assets |
||||||||||||||||
| Investments |
||||||||||||||||
| Long-Term Investments |
||||||||||||||||
| Common Stocks |
||||||||||||||||
| Aerospace & Defense |
$ | 109,366,681 | $ | — | $ | — | $ | 109,366,681 | ||||||||
| Air Freight & Logistics |
16,741,388 | — | — | 16,741,388 | ||||||||||||
| Automobile Components |
24,548,549 | — | — | 24,548,549 | ||||||||||||
| Biotechnology |
15,169,493 | — | — | 15,169,493 | ||||||||||||
| Building Products |
31,763,221 | — | — | 31,763,221 | ||||||||||||
| Capital Markets |
84,497,075 | — | — | 84,497,075 | ||||||||||||
| Construction & Engineering |
24,619,933 | — | — | 24,619,933 | ||||||||||||
| Diversified Consumer Services |
25,372,492 | — | 33,414,190 | 58,786,682 | ||||||||||||
| Entertainment |
25,863,414 | — | — | 25,863,414 | ||||||||||||
| Food Products |
5,447,487 | — | — | 5,447,487 | ||||||||||||
| Ground Transportation |
53,530,764 | — | — | 53,530,764 | ||||||||||||
| 100 | 2 0 2 3 B L A C K R O C K A N N U A L R E P O R T T O S H A R E H O L D E R S |
| Schedule of Investments (continued) December 31, 2023
|
BlackRock Innovation and Growth Term Trust (BIGZ) |
Fair Value Hierarchy as of Period End (continued)
| Level 1 | Level 2 | Level 3 | Total | |||||||||||||
| Common Stocks (continued) |
||||||||||||||||
| Health Care Equipment & Supplies |
$ | 100,464,638 | $ | — | $ | — | $ | 100,464,638 | ||||||||
| Health Care Providers & Services |
20,844,044 | — | — | 20,844,044 | ||||||||||||
| Hotels, Restaurants & Leisure |
70,114,176 | — | — | 70,114,176 | ||||||||||||
| Industrial REITs |
2,131,998 | — | — | 2,131,998 | ||||||||||||
| IT Services |
99,387,468 | — | 16,990,129 | 116,377,597 | ||||||||||||
| Life Sciences Tools & Services |
179,192,241 | — | — | 179,192,241 | ||||||||||||
| Machinery |
— | 27,030,178 | — | 27,030,178 | ||||||||||||
| Professional Services |
6,419,927 | — | — | 6,419,927 | ||||||||||||
| Real Estate Management & Development |
55,664,109 | — | — | 55,664,109 | ||||||||||||
| Semiconductors & Semiconductor Equipment |
144,123,267 | 42,460,310 | — | 186,583,577 | ||||||||||||
| Software |
298,586,878 | 18,874,399 | 21,501,392 | 338,962,669 | ||||||||||||
| Specialty Retail |
29,245,566 | — | — | 29,245,566 | ||||||||||||
| Textiles, Apparel & Luxury Goods |
21,410,323 | — | — | 21,410,323 | ||||||||||||
| Preferred Securities |
||||||||||||||||
| Preferred Stocks |
— | — | 441,207,138 | 441,207,138 | ||||||||||||
| Short-Term Securities |
||||||||||||||||
| Money Market Funds |
326,227 | — | — | 326,227 | ||||||||||||
|
|
|
|
|
|
|
|
|
|||||||||
| $ | 1,444,831,359 | $ | 88,364,887 | $ | 513,112,849 | 2,046,309,095 | ||||||||||
|
|
|
|
|
|
|
|
|
|||||||||
| Investments Valued at NAV(a) |
20,505,005 | |||||||||||||||
|
|
|
|||||||||||||||
| $ | 2,066,814,100 | |||||||||||||||
|
|
|
|||||||||||||||
| Derivative Financial Instruments(b) |
||||||||||||||||
| Liabilities |
||||||||||||||||
| Equity Contracts |
$ | (11,797,434 | ) | $ | (5,180,879 | ) | $ | — | $ | (16,978,313 | ) | |||||
|
|
|
|
|
|
|
|
|
|||||||||
| (a) | Certain investments of the Trust were fair valued using NAV as a practical expedient as no quoted market value is available and therefore have been excluded from the fair value hierarchy. |
| (b) | Derivative financial instruments are options written. Options written are shown at value. |
A reconciliation of Level 3 financial instruments is presented when the Trust had a significant amount of Level 3 investments and derivative financial instruments at the beginning and/or end of the year in relation to net assets. The following table is a reconciliation of Level 3 investments for which significant unobservable inputs were used in determining fair value:
| Common Stocks |
Preferred Stocks |
Total | ||||||||||
| Assets |
||||||||||||
| Opening balance, as of December 31, 2022 |
$ | 102,169,910 | $ | 471,282,347 | $ | 573,452,257 | ||||||
| Transfers into Level 3 |
— | — | — | |||||||||
| Transfers out of Level 3 |
— | — | — | |||||||||
| Accrued discounts/premiums |
— | — | — | |||||||||
| Net realized gain (loss) |
— | — | — | |||||||||
| Net change in unrealized appreciation (depreciation)(a)(b) |
(30,264,199 | ) | (30,075,209 | ) | (60,339,408 | ) | ||||||
| Purchases |
— | — | — | |||||||||
| Sales |
— | — | — | |||||||||
|
|
|
|
|
|
|
|||||||
| Closing balance, as of December 31, 2023 |
$ | 71,905,711 | $ | 441,207,138 | $ | 513,112,849 | ||||||
|
|
|
|
|
|
|
|||||||
| Net change in unrealized appreciation (depreciation) on investments still held at December 31, 2023(b) |
$ | (30,264,199 | ) | $ | (30,075,209 | ) | $ | (60,339,408 | ) | |||
|
|
|
|
|
|
|
|||||||
| (a) | Included in the related net change in unrealized appreciation (depreciation) in the Statements of Operations. |
| (b) | Any difference between net change in unrealized appreciation (depreciation) and net change in unrealized appreciation (depreciation) on investments still held at December 31, 2023 is generally due to investments no longer held or categorized as Level 3 at period end. |
The following table summarizes the valuation approaches used and unobservable inputs utilized by the BlackRock Valuation Committee (the “Valuation Committee”) to determine the value of certain of the Trust’s Level 3 financial instruments as of period end.
| Value | |
Valuation Approach |
|
Unobservable Inputs |
|
Range of Unobservable Inputs Utilized |
(a) |
|
Weighted Average of Inputs Based on Fair Value |
| ||||||||
| Assets |
||||||||||||||||||
| Common Stocks |
$ | 71,905,711 | Market | Revenue Multiple | 1.30x - 22.00x | 12.41x | ||||||||||||
| S C H E D U L E O F I N V E S T M E N T S |
101 |
| Schedule of Investments (continued) December 31, 2023 |
BlackRock Innovation and Growth Term Trust (BIGZ) |
| Value | Valuation Approach |
Unobservable Inputs |
Range of Unobservable Inputs Utilized(a) |
Weighted Average of Unobservable Inputs Based on Fair Value |
||||||||||||||
| Time to Exit | 2.0 years | — | ||||||||||||||||
| Volatility | 90% | — | ||||||||||||||||
| Gross Profit Multiple | 15.00x | — | ||||||||||||||||
| Preferred Stocks |
$ | 441,207,138 | Market | Revenue Multiple | 1.90x - 24.00x | 9.85x | ||||||||||||
| Time to Exit | 1.0 - 5.0 years | 3.2 years | ||||||||||||||||
| Volatility | 40% - 100% | 70% | ||||||||||||||||
| Market Adjustment Multiple | 0.55x - 1.20x | 0.93x | ||||||||||||||||
|
|
|
|||||||||||||||||
| $ | 513,112,849 | |||||||||||||||||
|
|
|
|||||||||||||||||
| (a) | A significant change in unobservable input would have resulted in a correlated (inverse) significant change to value. |
See notes to financial statements.
| 102 | 2 0 2 3 B L A C K R O C K A N N U A L R E P O R T T O S H A R E H O L D E R S |
| Schedule of Investments December 31, 2023 |
BlackRock Resources & Commodities Strategy Trust (BCX) (Percentages shown are based on Net Assets) |
| Security |
Shares |
Value |
||||||
| Common Stocks |
||||||||
| Chemicals — 5.8% |
||||||||
| Albemarle Corp. |
19,588 | $ | 2,830,074 | |||||
| CF Industries Holdings, Inc.(a) |
383,868 | 30,517,506 | ||||||
| Nutrien Ltd. |
330,969 | 18,643,484 | ||||||
|
|
|
|||||||
| 51,991,064 | ||||||||
| Containers & Packaging — 7.5% | ||||||||
| Avery Dennison Corp. |
70,747 | 14,302,214 | ||||||
| Graphic Packaging Holding Co. |
371,023 | 9,145,717 | ||||||
| Packaging Corp. of America(a) |
102,319 | 16,668,788 | ||||||
| Smurfit Kappa Group PLC |
680,511 | 26,975,801 | ||||||
|
|
|
|||||||
| 67,092,520 | ||||||||
| Energy Equipment & Services — 1.4% | ||||||||
| Schlumberger NV |
233,156 | 12,133,438 | ||||||
|
|
|
|||||||
| Food Products — 4.9% | ||||||||
| Archer-Daniels-Midland Co. |
261,696 | 18,899,693 | ||||||
| Bunge Global SA |
168,237 | 16,983,525 | ||||||
| Hofseth International, (Acquired 05/26/21, Cost: $10,198,056)(b)(c)(d) |
18,993,283 | 7,776,854 | ||||||
|
|
|
|||||||
| 43,660,072 | ||||||||
| Machinery — 1.9% | ||||||||
| AGCO Corp.(e) |
139,452 | 16,930,869 | ||||||
|
|
|
|||||||
| Metals & Mining — 37.5% | ||||||||
| Alcoa Corp. |
212,525 | 7,225,850 | ||||||
| Anglo American PLC |
282,853 | 7,078,877 | ||||||
| ArcelorMittal SA, ADR(f) |
579,793 | 16,460,323 | ||||||
| Barrick Gold Corp. |
761,298 | 13,771,881 | ||||||
| BHP Group Ltd., Series L, ADR(a) |
637,814 | 43,569,074 | ||||||
| Filo Corp.(c) |
109,223 | 1,740,083 | ||||||
| Filo Corp. Legend(c) |
175,560 | 2,796,930 | ||||||
| First Quantum Minerals Ltd. |
488,526 | 4,000,232 | ||||||
| Franco-Nevada Corp. |
64,021 | 7,094,167 | ||||||
| Freeport-McMoRan, Inc.(a)(e) |
727,912 | 30,987,214 | ||||||
| Glencore PLC |
7,075,731 | 42,532,536 | ||||||
| Newmont Corp. |
374,569 | 15,503,411 | ||||||
| Norsk Hydro ASA |
3,371,460 | 22,661,622 | ||||||
| Polyus PJSC(b)(c) |
104,732 | 12 | ||||||
| Rio Tinto PLC |
370,896 | 27,587,639 | ||||||
| Stelco Holdings, Inc. |
399,098 | 15,116,961 | ||||||
| Teck Resources Ltd., Class B(f) |
137,086 | 5,794,625 | ||||||
| Vale SA, ADR |
2,325,042 | 36,875,166 | ||||||
| Wheaton Precious Metals Corp. |
666,054 | 32,863,104 | ||||||
|
|
|
|||||||
| 333,659,707 | ||||||||
| Oil, Gas & Consumable Fuels — 37.4% | ||||||||
| BP PLC |
6,065,163 | 35,954,697 | ||||||
| Cameco Corp. |
273,333 | 11,780,652 | ||||||
| Canadian Natural Resources Ltd. |
290,681 | 19,043,823 | ||||||
| Cheniere Energy, Inc.(e) |
86,708 | 14,801,923 | ||||||
| Chevron Corp.(a)(e) |
255,423 | 38,098,895 | ||||||
| ConocoPhillips(a) |
211,898 | 24,595,001 | ||||||
| EOG Resources, Inc.(a) |
82,977 | 10,036,068 | ||||||
| Exxon Mobil Corp.(a) |
480,000 | 47,990,400 | ||||||
| Galp Energia SGPS SA |
434,726 | 6,396,417 | ||||||
| Gazprom PJSC(b)(c) |
5,430,000 | 608 | ||||||
| Shell PLC, ADR(a) |
1,040,175 | 68,443,515 | ||||||
| TotalEnergies SE |
828,786 | 56,356,600 | ||||||
|
|
|
|||||||
| 333,498,599 | ||||||||
| Security |
Shares |
Value |
||||||
| Paper & Forest Products — 2.3% | ||||||||
| Precious Woods Holding AG, Registered Shares(c) |
20,000 | $ | 142,679 | |||||
| UPM-Kymmene OYJ |
540,993 | 20,406,621 | ||||||
|
|
|
|||||||
| 20,549,300 | ||||||||
|
|
|
|||||||
| Total Common Stocks — 98.7% |
879,515,569 | |||||||
|
|
|
|||||||
| Par (000) |
||||||||
| Corporate Bonds |
||||||||
| Metals & Mining — 0.8% | ||||||||
| Allied Gold Corp., 8.75%, 09/07/28 |
$ | 7,200 | 7,200,000 | |||||
|
|
|
|||||||
| Total Corporate Bonds — 0.8% |
7,200,000 | |||||||
|
|
|
|||||||
| Total Long-Term Investments — 99.5% |
886,715,569 | |||||||
|
|
|
|||||||
| Shares | ||||||||
| Short-Term Securities | ||||||||
| Money Market Funds — 2.3% | ||||||||
| BlackRock Liquidity Funds, T-Fund, Institutional Class, 5.26%(g)(h) |
14,160,077 | 14,160,077 | ||||||
| SL Liquidity Series, LLC, Money Market Series, 5.58%(g)(h)(i) |
6,148,624 | 6,150,469 | ||||||
|
|
|
|||||||
| Total Short-Term Securities — 2.3% |
|
20,310,546 | ||||||
|
|
|
|||||||
| Total Investments Before Options Written — 101.8% |
|
907,026,115 | ||||||
|
|
|
|||||||
| Options Written — (1.2)% |
|
(10,021,060 | ) | |||||
|
|
|
|||||||
| Total Investments, Net of Options Written — 100.6% |
|
897,005,055 | ||||||
| Liabilities in Excess of Other Assets — (0.6)% |
|
(5,666,563 | ) | |||||
|
|
|
|||||||
| Net Assets — 100.0% |
$ | 891,338,492 | ||||||
|
|
|
|||||||
| (a) | All or a portion of the security has been pledged and/or segregated as collateral in connection with outstanding exchange-traded options written. |
| (b) | Security is valued using significant unobservable inputs and is classified as Level 3 in the fair value hierarchy. |
| (c) | Non-income producing security. |
| (d) | Restricted security as to resale, excluding 144A securities. The Trust held restricted securities with a current value of $7,776,854, representing 0.9% of its net assets as of period end, and an original cost of $10,198,056. |
| (e) | All or a portion of the security has been pledged as collateral in connection with outstanding OTC derivatives. |
| (f) | All or a portion of this security is on loan. |
| (g) | Affiliate of the Trust. |
| (h) | Annualized 7-day yield as of period end. |
| (i) | All or a portion of this security was purchased with the cash collateral from loaned securities. |
For Trust compliance purposes, the Trust’s industry classifications refer to one or more of the industry sub-classifications used by one or more widely recognized market indexes or rating group indexes, and/or as defined by the investment adviser. These definitions may not apply for purposes of this report, which may combine such industry sub-classifications for reporting ease.
| S C H E D U L E O F I N V E S T M E N T S |
103 |
| Schedule of Investments (continued) December 31, 2023
|
BlackRock Resources & Commodities Strategy Trust (BCX) |
Affiliates
Investments in issuers considered to be affiliate(s) of the Trust during the year ended December 31, 2023 for purposes of Section 2(a)(3) of the Investment Company Act of 1940, as amended, were as follows:
| Affiliated Issuer | Value at 12/31/22 |
Purchases at Cost |
Proceeds from Sale |
Net Realized Gain (Loss) |
Change in Unrealized Appreciation (Depreciation) |
Value at 12/31/23 |
Shares Held at 12/31/23 |
Income | Capital Gain Distributions from Underlying Funds |
|||||||||||||||||||||||||||
| BlackRock Liquidity Funds, T-Fund, Institutional Class |
$ | 19,404,102 | $ | — | $ | (5,244,025 | )(a) | $ | — | $ | — | $ | 14,160,077 | 14,160,077 | $ | 1,252,534 | $ | — | ||||||||||||||||||
| SL Liquidity Series, LLC, Money Market Series |
— | 6,146,031 | (a) | — | 4,937 | (499 | ) | 6,150,469 | 6,148,624 | 17,994 | (b) | — | ||||||||||||||||||||||||
|
|
|
|
|
|
|
|
|
|
|
|||||||||||||||||||||||||||
| $ | 4,937 | $ | (499 | ) | $ | 20,310,546 | $ | 1,270,528 | $ | — | ||||||||||||||||||||||||||
|
|
|
|
|
|
|
|
|
|
|
|||||||||||||||||||||||||||
| (a) | Represents net amount purchased (sold). |
| (b) | All or a portion represents securities lending income earned from the reinvestment of cash collateral from loaned securities, net of fees and collateral investment expenses, and other payments to and from borrowers of securities. |
Derivative Financial Instruments Outstanding as of Period End
Exchange-Traded Options Written
| Description | Number of Contracts |
Expiration Date |
Exercise Price | Notional Amount (000) |
Value | |||||||||||||||||||||||
| Call |
||||||||||||||||||||||||||||
| Archer-Daniels-Midland Co. |
272 | 01/05/24 | USD | 75.00 | USD | 1,964 | $ | (2,040 | ) | |||||||||||||||||||
| Barrick Gold Corp. |
945 | 01/05/24 | USD | 18.50 | USD | 1,710 | (10,395 | ) | ||||||||||||||||||||
| Exxon Mobil Corp. |
291 | 01/05/24 | USD | 107.00 | USD | 2,909 | (873 | ) | ||||||||||||||||||||
| Freeport-McMoRan, Inc. |
930 | 01/05/24 | USD | 38.00 | USD | 3,959 | (427,800 | ) | ||||||||||||||||||||
| Newmont Corp. |
328 | 01/05/24 | USD | 40.00 | USD | 1,358 | (51,332 | ) | ||||||||||||||||||||
| Newmont Corp. |
22 | 01/05/24 | USD | 41.00 | USD | 91 | (1,782 | ) | ||||||||||||||||||||
| Schlumberger NV |
237 | 01/05/24 | USD | 54.00 | USD | 1,233 | (2,963 | ) | ||||||||||||||||||||
| Albemarle Corp. |
36 | 01/12/24 | USD | 130.00 | USD | 520 | (57,060 | ) | ||||||||||||||||||||
| Alcoa Corp. |
192 | 01/12/24 | USD | 28.00 | USD | 653 | (117,600 | ) | ||||||||||||||||||||
| ArcelorMittal SA, ADR |
1,100 | 01/12/24 | USD | 26.00 | USD | 3,123 | (283,250 | ) | ||||||||||||||||||||
| Archer-Daniels-Midland Co. |
269 | 01/12/24 | USD | 75.00 | USD | 1,943 | (6,725 | ) | ||||||||||||||||||||
| Cameco Corp. |
511 | 01/12/24 | USD | 49.00 | USD | 2,202 | (3,833 | ) | ||||||||||||||||||||
| Chevron Corp. |
296 | 01/12/24 | USD | 155.00 | USD | 4,415 | (16,428 | ) | ||||||||||||||||||||
| ConocoPhillips |
171 | 01/12/24 | USD | 119.00 | USD | 1,985 | (15,989 | ) | ||||||||||||||||||||
| EOG Resources, Inc. |
134 | 01/12/24 | USD | 124.50 | USD | 1,621 | (13,400 | ) | ||||||||||||||||||||
| Exxon Mobil Corp. |
319 | 01/12/24 | USD | 106.00 | USD | 3,189 | (7,018 | ) | ||||||||||||||||||||
| Newmont Corp. |
350 | 01/12/24 | USD | 40.36 | USD | 1,449 | (55,298 | ) | ||||||||||||||||||||
| Nutrien Ltd. |
874 | 01/12/24 | USD | 57.00 | USD | 4,923 | (87,400 | ) | ||||||||||||||||||||
| Schlumberger NV |
250 | 01/12/24 | USD | 51.00 | USD | 1,301 | (44,000 | ) | ||||||||||||||||||||
| Shell PLC, ADR |
932 | 01/12/24 | USD | 66.00 | USD | 6,133 | (81,550 | ) | ||||||||||||||||||||
| AGCO Corp. |
280 | 01/19/24 | USD | 125.00 | USD | 3,399 | (37,100 | ) | ||||||||||||||||||||
| AGCO Corp. |
80 | 01/19/24 | USD | 120.00 | USD | 971 | (29,600 | ) | ||||||||||||||||||||
| Albemarle Corp. |
37 | 01/19/24 | USD | 135.00 | USD | 535 | (47,360 | ) | ||||||||||||||||||||
| Alcoa Corp. |
281 | 01/19/24 | USD | 30.00 | USD | 955 | (123,640 | ) | ||||||||||||||||||||
| ArcelorMittal SA, ADR |
1,067 | 01/19/24 | USD | 26.00 | USD | 3,029 | (277,420 | ) | ||||||||||||||||||||
| Archer-Daniels-Midland Co. |
211 | 01/19/24 | USD | 77.50 | USD | 1,524 | (2,638 | ) | ||||||||||||||||||||
| Avery Dennison Corp. |
132 | 01/19/24 | USD | 200.00 | USD | 2,669 | (64,020 | ) | ||||||||||||||||||||
| Barrick Gold Corp. |
700 | 01/19/24 | USD | 16.00 | USD | 1,266 | (157,150 | ) | ||||||||||||||||||||
| BHP Group Ltd., ADR |
755 | 01/19/24 | USD | 62.50 | USD | 5,157 | (468,100 | ) | ||||||||||||||||||||
| Bunge Global SA |
333 | 01/19/24 | USD | 111.00 | USD | 3,362 | (2,487 | ) | ||||||||||||||||||||
| Cameco Corp. |
510 | 01/19/24 | USD | 48.00 | USD | 2,198 | (12,495 | ) | ||||||||||||||||||||
| Canadian Natural Resources Ltd. |
884 | 01/19/24 | CAD | 94.00 | CAD | 7,674 | (11,341 | ) | ||||||||||||||||||||
| Chevron Corp. |
306 | 01/19/24 | USD | 150.00 | USD | 4,564 | (82,008 | ) | ||||||||||||||||||||
| ConocoPhillips |
332 | 01/19/24 | USD | 125.00 | USD | 3,854 | (9,130 | ) | ||||||||||||||||||||
| Exxon Mobil Corp. |
897 | 01/19/24 | USD | 100.00 | USD | 8,968 | (196,891 | ) | ||||||||||||||||||||
| Filo Corp. |
400 | 01/19/24 | CAD | 19.50 | CAD | 844 | (60,375 | ) | ||||||||||||||||||||
| Franco-Nevada Corp. |
239 | 01/19/24 | USD | 120.00 | USD | 2,648 | (14,340 | ) | ||||||||||||||||||||
| Freeport-McMoRan, Inc. |
575 | 01/19/24 | USD | 36.00 | USD | 2,448 | (383,812 | ) | ||||||||||||||||||||
| Newmont Corp. |
207 | 01/19/24 | USD | 37.50 | USD | 857 | (86,940 | ) | ||||||||||||||||||||
| Newmont Corp. |
143 | 01/19/24 | USD | 42.50 | USD | 592 | (10,225 | ) | ||||||||||||||||||||
| 104 | 2 0 2 3 B L A C K R O C K A N N U A L R E P O R T T O S H A R E H O L D E R S |
| Schedule of Investments (continued) December 31, 2023
|
BlackRock Resources & Commodities Strategy Trust (BCX) |
Exchange-Traded Options Written (continued)
| Description | Number of Contracts |
Expiration Date |
Exercise Price | Notional Amount (000) |
Value | |||||||||||||||||||||||
| Call (continued) |
||||||||||||||||||||||||||||
| Packaging Corp. of America |
200 | 01/19/24 | USD | 165.00 | USD | 3,258 | $ | (44,000 | ) | |||||||||||||||||||
| Schlumberger NV |
110 | 01/19/24 | USD | 52.50 | USD | 572 | (15,070 | ) | ||||||||||||||||||||
| Schlumberger NV |
112 | 01/19/24 | USD | 55.00 | USD | 583 | (5,992 | ) | ||||||||||||||||||||
| Shell PLC, ADR |
658 | 01/19/24 | USD | 65.00 | USD | 4,330 | (111,860 | ) | ||||||||||||||||||||
| Stelco Holdings, Inc. |
780 | 01/19/24 | CAD | 44.00 | CAD | 3,915 | (394,400 | ) | ||||||||||||||||||||
| Stelco Holdings, Inc. |
159 | 01/19/24 | CAD | 41.00 | CAD | 798 | (113,996 | ) | ||||||||||||||||||||
| Teck Resources Ltd., Class B |
512 | 01/19/24 | USD | 40.00 | USD | 2,164 | (143,616 | ) | ||||||||||||||||||||
| Vale SA, ADR |
1,576 | 01/19/24 | USD | 16.00 | USD | 2,500 | (54,372 | ) | ||||||||||||||||||||
| Alcoa Corp. |
178 | 01/26/24 | USD | 27.00 | USD | 605 | (128,605 | ) | ||||||||||||||||||||
| Barrick Gold Corp. |
600 | 01/26/24 | USD | 17.00 | USD | 1,085 | (81,300 | ) | ||||||||||||||||||||
| Chevron Corp. |
343 | 01/26/24 | USD | 145.00 | USD | 5,116 | (220,377 | ) | ||||||||||||||||||||
| ConocoPhillips |
23 | 01/26/24 | USD | 116.00 | USD | 267 | (7,418 | ) | ||||||||||||||||||||
| EOG Resources, Inc. |
176 | 01/26/24 | USD | 121.50 | USD | 2,129 | (49,280 | ) | ||||||||||||||||||||
| Exxon Mobil Corp. |
287 | 01/26/24 | USD | 106.00 | USD | 2,869 | (18,655 | ) | ||||||||||||||||||||
| Freeport-McMoRan, Inc. |
871 | 01/26/24 | USD | 42.00 | USD | 3,708 | (160,699 | ) | ||||||||||||||||||||
| Newmont Corp. |
328 | 01/26/24 | USD | 45.00 | USD | 1,358 | (11,152 | ) | ||||||||||||||||||||
| Nutrien Ltd. |
350 | 01/26/24 | USD | 58.00 | USD | 1,972 | (42,875 | ) | ||||||||||||||||||||
| Schlumberger NV |
162 | 01/26/24 | USD | 56.00 | USD | 843 | (8,262 | ) | ||||||||||||||||||||
| Shell PLC, ADR |
1,105 | 01/26/24 | USD | 67.00 | USD | 7,271 | (99,450 | ) | ||||||||||||||||||||
| ConocoPhillips |
87 | 02/02/24 | USD | 121.00 | USD | 1,010 | (15,225 | ) | ||||||||||||||||||||
| Newmont Corp. |
7 | 02/02/24 | USD | 44.00 | USD | 29 | (459 | ) | ||||||||||||||||||||
| Vale SA, ADR |
2,390 | 02/05/24 | USD | 15.90 | USD | 3,791 | (141,851 | ) | ||||||||||||||||||||
| Bunge Global SA |
295 | 02/07/24 | USD | 105.01 | USD | 2,978 | (52,643 | ) | ||||||||||||||||||||
| AGCO Corp. |
161 | 02/16/24 | USD | 120.00 | USD | 1,955 | (114,310 | ) | ||||||||||||||||||||
| Alcoa Corp. |
143 | 02/16/24 | USD | 30.00 | USD | 486 | (74,002 | ) | ||||||||||||||||||||
| Archer-Daniels-Midland Co. |
226 | 02/16/24 | USD | 77.50 | USD | 1,632 | (15,820 | ) | ||||||||||||||||||||
| Avery Dennison Corp. |
132 | 02/16/24 | USD | 201.00 | USD | 2,669 | (107,099 | ) | ||||||||||||||||||||
| Barrick Gold Corp. |
600 | 02/16/24 | USD | 19.00 | USD | 1,085 | (28,500 | ) | ||||||||||||||||||||
| BHP Group Ltd., ADR |
956 | 02/16/24 | USD | 62.50 | USD | 6,530 | (664,420 | ) | ||||||||||||||||||||
| Canadian Natural Resources Ltd. |
202 | 02/16/24 | CAD | 86.00 | CAD | 1,754 | (59,073 | ) | ||||||||||||||||||||
| ConocoPhillips |
171 | 02/16/24 | USD | 120.00 | USD | 1,985 | (48,564 | ) | ||||||||||||||||||||
| Freeport-McMoRan, Inc. |
344 | 02/16/24 | USD | 39.00 | USD | 1,464 | (153,080 | ) | ||||||||||||||||||||
| Packaging Corp. of America |
182 | 02/16/24 | USD | 170.00 | USD | 2,965 | (60,970 | ) | ||||||||||||||||||||
| Shell PLC, ADR |
1,153 | 02/16/24 | USD | 67.50 | USD | 7,587 | (147,007 | ) | ||||||||||||||||||||
| Stelco Holdings, Inc. |
560 | 02/16/24 | CAD | 46.00 | CAD | 2,811 | (258,858 | ) | ||||||||||||||||||||
| Vale SA, ADR |
2,390 | 02/16/24 | USD | 16.00 | USD | 3,791 | (152,960 | ) | ||||||||||||||||||||
| Vale SA, ADR |
2,334 | 02/27/24 | USD | 15.87 | USD | 3,702 | (181,529 | ) | ||||||||||||||||||||
|
|
|
|||||||||||||||||||||||||||
| $ | (7,351,557 | ) | ||||||||||||||||||||||||||
|
|
|
|||||||||||||||||||||||||||
OTC Options Written
| Description | Counterparty | Number of Contracts |
Expiration Date |
Exercise Price | Notional Amount (000) |
Value | ||||||||||||||||||||||||
| Call |
||||||||||||||||||||||||||||||
| BHP Group Ltd., ADR |
JPMorgan Chase Bank N.A. | 67,200 | 01/04/24 | USD | 63.08 | USD | 4,590 | $ | (356,206 | ) | ||||||||||||||||||||
| Galp Energia SGPS SA |
Goldman Sachs International | 87,100 | 01/04/24 | EUR | 13.73 | EUR | 1,161 | (2,739 | ) | |||||||||||||||||||||
| Rio Tinto PLC |
Goldman Sachs International | 48,300 | 01/05/24 | GBP | 56.22 | GBP | 2,819 | (145,938 | ) | |||||||||||||||||||||
| UPM-Kymmene OYJ |
Bank of America N.A. | 95,400 | 01/10/24 | EUR | 33.52 | EUR | 3,260 | (89,024 | ) | |||||||||||||||||||||
| Anglo American PLC |
Morgan Stanley & Co. International PLC | 105,700 | 01/11/24 | GBP | 21.58 | GBP | 2,075 | (4,861 | ) | |||||||||||||||||||||
| Glencore PLC |
Morgan Stanley & Co. International PLC | 955,400 | 01/11/24 | GBP | 4.55 | GBP | 4,505 | (240,540 | ) | |||||||||||||||||||||
| Smurfit Kappa Group PLC |
Bank of America N.A. | 78,700 | 01/11/24 | EUR | 32.70 | EUR | 2,826 | (282,159 | ) | |||||||||||||||||||||
| UPM-Kymmene OYJ |
UBS AG | 69,500 | 01/17/24 | EUR | 33.08 | EUR | 2,375 | (100,152 | ) | |||||||||||||||||||||
| UPM-Kymmene OYJ |
UBS AG | 37,300 | 01/17/24 | EUR | 33.34 | EUR | 1,274 | (45,422 | ) | |||||||||||||||||||||
| Glencore PLC |
Bank of America N.A. | 1,689,257 | 01/23/24 | GBP | 4.55 | GBP | 7,966 | (486,045 | ) | |||||||||||||||||||||
| Graphic Packaging Holding Co. |
Bank of America N.A. | 69,300 | 01/25/24 | USD | 23.67 | USD | 1,708 | (88,904 | ) | |||||||||||||||||||||
| Rio Tinto PLC |
Goldman Sachs International | 48,300 | 01/25/24 | GBP | 56.76 | GBP | 2,819 | (160,446 | ) | |||||||||||||||||||||
| BP PLC |
Morgan Stanley & Co. International PLC | 1,612,500 | 01/30/24 | GBP | 4.87 | GBP | 7,499 | (105,174 | ) | |||||||||||||||||||||
| Smurfit Kappa Group PLC |
Goldman Sachs International | 99,200 | 01/30/24 | EUR | 34.87 | EUR | 3,562 | (195,104 | ) | |||||||||||||||||||||
| TotalEnergies SE |
Morgan Stanley & Co. International PLC | 258,800 | 01/30/24 | EUR | 63.63 | EUR | 15,941 | (129,583 | ) | |||||||||||||||||||||
| Galp Energia SGPS SA |
Bank of America N.A. | 75,400 | 02/01/24 | EUR | 13.66 | EUR | 1,005 | (18,789 | ) | |||||||||||||||||||||
| S C H E D U L E O F I N V E S T M E N T S |
105 |
| Schedule of Investments (continued) December 31, 2023
|
BlackRock Resources & Commodities Strategy Trust (BCX) |
OTC Options Written (continued)
| Description | Counterparty | Number of Contracts |
Expiration Date |
Exercise Price | Notional Amount (000) |
Value | ||||||||||||||||||||||||
| Call (continued) |
||||||||||||||||||||||||||||||
| BP PLC |
Bank of America N.A. | 654,400 | 02/08/24 | GBP | 4.68 | GBP | 3,043 | $ | (120,757 | ) | ||||||||||||||||||||
| Graphic Packaging Holding Co. |
Bank of America N.A. | 69,300 | 02/14/24 | USD | 23.78 | USD | 1,708 | (97,660 | ) | |||||||||||||||||||||
|
|
|
|||||||||||||||||||||||||||||
| $ | (2,669,503 | ) | ||||||||||||||||||||||||||||
|
|
|
|||||||||||||||||||||||||||||
Balances Reported in the Statements of Assets and Liabilities for Options Written
| Description | Swap Premiums Paid |
Swap Premiums Received |
Unrealized Appreciation |
Unrealized Depreciation |
Value | |||||||||||||||
| Options Written |
$ | N/A | $ | N/A | $ | 1,600,359 | $ | (4,844,088 | ) | $ | (10,021,060 | ) | ||||||||
Derivative Financial Instruments Categorized by Risk Exposure
As of period end, the fair values of derivative financial instruments located in the Statements of Assets and Liabilities were as follows:
| Commodity Contracts |
Credit Contracts |
Equity Contracts |
Foreign Currency Exchange Contracts |
Interest Rate Contracts |
Other Contracts |
Total | ||||||||||||||||||||||
| Liabilities — Derivative Financial Instruments |
||||||||||||||||||||||||||||
| Options written |
||||||||||||||||||||||||||||
| Options written at value |
$ | — | $ | — | $ | 10,021,060 | $ | — | $ | — | $ | — | $ | 10,021,060 | ||||||||||||||
|
|
|
|
|
|
|
|
|
|
|
|
|
|
|
|||||||||||||||
For the period ended December 31, 2023, the effect of derivative financial instruments in the Statements of Operations was as follows:
| Commodity Contracts |
Credit Contracts |
Equity Contracts |
Foreign Currency Exchange Contracts |
Interest Rate Contracts |
Other Contracts |
Total | ||||||||||||||||||||||
| Net Realized Gain (Loss) from: |
||||||||||||||||||||||||||||
| Options purchased(a) |
$ | — | $ | — | $ | (1,777,915 | ) | $ | — | $ | — | $ | — | $ | (1,777,915 | ) | ||||||||||||
| Options written |
— | — | 21,043,307 | — | — | — | 21,043,307 | |||||||||||||||||||||
|
|
|
|
|
|
|
|
|
|
|
|
|
|
|
|||||||||||||||
| $ | — | $ | — | $ | 19,265,392 | $ | — | $ | — | $ | — | $ | 19,265,392 | |||||||||||||||
|
|
|
|
|
|
|
|
|
|
|
|
|
|
|
|||||||||||||||
| Net Change in Unrealized Appreciation (Depreciation) on: |
||||||||||||||||||||||||||||
| Options written |
$ | — | $ | — | $ | (6,718,319 | ) | $ | — | $ | — | $ | — | $ | (6,718,319 | ) | ||||||||||||
|
|
|
|
|
|
|
|
|
|
|
|
|
|
|
|||||||||||||||
| (a) | Options purchased are included in net realized gain (loss) from investments — unaffiliated. |
Average Quarterly Balances of Outstanding Derivative Financial Instruments
| Options: |
||||
| Average value of option contracts purchased |
$ | — | (a) | |
| Average value of option contracts written |
$ | 7,632,191 |
| (a) | Derivative financial instrument not held at any quarter-end. The risk exposure table serves as an indicator of activity during the period. |
For more information about the Trust’s investment risks regarding derivative financial instruments, refer to the Notes to Financial Statements.
| 106 | 2 0 2 3 B L A C K R O C K A N N U A L R E P O R T T O S H A R E H O L D E R S |
| Schedule of Investments (continued) December 31, 2023
|
BlackRock Resources & Commodities Strategy Trust (BCX) |
Derivative Financial Instruments — Offsetting as of Period End
The Trust’s derivative assets and liabilities (by type) were as follows:
| Assets | Liabilities | |||||||
| Derivative Financial Instruments |
||||||||
| Options |
$ | — | $ | 10,021,060 | ||||
|
|
|
|
|
|||||
| Total derivative assets and liabilities in the Statements of Assets and Liabilities |
— | 10,021,060 | ||||||
|
|
|
|
|
|||||
| Derivatives not subject to a Master Netting Agreement or similar agreement (“MNA”) |
— | (7,351,557 | ) | |||||
|
|
|
|
|
|||||
| Total derivative assets and liabilities subject to an MNA |
$ | — | $ | 2,669,503 | ||||
|
|
|
|
|
|||||
The following table presents the Trust’s derivative liabilities by counterparty net of amounts available for offset under an MNA and net of the related collateral pledged by the Trust:
| Counterparty | |
Derivative Liabilities Subject to an MNA by Counterparty |
|
|
Derivatives Available for Offset |
|
|
Non-Cash Collateral Pledged |
(a) |
|
Cash Collateral Pledged |
|
|
Net Amount of Derivative Liabilities |
(b) | |||||
| Bank of America N.A. |
$ | 1,183,338 | $ | — | $ | (1,183,338 | ) | $ | — | $ | — | |||||||||
| Goldman Sachs International |
504,227 | — | (504,227 | ) | — | — | ||||||||||||||
| JPMorgan Chase Bank N.A. |
356,206 | — | (356,206 | ) | — | — | ||||||||||||||
| Morgan Stanley & Co. International PLC |
480,158 | — | (480,158 | ) | — | — | ||||||||||||||
| UBS AG |
145,574 | — | — | — | 145,574 | |||||||||||||||
|
|
|
|
|
|
|
|
|
|
|
|||||||||||
| $ | 2,669,503 | $ | — | $ | (2,523,929 | ) | $ | — | $ | 145,574 | ||||||||||
|
|
|
|
|
|
|
|
|
|
|
|||||||||||
| (a) | Excess of collateral received/pledged, if any, from the individual counterparty is not shown for financial reporting purposes. |
| (b) | Net amount represents the net amount payable due to counterparty in the event of default. Net amount may be offset further by the options written receivable/payable on the Statements of Assets and Liabilities. |
Fair Value Hierarchy as of Period End
Various inputs are used in determining the fair value of financial instruments. For a description of the input levels and information about the Trust’s policy regarding valuation of financial instruments, refer to the Notes to Financial Statements.
The following table summarizes the Trust’s financial instruments categorized in the fair value hierarchy. The breakdown of the Trust’s financial instruments into major categories is disclosed in the Schedule of Investments above.
| Level 1 | Level 2 | Level 3 | Total | |||||||||||||||||||||||||
| Assets |
||||||||||||||||||||||||||||
| Investments |
||||||||||||||||||||||||||||
| Long-Term Investments |
||||||||||||||||||||||||||||
| Common Stocks |
||||||||||||||||||||||||||||
| Chemicals |
$ | 51,991,064 | $ | — | $ | — | $ | 51,991,064 | ||||||||||||||||||||
| Containers & Packaging |
40,116,719 | 26,975,801 | — | 67,092,520 | ||||||||||||||||||||||||
| Energy Equipment & Services |
12,133,438 | — | — | 12,133,438 | ||||||||||||||||||||||||
| Food Products |
35,883,218 | — | 7,776,854 | 43,660,072 | ||||||||||||||||||||||||
| Machinery |
16,930,869 | — | — | 16,930,869 | ||||||||||||||||||||||||
| Metals & Mining |
231,002,091 | 102,657,604 | 12 | 333,659,707 | ||||||||||||||||||||||||
| Oil, Gas & Consumable Fuels |
234,790,277 | 98,707,714 | 608 | 333,498,599 | ||||||||||||||||||||||||
| Paper & Forest Products |
— | 20,549,300 | — | 20,549,300 | ||||||||||||||||||||||||
| Corporate Bonds |
— | 7,200,000 | — | 7,200,000 | ||||||||||||||||||||||||
| Short-Term Securities |
||||||||||||||||||||||||||||
| Money Market Funds |
14,160,077 | — | — | 14,160,077 | ||||||||||||||||||||||||
|
|
|
|
|
|
|
|
|
|||||||||||||||||||||
| $ | 637,007,753 | $ | 256,090,419 | $ | 7,777,474 | 900,875,646 | ||||||||||||||||||||||
|
|
|
|
|
|
|
|
|
|||||||||||||||||||||
| Investments Valued at NAV(a) |
6,150,469 | |||||||||||||||||||||||||||
|
|
|
|||||||||||||||||||||||||||
| $ | 907,026,115 | |||||||||||||||||||||||||||
|
|
|
|||||||||||||||||||||||||||
| S C H E D U L E O F I N V E S T M E N T S |
107 |
| Schedule of Investments (continued) December 31, 2023
|
BlackRock Resources & Commodities Strategy Trust (BCX) |
Fair Value Hierarchy as of Period End (continued)
| Level 1 | Level 2 | Level 3 | Total | |||||||||||||||||||||||||
| Derivative Financial Instruments(b) |
||||||||||||||||||||||||||||
| Liabilities |
||||||||||||||||||||||||||||
| Equity Contracts |
$ | (6,810,650 | ) | $ | (3,210,410 | ) | $ | — | $ | (10,021,060 | ) | |||||||||||||||||
|
|
|
|
|
|
|
|
|
|||||||||||||||||||||
| (a) | Certain investments of the Trust were fair valued using NAV as a practical expedient as no quoted market value is available and therefore have been excluded from the fair value hierarchy. |
| (b) | Derivative financial instruments are options written. Options written are shown at value. |
A reconciliation of Level 3 financial instruments is presented when the Trust had a significant amount of Level 3 investments and derivative financial instruments at the beginning and/or end of the year in relation to net assets. The following table is a reconciliation of Level 3 investments for which significant unobservable inputs were used in determining fair value:
|
|
||||
| Common Stocks |
||||
|
|
||||
| Assets |
||||
| Opening balance, as of December 31, 2022 |
$ | 9,267,847 | ||
| Transfers into Level 3 |
— | |||
| Transfers out of Level 3 |
— | |||
| Accrued discounts/premiums |
— | |||
| Net realized gain (loss) |
— | |||
| Net change in unrealized appreciation (depreciation)(a)(b) |
(1,490,373 | ) | ||
| Purchases |
— | |||
| Sales |
— | |||
|
|
|
|||
| Closing balance, as of December 31, 2023 |
$ | 7,777,474 | ||
|
|
|
|||
| Net change in unrealized appreciation (depreciation) on investments still held at December 31, 2023(b) |
$ | (1,490,373 | ) | |
|
|
|
|||
| (a) | Included in the related net change in unrealized appreciation (depreciation) in the Statements of Operations. |
| (b) | Any difference between net change in unrealized appreciation (depreciation) and net change in unrealized appreciation (depreciation) on investments still held at December 31, 2023 is generally due to investments no longer held or categorized as Level 3 at period end. |
The Trust’s financial instruments that are categorized as Level 3 were valued utilizing third-party pricing information without adjustment. Such valuations are based on unobservable inputs. A significant change in third-party information could result in a significantly lower or higher value of such Level 3 financial instruments.
See notes to financial statements.
| 108 | 2 0 2 3 B L A C K R O C K A N N U A L R E P O R T T O S H A R E H O L D E R S |
| Consolidated Schedule of Investments December 31, 2023
|
BlackRock Science and Technology Term Trust (BSTZ) (Percentages shown are based on Net Assets) |
| Security |
Shares |
Value | ||||||
| Common Stocks |
||||||||
| Automobiles — 2.0% | ||||||||
| Tesla, Inc.(a)(b) |
129,453 | $ | 32,166,482 | |||||
|
|
|
|||||||
| Broadline Retail — 1.6% | ||||||||
| MercadoLibre, Inc.(b) |
16,617 | 26,114,280 | ||||||
|
|
|
|||||||
| Communications Equipment — 1.2% | ||||||||
| Accton Technology Corp. |
1,151,000 | 19,563,294 | ||||||
|
|
|
|||||||
| Consumer Finance — 0.9% | ||||||||
| Kaspi.KZ JSC, GDR, Registered Shares |
166,340 | 15,303,280 | ||||||
|
|
|
|||||||
| Diversified Consumer Services — 0.1% | ||||||||
| Think & Learn Private Ltd., (Acquired 09/30/20, Cost: $7,113,729)(b)(c)(d) |
4,651 | 975,251 | ||||||
|
|
|
|||||||
| Electronic Equipment, Instruments & Components — 4.9% | ||||||||
| Coherent Corp.(b) |
154,995 | 6,746,931 | ||||||
| Ibiden Co. Ltd. |
209,800 | 11,573,763 | ||||||
| Jabil, Inc. |
222,958 | 28,404,849 | ||||||
| Lotes Co. Ltd. |
243,000 | 8,449,942 | ||||||
| Sunny Optical Technology Group Co. Ltd. |
749,900 | 6,817,254 | ||||||
| TDK Corp. |
156,500 | 7,421,912 | ||||||
| Yageo Corp. |
571,000 | 11,087,355 | ||||||
|
|
|
|||||||
| 80,502,006 | ||||||||
| Entertainment — 3.6% | ||||||||
| Nexon Co. Ltd. |
195,500 | 3,555,967 | ||||||
| Nintendo Co. Ltd. |
186,900 | 9,725,130 | ||||||
| Roku, Inc., Class A(b) |
79,125 | 7,252,598 | ||||||
| Spotify Technology SA(b) |
82,970 | 15,590,893 | ||||||
| Take-Two Interactive Software, Inc.(b) |
142,462 | 22,929,259 | ||||||
|
|
|
|||||||
| 59,053,847 | ||||||||
| Financial Services — 0.5% | ||||||||
| Wise PLC, Class A(b) |
763,574 | 8,492,073 | ||||||
|
|
|
|||||||
| Hotels, Restaurants & Leisure — 0.4% | ||||||||
| Expedia Group, Inc.(b) |
39,542 | 6,002,080 | ||||||
|
|
|
|||||||
| Interactive Media & Services — 2.0% | ||||||||
| Kakao Corp. |
187,210 | 7,853,398 | ||||||
| NAVER Corp.(b) |
70,822 | 12,253,638 | ||||||
| Pinterest, Inc., Class A(b) |
325,200 | 12,045,408 | ||||||
|
|
|
|||||||
| 32,152,444 | ||||||||
| IT Services — 5.6% | ||||||||
| Automattic, Inc., Series E, (Acquired 02/03/21, |
400,000 | 17,944,000 | ||||||
| Cloudflare, Inc., Class A(b) |
103,807 | 8,642,971 | ||||||
| CNEX Labs, Inc., (Acquired 12/ |
1,161,804 | 2,358,462 | ||||||
| Farmer’s Business Network, Inc.(b)(c) |
361,834 | 1,418,389 | ||||||
| Klarna Holdings AB, Ordinary Shares, (Acquired 08/07/19, |
86,839 | 24,620,016 | ||||||
| MongoDB, Inc., Class A(b)(e)(f) |
69,850 | 28,558,173 | ||||||
| NEC Corp. |
123,500 | 7,297,138 | ||||||
|
|
|
|||||||
| 90,839,149 | ||||||||
| Machinery — 0.4% | ||||||||
| Harmonic Drive Systems, Inc. |
236,600 | 6,961,217 | ||||||
|
|
|
|||||||
| Media — 1.6% | ||||||||
| Informa PLC |
2,631,592 | 26,174,876 | ||||||
|
|
|
|||||||
| Security |
Shares |
Value | ||||||
| Professional Services — 1.9% | ||||||||
| Legalzoom.com, Inc.(b) |
635,469 | $ | 7,180,800 | |||||
| Wolters Kluwer NV, Class C |
164,326 | 23,378,574 | ||||||
|
|
|
|||||||
| 30,559,374 | ||||||||
| Real Estate Management & Development — 0.7% | ||||||||
| Zillow Group, Inc., Class C(b) |
204,329 | 11,822,476 | ||||||
|
|
|
|||||||
| Semiconductors & Semiconductor Equipment — 25.1% | ||||||||
| AIXTRON SE |
191,444 | 8,151,211 | ||||||
| Alchip Technologies Ltd. |
162,000 | 17,213,846 | ||||||
| Alphawave IP Group PLC(b) |
4,742,583 | 7,784,301 | ||||||
| Amkor Technology, Inc. |
217,640 | 7,240,883 | ||||||
| ARM Holdings PLC, ADR(b)(f) |
173,541 | 13,040,738 | ||||||
| ASM International NV |
51,003 | 26,545,761 | ||||||
| BE Semiconductor Industries NV |
161,788 | 24,426,095 | ||||||
| Credo Technology Group Holding Ltd.(b) |
1,402,517 | 27,307,006 | ||||||
| eMemory Technology, Inc. |
100,000 | 7,951,434 | ||||||
| King Yuan Electronics Co. Ltd. |
2,316,000 | 6,392,516 | ||||||
| Lasertec Corp. |
72,400 | 19,006,914 | ||||||
| Lattice Semiconductor Corp.(b) |
278,514 | 19,214,681 | ||||||
| Marvell Technology, Inc.(e) |
273,265 | 16,480,612 | ||||||
| Monolithic Power Systems, Inc.(e) |
38,890 | 24,531,034 | ||||||
| Mythic AI, Inc., Series C, (Acquired 01/26/21, Cost: $7,000,000)(b)(c)(d) |
10,189 | — | ||||||
| NVIDIA Corp.(a) |
163,273 | 80,856,055 | ||||||
| Phison Electronics Corp. |
480,000 | 8,113,364 | ||||||
| Rambus, Inc.(b) |
325,023 | 22,182,820 | ||||||
| SK Hynix, Inc. |
286,367 | 31,253,502 | ||||||
| SOITEC(b) |
145,996 | 26,125,167 | ||||||
| Wolfspeed, Inc.(b)(e) |
335,547 | 14,599,650 | ||||||
|
|
|
|||||||
| 408,417,590 | ||||||||
| Software — 17.4% | ||||||||
| Altium Ltd. |
750,551 | 23,925,740 | ||||||
| Appier Group, Inc.(b) |
488,100 | 6,373,877 | ||||||
| Databricks, Inc., (Acquired 07/24/20, Cost: $5,501,686)(b)(c)(d) |
343,659 | 26,551,094 | ||||||
| Datadog, Inc., Class A(b) |
93,787 | 11,383,866 | ||||||
| DataRobot, Inc., (Acquired 03/01/21, Cost: $1,384,813)(b)(c)(d) |
92,093 | 424,549 | ||||||
| Freee KK(b) |
416,300 | 8,984,394 | ||||||
| HashiCorp, Inc., Class A(b) |
338,505 | 8,002,258 | ||||||
| Kinaxis, Inc.(b) |
84,207 | 9,450,529 | ||||||
| Klaviyo, Inc., Series A(b) |
543,117 | 15,087,790 | ||||||
| Manhattan Associates, Inc.(b) |
36,367 | 7,830,542 | ||||||
| Palo Alto Networks, Inc.(b)(f) |
96,500 | 28,455,920 | ||||||
| Samsara, Inc., Class A(b) |
429,023 | 14,320,788 | ||||||
| SentinelOne, Inc., Class A(b) |
392,516 | 10,770,639 | ||||||
| SiteMinder Ltd.(b) |
3,068,245 | 10,722,903 | ||||||
| Snorkel AI, Inc., (Acquired 10/13/20, Cost: $2,017,593)(b)(c)(d) |
500,250 | 4,352,175 | ||||||
| Snyk Ltd., Ordinary Shares, (Acquired 11/02/20, Cost: $9,287,400)(b)(c)(d) |
1,267,643 | 13,842,662 | ||||||
| Synopsys, Inc.(b)(e) |
115,666 | 59,557,580 | ||||||
| Unity Software, Inc.(b) |
223,386 | 9,134,254 | ||||||
| Xero Ltd.(b) |
185,993 | 14,189,133 | ||||||
|
|
|
|||||||
| 283,360,693 | ||||||||
| Technology Hardware, Storage & Peripherals — 3.5% | ||||||||
| Pure Storage, Inc., Class A(b) |
655,052 | 23,359,154 | ||||||
| Super Micro Computer, Inc.(b) |
26,070 | 7,410,658 | ||||||
| Western Digital Corp.(b) |
205,636 | 10,769,157 | ||||||
| C O N S O L I D A T E D S C H E D U L E O F I N V E S T M E N T S |
109 |
| Consolidated Schedule of Investments (continued) December 31, 2023 |
BlackRock Science and Technology Term Trust (BSTZ) (Percentages shown are based on Net Assets) |
| Security |
Shares |
Value | ||||||
| Technology Hardware, Storage & Peripherals (continued) | ||||||||
| Wistron Corp. |
1,842,000 | $ | 5,892,734 | |||||
| Wiwynn Corp. |
174,000 | 10,302,628 | ||||||
|
|
|
|||||||
| 57,734,331 | ||||||||
|
|
|
|||||||
| Total Common Stocks — 73.4% |
1,196,194,743 | |||||||
|
|
|
|||||||
| Preferred Securities |
||||||||
| Preferred Stocks — 27.5%(b)(c)(d) | ||||||||
| Communications Equipment — 1.0% | ||||||||
| Astranis Space Technologies Corp., Series C, (Acquired 03/19/21, Cost: $17,000,010) |
775,515 | 15,456,014 | ||||||
|
|
|
|||||||
| Consumer Staples Distribution & Retail — 2.4% | ||||||||
| GrubMarket, Inc., Series D, (Acquired 07/23/20, Cost: $8,000,001) |
1,762,969 | 39,843,099 | ||||||
|
|
|
|||||||
| Diversified Consumer Services — 1.6% | ||||||||
| FlixMobility GmbH, Series F, (Acquired 07/26/19, Cost: $16,947,253) |
850 | 25,413,540 | ||||||
| Think & Learn Private Ltd., Series F, (Acquired 09/30/20, Cost: $14,251,080) |
4,920 | 1,031,657 | ||||||
|
|
|
|||||||
| 26,445,197 | ||||||||
| Entertainment — 0.4% | ||||||||
| ResearchGate GmbH, Series D, (Acquired 09/24/20, Cost: $6,999,988) |
424,688 | 6,493,479 | ||||||
|
|
|
|||||||
| Financial Services(g) — 1.3% | ||||||||
| Trumid Holdings LLC |
||||||||
| Class J-A, (Acquired 07/24/20, Cost: $9,999,857) |
20,154 | 10,782,390 | ||||||
| Class J-B, (Acquired 07/24/20, Cost: $5,999,914) |
20,154 | 10,782,390 | ||||||
|
|
|
|||||||
| 21,564,780 | ||||||||
| Interactive Media & Services — 3.1% | ||||||||
| ByteDance Ltd., Series E-1, (Acquired 11/11/20, Cost: $33,777,337) |
308,260 | 50,306,991 | ||||||
|
|
|
|||||||
| IT Services — 1.5% | ||||||||
| Deep Instinct Ltd., Series D-2, (Acquired 03/19/21, Cost: $12,000,008) |
1,974,374 | 10,859,057 | ||||||
| TRAX Ltd. |
||||||||
| (Acquired 09/12/19, Cost: $10,999,988) |
293,333 | 7,978,658 | ||||||
| (Acquired 02/18/21, Cost: $9,999,998) |
191,806 | 5,217,123 | ||||||
|
|
|
|||||||
| 24,054,838 | ||||||||
| Professional Services — 0.8% | ||||||||
| Rapyd Financial Network Ltd., Series E, (Acquired 03/31/21, Cost: $13,999,978) |
190,705 | 13,034,687 | ||||||
|
|
|
|||||||
| Semiconductors & Semiconductor Equipment — 7.0% | ||||||||
| PsiQuantum Corp. |
||||||||
| Series C, (Acquired 09/09/19, Cost: $9,101,310) |
1,962,335 | 47,056,793 | ||||||
| Series D, (Acquired 05/21/21, Cost: $19,999,969) |
762,595 | 21,672,950 | ||||||
| SambaNova Systems, Inc. |
||||||||
| Series C, (Acquired 02/20/20, Cost: $33,904,162) |
636,800 | 40,678,784 | ||||||
| Series D, (Acquired 04/09/21, Cost: $6,999,979) |
73,670 | 4,706,040 | ||||||
|
|
|
|||||||
| 114,114,567 | ||||||||
| Software — 8.4% | ||||||||
| Databricks, Inc. |
||||||||
| Series F, (Acquired 10/22/19, Cost: $13,200,019) |
922,038 | 71,236,656 | ||||||
| Security |
Shares |
Value | ||||||
| Software (continued) | ||||||||
| Databricks, Inc. (continued) |
||||||||
| Series G, (Acquired 02/01/21, Cost: $18,500,004) |
312,909 | $ | 24,175,349 | |||||
| DataRobot, Inc., Series F, (Acquired 10/27/20, Cost: $11,499,999) |
875,059 | 5,022,839 | ||||||
| Snorkel AI, Inc., Series B, (Acquired 10/13/20, Cost: $999,996) |
247,943 | 2,157,104 | ||||||
| Snyk Ltd., Seed Preferred, (Acquired 11/02/20, Cost: $13,212,590) |
2,663,936 | 29,090,181 | ||||||
| Unqork, Inc. |
||||||||
| Series B, (Acquired 09/19/19, Cost: $6,801,016) |
597,680 | 3,711,593 | ||||||
| Series C, (Acquired 09/18/20, Cost: $7,994,787) |
292,000 | 2,271,760 | ||||||
|
|
|
|||||||
| 137,665,482 | ||||||||
|
|
|
|||||||
| 448,979,134 | ||||||||
|
|
|
|||||||
| Total Preferred Securities — 27.5% |
|
448,979,134 | ||||||
|
|
|
|||||||
| Total Long-Term Investments — 100.9% |
|
1,645,173,877 | ||||||
|
|
|
|||||||
| Short-Term Securities |
||||||||
| Money Market Funds — 0.3% | ||||||||
| BlackRock Liquidity Funds, T-Fund, Institutional Class, 5.26%(h)(i) |
1,471,804 | 1,471,804 | ||||||
| SL Liquidity Series, LLC, Money Market Series, 5.58%(h)(i)(j) |
2,877,856 | 2,878,719 | ||||||
|
|
|
|||||||
| Total Short-Term Securities — 0.3% |
4,350,523 | |||||||
|
|
|
|||||||
| Total Investments Before Options Written — 101.2% |
|
1,649,524,400 | ||||||
|
|
|
|||||||
| Options Written — (1.2)% |
|
(18,907,082 | ) | |||||
|
|
|
|||||||
| Total Investments, Net of Options Written — 100.0% |
|
1,630,617,318 | ||||||
| Liabilities in Excess of Other Assets — 0.0% |
|
(793,089 | ) | |||||
|
|
|
|||||||
| Net Assets — 100.0% |
$ | 1,629,824,229 | ||||||
|
|
|
|||||||
| (a) | All or a portion of the security has been pledged as collateral in connection with outstanding OTC derivatives. |
| (b) | Non-income producing security. |
| (c) | Security is valued using significant unobservable inputs and is classified as Level 3 in the fair value hierarchy. |
| (d) | Restricted security as to resale, excluding 144A securities. The Trust held restricted securities with a current value of $540,047,343, representing 33.1% of its net assets as of period end, and an original cost of $397,549,459. |
| (e) | All or a portion of the security has been pledged and/or segregated as collateral in connection with outstanding exchange-traded options written. |
| (f) | All or a portion of this security is on loan. |
| (g) | All or a portion of the security is held by a wholly-owned subsidiary. See Note 1 of the Notes to Consolidated Financial Statements for details on the wholly-owned subsidiary. |
| (h) | Affiliate of the Trust. |
| (i) | Annualized 7-day yield as of period end. |
| (j) | All or a portion of this security was purchased with the cash collateral from loaned securities. |
For Trust compliance purposes, the Trust’s industry classifications refer to one or more of the industry sub-classifications used by one or more widely recognized market indexes or rating group indexes, and/or as defined by the investment adviser. These definitions may not apply for purposes of this report, which may combine such industry sub-classifications for reporting ease.
| 110 | 2 0 2 3 B L A C K R O C K A N N U A L R E P O R T T O S H A R E H O L D E R S |
| Consolidated Schedule of Investments (continued) December 31, 2023
|
BlackRock Science and Technology Term Trust (BSTZ) |
Affiliates
Investments in issuers considered to be affiliate(s) of the Trust during the year ended December 31, 2023 for purposes of Section 2(a)(3) of the Investment Company Act of 1940, as amended, were as follows:
| Affiliated Issuer | Value at 12/31/22 |
Purchases at Cost |
Proceeds from Sale |
Net Realized Gain (Loss) |
Change in Unrealized Appreciation (Depreciation) |
Value at 12/31/23 |
Shares Held at 12/31/23 |
Income | Capital Gain Distributions from Underlying Funds |
|||||||||||||||||||||||||||
| BlackRock Liquidity Funds, T-Fund, Institutional Class |
$ | 20,683,361 | $ | — | $ | (19,211,557 | )(a) | $ | — | $ | — | $ | 1,471,804 | 1,471,804 | $ | 395,145 | $ | — | ||||||||||||||||||
| SL Liquidity Series, LLC, Money Market Series |
— | 2,865,526 | (a) | — | 12,631 | 562 | 2,878,719 | 2,877,856 | 78,328 | (b) | — | |||||||||||||||||||||||||
|
|
|
|
|
|
|
|
|
|
|
|||||||||||||||||||||||||||
| $ | 12,631 | $ | 562 | $ | 4,350,523 | $ | 473,473 | $ | — | |||||||||||||||||||||||||||
|
|
|
|
|
|
|
|
|
|
|
|||||||||||||||||||||||||||
| (a) | Represents net amount purchased (sold). |
| (b) | All or a portion represents securities lending income earned from the reinvestment of cash collateral from loaned securities, net of fees and collateral investment expenses, and other payments to and from borrowers of securities. |
Derivative Financial Instruments Outstanding as of Period End
Exchange-Traded Options Written
| Description | Number of Contracts |
Expiration Date |
Exercise Price | Notional Amount (000) |
Value | |||||||||||||||||||||||
| Call |
||||||||||||||||||||||||||||
| Credo Technology Group Holding Ltd. |
787 | 01/04/24 | USD | 19.75 | USD | 1,532 | $ | (24,289 | ) | |||||||||||||||||||
| MercadoLibre, Inc. |
16 | 01/05/24 | USD | 1,600.00 | USD | 2,514 | (15,680 | ) | ||||||||||||||||||||
| NVIDIA Corp. |
84 | 01/05/24 | USD | 490.00 | USD | 4,160 | (85,680 | ) | ||||||||||||||||||||
| Pinterest, Inc., Class A |
423 | 01/05/24 | USD | 33.00 | USD | 1,567 | (173,430 | ) | ||||||||||||||||||||
| SentinelOne, Inc., Class A |
378 | 01/05/24 | USD | 24.00 | USD | 1,037 | (160,650 | ) | ||||||||||||||||||||
| Super Micro Computer, Inc. |
42 | 01/05/24 | USD | 290.00 | USD | 1,194 | (21,840 | ) | ||||||||||||||||||||
| Tesla, Inc. |
80 | 01/05/24 | USD | 255.00 | USD | 1,988 | (30,200 | ) | ||||||||||||||||||||
| Wolfspeed, Inc. |
356 | 01/05/24 | USD | 45.00 | USD | 1,549 | (30,260 | ) | ||||||||||||||||||||
| ARM Holdings PLC, ADR |
346 | 01/12/24 | USD | 75.00 | USD | 2,600 | (99,302 | ) | ||||||||||||||||||||
| Cloudflare, Inc., Class A |
217 | 01/12/24 | USD | 80.00 | USD | 1,807 | (100,363 | ) | ||||||||||||||||||||
| Credo Technology Group Holding Ltd. |
720 | 01/12/24 | USD | 16.75 | USD | 1,402 | (201,691 | ) | ||||||||||||||||||||
| Datadog, Inc., Class A |
178 | 01/12/24 | USD | 125.00 | USD | 2,161 | (26,522 | ) | ||||||||||||||||||||
| Expedia Group, Inc. |
98 | 01/12/24 | USD | 145.00 | USD | 1,488 | (78,645 | ) | ||||||||||||||||||||
| Marvell Technology, Inc. |
284 | 01/12/24 | USD | 56.00 | USD | 1,713 | (131,350 | ) | ||||||||||||||||||||
| MercadoLibre, Inc. |
3 | 01/12/24 | USD | 1,620.00 | USD | 471 | (4,650 | ) | ||||||||||||||||||||
| MongoDB, Inc., Class A |
44 | 01/12/24 | USD | 430.00 | USD | 1,799 | (19,800 | ) | ||||||||||||||||||||
| NVIDIA Corp. |
96 | 01/12/24 | USD | 475.00 | USD | 4,754 | (245,520 | ) | ||||||||||||||||||||
| NVIDIA Corp. |
96 | 01/12/24 | USD | 485.00 | USD | 4,754 | (177,120 | ) | ||||||||||||||||||||
| Palo Alto Networks, Inc. |
246 | 01/12/24 | USD | 305.00 | USD | 7,254 | (70,479 | ) | ||||||||||||||||||||
| Roku, Inc., Class A |
166 | 01/12/24 | USD | 112.00 | USD | 1,522 | (2,656 | ) | ||||||||||||||||||||
| SentinelOne, Inc., Class A |
340 | 01/12/24 | USD | 21.50 | USD | 933 | (214,200 | ) | ||||||||||||||||||||
| Spotify Technology SA |
109 | 01/12/24 | USD | 210.00 | USD | 2,048 | (2,725 | ) | ||||||||||||||||||||
| Take-Two Interactive Software, Inc. |
203 | 01/12/24 | USD | 162.50 | USD | 3,267 | (42,427 | ) | ||||||||||||||||||||
| Tesla, Inc. |
217 | 01/12/24 | USD | 255.00 | USD | 5,392 | (133,997 | ) | ||||||||||||||||||||
| Unity Software, Inc. |
343 | 01/12/24 | USD | 33.00 | USD | 1,403 | (261,537 | ) | ||||||||||||||||||||
| Wolfspeed, Inc. |
645 | 01/12/24 | USD | 40.00 | USD | 2,806 | (280,575 | ) | ||||||||||||||||||||
| ARM Holdings PLC, ADR |
338 | 01/19/24 | USD | 55.00 | USD | 2,540 | (687,830 | ) | ||||||||||||||||||||
| Cloudflare, Inc., Class A |
394 | 01/19/24 | USD | 85.00 | USD | 3,280 | (97,909 | ) | ||||||||||||||||||||
| Credo Technology Group Holding Ltd. |
2,176 | 01/19/24 | USD | 20.00 | USD | 4,237 | (125,120 | ) | ||||||||||||||||||||
| Datadog, Inc., Class A |
165 | 01/19/24 | USD | 125.00 | USD | 2,003 | (36,548 | ) | ||||||||||||||||||||
| Expedia Group, Inc. |
61 | 01/19/24 | USD | 120.00 | USD | 926 | (197,182 | ) | ||||||||||||||||||||
| Jabil, Inc. |
446 | 01/19/24 | USD | 130.00 | USD | 5,682 | (86,970 | ) | ||||||||||||||||||||
| Kinaxis, Inc. |
166 | 01/19/24 | CAD | 155.00 | CAD | 2,469 | (23,490 | ) | ||||||||||||||||||||
| Klaviyo, Inc., Series A |
555 | 01/19/24 | USD | 35.00 | USD | 1,542 | (22,200 | ) | ||||||||||||||||||||
| Klaviyo, Inc., Series A |
555 | 01/19/24 | USD | 32.50 | USD | 1,542 | (8,325 | ) | ||||||||||||||||||||
| Legalzoom.com, Inc. |
1,474 | 01/19/24 | USD | 12.50 | USD | 1,666 | (14,740 | ) | ||||||||||||||||||||
| Manhattan Associates, Inc. |
80 | 01/19/24 | USD | 230.00 | USD | 1,723 | (7,200 | ) | ||||||||||||||||||||
| Marvell Technology, Inc. |
295 | 01/19/24 | USD | 52.50 | USD | 1,779 | (236,000 | ) | ||||||||||||||||||||
| Marvell Technology, Inc. |
106 | 01/19/24 | USD | 61.00 | USD | 639 | (16,748 | ) | ||||||||||||||||||||
| MercadoLibre, Inc. |
22 | 01/19/24 | USD | 1,600.00 | USD | 3,457 | (66,110 | ) | ||||||||||||||||||||
| MongoDB, Inc., Class A |
55 | 01/19/24 | USD | 410.00 | USD | 2,249 | (78,375 | ) | ||||||||||||||||||||
| C O N S O L I D A T E D S C H E D U L E O F I N V E S T M E N T S |
111 |
| Consolidated Schedule of Investments (continued) December 31, 2023
|
BlackRock Science and Technology Term Trust (BSTZ) |
Exchange-Traded Options Written (continued)
| Description | Number of Contracts |
Expiration Date |
Exercise Price | Notional Amount (000) |
Value | |||||||||||||||||||||||
| Call (continued) |
||||||||||||||||||||||||||||
| NVIDIA Corp. |
113 | 01/19/24 | USD | 490.00 | USD | 5,596 | $ | (207,920 | ) | |||||||||||||||||||
| Palo Alto Networks, Inc. |
88 | 01/19/24 | USD | 286.67 | USD | 2,595 | (117,700 | ) | ||||||||||||||||||||
| Pinterest, Inc., Class A |
284 | 01/19/24 | USD | 35.00 | USD | 1,052 | (68,586 | ) | ||||||||||||||||||||
| Rambus, Inc. |
630 | 01/19/24 | USD | 70.00 | USD | 4,300 | (129,150 | ) | ||||||||||||||||||||
| Roku, Inc., Class A |
150 | 01/19/24 | USD | 105.00 | USD | 1,375 | (12,450 | ) | ||||||||||||||||||||
| Samsara, Inc., Class A |
550 | 01/19/24 | USD | 30.00 | USD | 1,836 | (214,500 | ) | ||||||||||||||||||||
| Samsara, Inc., Class A |
123 | 01/19/24 | USD | 40.00 | USD | 411 | (2,460 | ) | ||||||||||||||||||||
| SentinelOne, Inc., Class A |
378 | 01/19/24 | USD | 24.00 | USD | 1,037 | (139,860 | ) | ||||||||||||||||||||
| Spotify Technology SA |
125 | 01/19/24 | USD | 185.00 | USD | 2,349 | (90,625 | ) | ||||||||||||||||||||
| Super Micro Computer, Inc. |
30 | 01/19/24 | USD | 330.00 | USD | 853 | (9,225 | ) | ||||||||||||||||||||
| Synopsys, Inc. |
157 | 01/19/24 | USD | 540.00 | USD | 8,084 | (57,305 | ) | ||||||||||||||||||||
| Take-Two Interactive Software, Inc. |
190 | 01/19/24 | USD | 155.00 | USD | 3,058 | (143,449 | ) | ||||||||||||||||||||
| Tesla, Inc. |
179 | 01/19/24 | USD | 246.67 | USD | 4,448 | (211,667 | ) | ||||||||||||||||||||
| Unity Software, Inc. |
408 | 01/19/24 | USD | 35.00 | USD | 1,668 | (251,940 | ) | ||||||||||||||||||||
| Wolfspeed, Inc. |
356 | 01/19/24 | USD | 47.50 | USD | 1,549 | (48,060 | ) | ||||||||||||||||||||
| Zillow Group, Inc., Class C |
230 | 01/19/24 | USD | 45.00 | USD | 1,331 | (300,150 | ) | ||||||||||||||||||||
| Marvell Technology, Inc. |
408 | 01/26/24 | USD | 55.00 | USD | 2,461 | (244,800 | ) | ||||||||||||||||||||
| MercadoLibre, Inc. |
25 | 01/26/24 | USD | 1,625.00 | USD | 3,929 | (71,625 | ) | ||||||||||||||||||||
| MongoDB, Inc., Class A |
101 | 01/26/24 | USD | 400.00 | USD | 4,129 | (233,562 | ) | ||||||||||||||||||||
| NVIDIA Corp. |
122 | 01/26/24 | USD | 495.00 | USD | 6,042 | (227,530 | ) | ||||||||||||||||||||
| Pinterest, Inc., Class A |
190 | 01/26/24 | USD | 36.00 | USD | 704 | (36,385 | ) | ||||||||||||||||||||
| Spotify Technology SA |
97 | 01/26/24 | USD | 200.00 | USD | 1,823 | (24,493 | ) | ||||||||||||||||||||
| Super Micro Computer, Inc. |
32 | 01/26/24 | USD | 320.00 | USD | 910 | (24,160 | ) | ||||||||||||||||||||
| Tesla, Inc. |
169 | 01/26/24 | USD | 270.00 | USD | 4,199 | (104,358 | ) | ||||||||||||||||||||
| Western Digital Corp. |
199 | 01/26/24 | USD | 53.00 | USD | 1,042 | (31,641 | ) | ||||||||||||||||||||
| NVIDIA Corp. |
143 | 02/02/24 | USD | 505.00 | USD | 7,082 | (244,172 | ) | ||||||||||||||||||||
| Tesla, Inc. |
143 | 02/02/24 | USD | 279.65 | USD | 3,553 | (77,350 | ) | ||||||||||||||||||||
| Western Digital Corp. |
622 | 02/09/24 | USD | 53.00 | USD | 3,257 | (154,878 | ) | ||||||||||||||||||||
| Credo Technology Group Holding Ltd. |
2,060 | 02/16/24 | USD | 20.00 | USD | 4,011 | (216,300 | ) | ||||||||||||||||||||
| Kinaxis, Inc. |
170 | 02/16/24 | CAD | 160.00 | CAD | 2,528 | (43,942 | ) | ||||||||||||||||||||
| MongoDB, Inc., Class A |
79 | 02/16/24 | USD | 480.00 | USD | 3,230 | (40,488 | ) | ||||||||||||||||||||
| Monolithic Power Systems, Inc. |
99 | 02/16/24 | USD | 630.00 | USD | 6,245 | (408,870 | ) | ||||||||||||||||||||
| Pinterest, Inc., Class A |
403 | 02/16/24 | USD | 35.00 | USD | 1,493 | (151,125 | ) | ||||||||||||||||||||
| Rambus, Inc. |
670 | 02/16/24 | USD | 70.00 | USD | 4,573 | (278,050 | ) | ||||||||||||||||||||
| Samsara, Inc., Class A |
673 | 02/16/24 | USD | 36.09 | USD | 2,246 | (131,839 | ) | ||||||||||||||||||||
| Take-Two Interactive Software, Inc. |
192 | 02/16/24 | USD | 165.00 | USD | 3,090 | (105,600 | ) | ||||||||||||||||||||
| Unity Software, Inc. |
589 | 02/16/24 | USD | 39.00 | USD | 2,408 | (276,830 | ) | ||||||||||||||||||||
| Datadog, Inc., Class A |
32 | 03/15/24 | USD | 140.00 | USD | 388 | (11,280 | ) | ||||||||||||||||||||
| Monolithic Power Systems, Inc. |
70 | 03/15/24 | USD | 640.00 | USD | 4,415 | (314,650 | ) | ||||||||||||||||||||
| Samsara, Inc., Class A |
760 | 03/15/24 | USD | 40.00 | USD | 2,537 | (125,400 | ) | ||||||||||||||||||||
| SentinelOne, Inc., Class A |
474 | 03/15/24 | USD | 32.00 | USD | 1,301 | (46,215 | ) | ||||||||||||||||||||
| Zillow Group, Inc., Class C |
460 | 03/15/24 | USD | 60.00 | USD | 2,662 | (186,300 | ) | ||||||||||||||||||||
|
|
|
|||||||||||||||||||||||||||
| $ | (10,157,225 | ) | ||||||||||||||||||||||||||
|
|
|
|||||||||||||||||||||||||||
OTC Options Written
| Description | Counterparty | Number of Contracts |
Expiration Date |
Exercise Price | Notional Amount (000) |
Value | ||||||||||||||||||||||||
| Call |
||||||||||||||||||||||||||||||
| Kaspi.KZ JSC, GDR, Registered Shares |
Bank of America N.A. | 2,300 | 01/04/24 | USD | 93.03 | USD | 212 | $ | (2,331 | ) | ||||||||||||||||||||
| Palo Alto Networks, Inc. |
Citibank N.A. | 8,700 | 01/04/24 | USD | 256.59 | USD | 2,565 | (335,177 | ) | |||||||||||||||||||||
| SiteMinder Ltd. |
Goldman Sachs International | 43,200 | 01/04/24 | AUD | 4.61 | AUD | 222 | (15,304 | ) | |||||||||||||||||||||
| SK Hynix, Inc. |
JPMorgan Chase Bank N.A. | 6,800 | 01/04/24 | KRW | 138,107.44 | KRW | 955,799 | (23,105 | ) | |||||||||||||||||||||
| Lattice Semiconductor Corp. |
JPMorgan Chase Bank N.A. | 39,900 | 01/08/24 | USD | 79.66 | USD | 2,753 | (1,309 | ) | |||||||||||||||||||||
| Altium Ltd. |
UBS AG | 56,900 | 01/09/24 | AUD | 44.26 | AUD | 2,662 | (105,046 | ) | |||||||||||||||||||||
| BE Semiconductor Industries NV |
Bank of America N.A. | 12,800 | 01/09/24 | EUR | 115.92 | EUR | 1,751 | (292,773 | ) | |||||||||||||||||||||
| SiteMinder Ltd. |
UBS AG | 46,400 | 01/09/24 | AUD | 4.82 | AUD | 238 | (10,550 | ) | |||||||||||||||||||||
| SOITEC |
Bank of America N.A. | 4,400 | 01/09/24 | EUR | 167.27 | EUR | 713 | (5,552 | ) | |||||||||||||||||||||
| Yageo Corp. |
Morgan Stanley & Co. International PLC | 116,000 | 01/09/24 | TWD | 559.98 | TWD | 69,128 | (125,134 | ) | |||||||||||||||||||||
| Alphawave IP Group PLC |
Barclays Bank PLC | 100,000 | 01/10/24 | GBP | 1.15 | GBP | 129 | (18,046 | ) | |||||||||||||||||||||
| Informa PLC |
Bank of America N.A. | 72,600 | 01/10/24 | GBP | 7.34 | GBP | 567 | (45,121 | ) | |||||||||||||||||||||
| 112 | 2 0 2 3 B L A C K R O C K A N N U A L R E P O R T T O S H A R E H O L D E R S |
| Consolidated Schedule of Investments (continued) December 31, 2023
|
BlackRock Science and Technology Term Trust (BSTZ) |
OTC Options Written (continued)
| Description | Counterparty | Number of Contracts |
Expiration Date |
Exercise Price |
Notional Amount (000) |
Value | ||||||||||||||||||||||||
| Call (continued) |
||||||||||||||||||||||||||||||
| Synopsys, Inc. |
UBS AG | 16,000 | 01/10/24 | USD | 539.69 | USD | 8,239 | $ | (31,870 | ) | ||||||||||||||||||||
| Kaspi.KZ JSC, GDR, Registered Shares |
Bank of America N.A. | 3,000 | 01/11/24 | USD | 94.55 | USD | 276 | (3,476 | ) | |||||||||||||||||||||
| Wise PLC, Class A |
Bank of America N.A. | 95,000 | 01/11/24 | GBP | 7.59 | GBP | 829 | (143,867 | ) | |||||||||||||||||||||
| AIXTRON SE |
UBS AG | 76,500 | 01/12/24 | EUR | 34.41 | EUR | 2,950 | (366,695 | ) | |||||||||||||||||||||
| Alphawave IP Group PLC |
UBS AG | 150,000 | 01/12/24 | GBP | 1.21 | GBP | 193 | (18,254 | ) | |||||||||||||||||||||
| Freee KK |
Citibank N.A. | 87,400 | 01/12/24 | JPY | 3,664.75 | JPY | 265,958 | (5,273 | ) | |||||||||||||||||||||
| Kaspi.KZ JSC, GDR, Registered Shares |
Morgan Stanley & Co. International PLC | 8,000 | 01/12/24 | USD | 98.58 | USD | 736 | (2,899 | ) | |||||||||||||||||||||
| Pure Storage, Inc., Class A |
JPMorgan Chase Bank N.A. | 160,000 | 01/12/24 | USD | 36.98 | USD | 5,706 | (53,494 | ) | |||||||||||||||||||||
| SiteMinder Ltd. |
UBS AG | 67,000 | 01/12/24 | AUD | 5.14 | AUD | 344 | (5,394 | ) | |||||||||||||||||||||
| SK Hynix, Inc. |
JPMorgan Chase Bank N.A. | 33,000 | 01/12/24 | KRW | 124,206.67 | KRW | 4,638,438 | (447,461 | ) | |||||||||||||||||||||
| Altium Ltd. |
Goldman Sachs International | 34,500 | 01/17/24 | AUD | 44.43 | AUD | 1,614 | (63,802 | ) | |||||||||||||||||||||
| Kaspi.KZ JSC, GDR, Registered Shares |
Bank of America N.A. | 3,000 | 01/17/24 | USD | 94.45 | USD | 276 | (4,824 | ) | |||||||||||||||||||||
| Yageo Corp. |
Morgan Stanley & Co. International PLC | 116,000 | 01/17/24 | TWD | 555.90 | TWD | 69,128 | (145,184 | ) | |||||||||||||||||||||
| Alphawave IP Group PLC |
Morgan Stanley & Co. International PLC | 80,000 | 01/18/24 | GBP | 1.15 | GBP | 103 | (15,271 | ) | |||||||||||||||||||||
| BE Semiconductor Industries NV |
Morgan Stanley & Co. International PLC | 40,100 | 01/18/24 | EUR | 126.33 | EUR | 5,484 | (506,213 | ) | |||||||||||||||||||||
| Ibiden Co. Ltd. |
Societe Generale | 80,600 | 01/18/24 | JPY | 8,027.85 | JPY | 626,936 | (122,574 | ) | |||||||||||||||||||||
| SiteMinder Ltd. |
Goldman Sachs International | 92,500 | 01/18/24 | AUD | 4.78 | AUD | 474 | (24,339 | ) | |||||||||||||||||||||
| SOITEC |
Morgan Stanley & Co. International PLC | 7,100 | 01/18/24 | EUR | 169.69 | EUR | 1,151 | (11,330 | ) | |||||||||||||||||||||
| Wolters Kluwer NV, Class C |
Goldman Sachs International | 65,700 | 01/18/24 | EUR | 124.95 | EUR | 8,467 | (336,324 | ) | |||||||||||||||||||||
| Alphawave IP Group PLC |
UBS AG | 150,000 | 01/23/24 | GBP | 1.22 | GBP | 193 | (19,305 | ) | |||||||||||||||||||||
| Altium Ltd. |
UBS AG | 54,400 | 01/23/24 | AUD | 45.84 | AUD | 2,545 | (65,238 | ) | |||||||||||||||||||||
| Altium Ltd. |
UBS AG | 37,100 | 01/23/24 | AUD | 45.77 | AUD | 1,736 | (45,830 | ) | |||||||||||||||||||||
| ASM International NV |
Bank of America N.A. | 22,200 | 01/23/24 | EUR | 461.39 | EUR | 10,467 | (499,410 | ) | |||||||||||||||||||||
| BE Semiconductor Industries NV |
Bank of America N.A. | 15,200 | 01/23/24 | EUR | 132.60 | EUR | 2,079 | (117,506 | ) | |||||||||||||||||||||
| Informa PLC |
Goldman Sachs International | 329,500 | 01/23/24 | GBP | 7.74 | GBP | 2,571 | (71,849 | ) | |||||||||||||||||||||
| Kaspi.KZ JSC, GDR, Registered Shares |
Morgan Stanley & Co. International PLC | 3,000 | 01/23/24 | USD | 104.55 | USD | 276 | (586 | ) | |||||||||||||||||||||
| Lattice Semiconductor Corp. |
Citibank N.A. | 3,000 | 01/23/24 | USD | 62.43 | USD | 207 | (22,725 | ) | |||||||||||||||||||||
| Lotes Co. Ltd. |
Morgan Stanley & Co. International PLC | 28,000 | 01/23/24 | TWD | 916.70 | TWD | 29,882 | (142,709 | ) | |||||||||||||||||||||
| SiteMinder Ltd. |
UBS AG | 67,000 | 01/23/24 | AUD | 5.24 | AUD | 344 | (5,357 | ) | |||||||||||||||||||||
| Wise PLC, Class A |
UBS AG | 90,000 | 01/23/24 | GBP | 8.32 | GBP | 785 | (76,094 | ) | |||||||||||||||||||||
| Wise PLC, Class A |
UBS AG | 10,900 | 01/23/24 | GBP | 8.44 | GBP | 95 | (8,138 | ) | |||||||||||||||||||||
| Xero Ltd. |
Goldman Sachs International | 40,300 | 01/23/24 | AUD | 105.92 | AUD | 4,512 | (231,619 | ) | |||||||||||||||||||||
| Alphawave IP Group PLC |
UBS AG | 80,000 | 01/24/24 | GBP | 1.18 | GBP | 103 | (13,624 | ) | |||||||||||||||||||||
| SiteMinder Ltd. |
UBS AG | 50,000 | 01/24/24 | AUD | 4.98 | AUD | 256 | (8,621 | ) | |||||||||||||||||||||
| Accton Technology Corp. |
JPMorgan Chase Bank N.A. | 111,600 | 01/25/24 | TWD | 584.60 | TWD | 58,215 | (18,870 | ) | |||||||||||||||||||||
| NEC Corp. |
Citibank N.A. | 24,700 | 01/25/24 | JPY | 8,391.41 | JPY | 205,779 | (33,021 | ) | |||||||||||||||||||||
| SOITEC |
Morgan Stanley & Co. International PLC | 7,100 | 01/25/24 | EUR | 169.69 | EUR | 1,151 | (17,793 | ) | |||||||||||||||||||||
| Xero Ltd. |
Goldman Sachs International | 42,300 | 01/25/24 | AUD | 105.71 | AUD | 4,735 | (251,864 | ) | |||||||||||||||||||||
| Alphawave IP Group PLC |
Goldman Sachs International | 80,000 | 01/30/24 | GBP | 1.24 | GBP | 103 | (10,102 | ) | |||||||||||||||||||||
| Kaspi.KZ JSC, GDR, Registered Shares |
Morgan Stanley & Co. International PLC | 3,000 | 01/30/24 | USD | 104.55 | USD | 276 | (994 | ) | |||||||||||||||||||||
| NAVER Corp. |
JPMorgan Chase Bank N.A. | 28,300 | 01/30/24 | KRW | 219,950.00 | KRW | 6,306,166 | (220,304 | ) | |||||||||||||||||||||
| SiteMinder Ltd. |
Goldman Sachs International | 50,000 | 01/30/24 | AUD | 4.99 | AUD | 256 | (9,088 | ) | |||||||||||||||||||||
| Legalzoom.com, Inc. |
Morgan Stanley & Co. International PLC | 118,400 | 01/31/24 | USD | 11.56 | USD | 1,338 | (45,204 | ) | |||||||||||||||||||||
| Manhattan Associates, Inc. |
UBS AG | 6,500 | 01/31/24 | USD | 220.21 | USD | 1,400 | (46,499 | ) | |||||||||||||||||||||
| Synopsys, Inc. |
Citibank N.A. | 16,100 | 01/31/24 | USD | 582.67 | USD | 8,290 | (26,113 | ) | |||||||||||||||||||||
| Wise PLC, Class A |
Goldman Sachs International | 30,000 | 01/31/24 | GBP | 9.42 | GBP | 262 | (7,626 | ) | |||||||||||||||||||||
| Alphawave IP Group PLC |
UBS AG | 150,000 | 02/01/24 | GBP | 1.21 | GBP | 193 | (23,139 | ) | |||||||||||||||||||||
| Altium Ltd. |
UBS AG | 60,400 | 02/01/24 | AUD | 46.58 | AUD | 2,825 | (63,634 | ) | |||||||||||||||||||||
| Freee KK |
Societe Generale | 94,600 | 02/01/24 | JPY | 3,141.60 | JPY | 287,868 | (119,557 | ) | |||||||||||||||||||||
| Informa PLC |
UBS AG | 343,500 | 02/01/24 | GBP | 7.79 | GBP | 2,680 | (73,212 | ) | |||||||||||||||||||||
| Kaspi.KZ JSC, GDR, Registered Shares |
Bank of America N.A. | 8,000 | 02/01/24 | USD | 99.70 | USD | 736 | (8,380 | ) | |||||||||||||||||||||
| Lasertec Corp. |
Societe Generale | 37,300 | 02/01/24 | JPY | 36,077.60 | JPY | 1,380,705 | (637,500 | ) | |||||||||||||||||||||
| Lotes Co. Ltd. |
Bank of America N.A. | 12,000 | 02/01/24 | TWD | 968.20 | TWD | 12,807 | (45,087 | ) | |||||||||||||||||||||
| SOITEC |
Morgan Stanley & Co. International PLC | 7,100 | 02/01/24 | EUR | 169.69 | EUR | 1,151 | (24,575 | ) | |||||||||||||||||||||
| Accton Technology Corp. |
JPMorgan Chase Bank N.A. | 349,000 | 02/05/24 | TWD | 552.44 | TWD | 182,052 | (183,410 | ) | |||||||||||||||||||||
| Alchip Technologies Ltd. |
JPMorgan Chase Bank N.A. | 65,000 | 02/05/24 | TWD | 3,942.00 | TWD | 211,973 | (74,722 | ) | |||||||||||||||||||||
| eMemory Technology, Inc. |
JPMorgan Chase Bank N.A. | 60,000 | 02/05/24 | TWD | 2,819.50 | TWD | 146,420 | (86,536 | ) | |||||||||||||||||||||
| Lotes Co. Ltd. |
JPMorgan Chase Bank N.A. | 57,000 | 02/05/24 | TWD | 1,009.40 | TWD | 60,831 | (162,588 | ) | |||||||||||||||||||||
| Wiwynn Corp. |
JPMorgan Chase Bank N.A. | 70,000 | 02/05/24 | TWD | 1,799.20 | TWD | 127,204 | (301,629 | ) | |||||||||||||||||||||
| Kaspi.KZ JSC, GDR, Registered Shares |
Morgan Stanley & Co. International PLC | 3,000 | 02/06/24 | USD | 104.55 | USD | 276 | (1,543 | ) | |||||||||||||||||||||
| Lattice Semiconductor Corp. |
Goldman Sachs International | 27,800 | 02/06/24 | USD | 62.25 | USD | 1,918 | (239,848 | ) | |||||||||||||||||||||
| Nintendo Co., Ltd. |
BNP Paribas SA | 72,800 | 02/06/24 | JPY | 7,099.15 | JPY | 534,117 | (196,929 | ) | |||||||||||||||||||||
| C O N S O L I D A T E D S C H E D U L E O F I N V E S T M E N T S |
113 |
| Consolidated Schedule of Investments (continued) December 31, 2023 |
BlackRock Science and Technology Term Trust (BSTZ) |
OTC Options Written (continued)
| Description | Counterparty | Number of Contracts |
Expiration Date |
Exercise Price | Notional Amount (000) |
Value | ||||||||||||||||||||||||
| Call (continued) |
||||||||||||||||||||||||||||||
| Samsara, Inc., Class A |
Bank of America N.A. | 41,000 | 02/06/24 | USD | 27.90 | USD | 1,369 | $ | (247,799 | ) | ||||||||||||||||||||
| SK Hynix, Inc. |
Morgan Stanley & Co. International PLC | 19,000 | 02/06/24 | KRW | 139,072.00 | KRW | 2,670,616 | (100,531 | ) | |||||||||||||||||||||
| Alphawave IP Group PLC |
UBS AG | 150,000 | 02/07/24 | GBP | 1.23 | GBP | 193 | (21,456 | ) | |||||||||||||||||||||
| Altium Ltd. |
UBS AG | 57,000 | 02/07/24 | AUD | 47.48 | AUD | 2,666 | (47,928 | ) | |||||||||||||||||||||
| Informa PLC |
Goldman Sachs International | 307,100 | 02/07/24 | GBP | 7.90 | GBP | 2,396 | (49,052 | ) | |||||||||||||||||||||
| NEC Corp. |
Societe Generale | 24,700 | 02/07/24 | JPY | 8,391.41 | JPY | 205,779 | (41,357 | ) | |||||||||||||||||||||
| SOITEC |
UBS AG | 7,000 | 02/07/24 | EUR | 167.99 | EUR | 1,135 | (33,933 | ) | |||||||||||||||||||||
| Appier Group, Inc. |
Citibank N.A. | 195,300 | 02/08/24 | JPY | 1,629.72 | JPY | 359,597 | (374,989 | ) | |||||||||||||||||||||
| SiteMinder Ltd. |
Goldman Sachs International | 92,000 | 02/08/24 | AUD | 5.05 | AUD | 472 | (15,939 | ) | |||||||||||||||||||||
| Wise PLC, Class A |
UBS AG | 79,600 | 02/08/24 | GBP | 8.72 | GBP | 695 | (52,171 | ) | |||||||||||||||||||||
| Kaspi.KZ JSC, GDR, Registered Shares |
Morgan Stanley & Co. International PLC | 3,000 | 02/13/24 | USD | 104.55 | USD | 276 | (2,054 | ) | |||||||||||||||||||||
| SiteMinder Ltd. |
Goldman Sachs International | 92,000 | 02/13/24 | AUD | 5.05 | AUD | 472 | (16,770 | ) | |||||||||||||||||||||
| SOITEC |
Bank of America N.A. | 8,300 | 02/13/24 | EUR | 171.44 | EUR | 1,345 | (37,707 | ) | |||||||||||||||||||||
| Alphawave IP Group PLC |
Barclays Bank PLC | 100,000 | 02/14/24 | GBP | 1.30 | GBP | 129 | (10,457 | ) | |||||||||||||||||||||
| Kaspi.KZ JSC, GDR, Registered Shares |
Morgan Stanley & Co. International PLC | 3,000 | 02/21/24 | USD | 104.55 | USD | 276 | (2,601 | ) | |||||||||||||||||||||
| SiteMinder Ltd. |
JPMorgan Chase Bank N.A. | 92,000 | 02/21/24 | AUD | 5.05 | AUD | 472 | (18,020 | ) | |||||||||||||||||||||
| SOITEC |
Bank of America N.A. | 8,200 | 02/21/24 | EUR | 171.44 | EUR | 1,329 | (43,893 | ) | |||||||||||||||||||||
| Kaspi.KZ JSC, GDR, Registered Shares |
Morgan Stanley & Co. International PLC | 3,000 | 02/28/24 | USD | 104.55 | USD | 276 | (3,252 | ) | |||||||||||||||||||||
| SOITEC |
Barclays Bank PLC | 9,100 | 02/28/24 | EUR | 168.35 | EUR | 1,475 | (64,870 | ) | |||||||||||||||||||||
| Kaspi.KZ JSC, GDR, Registered Shares |
Morgan Stanley & Co. International PLC | 3,000 | 03/05/24 | USD | 104.55 | USD | 276 | (3,791 | ) | |||||||||||||||||||||
| Kaspi.KZ JSC, GDR, Registered Shares |
Morgan Stanley & Co. International PLC | 3,000 | 03/12/24 | USD | 104.55 | USD | 276 | (4,396 | ) | |||||||||||||||||||||
| Kaspi.KZ JSC, GDR, Registered Shares |
Morgan Stanley & Co. International PLC | 3,000 | 03/19/24 | USD | 104.55 | USD | 276 | (4,979 | ) | |||||||||||||||||||||
| Kaspi.KZ JSC, GDR, Registered Shares |
Morgan Stanley & Co. International PLC | 3,000 | 03/26/24 | USD | 104.55 | USD | 276 | (5,542 | ) | |||||||||||||||||||||
|
|
|
|||||||||||||||||||||||||||||
| $ | (8,749,857 | ) | ||||||||||||||||||||||||||||
|
|
|
|||||||||||||||||||||||||||||
Balances Reported in the Consolidated Statements of Assets and Liabilities for Options Written
| Description | Swap Premiums Paid |
Swap Premiums Received |
Unrealized Appreciation |
Unrealized Depreciation |
Value | |||||||||||||||
| Options Written |
$ | N/A | $ | N/A | $ | 3,605,089 | $ | (7,876,277 | ) | $ | (18,907,082 | ) | ||||||||
Derivative Financial Instruments Categorized by Risk Exposure
As of period end, the fair values of derivative financial instruments located in the Consolidated Statements of Assets and Liabilities were as follows:
| Commodity Contracts |
Credit Contracts |
Equity Contracts |
Foreign Currency Exchange Contracts |
Interest Rate Contracts |
Other Contracts |
Total | ||||||||||||||||||||||
| Liabilities — Derivative Financial Instruments |
||||||||||||||||||||||||||||
| Options written |
||||||||||||||||||||||||||||
| Options written at value |
$ | — | $ | — | $ | 18,907,082 | $ | — | $ | — | $ | — | $ | 18,907,082 | ||||||||||||||
|
|
|
|
|
|
|
|
|
|
|
|
|
|
|
|||||||||||||||
For the period ended December 31, 2023, the effect of derivative financial instruments in the Consolidated Statements of Operations was as follows:
| Commodity Contracts |
Credit Contracts |
Equity Contracts |
Foreign Currency Exchange Contracts |
Interest Rate Contracts |
Other Contracts |
Total | ||||||||||||||||||||||
| Net Realized Gain (Loss) from: |
||||||||||||||||||||||||||||
| Options purchased(a) |
$ | — | $ | — | $ | (4,070,240 | ) | $ | — | $ | — | $ | — | $ | (4,070,240 | ) | ||||||||||||
| Options written |
— | — | (25,763,522 | ) | — | — | — | (25,763,522 | ) | |||||||||||||||||||
|
|
|
|
|
|
|
|
|
|
|
|
|
|
|
|||||||||||||||
| $ | — | $ | — | $ | (29,833,762 | ) | $ | — | $ | — | $ | — | $ | (29,833,762 | ) | |||||||||||||
|
|
|
|
|
|
|
|
|
|
|
|
|
|
|
|||||||||||||||
| Net Change in Unrealized Appreciation (Depreciation) on: |
||||||||||||||||||||||||||||
| Options written |
$ | — | $ | — | $ | (13,974,383 | ) | $ | — | $ | — | $ | — | $ | (13,974,383 | ) | ||||||||||||
|
|
|
|
|
|
|
|
|
|
|
|
|
|
|
|||||||||||||||
| (a) | Options purchased are included in net realized gain (loss) from investments — unaffiliated. |
| 114 | 2 0 2 3 B L A C K R O C K A N N U A L R E P O R T T O S H A R E H O L D E R S |
| Consolidated Schedule of Investments (continued) December 31, 2023 |
BlackRock Science and Technology Term Trust (BSTZ) |
Average Quarterly Balances of Outstanding Derivative Financial Instruments
| Options: |
||||||||
| Average value of option contracts purchased |
$ | — | (a) | |||||
| Average value of option contracts written |
$ | 20,879,531 |
| (a) | Derivative financial instrument not held at any quarter-end. The risk exposure table serves as an indicator of activity during the period. |
For more information about the Trust’s investment risks regarding derivative financial instruments, refer to the Notes to Consolidated Financial Statements.
Derivative Financial Instruments — Offsetting as of Period End
The Trust’s derivative assets and liabilities (by type) were as follows:
| Assets | Liabilities | |||||||
| Derivative Financial Instruments |
||||||||
| Options |
$ | — | $ | 18,907,082 | ||||
|
|
|
|
|
|||||
| Total derivative assets and liabilities in the Consolidated Statements of Assets and Liabilities |
— | 18,907,082 | ||||||
|
|
|
|
|
|||||
| Derivatives not subject to a Master Netting Agreement or similar agreement (“MNA”) |
— | (10,157,225 | ) | |||||
|
|
|
|
|
|||||
| Total derivative assets and liabilities subject to an MNA |
$ | — | $ | 8,749,857 | ||||
|
|
|
|
|
|||||
The following table presents the Trust’s derivative liabilities by counterparty net of amounts available for offset under an MNA and net of the related collateral pledged by the Trust:
| Counterparty | |
Derivative Liabilities Subject to an MNA by Counterparty |
|
|
Derivatives Available for Offset |
|
|
Non-Cash Collateral Pledged |
(a) |
|
Cash Collateral Pledged |
(a) |
|
Net Amount of Derivative Liabilities |
(b) | |||||
| Bank of America N.A. |
$ | 1,497,726 | $ | — | $ | — | $ | (1,497,726 | ) | $ | — | |||||||||
| Barclays Bank PLC |
93,373 | — | — | — | 93,373 | |||||||||||||||
| BNP Paribas SA |
196,929 | — | (167,880 | ) | — | 29,049 | ||||||||||||||
| Citibank N.A. |
797,298 | — | — | (797,298 | ) | — | ||||||||||||||
| Goldman Sachs International |
1,343,526 | — | (1,343,526 | ) | — | — | ||||||||||||||
| JPMorgan Chase Bank N.A. |
1,591,448 | — | (1,591,448 | ) | — | — | ||||||||||||||
| Morgan Stanley & Co. International PLC |
1,166,581 | — | (1,166,581 | ) | — | — | ||||||||||||||
| Societe Generale |
920,988 | — | (920,988 | ) | — | — | ||||||||||||||
| UBS AG |
1,141,988 | — | (1,141,988 | ) | — | — | ||||||||||||||
|
|
|
|
|
|
|
|
|
|
|
|||||||||||
| $ | 8,749,857 | $ | — | $ | (6,332,411 | ) | $ | (2,295,024 | ) | $ | 122,422 | |||||||||
|
|
|
|
|
|
|
|
|
|
|
|||||||||||
| (a) | Excess of collateral received/pledged, if any, from the individual counterparty is not shown for financial reporting purposes. |
| (b) | Net amount represents the net amount payable due to counterparty in the event of default. Net amount may be offset further by the options written receivable/payable on the Consolidated Statements of Assets and Liabilities. |
Fair Value Hierarchy as of Period End
Various inputs are used in determining the fair value of financial instruments. For a description of the input levels and information about the Trust’s policy regarding valuation of financial instruments, refer to the Notes to Consolidated Financial Statements.
The following table summarizes the Trust’s financial instruments categorized in the fair value hierarchy. The breakdown of the Trust’s financial instruments into major categories is disclosed in the Consolidated Schedule of Investments above.
| Level 1 | Level 2 | Level 3 | Total | |||||||||||||
| Assets |
||||||||||||||||
| Investments |
||||||||||||||||
| Long-Term Investments |
||||||||||||||||
| Common Stocks |
||||||||||||||||
| Automobiles |
$ | 32,166,482 | $ | — | $ | — | $ | 32,166,482 | ||||||||
| Broadline Retail |
26,114,280 | — | — | 26,114,280 | ||||||||||||
| Communications Equipment |
— | 19,563,294 | — | 19,563,294 | ||||||||||||
| Consumer Finance |
15,303,280 | — | — | 15,303,280 | ||||||||||||
| Diversified Consumer Services |
— | — | 975,251 | 975,251 | ||||||||||||
| Electronic Equipment, Instruments & Components |
35,151,780 | 45,350,226 | — | 80,502,006 | ||||||||||||
| Entertainment |
45,772,750 | 13,281,097 | — | 59,053,847 | ||||||||||||
| C O N S O L I D A T E D S C H E D U L E O F I N V E S T M E N T S |
115 |
| Consolidated Schedule of Investments (continued) December 31, 2023 |
BlackRock Science and Technology Term Trust (BSTZ) |
Fair Value Hierarchy as of Period End (continued)
| Level 1 | Level 2 | Level 3 | Total | |||||||||||||
| Common Stocks (continued) |
||||||||||||||||
| Financial Services |
$ | — | $ | 8,492,073 | $ | — | $ | 8,492,073 | ||||||||
| Hotels, Restaurants & Leisure |
6,002,080 | — | — | 6,002,080 | ||||||||||||
| Interactive Media & Services |
12,045,408 | 20,107,036 | — | 32,152,444 | ||||||||||||
| IT Services |
37,201,144 | 7,297,138 | 46,340,867 | 90,839,149 | ||||||||||||
| Machinery |
— | 6,961,217 | — | 6,961,217 | ||||||||||||
| Media |
— | 26,174,876 | — | 26,174,876 | ||||||||||||
| Professional Services |
7,180,800 | 23,378,574 | — | 30,559,374 | ||||||||||||
| Real Estate Management & Development |
11,822,476 | — | — | 11,822,476 | ||||||||||||
| Semiconductors & Semiconductor Equipment |
225,453,479 | 182,964,111 | — | 408,417,590 | ||||||||||||
| Software |
173,994,166 | 64,196,047 | 45,170,480 | 283,360,693 | ||||||||||||
| Technology Hardware, Storage & Peripherals |
41,538,969 | 16,195,362 | — | 57,734,331 | ||||||||||||
| Preferred Securities |
||||||||||||||||
| Preferred Stocks |
— | — | 448,979,134 | 448,979,134 | ||||||||||||
| Short-Term Securities |
||||||||||||||||
| Money Market Funds |
1,471,804 | — | — | 1,471,804 | ||||||||||||
|
|
|
|
|
|
|
|
|
|||||||||
| $ | 671,218,898 | $ | 433,961,051 | $ | 541,465,732 | 1,646,645,681 | ||||||||||
|
|
|
|
|
|
|
|
|
|||||||||
| Investments Valued at NAV(a) |
2,878,719 | |||||||||||||||
|
|
|
|||||||||||||||
| $ | 1,649,524,400 | |||||||||||||||
|
|
|
|||||||||||||||
| Derivative Financial Instruments(b) |
||||||||||||||||
| Liabilities |
||||||||||||||||
| Equity Contracts |
$ | (9,722,056 | ) | $ | (9,185,026 | ) | $ | — | $ | (18,907,082 | ) | |||||
|
|
|
|
|
|
|
|
|
|||||||||
| (a) | Certain investments of the Trust were fair valued using NAV as a practical expedient as no quoted market value is available and therefore have been excluded from the fair value hierarchy. |
| (b) | Derivative financial instruments are options written. Options written are shown at value. |
A reconciliation of Level 3 financial instruments is presented when the Trust had a significant amount of Level 3 investments and derivative financial instruments at the beginning and/or end of the year in relation to net assets. The following table is a reconciliation of Level 3 investments for which significant unobservable inputs were used in determining fair value:
| Common Stocks |
Preferred Stocks |
Warrants | Total | |||||||||||||
| Assets |
||||||||||||||||
| Opening balance, as of December 31, 2022 |
$ | 94,490,236 | $ | 413,908,201 | $ | 44,581 | $ | 508,443,018 | ||||||||
| Transfers into Level 3 |
— | — | — | — | ||||||||||||
| Transfers out of Level 3 |
— | — | — | — | ||||||||||||
| Other(a) |
(11,996,492 | ) | 11,996,492 | — | — | |||||||||||
| Accrued discounts/premiums |
— | — | — | — | ||||||||||||
| Net realized gain (loss) |
— | — | — | — | ||||||||||||
| Net change in unrealized appreciation (depreciation)(b)(c) |
(1,968,145 | ) | 35,035,442 | (44,581 | ) | 33,022,716 | ||||||||||
| Purchases |
11,960,999 | — | — | 11,960,999 | ||||||||||||
| Sales |
— | (11,961,001 | ) | — | (11,961,001 | ) | ||||||||||
|
|
|
|
|
|
|
|
|
|||||||||
| Closing balance, as of December 31, 2023 |
$ | 92,486,598 | $ | 448,979,134 | $ | — | $ | 541,465,732 | ||||||||
|
|
|
|
|
|
|
|
|
|||||||||
| Net change in unrealized appreciation (depreciation) on investments still held at December 31, 2023(c) |
$ | (1,968,145 | ) | $ | 39,939,523 | $ | — | $ | 37,971,378 | |||||||
|
|
|
|
|
|
|
|
|
|||||||||
| (a) | Certain Level 3 investments were re-classified between Common Stocks and Preferred Stocks. |
| (b) | Included in the related net change in unrealized appreciation (depreciation) in the Consolidated Statements of Operations. |
| (c) | Any difference between net change in unrealized appreciation (depreciation) and net change in unrealized appreciation (depreciation) on investments still held at December 31, 2023 is generally due to investments no longer held or categorized as Level 3 at period end. |
The following table summarizes the valuation approaches used and unobservable inputs utilized by the BlackRock Valuation Committee (the “Valuation Committee”) to determine the value of certain of the Trust’s Level 3 financial instruments as of period end.
| Value | Valuation Approach |
Unobservable Inputs |
|
Range of Unobservable Inputs Utilized |
(a) |
|
Weighted Average of Unobservable Inputs Based on Fair Value |
| ||||||||
| Assets |
||||||||||||||||
| Common Stocks |
$ | 92,486,598 | Market | Revenue Multiple | 1.00x - 29.00x | 14.58x | ||||||||||
| 116 | 2 0 2 3 B L A C K R O C K A N N U A L R E P O R T T O S H A R E H O L D E R S |
| Consolidated Schedule of Investments (continued) December 31, 2023 |
BlackRock Science and Technology Term Trust (BSTZ) |
| Value | Valuation Approach |
Unobservable Inputs |
|
Range of Unobservable Inputs Utilized |
(a) |
|
Weighted Average of Unobservable Inputs Based on Fair Value |
| ||||||||
| Volatility | 60% - 70% | 62% | ||||||||||||||
| Time to Exit | 1.0 - 3.0 years | 1.3 years | ||||||||||||||
| Preferred Stocks(b) |
448,979,134 | Market | Revenue Multiple | 1.00x - 31.00x | 16.88x | |||||||||||
| Time to Exit | 2.0 - 4.0 years | 3.6 years | ||||||||||||||
| Volatility | 39% - 80% | 57% | ||||||||||||||
| Market Adjustment Multiple | 1.20x - 1.20x | 1.20x | ||||||||||||||
| Gross Profit Multiple | 6.50x | — | ||||||||||||||
|
|
|
|||||||||||||||
| $ | 541,465,732 | |||||||||||||||
|
|
|
|||||||||||||||
| (a) | A significant change in unobservable input would have resulted in a correlated (inverse) significant change to value. |
| (b) | For the period end December 31, 2023, the valuation technique for certain investments classified as Preferred Stocks used recent prior transaction prices as inputs within the model used for the approximation of fair value. |
See notes to financial statements.
| C O N S O L I D A T E D S C H E D U L E O F I N V E S T M E N T S |
117 |
| Consolidated Schedule of Investments December 31, 2023
|
BlackRock Science and Technology Trust (BST) (Percentages shown are based on Net Assets) |
| Security | Shares | Value | ||||||
| Common Stocks |
||||||||
| Automobiles — 1.8% | ||||||||
| Tesla, Inc.(a)(b) |
88,868 | $ | 22,081,921 | |||||
|
|
|
|||||||
| Broadline Retail(b) — 3.7% | ||||||||
| Amazon.com, Inc. |
173,939 | 26,428,291 | ||||||
| MercadoLibre, Inc.(a) |
11,498 | 18,069,567 | ||||||
|
|
|
|||||||
| 44,497,858 | ||||||||
| Capital Markets — 0.7% | ||||||||
| S&P Global, Inc. |
19,255 | 8,482,213 | ||||||
|
|
|
|||||||
| Communications Equipment — 1.2% | ||||||||
| Arista Networks, Inc.(b) |
36,016 | 8,482,128 | ||||||
| Motorola Solutions, Inc. |
16,945 | 5,305,310 | ||||||
|
|
|
|||||||
| 13,787,438 | ||||||||
| Diversified Consumer Services(b)(c)(d) — 1.0% | ||||||||
| Grammarly, Inc., (Acquired 11/17/21, |
715,323 | 12,267,790 | ||||||
| Think & Learn Private Ltd., (Acquired 09/30/20, Cost: $1,524,948) |
997 | 209,057 | ||||||
|
|
|
|||||||
| 12,476,847 | ||||||||
| Entertainment — 2.0% | ||||||||
| Nintendo Co. Ltd. |
130,100 | 6,769,606 | ||||||
| Spotify Technology SA(b) |
49,956 | 9,387,232 | ||||||
| Take-Two Interactive Software, Inc.(b) |
47,267 | 7,607,624 | ||||||
|
|
|
|||||||
| 23,764,462 | ||||||||
| Financial Services — 4.5% | ||||||||
| Mastercard, Inc., Class A |
64,052 | 27,318,818 | ||||||
| Visa, Inc., Class A |
79,203 | 20,620,501 | ||||||
| Wise PLC, Class A(b) |
499,198 | 5,551,821 | ||||||
|
|
|
|||||||
| 53,491,140 | ||||||||
| Ground Transportation — 1.0% | ||||||||
| Uber Technologies, Inc.(b) |
191,091 | 11,765,473 | ||||||
|
|
|
|||||||
| Household Durables — 0.5% | ||||||||
| Sony Group Corp. |
63,100 | 5,971,333 | ||||||
|
|
|
|||||||
| Interactive Media & Services(b) — 4.0% | ||||||||
| Alphabet, Inc., Class A |
165,332 | 23,095,227 | ||||||
| Meta Platforms, Inc., Class A |
71,332 | 25,248,675 | ||||||
|
|
|
|||||||
| 48,343,902 | ||||||||
| IT Services — 4.5% | ||||||||
| Automattic, Inc., Series E, (Acquired 02/03/21, Cost: $7,999,945)(b)(c)(d) |
94,117 | 4,222,089 | ||||||
| Farmer’s Business Network, Inc.(b)(c) |
203,366 | 797,195 | ||||||
| Fujitsu Ltd. |
34,700 | 5,222,128 | ||||||
| Klarna Holdings AB, Ordinary Shares, (Acquired 08/07/19, Cost: $7,971,978)(b)(c)(d) |
26,430 | 7,493,258 | ||||||
| MongoDB, Inc., Class A(b)(e) |
37,832 | 15,467,613 | ||||||
| Patreon, Inc., (Acquired 08/19/21, |
59,524 | 1,678,577 | ||||||
| Shopify, Inc., Class A(b)(e) |
98,199 | 7,649,702 | ||||||
| Snowflake, Inc., Class A(b) |
25,853 | 5,144,747 | ||||||
| Teya Services Ltd., (Acquired 12/17/21, Cost: $24,999,987)(b)(c)(d) |
12,871 | 5,557,569 | ||||||
|
|
|
|||||||
| 53,232,878 | ||||||||
| Security | Shares | Value | ||||||
| Professional Services — 1.6% | ||||||||
| Ant Group Co., Ltd., Series C(b)(c) |
1,703,548 | $ | 4,480,331 | |||||
| Equifax, Inc. |
20,539 | 5,079,089 | ||||||
| RELX PLC |
239,670 | 9,508,622 | ||||||
|
|
|
|||||||
| 19,068,042 | ||||||||
| Semiconductors & Semiconductor Equipment — 24.7% | ||||||||
| Advanced Micro Devices, Inc.(b)(f) |
152,642 | 22,500,957 | ||||||
| ARM Holdings PLC, ADR(b)(e) |
122,687 | 9,219,315 | ||||||
| ASM International NV |
25,186 | 13,108,672 | ||||||
| ASML Holding NV(b) |
37,127 | 28,026,708 | ||||||
| Broadcom, Inc.(a) |
31,215 | 34,843,744 | ||||||
| Credo Technology Group Holding Ltd.(b) |
505,651 | 9,845,025 | ||||||
| Lam Research Corp. |
18,864 | 14,775,417 | ||||||
| Marvell Technology, Inc. |
129,364 | 7,801,943 | ||||||
| Micron Technology, Inc. |
214,444 | 18,300,651 | ||||||
| Monolithic Power Systems, Inc.(a) |
15,577 | 9,825,660 | ||||||
| NVIDIA Corp.(f) |
174,497 | 86,414,404 | ||||||
| QUALCOMM, Inc. |
41,834 | 6,050,451 | ||||||
| SOITEC(b) |
68,927 | 12,334,100 | ||||||
| STMicroelectronics NV |
111,740 | 5,604,762 | ||||||
| Taiwan Semiconductor Manufacturing Co. Ltd., ADR |
76,372 | 7,942,688 | ||||||
| Wolfspeed, Inc.(a)(b) |
208,349 | 9,065,265 | ||||||
|
|
|
|||||||
| 295,659,762 | ||||||||
| Software — 23.6% | ||||||||
| Adobe, Inc.(b) |
15,654 | 9,339,177 | ||||||
| ANSYS, Inc.(b) |
22,559 | 8,186,210 | ||||||
| Autodesk, Inc.(b) |
28,054 | 6,830,588 | ||||||
| Cadence Design Systems, Inc.(a)(b) |
123,246 | 33,568,513 | ||||||
| Constellation Software, Inc./Canada |
3,971 | 9,845,521 | ||||||
| Crowdstrike Holdings, Inc., Class A(b) |
42,478 | 10,845,483 | ||||||
| Databricks, Inc., (Acquired 07/24/20, Cost: $960,476)(b)(c)(d) |
59,997 | 4,635,368 | ||||||
| Datadog, Inc., Class A(b) |
40,806 | 4,953,032 | ||||||
| DataRobot, Inc., (Acquired 03/01/21, Cost: $583,275)(b)(c)(d) |
38,789 | 178,817 | ||||||
| Intuit, Inc. |
25,968 | 16,230,779 | ||||||
| Microsoft Corp.(a)(f) |
297,098 | 111,720,732 | ||||||
| Oracle Corp.(a) |
120,170 | 12,669,523 | ||||||
| Palo Alto Networks, Inc.(b) |
28,947 | 8,535,891 | ||||||
| Salesforce, Inc.(b) |
64,706 | 17,026,737 | ||||||
| ServiceNow, Inc.(b) |
19,645 | 13,878,996 | ||||||
| SiteMinder Ltd.(b) |
951,492 | 3,325,275 | ||||||
| Snorkel AI, Inc., (Acquired 06/30/21, Cost: $997,636)(b)(c)(d) |
66,422 | 577,871 | ||||||
| Snyk Ltd., Ordinary Shares, (Acquired 09/02/21, Cost: $5,192,307)(b)(c)(d) |
361,972 | 3,952,734 | ||||||
| Xero Ltd.(b) |
77,120 | 5,883,372 | ||||||
|
|
|
|||||||
| 282,184,619 | ||||||||
| Specialty Retail — 0.0% | ||||||||
| AceVector Limited, Series I, (Acquired 08/31/18, Cost: $1,998,435)(b)(c)(d) |
168,640 | 84,691 | ||||||
|
|
|
|||||||
| Technology Hardware, Storage & Peripherals — 8.8% | ||||||||
| Apple, Inc.(a) |
487,116 | 93,784,443 | ||||||
| 118 | 2 0 2 3 B L A C K R O C K A N N U A L R E P O R T T O S H A R E H O L D E R S |
| Consolidated Schedule of Investments (continued) December 31, 2023
|
BlackRock Science and Technology Trust (BST) (Percentages shown are based on Net Assets) |
| Security | Shares | Value | ||||||
| Technology Hardware, Storage & Peripherals (continued) | ||||||||
| Quanta Computer, Inc. |
762,000 | $ | 5,547,679 | |||||
| Western Digital Corp.(b) |
112,683 | 5,901,209 | ||||||
|
|
|
|||||||
| 105,233,331 | ||||||||
|
|
|
|||||||
| Total Common Stocks — 83.6% |
1,000,125,910 | |||||||
|
|
|
|||||||
| Par (000) |
||||||||
| Convertible Notes |
||||||||
| Financial Services — 0.0% | ||||||||
| Wyre, Inc., (Acquired: 12/14/21, Cost: $8,000,000), 6.00%, 12/08/24(c)(d) |
$ | 80 | 1 | |||||
|
|
|
|||||||
| Total Convertible Notes — 0.0% |
1 | |||||||
|
|
|
|||||||
| Shares | ||||||||
| Preferred Securities |
||||||||
| Preferred Stocks — 17.7%(b)(c) | ||||||||
| Chemicals — 0.8% | ||||||||
| Solugen, Inc., Series C, (Acquired 09/02/21, Cost: $9,999,977)(d) |
269,284 | 9,290,298 | ||||||
|
|
|
|||||||
| Consumer Staples Distribution & Retail — 1.3% | ||||||||
| Grubmarket, Inc., Series E, (Acquired 10/18/21, Cost: $6,999,994)(d) |
709,724 | 16,039,762 | ||||||
|
|
|
|||||||
| Diversified Consumer Services(d) — 1.1% | ||||||||
| FlixMobility GmbH, Series F, (Acquired 07/26/19, Cost: $5,482,937) |
275 | 8,222,028 | ||||||
| Grammarly, Inc., Series 3, (Acquired 11/17/21, Cost: $6,249,992) |
238,441 | 4,213,252 | ||||||
| Think & Learn Private Ltd., Series F, (Acquired 09/30/20, Cost: $3,052,975) |
1,054 | 221,009 | ||||||
|
|
|
|||||||
| 12,656,289 | ||||||||
| Diversified Telecommunication Services — 0.4% | ||||||||
| Discord, Inc., Series I, (Acquired 09/13/21, |
12,713 | 4,978,665 | ||||||
|
|
|
|||||||
| Financial Services(d)(g) — 1.0% | ||||||||
| Trumid Holdings LLC |
||||||||
| Class J-A, (Acquired 07/24/20, Cost: $2,499,716) |
5,038 | 2,695,330 | ||||||
| Class J-B, (Acquired 07/24/20, Cost: $1,499,830) |
5,038 | 2,695,330 | ||||||
| Class L, (Acquired 09/15/21, Cost: $9,999,695) |
11,420 | 6,109,700 | ||||||
|
|
|
|||||||
| 11,500,360 | ||||||||
| Interactive Media & Services — 1.2% | ||||||||
| ByteDance Ltd., Series E-1, (Acquired 11/11/20, Cost: $9,650,746)(d) |
88,075 | 14,373,542 | ||||||
|
|
|
|||||||
| IT Services(d) — 3.5% | ||||||||
| Deep Instinct Ltd., Series D-2, (Acquired 03/19/21, Cost: $2,999,391) |
493,493 | 2,714,212 | ||||||
| Security | Shares | Value | ||||||
| IT Services (continued) | ||||||||
| MNTN Digital, Inc., Series D, (Acquired 11/05/21, Cost: $24,999,980) |
1,088,598 | $ | 13,770,765 | |||||
| Patreon, Inc., Series D, (Acquired 07/14/21, Cost: $6,666,632) |
119,047 | 3,357,125 | ||||||
| TRAX Ltd. |
||||||||
| (Acquired 09/12/19, Cost: $4,000,013) |
106,667 | 2,901,342 | ||||||
| (Acquired 02/18/21, Cost: $1,999,989) |
38,361 | 1,043,419 | ||||||
| Voltron Data, Inc. | ||||||||
| Series A, (Acquired 01/18/22, Cost: $10,000,000) |
6,201,935 | 8,992,806 | ||||||
| Series SEED, (Acquired 07/14/21, Cost: $5,000,000) |
9,090,909 | 9,727,273 | ||||||
|
|
|
|||||||
| 42,506,942 | ||||||||
| Semiconductors & Semiconductor Equipment — 3.9% | ||||||||
| PsiQuantum Corp.(d) |
||||||||
| Series C, (Acquired 09/09/19, Cost: $3,200,234) |
690,003 | 16,546,272 | ||||||
| Series D, (Acquired 05/21/21, Cost: $5,000,025) |
190,650 | 5,418,273 | ||||||
| Rivos, Inc. |
||||||||
| Series A1 |
2,700,557 | 5,887,214 | ||||||
| Series A2 |
2,464,862 | 4,831,130 | ||||||
| Series A3 |
1,027,026 | 2,012,971 | ||||||
| SambaNova Systems, Inc., Series C, (Acquired 02/20/20, Cost: $9,972,125)(d) |
187,300 | 11,964,724 | ||||||
|
|
|
|||||||
| 46,660,584 | ||||||||
| Software(d) — 4.5% | ||||||||
| Bolt Financial, Inc., Series E, (Acquired 01/18/22, Cost: $29,999,955) |
598,682 | 12,763,900 | ||||||
| Databricks, Inc. |
||||||||
| Series F, (Acquired 10/22/19, Cost: $3,999,999) |
279,405 | 21,586,830 | ||||||
| Series G, (Acquired 02/01/21, Cost: $4,500,001) |
76,113 | 5,880,491 | ||||||
| DataRobot, Inc., Series F, (Acquired 10/27/20, Cost: $2,999,996) |
228,276 | 1,310,304 | ||||||
| Prosimo, Inc., Series B, (Acquired 11/04/21, Cost: $4,999,998) |
2,515,811 | 3,874,349 | ||||||
| Snorkel AI, Inc., Series C, (Acquired 06/30/21, Cost: $4,999,985) |
332,896 | 2,896,195 | ||||||
| Snyk Ltd., Series F, (Acquired 09/02/21, Cost: $4,807,688) |
337,018 | 3,680,237 | ||||||
| Unqork, Inc. |
||||||||
| Series B, (Acquired 09/19/19, Cost: $3,198,416) |
281,080 | 1,745,507 | ||||||
| Series C, (Acquired 09/18/20, Cost: $1,303,260) |
47,600 | 370,328 | ||||||
|
|
|
|||||||
| 54,108,141 | ||||||||
|
|
|
|||||||
| 212,114,583 | ||||||||
|
|
|
|||||||
| Total Preferred Securities — 17.7% |
212,114,583 | |||||||
|
|
|
|||||||
| C O N S O L I D A T E D S C H E D U L E O F I N V E S T M E N T S |
119 |
| Consolidated Schedule of Investments (continued) December 31, 2023
|
BlackRock Science and Technology Trust (BST) (Percentages shown are based on Net Assets) |
| Security | Shares | Value | ||||||
| Warrants |
|
|||||||
| Software — 0.0% | ||||||||
| Constellation Software, Inc., (Issued 08/29/23, 1 Share for 1 Warrant, Expires 03/31/40, Strike Price CAD 11.50)(b)(c) |
3,923 | $ | — | |||||
|
|
|
|||||||
| Total Warrants — 0.0% |
|
— | ||||||
|
|
|
|||||||
| Total Long-Term Investments — 101.3% |
|
1,212,240,494 | ||||||
|
|
|
|||||||
| Short-Term Securities |
|
|||||||
| Money Market Funds — 0.5% | ||||||||
| BlackRock Liquidity Funds, T-Fund, Institutional Class, 5.26%(h)(i) |
365,499 | 365,499 | ||||||
| SL Liquidity Series, LLC, Money Market Series, 5.58%(h)(i)(j) |
5,859,120 | 5,860,878 | ||||||
|
|
|
|||||||
| Total Short-Term Securities — 0.5% |
|
6,226,377 | ||||||
|
|
|
|||||||
| Total Investments Before Options Written — 101.8% |
|
1,218,466,871 | ||||||
|
|
|
|||||||
| Options Written — (1.3)% |
|
(15,464,670 | ) | |||||
|
|
|
|||||||
| Total Investments, Net of Options Written — 100.5% |
|
1,203,002,201 | ||||||
| Liabilities in Excess of Other Assets — (0.5)% |
|
(6,577,575 | ) | |||||
|
|
|
|||||||
| Net Assets — 100.0% |
|
$ | 1,196,424,626 | |||||
|
|
|
|||||||
| (a) | All or a portion of the security has been pledged and/or segregated as collateral in connection with outstanding exchange-traded options written. |
| (b) | Non-income producing security. |
| (c) | Security is valued using significant unobservable inputs and is classified as Level 3 in the fair value hierarchy. |
| (d) | Restricted security as to resale, excluding 144A securities. The Trust held restricted securities with a current value of $240,241,090, representing 20.1% of its net assets as of period end, and an original cost of $279,414,825. |
| (e) | All or a portion of this security is on loan. |
| (f) | All or a portion of the security has been pledged as collateral in connection with outstanding OTC derivatives. |
| (g) | All or a portion of the security is held by a wholly-owned subsidiary. See Note 1 of the Notes to Consolidated Financial Statements for details on the wholly-owned subsidiary. |
| (h) | Affiliate of the Trust. |
| (i) | Annualized 7-day yield as of period end. |
| (j) | All or a portion of this security was purchased with the cash collateral from loaned securities. |
For Trust compliance purposes, the Trust’s industry classifications refer to one or more of the industry sub-classifications used by one or more widely recognized market indexes or rating group indexes, and/or as defined by the investment adviser. These definitions may not apply for purposes of this report, which may combine such industry sub-classifications for reporting ease.
Affiliates
Investments in issuers considered to be affiliate(s) of the Trust during the year ended December 31, 2023 for purposes of Section 2(a)(3) of the Investment Company Act of 1940, as amended, were as follows:
| Affiliated Issuer | Value at 12/31/22 |
Purchases at Cost |
Proceeds from Sale |
Net Realized Gain (Loss) |
Change in Unrealized Appreciation (Depreciation) |
Value at 12/31/23 |
Shares Held at 12/31/23 |
Income | Capital Gain Distributions from Underlying Funds |
|||||||||||||||||||||||||||
| BlackRock Liquidity Funds, T-Fund, Institutional Class |
$ | 5,779,501 | $ | — | $ | (5,414,002 | )(a) | $ | — | $ | — | $ | 365,499 | 365,499 | $ | 354,864 | $ | — | ||||||||||||||||||
| SL Liquidity Series, LLC, Money Market Series |
825,025 | 5,035,416 | (a) | — | 1,012 | (575 | ) | 5,860,878 | 5,859,120 | 16,851 | (b) | — | ||||||||||||||||||||||||
|
|
|
|
|
|
|
|
|
|
|
|||||||||||||||||||||||||||
| $ | 1,012 | $ | (575 | ) | $ | 6,226,377 | $ | 371,715 | $ | — | ||||||||||||||||||||||||||
|
|
|
|
|
|
|
|
|
|
|
|||||||||||||||||||||||||||
| (a) | Represents net amount purchased (sold). |
| (b) | All or a portion represents securities lending income earned from the reinvestment of cash collateral from loaned securities, net of fees and collateral investment expenses, and other payments to and from borrowers of securities. |
Derivative Financial Instruments Outstanding as of Period End
Exchange-Traded Options Written
| Description |
Number of Contracts |
Expiration Date |
Exercise Price | Notional Amount (000) |
Value |
|||||||||||||||||||||||
| Call |
||||||||||||||||||||||||||||
| Credo Technology Group Holding Ltd. |
306 | 01/04/24 | USD | 19.75 | USD | 596 | $ | (9,444 | ) | |||||||||||||||||||
| Adobe, Inc. |
32 | 01/05/24 | USD | 625.00 | USD | 1,909 | (2,048 | ) | ||||||||||||||||||||
| 120 | 2 0 2 3 B L A C K R O C K A N N U A L R E P O R T T O S H A R E H O L D E R S |
| Consolidated Schedule of Investments (continued) December 31, 2023
|
BlackRock Science and Technology Trust (BST) |
Exchange-Traded Options Written (continued)
| Description | Number of Contracts |
Expiration Date |
Exercise Price | Notional Amount (000) |
Value | |||||||||||||||||||||||
| Call (continued) |
||||||||||||||||||||||||||||
| Advanced Micro Devices, Inc. |
212 | 01/05/24 | USD | 125.00 | USD | 3,125 | $ | (479,650 | ) | |||||||||||||||||||
| Amazon.com, Inc. |
173 | 01/05/24 | USD | 152.50 | USD | 2,629 | (26,210 | ) | ||||||||||||||||||||
| Crowdstrike Holdings, Inc., Class A |
81 | 01/05/24 | USD | 240.00 | USD | 2,068 | (126,157 | ) | ||||||||||||||||||||
| Lam Research Corp. |
45 | 01/05/24 | USD | 725.00 | USD | 3,525 | (267,075 | ) | ||||||||||||||||||||
| MercadoLibre, Inc. |
14 | 01/05/24 | USD | 1,600.00 | USD | 2,200 | (13,720 | ) | ||||||||||||||||||||
| Meta Platforms, Inc., Class A |
55 | 01/05/24 | USD | 340.00 | USD | 1,947 | (82,775 | ) | ||||||||||||||||||||
| NVIDIA Corp. |
122 | 01/05/24 | USD | 490.00 | USD | 6,042 | (124,441 | ) | ||||||||||||||||||||
| S&P Global, Inc. |
32 | 01/05/24 | USD | 415.00 | USD | 1,410 | (84,160 | ) | ||||||||||||||||||||
| ServiceNow, Inc. |
21 | 01/05/24 | USD | 710.00 | USD | 1,484 | (15,330 | ) | ||||||||||||||||||||
| Shopify, Inc., Class A |
233 | 01/05/24 | USD | 70.00 | USD | 1,815 | (185,235 | ) | ||||||||||||||||||||
| Taiwan Semiconductor Manufacturing Co. Ltd. |
61 | 01/05/24 | USD | 98.00 | USD | 634 | (37,515 | ) | ||||||||||||||||||||
| Tesla, Inc. |
50 | 01/05/24 | USD | 255.00 | USD | 1,242 | (18,875 | ) | ||||||||||||||||||||
| Uber Technologies, Inc. |
516 | 01/05/24 | USD | 56.00 | USD | 3,177 | (287,670 | ) | ||||||||||||||||||||
| Wolfspeed, Inc. |
246 | 01/05/24 | USD | 45.00 | USD | 1,070 | (20,910 | ) | ||||||||||||||||||||
| Advanced Micro Devices, Inc. |
32 | 01/12/24 | USD | 129.00 | USD | 472 | (60,400 | ) | ||||||||||||||||||||
| Alphabet, Inc., Class A |
194 | 01/12/24 | USD | 141.00 | USD | 2,710 | (34,241 | ) | ||||||||||||||||||||
| Amazon.com, Inc. |
60 | 01/12/24 | USD | 147.25 | USD | 912 | (37,513 | ) | ||||||||||||||||||||
| ARM Holdings PLC, ADR |
268 | 01/12/24 | USD | 75.00 | USD | 2,014 | (76,916 | ) | ||||||||||||||||||||
| Autodesk, Inc. |
65 | 01/12/24 | USD | 230.00 | USD | 1,583 | (94,900 | ) | ||||||||||||||||||||
| Credo Technology Group Holding Ltd. |
310 | 01/12/24 | USD | 16.75 | USD | 604 | (86,839 | ) | ||||||||||||||||||||
| Intuit, Inc. |
59 | 01/12/24 | USD | 590.00 | USD | 3,688 | (226,855 | ) | ||||||||||||||||||||
| Marvell Technology, Inc. |
186 | 01/12/24 | USD | 56.00 | USD | 1,122 | (86,025) | |||||||||||||||||||||
| Mastercard, Inc., Class A |
127 | 01/12/24 | USD | 415.00 | USD | 5,417 | (169,545 | ) | ||||||||||||||||||||
| MercadoLibre, Inc. |
6 | 01/12/24 | USD | 1,620.00 | USD | 943 | (9,300 | ) | ||||||||||||||||||||
| Meta Platforms, Inc., Class A |
77 | 01/12/24 | USD | 325.00 | USD | 2,725 | (232,155 | ) | ||||||||||||||||||||
| MongoDB, Inc., Class A |
19 | 01/12/24 | USD | 430.00 | USD | 777 | (8,550 | ) | ||||||||||||||||||||
| NVIDIA Corp. |
104 | 01/12/24 | USD | 475.00 | USD | 5,150 | (265,980 | ) | ||||||||||||||||||||
| NVIDIA Corp. |
104 | 01/12/24 | USD | 485.00 | USD | 5,150 | (191,880 | ) | ||||||||||||||||||||
| Palo Alto Networks, Inc. |
10 | 01/12/24 | USD | 305.00 | USD | 295 | (2,865 | ) | ||||||||||||||||||||
| QUALCOMM, Inc. |
80 | 01/12/24 | USD | 134.00 | USD | 1,157 | (88,600 | ) | ||||||||||||||||||||
| Salesforce, Inc. |
182 | 01/12/24 | USD | 250.00 | USD | 4,789 | (255,710 | ) | ||||||||||||||||||||
| ServiceNow, Inc. |
40 | 01/12/24 | USD | 705.00 | USD | 2,826 | (57,400 | ) | ||||||||||||||||||||
| Snowflake, Inc., Class A |
48 | 01/12/24 | USD | 200.00 | USD | 955 | (22,680 | ) | ||||||||||||||||||||
| Spotify Technology SA |
51 | 01/12/24 | USD | 210.00 | USD | 958 | (1,275 | ) | ||||||||||||||||||||
| Take-Two Interactive Software, Inc. |
94 | 01/12/24 | USD | 162.50 | USD | 1,513 | (19,646 | ) | ||||||||||||||||||||
| Tesla, Inc. |
161 | 01/12/24 | USD | 255.00 | USD | 4,001 | (99,417 | ) | ||||||||||||||||||||
| Visa, Inc., Class A |
8 | 01/12/24 | USD | 260.00 | USD | 208 | (2,660 | ) | ||||||||||||||||||||
| Wolfspeed, Inc. |
445 | 01/12/24 | USD | 40.00 | USD | 1,936 | (193,575 | ) | ||||||||||||||||||||
| Adobe, Inc. |
38 | 01/19/24 | USD | 610.00 | USD | 2,267 | (31,635 | ) | ||||||||||||||||||||
| Advanced Micro Devices, Inc. |
240 | 01/19/24 | USD | 145.00 | USD | 3,538 | (153,600 | ) | ||||||||||||||||||||
| Alphabet, Inc., Class A |
268 | 01/19/24 | USD | 137.00 | USD | 3,744 | (125,960 | ) | ||||||||||||||||||||
| Amazon.com, Inc. |
61 | 01/19/24 | USD | 142.50 | USD | 927 | (64,050 | ) | ||||||||||||||||||||
| ANSYS, Inc. |
73 | 01/19/24 | USD | 310.00 | USD | 2,649 | (404,055) | |||||||||||||||||||||
| Arista Networks, Inc. |
50 | 01/19/24 | USD | 220.00 | USD | 1,178 | (85,750 | ) | ||||||||||||||||||||
| ARM Holdings PLC, ADR |
268 | 01/19/24 | USD | 55.00 | USD | 2,014 | (545,380 | ) | ||||||||||||||||||||
| Cadence Design Systems, Inc. |
260 | 01/19/24 | USD | 270.00 | USD | 7,082 | (202,800 | ) | ||||||||||||||||||||
| Credo Technology Group Holding Ltd. |
829 | 01/19/24 | USD | 20.00 | USD | 1,614 | (47,668 | ) | ||||||||||||||||||||
| Crowdstrike Holdings, Inc., Class A |
110 | 01/19/24 | USD | 275.00 | USD | 2,809 | (18,370 | ) | ||||||||||||||||||||
| Lam Research Corp. |
39 | 01/19/24 | USD | 740.00 | USD | 3,055 | (197,730 | ) | ||||||||||||||||||||
| Marvell Technology, Inc. |
185 | 01/19/24 | USD | 52.50 | USD | 1,116 | (148,000 | ) | ||||||||||||||||||||
| Marvell Technology, Inc. |
42 | 01/19/24 | USD | 61.00 | USD | 253 | (6,636 | ) | ||||||||||||||||||||
| MercadoLibre, Inc. |
15 | 01/19/24 | USD | 1,600.00 | USD | 2,357 | (45,075 | ) | ||||||||||||||||||||
| Meta Platforms, Inc., Class A |
78 | 01/19/24 | USD | 330.00 | USD | 2,761 | (207,870 | ) | ||||||||||||||||||||
| MongoDB, Inc., Class A |
47 | 01/19/24 | USD | 410.00 | USD | 1,922 | (66,975 | ) | ||||||||||||||||||||
| Motorola Solutions, Inc. |
87 | 01/19/24 | USD | 320.00 | USD | 2,724 | (14,790 | ) | ||||||||||||||||||||
| NVIDIA Corp. |
127 | 01/19/24 | USD | 490.00 | USD | 6,289 | (233,680 | ) | ||||||||||||||||||||
| Palo Alto Networks, Inc. |
84 | 01/19/24 | USD | 286.67 | USD | 2,477 | (112,350 | ) | ||||||||||||||||||||
| QUALCOMM, Inc. |
83 | 01/19/24 | USD | 140.00 | USD | 1,200 | (52,083 | ) | ||||||||||||||||||||
| S&P Global, Inc. |
32 | 01/19/24 | USD | 420.00 | USD | 1,410 | (74,560 | ) | ||||||||||||||||||||
| Salesforce, Inc. |
80 | 01/19/24 | USD | 260.00 | USD | 2,105 | (57,600 | ) | ||||||||||||||||||||
| Snowflake, Inc., Class A |
38 | 01/19/24 | USD | 170.00 | USD | 756 | (113,620 | ) | ||||||||||||||||||||
| Spotify Technology SA |
105 | 01/19/24 | USD | 185.00 | USD | 1,973 | (76,125 | ) | ||||||||||||||||||||
| C O N S O L I D A T E D S C H E D U L E O F I N V E S T M E N T S |
121 |
| Consolidated Schedule of Investments (continued) December 31, 2023
|
BlackRock Science and Technology Trust (BST) |
Exchange-Traded Options Written (continued)
| Description | Number of Contracts |
Expiration Date |
Exercise Price | Notional Amount (000) |
Value | |||||||||||||||||||||||
| Call (continued) |
||||||||||||||||||||||||||||
| Taiwan Semiconductor Manufacturing Co. Ltd. |
129 | 01/19/24 | USD | 105.00 | USD | 1,342 | $ | (35,282) | ||||||||||||||||||||
| Take-Two Interactive Software, Inc. |
104 | 01/19/24 | USD | 155.00 | USD | 1,674 | (78,520 | ) | ||||||||||||||||||||
| Tesla, Inc. |
146 | 01/19/24 | USD | 246.67 | USD | 3,628 | (172,645 | ) | ||||||||||||||||||||
| Visa, Inc., Class A |
124 | 01/19/24 | USD | 255.00 | USD | 3,228 | (96,720 | ) | ||||||||||||||||||||
| Wolfspeed, Inc. |
246 | 01/19/24 | USD | 47.50 | USD | 1,070 | (33,210 | ) | ||||||||||||||||||||
| Alphabet, Inc., Class A |
102 | 01/26/24 | USD | 146.00 | USD | 1,425 | (14,025 | ) | ||||||||||||||||||||
| Amazon.com, Inc. |
190 | 01/26/24 | USD | 150.00 | USD | 2,887 | (103,075 | ) | ||||||||||||||||||||
| Arista Networks, Inc. |
114 | 01/26/24 | USD | 250.00 | USD | 2,685 | (26,220 | ) | ||||||||||||||||||||
| Autodesk, Inc. |
61 | 01/26/24 | USD | 245.00 | USD | 1,485 | (35,380 | ) | ||||||||||||||||||||
| Broadcom, Inc. |
10 | 01/26/24 | USD | 1,150.00 | USD | 1,116 | (17,550 | ) | ||||||||||||||||||||
| Broadcom, Inc. |
68 | 01/26/24 | USD | 1,135.00 | USD | 7,591 | (161,500 | ) | ||||||||||||||||||||
| Intuit, Inc. |
57 | 01/26/24 | USD | 630.00 | USD | 3,563 | (76,950 | ) | ||||||||||||||||||||
| Marvell Technology, Inc. |
169 | 01/26/24 | USD | 55.00 | USD | 1,019 | (101,400 | ) | ||||||||||||||||||||
| Mastercard, Inc., Class A |
177 | 01/26/24 | USD | 420.00 | USD | 7,549 | (230,985 | ) | ||||||||||||||||||||
| MercadoLibre, Inc. |
16 | 01/26/24 | USD | 1,625.00 | USD | 2,514 | (45,840 | ) | ||||||||||||||||||||
| Meta Platforms, Inc., Class A |
84 | 01/26/24 | USD | 340.00 | USD | 2,973 | (167,790 | ) | ||||||||||||||||||||
| Micron Technology, Inc. |
131 | 01/26/24 | USD | 87.00 | USD | 1,118 | (25,087 | ) | ||||||||||||||||||||
| MongoDB, Inc., Class A |
67 | 01/26/24 | USD | 400.00 | USD | 2,739 | (154,937 | ) | ||||||||||||||||||||
| NVIDIA Corp. |
181 | 01/26/24 | USD | 495.00 | USD | 8,963 | (337,565 | ) | ||||||||||||||||||||
| Oracle Corp. |
187 | 01/26/24 | USD | 104.00 | USD | 1,972 | (60,308 | ) | ||||||||||||||||||||
| ServiceNow, Inc. |
27 | 01/26/24 | USD | 700.00 | USD | 1,908 | (81,405 | ) | ||||||||||||||||||||
| Shopify, Inc., Class A |
208 | 01/26/24 | USD | 73.00 | USD | 1,620 | (134,680) | |||||||||||||||||||||
| Spotify Technology SA |
168 | 01/26/24 | USD | 200.00 | USD | 3,157 | (42,420 | ) | ||||||||||||||||||||
| Tesla, Inc. |
119 | 01/26/24 | USD | 270.00 | USD | 2,957 | (73,482 | ) | ||||||||||||||||||||
| Visa, Inc., Class A |
130 | 01/26/24 | USD | 260.00 | USD | 3,385 | (76,700 | ) | ||||||||||||||||||||
| Western Digital Corp. |
119 | 01/26/24 | USD | 53.00 | USD | 623 | (18,921 | ) | ||||||||||||||||||||
| Amazon.com, Inc. |
249 | 02/02/24 | USD | 157.40 | USD | 3,783 | (78,893 | ) | ||||||||||||||||||||
| Micron Technology, Inc. |
132 | 02/02/24 | USD | 87.00 | USD | 1,126 | (31,482 | ) | ||||||||||||||||||||
| NVIDIA Corp. |
147 | 02/02/24 | USD | 505.00 | USD | 7,280 | (251,002 | ) | ||||||||||||||||||||
| Tesla, Inc. |
110 | 02/02/24 | USD | 279.65 | USD | 2,733 | (59,500 | ) | ||||||||||||||||||||
| Visa, Inc., Class A |
104 | 02/02/24 | USD | 260.68 | USD | 2,708 | (66,761 | ) | ||||||||||||||||||||
| Micron Technology, Inc. |
259 | 02/09/24 | USD | 87.00 | USD | 2,210 | (71,872 | ) | ||||||||||||||||||||
| Oracle Corp. |
363 | 02/09/24 | USD | 110.00 | USD | 3,827 | (48,098 | ) | ||||||||||||||||||||
| Western Digital Corp. |
388 | 02/09/24 | USD | 53.00 | USD | 2,032 | (96,612 | ) | ||||||||||||||||||||
| Advanced Micro Devices, Inc. |
202 | 02/16/24 | USD | 140.00 | USD | 2,978 | (281,790 | ) | ||||||||||||||||||||
| Alphabet, Inc., Class A |
179 | 02/16/24 | USD | 145.00 | USD | 2,500 | (68,915 | ) | ||||||||||||||||||||
| Amazon.com, Inc. |
49 | 02/16/24 | USD | 150.00 | USD | 745 | (43,365 | ) | ||||||||||||||||||||
| ANSYS, Inc. |
34 | 02/16/24 | USD | 310.00 | USD | 1,234 | (199,240 | ) | ||||||||||||||||||||
| Cadence Design Systems, Inc. |
300 | 02/16/24 | USD | 280.00 | USD | 8,171 | (252,000 | ) | ||||||||||||||||||||
| Credo Technology Group Holding Ltd. |
1,960 | 02/16/24 | USD | 20.00 | USD | 3,816 | (205,800 | ) | ||||||||||||||||||||
| Micron Technology, Inc. |
188 | 02/16/24 | USD | 77.50 | USD | 1,604 | (176,250 | ) | ||||||||||||||||||||
| MongoDB, Inc., Class A |
37 | 02/16/24 | USD | 480.00 | USD | 1,513 | (18,963 | ) | ||||||||||||||||||||
| Monolithic Power Systems, Inc. |
59 | 02/16/24 | USD | 630.00 | USD | 3,722 | (243,670) | |||||||||||||||||||||
| QUALCOMM, Inc. |
25 | 02/16/24 | USD | 150.00 | USD | 362 | (10,875 | ) | ||||||||||||||||||||
| Snowflake, Inc., Class A |
30 | 02/16/24 | USD | 190.00 | USD | 597 | (49,725 | ) | ||||||||||||||||||||
| Take-Two Interactive Software, Inc. |
18 | 02/16/24 | USD | 165.00 | USD | 290 | (9,900 | ) | ||||||||||||||||||||
| Uber Technologies, Inc. |
479 | 02/16/24 | USD | 60.00 | USD | 2,949 | (220,340 | ) | ||||||||||||||||||||
| Datadog, Inc., Class A |
183 | 03/15/24 | USD | 140.00 | USD | 2,221 | (64,507 | ) | ||||||||||||||||||||
| Micron Technology, Inc. |
254 | 03/15/24 | USD | 87.50 | USD | 2,168 | (104,140 | ) | ||||||||||||||||||||
| Monolithic Power Systems, Inc. |
15 | 03/15/24 | USD | 640.00 | USD | 946 | (67,425 | ) | ||||||||||||||||||||
| Salesforce, Inc. |
29 | 03/15/24 | USD | 290.00 | USD | 763 | (13,050 | ) | ||||||||||||||||||||
| Uber Technologies, Inc. |
247 | 03/15/24 | USD | 70.00 | USD | 1,521 | (37,421 | ) | ||||||||||||||||||||
|
|
|
|||||||||||||||||||||||||||
| $ | (12,366,697 | ) | ||||||||||||||||||||||||||
|
|
|
|||||||||||||||||||||||||||
OTC Options Written
| Description | Counterparty | Number of Contracts |
Expiration Date |
Exercise Price | Notional Amount (000) |
Value | ||||||||||||||||||||||||
| Call |
||||||||||||||||||||||||||||||
| Palo Alto Networks, Inc. |
Citibank N.A. | 3,600 | 01/04/24 | USD | 256.59 | USD | 1,062 | $ | (138,694 | ) | ||||||||||||||||||||
| SiteMinder Ltd. |
Goldman Sachs International | 12,900 | 01/04/24 | AUD | 4.61 | AUD | 66 | (4,570 | ) | |||||||||||||||||||||
| 122 | 2 0 2 3 B L A C K R O C K A N N U A L R E P O R T T O S H A R E H O L D E R S |
| Consolidated Schedule of Investments (continued) December 31, 2023
|
BlackRock Science and Technology Trust (BST) |
OTC Options Written (continued)
| Description | Counterparty | Number of Contracts |
Expiration Date |
Exercise Price | Notional Amount (000) |
Value | ||||||||||||||||||||||||
| Call (continued) |
||||||||||||||||||||||||||||||
| ASML Holding NV |
Goldman Sachs International | 17,400 | 01/09/24 | EUR | 615.00 | EUR | 11,898 | $ | (1,302,964 | ) | ||||||||||||||||||||
| RELX PLC |
Goldman Sachs International | 102,300 | 01/09/24 | GBP | 29.57 | GBP | 3,184 | (209,634 | ) | |||||||||||||||||||||
| SiteMinder Ltd. |
UBS AG | 14,100 | 01/09/24 | AUD | 4.82 | AUD | 72 | (3,206 | ) | |||||||||||||||||||||
| SOITEC |
Bank of America N.A. | 2,000 | 01/09/24 | EUR | 167.27 | EUR | 324 | (2,524 | ) | |||||||||||||||||||||
| Sony Group Corp. |
Societe Generale | 14,000 | 01/09/24 | JPY | 13,611.90 | JPY | 186,805 | (15,409 | ) | |||||||||||||||||||||
| Wise PLC, Class A |
Bank of America N.A. | 70,000 | 01/11/24 | GBP | 7.59 | GBP | 611 | (106,007 | ) | |||||||||||||||||||||
| SiteMinder Ltd. |
UBS AG | 22,000 | 01/12/24 | AUD | 5.14 | AUD | 113 | (1,771 | ) | |||||||||||||||||||||
| SiteMinder Ltd. |
Goldman Sachs International |
25,500 | 01/18/24 | AUD | 4.78 | AUD | 131 | (6,710 | ) | |||||||||||||||||||||
| SOITEC |
Morgan Stanley & Co. International PLC |
4,400 | 01/18/24 | EUR | 169.69 | EUR | 713 | (7,021 | ) | |||||||||||||||||||||
| Sony Group Corp. |
Societe Generale |
12,300 | 01/18/24 | JPY | 12,904.75 | JPY | 164,122 | (58,269 | ) | |||||||||||||||||||||
| ASM International NV |
Bank of America N.A. |
12,200 | 01/23/24 | EUR | 461.39 | EUR | 5,752 | (274,450 | ) | |||||||||||||||||||||
| SiteMinder Ltd. |
UBS AG |
22,000 | 01/23/24 | AUD | 5.24 | AUD | 113 | (1,759 | ) | |||||||||||||||||||||
| STMicroelectronics NV |
Goldman Sachs International |
52,500 | 01/23/24 | EUR | 45.81 | EUR | 2,385 | (64,479 | ) | |||||||||||||||||||||
| Wise PLC, Class A |
UBS AG |
61,800 | 01/23/24 | GBP | 8.32 | GBP | 539 | (52,251 | ) | |||||||||||||||||||||
| Wise PLC, Class A |
UBS AG |
13,300 | 01/23/24 | GBP | 8.44 | GBP | 116 | (9,929 | ) | |||||||||||||||||||||
| Xero Ltd. |
Goldman Sachs International |
18,200 | 01/23/24 | AUD | 105.92 | AUD | 2,037 | (104,602 | ) | |||||||||||||||||||||
| SiteMinder Ltd. |
UBS AG |
15,000 | 01/24/24 | AUD | 4.98 | AUD | 77 | (2,586 | ) | |||||||||||||||||||||
| Fujitsu, Ltd. |
Citibank N.A. |
8,000 | 01/25/24 | JPY | 21,335.37 | JPY | 169,757 | (28,386 | ) | |||||||||||||||||||||
| SOITEC |
Morgan Stanley & Co. International PLC |
4,400 | 01/25/24 | EUR | 169.69 | EUR | 713 | (11,026 | ) | |||||||||||||||||||||
| Xero Ltd. |
Goldman Sachs International |
18,700 | 01/25/24 | AUD | 105.71 | AUD | 2,093 | (111,344 | ) | |||||||||||||||||||||
| SiteMinder Ltd. |
Goldman Sachs International |
15,000 | 01/30/24 | AUD | 4.99 | AUD | 77 | (2,726 | ) | |||||||||||||||||||||
| Meta Platforms, Inc., Class A |
Citibank N.A. |
2,600 | 01/31/24 | USD | 361.74 | USD | 920 | (36,984 | ) | |||||||||||||||||||||
| Wise PLC, Class A |
Goldman Sachs International |
18,500 | 01/31/24 | GBP | 9.42 | GBP | 161 | (4,703 | ) | |||||||||||||||||||||
| Fujitsu, Ltd. |
BNP Paribas SA |
8,000 | 02/01/24 | JPY | 21,335.38 | JPY | 169,757 | (32,304 | ) | |||||||||||||||||||||
| Quanta Computer, Inc. |
JPMorgan Chase Bank N.A. |
382,000 | 02/01/24 | TWD | 210.08 | TWD | 85,354 | (197,822 | ) | |||||||||||||||||||||
| SOITEC |
Morgan Stanley & Co. International PLC |
4,400 | 02/01/24 | EUR | 169.69 | EUR | 713 | (15,229 | ) | |||||||||||||||||||||
| Nintendo Co., Ltd. |
BNP Paribas SA |
56,300 | 02/06/24 | JPY | 7,099.15 | JPY | 413,060 | (152,295 | ) | |||||||||||||||||||||
| SOITEC |
UBS AG |
5,000 | 02/07/24 | EUR | 167.99 | EUR | 810 | (24,238 | ) | |||||||||||||||||||||
| SiteMinder Ltd. |
Goldman Sachs International |
31,000 | 02/08/24 | AUD | 5.05 | AUD | 159 | (5,371 | ) | |||||||||||||||||||||
| Wise PLC, Class A |
UBS AG |
61,100 | 02/08/24 | GBP | 8.72 | GBP | 533 | (40,046 | ) | |||||||||||||||||||||
| SiteMinder Ltd. |
Goldman Sachs International |
31,000 | 02/13/24 | AUD | 5.05 | AUD | 159 | (5,651 | ) | |||||||||||||||||||||
| SOITEC |
Bank of America N.A. |
5,700 | 02/13/24 | EUR | 171.44 | EUR | 924 | (25,895 | ) | |||||||||||||||||||||
| SiteMinder Ltd. |
JPMorgan Chase Bank N.A. |
31,000 | 02/21/24 | AUD | 5.05 | AUD | 159 | (6,072 | ) | |||||||||||||||||||||
| SOITEC |
Bank of America N.A. |
5,800 | 02/21/24 | EUR | 171.44 | EUR | 940 | (31,046 | ) | |||||||||||||||||||||
|
|
|
|||||||||||||||||||||||||||||
| $ | (3,097,973 | ) | ||||||||||||||||||||||||||||
|
|
|
|||||||||||||||||||||||||||||
Balances Reported in the Consolidated Statements of Assets and Liabilities for Options Written
| Description | Swap Premiums Paid |
Swap Premiums Received |
Unrealized Appreciation |
Unrealized Depreciation |
Value | |||||||||||||||
| Options Written |
$ N/A | $ N/A | $ 1,565,851 | $ (6,534,552 | ) | $ (15,464,670 | ) | |||||||||||||
Derivative Financial Instruments Categorized by Risk Exposure
As of period end, the fair values of derivative financial instruments located in the Consolidated Statements of Assets and Liabilities were as follows:
| Commodity Contracts |
Credit Contracts |
Equity Contracts |
Foreign Currency Exchange Contracts |
Interest Rate Contracts |
Other Contracts |
Total | ||||||||||||||||||||||
| Liabilities — Derivative Financial Instruments |
||||||||||||||||||||||||||||
| Options written |
$ | — | $ | — | $ | 15,464,670 | $ | — | $ | — | $ | — | $ | 15,464,670 | ||||||||||||||
|
|
|
|
|
|
|
|
|
|
|
|
|
|
|
|||||||||||||||
| C O N S O L I D A T E D S C H E D U L E O F I N V E S T M E N T S |
123 |
| Consolidated Schedule of Investments (continued) December 31, 2023
|
BlackRock Science and Technology Trust (BST) |
For the period ended December 31, 2023, the effect of derivative financial instruments in the Consolidated Statements of Operations was as follows:
| Commodity Contracts |
Credit Contracts |
Equity Contracts |
Foreign Currency Exchange Contracts |
Interest Rate Contracts |
Other Contracts |
Total | ||||||||||||||||||||||
| Net Realized Gain (Loss) from: |
||||||||||||||||||||||||||||
| Options purchased(a) |
$ | — | $ | — | $ | (2,858,012 | ) | $ | — | $ | — | $ | — | $ | (2,858,012 | ) | ||||||||||||
| Options written |
— | — | (31,419,636 | ) | — | — | — | (31,419,636 | ) | |||||||||||||||||||
|
|
|
|
|
|
|
|
|
|
|
|
|
|
|
|||||||||||||||
| $ | — | $ | — | $ | (34,277,648 | ) | $ | — | $ | — | $ | — | $ | (34,277,648 | ) | |||||||||||||
|
|
|
|
|
|
|
|
|
|
|
|
|
|
|
|||||||||||||||
| Net Change in Unrealized Appreciation (Depreciation) on: |
||||||||||||||||||||||||||||
| Options written |
$ | — | $ | — | $ | (12,373,937 | ) | $ | — | $ | — | $ | — | $ | (12,373,937 | ) | ||||||||||||
|
|
|
|
|
|
|
|
|
|
|
|
|
|
|
|||||||||||||||
| (a) | Options purchased are included in net realized gain (loss) from investments — unaffiliated. |
Average Quarterly Balances of Outstanding Derivative Financial Instruments
|
|
||||
| Options: |
||||
| Average value of option contracts purchased |
$ | — | (a) | |
| Average value of option contracts written |
$ | 13,976,316 | ||
|
|
||||
| (a) | Derivative financial instrument not held at any quarter-end. The risk exposure table serves as an indicator of activity during the period. |
For more information about the Trust’s investment risks regarding derivative financial instruments, refer to the Notes to Consolidated Financial Statements.
Derivative Financial Instruments — Offsetting as of Period End
The Trust’s derivative assets and liabilities (by type) were as follows:
|
|
||||||||||||
| Assets | Liabilities | |||||||||||
|
|
||||||||||||
| Derivative Financial Instruments |
$ | — | $ | 15,464,670 | ||||||||
|
|
|
|
|
|||||||||
| Total derivative assets and liabilities in the Consolidated Statements of Assets and Liabilities |
— | 15,464,670 | ||||||||||
|
|
|
|
|
|||||||||
| Derivatives not subject to a Master Netting Agreement or similar agreement (“MNA”) |
— | (12,366,697 | ) | |||||||||
|
|
|
|
|
|||||||||
| Total derivative assets and liabilities subject to an MNA |
$ | — | $ | 3,097,973 | ||||||||
|
|
|
|
|
|||||||||
The following table presents the Trust’s derivative liabilities by counterparty net of amounts available for offset under an MNA and net of the related collateral pledged by the Trust:
| Counterparty |
|
Derivative Liabilities Subject to an MNA by Counterparty |
|
|
Derivatives Available for Offset |
|
|
Non-Cash Collateral Pledged |
(a) |
|
Cash Collateral Pledged |
(a) |
|
Net Amount of Derivative Liabilities |
(b) | |||||
| Bank of America N.A. |
$ | 439,922 | $ | — | $ | — | $ | (439,922 | ) | $ | — | |||||||||
| BNP Paribas SA |
184,599 | — | — | — | 184,599 | |||||||||||||||
| Citibank N.A. |
204,064 | — | — | (10,000 | ) | 194,064 | ||||||||||||||
| Goldman Sachs International |
1,822,754 | — | (1,822,754 | ) | — | — | ||||||||||||||
| JPMorgan Chase Bank N.A. |
203,894 | — | — | — | 203,894 | |||||||||||||||
| Morgan Stanley & Co. International PLC |
33,276 | — | (33,276 | ) | — | — | ||||||||||||||
| Societe Generale |
73,678 | — | — | — | 73,678 | |||||||||||||||
| UBS AG |
135,786 | — | (135,786 | ) | — | — | ||||||||||||||
|
|
|
|
|
|
|
|
|
|
|
|||||||||||
| $ | 3,097,973 | $ | — | $ | (1,991,816 | ) | $ | (449,922 | ) | $ | 656,235 | |||||||||
|
|
|
|
|
|
|
|
|
|
|
|||||||||||
| (a) | Excess of collateral received/pledged, if any, from the individual counterparty is not shown for financial reporting purposes. |
| (b) | Net amount represents the net amount payable due to counterparty in the event of default. Net amount may be offset further by the options written receivable/payable on the Consolidated Statements of Assets and Liabilities. |
| 124 | 2 0 2 3 B L A C K R O C K A N N U A L R E P O R T T O S H A R E H O L D E R S |
| Consolidated Schedule of Investments (continued) December 31, 2023
|
BlackRock Science and Technology Trust (BST) |
Fair Value Hierarchy as of Period End
Various inputs are used in determining the fair value of financial instruments. For a description of the input levels and information about the Trust’s policy regarding valuation of financial instruments, refer to the Notes to Consolidated Financial Statements.
The following table summarizes the Trust’s financial instruments categorized in the fair value hierarchy. The breakdown of the Trust’s financial instruments into major categories is disclosed in the Consolidated Schedule of Investments above.
| Level 1 | Level 2 | Level 3 | Total | |||||||||||||
| Assets |
||||||||||||||||
| Investments |
||||||||||||||||
| Long-Term Investments |
||||||||||||||||
| Common Stocks |
||||||||||||||||
| Automobiles |
$ | 22,081,921 | $ | — | $ | — | $ | 22,081,921 | ||||||||
| Broadline Retail |
44,497,858 | — | — | 44,497,858 | ||||||||||||
| Capital Markets |
8,482,213 | — | — | 8,482,213 | ||||||||||||
| Communications Equipment |
13,787,438 | — | — | 13,787,438 | ||||||||||||
| Diversified Consumer Services |
— | — | 12,476,847 | 12,476,847 | ||||||||||||
| Entertainment |
16,994,856 | 6,769,606 | — | 23,764,462 | ||||||||||||
| Financial Services |
47,939,319 | 5,551,821 | — | 53,491,140 | ||||||||||||
| Ground Transportation |
11,765,473 | — | — | 11,765,473 | ||||||||||||
| Household Durables |
— | 5,971,333 | — | 5,971,333 | ||||||||||||
| Interactive Media & Services |
48,343,902 | — | — | 48,343,902 | ||||||||||||
| IT Services |
28,262,062 | 5,222,128 | 19,748,688 | 53,232,878 | ||||||||||||
| Professional Services |
5,079,089 | 9,508,622 | 4,480,331 | 19,068,042 | ||||||||||||
| Semiconductors & Semiconductor Equipment |
236,585,520 | 59,074,242 | — | 295,659,762 | ||||||||||||
| Software |
263,631,182 | 9,208,647 | 9,344,790 | 282,184,619 | ||||||||||||
| Specialty Retail |
— | — | 84,691 | 84,691 | ||||||||||||
| Technology Hardware, Storage & Peripherals |
99,685,652 | 5,547,679 | — | 105,233,331 | ||||||||||||
| Convertible Notes |
— | — | 1 | 1 | ||||||||||||
| Preferred Securities |
||||||||||||||||
| Preferred Stocks |
— | — | 212,114,583 | 212,114,583 | ||||||||||||
| Warrants |
— | — | — | — | ||||||||||||
| Short-Term Securities |
||||||||||||||||
| Money Market Funds |
365,499 | — | — | 365,499 | ||||||||||||
|
|
|
|
|
|
|
|
|
|||||||||
| $ | 847,501,984 | $ | 106,854,078 | $ | 258,249,931 | 1,212,605,993 | ||||||||||
|
|
|
|
|
|
|
|
|
|||||||||
| Investments Valued at NAV(a) |
5,860,878 | |||||||||||||||
|
|
|
|||||||||||||||
| $ | 1,218,466,871 | |||||||||||||||
|
|
|
|||||||||||||||
| Derivative Financial Instruments(b) |
||||||||||||||||
| Liabilities |
||||||||||||||||
| Equity Contracts |
$ | (12,027,747 | ) | $ | (3,436,923 | ) | $ | — | $ | (15,464,670 | ) | |||||
|
|
|
|
|
|
|
|
|
|||||||||
| (a) | Certain investments of the Trust were fair valued using NAV as a practical expedient as no quoted market value is available and therefore have been excluded from the fair value hierarchy. |
| (b) | Derivative financial instruments are options written. Options written are shown at value. |
A reconciliation of Level 3 financial instruments is presented when the Trust had a significant amount of Level 3 investments and derivative financial instruments at the beginning and/or end of the year in relation to net assets. The following table is a reconciliation of Level 3 investments for which significant unobservable inputs were used in determining fair value:
|
|
||||||||||||||||||||
| Common Stocks |
Convertible Notes |
Preferred Stocks |
Warrants | Total | ||||||||||||||||
|
|
||||||||||||||||||||
| Assets |
||||||||||||||||||||
| Opening balance, as of December 31, 2022 |
$ | 60,069,300 | $ | 1,920,000 | $ | 195,967,596 | $ | 16,212 | $ | 257,973,108 | ||||||||||
| Transfers into Level 3 |
— | — | — | — | — | |||||||||||||||
| Transfers out of Level 3 |
— | — | — | — | — | |||||||||||||||
| Other(a) |
(11,157,597 | ) | — | 11,157,597 | — | — | ||||||||||||||
| Accrued discounts/premiums |
— | — | — | — | — | |||||||||||||||
| Net realized gain (loss) |
— | — | — | — | — | |||||||||||||||
| Net change in unrealized appreciation (depreciation)(b)(c) |
(12,776,204 | ) | (1,919,999 | ) | 12,989,241 | (16,212 | ) | (1,723,174 | ) | |||||||||||
| C O N S O L I D A T E D S C H E D U L E O F I N V E S T M E N T S |
125 |
| Consolidated Schedule of Investments (continued) December 31, 2023
|
BlackRock Science and Technology Trust (BST) |
|
|
||||||||||||||||||||
| Common Stocks |
Convertible Notes |
Preferred Stocks |
Warrants | Total | ||||||||||||||||
|
|
||||||||||||||||||||
| Purchases |
$ | 9,999,848 | $ | — | $ | 6,799,994 | $ | — | $ | 16,799,842 | ||||||||||
| Sales |
— | — | (14,799,845 | ) | — | (14,799,845 | ) | |||||||||||||
|
|
|
|
|
|
|
|
|
|
|
|||||||||||
| Closing balance, as of December 31, 2023 |
$ | 46,135,347 | $ | 1 | $ | 212,114,583 | $ | — | (d) | $ | 258,249,931 | |||||||||
|
|
|
|
|
|
|
|
|
|
|
|||||||||||
| Net change in unrealized appreciation (depreciation) on investments still held at December 31, 2023(c) |
$ | (12,776,204 | ) | $ | (1,919,999 | ) | $ | 12,468,281 | $ | — | (d) | $ | (2,227,922 | ) | ||||||
|
|
|
|
|
|
|
|
|
|
|
|||||||||||
| (a) | Certain Level 3 investments were re-classified between Common Stocks and Preferred Stocks. |
| (b) | Included in the related net change in unrealized appreciation (depreciation) in the Consolidated Statements of Operations. |
| (c) | Any difference between net change in unrealized appreciation (depreciation) and net change in unrealized appreciation (depreciation) on investments still held at December 31, 2023 is generally due to investments no longer held or categorized as Level 3 at period end. |
| (d) | Rounds to less than $1. |
The following table summarizes the valuation approaches used and unobservable inputs utilized by the BlackRock Valuation Committee (the “Valuation Committee”) to determine the value of certain of the Trust’s Level 3 financial instruments as of period end. The table does not include Level 3 financial instruments with values based upon unadjusted third-party pricing information in the amount of $1. A significant change in third party information could result in a significantly lower or higher value of such Level 3 financial instruments.
| Value | Valuation Approach |
Unobservable Inputs |
|
Range of Unobservable Inputs |
|
|
Weighted Average of Unobservable Inputs Based on Fair Value |
| ||||||||
| Assets |
||||||||||||||||
| Common Stocks |
$ | 46,135,347 | Market | Revenue Multiple | 1.00x - 29.00x | 12.50x | ||||||||||
| Volatility | 70% | — | ||||||||||||||
| Time to Exit | 2.6 - 3.0 years | 2.6 years | ||||||||||||||
| Gross Profit Multiple | 15.00x | — | ||||||||||||||
| Terminal Growth Rate | 5% | — | ||||||||||||||
| Income | Discount | 12% | — | |||||||||||||
| Preferred Stocks(b) |
212,114,583 | Market | Revenue Multiple | 1.00x - 31.00x | 15.54x | |||||||||||
| Volatility | 50% - 75% | 64% | ||||||||||||||
| Time to Exit | 2.0 - 5.0 years | 4.0 years | ||||||||||||||
| Market Adjustment Multiple | 1.20x - 1.20x | 1.20x | ||||||||||||||
| Gross Profit Multiple | 6.50x | — | ||||||||||||||
|
|
|
|||||||||||||||
| $ | 258,249,930 | |||||||||||||||
|
|
|
|||||||||||||||
| (a) | A significant change in unobservable input would have resulted in a correlated (inverse) significant change to value. |
| (b) | For the period end December 31, 2023, the valuation technique for certain investments classified as Preferred Stocks used recent prior transaction prices as inputs within the model used for the approximation of fair value. |
See notes to financial statements.
| 126 | 2 0 2 3 B L A C K R O C K A N N U A L R E P O R T T O S H A R E H O L D E R S |
| Schedule of Investments December 31, 2023
|
BlackRock Utilities, Infrastructure & Power Opportunities Trust (BUI) (Percentages shown are based on Net Assets) |
| Security | Shares | Value | ||||||
| Common Stocks |
||||||||
| Building Products — 8.1% | ||||||||
| Cie de Saint-Gobain SA |
124,450 | $ | 9,177,853 | |||||
| Johnson Controls International PLC |
187,209 | 10,790,727 | ||||||
| Kingspan Group PLC |
82,065 | 7,092,494 | ||||||
| Trane Technologies PLC |
56,900 | 13,877,910 | ||||||
|
|
|
|||||||
| 40,938,984 | ||||||||
| Chemicals — 3.1% | ||||||||
| Air Liquide SA |
40,768 | 7,937,343 | ||||||
| Linde PLC |
18,778 | 7,712,313 | ||||||
|
|
|
|||||||
| 15,649,656 | ||||||||
| Commercial Services & Supplies — 4.2% | ||||||||
| Republic Services, Inc. |
63,250 | 10,430,557 | ||||||
| Waste Management, Inc. |
60,250 | 10,790,775 | ||||||
|
|
|
|||||||
| 21,221,332 | ||||||||
| Construction & Engineering — 5.8% | ||||||||
| Quanta Services, Inc. |
49,260 | 10,630,308 | ||||||
| Vinci SA |
148,150 | 18,643,971 | ||||||
|
|
|
|||||||
| 29,274,279 | ||||||||
| Electric Utilities — 29.1% | ||||||||
| American Electric Power Co., Inc.(a) |
75,350 | 6,119,929 | ||||||
| Duke Energy Corp.(a) |
140,018 | 13,587,347 | ||||||
| EDP - Energias de Portugal SA |
2,285,000 | 11,500,401 | ||||||
| Enel SpA |
2,922,775 | 21,744,882 | ||||||
| Exelon Corp.(a) |
275,958 | 9,906,892 | ||||||
| Neoenergia SA |
902,200 | 3,962,332 | ||||||
| NextEra Energy, Inc.(a)(b) |
598,330 | 36,342,564 | ||||||
| Orsted A/S(c) |
74,600 | 4,135,567 | ||||||
| PG&E Corp.(d) |
682,650 | 12,308,179 | ||||||
| Southern Co. |
160,250 | 11,236,730 | ||||||
| SSE PLC |
481,500 | 11,366,279 | ||||||
| Xcel Energy, Inc. |
82,590 | 5,113,147 | ||||||
|
|
|
|||||||
| 147,324,249 | ||||||||
| Electrical Equipment — 6.9% | ||||||||
| Eaton Corp. PLC |
16,090 | 3,874,794 | ||||||
| Prysmian SpA |
100,900 | 4,599,533 | ||||||
| Schneider Electric SE |
34,332 | 6,911,244 | ||||||
| Sunrun, Inc.(d) |
140,600 | 2,759,978 | ||||||
| Vestas Wind Systems A/S(d) |
528,921 | 16,735,963 | ||||||
|
|
|
|||||||
| 34,881,512 | ||||||||
| Electronic Equipment, Instruments & Components(d) — 1.5% | ||||||||
| Rogers Corp. |
27,250 | 3,598,908 | ||||||
| Samsung SDI Co. Ltd. |
10,750 | 3,913,973 | ||||||
|
|
|
|||||||
| 7,512,881 | ||||||||
| Ground Transportation — 1.2% | ||||||||
| Union Pacific Corp. |
25,800 | 6,336,996 | ||||||
|
|
|
|||||||
| Independent Power and Renewable Electricity Producers — 8.7% | ||||||||
| AES Corp. |
239,890 | 4,617,882 | ||||||
| China Longyuan Power Group Corp. Ltd., Class H |
3,620,000 | 2,748,970 | ||||||
| EDP Renovaveis SA |
537,080 | 10,994,731 | ||||||
| Orron Energy AB(d) |
3,401,100 | 2,690,207 | ||||||
| RWE AG |
502,645 | 22,876,832 | ||||||
|
|
|
|||||||
| 43,928,622 | ||||||||
| Machinery — 6.2% | ||||||||
| Atlas Copco AB, B Shares |
1,064,300 | 15,790,098 | ||||||
| Ingersoll Rand, Inc. |
131,700 | 10,185,678 | ||||||
| Spirax-Sarco Engineering PLC |
40,950 | 5,478,933 | ||||||
|
|
|
|||||||
| 31,454,709 | ||||||||
| Security | Shares | Value | ||||||
| Multi-Utilities — 10.6% | ||||||||
| CenterPoint Energy, Inc. |
179,000 | $ | 5,114,030 | |||||
| CMS Energy Corp.(a) |
169,260 | 9,828,927 | ||||||
| Dominion Energy, Inc.(a) |
122,898 | 5,776,206 | ||||||
| National Grid PLC |
552,524 | 7,443,225 | ||||||
| Public Service Enterprise Group, Inc. |
184,792 | 11,300,031 | ||||||
| Sempra(b) |
194,200 | 14,512,566 | ||||||
|
|
|
|||||||
| 53,974,985 | ||||||||
| Oil, Gas & Consumable Fuels — 9.4% | ||||||||
| Cheniere Energy, Inc.(b) |
70,350 | 12,009,449 | ||||||
| Enterprise Products Partners LP |
137,063 | 3,611,610 | ||||||
| Hess Midstream LP, Class A |
113,800 | 3,599,494 | ||||||
| Pembina Pipeline Corp. |
191,600 | 6,596,575 | ||||||
| TC Energy Corp. |
247,700 | 9,675,825 | ||||||
| Williams Cos., Inc.(b) |
352,805 | 12,288,198 | ||||||
|
|
|
|||||||
| 47,781,151 | ||||||||
| Semiconductors & Semiconductor Equipment — 5.5% | ||||||||
| Analog Devices, Inc. |
27,174 | 5,395,669 | ||||||
| ASML Holding NV |
7,750 | 5,850,378 | ||||||
| Canadian Solar, Inc.(d)(e) |
88,290 | 2,315,847 | ||||||
| First Solar, Inc.(d)(e) |
20,234 | 3,485,914 | ||||||
| Infineon Technologies AG, Class N |
116,050 | 4,846,551 | ||||||
| STMicroelectronics NV |
118,700 | 5,953,868 | ||||||
|
|
|
|||||||
| 27,848,227 | ||||||||
|
|
|
|||||||
| Total Long-Term Investments — 100.3% |
|
508,127,583 | ||||||
|
|
|
|||||||
| Short-Term Securities |
|
|||||||
| Money Market Funds — 1.3% | ||||||||
| BlackRock Liquidity Funds, T-Fund, Institutional Class, 5.26%(f)(g) |
5,318,307 | 5,318,307 | ||||||
| SL Liquidity Series, LLC, Money Market Series, 5.58%(f)(g)(h) |
1,297,588 | 1,297,977 | ||||||
|
|
|
|||||||
| Total Short-Term Securities — 1.3% |
|
6,616,284 | ||||||
|
|
|
|||||||
| Total Investments Before Options Written — 101.6% |
|
514,743,867 | ||||||
|
|
|
|||||||
| Options Written — (1.5)% |
|
(7,790,856 | ) | |||||
|
|
|
|||||||
| Total Investments, Net of Options Written — 100.1% |
|
506,953,011 | ||||||
| Liabilities in Excess of Other Assets — (0.1)% |
|
(491,081 | ) | |||||
|
|
|
|||||||
| Net Assets — 100.0% |
|
$ | 506,461,930 | |||||
|
|
|
|||||||
| (a) | All or a portion of the security has been pledged and/or segregated as collateral in connection with outstanding exchange-traded options written. |
| (b) | All or a portion of the security has been pledged as collateral in connection with outstanding OTC derivatives. |
| (c) | Security exempt from registration pursuant to Rule 144A under the Securities Act of 1933, as amended. These securities may be resold in transactions exempt from registration to qualified institutional investors. |
| (d) | Non-income producing security. |
| (e) | All or a portion of this security is on loan. |
| (f) | Affiliate of the Trust. |
| (g) | Annualized 7-day yield as of period end. |
| (h) | All or a portion of this security was purchased with the cash collateral from loaned securities. |
| S C H E D U L E O F I N V E S T M E N T S |
127 |
| Schedule of Investments (continued) December 31, 2023
|
BlackRock Utilities, Infrastructure & Power Opportunities Trust (BUI) |
For Trust compliance purposes, the Trust’s industry classifications refer to one or more of the industry sub-classifications used by one or more widely recognized market indexes or rating group indexes, and/or as defined by the investment adviser. These definitions may not apply for purposes of this report, which may combine such industry sub-classifications for reporting ease.
Affiliates
Investments in issuers considered to be affiliate(s) of the Trust during the year ended December 31, 2023 for purposes of Section 2(a)(3) of the Investment Company Act of 1940, as amended, were as follows:
| Affiliated Issuer | Value at 12/31/22 |
Purchases at Cost |
Proceeds from Sale |
Net Realized Gain (Loss) |
Change in Unrealized Appreciation (Depreciation) |
Value at 12/31/23 |
Shares Held at 12/31/23 |
Income | Capital Gain Distributions from Underlying Funds |
|||||||||||||||||||||||||||
| BlackRock Liquidity Funds, T-Fund, Institutional Class |
$ | 11,042,199 | $ | — | $ | (5,723,892 | )(a) | $ | — | $ | — | $ | 5,318,307 | 5,318,307 | $ | 525,353 | $ | — | ||||||||||||||||||
| SL Liquidity Series, LLC, Money Market Series |
225,179 | 1,071,499 | (a) | — | 1,417 | (118 | ) | 1,297,977 | 1,297,588 | 10,772 | (b) | — | ||||||||||||||||||||||||
|
|
|
|
|
|
|
|
|
|
|
|||||||||||||||||||||||||||
| $ | 1,417 | $ | (118 | ) | $ | 6,616,284 | $ | 536,125 | $ | — | ||||||||||||||||||||||||||
|
|
|
|
|
|
|
|
|
|
|
|||||||||||||||||||||||||||
| (a) | Represents net amount purchased (sold). |
| (b) | All or a portion represents securities lending income earned from the reinvestment of cash collateral from loaned securities, net of fees and collateral investment expenses, and other payments to and from borrowers of securities. |
Derivative Financial Instruments Outstanding as of Period End
Exchange-Traded Options Written
| Description |
Number of Contracts |
Expiration Date |
Exercise Price | Notional Amount (000) |
Value |
|||||||||||||||||||||||
| Call |
||||||||||||||||||||||||||||
| Analog Devices, Inc. |
51 | 01/05/24 | USD | 190.00 | USD | 1,013 | $ | (43,860 | ) | |||||||||||||||||||
| Analog Devices, Inc. |
44 | 01/05/24 | USD | 185.00 | USD | 874 | (60,280 | ) | ||||||||||||||||||||
| Linde PLC |
32 | 01/05/24 | USD | 415.00 | USD | 1,314 | (4,640 | ) | ||||||||||||||||||||
| Southern Co. |
280 | 01/05/24 | USD | 72.00 | USD | 1,963 | (1,400 | ) | ||||||||||||||||||||
| Waste Management, Inc. |
51 | 01/05/24 | USD | 172.52 | USD | 913 | (35,141 | ) | ||||||||||||||||||||
| Williams Cos., Inc. |
603 | 01/05/24 | USD | 37.00 | USD | 2,100 | (3,015 | ) | ||||||||||||||||||||
| CMS Energy Corp. |
241 | 01/10/24 | USD | 59.00 | USD | 1,399 | (8,491 | ) | ||||||||||||||||||||
| First Solar, Inc. |
35 | 01/12/24 | USD | 160.00 | USD | 603 | (50,050 | ) | ||||||||||||||||||||
| PG&E Corp. |
649 | 01/12/24 | USD | 17.50 | USD | 1,170 | (47,377 | ) | ||||||||||||||||||||
| Union Pacific Corp. |
22 | 01/12/24 | USD | 235.00 | USD | 540 | (25,410 | ) | ||||||||||||||||||||
| Union Pacific Corp. |
45 | 01/12/24 | USD | 240.00 | USD | 1,105 | (32,850 | ) | ||||||||||||||||||||
| AES Corp. |
780 | 01/19/24 | USD | 17.00 | USD | 1,502 | (187,200 | ) | ||||||||||||||||||||
| American Electric Power Co., Inc. |
128 | 01/19/24 | USD | 80.00 | USD | 1,040 | (29,120 | ) | ||||||||||||||||||||
| CMS Energy Corp. |
351 | 01/19/24 | USD | 60.00 | USD | 2,038 | (7,897 | ) | ||||||||||||||||||||
| Dominion Energy, Inc. |
312 | 01/19/24 | USD | 47.50 | USD | 1,466 | (26,520 | ) | ||||||||||||||||||||
| Duke Energy Corp. |
295 | 01/19/24 | USD | 92.50 | USD | 2,863 | (144,550 | ) | ||||||||||||||||||||
| Eaton Corp. PLC |
56 | 01/19/24 | USD | 240.00 | USD | 1,349 | (28,560 | ) | ||||||||||||||||||||
| Enterprise Products Partners LP |
101 | 01/19/24 | USD | 27.51 | USD | 266 | (212 | ) | ||||||||||||||||||||
| Exelon Corp. |
170 | 01/19/24 | USD | 41.00 | USD | 610 | (850 | ) | ||||||||||||||||||||
| Hess Midstream LP, Class A |
200 | 01/19/24 | USD | 33.00 | USD | 633 | (5,000 | ) | ||||||||||||||||||||
| Ingersoll Rand, Inc. |
150 | 01/19/24 | USD | 70.00 | USD | 1,160 | (116,250 | ) | ||||||||||||||||||||
| Ingersoll Rand, Inc. |
310 | 01/19/24 | USD | 75.00 | USD | 2,398 | (116,250 | ) | ||||||||||||||||||||
| Johnson Controls International PLC |
229 | 01/19/24 | USD | 55.00 | USD | 1,320 | (70,990 | ) | ||||||||||||||||||||
| Linde PLC |
33 | 01/19/24 | USD | 415.00 | USD | 1,355 | (13,860 | ) | ||||||||||||||||||||
| PG&E Corp. |
889 | 01/19/24 | USD | 17.00 | USD | 1,603 | (111,126 | ) | ||||||||||||||||||||
| Republic Services, Inc. |
100 | 01/19/24 | USD | 160.00 | USD | 1,649 | (58,500 | ) | ||||||||||||||||||||
| Sempra |
366 | 01/19/24 | USD | 75.00 | USD | 2,735 | (40,260 | ) | ||||||||||||||||||||
| Southern Co. |
280 | 01/19/24 | USD | 72.50 | USD | 1,963 | (6,300 | ) | ||||||||||||||||||||
| Trane Technologies PLC |
199 | 01/19/24 | USD | 230.00 | USD | 4,854 | (294,520 | ) | ||||||||||||||||||||
| Union Pacific Corp. |
22 | 01/19/24 | USD | 235.00 | USD | 540 | (26,950 | ) | ||||||||||||||||||||
| Waste Management, Inc. |
159 | 01/19/24 | USD | 170.32 | USD | 2,848 | (164,349 | ) | ||||||||||||||||||||
| Williams Cos., Inc. |
603 | 01/19/24 | USD | 37.00 | USD | 2,100 | (6,030 | ) | ||||||||||||||||||||
| Enterprise Products Partners LP |
100 | 01/26/24 | USD | 26.27 | USD | 264 | (5,044 | ) | ||||||||||||||||||||
| First Solar, Inc. |
35 | 01/26/24 | USD | 190.00 | USD | 603 | (9,625 | ) | ||||||||||||||||||||
| PG&E Corp. |
136 | 01/26/24 | USD | 17.50 | USD | 245 | (11,696 | ) | ||||||||||||||||||||
| Williams Cos., Inc. |
28 | 01/26/24 | USD | 36.00 | USD | 98 | (840 | ) | ||||||||||||||||||||
| 128 | 2 0 2 3 B L A C K R O C K A N N U A L R E P O R T T O S H A R E H O L D E R S |
| Schedule of Investments (continued) December 31, 2023
|
BlackRock Utilities, Infrastructure & Power Opportunities Trust (BUI) |
Exchange-Traded Options Written (continued)
| Description | Number of Contracts |
Expiration Date |
Exercise Price | Notional Amount (000) |
Value | |||||||||||||||||||||||||||
| Call (continued) |
||||||||||||||||||||||||||||||||
| Xcel Energy, Inc. |
146 | 02/01/24 | USD | 62.75 | USD | 904 | $ | (16,522 | ) | |||||||||||||||||||||||
| PG&E Corp. |
715 | 02/02/24 | USD | 18.00 | USD | 1,289 | (40,755 | ) | ||||||||||||||||||||||||
| AES Corp. |
60 | 02/16/24 | USD | 20.00 | USD | 116 | (3,300 | ) | ||||||||||||||||||||||||
| American Electric Power Co., Inc. |
136 | 02/16/24 | USD | 82.50 | USD | 1,105 | (23,460 | ) | ||||||||||||||||||||||||
| CenterPoint Energy, Inc. |
313 | 02/16/24 | USD | 30.00 | USD | 894 | (7,825 | ) | ||||||||||||||||||||||||
| Dominion Energy, Inc. |
127 | 02/16/24 | USD | 50.00 | USD | 597 | (8,255 | ) | ||||||||||||||||||||||||
| Duke Energy Corp. |
195 | 02/16/24 | USD | 98.35 | USD | 1,892 | (31,876 | ) | ||||||||||||||||||||||||
| Enterprise Products Partners LP |
193 | 02/16/24 | USD | 26.14 | USD | 509 | (8,850 | ) | ||||||||||||||||||||||||
| Exelon Corp. |
757 | 02/16/24 | USD | 40.50 | USD | 2,718 | (7,746 | ) | ||||||||||||||||||||||||
| Exelon Corp. |
38 | 02/16/24 | USD | 37.00 | USD | 136 | (2,660 | ) | ||||||||||||||||||||||||
| Hess Midstream LP, Class A |
200 | 02/16/24 | USD | 33.00 | USD | 633 | (16,000 | ) | ||||||||||||||||||||||||
| Quanta Services, Inc. |
74 | 02/16/24 | USD | 210.00 | USD | 1,597 | (89,170 | ) | ||||||||||||||||||||||||
| Republic Services, Inc. |
121 | 02/16/24 | USD | 164.96 | USD | 1,995 | (53,698 | ) | ||||||||||||||||||||||||
| Sempra |
316 | 02/16/24 | USD | 76.48 | USD | 2,361 | (43,349 | ) | ||||||||||||||||||||||||
| Enterprise Products Partners LP |
85 | 03/15/24 | USD | 27.00 | USD | 224 | (2,295 | ) | ||||||||||||||||||||||||
| Quanta Services, Inc. |
98 | 03/15/24 | USD | 216.50 | USD | 2,115 | (107,325 | ) | ||||||||||||||||||||||||
|
|
|
|||||||||||||||||||||||||||||||
| $ | (2,258,099 | ) | ||||||||||||||||||||||||||||||
|
|
|
|||||||||||||||||||||||||||||||
OTC Options Written
| Description | Counterparty | Number of Contracts |
Expiration Date |
Exercise Price | Notional Amount (000) |
Value | ||||||||||||||||||||||||||
| Call |
||||||||||||||||||||||||||||||||
| Atlas Copco AB, B Shares |
UBS AG | 106,600 | 01/04/24 | SEK | 130.52 | SEK | 15,951 | $ | (200,506 | ) | ||||||||||||||||||||||
| ASML Holding NV |
Goldman Sachs International | 2,700 | 01/09/24 | EUR | 615.00 | EUR | 1,846 | (202,184 | ) | |||||||||||||||||||||||
| TC Energy Corp. |
Royal Bank of Canada | 27,900 | 01/09/24 | CAD | 48.31 | CAD | 1,444 | (75,321 | ) | |||||||||||||||||||||||
| Air Liquide SA |
Morgan Stanley & Co. International PLC | 14,300 | 01/10/24 | EUR | 168.61 | EUR | 2,522 | (127,500 | ) | |||||||||||||||||||||||
| China Longyuan Power Group Corp. Ltd., Class H |
Goldman Sachs International | 597,000 | 01/10/24 | HKD | 6.90 | HKD | 3,540 | (138 | ) | |||||||||||||||||||||||
| Kingspan Group PLC |
Bank of America N.A. | 14,400 | 01/10/24 | EUR | 67.66 | EUR | 1,127 | (172,411 | ) | |||||||||||||||||||||||
| Prysmian SpA |
Morgan Stanley & Co. International PLC | 12,600 | 01/10/24 | EUR | 36.02 | EUR | 520 | (72,424 | ) | |||||||||||||||||||||||
| Vinci SA |
Bank of America N.A. | 51,800 | 01/10/24 | EUR | 107.53 | EUR | 5,905 | (365,008 | ) | |||||||||||||||||||||||
| EDP - Energias de Portugal SA |
Bank of America N.A. | 169,200 | 01/11/24 | EUR | 4.32 | EUR | 771 | (47,726 | ) | |||||||||||||||||||||||
| NextEra Energy, Inc. |
Barclays Bank PLC | 107,500 | 01/11/24 | USD | 57.37 | USD | 6,530 | (403,429 | ) | |||||||||||||||||||||||
| Orron Energy AB |
Morgan Stanley & Co. International PLC | 236,000 | 01/11/24 | SEK | 7.50 | SEK | 1,883 | (12,940 | ) | |||||||||||||||||||||||
| Schneider Electric SE |
Goldman Sachs International | 5,900 | 01/11/24 | EUR | 168.08 | EUR | 1,076 | (91,759 | ) | |||||||||||||||||||||||
| Neoenergia SA |
Morgan Stanley & Co. International PLC | 118,400 | 01/12/24 | BRL | 19.85 | BRL | 2,526 | (32,113 | ) | |||||||||||||||||||||||
| China Longyuan Power Group Corp. Ltd., Class H |
Bank of America N.A. | 670,000 | 01/17/24 | HKD | 6.91 | HKD | 3,973 | (668 | ) | |||||||||||||||||||||||
| EDP - Energias de Portugal SA |
Bank of America N.A. | 386,000 | 01/17/24 | EUR | 4.32 | EUR | 1,760 | (110,903 | ) | |||||||||||||||||||||||
| Kingspan Group PLC |
Morgan Stanley & Co. International PLC | 14,400 | 01/17/24 | EUR | 70.94 | EUR | 1,127 | (123,949 | ) | |||||||||||||||||||||||
| Orron Energy AB |
Morgan Stanley & Co. International PLC | 400,000 | 01/17/24 | SEK | 7.59 | SEK | 3,191 | (20,840 | ) | |||||||||||||||||||||||
| EDP Renovaveis SA |
Morgan Stanley & Co. International PLC | 39,000 | 01/18/24 | EUR | 16.91 | EUR | 723 | (76,070 | ) | |||||||||||||||||||||||
| Enel SpA |
Morgan Stanley & Co. International PLC | 519,400 | 01/18/24 | EUR | 6.40 | EUR | 3,500 | (207,533 | ) | |||||||||||||||||||||||
| Infineon Technologies AG, Class N |
Goldman Sachs International | 19,200 | 01/18/24 | EUR | 37.84 | EUR | 726 | (18,891 | ) | |||||||||||||||||||||||
| Infineon Technologies AG, Class N |
UBS AG | 400 | 01/18/24 | EUR | 35.66 | EUR | 15 | (1,108 | ) | |||||||||||||||||||||||
| National Grid PLC |
Morgan Stanley & Co. International PLC | 125,200 | 01/18/24 | GBP | 10.15 | GBP | 1,323 | (76,437 | ) | |||||||||||||||||||||||
| Orsted A/S |
Bank of America N.A. | 19,200 | 01/18/24 | DKK | 323.67 | DKK | 7,187 | (153,224 | ) | |||||||||||||||||||||||
| Public Service Enterprise Group, Inc. |
JPMorgan Chase Bank N.A. | 23,200 | 01/22/24 | USD | 64.49 | USD | 1,419 | (4,272 | ) | |||||||||||||||||||||||
| EDP Renovaveis SA |
Bank of America N.A. | 60,900 | 01/23/24 | EUR | 17.44 | EUR | 1,129 | (94,878 | ) | |||||||||||||||||||||||
| Neoenergia SA |
Morgan Stanley & Co. International PLC | 118,400 | 01/23/24 | BRL | 19.85 | BRL | 2,526 | (37,004 | ) | |||||||||||||||||||||||
| Neoenergia SA |
Morgan Stanley & Co. International PLC | 79,000 | 01/23/24 | BRL | 21.25 | BRL | 1,685 | (5,780 | ) | |||||||||||||||||||||||
| Prysmian SpA |
Goldman Sachs International | 22,800 | 01/23/24 | EUR | 37.79 | EUR | 941 | (91,145 | ) | |||||||||||||||||||||||
| RWE AG |
Bank of America N.A. | 159,300 | 01/23/24 | EUR | 40.96 | EUR | 6,568 | (161,200 | ) | |||||||||||||||||||||||
| SSE PLC |
Morgan Stanley & Co. International PLC | 147,500 | 01/23/24 | GBP | 19.07 | GBP | 2,732 | (17,494 | ) | |||||||||||||||||||||||
| STMicroelectronics NV |
Goldman Sachs International | 41,500 | 01/23/24 | EUR | 45.81 | EUR | 1,886 | (50,969 | ) | |||||||||||||||||||||||
| Compagnie de Saint-Gobain S.A. |
UBS AG | 21,800 | 01/25/24 | EUR | 61.66 | EUR | 1,456 | (131,333 | ) | |||||||||||||||||||||||
| RWE AG |
UBS AG | 16,700 | 01/25/24 | EUR | 40.75 | EUR | 688 | (20,012 | ) | |||||||||||||||||||||||
| Spirax-Sarco Engineering PLC |
Morgan Stanley & Co. International PLC | 14,300 | 01/25/24 | GBP | 93.90 | GBP | 1,501 | (213,320 | ) | |||||||||||||||||||||||
| TC Energy Corp. |
Royal Bank of Canada | 29,400 | 01/29/24 | CAD | 52.43 | CAD | 1,522 | (13,911 | ) | |||||||||||||||||||||||
| Atlas Copco AB, B Shares |
Goldman Sachs International | 250,000 | 01/30/24 | SEK | 145.58 | SEK | 37,410 | (152,791 | ) | |||||||||||||||||||||||
| EDP Renovaveis SA |
Morgan Stanley & Co. International PLC | 4,700 | 01/30/24 | EUR | 17.33 | EUR | 87 | (8,192 | ) | |||||||||||||||||||||||
| Enel SpA |
Bank of America N.A. | 503,600 | 01/30/24 | EUR | 6.56 | EUR | 3,394 | (64,746 | ) | |||||||||||||||||||||||
| S C H E D U L E O F I N V E S T M E N T S |
129 |
| Schedule of Investments (continued) December 31, 2023
|
BlackRock Utilities, Infrastructure & Power Opportunities Trust (BUI) |
OTC Options Written (continued)
| Description | Counterparty | Number of Contracts |
Expiration Date |
Exercise Price | Notional Amount (000) |
Value | ||||||||||||||||||||||||||
| Call (continued) |
||||||||||||||||||||||||||||||||
| Johnson Controls International PLC |
JPMorgan Chase Bank N.A. | 42,600 | 01/30/24 | USD | 55.64 | USD | 2,455 | $ | (135,681 | ) | ||||||||||||||||||||||
| Orron Energy AB |
Morgan Stanley & Co. International PLC | 550,000 | 01/30/24 | SEK | 7.60 | SEK | 4,388 | (30,966 | ) | |||||||||||||||||||||||
| Orsted A/S |
Morgan Stanley & Co. International PLC | 6,900 | 01/30/24 | DKK | 338.22 | DKK | 2,583 | (47,695 | ) | |||||||||||||||||||||||
| Schneider Electric SE |
Bank of America N.A. | 6,100 | 01/30/24 | EUR | 172.21 | EUR | 1,112 | (76,860 | ) | |||||||||||||||||||||||
| Vestas Wind Systems A/S |
UBS AG | 103,000 | 01/30/24 | DKK | 193.49 | DKK | 22,008 | (370,846 | ) | |||||||||||||||||||||||
| Public Service Enterprise Group, Inc. |
JPMorgan Chase Bank N.A. | 20,700 | 01/31/24 | USD | 63.86 | USD | 1,266 | (7,760 | ) | |||||||||||||||||||||||
| EDP - Energias de Portugal SA |
Bank of America N.A. | 178,000 | 02/01/24 | EUR | 4.64 | EUR | 812 | (19,338 | ) | |||||||||||||||||||||||
| SSE PLC |
Morgan Stanley & Co. International PLC | 147,500 | 02/01/24 | GBP | 19.07 | GBP | 2,732 | (26,261 | ) | |||||||||||||||||||||||
| NextEra Energy, Inc. |
Barclays Bank PLC | 107,500 | 02/02/24 | USD | 57.94 | USD | 6,530 | (440,336 | ) | |||||||||||||||||||||||
| Vestas Wind Systems A/S |
UBS AG | 82,100 | 02/06/24 | DKK | 196.73 | DKK | 17,542 | (277,447 | ) | |||||||||||||||||||||||
| EDP - Energias de Portugal SA |
Morgan Stanley & Co. International PLC | 66,500 | 02/08/24 | EUR | 4.54 | EUR | 303 | (11,604 | ) | |||||||||||||||||||||||
| EDP Renovaveis SA |
Bank of America N.A. | 83,400 | 02/08/24 | EUR | 17.70 | EUR | 1,547 | (130,704 | ) | |||||||||||||||||||||||
| Infineon Technologies AG, Class N |
Morgan Stanley & Co. International PLC | 21,100 | 02/08/24 | EUR | 38.15 | EUR | 798 | (31,107 | ) | |||||||||||||||||||||||
| Public Service Enterprise Group, Inc. |
JPMorgan Chase Bank N.A. | 20,700 | 02/12/24 | USD | 61.90 | USD | 1,266 | (25,837 | ) | |||||||||||||||||||||||
| National Grid PLC |
Goldman Sachs International | 68,200 | 02/13/24 | GBP | 10.56 | GBP | 721 | (25,696 | ) | |||||||||||||||||||||||
| Compagnie de Saint-Gobain S.A. |
UBS AG | 21,800 | 02/14/24 | EUR | 61.96 | EUR | 1,456 | (135,610 | ) | |||||||||||||||||||||||
| Atlas Copco AB, B Shares |
Morgan Stanley & Co. International PLC | 16,000 | 02/21/24 | SEK | 144.79 | SEK | 2,394 | (12,491 | ) | |||||||||||||||||||||||
| Xcel Energy, Inc. |
Goldman Sachs International | 14,300 | 02/21/24 | USD | 61.55 | USD | 885 | (31,653 | ) | |||||||||||||||||||||||
| TC Energy Corp. |
Royal Bank of Canada | 29,400 | 02/26/24 | CAD | 52.43 | CAD | 1,522 | (27,082 | ) | |||||||||||||||||||||||
| Pembina Pipeline Corp. |
Morgan Stanley & Co. International PLC | 13,600 | 02/27/24 | CAD | 46.91 | CAD | 620 | (7,654 | ) | |||||||||||||||||||||||
|
|
|
|||||||||||||||||||||||||||||||
| $ | (5,532,757 | ) | ||||||||||||||||||||||||||||||
|
|
|
|||||||||||||||||||||||||||||||
Balances Reported in the Statements of Assets and Liabilities for Options Written
| Description | Swap Premiums Paid |
Swap Premiums Received |
Unrealized Appreciation |
Unrealized Depreciation |
Value | |||||||||||||||
| Options Written |
$ | N/A | $ | N/A | $ | 511,521 | $ | (4,307,711 | ) | $ | (7,790,856 | ) | ||||||||
Derivative Financial Instruments Categorized by Risk Exposure
As of period end, the fair values of derivative financial instruments located in the Statements of Assets and Liabilities were as follows:
| Commodity Contracts |
Credit Contracts |
Equity Contracts |
Foreign Currency Exchange Contracts |
Interest Rate Contracts |
Other Contracts |
Total | ||||||||||||||||||||||
| Liabilities — Derivative Financial Instruments |
||||||||||||||||||||||||||||
| Options written |
||||||||||||||||||||||||||||
| Options written at value |
$ | — | $ | — | $ | 7,790,856 | $ | — | $ | — | $ | — | $ | 7,790,856 | ||||||||||||||
|
|
|
|
|
|
|
|
|
|
|
|
|
|
|
|||||||||||||||
For the period ended December 31, 2023, the effect of derivative financial instruments in the Statements of Operations was as follows:
| Commodity Contracts |
Credit Contracts |
Equity Contracts |
Foreign Currency Exchange Contracts |
Interest Rate Contracts |
Other Contracts |
Total | ||||||||||||||||||||||
| Net Realized Gain (Loss) from: |
||||||||||||||||||||||||||||
| Options purchased(a) |
$ | — | $ | — | $ | (2,511,082 | ) | $ | — | $ | — | $ | — | $ | (2,511,082 | ) | ||||||||||||
| Options written |
— | — | 7,412,060 | — | — | — | 7,412,060 | |||||||||||||||||||||
|
|
|
|
|
|
|
|
|
|
|
|
|
|
|
|||||||||||||||
| $ | — | $ | — | $ | 4,900,978 | $ | — | $ | — | $ | — | $ | 4,900,978 | |||||||||||||||
|
|
|
|
|
|
|
|
|
|
|
|
|
|
|
|||||||||||||||
| Net Change in Unrealized Appreciation (Depreciation) on: |
||||||||||||||||||||||||||||
| Options written |
$ | — | $ | — | $ | (5,317,561 | ) | $ | — | $ | — | $ | — | $ | (5,317,561 | ) | ||||||||||||
|
|
|
|
|
|
|
|
|
|
|
|
|
|
|
|||||||||||||||
| (a) | Options purchased are included in net realized gain (loss) from investments — unaffiliated. |
| 130 | 2 0 2 3 B L A C K R O C K A N N U A L R E P O R T T O S H A R E H O L D E R S |
| Schedule of Investments (continued) December 31, 2023
|
BlackRock Utilities, Infrastructure & Power Opportunities Trust (BUI) |
Average Quarterly Balances of Outstanding Derivative Financial Instruments
| Options: |
||||
| Average value of option contracts purchased |
$ | — | (a) | |
| Average value of option contracts written |
$ | 4,659,318 | ||
| (a) | Derivative financial instrument not held at any quarter-end. The risk exposure table serves as an indicator of activity during the period. |
For more information about the Trust’s investment risks regarding derivative financial instruments, refer to the Notes to Financial Statements.
Derivative Financial Instruments — Offsetting as of Period End
The Trust’s derivative assets and liabilities (by type) were as follows:
| Assets | Liabilities | |||||||
| Derivative Financial Instruments |
||||||||
| Options |
$ | — | $ | 7,790,856 | ||||
|
|
|
|
|
|||||
| Total derivative assets and liabilities in the Statements of Assets and Liabilities |
— | 7,790,856 | ||||||
|
|
|
|
|
|||||
| Derivatives not subject to a Master Netting Agreement or similar agreement (“MNA”) |
— | (2,258,099 | ) | |||||
|
|
|
|
|
|||||
| Total derivative assets and liabilities subject to an MNA |
$ | — | $ | 5,532,757 | ||||
|
|
|
|
|
|||||
The following table presents the Trust’s derivative liabilities by counterparty net of amounts available for offset under an MNA and net of the related collateral pledged by the Trust:
| Counterparty | Derivative an MNA by |
Derivatives for Offset |
Non-Cash Collateral Pledged(a) |
Cash Collateral Pledged |
Net Amount of Derivative Liabilities(b) |
|||||||||||||||
| Bank of America N.A. |
$ | 1,397,666 | $ | — | $ | (1,397,666 | ) | $ | — | $ | — | |||||||||
| Barclays Bank PLC |
843,765 | — | (843,765 | ) | — | — | ||||||||||||||
| Goldman Sachs International |
665,226 | — | (665,226 | ) | — | — | ||||||||||||||
| JPMorgan Chase Bank N.A. |
173,550 | — | (75,257 | ) | — | 98,293 | ||||||||||||||
| Morgan Stanley & Co. International PLC |
1,199,374 | — | (1,199,374 | ) | — | — | ||||||||||||||
| Royal Bank of Canada |
116,314 | — | — | — | 116,314 | |||||||||||||||
| UBS AG |
1,136,862 | — | (1,136,862 | ) | — | — | ||||||||||||||
|
|
|
|
|
|
|
|
|
|
|
|||||||||||
| $ | 5,532,757 | $ | — | $ | (5,318,150 | ) | $ | — | $ | 214,607 | ||||||||||
|
|
|
|
|
|
|
|
|
|
|
|||||||||||
| (a) | Excess of collateral received/pledged, if any, from the individual counterparty is not shown for financial reporting purposes. |
| (b) | Net amount represents the net amount payable due to counterparty in the event of default. Net amount may be offset further by the options written receivable/payable on the Statements of Assets and Liabilities. |
Fair Value Hierarchy as of Period End
Various inputs are used in determining the fair value of financial instruments. For a description of the input levels and information about the Trust’s policy regarding valuation of financial instruments, refer to the Notes to Financial Statements.
The following table summarizes the Trust’s financial instruments categorized in the fair value hierarchy. The breakdown of the Trust’s financial instruments into major categories is disclosed in the Schedule of Investments above.
| Level 1 | Level 2 | Level 3 | Total | |||||||||||||
| Assets |
||||||||||||||||
| Investments |
||||||||||||||||
| Long-Term Investments |
||||||||||||||||
| Common Stocks |
||||||||||||||||
| Building Products |
$ | 24,668,637 | $ | 16,270,347 | $ | — | $ | 40,938,984 | ||||||||
| Chemicals |
7,712,313 | 7,937,343 | — | 15,649,656 | ||||||||||||
| Commercial Services & Supplies |
21,221,332 | — | — | 21,221,332 | ||||||||||||
| Construction & Engineering |
10,630,308 | 18,643,971 | — | 29,274,279 | ||||||||||||
| Electric Utilities |
94,614,788 | 52,709,461 | — | 147,324,249 | ||||||||||||
| Electrical Equipment |
6,634,772 | 28,246,740 | — | 34,881,512 | ||||||||||||
| Electronic Equipment, Instruments & Components |
3,598,908 | 3,913,973 | — | 7,512,881 | ||||||||||||
| Ground Transportation |
6,336,996 | — | — | 6,336,996 | ||||||||||||
| Independent Power and Renewable Electricity Producers |
4,617,882 | 39,310,740 | — | 43,928,622 | ||||||||||||
| S C H E D U L E O F I N V E S T M E N T S |
131 |
| Schedule of Investments (continued) December 31, 2023
|
BlackRock Utilities, Infrastructure & Power Opportunities Trust (BUI) |
Fair Value Hierarchy as of Period End (continued)
| Level 1 | Level 2 | Level 3 | Total | |||||||||||||
| Common Stocks (continued) |
||||||||||||||||
| Machinery |
$ | 10,185,678 | $ | 21,269,031 | $ | — | $ | 31,454,709 | ||||||||
| Multi-Utilities |
46,531,760 | 7,443,225 | — | 53,974,985 | ||||||||||||
| Oil, Gas & Consumable Fuels |
47,781,151 | — | — | 47,781,151 | ||||||||||||
| Semiconductors & Semiconductor Equipment |
11,197,430 | 16,650,797 | — | 27,848,227 | ||||||||||||
| Short-Term Securities |
||||||||||||||||
| Money Market Funds |
5,318,307 | — | — | 5,318,307 | ||||||||||||
|
|
|
|
|
|
|
|
|
|||||||||
| $ | 301,050,262 | $ | 212,395,628 | $ | — | 513,445,890 | ||||||||||
|
|
|
|
|
|
|
|
|
|||||||||
| Investments Valued at NAV(a) |
1,297,977 | |||||||||||||||
|
|
|
|||||||||||||||
| $ | 514,743,867 | |||||||||||||||
|
|
|
|||||||||||||||
| Derivative Financial Instruments(b) |
||||||||||||||||
| Liabilities |
||||||||||||||||
| Equity Contracts |
$ | (1,775,496 | ) | $ | (6,015,360 | ) | $ | — | $ | (7,790,856 | ) | |||||
|
|
|
|
|
|
|
|
|
|||||||||
| (a) | Certain investments of the Trust were fair valued using NAV as a practical expedient as no quoted market value is available and therefore have been excluded from the fair value hierarchy. |
| (b) | Derivative financial instruments are options written. Options written are shown at value. |
See notes to financial statements.
| 132 | 2 0 2 3 B L A C K R O C K A N N U A L R E P O R T T O S H A R E H O L D E R S |
Statements of Assets and Liabilities
December 31, 2023
| BGR | CII | BDJ(a) | BOE | |||||||||||||
| ASSETS |
||||||||||||||||
| Investments, at value — unaffiliated(b)(c) |
$ | 385,543,583 | $ | 880,409,887 | $ | 1,672,515,459 | $ | 733,836,650 | ||||||||
| Investments, at value — affiliated(d) |
3,612,320 | 13,330,465 | 5,204,534 | 2,668,223 | ||||||||||||
| Cash |
— | — | 272,377 | — | ||||||||||||
| Cash pledged as collateral for OTC derivatives |
— | — | — | 530,000 | ||||||||||||
| Foreign currency, at value(e) |
163,667 | — | 882 | 24 | ||||||||||||
| Receivables: |
||||||||||||||||
| Investments sold |
484,023 | — | — | 306,893 | ||||||||||||
| Options written |
108,187 | 124,997 | 111,675 | 40,637 | ||||||||||||
| Securities lending income — affiliated |
— | 315 | — | — | ||||||||||||
| Dividends — unaffiliated |
601,043 | 513,627 | 2,060,255 | 1,826,743 | ||||||||||||
| Dividends — affiliated |
21,673 | 39,772 | 89,084 | 16,407 | ||||||||||||
| Deferred offering costs |
— | — | 208,889 | — | ||||||||||||
| Prepaid expenses |
3,815 | 6,042 | 14,631 | 6,414 | ||||||||||||
|
|
|
|
|
|
|
|
|
|||||||||
| Total assets |
390,538,311 | 894,425,105 | 1,680,477,786 | 739,231,991 | ||||||||||||
|
|
|
|
|
|
|
|
|
|||||||||
| LIABILITIES |
||||||||||||||||
| Due to broker |
— | — | — | 530,000 | ||||||||||||
| Collateral on securities loaned |
— | 397,585 | — | — | ||||||||||||
| Options written, at value(f) |
1,725,858 | 18,548,876 | 36,487,628 | 10,846,451 | ||||||||||||
| Payables: |
||||||||||||||||
| Investments purchased |
— | — | — | 117 | ||||||||||||
| Accounting services fees |
10,983 | 11,774 | 22,979 | 14,255 | ||||||||||||
| Custodian fees |
8,435 | 7,886 | 32,245 | 26,592 | ||||||||||||
| Investment advisory fees |
321,437 | 618,507 | 1,099,961 | 500,730 | ||||||||||||
| Trustees’ and Officer’s fees |
421,043 | 254,806 | 1,019,525 | 676,190 | ||||||||||||
| Options written |
— | 43,370 | 49,358 | 11,852 | ||||||||||||
| Other accrued expenses |
9,083 | 3,046 | 8,368 | 14,212 | ||||||||||||
| Professional fees |
46,669 | 71,873 | 119,829 | 104,414 | ||||||||||||
| Transfer agent fees |
12,946 | 16,601 | 36,770 | 17,991 | ||||||||||||
|
|
|
|
|
|
|
|
|
|||||||||
| Total liabilities |
2,556,454 | 19,974,324 | 38,876,663 | 12,742,804 | ||||||||||||
|
|
|
|
|
|
|
|
|
|||||||||
| Commitments and contingent liabilities |
||||||||||||||||
| NET ASSETS |
$ | 387,981,857 | $ | 874,450,781 | $ | 1,641,601,123 | $ | 726,489,187 | ||||||||
|
|
|
|
|
|
|
|
|
|||||||||
| NET ASSETS CONSIST OF |
||||||||||||||||
| Paid-in capital(g)(h)(i) |
$ | 507,480,248 | $ | 561,832,951 | $ | 1,310,873,538 | $ | 650,889,396 | ||||||||
| Accumulated earnings (loss) |
(119,498,391 | ) | 312,617,830 | 330,727,585 | 75,599,791 | |||||||||||
|
|
|
|
|
|
|
|
|
|||||||||
| NET ASSETS |
$ | 387,981,857 | $ | 874,450,781 | $ | 1,641,601,123 | $ | 726,489,187 | ||||||||
|
|
|
|
|
|
|
|
|
|||||||||
| Net asset value |
$ | 14.13 | $ | 19.81 | $ | 8.82 | $ | 11.81 | ||||||||
|
|
|
|
|
|
|
|
|
|||||||||
| (a) Consolidated Statement of Assets and Liabilities. |
||||||||||||||||
| (b) Investments, at cost — unaffiliated |
$ | 261,065,835 | $ | 554,276,107 | $ | 1,420,450,150 | $ | 605,816,932 | ||||||||
| (c) Securities loaned, at value |
$ | — | $ | 389,928 | $ | — | $ | — | ||||||||
| (d) Investments, at cost — affiliated |
$ | 3,612,320 | $ | 13,330,505 | $ | 5,204,534 | $ | 2,668,223 | ||||||||
| (e) Foreign currency, at cost |
$ | 164,468 | $ | — | $ | 1,015 | $ | 29 | ||||||||
| (f) Premiums received |
$ | 2,439,087 | $ | 10,266,670 | $ | 20,613,526 | $ | 6,679,071 | ||||||||
| (g) Shares outstanding |
27,464,975 | 44,146,919 | 186,135,109 | 61,525,804 | ||||||||||||
| (h) Shares authorized |
Unlimited | 200 million | Unlimited | Unlimited | ||||||||||||
| (i) Par value |
$ | 0.001 | $ | 0.10 | $ | 0.001 | $ | 0.001 | ||||||||
See notes to financial statements.
| F I N A N C I A L S T A T E M E N T S |
133 |
Statements of Assets and Liabilities (continued)
December 31, 2023
| BGY | BMEZ | BME | BIGZ | |||||||||||||
| ASSETS |
||||||||||||||||
| Investments, at value — unaffiliated(a)(b) |
$ | 624,733,185 | $ | 1,897,904,122 | $ | 563,003,496 | $ | 2,045,982,868 | ||||||||
| Investments, at value — affiliated(c) |
8,260,103 | 52,782,059 | 31,396,977 | 20,831,232 | ||||||||||||
| Cash pledged as collateral for OTC derivatives |
— | 456,000 | — | — | ||||||||||||
| Foreign currency, at value(d) |
71,830 | 1,168 | 534 | 367 | ||||||||||||
| Receivables: |
||||||||||||||||
| Investments sold |
114,555 | 68,999 | 958,057 | — | ||||||||||||
| Options written |
— | 60,590 | 38,374 | — | ||||||||||||
| Securities lending income — affiliated |
— | 10,797 | 146 | 4,367 | ||||||||||||
| Dividends — unaffiliated |
1,006,356 | 1,032,893 | 473,056 | 321,424 | ||||||||||||
| Dividends — affiliated |
32,178 | 310,218 | 145,414 | 7,085 | ||||||||||||
| Unrealized appreciation on forward foreign currency exchange contracts |
— | 1,429,095 | — | — | ||||||||||||
| Deferred offering costs |
— | — | 82,600 | — | ||||||||||||
| Prepaid expenses |
5,495 | 16,160 | 5,292 | 16,620 | ||||||||||||
|
|
|
|
|
|
|
|
|
|||||||||
| Total assets |
634,223,702 | 1,954,072,101 | 596,103,946 | 2,067,163,963 | ||||||||||||
|
|
|
|
|
|
|
|
|
|||||||||
| LIABILITIES |
||||||||||||||||
| Bank overdraft |
— | 291,881 | 60,686 | — | ||||||||||||
| Collateral on securities loaned |
— | 12,300,667 | — | 20,504,459 | ||||||||||||
| Options written, at value(e) |
10,496,177 | 31,431,446 | 7,272,745 | 16,978,313 | ||||||||||||
| Payables: |
||||||||||||||||
| Accounting services fees |
11,774 | 73,720 | 6,786 | 77,172 | ||||||||||||
| Custodian fees |
30,184 | 70,982 | 14,995 | 25,318 | ||||||||||||
| Deferred foreign capital gain tax |
4,475 | — | — | — | ||||||||||||
| Investment advisory fees |
515,908 | 1,954,724 | 489,107 | 2,101,647 | ||||||||||||
| Trustees’ and Officer’s fees |
566,973 | 220,367 | 35,975 | 190,437 | ||||||||||||
| Options written |
— | 637 | 181 | — | ||||||||||||
| Other accrued expenses |
15,681 | 69,110 | 13,695 | 225,454 | ||||||||||||
| Professional fees |
82,978 | 170,562 | 60,267 | 241,684 | ||||||||||||
| Proxy fees |
— | 88,733 | — | 309,518 | ||||||||||||
| Transfer agent fees |
17,702 | 28,340 | 14,079 | 40,123 | ||||||||||||
|
|
|
|
|
|
|
|
|
|||||||||
| Total liabilities |
11,741,852 | 46,701,169 | 7,968,516 | 40,694,125 | ||||||||||||
|
|
|
|
|
|
|
|
|
|||||||||
| Commitments and contingent liabilities |
||||||||||||||||
| NET ASSETS |
$ | 622,481,850 | $ | 1,907,370,932 | $ | 588,135,430 | $ | 2,026,469,838 | ||||||||
|
|
|
|
|
|
|
|
|
|||||||||
| NET ASSETS CONSIST OF |
||||||||||||||||
| Paid-in capital(f)(g)(h) |
$ | 540,011,552 | $ | 1,951,060,860 | $ | 417,617,800 | $ | 4,022,207,780 | ||||||||
| Accumulated earnings (loss) |
82,470,298 | (43,689,928 | ) | 170,517,630 | (1,995,737,942 | ) | ||||||||||
|
|
|
|
|
|
|
|
|
|||||||||
| NET ASSETS |
$ | 622,481,850 | $ | 1,907,370,932 | $ | 588,135,430 | $ | 2,026,469,838 | ||||||||
|
|
|
|
|
|
|
|
|
|||||||||
| Net asset value |
$ | 6.21 | $ | 17.91 | $ | 42.18 | $ | 9.03 | ||||||||
|
|
|
|
|
|
|
|
|
|||||||||
| (a) Investments, at cost — unaffiliated |
$ | 516,484,782 | $ | 1,853,674,255 | $ | 382,327,860 | $ | 2,119,760,855 | ||||||||
| (b) Securities loaned, at value |
$ | — | $ | 11,862,741 | $ | — | $ | 19,672,989 | ||||||||
| (c) Investments, at cost — affiliated |
$ | 8,260,103 | $ | 52,782,639 | $ | 31,396,977 | $ | 20,830,071 | ||||||||
| (d) Foreign currency, at cost |
$ | 72,034 | $ | 1,152 | $ | 531 | $ | 365 | ||||||||
| (e) Premiums received |
$ | 6,047,973 | $ | 14,726,316 | $ | 4,793,338 | $ | 8,337,243 | ||||||||
| (f) Shares outstanding |
100,271,847 | 106,514,258 | 13,943,973 | 224,418,826 | ||||||||||||
| (g) Shares authorized |
Unlimited | Unlimited | Unlimited | Unlimited | ||||||||||||
| (h) Par value |
$ | 0.001 | $ | 0.001 | $ | 0.001 | $ | 0.001 | ||||||||
See notes to financial statements.
| 134 | 2 0 2 3 B L A C K R O C K A N N U A L R E P O R T T O S H A R E H O L D E R S |
Statements of Assets and Liabilities (continued)
December 31, 2023
| BCX | BSTZ(a) | BST(a) | BUI | |||||||||||||
| ASSETS |
||||||||||||||||
| Investments, at value — unaffiliated(b)(c) |
$ | 886,715,569 | $ | 1,645,173,877 | $ | 1,212,240,494 | $ | 508,127,583 | ||||||||
| Investments, at value — affiliated(d) |
20,310,546 | 4,350,523 | 6,226,377 | 6,616,284 | ||||||||||||
| Cash |
11,212 | — | — | 118,852 | ||||||||||||
| Cash pledged as collateral for OTC derivatives |
— | 2,810,000 | 480,000 | — | ||||||||||||
| Foreign currency, at value(e) |
32 | — | 3,106 | 311,516 | ||||||||||||
| Receivables: |
||||||||||||||||
| Investments sold |
— | 5,008,596 | 1,911,624 | — | ||||||||||||
| Options written |
144,623 | 73,559 | 64,797 | 5,666 | ||||||||||||
| Securities lending income — affiliated |
1,145 | 2,549 | 3,275 | 390 | ||||||||||||
| Dividends — unaffiliated |
1,303,716 | 249,242 | 165,225 | 766,502 | ||||||||||||
| Dividends — affiliated |
59,141 | 16,169 | 5,862 | 39,225 | ||||||||||||
| Interest — unaffiliated |
159,250 | — | — | — | ||||||||||||
| Deferred offering costs |
— | — | 190,226 | 104,426 | ||||||||||||
| Prepaid expenses |
— | 12,591 | 10,113 | — | ||||||||||||
|
|
|
|
|
|
|
|
|
|||||||||
| Total assets |
908,705,234 | 1,657,697,106 | 1,221,301,099 | 516,090,444 | ||||||||||||
|
|
|
|
|
|
|
|
|
|||||||||
| LIABILITIES |
||||||||||||||||
| Bank overdraft |
— | 343,159 | 506,784 | — | ||||||||||||
| Foreign bank overdraft(f) |
— | 4,202 | — | — | ||||||||||||
| Due to broker |
— | 680,000 | — | — | ||||||||||||
| Collateral on securities loaned |
6,147,790 | 2,865,527 | 5,861,189 | 1,296,550 | ||||||||||||
| Options written, at value(g) |
10,021,060 | 18,907,082 | 15,464,670 | 7,790,856 | ||||||||||||
| Payables: |
||||||||||||||||
| Investments purchased |
— | 984,914 | 1,560,753 | — | ||||||||||||
| Accounting services fees |
14,708 | 63,912 | 12,205 | 12,205 | ||||||||||||
| Custodian fees |
16,921 | 69,972 | 22,959 | 16,734 | ||||||||||||
| Deferred capital gain tax |
— | 1,502,552 | — | — | ||||||||||||
| Investment advisory fees |
744,129 | 1,706,024 | 1,000,816 | 421,840 | ||||||||||||
| Offering costs |
— | — | 122,160 | — | ||||||||||||
| Trustees’ and Officer’s fees |
270,533 | 207,525 | 18,503 | 8,241 | ||||||||||||
| Options written |
— | 10,649 | — | — | ||||||||||||
| Other accrued expenses |
31,460 | 115,292 | 81,798 | 28,508 | ||||||||||||
| Professional fees |
95,437 | 381,996 | 196,191 | 39,716 | ||||||||||||
| Transfer agent fees |
24,704 | 30,071 | 28,445 | 13,864 | ||||||||||||
|
|
|
|
|
|
|
|
|
|||||||||
| Total liabilities |
17,366,742 | 27,872,877 | 24,876,473 | 9,628,514 | ||||||||||||
|
|
|
|
|
|
|
|
|
|||||||||
| Commitments and contingent liabilities |
||||||||||||||||
| NET ASSETS |
$ | 891,338,492 | $ | 1,629,824,229 | $ | 1,196,424,626 | $ | 506,461,930 | ||||||||
|
|
|
|
|
|
|
|
|
|||||||||
| NET ASSETS CONSIST OF |
||||||||||||||||
| Paid-in capital(h)(i)(j) |
$ | 1,017,257,473 | $ | 1,204,518,485 | $ | 778,585,324 | $ | 376,938,330 | ||||||||
| Accumulated earnings (loss) |
(125,918,981 | ) | 425,305,744 | 417,839,302 | 129,523,600 | |||||||||||
|
|
|
|
|
|
|
|
|
|||||||||
| NET ASSETS |
$ | 891,338,492 | $ | 1,629,824,229 | $ | 1,196,424,626 | $ | 506,461,930 | ||||||||
|
|
|
|
|
|
|
|
|
|||||||||
| Net asset value |
$ | 10.57 | $ | 21.43 | $ | 34.74 | $ | 22.53 | ||||||||
|
|
|
|
|
|
|
|
|
|||||||||
| (a) Consolidated Statement of Assets and Liabilities. |
||||||||||||||||
| (b) Investments, at cost — unaffiliated |
$ | 763,800,468 | $ | 1,116,742,952 | $ | 772,151,828 | $ | 353,774,571 | ||||||||
| (c) Securities loaned, at value |
$ | 5,956,421 | $ | 2,734,659 | $ | 5,574,481 | $ | 1,261,058 | ||||||||
| (d) Investments, at cost — affiliated |
$ | 20,311,045 | $ | 4,349,961 | $ | 6,226,872 | $ | 6,616,280 | ||||||||
| (e) Foreign currency, at cost |
$ | 31 | $ | — | $ | 3,199 | $ | 311,331 | ||||||||
| (f) Foreign bank overdraft, at cost |
$ | — | $ | 4,244 | $ | — | $ | — | ||||||||
| (g) Premiums received |
$ | 6,777,331 | $ | 14,635,894 | $ | 10,495,969 | $ | 3,994,666 | ||||||||
| (h) Shares outstanding |
84,363,295 | 76,070,675 | 34,439,660 | 22,475,026 | ||||||||||||
| (i) Shares authorized |
Unlimited | Unlimited | Unlimited | Unlimited | ||||||||||||
| (j) Par value |
$ | 0.001 | $ | 0.001 | $ | 0.001 | $ | 0.001 | ||||||||
See notes to financial statements.
| F I N A N C I A L S T A T E M E N T S |
135 |
Year Ended December 31, 2023
| BGR | CII | BDJ(a) | BOE | |||||||||||||
| INVESTMENT INCOME |
||||||||||||||||
| Dividends — unaffiliated |
$ | 14,969,795 | $ | 9,850,246 | $ | 45,971,564 | $ | 20,734,128 | ||||||||
| Dividends — affiliated |
298,320 | 617,975 | 2,734,658 | 436,584 | ||||||||||||
| Securities lending income — affiliated — net |
— | 6,751 | 1,130 | 2,641 | ||||||||||||
| Other income — unaffiliated |
— | — | — | 1,660 | ||||||||||||
| Foreign taxes withheld |
(677,148 | ) | (229,698 | ) | (669,939 | ) | (1,152,741 | ) | ||||||||
| Foreign withholding tax claims |
— | — | — | 92,863 | ||||||||||||
|
|
|
|
|
|
|
|
|
|||||||||
| Total investment income |
14,590,967 | 10,245,274 | 48,037,413 | 20,115,135 | ||||||||||||
|
|
|
|
|
|
|
|
|
|||||||||
| EXPENSES |
||||||||||||||||
| Investment advisory |
4,701,620 | 7,010,587 | 12,943,290 | 7,083,506 | ||||||||||||
| Trustees and Officer |
68,275 | 68,931 | 223,235 | 107,935 | ||||||||||||
| Professional |
67,273 | 63,469 | 83,302 | 85,609 | ||||||||||||
| Transfer agent |
61,481 | 83,739 | 166,466 | 92,586 | ||||||||||||
| Accounting services |
44,026 | 50,619 | 95,592 | 60,591 | ||||||||||||
| Custodian |
38,393 | 30,538 | 121,839 | 101,549 | ||||||||||||
| Printing and postage |
12,806 | 12,250 | 12,155 | 13,049 | ||||||||||||
| Registration |
9,635 | 15,141 | 63,956 | 21,543 | ||||||||||||
| Miscellaneous |
43,350 | 45,572 | 122,140 | 111,703 | ||||||||||||
|
|
|
|
|
|
|
|
|
|||||||||
| Total expenses excluding interest expense |
5,046,859 | 7,380,846 | 13,831,975 | 7,678,071 | ||||||||||||
| Interest expense |
1,981 | 25 | 1,285 | 12,510 | ||||||||||||
|
|
|
|
|
|
|
|
|
|||||||||
| Total expenses |
5,048,840 | 7,380,871 | 13,833,260 | 7,690,581 | ||||||||||||
| Less: |
||||||||||||||||
| Fees waived and/or reimbursed by the Manager |
(866,525 | ) | (9,345 | ) | (42,031 | ) | (1,246,244 | ) | ||||||||
|
|
|
|
|
|
|
|
|
|||||||||
| Total expenses after fees waived and/or reimbursed |
4,182,315 | 7,371,526 | 13,791,229 | 6,444,337 | ||||||||||||
|
|
|
|
|
|
|
|
|
|||||||||
| Net investment income |
10,408,652 | 2,873,748 | 34,246,184 | 13,670,798 | ||||||||||||
|
|
|
|
|
|
|
|
|
|||||||||
| REALIZED AND UNREALIZED GAIN (LOSS) |
||||||||||||||||
| Net realized gain (loss) from: |
||||||||||||||||
| Investments — unaffiliated |
13,956,583 | 38,254,751 | 109,803,621 | (8,384,018 | ) | |||||||||||
| Investments — affiliated |
— | (486 | ) | (331 | ) | 1,183 | ||||||||||
| Foreign currency transactions |
(19,792 | ) | 5,820 | (29,970 | ) | 49,737 | ||||||||||
| Options written |
9,232,797 | (10,946,814 | ) | (6,887,226 | ) | 4,801,919 | ||||||||||
|
|
|
|
|
|
|
|
|
|||||||||
| 23,169,588 | 27,313,271 | 102,886,094 | (3,531,179 | ) | ||||||||||||
|
|
|
|
|
|
|
|
|
|||||||||
| Net change in unrealized appreciation (depreciation) on: |
||||||||||||||||
| Investments — unaffiliated |
(13,465,014 | ) | 135,702,696 | 36,602,051 | 94,322,957 | |||||||||||
| Investments — affiliated |
— | (40 | ) | — | — | |||||||||||
| Foreign currency translations |
7,464 | — | 56,565 | 70,714 | ||||||||||||
| Options written |
(1,712,020 | ) | (13,682,244 | ) | (23,815,466 | ) | (7,553,097 | ) | ||||||||
|
|
|
|
|
|
|
|
|
|||||||||
| (15,169,570 | ) | 122,020,412 | 12,843,150 | 86,840,574 | ||||||||||||
|
|
|
|
|
|
|
|
|
|||||||||
| Net realized and unrealized gain |
8,000,018 | 149,333,683 | 115,729,244 | 83,309,395 | ||||||||||||
|
|
|
|
|
|
|
|
|
|||||||||
| NET INCREASE IN NET ASSETS RESULTING FROM OPERATIONS |
$ | 18,408,670 | $ | 152,207,431 | $ | 149,975,428 | $ | 96,980,193 | ||||||||
|
|
|
|
|
|
|
|
|
|||||||||
| (a) | Consolidated Statement of Operations. |
See notes to financial statements.
| 136 | 2 0 2 3 B L A C K R O C K A N N U A L R E P O R T T O S H A R E H O L D E R S |
Statements of Operations (continued)
Year Ended December 31, 2023
| BGY | BMEZ | BME | BIGZ | |||||||||||||
| INVESTMENT INCOME |
||||||||||||||||
| Dividends — unaffiliated |
$ | 16,468,093 | $ | 10,039,140 | $ | 6,937,337 | $ | 4,032,845 | ||||||||
| Dividends — affiliated |
518,836 | 2,845,610 | 1,268,777 | 445,542 | ||||||||||||
| Securities lending income — affiliated — net |
— | 458,690 | 25,650 | 63,099 | ||||||||||||
| Foreign taxes withheld |
(1,573,063 | ) | (197,616 | ) | (38,198 | ) | (103,355 | ) | ||||||||
|
|
|
|
|
|
|
|
|
|||||||||
| Total investment income |
15,413,866 | 13,145,824 | 8,193,566 | 4,438,131 | ||||||||||||
|
|
|
|
|
|
|
|
|
|||||||||
| EXPENSES |
||||||||||||||||
| Investment advisory |
6,151,366 | 24,524,202 | 5,832,589 | 25,361,872 | ||||||||||||
| Custodian |
134,274 | 122,197 | 51,615 | 76,364 | ||||||||||||
| Professional |
106,618 | 132,875 | 98,133 | 189,064 | ||||||||||||
| Trustees and Officer |
90,917 | 131,469 | 37,651 | 130,669 | ||||||||||||
| Transfer agent |
84,967 | 112,265 | 75,539 | 113,140 | ||||||||||||
| Accounting services |
50,619 | 210,489 | 30,592 | 211,126 | ||||||||||||
| Registration |
35,250 | 77,430 | 6,969 | 118,823 | ||||||||||||
| Printing and postage |
13,432 | 7,656 | 12,150 | 51,776 | ||||||||||||
| Proxy |
— | 384,226 | — | 2,215,984 | ||||||||||||
| Miscellaneous |
119,953 | 311,104 | 61,916 | 810,404 | ||||||||||||
|
|
|
|
|
|
|
|
|
|||||||||
| Total expenses excluding interest expense |
6,787,396 | 26,013,913 | 6,207,154 | 29,279,222 | ||||||||||||
| Interest expense |
11,998 | 2,572 | 55 | 1,499 | ||||||||||||
|
|
|
|
|
|
|
|
|
|||||||||
| Total expenses |
6,799,394 | 26,016,485 | 6,207,209 | 29,280,721 | ||||||||||||
| Less: |
||||||||||||||||
| Fees waived and/or reimbursed by the Manager |
(7,794 | ) | (42,748 | ) | (19,166 | ) | (6,701 | ) | ||||||||
|
|
|
|
|
|
|
|
|
|||||||||
| Total expenses after fees waived and/or reimbursed |
6,791,600 | 25,973,737 | 6,188,043 | 29,274,020 | ||||||||||||
|
|
|
|
|
|
|
|
|
|||||||||
| Net investment income (loss) |
8,622,266 | (12,827,913 | ) | 2,005,523 | (24,835,889 | ) | ||||||||||
|
|
|
|
|
|
|
|
|
|||||||||
| REALIZED AND UNREALIZED GAIN (LOSS) |
||||||||||||||||
| Net realized gain (loss) from: |
||||||||||||||||
| Investments — unaffiliated |
11,484,884 | (a) | (24,744,005 | ) | 21,495,636 | (393,354,886 | ) | |||||||||
| Investments — affiliated |
— | 486,796 | 1,094 | (616 | ) | |||||||||||
| Forward foreign currency exchange contracts |
— | (57,158 | ) | — | — | |||||||||||
| Foreign currency transactions |
92,350 | (226,545 | ) | (16,353 | ) | 14,472 | ||||||||||
| Options written |
13,525,844 | 24,415,306 | 5,205,429 | (1,695,478 | ) | |||||||||||
|
|
|
|
|
|
|
|
|
|||||||||
| 25,103,078 | (125,606 | ) | 26,685,806 | (395,036,508 | ) | |||||||||||
|
|
|
|
|
|
|
|
|
|||||||||
| Net change in unrealized appreciation (depreciation) on: |
||||||||||||||||
| Investments — unaffiliated |
55,264,286 | (b) | 105,248,841 | (4,024,478 | ) | 645,656,803 | ||||||||||
| Investments — affiliated |
— | 148,903 | (265 | ) | 1,161 | |||||||||||
| Forward foreign currency exchange contracts |
— | (3,535,460 | ) | — | — | |||||||||||
| Foreign currency translations |
76,633 | 30,590 | 8,828 | (3,742 | ) | |||||||||||
| Options written |
(5,754,650 | ) | (19,080,793 | ) | (4,658,396 | ) | (14,212,806 | ) | ||||||||
|
|
|
|
|
|
|
|
|
|||||||||
| 49,586,269 | 82,812,081 | (8,674,311 | ) | 631,441,416 | ||||||||||||
|
|
|
|
|
|
|
|
|
|||||||||
| Net realized and unrealized gain |
74,689,347 | 82,686,475 | 18,011,495 | 236,404,908 | ||||||||||||
|
|
|
|
|
|
|
|
|
|||||||||
| NET INCREASE IN NET ASSETS RESULTING FROM OPERATIONS |
$ | 83,311,613 | $ | 69,858,562 | $ | 20,017,018 | $ | 211,569,019 | ||||||||
|
|
|
|
|
|
|
|
|
|||||||||
| (a) Net of foreign capital gain tax and capital gain tax refund, if applicable of |
$ | 5,424 | $ | — | $ | — | $ | — | ||||||||
| (b) Net of reduction in deferred foreign capital gain tax of |
$ | 68,252 | $ | — | $ | — | $ | — | ||||||||
See notes to financial statements.
| F I N A N C I A L S T A T E M E N T S |
137 |
Statements of Operations (continued)
Year Ended December 31, 2023
| BCX | BSTZ(a) | BST(a) | BUI | |||||||||||||
| INVESTMENT INCOME |
||||||||||||||||
| Dividends — unaffiliated |
$ | 34,681,757 | $ | 6,443,460 | $ | 4,090,208 | $ | 13,347,378 | ||||||||
| Dividends — affiliated |
1,252,534 | 395,145 | 354,864 | 525,353 | ||||||||||||
| Securities lending income — affiliated — net |
17,994 | 78,328 | 16,851 | 10,772 | ||||||||||||
| Foreign taxes withheld |
(1,719,124 | ) | (763,345 | ) | (125,252 | ) | (689,625 | ) | ||||||||
| Foreign withholding tax claims |
— | — | — | 25,957 | ||||||||||||
|
|
|
|
|
|
|
|
|
|||||||||
| Total investment income |
34,233,161 | 6,153,588 | 4,336,671 | 13,219,835 | ||||||||||||
|
|
|
|
|
|
|
|
|
|||||||||
| EXPENSES |
||||||||||||||||
| Investment advisory |
9,268,898 | 19,807,795 | 10,967,904 | 4,969,829 | ||||||||||||
| Transfer agent |
119,977 | 151,677 | 147,249 | 72,110 | ||||||||||||
| Custodian |
84,957 | 202,787 | 102,677 | 64,294 | ||||||||||||
| Trustees and Officer |
81,038 | 106,732 | 61,745 | 29,277 | ||||||||||||
| Professional |
72,375 | 185,694 | 191,977 | 76,063 | ||||||||||||
| Accounting services |
59,025 | 173,820 | 49,023 | 49,023 | ||||||||||||
| Registration |
30,063 | 26,861 | 14,365 | 12,685 | ||||||||||||
| Printing and postage |
12,892 | 11,562 | 15,566 | 12,845 | ||||||||||||
| Miscellaneous |
116,687 | 627,205 | 432,022 | 97,398 | ||||||||||||
|
|
|
|
|
|
|
|
|
|||||||||
| Total expenses excluding interest expense |
9,845,912 | 21,294,133 | 11,982,528 | 5,383,524 | ||||||||||||
| Interest expense |
2,847 | 21,132 | 14,556 | 2,654 | ||||||||||||
|
|
|
|
|
|
|
|
|
|||||||||
| Total expenses |
9,848,759 | 21,315,265 | 11,997,084 | 5,386,178 | ||||||||||||
| Less: |
||||||||||||||||
| Fees waived and/or reimbursed by the Manager |
(18,912 | ) | (5,929 | ) | (5,407 | ) | (8,011 | ) | ||||||||
|
|
|
|
|
|
|
|
|
|||||||||
| Total expenses after fees waived and/or reimbursed |
9,829,847 | 21,309,336 | 11,991,677 | 5,378,167 | ||||||||||||
|
|
|
|
|
|
|
|
|
|||||||||
| Net investment income (loss) |
24,403,314 | (15,155,748 | ) | (7,655,006 | ) | 7,841,668 | ||||||||||
|
|
|
|
|
|
|
|
|
|||||||||
| REALIZED AND UNREALIZED GAIN (LOSS) |
||||||||||||||||
| Net realized gain (loss) from: |
||||||||||||||||
| Investments — unaffiliated |
12,875,880 | (14,848,604 | ) | 81,791,251 | 11,729,367 | |||||||||||
| Investments — affiliated |
4,937 | 12,631 | 1,012 | 1,417 | ||||||||||||
| Foreign currency transactions |
25,265 | (425,111 | ) | (6,781 | ) | 49,491 | ||||||||||
| Options written |
21,043,307 | (25,763,522 | ) | (31,419,636 | ) | 7,412,060 | ||||||||||
| Payment by affiliate |
— | 127,092 | — | — | ||||||||||||
|
|
|
|
|
|
|
|
|
|||||||||
| 33,949,389 | (40,897,514 | ) | 50,365,846 | 19,192,335 | ||||||||||||
|
|
|
|
|
|
|
|
|
|||||||||
| Net change in unrealized appreciation (depreciation) on: |
||||||||||||||||
| Investments — unaffiliated |
(60,295,894 | ) | 349,981,389 | (b) | 259,808,753 | (b) | 14,349,399 | |||||||||
| Investments — affiliated |
(499 | ) | 562 | (575 | ) | (118 | ) | |||||||||
| Foreign currency translations |
24,073 | 6,975 | 150 | 18,026 | ||||||||||||
| Options written |
(6,718,319 | ) | (13,974,383 | ) | (12,373,937 | ) | (5,317,561 | ) | ||||||||
|
|
|
|
|
|
|
|
|
|||||||||
| (66,990,639 | ) | 336,014,543 | 247,434,391 | 9,049,746 | ||||||||||||
|
|
|
|
|
|
|
|
|
|||||||||
| Net realized and unrealized gain (loss) |
(33,041,250 | ) | 295,117,029 | 297,800,237 | 28,242,081 | |||||||||||
|
|
|
|
|
|
|
|
|
|||||||||
| NET INCREASE (DECREASE) IN NET ASSETS RESULTING FROM OPERATIONS |
$ | (8,637,936 | ) | $ | 279,961,281 | $ | 290,145,231 | $ | 36,083,749 | |||||||
|
|
|
|
|
|
|
|
|
|||||||||
| (a) Consolidated Statement of Operations. |
||||||||||||||||
| (b) Net of reduction in deferred capital gain tax of |
$ | — | $ | 1,956,748 | $ | 113,475 | $ | — | ||||||||
See notes to financial statements.
| 138 | 2 0 2 3 B L A C K R O C K A N N U A L R E P O R T T O S H A R E H O L D E R S |
Statements of Changes in Net Assets
| BGR | CII | |||||||||||||||||||
| Year Ended 12/31/23 |
Year Ended 12/31/22 |
Year Ended 12/31/23 |
Year Ended 12/31/22 |
|||||||||||||||||
|
|
||||||||||||||||||||
| INCREASE (DECREASE) IN NET ASSETS |
||||||||||||||||||||
| OPERATIONS |
||||||||||||||||||||
| Net investment income |
$ | 10,408,652 | $ | 12,071,039 | $ | 2,873,748 | $ | 2,696,846 | ||||||||||||
| Net realized gain |
23,169,588 | 34,809,940 | 27,313,271 | 100,213,617 | ||||||||||||||||
| Net change in unrealized appreciation (depreciation) |
(15,169,570 | ) | 66,906,553 | 122,020,412 | (211,028,139 | ) | ||||||||||||||
|
|
|
|
|
|
|
|
|
|||||||||||||
| Net increase (decrease) in net assets resulting from operations |
18,408,670 | 113,787,532 | 152,207,431 | (108,117,676 | ) | |||||||||||||||
|
|
|
|
|
|
|
|
|
|||||||||||||
| DISTRIBUTIONS TO SHAREHOLDERS(a) |
||||||||||||||||||||
| From net investment income and net realized gain |
(10,396,825 | ) | (11,890,970 | ) | (52,698,168 | ) | (92,693,757 | ) | ||||||||||||
| Return of capital |
(11,108,880 | ) | (4,610,793 | ) | — | — | ||||||||||||||
|
|
|
|
|
|
|
|
|
|||||||||||||
| Decrease in net assets resulting from distributions to shareholders |
(21,505,705 | ) | (16,501,763 | ) | (52,698,168 | ) | (92,693,757 | ) | ||||||||||||
|
|
|
|
|
|
|
|
|
|||||||||||||
| CAPITAL SHARE TRANSACTIONS |
||||||||||||||||||||
| Reinvestment of distributions |
— | — | 274,446 | — | ||||||||||||||||
| Redemption of shares resulting from share repurchase program (including transaction costs) |
(7,413,692 | ) | (12,296,655 | ) | — | — | ||||||||||||||
|
|
|
|
|
|
|
|
|
|||||||||||||
| Net increase (decrease) in net assets derived from capital share transactions |
(7,413,692 | ) | (12,296,655 | ) | 274,446 | — | ||||||||||||||
|
|
|
|
|
|
|
|
|
|||||||||||||
| NET ASSETS |
||||||||||||||||||||
| Total increase (decrease) in net assets |
(10,510,727 | ) | 84,989,114 | 99,783,709 | (200,811,433 | ) | ||||||||||||||
| Beginning of year |
398,492,584 | 313,503,470 | 774,667,072 | 975,478,505 | ||||||||||||||||
|
|
|
|
|
|
|
|
|
|||||||||||||
| End of year |
$ | 387,981,857 | $ | 398,492,584 | $ | 874,450,781 | $ | 774,667,072 | ||||||||||||
|
|
|
|
|
|
|
|
|
|||||||||||||
| (a) | Distributions for annual periods determined in accordance with U.S. federal income tax regulations. |
See notes to financial statements.
| F I N A N C I A L S T A T E M E N T S |
139 |
Statements of Changes in Net Assets (continued)
| BDJ(a) | BOE | |||||||||||||||||||
| Year Ended 12/31/23 |
Year Ended 12/31/22 |
Year Ended 12/31/23 |
Year Ended 12/31/22 |
|||||||||||||||||
|
|
||||||||||||||||||||
| INCREASE (DECREASE) IN NET ASSETS |
||||||||||||||||||||
| OPERATIONS |
||||||||||||||||||||
| Net investment income |
$ | 34,246,184 | $ | 30,038,016 | $ | 13,670,798 | $ | 12,760,469 | ||||||||||||
| Net realized gain (loss) |
102,886,094 | 147,475,079 | (3,531,179 | ) | 15,653,551 | |||||||||||||||
| Net change in unrealized appreciation (depreciation) |
12,843,150 | (250,207,024 | ) | 86,840,574 | (137,096,032 | ) | ||||||||||||||
|
|
|
|
|
|
|
|
|
|||||||||||||
| Net increase (decrease) in net assets resulting from operations |
149,975,428 | (72,693,929 | ) | 96,980,193 | (108,682,012 | ) | ||||||||||||||
|
|
|
|
|
|
|
|
|
|||||||||||||
| DISTRIBUTIONS TO SHAREHOLDERS(b) |
||||||||||||||||||||
| From net investment income and net realized gain |
(135,982,780 | ) | (204,152,869 | ) | (13,739,848 | ) | (38,142,002 | ) | ||||||||||||
| Return of capital |
— | — | (33,325,380 | ) | (9,962,064 | ) | ||||||||||||||
|
|
|
|
|
|
|
|
|
|||||||||||||
| Decrease in net assets resulting from distributions to shareholders |
(135,982,780 | ) | (204,152,869 | ) | (47,065,228 | ) | (48,104,066 | ) | ||||||||||||
|
|
|
|
|
|
|
|
|
|||||||||||||
| CAPITAL SHARE TRANSACTIONS |
||||||||||||||||||||
| Reinvestment of distributions |
702,786 | 3,650,249 | — | — | ||||||||||||||||
| Redemption of shares resulting from share repurchase program (including transaction costs) |
(2,735,878 | ) | — | (11,889,663 | ) | (12,470,648 | ) | |||||||||||||
|
|
|
|
|
|
|
|
|
|||||||||||||
| Net increase (decrease) in net assets derived from capital share transactions |
(2,033,092 | ) | 3,650,249 | (11,889,663 | ) | (12,470,648 | ) | |||||||||||||
|
|
|
|
|
|
|
|
|
|||||||||||||
| NET ASSETS |
||||||||||||||||||||
| Total increase (decrease) in net assets |
11,959,556 | (273,196,549 | ) | 38,025,302 | (169,256,726 | ) | ||||||||||||||
| Beginning of year |
1,629,641,567 | 1,902,838,116 | 688,463,885 | 857,720,611 | ||||||||||||||||
|
|
|
|
|
|
|
|
|
|||||||||||||
| End of year |
$ | 1,641,601,123 | $ | 1,629,641,567 | $ | 726,489,187 | $ | 688,463,885 | ||||||||||||
|
|
|
|
|
|
|
|
|
|||||||||||||
| (a) | Consolidated Statement of Changes in Net Assets. |
| (b) | Distributions for annual periods determined in accordance with U.S. federal income tax regulations. |
See notes to financial statements.
| 140 | 2 0 2 3 B L A C K R O C K A N N U A L R E P O R T T O S H A R E H O L D E R S |
Statements of Changes in Net Assets (continued)
| BGY | BMEZ | |||||||||||||||||||
| Year Ended 12/31/23 |
Year Ended 12/31/22 |
Year Ended 12/31/23 |
Year Ended 12/31/22 |
|||||||||||||||||
|
|
||||||||||||||||||||
| INCREASE (DECREASE) IN NET ASSETS |
||||||||||||||||||||
| OPERATIONS |
||||||||||||||||||||
| Net investment income (loss) |
$ | 8,622,266 | $ | 10,518,833 | $ | (12,827,913 | ) | $ | (20,420,947 | ) | ||||||||||
| Net realized gain (loss) |
25,103,078 | 14,980,788 | (125,606 | ) | (26,244,107 | ) | ||||||||||||||
| Net change in unrealized appreciation (depreciation) |
49,586,269 | (92,154,694 | ) | 82,812,081 | (636,053,199 | ) | ||||||||||||||
|
|
|
|
|
|
|
|
|
|||||||||||||
| Net increase (decrease) in net assets resulting from operations |
83,311,613 | (66,655,073 | ) | 69,858,562 | (682,718,253 | ) | ||||||||||||||
|
|
|
|
|
|
|
|
|
|||||||||||||
| DISTRIBUTIONS TO SHAREHOLDERS(a) |
||||||||||||||||||||
| From net investment income and net realized gain |
(17,300,662 | ) | (20,170,266 | ) | — | (183,050,144 | ) | |||||||||||||
| Return of capital |
(23,857,237 | ) | (21,930,456 | ) | (170,987,587 | ) | (11,869,565 | ) | ||||||||||||
|
|
|
|
|
|
|
|
|
|||||||||||||
| Decrease in net assets resulting from distributions to shareholders |
(41,157,899 | ) | (42,100,722 | ) | (170,987,587 | ) | (194,919,709 | ) | ||||||||||||
|
|
|
|
|
|
|
|
|
|||||||||||||
| CAPITAL SHARE TRANSACTIONS |
||||||||||||||||||||
| Redemption of shares resulting from share repurchase program (including transaction costs) |
(13,143,239 | ) | (7,282,700 | ) | (47,918,763 | ) | (47,829,587 | ) | ||||||||||||
|
|
|
|
|
|
|
|
|
|||||||||||||
| NET ASSETS |
||||||||||||||||||||
| Total increase (decrease) in net assets |
29,010,475 | (116,038,495 | ) | (149,047,788 | ) | (925,467,549 | ) | |||||||||||||
| Beginning of year |
593,471,375 | 709,509,870 | 2,056,418,720 | 2,981,886,269 | ||||||||||||||||
|
|
|
|
|
|
|
|
|
|||||||||||||
| End of year |
$ | 622,481,850 | $ | 593,471,375 | $ | 1,907,370,932 | $ | 2,056,418,720 | ||||||||||||
|
|
|
|
|
|
|
|
|
|||||||||||||
| (a) | Distributions for annual periods determined in accordance with U.S. federal income tax regulations. |
See notes to financial statements.
| F I N A N C I A L S T A T E M E N T S |
141 |
Statements of Changes in Net Assets (continued)
| BME | BIGZ | |||||||||||||||||||
| Year Ended 12/31/23 |
Year Ended 12/31/22 |
Year Ended 12/31/23 |
Year Ended 12/31/22 |
|||||||||||||||||
|
|
||||||||||||||||||||
| INCREASE (DECREASE) IN NET ASSETS |
||||||||||||||||||||
| OPERATIONS |
||||||||||||||||||||
| Net investment income (loss) |
$ | 2,005,523 | $ | 1,539,556 | $ | (24,835,889 | ) | $ | (31,271,483 | ) | ||||||||||
| Net realized gain (loss) |
26,685,806 | 13,676,395 | (395,036,508 | ) | (1,316,372,963 | ) | ||||||||||||||
| Net change in unrealized appreciation (depreciation) |
(8,674,311 | ) | (41,687,030 | ) | 631,441,416 | (308,670,678 | ) | |||||||||||||
|
|
|
|
|
|
|
|
|
|||||||||||||
| Net increase (decrease) in net assets resulting from operations |
20,017,018 | (26,471,079 | ) | 211,569,019 | (1,656,315,124 | ) | ||||||||||||||
|
|
|
|
|
|
|
|
|
|||||||||||||
| DISTRIBUTIONS TO SHAREHOLDERS(a) |
||||||||||||||||||||
| From net investment income and net realized gain |
(25,396,234 | ) | (32,998,527 | ) | — | — | ||||||||||||||
| Return of capital |
(10,214,453 | ) | (1,403,564 | ) | (173,714,456 | ) | (233,929,900 | ) | ||||||||||||
|
|
|
|
|
|
|
|
|
|||||||||||||
| Decrease in net assets resulting from distributions to shareholders |
(35,610,687 | ) | (34,402,091 | ) | (173,714,456 | ) | (233,929,900 | ) | ||||||||||||
|
|
|
|
|
|
|
|
|
|||||||||||||
| CAPITAL SHARE TRANSACTIONS |
||||||||||||||||||||
| Net proceeds from the issuance of shares |
3,020,683 | 33,618,939 | — | — | ||||||||||||||||
| Reinvestment of distributions |
511,503 | 1,676,333 | — | — | ||||||||||||||||
| Redemption of shares resulting from share repurchase program (including transaction costs) |
— | — | (37,872,639 | ) | (64,919,571 | ) | ||||||||||||||
|
|
|
|
|
|
|
|
|
|||||||||||||
| Net increase (decrease) in net assets derived from capital share transactions |
3,532,186 | 35,295,272 | (37,872,639 | ) | (64,919,571 | ) | ||||||||||||||
|
|
|
|
|
|
|
|
|
|||||||||||||
| NET ASSETS |
||||||||||||||||||||
| Total decrease in net assets |
(12,061,483 | ) | (25,577,898 | ) | (18,076 | ) | (1,955,164,595 | ) | ||||||||||||
| Beginning of year |
600,196,913 | 625,774,811 | 2,026,487,914 | 3,981,652,509 | ||||||||||||||||
|
|
|
|
|
|
|
|
|
|||||||||||||
| End of year |
$ | 588,135,430 | $ | 600,196,913 | $ | 2,026,469,838 | $ | 2,026,487,914 | ||||||||||||
|
|
|
|
|
|
|
|
|
|||||||||||||
| (a) | Distributions for annual periods determined in accordance with U.S. federal income tax regulations. |
See notes to financial statements.
| 142 | 2 0 2 3 B L A C K R O C K A N N U A L R E P O R T T O S H A R E H O L D E R S |
Statements of Changes in Net Assets (continued)
| BCX | BSTZ(a) | |||||||||||||||||||
| Year Ended 12/31/23 |
Year Ended 12/31/22 |
Year Ended 12/31/23 |
Year Ended 12/31/22 |
|||||||||||||||||
|
|
||||||||||||||||||||
| INCREASE (DECREASE) IN NET ASSETS |
||||||||||||||||||||
| OPERATIONS |
||||||||||||||||||||
| Net investment income (loss) |
$ | 24,403,314 | $ | 26,122,375 | $ | (15,155,748 | ) | $ | (23,377,483 | ) | ||||||||||
| Net realized gain (loss) |
33,949,389 | 164,961,884 | (40,897,514 | ) | 116,813,048 | |||||||||||||||
| Net change in unrealized appreciation (depreciation) |
(66,990,639 | ) | (53,573,504 | ) | 336,014,543 | (1,429,494,278 | ) | |||||||||||||
|
|
|
|
|
|
|
|
|
|||||||||||||
| Net increase (decrease) in net assets resulting from operations |
(8,637,936 | ) | 137,510,755 | 279,961,281 | (1,336,058,713 | ) | ||||||||||||||
|
|
|
|
|
|
|
|
|
|||||||||||||
| DISTRIBUTIONS TO SHAREHOLDERS(b) |
||||||||||||||||||||
| From net investment income and net realized gain |
(24,357,046 | ) | (26,024,883 | ) | — | (70,402,537 | ) | |||||||||||||
| Return of capital |
(29,035,558 | ) | (22,531,891 | ) | (140,469,092 | ) | (110,549,120 | ) | ||||||||||||
|
|
|
|
|
|
|
|
|
|||||||||||||
| Decrease in net assets resulting from distributions to shareholders |
(53,392,604 | ) | (48,556,774 | ) | (140,469,092 | ) | (180,951,657 | ) | ||||||||||||
|
|
|
|
|
|
|
|
|
|||||||||||||
| CAPITAL SHARE TRANSACTIONS |
||||||||||||||||||||
| Redemption of shares resulting from share repurchase program (including transaction costs) |
(29,812,008 | ) | (7,554,830 | ) | (34,325,597 | ) | (7,293,625 | ) | ||||||||||||
|
|
|
|
|
|
|
|
|
|||||||||||||
| NET ASSETS |
||||||||||||||||||||
| Total increase (decrease) in net assets |
(91,842,548 | ) | 81,399,151 | 105,166,592 | (1,524,303,995 | ) | ||||||||||||||
| Beginning of year |
983,181,040 | 901,781,889 | 1,524,657,637 | 3,048,961,632 | ||||||||||||||||
|
|
|
|
|
|
|
|
|
|||||||||||||
| End of year |
$ | 891,338,492 | $ | 983,181,040 | $ | 1,629,824,229 | $ | 1,524,657,637 | ||||||||||||
|
|
|
|
|
|
|
|
|
|||||||||||||
| (a) | Consolidated Statement of Changes in Net Assets. |
| (b) | Distributions for annual periods determined in accordance with U.S. federal income tax regulations. |
See notes to financial statements.
| F I N A N C I A L S T A T E M E N T S |
143 |
Statements of Changes in Net Assets (continued)
| BST(a) | BUI | |||||||||||||||||||
| Year Ended 12/31/23 |
Year Ended 12/31/22 |
Year Ended 12/31/23 |
Year Ended 12/31/22 |
|||||||||||||||||
|
|
||||||||||||||||||||
| INCREASE (DECREASE) IN NET ASSETS |
||||||||||||||||||||
| OPERATIONS |
||||||||||||||||||||
| Net investment income (loss) |
$ | (7,655,006 | ) | $ | (9,272,089 | ) | $ | 7,841,668 | $ | 7,295,744 | ||||||||||
| Net realized gain |
50,365,846 | 51,379,805 | 19,192,335 | 7,425,254 | ||||||||||||||||
| Net change in unrealized appreciation (depreciation) |
247,434,391 | (696,878,029 | ) | 9,049,746 | (59,248,817 | ) | ||||||||||||||
|
|
|
|
|
|
|
|
|
|||||||||||||
| Net increase (decrease) in net assets resulting from operations |
290,145,231 | (654,770,313 | ) | 36,083,749 | (44,527,819 | ) | ||||||||||||||
|
|
|
|
|
|
|
|
|
|||||||||||||
| DISTRIBUTIONS TO SHAREHOLDERS(b) |
||||||||||||||||||||
| From net investment income and net realized gain |
(50,091,649 | ) | (69,684,200 | ) | (21,447,319 | ) | (18,983,124 | ) | ||||||||||||
| Return of capital |
(51,595,440 | ) | (27,306,002 | ) | (11,077,670 | ) | (13,135,583 | ) | ||||||||||||
|
|
|
|
|
|
|
|
|
|||||||||||||
| Decrease in net assets resulting from distributions to shareholders |
(101,687,089 | ) | (96,990,202 | ) | (32,524,989 | ) | (32,118,707 | ) | ||||||||||||
|
|
|
|
|
|
|
|
|
|||||||||||||
| CAPITAL SHARE TRANSACTIONS |
||||||||||||||||||||
| Net proceeds from the issuance of shares |
41,619,188 | 28,525,537 | 3,779,817 | 14,467,890 | ||||||||||||||||
| Reinvestment of distributions |
5,644,095 | 2,771,741 | 730,387 | 766,909 | ||||||||||||||||
|
|
|
|
|
|
|
|
|
|||||||||||||
| Net increase in net assets derived from capital share transactions |
47,263,283 | 31,297,278 | 4,510,204 | 15,234,799 | ||||||||||||||||
|
|
|
|
|
|
|
|
|
|||||||||||||
| NET ASSETS |
||||||||||||||||||||
| Total increase (decrease) in net assets |
235,721,425 | (720,463,237 | ) | 8,068,964 | (61,411,727 | ) | ||||||||||||||
| Beginning of year |
960,703,201 | 1,681,166,438 | 498,392,966 | 559,804,693 | ||||||||||||||||
|
|
|
|
|
|
|
|
|
|||||||||||||
| End of year |
$ | 1,196,424,626 | $ | 960,703,201 | $ | 506,461,930 | $ | 498,392,966 | ||||||||||||
|
|
|
|
|
|
|
|
|
|||||||||||||
| (a) | Consolidated Statement of Changes in Net Assets. |
| (b) | Distributions for annual periods determined in accordance with U.S. federal income tax regulations. |
See notes to financial statements.
| 144 | 2 0 2 3 B L A C K R O C K A N N U A L R E P O R T T O S H A R E H O L D E R S |
Year Ended December 31, 2023
| BGR | CII | BDJ(a) | BOE | |||||||||||||
| CASH PROVIDED BY (USED FOR) OPERATING ACTIVITIES |
||||||||||||||||
| Net increase in net assets resulting from operations |
$ | 18,408,670 | $ | 152,207,431 | $ | 149,975,428 | $ | 96,980,193 | ||||||||
| Adjustments to reconcile net increase in net assets resulting from operations to net cash provided by operating activities: |
||||||||||||||||
| Proceeds from sales of long-term investments and principal paydowns/payups |
155,259,253 | 299,421,903 | 738,966,890 | 363,701,155 | ||||||||||||
| Purchases of long-term investments |
(147,272,203 | ) | (235,741,075 | ) | (698,110,301 | ) | (330,769,604 | ) | ||||||||
| Net proceeds from sales of short-term securities |
4,083,155 | 1,330,166 | 70,837,572 | 3,976,712 | ||||||||||||
| Premiums paid on closing options written |
(21,610,723 | ) | (113,646,798 | ) | (165,872,491 | ) | (50,374,267 | ) | ||||||||
| Premiums received from options written |
28,273,392 | 99,822,466 | 158,385,773 | 54,159,601 | ||||||||||||
| Net realized (gain) loss on investments and options written |
(22,920,725 | ) | (27,280,542 | ) | (102,827,132 | ) | 3,739,905 | |||||||||
| Net unrealized (appreciation) depreciation on investments, options written and foreign currency translations |
15,177,844 | (122,020,412 | ) | (12,786,583 | ) | (86,769,860 | ) | |||||||||
| (Increase) Decrease in Assets |
||||||||||||||||
| Receivables |
||||||||||||||||
| Dividends — affiliated |
2,178 | 46,761 | 233,670 | 10,292 | ||||||||||||
| Dividends — unaffiliated |
119,573 | 43,195 | 309,576 | (145,719 | ) | |||||||||||
| Securities lending income — affiliated |
— | (315 | ) | — | — | |||||||||||
| Prepaid expenses |
(3,815 | ) | (6,042 | ) | (14,631 | ) | (6,414 | ) | ||||||||
| Deferred offering costs |
— | — | (208,889 | ) | — | |||||||||||
| Increase (Decrease) in Liabilities |
||||||||||||||||
| Due to broker |
— | — | — | 530,000 | ||||||||||||
| Collateral on securities loaned |
— | 397,585 | — | — | ||||||||||||
| Payables |
||||||||||||||||
| Accounting services fees |
(3,703 | ) | (3,884 | ) | (7,699 | ) | (4,754 | ) | ||||||||
| Custodian fees |
(7,606 | ) | (68 | ) | (20,442 | ) | (14,517 | ) | ||||||||
| Investment advisory fees |
(6,328 | ) | 39,963 | (34,244 | ) | 12,621 | ||||||||||
| Trustees’ and Officer’s fees |
14,268 | 26,371 | 108,558 | 29,364 | ||||||||||||
| Other accrued expenses |
(19,397 | ) | (48,293 | ) | (32,354 | ) | (14,595 | ) | ||||||||
| Professional fees |
(24,123 | ) | (30,540 | ) | (52,758 | ) | (27,087 | ) | ||||||||
| Transfer agent fees |
(9,570 | ) | (10,588 | ) | (23,655 | ) | (13,244 | ) | ||||||||
| Other liabilities |
— | — | (666,808 | ) | — | |||||||||||
|
|
|
|
|
|
|
|
|
|||||||||
| Net cash provided by operating activities |
29,460,140 | 54,547,284 | 138,159,480 | 54,999,782 | ||||||||||||
|
|
|
|
|
|
|
|
|
|||||||||
| CASH PROVIDED BY (USED FOR) FINANCING ACTIVITIES |
||||||||||||||||
| Cash dividends paid to shareholders |
(21,597,278 | ) | (54,523,046 | ) | (135,279,994 | ) | (47,201,093 | ) | ||||||||
| Net payments on redemption of capital shares |
(7,673,529 | ) | — | (2,735,878 | ) | (12,222,062 | ) | |||||||||
| Decrease in bank overdraft |
(83,281 | ) | (24,238 | ) | — | — | ||||||||||
|
|
|
|
|
|
|
|
|
|||||||||
| Net cash used for financing activities |
(29,354,088 | ) | (54,547,284 | ) | (138,015,872 | ) | (59,423,155 | ) | ||||||||
|
|
|
|
|
|
|
|
|
|||||||||
| CASH IMPACT FROM FOREIGN EXCHANGE FLUCTUATIONS |
||||||||||||||||
| Cash impact from foreign exchange fluctuations |
(810 | ) | — | (2 | ) | (155 | ) | |||||||||
|
|
|
|
|
|
|
|
|
|||||||||
| CASH AND FOREIGN CURRENCY |
||||||||||||||||
| Net increase (decrease) in restricted and unrestricted cash and foreign currency |
105,242 | — | 143,606 | (4,423,528 | ) | |||||||||||
| Restricted and unrestricted cash and foreign currency at beginning of year |
58,425 | — | 129,653 | 4,953,552 | ||||||||||||
|
|
|
|
|
|
|
|
|
|||||||||
| Restricted and unrestricted cash and foreign currency at end of year |
$ | 163,667 | $ | — | $ | 273,259 | $ | 530,024 | ||||||||
|
|
|
|
|
|
|
|
|
|||||||||
| SUPPLEMENTAL DISCLOSURE OF CASH FLOW INFORMATION |
||||||||||||||||
| Cash paid during the year for interest expense |
$ | 1,981 | $ | 25 | $ | 1,285 | $ | 12,510 | ||||||||
|
|
|
|
|
|
|
|
|
|||||||||
| NON-CASH FINANCING ACTIVITIES |
||||||||||||||||
| Reinvestment of distributions |
$ | — | $ | 274,446 | $ | 702,786 | $ | — | ||||||||
|
|
|
|
|
|
|
|
|
|||||||||
| F I N A N C I A L S T A T E M E N T S |
145 |
Statements of Cash Flows (continued)
Year Ended December 31, 2023
| BGR | CII | BDJ(a) | BOE | |||||||||||||
| RECONCILIATION OF RESTRICTED AND UNRESTRICTED CASH AND FOREIGN CURRENCY AT THE END OF YEAR TO THE STATEMENTS OF ASSETS AND LIABILITIES |
||||||||||||||||
| Cash |
$ | — | $ | — | $ | 272,377 | $ | — | ||||||||
| Cash pledged |
||||||||||||||||
| Collateral — OTC derivatives |
— | — | — | 530,000 | ||||||||||||
| Foreign currency at value |
163,667 | — | 882 | 24 | ||||||||||||
|
|
|
|
|
|
|
|
|
|||||||||
| $ | 163,667 | $ | — | $ | 273,259 | $ | 530,024 | |||||||||
|
|
|
|
|
|
|
|
|
|||||||||
| (a) | Consolidated Statement of Cash Flows. |
See notes to financial statements.
| 146 | 2 0 2 3 B L A C K R O C K A N N U A L R E P O R T T O S H A R E H O L D E R S |
Statements of Cash Flows (continued)
Year Ended December 31, 2023
| BGY | BMEZ | BME | BIGZ | |||||||||||||
| CASH PROVIDED BY (USED FOR) OPERATING ACTIVITIES |
||||||||||||||||
| Net increase in net assets resulting from operations |
$ | 83,311,613 | $ | 69,858,562 | $ | 20,017,018 | $ | 211,569,019 | ||||||||
| Adjustments to reconcile net increase in net assets resulting from operations to net cash provided by operating activities: |
||||||||||||||||
| Proceeds from sales of long-term investments |
378,012,871 | 1,388,198,381 | 276,514,413 | 1,004,863,164 | ||||||||||||
| Purchases of long-term investments |
(350,204,293 | ) | (1,212,826,357 | ) | (241,735,506 | ) | (779,071,516 | ) | ||||||||
| Net proceeds from sales (purchases) of short-term securities |
(2,637,782 | ) | 32,057,220 | (7,524,854 | ) | 132,541 | ||||||||||
| Premiums paid on closing options written |
(29,738,122 | ) | (100,995,609 | ) | (38,654,231 | ) | (71,188,435 | ) | ||||||||
| Premiums received from options written |
43,528,696 | 119,727,132 | 42,173,622 | 66,060,586 | ||||||||||||
| Net realized (gain) loss on investments and options written |
(24,861,160 | ) | 1,723,983 | (26,689,552 | ) | 395,265,926 | ||||||||||
| Net unrealized (appreciation) depreciation on investments, options written and foreign currency translations |
(49,439,379 | ) | (82,781,507 | ) | 8,683,167 | (631,426,944 | ) | |||||||||
| (Increase) Decrease in Assets |
||||||||||||||||
| Receivables |
||||||||||||||||
| Dividends — affiliated |
(16,306 | ) | (137,063 | ) | (73,363 | ) | 10,476 | |||||||||
| Dividends — unaffiliated |
281,025 | (237,570 | ) | 51,234 | (113,427 | ) | ||||||||||
| Securities lending income — affiliated |
— | 31,029 | 4,310 | 3,221 | ||||||||||||
| Prepaid expenses |
(5,495 | ) | (16,160 | ) | (5,292 | ) | (16,620 | ) | ||||||||
| Deferred offering costs |
— | — | (4,426 | ) | — | |||||||||||
| Increase (Decrease) in Liabilities |
||||||||||||||||
| Collateral on securities loaned |
— | 10,470,673 | (675,895 | ) | 20,319,859 | |||||||||||
| Payables |
||||||||||||||||
| Accounting services fees |
(3,884 | ) | (1,418 | ) | (2,228 | ) | (2,428 | ) | ||||||||
| Custodian fees |
(12,737 | ) | (47,364 | ) | (1,746 | ) | (2,794 | ) | ||||||||
| Deferred foreign capital gain tax |
(68,252 | ) | — | — | — | |||||||||||
| Investment advisory fees |
7,499 | (256,219 | ) | (22,241 | ) | (106,788 | ) | |||||||||
| Trustees’ and Officer’s fees |
18,863 | 77,726 | 12,638 | 78,419 | ||||||||||||
| Other accrued expenses |
(13,184 | ) | (126,201 | ) | (24,844 | ) | (109,246 | ) | ||||||||
| Professional fees |
(21,108 | ) | 3,689 | (15,408 | ) | 36,486 | ||||||||||
| Proxy fees |
— | 88,733 | — | 309,518 | ||||||||||||
| Transfer agent fees |
(10,140 | ) | (24,185 | ) | (8,140 | ) | (38,665 | ) | ||||||||
|
|
|
|
|
|
|
|
|
|||||||||
| Net cash provided by operating activities |
48,128,725 | 224,787,475 | 32,018,676 | 216,572,352 | ||||||||||||
|
|
|
|
|
|
|
|
|
|||||||||
| CASH PROVIDED BY (USED FOR) FINANCING ACTIVITIES |
||||||||||||||||
| Cash dividends paid to shareholders |
(41,320,547 | ) | (173,524,946 | ) | (35,099,184 | ) | (176,112,694 | ) | ||||||||
| Payments for offering costs |
— | — | (497 | ) | — | |||||||||||
| Net payments on redemption of capital shares |
(13,143,239 | ) | (51,038,060 | ) | — | (40,459,636 | ) | |||||||||
| Increase in bank overdraft |
— | 196,568 | 57,766 | — | ||||||||||||
| Proceeds from issuance of capital shares |
— | — | 3,020,683 | — | ||||||||||||
|
|
|
|
|
|
|
|
|
|||||||||
| Net cash used for financing activities |
(54,463,786 | ) | (224,366,438 | ) | (32,021,232 | ) | (216,572,330 | ) | ||||||||
|
|
|
|
|
|
|
|
|
|||||||||
| CASH IMPACT FROM FOREIGN EXCHANGE FLUCTUATIONS |
||||||||||||||||
| Cash impact from foreign exchange fluctuations |
(2,005 | ) | 16 | (28 | ) | 10 | ||||||||||
|
|
|
|
|
|
|
|
|
|||||||||
| CASH AND FOREIGN CURRENCY |
||||||||||||||||
| Net increase (decrease) in restricted and unrestricted cash and foreign currency |
(6,337,066 | ) | 421,053 | (2,584 | ) | 32 | ||||||||||
| Restricted and unrestricted cash and foreign currency at beginning of year |
6,408,896 | 36,115 | 3,118 | 335 | ||||||||||||
|
|
|
|
|
|
|
|
|
|||||||||
| Restricted and unrestricted cash and foreign currency at end of year |
$ | 71,830 | $ | 457,168 | $ | 534 | $ | 367 | ||||||||
|
|
|
|
|
|
|
|
|
|||||||||
| SUPPLEMENTAL DISCLOSURE OF CASH FLOW INFORMATION |
||||||||||||||||
| Cash paid during the year for interest expense |
$ | 11,998 | $ | 2,572 | $ | 55 | $ | 1,499 | ||||||||
|
|
|
|
|
|
|
|
|
|||||||||
| NON-CASH FINANCING ACTIVITIES |
||||||||||||||||
| Reinvestment of distributions |
$ | — | $ | — | $ | 511,503 | $ | — | ||||||||
|
|
|
|
|
|
|
|
|
|||||||||
| F I N A N C I A L S T A T E M E N T S |
147 |
Statements of Cash Flows (continued)
Year Ended December 31, 2023
| BGY | BMEZ | BME | BIGZ | |||||||||||||
| RECONCILIATION OF RESTRICTED AND UNRESTRICTED CASH AND FOREIGN CURRENCY AT THE END OF YEAR TO THE STATEMENTS OF ASSETS AND LIABILITIES |
||||||||||||||||
| Cash pledged |
||||||||||||||||
| Collateral — OTC derivatives |
$ | — | $ | 456,000 | $ | — | $ | — | ||||||||
| Foreign currency at value |
71,830 | 1,168 | 534 | 367 | ||||||||||||
|
|
|
|
|
|
|
|
|
|||||||||
| $ | 71,830 | $ | 457,168 | $ | 534 | $ | 367 | |||||||||
|
|
|
|
|
|
|
|
|
|||||||||
See notes to financial statements.
| 148 | 2 0 2 3 B L A C K R O C K A N N U A L R E P O R T T O S H A R E H O L D E R S |
Statements of Cash Flows (continued)
Year Ended December 31, 2023
| BCX | BSTZ(a) | BST(a) | BUI | |||||||||||||
| CASH PROVIDED BY (USED FOR) OPERATING ACTIVITIES |
||||||||||||||||
| Net increase (decrease) in net assets resulting from operations |
$ | (8,637,936 | ) | $ | 279,961,281 | $ | 290,145,231 | $ | 36,083,749 | |||||||
| Adjustments to reconcile net increase (decrease) in net assets resulting from operations to net cash provided by operating activities: |
||||||||||||||||
| Proceeds from sales of long-term investments and principal paydowns/payups |
454,061,490 | 814,156,277 | 436,821,798 | 163,826,356 | ||||||||||||
| Purchases of long-term investments |
(417,686,429 | ) | (617,172,687 | ) | (350,433,270 | ) | (156,804,674 | ) | ||||||||
| Net proceeds from sales (purchases) of short-term securities |
(902,005 | ) | 16,346,031 | 378,587 | 4,652,393 | |||||||||||
| Premiums paid on closing options written |
(48,050,251 | ) | (155,845,035 | ) | (131,697,471 | ) | (23,113,180 | ) | ||||||||
| Premiums received from options written |
65,847,566 | 126,407,741 | 99,092,517 | 29,917,467 | ||||||||||||
| Net realized (gain) loss on investments and options written |
(33,581,296 | ) | 41,324,283 | (49,817,838 | ) | (18,317,996 | ) | |||||||||
| Net unrealized (appreciation) depreciation on investments, options written and foreign currency translations |
67,014,722 | (334,050,748 | ) | (247,319,836 | ) | (9,031,905 | ) | |||||||||
| (Increase) Decrease in Assets |
||||||||||||||||
| Receivables |
||||||||||||||||
| Dividends — affiliated |
18,603 | 42,344 | 28,000 | (470 | ) | |||||||||||
| Dividends — unaffiliated |
298,258 | (3,314 | ) | 208,491 | 240,077 | |||||||||||
| Interest — unaffiliated |
(159,250 | ) | — | — | — | |||||||||||
| Securities lending income — affiliated |
(1,145 | ) | (2,549 | ) | (2,001 | ) | 1,742 | |||||||||
| Prepaid expenses |
— | (12,591 | ) | (10,113 | ) | — | ||||||||||
| Other assets |
— | 680,607 | — | — | ||||||||||||
| Deferred offering costs |
— | — | 15,149 | (1,089 | ) | |||||||||||
| Increase (Decrease) in Liabilities |
||||||||||||||||
| Due to broker |
— | 680,000 | — | — | ||||||||||||
| Collateral on securities loaned |
6,147,790 | 2,865,527 | 5,036,333 | 1,071,499 | ||||||||||||
| Payables |
||||||||||||||||
| Accounting services fees |
(4,977 | ) | (3,794 | ) | (4,128 | ) | (4,128 | ) | ||||||||
| Custodian fees |
(9,391 | ) | 7,468 | (14,492 | ) | (9,453 | ) | |||||||||
| Deferred capital gain tax |
— | (1,956,748 | ) | (113,475 | ) | — | ||||||||||
| Investment advisory fees |
(93,556 | ) | 23,937 | 154,885 | (6,370 | ) | ||||||||||
| Trustees’ and Officer’s fees |
17,514 | 61,976 | 15,517 | 7,795 | ||||||||||||
| Other accrued expenses |
(87,879 | ) | (68,059 | ) | (68,655 | ) | (81,981 | ) | ||||||||
| Professional fees |
(37,767 | ) | 6,639 | 20,994 | (23,282 | ) | ||||||||||
| Transfer agent fees |
(17,661 | ) | (24,601 | ) | (18,683 | ) | (7,601 | ) | ||||||||
|
|
|
|
|
|
|
|
|
|||||||||
| Net cash provided by operating activities |
84,136,400 | 173,423,985 | 52,417,540 | 28,398,949 | ||||||||||||
|
|
|
|
|
|
|
|
|
|||||||||
| CASH PROVIDED BY (USED FOR) FINANCING ACTIVITIES |
||||||||||||||||
| Cash dividends paid to shareholders |
(53,560,583 | ) | (142,794,066 | ) | (96,618,820 | ) | (31,944,926 | ) | ||||||||
| Payments for offering costs |
— | — | (7,750 | ) | — | |||||||||||
| Net payments on redemption of capital shares |
(30,516,383 | ) | (36,266,037 | ) | — | — | ||||||||||
| Increase (decrease) in bank overdraft |
(117,583 | ) | 347,361 | 418,700 | — | |||||||||||
| Proceeds from issuance of capital shares |
— | — | 41,619,188 | 3,779,817 | ||||||||||||
|
|
|
|
|
|
|
|
|
|||||||||
| Net cash used for financing activities |
(84,194,549 | ) | (178,712,742 | ) | (54,588,682 | ) | (28,165,109 | ) | ||||||||
|
|
|
|
|
|
|
|
|
|||||||||
| CASH IMPACT FROM FOREIGN EXCHANGE FLUCTUATIONS |
||||||||||||||||
| Cash impact from foreign exchange fluctuations |
(10 | ) | (72 | ) | (930 | ) | 185 | |||||||||
|
|
|
|
|
|
|
|
|
|||||||||
| CASH AND FOREIGN CURRENCY |
||||||||||||||||
| Net increase (decrease) in restricted and unrestricted cash and foreign currency |
(58,159 | ) | (5,288,829 | ) | (2,172,072 | ) | 234,025 | |||||||||
| Restricted and unrestricted cash and foreign currency at beginning of year |
69,403 | 8,098,829 | 2,655,178 | 196,343 | ||||||||||||
|
|
|
|
|
|
|
|
|
|||||||||
| Restricted and unrestricted cash and foreign currency at end of year |
$ | 11,244 | $ | 2,810,000 | $ | 483,106 | $ | 430,368 | ||||||||
|
|
|
|
|
|
|
|
|
|||||||||
| SUPPLEMENTAL DISCLOSURE OF CASH FLOW INFORMATION |
||||||||||||||||
| Cash paid during the year for interest expense |
$ | 2,847 | $ | 21,132 | $ | 14,556 | $ | 2,654 | ||||||||
|
|
|
|
|
|
|
|
|
|||||||||
| NON-CASH FINANCING ACTIVITIES |
||||||||||||||||
| Reinvestment of distributions |
$ | — | $ | — | $ | 5,644,095 | $ | 730,387 | ||||||||
|
|
|
|
|
|
|
|
|
|||||||||
| F I N A N C I A L S T A T E M E N T S |
149 |
Statements of Cash Flows (continued)
Year Ended December 31, 2023
| BCX | BSTZ(a) | BST(a) | BUI | |||||||||||||
| RECONCILIATION OF RESTRICTED AND UNRESTRICTED CASH AND FOREIGN CURRENCY AT THE END OF YEAR TO THE STATEMENTS OF ASSETS AND LIABILITIES |
||||||||||||||||
| Cash |
$ | 11,212 | $ | — | $ | — | $ | 118,852 | ||||||||
| Cash pledged |
||||||||||||||||
| Collateral — OTC derivatives |
— | 2,810,000 | 480,000 | — | ||||||||||||
| Foreign currency at value |
32 | — | 3,106 | 311,516 | ||||||||||||
|
|
|
|
|
|
|
|
|
|||||||||
| $ | 11,244 | $ | 2,810,000 | $ | 483,106 | $ | 430,368 | |||||||||
|
|
|
|
|
|
|
|
|
|||||||||
| (a) | Consolidated Statement of Cash Flows. |
See notes to financial statements.
| 150 | 2 0 2 3 B L A C K R O C K A N N U A L R E P O R T T O S H A R E H O L D E R S |
(For a share outstanding throughout each period)
| BGR | ||||||||||||||||||||
| Year Ended 12/31/23 |
Year Ended 12/31/22 |
Year Ended 12/31/21 |
Year Ended 12/31/20 |
Year Ended 12/31/19 |
||||||||||||||||
| Net asset value, beginning of year |
$ | 14.21 | $ | 10.77 | $ | 8.17 | $ | 12.57 | $ | 11.98 | ||||||||||
|
|
|
|
|
|
|
|
|
|
|
|||||||||||
| Net investment income(a) |
0.37 | 0.42 | 0.28 | 0.32 | 0.34 | |||||||||||||||
| Net realized and unrealized gain (loss) |
0.32 | 3.60 | 2.77 | (4.06 | ) | 1.18 | ||||||||||||||
|
|
|
|
|
|
|
|
|
|
|
|||||||||||
| Net increase (decrease) from investment operations |
0.69 | 4.02 | 3.05 | (3.74 | ) | 1.52 | ||||||||||||||
|
|
|
|
|
|
|
|
|
|
|
|||||||||||
| Distributions(b) |
||||||||||||||||||||
| From net investment income |
(0.37 | ) | (0.42 | ) | (0.28 | ) | (0.32 | ) | (0.34 | ) | ||||||||||
| Return of capital |
(0.40 | ) | (0.16 | ) | (0.17 | ) | (0.34 | ) | (0.59 | ) | ||||||||||
|
|
|
|
|
|
|
|
|
|
|
|||||||||||
| Total distributions |
(0.77 | ) | (0.58 | ) | (0.45 | ) | (0.66 | ) | (0.93 | ) | ||||||||||
|
|
|
|
|
|
|
|
|
|
|
|||||||||||
| Net asset value, end of year |
$ | 14.13 | $ | 14.21 | $ | 10.77 | $ | 8.17 | $ | 12.57 | ||||||||||
|
|
|
|
|
|
|
|
|
|
|
|||||||||||
| Market price, end of year |
$ | 12.45 | $ | 12.53 | $ | 9.48 | $ | 7.10 | $ | 11.88 | ||||||||||
|
|
|
|
|
|
|
|
|
|
|
|||||||||||
| Total Return(c) |
||||||||||||||||||||
| Based on net asset value |
5.75 | % | 38.51 | % | 38.36 | %(d) | (29.03 | )% | 13.74 | % | ||||||||||
|
|
|
|
|
|
|
|
|
|
|
|||||||||||
| Based on market price |
5.66 | % | 38.76 | % | 40.14 | % | (34.74 | )% | 23.23 | % | ||||||||||
|
|
|
|
|
|
|
|
|
|
|
|||||||||||
| Ratios to Average Net Assets(e) |
||||||||||||||||||||
| Total expenses |
1.29 | % | 1.26 | % | 1.33 | % | 1.37 | % | 1.35 | % | ||||||||||
|
|
|
|
|
|
|
|
|
|
|
|||||||||||
| Total expenses after fees waived and/or reimbursed |
1.07 | % | 1.04 | % | 1.11 | % | 1.15 | % | 1.16 | % | ||||||||||
|
|
|
|
|
|
|
|
|
|
|
|||||||||||
| Net investment income |
2.66 | % | 3.21 | % | 2.88 | % | 3.77 | % | 2.67 | % | ||||||||||
|
|
|
|
|
|
|
|
|
|
|
|||||||||||
| Supplemental Data |
||||||||||||||||||||
| Net assets, end of year (000) |
$ | 387,982 | $ | 398,493 | $ | 313,503 | $ | 237,868 | $ | 374,896 | ||||||||||
|
|
|
|
|
|
|
|
|
|
|
|||||||||||
| Portfolio turnover rate |
38 | % | 76 | % | 61 | % | 62 | % | 24 | % | ||||||||||
|
|
|
|
|
|
|
|
|
|
|
|||||||||||
| (a) | Based on average shares outstanding. |
| (b) | Distributions for annual periods determined in accordance with U.S. federal income tax regulations. |
| (c) | Total returns based on market price, which can be significantly greater or less than the net asset value, may result in substantially different returns. Where applicable, excludes the effects of any sales charges and assumes the reinvestment of distributions at actual reinvestment prices. |
| (d) | Includes payment from an affiliate, which had no impact on the Trust’s total return. |
| (e) | Excludes fees and expenses incurred indirectly as a result of investments in underlying funds. |
See notes to financial statements.
| F I N A N C I A L H I G H L I G H T S |
151 |
Financial Highlights (continued)
(For a share outstanding throughout each period)
| CII | ||||||||||||||||||||
| Year Ended 12/31/23 |
Year Ended 12/31/22 |
Year Ended 12/31/21 |
Year Ended 12/31/20 |
Year Ended 12/31/19 |
||||||||||||||||
| Net asset value, beginning of year |
$ | 17.55 | $ | 22.10 | $ | 19.12 | $ | 17.96 | $ | 15.28 | ||||||||||
|
|
|
|
|
|
|
|
|
|
|
|||||||||||
| Net investment income(a) |
0.07 | 0.06 | 0.04 | 0.13 | 0.18 | |||||||||||||||
| Net realized and unrealized gain (loss) |
3.38 | (2.51 | ) | 4.04 | 2.08 | 3.50 | ||||||||||||||
|
|
|
|
|
|
|
|
|
|
|
|||||||||||
| Net increase (decrease) from investment operations |
3.45 | (2.45 | ) | 4.08 | 2.21 | 3.68 | ||||||||||||||
|
|
|
|
|
|
|
|
|
|
|
|||||||||||
| Distributions(b) |
||||||||||||||||||||
| From net investment income |
(0.07 | ) | (0.04 | ) | (0.04 | ) | (0.13 | ) | (0.19 | ) | ||||||||||
| From net realized gain |
(1.12 | ) | (2.06 | ) | (1.06 | ) | (0.92 | ) | (0.44 | ) | ||||||||||
| Return of capital |
— | — | — | — | (0.37 | ) | ||||||||||||||
|
|
|
|
|
|
|
|
|
|
|
|||||||||||
| Total distributions |
(1.19 | ) | (2.10 | ) | (1.10 | ) | (1.05 | ) | (1.00 | ) | ||||||||||
|
|
|
|
|
|
|
|
|
|
|
|||||||||||
| Net asset value, end of year |
$ | 19.81 | $ | 17.55 | $ | 22.10 | $ | 19.12 | $ | 17.96 | ||||||||||
|
|
|
|
|
|
|
|
|
|
|
|||||||||||
| Market price, end of year |
$ | 19.00 | $ | 17.12 | $ | 22.12 | $ | 17.40 | $ | 17.25 | ||||||||||
|
|
|
|
|
|
|
|
|
|
|
|||||||||||
| Total Return(c) |
||||||||||||||||||||
| Based on net asset value |
20.45 | % | (10.95 | )% | 21.97 | % | 13.94 | % | 25.08 | % | ||||||||||
|
|
|
|
|
|
|
|
|
|
|
|||||||||||
| Based on market price |
18.43 | % | (13.21 | )% | 34.15 | % | 7.97 | % | 30.38 | % | ||||||||||
|
|
|
|
|
|
|
|
|
|
|
|||||||||||
| Ratios to Average Net Assets(d) |
||||||||||||||||||||
| Total expenses |
0.89 | % | 0.89 | % | 0.90 | % | 0.91 | % | 0.91 | % | ||||||||||
|
|
|
|
|
|
|
|
|
|
|
|||||||||||
| Total expenses after fees waived and/or reimbursed |
0.89 | % | 0.89 | % | 0.90 | % | 0.91 | % | 0.91 | % | ||||||||||
|
|
|
|
|
|
|
|
|
|
|
|||||||||||
| Net investment income |
0.35 | % | 0.31 | % | 0.21 | % | 0.78 | % | 1.08 | % | ||||||||||
|
|
|
|
|
|
|
|
|
|
|
|||||||||||
| Supplemental Data |
||||||||||||||||||||
| Net assets, end of year (000) |
$ | 874,451 | $ | 774,667 | $ | 975,479 | $ | 843,673 | $ | 792,638 | ||||||||||
|
|
|
|
|
|
|
|
|
|
|
|||||||||||
| Portfolio turnover rate |
28 | % | 32 | % | 27 | % | 46 | % | 32 | % | ||||||||||
|
|
|
|
|
|
|
|
|
|
|
|||||||||||
| (a) | Based on average shares outstanding. |
| (b) | Distributions for annual periods determined in accordance with U.S. federal income tax regulations. |
| (c) | Total returns based on market price, which can be significantly greater or less than the net asset value, may result in substantially different returns. Where applicable, excludes the effects of any sales charges and assumes the reinvestment of distributions at actual reinvestment prices. |
| (d) | Excludes fees and expenses incurred indirectly as a result of investments in underlying funds. |
See notes to financial statements.
| 152 | 2 0 2 3 B L A C K R O C K A N N U A L R E P O R T T O S H A R E H O L D E R S |
Financial Highlights (continued)
(For a share outstanding throughout each period)
| BDJ | ||||||||||||||||||||
| |
Year Ended 12/31/23 |
(a) |
|
Year Ended 12/31/22 |
(a) |
|
Year Ended 12/31/21 |
|
|
Year Ended 12/31/20 |
|
|
Year Ended 12/31/19 |
| ||||||
| Net asset value, beginning of year |
$ | 8.74 | $ | 10.23 | $ | 9.35 | $ | 10.03 | $ | 8.74 | ||||||||||
|
|
|
|
|
|
|
|
|
|
|
|||||||||||
| Net investment income(b) |
0.18 | 0.16 | 0.15 | 0.18 | 0.18 | |||||||||||||||
| Net realized and unrealized gain (loss) |
0.63 | (0.56 | ) | 1.60 | (0.26 | ) | 1.86 | |||||||||||||
|
|
|
|
|
|
|
|
|
|
|
|||||||||||
| Net increase (decrease) from investment operations |
0.81 | (0.40 | ) | 1.75 | (0.08 | ) | 2.04 | |||||||||||||
|
|
|
|
|
|
|
|
|
|
|
|||||||||||
| Distributions(c) |
||||||||||||||||||||
| From net investment income |
(0.13 | ) | (0.04 | ) | (0.28 | ) | (0.15 | ) | (0.08 | ) | ||||||||||
| From net realized gain |
(0.60 | ) | (1.05 | ) | (0.59 | ) | (0.45 | ) | (0.67 | ) | ||||||||||
|
|
|
|
|
|
|
|
|
|
|
|||||||||||
| Total distributions |
(0.73 | ) | (1.09 | ) | (0.87 | ) | (0.60 | ) | (0.75 | ) | ||||||||||
|
|
|
|
|
|
|
|
|
|
|
|||||||||||
| Net asset value, end of year |
$ | 8.82 | $ | 8.74 | $ | 10.23 | $ | 9.35 | $ | 10.03 | ||||||||||
|
|
|
|
|
|
|
|
|
|
|
|||||||||||
| Market price, end of year |
$ | 7.69 | $ | 9.01 | $ | 10.08 | $ | 8.47 | $ | 9.92 | ||||||||||
|
|
|
|
|
|
|
|
|
|
|
|||||||||||
| Total Return(d) |
||||||||||||||||||||
| Based on net asset value |
10.37 | % | (3.71 | )%(e) | 19.33 | % | 0.77 | % | 24.52 | % | ||||||||||
|
|
|
|
|
|
|
|
|
|
|
|||||||||||
| Based on market price |
(6.65 | )% | 0.74 | % | 29.80 | % | (7.70 | )% | 38.53 | % | ||||||||||
|
|
|
|
|
|
|
|
|
|
|
|||||||||||
| Ratios to Average Net Assets(f) |
||||||||||||||||||||
| Total expenses |
0.86 | % | 0.84 | % | 0.85 | % | 0.86 | % | 0.87 | % | ||||||||||
|
|
|
|
|
|
|
|
|
|
|
|||||||||||
| Total expenses after fees waived and/or reimbursed |
0.86 | % | 0.84 | % | 0.85 | % | 0.86 | % | 0.87 | % | ||||||||||
|
|
|
|
|
|
|
|
|
|
|
|||||||||||
| Net investment income |
2.12 | % | 1.69 | % | 1.44 | % | 2.15 | % | 1.99 | % | ||||||||||
|
|
|
|
|
|
|
|
|
|
|
|||||||||||
| Supplemental Data |
||||||||||||||||||||
| Net assets, end of year (000) |
$ | 1,641,601 | $ | 1,629,642 | $ | 1,902,838 | $ | 1,739,122 | $ | 1,881,675 | ||||||||||
|
|
|
|
|
|
|
|
|
|
|
|||||||||||
| Portfolio turnover rate |
43 | % | 81 | % | 40 | % | 48 | % | 40 | % | ||||||||||
|
|
|
|
|
|
|
|
|
|
|
|||||||||||
| (a) | Consolidated Financial Highlights. |
| (b) | Based on average shares outstanding. |
| (c) | Distributions for annual periods determined in accordance with U.S. federal income tax regulations. |
| (d) | Total returns based on market price, which can be significantly greater or less than the net asset value, may result in substantially different returns. Where applicable, excludes the effects of any sales charges and assumes the reinvestment of distributions at actual reinvestment prices. |
| (e) | Includes payment from an affiliate, which had no impact on the Trust’s total return. |
| (f) | Excludes fees and expenses incurred indirectly as a result of investments in underlying funds. |
See notes to financial statements.
| F I N A N C I A L H I G H L I G H T S |
153 |
Financial Highlights (continued)
(For a share outstanding throughout each period)
| BOE | ||||||||||||||||||||
| Year Ended 12/31/23 |
Year Ended 12/31/22 |
Year Ended 12/31/21 |
Year Ended 12/31/20 |
Year Ended 12/31/19 |
||||||||||||||||
| Net asset value, beginning of year |
$ | 10.97 | $ | 13.40 | $ | 12.28 | $ | 12.32 | $ | 11.07 | ||||||||||
|
|
|
|
|
|
|
|
|
|
|
|||||||||||
| Net investment income(a) |
0.22 | 0.20 | 0.19 | 0.26 | 0.30 | |||||||||||||||
| Net realized and unrealized gain (loss) |
1.38 | (1.87 | ) | 1.69 | 0.46 | 1.71 | ||||||||||||||
|
|
|
|
|
|
|
|
|
|
|
|||||||||||
| Net increase (decrease) from investment operations |
1.60 | (1.67 | ) | 1.88 | 0.72 | 2.01 | ||||||||||||||
|
|
|
|
|
|
|
|
|
|
|
|||||||||||
| Distributions(b) |
||||||||||||||||||||
| From net investment income |
(0.22 | ) | (0.19 | ) | (0.19 | ) | (0.26 | ) | (0.31 | ) | ||||||||||
| From net realized gain |
— | (0.41 | ) | (0.57 | ) | — | — | |||||||||||||
| Return of capital |
(0.54 | ) | (0.16 | ) | — | (0.50 | ) | (0.45 | ) | |||||||||||
|
|
|
|
|
|
|
|
|
|
|
|||||||||||
| Total distributions |
(0.76 | ) | (0.76 | ) | (0.76 | ) | (0.76 | ) | (0.76 | ) | ||||||||||
|
|
|
|
|
|
|
|
|
|
|
|||||||||||
| Net asset value, end of year |
$ | 11.81 | $ | 10.97 | $ | 13.40 | $ | 12.28 | $ | 12.32 | ||||||||||
|
|
|
|
|
|
|
|
|
|
|
|||||||||||
| Market price, end of year |
$ | 9.92 | $ | 9.56 | $ | 12.18 | $ | 10.91 | $ | 10.99 | ||||||||||
|
|
|
|
|
|
|
|
|
|
|
|||||||||||
| Total Return(c) |
||||||||||||||||||||
| Based on net asset value |
16.16 | % | (11.87 | )% | 16.21 | % | 7.65 | % | 19.54 | % | ||||||||||
|
|
|
|
|
|
|
|
|
|
|
|||||||||||
| Based on market price |
11.95 | % | (15.51 | )% | 18.89 | % | 7.22 | % | 25.98 | % | ||||||||||
|
|
|
|
|
|
|
|
|
|
|
|||||||||||
| Ratios to Average Net Assets(d) |
||||||||||||||||||||
| Total expenses |
1.09 | % | 1.06 | % | 1.07 | % | 1.09 | % | 1.12 | % | ||||||||||
|
|
|
|
|
|
|
|
|
|
|
|||||||||||
| Total expenses after fees waived and/or reimbursed |
0.91 | % | 0.89 | % | 0.90 | % | 0.92 | % | 0.94 | % | ||||||||||
|
|
|
|
|
|
|
|
|
|
|
|||||||||||
| Total expenses after fees waived and/or reimbursed and excluding professional fees for foreign withholding taxes |
0.91 | % | 0.88 | % | 0.90 | % | 0.92 | % | 0.94 | % | ||||||||||
|
|
|
|
|
|
|
|
|
|
|
|||||||||||
| Net investment income |
1.93 | % | 1.72 | % | 1.46 | % | 2.33 | % | 2.62 | % | ||||||||||
|
|
|
|
|
|
|
|
|
|
|
|||||||||||
| Supplemental Data |
||||||||||||||||||||
| Net assets, end of year (000) |
$ | 726,489 | $ | 688,464 | $ | 857,721 | $ | 786,230 | $ | 807,712 | ||||||||||
|
|
|
|
|
|
|
|
|
|
|
|||||||||||
| Portfolio turnover rate |
46 | % | 44 | % | 65 | % | 61 | % | 26 | % | ||||||||||
|
|
|
|
|
|
|
|
|
|
|
|||||||||||
| (a) | Based on average shares outstanding. |
| (b) | Distributions for annual periods determined in accordance with U.S. federal income tax regulations. |
| (c) | Total returns based on market price, which can be significantly greater or less than the net asset value, may result in substantially different returns. Where applicable, excludes the effects of any sales charges and assumes the reinvestment of distributions at actual reinvestment prices. |
| (d) | Excludes fees and expenses incurred indirectly as a result of investments in underlying funds. |
See notes to financial statements.
| 154 | 2 0 2 3 B L A C K R O C K A N N U A L R E P O R T T O S H A R E H O L D E R S |
Financial Highlights (continued)
(For a share outstanding throughout each period)
| BGY | ||||||||||||||||||||
| Year Ended 12/31/23 |
Year Ended 12/31/22 |
Year Ended 12/31/21 |
Year Ended 12/31/20 |
Year Ended 12/31/19 |
||||||||||||||||
| Net asset value, beginning of year |
$ | 5.78 | $ | 6.81 | $ | 6.49 | $ | 6.47 | $ | 5.79 | ||||||||||
|
|
|
|
|
|
|
|
|
|
|
|||||||||||
| Net investment income(a) |
0.09 | 0.10 | 0.09 | 0.12 | 0.16 | |||||||||||||||
| Net realized and unrealized gain (loss) |
0.75 | (0.72 | ) | 0.64 | 0.31 | 0.93 | ||||||||||||||
|
|
|
|
|
|
|
|
|
|
|
|||||||||||
| Net increase (decrease) from investment operations |
0.84 | (0.62 | ) | 0.73 | 0.43 | 1.09 | ||||||||||||||
|
|
|
|
|
|
|
|
|
|
|
|||||||||||
| Distributions(b) |
||||||||||||||||||||
| From net investment income |
(0.08 | ) | (0.10 | ) | (0.14 | ) | (0.13 | ) | (0.16 | ) | ||||||||||
| From net realized gain |
(0.09 | ) | (0.10 | ) | (0.15 | ) | — | (0.19 | ) | |||||||||||
| Return of capital |
(0.24 | ) | (0.21 | ) | (0.12 | ) | (0.28 | ) | (0.06 | ) | ||||||||||
|
|
|
|
|
|
|
|
|
|
|
|||||||||||
| Total distributions |
(0.41 | ) | (0.41 | ) | (0.41 | ) | (0.41 | ) | (0.41 | ) | ||||||||||
|
|
|
|
|
|
|
|
|
|
|
|||||||||||
| Net asset value, end of year |
$ | 6.21 | $ | 5.78 | $ | 6.81 | $ | 6.49 | $ | 6.47 | ||||||||||
|
|
|
|
|
|
|
|
|
|
|
|||||||||||
| Market price, end of year |
$ | 5.27 | $ | 5.02 | $ | 6.28 | $ | 5.87 | $ | 5.89 | ||||||||||
|
|
|
|
|
|
|
|
|
|
|
|||||||||||
| Total Return(c) |
||||||||||||||||||||
| Based on net asset value |
15.94 | % | (8.33 | )% | 11.92 | % | 8.18 | % | 20.20 | % | ||||||||||
|
|
|
|
|
|
|
|
|
|
|
|||||||||||
| Based on market price |
13.29 | % | (13.67 | )% | 14.11 | % | 7.49 | % | 27.22 | % | ||||||||||
|
|
|
|
|
|
|
|
|
|
|
|||||||||||
| Ratios to Average Net Assets(d) |
||||||||||||||||||||
| Total expenses |
1.10 | % | 1.08 | % | 1.09 | % | 1.10 | % | 1.13 | % | ||||||||||
|
|
|
|
|
|
|
|
|
|
|
|||||||||||
| Total expenses after fees waived and/or reimbursed |
1.10 | % | 1.03 | % | 0.99 | % | 1.00 | % | 1.03 | % | ||||||||||
|
|
|
|
|
|
|
|
|
|
|
|||||||||||
| Total expenses after fees waived and/or reimbursed and excluding professional fees for foreign withholding taxes |
1.10 | % | 1.02 | % | 0.99 | % | 1.00 | % | 1.03 | % | ||||||||||
|
|
|
|
|
|
|
|
|
|
|
|||||||||||
| Net investment income |
1.40 | % | 1.71 | % | 1.34 | % | 1.99 | % | 2.57 | % | ||||||||||
|
|
|
|
|
|
|
|
|
|
|
|||||||||||
| Supplemental Data |
||||||||||||||||||||
| Net assets, end of year (000) |
$ | 622,482 | $ | 593,471 | $ | 709,510 | $ | 676,949 | $ | 683,247 | ||||||||||
|
|
|
|
|
|
|
|
|
|
|
|||||||||||
| Portfolio turnover rate |
55 | % | 41 | % | 71 | % | 60 | % | 28 | % | ||||||||||
|
|
|
|
|
|
|
|
|
|
|
|||||||||||
| (a) | Based on average shares outstanding. |
| (b) | Distributions for annual periods determined in accordance with U.S. federal income tax regulations. |
| (c) | Total returns based on market price, which can be significantly greater or less than the net asset value, may result in substantially different returns. Where applicable, excludes the effects of any sales charges and assumes the reinvestment of distributions at actual reinvestment prices. |
| (d) | Excludes fees and expenses incurred indirectly as a result of investments in underlying funds. |
See notes to financial statements.
| F I N A N C I A L H I G H L I G H T S |
155 |
Financial Highlights (continued)
(For a share outstanding throughout each period)
| BMEZ | ||||||||||||||||
| |
Year Ended 12/31/23 |
|
|
Year Ended 12/31/22 |
|
|
Year Ended 12/31/21 |
|
|
Period from 01/30/20 to 12/31/20 |
(a)
| |||||
| Net asset value, beginning of period |
$ | 18.76 | $ | 26.47 | $ | 30.73 | $ | 20.00 | ||||||||
|
|
|
|
|
|
|
|
|
|||||||||
| Net investment loss(b) |
(0.12 | ) | (0.18 | ) | (0.32 | ) | (0.22 | ) | ||||||||
| Net realized and unrealized gain (loss) |
0.85 | (5.79 | ) | (2.23 | ) | 11.85 | ||||||||||
|
|
|
|
|
|
|
|
|
|||||||||
| Net increase (decrease) from investment operations |
0.73 | (5.97 | ) | (2.55 | ) | 11.63 | ||||||||||
|
|
|
|
|
|
|
|
|
|||||||||
| Distributions(c) |
||||||||||||||||
| From net realized gain |
— | (1.63 | ) | (1.71 | ) | (0.90 | ) | |||||||||
| Return of capital |
(1.58 | ) | (0.11 | ) | — | — | ||||||||||
|
|
|
|
|
|
|
|
|
|||||||||
| Total distributions |
(1.58 | ) | (1.74 | ) | (1.71 | ) | (0.90 | ) | ||||||||
|
|
|
|
|
|
|
|
|
|||||||||
| Net asset value, end of period |
$ | 17.91 | $ | 18.76 | $ | 26.47 | $ | 30.73 | ||||||||
|
|
|
|
|
|
|
|
|
|||||||||
| Market price, end of period |
$ | 14.65 | $ | 15.43 | $ | 25.36 | $ | 28.65 | ||||||||
|
|
|
|
|
|
|
|
|
|||||||||
| Total Return(d) |
||||||||||||||||
| Based on net asset value |
5.60 | % | (21.66 | )% | (8.31 | )% | 59.62 | %(e)(f) | ||||||||
|
|
|
|
|
|
|
|
|
|||||||||
| Based on market price |
5.02 | % | (32.75 | )% | (5.76 | )% | 48.82 | %(f) | ||||||||
|
|
|
|
|
|
|
|
|
|||||||||
| Ratios to Average Net Assets(g) |
||||||||||||||||
| Total expenses |
1.33 | %(h) | 1.32 | % | 1.30 | % | 1.29 | %(i) | ||||||||
|
|
|
|
|
|
|
|
|
|||||||||
| Total expenses after fees waived and/or reimbursed |
1.32 | %(h) | 1.32 | % | 1.30 | % | 1.28 | %(i) | ||||||||
|
|
|
|
|
|
|
|
|
|||||||||
| Net investment loss |
(0.65 | )% | (0.91 | )% | (1.10 | )% | (1.00 | )%(i) | ||||||||
|
|
|
|
|
|
|
|
|
|||||||||
| Supplemental Data |
||||||||||||||||
| Net assets, end of period (000) |
$ | 1,907,371 | $ | 2,056,419 | $ | 2,981,886 | $ | 3,462,638 | ||||||||
|
|
|
|
|
|
|
|
|
|||||||||
| Portfolio turnover rate |
63 | % | 63 | % | 44 | % | 43 | % | ||||||||
|
|
|
|
|
|
|
|
|
|||||||||
| (a) | Commencement of operations. |
| (b) | Based on average shares outstanding. |
| (c) | Distributions for annual periods determined in accordance with U.S. federal income tax regulations. |
| (d) | Total returns based on market price, which can be significantly greater or less than the net asset value, may result in substantially different returns. Where applicable, excludes the effects of any sales charges and assumes the reinvestment of distributions at actual reinvestment prices. |
| (e) | Includes payment from an affiliate, which had no impact on the Trust’s total return. |
| (f) | Not annualized. |
| (g) | Excludes fees and expenses incurred indirectly as a result of investments in underlying funds. |
| (h) | Includes non-recurring expenses of proxy costs. Without these costs, total expenses, total expenses after fees waived and/or reimbursed would have been 1.31% and 1.30%, respectively. |
| (i) | Annualized. |
See notes to financial statements.
| 156 | 2 0 2 3 B L A C K R O C K A N N U A L R E P O R T T O S H A R E H O L D E R S |
Financial Highlights (continued)
(For a share outstanding throughout each period)
| BME | ||||||||||||||||||||
| Year Ended 12/31/23 |
Year Ended 12/31/22 |
Year Ended 12/31/21 |
Year Ended 12/31/20 |
Year Ended 12/31/19 |
||||||||||||||||
| Net asset value, beginning of year |
$ | 43.30 | $ | 47.96 | $ | 45.66 | $ | 41.19 | $ | 35.87 | ||||||||||
|
|
|
|
|
|
|
|
|
|
|
|||||||||||
| Net investment income(a) |
0.14 | 0.11 | — | 0.01 | 0.06 | |||||||||||||||
| Net realized and unrealized gain (loss) |
1.30 | (2.21 | ) | 4.74 | 6.86 | 7.66 | ||||||||||||||
|
|
|
|
|
|
|
|
|
|
|
|||||||||||
| Net increase (decrease) from investment operations |
1.44 | (2.10 | ) | 4.74 | 6.87 | 7.72 | ||||||||||||||
|
|
|
|
|
|
|
|
|
|
|
|||||||||||
| Distributions(b) |
||||||||||||||||||||
| From net investment income |
(0.17 | ) | (0.12 | ) | (0.00 | )(c) | (0.05 | ) | (0.12 | ) | ||||||||||
| From net realized gain |
(1.66 | ) | (2.34 | ) | (2.44 | ) | (2.35 | ) | (2.28 | ) | ||||||||||
| Return of capital |
(0.73 | ) | (0.10 | ) | — | — | — | |||||||||||||
|
|
|
|
|
|
|
|
|
|
|
|||||||||||
| Total distributions |
(2.56 | ) | (2.56 | ) | (2.44 | ) | (2.40 | ) | (2.40 | ) | ||||||||||
|
|
|
|
|
|
|
|
|
|
|
|||||||||||
| Net asset value, end of year |
$ | 42.18 | $ | 43.30 | $ | 47.96 | $ | 45.66 | $ | 41.19 | ||||||||||
|
|
|
|
|
|
|
|
|
|
|
|||||||||||
| Market price, end of year |
$ | 40.46 | $ | 43.58 | $ | 48.50 | $ | 47.59 | $ | 42.50 | ||||||||||
|
|
|
|
|
|
|
|
|
|
|
|||||||||||
| Total Return(d) |
||||||||||||||||||||
| Based on net asset value |
3.80 | % | (4.19 | )% | 10.66 | %(e) | 17.50 | % | 22.26 | % | ||||||||||
|
|
|
|
|
|
|
|
|
|
|
|||||||||||
| Based on market price |
(1.08 | )% | (4.64 | )% | 7.37 | % | 18.69 | % | 24.15 | % | ||||||||||
|
|
|
|
|
|
|
|
|
|
|
|||||||||||
| Ratios to Average Net Assets(f) |
||||||||||||||||||||
| Total expenses |
1.06 | % | 1.08 | % | 1.08 | % | 1.10 | % | 1.09 | % | ||||||||||
|
|
|
|
|
|
|
|
|
|
|
|||||||||||
| Total expenses after fees waived and/or reimbursed |
1.06 | % | 1.07 | % | 1.08 | % | 1.10 | % | 1.09 | % | ||||||||||
|
|
|
|
|
|
|
|
|
|
|
|||||||||||
| Net investment income |
0.34 | % | 0.27 | % | 0.01 | % | 0.01 | % | 0.16 | % | ||||||||||
|
|
|
|
|
|
|
|
|
|
|
|||||||||||
| Supplemental Data |
||||||||||||||||||||
| Net assets, end of year (000) |
$ | 588,135 | $ | 600,197 | $ | 625,775 | $ | 545,936 | $ | 446,773 | ||||||||||
|
|
|
|
|
|
|
|
|
|
|
|||||||||||
| Portfolio turnover rate |
43 | % | 41 | % | 49 | % | 28 | % | 47 | % | ||||||||||
|
|
|
|
|
|
|
|
|
|
|
|||||||||||
| (a) | Based on average shares outstanding. |
| (b) | Distributions for annual periods determined in accordance with U.S. federal income tax regulations. |
| (c) | Amount is greater than $(0.005) per share. |
| (d) | Total returns based on market price, which can be significantly greater or less than the net asset value, may result in substantially different returns. Where applicable, excludes the effects of any sales charges and assumes the reinvestment of distributions at actual reinvestment prices. |
| (e) | Includes payment from an affiliate, which had no impact on the Trust’s total return. |
| (f) | Excludes fees and expenses incurred indirectly as a result of investments in underlying funds. |
See notes to financial statements.
| F I N A N C I A L H I G H L I G H T S |
157 |
Financial Highlights (continued)
(For a share outstanding throughout each period)
| BIGZ | ||||||||||||
| Year Ended 12/31/23 |
Year Ended 12/31/22 |
Period from 03/29/21(a) to 12/31/21 |
||||||||||
| Net asset value, beginning of period |
$ | 8.82 | $ | 16.72 | $ | 20.00 | ||||||
|
|
|
|
|
|
|
|||||||
| Net investment loss(b) |
(0.11 | ) | (0.13 | ) | (0.15 | ) | ||||||
| Net realized and unrealized gain (loss) |
1.09 | (6.78 | ) | (2.43 | ) | |||||||
|
|
|
|
|
|
|
|||||||
| Net increase (decrease) from investment operations |
0.98 | (6.91 | ) | (2.58 | ) | |||||||
|
|
|
|
|
|
|
|||||||
| Distribution from return of capital(c) |
(0.77 | ) | (0.99 | ) | (0.70 | ) | ||||||
|
|
|
|
|
|
|
|||||||
| Net asset value, end of period |
$ | 9.03 | $ | 8.82 | $ | 16.72 | ||||||
|
|
|
|
|
|
|
|||||||
| Market price, end of period |
$ | 7.33 | $ | 6.81 | $ | 14.54 | ||||||
|
|
|
|
|
|
|
|||||||
| Total Return(d) |
||||||||||||
| Based on net asset value |
13.28 | % | (41.14 | )%(e) | (13.03 | )%(f) | ||||||
|
|
|
|
|
|
|
|||||||
| Based on market price |
19.09 | % | (47.74 | )% | (24.37 | )%(f) | ||||||
|
|
|
|
|
|
|
|||||||
| Ratios to Average Net Assets(g) |
||||||||||||
| Total expenses |
1.44 | %(h) | 1.36 | % | 1.29 | %(i) | ||||||
|
|
|
|
|
|
|
|||||||
| Total expenses after fees waived and/or reimbursed |
1.44 | %(h) | 1.36 | % | 1.28 | %(i) | ||||||
|
|
|
|
|
|
|
|||||||
| Net investment loss |
(1.22 | )% | (1.22 | )% | (1.02 | )%(i) | ||||||
|
|
|
|
|
|
|
|||||||
| Supplemental Data |
||||||||||||
| Net assets, end of period (000) |
$ | 2,026,470 | $ | 2,026,488 | $ | 3,981,653 | ||||||
|
|
|
|
|
|
|
|||||||
| Portfolio turnover rate |
37 | % | 41 | % | 55 | % | ||||||
|
|
|
|
|
|
|
|||||||
| (a) | Commencement of operations. |
| (b) | Based on average shares outstanding. |
| (c) | Distributions for annual periods determined in accordance with U.S. federal income tax regulations. |
| (d) | Total returns based on market price, which can be significantly greater or less than the net asset value, may result in substantially different returns. Where applicable, excludes the effects of any sales charges and assumes the reinvestment of distributions at actual reinvestment prices. |
| (e) | Includes payment from an affiliate, which had no impact on the Trust’s total return. |
| (f) | Not annualized. |
| (g) | Excludes fees and expenses incurred indirectly as a result of investments in underlying funds. |
| (h) | Includes non-recurring expenses of proxy costs. Without these costs, total expenses, total expenses after fees waived and/or reimbursed would have been 1.33% and 1.33%, respectively. |
| (i) | Annualized. |
See notes to financial statements.
| 158 | 2 0 2 3 B L A C K R O C K A N N U A L R E P O R T T O S H A R E H O L D E R S |
Financial Highlights (continued)
(For a share outstanding throughout each period)
| BCX | ||||||||||||||||||||
| Year Ended 12/31/23 |
Year Ended 12/31/22 |
Year Ended 12/31/21 |
Year Ended 12/31/20 |
Year Ended 12/31/19 |
||||||||||||||||
| Net asset value, beginning of year |
$ | 11.23 | $ | 10.21 | $ | 8.45 | $ | 9.04 | $ | 8.44 | ||||||||||
|
|
|
|
|
|
|
|
|
|
|
|||||||||||
| Net investment income(a) |
0.29 | 0.30 | 0.29 | 0.20 | 0.23 | |||||||||||||||
| Net realized and unrealized gain (loss) |
(0.33 | ) | 1.27 | 1.95 | (0.26 | ) | 0.99 | |||||||||||||
|
|
|
|
|
|
|
|
|
|
|
|||||||||||
| Net increase (decrease) from investment operations |
(0.04 | ) | 1.57 | 2.24 | (0.06 | ) | 1.22 | |||||||||||||
|
|
|
|
|
|
|
|
|
|
|
|||||||||||
| Distributions(b) |
||||||||||||||||||||
| From net investment income |
(0.28 | ) | (0.29 | ) | (0.38 | ) | (0.23 | ) | (0.23 | ) | ||||||||||
| Return of capital |
(0.34 | ) | (0.26 | ) | (0.10 | ) | (0.30 | ) | (0.39 | ) | ||||||||||
|
|
|
|
|
|
|
|
|
|
|
|||||||||||
| Total distributions |
(0.62 | ) | (0.55 | ) | (0.48 | ) | (0.53 | ) | (0.62 | ) | ||||||||||
|
|
|
|
|
|
|
|
|
|
|
|||||||||||
| Net asset value, end of year |
$ | 10.57 | $ | 11.23 | $ | 10.21 | $ | 8.45 | $ | 9.04 | ||||||||||
|
|
|
|
|
|
|
|
|
|
|
|||||||||||
| Market price, end of year |
$ | 8.88 | $ | 9.97 | $ | 9.35 | $ | 7.41 | $ | 8.07 | ||||||||||
|
|
|
|
|
|
|
|
|
|
|
|||||||||||
| Total Return(c) |
||||||||||||||||||||
| Based on net asset value |
0.56 | % | 16.31 | % | 27.20 | % | 1.56 | % | 15.88 | % | ||||||||||
|
|
|
|
|
|
|
|
|
|
|
|||||||||||
| Based on market price |
(4.84 | )% | 12.76 | % | 32.83 | % | (0.23 | )% | 23.67 | % | ||||||||||
|
|
|
|
|
|
|
|
|
|
|
|||||||||||
| Ratios to Average Net Assets(d) |
||||||||||||||||||||
| Total expenses |
1.06 | % | 1.05 | % | 1.07 | % | 1.09 | % | 1.11 | % | ||||||||||
|
|
|
|
|
|
|
|
|
|
|
|||||||||||
| Total expenses after fees waived and/or reimbursed |
1.06 | % | 1.05 | % | 1.07 | % | 1.09 | % | 1.11 | % | ||||||||||
|
|
|
|
|
|
|
|
|
|
|
|||||||||||
| Total expenses after fees waived and/or reimbursed and excluding professional fees for foreign withholding taxes |
1.06 | % | 1.05 | % | 1.07 | % | 1.09 | % | 1.11 | % | ||||||||||
|
|
|
|
|
|
|
|
|
|
|
|||||||||||
| Net investment income |
2.63 | % | 2.73 | % | 3.05 | % | 2.62 | % | 2.56 | % | ||||||||||
|
|
|
|
|
|
|
|
|
|
|
|||||||||||
| Supplemental Data |
||||||||||||||||||||
| Net assets, end of year (000) |
$ | 891,338 | $ | 983,181 | $ | 901,782 | $ | 746,615 | $ | 822,754 | ||||||||||
|
|
|
|
|
|
|
|
|
|
|
|||||||||||
| Portfolio turnover rate |
46 | % | 92 | % | 66 | % | 78 | % | 69 | % | ||||||||||
|
|
|
|
|
|
|
|
|
|
|
|||||||||||
| (a) | Based on average shares outstanding. |
| (b) | Distributions for annual periods determined in accordance with U.S. federal income tax regulations. |
| (c) | Total returns based on market price, which can be significantly greater or less than the net asset value, may result in substantially different returns. Where applicable, excludes the effects of any sales charges and assumes the reinvestment of distributions at actual reinvestment prices. |
| (d) | Excludes fees and expenses incurred indirectly as a result of investments in underlying funds. |
See notes to financial statements.
| F I N A N C I A L H I G H L I G H T S |
159 |
Financial Highlights (continued)
(For a share outstanding throughout each period)
| BSTZ | ||||||||||||||||||||
| Year Ended 12/31/23(a) |
Year Ended 12/31/22(a) |
Year Ended 12/31/21(a) |
Year Ended 12/31/20(a) |
Period from 06/27/19(b) to 12/31/19 |
||||||||||||||||
| Net asset value, beginning of period |
$ | 19.53 | $ | 38.82 | $ | 38.72 | $ | 20.95 | $ | 20.00 | ||||||||||
|
|
|
|
|
|
|
|
|
|
|
|||||||||||
| Net investment loss(c) |
(0.20 | ) | (0.30 | ) | (0.51 | ) | (0.30 | ) | (0.05 | ) | ||||||||||
| Net realized and unrealized gain (loss) |
3.92 | (16.69 | ) | 3.69 | 19.32 | 1.50 | ||||||||||||||
|
|
|
|
|
|
|
|
|
|
|
|||||||||||
| Net increase (decrease) from investment operations |
3.72 | (16.99 | ) | 3.18 | 19.02 | 1.45 | ||||||||||||||
|
|
|
|
|
|
|
|
|
|
|
|||||||||||
| Distributions(d) |
||||||||||||||||||||
| From net realized gain |
— | (0.89 | ) | (3.08 | ) | (1.10 | ) | — | ||||||||||||
| Return of capital |
(1.82 | ) | (1.41 | ) | — | (0.15 | ) | (0.50 | ) | |||||||||||
|
|
|
|
|
|
|
|
|
|
|
|||||||||||
| Total distributions |
(1.82 | ) | (2.30 | ) | (3.08 | ) | (1.25 | ) | (0.50 | ) | ||||||||||
|
|
|
|
|
|
|
|
|
|
|
|||||||||||
| Net asset value, end of period |
$ | 21.43 | $ | 19.53 | $ | 38.82 | $ | 38.72 | $ | 20.95 | ||||||||||
|
|
|
|
|
|
|
|
|
|
|
|||||||||||
| Market price, end of period |
$ | 16.71 | $ | 15.64 | $ | 38.94 | $ | 36.38 | $ | 20.50 | ||||||||||
|
|
|
|
|
|
|
|
|
|
|
|||||||||||
| Total Return(e) |
||||||||||||||||||||
| Based on net asset value |
21.74 | %(f) | (43.98 | )% | 8.41 | % | 94.60 | %(f) | 7.40 | %(g) | ||||||||||
|
|
|
|
|
|
|
|
|
|
|
|||||||||||
| Based on market price |
18.54 | % | (55.27 | )% | 15.75 | % | 86.85 | % | 5.10 | %(g) | ||||||||||
|
|
|
|
|
|
|
|
|
|
|
|||||||||||
| Ratios to Average Net Assets(h) |
||||||||||||||||||||
| Total expenses |
1.35 | % | 1.33 | % | 1.31 | % | 1.33 | % | 1.32 | %(i) | ||||||||||
|
|
|
|
|
|
|
|
|
|
|
|||||||||||
| Total expenses after fees waived and/or reimbursed |
1.34 | % | 1.33 | % | 1.31 | % | 1.33 | % | 1.30 | %(i) | ||||||||||
|
|
|
|
|
|
|
|
|
|
|
|||||||||||
| Net investment loss |
(0.96 | )% | (1.16 | )% | (1.25 | )% | (1.16 | )% | (0.48 | )%(i) | ||||||||||
|
|
|
|
|
|
|
|
|
|
|
|||||||||||
| Supplemental Data |
||||||||||||||||||||
| Net assets, end of period (000) |
$ | 1,629,824 | $ | 1,524,658 | $ | 3,048,962 | $ | 3,023,744 | $ | 1,635,966 | ||||||||||
|
|
|
|
|
|
|
|
|
|
|
|||||||||||
| Portfolio turnover rate |
38 | % | 47 | % | 18 | % | 45 | % | 16 | % | ||||||||||
|
|
|
|
|
|
|
|
|
|
|
|||||||||||
| (a) | Consolidated Financial Highlights. |
| (b) | Commencement of operations. |
| (c) | Based on average shares outstanding. |
| (d) | Distributions for annual periods determined in accordance with U.S. federal income tax regulations. |
| (e) | Total returns based on market price, which can be significantly greater or less than the net asset value, may result in substantially different returns. Where applicable, excludes the effects of any sales charges and assumes the reinvestment of distributions at actual reinvestment prices. |
| (f) | Includes payment from an affiliate, which impacted the Fund’s total return. Excluding the payment from an affiliate, the Fund’s total return would have been 21.68%. |
| (g) | Not annualized. |
| (h) | Excludes fees and expenses incurred indirectly as a result of investments in underlying funds. |
| (i) | Annualized. |
See notes to financial statements.
| 160 | 2 0 2 3 B L A C K R O C K A N N U A L R E P O R T T O S H A R E H O L D E R S |
Financial Highlights (continued)
(For a share outstanding throughout each period)
| BST | ||||||||||||||||||||
| Year Ended 12/31/23(a) |
Year Ended 12/31/22(a) |
Year Ended 12/31/21(a) |
Year Ended 12/31/20(a) |
Year Ended 12/31/19 |
||||||||||||||||
| Net asset value, beginning of year |
$ | 29.11 | $ | 52.40 | $ | 51.94 | $ | 32.45 | $ | 26.21 | ||||||||||
|
|
|
|
|
|
|
|
|
|
|
|||||||||||
| Net investment loss(b) |
(0.23 | ) | (0.29 | ) | (0.43 | ) | (0.28 | ) | (0.17 | ) | ||||||||||
| Net realized and unrealized gain (loss) |
8.86 | (20.00 | ) | 5.84 | 21.82 | 9.92 | ||||||||||||||
|
|
|
|
|
|
|
|
|
|
|
|||||||||||
| Net increase (decrease) from investment operations |
8.63 | (20.29 | ) | 5.41 | 21.54 | 9.75 | ||||||||||||||
|
|
|
|
|
|
|
|
|
|
|
|||||||||||
| Distributions(c) |
||||||||||||||||||||
| From net realized gain |
(1.48 | ) | (2.16 | ) | (4.27 | ) | (2.05 | ) | (3.51 | ) | ||||||||||
| Return of capital |
(1.52 | ) | (0.84 | ) | — | — | — | |||||||||||||
|
|
|
|
|
|
|
|
|
|
|
|||||||||||
| Total distributions |
(3.00 | ) | (3.00 | ) | (4.27 | ) | (2.05 | ) | (3.51 | ) | ||||||||||
|
|
|
|
|
|
|
|
|
|
|
|||||||||||
| Dilutive effect of rights offer (Note 10) |
— | — | (0.68 | ) | — | — | ||||||||||||||
|
|
|
|
|
|
|
|
|
|
|
|||||||||||
| Net asset value, end of year |
$ | 34.74 | $ | 29.11 | $ | 52.40 | $ | 51.94 | $ | 32.45 | ||||||||||
|
|
|
|
|
|
|
|
|
|
|
|||||||||||
| Market price, end of year |
$ | 33.66 | $ | 28.37 | $ | 49.97 | $ | 53.30 | $ | 33.27 | ||||||||||
|
|
|
|
|
|
|
|
|
|
|
|||||||||||
| Total Return(d) |
||||||||||||||||||||
| Based on net asset value |
30.78 | % | (39.56 | )%(e) | 9.44 | % | 68.76 | %(f) | 37.82 | % | ||||||||||
|
|
|
|
|
|
|
|
|
|
|
|||||||||||
| Based on market price |
30.03 | % | (38.23 | )% | 1.70 | % | 68.92 | % | 34.77 | % | ||||||||||
|
|
|
|
|
|
|
|
|
|
|
|||||||||||
| Ratios to Average Net Assets(g) |
||||||||||||||||||||
| Total expenses |
1.09 | % | 1.11 | % | 1.05 | % | 1.09 | % | 1.08 | % | ||||||||||
|
|
|
|
|
|
|
|
|
|
|
|||||||||||
| Total expenses after fees waived and/or reimbursed |
1.09 | % | 1.11 | % | 1.00 | % | 0.99 | % | 0.92 | % | ||||||||||
|
|
|
|
|
|
|
|
|
|
|
|||||||||||
| Total expenses after fees waived and/or reimbursed and excluding dividend expense |
1.09 | % | 1.10 | % | 1.00 | % | 0.99 | % | 0.92 | % | ||||||||||
|
|
|
|
|
|
|
|
|
|
|
|||||||||||
| Net investment loss |
(0.70 | )% | (0.77 | )% | (0.78 | )% | (0.73 | )% | (0.52 | )% | ||||||||||
|
|
|
|
|
|
|
|
|
|
|
|||||||||||
| Supplemental Data |
||||||||||||||||||||
| Net assets, end of year (000) |
$ | 1,196,425 | $ | 960,703 | $ | 1,681,166 | $ | 1,297,344 | $ | 742,672 | ||||||||||
|
|
|
|
|
|
|
|
|
|
|
|||||||||||
| Portfolio turnover rate |
32 | % | 38 | % | 31 | % | 20 | % | 32 | % | ||||||||||
|
|
|
|
|
|
|
|
|
|
|
|||||||||||
| (a) | Consolidated Financial Highlights. |
| (b) | Based on average shares outstanding. |
| (c) | Distributions for annual periods determined in accordance with U.S. federal income tax regulations. |
| (d) | Total returns based on market price, which can be significantly greater or less than the net asset value, may result in substantially different returns. Where applicable, excludes the effects of any sales charges and assumes the reinvestment of distributions at actual reinvestment prices. |
| (e) | Includes payment from an affiliate, which had no impact on the Trust’s total return. |
| (f) | For financial reporting purposes, the market value of a certain investment was adjusted as of the report date. Accordingly, the net asset value (NAV) per share and total return performance based on NAV presented herein are different than the information previously published as of December 31, 2020. |
| (g) | Excludes fees and expenses incurred indirectly as a result of investments in underlying funds. |
See notes to financial statements.
| F I N A N C I A L H I G H L I G H T S |
161 |
Financial Highlights (continued)
(For a share outstanding throughout each period)
| BUI | ||||||||||||||||||||
| Year Ended 12/31/23 |
Year Ended 12/31/22 |
Year Ended 12/31/21 |
Year Ended 12/31/20 |
Year Ended 12/31/19 |
||||||||||||||||
| Net asset value, beginning of year |
$ | 22.37 | $ | 25.86 | $ | 23.80 | $ | 22.02 | $ | 18.77 | ||||||||||
|
|
|
|
|
|
|
|
|
|
|
|||||||||||
| Net investment income(a) |
0.35 | 0.33 | 0.24 | 0.33 | 0.37 | |||||||||||||||
| Net realized and unrealized gain (loss) |
1.26 | (2.37 | ) | 3.27 | 2.90 | 4.33 | ||||||||||||||
|
|
|
|
|
|
|
|
|
|
|
|||||||||||
| Net increase (decrease) from investment operations |
1.61 | (2.04 | ) | 3.51 | 3.23 | 4.70 | ||||||||||||||
|
|
|
|
|
|
|
|
|
|
|
|||||||||||
| Distributions(b) |
||||||||||||||||||||
| From net investment income |
(0.37 | ) | (0.30 | ) | (0.24 | ) | (0.20 | ) | (0.24 | ) | ||||||||||
| From net realized gain |
(0.59 | ) | (0.56 | ) | (0.76 | ) | (1.08 | ) | (1.06 | ) | ||||||||||
| Return of capital |
(0.49 | ) | (0.59 | ) | (0.45 | ) | (0.17 | ) | (0.15 | ) | ||||||||||
|
|
|
|
|
|
|
|
|
|
|
|||||||||||
| Total distributions |
(1.45 | ) | (1.45 | ) | (1.45 | ) | (1.45 | ) | (1.45 | ) | ||||||||||
|
|
|
|
|
|
|
|
|
|
|
|||||||||||
| Net asset value, end of year |
$ | 22.53 | $ | 22.37 | $ | 25.86 | $ | 23.80 | $ | 22.02 | ||||||||||
|
|
|
|
|
|
|
|
|
|
|
|||||||||||
| Market price, end of year |
$ | 21.82 | $ | 20.77 | $ | 26.62 | $ | 25.04 | $ | 22.31 | ||||||||||
|
|
|
|
|
|
|
|
|
|
|
|||||||||||
| Total Return(c) |
||||||||||||||||||||
| Based on net asset value |
7.66 | % | (7.73 | )% | 15.13 | % | 15.87 | % | 25.63 | % | ||||||||||
|
|
|
|
|
|
|
|
|
|
|
|||||||||||
| Based on market price |
12.30 | % | (16.78 | )% | 12.65 | % | 20.32 | % | 20.91 | % | ||||||||||
|
|
|
|
|
|
|
|
|
|
|
|||||||||||
| Ratios to Average Net Assets(d) |
||||||||||||||||||||
| Total expenses |
1.08 | % | 1.08 | % | 1.08 | % | 1.13 | % | 1.12 | % | ||||||||||
|
|
|
|
|
|
|
|
|
|
|
|||||||||||
| Total expenses after fees waived and/or reimbursed |
1.08 | % | 1.08 | % | 1.07 | % | 1.10 | % | 1.10 | % | ||||||||||
|
|
|
|
|
|
|
|
|
|
|
|||||||||||
| Net investment income |
1.58 | % | 1.44 | % | 0.97 | % | 1.58 | % | 1.78 | % | ||||||||||
|
|
|
|
|
|
|
|
|
|
|
|||||||||||
| Supplemental Data |
||||||||||||||||||||
| Net assets, end of year (000) |
$ | 506,462 | $ | 498,393 | $ | 559,805 | $ | 444,526 | $ | 383,337 | ||||||||||
|
|
|
|
|
|
|
|
|
|
|
|||||||||||
| Portfolio turnover rate |
31 | % | 36 | % | 20 | % | 39 | % | 39 | % | ||||||||||
|
|
|
|
|
|
|
|
|
|
|
|||||||||||
| (a) | Based on average shares outstanding. |
| (b) | Distributions for annual periods determined in accordance with U.S. federal income tax regulations. |
| (c) | Total returns based on market price, which can be significantly greater or less than the net asset value, may result in substantially different returns. Where applicable, excludes the effects of any sales charges and assumes the reinvestment of distributions at actual reinvestment prices. |
| (d) | Excludes fees and expenses incurred indirectly as a result of investments in underlying funds. |
See notes to financial statements.
| 162 | 2 0 2 3 B L A C K R O C K A N N U A L R E P O R T T O S H A R E H O L D E R S |
1. ORGANIZATION
The following are registered under the Investment Company Act of 1940, as amended (the “1940 Act”), as closed-end management investment companies and are referred to herein collectively as the “Trusts”, or individually as a “Trust”:
| Trust Name | Herein Referred To As | Organized | Diversification Classification | |||
| BlackRock Energy and Resources Trust |
BGR | Delaware | Non-diversified | |||
| BlackRock Enhanced Capital and Income Fund, Inc. |
CII | Maryland | Diversified | |||
| BlackRock Enhanced Equity Dividend Trust |
BDJ | Delaware | Diversified | |||
| BlackRock Enhanced Global Dividend Trust |
BOE | Delaware | Diversified | |||
| BlackRock Enhanced International Dividend Trust |
BGY | Delaware | Diversified | |||
| BlackRock Health Sciences Term Trust |
BMEZ | Maryland | Non-diversified | |||
| BlackRock Health Sciences Trust |
BME | Delaware | Diversified | |||
| BlackRock Innovation and Growth Term Trust |
BIGZ | Maryland | Non-diversified | |||
| BlackRock Resources & Commodities Strategy Trust |
BCX | Delaware | Non-diversified | |||
| BlackRock Science and Technology Term Trust |
BSTZ | Delaware | Diversified* | |||
| BlackRock Science and Technology Trust |
BST | Delaware | Diversified | |||
| BlackRock Utilities, Infrastructure & Power Opportunities Trust |
BUI | Delaware | Diversified | |||
| * | The Trust’s classification changed from non-diversified to diversified during the reporting period. |
The Boards of Directors and Boards of Trustees of the Trusts are collectively referred to throughout this report as the “Board,” and the trustees thereof are collectively referred to throughout this report as “Trustees”. The Trusts determine and make available for publication the net asset values (“NAVs”) of their Common Shares on a daily basis.
On March 31, 2023, the Board approved a proposal to change the name of BlackRock Innovation and Growth Trust, BlackRock Health Sciences Trust II and BlackRock Science and Technology Trust II , effective as of April 5, 2023, to BlackRock Innovation and Growth Term Trust, BlackRock Health Sciences Term Trust and BlackRock Science and Technology Term Trust, respectively. There were no changes to the Trusts’ investment policies or strategies in conjunction with the name changes.
The Trusts, together with certain other registered investment companies advised by BlackRock Advisors, LLC (the “Manager”) or its affiliates, are included in a complex of funds referred to as the BlackRock Fixed-Income Complex.
Basis of Consolidation: The accompanying consolidated financial statements of BDJ include the accounts of BDJ Subsidiary, LLC (the “BDJ Taxable Subsidiary”), which is a wholly-owned taxable subsidiary of BDJ. The BDJ Taxable Subsidiary enables BDJ to hold certain pass-through investments and satisfy regulated investment company tax requirements. Income earned and gains realized on the investment held by the BDJ Taxable Subsidiary are taxable to such subsidiary. A tax provision for income, if any, is shown as income tax in the Consolidated Statement of Operations for BDJ. A tax provision for realized and unrealized gains, if any, is included as a reduction of realized and/or unrealized gain (loss) in the Consolidated Statement of Operations for BDJ. Taxes payable or deferred as of December 31, 2023, if any, are disclosed in the Consolidated Statements of Assets and Liabilities. BDJ may invest up to 25% of its total assets in the BDJ Taxable Subsidiary. The net assets of the BDJ Taxable Subsidiary as of period end were $10,716,626, which is 0.6% of BDJ’s consolidated net assets. Intercompany accounts and transactions, if any, have been eliminated. The BDJ Taxable Subsidiary is subject to the same investment policies and restrictions that apply to BDJ.
The accompanying consolidated financial statements of BSTZ include the accounts of BSTZ Subsidiary, LLC (the “BSTZ Taxable Subsidiary”), which is a wholly-owned taxable subsidiary of BSTZ. The BSTZ Taxable Subsidiary enables BSTZ to hold certain pass-through investments and satisfy regulated investment company tax requirements. Income earned and gains realized on the investment held by the BSTZ Taxable Subsidiary are taxable to such subsidiary. A tax provision for income, if any, is shown as income tax in the Consolidated Statement of Operations for BSTZ. A tax provision for realized and unrealized gains, if any, is included as a reduction of realized and/or unrealized gain (loss) in the Consolidated Statement of Operations for BSTZ. Taxes payable or deferred as of December 31, 2023, if any, are disclosed in the Consolidated Statements of Assets and Liabilities. BSTZ may invest up to 25% of its total assets in the BSTZ Taxable Subsidiary. The net assets of the BSTZ Taxable Subsidiary as of period end were $21,564,780, which is 1.3% of BSTZ’s consolidated net assets. Intercompany accounts and transactions, if any, have been eliminated. The BSTZ Taxable Subsidiary is subject to the same investment policies and restrictions that apply to BSTZ.
The accompanying consolidated financial statements of BST include the accounts of BST Subsidiary, LLC (the “BST Taxable Subsidiary”), which is a wholly-owned taxable subsidiary of BST. The BST Taxable Subsidiary enables BST to hold certain pass-through investments and satisfy regulated investment company tax requirements. Income earned and gains realized on the investment held by the BST Taxable Subsidiary are taxable to such subsidiary. A tax provision for income, if any, is shown as income tax in the Consolidated Statement of Operations for BST. A tax provision for realized and unrealized gains, if any, is included as a reduction of realized and/or unrealized gain (loss) in the Consolidated Statement of Operations for BST. Taxes payable or deferred as of December 31, 2023, if any, are disclosed in the Consolidated Statements of Assets and Liabilities. BST may invest up to 25% of its total assets in the BST Taxable Subsidiary. The net assets of the BST Taxable Subsidiary as of period end were $11,500,360, which is 0.9% of BST’s consolidated net assets. Intercompany accounts and transactions, if any, have been eliminated. The BST Taxable Subsidiary is subject to the same investment policies and restrictions that apply to BST.
2. SIGNIFICANT ACCOUNTING POLICIES
The financial statements are prepared in conformity with accounting principles generally accepted in the United States of America (“U.S. GAAP”), which may require management to make estimates and assumptions that affect the reported amounts of assets and liabilities in the financial statements, disclosure of contingent assets and liabilities at the date of the financial statements and the reported amounts of increases and decreases in net assets from operations during the reporting period. Actual results
| N O T E S T O F I N A N C I A L S T A T E M E N T S |
163 |
Notes to Financial Statements (continued)
could differ from those estimates. Each Trust is considered an investment company under U.S. GAAP and follows the accounting and reporting guidance applicable to investment companies. Below is a summary of significant accounting policies:
Investment Transactions and Income Recognition: For financial reporting purposes, investment transactions are recorded on the dates the transactions are executed. Realized gains and losses on investment transactions are determined using the specific identification method. Dividend income and capital gain distributions, if any, are recorded on the ex-dividend dates. Non-cash dividends, if any, are recorded on the ex-dividend dates at fair value. Dividends from foreign securities where the ex-dividend dates may have passed are subsequently recorded when the Trusts are informed of the ex-dividend dates. Under the applicable foreign tax laws, a withholding tax at various rates may be imposed on capital gains, dividends and interest. Upon notification from issuers, a portion of the dividend income received from a real estate investment trust may be redesignated as a reduction of cost of the related investment and/or realized gain. Interest income, including amortization and accretion of premiums and discounts on debt securities, is recognized daily on an accrual basis.
Foreign Currency Translation: Each Trust’s books and records are maintained in U.S. dollars. Securities and other assets and liabilities denominated in foreign currencies are translated into U.S. dollars using exchange rates determined as of the close of trading on the New York Stock Exchange (“NYSE”). Purchases and sales of investments are recorded at the rates of exchange prevailing on the respective dates of such transactions. Generally, when the U.S. dollar rises in value against a foreign currency, the investments denominated in that currency will lose value; the opposite effect occurs if the U.S. dollar falls in relative value.
Each Trust does not isolate the effect of fluctuations in foreign exchange rates from the effect of fluctuations in the market prices of investments for financial reporting purposes. Accordingly, the effects of changes in exchange rates on investments are not segregated in the Statements of Operations from the effects of changes in market prices of those investments, but are included as a component of net realized and unrealized gain (loss) from investments. Each Trust reports realized currency gains (losses) on foreign currency related transactions as components of net realized gain (loss) for financial reporting purposes, whereas such components are generally treated as ordinary income for U.S. federal income tax purposes.
ForeignTaxes: The Trusts may be subject to foreign taxes (a portion of which may be reclaimable) on income, stock dividends, capital gains on investments, or certain foreign currency transactions. All foreign taxes are recorded in accordance with the applicable foreign tax regulations and rates that exist in the foreign jurisdictions in which each Trust invests. These foreign taxes, if any, are paid by each Trust and are reflected in its Statements of Operations as follows: foreign taxes withheld at source are presented as a reduction of income, foreign taxes on securities lending income are presented as a reduction of securities lending income, foreign taxes on stock dividends are presented as “Foreign taxes withheld”, and foreign taxes on capital gains from sales of investments and foreign taxes on foreign currency transactions are included in their respective net realized gain (loss) categories. Foreign taxes payable or deferred as of December 31, 2023, if any, are disclosed in the Statements of Assets and Liabilities.
The Trusts file withholding tax reclaims in certain jurisdictions to recover a portion of amounts previously withheld. The Trusts may record a reclaim receivable based on collectability, which includes factors such as the jurisdiction’s applicable laws, payment history and market convention. The Statements of Operations include tax reclaims recorded as well as professional and other fees, if any, associated with recovery of foreign withholding taxes.
Bank Overdraft: The Trusts had outstanding cash disbursements exceeding deposited cash amounts at the custodian during the reporting period and as of the report date. The Trusts are obligated to repay the custodian for any overdraft, including any related costs or expenses, where applicable. For financial reporting purposes, overdraft fees, if any, are included in interest expense in the Statements of Operations.
Collateralization: If required by an exchange or counterparty agreement, the Trusts may be required to deliver/deposit cash and/or securities to/with an exchange, or broker-dealer or custodian as collateral for certain investments.
Distributions: Distributions paid by the Trusts are recorded on the ex-dividend dates. Subject to the Trusts’ managed distribution plan, the Trusts intend to make monthly cash distributions to shareholders, which may consist of net investment income, and net realized and unrealized gains on investments and/or return of capital.
The character of distributions is determined in accordance with U.S. federal income tax regulations, which may differ from U.S. GAAP. The portion of distributions that exceeds a Trust’s current and accumulated earnings and profits, which are measured on a tax basis, will constitute a non-taxable return of capital. See Income Tax Information note for the tax character of each Trust’s distributions paid during the year.
Deferred Compensation Plan: Under the Deferred Compensation Plan (the “Plan”) approved by each Trust’s Board, the trustees who are not “interested persons” of the Trusts, as defined in the 1940 Act (“Independent Trustees”), may defer a portion of their annual complex-wide compensation. Deferred amounts earn an approximate return as though equivalent dollar amounts had been invested in common shares of certain funds in the BlackRock Fixed-Income Complex selected by the Independent Trustees. This has the same economic effect for the Independent Trustees as if the Independent Trustees had invested the deferred amounts directly in certain funds in the BlackRock Fixed-Income Complex.
The Plan is not funded and obligations thereunder represent general unsecured claims against the general assets of each Trust, as applicable. Deferred compensation liabilities, if any, are included in the Trustees’ and Officer’s fees payable in the Statements of Assets and Liabilities and will remain as a liability of the Trusts until such amounts are distributed in accordance with the Plan. Net appreciation (depreciation) in the value of participants’ deferral accounts is allocated among the participating funds in the BlackRock Fixed-Income Complex and reflected as Trustees and Officer expense on the Statements of Operations. The Trustees and Officer expense may be negative as a result of a decrease in value of the deferred accounts.
Indemnifications: In the normal course of business, a Trust enters into contracts that contain a variety of representations that provide general indemnification. A Trust’s maximum exposure under these arrangements is unknown because it involves future potential claims against a Trust, which cannot be predicted with any certainty.
Other: Expenses directly related to a Trust are charged to that Trust. Other operating expenses shared by several funds, including other funds managed by the Manager, are prorated among those funds on the basis of relative net assets or other appropriate methods.
| 164 | 2 0 2 3 B L A C K R O C K A N N U A L R E P O R T T O S H A R E H O L D E R S |
Notes to Financial Statements (continued)
3. INVESTMENT VALUATION AND FAIR VALUE MEASUREMENTS
Investment Valuation Policies: Each Trust’s investments are valued at fair value (also referred to as “market value” within the financial statements) each day that the Trust is open for business and, for financial reporting purposes, as of the report date. U.S. GAAP defines fair value as the price a fund would receive to sell an asset or pay to transfer a liability in an orderly transaction between market participants at the measurement date. The Board has approved the designation of each Trust’s Manager as the valuation designee for each Trust. Each Trust determines the fair values of its financial instruments using various independent dealers or pricing services under the Manager’s policies. If a security’s market price is not readily available or does not otherwise accurately represent the fair value of the security, the security will be valued in accordance with the Manager’s policies and procedures as reflecting fair value. The Manager has formed a committee (the “Valuation Committee”) to develop pricing policies and procedures and to oversee the pricing function for all financial instruments, with assistance from other BlackRock pricing committees.
Fair Value Inputs and Methodologies: The following methods and inputs are used to establish the fair value of each Trust’s assets and liabilities:
| • | Equity investments traded on a recognized securities exchange are valued at that day’s official closing price, as applicable, on the exchange where the stock is primarily traded. Equity investments traded on a recognized exchange for which there were no sales on that day may be valued at the last available bid (long positions) or ask (short positions) price. |
| • | Fixed-income investments for which market quotations are readily available are generally valued using the last available bid price or current market quotations provided by independent dealers or third-party pricing services. Pricing services generally value fixed-income securities assuming orderly transactions of an institutional round lot size, but a fund may hold or transact in such securities in smaller, odd lot sizes. Odd lots may trade at lower prices than institutional round lots. The pricing services may use matrix pricing or valuation models that utilize certain inputs and assumptions to derive values, including transaction data (e.g., recent representative bids and offers), market data, credit quality information, perceived market movements, news, and other relevant information. Certain fixed-income securities, including asset-backed and mortgage related securities may be valued based on valuation models that consider the estimated cash flows of each tranche of the entity, establish a benchmark yield and develop an estimated tranche specific spread to the benchmark yield based on the unique attributes of the tranche. The amortized cost method of valuation may be used with respect to debt obligations with sixty days or less remaining to maturity unless the Manager determines such method does not represent fair value. |
| • | Investments in open-end U.S. mutual funds (including money market funds) are valued at that day’s published NAV. |
| • | The Trusts value their investment in SL Liquidity Series, LLC, Money Market Series (the “Money Market Series”) at fair value, which is ordinarily based upon their pro rata ownership in the underlying fund’s net assets. |
| • | Forward foreign currency exchange contracts are valued at the mean between the bid and ask prices and are determined as of the close of trading on the NYSE based on that day’s prevailing forward exchange rate for the underlying currencies. |
| • | Exchange-traded options are valued at the mean between the last bid and ask prices at the close of the options market in which the options trade. An exchange-traded option for which there is no mean price is valued at the last bid (long positions) or ask (short positions) price. If no bid or ask price is available, the prior day’s price will be used, unless it is determined that the prior day’s price no longer reflects the fair value of the option. Over-the-counter (“OTC”) options and options on swaps (“swaptions”) are valued by an independent pricing service using a mathematical model, which incorporates a number of market data factors, such as the trades and prices of the underlying instruments. |
Generally, trading in foreign instruments is substantially completed each day at various times prior to the close of trading on the NYSE. Each business day, the Trusts use current market factors supplied by independent pricing services to value certain foreign instruments (“Systematic Fair Value Price”). The Systematic Fair Value Price is designed to value such foreign securities at fair value as of the close of trading on the NYSE, which follows the close of the local markets.
If events (e.g., market volatility, company announcement or a natural disaster) occur that are expected to materially affect the value of such investment, or in the event that application of these methods of valuation results in a price for an investment that is deemed not to be representative of the market value of such investment, or if a price is not available, the investment will be valued by the Valuation Committee in accordance with the Manager’s policies and procedures as reflecting fair value (“Fair Valued Investments”). The fair valuation approaches that may be used by the Valuation Committee include market approach, income approach and cost approach. Valuation techniques such as discounted cash flow, use of market comparables and matrix pricing are types of valuation approaches and are typically used in determining fair value. When determining the price for Fair Valued Investments, the Valuation Committee seeks to determine the price that each Trust might reasonably expect to receive or pay from the current sale or purchase of that asset or liability in an arm’s-length transaction. Fair value determinations shall be based upon all available factors that the Valuation Committee deems relevant and consistent with the principles of fair value measurement.
For investments in equity or debt issued by privately held companies or funds (“Private Company” or collectively, the “Private Companies”) and other Fair Valued Investments, the fair valuation approaches that are used by the Valuation Committee and third-party pricing services utilized by the Valuation Committee include one or a combination of, but not limited to, the following inputs.
| Standard Inputs Generally Considered By The Valuation Committee And Third-Party Pricing Services | ||
| Market approach |
(i) recent market transactions, including subsequent rounds of financing, in the underlying investment or comparable issuers; (ii) recapitalizations and other transactions across the capital structure; and (iii) market multiples of comparable issuers. | |
| Income approach |
(i) future cash flows discounted to present and adjusted as appropriate for liquidity, credit, and/or market risks; (ii) quoted prices for similar investments or assets in active markets; and | |
| N O T E S T O F I N A N C I A L S T A T E M E N T S |
165 |
Notes to Financial Statements (continued)
| Standard Inputs Generally Considered By The Valuation Committee And Third-Party Pricing Services | ||
| (iii) other risk factors, such as interest rates, yield curves, volatilities, prepayment speeds, loss severities, credit risks, recovery rates, liquidation amounts and/or default rates. | ||
| Cost approach |
(i) audited or unaudited financial statements, investor communications and financial or operational metrics issued by the Private Company; (ii) changes in the valuation of relevant indices or publicly traded companies comparable to the Private Company; (iii) relevant news and other public sources; and (iv) known secondary market transactions in the Private Company’s interests and merger or acquisition activity in companies comparable to the Private Company. | |
Investments in series of preferred stock issued by Private Companies are typically valued utilizing market approach in determining the enterprise value of the company. Such investments often contain rights and preferences that differ from other series of preferred and common stock of the same issuer. Enterprise valuation techniques such as an option pricing model (“OPM”), a probability weighted expected return model (“PWERM”), current value method or a hybrid of those techniques are used as deemed appropriate under the circumstances. The use of these valuation techniques involves a determination of the exit scenarios of the investment in order to appropriately allocate the enterprise value of the company among the various parts of its capital structure.
The Private Companies are not subject to the public company disclosure, timing, and reporting standards applicable to other investments held by a Trust. Typically, the most recently available information by a Private Company is as of a date that is earlier than the date a Trust is calculating its NAV. This factor may result in a difference between the value of the investment and the price a Trust could receive upon the sale of the investment.
Fair Value Hierarchy: Various inputs are used in determining the fair value of financial instruments. These inputs to valuation techniques are categorized into a fair value hierarchy consisting of three broad levels for financial reporting purposes as follows:
| • | Level 1 – Unadjusted price quotations in active markets/exchanges for identical assets or liabilities that each Trust has the ability to access; |
| • | Level 2 – Other observable inputs (including, but not limited to, quoted prices for similar assets or liabilities in markets that are active, quoted prices for identical or similar assets or liabilities in markets that are not active, inputs other than quoted prices that are observable for the assets or liabilities (such as interest rates, yield curves, volatilities, prepayment speeds, loss severities, credit risks and default rates) or other market–corroborated inputs); and |
| • | Level 3 – Unobservable inputs based on the best information available in the circumstances, to the extent observable inputs are not available (including the Valuation Committee’s assumptions used in determining the fair value of financial instruments). |
The hierarchy gives the highest priority to unadjusted quoted prices in active markets for identical assets or liabilities (Level 1 measurements) and the lowest priority to unobservable inputs (Level 3 measurements). Accordingly, the degree of judgment exercised in determining fair value is greatest for instruments categorized in Level 3. The inputs used to measure fair value may fall into different levels of the fair value hierarchy. In such cases, for disclosure purposes, the fair value hierarchy classification is determined based on the lowest level input that is significant to the fair value measurement in its entirety. Investments classified within Level 3 have significant unobservable inputs used by the Valuation Committee in determining the price for Fair Valued Investments. Level 3 investments include equity or debt issued by Private Companies that may not have a secondary market and/or may have a limited number of investors. The categorization of a value determined for financial instruments is based on the pricing transparency of the financial instruments and is not necessarily an indication of the risks associated with investing in those securities.
As of December 31, 2023, certain investments of CII, BMEZ, BIGZ, BCX, BSTZ, BST and BUI were fair valued using NAV as a practical expedient as no quoted market value is available and therefore have been excluded from the fair value hierarchy.
4. SECURITIES AND OTHER INVESTMENTS
Preferred Stocks: Preferred stock has a preference over common stock in liquidation (and generally in receiving dividends as well), but is subordinated to the liabilities of the issuer in all respects. As a general rule, the market value of preferred stock with a fixed dividend rate and no conversion element varies inversely with interest rates and perceived credit risk, while the market price of convertible preferred stock generally also reflects some element of conversion value. Because preferred stock is junior to debt securities and other obligations of the issuer, deterioration in the credit quality of the issuer will cause greater changes in the value of a preferred stock than in a more senior debt security with similar stated yield characteristics. Unlike interest payments on debt securities, preferred stock dividends are payable only if declared by the issuer’s board of directors. Preferred stock also may be subject to optional or mandatory redemption provisions.
Warrants: Warrants entitle a fund to purchase a specified number of shares of common stock and are non-income producing. The purchase price and number of shares are subject to adjustment under certain conditions until the expiration date of the warrants, if any. If the price of the underlying stock does not rise above the strike price before the warrant expires, the warrant generally expires without any value and a fund will lose any amount it paid for the warrant. Thus, investments in warrants may involve more risk than investments in common stock. Warrants may trade in the same markets as their underlying stock; however, the price of the warrant does not necessarily move with the price of the underlying stock.
Commitments: Commitments are agreements to acquire an investment at a future date (subject to conditions) in connection with a potential public or non-public offering. Such agreements may obligate a fund to make future cash payments. As of December 31, 2023, BDJ had outstanding commitments of $7,443,073. These commitments are not included in the net assets of BDJ as of December 31, 2023.
Securities Lending: Certain Trusts may lend their securities to approved borrowers, such as brokers, dealers and other financial institutions. The borrower pledges and maintains with the Trusts collateral consisting of cash, an irrevocable letter of credit issued by a bank, or securities issued or guaranteed by the U.S. Government. The initial
| 166 | 2 0 2 3 B L A C K R O C K A N N U A L R E P O R T T O S H A R E H O L D E R S |
Notes to Financial Statements (continued)
collateral received by each Trust is required to have a value of at least 102% of the current value of the loaned securities for securities traded on U.S. exchanges and a value of at least 105% for all other securities. The collateral is maintained thereafter at a value equal to at least 100% of the current market value of the securities on loan. The market value of the loaned securities is determined at the close of each business day of the Trust and any additional required collateral is delivered to the Trust, or excess collateral returned by the Trust, on the next business day. During the term of the loan, the Trusts are entitled to all distributions made on or in respect of the loaned securities, but do not receive interest income on securities received as collateral. Loans of securities are terminable at any time and the borrower, after notice, is required to return borrowed securities within the standard time period for settlement of securities transactions.
As of period end, any securities on loan were collateralized by cash and/or U.S. Government obligations. Cash collateral invested by the securities lending agent, BlackRock Investment Management, LLC (“BIM”), if any, is disclosed in the Schedules of Investments. Any non-cash collateral received cannot be sold, re-invested or pledged by the Trust, except in the event of borrower default. The securities on loan, if any, are disclosed in the Trusts’ Schedules of Investments. The market value of any securities on loan and the value of related collateral, if any, are shown separately in the Statements of Assets and Liabilities as a component of investments at value – unaffiliated and collateral on securities loaned, respectively.
Securities lending transactions are entered into by the Trusts under Master Securities Lending Agreements (each, an “MSLA”), which provide the right, in the event of default (including bankruptcy or insolvency), for the non-defaulting party to liquidate the collateral and calculate a net exposure to the defaulting party or request additional collateral. In the event that a borrower defaults, the Trusts, as lender, would offset the market value of the collateral received against the market value of the securities loaned. When the value of the collateral is greater than that of the market value of the securities loaned, the lender is left with a net amount payable to the defaulting party. However, bankruptcy or insolvency laws of a particular jurisdiction may impose restrictions on or prohibitions against such a right of offset in the event of an MSLA counterparty’s bankruptcy or insolvency. Under the MSLA, absent an event of default, the borrower can resell or re-pledge the loaned securities, and the Trusts can reinvest cash collateral received in connection with loaned securities. Upon an event of default, the parties’ obligations to return the securities or collateral to the other party are extinguished, and the parties can resell or re-pledge the loaned securities or the collateral received in connection with the loaned securities in order to satisfy the defaulting party’s net payment obligation for all transactions under the MSLA. The defaulting party remains liable for any deficiency.
As of period end, the following table is a summary of the Trusts’ securities on loan by counterparty which are subject to offset under an MSLA:
| Trust Name/Counterparty |
|
Securities Loaned at Value |
|
|
Cash Collateral Received |
(a) |
|
Non-Cash Collateral Received, at Fair Value |
(a) |
|
Net Amount |
| ||||
| CII |
||||||||||||||||
| Citigroup Global Markets, Inc. |
$ | 388,229 | $ | (388,229 | ) | $ | — | $ | — | |||||||
| Credit Suisse Securities (USA) LLC |
1,699 | (1,699 | ) | — | — | |||||||||||
|
|
|
|
|
|
|
|
|
|||||||||
| $ | 389,928 | $ | (389,928 | ) | $ | — | $ | — | ||||||||
|
|
|
|
|
|
|
|
|
|||||||||
| BMEZ |
||||||||||||||||
| Barclays Capital, Inc. |
$ | 229,896 | $ | (229,896 | ) | $ | — | $ | — | |||||||
| BofA Securities, Inc. |
16,500 | (16,500 | ) | — | — | |||||||||||
| Citigroup Global Markets, Inc. |
6,461,660 | (6,461,660 | ) | — | — | |||||||||||
| Goldman Sachs & Co. LLC |
2,252,539 | (2,252,539 | ) | — | — | |||||||||||
| Morgan Stanley |
2,115,151 | (2,115,151 | ) | — | — | |||||||||||
| National Financial Services LLC |
785,307 | (785,307 | ) | — | — | |||||||||||
| Toronto-Dominion Bank |
1,688 | (1,688 | ) | — | — | |||||||||||
|
|
|
|
|
|
|
|
|
|||||||||
| $ | 11,862,741 | $ | (11,862,741 | ) | $ | — | $ | — | ||||||||
|
|
|
|
|
|
|
|
|
|||||||||
| BIGZ |
||||||||||||||||
| Barclays Capital, Inc. |
$ | 3,929,480 | $ | (3,929,480 | ) | $ | — | $ | — | |||||||
| J.P. Morgan Securities LLC |
1,959,182 | (1,959,182 | ) | — | — | |||||||||||
| Morgan Stanley |
1,518,708 | (1,518,708 | ) | — | — | |||||||||||
| State Street Bank & Trust Co. |
9,985,344 | (9,985,344 | ) | — | — | |||||||||||
| Toronto-Dominion Bank |
2,280,275 | (2,280,275 | ) | — | — | |||||||||||
|
|
|
|
|
|
|
|
|
|||||||||
| $ | 19,672,989 | $ | (19,672,989 | ) | $ | — | $ | — | ||||||||
|
|
|
|
|
|
|
|
|
|||||||||
| BCX |
||||||||||||||||
| Citigroup Global Markets, Inc. |
$ | 3,633,437 | $ | (3,633,437 | ) | $ | — | $ | — | |||||||
| Credit Suisse Securities (USA) LLC |
312,291 | (312,291 | ) | — | — | |||||||||||
| J.P. Morgan Securities LLC |
1,854,548 | (1,854,548 | ) | — | — | |||||||||||
| Morgan Stanley |
156,145 | (156,145 | ) | — | — | |||||||||||
|
|
|
|
|
|
|
|
|
|||||||||
| $ | 5,956,421 | $ | (5,956,421 | ) | $ | — | $ | — | ||||||||
|
|
|
|
|
|
|
|
|
|||||||||
| BSTZ |
||||||||||||||||
| Goldman Sachs & Co. LLC |
$ | 825,664 | $ | (825,664 | ) | $ | — | $ | — | |||||||
| J.P. Morgan Securities LLC |
69,960 | (69,960 | ) | — | — | |||||||||||
| Morgan Stanley |
1,743,364 | (1,743,364 | ) | — | — | |||||||||||
| State Street Bank & Trust Co. |
95,671 | (95,671 | ) | — | — | |||||||||||
|
|
|
|
|
|
|
|
|
|||||||||
| $ | 2,734,659 | $ | (2,734,659 | ) | $ | — | $ | — | ||||||||
|
|
|
|
|
|
|
|
|
|||||||||
| BST |
||||||||||||||||
| Citigroup Global Markets, Inc. |
$ | 1,022,125 | $ | (1,022,125 | ) | $ | — | $ | — | |||||||
| N O T E S T O F I N A N C I A L S T A T E M E N T S |
167 |
Notes to Financial Statements (continued)
| Trust Name/Counterparty |
|
Securities Loaned at Value |
|
|
Cash Collateral Received |
(a) |
|
Non-Cash Collateral Received, at Fair Value |
(a) |
|
Net Amount |
| ||||
| BST (continued) |
||||||||||||||||
| J.P. Morgan Securities LLC |
$ | 3,687,666 | $ | (3,687,666 | ) | $ | — | $ | — | |||||||
| Toronto-Dominion Bank |
864,690 | (864,690 | ) | — | — | |||||||||||
|
|
|
|
|
|
|
|
|
|||||||||
| $ | 5,574,481 | $ | (5,574,481 | ) | $ | — | $ | — | ||||||||
|
|
|
|
|
|
|
|
|
|||||||||
| BUI |
||||||||||||||||
| Barclays Capital, Inc. |
$ | 1,040,726 | $ | (1,040,726 | ) | $ | — | $ | — | |||||||
| Goldman Sachs & Co. LLC |
23,607 | (23,607 | ) | — | — | |||||||||||
| Morgan Stanley |
196,725 | (196,725 | ) | — | — | |||||||||||
|
|
|
|
|
|
|
|
|
|||||||||
| $ | 1,261,058 | $ | (1,261,058 | ) | $ | — | $ | — | ||||||||
|
|
|
|
|
|
|
|
|
|||||||||
| (a) | Collateral received, if any, in excess of the market value of securities on loan is not presented in this table. The total cash collateral received by each Trust is disclosed in the Trust’s Statements of Assets and Liabilities. |
The risks of securities lending include the risk that the borrower may not provide additional collateral when required or may not return the securities when due. To mitigate these risks, the Trusts benefit from a borrower default indemnity provided by BIM. BIM’s indemnity allows for full replacement of the securities loaned to the extent the collateral received does not cover the value on the securities loaned in the event of borrower default. Each Trust could incur a loss if the value of an investment purchased with cash collateral falls below the market value of loaned securities or if the value of an investment purchased with cash collateral falls below the value of the original cash collateral received. Such losses are borne entirely by the Trusts.
5. DERIVATIVE FINANCIAL INSTRUMENTS
The Trusts engage in various portfolio investment strategies using derivative contracts both to increase the returns of the Trusts and/or to manage their exposure to certain risks such as credit risk, equity risk, interest rate risk, foreign currency exchange rate risk, commodity price risk or other risks (e.g., inflation risk). Derivative financial instruments categorized by risk exposure are included in the Schedules of Investments. These contracts may be transacted on an exchange or OTC.
Forward Foreign Currency Exchange Contracts: Forward foreign currency exchange contracts are entered into to gain or reduce exposure to foreign currencies (foreign currency exchange rate risk).
A forward foreign currency exchange contract is an agreement between two parties to buy and sell a currency at a set exchange rate on a specified date. These contracts help to manage the overall exposure to the currencies in which some of the investments held by the Trusts are denominated and in some cases, may be used to obtain exposure to a particular market. The contracts are traded OTC and not on an organized exchange.
The contract is marked-to-market daily and the change in market value is recorded as unrealized appreciation (depreciation) in the Statements of Assets and Liabilities. When a contract is closed, a realized gain or loss is recorded in the Statements of Operations equal to the difference between the value at the time it was opened and the value at the time it was closed. Non-deliverable forward foreign currency exchange contracts are settled with the counterparty in cash without the delivery of foreign currency. The use of forward foreign currency exchange contracts involves the risk that the value of a forward foreign currency exchange contract changes unfavorably due to movements in the value of the referenced foreign currencies, and such value may exceed the amount(s) reflected in the Statements of Assets and Liabilities. Cash amounts pledged for forward foreign currency exchange contracts are considered restricted and are included in cash pledged as collateral for OTC derivatives in the Statements of Assets and Liabilities. The Trust’s risk of loss from counterparty credit risk on OTC derivatives is generally limited to the aggregate unrealized gain netted against any collateral held by the Trust.
Options: The Trusts may purchase and write call and put options to increase or decrease their exposure to the risks of underlying instruments, including equity risk, interest rate risk and/or commodity price risk and/or, in the case of options written, to generate gains from options premiums.
A call option gives the purchaser (holder) of the option the right (but not the obligation) to buy, and obligates the seller (writer) to sell (when the option is exercised) the underlying instrument at the exercise or strike price at any time or at a specified time during the option period. A put option gives the holder the right to sell and obligates the writer to buy the underlying instrument at the exercise or strike price at any time or at a specified time during the option period.
Premiums paid on options purchased and premiums received on options written, as well as the daily fluctuation in market value, are included in investments at value – unaffiliated and options written at value, respectively, in the Statements of Assets and Liabilities. When an instrument is purchased or sold through the exercise of an option, the premium is offset against the cost or proceeds of the underlying instrument. When an option expires, a realized gain or loss is recorded in the Statements of Operations to the extent of the premiums received or paid. When an option is closed or sold, a gain or loss is recorded in the Statements of Operations to the extent the cost of the closing transaction exceeds the premiums received or paid. When the Trusts write a call option, such option is typically “covered,” meaning that they hold the underlying instrument subject to being called by the option counterparty. When the Trusts write a put option, cash is segregated in an amount sufficient to cover the obligation. These amounts, which are considered restricted, are included in cash pledged as collateral for options written in the Statements of Assets and Liabilities.
In purchasing and writing options, the Trusts bear the risk of an unfavorable change in the value of the underlying instrument or the risk that they may not be able to enter into a closing transaction due to an illiquid market. Exercise of a written option could result in the Trusts purchasing or selling a security when they otherwise would not, or at a price different from the current market value.
Master Netting Arrangements: In order to define its contractual rights and to secure rights that will help it mitigate its counterparty risk, a Trust may enter into an International Swaps and Derivatives Association, Inc. Master Agreement (“ISDA Master Agreement”) or similar agreement with its derivative contract counterparties. An ISDA Master Agreement is a bilateral agreement between a Trust and a counterparty that governs certain OTC derivatives and typically contains, among other things, collateral posting
| 168 | 2 0 2 3 B L A C K R O C K A N N U A L R E P O R T T O S H A R E H O L D E R S |
Notes to Financial Statements (continued)
terms and netting provisions in the event of a default and/or termination event. Under an ISDA Master Agreement, a Trust may, under certain circumstances, offset with the counterparty certain derivative financial instruments’ payables and/or receivables with collateral held and/or posted and create one single net payment. The provisions of the ISDA Master Agreement typically permit a single net payment in the event of default including the bankruptcy or insolvency of the counterparty. However, bankruptcy or insolvency laws of a particular jurisdiction may impose restrictions on or prohibitions against the right of offset in bankruptcy, insolvency or other events.
Collateral Requirements: For derivatives traded under an ISDA Master Agreement, the collateral requirements are typically calculated by netting the mark-to-market amount for each transaction under such agreement and comparing that amount to the value of any collateral currently pledged by the Trusts and the counterparty.
Cash collateral that has been pledged to cover obligations of the Trusts and cash collateral received from the counterparty, if any, is reported separately in the Statements of Assets and Liabilities as cash pledged as collateral and cash received as collateral, respectively. Non-cash collateral pledged by the Trusts, if any, is noted in the Schedules of Investments. Generally, the amount of collateral due from or to a counterparty is subject to a certain minimum transfer amount threshold before a transfer is required, which is determined at the close of business of the Trusts. Any additional required collateral is delivered to/pledged by the Trusts on the next business day. Typically, the counterparty is not permitted to sell, re-pledge or use cash and non-cash collateral it receives. A Trust generally agrees not to use non-cash collateral that it receives but may, absent default or certain other circumstances defined in the underlying ISDA Master Agreement, be permitted to use cash collateral received. In such cases, interest may be paid pursuant to the collateral arrangement with the counterparty. To the extent amounts due to the Trusts from the counterparties are not fully collateralized, each Trust bears the risk of loss from counterparty non-performance. Likewise, to the extent the Trusts have delivered collateral to a counterparty and stand ready to perform under the terms of their agreement with such counterparty, each Trust bears the risk of loss from a counterparty in the amount of the value of the collateral in the event the counterparty fails to return such collateral. Based on the terms of agreements, collateral may not be required for all derivative contracts.
For financial reporting purposes, the Trusts do not offset derivative assets and derivative liabilities that are subject to netting arrangements, if any, in the Statements of Assets and Liabilities.
6. INVESTMENT ADVISORY AGREEMENT AND OTHER TRANSACTIONS WITH AFFILIATES
Investment Advisory: Each Trust entered into an Investment Advisory Agreement with the Manager, the Trusts’ investment adviser and an indirect, wholly-owned subsidiary of BlackRock, Inc. (“BlackRock”), to provide investment advisory and administrative services. The Manager is responsible for the management of each Trust’s portfolio and provides the personnel, facilities, equipment and certain other services necessary to the operations of each Trust.
For such services, each Trust, except BCX, pays the Manager a monthly fee at the following annual rates:
Average weekly value of each Trust’s net assets:
| BGR | BDJ | BOE | BME | |||||||||||||
| Investment advisory fees |
1.20 | % | 0.80 | % | 1.00 | % | 1.00 | % | ||||||||
Average daily value of each Trust’s net assets, plus the proceeds of any outstanding debt securities or borrowings for leverage:
| CII | ||||
| Investment advisory fees |
0.85 | % | ||
Average daily value of each Trust’s net assets:
| BGY | BUI | |||||||
| Investment advisory fees |
1.00 | % | 1.00 | % | ||||
Average daily value of each Trust’s managed assets:
| BMEZ | BIGZ | BSTZ | BST | |||||||||||||
| Investment advisory fees |
1.25 | % | 1.25 | % | 1.25 | % | 1.00 | % | ||||||||
For such services, BCX pays the Manager a monthly fee at an annual rate equal to 1.00% of the sum of the average daily value of the net assets of the Trust (excluding the value of the Trust’s interest in the BCX Subsidiary, LLC (the “BCX Taxable Subsidiary”), which is a wholly-owned taxable subsidiary of BCX) and the average daily value of the net assets of its subsidiary, which fee is allocated pro rata between the Trust and the BCX Taxable Subsidiary based on the average daily value of their respective net assets (excluding, in the case of the Trust, the value of the Trust’s interest in the BCX Taxable Subsidiary). The BCX Taxable Subsidiary had no net assets or activity during the period ended December 31, 2023.
For purposes of calculating these fees, “net assets” mean the total assets of BGR, CII, BDJ, BOE, BGY, BME, BCX and BUI minus the sum of its accrued liabilities.
For purposes of calculating these fees, “managed assets” are determined as total assets of BMEZ, BIGZ, BSTZ and BST (including any assets attributable to money borrowed for investment purposes) less the sum of its accrued liabilities (other than money borrowed for investment purposes).
The Manager provides investment management and other services to BDJ Taxable Subsidiary, BSTZ Taxable Subsidiary and BST Taxable Subsidiary. The Manager does not receive separate compensation from the BDJ Taxable Subsidiary, BSTZ Taxable Subsidiary or BST Taxable Subsidiary for providing investment management or administrative services. However, BDJ pays the Manager based on the Trust’s net assets, which includes the assets of the BDJ Taxable Subsidiary, and BSTZ and BST pay the Manager based on the Trust’s managed assets, which includes the assets of the BSTZ Taxable Subsidiary and BST Taxable Subsidiary, respectively.
| N O T E S T O F I N A N C I A L S T A T E M E N T S |
169 |
Notes to Financial Statements (continued)
With respect to BGR, BOE, BGY, BCX and BUI, the Manager entered into separate sub-advisory agreements with BlackRock International Limited (“BIL”), an affiliate of the Manager. The Manager pays BIL for services it provides for that portion of each Trust for which BIL acts as sub-adviser, a monthly fee that is equal to a percentage of the investment advisory fees paid by each Trust to the Manager.
Distribution Fees: BDJ, BME, BST and BUI have each entered into Distribution Agreements with BlackRock Investments, LLC (“BRIL”), an affiliate of the Manager, to provide for distribution of BDJ’s, BME’s, BST’s and BUI’s common shares on a reasonable best efforts basis through an equity shelf offering (a “Shelf Offering”) (the “Distribution Agreement”). Pursuant to the Distribution Agreement, BRIL will receive commissions with respect to sales of common shares at a commission rate of 1.00% of the gross proceeds of the sale of BDJ’s, BME’s, BST’s and BUI’s common shares and a portion of such commission is re-allowed to broker-dealers engaged by BRIL. The commissions retained by BRIL during the year ended December 31, 2023 amounted to $0, $6,106, $84,111 and $7,641 for each of BDJ, BME, BST and BUI, respectively.
Expense Limitations, Waivers and Reimbursements: The Manager voluntarily agreed to waive a portion of the investment advisory fees on the following Trusts as a percentage of their average weekly net assets, as follows:
| BGR | BOE | |||||||
| 0.220 | % | 0.175 | % | |||||
These voluntary waivers may be reduced or discontinued at any time without notice.
For the year ended December 31, 2023, the investment advisory fees waived, which are included in fees waived and/or reimbursed by the Manager in the Statements of Operations, were as follows:
| Trust Name | Fees Waived and/or Reimbursed by the Manager |
|||
| BGR |
$ | 861,964 | ||
| BOE |
1,239,614 | |||
With respect to each Trust, the Manager contractually agreed to waive its investment advisory fees by the amount of investment advisory fees each Trust pays to the Manager indirectly through its investment in affiliated money market funds (the “affiliated money market fund waiver”) through June 30, 2025. The contractual agreement may be terminated upon 90 days’ notice by a majority of the Independent trustees, or by a vote of a majority of the outstanding voting securities of a Trust. These amounts are included in fees waived and/or reimbursed by the Manager in the Statements of Operations. For the year ended December 31, 2023, the amounts waived were as follows:
| Trust Name | Fees Waived and/or Reimbursed by the Manager |
|||
| BGR |
$ | 4,561 | ||
| CII |
9,345 | |||
| BDJ |
42,031 | |||
| BOE |
6,630 | |||
| BGY |
7,794 | |||
| BMEZ |
42,748 | |||
| BME |
19,166 | |||
| BIGZ |
6,701 | |||
| BCX |
18,912 | |||
| BSTZ |
5,929 | |||
| BST |
5,407 | |||
| BUI |
8,011 | |||
The Manager contractually agreed to waive its investment advisory fee with respect to any portion of each Trust’s assets invested in affiliated equity and fixed-income mutual funds and affiliated exchange-traded funds that have a contractual management fee through June 30, 2025. The agreement can be renewed for annual periods thereafter, and may be terminated on 90 days’ notice, each subject to approval by a majority of the Trusts’ Independent Trustees. For the year ended December 31, 2023, there were no fees waived by the Manager pursuant to this arrangement.
Securities Lending: The U.S. Securities and Exchange Commission (“SEC”) has issued an exemptive order which permits BIM, an affiliate of the Manager, to serve as securities lending agent for the Trusts, subject to applicable conditions. As securities lending agent, BIM bears all operational costs directly related to securities lending. The Trusts are responsible for expenses in connection with the investment of cash collateral received for securities on loan (the “collateral investment expenses”). The cash collateral is invested in a private investment company, Money Market Series, managed by the Manager or its affiliates. However, BIM has agreed to cap the collateral investment expenses of the Money Market Series to an annual rate of 0.04%. The investment adviser to the Money Market Series will not charge any advisory fees with respect to shares purchased by the Trusts. The Money Market Series may impose a discretionary liquidity fee of up to 2% of the value withdrawn, if such fee is determined to be in the best interests of the Money Market Series. The Money Market Series seeks current income consistent with maintaining liquidity and preserving capital. Although the Money Market Series is not registered under the 1940 Act, its investments may follow the parameters of investments by a money market fund that is subject to Rule 2a-7 under the 1940 Act.
Securities lending income is equal to the total of income earned from the reinvestment of cash collateral, net of fees and other payments to and from borrowers of securities, and less the collateral investment expenses. Each Trust retains a portion of securities lending income and remits a remaining portion to BIM as compensation for its services as securities lending agent.
| 170 | 2 0 2 3 B L A C K R O C K A N N U A L R E P O R T T O S H A R E H O L D E R S |
Notes to Financial Statements (continued)
Pursuant to the current securities lending agreement, each of CII, BDJ, BMEZ, BME, BIGZ and BST retains 81% of securities lending income (which excludes collateral investment expenses), and this amount retained can never be less than 70% of the total of securities lending income plus the collateral investment expenses.
In addition, commencing the business day following the date that the aggregate securities lending income earned across the BlackRock Fixed-Income Complex in a calendar year exceeds a specified threshold, each of CII, BDJ, BMEZ, BME, BIGZ and BST, pursuant to the securities lending agreement, will retain for the remainder of that calendar year securities lending income in an amount equal to 81% of securities lending income (which excludes collateral investment expenses), and this amount retained can never be less than 70% of the total of securities lending income plus the collateral investment expenses.
Pursuant to the current securities lending agreement, each of BGR, BOE, BGY, BCX, BSTZ and BUI retains 82% of securities lending income (which excludes collateral investment expenses), and this amount retained can never be less than 70% of the total of securities lending income plus the collateral investment expenses.
In addition, commencing the business day following the date that the aggregate securities lending income earned across the BlackRock Fixed-Income Complex in a calendar year exceeds a specified threshold, each of BGR, BOE, BGY, BCX, BSTZ and BUI, pursuant to the securities lending agreement, will retain for the remainder of that calendar year securities lending income in an amount equal to 85% of securities lending income (which excludes collateral investment expenses), and this amount retained can never be less than 70% of the total of securities lending income plus the collateral investment expenses.
Prior to January 1, 2023, BIM was permitted to lend each Trust’s securities only when the difference between the borrower rebate rate (i.e., a negotiated interest rate payment for cash collateral pledged in connection with a securities lending transaction) and the risk free rate exceeded a certain level (such securities, the “specials only securities”). Effective January 1, 2023, this limitation no longer applies.
The share of securities lending income earned by each Trust is shown as securities lending income — affiliated — net in the Statements of Operations. For the year ended December 31, 2023, each Trust paid BIM the following amounts for securities lending agent services:
| Trust Name | Amounts | |||
| CII |
$ | 1,530 | ||
| BDJ |
230 | |||
| BOE |
566 | |||
| BMEZ |
107,504 | |||
| BME |
5,993 | |||
| BIGZ |
14,292 | |||
| BCX |
3,731 | |||
| BSTZ |
15,199 | |||
| BST |
3,859 | |||
| BUI |
2,253 | |||
Trustees and Officers: Certain trustees and/or officers of the Trusts are directors and/or officers of BlackRock or its affiliates. The Trusts reimburse the Manager for a portion of the compensation paid to the Trusts’ Chief Compliance Officer, which is included in Trustees and Officer in the Statements of Operations.
Other Transactions: During the period ended December 31, 2023, BSTZ received a reimbursement of $127,092, from an affiliate, which is included in payment by affiliate in the Statements of Operations, related to an operating event.
The Trusts may purchase securities from, or sell securities to, an affiliated fund provided the affiliation is due solely to having a common investment adviser, common officers, or common trustees. For the year ended December 31, 2023, the purchase and sale transactions and any net realized gains (losses) with affiliated funds in compliance with Rule 17a-7 under the 1940 Act were as follows:
| Trust Name | Purchases | Sales | Net Realized Gain (Loss) |
|||||||||
| BOE |
$ | — | $ | 1,624,132 | $ | 48,460 | ||||||
| BGY |
2,972,174 | — | — | |||||||||
| BUI |
261,340 | — | — | |||||||||
7. PURCHASES AND SALES
For the year ended December 31, 2023, purchases and sales of investments, excluding short-term securities, were as follows:
| Trust Name | Purchases | Sales | ||||||
| BGR |
$ | 146,537,617 | $ | 155,743,276 | ||||
| CII |
235,741,075 | 299,421,903 | ||||||
| BDJ |
689,480,343 | 734,197,999 | ||||||
| BOE |
322,976,129 | 363,804,994 | ||||||
| BGY |
337,874,205 | 378,018,464 | ||||||
| BMEZ |
1,209,309,621 | 1,388,053,476 | ||||||
| BME |
241,292,839 | 275,704,754 | ||||||
| BIGZ |
761,816,098 | 1,000,525,033 | ||||||
| BCX |
415,902,973 | 448,984,371 | ||||||
| BSTZ |
607,642,765 | 812,220,813 | ||||||
| N O T E S T O F I N A N C I A L S T A T E M E N T S |
171 |
Notes to Financial Statements (continued)
|
|
||||||||
| Trust Name | Purchases | Sales | ||||||
|
|
||||||||
| BST |
$ | 348,579,186 | $ | 437,668,495 | ||||
| BUI |
154,271,528 | 163,843,293 | ||||||
|
|
||||||||
8. INCOME TAX INFORMATION
It is each Trust’s policy to comply with the requirements of the Internal Revenue Code of 1986, as amended, applicable to regulated investment companies, and to distribute substantially all of its taxable income to its shareholders. Therefore, no U.S. federal income tax provision is required.
Each Trust files U.S. federal and various state and local tax returns. No income tax returns are currently under examination. The statute of limitations on each Trust’s U.S. federal tax returns generally remains open for a period of three years after they are filed. The statutes of limitations on each Trust’s state and local tax returns may remain open for an additional year depending upon the jurisdiction.
Management has analyzed tax laws and regulations and their application to the Trusts as of December 31, 2023, inclusive of the open tax return years, and does not believe that there are any uncertain tax positions that require recognition of a tax liability in the Trusts’ financial statements.
U.S. GAAP requires that certain components of net assets be adjusted to reflect permanent differences between financial and tax reporting. These reclassifications have no effect on net assets or NAVs per share. As of period end, permanent differences attributable to timing and recognition of partnership income, non-deductible expenses, the realization for tax purposes of unrealized gains on investments in passive foreign investment companies and net operating losses were reclassified to the following accounts:
|
|
||||||||
| Trust Name | Paid-in Capital | Accumulated Earnings (Loss) |
||||||
|
|
||||||||
| BGR |
$ | 558,373 | $ | (558,373 | ) | |||
| BDJ |
(5,192 | ) | 5,192 | |||||
| BMEZ |
(7,775,158 | ) | 7,775,158 | |||||
| BIGZ |
(17,277,154 | ) | 17,277,154 | |||||
| BSTZ |
6,950,700 | (6,950,700 | ) | |||||
| BST |
(6,831,334 | ) | 6,831,334 | |||||
| BUI |
(828 | ) | 828 | |||||
|
|
||||||||
The tax character of distributions paid was as follows:
|
|
||||||||
| Trust Name | Year Ended 12/31/23 |
Year Ended 12/31/22 |
||||||
|
|
||||||||
| BGR |
||||||||
| Ordinary income |
$ | 10,396,825 | $ | 11,890,970 | ||||
| Return of capital |
11,108,880 | 4,610,793 | ||||||
|
|
|
|
|
|||||
| $ | 21,505,705 | $ | 16,501,763 | |||||
|
|
|
|
|
|||||
| CII |
||||||||
| Ordinary income |
$ | 11,634,813 | $ | 21,905,388 | ||||
| Long-term capital gains |
41,063,355 | 70,788,369 | ||||||
|
|
|
|
|
|||||
| $ | 52,698,168 | $ | 92,693,757 | |||||
|
|
|
|
|
|||||
| BDJ |
||||||||
| Ordinary income |
$ | 33,363,489 | $ | 25,303,490 | ||||
| Long-term capital gains |
102,619,291 | 178,849,379 | ||||||
|
|
|
|
|
|||||
| $ | 135,982,780 | $ | 204,152,869 | |||||
|
|
|
|
|
|||||
| BOE |
||||||||
| Ordinary income |
$ | 13,739,848 | $ | 16,041,931 | ||||
| Long-term capital gains |
— | 22,100,071 | ||||||
| Return of capital |
33,325,380 | 9,962,064 | ||||||
|
|
|
|
|
|||||
| $ | 47,065,228 | $ | 48,104,066 | |||||
|
|
|
|
|
|||||
| BGY |
||||||||
| Ordinary income |
$ | 9,930,219 | $ | 13,622,966 | ||||
| Long-term capital gains |
7,370,443 | 6,547,300 | ||||||
| Return of capital |
23,857,237 | 21,930,456 | ||||||
|
|
|
|
|
|||||
| $ | 41,157,899 | $ | 42,100,722 | |||||
|
|
|
|
|
|||||
| BMEZ |
||||||||
| Ordinary income |
$ | — | $ | 82,094,690 | ||||
| Long-term capital gains |
— | 100,955,454 | ||||||
| Return of capital |
170,987,587 | 11,869,565 | ||||||
|
|
|
|
|
|||||
| $ | 170,987,587 | $ | 194,919,709 | |||||
|
|
|
|
|
|||||
| 172 | 2 0 2 3 B L A C K R O C K A N N U A L R E P O R T T O S H A R E H O L D E R S |
Notes to Financial Statements (continued)
|
|
||||||||
| Trust Name | Year Ended 12/31/23 |
Year Ended 12/31/22 |
||||||
|
|
||||||||
| BME |
||||||||
| Ordinary income |
$ | 2,244,293 | $ | 1,635,849 | ||||
| Long-term capital gains |
23,151,941 | 31,362,678 | ||||||
| Return of capital |
10,214,453 | 1,403,564 | ||||||
|
|
|
|
|
|||||
| $ | 35,610,687 | $ | 34,402,091 | |||||
|
|
|
|
|
|||||
| BIGZ |
||||||||
| Return of capital |
$ | 173,714,456 | $ | 233,929,900 | ||||
|
|
|
|
|
|||||
| BCX |
||||||||
| Ordinary income |
$ | 24,357,046 | $ | 26,024,883 | ||||
| Return of capital |
29,035,558 | 22,531,891 | ||||||
|
|
|
|
|
|||||
| $ | 53,392,604 | $ | 48,556,774 | |||||
|
|
|
|
|
|||||
| BSTZ |
||||||||
| Long-term capital gains |
$ | — | $ | 70,402,537 | ||||
| Return of capital |
140,469,092 | 110,549,120 | ||||||
|
|
|
|
|
|||||
| $ | 140,469,092 | $ | 180,951,657 | |||||
|
|
|
|
|
|||||
| BST |
||||||||
| Long-term capital gains |
$ | 50,091,649 | $ | 69,684,200 | ||||
| Return of capital |
51,595,440 | 27,306,002 | ||||||
|
|
|
|
|
|||||
| $ | 101,687,089 | $ | 96,990,202 | |||||
|
|
|
|
|
|||||
| BUI |
||||||||
| Ordinary income |
$ | 19,423,039 | $ | 6,721,779 | ||||
| Long-term capital gains |
2,024,280 | 12,261,345 | ||||||
| Return of capital |
11,077,670 | 13,135,583 | ||||||
|
|
|
|
|
|||||
| $ | 32,524,989 | $ | 32,118,707 | |||||
|
|
|
|
|
|||||
As of December 31, 2023, the tax components of accumulated earnings (loss) were as follows:
|
|
||||||||||||||||||||||||||||
| Trust Name | Undistributed Ordinary Income |
Undistributed Long-Term Capital Gains |
Non-Expiring Capital Loss Carryforwards(a) |
Net Unrealized Gains (Losses)(b) |
Qualified Late-Year Capital Losses(c) |
Qualified Late-Year Ordinary Losses(c) |
Total | |||||||||||||||||||||
|
|
||||||||||||||||||||||||||||
| BGR |
$ | — | $ | — | $ | (216,932,775 | ) | $ | 97,434,384 | $ | — | $ | — | $ | (119,498,391 | ) | ||||||||||||
| CII |
760,791 | 6,838,242 | — | 305,018,797 | — | — | 312,617,830 | |||||||||||||||||||||
| BDJ |
48,047,312 | 59,596,798 | — | 223,083,475 | — | — | 330,727,585 | |||||||||||||||||||||
| BOE |
— | — | (25,380,164 | ) | 100,988,008 | — | (8,053 | ) | 75,599,791 | |||||||||||||||||||
| BGY |
— | — | — | 82,521,124 | — | (50,826 | ) | 82,470,298 | ||||||||||||||||||||
| BMEZ |
— | — | (42,780,406 | ) | (909,522 | ) | — | — | (43,689,928 | ) | ||||||||||||||||||
| BME |
— | — | — | 170,517,630 | — | — | 170,517,630 | |||||||||||||||||||||
| BIGZ |
— | — | (1,900,736,865 | ) | (95,001,077 | ) | — | — | (1,995,737,942 | ) | ||||||||||||||||||
| BCX |
— | — | (226,104,461 | ) | 100,185,480 | — | — | (125,918,981 | ) | |||||||||||||||||||
| BSTZ |
— | — | (42,767,288 | ) | 468,073,032 | — | — | 425,305,744 | ||||||||||||||||||||
| BST |
— | — | — | 417,844,294 | — | (4,992 | ) | 417,839,302 | ||||||||||||||||||||
| BUI |
— | — | — | 130,638,968 | (1,112,144 | ) | (3,224 | ) | 129,523,600 | |||||||||||||||||||
|
|
||||||||||||||||||||||||||||
| (a) | Amounts available to offset future realized capital gains. |
| (b) | The difference between book-basis and tax-basis net unrealized gains (losses) was attributable primarily to the tax deferral of losses on wash sales and straddles, the realization for tax purposes of unrealized gains (losses) on certain futures and foreign currency exchange contracts, the realization for tax purposes of unrealized gains on investments in passive foreign investment companies, the timing and recognition of partnership income, the characterization of corporate actions and the deferral of compensation to Trustees. |
| (c) | The Trust has elected to defer these qualified late-year losses and recognize such losses in the next taxable year. |
During the year ended December 31, 2023, the Trusts listed below utilized the following amounts of their respective capital loss carryforwards:
| Trust Name | Amounts | |||
| BGR |
$ | 23,500,872 | ||
| BCX |
32,537,780 | |||
As of December 31, 2023, gross unrealized appreciation and depreciation based on cost of investments (including short positions and derivatives, if any) for U.S. federal income tax purposes were as follows:
|
|
||||||||||||||||
| Trust Name | Tax Cost | Gross Unrealized Appreciation |
Gross Unrealized Depreciation |
Net Unrealized Appreciation (Depreciation) |
||||||||||||
|
|
||||||||||||||||
| BGR |
$ | 281,286,449 | $ | 114,088,294 | $ | (5,505,611 | ) | $ | 108,582,683 | |||||||
|
|
||||||||||||||||
| N O T E S T O F I N A N C I A L S T A T E M E N T S |
173 |
Notes to Financial Statements (continued)
| Trust Name | Tax Cost | Gross Unrealized Appreciation |
Gross Unrealized Depreciation |
Net Unrealized Appreciation (Depreciation) |
||||||||||||
| CII |
$ | 570,272,743 | $ | 335,884,367 | $ | (20,698,964 | ) | $ | 315,185,403 | |||||||
| BDJ |
1,420,599,223 | 319,272,656 | (78,025,988 | ) | 241,246,668 | |||||||||||
| BOE |
611,807,574 | 144,094,769 | (23,564,850 | ) | 120,529,919 | |||||||||||
| BGY |
526,743,102 | 123,625,084 | (21,823,102 | ) | 101,801,982 | |||||||||||
| BMEZ |
1,928,270,758 | 282,639,045 | (276,928,752 | ) | 5,710,293 | |||||||||||
| BME |
415,025,903 | 194,342,100 | (17,446,937 | ) | 176,895,163 | |||||||||||
| BIGZ |
2,148,876,232 | 331,360,334 | (422,063,536 | ) | (90,703,202 | ) | ||||||||||
| BCX |
795,748,271 | 167,473,973 | (59,439,858 | ) | 108,034,115 | |||||||||||
| BSTZ |
1,146,622,280 | 608,585,224 | (109,954,292 | ) | 498,630,932 | |||||||||||
| BST |
780,348,418 | 555,341,869 | (122,192,117 | ) | 433,149,752 | |||||||||||
| BUI |
359,156,640 | 161,999,603 | (10,208,566 | ) | 151,791,037 | |||||||||||
9. PRINCIPAL RISKS
In the normal course of business, the Trusts invest in securities or other instruments and may enter into certain transactions, and such activities subject each Trust to various risks, including among others, fluctuations in the market (market risk) or failure of an issuer to meet all of its obligations. The value of securities or other instruments may also be affected by various factors, including, without limitation: (i) the general economy; (ii) the overall market as well as local, regional or global political and/or social instability; (iii) regulation, taxation or international tax treaties between various countries; or (iv) currency, interest rate and price fluctuations. Local, regional or global events such as war, acts of terrorism, the spread of infectious illness or other public health issues, recessions, or other events could have a significant impact on the Trusts and their investments. BDJ’s, BME’s, BST’s and BUI’s prospectuses provide details of the risks to which each Trust is subject.
The Trusts may be exposed to additional risks when reinvesting cash collateral in money market funds that do not seek to maintain a stable NAV per share of $1.00, which may be subject to discretionary liquidity fees under certain circumstances.
Illiquidity Risk: Each Trust may invest without limitation in illiquid or less liquid investments or investments in which no secondary market is readily available or which are otherwise illiquid, including private placement securities. A Trust may not be able to readily dispose of such investments at prices that approximate those at which a Trust could sell such investments if they were more widely traded and, as a result of such illiquidity, a Trust may have to sell other investments or engage in borrowing transactions if necessary to raise funds to meet its obligations. Limited liquidity can also affect the market price of investments, thereby adversely affecting a Trust’s NAV and ability to make dividend distributions. Privately issued debt securities are often of below investment grade quality, frequently are unrated and present many of the same risks as investing in below investment grade public debt securities.
Valuation Risk: The market values of equities, such as common stocks and preferred securities or equity related investments, such as futures and options, may decline due to general market conditions which are not specifically related to a particular company. They may also decline due to factors which affect a particular industry or industries. A Trust may invest in illiquid investments. An illiquid investment is any investment that a Trust reasonably expects cannot be sold or disposed of in current market conditions in seven calendar days or less without the sale or disposition significantly changing the market value of the investment. A Trust may experience difficulty in selling illiquid investments in a timely manner at the price that it believes the investments are worth. Prices may fluctuate widely over short or extended periods in response to company, market or economic news. Markets also tend to move in cycles, with periods of rising and falling prices. This volatility may cause each Trust’s NAV to experience significant increases or decreases over short periods of time. If there is a general decline in the securities and other markets, the NAV of a Trust may lose value, regardless of the individual results of the securities and other instruments in which a Trust invests.
The price a Trust could receive upon the sale of any particular portfolio investment may differ from a Trust’s valuation of the investment, particularly for securities that trade in thin or volatile markets or that are valued using a fair valuation technique or a price provided by an independent pricing service. Changes to significant unobservable inputs and assumptions (i.e., publicly traded company multiples, growth rate, time to exit) due to the lack of observable inputs may significantly impact the resulting fair value and therefore a Trust’s results of operations. As a result, the price received upon the sale of an investment may be less than the value ascribed by a Trust, and a Trust could realize a greater than expected loss or lesser than expected gain upon the sale of the investment. A Trust’s ability to value its investments may also be impacted by technological issues and/or errors by pricing services or other third-party service providers.
Counterparty Credit Risk: The Trusts may be exposed to counterparty credit risk, or the risk that an entity may fail to or be unable to perform on its commitments related to unsettled or open transactions, including making timely interest and/or principal payments or otherwise honoring its obligations. The Trusts manage counterparty credit risk by entering into transactions only with counterparties that the Manager believes have the financial resources to honor their obligations and by monitoring the financial stability of those counterparties. Financial assets, which potentially expose the Trusts to market, issuer and counterparty credit risks, consist principally of financial instruments and receivables due from counterparties. The extent of the Trusts’ exposure to market, issuer and counterparty credit risks with respect to these financial assets is approximately their value recorded in the Statements of Assets and Liabilities, less any collateral held by the Trusts.
A derivative contract may suffer a mark-to-market loss if the value of the contract decreases due to an unfavorable change in the market rates or values of the underlying instrument. Losses can also occur if the counterparty does not perform under the contract.
For OTC options purchased, each Trust bears the risk of loss in the amount of the premiums paid plus the positive change in market values net of any collateral held by the Trusts should the counterparty fail to perform under the contracts. Options written by the Trusts do not typically give rise to counterparty credit risk, as options written generally obligate the Trusts, and not the counterparty, to perform. The Trusts may be exposed to counterparty credit risk with respect to options written to the extent each Trust deposits collateral with its counterparty to a written option.
| 174 | 2 0 2 3 B L A C K R O C K A N N U A L R E P O R T T O S H A R E H O L D E R S |
Notes to Financial Statements (continued)
With exchange-traded options purchased, there is less counterparty credit risk to the Trusts since the exchange or clearinghouse, as counterparty to such instruments, guarantees against a possible default. The clearinghouse stands between the buyer and the seller of the contract; therefore, credit risk is limited to failure of the clearinghouse. While offset rights may exist under applicable law, a Trust does not have a contractual right of offset against a clearing broker or clearinghouse in the event of a default (including the bankruptcy or insolvency).
Geographic/Asset Class Risk: A diversified portfolio, where this is appropriate and consistent with a fund’s objectives, minimizes the risk that a price change of a particular investment will have a material impact on the NAV of a fund. The investment concentrations within each Trust’s portfolio are disclosed in its Schedule of Investments.
As of period end, the Trusts listed below invested a significant portion of their assets in securities in the following sectors:
| Sectors | Trust Name | |||
| Energy |
BGR, BCX | |||
| Financials |
BDJ | |||
| Health Care |
BMEZ, BME | |||
| Information Technology |
CII, BSTZ, BST, BIGZ | |||
| Materials |
BCX | |||
| Utilities |
BUI | |||
Changes in economic conditions affecting such sectors would have a greater impact on the Trusts and could affect the value, income and/or liquidity of positions in such securities.
Certain Trusts invest a significant portion of their assets in securities within a single or limited number of market sectors. When a fund concentrates its investments in this manner, it assumes the risk that economic, regulatory, political and social conditions affecting such sectors may have a significant impact on the Trust and could affect the income from, or the value or liquidity of, the Trust’s portfolio. Investment percentages in specific sectors are presented in the Schedules of Investments.
Certain Trusts invest a substantial amount of their assets in issuers located in a single country or a limited number of countries. When a fund concentrates its investments in this manner, it assumes the risk that economic, regulatory, political and social conditions in those countries may have a significant impact on their investment performance and could affect the income from, or the value or liquidity of, the Trust’s portfolio. Unanticipated or sudden political or social developments may cause uncertainty in the markets and as a result adversely affect the Trust’s investments. Foreign issuers may not be subject to the same uniform accounting, auditing and financial reporting standards and practices as used in the United States. Foreign securities markets may also be more volatile and less liquid than U.S. securities and may be less subject to governmental supervision not typically associated with investing in U.S. securities. Investment percentages in specific countries are presented in the Schedules of Investments.
Certain Trusts invest a significant portion of their assets in securities of issuers located in the United States. A decrease in imports or exports, changes in trade regulations, inflation and/or an economic recession in the United States may have a material adverse effect on the U.S. economy and the securities listed on U.S. exchanges. Proposed and adopted policy and legislative changes in the United States may also have a significant effect on U.S. markets generally, as well as on the value of certain securities. Governmental agencies project that the United States will continue to maintain elevated public debt levels for the foreseeable future which may constrain future economic growth. Circumstances could arise that could prevent the timely payment of interest or principal on U.S. government debt, such as reaching the legislative “debt ceiling.” Such non-payment would result in substantial negative consequences for the U.S. economy and the global financial system. If U.S. relations with certain countries deteriorate, it could adversely affect issuers that rely on the United States for trade. The United States has also experienced increased internal unrest and discord. If these trends were to continue, they may have an adverse impact on the U.S. economy and the issuers in which the Trusts invest.
Certain Trusts invest a significant portion of their assets in securities of issuers located in Europe or with significant exposure to European issuers or countries. The European financial markets have recently experienced volatility and adverse trends due to concerns about economic downturns in, or rising government debt levels of, several European countries as well as acts of war in the region. These events may spread to other countries in Europe and may affect the value and liquidity of certain of the Trusts’ investments.
Responses to the financial problems by European governments, central banks and others, including austerity measures and reforms, may not work, may result in social unrest and may limit future growth and economic recovery or have other unintended consequences. Further defaults or restructurings by governments and others of their debt could have additional adverse effects on economies, financial markets and asset valuations around the world. The United Kingdom has withdrawn from the European Union, and one or more other countries may withdraw from the European Union and/or abandon the Euro, the common currency of the European Union. These events and actions have adversely affected, and may in the future adversely affect, the value and exchange rate of the Euro and may continue to significantly affect the economies of every country in Europe, including countries that do not use the Euro and non-European Union member states. The impact of these actions, especially if they occur in a disorderly fashion, is not clear but could be significant and far reaching. In addition, Russia launched a large-scale invasion of Ukraine on February 24, 2022. The extent and duration of the military action, resulting sanctions and resulting future market disruptions in the region are impossible to predict, but have been, and may continue to be, significant and have a severe adverse effect on the region, including significant negative impacts on the economy and the markets for certain securities and commodities, such as oil and natural gas, as well as other sectors.
10. CAPITAL SHARE TRANSACTIONS
Each Trust is authorized to issue an unlimited number of shares, with the exception of CII, all of which were initially classified as Common Shares. CII is authorized to issue 200 million Common Shares. The par value for each Trust’s Common Shares is $0.001, except for CII, which is $0.10. The Board is authorized, however, to reclassify any unissued Common Shares to Preferred Shares without the approval of Common Shareholders.
BDJ, BME, BST and BUI have each filed a prospectus with the SEC allowing them to issue an additional 40,000,000, 4,000,000, 18,000,000 and 8,000,000 Common Shares, respectively, through an equity Shelf Offering. Under the Shelf Offerings, BDJ, BME, BST and BUI, subject to market conditions, may raise additional equity capital from time to time in varying amounts and utilizing various offering methods at a net price at or above each Trust’s NAV per Common Share (calculated within 48 hours of pricing). As of
| N O T E S T O F I N A N C I A L S T A T E M E N T S |
175 |
Notes to Financial Statements (continued)
period end, 40,000,000, 3,332,695, 15,898,551 and 7,658,406 Common Shares, respectively, remain available for issuance under the Shelf Offerings. During the year ended December 31, 2023, BDJ, BME, BST and BUI issued 0, 71,333, 1,266,090 and 167,658 shares, respectively, under the Trust’s respective current Shelf Offering and the Trust’s prior Shelf Offering. See Additional Information — Shelf Offering Program for additional information.
Initial costs incurred by each of BDJ, BME, BST and BUI in connection with their Shelf Offerings are recorded as “Deferred offering costs” in the Statements of Assets and Liabilities. As shares are sold, a portion of the costs attributable to the shares sold will be charged against paid-in-capital. Any remaining deferred charges at the end of the Shelf Offering period will be charged to expense.
For the periods shown, shares issued and outstanding increased by the following amounts as a result of shares issued through the Shelf Offering:
| Year Ended | ||||||||
| Trust Name | 12/31/23 | 12/31/22 | ||||||
| BME |
71,333 | 774,304 | ||||||
| BST |
1,266,090 | 835,359 | ||||||
| BUI |
167,658 | 590,894 | ||||||
For the periods shown, shares issued and outstanding increased by the following amounts as a result of dividend reinvestment:
| Year Ended | ||||||||
| Trust Name | 12/31/23 | 12/31/22 | ||||||
| CII |
14,818 | — | ||||||
| BDJ |
78,103 | 412,658 | ||||||
| BME |
12,112 | 38,955 | ||||||
| BST |
173,563 | 81,277 | ||||||
| BUI |
31,913 | 32,898 | ||||||
The Trusts participate in an open market share repurchase program (the “Repurchase Program”). From December 1, 2022 through November 30, 2023, each Trust may repurchase up to 5% of its outstanding common shares under the Repurchase Program, based on common shares outstanding as of the close of business on November 30, 2022, subject to certain conditions. From December 1, 2023 through November 30, 2024, each Trust may repurchase up to 5% of its outstanding common shares under the Repurchase Program, based on common shares outstanding as of the close of business on November 30, 2023, subject to certain conditions. The Repurchase Program has an accretive effect as shares are purchased at a discount to the Trust’s NAV. There is no assurance that the Trusts will purchase shares in any particular amounts. For the year ended December 31, 2023, CII, BME, BST and BUI did not repurchase any shares.
The total cost of the shares repurchased is reflected in the Trusts’ Statements of Changes in Net Assets. For the periods shown, shares repurchased and cost, including transaction costs, were as follows:
| BGR | ||||||||
| Shares | Amounts | |||||||
| Year Ended December 31, 2023 |
587,768 | $ | 7,413,692 | |||||
| Year Ended December 31, 2022 |
1,055,728 | 12,296,655 | ||||||
| BDJ | ||||||||
| Shares | Amounts | |||||||
| Year Ended December 31, 2023 |
359,086 | $ | 2,735,878 | |||||
| BOE | ||||||||
| Shares | Amounts | |||||||
| Year Ended December 31, 2023 |
1,214,010 | $ | 11,889,663 | |||||
| Year Ended December 31, 2022 |
1,285,502 | 12,470,648 | ||||||
| BGY | ||||||||
| Shares | Amounts | |||||||
| Year Ended December 31, 2023 |
2,473,793 | $ | 13,143,239 | |||||
| Year Ended December 31, 2022 |
1,492,331 | 7,282,700 | ||||||
| BMEZ | ||||||||
| Shares | Amounts | |||||||
| Year Ended December 31, 2023 |
3,082,831 | $ | 47,918,763 | |||||
| Year Ended December 31, 2022 |
3,072,736 | 47,829,587 | ||||||
| BIGZ | ||||||||
| Shares | Amounts | |||||||
| Year Ended December 31, 2023 |
5,247,265 | $ | 37,872,639 | |||||
| Year Ended December 31, 2022 |
8,519,618 | 64,919,571 | ||||||
| 176 | 2 0 2 3 B L A C K R O C K A N N U A L R E P O R T T O S H A R E H O L D E R S |
Notes to Financial Statements (continued)
| BCX | ||||||||
| Shares | Amounts | |||||||
| Year Ended December 31, 2023 |
3,155,189 | $ | 29,812,008 | |||||
| Year Ended December 31, 2022 |
797,510 | 7,554,830 | ||||||
| BSTZ | ||||||||
| Shares | Amounts | |||||||
| Year Ended December 31, 2023 |
2,006,073 | $ | 34,325,597 | |||||
| Year Ended December 31, 2022 |
461,288 | 7,293,625 | ||||||
For the year ended December 31, 2022, shares issued and outstanding remained constant for CII.
As of December 31, 2023, BlackRock Financial Management, Inc., an affiliate of the Trust, owned 5,000 Shares of BIGZ.
11. FOREIGN WITHHOLDINGS TAX CLAIMS
The Internal Revenue Service (“IRS”) has issued guidance to address U.S. income tax liabilities attributable to fund shareholders resulting from the recovery of foreign taxes withheld in prior calendar years. These withheld foreign taxes were passed through to shareholders in the form of foreign tax credits in the year the taxes were withheld. Assuming there are sufficient foreign taxes paid which BOE and BUI is able to pass through to shareholders as a foreign tax credit in the current year, BOE and BUI will be able to offset the prior years’ withholding taxes recovered against the foreign taxes paid in the current year. Accordingly, no federal income tax liability is recorded by the BOE and BUI.
12. SUBSEQUENT EVENTS
Management’s evaluation of the impact of all subsequent events on the Trusts’ financial statements was completed through the date the financial statements were issued and the following item was noted:
The Trusts declared and paid or will pay distributions to Common Shareholders as follows:
| Trust Name | Declaration Date |
Record Date |
Payable/ Paid Date |
Dividend Per Common Share |
||||||||||||
| BGR |
01/02/24 | 01/12/24 | 01/31/24 | $ | 0.065700 | |||||||||||
| 02/01/24 | 02/15/24 | 02/29/24 | 0.065700 | |||||||||||||
| CII |
01/02/24 | 01/12/24 | 01/31/24 | 0.099500 | ||||||||||||
| 02/01/24 | 02/15/24 | 02/29/24 | 0.099500 | |||||||||||||
| BDJ |
01/02/24 | 01/12/24 | 01/31/24 | 0.056200 | ||||||||||||
| 02/01/24 | 02/15/24 | 02/29/24 | 0.056200 | |||||||||||||
| BOE |
01/02/24 | 01/12/24 | 01/31/24 | 0.063000 | ||||||||||||
| 02/01/24 | 02/15/24 | 02/29/24 | 0.063000 | |||||||||||||
| BGY |
01/02/24 | 01/12/24 | 01/31/24 | 0.033800 | ||||||||||||
| 02/01/24 | 02/15/24 | 02/29/24 | 0.033800 | |||||||||||||
| BMEZ |
01/02/24 | 01/12/24 | 01/31/24 | 0.090910 | ||||||||||||
| 02/01/24 | 02/15/24 | 02/29/24 | 0.090440 | |||||||||||||
| BME |
01/02/24 | 01/12/24 | 01/31/24 | 0.213000 | ||||||||||||
| 02/01/24 | 02/15/24 | 02/29/24 | 0.213000 | |||||||||||||
| BIGZ |
01/02/24 | 01/12/24 | 01/31/24 | 0.044720 | ||||||||||||
| 02/01/24 | 02/15/24 | 02/29/24 | 0.044660 | |||||||||||||
| BCX |
01/02/24 | 01/12/24 | 01/31/24 | 0.051800 | ||||||||||||
| 02/01/24 | 02/15/24 | 02/29/24 | 0.051800 | |||||||||||||
| BSTZ |
01/02/24 | 01/12/24 | 01/31/24 | 0.102710 | ||||||||||||
| 02/01/24 | 02/15/24 | 02/29/24 | 0.103260 | |||||||||||||
| BST |
01/02/24 | 01/12/24 | 01/31/24 | 0.250000 | ||||||||||||
| 02/01/24 | 02/15/24 | 02/29/24 | 0.250000 | |||||||||||||
| BUI |
01/02/24 | 01/12/24 | 01/31/24 | 0.121000 | ||||||||||||
| 02/01/24 | 02/15/24 | 02/29/24 | 0.121000 | |||||||||||||
| N O T E S T O F I N A N C I A L S T A T E M E N T S |
177 |
Report of Independent Registered Public Accounting Firm
To the Shareholders and the Board of Trustees/Directors of BlackRock Energy and Resources Trust, BlackRock Enhanced Capital and Income Fund, Inc., BlackRock Enhanced Equity Dividend Trust, BlackRock Enhanced Global Dividend Trust, BlackRock Enhanced International Dividend Trust, BlackRock Health Sciences Term Trust, BlackRock Health Sciences Trust, BlackRock Innovation and Growth Term Trust, BlackRock Resources & Commodities Strategy Trust, BlackRock Science and Technology Term Trust, BlackRock Science and Technology Trust and BlackRock Utilities, Infrastructure & Power Opportunities Trust:
Opinion on the Financial Statements and Financial Highlights
We have audited the accompanying statements of assets and liabilities of BlackRock Energy and Resources Trust, BlackRock Enhanced Capital and Income Fund, Inc., BlackRock Enhanced Equity Dividend Trust, BlackRock Enhanced Global Dividend Trust, BlackRock Enhanced International Dividend Trust, BlackRock Health Sciences Term Trust (formerly, BlackRock Health Sciences Trust II), BlackRock Health Sciences Trust, BlackRock Innovation and Growth Term Trust (formerly, BlackRock Innovation and Growth Trust), BlackRock Resources & Commodities Strategy Trust, BlackRock Science and Technology Term Trust (formerly, BlackRock Science and Technology Trust II), BlackRock Science and Technology Trust and BlackRock Utilities, Infrastructure & Power Opportunities Trust (the “Funds”), including the schedules of investments, as of December 31, 2023, the related statements of operations and cash flows for the year then ended, the statements of changes in net assets for each of the two years in the period then ended, and the financial highlights for the periods indicated in the table below, and the related notes. Such financial statements and financial highlights of BlackRock Science and Technology Trust and BlackRock Science and Technology Term Trust are consolidated as of and for the four years in the period ended December 31, 2023. Such financial statements and financial highlights of BlackRock Enhanced Equity Dividend Trust are consolidated as of and for the two years in the period ended December 31, 2023. In our opinion, the financial statements and financial highlights present fairly, in all material respects, the financial position of the Funds as of December 31, 2023, and the results of their operations and their cash flows for the year then ended, the statements of changes in their net assets for each of the two years in the period then ended, and the financial highlights for the periods indicated in the table below, in conformity with accounting principles generally accepted in the United States of America.
| Fund | Financial Highlights | |
| BlackRock Energy and Resources Trust, BlackRock Enhanced Capital and Income Fund, Inc., BlackRock Enhanced Equity Dividend Trust, BlackRock Enhanced Global Dividend Trust, BlackRock Enhanced International Dividend Trust, BlackRock Health Sciences Trust, BlackRock Resources & Commodities Strategy Trust, BlackRock Science and Technology Trust and BlackRock Utilities, Infrastructure & Power Opportunities Trust |
For each of the five years in the period ended December 31, 2023 | |
| BlackRock Science and Technology Term Trust |
For each of the four years in the period ended December 31, 2023 and for the period from June 27, 2019 (commencement of operations) through December 31, 2019 | |
| BlackRock Health Sciences Term Trust |
For each of the three years in the period ended December 31, 2023 and for the period from January 30, 2020 (commencement of operations) through December 31, 2020 | |
| BlackRock Innovation and Growth Term Trust |
For each of the two years in the period ended December 31, 2023 and for the period from March 29, 2021 (commencement of operations) through December 31, 2021 | |
Basis for Opinion
These financial statements and financial highlights are the responsibility of the Funds’ management. Our responsibility is to express an opinion on the Funds’ financial statements and financial highlights based on our audits. We are a public accounting firm registered with the Public Company Accounting Oversight Board (United States) (PCAOB) and are required to be independent with respect to the Funds in accordance with the U.S. federal securities laws and the applicable rules and regulations of the Securities and Exchange Commission and the PCAOB.
We conducted our audits in accordance with the standards of the PCAOB. Those standards require that we plan and perform the audit to obtain reasonable assurance about whether the financial statements and financial highlights are free of material misstatement, whether due to error or fraud. The Funds are not required to have, nor were we engaged to perform, an audit of their internal control over financial reporting. As part of our audits we are required to obtain an understanding of internal control over financial reporting but not for the purpose of expressing an opinion on the effectiveness of the Funds’ internal control over financial reporting. Accordingly, we express no such opinion.
Our audits included performing procedures to assess the risks of material misstatement of the financial statements and financial highlights, whether due to error or fraud, and performing procedures that respond to those risks. Such procedures included examining, on a test basis, evidence regarding the amounts and disclosures in the financial statements and financial highlights. Our audits also included evaluating the accounting principles used and significant estimates made by management, as well as evaluating the overall presentation of the financial statements and financial highlights. Our procedures included confirmation of securities owned as of December 31, 2023, by correspondence with custodians or counterparties; when replies were not received, we performed other auditing procedures. We believe that our audits provide a reasonable basis for our opinion.
Deloitte & Touche LLP
Boston, Massachusetts
February 23, 2024
We have served as the auditor of one or more BlackRock investment companies since 1992.
| 178 | 2 0 2 3 B L A C K R O C K A N N U A L R E P O R T T O S H A R E H O L D E R S |
Important Tax Information (unaudited)
The following amounts, or maximum amounts allowable by law, are hereby designated as qualified dividend income for individuals for the fiscal year ended December 31, 2023:
|
|
||||
| Trust Name | Qualified Dividend Income |
|||
|
|
||||
| BGR |
$ | 13,529,966 | ||
| CII |
9,319,392 | |||
| BDJ |
37,581,659 | |||
| BOE |
15,057,065 | |||
| BGY |
8,994,577 | |||
| BME |
6,649,650 | |||
| BCX |
32,387,805 | |||
| BUI |
11,804,459 | |||
|
|
||||
The Trusts hereby designate the following amounts, or maximum amounts allowable by law, as capital gain dividends, subject to a long-term capital gains tax rate as noted below, for the fiscal year ended December 31, 2023:
|
|
||||
| Trust Name | 20% Rate Long-Term Capital Gain Dividends |
|||
|
|
||||
| CII |
$ | 41,063,355 | ||
| BDJ |
102,619,291 | |||
| BGY |
7,370,443 | |||
| BME |
23,151,941 | |||
| BST |
50,091,649 | |||
| BUI |
2,024,280 | |||
|
|
||||
The Trusts intend to pass through to their shareholders the following amounts, or maximum amounts allowable by law, of foreign source income earned and foreign taxes paid for the fiscal year ended December 31, 2023:
|
|
||||||||
| Trust Name | Foreign Source Income Earned |
Foreign Taxes Paid |
||||||
|
|
||||||||
| BOE |
$ | 8,597,159 | $ | 1,044,144 | ||||
| BGY |
9,311,402 | 1,554,067 | ||||||
| BCX |
18,451,675 | 1,746,843 | ||||||
| BUI |
4,035,929 | 669,585 | ||||||
|
|
||||||||
The Funds hereby designate the following amounts, or maximum amounts allowable by law, of distributions from direct federal obligation interest for the fiscal year ended December 31, 2023:
|
|
||||
| Trust Name | Federal Obligation Interest |
|||
|
|
||||
| BGR |
$ | 31,845 | ||
| CII |
26,735 | |||
| BDJ |
305,744 | |||
| BOE |
45,218 | |||
| BGY |
47,256 | |||
| BME |
52,698 | |||
| BCX |
136,130 | |||
| BUI |
48,902 | |||
|
|
||||
The law varies in each state as to whether and what percent of ordinary income dividends attributable to federal obligations is exempt from state income tax. Shareholders are advised to check with their tax advisers to determine if any portion of the dividends received is exempt from state income tax.
The following percentages, or maximum percentages allowable by law, of ordinary income distributions paid during the fiscal year ended December 31, 2023 qualified for the dividends-received deduction for corporate shareholders:
|
|
||||
| Trust Name | Dividends-Received Deduction |
|||
|
|
||||
| BGR |
73.52% | |||
| CII |
39.13 | |||
| BDJ |
67.24 | |||
| BOE |
51.50 | |||
| BGY |
8.09 | |||
| BME |
100.00 | |||
| BCX |
31.07 | |||
| BUI |
33.61 | |||
|
|
||||
| I M P O R T A N T T A X I N F O R M A T I O N |
179 |
Important Tax Information (unaudited) (continued)
The Funds hereby designate the following amounts, or maximum amounts allowable by law, as interest income eligible to be treated as a Section 163(j) interest dividend for the fiscal year ended December 31, 2023:
|
|
||||
| Trust Name | Interest Dividends |
|||
|
|
||||
| BGR |
$ | 203,142 | ||
| CII |
170,587 | |||
| BDJ |
1,950,371 | |||
| BOE |
288,451 | |||
| BGY |
307,117 | |||
| BME |
336,323 | |||
| BCX |
868,386 | |||
| BUI |
312,452 | |||
|
|
||||
The Trusts hereby designate the following amounts, or maximum amounts allowable by law, as interest-related dividends and qualified short-term capital gains eligible for exemption from U.S. withholding tax for nonresident aliens and foreign corporations for the fiscal year ended December 31, 2023:
|
|
||||||||
| Trust Name | Interest- Related Dividends |
Qualified Short-Term |
||||||
|
|
||||||||
| BGR |
$ | 203,142 | $ | — | ||||
| CII |
170,587 | 8,705,798 | ||||||
| BDJ |
1,950,371 | 9,829,694 | ||||||
| BOE |
288,451 | — | ||||||
| BGY |
301,449 | 1,289,033 | ||||||
| BME |
336,323 | — | ||||||
| BCX |
868,386 | — | ||||||
| BUI |
311,874 | 11,232,021 | ||||||
|
|
||||||||
| 180 | 2 0 2 3 B L A C K R O C K A N N U A L R E P O R T T O S H A R E H O L D E R S |
Investment Objectives, Policies and Risks
Recent Changes
The following information is a summary of certain changes since December 31, 2022.This information may not reflect all of the changes that have occurred since you purchased the relevant Trust.
Effective August 28, 2023, BlackRock Science and Technology Term Trust (BSTZ) began operating as a diversified fund.
Except as noted above, during each Trust’s most recent fiscal year, there were no material changes in the Trust’s investment objectives or policies that have not been approved by shareholders or in the principal risk factors associated with investment in the Trust.
Investment Objectives and Policies
BlackRock Energy and Resources Trust (BGR)
The Trust’s investment objective is to provide total return through a combination of current income and capital appreciation. The Trust seeks to achieve this objective by investing primarily in equity securities of companies engaged in the energy and natural resources business and equity derivatives with exposure to the energy and natural resources industry.
Under normal market conditions, the Trust invests at least 80% of its total assets in equity securities of energy and natural resources companies and equity derivatives with exposure to the energy and natural resources industry. The Trust may invest directly in securities or synthetically through the use of derivatives. The Trust will not invest, under normal market conditions, less than 25% of its total assets in securities of energy and natural resources companies and equity derivatives with exposure to the energy and natural resources industry without shareholder approval. Companies in the energy and natural resources industry include those companies involved in the exploration, production or distribution of energy or natural resources, such as gas, oil, metals and minerals as well as related transportation companies and equipment manufacturers. These equity securities may include common stocks, preferred shares, convertible securities, warrants, depositary receipts, equity interests in Canadian Royalty Trusts and equity interests in master limited partnerships (“MLPs”). The Trust will not invest more than 25% of its total assets in MLPs. The Trust may invest in companies located anywhere in the world. The Trust expects to invest primarily in companies located in developed countries, but may invest in companies located in emerging markets. Under normal market conditions, the Trust will invest at least 30% of its total assets in at least two countries other than the United States. The Trust may invest in companies of any market capitalization, including small capitalization and mid-capitalization companies. The Trust does not intend to invest directly in commodities.
As part of its strategy, the Trust currently intends to employ an option strategy of writing (selling) covered call options on common stocks. The Trust seeks to produce current income and gains generated from option writing premiums. In addition to its covered call strategy the Trust may, to a lesser extent, pursue an option strategy that includes the sale (writing) of both put options and call options on certain of the common stocks in the Trust’s portfolio.
The Trust may invest up to 20% of its total assets in other U.S. and other non-U.S. investments. These investments may include equity and debt securities of companies not engaged in the energy and natural resources industry. The Trust reserves the right to invest up to 10% of its total assets in non-investment grade debt securities, commonly known as “junk bonds.”
In addition to the option strategies discussed above, the Trust may engage in transactions such as options, futures, swaps, foreign currency transactions including forward foreign currency contracts, currency swaps or options on currency and currency futures and other derivatives transactions for hedging purposes or to enhance total return. The Trust may also engage in short sales of securities.
The percentage limitations applicable to the Trust’s portfolio described herein apply only at the time of investment and the Trust will not be required to sell securities due to subsequent changes in the value of securities it owns.
Application of the Trust’s investment philosophy, from time to time, may cause the Trust to invest a significant portion of its assets in a particular country or region of the world. The Trust anticipates that its investment strategy will cause it to invest in a number of countries throughout the world, but the actual number of countries represented in the Trust’s portfolio will vary over time. The Trust anticipates that application of its investment philosophy currently would cause it to invest in issuers located in 10 countries globally, including the United States. Under normal market conditions, the Trust will invest in the equity securities of issuers in at least three different countries, including the United States, and will invest at least 30% of its total assets at the time of investment in the equity securities of non-United States issuers. However, the Trust may invest in the securities of non-United States issuers without limit.
Leverage: The Trust may, but does not currently intend to, incur indebtedness or issue preferred shares for investment purposes.
The Trust may enter into derivative transactions that have leverage embedded in them.
BlackRock Enhanced Capital and Income Fund, Inc. (CII)
The Trust’s investment objective is to provide current income and capital appreciation. The Trust’s investment objective is a fundamental policy and may not be changed without the approval of a majority of the outstanding voting securities of the Trust (as defined in the Investment Company Act of 1940, as amended (the “Investment Company Act”)).
The Trust seeks to achieve its investment objective by investing in a portfolio of equity securities of U.S. and foreign issuers. The Trust may invest directly in securities or synthetically through the use of derivatives. BlackRock Advisors, LLC (the “Manager”) from time to time may vary the percentage of the Trust’s assets invested in any particular type of equity security based on such factors as market and economic conditions, fiscal and monetary policy and the relative security valuation of the various equity asset classes.
| I N V E S T M E N T O B J E C T I V E S , P O L I C I E S A N D R I S K S |
181 |
Investment Objectives, Policies and Risks (continued)
Investment Objectives and Policies (continued)
The Trust also seeks to achieve its investment objective by employing a strategy of writing (selling) call and put options on indices of securities and sectors of securities. In addition to its option strategy on indices, the Trust may pursue a strategy that includes the writing (selling) of both call and put options on individual common stocks. These option strategies are intended to generate current gains from option premiums as a means to enhance distributions payable to the Trust’s stockholders. As the Trust writes calls and puts over more of its portfolio, its ability to benefit from capital appreciation becomes more limited.
To the extent the Trust invests in dividend-paying common stocks, the Manager currently intends to emphasize those securities that: (i) are eligible to pay “qualified dividend” income and/or (ii) make payments that are eligible for the dividends received deduction allowed to corporate taxpayers (“Dividends Received Deduction”) pursuant to Section 243 of the Internal Revenue Code of 1986, as amended (the “Code”). Long-term capital gains and qualified dividend income are currently eligible for reduced U.S. federal income tax rates for individuals. Long-term capital gains and qualified dividend income included in distributions of a regulated investment company (a “RIC”) to its individual stockholders are generally passed through to such stockholders and taxed at such reduced rates. Pursuant to Section 243 of the Code, corporations generally may deduct a portion of the dividend income they receive from domestic corporations. Corporate stockholders of a RIC generally are permitted to claim a deduction with respect to that portion of their dividend distributions attributable to amounts that the RIC designates as qualifying for the Dividends Received Deduction. Although the Trust has the ability to borrow money for investment purposes, it has no current intention to do so. If, however, the Trust did use leverage, the use of leverage through borrowings may reduce the amount of dividends it can designate as qualifying for the Dividends Received Deduction which will, in turn, limit the tax benefit to a corporate stockholder of investing in the Trust. Corporate stockholders should consider whether an investment in the Trust is appropriate in light of the Trust’s ability to borrow. No assurance can be given as to what percentage of the dividends paid on the Trust’s common stock will be eligible for: (i) the reduced U.S. federal income tax rate for qualified dividend income and long-term capital gains for individuals or (ii) the Dividends Received Deduction for corporate stockholders of the Trust.
Investment in the Trust’s common stock offers the individual investor several potential benefits. The Trust offers investors the opportunity to invest in a professionally managed portfolio which contains common stocks and preferred securities of U.S. and foreign issuers. The Manager provides professional management, which includes the extensive securities and credit analysis needed to invest in common stocks, preferred securities and foreign securities. The Trust also relieves the investor of the burdensome administrative details involved in managing a portfolio of such investments. These benefits are at least partially offset by the expenses involved in running an investment company. Such expenses primarily consist of advisory fees and operational costs. The use of leverage also involves certain expenses and risk considerations.
The Trust may engage in various portfolio strategies to seek to increase its return or to hedge its portfolio against movements in interest rates, in currency rates and in the securities markets through the use of derivatives, such as indexed and inverse securities, options, futures, options on futures, total return swaps, short selling and foreign exchange transactions. No assurance can be given that the Trust will employ these strategies or that, if employed, they will be effective.
The Trust may vary its investment objective and policies for temporary defensive purposes during periods in which the Manager believes that conditions in the securities markets or other economic, financial or political conditions warrant and in order to keep the Trust’s cash fully invested, including during the periods which the net proceeds of the offering are being invested. Under such conditions, the Trust may invest up to 100% of its total assets in securities issued or guaranteed by the United States government or its instrumentalities or agencies, certificates of deposit, bankers’ acceptances and other bank obligations, commercial paper rated in the highest category by an established rating service, or other debt securities deemed by the Manager to be consistent with a defensive posture, or may hold its assets in cash.
Leverage: The Trust does not currently intend to, but may, leverage its portfolio through borrowings, the issuance of debt securities, the issuance of preferred stock or a combination thereof.
The Trust may enter into derivative transactions that have leverage embedded in them.
BlackRock Enhanced Equity Dividend Trust (BDJ)
The Trust’s primary investment objective is to provide current income and current gains, with a secondary objective of long-term capital appreciation. The Trust’s investment objectives are not fundamental and may be changed by the Board of Trustees without shareholder approval.
The Trust seeks to achieve its investment objectives by investing in common stocks that pay dividends and have the potential for capital appreciation and by utilizing an option writing strategy to enhance distributions to its shareholders. The Trust uses an option strategy that writes options on approximately 50-60% of its total assets.
Under normal market conditions, the Trust invests at least 80% of its total assets in dividend-paying equities and may invest up to 20% of its total assets in equity securities of issuers that do not pay dividends. The Trust may invest directly in securities or synthetically through the use of derivatives.
To the extent the Trust invests in dividend-paying common stocks, BlackRock Advisors, LLC (the “Manager”) may emphasize those securities that: (i) are eligible to pay “qualified dividend” income, and/or (ii) make payments that are eligible for the dividends received deduction allowed to corporate taxpayers pursuant to Section 243 of the Internal Revenue Code of 1986, as amended (the “Code”). Long-term capital gains and qualified dividend income are currently eligible for reduced U.S. federal income tax rates for individuals. Long-term capital gains and qualified dividend income properly reported as being included in distributions of a regulated investment company (a “RIC”) to its individual shareholders are generally passed through to such shareholders and taxed at such reduced rates. Pursuant to Section 243 of the Code, corporations generally may deduct a portion of the dividend income they receive from domestic corporations. Corporate shareholders of a RIC generally are permitted to claim a deduction with respect to that portion of their dividend distributions attributable to amounts that the RIC reports as qualifying for the dividends received deduction. Although the Trust has the ability to borrow money for investment purposes, it has no current intention to do so. If, however, the Trust did use leverage, the use of leverage through borrowings may reduce the amount of dividends it can designate as qualifying for the dividends received deduction which will, in turn, limit the tax benefit to a corporate shareholder of investing in the Trust. Corporate shareholders should consider whether an investment in the Trust is appropriate in light of the Trust’s ability to borrow. No assurance can be given as to what percentage of the dividends paid on the Trust’s common stock will be eligible for: (i) the reduced U.S. federal income tax rate for qualified dividend income and long-term capital gains for individuals, or (ii) the dividends received deduction for corporate shareholders of the Trust.
The Trust may invest up to 20% of its total assets in preferred securities.
| 182 | 2 0 2 3 B L A C K R O C K A N N U A L R E P O R T T O S H A R E H O L D E R S |
Investment Objectives, Policies and Risks (continued)
Investment Objectives and Policies (continued)
The Trust may invest up to 10% of its total assets in privately placed or restricted securities (including in Rule 144A securities, which are privately placed securities purchased by qualified institutional buyers), illiquid securities and securities in which no secondary market is readily available, including those of private companies.
The Trust may invest in shares of real estate investment trusts.
The Trust may invest up to 20% of its total assets in non-U.S. securities, which may include securities denominated in U.S. dollars or in foreign currencies or multinational currency units. The Trust may invest in foreign securities of emerging market issuers, but investments in such securities will not comprise more than 10% of its total assets. The Trust will consider a company a U.S. company and not a foreign company if it meets one or more of the following tests: (i) such company was organized in the United States; (ii) such company’s primary business office is in the United States; (iii) the principal trading market for such company’s assets are located in the United States; (iv) 50% or more of such company’s assets are located in the United States; or (v) 50% or more of such issuer’s revenues are derived from the United States.
The Trust may enter into forward currency contracts to purchase or sell foreign currencies for a fixed amount of U.S. dollars or another foreign currency.
The Trust may enter into are interest rate swaps and the purchase or sale of interest rate caps and floors. The Trust expects to enter into these transactions primarily to preserve a return or spread on a particular investment or portion of its portfolio as a duration management technique or to protect against any increase in the price of securities the Trust anticipates purchasing at a later date. The Trust intends to use these transactions for hedging and risk management purposes and not as a speculative investment. The Trust will not sell interest rate caps or floors that it does not own. The Trust will only enter into interest rate swap, cap or floor transactions with counterparties the Investment Advisor believes to be creditworthy at the time they enter into such transactions.
The Trust will not make a short sale if, after giving effect to such sale, the market value of all securities sold short exceeds 25% of the value of the Trust’s total assets or the Trust’s aggregate short sales of a particular class of securities exceeds 25% of the outstanding securities of that class. The Trust may also make short sales “against the box” without respect to such limitations.
Leverage: The Trust may borrow funds for investment purposes and/or issue debt securities or preferred shares to purchase additional securities. These practices are known as “leverage.” The Trust may borrow from banks and other financial institutions and may also borrow additional funds using such investment techniques as the Manager may from time to time determine. The Trust may borrow in an amount up to 5% of its total assets for temporary or emergency purposes.
The Trust currently does not intend to incur indebtedness or issue preferred shares for investment purposes, except in connection with derivative instruments such as exchange listed and over-the-counter put and call options on securities, financial futures, equity indices, and other financial instruments, purchase and sell futures contracts and options thereon, swaps, forward foreign currency contracts and various interest rate transactions, short sales, repurchase agreements, reverse repurchase agreements, when issued or forward commitment transactions and similar investment strategies.
The Trust may enter into derivative transactions that have leverage embedded in them.
BlackRock Enhanced Global Dividend Trust (BOE)
The Trust’s investment objective is primarily to seek current income and current gains, with a secondary objective of long-term capital appreciation. The Trust’s investment objective is not a fundamental policy and may be changed without prior shareholder approval.
The Trust seeks to achieve its investment objective by investing primarily in equity securities issued by companies located in countries throughout the world and by utilizing an option writing strategy to enhance current gains. BlackRock Advisors, LLC (the “Manager”) or BlackRock International Limited (“BIL” and together with the Manager, the “Advisors”), the Trust’s sub-advisor, from time to time may vary the percentage of the Trust’s assets invested in any particular type of equity security, based on factors such as market and economic conditions, fiscal and monetary policy and the relative security valuation of the various equity asset classes.
The Trust also seeks to achieve its investment objective by employing a strategy of writing (selling) call and put options on indices of securities and sectors of securities. The Trust intends to write covered put and call options with respect to approximately 30% to 45% of its total assets, although this percentage may vary from time to time with market conditions. In addition to its option strategy on indices, the Trust may pursue a strategy that includes the writing (selling) of both call and put options on individual common stocks. These option strategies are intended to generate current gains from option premiums as a means to enhance distributions payable to the Trust’s shareholders. As the Trust writes calls and puts over more of its portfolio, its ability to benefit from capital appreciation becomes more limited.
Under normal market conditions, the Trust is required to invest at least 80% of its net assets in dividend-paying equity securities and at least 40% of its assets outside of the U.S. (unless market conditions are not deemed favorable by Trust management, in which case the Trust would invest at least 30% of its assets outside of the U.S.). The Trust may invest directly in securities or synthetically through the use of derivatives. Equity securities in which the Trust invests include common stocks, preferred stocks, convertible securities, warrants, depositary receipts and equity interests in real estate investment trusts. The Trust may invest in companies located anywhere in the world. The Trust may invest in companies of any size market capitalization, but intends to invest primarily in the securities of large capitalization companies. The Trust may invest in companies conducting initial public offerings. The Trust may invest up to 25% of its total assets in equity securities of issuers in emerging countries. The Trust may invest up to 20% of its total assets in debt securities, including debt securities issued by companies located in emerging markets. The Trust may invest up to 10% of its total assets in non-investment grade debt securities, commonly known as “junk bonds.”
Application of the Trust’s investment philosophy, from time to time, may cause the Trust to invest a significant portion of its assets in a particular country or region of the world. The Trust’s investment strategy causes it to invest in issuers located in a number of countries throughout the world, but the actual number of countries represented in the Trust’s portfolio will vary over time. Under normal market conditions, the Trust invests in the equity securities of issuers in at least three different countries, including the United States. However, the Trust may invest in the securities of non-U.S. issuers without limit.
| I N V E S T M E N T O B J E C T I V E S , P O L I C I E S A N D R I S K S |
183 |
Investment Objectives, Policies and Risks (continued)
Investment Objectives and Policies (continued)
The Trust may engage in various portfolio strategies to seek to increase its return or to hedge its portfolio against movements in interest rates, in currency rates and in the securities markets through the use of derivatives, such as indexed and inverse securities, options, futures, options on futures, interest rate transactions, including interest rate swaps, total return swaps and credit default swaps and short selling and foreign exchange transactions. Each of these portfolio strategies is described below. No assurance can be given that the Trust will employ these strategies or that, if employed, they will be effective.
The percentage limitations applicable to the Trust’s portfolio described herein apply only at the time of investment, and the Trust will not be required to sell securities due to subsequent changes in the value of securities it owns.
To the extent the Trust invests in dividend-paying common stocks, the Advisors currently intend to emphasize those securities that: (i) are eligible to pay “qualified dividend” income and/or (ii) make payments that are eligible for the dividends received deduction allowed to corporate taxpayers pursuant to Section 243 of the Internal Revenue Code of 1986, as amended (the “Code”). Long-term capital gains and qualified dividend income are currently eligible for reduced U.S. federal income tax rates for individuals. Long-term capital gains and qualified dividend income included in distributions of a regulated investment company (a “RIC”) to its individual shareholders are generally passed through to such shareholders and taxed at such reduced rates. Pursuant to Section 243 of the Code, corporations generally may deduct a portion of the dividend income they receive from domestic corporations. Corporate shareholders of a RIC generally are permitted to claim a deduction with respect to that portion of their dividend distributions attributable to amounts that the RIC designates as qualifying for the Dividends Received Deduction. Although the Trust has the ability to borrow money for investment purposes, it has no current intention to do so. If, however, the Trust did use leverage, the use of leverage through borrowings may reduce the amount of dividends it can designate as qualifying for the Dividends Received Deduction which will, in turn, limit the tax benefit to a corporate shareholder of investing in the Trust. Corporate shareholders should consider whether an investment in the Trust is appropriate in light of the Trust’s ability to borrow. No assurance can be given as to what percentage of the dividends paid on the Trust’s common stock will be eligible for: (i) the reduced U.S. federal income tax rate for qualified dividend income and long-term capital gains for individuals or (ii) the Dividends Received Deduction for corporate shareholders of the Trust.
In selecting investments for the Trust, the Advisors combine fundamental research with a top-down strategy, analyzing 70 sub-industry groups on an ongoing basis. The Advisors seek to identify companies that it believes have the potential to outperform the market. The Advisors’ investment techniques for the Trust include assessing industry structure and dynamics, evaluating growth catalysts on an industry and individual company basis and assessing a company’s valuation relative to the broad market and its respective industry group. The Advisors seek to invest in companies that it believes have sizeable market opportunities, global, regional or local competitive advantages, sound business models and financial strength, proven management teams and compelling relative and absolute valuations.
Leverage: The Trust may, but does not currently intend to, incur indebtedness or issue preferred shares for investment purposes.
The Trust may enter into derivative transactions that have leverage embedded in them
BlackRock Enhanced International Dividend Trust (BGY)
The Trust’s primary investment objective is to seek current income and current gains, with a secondary objective of long-term capital appreciation. “Current gains” means gains realized from the Trust’s option strategy (described below) pursuant to which the Trust seeks to enhance monthly distributions to investors. The Trust’s investment objectives may be changed without shareholder approval.
The Trust seeks to achieve its objectives by investing primarily in equity securities issued by companies of any market capitalization located in countries throughout the world and utilizing an option writing (selling) strategy to enhance current gains. Under normal circumstances, the Trust invests at least 80% of its net assets in dividend-paying equity securities issued by non-U.S. companies of any market capitalization, but intends to invest primarily in securities of large capitalization companies. The Trust may invest directly in securities or synthetically through the use of derivatives. The Trust may invest up to 20% of its total assets in equity securities of issuers located in the United States. The Trust may invest up to 50% of its total assets in equity securities of issuers located in emerging market countries. Emerging market countries generally include every nation in the world except the United States, Canada, Japan, Australia, New Zealand and most countries in Western Europe. Equity securities in which the Trust anticipates investing include common stocks, preferred stocks, convertible securities, warrants, depositary receipts and equity interests in real estate investment trusts.
Under normal circumstances, the Trust anticipates it will allocate a substantial amount (approximately 40% or more — unless market conditions are not deemed favorable by BlackRock Advisors, LLC (the “Manager”) or BlackRock International Limited (“BIL” and together with the Manager, the “Advisors”), the Trust’s sub-advisor, in which case the Trust would invest at least 30%) — of its total assets in securities of (i) foreign government issuers, (ii) issuers organized or located outside the U.S., (iii) issuers which primarily trade in a market located outside the U.S., or (iv) issuers doing a substantial amount of business outside the U.S., which the Trust considers to be companies that derive at least 50% of their revenue or profits from business outside the U.S. or have at least 50% of their sales or assets outside the U.S. The Trust will allocate its assets among various regions and countries, including the United States (but in no less than three different countries). For temporary defensive purposes, the Trust may deviate very substantially from the allocation described above.
The Trust seeks to generate current dividends and income by investing in equity securities that pay dividends. The Trust will seek income a portion of which is classified as “qualified dividend income,” which is dividend income that is eligible to be taxed at a maximum U.S. federal income tax rate of generally 20%. The lower U.S. federal tax rates generally apply to dividend income from taxable domestic corporations and certain qualified foreign corporations, provided that holding period and other requirements are met by both the Trust and the shareholder.
As part of its investment strategy, the Trust intends to write (sell) covered call and put options on individual common stocks, stock indices and stock sectors. The Trust may utilize over-the-counter options to a significant extent in order to employ its option strategy. This option strategy is intended to generate current gains from option premiums as a means to enhance distributions payable to the Trust’s shareholders. As the Trust writes covered calls over more of its portfolio, its ability to benefit from capital appreciation becomes more limited.
| 184 | 2 0 2 3 B L A C K R O C K A N N U A L R E P O R T T O S H A R E H O L D E R S |
Investment Objectives, Policies and Risks (continued)
Investment Objectives and Policies (continued)
A call option written by the Trust on a security is “covered” if the Trust owns the security underlying the call or has an absolute and immediate right to acquire that security without additional cash consideration (or, if additional cash consideration is required, the Trust’s custodian segregates sufficient cash or other assets determined to be liquid by the Advisors (in accordance with procedures established by the Board of Trustees (the “Board”))) upon conversion or exchange of other securities held by the Trust. A call option is also covered if the Trust holds a call on the same security as the call written where the exercise price of the call held is (i) equal to or less than the exercise price of the call written or (ii) greater than the exercise price of the call written, provided the difference is maintained by the Trust in segregated assets determined to be liquid by the Advisors as described above.
A put option written by the Trust on a security is “covered” if the Trust segregates assets determined to be liquid by the Advisors (in accordance with procedures established by the Board) equal to the exercise price. A put option is also covered if the Trust holds a put on the same security as the put written where the exercise price of the put held is (i) equal to or greater than the exercise price of the put written or (ii) less than the exercise price of the put written, provided the difference is maintained by the Trust in segregated assets determined to be liquid by the Advisors as described above.
An index- or sector-oriented option is considered “covered” if the Trust maintains with its custodian assets determined to be liquid in an amount equal to the contract value of the applicable basket of securities. An index or sector call option also is covered if the Trust holds a call on the same basket of securities as the call written where the exercise price of the call held is (i) equal to or less than the exercise price of the call written or (ii) greater than the exercise price of the call written, provided the difference is maintained by the Trust in segregated assets determined to be liquid. An index or sector put option also is covered if the Trust holds a put on the same basket of securities as the put written where the exercise price of the put held is (i) equal to or more than the exercise price of the put written or (ii) less than the exercise price of the put written, provided the difference is maintained by the Trust in segregated assets determined to be liquid. Because index and sector options both refer to options on baskets of securities and generally have similar characteristics, we refer to these types of options collectively as “index options.”
The Trust generally intends to write covered put and call options with respect to approximately 30% to 45% of its total assets, although this percentage may vary from time to time with market conditions. As the Trust writes covered calls over more of its portfolio, its ability to benefit from capital appreciation becomes more limited.
The Trust may hold or have exposure to equity securities of issuers of any size, including small and medium capitalization companies, and to issuers in any industry or sector. The Trust will not invest 25% or more of its total assets in securities of issuers in any single industry.
The Trust may invest in the securities of smaller, less seasoned companies. The Trust also may engage in short sales of securities and may lend its portfolio securities to banks or dealers which meet the creditworthiness standards established by the Board.
Although not intended to be a significant element in the Trust’s investment strategy, from time to time the Trust may purchase and sell derivative instruments such as exchange-listed and over-the-counter put and call options on securities, financial futures, equity indices and other financial instruments, purchase and sell financial futures contracts and options thereon, engage in swaps and purchase derivative instruments that combine features of these instruments for hedging and risk management purposes or to enhance total return. The percentage limitations set herein apply at the time of investment, and the Trust will not be required to sell securities because of subsequent changes in market values.
Leverage: Although the Agreement and Declaration of Trust of the Trust provides that the Board of the Trust may authorize the Trust to issue preferred shares or incur indebtedness, the Trust currently does not intend to issue preferred shares or incur indebtedness for investment purposes.
The Trust may enter into derivative transactions that have leverage embedded in them.
BlackRock Health Sciences Trust (BME)
The Trust’s investment objective is to provide total return through a combination of current income, current gains and long-term capital appreciation. The Trust seeks to achieve its investment objective by investing, under normal market conditions, at least 80% of its total assets in equity securities of companies engaged in the health sciences and related industries and equity derivatives with exposure to the health sciences industry. Equity derivatives in which the Trust invests as part of this non-fundamental investment policy include purchased and sold (written) call and put options on equity securities of companies in the health sciences and related industries.
The Trust’s investment objective may be changed by the Board of Trustees without prior shareholder approval; however, the Trust will not change its policy of investing, under normal market conditions, at least 80% of its total assets in equity securities of companies engaged in the health sciences and related industries and equity derivatives with exposure to the health sciences industry unless it provides shareholders with notice at least 60 days prior to changing this non-fundamental policy, or unless such change was previously approved by shareholders.
Companies in the health sciences industry include health care providers as well as businesses involved in researching, developing, producing, distributing or delivering medical, dental, optical, pharmaceutical or biotechnology products, supplies, equipment or services or that provide support services to these companies. These companies also include those that own or operate health facilities and hospitals or provide related administrative, management or financial support. Other health sciences industries in which the Trust may invest include: clinical testing laboratories; diagnostics; hospital, laboratory or physician ancillary products and support services; rehabilitation services; employer health insurance management services; and vendors of goods and services specifically to companies engaged in the health sciences. BlackRock Advisors, LLC (the “Manager”) determines, in its discretion, whether a company is engaged in the health sciences and related industries.
While the Trust will invest primarily in companies providing products and services for human health, it may also invest in companies whose products or services relate to the growth or survival of animals and plants. Non-human health sciences industries include companies engaged in the development, production or distribution of products or services that: increase crop, animal and animal product yields by enhancing growth or increasing disease resistance, improve agricultural product characteristics, such as taste, appearance, nutritional content and shelf life; reduce the cost of producing agricultural products; or improve pet health.
| I N V E S T M E N T O B J E C T I V E S , P O L I C I E S A N D R I S K S |
185 |
Investment Objectives, Policies and Risks (continued)
Investment Objectives and Policies (continued)
The Trust will consider a company to be principally engaged in a health sciences or related industry if 50% or more of its revenues are derived from, or 50% or more of its assets are related to, its health sciences business. Although the Trust generally will invest in companies included in the Russell 3000® Index, the Trust may invest in equity securities of health sciences companies with any size market capitalization, including small and mid-cap health sciences companies and companies that are not included in the Russell 3000® Index.
As part of its investment strategy, the Trust employs an option strategy of writing (selling) covered call options on common stocks in its portfolio, writing other call and put options on individual common stocks and, to a lesser extent, writing call and put options on indices of health sciences securities. The Trust seeks to generate current gains from options premiums and to enhance the Trust’s risk-adjusted returns. The Trust generally intends to write call and put options with respect to approximately 30% to 50% of its total assets, although this percentage may vary from time to time with market conditions.
The Trust invests primarily in equity securities, including common stocks, preferred stocks, convertible securities, warrants and depositary receipts, of issuers engaged in the health sciences or related industries and equity interests in real estate investment trusts (“REITs”) that own hospitals. The Trust may invest in companies of any size market capitalization.
The Trust may invest in preferred securities, including preferred securities that may be converted into common stock or other securities of the same or a different issuer. The types of preferred securities in which the Trust may invest include trust preferred securities.
The Trust may invest in convertible securities. A convertible security is a bond, debenture, note, preferred security or other security that may be converted into or exchanged for a prescribed amount of common stock or other equity security of the same or a different issuer within a particular period of time at a specified price or formula.
The Trust may purchase warrants, which are privileges issued by corporations enabling the owners to subscribe to and purchase a specified number of shares of the corporation at a specified price during a specified period of time.
The Trust may invest in sponsored and unsponsored American Depositary Receipts (“ADRs”), European Depositary Receipts (“EDRs”), Global Depositary Receipts (“GDRs”) and other similar global instruments.
The Trust may invest in equity interests of REITs. REITs possess certain risks which differ from an investment in common stocks. REITs are financial vehicles that pool investor’s capital to purchase or finance real estate. REITs may concentrate their investments in specific geographic areas or in specific property types (i.e., hotels, shopping malls, residential complexes and office buildings).
The Trust may invest without limitation in securities of U.S. issuers and non-U.S. issuers located in countries throughout the world, including in developed and emerging markets. Foreign securities in which the Trust may invest may be U.S. dollar-denominated or non-U.S. dollar-denominated. For purposes of the Trust, a company is deemed to be a non-U.S. company if it meets the following tests: (i) such company was not organized in the United States; (ii) such company’s primary business office is not in the United States; (iii) the principal trading market for such company’s securities is not located in the United States; (iv) less than 50% of such company’s assets are located in the United States; or (v) 50% or more of such issuer’s revenues are derived from outside the United States.
The Trust may invest up to 20% of its total assets in other investments. These investments may include equity and debt securities of companies not engaged in the health sciences industry. Fixed-income securities in which the Trust may invest include bonds or other debt securities issued by U.S. or foreign (non-U.S.) corporations or other business entities and U.S. Government and agency securities. The Trust has no set policy regarding portfolio maturity or duration of the fixed-income securities it may hold, and such securities may be of any maturity.
The Trust reserves the right to invest up to 10% of its total assets in securities rated, at the time of investment, below investment grade quality, such as those rated “Ba” or below by Moody’s Investors Service, Inc. and “BB” or below by S&P Global Ratings, or securities comparably rated by other rating agencies or in securities determined by the Manager to be of comparable quality. Such securities commonly are referred to as “high yield” or “junk” bonds.
The Trust may invest in registered investment companies in accordance with the Investment Company Act of 1940, as amended (the “Investment Company Act”). The Investment Company Act generally prohibits the Trust from investing more than 5% of its assets in any one other investment company or more than 10% of its assets in all other investment companies.
In addition to the option strategies discussed above, the Trust may engage in strategic transactions to facilitate portfolio management, mitigate risks and generate total return. The Trust may use a variety of other investment management techniques and instruments. The Trust may purchase and sell futures contracts, enter into various interest rate transactions such as swaps, caps, floors or collars, currency transactions such as currency forward contracts, currency futures contracts, currency swaps or options on currency or currency futures and swap contracts (including, but not limited to, credit default swaps) and may purchase and sell exchange-listed and over-the-counter put and call options on securities and swap contracts, financial indices and futures contracts and use other derivative instruments or management techniques. The Trust also may purchase derivative instruments that combine features of these instruments.
In connection with its hedging and other risk management strategies, the Trust may also enter into contracts for the purchase or sale for future delivery (“future contracts”) of securities, aggregates of securities, financial indices, and U.S. Government debt securities or options on the foregoing to hedge the value of its portfolio securities that might result from a change in interest rates or market movements. The Trust may engage in such transactions for bona fide hedging, risk management and other appropriate portfolio management purposes.
The Trust may enter into such transactions without limit for bona fide strategic purposes, including risk management and duration management and other portfolio strategies. The Trust may also engage in transactions in futures contracts or related options for non-strategic purposes to enhance income or gain provided that the Trust will not enter into a futures contract or related option (except for closing transactions) for purposes other than bona fide strategic purposes, or risk management including duration management unless it does so consistent with the rules of the Commodities Futures Trading Commission (the “CFTC”).
| 186 | 2 0 2 3 B L A C K R O C K A N N U A L R E P O R T T O S H A R E H O L D E R S |
Investment Objectives, Policies and Risks (continued)
Investment Objectives and Policies (continued)
The Trust may engage in options and futures transactions on exchanges and options in the over-the-counter (“OTC”) markets.
The Trust intends to enter into options and futures transactions only with banks or dealers the Manager believes to be creditworthy at the time they enter into such transactions.
The CFTC subjects advisers to registered investment companies to regulation by the CFTC if a fund that is advised by the investment adviser either (i) invests, directly or indirectly, more than a prescribed level of its liquidation value in CFTC-regulated futures, options and swaps (“CFTC Derivatives”), or (ii) markets itself as providing investment exposure to such instruments. To the extent the Trust uses CFTC Derivatives, it intends to do so below such prescribed levels and will not market itself as a “commodity pool” or a vehicle for trading such instruments. Accordingly, the Manager has claimed an exclusion from the definition of the term “commodity pool operator” under the Commodity Exchange Act (“CEA”) pursuant to Rule 4.5 under the CEA. The Manager is not, therefore, subject to registration or regulation as a “commodity pool operator” under the CEA in respect of the Trust.
In order to enhance income or reduce fluctuations in net asset value, the Trust may sell or purchase call options on securities and indices based upon the prices of futures contracts and debt or equity securities that are traded on U.S. and non-U.S. securities exchanges and on the over-the-counter markets.
As with calls, the Trust may purchase put options on securities (whether or not it holds such securities in its portfolio), indices or future contracts. For the same purposes, the Trust may also sell puts on securities, indices or futures contracts on such securities if the Trust’s contingent obligations on such puts are secured by designating cash or liquid assets on its books and records having a value not less than the exercise price. The Trust will not sell puts if, as a result, more than 50% of the Trust’s assets would be required to be segregated on its books to cover its potential obligation under its hedging and other investment transactions.
The Trust may enter into interest rate swaps and the purchase or sale of interest rate caps and floors. The Trust expects to enter into these transactions primarily to preserve a return or spread on a particular investment or portion of its portfolio as a duration management technique or to protect against any increase in the price of securities the Trust anticipates purchasing at a later date. The Trust may enter into interest rate swaps, caps and floors on either an asset-based or liability-based basis.
The Trust intends to use these transactions for risk management purposes and not as a speculative investment. The Trust will not sell interest rate caps or floors that it does not own. The Trust will only enter into interest rate swap, cap or floor transactions with counterparties the Manager believes to be creditworthy at the time they enter into such transactions.
The Trust may engage in credit derivative transactions. There are two broad categories of credit derivatives: default price risk derivatives and market spread derivatives. Default price risk derivatives are linked to the price of reference securities or loans after a default by the issuer or borrower, respectively. Market spread derivatives are based on the risk that changes in market factors, such as credit spreads, can cause a decline in the value of a security, loan or index. There are three basic transactional forms for credit derivatives: swaps, options and structured instruments.
The Trust may enter into forward currency contracts to purchase or sell foreign currencies for a fixed amount of U.S. dollars or another foreign currency. A forward currency contract involves an obligation to purchase or sell a specific currency at a future date, which may be any fixed number of days (term) from the date of the forward currency contract agreed upon by the parties, at a price set at the time the forward currency contract is entered into. Forward currency contracts are traded directly between currency traders (usually large commercial banks) and their customers.
The Trust may make short sales of securities for risk management, in order to maintain portfolio flexibility or to enhance income or gain. The Trust will not make a short sale if, after giving effect to such sale, the market value of all securities sold short exceeds 25% of the value of its total assets or the Trust’s aggregate short sales of a particular class of securities exceeds 25% of the outstanding securities of that class. The Trust may also make short sales “against the box” without respect to such limitations. In this type of short sale, at the time of the sale, the Trust owns or has the immediate and unconditional right to acquire at no additional cost the identical security.
The Trust may invest in illiquid investments. Illiquid investments are subject to legal or contractual restrictions on disposition or lack an established secondary market. The sale of restricted and illiquid investments often requires more time and results in higher brokerage charges or dealer discounts and other selling expenses than does the sale of investments eligible for trading on national securities exchanges or in the over-the-counter markets. Restricted investments may sell at a price lower than similar investments that are not subject to restrictions on resale.
The Trust may purchase securities on a “when-issued” basis and may purchase or sell securities on a “forward commitment” basis in order to acquire the security or to hedge against anticipated changes in interest rates and prices. When-issued securities and forward commitments may be sold prior to the settlement date, but the Trust will enter into when-issued and forward commitments only with the intention of actually receiving or delivering the securities, as the case may be.
The Trust may lend securities with a value up to 33 1/3% of its total assets (including such loans) to banks, brokers and other financial institutions.
As temporary investments, the Trust may invest in repurchase agreements. The Trust will only enter into repurchase agreements with registered securities dealers or domestic banks that, in the opinion of the Manager, present minimal credit risk.
The Trust may deviate from its investment strategy and invest all or any portion of its assets in cash, cash equivalents or short-term debt securities when the Manager determines that it is temporarily unable to follow the Trust’s investment strategy or that it is impractical to do so or pending re-investment of proceeds received in connection with the sale of a security. The Trust may not achieve its investment objective when it does so. The Manager’s determination that it is temporarily unable to follow the Trust’s investment strategy or that it is impractical to do so will generally occur only in situations in which a market disruption event has occurred and where trading in the securities selected through application of the Trust’s investment strategy is extremely limited or absent. Short-term debt investments include U.S. Government securities, including bills, notes and bonds differing as to maturity and rates of interest that are either issued or guaranteed by the U.S. Treasury or by U.S. Government agencies or instrumentalities, certificates of deposit issued against funds deposited in a bank or a savings and loan association, repurchase agreements, which involve purchases of debt securities, and commercial paper, which consists of short-term unsecured promissory notes, including variable rate master demand notes issued by corporations to finance their current
| I N V E S T M E N T O B J E C T I V E S , P O L I C I E S A N D R I S K S |
187 |
Investment Objectives, Policies and Risks (continued)
Investment Objectives and Policies (continued)
operations. Investments in commercial paper will be limited to commercial paper rated in the highest categories by a major rating agency and which mature within one year of the date of purchase or carry a variable or floating rate of interest.
Leverage: The Trust does not currently borrow money for investment purposes or have preferred shares outstanding, and has no present intention of borrowing money for investment purposes or issuing preferred shares in the future.
The Trust may enter into derivative transactions that have leverage embedded in them.
The Trust may enter into reverse repurchase agreements and “dollar roll” transactions.
BlackRock Health Sciences Term Trust (BMEZ)
The Trust’s investment objectives are to provide total return and income through a combination of current income, current gains and long-term capital appreciation. The Trust’s investment objectives may be changed by the Board of Trustees of the Trust (the “Board”) without prior shareholder approval.
BlackRock Advisors, LLC (the “Manager”) believes that the knowledge and experience of its Health Sciences Team enable it to evaluate the macro environment and assess its impact on health sciences companies and the various sub-industries within the health sciences group of industries. Within this framework, the Manager identifies stocks with attractive characteristics, evaluates the use of options and provides ongoing portfolio risk management.
The top-down or macro component of the investment process is designed to assess the various interrelated macro variables affecting the health sciences group of industries as a whole. The Manager evaluates health sciences sub-industries (i.e., pharmaceuticals, biotechnology, medical devices, healthcare services, etc.). Selection of sub-industries within the health sciences group of industries is a result of both the Manager’s sub-industry analysis, as well as the Manager’s bottom-up fundamental company analysis. Risk/reward analysis is a key component of both top-down and bottom-up analysis.
Bottom-up security selection is focused on identifying companies with the most attractive characteristics within each sub-industry of the health sciences group of industries. The Manager seeks to identify companies with strong product potential, solid earnings growth and/or earnings power which are under appreciated by investors, a quality management team and compelling relative and absolute valuation. The Manager believes that the knowledge and experience of its Health Sciences Team enables it to identify attractive health sciences securities.
The Manager intends to utilize option strategies that consist of writing (selling) call options on a portion of the common stocks in the Trust’s portfolio, as well as other option strategies such as writing other calls and puts or using options to manage risk. The portfolio management team will work closely to determine which option strategies to pursue to seek to generate current gains from options premiums and to enhance the Trust’s risk-adjusted returns.
Under normal market conditions, the Trust will invest at least 80% of its total assets in equity securities of companies principally engaged in the health sciences group of industries and equity derivatives with exposure to the health sciences group of industries. Equity derivatives in which the Trust invests as part of this non-fundamental investment policy include purchased and sold (written) call and put options on equity securities of companies in the health sciences group of industries.
The Trust will consider a company to be principally engaged in the health sciences group of industries if (i) it is classified in an industry within the health sciences group of industries by a third-party industry classification system or (ii) it is not classified in any industry by such third-party industry classification system and the Manager determines that the company is principally engaged in the health sciences group of industries.
Companies in the health sciences group of industries include health care providers as well as businesses involved in researching, developing, producing, distributing or delivering medical, dental, optical, pharmaceutical or biotechnology products, supplies, equipment or services or that provide support services to these companies. These companies also include those that own or operate health facilities and hospitals or provide related administrative, management or financial support. Other companies in the health sciences group of industries in which the Trust may invest include: clinical testing laboratories; diagnostics; hospital, laboratory or physician ancillary products and support services; rehabilitation services; employer health insurance management services; and vendors of goods and services specifically to companies engaged in the health sciences. The Trust will concentrate its investments in the health sciences group of industries.
While the Trust will invest primarily in companies providing products and services for human health, it may also invest in companies whose products or services relate to the growth or survival of animals and plants. Non-human health sciences companies include those engaged in the development, production or distribution of products or services that: increase crop, animal and animal product yields by enhancing growth or increasing disease resistance; improve agricultural product characteristics, such as taste, appearance, nutritional content and shelf life; reduce the cost of producing agricultural products; or improve pet health.
The Trust may invest in companies of any market capitalization located anywhere in the world, including companies located in emerging markets. The Trust will focus its investments in mid- and small-capitalization companies. Foreign securities in which the Trust may invest may be U.S. dollar-denominated or non-U.S. dollar-denominated.
The Trust invests primarily in equity securities, including common stocks, preferred stocks, convertible securities, warrants and depositary receipts, of health sciences companies and limited partnership interests in REITs that own hospitals.
The Trust may invest in shares of companies through IPOs. The Trust may also invest, without limit, in privately placed or restricted securities (including in Rule 144A securities, which are privately placed securities purchased by qualified institutional buyers), illiquid securities and securities in which no secondary market is readily available, including those of private companies. Issuers of these securities may not have a class of securities registered, and may not be subject to periodic reporting, pursuant to the Securities Exchange Act of 1934, as amended. The Trust intends to invest up to 25% of its total assets, measured at the time of investment, in illiquid privately placed or restricted securities. The Trust expects certain of such investments to be in “late-stage private securities,” which are securities of private companies that have demonstrated sustainable
| 188 | 2 0 2 3 B L A C K R O C K A N N U A L R E P O R T T O S H A R E H O L D E R S |
Investment Objectives, Policies and Risks (continued)
Investment Objectives and Policies (continued)
business operations and generally have a well-known product or service with a strong market presence. Late-stage private companies have generally had large cash flows from their core business operations and are expanding into new markets with their products or services. Late-stage private companies may also be referred to as “pre-IPO companies.”
The Trust may invest up to 20% of its total assets in other investments, including equity securities issued by companies that are not principally engaged in the health sciences group of industries and debt securities issued by any issuer, including non-investment grade debt securities. The Trust’s investments in non-investment grade securities and those deemed to be of similar quality are considered speculative with respect to the issuer’s capacity to pay interest and repay principal and are commonly referred to as “junk” or “high yield” securities. The Trust has no set policy regarding portfolio maturity or duration of the fixed-income securities it may hold, and such securities may be of any maturity.
As part of its investment strategy, the Trust intends to employ a strategy of writing (selling) covered call options on a portion of the common stocks in its portfolio, writing (selling) other call and put options on individual common stocks, and, to a lesser extent, writing (selling) call and put index options. This options writing strategy is intended to generate current gains from options premiums and to enhance the Trust’s risk-adjusted returns. A substantial portion of the options written by the Trust may be over-the-counter (“OTC”) options.
During temporary defensive periods (i.e., in response to adverse market, economic or political conditions), the Trust may invest up to 100% of its total assets in liquid, short-term investments, including high quality, short-term securities. The Trust may not achieve its investment objectives under these circumstances. The Manager’s determination that it is temporarily unable to follow the Trust’s investment strategy or that it is impractical to do so will generally occur only in situations in which a market disruption event has occurred and where trading in the securities selected through application of the Trust’s investment strategy is extremely limited or absent.
The Trust may purchase and sell futures contracts, enter into various interest rate transactions such as swaps, caps, floors or collars, currency transactions such as currency forward contracts, currency futures contracts, currency swaps or options on currency or currency futures and swap contracts (including, but not limited to, credit default swaps) and may purchase and sell exchange-listed and OTC put and call options on securities and swap contracts, financial indices and futures contracts and use other derivative instruments or management techniques for duration management and other risk management purposes, including to attempt to protect against possible changes in the market value of the Trust’s portfolio resulting from trends in the securities markets and changes in interest rates or to protect the Trust’s unrealized gains in the value of its portfolio securities, to facilitate the sale of portfolio securities for investment purposes, to establish a position in the securities markets as a temporary substitute for purchasing particular securities or to enhance income or gain.
The Trust may also invest in securities of other open- or closed-end investment companies, including exchange-traded funds and business development companies, subject to applicable regulatory limits, that invest primarily in securities of the types in which the Trust may invest directly. The Trust classifies its investments in such investment companies as “equity securities” for purposes of its investment policies based upon such investment companies’ stated investment objectives, policies and restrictions.
The Trust may lend securities with a value of up to 33 1/3% of its total assets (including such loans) to financial institutions that provide cash or securities issued or guaranteed by the U.S. Government as collateral.
The Trust may also engage in short sales of securities. The Trust will not make a short sale if, after giving effect to such sale, the market value of all securities sold short exceeds 25% of the value of its Managed Assets or the Trust’s aggregate short sales of a particular class of securities exceeds 25% of the outstanding securities of that class. The Trust may make short sales “against the box” without respect to such limitations. In this type of short sale, at the time of the sale the Trust owns or has the immediate and unconditional right to acquire at no additional cost the identical security. “Managed Assets” means the total assets of the Trust (including any assets attributable to money borrowed for investment purposes) minus the sum of the Trust’s accrued liabilities (other than money borrowed for investment purposes).
Unless otherwise stated herein, the Trust’s investment policies are non-fundamental policies and may be changed by the Board without prior shareholder approval. The percentage limitations applicable to the Trust’s portfolio described herein apply only at the time of initial investment and the Trust will not be required to sell investments due to subsequent changes in the value of investments that it owns. The Trust’s investment objectives may be changed by the Board without prior shareholder approval; however, the Trust will not change its policy of investing, under normal market conditions, at least 80% of its total assets in equity securities of companies principally engaged in the health sciences group of industries and equity derivatives with exposure to the health sciences group of industries unless it provides shareholders at least 60 days’ written notice before implementation of the change in compliance with rules of the Securities and Exchange Commission.
Leverage: The Trust currently does not intend to borrow money or issue debt securities or preferred shares. Although it has no present intention to do so, the Trust reserves the right to borrow money from banks or other financial institutions, or issue debt securities or preferred shares, in the future if it believes that market conditions would be conducive to the successful implementation of a leveraging strategy through borrowing money or issuing debt securities or preferred shares. Any such leveraging will not be fully achieved until the proceeds resulting from the use of leverage have been invested in accordance with the Trust’s investment objectives and policies.
The Trust may enter into reverse repurchase agreements with respect to its portfolio investments subject to certain investment restrictions.
The Trust may enter into “dollar roll” transactions.
The Trust may enter into derivative transactions that have leverage embedded in them.
The Trust may also borrow money as a temporary measure for extraordinary or emergency purposes, including the payment of dividends and the settlement of securities transactions which otherwise might require untimely dispositions of Trust securities.
| I N V E S T M E N T O B J E C T I V E S , P O L I C I E S A N D R I S K S |
189 |
Investment Objectives, Policies and Risks (continued)
Investment Objectives and Policies (continued)
BlackRock Innovation and Growth Term Trust (BIGZ)
The Trust’s investment objectives are to provide total return and income through a combination of current income, current gains and long-term capital appreciation. The Trust is not intended as, and you should not construe it to be, a complete investment program. There can be no assurance that the Trust’s investment objectives will be achieved or that the Trust’s investment program will be successful. The Trust’s investment objectives may be changed by the Board of Trustees of the Trust (the “Board”) without prior shareholder approval.
In selecting investments for the Trust, BlackRock Advisors, LLC (the “Manager”) focuses on equity securities of mid- and small-capitalization growth companies that are “innovative.” These are companies that have introduced, or are seeking to introduce, a new product or service that potentially changes the marketplace. In evaluating innovative companies, the Manager seeks to identify, using its own internal research and analysis, companies capitalizing on innovation or that are enabling the further development of the theme of innovation in the markets in which they operate.
Among other things, common criteria for innovative companies across industries may include developing new products, selling in new markets or channels, applying a new or superior technology to legacy industries, refining existing processes for efficiency, changing or pivoting business model, or creating tools that empower new breakthroughs.
In addition, the Trust seeks to invest in companies where, in the opinion of the Manager, free cash flow is likely to grow for a sustained period. Factors considered in the Manager’s analysis of a company may include 1) a large and underpenetrated addressable market, 2) a technology or service model that creates recurring demand for product, and 3) a competitive landscape that allows for stable or expanding margins. The Manager’s outlook for a company based upon these and other factors is then compared to the outlook of the company implied in the current share price of the company. The Manager looks to invest in companies where its view of future cash flows is more favorable than that which it believes is reflected by the current price.
The Manager will identify trends that have ramifications for individual companies or entire industries. Risk/reward analysis is a key component of both top-down and bottom-up analysis.
Bottom-up security selection is focused on identifying innovative companies with the most attractive growth characteristics. The Manager seeks to identify companies with strong product potential, solid earnings growth and/or earnings power which are under appreciated by investors, a quality management team and compelling relative and absolute valuation. The Manager believes that the knowledge and experience of its investment team enables it to identify attractive innovative companies.
The Trust intends to utilize option strategies that consist of writing (selling) call options on a portion of the common stocks in its portfolio, as well as other option strategies such as writing other calls and puts or using options to manage risk. The portfolio management team will work closely to determine which option strategies to pursue to seek to generate current gains from options premiums and to enhance the Trust’s risk-adjusted returns.
The Trust will invest primarily in equity securities issued by mid- and small-capitalization companies that the Manager believes have above-average earnings growth potential.
Equity securities include common stocks, preferred stocks, convertible securities, warrants and depositary receipts, though the Trust seeks to buy primarily common stock. Although universal definitions of mid-capitalization companies and small-capitalization companies do not exist, the Trust generally defines mid-capitalization and small-capitalization companies as those companies with market capitalizations, at the time of the Trust’s investment, comparable in size to the companies in the Russell 2500™ Growth Index (between $20.75 million and $20.98 billion as of December 31, 2023). In the future, the Trust may define mid- and small-capitalization companies using a different index or classification system.
The Trust may invest in shares of companies through IPOs. The Trust may also invest, without limit, in privately placed or restricted securities (including in Rule 144A securities, which are privately placed securities purchased by qualified institutional buyers), illiquid securities and securities in which no secondary market is readily available, including those of private companies. Issuers of these securities may not have a class of securities registered, and may not be subject to periodic reporting, pursuant to the Exchange Act. Under normal market conditions, the Trust currently intends to invest up to 25% of its total assets, measured at the time of investment, in illiquid privately placed or restricted securities. The Trust expects certain of such investments to be in “late-stage private securities,” which are securities of private companies that have demonstrated sustainable business operations and generally have a well-known product or service with a strong market presence. Late-stage private companies have generally had large cash flows from their core business operations and are expanding into new markets with their products or services. Late-stage private companies may also be referred to as “pre-IPO companies.”
The Trust may invest up to 25% of its assets in securities of foreign companies, including companies located in emerging markets. Foreign securities in which the Trust may invest may be U.S. dollar-denominated or non-U.S. dollar-denominated.
The Trust may also invest in securities of other open- or closed-end investment companies, including exchange-traded funds and business development companies, subject to applicable regulatory limits, that invest primarily in securities of the types in which the Trust may invest directly. The Trust classifies its investments in such investment companies as “equity securities” for purposes of its investment policies based upon such investment companies’ stated investment objectives, policies and restrictions.
As part of its investment strategy, the Trust intends to employ a strategy of writing (selling) covered call options on a portion of the common stocks in its portfolio, writing (selling) other call and put options on individual common stocks, including uncovered call and put options, and, to a lesser extent, writing (selling) covered and uncovered call and put index options. This options writing strategy is intended to generate current gains from options premiums and to enhance the Trust’s risk-adjusted returns. A substantial portion of the options written by the Trust may be over-the-counter options.
The Trust may also purchase and sell futures contracts, enter into various interest rate transactions such as swaps, caps, floors or collars, currency transactions such as currency forward contracts, currency futures contracts, currency swaps or options on currency or currency futures and swap contracts (including, but not limited to, credit default swaps) and may purchase and sell exchange-listed and over-the-counter (“OTC”) put and call options on securities and swap contracts, financial indices and futures contracts and use other derivative instruments or management techniques for duration management and other risk management purposes, including to attempt to protect
| 190 | 2 0 2 3 B L A C K R O C K A N N U A L R E P O R T T O S H A R E H O L D E R S |
Investment Objectives, Policies and Risks (continued)
Investment Objectives and Policies (continued)
against possible changes in the market value of the Trust’s portfolio resulting from trends in the securities markets and changes in interest rates or to protect the Trust’s unrealized gains in the value of its portfolio securities, to facilitate the sale of portfolio securities for investment purposes, to establish a position in the securities markets as a temporary substitute for purchasing particular securities or to enhance income or gain.
During temporary defensive periods (i.e., in response to adverse market, economic or political conditions), the Trust may invest up to 100% of its total assets in liquid, short-term investments, including high quality, short-term securities. The Trust may not achieve its investment objectives under these circumstances. The Manager’s determination that it is temporarily unable to follow the Trust’s investment strategy or that it is impractical to do so will generally occur only in situations in which a market disruption event has occurred and where trading in the securities selected through application of the Trust’s investment strategy is extremely limited or absent.
The Trust may lend securities with a value of up to 33 1/3% of its total assets (including such loans) to financial institutions that provide cash or securities issued or guaranteed by the U.S. Government as collateral.
The Trust may engage in active and frequent trading of portfolio securities to achieve its investment objectives.
Unless otherwise stated herein, the Trust’s investment policies are non-fundamental policies and may be changed by the Board without prior shareholder approval. The percentage limitations applicable to the Trust’s portfolio described in this prospectus apply only at the time of initial investment and the Trust will not be required to sell investments due to subsequent changes in the value of investments that it owns. The Trust’s investment objectives may be changed by the Board without prior shareholder approval.
Leverage: The Trust currently does not intend to borrow money or issue debt securities or preferred shares. The Trust is, however, permitted to borrow money or issue debt securities in an amount up to 33 1/3% of its Managed Assets (50% of its net assets), and issue preferred shares in an amount up to 50% of its Managed Assets (100% of its net assets). “Managed Assets” means the total assets of the Trust (including any assets attributable to money borrowed for investment purposes) minus the sum of the Trust’s accrued liabilities (other than money borrowed for investment purposes). Although it has no present intention to do so, the Trust reserves the right to borrow money from banks or other financial institutions, or issue debt securities or preferred shares, in the future if it believes that market conditions would be conducive to the successful implementation of a leveraging strategy through borrowing money or issuing debt securities or preferred shares.
The Trust is permitted to leverage its portfolio by entering into one or more credit facilities.
The Trust may enter into reverse repurchase agreements with respect to its portfolio investments subject to the Trust’s investment restrictions.
The Trust may enter into “dollar roll” transactions.
The Trust may enter into derivative transactions that have leverage embedded in them.
The Trust may also borrow money as a temporary measure for extraordinary or emergency purposes, including the payment of dividends and the settlement of securities transactions which otherwise might require untimely dispositions of Trust securities.
BlackRock Resources & Commodities Strategy Trust (BCX)
The Trust’s primary investment objective is to seek high current income and current gains, with a secondary objective of capital appreciation. The Trust will seek to achieve its objectives by investing substantially all of its assets in equity securities issued by commodity or natural resources companies, derivatives with exposure to commodity or natural resources companies or investments in securities and derivatives linked to the underlying price movement of commodities or natural resources, including commodity-linked derivatives such as commodity-linked notes, commodity futures, forward contracts and swaps and other similar derivative instruments and investment vehicles that invest in commodities, natural resources or commodity-linked derivatives. The Trust’s investment objectives are not fundamental and may be changed by the Board of Trustees of the Trust (the “Board”).
The Trust will seek to achieve its investment objectives, under normal market conditions, by investing at least 80% of its total assets in equity securities issued by commodity or natural resources companies, derivatives with exposure to commodity or natural resources companies or investments in securities and derivatives linked to the underlying price movement of commodities or natural resources, including commodity-linked derivatives such as commodity-linked notes, commodity futures, forward contracts and swaps and other similar derivative instruments and investment vehicles that invest in commodities, natural resources or commodity-linked derivatives. Commodities and natural resources include, without limitation, minerals, metals (including precious, industrial and rare metals), steel, agricultural products and commodities, livestock, environmental commodities, wool, ethanol, chemicals, forest products (including wood, pulp and paper), plastic, rubber, sugar, cotton, cocoa, coffee, basic materials, building materials, water, oil, gas, consumable fuel, energy and other natural resources. Commodity and natural resources companies, include, but are not limited to, companies in commodities, natural resources and energy businesses and in associated businesses and companies that provide services or have exposure to such businesses (collectively, the “Commodities and Natural Resources Sector”). These companies include, without limitation, companies engaged in the exploration, ownership, production, refinement, processing, transportation, distribution or marketing of commodities or natural resources, companies that use commodities and natural resources extensively in their products, including companies that are engaged in businesses such as integrated oil, oil and gas exploration and production, gold, metals and minerals, steel and iron ore production, aluminum and related products, energy services, and technology, metal production, forest products, including timber and related wood and paper products, chemicals, fertilizer and agricultural chemicals, building materials, coal and other consumable fuel, alternative energy sources, environmental services and agricultural products (including crop growers, owners of plantations, and companies that produce and process foods), as well as related transportation companies and equipment manufacturers. The Trust will consider a company to be a commodity or natural resources company if: (i) at least 50% of the company’s assets, income, sales or profits are committed to or derived from the Commodities and Natural Resources Sector; or (ii) a third party classification (such as (a) Standard Industry Classifications and the North American Industry Classification
| I N V E S T M E N T O B J E C T I V E S , P O L I C I E S A N D R I S K S |
191 |
Investment Objectives, Policies and Risks (continued)
Investment Objectives and Policies (continued)
System, each of which is published by the Executive Office of the President, Office of Management and Budget and (b) classifications used by third party data providers including, without limitation, FactSet Research Systems Inc. and MSCI Barra), has given the company an industry or sector classification consistent with the Commodities and Natural Resources Sector.
Equity securities held by the Trust may include common stocks, preferred stocks, convertible securities, warrants, depositary receipts, equity interests in Canadian Royalty Trusts, and equity interests in master limited partnerships (“MLPs”). The Trust will not invest more than 25% of the value of its total assets in MLPs. The Trust’s economic exposure to securities and derivatives linked to the underlying price movements of commodities or natural resources, including commodity-linked derivatives such as commodity-linked notes, commodity futures, forward contracts and swaps and other similar derivative instruments and investment vehicles that invest in commodities, natural resources or commodity-linked derivatives (“Commodity-Related Instruments”) will not exceed 20% of its total assets. Commodity-Related Instruments may include, but will not be limited to, investments in structured notes, partnership interests, exchange-traded funds that make commodity-related or natural resources-related investments, mutual funds and strategic transactions, including futures contracts on commodities and natural resources, forward contracts on commodities and natural resources and swap contracts on commodities and natural resources.
The Trust may invest in such Commodity-Related Instruments either directly or indirectly through the BlackRock Cayman Resources & Commodities Strategy Fund, Ltd., a wholly-owned subsidiary of the Trust formed in the Cayman Islands (the “Subsidiary”). Investments in the Subsidiary are intended to provide the Trust with exposure to commodities market returns within the limitations of the federal tax requirements that apply to the Trust. The Trust may gain exposure to certain Commodity-Related Instruments and certain other commodity-related and natural resources-related investments that, if the Trust invested in such investments directly, would not produce qualifying income for purposes of the income tests applicable to regulated investment companies under the Internal Revenue Code of 1986, as amended, by investing in the Subsidiary. The Manager is the manager of the Subsidiary. The Subsidiary (unlike the Trust) may invest without limitation in commodity-related instruments.
The Subsidiary will be managed pursuant to compliance policies and procedures that are the same, in all material respects, as the policies and procedures adopted by the Trust. As a result, the Manager, in managing the Subsidiary’s portfolio, will be subject to the same investment policies and restrictions that apply to the management of the Trust, and, in particular, to the requirements relating to portfolio leverage, liquidity, brokerage, and the timing and method of the valuation of the Subsidiary’s portfolio investments and shares of the Subsidiary. The Trust’s Chief Compliance Officer will oversee implementation of the Subsidiary’s policies and procedures, and make periodic reports to the Board regarding the Subsidiary’s compliance with its policies and procedures. The Trust and Subsidiary will test for compliance with certain investment restrictions on a consolidated basis, except that with respect to the Subsidiary’s investments in certain securities that may involve leverage, the Subsidiary will comply with asset segregation requirements to the same extent as the Trust.
The Manager will provide investment management and other services to the Subsidiary pursuant to the investment management agreement among the Manager, the Trust and the Subsidiary. The Trust and the Subsidiary will pay the Manager based on the Trust’s assets (excluding the value of the Trust’s interest in the Subsidiary) and the Subsidiary’s assets, respectively. The Subsidiary has also entered into separate contracts for the provision of custody and audit services with the same or with affiliates of the same service providers that provide those services to the Trust. The financial statements of the Subsidiary are consolidated with the Trust’s financial statements in the Trust’s annul and semi-annual reports.
Although the Trust is permitted to invest up to 20% of its total assets in Commodity-Related Instruments, the Trust is not required to invest in Commodity-Related Instruments and does not currently expect to invest in securities and derivatives linked to the underlying price movement of commodities or natural resources. The Trust may invest in Commodity-Related Instruments (either directly or through the Subsidiary) when BlackRock Advisors, LLC (the “Manager”) or BlackRock International Limited (“BIL” and together with the Manager, the “Advisors”), the Trust’s sub-advisor, believes it is advantageous for the Trust to do so.
While permitted, the Trust does not currently expect to invest in securities and derivatives linked to the underlying price movement of commodities or natural resources; therefore, the Trust does not currently intend to invest any assets in the Subsidiary.
The Commodity Futures Trading Commission (the “CFTC”) subjects advisers to registered investment companies to regulation by the CFTC if a fund that is advised by the investment adviser either (i) invests directly or indirectly more than a prescribed level of its liquidation value in CFTC-regulated futures, options and swaps (“CFTC Derivatives”), or (ii) markets itself as providing investment exposure to such instruments. To the extent the Trust uses CFTC Derivatives, it intends to do so below such prescribed levels and will not market itself as a “commodity pool” or a vehicle for trading such instruments. Accordingly, the Manager has claimed an exclusion from the definition of the term “commodity pool operator” under the Commodity Exchange Act (“CEA”) pursuant to Rule 4.5 under the CEA. The Manager is not, therefore, subject to registration or regulation as a “commodity pool operator” under the CEA in respect of the Trust.
The Trust may invest in companies of any market capitalization located anywhere in the world. The Trust expects to invest primarily in companies located in developed countries, but may invest in companies located in emerging markets.
The Trust may invest up to 20% of its total assets in debt securities issued by companies in the Commodities and Natural Resources Sector or any type of securities issued by companies that are not in the Commodities and Natural Resources Sector.
As part of its investment strategy, the Trust may employ a strategy of writing (selling) covered call options on a portion of the common stocks in its portfolio, writing (selling) covered put options and, to a lesser extent, writing (selling) covered call and put options on indices of securities and sectors of securities. This option strategy is intended to generate current gains from option premiums as a means to enhance distributions payable to the Trust’s shareholders.
In addition to the option strategies discussed above, the Trust may engage in strategic transactions for hedging purposes or to enhance total return. The Trust may also engage in short sales of securities.
The Trust may lend securities with a value up to 33 1/3% of its total assets (including such loans) to financial institutions that provide cash or securities issued or guaranteed by the U.S. Government as collateral.
| 192 | 2 0 2 3 B L A C K R O C K A N N U A L R E P O R T T O S H A R E H O L D E R S |
Investment Objectives, Policies and Risks (continued)
Investment Objectives and Policies (continued)
The Trust may implement various temporary “defensive” strategies at times when the Advisors determine that conditions in the markets make pursuing the Trust’s basic investment strategy inconsistent with the best interests of its shareholders. These strategies may include investing all or a portion of the Trust’s assets in U.S. Government obligations and short-term debt securities that may be either tax-exempt or taxable.
Under current market conditions, the Trust currently does not intend to engage in short sales or incur indebtedness or issue preferred shares for investment purposes, except the Trust may engage for hedging purposes, risk management, or to enhance total return, including engaging in transactions, such as options, futures, swaps, foreign currency transactions, such as forward foreign currency contracts, currency swaps or options on currency and currency futures and other derivatives transactions , repurchase agreements, reverse repurchase agreements, when issued or forward commitment transactions and similar investment strategies, which may give rise to a form of leverage.
Unless otherwise stated herein, the Trust’s investment objectives and investment policies are non-fundamental policies and may be changed by the Board. In addition, the percentage limitations applicable to the Trust’s portfolio described herein apply only at the time of investment, and the Trust will not be required to sell investments due to subsequent changes in the value of investments that it owns.
BlackRock Science and Technology Trust (BST)
The Trust’s investment objectives are to provide income and total return through a combination of current income, current gains and long-term capital appreciation. The Trust’s investment objectives may be changed by the Board of Trustees (the “Board”) without prior shareholder approval.
BlackRock Advisors, LLC (the “Manager”) may consider a variety of factors when choosing investments for the Trust, such as:
| • | selecting companies with the potential for rapid and sustainable growth from the development, advancement and use of science and/or technology (high growth science and technology stocks); and |
| • | identifying companies that have above-average return potential based on factors such as revenue and earnings growth, profitability, valuation and dividend yield (cyclical science and technology stocks. |
In addition, a variety of countries, including emerging market countries, and industries are likely to be represented in the Trust’s portfolio.
The Trust generally will sell a stock when, in the Manager’s opinion, the stock is fully valued, there is a need to rebalance the portfolio or there is a better opportunity elsewhere.
The Trust may engage in active and frequent trading of portfolio securities to seek to achieve its investment objectives.
Under normal market conditions, the Trust invests at least 80% of its total assets in equity securities issued by U.S. and non-U.S. science and technology companies in any market capitalization range, selected for their rapid and sustainable growth potential from the development, advancement and use of science and/or technology (high growth science and technology stocks), and/or potential to generate current income from advantageous dividend yields (cyclical science and technology stocks).
Science and technology companies are companies whose products, processes or services, in the Manager’s view, are being, or are expected to be, significantly benefited by the use or commercial application of scientific or technological developments or discoveries. These companies include companies that, in the Manager’s view, derive a competitive advantage by the application of scientific or technological developments or discoveries to grow their business or increase their competitive advantage, as well as companies that utilize science and/or technology as an agent of change to significantly enhance their business opportunities.
Science, technology and science- or technology-related companies may include companies operating in any industry, including, but not limited to software, internet software & services, IT services, hardware, communications equipment, semiconductors and semiconductor equipment, media, internet retail, consumer finance, life sciences tools & services, biotechnology, pharmaceuticals, energy, defense/aerospace, diversified telecom services and wireless telecom services. Examples of potential high growth companies include those operating in IT services, the internet, software and sciences; examples of potential cyclical companies include those operating in hardware, telecom, semiconductors and components. The Manager determines, in its discretion, whether a company is a science, technology or science- or technology-related company.
The Trust may invest in companies of any market capitalization located anywhere in the world, including companies located in emerging markets. Equity securities in which the Trust may invest include common stocks, preferred stocks, convertible securities, warrants, depositary receipts, exchange-traded funds and equity interests in real estate investment trusts and master limited partnerships. From time to time, the Trust may invest in shares of companies through initial public offerings. The Trust may also invest, without limit, in privately placed or restricted securities (including in Rule 144A securities, which are privately placed securities purchased by qualified institutional buyers), illiquid securities and securities in which no secondary market is readily available, including those of private companies. Issuers of these securities may not have a class of securities registered, and may not be subject to periodic reporting, pursuant to the Securities Exchange Act of 1934, as amended. The Trust currently intends to invest up to 25% of its total assets, measured at the time of investment, in illiquid privately placed or restricted securities. Foreign securities in which the Trust may invest may be U.S. dollar-denominated or non-U.S. dollar-denominated.
The Trust may also invest in securities of other open- or closed-end investment companies, including exchange-traded funds and business development companies, subject to applicable regulatory limits, that invest primarily in securities of the types in which the Trust may invest directly. The Trust classifies its investments in such investment companies as “equity securities” for purposes of its investment policies based upon such investment companies’ stated investment objectives, policies and restrictions.
The Trust will concentrate its investments in companies operating in one or more industries within the technology group of industries.
The Trust may invest up to 20% of its total assets in equity securities issued by companies that are not science or technology companies and in debt securities issued by any issuer, including non-investment grade debt securities. The Trust’s investments in non-investment grade securities and those deemed to be of similar quality are considered speculative with respect to the issuer’s capacity to pay interest and repay principal and are commonly referred to as “junk” or “high yield” securities.
| I N V E S T M E N T O B J E C T I V E S , P O L I C I E S A N D R I S K S |
193 |
Investment Objectives, Policies and Risks (continued)
Investment Objectives and Policies (continued)
As part of its investment strategy, the Trust intends to employ a strategy of writing (selling) covered call options on a portion of the common stocks in its portfolio, writing (selling) other call and put options on individual common stocks, and, to a lesser extent, writing (selling) call and put index options. This options writing strategy is intended to generate current gains from options premiums and to enhance the Trust’s risk-adjusted returns. A substantial portion of the options written by the Trust may be over-the-counter options.
During temporary defensive periods (i.e., in response to adverse market, economic or political conditions), the Trust may invest up to 100% of its total assets in liquid, short-term investments, including high quality, short-term securities. The Trust may not achieve its investment objectives under these circumstances. The Manager’s determination that it is temporarily unable to follow the Trust’s investment strategy or that it is impractical to do so will generally occur only in situations in which a market disruption event has occurred and where trading in the securities selected through application of the Trust’s investment strategy is extremely limited or absent.
The Trust may invest in structured instruments (such as equity-linked notes) for investment purposes, as an alternative or complement to its options writing strategy or for risk management or leveraging purposes.
The Trust may purchase and sell futures contracts, enter into various interest rate transactions such as swaps, caps, floors or collars, currency transactions such as currency forward contracts, currency futures contracts, currency swaps or options on currency or currency futures and swap contracts (including, but not limited to, credit default swaps) and may purchase and sell exchange-listed and over-the-counter put and call options on securities and swap contracts, financial indices and futures contracts and use other derivative instruments or management techniques for duration management and other risk management purposes, including to attempt to protect against possible changes in the market value of the Trust’s portfolio resulting from trends in the securities markets and changes in interest rates or to protect the Trust’s unrealized gains in the value of its portfolio securities, to facilitate the sale of portfolio securities for investment purposes, to establish a position in the securities markets as a temporary substitute for purchasing particular securities or to enhance income or gain.
The Trust may lend securities with a value of up to 33 1/3% of its total assets (including such loans) to financial institutions that provide cash or securities issued or guaranteed by the U.S. Government as collateral.
The Trust may also engage in short sales of securities. The Trust will not make a short sale if, after giving effect to such sale, the market value of all securities sold short exceeds 25% of the value of its Managed Assets or the Trust’s aggregate short sales of a particular class of securities exceeds 25% of the outstanding securities of that class. The Trust may make short sales “against the box” without respect to such limitations. In this type of short sale, at the time of the sale the Trust owns or has the immediate and unconditional right to acquire at no additional cost the identical security. “Managed Assets” means the total assets of the Trust (including any assets attributable to money borrowed for investment purposes) minus the sum of the Trust’s accrued liabilities (other than money borrowed for investment purposes).
Unless otherwise stated herein, the Trust’s investment policies are non-fundamental policies and may be changed by the Board without prior shareholder approval. The percentage limitations applicable to the Trust’s portfolio described herein apply only at the time of initial investment and the Trust will not be required to sell investments due to subsequent changes in the value of investments that it owns. The Trust’s policy to invest at least 80% of its total assets in equity securities issued by U.S. and non-U.S. science and technology companies in any market capitalization range may be changed by the Board; however, if this policy changes, the Trust will provide shareholders at least 60 days’ written notice before implementation of the change in compliance with rules of the Securities and Exchange Commission.
Leverage: The Trust currently does not intend to borrow money or issue debt securities or preferred shares. Although it has no present intention to do so, the Trust reserves the right to borrow money from banks or other financial institutions, or issue debt securities or preferred shares, in the future if it believes that market conditions would be conducive to the successful implementation of a leveraging strategy through borrowing money or issuing debt securities or preferred shares.
The Trust may enter into reverse repurchase agreements with respect to its portfolio investments subject to certain investment restrictions.
The Trust may enter into “dollar roll” transactions.
The Trust may enter into derivative transactions that have leverage embedded in them.
The Trust may also borrow money as a temporary measure for extraordinary or emergency purposes, including the payment of dividends and the settlement of securities transactions which otherwise might require untimely dispositions of Trust securities.
BlackRock Science and Technology Term Trust (BSTZ)
The Trust’s investment objectives are to provide total return and income through a combination of current income, current gains and long-term capital appreciation. The Trust’s investment objectives may be changed by the Board of Trustees of the Trust (the “Board”) without prior shareholder approval.
BlackRock Advisors, LLC (the “Manager”) may consider a variety of factors when choosing investments for the Trust, but expects to select companies with the potential for rapid and sustainable growth from the development, advancement and use of science and/or technology.
In addition, a variety of countries, including emerging market countries, and industries are likely to be represented in the Trust’s portfolio.
The Trust generally will sell a stock when, in the Manager’s opinion, the stock is fully valued, there is a need to rebalance the portfolio or there is a better opportunity elsewhere.
The Trust may engage in active and frequent trading of portfolio securities to seek to achieve its investment objectives.
Under normal market conditions, the Trust will invest at least 80% of its total assets in equity securities issued by U.S. and non-U.S. science and technology companies in any market capitalization range, selected for their rapid and sustainable growth potential from the development, advancement and use of science and/or technology.
| 194 | 2 0 2 3 B L A C K R O C K A N N U A L R E P O R T T O S H A R E H O L D E R S |
Investment Objectives, Policies and Risks (continued)
Investment Objectives and Policies (continued)
Science and technology companies are companies whose products, processes or services, in the Manager’s view, are being, or are expected to be, significantly benefited by the use or commercial application of scientific or technological developments or discoveries. These companies include companies that, in the Manager’s view, derive a competitive advantage by the application of scientific or technological developments or discoveries to grow their business or increase their competitive advantage, as well as companies that utilize science and/or technology as an agent of change to significantly enhance their business opportunities.
Science, technology and science- or technology-related companies may include companies operating in any industry, including, but not limited to software, internet software & services, IT services, hardware, communications equipment, semiconductors and semiconductor equipment, media, internet retail, consumer finance, life sciences tools & services, biotechnology, pharmaceuticals, energy, defense/aerospace, diversified telecom services and wireless telecom services. It is anticipated that the Trust’s investments will be focused on companies within such industries that the Manager expects will generate a majority of their revenues from the development, advancement, use or sale of new and emerging, or “next generation,” science- or technology-related products, processes or services. There is no assurance, however, that any of the Trust’s assets will be invested in such companies at any time. The Manager determines, in its discretion, whether a company is a science, technology or science- or technology-related company.
The Trust may invest in companies of any market capitalization located anywhere in the world, including companies located in emerging markets. Equity securities in which the Trust may invest include common stocks, preferred stocks, convertible securities, warrants, depositary receipts, exchange-traded funds (“ETFs”) and equity interests in real estate investment trusts (“REITs”) and master limited partnerships. The Trust may invest in shares of companies through initial public offerings (“IPOs”). The Trust may also invest, without limit, in privately placed or restricted securities (including in Rule 144A securities, which are privately placed securities purchased by qualified institutional buyers), illiquid securities and securities in which no secondary market is readily available, including those of private companies. Issuers of these securities may not have a class of securities registered, and may not be subject to periodic reporting, pursuant to the Securities Exchange Act of 1934, as amended. Under normal market conditions, the Trust currently intends to invest up to 25% of its total assets, measured at the time of investment, in illiquid privately placed or restricted securities. The Trust expects certain of such investments to be in “pre-IPO securities,” which are securities of new and early stage companies, often funded by venture capital, whose securities have not been offered to the public and are not publicly traded. Foreign securities in which the Trust may invest may be U.S. dollar-denominated or non-U.S. dollar-denominated.
The Trust may also invest in securities of other open- or closed-end investment companies, including ETFs and business development companies, subject to applicable regulatory limits, that invest primarily in securities of the types in which the Trust may invest directly. The Trust classifies its investments in such investment companies as “equity securities” for purposes of its investment policies based upon such investment companies’ stated investment objectives, policies and restrictions.
The Trust will concentrate its investments in companies operating in one or more industries within the technology group of industries.
The Trust may invest up to 20% of its total assets in equity securities issued by companies that are not science or technology companies and in debt securities issued by any issuer, including non-investment grade debt securities. The Trust’s investments in non-investment grade securities and those deemed to be of similar quality are considered speculative with respect to the issuer’s capacity to pay interest and repay principal and are commonly referred to as “junk” or “high yield” securities.
As part of its investment strategy, the Trust intends to employ a strategy of writing (selling) covered call options on a portion of the common stocks in its portfolio, writing (selling) other call and put options on individual common stocks, and, to a lesser extent, writing (selling) call and put index options. This options writing strategy is intended to generate current gains from options premiums and to enhance the Trust’s risk-adjusted returns. A substantial portion of the options written by the Trust may be over-the-counter options.
During temporary defensive periods (i.e., in response to adverse market, economic or political conditions), the Trust may invest up to 100% of its total assets in liquid, short-term investments, including high quality, short-term securities. The Trust may not achieve its investment objectives under these circumstances. The Manager’s determination that it is temporarily unable to follow the Trust’s investment strategy or that it is impractical to do so will generally occur only in situations in which a market disruption event has occurred and where trading in the securities selected through application of the Trust’s investment strategy is extremely limited or absent.
The Trust may invest in structured instruments (such as equity-linked notes) for investment purposes, as an alternative or complement to its options writing strategy or for risk management or leveraging purposes.
The Trust may purchase and sell futures contracts, enter into various interest rate transactions such as swaps, caps, floors or collars, currency transactions such as currency forward contracts, currency futures contracts, currency swaps or options on currency or currency futures and swap contracts (including, but not limited to, credit default swaps) and may purchase and sell exchange-listed and over-the-counter put and call options on securities and swap contracts, financial indices and futures contracts and use other derivative instruments or management techniques for duration management and other risk management purposes, including to attempt to protect against possible changes in the market value of the Trust’s portfolio resulting from trends in the securities markets and changes in interest rates or to protect the Trust’s unrealized gains in the value of its portfolio securities, to facilitate the sale of portfolio securities for investment purposes, to establish a position in the securities markets as a temporary substitute for purchasing particular securities or to enhance income or gain.
The Trust may lend securities with a value of up to 33 1/3% of its total assets (including such loans) to financial institutions that provide cash or securities issued or guaranteed by the U.S. Government as collateral.
The Trust may also engage in short sales of securities. The Trust will not make a short sale if, after giving effect to such sale, the market value of all securities sold short exceeds 25% of the value of its Managed Assets or the Trust’s aggregate short sales of a particular class of securities exceeds 25% of the outstanding securities of that class. The Trust may make short sales “against the box” without respect to such limitations. In this type of short sale, at the time of the sale the Trust owns or has the immediate and unconditional right to acquire at no additional cost the identical security. “Managed Assets” means the total assets of the Trust (including any assets attributable to money borrowed for investment purposes) minus the sum of the Trust’s accrued liabilities (other than money borrowed for investment purposes).
Unless otherwise stated herein, the Trust’s investment policies are non-fundamental policies and may be changed by the Board without prior shareholder approval. The percentage limitations applicable to the Trust’s portfolio described herein apply only at the time of initial investment and the Trust will not be required to sell investments due to subsequent changes in the value of investments that it owns. The Trust’s policy to invest at least 80% of its total assets in equity securities issued by U.S. and non-U.S. science
| I N V E S T M E N T O B J E C T I V E S , P O L I C I E S A N D R I S K S |
195 |
Investment Objectives, Policies and Risks (continued)
Investment Objectives and Policies (continued)
and technology companies in any market capitalization range may be changed by the Board; however, if this policy changes, the Trust will provide shareholders at least 60 days’ written notice before implementation of the change in compliance with rules of the Securities and Exchange Commission.
Leverage: The Trust currently does not intend to borrow money or issue debt securities or preferred shares. Although it has no present intention to do so, the Trust reserves the right to borrow money from banks or other financial institutions, or issue debt securities or preferred shares, in the future if it believes that market conditions would be conducive to the successful implementation of a leveraging strategy through borrowing money or issuing debt securities or preferred shares. Any such leveraging will not be fully achieved until the proceeds resulting from the use of leverage have been invested in accordance with the Trust’s investment objectives and policies.
The Trust may enter into reverse repurchase agreements with respect to its portfolio investments subject to certain investment restrictions.
The Trust may enter into “dollar roll” transactions.
The Trust may enter into derivative transactions that have leverage embedded in them.
The Trust may also borrow money as a temporary measure for extraordinary or emergency purposes, including the payment of dividends and the settlement of securities transactions which otherwise might require untimely dispositions of Trust securities.
BlackRock Utilities, Infrastructure & Power Opportunities Trust (BUI)
The Trust’s investment objective is to provide total return through a combination of current income, current gains and long-term capital appreciation. The Trust’s investment objective may be changed by the Board of Trustees of the Trust (the “Board”) without prior shareholder approval.
The Trust seeks to achieve its investment objective by investing primarily in equity securities issued by companies that are engaged in the Utilities, Infrastructure or Power Opportunities business segments (as defined below) anywhere in the world and by employing a strategy of writing (selling) covered call and put options.
Under normal market conditions, the Trust will invest at least 80% of its total assets in equity securities issued by companies that are engaged in the Utilities, Infrastructure or Power Opportunities business segments. The Trust considers the “Utilities” business segment to include products, technologies and services connected to the management, ownership operation, construction, development or financing of facilities used to generate, transmit or distribute electricity, water, natural resources or telecommunications, the “Infrastructure” business segment to include companies that own or operate infrastructure assets or that are involved in the development, construction, distribution or financing of infrastructure assets (as described herein), and the “Power Opportunities” business segment to include companies with a significant involvement in, supporting, or necessary to renewable energy technology and development, alternative fuels, energy efficiency, automotive and sustainable mobility and technologies that enable or support the growth and adoption of new power and energy sources. Such companies may include, among others, electrical equipment producers (such as wind turbine manufacturers), producers of industrial and specialty chemicals (such as building insulation producers) and semi-conductor and equipment companies (such as solar panel manufacturers).
The Trust may invest in companies of any market capitalization. Under normal circumstances, the Trust invests a substantial amount of its total assets in foreign issuers, issuers that primarily trade in a market located outside the United States or issuers that do a substantial amount of business outside the United States. Although the Trust expects to invest primarily in companies located in developed countries, it may invest in companies located in emerging markets. Equity securities in which the Trust may invest include common stocks, preferred stocks, convertible securities, warrants, depositary receipts, exchange-traded funds, equity interests in real estate investment trusts, Canadian Royalty Trusts and master limited partnerships (“MLPs”). The Trust will not invest more than 25% of the value of its total assets in MLPs. The Trust may invest directly in equity securities or synthetically through the use of derivatives.
The Trust may invest up to 20% of its total assets in equity securities issued by companies that are not engaged in the Utilities, Infrastructure or Power Opportunities business segments and debt securities issued by any issuer, including up to 10% of its total assets in non-investment grade debt securities. The Trust’s investments in non-investment grade securities and those deemed to be of similar quality are considered speculative with respect to the issuer’s capacity to pay interest and repay principal and are commonly referred to as “junk” or “high yield” securities.
As part of its investment strategy, the Trust intends to employ a strategy of writing (selling) covered call options on a portion of the common stocks in its portfolio, writing (selling) other call and put options on individual common stocks, and, to a lesser extent, writing (selling) call and put index options. This options writing strategy is intended to generate current gains from options premiums and to enhance the Trust’s risk-adjusted returns. A substantial portion of the options written by the Trust may be over-the-counter options.
During temporary defensive periods (i.e., in response to adverse market, economic or political conditions), the Trust may invest up to 100% of its total assets in liquid, short-term investments, including high quality, short-term securities. The Trust may not achieve its investment objective under these circumstances. BlackRock Advisors, LLC’s (the “Manager”) and BlackRock International Limited’s (“BIL” and together with the Manager, the “Advisors”), the Trust’s sub-advisor, determination that they are temporarily unable to follow the Trust’s investment strategy or that it is impractical to do so will generally occur only in situations in which a market disruption event has occurred and where trading in the securities selected through application of the Trust’s investment strategy is extremely limited or absent.
The Trust may purchase and sell futures contracts, enter into various interest rate transactions such as swaps, caps, floors or collars, currency transactions such as currency forward contracts, currency futures contracts, currency swaps or options on currency or currency futures and swap contracts (including, but not limited to, credit default swaps) and may purchase and sell exchange-listed and over-the-counter put and call options on securities and swap contracts, financial indices and futures contracts and use other derivative instruments or management techniques for duration management and other risk management purposes, including to attempt to protect against possible changes in the market value of the Trust’s portfolio resulting from trends in the securities markets and changes in interest rates or to protect the Trust’s unrealized gains in the value of its portfolio securities, to facilitate the sale of portfolio securities for investment purposes, to establish a position in the securities markets as a temporary substitute for purchasing particular securities or to enhance income or gain.
| 196 | 2 0 2 3 B L A C K R O C K A N N U A L R E P O R T T O S H A R E H O L D E R S |
Investment Objectives, Policies and Risks (continued)
Investment Objectives and Policies (continued)
The Trust may lend securities with a value up to 33 1/3% of its total assets (including such loans) to financial institutions that provide cash or securities issued or guaranteed by the U.S. Government as collateral.
The Trust may also engage in short sales of securities. The Trust will not make a short sale if, after giving effect to such sale, the market value of all securities sold short exceeds 15% of the value of its total assets or the Trust’s aggregate short sales of a particular class of securities exceeds 15% of the outstanding securities of that class. The Trust may make short sales “against the box” without respect to such limitations. In this type of short sale, at the time of the sale the Trust owns or has the immediate and unconditional right to acquire at no additional cost the identical security.
Unless otherwise stated herein, the Trust’s investment objective and policies are non-fundamental policies and may be changed by the Board without prior shareholder approval. The Trust’s policy to invest at least 80% of its total assets in equity securities issued by companies that are engaged in the Utilities, Infrastructure and Power Opportunities business segments may be changed by the Board; however, if this policy changes, the Trust will provide shareholders at least 60 days’ written notice before implementation of the change in compliance with rules of the Securities and Exchange Commission.
Leverage: The Trust currently does not intend to borrow money or issue debt securities or preferred shares. Although it has no present intention to do so, the Trust reserves the right to borrow money from banks or other financial institutions, or issue debt securities or preferred shares, in the future if it believes that market conditions would be conducive to the successful implementation of a leveraging strategy through borrowing money or issuing debt securities or preferred shares. Any such leveraging will not be fully achieved until the proceeds resulting from the use of leverage have been invested in accordance with the Trust’s investment objective and policies.
The Trust may enter into reverse repurchase agreements with respect to its portfolio investments subject to certain investment restrictions.
The Trust may enter into derivative transactions that have leverage embedded in them.
The Trust may also borrow money as a temporary measure for extraordinary or emergency purposes, including the payment of dividends and the settlement of securities transactions which otherwise might require untimely dispositions of Trust securities.
Risk Factors
This section contains a discussion of the general risks of investing in each Trust. The net asset value and market price of, and dividends paid on, the common shares will fluctuate with and be affected by, among other things, the risks more fully described below. As with any fund, there can be no guarantee that a Trust will meet its investment objective or that the Trust’s performance will be positive for any period of time. Each risk noted below is applicable to each Trust unless the specific Trust or Trusts are noted in a parenthetical. The order of the below risk factors does not indicate the significance of any particular risk factor.
Non-Diversification Risk (BGR, BIGZ, BMEZ and BCX): The Trust is a non-diversified fund. Because the Trust may invest in securities of a smaller number of issuers, it may be more exposed to the risks associated with and developments affecting an individual issuer than a fund that invests more widely.
Limited Term Risk (BMEZ, BIGZ and BSTZ): In accordance with the Trust’s Agreement and Declaration of Trust, the Trust intends to dissolve as of the first business day following the twelfth anniversary of the effective date of the Trust’s initial registration statement (the “Dissolution Date”); provided that the Board may, by a vote of a majority of the Board and seventy-five percent (75%) of the members of the Board who either (i) have been a member of the Board for a period of at least thirty-six months (or since the commencement of the Trust’s operations, if less than thirty-six months) or (ii) were nominated to serve as a member of the Board by a majority of the Continuing Trustees then members of the Board (a “Board Action Vote”), without shareholder approval, extend the Dissolution Date: (i) once for up to one year, and (ii) once for up to an additional six months, to a date up to and including eighteen months after the initial Dissolution Date (which date shall then become the Dissolution Date). As of a date within twelve months preceding the Dissolution Date (as may be extended as described above), the Board may, by a Board Action Vote, cause the Trust to conduct a tender offer to all common shareholders to purchase 100% of the then outstanding common shares of the Trust at a price equal to the net asset value (“NAV”) per common share on the expiration date of the tender offer (an “Eligible Tender Offer”). The Board has established that the Trust must have at least $200 million of aggregate net assets immediately following the completion of an Eligible Tender Offer to ensure the continued viability of the Trust (the “Dissolution Threshold”). In an Eligible Tender Offer, the Trust will offer to purchase all common shares held by each common shareholder; provided that if the payment for properly tendered common shares would result in the Trust having aggregate net assets below the Dissolution Threshold, the Eligible Tender Offer will be canceled and no common shares will be repurchased pursuant to the Eligible Tender Offer. Instead, the Trust will begin (or continue) liquidating its portfolio and proceed to dissolve on or about the Dissolution Date. If the payment for properly tendered common shares would result in the Trust having aggregate net assets greater than or equal to the Dissolution Threshold, all common shares properly tendered and not withdrawn will be purchased by the Trust pursuant to the terms of the Eligible Tender Offer. Following the completion of an Eligible Tender Offer, the Board may, by a Board Action Vote, eliminate the Dissolution Date without shareholder approval and provide for the Trust’s perpetual existence.
Unless the limited term provision of the Trust’s Agreement and Declaration of Trust is amended by shareholders in accordance with the Agreement and Declaration of Trust, or unless the Trust completes an Eligible Tender Offer and converts to perpetual existence, the Trust will dissolve on or about the first business day following the Dissolution Date. The Trust is not a so called “target date” or “life cycle” fund whose asset allocation becomes more conservative over time as its target date, often associated with retirement, approaches. In addition, the Trust is not a “target term” fund and thus does not seek to return its initial public offering price per common share upon dissolution. As the assets of the Trust will be liquidated in connection with its dissolution, the Trust may be required to sell portfolio securities when it otherwise would not, including at times when market conditions are not favorable, which may cause the Trust to lose money. In addition, as the Trust approaches the Dissolution Date, the Manager may invest the proceeds of sold, matured or called securities in money market mutual funds, cash, cash equivalents, securities issued or guaranteed by the U.S. government or its instrumentalities or agencies, high quality, short-term money market instruments, short-term debt securities, certificates of deposit, bankers’ acceptances and other bank obligations, commercial paper or other liquid debt securities, which may adversely affect the Trust’s investment performance. Rather than reinvesting proceeds received from sales of or payments received in respect of portfolio securities, the Trust may distribute such proceeds in one or more liquidating distributions prior to the final dissolution, which may cause the Trust’s fixed expenses to increase when expressed as a percentage of net assets attributable to common shares, or the Trust may invest the proceeds in lower yielding securities or hold the proceeds in cash or cash equivalents, which may adversely affect the performance of the
| I N V E S T M E N T O B J E C T I V E S , P O L I C I E S A N D R I S K S |
197 |
Investment Objectives, Policies and Risks (continued)
Risk Factors (continued)
Trust. The final distribution of net assets upon dissolution may be more than, equal to or less than $20.00 per common share. Because the Trust may adopt a plan of liquidation and make liquidating distributions in advance of the Dissolution Date, the total value of the Trust’s assets returned to common shareholders upon dissolution will be impacted by decisions of the Board and the Manager regarding the timing of adopting a plan of liquidation and making liquidating distributions. This may result in common shareholders receiving liquidating distributions with a value more or less than the value that would have been received if the Trust had liquidated all of its assets on the Dissolution Date, or any other potential date for liquidation, and distributed the proceeds thereof to shareholders.
If the Trust conducts an Eligible Tender Offer, the Trust anticipates that funds to pay the aggregate purchase price of shares accepted for purchase pursuant to the tender offer will be first derived from any cash on hand and then from the proceeds from the sale of portfolio investments held by the Trust. The risks related to the disposition of securities in connection with the Trust’s dissolution also would be present in connection with the disposition of securities in connection with an Eligible Tender Offer. It is likely that during the pendency of a tender offer, and possibly for a time thereafter, the Trust will hold a greater than normal percentage of its total assets in cash and cash equivalents, which may impede the Trust’s ability to achieve its investment objectives and decrease returns to shareholders. The tax effect of any such dispositions of portfolio investments will depend on the difference between the price at which the investments are sold and the tax basis of the Trust in the investments.
Any capital gains recognized on such dispositions, as reduced by any capital losses the Trust realizes in the year of such dispositions and by any available capital loss carryforwards, will be distributed to shareholders as capital gain dividends (to the extent of net long-term capital gains over net short-term capital losses) or ordinary dividends (to the extent of net short-term capital gains over net long-term capital losses) during or with respect to such year, and such distributions will generally be taxable to common shareholders. If the Trust’s tax basis for the investments sold is less than the sale proceeds, the Trust will recognize capital gains, which the Trust intends to distribute to common shareholders. In addition, the Trust’s purchase of tendered common shares pursuant to an Eligible Tender Offer will have tax consequences for tendering common shareholders and may have tax consequences for non-tendering common shareholders.
The purchase of common shares by the Trust pursuant to an Eligible Tender Offer will have the effect of increasing the proportionate interest in the Trust of non-tendering common shareholders. All common shareholders remaining after an Eligible Tender Offer will be subject to any increased risks associated with the reduction in the Trust’s assets resulting from payment for the tendered common shares, such as greater volatility due to decreased diversification and proportionately higher expenses. The reduced assets of the Trust as a result of an Eligible Tender Offer may result in less investment flexibility for the Trust and may have an adverse effect on the Trust’s investment performance. Such reduction in the Trust’s assets may also cause common shares of the Trust to become thinly traded or otherwise negatively impact secondary trading of common shares. A reduction in assets, and the corresponding increase in the Trust’s expense ratio, could result in lower returns and put the Trust at a disadvantage relative to its peers and potentially cause the Trust’s common shares to trade at a wider discount, or smaller premium, to NAV than they otherwise would. Furthermore, the portfolio of the Trust following an Eligible Tender Offer could be significantly different and, therefore, common shareholders retaining an investment in the Trust could be subject to greater risk. For example, the Trust may be required to sell its more liquid, higher quality portfolio investments to purchase common shares that are tendered in an Eligible Tender Offer, which would leave a less liquid, lower quality portfolio for remaining shareholders. The prospects of an Eligible Tender Offer may attract arbitrageurs who would purchase the common shares prior to the tender offer for the sole purpose of tendering those shares which could have the effect of exacerbating the risks described herein for shareholders retaining an investment in the Trust following an Eligible Tender Offer.
The Trust is not required to conduct an Eligible Tender Offer. If the Trust conducts an Eligible Tender Offer, there can be no assurance that the payment for tendered common shares would not result in the Trust having aggregate net assets below the Dissolution Threshold, in which case the Eligible Tender Offer will be canceled, no common shares will be repurchased pursuant to the Eligible Tender Offer and the Trust will liquidate on the Dissolution Date (subject to possible extensions). Following the completion of an Eligible Tender Offer in which the payment for tendered common shares would result in the Trust having aggregate net assets greater than or equal to the Dissolution Threshold, the Board may, by a Board Action Vote, eliminate the Dissolution Date without shareholder approval and provide for the Trust’s perpetual existence. Thereafter, the Trust will have a perpetual existence. There is no guarantee that the Board will eliminate the Dissolution Date following the completion of an Eligible Tender Offer so that the Trust will have a perpetual existence. The Manager may have a conflict of interest in recommending to the Board that the Dissolution Date be eliminated and the Trust have a perpetual existence. The Trust is not required to conduct additional tender offers following an Eligible Tender Offer and conversion to perpetual existence. Therefore, remaining common shareholders may not have another opportunity to participate in a tender offer. Shares of closed-end management investment companies frequently trade at a discount from their NAV, and as a result remaining common shareholders may only be able to sell their shares at a discount to NAV.
Although it is anticipated that the Trust will have distributed substantially all of its net assets to shareholders as soon as practicable after the Dissolution Date, securities for which no market exists or securities trading at depressed prices, if any, may be placed in a liquidating trust. Securities placed in a liquidating trust may be held for an indefinite period of time, potentially several years or longer, until they can be sold or pay out all of their cash flows. During such time, the shareholders will continue to be exposed to the risks associated with the Trust and the value of their interest in the liquidating trust will fluctuate with the value of the liquidating trust’s remaining assets. Additionally, the tax treatment of the liquidating trust’s assets may differ from the tax treatment applicable to such assets when held by the Trust. To the extent the costs associated with a liquidating trust exceed the value of the remaining securities, the liquidating trust trustees may determine to dispose of the remaining securities in a manner of their choosing. The Trust cannot predict the amount, if any, of securities that will be required to be placed in a liquidating trust or how long it will take to sell or otherwise dispose of such securities.
Investment and Market Discount Risk: An investment in the Trust’s common shares is subject to investment risk, including the possible loss of the entire amount that you invest. As with any stock, the price of the Trust’s common shares will fluctuate with market conditions and other factors. If shares are sold, the price received may be more or less than the original investment. Common shares are designed for long-term investors and the Trust should not be treated as a trading vehicle. Shares of closed-end management investment companies frequently trade at a discount from their net asset value. This risk is separate and distinct from the risk that the Trust’s net asset value could decrease as a result of its investment activities. At any point in time an investment in the Trust’s common shares may be worth less than the original amount invested, even after taking into account distributions paid by the Trust. During periods in which the Trust may use leverage, the Trust’s investment, market discount and certain other risks will be magnified.
Equity Securities Risk: Stock markets are volatile. The price of equity securities fluctuates based on changes in a company’s financial condition and overall market and economic conditions.
| 198 | 2 0 2 3 B L A C K R O C K A N N U A L R E P O R T T O S H A R E H O L D E R S |
Investment Objectives, Policies and Risks (continued)
Risk Factors (continued)
Common Stock Risk: Common stocks represent equity ownership in a company. Stock markets are volatile. The price of common stock will fluctuate and can decline and reduce the value of a portfolio investing in equities. The value of common stock purchased by the Trust could decline if the financial condition of the companies the Trust invests in declines or if overall market and economic conditions deteriorate. The value of equity securities may also decline due to factors that affect a particular industry or industries, such as labor shortages or an increase in production costs and competitive conditions within an industry. In addition, the value may decline due to general market conditions that are not specifically related to a company or industry, such as real or perceived adverse economic conditions, changes in the general outlook for corporate earnings, changes in inflation, interest or currency rates or generally adverse investor sentiment.
Small and Mid-Capitalization Company Risk: Companies with small or mid-size market capitalizations will normally have more limited product lines, markets and financial resources and will be dependent upon a more limited management group than larger capitalized companies. In addition, it is more difficult to get information on smaller companies, which tend to be less well known, have shorter operating histories, do not have significant ownership by large investors and are followed by relatively few securities analysts.
Preferred Securities Risk: Preferred securities may pay fixed or adjustable rates of return. Preferred securities are subject to issuer-specific and market risks applicable generally to equity securities. In addition, a company’s preferred securities generally pay dividends only after the company makes required payments to holders of its bonds and other debt. For this reason, the value of preferred securities will usually react more strongly than bonds and other debt to actual or perceived changes in the company’s financial condition or prospects. Preferred securities of smaller companies may be more vulnerable to adverse developments than preferred securities of larger companies.
Convertible Securities Risk (BGR, BDJ, BOE, BGY, BME, BMEZ, BIGZ, BCX, BST, BSTZ and BUI): The market value of a convertible security performs like that of a regular debt security; that is, if market interest rates rise, the value of a convertible security usually falls. In addition, convertible securities are subject to the risk that the issuer will not be able to pay interest, principal or dividends when due, and their market value may change based on changes in the issuer’s credit rating or the market’s perception of the issuer’s creditworthiness. Since it derives a portion of its value from the common stock into which it may be converted, a convertible security is also subject to the same types of market and issuer risks that apply to the underlying common stock, including the potential for increased volatility in the price of the convertible security.
Warrants Risk (BGR, BOE, BGY, BME, BMEZ, BIGZ, BCX, BST, BSTZ and BUI): If the price of the underlying stock does not rise above the exercise price before the warrant expires, the warrant generally expires without any value and the Trust will lose any amount it paid for the warrant. Thus, investments in warrants may involve substantially more risk than investments in common stock. Warrants may trade in the same markets as their underlying stock; however, the price of the warrant does not necessarily move with the price of the underlying stock.
Depositary Receipts Risk (BGR, BOE, BGY, BME, BMEZ, BIGZ, BCX, BST, BSTZ and BUI): Depositary receipts are generally subject to the same risks as the foreign securities that they evidence or into which they may be converted. In addition to investment risks associated with the underlying issuer, depositary receipts expose the Trust to additional risks associated with the non-uniform terms that apply to depositary receipt programs, credit exposure to the depository bank and to the sponsors and other parties with whom the depository bank establishes the programs, currency risk and the risk of an illiquid market for depositary receipts. The issuers of unsponsored depositary receipts are not obligated to disclose information that is, in the United States, considered material. Therefore, there may be less information available regarding these issuers and there may not be a correlation between such information and the market value of the depositary receipts. While depositary receipts provide an alternative to directly purchasing underlying foreign securities in their respective markets and currencies, they continue to be subject to many of the risks associated with investing directly in foreign securities, including political, economic, and currency risk.
REIT Investment Risk (BDJ, BOE, BGY, BME, BMEZ, BST, BSTZ and BUI): Investments in REITs involve unique risks. REITs may have limited financial resources, may trade less frequently and in limited volume, may engage in dilutive offerings of securities and may be more volatile than other securities. REIT issuers may also fail to maintain their exemptions from investment company registration or fail to qualify for the “dividends paid deduction” under the Internal Revenue Code of 1986, as amended, which allows REITs to reduce their corporate taxable income for dividends paid to their shareholders.
Master Limited Partnerships Risk (BGR, BCX, BST, BSTZ and BUI): The common units of a master limited partnership (“MLP”) are listed and traded on U.S. securities exchanges and their value fluctuates predominantly based on prevailing market conditions and the success of the MLP. Unlike owners of common stock of a corporation, owners of common units have limited voting rights and have no ability to annually elect directors. In the event of liquidation, common units have preference over subordinated units, but not over debt or preferred units, to the remaining assets of the MLP.
Canadian Royalty Trust Risk (BGR, BCX and BUI): Canadian Royalty Trusts are exposed to many of the same risks as energy and natural resources companies, such as commodity pricing risk, supply and demand risk and depletion and exploration risk.
Initial Public Offerings (“IPOs”) Risk (BOE, BME, BMEZ, BIGZ, BST and BSTZ): The Trust may invest in shares of companies through IPOs. Securities issued in IPOs have no trading history, and information about the companies may be available for limited periods of time. In addition, the prices of securities sold in IPOs may be highly volatile or may decline shortly after the IPO.
Investments in Unseasoned Companies (BDJ, BOE, BGY, BME, BMEZ, BIGZ, BCX and BSTZ): The Trust may invest in the securities of smaller, less seasoned companies. These investments may present greater opportunities for growth, but also involve greater risks than customarily are associated with investments in securities of more established companies. Some of the companies in which the Trust may invest may be start-up companies which may have insubstantial operational or earnings histories or may have limited products, markets, financial resources or management depth. Some may also be emerging companies at the research and development stage with no products or technologies to market or approved for marketing. Securities of emerging companies may lack an active secondary market and may be subject to more abrupt or erratic price movements than securities of larger, more established companies or stock market averages in general. Competitors of certain companies may have substantially greater financial resources than many of the companies in which the Trust may invest. Further, an unseasoned company is more at risk of loss in an adverse market due to its lack of financial resources and ability to sustain itself for an extended period of time in such a market.
| I N V E S T M E N T O B J E C T I V E S , P O L I C I E S A N D R I S K S |
199 |
Investment Objectives, Policies and Risks (continued)
Risk Factors (continued)
Dividend-Paying Equity Securities Risk (CII, BDJ, BOE, BGY and BME): Dividends on common equity securities that the Trust may hold are not fixed but are declared at the discretion of an issuer’s board of directors. Companies that have historically paid dividends on their securities are not required to continue to pay dividends on such securities. There is no guarantee that the issuers of the common equity securities in which the Trust invests will declare dividends in the future or that, if declared, they will remain at current levels or increase over time. Therefore, there is the possibility that such companies could reduce or eliminate the payment of dividends in the future. Dividend producing equity securities, in particular those whose market price is closely related to their yield, may exhibit greater sensitivity to interest rate changes. The Trust’s investments in dividend producing equity securities may also limit its potential for appreciation during a broad market advance.
The prices of dividend producing equity securities can be highly volatile. Investors should not assume that the Trust’s investments in these securities will necessarily reduce the volatility of the Trust’s NAV or provide “protection,” compared to other types of equity securities, when markets perform poorly.
Investment Style Risk: Under certain market conditions, growth investments have performed better during the later stages of economic expansion and value investments have performed better during periods of economic recovery. Therefore, these investment styles may over time go in and out of favor. At times when the investment style used by the Trust is out of favor, the Trust may underperform other equity funds that use different investment styles.
Risks Associated with the Trust’s Options Strategy: The ability of the Trust to generate current gains from options premiums and to enhance the Trust’s risk-adjusted returns is partially dependent on the successful implementation of its options strategy. There are several risks associated with transactions in options on securities. For example, there are significant differences between the securities and options markets that could result in an imperfect correlation between these markets, causing a given transaction not to achieve its objectives. A decision as to whether, when and how to use options involves the exercise of skill and judgment, and even a well-conceived transaction may be unsuccessful to some degree because of market behavior or unexpected events.
| • | Risks of Writing Options – As the writer of a covered call option, the Trust forgoes, during the option’s life, the opportunity to profit from increases in the market value of the security covering the call option above the sum of the premium and the strike price of the call, but has retained the risk of loss should the price of the underlying security decline. In other words, as the Trust writes covered calls over more of its portfolio, the Trust’s ability to benefit from capital appreciation becomes more limited. |
If the Trust writes call options on individual securities or index call options that include securities, in each case, that are not in the Trust’s portfolio or that are not in the same proportion as securities in the Trust’s portfolio, the Trust will experience loss, which theoretically could be unlimited, if the value of the individual security, index or basket of securities appreciates above the exercise price of the index option written by the Trust.
When the Trust writes put options, it bears the risk of loss if the value of the underlying stock declines below the exercise price minus the put premium. If the option is exercised, the Trust could incur a loss if it is required to purchase the stock underlying the put option at a price greater than the market price of the stock at the time of exercise plus the put premium the Trust received when it wrote the option. While the Trust’s potential gain in writing a put option is limited to the premium received from the purchaser of the put option, the Trust risks a loss equal to the entire exercise price of the option minus the put premium.
| • | Exchange-Listed Options Risks – There can be no assurance that a liquid market will exist when the Trust seeks to close out an exchange-listed option position. Reasons for the absence of a liquid secondary market on an exchange include the following: (i) there may be insufficient trading interest in certain options; (ii) restrictions may be imposed by an exchange on opening transactions or closing transactions or both; (iii) trading halts, suspensions or other restrictions may be imposed with respect to particular classes or series of options; (iv) unusual or unforeseen circumstances may interrupt normal operations on an exchange; (v) the facilities of an exchange or the Options Clearing Corporation (the “OCC”) may not at all times be adequate to handle current trading volume; or (vi) one or more exchanges could, for economic or other reasons, decide or be compelled at some future date to discontinue the trading of options (or a particular class or series of options). |
| • | Over-the-Counter Options Risk – The Trust may write (sell) unlisted OTC options. OTC options differ from exchange-listed options in that they are two-party contracts, with exercise price, premium and other terms negotiated between buyer and seller, and generally do not have as much market liquidity as exchange-listed options. The OTC options written by the Trust will not be issued, guaranteed or cleared by the OCC. In addition, the Trust’s ability to terminate OTC options may be more limited than with exchange-traded options. Banks, broker-dealers or other financial institutions participating in such transactions may fail to settle a transaction in accordance with the terms of the option as written. In the event of default or insolvency of the counterparty, the Trust may be unable to liquidate an OTC option position. |
| • | Index Options Risk – The Trust may sell index put and call options from time to time. The purchaser of an index put option has the right to any depreciation in the value of the index below the exercise price of the option on or before the expiration date. The purchaser of an index call option has the right to any appreciation in the value of the index over the exercise price of the option on or before the expiration date. Because the exercise of index options is settled in cash, sellers of index call options, such as the Trust, cannot provide in advance for their potential settlement obligations by acquiring and holding the underlying securities. The Trust will lose money if it is required to pay the purchaser of an index option the difference between the cash value of the index on which the option was written and the exercise price and such difference is greater than the premium received by the Trust for writing the option. |
| • | Limitation on Options Writing Risk – The number of call options the Trust can write is limited by the total assets the Trust holds. Furthermore, the Trust’s exchange-listed options transactions will be subject to limitations established by each of the exchanges, boards of trade or other trading facilities, if any, on which such options are traded and cleared. |
| • | Tax Risk – Income on options on individual stocks will generally not be recognized by the Trust for tax purposes until an option is exercised, lapses or is subject to a “closing transaction” (as defined by applicable regulations) pursuant to which the Trust’s obligations with respect to the option are otherwise terminated. If the option lapses without exercise or is otherwise subject to a closing transaction, the premiums received by the Trust from the writing of such options will generally be characterized as short-term capital gain. If an option written by the Trust is exercised, the Trust may recognize taxable gain depending on the exercise price of the option, the option premium, and the tax basis of the security underlying the option. The character of any gain on the sale of the underlying security as short-term or |
| 200 | 2 0 2 3 B L A C K R O C K A N N U A L R E P O R T T O S H A R E H O L D E R S |
Investment Objectives, Policies and Risks (continued)
Risk Factors (continued)
long-term capital gain will depend on the holding period of the Trust in the underlying security. In general, distributions received by shareholders of the Trust that are attributable to short-term capital gains recognized by the Trust from its options writing activities will be taxed to such shareholders as ordinary income and will not be eligible for the reduced tax rate applicable to qualified dividend income.
Index options will generally be “marked-to-market” for U.S. federal income tax purposes. As a result, the Trust will generally recognize gain or loss on the last day of each taxable year equal to the difference between the value of the index option on that date and the adjusted basis of the index option. The adjusted basis of the index option will consequently be increased by such gain or decreased by such loss. Any gain or loss with respect to index options will be treated as short-term capital gain or loss to the extent of 40% of such gain or loss and long-term capital gain or loss to the extent of 60% of such gain or loss. Because the mark-to-market rules may cause the Trust to recognize gain in advance of the receipt of cash, the Trust may be required to dispose of investments in order to meet its U.S. federal income tax distribution requirements.
Debt Securities Risk (BGR, BOE, BME, BMEZ, BCX, BST, BSTZ and BUI): Debt securities, such as bonds, involve interest rate risk, such as credit risk, interest rate risk, extension risk, and prepayment risk, each of which are described in further detail below:
| • | Credit Risk – Credit risk refers to the possibility that the issuer of a debt security (i.e., the borrower) will not be able to make payments of interest and principal when due. Changes in an issuer’s credit rating or the market’s perception of an issuer’s creditworthiness may also affect the value of the Trust’s investment in that issuer. The degree of credit risk depends on both the financial condition of the issuer and the terms of the obligation. |
| • | Interest Rate Risk – The market value of bonds and other fixed-income securities changes in response to interest rate changes and other factors. Interest rate risk is the risk that prices of bonds and other fixed-income securities will increase as interest rates fall and decrease as interest rates rise. |
The Trust may be subject to a greater risk of rising interest rates due to the recent period of historically low interest rates. For example, if interest rates increase by 1%, assuming a current portfolio duration of ten years, and all other factors being equal, the value of the Trust’s investments would be expected to decrease by 10%. (Duration is a measure of the price sensitivity of a debt security or portfolio of debt securities to relative changes in interest rates.) The magnitude of these fluctuations in the market price of bonds and other fixed-income securities is generally greater for those securities with longer maturities. Fluctuations in the market price of the Trust’s investments will not affect interest income derived from instruments already owned by the Trust, but will be reflected in the Trust’s net asset value. The Trust may lose money if short-term or long-term interest rates rise sharply in a manner not anticipated by Trust management.
To the extent the Trust invests in debt securities that may be prepaid at the option of the obligor (such as mortgage-backed securities), the sensitivity of such securities to changes in interest rates may increase (to the detriment of the Trust) when interest rates rise. Moreover, because rates on certain floating rate debt securities typically reset only periodically, changes in prevailing interest rates (and particularly sudden and significant changes) can be expected to cause some fluctuations in the net asset value of the Trust to the extent that it invests in floating rate debt securities.
These basic principles of bond prices also apply to U.S. Government securities. A security backed by the “full faith and credit” of the U.S. Government is guaranteed only as to its stated interest rate and face value at maturity, not its current market price. Just like other fixed-income securities, government-guaranteed securities will fluctuate in value when interest rates change.
A general rise in interest rates has the potential to cause investors to move out of fixed-income securities on a large scale, which may increase redemptions from funds that hold large amounts of fixed-income securities. Heavy redemptions could cause the Trust to sell assets at inopportune times or at a loss or depressed value and could hurt the Trust’s performance.
| • | Extension Risk – When interest rates rise, certain obligations will be paid off by the obligor more slowly than anticipated, causing the value of these obligations to fall. |
| • | Prepayment Risk – When interest rates fall, certain obligations will be paid off by the obligor more quickly than originally anticipated, and the Trust may have to invest the proceeds in securities with lower yields. |
High Yield Bonds Risk (BGR, BOE, BME, BMEZ, BCX, BST, BSTZ and BUI): Although junk bonds generally pay higher rates of interest than investment grade bonds, junk bonds are high risk investments that are considered speculative and may cause income and principal losses for the Trust.
U.S. Government Obligations Risk (CII, BME, BMEZ, BCX, BSTZ and BUI): Certain securities in which the Trust may invest, including securities issued by certain U.S. Government agencies and U.S. Government sponsored enterprises, are not guaranteed by the U.S. Government or supported by the full faith and credit of the United States. In addition, circumstances could arise that could prevent the timely payment of interest or principal on U.S. Government obligations, such as reaching the legislative “debt ceiling.” Such non-payment could result in losses to the Trust and substantial negative consequences for the U.S. economy and the global financial system.
Structured Securities Risk (BME, BMEZ, BCX, BST and BSTZ): Because structured securities of the type in which the Trust may invest typically involve no credit enhancement, their credit risk generally will be equivalent to that of the underlying instruments, index or reference obligation and will also be subject to counterparty risk. The Trust may have the right to receive payments only from the structured security, and generally does not have direct rights against the issuer or the entity that sold the assets to be securitized. In addition to the general risks associated with debt securities discussed herein, structured securities carry additional risks, including, but not limited to: the possibility that distributions from collateral securities will not be adequate to make interest or other payments; the quality of the collateral may decline in value or default; and the possibility that the structured securities are subordinate to other classes. The Trust is permitted to invest in a class of structured securities that is either subordinated or unsubordinated to the right of payment of another class. Subordinated structured securities typically have higher yields and present greater risks than unsubordinated structured securities. Structured securities are typically sold in private placement transactions, and there currently is no active trading market for structured securities. Structured securities are based upon the movement of one or more factors, including currency exchange rates, interest rates, reference bonds and stock indices, and changes
| I N V E S T M E N T O B J E C T I V E S , P O L I C I E S A N D R I S K S |
201 |
Investment Objectives, Policies and Risks (continued)
Risk Factors (continued)
in interest rates and impact of these factors may cause significant price fluctuations. Additionally, changes in the reference instrument or security may cause the interest rate on the structured security to be reduced to zero. Certain issuers of such structured securities may be deemed to be “investment companies” as defined in the Investment Company Act. As a result, the Trust’s investment in such securities may be limited by certain investment restrictions contained in the Investment Company Act.
Derivatives Risk: The Trust’s use of derivatives may increase its costs, reduce the Trust’s returns and/or increase volatility. Derivatives involve significant risks, including:
| • | Leverage Risk – The Trust’s use of derivatives can magnify the Trust’s gains and losses. Relatively small market movements may result in large changes in the value of a derivatives position and can result in losses that greatly exceed the amount originally invested. |
| • | Market Risk – Some derivatives are more sensitive to interest rate changes and market price fluctuations than other securities. The Trust could also suffer losses related to its derivatives positions as a result of unanticipated market movements, which losses are potentially unlimited. Finally, the Manager may not be able to predict correctly the direction of securities prices, interest rates and other economic factors, which could cause the Trust’s derivatives positions to lose value. |
| • | Counterparty Risk – Derivatives are also subject to counterparty risk, which is the risk that the other party in the transaction will be unable or unwilling to fulfill its contractual obligation, and the related risks of having concentrated exposure to such a counterparty. |
| • | Illiquidity Risk – The possible lack of a liquid secondary market for derivatives and the resulting inability of the Trust to sell or otherwise close a derivatives position could expose the Trust to losses and could make derivatives more difficult for the Trust to value accurately. |
| • | Operational Risk – The use of derivatives includes the risk of potential operational issues, including documentation issues, settlement issues, systems failures, inadequate controls and human error. |
| • | Legal Risk – The risk of insufficient documentation, insufficient capacity or authority of counterparty, or legality or enforceability of a contract. |
| • | Volatility and Correlation Risk – Volatility is defined as the characteristic of a security, an index or a market to fluctuate significantly in price within a short time period. A risk of the Trust’s use of derivatives is that the fluctuations in their values may not correlate with the overall securities markets. |
| • | Valuation Risk – Valuation for derivatives may not be readily available in the market. Valuation may be more difficult in times of market turmoil since many investors and market makers may be reluctant to purchase complex instruments or quote prices for them. |
| • | Hedging Risk – Hedges are sometimes subject to imperfect matching between the derivative and the underlying security, and there can be no assurance that the Trust’s hedging transactions will be effective. The use of hedging may result in certain adverse tax consequences. |
| • | Tax Risk – Certain aspects of the tax treatment of derivative instruments, including swap agreements and commodity-linked derivative instruments, are currently unclear and may be affected by changes in legislation, regulations or other legally binding authority. Such treatment may be less favorable than that given to a direct investment in an underlying asset and may adversely affect the timing, character and amount of income the Trust realizes from its investments. |
Foreign Securities Risk: Foreign investments often involve special risks not present in U.S. investments that can increase the chances that the Trust will lose money. These risks include:
| • | The Trust generally holds its foreign securities and cash in foreign banks and securities depositories, which may be recently organized or new to the foreign custody business and may be subject to only limited or no regulatory oversight. |
| • | Changes in foreign currency exchange rates can affect the value of the Trust’s portfolio. |
| • | The economies of certain foreign markets may not compare favorably with the economy of the United States with respect to such issues as growth of gross national product, reinvestment of capital, resources and balance of payments position. |
| • | The governments of certain countries, or the U.S. Government with respect to certain countries, may prohibit or impose substantial restrictions through capital controls and/or sanctions on foreign investments in the capital markets or certain industries in those countries, which may prohibit or restrict the ability to own or transfer currency, securities, derivatives or other assets. |
| • | Many foreign governments do not supervise and regulate stock exchanges, brokers and the sale of securities to the same extent as does the United States and may not have laws to protect investors that are comparable to U.S. securities laws. |
| • | Settlement and clearance procedures in certain foreign markets may result in delays in payment for or delivery of securities not typically associated with settlement and clearance of U.S. investments. |
| • | The Trust’s claims to recover foreign withholding taxes may not be successful, and if the likelihood of recovery of foreign withholding taxes materially decreases, due to, for example, a change in tax regulation or approach in the foreign country, accruals in the Trust’s net asset value for such refunds may be written down partially or in full, which will adversely affect the Trust’s net asset value. |
| • | The European financial markets have recently experienced volatility and adverse trends due to concerns about economic downturns in, or rising government debt levels of, several European countries as well as acts of war in the region. These events may spread to other countries in Europe and may affect the value and liquidity of certain of the Trust’s investments. |
| 202 | 2 0 2 3 B L A C K R O C K A N N U A L R E P O R T T O S H A R E H O L D E R S |
Investment Objectives, Policies and Risks (continued)
Risk Factors (continued)
Foreign Currency Transactions Risk (BGR, BDJ, BME and BCX): The Trust may invest in forward foreign currency exchange contracts. Forward foreign currency exchange contracts do not eliminate movements in the value of non-U.S. currencies and securities but rather allow the Trust to establish a fixed rate of exchange for a future point in time. This strategy can have the effect of reducing returns and minimizing opportunities for gain.
Emerging Markets Risk: Emerging markets are riskier than more developed markets because they tend to develop unevenly and may never fully develop. Investments in emerging markets may be considered speculative. Emerging markets are more likely to experience hyperinflation and currency devaluations, which adversely affect returns to U.S. investors. In addition, many emerging securities markets have far lower trading volumes and less liquidity than developed markets.
Concentration Risk (BGR, BME, BMEZ, BCX, BST and BSTZ): The Trust’s strategy of concentrating a particular industry means that its performance will be closely tied to the performance of a particular market segment. The Trust’s concentration in these companies may present more risks than if it were broadly diversified over numerous industries and sectors of the economy. A downturn in these companies would have a larger impact on the Trust than on a fund that does not concentrate in such companies. At times, the performance of these companies will lag the performance of other industries or the broader market as a whole.
Science and Technology Risk (BST and BSTZ): The Trust’s investments in science and technology companies expose the Trust to special risks. For example, rapid advances in science and technology might cause existing products to become obsolete, and the Trust’s returns could suffer to the extent it holds an affected company’s shares. Companies in a number of science and technology industries are also subject to more government regulations and approval processes than many other industries. This fact may affect a company’s overall profitability and cause its stock price to be more volatile. Earnings disappointments and intense competition for market share can result in sharp price declines. Profitability of science and technology companies can be negatively impacted by aggressive pricing from competitors, research and development costs, and the availability and prices of components. Additionally, science and technology companies are dependent upon consumer and business acceptance as new technologies evolve.
Health Sciences and Healthcare Companies Risk (BME and BMEZ): The Trust’s investments in health sciences companies are subject to a number of risks, including the adverse impact of legislative actions and government regulations. These actions and regulations can affect the approval process for patents, medical devices and drugs, the funding of research and medical care programs, and the operation and licensing of facilities and personnel. The goods and services of health sciences companies are subject to risks of rapid technological change and obsolescence, product liability litigation, and intense price and other competitive pressures.
Energy Sector Risk (BGR): The market value of securities in the energy sector may decline for many reasons, including, among others, changes in energy prices, energy supply and demand, government regulations and energy conservation efforts. Energy companies can be significantly affected by the supply of, and demand for, specific products (e.g., oil and natural gas) and services, exploration and production spending, government subsidization, world events and general economic conditions. In 2020, the energy sector has experienced increased volatility. In particular, significant market volatility occurred and is continuing in the crude oil markets as well as the oil futures markets, which resulted in the market price of the front month futures contract falling fell below zero for a period of time.
Energy and Natural Resources Risk (BCX): The Trust’s investments in energy and natural resources companies are especially affected by variations in the commodities markets (that may be due to market events, regulatory developments or other factors that the Trust cannot control) and these companies may lack the resources and the broad business lines to weather hard times. Energy companies can be significantly affected by the supply of and demand for specific products and services, the supply of and demand for oil and gas, the price of oil and gas, exploration and production spending, government regulation, world events and economic conditions. Natural resources companies can be significantly affected by events relating to international political developments, energy conservation, the success of exploration projects, commodity prices, and tax and government regulations.
Commodities Related Investments Risk (BCX): Exposure to the commodities markets may subject the Trust to greater volatility than investments in traditional securities. The value of commodity-linked derivative investments may be affected by changes in overall market movements, commodity index volatility, changes in inflation, interest rates, or factors affecting a particular industry or commodity, such as drought, floods, weather, embargoes, tariffs and international economic, political and regulatory developments.
Commodities Market Risk (BCX): Stocks of companies engaged in commodities related industries, such as energy or natural resources companies, are especially affected by variations in the commodities markets (that may be due to market events, regulatory developments or other factors that the Trust cannot control) and these companies may lack the resources and the broad business lines to weather hard times.
Risks of Investing in Utilities, Infrastructure and Power Opportunities Issuers (BUI): Investments in issuers in the Utilities, Infrastructure and Power Opportunities business segments are subject to certain risks, including the following, among others:
| • | Utilities Companies Risk – A variety of factors may adversely affect the business or operations of Utilities issuers, including, but not limited to: high interest costs in connection with capital construction and improvement programs; governmental regulation of rates charged to customers (including the potential that costs incurred by the utility change more rapidly than the rate the utility is permitted to charge its customers); costs associated with compliance with and changes in environmental and other regulations; effects of economic slowdowns and surplus capacity; increased competition from other providers of utility services; inexperience with and potential losses resulting from a developing deregulatory environment; costs associated with reduced availability of certain types of fuel; the effects of energy conservation policies; effects of a national energy policy; technological innovations; potential impact of terrorist activities; the impact of natural or man-made disasters; regulation by various governmental authorities, including the imposition of special tariffs; and changes in tax laws, regulatory policies and accounting standards. |
| • | Infrastructure Companies Risk – Infrastructure issuers may be susceptible to a variety of factors that may adversely affect their business and operations, including, but not limited to: high interest costs in connection with capital construction programs; high leverage; costs associated with environmental and other regulations; surplus capacity costs; and reduced investment in public and private infrastructure projects. A slowdown in new infrastructure projects in developing or developed markets may constrain the abilities of Infrastructure issuers to grow in global markets. Other developments, such as significant changes in population levels or changes in the urbanization and industrialization of developing countries, may reduce demand for products or services provided by Infrastructure issuers. |
| I N V E S T M E N T O B J E C T I V E S , P O L I C I E S A N D R I S K S |
203 |
Investment Objectives, Policies and Risks (continued)
Risk Factors (continued)
| • | Power Opportunities Companies Risk – A variety of factors may adversely affect the business or operations of Power Opportunities issuers, including, but not limited to: research and development costs related to new technologies; the success or failure of efforts to develop or implement new or existing technologies; government regulation (including environmental regulation); world events and economic conditions, the cyclical nature of the energy sector; intense competition; events relating to domestic and international political developments; energy conservation; environmental costs and liabilities; and the success of exploration projects. |
Innovative Securities Risk (BIGZ): There can be no assurance that a company identified as innovative by the Manager will ultimately introduce a new product or service or that such product or service may not be significantly delayed.
Supply and Demand Risk (BGR): A decrease in the production of natural gas, natural gas liquids (“NGLs”), crude oil, coal or other energy commodities or a decrease in the volume of such commodities available for transportation, mining, processing, storage or distribution may adversely impact the financial performance of energy and natural resources companies. Production declines and volume decreases could be caused by various factors, including catastrophic events affecting production, depletion of resources, labor difficulties, environmental proceedings, increased regulations, equipment failures and unexpected maintenance problems, import supply disruption, increased competition from alternative energy sources or commodity prices. Alternatively, a sustained decline in demand for such commodities could also adversely affect the financial performance of energy and natural resources companies. Factors which could lead to a decline in demand include economic recession or other adverse economic conditions, higher fuel taxes or governmental regulations, increases in fuel economy, consumer shifts to the use of alternative fuel sources, changes in commodity prices, or weather.
Depletion and Exploration Risk (BGR): Many energy and natural resources companies are either engaged in the production of natural gas, NGLs, crude oil, refined petroleum products or coal, or are engaged in transporting, storing, distributing and processing these items on behalf of shippers. To maintain or grow their revenues, these companies or their customers need to maintain or expand their reserves through exploration of new sources of supply, through the development of existing sources, through acquisitions, or through long-term contracts to acquire reserves. The financial performance of energy and natural resources companies may be adversely affected if they, or the companies to whom they provide the service, are unable to cost-effectively acquire additional reserves sufficient to replace the natural decline.
Commodity Pricing Risk (BGR): The operations and financial performance of energy and natural resources companies may be directly affected by energy commodity prices, especially those energy and natural resources companies which own the underlying energy commodity. Commodity prices fluctuate for several reasons, including changes in market and economic conditions, the impact of weather on demand, levels of domestic production and imported commodities, energy conservation, domestic and foreign governmental regulation and taxation and the availability of local, intrastate and interstate transportation systems. Volatility of commodity prices, which may lead to a reduction in production or supply, may also negatively impact the performance of energy and natural resources companies which are solely involved in the transportation, processing, storing, distribution or marketing of commodities. Volatility of commodity prices may also make it more difficult for energy and natural resources companies to raise capital to the extent the market perceives that their performance may be directly or indirectly tied to commodity prices.
Leverage Risk: The Trust’s use of leverage may increase or decrease from time to time in its discretion and the Trust may, in the future, determine not to use leverage.
The use of leverage creates an opportunity for increased common share net investment income dividends, but also creates risks for the holders of common shares. The Trust cannot assure you that the use of leverage will result in a higher yield on the common shares. Any leveraging strategy the Trust employs may not be successful.
Leverage involves risks and special considerations for common shareholders, including:
| • | the likelihood of greater volatility of net asset value, market price and dividend rate of the common shares than a comparable portfolio without leverage; |
| • | the risk that fluctuations in interest rates or dividend rates on any leverage that the Trust must pay will reduce the return to the common shareholders; |
| • | the effect of leverage in a declining market, which is likely to cause a greater decline in the net asset value of the common shares than if the Trust were not leveraged, which may result in a greater decline in the market price of the common shares; |
| • | leverage may increase operating costs, which may reduce total return. |
Any decline in the net asset value of the Trust’s investments will be borne entirely by the holders of common shares. Therefore, if the market value of the Trust’s portfolio declines, leverage will result in a greater decrease in net asset value to the holders of common shares than if the Trust were not leveraged. This greater net asset value decrease will also tend to cause a greater decline in the market price for the common shares.
Reverse Repurchase Agreements Risk (BDJ, BME, BMEZ, BIGZ, BCX, BST, BSTZ and BUI): Reverse repurchase agreements involve the sale of securities held by the Trust with an agreement to repurchase the securities at an agreed-upon price, date and interest payment. Reverse repurchase agreements involve the risk that the other party may fail to return the securities in a timely manner or at all. The Trust could lose money if it is unable to recover the securities and the value of the collateral held by the Trust, including the value of the investments made with cash collateral, is less than the value of the securities. These events could also trigger adverse tax consequences for the Trust. In addition, reverse repurchase agreements involve the risk that the interest income earned in the investment of the proceeds will be less than the interest expense.
Dollar Rolls Risk (BME, BMEZ, BIGZ, BST and BSTZ): Dollar rolls involve the risk that the market value of the securities that the Trust is committed to buy may decline below the price of the securities the Trust has sold. These transactions may involve leverage.
When-Issued and Delayed Delivery Securities and Forward Commitments Risk (BDJ, BME, BMEZ, BCX and BSTZ): When-issued and delayed delivery securities and forward commitments involve the risk that the security the Trust buys will lose value prior to its delivery. There also is the risk that the security will not be issued or that the other party to the transaction will not meet its obligation. If this occurs, the Trust may lose both the investment opportunity for the assets it set aside to pay for the security and any gain in the security’s price.
| 204 | 2 0 2 3 B L A C K R O C K A N N U A L R E P O R T T O S H A R E H O L D E R S |
Investment Objectives, Policies and Risks (continued)
Risk Factors (continued)
Short Sales Risk (BDJ, BGY, BME, BMEZ, BCX, BST, BSTZ and BUI): Because making short sales in securities that it does not own exposes the Trust to the risks associated with those securities, such short sales involve speculative exposure risk. The Trust will incur a loss as a result of a short sale if the price of the security increases between the date of the short sale and the date on which the Trust replaces the security sold short.
Repurchase Agreements and Purchase and Sale Contracts Risk (BDJ, BME, BMEZ, BCX and BSTZ): If the other party to a repurchase agreement or purchase and sale contract defaults on its obligation under the agreement, the Trust may suffer delays and incur costs or lose money in exercising its rights under the agreement. If the seller fails to repurchase the security in either situation and the market value of the security declines, the Trust may lose money.
Risks Associated with Private Company Investments (BDJ, BMEZ, BIGZ, BST and BSTZ): Private companies are generally not subject to SEC reporting requirements, are not required to maintain their accounting records in accordance with generally accepted accounting principles, and are not required to maintain effective internal controls over financial reporting. As a result, the Manager may not have timely or accurate information about the business, financial condition and results of operations of the private companies in which the Trust invests. There is risk that the Trust may invest on the basis of incomplete or inaccurate information, which may adversely affect the Trust’s investment performance. Private companies in which the Trust may invest may have limited financial resources, shorter operating histories, more asset concentration risk, narrower product lines and smaller market shares than larger businesses, which tend to render such private companies more vulnerable to competitors’ actions and market conditions, as well as general economic downturns.
These companies generally have less predictable operating results, may from time to time be parties to litigation, may be engaged in rapidly changing businesses with products subject to a substantial risk of obsolescence, and may require substantial additional capital to support their operations, finance expansion or maintain their competitive position. These companies may have difficulty accessing the capital markets to meet future capital needs, which may limit their ability to grow or to repay their outstanding indebtedness upon maturity. In addition, the Trust’s investment also may be structured as pay-in-kind securities with minimal or no cash interest or dividends until the company meets certain growth and liquidity objectives.
Typically, investments in private companies are in restricted securities that are not traded in public markets and subject to substantial holding periods, so that the Trust may not be able to resell some of its holdings for extended periods, which may be several years. There can be no assurance that the Trust will be able to realize the value of private company investments in a timely manner.
| • | Late-Stage Private Companies Risk (BMEZ and BIGZ) – Investments in late-stage private companies involve greater risks than investments in shares of companies that have traded publicly on an exchange for extended periods of time. These investments may present significant opportunities for capital appreciation but involve a high degree of risk that may result in significant decreases in the value of these investments. The Trust may not be able to sell such investments when the Manager deems it appropriate to do so because they are not publicly traded. As such, these investments are generally considered to be illiquid until a company’s public offering (which may never occur) and are often subject to additional contractual restrictions on resale following any public offering that may prevent the Trust from selling its shares of these companies for a period of time. See “Illiquid Investments Risk.” Market conditions, developments within a company, investor perception or regulatory decisions may adversely affect a late-stage private company and delay or prevent such a company from ultimately offering its securities to the public. If a company does issue shares in an IPO, IPOs are risky and volatile and may cause the value of the Trust’s investment to decrease significantly. |
| • | Pre-IPO Securities Risk (BSTZ) – Investments in pre-IPO securities involve greater risks than investments in shares of companies that have traded publicly on an exchange for extended periods of time. These investments may present significant opportunities for capital appreciation but involve a high degree of risk that may result in significant decreases in the value of these investments. Issuers of pre-IPO securities may not have established products, experienced management or earnings history. The Trust may not be able to sell such investments when the Manager deems it appropriate to do so because they are not publicly traded. As such, these investments are generally considered to be illiquid until a company’s public offering (which may never occur) and are often subject to additional contractual restrictions on resale following any public offering that may prevent the Trust from selling its shares of these companies for a period of time. See “Illiquid Investments Risk.” Market conditions, developments within a company, investor perception or regulatory decisions may adversely affect an issuer of pre-IPO securities and delay or prevent such an issuer from ultimately offering its securities to the public. If a company does issue shares in an IPO, IPOs are risky and volatile and may cause the value of the Trust’s investment to decrease significantly. |
Illiquid Investments Risk: The Trust may invest in illiquid or less liquid investments or investments in which no secondary market is readily available or which are otherwise illiquid, including private placement securities. The Trust may not be able to readily dispose of such investments at prices that approximate those at which the Trust could sell such investments if they were more widely traded and, as a result of such illiquidity, the Trust may have to sell other investments or engage in borrowing transactions if necessary to raise cash to meet its obligations. Limited liquidity can also affect the market price of investments, thereby adversely affecting the Trust’s net asset value and ability to make dividend distributions. The financial markets in general, and certain segments of the mortgage-related securities markets in particular, have in recent years experienced periods of extreme secondary market supply and demand imbalance, resulting in a loss of liquidity during which market prices were suddenly and substantially below traditional measures of intrinsic value. During such periods, some investments could be sold only at arbitrary prices and with substantial losses. Periods of such market dislocation may occur again at any time. Privately issued debt securities are often of below investment grade quality, frequently are unrated and present many of the same risks as investing in below investment grade public debt securities.
Investment Companies and ETFs Risk (BME, BMEZ, BIGZ, BCX, BST, BSTZ and BUI): Subject to the limitations set forth in the Investment Company Act and the rules thereunder, the Trust may acquire shares in other investment companies and in ETFs, some of which may be affiliated investment companies. The market value of the shares of other investment companies and ETFs may differ from their net asset value. As an investor in investment companies and ETFs, the Trust would bear its ratable share of that entity’s expenses, including its investment advisory and administration fees, while continuing to pay its own advisory and administration fees and other expenses (to the extent not offset by the Manager through waivers). As a result, shareholders will be absorbing duplicate levels of fees with respect to investments in other investment companies and ETFs (to the extent not offset by the Manager through waivers).
| I N V E S T M E N T O B J E C T I V E S , P O L I C I E S A N D R I S K S |
205 |
Investment Objectives, Policies and Risks (continued)
Risk Factors (continued)
The securities of other investment companies and ETFs in which the Trust may invest may be leveraged. As a result, the Trust may be indirectly exposed to leverage through an investment in such securities. An investment in securities of other investment companies and ETFs that use leverage may expose the Trust to higher volatility in the market value of such securities and the possibility that the Trust’s long-term returns on such securities (and, indirectly, the long-term returns of shares of the Trust) will be diminished.
As with other investments, investments in other investment companies, including ETFs, are subject to market and selection risk. To the extent the Trust is held by an affiliated fund, the ability of the Trust itself to hold other investment companies may be limited.
Subsidiary Risk (BCX): By investing in the Subsidiary, the Trust is indirectly exposed to the risks associated with the Subsidiary’s investments. The commodity-related instruments held by the Subsidiary are generally similar to those that are permitted to be held by the Trust and are subject to the same risks that apply to similar investments if held directly by the Trust (see “Commodities Related Investments Risk” above). There can be no assurance that the investment objective of the Subsidiary will be achieved. The Subsidiary is not registered under the Investment Company Act, and, unless otherwise noted, is not subject to all the investor protections of the Investment Company Act. However, the Trust wholly owns and controls the Subsidiary, and the Trust and the Subsidiary are both managed by the Manager, making it unlikely that the Subsidiary will take action contrary to the interests of the Trust and its shareholders. The Board has oversight responsibility for the investment activities of the Trust, including its investment in the Subsidiary, and the Trust’s role as sole shareholder of the Subsidiary. The Subsidiary is subject to the same investment restrictions and limitations, and follows the same compliance policies and procedures, as the Trust. Changes in the laws of the United States and/or the Cayman Islands could result in the inability of the Trust and/or the Subsidiary to operate as described and could adversely affect the Trust.
Securities Lending Risk (BDJ, BGY, BME, BMEZ, BIGZ, BCX, BST, BSTZ and BUI): Securities lending involves the risk that the borrower may fail to return the securities in a timely manner or at all. As a result, the Trust may lose money and there may be a delay in recovering the loaned securities. The Trust could also lose money if it does not recover the securities and/or the value of the collateral falls, including the value of investments made with cash collateral. These events could trigger adverse tax consequences for the Trust.
Risk of Investing in the United States (BGR, CII, BDJ, BOE, BME, BMEZ, BIGZ, BCX, BST, BSTZ and BUI): Certain changes in the U.S. economy, such as when the U.S. economy weakens or when its financial markets decline, may have an adverse effect on the securities to which the Trust has exposure.
Market Risk and Selection Risk: Market risk is the risk that one or more markets in which the Trust invests will go down in value, including the possibility that the markets will go down sharply and unpredictably. The value of a security or other asset may decline due to changes in general market conditions, economic trends or events that are not specifically related to the issuer of the security or other asset, or factors that affect a particular issuer or issuers, exchange, country, group of countries, region, market, industry, group of industries, sector or asset class. Local, regional or global events such as war, acts of terrorism, the spread of infectious illness or other public health issues like pandemics or epidemics, recessions, or other events could have a significant impact on the Trust and its investments. Selection risk is the risk that the securities selected by Trust management will underperform the markets, the relevant indices or the securities selected by other funds with similar investment objectives and investment strategies. This means you may lose money.
An outbreak of an infectious coronavirus (COVID-19) that was first detected in December 2019 developed into a global pandemic that has resulted in numerous disruptions in the market and has had significant economic impact leaving general concern and uncertainty. Although vaccines have been developed and approved for use by various governments, the duration of the pandemic and its effects cannot be predicted with certainty. The impact of this coronavirus, and other epidemics and pandemics that may arise in the future, could affect the economies of many nations, individual companies and the market in general ways that cannot necessarily be foreseen at the present time.
Shareholder Activism Risk: Shareholder activism involving closed-end funds has recently been increasing. Shareholder activism can take many forms, including engaging in public campaigns to demand that the Trust consider significant transactions such as a tender offer, merger or liquidation or to attempt to influence the Trust’s corporate governance and/or management, commencing proxy contests to attempt to elect the activists’ representatives or others to the Trust’s Board of Trustees, or to seek other actions such as a termination of the Trust’s investment advisory contract with its current investment manager or commencing litigation. If the Trust becomes the subject of shareholder activism, then management and the Board may be required to divert significant resources and attention to respond to the activist and the Trust may incur substantial costs defending against such activism if management and the Board determine that the activist’s demands are not in the best interest of the Trust. Further, the Trust’s share price could be subject to significant fluctuation or otherwise be adversely affected by the events, risks and uncertainties of any shareholder activism.
| 206 | 2 0 2 3 B L A C K R O C K A N N U A L R E P O R T T O S H A R E H O L D E R S |
Shareholder Update (unaudited)
The following information is presented for BDJ, BME, BST and BUI, in conformance with annual reporting requirements for funds that have filed a shelf offering registration statement pursuant to General Instruction A.2 of Form N-2.
Summary of Expenses
BlackRock Enhanced Equity Dividend Trust (BDJ)
The following table and example are intended to assist shareholders in understanding the various costs and expenses directly or indirectly associated with investing in BDJ’s common shares.
| BDJ | ||||
| Shareholder Transaction Expenses |
||||
| Maximum sales load (as a percentage of offering price)(a) |
1.00 | % | ||
| Offering expenses borne by the Trust (as a percentage of offering price)(a) |
0.01 | % | ||
| $0.02 per share | ||||
| for open market | ||||
| purchases of | ||||
| Dividend reinvestment plan fees |
common shares | (b) | ||
| Estimated Annual Expenses (as a percentage of net assets attributable to common shares) Investment advisory fees(c)(d) |
0.80 | % | ||
| Other expenses |
0.06 | |||
| Acquired fund fees and expenses(e) |
0.01 | |||
| Total annual expenses(e) |
0.87 | |||
| Fee waivers(d) |
— | |||
| Total annual Trust operating expenses after fee waivers(d) |
0.87 | |||
| (a) | If the common shares are sold to or through underwriters, the Prospectus Supplement will set forth any applicable sales load and the estimated offering expenses. Trust shareholders will pay all offering expenses involved with an offering. |
| (b) | Computershare Trust Company, N.A. (the “Reinvestment Plan Agent”) fees for the handling of the reinvestment of dividends will be paid by BDJ. However, shareholders will pay a $0.02 per share fee incurred in connection with open-market purchases, which will be deducted from the value of the dividend. Shareholders will also be charged a $0.02 per share fee if a shareholder directs the Reinvestment Plan Agent to sell the common shares held in a dividend reinvestment account. Per share fees include any applicable brokerage commissions the Reinvestment Plan Agent is required to pay. |
| (c) | BDJ currently pays the Manager a monthly fee at an annual contractual investment advisory fee rate of 0.80% of its average weekly value of BDJ’s net assets. |
| (d) | BDJ and the Manager have entered into a fee waiver agreement (the “Fee Waiver Agreement”), pursuant to which the Manager has contractually agreed to waive the investment advisory fees with respect to any portion of BDJ’s assets attributable to investments in any equity and fixed-income mutual funds and exchange-traded funds (“ETFs”) managed by the Manager or its affiliates that have a contractual fee, through June 30, 2025. In addition, pursuant to the Fee Waiver Agreement, the Manager has contractually agreed to waive its investment advisory fees by the amount of investment advisory fees BDJ pays to the Manager indirectly through its investment in money market funds managed by the Manager or its affiliates, through June 30, 2025. The Fee Waiver Agreement may be terminated at any time, without the payment of any penalty, only by BDJ (upon the vote of a majority of the Trustees who are not “interested persons” (as defined in the Investment Company Act of 1940, as amended (the “Investment Company Act”), of BDJ (the “Independent Trustees”)) or a majority of the outstanding voting securities of BDJ), upon 90 days’ written notice by BDJ to the Manager. |
| (e) | The total annual expenses do not correlate to the ratios to average net assets shown in BDJ’s Financial Highlights for the year ended December 31, 2023, which do not include acquired fund fees and expenses. |
The following example illustrates BDJ’s expenses (including the sales load of $10.00 and offering costs of $0.15) that shareholders would pay on a $1,000 investment in common shares, assuming (i) total net annual expenses of 0.87% of net assets attributable to common shares and (ii) a 5% annual return:
| 1 Year | 3 Years | 5 Years | 10 Years | |||||||||||||||||
|
|
||||||||||||||||||||
| Total expenses incurred |
$ | 19 | $ | 38 | $ | 58 | $ | 116 | ||||||||||||
The example should not be considered a representation of future expenses. The example assumes that the estimated “Other expenses” set forth in the Estimated Annual Expenses table are accurate and that all dividends and distributions are reinvested at NAV. Actual expenses may be greater or less than those assumed. BDJ’s actual rate of return may be greater or less than the hypothetical 5% return shown in the example.
|
S H A R E H O L D E R U P D A T E |
207 |
Shareholder Update (unaudited) (continued)
BlackRock Health Sciences Trust (BME)
The following table and example are intended to assist shareholders in understanding the various costs and expenses directly or indirectly associated with investing in BME’s common shares.
| BME | ||||
| Shareholder Transaction Expenses |
||||
| Maximum sales load (as a percentage of offering price)(a) |
1.00 | % | ||
| Offering expenses borne by the Trust (as a percentage of offering price)(a) |
0.01 | % | ||
| $0.02 per share | ||||
| for open market | ||||
| purchases of | ||||
| Dividend reinvestment plan fees |
common shares | (b) | ||
| Estimated Annual Expenses (as a percentage of net assets attributable to common shares) Investment advisory fees(c)(d) |
1.00 | % | ||
| Other expenses |
0.06 | |||
| Acquired fund fees and expenses(e) |
0.01 | |||
| Total annual expenses(e) |
1.07 | |||
| Fee waivers(d) |
— | |||
| Total annual Trust operating expenses after fee waivers(d) |
1.07 | |||
| (a) | If the common shares are sold to or through underwriters, the Prospectus Supplement will set forth any applicable sales load and the estimated offering expenses. Trust shareholders will pay all offering expenses involved with an offering. |
| (b) | Computershare Trust Company, N.A.’s (the “Reinvestment Plan Agent”) fees for the handling of the reinvestment of dividends will be paid by BME. However, shareholders will pay a $0.02 per share fee incurred in connection with open-market purchases, which will be deducted from the value of the dividend. Shareholders will also be charged a $0.02 per share fee if a shareholder directs the Reinvestment Plan Agent to sell the common shares held in a dividend reinvestment account. Per share fees include any applicable brokerage commissions the Reinvestment Plan Agent is required to pay. |
| (c) | BME currently pays the Manager a contractual investment advisory fee at an annual rate of 1.00% based on BME’s average weekly net assets. |
| (d) | BME and the Manager have entered into a fee waiver agreement (the “Fee Waiver Agreement”), pursuant to which the Manager has contractually agreed to waive the investment advisory fees with respect to any portion of BME’s assets attributable to investments in any equity and fixed-income mutual funds and exchange-traded funds managed by the Manager or its affiliates that have a contractual management fee, through June 30, 2025. In addition, pursuant to the Fee Waiver Agreement, the Manager has contractually agreed to waive its investment advisory fees by the amount of investment advisory fees BME pays to the Manager indirectly through its investment in money market funds managed by the Manager or its affiliates, through June 30, 2025. The Fee Waiver Agreement may be terminated at any time, without the payment of any penalty, only by BME (upon the vote of a majority of the Trustees who are not “interested persons” (as defined in the Investment Company Act) of BME or a majority of the outstanding voting securities of BME), upon 90 days’ written notice by BME to the Manager. |
| (e) | The total annual expenses do not correlate to the ratios to average net assets shown in BME’s Financial Highlights for the year ended December 31, 2023, which do not include acquired fund fees and expenses. |
The following example illustrates BME’s expenses (including the sales load of $10.00 and offering costs of $0.15) that shareholders would pay on a $1,000 investment in common shares, assuming (i) total net annual expenses of 1.07% of net assets attributable to common shares and (ii) a 5% annual return:
| 1 Year | 3 Years | 5 Years | 10 Years | |||||||||||||||||
|
|
||||||||||||||||||||
| Total expenses incurred |
$ | 21 | $ | 44 | $ | 69 | $ | 139 | ||||||||||||
The example should not be considered a representation of future expenses. The example assumes that the estimated “Other expenses” set forth in the Estimated Annual Expenses table are accurate and that all dividends and distributions are reinvested at NAV. Actual expenses may be greater or less than those assumed. BME’s actual rate of return may be greater or less than the hypothetical 5% return shown in the example.
| 208 | 2 0 2 3 B L A C K R O C K A N N U A L R E P O R T T O S H A R E H O L D E R S |
Shareholder Update (unaudited) (continued)
BlackRock Science and Technology Trust (BST)
The following table and example are intended to assist shareholders in understanding the various costs and expenses directly or indirectly associated with investing in BST’s common shares.
| BST | ||||
| Shareholder Transaction Expenses |
||||
| Maximum sales load (as a percentage of offering price)(a) |
1.00 | % | ||
| Offering expenses borne by the Trust (as a percentage of offering price)(a) |
0.02 | % | ||
| $0.02 per share | ||||
| for open market | ||||
| purchases of | ||||
| Dividend reinvestment plan fees |
common shares | (b) | ||
| Dividend reinvestment plan sale transaction fee |
$2.50 | (b) | ||
| Estimated Annual Expenses (as a percentage of net assets attributable to common shares) Investment advisory fees(c)(d) |
1.00 | % | ||
| Other expenses |
0.09 | |||
| Total annual expenses |
1.09 | |||
| Fee waivers(d) |
— | |||
| Total annual Trust operating expenses after fee waivers(d) |
1.09 | |||
| (a) | If the common shares are sold to or through underwriters, the Prospectus Supplement will set forth any applicable sales load and the estimated offering expenses. Trust shareholders will pay all offering expenses involved with an offering. |
| (b) | Computershare Trust Company, N.A.’s (the “Reinvestment Plan Agent”) fees for the handling of the reinvestment of dividends will be paid by BST. However, shareholders will pay a $0.02 per share fee incurred in connection with open-market purchases, which will be deducted from the value of the dividend. Shareholders will also be charged a $2.50 sales fee and pay a $0.15 per share fee if a shareholder directs the Reinvestment Plan Agent to sell the common shares held in a dividend reinvestment account. Per share fees include any applicable brokerage commissions the Reinvestment Plan Agent is required to pay. |
| (c) | BST currently pays the Manager a contractual investment advisory fee at an annual rate of 1.00% based on BST’s average daily managed assets. “Managed Assets” means the total assets of BST (including any assets attributable to money borrowed for investment purposes) minus the sum of BST’s accrued liabilities (other than money borrowed for investment purposes). |
| (d) | BST and the Manager have entered into a fee waiver agreement (the “Fee Waiver Agreement”), pursuant to which the Manager has contractually agreed to waive the investment advisory fees with respect to any portion of BST’s assets attributable to investments in any equity and fixed-income mutual funds and exchange-traded funds managed by the Manager or its affiliates that have a contractual management fee, through June 30, 2025. In addition, pursuant to the Fee Waiver Agreement, the Manager has contractually agreed to waive its investment advisory fees by the amount of investment advisory fees BST pays to the Manager indirectly through its investment in money market funds managed by the Manager or its affiliates, through June 30, 2025. The Fee Waiver Agreement may be terminated at any time, without the payment of any penalty, only by BST (upon the vote of a majority of the Trustees who are not “interested persons” (as defined in the Investment Company Act) of BST or a majority of the outstanding voting securities of BST), upon 90 days’ written notice by BST to the Manager. |
The following example illustrates BST’s expenses (including the sales load of $10.00 and offering costs of $0.16) that shareholders would pay on a $1,000 investment in common shares, assuming (i) total net annual expenses of 1.09% of net assets attributable to common shares and (ii) a 5% annual return:
| 1 Year | 3 Years | 5 Years | 10 Years | |||||||||||||||||
|
|
||||||||||||||||||||
| Total expenses incurred |
$ | 21 | $ | 44 | $ | 70 | $ | 142 | ||||||||||||
The example should not be considered a representation of future expenses. The example assumes that the estimated “Other expenses” set forth in the Estimated Annual Expenses table are accurate and that all dividends and distributions are reinvested at NAV. Actual expenses may be greater or less than those assumed. BST’s actual rate of return may be greater or less than the hypothetical 5% return shown in the example.
|
S H A R E H O L D E R U P D A T E |
209 |
Shareholder Update (unaudited) (continued)
BlackRock Utilities, Infrastructure & Power Opportunities Trust (BUI)
The following table and example are intended to assist shareholders in understanding the various costs and expenses directly or indirectly associated with investing in BUI’s common shares.
| BUI | ||||
| Shareholder Transaction Expenses |
||||
| Maximum sales load (as a percentage of offering price)(a) |
1.00 | % | ||
| Offering expenses borne by the Trust (as a percentage of offering price)(a) |
0.02 | % | ||
| $0.02 per share | ||||
| for open market | ||||
| purchases of | ||||
| Dividend reinvestment plan fees |
common shares | (b) | ||
| Estimated Annual Expenses (as a percentage of net assets attributable to common shares) Investment advisory fees(c)(d) |
1.00 | % | ||
| Other expenses |
0.08 | |||
| Total annual expenses |
1.08 | |||
| Fee waivers(d) |
— | |||
| Total annual Trust operating expenses after fee waivers(d) |
1.08 | |||
| (a) | If the common shares are sold to or through underwriters, the Prospectus Supplement will set forth any applicable sales load and the estimated offering expenses. Trust shareholders will pay all offering expenses involved with an offering. |
| (b) | Computershare Trust Company, N.A.’s (the “Reinvestment Plan Agent”) fees for the handling of the reinvestment of dividends will be paid by BUI. However, shareholders will pay a $0.02 per share fee incurred in connection with open-market purchases, which will be deducted from the value of the dividend. Shareholders will also be charged a $0.02 per share fee if a shareholder directs the Reinvestment Plan Agent to sell the common shares held in a dividend reinvestment account. Per share fees include any applicable brokerage commissions the Reinvestment Plan Agent is required to pay. |
| (c) | BUI currently pays the Manager a contractual investment advisory fee at an annual rate of 1.00% based on BUI’s average daily managed assets. “Managed Assets” means the total assets of BUI (including any assets attributable to money borrowed for investment purposes) minus the sum of BUI’s accrued liabilities (other than money borrowed for investment purposes). |
| (d) | BUI and the Manager have entered into a fee waiver agreement (the “Fee Waiver Agreement”), pursuant to which the Manager has contractually agreed to waive the investment advisory fees with respect to any portion of BUI’s assets attributable to investments in any equity and fixed-income mutual funds and exchange-traded funds managed by the Manager or its affiliates that have a contractual management fee, through June 30, 2025. In addition, pursuant to the Fee Waiver Agreement, the Manager has contractually agreed to waive its investment advisory fees by the amount of investment advisory fees BUI pays to the Manager indirectly through its investment in money market funds managed by the Manager or its affiliates, through June 30, 2025. The Fee Waiver Agreement may be terminated at any time, without the payment of any penalty, only by BUI (upon the vote of a majority of the Trustees who are not “interested persons” (as defined in the Investment Company Act) of BUI or a majority of the outstanding voting securities of BUI), upon 90 days’ written notice by BUI to the Manager. |
The following example illustrates BUI’s expenses (including the sales load of $10.00 and offering costs of $0.21) that shareholders would pay on a $1,000 investment in common shares, assuming (i) total net annual expenses of 1.08% of net assets attributable to common shares and (ii) a 5% annual return:
| 1 Year | 3 Years | 5 Years | 10 Years | |||||||||||||||||
|
|
||||||||||||||||||||
| Total expenses incurred |
$ | 21 | $ | 44 | $ | 69 | $ | 141 | ||||||||||||
The example should not be considered a representation of future expenses. The example assumes that the estimated “Other expenses” set forth in the Estimated Annual Expenses table are accurate and that all dividends and distributions are reinvested at NAV. Actual expenses may be greater or less than those assumed. BUI’s actual rate of return may be greater or less than the hypothetical 5% return shown in the example.
| 210 | 2 0 2 3 B L A C K R O C K A N N U A L R E P O R T T O S H A R E H O L D E R S |
Shareholder Update (unaudited) (continued)
Share Price Data
The following tables summarize each Trust’s highest and lowest daily closing market prices on the NYSE per common share, the NAV per common share, and the premium to or discount from NAV, on the date of each of the high and low market prices. The trading volume indicates the number of common shares traded on the NYSE during the respective quarters.
| NYSE Market Price Per Common Share |
NAV per Common Share on Date of Market Price |
Premium/ (Discount) on Date of Market Price |
||||||||||||||||||||||||||||||||||||||
| BDJ — During Quarter Ended | High | Low | High | Low | High | Low | Trading Volume | |||||||||||||||||||||||||||||||||
| December 31, 2023 |
$ | 7.91 | $ | 6.92 | $ | 8.68 | $ | 8.17 | (8.87 | )% | (15.30 | )% | 38,503,054 | |||||||||||||||||||||||||||
| September 30, 2023 |
8.39 | 7.47 | 8.96 | 8.38 | (6.36 | ) | (10.86 | ) | 35,094,623 | |||||||||||||||||||||||||||||||
| June 30, 2023 |
8.60 | 8.03 | 8.76 | 8.56 | (1.83 | ) | (6.19 | ) | 24,527,314 | |||||||||||||||||||||||||||||||
| March 31, 2023 |
9.36 | 8.26 | 9.15 | 8.23 | 2.30 | 0.36 | 25,059,984 | |||||||||||||||||||||||||||||||||
| December 31, 2022 |
9.50 | 8.14 | 9.49 | 8.58 | 0.11 | (5.13 | ) | 29,748,145 | ||||||||||||||||||||||||||||||||
| September 30, 2022 |
9.71 | 8.08 | 9.42 | 8.47 | 3.08 | (4.60 | ) | 27,876,699 | ||||||||||||||||||||||||||||||||
| June 30, 2022 |
9.96 | 8.29 | 10.26 | 9.26 | (2.92 | ) | (10.48 | ) | 31,606,667 | |||||||||||||||||||||||||||||||
| March 31, 2022 |
10.43 | 9.15 | 10.55 | 9.73 | (1.14 | ) | (5.96 | ) | 40,186,783 | |||||||||||||||||||||||||||||||
As of December 31, 2023, BDJ’s market price, NAV per Common Share, and premium/(discount) to NAV per Common Share were $7.69, $8.82, and (12.81)%, respectively.
| NYSE Market Price Per Common Share |
NAV per Common Share on Date of Market Price |
Premium/ (Discount) on Date of Market Price |
||||||||||||||||||||||||||||||||||||||
| BME — During Quarter Ended | High | Low | High | Low | High | Low | Trading Volume | |||||||||||||||||||||||||||||||||
| December 31, 2023 |
$ | 40.46 | $ | 35.53 | $ | 42.18 | $ | 39.01 | (4.08 | )% | (8.92 | )% | 2,698,691 | |||||||||||||||||||||||||||
| September 30, 2023 |
40.90 | 38.98 | 43.13 | 41.02 | (5.17 | ) | (4.97 | ) | 2,017,234 | |||||||||||||||||||||||||||||||
| June 30, 2023 |
42.93 | 39.55 | 42.91 | 41.26 | 0.05 | (4.14 | ) | 1,769,337 | ||||||||||||||||||||||||||||||||
| March 31, 2023 |
43.68 | 39.34 | 43.03 | 40.48 | 1.51 | (2.82 | ) | 1,728,269 | ||||||||||||||||||||||||||||||||
| December 31, 2022 |
44.88 | 38.85 | 42.39 | 40.17 | 5.87 | (3.29 | ) | 2,275,787 | ||||||||||||||||||||||||||||||||
| September 30, 2022 |
44.96 | 38.27 | 43.41 | 39.41 | 3.57 | (2.89 | ) | 2,093,916 | ||||||||||||||||||||||||||||||||
| June 30, 2022 |
46.86 | 39.97 | 46.49 | 39.35 | 0.80 | 1.58 | 2,651,572 | |||||||||||||||||||||||||||||||||
| March 31, 2022 |
48.20 | 41.70 | 47.26 | 42.50 | 1.99 | (1.88 | ) | 2,486,253 | ||||||||||||||||||||||||||||||||
As of December 31, 2023, BME’s market price, NAV per Common Share, and premium/(discount) to NAV per Common Share were $40.46, $42.18, and (4.08)%, respectively.
| NYSE Market Price Per Common Share |
NAV per Common Share on Date of Market Price |
Premium/ (Discount) on Date of Market Price |
||||||||||||||||||||||||||||||||||
| BST — During Quarter Ended | High | Low | High | Low | High | Low | Trading Volume | |||||||||||||||||||||||||||||
| December 31, 2023 |
$ | 34.48 | $ | 29.72 | $ | 34.21 | $ | 30.15 | 0.79 | % | (1.43 | )% | 6,323,509 | |||||||||||||||||||||||
| September 30, 2023 |
35.25 | 30.61 | 34.81 | 31.31 | 1.26 | (2.24 | ) | 5,818,231 | ||||||||||||||||||||||||||||
| June 30, 2023 |
34.44 | 30.25 | 34.14 | 30.31 | 0.88 | (0.20 | ) | 5,884,379 | ||||||||||||||||||||||||||||
| March 31, 2023 |
34.12 | 28.52 | 32.41 | 28.95 | 5.28 | (1.49 | ) | 8,051,284 | ||||||||||||||||||||||||||||
| December 31, 2022 |
32.45 | 28.07 | 31.69 | 28.47 | 2.40 | (1.40 | ) | 9,877,821 | ||||||||||||||||||||||||||||
| September 30, 2022 |
38.73 | 29.38 | 37.18 | 31.02 | 4.17 | (5.29 | ) | 9,463,720 | ||||||||||||||||||||||||||||
| June 30, 2022 |
44.15 | 31.25 | 45.87 | 33.58 | (3.75 | ) | (6.94 | ) | 9,431,070 | |||||||||||||||||||||||||||
| March 31, 2022 |
50.99 | 40.14 | 52.59 | 42.32 | (3.04 | ) | (5.15 | ) | 11,617,438 | |||||||||||||||||||||||||||
As of December 31, 2023, BST’s market price, NAV per Common Share, and premium/(discount) to NAV per Common Share were $33.66, $34.74, and (3.11)%, respectively.
| NYSE Market Price Per Common Share |
NAV per Common Share on Date of Market Price |
Premium/ (Discount) on Date of Market Price |
||||||||||||||||||||||||||||||||||||||
| BUI — During Quarter Ended | High | Low | High | Low | High | Low | Trading Volume | |||||||||||||||||||||||||||||||||
| December 31, 2023 |
$ | 21.82 | $ | 18.75 | $ | 22.54 | $ | 19.79 | (3.19 | )% | (5.26 | )% | 4,511,140 | |||||||||||||||||||||||||||
| September 30, 2023 |
23.34 | 19.64 | 23.05 | 20.42 | 1.26 | (3.82 | ) | 3,117,194 | ||||||||||||||||||||||||||||||||
| June 30, 2023 |
23.73 | 21.56 | 22.95 | 22.18 | 3.40 | (2.80 | ) | 2,819,113 | ||||||||||||||||||||||||||||||||
| March 31, 2023 |
23.98 | 20.99 | 22.97 | 22.33 | 4.40 | (6.00 | ) | 3,092,154 | ||||||||||||||||||||||||||||||||
| December 31, 2022 |
22.24 | 19.02 | 23.13 | 19.61 | (3.85 | ) | (3.01 | ) | 3,657,444 | |||||||||||||||||||||||||||||||
| September 30, 2022 |
24.47 | 20.06 | 23.61 | 20.19 | 3.64 | (0.64 | ) | 3,404,776 | ||||||||||||||||||||||||||||||||
| June 30, 2022 |
25.79 | 20.46 | 25.13 | 21.06 | 2.63 | (2.85 | ) | 3,775,619 | ||||||||||||||||||||||||||||||||
|
S H A R E H O L D E R U P D A T E |
211 |
Shareholder Update (unaudited) (continued)
| NYSE Market Price Per Common Share |
NAV per Common Share on Date of Market Price |
Premium/ (Discount) on Date of Market Price |
||||||||||||||||||||||||||||||||||||
| BUI — During Quarter Ended | High | Low | High | Low | High | Low | Trading Volume | |||||||||||||||||||||||||||||||
| March 31, 2022 |
$ | 27.28 | $ | 22.88 | $ | 25.09 | $ | 23.27 | 8.73 | % | (1.68 | )% | 4,035,794 | |||||||||||||||||||||||||
As of December 31, 2023, BUI’s market price, NAV per Common Share, and premium/(discount) to NAV per Common Share were $21.82, $22.53, and (3.15)%, respectively.
Common shares of each Trust have historically traded at both a premium and discount to NAV.
Shares of closed-end funds frequently trade at a discount to their NAV. Because of this possibility and the recognition that any such discount may not be in the interest of shareholders, the Board might consider from time to time engaging in open-market repurchases, managed distribution plans, or other programs intended to reduce the discount. We cannot guarantee or assure, however, that the Board will decide to engage in any of these actions. Nor is there any guarantee or assurance that such actions, if undertaken, would result in the shares trading at a price equal or close to the NAV.
| 212 | 2 0 2 3 B L A C K R O C K A N N U A L R E P O R T T O S H A R E H O L D E R S |
Shareholder Update (unaudited) (continued)
Financial Highlights
The financial highlights table is intended to help the shareholder to understand BDJ’s financial performance for the periods presented. Certain information reflects financial results for a single common share of BDJ.
| BDJ | ||||||||||||||||||||||||
| Year Ended 12/31/18 |
Year Ended 12/31/17 |
Year Ended 12/31/16 |
Year Ended 12/31/15 |
Period from 11/01/14 to 12/31/14 |
Year Ended 10/31/14 |
|||||||||||||||||||
| Net asset value, beginning of period |
$ | 9.96 | $ | 9.22 | $ | 8.70 | $ | 9.24 | $ | 9.19 | $ | 8.88 | ||||||||||||
|
|
|
|
|
|
|
|
|
|
|
|
|
|||||||||||||
| Net investment income(a) |
0.18 | (b) | 0.16 | 0.17 | 0.17 | 0.04 | 0.16 | |||||||||||||||||
| Net realized and unrealized gain (loss) |
(0.84 | ) | 1.14 | 0.91 | (0.15 | ) | 0.10 | 0.76 | ||||||||||||||||
|
|
|
|
|
|
|
|
|
|
|
|
|
|||||||||||||
| Net increase (decrease) from investment operations |
(0.66 | ) | 1.30 | 1.08 | 0.02 | 0.14 | 0.92 | |||||||||||||||||
|
|
|
|
|
|
|
|
|
|
|
|
|
|||||||||||||
| Distributions(c) |
||||||||||||||||||||||||
| From net investment income |
(0.56 | ) | (0.17 | ) | (0.17 | ) | (0.17 | ) | (0.03 | ) | (0.17 | ) | ||||||||||||
| From net realized gain |
— | (0.39 | ) | — | — | — | — | |||||||||||||||||
| From return of capital |
— | — | (0.39 | ) | (0.39 | ) | (0.06 | ) | (0.44 | ) | ||||||||||||||
|
|
|
|
|
|
|
|
|
|
|
|
|
|||||||||||||
| Total distributions |
(0.56 | ) | (0.56 | ) | (0.56 | ) | (0.56 | ) | (0.09 | ) | (0.61 | ) | ||||||||||||
|
|
|
|
|
|
|
|
|
|
|
|
|
|||||||||||||
| Net asset value, end of period |
$ | 8.74 | $ | 9.96 | $ | 9.22 | $ | 8.70 | $ | 9.24 | $ | 9.19 | ||||||||||||
|
|
|
|
|
|
|
|
|
|
|
|
|
|||||||||||||
| Market price, end of period |
$ | 7.77 | $ | 9.23 | $ | 8.15 | $ | 7.61 | $ | 8.12 | $ | 8.35 | ||||||||||||
|
|
|
|
|
|
|
|
|
|
|
|
|
|||||||||||||
| Total Return(d) |
||||||||||||||||||||||||
| Based on net asset value |
(6.59 | )% | 15.06 | % | 13.90 | % | 1.10 | % | 1.69 | %(e) | 11.40 | % | ||||||||||||
|
|
|
|
|
|
|
|
|
|
|
|
|
|||||||||||||
| Based on market price |
(10.39 | )% | 20.63 | % | 15.11 | % | 0.63 | % | (1.65 | )%(e) | 16.42 | % | ||||||||||||
|
|
|
|
|
|
|
|
|
|
|
|
|
|||||||||||||
| Ratios to Average Net Assets |
||||||||||||||||||||||||
| Total expenses |
0.85 | % | 0.86 | % | 0.87 | % | 0.86 | % | 0.87 | %(f) | 0.87 | %(g) | ||||||||||||
|
|
|
|
|
|
|
|
|
|
|
|
|
|||||||||||||
| Total expenses after fees waived and/or reimbursed |
0.85 | % | 0.86 | % | 0.85 | % | 0.85 | % | 0.84 | %(f) | 0.86 | %(g) | ||||||||||||
|
|
|
|
|
|
|
|
|
|
|
|
|
|||||||||||||
| Net investment income |
1.85 | %(b) | 1.73 | % | 1.91 | % | 1.85 | % | 2.30 | %(f) | 1.81 | % | ||||||||||||
|
|
|
|
|
|
|
|
|
|
|
|
|
|||||||||||||
| Supplemental Data |
||||||||||||||||||||||||
| Net assets, end of period (000) |
$ | 1,638,237 | $ | 1,868,457 | $ | 1,741,649 | $ | 1,643,508 | $ | 1,747,070 | $ | 1,648,683 | ||||||||||||
|
|
|
|
|
|
|
|
|
|
|
|
|
|||||||||||||
| Portfolio turnover rate |
34 | % | 42 | % | 33 | % | 26 | % | 0 | %(h) | 63 | % | ||||||||||||
|
|
|
|
|
|
|
|
|
|
|
|
|
|||||||||||||
| (a) | Based on average Common Shares outstanding. |
| (b) | Net investment income per share and the ratio of net investment income to average net assets includes $0.01 per share and 0.14%, respectively, resulting from a special dividend. |
| (c) | Distributions for annual periods determined in accordance with U.S. federal income tax regulations. |
| (d) | Total returns based on market price, which can be significantly greater or less than the net asset value, may result in substantially different returns. Where applicable, excludes the effects of any sales charges and assumes the reinvestment of distributions at actual reinvestment prices. |
| (e) | Aggregate total return. |
| (f) | Annualized. |
| (g) | Includes reorganization costs associated with the Trust’s merger. Without these costs, total expenses and total expenses after fees waived and/or reimbursed would have been 0.86% and 0.86%, respectively. |
| (h) | Amount is less than 0.5%. |
|
S H A R E H O L D E R U P D A T E |
213 |
Shareholder Update (unaudited) (continued)
Financial Highlights
The financial highlights table is intended to help the shareholder to understand BME’s financial performance for the periods presented. Certain information reflects financial results for a single common share of BME.
| BME | ||||||||||||||||||||||||
| Year Ended 12/31/18 |
Year Ended 12/31/17 |
Year Ended 12/31/16 |
Year Ended 12/31/15 |
Period from 11/01/14 to 12/31/14 |
Year Ended 10/31/14 |
|||||||||||||||||||
| Net asset value, beginning of period |
$ | 35.69 | $ | 31.30 | $ | 36.19 | $ | 38.61 | $ | 40.22 | $ | 34.92 | ||||||||||||
|
|
|
|
|
|
|
|
|
|
|
|
|
|||||||||||||
| Net investment income (loss)(a) |
0.07 | 0.02 | 0.02 | (0.06 | ) | (0.01 | ) | (0.00 | )(b) | |||||||||||||||
| Net realized and unrealized gain (loss) |
2.51 | 6.77 | (1.91 | ) | 4.34 | 1.10 | 9.14 | |||||||||||||||||
|
|
|
|
|
|
|
|
|
|
|
|
|
|||||||||||||
| Net increase (decrease) from investment operations |
2.58 | 6.79 | (1.89 | ) | 4.28 | 1.09 | 9.14 | |||||||||||||||||
|
|
|
|
|
|
|
|
|
|
|
|
|
|||||||||||||
| Distributions(c) |
||||||||||||||||||||||||
| From net investment income |
(2.40 | ) | (0.04 | ) | (0.03 | ) | (0.63 | ) | (0.01 | ) | (0.10 | ) | ||||||||||||
| From net realized gain |
— | (2.11 | ) | (2.97 | ) | (6.07 | ) | (2.69 | ) | (3.74 | ) | |||||||||||||
| Return of capital |
— | (0.25 | ) | — | — | — | — | |||||||||||||||||
|
|
|
|
|
|
|
|
|
|
|
|
|
|||||||||||||
| Total distributions |
(2.40 | ) | (2.40 | ) | (3.00 | ) | (6.70 | ) | (2.70 | ) | (3.84 | ) | ||||||||||||
|
|
|
|
|
|
|
|
|
|
|
|
|
|||||||||||||
| Net asset value, end of period |
$ | 35.87 | $ | 35.69 | $ | 31.30 | $ | 36.19 | $ | 38.61 | $ | 40.22 | ||||||||||||
|
|
|
|
|
|
|
|
|
|
|
|
|
|||||||||||||
| Market price, end of period |
$ | 36.45 | $ | 36.50 | $ | 31.75 | $ | 39.35 | $ | 42.70 | $ | 41.37 | ||||||||||||
|
|
|
|
|
|
|
|
|
|
|
|
|
|||||||||||||
| Total Return(d) |
||||||||||||||||||||||||
| Based on net asset value |
7.26 | % | 22.17 | % | (5.36 | )% | 10.70 | % | 2.38 | %(e) | 28.00 | % | ||||||||||||
|
|
|
|
|
|
|
|
|
|
|
|
|
|||||||||||||
| Based on market price |
6.57 | % | 23.17 | % | (11.71 | )% | 8.87 | % | 10.07 | %(e) | 36.99 | % | ||||||||||||
|
|
|
|
|
|
|
|
|
|
|
|
|
|||||||||||||
| Ratios to Average Net Assets(f) |
||||||||||||||||||||||||
| Total expenses |
1.11 | % | 1.12 | % | 1.15 | %(g) | 1.13 | % | 1.16 | %(h) | 1.11 | % | ||||||||||||
|
|
|
|
|
|
|
|
|
|
|
|
|
|||||||||||||
| Total expenses after fees waived and/or reimbursed and excluding amortization of offering costs |
1.11 | % | 1.12 | % | 1.14 | % | 1.12 | % | 1.11 | %(h) | 1.11 | % | ||||||||||||
|
|
|
|
|
|
|
|
|
|
|
|
|
|||||||||||||
| Net investment income (loss) |
0.19 | % | 0.06 | % | 0.07 | % | (0.14 | )% | (0.10 | )%(h) | 0.01 | % | ||||||||||||
|
|
|
|
|
|
|
|
|
|
|
|
|
|||||||||||||
| Supplemental Data |
||||||||||||||||||||||||
| Net assets, end of period (000) |
$ | 352,675 | $ | 331,858 | $ | 270,693 | $ | 297,530 | $ | 303,103 | $ | 313,933 | ||||||||||||
|
|
|
|
|
|
|
|
|
|
|
|
|
|||||||||||||
| Portfolio turnover rate |
37 | % | 38 | % | 59 | % | 68 | % | 6 | % | 74 | % | ||||||||||||
|
|
|
|
|
|
|
|
|
|
|
|
|
|||||||||||||
| (a) | Based on average shares outstanding. |
| (b) | Amount is greater than $(0.005) per share. |
| (c) | Distributions for annual periods determined in accordance with U.S. federal income tax regulations. |
| (d) | Total returns based on market price, which can be significantly greater or less than the net asset value, may result in substantially different returns. Where applicable, excludes the effects of any sales charges and assumes the reinvestment of distributions at actual reinvestment prices. |
| (e) | Aggregate total return. |
| (f) | Excludes expenses incurred indirectly as a result of investments in underlying funds as follows: |
| Year Ended | Year Ended | Year Ended | Year Ended | Period from | Year Ended | |||||||||||||||||||
| 12/31/18 | 12/31/17 | 12/31/16 | 12/31/15 | 11/01/14 to 12/31/14 |
10/31/14 | |||||||||||||||||||
| Investments in underlying funds |
0.01 | % | 0.01 | % | — | % | — | % | — | % | — | % | ||||||||||||
|
|
|
|
|
|
|
|
|
|
|
|
|
|||||||||||||
| (g) | Offering costs were not annualized in the calculation of the expense ratios. If these expenses were annualized, the total expenses would have been 1.16%. |
| (h) | Annualized. |
| 214 | 2 0 2 3 B L A C K R O C K A N N U A L R E P O R T T O S H A R E H O L D E R S |
Shareholder Update (unaudited) (continued)
Financial Highlights
The financial highlights table is intended to help the shareholder to understand BST’s financial performance for the periods presented. Certain information reflects financial results for a single common share of BST.
| BST | ||||||||||||||||||||
| |
Year Ended 12/31/18 |
|
|
Year Ended 12/31/17 |
|
|
Year Ended 12/31/16 |
|
|
Year Ended 12/31/15 |
|
|
Period from 10/30/2014 to 12/31/2014 |
(a) | ||||||
| Net asset value, beginning of period |
$ | 27.73 | $ | 20.10 | $ | 19.70 | $ | 19.43 | $ | 19.10 | (b) | |||||||||
|
|
|
|
|
|
|
|
|
|
|
|||||||||||
| Net investment income (loss)(c) |
(0.13 | ) | (0.05 | ) | 0.00 | (d) | 0.03 | (0.01 | ) | |||||||||||
| Net realized and unrealized gain |
0.37 | 8.96 | 1.60 | 1.44 | 0.48 | |||||||||||||||
|
|
|
|
|
|
|
|
|
|
|
|||||||||||
| Net increase (decrease) from investment operations |
0.24 | 8.91 | 1.60 | 1.47 | 0.47 | |||||||||||||||
|
|
|
|
|
|
|
|
|
|
|
|||||||||||
| Distributions(e) |
||||||||||||||||||||
| From net investment income |
(1.68 | ) | (0.05 | ) | — | (0.03 | ) | (0.00 | )(f) | |||||||||||
| From net realized gain |
(0.08 | ) | (0.22 | ) | — | (0.01 | ) | — | ||||||||||||
| Return of capital |
— | (1.01 | ) | (1.20 | ) | (1.16 | ) | (0.10 | ) | |||||||||||
|
|
|
|
|
|
|
|
|
|
|
|||||||||||
| Total distributions |
(1.76 | ) | (1.28 | ) | (1.20 | ) | (1.20 | ) | (0.10 | ) | ||||||||||
|
|
|
|
|
|
|
|
|
|
|
|||||||||||
| Capital changes with respect to issuance of Common Shares |
— | — | — | — | (0.04 | ) | ||||||||||||||
|
|
|
|
|
|
|
|
|
|
|
|||||||||||
| Net asset value, end of period |
$ | 26.21 | $ | 27.73 | $ | 20.10 | $ | 19.70 | $ | 19.43 | ||||||||||
|
|
|
|
|
|
|
|
|
|
|
|||||||||||
| Market price, end of period |
$ | 27.48 | $ | 26.69 | $ | 17.94 | $ | 17.31 | $ | 17.59 | ||||||||||
|
|
|
|
|
|
|
|
|
|
|
|||||||||||
| Total Return(g) |
||||||||||||||||||||
| Based on net asset value |
0.24 | % | 45.73 | % | 9.36 | % | 8.61 | % | 2.31 | %(h) | ||||||||||
|
|
|
|
|
|
|
|
|
|
|
|||||||||||
| Based on market price |
9.18 | % | 57.15 | % | 11.08 | % | 5.36 | % | (11.55 | )%(h) | ||||||||||
|
|
|
|
|
|
|
|
|
|
|
|||||||||||
| Ratios to Average Net Assets |
||||||||||||||||||||
| Total expenses |
1.09 | % | 1.09 | % | 1.10 | % | 1.12 | % | 1.19 | %(i) | ||||||||||
|
|
|
|
|
|
|
|
|
|
|
|||||||||||
| Total expenses after fees waived and/or reimbursed |
0.89 | % | 0.89 | % | 0.90 | % | 0.92 | % | 0.97 | %(i) | ||||||||||
|
|
|
|
|
|
|
|
|
|
|
|||||||||||
| Net investment income (loss) |
(0.43 | )% | (0.19 | )% | 0.02 | % | 0.15 | % | (0.24 | )%(i) | ||||||||||
|
|
|
|
|
|
|
|
|
|
|
|||||||||||
| Supplemental Data |
||||||||||||||||||||
| Net assets, end of period (000) |
$ | 587,908 | $ | 620,300 | $ | 452,443 | $ | 443,477 | $ | 437,380 | ||||||||||
|
|
|
|
|
|
|
|
|
|
|
|||||||||||
| Portfolio turnover rate |
53 | % | 41 | % | 74 | % | 91 | % | 7 | % | ||||||||||
|
|
|
|
|
|
|
|
|
|
|
|||||||||||
| (a) | Commencement of investment operations. This information includes the initial investment by BlackRock HoldCo2, Inc. |
| (b) | Net asset value, beginning of period, reflects a deduction of $0.8975 per share sales charge from initial offering price of $20.00 per share. |
| (c) | Based on average shares outstanding. |
| (d) | Amount is less than $0.005 per share. |
| (e) | Distributions for annual periods determined in accordance with U.S. federal income tax regulations. |
| (f) | Amount is greater than $(0.005) per share. |
| (g) | Total returns based on market price, which can be significantly greater or less than the net asset value, may result in substantially different returns. Where applicable, excludes the effects of any sales charges and assumes the reinvestment of distributions at actual reinvestment prices. |
| (h) | Aggregate total return. |
| (i) | Annualized. |
|
S H A R E H O L D E R U P D A T E |
215 |
Shareholder Update (unaudited) (continued)
Financial Highlights
The financial highlights table is intended to help the shareholder to understand BUI’s financial performance for the periods presented. Certain information reflects financial results for a single common share of BUI.
| BUI | ||||||||||||||||||||||||
| Year Ended 12/31/18 |
Year Ended 12/31/17 |
Year Ended 12/31/16 |
Year Ended 12/31/15 |
Period from 11/01/14 to 12/31/14 |
Year Ended 10/30/14 |
|||||||||||||||||||
| Net asset value, beginning of period |
$ | 21.12 | $ | 19.42 | $ | 19.50 | $ | 22.47 | $ | 22.40 | $ | 20.78 | ||||||||||||
|
|
|
|
|
|
|
|
|
|
|
|
|
|||||||||||||
| Net investment income(a) |
0.49 | 0.56 | 0.56 | 0.47 | 0.11 | 0.51 | ||||||||||||||||||
| Net realized and unrealized gain (loss) |
(1.39 | ) | 2.59 | 0.81 | (1.99 | ) | 0.20 | 2.68 | ||||||||||||||||
|
|
|
|
|
|
|
|
|
|
|
|
|
|||||||||||||
| Net increase (decrease) from investment operations |
(0.90 | ) | 3.15 | 1.37 | (1.52 | ) | 0.31 | 3.19 | ||||||||||||||||
|
|
|
|
|
|
|
|
|
|
|
|
|
|||||||||||||
| Distributions(b) |
||||||||||||||||||||||||
| From net investment income |
(1.44 | ) | (0.47 | ) | (0.49 | ) | (0.42 | ) | (0.10 | ) | (0.51 | ) | ||||||||||||
| From net realized gain |
— | (0.98 | ) | (0.53 | ) | (0.54 | ) | — | (0.37 | ) | ||||||||||||||
| Return of capital |
(0.01 | ) | — | (0.43 | ) | (0.49 | ) | (0.14 | ) | (0.69 | ) | |||||||||||||
|
|
|
|
|
|
|
|
|
|
|
|
|
|||||||||||||
| Total distributions |
(1.45 | ) | (1.45 | ) | (1.45 | ) | (1.45 | ) | (0.24 | ) | (1.57 | ) | ||||||||||||
|
|
|
|
|
|
|
|
|
|
|
|
|
|||||||||||||
| Net asset value, end of period |
$ | 18.77 | $ | 21.12 | $ | 19.42 | $ | 19.50 | $ | 22.47 | $ | 22.40 | ||||||||||||
|
|
|
|
|
|
|
|
|
|
|
|
|
|||||||||||||
| Market price, end of period |
$ | 19.76 | $ | 21.62 | $ | 18.41 | $ | 16.78 | $ | 20.74 | $ | 20.02 | ||||||||||||
|
|
|
|
|
|
|
|
|
|
|
|
|
|||||||||||||
| Total Return(c) |
||||||||||||||||||||||||
| Based on net asset value |
(4.40 | )% | 16.62 | % | 7.57 | % | (6.09 | )% | 1.50 | %(d) | 16.94 | % | ||||||||||||
|
|
|
|
|
|
|
|
|
|
|
|
|
|||||||||||||
| Based on market price |
(1.68 | )% | 25.93 | % | 18.50 | % | (12.45 | )% | 4.82 | %(d) | 18.29 | % | ||||||||||||
|
|
|
|
|
|
|
|
|
|
|
|
|
|||||||||||||
| Ratios to Average Net Assets |
||||||||||||||||||||||||
| Total expenses |
1.12 | % | 1.11 | % | 1.13 | % | 1.11 | % | 1.17 | %(e) | 1.10 | % | ||||||||||||
|
|
|
|
|
|
|
|
|
|
|
|
|
|||||||||||||
| Total expenses after fees waived and/or reimbursed |
1.09 | % | 1.09 | % | 1.13 | % | 1.11 | % | 1.11 | %(e) | 1.10 | % | ||||||||||||
|
|
|
|
|
|
|
|
|
|
|
|
|
|||||||||||||
| Net investment income |
2.46 | % | 2.70 | % | 2.83 | % | 2.24 | % | 2.83 | %(e) | 2.36 | % | ||||||||||||
|
|
|
|
|
|
|
|
|
|
|
|
|
|||||||||||||
| Supplemental Data |
||||||||||||||||||||||||
| Net assets, end of period (000) |
$ | 318,933 | $ | 357,776 | $ | 328,297 | $ | 329,747 | $ | 379,830 | $ | 378,762 | ||||||||||||
|
|
|
|
|
|
|
|
|
|
|
|
|
|||||||||||||
| Portfolio turnover rate |
28 | % | 31 | % | 8 | % | 20 | % | 2 | % | 41 | % | ||||||||||||
|
|
|
|
|
|
|
|
|
|
|
|
|
|||||||||||||
| (a) | Based on average shares outstanding. |
| (b) | Distributions for annual periods determined in accordance with U.S. federal income tax regulations. |
| (c) | Total returns based on market price, which can be significantly greater or less than the net asset value, may result in substantially different returns. Where applicable, excludes the effects of any sales charges and assumes the reinvestment of distributions at actual reinvestment prices. |
| (d) | Aggregate total return. |
| (e) | Annualized. |
| 216 | 2 0 2 3 B L A C K R O C K A N N U A L R E P O R T T O S H A R E H O L D E R S |
Automatic Dividend Reinvestment Plan
Pursuant to BGR, CII, BDJ, BOE, BGY, BME, BMEZ, BIGZ, BCX, BST, BSTZ and BUI’s Dividend Reinvestment Plan (the “Reinvestment Plan”), Common Shareholders are automatically enrolled to have all distributions of dividends and capital gains and other distributions reinvested by Computershare Trust Company, N.A. (the “Reinvestment Plan Agent”) in the respective Trust’s Common Shares pursuant to the Reinvestment Plan. Shareholders who do not participate in the Reinvestment Plan will receive all distributions in cash paid by check and mailed directly to the shareholders of record (or if the shares are held in street name or other nominee name, then to the nominee) by the Reinvestment Plan Agent, which serves as agent for the shareholders in administering the Reinvestment Plan.
After BGR, CII, BDJ, BOE, BGY, BME, BMEZ, BIGZ, BCX, BST, BSTZ and BUI declare a dividend or determine to make a capital gain or other distribution, the Reinvestment Plan Agent will acquire shares for the participants’ accounts, depending upon the following circumstances, either (i) through receipt of unissued but authorized shares from the Trusts (“newly issued shares”) or (ii) by purchase of outstanding shares on the open market or on the Trust’s primary exchange (“open-market purchases”). If, on the dividend payment date, the net asset value (“NAV”) per share is equal to or less than the market price per share plus estimated brokerage commissions (such condition often referred to as a “market premium”), the Reinvestment Plan Agent will invest the dividend amount in newly issued shares acquired on behalf of the participants. The number of newly issued shares to be credited to each participant’s account will be determined by dividing the dollar amount of the dividend by the NAV on the date the shares are issued. However, if the NAV is less than 95% of the market price on the dividend payment date, the dollar amount of the dividend will be divided by 95% of the market price on the dividend payment date. If, on the dividend payment date, the NAV is greater than the market price per share plus estimated brokerage commissions (such condition often referred to as a “market discount”), the Reinvestment Plan Agent will invest the dividend amount in shares acquired on behalf of the participants in open-market purchases. If the Reinvestment Plan Agent is unable to invest the full dividend amount in open-market purchases, or if the market discount shifts to a market premium during the purchase period, the Reinvestment Plan Agent will invest any un-invested portion in newly issued shares. Investments in newly issued shares made in this manner would be made pursuant to the same process described above and the date of issue for such newly issued shares will substitute for the dividend payment date.
You may elect not to participate in the Reinvestment Plan and to receive all dividends in cash by contacting the Reinvestment Plan Agent, at the address set forth below.
Participation in the Reinvestment Plan is completely voluntary and may be terminated or resumed at any time without penalty by notice if received and processed by the Reinvestment Plan Agent prior to the dividend record date. Additionally, the Reinvestment Plan Agent seeks to process notices received after the record date but prior to the payable date and such notices often will become effective by the payable date. Where late notices are not processed by the applicable payable date, such termination or resumption will be effective with respect to any subsequently declared dividend or other distribution.
The Reinvestment Plan Agent’s fees for the handling of the reinvestment of distributions will be paid by each Trust. However, each participant will pay a pro rata share of brokerage commissions incurred with respect to the Reinvestment Plan Agent’s open-market purchases in connection with the reinvestment of all distributions. The automatic reinvestment of all distributions will not relieve participants of any U.S. federal, state or local income tax that may be payable on such dividends or distributions.
Each Trust reserves the right to amend or terminate the Reinvestment Plan. There is no direct service charge to participants in the Reinvestment Plan; however, each Trust reserves the right to amend the Reinvestment Plan to include a service charge payable by the participants. Participants in BMEZ, BIGZ, BST and BSTZ that request a sale of shares are subject to a $2.50 sales fee and a $0.15 per share sold fee. Per share fees include any applicable brokerage commissions the Reinvestment Plan Agent is required to pay. Participants in BGR, CII, BDJ, BOE, BGY, BME, BCX and BUI that request a sale of shares are subject to a $0.02 per share sold brokerage commission. All correspondence concerning the Reinvestment Plan should be directed to Computershare Trust Company, N.A. through the internet at computershare.com/blackrock, or in writing to Computershare, P.O. Box 43006, Providence, RI 02940-3078, Telephone: (800) 699-1236. Overnight correspondence should be directed to the Reinvestment Plan Agent at Computershare, 150 Royall Street, Suite 101, Canton, MA 02021.
| A U T O M A T I C D I V I D E N D R E I N V E S T M E N T P L A N |
217 |
Trustee and Officer Information
| Independent Trustees(a) | ||||||||
| Name Year of Birth(b) |
Position(s) Held (Length of Service)(c) |
Principal Occupation(s) During Past 5 Years | Number of BlackRock-Advised Registered Investment Companies (“RICs”) Consisting of Investment Portfolios (“Portfolios”) Overseen |
Public Company Past 5 Years | ||||
| R. Glenn Hubbard 1958 |
Chair of the Board (Since
2022) (Since 2007) |
Dean, Columbia Business School from 2004 to 2019; Faculty member, Columbia Business School since 1988. | 69 RICs consisting of 102 Portfolios | ADP (data and information services) from 2004 to 2020; Metropolitan Life Insurance Company (insurance); TotalEnergies SE (multi-energy) | ||||
| W. Carl Kester(d) 1951 |
Vice Chair of the Board (Since 2022) (Since 2007) |
Baker Foundation Professor and George Fisher Baker Jr. Professor of Business Administration, Emeritus, Harvard Business School since 2022; George Fisher Baker Jr. Professor of Business Administration, Harvard Business School from 2008 to 2022; Deputy Dean for Academic Affairs from 2006 to 2010; Chairman of the Finance Unit, from 2005 to 2006; Senior Associate Dean and Chairman of the MBA Program from 1999 to 2005; Member of the faculty of Harvard Business School since 1981. | 71 RICs consisting of 104 Portfolios | None | ||||
| Cynthia L. Egan 1955 |
Trustee (Since 2016) |
Advisor, U.S. Department of the Treasury from 2014 to 2015; President, Retirement Plan Services, for T. Rowe Price Group, Inc. from 2007 to 2012; executive positions within Fidelity Investments from 1989 to 2007. | 71 RICs consisting of 104 Portfolios | Unum (insurance); The Hanover Insurance Group (Board Chair); Huntsman Corporation (Lead Independent Director and non- Executive Vice Chair of the Board) (chemical products) | ||||
| Frank J. Fabozzi(d) 1948 |
Trustee (Since 2007) |
Editor of The Journal of Portfolio Management since 1986; Professor of Finance, EDHEC Business School (France) from 2011 to 2022; Professor of Practice, Johns Hopkins University since 2021; Professor in the Practice of Finance, Yale University School of Management from 1994 to 2011 and currently a Teaching Fellow in Yale’s Executive Programs; Visiting Professor, Rutgers University for the Spring 2019 semester; Visiting Professor, New York University for the 2019 academic year; Adjunct Professor of Finance, Carnegie Mellon University in fall 2020 semester. | 71 RICs consisting of 104 Portfolios | None | ||||
| Lorenzo A. Flores 1964 |
Trustee (Since 2021) |
Vice Chairman, Kioxia, Inc. since 2019; Chief Financial Officer, Xilinx, Inc. from 2016 to 2019; Corporate Controller, Xilinx, Inc. from 2008 to 2016. | 69 RICs consisting of 102 Portfolios | None | ||||
| Stayce D. Harris 1959 |
Trustee (Since 2021) |
Lieutenant General, Inspector General of the United States Air Force from 2017 to 2019; Lieutenant General, Assistant Vice Chief of Staff and Director, Air Staff, United States Air Force from 2016 to 2017; Major General, Commander, 22nd Air Force, AFRC, Dobbins Air Reserve Base, Georgia from 2014 to 2016; Pilot, United Airlines from 1990 to 2020. | 69 RICs consisting of 102 Portfolios | KULR Technology Group, Inc. in 2021; The Boeing Company (airplane manufacturer) | ||||
| 218 | 2 0 2 3 B L A C K R O C K A N N U A L R E P O R T T O S H A R E H O L D E R S |
Trustee and Officer Information (continued)
| Independent Trustees(a) (continued) | ||||||||
| Name Year of Birth(b) |
Position(s) Held (Length of Service)(c) |
Principal Occupation(s) During Past 5 Years | Number of BlackRock-Advised Registered Investment Companies (“RICs”) Consisting of Investment Portfolios (“Portfolios”) Overseen |
Public Company Past 5 Years | ||||
| J. Phillip Holloman 1955 |
Trustee (Since 2021) |
President and Chief Operating Officer, Cintas Corporation from 2008 to 2018. | 69 RICs consisting of 102 Portfolios | PulteGroup, Inc. (home construction); Rockwell Automation Inc. (industrial automation); Vestis Corporation (uniforms and facilities services) | ||||
| Catherine A. Lynch(d) 1961 |
Trustee (Since 2016) |
Chief Executive Officer, Chief Investment Officer and various other positions, National Railroad Retirement Investment Trust from 2003 to 2016; Associate Vice President for Treasury Management, The George Washington University from 1999 to 2003; Assistant Treasurer, Episcopal Church of America from 1995 to 1999. | 71 RICs consisting of 104 Portfolios | PennyMac Mortgage Investment Trust | ||||
| Non-Management Interested Trustee(a)(f) | ||||||||
| Name Year of Birth(b) |
Position(s) Held (Length of Service) |
Principal Occupation(s) During Past 5 Years | Number of BlackRock-Advised Registered Investment Companies (“RICs”) Consisting of Investment Portfolios (“Portfolios”) Overseen |
Public Company Held During Past 5 Years | ||||
| Arthur P. Steinmetz 1958 |
Trustee (Since 2023) |
Consultant, Posit PBC (enterprise data science) since 2020; Director, ScotiaBank (U.S.) from 2020 to 2023; Chairman, Chief Executive Officer and President of OppenheimerFunds, Inc. from 2015, 2014 and 2013, respectively to 2019; Trustee, President and Principal Executive Officer of 104 OppenheimerFunds funds from 2014 to 2019; Portfolio manager of various OppenheimerFunds fixed income mutual funds from 1986 to 2014. | 70 RICs consisting of 103 Portfolios | Trustee of 104 OppenheimerFunds funds from 2014 to 2019 | ||||
| T R U S T E E A N D O F F I C E R I N F O R M A T I O N |
219 |
Trustee and Officer Information (continued)
| Interested Trustees(a)(e) | ||||||||
| Name Year of Birth(b) |
Position(s) Held (Length of Service)(c) |
Principal Occupation(s) During Past 5 Years | Number of BlackRock-Advised Registered Investment Companies (“RICs”) Consisting of Investment Portfolios (“Portfolios”) Overseen |
Public Company Held During Past 5 Years | ||||
| Robert Fairbairn 1965 |
Trustee (Since 2018) |
Vice Chairman of BlackRock, Inc. since 2019; Member of BlackRock’s Global Executive and Global Operating Committees; Co-Chair of BlackRock’s Human Capital Committee; Senior Managing Director of BlackRock, Inc. from 2010 to 2019; oversaw BlackRock’s Strategic Partner Program and Strategic Product Management Group from 2012 to 2019; Member of the Board of Managers of BlackRock Investments, LLC from 2011 to 2018; Global Head of BlackRock’s Retail and iShares® businesses from 2012 to 2016. | 97 RICs consisting of 268 Portfolios | None | ||||
| John M. Perlowski(d) 1964 |
Trustee (Since 2015) President and Chief Executive Officer (Since 2010) |
Managing Director of BlackRock, Inc. since 2009; Head of BlackRock Global Accounting and Product Services since 2009; Advisory Director of Family Resource Network (charitable foundation) since 2009. | 99 RICs consisting of 270 Portfolios | None | ||||
| (a) | The address of each Trustee is c/o BlackRock, Inc., 50 Hudson Yards, New York, New York 10001. |
| (b) | Each Independent Trustee holds office until his or her successor is duly elected and qualifies or until his or her earlier death, resignation, retirement or removal as provided by the Trust’s by-laws or charter or statute, or until December 31 of the year in which he or she turns 75. Trustees who are “interested persons,” as defined in the Investment Company Act serve until their successor is duly elected and qualifies or until their earlier death, resignation, retirement or removal as provided by the Trust’s by-laws or statute, or until December 31 of the year in which they turn 72. The Board may determine to extend the terms of Independent Trustees on a case-by-case basis, as appropriate. |
| (c) | Following the combination of Merrill Lynch Investment Managers, L.P. (“MLIM”) and BlackRock, Inc. in September 2006, the various legacy MLIM and legacy BlackRock fund boards were realigned and consolidated into three new fund boards in 2007. Certain Independent Trustees first became members of the boards of other legacy MLIM or legacy BlackRock funds as follows: Frank J. Fabozzi, 1988; R. Glenn Hubbard, 2004; and W. Carl Kester, 1995. |
| (d) | Dr. Fabozzi, Ms. Egan, Dr. Kester, Ms. Lynch, Mr. Steinmetz and Mr. Perlowski are also trustees of the BlackRock Credit Strategies Fund and BlackRock Private Investments Fund. |
| (e) | Mr. Fairbairn and Mr. Perlowski are both “interested persons,” as defined in the 1940 Act, of the Fund based on their positions with BlackRock, Inc. and its affiliates. Mr. Fairbairn and Mr. Perlowski are also board members of the BlackRock Multi-Asset Complex. |
| (f) | Mr. Steinmetz is currently classified as a non-management interested Trustee based on his former directorship at another company that is not an affiliate of BlackRock, Inc. Mr. Steinmetz does not currently serve as an officer or employee of BlackRock, Inc. or its affiliates or own any securities of BlackRock, Inc. It is anticipated that Mr. Steinmetz will become an Independent Trustee effective January 19, 2024. |
| Officers Who Are Not Trustees(a) | ||||
| Name Year of Birth(b) |
Position(s) Held (Length of Service) |
Principal Occupation(s) During Past 5 Years | ||
| Jonathan Diorio 1980 |
Vice President (Since 2015) |
Managing Director of BlackRock, Inc. since 2015; Director of BlackRock, Inc. from 2011 to 2015. | ||
| Trent Walker 1974 |
Chief Financial Officer (Since 2021) |
Managing Director of BlackRock, Inc. since September 2019; Executive Vice President of PIMCO from 2016 to 2019; Senior Vice President of PIMCO from 2008 to 2015; Treasurer from 2013 to 2019 and Assistant Treasurer from 2007 to 2017 of PIMCO Funds, PIMCO Variable Insurance Trust, PIMCO ETF Trust, PIMCO Equity Series, PIMCO Equity Series VIT, PIMCO Managed Accounts Trust, 2 PIMCO-sponsored interval funds and 21 PIMCO-sponsored closed-end funds. | ||
| Jay M. Fife 1970 |
Treasurer (Since 2007) |
Managing Director of BlackRock, Inc. since 2007. | ||
| Aaron Wasserman 1974 |
Chief Compliance Officer (Since 2023) |
Managing Director of BlackRock, Inc. since 2018; Chief Compliance Officer of the BlackRock-advised funds in the BlackRock Multi-Asset Complex, the BlackRock Fixed-Income Complex and the iShares Complex since 2023; Deputy Chief Compliance Officer for the BlackRock-advised funds in the BlackRock Multi-Asset Complex, the BlackRock Fixed- Income Complex and the iShares Complex from 2014 to 2023. | ||
| Janey Ahn 1975 |
Secretary (Since 2012) |
Managing Director of BlackRock, Inc. since 2018; Director of BlackRock, Inc. from 2009 to 2017. | ||
| (a) | The address of each Officer is c/o BlackRock, Inc., 50 Hudson Yards, New York, New York 10001. |
| (b) | Officers of the Trust serve at the pleasure of the Board. |
| 220 | 2 0 2 3 B L A C K R O C K A N N U A L R E P O R T T O S H A R E H O L D E R S |
Trustee and Officer Information (continued)
Further information about the BME’s, BST’s and BUI’s Trustees and Officers is available in the Trust’s Statement of Additional Information, which can be obtained without charge by calling (800) 882-0052.
Effective July 1, 2023, Aaron Wasserman replaced Charles Park as Chief Compliance Officer of the Trusts.
Effective December 31, 2023, Frank Fabozzi retired as Trustee of the Trusts.
Effective January 19, 2024, Arthur Steinmetz became an Independent Trustee of the Trusts.
Effective June 15, 2023, Rosie Edwards became a portfolio manager of BGY. Ms. Edwards has been employed by BlackRock since 2019 and previously was employed by Berenberg.
Effective January 12, 2023, Misha Lozovik is no longer a portfolio manager of BIGZ.
Effective March 28, 2023, William Broadbent is no longer a portfolio manager of BIGZ.
Effective June 27, 2023, Jeff Lee is no longer a portfolio manager of BME.
Effective June 27, 2023, Jeff Lee is no longer a portfolio manager of BMEZ.
Effective September 14, 2023, Caroline Tall is no longer a portfolio manager of BST.
Effective September 14, 2023, Caroline Tall is no longer a portfolio manager of BSTZ.
Effective June 1, 2023, Lindsay Sinclair became a portfolio manager of BUI. Ms. Sinclair has been employed by BlackRock since 2016.
| T R U S T E E A N D O F F I C E R I N F O R M A T I O N |
221 |
Proxy Results
The Annual Meeting of Shareholders was held on July 12, 2023 for shareholders of record on May 15, 2023, to elect trustee nominees for each Trust other than BIGZ and BMEZ. There were no broker non-votes with regard to any of the Trusts.
Shareholders elected the Class I Trustees as follows:
|
|
||||||||||||||||||||||||||||||||||
| Lorenzo A. Flores | R. Glenn Hubbard | John M. Perlowski | W. Carl Kester | |||||||||||||||||||||||||||||||
| Trust Name | Votes For | Votes Withheld | Votes For | Votes Withheld | Votes For | Votes Withheld | Votes For | Votes Withheld | ||||||||||||||||||||||||||
|
|
||||||||||||||||||||||||||||||||||
| BDJ |
141,029,718 | 5,692,272 | 141,033,404 | 5,688,586 | 141,229,386 | 5,492,604 | 140,804,103 | 5,917,887 | ||||||||||||||||||||||||||
| BGR |
21,897,595 | 1,003,784 | 21,885,807 | 1,015,572 | 21,930,670 | 970,709 | 21,929,931 | 971,448 | ||||||||||||||||||||||||||
| BOE |
48,035,270 | 5,950,023 | 49,144,505 | 4,840,788 | 49,182,140 | 4,803,153 | 49,141,586 | 4,843,707 | ||||||||||||||||||||||||||
| BME |
10,583,103 | 420,283 | 10,551,945 | 451,441 | 10,535,294 | 468,092 | 10,514,156 | 489,230 | ||||||||||||||||||||||||||
| BGY |
79,852,648 | 9,010,840 | 80,094,143 | 8,769,345 | 80,154,505 | 8,708,983 | 80,077,439 | 8,786,049 | ||||||||||||||||||||||||||
| BCX |
64,122,052 | 4,576,675 | 64,282,133 | 4,416,594 | 64,405,796 | 4,292,931 | 64,276,699 | 4,422,028 | ||||||||||||||||||||||||||
| BUI |
16,025,231 | 776,397 | 16,013,846 | 787,782 | 16,033,320 | 768,308 | 16,003,820 | 797,808 | ||||||||||||||||||||||||||
| BST |
24,651,506 | 810,676 | 24,528,089 | 934,093 | 24,577,536 | 884,646 | 24,530,482 | 931,700 | ||||||||||||||||||||||||||
|
|
||||||||||||||||||||||||||||||||||
For the Trusts listed above, Trustees whose term of office continued after the Annual Meeting of Shareholders because they were not up for election are Cynthia L. Egan, Robert Fairbairn, Stayce D. Harris, J. Phillip Holloman, Catherine A. Lynch, and Frank J. Fabozzi.
Shareholders elected the Class I Trustees as follows:
|
|
||||||||||||||||||||||||||||||||||
| Cynthia L. Egan | Lorenzo A. Flores | Stayce D. Harris | Catherine A. Lynch |
| ||||||||||||||||||||||||||||||
| Trust Name | Votes For | Votes Withheld | Votes For | Votes Withheld | Votes For | Votes Withheld | Votes For | Votes Withheld | ||||||||||||||||||||||||||
|
|
||||||||||||||||||||||||||||||||||
| BSTZ |
60,142,236 | 4,095,890 | 59,916,192 | 4,321,934 | 60,190,111 | 4,048,015 | 60,006,494 | 4,231,632 | ||||||||||||||||||||||||||
| CII |
33,835,792 | 1,644,311 | 33,878,479 | 1,601,624 | 33,959,360 | 1,520,743 | 34,009,819 | 1,470,284 | ||||||||||||||||||||||||||
|
|
||||||||||||||||||||||||||||||||||
For the Trusts listed above, Trustees whose term of office continued after the Annual Meeting of Shareholders because they were not up for election are Robert Fairbairn, J. Phillip Holloman, R. Glenn Hubbard, John M. Perlowski, Frank J. Fabozzi and W. Carl Kester.
The Annual Meeting of Shareholders was held on July 11, 2023 for shareholders of record on May 12, 2023, to elect trustee nominees for BMEZ. There were no broker non-votes with regard to the Trust.
Shareholders elected the Class I Trustees as follows:
|
|
||||||||||||||||||||||||||||||||||||
| Cynthia L. Egan | Lorenzo A. Flores | Stayce D. Harris | Catherine A. Lynch | |||||||||||||||||||||||||||||||||
| Trust Name | Votes For | Votes Withheld | Votes For | Votes Withheld | Votes For | Votes Withheld | Votes For | Votes Withheld | ||||||||||||||||||||||||||||
|
|
||||||||||||||||||||||||||||||||||||
| BMEZ |
91,085,783 | 5,702,510 | 91,302,495 | 5,485,798 | 91,510,395 | 5,277,898 | 90,904,258 | 5,884,035 | ||||||||||||||||||||||||||||
|
|
||||||||||||||||||||||||||||||||||||
For the Trust listed above, Trustees whose term of office continued after the Annual Meeting of Shareholders because they were not up for election are Robert Fairbairn, J. Phillip Holloman, R. Glenn Hubbard, John M. Perlowski, Frank J. Fabozzi and W. Carl Kester.
The Annual Meeting of Shareholders of BIGZ (the “Meeting”) was called for July 10, 2023 for shareholders of record on May 12, 2023 to consider and vote on a proposal to elect four Class I Trustees. The Board of Trustees of BIGZ (the “Board”) nominated four nominees who currently serve as Class I Trustees. A hedge fund managed by Saba Capital Management, L.P. (“Saba”) also nominated four nominees. The Meeting was adjourned to July 25, 2023 and further adjourned to August 7, 2023 to seek additional shareholder participation. A quorum of shareholders required to conduct business at the Meeting was not obtained.
The ballots and proxies received by First Coast Results, Inc., the independent Inspector of Election of the Meeting, reflected votes with respect to the nominees as follows:
Board Nominees/Incumbent Trustees
|
|
||||||||||||||||||||||||||||||||||||
| Cynthia L. Egan | Lorenzo A. Flores | Stayce D. Harris | ||||||||||||||||||||||||||||||||||
| Trust Name | Votes For | Votes Against | Abstain | Votes For | Votes Against | Abstain | Votes For | Votes Against | Abstain | |||||||||||||||||||||||||||
|
|
||||||||||||||||||||||||||||||||||||
| BIGZ |
32,261,222 | 4,432,605 | 3,479,799 | 32,207,921 | 4,478,253 | 3,487,452 | 32,073,881 | 4,531,170 | 3,568,575 | |||||||||||||||||||||||||||
|
|
||||||||||||||||||||||||||||||||||||
|
|
||||||||||||||||||||||||||||||||||||
| Catherine A. Lynch | ||||||||||||||||||||||||||||||||||||
| Trust Name | Votes For | Votes Against | Abstain | |||||||||||||||||||||||||||||||||
|
|
||||||||||||||||||||||||||||||||||||
| BIGZ |
32,254,080 | 4,374,506 | 3,545,040 | |||||||||||||||||||||||||||||||||
|
|
||||||||||||||||||||||||||||||||||||
| 222 | 2 0 2 3 B L A C K R O C K A N N U A L R E P O R T T O S H A R E H O L D E R S |
Additional Information (continued)
Saba Nominees(a)
|
|
||||||||||||||||||||||||||||||||||||
| Ravi Bhasin | Ilya Gurevich | Richard Thiemann | ||||||||||||||||||||||||||||||||||
| Trust Name | Votes For | Votes Against | Abstain | Votes For | Votes Against | Abstain | Votes For | Votes Against | Abstain | |||||||||||||||||||||||||||
|
|
||||||||||||||||||||||||||||||||||||
| BIGZ |
0 | 0 | 0 | 0 | 0 | 0 | 0 | 0 | 0 | |||||||||||||||||||||||||||
|
|
||||||||||||||||||||||||||||||||||||
|
|
||||||||||||||||||||||||||||||||||||
| Emmanuel Werthenschlag |
||||||||||||||||||||||||||||||||||||
|
|
|
|||||||||||||||||||||||||||||||||||
| Trust Name | Votes For | Votes Against | Abstain | |||||||||||||||||||||||||||||||||
|
|
||||||||||||||||||||||||||||||||||||
| BIGZ |
0 | 0 | 0 | |||||||||||||||||||||||||||||||||
|
|
||||||||||||||||||||||||||||||||||||
| (a) | Saba did not submit for voting any shares held directly or for other shareholders who authorized Saba via proxy to vote on their behalf. A quorum of shareholders required to conduct business at the Meeting was not obtained. |
Because a quorum was not obtained to conduct business at the Meeting, each incumbent Class I Trustee listed above will continue to serve on the Board of BIGZ as a “holdover” Trustee until his or her successor has been duly elected and qualified.
The Trustees of BIGZ whose term of office continued after the Meeting because they were not up for election are Frank J. Fabozzi, Robert Fairbairn, J. Phillip Holloman, R. Glenn Hubbard, W. Carl Kester and John M. Perlowski.
Trust Certification
The Trusts are listed for trading on the NYSE and have filed with the NYSE their annual chief executive officer certification regarding compliance with the NYSE’s listing standards. The Trusts filed with the SEC the certification of its chief executive officer and chief financial officer required by Section 302 of the Sarbanes-Oxley Act.
Environmental, Social and Governance (“ESG”) Integration
Although the Trusts do not seek to implement a specific sustainability objective, strategy or process unless otherwise disclosed, Trust management will consider ESG factors as part of the investment process for the Trusts. Trust management views ESG integration as the practice of incorporating financially material ESG data or information into investment processes with the objective of enhancing risk-adjusted returns. These ESG considerations will vary depending on the Trusts’ particular investment strategies and may include consideration of third-party research as well as consideration of proprietary BlackRock research across the ESG risks and opportunities regarding an issuer. The ESG characteristics utilized in the Trusts’ investment process are anticipated to evolve over time and one or more characteristics may not be relevant with respect to all issuers that are eligible for investment. Certain of these considerations may affect the Trusts’ exposure to certain companies or industries. While Trust management views ESG considerations as having the potential to contribute to the Trusts’ long-term performance, there is no guarantee that such results will be achieved.
Dividend Policy
Each Trust’s policy is to make monthly distributions to shareholders. In order to provide shareholders with a more stable level of dividend distributions, each Trust employs a managed distribution plan (the “Plan”), the goal of which is to provide shareholders with consistent and predictable cash flows by setting distribution rates based on expected long-term returns of each Trust.
The distributions paid by each Trust for any particular month may be more or less than the amount of net investment income earned by each Trust during such month. Furthermore, the final tax characterization of distributions is determined after the year-end of a Trust and is reported in each Trust’s annual report to shareholders. Distributions can be characterized as ordinary income, capital gains and/or return of capital. Each Trust’s taxable net investment income and net realized capital gains (“taxable income”) may not be sufficient to support the level of distributions paid. To the extent that distributions exceed the Trust’s current and accumulated earnings and profits, the excess may be treated as a non-taxable return of capital.
A return of capital is a return of a portion of an investor’s original investment. A return of capital is not expected to be taxable, but it reduces a shareholder’s tax basis in his or her shares, thus reducing any loss or increasing any gain on a subsequent disposition by the shareholder of his or her shares. It is possible that a substantial portion of the distributions paid during a calendar year may ultimately be classified as return of capital for U.S. federal income tax purposes when the final determination of the source and character of the distributions is made.
Such distributions, under certain circumstances, may exceed a Trust’s total return performance. When total distributions exceed total return performance for the period, the difference reduces the Trust’s total assets and net asset value (“NAV”) per share and, therefore, could have the effect of increasing the Trust’s expense ratio and reducing the amount of assets the Trust has available for long term investment.
General Information
The Trusts, other than BDJ, BME, BST and BUI, do not make available copies of their Statements of Additional Information because the Trusts’ shares, other than BDJ, BME, BST and BUI, are not continuously offered, which means that the Statement of Additional Information of each Trust, other than BDJ, BME, BST and BUI, has not been updated after completion of the respective Trust’s offerings and the information contained in each Trust’s Statement of Additional Information may have become outdated.
BDJ’s, BME’s, BST’s and BUI’s Statements of Additional Information include additional information about the Board and are available, without charge upon request by calling (800)882-0052.
| A D D I T I O N A L I N F O R M A T I O N |
223 |
Additional Information (continued)
General Information (continued)
The following information is a summary of certain changes since December 31, 2022. This information may not reflect all of the changes that have occurred since you purchased the relevant Trust.
Except if noted otherwise herein, there were no changes to the Trusts’ charters or by-laws that would delay or prevent a change of control of the Trusts that were not approved by the shareholders. Except if noted otherwise herein, there have been no changes in the persons who are primarily responsible for the day-to-day management of the Trusts’ portfolios.
In accordance with Section 23(c) of the Investment Company Act of 1940, each Trust may from time to time purchase shares of its common stock in the open market or in private transactions.
Quarterly performance, semi-annual and annual reports, current net asset value and other information regarding the Trusts may be found on BlackRock’s website, which can be accessed at blackrock.com. Any reference to BlackRock’s website in this report is intended to allow investors public access to information regarding the Trusts and does not, and is not intended to, incorporate BlackRock’s website in this report.
Electronic Delivery
Shareholders can sign up for e-mail notifications of quarterly statements, annual and semi-annual shareholder reports and, for BDJ, BME, BST and BUI only, prospectuses, by enrolling in the electronic delivery program. Electronic copies of shareholder reports and, for BDJ, BME, BST and BUI only, prospectuses, are available on BlackRock’s website.
To enroll in electronic delivery:
Shareholders Who Hold Accounts with Investment Advisers, Banks or Brokerages:
Please contact your financial adviser. Please note that not all investment advisers, banks or brokerages may offer this service.
Householding
The Trusts will mail only one copy of shareholder documents, including for BDJ, BME, BST and BUI only, prospectuses, annual and semi-annual reports, Rule 30e-3 notices and proxy statements, to shareholders with multiple accounts at the same address. This practice is commonly called “householding” and is intended to reduce expenses and eliminate duplicate mailings of shareholder documents. Mailings of your shareholder documents may be householded indefinitely unless you instruct us otherwise. If you do not want the mailing of these documents to be combined with those for other members of your household, please call the Trusts at (800) 882-0052.
Availability of Quarterly Schedule of Investments
The Trusts file their complete schedules of portfolio holdings with the SEC for the first and third quarters of each fiscal year as an exhibit to their reports on Form N-PORT. The Trusts’ Forms N-PORT are available on the SEC’s website at sec.gov. Additionally, each Trust makes its portfolio holdings for the first and third quarters of each fiscal year available at blackrock.com/fundreports.
Availability of Proxy Voting Policies, Procedures and Voting Records
A description of the policies and procedures that the Trusts use to determine how to vote proxies relating to portfolio securities and information about how the Trusts voted proxies relating to securities held in the Trusts’ portfolios during the most recent 12-month period ended June 30 is available without charge, upon request (1) by calling (800) 882-0052; (2) on the BlackRock website at blackrock.com; and (3) on the SEC’s website at sec.gov.
Availability of Trust Updates
BlackRock will update performance and certain other data for the Trusts on a monthly basis on its website in the “Closed-end Funds” section of blackrock.com as well as certain other material information as necessary from time to time. Investors and others are advised to check the website for updated performance information and the release of other material information about the Trusts. This reference to BlackRock’s website is intended to allow investors public access to information regarding the Trusts and does not, and is not intended to, incorporate BlackRock’s website in this report.
Shelf Offering Program
From time to time, BDJ, BME, BST and BUI may seek to raise additional equity capital through a Shelf Offering. In a Shelf Offering, BDJ, BME, BST and BUI may, subject to market conditions, raise additional equity capital by issuing new Common Shares from time to time in varying amounts at a net price at or above BDJ’s, BME’s, BST’s and BUI’s net asset value (“NAV”) per Common Share (calculated within 48 hours of pricing). While any such Shelf Offering may allow BDJ, BME, BST and BUI to pursue additional investment opportunities without the need to sell existing portfolio investments, it could also entail risks – including that the issuance of additional Common Shares may limit the extent to which the Common Shares are able to trade at a premium to NAV in the secondary market.
BDJ, BME, BST and BUI filed final prospectuses with the SEC in connection with its Shelf Offering on June 2, 2023, April 26, 2022, May 10, 2022 and March 10, 2022, respectively. This report and the prospectuses of BDJ, BME, BST and BUI are not offers to sell BDJ, BME, BST and BUI Common Shares or solicitations of an offer to buy BDJ, BME, BST and BUI Common Shares in any jurisdiction where such offers or sales are not permitted. The prospectuses of BDJ, BME, BST and BUI contains important
| 224 | 2 0 2 3 B L A C K R O C K A N N U A L R E P O R T T O S H A R E H O L D E R S |
Additional Information (continued)
information about BDJ, BME, BST and BUI, including their investment objectives, risks, charges and expenses. Investors are urged to read the prospectuses of BDJ, BME, BST and BUI carefully and in their entirety before investing. Copies of the final prospectuses for BDJ, BME, BST and BUI can be obtained from BlackRock at blackrock.com.
BlackRock Privacy Principles
BlackRock is committed to maintaining the privacy of its current and former fund investors and individual clients (collectively, “Clients”) and to safeguarding their non-public personal information. The following information is provided to help you understand what personal information BlackRock collects, how we protect that information and why in certain cases we share such information with select parties.
If you are located in a jurisdiction where specific laws, rules or regulations require BlackRock to provide you with additional or different privacy-related rights beyond what is set forth below, then BlackRock will comply with those specific laws, rules or regulations.
BlackRock obtains or verifies personal non-public information from and about you from different sources, including the following: (i) information we receive from you or, if applicable, your financial intermediary, on applications, forms or other documents; (ii) information about your transactions with us, our affiliates, or others; (iii) information we receive from a consumer reporting agency; and (iv) from visits to our websites.
BlackRock does not sell or disclose to non-affiliated third parties any non-public personal information about its Clients, except as permitted by law or as is necessary to respond to regulatory requests or to service Client accounts. These non-affiliated third parties are required to protect the confidentiality and security of this information and to use it only for its intended purpose.
We may share information with our affiliates to service your account or to provide you with information about other BlackRock products or services that may be of interest to you. In addition, BlackRock restricts access to non-public personal information about its Clients to those BlackRock employees with a legitimate business need for the information. BlackRock maintains physical, electronic and procedural safeguards that are designed to protect the non-public personal information of its Clients, including procedures relating to the proper storage and disposal of such information.
Trust and Service Providers
| Investment Adviser |
(a) For BGR, BOE, BGY, BCX and BUI. | |
| BlackRock Advisors, LLC |
(b) For BDJ, BME, BST and BUI. | |
| Wilmington, DE 19809 |
||
| Independent Registered Public Accounting Firm | ||
| Sub-Adviser |
Deloitte & Touche LLP | |
| BlackRock International Limited(a) |
Boston, MA 02116 | |
| Edinburgh, EH3 8BL |
||
| United Kingdom |
Legal Counsel | |
| Willkie Farr & Gallagher LLP | ||
| Accounting Agent and Custodian |
New York, NY 10019 | |
| State Street Bank and Trust Company |
||
| Boston, MA 02114 |
Address of the Trusts | |
| 100 Bellevue Parkway | ||
| Transfer Agent |
Wilmington, DE 19809 | |
| Computershare Trust Company, N.A. |
||
| Canton, MA 02021 |
||
| Distributor |
||
| BlackRock Investments, LLC(b) |
||
| New York, NY 10001 |
||
| A D D I T I O N A L I N F O R M A T I O N |
225 |
Glossary of Terms Used in this Report
| Currency Abbreviation | ||
| AUD | Australian Dollar | |
| BRL | Brazilian Real | |
| CAD | Canadian Dollar | |
| CHF | Swiss Franc | |
| DKK | Danish Krone | |
| EUR | Euro | |
| GBP | British Pound | |
| HKD | Hong Kong Dollar | |
| JPY | Japanese Yen | |
| KRW | South Korean Won | |
| MXN | Mexican Peso | |
| NOK | Norwegian Krone | |
| SEK | Swedish Krona | |
| SGD | Singapore Dollar | |
| TWD | New Taiwan Dollar | |
| USD | United States Dollar | |
| Portfolio Abbreviation | ||
| ADR | American Depositary Receipt | |
| CVR | Contingent Value Right | |
| GDR | Global Depositary Receipt | |
| JSC | Joint Stock Company | |
| LP | Limited Partnership | |
| PJSC | Public Joint Stock Company | |
| REIT | Real Estate Investment Trust | |
| S&P | Standard & Poor’s | |
| SAB | Special Assessment Bonds | |
| 226 | 2 0 2 3 B L A C K R O C K A N N U A L R E P O R T T O S H A R E H O L D E R S |
THIS PAGE INTENTIONALLY LEFT BLANK.
Want to know more?
blackrock.com | 800-882-0052
This report is intended for current holders. It is not a prospectus. Past performance results shown in this report should not be considered a representation of future performance. Statements and other information herein are as dated and are subject to change.
CEF-BK9-12/23-AR
|
|
|
(b) Not Applicable
| Item 3 – | Audit Committee Financial Expert – The registrant’s board of directors (the “board of directors”), has determined that (i) the registrant has the following audit committee financial experts serving on its audit committee and (ii) each audit committee financial expert is independent: |
Frank J. Fabozzi
Lorenzo A. Flores
Catherine A. Lynch
Under applicable securities laws, a person determined to be an audit committee financial expert will not be deemed an “expert” for any purpose, including without limitation for the purposes of Section 11 of the Securities Act of 1933, as a result of being designated or identified as an audit committee financial expert. The designation or identification of a person as an audit committee financial expert does not impose on such person any duties, obligations, or liabilities greater than the duties, obligations, and liabilities imposed on such person as a member of the audit committee and board of directors in the absence of such designation or identification. The designation or identification of a person as an audit committee financial expert does not affect the duties, obligations, or liability of any other member of the audit committee or board of directors.
| Item 4 – | Principal Accountant Fees and Services |
The following table presents fees billed by Deloitte & Touche LLP (“D&T”) in each of the last two fiscal years for the services rendered to the Fund:
| (a) Audit Fees |
(b) Audit-Related Fees1 |
(c) Tax Fees2 | (d) All Other Fees3 | |||||||||||||
| Entity Name |
Current End |
Previous End |
Current End |
Previous End |
Current End |
Previous End |
Current End |
Previous End | ||||||||
| BlackRock Energy and Resources Trust |
$37,944 | $36,516 | $0 | $0 | $17,648 | $16,200 | $407 | $431 | ||||||||
The following table presents fees billed by D&T that were required to be approved by the registrant’s audit committee (the “Committee”) for services that relate directly to the operations or financial reporting of the Fund and that are rendered on behalf of BlackRock Advisors, LLC ( the “Investment Adviser” or “BlackRock”) and entities controlling, controlled by, or under common control with BlackRock (not including any sub-adviser whose role is primarily portfolio management and is subcontracted with or overseen by another investment adviser) that provide ongoing services to the Fund (“Affiliated Service Providers”):
2
| Current Fiscal Year End | Previous Fiscal Year End | |||
| (b) Audit-Related Fees1 |
$0 | $0 | ||
| (c) Tax Fees2 |
$0 | $0 | ||
| (d) All Other Fees3 |
$2,154,000 | $2,098,000 |
1 The nature of the services includes assurance and related services reasonably related to the performance of the audit or review of financial statements not included in Audit Fees, including accounting consultations, agreed-upon procedure reports, attestation reports, comfort letters, out-of-pocket expenses and internal control reviews not required by regulators.
2 The nature of the services includes tax compliance and/or tax preparation, including services relating to the filing or amendment of federal, state or local income tax returns, regulated investment company qualification reviews, taxable income and tax distribution calculations.
3 Non-audit fees of $2,154,000 and $2,098,000 for the current fiscal year and previous fiscal year, respectively, were paid to the Fund’s principal accountant in their entirety by BlackRock, in connection with services provided to the Affiliated Service Providers of the Fund and of certain other funds sponsored and advised by BlackRock or its affiliates for a service organization review and an accounting research tool subscription. These amounts represent aggregate fees paid by BlackRock and were not allocated on a per fund basis.
(e)(1) Audit Committee Pre-Approval Policies and Procedures:
The Committee has adopted policies and procedures with regard to the pre-approval of services. Audit, audit-related and tax compliance services provided to the registrant on an annual basis require specific pre-approval by the Committee. The Committee also must approve other non-audit services provided to the registrant and those non-audit services provided to the Investment Adviser and Affiliated Service Providers that relate directly to the operations and the financial reporting of the registrant. Certain of these non-audit services that the Committee believes are (a) consistent with the SEC’s auditor independence rules and (b) routine and recurring services that will not impair the independence of the independent accountants may be approved by the Committee without consideration on a specific case-by-case basis (“general pre-approval”). The term of any general pre-approval is 12 months from the date of the pre-approval, unless the Committee provides for a different period. Tax or other non-audit services provided to the registrant which have a direct impact on the operations or financial reporting of the registrant will only be deemed pre-approved provided that any individual project does not exceed $10,000 attributable to the registrant or $50,000 per project. For this purpose, multiple projects will be aggregated to determine if they exceed the previously mentioned cost levels.
Any proposed services exceeding the pre-approved cost levels will require specific pre-approval by the Committee, as will any other services not subject to general pre-approval (e.g., unanticipated but permissible services). The Committee is informed of each service approved subject to general pre-approval at the next regularly scheduled in-person board meeting. At this meeting, an analysis of such services is presented to the Committee for ratification. The Committee may delegate to the Committee Chairman the authority to approve the provision of and fees for any specific engagement of permitted non-audit services, including services exceeding pre-approved cost levels.
(e)(2) None of the services described in each of Items 4(b) through (d) were approved by the Committee pursuant to the de minimis exception in paragraph (c)(7)(i)(C) of Rule 2-01 of Regulation S-X.
(f) Not Applicable
(g) The aggregate non-audit fees, defined as the sum of the fees shown under “Audit-Related Fees,”
3
“Tax Fees” and “All Other Fees,” paid to the accountant for services rendered by the accountant to the registrant, the Investment Adviser and the Affiliated Service Providers were:
| Entity Name |
Current Fiscal Year End |
Previous Fiscal End |
||||
| BlackRock Energy and Resources Trust |
$18,055 | $16,631 |
Additionally, the amounts billed by D&T in connection with services provided to the Affiliated Service Providers of the Fund and of other funds sponsored or advised by BlackRock or its affiliates during the current and previous fiscal years for a service organization review and an accounting research tool subscription were:
| Current Fiscal Year End |
Previous Fiscal Year End | |
|
$2,154,000 |
$2,098,000 |
These amounts represent aggregate fees paid by BlackRock and were not allocated on a per fund basis.
(h) The Committee has considered and determined that the provision of non-audit services that were rendered to the Investment Adviser, and the Affiliated Service Providers that were not pre-approved pursuant to paragraph (c)(7)(ii) of Rule 2-01 of Regulation S-X is compatible with maintaining the principal accountant’s independence.
(i) – Not Applicable
(j) – Not Applicable
| Item 5 – | Audit Committee of Listed Registrants |
(a) The following individuals are members of the registrant’s separately designated standing audit committee established in accordance with Section 3(a)(58)(A) of the Securities Exchange Act of 1934 (15 U.S.C. 78c(a)(58)(A)):
Frank J. Fabozzi
Lorenzo A. Flores
J. Phillip Holloman
Catherine A. Lynch
(b) Not Applicable
| Item 6 – | Investments |
(a) The registrant’s Schedule of Investments is included as part of the Report to Stockholders filed under Item 1(a) of this Form.
4
(b) Not Applicable due to no such divestments during the semi-annual period covered since the previous Form N-CSR filing.
| Item 7 – | Disclosure of Proxy Voting Policies and Procedures for Closed-End Management Investment Companies – The board of directors has delegated the voting of proxies for the Fund’s portfolio securities to the Investment Adviser pursuant to the Investment Adviser’s proxy voting guidelines. Under these guidelines, the Investment Adviser will vote proxies related to Fund securities in the best interests of the Fund and its stockholders. From time to time, a vote may present a conflict between the interests of the Fund’s stockholders, on the one hand, and those of the Investment Adviser, or any affiliated person of the Fund or the Investment Adviser, on the other. In such event, provided that the Investment Adviser’s Equity Investment Policy Oversight Committee, or a sub-committee thereof (the “Oversight Committee”) is aware of the real or potential conflict or material non-routine matter and if the Oversight Committee does not reasonably believe it is able to follow its general voting guidelines (or if the particular proxy matter is not addressed in the guidelines) and vote impartially, the Oversight Committee may retain an independent fiduciary to advise the Oversight Committee on how to vote or to cast votes on behalf of the Investment Adviser’s clients. If the Investment Adviser determines not to retain an independent fiduciary, or does not desire to follow the advice of such independent fiduciary, the Oversight Committee shall determine how to vote the proxy after consulting with the Investment Adviser’s Portfolio Management Group and/or the Investment Adviser’s Legal and Compliance Department and concluding that the vote cast is in its client’s best interest notwithstanding the conflict. A copy of the Fund’s Proxy Voting Policy and Procedures are attached as Exhibit 99.PROXYPOL, a copy of the Fund’s Global Corporate Governance & Engagement Principles are attached as Exhibit 99.GLOBAL.CORP.GOV and a copy of the Fund’s Corporate Governance and Proxy Voting Guidelines for U.S. Securities are attached as Exhibit 99.US.CORP.GOV. Information on how the Fund voted proxies relating to portfolio securities during the most recent 12-month period ended June 30 is available without charge, (i) at www.blackrock.com and (ii) on the SEC’s website at http://www.sec.gov. |
| Item 8 – | Portfolio Managers of Closed-End Management Investment Companies |
(a)(1) As of the date of filing this Report:
The registrant is managed by a team of investment professionals comprised of Kyle G. McClements, CFA, Managing Director at BlackRock, Christopher Accettella, Director at BlackRock, Alastair Bishop, Managing Director at BlackRock and Mark Hume, Managing Director at BlackRock. Messrs. McClements, Accettella, Bishop and Hume are the Fund’s portfolio managers and are responsible for the day-to-day management of the Fund’s portfolio and the selection of its investments. Messrs. McClements and Accettella have been members of the Fund’s portfolio management team since 2012. Messrs. Bishop and Hume have been members of the Fund’s portfolio management team since 2015 and 2018, respectively.
| Portfolio Manager
|
Biography
| |
| Kyle G. McClements, CFA | Managing Director of BlackRock since 2009; Director of BlackRock from 2006 to 2008; Vice President of BlackRock in 2005; Vice President of State Street Research & Management from 2004 to 2005. | |
5
| Christopher Accettella | Director of BlackRock since 2008; Vice President of BlackRock, Inc. from 2005 to 2008. | |
| Alastair Bishop | Managing Director of BlackRock since 2019; Director of BlackRock from 2010 to 2018. | |
| Mark Hume | Managing Director of BlackRock since2023; Director of BlackRock from 2017 to 2022; Portfolio Manager at Colonial First State Global Asset Management from 2010 to 2017; Senior Director of Bank of America Merrill Lynch from 2008 to 2010. | |
(a)(2) As of December 31, 2023:
| (ii) Number of Other Accounts Managed and Assets by Account Type |
(iii)
Number of Other Accounts and Assets for Which Advisory Fee is Performance-Based | |||||||||||
| (i) Name of Portfolio Manager |
Other Registered Investment Companies |
Other Pooled Investment Vehicles |
Other Accounts |
Other Registered Investment Companies |
Other Pooled Investment Vehicles |
Other Accounts | ||||||
| Kyle McClements, CFA |
16 | 11 | 1 | 0 | 0 | 0 | ||||||
| $15.68 Billion | $2.55 Billion | $469.5 Million | $0 | $0 | $0 | |||||||
| Christopher Accettella |
16 | 7 | 0 | 0 | 0 | 0 | ||||||
| $15.68 Billion | $1.94 Billion | $0 | $0 | $0 | $0 | |||||||
| Alastair Bishop |
7 | 13 | 3 | 0 | 1 | 0 | ||||||
| $3.09 Billion | $11.97 Billion | $38.54 Million | $0 | $0.04 Million | $0 | |||||||
| Mark Hume |
1 | 2 | 0 | 0 | 0 | 0 | ||||||
| $313.9 Million | $3.07 Billion | $0 | $0 | $0 | $0 | |||||||
(iv) Portfolio Manager Potential Material Conflicts of Interest
BlackRock has built a professional working environment, firm-wide compliance culture and compliance procedures and systems designed to protect against potential incentives that may favor one account over another. BlackRock has adopted policies and procedures that address the allocation of investment opportunities, execution of portfolio transactions, personal trading by employees and other potential conflicts of interest that are designed to ensure that all client accounts are treated equitably over time. Nevertheless, BlackRock furnishes investment management and advisory services to numerous clients in addition to the Fund, and BlackRock may, consistent with applicable law, make investment recommendations to other clients or accounts (including accounts which are hedge funds or have performance or higher fees paid to BlackRock, or in which portfolio managers have a personal interest in the receipt of such fees), which may be the same as or different from those made to the Fund. In addition, BlackRock, Inc., its affiliates and significant shareholders and any officer, director, shareholder or employee may or may not have an interest in the securities whose purchase and sale BlackRock recommends to the Fund. BlackRock, Inc., or any of its affiliates or significant shareholders, or any officer, director, shareholder, employee or any member of their families may take different actions than those recommended to the Fund by BlackRock with respect to the same securities. Moreover, BlackRock may refrain from rendering any advice or services concerning securities of companies of which any of BlackRock, Inc.’s (or its affiliates’ or significant shareholders’) officers, directors or employees are directors or officers, or companies as to which BlackRock, Inc. or any of its affiliates or significant shareholders or the officers, directors and employees of any of them has any substantial economic interest or possesses material non-public information. Certain portfolio managers also may manage accounts whose investment strategies may
6
at times be opposed to the strategy utilized for a fund. It should also be noted that Messrs. Bishop and Hume may be managing hedge fund and/or long only accounts, or may be part of a team managing hedge fund and/or long only accounts, subject to incentive fees. Messrs. Bishop and Hume may therefore be entitled to receive a portion of any incentive fees earned on such accounts.
As a fiduciary, BlackRock owes a duty of loyalty to its clients and must treat each client fairly. When BlackRock purchases or sells securities for more than one account, the trades must be allocated in a manner consistent with its fiduciary duties. BlackRock attempts to allocate investments in a fair and equitable manner among client accounts, with no account receiving preferential treatment. To this end, BlackRock, Inc. has adopted policies that are intended to ensure reasonable efficiency in client transactions and provide BlackRock with sufficient flexibility to allocate investments in a manner that is consistent with the particular investment discipline and client base, as appropriate.
(a)(3) As of December 31, 2023:
Portfolio Manager Compensation Overview
The discussion below describes the portfolio managers’ compensation as of December 31, 2023.
BlackRock’s financial arrangements with its portfolio managers, its competitive compensation and its career path emphasis at all levels reflect the value senior management places on key resources. Compensation may include a variety of components and may vary from year to year based on a number of factors. The principal components of compensation include a base salary, a performance-based discretionary bonus, participation in various benefits programs and one or more of the incentive compensation programs established by BlackRock.
Base Compensation. Generally, portfolio managers receive base compensation based on their position with the firm.
Discretionary Incentive Compensation – Messrs. Bishop and Hume
Generally, discretionary incentive compensation for Fundamental Equities portfolio managers is based on a formulaic compensation program. BlackRock’s formulaic portfolio manager compensation program is based on team revenue and pre-tax investment performance relative to appropriate competitors or benchmarks over 1-, 3- and 5-year performance periods, as applicable. In most cases, these benchmarks are the same as the benchmark or benchmarks against which the performance of the funds or other accounts managed by the portfolio managers are measured. BlackRock’s Chief Investment Officers determine the benchmarks or rankings against which the performance of funds and other accounts managed by each portfolio management team is compared and the period of time over which performance is evaluated. With respect to these portfolio managers, such benchmarks for the Fund and other accounts are: Bloomberg Commodity Index Total Return; FTSE Gold Mines Index (Gross Total Return); FTSE Gold Mining Index - expressed in JPY; FTSE Gold Mining Index - GBP Price; LIBOR 3 Month Index; MSCI 10/40 DW Energy (Net); MSCI ACWI Metals & Mining 30% Buffer 10/40 (1994) GBP Net TR; MSCI ACWI Metals & Mining 30% Buffer 10/40 (1994) USD Net TR; MSCI World Energy Net Daily TR Index; NYSE Arca Gold Miners Index EUR Net Total Return; S&P Global Natural Resources Index; S&P Global Natural Resources Index - In GBP; S&P Global Natural Resources Net Return.
7
A smaller element of portfolio manager discretionary compensation may include consideration of: financial results, expense control, profit margins, strategic planning and implementation, quality of client service, market share, corporate reputation, capital allocation, compliance and risk control, leadership, technology and innovation. These factors are considered collectively by BlackRock management and the relevant Chief Investment Officers.
Discretionary Incentive Compensation - Messrs. Accettella and McClements
Discretionary incentive compensation is a function of several components: the performance of BlackRock, Inc., the performance of the portfolio manager’s group within BlackRock, the investment performance, including risk-adjusted returns, of the firm’s assets or strategies under management or supervision by that portfolio manager, and/or the individual’s performance and contribution to the overall performance of these portfolios and BlackRock. Among other things, BlackRock’s Chief Investment Officers make a subjective determination with respect to each portfolio manager’s compensation based on the performance of the funds, other accounts or strategies managed by each portfolio manager. Performance is generally measured on a pre-tax basis over various time periods including 1-, 3- and 5- year periods, as applicable. The performance of some funds, other accounts or strategies may not be measured against a specific benchmark.
Distribution of Discretionary Incentive Compensation. Discretionary incentive compensation is distributed to portfolio managers in a combination of cash, deferred BlackRock, Inc. stock awards, and/or deferred cash awards that notionally track the return of certain BlackRock investment products.
Portfolio managers receive their annual discretionary incentive compensation in the form of cash. Portfolio managers whose total compensation is above a specified threshold also receive deferred BlackRock, Inc. stock awards annually as part of their discretionary incentive compensation. Paying a portion of discretionary incentive compensation in the form of deferred BlackRock, Inc. stock puts compensation earned by a portfolio manager for a given year “at risk” based on BlackRock’s ability to sustain and improve its performance over future periods. In some cases, additional deferred BlackRock, Inc. stock may be granted to certain key employees as part of a long-term incentive award to aid in retention, align interests with long-term shareholders and motivate performance. Deferred BlackRock, Inc. stock awards are generally granted in the form of BlackRock, Inc. restricted stock units that vest pursuant to the terms of the applicable plan and, once vested, settle in BlackRock, Inc. common stock. The portfolio managers of this Fund have deferred BlackRock, Inc. stock awards.
For certain portfolio managers, a portion of the discretionary incentive compensation is also distributed in the form of deferred cash awards that notionally track the returns of select BlackRock investment products they manage, which provides direct alignment of portfolio manager discretionary incentive compensation with investment product results. Deferred cash awards vest ratably over a number of years and, once vested, settle in the form of cash. Only portfolio managers who manage specified products and whose total compensation is above a specified threshold are eligible to participate in the deferred cash award program.
Other Compensation Benefits. In addition to base salary and discretionary incentive compensation, portfolio managers may be eligible to receive or participate in one or more of the following:
Incentive Savings Plans — BlackRock, Inc. has created a variety of incentive savings plans in which BlackRock, Inc. employees are eligible to participate, including a 401(k) plan, the BlackRock
8
Retirement Savings Plan (RSP), and the BlackRock Employee Stock Purchase Plan (ESPP). The employer contribution components of the RSP include a company match equal to 50% of the first 8% of eligible pay contributed to the plan capped at $5,000 per year, and a company retirement contribution equal to 3-5% of eligible compensation up to the Internal Revenue Service limit ($330,000 for 2023). The RSP offers a range of investment options, including registered investment companies and collective investment funds managed by the firm. BlackRock, Inc. contributions follow the investment direction set by participants for their own contributions or, absent participant investment direction, are invested into a target date fund that corresponds to, or is closest to, the year in which the participant attains age 65. The ESPP allows for investment in BlackRock, Inc. common stock at a 5% discount on the fair market value of the stock on the purchase date. Annual participation in the ESPP is limited to the purchase of 1,000 shares of common stock or a dollar value of $25,000 based on its fair market value on the purchase date. Messrs. Accettella and McClements are eligible to participate in these plans.
United Kingdom-based portfolio managers are also eligible to participate in broad-based plans offered generally to BlackRock employees, including broad-based retirement, health and other employee benefit plans. For example, BlackRock has created a variety of incentive savings plans in which BlackRock employees are eligible to participate, including the BlackRock Retirement Savings Plan (RSP) and the BlackRock Employee Stock Purchase Plan (ESPP). The employer contribution to the RSP is between 10% and 15% of eligible pay capped at £160,000 per annum. The RSP offers a range of investment options, including several collective investment funds managed by the firm. BlackRock contributions follow the investment direction set by participants for their own contributions or, in the absence of an investment election being made, are invested into a target date fund that corresponds to, or is closest to, the year in which the participant attains age 65. The ESPP allows for investment in BlackRock common stock at a 5% discount on the fair market value of the stock on the purchase date. Annual participation in the ESPP is limited to the purchase of 1,000 shares of common stock or a US dollar value of $25,000 based on its fair market value on the purchase date. Messrs. Bishop and Hume are eligible to participate in these plans.
(a)(4) Beneficial Ownership of Securities – As of December 31, 2023.
| Portfolio Manager |
Dollar Range of Equity Securities of the Fund Beneficially Owned | |
| Kyle G. McClements, CFA |
$50,001 - $100,000 | |
| Christopher Accettella |
$10,001 - $50,000 | |
| Alastair Bishop |
$100,001 - $500,000 | |
| Mark Hume |
$10,001 - $50,000 |
(b) Not Applicable
| Item 9 – | Purchases of Equity Securities by Closed-End Management Investment Company and Affiliated Purchasers |
| Period | (a) Total Number of Shares Purchased1 |
(b) Average Price Paid per Share |
(c) Total Number of Shares Purchased as Part of Publicly Announced Plans or Programs1 |
(d) Maximum Number of Shares that May Yet Be Purchased Under the Plans or Programs1 | ||||
| July 1-31, 2023 |
59,820 | $12.2954 | 59,820 | 1,038,798 |
9
| August 1-31, 2023 |
92,409 | $12.6909 | 92,409 | 946,389 | ||||
| September 1-30, 2023 |
61,905 | $13.1858 | 61,905 | 884,484 | ||||
| October 1-31, 2023 |
71,757 | $12.7283 | 71,757 | 812,727 | ||||
| November 1-30, 2023 |
77,044 | $12.6803 | 77,044 | 735,683 | ||||
| December 1-31, 2023 |
0 | $ — | 0 | 1,373,249 | ||||
| Total: |
362,935 | 12.7153 | 362,935 | 1,373,249 |
1 On September 8, 2022, the Fund announced a continuation of its open market share repurchase program. Commencing on December 1, 2022, the Fund may repurchase through November 30, 2023, up to 5% of its common shares outstanding as of the close of business on November 30, 2022, subject to certain conditions. On November 15, 2023, the Fund announced a further continuation of its open market share repurchase program. Commencing on December 1, 2023, the Fund may repurchase through November 30, 2024, up to 5% of its common shares outstanding as of the close of business on November 30, 2023, subject to certain conditions
| Item 10 – | Submission of Matters to a Vote of Security Holders – There have been no material changes to these procedures. |
| Item 11 – | Controls and Procedures |
(a) The registrant’s principal executive and principal financial officers, or persons performing similar functions, have concluded that the registrant’s disclosure controls and procedures (as defined in Rule 30a-3(c) under the Investment Company Act of 1940, as amended (the “1940 Act”)) are effective as of a date within 90 days of the filing of this report based on the evaluation of these controls and procedures required by Rule 30a-3(b) under the 1940 Act and Rule 13a-15(b) under the Securities Exchange Act of 1934, as amended.
(b) There were no changes in the registrant’s internal control over financial reporting (as defined in Rule 30a-3(d) under the 1940 Act) that occurred during the period covered by this report that have materially affected, or are reasonably likely to materially affect, the registrant’s internal control over financial reporting.
| Item 12 – | Disclosure of Securities Lending Activities for Closed-End Management Investment Companies – Not Applicable |
| Item 13 – | Recovery of Erroneously Awarded Compensation – Not Applicable |
| Item 14 – | Exhibits attached hereto |
(a)(1) Code of Ethics – See Item 2
(a)(2) Section 302 Certifications are attached
(a)(3) Any written solicitation to purchase securities under Rule 23c-1 – Not Applicable
(a)(4) Change in Registrant’s independent public accountant – Not Applicable
10
(b) Section 906 Certifications are attached
|
| ||
| 1 The Fund has received exemptive relief from the Securities and Exchange Commission permitting it to make periodic distributions of long-term capital gains with respect to its outstanding common stock as frequently as twelve times each year, and as frequently as distributions are specified by or in accordance with the terms of its outstanding preferred stock. This relief is conditioned, in part, on an undertaking by the Fund to make the disclosures to the holders of the Fund’s common shares, in addition to the information required by Section 19(a) of the 1940 Act and Rule 19a-1 thereunder. The Fund is likewise obligated to file with the SEC the information contained in any such notice to shareholders and, in that regard, has attached hereto copies of each such notice made during the period. |
11
Pursuant to the requirements of the Securities Exchange Act of 1934 and the Investment Company Act of 1940, the registrant has duly caused this report to be signed on its behalf by the undersigned, thereunto duly authorized.
BlackRock Energy and Resources Trust
| By: |
/s/ John M. Perlowski | |||
| John M. Perlowski | ||||
| Chief Executive Officer (principal executive officer) of | ||||
| BlackRock Energy and Resources Trust |
Date: February 23, 2024
Pursuant to the requirements of the Securities Exchange Act of 1934 and the Investment Company Act of 1940, this report has been signed below by the following persons on behalf of the registrant and in the capacities and on the dates indicated.
| By: |
/s/ John M. Perlowski | |||
| John M. Perlowski | ||||
| Chief Executive Officer (principal executive officer) of | ||||
| BlackRock Energy and Resources Trust |
Date: February 23, 2024
| By: |
/s/ Trent Walker | |||
| Trent Walker | ||||
| Chief Financial Officer (principal financial officer) of | ||||
| BlackRock Energy and Resources Trust |
Date: February 23, 2024
11
EX-99. CERT
CERTIFICATION PURSUANT TO RULE 30a-2(a) UNDER THE 1940 ACT AND SECTION 302 OF THE
SARBANES-OXLEY ACT OF 2002
I, John M. Perlowski, Chief Executive Officer (principal executive officer) of BlackRock Energy and Resources Trust, certify that:
1. I have reviewed this report on Form N-CSR of BlackRock Energy and Resources Trust;
2. Based on my knowledge, this report does not contain any untrue statement of a material fact or omit to state a material fact necessary to make the statements made, in light of the circumstances under which such statements were made, not misleading with respect to the period covered by this report;
3. Based on my knowledge, the financial statements, and other financial information included in this report, fairly present in all material respects the financial condition, results of operations, changes in net assets, and cash flows (if the financial statements are required to include a statement of cash flows) of the registrant as of, and for, the periods presented in this report;
4. The registrant’s other certifying officer(s) and I are responsible for establishing and maintaining disclosure controls and procedures (as defined in Rule 30a-3(c) under the Investment Company Act of 1940) and internal control over financial reporting (as defined in Rule 30a-3(d) under the Investment Company Act of 1940) for the registrant and have:
a) designed such disclosure controls and procedures, or caused such disclosure controls and procedures to be designed under our supervision, to ensure that material information relating to the registrant, including its consolidated subsidiaries, is made known to us by others within those entities, particularly during the period in which this report is being prepared;
b) designed such internal control over financial reporting, or caused such internal control over financial reporting to be designed under our supervision, to provide reasonable assurance regarding the reliability of financial reporting and the preparation of financial statements for external purposes in accordance with generally accepted accounting principles;
c) evaluated the effectiveness of the registrant’s disclosure controls and procedures and presented in this report our conclusions about the effectiveness of the disclosure controls and procedures, as of a date within 90 days prior to the filing date of this report based on such evaluation; and
d) disclosed in this report any change in the registrant’s internal control over financial reporting that occurred during the period covered by this report that has materially affected, or is reasonably likely to materially affect, the registrant’s internal control over financial reporting; and
5. The registrant’s other certifying officer(s) and I have disclosed to the registrant’s auditors and the audit committee of the registrant’s board of directors (or persons performing the equivalent functions):
a) all significant deficiencies and material weaknesses in the design or operation of internal control over financial reporting which are reasonably likely to adversely affect the registrant’s ability to record, process, summarize, and report financial information; and
b) any fraud, whether or not material, that involves management or other employees who have a significant role in the registrant’s internal control over financial reporting.
| Date: February 23, 2024 |
| /s/ John M. Perlowski |
| John M. Perlowski |
| Chief Executive Officer (principal executive officer) of |
| BlackRock Energy and Resources Trust |
EX-99. CERT
CERTIFICATION PURSUANT TO RULE 30a-2(a) UNDER THE 1940 ACT AND SECTION 302 OF THE
SARBANES-OXLEY ACT OF 2002
I, Trent Walker, Chief Financial Officer (principal financial officer) of BlackRock Energy and Resources Trust, certify that:
1. I have reviewed this report on Form N-CSR of BlackRock Energy and Resources Trust;
2. Based on my knowledge, this report does not contain any untrue statement of a material fact or omit to state a material fact necessary to make the statements made, in light of the circumstances under which such statements were made, not misleading with respect to the period covered by this report;
3. Based on my knowledge, the financial statements, and other financial information included in this report, fairly present in all material respects the financial condition, results of operations, changes in net assets, and cash flows (if the financial statements are required to include a statement of cash flows) of the registrant as of, and for, the periods presented in this report;
4. The registrant’s other certifying officer(s) and I are responsible for establishing and maintaining disclosure controls and procedures (as defined in Rule 30a-3(c) under the Investment Company Act of 1940) and internal control over financial reporting (as defined in Rule 30a-3(d) under the Investment Company Act of 1940) for the registrant and have:
a) designed such disclosure controls and procedures, or caused such disclosure controls and procedures to be designed under our supervision, to ensure that material information relating to the registrant, including its consolidated subsidiaries, is made known to us by others within those entities, particularly during the period in which this report is being prepared;
b) designed such internal control over financial reporting, or caused such internal control over financial reporting to be designed under our supervision, to provide reasonable assurance regarding the reliability of financial reporting and the preparation of financial statements for external purposes in accordance with generally accepted accounting principles;
c) evaluated the effectiveness of the registrant’s disclosure controls and procedures and presented in this report our conclusions about the effectiveness of the disclosure controls and procedures, as of a date within 90 days prior to the filing date of this report based on such evaluation; and
d) disclosed in this report any change in the registrant’s internal control over financial reporting that occurred during the period covered by this report that has materially affected, or is reasonably likely to materially affect, the registrant’s internal control over financial reporting; and
5. The registrant’s other certifying officer(s) and I have disclosed to the registrant’s auditors and the audit committee of the registrant’s board of directors (or persons performing the equivalent functions):
a) all significant deficiencies and material weaknesses in the design or operation of internal control over financial reporting which are reasonably likely to adversely affect the registrant’s ability to record, process, summarize, and report financial information; and
b) any fraud, whether or not material, that involves management or other employees who have a significant role in the registrant’s internal control over financial reporting.
| Date: February 23, 2024 |
| /s/ Trent Walker |
| Trent Walker |
| Chief Financial Officer (principal financial officer) of |
| BlackRock Energy and Resources Trust |
Exhibit 99.906CERT
Certification Pursuant to Rule 30a-2(b) under the 1940 Act and
Section 906 of the Sarbanes-Oxley Act of 2002
Pursuant to 18 U.S.C. § 1350, the undersigned officer of BlackRock Energy and Resources Trust (the “Registrant”), hereby certifies, to the best of his knowledge, that the Registrant’s Report on Form N-CSR for the period ended December 31, 2023 (the “Report”) fully complies with the requirements of Section 13(a) of the Securities Exchange Act of 1934, as amended, and that the information contained in the Report fairly presents, in all material respects, the financial condition and results of operations of the Registrant.
Date: February 23, 2024
/s/ John M. Perlowski
John M. Perlowski
Chief Executive Officer (principal executive officer) of
BlackRock Energy and Resources Trust
Pursuant to 18 U.S.C. § 1350, the undersigned officer of BlackRock Energy and Resources Trust (the “Registrant”), hereby certifies, to the best of his knowledge, that the Registrant’s Report on Form N-CSR for the period ended December 31, 2023 (the “Report”) fully complies with the requirements of Section 13(a) of the Securities Exchange Act of 1934, as amended, and that the information contained in the Report fairly presents, in all material respects, the financial condition and results of operations of the Registrant.
Date: February 23, 2024
/s/ Trent Walker
Trent Walker
Chief Financial Officer (principal financial officer) of
BlackRock Energy and Resources Trust
This certification is being furnished pursuant to Rule 30a-2(b) under the Investment Company Act of 1940, as amended, and 18 U.S.C. § 1350 and is not being filed as part of the Form N-CSR with the Securities and Exchange Commission.
Closed-End Fund Proxy Voting Policy
August 1, 2021

| Closed-End Fund Proxy Voting Policy
Procedures Governing Delegation of Proxy Voting to Fund Adviser
|
| Effective Date: August 1, 2021 Last Review Date: August 25, 2023 |
|
Applies to the following types of Funds registered under the 1940 Act: |
|
☐ Open-End Mutual Funds (including money market funds) |
|
☐ Money Market Funds |
|
☐ Exchange-Traded Funds |
|
☒ Closed-End Funds |
|
☐ Other |
Objective and Scope
Set forth below is the Closed-End Fund Proxy Voting Policy.
Policy / Document Requirements and Statements
The Boards of Trustees/Directors (the “Directors”) of the closed-end funds advised by BlackRock Advisors, LLC (“BlackRock”), (the “Funds”) have the responsibility for the oversight of voting proxies relating to portfolio securities of the Funds, and have determined that it is in the best interests of the Funds and their shareholders to delegate that responsibility to BlackRock as part of BlackRock’s authority to manage, acquire and dispose of account assets, all as contemplated by the Funds’ respective investment management agreements.
BlackRock has adopted guidelines and procedures (together and as from time to time amended, the “BlackRock proxy voting guidelines”) governing proxy voting by accounts managed by BlackRock. BlackRock will cast votes on behalf of each of the Funds on specific proxy issues in respect of securities held by each such Fund in accordance with the BlackRock Proxy voting guidelines; provided, however, that in the case of underlying closed-end funds (including business development companies and other similarly-situated asset pools) held by the Funds that have, or are proposing to adopt, a classified board structure, BlackRock will typically (a) vote in favor of proposals to adopt classification and against proposals to eliminate classification, and (b) not vote against directors as a result of their adoption of a classified board structure.
BlackRock will report on an annual basis to the Directors on (1) a summary of the proxy voting process as applicable to the Funds in the preceding year together with a representation that all votes were in accordance with the BlackRock proxy voting guidelines (as modified pursuant to the immediately preceding paragraph), and (2) any changes to the BlackRock proxy voting guidelines that have not previously been reported.

|
||||
| Public | Page 1 of 1 |

BlackRock Investment Stewardship Global Principles Effective as of January 2024
| 3 | ||||
| 3 | ||||
| 3 | ||||
| 5 | ||||
| 6 | ||||
| 8 | ||||
| Capital structure, mergers, asset sales, and other special transactions |
9 | |||
| 10 | ||||
| 11 | ||||
| Other corporate governance matters and shareholder protections |
13 | |||
| 14 | ||||
| BlackRock’s oversight of its investment stewardship activities |
15 | |||
| 16 | ||||
| 17 | ||||
| 17 | ||||
| 18 | ||||
| 19 | ||||
| 19 | ||||
The purpose of this document is to provide an overarching explanation of BlackRock’s approach globally to our responsibilities as a shareholder on behalf of our clients, our expectations of companies, and our commitments to clients in terms of our own governance and transparency.
| BlackRock Investment Stewardship | Global Principles | 2 |
BlackRock’s purpose is to help more and more people experience financial well-being. We manage assets on behalf of institutional and individual clients, across a full spectrum of investment strategies, asset classes, and regions. Our client base includes pension plans, endowments, foundations, charities, official institutions, insurers, and other financial institutions, as well as individuals around the world.
Philosophy on investment stewardship
As part of our fiduciary duty to our clients, we consider it one of our responsibilities to promote sound corporate governance as an informed, engaged shareholder on their behalf. At BlackRock, this is the responsibility of the BlackRock Investment Stewardship (BIS) team.
In our experience, sound governance is critical to the success of a company, the protection of investors’ interests, and long-term financial value creation. We take a constructive, long-term approach with companies and seek to understand how they are managing the drivers of risk and financial value creation in their business models. We have observed that well-managed companies will effectively evaluate and address risks and opportunities relevant to their businesses, which supports durable, long-term financial value creation. As one of many minority shareholders, BlackRock cannot – and does not try to – direct a company’s strategy or its implementation.
We believe that there are certain fundamental rights attached to shareholding. Shareholders should have the right to:
| • | Elect, remove, and nominate directors, approve the appointment of the auditor, and amend the corporate charter or by-laws. |
| • | Vote on key board decisions that are material to the protection of their investment, including but not limited to, changes to the purpose of the business, dilution levels and pre-emptive rights, and the distribution of income and capital structure. |
| • | Access sufficient and timely information on material governance, strategic, and business matters to make informed decisions. |
In our view, shareholder voting rights should be proportionate to economic ownership—the principle of “one share, one vote” helps to achieve this balance.
Consistent with these shareholder rights, BlackRock monitors and provides feedback to companies in our role as stewards of our clients’ assets. Investment stewardship is how we use our voice as an investor to promote sound corporate governance and business practices that support the ability of companies to deliver long-term financial performance for our clients. We do this through engagement with companies, proxy voting on behalf of those clients who have given us authority, and participating in market-level dialogue to improve corporate governance standards.
Engagement is an important mechanism for providing feedback on company practices and disclosures, particularly where our observations indicate that they could be enhanced to support a company’s ability to deliver financial performance. Similarly, it provides us with an opportunity to hear directly from company boards and management on how they believe their actions are aligned with the long-term
| BlackRock Investment Stewardship | Global Principles | 3 |
economic interests of shareholders. Engagement with companies may also inform our proxy voting decisions.
As a fiduciary, we vote in the long-term economic interests of our clients. Generally, we support the recommendations of the board of directors and management. However, there may be instances where we vote against the election of directors or other management proposals, or support shareholder proposals. For instance, we may vote against management recommendations where we are concerned that the board may not be acting in the long-term economic interests of shareholders, or disclosures do not provide sufficient information to assess how material, strategic risks and opportunities are being managed. Our regional proxy voting guidelines are informed by our market-specific approach and standards of corporate governance best practices.
| BlackRock Investment Stewardship | Global Principles | 4 |
While accepted standards and norms of corporate governance can differ between markets, in our experience, there are certain globally-applicable fundamental elements of governance that contribute to a company’s ability to create long-term financial value for shareholders. These global themes are set out in this overarching set of principles (the “Principles”), which are anchored in transparency and accountability. At a minimum, it is our view that companies should observe the accepted corporate governance standards in their domestic market and we ask that, if they do not, they explain how their approach better supports durable, long-term financial value creation.
These Principles cover seven key subjects:
| • | Boards and directors |
| • | Auditors and audit-related issues |
| • | Capital structure, mergers, asset sales, and other special transactions |
| • | Executive compensation |
| • | Material sustainability-related risks and opportunities |
| • | Other corporate governance matters and shareholder protections |
| • | Shareholder proposals |
Our regional and market-specific voting guidelines explain how these Principles inform our voting decisions in relation to common ballot items for shareholder meetings in those markets. Alongside the Principles and regional voting guidelines, BIS publishes our engagement priorities which reflect the five themes on which we most frequently engage companies, where they are relevant, as these can be a source of material business risk or opportunity. Collectively, these BIS policies set out the core elements of corporate governance that guide our investment stewardship efforts globally and within each market, including when engaging with companies and voting at shareholder meetings. The BIS policies are applied on a case-by-case basis, taking into consideration the context within which a company is operating.
| BlackRock Investment Stewardship | Global Principles | 5 |
We believe that an effective and well-functioning board that has appropriate governance structures to facilitate oversight of a company’s management and strategic initiatives is critical to the long-term financial success of a company and the protection of shareholders’ economic interests. In our view, a strong board can be a competitive advantage to a company, providing valuable oversight of and perspectives to management on the most important decisions in support of long-term financial performance. As part of their responsibilities, board members have a fiduciary duty to shareholders to oversee the strategic direction, operations, and risk management of a company. For this reason, BIS sees engagement with and the election of directors as one of our most important responsibilities. Disclosure of material risks that may affect a company’s long-term strategy and financial value creation, including material sustainability-related factors when relevant, is essential for shareholders to appropriately understand and assess how effectively management is identifying, managing, and mitigating such risks.
The board should establish and maintain a framework of robust and effective governance mechanisms to support its oversight of the company’s strategy and operations consistent with the long-term economic interests of investors. There should be clear descriptions of the role of the board and the committees of the board and how directors engage with and oversee management. We look to the board to articulate the effectiveness of these mechanisms in overseeing the management of business risks and opportunities and the fulfillment of the company’s purpose and strategy.
Where a company has not adequately disclosed and demonstrated that its board has fulfilled these corporate governance and risk oversight responsibilities, we will consider voting against the election of directors who, on our assessment, have particular responsibility for the issues. We assess director performance on a case-by-case basis and in light of each company’s circumstances, taking into consideration their governance, business practices that support durable, long-term financial value creation, and performance. Set out below are ways in which boards and directors can demonstrate a commitment to acting in the long-term economic interests of all shareholders.
Regular accountability through director elections
It is our view that directors should stand for election on a regular basis, ideally annually. In our experience, annual director elections allow shareholders to reaffirm their support for board members and/or hold them accountable for their decisions in a timely manner. When board members are not elected annually, in our experience, it is good practice for boards to have a rotation policy to ensure that, through a board cycle, all directors have had their appointment re-confirmed, with a proportion of directors being put forward for election at each annual general meeting.
Effective board composition
Regular director elections also give boards the opportunity to adjust their composition in an orderly way to reflect developments in the company’s strategy and the market environment. In our view, it is beneficial for new directors to be brought onto the board periodically to refresh the group’s thinking, while supporting both continuity and appropriate succession planning. We consider the average overall tenure of the board, and seek a balance between the knowledge and experience of longer-serving directors and the fresh perspectives of directors who joined more recently. We encourage companies to regularly review the effectiveness of their board (including its size), and assess directors nominated for election in the context of the composition of the board as a whole. In our view, the company’s assessment should consider a number of factors, including each director’s independence and time commitments, as well as
| BlackRock Investment Stewardship | Global Principles | 6 |
the diversity and relevance of director experiences and skillsets, and how these factors may contribute to the financial performance of the company.
Similarly, there should be a sufficient number of independent directors, free from conflicts of interest or undue influence from connected parties, to ensure objectivity in the decision-making of the board and its ability to oversee management. Common impediments to independence may include but are not limited to:
| • | Current or recent employment at the company or a subsidiary |
| • | Being, or representing, a shareholder with a substantial shareholding in the company |
| • | Interlocking directorships |
| • | Having any other interest, business, or other relationship which could, or could reasonably be perceived to, materially interfere with a director’s ability to act in the best interests of the company and shareholders. |
In our experience, boards are most effective at overseeing and advising management when there is a senior, independent board leader. This director may chair the board, or, where the chair is also the CEO (or is otherwise not independent), be designated as a lead independent director. The role of this director is to enhance the effectiveness of the independent members of the board through shaping the agenda, ensuring adequate information is provided to the board, and encouraging independent director participation in board deliberations. The lead independent director or another appropriate director should be available to meet with shareholders in those situations where an independent director is best placed to explain and contextualize a company’s approach.
There are matters for which the board has responsibility that may involve a conflict of interest for executives or for affiliated directors, or require additional focus. It is our view that objective oversight of such matters is best achieved when the board forms committees comprised entirely of independent directors. In many markets, these committees of the board specialize in audit, director nominations, and compensation matters. An ad hoc committee might also be formed to decide on a special transaction, particularly one involving a related party, or to investigate a significant adverse event.
When nominating directors to the board, we look to companies to provide sufficient information on the individual candidates so that shareholders can assess the capabilities and suitability of each individual nominee and their fit within overall board composition. These disclosures should give an understanding of how the collective experience and expertise of the board, as well as the particular skill-sets of individual directors, aligns with the company’s long-term strategy and business model. Highly qualified, engaged directors with professional characteristics relevant to a company’s business and strategy enhance the ability of the board to add value and be the voice of shareholders in board discussions.
It is in this context that we are interested in diversity in the board room. We see it as a means to promoting diversity of thought and avoiding “group think” when the board advises and oversees management. This position is based on our view that diversity of perspective and thought – in the board room, in the management team, and throughout the company – leads to better long-term economic outcomes for companies. Academic research has revealed correlations between specific dimensions of diversity and effects on decision-making processes and outcomes.1 In our experience, greater diversity in the board
1 For a discussion on the different impacts of diversity see: McKinsey, “Diversity Wins: How Inclusion Matters,” May 2022; Harvard Business Review, “Diverse Teams Feel Less Comfortable – and That’s Why They Perform Better,” September 2016; “Do Diverse Directors Influence DEI Outcomes,” September 2022.
| BlackRock Investment Stewardship | Global Principles | 7 |
room can contribute to more robust discussions and more innovative and resilient decisions. Over time, greater diversity in the board room can also promote greater diversity and resilience in the leadership team, and the workforce more broadly. That diversity can enable companies to develop businesses that better address the needs of the customers and communities they serve.
We ask boards to disclose how diversity is considered in board composition, including professional characteristics, such as a director’s industry experience, specialist areas of expertise and geographic location; as well as demographic characteristics such as gender, race/ethnicity, and age.
We look to understand a board’s diversity in the context of a company’s domicile, market capitalization, business model, and strategy. Increasingly, we see the most effective boards nominating directors from diverse backgrounds which helps ensure boards can more effectively understand the company’s customers, employees, and communities. We note that in many markets, policymakers have set board gender diversity goals which we may discuss with companies, particularly if there is a risk their board composition may be misaligned. Self-identified board demographic diversity can usefully be disclosed in aggregate, consistent with local law. We encourage boards to aspire to meaningful diversity of membership, while recognizing that building a strong, diverse board can take time.
Sufficient capacity
As the role and expectations of a director are increasingly demanding, directors must be able to commit an appropriate amount of time to board and committee matters. It is important that directors have the capacity to meet all of their responsibilities - including when there are unforeseen events – and therefore, they should not take on an excessive number of roles that would impair their ability to fulfill their duties.
Auditors and audit-related issues
BlackRock recognizes the critical importance of financial statements, which should provide a true and fair picture of a company’s financial condition. Accordingly, the assumptions made by management and reviewed by the auditor in preparing the financial statements should be reasonable and justified.
The accuracy of financial statements, inclusive of financial and non-financial information as required or permitted under market-specific accounting rules, is of paramount importance to BlackRock. Investors increasingly recognize that a broader range of risks and opportunities have the potential to materially impact financial performance. Over time, we anticipate investors and other users of company reporting will increasingly seek to understand and scrutinize the assumptions underlying financial statements, particularly those that pertain to the impact of the transition to a low-carbon economy on a company’s business model and asset mix. We recognize that this is an area of evolving practice and note that international standards setters, such as the International Financial Reporting Standards (IFRS) Board and the International Auditing and Assurance Standards Board (IAASB), continue to develop their guidance to companies.2
In this context, audit committees, or equivalent, play a vital role in a company’s financial reporting system by providing independent oversight of the accounts, material financial and, where appropriate to the jurisdiction, non-financial information and internal control frameworks. Moreover, in the absence of a dedicated risk committee, these committees can provide oversight of Enterprise Risk Management
2 IFRS, “IFRS S1 General Requirements for Disclosure of Sustainability-related Financial Information”, June 2023, and IAASB, “IAASB Launches Public Consultation on Landmark Proposed Global Sustainability Assurance Standard”, August 2023.
| BlackRock Investment Stewardship | Global Principles | 8 |
systems.3 In our view, effective audit committee oversight strengthens the quality and reliability of a company’s financial statements and provides an important level of reassurance to shareholders.
We hold members of the audit committee or equivalent responsible for overseeing the management of the audit function. Audit committees or equivalent should have clearly articulated charters that set out their responsibilities and have a rotation plan in place that allows for a periodic refreshment of the committee membership to introduce fresh perspectives to audit oversight. We recognize that audit committees will rely on management, internal audit, and the independent auditor in fulfilling their responsibilities but look to committee members to demonstrate they have relevant expertise to monitor and oversee the audit process and related activities.
We take particular note of unexplained changes in reporting methodology, cases involving significant financial restatements, or ad hoc notifications of material financial weakness. In this respect, audit committees should provide timely disclosure on the remediation of Key and Critical Audit Matters identified either by the external auditor or internal audit function.
The integrity of financial statements depends on the auditor being free of any impediments to being an effective check on management. To that end, it is important that auditors are, and are seen to be, independent. Where an audit firm provides services to the company in addition to the audit, the fees earned should be disclosed and explained. Audit committees should have in place a procedure for assessing annually the independence of the auditor and the quality of the external audit process.
Comprehensive disclosure provides investors with a sense of the company’s long-term operational risk management practices and, more broadly, the quality of the board’s oversight. The audit or risk committee, should periodically review the company’s risk assessment and risk management policies and the significant risks and exposures identified by management, the internal auditors or the independent auditors and management’s steps to address them. In the absence of detailed disclosures, we may reasonably conclude that companies are not adequately managing risk.
Capital structure, mergers, asset sales, and other special transactions
The capital structure of a company is critical to shareholders as it impacts the value of their investment and the priority of their interest in the company relative to that of other equity or debt investors. Preemptive rights are a key protection for shareholders against the dilution of their interests.
Effective voting rights are basic rights of share ownership and a core principle of effective governance. Shareholders, as the residual claimants, have the strongest interest in protecting the financial value of the company, and voting rights should match economic exposure, i.e. one share, one vote.
In principle, we disagree with the creation of a share class with equivalent economic exposure and preferential, differentiated voting rights. In our view, this structure violates the fundamental corporate governance principle of proportionality and results in a concentration of power in the hands of a few shareholders, thus disenfranchising other shareholders and amplifying any potential conflicts of interest. However, we recognize that in certain markets, at least for a period of time, companies may have a valid
3 Enterprise risk management is a process, effected by the entity’s board of directors, management, and other personnel, applied in strategy setting and across the enterprise, designed to identify potential events that may affect the entity, and manage risk to be within the risk appetite, to provide reasonable assurance regarding the achievement of objectives. (Committee of Sponsoring Organizations of the Treadway Commission (COSO), Enterprise Risk Management — Integrated Framework, September 2004, New York, NY, updated in 2017. Please see: https://www.coso.org/SitePages/Home.aspx).
| BlackRock Investment Stewardship | Global Principles | 9 |
argument for listing dual classes of shares with differentiated voting rights. In our view, such companies should review these share class structures on a regular basis or as company circumstances change. Additionally, they should seek shareholder approval of their capital structure on a periodic basis via a management proposal at the company’s shareholder meeting. The proposal should give unaffiliated shareholders the opportunity to affirm the current structure or establish mechanisms to end or phase out controlling structures at the appropriate time, while minimizing costs to shareholders.
In assessing mergers, asset sales, or other special transactions, BlackRock’s primary consideration is the long-term economic interests of our clients as shareholders. Boards proposing a transaction should clearly explain the economic and strategic rationale behind it. We will review a proposed transaction to determine the degree to which it can enhance long-term shareholder value. We find long-term investors like our clients typically benefit when proposed transactions have the unanimous support of the board and have been negotiated at arm’s length. We may seek reassurance from the board that the financial interests of executives and/or board members in a given transaction have not adversely affected their ability to place shareholders’ interests before their own. Where the transaction involves related parties, the recommendation to support should come from the independent directors, a best practice in most markets, and ideally, the terms should have been assessed through an independent appraisal process. In addition, it is good practice that it be approved by a separate vote of the non-conflicted parties.
As a matter of sound governance practice, shareholders should have a right to dispose of company shares in the open market without unnecessary restriction. In our view, corporate mechanisms designed to limit shareholders’ ability to sell their shares are contrary to basic property rights. Such mechanisms can serve to protect and entrench interests other than those of the shareholders. In our view, shareholders are broadly capable of making decisions in their own best interests. We encourage any so-called “shareholder rights plans” proposed by a board to be subject to shareholder approval upon introduction and periodically thereafter.
In most markets, one of the most important roles for a company’s board of directors is to put in place a compensation structure that incentivizes and rewards executives appropriately. There should be a clear link between variable pay and operational and financial performance. Performance metrics should be stretching and aligned with a company’s strategy and business model. BIS does not have a position on the use of sustainability-related criteria in compensation structures, but in our view, where companies choose to include these components, they should be adequately disclosed, material to the company’s strategy, and as rigorous as other financial or operational targets. Long-term incentive plans should encompass timeframes that 1) are distinct from annual executive compensation structures and metrics, and 2) encourage the delivery of strong financial results over a period of years. Compensation committees should guard against contractual arrangements that would entitle executives to material compensation for early termination of their employment. Finally, pension contributions and other deferred compensation arrangements should be reasonable, in light of market practices.
We are not supportive of one-off or special bonuses unrelated to company or individual performance. Where discretion has been used by the compensation committee or its equivalent, we expect disclosure relating to how and why the discretion was used, and how the adjusted outcome is aligned with the interests of shareholders. We acknowledge that the use of peer group evaluation by compensation committees can help ensure competitive pay; however, we are concerned when the rationale for increases in total compensation at a company is solely based on peer benchmarking, rather than a rigorous
| BlackRock Investment Stewardship | Global Principles | 10 |
measure of outperformance. We encourage companies to clearly explain how compensation outcomes have rewarded performance.
We encourage boards to consider building clawback provisions into incentive plans such that companies could clawback compensation or require executives to forgo awards when compensation was based on faulty financial statements or deceptive business practices. We also favor recoupment from or the foregoing of the grant of any awards by any senior executive whose behavior caused material financial harm to shareholders, material reputational risk to the company, or resulted in a criminal investigation, even if such actions did not ultimately result in a material restatement of past results.
Non-executive directors should be compensated in a manner that is commensurate with the time and effort expended in fulfilling their professional responsibilities. Additionally, these compensation arrangements should not risk compromising directors’ independence or aligning their interests too closely with those of the management, whom they are charged with overseeing.
We use third party research, in addition to our own analysis, to evaluate existing and proposed compensation structures. BIS may signal concerns through not supporting management’s proposals to approve compensation, where they are on the agenda. We may also vote against members of the compensation committee or equivalent board members for poor compensation practices or structures.
Material sustainability-related risks and opportunities
It is our view that well-managed companies will effectively evaluate and manage material sustainability-related risks and opportunities relevant to their businesses. As with all risks and opportunities in a company’s business model, appropriate oversight of material sustainability considerations is a core component of having an effective governance framework, which supports durable, long-term financial value creation.
Robust disclosure is essential for investors to effectively evaluate companies’ strategy and business practices related to material sustainability-related risks and opportunities. Long-term investors like our clients can benefit when companies demonstrate that they have a resilient business model through disclosures thatcover governance, strategy, risk management, and metrics and targets, including industry-specific metrics. The International Sustainability Standards Board (ISSB) standards, IFRS S1 and S2,4 provide companies with a useful guide to preparing this disclosure. The standards build on the Task Force on Climate-related Financial Disclosures (TCFD) framework and the standards and metrics developed by the Sustainability Accounting Standards Board (SASB), which have converged under the ISSB. We recognize that companies may phase in reporting aligned with the ISSB standards over several years. We also recognize that some companies may report using different standards, which may be required by regulation, or one of a number of voluntary standards. In such cases, we ask that companies highlight the metrics that are industry- or company-specific.
We note that climate and other sustainability-related disclosures often require companies to collect and aggregate data from various internal and external sources. We recognize that the practical realities of data collection and reporting may not line up with financial reporting cycles and companies may require additional time after their fiscal year-end to accurately collect, analyze, and report this data to investors.
4 The objective of IFRS S1 General Requirements for Disclosure of Sustainability-related Financial Information is to require an entity to disclose information about its sustainability-related risks and opportunities that is useful to primary users of general-purpose financial reports in making decisions relating to providing resources to the entity. The objective of IFRS S2 Climate-related Disclosures is to require an entity to disclose information about its climate-related risks and opportunities that is useful to primary users of general-purpose financial reports in making decisions relating to providing resources to the entity.
| BlackRock Investment Stewardship | Global Principles | 11 |
That said, to give investors time to assess the data, we encourage companies to produce climate and other sustainability-related disclosures sufficiently in advance of their annual meeting, to the best of their abilities.
Companies may also choose to adopt or refer to guidance on sustainable and responsible business conduct issued by supranational organizations such as the United Nations or the Organization for Economic Cooperation and Development. Further, industry initiatives on managing specific operational risks may provide useful guidance to companies on best practices and disclosures. We find it helpful to our understanding of investment risk when companies disclose any relevant global climate and other sustainability-related standards adopted, the industry initiatives in which they participate, any peer group benchmarking undertaken, and any assurance processes to help investors understand their approach to sustainable and responsible business practices. We will express any concerns through our voting where a company’s actions or disclosures do not seem adequate in light of the materiality of the business risks.
Climate and nature-related risk
While companies in various sectors and geographies may be affected differently by climate-related risks and opportunities, the low-carbon transition is an investment factor that can be material for many companies and economies around the globe.
We seek to understand, from company disclosures and engagement, the strategies companies have in place to manage material risks to, and opportunities for, their long-term business model associated with a range of climate-related scenarios, including a scenario in which global warming is limited to well below 2°C, considering global ambitions to achieve a limit of 1.5°C. As one of many shareholders, and typically a minority one, BlackRock does not tell companies what to do. It is the role of the board and management to set and implement a company’s long-term strategy to deliver long-term financial returns.
Our research shows that the low-carbon transition is a structural shift in the global economy that will be shaped by changes in government policies, technology, and consumer preferences, which may be material for many companies.5 Yet the path to a low-carbon economy is deeply uncertain and uneven, with different parts of the economy moving at different speeds. BIS recognizes that it can be challenging for companies to predict the impact of climate-related risk and opportunity on their businesses and operating environments. Many companies are assessing how to navigate the low-carbon transition while delivering long-term value to investors. In this context, we encourage companies to publicly disclose, consistent with their business model and sector, how they intend to deliver long-term financial performance through the transition to a low-carbon economy. Where available, we appreciate companies publishing their transition plan.6
Consistent with the ISSB standards, we are better able to assess preparedness for the low-carbon transition when companies disclose short-, medium- and long-term targets, ideally science-based where these are available for their sector, for scope 1 and 2 greenhouse gas emissions (GHG) reductions and to demonstrate how their targets are consistent with the long-term financial interests of their investors.
5 BlackRock Investment Institute, “Tracking the low-carbon transition”, July 2023.
6 We have observed that more companies are developing such plans, and public policy makers in a number of markets are signaling their intentions to require them. We view transition plans (TPs) as a method for a company to both internally assess and externally communicate long-term strategy, ambition, objectives, and actions to create financial value through the global transition towards a low-carbon economy. While many initiatives across jurisdictions outline a framework for TPs, there is no consensus on the key elements these plans should contain. We view useful disclosure as that which communicates a company’s approach to managing financially material, business relevant risks and opportunities – including climate-related risks – to deliver long-term financial performance, thus enabling investors to make more informed decisions.
| BlackRock Investment Stewardship | Global Principles | 12 |
While we recognize that regulators in some markets are moving to mandate certain disclosures, at this stage, we view scope 3 emissions differently from scopes 1 and 2, given methodological complexity, regulatory uncertainty, concerns about double-counting, and lack of direct control by companies. We welcome disclosures and commitments companies choose to make regarding scope 3 emissions and recognize these are provided on a good-faith basis as methodology develops. Our publicly available commentary provides more information on our approach to climate-related risks and opportunities.
In addition to climate-related risks and opportunities, the management of nature-related factors is increasingly a component of some companies’ ability to generate durable, long-term financial returns for shareholders, particularly where a company’s strategy is heavily reliant on the availability of natural capital, or whose supply chains are exposed to locations with nature-related risks. We look for such companies to disclose how they manage any reliance and impact on, as well as use of, natural capital, including appropriate risk oversight and relevant metrics and targets, to understand how these factors are integrated into strategy. We will evaluate these disclosures to inform our view of how a company is managing material nature-related risks and opportunities, as well as in our assessment of relevant shareholder proposals. Our publicly available commentary provides more information on our approach to natural capital.7
Key stakeholder interests
In order to advance long-term shareholders’ interests, companies should consider the interests of the various parties on whom they depend for their success over time. It is for each company to determine their key stakeholders based on what is material to their business and long-term financial performance. For many companies, key stakeholders include employees, business partners (such as suppliers and distributors), clients and consumers, regulators, and the communities in which they operate.
As a long-term shareholder on behalf of our clients, we find it helpful when companies disclose how they have identified their key stakeholders and considered their interests in business decision-making. In addition to understanding broader stakeholder relationships, BIS finds it helpful when companies consider the needs of their workforce today, and the skills required for their future business strategy. We are also interested to understand the role of the board, which is well positioned to ensure that the approach taken is informed by and aligns with the company’s strategy and purpose.
Companies should articulate how they address material adverse impacts that could arise from their business practices and affect critical relationships with their stakeholders. We encourage companies to implement, to the extent appropriate, monitoring processes (often referred to as due diligence) to identify and mitigate potential adverse impacts and grievance mechanisms to remediate any actual adverse material impacts. In our view, maintaining trust within these relationships can contribute to a company’s long-term success.
Other corporate governance matters and shareholder protections
7 Given the growing awareness of the materiality of these issues for certain businesses, enhanced reporting on a company’s natural capital dependencies and impacts would aid investors’ understanding. In our view, the final recommendations of the Taskforce on Nature-related Financial Disclosures may prove useful to some companies. We recognize that some companies may report using different standards, which may be required by regulation, or one of a number of other private sector standards.
| BlackRock Investment Stewardship | Global Principles | 13 |
In our view, shareholders have a right to material and timely information on the financial performance and viability of the companies in which they invest. In addition, companies should publish information on the governance structures in place and the rights of shareholders to influence these structures. The reporting and disclosure provided by companies help shareholders assess the effectiveness of the board’s oversight of management and whether investors’ economic interests have been protected. We believe shareholders should have the right to vote on key corporate governance matters, including changes to governance mechanisms, to submit proposals to the shareholders’ meeting, and to call special meetings of shareholders.
Corporate form
In our view, it is the responsibility of the board to determine the corporate form that is most appropriate given the company’s purpose and business model.8 Companies proposing to change their corporate form to a public benefit corporation or similar entity should put it to a shareholder vote if not already required to do so under applicable law. Supporting documentation from companies or shareholder proponents proposing to alter the corporate form should clearly articulate how the interests of shareholders and different stakeholders would be impacted as well as the accountability and voting mechanisms that would be available to shareholders. As a fiduciary on behalf of clients, we generally support management proposals if our analysis indicates that shareholders’ economic interests are adequately protected. Relevant shareholder proposals are evaluated on a case-by-case basis.
In most markets in which BlackRock invests on behalf of clients, shareholders have the right to submit proposals to be voted on by shareholders at a company’s annual or extraordinary meeting, as long as eligibility and procedural requirements are met. The matters that we see put forward by shareholders address a wide range of topics, including governance reforms, capital management, and improvements in the management or disclosure of sustainability-related risks.
BlackRock is subject to legal and regulatory requirements in the U.S. that place restrictions and limitations on how BlackRock can interact with the companies in which we invest on behalf of our clients, including our ability to submit shareholder proposals. We can vote, on behalf of clients who authorize us to do so, on proposals put forth by others.
When assessing shareholder proposals, we evaluate each proposal on its merit, with a singular focus on its implications for long-term financial value creation by that company. We believe it is helpful for companies to disclose the names of the proponent or organization that has submitted or advised on the proposal. We consider the business and economic relevance of the issue raised, as well as its materiality and the urgency with which our experience indicates it should be addressed. We would not support proposals that we believe would result in over-reaching into the basic business decisions of the company. We take into consideration the legal effect of the proposal, as shareholder proposals may be advisory or legally binding depending on the jurisdiction, while others may make requests that would be deemed illegal in a given jurisdiction.
Where a proposal is focused on a material business risk that we agree needs to be addressed and the intended outcome is consistent with long-term financial value creation, we will look to the board and management to demonstrate that the company has met the intent of the request made in the shareholder proposal. Where our analysis and/or engagement indicate an opportunity for improvement in the
8 Corporate form refers to the legal structure by which a business is organized.
| BlackRock Investment Stewardship | Global Principles | 14 |
company’s approach to the issue, we may support shareholder proposals that are reasonable and not unduly prescriptive or constraining on management.
We recognize that some shareholder proposals bundle topics and/or specific requests and include supporting statements that explain the reasoning or objectives of the proponent. In voting on behalf of clients, we do not submit or edit proposals or the supporting statements – we must vote yes or no on the proposal as phrased by the proponent. Therefore, when we vote in support of a proposal, we are not necessarily endorsing every element of the proposal or the reasoning, objectives, or supporting statement of the proponent. We may support a proposal for different reasons from those put forth by the proponent, when we believe that, overall, it can advance our clients’ long-term financial interests. We would normally explain to the company our rationale for supporting such proposals.
Alternatively, or in addition, we may vote against the election of one or more directors if, in our assessment, the board has not responded sufficiently or with an appropriate sense of urgency. We may also support a proposal if management is on track, but we believe that voting in favor might accelerate efforts to address a material risk.
BlackRock’s oversight of its investment stewardship activities
Oversight
BlackRock maintains three regional advisory committees (Stewardship Advisory Committees) for a) the Americas; b) Europe, the Middle East and Africa; and c) Asia-Pacific, generally consisting of senior BlackRock investment professionals and/or senior employees with practical boardroom experience. The regional Stewardship Advisory Committees review and advise on amendments to BIS regional proxy voting guidelines (the Guidelines) covering markets within each respective region. The advisory committees do not determine voting decisions, which are the responsibility of BIS.
In addition to the regional Stewardship Advisory Committees, the Investment Stewardship Global Oversight Committee (Global Oversight Committee) is a risk-focused committee, comprised of senior representatives from various BlackRock investment teams, a senior legal representative, the Global Head of Investment Stewardship (Global Head), and other senior executives with relevant experience and team oversight. The Global Committee does not determine voting decisions, which are the responsibility of BIS.
The Global Head has primary oversight of the activities of BIS, including voting in accordance with the Guidelines, which require the application of professional judgment and consideration of each company’s unique circumstances. The Global Committee reviews and approves amendments to these Principles. The Global Committee also reviews and approves amendments to the regional Guidelines, as proposed by the regional Stewardship Advisory Committees.
In addition, the Global Committee receives and reviews periodic reports regarding the votes cast by BIS, as well as updates on material process issues, procedural changes, and other risk oversight considerations. The Global Committee reviews these reports in an oversight capacity as informed by the Guidelines.
BIS carries out engagement with companies, executes proxy votes, and conducts vote operations (including maintaining records of votes cast) in a manner consistent with the relevant Guidelines. BIS also conducts research on corporate governance issues and participates in industry discussions to contribute to and keep abreast of important developments in the corporate governance field. BIS may
| BlackRock Investment Stewardship | Global Principles | 15 |
utilize third parties for certain of the foregoing activities and performs oversight of those third parties. BIS may raise complicated or particularly controversial matters for internal discussion with the relevant investment teams and governance specialists for discussion and guidance prior to making a voting decision.
Vote execution
BlackRock votes on proxy issues when our clients authorize us to do so. When BlackRock has been authorized to vote on behalf of our clients, we carefully consider proxies submitted to funds and other fiduciary account(s) (Fund or Funds) for which we have voting authority. BlackRock votes (or refrains from voting) proxies for each Fund for which we have voting authority based on our evaluation of the alignment of the voting items with the long-term economic interests of our clients, in the exercise of our independent business judgment, and without regard to the relationship of the issuer of the proxy (or any shareholder proponent or dissident shareholder) to the Fund, the Fund’s affiliates (if any), BlackRock or BlackRock’s affiliates, or BlackRock employees (see “Conflicts management policies and procedures,” below).
When exercising voting rights, BIS will normally vote on specific proxy issues in accordance with the Guidelines for the relevant market, as well as the Global Principles. The Guidelines are reviewed annually and are amended consistent with changes in the local market practice, as developments in corporate governance occur, or as otherwise deemed advisable by the applicable Stewardship Advisory Committees. BIS analysts may, in the exercise of their professional judgment, conclude that the Guidelines do not cover the specific matter upon which a proxy vote is required or that an exception to the Guidelines would be in the long-term economic interests of BlackRock’s clients.
In the uncommon circumstance of there being a vote with respect to fixed income securities or the securities of privately held issuers, the decision generally will be made by a Fund’s portfolio managers and/or BIS based on an assessment of the particular transactions or other matters at issue.
In certain markets, proxy voting involves logistical issues which can affect BIS’ ability to vote such proxies, as well as the desirability of voting such proxies. These issues include, but are not limited to: i) untimely notice of shareholder meetings; ii) restrictions on a foreigner’s ability to exercise votes; iii) requirements to vote proxies in person; iv) “share-blocking” (requirements that investors who exercise their voting rights surrender the right to dispose of their holdings for some specified period in proximity to the shareholder meeting); v) potential difficulties in translating the proxy; vi) regulatory constraints; and vii) requirements to provide local agents with unrestricted powers of attorney to facilitate voting instructions. We are not supportive of impediments to the exercise of voting rights such as share-blocking or overly burdensome administrative requirements.
As a consequence, BlackRock votes proxies in these situations on a “best-efforts” basis. In addition, BIS may determine that it is generally in the interests of BlackRock’s clients not to vote proxies (or not to vote our full allocation) if the costs (including but not limited to opportunity costs associated with share-blocking constraints) associated with exercising a vote are expected to outweigh the benefit the client would derive by voting on the proposal.
Active portfolio managers have full discretion to vote the shares in the Funds they manage based on their analysis of the economic impact of a particular ballot item on their investors. Portfolio managers may, from time to time, reach differing views on how to maximize economic value with respect to a particular investment. Therefore, portfolio managers may, and sometimes do, vote shares in the Funds under their
| BlackRock Investment Stewardship | Global Principles | 16 |
management differently from BIS or from one another. However, because BlackRock’s clients are mostly long-term investors with long-term economic goals, ballots are generally cast in a uniform manner.
BlackRock offers a Voting Choice program, which provides eligible clients with more opportunities to participate in the proxy voting process where legally and operationally viable. BlackRock Voting Choice aims to make proxy voting easier and more accessible for eligible clients.
Voting Choice is currently available for eligible clients invested in certain institutional pooled funds in the U.S., UK, Ireland, and Canada that utilize equity index investment strategies, as well as eligible clients in certain institutional pooled funds in the U.S., UK, and Canada that use systematic active equity (SAE) strategies. Currently, this includes over 650 pooled investment funds, including equity index funds and SAE investment funds. In addition, institutional clients in separately managed accounts (SMAs) continue to be eligible for BlackRock Voting Choice regardless of their investment strategies.9
As a result, the shares attributed to BlackRock in company share registers may be voted differently depending on whether our clients have authorized BIS to vote on their behalf, have authorized BIS to vote in accordance with a third-party policy, or have elected to vote shares in accordance with their own policy. Agreements with our clients to allow them greater control over their voting, including which policies they have selected, will be treated confidentially consistent with our treatment of similar client agreements.
Conflicts management policies and procedures
BIS maintains policies and procedures that seek to prevent undue influence on BlackRock’s proxy voting activity. Such influence might stem from any relationship between the investee company (or any shareholder proponent or dissident shareholder) and BlackRock, BlackRock’s affiliates, a Fund or a Fund’s affiliates, or BlackRock employees. The following are examples of sources of perceived or potential conflicts of interest:
| • | BlackRock clients who may be issuers of securities or proponents of shareholder resolutions |
| • | BlackRock business partners or third parties who may be issuers of securities or proponents of shareholder resolutions |
| • | BlackRock employees who may sit on the boards of public companies held in Funds managed by BlackRock |
| • | Significant BlackRock, Inc. investors who may be issuers of securities held in Funds managed by BlackRock |
| • | Securities of BlackRock, Inc. or BlackRock investment funds held in Funds managed by BlackRock |
| • | BlackRock, Inc. board members who serve as senior executives or directors of public companies held in Funds managed by BlackRock |
9 Read more about BlackRock Voting Choice on our website.
| BlackRock Investment Stewardship | Global Principles | 17 |
BlackRock has taken certain steps to mitigate perceived or potential conflicts including, but not limited to, the following:
| • | Adopted the Guidelines which are designed to advance our clients’ long-term economic interests in the companies in which BlackRock invests on their behalf |
| • | Established a reporting structure that separates BIS from employees with sales, vendor management, or business partnership roles. In addition, BlackRock seeks to ensure that all engagements with corporate issuers, dissident shareholders or shareholder proponents are managed consistently and without regard to BlackRock’s relationship with such parties. Clients or business partners are not given special treatment or differentiated access to BIS. BIS prioritizes engagements based on factors including, but not limited to, our need for additional information to make a voting decision or our view on the likelihood that an engagement could lead to positive outcome(s) over time for the economic value of the company. Within the normal course of business, BIS may engage directly with BlackRock clients, business partners and/or third parties, and/or with employees with sales, vendor management, or business partnership roles, in discussions regarding our approach to stewardship, general corporate governance matters, client reporting needs, and/or to otherwise ensure that proxy-related client service levels are met |
| • | Determined to engage, in certain instances, an independent third-party voting service provider to make proxy voting recommendations as a further safeguard to avoid potential conflicts of interest, to satisfy regulatory compliance requirements, or as may be otherwise required by applicable law. In such circumstances, the independent third-party voting service provider provides BlackRock with recommendations, in accordance with the Guidelines, as to how to vote such proxies. BlackRock uses an independent third-party voting service provider to make proxy voting recommendations for shares of BlackRock, Inc. and companies affiliated with BlackRock, Inc. BlackRock may also use an independent third-party voting service provider to make proxy voting recommendations for: |
| ○ | public companies that include BlackRock employees on their boards of directors |
| ○ | public companies of which a BlackRock, Inc. board member serves as a senior executive or a member of the board of directors |
| ○ | public companies that are the subject of certain transactions involving BlackRock Funds |
| ○ | public companies that are joint venture partners with BlackRock, and |
| ○ | public companies when legal or regulatory requirements compel BlackRock to use an independent third-party voting service provider |
In selecting an independent third-party voting service provider, we assess several characteristics, including but not limited to: independence, an ability to analyze proxy issues and make recommendations in the economic interest of our clients in accordance with the Guidelines, reputation for reliability and integrity, and operational capacity to accurately deliver the assigned recommendations in a timely manner. We may engage more than one independent third-party voting service provider, in part to mitigate potential or perceived conflicts of interest at a single voting service provider. The Global Committee appoints and reviews the performance of the independent third-party voting service providers, generally on an annual basis.
| BlackRock Investment Stewardship | Global Principles | 18 |
When so authorized, BlackRock acts as a securities lending agent on behalf of Funds. Securities lending is a well-regulated practice that contributes to capital market efficiency. It also enables funds to generate additional returns while allowing fund providers to keep fund expenses lower.
With regard to the relationship between securities lending and proxy voting, BlackRock cannot vote shares on loan and may determine to recall them for voting, as guided by our fiduciary responsibility to act in our clients’ financial interests. While this has occurred in a limited number of cases, the decision to recall securities on loan as part of BlackRock’s securities lending program in order to vote is based on an evaluation of various factors that include, but are not limited to, assessing potential securities lending revenue alongside the potential long-term financial value to clients of voting those securities (based on the information available at the time of recall consideration).10 BIS works with colleagues in the Securities Lending and Risk and Quantitative Analysis teams to evaluate the costs and benefits to clients of recalling shares on loan.
In almost all instances, BlackRock anticipates that the potential long-term financial value to the Fund of voting shares would be less than the potential revenue the loan may provide the Fund. However, in certain instances, BlackRock may determine, in our independent business judgment as a fiduciary, that the value of voting outweighs the securities lending revenue loss to clients and would therefore recall shares to be voted in those instances.
Periodically, BlackRock reviews our process for determining whether to recall securities on loan in order to vote and may modify it as necessary.
The voting guidelines published for each region/country in which we vote are intended to summarize BlackRock’s general philosophy and approach to issues that may commonly arise in the proxy voting context in each market where we invest. The Guidelines are not intended to be exhaustive. BIS applies the Guidelines on a case-by-case basis, in the context of the individual circumstances of each company and the specific issue under review. As such, the Guidelines do not indicate how BIS will vote in every instance. Rather, they reflect our view about corporate governance issues generally, and provide insight into how we typically approach issues that commonly arise on corporate ballots. As previously discussed, the Guidelines should be read in conjunction with the Principles and engagement priorities. Collectively, these “BIS policies” set out the core elements of corporate governance that guide our investment stewardship efforts globally and within each market, including when engaging with companies and voting at shareholder meetings. The BIS policies are applied on a case-by-case basis, taking into consideration the context within which a company is operating.
Reporting and vote transparency
We are committed to transparency in the stewardship work we do on behalf of clients. We inform clients about our engagement and voting policies and activities through direct communication and through disclosure on our website. Each year we publish an annual report that provides a global overview of our
10 Recalling securities on loan can be impacted by the timing of record dates. In the U.S., for example, the record date of a shareholder meeting typically falls before the proxy statements are released. Accordingly, it is not practicable to evaluate a proxy statement, determine that a vote has a material impact on a fund and recall any shares on loan in advance of the record date for the annual meeting. As a result, managers must weigh independent business judgement as a fiduciary, the benefit to a fund’s shareholders of recalling loaned shares in advance of an estimated record date without knowing whether there will be a vote on matters which have a material impact on the fund (thereby forgoing potential securities lending revenue for the fund’s shareholders) or leaving shares on loan to potentially earn revenue for the fund (thereby forgoing the opportunity to vote).
| BlackRock Investment Stewardship | Global Principles | 19 |
investment stewardship engagement and voting activities and a voting spotlight that summarizes our voting over a proxy year.11 Additionally, we make public our regional proxy voting guidelines for the benefit of clients and the companies in which we invest on their behalf. We also publish commentaries to share our perspective on market developments and emerging key themes.
At a more granular level, on a quarterly basis, we publish our vote record for each company that held a shareholder meeting during the period, showing how BIS voted on each proposal and providing our rationale for any votes against management proposals or on shareholder proposals. For shareholder meetings where a vote might be high profile or of significant interest to clients, we may publish a vote bulletin after the meeting, disclosing and explaining our vote on key proposals. We also publish a quarterly list of all companies with which we engaged and the key topics addressed in the engagement meeting.
In this way, we help inform our clients about the work we do on their behalf in promoting the governance and business practices that support durable, long-term financial value creation.
11 The proxy year runs from July 1 to June 30.
| BlackRock Investment Stewardship | Global Principles | 20 |
Want to know more?
blackrock.com/stewardship | contactstewardship@blackrock.com
This document is provided for information and educational purposes only. Investing involves risk, including the loss of principal.
Prepared by BlackRock, Inc.
©2024 BlackRock, Inc. All rights reserved. BLACKROCK is a trademark of BlackRock, Inc., or its subsidiaries in the United States and elsewhere. All other trademarks are those of their respective owners.

BlackRock Investment Stewardship Proxy voting guidelines for U.S. securities Effective as of January 2024
Contents
| 3 | ||||
| 3 | ||||
| 4 | ||||
| 6 | ||||
| 8 | ||||
| 9 | ||||
| 11 | ||||
| 11 | ||||
| Mergers, acquisitions, transactions, and other special situations |
12 | |||
| 14 | ||||
| 17 | ||||
| 20 | ||||
| 23 | ||||
| BlackRock Investment Stewardship | Proxy voting guidelines for U.S. securities | 2 |
These guidelines should be read in conjunction with the BlackRock Investment Stewardship Global Principles.
BlackRock’s clients depend on us to help them meet their long-term investment goals. Given that the business decisions that companies make have a direct impact on our clients’ long-term investment outcomes and financial well-being, we consider it one of our responsibilities to promote sound corporate governance as an informed, engaged shareholder on their behalf. At BlackRock, this is the responsibility of the BlackRock Investment Stewardship (BIS) team, which serves as a link between BlackRock’s clients and the companies we invest in on their behalf. In BIS’ experience, sound governance is critical to the success of a company, the protection of investors’ interests, and long-term financial value creation.
To that end, BIS takes a long-term approach to stewardship, focused on understanding the drivers of risk and financial value creation in companies’ business models. We do this in three ways:
| 1. | Engaging with companies to build our understanding of a company’s approach to corporate governance and business risks and opportunities. |
| 2. | Voting at shareholder meetings on management and shareholder proposals on behalf of clients who have delegated voting authority to BlackRock. Voting is the formal mechanism through which we signal our support for, or concerns about, how companies are serving the long-term financial interests of BlackRock’s clients. |
| 3. | Contributing to emerging thinking on stewardship to share our perspectives with clients, policymakers, and others in the corporate governance ecosystem, on topical and emerging stewardship issues that we believe may impact clients’ financial interests as long-term investors. |
The following issue-specific proxy voting guidelines (the “Guidelines”) summarize BIS’ philosophy and approach to engagement and voting, as well as our view of governance best practices and the roles and responsibilities of boards and directors for publicly listed U.S. companies. These Guidelines are not intended to limit the analysis of individual issues at specific companies or provide a guide to how BIS will engage and/or vote in every instance. They are to be applied with discretion, taking into consideration the range of issues and facts specific to the company, as well as individual ballot items at shareholder meetings.
These guidelines are divided into eight key themes, which group together the issues that frequently appear on the agenda of shareholder meetings:
| • | Boards and directors |
| • | Auditors and audit-related issues |
| • | Capital structure |
| • | Mergers, acquisitions, asset sales, and other special transactions |
| • | Executive compensation |
| BlackRock Investment Stewardship | Proxy voting guidelines for U.S. securities | 3 |
| • | Material sustainability-related risks and opportunities |
| • | General corporate governance matters |
| • | Shareholder protections |
We believe that an effective and well-functioning board that has appropriate governance structures to facilitate oversight of a company’s management and strategic initiatives is critical to the long-term financial success of a company and the protection of shareholders’ economic interests. In our view, a strong board can be a competitive advantage to a company, providing valuable oversight of and perspectives to management on the most important decisions in support of long-term financial performance. As part of their responsibilities, board members have a fiduciary duty to shareholders to oversee the strategic direction, operations, and risk management of a company. For this reason, BIS sees engagement with and the election of directors as one of our most important responsibilities.
Disclosure of material risks that may affect a company’s long-term strategy and financial value creation, including material sustainability-related factors when relevant, is essential for shareholders to appropriately understand and assess how effectively management is identifying, managing, and mitigating such risks.
Where a company has not adequately disclosed and demonstrated that its board has fulfilled these corporate governance and risk oversight responsibilities, we will consider voting against the election of directors who, on our assessment, have particular responsibility for the issues, as indicated below.
Independence
It is our view that a majority of the directors on the board should be independent to ensure objectivity in the decision-making of the board and its ability to oversee management. In addition, all members of audit, compensation, and nominating/governance board committees should be independent. Our view of independence may vary from listing standards.
Common impediments to independence may include:
| • | Employment as a senior executive by the company or a subsidiary within the past five years |
| • | An equity ownership in the company in excess of 20% |
| • | Having any other interest, business, or relationship (professional or personal) which could, or could reasonably be perceived to, materially interfere with the director’s ability to act in the best interests of the company and its shareholders |
We may vote against directors who we do not consider to be independent, including at controlled companies, when we believe oversight could be enhanced with greater independent director representation. To signal our concerns, we may also vote against the chair of the nominating/governance committee, or where no chair exists, the nominating/governance committee member with the longest tenure.
| BlackRock Investment Stewardship | Proxy voting guidelines for U.S. securities | 4 |
Oversight role of the board
The board should exercise appropriate oversight of management and the business activities of the company. Where we determine that a board has failed to do so in a way that may impede a company’s ability to deliver long-term financial value, we may vote against the responsible committees and/or individual directors.
Common circumstances are illustrated below:
| • | Where the board has failed to facilitate quality, independent auditing or accounting practices, we may vote against members of the audit committee |
| • | Where the company has failed to provide shareholders with adequate disclosure to conclude that appropriate strategic consideration is given to material risk factors (including, where relevant, material sustainability factors), we may vote against members of the responsible committee, or the most relevant director |
| • | Where it appears that a director has acted (at the company or at other companies) in a manner that compromises their ability to represent the best long-term economic interests of shareholders, we may vote against that individual |
| • | Where a director has a multi-year pattern of poor attendance at combined board and applicable committee meetings, or a director has poor attendance in a single year with no disclosed rationale, we may vote against that individual. Excluding exigent circumstances, BIS generally considers attendance at less than 75% of the combined board and applicable committee meetings to be poor attendance |
Sufficient capacity
Where a director serves on an excessive number of boards, which may limit their capacity to focus on each board’s needs, we may vote against that individual. The following identifies the maximum number of boards on which a director may serve, before BIS considers them to be over-committed:
| Total # of Public Boards | ||
|
Public Company Executives1 |
2 | |
|
Non-Executive Directors |
4 | |
In addition, we recognize that board leadership roles may vary in responsibility and time requirements in different markets around the world. In particular, where a director maintains a Chair role of a publicly listed company in European markets, we may consider that responsibility as equal to two board commitments, consistent with our EMEA Proxy Voting Guidelines. We will take the total number of board commitments across our global policies into account for director elections.
1 A public company executive is defined as a Named Executive Officer or Executive Chair.
| BlackRock Investment Stewardship | Proxy voting guidelines for U.S. securities | 5 |
Risk oversight
Companies should have an established process for identifying, monitoring, and managing business and material risks. Independent directors should have access to relevant management information and outside advice, as appropriate, to ensure they can properly oversee risk. We encourage companies to provide transparency around risk management, mitigation, and reporting to the board. We are particularly interested in understanding how risk oversight processes evolve in response to changes in corporate strategy and/or shifts in the business and related risk environment. Comprehensive disclosures provide investors with a sense of the company’s long-term risk management practices and, more broadly, the quality of the board’s oversight. In the absence of robust disclosures, we may reasonably conclude that companies are not adequately managing risk.
Classified board of directors/staggered terms
Directors should be re-elected annually; classification of the board generally limits shareholders’ rights to regularly evaluate a board’s performance and select directors. While we will typically support proposals requesting board de-classification, we may make exceptions, should the board articulate an appropriate strategic rationale for a classified board structure. This may include when a company needs consistency and stability during a time of transition, e.g., newly public companies or companies undergoing a strategic restructuring. A classified board structure may also be justified at non-operating companies, e.g., closed-end funds or business development companies (“BDC”),2 in certain circumstances. However, in these instances, boards should periodically review the rationale for a classified structure and consider when annual elections might be more appropriate.
Without a voting mechanism to immediately address concerns about a specific director, we may choose to vote against the directors up for election at the time (see “Shareholder rights” for additional detail).
Independent leadership
There are two commonly accepted structures for independent leadership to balance the CEO role in the boardroom: 1) an independent Chair; or 2) a Lead Independent Director when the roles of Chair and CEO are combined, or when the Chair is otherwise not independent.
In the absence of a significant governance concern, we defer to boards to designate the most appropriate leadership structure to ensure adequate balance and independence.3 However, BIS may vote against the most senior non-executive member of the board when appropriate independence is lacking in designated leadership roles.
In the event that the board chooses to have a combined Chair/CEO or a non-independent Chair, we support the designation of a Lead Independent Director, with the ability to: 1) provide formal input into board meeting agendas; 2) call meetings of the independent directors; and 3) preside at meetings of independent directors. These roles and responsibilities should be disclosed and easily accessible.
2 A BDC is a special investment vehicle under the Investment Company Act of 1940 that is designed to facilitate capital formation for small and middle-market companies.
3 To this end, we do not view shareholder proposals asking for the separation of Chair and CEO to be a proxy for other concerns we may have at the company for which a vote against directors would be more appropriate. Rather, support for such a proposal might arise in the case of overarching and sustained governance concerns such as lack of independence or failure to oversee a material risk over consecutive years.
| BlackRock Investment Stewardship | Proxy voting guidelines for U.S. securities | 6 |
The following table illustrates examples4 of responsibilities under each board leadership model:
| Combined Chair/CEO or CEO + Non-independent Chair | Separate Independent Chair | |||||
| Chair/CEO or Non- independent Chair |
Lead Independent Director | Independent Chair | ||||
| Board Meetings |
Authority to call full meetings of the board of directors | Authority to call meetings of independent directors | Authority to call full meetings of the board of directors | |||
| Attends full meetings of the board of directors | ||||||
| Briefs CEO on issues arising from executive sessions | ||||||
| Agenda | Primary responsibility for shaping board agendas, consulting with the lead independent director | Collaborates with chair/CEO to set board agenda and board information | Primary responsibility for shaping board agendas, in conjunction with CEO | |||
| Board Communications | Communicates with all directors on key issues and concerns outside of full board meetings | Facilitates discussion among independent directors on key issues and concerns outside of full board meetings, including contributing to the oversight of CEO and management succession planning | Facilitates discussion among independent directors on key issues and concerns outside of full board meetings, including contributing to the oversight of CEO and management succession planning | |||
CEO and management succession planning
Companies should have a robust CEO and senior management succession plan in place at the board level that is reviewed and updated on a regular basis. Succession planning should cover scenarios over both the long-term, consistent with the strategic direction of the company and identified leadership needs over time, as well as the short-term, in the event of an unanticipated executive departure. We encourage the company to explain their executive succession planning process, including where accountability lies within the boardroom for this task, without prematurely divulging sensitive information commonly associated with this exercise.
Where there is significant concern regarding the board’s succession planning efforts, we may vote against members of the responsible committee, or the most relevant director.
During a CEO transition, companies may elect for the departing CEO to maintain a role in the boardroom. We ask for disclosures to understand the timeframe and responsibilities of this role. In such instances, we typically look for the board to have appropriate independent leadership structures in place. (See chart above.)
Director compensation and equity programs
Compensation for directors should generally be structured to attract and retain directors, while also aligning their interests with those of shareholders. In our view, director compensation packages that are
4 This table is for illustrative purposes only. The roles and responsibilities cited here are not all-encompassing and are noted for reference as to how these leadership positions may be defined.
| BlackRock Investment Stewardship | Proxy voting guidelines for U.S. securities | 7 |
based on the company’s long-term value creation and include some form of long-term equity compensation are more likely to meet this goal.
Board composition and effectiveness
Director qualifications and skills
We encourage boards to periodically review director qualifications and skills to ensure relevant experience and diverse perspectives are represented in the boardroom. To this end, performance reviews and skills assessments should be conducted by the nominating/governance committee or the Lead Independent Director. This process may include internal board evaluations; however, boards may also find it useful to periodically conduct an assessment with a third party. We encourage boards to disclose their approach to evaluations, including objectives of the evaluation; if an external party conducts the evaluation; the frequency of the evaluations; and, whether that evaluation occurs on an individual director basis.
Board term limits and director tenure
Where boards find that age limits or term limits are a valuable mechanism for ensuring periodic board refreshment, we generally defer to the board’s determination in setting such limits. BIS will also consider the average board tenure to evaluate processes for board renewal. We may oppose boards that appear to have an insufficient mix of short-, medium-, and long-tenured directors.
In addition, where boards have adopted corporate governance guidelines regarding committee leadership and/or membership rotation, we appreciate clear disclosure of those policies.
Board diversity
As noted above, highly qualified, engaged directors with professional characteristics relevant to a company’s business enhance the ability of the board to add value and be the voice of shareholders in board discussions. In our view, a strong board provides a competitive advantage to a company, providing valuable oversight and contributing to the most important management decisions that support long-term financial performance.
It is in this context that we are interested in diversity in the boardroom. We see it as a means to promoting diversity of thought and avoiding ‘group think’ in the board’s advising of and overseeing management. It can help boards to have deeper discussions and make more resilient decisions. We ask boards to disclose how diversity is considered in board composition, including professional characteristics, such as a director’s relevant industry experience, specialist areas of expertise and geographic location; as well as demographic characteristics such as gender, race/ethnicity, and age.
We look to understand a board’s diversity in the context of a company’s domicile, market capitalization, business model, and strategy. Increasingly, we see leading boards nominating directors from diverse backgrounds which helps ensure boards can more effectively understand the company’s customers, employees, and communities. Self-identified board demographic diversity can usefully be disclosed in aggregate, consistent with local law. We encourage boards to aspire to meaningful diversity of membership, at least consistent with local regulatory requirements and best practices, while recognizing that building a strong, diverse board can take time. We take a case-by-case approach and consider the size of the board in our evaluation of overall composition and diversity. Business model, strategy, location, and company size may also impact our analysis of board diversity. We acknowledge that these factors
| BlackRock Investment Stewardship | Proxy voting guidelines for U.S. securities | 8 |
may also play into the various elements of diversity that a board may attract. We look for disclosures from companies to help us understand their approach and do not prescribe any particular board composition.
In the U.S., we believe that boards should aspire to at least 30% diversity of membership,5 and we encourage large companies, such as those in the S&P 500, to lead in achieving this standard. In light of market developments,6 an informative indicator of diversity for such companies is having at least two women and a director who identifies as a member of an underrepresented group.7 We recognize that companies with smaller market capitalizations and in certain sectors may face more challenges. Among these smaller companies, we look for the presence of diversity and take into consideration the steps that companies are taking to ensure diversity on their board.
In order to help investors understand overall diversity, we look to boards to disclose:
| • | The process by which candidates for board positions are identified, including whether professional firms or other resources outside of incumbent directors’ networks are engaged to identify and/or assess candidates, and whether a diverse slate of nominees is considered for all available board nominations |
| • | How directors’ professional characteristics, which may include domain expertise such as finance or technology, and sector- or market-specific experience, are complementary and link to the company’s long-term strategy |
| • | How diversity, including professional characteristics and demographic factors, is considered in board composition, given the company’s long-term strategy and business model |
To the extent that, based on our assessment of corporate disclosures, a company has not adequately explained their approach to diversity in their board composition, we may vote against members of the nominating/governance committee. Our publicly available commentary provides more information on our approach to board diversity.
Board size
We typically defer to the board in setting the appropriate size and believe that directors are generally in the best position to assess the optimal board size to ensure effectiveness. However, we may vote against the appropriate committees and/or individual directors if, in our view, the board is ineffective in its oversight, either because it is too small to allow for the necessary range of skills and experience or too large to function efficiently.
Board responsiveness and shareholder rights
Shareholder rights
5 For a discussion on the different impacts of diversity see: McKinsey, “Diversity Wins: How Inclusion Matters”, May 2022; Harvard Business Review, “Diverse Teams Feel Less Comfortable – and That’s Why They Perform Better”, September 2016; “Do Diverse Directors Influence DEI Outcomes”, September 2022
6 Spierings, Merel “Corporate Director Diversity Can Contribute to Board Effectiveness” Harvard Law School Forum on Corporate Governance (Nov. 2023) https://corpgov.law.harvard.edu/2023/11/24/us-public-company-board-diversity-in-2023/
7 Including, but not limited to, individuals who identify as Black or African American, Hispanic or Latinx, Asian, Native American or Alaska Native, or Native Hawaiian or Pacific Islander; individuals who identify as LGBTQ+; individuals who identify as underrepresented based on national, Indigenous, religious, or cultural identity; individuals with disabilities; and veterans.
| BlackRock Investment Stewardship | Proxy voting guidelines for U.S. securities | 9 |
Where we determine that a board has not acted in the best interests of the company’s shareholders, or takes action to unreasonably limit shareholder rights, we may vote against the relevant committees and/or individual directors. Common circumstances are illustrated below:
| • | The independent Chair or Lead Independent Director and members of the nominating/governance committee, where a board implements or renews a poison pill without shareholder approval |
| • | The independent Chair or Lead Independent Director and members of the nominating/governance committee, where a board amends the charter/articles/bylaws and where the effect may be to entrench directors or to unreasonably reduce shareholder rights |
| • | Members of the compensation committee where the company has repriced options without shareholder approval |
If a board maintains a classified structure, it is possible that the director(s) or committee members with whom we have a particular concern may not be subject to election in the year that the concern arises. In such situations, we may register our concern by voting against the most relevant director(s) up for election.
Responsiveness to shareholders
A board should be engaged with and responsive to the company’s shareholders, including acknowledging voting outcomes for director elections, compensation, shareholder proposals, and other ballot items. Where we determine that a board has not substantially addressed shareholder concerns that we deem material to the business, we may vote against the responsible committees and/or individual directors. Common circumstances are illustrated below:
| • | The Independent Chair or Lead Independent Director, members of the nominating/governance committee, and/or the longest tenured director(s), where we observe a lack of board responsiveness to shareholders, evidence of board entrenchment, and/or failure to plan for adequate board member succession |
| • | The chair of the nominating/governance committee, or where the chair is not standing for election, the nominating/governance committee member with the longest tenure, where board member(s) at the most recent election of directors have received against votes from more than 25% of shares voted, and the board has not taken appropriate action to respond to shareholder concerns. This may not apply in cases where BIS did not support the initial vote against such board member(s) |
| • | The Independent Chair or Lead Independent Director and/or members of the nominating/governance committee, where a board fails to consider shareholder proposals that (1) receive substantial support, and (2) in our view, have a material impact on the business, shareholder rights, or the potential for long-term value creation |
Majority vote requirements
Directors should generally be elected by a majority of the shares voted. We will normally support proposals seeking to introduce bylaws requiring a majority vote standard for director elections. Majority vote standards generally assist in ensuring that directors who are not broadly supported by shareholders are not elected to serve as their representatives. As a best practice, companies with either a majority vote standard or a plurality vote standard should adopt a resignation policy for directors who do not receive support from at least a majority of votes cast. Where the company already has a sufficiently robust
| BlackRock Investment Stewardship | Proxy voting guidelines for U.S. securities | 10 |
majority voting process in place, we are unlikely to support a shareholder proposal seeking an alternative mechanism.
We note that majority voting may not be appropriate in all circumstances, for example, in the context of a contested election, or for majority-controlled companies or those with concentrated ownership structures.
Cumulative voting
As stated above, a majority vote standard is generally in the best long-term interests of shareholders, as it ensures director accountability through the requirement to be elected by more than half of the votes cast. As such, we will generally oppose proposals requesting the adoption of cumulative voting, which may disproportionately aggregate votes on certain issues or director candidates.
Auditors and audit-related issues
BIS recognizes the critical importance of financial statements to provide a complete and accurate portrayal of a company’s financial condition. Consistent with our approach to voting on directors, we seek to hold the audit committee of the board responsible for overseeing the management of the independent auditor and the internal audit function at a company.
We may vote against the audit committee members where the board has failed to facilitate quality, independent auditing. We look to public disclosures for insight into the scope of the audit committee responsibilities, including an overview of audit committee processes, issues on the audit committee agenda, and key decisions taken by the audit committee. We take particular note of cases involving significant financial restatements or material weakness disclosures, and we look for timely disclosure and remediation of accounting irregularities.
The integrity of financial statements depends on the auditor effectively fulfilling its role. To that end, we favor an independent auditor. In addition, to the extent that an auditor fails to reasonably identify and address issues that eventually lead to a significant financial restatement, or the audit firm has violated standards of practice, we may also vote against ratification.
From time to time, shareholder proposals may be presented to promote auditor independence or the rotation of audit firms. We may support these proposals when they are consistent with our views as described above.
Equal voting rights
In our view, shareholders should be entitled to voting rights in proportion to their economic interests. In addition, companies that have implemented dual or multiple class share structures should review these structures on a regular basis, or as company circumstances change. Companies with multiple share classes should receive shareholder approval of their capital structure on a periodic basis via a management proposal on the company’s proxy. The proposal should give unaffiliated shareholders the opportunity to affirm the current structure or establish mechanisms to end or phase out controlling structures at the appropriate time, while minimizing costs to shareholders. Where companies are unwilling to voluntarily implement “one share, one vote” within a specified timeframe, or are unresponsive
| BlackRock Investment Stewardship | Proxy voting guidelines for U.S. securities | 11 |
to shareholder feedback for change over time, we generally support shareholder proposals to recapitalize stock into a single voting class.
Blank check preferred stock
We frequently oppose proposals requesting authorization of a class of preferred stock with unspecified voting, conversion, dividend distribution, and other rights (“blank check” preferred stock) because they may serve as a transfer of authority from shareholders to the board and as a possible entrenchment device. We generally view the board’s discretion to establish voting rights on a when-issued basis as a potential anti-takeover device, as it affords the board the ability to place a block of stock with an investor sympathetic to management, thereby foiling a takeover bid without a shareholder vote.
Nonetheless, we may support the proposal where the company:
| • | Appears to have a legitimate financing motive for requesting blank check authority |
| • | Has committed publicly that blank check preferred shares will not be used for anti-takeover purposes |
| • | Has a history of using blank check preferred stock for financings |
| • | Has blank check preferred stock previously outstanding such that an increase would not necessarily provide further anti-takeover protection but may provide greater financing flexibility |
Increase in authorized common shares
BIS will evaluate requests to increase authorized shares on a case-by-case basis, in conjunction with industry-specific norms and potential dilution, as well as a company’s history with respect to the use of its common shares.
Increase or issuance of preferred stock
We generally support proposals to increase or issue preferred stock in cases where the company specifies the voting, dividend, conversion, and other rights of such stock and where the terms of the preferred stock appear reasonable.
Stock splits
We generally support stock splits that are not likely to negatively affect the ability to trade shares or the economic value of a share. We generally support reverse stock splits that are designed to avoid delisting or to facilitate trading in the stock, where the reverse split will not have a negative impact on share value (e.g., one class is reduced while others remain at pre-split levels). In the event of a proposal for a reverse split that would not proportionately reduce the company’s authorized stock, we apply the same analysis we would use for a proposal to increase authorized stock.
Mergers, acquisitions, transactions, and other special situations
Mergers, acquisitions, and transactions
In assessing mergers, acquisitions, or other transactions – including business combinations involving Special Purpose Acquisition Companies (“SPACs”) – BIS’ primary consideration is the long-term economic interests of our clients as shareholders. Boards should clearly explain the economic and
| BlackRock Investment Stewardship | Proxy voting guidelines for U.S. securities | 12 |
strategic rationale for any proposed transactions or material changes to the business. We will review a proposed transaction to determine the degree to which it has the potential to enhance long-term shareholder value. While mergers, acquisitions, asset sales, business combinations, and other special transaction proposals vary widely in scope and substance, we closely examine certain salient features in our analyses, such as:
| • | The degree to which the proposed transaction represents a premium to the company’s trading price. We consider the share price over multiple time periods prior to the date of the merger announcement. We may consider comparable transaction analyses provided by the parties’ financial advisors and our own valuation assessments. For companies facing insolvency or bankruptcy, a premium may not apply |
| • | There should be clear strategic, operational, and/or financial rationale for the combination |
| • | Unanimous board approval and arm’s-length negotiations are preferred. We will consider whether the transaction involves a dissenting board or does not appear to be the result of an arm’s-length bidding process. We may also consider whether executive and/or board members’ financial interests appear likely to affect their ability to place shareholders’ interests before their own, as well as measures taken to address conflicts of interest |
| • | We prefer transaction proposals that include the fairness opinion of a reputable financial advisor assessing the value of the transaction to shareholders in comparison to recent similar transactions |
Contested director elections and special situations
Contested elections and other special situations8 are assessed on a case-by-case basis. We evaluate a number of factors, which may include: the qualifications and past performance of the dissident and management candidates; the validity of the concerns identified by the dissident; the viability of both the dissident’s and management’s plans; the ownership stake and holding period of the dissident; the likelihood that the dissident’s strategy will produce the desired change; and whether the dissident represents the best option for enhancing long-term shareholder value.
We will evaluate the actions that the company has taken to limit shareholders’ ability to exercise the right to nominate dissident director candidates, including those actions taken absent the immediate threat of a contested situation. BIS may take voting action against directors (up to and including the full board) where those actions are viewed as egregiously infringing on shareholder rights.
We will consider a variety of possible voting outcomes in contested situations, including the ability to support a mix of management and dissident nominees.
Poison pill plans
Where a poison pill is put to a shareholder vote by management, our policy is to examine these plans individually. Although we have historically opposed most plans, we may support plans that include a reasonable “qualifying offer clause.” Such clauses typically require shareholder ratification of the pill and stipulate a sunset provision whereby the pill expires unless it is renewed. These clauses also tend to specify that an all-cash bid for all shares that includes a fairness opinion and evidence of financing does
8 Special situations are broadly defined as events that are non-routine and differ from the normal course of business for a company’s shareholder meeting, involving a solicitation other than by management with respect to the exercise of voting rights in a manner inconsistent with management’s recommendation. These may include instances where shareholders nominate director candidates, oppose the view of management and/or the board on mergers, acquisitions, or other transactions, etc.
| BlackRock Investment Stewardship | Proxy voting guidelines for U.S. securities | 13 |
not trigger the pill, but forces either a special meeting at which the offer is put to a shareholder vote or requires the board to seek the written consent of shareholders, where shareholders could rescind the pill at their discretion. We may also support a pill where it is the only effective method for protecting tax or other economic benefits that may be associated with limiting the ownership changes of individual shareholders. Lastly, we look for shareholder approval of poison pill plans within one year of adoption of implementation.
Reimbursement of expense for successful shareholder campaigns
We generally do not support shareholder proposals seeking the reimbursement of proxy contest expenses, even in situations where we support the shareholder campaign. Introducing the possibility of such reimbursement may incentivize disruptive and unnecessary shareholder campaigns.
A company’s board of directors should put in place a compensation structure that balances incentivizing, rewarding, and retaining executives appropriately across a wide range of business outcomes. This structure should be aligned with shareholder interests, particularly the generation of sustainable, long-term value.
The compensation committee should carefully consider the specific circumstances of the company and the key individuals the board is focused on incentivizing. We encourage companies to ensure that their compensation plans incorporate appropriate and rigorous performance metrics, consistent with corporate strategy and market practice. Performance-based compensation should include metrics that are relevant to the business and stated strategy and/or risk mitigation efforts. Goals, and the processes used to set these goals, should be clearly articulated and appropriately rigorous. We use third party research, in addition to our own analysis, to evaluate existing and proposed compensation structures. We hold members of the compensation committee, or equivalent board members, accountable for poor compensation practices and/or structures.
There should be a clear link between variable pay and company performance that drives sustained value creation for our clients as shareholders. Where compensation structures provide for a front-loaded9 award, we look for appropriate structures (including vesting and/or holding periods) that motivate sustained performance for shareholders over a number of years. We generally do not favor programs focused on awards that require performance levels to be met and maintained for a relatively short time period for payouts to be earned, unless there are extended vesting and/or holding requirements.
Compensation structures should generally drive outcomes that align the pay of the executives with performance of the company and the value received by shareholders. When evaluating performance, we examine both executive teams’ efforts, as well as outcomes realized by shareholders. Payouts to executives should reflect both the executive’s contributions to the company’s ongoing success, as well as exogenous factors that impacted shareholder value. Where discretion has been used by the compensation committee, we look for disclosures relating to how and why the discretion was used and how the adjusted outcome is aligned with the interests of shareholders. While we believe special awards10 should be used sparingly, we acknowledge that there may be instances when such awards are appropriate. When evaluating these awards, we consider a variety of factors, including the magnitude and
9 Front-loaded awards are generally those that accelerate the grant of multiple years’ worth of compensation in a single year.
10 “Special awards” refers to awards granted outside the company’s typical compensation program.
| BlackRock Investment Stewardship | Proxy voting guidelines for U.S. securities | 14 |
structure of the award, the scope of award recipients, the alignment of the grant with shareholder value, and the company’s historical use of such awards, in addition to other company-specific circumstances.
We acknowledge that the use of peer group evaluation by compensation committees can help calibrate competitive pay; however, we are concerned when the rationale for increases in total compensation is solely based on peer benchmarking.
We support incentive plans that foster the sustainable achievement of results – both financial and non-financial – consistent with the company’s strategic initiatives. Compensation committees should guard against contractual arrangements that would entitle executives to material compensation for early termination of their contract. Finally, pension contributions and other deferred compensation arrangements should be reasonable in light of market practices. Our publicly available commentary provides more information on our approach to executive compensation.
Where executive compensation appears excessive relative to the performance of the company and/or compensation paid by peers, or where an equity compensation plan is not aligned with shareholders’ interests, we may vote against members of the compensation committee.
“Say on Pay” advisory resolutions
In cases where there is a “Say on Pay” vote, BIS will respond to the proposal as informed by our evaluation of compensation practices at that particular company and in a manner that appropriately addresses the specific question posed to shareholders. Where we conclude that a company has failed to align pay with performance, we will generally vote against the management compensation proposal and relevant compensation committee members.
Frequency of “Say on Pay” advisory resolutions
BIS will generally support annual advisory votes on executive compensation. It is our view that shareholders should have the opportunity to express feedback on annual incentive programs and changes to long-term compensation before multiple cycles are issued. Where a company has failed to implement a “Say on Pay” advisory vote within the frequency period that received the most support from shareholders or a “Say on Pay” resolution is omitted without explanation, BIS may vote against members of the compensation committee.
Clawback proposals
We generally favor prompt recoupment from any senior executive whose compensation was based on faulty financial reporting or deceptive business practices. We appreciate when companies disclose recovery policies in compliance with the Dodd-Frank Wall Street Reform and Consumer Protection Act. We also favor recoupment from or the foregoing of the grant of any awards by any senior executive whose behavior caused material financial harm to shareholders, material reputational risk to the company, or resulted in a criminal investigation, even if such actions did not ultimately result in a material restatement of past results. This includes, but is not limited to, settlement agreements arising from such behavior and paid for directly by the company. We typically support shareholder proposals on these matters unless the company already has a robust clawback policy that sufficiently addresses our concerns.
Employee stock purchase plans
Employee stock purchase plans (“ESPP”) are an important part of a company’s overall human capital management strategy and can provide performance incentives to help align employees’ interests with
| BlackRock Investment Stewardship | Proxy voting guidelines for U.S. securities | 15 |
those of shareholders. The most common form of ESPP qualifies for favorable tax treatment under Section 423 of the Internal Revenue Code. We will typically support qualified ESPP proposals.
Equity compensation plans
BIS supports equity plans that align the economic interests of directors, managers, and other employees with those of shareholders. Boards should establish policies prohibiting the use of equity awards in a manner that could disrupt the intended alignment with shareholder interests, such as the excessive pledging or heading of stock. We may support shareholder proposals requesting the establishment of such policies.
Our evaluation of equity compensation plans is based on a company’s executive pay and performance relative to peers and whether the plan plays a significant role in a pay-for-performance disconnect. We generally oppose plans that contain “evergreen” provisions, which allow for automatic annual increases of shares available for grant without requiring further shareholder approval; we note that the aggregate impacts of such increases are difficult to predict and may lead to significant dilution. We also generally oppose plans that allow for repricing without shareholder approval. We may oppose plans that provide for the acceleration of vesting of equity awards even in situations where an actual change of control may not occur. We encourage companies to structure their change of control provisions to require the termination of the covered employee before acceleration or special payments are triggered (commonly referred to as “double trigger” change of control provisions).
Golden parachutes
We generally view golden parachutes as encouragement to management to consider transactions that might be beneficial to shareholders. However, a large potential payout under a golden parachute arrangement also presents the risk of motivating a management team to support a sub-optimal sale price for a company.
When determining whether to support or oppose an advisory vote on a golden parachute plan, BIS may consider several factors, including:
| • | Whether we determine that the triggering event is in the best interests of shareholders |
| • | Whether management attempted to maximize shareholder value in the triggering event |
| • | The percentage of total premium or transaction value that will be transferred to the management team, rather than shareholders, as a result of the golden parachute payment |
| • | Whether excessively large excise tax gross-up payments are part of the pay-out |
| • | Whether the pay package that serves as the basis for calculating the golden parachute payment was reasonable in light of performance and peers |
| • | Whether the golden parachute payment will have the effect of rewarding a management team that has failed to effectively manage the company |
It may be difficult to anticipate the results of a plan until after it has been triggered; as a result, BIS may vote against a golden parachute proposal even if the golden parachute plan under review was approved by shareholders when it was implemented.
We may support shareholder proposals requesting that implementation of such arrangements require shareholder approval.
| BlackRock Investment Stewardship | Proxy voting guidelines for U.S. securities | 16 |
Option exchanges
There may be legitimate instances where underwater options create an overhang on a company’s capital structure and a repricing or option exchange may be warranted. We will evaluate these instances on a case-by-case basis. BIS may support a request to reprice or exchange underwater options under the following circumstances:
| • | The company has experienced significant stock price decline as a result of macroeconomic trends, not individual company performance |
| • | Directors and executive officers are excluded; the exchange is value neutral or value creative to shareholders; tax, accounting, and other technical considerations have been fully contemplated |
| • | There is clear evidence that absent repricing, employee incentives, retention, and/or recruiting may be impacted |
BIS may also support a request to exchange underwater options in other circumstances, if we determine that the exchange is in the best interests of shareholders.
Supplemental executive retirement plans
BIS may support shareholder proposals requesting to put extraordinary benefits contained in supplemental executive retirement plans (“SERP”) to a shareholder vote unless the company’s executive pension plans do not contain excessive benefits beyond what is offered under employee-wide plans.
Material sustainability-related risks and opportunities
It is our view that well-managed companies will effectively evaluate and manage material sustainability-related risks and opportunities relevant to their businesses. As with all risks and opportunities in a company’s business model, appropriate oversight of material sustainability considerations is a core component of having an effective governance framework, which supports durable, long-term financial value creation.
When assessing how to vote – including on the election of directors and relevant shareholder proposals – robust disclosures are essential for investors to understand, where appropriate, how companies are integrating material sustainability risks and opportunities across their business and strategic, long-term planning. Where a company has failed to appropriately provide the necessary disclosures and evidence of effective business practices to support our assessment, BIS may express concerns through our engagement and voting. As part of this consideration, we encourage companies to produce sustainability-related disclosures sufficiently in advance of their annual meeting so that the disclosures can be considered in relevant vote decisions.
Robust disclosure is essential for investors to effectively evaluate companies’ strategy and business practices related to material sustainability-related risks and opportunities. Long-term investors like our clients can benefit when companies demonstrate that they have a resilient business model through disclosures that cover governance, strategy, risk management, and metrics and targets, including industry-specific metrics. The International Sustainability Standards Board (ISSB) standards, IFRS S1 and
| BlackRock Investment Stewardship | Proxy voting guidelines for U.S. securities | 17 |
S2,11 provide companies with a useful guide to preparing this disclosure. The standards build on the Task Force on Climate-related Financial Disclosures (TCFD) framework and the standards and metrics developed by the Sustainability Accounting Standards Board (SASB), which have converged under the ISSB. We recognize that companies may phase in reporting aligned with the ISSB standards over several years. We also recognize that some companies may report using different standards, which may be required by regulation, or one of a number of voluntary standards. In such cases, we ask that companies highlight the metrics that are industry-or company-specific.
Companies may also disclose any material supranational standards adopted, the industry initiatives in which they participate, any peer group benchmarking undertaken, and any assurance processes to help investors understand their approach to sustainable and responsible business conduct.
Climate risk
While companies in various sectors and geographies may be affected differently by climate-related risks and opportunities, the low-carbon transition is an investment factor that can be material for many companies and economies around the globe.
We seek to understand, from company disclosures and engagement, the strategies companies have in place to manage material risks to, and opportunities for, their long-term business model associated with a range of climate-related scenarios, including a scenario in which global warming is limited to well below 2°C, considering global ambitions to achieve a limit of 1.5°C. As one of many shareholders, and typically a minority one, BlackRock does not tell companies what to do. It is the role of the board and management to set and implement a company’s long-term strategy to deliver long-term financial returns.
Our research shows that the low-carbon transition is a structural shift in the global economy that will be shaped by changes in government policies, technology, and consumer preferences, which may be material for many companies.12 Yet the path to a low-carbon economy is deeply uncertain and uneven, with different parts of the economy moving at different speeds. BIS recognizes that it can be challenging for companies to predict the impact of climate-related risk and opportunity on their businesses and operating environments. Many companies are assessing how to navigate the low-carbon transition while delivering long-term value to investors. In this context, we encourage companies to publicly disclose, consistent with their business model and sector, how they intend to deliver long-term financial performance through the transition to a low-carbon economy. Where available, we appreciate companies publishing their transition plan.13
Consistent with the ISSB standards, we are better able to assess preparedness for the low-carbon transition when companies disclose short-, medium- and long-term targets, ideally science-based where
11 The objective of IFRS S1 General Requirements for Disclosure of Sustainability-related Financial Information is to require an entity to disclose information about its sustainability-related risks and opportunities that is useful to primary users of general-purpose financial reports in making decisions relating to providing resources to the entity. The objective of IFRS S2 Climate-related Disclosures is to require an entity to disclose information about its climate-related risks and opportunities that is useful to primary users of general-purpose financial reports in making decisions relating to providing resources to the entity.
12 BlackRock Investment Institute, “Tracking the low-carbon transition”, July 2023.
13 We have observed that more companies are developing such plans, and public policy makers in a number of markets are signaling their intentions to require them. We view transition plans (TPs) as a method for a company to both internally assess and externally communicate long-term strategy, ambition, objectives, and actions to create financial value through the global transition towards a low-carbon economy. While many initiatives across jurisdictions outline a framework for TPs, there is no consensus on the key elements these plans should contain. We view useful disclosure as that which communicates a company’s approach to managing financially material, business relevant risks and opportunities – including climate-related risks – to deliver long-term financial performance, thus enabling investors to make more informed decisions.
| BlackRock Investment Stewardship | Proxy voting guidelines for U.S. securities | 18 |
these are available for their sector, for scope 1 and 2 greenhouse gas emissions (GHG) reductions and to demonstrate how their targets are consistent with the long-term financial interests of their investors.
While we recognize that regulators in some markets are moving to mandate certain disclosures, at this stage, we view scope 3 emissions differently from scopes 1 and 2, given methodological complexity, regulatory uncertainty, concerns about double-counting, and lack of direct control by companies. We welcome disclosures and commitments companies choose to make regarding scope 3 emissions and recognize these are provided on a good-faith basis as methodology develops. Our publicly available commentary provides more information on our approach to climate-related risks and opportunities.
Natural capital
In addition to climate-related risks and opportunities, the management of nature-related factors is increasingly a component of some companies’ ability to generate durable, long-term financial returns for shareholders, particularly where a company’s strategy is heavily reliant on the availability of natural capital, or whose supply chains are exposed to locations with nature-related risks. We look for such companies to disclose how they manage any reliance and impact on, as well as use of, natural capital, including appropriate risk oversight and relevant metrics and targets, to understand how these factors are integrated into strategy. We will evaluate these disclosures to inform our view of how a company is managing material nature-related risks and opportunities, as well as in our assessment of relevant shareholder proposals. Our publicly available commentary provides more information on our approach to natural capital.14
Key stakeholder interests
In order to advance long-term shareholders’ interests, companies should consider the interests of the various parties on whom they depend for their success over time. It is for each company to determine their key stakeholders based on what is material to their business and long-term financial performance. For many companies, key stakeholders include employees, business partners (such as suppliers and distributors), clients and consumers, regulators, and the communities in which they operate.
As a long-term shareholder on behalf of our clients, we find it helpful when companies disclose how they have identified their key stakeholders and considered their interests in business decision-making. In addition to understanding broader stakeholder relationships, BIS finds it helpful when companies consider the needs of their workforce today, and the skills required for their future business strategy. We are also interested to understand the role of the board, which is well positioned to ensure that the approach taken is informed by and aligns with the company’s strategy and purpose.
Companies should articulate how they address material adverse impacts that could arise from their business practices and affect critical relationships with their stakeholders. We encourage companies to implement, to the extent appropriate, monitoring processes (often referred to as due diligence) to identify and mitigate potential adverse impacts and grievance mechanisms to remediate any actual adverse material impacts. In our view, maintaining trust within these relationships can contribute to a company’s long-term success.
14 Given the growing awareness of the materiality of these issues for certain businesses, enhanced reporting on a company’s natural capital dependencies and impacts would aid investors’ understanding. In our view, the final recommendations of the Taskforce on Nature-related Financial Disclosures may prove useful to some companies. We recognize that some companies may report using different standards, which may be required by regulation, or one of a number of other private sector standards.
| BlackRock Investment Stewardship | Proxy voting guidelines for U.S. securities | 19 |
Human capital management
A company’s approach to human capital management (“HCM”) is a critical factor in fostering an inclusive, diverse, and engaged workforce, which contributes to business continuity, innovation, and long-term value creation. Consequently, we ask companies to demonstrate a robust approach to HCM and provide shareholders with clear and consistent disclosures to help investors understand how a company’s approach aligns with its stated strategy and business model.
Some components of HCM are consistent across most companies, such as the approach to diversity, equity, and inclusion (“DEI”). We ask companies to disclose their approach to DEI as well as workforce demographics, which are baselined by their responses to the U.S. Equal Employment Opportunity Commission’s EEO-1 Survey.
Other relevant HCM factors may be more nuanced to a company’s strategy and business model. Those more nuanced factors may include the company’s approach to workplace safety, compensation, benefits, talent development, and performance management. We ask companies to disclose and provide context on the most relevant HCM factors for their business.
Our publicly available commentary provides more information on our approach to HCM.
Corporate political activities
Companies may engage in certain political activities, within legal and regulatory limits, in order to support public policy matters material to their long-term strategies. These activities can also create risks, including: the potential for allegations of corruption; certain reputational risks; and risks that arise from the complex legal, regulatory, and compliance considerations associated with corporate political spending and lobbying activity. Companies that engage in political activities should develop and maintain robust processes, including board oversight, to guide these activities and mitigate risks.
We depend on companies to provide accessible and clear disclosures so that investors can easily understand how their political activities support their long-term strategy, including on stated public policy priorities. When presented with shareholder proposals requesting increased disclosure on corporate political activities, BIS will evaluate publicly available information to consider how a company’s lobbying and political activities may impact the company. We will also evaluate whether there is general consistency between a company’s stated positions on policy matters material to their strategy and the material positions taken by significant industry groups of which they are a member. We may decide to support a shareholder proposal requesting additional disclosures if we identify a material inconsistency or determine that further transparency may clarify how the company’s political activities support its long-term strategy. Our publicly available commentary provides more information on our approach to corporate political activities.
General corporate governance matters
IPO governance
Boards should disclose how the corporate governance structures adopted upon a company’s initial public offering (“IPO”) are in shareholders’ best long-term interests. We also ask boards to conduct a regular review of corporate governance and control structures, such that boards might evolve foundational corporate governance structures as company circumstances change, without undue costs and disruption
| BlackRock Investment Stewardship | Proxy voting guidelines for U.S. securities | 20 |
to shareholders. In our letter on unequal voting structures, we articulate our view that “one vote for one share” is the preferred structure for publicly-traded companies. We also recognize the potential benefits of dual class shares to newly public companies as they establish themselves; however, these structures should have a specific and limited duration. We will generally engage newly listed companies on topics such as classified boards and supermajority vote provisions to amend bylaws, as we think that such arrangements may not be in the best interests of shareholders over the long-term.
We may apply a one-year grace period for the application of certain director-related guidelines (including, but not limited to, responsibilities on other public company boards and board composition concerns), during which we ask boards to take steps to bring corporate governance standards in line with market norms.
Further, if a company qualifies as an emerging growth company (an “EGC”) under the Jumpstart Our Business Startups Act of 2012 (the “JOBS Act”), we will give consideration to the NYSE and NASDAQ governance exemptions granted under the JOBS Act for the duration such a company is categorized as an EGC. An EGC should have an independent audit committee by the first anniversary of its IPO, with our standard approach to voting on auditors and audit-related issues applicable in full for an EGC on the first anniversary of its IPO.
Corporate form
Proposals to change a corporation’s form, including those to convert to a public benefit corporation (“PBC”) structure, should clearly articulate the stakeholder groups the company seeks to benefit and provide detail on how the interests of shareholders would be augmented or adversely affected with the change to a PBC. These disclosures should also include the accountability and voting mechanisms that would be available to shareholders. We generally support management proposals to convert to a PBC if our analysis indicates that shareholders’ interests are adequately protected. Corporate form shareholder proposals are evaluated on a case-by-case basis.
Shareholder Proposals
When assessing shareholder proposals, BIS evaluates each proposal on its merit, with a singular focus on its implications for long-term financial value creation by that company. We would not support proposals that we believe would result in over-reaching into the basic business decisions of the company. In addition, we believe it helpful for companies to disclose the names of the proponent or organization that has submitted or advised on the proposal. We consider the business and economic relevance of the issue raised, as well as its materiality and the urgency with which our experience indicates it should be addressed.
Where a proposal is focused on a material business risk that we agree needs to be addressed and the intended outcome is consistent with long-term financial value creation, we will look to the board and management to demonstrate that the company has met the intent of the request made in the shareholder proposal. Where our analysis and/or engagement indicate an opportunity for improvement in the company’s approach to the issue, we may support shareholder proposals that are reasonable and not unduly prescriptive or constraining on management.
We recognize that some shareholder proposals bundle topics and/or specific requests and include supporting statements that explain the reasoning or objectives of the proponent. In voting on behalf of clients, we do not submit or edit proposals or the supporting statements – we must vote yes or no on the proposal as phrased by the proponent. Therefore, when we vote in support of a proposal, we are not necessarily endorsing every element of the proposal or the reasoning, objectives, or supporting statement
| BlackRock Investment Stewardship | Proxy voting guidelines for U.S. securities | 21 |
of the proponent. We may support a proposal for different reasons from those put forth by the proponent, when we believe that, overall, it can advance our clients’ long-term financial interests. We would normally explain to the company our rationale for supporting such proposals.
Alternatively, or in addition, we may vote against the election of one or more directors if, in our assessment, the board has not responded sufficiently or with an appropriate sense of urgency. We may also support a proposal if management is on track, but we believe that voting in favor might accelerate efforts to address a material risk.
Exclusive forum provisions
BIS generally supports proposals to seek exclusive forum for certain shareholder litigation. In cases where a board unilaterally adopts exclusive forum provisions that we consider unfavorable to the interests of shareholders, we will vote against the Independent Chair or Lead Independent director and members of the nominating/governance committee.
Reincorporation
We will evaluate the economic and strategic rationale behind the company’s proposal to reincorporate on a case-by-case basis. In all instances, we will evaluate the changes to shareholder protections under the new charter/articles/bylaws to assess whether the move increases or decreases shareholder protections. Where we find that shareholder protections are diminished, we may support reincorporation if we determine that the overall benefits outweigh the diminished rights.
Multi-jurisdictional companies
Where a company is listed on multiple exchanges or incorporated in a country different from their primary listing, we will seek to apply the most relevant market guideline(s) to our analysis of the company’s governance structure and specific proposals on the shareholder meeting agenda. In doing so, we typically consider the governance standards of the company’s primary listing, the market standards by which the company governs themselves, and the market context of each specific proposal on the agenda. If the relevant standards are silent on the issue under consideration, we will use our professional judgment as to what voting outcome would best protect the long-term economic interests of investors. Companies should disclose the rationale for their selection of primary listing, country of incorporation, and choice of governance structures, particularly where there is conflict between relevant market governance practices.
Adjourn meeting to solicit additional votes
We generally support such proposals unless the agenda contains items that we judge to be detrimental to shareholders’ best long-term economic interests.
Bundled proposals
Shareholders should have the opportunity to review substantial governance changes individually without having to accept bundled proposals. Where several measures are grouped into one proposal, BIS may reject certain positive changes when linked with proposals that generally contradict or impede the rights and economic interests of shareholders.
Other business
We oppose voting on matters where we are not given the opportunity to review and understand those measures and carry out an appropriate level of shareholder oversight.
| BlackRock Investment Stewardship | Proxy voting guidelines for U.S. securities | 22 |
Amendment to charter/articles/bylaws
Shareholders should have the right to vote on key corporate governance matters, including changes to governance mechanisms and amendments to the charter/articles/bylaws. We may vote against certain directors where changes to governing documents are not put to a shareholder vote within a reasonable period of time, particularly if those changes have the potential to impact shareholder rights (see “Director elections”). In cases where a board’s unilateral adoption of changes to the charter/articles/bylaws promotes cost and operational efficiency benefits for the company and its shareholders, we may support such action if it does not have a negative effect on shareholder rights or the company’s corporate governance structure.
When voting on a management or shareholder proposal to make changes to the charter/articles/bylaws, we will consider in part the company’s and/or proponent’s publicly stated rationale for the changes; the company’s governance profile and history; relevant jurisdictional laws; and situational or contextual circumstances which may have motivated the proposed changes, among other factors. We will typically support amendments to the charter/articles/bylaws where the benefits to shareholders outweigh the costs of failing to make such changes.
Proxy access
It is our view that long-term shareholders should have the opportunity, when necessary and under reasonable conditions, to nominate directors on the company’s proxy card.15
Securing the right of shareholders to nominate directors without engaging in a control contest can enhance shareholders’ ability to meaningfully participate in the director election process, encourage board attention to shareholder interests, and provide shareholders an effective means of directing that attention where it is lacking. Proxy access mechanisms should provide shareholders with a reasonable opportunity to use this right without stipulating overly restrictive or onerous parameters for use, and also provide assurances that the mechanism will not be subject to abuse by short-term investors, investors without a substantial investment in the company, or investors seeking to take control of the board.
In general, we support market-standardized proxy access proposals, which allow a shareholder (or group of up to 20 shareholders) holding three percent of a company’s outstanding shares for at least three years the right to nominate the greater of up to two directors or 20% of the board. Where a standardized proxy access provision exists, we will generally oppose shareholder proposals requesting outlier thresholds.
Right to act by written consent
In exceptional circumstances and with sufficiently broad support, shareholders should have the opportunity to raise issues of substantial importance without having to wait for management to schedule a meeting. Accordingly, shareholders should have the right to solicit votes by written consent provided that: 1) there are reasonable requirements to initiate the consent solicitation process (in order to avoid the waste of corporate resources in addressing narrowly supported interests); and 2) shareholders receive a minimum of 50% of outstanding shares to effectuate the action by written consent.
15 BlackRock is subject to certain regulations and laws in the United States that place restrictions and limitations on how BlackRock can interact with the companies in which we invest on behalf of our clients, including our ability to submit shareholder proposals or elect directors to the board.
| BlackRock Investment Stewardship | Proxy voting guidelines for U.S. securities | 23 |
We may oppose shareholder proposals requesting the right to act by written consent in cases where the proposal is structured for the benefit of a dominant shareholder to the exclusion of others, or if the proposal is written to discourage the board from incorporating appropriate mechanisms to avoid the waste of corporate resources when establishing a right to act by written consent. Additionally, we may oppose shareholder proposals requesting the right to act by written consent if the company already provides a shareholder right to call a special meeting that offers shareholders a reasonable opportunity to raise issues of substantial importance without having to wait for management to schedule a meeting.
Right to call a special meeting
In exceptional circumstances and with sufficiently broad support, shareholders should have the opportunity to raise issues of substantial importance without having to wait for management to schedule a meeting. Accordingly, shareholders should have the right to call a special meeting in cases where a reasonably high proportion of shareholders (typically a minimum of 15% but no higher than 25%) are required to agree to such a meeting before it is called. However, we may oppose this right in cases where the proposal is structured for the benefit of a dominant shareholder, or where a lower threshold may lead to an ineffective use of corporate resources. We generally think that a right to act via written consent is not a sufficient alternative to the right to call a special meeting.
Consent solicitation
While BlackRock is supportive of the shareholder rights to act by written consent and call a special meeting, BlackRock is subject to certain regulations and laws that place restrictions and limitations on how BlackRock can interact with the companies in which we invest on behalf of our clients, including our ability to participate in consent solicitations. As a result, BlackRock will generally not participate in consent solicitations or related processes. However, once an item comes to a shareholder vote, we uphold our fiduciary duty to vote in the best long-term interests of our clients, where we are authorized to do so.
Simple majority voting
We generally favor a simple majority voting requirement to pass proposals. Therefore, we will generally support the reduction or the elimination of supermajority voting requirements to the extent that we determine shareholders’ ability to protect their economic interests is improved. Nonetheless, in situations where there is a substantial or dominant shareholder, supermajority voting may be protective of minority shareholder interests, and we may support supermajority voting requirements in those situations.
Virtual meetings
Shareholders should have the opportunity to participate in the annual and special meetings for the companies in which they are invested, as these meetings are an opportunity for shareholders to provide feedback and hear from the board and management. While these meetings have traditionally been conducted in-person, virtual meetings are an increasingly viable way for companies to utilize technology to facilitate shareholder accessibility, inclusiveness, and cost efficiencies. Shareholders should have a meaningful opportunity to participate in the meeting and interact with the board and management in these virtual settings; companies should facilitate open dialogue and allow shareholders to voice concerns and provide feedback without undue censorship. Relevant shareholder proposals are assessed on a case-by-case basis.
| BlackRock Investment Stewardship | Proxy voting guidelines for U.S. securities | 24 |
Want to know more?
blackrock.com/stewardship | contactstewardship@blackrock.com
This document is provided for information and educational purposes only. Investing involves risk, including the loss of principal.
Prepared by BlackRock, Inc.
©2024 BlackRock, Inc. All rights reserved. BLACKROCK is a trademark of BlackRock, Inc., or its subsidiaries in the United States and elsewhere. All other trademarks are those of their respective owners.
BlackRock Energy and Resources Trust
Cusip: 09250U101
Ticker: BGR
| Record Date | December 15, 2023 | |||
| Pay Date | December 20, 2023 | |||
| Distribution Amount per share | $ 0.065700 | |||
The following table sets forth the estimated amounts of the current distribution and the cumulative distributions paid this fiscal year to date from the following sources: net income, net realized short-term capital gains, net realized long-term capital gains and return of capital. All amounts are expressed per common share.
| Current Distribution | % Breakdown of the Current Distribution |
Total Cumulative Distributions for the Fiscal Year to Date |
% Breakdown of the Total Cumulative Distributions for the Fiscal Year to Date |
|||||||||||||
| Net Income |
$ | 0.060453 | 92% | $ | 0.386340 | 50% | ||||||||||
| Net Realized Short-Term Capital Gains |
$ | - | 0% | $ | - | 0% | ||||||||||
| Net Realized Long-Term Capital Gains |
$ | - | 0% | $ | - | 0% | ||||||||||
| Return of Capital |
$ | 0.005247 | 8% | $ | 0.387660 | 50% | ||||||||||
|
|
|
|
|
|
|
|
|
|||||||||
| Total (per common share) |
$ | 0.065700 | 100% | $ | 0.774000 | 100% | ||||||||||
|
|
|
|
|
|
|
|
|
|||||||||
| Average annual total return (in relation to NAV) for the 5-year period ending on November 30, 2023 |
|
8.36% | ||||||||||||||
|
|
|
|||||||||||||||
| Annualized current distribution rate expressed as a percentage of NAV as of November 30, 2023 |
|
5.52% | ||||||||||||||
|
|
|
|||||||||||||||
| Cumulative total return (in relation to NAV) for the fiscal year through November 30, 2023 |
|
6.38% | ||||||||||||||
|
|
|
|||||||||||||||
| Cumulative fiscal year distributions as a percentage of NAV as of November 30, 2023 |
|
4.96% | ||||||||||||||
|
|
|
|||||||||||||||
You should not draw any conclusions about the Trust’s investment performance from the amount of this distribution or from the terms of the Trust’s Managed Distribution Plan.
The Fund estimates that it has distributed more than its net income and net realized capital gains; therefore, a portion of your distribution may be a return of capital. A return of capital may occur, for example, when some or all of the money that you invested in the Fund is paid back to you. A return of capital does not necessarily reflect the Fund’s investment performance and should not be confused with ‘yield’ or ‘income’.
When distributions exceed total return performance, the difference will reduce the Fund’s net asset value per share.
The amounts and sources of distributions reported in this Notice are only estimates and are not being provided for tax reporting purposes. The actual amounts and sources of the amounts for tax reporting purposes will depend upon the Fund’s investment experience during its fiscal year and may be subject to changes based on tax regulations. The Fund will send you a Form 1099-DIV for the calendar year that will tell you how to report these distributions for federal income tax purposes.
Contact Number: 800-882-0052
BlackRock Energy and Resources Trust
Cusip: 09250U101
Ticker: BGR
| Record Date | January 12, 2024 | |||
| Pay Date | January 31, 2024 | |||
| Distribution Amount per share | $ 0.065700 | |||
The following table sets forth the estimated amounts of the current distribution and the cumulative distributions paid this fiscal year to date from the following sources: net income, net realized short-term capital gains, net realized long-term capital gains and return of capital. All amounts are expressed per common share.
| Current Distribution | % Breakdown of the Current Distribution |
Total Cumulative Distributions for the Fiscal Year to Date |
% Breakdown of the Total Cumulative Distributions for the Fiscal Year to Date |
|||||||||||||
| Net Income |
$ | 0.010370 | 16% | $ | 0.010370 | 16% | ||||||||||
| Net Realized Short-Term Capital Gains |
$ | 0.024560 | 37% | $ | 0.024560 | 37% | ||||||||||
| Net Realized Long-Term Capital Gains |
$ | 0.013790 | 21% | $ | 0.013790 | 21% | ||||||||||
| Return of Capital |
$ | 0.016980 | 26% | $ | 0.016980 | 26% | ||||||||||
|
|
|
|
|
|
|
|
|
|||||||||
| Total (per common share) |
$ | 0.065700 | 100% | $ | 0.065700 | 100% | ||||||||||
|
|
|
|
|
|
|
|
|
|||||||||
| Average annual total return (in relation to NAV) for the 5-year period ending on December 31, 2023 |
|
10.34% | ||||||||||||||
|
|
|
|||||||||||||||
| Annualized current distribution rate expressed as a percentage of NAV as of December 31, 2023 |
|
5.58% | ||||||||||||||
|
|
|
|||||||||||||||
| Cumulative total return (in relation to NAV) for the fiscal year through December 31, 2023 |
|
5.82% | ||||||||||||||
|
|
|
|||||||||||||||
| Cumulative fiscal year distributions as a percentage of NAV as of December 31, 2023 |
|
0.46% | ||||||||||||||
|
|
|
|||||||||||||||
You should not draw any conclusions about the Trust’s investment performance from the amount of this distribution or from the terms of the Trust’s Managed Distribution Plan.
The Fund estimates that it has distributed more than its net income and net realized capital gains; therefore, a portion of your distribution may be a return of capital. A return of capital may occur, for example, when some or all of the money that you invested in the Fund is paid back to you. A return of capital does not necessarily reflect the Fund’s investment performance and should not be confused with ‘yield’ or ‘income’.
When distributions exceed total return performance, the difference will reduce the Fund’s net asset value per share.
The amounts and sources of distributions reported in this Notice are only estimates and are not being provided for tax reporting purposes. The actual amounts and sources of the amounts for tax reporting purposes will depend upon the Fund’s investment experience during its fiscal year and may be subject to changes based on tax regulations. The Fund will send you a Form 1099-DIV for the calendar year that will tell you how to report these distributions for federal income tax purposes.
Contact Number: 800-882-0052