UNITED STATES
SECURITIES AND EXCHANGE COMMISSION
Washington, D.C. 20549
Form N-CSR
CERTIFIED SHAREHOLDER REPORT OF REGISTERED MANAGEMENT
INVESTMENT COMPANIES
Investment Company Act File Number 811-22321
MAINSTAY FUNDS TRUST
(Exact name of Registrant as specified in charter)
51 Madison Avenue, New York, NY 10010
(Address of principal executive offices) (Zip code)
J. Kevin Gao, Esq.
30 Hudson
Street
Jersey City, New Jersey 07302
(Name and address of agent for service)
Registrant’s telephone number, including area code: (212) 576-7000
Date of fiscal year end: April 30
(MainStay CBRE Global
Infrastructure Fund, MainStay CBRE Real Estate Fund, MainStay Conservative ETF Allocation Fund, MainStay Defensive ETF Allocation Fund, MainStay Equity ETF Allocation Fund, MainStay Growth ETF Allocation Fund, MainStay Moderate ETF Allocation Fund,
MainStay ESG Multi-Asset Allocation Fund, MainStay MacKay Short Term Municipal Fund, and MainStay Strategic Municipal Allocation Fund)
Date of reporting
period: October 31, 2022
FORM N-CSR
The information presented in this Form N-CSR relates solely to the
MainStay CBRE Global Infrastructure Fund, MainStay CBRE Real Estate Fund, MainStay Conservative ETF Allocation Fund, MainStay Defensive ETF
Allocation Fund, MainStay Equity ETF Allocation Fund, MainStay Growth ETF Allocation Fund, MainStay Moderate ETF Allocation Fund, MainStay ESG Multi-Asset Allocation Fund, MainStay MacKay Short Term Municipal Fund and MainStay Strategic Municipal
Allocation Fund
series of the Registrant.
Item 1. Reports to Stockholders.
MainStay CBRE Global Infrastructure Fund
Message from the President and Semiannual Report
Unaudited | October 31, 2022
Sign up for e-delivery of your shareholder reports. For full
details on e-delivery, including who can participate and what you can receive via e-delivery,
please log in to newyorklifeinvestments.com/accounts.
| Not
FDIC/NCUA Insured |
Not
a Deposit |
May
Lose Value |
No
Bank Guarantee |
Not
Insured by Any Government Agency |
This page intentionally left blank
Message from the President
A series of economic and geopolitical challenges undermined equity and
fixed-income markets during the six-month reporting period ended October 31, 2022. Stocks and bonds alike trended lower in the face of sharply rising interest rates, increasing inflationary pressures, slowing economic growth and Russia’s
invasion of Ukraine.
The reporting period began on a
mixed note, with concerns about rising inflation and Russia’s invasion of Ukraine weighing on markets. On one hand, rising commodity prices and hopes that inflationary pressures might subside supported some asset classes and sectors. On the
other, the U.S. Federal Reserve (the “Fed”) issued increasingly hawkish statements regarding its intention to combat mounting inflation. As a result, equity markets remained flat while U.S. fixed-income markets gained modest ground in
May. Early June saw a downturn across asset classes as economic data showed increasing inflationary pressures, causing investors to anticipate a higher-than-previously-expected rate increase from the Fed at its meeting on June 15, 2022. Indeed, the
Fed raised rates by 0.75% at that meeting, from a range of 0.75% to 1.00% to a range of 1.50% to 1.75%, its largest increase of the year to date. Markets rallied in the wake of the Fed meeting as investors started to hope that slowing economic
growth might lead to rate decreases later in the year. In August, however, signs of persistently increasing inflation and statements from the Fed indicated that further rate increases were seen as necessary, undercutting optimism and driving stock
and bond prices lower through mid-October. The Fed implemented two additional 0.75% rate increases during that time, with additional increases expected before the end of the year. International central banks generally raised rates as well in efforts
to curb local inflation, although most increases remained significantly more modest than those in the United States. Relatively high U.S. interest rates and international risk-averse sentiment pushed U.S. dollar values higher compared to most other
currencies, with the ensuing negative impact on global prices for food, fuel and other key, U.S.-dollar-denominated products.
Despite a rally in the closing weeks of October, the S&P
500® Index, a widely regarded benchmark of U.S. market performance, declined by more than 5% during the reporting period. Although the energy sector generated strong gains,
bolstered by elevated oil and gas prices, most other industry areas recorded losses. The more cyclical and growth-oriented sectors of consumer discretionary, real estate and information technology delivered the
weakest returns, while the traditionally defensive and value-oriented
consumer staples, utilities and health care sectors outperformed. International stocks lagged compared to their U.S. counterparts, with some emerging markets, such as China, suffering particularly steep losses. A few markets, however, including
Brazil and Mexico, gained ground. Fixed-income markets saw bond prices broadly decline as yields rose along with interest rates. Short-term yields rose faster than long-term yields, producing a yield curve inversion from July through the end of the
reporting period, with long-term rates remaining below short-term rates. Some floating-rate instruments, which feature variable interest rates that allow investors to benefit from a rising rate environment, provided a degree of insulation from
inflation-driven trends.
While the Fed acknowledges the
costs of rising rates in terms of weaker GDP (gross domestic product) growth and unsettled financial markets over the short term, its primary focus continues to be the longer-term economic impact of inflation. With the latest figures as of the date
of this report showing that inflation remains above 8%, versus a target rate of just 2%, the Fed clearly has a distance yet to go, making further rate increases and market volatility more likely in the coming months. The question remains as to
whether the Fed and other central banks will manage a so-called “soft landing,” curbing inflation while avoiding a persistent economic slowdown. If they prove successful, we expect that favorable inflation trends and increasingly
attractive valuations in both equity and bond markets should eventually translate into sustainable improvements in the investment environment.
Whatever actions the Fed takes and however financial markets
react, as a MainStay investor, you can depend on us to continue providing the insight, expertise and service that have log defined New York Life Investments. Thank you for trusting us to help you meet your investment needs.
Sincerely,
Kirk C. Lehneis
President
The opinions expressed are as of the date of this report and
are subject to change. There is no guarantee that any forecast made will come to pass. This material does not constitute investment advice and is not intended as an endorsement of any specific investment. Past performance is no guarantee of future
results.
Not part of the Semiannual Report
Investors should refer to the Fund’s Summary Prospectus
and/or Prospectus and consider the Fund’s investment objectives, strategies, risks, charges and expenses carefully before investing. The Summary Prospectus and/or Prospectus contain this and other information about the Fund. You may obtain
copies of the Fund’s Summary Prospectus, Prospectus and Statement of Additional Information, which includes information about the MainStay Funds Trust's Trustees, free of charge, upon request, by calling toll-free 800-624-6782, by writing to
NYLIFE Distributors LLC, Attn: MainStay Marketing Department, 30 Hudson Street, Jersey City, NJ 07302 or by sending an e-mail to MainStayShareholderServices@nylim.com. These documents are also available via the MainStay Funds’ website at
newyorklifeinvestments.com. Please read the Fund’s Summary Prospectus and/or Prospectus carefully before investing.
Investment and
Performance Comparison (Unaudited)
Performance data quoted represents past performance. Past performance is no
guarantee of future results. Because of market volatility and other factors, current performance may be lower or higher than the figures shown. Investment return and principal value will fluctuate, and as a result, when shares are redeemed, they may
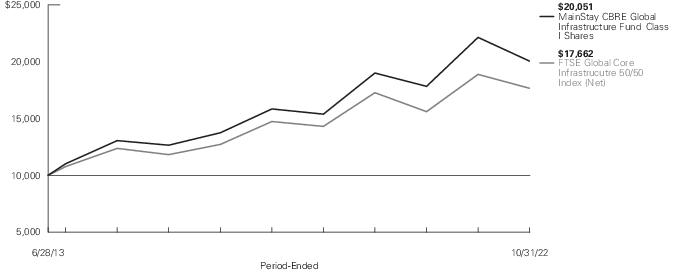
be worth more or less than their original cost. The graph below depicts the historical performance of Class I shares of the Fund. Performance will vary from class to class based on differences in class-specific expenses and sales charges. For performance information current to the most recent month-end, please call 800-624-6782 or visit newyorklifeinvestments.com.
The performance table and graph do not reflect the deduction
of taxes that a shareholder would pay on distributions or Fund share redemptions. Total returns reflect maximum applicable sales charges as indicated in the table below, if any, changes in share price, and reinvestment of dividend and capital gain
distributions. The graph assumes the initial investment amount shown below and reflects the deduction of all sales charges that would have applied for the period of investment. Performance figures may reflect certain fee waivers and/or expense
limitations, without which total returns may have been lower. For more information on share classes and current fee waivers and/or expense limitations (if any), please refer to the Notes to Financial Statements.
| Average
Annual Total Returns for the Period-Ended October 31, 2022 |
| Class
|
Sales
Charge |
|
Inception
Date1 |
Six
Months2 |
One
Year |
Five
Years |
Since
Inception |
Gross
Expense
Ratio3 |
| Class
A Shares4 |
Maximum
5.5% Initial Sales Charge |
With
sales charges |
10/16/2013
|
-14.95%
|
-14.60%
|
3.30%
|
6.11%
|
1.26%
|
| |
|
Excluding
sales charges |
|
-10.00
|
-9.62
|
4.53
|
6.80
|
1.26
|
| Investor
Class Shares5 |
Maximum
5% Initial Sales Charge |
With
sales charges |
2/24/2020
|
-14.56
|
-14.17
|
N/A
|
-3.11
|
1.31
|
| |
|
Excluding
sales charges |
|
-10.06
|
-9.65
|
N/A
|
-1.05
|
1.31
|
| Class
C Shares4 |
Maximum
1% CDSC |
With
sales charges |
2/28/2019
|
-11.26
|
-11.29
|
N/A
|
3.65
|
2.06
|
| |
if
Redeemed Within One Year of Purchase |
Excluding
sales charges |
|
-10.37
|
-10.40
|
N/A
|
3.65
|
2.06
|
| Class
I Shares4 |
No
Sales Charge |
|
6/28/2013
|
-9.86
|
-9.44
|
4.82
|
7.73
|
1.01
|
| Class
R6 Shares |
No
Sales Charge |
|
2/24/2020
|
-9.82
|
-9.31
|
N/A
|
-0.62
|
0.91
|
| 1.
|
Effective
at the close of business on February 21, 2020, the Fund changed its fiscal and tax year end from October 31 to April 30. |
| 2.
|
Not
annualized. |
| 3.
|
The gross
expense ratios presented reflect the Fund’s “Total Annual Fund Operating Expenses” from the most recent Prospectus, as supplemented, and may differ from other expense ratios disclosed in this report. |
| 4.
|
Performance figures
for Class A shares, Class C shares and Class I shares reflect the historical performance of the then-existing Class A shares, Class C shares and Class I shares, respectively, of the Voya CBRE Global Infrastructure Fund (the predecessor to the Fund,
which was subject to a different fee structure) for periods prior to February 21, 2020. The MainStay CBRE Global Infrastructure Fund commenced operations on February 24, 2020. |
| 5.
|
Prior
to June 30, 2020, the maximum initial sales charge was 5.5%, which is reflected in the applicable average annual total return figures shown. |
The footnotes on the next page are an integral part of the
table and graph and should be carefully read in conjunction with them.
| Benchmark
Performance* |
Six
Months1 |
One
Year |
Five
Years |
Since
Inception |
| FTSE
Global Core Infrastructure 50/50 Index (Net)2 |
-9.73%
|
-6.47%
|
3.69%
|
6.28%
|
| Morningstar
Infrastructure Category Average3 |
-9.92
|
-11.00
|
3.50
|
5.67
|
| *
|
Returns
for indices reflect no deductions for fees, expenses or taxes, except for foreign withholding taxes where applicable. Results assume reinvestment of all dividends and capital gains. An investment cannot be made directly in an index.
|
| 1.
|
Not
annualized. |
| 2.
|
The FTSE
Global Core Infrastructure 50/50 Index (Net) is a market-capitalization-weighted index of worldwide infrastructure and infrastructure-related securities. Constituent weights are adjusted semi-annually according to three broad industry sectors:
50% utilities, 30% transportation, and a 20% mix of other sectors. |
| 3.
|
The
Morningstar Infrastructure Category Average is representative of funds that invest more than 60% of their assets in stocks of companies engaged in infrastructure activities. Industries considered to be part of the infrastructure sector include: oil
& gas midstream; waste management; airports; integrated shipping; railroads; shipping & ports; trucking; engineering & construction; infrastructure operations; and the utilities sector. Results are based on average total returns of
similar funds with all dividends and capital gain distributions reinvested. |
The footnotes on the preceding page are an integral part of the
table and graph and should be carefully read in conjunction with them.
| 6
|
MainStay CBRE Global
Infrastructure Fund |
Cost in Dollars of
a $1,000 Investment in MainStay CBRE Global Infrastructure Fund (Unaudited)
The example below is intended to describe the fees and expenses
borne by shareholders during the six-month period from May 1, 2022 to October 31, 2022, and the impact of those costs on your investment.
Example
As a shareholder of the Fund you incur two types of costs: (1)
transaction costs, including exchange fees and sales charges (loads) on purchases (as applicable), and (2) ongoing costs, including management fees, distribution and/or service (12b-1) fees and other Fund expenses (as applicable). This example is
intended to help you understand your ongoing costs (in dollars) of investing in the Fund and to compare these costs with the ongoing costs of investing in other mutual funds. The example is based on an investment of $1,000 made at the beginning of
the six-month period and held for the entire period from May 1, 2022 to October 31, 2022.
This example illustrates your Fund’s ongoing costs in two
ways:
Actual Expenses
The second and third data columns in the table below provide information about
actual account values and actual expenses. You may use the information in these columns, together with the amount you invested, to estimate the expenses that you paid during the six months ended October 31, 2022. Simply divide your account value by
$1,000 (for example, an
$8,600 account value divided by $1,000 = 8.6), then multiply the result by the
number under the heading entitled “Expenses Paid During Period” to estimate the expenses you paid on your account during this period.
Hypothetical Example for Comparison Purposes
The fourth and fifth data columns in the table below provide information about
hypothetical account values and hypothetical expenses based on the Fund’s actual expense ratio and an assumed rate of return of 5% per year before expenses, which is not the Fund’s actual return. The hypothetical account values and
expenses may not be used to estimate the actual ending account balances or expenses you paid for the six-month period shown. You may use this information to compare the ongoing costs of investing in the Fund with the ongoing costs of investing in
other mutual funds. To do so, compare this 5% hypothetical example with the 5% hypothetical examples that appear in the shareholder reports of the other mutual funds.
Please note that the expenses shown in the table are meant to
highlight your ongoing costs only and do not reflect any transactional costs, such as exchange fees or sales charges (loads). Therefore, the fourth and fifth data columns of the table are useful in comparing ongoing costs only and will not help you
determine the relative total costs of owning different funds. In addition, if these transactional costs were included, your costs would have been higher.
| Share
Class |
Beginning
Account
Value
5/1/22 |
Ending
Account
Value (Based
on Actual
Returns and
Expenses)
10/31/22 |
Expenses
Paid
During
Period1 |
Ending
Account
Value (Based
on Hypothetical
5% Annualized
Return and
Actual Expenses)
10/31/22 |
Expenses
Paid
During
Period1 |
Net
Expense
Ratio
During
Period2 |
| Class
A Shares |
$1,000.00
|
$900.00
|
$5.94
|
$1,018.95
|
$
6.31 |
1.24%
|
| Investor
Class Shares |
$1,000.00
|
$899.40
|
$6.13
|
$1,018.75
|
$
6.51 |
1.28%
|
| Class
C Shares |
$1,000.00
|
$896.30
|
$9.70
|
$1,014.97
|
$10.31
|
2.03%
|
| Class
I Shares |
$1,000.00
|
$901.40
|
$4.65
|
$1,020.32
|
$
4.94 |
0.97%
|
| Class
R6 Shares |
$1,000.00
|
$901.80
|
$4.22
|
$1,020.77
|
$
4.48 |
0.88%
|
| 1.
|
Expenses are
equal to the Fund’s annualized expense ratio of each class multiplied by the average account value over the period, divided by 365 and multiplied by 184 (to reflect the six-month period). The table above represents the actual expenses incurred
during the six-month period. In addition to the fees and expenses which the Fund bears directly, it also indirectly bears a pro rata share of the fees and expenses of the underlying funds in which it invests. Such indirect expenses are not included
in the above-reported expense figures. |
| 2.
|
Expenses
are equal to the Fund's annualized expense ratio to reflect the six-month period. |
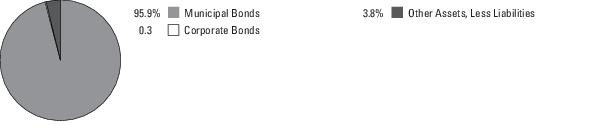
Country Composition as of October 31, 2022
(Unaudited)
| United
States |
59.5%
|
| Australia
|
9.5
|
| Spain
|
6.6
|
| Canada
|
6.1
|
| France
|
5.3
|
| United
Kingdom |
3.3
|
| Italy
|
2.9
|
| Japan
|
1.8
|
| China
|
1.5%
|
| Portugal
|
1.4
|
| Mexico
|
1.2
|
| New
Zealand |
0.8
|
| Other
Assets, Less Liabilities |
0.1
|
| |
100.0%
|
See Portfolio of Investments beginning on page 11
for specific holdings within these categories. The Fund's holdings are subject to change.
Top Ten Holdings and/or Issuers Held as of October 31, 2022 (excluding short-term investments) (Unaudited)
| 1.
|
NextEra
Energy, Inc. |
| 2.
|
American
Tower Corp. |
| 3.
|
Transurban
Group |
| 4.
|
American
Electric Power Co., Inc. |
| 5.
|
WEC
Energy Group, Inc. |
| 6.
|
Cellnex
Telecom SA |
| 7.
|
Cheniere
Energy, Inc. |
| 8.
|
Atlas
Arteria Ltd. |
| 9.
|
Vinci
SA |
| 10.
|
Ameren
Corp. |
| 8
|
MainStay CBRE Global
Infrastructure Fund |
Portfolio
Management Discussion and Analysis (Unaudited)
Questions answered by portfolio managers Jeremy
Anagnos, CFA, Joseph P. Smith, CFA, Daniel Foley, CFA, and Hinds Howard of CBRE Investment Management Listed Real Assets LLC.
How did MainStay CBRE Global Infrastructure Fund perform relative to its
benchmark and peer group during the six months ended October 31, 2022?
For the six months ended October 31, 2022, Class I shares of
MainStay CBRE Global Infrastructure Fund returned −9.86%, underperforming the −9.73% return of the Fund’s primary benchmark, the FTSE Global Core Infrastructure 50/50 Index (Net) (the “Index”). Over the same period,
Class I shares outperformed the −9.92% return of the Morningstar Infrastructure Category Average.1
What factors affected the Fund’s relative
performance during the reporting period?
The Fund
underperformed the Index by a small margin due largely to negative sector allocation effects, which offset positive stock selection. Overweight exposure to utilities and communication stocks in continental Europe provided the most significant drag
on relative returns. Underweight exposure to outperforming emerging markets further detracted. On the other hand, stock selection in the Americas in the utilities and midstream sectors made positive contributions to relative performance.
(Contributions take weightings and total returns into account.) Utilities positioning benefited from exposure to renewable-development-oriented companies likely to directly benefit from the U.S. Inflation Reduction Act of 2022 enacted in August. In
the midstream sector, ongoing energy security concerns bolstered the Fund’s midstream holdings, as robust demand for natural gas drove volumes through pipelines and liquid natural gas (“LNG”) export infrastructure. Outside of the
Americas, modestly positive stock selection impacts came from exposure to outperforming Japanese passenger rail stocks and from the relatively strong performance of toll road stocks in continental Europe.
During the reporting period, which sectors and
subsectors were the strongest positive contributors to the Fund’s relative performance and which sectors and subsectors were particularly weak?
The strongest positive contributions to the Fund’s
performance relative to the Index came from the North American utilities and midstream sectors. The utilities sector outperformed global infrastructure. Strong stock selection, driven by out-of-index utilities holdings in companies positioned to
directly benefit from the Inflation Reduction Act, enhanced relative returns, in addition to underweight exposure to more bond-like regulated utilities, a subsector that underperformed on rising interest rates. The midstream sector generated the
strongest (and only positive) return among all infrastructure sectors during the reporting period, and the Fund’s stock selections outperformed. Midstream holdings benefited from the tight global commodity market, which drove demand for U.S.
hydrocarbons, especially LNG. Ongoing
capital discipline across the energy complex continued to power positive free
cash flow and led to leverage reduction, dividend growth and stock buybacks.
The weakest contributors to relative performance were the
continental European communication sector and the emerging-markets utilities sector. The Fund held significantly overweight exposure to tower stocks in Europe, which materially underperformed on rising interest rates and weakness across European
equities. The group underperformed despite a strong fundamental outlook and private market support for the assets, including a large private transaction for a tower platform at a premium valuation. Emerging-markets utilities exposure included two
natural gas utilities and one water utility in China. Ongoing COVID-19 lockdowns and property market concerns led to extreme volatility and valuation contraction among Chinese stocks, including the Fund’s utilities holdings, compared with
milder declines among other emerging-markets utilities.
During the reporting period, which individual stocks
made the strongest positive contributions to the Fund’s absolute performance and which stocks detracted the most?
The holdings making the largest positive contributions to
absolute performance during the reporting period included midstream company Cheniere Energy and diversified utility The AES Corporation. Cheniere benefited from sharply rising global LNG prices that improved the outlook for the company’s
assets and led to multiple positive guidance revisions. AES directly benefited from the Inflation Reduction Act, which extended tax credits for renewable development to 10 years and also expanded the scope of tax credits to include battery storage,
an area where AES is a global leader.
The two stocks
that detracted most from the Fund’s absolute performance were Spain-based wireless telecommunications infrastructure company Cellnex Telecom and Italy-based utility Enel Group. Cellnex is a major owner of European tower assets, with a strong
track record of growth and a book of contracts with explicit inflation passthrough provisions. Weakness across European stocks and rising interest rates appeared to undermine Cellnex shares, which sold off sharply in September and October 2022 as
interest rates spiked. The Fund continues to hold Cellnex as of the end of the reporting period in the belief that the stock is undervalued given the company’s growth outlook and comparable tower transactions in Europe. Enel's stock price was
hurt by rising power prices and related political risk that threatened to undermine integrated utilities in Europe, as well as fears of rising inflation and supply-chain disruptions taking a toll on returns from the company’s renewable
development pipeline. We reduced the size of the Fund’s holdings in Enel, but maintained a position given
| 1.
|
See page 5 for other share class
returns, which may be higher or lower than Class I share returns. See page 6 for more information on benchmark and peer group returns. |
what we believe to be an attractive valuation of this global leader in
renewable development that’s playing a key role in Europe’s efforts to improve energy security.
What were some of the Fund’s largest purchases and
sales during the reporting period?
During the reporting
period, the Fund initiated a new position in Equinix, a global leader in network-dense data centers. In the wake of the sell-off in technology and communications infrastructure stocks that occurred earlier in the reporting period, Equinix appeared
attractively valued relative to its market-leading position and recession-resistant business model. We also added substantially to the Fund’s position in American Tower, one of the largest communications tower owners in the United States,
after shares declined, offering a compelling entry point in a sector with what we believe to be a positive outlook for growth and a high degree of built-in inflation protection.
The Fund’s largest sale during the reporting period
involved its entire position in Norfolk Southern Railway, prompted by a change in the fundamental outlook for North American rails. Service issues across the group resulted in weaker-than-expected volumes, which the industry aimed to solve by hiring
employees. The hiring process for Norfolk progressed slower than for other rails, presenting a headwind to the company’s volume and margin outlook. The Fund also exited its position in European integrated utility Engie; the company owned a
position in the Nord Stream pipelines, which were sabotaged during the Russia-Ukraine war. Without access to natural gas, Engie was challenged to procure supply for its customers at a time of spiking prices.
How did the Fund’s subsector weightings change
during the reporting period?
Relative to the Index, the
Fund increased its communications sector exposure in response to what we believe to be weakness and discounted valuations across that group. We are expecting a recession in 2023 and since the communications sector is less exposed to cyclical
factors than most other infrastructure sectors, it should continue to produce relatively strong operating results in a contracting economic environment. The Fund also increased its exposure to towers and data center stocks, along with U.S.
utilities, in order to benefit from what we believe to be attractive valuations and resilient growth outlooks, likely to be supported by growth in renewable development and counter-cyclical spending to reach targets. Conversely, the Fund
reduced its utilities exposure in Europe given ongoing political and economic risks stemming from higher energy costs. The Fund also reduced its exposure to U.S. rail stocks on expectations of challenged
volumes and margins driven by a weaker economic outlook, competition from
trucks, and higher costs.
How was the Fund
positioned at the end of the reporting period?
As of
October 31, 2022, we believe the Fund remains positioned to benefit from long-term growth in renewable development, which translates into a preference for integrated utilities over regulated utilities. The Fund, in our opinion, is also positioned to
benefit from exposure to long-term data growth through a preference for communications infrastructure exposure. Within transports, we prefer toll roads and rails stocks over airport stocks. As of the end of the reporting period, the Fund held
underweight exposure to emerging markets due to ongoing regulatory and policy challenges that can lead to negative returns and excessive volatility.
The opinions expressed are those of the portfolio
managers as of the date of this report and are subject to change. There is no guarantee that any forecasts will come to pass. This material does not constitute investment advice and is not intended as an endorsement of any specific investment.
| 10
|
MainStay CBRE Global
Infrastructure Fund |
Portfolio of
Investments October 31, 2022† (Unaudited)
| |
Shares
|
Value
|
| Common
Stocks 98.4% |
| Australia
9.5% |
| Atlas
Arteria Ltd. (Transportation) |
15,047,183
|
$ 63,428,293
|
| NEXTDC
Ltd. (Communications) (a)(b) |
4,592,609
|
24,441,351 |
| Transurban
Group (Transportation) |
10,132,702
|
85,943,136
|
| |
|
173,812,780
|
| Canada
6.1% |
| Canadian
National Railway Co. (Transportation) |
233,294
|
27,638,750 |
| Enbridge,
Inc. (Midstream / Pipelines) |
1,346,582
|
52,465,646 |
| Pembina
Pipeline Corp. (Midstream / Pipelines) (b) |
961,843
|
31,756,669
|
| |
|
111,861,065
|
| China
1.5% |
| China
Resources Gas Group Ltd. (Utilities) |
4,331,200
|
11,090,574 |
| ENN
Energy Holdings Ltd. (Utilities) |
838,700
|
8,339,293 |
| Guangdong
Investment Ltd. (Utilities) |
14,180,253
|
8,942,087
|
| |
|
28,371,954
|
| France
5.3% |
| Eiffage
SA (Transportation) |
424,304
|
38,384,409 |
| Vinci
SA (Transportation) |
641,941
|
59,113,224
|
| |
|
97,497,633
|
| Italy
2.9% |
| Enel
SpA (Utilities) |
5,632,965
|
25,156,268
|
| Infrastrutture
Wireless Italiane SpA (Communications) |
2,149,838
|
18,976,726
|
| Terna
- Rete Elettrica Nazionale (Utilities) |
1,381,447
|
9,157,862
|
| |
|
53,290,856
|
| Japan
1.8% |
| Central
Japan Railway Co. (Transportation) |
154,333
|
17,919,629
|
| West
Japan Railway Co. (Transportation) |
369,713
|
14,672,157
|
| |
|
32,591,786
|
| Mexico
1.2% |
| Grupo
Aeroportuario del Pacifico SAB de CV, Class B (Transportation) |
1,424,689
|
22,068,190
|
| New
Zealand 0.8% |
| Infratil
Ltd. (Diversified) |
3,018,460
|
15,338,111
|
| |
Shares
|
Value
|
| |
| Portugal
1.4% |
| EDP
- Energias de Portugal SA (Utilities) |
5,872,710
|
$ 25,681,398
|
| Spain
6.6% |
| Aena
SME SA (Transportation) (a) |
338,268
|
39,831,053 |
| Cellnex
Telecom SA (Communications) |
2,071,665
|
67,766,389 |
| Ferrovial
SA (Transportation) |
520,361
|
12,707,037
|
| |
|
120,304,479
|
| United
Kingdom 3.3% |
| National
Grid plc (Utilities) |
4,464,629
|
48,558,426 |
| Pennon
Group plc (Utilities) |
1,217,660
|
11,694,955
|
| |
|
60,253,381
|
| United
States 58.0% |
| AES
Corp. (The) (Utilities) |
1,885,984
|
49,337,341 |
| Ameren
Corp. (Utilities) |
721,200
|
58,792,224 |
| American
Electric Power Co., Inc. (Utilities) |
959,547
|
84,363,372 |
| American
Tower Corp. (Communications) |
448,961
|
93,020,229 |
| Cheniere
Energy, Inc. (Midstream / Pipelines) |
368,161
|
64,947,282 |
| CMS
Energy Corp. (Utilities) |
645,446
|
36,822,694
|
| Constellation
Energy Corp. (Utilities) |
228,909
|
21,641,057
|
| Crown
Castle, Inc. (Communications) |
360,539
|
48,045,427
|
| Dominion
Energy, Inc. (Utilities) |
592,100
|
41,429,237
|
| Equinix,
Inc. (Communications) |
55,602
|
31,495,197
|
| Essential
Utilities, Inc. (Utilities) |
427,682
|
18,912,098
|
| FirstEnergy
Corp. (Utilities) |
765,308
|
28,859,765
|
| Legacy
Reserves, Inc. (Midstream / Pipelines) (a)(c)(d) |
5,055
|
22,444
|
| Legacy
Reserves, Inc. (Midstream / Pipelines) (a)(c)(d) |
27,942
|
124,062
|
| NextEra
Energy, Inc. (Utilities) |
1,283,447
|
99,467,143
|
| NiSource,
Inc. (Utilities) |
821,336
|
21,100,122
|
| OGE
Energy Corp. (Utilities) |
574,600
|
21,047,598
|
| PPL
Corp. (Utilities) |
1,438,351
|
38,101,918
|
| Public
Service Enterprise Group, Inc. (Utilities) |
722,640
|
40,518,425
|
| Sempra
Energy (Utilities) |
375,676
|
56,704,535
|
| Southwest
Gas Holdings, Inc. (Utilities) |
222,300
|
16,243,461
|
| Targa
Resources Corp. (Midstream / Pipelines) |
320,037
|
21,880,930
|
| Union
Pacific Corp. (Transportation) |
132,706
|
26,161,661
|
| WEC
Energy Group, Inc. (Utilities) |
816,066
|
74,531,308
|
| Williams
Cos., Inc. (The) (Midstream / Pipelines) |
933,288
|
30,546,516
|
The notes to the financial statements are an integral part of, and
should be read in conjunction with, the financial statements.
11
Portfolio of
Investments October 31, 2022† (Unaudited) (continued)
| |
Shares
|
|
Value
|
| Common
Stocks (continued) |
| United
States (continued) |
| Xcel
Energy, Inc. (Utilities) |
638,633
|
|
$ 41,581,395
|
| |
|
|
1,065,697,441
|
Total
Common Stocks
(Cost $1,924,978,490) |
|
|
1,806,769,074
|
| Short-Term
Investments 1.5% |
| Affiliated
Investment Company 1.5% |
| United
States 1.5% |
| MainStay
U.S. Government Liquidity Fund, 2.905% (e) |
27,643,680
|
|
27,643,680
|
| Unaffiliated
Investment Company 0.0% ‡ |
| United
States 0.0% ‡ |
| Invesco
Government & Agency Portfolio, 3.163% (e)(f) |
2,668
|
|
2,668
|
Total
Short-Term Investments
(Cost $27,646,348) |
|
|
27,646,348
|
Total
Investments
(Cost $1,952,624,838) |
99.9%
|
|
1,834,415,422
|
| Other
Assets, Less Liabilities |
0.1
|
|
2,238,915
|
| Net
Assets |
100.0%
|
|
$ 1,836,654,337
|
| †
|
Percentages
indicated are based on Fund net assets. |
| ‡
|
Less than
one-tenth of a percent. |
| (a)
|
Non-income
producing security. |
| (b)
|
All or a
portion of this security was held on loan. As of October 31, 2022, the aggregate market value of securities on loan was $102,095; the total market value of collateral held by the Fund was $111,420. The market value of the collateral held included
non-cash collateral in the form of U.S. Treasury securities with a value of $108,752. The Fund received cash collateral with a value of $2,668. (See Note 2(I)) |
| (c)
|
Illiquid
security—As of October 31, 2022, the total market value deemed illiquid under procedures approved by the Board of Trustees was $146,506, which represented less than one-tenth of a percent of the Fund’s net assets. |
| (d)
|
Security
in which significant unobservable inputs (Level 3) were used in determining fair value. |
| (e)
|
Current
yield as of October 31, 2022. |
| (f)
|
Represents
a security purchased with cash collateral received for securities on loan. |
The notes to the financial statements are an integral part of,
and should be read in conjunction with, the financial statements.
| 12
|
MainStay CBRE Global
Infrastructure Fund |
Investments in Affiliates (in 000's)
Investments in issuers considered to be affiliate(s) of the
Fund during the six-month period ended October 31, 2022 for purposes of Section 2(a)(3) of the Investment Company Act of 1940, as amended, were as follows:
| Affiliated
Investment Companies |
Value,
Beginning
of Period |
Purchases
at Cost |
Proceeds
from
Sales |
Net
Realized
Gain/(Loss)
on Sales |
Change
in
Unrealized
Appreciation/
(Depreciation) |
Value,
End of
Period |
Dividend
Income |
Other
Distributions |
Shares
End of
Period |
| MainStay
U.S. Government Liquidity Fund |
$ 57,455
|
$ 266,652
|
$ (296,463)
|
$ —
|
$ —
|
$ 27,644
|
$ 251
|
$ —
|
27,644
|
The following is a summary of the fair valuations according to
the inputs used as of October 31, 2022, for valuing the Fund’s assets:
| Description
|
Quoted
Prices in
Active
Markets for
Identical
Assets
(Level 1) |
|
Significant
Other
Observable
Inputs
(Level 2) |
|
Significant
Unobservable
Inputs
(Level 3) |
|
Total
|
| Asset
Valuation Inputs |
|
|
|
|
|
|
|
| Investments
in Securities (a) |
|
|
|
|
|
|
|
| Common
Stocks |
$ 1,806,622,568
|
|
$ —
|
|
$
146,506 |
|
$ 1,806,769,074
|
| Short-Term
Investments |
|
|
|
|
|
|
|
| Affiliated
Investment Company |
27,643,680
|
|
—
|
|
—
|
|
27,643,680
|
| Unaffiliated
Investment Company |
2,668
|
|
—
|
|
—
|
|
2,668
|
| Total
Short-Term Investments |
27,646,348
|
|
—
|
|
—
|
|
27,646,348
|
| Total
Investments in Securities |
$ 1,834,268,916
|
|
$ —
|
|
$
146,506 |
|
$ 1,834,415,422
|
| (a)
|
For
a complete listing of investments and their industries, see the Portfolio of Investments. |
The notes to the financial statements are an integral part of,
and should be read in conjunction with, the financial statements.
13
Portfolio of
Investments October 31, 2022† (Unaudited) (continued)
The
table below sets forth the diversification of the Fund’s investments by sector.
Sector Diversification
| |
Value
|
|
Percent
|
| Utilities
|
$
898,074,556 |
|
48.9%
|
| Transportation
|
407,867,539
|
|
22.3
|
| Communications
|
283,745,319
|
|
15.4
|
| Midstream
/ Pipelines |
201,743,549
|
|
11.0
|
| Diversified
|
15,338,111
|
|
0.8
|
| |
1,806,769,074
|
|
98.4
|
| Short-Term
Investments |
27,646,348
|
|
1.5
|
| Other
Assets, Less Liabilities |
2,238,915
|
|
0.1
|
| Net
Assets |
$1,836,654,337
|
|
100.0%
|
| †
|
Percentages
indicated are based on Fund net assets. |
The notes to the financial statements are an integral part of,
and should be read in conjunction with, the financial statements.
| 14
|
MainStay CBRE Global
Infrastructure Fund |
Statement of
Assets and Liabilities as of October 31, 2022 (Unaudited)
| Assets
|
Investment
in unaffiliated securities, at value
(identified cost $1,924,981,158) including securities on loan of $102,095 |
$1,806,771,742
|
Investment
in affiliated investment companies, at value
(identified cost $27,643,680) |
27,643,680
|
| Cash
|
29,317
|
Cash
denominated in foreign currencies
(identified cost $1,183) |
1,173
|
| Receivables:
|
|
| Fund
shares sold |
5,539,323
|
| Investment
securities sold |
4,213,441
|
| Dividends
|
1,618,068
|
| Securities
lending |
1,130
|
| Other
assets |
114,424
|
| Total
assets |
1,845,932,298
|
| Liabilities
|
| Cash
collateral received for securities on loan |
2,668
|
| Payables:
|
|
| Investment
securities purchased |
6,076,300
|
| Fund
shares redeemed |
1,707,020
|
| Manager
(See Note 3) |
1,218,127
|
| Transfer
agent (See Note 3) |
141,233
|
| Professional
fees |
60,711
|
| NYLIFE
Distributors (See Note 3) |
35,992
|
| Shareholder
communication |
24,419
|
| Custodian
|
11,491
|
| Total
liabilities |
9,277,961
|
| Net
assets |
$1,836,654,337
|
| Composition
of Net Assets |
| Shares
of beneficial interest outstanding (par value of $.001 per share) unlimited number of shares authorized |
$
157,127 |
| Additional
paid-in-capital |
2,200,016,376
|
| |
2,200,173,503
|
| Total
distributable earnings (loss) |
(363,519,166)
|
| Net
assets |
$1,836,654,337
|
| Class
A |
|
| Net
assets applicable to outstanding shares |
$
90,718,802 |
| Shares
of beneficial interest outstanding |
7,767,798
|
| Net
asset value per share outstanding |
$
11.68 |
| Maximum
sales charge (5.50% of offering price) |
0.68
|
| Maximum
offering price per share outstanding |
$
12.36 |
| Investor
Class |
|
| Net
assets applicable to outstanding shares |
$
2,193,528 |
| Shares
of beneficial interest outstanding |
187,900
|
| Net
asset value per share outstanding |
$
11.67 |
| Maximum
sales charge (5.00% of offering price) |
0.61
|
| Maximum
offering price per share outstanding |
$
12.28 |
| Class
C |
|
| Net
assets applicable to outstanding shares |
$
20,377,680 |
| Shares
of beneficial interest outstanding |
1,753,796
|
| Net
asset value and offering price per share outstanding |
$
11.62 |
| Class
I |
|
| Net
assets applicable to outstanding shares |
$1,713,483,418
|
| Shares
of beneficial interest outstanding |
146,572,662
|
| Net
asset value and offering price per share outstanding |
$
11.69 |
| Class
R6 |
|
| Net
assets applicable to outstanding shares |
$
9,880,909 |
| Shares
of beneficial interest outstanding |
845,156
|
| Net
asset value and offering price per share outstanding |
$
11.69 |
The notes to the financial statements are an
integral part of, and should be read in conjunction with, the financial statements.
15
Statement of
Operations for the six months ended October 31, 2022 (Unaudited)
| Investment
Income (Loss) |
| Income
|
|
| Dividends-unaffiliated
(net of foreign tax withholding of $800,088) |
$
25,277,461 |
| Dividends-affiliated
|
251,268
|
| Securities
lending, net |
17,368
|
| Total
income |
25,546,097
|
| Expenses
|
|
| Manager
(See Note 3) |
7,875,464
|
| Transfer
agent (See Note 3) |
1,030,139
|
| Distribution/Service—Class
A (See Note 3) |
117,241
|
| Distribution/Service—Investor
Class (See Note 3) |
2,999
|
| Distribution/Service—Class
C (See Note 3) |
116,413
|
| Registration
|
110,539
|
| Professional
fees |
50,817
|
| Custodian
|
46,147
|
| Shareholder
communication |
45,972
|
| Trustees
|
18,467
|
| Miscellaneous
|
13,300
|
| Total
expenses before waiver/reimbursement |
9,427,498
|
| Expense
waiver/reimbursement from Manager (See Note 3) |
(190,679)
|
| Net
expenses |
9,236,819
|
| Net
investment income (loss) |
16,309,278
|
| Realized
and Unrealized Gain (Loss) |
| Net
realized gain (loss) on: |
|
| Unaffiliated
investment transactions |
(47,754,439)
|
| Foreign
currency transactions |
(263,231)
|
| Net
realized gain (loss) |
(48,017,670)
|
| Net
change in unrealized appreciation (depreciation) on: |
|
| Unaffiliated
investments |
(168,024,685)
|
| Translation
of other assets and liabilities in foreign currencies |
(33,011)
|
| Net
change in unrealized appreciation (depreciation) |
(168,057,696)
|
| Net
realized and unrealized gain (loss) |
(216,075,366)
|
| Net
increase (decrease) in net assets resulting from operations |
$(199,766,088)
|
The notes to the financial statements are an integral part of,
and should be read in conjunction with, the financial statements.
| 16
|
MainStay CBRE Global
Infrastructure Fund |
Statements of
Changes in Net Assets
for the six months ended October 31, 2022 (Unaudited) and the year ended April 30, 2022
| |
Six months
ended
October 31,
2022 |
Year
ended
April 30,
2022 |
| Increase
(Decrease) in Net Assets |
| Operations:
|
|
|
| Net
investment income (loss) |
$
16,309,278 |
$
18,549,262 |
| Net
realized gain (loss) |
(48,017,670)
|
21,485,168
|
| Net
change in unrealized appreciation (depreciation) |
(168,057,696)
|
(14,049,896)
|
| Net
increase (decrease) in net assets resulting from operations |
(199,766,088)
|
25,984,534
|
| Distributions
to shareholders: |
|
|
| Class
A |
(905,192)
|
(996,517)
|
| Investor
Class |
(23,643)
|
(29,596)
|
| Class
C |
(131,773)
|
(143,440)
|
| Class
I |
(19,274,290)
|
(13,609,224)
|
| Class
R6 |
(122,915)
|
(38,065)
|
| Total
distributions to shareholders |
(20,457,813)
|
(14,816,842)
|
| Capital
share transactions: |
|
|
| Net
proceeds from sales of shares |
610,745,665
|
1,274,898,463
|
| Net
asset value of shares issued to shareholders in reinvestment of distributions |
14,267,703
|
13,281,784
|
| Cost
of shares redeemed |
(221,487,845)
|
(170,967,771)
|
| Increase
(decrease) in net assets derived from capital share transactions |
403,525,523
|
1,117,212,476
|
| Net
increase (decrease) in net assets |
183,301,622
|
1,128,380,168
|
| Net
Assets |
| Beginning
of period |
1,653,352,715
|
524,972,547
|
| End
of period |
$1,836,654,337
|
$1,653,352,715
|
The notes to the financial statements are an integral part of,
and should be read in conjunction with, the financial statements.
17
Financial
Highlights selected per share data and ratios
| |
Six
months ended
October 31, |
|
Year
Ended April 30, |
|
November
1,
2019
through
April 30, |
|
Year
Ended October 31, |
| Class
A |
2022
* |
|
2022
|
|
2021
|
|
2020
# |
|
2019
|
|
2018
|
|
2017
|
| Net
asset value at beginning of period |
$
13.11 |
|
$
12.81 |
|
$
10.39 |
|
$
11.99 |
|
$
10.04 |
|
$
11.40 |
|
$
10.78 |
| Net
investment income (loss) |
0.10(a)
|
|
0.23(a)
|
|
0.16(a)
|
|
0.07(a)
|
|
0.16
|
|
0.19
|
|
0.17(a)
|
| Net
realized and unrealized gain (loss) |
(1.41)
|
|
0.26
|
|
2.42
|
|
(1.30)
|
|
2.12
|
|
(0.51)
|
|
1.30
|
| Total
from investment operations |
(1.31)
|
|
0.49
|
|
2.58
|
|
(1.23)
|
|
2.28
|
|
(0.32)
|
|
1.47
|
| Less
distributions: |
|
|
|
|
|
|
|
|
|
|
|
|
|
| From
net investment income |
(0.12)
|
|
(0.19)
|
|
(0.16)
|
|
(0.06)
|
|
(0.17)
|
|
(0.25)
|
|
(0.12)
|
| From
net realized gain on investments |
—
|
|
—
|
|
—
|
|
(0.29)
|
|
(0.16)
|
|
(0.79)
|
|
(0.73)
|
| Return
of capital |
—
|
|
—
|
|
—
|
|
(0.02)
|
|
—
|
|
—
|
|
—
|
| Total
distributions |
(0.12)
|
|
(0.19)
|
|
(0.16)
|
|
(0.37)
|
|
(0.33)
|
|
(1.04)
|
|
(0.85)
|
| Net
asset value at end of period |
$
11.68 |
|
$
13.11 |
|
$
12.81 |
|
$
10.39 |
|
$
11.99 |
|
$
10.04 |
|
$
11.40 |
| Total
investment return (b) |
(10.00)%
|
|
3.91%
|
|
25.04%
|
|
(10.57)%
|
|
23.24%
|
|
(3.16)%
|
|
14.96%
|
| Ratios
(to average net assets)/Supplemental Data: |
|
|
|
|
|
|
|
|
|
|
|
|
|
| Net
investment income (loss) |
1.53%††
|
|
1.75%
|
|
1.35%
|
|
1.32%††
|
|
1.51%
|
|
1.89%
|
|
1.59%
|
| Net
expenses |
1.24%††(c)
|
|
1.26%(c)
|
|
1.29%(c)
|
|
1.32%†† (c)(d)
|
|
1.35%
|
|
1.35%
|
|
1.53%
|
| Expenses
(before waiver/reimbursement) |
1.24%††(c)
|
|
1.26%(c)
|
|
1.35%(c)
|
|
1.54%†† (c)(d)
|
|
1.56%
|
|
1.83%
|
|
2.36%
|
| Portfolio
turnover rate |
23%
|
|
32%
|
|
51%
|
|
49%
|
|
53%
|
|
61%
|
|
85%
|
| Net
assets at end of period (in 000's) |
$
90,719 |
|
$
88,715 |
|
$
45,642 |
|
$
11,237 |
|
$
11,700 |
|
$
1,787 |
|
$
1,146 |
| *
|
Unaudited.
|
| #
|
The Fund
changed its fiscal year end from October 31 to April 30. |
| ††
|
Annualized.
|
| (a)
|
Per share
data based on average shares outstanding during the period. |
| (b)
|
Total
investment return is calculated exclusive of sales charges and assumes the reinvestment of dividends and distributions. For periods of less than one year, total return is not annualized. |
| (c)
|
In addition
to the fees and expenses which the Fund bears directly, it also indirectly bears a pro-rata share of the fees and expenses of the underlying funds in which it invests. Such indirect expenses are not included in the above expense ratios. |
| (d)
|
Net
of interest expense of less than 0.01%. |
The
notes to the financial statements are an integral part of, and should be read in conjunction with, the financial statements.
| 18
|
MainStay CBRE Global
Infrastructure Fund |
Financial
Highlights selected per share data and ratios
| |
Six
months ended
October 31, |
|
Year
Ended April 30, |
|
February
24, 2020^ through
April 30, |
| Investor
Class |
2022
* |
|
2022
|
|
2021
|
|
2020
|
| Net
asset value at beginning of period |
$
13.11 |
|
$
12.80 |
|
$
10.38 |
|
$
12.50 |
| Net
investment income (loss) (a) |
0.10
|
|
0.23
|
|
0.13
|
|
(0.00)‡
|
| Net
realized and unrealized gain (loss) |
(1.42)
|
|
0.26
|
|
2.43
|
|
(2.08)
|
| Total
from investment operations |
(1.32)
|
|
0.49
|
|
2.56
|
|
(2.08)
|
| Less
distributions: |
|
|
|
|
|
|
|
| From
net investment income |
(0.12)
|
|
(0.18)
|
|
(0.14)
|
|
(0.03)
|
| Return
of capital |
—
|
|
—
|
|
—
|
|
(0.01)
|
| Total
distributions |
(0.12)
|
|
(0.18)
|
|
(0.14)
|
|
(0.04)
|
| Net
asset value at end of period |
$
11.67 |
|
$
13.11 |
|
$
12.80 |
|
$
10.38 |
| Total
investment return (b) |
(10.06)%
|
|
3.85%
|
|
24.87%
|
|
(16.66)%
|
| Ratios
(to average net assets)/Supplemental Data: |
|
|
|
|
|
|
|
| Net
investment income (loss) |
1.52%††
|
|
1.77%
|
|
1.11%
|
|
(0.12)%††
|
| Net
expenses (c) |
1.28%††
|
|
1.31%
|
|
1.45%
|
|
1.45%††
|
| Expenses
(before waiver/reimbursement) (c) |
1.28%††
|
|
1.31%
|
|
1.76%
|
|
1.67%††
|
| Portfolio
turnover rate |
23%
|
|
32%
|
|
51%
|
|
49%
|
| Net
assets at end of period (in 000's) |
$
2,194 |
|
$
2,430 |
|
$
2,159 |
|
$
106 |
| *
|
Unaudited.
|
| ^
|
Inception
date. |
| ‡
|
Less than
one cent per share. |
| ††
|
Annualized.
|
| (a)
|
Per share
data based on average shares outstanding during the period. |
| (b)
|
Total
investment return is calculated exclusive of sales charges and assumes the reinvestment of dividends and distributions. For periods of less than one year, total return is not annualized. |
| (c)
|
In
addition to the fees and expenses which the Fund bears directly, it also indirectly bears a pro-rata share of the fees and expenses of the underlying funds in which it invests. Such indirect expenses are not included in the above expense ratios.
|
The
notes to the financial statements are an integral part of, and should be read in conjunction with, the financial statements.
19
Financial
Highlights selected per share data and ratios
| |
Six
months ended
October 31, |
|
Year
Ended April 30, |
|
November
1,
2019
through
April 30,
2020# |
|
February
28,
2019^
through
October 31, |
| Class
C |
2022
* |
|
2022
|
|
2021
|
|
2019
|
| Net
asset value at beginning of period |
$
13.04 |
|
$
12.75 |
|
$
10.37 |
|
$
11.96 |
|
$
10.82 |
| Net
investment income (loss) (a) |
0.05
|
|
0.12
|
|
0.06
|
|
0.03
|
|
0.04
|
| Net
realized and unrealized gain (loss) |
(1.40)
|
|
0.27
|
|
2.42
|
|
(1.29)
|
|
1.22
|
| Total
from investment operations |
(1.35)
|
|
0.39
|
|
2.48
|
|
(1.26)
|
|
1.26
|
| Less
distributions: |
|
|
|
|
|
|
|
|
|
| From
net investment income |
(0.07)
|
|
(0.10)
|
|
(0.10)
|
|
(0.03)
|
|
(0.12)
|
| From
net realized gain on investments |
—
|
|
—
|
|
—
|
|
(0.29)
|
|
—
|
| Return
of capital |
—
|
|
—
|
|
—
|
|
(0.01)
|
|
—
|
| Total
distributions |
(0.07)
|
|
(0.10)
|
|
(0.10)
|
|
(0.33)
|
|
(0.12)
|
| Net
asset value at end of period |
$
11.62 |
|
$
13.04 |
|
$
12.75 |
|
$
10.37 |
|
$
11.96 |
| Total
investment return (b) |
(10.37)%
|
|
3.11%
|
|
24.04%
|
|
(10.89)%
|
|
11.67%
|
| Ratios
(to average net assets)/Supplemental Data: |
|
|
|
|
|
|
|
|
|
| Net
investment income (loss) |
0.79%††
|
|
0.89%
|
|
0.52%
|
|
0.58%††
|
|
0.46%††
|
| Net
expenses |
2.03%††(c)
|
|
2.06%(c)
|
|
2.08%(c)
|
|
2.09%†† (c)(d)
|
|
2.10%††
|
| Expenses
(before waiver/reimbursement) |
2.03%††(c)
|
|
2.06%(c)
|
|
2.51%(c)
|
|
2.36%†† (c)(d)
|
|
2.31%††
|
| Portfolio
turnover rate |
23%
|
|
32%
|
|
51%
|
|
49%
|
|
53%
|
| Net
assets at end of period (in 000’s) |
$
20,378 |
|
$
24,119 |
|
$
11,522 |
|
$
992 |
|
$
1,048 |
| *
|
Unaudited.
|
| #
|
The Fund
changed its fiscal year end from October 31 to April 30. |
| ^
|
Inception
date. |
| ††
|
Annualized.
|
| (a)
|
Per share
data based on average shares outstanding during the period. |
| (b)
|
Total
investment return is calculated exclusive of sales charges and assumes the reinvestment of dividends and distributions. For periods of less than one year, total return is not annualized. |
| (c)
|
In addition
to the fees and expenses which the Fund bears directly, it also indirectly bears a pro-rata share of the fees and expenses of the underlying funds in which it invests. Such indirect expenses are not included in the above expense ratios. |
| (d)
|
Net
of interest expense of less than 0.01%. |
The
notes to the financial statements are an integral part of, and should be read in conjunction with, the financial statements.
| 20
|
MainStay CBRE Global
Infrastructure Fund |
Financial
Highlights selected per share data and ratios
| |
Six
months ended
October 31, |
|
Year
Ended April 30, |
|
November
1,
2019
through
April 30,
2020# |
|
Year
Ended October 31, |
| Class
I |
2022
* |
|
2022
|
|
2021
|
|
2019
|
|
2018
|
|
2017
|
| Net
asset value at beginning of period |
$
13.12 |
|
$
12.82 |
|
$
10.39 |
|
$
11.99 |
|
$
10.04 |
|
$
11.40 |
|
$
10.78 |
| Net
investment income (loss) |
0.11(a)
|
|
0.27(a)
|
|
0.21(a)
|
|
0.09(a)
|
|
0.20
|
|
0.23
|
|
0.20
|
| Net
realized and unrealized gain (loss) |
(1.40)
|
|
0.26
|
|
2.41
|
|
(1.30)
|
|
2.11
|
|
(0.52)
|
|
1.30
|
| Total
from investment operations |
(1.29)
|
|
0.53
|
|
2.62
|
|
(1.21)
|
|
2.31
|
|
(0.29)
|
|
1.50
|
| Less
distributions: |
|
|
|
|
|
|
|
|
|
|
|
|
|
| From
net investment income |
(0.14)
|
|
(0.23)
|
|
(0.19)
|
|
(0.08)
|
|
(0.20)
|
|
(0.28)
|
|
(0.15)
|
| From
net realized gain on investments |
—
|
|
—
|
|
—
|
|
(0.29)
|
|
(0.16)
|
|
(0.79)
|
|
(0.73)
|
| Return
of capital |
—
|
|
—
|
|
—
|
|
(0.02)
|
|
—
|
|
—
|
|
—
|
| Total
distributions |
(0.14)
|
|
(0.23)
|
|
(0.19)
|
|
(0.39)
|
|
(0.36)
|
|
(1.07)
|
|
(0.88)
|
| Net
asset value at end of period |
$
11.69 |
|
$
13.12 |
|
$
12.82 |
|
$
10.39 |
|
$
11.99 |
|
$
10.04 |
|
$
11.40 |
| Total
investment return (b) |
(9.86)%
|
|
4.19%
|
|
25.46%
|
|
(10.46)%
|
|
23.52%
|
|
(2.88)%
|
|
15.25%
|
| Ratios
(to average net assets)/Supplemental Data: |
|
|
|
|
|
|
|
|
|
|
|
|
|
| Net
investment income (loss) |
1.79%††
|
|
2.09%
|
|
1.78%
|
|
1.59%††
|
|
1.83%
|
|
2.14%
|
|
1.83%
|
| Net
expenses |
0.97%††(c)
|
|
0.97%(c)
|
|
0.97%(c)
|
|
1.05%†† (c)(d)
|
|
1.10%
|
|
1.10%
|
|
1.21%
|
| Expenses
(before waiver/reimbursement) |
0.99%††(c)
|
|
1.01%(c)
|
|
1.10%(c)
|
|
1.18%†† (c)(d)
|
|
1.14%
|
|
1.41%
|
|
1.61%
|
| Portfolio
turnover rate |
23%
|
|
32%
|
|
51%
|
|
49%
|
|
53%
|
|
61%
|
|
85%
|
| Net
assets at end of period (in 000's) |
$
1,713,483 |
|
$
1,527,548 |
|
$
465,299 |
|
$
208,291 |
|
$
225,176 |
|
$
71,919 |
|
$
36,755 |
| *
|
Unaudited.
|
| #
|
The Fund
changed its fiscal year end from October 31 to April 30. |
| ††
|
Annualized.
|
| (a)
|
Per share
data based on average shares outstanding during the period. |
| (b)
|
Total
investment return is calculated exclusive of sales charges and assumes the reinvestment of dividends and distributions. Class I shares are not subject to sales charges. For periods of less than one year, total return is not annualized. |
| (c)
|
In addition
to the fees and expenses which the Fund bears directly, it also indirectly bears a pro-rata share of the fees and expenses of the underlying funds in which it invests. Such indirect expenses are not included in the above expense ratios. |
| (d)
|
Net
of interest expense of less than 0.01%. |
The
notes to the financial statements are an integral part of, and should be read in conjunction with, the financial statements.
21
Financial
Highlights selected per share data and ratios
| |
Six
months ended
October 31, |
|
Year
Ended April 30, |
|
February
24, 2020^ through
April 30, |
| Class
R6 |
2022
* |
|
2022
|
|
2021
|
|
2020
|
| Net
asset value at beginning of period |
$
13.12 |
|
$
12.82 |
|
$
10.39 |
|
$
12.51 |
| Net
investment income (loss) (a) |
0.12
|
|
0.35
|
|
0.17
|
|
0.02
|
| Net
realized and unrealized gain (loss) |
(1.40)
|
|
0.19
|
|
2.45
|
|
(2.11)
|
| Total
from investment operations |
(1.28)
|
|
0.54
|
|
2.62
|
|
(2.09)
|
| Less
distributions: |
|
|
|
|
|
|
|
| From
net investment income |
(0.15)
|
|
(0.24)
|
|
(0.19)
|
|
(0.02)
|
| Return
of capital |
—
|
|
—
|
|
—
|
|
(0.01)
|
| Total
distributions |
(0.15)
|
|
(0.24)
|
|
(0.19)
|
|
(0.03)
|
| Net
asset value at end of period |
$
11.69 |
|
$
13.12 |
|
$
12.82 |
|
$
10.39 |
| Total
investment return (b) |
(9.82)%
|
|
4.23%
|
|
25.50%
|
|
(16.65)%
|
| Ratios
(to average net assets)/Supplemental Data: |
|
|
|
|
|
|
|
| Net
investment income (loss) |
1.90%††
|
|
2.63%
|
|
1.47%
|
|
0.85%††
|
| Net
expenses (c) |
0.88%††
|
|
0.91%
|
|
0.95%
|
|
0.95%††
|
| Expenses
(before waiver/reimbursement) (c) |
0.88%††
|
|
0.91%
|
|
1.02%
|
|
1.13%††
|
| Portfolio
turnover rate |
23%
|
|
32%
|
|
51%
|
|
49%
|
| Net
assets at end of period (in 000's) |
$
9,881 |
|
$
10,541 |
|
$
350 |
|
$
21 |
| *
|
Unaudited.
|
| ^
|
Inception
date. |
| ††
|
Annualized.
|
| (a)
|
Per share
data based on average shares outstanding during the period. |
| (b)
|
Total
investment return is calculated exclusive of sales charges and assumes the reinvestment of dividends and distributions. Class R6 shares are not subject to sales charges. For periods of less than one year, total return is not annualized. |
| (c)
|
In
addition to the fees and expenses which the Fund bears directly, it also indirectly bears a pro-rata share of the fees and expenses of the underlying funds in which it invests. Such indirect expenses are not included in the above expense ratios.
|
The notes to the financial statements are an integral part of, and should be
read in conjunction with, the financial statements.
| 22
|
MainStay CBRE Global
Infrastructure Fund |
Notes to Financial
Statements (Unaudited)
Note 1-Organization and Business
MainStay Funds Trust (the “Trust”) was organized as
a Delaware statutory trust on April 28, 2009. The Trust is registered under the Investment Company Act of 1940, as amended (the “1940 Act”), as an open-end management investment company, and is comprised of thirty-three funds
(collectively referred to as the “Funds”). These financial statements and notes relate to the MainStay CBRE Global Infrastructure Fund (the "Fund"), a “diversified” fund, as that term is defined in the 1940 Act, as
interpreted or modified by regulatory authorities having jurisdiction, from time to time.
The following table lists the Fund's share classes that have
been registered and commenced operations:
| Class
|
Commenced
Operations |
| Class
A |
October
16, 2013 |
| Investor
Class |
February
24, 2020 |
| Class
C |
February
28, 2019 |
| Class
I |
June
28, 2013 |
| Class
R6 |
February
24, 2020 |
| SIMPLE
Class |
N/A*
|
| *
|
SIMPLE
Class shares were registered for sale effective as of August 31, 2020 but have not yet commenced operations. |
Class A and Investor Class shares are offered at net asset
value (“NAV”) per share plus an initial sales charge. No initial sales charge applies to investments of $1 million or more (and certain other qualified purchases) in Class A and Investor Class shares. However, a contingent deferred sales
charge (“CDSC”) of 1.00% may be imposed on certain redemptions made within 18 months of the date of purchase on shares that were purchased without an initial sales charge. Class C shares are offered at NAV without an initial sales
charge, although a 1.00% CDSC may be imposed on certain redemptions of such shares made within one year of the date of purchase of Class C shares. Class I and Class R6 shares are offered at NAV without a sales charge. SIMPLE Class shares are
expected to be offered at NAV without a sales charge if such shares are offered in the future. In addition, depending upon eligibility, Class C shares convert to either Class A or Investor Class shares at the end of the calendar quarter eight years
after the date they were purchased. Additionally, Investor Class shares may convert automatically to Class A shares. Under certain circumstances and as may be permitted by the Trust’s multiple class plan pursuant to Rule 18f-3 under the 1940
Act, specified share classes of the Fund may be converted to one or more other share classes of the Fund as disclosed in the capital share transactions within these Notes. The classes of shares have the same voting (except for issues that relate
solely to one class), dividend, liquidation and other rights, and the same terms and conditions, except that under distribution plans pursuant to Rule 12b-1 under the 1940 Act, Class C shares are subject to higher distribution and/or service fees
than Class A, Investor Class and SIMPLE Class shares. Class I and Class R6 shares are not subject to a distribution and/or service fee.
The Fund's investment objective is to seek total return.
Note 2–Significant Accounting Policies
The Fund is an investment company and accordingly follows the
investment company accounting and reporting guidance of the Financial Accounting Standards Board (“FASB”) Accounting Standards Codification Topic 946 Financial Services—Investment Companies. The Fund prepares its financial statements in accordance with generally accepted accounting principles (“GAAP”) in the United States of America and follows the significant accounting policies described
below.
(A) Securities Valuation. Investments are usually valued as of the close of regular trading on the New York Stock Exchange (the "Exchange") (usually 4:00 p.m. Eastern time) on each day the Fund is open for business
("valuation date").
Effective September 8, 2022,
and pursuant to Rule 2a-5 under the 1940 Act, the Board of Trustees of the Trust (the "Board") designated New York Life Investment Management LLC (“New York Life Investments” or the "Manager") as its Valuation Designee (the "Valuation
Designee"). The Valuation Designee is responsible for performing fair valuations relating to all investments in the Fund’s portfolio for which market quotations are not readily available; periodically assessing and managing material valuation
risks; establishing and applying fair value methodologies; testing fair valuation methodologies; evaluating and overseeing pricing services; segregation of valuation and portfolio management functions; providing quarterly, annual and prompt
reporting to the Board, as appropriate; identifying potential conflicts of interest; and maintaining appropriate records. The Valuation Designee has established a valuation committee ("Valuation Committee") to assist in carrying out the Valuation
Designee’s responsibilities and establish prices of securities for which market quotations are not readily available. The Fund’s and the Valuation Designee's policies and procedures ("Valuation Procedures") govern the Valuation
Designee’s selection and application of methodologies for determining and calculating the fair value of Fund investments. The Valuation Designee may value Fund portfolio securities for which market quotations are not readily available and
other Fund assets utilizing inputs from pricing services and other third-party sources (together, “Pricing Sources”). The Valuation Committee meets (in person, via electronic mail or via teleconference) on an ad-hoc basis to determine
fair valuations and on a quarterly basis to review fair value events (excluding fair valuations from pricing services), including valuation risks and back-testing results, and preview reports to the Board.
The Valuation Committee establishes prices of securities for
which market quotations are not readily available based on such methodologies and measurements on a regular basis after considering information that is reasonably available and deemed relevant by the Valuation Committee. The Board shall oversee the
Valuation Designee and review fair valuation materials on a prompt, quarterly and annual basis and approve proposed revisions to the Valuation Procedures.
Investments for which market quotations are not readily
available are valued at fair value as determined in good faith pursuant to the Valuation Procedures. A market quotation is readily available only when that
Notes to Financial
Statements (Unaudited) (continued)
quotation is a quoted price (unadjusted) in active markets for identical
investments that the Fund can access at the measurement date, provided that a quotation will not be readily available if it is not reliable. Fair value measurements are determined within a framework that establishes a three-tier hierarchy that
maximizes the use of observable market data and minimizes the use of unobservable inputs to establish a classification of fair value measurements for disclosure purposes. "Inputs" refer broadly to the assumptions that market participants would use
in pricing the asset or liability, including assumptions about risk, such as the risk inherent in a particular valuation technique used to measure fair value using a pricing model and/or the risk inherent in the inputs for the valuation technique.
Inputs may be observable or unobservable. Observable inputs reflect the assumptions market participants would use in pricing the asset or liability based on market data obtained from sources independent of the Fund. Unobservable inputs reflect the
Fund’s own assumptions about the assumptions market participants would use in pricing the asset or liability based on the information available. The inputs or methodology used for valuing assets or liabilities may not be an indication of the
risks associated with investing in those assets or liabilities. The three-tier hierarchy of inputs is summarized below.
| •
|
Level
1—quoted prices (unadjusted) in active markets for an identical asset or liability |
| •
|
Level
2—other significant observable inputs (including quoted prices for a similar asset or liability in active markets, interest rates and yield curves, prepayment speeds, credit risk, etc.) |
| •
|
Level
3—significant unobservable inputs (including the Fund's own assumptions about the assumptions that market participants would use in measuring fair value of an asset or liability) |
The level of an asset or liability within the fair value
hierarchy is based on the lowest level of an input, both individually and in the aggregate, that is significant to the fair value measurement. The aggregate value by input level of the Fund’s assets and liabilities as of October 31, 2022, is
included at the end of the Portfolio of Investments.
The
Fund may use third-party vendor evaluations, whose prices may be derived from one or more of the following standard inputs, among others:
| •
Broker/dealer quotes |
•
Benchmark securities |
| •
Two-sided markets |
•
Reference data (corporate actions or material event notices) |
| •
Bids/offers |
•
Monthly payment information |
| •
Industry and economic events |
•
Reported trades |
An asset or
liability for which a market quotation is not readily available is valued by methods deemed reasonable in good faith by the Valuation Committee, following the Valuation Procedures to represent fair value. Under these procedures, the Valuation
Designee generally uses a market-based approach which may use related or comparable assets or liabilities, recent transactions, market multiples, book values and other relevant information. The Valuation Designee may also use an income-based
valuation approach in which the anticipated future cash
flows of the asset or liability are discounted to calculate fair value.
Discounts may also be applied due to the nature and/or duration of any restrictions on the disposition of the asset or liability. Fair value represents a good faith approximation of the value of a security. Fair value determinations involve the
consideration of a number of subjective factors, an analysis of applicable facts and circumstances and the exercise of judgment. As a result, it is possible that the fair value for a security determined in good faith in accordance with the Valuation
Procedures may differ from valuations for the same security determined for other funds using their own valuation procedures. Although the Valuation Procedures are designed to value a security at the price the Fund may reasonably expect to receive
upon the security's sale in an orderly transaction, there can be no assurance that any fair value determination thereunder would, in fact, approximate the amount that the Fund would actually realize upon the sale of the security or the price at
which the security would trade if a reliable market price were readily available. During the six-month period ended October 31, 2022, there were no material changes to the fair value methodologies.
Securities which may be valued in this manner include, but are
not limited to: (i) a security for which trading has been halted or suspended or otherwise does not have a readily available market quotation on a given day; (ii) a debt security that has recently gone into default and for which there is not a
current market quotation; (iii) a security of an issuer that has entered into a restructuring; (iv) a security that has been delisted from a national exchange; (v) a security subject to trading collars for which no or limited trading takes place;
and (vi) a security whose principal market has been temporarily closed at a time when, under normal conditions, it would be open. Securities valued in this manner are generally categorized as Level 2 or 3 in the hierarchy.
Certain securities held by the Fund may principally trade in
foreign markets. Events may occur between the time the foreign markets close and the time at which the Fund's NAVs are calculated. These events may include, but are not limited to, situations relating to a single issuer in a market sector,
significant fluctuations in U.S. or foreign markets, natural disasters, armed conflicts, governmental actions or other developments not tied directly to the securities markets. Should the Valuation Designee conclude that such events may have
affected the accuracy of the last price of such securities reported on the local foreign market, the Valuation Designee may, pursuant to the Valuation Procedures, adjust the value of the local price to reflect the estimated impact on the price of
such securities as a result of such events. In this instance, securities are generally categorized as Level 3 in the hierarchy. Additionally, certain foreign equity securities are also fair valued whenever the movement of a particular index exceeds
certain thresholds. In such cases, the securities are fair valued by applying factors provided by a third-party vendor in accordance with the Valuation Procedures and are generally categorized as Level 2 in the hierarchy. No foreign equity
securities held by the Fund as of October 31, 2022 were fair valued in such a manner.
If the principal market of certain foreign equity securities is
closed in observance of a local foreign holiday, these securities are valued using the last closing price of regular trading on the relevant exchange and fair
| 24
|
MainStay CBRE Global
Infrastructure Fund |
valued by applying factors provided by a third-party vendor in accordance with
the Valuation Procedures. These securities are generally categorized as Level 2 in the hierarchy. No securities held by the Fund as of October 31, 2022, were fair valued in such a manner.
Equity securities are valued at the last quoted sales prices as
of the close of regular trading on the relevant exchange on each valuation date. Securities that are not traded on the valuation date are valued at the mean of the last quoted bid and ask prices. Prices are normally taken from the principal market
in which each security trades. These securities are generally categorized as Level 1 in the hierarchy.
Investments in mutual funds, including money market funds, are
valued at their respective NAVs at the close of business each day on the valuation date. These securities are generally categorized as Level 1 in the hierarchy.
Temporary cash investments acquired in excess of 60 days to
maturity at the time of purchase are valued using the latest bid prices or using valuations based on a matrix system (which considers such factors as security prices, yields, maturities and ratings), both as furnished by independent pricing
services. Temporary cash investments that mature in 60 days or less at the time of purchase ("Short-Term Investments") are valued using the amortized cost method of valuation, unless the use of such method would be inappropriate. The amortized cost
method involves valuing a security at its cost on the date of purchase and thereafter assuming a constant amortization to maturity of the difference between such cost and the value on maturity date. Amortized cost approximates the current fair value
of a security. Securities valued using the amortized cost method are not valued using quoted prices in an active market and are generally categorized as Level 2 in the hierarchy.
The information above is not intended to reflect an exhaustive
list of the methodologies that may be used to value portfolio investments. The Valuation Procedures permit the use of a variety of valuation methodologies in connection with valuing portfolio investments. The methodology used for a specific type of
investment may vary based on the market data available or other considerations. The methodologies summarized above may not represent the specific means by which portfolio investments are valued on any particular business day.
A portfolio investment may be classified as an illiquid
investment under the Trust's written liquidity risk management program and related procedures (“Liquidity Program”). Illiquidity of an investment might prevent the sale of such investment at a time when the Manager or the Subadvisor
might wish to sell, and these investments could have the effect of decreasing the overall level of the Fund's liquidity. Further, the lack of an established secondary market may make it more difficult to value illiquid investments, requiring the
Fund to rely on judgments that may be somewhat subjective in measuring value, which could vary materially from the amount that the Fund could realize upon disposition. Difficulty in selling illiquid investments may result in a loss or may be costly
to the Fund. An illiquid investment is any investment that the Manager or Subadvisor reasonably expects cannot be sold or disposed of in current market conditions in seven calendar days or less without the
sale or disposition significantly changing the market value of the investment.
The liquidity classification of each investment will be made using information obtained after reasonable inquiry and taking into account, among other things, relevant market, trading and investment-specific considerations in accordance with the
Liquidity Program. Illiquid investments are often fair valued in accordance with the Fund's procedures described above. The liquidity of the Fund's investments was determined as of October 31, 2022, and can change at any time. Illiquid investments
as of October 31, 2022, are shown in the Portfolio of Investments.
(B) Income Taxes. The Fund's policy is to comply with the requirements of the Internal Revenue Code of 1986, as amended (the “Internal Revenue Code”), applicable to regulated investment companies
and to distribute all of its taxable income to the shareholders of the Fund within the allowable time limits.
The Manager evaluates the Fund’s tax positions to
determine if the tax positions taken meet the minimum recognition threshold in connection with accounting for uncertainties in income tax positions taken or expected to be taken for the purposes of measuring and recognizing tax liabilities in the
financial statements. Recognition of tax benefits of an uncertain tax position is permitted only to the extent the position is “more likely than not” to be sustained assuming examination by taxing authorities. The Manager analyzed the
Fund's tax positions taken on federal, state and local income tax returns for all open tax years (for up to three tax years) and has concluded that no provisions for federal, state and local income tax are required in the Fund's financial
statements. The Fund's federal, state and local income tax and federal excise tax returns for tax years for which the applicable statutes of limitations have not expired are subject to examination by the Internal Revenue Service and state and local
departments of revenue.
(C) Foreign Taxes. The Fund may be subject to foreign taxes on income and other transaction-based taxes imposed by certain countries in which it invests. A portion of the taxes on gains on investments or
currency purchases/repatriation may be reclaimable. The Fund will accrue such taxes and reclaims as applicable, based upon its current interpretation of tax rules and regulations that exist in the markets in which it invests.
The Fund may be subject to taxation on realized capital gains,
repatriation proceeds and other transaction-based taxes imposed by certain countries in which it invests. The Fund will accrue such taxes as applicable based upon its current interpretation of tax rules and regulations that exist in the market in
which it invests. Capital gains taxes relating to positions still held are reflected as a liability in the Statement of Assets and Liabilities, as well as an adjustment to the Fund's net unrealized appreciation (depreciation). Taxes related to
capital gains realized, if any, are reflected as part of net realized gain (loss) in the Statement of Operations. Changes in tax liabilities related to capital gains taxes on unrealized investment gains, if any, are reflected as part of the change
in net unrealized appreciation (depreciation) on investments in the Statement of
Notes to Financial
Statements (Unaudited) (continued)
Operations. Transaction-based charges are generally assessed as a percentage
of the transaction amount.
(D) Dividends and
Distributions to Shareholders. Dividends and distributions are recorded on the ex-dividend date. The Fund intends to declare and pay dividends from net investment income, if any,
at least quarterly and distributions from net realized capital and currency gains, if any, at least annually. Unless a shareholder elects otherwise, all dividends and distributions are reinvested at NAV in the same class of shares of the Fund.
Dividends and distributions to shareholders are determined in accordance with federal income tax regulations and may differ from determinations using GAAP.
(E) Security Transactions and Investment Income. The Fund records security transactions on the trade date. Realized gains and losses on security transactions are determined using the identified cost method. Dividend income is recognized
on the ex-dividend date, net of any foreign tax withheld at the source, and interest income is accrued as earned using the effective interest rate method. Distributions received from real estate investment trusts may be classified as dividends,
capital gains and/or return of capital.
The Fund
may also invest up to 25% of its net assets in master limited partnerships.
Investment income and realized and unrealized gains and losses
on investments of the Fund are allocated pro rata to the separate classes of shares based upon their relative net assets on the date the income is earned or realized and unrealized gains and losses are incurred.
(F) Expenses. Expenses of the Trust are allocated to the individual Funds in proportion to the net assets of the respective Funds when the expenses are incurred, except where direct allocations of
expenses can be made. Expenses (other than transfer agent expenses and fees incurred under the shareholder services plans and/or the distribution plans further discussed in Note 3(B)) are allocated to separate classes of shares pro rata based upon
their relative net assets on the date the expenses are incurred. The expenses borne by the Fund, including those of related parties to the Fund, are shown in the Statement of Operations.
Additionally, the Fund may invest in mutual funds, which are
subject to management fees and other fees that may cause the costs of investing in mutual funds to be greater than the costs of owning the underlying securities directly. These indirect expenses of mutual funds are not included in the amounts shown
as expenses in the Statement of Operations or in the expense ratios included in the Financial Highlights.
(G) Use of Estimates. In preparing financial statements in conformity with GAAP, the Manager makes estimates and assumptions that affect the reported amounts and disclosures in the financial statements. Actual
results could differ from those estimates and assumptions.
(H) Foreign Currency Transactions. The Fund's books and records are maintained in U.S. dollars. Prices of securities denominated in foreign currency amounts are translated into U.S. dollars at the mean between
the buying and selling rates last quoted by any major U.S. bank at the
following dates:
(i) market value of investment
securities, other assets and liabilities— at the valuation date; and
(ii) purchases and sales of investment securities, income and
expenses—at the date of such transactions.
The
assets and liabilities that are denominated in foreign currency amounts are presented at the exchange rates and market values at the close of the period. The realized and unrealized changes in net assets arising from fluctuations in exchange rates
and market prices of securities are not separately presented.
Net realized gain (loss) on foreign currency transactions
represents net currency gains or losses realized as a result of differences between the amounts of securities sale proceeds or purchase cost, dividends, interest and withholding taxes as recorded on the Fund's books, and the U.S. dollar equivalent
amount actually received or paid. Net currency gains or losses from valuing such foreign currency denominated assets and liabilities, other than investments at valuation date exchange rates, are reflected in unrealized foreign exchange gains or
losses.
(I) Securities Lending. In order to realize additional income, the Fund may engage in securities lending, subject to the limitations set forth in the 1940 Act and relevant guidance by the staff of the Securities
and Exchange Commission (“SEC”). If the Fund engages in securities lending, the Fund will lend through its custodian, JPMorgan Chase Bank, N.A., ("JPMorgan"), acting as securities lending agent on behalf of the Fund. Under the current
arrangement, JPMorgan will manage the Fund's collateral in accordance with the securities lending agency agreement between the Fund and JPMorgan, and indemnify the Fund against counterparty risk. The loans will be collateralized by cash (which may
be invested in a money market fund) and/or non-cash collateral (which may include U.S. Treasury securities and/or U.S. government agency securities issued or guaranteed by the United States government or its agencies or instrumentalities) at least
equal at all times to the market value of the securities loaned. The Fund bears the risk of delay in recovery of, or loss of rights in, the securities loaned. The Fund may also record a realized gain or loss on securities deemed sold due to a
borrower’s inability to return securities on loan. The Fund bears the risk of any loss on investment of cash collateral. The Fund will receive compensation for lending its securities in the form of fees or it will retain a portion of interest
earned on the investment of any cash collateral. The Fund will also continue to receive interest and dividends on the securities loaned and any gain or loss in the market price of the securities loaned that may occur during the term of the loan will
be for the account of the Fund. Income earned from securities lending activities, if any, is reflected in the Statement of Operations. Securities on loan as of October 31, 2022, are shown in the Portfolio of Investments.
(J) Foreign Securities Risk. The Fund invests in foreign securities, which carry certain risks that are in addition to the usual risks inherent in domestic securities. These risks include those resulting from
currency
| 26
|
MainStay CBRE Global
Infrastructure Fund |
fluctuations, future adverse political or economic developments and possible
imposition of currency exchange blockages or other foreign governmental laws or restrictions. These risks are likely to be greater in emerging markets than in developed markets. The ability of issuers of debt securities held by the Fund to meet
their obligations may be affected by, among other things, economic or political developments in a specific country, industry or region.
(K) Indemnifications. Under the Trust’s organizational documents, its officers and trustees are indemnified against certain liabilities that may arise out of performance of their duties to the Trust.
Additionally, in the normal course of business, the Fund enters into contracts with third-party service providers that contain a variety of representations and warranties and that may provide general indemnifications. The Fund's maximum exposure
under these arrangements is unknown, as this would involve future claims that may be made against the Fund that have not yet occurred. The Manager believes that the risk of loss in connection with these potential indemnification obligations is
remote. However, there can be no assurance that material liabilities related to such obligations will not arise in the future, which could adversely impact the Fund.
Note 3–Fees and Related Party Transactions
(A) Manager and Subadvisor. New York Life Investments, a registered investment adviser and an indirect, wholly-owned subsidiary of New York Life Insurance Company ("New York Life"), serves as the Fund's Manager
pursuant to an Amended and Restated Management Agreement ("Management Agreement"). The Manager provides offices, conducts clerical, recordkeeping and bookkeeping services and keeps most of the financial and accounting records required to be
maintained by the Fund. Except for the portion of salaries and expenses that are the responsibility of the Fund, the Manager pays the salaries and expenses of all personnel affiliated with the Fund and certain operational expenses of the Fund.
During a portion of the six-month period ended October 31, 2022, the Fund reimbursed New York Life Investments in an amount equal to the portion of the compensation of the Chief Compliance Officer attributable to the Fund. CBRE Investment Management
Listed Real Assets LLC ("CBRE" or the "Subadvisor"), a registered investment adviser, serves as the Subadvisor to the Fund and is responsible for the day-to-day portfolio management of the Fund. Pursuant to the terms of a Subadvisory Agreement
("Subadvisory Agreement") between New York Life Investments and CBRE, New York Life Investments pays for the services of the Subadvisor.
Pursuant to the Management Agreement, the Fund pays the Manager
a monthly fee for the services performed and the facilities furnished at an annual rate of 0.85% of the Fund's average daily net assets.
New York Life Investments has contractually agreed to waive
fees and/or reimburse expenses so that Total Annual Fund Operating Expenses (excluding taxes, interest, litigation, extraordinary expenses, brokerage and other transaction expenses relating to the purchase or sale of portfolio investments and
acquired (underlying) fund fees and expenses) do not exceed the following percentages of average daily net
assets: Class A, 1.33%; Investor Class, 1.45%; Class C, 2.08%; Class I, 0.97%;
and Class R6, 0.95%. This agreement will remain in effect until August 31, 2023, and shall renew automatically for one-year terms unless New York Life Investments provides written notice of termination prior to the start of the next term or upon
approval of the Board.
During the six-month period ended
October 31, 2022, New York Life Investments earned fees from the Fund in the amount of $7,875,464 and waived fees and/or reimbursed expenses, including the waiver/reimbursement of certain class specific expenses in the amount of $190,679 and paid
the Subadvisor fees in the amount of $3,842,391.
JPMorgan
provides sub-administration and sub-accounting services to the Fund pursuant to an agreement with New York Life Investments. These services include calculating the daily NAVs of the Fund, maintaining the general ledger and sub-ledger accounts for
the calculation of the Fund's NAVs, and assisting New York Life Investments in conducting various aspects of the Fund's administrative operations. For providing these services to the Fund, JPMorgan is compensated by New York Life Investments.
Pursuant to an agreement between the Trust and New York Life
Investments, New York Life Investments is responsible for providing or procuring certain regulatory reporting services for the Fund. The Fund will reimburse New York Life Investments for the actual costs incurred by New York Life Investments in
connection with providing or procuring these services for the Fund.
(B) Distribution and Service Fees. The Trust, on behalf of the Fund, has entered into a distribution agreement with NYLIFE Distributors LLC (the “Distributor”), an affiliate of New York Life Investments. The Fund
has adopted distribution plans (the “Plans”) in accordance with the provisions of Rule 12b-1 under the 1940 Act.
Pursuant to the Class A and Investor Class Plans, the
Distributor receives a monthly fee from the Class A and Investor Class shares at an annual rate of 0.25% of the average daily net assets of the Class A and Investor Class shares for distribution and/or service activities as designated by the
Distributor. Pursuant to the Class C Plan, Class C shares pay the Distributor a monthly distribution fee at an annual rate of 0.75% of the average daily net assets of the Class C shares, along with a service fee at an annual rate of 0.25% of the
average daily net assets of the Class C shares, for a total 12b-1 fee of 1.00%. Class I and Class R6 shares are not subject to a distribution and/or service fee.
The Plans provide that the distribution and service fees are
payable to the Distributor regardless of the amounts actually expended by the Distributor for distribution of the Fund's shares and service activities.
(C) Sales Charges. The Fund was advised by the Distributor that the amount of initial sales charges retained on sales of Class A and Investor Class shares during the six-month period ended October 31, 2022,
were $19,597 and $165, respectively.
Notes to Financial
Statements (Unaudited) (continued)
The Fund was also advised that the Distributor retained CDSCs on redemptions
of Class A and Class C shares during the six-month period ended October 31, 2022, of $1,664 and $2,542, respectively.
(D) Transfer, Dividend Disbursing and Shareholder Servicing
Agent. NYLIM Service Company LLC, an affiliate of New York Life Investments, is the Fund's transfer, dividend disbursing and shareholder servicing agent pursuant to an agreement
between NYLIM Service Company LLC and the Trust. NYLIM Service Company LLC has entered into an agreement with DST Asset Manager Solutions, Inc. ("DST"), pursuant to which DST performs certain transfer agent services on behalf of NYLIM Service
Company LLC. New York Life Investments has contractually agreed to limit the transfer agency expenses charged to the Fund’s share classes to a maximum of 0.35% of that share class’s average daily net assets on an annual basis after
deducting any applicable Fund or class-level expense reimbursement or small account fees. This agreement will remain in effect until August 31, 2023, and shall renew automatically for one-year terms unless New York Life Investments provides written
notice of termination prior to the start of the next term or upon approval of the Board. During the six-month period ended October 31, 2022, transfer agent expenses incurred by the Fund and any reimbursements, pursuant to the aforementioned Transfer
Agency expense limitation agreement, were as follows:
| Class
|
Expense
|
Waived
|
| Class
A |
$
52,137 |
$—
|
| Investor
Class |
1,741
|
—
|
| Class
C |
16,857
|
—
|
| Class
I |
959,191
|
—
|
| Class
R6 |
213
|
—
|
(E) Small Account Fee. Shareholders with small accounts adversely impact the cost of providing transfer agency services. In an effort to reduce total transfer agency expenses, the Fund has implemented a small
account fee on certain types of accounts. As described in the Fund's prospectus, certain shareholders with an account balance of less than $1,000 ($5,000 for Class A share accounts) are charged an annual per account fee of $20 (assessed
semi-annually), the proceeds from which offset transfer agent fees as reflected in the Statement of Operations. This small account fee will not apply to certain types of accounts as described further in the Fund’s prospectus.
Note 4-Federal Income Tax
As of October 31, 2022, the cost and unrealized appreciation
(depreciation) of the Fund’s investment portfolio, including applicable derivative contracts and other financial instruments, as determined on a federal income tax basis, were as follows:
| |
Federal
Tax
Cost |
Gross
Unrealized
Appreciation |
Gross
Unrealized
(Depreciation) |
Net
Unrealized
Appreciation/
(Depreciation) |
| Investments
in Securities |
$1,958,885,295
|
$69,396,960
|
$(193,866,833)
|
$(124,469,873)
|
As of April 30, 2022, for federal income tax purposes, capital loss
carryforwards of $210,581,712 is limited to $405,362 on an annual basis to offset any net realized capital gains. This limitation is due to Internal Revenue Code Sections 381-384. Capital loss carryforwards, as shown in the table below, were
available to the extent provided by the regulations to offset future realized gains of the Fund subject to the limitation described above.
Total
Capital Loss
Available Through |
Short-Term
Capital Loss
Amounts (000’s) |
Long-Term
Capital Loss
Amounts (000’s) |
| Unlimited
|
$119,451
|
$91,131
|
During the year ended April 30,
2022, the tax character of distributions paid as reflected in the Statements of Changes in Net Assets was as follows:
| |
2022
|
| Distributions
paid from: |
|
| Ordinary
Income |
$14,816,842
|
Note 5–Custodian
JPMorgan is the custodian of cash and securities held by the
Fund. Custodial fees are charged to the Fund based on the Fund's net assets and/or the market value of securities held by the Fund and the number of certain transactions incurred by the Fund.
Note 6–Line of Credit
The Fund and certain other funds managed by New York Life
Investments maintain a line of credit with a syndicate of banks in order to secure a source of funds for temporary purposes to meet unanticipated or excessive redemption requests.
Effective July 26, 2022, under the credit agreement (the
“Credit Agreement”), the aggregate commitment amount is $600,000,000 with an additional uncommitted amount of $100,000,000. The commitment fee is an annual rate of 0.15% of the average commitment amount payable quarterly, regardless of
usage, to JPMorgan, who serves as the agent to the syndicate. The commitment fee is allocated among the Fund and certain other funds managed by New York Life Investments based upon their respective net assets and other factors. Interest on any
revolving credit loan is charged based upon the Federal Funds Rate, Daily Simple Secured Overnight Financing Rate ("SOFR") + 0.10%, or the Overnight Bank Funding Rate, whichever is higher. The Credit Agreement expires on July 25, 2023, although the
Fund, certain other funds managed by New York Life Investments and the syndicate of banks may renew the Credit Agreement for an additional year on the same or different terms or enter into a credit agreement with a different syndicate of banks.
Prior to July 26, 2022, the aggregate commitment amount and the commitment fee were the same as those under the current Credit Agreement. During the six-month period ended October 31, 2022, there were no borrowings made or outstanding with respect
to the Fund under the Credit Agreement.
| 28
|
MainStay CBRE Global
Infrastructure Fund |
Note 7–Interfund Lending Program
Pursuant to an exemptive order issued by the SEC, the Fund,
along with certain other funds managed by New York Life Investments, may participate in an interfund lending program. The interfund lending program provides an alternative credit facility that permits the Fund and certain other funds managed by New
York Life Investments to lend or borrow money for temporary purposes directly to or from one another, subject to the conditions of the exemptive order. During the six-month period ended October 31, 2022, there were no interfund loans made or
outstanding with respect to the Fund.
Note
8–Purchases and Sales of Securities (in 000’s)
During the six-month period ended October 31, 2022, purchases
and sales of securities, other than short-term securities, were $832,711 and $418,427, respectively.
Note 9–Capital Share Transactions
Transactions in capital shares for the six-month period ended
October 31, 2022 and the year ended April 30, 2022, were as follows:
| Class
A |
Shares
|
Amount
|
| Six-month
period ended October 31, 2022: |
|
|
| Shares
sold |
1,933,121
|
$
24,623,146 |
| Shares
issued to shareholders in reinvestment of distributions |
72,681
|
877,325
|
| Shares
redeemed |
(1,008,082)
|
(12,299,445)
|
| Net
increase (decrease) in shares outstanding before conversion |
997,720
|
13,201,026
|
| Shares
converted into Class A (See Note 1) |
7,237
|
93,654
|
| Shares
converted from Class A (See Note 1) |
(2,555)
|
(28,820)
|
| Net
increase (decrease) |
1,002,402
|
$
13,265,860 |
| Year
ended April 30, 2022: |
|
|
| Shares
sold |
4,411,145
|
$
57,605,328 |
| Shares
issued to shareholders in reinvestment of distributions |
75,944
|
975,716
|
| Shares
redeemed |
(1,226,961)
|
(16,049,703)
|
| Net
increase (decrease) in shares outstanding before conversion |
3,260,128
|
42,531,341
|
| Shares
converted into Class A (See Note 1) |
21,293
|
278,101
|
| Shares
converted from Class A (See Note 1) |
(78,805)
|
(1,050,609)
|
| Net
increase (decrease) |
3,202,616
|
$
41,758,833 |
| |
| Investor
Class |
Shares
|
Amount
|
| Six-month
period ended October 31, 2022: |
|
|
| Shares
sold |
19,745
|
$
252,315 |
| Shares
issued to shareholders in reinvestment of distributions |
1,905
|
23,075
|
| Shares
redeemed |
(13,184)
|
(166,282)
|
| Net
increase (decrease) in shares outstanding before conversion |
8,466
|
109,108
|
| Shares
converted into Investor Class (See Note 1) |
947
|
12,536
|
| Shares
converted from Investor Class (See Note 1) |
(6,812)
|
(88,162)
|
| Net
increase (decrease) |
2,601
|
$
33,482 |
| Year
ended April 30, 2022: |
|
|
| Shares
sold |
50,651
|
$
678,517 |
| Shares
issued to shareholders in reinvestment of distributions |
2,248
|
28,825
|
| Shares
redeemed |
(22,119)
|
(288,283)
|
| Net
increase (decrease) in shares outstanding before conversion |
30,780
|
419,059
|
| Shares
converted into Investor Class (See Note 1) |
3,078
|
40,150
|
| Shares
converted from Investor Class (See Note 1) |
(17,270)
|
(225,640)
|
| Net
increase (decrease) |
16,588
|
$
233,569 |
| |
| Class
C |
Shares
|
Amount
|
| Six-month
period ended October 31, 2022: |
|
|
| Shares
sold |
172,415
|
$
2,189,751 |
| Shares
issued to shareholders in reinvestment of distributions |
10,638
|
130,225
|
| Shares
redeemed |
(277,303)
|
(3,356,020)
|
| Net
increase (decrease) in shares outstanding before conversion |
(94,250)
|
(1,036,044)
|
| Shares
converted from Class C (See Note 1) |
(1,383)
|
(18,028)
|
| Net
increase (decrease) |
(95,633)
|
$
(1,054,072) |
| Year
ended April 30, 2022: |
|
|
| Shares
sold |
1,163,935
|
$
15,167,647 |
| Shares
issued to shareholders in reinvestment of distributions |
11,316
|
142,471
|
| Shares
redeemed |
(222,223)
|
(2,883,848)
|
| Net
increase (decrease) in shares outstanding before conversion |
953,028
|
12,426,270
|
| Shares
converted from Class C (See Note 1) |
(7,157)
|
(92,611)
|
| Net
increase (decrease) |
945,871
|
$
12,333,659 |
| |
Notes to Financial
Statements (Unaudited) (continued)
| Class
I |
Shares
|
Amount
|
| Six-month
period ended October 31, 2022: |
|
|
| Shares
sold |
45,806,737
|
$
582,888,160 |
| Shares
issued to shareholders in reinvestment of distributions |
1,088,135
|
13,114,836
|
| Shares
redeemed |
(16,710,575)
|
(205,315,724)
|
| Net
increase (decrease) in shares outstanding before conversion |
30,184,297
|
390,687,272
|
| Shares
converted into Class I (See Note 1) |
2,552
|
28,820
|
| Net
increase (decrease) |
30,186,849
|
$
390,716,092 |
| Year
ended April 30, 2022: |
|
|
| Shares
sold |
90,600,814
|
$1,191,344,996
|
| Shares
issued to shareholders in reinvestment of distributions |
936,782
|
12,096,707
|
| Shares
redeemed |
(11,518,740)
|
(151,517,719)
|
| Net
increase (decrease) in shares outstanding before conversion |
80,018,856
|
1,051,923,984
|
| Shares
converted into Class I (See Note 1) |
78,742
|
1,050,609
|
| Net
increase (decrease) |
80,097,598
|
$1,052,974,593
|
| |
| Class
R6 |
Shares
|
Amount
|
| Six-month
period ended October 31, 2022: |
|
|
| Shares
sold |
61,573
|
$
792,293 |
| Shares
issued to shareholders in reinvestment of distributions |
10,146
|
122,242
|
| Shares
redeemed |
(29,818)
|
(350,374)
|
| Net
increase (decrease) |
41,901
|
$
564,161 |
| Year
ended April 30, 2022: |
|
|
| Shares
sold |
790,403
|
$
10,101,975 |
| Shares
issued to shareholders in reinvestment of distributions |
2,801
|
38,065
|
| Shares
redeemed |
(17,275)
|
(228,218)
|
| Net
increase (decrease) |
775,929
|
$
9,911,822 |
Note 10–Other Matters
As of the date of this report, interest rates in the United
States and many parts of the world, including certain European countries, are ascending from historically low levels. Thus, the Fund currently faces a heightened level of risk associated with rising interest rates. This could be driven by a variety
of factors, including but not limited to central bank monetary policies, changing inflation or real growth rates, general economic conditions, increasing bond issuances or reduced market demand for low yielding investments.
An outbreak of COVID-19, first detected in December 2019, has
developed into a global pandemic and has resulted in travel restrictions, closure of international borders, certain businesses and securities markets, restrictions on securities trading activities, prolonged quarantines, supply chain disruptions,
and lower consumer demand, as well as general concern and uncertainty. In 2022, many countries lifted some or all restrictions related to COVID-19. However, the continued
impact of COVID-19 and related variants is uncertain and could further
adversely affect the global economy, national economies, individual issuers and capital markets in unforeseeable ways and result in a substantial and extended economic downturn. Developments that disrupt global economies and financial markets, such
as COVID-19, may magnify factors that affect the Fund's performance.
Note 11–Subsequent Events
In connection with the preparation of the financial statements
of the Fund as of and for the six-month period ended October 31, 2022, events and transactions subsequent to October 31, 2022, through the date the financial statements were issued have been evaluated by the Manager for possible adjustment and/or
disclosure. No subsequent events requiring financial statement adjustment or disclosure have been identified.
| 30
|
MainStay CBRE Global
Infrastructure Fund |
Proxy Voting Policies and Procedures and Proxy Voting
Record
The Fund is required to file with the SEC its
proxy voting record for the 12-month period ending June 30 on Form N-PX. A description of the policies and procedures that are used to vote proxies relating to portfolio securities of the Fund is available free of charge upon request by calling
800-624-6782 or visiting the SEC’s website at www.sec.gov. The most recent Form N-PX or proxy voting record is available free of charge upon request by calling 800-624-6782; visiting
newyorklifeinvestments.com; or visiting the SEC’s website at www.sec.gov.
Shareholder Reports and Quarterly Portfolio Disclosure
The Fund is required to file its complete schedule of portfolio
holdings with the SEC 60 days after its first and third fiscal quarter on Form N-PORT. The Fund's holdings report is available free of charge upon request by calling New York Life Investments at 800-624-6782.
This page intentionally left
blank.
This page intentionally left
blank.
This page intentionally left
blank.
Equity
U.S. Equity
MainStay Epoch U.S. Equity Yield Fund
MainStay S&P 500 Index Fund1
MainStay Winslow Large Cap Growth Fund
MainStay WMC Enduring Capital Fund
MainStay WMC Growth Fund
MainStay WMC Small Companies Fund
MainStay WMC Value Fund
International Equity
MainStay Epoch International Choice Fund
MainStay MacKay International Equity Fund
MainStay WMC International Research Equity Fund
Emerging Markets Equity
MainStay Candriam Emerging Markets Equity Fund
Global Equity
MainStay Epoch Capital Growth Fund
MainStay Epoch Global Equity Yield Fund
Fixed Income
Taxable Income
MainStay Candriam Emerging Markets Debt Fund
MainStay Floating Rate Fund
MainStay MacKay High Yield Corporate Bond Fund
MainStay MacKay Short Duration High Yield Fund
MainStay MacKay Strategic Bond Fund
MainStay MacKay Total Return Bond Fund
MainStay MacKay U.S. Infrastructure Bond Fund
MainStay Short Term Bond Fund
Tax-Exempt Income
MainStay MacKay California Tax Free Opportunities Fund2
MainStay MacKay High Yield Municipal Bond Fund
MainStay MacKay New York Tax Free Opportunities Fund3
MainStay MacKay Short Term Municipal Fund
MainStay MacKay Strategic Municipal Allocation Fund
MainStay MacKay Tax Free Bond Fund
Money Market
MainStay Money Market Fund
Mixed Asset
MainStay Balanced Fund
MainStay Income Builder Fund
MainStay MacKay Convertible Fund
Speciality
MainStay CBRE Global Infrastructure Fund
MainStay CBRE Real Estate Fund
MainStay Cushing MLP Premier Fund
Asset Allocation
MainStay Conservative Allocation Fund
MainStay Conservative ETF Allocation Fund
MainStay Defensive ETF Allocation Fund
MainStay Equity Allocation Fund
MainStay Equity ETF Allocation Fund
MainStay ESG Multi-Asset Allocation Fund
MainStay Growth Allocation Fund
MainStay Growth ETF Allocation Fund
MainStay Moderate Allocation Fund
MainStay Moderate ETF Allocation Fund
Manager
New York Life Investment Management LLC
New York, New York
Subadvisors
Candriam4
Strassen, Luxembourg
CBRE Investment Management Listed Real Assets LLC
Radnor, Pennsylvania
Cushing Asset Management, LP
Dallas, Texas
Epoch Investment Partners, Inc.
New York, New York
MacKay Shields LLC4
New York, New York
NYL Investors LLC4
New York, New York
Wellington Management Company LLP
Boston, Massachusetts
Winslow Capital Management, LLC
Minneapolis, Minnesota
Legal Counsel
Dechert LLP
Washington, District of Columbia
Independent Registered Public Accounting Firm
KPMG LLP
Philadelphia, Pennsylvania
Distributor
NYLIFE Distributors LLC4
Jersey City, New Jersey
Custodian
JPMorgan Chase Bank, N.A.
New York, New York
1.
Prior to February 28, 2022, the Fund's name was
MainStay MacKay S&P 500 Index Fund.
| 2. |
This Fund is registered for
sale in AZ, CA, NV, OR, TX, UT, WA and MI (Class A and Class I shares only), and CO, FL, GA, HI, ID, MA, MD, NH, NJ and NY (Class I shares only). |
| 3. |
This Fund is registered for
sale in CA, CT, DE, FL, MA, NJ, NY and VT. |
| 4. |
An affiliate of New York Life
Investment Management LLC. |
Not part of the Semiannual Report
For more information
800-624-6782
newyorklifeinvestments.com
“New York Life Investments” is both a service mark,
and the common trade name, of certain investment advisors affiliated with New York Life Insurance Company. The MainStay Funds® are managed by New York Life Investment
Management LLC and distributed by NYLIFE Distributors LLC, 30 Hudson Street, Jersey City, NJ 07302, a wholly owned subsidiary of New York Life Insurance Company. NYLIFE Distributors LLC is a Member FINRA/SIPC.
©2022 NYLIFE Distributors LLC. All rights reserved.
| 5013764.2MS229-22 |
MSCBGI10-12/22
|
(NYLIM) NL479
MainStay CBRE Real Estate Fund
Message from the President and Semiannual Report
Unaudited | October 31, 2022
Sign up for e-delivery of your shareholder reports. For full
details on e-delivery, including who can participate and what you can receive via e-delivery,
please log in to newyorklifeinvestments.com/accounts.
| Not
FDIC/NCUA Insured |
Not
a Deposit |
May
Lose Value |
No
Bank Guarantee |
Not
Insured by Any Government Agency |
This page intentionally left blank
Message from the President
A series of economic and geopolitical challenges undermined equity and
fixed-income markets during the six-month reporting period ended October 31, 2022. Stocks and bonds alike trended lower in the face of sharply rising interest rates, increasing inflationary pressures, slowing economic growth and Russia’s
invasion of Ukraine.
The reporting period began on a
mixed note, with concerns about rising inflation and Russia’s invasion of Ukraine weighing on markets. On one hand, rising commodity prices and hopes that inflationary pressures might subside supported some asset classes and sectors. On the
other, the U.S. Federal Reserve (the “Fed”) issued increasingly hawkish statements regarding its intention to combat mounting inflation. As a result, equity markets remained flat while U.S. fixed-income markets gained modest ground in
May. Early June saw a downturn across asset classes as economic data showed increasing inflationary pressures, causing investors to anticipate a higher-than-previously-expected rate increase from the Fed at its meeting on June 15, 2022. Indeed, the
Fed raised rates by 0.75% at that meeting, from a range of 0.75% to 1.00% to a range of 1.50% to 1.75%, its largest increase of the year to date. Markets rallied in the wake of the Fed meeting as investors started to hope that slowing economic
growth might lead to rate decreases later in the year. In August, however, signs of persistently increasing inflation and statements from the Fed indicated that further rate increases were seen as necessary, undercutting optimism and driving stock
and bond prices lower through mid-October. The Fed implemented two additional 0.75% rate increases during that time, with additional increases expected before the end of the year. International central banks generally raised rates as well in efforts
to curb local inflation, although most increases remained significantly more modest than those in the United States. Relatively high U.S. interest rates and international risk-averse sentiment pushed U.S. dollar values higher compared to most other
currencies, with the ensuing negative impact on global prices for food, fuel and other key, U.S.-dollar-denominated products.
Despite a rally in the closing weeks of October, the S&P
500® Index, a widely regarded benchmark of U.S. market performance, declined by more than 5% during the reporting period. Although the energy sector generated strong gains,
bolstered by elevated oil and gas prices, most other industry areas recorded losses. The more cyclical and growth-oriented sectors of consumer discretionary, real estate and information technology delivered the
weakest returns, while the traditionally defensive and value-oriented
consumer staples, utilities and health care sectors outperformed. International stocks lagged compared to their U.S. counterparts, with some emerging markets, such as China, suffering particularly steep losses. A few markets, however, including
Brazil and Mexico, gained ground. Fixed-income markets saw bond prices broadly decline as yields rose along with interest rates. Short-term yields rose faster than long-term yields, producing a yield curve inversion from July through the end of the
reporting period, with long-term rates remaining below short-term rates. Some floating-rate instruments, which feature variable interest rates that allow investors to benefit from a rising rate environment, provided a degree of insulation from
inflation-driven trends.
While the Fed acknowledges the
costs of rising rates in terms of weaker GDP (gross domestic product) growth and unsettled financial markets over the short term, its primary focus continues to be the longer-term economic impact of inflation. With the latest figures as of the date
of this report showing that inflation remains above 8%, versus a target rate of just 2%, the Fed clearly has a distance yet to go, making further rate increases and market volatility more likely in the coming months. The question remains as to
whether the Fed and other central banks will manage a so-called “soft landing,” curbing inflation while avoiding a persistent economic slowdown. If they prove successful, we expect that favorable inflation trends and increasingly
attractive valuations in both equity and bond markets should eventually translate into sustainable improvements in the investment environment.
Whatever actions the Fed takes and however financial markets
react, as a MainStay investor, you can depend on us to continue providing the insight, expertise and service that have log defined New York Life Investments. Thank you for trusting us to help you meet your investment needs.
Sincerely,
Kirk C. Lehneis
President
The opinions expressed are as of the date of this report and
are subject to change. There is no guarantee that any forecast made will come to pass. This material does not constitute investment advice and is not intended as an endorsement of any specific investment. Past performance is no guarantee of future
results.
Not part of the Semiannual Report
Investors should refer to the Fund’s Summary Prospectus
and/or Prospectus and consider the Fund’s investment objectives, strategies, risks, charges and expenses carefully before investing. The Summary Prospectus and/or Prospectus contain this and other information about the Fund. You may obtain
copies of the Fund’s Summary Prospectus, Prospectus and Statement of Additional Information, which includes information about the MainStay Funds Trust's Trustees, free of charge, upon request, by calling toll-free 800-624-6782, by writing to
NYLIFE Distributors LLC, Attn: MainStay Marketing Department, 30 Hudson Street, Jersey City, NJ 07302 or by sending an e-mail to MainStayShareholderServices@nylim.com. These documents are also available via the MainStay Funds’ website at
newyorklifeinvestments.com. Please read the Fund’s Summary Prospectus and/or Prospectus carefully before investing.
Investment and
Performance Comparison (Unaudited)
Performance data quoted represents past performance. Past performance is no
guarantee of future results. Because of market volatility and other factors, current performance may be lower or higher than the figures shown. Investment return and principal value will fluctuate, and as a result, when shares are redeemed, they may
be worth more or less than their original cost. The graph below depicts the historical performance of Class I shares of the Fund. Performance will vary from class to class based on differences in class-specific expenses and sales charges. For performance information current to the most recent month-end, please call 800-624-6782 or visit newyorklifeinvestments.com.
The performance table and graph do not reflect the deduction
of taxes that a shareholder would pay on distributions or Fund share redemptions. Total returns reflect maximum applicable sales charges as indicated in the table below, if any, changes in share price, and reinvestment of dividend and capital gain
distributions. The graph assumes the initial investment amount shown below and reflects the deduction of all sales charges that would have applied for the period of investment. Performance figures may reflect certain fee waivers and/or expense
limitations, without which total returns may have been lower. For more information on share classes and current fee waivers and/or expense limitations (if any), please refer to the Notes to Financial Statements.
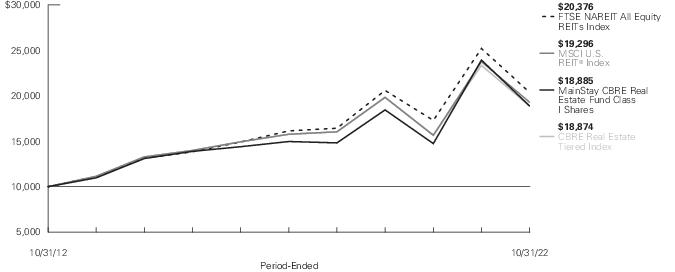
| Average
Annual Total Returns for the Period-Ended October 31, 2022 |
| Class
|
Sales
Charge |
|
Inception
Date1 |
Six
Months2 |
One
Year |
Five
Years |
Ten
Years
or Since
Inception |
Gross
Expense
Ratio3 |
| Class
A Shares4 |
Maximum
5.5% Initial Sales Charge |
With
sales charges |
12/20/2002
|
-23.83%
|
-25.70%
|
3.15%
|
5.62%
|
1.30%
|
| |
|
Excluding
sales charges |
|
-19.39
|
-21.38
|
4.38
|
6.25
|
1.30
|
| Investor
Class Shares5 |
Maximum
5% Initial Sales Charge |
With
sales charges |
2/24/2020
|
-23.46
|
-25.27
|
N/A
|
-3.40
|
1.26
|
| |
|
Excluding
sales charges |
|
-19.43
|
-21.34
|
N/A
|
-1.35
|
1.26
|
| Class
C Shares4 |
Maximum
1% CDSC |
With
sales charges |
1/17/2003
|
-20.45
|
-22.65
|
3.62
|
5.42
|
2.01
|
| |
If
Redeemed Within One Year of Purchase |
Excluding
sales charges |
|
-19.67
|
-21.89
|
3.62
|
5.42
|
2.01
|
| Class
I Shares4 |
No
Sales Charge |
|
12/31/1996
|
-19.26
|
-21.08
|
4.76
|
6.56
|
1.05
|
| Class
R3 Shares4 |
No
Sales Charge |
|
8/5/2011
|
-19.54
|
-21.57
|
4.13
|
5.99
|
1.65
|
| Class
R6 Shares4 |
No
Sales Charge |
|
7/3/2014
|
-19.22
|
-21.00
|
4.85
|
5.32
|
0.84
|
| 1.
|
Effective
at the close of business on February 21, 2020, the Fund changed its fiscal and tax year end from October 31 to April 30. |
| 2.
|
Not
annualized. |
| 3.
|
The gross
expense ratios presented reflect the Fund’s “Total Annual Fund Operating Expenses” from the most recent Prospectus, as supplemented, and may differ from other expense ratios disclosed in this report. |
| 4.
|
Performance figures
for Class A shares, Class C shares, Class I shares, Class R3 shares and Class R6 shares, reflect the historical performance of the then-existing Class A shares, Class C shares, Class I shares, Class R and Class R6 shares of the Voya Real Estate
Fund (the predecessor to the Fund, which was subject to a different fee structure) for periods prior to February 21, 2020. |
| 5.
|
Prior
to June 30, 2020, the maximum initial sales charge for Investor Class shares was 5.5%, which is reflected in the average annual total return figures shown. |
The footnotes on the next page are an integral part of the
table and graph and should be carefully read in conjunction with them.
| Benchmark
Performance* |
Six
Months1 |
One
Year |
Five
Years |
Ten
Years |
| FTSE
NAREIT All Equity REITs Index2 |
-18.37%
|
-19.16%
|
4.77%
|
7.38%
|
| CBRE
Real Estate Tiered Index3 |
-18.37
|
-19.16
|
3.66
|
6.56
|
| MSCI
U.S. REIT® Index4 |
-17.92
|
-18.78
|
4.12
|
6.79
|
| Morningstar
Real Estate Category Average5 |
-18.61
|
-20.97
|
3.60
|
6.06
|
| *
|
Returns
for indices reflect no deductions for fees, expenses or taxes, except for foreign withholding taxes where applicable. Results assume reinvestment of all dividends and capital gains. An investment cannot be made directly in an index.
|
| 1.
|
Not
annualized. |
| 2.
|
The Fund
has selected the FTSE NAREIT All Equity REITs Index as its primary benchmark. The FTSE NAREIT All Equity REITs Index is a free-float adjusted, market capitalization-weighted index of U.S. equity REITs. Constituents of the index include all
tax-qualified REITs with more than 50 percent of total assets in qualifying real estate assets other than mortgages secured by real property. |
| 3.
|
The Fund
has selected a tiered benchmark as its secondary benchmark. The returns for the tiered benchmark represent the returns of the MSCI U.S. REIT® Index prior to January 1, 2021
and the returns of the FTSE Nareit All Equity REITs Index thereafter. |
| 4.
|
The MSCI
U.S. REIT® Index is a free float-adjusted market capitalization weighted index that is comprised of equity REITs. The MSCI U.S. REIT® Index is based on the MSCI USA Investable Market Index, its parent index, which captures the large, mid and small cap segments of the U.S. market. |
| 5.
|
The
Morningstar Real Estate Category Average is representative of funds that invest primarily in real estate investment trusts of various types. REITs are companies that develop and manage real estate properties. There are several different types of
REITs, including apartment, factory-outlet, healthcare, hotel, industrial, mortgage, office, and shopping center REITs. Some portfolios in this category also invest in real estate operating companies. Results are based on average total returns of
similar funds with all dividends and capital gain distributions reinvested. |
The footnotes on the preceding page are an integral part of the
table and graph and should be carefully read in conjunction with them.
| 6
|
MainStay CBRE Real Estate
Fund |
Cost in Dollars of
a $1,000 Investment in MainStay CBRE Real Estate Fund (Unaudited)
The example below is intended to describe the fees and expenses
borne by shareholders during the six-month period from May 1, 2022 to October 31, 2022, and the impact of those costs on your investment.
Example
As a shareholder of the Fund you incur two types of costs: (1)
transaction costs, including exchange fees and sales charges (loads) on purchases (as applicable), and (2) ongoing costs, including management fees, distribution and/or service (12b-1) fees and other Fund expenses (as applicable). This example is
intended to help you understand your ongoing costs (in dollars) of investing in the Fund and to compare these costs with the ongoing costs of investing in other mutual funds. The example is based on an investment of $1,000 made at the beginning of
the six-month period and held for the entire period from May 1, 2022 to October 31, 2022.
This example illustrates your Fund’s ongoing costs in two
ways:
Actual Expenses
The second and third data columns in the table below provide information about
actual account values and actual expenses. You may use the information in these columns, together with the amount you invested, to estimate the expenses that you paid during the six months ended October 31, 2022. Simply divide your account value by
$1,000 (for example, an
$8,600 account value divided by $1,000 = 8.6), then multiply the result by the
number under the heading entitled “Expenses Paid During Period” to estimate the expenses you paid on your account during this period.
Hypothetical Example for Comparison Purposes
The fourth and fifth data columns in the table below provide information about
hypothetical account values and hypothetical expenses based on the Fund’s actual expense ratio and an assumed rate of return of 5% per year before expenses, which is not the Fund’s actual return. The hypothetical account values and
expenses may not be used to estimate the actual ending account balances or expenses you paid for the six-month period shown. You may use this information to compare the ongoing costs of investing in the Fund with the ongoing costs of investing in
other mutual funds. To do so, compare this 5% hypothetical example with the 5% hypothetical examples that appear in the shareholder reports of the other mutual funds.
Please note that the expenses shown in the table are meant to
highlight your ongoing costs only and do not reflect any transactional costs, such as exchange fees or sales charges (loads). Therefore, the fourth and fifth data columns of the table are useful in comparing ongoing costs only and will not help you
determine the relative total costs of owning different funds. In addition, if these transactional costs were included, your costs would have been higher.
| Share
Class |
Beginning
Account
Value
5/1/22 |
Ending
Account
Value (Based
on Actual
Returns and
Expenses)
10/31/22 |
Expenses
Paid
During
Period1 |
Ending
Account
Value (Based
on Hypothetical
5% Annualized
Return and
Actual Expenses)
10/31/22 |
Expenses
Paid
During
Period1 |
Net
Expense
Ratio
During
Period2 |
| Class
A Shares |
$1,000.00
|
$806.10
|
$5.37
|
$1,019.26
|
$6.01
|
1.18%
|
| Investor
Class Shares |
$1,000.00
|
$805.70
|
$5.46
|
$1,019.16
|
$6.11
|
1.20%
|
| Class
C Shares |
$1,000.00
|
$803.30
|
$8.77
|
$1,015.48
|
$9.80
|
1.93%
|
| Class
I Shares |
$1,000.00
|
$807.40
|
$3.78
|
$1,021.02
|
$4.23
|
0.83%
|
| Class
R3 Shares |
$1,000.00
|
$804.60
|
$6.50
|
$1,018.00
|
$7.27
|
1.43%
|
| Class
R6 Shares |
$1,000.00
|
$807.80
|
$3.37
|
$1,021.47
|
$3.77
|
0.74%
|
| 1.
|
Expenses are
equal to the Fund’s annualized expense ratio of each class multiplied by the average account value over the period, divided by 365 and multiplied by 184 (to reflect the six-month period). The table above represents the actual expenses incurred
during the six-month period. In addition to the fees and expenses which the Fund bears directly, it also indirectly bears a pro rata share of the fees and expenses of the underlying funds in which it invests. Such indirect expenses are not included
in the above-reported expense figures. |
| 2.
|
Expenses
are equal to the Fund's annualized expense ratio to reflect the six-month period. |
Sector Composition as of October 31, 2022
(Unaudited)
| Residential
|
18.7%
|
| Net
Lease Properties |
12.5
|
| Industrial
Properties |
12.3
|
| Technology
Towers |
12.2
|
| Self
Storage Property |
11.6
|
| Technology
Datacenters |
10.1
|
| Healthcare
Facilities |
6.6
|
| Hotels
|
5.4
|
| Enclosed
Mall |
4.5%
|
| Community
Shopping Centers |
3.4
|
| Office
Buildings |
2.4
|
| Short–Term
Investments |
0.5
|
| Other
Assets, Less Liabilities |
–0.2
|
| |
100.0%
|
See Portfolio of Investments beginning on page 10
for specific holdings within these categories. The Fund's holdings are subject to change.
Top Ten Holdings and/or Issuers Held as of October 31, 2022 (excluding short-term investments) (Unaudited)
| 1.
|
Prologis,
Inc. |
| 2.
|
Equinix,
Inc. |
| 3.
|
Crown
Castle, Inc. |
| 4.
|
American
Tower Corp. |
| 5.
|
CubeSmart
|
| 6.
|
Simon
Property Group, Inc. |
| 7.
|
Alexandria
Real Estate Equities, Inc. |
| 8.
|
Sun
Communities, Inc. |
| 9.
|
Extra
Space Storage, Inc. |
| 10.
|
Invitation
Homes, Inc. |
| 8
|
MainStay CBRE Real Estate
Fund |
Portfolio
Management Discussion and Analysis (Unaudited)
Questions answered by portfolio managers Joseph P.
Smith, CFA, Jonathan Miniman, CFA, and Kenneth S. Weinberg, CFA, of CBRE Investment Management Listed Real Assets LLC.
How did MainStay CBRE Real Estate Fund perform relative to its
benchmarks and peer group during the six months ended October 31, 2022?
For the six months ended October 31, 2022, Class I shares of
MainStay CBRE Real Estate Fund returned −19.26%, underperforming the −18.37% return of the Fund’s primary benchmark, the FTSE Nareit All Equity REITs Index; the −18.37% return of the CBRE Real Estate Tiered Index, which is
the Fund’s secondary benchmark; and the −17.92% return of MSCI U.S. REIT® Index, which is an additional benchmark of the Fund. Over the same period, Class I
shares also underperformed the −18.61% return of the Morningstar Real Estate Category Average.1
What factors affected the Fund’s relative
performance during the reporting period?
During the
reporting period, the Fund underperformed the FTSE Nareit All Equity REITs Index primarily due to stock selection. Negative stock selection was partly balanced by positive contributions from sector allocation. (Contributions take weightings and
total returns into account.)
During the reporting
period, which sectors were the strongest positive contributors to the Fund’s relative performance and which sectors were particularly weak?
The strongest positive contributions to the Fund’s
relative performance from a sector allocation perspective came from self-storage properties, industrial properties and hotels. The weakest relative contributors to performance included net lease properties, data centers and residential
properties.
During the reporting period, which
individual stocks made the strongest positive contributions to the Fund’s absolute performance and which stocks detracted the most?
The strongest positive contributors to the Fund’s
absolute performance during the reporting period included holdings in STORE Capital (net lease), ExtraSpace Storage (self storage) and CubeSmart (storage). The Fund’s weakest-performing holdings included Hudson Pacific Properties (office and
commercial), Tricon Residential (residential) and Rexford Industrial Realty (industrial).
What were some of the Fund’s largest purchases and
sales during the reporting period?
The Fund’s
largest purchases during the reporting period included shares in data center REIT Digital Realty Trust ("Digital") and life sciences REIT Alexandria Real Estate Equities ("Alexandria"). In
our opinion, Digital offered an attractive combination of growth and value,
while Alexandria featured an accelerating revenue and profit outlook. The Fund’s largest sales during the same period included holdings in retail REIT Realty Income and diversified REIT Vici Properties. Both sales reflected the stocks’
rich valuation in the wake of strong relative performance.
How did the Fund’s sector weightings change during
the reporting period?
During the reporting period, the
Fund increased its exposure most substantially to the data center and industrial sectors; these are areas where we believe there are attractive relative valuations combined with accelerating earnings potential. During the same period, the Fund
reduced its exposure most substantially to the net lease and timber sectors due to prior outperformance, overvaluation and moderating earnings growth outlooks.
How was the Fund positioned at the end of the reporting
period?
As of October 31, 2022, the Fund held overweight
positions relative to the FTSE Nareit All Equity REITs Index in the self-storage, hotels and residential sectors. As of the same date, the Fund held relatively underweight positions in the health care, towers and office sectors.
| 1.
|
See page 5 for other share class
returns, which may be higher or lower than Class I share returns. See page 6 for more information on benchmark and peer group returns. |
The opinions expressed are those of the portfolio
managers as of the date of this report and are subject to change. There is no guarantee that any forecasts will come to pass. This material does not constitute investment advice and is not intended as an endorsement of any specific investment.
Portfolio of
Investments October 31, 2022† (Unaudited)
| |
Shares
|
Value
|
| Common
Stocks 99.7% |
| Community
Shopping Centers 3.4% |
| Kite
Realty Group Trust |
319,300
|
$ 6,271,052
|
| Retail
Opportunity Investments Corp. |
170,190
|
2,464,351 |
| Urban
Edge Properties |
184,257
|
2,601,709
|
| |
|
11,337,112
|
| Enclosed
Mall 4.5% |
| Simon
Property Group, Inc. |
137,000
|
14,930,260
|
| Healthcare
Facilities 6.6% |
| Alexandria
Real Estate Equities, Inc. |
99,711
|
14,488,008 |
| Ventas,
Inc. |
196,431
|
7,686,345
|
| |
|
22,174,353
|
| Hotels
5.4% |
| DiamondRock
Hospitality Co. |
440,655
|
4,115,718 |
| Park
Hotels & Resorts, Inc. |
397,025
|
5,193,087 |
| Pebblebrook
Hotel Trust |
77,182
|
1,237,999 |
| Sunstone
Hotel Investors, Inc. |
338,998
|
3,779,828 |
| Xenia
Hotels & Resorts, Inc. |
211,278
|
3,608,628
|
| |
|
17,935,260
|
| Industrial
Properties 12.3% |
| First
Industrial Realty Trust, Inc. |
108,900
|
5,186,907
|
| Prologis,
Inc. |
269,450
|
29,841,587
|
| Rexford
Industrial Realty, Inc. |
110,027
|
6,082,293
|
| |
|
41,110,787
|
| Net
Lease Properties 12.5% |
| Broadstone
Net Lease, Inc. |
260,973
|
4,473,077
|
| Four
Corners Property Trust, Inc. |
163,213
|
4,181,517
|
| Getty
Realty Corp. |
121,209
|
3,816,871
|
| Iron
Mountain, Inc. |
116,153
|
5,815,781
|
| NETSTREIT
Corp. (a) |
242,315
|
4,560,368
|
| Realty
Income Corp. |
62,582
|
3,896,981
|
| Spirit
Realty Capital, Inc. |
192,855
|
7,488,560
|
| STAG
Industrial, Inc. |
246,579
|
7,789,431
|
| |
|
42,022,586
|
| Office
Buildings 2.4% |
| Hudson
Pacific Properties, Inc. |
351,673
|
3,882,470
|
| Piedmont
Office Realty Trust, Inc., Class A |
386,689
|
4,040,900
|
| |
|
7,923,370
|
| Residential
18.7% |
| Apartment
Income REIT Corp. |
86,563
|
3,326,616
|
| AvalonBay
Communities, Inc. |
48,025
|
8,410,138
|
| Camden
Property Trust |
84,536
|
9,768,135
|
| Essex
Property Trust, Inc. |
31,951
|
7,100,790
|
| |
Shares
|
|
Value
|
| |
| Residential
(continued) |
| Independence
Realty Trust, Inc. |
230,716
|
|
$ 3,866,800
|
| Invitation
Homes, Inc. |
326,990
|
|
10,362,313 |
| NexPoint
Residential Trust, Inc. |
44,474
|
|
2,028,014 |
| Sun
Communities, Inc. |
99,763
|
|
13,453,041 |
| Tricon
Residential, Inc. |
535,236
|
|
4,512,040
|
| |
|
|
62,827,887
|
| Self
Storage Property 11.6% |
| CubeSmart
|
388,482
|
|
16,265,741 |
| Extra
Space Storage, Inc. |
71,345
|
|
12,659,457 |
| Life
Storage, Inc. |
91,162
|
|
10,083,429
|
| |
|
|
39,008,627
|
| Technology
Datacenters 10.1% |
| Digital
Realty Trust, Inc. |
100,089
|
|
10,033,922 |
| Equinix,
Inc. |
41,995
|
|
23,787,647
|
| |
|
|
33,821,569
|
| Technology
Towers 12.2% |
| American
Tower Corp. |
88,402
|
|
18,316,011
|
| Crown
Castle, Inc. |
169,393
|
|
22,573,311
|
| |
|
|
40,889,322
|
Total
Common Stocks
(Cost $341,262,912) |
|
|
333,981,133
|
| Short-Term
Investments 0.5% |
| Affiliated
Investment Company 0.4% |
| MainStay
U.S. Government Liquidity Fund, 2.905% (b) |
1,452,230
|
|
1,452,230
|
| Unaffiliated
Investment Company 0.1% |
| Invesco
Government & Agency Portfolio, 3.163% (b)(c) |
288,893
|
|
288,893
|
Total
Short-Term Investments
(Cost $1,741,123) |
|
|
1,741,123
|
Total
Investments
(Cost $343,004,035) |
100.2%
|
|
335,722,256
|
| Other
Assets, Less Liabilities |
(0.2)
|
|
(659,871)
|
| Net
Assets |
100.0%
|
|
$ 335,062,385
|
| †
|
Percentages
indicated are based on Fund net assets. |
| (a)
|
All or a
portion of this security was held on loan. As of October 31, 2022, the aggregate market value of securities on loan was $283,100. The Fund received cash collateral with a value of $288,893. (See Note 2(H)) |
| (b)
|
Current
yield as of October 31, 2022. |
The notes to the financial statements are an integral part of, and
should be read in conjunction with, the financial statements.
| 10
|
MainStay CBRE Real Estate
Fund |
| (c)
|
Represents
a security purchased with cash collateral received for securities on loan. |
Investments in Affiliates (in 000's)
Investments in issuers considered to be affiliate(s) of the
Fund during the six-month period ended October 31, 2022 for purposes of Section 2(a)(3) of the Investment Company Act of 1940, as amended, were as follows:
| Affiliated
Investment Companies |
Value,
Beginning
of Period |
Purchases
at Cost |
Proceeds
from
Sales |
Net
Realized
Gain/(Loss)
on Sales |
Change
in
Unrealized
Appreciation/
(Depreciation) |
Value,
End of
Period |
Dividend
Income |
Other
Distributions |
Shares
End of
Period |
| MainStay
U.S. Government Liquidity Fund |
$ 2,238
|
$ 43,202
|
$ (43,988)
|
$ —
|
$ —
|
$ 1,452
|
$ 14
|
$ —
|
1,452
|
| Abbreviation(s):
|
| REIT—Real
Estate Investment Trust |
The
following is a summary of the fair valuations according to the inputs used as of October 31, 2022, for valuing the Fund’s assets:
| Description
|
Quoted
Prices in
Active
Markets for
Identical
Assets
(Level 1) |
|
Significant
Other
Observable
Inputs
(Level 2) |
|
Significant
Unobservable
Inputs
(Level 3) |
|
Total
|
| Asset
Valuation Inputs |
|
|
|
|
|
|
|
| Investments
in Securities (a) |
|
|
|
|
|
|
|
| Common
Stocks |
$ 333,981,133
|
|
$ —
|
|
$ —
|
|
$ 333,981,133
|
| Short-Term
Investments |
|
|
|
|
|
|
|
| Affiliated
Investment Company |
1,452,230
|
|
—
|
|
—
|
|
1,452,230
|
| Unaffiliated
Investment Company |
288,893
|
|
—
|
|
—
|
|
288,893
|
| Total
Short-Term Investments |
1,741,123
|
|
—
|
|
—
|
|
1,741,123
|
| Total
Investments in Securities |
$ 335,722,256
|
|
$ —
|
|
$ —
|
|
$ 335,722,256
|
| (a)
|
For
a complete listing of investments and their industries, see the Portfolio of Investments. |
The notes to the financial statements are an integral part of,
and should be read in conjunction with, the financial statements.
11
Statement of
Assets and Liabilities as of October 31, 2022 (Unaudited)
| Assets
|
Investment
in unaffiliated securities, at value
(identified cost $341,551,805) including securities on loan of $283,100 |
$334,270,026
|
Investment
in affiliated investment companies, at value
(identified cost $1,452,230) |
1,452,230
|
| Cash
|
73
|
| Receivables:
|
|
| Investment
securities sold |
465,634
|
| Dividends
|
205,835
|
| Fund
shares sold |
156,465
|
| Other
assets |
37,909
|
| Total
assets |
336,588,172
|
| Liabilities
|
| Cash
collateral received for securities on loan |
288,893
|
| Payables:
|
|
| Investment
securities purchased |
393,093
|
| Fund
shares redeemed |
364,682
|
| Manager
(See Note 3) |
136,478
|
| Transfer
agent (See Note 3) |
100,758
|
| Shareholder
communication |
89,597
|
| Professional
fees |
73,810
|
| NYLIFE
Distributors (See Note 3) |
34,442
|
| Custodian
|
6,258
|
| Trustees
|
216
|
| Accrued
expenses |
37,560
|
| Total
liabilities |
1,525,787
|
| Net
assets |
$335,062,385
|
| Composition
of Net Assets |
| Shares
of beneficial interest outstanding (par value of $.001 per share) unlimited number of shares authorized |
$
29,131 |
| Additional
paid-in-capital |
259,873,108
|
| |
259,902,239
|
| Total
distributable earnings (loss) |
75,160,146
|
| Net
assets |
$335,062,385
|
| Class
A |
|
| Net
assets applicable to outstanding shares |
$145,421,868
|
| Shares
of beneficial interest outstanding |
13,872,229
|
| Net
asset value per share outstanding |
$
10.48 |
| Maximum
sales charge (5.50% of offering price) |
0.61
|
| Maximum
offering price per share outstanding |
$
11.09 |
| Investor
Class |
|
| Net
assets applicable to outstanding shares |
$
175,703 |
| Shares
of beneficial interest outstanding |
16,778
|
| Net
asset value per share outstanding |
$
10.47 |
| Maximum
sales charge (5.00% of offering price) |
0.55
|
| Maximum
offering price per share outstanding |
$
11.02 |
| Class
C |
|
| Net
assets applicable to outstanding shares |
$
4,645,637 |
| Shares
of beneficial interest outstanding |
392,495
|
| Net
asset value and offering price per share outstanding |
$
11.84 |
| Class
I |
|
| Net
assets applicable to outstanding shares |
$166,062,255
|
| Shares
of beneficial interest outstanding |
13,316,867
|
| Net
asset value and offering price per share outstanding |
$
12.47 |
| Class
R3 |
|
| Net
assets applicable to outstanding shares |
$
1,767,408 |
| Shares
of beneficial interest outstanding |
170,198
|
| Net
asset value and offering price per share outstanding |
$
10.38 |
| Class
R6 |
|
| Net
assets applicable to outstanding shares |
$
16,989,514 |
| Shares
of beneficial interest outstanding |
1,362,260
|
| Net
asset value and offering price per share outstanding |
$
12.47 |
The notes to the financial statements are an
integral part of, and should be read in conjunction with, the financial statements.
| 12
|
MainStay CBRE Real Estate
Fund |
Statement of
Operations for the six months ended October 31, 2022 (Unaudited)
| Investment
Income (Loss) |
| Income
|
|
| Dividends-unaffiliated
(net of foreign tax withholding of $8,555) |
$
7,432,237 |
| Dividends-affiliated
|
14,262
|
| Securities
lending, net |
1,586
|
| Total
income |
7,448,085
|
| Expenses
|
|
| Manager
(See Note 3) |
1,488,321
|
| Transfer
agent (See Note 3) |
461,244
|
| Distribution/Service—Class
A (See Note 3) |
206,272
|
| Distribution/Service—Investor
Class (See Note 3) |
242
|
| Distribution/Service—Class
C (See Note 3) |
29,816
|
| Distribution/Service—Class
R3 (See Note 3) |
5,499
|
| Registration
|
48,976
|
| Shareholder
communication |
47,235
|
| Professional
fees |
28,472
|
| Custodian
|
9,484
|
| Trustees
|
4,761
|
| Shareholder
service (See Note 3) |
1,100
|
| Miscellaneous
|
13,851
|
| Total
expenses before waiver/reimbursement |
2,345,273
|
| Expense
waiver/reimbursement from Manager (See Note 3) |
(378,302)
|
| Net
expenses |
1,966,971
|
| Net
investment income (loss) |
5,481,114
|
| Realized
and Unrealized Gain (Loss) |
| Net
realized gain (loss) on: |
|
| Unaffiliated
investment transactions |
(8,636,786)
|
| Foreign
currency transactions |
(1,976)
|
| Net
realized gain (loss) |
(8,638,762)
|
| Net
change in unrealized appreciation (depreciation) on: |
|
| Unaffiliated
investments |
(84,645,487)
|
| Translation
of other assets and liabilities in foreign currencies |
(13,626)
|
| Net
change in unrealized appreciation (depreciation) |
(84,659,113)
|
| Net
realized and unrealized gain (loss) |
(93,297,875)
|
| Net
increase (decrease) in net assets resulting from operations |
$(87,816,761)
|
The notes to the financial statements are an integral part of,
and should be read in conjunction with, the financial statements.
13
Statements of
Changes in Net Assets
for the six months ended October 31, 2022 (Unaudited) and the year ended April 30, 2022
| |
Six months
ended
October 31,
2022 |
Year
ended
April 30,
2022 |
| Increase
(Decrease) in Net Assets |
| Operations:
|
|
|
| Net
investment income (loss) |
$
5,481,114 |
$
5,229,744 |
| Net
realized gain (loss) |
(8,638,762)
|
111,598,258
|
| Net
change in unrealized appreciation (depreciation) |
(84,659,113)
|
(62,634,172)
|
| Net
increase (decrease) in net assets resulting from operations |
(87,816,761)
|
54,193,830
|
| Distributions
to shareholders: |
|
|
| Class
A |
(4,429,069)
|
(5,974,725)
|
| Investor
Class |
(5,335)
|
(6,177)
|
| Class
C |
(117,542)
|
(157,619)
|
| Class
I |
(4,958,293)
|
(6,879,898)
|
| Class
R3 |
(57,072)
|
(77,566)
|
| Class
R6 |
(475,521)
|
(612,169)
|
| Total
distributions to shareholders |
(10,042,832)
|
(13,708,154)
|
| Capital
share transactions: |
|
|
| Net
proceeds from sales of shares |
25,306,137
|
107,349,432
|
| Net
asset value of shares issued to shareholders in reinvestment of distributions |
9,436,394
|
12,708,131
|
| Cost
of shares redeemed |
(69,157,348)
|
(101,363,518)
|
| Increase
(decrease) in net assets derived from capital share transactions |
(34,414,817)
|
18,694,045
|
| Net
increase (decrease) in net assets |
(132,274,410)
|
59,179,721
|
| Net
Assets |
| Beginning
of period |
467,336,795
|
408,157,074
|
| End
of period |
$
335,062,385 |
$
467,336,795 |
The notes to the financial statements are an integral part of,
and should be read in conjunction with, the financial statements.
| 14
|
MainStay CBRE Real Estate
Fund |
Financial
Highlights selected per share data and ratios
| |
Six
months ended
October 31,
2022* |
|
Year
Ended April 30, |
|
June
1,
2019
through
April 30,
2020# |
|
Year
Ended May 31, |
| Class
A |
2022
|
|
2021
|
|
2019
|
|
2018
|
|
2017
|
| Net
asset value at beginning of period |
$
13.38 |
|
$
12.20 |
|
$
8.97 |
|
$
12.32 |
|
$
14.43 |
|
$
17.81 |
|
$
19.40 |
| Net
investment income (loss) (a) |
0.15
|
|
0.13
|
|
0.16
|
|
0.18
|
|
0.21
|
|
0.28
|
|
0.19
|
| Net
realized and unrealized gain (loss) |
(2.73)
|
|
1.47
|
|
3.59
|
|
(1.52)
|
|
1.29
|
|
(0.07)
|
|
(0.26)
|
| Total
from investment operations |
(2.58)
|
|
1.60
|
|
3.75
|
|
(1.34)
|
|
1.50
|
|
0.21
|
|
(0.07)
|
| Less
distributions: |
|
|
|
|
|
|
|
|
|
|
|
|
|
| From
net investment income |
(0.32)
|
|
(0.24)
|
|
(0.20)
|
|
(0.26)
|
|
(0.21)
|
|
(0.28)
|
|
(0.27)
|
| From
net realized gain on investments |
—
|
|
(0.18)
|
|
—
|
|
(1.32)
|
|
(3.40)
|
|
(3.31)
|
|
(1.25)
|
| Return
of capital |
—
|
|
—
|
|
(0.32)
|
|
(0.43)
|
|
—
|
|
—
|
|
—
|
| Total
distributions |
(0.32)
|
|
(0.42)
|
|
(0.52)
|
|
(2.01)
|
|
(3.61)
|
|
(3.59)
|
|
(1.52)
|
| Net
asset value at end of period |
$
10.48 |
|
$
13.38 |
|
$
12.20 |
|
$
8.97 |
|
$
12.32 |
|
$
14.43 |
|
$
17.81 |
| Total
investment return (b) |
(19.39)%
|
|
13.06%
|
|
42.72%
|
|
(13.80)%
|
|
12.73%
|
|
0.23%
|
|
(0.36)%
|
| Ratios
(to average net assets)/Supplemental Data: |
|
|
|
|
|
|
|
|
|
|
|
|
|
| Net
investment income (loss) |
2.57%††
|
|
0.96%
|
|
1.64%
|
|
1.69%††
|
|
1.58%
|
|
1.69%
|
|
1.02%
|
| Net
expenses |
1.18%††(c)
|
|
1.18%(c)
|
|
1.18%(c)
|
|
1.17%†† (c)(d)
|
|
1.24%
|
|
1.29%
|
|
1.27%
|
| Expenses
(before waiver/reimbursement) |
1.32%††(c)
|
|
1.30%(c)
|
|
1.45%(c)
|
|
1.36%†† (c)(d)
|
|
1.31%
|
|
1.31%
|
|
1.27%
|
| Portfolio
turnover rate |
31%
|
|
70%
|
|
93%
|
|
88%
|
|
82%
|
|
102%
|
|
53%
|
| Net
assets at end of period (in 000's) |
$
145,422 |
|
$
193,441 |
|
$
177,328 |
|
$
149,970 |
|
$
89,037 |
|
$
81,475 |
|
$
136,095 |
| *
|
Unaudited.
|
| #
|
The Fund
changed its fiscal year end from May 31 to April 30. |
| ††
|
Annualized.
|
| (a)
|
Per share
data based on average shares outstanding during the period. |
| (b)
|
Total
investment return is calculated exclusive of sales charges and assumes the reinvestment of dividends and distributions. For periods of less than one year, total return is not annualized. |
| (c)
|
In addition
to the fees and expenses which the Fund bears directly, it also indirectly bears a pro-rata share of the fees and expenses of the underlying funds in which it invests. Such indirect expenses are not included in the above expense ratios. |
| (d)
|
Net
of interest expense of less than 0.01%. |
The
notes to the financial statements are an integral part of, and should be read in conjunction with, the financial statements.
15
Financial
Highlights selected per share data and ratios
| |
Six
months ended
October 31,
2022* |
|
Year
Ended April 30, |
|
February
24, 2020^ through
April 30,
2020 |
| Investor
Class |
2022
|
|
2021
|
|
| Net
asset value at beginning of period |
$
13.39 |
|
$
12.19 |
|
$
8.97 |
|
$
12.17 |
| Net
investment income (loss) (a) |
0.15
|
|
0.13
|
|
0.15
|
|
(0.04)
|
| Net
realized and unrealized gain (loss) |
(2.74)
|
|
1.48
|
|
3.58
|
|
(3.10)
|
| Total
from investment operations |
(2.59)
|
|
1.61
|
|
3.73
|
|
(3.14)
|
| Less
distributions: |
|
|
|
|
|
|
|
| From
net investment income |
(0.33)
|
|
(0.23)
|
|
(0.20)
|
|
(0.06)
|
| From
net realized gain on investments |
—
|
|
(0.18)
|
|
—
|
|
—
|
| Return
of capital |
—
|
|
—
|
|
(0.31)
|
|
—
|
| Total
distributions |
(0.33)
|
|
(0.41)
|
|
(0.51)
|
|
(0.06)
|
| Net
asset value at end of period |
$
10.47 |
|
$
13.39 |
|
$
12.19 |
|
$
8.97 |
| Total
investment return (b) |
(19.43)%
|
|
13.15%
|
|
42.41%
|
|
(25.74)%
|
| Ratios
(to average net assets)/Supplemental Data: |
|
|
|
|
|
|
|
| Net
investment income (loss) |
2.57%††
|
|
0.98%
|
|
1.53%
|
|
(2.55)%††
|
| Net
expenses (c) |
1.20%††
|
|
1.15%
|
|
1.26%
|
|
1.35%††
|
| Expenses
(before waiver/reimbursement) (c) |
1.29%††
|
|
1.26%
|
|
1.34%
|
|
1.56%††
|
| Portfolio
turnover rate |
31%
|
|
70%
|
|
93%
|
|
88%
|
| Net
assets at end of period (in 000's) |
$
176 |
|
$
227 |
|
$
157 |
|
$
103 |
| *
|
Unaudited.
|
| ^
|
Inception
date. |
| ††
|
Annualized.
|
| (a)
|
Per share
data based on average shares outstanding during the period. |
| (b)
|
Total
investment return is calculated exclusive of sales charges and assumes the reinvestment of dividends and distributions. For periods of less than one year, total return is not annualized. |
| (c)
|
In
addition to the fees and expenses which the Fund bears directly, it also indirectly bears a pro-rata share of the fees and expenses of the underlying funds in which it invests. Such indirect expenses are not included in the above expense ratios.
|
The
notes to the financial statements are an integral part of, and should be read in conjunction with, the financial statements.
| 16
|
MainStay CBRE Real Estate
Fund |
Financial
Highlights selected per share data and ratios
| |
Six
months ended
October 31,
2022* |
|
Year
Ended April 30, |
|
June
1,
2019
through
April 30,
2020# |
|
Year
Ended May 31, |
| Class
C |
2022
|
|
2021
|
|
2019
|
|
2018
|
|
2017
|
| Net
asset value at beginning of period |
$
15.05 |
|
$
13.66 |
|
$
9.96 |
|
$
13.47 |
|
$
15.44 |
|
$
18.80 |
|
$
20.38 |
| Net
investment income (loss) |
0.12(a)
|
|
0.03(a)
|
|
0.07(a)
|
|
0.11(a)
|
|
0.11
|
|
0.16(a)
|
|
0.05(a)
|
| Net
realized and unrealized gain (loss) |
(3.07)
|
|
1.66
|
|
4.02
|
|
(1.71)
|
|
1.42
|
|
(0.08)
|
|
(0.28)
|
| Total
from investment operations |
(2.95)
|
|
1.69
|
|
4.09
|
|
(1.60)
|
|
1.53
|
|
0.08
|
|
(0.23)
|
| Less
distributions: |
|
|
|
|
|
|
|
|
|
|
|
|
|
| From
net investment income |
(0.26)
|
|
(0.12)
|
|
(0.15)
|
|
(0.18)
|
|
(0.10)
|
|
(0.13)
|
|
(0.10)
|
| From
net realized gain on investments |
—
|
|
(0.18)
|
|
—
|
|
(1.32)
|
|
(3.40)
|
|
(3.31)
|
|
(1.25)
|
| Return
of capital |
—
|
|
—
|
|
(0.24)
|
|
(0.41)
|
|
—
|
|
—
|
|
—
|
| Total
distributions |
(0.26)
|
|
(0.30)
|
|
(0.39)
|
|
(1.91)
|
|
(3.50)
|
|
(3.44)
|
|
(1.35)
|
| Net
asset value at end of period |
$
11.84 |
|
$
15.05 |
|
$
13.66 |
|
$
9.96 |
|
$
13.47 |
|
$
15.44 |
|
$
18.80 |
| Total
investment return (b) |
(19.67)%
|
|
12.27%
|
|
41.65%
|
|
(14.44)%
|
|
11.90%
|
|
(0.50)%
|
|
(1.10)%
|
| Ratios
(to average net assets)/Supplemental Data: |
|
|
|
|
|
|
|
|
|
|
|
|
|
| Net
investment income (loss) |
1.83%††
|
|
0.22%
|
|
0.66%
|
|
1.00%††
|
|
0.85%
|
|
0.90%
|
|
0.27%
|
| Net
expenses |
1.93%††(c)
|
|
1.91%(c)
|
|
1.93%(c)
|
|
1.92%†† (c)(d)
|
|
1.99%
|
|
2.04%
|
|
2.02%
|
| Expenses
(before waiver/reimbursement) |
2.04%††(c)
|
|
2.01%(c)
|
|
2.09%(c)
|
|
2.13%†† (c)(d)
|
|
2.06%
|
|
2.06%
|
|
2.02%
|
| Portfolio
turnover rate |
31%
|
|
70%
|
|
93%
|
|
88%
|
|
82%
|
|
102%
|
|
53%
|
| Net
assets at end of period (in 000's) |
$
4,646 |
|
$
7,220 |
|
$
10,202 |
|
$
20,942 |
|
$
11,216 |
|
$
13,449 |
|
$
22,084 |
| *
|
Unaudited.
|
| #
|
The Fund
changed its fiscal year end from May 31 to April 30. |
| ††
|
Annualized.
|
| (a)
|
Per share
data based on average shares outstanding during the period. |
| (b)
|
Total
investment return is calculated exclusive of sales charges and assumes the reinvestment of dividends and distributions. For periods of less than one year, total return is not annualized. |
| (c)
|
In addition
to the fees and expenses which the Fund bears directly, it also indirectly bears a pro-rata share of the fees and expenses of the underlying funds in which it invests. Such indirect expenses are not included in the above expense ratios. |
| (d)
|
Net
of interest expense of less than 0.01%. |
The
notes to the financial statements are an integral part of, and should be read in conjunction with, the financial statements.
17
Financial
Highlights selected per share data and ratios
| |
Six
months ended
October 31,
2022* |
|
Year
Ended April 30, |
|
June
1,
2019
through
April 30,
2020# |
|
Year
Ended May 31, |
| Class
I |
2022
|
|
2021
|
|
2019
|
|
2018
|
|
2017
|
| Net
asset value at beginning of period |
$
15.85 |
|
$
14.37 |
|
$
10.49 |
|
$
14.08 |
|
$
15.99 |
|
$
19.36 |
|
$
20.95 |
| Net
investment income (loss) (a) |
0.20
|
|
0.21
|
|
0.22
|
|
0.24
|
|
0.30
|
|
0.37
|
|
0.28
|
| Net
realized and unrealized gain (loss) |
(3.24)
|
|
1.74
|
|
4.22
|
|
(1.79)
|
|
1.45
|
|
(0.09)
|
|
(0.28)
|
| Total
from investment operations |
(3.04)
|
|
1.95
|
|
4.44
|
|
(1.55)
|
|
1.75
|
|
0.28
|
|
—
|
| Less
distributions: |
|
|
|
|
|
|
|
|
|
|
|
|
|
| From
net investment income |
(0.34)
|
|
(0.29)
|
|
(0.22)
|
|
(0.28)
|
|
(0.26)
|
|
(0.34)
|
|
(0.34)
|
| From
net realized gain on investments |
—
|
|
(0.18)
|
|
—
|
|
(1.32)
|
|
(3.40)
|
|
(3.31)
|
|
(1.25)
|
| Return
of capital |
—
|
|
—
|
|
(0.34)
|
|
(0.44)
|
|
—
|
|
—
|
|
—
|
| Total
distributions |
(0.34)
|
|
(0.47)
|
|
(0.56)
|
|
(2.04)
|
|
(3.66)
|
|
(3.65)
|
|
(1.59)
|
| Net
asset value at end of period |
$
12.47 |
|
$
15.85 |
|
$
14.37 |
|
$
10.49 |
|
$
14.08 |
|
$
15.99 |
|
$
19.36 |
| Total
investment return (b) |
(19.26)%
|
|
13.51%
|
|
43.19%
|
|
(13.54)%
|
|
13.08%
|
|
0.63%
|
|
0.04%
|
| Ratios
(to average net assets)/Supplemental Data: |
|
|
|
|
|
|
|
|
|
|
|
|
|
| Net
investment income (loss) |
2.92%††
|
|
1.32%
|
|
1.92%
|
|
2.01%††
|
|
1.95%
|
|
2.02%
|
|
1.37%
|
| Net
expenses |
0.83%††(c)
|
|
0.83%(c)
|
|
0.83%(c)
|
|
0.84%†† (c)(d)
|
|
0.91%
|
|
0.91%
|
|
0.90%
|
| Expenses
(before waiver/reimbursement) |
1.07%††(c)
|
|
1.05%(c)
|
|
1.20%(c)
|
|
1.04%†† (c)(d)
|
|
0.97%
|
|
0.92%
|
|
0.90%
|
| Portfolio
turnover rate |
31%
|
|
70%
|
|
93%
|
|
88%
|
|
82%
|
|
102%
|
|
53%
|
| Net
assets at end of period (in 000's) |
$
166,062 |
|
$
241,719 |
|
$
202,597 |
|
$
232,730 |
|
$
166,056 |
|
$
311,814 |
|
$
723,538 |
| *
|
Unaudited.
|
| #
|
The Fund
changed its fiscal year end from May 31 to April 30. |
| ††
|
Annualized.
|
| (a)
|
Per share
data based on average shares outstanding during the period. |
| (b)
|
Total
investment return is calculated exclusive of sales charges and assumes the reinvestment of dividends and distributions. Class I shares are not subject to sales charges. For periods of less than one year, total return is not annualized. |
| (c)
|
In addition
to the fees and expenses which the Fund bears directly, it also indirectly bears a pro-rata share of the fees and expenses of the underlying funds in which it invests. Such indirect expenses are not included in the above expense ratios. |
| (d)
|
Net
of interest expense of less than 0.01%. |
The
notes to the financial statements are an integral part of, and should be read in conjunction with, the financial statements.
| 18
|
MainStay CBRE Real Estate
Fund |
Financial
Highlights selected per share data and ratios
| |
Six
months ended
October 31,
2022* |
|
Year
Ended April 30, |
|
June
1,
2019
through
April 30,
2020# |
|
Year
Ended May 31, |
| Class
R3 |
2022
|
|
2021
|
|
2019
|
|
2018
|
|
2017
|
| Net
asset value at beginning of period |
$
13.26 |
|
$
12.09 |
|
$
8.89 |
|
$
12.23 |
|
$
14.35 |
|
$
17.73 |
|
$
19.33 |
| Net
investment income (loss) |
0.14(a)
|
|
0.10(a)
|
|
0.11(a)
|
|
0.15(a)
|
|
0.18
|
|
0.23(a)
|
|
0.15
|
| Net
realized and unrealized gain (loss) |
(2.72)
|
|
1.46
|
|
3.59
|
|
(1.51)
|
|
1.28
|
|
(0.06)
|
|
(0.27)
|
| Total
from investment operations |
(2.58)
|
|
1.56
|
|
3.70
|
|
(1.36)
|
|
1.46
|
|
0.17
|
|
(0.12)
|
| Less
distributions: |
|
|
|
|
|
|
|
|
|
|
|
|
|
| From
net investment income |
(0.30)
|
|
(0.21)
|
|
(0.19)
|
|
(0.23)
|
|
(0.18)
|
|
(0.24)
|
|
(0.23)
|
| From
net realized gain on investments |
—
|
|
(0.18)
|
|
—
|
|
(1.32)
|
|
(3.40)
|
|
(3.31)
|
|
(1.25)
|
| Return
of capital |
—
|
|
—
|
|
(0.31)
|
|
(0.43)
|
|
—
|
|
—
|
|
—
|
| Total
distributions |
(0.30)
|
|
(0.39)
|
|
(0.50)
|
|
(1.98)
|
|
(3.58)
|
|
(3.55)
|
|
(1.48)
|
| Net
asset value at end of period |
$
10.38 |
|
$
13.26 |
|
$
12.09 |
|
$
8.89 |
|
$
12.23 |
|
$
14.35 |
|
$
17.73 |
| Total
investment return (b) |
(19.54)%
|
|
12.83%
|
|
42.47%
|
|
(14.04)%
|
|
12.43%
|
|
—%
|
|
(0.63)%
|
| Ratios
(to average net assets)/Supplemental Data: |
|
|
|
|
|
|
|
|
|
|
|
|
|
| Net
investment income (loss) |
2.34%††
|
|
0.72%
|
|
1.14%
|
|
1.42%††
|
|
1.36%
|
|
1.43%
|
|
0.77%
|
| Net
expenses |
1.43%††(c)
|
|
1.43%(c)
|
|
1.43%(c)
|
|
1.42%†† (c)(d)
|
|
1.49%
|
|
1.54%
|
|
1.52%
|
| Expenses
(before waiver/reimbursement) |
1.67%††(c)
|
|
1.65%(c)
|
|
1.80%(c)
|
|
1.61%†† (c)(d)
|
|
1.56%
|
|
1.56%
|
|
1.52%
|
| Portfolio
turnover rate |
31%
|
|
70%
|
|
93%
|
|
88%
|
|
82%
|
|
102%
|
|
53%
|
| Net
assets at end of period (in 000's) |
$
1,767 |
|
$
2,672 |
|
$
2,298 |
|
$
2,527 |
|
$
2,454 |
|
$
2,965 |
|
$
4,448 |
| *
|
Unaudited.
|
| #
|
The Fund
changed its fiscal year end from May 31 to April 30. |
| ††
|
Annualized.
|
| (a)
|
Per share
data based on average shares outstanding during the period. |
| (b)
|
Total
investment return is calculated exclusive of sales charges and assumes the reinvestment of dividends and distributions. Class R3 shares are not subject to sales charges. For periods of less than one year, total return is not annualized. |
| (c)
|
In addition
to the fees and expenses which the Fund bears directly, it also indirectly bears a pro-rata share of the fees and expenses of the underlying funds in which it invests. Such indirect expenses are not included in the above expense ratios. |
| (d)
|
Net
of interest expense of less than 0.01%. |
The
notes to the financial statements are an integral part of, and should be read in conjunction with, the financial statements.
19
Financial
Highlights selected per share data and ratios
| |
Six
months ended
October 31,
2022* |
|
Year
Ended April 30, |
|
June
1,
2019
through
April 30,
2020# |
|
Year
Ended May 31, |
| Class
R6 |
2022
|
|
2021
|
|
2019
|
|
2018
|
|
2017
|
| Net
asset value at beginning of period |
$
15.85 |
|
$
14.37 |
|
$
10.49 |
|
$
14.09 |
|
$
15.99 |
|
$
19.36 |
|
$
20.96 |
| Net
investment income (loss) |
0.21(a)
|
|
0.22(a)
|
|
0.09(a)
|
|
0.26(a)
|
|
0.32
|
|
0.37(a)
|
|
0.30(a)
|
| Net
realized and unrealized gain (loss) |
(3.24)
|
|
1.74
|
|
4.36
|
|
(1.80)
|
|
1.45
|
|
(0.08)
|
|
(0.30)
|
| Total
from investment operations |
(3.03)
|
|
1.96
|
|
4.45
|
|
(1.54)
|
|
1.77
|
|
0.29
|
|
0.00‡
|
| Less
distributions: |
|
|
|
|
|
|
|
|
|
|
|
|
|
| From
net investment income |
(0.35)
|
|
(0.30)
|
|
(0.22)
|
|
(0.30)
|
|
(0.27)
|
|
(0.35)
|
|
(0.35)
|
| From
net realized gain on investments |
—
|
|
(0.18)
|
|
—
|
|
(1.32)
|
|
(3.40)
|
|
(3.31)
|
|
(1.25)
|
| Return
of capital |
—
|
|
—
|
|
(0.35)
|
|
(0.44)
|
|
—
|
|
—
|
|
—
|
| Total
distributions |
(0.35)
|
|
(0.48)
|
|
(0.57)
|
|
(2.06)
|
|
(3.67)
|
|
(3.66)
|
|
(1.60)
|
| Net
asset value at end of period |
$
12.47 |
|
$
15.85 |
|
$
14.37 |
|
$
10.49 |
|
$
14.09 |
|
$
15.99 |
|
$
19.36 |
| Total
investment return (b) |
(19.22)%
|
|
13.61%
|
|
43.35%
|
|
(13.53)%
|
|
13.24%
|
|
0.69%
|
|
0.03%
|
| Ratios
(to average net assets)/Supplemental Data: |
|
|
|
|
|
|
|
|
|
|
|
|
|
| Net
investment income (loss) |
3.02%††
|
|
1.40%
|
|
0.80%
|
|
2.06%††
|
|
2.05%
|
|
2.12%
|
|
1.47%
|
| Net
expenses |
0.74%††(c)
|
|
0.74%(c)
|
|
0.74%(c)
|
|
0.76%†† (c)(d)
|
|
0.83%
|
|
0.86%
|
|
0.86%
|
| Expenses
(before waiver/reimbursement) |
0.83%††(c)
|
|
0.84%(c)
|
|
0.84%(c)
|
|
0.88%†† (c)(d)
|
|
0.89%
|
|
0.86%
|
|
0.86%
|
| Portfolio
turnover rate |
31%
|
|
70%
|
|
93%
|
|
88%
|
|
82%
|
|
102%
|
|
53%
|
| Net
assets at end of period (in 000's) |
$
16,990 |
|
$
22,058 |
|
$
15,574 |
|
$
56,250 |
|
$
79,327 |
|
$
79,646 |
|
$
42,574 |
| *
|
Unaudited.
|
| #
|
The Fund
changed its fiscal year end from May 31 to April 30. |
| ‡
|
Less than
one cent per share. |
| ††
|
Annualized.
|
| (a)
|
Per share
data based on average shares outstanding during the period. |
| (b)
|
Total
investment return is calculated exclusive of sales charges and assumes the reinvestment of dividends and distributions. Class R6 shares are not subject to sales charges. For periods of less than one year, total return is not annualized. |
| (c)
|
In addition
to the fees and expenses which the Fund bears directly, it also indirectly bears a pro-rata share of the fees and expenses of the underlying funds in which it invests. Such indirect expenses are not included in the above expense ratios. |
| (d)
|
Net
of interest expense of less than 0.01%. |
The notes to the financial statements are an integral part of, and should be
read in conjunction with, the financial statements.
| 20
|
MainStay CBRE Real Estate
Fund |
Notes to Financial
Statements (Unaudited)
Note 1-Organization and Business
MainStay Funds Trust (the “Trust”) was organized as
a Delaware statutory trust on April 28, 2009. The Trust is registered under the Investment Company Act of 1940, as amended (the “1940 Act”), as an open-end management investment company, and is comprised of thirty-three funds
(collectively referred to as the “Funds”). These financial statements and notes relate to the MainStay CBRE Real Estate Fund (the "Fund"), a “non-diversified” fund, as that term is defined in the 1940 Act, as interpreted or
modified by regulatory authorities having jurisdiction, from time to time.
The following table lists the Fund's share classes that have
been registered and commenced operations:
| Class
|
Commenced
Operations |
| Class
A |
December
20, 2002 |
| Investor
Class |
February
24, 2020 |
| Class
C |
January
17, 2003 |
| Class
I |
December
31, 1996 |
| Class
R3 |
August
5, 2011 |
| Class
R6 |
July
3, 2014 |
| SIMPLE
Class |
N/A*
|
| *
|
SIMPLE
Class shares were registered for sale effective as of August 31, 2020 but have not yet commenced operations. |
Class A and Investor Class shares are offered at net asset
value (“NAV”) per share plus an initial sales charge. No initial sales charge applies to investments of $1 million or more (and certain other qualified purchases) in Class A and Investor Class shares. A contingent deferred sales charge
(“CDSC”) of 1.00% may be imposed on certain redemptions of Class A and Investor Class shares made within 18 months of the date of purchase on shares that were purchased without an initial sales charge. Class C shares are offered at NAV
without an initial sales charge, although a 1.00% CDSC may be imposed on certain redemptions of such shares made within one year of the date of purchase of Class C shares. Class I, Class R3 and Class R6 shares are offered at NAV without a sales
charge. SIMPLE Class shares are expected to be offered at NAV without a sales charge if such shares are offered in the future. In addition, depending upon eligibility, Class C shares convert to either Class A or Investor Class shares at the end of
the calendar quarter eight years after the date they were purchased. Additionally, as disclosed in the Fund’s prospectus, Class A shares may convert automatically to Investor Class shares and Investor Class shares may convert automatically to
Class A shares. Under certain circumstances and as may be permitted by the Trust’s multiple class plan pursuant to Rule 18f-3 under the 1940 Act, specified share classes of the Fund may be converted to one or more other share classes of the
Fund as disclosed in the capital share transactions. See Note 9 for additional information. The six classes of shares have the same voting (except for issues that relate solely to one class), dividend, liquidation and other rights, and the same
terms and conditions, except that under distribution plans pursuant to Rule 12b-1 under the 1940 Act, Class C shares are subject to higher distribution and/or service fees than Class A,
Investor Class and Class R3 shares. Class I and Class R6 shares are not
subject to a distribution and/or service fee.
The Fund's
investment objective is to seek total return.
Note
2–Significant Accounting Policies
The Fund is an
investment company and accordingly follows the investment company accounting and reporting guidance of the Financial Accounting Standards Board (“FASB”) Accounting Standards Codification Topic 946
Financial Services—Investment Companies. The Fund prepares its financial statements in accordance with generally accepted accounting principles (“GAAP”) in the United States of America
and follows the significant accounting policies described below.
(A) Securities Valuation. Investments are usually valued as of the close of regular trading on the New York Stock Exchange (the "Exchange") (usually 4:00 p.m. Eastern time) on each day the Fund is open for business
("valuation date").
Effective September 8, 2022,
and pursuant to Rule 2a-5 under the 1940 Act, the Board of Trustees of the Trust (the "Board") designated New York Life Investment Management LLC (“New York Life Investments” or the "Manager") as its Valuation Designee (the "Valuation
Designee"). The Valuation Designee is responsible for performing fair valuations relating to all investments in the Fund’s portfolio for which market quotations are not readily available; periodically assessing and managing material valuation
risks; establishing and applying fair value methodologies; testing fair valuation methodologies; evaluating and overseeing pricing services; segregation of valuation and portfolio management functions; providing quarterly, annual and prompt
reporting to the Board, as appropriate; identifying potential conflicts of interest; and maintaining appropriate records. The Valuation Designee has established a valuation committee ("Valuation Committee") to assist in carrying out the Valuation
Designee’s responsibilities and establish prices of securities for which market quotations are not readily available. The Fund’s and the Valuation Designee's policies and procedures ("Valuation Procedures") govern the Valuation
Designee’s selection and application of methodologies for determining and calculating the fair value of Fund investments. The Valuation Designee may value Fund portfolio securities for which market quotations are not readily available and
other Fund assets utilizing inputs from pricing services and other third-party sources (together, “Pricing Sources”). The Valuation Committee meets (in person, via electronic mail or via teleconference) on an ad-hoc basis to determine
fair valuations and on a quarterly basis to review fair value events (excluding fair valuations from pricing services), including valuation risks and back-testing results, and preview reports to the Board.
The Valuation Committee establishes prices of securities for
which market quotations are not readily available based on such methodologies and measurements on a regular basis after considering information that is reasonably available and deemed relevant by the Valuation Committee. The Board shall oversee the
Valuation Designee and review fair valuation
Notes to Financial
Statements (Unaudited) (continued)
materials on a prompt, quarterly and annual basis and approve proposed
revisions to the Valuation Procedures.
Investments for
which market quotations are not readily available are valued at fair value as determined in good faith pursuant to the Valuation Procedures. A market quotation is readily available only when that quotation is a quoted price (unadjusted) in active
markets for identical investments that the Fund can access at the measurement date, provided that a quotation will not be readily available if it is not reliable. Fair value measurements are determined within a framework that establishes a
three-tier hierarchy that maximizes the use of observable market data and minimizes the use of unobservable inputs to establish a classification of fair value measurements for disclosure purposes. "Inputs" refer broadly to the assumptions that
market participants would use in pricing the asset or liability, including assumptions about risk, such as the risk inherent in a particular valuation technique used to measure fair value using a pricing model and/or the risk inherent in the inputs
for the valuation technique. Inputs may be observable or unobservable. Observable inputs reflect the assumptions market participants would use in pricing the asset or liability based on market data obtained from sources independent of the Fund.
Unobservable inputs reflect the Fund’s own assumptions about the assumptions market participants would use in pricing the asset or liability based on the information available. The inputs or methodology used for valuing assets or liabilities
may not be an indication of the risks associated with investing in those assets or liabilities. The three-tier hierarchy of inputs is summarized below.
| •
|
Level
1—quoted prices (unadjusted) in active markets for an identical asset or liability |
| •
|
Level
2—other significant observable inputs (including quoted prices for a similar asset or liability in active markets, interest rates and yield curves, prepayment speeds, credit risk, etc.) |
| •
|
Level
3—significant unobservable inputs (including the Fund's own assumptions about the assumptions that market participants would use in measuring fair value of an asset or liability) |
The level of an asset or liability within the fair value
hierarchy is based on the lowest level of an input, both individually and in the aggregate, that is significant to the fair value measurement. The aggregate value by input level of the Fund’s assets and liabilities as of October 31, 2022, is
included at the end of the Portfolio of Investments.
The
Fund may use third-party vendor evaluations, whose prices may be derived from one or more of the following standard inputs, among others:
| •
Broker/dealer quotes |
•
Benchmark securities |
| •
Two-sided markets |
•
Reference data (corporate actions or material event notices) |
| •
Bids/offers |
•
Monthly payment information |
| •
Industry and economic events |
•
Reported trades |
An asset or
liability for which a market quotation is not readily available is valued by methods deemed reasonable in good faith by the Valuation Committee, following the Valuation Procedures to represent fair value.
Under these procedures, the Valuation Designee generally uses a market-based
approach which may use related or comparable assets or liabilities, recent transactions, market multiples, book values and other relevant information. The Valuation Designee may also use an income-based valuation approach in which the anticipated
future cash flows of the asset or liability are discounted to calculate fair value. Discounts may also be applied due to the nature and/or duration of any restrictions on the disposition of the asset or liability. Fair value represents a good faith
approximation of the value of a security. Fair value determinations involve the consideration of a number of subjective factors, an analysis of applicable facts and circumstances and the exercise of judgment. As a result, it is possible that the
fair value for a security determined in good faith in accordance with the Valuation Procedures may differ from valuations for the same security determined for other funds using their own valuation procedures. Although the Valuation Procedures are
designed to value a security at the price the Fund may reasonably expect to receive upon the security's sale in an orderly transaction, there can be no assurance that any fair value determination thereunder would, in fact, approximate the amount
that the Fund would actually realize upon the sale of the security or the price at which the security would trade if a reliable market price were readily available. During the six-month period ended October 31, 2022, there were no material changes
to the fair value methodologies.
Securities which may be
valued in this manner include, but are not limited to: (i) a security for which trading has been halted or suspended or otherwise does not have a readily available market quotation on a given day; (ii) a debt security that has recently gone into
default and for which there is not a current market quotation; (iii) a security of an issuer that has entered into a restructuring; (iv) a security that has been delisted from a national exchange; (v) a security subject to trading collars for which
no or limited trading takes place; and (vi) a security whose principal market has been temporarily closed at a time when, under normal conditions, it would be open. Securities valued in this manner are generally categorized as Level 2 or 3 in the
hierarchy.
Equity securities are valued at the last
quoted sales prices as of the close of regular trading on the relevant exchange on each valuation date. Securities that are not traded on the valuation date are valued at the mean of the last quoted bid and ask prices. Prices are normally taken from
the principal market in which each security trades. These securities are generally categorized as Level 1 in the hierarchy.
Investments in mutual funds, including money market funds, are
valued at their respective NAVs at the close of business each day on the valuation date. These securities are generally categorized as Level 1 in the hierarchy.
Temporary cash investments acquired in excess of 60 days to
maturity at the time of purchase are valued using the latest bid prices or using valuations based on a matrix system (which considers such factors as security prices, yields, maturities and ratings), both as furnished by independent pricing
services. Temporary cash investments that mature in 60 days or less at the time of purchase ("Short-Term Investments") are
| 22
|
MainStay CBRE Real Estate
Fund |
valued using the amortized cost method of valuation, unless the use of such
method would be inappropriate. The amortized cost method involves valuing a security at its cost on the date of purchase and thereafter assuming a constant amortization to maturity of the difference between such cost and the value on maturity date.
Amortized cost approximates the current fair value of a security. Securities valued using the amortized cost method are not valued using quoted prices in an active market and are generally categorized as Level 2 in the hierarchy.
The information above is not intended to reflect an exhaustive
list of the methodologies that may be used to value portfolio investments. The Valuation Procedures permit the use of a variety of valuation methodologies in connection with valuing portfolio investments. The methodology used for a specific type of
investment may vary based on the market data available or other considerations. The methodologies summarized above may not represent the specific means by which portfolio investments are valued on any particular business day.
(B) Income Taxes. The Fund's policy is to comply with the requirements of the Internal Revenue Code of 1986, as amended (the “Internal Revenue Code”), applicable to regulated investment companies
and to distribute all of its taxable income to the shareholders of the Fund within the allowable time limits.
The Manager evaluates the Fund’s tax positions to
determine if the tax positions taken meet the minimum recognition threshold in connection with accounting for uncertainties in income tax positions taken or expected to be taken for the purposes of measuring and recognizing tax liabilities in the
financial statements. Recognition of tax benefits of an uncertain tax position is permitted only to the extent the position is “more likely than not” to be sustained assuming examination by taxing authorities. The Manager analyzed the
Fund's tax positions taken on federal, state and local income tax returns for all open tax years (for up to three tax years) and has concluded that no provisions for federal, state and local income tax are required in the Fund's financial
statements. The Fund's federal, state and local income tax and federal excise tax returns for tax years for which the applicable statutes of limitations have not expired are subject to examination by the Internal Revenue Service and state and local
departments of revenue.
(C) Dividends and
Distributions to Shareholders. Dividends and distributions are recorded on the ex-dividend date. The Fund intends to declare and pay dividends from net investment income, if any,
at least quarterly and distributions from net realized capital and currency gains, if any, at least annually. Unless a shareholder elects otherwise, all dividends and distributions are reinvested at NAV in the same class of shares of the Fund.
Dividends and distributions to shareholders are determined in accordance with federal income tax regulations and may differ from determinations using GAAP.
(D) Security Transactions and Investment Income. The Fund records security transactions on the trade date. Realized gains and losses on security transactions are determined using the identified cost method. Dividend income is recognized
on the ex-dividend date, net of any foreign
tax withheld at the source, and interest income is accrued as earned using the
effective interest rate method. Distributions received from real estate investment trusts may be classified as dividends, capital gains and/or return of capital.
Investment income and realized and unrealized gains and losses
on investments of the Fund are allocated pro rata to the separate classes of shares based upon their relative net assets on the date the income is earned or realized and unrealized gains and losses are incurred.
(E) Expenses. Expenses of the Trust are allocated to the individual Funds in proportion to the net assets of the respective Funds when the expenses are incurred, except where direct allocations of
expenses can be made. Expenses (other than transfer agent expenses and fees incurred under the shareholder services plans and/or the distribution plans further discussed in Note 3(B)) are allocated to separate classes of shares pro rata based upon
their relative net assets on the date the expenses are incurred. The expenses borne by the Fund, including those of related parties to the Fund, are shown in the Statement of Operations.
Additionally, the Fund may invest in mutual funds, which are
subject to management fees and other fees that may cause the costs of investing in mutual funds to be greater than the costs of owning the underlying securities directly. These indirect expenses of mutual funds are not included in the amounts shown
as expenses in the Statement of Operations or in the expense ratios included in the Financial Highlights.
(F) Use of Estimates. In preparing financial statements in conformity with GAAP, the Manager makes estimates and assumptions that affect the reported amounts and disclosures in the financial statements. Actual
results could differ from those estimates and assumptions.
(G) Foreign Currency Transactions. The Fund's books and records are maintained in U.S. dollars. Prices of securities denominated in foreign currency amounts are translated into U.S. dollars at the mean between the buying and
selling rates last quoted by any major U.S. bank at the following dates:
(i) market value of investment securities, other assets and
liabilities— at the valuation date; and
(ii)
purchases and sales of investment securities, income and expenses—at the date of such transactions.
The assets and liabilities that are denominated in foreign
currency amounts are presented at the exchange rates and market values at the close of the period. The realized and unrealized changes in net assets arising from fluctuations in exchange rates and market prices of securities are not separately
presented.
Net realized gain (loss) on foreign currency
transactions represents net currency gains or losses realized as a result of differences between the amounts of securities sale proceeds or purchase cost, dividends, interest and withholding taxes as recorded on the Fund's books, and the U.S. dollar
equivalent amount actually received or paid. Net currency gains or losses from valuing such foreign currency denominated assets and
Notes to Financial
Statements (Unaudited) (continued)
liabilities, other than investments at valuation date exchange rates, are
reflected in unrealized foreign exchange gains or losses.
(H) Securities Lending. In order to realize additional income, the Fund may engage in securities lending, subject to the limitations set forth in the 1940 Act and relevant guidance by the staff of the Securities
and Exchange Commission (“SEC”). If the Fund engages in securities lending, the Fund will lend through its custodian, JPMorgan Chase Bank, N.A., ("JPMorgan"), acting as securities lending agent on behalf of the Fund. Under the current
arrangement, JPMorgan will manage the Fund's collateral in accordance with the securities lending agency agreement between the Fund and JPMorgan, and indemnify the Fund against counterparty risk. The loans will be collateralized by cash (which may
be invested in a money market fund) and/or non-cash collateral (which may include U.S. Treasury securities and/or U.S. government agency securities issued or guaranteed by the United States government or its agencies or instrumentalities) at least
equal at all times to the market value of the securities loaned. The Fund bears the risk of delay in recovery of, or loss of rights in, the securities loaned. The Fund may also record a realized gain or loss on securities deemed sold due to a
borrower’s inability to return securities on loan. The Fund bears the risk of any loss on investment of cash collateral. The Fund will receive compensation for lending its securities in the form of fees or it will retain a portion of interest
earned on the investment of any cash collateral. The Fund will also continue to receive interest and dividends on the securities loaned and any gain or loss in the market price of the securities loaned that may occur during the term of the loan will
be for the account of the Fund. Income earned from securities lending activities, if any, is reflected in the Statement of Operations. Securities on loan as of October 31, 2022, are shown in the Portfolio of Investments.
(I) Real Estate Investments. The Fund’s investments in the real estate sector have many of the same risks as direct ownership of real estate, including the risk that the value of real estate could decline due to
a variety of factors that affect the real estate market generally. These risks include, among others, declines in the value of real estate, changes in local and general economic conditions, supply and demand, interest rates, changes in zoning laws,
overbuilding, extended vacancies of properties, regulatory limitations on rents, losses due to environmental liabilities, property taxes and operating expenses. The Fund’s investments in real estate companies are particularly sensitive to
economic downturns.
(J) Indemnifications.
Under the Trust’s organizational documents, its officers and trustees are indemnified against certain liabilities that may arise out of performance of their duties to the
Trust. Additionally, in the normal course of business, the Fund enters into contracts with third-party service providers that contain a variety of representations and warranties and that may provide general indemnifications. The Fund's maximum
exposure under these arrangements is unknown, as this would involve future claims that may be made against the Fund that have not yet occurred. The Manager believes that the risk of loss in connection with these potential indemnification obligations
is remote. However, there can
be no assurance that material liabilities related to such obligations will not
arise in the future, which could adversely impact the Fund.
Note 3–Fees and Related Party Transactions
(A) Manager and Subadvisor. New York Life Investments, a registered investment adviser and an indirect, wholly-owned subsidiary of New York Life Insurance Company ("New York Life"), serves as the Fund's Manager
pursuant to an Amended and Restated Management Agreement ("Management Agreement"). The Manager provides offices, conducts clerical, recordkeeping and bookkeeping services and keeps most of the financial and accounting records required to be
maintained by the Fund. Except for the portion of salaries and expenses that are the responsibility of the Fund, the Manager pays the salaries and expenses of all personnel affiliated with the Fund and certain operational expenses of the Fund.
During a portion of the six-month period ended October 31, 2022, the Fund reimbursed New York Life Investments in an amount equal to the portion of the compensation of the Chief Compliance Officer attributable to the Fund. CBRE Investment Management
Listed Real Assets LLC ("CBRE" or the "Subadvisor"), a registered investment adviser, serves as the Subadvisor to the Fund and is responsible for the day-to-day portfolio management of the Fund. Pursuant to the terms of a Subadvisory Agreement
("Subadvisory Agreement") between New York Life Investments and CBRE, New York Life Investments pays for the services of the Subadvisor.
Pursuant to the Management Agreement, the Fund pays the Manager
a monthly fee for the services performed and the facilities furnished at an annual rate of 0.75% of the Fund's average daily net assets.
New York Life Investments has contractually agreed to waive
fees and/or reimburse expenses so that Total Annual Fund Operating Expenses (excluding taxes, interest, litigation, extraordinary expenses, brokerage and other transaction expenses relating to the purchase or sale of portfolio investments and
acquired (underlying) fund fees and expenses) do not exceed the following percentages of average daily net assets: Class A, 1.18%; Investor Class, 1.35%; Class C, 1.93%; Class I, 0.83%; Class R3, 1.43% and Class R6, 0.74%. This agreement will remain
in effect until August 31, 2023, and shall renew automatically for one-year terms unless New York Life Investments provides written notice of termination prior to the start of the next term or upon approval of the Board.
During the six-month period ended October 31, 2022, New York
Life Investments earned fees from the Fund in the amount of $1,488,321 and waived fees and/or reimbursed expenses, including the waiver/reimbursement of certain class specific expenses in the amount of $378,302 and paid the Subadvisor fees in the
amount of $555,009.
JPMorgan provides sub-administration
and sub-accounting services to the Fund pursuant to an agreement with New York Life Investments. These services include calculating the daily NAVs of the Fund, maintaining the general ledger and sub-ledger accounts for the calculation of the Fund's
NAVs, and assisting New York Life Investments
| 24
|
MainStay CBRE Real Estate
Fund |
in conducting various aspects of the Fund's administrative operations. For
providing these services to the Fund, JPMorgan is compensated by New York Life Investments.
Pursuant to an agreement between the Trust and New York Life
Investments, New York Life Investments is responsible for providing or procuring certain regulatory reporting services for the Fund. The Fund will reimburse New York Life Investments for the actual costs incurred by New York Life Investments in
connection with providing or procuring these services for the Fund.
(B) Distribution and Service Fees. The Trust, on behalf of the Fund, has entered into a distribution agreement with NYLIFE Distributors LLC (the “Distributor”), an affiliate of New York Life Investments. The Fund
has adopted distribution plans (the “Plans”) in accordance with the provisions of Rule 12b-1 under the 1940 Act.
Pursuant to the Class A and Investor Class Plans, the
Distributor receives a monthly fee from the Class A and Investor Class shares at an annual rate of 0.25% of the average daily net assets of the Class A and Investor Class shares for distribution and/or service activities as designated by the
Distributor. Pursuant to the Class C Plan, Class C shares pay the Distributor a monthly distribution fee at an annual rate of 0.75% of the average daily net assets of the Class C shares along with a service fee at an annual rate of 0.25% of the
average daily net assets of the Class C shares, for a total 12b-1 fee of 1.00%. Pursuant to the Class R3 Plan, Class R3 shares pay the Distributor a monthly distribution fee at an annual rate of 0.25% of the average daily net assets of the Class R3
shares along with a service fee at an annual rate of 0.25% of the average daily net assets of the Class R3 shares, for a total 12b-1 fee of 0.50%. Class I and Class R6 shares are not subject to a distribution and/or service fee.
The Plans provide that the distribution and service fees are
payable to the Distributor regardless of the amounts actually expended by the Distributor for distribution of the Fund's shares and service activities.
In accordance with the Shareholder Services Plans for the Class
R3 shares, the Manager has agreed to provide, through its affiliates or independent third parties, various shareholder and administrative support services to shareholders of the Class R3 shares. For its services, the Manager, its affiliates or
independent third-party service providers are entitled to a shareholder service fee accrued daily and paid monthly at an annual rate of 0.10% of the average daily net assets of the Class R3 shares. This is in addition to any fees paid under the
Class R3 Plan.
During the six-month period ended October
31, 2022, shareholder service fees incurred by the Fund were as follows:
(C) Sales Charges. The Fund was advised by the Distributor that the amount of initial sales charges retained on sales of Class A and Investor Class shares during the six-month period ended October 31, 2022,
were $2,116 and $28, respectively.
The Fund was also advised that the Distributor retained CDSCs
on redemptions of Class A and Class C shares during the six-month period ended October 31, 2022, of $43 and $602, respectively.
(D) Transfer, Dividend Disbursing and Shareholder Servicing
Agent. NYLIM Service Company LLC, an affiliate of New York Life Investments, is the Fund's transfer, dividend disbursing and shareholder servicing agent pursuant to an agreement
between NYLIM Service Company LLC and the Trust. NYLIM Service Company LLC has entered into an agreement with DST Asset Manager Solutions, Inc. ("DST"), pursuant to which DST performs certain transfer agent services on behalf of NYLIM Service
Company LLC. New York Life Investments has contractually agreed to limit the transfer agency expenses charged to the Fund’s share classes to a maximum of 0.35% of that share class’s average daily net assets on an annual basis after
deducting any applicable Fund or class-level expense reimbursement or small account fees. This agreement will remain in effect until August 31, 2023, and shall renew automatically for one-year terms unless New York Life Investments provides written
notice of termination prior to the start of the next term or upon approval of the Board. During the six-month period ended October 31, 2022, transfer agent expenses incurred by the Fund and any reimbursements, pursuant to the aforementioned Transfer
Agency expense limitation agreement, were as follows:
| Class
|
Expense
|
Waived
|
| Class
A |
$202,361
|
$—
|
| Investor
Class |
203
|
—
|
| Class
C |
6,234
|
—
|
| Class
I |
249,384
|
—
|
| Class
R3 |
2,678
|
—
|
| Class
R6 |
384
|
—
|
(E) Small Account Fee. Shareholders with small accounts adversely impact the cost of providing transfer agency services. In an effort to reduce total transfer agency expenses, the Fund has implemented a small
account fee on certain types of accounts. As described in the Fund's prospectus, certain shareholders with an account balance of less than $1,000 ($5,000 for Class A share accounts) are charged an annual per account fee of $20 (assessed
semi-annually), the proceeds from which offset transfer agent fees as reflected in the Statement of Operations. This small account fee will not apply to certain types of accounts as described further in the Fund’s prospectus.
Notes to Financial
Statements (Unaudited) (continued)
Note 4-Federal Income Tax
As of October 31, 2022, the cost and unrealized appreciation
(depreciation) of the Fund’s investment portfolio, including applicable derivative contracts and other financial instruments, as determined on a federal income tax basis, were as follows:
| |
Federal
Tax
Cost |
Gross
Unrealized
Appreciation |
Gross
Unrealized
(Depreciation) |
Net
Unrealized
Appreciation/
(Depreciation) |
| Investments
in Securities |
$344,348,313
|
$38,844,425
|
$(47,470,482)
|
$(8,626,057)
|
During the year ended April 30,
2022, the tax character of distributions paid as reflected in the Statements of Changes in Net Assets was as follows:
| |
2022
|
| Distributions
paid from: |
|
| Ordinary
Income |
$
8,176,041 |
| Long-Term
Capital Gains |
5,532,113
|
| Total
|
$13,708,154
|
Note 5–Custodian
JPMorgan is the custodian of cash and securities held by the
Fund. Custodial fees are charged to the Fund based on the Fund's net assets and/or the market value of securities held by the Fund and the number of certain transactions incurred by the Fund.
Note 6–Line of Credit
The Fund and certain other funds managed by New York Life
Investments maintain a line of credit with a syndicate of banks in order to secure a source of funds for temporary purposes to meet unanticipated or excessive redemption requests.
Effective July 26, 2022, under the credit agreement (the
“Credit Agreement”), the aggregate commitment amount is $600,000,000 with an additional uncommitted amount of $100,000,000. The commitment fee is an annual rate of 0.15% of the average commitment amount payable quarterly, regardless of
usage, to JPMorgan, who serves as the agent to the syndicate. The commitment fee is allocated among the Fund and certain other funds managed by New York Life Investments based upon their respective net assets and other factors. Interest on any
revolving credit loan is charged based upon the Federal Funds Rate, Daily Simple Secured Overnight Financing Rate ("SOFR") + 0.10%, or the Overnight Bank Funding Rate, whichever is higher. The Credit Agreement expires on July 25, 2023, although the
Fund, certain other funds managed by New York Life Investments and the syndicate of banks may renew the Credit Agreement for an additional year on the same or different terms or enter into a credit agreement with a different syndicate of banks.
Prior to July 26, 2022, the aggregate commitment amount and the commitment fee were the same as those under the current Credit
Agreement. During the six-month period ended October 31, 2022, there were no
borrowings made or outstanding with respect to the Fund under the Credit Agreement.
Note 7–Interfund Lending Program
Pursuant to an exemptive order issued by the SEC, the Fund,
along with certain other funds managed by New York Life Investments, may participate in an interfund lending program. The interfund lending program provides an alternative credit facility that permits the Fund and certain other funds managed by New
York Life Investments to lend or borrow money for temporary purposes directly to or from one another, subject to the conditions of the exemptive order. During the six-month period ended October 31, 2022, there were no interfund loans made or
outstanding with respect to the Fund.
Note
8–Purchases and Sales of Securities (in 000’s)
During the six-month period ended October 31, 2022, purchases
and sales of securities, other than short-term securities, were $121,659 and $154,915, respectively.
Note 9–Capital Share Transactions
Transactions in capital shares for the six-month period ended
October 31, 2022 and the year ended April 30, 2022, were as follows:
| Class
A |
Shares
|
Amount
|
| Six-month
period ended October 31, 2022: |
|
|
| Shares
sold |
500,726
|
$
5,768,158 |
| Shares
issued to shareholders in reinvestment of distributions |
376,677
|
4,156,765
|
| Shares
redeemed |
(1,457,843)
|
(17,032,773)
|
| Net
increase (decrease) in shares outstanding before conversion |
(580,440)
|
(7,107,850)
|
| Shares
converted into Class A (See Note 1) |
818
|
9,362
|
| Shares
converted from Class A (See Note 1) |
(2,209)
|
(24,915)
|
| Net
increase (decrease) |
(581,831)
|
$
(7,123,403) |
| Year
ended April 30, 2022: |
|
|
| Shares
sold |
2,474,614
|
$
33,342,180 |
| Shares
issued to shareholders in reinvestment of distributions |
407,302
|
5,603,692
|
| Shares
redeemed |
(2,975,753)
|
(39,795,668)
|
| Net
increase (decrease) in shares outstanding before conversion |
(93,837)
|
(849,796)
|
| Shares
converted into Class A (See Note 1) |
11,379
|
146,928
|
| Shares
converted from Class A (See Note 1) |
(4,131)
|
(53,907)
|
| Net
increase (decrease) |
(86,589)
|
$
(756,775) |
| |
| 26
|
MainStay CBRE Real Estate
Fund |
| Investor
Class |
Shares
|
Amount
|
| Six-month
period ended October 31, 2022: |
|
|
| Shares
sold |
1,251
|
$
14,649 |
| Shares
issued to shareholders in reinvestment of distributions |
485
|
5,335
|
| Shares
redeemed |
(2,570)
|
(29,449)
|
| Net
increase (decrease) in shares outstanding before conversion |
(834)
|
(9,465)
|
| Shares
converted into Investor Class (See Note 1) |
619
|
7,429
|
| Net
increase (decrease) |
(215)
|
$
(2,036) |
| Year
ended April 30, 2022: |
|
|
| Shares
sold |
4,933
|
$
66,875 |
| Shares
issued to shareholders in reinvestment of distributions |
448
|
6,176
|
| Shares
redeemed |
(1,138)
|
(15,703)
|
| Net
increase (decrease) in shares outstanding before conversion |
4,243
|
57,348
|
| Shares
converted into Investor Class (See Note 1) |
973
|
12,962
|
| Shares
converted from Investor Class (See Note 1) |
(1,093)
|
(13,822)
|
| Net
increase (decrease) |
4,123
|
$
56,488 |
| |
| Class
C |
Shares
|
Amount
|
| Six-month
period ended October 31, 2022: |
|
|
| Shares
sold |
5,028
|
$
69,174 |
| Shares
issued to shareholders in reinvestment of distributions |
9,344
|
117,181
|
| Shares
redeemed |
(100,316)
|
(1,272,683)
|
| Net
increase (decrease) in shares outstanding before conversion |
(85,944)
|
(1,086,328)
|
| Shares
converted from Class C (See Note 1) |
(1,276)
|
(16,791)
|
| Net
increase (decrease) |
(87,220)
|
$
(1,103,119) |
| Year
ended April 30, 2022: |
|
|
| Shares
sold |
51,919
|
$
789,439 |
| Shares
issued to shareholders in reinvestment of distributions |
10,012
|
156,795
|
| Shares
redeemed |
(319,942)
|
(4,760,464)
|
| Net
increase (decrease) in shares outstanding before conversion |
(258,011)
|
(3,814,230)
|
| Shares
converted from Class C (See Note 1) |
(9,305)
|
(134,919)
|
| Net
increase (decrease) |
(267,316)
|
$
(3,949,149) |
| |
| Class
I |
Shares
|
Amount
|
| Six-month
period ended October 31, 2022: |
|
|
| Shares
sold |
1,234,591
|
$
17,270,539 |
| Shares
issued to shareholders in reinvestment of distributions |
358,844
|
4,710,901
|
| Shares
redeemed |
(3,531,757)
|
(47,406,938)
|
| Net
increase (decrease) in shares outstanding before conversion |
(1,938,322)
|
(25,425,498)
|
| Shares
converted into Class I (See Note 1) |
1,861
|
24,915
|
| Net
increase (decrease) |
(1,936,461)
|
$(25,400,583)
|
| Year
ended April 30, 2022: |
|
|
| Shares
sold |
4,016,150
|
$
64,133,515 |
| Shares
issued to shareholders in reinvestment of distributions |
390,452
|
6,333,075
|
| Shares
redeemed |
(3,151,388)
|
(50,417,941)
|
| Net
increase (decrease) in shares outstanding before conversion |
1,255,214
|
20,048,649
|
| Shares
converted into Class I (See Note 1) |
3,502
|
53,907
|
| Shares
converted from Class I (See Note 1) |
(107,874)
|
(1,682,829)
|
| Net
increase (decrease) |
1,150,842
|
$
18,419,727 |
| |
| Class
R3 |
Shares
|
Amount
|
| Six-month
period ended October 31, 2022: |
|
|
| Shares
sold |
9,923
|
$
115,536 |
| Shares
issued to shareholders in reinvestment of distributions |
4,926
|
54,128
|
| Shares
redeemed |
(46,179)
|
(545,739)
|
| Net
increase (decrease) |
(31,330)
|
$
(376,075) |
| Year
ended April 30, 2022: |
|
|
| Shares
sold |
53,893
|
$
721,265 |
| Shares
issued to shareholders in reinvestment of distributions |
5,408
|
73,969
|
| Shares
redeemed |
(47,089)
|
(640,654)
|
| Net
increase (decrease) in shares outstanding before conversion |
12,212
|
154,580
|
| Shares
converted from Class R3 (See Note 1) |
(850)
|
(11,149)
|
| Net
increase (decrease) |
11,362
|
$
143,431 |
| |
| Class
R6 |
Shares
|
Amount
|
| Six-month
period ended October 31, 2022: |
|
|
| Shares
sold |
150,060
|
$
2,068,081 |
| Shares
issued to shareholders in reinvestment of distributions |
29,970
|
392,084
|
| Shares
redeemed |
(209,447)
|
(2,869,766)
|
| Net
increase (decrease) |
(29,417)
|
$
(409,601) |
| Year
ended April 30, 2022: |
|
|
| Shares
sold |
522,511
|
$
8,296,158 |
| Shares
issued to shareholders in reinvestment of distributions |
32,944
|
534,424
|
| Shares
redeemed |
(355,617)
|
(5,733,088)
|
| Net
increase (decrease) in shares outstanding before conversion |
199,838
|
3,097,494
|
| Shares
converted into Class R6 (See Note 1) |
107,874
|
1,682,829
|
| Net
increase (decrease) |
307,712
|
$
4,780,323 |
Notes to Financial
Statements (Unaudited) (continued)
Note 10–Other Matters
As of the date of this report, interest rates in the United
States and many parts of the world, including certain European countries, are ascending from historically low levels. Thus, the Fund currently faces a heightened level of risk associated with rising interest rates. This could be driven by a variety
of factors, including but not limited to central bank monetary policies, changing inflation or real growth rates, general economic conditions, increasing bond issuances or reduced market demand for low yielding investments.
An outbreak of COVID-19, first detected in December 2019, has
developed into a global pandemic and has resulted in travel restrictions, closure of international borders, certain businesses and securities markets, restrictions on securities trading activities, prolonged quarantines, supply chain disruptions,
and lower consumer demand, as well as general concern and uncertainty. In 2022, many countries lifted some or all restrictions related to COVID-19. However, the continued impact of COVID-19 and related variants is uncertain and could further
adversely affect the global economy, national economies, individual issuers and capital markets in unforeseeable ways and result in a substantial and extended economic downturn. Developments that disrupt global economies and financial markets, such
as COVID-19, may magnify factors that affect the Fund's performance.
Note 11–Subsequent Events
In connection with the preparation of the financial statements
of the Fund as of and for the six-month period ended October 31, 2022, events and transactions subsequent to October 31, 2022, through the date the financial statements were issued have been evaluated by the Manager for possible adjustment and/or
disclosure. No subsequent events requiring financial statement adjustment or disclosure have been identified.
| 28
|
MainStay CBRE Real Estate
Fund |
Proxy Voting Policies and Procedures and Proxy Voting
Record
The Fund is required to file with the SEC its
proxy voting record for the 12-month period ending June 30 on Form N-PX. A description of the policies and procedures that are used to vote proxies relating to portfolio securities of the Fund is available free of charge upon request by calling
800-624-6782 or visiting the SEC’s website at www.sec.gov. The most recent Form N-PX or proxy voting record is available free of charge upon request by calling 800-624-6782; visiting
newyorklifeinvestments.com; or visiting the SEC’s website at www.sec.gov.
Shareholder Reports and Quarterly Portfolio Disclosure
The Fund is required to file its complete schedule of portfolio
holdings with the SEC 60 days after its first and third fiscal quarter on Form N-PORT. The Fund's holdings report is available free of charge upon request by calling New York Life Investments at 800-624-6782.
This page intentionally left
blank.
Equity
U.S. Equity
MainStay Epoch U.S. Equity Yield Fund
MainStay S&P 500 Index Fund1
MainStay Winslow Large Cap Growth Fund
MainStay WMC Enduring Capital Fund
MainStay WMC Growth Fund
MainStay WMC Small Companies Fund
MainStay WMC Value Fund
International Equity
MainStay Epoch International Choice Fund
MainStay MacKay International Equity Fund
MainStay WMC International Research Equity Fund
Emerging Markets Equity
MainStay Candriam Emerging Markets Equity Fund
Global Equity
MainStay Epoch Capital Growth Fund
MainStay Epoch Global Equity Yield Fund
Fixed Income
Taxable Income
MainStay Candriam Emerging Markets Debt Fund
MainStay Floating Rate Fund
MainStay MacKay High Yield Corporate Bond Fund
MainStay MacKay Short Duration High Yield Fund
MainStay MacKay Strategic Bond Fund
MainStay MacKay Total Return Bond Fund
MainStay MacKay U.S. Infrastructure Bond Fund
MainStay Short Term Bond Fund
Tax-Exempt Income
MainStay MacKay California Tax Free Opportunities Fund2
MainStay MacKay High Yield Municipal Bond Fund
MainStay MacKay New York Tax Free Opportunities Fund3
MainStay MacKay Short Term Municipal Fund
MainStay MacKay Strategic Municipal Allocation Fund
MainStay MacKay Tax Free Bond Fund
Money Market
MainStay Money Market Fund
Mixed Asset
MainStay Balanced Fund
MainStay Income Builder Fund
MainStay MacKay Convertible Fund
Speciality
MainStay CBRE Global Infrastructure Fund
MainStay CBRE Real Estate Fund
MainStay Cushing MLP Premier Fund
Asset Allocation
MainStay Conservative Allocation Fund
MainStay Conservative ETF Allocation Fund
MainStay Defensive ETF Allocation Fund
MainStay Equity Allocation Fund
MainStay Equity ETF Allocation Fund
MainStay ESG Multi-Asset Allocation Fund
MainStay Growth Allocation Fund
MainStay Growth ETF Allocation Fund
MainStay Moderate Allocation Fund
MainStay Moderate ETF Allocation Fund
Manager
New York Life Investment Management LLC
New York, New York
Subadvisors
Candriam4
Strassen, Luxembourg
CBRE Investment Management Listed Real Assets LLC
Radnor, Pennsylvania
Cushing Asset Management, LP
Dallas, Texas
Epoch Investment Partners, Inc.
New York, New York
MacKay Shields LLC4
New York, New York
NYL Investors LLC4
New York, New York
Wellington Management Company LLP
Boston, Massachusetts
Winslow Capital Management, LLC
Minneapolis, Minnesota
Legal Counsel
Dechert LLP
Washington, District of Columbia
Independent Registered Public Accounting Firm
KPMG LLP
Philadelphia, Pennsylvania
Distributor
NYLIFE Distributors LLC4
Jersey City, New Jersey
Custodian
JPMorgan Chase Bank, N.A.
New York, New York
1.
Prior to February 28, 2022, the Fund's name was
MainStay MacKay S&P 500 Index Fund.
| 2. |
This Fund is registered for
sale in AZ, CA, NV, OR, TX, UT, WA and MI (Class A and Class I shares only), and CO, FL, GA, HI, ID, MA, MD, NH, NJ and NY (Class I shares only). |
| 3. |
This Fund is registered for
sale in CA, CT, DE, FL, MA, NJ, NY and VT. |
| 4. |
An affiliate of New York Life
Investment Management LLC. |
Not part of the Semiannual Report
For more information
800-624-6782
newyorklifeinvestments.com
“New York Life Investments” is both a service mark,
and the common trade name, of certain investment advisors affiliated with New York Life Insurance Company. The MainStay Funds® are managed by New York Life Investment
Management LLC and distributed by NYLIFE Distributors LLC, 30 Hudson Street, Jersey City, NJ 07302, a wholly owned subsidiary of New York Life Insurance Company. NYLIFE Distributors LLC is a Member FINRA/SIPC.
©2022 NYLIFE Distributors LLC. All rights reserved.
| 5013903.2MS229-22 |
MSCBRE10-12/22
|
(NYLIM) NL480
MainStay MacKay Short Term Municipal Fund
Message from the President and Semiannual Report
Unaudited | October 31, 2022
Sign up for e-delivery of your shareholder reports. For full
details on e-delivery, including who can participate and what you can receive via e-delivery,
please log in to newyorklifeinvestments.com/accounts.
| Not
FDIC/NCUA Insured |
Not
a Deposit |
May
Lose Value |
No
Bank Guarantee |
Not
Insured by Any Government Agency |
This page intentionally left blank
Message from the President
A series of economic and geopolitical challenges undermined equity and
fixed-income markets during the six-month reporting period ended October 31, 2022. Stocks and bonds alike trended lower in the face of sharply rising interest rates, increasing inflationary pressures, slowing economic growth and Russia’s
invasion of Ukraine.
The reporting period began on a
mixed note, with concerns about rising inflation and Russia’s invasion of Ukraine weighing on markets. On one hand, rising commodity prices and hopes that inflationary pressures might subside supported some asset classes and sectors. On the
other, the U.S. Federal Reserve (the “Fed”) issued increasingly hawkish statements regarding its intention to combat mounting inflation. As a result, equity markets remained flat while U.S. fixed-income markets gained modest ground in
May. Early June saw a downturn across asset classes as economic data showed increasing inflationary pressures, causing investors to anticipate a higher-than-previously-expected rate increase from the Fed at its meeting on June 15, 2022. Indeed, the
Fed raised rates by 0.75% at that meeting, from a range of 0.75% to 1.00% to a range of 1.50% to 1.75%, its largest increase of the year to date. Markets rallied in the wake of the Fed meeting as investors started to hope that slowing economic
growth might lead to rate decreases later in the year. In August, however, signs of persistently increasing inflation and statements from the Fed indicated that further rate increases were seen as necessary, undercutting optimism and driving stock
and bond prices lower through mid-October. The Fed implemented two additional 0.75% rate increases during that time, with additional increases expected before the end of the year. International central banks generally raised rates as well in efforts
to curb local inflation, although most increases remained significantly more modest than those in the United States. Relatively high U.S. interest rates and international risk-averse sentiment pushed U.S. dollar values higher compared to most other
currencies, with the ensuing negative impact on global prices for food, fuel and other key, U.S.-dollar-denominated products.
Despite a rally in the closing weeks of October, the S&P
500® Index, a widely regarded benchmark of U.S. market performance, declined by more than 5% during the reporting period. Although the energy sector generated strong gains,
bolstered by elevated oil and gas prices, most other industry areas recorded losses. The more cyclical and growth-oriented sectors of consumer discretionary, real estate and information technology delivered the
weakest returns, while the traditionally defensive and value-oriented
consumer staples, utilities and health care sectors outperformed. International stocks lagged compared to their U.S. counterparts, with some emerging markets, such as China, suffering particularly steep losses. A few markets, however, including
Brazil and Mexico, gained ground. Fixed-income markets saw bond prices broadly decline as yields rose along with interest rates. Short-term yields rose faster than long-term yields, producing a yield curve inversion from July through the end of the
reporting period, with long-term rates remaining below short-term rates. Some floating-rate instruments, which feature variable interest rates that allow investors to benefit from a rising rate environment, provided a degree of insulation from
inflation-driven trends.
While the Fed acknowledges the
costs of rising rates in terms of weaker GDP (gross domestic product) growth and unsettled financial markets over the short term, its primary focus continues to be the longer-term economic impact of inflation. With the latest figures as of the date
of this report showing that inflation remains above 8%, versus a target rate of just 2%, the Fed clearly has a distance yet to go, making further rate increases and market volatility more likely in the coming months. The question remains as to
whether the Fed and other central banks will manage a so-called “soft landing,” curbing inflation while avoiding a persistent economic slowdown. If they prove successful, we expect that favorable inflation trends and increasingly
attractive valuations in both equity and bond markets should eventually translate into sustainable improvements in the investment environment.
Whatever actions the Fed takes and however financial markets
react, as a MainStay investor, you can depend on us to continue providing the insight, expertise and service that have log defined New York Life Investments. Thank you for trusting us to help you meet your investment needs.
Sincerely,
Kirk C. Lehneis
President
The opinions expressed are as of the date of this report and
are subject to change. There is no guarantee that any forecast made will come to pass. This material does not constitute investment advice and is not intended as an endorsement of any specific investment. Past performance is no guarantee of future
results.
Not part of the Semiannual Report
Investors should refer to the Fund’s Summary Prospectus
and/or Prospectus and consider the Fund’s investment objectives, strategies, risks, charges and expenses carefully before investing. The Summary Prospectus and/or Prospectus contain this and other information about the Fund. You may obtain
copies of the Fund’s Summary Prospectus, Prospectus and Statement of Additional Information, which includes information about the MainStay Funds Trust's Trustees, free of charge, upon request, by calling toll-free 800-624-6782, by writing to
NYLIFE Distributors LLC, Attn: MainStay Marketing Department, 30 Hudson Street, Jersey City, NJ 07302 or by sending an e-mail to MainStayShareholderServices@nylim.com. These documents are also available via the MainStay Funds’ website at
newyorklifeinvestments.com. Please read the Fund’s Summary Prospectus and/or Prospectus carefully before investing.
Investment and
Performance Comparison (Unaudited)
Performance data quoted represents past performance. Past performance is no
guarantee of future results. Because of market volatility and other factors, current performance may be lower or higher than the figures shown. Investment return and principal value will fluctuate, and as a result, when shares are redeemed, they may
be worth more or less than their original cost. The graph below depicts the historical performance of Class I shares of the Fund. Performance will vary from class to class based on differences in class-specific expenses and sales charges. For performance information current to the most recent month-end, please call 800-624-6782 or visit newyorklifeinvestments.com.
The performance table and graph do not reflect the deduction
of taxes that a shareholder would pay on distributions or Fund share redemptions. Total returns reflect maximum applicable sales charges as indicated in the table below, if any, changes in share price, and reinvestment of dividend and capital gain
distributions. The graph assumes the initial investment amount shown below and reflects the deduction of all sales charges that would have applied for the period of investment. Performance figures may reflect certain fee waivers and/or expense
limitations, without which total returns may have been lower. For more information on share classes and current fee waivers and/or expense limitations (if any), please refer to the Notes to Financial Statements.
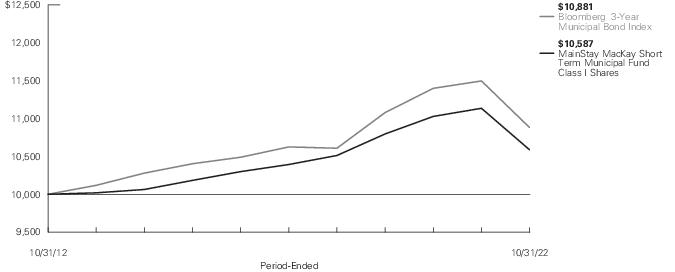
| Average
Annual Total Returns for the Period-Ended October 31, 2022 |
| Class
|
Sales
Charge |
|
Inception
Date1 |
Six
Months2 |
One
Year |
Five
Years |
Ten
Years
or Since
Inception |
Gross
Expense
Ratio3 |
| Class
A Shares |
Maximum
1% Initial Sales Charge |
With
sales charges |
1/2/2004
|
-2.55%
|
-6.13%
|
-0.11%
|
N/A
|
0.67%
|
| |
|
Excluding
sales charges |
|
-1.57
|
-5.18
|
0.09
|
0.30%
|
0.67
|
| Class
A2 Shares |
Maximum
2% Initial Sales Charge |
With
sales charges |
9/30/2020
|
-3.43
|
-6.97
|
N/A
|
-3.11
|
0.67
|
| |
|
Excluding
sales charges |
|
-1.46
|
-5.07
|
N/A
|
-2.16
|
0.67
|
| Investor
Class Shares4, 5 |
Maximum
.5% Initial Sales Charge |
With
sales charges |
2/28/2008
|
-2.11
|
-5.96
|
-0.47
|
-0.37
|
1.24
|
| |
|
Excluding
sales charges |
|
-1.62
|
-5.48
|
-0.27
|
-0.07
|
1.24
|
| Class
I Shares |
No
Sales Charge |
|
1/2/1991
|
-1.43
|
-4.92
|
0.37
|
0.57
|
0.42
|
| Class
R6 Shares |
No
Sales Charge |
|
5/2/2022
|
N/A
|
N/A
|
N/A
|
-1.33
|
0.40
|
| 1.
|
Effective
June 1, 2015, the Fund changed, among other things, its investment objective and principal investment strategies. Effective May 22, 2018, the Fund made further changes to, among other things, its principal investment strategies. Effective February
28, 2019, the Fund further changed its investment objective. The performance information shown in this report reflects the Fund’s prior investment objectives and principal investment strategies, as applicable. |
| 2.
|
Not
annualized. |
| 3.
|
The gross
expense ratios presented reflect the Fund’s “Total Annual Fund Operating Expenses” from the most recent Prospectus, as supplemented, and may differ from other expense ratios disclosed in this report. |
| 4.
|
Prior to
June 1, 2015, the maximum initial sales charge was 3.0%, which is reflected in the average annual total return figures shown. |
| 5.
|
From
June 1, 2015 to June 30, 2020, the maximum initial sales charge was 1.0%, which is reflected in the applicable average annual total return figures shown. |
The footnotes on the next page are an integral part of the
table and graph and should be carefully read in conjunction with them.
| Benchmark
Performance* |
Six
Months1 |
One
Year |
Five
Years |
Ten
Years |
| Bloomberg
3-Year Municipal Bond Index2 |
-0.92%
|
-5.35%
|
0.48%
|
0.85%
|
| Morningstar
Muni National Short Category Average3 |
-0.89
|
-4.12
|
0.44
|
0.61
|
| *
|
Returns
for indices reflect no deductions for fees, expenses or taxes, except for foreign withholding taxes where applicable. Results assume reinvestment of all dividends and capital gains. An investment cannot be made directly in an index.
|
| 1.
|
Not
annualized. |
| 2.
|
The
Bloomberg 3-Year Municipal Bond Index is the Fund's primary broad-based securities-market index for comparison purposes. The Bloomberg 3-Year Municipal Bond Index is considered representative of the broad-based market for investment grade,
tax-exempt bonds with a maturity range of 2-4 years. |
| 3.
|
The
Morningstar Muni National Short Category Average is representative of funds that invest in bonds issued by state and local governments to fund public projects. The income from these bonds is generally free from federal taxes and/or from state taxes
in the issuing state. To lower risk, some of these portfolios spread their assets across many states and sectors. Other portfolios buy bonds from only one state in order to get the state-tax benefit. These portfolios have durations of less than 4.5
years. Results are based on average total returns of similar funds with all dividends and capital gain distributions reinvested. |
The footnotes on the preceding page are an integral part of the
table and graph and should be carefully read in conjunction with them.
| 6
|
MainStay MacKay Short Term
Municipal Fund |
Cost in Dollars of
a $1,000 Investment in MainStay MacKay Short Term Municipal Fund (Unaudited)
The example below is intended to describe the fees and expenses
borne by shareholders during the six-month period from May 1, 2022 to October 31, 2022, and the impact of those costs on your investment.
Example
As a shareholder of the Fund you incur two types of costs: (1)
transaction costs, including exchange fees and sales charges (loads) on purchases (as applicable), and (2) ongoing costs, including management fees, distribution and/or service (12b-1) fees and other Fund expenses (as applicable). This example is
intended to help you understand your ongoing costs (in dollars) of investing in the Fund and to compare these costs with the ongoing costs of investing in other mutual funds. The example is based on an investment of $1,000 made at the beginning of
the six-month period and held for the entire period from May 1, 2022 to October 31, 2022.
This example illustrates your Fund’s ongoing costs in two
ways:
Actual Expenses
The second and third data columns in the table below provide information about
actual account values and actual expenses. You may use the information in these columns, together with the amount you invested, to estimate the expenses that you paid during the six months ended October 31, 2022. Simply divide your account value by
$1,000 (for example, an
$8,600 account value divided by $1,000 = 8.6), then multiply the result by the
number under the heading entitled “Expenses Paid During Period” to estimate the expenses you paid on your account during this period.
Hypothetical Example for Comparison Purposes
The fourth and fifth data columns in the table below provide information about
hypothetical account values and hypothetical expenses based on the Fund’s actual expense ratio and an assumed rate of return of 5% per year before expenses, which is not the Fund’s actual return. The hypothetical account values and
expenses may not be used to estimate the actual ending account balances or expenses you paid for the six-month period shown. You may use this information to compare the ongoing costs of investing in the Fund with the ongoing costs of investing in
other mutual funds. To do so, compare this 5% hypothetical example with the 5% hypothetical examples that appear in the shareholder reports of the other mutual funds.
Please note that the expenses shown in the table are meant to
highlight your ongoing costs only and do not reflect any transactional costs, such as exchange fees or sales charges (loads). Therefore, the fourth and fifth data columns of the table are useful in comparing ongoing costs only and will not help you
determine the relative total costs of owning different funds. In addition, if these transactional costs were included, your costs would have been higher.
| Share
Class |
Beginning
Account
Value
5/1/22 |
Ending
Account
Value (Based
on Actual
Returns and
Expenses)
10/31/22 |
Expenses
Paid
During
Period1 |
Ending
Account
Value (Based
on Hypothetical
5% Annualized
Return and
Actual Expenses)
10/31/22 |
Expenses
Paid
During
Period1 |
Net
Expense
Ratio
During
Period2 |
| Class
A Shares |
$1,000.00
|
$984.30
|
$3.40
|
$1,021.78
|
$3.47
|
0.68%
|
| Class
A2 Shares |
$1,000.00
|
$985.40
|
$3.40
|
$1,021.78
|
$3.47
|
0.68%
|
| Investor
Class Shares |
$1,000.00
|
$983.80
|
$5.00
|
$1,020.16
|
$5.09
|
1.00%
|
| Class
I Shares |
$1,000.00
|
$985.70
|
$2.00
|
$1,023.19
|
$2.04
|
0.40%
|
| Class
R6 Shares 3, 4 |
$1,000.00
|
$986.70
|
$1.98
|
$1,022.94
|
$2.02
|
0.40%
|
| 1.
|
Expenses are
equal to the Fund’s annualized expense ratio of each class multiplied by the average account value over the period, divided by 365 and multiplied by 184 (to reflect the six-month period) and 182 days for Class R6 (to reflect the
since-inception period). The table above represents the actual expenses incurred during the six-month period. In addition to the fees and expenses which the Fund bears directly, it also indirectly bears a pro rata share of the fees and expenses of
the underlying funds in which it invests. Such indirect expenses are not included in the above-reported expense figures. |
| 2.
|
Expenses
are equal to the Fund's annualized expense ratio to reflect the six-month period. |
| 3.
|
Expenses
paid during the period reflect ongoing costs for the period from inception through October 31, 2022. Had these shares been offered for the full six-month period ended October 31, 2022, and had the Fund provided a hypothetical 5% annualized return,
expenses paid during the period would have been $2.04 for Class R6 shares and the ending account value would have been $1,023.19 for Class R6 shares. |
| 4.
|
The
inception date was May 2, 2022. |
Portfolio Composition as of October 31, 2022
(Unaudited)
See Portfolio of
Investments beginning on page 11 for specific holdings within these categories. The Fund's holdings are subject to change.
Top Ten Holdings and/or Issuers Held as of October 31, 2022 (excluding short-term investments) (Unaudited)
| 1.
|
Black
Belt Energy Gas District, 2.59%-5.50%, due 10/1/49–11/1/53 |
| 2.
|
Metropolitan
Transportation Authority, 1.60%-5.25%, due 2/1/23–11/15/50 |
| 3.
|
State
of Illinois, 5.00%-6.00%, due 7/1/23–11/1/29 |
| 4.
|
New
York Transportation Development Corp., 5.00%, due 1/1/23–12/1/30 |
| 5.
|
Louisiana
Stadium & Exposition District, 1.872%-5.00%, due 7/1/23–7/3/23 |
| 6.
|
Southeast
Energy Authority, (zero coupon)-4.00%, due 10/1/26–1/1/53 |
| 7.
|
Matching
Fund Special Purpose Securitization Corp., 5.00%, due 10/1/25–10/1/26 |
| 8.
|
County
of King WA, 2.47%, due 1/1/40 |
| 9.
|
California
Infrastructure and Economic Development Bank, 0.85%, due 1/1/50 |
| 10.
|
Compton
Community Redevelopment Agency, 5.00%-5.25%, due 8/1/23–8/1/32 |
| 8
|
MainStay MacKay Short Term
Municipal Fund |
Portfolio
Management Discussion and Analysis (Unaudited)
Questions answered by portfolio managers John Loffredo,
CFA, Robert DiMella, CFA, Michael Petty, David Dowden, Scott Sprauer, Frances Lewis and John Lawlor of MacKay Shields LLC, the Fund’s Subadvisor.
How did MainStay MacKay Short Term Municipal Fund perform relative to
its benchmark and peer group during the six months ended October 31, 2022?
For the six months ended October 31, 2022, Class I shares of
MainStay MacKay Short Term Municipal Fund returned −1.43%, underperforming the −0.92% return of the Fund’s benchmark, the Bloomberg 3-Year Municipal Bond Index (the “Index”). Over the same period, Class I shares also
underperformed the −0.89% return of the Morningstar Muni National Short Category Average.1
What factors affected the Fund’s relative
performance during the reporting period?
During the
reporting period, the Fund underperformed the Index largely due to overweight exposure to bonds from Illinois. However, the negative impact of this position was partly offset by positive contributions to relative performance from the Fund’s
underweight allocation to bonds rated AAA-AA,2 and underweight exposure to bonds from states Virginia and Massachusetts. (Contributions take weightings and total returns into
account.)
During the reporting period, were there
any market events that materially impacted the Fund’s performance or liquidity?
During the reporting period, markets extended their historic
drawdown driven by the combination of rising U.S. Treasury yields, ongoing monetary policy tightening and geopolitical uncertainty. The municipal market mirrored this broader sell-off, and many investors reacted by withdrawing money from their
municipal holdings. The municipal market experienced record outflows, which ultimately drove municipal rates higher.
During the reporting period, how was the Fund’s
performance materially affected by investments in derivatives?
The Fund’s performance was not materially affected by
investments in derivatives during the reporting period.
What was the Fund’s duration3 strategy during the reporting period?
As relative value investors, the management team aims to keep
the Fund’s duration within a neutral range relative to that of the Index. As of October 31, 2022, the Fund's modified duration to worst4 was 2.03 years while the
Index’s modified duration to worst was 2.52 years.
During the reporting period, which sectors were the
strongest positive contributors to the Fund’s relative performance and which sectors were particularly weak?
Across sectors, underweight exposure to the prerefunded/ETM
(escrowed to maturity) and leasing sectors, as well as overweight exposure to the local general obligation sector, contributed positively to the Fund’s returns relative to the Index. Meanwhile, overweight exposure to the IDR/PCR (industry
development revenue/pollution control revenue), transportation and education sectors weakened relative results.
How did the Fund’s sector weighting change during
the reporting period?
During the reporting period, there
were no material changes to the weightings in the Fund. There were small increases in the Fund’s exposure to the housing, state general obligation and special tax sectors, and to bonds rated AAA. Conversely, there was a small decrease in
exposure to the hospital and local general obligation sectors.
How was the Fund positioned at the end of the reporting
period?
As of October 31, 2022, the Fund held overweight
positions relative to the Index in the IDR/PCR, transportation and local general obligation sectors, as well as to bonds rated BBB.5 From a geographic perspective, the Fund held
overweight exposure to bonds from Illinois and New Jersey. As of the same date, the Fund held underweight exposure to bonds from California and New York, in addition to ultra-high-quality AAA-rated bonds.
| 1.
|
See page 5 for other share class
returns, which may be higher or lower than Class I share returns. See page 6 for more information on benchmark and peer group returns. |
| 2.
|
An obligation rated
‘AAA’ has the highest rating assigned by Standard & Poor’s (“S&P”), and in the opinion of S&P, the obligor’s capacity to meet its financial commitment on the obligation is extremely strong. An
obligation rated ‘AA’ by S&P is deemed by S&P to differ from the highest-rated obligations only to a small degree. In the opinion of S&P, the obligor's capacity to meet its financial commitment on the obligation is very
strong. When applied to Fund holdings, ratings are based solely on the creditworthiness of the bonds in the portfolio and are not meant to represent the security or safety of the Fund. |
| 3.
|
Duration is a measure of the
price sensitivity of a fixed-income investment to changes in interest rates. Duration is expressed as a number of years and is considered a more accurate sensitivity gauge than average maturity. |
| 4.
|
Modified duration is
inversely related to the approximate percentage change in price for a given change in yield. Duration to worst is the duration of a bond computed using the bond’s nearest call date or maturity, whichever comes first. This measure ignores
future cash flow fluctuations due to embedded optionality. |
| 5.
|
An obligation rated
‘BBB’ by S&P is deemed by S&P to exhibit adequate protection parameters. In the opinion of S&P, however, adverse economic conditions or changing circumstances are more likely to lead to a weakened capacity of the obligor to
meet its financial commitment on the obligation. When applied to Fund holdings, ratings are based solely on the creditworthiness of the bonds in the portfolio and are not meant to represent the security or safety of the Fund. |
The opinions expressed are those of the portfolio
managers as of the date of this report and are subject to change. There is no guarantee that any forecasts will come to pass. This material does not constitute investment advice and is not intended as an endorsement of any specific investment.
| 10
|
MainStay MacKay Short Term
Municipal Fund |
Portfolio of
Investments October 31, 2022† (Unaudited)
| |
Principal
Amount |
Value
|
| Municipal
Bonds 95.9% |
| Long-Term
Municipal Bonds 76.1% |
| Alabama
4.9% |
| Alabama
Community College System, Revenue Bonds |
|
|
| Insured:
BAM |
|
|
| 3.00%,
due 6/1/24 |
$
100,000 |
$ 99,255
|
| Alabama
Community College System, Enhancements Fee, Revenue Bonds |
|
|
| Insured:
AGM |
|
|
| 4.00%,
due 9/1/24 |
40,000 |
40,252 |
| Alabama
Community College System, Wallace State Community College-Hanceville, Revenue Bonds |
|
|
| Insured:
BAM |
|
|
| 4.00%,
due 11/1/26 |
260,000
|
262,591
|
| Insured:
BAM |
|
|
| 4.00%,
due 11/1/27 |
365,000
|
369,334
|
| Insured:
BAM |
|
|
| 4.00%,
due 11/1/28 |
260,000
|
263,892
|
| Birmingham
Airport Authority, Revenue Bonds |
|
|
| Insured:
BAM |
|
|
| 5.00%,
due 7/1/23 |
125,000
|
126,320
|
| Insured:
BAM |
|
|
| 5.00%,
due 7/1/24 |
625,000
|
640,189
|
| Black
Belt Energy Gas District, Project No.5, Revenue Bonds |
|
|
| Series
A-1 |
|
|
| 4.00%,
due 10/1/49 (a) |
10,000,000
|
9,607,882
|
| Black
Belt Energy Gas District, Gas Project No.6, Revenue Bonds |
|
|
| Series
B |
|
|
| 4.00%,
due 10/1/52 (a) |
3,500,000
|
3,370,363
|
| Black
Belt Energy Gas District, Gas Project No.7, Revenue Bonds |
|
|
| Series
C-1 |
|
|
| 4.00%,
due 10/1/52 (a) |
2,500,000
|
2,407,402
|
| Black
Belt Energy Gas District, Revenue Bonds (a) |
|
|
| Series
B-1 |
|
|
| 4.00%,
due 4/1/53 |
13,920,000
|
13,212,501
|
| Series
F |
|
|
| 5.50%,
due 11/1/53 |
10,000,000
|
10,105,379
|
| City
of Bessemer AL, Limited General Obligation |
|
|
| Series
C, Insured: AGM |
|
|
| 4.00%,
due 2/1/23 |
425,000
|
425,730
|
| |
Principal
Amount |
Value
|
| |
| Alabama
(continued) |
| City
of Bessemer AL, Limited General Obligation (continued) |
|
|
| Series
C, Insured: AGM |
|
|
| 4.00%,
due 2/1/26 |
$
305,000 |
$ 309,940
|
| Coosa
Valley Water Supply District, Inc., Revenue Bonds |
|
|
| 4.00%,
due 10/1/26 |
200,000 |
203,561 |
| County
of Dallas AL, Unlimited General Obligation |
|
|
| Series
A, Insured: AGM |
|
|
| (zero
coupon), due 5/1/23 |
135,000 |
131,420 |
| Series
B, Insured: AGM |
|
|
| (zero
coupon), due 5/1/24 |
300,000
|
276,147
|
| Series
A, Insured: AGM |
|
|
| (zero
coupon), due 5/1/25 |
270,000
|
235,053
|
| County
of Lowndes AL, Unlimited General Obligation |
|
|
| Series
A, Insured: AGM |
|
|
| 4.00%,
due 2/1/25 |
540,000
|
542,508
|
| Greenville
Waterworks & Sewer Board, Revenue Bonds |
|
|
| Insured:
BAM |
|
|
| 4.00%,
due 3/1/27 |
205,000
|
208,289
|
| Lower
Alabama Gas District (The), Gas Project, Project No. 2, Revenue Bonds |
|
|
| 4.00%,
due 12/1/22 |
350,000
|
349,867
|
| 4.00%,
due 12/1/23 |
750,000
|
745,172
|
| Prichard
Water Works & Sewer Board, Revenue Bonds |
|
|
| 5.00%,
due 11/1/22 |
415,000
|
415,000
|
| Southeast
Alabama Gas Supply District, Project No. 1, Revenue Bonds |
|
|
| Series
A |
|
|
| 5.00%,
due 4/1/24 |
1,500,000
|
1,501,763
|
| Southeast
Alabama Gas Supply District (The), Project No. 2, Revenue Bonds |
|
|
| Series
A |
|
|
| 4.00%,
due 6/1/23 |
255,000
|
253,996
|
| Southeast
Energy Authority, A Cooperative District, Project No. 3, Revenue Bonds |
|
|
| Series
A-1 |
|
|
| (zero
coupon), due 1/1/53 |
10,000,000
|
10,113,908
|
The notes to the financial statements are an integral part of, and
should be read in conjunction with, the financial statements.
11
Portfolio of
Investments October 31, 2022† (Unaudited) (continued)
| |
Principal
Amount |
Value
|
| Long-Term
Municipal Bonds (continued) |
| Alabama
(continued) |
| Southeast
Energy Authority, A Cooperative District, Project No. 1, Revenue Bonds |
|
|
| Series
A |
|
|
| 4.00%,
due 10/1/26 |
$
1,400,000 |
$ 1,350,814
|
| Series
A |
|
|
| 4.00%,
due 10/1/27 |
2,975,000 |
2,832,302 |
| Series
A |
|
|
| 4.00%,
due 11/1/51 (a) |
4,635,000 |
4,329,043 |
| Southeast
Energy Authority, A Cooperative District, Project No. 2, Revenue Bonds |
|
|
| Series
B |
|
|
| 4.00%,
due 12/1/51 (a) |
1,190,000
|
1,072,035
|
| Special
Care Facilities Financing Authority of the City of Pell City Alabama, Noland Health Services, Inc., Revenue Bonds |
|
|
| Series
A |
|
|
| 5.00%,
due 12/1/22 |
725,000
|
725,498
|
| University
of West Alabama, Revenue Bonds |
|
|
| Insured:
AGM |
|
|
| 4.00%,
due 1/1/23 |
125,000
|
125,120
|
| Insured:
AGM |
|
|
| 4.00%,
due 1/1/24 |
100,000
|
100,598
|
| Insured:
AGM |
|
|
| 4.00%,
due 1/1/25 |
150,000
|
150,367
|
| Insured:
AGM |
|
|
| 5.00%,
due 1/1/26 |
180,000
|
185,530
|
| |
|
67,089,021
|
| Alaska
0.6% |
| Alaska
Industrial Development & Export Authority, Tanana Chiefs Conference Project, Revenue Bonds |
|
|
| 5.00%,
due 10/1/23 |
585,000
|
591,993
|
| Northern
Tobacco Securitization Corp., Tobacco Settlement Asset-Backed, Revenue Bonds, Senior Lien |
|
|
| Series
B1, Class 2 |
|
|
| 0.50%,
due 6/1/31 |
115,000
|
113,202
|
| State
of Alaska International Airports System, Revenue Bonds (b) |
|
|
| Series
C |
|
|
| 5.00%,
due 10/1/27 |
3,030,000
|
3,128,972
|
| |
Principal
Amount |
Value
|
| |
| Alaska
(continued) |
State
of Alaska International Airports System, Revenue Bonds (b)
(continued) |
|
|
| Series
C |
|
|
| 5.00%,
due 10/1/29 |
$
3,600,000 |
$ 3,715,922
|
| |
|
7,550,089
|
| Arizona
0.0% ‡ |
| City
of Phoenix AZ, Downtown Phoenix Student Housing LLC, Revenue Bonds |
|
|
| 5.00%,
due 7/1/23 |
50,000 |
50,191 |
| Sedona
Wastewater Municipal Property Corp., Capital Appreciation, Revenue Bonds |
|
|
| Insured:
NATL-RE |
|
|
| (zero
coupon), due 7/1/24 |
500,000
|
468,181
|
| |
|
518,372
|
| Arkansas
0.1% |
| City
of West Memphis AR, Public Utility System, Revenue Bonds |
|
|
| Insured:
BAM |
|
|
| 4.00%,
due 12/1/26 |
190,000
|
193,000
|
| North
Little Rock School District No. 1, Limited General Obligation |
|
|
| Insured:
State Aid Withholding |
|
|
| 5.00%,
due 2/1/26 |
1,400,000
|
1,473,668
|
| |
|
1,666,668
|
| California
6.1% |
| Alameda
Unified School District-Alameda County, Unlimited General Obligation |
|
|
| Series
A, Insured: AGM |
|
|
| (zero
coupon), due 8/1/26 |
330,000
|
287,265
|
| Alta
Loma School District, Unlimited General Obligation |
|
|
| Series
B, Insured: NATL-RE |
|
|
| (zero
coupon), due 8/1/25 |
200,000
|
180,212
|
| Antelope
Valley Union High School District, Capital Appreciation, Election 2002, Unlimited General Obligation |
|
|
| Series
C, Insured: NATL-RE |
|
|
| (zero
coupon), due 8/1/25 |
300,000
|
269,591
|
The notes to the financial statements are an integral part of, and
should be read in conjunction with, the financial statements.
| 12
|
MainStay MacKay Short Term
Municipal Fund |
| |
Principal
Amount |
Value
|
| Long-Term
Municipal Bonds (continued) |
| California
(continued) |
| California
County Tobacco Securitization Agency, Tobacco Settlement, Revenue Bonds, Senior Lien |
|
|
| Series
A |
|
|
| 5.00%,
due 6/1/24 |
$
450,000 |
$ 458,818
|
| California
Educational Facilities Authority, Art Center College of Design, Revenue Bonds |
|
|
| Series
A |
|
|
| 5.00%,
due 12/1/22 |
200,000 |
200,188 |
| California
Health Facilities Financing Authority, Lundquist Institute For Biomedical Innovation, Revenue Bonds |
|
|
| 4.00%,
due 9/1/23 |
310,000 |
310,987 |
| California
Municipal Finance Authority, CHF-Davis I LLC - West Village Student Housing Project, Revenue Bonds |
|
|
| 5.00%,
due 5/15/23 |
1,520,000
|
1,526,514
|
| 5.00%,
due 5/15/24 |
1,200,000
|
1,212,337
|
| California
Municipal Finance Authority, LINXS APM Project, Revenue Bonds, Senior Lien (b) |
|
|
| 5.00%,
due 12/31/23 |
1,400,000
|
1,414,604
|
| 5.00%,
due 6/30/25 |
685,000
|
698,327
|
| California
School Finance Authority, Kipp SoCal Public Schools Project, Revenue Bonds |
|
|
| Series
A |
|
|
| 5.00%,
due 7/1/25 (c) |
55,000
|
55,836
|
| Central
Basin Municipal Water District, Revenue Bonds |
|
|
| Series
B, Insured: BAM |
|
|
| 1.936%,
due 8/1/24 |
600,000
|
569,421
|
| Chino
Basin Regional Financing Authority, Revenue Bonds |
|
|
| Series
B |
|
|
| 4.00%,
due 11/1/25 |
2,665,000
|
2,717,541
|
| City
of Fresno CA, Airport, Revenue Bonds |
|
|
| Series
B |
|
|
| 5.00%,
due 7/1/23 (b) |
690,000
|
695,474
|
| City
of Los Angeles CA, Department of Airports, Revenue Bonds |
|
|
| 5.00%,
due 5/15/24 (b) |
500,000
|
508,823
|
| |
Principal
Amount |
Value
|
| |
| California
(continued) |
| City
of Montebello CA, Revenue Bonds |
|
|
| Insured:
AGM |
|
|
| 2.173%,
due 6/1/23 |
$
2,000,000 |
$ 1,963,595
|
| City
of Palm Springs CA, Airport Passenger Facility Charge, Revenue Bonds (b) |
|
|
| Insured:
BAM |
|
|
| 5.00%,
due 6/1/25 |
925,000 |
944,118 |
| Insured:
BAM |
|
|
| 5.00%,
due 6/1/28 |
655,000 |
664,490 |
| City
of Sacramento CA, Transient Occupancy Tax, Revenue Bonds |
|
|
| 5.00%,
due 6/1/23 |
850,000
|
856,460
|
| Series
C |
|
|
| 5.00%,
due 6/1/25 |
495,000
|
509,875
|
| Series
A |
|
|
| 5.00%,
due 6/1/26 |
1,375,000
|
1,433,326
|
| Series
C |
|
|
| 5.00%,
due 6/1/26 |
500,000
|
520,018
|
| City
of Sacramento CA, Airport System, Revenue Bonds |
|
|
| Series
E |
|
|
| 5.00%,
due 7/1/25 |
260,000
|
271,124
|
| Compton
Community College District, Election of 2002, Unlimited General Obligation |
|
|
| Series
D, Insured: BAM |
|
|
| (zero
coupon), due 8/1/36 |
2,825,000
|
1,159,109
|
| Compton
Community Redevelopment Agency, Tax Allocation |
|
|
| Series
A, Insured: AGM |
|
|
| 5.00%,
due 8/1/23 |
1,000,000
|
1,009,949
|
| Series
A, Insured: AGM |
|
|
| 5.00%,
due 8/1/24 |
1,625,000
|
1,660,750
|
| Series
A, Insured: AGM |
|
|
| 5.00%,
due 8/1/25 |
4,090,000
|
4,213,584
|
| Series
A, Insured: AGM |
|
|
| 5.00%,
due 8/1/26 |
7,045,000
|
7,320,907
|
| Series
A, Insured: AGM |
|
|
| 5.25%,
due 8/1/32 |
2,345,000
|
2,530,621
|
| El
Camino Healthcare District, Capital Appreciation, Unlimited General Obligation |
|
|
| Insured:
NATL-RE |
|
|
| (zero
coupon), due 8/1/26 |
380,000
|
329,333
|
The notes to the financial statements are an integral part of, and
should be read in conjunction with, the financial statements.
13
Portfolio of
Investments October 31, 2022† (Unaudited) (continued)
| |
Principal
Amount |
Value
|
| Long-Term
Municipal Bonds (continued) |
| California
(continued) |
| Foothill-Eastern
Transportation Corridor Agency, Revenue Bonds, Senior Lien |
|
|
| Series
A |
|
|
| (zero
coupon), due 1/1/27 |
$
4,500,000 |
$ 3,903,783
|
| Golden
West Schools Financing Authority, Revenue Bonds |
|
|
| Series
A, Insured: NATL-RE |
|
|
| 5.80%,
due 2/1/23 |
115,000 |
115,678 |
| Grossmont
Union High School District, Election 2004, Unlimited General Obligation |
|
|
| Insured:
NATL-RE |
|
|
| (zero
coupon), due 8/1/26 |
1,905,000
|
1,649,179
|
| Independent
Cities Finance Authority, Sales Tax, Revenue Bonds (c) |
|
|
| Insured:
AGM |
|
|
| 4.00%,
due 6/1/24 |
150,000
|
150,367
|
| Insured:
AGM |
|
|
| 4.00%,
due 6/1/25 |
510,000
|
511,934
|
| Insured:
AGM |
|
|
| 4.00%,
due 6/1/26 |
175,000
|
175,492
|
| Los
Angeles Department of Water & Power, Revenue Bonds |
|
|
| Series
C |
|
|
| 5.00%,
due 7/1/25 |
450,000
|
463,735
|
| Los
Angeles Unified School District, Unlimited General Obligation |
|
|
| Series
C |
|
|
| 5.00%,
due 7/1/23 |
2,000,000
|
2,026,005
|
| Mammoth
Unified School District, Unlimited General Obligation |
|
|
| Insured:
NATL-RE |
|
|
| (zero
coupon), due 8/1/26 |
280,000
|
244,278
|
| Marysville
Joint Unified School District, Energy Effeciency Projects, Green Bond, Certificate of Participation |
|
|
| Insured:
BAM |
|
|
| 4.00%,
due 6/1/23 |
470,000
|
472,002
|
| Insured:
BAM |
|
|
| 4.00%,
due 6/1/26 |
275,000
|
280,100
|
| Mount
Diablo Unified School District, Capital Appreciation, Election 2010, Unlimited General Obligation |
|
|
| Series
A, Insured: AGM |
|
|
| 5.00%,
due 8/1/25 (d) |
445,000
|
461,511
|
| |
Principal
Amount |
Value
|
| |
| California
(continued) |
| Norman
Y Mineta San Jose International Airport SJC, Revenue Bonds |
|
|
| Series
A |
|
|
| 5.00%,
due 3/1/24 (b) |
$
250,000 |
$ 253,435
|
| North
Coast County Water District, Certificate of Participation |
|
|
| Insured:
AGM |
|
|
| 4.00%,
due 10/1/24 |
90,000 |
91,153 |
| Peninsula
Corridor Joint Powers Board, Revenue Bonds |
|
|
| Series
A |
|
|
| 5.00%,
due 10/1/23 |
585,000
|
593,576
|
| River
Islands Public Financing Authority, Community Facilities District No. 2003-1, Special Tax |
|
|
| Series
A-1, Insured: AGM |
|
|
| 5.00%,
due 9/1/26 |
150,000
|
158,120
|
| Series
A-1, Insured: AGM |
|
|
| 5.00%,
due 9/1/27 |
225,000
|
239,416
|
| Riverside
County Asset Leasing Corp., Riverside County Hospital Project, Revenue Bonds |
|
|
| Insured:
NATL-RE |
|
|
| (zero
coupon), due 6/1/25 |
2,205,000
|
2,005,152
|
| Sacramento
City Unified School District, Election of 2002, Unlimited General Obligation |
|
|
| Insured:
AGM |
|
|
| (zero
coupon), due 7/1/23 |
2,065,000
|
2,019,018
|
| Sacramento
City Unified School District, Unlimited General Obligation |
|
|
| Series
E |
|
|
| 5.00%,
due 8/1/23 |
300,000
|
303,206
|
| Insured:
BAM |
|
|
| 5.00%,
due 7/1/24 |
1,420,000
|
1,454,740
|
| Insured:
BAM |
|
|
| 5.00%,
due 7/1/25 |
1,000,000
|
1,040,968
|
| Insured:
BAM |
|
|
| 5.00%,
due 7/1/26 |
1,350,000
|
1,423,086
|
| San
Bernardino County Redevelopment Agency Successor Agency, Tax Allocation |
|
|
| Series
A, Insured: AGM |
|
|
| 1.057%,
due 9/1/23 |
280,000
|
270,186
|
The notes to the financial statements are an integral part of, and
should be read in conjunction with, the financial statements.
| 14
|
MainStay MacKay Short Term
Municipal Fund |
| |
Principal
Amount |
Value
|
| Long-Term
Municipal Bonds (continued) |
| California
(continued) |
| San
Diego County Regional Airport Authority, Revenue Bonds (b) |
|
|
| Series
B |
|
|
| 5.00%,
due 7/1/26 |
$
2,000,000 |
$ 2,047,957
|
| Series
B |
|
|
| 5.00%,
due 7/1/27 |
1,000,000 |
1,024,940 |
| San
Francisco City & County Airport Commission, San Francisco International Airport, Revenue Bonds, Second Series (b) |
|
|
| Series
D |
|
|
| 5.00%,
due 5/1/25 |
210,000 |
214,471 |
| Series
H |
|
|
| 5.00%,
due 5/1/25 |
2,730,000
|
2,788,120
|
| San
Joaquin Hills Transportation Corridor Agency, Toll Road, Revenue Bonds |
|
|
| Series
A, Insured: NATL-RE |
|
|
| (zero
coupon), due 1/15/25 |
1,000,000
|
910,942
|
| San
Mateo County Community College District, Capital Appreciation, Election 2005, Unlimited General Obligation |
|
|
| Series
A, Insured: NATL-RE |
|
|
| (zero
coupon), due 9/1/26 |
1,100,000
|
961,034
|
| San
Ysidro School District, Capital Appreciation, Election 1997, Unlimited General Obligation |
|
|
| Series
D, Insured: NATL-RE |
|
|
| (zero
coupon), due 8/1/25 |
400,000
|
360,619
|
| Santa
Cruz City Elementary School District, Capital Appreciation, Election 1998, Unlimited General Obligation |
|
|
| Insured:
AGM |
|
|
| (zero
coupon), due 2/1/23 |
100,000
|
99,155
|
| South
Pasadena Unified School District, Unlimited General Obligation |
|
|
| Series
C, Insured: NATL-RE |
|
|
| (zero
coupon), due 5/1/24 |
700,000
|
663,748
|
| State
of California, Unlimited General Obligation |
|
|
| Series
CT |
|
|
| 0.35%,
due 12/1/22 |
1,990,000
|
1,985,276
|
| |
Principal
Amount |
Value
|
| |
| California
(continued) |
| State
of California, Various Purpose, Unlimited General Obligation |
|
|
| 3.00%,
due 11/1/30 |
$
5,500,000 |
$ 4,703,505
|
| Sweetwater
Union High School District, Unlimited General Obligation |
|
|
| Insured:
BAM |
|
|
| 5.00%,
due 8/1/26 |
365,000 |
374,713 |
| Torrance
Unified School District, Election of 2008, Unlimited General Obligation |
|
|
| (zero
coupon), due 8/1/27 |
2,500,000 |
2,051,346 |
| (zero
coupon), due 8/1/28 |
2,500,000 |
1,951,250 |
| (zero
coupon), due 8/1/29 |
4,500,000
|
3,328,652
|
| (zero
coupon), due 8/1/30 |
1,500,000
|
1,049,196
|
| Tulare
Union High School District, Capital Appreciation, Election of 2004, Unlimited General Obligation |
|
|
| Series
A, Insured: NATL-RE |
|
|
| (zero
coupon), due 8/1/26 |
1,000,000
|
862,535
|
| Upper
Lake Union High School District, Unlimited General Obligation |
|
|
| Series
A, Insured: NATL-RE |
|
|
| (zero
coupon), due 8/1/23 |
255,000
|
248,126
|
| Vacaville
Unified School District, Unlimited General Obligation |
|
|
| Series
D |
|
|
| 4.00%,
due 8/1/25 |
125,000
|
127,612
|
| Victor
Elementary School District, Unlimited General Obligation |
|
|
| Series
B, Insured: NATL-RE |
|
|
| (zero
coupon), due 8/1/27 |
350,000
|
290,651
|
| Vista
Unified School District, Capital Appreciation, Unlimited General Obligation |
|
|
| Series
A, Insured: AGM |
|
|
| (zero
coupon), due 8/1/26 |
325,000
|
281,046
|
| |
|
83,124,211
|
| Colorado
1.3% |
| City
& County of Denver CO, Revenue Bonds |
|
|
| Series
A |
|
|
| 5.00%,
due 11/15/22 (b) |
720,000
|
720,408
|
| Series
A |
|
|
| 5.00%,
due 11/15/23 |
520,000
|
528,858
|
The notes to the financial statements are an integral part of, and
should be read in conjunction with, the financial statements.
15
Portfolio of
Investments October 31, 2022† (Unaudited) (continued)
| |
Principal
Amount |
Value
|
| Long-Term
Municipal Bonds (continued) |
| Colorado
(continued) |
| City
& County of Denver CO, Revenue Bonds (continued) |
|
|
| Series
B1 |
|
|
| 5.00%,
due 11/15/23 (b) |
$
940,000 |
$ 953,611
|
| Colliers
Hill Metropolitan District No. 2 CO, Limited General Obligation |
|
|
| Series
A |
|
|
| 6.50%,
due 12/1/47 |
1,000,000 |
1,032,360 |
| Colorado
Bridge Enterprise, Colorado High Performance Transportation Enterprise, Revenue Bonds |
|
|
| 4.00%,
due 12/31/26 (b) |
3,950,000 |
3,916,166 |
| Colorado
Educational & Cultural Facilities Authority, Johnson & Wales University Project, Revenue Bonds |
|
|
| Series
A |
|
|
| 4.00%,
due 4/1/23 |
315,000
|
315,937
|
| Series
B |
|
|
| 5.00%,
due 4/1/24 |
500,000
|
503,523
|
| Colorado
Educational & Cultural Facilities Authority, Westgate Community School Project, Revenue Bonds |
|
|
| Series
A, Insured: Moral Obligation |
|
|
| 4.00%,
due 7/1/23 |
50,000
|
50,072
|
| Series
A, Insured: Moral Obligation |
|
|
| 4.00%,
due 7/1/25 |
105,000
|
105,478
|
| Series
A, Insured: Moral Obligation |
|
|
| 4.00%,
due 7/1/26 |
160,000
|
160,404
|
| Series
A, Insured: Moral Obligation |
|
|
| 4.00%,
due 7/1/27 |
170,000
|
169,626
|
| Colorado
Educational & Cultural Facilities Authority, Banning Lewis Ranch Academy Building Co. LLC, Revenue Bonds |
|
|
| Series
A, Insured: Moral Obligation |
|
|
| 4.00%,
due 12/15/25 |
75,000
|
74,683
|
| Series
A, Insured: Moral Obligation |
|
|
| 4.00%,
due 12/15/26 |
150,000
|
148,747
|
| Colorado
School of Mines, Capital Appreciation, Revenue Bonds |
|
|
| Insured:
NATL-RE |
|
|
| (zero
coupon), due 12/1/25 |
100,000
|
88,959
|
| |
Principal
Amount |
Value
|
| |
| Colorado
(continued) |
| Copperleaf
Metropolitan District No. 2, Limited General Obligation |
|
|
| Insured:
BAM |
|
|
| 4.00%,
due 12/1/26 |
$
385,000 |
$ 391,080
|
| Crystal
Valley Metropolitan District No. 2, Limited General Obligation |
|
|
| Series
A, Insured: AGM |
|
|
| 5.00%,
due 12/1/22 |
100,000 |
100,141 |
| Series
A, Insured: AGM |
|
|
| 5.00%,
due 12/1/23 |
140,000 |
142,406 |
| Series
A, Insured: AGM |
|
|
| 5.00%,
due 12/1/24 |
175,000
|
180,369
|
| Series
A, Insured: AGM |
|
|
| 5.00%,
due 12/1/25 |
250,000
|
261,047
|
| E-470
Public Highway Authority, Revenue Bonds |
|
|
| Series
B, Insured: NATL-RE |
|
|
| (zero
coupon), due 9/1/26 |
250,000
|
214,028
|
| Series
A, Insured: NATL-RE |
|
|
| (zero
coupon), due 9/1/28 |
3,080,000
|
2,408,410
|
| Eagle
County Airport Terminal Corp., Revenue Bonds |
|
|
| Series
B |
|
|
| 4.00%,
due 5/1/24 (b) |
330,000
|
327,714
|
| El
Paso County School District No. 3 Widefield, Recreation Facility Project, Certificate of Participation |
|
|
| Insured:
AGM |
|
|
| 4.00%,
due 12/1/22 |
175,000
|
175,095
|
| Erie
Commons Metropolitan District No. 2, Limited General Obligation, Senior Lien |
|
|
| Series
A, Insured: AGM |
|
|
| 5.00%,
due 12/1/23 |
130,000
|
132,303
|
| Erie
Highlands Metropolitan District No. 1, Limited General Obligation |
|
|
| Insured:
BAM |
|
|
| 3.00%,
due 12/1/24 |
245,000
|
242,230
|
| Goldsmith
Metropolitan District, Unlimited General Obligation |
|
|
| Insured:
AGM |
|
|
| 4.00%,
due 12/1/22 |
100,000
|
100,072
|
| Insured:
AGM |
|
|
| 4.00%,
due 12/1/24 |
20,000
|
20,320
|
| Insured:
AGM |
|
|
| 4.00%,
due 12/1/26 |
135,000
|
138,525
|
The notes to the financial statements are an integral part of, and
should be read in conjunction with, the financial statements.
| 16
|
MainStay MacKay Short Term
Municipal Fund |
| |
Principal
Amount |
Value
|
| Long-Term
Municipal Bonds (continued) |
| Colorado
(continued) |
| Leyden
Rock Metropolitan District, Limited General Obligation |
|
|
| Insured:
AGM |
|
|
| 5.00%,
due 12/1/22 |
$
180,000 |
$ 180,236
|
| Insured:
AGM |
|
|
| 5.00%,
due 12/1/27 |
365,000 |
390,121 |
| Insured:
AGM |
|
|
| 5.00%,
due 12/1/28 |
330,000 |
356,364 |
| North
Pine Vistas Metropolitan District No. 3, Limited General Obligation, Senior Lien |
|
|
| Series
A, Insured: AGM |
|
|
| 5.00%,
due 12/1/22 |
50,000
|
50,061
|
| Series
A, Insured: AGM |
|
|
| 5.00%,
due 12/1/23 |
95,000
|
96,460
|
| Series
A, Insured: AGM |
|
|
| 5.00%,
due 12/1/25 |
155,000
|
161,343
|
| Poudre
Tech Metropolitan District, Unlimited General Obligation |
|
|
| Insured:
AGM |
|
|
| 3.00%,
due 12/1/23 |
400,000
|
397,044
|
| Insured:
AGM |
|
|
| 3.00%,
due 12/1/24 |
400,000
|
393,254
|
| Insured:
AGM |
|
|
| 3.00%,
due 12/1/25 |
150,000
|
146,123
|
| Insured:
AGM |
|
|
| 3.00%,
due 12/1/27 |
170,000
|
161,953
|
| Regional
Transportation District, Denver Transit Partners Eagle P3 Project, Revenue Bonds |
|
|
| 3.00%,
due 7/15/23 |
100,000
|
99,601
|
| 5.00%,
due 7/15/24 |
300,000
|
301,762
|
| 5.00%,
due 7/15/25 |
400,000
|
405,744
|
| Saddle
Rock Metropolitan District, Unlimited General Obligation |
|
|
| Insured:
BAM |
|
|
| 3.00%,
due 12/1/22 |
75,000
|
74,984
|
| Sand
Creek Metropolitan District, Limited General Obligation |
|
|
| Series
A, Insured: AGM |
|
|
| 4.00%,
due 12/1/22 |
125,000
|
125,067
|
| Triview
Metropolitan District, Green Bond, Revenue Bonds |
|
|
| Insured:
BAM |
|
|
| 5.00%,
due 12/1/22 |
210,000
|
210,305
|
| Insured:
BAM |
|
|
| 5.00%,
due 12/1/24 |
315,000
|
325,304
|
| |
Principal
Amount |
Value
|
| |
| Colorado
(continued) |
| Triview
Metropolitan District, Green Bond, Revenue Bonds (continued) |
|
|
| Insured:
BAM |
|
|
| 5.00%,
due 12/1/25 |
$
255,000 |
$ 266,648
|
| Vauxmont
Metropolitan District, Limited General Obligation |
|
|
| Insured:
AGM |
|
|
| 5.00%,
due 12/15/22 |
100,000 |
100,169
|
| |
|
17,845,115
|
| Connecticut
1.5% |
| City
of Bridgeport CT, Unlimited General Obligation |
|
|
| Series
A |
|
|
| 5.00%,
due 6/1/23 |
600,000
|
605,768
|
| Series
A |
|
|
| 5.00%,
due 6/1/24 |
865,000
|
885,598
|
| City
of Hartford CT, Unlimited General Obligation |
|
|
| Series
A, Insured: State Guaranteed |
|
|
| 5.00%,
due 4/1/23 |
490,000
|
493,797
|
| Series
B, Insured: AGM State Guaranteed |
|
|
| 5.00%,
due 10/1/24 |
1,380,000
|
1,419,957
|
| Series
A, Insured: BAM State Guaranteed |
|
|
| 5.00%,
due 12/1/25 |
1,875,000
|
1,954,510
|
| Series
A, Insured: BAM State Guaranteed |
|
|
| 5.00%,
due 12/1/26 |
1,760,000
|
1,856,012
|
| City
of New Haven CT, Unlimited General Obligation |
|
|
| Series
A |
|
|
| 5.25%,
due 8/1/25 |
155,000
|
161,136
|
| City
of West Haven CT, Unlimited General Obligation |
|
|
| Insured:
BAM |
|
|
| 4.00%,
due 3/15/23 |
250,000
|
250,635
|
| Insured:
BAM |
|
|
| 4.00%,
due 3/15/24 |
380,000
|
383,126
|
| Insured:
BAM |
|
|
| 4.00%,
due 3/15/26 |
200,000
|
203,422
|
| 4.00%,
due 9/15/26 |
255,000
|
257,579
|
| Connecticut
State Higher Education Supplement Loan Authority, Chesla Loan Program, Revenue Bonds |
|
|
| 3.00%,
due 11/15/25 |
800,000
|
791,636
|
| 5.00%,
due 11/15/22 (b) |
425,000
|
425,239
|
The notes to the financial statements are an integral part of, and
should be read in conjunction with, the financial statements.
17
Portfolio of
Investments October 31, 2022† (Unaudited) (continued)
| |
Principal
Amount |
Value
|
| Long-Term
Municipal Bonds (continued) |
| Connecticut
(continued) |
Connecticut
State Higher Education Supplement Loan Authority, Chesla Loan Program, Revenue Bonds
(continued) |
|
|
| 5.00%,
due 11/15/23 |
$
200,000 |
$ 203,267
|
| 5.00%,
due 11/15/24 |
765,000 |
788,321 |
| Series
B |
|
|
| 5.00%,
due 11/15/24 (b) |
255,000 |
261,406 |
| 5.00%,
due 11/15/25 (b) |
1,000,000 |
1,035,466 |
| State
of Connecticut, Unlimited General Obligation |
|
|
| Series
A |
|
|
| 0.508%,
due 6/1/24 |
1,000,000
|
934,185
|
| Series
B |
|
|
| 4.00%,
due 3/1/24 |
100,000
|
100,262
|
| Series
A |
|
|
| 5.00%,
due 4/15/23 |
3,200,000
|
3,227,101
|
| Series
C |
|
|
| 5.00%,
due 6/15/23 |
1,500,000
|
1,517,159
|
| State
of Connecticut, Transportation Infrastructure, Special Tax, Revenue Bonds |
|
|
| 5.00%,
due 5/1/23 |
675,000
|
680,874
|
| State
of Connecticut, Transportation Infrastructure, Special Tax |
|
|
| Series
D |
|
|
| 5.00%,
due 11/1/26 |
700,000
|
742,878
|
| Town
of Hamden CT, Unlimited General Obligation |
|
|
| Insured:
BAM |
|
|
| 4.00%,
due 8/15/27 |
325,000
|
331,151
|
| Town
of Windham CT, Unlimited General Obligation |
|
|
| Series
A, Insured: BAM |
|
|
| 4.00%,
due 8/15/27 |
825,000
|
848,301
|
| |
|
20,358,786
|
| Delaware
0.1% |
| Delaware
State Economic Development Authority, Newark Charter School, Inc. Project, Revenue Bonds |
|
|
| 4.00%,
due 9/1/24 |
370,000
|
367,478
|
| 4.00%,
due 9/1/24 |
130,000
|
129,114
|
| 4.00%,
due 9/1/25 |
105,000
|
103,779
|
| 4.00%,
due 9/1/26 |
140,000
|
137,425
|
| |
Principal
Amount |
Value
|
| |
| Delaware
(continued) |
| Delaware
Transportation Authority, Revenue Bonds |
|
|
| 5.00%,
due 9/1/26 |
$
1,150,000 |
$ 1,212,254
|
| |
|
1,950,050
|
| District
of Columbia 1.3% |
| District
of Columbia, Gallery Place Project, Tax Allocation |
|
|
| 5.00%,
due 6/1/27 |
1,720,000 |
1,722,000 |
| District
of Columbia, Friendship Public Charter School, Inc., Revenue Bonds |
|
|
| Series
A |
|
|
| 5.00%,
due 6/1/42 |
2,000,000
|
2,002,769
|
| Metropolitan
Washington Airports Authority, Airport System, Revenue Bonds (b) |
|
|
| Series
A |
|
|
| 5.00%,
due 10/1/24 |
445,000
|
455,063
|
| 5.00%,
due 10/1/26 |
930,000
|
961,022
|
| Series
A |
|
|
| 5.00%,
due 10/1/27 |
1,000,000
|
1,015,348
|
| Metropolitan
Washington Airports Authority, Revenue Bonds (b) |
|
|
| Series
A |
|
|
| 5.00%,
due 10/1/27 |
2,160,000
|
2,240,250
|
| Series
A |
|
|
| 5.00%,
due 10/1/28 |
1,020,000
|
1,058,248
|
| Metropolitan
Washington Airports Authority Aviation, Revenue Bonds (b) |
|
|
| Series
A |
|
|
| 5.00%,
due 10/1/23 |
2,000,000
|
2,023,908
|
| Series
A |
|
|
| 5.00%,
due 10/1/24 |
2,230,000
|
2,280,428
|
| Series
A |
|
|
| 5.00%,
due 10/1/25 |
1,665,000
|
1,711,639
|
| Series
A |
|
|
| 5.00%,
due 10/1/27 |
2,700,000
|
2,800,312
|
| |
|
18,270,987
|
| Florida
2.1% |
| Centre
Lake Community Development District, Special Assessment |
|
|
| 2.75%,
due 5/1/27 |
235,000
|
210,113
|
The notes to the financial statements are an integral part of, and
should be read in conjunction with, the financial statements.
| 18
|
MainStay MacKay Short Term
Municipal Fund |
| |
Principal
Amount |
Value
|
| Long-Term
Municipal Bonds (continued) |
| Florida
(continued) |
| City
of Orlando FL, Tourist Development Tax, Revenue Bonds, Senior Lien |
|
|
| Insured:
AGM |
|
|
| 5.00%,
due 11/1/25 |
$
1,095,000 |
$ 1,136,843
|
| City
of Tampa FL, H Lee Moffitt Cancer Center Project, Revenue Bonds |
|
|
| 5.00%,
due 7/1/23 |
75,000 |
75,669 |
| 5.00%,
due 7/1/24 |
300,000 |
305,682 |
| 5.00%,
due 7/1/25 |
425,000 |
437,597 |
| County
of Broward FL, Port Facilities, Revenue Bonds |
|
|
| Series
D |
|
|
| 5.00%,
due 9/1/23 (b) |
1,000,000
|
1,013,009
|
| 5.00%,
due 9/1/24 |
500,000
|
511,033
|
| 5.00%,
due 9/1/25 |
700,000
|
722,308
|
| 5.00%,
due 9/1/26 |
835,000
|
868,641
|
| 5.00%,
due 9/1/27 |
1,995,000
|
2,088,513
|
| County
of Monroe FL, Airport, Revenue Bonds (b) |
|
|
| Series
202 |
|
|
| 5.00%,
due 10/1/26 |
200,000
|
205,869
|
| Series
202 |
|
|
| 5.00%,
due 10/1/27 |
200,000
|
206,533
|
| Greater
Orlando Aviation Authority, Airport Facilities, Revenue Bonds (b) |
|
|
| Series
A |
|
|
| 5.00%,
due 10/1/23 |
290,000
|
293,545
|
| Series
A |
|
|
| 5.00%,
due 10/1/23 |
210,000
|
212,189
|
| Series
A |
|
|
| 5.00%,
due 10/1/23 |
8,895,000
|
8,990,935
|
| Herons
Glen Recreation District, Special Assessment |
|
|
| Insured:
BAM |
|
|
| 2.50%,
due 5/1/23 |
230,000
|
227,846
|
| Insured:
BAM |
|
|
| 2.50%,
due 5/1/24 |
150,000
|
145,982
|
| Hillsborough
County Industrial Development Authority, Tampa General Hospital Project, Revenue Bonds |
|
|
| Series
A |
|
|
| 5.00%,
due 8/1/25 |
260,000
|
267,582
|
| |
Principal
Amount |
Value
|
| |
| Florida
(continued) |
| Hillsborough
County Industrial Development Authority, Tampa General Hospital Project, Revenue Bonds (continued) |
|
|
| Series
A |
|
|
| 5.00%,
due 8/1/26 |
$
315,000 |
$ 327,114
|
| Lakewood
Ranch Stewardship District, Lakewood Center and NW Sector Projects, Special Assessment, Senior Lien |
|
|
| Insured:
AGM |
|
|
| 1.164%,
due 5/1/23 |
540,000 |
530,039 |
| Miami-Dade
County Expressway Authority, Revenue Bonds |
|
|
| Series
B |
|
|
| 5.00%,
due 7/1/25 |
265,000
|
270,707
|
| Series
B, Insured: BAM |
|
|
| 5.00%,
due 7/1/26 |
5,000,000
|
5,108,489
|
| Orange
County Health Facilities Authority, AdventHealth Obligated Group, Revenue Bonds |
|
|
| Series
C |
|
|
| 5.00%,
due 11/15/52 (a) |
2,340,000
|
2,448,526
|
| St.
Lucie County School Board, Certificate of Participation |
|
|
| Insured:
AGM |
|
|
| 3.00%,
due 8/15/26 |
350,000
|
338,032
|
| State
of Florida, Right-of-Way Acquisition and Bridge Construction, Unlimited General Obligation |
|
|
| Series
A |
|
|
| 5.00%,
due 7/1/27 |
1,075,000
|
1,152,813
|
| University
of North Florida Financing Corp. (The), Housing Project, Revenue Bonds |
|
|
| Insured:
AGM |
|
|
| 5.00%,
due 11/1/22 |
1,000,000
|
1,000,000
|
| |
|
29,095,609
|
| Georgia
0.7% |
| City
of Dalton GA, Georgia Combined Utilities, Revenue Bonds |
|
|
| 5.00%,
due 3/1/23 |
500,000
|
502,760
|
| County
of Paulding GA, Water & Sewerage, Revenue Bonds |
|
|
| 5.00%,
due 12/1/22 |
100,000
|
100,148
|
The notes to the financial statements are an integral part of, and
should be read in conjunction with, the financial statements.
19
Portfolio of
Investments October 31, 2022† (Unaudited) (continued)
| |
Principal
Amount |
Value
|
| Long-Term
Municipal Bonds (continued) |
| Georgia
(continued) |
| Main
Street Natural Gas, Inc., Revenue Bonds |
|
|
| Series
A |
|
|
| 4.00%,
due 4/1/48 (a) |
$
2,500,000 |
$ 2,494,866
|
| Series
C |
|
|
| 4.00%,
due 3/1/50 (a) |
2,625,000 |
2,520,584 |
| Series
A |
|
|
| 5.00%,
due 5/15/23 |
1,110,000 |
1,114,316 |
| Municipal
Electric Authority of Georgia, Combined Cycle Project, Revenue Bonds |
|
|
| Series
A |
|
|
| 3.00%,
due 11/1/22 |
445,000
|
445,000
|
| Municipal
Electric Authority of Georgia, Plant Vogtle Units 3 & 4 Project, Revenue Bonds |
|
|
| 5.00%,
due 1/1/23 |
350,000
|
350,768
|
| 5.00%,
due 1/1/24 |
445,000
|
451,924
|
| 5.00%,
due 1/1/25 |
90,000
|
92,202
|
| Municipal
Electric Authority of Georgia, Project One Subordinated Bonds, Revenue Bonds |
|
|
| Series
A |
|
|
| 5.00%,
due 1/1/26 |
970,000
|
1,000,677
|
| Private
Colleges & Universities Authority, Savannah College of Art & Design, Revenue Bonds |
|
|
| 5.00%,
due 4/1/24 |
65,000
|
66,350
|
| Private
Colleges & Universities Authority, Mercer University Project, Revenue Bonds |
|
|
| 5.00%,
due 10/1/26 |
625,000
|
652,747
|
| |
|
9,792,342
|
| Guam
0.4% |
| Antonio
B Won Pat International Airport Authority, Revenue Bonds |
|
|
| Series
B |
|
|
| 3.133%,
due 10/1/24 |
1,310,000
|
1,269,966
|
| Series
B |
|
|
| 3.133%,
due 10/1/24 |
630,000
|
601,349
|
| Guam
Government Waterworks Authority, Revenue Bonds |
|
|
| 5.00%,
due 7/1/24 |
400,000
|
404,997
|
| Series
A |
|
|
| 5.00%,
due 7/1/24 |
300,000
|
303,748
|
| |
Principal
Amount |
Value
|
| |
| Guam
(continued) |
| Guam
Power Authority, Revenue Bonds |
|
|
| Series
A |
|
|
| 5.00%,
due 10/1/25 |
$
2,500,000 |
$ 2,563,106
|
| |
|
5,143,166
|
| Hawaii
0.1% |
| State
of Hawaii Airports System, Certificate of Participation |
|
|
| 5.25%,
due 8/1/24 |
250,000 |
252,899 |
| 5.25%,
due 8/1/25 |
1,300,000 |
1,310,724
|
| |
|
1,563,623
|
| Illinois
11.5% |
| Carol
Stream Park District, Unlimited General Obligation |
|
|
| Series
C, Insured: BAM |
|
|
| 4.00%,
due 11/1/25 |
450,000
|
456,284
|
| Series
C, Insured: BAM |
|
|
| 4.00%,
due 11/1/26 |
550,000
|
559,161
|
| Chicago
Board of Education, Unlimited General Obligation |
|
|
| Series
A, Insured: NATL-RE |
|
|
| (zero
coupon), due 12/1/22 |
150,000
|
149,559
|
| Series
A, Insured: AGM |
|
|
| 5.00%,
due 12/1/23 |
4,650,000
|
4,715,063
|
| Chicago
Board of Education, Capital Appreciation, School Reform, Unlimited General Obligation |
|
|
| Insured:
NATL-RE |
|
|
| (zero
coupon), due 12/1/23 |
500,000
|
477,360
|
| Series
A, Insured: NATL-RE |
|
|
| (zero
coupon), due 12/1/25 |
1,630,000
|
1,416,313
|
| Chicago
Midway International Airport, Revenue Bonds, Second Lien |
|
|
| Series
A |
|
|
| 5.00%,
due 1/1/27 (b) |
1,040,000
|
1,046,441
|
| Chicago
O'Hare International Airport, Revenue Bonds, Senior Lien |
|
|
| Series
D |
|
|
| 1.168%,
due 1/1/24 |
1,000,000
|
957,775
|
| Series
D |
|
|
| 5.00%,
due 1/1/24 (b) |
150,000
|
151,906
|
| Series
D |
|
|
| 5.00%,
due 1/1/24 |
850,000
|
852,514
|
| Series
B |
|
|
| 5.00%,
due 1/1/26 |
1,250,000
|
1,300,104
|
The notes to the financial statements are an integral part of, and
should be read in conjunction with, the financial statements.
| 20
|
MainStay MacKay Short Term
Municipal Fund |
| |
Principal
Amount |
Value
|
| Long-Term
Municipal Bonds (continued) |
| Illinois
(continued) |
| Chicago
O'Hare International Airport, Passenger Facility Charge, Revenue Bonds |
|
|
| 5.00%,
due 1/1/25 (b) |
$
835,000 |
$ 835,546
|
| Chicago
O'Hare International Airport, General, Revenue Bonds, Senior Lien |
|
|
| Series
C |
|
|
| 5.00%,
due 1/1/25 (b) |
1,000,000 |
1,018,629 |
| Chicago
Park District, Unlimited General Obligation |
|
|
| Series
F-2 |
|
|
| 5.00%,
due 1/1/25 |
400,000 |
407,286 |
| Series
F-2 |
|
|
| 5.00%,
due 1/1/26 |
550,000
|
562,461
|
| City
of Berwyn IL, Unlimited General Obligation |
|
|
| Series
A |
|
|
| 5.00%,
due 12/1/23 |
330,000
|
332,312
|
| Series
A |
|
|
| 5.00%,
due 12/1/24 |
820,000
|
826,937
|
| Series
A |
|
|
| 5.00%,
due 12/1/25 |
465,000
|
469,206
|
| Series
A |
|
|
| 5.00%,
due 12/1/26 |
705,000
|
712,134
|
| City
of Canton IL, Alternative Revenue Source, Unlimited General Obligation |
|
|
| Series
A, Insured: BAM |
|
|
| 3.00%,
due 12/1/22 |
635,000
|
634,266
|
| Series
A, Insured: BAM |
|
|
| 3.00%,
due 12/1/23 |
550,000
|
542,482
|
| City
of Chicago Heights IL, Unlimited General Obligation |
|
|
| Insured:
BAM |
|
|
| 4.00%,
due 12/1/24 |
300,000
|
302,864
|
| Insured:
BAM |
|
|
| 4.00%,
due 12/1/25 |
300,000
|
304,143
|
| Insured:
BAM |
|
|
| 4.00%,
due 12/1/26 |
300,000
|
303,600
|
| City
of Chicago IL, Unlimited General Obligation |
|
|
| Series
C |
|
|
| (zero
coupon), due 1/1/25 |
2,255,000
|
2,057,153
|
| Series
C |
|
|
| 5.00%,
due 1/1/24 |
3,520,000
|
3,532,337
|
| |
Principal
Amount |
Value
|
| |
| Illinois
(continued) |
| City
of Chicago IL, Unlimited General Obligation (continued) |
|
|
| Series
A |
|
|
| 5.00%,
due 1/1/26 |
$
405,000 |
$ 405,834
|
| 5.25%,
due 1/1/28 |
925,000 |
928,570 |
| City
of Chicago IL, Revenue Bonds, Second Lien |
|
|
| 3.15%,
due 11/1/24 |
475,000 |
467,390 |
| City
of Chicago IL, Wastewater Transmission, Revenue Bonds |
|
|
| Series
A, Insured: NATL-RE |
|
|
| (zero
coupon), due 1/1/26 |
2,090,000
|
1,832,145
|
| Series
A, Insured: NATL-RE |
|
|
| (zero
coupon), due 1/1/27 |
12,120,000
|
10,142,972
|
| City
of Chicago IL, Wastewater Transmission, Revenue Bonds, Second Lien |
|
|
| 5.00%,
due 1/1/24 |
150,000
|
152,420
|
| 5.00%,
due 1/1/26 |
1,130,000
|
1,130,900
|
| City
of Chicago IL, Waterworks, Revenue Bonds, Second Lien |
|
|
| 5.00%,
due 11/1/22 |
500,000
|
500,000
|
| 5.00%,
due 11/1/24 |
250,000
|
250,670
|
| 5.00%,
due 11/1/25 |
155,000
|
158,029
|
| Insured:
BAM |
|
|
| 5.00%,
due 11/1/25 |
135,000
|
139,605
|
| Insured:
AGM-CR |
|
|
| 5.00%,
due 11/1/25 |
400,000
|
401,251
|
| 5.00%,
due 11/1/26 |
410,000
|
417,638
|
| City
of Chicago IL, Neighbourhoods Alive 21 Program, Unlimited General Obligation |
|
|
| Series
2002B |
|
|
| 5.00%,
due 1/1/24 |
150,000
|
150,526
|
| Series
2002B |
|
|
| 5.00%,
due 1/1/26 |
170,000
|
170,564
|
| Series
2002B |
|
|
| 5.25%,
due 1/1/28 |
150,000
|
150,579
|
| City
of Country Club Hills IL, Unlimited General Obligation |
|
|
| Insured:
BAM |
|
|
| 3.00%,
due 1/1/26 |
300,000
|
289,926
|
| Insured:
BAM |
|
|
| 3.00%,
due 1/1/27 |
250,000
|
238,653
|
| City
of Galesburg IL, Knox College Project, Revenue Bonds |
|
|
| Series
B |
|
|
| 1.588%,
due 10/1/23 |
150,000
|
145,279
|
The notes to the financial statements are an integral part of, and
should be read in conjunction with, the financial statements.
21
Portfolio of
Investments October 31, 2022† (Unaudited) (continued)
| |
Principal
Amount |
Value
|
| Long-Term
Municipal Bonds (continued) |
| Illinois
(continued) |
| City
of Galesburg IL, Knox College Project, Revenue Bonds (continued) |
|
|
| Series
A |
|
|
| 5.00%,
due 10/1/26 |
$
175,000 |
$ 180,199
|
| Series
A |
|
|
| 5.00%,
due 10/1/27 |
175,000 |
180,795 |
| City
of Kankakee IL, Unlimited General Obligation |
|
|
| Series
A, Insured: BAM |
|
|
| 4.00%,
due 1/1/24 |
750,000 |
753,630 |
| City
of Kankakee IL, Special Obligation, Unlimited General Obligation |
|
|
| Series
A, Insured: BAM |
|
|
| 4.00%,
due 1/1/25 |
800,000
|
808,713
|
| City
of Monmouth IL, Unlimited General Obligation |
|
|
| Series
A, Insured: BAM |
|
|
| 4.00%,
due 12/1/22 |
350,000
|
350,138
|
| Series
A, Insured: BAM |
|
|
| 4.00%,
due 12/1/23 |
365,000
|
366,662
|
| Series
A, Insured: BAM |
|
|
| 4.00%,
due 12/1/24 |
380,000
|
383,714
|
| City
of Rock Island IL, Green Bond, Unlimited General Obligation |
|
|
| Insured:
BAM |
|
|
| 4.00%,
due 12/1/22 |
220,000
|
220,134
|
| Insured:
BAM |
|
|
| 4.00%,
due 12/1/25 |
175,000
|
177,366
|
| City
of Rock Island IL, Unlimited General Obligation |
|
|
| Series
B, Insured: AGM |
|
|
| 4.00%,
due 12/1/22 |
275,000
|
275,167
|
| City
of Rockford IL, Unlimited General Obligation |
|
|
| Insured:
BAM |
|
|
| 4.00%,
due 12/15/22 |
250,000
|
250,206
|
| Insured:
BAM |
|
|
| 4.00%,
due 12/15/23 |
560,000
|
563,543
|
| Insured:
BAM |
|
|
| 4.00%,
due 12/15/24 |
285,000
|
288,051
|
| City
of Rockford IL, Alternative Revenue Source, Unlimited General Obligation |
|
|
| Series
A, Insured: AGM |
|
|
| 4.00%,
due 12/15/22 |
135,000
|
135,111
|
| |
Principal
Amount |
Value
|
| |
| Illinois
(continued) |
| City
of Rockford IL, Alternative Revenue Source, Unlimited General Obligation (continued) |
|
|
| Series
A, Insured: AGM |
|
|
| 4.00%,
due 12/15/23 |
$
140,000 |
$ 140,886
|
| Series
A, Insured: AGM |
|
|
| 4.00%,
due 12/15/24 |
290,000 |
293,342 |
| City
of Sterling IL, Unlimited General Obligation |
|
|
| Series
B, Insured: BAM |
|
|
| 0.40%,
due 11/1/23 |
20,000 |
19,150 |
| Series
B, Insured: BAM |
|
|
| 4.00%,
due 11/1/25 |
100,000
|
101,539
|
| Series
B, Insured: BAM |
|
|
| 4.00%,
due 11/1/26 |
370,000
|
376,163
|
| Series
B, Insured: BAM |
|
|
| 4.00%,
due 11/1/29 |
285,000
|
289,386
|
| City
of Waukegan IL, Water & Sewer System, Revenue Bonds, First Lien |
|
|
| Insured:
AGM |
|
|
| 4.00%,
due 12/30/23 |
100,000
|
100,540
|
| Insured:
AGM |
|
|
| 4.00%,
due 12/30/24 |
110,000
|
111,174
|
| Insured:
AGM |
|
|
| 4.00%,
due 12/30/25 |
150,000
|
152,225
|
| City
of Waukegan IL, Unlimited General Obligation |
|
|
| Series
A, Insured: BAM |
|
|
| 4.00%,
due 12/30/23 |
250,000
|
251,349
|
| Series
A, Insured: BAM |
|
|
| 4.00%,
due 12/30/24 |
280,000
|
282,988
|
| Series
A, Insured: BAM |
|
|
| 4.00%,
due 12/30/26 |
300,000
|
305,045
|
| Cook
County Community Unit School District No. 401 Elmwood Park, Unlimited General Obligation |
|
|
| 3.00%,
due 12/1/22 |
500,000
|
499,883
|
| Cook
County School District No. 122 Ridgeland, Unlimited General Obligation |
|
|
| Series
A |
|
|
| 3.00%,
due 12/1/22 |
950,000
|
949,778
|
| Cook
County School District No. 94, Unlimited General Obligation |
|
|
| Insured:
BAM |
|
|
| 5.00%,
due 12/1/22 |
340,000
|
340,459
|
| Insured:
BAM |
|
|
| 5.00%,
due 12/1/23 |
555,000
|
563,060
|
The notes to the financial statements are an integral part of, and
should be read in conjunction with, the financial statements.
| 22
|
MainStay MacKay Short Term
Municipal Fund |
| |
Principal
Amount |
Value
|
| Long-Term
Municipal Bonds (continued) |
| Illinois
(continued) |
Cook
County School District No. 94, Unlimited General Obligation
(continued) |
|
|
| Insured:
BAM |
|
|
| 5.00%,
due 12/1/24 |
$
370,000 |
$ 379,479
|
| Insured:
BAM |
|
|
| 5.00%,
due 12/1/25 |
390,000 |
404,345 |
| Cook
County Township High School District No. 220 Reavis, Unlimited General Obligation |
|
|
| Insured:
BAM |
|
|
| 4.00%,
due 12/1/23 |
760,000 |
763,620 |
| Insured:
BAM |
|
|
| 5.00%,
due 12/1/24 |
570,000
|
585,178
|
| Cook
County Township High School District No. 225, Unlimited General Obligation |
|
|
| 5.00%,
due 12/1/26 |
1,180,000
|
1,247,589
|
| County
of Sangamon IL, Limited General Obligation |
|
|
| Insured:
BAM |
|
|
| 5.00%,
due 12/15/22 |
135,000
|
135,277
|
| Insured:
BAM |
|
|
| 5.00%,
due 12/15/25 |
230,000
|
240,209
|
| Crawford
Hospital District, Unlimited General Obligation |
|
|
| Insured:
AGM |
|
|
| 4.00%,
due 1/1/23 |
265,000
|
265,277
|
| Insured:
AGM |
|
|
| 4.00%,
due 1/1/24 |
280,000
|
281,482
|
| Insured:
AGM |
|
|
| 4.00%,
due 1/1/25 |
285,000
|
287,926
|
| Insured:
AGM |
|
|
| 4.00%,
due 1/1/26 |
300,000
|
304,272
|
| Darien-Woodridge
Fire Protection District, Unlimited General Obligation |
|
|
| Insured:
BAM |
|
|
| 3.00%,
due 12/30/22 |
75,000
|
74,927
|
| Insured:
BAM |
|
|
| 3.00%,
due 12/30/23 |
100,000
|
99,200
|
| Insured:
BAM |
|
|
| 3.00%,
due 12/30/25 |
100,000
|
97,783
|
| Illinois
Finance Authority, Regenct Park, Revenue Bonds |
|
|
| (zero
coupon), due 7/15/25 |
11,295,000
|
10,216,669
|
| |
Principal
Amount |
Value
|
| |
| Illinois
(continued) |
| Illinois
Finance Authority, Learn Charter School Project, Revenue Bonds |
|
|
| 4.00%,
due 11/1/22 |
$
125,000 |
$ 125,000
|
| 4.00%,
due 11/1/23 |
135,000 |
134,595 |
| 4.00%,
due 11/1/24 |
135,000 |
133,430 |
| 4.00%,
due 11/1/25 |
210,000 |
206,034 |
| 4.00%,
due 11/1/26 |
215,000 |
209,345 |
| Illinois
Finance Authority, OSF Healthcare System, Revenue Bonds |
|
|
| Series
A |
|
|
| 5.00%,
due 5/15/23 |
400,000
|
403,248
|
| Illinois
Sports Facilities Authority (The), Revenue Bonds |
|
|
| Insured:
AGM |
|
|
| 5.00%,
due 6/15/25 |
115,000
|
116,800
|
| Illinois
State Toll Highway Authority, Revenue Bonds |
|
|
| Series
A |
|
|
| 5.00%,
due 12/1/22 |
3,010,000
|
3,014,439
|
| Illinois
State University, Auxiliary Facilities System, Revenue Bonds |
|
|
| Insured:
AGM |
|
|
| 5.00%,
due 4/1/24 |
2,360,000
|
2,404,104
|
| Kane
County School District No. 129 West Aurora, Unlimited General Obligation |
|
|
| Series
C, Insured: BAM |
|
|
| 5.00%,
due 2/1/25 |
1,800,000
|
1,854,608
|
| Kane
County School District No. 131 Aurora East Side, Unlimited General Obligation |
|
|
| Insured:
BAM |
|
|
| 4.00%,
due 12/1/22 |
580,000
|
580,324
|
| Kankakee
County School District No. 111 Kankakee, Limited General Obligation |
|
|
| Insured:
BAM |
|
|
| 4.00%,
due 1/1/24 |
370,000
|
372,211
|
| Insured:
BAM |
|
|
| 4.00%,
due 1/1/25 |
390,000
|
393,942
|
| Knox
& Warren Counties Community Unit School District No. 205 Galesburg, Unlimited General Obligation |
|
|
| Series
A, Insured: BAM |
|
|
| 4.00%,
due 12/1/25 |
685,000
|
692,663
|
The notes to the financial statements are an integral part of, and
should be read in conjunction with, the financial statements.
23
Portfolio of
Investments October 31, 2022† (Unaudited) (continued)
| |
Principal
Amount |
Value
|
| Long-Term
Municipal Bonds (continued) |
| Illinois
(continued) |
| Knox
& Warren Counties Community Unit School District No. 205 Galesburg, Unlimited General Obligation (continued) |
|
|
| Series
B, Insured: BAM |
|
|
| 4.00%,
due 1/1/26 |
$
640,000 |
$ 647,199
|
| Series
A, Insured: BAM |
|
|
| 4.00%,
due 12/1/26 |
680,000 |
688,417 |
| La
Salle County School District No. 141 Ottawa, Unlimited General Obligation |
|
|
| Insured:
AGM |
|
|
| 4.00%,
due 12/1/22 |
370,000 |
370,177 |
| Lake
County Community Consolidated School District No. 3 Beach Park, Unlimited General Obligation |
|
|
| Insured:
AGM |
|
|
| 4.00%,
due 2/1/24 |
405,000
|
407,176
|
| Insured:
AGM |
|
|
| 4.00%,
due 2/1/25 |
450,000
|
454,767
|
| Lake
County Consolidated High School District No. 120 Mundelein, Limited General Obligation |
|
|
| 5.50%,
due 12/1/25 |
250,000
|
263,546
|
| 5.50%,
due 12/1/26 |
260,000
|
278,163
|
| Macon
& De Witt Counties Community Unit School District No. 2, Unlimited General Obligation |
|
|
| Insured:
AGM |
|
|
| 4.00%,
due 12/1/25 |
385,000
|
388,747
|
| Insured:
AGM |
|
|
| 4.00%,
due 12/1/26 |
415,000
|
419,666
|
| Insured:
AGM |
|
|
| 4.00%,
due 12/1/27 |
350,000
|
354,559
|
| Macon
County School District No. 61 Decatur, Unlimited General Obligation |
|
|
| Series
C, Insured: AGM |
|
|
| 4.00%,
due 1/1/24 |
750,000
|
755,250
|
| Insured:
AGM |
|
|
| 4.00%,
due 12/1/24 |
100,000
|
100,775
|
| Insured:
AGM |
|
|
| 4.00%,
due 12/1/27 |
1,020,000
|
1,021,565
|
| |
Principal
Amount |
Value
|
| |
| Illinois
(continued) |
| Macoupin
County Community Unit School District No. 1 Carlinville, Limited General Obligation |
|
|
| Series
B, Insured: BAM |
|
|
| 3.00%,
due 12/1/26 |
$
750,000 |
$ 726,835
|
| Madison-Macoupin
Etc Counties Community College District No. 536, Revenue Bonds |
|
|
| Series
A, Insured: BAM |
|
|
| 4.00%,
due 11/1/22 |
350,000 |
350,000 |
| Madison-Macoupin
Etc Counties Community College District No. 536, Lewis & Clark Community Project, Unlimited General Obligation |
|
|
| 5.00%,
due 11/1/22 |
420,000 |
420,000 |
| McHenry
& Kane Counties Community Consolidated School District No. 158 Huntley, Unlimited General Obligation |
|
|
| Insured:
AGM-CR |
|
|
| (zero
coupon), due 1/1/24 |
350,000
|
334,468
|
| Metropolitan
Pier & Exposition Authority, Revenue Bonds |
|
|
| Series
A, Insured: NATL-RE |
|
|
| (zero
coupon), due 12/15/22 |
115,000
|
114,426
|
| Metropolitan
Pier & Exposition Authority, McCormick Place Expansion Project, Revenue Bonds |
|
|
| Insured:
NATL-RE |
|
|
| (zero
coupon), due 12/15/23 |
175,000
|
166,685
|
| Montgomery
& Macoupin Counties Community Unit School District No. 12 Litchfield, Unlimited General Obligation |
|
|
| Series
C, Insured: BAM |
|
|
| 4.00%,
due 10/1/25 |
355,000
|
359,057
|
| Series
C, Insured: BAM |
|
|
| 4.00%,
due 10/1/26 |
380,000
|
384,904
|
| Series
C, Insured: BAM |
|
|
| 4.00%,
due 10/1/27 |
405,000
|
411,928
|
| Series
C, Insured: BAM |
|
|
| 4.00%,
due 10/1/28 |
430,000
|
435,396
|
| Northern
Illinois University, Revenue Bonds |
|
|
| Series
B, Insured: BAM |
|
|
| 5.00%,
due 4/1/23 |
240,000
|
241,562
|
The notes to the financial statements are an integral part of, and
should be read in conjunction with, the financial statements.
| 24
|
MainStay MacKay Short Term
Municipal Fund |
| |
Principal
Amount |
Value
|
| Long-Term
Municipal Bonds (continued) |
| Illinois
(continued) |
| Northern
Illinois University, Revenue Bonds (continued) |
|
|
| Series
B, Insured: BAM |
|
|
| 5.00%,
due 4/1/25 |
$
850,000 |
$ 871,056
|
| Public
Building Commission of Chicago, Revenue Bonds |
|
|
| Insured:
AMBAC |
|
|
| 5.25%,
due 3/1/24 |
1,000,000 |
1,018,900 |
| Regional
Transportation Authority, Revenue Bonds |
|
|
| Series
A, Insured: NATL-RE |
|
|
| 6.00%,
due 7/1/23 |
1,145,000
|
1,164,158
|
| Rock
Island County Metropolitan Airport Authority, Unlimited General Obligation |
|
|
| Insured:
AGM |
|
|
| 4.00%,
due 12/1/22 |
1,185,000
|
1,185,498
|
| Rock
Island County School District No. 41 Rock Island, Unlimited General Obligation |
|
|
| Insured:
BAM |
|
|
| 4.00%,
due 12/1/23 |
385,000
|
387,770
|
| Saline
County Community Unit School District No. 3 Harrisburg, Unlimited General Obligation |
|
|
| Series
B, Insured: BAM |
|
|
| 3.00%,
due 12/1/26 |
765,000
|
741,371
|
| Sangamon
County School District No. 186 Springfield, Unlimited General Obligation |
|
|
| Series
C, Insured: AGM |
|
|
| 4.00%,
due 6/1/24 |
1,000,000
|
1,006,262
|
| Series
C, Insured: AGM |
|
|
| 4.00%,
due 6/1/25 |
875,000
|
882,603
|
| Series
C, Insured: AGM |
|
|
| 5.00%,
due 6/1/26 |
910,000
|
947,052
|
| Series
C, Insured: AGM |
|
|
| 5.00%,
due 6/1/27 |
955,000
|
1,003,152
|
| South
Sangamon Water Commission, Alternative Revenue Source, Unlimited General Obligation |
|
|
| Insured:
AGM |
|
|
| 4.00%,
due 1/1/23 |
165,000
|
165,061
|
| Insured:
AGM |
|
|
| 4.00%,
due 1/1/24 |
350,000
|
350,505
|
| Insured:
AGM |
|
|
| 4.00%,
due 1/1/25 |
250,000
|
250,457
|
| |
Principal
Amount |
Value
|
| |
| Illinois
(continued) |
| Southern
Illinois University, Housing & Auxiliary Facilities System, Revenue Bonds |
|
|
| Series
B, Insured: BAM |
|
|
| 5.00%,
due 4/1/26 |
$
1,175,000 |
$ 1,205,742
|
| Stark
Knox Marshall Henry & Peoria Counties Community Unit School Dist No. 100, Unlimited General Obligation |
|
|
| Insured:
BAM |
|
|
| 4.00%,
due 12/1/26 |
260,000 |
264,106 |
| State
of Illinois, Unlimited General Obligation |
|
|
| 5.00%,
due 7/1/23 |
400,000 |
402,526 |
| Series
A |
|
|
| 5.00%,
due 10/1/23 |
200,000
|
201,530
|
| Series
A |
|
|
| 5.00%,
due 10/1/24 |
200,000
|
201,788
|
| Series
D |
|
|
| 5.00%,
due 11/1/24 |
10,000,000
|
10,088,776
|
| Series
D |
|
|
| 5.00%,
due 11/1/25 |
5,000,000
|
5,040,072
|
| Series
A |
|
|
| 5.00%,
due 12/1/26 |
1,980,000
|
1,994,074
|
| Series
A |
|
|
| 5.00%,
due 3/1/27 |
525,000
|
528,415
|
| Series
D |
|
|
| 5.00%,
due 11/1/27 |
2,175,000
|
2,183,559
|
| Series
A |
|
|
| 5.00%,
due 3/1/29 |
3,745,000
|
3,751,184
|
| Series
C |
|
|
| 5.00%,
due 11/1/29 |
5,920,000
|
5,925,146
|
| Series
B |
|
|
| 5.15%,
due 1/1/24 |
500,000
|
499,436
|
| Series
A |
|
|
| 5.25%,
due 10/1/23 |
10,000,000
|
10,004,260
|
| State
of Illinois, Unlimited General Obligation, First Series |
|
|
| Insured:
NATL-RE |
|
|
| 6.00%,
due 11/1/26 |
4,115,000
|
4,276,334
|
| Village
of Antioch IL, Green Bond, Unlimited General Obligation |
|
|
| Insured:
BAM |
|
|
| 4.00%,
due 12/1/27 |
875,000
|
892,788
|
| Village
of Brookfield IL, Unlimited General Obligation |
|
|
| Insured:
BAM |
|
|
| 4.00%,
due 3/1/23 |
270,000
|
270,657
|
The notes to the financial statements are an integral part of, and
should be read in conjunction with, the financial statements.
25
Portfolio of
Investments October 31, 2022† (Unaudited) (continued)
| |
Principal
Amount |
Value
|
| Long-Term
Municipal Bonds (continued) |
| Illinois
(continued) |
| Village
of Franklin Park IL, Revenue Bonds |
|
|
| Series
A, Insured: BAM |
|
|
| 3.00%,
due 10/1/25 |
$
280,000 |
$ 273,817
|
| Insured:
BAM |
|
|
| 5.00%,
due 4/1/23 |
10,000 |
10,067 |
| Village
of McCook IL, Unlimited General Obligation |
|
|
| Series
A, Insured: AGM |
|
|
| 4.00%,
due 12/1/23 |
230,000 |
231,411 |
| Village
of Park Forest IL, Green Bond, Unlimited General Obligation |
|
|
| Insured:
BAM |
|
|
| 4.00%,
due 1/1/26 |
500,000
|
507,025
|
| Insured:
BAM |
|
|
| 4.00%,
due 1/1/27 |
525,000
|
533,181
|
| Village
of Sauk Village IL, Unlimited General Obligation |
|
|
| Series
C, Insured: BAM |
|
|
| 4.00%,
due 12/1/22 |
100,000
|
100,040
|
| Series
C, Insured: BAM |
|
|
| 4.00%,
due 12/1/23 |
1,030,000
|
1,034,689
|
| Village
of Stone Park IL, Unlimited General Obligation |
|
|
| Series
B, Insured: BAM |
|
|
| 4.00%,
due 2/1/24 |
135,000
|
135,693
|
| Series
B, Insured: BAM |
|
|
| 4.00%,
due 2/1/25 |
150,000
|
151,244
|
| Village
of Westchester IL, Unlimited General Obligation |
|
|
| Insured:
BAM |
|
|
| 4.00%,
due 12/1/26 |
290,000
|
295,242
|
| West
Chicago Park District, Unlimited General Obligation |
|
|
| Series
B, Insured: BAM |
|
|
| 3.00%,
due 12/1/23 |
225,000
|
223,515
|
| Series
B, Insured: BAM |
|
|
| 3.00%,
due 12/1/24 |
485,000
|
478,095
|
| Series
B, Insured: BAM |
|
|
| 3.00%,
due 12/1/25 |
520,000
|
507,849
|
| Western
Illinois University, Revenue Bonds |
|
|
| Insured:
BAM |
|
|
| 4.00%,
due 4/1/26 |
1,340,000
|
1,348,030
|
| Insured:
BAM |
|
|
| 4.00%,
due 4/1/27 |
1,400,000
|
1,404,882
|
| |
Principal
Amount |
Value
|
| |
| Illinois
(continued) |
| White
Oak Library District, Unlimited General Obligation |
|
|
| 5.00%,
due 1/1/23 |
$
430,000 |
$ 431,214
|
| Will
County Community High School District No. 210 Lincoln-Way, Unlimited General Obligation |
|
|
| Insured:
AGM |
|
|
| (zero
coupon), due 1/1/25 |
685,000 |
627,954 |
| Will
County Community Unit School District No. 201-U, Crete-Monee, Limited General Obligation |
|
|
| Series
E, Insured: AGM |
|
|
| 5.00%,
due 1/1/24 |
275,000 |
279,783 |
| Series
E, Insured: AGM |
|
|
| 5.00%,
due 1/1/25 |
340,000
|
350,173
|
| Woodford
Lasalle Livingston Etc Counties Community Unit Sch Dist No. 6 Fieldcrest, Unlimited General Obligation |
|
|
| Series
A, Insured: BAM |
|
|
| 4.00%,
due 12/1/25 |
200,000
|
202,587
|
| Series
A, Insured: BAM |
|
|
| 4.00%,
due 12/1/26 |
175,000
|
177,431
|
| Series
A, Insured: BAM |
|
|
| 4.00%,
due 12/1/26 |
330,000
|
334,585
|
| Series
A, Insured: BAM |
|
|
| 4.00%,
due 12/1/27 |
285,000
|
289,637
|
| Series
A, Insured: BAM |
|
|
| 4.00%,
due 12/1/27 |
400,000
|
406,508
|
| |
|
156,865,317
|
| Indiana
1.5% |
| Center
Grove Community School Corp., Limited General Obligation |
|
|
| Insured:
State Intercept |
|
|
| 5.00%,
due 7/1/23 (e) |
2,830,000
|
2,846,972
|
| City
of Evansville IN, Medical School Project, Tax Allocation |
|
|
| Series
A, Insured: BAM |
|
|
| 5.00%,
due 2/1/23 |
535,000
|
537,274
|
| City
of Goshen IN, Sewage Works, Revenue Bonds |
|
|
| Insured:
AGM |
|
|
| 3.00%,
due 1/1/23 |
185,000
|
184,886
|
| Greater
Clark Building Corp., Revenue Bonds |
|
|
| Insured:
State Intercept |
|
|
| 5.00%,
due 7/15/24 |
225,000
|
230,810
|
The notes to the financial statements are an integral part of, and
should be read in conjunction with, the financial statements.
| 26
|
MainStay MacKay Short Term
Municipal Fund |
| |
Principal
Amount |
Value
|
| Long-Term
Municipal Bonds (continued) |
| Indiana
(continued) |
| Greater
Clark Building Corp., Revenue Bonds (continued) |
|
|
| Insured:
State Intercept |
|
|
| 5.00%,
due 1/15/25 |
$
325,000 |
$ 334,399
|
| Insured:
State Intercept |
|
|
| 5.00%,
due 7/15/25 |
475,000 |
491,364 |
| Insured:
State Intercept |
|
|
| 5.00%,
due 1/15/26 |
655,000 |
680,939 |
| Insured:
State Intercept |
|
|
| 5.00%,
due 7/15/26 |
1,190,000
|
1,243,645
|
| Greater
Jasper School Building Corp., Indiana Ad Valorem Property Tax, 1st Mortgage, Revenue Bonds |
|
|
| Insured:
State Intercept |
|
|
| 5.00%,
due 1/15/27 |
100,000
|
105,117
|
| Indiana
Finance Authority, Indianapolis Power & Light Co., Revenue Bonds |
|
|
| Series
A |
|
|
| 1.40%,
due 8/1/29 (a) |
4,095,000
|
3,279,034
|
| Indiana
Finance Authority, BHI Senior Living, Inc., Revenue Bonds |
|
|
| Series
B |
|
|
| 2.45%,
due 11/15/25 |
355,000
|
319,411
|
| Series
B |
|
|
| 2.52%,
due 11/15/26 |
515,000
|
453,583
|
| Series
B |
|
|
| 2.92%,
due 11/15/27 |
655,000
|
568,186
|
| Indiana
Finance Authority, University Health, Revenue Bonds |
|
|
| Series
A |
|
|
| 5.00%,
due 12/1/22 |
250,000
|
250,344
|
| Indiana
Finance Authority, Marian University Project, Revenue Bonds |
|
|
| Series
A |
|
|
| 5.00%,
due 9/15/23 |
75,000
|
75,568
|
| Indianapolis
Local Public Improvement Bond Bank, Revenue Bonds (b) |
|
|
| Series
D |
|
|
| 5.00%,
due 1/1/26 |
2,495,000
|
2,555,242
|
| Series
D |
|
|
| 5.00%,
due 1/1/29 |
1,480,000
|
1,489,051
|
| Muncie
Sanitary District, Revenue Bonds |
|
|
| Series
A, Insured: AGM |
|
|
| 4.00%,
due 7/1/25 |
975,000
|
988,860
|
| Series
A, Insured: AGM |
|
|
| 5.00%,
due 1/1/26 |
215,000
|
223,748
|
| |
Principal
Amount |
Value
|
| |
| Indiana
(continued) |
| Muncie
Sanitary District, Revenue Bonds (continued) |
|
|
| Series
A, Insured: AGM |
|
|
| 5.00%,
due 7/1/26 |
$
525,000 |
$ 549,367
|
| Terre
Haute Sanitary District, Revenue Bonds |
|
|
| Series
A, Insured: BAM |
|
|
| 3.00%,
due 1/1/23 |
320,000 |
319,699 |
| Series
A, Insured: BAM |
|
|
| 3.00%,
due 7/1/23 |
390,000 |
388,438 |
| Series
A, Insured: BAM |
|
|
| 3.00%,
due 1/1/24 |
350,000
|
347,254
|
| Series
A, Insured: BAM |
|
|
| 3.00%,
due 7/1/24 |
385,000
|
379,829
|
| Series
A, Insured: BAM |
|
|
| 3.00%,
due 7/1/25 |
290,000
|
282,981
|
| Series
A, Insured: BAM |
|
|
| 3.00%,
due 7/1/26 |
280,000
|
269,671
|
| Wayne
Township Metropolitan School District, Limited General Obligation |
|
|
| Insured:
State Intercept |
|
|
| 4.00%,
due 1/15/23 |
1,035,000
|
1,036,230
|
| |
|
20,431,902
|
| Iowa
1.5% |
| Cedar
Falls Community School District, Unlimited General Obligation |
|
|
| Insured:
AGM |
|
|
| 4.00%,
due 6/1/24 |
2,440,000
|
2,464,264
|
| Insured:
AGM |
|
|
| 4.00%,
due 6/1/25 |
2,540,000
|
2,576,465
|
| City
of Coralville IA, Unlimited General Obligation |
|
|
| Series
C |
|
|
| 4.00%,
due 5/1/26 |
645,000
|
645,182
|
| Series
C |
|
|
| 4.00%,
due 5/1/28 |
500,000
|
498,858
|
| City
of New Hampton IA, Electric, Revenue Bonds |
|
|
| Insured:
BAM |
|
|
| 3.00%,
due 6/1/23 |
140,000
|
139,560
|
| Insured:
BAM |
|
|
| 3.00%,
due 6/1/24 |
140,000
|
138,600
|
| City
of Orange IA, Water, Revenue Bonds |
|
|
| Series
B, Insured: AGM |
|
|
| 5.00%,
due 6/1/23 |
250,000
|
252,389
|
The notes to the financial statements are an integral part of, and
should be read in conjunction with, the financial statements.
27
Portfolio of
Investments October 31, 2022† (Unaudited) (continued)
| |
Principal
Amount |
Value
|
| Long-Term
Municipal Bonds (continued) |
| Iowa
(continued) |
| City
of Orange IA, Water, Revenue Bonds (continued) |
|
|
| Series
B, Insured: AGM |
|
|
| 5.00%,
due 6/1/25 |
$
390,000 |
$ 404,345
|
| Series
B, Insured: AGM |
|
|
| 5.00%,
due 6/1/27 |
425,000 |
450,095 |
| Collins-Maxwell
Community School District Sales Services & Use Tax, Revenue Bonds |
|
|
| Insured:
BAM |
|
|
| 4.00%,
due 6/1/27 |
195,000 |
199,505 |
| Insured:
BAM |
|
|
| 4.00%,
due 6/1/28 |
205,000
|
210,482
|
| Insured:
BAM |
|
|
| 4.00%,
due 6/1/29 |
215,000
|
221,429
|
| Iowa
Finance Authority, Renewable Natural Gas Project, Green Bond, Revenue Bonds |
|
|
| 1.50%,
due 1/1/42 (a)(b) |
2,000,000
|
1,936,442
|
| Iowa
Higher Education Loan Authority, University of Dubuque Project, Revenue Bonds |
|
|
| 4.00%,
due 10/1/26 |
200,000
|
197,794
|
| 4.00%,
due 10/1/27 |
200,000
|
196,706
|
| Iowa
Higher Education Loan Authority, Des Moines University Project, Revenue Bonds |
|
|
| 5.00%,
due 10/1/23 |
515,000
|
519,308
|
| 5.00%,
due 10/1/24 |
550,000
|
557,965
|
| 5.00%,
due 10/1/25 |
570,000
|
582,344
|
| Iowa
Student Loan Liquidity Corp., Revenue Bonds |
|
|
| Series
A |
|
|
| 5.00%,
due 12/1/24 (b) |
275,000
|
279,837
|
| PEFA,
Inc., Revenue Bonds |
|
|
| 5.00%,
due 9/1/49 (a) |
7,940,000
|
7,934,734
|
| Waterloo
Community School District Infrastructure Sales Services & Use Tax, Revenue Bonds |
|
|
| Insured:
AGM |
|
|
| 4.00%,
due 7/1/25 |
400,000
|
405,584
|
| Insured:
AGM |
|
|
| 4.00%,
due 7/1/26 |
100,000
|
101,662
|
| |
|
20,913,550
|
| |
Principal
Amount |
Value
|
| |
| Kansas
0.2% |
| Chisholm
Creek Utility Authority, Revenue Bonds |
|
|
| Insured:
AMBAC |
|
|
| 5.25%,
due 9/1/23 |
$
1,165,000 |
$ 1,178,690
|
| Franklin
County Unified School District No. 287 West Franklin, Unlimited General Obligation |
|
|
| Insured:
AGM |
|
|
| 5.00%,
due 9/1/23 |
305,000 |
309,294 |
| Kansas
Development Finance Authority, Pittsburg State University, Revenue Bonds |
|
|
| Series
E, Insured: BAM |
|
|
| 5.00%,
due 2/1/25 |
715,000
|
737,629
|
| |
|
2,225,613
|
| Kentucky
1.2% |
| City
of Columbia KY, Lindsey Wilson College, Inc., Revenue Bonds |
|
|
| 4.00%,
due 12/1/22 |
175,000
|
175,012
|
| 4.00%,
due 12/1/24 |
465,000
|
464,275
|
| 4.00%,
due 12/1/26 |
500,000
|
494,771
|
| City
of Somerset KY, Unlimited General Obligation |
|
|
| Insured:
AGM |
|
|
| 4.00%,
due 6/1/26 |
200,000
|
202,564
|
| Insured:
AGM |
|
|
| 4.00%,
due 6/1/27 |
530,000
|
537,438
|
| Kentucky
Economic Development Finance Authority, Next Generation Kentucky Information Highway Project, Revenue Bonds, Senior Lien |
|
|
| 5.00%,
due 7/1/26 |
3,450,000
|
3,477,950
|
| Kentucky
Public Energy Authority, Gas Supply, Revenue Bonds |
|
|
| Series
C |
|
|
| 4.00%,
due 8/1/23 |
390,000
|
387,909
|
| Series
A |
|
|
| 4.00%,
due 4/1/48 (a) |
6,500,000
|
6,421,804
|
| Kentucky
State Property & Building Commission, Project No. 124, Revenue Bonds |
|
|
| Series
A, Insured: AGM |
|
|
| 5.00%,
due 11/1/27 |
1,500,000
|
1,589,847
|
The notes to the financial statements are an integral part of, and
should be read in conjunction with, the financial statements.
| 28
|
MainStay MacKay Short Term
Municipal Fund |
| |
Principal
Amount |
Value
|
| Long-Term
Municipal Bonds (continued) |
| Kentucky
(continued) |
| Kentucky
State University, Kentucky State University Project, Certificate of Participation |
|
|
| Insured:
BAM |
|
|
| 5.00%,
due 11/1/26 |
$
220,000 |
$ 231,372
|
| Insured:
BAM |
|
|
| 5.00%,
due 11/1/27 |
200,000 |
212,543 |
| Murray
Electric Plant Board, Revenue Bonds |
|
|
| Series
B, Insured: AGM |
|
|
| 4.00%,
due 12/1/22 |
230,000 |
230,119 |
| Paducah
Electric Plant Board, Revenue Bonds |
|
|
| Series
A, Insured: AGM |
|
|
| 5.00%,
due 10/1/24 |
600,000
|
617,597
|
| Rural
Water Financing Agency, Public Projects, Revenue Notes |
|
|
| Series
A |
|
|
| 0.40%,
due 5/1/23 |
2,000,000
|
1,963,927
|
| |
|
17,007,128
|
| Louisiana
2.2% |
| Cameron
Parish School District No. 15, Unlimited General Obligation |
|
|
| 5.00%,
due 10/1/24 |
340,000
|
347,121
|
| 5.00%,
due 10/1/25 |
220,000
|
226,774
|
| 5.00%,
due 10/1/26 |
230,000
|
238,768
|
| City
of Shreveport LA, Water & Sewer, Revenue Bonds |
|
|
| Series
B, Insured: BAM |
|
|
| 5.00%,
due 12/1/26 |
210,000
|
222,356
|
| Louisiana
Local Government Environmental Facilities & Community Development Authority, City of Crowley Louisiana Project, Revenue Bonds |
|
|
| Insured:
BAM |
|
|
| 4.00%,
due 10/1/23 |
515,000
|
517,632
|
| Insured:
BAM |
|
|
| 4.00%,
due 10/1/24 |
535,000
|
541,060
|
| |
Principal
Amount |
Value
|
| |
| Louisiana
(continued) |
| Louisiana
Local Government Environmental Facilities & Community Development Authority, University Facilities, Inc. Project, Revenue Bonds |
|
|
| Insured:
AGM |
|
|
| 4.00%,
due 10/1/24 |
$
395,000 |
$ 398,597
|
| Insured:
AGM |
|
|
| 4.00%,
due 10/1/25 |
305,000 |
308,750 |
| Louisiana
Local Government Environmental Facilities & Community Development Authority, Innovative Student Facilities, Inc. Project, Revenue Bonds |
|
|
| Insured:
BAM |
|
|
| 5.00%,
due 10/1/23 |
230,000 |
233,497 |
| Insured:
BAM |
|
|
| 5.00%,
due 10/1/24 |
225,000
|
231,388
|
| Insured:
BAM |
|
|
| 5.00%,
due 10/1/25 |
250,000
|
260,287
|
| Louisiana
Local Government Environmental Facilities & Community Development Authority, Ragin Cajun Facilities, Inc., Revenue Bonds |
|
|
| Insured:
AGM |
|
|
| 5.00%,
due 10/1/24 |
1,770,000
|
1,812,329
|
| Louisiana
Public Facilities Authority, Loyola University Project, Revenue Bonds |
|
|
| 5.00%,
due 10/1/26 |
165,000
|
167,637
|
| Louisiana
Stadium & Exposition District, Revenue Notes |
|
|
| Series
A |
|
|
| 1.872%,
due 7/3/23 (c) |
7,000,000
|
6,830,491
|
| Louisiana
Stadium & Exposition District, Revenue Bonds |
|
|
| 4.00%,
due 7/3/23 |
6,150,000
|
6,146,833
|
| 5.00%,
due 7/3/23 |
10,500,000
|
10,513,826
|
| Louisiana
Stadium & Exposition District, Revenue Bonds, Senior Lien |
|
|
| Series
A |
|
|
| 5.00%,
due 7/1/23 |
800,000
|
807,922
|
The notes to the financial statements are an integral part of, and
should be read in conjunction with, the financial statements.
29
Portfolio of
Investments October 31, 2022† (Unaudited) (continued)
| |
Principal
Amount |
Value
|
| Long-Term
Municipal Bonds (continued) |
| Louisiana
(continued) |
| Rapides
Parish Recreation District Ward No. 9, Unlimited General Obligation |
|
|
| Insured:
AGM |
|
|
| 3.00%,
due 3/1/23 |
$
120,000 |
$ 119,742
|
| Insured:
AGM |
|
|
| 3.00%,
due 3/1/24 |
130,000 |
128,797 |
| Insured:
AGM |
|
|
| 3.00%,
due 3/1/25 |
150,000 |
147,603
|
| |
|
30,201,410
|
| Maine
0.2% |
| Finance
Authority of Maine, Supplemental Education Loan Program, Revenue Bonds (b) |
|
|
| Insured:
AGM |
|
|
| 5.00%,
due 12/1/22 |
500,000
|
500,656
|
| Insured:
AGM |
|
|
| 5.00%,
due 12/1/23 |
545,000
|
552,915
|
| Insured:
AGM |
|
|
| 5.00%,
due 12/1/24 |
520,000
|
531,751
|
| Insured:
AGM |
|
|
| 5.00%,
due 12/1/25 |
475,000
|
488,984
|
| |
|
2,074,306
|
| Maryland
1.6% |
| Maryland
Economic Development Corp., Terminal Project, Revenue Bonds |
|
|
| 3.40%,
due 6/1/23 |
750,000
|
740,777
|
| Series
B |
|
|
| 3.60%,
due 6/1/23 |
3,925,000
|
3,881,151
|
| 3.70%,
due 6/1/25 |
1,000,000
|
952,593
|
| Maryland
Economic Development Corp., University of Maryland, College Park Projects, Revenue Bonds |
|
|
| Insured:
AGM |
|
|
| 4.00%,
due 6/1/25 |
300,000
|
303,178
|
| Maryland
Health & Higher Educational Facilities Authority, Johns Hopkins University Issue, Revenue Bonds |
|
|
| Series
B |
|
|
| 5.00%,
due 7/1/23 |
345,000
|
349,053
|
| |
Principal
Amount |
Value
|
| |
| Maryland
(continued) |
| Maryland
Health & Higher Educational Facilities Authority, Stevenson University, Inc. Project, Revenue Bonds |
|
|
| 5.00%,
due 6/1/28 |
$
200,000 |
$ 204,301
|
| 5.00%,
due 6/1/30 |
350,000 |
356,605 |
| State
of Maryland, Unlimited General Obligation |
|
|
| Series
C |
|
|
| 0.41%,
due 8/1/23 |
8,800,000 |
8,540,208 |
| State
of Maryland, Unlimited General Obligation, Second Series |
|
|
| Series
A |
|
|
| 5.00%,
due 8/1/25 |
6,700,000
|
7,007,512
|
| |
|
22,335,378
|
| Massachusetts
0.4% |
| City
of Fall River MA, Qualified Municipal Purpose Loan, Limited General Obligation |
|
|
| Insured:
State Aid Withholding |
|
|
| 5.00%,
due 12/1/26 |
350,000
|
371,965
|
| Insured:
State Aid Withholding |
|
|
| 5.00%,
due 12/1/27 |
315,000
|
338,196
|
| Massachusetts
Development Finance Agency, South Shore Hospital Issue, Revenue Bonds |
|
|
| Series
I |
|
|
| 5.00%,
due 7/1/23 |
555,000
|
559,658
|
| Massachusetts
Educational Financing Authority, Revenue Bonds, Senior Lien |
|
|
| Series
B |
|
|
| 5.00%,
due 7/1/25 (b) |
100,000
|
102,175
|
| Massachusetts
Educational Financing Authority, Revenue Bonds |
|
|
| 5.00%,
due 1/1/27 (b) |
3,000,000
|
3,041,602
|
| Massachusetts
State College Building Authority, Capital Appreciation, Revenue Bonds |
|
|
| Series
A, Insured: NATL-RE |
|
|
| (zero
coupon), due 5/1/23 |
145,000
|
142,672
|
| Southfield
Redevelopment Authority, Revenue Bonds |
|
|
| Series
A, Insured: BAM |
|
|
| 6.00%,
due 8/15/24 |
455,000
|
475,896
|
The notes to the financial statements are an integral part of, and
should be read in conjunction with, the financial statements.
| 30
|
MainStay MacKay Short Term
Municipal Fund |
| |
Principal
Amount |
Value
|
| Long-Term
Municipal Bonds (continued) |
| Massachusetts
(continued) |
| Southfield
Redevelopment Authority, Revenue Bonds (continued) |
|
|
| Series
A, Insured: BAM |
|
|
| 6.00%,
due 8/15/25 |
$
455,000 |
$ 483,436
|
| |
|
5,515,600
|
| Michigan
1.4% |
| Allen
Park Public School District, Unlimited General Obligation |
|
|
| Insured:
Q-SBLF |
|
|
| 5.00%,
due 5/1/24 |
630,000 |
644,375 |
| Allendale
Public School District, Unlimited General Obligation |
|
|
| Insured:
Q-SBLF |
|
|
| 5.00%,
due 11/1/22 |
525,000
|
525,000
|
| City
of Manistee MI, Limited General Obligation |
|
|
| Insured:
AGM |
|
|
| 3.00%,
due 10/1/24 |
200,000
|
197,373
|
| Insured:
AGM |
|
|
| 3.00%,
due 10/1/25 |
170,000
|
166,649
|
| City
of Port Huron MI, Water Supply System, Revenue Bonds |
|
|
| Insured:
AGM |
|
|
| 4.00%,
due 10/1/24 |
200,000
|
201,895
|
| Insured:
AGM |
|
|
| 4.00%,
due 10/1/25 |
210,000
|
214,325
|
| City
of Saginaw MI, Water Supply System, Revenue Bonds |
|
|
| Insured:
AGM |
|
|
| 4.00%,
due 7/1/27 |
905,000
|
921,765
|
| City
of Taylor MI, Michigan Transportation, Limited General Obligation |
|
|
| Insured:
BAM |
|
|
| 4.00%,
due 3/1/28 |
900,000
|
911,991
|
| County
of Genesee MI, Revenue Bonds |
|
|
| Series
A, Insured: BAM |
|
|
| 3.00%,
due 6/1/23 |
150,000
|
149,373
|
| Series
A, Insured: BAM |
|
|
| 3.00%,
due 6/1/24 |
160,000
|
157,083
|
| Fitzgerald
Public School District, Unlimited General Obligation |
|
|
| Insured:
BAM |
|
|
| 4.00%,
due 5/1/24 |
870,000
|
877,132
|
| |
Principal
Amount |
Value
|
| |
| Michigan
(continued) |
| Flint
Public Library, Unlimited General Obligation |
|
|
| Insured:
AGM |
|
|
| 3.00%,
due 5/1/26 |
$
10,000 |
$ 9,811
|
| Jackson
County Intermediate School District, School Building and Site Bonds, Limited General Obligation |
|
|
| Insured:
AGM |
|
|
| 5.00%,
due 5/1/27 |
275,000 |
291,459 |
| Lake
Superior State University, Revenue Bonds |
|
|
| Insured:
AGM |
|
|
| 4.00%,
due 11/15/25 |
760,000
|
764,022
|
| Insured:
AGM |
|
|
| 4.00%,
due 11/15/27 |
815,000
|
815,442
|
| Michigan
Finance Authority, Revenue Bonds, Senior Lien |
|
|
| Series
A-1 |
|
|
| 2.326%,
due 6/1/30 |
3,982,286
|
3,565,702
|
| Michigan
Finance Authority, Tobacco Settlement Asset-Backed, Revenue Bonds, Senior Lien |
|
|
| Series
A, Class 1 |
|
|
| 4.00%,
due 6/1/23 |
610,000
|
610,228
|
| Michigan
Finance Authority, Energy Conservation Local Project, Revenue Bonds |
|
|
| Series
B |
|
|
| 4.00%,
due 6/15/23 |
240,000
|
241,066
|
| Series
B |
|
|
| 4.00%,
due 6/15/24 |
270,000
|
272,782
|
| Series
B |
|
|
| 4.00%,
due 6/15/25 |
200,000
|
202,154
|
| Series
B |
|
|
| 4.00%,
due 6/15/26 |
385,000
|
390,198
|
| Michigan
Finance Authority, County of Wayne Criminal Center Justice Project, Revenue Bonds, Senior Lien |
|
|
| 5.00%,
due 11/1/22 |
500,000
|
500,000
|
| Michigan
Finance Authority, Student Loan Program, Revenue Bonds |
|
|
| Series
25-A |
|
|
| 5.00%,
due 11/1/22 (b) |
1,775,000
|
1,775,000
|
| Michigan
Finance Authority, Kettering University Project, Revenue Bonds |
|
|
| 5.00%,
due 9/1/24 |
200,000
|
203,738
|
| 5.00%,
due 9/1/27 |
550,000
|
570,387
|
The notes to the financial statements are an integral part of, and
should be read in conjunction with, the financial statements.
31
Portfolio of
Investments October 31, 2022† (Unaudited) (continued)
| |
Principal
Amount |
Value
|
| Long-Term
Municipal Bonds (continued) |
| Michigan
(continued) |
Michigan
Finance Authority, Kettering University Project, Revenue Bonds
(continued) |
|
|
| 5.00%,
due 9/1/28 |
$
500,000 |
$ 521,431
|
| Michigan
Strategic Fund, State of Michigan Department of Technology Management & Budget, Revenue Bonds |
|
|
| 5.00%,
due 3/1/27 |
1,000,000 |
1,033,659 |
| South
Huron Valley Utility Authority, Revenue Bonds |
|
|
| Insured:
BAM |
|
|
| 3.00%,
due 5/1/23 |
480,000 |
479,064 |
| Insured:
BAM |
|
|
| 4.00%,
due 5/1/24 |
500,000
|
504,900
|
| Insured:
BAM |
|
|
| 4.00%,
due 5/1/25 |
515,000
|
519,868
|
| Universal
Academy, Michigan Public School Academy, Revenue Bonds |
|
|
| 2.00%,
due 12/1/26 |
425,000
|
395,108
|
| |
|
18,632,980
|
| Minnesota
0.6% |
| Kenyon
Wanamingo Independent School District No. 2172, Unlimited General Obligation |
|
|
| Series
A, Insured: SD CRED PROG |
|
|
| 3.00%,
due 2/1/23 |
830,000
|
829,062
|
| Minneapolis-St.
Paul Metropolitan Airports Commission, Revenue Bonds |
|
|
| Series
B |
|
|
| 5.00%,
due 1/1/23 |
200,000
|
200,532
|
| Minnesota
Office of Higher Education, Supplemental Student Loan Program, Revenue Bonds |
|
|
| 5.00%,
due 11/1/24 (b) |
590,000
|
601,714
|
| Rochester
Independent School District No. 535, Unlimited General Obligation |
|
|
| Insured:
SD CRED PROG |
|
|
| 4.00%,
due 2/1/29 |
3,000,000
|
3,087,008
|
| Southern
Minnesota Municipal Power Agency, Capital Appreciation, Revenue Bonds |
|
|
| Series
A, Insured: NATL-RE |
|
|
| (zero
coupon), due 1/1/25 |
2,250,000
|
2,074,475
|
| |
Principal
Amount |
Value
|
| |
| Minnesota
(continued) |
| State
of Minnesota, Unlimited General Obligation |
|
|
| Series
B |
|
|
| 5.00%,
due 8/1/28 |
$
1,540,000 |
$ 1,675,819
|
| |
|
8,468,610
|
| Mississippi
0.3% |
| City
of Jackson MS, Unlimited General Obligation |
|
|
| 5.00%,
due 3/1/23 |
325,000 |
326,740 |
| Mississippi
Development Bank, Hinds County School District Project, Revenue Bonds |
|
|
| 4.00%,
due 3/1/24 |
330,000
|
332,431
|
| Mississippi
Development Bank, Madison County Highway Project, Revenue Bonds |
|
|
| Series
C |
|
|
| 5.00%,
due 1/1/26 |
2,210,000
|
2,306,650
|
| Mississippi
Development Bank, Municipal Energy Agency of Mississippi Power Supply Refunding Project, Revenue Bonds |
|
|
| Insured:
AGM |
|
|
| 5.00%,
due 3/1/27 |
300,000
|
311,666
|
| West
Rankin Utility Authority, Revenue Bonds |
|
|
| Insured:
AGM |
|
|
| 5.00%,
due 1/1/26 |
435,000
|
450,866
|
| |
|
3,728,353
|
| Missouri
0.4% |
| City
of Kansas City MO, Main Streetcar Extension Project, Revenue Bonds |
|
|
| Series
C |
|
|
| 5.00%,
due 9/1/24 |
1,000,000
|
1,029,936
|
| Series
C |
|
|
| 5.00%,
due 9/1/27 |
1,000,000
|
1,061,789
|
| Series
C |
|
|
| 5.00%,
due 9/1/28 |
675,000
|
723,047
|
| City
of St Louis MO, Unlimited General Obligation |
|
|
| Series
A, Insured: BAM |
|
|
| 5.00%,
due 2/15/30 |
400,000
|
417,596
|
The notes to the financial statements are an integral part of, and
should be read in conjunction with, the financial statements.
| 32
|
MainStay MacKay Short Term
Municipal Fund |
| |
Principal
Amount |
Value
|
| Long-Term
Municipal Bonds (continued) |
| Missouri
(continued) |
| Health
& Educational Facilities Authority of the State of Missouri, Lake Regional Health System, Revenue Bonds |
|
|
| 5.00%,
due 2/15/27 |
$
250,000 |
$ 256,424
|
| 5.00%,
due 2/15/28 |
260,000 |
267,855 |
| Kansas
City Municipal Assistance Corp., Capital Appreciation, Revenue Bonds |
|
|
| Insured:
AGC-ICC AMBAC |
|
|
| (zero
coupon), due 4/15/23 |
880,000 |
867,022 |
| Lincoln
University, Auxiliary System, Revenue Bonds |
|
|
| Insured:
AGM |
|
|
| 5.00%,
due 6/1/23 |
320,000
|
323,076
|
| |
|
4,946,745
|
| Montana
0.1% |
| Gallatin
County School District No. 72 Ophir, Unlimited General Obligation |
|
|
| 4.00%,
due 7/1/26 |
750,000
|
761,356
|
| State
of Montana, Unlimited General Obligation |
|
|
| Series
C |
|
|
| 5.00%,
due 8/1/24 |
440,000
|
453,371
|
| |
|
1,214,727
|
| Nebraska
0.3% |
| Ashland-Greenwood
Public Schools, Unlimited General Obligation |
|
|
| Insured:
AGM |
|
|
| 4.00%,
due 12/15/23 |
100,000
|
100,797
|
| Insured:
AGM |
|
|
| 4.00%,
due 12/15/24 |
100,000
|
101,357
|
| Insured:
AGM |
|
|
| 4.00%,
due 12/15/25 |
100,000
|
101,594
|
| Insured:
AGM |
|
|
| 4.00%,
due 12/15/26 |
135,000
|
137,407
|
| Central
Plains Energy Project, Revenue Bonds |
|
|
| 2.50%,
due 12/1/49 (a) |
1,550,000
|
1,468,091
|
| Cheyenne
County School District No. 1, Unlimited General Obligation |
|
|
| Series
B, Insured: AGM |
|
|
| 4.00%,
due 12/15/22 |
585,000
|
585,540
|
| Series
B, Insured: AGM |
|
|
| 4.00%,
due 12/15/23 |
650,000
|
654,896
|
| |
Principal
Amount |
Value
|
| |
| Nebraska
(continued) |
| Lincoln
Airport Authority, Revenue Bonds |
|
|
| 5.00%,
due 7/1/23 |
$
55,000 |
$ 55,526
|
| 5.00%,
due 7/1/26 |
790,000 |
812,722 |
| Omaha
Airport Authority, Revenue Bonds |
|
|
| Series
A |
|
|
| 5.00%,
due 12/15/22 (b) |
620,000 |
620,939
|
| |
|
4,638,869
|
| Nevada
0.6% |
| Clark
County School District, Limited General Obligation |
|
|
| Series
A, Insured: AGM |
|
|
| 3.00%,
due 6/15/23 |
650,000
|
648,444
|
| Series
A, Insured: AGM |
|
|
| 3.00%,
due 6/15/24 |
650,000
|
644,068
|
| Series
A, Insured: AGM |
|
|
| 5.00%,
due 6/15/25 |
3,780,000
|
3,928,627
|
| Series
D |
|
|
| 5.00%,
due 6/15/27 |
275,000
|
275,554
|
| Las
Vegas Convention & Visitors Authority, Revenue Bonds |
|
|
| Series
B |
|
|
| 5.00%,
due 7/1/23 |
150,000
|
151,436
|
| 5.00%,
due 7/1/26 |
2,000,000
|
2,092,825
|
| Series
B |
|
|
| 5.00%,
due 7/1/29 |
290,000
|
308,502
|
| Washoe
County School District, School Improvement Bonds, Limited General Obligation |
|
|
| Series
A |
|
|
| 5.00%,
due 10/1/23 |
535,000
|
543,569
|
| |
|
8,593,025
|
| New
Hampshire 0.0% ‡ |
| New
Hampshire Business Finance Authority, Pennichuck Water Works, Inc. Project, Revenue Bonds |
|
|
| 5.00%,
due 1/1/23 (b) |
600,000
|
601,525
|
| New
Jersey 4.5% |
| Atlantic
City Board of Education, Unlimited General Obligation |
|
|
| Insured:
AGM SCH BD RES FD |
|
|
| 4.00%,
due 4/1/24 |
325,000
|
327,753
|
The notes to the financial statements are an integral part of, and
should be read in conjunction with, the financial statements.
33
Portfolio of
Investments October 31, 2022† (Unaudited) (continued)
| |
Principal
Amount |
Value
|
| Long-Term
Municipal Bonds (continued) |
| New
Jersey (continued) |
| Buena
Regional School District, County of Atlantic, New Jersey School Energy Savings, Unlimited General Obligation |
|
|
| Insured:
AGM |
|
|
| 5.00%,
due 8/1/24 |
$
220,000 |
$ 226,119
|
| City
of Bridgeton NJ, General Improvement and Water\Sewer Utility Bonds, Unlimited General Obligation |
|
|
| Insured:
BAM |
|
|
| 3.00%,
due 3/1/27 |
390,000 |
374,580 |
| Insured:
BAM |
|
|
| 3.00%,
due 3/1/28 |
855,000 |
811,455 |
| City
of Millville NJ, Unlimited General Obligation |
|
|
| Insured:
AGM |
|
|
| 3.00%,
due 11/1/23 |
250,000
|
249,509
|
| City
of Newark NJ, Unlimited General Obligation |
|
|
| Series
A, Insured: AGM State Aid Withholding |
|
|
| 5.00%,
due 10/1/24 |
1,000,000
|
1,023,729
|
| Series
B, Insured: AGM SCH BD RES FD |
|
|
| 5.00%,
due 10/1/24 |
1,150,000
|
1,177,288
|
| Series
C, Insured: AGM State Aid Withholding |
|
|
| 5.00%,
due 10/1/24 |
145,000
|
148,441
|
| Series
A, Insured: AGM State Aid Withholding |
|
|
| 5.00%,
due 10/1/25 |
1,400,000
|
1,451,313
|
| City
of Perth Amboy NJ, Unlimited General Obligation |
|
|
| Insured:
AGM |
|
|
| 5.00%,
due 7/1/23 |
735,000
|
743,489
|
| Insured:
AGM |
|
|
| 5.00%,
due 7/1/24 |
760,000
|
780,455
|
| City
of Union City NJ, Unlimited General Obligation |
|
|
| Insured:
AGM State Aid Withholding |
|
|
| 0.05%,
due 8/1/24 |
1,210,000
|
1,106,601
|
| Insured:
AGM State Aid Withholding |
|
|
| 2.25%,
due 8/1/25 |
910,000
|
858,097
|
| |
Principal
Amount |
Value
|
| |
| New
Jersey (continued) |
| Essex
County Improvement Authority, North Star Academy Charter School Project, Revenue Bonds (c) |
|
|
| 2.37%,
due 8/1/23 |
$
500,000 |
$ 485,803
|
| 2.72%,
due 8/1/24 |
500,000 |
469,633 |
| 3.00%,
due 8/1/25 |
700,000 |
638,995 |
| 4.00%,
due 7/15/24 |
200,000 |
198,068 |
| 4.00%,
due 7/15/26 |
385,000 |
375,855 |
| Garden
State Preservation Trust, Revenue Bonds |
|
|
| Series
B, Insured: AGM |
|
|
| (zero
coupon), due 11/1/22 |
140,000
|
140,000
|
| Series
A |
|
|
| 5.00%,
due 11/1/22 |
1,200,000
|
1,200,000
|
| Garden
State Preservation Trust, Capital Appreciation, Revenue Bonds |
|
|
| Series
B, Insured: AGM |
|
|
| (zero
coupon), due 11/1/23 |
175,000
|
169,097
|
| Greater
Egg Harbor Regional High School District, Unlimited General Obligation |
|
|
| Insured:
AGM SCH BD RES FD |
|
|
| 5.00%,
due 2/1/23 |
650,000
|
652,665
|
| Manchester
Township Board of Education, Unlimited General Obligation |
|
|
| Insured:
BAM SCH BD RES FD |
|
|
| 4.00%,
due 3/1/23 |
355,000
|
355,700
|
| Morris-Union
Jointure Commission, Certificate of Participation |
|
|
| Insured:
AGM |
|
|
| 5.00%,
due 8/1/26 |
420,000
|
424,660
|
| New
Jersey Economic Development Authority, New Jersey-American Water Co., Inc., Revenue Bonds |
|
|
| Series
E |
|
|
| 0.85%,
due 12/1/25 (b) |
1,550,000
|
1,375,171
|
| New
Jersey Economic Development Authority, Facilities Construction, Revenue Bonds |
|
|
| Series
FFF |
|
|
| 5.00%,
due 6/15/23 |
750,000
|
756,091
|
| New
Jersey Economic Development Authority, School Facilities Construction, Revenue Bonds |
|
|
| Series
QQQ |
|
|
| 5.00%,
due 6/15/23 |
220,000
|
221,787
|
The notes to the financial statements are an integral part of, and
should be read in conjunction with, the financial statements.
| 34
|
MainStay MacKay Short Term
Municipal Fund |
| |
Principal
Amount |
Value
|
| Long-Term
Municipal Bonds (continued) |
| New
Jersey (continued) |
New
Jersey Economic Development Authority, School Facilities Construction, Revenue Bonds
(continued) |
|
|
| Series
QQQ |
|
|
| 5.00%,
due 6/15/24 |
$
300,000 |
$ 305,925
|
| New
Jersey Economic Development Authority, New Jersey Transit Corp., Revenue Bonds |
|
|
| Series
B |
|
|
| 5.00%,
due 11/1/25 |
4,035,000 |
4,155,654 |
| New
Jersey Economic Development Authority, State of New Jersey Motor Vehicle Surcharge, Revenue Bonds |
|
|
| Series
A, Insured: BAM |
|
|
| 5.00%,
due 7/1/28 |
275,000
|
285,158
|
| New
Jersey Economic Development Authority, School Facility Surcharge, Revenue Bonds |
|
|
| Series
N-1, Insured: NATL-RE |
|
|
| 5.50%,
due 9/1/23 |
1,500,000
|
1,522,016
|
| New
Jersey Educational Facilities Authority, Stockton University, Revenue Bonds |
|
|
| Series
A, Insured: BAM |
|
|
| 5.00%,
due 7/1/25 |
2,825,000
|
2,915,245
|
| New
Jersey Higher Education Student Assistance Authority, Revenue Bonds, Senior Lien |
|
|
| Series
B |
|
|
| 5.00%,
due 12/1/25 (b) |
250,000
|
255,685
|
| New
Jersey Housing & Mortgage Finance Agency, Amity Heights Apartments, Revenue Bonds |
|
|
| Series
A, Insured: HUD Sector 8 |
|
|
| 3.50%,
due 7/1/25 (a) |
10,067,000
|
9,939,997
|
| New
Jersey Transportation Trust Fund Authority, Transportation System, Revenue Bonds |
|
|
| Series
A |
|
|
| (zero
coupon), due 12/15/24 |
560,000
|
514,182
|
| Insured:
AMBAC |
|
|
| (zero
coupon), due 12/15/26 |
1,000,000
|
842,224
|
| Series
A |
|
|
| 5.00%,
due 6/15/24 |
1,100,000
|
1,121,725
|
| |
Principal
Amount |
Value
|
| |
| New
Jersey (continued) |
| New
Jersey Transportation Trust Fund Authority, Transportation System, Revenue Bonds (continued) |
|
|
| Series
D |
|
|
| 5.00%,
due 12/15/24 |
$
960,000 |
$ 981,079
|
| New
Jersey Transportation Trust Fund Authority, Capital Appreciation, Transportation System, Revenue Bonds |
|
|
| Series
A |
|
|
| (zero
coupon), due 12/15/25 |
390,000 |
342,943 |
| New
Jersey Transportation Trust Fund Authority, Capital Appreciation, Revenue Bonds |
|
|
| Series
C, Insured: AGC-ICC AMBAC |
|
|
| (zero
coupon), due 12/15/25 |
410,000
|
361,634
|
| New
Jersey Transportation Trust Fund Authority, Highway Reimbursement Notes, Revenue Bonds |
|
|
| 5.00%,
due 6/15/23 |
355,000
|
357,970
|
| Series
A1 |
|
|
| 5.00%,
due 6/15/25 |
1,360,000
|
1,399,022
|
| Series
A |
|
|
| 5.00%,
due 6/15/30 |
4,110,000
|
4,221,594
|
| 5.00%,
due 6/15/31 |
500,000
|
512,194
|
| Newark
Board of Education, School Energy Saving, Unlimited General Obligation |
|
|
| Insured:
BAM SCH BD RES FD |
|
|
| 5.00%,
due 7/15/26 |
775,000
|
813,497
|
| Insured:
BAM SCH BD RES FD |
|
|
| 5.00%,
due 7/15/28 |
750,000
|
801,232
|
| Insured:
BAM SCH BD RES FD |
|
|
| 5.00%,
due 7/15/29 |
1,350,000
|
1,454,985
|
| Passaic
Valley Sewerage Commission, Revenue Bonds |
|
|
| Series
H, Insured: AGM |
|
|
| 5.00%,
due 12/1/23 |
2,190,000
|
2,226,467
|
| Plumsted
Township School District, Unlimited General Obligation |
|
|
| Insured:
AGM SCH BD RES FD |
|
|
| 4.00%,
due 7/15/23 |
440,000
|
442,179
|
| Salem
County Improvement Authority, Finlaw State Office Building Project, Revenue Bonds |
|
|
| Insured:
AGM MUN GOVT GTD |
|
|
| 4.00%,
due 8/15/27 |
505,000
|
505,736
|
The notes to the financial statements are an integral part of, and
should be read in conjunction with, the financial statements.
35
Portfolio of
Investments October 31, 2022† (Unaudited) (continued)
| |
Principal
Amount |
Value
|
| Long-Term
Municipal Bonds (continued) |
| New
Jersey (continued) |
| Salem
County Improvement Authority, Finlaw State Office Building Project, Revenue Bonds (continued) |
|
|
| Insured:
AGM MUN GOVT GTD |
|
|
| 4.00%,
due 8/15/28 |
$
400,000 |
$ 398,340
|
| Insured:
AGM MUN GOVT GTD |
|
|
| 4.00%,
due 8/15/29 |
300,000 |
297,711 |
| South
Jersey Transportation Authority, Revenue Bonds |
|
|
| Series
A |
|
|
| 5.00%,
due 11/1/27 |
500,000 |
506,564 |
| Series
A |
|
|
| 5.00%,
due 11/1/28 |
750,000
|
759,564
|
| Series
A |
|
|
| 5.00%,
due 11/1/29 |
1,200,000
|
1,214,659
|
| State
of New Jersey, Various Purpose, Unlimited General Obligation |
|
|
| 5.00%,
due 6/1/24 |
250,000
|
255,953
|
| State
of New Jersey, Unlimited General Obligation |
|
|
| 5.00%,
due 6/1/27 |
2,910,000
|
3,086,876
|
| Tobacco
Settlement Financing Corp., Revenue Bonds |
|
|
| Series
A |
|
|
| 5.00%,
due 6/1/23 |
1,000,000
|
1,007,047
|
| Township
of Irvington NJ, Unlimited General Obligation |
|
|
| Insured:
BAM |
|
|
| 3.00%,
due 6/1/25 |
200,000
|
196,182
|
| |
|
60,743,593
|
| New
Mexico 0.2% |
| Albuquerque
Municipal School District No. 12, Unlimited General Obligation |
|
|
| Insured:
State Aid Withholding |
|
|
| 5.00%,
due 8/1/23 |
1,165,000
|
1,179,781
|
| County
of Colfax NM, Tax Receipts, Revenue Bonds |
|
|
| Insured:
BAM |
|
|
| 3.00%,
due 8/1/23 |
270,000
|
267,983
|
| Insured:
BAM |
|
|
| 3.00%,
due 8/1/24 |
280,000
|
275,321
|
| Village
of Los Ranchos de Albuquerque NM, Albuquerque Academy Project, Revenue Bonds |
|
|
| 4.00%,
due 9/1/23 |
135,000
|
135,276
|
| |
Principal
Amount |
Value
|
| |
| New
Mexico (continued) |
Village
of Los Ranchos de Albuquerque NM, Albuquerque Academy Project, Revenue Bonds
(continued) |
|
|
| 4.00%,
due 9/1/24 |
$
100,000 |
$ 100,348
|
| 4.00%,
due 9/1/25 |
150,000 |
150,696 |
| 5.00%,
due 9/1/26 |
170,000 |
176,972
|
| |
|
2,286,377
|
| New
York 5.3% |
| Albany
County Airport Authority, Revenue Bonds |
|
|
| Series
B |
|
|
| 5.00%,
due 12/15/22 (b) |
250,000
|
250,348
|
| Series
B |
|
|
| 5.00%,
due 12/15/23 (b) |
200,000
|
202,452
|
| Series
A |
|
|
| 5.00%,
due 12/15/24 |
60,000
|
62,022
|
| Series
A |
|
|
| 5.00%,
due 12/15/24 |
480,000
|
494,286
|
| Amherst
Development Corp., UBF Faculty-Student Housing Corp., Revenue Bonds |
|
|
| Insured:
BAM |
|
|
| 5.00%,
due 10/1/26 |
340,000
|
356,862
|
| Camden
Central School District, Unlimited General Obligation |
|
|
| Insured:
State Aid Withholding |
|
|
| 4.00%,
due 3/15/23 |
635,000
|
636,729
|
| Insured:
BAM State Aid Withholding |
|
|
| 4.00%,
due 3/15/25 |
765,000
|
774,170
|
| City
of Elmira City NY, Public Improvement, Limited General Obligation |
|
|
| Insured:
AGM |
|
|
| 4.00%,
due 5/1/28 |
355,000
|
361,345
|
| Insured:
AGM |
|
|
| 4.00%,
due 5/1/29 |
140,000
|
142,580
|
| City
of Long Beach NY, Limited General Obligation |
|
|
| Series
B |
|
|
| 5.25%,
due 7/15/26 |
300,000
|
311,045
|
| Series
B |
|
|
| 5.50%,
due 7/15/24 |
200,000
|
205,034
|
| Series
B |
|
|
| 5.50%,
due 7/15/25 |
125,000
|
129,433
|
The notes to the financial statements are an integral part of, and
should be read in conjunction with, the financial statements.
| 36
|
MainStay MacKay Short Term
Municipal Fund |
| |
Principal
Amount |
Value
|
| Long-Term
Municipal Bonds (continued) |
| New
York (continued) |
| City
of New York NY, Unlimited General Obligation |
|
|
| Series
B-1 |
|
|
| 4.00%,
due 10/1/24 |
$
300,000 |
$ 304,010
|
| City
of Olean NY, Limited General Obligation |
|
|
| Insured:
AGM |
|
|
| 4.00%,
due 8/1/25 |
415,000 |
420,613 |
| County
of Rockland NY, Public Improvement, Limited General Obligation |
|
|
| Series
C, Insured: AGM |
|
|
| 4.00%,
due 5/1/23 |
2,000,000
|
2,008,699
|
| County
of Suffolk NY, Limited General Obligation |
|
|
| Series
C, Insured: BAM |
|
|
| 5.00%,
due 2/1/23 |
495,000
|
497,079
|
| County
of Suffolk NY, Public Improvement, Limited General Obligation |
|
|
| Series
A, Insured: AGM |
|
|
| 5.00%,
due 6/1/26 |
635,000
|
666,717
|
| Genesee
Valley Central School District, Unlimited General Obligation |
|
|
| Insured:
AGM State Aid Withholding |
|
|
| 5.00%,
due 6/15/29 |
1,540,000
|
1,663,298
|
| Insured:
AGM State Aid Withholding |
|
|
| 5.00%,
due 6/15/30 |
1,565,000
|
1,701,937
|
| Long
Island Power Authority, Electric System, Revenue Bonds |
|
|
| Series
A, Insured: AGM |
|
|
| (zero
coupon), due 6/1/23 |
160,000
|
156,944
|
| Metropolitan
Transportation Authority, Revenue Bonds |
|
|
| Series
A |
|
|
| 4.00%,
due 11/15/26 |
225,000
|
229,849
|
| Series
A-1 |
|
|
| 5.00%,
due 2/1/23 |
250,000
|
250,850
|
| Series
A |
|
|
| 5.00%,
due 11/15/26 |
1,225,000
|
1,226,214
|
| Series
D |
|
|
| 5.00%,
due 11/15/26 |
2,500,000
|
2,501,317
|
| Series
B, Insured: AMBAC |
|
|
| 5.25%,
due 11/15/24 |
7,695,000
|
7,907,787
|
| |
Principal
Amount |
Value
|
| |
| New
York (continued) |
| Metropolitan
Transportation Authority, Green Bond, Revenue Bonds |
|
|
| Series
B |
|
|
| 5.00%,
due 11/15/23 |
$
1,245,000 |
$ 1,261,529
|
| Monroe
County Industrial Development Corp., Rochester Regional Health Project, Revenue Bonds |
|
|
| 5.00%,
due 12/1/23 |
700,000 |
710,017 |
| Mount
Vernon City School District, Unlimited General Obligation |
|
|
| Insured:
State Aid Withholding |
|
|
| 5.00%,
due 8/15/26 |
1,040,000 |
1,089,688 |
| New
York City Industrial Development Agency, Yankee Stadium Project, Revenue Bonds |
|
|
| Insured:
NATL-RE |
|
|
| 9.123%,
due 3/1/24 (f) |
500,000
|
501,323
|
| New
York State Dormitory Authority, Interagency Coumcil Pooled Loan Program, Revenue Bonds |
|
|
| 4.00%,
due 7/1/23 |
430,000
|
431,661
|
| New
York State Dormitory Authority, St Joseph's College, Revenue Bonds |
|
|
| Series
A |
|
|
| 5.00%,
due 7/1/23 |
880,000
|
884,966
|
| New
York State Dormitory Authority, Revenue Bonds |
|
|
| Series
A, Insured: State Aid Withholding |
|
|
| 5.00%,
due 10/1/23 |
4,150,000
|
4,214,591
|
| New
York State Dormitory Authority, Montefiore Obligated Group, Revenue Bonds |
|
|
| 5.00%,
due 8/1/25 |
1,535,000
|
1,542,759
|
| New
York State Dormitory Authority, State Personal Income Tax, Revenue Bonds |
|
|
| Series
E |
|
|
| 5.00%,
due 2/15/26 |
2,400,000
|
2,492,222
|
| New
York State Energy Research & Development Authority, Green Bond, Revenue Bonds |
|
|
| Series
A |
|
|
| 3.745%,
due 4/1/24 |
1,100,000
|
1,078,196
|
| Series
A |
|
|
| 3.845%,
due 4/1/25 |
1,100,000
|
1,062,943
|
The notes to the financial statements are an integral part of, and
should be read in conjunction with, the financial statements.
37
Portfolio of
Investments October 31, 2022† (Unaudited) (continued)
| |
Principal
Amount |
Value
|
| Long-Term
Municipal Bonds (continued) |
| New
York (continued) |
| New
York State Urban Development Corp., Personal Income Tax, Revenue Bonds |
|
|
| Series
B |
|
|
| 3.32%,
due 3/15/29 |
$
3,000,000 |
$ 2,708,957
|
| New
York Transportation Development Corp., Delta Air Lines, Inc. Laguardia Airport Terminals C&D Redevelopment Project, Revenue Bonds |
|
|
| 5.00%,
due 1/1/23 (b) |
4,335,000 |
4,336,056 |
| New
York Transportation Development Corp., Terminal One Group Association LP, Revenue Bonds |
|
|
| 5.00%,
due 1/1/23 (b) |
2,150,000 |
2,152,576 |
| New
York Transportation Development Corp., John F. kennedy International Airport Project, Revenue Bonds |
|
|
| 5.00%,
due 12/1/24 (b) |
3,375,000
|
3,414,211
|
| 5.00%,
due 12/1/25 (b) |
3,690,000
|
3,744,078
|
| 5.00%,
due 12/1/25 |
1,600,000
|
1,643,366
|
| New
York Transportation Development Corp., Terminal 4 JFK International Airport Project, Revenue Bonds (b) |
|
|
| 5.00%,
due 12/1/26 |
5,000,000
|
5,060,225
|
| 5.00%,
due 12/1/29 |
4,000,000
|
3,983,728
|
| 5.00%,
due 12/1/30 |
1,000,000
|
994,373
|
| Niagara
Falls City School District, Certificate of Participation |
|
|
| Insured:
AGM |
|
|
| 4.00%,
due 6/15/26 |
50,000
|
50,248
|
| Niagara
Frontier Transportation Authority, Revenue Bonds |
|
|
| 5.00%,
due 4/1/23 (b) |
825,000
|
829,384
|
| Onondaga
Civic Development Corp., Upstate Properties Development, Inc. Project, Revenue Bonds |
|
|
| Insured:
BAM |
|
|
| 1.078%,
due 12/1/23 |
690,000
|
662,987
|
| Insured:
BAM |
|
|
| 1.167%,
due 12/1/24 |
700,000
|
649,239
|
| Port
Authority of New York & New Jersey, Revenue Bonds |
|
|
| Series
178 |
|
|
| 5.00%,
due 12/1/25 (b) |
265,000
|
267,698
|
| |
Principal
Amount |
Value
|
| |
| New
York (continued) |
| Suffolk
Tobacco Asset Securitization Corp., Tobacco Settlement, Asset Backed, Revenue Bonds |
|
|
| Series
B-1 |
|
|
| 0.45%,
due 6/1/31 |
$
425,000 |
$ 421,905
|
| Town
of Oyster Bay NY, Limited General Obligation |
|
|
| 4.00%,
due 11/1/22 |
945,000 |
945,000 |
| Insured:
AGM |
|
|
| 4.00%,
due 3/1/25 |
2,295,000 |
2,326,235
|
| |
|
72,921,781
|
| North
Carolina 0.3% |
| North
Carolina Capital Facilities Finance Agency, Campbell University, Revenue Bonds |
|
|
| Series
B |
|
|
| 1.05%,
due 10/1/23 |
1,000,000
|
958,243
|
| North
Carolina Capital Facilities Finance Agency, High Point University, Revenue Bonds |
|
|
| 5.00%,
due 5/1/25 |
240,000
|
247,467
|
| 5.00%,
due 5/1/26 |
275,000
|
286,066
|
| 5.00%,
due 5/1/27 |
395,000
|
413,787
|
| 5.00%,
due 5/1/28 |
400,000
|
421,243
|
| North
Carolina Turnpike Authority, Revenue Bonds |
|
|
| Series
A |
|
|
| 5.00%,
due 7/1/23 |
250,000
|
251,819
|
| Raleigh
Durham Airport Authority, Revenue Bonds |
|
|
| Series
A |
|
|
| 5.00%,
due 5/1/28 (b) |
1,205,000
|
1,247,890
|
| Winston-Salem
State University, Student Housing Project, Revenue Bonds |
|
|
| Insured:
BAM |
|
|
| 5.00%,
due 6/1/24 |
500,000
|
511,906
|
| |
|
4,338,421
|
| North
Dakota 0.1% |
| City
of Grand Forks ND, Altru Health System Obligated Group, Revenue Bonds |
|
|
| 5.00%,
due 12/1/26 |
275,000
|
283,460
|
The notes to the financial statements are an integral part of, and
should be read in conjunction with, the financial statements.
| 38
|
MainStay MacKay Short Term
Municipal Fund |
| |
Principal
Amount |
Value
|
| Long-Term
Municipal Bonds (continued) |
| North
Dakota (continued) |
| University
of North Dakota, Certificate of Participation |
|
|
| Series
A, Insured: AGM |
|
|
| 5.00%,
due 6/1/24 |
$
800,000 |
$ 819,050
|
| |
|
1,102,510
|
| Ohio
2.6% |
| Akron
Bath Copley Joint Township Hospital District, Summa Health System Obligated Group, Revenue Bonds |
|
|
| 5.00%,
due 11/15/25 |
250,000 |
256,047 |
| 5.00%,
due 11/15/26 |
400,000 |
412,201 |
| Bethel
Local School District, School Facilities, Certificate of Participation |
|
|
| Insured:
BAM |
|
|
| 4.00%,
due 12/1/22 |
120,000
|
120,063
|
| Buckeye
Tobacco Settlement Financing Authority, Revenue Bonds, Senior Lien |
|
|
| Series
A-1 |
|
|
| 2.00%,
due 6/1/27 |
5,370,000
|
4,609,627
|
| City
of Cleveland OH, Airport System, Revenue Bonds |
|
|
| Series
B |
|
|
| 5.00%,
due 1/1/23 (b) |
400,000
|
400,990
|
| Series
C |
|
|
| 5.00%,
due 1/1/24 |
430,000
|
437,429
|
| City
of Dayton OH, Airport, Revenue Bonds (b) |
|
|
| Series
A, Insured: AGM |
|
|
| 5.00%,
due 12/1/23 |
1,155,000
|
1,156,262
|
| Insured:
AGM |
|
|
| 5.00%,
due 12/1/25 |
585,000
|
585,356
|
| City
of Lorain OH, Limited General Obligation |
|
|
| Insured:
BAM |
|
|
| 3.00%,
due 12/1/22 |
300,000
|
299,911
|
| Series
A, Insured: BAM |
|
|
| 4.00%,
due 12/1/23 |
300,000
|
302,000
|
| City
of Middleburg Heights OH, Southwest General Health Center Project, Revenue Bonds |
|
|
| 4.00%,
due 8/1/24 |
180,000
|
180,549
|
| 4.00%,
due 8/1/25 |
150,000
|
150,697
|
| |
Principal
Amount |
Value
|
| |
| Ohio
(continued) |
| City
of Sharonville OH, Revenue Bonds |
|
|
| Insured:
BAM |
|
|
| 4.00%,
due 12/1/22 |
$
300,000 |
$ 300,204
|
| Insured:
BAM |
|
|
| 4.00%,
due 12/1/23 |
580,000 |
584,173 |
| Insured:
BAM |
|
|
| 4.00%,
due 12/1/24 |
745,000 |
754,204 |
| Insured:
BAM |
|
|
| 4.00%,
due 12/1/25 |
715,000
|
726,338
|
| Cleveland-Cuyahoga
County Port Authority, Cleveland Museum of Natural History Project, Revenue Bonds |
|
|
| 5.00%,
due 7/1/25 |
125,000
|
129,411
|
| 5.00%,
due 7/1/26 |
125,000
|
130,627
|
| 5.00%,
due 7/1/27 |
125,000
|
131,616
|
| 5.00%,
due 7/1/28 |
125,000
|
132,442
|
| Cloverleaf
Local School District, Certificate of Participation |
|
|
| Insured:
BAM |
|
|
| 3.00%,
due 12/1/22 |
355,000
|
354,851
|
| Insured:
BAM |
|
|
| 4.00%,
due 12/1/26 |
275,000
|
279,029
|
| County
of Lucas OH, Revenue Notes |
|
|
| 5.25%,
due 10/13/23 |
12,130,000
|
12,110,409
|
| Hillsdale
Local School District, School Facilities Project, Certificate of Participation |
|
|
| Insured:
BAM |
|
|
| 4.00%,
due 12/1/22 |
1,200,000
|
1,200,700
|
| Ironton
City School District, Unlimited General Obligation |
|
|
| Insured:
SD CRED PROG |
|
|
| (zero
coupon), due 12/1/24 |
660,000
|
610,561
|
| Lancaster
Port Authority, Revenue Bonds |
|
|
| Series
A |
|
|
| 5.00%,
due 8/1/49 (a) |
8,140,000
|
8,238,137
|
| State
of Ohio, Premier Health Partners Obligated Group, Revenue Bonds |
|
|
| 5.00%,
due 11/15/24 |
135,000
|
137,330
|
| 5.00%,
due 11/15/25 |
140,000
|
143,507
|
| 5.00%,
due 11/15/26 |
140,000
|
144,323
|
| Triway
Local School District, Certificate of Participation |
|
|
| Insured:
BAM |
|
|
| 4.00%,
due 12/1/26 |
630,000
|
640,428
|
| |
|
35,659,422
|
The notes to the financial statements are an integral part of, and
should be read in conjunction with, the financial statements.
39
Portfolio of
Investments October 31, 2022† (Unaudited) (continued)
| |
Principal
Amount |
Value
|
| Long-Term
Municipal Bonds (continued) |
| Oregon
1.0% |
| Columbia
County School District No. 502, Unlimited General Obligation |
|
|
| Insured:
School Bond Guaranty |
|
|
| 5.00%,
due 6/15/26 |
$
565,000 |
$ 596,836
|
| County
of Yamhill OR, George Fox University Project, Revenue Bonds |
|
|
| 4.00%,
due 12/1/22 |
175,000 |
175,083 |
| 4.00%,
due 12/1/25 |
780,000 |
783,708 |
| Salem-Keizer
School District No. 24J, Limited General Obligation |
|
|
| (zero
coupon), due 6/15/25 |
1,830,000 |
1,664,724 |
| Salem-Keizer
School District No. 24J, Unlimited General Obligation |
|
|
| Series
B, Insured: School Bond Guaranty |
|
|
| (zero
coupon), due 6/15/25 |
6,300,000
|
5,725,124
|
| Series
B, Insured: School Bond Guaranty |
|
|
| (zero
coupon), due 6/15/26 |
2,335,000
|
2,038,783
|
| Warm
Springs Reservation Confederated Tribe, Pelton-Round Butte Project, Revenue Bonds (c) |
|
|
| 2.015%,
due 11/1/25 |
750,000
|
687,604
|
| 2.165%,
due 11/1/26 |
1,000,000
|
897,193
|
| 2.37%,
due 11/1/27 |
1,000,000
|
878,386
|
| |
|
13,447,441
|
| Pennsylvania
3.8% |
| Borough
of Quakertown PA, Unlimited General Obligation |
|
|
| Insured:
AGM |
|
|
| 4.00%,
due 2/1/23 |
275,000
|
275,472
|
| Brownsville
Area School District, Limited General Obligation |
|
|
| Insured:
AGM State Aid Withholding |
|
|
| 4.00%,
due 11/15/22 |
375,000
|
375,100
|
| City
of Allentown PA, Unlimited General Obligation |
|
|
| Insured:
BAM |
|
|
| 4.00%,
due 10/1/23 |
410,000
|
411,985
|
| City
of Philadelphia PA, Airport, Revenue Bonds |
|
|
| 5.00%,
due 7/1/25 (b) |
1,750,000
|
1,788,951
|
| |
Principal
Amount |
Value
|
| |
| Pennsylvania
(continued) |
| City
of Pittston PA, Unlimited General Obligation |
|
|
| Series
A, Insured: BAM |
|
|
| 1.00%,
due 11/15/22 |
$
125,000 |
$ 124,850
|
| Series
A, Insured: BAM |
|
|
| 4.00%,
due 11/15/23 |
175,000 |
175,451 |
| Series
A, Insured: BAM |
|
|
| 4.00%,
due 11/15/24 |
265,000 |
265,475 |
| Series
A, Insured: BAM |
|
|
| 4.00%,
due 11/15/25 |
275,000
|
275,360
|
| City
of Reading PA, Unlimited General Obligation |
|
|
| Series
A, Insured: BAM |
|
|
| 5.00%,
due 11/1/24 |
1,665,000
|
1,710,950
|
| City
of Williamsport PA, Unlimited General Obligation |
|
|
| Insured:
AGM |
|
|
| 5.00%,
due 7/1/25 |
25,000
|
25,960
|
| Coatesville
School District, Limited General Obligation |
|
|
| Insured:
AGM State Aid Withholding |
|
|
| 5.00%,
due 8/1/24 |
625,000
|
641,632
|
| Commonwealth
Financing Authority, Tobacco Master Settlement Payment, Revenue Bonds |
|
|
| 5.00%,
due 6/1/25 |
1,500,000
|
1,537,649
|
| County
of Lackawanna PA, Unlimited General Obligation |
|
|
| Series
B, Insured: BAM |
|
|
| 3.00%,
due 9/15/29 |
100,000
|
94,709
|
| County
of Lawrence PA, Unlimited General Obligation |
|
|
| Series
A, Insured: BAM |
|
|
| 5.00%,
due 5/15/24 |
15,000
|
15,346
|
| Deer
Creek Drainage Basin Authority, Revenue Bonds |
|
|
| Insured:
AGM |
|
|
| 5.00%,
due 12/1/25 |
365,000
|
381,564
|
| Insured:
AGM |
|
|
| 5.00%,
due 12/1/26 |
265,000
|
279,766
|
| Indiana
County Industrial Development Authority, Foundation for Indiana University of Pennsylvania (The), Revenue Bonds |
|
|
| Insured:
BAM |
|
|
| 5.00%,
due 5/1/23 |
110,000
|
110,611
|
| Insured:
BAM |
|
|
| 5.00%,
due 5/1/24 |
110,000
|
111,690
|
The notes to the financial statements are an integral part of, and
should be read in conjunction with, the financial statements.
| 40
|
MainStay MacKay Short Term
Municipal Fund |
| |
Principal
Amount |
Value
|
| Long-Term
Municipal Bonds (continued) |
| Pennsylvania
(continued) |
| Laurel
Highlands School District, Limited General Obligation |
|
|
| Insured:
BAM State Aid Withholding |
|
|
| 4.00%,
due 2/1/23 |
$
300,000 |
$ 300,359
|
| Insured:
BAM State Aid Withholding |
|
|
| 4.00%,
due 2/1/24 |
315,000 |
316,616 |
| Insured:
BAM State Aid Withholding |
|
|
| 4.00%,
due 2/1/25 |
345,000 |
348,803 |
| Mckeesport
Area School District, Capital Appreciation, Unlimited General Obligation |
|
|
| Series
C, Insured: AMBAC State Aid Withholding |
|
|
| (zero
coupon), due 10/1/28 |
145,000
|
111,030
|
| Mount
Union Area School District, Limited General Obligation |
|
|
| Insured:
BAM State Aid Withholding |
|
|
| 4.00%,
due 8/1/24 |
915,000
|
921,800
|
| Municipality
of Norristown PA, Unlimited General Obligation |
|
|
| Series
B, Insured: AGM |
|
|
| 4.00%,
due 11/1/22 |
460,000
|
460,000
|
| Series
B, Insured: AGM |
|
|
| 4.00%,
due 11/1/23 |
480,000
|
483,266
|
| North
Huntingdon Township Municipal Authority, Revenue Bonds |
|
|
| Insured:
AGM |
|
|
| 5.00%,
due 4/1/28 |
200,000
|
214,417
|
| Insured:
AGM |
|
|
| 5.00%,
due 4/1/29 |
365,000
|
395,238
|
| Norwin
School District, Limited General Obligation |
|
|
| Insured:
BAM State Aid Withholding |
|
|
| 5.00%,
due 11/15/22 |
165,000
|
165,101
|
| Penn
Hills School District, Limited General Obligation |
|
|
| Insured:
BAM State Aid Withholding |
|
|
| 5.00%,
due 10/1/26 |
4,845,000
|
5,079,872
|
| Pennsylvania
Economic Development Financing Authority, PPL Electric Utilities Corp., Revenue Bonds |
|
|
| 0.40%,
due 10/1/23 |
4,800,000
|
4,606,123
|
| Pennsylvania
Economic Development Financing Authority, Water & Wastewater, Revenue Bonds |
|
|
| 3.00%,
due 1/1/23 |
745,000
|
744,272
|
| |
Principal
Amount |
Value
|
| |
| Pennsylvania
(continued) |
| Pennsylvania
Higher Educational Facilities Authority, Drexel University, Revenue Bonds |
|
|
| 5.00%,
due 5/1/24 |
$
325,000 |
$ 331,891
|
| Pennsylvania
Turnpike Commission, Revenue Bonds, Second Series |
|
|
| Series
B |
|
|
| 5.00%,
due 6/1/29 |
10,000,000
|
10,378,501 |
| Philadelphia
Gas Works Co., Revenue Bonds |
|
|
| 5.00%,
due 10/1/24 |
1,000,000 |
1,024,846 |
| Philadelphia
Municipal Authority, Revenue Bonds |
|
|
| Series
B, Insured: AGM |
|
|
| 5.00%,
due 1/15/23 |
825,000
|
827,727
|
| Pottstown
School District, Limited General Obligation |
|
|
| Insured:
BAM State Aid Withholding |
|
|
| 4.00%,
due 6/1/23 |
375,000
|
376,297
|
| Insured:
BAM State Aid Withholding |
|
|
| 4.00%,
due 6/1/24 |
650,000
|
655,066
|
| Reading
School District, Limited General Obligation |
|
|
| Series
C, Insured: BAM State Aid Withholding |
|
|
| 5.00%,
due 4/1/24 |
3,325,000
|
3,390,363
|
| School
District of Philadelphia (The), Limited General Obligation |
|
|
| Series
F, Insured: BAM State Aid Withholding |
|
|
| 5.00%,
due 9/1/25 |
500,000
|
517,560
|
| Series
A, Insured: State Aid Withholding |
|
|
| 5.00%,
due 9/1/26 |
550,000
|
571,563
|
| South
Wayne County Water and Sewer Authority, Revenue Bonds |
|
|
| Insured:
BAM |
|
|
| 4.00%,
due 2/15/26 |
410,000
|
416,422
|
| Sports
& Exhibition Authority of Pittsburgh and Allegheny County, Revenue Bonds |
|
|
| Insured:
AGM |
|
|
| 5.00%,
due 2/1/26 |
2,930,000
|
3,063,926
|
| State
Public School Building Authority, Crawford County Career and Technical Center, Revenue Bonds |
|
|
| Insured:
BAM State Aid Withholding |
|
|
| 4.00%,
due 3/1/23 |
395,000
|
395,831
|
The notes to the financial statements are an integral part of, and
should be read in conjunction with, the financial statements.
41
Portfolio of
Investments October 31, 2022† (Unaudited) (continued)
| |
Principal
Amount |
Value
|
| Long-Term
Municipal Bonds (continued) |
| Pennsylvania
(continued) |
State
Public School Building Authority, Crawford County Career and Technical Center, Revenue Bonds
(continued) |
|
|
| Insured:
BAM State Aid Withholding |
|
|
| 4.00%,
due 3/1/26 |
$
185,000 |
$ 187,858
|
| State
Public School Building Authority, Northampton County Area Community College Foundation, Revenue Bonds |
|
|
| Insured:
BAM State Aid Withholding |
|
|
| 5.00%,
due 3/1/23 |
520,000 |
522,836 |
| State
Public School Building Authority, Harrisburg School District, Revenue Bonds |
|
|
| Insured:
AGM State Aid Withholding |
|
|
| 5.00%,
due 12/1/23 |
300,000
|
305,412
|
| Insured:
AGM State Aid Withholding |
|
|
| 5.00%,
due 12/1/23 |
1,700,000
|
1,729,214
|
| State
Public School Building Authority, Community College of Allegheny County, Revenue Bonds |
|
|
| Insured:
BAM |
|
|
| 5.00%,
due 7/15/24 |
430,000
|
440,099
|
| United
School District, Unlimited General Obligation |
|
|
| Insured:
AGM State Aid Withholding |
|
|
| 3.00%,
due 11/15/22 |
525,000
|
524,914
|
| Valley
View School District, Limited General Obligation |
|
|
| Series
A, Insured: BAM State Aid Withholding |
|
|
| 1.25%,
due 5/15/23 |
30,000
|
29,425
|
| Series
B, Insured: BAM State Aid Withholding |
|
|
| 1.55%,
due 5/15/24 |
600,000
|
571,100
|
| Waverly
Township Municipal Authority, Revenue Bonds |
|
|
| Insured:
BAM State Aid Withholding |
|
|
| 4.00%,
due 2/15/26 |
415,000
|
421,371
|
| West
Cornwall Township Municipal Authority, Lebanon Valley Brethren Home Project, Revenue Bonds |
|
|
| 4.00%,
due 11/15/22 |
140,000
|
139,980
|
| 4.00%,
due 11/15/24 |
110,000
|
109,024
|
| 4.00%,
due 11/15/25 |
115,000
|
113,351
|
| 4.00%,
due 11/15/26 |
120,000
|
117,330
|
| |
Principal
Amount |
Value
|
| |
| Pennsylvania
(continued) |
| Westmoreland
County Industrial Development Authority, Excela Health Project, Revenue Bonds |
|
|
| Series
A |
|
|
| 4.00%,
due 7/1/23 |
$
350,000 |
$ 349,561
|
| Series
A |
|
|
| 4.00%,
due 7/1/24 |
350,000 |
348,232 |
| Wilkinsburg-Penn
Joint Water Authority (The), Green Bond, Revenue Bonds |
|
|
| Insured:
BAM |
|
|
| 4.00%,
due 9/15/27 |
650,000 |
663,652
|
| |
|
51,272,770
|
| Puerto
Rico 0.0% ‡ |
| Puerto
Rico Industrial, Tourist, Educational, Medical and Environmental Control Facilities Financing Authority, Hospital Auxilio Mutuo Obligated Group, Revenue Bonds |
|
|
| 5.00%,
due 7/1/27 |
450,000
|
466,213
|
| Rhode
Island 0.5% |
| Providence
Public Building Authority, Capital Improvement Projects, Revenue Bonds |
|
|
| Series
A, Insured: AGM |
|
|
| 4.00%,
due 9/15/23 |
1,000,000
|
1,004,737
|
| Rhode
Island Health and Educational Building Corp., Rhode Island School of Design, Revenue Bonds |
|
|
| 1.313%,
due 8/15/24 |
375,000
|
351,273
|
| Rhode
Island Health and Educational Building Corp., Lifespan Obligated Group, Revenue Bonds |
|
|
| 5.00%,
due 5/15/25 |
1,000,000
|
1,010,763
|
| Rhode
Island Housing and Mortgage Finance Corp., Revenue Bonds |
|
|
| Series
77A |
|
|
| 5.00%,
due 4/1/26 |
1,000,000
|
1,040,331
|
| Series
77A |
|
|
| 5.00%,
due 10/1/26 |
1,180,000
|
1,233,698
|
| Rhode
Island Student Loan Authority, Revenue Bonds |
|
|
| Series
A |
|
|
| 5.00%,
due 12/1/25 (b) |
1,000,000
|
1,028,271
|
The notes to the financial statements are an integral part of, and
should be read in conjunction with, the financial statements.
| 42
|
MainStay MacKay Short Term
Municipal Fund |
| |
Principal
Amount |
Value
|
| Long-Term
Municipal Bonds (continued) |
| Rhode
Island (continued) |
| Rhode
Island Student Loan Authority, Revenue Bonds, Senior Lien |
|
|
| Series
A |
|
|
| 5.00%,
due 12/1/25 (b) |
$
875,000 |
$ 894,390
|
| |
|
6,563,463
|
| South
Carolina 0.6% |
| Greenville
County School District, Building Equity Sooner, Revenue Bonds |
|
|
| 5.00%,
due 12/1/22 |
130,000 |
130,197 |
| Piedmont
Municipal Power Agency, Revenue Bonds |
|
|
| Series
A |
|
|
| 4.00%,
due 1/1/25 |
1,350,000
|
1,356,647
|
| South
Carolina Ports Authority, Revenue Bonds |
|
|
| 5.00%,
due 7/1/29 |
325,000
|
331,564
|
| South
Carolina Public Service Authority, Santee Cooper, Revenue Bonds |
|
|
| Series
C |
|
|
| 5.00%,
due 12/1/25 |
2,500,000
|
2,557,178
|
| South
Carolina Public Service Authority, Revenue Bonds |
|
|
| Series
A |
|
|
| 5.00%,
due 12/1/27 |
1,670,000
|
1,726,351
|
| Williamsburg
County Public Facilities Corp., Williamsburg County Project, Revenue Bonds |
|
|
| Insured:
BAM |
|
|
| 4.00%,
due 6/1/23 |
500,000
|
501,385
|
| Insured:
BAM |
|
|
| 4.00%,
due 6/1/25 |
1,025,000
|
1,035,856
|
| |
|
7,639,178
|
| South
Dakota 0.1% |
| County
of Lawrence SD, Certificate of Participation |
|
|
| Insured:
AGM |
|
|
| 5.00%,
due 12/1/22 |
100,000
|
100,141
|
| Insured:
AGM |
|
|
| 5.00%,
due 12/1/25 |
125,000
|
130,635
|
| Insured:
AGM |
|
|
| 5.00%,
due 12/1/26 |
100,000
|
105,494
|
| |
Principal
Amount |
Value
|
| |
| South
Dakota (continued) |
| South
Dakota Health & Educational Facilities Authority, Sanford, Revenue Bonds |
|
|
| 1.225%,
due 11/1/24 |
$
450,000 |
$ 417,312
|
| Tri-Valley
School District No. 49-6, Unlimited General Obligation |
|
|
| Insured:
AGM |
|
|
| 5.00%,
due 7/15/27 |
200,000 |
212,521 |
| Insured:
AGM |
|
|
| 5.00%,
due 7/15/28 |
220,000 |
236,317
|
| |
|
1,202,420
|
| Tennessee
0.8% |
| Memphis-Shelby
County Airport Authority, Revenue Bonds |
|
|
| Series
C |
|
|
| 1.875%,
due 7/1/25 (b) |
2,000,000
|
1,829,925
|
| 5.00%,
due 7/1/26 |
155,000
|
158,453
|
| Metropolitan
Government Nashville & Davidson County Health & Educational Facilities Board, Trevecca Nazarene University Project, Revenue Bonds |
|
|
| Series
B |
|
|
| 4.00%,
due 10/1/26 |
150,000
|
144,575
|
| Series
B |
|
|
| 4.00%,
due 10/1/27 |
585,000
|
557,674
|
| New
Memphis Arena Public Building Authority, City of Memphis, Revenue Bonds |
|
|
| (zero
coupon), due 4/1/28 |
1,375,000
|
1,199,527
|
| Tennessee
Energy Acquisition Corp., Revenue Bonds |
|
|
| 4.00%,
due 11/1/49 (a) |
7,650,000
|
7,437,987
|
| |
|
11,328,141
|
| Texas
8.7% |
| Alamito
Public Facility Corp., EP WH Cien Palmas LLC, Revenue Bonds |
|
|
| Insured:
HUD Sector 8 |
|
|
| 3.50%,
due 9/1/25 (a) |
3,500,000
|
3,435,825
|
| Aledo
Independent School District, Unlimited General Obligation |
|
|
| Insured:
PSF-GTD |
|
|
| (zero
coupon), due 2/15/26 |
200,000
|
176,624
|
| Alvin
Independent School District, Unlimited General Obligation |
|
|
| Series
A, Insured: PSF-GTD |
|
|
| 5.00%,
due 2/15/24 |
90,000
|
92,039
|
The notes to the financial statements are an integral part of, and
should be read in conjunction with, the financial statements.
43
Portfolio of
Investments October 31, 2022† (Unaudited) (continued)
| |
Principal
Amount |
Value
|
| Long-Term
Municipal Bonds (continued) |
| Texas
(continued) |
| Arlington
Higher Education Finance Corp., Uplift Education Project, Revenue Bonds |
|
|
| Series
A, Insured: PSF-GTD |
|
|
| 3.00%,
due 12/1/27 |
$
725,000 |
$ 684,857
|
| Series
A, Insured: PSF-GTD |
|
|
| 3.00%,
due 12/1/28 |
745,000 |
696,446 |
| Series
A, Insured: PSF-GTD |
|
|
| 3.00%,
due 12/1/29 |
770,000 |
713,182 |
| Arlington
Higher Education Finance Corp., Harmony Public Schools, Revenue Bonds |
|
|
| Series
C, Insured: PSF-GTD |
|
|
| 4.00%,
due 2/15/24 |
45,000
|
45,384
|
| Arlington
Higher Education Finance Corp., Compass Academy Charter School, Inc., Revenue Bonds |
|
|
| Series
A, Insured: PSF-GTD |
|
|
| 4.00%,
due 8/1/27 |
435,000
|
437,917
|
| Series
A, Insured: PSF-GTD |
|
|
| 4.00%,
due 8/1/28 |
255,000
|
255,403
|
| Arlington
Higher Education Finance Corp., Faith Family Academy Charter Schools, Revenue Bonds |
|
|
| Series
A, Insured: PSF-GTD |
|
|
| 4.00%,
due 8/15/27 |
135,000
|
135,900
|
| Series
A, Insured: PSF-GTD |
|
|
| 4.00%,
due 8/15/29 |
400,000
|
396,481
|
| Arlington
Higher Education Finance Corp., Great Hearts America - Texas, Revenue Bonds |
|
|
| Series
A, Insured: PSF-GTD |
|
|
| 5.00%,
due 8/15/23 |
355,000
|
359,748
|
| Series
A, Insured: PSF-GTD |
|
|
| 5.00%,
due 8/15/24 |
185,000
|
189,733
|
| Series
A, Insured: PSF-GTD |
|
|
| 5.00%,
due 8/15/24 |
450,000
|
461,512
|
| Belmont
Fresh Water Supply District No. 1, Unlimited General Obligation |
|
|
| Insured:
AGM |
|
|
| 3.50%,
due 3/1/23 |
495,000
|
494,814
|
| Brazoria
County Municipal Utility District No. 19, Unlimited General Obligation |
|
|
| Insured:
BAM |
|
|
| 3.00%,
due 9/1/23 |
410,000
|
407,803
|
| |
Principal
Amount |
Value
|
| |
| Texas
(continued) |
| Brazos
Higher Education Authority, Inc., Revenue Bonds |
|
|
| Series
1A |
|
|
| 1.305%,
due 4/1/24 |
$
750,000 |
$ 708,796
|
| Central
Texas Regional Mobility Authority, Revenue Bonds, Senior Lien |
|
|
| 5.00%,
due 1/1/26 |
245,000 |
254,078 |
| Central
Texas Regional Mobility Authority, Revenue Bonds, Sub. Lien |
|
|
| 5.00%,
due 1/1/27 |
12,655,000
|
12,988,018 |
| Cibolo
Canyons Special Improvement District, Valorem Tax Utility System, Limited General Obligation |
|
|
| Series
A, Insured: AGM |
|
|
| 5.00%,
due 8/15/23 |
575,000
|
580,322
|
| Cinco
Southwest Municipal Utility District No. 1, Unlimited General Obligation |
|
|
| Insured:
BAM |
|
|
| 2.00%,
due 12/1/22 |
470,000
|
469,185
|
| Series
A, Insured: BAM |
|
|
| 2.00%,
due 12/1/22 |
275,000
|
274,523
|
| City
of Alvin TX, Water & Sewer System, Revenue Bonds |
|
|
| Insured:
AGM |
|
|
| 5.00%,
due 2/1/24 |
1,225,000
|
1,250,600
|
| Insured:
AGM |
|
|
| 5.00%,
due 2/1/25 |
1,225,000
|
1,269,410
|
| City
of Austin TX, Airport System, Revenue Bonds |
|
|
| 5.00%,
due 11/15/22 (b) |
200,000
|
200,092
|
| Series
B |
|
|
| 5.00%,
due 11/15/24 (b) |
250,000
|
254,412
|
| 5.00%,
due 11/15/25 (b) |
1,630,000
|
1,671,299
|
| 5.00%,
due 11/15/26 |
500,000
|
507,519
|
| City
of Austin TX, Electric Utility, Revenue Bonds |
|
|
| Series
A |
|
|
| 5.00%,
due 11/15/25 |
35,000
|
36,619
|
| City
of Dallas TX, Hotel Occupancy Tax, Revenue Bonds |
|
|
| 5.00%,
due 8/15/24 |
715,000
|
732,293
|
| City
of Dallas TX Housing Finance Corp., Highpoint at Wynnewood, Revenue Bonds |
|
|
| 3.50%,
due 2/1/44 (a) |
2,900,000
|
2,790,385
|
The notes to the financial statements are an integral part of, and
should be read in conjunction with, the financial statements.
| 44
|
MainStay MacKay Short Term
Municipal Fund |
| |
Principal
Amount |
Value
|
| Long-Term
Municipal Bonds (continued) |
| Texas
(continued) |
| City
of Houston TX, Hotel Occupancy Tax & Special Tax, Revenue Bonds |
|
|
| 5.00%,
due 9/1/23 |
$
1,005,000 |
$ 1,017,661
|
| 5.00%,
due 9/1/24 |
3,180,000 |
3,258,104 |
| 5.00%,
due 9/1/25 |
1,000,000 |
1,022,956 |
| 5.00%,
due 9/1/25 |
1,520,000 |
1,577,958 |
| 5.00%,
due 9/1/26 |
430,000 |
450,759 |
| City
of Houston TX, Airport System, Revenue Bonds, Sub. Lien |
|
|
| Series
D |
|
|
| 5.00%,
due 7/1/24 |
2,000,000
|
2,054,810
|
| Series
C |
|
|
| 5.00%,
due 7/1/25 (b) |
805,000
|
823,122
|
| Series
C |
|
|
| 5.00%,
due 7/1/27 (b) |
175,000
|
180,481
|
| City
of Lewisville TX, Lewisville Castle Hills Public Improvement District No. 3 Project, Special Assessment |
|
|
| Insured:
AGM |
|
|
| 5.00%,
due 9/1/24 |
1,045,000
|
1,059,712
|
| City
of Lockhart TX, Limited General Obligation |
|
|
| Insured:
BAM |
|
|
| 5.00%,
due 8/1/25 |
500,000
|
513,018
|
| City
of Mission TX, Certificates of Obligation, Limited General Obligation |
|
|
| Insured:
BAM |
|
|
| 5.00%,
due 2/15/25 |
900,000
|
929,145
|
| Insured:
BAM |
|
|
| 5.00%,
due 2/15/26 |
770,000
|
804,359
|
| City
of Mission TX, Limited General Obligation |
|
|
| Insured:
BAM |
|
|
| 5.00%,
due 2/15/25 |
570,000
|
588,458
|
| Insured:
BAM |
|
|
| 5.00%,
due 2/15/26 |
500,000
|
522,311
|
| City
of Mount Pleasant TX, Texas Combination Tax and Certificates of Obligation, Limited General Obligation |
|
|
| Insured:
AGM |
|
|
| 5.00%,
due 5/15/28 |
550,000
|
586,409
|
| |
Principal
Amount |
Value
|
| |
| Texas
(continued) |
| City
of Rio Grande City TX, Certificates of Obligation, Limited General Obligation |
|
|
| Insured:
AGM |
|
|
| 4.00%,
due 2/15/24 |
$
545,000 |
$ 548,210
|
| Insured:
AGM |
|
|
| 4.00%,
due 2/15/25 |
610,000 |
615,216 |
| City
of San Antonio TX, Electric & Gas Systems, Revenue Bonds |
|
|
| 5.00%,
due 2/1/24 |
2,500,000 |
2,551,014 |
| 5.00%,
due 2/1/25 |
4,250,000 |
4,411,559 |
| City
of Sugar Land TX, Waterworks & Sewer System, Revenue Bonds |
|
|
| 5.00%,
due 8/15/25 |
1,960,000
|
2,043,698
|
| Clear
Lake City Water Authority, Unlimited General Obligation |
|
|
| 4.00%,
due 3/1/23 |
150,000
|
150,306
|
| Clifton
Higher Education Finance Corp., IDEA Public Schools, Revenue Bonds |
|
|
| Series
A |
|
|
| 5.00%,
due 8/15/23 |
330,000
|
333,182
|
| Series
A |
|
|
| 5.00%,
due 8/15/24 |
340,000
|
346,627
|
| Clifton
Higher Education Finance Corp., International Leadership of Texas, Revenue Bonds |
|
|
| Insured:
PSF-GTD |
|
|
| 5.00%,
due 8/15/28 |
515,000
|
548,109
|
| Insured:
PSF-GTD |
|
|
| 5.00%,
due 8/15/29 |
275,000
|
295,228
|
| Comal
County Water Control & Improvement District No. 6, Unlimited General Obligation |
|
|
| Insured:
BAM |
|
|
| 4.50%,
due 3/1/24 |
10,000
|
10,139
|
| Insured:
BAM |
|
|
| 4.50%,
due 3/1/25 |
135,000
|
138,276
|
| Insured:
BAM |
|
|
| 4.50%,
due 3/1/26 |
280,000
|
289,224
|
| Insured:
BAM |
|
|
| 4.50%,
due 3/1/27 |
295,000
|
306,483
|
| Insured:
BAM |
|
|
| 4.50%,
due 3/1/28 |
305,000
|
318,577
|
| Comal
Independent School District, Unlimited General Obligation |
|
|
| Insured:
PSF-GTD |
|
|
| 5.00%,
due 2/1/25 |
1,650,000
|
1,710,543
|
The notes to the financial statements are an integral part of, and
should be read in conjunction with, the financial statements.
45
Portfolio of
Investments October 31, 2022† (Unaudited) (continued)
| |
Principal
Amount |
Value
|
| Long-Term
Municipal Bonds (continued) |
| Texas
(continued) |
| Decatur
Hospital Authority, Wise Health System, Revenue Bonds |
|
|
| Series
B |
|
|
| 5.00%,
due 9/1/25 |
$
650,000 |
$ 666,674
|
| Series
B |
|
|
| 5.00%,
due 9/1/26 |
750,000 |
773,206 |
| Series
B |
|
|
| 5.00%,
due 9/1/27 |
840,000 |
866,682 |
| Series
B |
|
|
| 5.00%,
due 9/1/28 |
845,000
|
873,702
|
| Series
B |
|
|
| 5.00%,
due 9/1/29 |
1,070,000
|
1,107,356
|
| Denton
County Municipal Utility District No. 6, Unlimited General Obligation |
|
|
| Insured:
AGM |
|
|
| 4.50%,
due 9/1/25 |
400,000
|
411,432
|
| Insured:
AGM |
|
|
| 4.50%,
due 9/1/25 |
280,000
|
288,003
|
| Ector
County Hospital District, Limited General Obligation |
|
|
| 5.00%,
due 9/15/23 |
430,000
|
433,184
|
| 5.00%,
due 9/15/24 |
450,000
|
455,573
|
| 5.00%,
due 9/15/25 |
500,000
|
508,376
|
| Ennis
Independent School District, Unlimited General Obligation |
|
|
| Insured:
PSF-GTD |
|
|
| (zero
coupon), due 8/15/26 |
1,385,000
|
1,198,075
|
| Insured:
PSF-GTD |
|
|
| (zero
coupon), due 8/25/30 |
800,000
|
578,548
|
| Fort
Bend County Municipal Utility District No. 134B, Unlimited General Obligation (e) |
|
|
| Insured:
AGM |
|
|
| 6.50%,
due 3/1/25 |
200,000
|
211,785
|
| Insured:
AGM |
|
|
| 6.50%,
due 3/1/27 |
390,000
|
429,872
|
| Fort
Bend County Municipal Utility District No. 134C, Unlimited General Obligation |
|
|
| Insured:
BAM |
|
|
| 3.00%,
due 9/1/26 |
515,000
|
500,830
|
| Fort
Bend County Municipal Utility District No. 169, Unlimited General Obligation |
|
|
| Insured:
AGM |
|
|
| 2.00%,
due 12/1/26 |
665,000
|
600,241
|
| |
Principal
Amount |
Value
|
| |
| Texas
(continued) |
| Fort
Bend County Municipal Utility District No. 194, Unlimited General Obligation |
|
|
| Series
A, Insured: AGM |
|
|
| 4.00%,
due 9/1/25 |
$
290,000 |
$ 294,488
|
| Fort
Bend County Municipal Utility District No. 206, Unlimited General Obligation |
|
|
| Insured:
BAM |
|
|
| 4.50%,
due 9/1/25 |
300,000 |
308,574 |
| Insured:
BAM |
|
|
| 4.50%,
due 9/1/26 |
300,000 |
310,595 |
| Fort
Bend County Municipal Utility District No. 57, Unlimited General Obligation |
|
|
| Insured:
AGM |
|
|
| 3.00%,
due 4/1/24 |
95,000
|
94,063
|
| Fort
Bend-Waller Counties Municipal Utility District No. 3, Unlimited General Obligation |
|
|
| Insured:
BAM |
|
|
| 4.50%,
due 4/1/23 |
175,000
|
175,711
|
| Insured:
BAM |
|
|
| 4.50%,
due 4/1/24 |
175,000
|
177,317
|
| Insured:
BAM |
|
|
| 4.50%,
due 4/1/25 |
175,000
|
178,756
|
| Galveston
County Municipal Utility District No. 56, Unlimited General Obligation |
|
|
| Insured:
BAM |
|
|
| 4.25%,
due 12/1/22 |
400,000
|
400,336
|
| Insured:
AGM |
|
|
| 4.50%,
due 12/1/23 |
425,000
|
430,520
|
| Insured:
AGM |
|
|
| 4.50%,
due 12/1/24 |
675,000
|
685,984
|
| Green
Valley Special Utility District, Revenue Bonds |
|
|
| Insured:
BAM |
|
|
| 7.00%,
due 9/15/24 |
375,000
|
396,849
|
| Insured:
BAM |
|
|
| 7.00%,
due 9/15/25 |
495,000
|
537,219
|
| Gulfgate
Redevelopment Authority, Tax Allocation |
|
|
| Insured:
AGM |
|
|
| 4.00%,
due 9/1/23 |
325,000
|
325,216
|
| Insured:
AGM |
|
|
| 4.00%,
due 9/1/25 |
440,000
|
445,979
|
The notes to the financial statements are an integral part of, and
should be read in conjunction with, the financial statements.
| 46
|
MainStay MacKay Short Term
Municipal Fund |
| |
Principal
Amount |
Value
|
| Long-Term
Municipal Bonds (continued) |
| Texas
(continued) |
| Harris
County Municipal Utility District No. 105, Unlimited General Obligation |
|
|
| Insured:
AGM |
|
|
| 4.50%,
due 3/1/26 |
$
250,000 |
$ 257,997
|
| Harris
County Municipal Utility District No. 370, Unlimited General Obligation |
|
|
| Insured:
AGM |
|
|
| 3.00%,
due 12/1/22 |
355,000 |
354,904 |
| Harris
County Municipal Utility District No. 480, Unlimited General Obligation |
|
|
| Insured:
AGM |
|
|
| 4.00%,
due 4/1/23 |
175,000
|
175,542
|
| Insured:
AGM |
|
|
| 4.00%,
due 4/1/24 |
175,000
|
176,121
|
| Harris
County Municipal Utility District No. 489, Unlimited General Obligation |
|
|
| Series
A, Insured: BAM |
|
|
| 3.00%,
due 9/1/25 |
275,000
|
269,026
|
| Harris
County Municipal Utility District No. 489, Green Bond, Unlimited General Obligation |
|
|
| Insured:
BAM |
|
|
| 4.00%,
due 9/1/24 |
615,000
|
622,472
|
| Insured:
BAM |
|
|
| 4.00%,
due 9/1/25 |
615,000
|
624,020
|
| Harris
County Municipal Utility District No. 50, Unlimited General Obligation |
|
|
| Insured:
BAM |
|
|
| 4.00%,
due 3/1/25 |
150,000
|
151,285
|
| Insured:
BAM |
|
|
| 4.00%,
due 3/1/26 |
150,000
|
151,493
|
| Insured:
BAM |
|
|
| 4.00%,
due 3/1/27 |
175,000
|
177,107
|
| Harris
County Water Control & Improvement District No. 158, Unlimited General Obligation (e) |
|
|
| Insured:
BAM |
|
|
| 7.00%,
due 9/1/25 |
310,000
|
334,543
|
| Insured:
BAM |
|
|
| 7.00%,
due 9/1/26 |
325,000
|
358,733
|
| |
Principal
Amount |
Value
|
| |
| Texas
(continued) |
| Harris
County-Houston Sports Authority, Revenue Bonds, Senior Lien |
|
|
| Series
A, Insured: AGM |
|
|
| 5.00%,
due 11/15/24 |
$
150,000 |
$ 154,065
|
| Series
A |
|
|
| 5.00%,
due 11/15/28 |
1,440,000 |
1,467,095 |
| Harris-Fort
Bend Counties Municipal Utility District No. 3, Unlimited General Obligation |
|
|
| Insured:
AGM |
|
|
| 4.00%,
due 4/1/25 |
560,000 |
567,861 |
| Insured:
AGM |
|
|
| 4.00%,
due 4/1/26 |
585,000
|
595,070
|
| Insured:
AGM |
|
|
| 4.00%,
due 4/1/27 |
615,000
|
626,640
|
| Horizon
Regional Municipal Utility District, Unlimited General Obligation |
|
|
| Insured:
BAM |
|
|
| 5.00%,
due 2/1/24 |
300,000
|
305,716
|
| Insured:
BAM |
|
|
| 5.00%,
due 2/1/25 |
300,000
|
308,774
|
| Houston
Higher Education Finance Corp., Houston Baptist University, Revenue Bonds |
|
|
| 1.75%,
due 10/1/24 |
115,000
|
107,814
|
| 2.00%,
due 10/1/25 |
150,000
|
136,713
|
| Hunt
Memorial Hospital District Charitable Health, Limited General Obligation |
|
|
| 5.00%,
due 2/15/23 |
325,000
|
326,178
|
| 5.00%,
due 2/15/24 |
275,000
|
278,487
|
| 5.00%,
due 2/15/25 |
450,000
|
459,503
|
| 5.00%,
due 2/15/26 |
800,000
|
823,174
|
| Imperial
Redevelopment District, Unlimited General Obligation |
|
|
| Insured:
AGM |
|
|
| 2.00%,
due 5/1/26 |
130,000
|
118,247
|
| Insured:
AGM |
|
|
| 4.50%,
due 5/1/23 |
120,000
|
120,609
|
| Insured:
AGM |
|
|
| 4.50%,
due 5/1/24 |
85,000
|
86,175
|
| Insured:
AGM |
|
|
| 4.50%,
due 5/1/25 |
125,000
|
127,542
|
The notes to the financial statements are an integral part of, and
should be read in conjunction with, the financial statements.
47
Portfolio of
Investments October 31, 2022† (Unaudited) (continued)
| |
Principal
Amount |
Value
|
| Long-Term
Municipal Bonds (continued) |
| Texas
(continued) |
| Lazy
Nine Municipal Utility District No. 1B, Unlimited General Obligation |
|
|
| Series
1B, Insured: AGM |
|
|
| 3.00%,
due 9/1/24 |
$
360,000 |
$ 353,843
|
| Insured:
BAM |
|
|
| 3.00%,
due 3/1/25 |
170,000 |
166,191 |
| Insured:
BAM |
|
|
| 6.50%,
due 3/1/25 |
300,000 |
318,906 |
| Insured:
BAM |
|
|
| 6.50%,
due 3/1/26 |
360,000
|
390,957
|
| Insured:
BAM |
|
|
| 6.50%,
due 3/1/27 |
375,000
|
414,651
|
| Insured:
BAM |
|
|
| 6.50%,
due 3/1/28 |
390,000
|
439,483
|
| Leander
Independent School District, Unlimited General Obligation |
|
|
| Series
C, Insured: PSF-GTD |
|
|
| 5.00%,
due 8/15/23 |
340,000
|
344,946
|
| Lower
Colorado River Authority, LCRA Transmission Services Corp., Revenue Bonds |
|
|
| 5.00%,
due 5/15/25 |
2,590,000
|
2,647,756
|
| Martin
County Hospital District, Limited General Obligation |
|
|
| 4.00%,
due 4/1/23 |
140,000
|
140,284
|
| 4.00%,
due 4/1/24 |
100,000
|
100,394
|
| 4.00%,
due 4/1/25 |
150,000
|
151,437
|
| 4.00%,
due 4/1/26 |
300,000
|
302,084
|
| Matagorda
County Navigation District No. 1, Revenue Bonds |
|
|
| Insured:
AMBAC |
|
|
| 5.125%,
due 11/1/28 |
6,530,000
|
6,862,627
|
| Metropolitan
Transit Authority of Harris County Sales & Use Tax, Revenue Bonds |
|
|
| Series
A |
|
|
| 5.00%,
due 11/1/25 |
255,000
|
267,255
|
| North
Forest Municipal Utility District, Unlimited General Obligation |
|
|
| Insured:
BAM |
|
|
| 3.00%,
due 4/1/23 |
30,000
|
29,935
|
| North
Texas Municipal Water District, Sabine Creek Regional Wastewater Systems Project, Revenue Bonds |
|
|
| Insured:
AGM |
|
|
| 4.00%,
due 6/1/24 |
350,000
|
352,728
|
| |
Principal
Amount |
Value
|
| |
| Texas
(continued) |
| Northwest
Harris County Municipal Utility District No. 10, Green Bond, Unlimited General Obligation |
|
|
| Insured:
BAM |
|
|
| 5.00%,
due 4/1/23 |
$
520,000 |
$ 523,363
|
| Insured:
BAM |
|
|
| 5.00%,
due 4/1/24 |
635,000 |
647,307 |
| Northwest
Harris County Municipal Utility District No. 19, Unlimited General Obligation |
|
|
| Insured:
AGM |
|
|
| 3.00%,
due 10/1/26 |
200,000 |
194,868 |
| Insured:
AGM |
|
|
| 3.00%,
due 10/1/28 |
155,000
|
148,429
|
| Northwest
Independent School District, Capital Appreciation, Unlimited General Obligation |
|
|
| Insured:
PSF-GTD |
|
|
| (zero
coupon), due 2/15/25 |
295,000
|
272,436
|
| Pasadena
Independent School District, Unlimited General Obligation |
|
|
| Insured:
PSF-GTD |
|
|
| 5.00%,
due 2/15/25 |
3,120,000
|
3,236,345
|
| San
Antonio Housing Trust Public Facility Corp., Country Club Village LP, Revenue Bonds |
|
|
| 4.00%,
due 8/1/26 (a) |
2,500,000
|
2,496,752
|
| Sienna
Municipal Utility District No. 4, Unlimited General Obligation |
|
|
| Insured:
AGM |
|
|
| 3.00%,
due 9/1/25 |
125,000
|
121,949
|
| Sonterra
Municipal Utility District, Unlimited General Obligation |
|
|
| Insured:
AGM |
|
|
| 4.00%,
due 8/15/26 |
350,000
|
354,257
|
| Southeast
Williamson County Municipal Utility District No. 1, Unlimited General Obligation |
|
|
| Insured:
BAM |
|
|
| 4.00%,
due 9/1/23 |
330,000
|
331,481
|
| Insured:
BAM |
|
|
| 4.00%,
due 9/1/24 |
345,000
|
347,724
|
| Insured:
BAM |
|
|
| 4.00%,
due 9/1/25 |
355,000
|
359,059
|
The notes to the financial statements are an integral part of, and
should be read in conjunction with, the financial statements.
| 48
|
MainStay MacKay Short Term
Municipal Fund |
| |
Principal
Amount |
Value
|
| Long-Term
Municipal Bonds (continued) |
| Texas
(continued) |
| Southwest
Houston Redevelopment Authority, Revenue Bonds |
|
|
| Insured:
AGM |
|
|
| 5.00%,
due 9/1/24 |
$
300,000 |
$ 306,139
|
| Insured:
AGM |
|
|
| 5.00%,
due 9/1/25 |
300,000 |
308,829 |
| Tarrant
County Cultural Education Facilities Finance Corp., Hendrick Medical Center Project, Revenue Bonds |
|
|
| Insured:
AGM |
|
|
| 1.356%,
due 9/1/24 |
825,000 |
771,473 |
| Insured:
AGM |
|
|
| 1.386%,
due 9/1/25 |
600,000
|
540,807
|
| Tarrant
County Cultural Education Facilities Finance Corp., Methodist Hospitals of Dallas, Revenue Bonds |
|
|
| 5.00%,
due 10/1/27 |
1,100,000
|
1,115,927
|
| Tarrant
County Cultural Education Facilities Finance Corp., Buckner Retirement Services, Inc. Project, Revenue Bonds |
|
|
| 5.00%,
due 11/15/29 |
875,000
|
900,200
|
| Texas
Public Finance Authority, Revenue Bonds |
|
|
| Insured:
BAM |
|
|
| 5.00%,
due 5/1/28 |
500,000
|
515,891
|
| Timber
Lane Utility District, Unlimited General Obligation |
|
|
| Series
A, Insured: AGM |
|
|
| 4.00%,
due 8/1/24 |
65,000
|
65,737
|
| Trinity
River Authority, Ten Mile Creek System, Revenue Bonds |
|
|
| 5.00%,
due 8/1/26 |
1,390,000
|
1,464,275
|
| Viridian
Municipal Management District, Unlimited General Obligation |
|
|
| Insured:
AGM |
|
|
| 4.00%,
due 12/1/22 |
550,000
|
550,298
|
| Insured:
AGM |
|
|
| 4.00%,
due 12/1/22 |
395,000
|
395,214
|
| Insured:
AGM |
|
|
| 4.00%,
due 12/1/23 |
300,000
|
301,936
|
| Insured:
AGM |
|
|
| 4.00%,
due 12/1/23 |
305,000
|
306,968
|
| |
Principal
Amount |
Value
|
| |
| Texas
(continued) |
| Viridian
Municipal Management District, Unlimited Tax Road Improvement, Unlimited General Obligation |
|
|
| Insured:
BAM |
|
|
| 4.00%,
due 12/1/22 |
$
175,000 |
$ 175,095
|
| Insured:
BAM |
|
|
| 4.00%,
due 12/1/24 |
370,000 |
374,348 |
| Williamson
County Municipal Utility District No. 19, Unlimited General Obligation |
|
|
| Series
A, Insured: BAM |
|
|
| 5.00%,
due 8/15/25 |
260,000 |
269,141
|
| |
|
118,584,650
|
| U.S.
Virgin Islands 1.5% |
| Matching
Fund Special Purpose Securitization Corp., Revenue Bonds |
|
|
| Series
A |
|
|
| 5.00%,
due 10/1/25 |
3,850,000
|
3,931,813
|
| Series
A |
|
|
| 5.00%,
due 10/1/26 |
15,430,000
|
15,751,170
|
| Virgin
Islands Public Finance Authority, Gross Receipts Taxes Loan, Revenue Bonds |
|
|
| Insured:
NATL-RE |
|
|
| 5.00%,
due 10/1/24 |
395,000
|
399,342
|
| |
|
20,082,325
|
| Utah
0.7% |
| City
of Salt Lake City UT, Airport, Revenue Bonds (b) |
|
|
| Series
A |
|
|
| 5.00%,
due 7/1/24 |
95,000
|
96,676
|
| Series
A |
|
|
| 5.00%,
due 7/1/29 |
3,365,000
|
3,459,063
|
| Utah
Charter School Finance Authority, North Star Academy Project, Revenue Bonds |
|
|
| Insured:
UT CSCE |
|
|
| (zero
coupon), due 4/15/25 |
615,000
|
541,150
|
| Utah
Charter School Finance Authority, Spectrum Academy Project, Revenue Bonds |
|
|
| Insured:
UT CSCE |
|
|
| 4.00%,
due 4/15/23 |
175,000
|
175,490
|
| Insured:
UT CSCE |
|
|
| 4.00%,
due 4/15/24 |
280,000
|
281,049
|
The notes to the financial statements are an integral part of, and
should be read in conjunction with, the financial statements.
49
Portfolio of
Investments October 31, 2022† (Unaudited) (continued)
| |
Principal
Amount |
Value
|
| Long-Term
Municipal Bonds (continued) |
| Utah
(continued) |
| Utah
Charter School Finance Authority, Spectrum Academy Project, Revenue Bonds (continued) |
|
|
| Insured:
UT CSCE |
|
|
| 4.00%,
due 4/15/26 |
$
400,000 |
$ 402,897
|
| Utah
Charter School Finance Authority, Revenue Bonds |
|
|
| Series
A, Insured: UT CSCE |
|
|
| 4.00%,
due 10/15/24 |
255,000 |
256,882 |
| Series
A, Insured: UT CSCE |
|
|
| 4.00%,
due 10/15/25 |
265,000 |
267,542 |
| Utah
Charter School Finance Authority, Summit Academy, Inc. Project, Revenue Bonds |
|
|
| Insured:
UT CSCE |
|
|
| 5.00%,
due 4/15/24 |
340,000
|
345,555
|
| Utah
Infrastructure Agency, Revenue Bonds |
|
|
| 3.00%,
due 10/15/25 |
565,000
|
535,188
|
| 4.00%,
due 10/15/23 |
755,000
|
748,958
|
| 4.00%,
due 10/15/27 |
550,000
|
525,513
|
| 4.00%,
due 10/15/28 |
350,000
|
329,825
|
| Utah
Infrastructure Agency, Syracuse City Project, Revenue Bonds |
|
|
| 3.00%,
due 10/15/27 |
145,000
|
140,219
|
| Utah
Infrastructure Agency, Telecommunication, Revenue Bonds |
|
|
| 5.00%,
due 10/15/26 |
1,265,000
|
1,266,802
|
| |
|
9,372,809
|
| Vermont
0.4% |
| City
of Burlington VT, Airport, Revenue Bonds |
|
|
| Series
A |
|
|
| 4.00%,
due 7/1/23 |
400,000
|
400,814
|
| Series
A |
|
|
| 4.00%,
due 7/1/24 |
415,000
|
416,501
|
| Series
A |
|
|
| 5.00%,
due 7/1/25 |
430,000
|
441,757
|
| Vermont
Student Assistance Corp., Revenue Bonds, Senior Lien (b) |
|
|
| Series
A |
|
|
| 5.00%,
due 6/15/23 |
1,150,000
|
1,159,269
|
| Series
A |
|
|
| 5.00%,
due 6/15/24 |
850,000
|
863,975
|
| |
Principal
Amount |
Value
|
| |
| Vermont
(continued) |
Vermont
Student Assistance Corp., Revenue Bonds, Senior Lien (b)
(continued) |
|
|
| Series
A |
|
|
| 5.00%,
due 6/15/25 |
$
875,000 |
$ 892,882
|
| Vermont
Student Assistance Corp., Revenue Bonds (b) |
|
|
| Series
A |
|
|
| 5.00%,
due 6/15/25 |
1,300,000 |
1,326,568 |
| Series
A |
|
|
| 5.00%,
due 6/15/26 |
175,000 |
179,155
|
| |
|
5,680,921
|
| Virginia
0.6% |
| Capital
Region Airport Commission, Revenue Bonds |
|
|
| Series
A, Insured: AGM |
|
|
| 4.00%,
due 7/1/27 |
1,005,000
|
1,007,026
|
| Lynchburg
Economic Development Authority, Centra Health Obligated Group, Revenue Bonds |
|
|
| 4.00%,
due 1/1/27 |
425,000
|
418,771
|
| Norfolk
Airport Authority, Revenue Bonds |
|
|
| 5.00%,
due 7/1/24 |
395,000
|
404,213
|
| 5.00%,
due 7/1/25 |
160,000
|
165,481
|
| Rockingham
County Economic Development Authority, Sunnyside Presbyterian Home, Revenue Bonds |
|
|
| 4.00%,
due 12/1/22 |
300,000
|
299,910
|
| Spotsylvania
County Economic Development Authority, Revenue Bonds |
|
|
| 5.00%,
due 6/1/25 |
3,130,000
|
3,258,481
|
| Virginia
Small Business Financing Authority, LifeSpire of Virginia, Revenue Bonds |
|
|
| 3.00%,
due 12/1/22 |
240,000
|
239,663
|
| 3.00%,
due 12/1/24 |
220,000
|
212,284
|
| 3.00%,
due 12/1/25 |
230,000
|
218,017
|
| 3.00%,
due 12/1/26 |
235,000
|
218,743
|
The notes to the financial statements are an integral part of, and
should be read in conjunction with, the financial statements.
| 50
|
MainStay MacKay Short Term
Municipal Fund |
| |
Principal
Amount |
Value
|
| Long-Term
Municipal Bonds (continued) |
| Virginia
(continued) |
| Virginia
Small Business Financing Authority, National Senior Campuses, Inc. Obligated Group, Revenue Bonds |
|
|
| 5.00%,
due 1/1/23 |
$
500,000 |
$ 500,607
|
| 5.00%,
due 1/1/24 |
550,000 |
555,612
|
| |
|
7,498,808
|
| Washington
0.5% |
| Northwest
Open Access Network, Revenue Bonds |
|
|
| 0.691%,
due 12/1/22 |
1,200,000 |
1,196,033 |
| 0.791%,
due 12/1/23 |
1,260,000 |
1,199,324 |
| Pend
Oreille County Public Utility District No. 1 Box Canyon, Green Bond, Revenue Bonds |
|
|
| 5.00%,
due 1/1/23 |
100,000
|
100,151
|
| Pierce
County School District No. 320 Sumner, Unlimited General Obligation |
|
|
| Insured:
School Bond Guaranty |
|
|
| 4.00%,
due 12/1/26 |
2,500,000
|
2,543,436
|
| Spokane
Public Facilities District, Revenue Bonds |
|
|
| Series
B |
|
|
| 5.00%,
due 12/1/23 |
1,175,000
|
1,186,499
|
| Washington
Higher Education Facilities Authority, Whitworth University Project, Revenue Bonds |
|
|
| 4.00%,
due 10/1/23 |
435,000
|
436,717
|
| 4.00%,
due 10/1/25 |
470,000
|
467,290
|
| Washington
Higher Education Facilities Authority, Seattle University Project, Revenue Bonds |
|
|
| 5.00%,
due 5/1/24 |
250,000
|
254,459
|
| |
|
7,383,909
|
| West
Virginia 0.1% |
| City
of Fairmont WV, Waterworks, Revenue Bonds |
|
|
| Series
A, Insured: BAM |
|
|
| 3.00%,
due 7/1/23 |
300,000
|
298,444
|
| Series
A, Insured: BAM |
|
|
| 3.00%,
due 7/1/24 |
500,000
|
492,810
|
| |
Principal
Amount |
Value
|
| |
| West
Virginia (continued) |
| City
of Wheeling WV, Waterworks & Sewerage System, Revenue Bonds |
|
|
| Series
A, Insured: BAM |
|
|
| 4.00%,
due 6/1/28 |
$
300,000 |
$ 307,280
|
| Morgantown
Utility Board, Inc., Green Bond, Revenue Bonds |
|
|
| Series
A, Insured: BAM |
|
|
| 3.00%,
due 12/1/22 |
225,000 |
224,934 |
| West
Virginia Hospital Finance Authority, Cabell Huntington Hospital Obligated Group, Revenue Bonds |
|
|
| 5.00%,
due 1/1/25 |
425,000 |
429,930
|
| |
|
1,753,398
|
| Wisconsin
0.6% |
| City
of Kaukauna WI, Electric System, Revenue Bonds |
|
|
| Insured:
AGM |
|
|
| 3.00%,
due 12/15/24 |
5,000
|
4,918
|
| Public
Finance Authority, United Methodist Retirement Homes, Inc., Revenue Bonds |
|
|
| Series
A |
|
|
| 4.00%,
due 10/1/25 |
290,000
|
285,373
|
| Series
A |
|
|
| 4.00%,
due 10/1/26 |
305,000
|
297,544
|
| Series
A |
|
|
| 4.00%,
due 10/1/27 |
195,000
|
188,319
|
| Public
Finance Authority, Northwest Nazarene University, Revenue Bonds |
|
|
| 5.00%,
due 10/1/25 |
500,000
|
506,993
|
| Town
of Manitowish Waters WI, Unlimited General Obligation |
|
|
| Insured:
AGM |
|
|
| 3.00%,
due 3/1/23 |
295,000
|
293,967
|
| Insured:
AGM |
|
|
| 3.00%,
due 3/1/24 |
300,000
|
295,042
|
| Insured:
AGM |
|
|
| 3.00%,
due 3/1/25 |
310,000
|
300,924
|
| Village
of Mount Pleasant WI, Revenue Bonds |
|
|
| Series
A, Insured: BAM |
|
|
| 3.00%,
due 3/1/27 |
6,000,000
|
5,896,786
|
| |
|
8,069,866
|
Total
Long-Term Municipal Bonds
(Cost $1,082,358,371) |
|
1,039,761,493
|
The notes to the financial statements are an integral part of, and
should be read in conjunction with, the financial statements.
51
Portfolio of
Investments October 31, 2022† (Unaudited) (continued)
| |
Principal
Amount |
Value
|
| Short-Term
Municipal Notes 19.8% |
| Alabama
1.6% |
| Black
Belt Energy Gas District, Gas Project No.7, Revenue Bonds |
|
|
| Series
C-2 |
|
|
| 2.59%,
due 10/1/52 (g) |
$
20,000,000 |
$ 18,697,694
|
| Southeast
Alabama Gas Supply District (The), Project No. 1, Revenue Bonds |
|
|
| Series
C |
|
|
| 2.89%,
due 4/1/49 (g) |
3,000,000 |
2,955,701
|
| |
|
21,653,395
|
| Arizona
1.1% |
| Arizona
Health Facilities Authority, Banner Health, Revenue Bonds |
|
|
| Series
B |
|
|
| 2.49%,
due 1/1/46 (g) |
15,000,000
|
14,469,720
|
| California
2.1% |
| California
Infrastructure and Economic Development Bank, Brightline West Passenger Rail Project, Revenue Bonds |
|
|
| Series
A |
|
|
| 0.85%,
due 1/1/50 (b)(c)(g) |
17,450,000
|
17,292,718
|
| California
Municipal Finance Authority, Waste Management, Inc. Project, Revenue Bonds |
|
|
| 0.70%,
due 12/1/44 (b)(g) |
6,500,000
|
6,250,180
|
| California
Municipal Finance Authority, Waste Management, Inc., Revenue Bonds |
|
|
| Series
A |
|
|
| 4.125%,
due 10/1/41 (b)(g) |
5,000,000
|
4,949,190
|
| |
|
28,492,088
|
| District
of Columbia 0.3% |
| District
of Columbia Housing Finance Agency, Cascade Park Apartments II Project, Revenue Bonds |
|
|
| 0.70%,
due 8/1/42 (g) |
4,500,000
|
4,216,052
|
| Georgia
0.2% |
| Bartow
County Development Authority, Georgia Power Company Plant Bowen Project, Revenue Bonds |
|
|
| 1.80%,
due 9/1/29 (g) |
2,800,000
|
2,400,989
|
| |
Principal
Amount |
Value
|
| |
| Georgia
(continued) |
| Development
Authority of Burke County (The), Georgia Power Co. Vogtle Project, Revenue Bonds |
|
|
| 2.15%,
due 10/1/32 (g) |
$
1,000,000 |
$ 963,503
|
| |
|
3,364,492
|
| Illinois
0.1% |
| Illinois
Finance Authority, Presbyterian Homes Obligated Group, Revenue Bonds |
|
|
| Series
B |
|
|
| 2.94%,
due 5/1/42 (g) |
1,125,000 |
1,091,321
|
| Indiana
0.3% |
| Indiana
Finance Authority, Indianapolis Power & Light Co., Revenue Bonds |
|
|
| Series
B |
|
|
| 0.95%,
due 12/1/38 (b)(g) |
2,265,000
|
1,911,507
|
| Indiana
Finance Authority, Deaconess Health System, Revenue Bonds |
|
|
| Series
B |
|
|
| 2.54%,
due 3/1/39 (g) |
1,925,000
|
1,875,226
|
| |
|
3,786,733
|
| Kansas
0.7% |
| City
of Wichita KS, Wichita Senior Housing, Revenue Bonds |
|
|
| Series
IV, Insured: FHA 221(D4) |
|
|
| 0.51%,
due 11/1/25 (g) |
10,300,000
|
9,525,875
|
| Louisiana
0.5% |
| Parish
of St. John the Baptist LA, Marathon Oil Corp. Project, Revenue Bonds (g) |
|
|
| 2.125%,
due 6/1/37 |
925,000
|
891,423
|
| Series
B-2 |
|
|
| 2.375%,
due 6/1/37 |
6,525,000
|
5,945,518
|
| |
|
6,836,941
|
| Michigan
0.9% |
| City
of Detroit MI, Water Sewage Disposal System, Revenue Bonds |
|
|
| Series
D, Insured: AGM |
|
|
| 3.108%,
due 7/1/32 (g) |
13,500,000
|
12,985,808
|
The notes to the financial statements are an integral part of, and
should be read in conjunction with, the financial statements.
| 52
|
MainStay MacKay Short Term
Municipal Fund |
| |
Principal
Amount |
Value
|
| Short-Term
Municipal Notes (continued) |
| Nebraska
0.5% |
| County
of Douglas NE, Creighton University, Revenue Bonds |
|
|
| Series
B |
|
|
| 2.77%,
due 7/1/35 (g) |
$
6,445,000 |
$ 6,341,555
|
| New
Jersey 0.4% |
| New
Jersey Turnpike Authority, Revenue Bonds (g) |
|
|
| Series
C-4 |
|
|
| 2.89%,
due 1/1/24 |
3,200,000 |
3,195,993 |
| Series
D-1 |
|
|
| 2.90%,
due 1/1/24 |
2,600,000
|
2,596,744
|
| |
|
5,792,737
|
| New
York 3.0% |
| Metropolitan
Transportation Authority, Revenue Bonds (g) |
|
|
| Series
E-1 |
|
|
| 1.60%,
due 11/15/50 |
10,865,000
|
10,865,000
|
| Series
D-2A-1, Insured: AGM |
|
|
| 2.587%,
due 11/1/32 |
11,250,000
|
11,000,248
|
| Series
D-2A-2, Insured: AGM |
|
|
| 2.837%,
due 11/1/32 |
10,875,000
|
10,314,908
|
| New
York City Housing Development Corp., Multi-Family Housing, Revenue Bonds |
|
|
| Series
F2, Insured: FHA 542(C) |
|
|
| 0.60%,
due 5/1/61 (g) |
5,000,000
|
4,507,707
|
| Triborough
Bridge & Tunnel Authority, MTA Bridges & Tunnels, Revenue Bonds |
|
|
| Series
B-4A |
|
|
| 2.417%,
due 1/1/32 (g) |
4,455,000
|
4,376,645
|
| |
|
41,064,508
|
| Ohio
1.2% |
| Ohio
Air Quality Development Authority, American Electric Power Co. Project, Revenue Bonds (g) |
|
|
| 2.10%,
due 10/1/28 (b) |
10,000,000
|
9,498,979
|
| 2.40%,
due 12/1/38 |
5,710,000
|
4,892,413
|
| 2.50%,
due 11/1/42 (b) |
2,500,000
|
2,143,260
|
| State
of Ohio, Cleveland Clinic Health System Obligated Group, Revenue Bonds |
|
|
| 2.64%,
due 1/1/52 (g) |
120,000
|
120,011
|
| |
|
16,654,663
|
| |
Principal
Amount |
Value
|
| |
| Pennsylvania
1.9% |
| County
of Allegheny PA, Unlimited General Obligation |
|
|
| Series
C-59B, Insured: AGM |
|
|
| 2.414%,
due 11/1/26 (g) |
$
815,000 |
$ 812,194
|
| Lehigh
County General Purpose Authority, Muhlenberg College Project, Revenue Bonds |
|
|
| 2.82%,
due 11/1/37 (g) |
13,110,000
|
13,091,486 |
| Pennsylvania
Economic Development Financing Authority, Waste Management, Inc., Revenue Bonds |
|
|
| Series
A |
|
|
| 2.64%,
due 6/1/41 (b)(g) |
9,000,000 |
8,645,360 |
| Pennsylvania
Higher Educational Facilities Authority, Indiana University, Revenue Bonds |
|
|
| Series
A, Insured: AGC |
|
|
| 3.108%,
due 7/1/27 (g) |
2,230,000
|
2,186,121
|
| University
of Pittsburgh-of the Commonwealth System of Higher Education, Revenue Bonds |
|
|
| 2.60%,
due 2/15/24 (g) |
2,000,000
|
1,999,346
|
| |
|
26,734,507
|
| Rhode
Island 0.4% |
| Rhode
Island Health and Educational Building Corp., Bryant University, Revenue Bonds |
|
|
| 1.50%,
due 6/1/44 (g) |
5,660,000
|
5,232,321
|
| South
Carolina 0.2% |
| Patriots
Energy Group Financing Agency, Revenue Bonds |
|
|
| Series
B |
|
|
| 2.966%,
due 10/1/48 (g) |
2,180,000
|
2,156,636
|
| Texas
2.3% |
| Capital
Area Housing Finance Corp., Grand Avenue Flats Ltd., Revenue Bonds |
|
|
| 0.29%,
due 8/1/39 (g) |
13,000,000
|
12,052,065
|
| Harris
County Cultural Education Facilities Finance Corp., Baylor College of Medicine, Revenue Bonds |
|
|
| Series
A |
|
|
| 2.85%,
due 11/15/46 (g) |
4,000,000
|
3,999,569
|
The notes to the financial statements are an integral part of, and
should be read in conjunction with, the financial statements.
53
Portfolio of
Investments October 31, 2022† (Unaudited) (continued)
| |
Principal
Amount |
|
Value
|
| Short-Term
Municipal Notes (continued) |
| Texas
(continued) |
| Texas
Municipal Gas Acquisition & Supply Corp. II, Revenue Bonds |
|
|
|
| Series
C |
|
|
|
| 2.863%,
due 9/15/27 (g) |
$
15,775,000 |
|
$ 15,148,092
|
| |
|
|
31,199,726
|
| Washington
2.1% |
| County
of King WA, Sewer, Revenue Bonds, Junior Lien |
|
|
|
| Series
A |
|
|
|
| 2.47%,
due 1/1/40 (g) |
20,000,000
|
|
19,457,206 |
| Washington
Health Care Facilities Authority, Fred Hutchinson Cancer Research Center, Revenue Bonds |
|
|
|
| 3.29%,
due 1/1/42 (g) |
9,000,000
|
|
9,006,693
|
| |
|
|
28,463,899
|
Total
Short-Term Municipal Notes
(Cost $279,978,053) |
|
|
270,062,977
|
Total
Municipal Bonds
(Cost $1,362,336,424) |
|
|
1,309,824,470
|
| |
| Long-Term
Bonds 0.3% |
| Corporate
Bonds 0.3% |
| Commercial
Services 0.2% |
| Yale
University |
|
|
|
| Series
2020 |
|
|
|
| 0.873%,
due 4/15/25 |
3,000,000
|
|
2,731,633
|
| Entertainment
0.1% |
| Smithsonian
Institution |
|
|
|
| 0.974%,
due 9/1/23 |
800,000
|
|
772,256
|
| Healthcare-Services
0.0% ‡ |
| Baptist
Health Obligated Group |
|
|
|
| 2.579%,
due 12/1/22 |
350,000
|
|
349,026
|
Total
Corporate Bonds
(Cost $3,990,144) |
|
|
3,852,915
|
Total
Long-Term Bonds
(Cost $3,990,144) |
|
|
3,852,915
|
Total
Investments
(Cost $1,366,326,568) |
96.2%
|
|
1,313,677,385
|
| Other
Assets, Less Liabilities |
3.8
|
|
51,923,342
|
| Net
Assets |
100.0%
|
|
$ 1,365,600,727
|
| †
|
Percentages
indicated are based on Fund net assets. |
| ‡
|
Less than
one-tenth of a percent. |
| (a)
|
Coupon
rate may change based on changes of the underlying collateral or prepayments of principal. Rate shown was the rate in effect as of October 31, 2022. |
| (b)
|
Interest
on these securities was subject to alternative minimum tax. |
| (c)
|
May be
sold to institutional investors only under Rule 144A or securities offered pursuant to Section 4(a)(2) of the Securities Act of 1933, as amended. |
| (d)
|
Step
coupon—Rate shown was the rate in effect as of October 31, 2022. |
| (e)
|
Delayed
delivery security. |
| (f)
|
Floating
rate—Rate shown was the rate in effect as of October 31, 2022. |
| (g)
|
Variable-rate
demand notes (VRDNs)—Provide the right to sell the security at face value on either that day or within the rate-reset period. VRDNs will normally trade as if the maturity is the earlier put date, even though stated maturity is longer. The
interest rate is reset on the put date at a stipulated daily, weekly, monthly, quarterly, or other specified time interval to reflect current market conditions. These securities do not indicate a reference rate and spread in their description. The
maturity date shown is the final maturity. |
| Abbreviation(s):
|
| AGC—Assured
Guaranty Corp. |
| AGM—Assured
Guaranty Municipal Corp. |
| AMBAC—Ambac
Assurance Corp. |
| BAM—Build
America Mutual Assurance Co. |
| CR—Custodial
Receipts |
| FHA—Federal
Housing Administration |
| ICC—Insured
Custody Certificates |
| MUN GOVT
GTD—Municipal Government Guaranteed |
| NATL-RE—National
Public Finance Guarantee Corp. |
| PSF-GTD—Permanent
School Fund Guaranteed |
| Q-SBLF—Qualified
School Board Loan Fund |
| SD CRED
PROG—School District Credit Enhancement Program |
| UT
CSCE—Utah Charter School Credit Enhancement Program |
The notes to the financial statements are an integral part of, and
should be read in conjunction with, the financial statements.
| 54
|
MainStay MacKay Short Term
Municipal Fund |
The following is
a summary of the fair valuations according to the inputs used as of October 31, 2022, for valuing the Fund’s assets:
| Description
|
Quoted
Prices in
Active
Markets for
Identical
Assets
(Level 1) |
|
Significant
Other
Observable
Inputs
(Level 2) |
|
Significant
Unobservable
Inputs
(Level 3) |
|
Total
|
| Asset
Valuation Inputs |
|
|
|
|
|
|
|
| Investments
in Securities (a) |
|
|
|
|
|
|
|
| Municipal
Bonds |
|
|
|
|
|
|
|
| Long-Term
Municipal Bonds |
$ —
|
|
$ 1,039,761,493
|
|
$ —
|
|
$ 1,039,761,493
|
| Short-Term
Municipal Notes |
—
|
|
270,062,977
|
|
—
|
|
270,062,977
|
| Total
Municipal Bonds |
—
|
|
1,309,824,470
|
|
—
|
|
1,309,824,470
|
| Long-Term
Bonds |
|
|
|
|
|
|
|
| Corporate
Bonds |
—
|
|
3,852,915
|
|
—
|
|
3,852,915
|
| Total
Corporate Bonds |
—
|
|
3,852,915
|
|
—
|
|
3,852,915
|
| Total
Investments in Securities |
$ —
|
|
$ 1,313,677,385
|
|
$ —
|
|
$ 1,313,677,385
|
| (a)
|
For
a complete listing of investments and their industries, see the Portfolio of Investments. |
The notes to the financial statements are an integral part
of, and should be read in conjunction with, the financial statements.
55
Statement of
Assets and Liabilities as of October 31, 2022 (Unaudited)
| Assets
|
Investment
in securities, at value
(identified cost $1,366,326,568) |
$1,313,677,385
|
| Cash
|
27,030,407
|
| Due
from custodian |
4,834,126
|
| Receivables:
|
|
| Investment
securities sold |
47,367,250
|
| Interest
|
13,434,239
|
| Fund
shares sold |
6,833,033
|
| Other
assets |
88,308
|
| Total
assets |
1,413,264,748
|
| Liabilities
|
| Payables:
|
|
| Investment
securities purchased |
34,825,799
|
| Fund
shares redeemed |
11,151,981
|
| Manager
(See Note 3) |
387,678
|
| NYLIFE
Distributors (See Note 3) |
97,681
|
| Custodian
|
93,605
|
| Transfer
agent (See Note 3) |
75,687
|
| Professional
fees |
65,310
|
| Shareholder
communication |
41,441
|
| Trustees
|
1,220
|
| Accrued
expenses |
63,330
|
| Distributions
payable |
860,289
|
| Total
liabilities |
47,664,021
|
| Net
assets |
$1,365,600,727
|
| Composition
of Net Assets |
| Shares
of beneficial interest outstanding (par value of $.001 per share) unlimited number of shares authorized |
$
149,828 |
| Additional
paid-in-capital |
1,464,359,712
|
| |
1,464,509,540
|
| Total
distributable earnings (loss) |
(98,908,813)
|
| Net
assets |
$1,365,600,727
|
| Class
A |
|
| Net
assets applicable to outstanding shares |
$371,938,172
|
| Shares
of beneficial interest outstanding |
40,807,128
|
| Net
asset value per share outstanding |
$
9.11 |
| Maximum
sales charge (1.00% of offering price) |
0.09
|
| Maximum
offering price per share outstanding |
$
9.20 |
| Class
A2 |
|
| Net
assets applicable to outstanding shares |
$
76,254,011 |
| Shares
of beneficial interest outstanding |
8,356,205
|
| Net
asset value and offering price per share outstanding |
$
9.13 |
| Investor
Class |
|
| Net
assets applicable to outstanding shares |
$
2,752,881 |
| Shares
of beneficial interest outstanding |
301,217
|
| Net
asset value per share outstanding |
$
9.14 |
| Maximum
sales charge (0.50% of offering price) |
0.05
|
| Maximum
offering price per share outstanding |
$
9.19 |
| Class
I |
|
| Net
assets applicable to outstanding shares |
$831,311,439
|
| Shares
of beneficial interest outstanding |
91,211,338
|
| Net
asset value and offering price per share outstanding |
$
9.11 |
| Class
R6 |
|
| Net
assets applicable to outstanding shares |
$
83,344,224 |
| Shares
of beneficial interest outstanding |
9,151,766
|
| Net
asset value and offering price per share outstanding |
$
9.11 |
The notes to the financial statements are an
integral part of, and should be read in conjunction with, the financial statements.
| 56
|
MainStay MacKay Short Term
Municipal Fund |
Statement of
Operations for the six months ended October 31, 2022 (Unaudited)
| Investment
Income (Loss) |
| Income
|
|
| Interest
|
$
13,309,585 |
| Expenses
|
|
| Manager
(See Note 3) |
2,690,352
|
| Distribution/Service—Class
A (See Note 3) |
512,698
|
| Distribution/Service—Class
A2 (See Note 3) |
114,464
|
| Distribution/Service—Investor
Class (See Note 3) |
3,613
|
| Transfer
agent (See Note 3) |
222,231
|
| Custodian
|
189,545
|
| Professional
fees |
85,299
|
| Registration
|
78,615
|
| Shareholder
communication |
26,810
|
| Trustees
|
19,382
|
| Miscellaneous
|
30,618
|
| Total
expenses before waiver/reimbursement |
3,973,627
|
| Expense
waiver/reimbursement from Manager (See Note 3) |
(130,115)
|
| Net
expenses |
3,843,512
|
| Net
investment income (loss) |
9,466,073
|
| Realized
and Unrealized Gain (Loss) |
| Net
realized gain (loss) on investments |
(29,794,586)
|
| Net
change in unrealized appreciation (depreciation) on investments |
79,004
|
| Net
realized and unrealized gain (loss) |
(29,715,582)
|
| Net
increase (decrease) in net assets resulting from operations |
$(20,249,509)
|
The notes to the financial statements are an integral part
of, and should be read in conjunction with, the financial statements.
57
Statements of
Changes in Net Assets
for the six months ended October 31, 2022 (Unaudited) and the year ended April 30, 2022
| |
Six months
ended
October 31,
2022 |
Year
ended
April 30,
2022 |
| Increase
(Decrease) in Net Assets |
| Operations:
|
|
|
| Net
investment income (loss) |
$
9,466,073 |
$
11,016,224 |
| Net
realized gain (loss) |
(29,794,586)
|
(9,580,898)
|
| Net
change in unrealized appreciation (depreciation) |
79,004
|
(72,063,429)
|
| Net
increase (decrease) in net assets resulting from operations |
(20,249,509)
|
(70,628,103)
|
| Distributions
to shareholders: |
|
|
| Class
A |
(2,380,989)
|
(2,489,358)
|
| Class
A2 |
(525,313)
|
(604,316)
|
| Investor
Class |
(12,124)
|
(7,453)
|
| Class
I |
(6,896,288)
|
(11,061,272)
|
| Class
R6 |
(710,548)
|
—
|
| Total
distributions to shareholders |
(10,525,262)
|
(14,162,399)
|
| Capital
share transactions: |
|
|
| Net
proceeds from sales of shares |
549,724,938
|
1,461,111,895
|
| Net
asset value of shares issued to shareholders in reinvestment of distributions |
6,483,976
|
9,157,948
|
| Cost
of shares redeemed |
(797,222,471)
|
(1,744,044,217)
|
| Increase
(decrease) in net assets derived from capital share transactions |
(241,013,557)
|
(273,774,374)
|
| Net
increase (decrease) in net assets |
(271,788,328)
|
(358,564,876)
|
| Net
Assets |
| Beginning
of period |
1,637,389,055
|
1,995,953,931
|
| End
of period |
$1,365,600,727
|
$
1,637,389,055 |
The notes to the financial statements are an integral part
of, and should be read in conjunction with, the financial statements.
| 58
|
MainStay MacKay Short Term
Municipal Fund |
Financial
Highlights selected per share data and ratios
| |
Six
months ended
October 31,
2022* |
|
Year
Ended April 30, |
| Class
A |
2022
|
|
2021
|
|
2020
|
|
2019
|
|
2018
|
| Net
asset value at beginning of period |
$
9.31 |
|
$
9.73 |
|
$
9.54 |
|
$
9.58 |
|
$
9.51 |
|
$
9.56 |
| Net
investment income (loss) (a) |
0.05
|
|
0.04
|
|
0.06
|
|
0.13
|
|
0.12
|
|
0.10
|
| Net
realized and unrealized gain (loss) |
(0.20)
|
|
(0.41)
|
|
0.21
|
|
(0.03)
|
|
0.07
|
|
(0.05)
|
| Total
from investment operations |
(0.15)
|
|
(0.37)
|
|
0.27
|
|
0.10
|
|
0.19
|
|
0.05
|
| Less
distributions: |
|
|
|
|
|
|
|
|
|
|
|
| From
net investment income |
(0.05)
|
|
(0.05)
|
|
(0.08)
|
|
(0.14)
|
|
(0.12)
|
|
(0.10)
|
| Net
asset value at end of period |
$
9.11 |
|
$
9.31 |
|
$
9.73 |
|
$
9.54 |
|
$
9.58 |
|
$
9.51 |
| Total
investment return (b) |
(1.57)%
|
|
(3.81)%
|
|
2.85%
|
|
1.05%
|
|
2.04%(c)
|
|
0.54%
|
| Ratios
(to average net assets)/Supplemental Data: |
|
|
|
|
|
|
|
|
|
|
|
| Net
investment income (loss) |
1.03%††
|
|
0.36%
|
|
0.63%
|
|
1.30%
|
|
1.28%
|
|
1.06%
|
| Net
expenses |
0.68%††
|
|
0.67%
|
|
0.65%
|
|
0.69%
|
|
0.71%
|
|
0.80%
|
| Expenses
(before waiver/reimbursement) |
0.68%††
|
|
0.67%
|
|
0.65%
|
|
0.70%
|
|
0.71%
|
|
0.84%
|
| Portfolio
turnover rate |
35%(d)
|
|
62%(d)
|
|
28%(d)
|
|
94%(d)
|
|
96%
|
|
69%
|
| Net
assets at end of period (in 000’s) |
$
371,938 |
|
$
409,722 |
|
$
503,769 |
|
$
152,614 |
|
$
113,023 |
|
$
98,982 |
| *
|
Unaudited.
|
| ††
|
Annualized.
|
| (a)
|
Per share
data based on average shares outstanding during the period. |
| (b)
|
Total
investment return is calculated exclusive of sales charges and assumes the reinvestment of dividends and distributions. For periods of less than one year, total return is not annualized. |
| (c)
|
Total
investment return may reflect adjustments to conform to generally accepted accounting principles. |
| (d)
|
The
portfolio turnover rate includes variable rate demand notes. |
| |
Six
months ended
October 31,
2022* |
|
Year
Ended April 30, |
|
September
30, 2020^ through
April 30,
2021 |
| Class
A2 |
2022
* |
|
| Net
asset value at beginning of period |
$
9.32 |
|
$
9.75 |
|
$
9.70** |
| Net
investment income (loss) (a) |
0.05
|
|
0.03
|
|
0.02
|
| Net
realized and unrealized gain (loss) |
(0.19)
|
|
(0.41)
|
|
0.07
|
| Total
from investment operations |
(0.14)
|
|
(0.38)
|
|
0.09
|
| Less
distributions: |
|
|
|
|
|
| From
net investment income |
(0.05)
|
|
(0.05)
|
|
(0.04)
|
| Net
asset value at end of period |
$
9.13 |
|
$
9.32 |
|
$
9.75 |
| Total
investment return (b) |
(1.46)%
|
|
(3.91)%
|
|
0.90%
|
| Ratios
(to average net assets)/Supplemental Data: |
|
|
|
|
|
| Net
investment income (loss) |
1.01%††
|
|
0.36%
|
|
0.40%††
|
| Net
expenses |
0.68%††
|
|
0.67%
|
|
0.65%††
|
| Portfolio
turnover rate (c) |
35%
|
|
62%
|
|
28%
|
| Net
assets at end of period (in 000's) |
$
76,254 |
|
$
98,890 |
|
$
88,248 |
| *
|
Unaudited.
|
| **
|
Based on the
net asset value of Class A as of September 30, 2020. |
| ^
|
Inception
date. |
| ††
|
Annualized.
|
| (a)
|
Per share
data based on average shares outstanding during the period. |
| (b)
|
Total
investment return is calculated exclusive of sales charges and assumes the reinvestment of dividends and distributions. For periods of less than one year, total return is not annualized. |
| (c)
|
The
portfolio turnover rate includes variable rate demand notes. |
The
notes to the financial statements are an integral part of, and should be read in conjunction with, the financial statements.
59
Financial
Highlights selected per share data and ratios
| |
Six
months ended
October 31,
2022* |
|
Year
Ended April 30, |
| Investor
Class |
2022
|
|
2021
|
|
2020
|
|
2019
|
|
2018
|
| Net
asset value at beginning of period |
$
9.33 |
|
$
9.76 |
|
$
9.57 |
|
$
9.61 |
|
$
9.54 |
|
$
9.59 |
| Net
investment income (loss) (a) |
0.03
|
|
0.01
|
|
0.04
|
|
0.09
|
|
0.08
|
|
0.06
|
| Net
realized and unrealized gain (loss) |
(0.18)
|
|
(0.42)
|
|
0.20
|
|
(0.02)
|
|
0.07
|
|
(0.05)
|
| Total
from investment operations |
(0.15)
|
|
(0.41)
|
|
0.24
|
|
0.07
|
|
0.15
|
|
0.01
|
| Less
distributions: |
|
|
|
|
|
|
|
|
|
|
|
| From
net investment income |
(0.04)
|
|
(0.02)
|
|
(0.05)
|
|
(0.11)
|
|
(0.08)
|
|
(0.06)
|
| Net
asset value at end of period |
$
9.14 |
|
$
9.33 |
|
$
9.76 |
|
$
9.57 |
|
$
9.61 |
|
$
9.54 |
| Total
investment return (b) |
(1.62)%
|
|
(4.19)%
|
|
2.64%
|
|
0.61%
|
|
1.56%
|
|
0.08%
|
| Ratios
(to average net assets)/Supplemental Data: |
|
|
|
|
|
|
|
|
|
|
|
| Net
investment income (loss) |
0.70%††
|
|
0.06%
|
|
0.41%
|
|
0.98%
|
|
0.81%
|
|
0.60%
|
| Net
expenses |
1.00%††
|
|
0.99%
|
|
0.98%
|
|
1.09%
|
|
1.18%
|
|
1.26%
|
| Expenses
(before waiver/reimbursement) |
1.31%††
|
|
1.24%
|
|
1.25%
|
|
1.28%
|
|
1.30%
|
|
1.36%
|
| Portfolio
turnover rate |
35%(c)
|
|
62%(c)
|
|
28%(c)
|
|
94%(c)
|
|
96%
|
|
69%
|
| Net
assets at end of period (in 000's) |
$
2,753 |
|
$
2,884 |
|
$
3,608 |
|
$
4,158 |
|
$
3,834 |
|
$
3,366 |
| *
|
Unaudited.
|
| ††
|
Annualized.
|
| (a)
|
Per share
data based on average shares outstanding during the period. |
| (b)
|
Total
investment return is calculated exclusive of sales charges and assumes the reinvestment of dividends and distributions. For periods of less than one year, total return is not annualized. |
| (c)
|
The
portfolio turnover rate includes variable rate demand notes. |
| |
Six
months ended
October 31,
2022* |
|
Year
Ended April 30, |
| Class
I |
2022
|
|
2021
|
|
2020
|
|
2019
|
|
2018
|
| Net
asset value at beginning of period |
$
9.31 |
|
$
9.73 |
|
$
9.54 |
|
$
9.58 |
|
$
9.51 |
|
$
9.56 |
| Net
investment income (loss) (a) |
0.06
|
|
0.06
|
|
0.09
|
|
0.15
|
|
0.15
|
|
0.13
|
| Net
realized and unrealized gain (loss) |
(0.19)
|
|
(0.40)
|
|
0.21
|
|
(0.02)
|
|
0.07
|
|
(0.05)
|
| Total
from investment operations |
(0.13)
|
|
(0.34)
|
|
0.30
|
|
0.13
|
|
0.22
|
|
0.08
|
| Less
distributions: |
|
|
|
|
|
|
|
|
|
|
|
| From
net investment income |
(0.07)
|
|
(0.08)
|
|
(0.11)
|
|
(0.17)
|
|
(0.15)
|
|
(0.13)
|
| Net
asset value at end of period |
$
9.11 |
|
$
9.31 |
|
$
9.73 |
|
$
9.54 |
|
$
9.58 |
|
$
9.51 |
| Total
investment return (b) |
(1.43)%
|
|
(3.55)%
|
|
3.12%
|
|
1.34%
|
|
2.34%
|
|
0.84%
|
| Ratios
(to average net assets)/Supplemental Data: |
|
|
|
|
|
|
|
|
|
|
|
| Net
investment income (loss) |
1.29%††
|
|
0.63%
|
|
0.89%
|
|
1.58%
|
|
1.61%
|
|
1.36%
|
| Net
expenses |
0.40%††
|
|
0.40%
|
|
0.40%
|
|
0.40%
|
|
0.40%
|
|
0.50%
|
| Expenses
(before waiver/reimbursement) |
0.43%††
|
|
0.42%
|
|
0.40%
|
|
0.45%
|
|
0.45%
|
|
0.59%
|
| Portfolio
turnover rate |
35%(c)
|
|
62%(c)
|
|
28%(c)
|
|
94%(c)
|
|
96%
|
|
69%
|
| Net
assets at end of period (in 000’s) |
$
831,311 |
|
$
1,125,893 |
|
$
1,400,328 |
|
$
412,193 |
|
$
337,116 |
|
$
157,945 |
| *
|
Unaudited.
|
| ††
|
Annualized.
|
| (a)
|
Per share
data based on average shares outstanding during the period. |
| (b)
|
Total
investment return is calculated exclusive of sales charges and assumes the reinvestment of dividends and distributions. For periods of less than one year, total return is not annualized. |
| (c)
|
The
portfolio turnover rate includes variable rate demand notes. |
The
notes to the financial statements are an integral part of, and should be read in conjunction with, the financial statements.
| 60
|
MainStay MacKay Short Term
Municipal Fund |
Financial
Highlights selected per share data and ratios
| |
May
2, 2022^ through
October 31,
2022* |
| Class
R6 |
| Net
asset value at beginning of period |
$
9.30** |
| Net
investment income (loss) (a) |
0.06
|
| Net
realized and unrealized gain (loss) |
(0.18)
|
| Total
from investment operations |
(0.12)
|
| Less
distributions: |
|
| From
net investment income |
(0.07)
|
| Net
asset value at end of period |
$
9.11 |
| Total
investment return (b) |
(1.33)%
|
| Ratios
(to average net assets)/Supplemental Data: |
|
| Net
investment income (loss) |
1.34%††
|
| Net
expenses |
0.40%††
|
| Portfolio
turnover rate (c) |
35%
|
| Net
assets at end of period (in 000’s) |
$
83,344 |
| *
|
Unaudited.
|
| **
|
Based on the
net asset value of Class I as of May 2, 2022. |
| ^
|
Inception
date. |
| ††
|
Annualized.
|
| (a)
|
Per share
data based on average shares outstanding during the period. |
| (b)
|
Total
investment return is calculated exclusive of sales charges and assumes the reinvestment of dividends and distributions. For periods of less than one year, total return is not annualized. |
| (c)
|
The
portfolio turnover rate includes variable rate demand notes. |
The notes to the financial statements are an integral part of, and should be
read in conjunction with, the financial statements.
61
Notes to Financial
Statements (Unaudited)
Note 1-Organization and Business
MainStay Funds Trust (the “Trust”) was organized as
a Delaware statutory trust on April 28, 2009. The Trust is registered under the Investment Company Act of 1940, as amended (the “1940 Act”), as an open-end management investment company, and is comprised of thirty-three funds
(collectively referred to as the “Funds”). These financial statements and notes relate to the MainStay MacKay Short Term Municipal Fund (the "Fund"), a “diversified” fund, as that term is defined in the 1940 Act, as
interpreted or modified by regulatory authorities having jurisdiction, from time to time.
The following table lists the Fund's share classes that have
been registered and commenced operations:
| Class
|
Commenced
Operations |
| Class
A |
January
2, 2004 |
| Class
A2 |
September
30, 2020 |
| Investor
Class |
February
28, 2008 |
| Class
I |
January
2, 1991 |
| Class
R6 |
May
2, 2022 |
| SIMPLE
Class |
N/A*
|
| *
|
SIMPLE
Class shares were registered for sale effective as of August 31, 2020 but have not yet commenced operations. |
Class A and Investor Class shares are offered at net asset
value (“NAV”) per share plus an initial sales charge. No initial sales charge applies to investments of $250,000 or more (and certain other qualified purchases) in Class A and Investor Class shares. However, a contingent deferred sales
charge (“CDSC”) of 0.50% may be imposed on certain redemptions made within 12 months of the date of purchase on shares that were purchased without an initial sales charge. Class A2 shares are offered at NAV without an initial sales
charge, although a 0.50% CDSC may be imposed on certain redemptions of such shares made within one year of the date of purchase of Class A2 shares. Class I shares are offered at NAV without a sales charge. Class R6 shares are currently expected to
be offered at NAV without a sales charge. SIMPLE Class shares are expected to be offered at NAV without a sales charge if such shares are offered in the future. Additionally, Investor Class shares may convert automatically to Class A shares. Under
certain circumstances and as may be permitted by the Trust’s multiple class plan pursuant to Rule 18f-3 under the 1940 Act, specified share classes of the Fund may be converted to one or more other share classes of the Fund as disclosed in the
capital share transactions within these Notes. The classes of shares have the same voting (except for issues that relate solely to one class), dividend, liquidation and other rights, and the same terms and conditions, except that under distribution
plans pursuant to Rule 12b-1 under the 1940 Act, Class A, Investor Class and SIMPLE Class shares are subject to a distribution and/or service fee. Class I and Class R6 shares are not subject to a distribution and/or service fee.
The Fund's investment objective is to seek current income
exempt from regular federal income tax.
Note 2–Significant Accounting Policies
The Fund is an investment company and accordingly follows the
investment company accounting and reporting guidance of the Financial Accounting Standards Board (“FASB”) Accounting Standards Codification Topic 946 Financial Services—Investment Companies. The Fund prepares its financial statements in accordance with generally accepted accounting principles (“GAAP”) in the United States of America and follows the significant accounting policies described
below.
(A) Securities Valuation. Investments are usually valued as of the close of regular trading on the New York Stock Exchange (the "Exchange") (usually 4:00 p.m. Eastern time) on each day the Fund is open for business
("valuation date").
Effective September 8, 2022,
and pursuant to Rule 2a-5 under the 1940 Act, the Board of Trustees of the Trust (the "Board") designated New York Life Investment Management LLC (“New York Life Investments” or the "Manager") as its Valuation Designee (the "Valuation
Designee"). The Valuation Designee is responsible for performing fair valuations relating to all investments in the Fund’s portfolio for which market quotations are not readily available; periodically assessing and managing material valuation
risks; establishing and applying fair value methodologies; testing fair valuation methodologies; evaluating and overseeing pricing services; segregation of valuation and portfolio management functions; providing quarterly, annual and prompt
reporting to the Board, as appropriate; identifying potential conflicts of interest; and maintaining appropriate records. The Valuation Designee has established a valuation committee ("Valuation Committee") to assist in carrying out the Valuation
Designee’s responsibilities and establish prices of securities for which market quotations are not readily available. The Fund’s and the Valuation Designee's policies and procedures ("Valuation Procedures") govern the Valuation
Designee’s selection and application of methodologies for determining and calculating the fair value of Fund investments. The Valuation Designee may value Fund portfolio securities for which market quotations are not readily available and
other Fund assets utilizing inputs from pricing services and other third-party sources (together, “Pricing Sources”). The Valuation Committee meets (in person, via electronic mail or via teleconference) on an ad-hoc basis to determine
fair valuations and on a quarterly basis to review fair value events (excluding fair valuations from pricing services), including valuation risks and back-testing results, and preview reports to the Board.
The Valuation Committee establishes prices of securities for
which market quotations are not readily available based on such methodologies and measurements on a regular basis after considering information that is reasonably available and deemed relevant by the Valuation Committee. The Board shall oversee the
Valuation Designee and review fair valuation materials on a prompt, quarterly and annual basis and approve proposed revisions to the Valuation Procedures.
Investments for which market quotations are not readily
available are valued at fair value as determined in good faith pursuant to the Valuation Procedures. A market quotation is readily available only when that
| 62
|
MainStay MacKay Short Term
Municipal Fund |
quotation is a quoted price (unadjusted) in active markets for identical
investments that the Fund can access at the measurement date, provided that a quotation will not be readily available if it is not reliable. Fair value measurements are determined within a framework that establishes a three-tier hierarchy that
maximizes the use of observable market data and minimizes the use of unobservable inputs to establish a classification of fair value measurements for disclosure purposes. "Inputs" refer broadly to the assumptions that market participants would use
in pricing the asset or liability, including assumptions about risk, such as the risk inherent in a particular valuation technique used to measure fair value using a pricing model and/or the risk inherent in the inputs for the valuation technique.
Inputs may be observable or unobservable. Observable inputs reflect the assumptions market participants would use in pricing the asset or liability based on market data obtained from sources independent of the Fund. Unobservable inputs reflect the
Fund’s own assumptions about the assumptions market participants would use in pricing the asset or liability based on the information available. The inputs or methodology used for valuing assets or liabilities may not be an indication of the
risks associated with investing in those assets or liabilities. The three-tier hierarchy of inputs is summarized below.
| •
|
Level
1—quoted prices (unadjusted) in active markets for an identical asset or liability |
| •
|
Level
2—other significant observable inputs (including quoted prices for a similar asset or liability in active markets, interest rates and yield curves, prepayment speeds, credit risk, etc.) |
| •
|
Level
3—significant unobservable inputs (including the Fund's own assumptions about the assumptions that market participants would use in measuring fair value of an asset or liability) |
The level of an asset or liability within the fair value
hierarchy is based on the lowest level of an input, both individually and in the aggregate, that is significant to the fair value measurement. The aggregate value by input level of the Fund’s assets and liabilities as of October 31, 2022, is
included at the end of the Portfolio of Investments.
The
Fund may use third-party vendor evaluations, whose prices may be derived from one or more of the following standard inputs, among others:
| •
Benchmark yields |
•
Reported trades |
| •
Broker/dealer quotes |
•
Issuer spreads |
| •
Two-sided markets |
•
Benchmark securities |
| •
Bids/offers |
•
Reference data (corporate actions or material event notices) |
| •
Industry and economic events |
•
Comparable bonds |
| •
Monthly payment information |
|
An asset or liability for which a market quotation is not
readily available is valued by methods deemed reasonable in good faith by the Valuation Committee, following the Valuation Procedures to represent fair value. Under these procedures, the Valuation Designee generally uses a market-based approach
which may use related or comparable assets or liabilities, recent transactions, market multiples, book values and other
relevant information. The Valuation Designee may also use an income-based
valuation approach in which the anticipated future cash flows of the asset or liability are discounted to calculate fair value. Discounts may also be applied due to the nature and/or duration of any restrictions on the disposition of the asset or
liability. Fair value represents a good faith approximation of the value of a security. Fair value determinations involve the consideration of a number of subjective factors, an analysis of applicable facts and circumstances and the exercise of
judgment. As a result, it is possible that the fair value for a security determined in good faith in accordance with the Valuation Procedures may differ from valuations for the same security determined for other funds using their own valuation
procedures. Although the Valuation Procedures are designed to value a security at the price the Fund may reasonably expect to receive upon the security's sale in an orderly transaction, there can be no assurance that any fair value determination
thereunder would, in fact, approximate the amount that the Fund would actually realize upon the sale of the security or the price at which the security would trade if a reliable market price were readily available. During the six-month period ended
October 31, 2022, there were no material changes to the fair value methodologies.
Securities which may be valued in this manner include, but are
not limited to: (i) a security for which trading has been halted or suspended or otherwise does not have a readily available market quotation on a given day; (ii) a debt security that has recently gone into default and for which there is not a
current market quotation; (iii) a security of an issuer that has entered into a restructuring; (iv) a security that has been delisted from a national exchange; (v) a security subject to trading collars for which no or limited trading takes place;
and (vi) a security whose principal market has been temporarily closed at a time when, under normal conditions, it would be open. Securities valued in this manner are generally categorized as Level 2 or 3 in the hierarchy.
Municipal debt securities are valued at the evaluated mean
prices supplied by a pricing agent or broker selected by the Manager, in consultation with the Subadvisor. The evaluations are market-based measurements processed through a pricing application and represents the pricing agent's good faith
determination as to what a holder may receive in an orderly transaction under market conditions. The rules-based logic utilizes valuation techniques that reflect participants' assumptions and vary by asset class and per methodology, maximizing the
use of relevant observable data including quoted prices for similar assets, benchmark yield curves and market corroborated inputs. The evaluated bid or mean prices are deemed by the Manager, in consultation with the Subadvisor, to be representative
of market values, at the regular close of trading of the Exchange on each valuation date. Municipal debt securities purchased on a delayed delivery basis are marked to market daily until settlement at the forward settlement date. Municipal debt
securities are generally categorized as Level 2 in the hierarchy.
The information above is not intended to reflect an exhaustive
list of the methodologies that may be used to value portfolio investments. The Valuation Procedures permit the use of a variety of valuation methodologies in connection with valuing portfolio investments. The
Notes to Financial
Statements (Unaudited) (continued)
methodology used for a specific type of investment may vary based on the
market data available or other considerations. The methodologies summarized above may not represent the specific means by which portfolio investments are valued on any particular business day.
(B) Income Taxes. The Fund's policy is to comply with the requirements of the Internal Revenue Code of 1986, as amended (the “Internal Revenue Code”), applicable to regulated investment companies
and to distribute all of its taxable income to the shareholders of the Fund within the allowable time limits.
The Manager evaluates the Fund’s tax positions to
determine if the tax positions taken meet the minimum recognition threshold in connection with accounting for uncertainties in income tax positions taken or expected to be taken for the purposes of measuring and recognizing tax liabilities in the
financial statements. Recognition of tax benefits of an uncertain tax position is permitted only to the extent the position is “more likely than not” to be sustained assuming examination by taxing authorities. The Manager analyzed the
Fund's tax positions taken on federal, state and local income tax returns for all open tax years (for up to three tax years) and has concluded that no provisions for federal, state and local income tax are required in the Fund's financial
statements. The Fund's federal, state and local income tax and federal excise tax returns for tax years for which the applicable statutes of limitations have not expired are subject to examination by the Internal Revenue Service and state and local
departments of revenue.
(C) Dividends and
Distributions to Shareholders. Dividends and distributions are recorded on the ex-dividend date. The Fund intends to declare dividends from net investment income, if any, daily
and intends to pay them at least monthly and distributions from net realized capital and currency gains, if any, at least annually. Unless a shareholder elects otherwise, all dividends and distributions are reinvested at NAV in the same class of
shares of the Fund. Dividends and distributions to shareholders are determined in accordance with federal income tax regulations and may differ from determinations using GAAP.
(D) Security Transactions and Investment Income. The Fund records security transactions on the trade date. Realized gains and losses on security transactions are determined using the identified cost method. Interest income is accrued as
earned using the effective interest rate method. Discounts and premiums on securities purchased, other than temporary cash investments that mature in 60 days or less at the time of purchase, for the Fund are accreted and amortized, respectively, on
the effective interest rate method.
Investment
income and realized and unrealized gains and losses on investments of the Fund are allocated pro rata to the separate classes of shares based upon their relative net assets on the date the income is earned or realized and unrealized gains and losses
are incurred.
The Fund may place a debt security on
non-accrual status and reduce related interest income by ceasing current accruals and writing off all or a portion of any interest receivables when the collection of all or a portion of such interest has become doubtful. A debt security is removed
from
non-accrual status when the issuer resumes interest payments or when
collectability of interest is reasonably assured.
(E) Expenses. Expenses of the Trust are allocated to the individual Funds in proportion to the net assets of the respective Funds when the expenses are incurred, except where direct allocations of
expenses can be made. Expenses (other than transfer agent expenses and fees incurred under the shareholder services plans and/or the distribution plans further discussed in Note 3(B)) are allocated to separate classes of shares pro rata based upon
their relative net assets on the date the expenses are incurred. The expenses borne by the Fund, including those of related parties to the Fund, are shown in the Statement of Operations.
(F) Use of Estimates. In preparing financial statements in conformity with GAAP, the Manager makes estimates and assumptions that affect the reported amounts and disclosures in the financial statements. Actual
results could differ from those estimates and assumptions.
(G) Delayed Delivery Transactions. The Fund may purchase or sell securities on a delayed delivery basis. These transactions involve a commitment by the Fund to purchase or sell securities for a predetermined price or yield,
with payment and delivery taking place beyond the customary settlement period. When delayed delivery purchases are outstanding, the Fund will designate liquid assets in an amount sufficient to meet the purchase price. When purchasing a security on a
delayed delivery basis, the Fund assumes the rights and risks of ownership of the security, including the risk of price and yield fluctuations, and takes such fluctuations into account when determining its NAV. The Fund may dispose of or renegotiate
a delayed delivery transaction after it is entered into, and may sell delayed delivery securities before they are delivered, which may result in a realized gain or loss. When the Fund has sold a security it owns on a delayed delivery basis, the Fund
does not participate in future gains and losses with respect to the security. Delayed delivery transactions as of October 31, 2022, are shown in the Portfolio of Investments.
(H) Debt Securities Risk. The Fund's investments may include securities such as variable rate notes, floaters and mortgage-related and asset-backed securities. If expectations about changes in interest rates or
assessments of an issuer's credit worthiness or market conditions are incorrect, investments in these types of securities could lose money for the Fund.
(I) Municipal Bond Risk. The Fund may invest more heavily in municipal bonds from certain cities, states, territories or regions than others, which may increase the Fund’s exposure to losses resulting from
economic, political, regulatory occurrences, or declines in tax revenue impacting these particular cities, states, territories or regions. In addition, many state and municipal governments that issue securities are under significant economic and
financial stress and may not be able to satisfy their obligations, and these events may be made worse due to economic challenges posed by COVID-19. The Fund may invest a substantial amount of its assets in municipal bonds whose interest is paid
solely from revenues of similar projects, such as tobacco settlement bonds. If the
| 64
|
MainStay MacKay Short Term
Municipal Fund |
Fund concentrates its investments in this manner, it assumes the legal and
economic risks relating to such projects and this may have a significant impact on the Fund’s investment performance.
Certain of the issuers in which the Fund may invest have
recently experienced, or may experience, significant financial difficulties and repeated credit rating downgrades. On May 3, 2017, the Commonwealth of Puerto Rico (the "Commonwealth") began proceedings pursuant to the Puerto Rico Oversight,
Management, and Economic Stability Act (“PROMESA”) to seek bankruptcy-type protections from approximately $74 billion in debt and approximately $48 billion in unfunded pension obligations. In addition, the economic downturn following the
outbreak of COVID-19 and the resulting pressure on Puerto Rico’s budget have further contributed to its financial challenges. The federal government has passed certain relief packages, including the Coronavirus Aid, Relief, and Economic
Security Act and the American Rescue Plan, which include an aggregate of more than $7 billion in disaster relief funds for the U.S. territories, including Puerto Rico. However, there can be no assurances that the federal funds allocated to the
Commonwealth will be sufficient to address the economic challenges arising from COVID-19.
The Commonwealth concluded its Title III restructuring
proceedings on behalf of itself and certain instrumentalities effective March 15th, 2022. Approximately $18.75 billion of claims related to debt guaranteed under Puerto Rico's constitution including the Commonwealth of Puerto Rico and Public
Building Authority were restructured with issuance of $7.4 billion in new Puerto Rico General Obligation Bonds, $7.1 billion of cash, and $3.5 billion of new Contingent Value instruments. In addition the Commonwealth's exit from the restructuring
proceedings resolved certain claims relating to the Commonwealth Employee Retirement System, Convention Center, Highway Authority, and Infrastructure Financing Authority. Several of Commonwealth's agencies are still under Title III restructuring
proceedings including the Highway Authority and Electric Authority.
Puerto Rico’s debt restructuring process and other
economic, political, social, environmental or health factors or developments could occur rapidly and may significantly affect the value of municipal securities of Puerto Rico. Due to the ongoing budget impact from COVID-19 on the
Commonwealth’s finances, the Federal Oversight and Management Board for Puerto Rico or the Commonwealth itself could seek to revise or even terminate earlier agreements reached with certain creditors prior to the outbreak of COVID-19. Any
agreement between the Federal Oversight and Management Board and creditors is subject to approval by the judge overseeing the Title III proceedings. The composition of the Federal Oversight and Management Board has changed during the recent period
due to existing members either stepping down or being replaced following the expiration of a member's term. There is no assurance that board members will approve the restructuring agreements the prior board had negotiated.
The Fund’s vulnerability to potential losses associated
with such developments may be reduced through investing in municipal securities that feature credit enhancements (such as bond insurance). The bond
insurance provider pays both principal and interest when due to the bond
holder. The magnitude of Puerto Rico’s debt restructuring or other adverse economic developments could pose significant strains on the ability of municipal securities insurers to meet all future claims. As of October 31, 2022, none of the
Puerto Rico municipal securities held by the Fund were insured.
(J) Indemnifications. Under the Trust’s organizational documents, its officers and trustees are indemnified against certain liabilities that may arise out of performance of their duties to the Trust.
Additionally, in the normal course of business, the Fund enters into contracts with third-party service providers that contain a variety of representations and warranties and that may provide general indemnifications. The Fund's maximum exposure
under these arrangements is unknown, as this would involve future claims that may be made against the Fund that have not yet occurred. The Manager believes that the risk of loss in connection with these potential indemnification obligations is
remote. However, there can be no assurance that material liabilities related to such obligations will not arise in the future, which could adversely impact the Fund.
Note 3–Fees and Related Party Transactions
(A) Manager and Subadvisor. New York Life Investments, a registered investment adviser and an indirect, wholly-owned subsidiary of New York Life Insurance Company ("New York Life"), serves as the Fund's Manager,
pursuant to an Amended and Restated Management Agreement ("Management Agreement"). The Manager provides offices, conducts clerical, recordkeeping and bookkeeping services and keeps most of the financial and accounting records required to be
maintained by the Fund. Except for the portion of salaries and expenses that are the responsibility of the Fund, the Manager pays the salaries and expenses of all personnel affiliated with the Fund and certain operational expenses of the Fund.
During a portion of the six-month period ended October 31, 2022, the Fund reimbursed New York Life Investments in an amount equal to the portion of the compensation of the Chief Compliance Officer attributable to the Fund. MacKay Shields LLC
("MacKay Shields" or the "Subadvisor"), a registered investment adviser and an indirect, wholly-owned subsidiary of New York Life, serves as the Subadvisor to the Fund and is responsible for the day-to-day portfolio management of the Fund. Pursuant
to the terms of an Amended and Restated Subadvisory Agreement ("Subadvisory Agreement") between New York Life Investments and MacKay Shields, New York Life Investments pays for the services of the Subadvisor.
Pursuant to the Management Agreement, the Fund pays the Manager
a monthly fee for the services performed and the facilities furnished at an annual rate of the Fund’s average daily net assets as follows: 0.35% on assets up to $ 1 billion; and 0.33% on assets from $1 billion up to $5 billion; and 0.32% on
assets over $5 billion. During the six-month period ended October 31, 2022, the effective management fee rate was 0.34% of the Fund’s average daily net assets, exclusive of any applicable waivers/reimbursements.
Notes to Financial
Statements (Unaudited) (continued)
New York Life Investments has contractually agreed to waive fees and/or
reimburse expenses so that Total Annual Fund Operating Expenses (excluding taxes, interest, litigation, extraordinary expenses, brokerage and other transaction expenses relating to the purchase or sale of portfolio investments and acquired
(underlying) fund fees and expenses) do not exceed the following percentages of daily net assets: Class A, 0.70%, Class A2, 0.70% and Class I, 0.40%. New York Life Investments will apply an equivalent waiver or reimbursement, in an equal number of
basis points of the Class A shares waiver/reimbursement, to Investor Class shares. This agreement will remain in effect until August 31, 2023, and shall renew automatically for one-year terms unless New York Life Investments provides written notice
of termination prior to the start of the next term or upon approval of the Board.
During the six-month period ended October 31, 2022, New York
Life Investments earned fees from the Fund in the amount of $2,690,352 and waived fees and/or reimbursed expenses in the amount of $130,115 and paid the Subadvisor fees of $1,280,118.
JPMorgan Chase Bank, N.A. ("JPMorgan") provides
sub-administration and sub-accounting services to the Fund pursuant to an agreement with New York Life Investments. These services include calculating the daily NAVs of the Fund, maintaining the general ledger and sub-ledger accounts for the
calculation of the Fund's NAVs, and assisting New York Life Investments in conducting various aspects of the Fund's administrative operations. For providing these services to the Fund, JPMorgan is compensated by New York Life Investments.
Pursuant to an agreement between the Trust and New York Life
Investments, New York Life Investments is responsible for providing or procuring certain regulatory reporting services for the Fund. The Fund will reimburse New York Life Investments for the actual costs incurred by New York Life Investments in
connection with providing or procuring these services for the Fund.
(B) Distribution and Service Fees. The Trust, on behalf of the Fund, has entered into a distribution agreement with NYLIFE Distributors LLC (the “Distributor”), an affiliate of New York Life Investments. The Fund
has adopted distribution plans (the “Plans”) in accordance with the provisions of Rule 12b-1 under the 1940 Act.
Pursuant to the Class A, Class A2 and Investor Class Plans, the
Distributor receives a monthly fee from Class A, Class A2 and Investor Class shares at an annual rate of 0.25% of the average daily net assets of the Class A, Class A2 and Investor Class shares for distribution and/or service activities as
designated by the Distributor. Class I shares are not subject to a distribution and/or service fee.
The Plans provide that the distribution and service fees are
payable to the Distributor regardless of the amounts actually expended by the Distributor for distribution of the Fund's shares and service activities.
(C) Sales Charges. The Fund was advised by the Distributor that the amount of initial sales charges retained on sales of Investor Class shares during the six-month period ended October 31, 2022, was
$108.
The Fund was also advised that the Distributor retained CDSCs on redemptions
of Class A and Investor Class shares during the six-month period ended October 31, 2022, of $100,477 and $1,974, respectively.
(D) Transfer, Dividend Disbursing and Shareholder Servicing
Agent. NYLIM Service Company LLC, an affiliate of New York Life Investments, is the Fund's transfer, dividend disbursing and shareholder servicing agent pursuant to an agreement
between NYLIM Service Company LLC and the Trust. NYLIM Service Company LLC has entered into an agreement with DST Asset Manager Solutions, Inc. ("DST"), pursuant to which DST performs certain transfer agent services on behalf of NYLIM Service
Company LLC. New York Life Investments has contractually agreed to limit the transfer agency expenses charged to the Fund’s share classes to a maximum of 0.35% of that share class’s average daily net assets on an annual basis after
deducting any applicable Fund or class-level expense reimbursement or small account fees. This agreement will remain in effect until August 31, 2023, and shall renew automatically for one-year terms unless New York Life Investments provides written
notice of termination prior to the start of the next term or upon approval of the Board. During the six-month period ended October 31, 2022, transfer agent expenses incurred by the Fund and any reimbursements, pursuant to the aforementioned
Transfer Agency expense limitation agreement, were as follows:
| Class
|
Expense
|
Waived
|
| Class
A |
$
58,925 |
$
— |
| Class
A2 |
13,133
|
—
|
| Investor
Class |
9,550
|
(4,467)
|
| Class
I |
138,691
|
—
|
| Class
R6 |
1,932
|
—
|
(E) Small Account Fee. Shareholders with small accounts adversely impact the cost of providing transfer agency services. In an effort to reduce total transfer agency expenses, the Fund has implemented a small
account fee on certain types of accounts. As described in the Fund's prospectus, certain shareholders with an account balance of less than $1,000 ($5,000 for Class A share accounts) are charged an annual per account fee of $20 (assessed
semi-annually), the proceeds from which offset transfer agent fees as reflected in the Statement of Operations. This small account fee will not apply to certain types of accounts as described further in the Fund’s prospectus.
(F) Capital. As of October 31, 2022, New York Life and its affiliates beneficially held shares of the Fund with the values and percentages of net assets as follows:
| Class
A |
$15,582,380
|
4.2%
|
| Class
A2 |
23,853
|
0.0‡
|
| Class
R6 |
24,628
|
0.0‡
|
| ‡
|
Less
than one-tenth of a percent. |
| 66
|
MainStay MacKay Short Term
Municipal Fund |
Note 4-Federal Income Tax
As of October 31, 2022, the cost and unrealized appreciation
(depreciation) of the Fund’s investment portfolio, including applicable derivative contracts and other financial instruments, as determined on a federal income tax basis, were as follows:
| |
Federal
Tax
Cost |
Gross
Unrealized
Appreciation |
Gross
Unrealized
(Depreciation) |
Net
Unrealized
Appreciation/
(Depreciation) |
| Investments
in Securities |
$1,369,288,796
|
$72,676
|
$(55,684,087)
|
$(55,611,411)
|
As of April 30, 2022, for federal
income tax purposes, capital loss carryforwards of $12,402,555, as shown in the table below, were available to the extent provided by the regulations to offset future realized gains of the Fund. Accordingly, no capital gains distributions are
expected to be paid to shareholders until net gains have been realized in excess of such amounts.
Capital
Loss
Available Through |
Short-Term
Capital Loss
Amounts (000’s) |
Long-Term
Capital Loss
Amounts (000’s) |
| Unlimited
|
$7,173
|
$5,229
|
During the year ended April 30,
2022, the tax character of distributions paid as reflected in the Statements of Changes in Net Assets was as follows:
| |
2022
|
| Distributions
paid from: |
|
| Ordinary
Income |
$
1,474,609 |
| Exempt
Interest Dividends |
12,687,790
|
| Total
|
$14,162,399
|
Note 5–Custodian
JPMorgan is the custodian of cash and securities held by the
Fund. Custodial fees are charged to the Fund based on the Fund's net assets and/or the market value of securities held by the Fund and the number of certain transactions incurred by the Fund.
Note 6–Line of Credit
The Fund and certain other funds managed by New York Life
Investments maintain a line of credit with a syndicate of banks in order to secure a source of funds for temporary purposes to meet unanticipated or excessive redemption requests.
Effective July 26, 2022, under the credit agreement (the
“Credit Agreement”), the aggregate commitment amount is $600,000,000 with an additional uncommitted amount of $100,000,000. The commitment fee is an annual rate of 0.15% of the average commitment amount payable quarterly, regardless of
usage, to JPMorgan, who serves as the agent to the syndicate. The commitment fee is allocated among the Fund and certain other funds managed by New York Life Investments based
upon their respective net assets and other factors. Interest on any revolving
credit loan is charged based upon the Federal Funds Rate, Daily Simple Secured Overnight Financing Rate ("SOFR") + 0.10%, or the Overnight Bank Funding Rate, whichever is higher. The Credit Agreement expires on July 25, 2023, although the Fund,
certain other funds managed by New York Life Investments and the syndicate of banks may renew the Credit Agreement for an additional year on the same or different terms or enter into a credit agreement with a different syndicate of banks. Prior to
July 26, 2022, the aggregate commitment amount and the commitment fee were the same as those under the current Credit Agreement. During the six-month period ended October 31, 2022, there were no borrowings made or outstanding with respect to the
Fund under the Credit Agreement.
Note
7–Interfund Lending Program
Pursuant to an
exemptive order issued by the SEC, the Fund, along with certain other funds managed by New York Life Investments, may participate in an interfund lending program. The interfund lending program provides an alternative credit facility that permits the
Fund and certain other funds managed by New York Life Investments to lend or borrow money for temporary purposes directly to or from one another, subject to the conditions of the exemptive order. During the six-month period ended October 31, 2022,
there were no interfund loans made or outstanding with respect to the Fund.
Note 8–Purchases and Sales of Securities (in
000’s)
During the six-month period ended October
31, 2022, purchases and sales of securities, other than short-term securities, were $511,689 and $725,147, respectively.
Note 9–Capital Share Transactions
Transactions in capital shares for the six-month period ended
October 31, 2022 and the year ended April 30, 2022, were as follows:
Notes to Financial
Statements (Unaudited) (continued)
| Class
A |
Shares
|
Amount
|
| Six-month
period ended October 31, 2022: |
|
|
| Shares
sold |
9,659,877
|
$
89,835,899 |
| Shares
issued to shareholders in reinvestment of distributions |
149,038
|
1,380,303
|
| Shares
redeemed |
(13,116,253)
|
(121,862,854)
|
| Net
increase (decrease) in shares outstanding before conversion |
(3,307,338)
|
(30,646,652)
|
| Shares
converted into Class A (See Note 1) |
103,314
|
961,720
|
| Shares
converted from Class A (See Note 1) |
(345)
|
(3,165)
|
| Net
increase (decrease) |
(3,204,369)
|
$
(29,688,097) |
| Year
ended April 30, 2022: |
|
|
| Shares
sold |
25,468,868
|
$
246,761,379 |
| Shares
issued to shareholders in reinvestment of distributions |
157,184
|
1,513,215
|
| Shares
redeemed |
(33,406,373)
|
(322,275,514)
|
| Net
increase (decrease) in shares outstanding before conversion |
(7,780,321)
|
(74,000,920)
|
| Shares
converted into Class A (See Note 1) |
41,919
|
402,782
|
| Shares
converted from Class A (See Note 1) |
(261)
|
(2,536)
|
| Net
increase (decrease) |
(7,738,663)
|
$
(73,600,674) |
| |
| Class
A2 |
Shares
|
Amount
|
| Six-month
period ended October 31, 2022: |
|
|
| Shares
sold |
1,047,877
|
$
9,740,471 |
| Shares
issued to shareholders in reinvestment of distributions |
56,603
|
525,313
|
| Shares
redeemed |
(3,317,635)
|
(30,792,212)
|
| Net
increase (decrease) in shares outstanding before conversion |
(2,213,155)
|
(20,526,428)
|
| Shares
converted from Class A2 (See Note 1) |
(41,230)
|
(384,679)
|
| Net
increase (decrease) |
(2,254,385)
|
$
(20,911,107) |
| Year
ended April 30, 2022: |
|
|
| Shares
sold |
8,256,657
|
$
80,252,982 |
| Shares
issued to shareholders in reinvestment of distributions |
62,731
|
604,025
|
| Shares
redeemed |
(6,763,650)
|
(64,920,522)
|
| Net
increase (decrease) |
1,555,738
|
$
15,936,485 |
| |
| Investor
Class |
Shares
|
Amount
|
| Six-month
period ended October 31, 2022: |
|
|
| Shares
sold |
67,086
|
$
627,282 |
| Shares
issued to shareholders in reinvestment of distributions |
1,262
|
11,710
|
| Shares
redeemed |
(47,256)
|
(441,056)
|
| Net
increase (decrease) in shares outstanding before conversion |
21,092
|
197,936
|
| Shares
converted from Investor Class (See Note 1) |
(28,845)
|
(269,054)
|
| Net
increase (decrease) |
(7,753)
|
$
(71,118) |
| Year
ended April 30, 2022: |
|
|
| Shares
sold |
125,760
|
$
1,214,335 |
| Shares
issued to shareholders in reinvestment of distributions |
750
|
7,255
|
| Shares
redeemed |
(145,542)
|
(1,409,867)
|
| Net
increase (decrease) in shares outstanding before conversion |
(19,032)
|
(188,277)
|
| Shares
converted into Investor Class (See Note 1) |
261
|
2,536
|
| Shares
converted from Investor Class (See Note 1) |
(41,789)
|
(402,782)
|
| Net
increase (decrease) |
(60,560)
|
$
(588,523) |
| |
| Class
I |
Shares
|
Amount
|
| Six-month
period ended October 31, 2022: |
|
|
| Shares
sold |
44,876,760
|
$
417,112,891 |
| Shares
issued to shareholders in reinvestment of distributions |
492,324
|
4,564,036
|
| Shares
redeemed |
(63,695,437)
|
(591,360,338)
|
| Net
increase (decrease) in shares outstanding before conversion |
(18,326,353)
|
(169,683,411)
|
| Shares
converted into Class I (See Note 1) |
345
|
3,165
|
| Shares
converted from Class I (See Note 1) |
(11,410,817)
|
(105,778,277)
|
| Net
increase (decrease) |
(29,736,825)
|
$
(275,458,523) |
| Year
ended April 30, 2022: |
|
|
| Shares
sold |
117,202,202
|
$
1,132,883,199 |
| Shares
issued to shareholders in reinvestment of distributions |
730,370
|
7,033,453
|
| Shares
redeemed |
(140,847,545)
|
(1,355,438,314)
|
| Net
increase (decrease) |
(22,914,973)
|
$
(215,521,662) |
| |
| 68
|
MainStay MacKay Short Term
Municipal Fund |
| Class
R6(a) |
Shares
|
Amount
|
| Period
ended October 31, 2022: |
|
|
| Shares
sold |
3,498,487
|
$
32,408,395 |
| Shares
issued to shareholders in reinvestment of distributions |
284
|
2,614
|
| Shares
redeemed |
(5,737,026)
|
(52,766,011)
|
| Net
increase (decrease) in shares outstanding before conversion |
(2,238,255)
|
(20,355,002)
|
| Shares
converted into Class R6 (See Note 1) |
11,423,140
|
105,778,278
|
| Shares
converted from Class R6 (See Note 1) |
(33,119)
|
(307,988)
|
| Net
increase (decrease) |
9,151,766
|
$
85,115,288 |
| (a)
|
The
inception of the class was May 2, 2022. |
Note 10–Other Matters
As of the date of this report, interest rates in the United
States and many parts of the world, including certain European countries, are ascending from historically low levels. Thus, the Fund currently faces a heightened level of risk associated with rising interest rates. This could be driven by a variety
of factors, including but not limited to central bank monetary policies, changing inflation or real growth rates, general economic conditions, increasing bond issuances or reduced market demand for low yielding investments.
An outbreak of COVID-19, first detected in December 2019, has
developed into a global pandemic and has resulted in travel restrictions, closure of international borders, certain businesses and securities markets, restrictions on securities trading activities, prolonged quarantines, supply chain disruptions,
and lower consumer demand, as well as general concern and uncertainty. In 2022, many countries lifted some or all restrictions related to COVID-19. However, the continued impact of COVID-19 and related variants is uncertain and could further
adversely affect the global economy, national economies, individual issuers and capital markets in unforeseeable ways and result in a substantial and extended economic downturn. Developments that disrupt global economies and financial markets, such
as COVID-19, may magnify factors that affect the Fund's performance.
Note 11–Subsequent Events
In connection with the preparation of the financial statements
of the Fund as of and for the six-month period ended October 31, 2022, events and transactions subsequent to October 31, 2022, through the date the financial statements were issued have been evaluated by the Manager for possible adjustment and/or
disclosure. No subsequent events requiring financial statement adjustment or disclosure have been identified, other than the following:
At meetings held on December 6-7, 2022, the Board of Trustees
of MainStay Funds Trust approved the change of the Fund's fiscal year end from April 30th to October 31st effective May 1, 2023.
Proxy Voting Policies and Procedures and Proxy Voting
Record
The Fund is required to file with the SEC its
proxy voting record for the 12-month period ending June 30 on Form N-PX. A description of the policies and procedures that are used to vote proxies relating to portfolio securities of the Fund is available free of charge upon request by calling
800-624-6782 or visiting the SEC’s website at www.sec.gov. The most recent Form N-PX or proxy voting record is available free of charge upon request by calling 800-624-6782; visiting
newyorklifeinvestments.com; or visiting the SEC’s website at www.sec.gov.
Shareholder Reports and Quarterly Portfolio Disclosure
The Fund is required to file its complete schedule of portfolio
holdings with the SEC 60 days after its first and third fiscal quarter on Form N-PORT. The Fund's holdings report is available free of charge upon request by calling New York Life Investments at 800-624-6782.
| 70
|
MainStay MacKay Short Term
Municipal Fund |
Equity
U.S. Equity
MainStay Epoch U.S. Equity Yield Fund
MainStay S&P 500 Index Fund1
MainStay Winslow Large Cap Growth Fund
MainStay WMC Enduring Capital Fund
MainStay WMC Growth Fund
MainStay WMC Small Companies Fund
MainStay WMC Value Fund
International Equity
MainStay Epoch International Choice Fund
MainStay MacKay International Equity Fund
MainStay WMC International Research Equity Fund
Emerging Markets Equity
MainStay Candriam Emerging Markets Equity Fund
Global Equity
MainStay Epoch Capital Growth Fund
MainStay Epoch Global Equity Yield Fund
Fixed Income
Taxable Income
MainStay Candriam Emerging Markets Debt Fund
MainStay Floating Rate Fund
MainStay MacKay High Yield Corporate Bond Fund
MainStay MacKay Short Duration High Yield Fund
MainStay MacKay Strategic Bond Fund
MainStay MacKay Total Return Bond Fund
MainStay MacKay U.S. Infrastructure Bond Fund
MainStay Short Term Bond Fund
Tax-Exempt Income
MainStay MacKay California Tax Free Opportunities Fund2
MainStay MacKay High Yield Municipal Bond Fund
MainStay MacKay New York Tax Free Opportunities Fund3
MainStay MacKay Short Term Municipal Fund
MainStay MacKay Strategic Municipal Allocation Fund
MainStay MacKay Tax Free Bond Fund
Money Market
MainStay Money Market Fund
Mixed Asset
MainStay Balanced Fund
MainStay Income Builder Fund
MainStay MacKay Convertible Fund
Speciality
MainStay CBRE Global Infrastructure Fund
MainStay CBRE Real Estate Fund
MainStay Cushing MLP Premier Fund
Asset Allocation
MainStay Conservative Allocation Fund
MainStay Conservative ETF Allocation Fund
MainStay Defensive ETF Allocation Fund
MainStay Equity Allocation Fund
MainStay Equity ETF Allocation Fund
MainStay ESG Multi-Asset Allocation Fund
MainStay Growth Allocation Fund
MainStay Growth ETF Allocation Fund
MainStay Moderate Allocation Fund
MainStay Moderate ETF Allocation Fund
Manager
New York Life Investment Management LLC
New York, New York
Subadvisors
Candriam4
Strassen, Luxembourg
CBRE Investment Management Listed Real Assets LLC
Radnor, Pennsylvania
Cushing Asset Management, LP
Dallas, Texas
Epoch Investment Partners, Inc.
New York, New York
MacKay Shields LLC4
New York, New York
NYL Investors LLC4
New York, New York
Wellington Management Company LLP
Boston, Massachusetts
Winslow Capital Management, LLC
Minneapolis, Minnesota
Legal Counsel
Dechert LLP
Washington, District of Columbia
Independent Registered Public Accounting Firm
KPMG LLP
Philadelphia, Pennsylvania
Distributor
NYLIFE Distributors LLC4
Jersey City, New Jersey
Custodian
JPMorgan Chase Bank, N.A.
New York, New York
1.
Prior to February 28, 2022, the Fund's name was
MainStay MacKay S&P 500 Index Fund.
| 2. |
This Fund is registered for
sale in AZ, CA, NV, OR, TX, UT, WA and MI (Class A and Class I shares only), and CO, FL, GA, HI, ID, MA, MD, NH, NJ and NY (Class I shares only). |
| 3. |
This Fund is registered for
sale in CA, CT, DE, FL, MA, NJ, NY and VT. |
| 4. |
An affiliate of New York Life
Investment Management LLC. |
Not part of the Semiannual Report
For more information
800-624-6782
newyorklifeinvestments.com
“New York Life Investments” is both a service mark,
and the common trade name, of certain investment advisors affiliated with New York Life Insurance Company. The MainStay Funds® are managed by New York Life Investment
Management LLC and distributed by NYLIFE Distributors LLC, 30 Hudson Street, Jersey City, NJ 07302, a wholly owned subsidiary of New York Life Insurance Company. NYLIFE Distributors LLC is a Member FINRA/SIPC.
©2022 NYLIFE Distributors LLC. All rights reserved.
| 5013757.2MS229-22 |
MSSTM10-12/22
|
(NYLIM) NL230
MainStay MacKay Strategic Municipal Allocation Fund
Message from the President and Semiannual Report
Unaudited | October 31, 2022
Sign up for e-delivery of your shareholder reports. For full
details on e-delivery, including who can participate and what you can receive via e-delivery,
please log in to newyorklifeinvestments.com/accounts.
| Not
FDIC/NCUA Insured |
Not
a Deposit |
May
Lose Value |
No
Bank Guarantee |
Not
Insured by Any Government Agency |
This page intentionally left blank
Message from the President
A series of economic and geopolitical challenges undermined equity and
fixed-income markets during the six-month reporting period ended October 31, 2022. Stocks and bonds alike trended lower in the face of sharply rising interest rates, increasing inflationary pressures, slowing economic growth and Russia’s
invasion of Ukraine.
The reporting period began on a
mixed note, with concerns about rising inflation and Russia’s invasion of Ukraine weighing on markets. On one hand, rising commodity prices and hopes that inflationary pressures might subside supported some asset classes and sectors. On the
other, the U.S. Federal Reserve (the “Fed”) issued increasingly hawkish statements regarding its intention to combat mounting inflation. As a result, equity markets remained flat while U.S. fixed-income markets gained modest ground in
May. Early June saw a downturn across asset classes as economic data showed increasing inflationary pressures, causing investors to anticipate a higher-than-previously-expected rate increase from the Fed at its meeting on June 15, 2022. Indeed, the
Fed raised rates by 0.75% at that meeting, from a range of 0.75% to 1.00% to a range of 1.50% to 1.75%, its largest increase of the year to date. Markets rallied in the wake of the Fed meeting as investors started to hope that slowing economic
growth might lead to rate decreases later in the year. In August, however, signs of persistently increasing inflation and statements from the Fed indicated that further rate increases were seen as necessary, undercutting optimism and driving stock
and bond prices lower through mid-October. The Fed implemented two additional 0.75% rate increases during that time, with additional increases expected before the end of the year. International central banks generally raised rates as well in efforts
to curb local inflation, although most increases remained significantly more modest than those in the United States. Relatively high U.S. interest rates and international risk-averse sentiment pushed U.S. dollar values higher compared to most other
currencies, with the ensuing negative impact on global prices for food, fuel and other key, U.S.-dollar-denominated products.
Despite a rally in the closing weeks of October, the S&P
500® Index, a widely regarded benchmark of U.S. market performance, declined by more than 5% during the reporting period. Although the energy sector generated strong gains,
bolstered by elevated oil and gas prices, most other industry areas recorded losses. The more cyclical and growth-oriented sectors of consumer discretionary, real estate and information technology delivered the
weakest returns, while the traditionally defensive and value-oriented
consumer staples, utilities and health care sectors outperformed. International stocks lagged compared to their U.S. counterparts, with some emerging markets, such as China, suffering particularly steep losses. A few markets, however, including
Brazil and Mexico, gained ground. Fixed-income markets saw bond prices broadly decline as yields rose along with interest rates. Short-term yields rose faster than long-term yields, producing a yield curve inversion from July through the end of the
reporting period, with long-term rates remaining below short-term rates. Some floating-rate instruments, which feature variable interest rates that allow investors to benefit from a rising rate environment, provided a degree of insulation from
inflation-driven trends.
While the Fed acknowledges the
costs of rising rates in terms of weaker GDP (gross domestic product) growth and unsettled financial markets over the short term, its primary focus continues to be the longer-term economic impact of inflation. With the latest figures as of the date
of this report showing that inflation remains above 8%, versus a target rate of just 2%, the Fed clearly has a distance yet to go, making further rate increases and market volatility more likely in the coming months. The question remains as to
whether the Fed and other central banks will manage a so-called “soft landing,” curbing inflation while avoiding a persistent economic slowdown. If they prove successful, we expect that favorable inflation trends and increasingly
attractive valuations in both equity and bond markets should eventually translate into sustainable improvements in the investment environment.
Whatever actions the Fed takes and however financial markets
react, as a MainStay investor, you can depend on us to continue providing the insight, expertise and service that have log defined New York Life Investments. Thank you for trusting us to help you meet your investment needs.
Sincerely,
Kirk C. Lehneis
President
The opinions expressed are as of the date of this report and
are subject to change. There is no guarantee that any forecast made will come to pass. This material does not constitute investment advice and is not intended as an endorsement of any specific investment. Past performance is no guarantee of future
results.
Not part of the Semiannual Report
Investors should refer to the Fund’s Summary Prospectus
and/or Prospectus and consider the Fund’s investment objectives, strategies, risks, charges and expenses carefully before investing. The Summary Prospectus and/or Prospectus contain this and other information about the Fund. You may obtain
copies of the Fund’s Summary Prospectus, Prospectus and Statement of Additional Information, which includes information about the MainStay Funds Trust's Trustees, free of charge, upon request, by calling toll-free 800-624-6782, by writing to
NYLIFE Distributors LLC, Attn: MainStay Marketing Department, 30 Hudson Street, Jersey City, NJ 07302 or by sending an e-mail to MainStayShareholderServices@nylim.com. These documents are also available via the MainStay Funds’ website at
newyorklifeinvestments.com. Please read the Fund’s Summary Prospectus and/or Prospectus carefully before investing.
Investment and
Performance Comparison (Unaudited)
Performance data quoted represents past performance. Past performance is no
guarantee of future results. Because of market volatility and other factors, current performance may be lower or higher than the figures shown. Investment return and principal value will fluctuate, and as a result, when shares are redeemed, they may
be worth more or less than their original cost. The graph below depicts the historical performance of Class I shares of the Fund. Performance will vary from class to class based on differences in class-specific expenses and sales charges. For performance information current to the most recent month-end, please call 800-624-6782 or visit newyorklifeinvestments.com.
The performance table and graph do not reflect the deduction
of taxes that a shareholder would pay on distributions or Fund share redemptions. Total returns reflect maximum applicable sales charges as indicated in the table below, if any, changes in share price, and reinvestment of dividend and capital gain
distributions. The graph assumes the initial investment amount shown below and reflects the deduction of all sales charges that would have applied for the period of investment. Performance figures may reflect certain fee waivers and/or expense
limitations, without which total returns may have been lower. For more information on share classes and current fee waivers and/or expense limitations (if any), please refer to the Notes to Financial Statements.
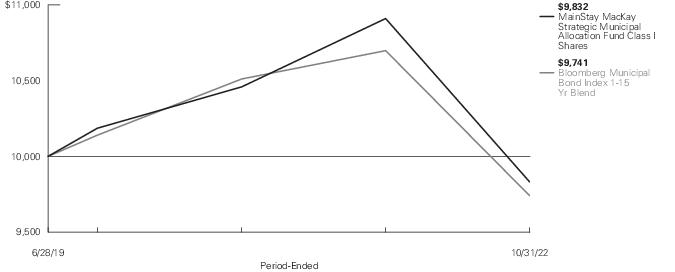
| Average
Annual Total Returns for the Period-Ended October 31, 2022 |
| Class
|
Sales
Charge |
|
Inception
Date |
Six
Months1 |
One
Year |
Since
Inception |
Gross
Expense
Ratio2 |
| Class
A Shares3 |
Maximum
3% Initial Sales Charge |
With
sales charges |
6/28/2019
|
-7.99%
|
-14.15%
|
-2.07%
|
0.97%
|
| |
|
Excluding
sales charges |
|
-3.65
|
-10.10
|
-0.71
|
0.97
|
| Investor
Class Shares4, 5 |
Maximum
2.5% Initial Sales Charge |
With
sales charges |
6/28/2019
|
-7.58
|
-13.74
|
-2.27
|
1.17
|
| |
|
Excluding
sales charges |
|
-3.73
|
-10.15
|
-0.92
|
1.17
|
| Class
C Shares |
Maximum
1% CDSC |
With
sales charges |
6/28/2019
|
-4.81
|
-11.44
|
-1.20
|
1.42
|
| |
if
redeemed Within One Year of Purchase |
Excluding
sales charges |
|
-3.86
|
-10.57
|
-1.20
|
1.42
|
| Class
I Shares |
No
Sales Charge |
|
6/28/2019
|
-3.43
|
-9.88
|
-0.51
|
0.71
|
| Class
R6 Shares |
No
Sales Charge |
|
6/28/2019
|
-3.53
|
-9.96
|
-0.53
|
0.70
|
| 1.
|
Not
annualized. |
| 2.
|
The gross
expense ratios presented reflect the Fund’s “Total Annual Fund Operating Expenses” from the most recent Prospectus, as supplemented, and may differ from other expense ratios disclosed in this report. |
| 3.
|
Prior to
August 10, 2022, the maximum initial sales charge was 4.5%, which is reflected in the applicable average annual total return figures shown. |
| 4.
|
Prior to
June 30, 2020, the maximum initial sales charge was 4.5%, which is reflected in the applicable average annual total return figures shown. |
| 5.
|
Prior
to August 10, 2022, the maximum initial sales charge was 4%, which is reflected in the applicable average annual total return figures shown. |
The footnotes on the next page are an integral part of the
table and graph and should be carefully read in conjunction with them.
| Benchmark
Performance* |
Six
Months1 |
One
Year |
Since
Inception |
| Bloomberg
Municipal Bond Index 1-15 Yr Blend2 |
-2.41%
|
-8.94%
|
-0.78%
|
| Morningstar
Muni National Intermediate Category Average3 |
-4.07
|
-11.21
|
-1.42
|
| *
|
Returns
for indices reflect no deductions for fees, expenses or taxes, except for foreign withholding taxes where applicable. Results assume reinvestment of all dividends and capital gains. An investment cannot be made directly in an index.
|
| 1.
|
Not
annualized. |
| 2.
|
The
Bloomberg Municipal Bond Index 1-15 Yr Blend is the Fund's primary broad-based securities-market index for comparison purposes. |
| 3.
|
The
Morningstar Municipal National Intermediate Category Average is representative of funds that invest in bonds issued by various state and local governments to fund public projects. The income from these bonds is generally free from federal taxes. To
lower risk, these portfolios spread their assets across many states and sectors. These portfolios have durations of 4.0 to 6.0 years (or average maturities of five to 12 years). Results are based on average total returns of similar funds with all
dividends and capital gain distributions reinvested. |
The footnotes on the preceding page are an integral part of the
table and graph and should be carefully read in conjunction with them.
| 6
|
MainStay MacKay Strategic
Municipal Allocation Fund |
Cost in Dollars of
a $1,000 Investment in MainStay MacKay Strategic Municipal Allocation Fund (Unaudited)
The example below is intended to describe the fees and expenses
borne by shareholders during the six-month period from May 1, 2022 to October 31, 2022, and the impact of those costs on your investment.
Example
As a shareholder of the Fund you incur two types of costs: (1)
transaction costs, including exchange fees and sales charges (loads) on purchases (as applicable), and (2) ongoing costs, including management fees, distribution and/or service (12b-1) fees and other Fund expenses (as applicable). This example is
intended to help you understand your ongoing costs (in dollars) of investing in the Fund and to compare these costs with the ongoing costs of investing in other mutual funds. The example is based on an investment of $1,000 made at the beginning of
the six-month period and held for the entire period from May 1, 2022 to October 31, 2022.
This example illustrates your Fund’s ongoing costs in two
ways:
Actual Expenses
The second and third data columns in the table below provide information about
actual account values and actual expenses. You may use the information in these columns, together with the amount you invested, to estimate the expenses that you paid during the six months ended October 31, 2022. Simply divide your account value by
$1,000 (for example, an
$8,600 account value divided by $1,000 = 8.6), then multiply the result by the
number under the heading entitled “Expenses Paid During Period” to estimate the expenses you paid on your account during this period.
Hypothetical Example for Comparison Purposes
The fourth and fifth data columns in the table below provide information about
hypothetical account values and hypothetical expenses based on the Fund’s actual expense ratio and an assumed rate of return of 5% per year before expenses, which is not the Fund’s actual return. The hypothetical account values and
expenses may not be used to estimate the actual ending account balances or expenses you paid for the six-month period shown. You may use this information to compare the ongoing costs of investing in the Fund with the ongoing costs of investing in
other mutual funds. To do so, compare this 5% hypothetical example with the 5% hypothetical examples that appear in the shareholder reports of the other mutual funds.
Please note that the expenses shown in the table are meant to
highlight your ongoing costs only and do not reflect any transactional costs, such as exchange fees or sales charges (loads). Therefore, the fourth and fifth data columns of the table are useful in comparing ongoing costs only and will not help you
determine the relative total costs of owning different funds. In addition, if these transactional costs were included, your costs would have been higher.
| Share
Class |
Beginning
Account
Value
5/1/22 |
Ending
Account
Value (Based
on Actual
Returns and
Expenses)
10/31/22 |
Expenses
Paid
During
Period1 |
Ending
Account
Value (Based
on Hypothetical
5% Annualized
Return and
Actual Expenses)
10/31/22 |
Expenses
Paid
During
Period |
Net
Expense
Ratio
During
Period2 |
| Class
A Shares |
$1,000.00
|
$963.50
|
$3.81
|
$1,021.32
|
$3.92
|
0.77%
|
| Investor
Class Shares |
$1,000.00
|
$962.70
|
$4.55
|
$1,020.57
|
$4.69
|
0.92%
|
| Class
C Shares |
$1,000.00
|
$961.40
|
$5.78
|
$1,019.31
|
$5.96
|
1.17%
|
| Class
I Shares |
$1,000.00
|
$965.70
|
$2.58
|
$1,022.58
|
$2.65
|
0.52%
|
| Class
R6 Shares |
$1,000.00
|
$964.70
|
$2.48
|
$1,022.68
|
$2.55
|
0.50%
|
| 1.
|
Expenses are
equal to the Fund’s annualized expense ratio of each class multiplied by the average account value over the period, divided by 365 and multiplied by 184 (to reflect the six-month period). The table above represents the actual expenses incurred
during the six-month period. In addition to the fees and expenses which the Fund bears directly, it also indirectly bears a pro rata share of the fees and expenses of the underlying funds in which it invests. Such indirect expenses are not included
in the above-reported expense figures. |
| 2.
|
Expenses
are equal to the Fund's annualized expense ratio to reflect the six-month period. |
Portfolio Composition as of October 31, 2022
(Unaudited)
| Illinois
|
12.1%
|
| New
York |
10.1
|
| Texas
|
9.4
|
| Florida
|
8.2
|
| California
|
6.2
|
| Alabama
|
5.8
|
| Georgia
|
3.6
|
| New
Jersey |
3.6
|
| Pennsylvania
|
3.3
|
| Utah
|
3.1
|
| Michigan
|
2.9
|
| Indiana
|
2.9
|
| Colorado
|
2.8
|
| Missouri
|
2.7
|
| North
Carolina |
2.6
|
| Wisconsin
|
2.5
|
| Ohio
|
2.0
|
| Nebraska
|
1.6
|
| Washington
|
1.5
|
| Rhode
Island |
1.4
|
| Tennessee
|
1.1
|
| Connecticut
|
1.1
|
| Puerto
Rico |
1.0
|
| Maryland
|
1.0
|
| Kansas
|
1.0%
|
| Massachusetts
|
1.0
|
| Guam
|
0.9
|
| Arizona
|
0.9
|
| Kentucky
|
0.9
|
| Minnesota
|
0.8
|
| Iowa
|
0.7
|
| Vermont
|
0.7
|
| West
Virginia |
0.6
|
| U.S.
Virgin Islands |
0.5
|
| Mississippi
|
0.4
|
| New
Mexico |
0.4
|
| New
Hampshire |
0.3
|
| Montana
|
0.3
|
| South
Dakota |
0.3
|
| Idaho
|
0.2
|
| Alaska
|
0.1
|
| Wyoming
|
0.1
|
| North
Dakota |
0.1
|
| Louisiana
|
0.1
|
| Hawaii
|
0.0‡
|
| Other
Assets, Less Liabilities |
–2.8
|
| |
100.0%
|
‡ Less than one–tenth of a
percent.
See Portfolio of Investments
beginning on page 11 for specific holdings within these categories. The Fund's holdings are subject to change.
Top Ten Holdings and/or Issuers Held as of October 31, 2022 (excluding short-term investments) (Unaudited)
| 1.
|
City
of New York NY, 1.65%-5.25%, due 10/1/38–10/1/47 |
| 2.
|
Black
Belt Energy Gas District, 2.59%-5.50%, due 12/1/49–11/1/53 |
| 3.
|
Southeast
Energy Authority, (zero coupon)-4.00%, due 11/1/51–1/1/53 |
| 4.
|
City
of Chicago IL, 4.00%-6.00%, due 1/1/33–1/1/38 |
| 5.
|
Port
Authority of New York & New Jersey, 4.00%-5.00%, due 11/1/37–8/1/38 |
| 6.
|
New
Jersey Economic Development Authority, 5.00%-5.625%, due 11/15/30–11/1/44 |
| 7.
|
Tender
Option Bond Trust Receipts, 2.38%, due 12/15/50 |
| 8.
|
State
of Illinois, 5.00%-5.50%, due 12/1/26–5/1/39 |
| 9.
|
California
Municipal Finance Authority, 4.125%-5.25%, due 11/1/36–10/1/41 |
| 10.
|
City
of Bloomington IN, 5.00%, due 7/1/30–7/1/36 |
| 8
|
MainStay MacKay Strategic
Municipal Allocation Fund |
Portfolio
Management Discussion and Analysis (Unaudited)
Questions answered by portfolio managers John Loffredo,
CFA, Robert DiMella, CFA, Michael Petty, David Dowden, Scott Sprauer, Frances Lewis, John Lawlor and Michael Denlinger, CFA, of MacKay Shields LLC, the Fund’s Subadvisor.
How did MainStay MacKay Strategic Municipal Allocation Fund perform
relative to its benchmark and peer group during the six months ended October 31, 2022?
For the six months ended October 31, 2022, Class I shares of
MainStay MacKay Strategic Municipal Allocation Fund returned −3.43%, underperforming the −2.41% return of the Fund’s benchmark, the Bloomberg Municipal Bond Index 1–15 Year Blend (the “Index”). Over the same
period, Class I shares outperformed the −4.07% return of the Morningstar Muni National Intermediate Category Average.1
What factors affected the Fund’s relative
performance during the reporting period?
The Fund
underperformed the Index partly due to underweight exposure to bonds rated AA and A.2 From a geographic perspective, overweight exposure to holdings from Illinois detracted from
relative results. The Fund’s overweight exposure to 4% coupons detracted from performance. Bonds maturing 14 years and over also detracted from relative return.
During the reporting period, were there any market
events that materially impacted the Fund’s performance or liquidity?
During the reporting period, markets extended their historic
drawdown, driven by the combination of rising U.S. Treasury yields, ongoing monetary policy tightening and geopolitical uncertainty. The municipal market mirrored this broader sell-off, and many investors reacted by withdrawing money from their
municipal holdings. The municipal market experienced record outflows, which ultimately drove municipal rates higher and impacted the Fund's return during the reporting period.
During the reporting period, how was the Fund’s performance
materially affected by investments in derivatives?
During the reporting period, the Fund held U.S. Treasury
futures to hedge the duration3 relative to the Index. This position made a positive contribution to the relative performance of the Fund. (Contributions take weightings and
total returns into account.)
What was the
Fund’s duration strategy during the reporting period?
As relative value investors, the team aims to keep the
Fund’s duration within a neutral range relative to that of the Index. As of October 31, 2022, the Fund's modified duration to worst4 was 5.45 years compared to 4.68 years
for the Index.
During the reporting period, which
sectors were the strongest positive contributors to the Fund’s relative performance and which sectors were particularly weak?
Across sectors, the Fund’s underweight positions in
state general obligation, leasing and prerefunded/ETM (escrowed to maturity) contributed positively to relative results. Meanwhile, overweight positions in the local general obligation, water & sewer and IDR/PCR (industrial development
revenue/pollution control revenue) sectors detracted from relative performance.
How did the Fund’s sector weighting change during
the reporting period?
During the reporting period, there
were no material changes to the weightings in the Fund. At the margin, the Fund increased sector exposure to electric and housing. In addition, there was increased exposure to AAA-rated5 bonds, as well as to 20-year bonds. Conversely, the Fund decreased sector exposure to the education and hospital sectors. Lastly, there was a decreased exposure to 30+ year bonds
and to Illinois holdings.
| 1.
|
See page 5 for other share class
returns, which may be higher or lower than Class I share returns. See page 6 for more information on benchmark and peer group returns. |
| 2.
|
An obligation rated
‘AA’ by Standard & Poor’s (“S&P”) is deemed by S&P to differ from the highest-rated obligations only to a small degree. In the opinion of S&P, the obligor's capacity to meet its financial commitment on
the obligation is very strong. An obligation rated ‘A’ by S&P is deemed by S&P to be somewhat more susceptible to the adverse effects of changes in circumstances and economic conditions than obligations in higher-rated
categories. In the opinion of S&P, however, the obligor's capacity to meet its financial commitment on the obligation is still strong. When applied to Fund holdings, ratings are based solely on the creditworthiness of the bonds in the portfolio
and are not meant to represent the security or safety of the Fund. |
| 3.
|
Duration is a measure of the
price sensitivity of a fixed-income investment to changes in interest rates. Duration is expressed as a number of years and is considered a more accurate sensitivity gauge than average maturity. |
| 4.
|
Modified duration is inversely
related to the approximate percentage change in price for a given change in yield. Duration to worst is the duration of a bond computed using the bond’s nearest call date or maturity, whichever comes first. This measure ignores future cash
flow fluctuations due to embedded optionality. |
| 5.
|
An obligation rated
‘AAA’ has the highest rating assigned by S&P, and in the opinion of S&P, the obligor’s capacity to meet its financial commitment on the obligation is extremely strong. When applied to Fund holdings, ratings are based solely
on the creditworthiness of the bonds in the portfolio and are not meant to represent the security or safety of the Fund. |
How was the
Fund positioned at the end of the reporting period?
As
of October 31, 2022, the Fund held overweight positions relative to the Index in the housing and local general obligation sectors, in addition to holdings from the state of Illinois and 17-year-and-over bonds. As of the same date, the Fund held
underweight exposure to the state general obligation and prerefunded/ETM sectors, and to the states of California and New York, and bonds maturing between 2 and 10 years.
The opinions expressed are those of the portfolio managers as of
the date of this report and are subject to change. There is no guarantee that any forecasts will come to pass. This material does not constitute investment advice and is not intended as an endorsement of any specific investment.
| 10
|
MainStay MacKay Strategic
Municipal Allocation Fund |
Portfolio of
Investments October 31, 2022† (Unaudited)
| |
Principal
Amount |
Value
|
| Municipal
Bonds 102.8% |
| Long-Term
Municipal Bonds 92.8% |
| Alabama
5.4% |
| Black
Belt Energy Gas District, Project No. 4, Revenue Bonds |
|
|
| Series
A-1 |
|
|
| 4.00%,
due 12/1/49 (a) |
$
1,480,000 |
$ 1,435,419
|
| Black
Belt Energy Gas District, Gas Project No.6, Revenue Bonds |
|
|
| Series
B |
|
|
| 4.00%,
due 10/1/52 (a) |
1,760,000
|
1,694,811 |
| Black
Belt Energy Gas District, Revenue Bonds (a) |
|
|
| Series
B-1 |
|
|
| 4.00%,
due 4/1/53 |
640,000
|
607,471
|
| Series
F |
|
|
| 5.50%,
due 11/1/53 |
1,600,000
|
1,616,861
|
| Prichard
Water Works & Sewer Board, Revenue Bonds |
|
|
| 2.375%,
due 11/1/28 |
205,000
|
123,000
|
| Southeast
Energy Authority, A Cooperative District, Project No. 3, Revenue Bonds |
|
|
| Series
A-1 |
|
|
| (zero
coupon), due 1/1/53 |
1,600,000
|
1,618,225
|
| Southeast
Energy Authority, A Cooperative District, Project No. 1, Revenue Bonds |
|
|
| Series
A |
|
|
| 4.00%,
due 11/1/51 (a) |
760,000
|
709,832
|
| Southeast
Energy Authority, A Cooperative District, Project No. 2, Revenue Bonds |
|
|
| Series
B |
|
|
| 4.00%,
due 12/1/51 (a) |
2,600,000
|
2,342,261
|
| |
|
10,147,880
|
| Alaska
0.1% |
| Alaska
Industrial Development & Export Authority, Interior Gas Utility Project, Revenue Bonds |
|
|
| Series
A |
|
|
| 5.00%,
due 6/1/28 |
250,000
|
246,544
|
| Arizona
0.9% |
| Arizona
Industrial Development Authority, Ball Charter Schools Projet, Revenue Bonds |
|
|
| 2.65%,
due 7/1/26 |
90,000
|
83,899
|
| |
Principal
Amount |
Value
|
| |
| Arizona
(continued) |
| City
of Mesa AZ, Utility System, Revenue Bonds |
|
|
| Series
A, Insured: BAM |
|
|
| 5.00%,
due 7/1/30 |
$
1,050,000 |
$ 1,131,287
|
| Glendale
Industrial Development Authority, Royal Oaks Life Care Community, Revenue Bonds |
|
|
| 4.00%,
due 5/15/28 |
620,000 |
576,397
|
| |
|
1,791,583
|
| California
5.1% |
| California
Municipal Finance Authority, Palomar Health Obligated Group, Certificate of Participation |
|
|
| Series
A, Insured: AGM |
|
|
| 5.25%,
due 11/1/36 (b) |
1,300,000
|
1,347,977
|
| California
Public Finance Authority, Enso Village Project, Revenue Bonds |
|
|
| Series
B-3 |
|
|
| 2.125%,
due 11/15/27 (c) |
250,000
|
228,164
|
| California
School Finance Authority, Classical Academies Oceanside Project, Revenue Bonds |
|
|
| Series
A |
|
|
| 4.00%,
due 10/1/27 (c) |
500,000
|
488,954
|
| California
School Finance Authority, Sonoma County Junior College District Project, Revenue Bonds |
|
|
| Series
A |
|
|
| 4.00%,
due 11/1/41 (c) |
240,000
|
174,700
|
| California
Statewide Communities Development Authority, Community Infrastructure Program, Special Assessment |
|
|
| Series
A |
|
|
| 4.00%,
due 9/2/26 |
260,000
|
249,111
|
| California
Statewide Communities Development Authority, CHF-Irvine LLC, Revenue Bonds |
|
|
| Insured:
BAM |
|
|
| 4.00%,
due 5/15/35 |
290,000
|
275,976
|
| City
of Long Beach CA, Airport System, Revenue Bonds |
|
|
| Series
B, Insured: AGM |
|
|
| 5.00%,
due 6/1/28 |
250,000
|
270,455
|
| Series
A, Insured: AGM |
|
|
| 5.00%,
due 6/1/31 |
250,000
|
276,580
|
The notes to the financial statements are an integral part of, and
should be read in conjunction with, the financial statements.
11
Portfolio of
Investments October 31, 2022† (Unaudited) (continued)
| |
Principal
Amount |
Value
|
| Long-Term
Municipal Bonds (continued) |
| California
(continued) |
| City
of Long Beach CA, Airport System, Revenue Bonds (continued) |
|
|
| Series
B, Insured: AGM |
|
|
| 5.00%,
due 6/1/31 |
$
150,000 |
$ 165,948
|
| City
of San Mateo CA, Community Facilities District No. 2008-1, Special Tax |
|
|
| Insured:
BAM |
|
|
| 5.25%,
due 9/1/35 |
1,000,000
|
1,053,493 |
| City
of Vernon CA, Electric System, Revenue Bonds |
|
|
| Series
A |
|
|
| 5.00%,
due 10/1/27 |
250,000
|
256,938
|
| Compton
Community College District, Election of 2002, Unlimited General Obligation |
|
|
| Series
D, Insured: BAM |
|
|
| (zero
coupon), due 8/1/38 |
1,000,000
|
355,659
|
| Corona
Community Facilities District, Community Facilities District No. 2018-2, Special Tax |
|
|
| Series
A |
|
|
| 5.00%,
due 9/1/29 |
100,000
|
104,511
|
| County
of Los Angeles CA Community Facilities District No. 2021-01, Improvement Area No. 1, Special Tax |
|
|
| 5.00%,
due 9/1/27 |
100,000
|
103,929
|
| 5.00%,
due 9/1/30 |
175,000
|
179,761
|
| 5.00%,
due 9/1/32 |
175,000
|
178,148
|
| Fresno
Unified School District, Election of 2020, Unlimited General Obligation |
|
|
| Series
B |
|
|
| 5.00%,
due 8/1/40 |
250,000
|
261,231
|
| Hercules
Redevelopment Agency Successor Agency, Tax Allocation |
|
|
| Series
A, Insured: AGM |
|
|
| 5.00%,
due 8/1/37 |
500,000
|
523,687
|
| Merced
City School District, Election 2014, Unlimited General Obligation |
|
|
| Insured:
AGM |
|
|
| 4.00%,
due 8/1/46 |
100,000
|
87,091
|
| Oakland
Unified School District, Election of 2020, Unlimited General Obligation |
|
|
| Series
A, Insured: BAM |
|
|
| 4.00%,
due 8/1/46 |
500,000
|
433,327
|
| |
Principal
Amount |
Value
|
| |
| California
(continued) |
| Ravenswood
City School District, Election 2018, Unlimited General Obligation |
|
|
| Insured:
AGM |
|
|
| 5.00%,
due 8/1/36 |
$
360,000 |
$ 381,717
|
| Sacramento
City Financing Authority, Capital Appreciation, Tax Allocation |
|
|
| Insured:
NATL-RE |
|
|
| (zero
coupon), due 12/1/23 |
735,000 |
707,769 |
| San
Joaquin Hills Transportation Corridor Agency, Revenue Bonds, Junior Lien |
|
|
| Series
B |
|
|
| 5.25%,
due 1/15/49 |
1,500,000
|
1,498,342
|
| |
|
9,603,468
|
| Colorado
2.7% |
| Arkansas
River Power Authority, Revenue Bonds |
|
|
| Series
A |
|
|
| 5.00%,
due 10/1/38 |
1,000,000
|
970,162
|
| Colorado
Health Facilities Authority, Aberdeen Ridge, Inc. Obligated Group, Revenue Bonds |
|
|
| Series
B-3 |
|
|
| 2.125%,
due 5/15/28 |
250,000
|
224,265
|
| Colorado
Health Facilities Authority, CommonSpirit Health, Revenue Bonds |
|
|
| Series
A-1 |
|
|
| 4.00%,
due 8/1/44 |
250,000
|
201,881
|
| Series
A-2 |
|
|
| 5.00%,
due 8/1/33 |
90,000
|
91,439
|
| Series
A-1 |
|
|
| 5.00%,
due 8/1/35 |
180,000
|
181,368
|
| Series
A |
|
|
| 5.25%,
due 11/1/37 |
1,450,000
|
1,476,383
|
| Fiddlers
Business Improvement District, Unlimited General Obligation |
|
|
| 5.00%,
due 12/1/32 (c) |
200,000
|
194,422
|
| Ground
Water Management Subdistrict of Central Colorado, Water Conservancy District, Limited General Obligation |
|
|
| Insured:
BAM |
|
|
| 4.00%,
due 12/1/40 |
250,000
|
222,519
|
| Jefferson
County School District R-1, Unlimited General Obligation |
|
|
| Series
A, Insured: BAM State Aid Withholding |
|
|
| 4.00%,
due 12/15/36 |
1,000,000
|
968,017
|
The notes to the financial statements are an integral part of, and
should be read in conjunction with, the financial statements.
| 12
|
MainStay MacKay Strategic
Municipal Allocation Fund |
| |
Principal
Amount |
Value
|
| Long-Term
Municipal Bonds (continued) |
| Colorado
(continued) |
| VDW
Metropolitan District No. 2, Limited General Obligation |
|
|
| Series
A-2, Insured: BAM |
|
|
| 4.00%,
due 12/1/45 |
$
580,000 |
$ 491,233
|
| |
|
5,021,689
|
| Connecticut
0.8% |
| State
of Connecticut, Transportation Infrastructure, Special Tax |
|
|
| Series
A |
|
|
| 5.25%,
due 7/1/40 |
1,500,000
|
1,612,196
|
| Florida
8.2% |
| CFM
Community Development District, Capital Improvement, Special Assessment |
|
|
| 2.875%,
due 5/1/31 |
100,000
|
82,654
|
| City
of Gainesville FL, Revenue Bonds |
|
|
| Series
A |
|
|
| 5.00%,
due 10/1/47 |
635,000
|
642,110
|
| City
of Palmetto FL, Renaissance Arts and Education, Inc., Revenue Bonds |
|
|
| Series
A |
|
|
| 4.25%,
due 6/1/27 |
160,000
|
156,031
|
| Series
A |
|
|
| 5.00%,
due 6/1/32 |
100,000
|
98,177
|
| City
of Pompano Beach FL, John Knox Village Projet, Revenue Bonds |
|
|
| Series
B-2 |
|
|
| 1.45%,
due 1/1/27 |
250,000
|
213,944
|
| Cobblestone
Community Development District, Assessment Area Two, Special Assessment |
|
|
| Series
2 |
|
|
| 3.40%,
due 5/1/27 (c) |
160,000
|
147,879
|
| County
of Miami-Dade FL, Transit System, Revenue Bonds |
|
|
| 5.00%,
due 7/1/43 |
2,300,000
|
2,398,084
|
| County
of Miami-Dade FL, Unlimited General Obligation |
|
|
| Series
A |
|
|
| 5.00%,
due 7/1/43 |
1,000,000
|
1,033,022
|
| Florida
Development Finance Corp., Mater Academy Project, Revenue Bonds |
|
|
| Series
A |
|
|
| 5.00%,
due 6/15/31 |
515,000
|
514,462
|
| |
Principal
Amount |
Value
|
| |
| Florida
(continued) |
| Florida
Development Finance Corp., UF Health Jacksonville Project, Revenue Bonds |
|
|
| Series
A |
|
|
| 5.00%,
due 2/1/37 |
$
500,000 |
$ 466,530
|
| Fort
Pierce Utilities Authority, Revenue Bonds |
|
|
| Series
A, Insured: AGM |
|
|
| 5.00%,
due 10/1/28 |
700,000 |
748,110 |
| Series
A, Insured: AGM |
|
|
| 5.00%,
due 10/1/30 |
350,000 |
378,330 |
| Series
A, Insured: AGM |
|
|
| 5.00%,
due 10/1/32 |
150,000
|
161,759
|
| Series
A, Insured: AGM |
|
|
| 5.00%,
due 10/1/34 |
325,000
|
346,585
|
| Series
A, Insured: AGM |
|
|
| 5.00%,
due 10/1/35 |
500,000
|
531,308
|
| Series
A, Insured: AGM |
|
|
| 5.00%,
due 10/1/36 |
475,000
|
503,267
|
| Harbor
Bay Community Development District, Special Assessment |
|
|
| Series
A-1 |
|
|
| 3.10%,
due 5/1/24 |
290,000
|
281,438
|
| Series
A-2 |
|
|
| 3.10%,
due 5/1/24 |
185,000
|
179,538
|
| Hilltop
Point Community Development District, Assessment Area One, Special Assessment |
|
|
| Series
1 |
|
|
| 4.60%,
due 5/1/27 |
100,000
|
97,153
|
| Hilltop
Point Community Development District, Assessment Area Two, Special Assessment |
|
|
| Series
2 |
|
|
| 4.75%,
due 5/1/27 |
200,000
|
194,559
|
| Laurel
Road Community Development District, Special Assessment |
|
|
| Series
A2 |
|
|
| 3.125%,
due 5/1/31 |
235,000
|
196,380
|
| Miami
Beach Health Facilities Authority, Mount Sinai Medical Center of Florida, Revenue Bonds |
|
|
| Series
B |
|
|
| 4.00%,
due 11/15/46 |
600,000
|
473,988
|
| Palm
Coast Park Community Development District, Spring Lake Tracts 2 and 3, Special Assessment |
|
|
| 2.40%,
due 5/1/26 |
100,000
|
90,789
|
The notes to the financial statements are an integral part of, and
should be read in conjunction with, the financial statements.
13
Portfolio of
Investments October 31, 2022† (Unaudited) (continued)
| |
Principal
Amount |
Value
|
| Long-Term
Municipal Bonds (continued) |
| Florida
(continued) |
| Palm
Coast Park Community Development District, Sawmill Branch Phase 2, Special Assessment |
|
|
| 4.15%,
due 5/1/27 |
$
400,000 |
$ 388,256
|
| Pinellas
County Industrial Development Authority, Drs Kiran & Pallavi Patel 2017 Foundation for Global Understanding, Inc. Project, Revenue Bonds |
|
|
| 5.00%,
due 7/1/29 |
500,000 |
499,125 |
| Preston
Cove Community Development District, Special Assessment |
|
|
| 3.25%,
due 5/1/27 |
170,000 |
156,113 |
| Reunion
East Community Development District, Series 2021 Project, Special Assessment |
|
|
| 2.85%,
due 5/1/31 |
100,000 |
82,714 |
| Reunion
West Community Development District, Special Assessment |
|
|
| 3.00%,
due 5/1/36 |
100,000
|
74,857
|
| Rolling
Hills Community Development District, Special Assessment |
|
|
| Series
A-2 |
|
|
| 3.65%,
due 5/1/32 |
200,000
|
172,642
|
| Seminole
Improvement District, Revenue Bonds |
|
|
| 5.00%,
due 10/1/32 |
250,000
|
240,903
|
| Southshore
Bay Community Development District, District Assessment Area One, Special Assessment |
|
|
| 3.00%,
due 5/1/33 (c) |
595,000
|
475,450
|
| Sunbridge
Stewardship District, Weslyn Park Project Assessment, Special Assessment |
|
|
| 4.60%,
due 5/1/32 |
460,000
|
430,660
|
| Tampa
Bay Water, Revenue Bonds |
|
|
| 5.00%,
due 10/1/40 |
1,580,000
|
1,681,483
|
| Verano
No. 3 Community Development District, Special Assessment |
|
|
| 2.375%,
due 5/1/26 |
40,000
|
36,284
|
| Village
Community Development District No. 13, Special Assessment |
|
|
| 2.85%,
due 5/1/36 |
1,495,000
|
1,046,999
|
| Watergrass
Community Development District II, Special Assessment |
|
|
| 2.50%,
due 5/1/31 |
100,000
|
80,130
|
| |
Principal
Amount |
Value
|
| |
| Florida
(continued) |
| Windward
at Lakewood Ranch Community Development District, Phase 2 Project, Special Assessment |
|
|
| 3.625%,
due 5/1/32 |
$
135,000 |
$ 116,877
|
| Wiregrass
II Community Development District, Assessment Area Two, Special Assessment |
|
|
| 4.80%,
due 5/1/32 |
100,000 |
94,169
|
| |
|
15,512,759
|
| Georgia
3.5% |
| Atlanta
Urban Redevelopment Agency, Atlanta BeltLine Special Service District, Revenue Bonds |
|
|
| Insured:
BAM |
|
|
| 2.875%,
due 7/1/31 (c) |
500,000
|
432,175
|
| City
of Atlanta GA, Department of Aviation, Revenue Bonds |
|
|
| Series
B |
|
|
| 5.00%,
due 7/1/34 (d) |
450,000
|
454,855
|
| City
of Atlanta GA, Airport Passenger Facility Charge, Revenue Bonds, Sub. Lien |
|
|
| Series
C |
|
|
| 5.00%,
due 7/1/40 |
1,350,000
|
1,380,550
|
| DeKalb
Private Hospital Authority, Children's Healthcare of Atlanta, Revenue Bonds |
|
|
| Series
B |
|
|
| 4.00%,
due 7/1/38 |
820,000
|
767,819
|
| Main
Street Natural Gas, Inc., Revenue Bonds |
|
|
| Series
A |
|
|
| 4.00%,
due 4/1/48 (a) |
1,250,000
|
1,247,433
|
| Municipal
Electric Authority of Georgia, Revenue Bonds |
|
|
| Series
A |
|
|
| 5.00%,
due 1/1/38 |
500,000
|
493,740
|
| Walton
County Water & Sewer Authority, Walton-Hard Labor Creek Reservoir Water Treatment Facility Project, Revenue Bonds |
|
|
| 5.25%,
due 2/1/47 |
1,700,000
|
1,782,212
|
| |
|
6,558,784
|
The notes to the financial statements are an integral part of, and
should be read in conjunction with, the financial statements.
| 14
|
MainStay MacKay Strategic
Municipal Allocation Fund |
| |
Principal
Amount |
Value
|
| Long-Term
Municipal Bonds (continued) |
| Guam
0.9% |
| Territory
of Guam, Business Privilege Tax, Revenue Bonds |
|
|
| Series
F |
|
|
| 4.00%,
due 1/1/36 |
$
400,000 |
$ 338,364
|
| Series
D |
|
|
| 5.00%,
due 11/15/27 |
365,000 |
365,423 |
| Territory
of Guam, Section 30, Revenue Bonds |
|
|
| Series
A |
|
|
| 5.00%,
due 12/1/34 |
1,000,000
|
961,731
|
| |
|
1,665,518
|
| Hawaii
0.0% ‡ |
| Kauai
County Community Facilities District, Kukui'ula Development Project, Special Tax |
|
|
| 4.00%,
due 5/15/26 |
80,000
|
78,092
|
| Idaho
0.2% |
| Idaho
Health Facilities Authority, Madison Memorial Hospital, Revenue Bonds |
|
|
| 5.00%,
due 9/1/37 |
370,000
|
353,617
|
| Illinois
12.1% |
| Chicago
Board of Education, Capital Appreciation, School Reform, Unlimited General Obligation |
|
|
| Series
A, Insured: NATL-RE |
|
|
| (zero
coupon), due 12/1/25 |
500,000
|
434,452
|
| Chicago
Board of Education, Unlimited General Obligation |
|
|
| Series
B |
|
|
| 5.00%,
due 12/1/31 |
1,000,000
|
971,932
|
| Series
A |
|
|
| 5.00%,
due 12/1/37 |
1,085,000
|
995,161
|
| Chicago
O'Hare International Airport, General, Revenue Bonds, Senior Lien |
|
|
| Series
D |
|
|
| 5.00%,
due 1/1/28 |
250,000
|
265,015
|
| Series
D |
|
|
| 5.00%,
due 1/1/36 |
1,000,000
|
1,042,717
|
| Series
D |
|
|
| 5.00%,
due 1/1/37 |
1,000,000
|
1,027,592
|
| |
Principal
Amount |
Value
|
| |
| Illinois
(continued) |
| City
of Chicago IL, Unlimited General Obligation |
|
|
| Series
A |
|
|
| 4.00%,
due 1/1/36 |
$
500,000 |
$ 420,856
|
| Series
A |
|
|
| 5.00%,
due 1/1/33 |
920,000 |
882,012 |
| Series
A |
|
|
| 6.00%,
due 1/1/38 |
2,500,000
|
2,547,027 |
| City
of Joliet IL, Rock Run Crossing Project, Unlimited General Obligation |
|
|
| Insured:
BAM |
|
|
| 5.50%,
due 12/15/42 |
2,000,000
|
2,150,127
|
| Illinois
Finance Authority, Washington and Jane Smith Home (The), Revenue Bonds |
|
|
| 4.00%,
due 10/15/23 |
205,000
|
202,980
|
| 4.00%,
due 10/15/24 |
215,000
|
210,185
|
| Illinois
Finance Authority, Acero Charter Schools, Inc., Revenue Bonds |
|
|
| 4.00%,
due 10/1/33 (c) |
250,000
|
214,156
|
| Illinois
Finance Authority, Carle Foundation, Revenue Bonds |
|
|
| Series
A |
|
|
| 5.00%,
due 8/15/33 |
250,000
|
261,521
|
| Illinois
Municipal Electric Agency, Revenue Bonds |
|
|
| Series
A |
|
|
| 4.00%,
due 2/1/34 |
1,500,000
|
1,462,927
|
| Illinois
State Toll Highway Authority, Revenue Bonds |
|
|
| Series
A |
|
|
| 5.00%,
due 1/1/43 |
1,000,000
|
1,014,518
|
| Lake
County Consolidated High School District No. 120 Mundelein, Limited General Obligation |
|
|
| Series
A |
|
|
| 5.50%,
due 12/1/38 |
825,000
|
874,818
|
| Regional
Transportation Authority, Revenue Bonds |
|
|
| Series
A, Insured: NATL-RE |
|
|
| 5.50%,
due 7/1/24 |
160,000
|
165,144
|
| Sales
Tax Securitization Corp., Revenue Bonds, Second Lien |
|
|
| Series
A |
|
|
| 5.00%,
due 1/1/30 |
500,000
|
518,791
|
The notes to the financial statements are an integral part of, and
should be read in conjunction with, the financial statements.
15
Portfolio of
Investments October 31, 2022† (Unaudited) (continued)
| |
Principal
Amount |
Value
|
| Long-Term
Municipal Bonds (continued) |
| Illinois
(continued) |
| Sangamon
& Morgan Counties Community Unit School District No. 16 New Berlin, Unlimited General Obligation |
|
|
| Series
A, Insured: AGM |
|
|
| 5.00%,
due 12/1/38 |
$
575,000 |
$ 593,228
|
| Series
A, Insured: AGM |
|
|
| 5.50%,
due 12/1/36 |
350,000 |
379,293 |
| Southwestern
Illinois Development Authority, Southwestern Illinois Flood Prevention District Council, Revenue Bonds |
|
|
| 4.00%,
due 4/15/33 |
525,000 |
515,222 |
| State
of Illinois, Unlimited General Obligation |
|
|
| Series
A |
|
|
| 5.00%,
due 12/1/26 |
500,000
|
503,554
|
| Series
D |
|
|
| 5.00%,
due 11/1/28 |
1,000,000
|
1,001,750
|
| 5.00%,
due 2/1/39 |
1,370,000
|
1,301,153
|
| 5.50%,
due 5/1/39 |
500,000
|
502,654
|
| Village
of Mundelein IL, Unlimited General Obligation |
|
|
| Insured:
AGM |
|
|
| 4.00%,
due 12/15/39 |
250,000
|
230,386
|
| Will
County School District No. 114, Manhattan, Unlimited General Obligation |
|
|
| Insured:
BAM |
|
|
| 5.25%,
due 1/1/39 |
175,000
|
183,785
|
| Insured:
BAM |
|
|
| 5.50%,
due 1/1/43 |
1,825,000
|
1,935,507
|
| |
|
22,808,463
|
| Indiana
2.9% |
| Center
Grove Community School Corp., Limited General Obligation |
|
|
| Insured:
State Intercept |
|
|
| 5.00%,
due 1/1/24 (b) |
1,500,000
|
1,516,192
|
| City
of Bloomington IN, Waterworks, Revenue Bonds |
|
|
| Insured:
BAM |
|
|
| 5.00%,
due 7/1/30 |
225,000
|
244,756
|
| Insured:
BAM |
|
|
| 5.00%,
due 7/1/31 |
250,000
|
269,992
|
| Insured:
BAM |
|
|
| 5.00%,
due 7/1/32 |
300,000
|
322,725
|
| |
Principal
Amount |
Value
|
| |
| Indiana
(continued) |
| City
of Bloomington IN, Waterworks, Revenue Bonds (continued) |
|
|
| Insured:
BAM |
|
|
| 5.00%,
due 7/1/33 |
$
250,000 |
$ 266,970
|
| Insured:
BAM |
|
|
| 5.00%,
due 7/1/36 |
1,495,000
|
1,583,587 |
| Evansville
Waterworks District, Revenue Bonds |
|
|
| Series
A, Insured: BAM |
|
|
| 5.00%,
due 1/1/36 |
500,000 |
529,083 |
| Series
A, Insured: BAM |
|
|
| 5.00%,
due 7/1/38 |
575,000
|
601,238
|
| Indiana
Finance Authority, Indianapolis Power & Light Co., Revenue Bonds |
|
|
| Series
A |
|
|
| 1.40%,
due 8/1/29 (a) |
250,000
|
200,185
|
| |
|
5,534,728
|
| Iowa
0.6% |
| Jesup
Community School District, Unlimited General Obligation |
|
|
| Insured:
AGM |
|
|
| 4.00%,
due 6/1/29 |
535,000
|
542,810
|
| Insured:
AGM |
|
|
| 4.00%,
due 6/1/30 |
560,000
|
565,421
|
| |
|
1,108,231
|
| Kansas
1.0% |
| City
of Dodge KS, Unlimited General Obligation |
|
|
| Series
A, Insured: AGM |
|
|
| 5.00%,
due 9/1/32 |
305,000
|
328,336
|
| Johnson
County Unified School District No. 233 Olathe, Unlimited General Obligation |
|
|
| Series
A |
|
|
| 4.00%,
due 9/1/36 |
1,685,000
|
1,631,227
|
| |
|
1,959,563
|
| Kentucky
0.6% |
| Kentucky
Bond Development Corp., Revenue Bonds |
|
|
| Insured:
BAM |
|
|
| 5.00%,
due 9/1/38 |
1,000,000
|
1,048,103
|
The notes to the financial statements are an integral part of, and
should be read in conjunction with, the financial statements.
| 16
|
MainStay MacKay Strategic
Municipal Allocation Fund |
| |
Principal
Amount |
Value
|
| Long-Term
Municipal Bonds (continued) |
| Louisiana
0.1% |
| Jefferson
Parish Consolidated Sewerage District No. 1, Revenue Bonds |
|
|
| Insured:
BAM |
|
|
| 4.00%,
due 2/1/42 |
$
260,000 |
$ 230,058
|
| Maryland
1.0% |
| City
of Baltimore MD, Harbor Point Project, Revenue Bonds |
|
|
| 4.50%,
due 6/1/33 |
100,000 |
91,528 |
| Maryland
Community Development Administration, Revenue Bonds |
|
|
| Series
A, Insured: GNMA / FNMA / FHLMC |
|
|
| 5.00%,
due 9/1/42 |
1,000,000
|
1,004,344
|
| Maryland
Economic Development Corp., Morgan View & Thurgood Marshall Student Housing, Revenue Bonds |
|
|
| Series
A |
|
|
| 5.25%,
due 7/1/32 (b) |
465,000
|
479,886
|
| State
of Maryland, Unlimited General Obligation |
|
|
| Series
A |
|
|
| 5.00%,
due 3/15/32 |
225,000
|
247,328
|
| |
|
1,823,086
|
| Massachusetts
1.0% |
| Commonwealth
of Massachusetts, COVID-19 Recovery Assessment, Revenue Bonds |
|
|
| Series
A |
|
|
| 3.564%,
due 7/15/23 |
2,000,000
|
1,984,556
|
| Michigan
2.9% |
| Calhoun
County Hospital Finance Authority, Oaklawn Hospital, Revenue Bonds |
|
|
| 5.00%,
due 2/15/28 |
240,000
|
243,096
|
| County
of Genesee MI, Limited General Obligation |
|
|
| Insured:
AGM |
|
|
| 5.00%,
due 6/1/27 |
355,000
|
373,968
|
| Insured:
AGM |
|
|
| 5.00%,
due 6/1/29 |
180,000
|
192,606
|
| |
Principal
Amount |
Value
|
| |
| Michigan
(continued) |
| Great
Lakes Water Authority, Sewage Disposal System, Revenue Bonds, Second Lien |
|
|
| Series
C |
|
|
| 5.00%,
due 7/1/36 |
$
1,000,000 |
$ 1,025,803
|
| Michigan
Finance Authority, Lawrence Technological University, Revenue Bonds |
|
|
| 4.00%,
due 2/1/27 |
185,000 |
174,843 |
| Michigan
Finance Authority, Tobacco Settlement Asset-Backed, Revenue Bonds, Senior Lien |
|
|
| Series
A, Class 1 |
|
|
| 4.00%,
due 6/1/34 |
500,000 |
452,384 |
| Michigan
Finance Authority, BHSH System Obligated Group, Revenue Bonds |
|
|
| 5.00%,
due 4/15/29 |
1,000,000
|
1,080,264
|
| Michigan
Finance Authority, Public Lighting Authority Local Project, Revenue Bonds |
|
|
| 5.00%,
due 7/1/31 |
100,000
|
100,124
|
| Richmond
Community Schools, School Building and Site, Unlimited General Obligation |
|
|
| Series
I, Insured: Q-SBLF |
|
|
| 4.00%,
due 5/1/36 |
750,000
|
727,432
|
| Summit
Academy North, Michigan Public School Academy, Revenue Bonds |
|
|
| 2.25%,
due 11/1/26 |
250,000
|
223,522
|
| Wayne-Westland
Community Schools, Unlimited General Obligation |
|
|
| Insured:
Q-SBLF |
|
|
| 4.00%,
due 11/1/38 |
500,000
|
457,820
|
| Wyoming
Public Schools, Unlimited General Obligation |
|
|
| Series
III, Insured: AGM |
|
|
| 4.00%,
due 5/1/41 |
500,000
|
444,649
|
| |
|
5,496,511
|
| Minnesota
0.8% |
| City
of Independence MN, Global Academy Project, Revenue Bonds |
|
|
| Series
A |
|
|
| 4.00%,
due 7/1/41 |
280,000
|
213,853
|
The notes to the financial statements are an integral part of, and
should be read in conjunction with, the financial statements.
17
Portfolio of
Investments October 31, 2022† (Unaudited) (continued)
| |
Principal
Amount |
Value
|
| Long-Term
Municipal Bonds (continued) |
| Minnesota
(continued) |
| Minneapolis
Special School District No. 1, School Building, Unlimited General Obligation |
|
|
| Series
B, Insured: SD CRED PROG |
|
|
| 5.00%,
due 2/1/28 |
$
460,000 |
$ 493,889
|
| Minneapolis
Special School District No. 1, Long Term Facilities Maintenance, Unlimited General Obligation |
|
|
| Series
B, Insured: SD CRED PROG |
|
|
| 5.00%,
due 2/1/31 |
750,000 |
802,824
|
| |
|
1,510,566
|
| Mississippi
0.4% |
| Mississippi
Hospital Equipment & Facilities Authority, Forrest County General Hospital Project, Revenue Bonds |
|
|
| 5.00%,
due 1/1/34 |
810,000
|
830,303
|
| Missouri
1.7% |
| Hickman
Mills C-1 School District, Unlimited General Obligation |
|
|
| Series
C-1, Insured: BAM |
|
|
| 5.75%,
due 3/1/42 (b) |
2,000,000
|
2,132,324
|
| Wright
City R-II School District, Unlimited General Obligation |
|
|
| Insured:
AGM |
|
|
| 6.00%,
due 3/1/28 |
200,000
|
222,943
|
| Insured:
AGM |
|
|
| 6.00%,
due 3/1/30 |
350,000
|
400,782
|
| Insured:
AGM |
|
|
| 6.00%,
due 3/1/32 |
415,000
|
484,718
|
| |
|
3,240,767
|
| Montana
0.3% |
| County
of Gallatin MT, Bozeman Fiber Project, Revenue Bonds (c) |
|
|
| Series
A |
|
|
| 4.00%,
due 10/15/32 |
300,000
|
256,635
|
| Series
A |
|
|
| 4.00%,
due 10/15/36 |
300,000
|
239,951
|
| |
|
496,586
|
| |
Principal
Amount |
Value
|
| |
| Nebraska
1.6% |
| Central
Plains Energy, Nebraska Gas Project No. 4, Revenue Bonds |
|
|
| Series
A |
|
|
| 5.00%,
due 3/1/50 (a) |
$
1,500,000 |
$ 1,500,973
|
| Omaha
Public Power District Nebraska City Station Unit 2, Revenue Bonds |
|
|
| Series
A |
|
|
| 5.25%,
due 2/1/42 |
1,500,000
|
1,533,328
|
| |
|
3,034,301
|
| New
Hampshire 0.3% |
| New
Hampshire Business Finance Authority, Pennichuck Water Works, Inc. Project, Revenue Bonds |
|
|
| Series
A |
|
|
| 4.00%,
due 4/1/30 (d) |
500,000
|
494,374
|
| New
Jersey 3.6% |
| Essex
County Improvement Authority, North Star Academy Charter School Project, Revenue Bonds |
|
|
| 4.00%,
due 7/15/30 (c) |
250,000
|
235,141
|
| New
Jersey Economic Development Authority, School Facilities Construction, Revenue Bonds |
|
|
| Series
UU |
|
|
| 5.00%,
due 6/15/40 |
470,000
|
461,832
|
| New
Jersey Economic Development Authority, New Jersey Transit Transportation Project, Revenue Bonds |
|
|
| 5.00%,
due 11/1/44 |
3,000,000
|
2,886,927
|
| New
Jersey Economic Development Authority, Continental Airlines, Inc. Project, Revenue Bonds |
|
|
| Series
B |
|
|
| 5.625%,
due 11/15/30 (d) |
250,000
|
246,749
|
| New
Jersey Housing & Mortgage Finance Agency, Amity Heights Apartments, Revenue Bonds |
|
|
| Series
A, Insured: HUD Sector 8 |
|
|
| 3.50%,
due 7/1/25 (a) |
2,000,000
|
1,974,768
|
| New
Jersey Turnpike Authority, Revenue Bonds |
|
|
| Series
B |
|
|
| 5.00%,
due 1/1/42 |
1,000,000
|
1,038,309
|
| |
|
6,843,726
|
The notes to the financial statements are an integral part of, and
should be read in conjunction with, the financial statements.
| 18
|
MainStay MacKay Strategic
Municipal Allocation Fund |
| |
Principal
Amount |
Value
|
| Long-Term
Municipal Bonds (continued) |
| New
Mexico 0.4% |
| New
Mexico Hospital Equipment Loan Council, La Vida Expansion Project, Revenue Bonds |
|
|
| Series
C |
|
|
| 2.25%,
due 7/1/23 |
$
750,000 |
$ 739,398
|
| New
York 6.9% |
| Albany
Capital Resource Corp., Albany Leadership Charter High School For Girls Project, Revenue Bonds |
|
|
| 4.00%,
due 6/1/29 |
360,000 |
333,325 |
| City
of New York NY, Unlimited General Obligation |
|
|
| Series
B-1 |
|
|
| 5.25%,
due 10/1/47 |
1,500,000
|
1,568,712
|
| Hudson
Yards Infrastructure Corp., Second Indenture, Revenue Bonds |
|
|
| Series
A, Insured: AGM |
|
|
| 4.00%,
due 2/15/47 |
540,000
|
459,548
|
| Metropolitan
Transportation Authority, Green Bond, Revenue Bonds |
|
|
| Series
A1 |
|
|
| 5.00%,
due 11/15/29 |
500,000
|
503,692
|
| Metropolitan
Transportation Authority, Revenue Bonds |
|
|
| Series
C |
|
|
| 5.00%,
due 11/15/38 |
250,000
|
241,522
|
| Series
C |
|
|
| 5.00%,
due 11/15/42 |
500,000
|
472,835
|
| Monroe
County Industrial Development Corp., Rochester Regional Health Project, Revenue Bonds |
|
|
| 4.00%,
due 12/1/36 |
375,000
|
319,244
|
| New
York City Municipal Water Finance Authority, Water & Sewer System Second General Resolution, Revenue Bonds |
|
|
| Series
AA-1 |
|
|
| 5.00%,
due 6/15/48 |
305,000
|
311,876
|
| New
York City Transitional Finance Authority, Future Tax Secured, Revenue Bonds |
|
|
| Series
F-1 |
|
|
| 5.00%,
due 5/1/42 |
750,000
|
761,917
|
| |
Principal
Amount |
Value
|
| |
| New
York (continued) |
| New
York Liberty Development Corp., Bank of America Tower at One Bryant Park Project, Revenue Bonds |
|
|
| 2.45%,
due 9/15/69 |
$
500,000 |
$ 419,029
|
| New
York Liberty Development Corp., Green Bond, Revenue Bonds |
|
|
| Series
A, Insured: AGM-CR |
|
|
| 2.75%,
due 11/15/41 |
370,000 |
257,941 |
| New
York Liberty Development Corp., 3 World Trade Center LLC, Revenue Bonds |
|
|
| Class
1 |
|
|
| 5.00%,
due 11/15/44 (c) |
250,000 |
219,652 |
| New
York State Dormitory Authority, State Personal Income Tax, Revenue Bonds |
|
|
| Series
E |
|
|
| 3.00%,
due 3/15/41 |
250,000
|
183,502
|
| New
York State Dormitory Authority, Sales tax, Revenue Bonds |
|
|
| Series
E-3 |
|
|
| 5.00%,
due 3/15/41 |
1,500,000
|
1,544,264
|
| New
York State Urban Development Corp., Personal Income Tax, Revenue Bonds |
|
|
| Series
A |
|
|
| 4.00%,
due 3/15/38 |
250,000
|
230,754
|
| Port
Authority of New York & New Jersey, Consolidated 218th, Revenue Bonds |
|
|
| Series
218 |
|
|
| 4.00%,
due 11/1/37 (d) |
380,000
|
337,674
|
| Port
Authority of New York & New Jersey, Consolidated 234th, Revenue Bonds |
|
|
| Series
234 |
|
|
| 5.00%,
due 8/1/38 (d) |
3,500,000
|
3,429,120
|
| Schenectady
County Capital Resource Corp., Union College Project, Revenue Bonds |
|
|
| 5.00%,
due 7/1/32 |
500,000
|
533,997
|
| Triborough
Bridge & Tunnel Authority, Payroll Mobility Tax, Revenue Bonds, Senior Lien |
|
|
| Series
A-2 |
|
|
| 2.00%,
due 5/15/45 (a) |
250,000
|
212,466
|
The notes to the financial statements are an integral part of, and
should be read in conjunction with, the financial statements.
19
Portfolio of
Investments October 31, 2022† (Unaudited) (continued)
| |
Principal
Amount |
Value
|
| Long-Term
Municipal Bonds (continued) |
| New
York (continued) |
| Triborough
Bridge & Tunnel Authority, MTA Bridges & Tunnels, Revenue Bonds |
|
|
| Series
B-3 |
|
|
| 5.00%,
due 11/15/38 |
$
640,000 |
$ 653,466
|
| |
|
12,994,536
|
| North
Carolina 1.7% |
| Greater
Asheville Regional Airport Authority, Revenue Bonds |
|
|
| Series
A, Insured: AGM |
|
|
| 5.00%,
due 7/1/30 (d) |
1,500,000
|
1,542,756 |
| North
Carolina Medical Care Commission, Lutheran Services for the Aging, Revenue Bonds |
|
|
| Series
A |
|
|
| 3.00%,
due 3/1/23 |
150,000
|
149,158
|
| North
Carolina Turnpike Authority, Triangle Expressway System, Revenue Bonds, Senior Lien |
|
|
| Insured:
AGM |
|
|
| 5.00%,
due 1/1/36 |
1,545,000
|
1,601,484
|
| |
|
3,293,398
|
| North
Dakota 0.1% |
| City
of Grand Forks ND, Altru Health System Obligated Group, Revenue Bonds |
|
|
| 4.00%,
due 12/1/37 |
310,000
|
265,163
|
| Ohio
2.0% |
| Akron
Bath Copley Joint Township Hospital District, Children's Hospital Medical Center of Akron, Revenue Bonds |
|
|
| Series
A |
|
|
| 5.00%,
due 11/15/30 |
100,000
|
107,652
|
| City
of Toledo OH, Various Purpose Improvement, Limited General Obligation (b) |
|
|
| Insured:
AGM |
|
|
| 5.25%,
due 12/1/35 |
1,000,000
|
1,070,505
|
| Insured:
AGM |
|
|
| 5.25%,
due 12/1/37 |
750,000
|
799,641
|
| City
of Upper Arlington OH, Various Purpose, Limited General Obligation |
|
|
| 5.75%,
due 12/1/38 (b) |
700,000
|
735,960
|
| |
Principal
Amount |
Value
|
| |
| Ohio
(continued) |
| Cloverleaf
Local School District, Certificate of Participation |
|
|
| Insured:
BAM |
|
|
| 5.375%,
due 12/1/37 (b) |
$
750,000 |
$ 784,723
|
| Ohio
Air Quality Development Authority, Ohio Valley Electric Corp. Project, Revenue Bonds |
|
|
| 2.875%,
due 2/1/26 |
250,000 |
232,141
|
| |
|
3,730,622
|
| Pennsylvania
3.3% |
| Bucks
County Industrial Development Authority, Grand View Hospital Project, Revenue Bonds |
|
|
| 5.00%,
due 7/1/34 |
300,000
|
283,122
|
| 5.00%,
due 7/1/35 |
300,000
|
279,071
|
| Chester
County Industrial Development Authority, Collegium Charter School, Revenue Bonds |
|
|
| 5.00%,
due 10/15/32 (c) |
250,000
|
239,033
|
| City
of Philadelphia PA, Unlimited General Obligation |
|
|
| Series
A |
|
|
| 5.00%,
due 5/1/34 |
1,000,000
|
1,044,309
|
| Dauphin
County General Authority, Harrisburg University Science Technology Project (The), Revenue Bonds (c) |
|
|
| 4.25%,
due 10/15/26 |
100,000
|
95,713
|
| 5.00%,
due 10/15/30 |
1,000,000
|
952,635
|
| Indiana
County Industrial Development Authority, Foundation for Indiana University of Pennsylvania (The), Revenue Bonds |
|
|
| Insured:
BAM |
|
|
| 5.00%,
due 5/1/29 |
250,000
|
260,467
|
| Lancaster
Industrial Development Authority, Landis Homes Retirement Community, Revenue Bonds |
|
|
| 4.00%,
due 7/1/37 |
100,000
|
83,163
|
| Pennsylvania
Turnpike Commission, Revenue Bonds |
|
|
| Series
B |
|
|
| 4.00%,
due 12/1/42 |
250,000
|
213,692
|
| Series
A |
|
|
| 5.50%,
due 12/1/46 |
1,155,000
|
1,171,297
|
The notes to the financial statements are an integral part of, and
should be read in conjunction with, the financial statements.
| 20
|
MainStay MacKay Strategic
Municipal Allocation Fund |
| |
Principal
Amount |
Value
|
| Long-Term
Municipal Bonds (continued) |
| Pennsylvania
(continued) |
| Philadelphia
Authority for Industrial Development, Philadelphia Performing Arts Charter School Project, Revenue Bonds |
|
|
| 5.00%,
due 6/15/30 (c) |
$
435,000 |
$ 425,017
|
| Pittsburgh
Water & Sewer Authority, Revenue Bonds, First Lien |
|
|
| Series
A, Insured: AGM |
|
|
| 5.00%,
due 9/1/35 (b) |
1,200,000
|
1,255,945
|
| |
|
6,303,464
|
| Puerto
Rico 1.0% |
| Commonwealth
of Puerto Rico, Unlimited General Obligation |
|
|
| Series
A-1 |
|
|
| (zero
coupon), due 7/1/24 |
6,953
|
6,327
|
| Series
A-1 |
|
|
| (zero
coupon), due 7/1/33 |
26,797
|
13,659
|
| Series
A-1 |
|
|
| 4.00%,
due 7/1/35 |
518,717
|
425,144
|
| Series
A-1 |
|
|
| 4.00%,
due 7/1/46 |
22,715
|
16,547
|
| Series
A-1 |
|
|
| 5.375%,
due 7/1/25 |
123,191
|
123,211
|
| Series
A-1 |
|
|
| 5.75%,
due 7/1/31 |
265,000
|
267,134
|
| Commonwealth
of Puerto Rico |
|
|
| (zero
coupon), due 11/1/43 |
103,450
|
47,328
|
| Puerto
Rico Commonwealth Aqueduct & Sewer Authority, Revenue Bonds, Senior Lien |
|
|
| Series
A |
|
|
| 5.00%,
due 7/1/37 (c) |
500,000
|
451,919
|
| Puerto
Rico Sales Tax Financing Corp., Revenue Bonds |
|
|
| Series
A-1 |
|
|
| 4.50%,
due 7/1/34 |
500,000
|
454,570
|
| |
|
1,805,839
|
| Rhode
Island 1.4% |
| Providence
Public Building Authority, Revenue Bonds |
|
|
| Series
A, Insured: AGM |
|
|
| 5.00%,
due 9/15/38 |
565,000
|
586,950
|
| |
Principal
Amount |
Value
|
| |
| Rhode
Island (continued) |
| Rhode
Island Health and Educational Building Corp., Public Schools Financing Program, Revenue Bonds |
|
|
| Series
F |
|
|
| 5.50%,
due 5/15/47 |
$
1,500,000 |
$ 1,579,911
|
| Rhode
Island Housing and Mortgage Finance Corp., Revenue Bonds |
|
|
| Series
77A |
|
|
| 5.00%,
due 4/1/27 |
555,000 |
580,732
|
| |
|
2,747,593
|
| South
Dakota 0.3% |
| Baltic
School District No. 49-1, Unlimited General Obligation |
|
|
| Insured:
AGM |
|
|
| 4.50%,
due 12/1/40 |
575,000
|
555,084
|
| Tennessee
1.1% |
| No
change, 619 at Old Stone Bridge Crossings LP, Revenue Bonds |
|
|
| Series
B |
|
|
| 4.00%,
due 4/1/26 (a) |
1,511,000
|
1,504,667
|
| Tennessee
Energy Acquisition Corp., Revenue Bonds |
|
|
| Series
B |
|
|
| 5.625%,
due 9/1/26 |
500,000
|
518,897
|
| |
|
2,023,564
|
| Texas
9.4% |
| Alamito
Public Facility Corp., EP WH Mesa Franklin LLC, Revenue Bonds |
|
|
| Insured:
FHA 221(D4) |
|
|
| 3.50%,
due 9/1/25 (a) |
1,003,000
|
984,609
|
| Alamito
Public Facility Corp., EP WH Cien Palmas LLC, Revenue Bonds |
|
|
| Insured:
HUD Sector 8 |
|
|
| 3.50%,
due 9/1/25 (a) |
1,008,000
|
989,518
|
| Barbers
Hill Independent School District, Unlimited General Obligation |
|
|
| Insured:
PSF-GTD |
|
|
| 4.00%,
due 2/15/41 |
1,000,000
|
949,462
|
| Belmont
Fresh Water Supply District No. 1, Unlimited General Obligation |
|
|
| Insured:
BAM |
|
|
| 5.00%,
due 3/1/30 |
440,000
|
462,148
|
The notes to the financial statements are an integral part of, and
should be read in conjunction with, the financial statements.
21
Portfolio of
Investments October 31, 2022† (Unaudited) (continued)
| |
Principal
Amount |
Value
|
| Long-Term
Municipal Bonds (continued) |
| Texas
(continued) |
| Central
Texas Turnpike System, Revenue Bonds, First Tier |
|
|
| Series
A |
|
|
| 5.00%,
due 8/15/39 |
$
1,000,000 |
$ 1,030,842
|
| City
of Arlington TX, Special Tax, Senior Lien |
|
|
| Series
A, Insured: AGM |
|
|
| 5.00%,
due 2/15/43 |
250,000 |
253,324 |
| City
of Austin TX, Public Improvement, Limited General Obligation |
|
|
| 5.00%,
due 9/1/23 |
250,000 |
253,767 |
| City
of Georgetown TX, Utility System, Revenue Bonds |
|
|
| Insured:
AGM |
|
|
| 5.00%,
due 8/15/28 |
1,035,000
|
1,102,648
|
| City
of Houston TX, Hotel Occupancy Tax & Special Tax, Revenue Bonds |
|
|
| 5.00%,
due 9/1/28 |
365,000
|
387,042
|
| Dallas
Fort Worth International Airport, Revenue Bonds |
|
|
| Series
A |
|
|
| 4.00%,
due 11/1/46 |
250,000
|
216,191
|
| Series
B |
|
|
| 5.00%,
due 11/1/36 |
1,000,000
|
1,038,289
|
| Greater
Texoma Utility Authority, City of Sherman Project, Revenue Bonds |
|
|
| Insured:
AGM |
|
|
| 5.00%,
due 10/1/34 |
1,190,000
|
1,270,665
|
| Insured:
AGM |
|
|
| 5.00%,
due 10/1/35 |
700,000
|
744,464
|
| Harris
County Municipal Utility District No. 319, Unlimited General Obligation |
|
|
| Insured:
AGM |
|
|
| 5.50%,
due 9/1/26 |
380,000
|
403,404
|
| Houston
Higher Education Finance Corp., KIPP, Inc., Revenue Bonds |
|
|
| Series
A, Insured: PSF-GTD |
|
|
| 4.00%,
due 2/15/39 |
1,000,000
|
926,284
|
| Laredo
Independent School District, Unlimited General Obligation |
|
|
| Insured:
PSF-GTD |
|
|
| 5.00%,
due 8/1/28 |
500,000
|
541,103
|
| New
Hope Cultural Education Facilities Finance Corp., Outlook at Windhaven Forefront Living, Revenue Bonds |
|
|
| Series
B-3 |
|
|
| 4.25%,
due 10/1/26 |
1,100,000
|
1,068,298
|
| |
Principal
Amount |
Value
|
| |
| Texas
(continued) |
| North
Texas Tollway Authority, Revenue Bonds, First Tier |
|
|
| Series
A |
|
|
| 5.25%,
due 1/1/38 |
$
1,000,000 |
$ 1,070,559
|
| Sabine-Neches
Navigation District, Waterway Project, Limited General Obligation |
|
|
| 5.25%,
due 2/15/39 |
1,500,000
|
1,588,210 |
| San
Antonio Public Facilities Corp., Revenue Bonds |
|
|
| 5.00%,
due 9/15/27 |
275,000 |
292,616 |
| Texas
Department of Housing & Community Affairs, Revenue Bonds |
|
|
| Series
A, Insured: GNMA |
|
|
| 3.50%,
due 7/1/52 |
645,000
|
610,554
|
| Texas
Water Development Board, State Revolving Fund, Revenue Bonds |
|
|
| 5.00%,
due 8/1/41 |
1,500,000
|
1,586,142
|
| |
|
17,770,139
|
| U.S.
Virgin Islands 0.5% |
| Matching
Fund Special Purpose Securitization Corp., Revenue Bonds |
|
|
| Series
A |
|
|
| 5.00%,
due 10/1/26 |
860,000
|
877,901
|
| Virgin
Islands Public Finance Authority, Gross Receipts Taxes Loan, Revenue Bonds |
|
|
| Series
C, Insured: AGM-CR |
|
|
| 5.00%,
due 10/1/30 |
100,000
|
100,425
|
| |
|
978,326
|
| Utah
2.9% |
| Central
Utah Water Conservancy District, Revenue Bonds |
|
|
| Series
B |
|
|
| 4.00%,
due 10/1/39 |
1,000,000
|
921,056
|
| Intermountain
Power Agency, Revenue Bonds |
|
|
| Series
A |
|
|
| 5.00%,
due 7/1/29 |
500,000
|
546,119
|
| Series
A |
|
|
| 5.00%,
due 7/1/30 |
375,000
|
413,190
|
| Series
A |
|
|
| 5.00%,
due 7/1/41 |
880,000
|
929,157
|
| UIPA
Crossroads Public Infrastructure District, Tax Allocation |
|
|
| 4.125%,
due 6/1/41 (c) |
500,000
|
404,423
|
The notes to the financial statements are an integral part of, and
should be read in conjunction with, the financial statements.
| 22
|
MainStay MacKay Strategic
Municipal Allocation Fund |
| |
Principal
Amount |
Value
|
| Long-Term
Municipal Bonds (continued) |
| Utah
(continued) |
| University
of Utah (The), Revenue Bonds |
|
|
| Series
B |
|
|
| 5.00%,
due 8/1/38 |
$
1,000,000 |
$ 1,074,231
|
| Utah
Charter School Finance Authority, North Star Academy Project, Revenue Bonds |
|
|
| Insured:
UT CSCE |
|
|
| 4.00%,
due 4/15/30 |
100,000 |
100,050 |
| Utah
Charter School Finance Authority, Spectrum Academy Project, Revenue Bonds |
|
|
| Insured:
UT CSCE |
|
|
| 4.00%,
due 4/15/40 |
250,000
|
215,578
|
| Utah
Charter School Finance Authority, Summit Academy, Inc. Project, Revenue Bonds |
|
|
| Insured:
UT CSCE |
|
|
| 5.00%,
due 4/15/28 |
200,000
|
210,549
|
| Insured:
UT CSCE |
|
|
| 5.00%,
due 4/15/29 |
185,000
|
196,130
|
| Utah
Infrastructure Agency, Revenue Bonds |
|
|
| Series
A |
|
|
| 5.00%,
due 10/15/28 |
460,000
|
458,683
|
| |
|
5,469,166
|
| Vermont
0.7% |
| Vermont
Student Assistance Corp., Revenue Bonds |
|
|
| Series
A |
|
|
| 5.00%,
due 6/15/23 (d) |
1,250,000
|
1,258,622
|
| Washington
1.1% |
| State
of Washington, Unlimited General Obligation |
|
|
| Series
A |
|
|
| 5.00%,
due 6/1/38 |
1,000,000
|
1,062,852
|
| Washington
State Convention Center Public Facilities District, Lodging Tax, Revenue Bonds |
|
|
| Series
B |
|
|
| 4.00%,
due 7/1/36 |
1,000,000
|
862,312
|
| |
Principal
Amount |
Value
|
| |
| Washington
(continued) |
| Washington
State Housing Finance Commission, Eliseo Project, Revenue Bonds |
|
|
| Series
B-2 |
|
|
| 2.125%,
due 7/1/27 (c) |
$
250,000 |
$ 220,721
|
| |
|
2,145,885
|
| West
Virginia 0.6% |
| West
Virginia Hospital Finance Authority, Charleston Area Medical Center, Inc. Obligated Group, Revenue Bonds |
|
|
| Series
A |
|
|
| 5.00%,
due 9/1/39 |
1,125,000
|
1,107,998
|
| Wisconsin
0.6% |
| Public
Finance Authority, Roseman University of Health Sciences, Revenue Bonds |
|
|
| 4.00%,
due 4/1/32 (c) |
215,000
|
189,077
|
| Public
Finance Authority, College Achieve Paterson Charter School Project, Revenue Bonds |
|
|
| Series
A |
|
|
| 4.00%,
due 6/15/42 (c) |
260,000
|
198,012
|
| Village
of Mount Pleasant WI, Revenue Bonds |
|
|
| Series
A, Insured: BAM |
|
|
| 3.00%,
due 3/1/27 |
250,000
|
245,699
|
| Wisconsin
Health & Educational Facilities Authority, Marshfield Clinic Health System, Inc., Revenue Bonds |
|
|
| Insured:
AGM |
|
|
| 5.00%,
due 2/15/32 |
400,000
|
423,030
|
| |
|
1,055,818
|
| Wyoming
0.1% |
| University
of Wyoming, Revenue Bonds |
|
|
| Series
C, Insured: AGM |
|
|
| 4.00%,
due 6/1/42 |
150,000
|
133,916
|
Total
Long-Term Municipal Bonds
(Cost $184,126,447) |
|
175,414,583
|
The notes to the financial statements are an integral part of, and
should be read in conjunction with, the financial statements.
23
Portfolio of
Investments October 31, 2022† (Unaudited) (continued)
| |
Principal
Amount |
Value
|
| Short-Term
Municipal Notes 10.0% |
| Alabama
0.4% |
| Black
Belt Energy Gas District, Gas Project No.7, Revenue Bonds |
|
|
| Series
C-2 |
|
|
| 2.59%,
due 10/1/52 (e) |
$
700,000 |
$ 654,419
|
| California
1.1% |
| California
Municipal Finance Authority, Waste Management, Inc., Revenue Bonds |
|
|
| Series
A |
|
|
| 4.125%,
due 10/1/41 (d)(e) |
1,500,000
|
1,484,757 |
| Metropolitan
Water District of Southern California, Waterworks, Revenue Bonds |
|
|
| Series
E |
|
|
| 2.38%,
due 7/1/37 (e) |
500,000
|
497,624
|
| |
|
1,982,381
|
| Colorado
0.1% |
| Colorado
Educational & Cultural Facilities Authority, Mandel Jewish Community Center of Cleveland (The), Revenue Bonds |
|
|
| Series
D-6 |
|
|
| 1.64%,
due 9/1/38 (e) |
250,000
|
250,000
|
| Connecticut
0.3% |
| Connecticut
State Health & Educational Facilities Authority, Yale University, Revenue Bonds |
|
|
| Series
V-1 |
|
|
| 1.33%,
due 7/1/36 (e) |
550,000
|
550,000
|
| Georgia
0.1% |
| Development
Authority of Burke County (The), Georgia Power Co. Vogtle Project, Revenue Bonds, First Series |
|
|
| 1.89%,
due 11/1/52 (e) |
250,000
|
250,000
|
| Iowa
0.1% |
| Iowa
Finance Authority, Unitypoint Health Project, Revenue Bonds |
|
|
| Series
B-1 |
|
|
| 1.62%,
due 2/15/39 (e) |
250,000
|
250,000
|
| |
Principal
Amount |
Value
|
| |
| Kentucky
0.3% |
| City
of Berea KY, Berea College, Revenue Bonds |
|
|
| Series
B |
|
|
| 1.64%,
due 6/1/29 (e) |
$
615,000 |
$ 615,000
|
| Missouri
1.0% |
| Health
& Educational Facilities Authority of the State of Missouri, Ranken Technical College, Revenue Bonds |
|
|
| Series
B |
|
|
| 1.64%,
due 11/1/31 (e) |
255,000 |
255,000 |
| Health
& Educational Facilities Authority of the State of Missouri, Washington University (The), Revenue Bonds |
|
|
| Series
B |
|
|
| 1.64%,
due 3/1/40 (e) |
1,700,000
|
1,700,000
|
| |
|
1,955,000
|
| New
York 3.2% |
| City
of New York NY, Unlimited General Obligation (e) |
|
|
| Series
A-2 |
|
|
| 1.65%,
due 10/1/38 |
400,000
|
400,000
|
| Series
B-3 |
|
|
| 2.53%,
due 10/1/46 |
655,000
|
655,000
|
| City
of New York NY, Limited General Obligation |
|
|
| Series
3 |
|
|
| 2.53%,
due 4/1/42 (e) |
3,700,000
|
3,700,000
|
| New
York City Municipal Water Finance Authority, Water & Sewer System Second General Resolution, Revenue Bonds (e) |
|
|
| Series
DD-1 |
|
|
| 1.60%,
due 6/15/43 |
500,000
|
500,000
|
| Series
DD |
|
|
| 2.53%,
due 6/15/33 |
405,000
|
405,000
|
| New
York City Transitional Finance Authority, Future Tax Secured, Revenue Bonds |
|
|
| Series
E-3 |
|
|
| 1.59%,
due 2/1/45 (e) |
400,000
|
400,000
|
| |
|
6,060,000
|
The notes to the financial statements are an integral part of, and
should be read in conjunction with, the financial statements.
| 24
|
MainStay MacKay Strategic
Municipal Allocation Fund |
| |
Principal
Amount |
|
Value
|
| Short-Term
Municipal Notes (continued) |
| North
Carolina 0.9% |
| Charlotte-Mecklenburg
Hospital Authority (The), Atrium Health Obligated Group, Revenue Bonds (e) |
|
|
|
| Series
B |
|
|
|
| 1.64%,
due 1/15/38 |
$
800,000 |
|
$ 800,000
|
| Series
G |
|
|
|
| 1.64%,
due 1/15/48 |
890,000 |
|
890,000
|
| |
|
|
1,690,000
|
| Utah
0.2% |
| City
of Murray UT, Intermountain Healthcare Obligated Group, Revenue Bonds |
|
|
|
| Series
C |
|
|
|
| 1.64%,
due 5/15/37 (e) |
400,000
|
|
400,000
|
| Washington
0.4% |
| County
of King WA, Sewer, Revenue Bonds, Junior Lien |
|
|
|
| Series
A |
|
|
|
| 2.47%,
due 1/1/40 (e) |
655,000
|
|
637,224
|
| Wisconsin
1.9% |
| Tender
Option Bond Trust Receipts, Revenue Bonds |
|
|
|
| Insured:
AGM |
|
|
|
| 2.38%,
due 12/15/50 (c)(e) |
3,500,000
|
|
3,500,000
|
Total
Short-Term Municipal Notes
(Cost $18,875,000) |
|
|
18,794,024
|
Total
Investments
(Cost $203,001,447) |
102.8%
|
|
194,208,607
|
| Other
Assets, Less Liabilities |
(2.8)
|
|
(5,248,458)
|
| Net
Assets |
100.0%
|
|
$ 188,960,149
|
| †
|
Percentages
indicated are based on Fund net assets. |
| ‡
|
Less than
one-tenth of a percent. |
| (a)
|
Coupon
rate may change based on changes of the underlying collateral or prepayments of principal. Rate shown was the rate in effect as of October 31, 2022. |
| (b)
|
Delayed
delivery security. |
| (c)
|
May be
sold to institutional investors only under Rule 144A or securities offered pursuant to Section 4(a)(2) of the Securities Act of 1933, as amended. |
| (d)
|
Interest
on these securities was subject to alternative minimum tax. |
| (e)
|
Variable-rate
demand notes (VRDNs)—Provide the right to sell the security at face value on either that day or within the rate-reset period. VRDNs will normally trade as if the maturity is the earlier put date, even though stated maturity is longer. The
interest rate is reset on the put date at a stipulated daily, weekly, monthly, quarterly, or other specified time interval to reflect current market conditions. These securities do not indicate a reference rate and spread in their description. The
maturity date shown is the final maturity. |
The notes to the financial statements are an integral part of, and
should be read in conjunction with, the financial statements.
25
Portfolio of
Investments October 31, 2022† (Unaudited) (continued)
Futures Contracts
As of October 31, 2022, the Fund held the following futures
contracts1:
| Type
|
Number
of
Contracts |
Expiration
Date |
Value
at
Trade Date |
Current
Notional
Amount |
Unrealized
Appreciation
(Depreciation)2 |
| Short
Contracts |
|
|
|
|
|
| U.S.
Treasury 10 Year Ultra Bonds |
(165)
|
December
2022 |
$ (20,024,302)
|
$ (19,137,422)
|
$ 886,880
|
| 1.
|
As of October
31, 2022, cash in the amount of $453,750 was on deposit with a broker or futures commission merchant for futures transactions. |
| 2.
|
Represents
the difference between the value of the contracts at the time they were opened and the value as of October 31, 2022. |
| Abbreviation(s):
|
| AGM—Assured
Guaranty Municipal Corp. |
| BAM—Build
America Mutual Assurance Co. |
| CHF—Collegiate
Housing Foundation |
| CR—Custodial
Receipts |
| FHA—Federal
Housing Administration |
| FHLMC—Federal
Home Loan Mortgage Corp. |
| FNMA—Federal
National Mortgage Association |
| GNMA—Government
National Mortgage Association |
| NATL-RE—National
Public Finance Guarantee Corp. |
| PSF-GTD—Permanent
School Fund Guaranteed |
| Q-SBLF—Qualified
School Board Loan Fund |
| SD CRED
PROG—School District Credit Enhancement Program |
| UT
CSCE—Utah Charter School Credit Enhancement Program |
The following is a summary of the fair valuations according to
the inputs used as of October 31, 2022, for valuing the Fund’s assets:
| Description
|
Quoted
Prices in
Active
Markets for
Identical
Assets
(Level 1) |
|
Significant
Other
Observable
Inputs
(Level 2) |
|
Significant
Unobservable
Inputs
(Level 3) |
|
Total
|
| Asset
Valuation Inputs |
|
|
|
|
|
|
|
| Investments
in Securities (a) |
|
|
|
|
|
|
|
| Municipal
Bonds |
|
|
|
|
|
|
|
| Long-Term
Municipal Bonds |
$
— |
|
$
175,414,583 |
|
$ —
|
|
$ 175,414,583
|
| Short-Term
Municipal Notes |
—
|
|
18,794,024
|
|
—
|
|
18,794,024
|
| Total
Municipal Bonds |
—
|
|
194,208,607
|
|
—
|
|
194,208,607
|
| Other
Financial Instruments |
|
|
|
|
|
|
|
| Futures
Contracts (b) |
886,880
|
|
—
|
|
—
|
|
886,880
|
| Total
Investments in Securities and Other Financial Instruments |
$
886,880 |
|
$
194,208,607 |
|
$ —
|
|
$ 195,095,487
|
| (a)
|
For a
complete listing of investments and their industries, see the Portfolio of Investments. |
| (b)
|
The
value listed for these securities reflects unrealized appreciation (depreciation) as shown on the Portfolio of Investments. |
The
notes to the financial statements are an integral part of, and should be read in conjunction with, the financial statements.
| 26
|
MainStay MacKay Strategic
Municipal Allocation Fund |
Statement of
Assets and Liabilities as of October 31, 2022 (Unaudited)
| Assets
|
Investment
in securities, at value
(identified cost $203,001,447) |
$194,208,607
|
| Cash
|
6,642,188
|
| Cash
collateral on deposit at broker for futures contracts |
453,750
|
| Due
from custodian |
5,606,177
|
| Receivables:
|
|
| Fund
shares sold |
2,786,611
|
| Investment
securities sold |
2,729,918
|
| Interest
|
1,945,002
|
| Variation
margin on futures contracts |
105,702
|
| Other
assets |
72,306
|
| Total
assets |
214,550,261
|
| Liabilities
|
| Payables:
|
|
| Investment
securities purchased |
25,182,406
|
| Fund
shares redeemed |
300,294
|
| Manager
(See Note 3) |
43,437
|
| Professional
fees |
30,924
|
| Shareholder
communication |
16,054
|
| Custodian
|
8,176
|
| NYLIFE
Distributors (See Note 3) |
3,614
|
| Accrued
expenses |
5,207
|
| Total
liabilities |
25,590,112
|
| Net
assets |
$188,960,149
|
| Composition
of Net Assets |
| Shares
of beneficial interest outstanding (par value of $.001 per share) unlimited number of shares authorized |
$
20,910 |
| Additional
paid-in-capital |
201,963,717
|
| |
201,984,627
|
| Total
distributable earnings (loss) |
(13,024,478)
|
| Net
assets |
$188,960,149
|
| Class
A |
|
| Net
assets applicable to outstanding shares |
$
15,001,987 |
| Shares
of beneficial interest outstanding |
1,657,623
|
| Net
asset value per share outstanding |
$
9.05 |
| Maximum
sales charge (3.00% of offering price) |
0.28
|
| Maximum
offering price per share outstanding |
$
9.33 |
| Investor
Class |
|
| Net
assets applicable to outstanding shares |
$
113,421 |
| Shares
of beneficial interest outstanding |
12,550
|
| Net
asset value per share outstanding |
$
9.04 |
| Maximum
sales charge (2.50% of offering price) |
0.23
|
| Maximum
offering price per share outstanding |
$
9.27 |
| Class
C |
|
| Net
assets applicable to outstanding shares |
$
1,309,916 |
| Shares
of beneficial interest outstanding |
144,994
|
| Net
asset value and offering price per share outstanding |
$
9.03 |
| Class
I |
|
| Net
assets applicable to outstanding shares |
$172,510,251
|
| Shares
of beneficial interest outstanding |
19,092,508
|
| Net
asset value and offering price per share outstanding |
$
9.04 |
| Class
R6 |
|
| Net
assets applicable to outstanding shares |
$
24,574 |
| Shares
of beneficial interest outstanding |
2,720
|
| Net
asset value and offering price per share outstanding |
$
9.03 |
The notes to the financial statements are an
integral part of, and should be read in conjunction with, the financial statements.
27
Statement of
Operations for the six months ended October 31, 2022 (Unaudited)
| Investment
Income (Loss) |
| Income
|
|
| Interest
|
$
1,967,707 |
| Expenses
|
|
| Manager
(See Note 3) |
286,514
|
| Registration
|
49,284
|
| Professional
fees |
33,563
|
| Custodian
|
22,858
|
| Transfer
agent (See Note 3) |
22,680
|
| Distribution/Service—Class
A (See Note 3) |
12,006
|
| Distribution/Service—Investor
Class (See Note 3) |
198
|
| Distribution/Service—Class
C (See Note 3) |
2,386
|
| Shareholder
communication |
8,841
|
| Trustees
|
1,306
|
| Miscellaneous
|
6,068
|
| Total
expenses before waiver/reimbursement |
445,704
|
| Expense
waiver/reimbursement from Manager (See Note 3) |
(61,288)
|
| Net
expenses |
384,416
|
| Net
investment income (loss) |
1,583,291
|
| Realized
and Unrealized Gain (Loss) |
| Net
realized gain (loss) on: |
|
| Unaffiliated
investment transactions |
(5,707,610)
|
| Futures
transactions |
1,397,969
|
| Net
realized gain (loss) |
(4,309,641)
|
| Net
change in unrealized appreciation (depreciation) on: |
|
| Unaffiliated
investments |
(3,674,688)
|
| Futures
contracts |
352,356
|
| Net
change in unrealized appreciation (depreciation) |
(3,322,332)
|
| Net
realized and unrealized gain (loss) |
(7,631,973)
|
| Net
increase (decrease) in net assets resulting from operations |
$(6,048,682)
|
The notes to the financial statements are an integral part of,
and should be read in conjunction with, the financial statements.
| 28
|
MainStay MacKay Strategic
Municipal Allocation Fund |
Statements of
Changes in Net Assets
for the six months ended October 31, 2022 (Unaudited) and the year ended April 30, 2022
| |
Six months
ended
October 31,
2022 |
Year
ended
April 30,
2022 |
| Increase
(Decrease) in Net Assets |
| Operations:
|
|
|
| Net
investment income (loss) |
$
1,583,291 |
$
1,039,155 |
| Net
realized gain (loss) |
(4,309,641)
|
417,800
|
| Net
change in unrealized appreciation (depreciation) |
(3,322,332)
|
(7,062,471)
|
| Net
increase (decrease) in net assets resulting from operations |
(6,048,682)
|
(5,605,516)
|
| Distributions
to shareholders: |
|
|
| Class
A |
(113,670)
|
(32,170)
|
| Investor
Class |
(1,676)
|
(1,324)
|
| Class
C |
(9,224)
|
(5,882)
|
| Class
I |
(1,669,919)
|
(1,888,346)
|
| Class
R6 |
(320)
|
(768)
|
| Total
distributions to shareholders |
(1,794,809)
|
(1,928,490)
|
| Capital
share transactions: |
|
|
| Net
proceeds from sales of shares |
200,558,431
|
58,605,291
|
| Net
asset value of shares issued to shareholders in reinvestment of distributions |
1,783,557
|
1,927,984
|
| Cost
of shares redeemed |
(103,540,549)
|
(16,807,791)
|
| Increase
(decrease) in net assets derived from capital share transactions |
98,801,439
|
43,725,484
|
| Net
increase (decrease) in net assets |
90,957,948
|
36,191,478
|
| Net
Assets |
| Beginning
of period |
98,002,201
|
61,810,723
|
| End
of period |
$
188,960,149 |
$
98,002,201 |
The notes to the financial statements are an integral part of,
and should be read in conjunction with, the financial statements.
29
Financial
Highlights selected per share data and ratios
| |
Six
months ended
October 31,
2022* |
|
Year
Ended April 30, |
|
June
28, 2019^ through
April 30, |
| Class
A |
2022
|
|
2021
|
|
2020
|
| Net
asset value at beginning of period |
$
9.50 |
|
$
10.43 |
|
$
9.65 |
|
$
10.00 |
| Net
investment income (loss) |
0.10(a)
|
|
0.12(a)
|
|
0.15(a)
|
|
0.14
|
| Net
realized and unrealized gain (loss) |
(0.44)
|
|
(0.78)
|
|
0.82
|
|
(0.29)
|
| Total
from investment operations |
(0.34)
|
|
(0.66)
|
|
0.97
|
|
(0.15)
|
| Less
distributions: |
|
|
|
|
|
|
|
| From
net investment income |
(0.11)
|
|
(0.17)
|
|
(0.19)
|
|
(0.14)
|
| From
net realized gain on investments |
—
|
|
(0.10)
|
|
—
|
|
(0.06)
|
| Total
distributions |
(0.11)
|
|
(0.27)
|
|
(0.19)
|
|
(0.20)
|
| Net
asset value at end of period |
$
9.05 |
|
$
9.50 |
|
$
10.43 |
|
$
9.65 |
| Total
investment return (b) |
(3.65)%
|
|
(6.54)%
|
|
10.02%
|
|
(1.44)%
|
| Ratios
(to average net assets)/Supplemental Data: |
|
|
|
|
|
|
|
| Net
investment income (loss) |
2.08%††
|
|
1.22%
|
|
1.47%
|
|
1.39%††
|
| Net
expenses |
0.77%††
|
|
0.77%
|
|
0.72%
|
|
0.77%††
|
| Expenses
(before waiver/reimbursement) |
0.85%††
|
|
0.97%
|
|
0.98%
|
|
1.12%††
|
| Portfolio
turnover rate (c) |
63%
|
|
32%
|
|
66%
|
|
108%
|
| Net
assets at end of period (in 000’s) |
$
15,002 |
|
$
5,246 |
|
$
454 |
|
$
136 |
| *
|
Unaudited.
|
| ^
|
Inception
date. |
| ††
|
Annualized.
|
| (a)
|
Per share
data based on average shares outstanding during the period. |
| (b)
|
Total
investment return is calculated exclusive of sales charges and assumes the reinvestment of dividends and distributions. For periods of less than one year, total return is not annualized. |
| (c)
|
The
portfolio turnover rate includes variable rate demand notes. |
| |
Six
months ended
October 31,
2022* |
|
Year
Ended April 30, |
|
June
28, 2019^ through
April 30, |
| Investor
Class |
2022
|
|
2021
|
|
2020
|
| Net
asset value at beginning of period |
$
9.49 |
|
$
10.41 |
|
$
9.65 |
|
$
10.00 |
| Net
investment income (loss) |
0.09(a)
|
|
0.11(a)
|
|
0.13(a)
|
|
0.14
|
| Net
realized and unrealized gain (loss) |
(0.44)
|
|
(0.79)
|
|
0.80
|
|
(0.29)
|
| Total
from investment operations |
(0.35)
|
|
(0.68)
|
|
0.93
|
|
(0.15)
|
| Less
distributions: |
|
|
|
|
|
|
|
| From
net investment income |
(0.10)
|
|
(0.14)
|
|
(0.17)
|
|
(0.14)
|
| From
net realized gain on investments |
—
|
|
(0.10)
|
|
—
|
|
(0.06)
|
| Total
distributions |
(0.10)
|
|
(0.24)
|
|
(0.17)
|
|
(0.20)
|
| Net
asset value at end of period |
$
9.04 |
|
$
9.49 |
|
$
10.41 |
|
$
9.65 |
| Total
investment return (b) |
(3.73)%
|
|
(6.69)%
|
|
9.65%
|
|
(1.56)%
|
| Ratios
(to average net assets)/Supplemental Data: |
|
|
|
|
|
|
|
| Net
investment income (loss) |
1.82%††
|
|
1.04%
|
|
1.23%
|
|
1.30%††
|
| Net
expenses |
0.92%††
|
|
0.97%
|
|
0.98%
|
|
0.79%††
|
| Expenses
(before waiver/reimbursement) |
1.00%††
|
|
1.17%
|
|
1.24%
|
|
1.14%††
|
| Portfolio
turnover rate (c) |
63%
|
|
32%
|
|
66%
|
|
108%
|
| Net
assets at end of period (in 000's) |
$
113 |
|
$
46 |
|
$
33 |
|
$
34 |
| *
|
Unaudited.
|
| ^
|
Inception
date. |
| ††
|
Annualized.
|
| (a)
|
Per share
data based on average shares outstanding during the period. |
| (b)
|
Total
investment return is calculated exclusive of sales charges and assumes the reinvestment of dividends and distributions. For periods of less than one year, total return is not annualized. |
| (c)
|
The
portfolio turnover rate includes variable rate demand notes. |
The
notes to the financial statements are an integral part of, and should be read in conjunction with, the financial statements.
| 30
|
MainStay MacKay Strategic
Municipal Allocation Fund |
Financial
Highlights selected per share data and ratios
| |
Six
months ended
October 31,
2022* |
|
Year
Ended April 30, |
|
June
28, 2019^ through
April 30, |
| Class
C |
2022
|
|
2021
|
|
2020
|
| Net
asset value at beginning of period |
$
9.48 |
|
$
10.42 |
|
$
9.65 |
|
$
10.00 |
| Net
investment income (loss) |
0.08(a)
|
|
0.08(a)
|
|
0.10(a)
|
|
0.12
|
| Net
realized and unrealized gain (loss) |
(0.44)
|
|
(0.80)
|
|
0.81
|
|
(0.29)
|
| Total
from investment operations |
(0.36)
|
|
(0.72)
|
|
0.91
|
|
(0.17)
|
| Less
distributions: |
|
|
|
|
|
|
|
| From
net investment income |
(0.09)
|
|
(0.12)
|
|
(0.14)
|
|
(0.12)
|
| From
net realized gain on investments |
—
|
|
(0.10)
|
|
—
|
|
(0.06)
|
| Total
distributions |
(0.09)
|
|
(0.22)
|
|
(0.14)
|
|
(0.18)
|
| Net
asset value at end of period |
$
9.03 |
|
$
9.48 |
|
$
10.42 |
|
$
9.65 |
| Total
investment return (b) |
(3.86)%
|
|
(7.12)%
|
|
9.49%
|
|
(1.76)%
|
| Ratios
(to average net assets)/Supplemental Data: |
|
|
|
|
|
|
|
| Net
investment income (loss) |
1.64%††
|
|
0.76%
|
|
0.97%
|
|
1.11%††
|
| Net
expenses |
1.17%††
|
|
1.22%
|
|
1.23%
|
|
1.03%††
|
| Expenses
(before waiver/reimbursement) |
1.25%††
|
|
1.42%
|
|
1.49%
|
|
1.38%††
|
| Portfolio
turnover rate (c) |
63%
|
|
32%
|
|
66%
|
|
108%
|
| Net
assets at end of period (in 000’s) |
$
1,310 |
|
$
558 |
|
$
113 |
|
$
79 |
| *
|
Unaudited.
|
| ^
|
Inception
date. |
| ††
|
Annualized.
|
| (a)
|
Per share
data based on average shares outstanding during the period. |
| (b)
|
Total
investment return is calculated exclusive of sales charges and assumes the reinvestment of dividends and distributions. For periods of less than one year, total return is not annualized. |
| (c)
|
The
portfolio turnover rate includes variable rate demand notes. |
The
notes to the financial statements are an integral part of, and should be read in conjunction with, the financial statements.
31
Financial
Highlights selected per share data and ratios
| |
Six
months ended
October 31,
2022* |
|
Year
Ended April 30, |
|
June
28, 2019^ through
April 30, |
| Class
I |
2022
|
|
2021
|
|
2020
|
| Net
asset value at beginning of period |
$
9.48 |
|
$
10.42 |
|
$
9.65 |
|
$
10.00 |
| Net
investment income (loss) |
0.11(a)
|
|
0.15(a)
|
|
0.18(a)
|
|
0.16
|
| Net
realized and unrealized gain (loss) |
(0.43)
|
|
(0.80)
|
|
0.81
|
|
(0.29)
|
| Total
from investment operations |
(0.32)
|
|
(0.65)
|
|
0.99
|
|
(0.13)
|
| Less
distributions: |
|
|
|
|
|
|
|
| From
net investment income |
(0.12)
|
|
(0.19)
|
|
(0.22)
|
|
(0.16)
|
| From
net realized gain on investments |
—
|
|
(0.10)
|
|
—
|
|
(0.06)
|
| Total
distributions |
(0.12)
|
|
(0.29)
|
|
(0.22)
|
|
(0.22)
|
| Net
asset value at end of period |
$
9.04 |
|
$
9.48 |
|
$
10.42 |
|
$
9.65 |
| Total
investment return (b) |
(3.43)%
|
|
(6.43)%
|
|
10.28%
|
|
(1.35)%
|
| Ratios
(to average net assets)/Supplemental Data: |
|
|
|
|
|
|
|
| Net
investment income (loss) |
2.22%††
|
|
1.49%
|
|
1.72%
|
|
1.57%††
|
| Net
expenses |
0.52%††
|
|
0.51%
|
|
0.50%
|
|
0.53%††
|
| Expenses
(before waiver/reimbursement) |
0.60%††
|
|
0.71%
|
|
0.76%
|
|
0.88%††
|
| Portfolio
turnover rate (c) |
63%
|
|
32%
|
|
66%
|
|
108%
|
| Net
assets at end of period (in 000’s) |
$
172,510 |
|
$
92,126 |
|
$
61,183 |
|
$
51,059 |
| *
|
Unaudited.
|
| ^
|
Inception
date. |
| ††
|
Annualized.
|
| (a)
|
Per share
data based on average shares outstanding during the period. |
| (b)
|
Total
investment return is calculated exclusive of sales charges and assumes the reinvestment of dividends and distributions. Class I shares are not subject to sales charges. For periods of less than one year, total return is not annualized. |
| (c)
|
The
portfolio turnover rate includes variable rate demand notes. |
The
notes to the financial statements are an integral part of, and should be read in conjunction with, the financial statements.
| 32
|
MainStay MacKay Strategic
Municipal Allocation Fund |
Financial
Highlights selected per share data and ratios
| |
Six
months ended
October 31,
2022* |
|
Year
Ended April 30, |
|
June
28, 2019^ through
April 30, |
| Class
R6 |
2022
|
|
2021
|
|
2020
|
| Net
asset value at beginning of period |
$
9.48 |
|
$
10.42 |
|
$
9.65 |
|
$
10.00 |
| Net
investment income (loss) |
0.10(a)
|
|
0.16(a)
|
|
0.18(a)
|
|
0.17
|
| Net
realized and unrealized gain (loss) |
(0.43)
|
|
(0.80)
|
|
0.81
|
|
(0.29)
|
| Total
from investment operations |
(0.33)
|
|
(0.64)
|
|
0.99
|
|
(0.12)
|
| Less
distributions: |
|
|
|
|
|
|
|
| From
net investment income |
(0.12)
|
|
(0.20)
|
|
(0.22)
|
|
(0.17)
|
| From
net realized gain on investments |
—
|
|
(0.10)
|
|
—
|
|
(0.06)
|
| Total
distributions |
(0.12)
|
|
(0.30)
|
|
(0.22)
|
|
(0.23)
|
| Net
asset value at end of period |
$
9.03 |
|
$
9.48 |
|
$
10.42 |
|
$
9.65 |
| Total
investment return (b) |
(3.53)%
|
|
(6.41)%
|
|
10.28%
|
|
(1.32)%
|
| Ratios
(to average net assets)/Supplemental Data: |
|
|
|
|
|
|
|
| Net
investment income (loss) |
2.21%††
|
|
1.51%
|
|
1.72%
|
|
1.60%††
|
| Net
expenses |
0.50%††
|
|
0.50%
|
|
0.50%
|
|
0.50%††
|
| Expenses
(before waiver/reimbursement) |
0.58%††
|
|
0.70%
|
|
0.77%
|
|
0.86%††
|
| Portfolio
turnover rate (c) |
63%
|
|
32%
|
|
66%
|
|
108%
|
| Net
assets at end of period (in 000’s) |
$
25 |
|
$
25 |
|
$
27 |
|
$
25 |
| *
|
Unaudited.
|
| ^
|
Inception
date. |
| ††
|
Annualized.
|
| (a)
|
Per share
data based on average shares outstanding during the period. |
| (b)
|
Total
investment return is calculated exclusive of sales charges and assumes the reinvestment of dividends and distributions. Class R6 shares are not subject to sales charges. For periods of less than one year, total return is not annualized. |
| (c)
|
The
portfolio turnover rate includes variable rate demand notes. |
The notes to the financial statements are an integral part of, and should be
read in conjunction with, the financial statements.
33
Notes to Financial
Statements (Unaudited)
Note 1-Organization and Business
MainStay Funds Trust (the “Trust”) was organized as
a Delaware statutory trust on April 28, 2009. The Trust is registered under the Investment Company Act of 1940, as amended (the “1940 Act”), as an open-end management investment company, and is comprised of thirty-three funds
(collectively referred to as the “Funds”). These financial statements and notes relate to the MainStay MacKay Strategic Municipal Allocation Fund (the "Fund"), a “diversified” fund, as that term is defined in the 1940 Act, as
interpreted or modified by regulatory authorities having jurisdiction, from time to time.
The following table lists the Fund's share classes that have
been registered and commenced operations:
| Class
|
Commenced
Operations |
| Class
A |
June
28, 2019 |
| Investor
Class |
June
28, 2019 |
| Class
C |
June
28, 2019 |
| Class
I |
June
28, 2019 |
| Class
R6 |
June
28, 2019 |
| SIMPLE
Class |
N/A*
|
| *
|
SIMPLE
Class shares were registered for sale effective as of August 31, 2020 but have not yet commenced operations. |
Class A and Investor Class shares are offered at net asset
value (“NAV”) per share plus an initial sales charge. No initial sales charge applies to investments of $250,000 or more (and certain other qualified purchases) in Class A and Investor Class shares. A contingent deferred sales charge
(“CDSC”) of 1.00% may be imposed on certain redemptions of Class A and Investor Class shares made within 18 months of the date of purchase on shares that were purchased without an initial sales charge. Class C shares are offered at NAV
without an initial sales charge, although a 1.00% CDSC may be imposed on certain redemptions of such shares made within one year of the date of purchase of Class C shares. Class I and Class R6 shares are offered at NAV without a sales charge. SIMPLE
Class share are expected to be offered at NAV without a sales charge if such shares are offered in the future. Depending upon eligibility, Class C shares convert to either Class A or Investor Class shares at the end of the calendar quarter eight
years after the date they were purchased. Additionally, as disclosed in the Fund’s prospectus, Class A shares may convert automatically to Investor Class shares and Investor Class shares may convert automatically to Class A shares. Under
certain circum-stances and as may be permitted by the Trust’s multiple class plan pursuant to Rule 18f-3 under the 1940 Act, specified share classes of the Fund may be converted to one or more other share classes of the Fund as disclosed in
the capital share transactions within these Notes. The classes of shares have the same voting (except for issues that relate solely to one class), dividend, liquidation and other rights, and the same terms and conditions, except that under
distribution plans pursuant to Rule 12b-1 under the 1940 Act, Class C and SIMPLE Class shares are subject to higher distribution and/or service fees than Class A and Investor Class shares. Class I and Class R6 shares are not subject to a
distribution and/or service fee.
The Fund's investment objective is to seek current income exempt from regular
federal income tax.
Note 2–Significant
Accounting Policies
The Fund is an investment company and
accordingly follows the investment company accounting and reporting guidance of the Financial Accounting Standards Board (“FASB”) Accounting Standards Codification Topic 946 Financial
Services—Investment Companies. The Fund prepares its financial statements in accordance with generally accepted accounting principles (“GAAP”) in the United States of America and
follows the significant accounting policies described below.
(A) Securities Valuation. Investments are usually valued as of the close of regular trading on the New York Stock Exchange (the "Exchange") (usually 4:00 p.m. Eastern time) on each day the Fund is open for business
("valuation date").
Effective September 8, 2022,
and pursuant to Rule 2a-5 under the 1940 Act, the Board of Trustees of the Trust (the "Board") designated New York Life Investment Management LLC (“New York Life Investments” or the "Manager") as its Valuation Designee (the "Valuation
Designee"). The Valuation Designee is responsible for performing fair valuations relating to all investments in the Fund’s portfolio for which market quotations are not readily available; periodically assessing and managing material valuation
risks; establishing and applying fair value methodologies; testing fair valuation methodologies; evaluating and overseeing pricing services; segregation of valuation and portfolio management functions; providing quarterly, annual and prompt
reporting to the Board, as appropriate; identifying potential conflicts of interest; and maintaining appropriate records. The Valuation Designee has established a valuation committee ("Valuation Committee") to assist in carrying out the Valuation
Designee’s responsibilities and establish prices of securities for which market quotations are not readily available. The Fund’s and the Valuation Designee's policies and procedures ("Valuation Procedures") govern the Valuation
Designee’s selection and application of methodologies for determining and calculating the fair value of Fund investments. The Valuation Designee may value Fund portfolio securities for which market quotations are not readily available and
other Fund assets utilizing inputs from pricing services and other third-party sources (together, “Pricing Sources”). The Valuation Committee meets (in person, via electronic mail or via teleconference) on an ad-hoc basis to determine
fair valuations and on a quarterly basis to review fair value events (excluding fair valuations from pricing services), including valuation risks and back-testing results, and preview reports to the Board.
The Valuation Committee establishes prices of securities for
which market quotations are not readily available based on such methodologies and measurements on a regular basis after considering information that is reasonably available and deemed relevant by the Valuation Committee. The Board shall oversee the
Valuation Designee and review fair valuation materials on a prompt, quarterly and annual basis and approve proposed revisions to the Valuation Procedures.
| 34
|
MainStay MacKay Strategic
Municipal Allocation Fund |
Investments for which market quotations are not readily
available are valued at fair value as determined in good faith pursuant to the Valuation Procedures. A market quotation is readily available only when that quotation is a quoted price (unadjusted) in active markets for identical investments that the
Fund can access at the measurement date, provided that a quotation will not be readily available if it is not reliable. Fair value measurements are determined within a framework that establishes a three-tier hierarchy that maximizes the use of
observable market data and minimizes the use of unobservable inputs to establish a classification of fair value measurements for disclosure purposes. "Inputs" refer broadly to the assumptions that market participants would use in pricing the asset
or liability, including assumptions about risk, such as the risk inherent in a particular valuation technique used to measure fair value using a pricing model and/or the risk inherent in the inputs for the valuation technique. Inputs may be
observable or unobservable. Observable inputs reflect the assumptions market participants would use in pricing the asset or liability based on market data obtained from sources independent of the Fund. Unobservable inputs reflect the Fund’s
own assumptions about the assumptions market participants would use in pricing the asset or liability based on the information available. The inputs or methodology used for valuing assets or liabilities may not be an indication of the risks
associated with investing in those assets or liabilities. The three-tier hierarchy of inputs is summarized below.
| •
|
Level
1—quoted prices (unadjusted) in active markets for an identical asset or liability |
| •
|
Level
2—other significant observable inputs (including quoted prices for a similar asset or liability in active markets, interest rates and yield curves, prepayment speeds, credit risk, etc.) |
| •
|
Level
3—significant unobservable inputs (including the Fund's own assumptions about the assumptions that market participants would use in measuring fair value of an asset or liability) |
The level of an asset or liability within the fair value
hierarchy is based on the lowest level of an input, both individually and in the aggregate, that is significant to the fair value measurement. The aggregate value by input level of the Fund’s assets and liabilities as of October 31, 2022, is
included at the end of the Portfolio of Investments.
The
Fund may use third-party vendor evaluations, whose prices may be derived from one or more of the following standard inputs, among others:
| •
Benchmark yields |
•
Reported trades |
| •
Broker/dealer quotes |
•
Issuer spreads |
| •
Two-sided markets |
•
Benchmark securities |
| •
Bids/offers |
•
Reference data (corporate actions or material event notices) |
| •
Industry and economic events |
•
Comparable bonds |
| •
Monthly payment information |
|
An asset or liability for which a market quotation is not
readily available is valued by methods deemed reasonable in good faith by the Valuation Committee, following the Valuation Procedures to represent fair value.
Under these procedures, the Valuation Designee generally uses a market-based
approach which may use related or comparable assets or liabilities, recent transactions, market multiples, book values and other relevant information. The Valuation Designee may also use an income-based valuation approach in which the anticipated
future cash flows of the asset or liability are discounted to calculate fair value. Discounts may also be applied due to the nature and/or duration of any restrictions on the disposition of the asset or liability. Fair value represents a good faith
approximation of the value of a security. Fair value determinations involve the consideration of a number of subjective factors, an analysis of applicable facts and circumstances and the exercise of judgment. As a result, it is possible that the
fair value for a security determined in good faith in accordance with the Valuation Procedures may differ from valuations for the same security determined for other funds using their own valuation procedures. Although the Valuation Procedures are
designed to value a security at the price the Fund may reasonably expect to receive upon the security's sale in an orderly transaction, there can be no assurance that any fair value determination thereunder would, in fact, approximate the amount
that the Fund would actually realize upon the sale of the security or the price at which the security would trade if a reliable market price were readily available. During the six-month period ended October 31, 2022, there were no material changes
to the fair value methodologies.
Securities which may be
valued in this manner include, but are not limited to: (i) a security for which trading has been halted or suspended or otherwise does not have a readily available market quotation on a given day; (ii) a debt security that has recently gone into
default and for which there is not a current market quotation; (iii) a security of an issuer that has entered into a restructuring; (iv) a security that has been delisted from a national exchange; (v) a security subject to trading collars for which
no or limited trading takes place; and (vi) a security whose principal market has been temporarily closed at a time when, under normal conditions, it would be open. Securities valued in this manner are generally categorized as Level 2 or 3 in the
hierarchy.
Futures contracts are valued at the last
posted settlement price on the market where such futures are primarily traded. These securities are generally categorized as Level 1 in the hierarchy.
Municipal debt securities are valued at the evaluated mean
prices supplied by a pricing agent or broker selected by the Manager, in consultation with the Subadvisor. The evaluations are market-based measurements processed through a pricing application and represents the pricing agent's good faith
determination as to what a holder may receive in an orderly transaction under market conditions. The rules-based logic utilizes valuation techniques that reflect participants' assumptions and vary by asset class and per methodology, maximizing the
use of relevant observable data including quoted prices for similar assets, benchmark yield curves and market corroborated inputs. The evaluated bid or mean prices are deemed by the Manager, in consultation with the Subadvisor, to be representative
of market values, at the regular close of trading of the Exchange on each valuation date. Municipal debt securities purchased on a delayed delivery basis are marked to market
Notes to Financial
Statements (Unaudited) (continued)
daily until settlement at the forward settlement date. Municipal debt
securities are generally categorized as Level 2 in the hierarchy.
The information above is not intended to reflect an exhaustive
list of the methodologies that may be used to value portfolio investments. The Valuation Procedures permit the use of a variety of valuation methodologies in connection with valuing portfolio investments. The methodology used for a specific type of
investment may vary based on the market data available or other considerations. The methodologies summarized above may not represent the specific means by which portfolio investments are valued on any particular business day.
(B) Income Taxes. The Fund's policy is to comply with the requirements of the Internal Revenue Code of 1986, as amended (the “Internal Revenue Code”), applicable to regulated investment companies
and to distribute all of its taxable income to the shareholders of the Fund within the allowable time limits.
The Manager evaluates the Fund’s tax positions to
determine if the tax positions taken meet the minimum recognition threshold in connection with accounting for uncertainties in income tax positions taken or expected to be taken for the purposes of measuring and recognizing tax liabilities in the
financial statements. Recognition of tax benefits of an uncertain tax position is permitted only to the extent the position is “more likely than not” to be sustained assuming examination by taxing authorities. The Manager analyzed the
Fund's tax positions taken on federal, state and local income tax returns for all open tax years (for up to three tax years) and has concluded that no provisions for federal, state and local income tax are required in the Fund's financial
statements. The Fund's federal, state and local income tax and federal excise tax returns for tax years for which the applicable statutes of limitations have not expired are subject to examination by the Internal Revenue Service and state and local
departments of revenue.
(C) Dividends and
Distributions to Shareholders. Dividends and distributions are recorded on the ex-dividend date. The Fund intends to declare dividends from net investment income, if any, daily
and intends to pay them at least monthly and declares and pays distributions from net realized capital gains, if any, at least annually. Unless a shareholder elects otherwise, all dividends and distributions are reinvested at NAV in the same class
of shares of the Fund. Dividends and distributions to shareholders are determined in accordance with federal income tax regulations and may differ from determinations using GAAP.
(D) Security Transactions and Investment Income. The Fund records security transactions on the trade date. Realized gains and losses on security transactions are determined using the identified cost method. Interest income is accrued as
earned using the effective interest rate method. Discounts and premiums on securities purchased, other than temporary cash investments that mature in 60 days or less at the time of purchase, for the Fund are accreted and amortized, respectively, on
the effective interest rate method.
Investment
income and realized and unrealized gains and losses on investments of the Fund are allocated pro rata to the separate classes of
shares based upon their relative net assets on the date the income is earned
or realized and unrealized gains and losses are incurred.
The Fund may place a debt security on non-accrual status and
reduce related interest income by ceasing current accruals and writing off all or a portion of any interest receivables when the collection of all or a portion of such interest has become doubtful. A debt security is removed from non-accrual status
when the issuer resumes interest payments or when collectability of interest is reasonably assured.
(E) Expenses. Expenses of the Trust are allocated to the individual Funds in proportion to the net assets of the respective Funds when the expenses are incurred, except where direct allocations of
expenses can be made. Expenses (other than transfer agent expenses and fees incurred under the shareholder services plans and/or the distribution plans further discussed in Note 3(B)) are allocated to separate classes of shares pro rata based upon
their relative net assets on the date the expenses are incurred. The expenses borne by the Fund, including those of related parties to the Fund, are shown in the Statement of Operations.
(F) Use of Estimates. In preparing financial statements in conformity with GAAP, the Manager makes estimates and assumptions that affect the reported amounts and disclosures in the financial statements. Actual
results could differ from those estimates and assumptions.
(G) Futures Contracts. A futures contract is an agreement to purchase or sell a specified quantity of an underlying instrument at a specified future date and price, or to make or receive a cash payment based on
the value of a financial instrument (e.g., foreign currency, interest rate, security or securities index). The Fund is subject to risks such as market price risk, leverage risk, liquidity risk, counterparty risk, operational risk, legal risk and/or
interest rate risk in the normal course of investing in these contracts. Upon entering into a futures contract, the Fund is required to pledge to the broker or futures commission merchant an amount of cash and/or U.S. government securities equal to
a certain percentage of the collateral amount, known as the “initial margin.” During the period the futures contract is open, changes in the value of the contract are recognized as unrealized appreciation or depreciation by marking to
market such contract on a daily basis to reflect the market value of the contract at the end of each day’s trading. The Fund agrees to receive from or pay to the broker or futures commission merchant an amount of cash equal to the daily
fluctuation in the value of the contract. Such receipts or payments are known as “variation margin.” When the futures contract is closed, the Fund records a realized gain or loss equal to the difference between the proceeds from (or cost
of) the closing transaction and the Fund's basis in the contract.
The use of futures contracts involves, to varying degrees,
elements of market risk in excess of the amount recognized in the Statement of Assets and Liabilities. The contract or notional amounts and variation margin reflect the extent of the Fund's involvement in open futures positions. There are several
risks associated with the use of futures contracts as hedging techniques. There can be no assurance that a liquid market will exist at the time when the Fund seeks to close out a futures
| 36
|
MainStay MacKay Strategic
Municipal Allocation Fund |
contract. If no liquid market exists, the Fund would remain obligated to meet
margin requirements until the position is closed. Futures contracts may involve a small initial investment relative to the risk assumed, which could result in losses greater than if the Fund did not invest in futures contracts. Futures contracts may
be more volatile than direct investments in the instrument underlying the futures and may not correlate to the underlying instrument, causing a given hedge not to achieve its objectives. The Fund's activities in futures contracts have minimal
counterparty risk as they are conducted through regulated exchanges that guarantee the futures against default by the counterparty. In the event of a bankruptcy or insolvency of a futures commission merchant that holds margin on behalf of the Fund,
the Fund may not be entitled to the return of the entire margin owed to the Fund, potentially resulting in a loss. The Fund may invest in futures contracts to seek enhanced returns or to reduce the risk of loss by hedging certain of its holdings.
The Fund's investment in futures contracts and other derivatives may increase the volatility of the Fund's NAVs and may result in a loss to the Fund. Open futures contracts as of October 31, 2022, are shown in the Portfolio of Investments.
(H) Delayed Delivery Transactions. The Fund may purchase or sell securities on a delayed delivery basis. These transactions involve a commitment by the Fund to purchase or sell securities for a predetermined price or yield,
with payment and delivery taking place beyond the customary settlement period. When delayed delivery purchases are outstanding, the Fund will designate liquid assets in an amount sufficient to meet the purchase price. When purchasing a security on a
delayed delivery basis, the Fund assumes the rights and risks of ownership of the security, including the risk of price and yield fluctuations, and takes such fluctuations into account when determining its NAV. The Fund may dispose of or renegotiate
a delayed delivery transaction after it is entered into, and may sell delayed delivery securities before they are delivered, which may result in a realized gain or loss. When the Fund has sold a security it owns on a delayed delivery basis, the Fund
does not participate in future gains and losses with respect to the security. Delayed delivery transactions as of October 31, 2022, are shown in the Portfolio of Investments.
(I) Municipal Bond Risk. The Fund may invest more heavily in municipal bonds from certain cities, states, territories or regions than others, which may increase the Fund’s exposure to losses resulting from
economic, political, regulatory occurrences, or declines in tax revenue impacting these particular cities, states, territories or regions. In addition, many state and municipal governments that issue securities are under significant economic and
financial stress and may not be able to satisfy their obligations, and these events may be made worse due to economic challenges posed by COVID-19. The Fund may invest a substantial amount of its assets in municipal bonds whose interest is paid
solely from revenues of similar projects, such as tobacco settlement bonds. If the Fund concentrates its investments in this manner, it assumes the legal and economic risks relating to such projects and this may have a significant impact on the
Fund’s investment performance.
Certain of the issuers in which the Fund may invest have
recently experienced, or may experience, significant financial difficulties and repeated credit rating downgrades. On May 3, 2017, the Commonwealth of Puerto Rico (the "Commonwealth") began proceedings pursuant to the Puerto Rico Oversight,
Management, and Economic Stability Act (“PROMESA”) to seek bankruptcy-type protections from approximately $74 billion in debt and approximately $48 billion in unfunded pension obligations. In addition, the economic downturn following the
outbreak of COVID-19 and the resulting pressure on Puerto Rico’s budget have further contributed to its financial challenges. The federal government has passed certain relief packages, including the Coronavirus Aid, Relief, and Economic
Security Act and the American Rescue Plan, which include an aggregate of more than $7 billion in disaster relief funds for the U.S. territories, including Puerto Rico. However, there can be no assurances that the federal funds allocated to the
Commonwealth will be sufficient to address the economic challenges arising from COVID-19.
The Commonwealth concluded its Title III restructuring
proceedings on behalf of itself and certain instrumentalities effective March 15th, 2022. Approximately $18.75 billion of claims related to debt guaranteed under Puerto Rico's constitution including the Commonwealth of Puerto Rico and Public
Building Authority were restructured with issuance of $7.4 billion in new Puerto Rico General Obligation Bonds, $7.1 billion of cash, and $3.5 billion of new Contingent Value instruments. In addition the Commonwealth's exit from the restructuring
proceedings resolved certain claims relating to the Commonwealth Employee Retirement System, Convention Center, Highway Authority, and Infrastructure Financing Authority. Several of Commonwealth's agencies are still under Title III restructuring
proceedings including the Highway Authority and Electric Authority.
Puerto Rico’s debt restructuring process and other
economic, political, social, environmental or health factors or developments could occur rapidly and may significantly affect the value of municipal securities of Puerto Rico. Due to the ongoing budget impact from COVID-19 on the
Commonwealth’s finances, the Federal Oversight and Management Board for Puerto Rico or the Commonwealth itself could seek to revise or even terminate earlier agreements reached with certain creditors prior to the outbreak of COVID-19. Any
agreement between the Federal Oversight and Management Board and creditors is subject to approval by the judge overseeing the Title III proceedings. The composition of the Federal Oversight and Management Board has changed during the recent period
due to existing members either stepping down or being replaced following the expiration of a member's term. There is no assurance that board members will approve the restructuring agreements the prior board had negotiated.
The Fund’s vulnerability to potential losses associated
with such developments may be reduced through investing in municipal securities that feature credit enhancements (such as bond insurance). The bond insurance provider pays both principal and interest when due to the bond holder. The magnitude of
Puerto Rico’s debt restructuring or other adverse economic developments could pose significant strains on the ability of municipal securities insurers to meet all future claims. As of
Notes to Financial
Statements (Unaudited) (continued)
October 31, 2022, none of the Puerto Rico municipal securities held by the
Fund were insured.
(J) Indemnifications. Under the Trust’s organizational documents, its officers and trustees are indemnified against certain liabilities that may arise out of performance of their duties to the Trust.
Additionally, in the normal course of business, the Fund enters into contracts with third-party service providers that contain a variety of representations and warranties and that may provide general indemnifications. The Fund's maximum exposure
under these arrangements is unknown, as this would involve future claims that may be made against the Fund that have not yet occurred. The Manager believes that the risk of loss in connection with these potential indemnification obligations is
remote. However, there can be no assurance that material liabilities related to such obligations will not arise in the future, which could adversely impact the Fund.
(K) Quantitative Disclosure of Derivative Holdings. The following tables show additional disclosures related to the Fund's derivative and hedging activities, including how such activities are accounted for and their effect on the Fund's
financial positions, performance and cash flows.
The Fund entered into futures contracts to manage its exposure
to the securities markets or to movements in interest rates and currency values.
Fair value of derivative instruments as of October 31,
2022:
| Asset
Derivatives |
Interest
Rate
Contracts
Risk |
Total
|
| Futures
Contracts - Net Assets—Net unrealized appreciation on futures contracts (a) |
$886,880
|
$886,880
|
| Total
Fair Value |
$886,880
|
$886,880
|
| (a)
|
Includes
cumulative appreciation (depreciation) of futures contracts as reported in the Portfolio of Investments. Only current day’s variation margin is reported within the Statement of Assets and Liabilities. |
The effect of derivative instruments on the Statement of
Operations for the six-month period ended October 31, 2022:
| Net
Realized Gain (Loss) from: |
Interest
Rate
Contracts
Risk |
Total
|
| Futures
Contracts |
$1,397,969
|
$1,397,969
|
| Total
Net Realized Gain (Loss) |
$1,397,969
|
$1,397,969
|
| Net
Change in Unrealized Appreciation (Depreciation) |
Interest
Rate
Contracts
Risk |
Total
|
| Futures
Contracts |
$352,356
|
$352,356
|
| Total
Net Change in Unrealized Appreciation (Depreciation) |
$352,356
|
$352,356
|
| Average
Notional Amount |
Total
|
| Futures
Contracts Short |
$(15,182,761)
|
Note 3–Fees and Related
Party Transactions
(A) Manager and Subadvisor. New York Life Investments, a registered investment adviser and an indirect, wholly-owned subsidiary of New York Life Insurance Company ("New York Life"), serves as the Fund's Manager,
pursuant to an Amended and Restated Management Agreement ("Management Agreement"). The Manager provides offices, conducts clerical, recordkeeping and bookkeeping services and keeps most of the financial and accounting records required to be
maintained by the Fund. Except for the portion of salaries and expenses that are the responsibility of the Fund, the Manager pays the salaries and expenses of all personnel affiliated with the Fund and certain operational expenses of the Fund.
During a portion of the six-month period ended October 31, 2022, the Fund reimbursed New York Life Investments in an amount equal to the portion of the compensation of the Chief Compliance Officer attributable to the Fund. MacKay Shields LLC
("MacKay Shields" or the "Subadvisor"), a registered investment adviser and an indirect, wholly-owned subsidiary of New York Life, serves as the Subadvisor to the Fund and is responsible for the day-to-day portfolio management of the Fund. Pursuant
to the terms of an Amended and Restated Subadvisory Agreement ("Subadvisory Agreement") between New York Life Investments and MacKay Shields, New York Life Investments pays for the services of the Subadvisor.
Pursuant to the Management Agreement, the Fund pays the Manager
a monthly fee for the services performed and the facilities furnished at an annual rate of 0.40% of the Fund's average daily net assets.
New York Life Investments has contractually agreed to waive
fees and/or reimburse expenses so that Total Annual Fund Operating Expenses (excluding taxes, interest, litigation, extraordinary expenses, brokerage and other transaction expenses relating to the purchase or sale of portfolio investments and
acquired (underlying) fund fees and expenses) do not exceed the following percentages of daily net assets: Class A, 0.77% and Class R6, 0.50%. New York Life Investments will apply an equivalent waiver or reimbursement, in an equal number of basis
points of the Class A shares waiver/reimbursement, to Investor Class, Class C and Class I shares. This agreement will remain in effect until August 31, 2023, and shall renew automatically for one-year terms unless New York Life Investments provides
written notice of termination prior to the start of the next term or upon approval of the Board.
During the six-month period ended October 31, 2022, New York
Life Investments earned fees from the Fund in the amount of $286,514 and waived fees and/or reimbursed expenses in the amount of $61,288 and paid the Subadvisor fees of $112,613.
JPMorgan Chase Bank, N.A. ("JPMorgan") provides
sub-administration and sub-accounting services to the Fund pursuant to an agreement with New York Life Investments. These services include calculating the daily NAVs of the Fund, maintaining the general ledger and sub-ledger
| 38
|
MainStay MacKay Strategic
Municipal Allocation Fund |
accounts for the calculation of the Fund's NAVs, and assisting New York Life
Investments in conducting various aspects of the Fund's administrative operations. For providing these services to the Fund, JPMorgan is compensated by New York Life Investments.
Pursuant to an agreement between the Trust and New York Life
Investments, New York Life Investments is responsible for providing or procuring certain regulatory reporting services for the Fund. The Fund will reimburse New York Life Investments for the actual costs incurred by New York Life Investments in
connection with providing or procuring these services for the Fund.
(B) Distribution and Service Fees. The Trust, on behalf of the Fund, has entered into a distribution agreement with NYLIFE Distributors LLC (the “Distributor”), an affiliate of New York Life Investments. The Fund
has adopted distribution plans (the “Plans”) in accordance with the provisions of Rule 12b-1 under the 1940 Act.
Pursuant to the Class A and Investor Class Plans, the
Distributor receives a monthly fee from the Class A and Investor Class shares at an annual rate of 0.25% of the average daily net assets of the Class A and Investor Class shares for distribution and/or service activities as designated by the
Distributor. Pursuant to the Class C Plan, Class C shares pay the Distributor a monthly distribution fee at an annual rate of 0.25% of the average daily net assets of the Class C shares, along with a service fee at an annual rate of 0.25% of the
average daily net assets of the Class C shares, for a total 12b-1 fee of 0.50%. Class I and Class R6 shares are not subject to a distribution and/or service fee.
The Plans provide that the distribution and service fees are
payable to the Distributor regardless of the amounts actually expended by the Distributor for distribution of the Fund's shares and service activities.
(C) Sales Charges. The Fund was advised by the Distributor that the amount of initial sales charges retained on sales of Class A and Investor Class shares during the six-month period ended October 31, 2022,
were $564 and $25, respectively.
The Fund was also
advised that the Distributor retained CDSCs on redemptions of Class A, Investor Class and Class C shares during the six-month period ended October 31, 2022, of $1,486, $99 and $46, respectively.
(D) Transfer, Dividend Disbursing and Shareholder Servicing
Agent. NYLIM Service Company LLC, an affiliate of New York Life Investments, is the Fund's transfer, dividend disbursing and shareholder servicing agent pursuant to an agreement
between NYLIM Service Company LLC and the Trust. NYLIM Service Company LLC has entered into an agreement with DST Asset Manager Solutions, Inc. ("DST"), pursuant to which DST performs certain transfer agent services on behalf of NYLIM Service
Company LLC. New York Life Investments has contractually agreed to limit the transfer agency expenses charged to the Fund’s share classes to a maximum of 0.35% of that share class’s average daily net assets on an annual basis after
deducting any applicable Fund or class-level expense reimbursement or small account
fees. This agreement will remain in effect until August 31, 2023, and shall
renew automatically for one-year terms unless New York Life Investments provides written notice of termination prior to the start of the next term or upon approval of the Board. During the six-month period ended October 31, 2022, transfer agent
expenses incurred by the Fund and any reimbursements, pursuant to the aforementioned Transfer Agency expense limitation agreement, were as follows:
| Class
|
Expense
|
Waived
|
| Class
A |
$
1,524 |
$—
|
| Investor
Class |
142
|
—
|
| Class
C |
872
|
—
|
| Class
I |
20,142
|
—
|
| Class
R6 |
—
|
—
|
(E) Small Account Fee. Shareholders with small accounts adversely impact the cost of providing transfer agency services. In an effort to reduce total transfer agency expenses, the Fund has implemented a small
account fee on certain types of accounts. As described in the Fund's prospectus, certain shareholders with an account balance of less than $1,000 ($5,000 for Class A share accounts) are charged an annual per account fee of $20 (assessed
semi-annually), the proceeds from which offset transfer agent fees as reflected in the Statement of Operations. This small account fee will not apply to certain types of accounts as described further in the Fund’s prospectus.
(F) Capital. As of October 31, 2022, New York Life and its affiliates beneficially held shares of the Fund with the values and percentages of net assets as follows:
| Class
A |
$24,346
|
0.2%
|
| Investor
Class |
24,183
|
21.3
|
| Class
C |
23,959
|
1.8
|
| Class
R6 |
24,496
|
99.7
|
Note 4-Federal Income Tax
As of October 31, 2022, the cost and unrealized appreciation
(depreciation) of the Fund’s investment portfolio, including applicable derivative contracts and other financial instruments, as determined on a federal income tax basis, were as follows:
| |
Federal
Tax
Cost |
Gross
Unrealized
Appreciation |
Gross
Unrealized
(Depreciation) |
Net
Unrealized
Appreciation/
(Depreciation) |
| Investments
in Securities |
$203,523,181
|
$88,971
|
$(9,403,545)
|
$(9,314,574)
|
Notes to Financial
Statements (Unaudited) (continued)
During the year ended April 30, 2022, the tax character of distributions paid
as reflected in the Statements of Changes in Net Assets was as follows:
| |
2022
|
| Distributions
paid from: |
|
| Ordinary
Income |
$
17,770 |
| Long-Term
Capital Gains |
594,960
|
| Exempt
Interest Dividends |
1,315,760
|
| Total
|
$1,928,490
|
Note 5–Custodian
JPMorgan is the custodian of cash and securities held by the
Fund. Custodial fees are charged to the Fund based on the Fund's net assets and/or the market value of securities held by the Fund and the number of certain transactions incurred by the Fund.
Note 6–Line of Credit
The Fund and certain other funds managed by New York Life
Investments maintain a line of credit with a syndicate of banks in order to secure a source of funds for temporary purposes to meet unanticipated or excessive redemption requests.
Effective July 26, 2022, under the credit agreement (the
“Credit Agreement”), the aggregate commitment amount is $600,000,000 with an additional uncommitted amount of $100,000,000. The commitment fee is an annual rate of 0.15% of the average commitment amount payable quarterly, regardless of
usage, to JPMorgan, who serves as the agent to the syndicate. The commitment fee is allocated among the Fund and certain other funds managed by New York Life Investments based upon their respective net assets and other factors. Interest on any
revolving credit loan is charged based upon the Federal Funds Rate, Daily Simple Secured Overnight Financing Rate ("SOFR") + 0.10%, or the Overnight Bank Funding Rate, whichever is higher. The Credit Agreement expires on July 25, 2023, although the
Fund, certain other funds managed by New York Life Investments and the syndicate of banks may renew the Credit Agreement for an additional year on the same or different terms or enter into a credit agreement with a different syndicate of banks.
Prior to July 26, 2022, the aggregate commitment amount and the commitment fee were the same as those under the current Credit Agreement. During the six-month period ended October 31, 2022, there were no borrowings made or outstanding with respect
to the Fund under the Credit Agreement.
Note
7–Interfund Lending Program
Pursuant to an
exemptive order issued by the SEC, the Fund, along with certain other funds managed by New York Life Investments, may participate in an interfund lending program. The interfund lending program provides an alternative credit facility that permits the
Fund and certain other funds managed by New York Life Investments to lend or borrow money for temporary purposes directly to or from one another,
subject to the conditions of the exemptive order. During the six-month period
ended October 31, 2022, there were no interfund loans made or outstanding with respect to the Fund.
Note 8–Purchases and Sales of Securities (in
000’s)
During the six-month period ended October
31, 2022, purchases and sales of securities, other than short-term securities, were $197,998 and $84,543, respectively.
Note 9–Capital Share Transactions
Transactions in capital shares for the six-month period ended
October 31, 2022 and the year ended April 30, 2022, were as follows:
| Class
A |
Shares
|
Amount
|
| Six-month
period ended October 31, 2022: |
|
|
| Shares
sold |
1,272,218
|
$
11,877,288 |
| Shares
issued to shareholders in reinvestment of distributions |
12,233
|
113,401
|
| Shares
redeemed |
(196,801)
|
(1,842,319)
|
| Net
increase (decrease) in shares outstanding before conversion |
1,087,650
|
10,148,370
|
| Shares
converted into Class A (See Note 1) |
17,915
|
166,839
|
| Net
increase (decrease) |
1,105,565
|
$
10,315,209 |
| Year
ended April 30, 2022: |
|
|
| Shares
sold |
627,789
|
$
6,160,870 |
| Shares
issued to shareholders in reinvestment of distributions |
3,108
|
31,706
|
| Shares
redeemed |
(123,551)
|
(1,239,097)
|
| Net
increase (decrease) in shares outstanding before conversion |
507,346
|
4,953,479
|
| Shares
converted into Class A (See Note 1) |
1,148
|
11,409
|
| Net
increase (decrease) |
508,494
|
$
4,964,888 |
| |
| 40
|
MainStay MacKay Strategic
Municipal Allocation Fund |
| Investor
Class |
Shares
|
Amount
|
| Six-month
period ended October 31, 2022: |
|
|
| Shares
sold |
44,569
|
$
424,003 |
| Shares
issued to shareholders in reinvestment of distributions |
156
|
1,457
|
| Shares
redeemed |
(19,118)
|
(180,019)
|
| Net
increase (decrease) in shares outstanding before conversion |
25,607
|
245,441
|
| Shares
converted from Investor Class (See Note 1) |
(17,939)
|
(166,839)
|
| Net
increase (decrease) |
7,668
|
$
78,602 |
| Year
ended April 30, 2022: |
|
|
| Shares
sold |
7,351
|
$
75,661 |
| Shares
issued to shareholders in reinvestment of distributions |
128
|
1,306
|
| Shares
redeemed |
(5,527)
|
(54,397)
|
| Net
increase (decrease) in shares outstanding before conversion |
1,952
|
22,570
|
| Shares
converted from Investor Class (See Note 1) |
(269)
|
(2,812)
|
| Net
increase (decrease) |
1,683
|
$
19,758 |
| |
| Class
C |
Shares
|
Amount
|
| Six-month
period ended October 31, 2022: |
|
|
| Shares
sold |
107,177
|
$
1,000,185 |
| Shares
issued to shareholders in reinvestment of distributions |
997
|
9,220
|
| Shares
redeemed |
(22,056)
|
(203,699)
|
| Net
increase (decrease) |
86,118
|
$
805,706 |
| Year
ended April 30, 2022: |
|
|
| Shares
sold |
67,637
|
$
681,825 |
| Shares
issued to shareholders in reinvestment of distributions |
577
|
5,875
|
| Shares
redeemed |
(19,293)
|
(192,733)
|
| Net
increase (decrease) in shares outstanding before conversion |
48,921
|
494,967
|
| Shares
converted from Class C (See Note 1) |
(882)
|
(8,597)
|
| Net
increase (decrease) |
48,039
|
$
486,370 |
| |
| Class
I |
Shares
|
Amount
|
| Six-month
period ended October 31, 2022: |
|
|
| Shares
sold |
20,006,267
|
$
187,256,955 |
| Shares
issued to shareholders in reinvestment of distributions |
178,616
|
1,659,159
|
| Shares
redeemed |
(10,805,710)
|
(101,314,512)
|
| Net
increase (decrease) |
9,379,173
|
$
87,601,602 |
| Year
ended April 30, 2022: |
|
|
| Shares
sold |
5,207,450
|
$
51,686,935 |
| Shares
issued to shareholders in reinvestment of distributions |
184,680
|
1,888,329
|
| Shares
redeemed |
(1,552,936)
|
(15,321,564)
|
| Net
increase (decrease) |
3,839,194
|
$
38,253,700 |
| |
| Class
R6 |
Shares
|
Amount
|
| Six-month
period ended October 31, 2022: |
|
|
| Shares
issued to shareholders in reinvestment of distributions |
34
|
$
320 |
| Net
increase (decrease) |
34
|
$
320 |
| Year
ended April 30, 2022: |
|
|
| Shares
issued to shareholders in reinvestment of distributions |
75
|
$
768 |
| Net
increase (decrease) |
75
|
$
768 |
Note 10–Other Matters
As of the date of this report, interest rates in the United
States and many parts of the world, including certain European countries, are ascending from historically low levels. Thus, the Fund currently faces a heightened level of risk associated with rising interest rates. This could be driven by a variety
of factors, including but not limited to central bank monetary policies, changing inflation or real growth rates, general economic conditions, increasing bond issuances or reduced market demand for low yielding investments.
An outbreak of COVID-19, first detected in December 2019, has
developed into a global pandemic and has resulted in travel restrictions, closure of international borders, certain businesses and securities markets, restrictions on securities trading activities, prolonged quarantines, supply chain disruptions,
and lower consumer demand, as well as general concern and uncertainty. In 2022, many countries lifted some or all restrictions related to COVID-19. However, the continued impact of COVID-19 and related variants is uncertain and could further
adversely affect the global economy, national economies, individual issuers and capital markets in unforeseeable ways and result in a substantial and extended economic downturn. Developments that disrupt global economies and financial markets, such
as COVID-19, may magnify factors that affect the Fund's performance.
Note 11–Subsequent Events
In connection with the preparation of the financial statements
of the Fund as of and for the six-month period ended October 31, 2022, events and transactions subsequent to October 31, 2022, through the date the financial statements were issued have been evaluated by the Manager for possible adjustment and/or
disclosure. No subsequent events requiring financial statement adjustment or disclosure have been identified, other than the following:
Effective December 13, 2022, Class C2 shares of the Fund are
now available for purchase.
At meetings held on December
6-7, 2022, the Board of Trustees of MainStay Funds Trust approved the change of the Fund's fiscal year end from April 30th to October 31st effective May 1, 2023.
Proxy Voting Policies and Procedures and Proxy Voting
Record
The Fund is required to file with the SEC its
proxy voting record for the 12-month period ending June 30 on Form N-PX. A description of the policies and procedures that are used to vote proxies relating to portfolio securities of the Fund is available free of charge upon request by calling
800-624-6782 or visiting the SEC’s website at www.sec.gov. The most recent Form N-PX or proxy voting record is available free of charge upon request by calling 800-624-6782; visiting
newyorklifeinvestments.com; or visiting the SEC’s website at www.sec.gov.
Shareholder Reports and Quarterly Portfolio Disclosure
The Fund is required to file its complete schedule of portfolio
holdings with the SEC 60 days after its first and third fiscal quarter on Form N-PORT. The Fund's holdings report is available free of charge upon request by calling New York Life Investments at 800-624-6782.
| 42
|
MainStay MacKay Strategic
Municipal Allocation Fund |
Equity
U.S. Equity
MainStay Epoch U.S. Equity Yield Fund
MainStay S&P 500 Index Fund1
MainStay Winslow Large Cap Growth Fund
MainStay WMC Enduring Capital Fund
MainStay WMC Growth Fund
MainStay WMC Small Companies Fund
MainStay WMC Value Fund
International Equity
MainStay Epoch International Choice Fund
MainStay MacKay International Equity Fund
MainStay WMC International Research Equity Fund
Emerging Markets Equity
MainStay Candriam Emerging Markets Equity Fund
Global Equity
MainStay Epoch Capital Growth Fund
MainStay Epoch Global Equity Yield Fund
Fixed Income
Taxable Income
MainStay Candriam Emerging Markets Debt Fund
MainStay Floating Rate Fund
MainStay MacKay High Yield Corporate Bond Fund
MainStay MacKay Short Duration High Yield Fund
MainStay MacKay Strategic Bond Fund
MainStay MacKay Total Return Bond Fund
MainStay MacKay U.S. Infrastructure Bond Fund
MainStay Short Term Bond Fund
Tax-Exempt Income
MainStay MacKay California Tax Free Opportunities Fund2
MainStay MacKay High Yield Municipal Bond Fund
MainStay MacKay New York Tax Free Opportunities Fund3
MainStay MacKay Short Term Municipal Fund
MainStay MacKay Strategic Municipal Allocation Fund
MainStay MacKay Tax Free Bond Fund
Money Market
MainStay Money Market Fund
Mixed Asset
MainStay Balanced Fund
MainStay Income Builder Fund
MainStay MacKay Convertible Fund
Speciality
MainStay CBRE Global Infrastructure Fund
MainStay CBRE Real Estate Fund
MainStay Cushing MLP Premier Fund
Asset Allocation
MainStay Conservative Allocation Fund
MainStay Conservative ETF Allocation Fund
MainStay Defensive ETF Allocation Fund
MainStay Equity Allocation Fund
MainStay Equity ETF Allocation Fund
MainStay ESG Multi-Asset Allocation Fund
MainStay Growth Allocation Fund
MainStay Growth ETF Allocation Fund
MainStay Moderate Allocation Fund
MainStay Moderate ETF Allocation Fund
Manager
New York Life Investment Management LLC
New York, New York
Subadvisors
Candriam4
Strassen, Luxembourg
CBRE Investment Management Listed Real Assets LLC
Radnor, Pennsylvania
Cushing Asset Management, LP
Dallas, Texas
Epoch Investment Partners, Inc.
New York, New York
MacKay Shields LLC4
New York, New York
NYL Investors LLC4
New York, New York
Wellington Management Company LLP
Boston, Massachusetts
Winslow Capital Management, LLC
Minneapolis, Minnesota
Legal Counsel
Dechert LLP
Washington, District of Columbia
Independent Registered Public Accounting Firm
KPMG LLP
Philadelphia, Pennsylvania
Distributor
NYLIFE Distributors LLC4
Jersey City, New Jersey
Custodian
JPMorgan Chase Bank, N.A.
New York, New York
1.
Prior to February 28, 2022, the Fund's name was
MainStay MacKay S&P 500 Index Fund.
| 2. |
This Fund is registered for
sale in AZ, CA, NV, OR, TX, UT, WA and MI (Class A and Class I shares only), and CO, FL, GA, HI, ID, MA, MD, NH, NJ and NY (Class I shares only). |
| 3. |
This Fund is registered for
sale in CA, CT, DE, FL, MA, NJ, NY and VT. |
| 4. |
An affiliate of New York Life
Investment Management LLC. |
Not part of the Semiannual Report
For more information
800-624-6782
newyorklifeinvestments.com
“New York Life Investments” is both a service mark,
and the common trade name, of certain investment advisors affiliated with New York Life Insurance Company. The MainStay Funds® are managed by New York Life Investment
Management LLC and distributed by NYLIFE Distributors LLC, 30 Hudson Street, Jersey City, NJ 07302, a wholly owned subsidiary of New York Life Insurance Company. NYLIFE Distributors LLC is a Member FINRA/SIPC.
©2022 NYLIFE Distributors LLC. All rights reserved.
| 5013753.2MS229-22 |
MSMSMA10-12/22
|
(NYLIM) NL466
MainStay ETF Asset Allocation Funds
Message from the President and Semiannual Report
Unaudited | October 31, 2022
| MainStay
Defensive ETF Allocation Fund |
| MainStay
Conservative ETF Allocation Fund |
| MainStay
Moderate ETF Allocation Fund |
| MainStay Growth
ETF Allocation Fund |
| MainStay Equity
ETF Allocation Fund |
| MainStay
ESG Multi-Asset Allocation Fund |
Sign up for e-delivery of your shareholder reports. For full
details on e-delivery, including who can participate and what you can receive via e-delivery,
please log in to newyorklifeinvestments.com/accounts.
| Not
FDIC/NCUA Insured |
Not
a Deposit |
May
Lose Value |
No
Bank Guarantee |
Not
Insured by Any Government Agency |
This page intentionally left blank
Message from the President
A series of economic and geopolitical challenges undermined equity and
fixed-income markets during the six-month reporting period ended October 31, 2022. Stocks and bonds alike trended lower in the face of sharply rising interest rates, increasing inflationary pressures, slowing economic growth and Russia’s
invasion of Ukraine.
The reporting period began on a
mixed note, with concerns about rising inflation and Russia’s invasion of Ukraine weighing on markets. On one hand, rising commodity prices and hopes that inflationary pressures might subside supported some asset classes and sectors. On the
other, the U.S. Federal Reserve (the “Fed”) issued increasingly hawkish statements regarding its intention to combat mounting inflation. As a result, equity markets remained flat while U.S. fixed-income markets gained modest ground in
May. Early June saw a downturn across asset classes as economic data showed increasing inflationary pressures, causing investors to anticipate a higher-than-previously-expected rate increase from the Fed at its meeting on June 15, 2022. Indeed, the
Fed raised rates by 0.75% at that meeting, from a range of 0.75% to 1.00% to a range of 1.50% to 1.75%, its largest increase of the year to date. Markets rallied in the wake of the Fed meeting as investors started to hope that slowing economic
growth might lead to rate decreases later in the year. In August, however, signs of persistently increasing inflation and statements from the Fed indicated that further rate increases were seen as necessary, undercutting optimism and driving stock
and bond prices lower through mid-October. The Fed implemented two additional 0.75% rate increases during that time, with additional increases expected before the end of the year. International central banks generally raised rates as well in efforts
to curb local inflation, although most increases remained significantly more modest than those in the United States. Relatively high U.S. interest rates and international risk-averse sentiment pushed U.S. dollar values higher compared to most other
currencies, with the ensuing negative impact on global prices for food, fuel and other key, U.S.-dollar-denominated products.
Despite a rally in the closing weeks of October, the S&P
500® Index, a widely regarded benchmark of U.S. market performance, declined by more than 5% during the reporting period. Although the energy sector generated strong gains,
bolstered by elevated oil and gas prices, most other industry areas recorded losses. The more cyclical and growth-oriented sectors of consumer discretionary, real estate and information technology delivered the
weakest returns, while the traditionally defensive and value-oriented
consumer staples, utilities and health care sectors outperformed. International stocks lagged compared to their U.S. counterparts, with some emerging markets, such as China, suffering particularly steep losses. A few markets, however, including
Brazil and Mexico, gained ground. Fixed-income markets saw bond prices broadly decline as yields rose along with interest rates. Short-term yields rose faster than long-term yields, producing a yield curve inversion from July through the end of the
reporting period, with long-term rates remaining below short-term rates. Some floating-rate instruments, which feature variable interest rates that allow investors to benefit from a rising rate environment, provided a degree of insulation from
inflation-driven trends.
While the Fed acknowledges the
costs of rising rates in terms of weaker GDP (gross domestic product) growth and unsettled financial markets over the short term, its primary focus continues to be the longer-term economic impact of inflation. With the latest figures as of the date
of this report showing that inflation remains above 8%, versus a target rate of just 2%, the Fed clearly has a distance yet to go, making further rate increases and market volatility more likely in the coming months. The question remains as to
whether the Fed and other central banks will manage a so-called “soft landing,” curbing inflation while avoiding a persistent economic slowdown. If they prove successful, we expect that favorable inflation trends and increasingly
attractive valuations in both equity and bond markets should eventually translate into sustainable improvements in the investment environment.
Whatever actions the Fed takes and however financial markets
react, as a MainStay investor, you can depend on us to continue providing the insight, expertise and service that have long defined New York Life Investments. Thank you for trusting us to help you meet your investment needs.
Sincerely,
Kirk C. Lehneis
President
The opinions expressed are as of the date of this report and
are subject to change. There is no guarantee that any forecast made will come to pass. This material does not constitute investment advice and is not intended as an endorsement of any specific investment. Past performance is no guarantee of future
results.
Not part of the Semiannual Report
Investors should refer to each Fund’s Summary Prospectus
and/or Prospectus and consider each Fund’s investment objectives, strategies, risks, charges and expenses carefully before investing. The Summary Prospectus and/or Prospectus contain this and other information about each Fund. You may obtain
copies of each Fund’s Summary Prospectus, Prospectus and Statement of Additional Information, which includes information about the MainStay Funds Trust's Trustees, free of charge, upon request, by calling toll-free 800-624-6782, by writing to
NYLIFE Distributors LLC, Attn: MainStay Marketing Department, 30 Hudson Street, Jersey City, NJ 07302 or by sending an e-mail to MainStayShareholderServices@nylim.com. These documents are also available via the MainStay Funds’ website at
newyorklifeinvestments.com. Please read each Fund’s Summary Prospectus and/or Prospectus carefully before investing.
MainStay Defensive
ETF Allocation Fund
Investment and Performance
Comparison (Unaudited)
Performance data quoted represents past performance. Past performance is no
guarantee of future results. Because of market volatility and other factors, current performance may be lower or higher than the figures shown. Investment return and principal value will fluctuate, and as a result, when shares are redeemed, they may
be worth more or less than their original cost. The graph below depicts the historical performance of Class I shares of the Fund. Performance will vary from class to class based on differences in class-specific expenses and sales charges. For performance information current to the most recent month-end, please call 800-624-6782 or visit newyorklifeinvestments.com.
The performance table and graph do not reflect the deduction
of taxes that a shareholder would pay on distributions or Fund share redemptions. Total returns reflect maximum applicable sales charges as indicated in the table below, if any, changes in share price, and reinvestment of dividend and capital gain
distributions. The graph assumes the initial investment amount shown below and reflects the deduction of all sales charges that would have applied for the period of investment. Performance figures may reflect certain fee waivers and/or expense
limitations, without which total returns may have been lower. For more information on share classes and current fee waivers and/or expense limitations (if any), please refer to the Notes to Financial Statements.
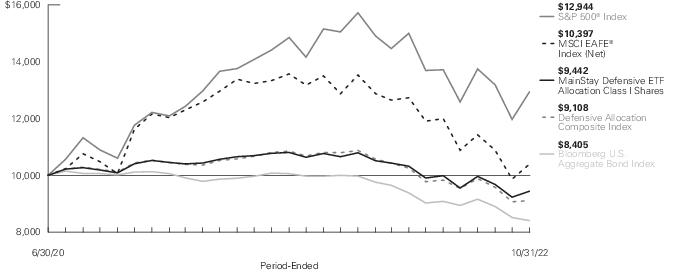
| Average
Annual Total Returns for the Period-Ended October 31, 2022 |
| Class
|
Sales
Charge |
|
Inception
Date |
Six
Months1 |
One
Year |
Since
Inception |
Gross
Expense
Ratio2 |
| Class
A Shares |
Maximum
3% Initial Sales Charge |
With
sales charges |
6/30/2020
|
-7.54%
|
-15.07%
|
-3.90%
|
1.89%
|
| |
|
Excluding
sales charges |
|
-4.68
|
-12.44
|
-2.64
|
1.89
|
| Class
C Shares |
Maximum
1% CDSC |
With
sales charges |
6/30/2020
|
-6.00
|
-13.98
|
-3.37
|
2.74
|
| |
if
redeemed Within One Year of Purchase |
Excluding
sales charges |
|
-5.06
|
-13.13
|
-3.37
|
2.74
|
| Class
I Shares |
No
Sales Charge |
|
6/30/2020
|
-4.67
|
-12.32
|
-2.42
|
1.64
|
| Class
R3 Shares |
No
Sales Charge |
|
6/30/2020
|
-4.89
|
-12.79
|
-3.00
|
2.24
|
| SIMPLE
Class Shares |
No
Sales Charge |
|
8/31/2020
|
-4.81
|
-12.69
|
-4.24
|
2.24
|
| 1.
|
Not
annualized. |
| 2.
|
The
gross expense ratios presented reflect the Fund’s “Total Annual Fund Operating Expenses” from the most recent Prospectus, as supplemented, and may differ from other expense ratios disclosed in this report. |
The
footnotes on the next page are an integral part of the table and graph and should be carefully read in conjunction with them.
| Benchmark
Performance* |
Six
Months1 |
One
Year |
Since
Inception |
| Bloomberg
U.S. Aggregate Bond Index2 |
-6.86%
|
-15.68%
|
-7.17%
|
| S&P
500® Index3 |
-5.50
|
-14.61
|
11.68
|
| MSCI
EAFE® Index (Net)4 |
-12.70
|
-23.00
|
1.68
|
| Defensive
Allocation Composite Index5 |
-6.82
|
-15.71
|
-3.92
|
| Morningstar
Allocation-15% to 30% Equity Category Average6 |
-5.94
|
-12.77
|
-0.80
|
| *
|
Returns
for indices reflect no deductions for fees, expenses or taxes, except for foreign withholding taxes where applicable. Results assume reinvestment of all dividends and capital gains. An investment cannot be made directly in an index.
|
| 1.
|
Not
annualized. |
| 2.
|
The Fund
has selected the Bloomberg U.S. Aggregate Bond Index as the primary broad-based securities market index for comparison purposes. The Bloomberg U.S. Aggregate Bond Index is a broad-based benchmark that measures the investment grade, U.S.
dollar-denominated, fixed-rate taxable bond market, including Treasuries, government-related and corporate securities, mortgage-backed securities (agency fixed-rate and hybrid adjustable rate mortgage pass-throughs), asset-backed securities and
commercial mortgage-backed securities. |
| 3.
|
The
S&P 500® Index is the Fund's secondary benchmark. The S&P 500® Index is widely regarded
as the standard index for measuring large-cap U.S. stock market performance. |
| 4.
|
The Fund
has selected the MSCI EAFE® Index (Net) as an additional benchmark. The MSCI EAFE® Index (Net)
consists of international stocks representing the developed world outside of North America. |
| 5.
|
The Fund
has selected the Defensive Allocation Index as an additional benchmark. The Defensive Allocation Index consists of the S&P 500® Index, the MSCI EAFE® Index and the Bloomberg U.S. Aggregate Bond Index weighted 15%, 5% and 80%, respectively. |
| 6.
|
The
Morningstar Allocation – 15% to 30% Equity Category Average is representative of funds that seek to provide both income and capital appreciation by investing in multiple asset classes, including stocks, bonds, and cash. These portfolios are
dominated by domestic holdings and have equity exposures between 15% and 30%. Results are based on average total returns of similar funds with all dividends and capital gain distributions reinvested. |
The
footnotes on the preceding page are an integral part of the table and graph and should be carefully read in conjunction with them.
| 6
|
MainStay Defensive ETF
Allocation Fund |
Cost in Dollars of
a $1,000 Investment in MainStay Defensive ETF Allocation Fund (Unaudited)
The example below is intended to describe the fees and expenses
borne by shareholders during the six-month period from May 1, 2022 to October 31, 2022, and the impact of those costs on your investment.
Example
As a shareholder of the Fund you incur two types of costs: (1)
transaction costs, including exchange fees and sales charges (loads) on purchases (as applicable), and (2) ongoing costs, including management fees, distribution and/or service (12b-1) fees and other Fund expenses (as applicable). This example is
intended to help you understand your ongoing costs (in dollars) of investing in the Fund and to compare these costs with the ongoing costs of investing in other mutual funds. The example is based on an investment of $1,000 made at the beginning of
the six-month period and held for the entire period from May 1, 2022 to October 31, 2022.
This example illustrates your Fund’s ongoing costs in two
ways:
Actual Expenses
The second and third data columns in the table below provide information about
actual account values and actual expenses. You may use the information in these columns, together with the amount you invested, to estimate the expenses that you paid during the six months ended October 31, 2022. Simply divide your account value by
$1,000 (for example, an
$8,600 account value divided by $1,000 = 8.6), then multiply the result by the
number under the heading entitled “Expenses Paid During Period” to estimate the expenses you paid on your account during this period.
Hypothetical Example for Comparison Purposes
The fourth and fifth data columns in the table below provide information about
hypothetical account values and hypothetical expenses based on the Fund’s actual expense ratio and an assumed rate of return of 5% per year before expenses, which is not the Fund’s actual return. The hypothetical account values and
expenses may not be used to estimate the actual ending account balances or expenses you paid for the six-month period shown. You may use this information to compare the ongoing costs of investing in the Fund with the ongoing costs of investing in
other mutual funds. To do so, compare this 5% hypothetical example with the 5% hypothetical examples that appear in the shareholder reports of the other mutual funds.
Please note that the expenses shown in the table are meant to
highlight your ongoing costs only and do not reflect any transactional costs, such as exchange fees or sales charges (loads). Therefore, the fourth and fifth data columns of the table are useful in comparing ongoing costs only and will not help you
determine the relative total costs of owning different funds. In addition, if these transactional costs were included, your costs would have been higher.
| Share
Class |
Beginning
Account
Value
5/1/22 |
Ending
Account
Value (Based
on Actual
Returns and
Expenses)
10/31/22 |
Expenses
Paid
During
Period1 |
Ending
Account
Value (Based
on Hypothetical
5% Annualized
Return and
Actual Expenses)
10/31/22 |
Expenses
Paid
During
Period1 |
Net
Expense
Ratio
During
Period2 |
| Class
A Shares |
$1,000.00
|
$953.20
|
$3.94
|
$1,021.17
|
$4.08
|
0.80%
|
| Class
C Shares |
$1,000.00
|
$949.40
|
$7.62
|
$1,017.39
|
$7.88
|
1.55%
|
| Class
I Shares |
$1,000.00
|
$953.30
|
$2.71
|
$1,022.43
|
$2.80
|
0.55%
|
| Class
R3 Shares |
$1,000.00
|
$951.10
|
$5.66
|
$1,019.41
|
$5.85
|
1.15%
|
| SIMPLE
Class Shares |
$1,000.00
|
$951.90
|
$5.17
|
$1,019.91
|
$5.35
|
1.05%
|
| 1.
|
Expenses are
equal to the Fund’s annualized expense ratio of each class multiplied by the average account value over the period, divided by 365 and multiplied by 184 (to reflect the six-month period). The table above represents the actual expenses incurred
during the six-month period. In addition to the fees and expenses which the Fund bears directly, it also indirectly bears a pro rata share of the fees and expenses of the underlying funds in which it invests. Such indirect expenses are not included
in the above-reported expense figures. |
| 2.
|
Expenses
are equal to the Fund's annualized expense ratio to reflect the six-month period. |
Asset Diversification as of October 31, 2022
(Unaudited)
| Equity
Funds |
21.2
% |
| Fixed
Income Funds |
72.0
|
| Short-Term
Investments |
26.5
|
| Other
Assets, Less Liabilities |
(19.7)
|
See Portfolio of Investments
beginning on page 12 for specific holdings within these categories. The Fund’s holdings are subject to change.
| 8
|
MainStay Defensive ETF
Allocation Fund |
Portfolio
Management Discussion and Analysis (Unaudited)
Questions answered by portfolio managers Jae S. Yoon,
CFA, Jonathan Swaney, Poul Kristensen, CFA, and Amit Soni, CFA, of New York Life Investment Management LLC, the Fund’s Manager.
How did MainStay Defensive ETF Allocation Fund perform relative to its
benchmarks and peer group during the six months ended October 31, 2022?
For the six months ended October 31, 2022, Class I shares of
MainStay Defensive ETF Allocation Fund returned −4.67%, outperforming the −6.86% return of the Fund’s primary benchmark, the Bloomberg U.S. Aggregate Bond Index (the "Index"), and the -5.50% return of the S&P 500® Index, which is the Fund’s secondary benchmark. Over the same period, Class I shares of the Fund outperformed the −12.70% return of the MSCI EAFE® Index (Net), and the −6.82% return of the Defensive Allocation Composite Index, both of which are additional benchmarks of the Fund. For the six months ended October
31, 2022, Class I shares of the Fund outperformed the −5.94% return of the Morningstar Allocation -15% to 30% Equity Category Average.1
What factors affected the Fund’s relative
performance during the reporting period?
The Fund is a
“fund of funds" that seeks to achieve its investment objective by investing in unaffiliated, passively-managed, exchange-traded funds (“Underlying ETFs”). The Underlying ETFs may invest in U.S. equities, international equities and
fixed-income instruments, making comparisons to any single index generally less suitable than a weighted combination of indices, which is a more useful yardstick by which to measure performance. During the reporting period, asset class policy was
the primary determinant of the Fund’s relative performance.
Fund management internally maintains a blend of indices that
are taken into consideration when managing the Fund. During the reporting period, the Fund materially outperformed the internally maintained blend of indices primarily due to active positioning at the asset class level. The Fund’s
outperformance was driven by the following factors:
| •
|
Management of the stock/bond
blend: The Fund’s management of its stock/bond blend proved generally successful, reflecting tactical adjustments made throughout the reporting period. With both investment-grade bonds and U.S. stocks posting declines in the mid-teens, there
was little cost or benefit to being persistently overweight or underweight in equities, although adjusting that exposure over time (buying dips and selling rallies) added significant value. |
| •
|
Value created within asset
classes: The equity portion of the Fund emphasized value over growth, with specific focus on energy companies and defensive sectors that the market rewarded. |
Conditions also favored the Fund’s skew toward profitable small-cap
companies.
| •
|
Shorter duration:2 We shortened the average duration of the fixed-income portion of the Fund by holding cash and emphasizing exposure to iShares® 0-5 Year High Yield Corporate Bond ETF over its full duration counterpart, iShares® Broad USD
High Yield Corporate Bond ETF. Both moves lifted relative returns. |
The most significant detractor from the Fund’s relative
performance was exposure to gold miner equities. The price of gold, and thus gold miners, tends to move inversely to real bond yields. The combination of the Federal Reserve (the "Fed") pushing rates higher and emerging signs that inflation may be
peaking spelled trouble for this particular position.
How did you allocate the Fund’s assets during the
reporting period and why?
Stock/bond blend: On average,
the Fund held a moderately overweight exposure to equities during the reporting period, with the magnitude of that bias managed tactically in response to swings in pricing, as described above. We are generally reluctant to position the Fund with an
underweight allocation to equities, as stocks have tended to perform well over time, and anticipating drawdowns is challenging. The opposite is less true; we are happy to increase the Fund’s allocation to equities when we believe they are well
supported fundamentally or when a correction has run further than we believe appropriate. This approach worked well during the reporting period. Although stocks declined by double digits, the Fund generated roughly 0.3% of excess return3 through tactical adjustments to its degree of overweight exposure to equities.
Duration: Believing inflationary pressures to be partially
structural in nature and likely to persist at elevated levels for the foreseeable future, we skewed the Fund’s fixed-income holdings to favor shorter maturity instruments less sensitive to rising bond yields, although we increased the
Fund’s duration as yields rose. By the end of the reporting period, the average duration of the fixed-income portion of the Fund was only slightly shorter than that of the benchmark. The Fund’s duration policy contributed positively to
performance. (Contributions take weightings and total returns into account.)
Equity style: In the same way that inflation is threatening to
long-duration bonds, equities with values disproportionately reflected in more distant cash flows (i.e., growth stocks with high prices relative to current earnings) are likewise vulnerable. Accordingly, we tilted the Fund to emphasize value stocks
that
| 1.
|
See page 5 for other share class
returns, which may be higher or lower than Class I share returns. See page 6 for more information on benchmark and peer group returns |
| 2.
|
Duration is a measure of the
price sensitivity of a fixed-income investment to changes in interest rates. Duration is expressed as a number of years and is considered a more accurate sensitivity gauge than average maturity. |
| 3.
|
The expression “excess
return” may refer to the return that a security or portfolio provides above (or below) an investment with the lowest perceived risk, such as comparable U.S. Treasury securities. The expression may also refer to the return that a security or
portfolio provides above (or below) an index or other benchmark. |
offered more attractive near-term cash flows, placing particular focus on
traditionally defensive sectors: real estate, utilities, consumer staples and (most of all) health care. The combined effect was a modest positive contribution to return of approximately 0.1%.
Equity size: Small-company stocks were more heavily owned in
the Fund than in the Index. The thesis behind this positioning was based on attractive small-cap valuations, insulation from economic weakness abroad, less sensitivity to dollar strength and disproportionate exposure to domestic demand, which
remained healthy. The Fund’s active position in small-cap companies contributed approximately 0.25% to relative performance.
Geographic exposure: In light of Russia’s invasion of
Ukraine, the Fund held an underweight exposure to developed international markets, benefiting performance at the margin. That improvement in returns was fully offset, however, by a small overweight position in emerging market equities. We believed
that China’s economy would benefit from the country’s relaxation of its zero-COVID policy, as well as additional fiscal support ahead of the October 2022 Party Congress; however, neither development materialized.
Gold miners: The Fund maintained a varying position in gold
miners as a hedge against inflation and/or a monetary policy mistake. With month-over-month readings on inflation starting to improve, the Fed demonstrating their mettle in aggressively tightening monetary policy input, costs for energy and labor
rising sharply, this proved to be an unfavorable environment for miners. The position subtracted almost 0.4% from the Fund’s return, making it by far the most significant detractor from Fund performance.
Energy: As with gold miners, the Fund maintained exposure to
upstream energy producers as a commodity play to provide an additional inflation hedge. These holdings also positioned the Fund to take advantage of opportunities for domestic producers to benefit as Western nations revisit energy policy to source
supplies from stable and friendly jurisdictions, rather than autocratic petrostates that present national security risks. While the Fund’s position was small, it had a disproportionately positive impact on performance as oil and gas prices
soared, fully offsetting the adverse impact of the Fund’s exposure to gold miners.
How did the Fund’s allocations change over the
course of the reporting period?
We reduced the
Fund’s allocation most significantly to iShares® Core MSCI EAFE ETF to lessen non-U.S. market exposure in anticipation of a global recession. We also trimmed holdings
in iShares® 0-5 Year High Yield Corporate Bond ETF and iShares® Broad USD High Yield Corporate
Bond ETF, as exposure to sub-investment-grade credit was pulled back to benchmark levels. Another downward adjustment involved trimming holdings of VanEck Oil Services ETF and
SPDR® S&P® Oil & Gas
Exploration ETF; these positions were reduced following a long period of
solid outperformance, with energy being the only sector to deliver positive returns during the reporting period.
The Fund’s cash position saw the largest increase, as we
parked proceeds from cutting back equity exposure. Allocations to defensive industries also grew via positions in Health Care Select Sector SPDR® ETF and Invesco S&P® 500 Low Volatility ETF. iShares® Core U.S. Aggregate Bond ETF, Schwab® U.S. Aggregate Bond ETF and iShares® Broad USD Investment Grade Corporate Bond ETF all saw
inflows resulting from the sale of high yield credits.
During the reporting period, which Underlying Equity
ETFs had the highest total returns and which Underlying Equity ETFs had the lowest total returns?
The Fund’s two top-performing Underlying Equity ETFs,
were SPDR® S&P® Oil & Gas Exploration ETF and VanEck Oil Services ETF. Also posting
positive returns were Health Care Select Sector SPDR® ETF and Vanguard Mega Cap Value ETF. The largest declines were seen in VanEck Gold Miners ETF, iShares® Core MSCI Emerging Markets Equity ETF and iShares® Semiconductor ETF.
Which Underlying Equity ETFs were the strongest positive
contributors to the Fund’s performance and which Underlying Equity ETFs were particularly weak?
The Underlying Equity ETFs providing the highest total returns
included Vanguard Mega Cap Value ETF, followed by SPDR® S&P® Oil & Gas Exploration ETF,
VanEck Oil Services ETF and then followed by the healthcare sector. The most significant detractors were iShares® Core MSCI EAFE ETF, followed closely by VanEck Gold Miners
ETF, with iShares® Semiconductor ETF next.
During the reporting period, which Underlying
Fixed-Income ETFs had the highest total returns and which Underlying Fixed-Income ETFs had the lowest total returns?
Other than Underlying Money Market Funds, all Underlying
Fixed-Income ETFs generated negative returns. iShares® 0-5 Year High Yield Corporate Bond ETF,
iShares® Broad USD High Yield Corporate Bond ETF and Invesco Senior Loan ETF registered the mildest losses. The largest losses came from iShares® Core U.S. Aggregate Bond ETF, Schwab® U.S. Aggregate Bond ETF and iShares® Broad USD Investment Grade Bond ETF.
Which Underlying Fixed-Income ETFs were the strongest
positive contributors to the Fund’s performance and which Underlying Fixed-Income ETFs were particularly weak?
With all Underlying Fixed-Income ETFs experiencing losses
during the reporting period, none contributed positively to performance.
| 10
|
MainStay Defensive ETF
Allocation Fund |
Those detracting the least
included iShares® 0-5 Year High Yield Corporate Bond ETF and iShares® Broad USD Investment
Grade Bond ETF. The most significant detractors were iShares® Core U.S. Aggregate Bond ETF and
Schwab® U.S. Aggregate Bond ETF.
How was the Fund positioned at the end of the reporting
period?
As the market rallied in October 2022, we
trimmed the Fund’s equity allocation, positioning the Fund very close to neutral as of October 31, 2022. We anticipate that the market will continue to move generally sideways within a very broad channel, presenting opportunities to trade
tactically, adding to equity holdings during periods of weakness and trimming them again as prices recover.
The bias we expect to have the largest impact on active return
is our preference for small- and mid-cap stocks. We believe that the large-cap space is potentially vulnerable to economic weakness abroad, a strong U.S. dollar, rich valuations and concentration in a relatively short list of very large companies
(mega-cap technology). Smaller companies, in contrast, cater primarily to what we view as a financially healthy domestic clientele and have historically been more successful than larger companies in protecting real earnings amid high
inflation.
Likewise, the Fund’s emphasis on value
stocks over growth stocks remains intact, with a particular emphasis on what we perceive to be the defensive “RUSH” sectors: real estate, utilities, consumer staples and health care. The thesis rests primarily on the idea that inflation
will prove persistent and jeopardize the high price multiples paid on fast-growing companies with current valuations that depend on distant earnings. We are also mindful of the economy’s progression in the business cycle and the possibility
that a recession may not be far away.
The Fund maintains
a position in energy sector firms, as we envision sustained supply constraints keeping commodity prices elevated, thus preserving meaty profit margins for several years to come. A small position in gold miner stocks also remains in the Fund's
portfolio as an intended hedge against a potential monetary policy mistake or as a safe harbor should the economy slide into recession.
Within fixed income, we have lessened the Fund’s
short-duration posture considerably as yields have climbed. As of October 31, 2022, the Fund’s duration is closer to the benchmark. We have also reduced the Fund’s exposure to credit, as corporate fundamentals show signs of gradual
deterioration.
None of Schwab Strategic Trust, Schwab® U.S. Aggregate Bond ETF, or Charles Schwab Investment Management, Inc. make any representations regarding the advisability of investing in MainStay Defensive ETF Allocation
Fund.
iShares® is a registered trademark of BlackRock (BlackRock, Inc. and its subsidiaries). Neither BlackRock nor the iShares® Funds make any representations regarding the advisability of investing in MainStay Defensive ETF Allocation Fund.
The opinions expressed are those of the portfolio managers as of
the date of this report and are subject to change. There is no guarantee that any forecasts will come to pass. This material does not constitute investment advice and is not intended as an endorsement of any specific investment.
Portfolio of
Investments October 31, 2022† (Unaudited)
| |
Shares
|
|
Value
|
| Investment
Companies 93.2% |
| Equity
Funds 21.2% |
| Health
Care Select Sector SPDR Fund (a) |
1,365
|
|
$ 181,204
|
| Invesco
S&P 500 Low Volatility ETF |
3,770
|
|
232,760 |
| iShares
Core MSCI EAFE ETF |
1,834
|
|
102,190 |
| iShares
Core S&P Small-Cap ETF |
4,703
|
|
460,518 |
| iShares
Semiconductor ETF (a) |
144
|
|
47,013 |
| Schwab
U.S. Mid-Cap ETF |
1,764
|
|
116,318 |
| Schwab
U.S. Small-Cap ETF |
6,077
|
|
254,262 |
| SPDR
S&P Oil & Gas Exploration & Production ETF |
351
|
|
53,103 |
| VanEck
Gold Miners ETF |
3,976
|
|
96,060 |
| VanEck
Oil Services ETF (a) |
213
|
|
63,623 |
| Vanguard
Mega Cap ETF |
1,436
|
|
192,984 |
| Vanguard
Mega Cap Value ETF (a) |
1,032
|
|
104,015 |
| Vanguard
Mid-Cap ETF |
934
|
|
190,527
|
Total
Equity Funds
(Cost $2,152,916) |
|
|
2,094,577
|
| Fixed
Income Funds 72.0% |
| Invesco
Senior Loan ETF (a) |
46,529
|
|
964,081 |
| iShares
0-5 Year High Yield Corporate Bond ETF (a) |
15,511
|
|
633,624
|
| iShares
20+ Year Treasury Bond ETF |
966
|
|
92,842
|
| iShares
Broad USD High Yield Corporate Bond ETF (a) |
9,991
|
|
344,590
|
| iShares
Broad USD Investment Grade Corporate Bond ETF |
20,063
|
|
951,789
|
| iShares
Core U.S. Aggregate Bond ETF |
23,063
|
|
2,188,679
|
| Schwab
U.S. Aggregate Bond ETF (a) |
43,125
|
|
1,927,256
|
Total
Fixed Income Funds
(Cost $8,121,485) |
|
|
7,102,861
|
Total
Investment Companies
(Cost $10,274,401) |
|
|
9,197,438
|
| Short-Term
Investments 26.5% |
| Affiliated
Investment Company 6.3% |
| MainStay
U.S. Government Liquidity Fund, 2.905% (b) |
623,216
|
|
623,216
|
| Unaffiliated
Investment Company 20.2% |
| Invesco
Government & Agency Portfolio, 3.163% (b)(c) |
1,988,887
|
|
1,988,887
|
Total
Short-Term Investments
(Cost $2,612,103) |
|
|
2,612,103
|
Total
Investments
(Cost $12,886,504) |
119.7%
|
|
11,809,541
|
| Other
Assets, Less Liabilities |
(19.7)
|
|
(1,943,655)
|
| Net
Assets |
100.0%
|
|
$
9,865,886 |
The
notes to the financial statements are an integral part of, and should be read in conjunction with, the financial statements.
| 12
|
MainStay Defensive ETF
Allocation Fund |
| †
|
Percentages
indicated are based on Fund net assets. |
| (a)
|
All or a
portion of this security was held on loan. As of October 31, 2022, the aggregate market value of securities on loan was $2,019,079; the total market value of collateral held by the Fund was $2,081,726. The market value of the collateral held
included non-cash collateral in the form of U.S. Treasury securities with a value of $92,839. The Fund received cash collateral with a value of $1,988,887. (See Note 2(G)) |
| (b)
|
Current
yield as of October 31, 2022. |
| (c)
|
Represents
a security purchased with cash collateral received for securities on loan. |
Investments in Affiliates (in 000's)
Investments in issuers considered to be affiliate(s) of the
Fund during the six-month period ended October 31, 2022 for purposes of Section 2(a)(3) of the Investment Company Act of 1940, as amended, were as follows:
| Affiliated
Investment Companies |
Value,
Beginning
of Period |
Purchases
at Cost |
Proceeds
from
Sales |
Net
Realized
Gain/(Loss)
on Sales |
Change
in
Unrealized
Appreciation/
(Depreciation) |
Value,
End of
Period |
Dividend
Income |
Other
Distributions |
Shares
End of
Period |
| MainStay
U.S. Government Liquidity Fund |
$ 274
|
$ 3,425
|
$ (3,076)
|
$ —
|
$ —
|
$ 623
|
$ 3
|
$ —
|
623
|
| Abbreviation(s):
|
| EAFE—Europe,
Australasia and Far East |
| ETF—Exchange-Traded
Fund |
| MSCI—Morgan
Stanley Capital International |
| SPDR—Standard
& Poor’s Depositary Receipt |
| USD—United
States Dollar |
The following is a
summary of the fair valuations according to the inputs used as of October 31, 2022, for valuing the Fund’s assets:
| Description
|
Quoted
Prices in
Active
Markets for
Identical
Assets
(Level 1) |
|
Significant
Other
Observable
Inputs
(Level 2) |
|
Significant
Unobservable
Inputs
(Level 3) |
|
Total
|
| Asset
Valuation Inputs |
|
|
|
|
|
|
|
| Investments
in Securities (a) |
|
|
|
|
|
|
|
| Investment
Companies |
|
|
|
|
|
|
|
| Equity
Funds |
$
2,094,577 |
|
$ —
|
|
$ —
|
|
$
2,094,577 |
| Fixed
Income Funds |
7,102,861
|
|
—
|
|
—
|
|
7,102,861
|
| Total
Investment Companies |
9,197,438
|
|
—
|
|
—
|
|
9,197,438
|
| Short-Term
Investments |
|
|
|
|
|
|
|
| Affiliated
Investment Company |
623,216
|
|
—
|
|
—
|
|
623,216
|
| Unaffiliated
Investment Company |
1,988,887
|
|
—
|
|
—
|
|
1,988,887
|
| Total
Short-Term Investments |
2,612,103
|
|
—
|
|
—
|
|
2,612,103
|
| Total
Investments in Securities |
$ 11,809,541
|
|
$ —
|
|
$ —
|
|
$ 11,809,541
|
| (a)
|
For
a complete listing of investments, see the Portfolio of Investments. |
The notes to the financial statements are an integral part of,
and should be read in conjunction with, the financial statements.
13
Statement of
Assets and Liabilities as of October 31, 2022 (Unaudited)
| Assets
|
Investment
in unaffiliated securities, at value
(identified cost $12,263,288) including securities on loan of $2,019,079 |
$11,186,325
|
Investment
in affiliated investment companies, at value
(identified cost $623,216) |
623,216
|
| Cash
|
2
|
| Receivables:
|
|
| Manager
(See Note 3) |
9,349
|
| Securities
lending |
6,123
|
| Fund
shares sold |
5,015
|
| Interest
|
1,136
|
| Other
assets |
55,946
|
| Total
assets |
11,887,112
|
| Liabilities
|
| Cash
collateral received for securities on loan |
1,988,887
|
| Payables:
|
|
| Professional
fees |
16,127
|
| Shareholder
communication |
5,415
|
| Custodian
|
3,390
|
| NYLIFE
Distributors (See Note 3) |
2,206
|
| Fund
shares redeemed |
2,000
|
| Trustees
|
475
|
| Transfer
agent (See Note 3) |
443
|
| Accrued
expenses |
2,283
|
| Total
liabilities |
2,021,226
|
| Net
assets |
$
9,865,886 |
| Composition
of Net Assets |
| Shares
of beneficial interest outstanding (par value of $.001 per share) unlimited number of shares authorized |
$
1,104 |
| Additional
paid-in-capital |
11,142,639
|
| |
11,143,743
|
| Total
distributable earnings (loss) |
(1,277,857)
|
| Net
assets |
$
9,865,886 |
| Class
A |
|
| Net
assets applicable to outstanding shares |
$9,260,728
|
| Shares
of beneficial interest outstanding |
1,036,268
|
| Net
asset value per share outstanding |
$
8.94 |
| Maximum
sales charge (3.00% of offering price) |
0.28
|
| Maximum
offering price per share outstanding |
$
9.22 |
| Class
C |
|
| Net
assets applicable to outstanding shares |
$
89,080 |
| Shares
of beneficial interest outstanding |
9,976
|
| Net
asset value and offering price per share outstanding |
$
8.93 |
| Class
I |
|
| Net
assets applicable to outstanding shares |
$
38,835 |
| Shares
of beneficial interest outstanding |
4,348
|
| Net
asset value and offering price per share outstanding |
$
8.93 |
| Class
R3 |
|
| Net
assets applicable to outstanding shares |
$
48,843 |
| Shares
of beneficial interest outstanding |
5,468
|
| Net
asset value and offering price per share outstanding |
$
8.93 |
| SIMPLE
Class |
|
| Net
assets applicable to outstanding shares |
$
428,400 |
| Shares
of beneficial interest outstanding |
47,939
|
| Net
asset value and offering price per share outstanding |
$
8.94 |
The notes to the financial statements are an
integral part of, and should be read in conjunction with, the financial statements.
| 14
|
MainStay Defensive ETF
Allocation Fund |
Statement of
Operations for the six months ended October 31, 2022 (Unaudited)
| Investment
Income (Loss) |
| Income
|
|
| Dividends-unaffiliated
|
$
145,280 |
| Securities
lending, net |
27,242
|
| Dividends-affiliated
|
3,120
|
| Total
income |
175,642
|
| Expenses
|
|
| Registration
|
39,110
|
| Professional
fees |
16,028
|
| Distribution/Service—Class
A (See Note 3) |
11,730
|
| Distribution/Service—Class
C (See Note 3) |
506
|
| Distribution/Service—Class
R3 (See Note 3) |
92
|
| Distribution/Service—SIMPLE
Class (See Note 3) |
899
|
| Manager
(See Note 3) |
9,919
|
| Custodian
|
8,903
|
| Transfer
agent (See Note 3) |
3,593
|
| Shareholder
communication |
1,594
|
| Trustees
|
48
|
| Shareholder
service (See Note 3) |
19
|
| Miscellaneous
|
2,146
|
| Total
expenses before waiver/reimbursement |
94,587
|
| Expense
waiver/reimbursement from Manager (See Note 3) |
(54,065)
|
| Net
expenses |
40,522
|
| Net
investment income (loss) |
135,120
|
| Realized
and Unrealized Gain (Loss) |
| Net
realized gain (loss) on unaffiliated investments |
(196,463)
|
| Net
change in unrealized appreciation (depreciation) on unaffiliated investments |
(414,007)
|
| Net
realized and unrealized gain (loss) |
(610,470)
|
| Net
increase (decrease) in net assets resulting from operations |
$(475,350)
|
The notes to the financial statements are an integral part of,
and should be read in conjunction with, the financial statements.
15
Statements of
Changes in Net Assets
for the six months ended October 31, 2022 (Unaudited) and the year ended April 30, 2022
| |
Six months
ended
October 31,
2022 |
Year
ended
April 30,
2022 |
| Increase
(Decrease) in Net Assets |
| Operations:
|
|
|
| Net
investment income (loss) |
$
135,120 |
$
169,523 |
| Net
realized gain (loss) |
(196,463)
|
29,411
|
| Net
change in unrealized appreciation (depreciation) |
(414,007)
|
(878,389)
|
| Net
increase (decrease) in net assets resulting from operations |
(475,350)
|
(679,455)
|
| Distributions
to shareholders: |
|
|
| Class
A |
(115,130)
|
(248,280)
|
| Class
C |
(864)
|
(2,845)
|
| Class
I |
(503)
|
(1,116)
|
| Class
R3 |
(422)
|
(758)
|
| SIMPLE
Class |
(3,941)
|
(3,645)
|
| Total
distributions to shareholders |
(120,860)
|
(256,644)
|
| Capital
share transactions: |
|
|
| Net
proceeds from sales of shares |
1,701,356
|
5,073,474
|
| Net
asset value of shares issued to shareholders in reinvestment of distributions |
120,125
|
254,651
|
| Cost
of shares redeemed |
(1,180,573)
|
(5,451,399)
|
| Increase
(decrease) in net assets derived from capital share transactions |
640,908
|
(123,274)
|
| Net
increase (decrease) in net assets |
44,698
|
(1,059,373)
|
| Net
Assets |
| Beginning
of period |
9,821,188
|
10,880,561
|
| End
of period |
$
9,865,886 |
$
9,821,188 |
The notes to the financial statements are an integral part of,
and should be read in conjunction with, the financial statements.
| 16
|
MainStay Defensive ETF
Allocation Fund |
Financial
Highlights selected per share data and ratios
| |
Six
months ended
October 31,
2022* |
|
Year
Ended April 30, |
|
June
30, 2020^ through
April 30, |
| Class
A |
2022
|
|
2021
|
| Net
asset value at beginning of period |
$
9.50 |
|
$
10.44 |
|
$
10.00 |
| Net
investment income (loss) (a) |
0.13
|
|
0.18
|
|
0.13
|
| Net
realized and unrealized gain (loss) |
(0.58)
|
|
(0.84)
|
|
0.41
|
| Total
from investment operations |
(0.45)
|
|
(0.66)
|
|
0.54
|
| Less
distributions: |
|
|
|
|
|
| From
net investment income |
(0.11)
|
|
(0.19)
|
|
(0.10)
|
| From
net realized gain on investments |
—
|
|
(0.09)
|
|
—
|
| Total
distributions |
(0.11)
|
|
(0.28)
|
|
(0.10)
|
| Net
asset value at end of period |
$
8.94 |
|
$
9.50 |
|
$
10.44 |
| Total
investment return (b) |
(4.68)%
|
|
(6.49)%
|
|
5.38%
|
| Ratios
(to average net assets)/Supplemental Data: |
|
|
|
|
|
| Net
investment income (loss) |
2.74%††
|
|
1.79%
|
|
1.45%††
|
| Net
expenses (c) |
0.80%††
|
|
0.80%
|
|
0.80%††
|
| Expenses
(before waiver/reimbursement) (c) |
1.89%††
|
|
1.75%
|
|
2.36%††
|
| Portfolio
turnover rate |
36%
|
|
79%
|
|
69%
|
| Net
assets at end of period (in 000’s) |
$
9,261 |
|
$
9,366 |
|
$
8,572 |
| *
|
Unaudited.
|
| ^
|
Inception
date. |
| ††
|
Annualized.
|
| (a)
|
Per share
data based on average shares outstanding during the period. |
| (b)
|
Total
investment return is calculated exclusive of sales charges and assumes the reinvestment of dividends and distributions. For periods of less than one year, total return is not annualized. |
| (c)
|
In
addition to the fees and expenses which the Fund bears directly, it also indirectly bears a pro-rata share of the fees and expenses of the underlying funds in which it invests. Such indirect expenses are not included in the above expense ratios.
|
The
notes to the financial statements are an integral part of, and should be read in conjunction with, the financial statements.
17
Financial
Highlights selected per share data and ratios
| |
Six
months ended
October 31,
2022* |
|
Year
Ended April 30, |
|
June
30, 2020^ through
April 30, |
| Class
C |
2022
|
|
2021
|
| Net
asset value at beginning of period |
$
9.49 |
|
$
10.44 |
|
$
10.00 |
| Net
investment income (loss) (a) |
0.10
|
|
0.11
|
|
0.06
|
| Net
realized and unrealized gain (loss) |
(0.58)
|
|
(0.85)
|
|
0.43
|
| Total
from investment operations |
(0.48)
|
|
(0.74)
|
|
0.49
|
| Less
distributions: |
|
|
|
|
|
| From
net investment income |
(0.08)
|
|
(0.12)
|
|
(0.05)
|
| From
net realized gain on investments |
—
|
|
(0.09)
|
|
—
|
| Total
distributions |
(0.08)
|
|
(0.21)
|
|
(0.05)
|
| Net
asset value at end of period |
$
8.93 |
|
$
9.49 |
|
$
10.44 |
| Total
investment return (b) |
(5.06)%
|
|
(7.28)%
|
|
4.85%
|
| Ratios
(to average net assets)/Supplemental Data: |
|
|
|
|
|
| Net
investment income (loss) |
2.24%††
|
|
1.07%
|
|
0.74%††
|
| Net
expenses (c) |
1.55%††
|
|
1.55%
|
|
1.55%††
|
| Expenses
(before waiver/reimbursement) (c) |
2.71%††
|
|
2.60%
|
|
3.13%††
|
| Portfolio
turnover rate |
36%
|
|
79%
|
|
69%
|
| Net
assets at end of period (in 000’s) |
$
89 |
|
$
117 |
|
$
162 |
| *
|
Unaudited.
|
| ^
|
Inception
date. |
| ††
|
Annualized.
|
| (a)
|
Per share
data based on average shares outstanding during the period. |
| (b)
|
Total
investment return is calculated exclusive of sales charges and assumes the reinvestment of dividends and distributions. For periods of less than one year, total return is not annualized. |
| (c)
|
In
addition to the fees and expenses which the Fund bears directly, it also indirectly bears a pro-rata share of the fees and expenses of the underlying funds in which it invests. Such indirect expenses are not included in the above expense ratios.
|
The
notes to the financial statements are an integral part of, and should be read in conjunction with, the financial statements.
| 18
|
MainStay Defensive ETF
Allocation Fund |
Financial
Highlights selected per share data and ratios
| |
Six
months ended
October 31,
2022* |
|
Year
Ended April 30, |
|
June
30, 2020^ through
April 30, |
| Class
I |
2022
|
|
2021
|
| Net
asset value at beginning of period |
$
9.50 |
|
$
10.44 |
|
$
10.00 |
| Net
investment income (loss) (a) |
0.14
|
|
0.24
|
|
0.16
|
| Net
realized and unrealized gain (loss) |
(0.58)
|
|
(0.87)
|
|
0.40
|
| Total
from investment operations |
(0.44)
|
|
(0.63)
|
|
0.56
|
| Less
distributions: |
|
|
|
|
|
| From
net investment income |
(0.13)
|
|
(0.22)
|
|
(0.12)
|
| From
net realized gain on investments |
—
|
|
(0.09)
|
|
—
|
| Total
distributions |
(0.13)
|
|
(0.31)
|
|
(0.12)
|
| Net
asset value at end of period |
$
8.93 |
|
$
9.50 |
|
$
10.44 |
| Total
investment return (b) |
(4.67)%
|
|
(6.25)%
|
|
5.65%
|
| Ratios
(to average net assets)/Supplemental Data: |
|
|
|
|
|
| Net
investment income (loss) |
3.08%††
|
|
2.33%
|
|
1.82%††
|
| Net
expenses (c) |
0.55%††
|
|
0.55%
|
|
0.55%††
|
| Expenses
(before waiver/reimbursement) (c) |
1.64%††
|
|
1.50%
|
|
2.11%††
|
| Portfolio
turnover rate |
36%
|
|
79%
|
|
69%
|
| Net
assets at end of period (in 000’s) |
$
39 |
|
$
35 |
|
$
2,040 |
| *
|
Unaudited.
|
| ^
|
Inception
date. |
| ††
|
Annualized.
|
| (a)
|
Per share
data based on average shares outstanding during the period. |
| (b)
|
Total
investment return is calculated exclusive of sales charges and assumes the reinvestment of dividends and distributions. Class I shares are not subject to sales charges. For periods of less than one year, total return is not annualized. |
| (c)
|
In
addition to the fees and expenses which the Fund bears directly, it also indirectly bears a pro-rata share of the fees and expenses of the underlying funds in which it invests. Such indirect expenses are not included in the above expense ratios.
|
The
notes to the financial statements are an integral part of, and should be read in conjunction with, the financial statements.
19
Financial
Highlights selected per share data and ratios
| |
Six
months ended
October 31,
2022* |
|
Year
Ended April 30, |
|
June
30, 2020^ through
April 30, |
| Class
R3 |
2022
|
|
2021
|
| Net
asset value at beginning of period |
$
9.49 |
|
$
10.44 |
|
$
10.00 |
| Net
investment income (loss) (a) |
0.11
|
|
0.15
|
|
0.11
|
| Net
realized and unrealized gain (loss) |
(0.57)
|
|
(0.85)
|
|
0.41
|
| Total
from investment operations |
(0.46)
|
|
(0.70)
|
|
0.52
|
| Less
distributions: |
|
|
|
|
|
| From
net investment income |
(0.10)
|
|
(0.16)
|
|
(0.08)
|
| From
net realized gain on investments |
—
|
|
(0.09)
|
|
—
|
| Total
distributions |
(0.10)
|
|
(0.25)
|
|
(0.08)
|
| Net
asset value at end of period |
$
8.93 |
|
$
9.49 |
|
$
10.44 |
| Total
investment return (b) |
(4.89)%
|
|
(6.91)%
|
|
5.18%
|
| Ratios
(to average net assets)/Supplemental Data: |
|
|
|
|
|
| Net
investment income (loss) |
2.32%††
|
|
1.45%
|
|
1.22%††
|
| Net
expenses (c) |
1.15%††
|
|
1.15%
|
|
1.15%††
|
| Expenses
(before waiver/reimbursement) (c) |
2.24%††
|
|
2.10%
|
|
2.71%††
|
| Portfolio
turnover rate |
36%
|
|
79%
|
|
69%
|
| Net
assets at end of period (in 000’s) |
$
49 |
|
$
32 |
|
$
26 |
| *
|
Unaudited.
|
| ^
|
Inception
date. |
| ††
|
Annualized.
|
| (a)
|
Per share
data based on average shares outstanding during the period. |
| (b)
|
Total
investment return is calculated exclusive of sales charges and assumes the reinvestment of dividends and distributions. Class R3 shares are not subject to sales charges. For periods of less than one year, total return is not annualized. |
| (c)
|
In
addition to the fees and expenses which the Fund bears directly, it also indirectly bears a pro-rata share of the fees and expenses of the underlying funds in which it invests. Such indirect expenses are not included in the above expense ratios.
|
The
notes to the financial statements are an integral part of, and should be read in conjunction with, the financial statements.
| 20
|
MainStay Defensive ETF
Allocation Fund |
Financial
Highlights selected per share data and ratios
| |
Six
months ended
October 31,
2022* |
|
Year
Ended April 30, |
|
August
31, 2020^ through
April 30, |
| SIMPLE
Class |
2022
|
|
2021
|
| Net
asset value at beginning of period |
$
9.50 |
|
$
10.44 |
|
$
10.26 |
| Net
investment income (loss) (a) |
0.11
|
|
0.15
|
|
0.10
|
| Net
realized and unrealized gain (loss) |
(0.57)
|
|
(0.83)
|
|
0.16
|
| Total
from investment operations |
(0.46)
|
|
(0.68)
|
|
0.26
|
| Less
distributions: |
|
|
|
|
|
| From
net investment income |
(0.10)
|
|
(0.17)
|
|
(0.08)
|
| From
net realized gain on investments |
—
|
|
(0.09)
|
|
—
|
| Total
distributions |
(0.10)
|
|
(0.26)
|
|
(0.08)
|
| Net
asset value at end of period |
$
8.94 |
|
$
9.50 |
|
$
10.44 |
| Total
investment return (b) |
(4.81)%
|
|
(6.74)%
|
|
2.56%
|
| Ratios
(to average net assets)/Supplemental Data: |
|
|
|
|
|
| Net
investment income (loss) |
2.37%††
|
|
1.45%
|
|
1.13%††
|
| Net
expenses (c) |
1.05%††
|
|
1.05%
|
|
1.05%††
|
| Expenses
(before waiver/reimbursement) (c) |
2.21%††
|
|
2.10%
|
|
2.63%††
|
| Portfolio
turnover rate |
36%
|
|
79%
|
|
69%
|
| Net
assets at end of period (in 000’s) |
$
428 |
|
$
271 |
|
$
80 |
| *
|
Unaudited.
|
| ^
|
Inception
date. |
| ††
|
Annualized.
|
| (a)
|
Per share
data based on average shares outstanding during the period. |
| (b)
|
Total
investment return is calculated exclusive of sales charges and assumes the reinvestment of dividends and distributions. SIMPLE Class shares are not subject to sales charges. For periods of less than one year, total return is not annualized.
|
| (c)
|
In
addition to the fees and expenses which the Fund bears directly, it also indirectly bears a pro-rata share of the fees and expenses of the underlying funds in which it invests. Such indirect expenses are not included in the above expense ratios.
|
The notes to the financial statements are an integral part of, and should be
read in conjunction with, the financial statements.
21
MainStay
Conservative ETF Allocation Fund
Investment and
Performance Comparison (Unaudited)
Performance data quoted represents past performance. Past performance is no
guarantee of future results. Because of market volatility and other factors, current performance may be lower or higher than the figures shown. Investment return and principal value will fluctuate, and as a result, when shares are redeemed, they may
be worth more or less than their original cost. The graph below depicts the historical performance of Class I shares of the Fund. Performance will vary from class to class based on differences in class-specific expenses and sales charges. For performance information current to the most recent month-end, please call 800-624-6782 or visit newyorklifeinvestments.com.
The performance table and graph do not reflect the deduction
of taxes that a shareholder would pay on distributions or Fund share redemptions. Total returns reflect maximum applicable sales charges as indicated in the table below, if any, changes in share price, and reinvestment of dividend and capital gain
distributions. The graph assumes the initial investment amount shown below and reflects the deduction of all sales charges that would have applied for the period of investment. Performance figures may reflect certain fee waivers and/or expense
limitations, without which total returns may have been lower. For more information on share classes and current fee waivers and/or expense limitations (if any), please refer to the Notes to Financial Statements.
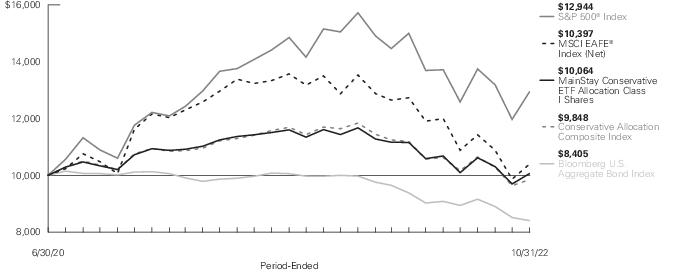
| Average
Annual Total Returns for the Period-Ended October 31, 2022 |
| Class
|
Sales
Charge |
|
Inception
Date |
Six
Months1 |
One
Year |
Since
Inception |
Gross
Expense
Ratio2 |
| Class
A Shares |
Maximum
3% Initial Sales Charge |
With
sales charges |
6/30/2020
|
-7.91%
|
-16.05%
|
-1.23%
|
1.03%
|
| |
|
Excluding
sales charges |
|
-5.06
|
-13.45
|
0.06
|
1.03
|
| Class
C Shares |
Maximum
1% CDSC |
With
sales charges |
6/30/2020
|
-6.29
|
-14.91
|
-0.71
|
1.85
|
| |
if
redeemed Within One Year of Purchase |
Excluding
sales charges |
|
-5.35
|
-14.07
|
-0.71
|
1.85
|
| Class
I Shares |
No
Sales Charge |
|
6/30/2020
|
-4.94
|
-13.31
|
0.27
|
0.78
|
| Class
R3 Shares |
No
Sales Charge |
|
6/30/2020
|
-5.24
|
-13.77
|
-0.31
|
1.38
|
| SIMPLE
Class Shares |
No
Sales Charge |
|
8/31/2020
|
-5.18
|
-13.66
|
-2.25
|
1.35
|
| 1.
|
Not
annualized. |
| 2.
|
The
gross expense ratios presented reflect the Fund’s “Total Annual Fund Operating Expenses” from the most recent Prospectus, as supplemented, and may differ from other expense ratios disclosed in this report. |
The
footnotes on the next page are an integral part of the table and graph and should be carefully read in conjunction with them.
| 22
|
MainStay Conservative ETF
Allocation Fund |
| Benchmark
Performance* |
Six
Months1 |
One
Year |
Since
Inception |
| Bloomberg
U.S. Aggregate Bond Index2 |
-6.86%
|
-15.68%
|
-7.17%
|
| S&P
500® Index3 |
-5.50
|
-14.61
|
11.68
|
| MSCI
EAFE® Index (Net)4 |
-12.70
|
-23.00
|
1.68
|
| Conservative
Allocation Composite Index5 |
-6.84
|
-15.83
|
-0.65
|
| Morningstar
Allocation-30% to 50% Equity Category Average6 |
-6.84
|
-14.82
|
0.98
|
| *
|
Returns
for indices reflect no deductions for fees, expenses or taxes, except for foreign withholding taxes where applicable. Results assume reinvestment of all dividends and capital gains. An investment cannot be made directly in an index.
|
| 1.
|
Not
annualized. |
| 2.
|
The Fund
has selected the Bloomberg U.S. Aggregate Bond Index as the primary broad-based securities market index for comparison purposes. The Bloomberg U.S. Aggregate Bond Index is a broad-based benchmark that measures the investment grade, U.S.
dollar-denominated, fixed-rate taxable bond market, including Treasuries, government-related and corporate securities, mortgage-backed securities (agency fixed-rate and hybrid adjustable rate mortgage pass-throughs), asset-backed securities and
commercial mortgage-backed securities. |
| 3.
|
The
S&P 500® Index is the Fund's secondary benchmark. The S&P 500® Index is widely regarded
as the standard index for measuring large-cap U.S. stock market performance. |
| 4.
|
The Fund
has selected the MSCI EAFE® Index (Net) as an additional benchmark. The MSCI EAFE® Index (Net)
consists of international stocks representing the developed world outside of North America. |
| 5.
|
The Fund
has selected the Conservative Allocation Composite Index as an additional benchmark. The Conservative Allocation Composite Index consists of the S&P 500® Index, the
MSCI EAFE® Index (Net) and the Bloomberg U.S. Aggregate Bond Index weighted 30%, 10% and 60%, respectively. |
| 6.
|
The
Morningstar Allocation – 30% to 50% Equity Category Average is representative of funds that seek to provide both income and capital appreciation by investing in multiple asset classes, including stocks, bonds, and cash. These portfolios are
dominated by domestic holdings and have equity exposures between 30% to 50%. Results are based on average total returns of similar funds with all dividends and capital gain distributions reinvested. |
The
footnotes on the preceding page are an integral part of the table and graph and should be carefully read in conjunction with them.
Cost in Dollars of
a $1,000 Investment in MainStay Conservative ETF Allocation Fund (Unaudited)
The example below is intended to describe the fees and expenses
borne by shareholders during the six-month period from May 1, 2022 to October 31, 2022, and the impact of those costs on your investment.
Example
As a shareholder of the Fund you incur two types of costs: (1)
transaction costs, including exchange fees and sales charges (loads) on purchases (as applicable), and (2) ongoing costs, including management fees, distribution and/or service (12b-1) fees and other Fund expenses (as applicable). This example is
intended to help you understand your ongoing costs (in dollars) of investing in the Fund and to compare these costs with the ongoing costs of investing in other mutual funds. The example is based on an investment of $1,000 made at the beginning of
the six-month period and held for the entire period from May 1, 2022 to October 31, 2022.
This example illustrates your Fund’s ongoing costs in two
ways:
Actual Expenses
The second and third data columns in the table below provide information about
actual account values and actual expenses. You may use the information in these columns, together with the amount you invested, to estimate the expenses that you paid during the six months ended October 31, 2022. Simply divide your account value by
$1,000 (for example, an
$8,600 account value divided by $1,000 = 8.6), then multiply the result by the
number under the heading entitled “Expenses Paid During Period” to estimate the expenses you paid on your account during this period.
Hypothetical Example for Comparison Purposes
The fourth and fifth data columns in the table below provide information about
hypothetical account values and hypothetical expenses based on the Fund’s actual expense ratio and an assumed rate of return of 5% per year before expenses, which is not the Fund’s actual return. The hypothetical account values and
expenses may not be used to estimate the actual ending account balances or expenses you paid for the six-month period shown. You may use this information to compare the ongoing costs of investing in the Fund with the ongoing costs of investing in
other mutual funds. To do so, compare this 5% hypothetical example with the 5% hypothetical examples that appear in the shareholder reports of the other mutual funds.
Please note that the expenses shown in the table are meant to
highlight your ongoing costs only and do not reflect any transactional costs, such as exchange fees or sales charges (loads). Therefore, the fourth and fifth data columns of the table are useful in comparing ongoing costs only and will not help you
determine the relative total costs of owning different funds. In addition, if these transactional costs were included, your costs would have been higher.
| Share
Class |
Beginning
Account
Value
5/1/22 |
Ending
Account
Value (Based
on Actual
Returns and
Expenses)
10/31/22 |
Expenses
Paid
During
Period1 |
Ending
Account
Value (Based
on Hypothetical
5% Annualized
Return and
Actual Expenses)
10/31/22 |
Expenses
Paid
During
Period1 |
Net
Expense
Ratio
During
Period2 |
| Class
A Shares |
$1,000.00
|
$949.40
|
$3.93
|
$1,021.17
|
$4.08
|
0.80%
|
| Class
C Shares |
$1,000.00
|
$946.50
|
$7.60
|
$1,017.39
|
$7.88
|
1.55%
|
| Class
I Shares |
$1,000.00
|
$950.60
|
$2.70
|
$1,022.43
|
$2.80
|
0.55%
|
| Class
R3 Shares |
$1,000.00
|
$947.60
|
$5.65
|
$1,019.41
|
$5.85
|
1.15%
|
| SIMPLE
Class Shares |
$1,000.00
|
$948.20
|
$5.16
|
$1,019.91
|
$5.35
|
1.05%
|
| 1.
|
Expenses are
equal to the Fund’s annualized expense ratio of each class multiplied by the average account value over the period, divided by 365 and multiplied by 184 (to reflect the six-month period). The table above represents the actual expenses incurred
during the six-month period. In addition to the fees and expenses which the Fund bears directly, it also indirectly bears a pro rata share of the fees and expenses of the underlying funds in which it invests. Such indirect expenses are not included
in the above-reported expense figures. |
| 2.
|
Expenses
are equal to the Fund's annualized expense ratio to reflect the six-month period. |
| 24
|
MainStay Conservative ETF
Allocation Fund |
Asset Diversification as of October 31, 2022
(Unaudited)
| Equity
Funds |
41.3
% |
| Fixed
Income Funds |
52.1
|
| Short-Term
Investments |
30.8
|
| Other
Assets, Less Liabilities |
(24.2)
|
See Portfolio of Investments
beginning on page 29 for specific holdings within these categories. The Fund’s holdings are subject to change.
Portfolio
Management Discussion and Analysis (Unaudited)
Questions answered by portfolio managers Jae S. Yoon,
CFA, Jonathan Swaney, Poul Kristensen, CFA, and Amit Soni, CFA, of New York Life Investment Management LLC, the Fund’s Manager.
How did MainStay Conservative ETF Allocation Fund perform relative to
its benchmarks and peer group during the six months ended October 31, 2022?
For the six months ended October 31, 2022, Class I shares of
MainStay Conservative ETF Allocation Fund returned −4.94%, outperforming the −6.86% return of the Fund’s primary benchmark, the Bloomberg U.S. Aggregate Bond Index (the "Index"), and the −5.50% return of the S&P 500® Index, which is the Fund’s secondary benchmark. Over the same period, Class I shares of the Fund outperformed the −12.70% return of the MSCI EAFE® Index (Net), and the −6.84% return of the Conservative Allocation Composite Index, both of which are additional benchmarks of the Fund. For the six months ended October
31, 2022, Class I shares of the Fund outperformed the −6.84% return of the Morningstar Allocation -30% to 50% Equity Category Average.1
What factors affected the Fund’s relative
performance during the reporting period?
The Fund is a
“fund of funds" that seeks to achieve its investment objective by investing in unaffiliated, passively-managed, exchange-traded funds (“Underlying ETFs”). The Underlying ETFs may invest in U.S. equities, international equities and
fixed-income instruments, making comparisons to any single index generally less suitable than a weighted combination of indices, which is a more useful yardstick by which to measure performance. During the reporting period, asset class policy was
the primary determinant of the Fund’s relative performance.
Fund management internally maintains a blend of indices that
are taken into consideration when managing the Fund. During the reporting period, the Fund materially outperformed the internally maintained blend of indices primarily due to active positioning at the asset class level. The Fund’s
outperformance was driven by the following factors:
| •
|
Management of the stock/bond
blend: The Fund’s management of its stock/bond blend proved generally successful, reflecting tactical adjustments made throughout the reporting period. With both investment-grade bonds and U.S. stocks posting declines in the mid-teens, there
was little cost or benefit to being persistently overweight or underweight in equities, although adjusting that exposure over time (buying dips and selling rallies) added significant value. |
| •
|
Value
created within asset classes: The equity portion of the Fund emphasized value over growth, with a specific focus on energy companies and defensive sectors that the market |
rewarded. Conditions also favored the Fund’s skew toward profitable
small-cap companies.
| •
|
Shorter duration:2 We shortened the average duration of the fixed-income portion of the Fund by holding cash and emphasizing exposure to iShares® 0-5 Year High Yield Corporate Bond ETF over its full duration counterpart, iShares® Broad USD
High Yield Corporate Bond ETF. Both moves lifted relative returns. |
| •
|
Also
noteworthy is the fact that the internally maintained blend of indices against which the Fund is managed significantly outperformed the median return of peers within the Morningstar category to which the Fund is assigned, providing a tailwind to
relative performance. |
The most
significant detractor from the Fund’s relative performance was exposure to gold miner equities. The price of gold, and thus gold miners, tends to move inversely to real bond yields. The combination of the Federal Reserve (the "Fed) pushing
rates higher and emerging signs that inflation may be peaking spelled trouble for this particular position.
How did you allocate the Fund’s assets during the
reporting period and why?
Stock/bond blend: On average,
the Fund held a moderately overweight exposure to equities during the reporting period, with the magnitude of that bias managed tactically in response to swings in pricing, as described above. We are generally reluctant to position the Fund with an
underweight allocation to equities, as stocks have tended to perform well over time, and anticipating drawdowns is challenging. The opposite is less true; we are happy to increase the Fund’s allocation to equities when we believe they are well
supported fundamentally or when a correction has run further than we believe appropriate. This approach worked well during the reporting period. Although stocks declined by double digits, the Fund generated roughly 0.3% of excess return3 through tactical adjustments to its degree of overweight exposure to equities.
Duration: Believing inflationary pressures to be partially
structural in nature and likely to persist at elevated levels for the foreseeable future, we skewed the Fund’s fixed-income holdings to favor shorter maturity instruments less sensitive to rising bond yields, although we increased the
Fund’s duration as yields rose. By the end of the reporting period, the average duration of the fixed-income portion of the Fund was only slightly shorter than that of the benchmark. The Fund’s duration policy contributed positively to
performance. (Contributions take weightings and total returns into account.)
| 1.
|
See page 22 for other share
class returns, which may be higher or lower than Class I share returns. See page 23 for more information on benchmark and peer group returns. |
| 2.
|
Duration is a measure of the
price sensitivity of a fixed-income investment to changes in interest rates. Duration is expressed as a number of years and is considered a more accurate sensitivity gauge than average maturity. |
| 3.
|
The expression “excess
return” may refer to the return that a security or portfolio provides above (or below) an investment with the lowest perceived risk, such as comparable U.S. Treasury securities. The expression may also refer to the return that a security or
portfolio provides above (or below) an index or other benchmark. |
| 26
|
MainStay Conservative ETF
Allocation Fund |
Equity style: In the same way that inflation is threatening to
long-duration bonds, equities with values disproportionately reflected in more distant cash flows (i.e., growth stocks with high prices relative to current earnings) are likewise vulnerable. Accordingly, we tilted the Fund to emphasize value stocks
that offered more attractive near-term cash flows, placing particular focus on traditionally defensive sectors: real estate, utilities, consumer staples and (most of all) health care. The combined effect was a modest positive contribution to return
of approximately 0.1%.
Equity size: Small-company stocks
were more heavily owned in the Fund than in the Index. The thesis behind this positioning was based on attractive small-cap valuations, insulation from economic weakness abroad, less sensitivity to dollar strength and disproportionate exposure to
domestic demand, which remained healthy. The Fund’s active position in small-cap companies contributed approximately 0.25% to relative performance.
Geographic exposure: In light of Russia’s invasion of
Ukraine, the Fund held an underweight exposure to developed international markets, benefiting performance at the margin. That improvement in returns was fully offset, however, by a small overweight position in emerging market equities. We believed
that China’s economy would benefit from the country’s relaxation of its zero-COVID policy, as well as additional fiscal support ahead of the October 2022 Party Congress; however, neither development materialized.
Gold miners: The Fund maintained a varying position in gold
miners as a hedge against inflation and/or a monetary policy mistake. With month-over-month readings on inflation starting to improve, the Fed demonstrating their mettle in aggressively tightening monetary policy, and input costs for energy and
labor rising sharply, this proved to be an unfavorable environment for miners. The position subtracted almost 0.4% from the Fund’s return, making it by far the most significant detractor from Fund performance.
Energy: As with gold miners, the Fund maintained exposure to
upstream energy producers as a commodity play to provide an additional inflation hedge. These holdings also positioned the Fund to take advantage of opportunities for domestic producers to benefit as Western nations revisit energy policy to source
supplies from stable and friendly jurisdictions, rather than autocratic petrostates that present national security risks. While the Fund’s position was small, it had a disproportionately positive impact on performance as oil and gas prices
soared, fully offsetting the adverse impact of the Fund’s exposure to gold miners.
How did the Fund’s allocations change over the
course of the reporting period?
We reduced the
Fund’s allocation most significantly to iShares® Core MSCI EAFE ETF to lessen non-U.S. market exposure in anticipation of a global recession. We also trimmed holdings
in
iShares®
0-5 Year High Yield Corporate Bond ETF and iShares® Broad USD High Yield Corporate Bond ETF, as exposure to sub-investment-grade credit was pulled back to benchmark
levels. Another downward adjustment involved trimming holdings of VanEck Oil Services ETF and SPDR®
S&P® Oil & Gas Exploration ETF; these positions were reduced following a long period of solid outperformance, with energy being the only sector to deliver positive
returns during the reporting period.
The Fund’s
cash position saw the largest increase, as we parked proceeds from cutting back equity exposure. Allocations to defensive industries also grew via positions in Health Care Select Sector SPDR® ETF and Invesco S&P® 500 Low Volatility ETF. iShares® Core U.S. Aggregate Bond ETF, Schwab® U.S. Aggregate Bond ETF and iShares® Broad USD Investment Grade Corporate Bond ETF all saw inflows resulting from the sale of high yield credits.
During the reporting period, which Underlying Equity
ETFs had the highest total returns and which Underlying Equity ETFs had the lowest total returns?
The Fund’s two top-performing Underlying Equity ETFs,
were SPDR® S&P® Oil & Gas Exploration ETF and VanEck Oil Services ETF. Also posting
positive returns were Health Care Select Sector SPDR® ETF and Vanguard Mega Cap Value ETF. The largest declines were seen in VanEck Gold Miners ETF, iShares® Core MSCI Emerging Markets Equity ETF and iShares® Semiconductor ETF.
Which Underlying Equity ETFs were the strongest positive
contributors to the Fund’s performance and which Underlying Equity ETFs were particularly weak?
The Underlying Equity ETFs providing the highest total
returns—SPDR® S&P® Oil & Gas Exploration ETF and VanEck Oil Services
ETF—also produced the strongest positive contributions to performance, followed by the healthcare sector and iShares® Core S&P® Small Cap ETF. The most significant detractors were iShares® Core MSCI EAFE ETF, followed by
VanEck Gold Miners ETF and iShares® Core MSCI Emerging Markets ETF.
During the reporting period, which Underlying
Fixed-Income ETFs had the highest total returns and which Underlying Fixed-Income ETFs had the lowest total returns?
Other than Underlying Money Market Funds, all Underlying
Fixed-Income ETFs generated negative returns. iShares® 0-5 Year High Yield Corporate Bond ETF,
iShares® Broad USD High Yield Corporate Bond ETF and Invesco Senior Loan ETF registered the mildest losses. The largest losses came from iShares® Core U.S. Aggregate Bond ETF, Schwab® U.S. Aggregate Bond ETF and iShares® Broad USD Investment Grade Bond ETF.
Which Underlying Fixed-Income ETFs were the strongest
positive contributors to the Fund’s performance and which Underlying Fixed-Income ETFs were particularly weak?
With all Underlying Fixed-Income ETFs experiencing losses
during the reporting period, none contributed positively to performance. Those detracting the least included iShares® 0-5 Year High Yield Corporate Bond ETF and iShares® Broad USD Investment Grade Bond ETF. The most significant detractors were iShares® Core U.S.
Aggregate Bond ETF and Schwab® U.S. Aggregate Bond ETF.
How was the Fund positioned at the end of the reporting
period?
As the market rallied in October 2022, we
trimmed the Fund’s equity allocation, positioning the Fund very close to neutral as of October 31, 2022. We anticipate that the market will continue to move generally sideways within a very broad channel, presenting opportunities to trade
tactically, adding to equity holdings during periods of weakness and trimming them again as prices recover.
The bias we expect to have the largest impact on active return
is our preference for small- and mid-cap stocks. We believe that the large-cap space is potentially vulnerable to economic weakness abroad, a strong U.S. dollar, rich valuations and concentration in a relatively short list of very large companies
(mega-cap technology). Smaller companies, in contrast, cater primarily to what we view as a financially healthy domestic clientele and have historically been more successful than larger companies in protecting real earnings amid high
inflation.
Likewise, the Fund’s emphasis on value
stocks over growth stocks remains intact, with a particular emphasis on what we perceive to be the defensive “RUSH” sectors: real estate, utilities, consumer staples and health care. The thesis rests primarily on the idea that inflation
will prove persistent and jeopardize the high price multiples paid on fast-growing companies with current valuations that depend on distant earnings. We are also mindful of the economy’s progression in the business cycle and the possibility
that a recession may not be far away.
The Fund maintains
a position in energy sector firms, as we envision sustained supply constraints keeping commodity prices elevated, thus preserving meaty profit margins for several years to come. A small position in gold miner stocks also remains in the Fund's
portfolio as an intended hedge against a potential
monetary policy mistake or as a safe harbor should the economy slide into
recession.
Within fixed income, we have lessened the
Fund’s short-duration posture considerably as yields have climbed. As of October 31, 2022, the Fund’s duration is closer to the benchmark. We have also reduced the Fund’s exposure to credit as corporate fundamentals show signs of
gradual deterioration.
None of Schwab Strategic Trust, Schwab® U.S. Aggregate Bond ETF, or Charles Schwab Investment Management, Inc. make any representations regarding the advisability of investing in MainStay Conservative ETF
Allocation Fund.
iShares® is a registered trademark of BlackRock (BlackRock, Inc. and its subsidiaries). Neither BlackRock nor the iShares® Funds make any representations regarding the advisability of investing in MainStay Conservative ETF Allocation Fund.
The opinions expressed are those of the portfolio
managers as of the date of this report and are subject to change. There is no guarantee that any forecasts will come to pass. This material does not constitute investment advice and is not intended as an endorsement of any specific investment.
| 28
|
MainStay Conservative ETF
Allocation Fund |
Portfolio of
Investments October 31, 2022† (Unaudited)
| |
Shares
|
Value
|
| Investment
Companies 93.4% |
| Equity
Funds 41.3% |
| Health
Care Select Sector SPDR Fund (a) |
4,724
|
$ 627,111
|
| Invesco
S&P 500 Low Volatility ETF |
13,023
|
804,040 |
| iShares
Core MSCI EAFE ETF |
28,080
|
1,564,618 |
| iShares
Core MSCI Emerging Markets ETF |
11,477
|
486,051 |
| iShares
Core S&P Small-Cap ETF (a) |
18,371
|
1,798,888 |
| iShares
Semiconductor ETF (a) |
527
|
172,055 |
| Schwab
U.S. Mid-Cap ETF |
11,785
|
777,103 |
| Schwab
U.S. Small-Cap ETF (a) |
42,879
|
1,794,057 |
| SPDR
S&P Oil & Gas Exploration & Production ETF (a) |
1,210
|
183,061 |
| VanEck
Gold Miners ETF |
13,802
|
333,456 |
| VanEck
Oil Services ETF (a) |
733
|
218,947 |
| Vanguard
Mega Cap ETF |
26,294
|
3,533,651 |
| Vanguard
Mega Cap Value ETF |
5,453
|
549,608 |
| Vanguard
Mid-Cap ETF |
6,619
|
1,350,210
|
Total
Equity Funds
(Cost $14,152,054) |
|
14,192,856
|
| Fixed
Income Funds 52.1% |
| Invesco
Senior Loan ETF (a) |
121,173
|
2,510,704
|
| iShares
0-5 Year High Yield Corporate Bond ETF (a) |
37,494
|
1,531,630
|
| iShares
20+ Year Treasury Bond ETF |
3,335
|
320,527
|
| iShares
Broad USD High Yield Corporate Bond ETF (a) |
29,698
|
1,024,284
|
| iShares
Broad USD Investment Grade Corporate Bond ETF |
48,365
|
2,294,436
|
| iShares
Core U.S. Aggregate Bond ETF |
58,559
|
5,557,250
|
| Schwab
U.S. Aggregate Bond ETF (a) |
104,105
|
4,652,452
|
Total
Fixed Income Funds
(Cost $20,509,883) |
|
17,891,283
|
Total
Investment Companies
(Cost $34,661,937) |
|
32,084,139
|
| Short-Term
Investments 30.8% |
| Affiliated
Investment Company 6.5% |
| MainStay
U.S. Government Liquidity Fund, 2.905% (b) |
2,214,307
|
2,214,307
|
| Unaffiliated
Investment Companies 24.3% |
| Invesco
Government & Agency Portfolio, 3.163% (b)(c) |
6,362,732
|
6,362,732
|
The notes to the financial statements are an integral part of, and should be
read in conjunction with, the financial statements.
29
Portfolio of
Investments October 31, 2022† (Unaudited) (continued)
| |
Shares
|
|
Value
|
| Short-Term
Investments (continued) |
| Unaffiliated
Investment Companies (continued) |
| State
Street Institutional U.S. Government Money Market Fund, 3.064% (b)(c) |
2,000,000
|
|
$ 2,000,000
|
Total
Unaffiliated Investment Companies
(Cost $8,362,732) |
|
|
8,362,732
|
Total
Short-Term Investments
(Cost $10,577,039) |
|
|
10,577,039
|
Total
Investments
(Cost $45,238,976) |
124.2%
|
|
42,661,178
|
| Other
Assets, Less Liabilities |
(24.2)
|
|
(8,310,689)
|
| Net
Assets |
100.0%
|
|
$ 34,350,489
|
| †
|
Percentages
indicated are based on Fund net assets. |
| (a)
|
All or a
portion of this security was held on loan. As of October 31, 2022, the aggregate market value of securities on loan was $8,663,772; the total market value of collateral held by the Fund was $8,958,944. The market value of the collateral held
included non-cash collateral in the form of U.S. Treasury securities with a value of $596,212. The Fund received cash collateral with a value of $8,362,732. (See Note 2(G)) |
| (b)
|
Current
yield as of October 31, 2022. |
| (c)
|
Represents
a security purchased with cash collateral received for securities on loan. |
Investments in Affiliates (in 000's)
Investments in issuers considered to be affiliate(s) of the
Fund during the six-month period ended October 31, 2022 for purposes of Section 2(a)(3) of the Investment Company Act of 1940, as amended, were as follows:
| Affiliated
Investment Companies |
Value,
Beginning
of Period |
Purchases
at Cost |
Proceeds
from
Sales |
Net
Realized
Gain/(Loss)
on Sales |
Change
in
Unrealized
Appreciation/
(Depreciation) |
Value,
End of
Period |
Dividend
Income |
Other
Distributions |
Shares
End of
Period |
| MainStay
U.S. Government Liquidity Fund |
$ 919
|
$ 9,042
|
$ (7,747)
|
$ —
|
$ —
|
$ 2,214
|
$ 11
|
$ —
|
2,214
|
| Abbreviation(s):
|
| EAFE—Europe,
Australasia and Far East |
| ETF—Exchange-Traded
Fund |
| MSCI—Morgan
Stanley Capital International |
| SPDR—Standard
& Poor’s Depositary Receipt |
| USD—United
States Dollar |
The notes to the financial statements are an integral part of, and should be
read in conjunction with, the financial statements.
| 30
|
MainStay Conservative ETF
Allocation Fund |
The following is
a summary of the fair valuations according to the inputs used as of October 31, 2022, for valuing the Fund’s assets:
| Description
|
Quoted
Prices in
Active
Markets for
Identical
Assets
(Level 1) |
|
Significant
Other
Observable
Inputs
(Level 2) |
|
Significant
Unobservable
Inputs
(Level 3) |
|
Total
|
| Asset
Valuation Inputs |
|
|
|
|
|
|
|
| Investments
in Securities (a) |
|
|
|
|
|
|
|
| Investment
Companies |
|
|
|
|
|
|
|
| Equity
Funds |
$ 14,192,856
|
|
$ —
|
|
$ —
|
|
$ 14,192,856
|
| Fixed
Income Funds |
17,891,283
|
|
—
|
|
—
|
|
17,891,283
|
| Total
Investment Companies |
32,084,139
|
|
—
|
|
—
|
|
32,084,139
|
| Short-Term
Investments |
|
|
|
|
|
|
|
| Affiliated
Investment Company |
2,214,307
|
|
—
|
|
—
|
|
2,214,307
|
| Unaffiliated
Investment Companies |
8,362,732
|
|
—
|
|
—
|
|
8,362,732
|
| Total
Short-Term Investments |
10,577,039
|
|
—
|
|
—
|
|
10,577,039
|
| Total
Investments in Securities |
$ 42,661,178
|
|
$ —
|
|
$ —
|
|
$ 42,661,178
|
| (a)
|
For
a complete listing of investments, see the Portfolio of Investments. |
The notes to the financial statements are an integral part of,
and should be read in conjunction with, the financial statements.
31
Statement of
Assets and Liabilities as of October 31, 2022 (Unaudited)
| Assets
|
Investment
in unaffiliated securities, at value
(identified cost $43,024,669) including securities on loan of $8,663,772 |
$40,446,871
|
Investment
in affiliated investment companies, at value
(identified cost $2,214,307) |
2,214,307
|
| Receivables:
|
|
| Fund
shares sold |
24,612
|
| Securities
lending |
18,717
|
| Dividends
|
3,873
|
| Other
assets |
54,600
|
| Total
assets |
42,762,980
|
| Liabilities
|
| Cash
collateral received for securities on loan |
8,362,732
|
| Due
to custodian |
59
|
| Payables:
|
|
| Professional
fees |
16,138
|
| Investment
securities purchased |
8,500
|
| NYLIFE
Distributors (See Note 3) |
7,758
|
| Shareholder
communication |
3,999
|
| Custodian
|
3,951
|
| Fund
shares redeemed |
3,881
|
| Transfer
agent (See Note 3) |
2,824
|
| Manager
(See Note 3) |
46
|
| Accrued
expenses |
2,603
|
| Total
liabilities |
8,412,491
|
| Net
assets |
$34,350,489
|
| Composition
of Net Assets |
| Shares
of beneficial interest outstanding (par value of $.001 per share) unlimited number of shares authorized |
$
3,582 |
| Additional
paid-in-capital |
38,218,720
|
| |
38,222,302
|
| Total
distributable earnings (loss) |
(3,871,813)
|
| Net
assets |
$34,350,489
|
| Class
A |
|
| Net
assets applicable to outstanding shares |
$32,101,064
|
| Shares
of beneficial interest outstanding |
3,347,440
|
| Net
asset value per share outstanding |
$
9.59 |
| Maximum
sales charge (3.00% of offering price) |
0.30
|
| Maximum
offering price per share outstanding |
$
9.89 |
| Class
C |
|
| Net
assets applicable to outstanding shares |
$
388,686 |
| Shares
of beneficial interest outstanding |
40,613
|
| Net
asset value and offering price per share outstanding |
$
9.57 |
| Class
I |
|
| Net
assets applicable to outstanding shares |
$
31,709 |
| Shares
of beneficial interest outstanding |
3,312
|
| Net
asset value and offering price per share outstanding |
$
9.57 |
| Class
R3 |
|
| Net
assets applicable to outstanding shares |
$
361,180 |
| Shares
of beneficial interest outstanding |
37,711
|
| Net
asset value and offering price per share outstanding |
$
9.58 |
| SIMPLE
Class |
|
| Net
assets applicable to outstanding shares |
$
1,467,850 |
| Shares
of beneficial interest outstanding |
153,217
|
| Net
asset value and offering price per share outstanding |
$
9.58 |
The notes to the financial statements are an
integral part of, and should be read in conjunction with, the financial statements.
| 32
|
MainStay Conservative ETF
Allocation Fund |
Statement of
Operations for the six months ended October 31, 2022 (Unaudited)
| Investment
Income (Loss) |
| Income
|
|
| Dividends-unaffiliated
|
$
477,653 |
| Securities
lending, net |
82,653
|
| Dividends-affiliated
|
10,674
|
| Total
income |
570,980
|
| Expenses
|
|
| Distribution/Service—Class
A (See Note 3) |
40,907
|
| Distribution/Service—Class
C (See Note 3) |
2,009
|
| Distribution/Service—Class
R3 (See Note 3) |
725
|
| Distribution/Service—SIMPLE
Class (See Note 3) |
3,207
|
| Registration
|
40,045
|
| Manager
(See Note 3) |
34,733
|
| Professional
fees |
16,716
|
| Transfer
agent (See Note 3) |
13,600
|
| Custodian
|
9,715
|
| Shareholder
communication |
2,766
|
| Trustees
|
395
|
| Shareholder
service (See Note 3) |
145
|
| Miscellaneous
|
2,265
|
| Total
expenses before waiver/reimbursement |
167,228
|
| Expense
waiver/reimbursement from Manager (See Note 3) |
(24,719)
|
| Net
expenses |
142,509
|
| Net
investment income (loss) |
428,471
|
| Realized
and Unrealized Gain (Loss) |
| Net
realized gain (loss) on unaffiliated investments |
(992,308)
|
| Net
change in unrealized appreciation (depreciation) on unaffiliated investments |
(1,221,945)
|
| Net
realized and unrealized gain (loss) |
(2,214,253)
|
| Net
increase (decrease) in net assets resulting from operations |
$(1,785,782)
|
The notes to the financial statements are an integral part of,
and should be read in conjunction with, the financial statements.
33
Statements of
Changes in Net Assets
for the six months ended October 31, 2022 (Unaudited) and the year ended April 30, 2022
| |
Six months
ended
October 31,
2022 |
Year
ended
April 30,
2022 |
| Increase
(Decrease) in Net Assets |
| Operations:
|
|
|
| Net
investment income (loss) |
$
428,471 |
$
513,281 |
| Net
realized gain (loss) |
(992,308)
|
(90,363)
|
| Net
change in unrealized appreciation (depreciation) |
(1,221,945)
|
(2,811,868)
|
| Net
increase (decrease) in net assets resulting from operations |
(1,785,782)
|
(2,388,950)
|
| Distributions
to shareholders: |
|
|
| Class
A |
(366,125)
|
(713,856)
|
| Class
C |
(2,968)
|
(6,834)
|
| Class
I |
(407)
|
(1,541)
|
| Class
R3 |
(3,497)
|
(1,667)
|
| SIMPLE
Class |
(13,103)
|
(13,388)
|
| Total
distributions to shareholders |
(386,100)
|
(737,286)
|
| Capital
share transactions: |
|
|
| Net
proceeds from sales of shares |
5,003,986
|
19,899,906
|
| Net
asset value of shares issued to shareholders in reinvestment of distributions |
383,797
|
727,750
|
| Cost
of shares redeemed |
(3,403,983)
|
(7,710,201)
|
| Increase
(decrease) in net assets derived from capital share transactions |
1,983,800
|
12,917,455
|
| Net
increase (decrease) in net assets |
(188,082)
|
9,791,219
|
| Net
Assets |
| Beginning
of period |
34,538,571
|
24,747,352
|
| End
of period |
$34,350,489
|
$34,538,571
|
The notes to the financial statements are an integral part of,
and should be read in conjunction with, the financial statements.
| 34
|
MainStay Conservative ETF
Allocation Fund |
Financial
Highlights selected per share data and ratios
| |
Six
months ended
October 31,
2022* |
|
Year
Ended April 30, |
|
June
30, 2020^ through
April 30, |
| Class
A |
2022
|
|
2021
|
| Net
asset value at beginning of period |
$
10.22 |
|
$
11.13 |
|
$
10.00 |
| Net
investment income (loss) (a) |
0.12
|
|
0.18
|
|
0.11
|
| Net
realized and unrealized gain (loss) |
(0.64)
|
|
(0.84)
|
|
1.12
|
| Total
from investment operations |
(0.52)
|
|
(0.66)
|
|
1.23
|
| Less
distributions: |
|
|
|
|
|
| From
net investment income |
(0.11)
|
|
(0.18)
|
|
(0.09)
|
| From
net realized gain on investments |
—
|
|
(0.07)
|
|
(0.01)
|
| Total
distributions |
(0.11)
|
|
(0.25)
|
|
(0.10)
|
| Net
asset value at end of period |
$
9.59 |
|
$
10.22 |
|
$
11.13 |
| Total
investment return (b) |
(5.06)%
|
|
(6.09)%
|
|
12.33%
|
| Ratios
(to average net assets)/Supplemental Data: |
|
|
|
|
|
| Net
investment income (loss) |
2.49%††
|
|
1.63%
|
|
1.25%††
|
| Net
expenses (c) |
0.80%††
|
|
0.80%
|
|
0.80%††
|
| Expenses
(before waiver/reimbursement) (c) |
0.94%††
|
|
0.91%
|
|
1.49%††
|
| Portfolio
turnover rate |
35%
|
|
62%
|
|
56%
|
| Net
assets at end of period (in 000’s) |
$
32,101 |
|
$
32,925 |
|
$
23,951 |
| *
|
Unaudited.
|
| ^
|
Inception
date. |
| ††
|
Annualized.
|
| (a)
|
Per share
data based on average shares outstanding during the period. |
| (b)
|
Total
investment return is calculated exclusive of sales charges and assumes the reinvestment of dividends and distributions. For periods of less than one year, total return is not annualized. |
| (c)
|
In
addition to the fees and expenses which the Fund bears directly, it also indirectly bears a pro-rata share of the fees and expenses of the underlying funds in which it invests. Such indirect expenses are not included in the above expense ratios.
|
The
notes to the financial statements are an integral part of, and should be read in conjunction with, the financial statements.
35
Financial
Highlights selected per share data and ratios
| |
Six
months ended
October 31,
2022* |
|
Year
Ended April 30, |
|
June
30, 2020^ through
April 30, |
| Class
C |
2022
|
|
2021
|
| Net
asset value at beginning of period |
$
10.19 |
|
$
11.10 |
|
$
10.00 |
| Net
investment income (loss) (a) |
0.09
|
|
0.10
|
|
0.05
|
| Net
realized and unrealized gain (loss) |
(0.64)
|
|
(0.85)
|
|
1.10
|
| Total
from investment operations |
(0.55)
|
|
(0.75)
|
|
1.15
|
| Less
distributions: |
|
|
|
|
|
| From
net investment income |
(0.07)
|
|
(0.09)
|
|
(0.04)
|
| From
net realized gain on investments |
—
|
|
(0.07)
|
|
(0.01)
|
| Total
distributions |
(0.07)
|
|
(0.16)
|
|
(0.05)
|
| Net
asset value at end of period |
$
9.57 |
|
$
10.19 |
|
$
11.10 |
| Total
investment return (b) |
(5.35)%
|
|
(6.81)%
|
|
11.51%
|
| Ratios
(to average net assets)/Supplemental Data: |
|
|
|
|
|
| Net
investment income (loss) |
1.74%††
|
|
0.90%
|
|
0.58%††
|
| Net
expenses (c) |
1.55%††
|
|
1.55%
|
|
1.55%††
|
| Expenses
(before waiver/reimbursement) (c) |
1.74%††
|
|
1.73%
|
|
2.24%††
|
| Portfolio
turnover rate |
35%
|
|
62%
|
|
56%
|
| Net
assets at end of period (in 000’s) |
$
389 |
|
$
413 |
|
$
472 |
| *
|
Unaudited.
|
| ^
|
Inception
date. |
| ††
|
Annualized.
|
| (a)
|
Per share
data based on average shares outstanding during the period. |
| (b)
|
Total
investment return is calculated exclusive of sales charges and assumes the reinvestment of dividends and distributions. For periods of less than one year, total return is not annualized. |
| (c)
|
In
addition to the fees and expenses which the Fund bears directly, it also indirectly bears a pro-rata share of the fees and expenses of the underlying funds in which it invests. Such indirect expenses are not included in the above expense ratios.
|
The
notes to the financial statements are an integral part of, and should be read in conjunction with, the financial statements.
| 36
|
MainStay Conservative ETF
Allocation Fund |
Financial
Highlights selected per share data and ratios
| |
Six
months ended
October 31,
2022* |
|
Year
Ended April 30, |
|
June
30, 2020^ through
April 30, |
| Class
I |
2022
|
|
2021
|
| Net
asset value at beginning of period |
$
10.20 |
|
$
11.13 |
|
$
10.00 |
| Net
investment income (loss) (a) |
0.14
|
|
0.21
|
|
0.15
|
| Net
realized and unrealized gain (loss) |
(0.65)
|
|
(0.85)
|
|
1.10
|
| Total
from investment operations |
(0.51)
|
|
(0.64)
|
|
1.25
|
| Less
distributions: |
|
|
|
|
|
| From
net investment income |
(0.12)
|
|
(0.22)
|
|
(0.11)
|
| From
net realized gain on investments |
—
|
|
(0.07)
|
|
(0.01)
|
| Total
distributions |
(0.12)
|
|
(0.29)
|
|
(0.12)
|
| Net
asset value at end of period |
$
9.57 |
|
$
10.20 |
|
$
11.13 |
| Total
investment return (b) |
(4.94)%
|
|
(5.86)%
|
|
12.47%
|
| Ratios
(to average net assets)/Supplemental Data: |
|
|
|
|
|
| Net
investment income (loss) |
2.74%††
|
|
1.89%
|
|
1.71%††
|
| Net
expenses (c) |
0.55%††
|
|
0.55%
|
|
0.55%††
|
| Expenses
(before waiver/reimbursement) (c) |
0.69%††
|
|
0.66%
|
|
1.24%††
|
| Portfolio
turnover rate |
35%
|
|
62%
|
|
56%
|
| Net
assets at end of period (in 000’s) |
$
32 |
|
$
33 |
|
$
61 |
| *
|
Unaudited.
|
| ^
|
Inception
date. |
| ††
|
Annualized.
|
| (a)
|
Per share
data based on average shares outstanding during the period. |
| (b)
|
Total
investment return is calculated exclusive of sales charges and assumes the reinvestment of dividends and distributions. Class I shares are not subject to sales charges. For periods of less than one year, total return is not annualized. |
| (c)
|
In
addition to the fees and expenses which the Fund bears directly, it also indirectly bears a pro-rata share of the fees and expenses of the underlying funds in which it invests. Such indirect expenses are not included in the above expense ratios.
|
The
notes to the financial statements are an integral part of, and should be read in conjunction with, the financial statements.
37
Financial
Highlights selected per share data and ratios
| |
Six
months ended
October 31,
2022* |
|
Year
Ended April 30, |
|
June
30, 2020^ through
April 30, |
| Class
R3 |
2022
|
|
2021
|
| Net
asset value at beginning of period |
$
10.21 |
|
$
11.12 |
|
$
10.00 |
| Net
investment income (loss) (a) |
0.10
|
|
0.14
|
|
0.07
|
| Net
realized and unrealized gain (loss) |
(0.64)
|
|
(0.84)
|
|
1.12
|
| Total
from investment operations |
(0.54)
|
|
(0.70)
|
|
1.19
|
| Less
distributions: |
|
|
|
|
|
| From
net investment income |
(0.09)
|
|
(0.14)
|
|
(0.06)
|
| From
net realized gain on investments |
—
|
|
(0.07)
|
|
(0.01)
|
| Total
distributions |
(0.09)
|
|
(0.21)
|
|
(0.07)
|
| Net
asset value at end of period |
$
9.58 |
|
$
10.21 |
|
$
11.12 |
| Total
investment return (b) |
(5.24)%
|
|
(6.42)%
|
|
11.96%
|
| Ratios
(to average net assets)/Supplemental Data: |
|
|
|
|
|
| Net
investment income (loss) |
1.96%††
|
|
1.29%
|
|
0.79%††
|
| Net
expenses (c) |
1.15%††
|
|
1.15%
|
|
1.15%††
|
| Expenses
(before waiver/reimbursement) (c) |
1.29%††
|
|
1.26%
|
|
1.84%††
|
| Portfolio
turnover rate |
35%
|
|
62%
|
|
56%
|
| Net
assets at end of period (in 000’s) |
$
361 |
|
$
90 |
|
$
68 |
| *
|
Unaudited.
|
| ^
|
Inception
date. |
| ††
|
Annualized.
|
| (a)
|
Per share
data based on average shares outstanding during the period. |
| (b)
|
Total
investment return is calculated exclusive of sales charges and assumes the reinvestment of dividends and distributions. Class R3 shares are not subject to sales charges. For periods of less than one year, total return is not annualized. |
| (c)
|
In
addition to the fees and expenses which the Fund bears directly, it also indirectly bears a pro-rata share of the fees and expenses of the underlying funds in which it invests. Such indirect expenses are not included in the above expense ratios.
|
The
notes to the financial statements are an integral part of, and should be read in conjunction with, the financial statements.
| 38
|
MainStay Conservative ETF
Allocation Fund |
Financial
Highlights selected per share data and ratios
| |
Six
months ended
October 31,
2022* |
|
Year
Ended April 30, |
|
August
31, 2020^ through
April 30, |
| SIMPLE
Class |
2022
|
|
2021
|
| Net
asset value at beginning of period |
$
10.21 |
|
$
11.12 |
|
$
10.46 |
| Net
investment income (loss) (a) |
0.11
|
|
0.14
|
|
0.08
|
| Net
realized and unrealized gain (loss) |
(0.64)
|
|
(0.82)
|
|
0.66
|
| Total
from investment operations |
(0.53)
|
|
(0.68)
|
|
0.74
|
| Less
distributions: |
|
|
|
|
|
| From
net investment income |
(0.10)
|
|
(0.16)
|
|
(0.07)
|
| From
net realized gain on investments |
—
|
|
(0.07)
|
|
(0.01)
|
| Total
distributions |
(0.10)
|
|
(0.23)
|
|
(0.08)
|
| Net
asset value at end of period |
$
9.58 |
|
$
10.21 |
|
$
11.12 |
| Total
investment return (b) |
(5.18)%
|
|
(6.29)%
|
|
7.13%
|
| Ratios
(to average net assets)/Supplemental Data: |
|
|
|
|
|
| Net
investment income (loss) |
2.20%††
|
|
1.30%
|
|
0.92%††
|
| Net
expenses (c) |
1.05%††
|
|
1.05%
|
|
1.05%††
|
| Expenses
(before waiver/reimbursement) (c) |
1.24%††
|
|
1.23%
|
|
1.74%††
|
| Portfolio
turnover rate |
35%
|
|
62%
|
|
56%
|
| Net
assets at end of period (in 000’s) |
$
1,468 |
|
$
1,077 |
|
$
195 |
| *
|
Unaudited.
|
| ^
|
Inception
date. |
| ††
|
Annualized.
|
| (a)
|
Per share
data based on average shares outstanding during the period. |
| (b)
|
Total
investment return is calculated exclusive of sales charges and assumes the reinvestment of dividends and distributions. SIMPLE Class shares are not subject to sales charges. For periods of less than one year, total return is not annualized.
|
| (c)
|
In
addition to the fees and expenses which the Fund bears directly, it also indirectly bears a pro-rata share of the fees and expenses of the underlying funds in which it invests. Such indirect expenses are not included in the above expense ratios.
|
The notes to the financial statements are an integral part of, and should be
read in conjunction with, the financial statements.
39
MainStay Moderate
ETF Allocation Fund
Investment and Performance
Comparison (Unaudited)
Performance data quoted represents past performance. Past performance is no
guarantee of future results. Because of market volatility and other factors, current performance may be lower or higher than the figures shown. Investment return and principal value will fluctuate, and as a result, when shares are redeemed, they may
be worth more or less than their original cost. The graph below depicts the historical performance of Class I shares of the Fund. Performance will vary from class to class based on differences in class-specific expenses and sales charges. For performance information current to the most recent month-end, please call 800-624-6782 or visit newyorklifeinvestments.com.
The performance table and graph do not reflect the deduction
of taxes that a shareholder would pay on distributions or Fund share redemptions. Total returns reflect maximum applicable sales charges as indicated in the table below, if any, changes in share price, and reinvestment of dividend and capital gain
distributions. The graph assumes the initial investment amount shown below and reflects the deduction of all sales charges that would have applied for the period of investment. Performance figures may reflect certain fee waivers and/or expense
limitations, without which total returns may have been lower. For more information on share classes and current fee waivers and/or expense limitations (if any), please refer to the Notes to Financial Statements.
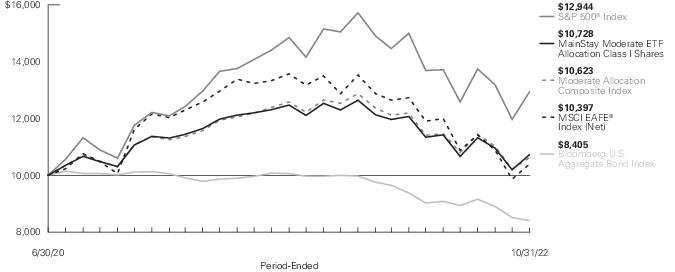
| Average
Annual Total Returns for the Period-Ended October 31, 2022 |
| Class
|
Sales
Charge |
|
Inception
Date |
Six
Months1 |
One
Year |
Since
Inception |
Gross
Expense
Ratio2 |
| Class
A Shares |
Maximum
3% Initial Sales Charge |
With
sales charges |
6/30/2020
|
-8.35%
|
-17.18%
|
1.44%
|
0.81%
|
| |
|
Excluding
sales charges |
|
-5.52
|
-14.62
|
2.77
|
0.81
|
| Class
C Shares |
Maximum
1% CDSC |
With
sales charges |
6/30/2020
|
-6.85
|
-16.24
|
1.94
|
1.66
|
| |
if
redeemed Within One Year of Purchase |
Excluding
sales charges |
|
-5.91
|
-15.40
|
1.94
|
1.66
|
| Class
I Shares |
No
Sales Charge |
|
6/30/2020
|
-5.42
|
-14.41
|
3.05
|
0.56
|
| Class
R3 Shares |
No
Sales Charge |
|
6/30/2020
|
-5.71
|
-14.95
|
2.43
|
1.16
|
| SIMPLE
Class Shares |
No
Sales Charge |
|
8/31/2020
|
-5.71
|
-14.93
|
-0.39
|
1.16
|
| 1.
|
Not
annualized. |
| 2.
|
The
gross expense ratios presented reflect the Fund’s “Total Annual Fund Operating Expenses” from the most recent Prospectus, as supplemented, and may differ from other expense ratios disclosed in this report. |
The
footnotes on the next page are an integral part of the table and graph and should be carefully read in conjunction with them.
| 40
|
MainStay Moderate ETF
Allocation Fund |
| Benchmark
Performance* |
Six
Months1 |
One
Year |
Since
Inception |
| S&P
500® Index2 |
-5.50%
|
-14.61%
|
11.68%
|
| MSCI
EAFE® Index (Net)3 |
-12.70
|
-23.00
|
1.68
|
| Bloomberg
U.S. Aggregate Bond Index4 |
-6.86
|
-15.68
|
-7.17
|
| Moderate
Allocation Composite Index5 |
-6.94
|
-16.04
|
2.62
|
| Morningstar
Allocation-50% to 70% Equity Category Average6 |
-6.12
|
-14.40
|
4.78
|
| *
|
Returns
for indices reflect no deductions for fees, expenses or taxes, except for foreign withholding taxes where applicable. Results assume reinvestment of all dividends and capital gains. An investment cannot be made directly in an index.
|
| 1.
|
Not
annualized. |
| 2.
|
The
S&P 500® Index is the Fund’s primary broad-based securities market index for comparison purposes. S&P 500® is a trademark of The McGraw-Hill Companies, Inc. The S&P 500® Index is widely regarded as
the standard index for measuring large-cap U.S. stock market performance. |
| 3.
|
The MSCI
EAFE® Index (Net) is the Fund's secondary benchmark. The MSCI EAFE® Index (Net) consists of
international stocks representing the developed world outside of North America. |
| 4.
|
The Fund
has selected the Bloomberg U.S. Aggregate Bond Index as an additional benchmark. The Bloomberg U.S. Aggregate Bond Index is a broad-based benchmark that measures the performance of the investment grade, U.S. dollar-denominated, fixed-rate taxable
bond market, including Treasurys, government-related and corporate securities, mortgage-backed securities (agency fixed-rate and hybrid adjustable rate mortgage pass-throughs), asset-backed securities, and commercial mortgage-backed securities.
|
| 5.
|
The Fund
has selected the Moderate Allocation Composite Index as an additional benchmark. The Moderate Allocation Composite Index consists of the S&P 500® Index, the MSCI EAFE® Index (Net) and the Bloomberg U.S. Aggregate Bond Index weighted 45%, 15% and 40%, respectively. |
| 6.
|
The
Morningstar Allocation – 50% to 70% Equity Category Average is representative of funds that seek to provide both income and capital appreciation by investing in multiple asset classes, including stocks, bonds, and cash. These portfolios are
dominated by domestic holdings and have equity exposures between 50% and 70%. Results are based on average total returns of similar funds with all dividends and capital gain distributions reinvested. |
The
footnotes on the preceding page are an integral part of the table and graph and should be carefully read in conjunction with them.
Cost in Dollars of
a $1,000 Investment in MainStay Moderate ETF Allocation Fund (Unaudited)
The example below is intended to describe the fees and expenses
borne by shareholders during the six-month period from May 1, 2022 to October 31, 2022, and the impact of those costs on your investment.
Example
As a shareholder of the Fund you incur two types of costs: (1)
transaction costs, including exchange fees and sales charges (loads) on purchases (as applicable), and (2) ongoing costs, including management fees, distribution and/or service (12b-1) fees and other Fund expenses (as applicable). This example is
intended to help you understand your ongoing costs (in dollars) of investing in the Fund and to compare these costs with the ongoing costs of investing in other mutual funds. The example is based on an investment of $1,000 made at the beginning of
the six-month period and held for the entire period from May 1, 2022 to October 31, 2022.
This example illustrates your Fund’s ongoing costs in two
ways:
Actual Expenses
The second and third data columns in the table below provide information about
actual account values and actual expenses. You may use the information in these columns, together with the amount you invested, to estimate the expenses that you paid during the six months ended October 31, 2022. Simply divide your account value by
$1,000 (for example, an
$8,600 account value divided by $1,000 = 8.6), then multiply the result by the
number under the heading entitled “Expenses Paid During Period” to estimate the expenses you paid on your account during this period.
Hypothetical Example for Comparison Purposes
The fourth and fifth data columns in the table below provide information about
hypothetical account values and hypothetical expenses based on the Fund’s actual expense ratio and an assumed rate of return of 5% per year before expenses, which is not the Fund’s actual return. The hypothetical account values and
expenses may not be used to estimate the actual ending account balances or expenses you paid for the six-month period shown. You may use this information to compare the ongoing costs of investing in the Fund with the ongoing costs of investing in
other mutual funds. To do so, compare this 5% hypothetical example with the 5% hypothetical examples that appear in the shareholder reports of the other mutual funds.
Please note that the expenses shown in the table are meant to
highlight your ongoing costs only and do not reflect any transactional costs, such as exchange fees or sales charges (loads). Therefore, the fourth and fifth data columns of the table are useful in comparing ongoing costs only and will not help you
determine the relative total costs of owning different funds. In addition, if these transactional costs were included, your costs would have been higher.
| Share
Class |
Beginning
Account
Value
5/1/22 |
Ending
Account
Value (Based
on Actual
Returns and
Expenses)
10/31/22 |
Expenses
Paid
During
Period1 |
Ending
Account
Value (Based
on Hypothetical
5% Annualized
Return and
Actual Expenses)
10/31/22 |
Expenses
Paid
During
Period1 |
Net
Expense
Ratio
During
Period2 |
| Class
A Shares |
$1,000.00
|
$944.80
|
$3.43
|
$1,021.68
|
$3.57
|
0.70%
|
| Class
C Shares |
$1,000.00
|
$940.90
|
$7.44
|
$1,017.54
|
$7.73
|
1.52%
|
| Class
I Shares |
$1,000.00
|
$945.80
|
$2.26
|
$1,022.89
|
$2.35
|
0.46%
|
| Class
R3 Shares |
$1,000.00
|
$942.90
|
$5.14
|
$1,019.91
|
$5.35
|
1.05%
|
| SIMPLE
Class Shares |
$1,000.00
|
$942.90
|
$5.00
|
$1,020.06
|
$5.19
|
1.02%
|
| 1.
|
Expenses are
equal to the Fund’s annualized expense ratio of each class multiplied by the average account value over the period, divided by 365 and multiplied by 184 (to reflect the six-month period). The table above represents the actual expenses incurred
during the six-month period. In addition to the fees and expenses which the Fund bears directly, it also indirectly bears a pro rata share of the fees and expenses of the underlying funds in which it invests. Such indirect expenses are not included
in the above-reported expense figures. |
| 2.
|
Expenses
are equal to the Fund's annualized expense ratio to reflect the six-month period. |
| 42
|
MainStay Moderate ETF
Allocation Fund |
Asset Diversification as of October 31, 2022
(Unaudited)
| Equity
Funds |
61.2
% |
| Fixed
Income Funds |
32.4
|
| Short-Term
Investments |
21.5
|
| Other
Assets, Less Liabilities |
(15.1)
|
See Portfolio of Investments
beginning on page 47 for specific holdings within these categories. The Fund’s holdings are subject to change.
Portfolio
Management Discussion and Analysis (Unaudited)
Questions answered by portfolio managers Jae S. Yoon,
CFA, Jonathan Swaney, Poul Kristensen, CFA, and Amit Soni, CFA, of New York Life Investment Management LLC, the Fund’s Manager.
How did MainStay Moderate ETF Allocation Fund perform relative to its
benchmarks and peer group during the reporting period ended October 31, 2022?
For the six months ended October 31, 2022, Class I shares of
MainStay Moderate ETF Allocation Fund returned −5.42%, outperforming the −5.50% return of the Fund’s primary benchmark, the S&P 500® Index (the
"Index"), and the −12.70% return of the MSCI EAFE® Index (Net), which is the Fund’s secondary benchmark. Over the same period, Class I shares of the Fund also
outperformed the −6.86% return of the Bloomberg U.S. Aggregate Bond Index, and the −6.94% return of the Moderate Allocation Composite Index, both of which are additional benchmarks of the Fund. For the six months ended October 31, 2022,
Class I shares of the Fund outperformed the −6.12% return of the Morningstar Allocation-50% to 70% Equity Category Average.1
What factors affected the Fund’s relative
performance during the reporting period?
The Fund is a
“fund of funds" that seeks to achieve its investment objective by investing in unaffiliated, passively-managed, exchange-traded funds (“Underlying ETFs”). The Underlying ETFs may invest in U.S. equities, international equities and
fixed-income instruments, making comparisons to any single index generally less suitable than a weighted combination of indices, which is a more useful yardstick by which to measure performance. During the reporting period, asset class policy was
the primary determinant of the Fund’s relative performance.
Fund management internally maintains a blend of indices that
are taken into consideration when managing the Fund. During the reporting period, the Fund materially outperformed the internally maintained blend of indices due to active positioning at the asset class level. The Fund’s outperformance was
driven by the following factors:
| •
|
Management of the stock/bond
blend: The Fund’s management of its stock/bond blend proved generally successful, reflecting tactical adjustments made throughout the reporting period. With both investment-grade bonds and U.S. stocks posting declines in the mid-teens, there
was little cost or benefit to being persistently overweight or underweight in equities, although adjusting that exposure over time (buying dips and selling rallies) added significant value. |
| •
|
Value
created within asset classes: The equity portion of the Fund emphasized value over growth, with specific focus on energy companies and defensive sectors that the market rewarded. |
Conditions also favored the Fund’s skew toward profitable small-cap
companies.
| •
|
Shorter duration:2 We shortened the average duration of the fixed-income portion of the Fund by holding cash and emphasizing exposure to iShares® 0-5 Year High Yield Corporate Bond ETF over its full duration counterpart, iShares® Broad USD
High Yield Corporate Bond ETF. Both moves lifted relative returns. |
The most significant detractor from the Fund’s relative
performance was exposure to gold miner equities. The price of gold, and thus gold miners, tends to move inversely to real bond yields. The combination of the Federal Reserve (the "Fed") pushing rates higher and emerging signs that inflation may be
peaking spelled trouble for this particular position.
Also noteworthy is the fact that the internally maintained
blend of indices against which the Fund is managed underperformed the median return of peers within the Morningstar category to which the Fund is assigned, creating a headwind to relative performance.
How did you allocate the Fund’s assets during the
reporting period and why?
Stock/bond blend: On average,
the Fund held a moderately overweight exposure to equities during the reporting period, with the magnitude of that bias managed tactically in response to swings in pricing, as described above. We are generally reluctant to position the Fund with an
underweight allocation to equities, as stocks have tended to perform well over time, and anticipating drawdowns is challenging. The opposite is less true; we are happy to increase the Fund’s allocation to equities when we believe they are well
supported fundamentally or when a correction has run further than we believe appropriate. This approach worked well during the reporting period. Although stocks declined by double digits, the Fund generated roughly 0.3% of excess return3 through tactical adjustments to its degree of overweight exposure to equities.
Duration: Believing inflationary pressures to be partially
structural in nature and likely to persist at elevated levels for the foreseeable future, we skewed the Fund’s fixed-income holdings to favor shorter maturity instruments less sensitive to rising bond yields, although we increased the
Fund’s duration as yields rose. By the end of the reporting period, the average duration of the fixed-income portion of the Fund was only slightly shorter than that of the benchmark. The Fund’s duration policy contributed positively to
performance. (Contributions take weightings and total returns into account.)
| 1.
|
See page 40 for other share
class returns, which may be higher or lower than Class I share returns. See page 41 for more information on benchmark and peer group returns. |
| 2.
|
Duration is a measure of the
price sensitivity of a fixed-income investment to changes in interest rates. Duration is expressed as a number of years and is considered a more accurate sensitivity gauge than average maturity. |
| 3.
|
The expression “excess
return” may refer to the return that a security or portfolio provides above (or below) an investment with the lowest perceived risk, such as comparable U.S. Treasury securities. The expression may also refer to the return that a security or
portfolio provides above (or below) an index or other benchmark. |
| 44
|
MainStay Moderate ETF
Allocation Fund |
Equity style: In the same way that inflation is threatening to
long-duration bonds, equities with values disproportionately reflected in more distant cash flows (i.e., growth stocks with high prices relative to current earnings) are likewise vulnerable. Accordingly, we tilted the Fund to emphasize value stocks
that offered more attractive near-term cash flows, placing particular focus on traditionally defensive sectors: real estate, utilities, consumer staples and (most of all) health care. The combined effect was a modest positive contribution to return
of approximately 0.1%.
Equity size: Small-company stocks
were more heavily owned in the Fund than in the Index. The thesis behind this positioning was based on attractive small-cap valuations, insulation from economic weakness abroad, less sensitivity to dollar strength and disproportionate exposure to
domestic demand, which remained healthy. The Fund’s active position in small-cap companies contributed approximately 0.25% to relative performance.
Geographic exposure: In light of Russia’s invasion of
Ukraine, the Fund held an underweight exposure to developed international markets, benefiting performance at the margin. That improvement in returns was fully offset, however, by a small overweight position in emerging market equities. We believed
that China’s economy would benefit from the country’s relaxation of its zero-COVID policy, as well as additional fiscal support ahead of the October 2022 Party Congress; however, neither development materialized.
Gold miners: The Fund maintained a varying position in gold
miners as a hedge against inflation and/or a monetary policy mistake. With month-over-month readings on inflation starting to improve, the Fed demonstrating their mettle in aggressively tightening monetary policy, and input costs for energy and
labor rising sharply, this proved to be an unfavorable environment for miners. The position subtracted almost 0.4% from the Fund’s return, making it by far the most significant detractor from Fund performance.
Energy: As with gold miners, the Fund maintained exposure to
upstream energy producers as a commodity play to provide an additional inflation hedge. These holdings also positioned the Fund to take advantage of opportunities for domestic producers to benefit as Western nations revisit energy policy to source
supplies from stable and friendly jurisdictions, rather than autocratic petrostates that present national security risks. While the Fund’s position was small, it had a disproportionately positive impact on performance as oil and gas prices
soared, fully offsetting the adverse impact of the Fund’s exposure to gold miners.
How did the Fund’s allocations change over the
course of the reporting period?
We reduced the
Fund’s allocation most significantly to iShares® Core MSCI EAFE ETF to lessen non-U.S. market exposure in anticipation of a global recession. We also trimmed holdings
in
iShares®
0-5 Year High Yield Corporate Bond ETF and iShares® Broad USD High Yield Corporate Bond ETF, as exposure to sub-investment-grade credit was pulled back to benchmark
levels. Another downward adjustment involved trimming holdings of VanEck Oil Services ETF and SPDR®
S&P® Oil & Gas Exploration ETF; these positions were reduced following a long period of solid outperformance, with energy being the only sector to deliver positive
returns during the reporting period.
The Fund’s
cash position saw the largest increase, as we parked proceeds from cutting back equity exposure. Allocations to defensive industries also grew via positions in Health Care Select Sector SPDR® ETF and Invesco S&P® 500 Low Volatility ETF. iShares® Core U.S. Aggregate Bond ETF, Schwab® U.S. Aggregate Bond ETF and iShares® Broad USD Investment Grade Corporate Bond ETF all saw inflows resulting from the sale of high yield credits.
During the reporting period, which Underlying Equity
ETFs had the highest total returns and which Underlying Equity ETFs had the lowest total returns?
The Fund’s two top-performing Underlying Equity ETFs,
were SPDR® S&P® Oil & Gas Exploration ETF and VanEck Oil Services ETF. Also posting
positive returns were Health Care Select Sector SPDR® ETF and Vanguard Mega Cap Value ETF. The largest declines were seen in VanEck Gold Miners ETF, iShares® Core MSCI Emerging Markets Equity ETF and iShares® Semiconductor ETF.
Which Underlying Equity ETFs were the strongest positive
contributors to the Fund’s performance and which Underlying Equity ETFs were particularly weak?
The Underlying Equity ETFs providing the highest total
returns—SPDR® S&P® Oil & Gas Exploration ETF and VanEck Oil Services
ETF—also produced the strongest positive contributions to performance, followed by the healthcare sector and iShares® Core S&P® Small Cap ETF. The most significant detractors were iShares® Core MSCI EAFE ETF, followed by
iShares® Core MSCI Emerging Markets ETF and Vanguard Mega Cap ETF.
During the reporting period, which Underlying
Fixed-Income ETFs had the highest total returns and which Underlying Fixed-Income ETFs had the lowest total returns?
Other than Underlying Money Market Funds, all Underlying
Fixed-Income ETFs generated negative returns. iShares® 0-5 Year High Yield Corporate Bond ETF,
iShares® Broad USD High Yield Corporate Bond ETF and Invesco Senior Loan ETF registered the mildest losses. The largest losses came from iShares® Core U.S. Aggregate Bond ETF, Schwab® U.S. Aggregate Bond ETF and iShares® Broad USD Investment Grade Bond ETF.
Which Underlying Fixed-Income ETFs were the strongest
positive contributors to the Fund’s performance and which Underlying Fixed-Income ETFs were particularly weak?
With all Underlying Fixed-Income ETFs experiencing losses
during the reporting period, none contributed positively to performance. Those detracting the least included iShares® 0-5 Year High Yield Corporate Bond ETF and Invesco
Senior Loan ETF. The most significant detractors were iShares® Core U.S. Aggregate Bond ETF and
Schwab® U.S. Aggregate Bond ETF.
How was the Fund positioned at the end of the reporting
period?
As the market rallied in October 2022, we
trimmed the Fund’s equity allocation, positioning the Fund very close to neutral as of October 31, 2022. We anticipate that the market will continue to move generally sideways within a very broad channel, presenting opportunities to trade
tactically, adding to equity holdings during periods of weakness and trimming them again as prices recover.
The bias we expect to have the largest impact on active return
is our preference for small- and mid-cap stocks. We believe that the large-cap space is potentially vulnerable to economic weakness abroad, a strong U.S. dollar, rich valuations and concentration in a relatively short list of very large companies
(mega-cap technology). Smaller companies, in contrast, cater primarily to what we view as a financially healthy domestic clientele and have historically been more successful than larger companies in protecting real earnings amid high
inflation.
Likewise, the Fund’s emphasis on value
stocks over growth stocks remains intact, with a particular emphasis on what we perceive to be the defensive “RUSH” sectors: real estate, utilities, consumer staples and health care. The thesis rests primarily on the idea that inflation
will prove persistent and jeopardize the high price multiples paid on fast-growing companies with current valuations that depend on distant earnings. We are also mindful of the economy’s progression in the business cycle and the possibility
that a recession may not be far away.
The Fund maintains
a position in energy sector firms, as we envision sustained supply constraints keeping commodity prices elevated, thus preserving meaty profit margins for several years to come. A small position in gold miner stocks also remains in the Fund's
portfolio as an intended hedge against a potential
monetary policy mistake or as a safe harbor should the economy slide into
recession.
Within fixed income, we have lessened the
Fund’s short-duration posture considerably as yields have climbed. As of October 31, 2022, the Fund’s duration is closer to the benchmark. We have also reduced the Fund’s exposure to credit as corporate fundamentals show signs of
gradual deterioration.
None of Schwab Strategic Trust, Schwab® U.S. Aggregate Bond ETF, or Charles Schwab Investment Management, Inc. make any representations regarding the advisability of investing in MainStay Moderate ETF Allocation
Fund.
iShares® is a registered trademark of BlackRock (BlackRock, Inc. and its subsidiaries). Neither BlackRock nor the iShares® Funds make any representations regarding the advisability of investing in MainStay Moderate ETF Allocation Fund.
The opinions expressed are those of the portfolio
managers as of the date of this report and are subject to change. There is no guarantee that any forecasts will come to pass. This material does not constitute investment advice and is not intended as an endorsement of any specific investment.
| 46
|
MainStay Moderate ETF
Allocation Fund |
Portfolio of
Investments October 31, 2022† (Unaudited)
| |
Shares
|
Value
|
| Investment
Companies 93.6% |
| Equity
Funds 61.2% |
| Health
Care Select Sector SPDR Fund (a) |
12,579
|
$ 1,669,862
|
| Invesco
S&P 500 Low Volatility ETF |
34,331
|
2,119,596 |
| iShares
Core MSCI EAFE ETF |
141,077
|
7,860,811 |
| iShares
Core MSCI Emerging Markets ETF |
50,724
|
2,148,162 |
| iShares
Core S&P Small-Cap ETF |
48,510
|
4,750,099 |
| iShares
Semiconductor ETF (a) |
1,396
|
455,766 |
| Schwab
U.S. Mid-Cap ETF |
57,053
|
3,762,075 |
| Schwab
U.S. Small-Cap ETF |
113,455
|
4,746,957 |
| SPDR
S&P Oil & Gas Exploration & Production ETF (a) |
3,194
|
483,220 |
| VanEck
Gold Miners ETF |
36,601
|
884,280 |
| VanEck
Oil Services ETF (a) |
1,940
|
579,478 |
| Vanguard
Mega Cap ETF |
139,458
|
18,741,761 |
| Vanguard
Mega Cap Value ETF |
14,461
|
1,457,524 |
| Vanguard
Mid-Cap ETF |
32,279
|
6,584,593
|
Total
Equity Funds
(Cost $56,962,349) |
|
56,244,184
|
| Fixed
Income Funds 32.4% |
| Invesco
Senior Loan ETF (a) |
212,705
|
4,407,247
|
| iShares
0-5 Year High Yield Corporate Bond ETF (a) |
54,761
|
2,236,987
|
| iShares
20+ Year Treasury Bond ETF |
8,843
|
849,901
|
| iShares
Broad USD High Yield Corporate Bond ETF (a) |
65,026
|
2,242,747
|
| iShares
Broad USD Investment Grade Corporate Bond ETF (a) |
72,893
|
3,458,044
|
| iShares
Core U.S. Aggregate Bond ETF |
99,261
|
9,419,869
|
| Schwab
U.S. Aggregate Bond ETF (a) |
160,124
|
7,155,941
|
Total
Fixed Income Funds
(Cost $33,690,119) |
|
29,770,736
|
Total
Investment Companies
(Cost $90,652,468) |
|
86,014,920
|
| Short-Term
Investments 21.5% |
| Affiliated
Investment Company 6.5% |
| MainStay
U.S. Government Liquidity Fund, 2.905% (b) |
5,940,951
|
5,940,951
|
| Unaffiliated
Investment Companies 15.0% |
| Invesco
Government & Agency Portfolio, 3.163% (b)(c) |
12,832,152
|
12,832,152
|
The notes to the financial statements are an integral part of, and should be
read in conjunction with, the financial statements.
47
Portfolio of
Investments October 31, 2022† (Unaudited) (continued)
| |
Shares
|
|
Value
|
| Short-Term
Investments (continued) |
| Unaffiliated
Investment Companies (continued) |
| State
Street Institutional U.S. Government Money Market Fund, 3.064% (b)(c) |
1,000,000
|
|
$ 1,000,000
|
Total
Unaffiliated Investment Companies
(Cost $13,832,152) |
|
|
13,832,152
|
Total
Short-Term Investments
(Cost $19,773,103) |
|
|
19,773,103
|
Total
Investments
(Cost $110,425,571) |
115.1%
|
|
105,788,023
|
| Other
Assets, Less Liabilities |
(15.1)
|
|
(13,861,743)
|
| Net
Assets |
100.0%
|
|
$
91,926,280 |
| †
|
Percentages
indicated are based on Fund net assets. |
| (a)
|
All or a
portion of this security was held on loan. As of October 31, 2022, the aggregate market value of securities on loan was $13,483,740; the total market value of collateral held by the Fund was $13,837,621. The market value of the collateral held
included non-cash collateral in the form of U.S. Treasury securities with a value of $5,469. The Fund received cash collateral with a value of $13,832,152. (See Note 2(G)) |
| (b)
|
Current
yield as of October 31, 2022. |
| (c)
|
Represents
a security purchased with cash collateral received for securities on loan. |
Investments in Affiliates (in 000's)
Investments in issuers considered to be affiliate(s) of the
Fund during the six-month period ended October 31, 2022 for purposes of Section 2(a)(3) of the Investment Company Act of 1940, as amended, were as follows:
| Affiliated
Investment Companies |
Value,
Beginning
of Period |
Purchases
at Cost |
Proceeds
from
Sales |
Net
Realized
Gain/(Loss)
on Sales |
Change
in
Unrealized
Appreciation/
(Depreciation) |
Value,
End of
Period |
Dividend
Income |
Other
Distributions |
Shares
End of
Period |
| MainStay
U.S. Government Liquidity Fund |
$ 2,260
|
$ 19,736
|
$ (16,055)
|
$ —
|
$ —
|
$ 5,941
|
$ 28
|
$ —
|
5,941
|
| Abbreviation(s):
|
| EAFE—Europe,
Australasia and Far East |
| ETF—Exchange-Traded
Fund |
| MSCI—Morgan
Stanley Capital International |
| SPDR—Standard
& Poor’s Depositary Receipt |
| USD—United
States Dollar |
The notes to the financial statements are an integral part of, and should be
read in conjunction with, the financial statements.
| 48
|
MainStay Moderate ETF
Allocation Fund |
The following is
a summary of the fair valuations according to the inputs used as of October 31, 2022, for valuing the Fund’s assets:
| Description
|
Quoted
Prices in
Active
Markets for
Identical
Assets
(Level 1) |
|
Significant
Other
Observable
Inputs
(Level 2) |
|
Significant
Unobservable
Inputs
(Level 3) |
|
Total
|
| Asset
Valuation Inputs |
|
|
|
|
|
|
|
| Investments
in Securities (a) |
|
|
|
|
|
|
|
| Investment
Companies |
|
|
|
|
|
|
|
| Equity
Funds |
$
56,244,184 |
|
$ —
|
|
$ —
|
|
$
56,244,184 |
| Fixed
Income Funds |
29,770,736
|
|
—
|
|
—
|
|
29,770,736
|
| Total
Investment Companies |
86,014,920
|
|
—
|
|
—
|
|
86,014,920
|
| Short-Term
Investments |
|
|
|
|
|
|
|
| Affiliated
Investment Company |
5,940,951
|
|
—
|
|
—
|
|
5,940,951
|
| Unaffiliated
Investment Companies |
13,832,152
|
|
—
|
|
—
|
|
13,832,152
|
| Total
Short-Term Investments |
19,773,103
|
|
—
|
|
—
|
|
19,773,103
|
| Total
Investments in Securities |
$ 105,788,023
|
|
$ —
|
|
$ —
|
|
$ 105,788,023
|
| (a)
|
For
a complete listing of investments, see the Portfolio of Investments. |
The notes to the financial statements are an integral part of,
and should be read in conjunction with, the financial statements.
49
Statement of
Assets and Liabilities as of October 31, 2022 (Unaudited)
| Assets
|
Investment
in unaffiliated securities, at value
(identified cost $104,484,620) including securities on loan of $13,483,740 |
$
99,847,072 |
Investment
in affiliated investment companies, at value
(identified cost $5,940,951) |
5,940,951
|
| Cash
|
833
|
| Due
from custodian |
59,662
|
| Receivables:
|
|
| Fund
shares sold |
94,585
|
| Investment
securities sold |
33,898
|
| Securities
lending |
32,419
|
| Dividends
|
10,420
|
| Other
assets |
55,673
|
| Total
assets |
106,075,513
|
| Liabilities
|
| Cash
collateral received for securities on loan |
13,832,152
|
| Payables:
|
|
| Fund
shares redeemed |
186,690
|
| Investment
securities purchased |
59,662
|
| NYLIFE
Distributors (See Note 3) |
20,469
|
| Professional
fees |
16,515
|
| Manager
(See Note 3) |
15,159
|
| Transfer
agent (See Note 3) |
7,890
|
| Custodian
|
4,457
|
| Shareholder
communication |
2,774
|
| Accrued
expenses |
3,465
|
| Total
liabilities |
14,149,233
|
| Net
assets |
$
91,926,280 |
| Composition
of Net Assets |
| Shares
of beneficial interest outstanding (par value of $.001 per share) unlimited number of shares authorized |
$
8,803 |
| Additional
paid-in-capital |
99,682,351
|
| |
99,691,154
|
| Total
distributable earnings (loss) |
(7,764,874)
|
| Net
assets |
$
91,926,280 |
| Class
A |
|
| Net
assets applicable to outstanding shares |
$85,414,414
|
| Shares
of beneficial interest outstanding |
8,176,661
|
| Net
asset value per share outstanding |
$
10.45 |
| Maximum
sales charge (3.00% of offering price) |
0.32
|
| Maximum
offering price per share outstanding |
$
10.77 |
| Class
C |
|
| Net
assets applicable to outstanding shares |
$
340,312 |
| Shares
of beneficial interest outstanding |
32,875
|
| Net
asset value and offering price per share outstanding |
$
10.35 |
| Class
I |
|
| Net
assets applicable to outstanding shares |
$
69,121 |
| Shares
of beneficial interest outstanding |
6,603
|
| Net
asset value and offering price per share outstanding |
$
10.47 |
| Class
R3 |
|
| Net
assets applicable to outstanding shares |
$
1,264,635 |
| Shares
of beneficial interest outstanding |
121,465
|
| Net
asset value and offering price per share outstanding |
$
10.41 |
| SIMPLE
Class |
|
| Net
assets applicable to outstanding shares |
$
4,837,798 |
| Shares
of beneficial interest outstanding |
464,984
|
| Net
asset value and offering price per share outstanding |
$
10.40 |
The notes to the financial statements are an
integral part of, and should be read in conjunction with, the financial statements.
| 50
|
MainStay Moderate ETF
Allocation Fund |
Statement of
Operations for the six months ended October 31, 2022 (Unaudited)
| Investment
Income (Loss) |
| Income
|
|
| Dividends-unaffiliated
|
$
1,163,741 |
| Securities
lending, net |
145,814
|
| Dividends-affiliated
|
28,235
|
| Total
income |
1,337,790
|
| Expenses
|
|
| Distribution/Service—Class
A (See Note 3) |
107,042
|
| Distribution/Service—Class
C (See Note 3) |
1,800
|
| Distribution/Service—Class
R3 (See Note 3) |
2,562
|
| Distribution/Service—SIMPLE
Class (See Note 3) |
9,880
|
| Manager
(See Note 3) |
91,041
|
| Registration
|
44,000
|
| Transfer
agent (See Note 3) |
37,036
|
| Professional
fees |
18,056
|
| Custodian
|
10,415
|
| Shareholder
communication |
4,058
|
| Trustees
|
1,003
|
| Shareholder
service (See Note 3) |
512
|
| Miscellaneous
|
2,686
|
| Total
expenses |
330,091
|
| Net
investment income (loss) |
1,007,699
|
| Realized
and Unrealized Gain (Loss) |
| Net
realized gain (loss) on unaffiliated investments |
(3,474,080)
|
| Net
change in unrealized appreciation (depreciation) on unaffiliated investments |
(2,701,062)
|
| Net
realized and unrealized gain (loss) |
(6,175,142)
|
| Net
increase (decrease) in net assets resulting from operations |
$(5,167,443)
|
The notes to the financial statements are an integral part of,
and should be read in conjunction with, the financial statements.
51
Statements of
Changes in Net Assets
for the six months ended October 31, 2022 (Unaudited) and the year ended April 30, 2022
| |
Six months
ended
October 31,
2022 |
Year
ended
April 30,
2022 |
| Increase
(Decrease) in Net Assets |
| Operations:
|
|
|
| Net
investment income (loss) |
$
1,007,699 |
$
1,203,799 |
| Net
realized gain (loss) |
(3,474,080)
|
(597,640)
|
| Net
change in unrealized appreciation (depreciation) |
(2,701,062)
|
(6,742,990)
|
| Net
increase (decrease) in net assets resulting from operations |
(5,167,443)
|
(6,136,831)
|
| Distributions
to shareholders: |
|
|
| Class
A |
—
|
(1,190,376)
|
| Class
C |
—
|
(3,546)
|
| Class
I |
—
|
(1,128)
|
| Class
R3 |
—
|
(9,056)
|
| SIMPLE
Class |
—
|
(22,031)
|
| Total
distributions to shareholders |
—
|
(1,226,137)
|
| Capital
share transactions: |
|
|
| Net
proceeds from sales of shares |
12,305,972
|
54,296,195
|
| Net
asset value of shares issued to shareholders in reinvestment of distributions |
—
|
1,224,058
|
| Cost
of shares redeemed |
(5,823,117)
|
(13,327,228)
|
| Increase
(decrease) in net assets derived from capital share transactions |
6,482,855
|
42,193,025
|
| Net
increase (decrease) in net assets |
1,315,412
|
34,830,057
|
| Net
Assets |
| Beginning
of period |
90,610,868
|
55,780,811
|
| End
of period |
$91,926,280
|
$
90,610,868 |
The notes to the financial statements are an integral part of,
and should be read in conjunction with, the financial statements.
| 52
|
MainStay Moderate ETF
Allocation Fund |
Financial
Highlights selected per share data and ratios
| |
Six
months ended
October 31,
2022* |
|
Year
Ended April 30, |
|
June
30, 2020^ through
April 30, |
| Class
A |
2022
|
|
2021
|
| Net
asset value at beginning of period |
$
11.06 |
|
$
11.88 |
|
$
10.00 |
| Net
investment income (loss) (a) |
0.12
|
|
0.18
|
|
0.10
|
| Net
realized and unrealized gain (loss) |
(0.73)
|
|
(0.83)
|
|
1.85
|
| Total
from investment operations |
(0.61)
|
|
(0.65)
|
|
1.95
|
| Less
distributions: |
|
|
|
|
|
| From
net investment income |
—
|
|
(0.15)
|
|
(0.06)
|
| From
net realized gain on investments |
—
|
|
(0.02)
|
|
(0.01)
|
| Total
distributions |
—
|
|
(0.17)
|
|
(0.07)
|
| Net
asset value at end of period |
$
10.45 |
|
$
11.06 |
|
$
11.88 |
| Total
investment return (b) |
(5.52)%
|
|
(5.60)%
|
|
19.50%
|
| Ratios
(to average net assets)/Supplemental Data: |
|
|
|
|
|
| Net
investment income (loss) |
2.24%††
|
|
1.53%
|
|
1.02%††
|
| Net
expenses (c) |
0.70%††
|
|
0.70%
|
|
0.80%††
|
| Expenses
(before waiver/reimbursement) (c) |
0.70%††
|
|
0.70%
|
|
1.04%††
|
| Portfolio
turnover rate |
33%
|
|
58%
|
|
45%
|
| Net
assets at end of period (in 000’s) |
$
85,414 |
|
$
86,128 |
|
$
54,345 |
| *
|
Unaudited.
|
| ^
|
Inception
date. |
| ††
|
Annualized.
|
| (a)
|
Per share
data based on average shares outstanding during the period. |
| (b)
|
Total
investment return is calculated exclusive of sales charges and assumes the reinvestment of dividends and distributions. For periods of less than one year, total return is not annualized. |
| (c)
|
In
addition to the fees and expenses which the Fund bears directly, it also indirectly bears a pro-rata share of the fees and expenses of the underlying funds in which it invests. Such indirect expenses are not included in the above expense ratios.
|
The
notes to the financial statements are an integral part of, and should be read in conjunction with, the financial statements.
53
Financial
Highlights selected per share data and ratios
| |
Six
months ended
October 31,
2022* |
|
Year
Ended April 30, |
|
June
30, 2020^ through
April 30, |
| Class
C |
2022
|
|
2021
|
| Net
asset value at beginning of period |
$
11.00 |
|
$
11.83 |
|
$
10.00 |
| Net
investment income (loss) (a) |
0.08
|
|
0.08
|
|
0.03
|
| Net
realized and unrealized gain (loss) |
(0.73)
|
|
(0.83)
|
|
1.85
|
| Total
from investment operations |
(0.65)
|
|
(0.75)
|
|
1.88
|
| Less
distributions: |
|
|
|
|
|
| From
net investment income |
—
|
|
(0.06)
|
|
(0.04)
|
| From
net realized gain on investments |
—
|
|
(0.02)
|
|
(0.01)
|
| Total
distributions |
—
|
|
(0.08)
|
|
(0.05)
|
| Net
asset value at end of period |
$
10.35 |
|
$
11.00 |
|
$
11.83 |
| Total
investment return (b) |
(5.91)%
|
|
(6.44)%
|
|
18.82%
|
| Ratios
(to average net assets)/Supplemental Data: |
|
|
|
|
|
| Net
investment income (loss) |
1.45%††
|
|
0.70%
|
|
0.29%††
|
| Net
expenses (c) |
1.52%††
|
|
1.54%
|
|
1.55%††
|
| Expenses
(before waiver/reimbursement) (c) |
1.52%††
|
|
1.54%
|
|
1.77%††
|
| Portfolio
turnover rate |
33%
|
|
58%
|
|
45%
|
| Net
assets at end of period (in 000’s) |
$
340 |
|
$
389 |
|
$
506 |
| *
|
Unaudited.
|
| ^
|
Inception
date. |
| ††
|
Annualized.
|
| (a)
|
Per share
data based on average shares outstanding during the period. |
| (b)
|
Total
investment return is calculated exclusive of sales charges and assumes the reinvestment of dividends and distributions. For periods of less than one year, total return is not annualized. |
| (c)
|
In
addition to the fees and expenses which the Fund bears directly, it also indirectly bears a pro-rata share of the fees and expenses of the underlying funds in which it invests. Such indirect expenses are not included in the above expense ratios.
|
The
notes to the financial statements are an integral part of, and should be read in conjunction with, the financial statements.
| 54
|
MainStay Moderate ETF
Allocation Fund |
Financial
Highlights selected per share data and ratios
| |
Six
months ended
October 31,
2022* |
|
Year
Ended April 30, |
|
June
30, 2020^ through
April 30, |
| Class
I |
2022
|
|
2021
|
| Net
asset value at beginning of period |
$
11.07 |
|
$
11.87 |
|
$
10.00 |
| Net
investment income (loss) (a) |
0.13
|
|
0.22
|
|
0.13
|
| Net
realized and unrealized gain (loss) |
(0.73)
|
|
(0.83)
|
|
1.84
|
| Total
from investment operations |
(0.60)
|
|
(0.61)
|
|
1.97
|
| Less
distributions: |
|
|
|
|
|
| From
net investment income |
—
|
|
(0.17)
|
|
(0.09)
|
| From
net realized gain on investments |
—
|
|
(0.02)
|
|
(0.01)
|
| Total
distributions |
—
|
|
(0.19)
|
|
(0.10)
|
| Net
asset value at end of period |
$
10.47 |
|
$
11.07 |
|
$
11.87 |
| Total
investment return (b) |
(5.42)%
|
|
(5.31)%
|
|
19.79%
|
| Ratios
(to average net assets)/Supplemental Data: |
|
|
|
|
|
| Net
investment income (loss) |
2.49%††
|
|
1.83%
|
|
1.40%††
|
| Net
expenses (c) |
0.46%††
|
|
0.45%
|
|
0.55%††
|
| Expenses
(before waiver/reimbursement) (c) |
0.46%††
|
|
0.45%
|
|
0.79%††
|
| Portfolio
turnover rate |
33%
|
|
58%
|
|
45%
|
| Net
assets at end of period (in 000’s) |
$
69 |
|
$
73 |
|
$
52 |
| *
|
Unaudited.
|
| ^
|
Inception
date. |
| ††
|
Annualized.
|
| (a)
|
Per share
data based on average shares outstanding during the period. |
| (b)
|
Total
investment return is calculated exclusive of sales charges and assumes the reinvestment of dividends and distributions. Class I shares are not subject to sales charges. For periods of less than one year, total return is not annualized. |
| (c)
|
In
addition to the fees and expenses which the Fund bears directly, it also indirectly bears a pro-rata share of the fees and expenses of the underlying funds in which it invests. Such indirect expenses are not included in the above expense ratios.
|
The
notes to the financial statements are an integral part of, and should be read in conjunction with, the financial statements.
55
Financial
Highlights selected per share data and ratios
| |
Six
months ended
October 31,
2022* |
|
Year
Ended April 30, |
|
June
30, 2020^ through
April 30, |
| Class
R3 |
2022
|
|
2021
|
| Net
asset value at beginning of period |
$
11.04 |
|
$
11.86 |
|
$
10.00 |
| Net
investment income (loss) (a) |
0.10
|
|
0.15
|
|
0.07
|
| Net
realized and unrealized gain (loss) |
(0.73)
|
|
(0.84)
|
|
1.85
|
| Total
from investment operations |
(0.63)
|
|
(0.69)
|
|
1.92
|
| Less
distributions: |
|
|
|
|
|
| From
net investment income |
—
|
|
(0.11)
|
|
(0.05)
|
| From
net realized gain on investments |
—
|
|
(0.02)
|
|
(0.01)
|
| Total
distributions |
—
|
|
(0.13)
|
|
(0.06)
|
| Net
asset value at end of period |
$
10.41 |
|
$
11.04 |
|
$
11.86 |
| Total
investment return (b) |
(5.71)%
|
|
(5.92)%
|
|
19.22%
|
| Ratios
(to average net assets)/Supplemental Data: |
|
|
|
|
|
| Net
investment income (loss) |
1.86%††
|
|
1.22%
|
|
0.76%††
|
| Net
expenses (c) |
1.05%††
|
|
1.05%
|
|
1.15%††
|
| Expenses
(before waiver/reimbursement) (c) |
1.05%††
|
|
1.05%
|
|
1.39%††
|
| Portfolio
turnover rate |
33%
|
|
58%
|
|
45%
|
| Net
assets at end of period (in 000’s) |
$
1,265 |
|
$
854 |
|
$
403 |
| *
|
Unaudited.
|
| ^
|
Inception
date. |
| ††
|
Annualized.
|
| (a)
|
Per share
data based on average shares outstanding during the period. |
| (b)
|
Total
investment return is calculated exclusive of sales charges and assumes the reinvestment of dividends and distributions. Class R3 shares are not subject to sales charges. For periods of less than one year, total return is not annualized. |
| (c)
|
In
addition to the fees and expenses which the Fund bears directly, it also indirectly bears a pro-rata share of the fees and expenses of the underlying funds in which it invests. Such indirect expenses are not included in the above expense ratios.
|
The
notes to the financial statements are an integral part of, and should be read in conjunction with, the financial statements.
| 56
|
MainStay Moderate ETF
Allocation Fund |
Financial
Highlights selected per share data and ratios
| |
Six
months ended
October 31,
2022* |
|
Year
Ended April 30, |
|
August
31, 2020^ through
April 30, |
| SIMPLE
Class |
2022
|
|
2021
|
| Net
asset value at beginning of period |
$
11.03 |
|
$
11.85 |
|
$
10.66 |
| Net
investment income (loss) (a) |
0.10
|
|
0.13
|
|
0.06
|
| Net
realized and unrealized gain (loss) |
(0.73)
|
|
(0.81)
|
|
1.19
|
| Total
from investment operations |
(0.63)
|
|
(0.68)
|
|
1.25
|
| Less
distributions: |
|
|
|
|
|
| From
net investment income |
—
|
|
(0.12)
|
|
(0.05)
|
| From
net realized gain on investments |
—
|
|
(0.02)
|
|
(0.01)
|
| Total
distributions |
—
|
|
(0.14)
|
|
(0.06)
|
| Net
asset value at end of period |
$
10.40 |
|
$
11.03 |
|
$
11.85 |
| Total
investment return (b) |
(5.71)%
|
|
(5.89)%
|
|
11.75%
|
| Ratios
(to average net assets)/Supplemental Data: |
|
|
|
|
|
| Net
investment income (loss) |
1.86%††
|
|
1.07%
|
|
0.62%††
|
| Net
expenses (c) |
1.02%††
|
|
1.05%
|
|
1.05%††
|
| Expenses
(before waiver/reimbursement) (c) |
1.02%††
|
|
1.05%
|
|
1.27%††
|
| Portfolio
turnover rate |
33%
|
|
58%
|
|
45%
|
| Net
assets at end of period (in 000’s) |
$
4,838 |
|
$
3,167 |
|
$
475 |
| *
|
Unaudited.
|
| ^
|
Inception
date. |
| ††
|
Annualized.
|
| (a)
|
Per share
data based on average shares outstanding during the period. |
| (b)
|
Total
investment return is calculated exclusive of sales charges and assumes the reinvestment of dividends and distributions. SIMPLE Class shares are not subject to sales charges. For periods of less than one year, total return is not annualized.
|
| (c)
|
In
addition to the fees and expenses which the Fund bears directly, it also indirectly bears a pro-rata share of the fees and expenses of the underlying funds in which it invests. Such indirect expenses are not included in the above expense ratios.
|
The notes to the financial statements are an integral part of, and should be
read in conjunction with, the financial statements.
57
MainStay Growth
ETF Allocation Fund
Investment and Performance
Comparison (Unaudited)
Performance data quoted represents past performance. Past performance is no
guarantee of future results. Because of market volatility and other factors, current performance may be lower or higher than the figures shown. Investment return and principal value will fluctuate, and as a result, when shares are redeemed, they may
be worth more or less than their original cost. The graph below depicts the historical performance of Class I shares of the Fund. Performance will vary from class to class based on differences in class-specific expenses and sales charges. For performance information current to the most recent month-end, please call 800-624-6782 or visit newyorklifeinvestments.com.
The performance table and graph do not reflect the deduction
of taxes that a shareholder would pay on distributions or Fund share redemptions. Total returns reflect maximum applicable sales charges as indicated in the table below, if any, changes in share price, and reinvestment of dividend and capital gain
distributions. The graph assumes the initial investment amount shown below and reflects the deduction of all sales charges that would have applied for the period of investment. Performance figures may reflect certain fee waivers and/or expense
limitations, without which total returns may have been lower. For more information on share classes and current fee waivers and/or expense limitations (if any), please refer to the Notes to Financial Statements.
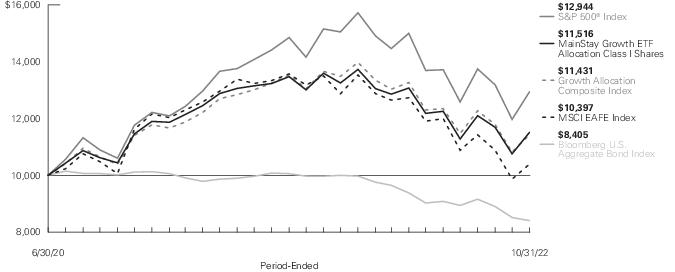
| Average
Annual Total Returns for the Period-Ended October 31, 2022 |
| Class
|
Sales
Charge |
|
Inception
Date |
Six
Months1 |
One
Year |
Since
Inception |
Gross
Expense
Ratio2 |
| Class
A Shares |
Maximum
3% Initial Sales Charge |
With
sales charges |
6/30/2020
|
-8.45%
|
-18.08%
|
4.57%
|
0.96%
|
| |
|
Excluding
sales charges |
|
-5.62
|
-15.54
|
5.94
|
0.96
|
| Class
C Shares |
Maximum
1% CDSC |
With
sales charges |
6/30/2020
|
-6.84
|
-16.91
|
5.16
|
1.75
|
| |
if
redeemed Within One Year of Purchase |
Excluding
sales charges |
|
-5.90
|
-16.08
|
5.16
|
1.75
|
| Class
I Shares |
No
Sales Charge |
|
6/30/2020
|
-5.47
|
-15.29
|
6.23
|
0.71
|
| Class
R3 Shares |
No
Sales Charge |
|
6/30/2020
|
-5.71
|
-15.74
|
5.60
|
1.31
|
| SIMPLE
Class Shares |
No
Sales Charge |
|
8/31/2020
|
-5.71
|
-15.71
|
2.17
|
1.25
|
| 1.
|
Not
annualized. |
| 2.
|
The
gross expense ratios presented reflect the Fund’s “Total Annual Fund Operating Expenses” from the most recent Prospectus, as supplemented, and may differ from other expense ratios disclosed in this report. |
The
footnotes on the next page are an integral part of the table and graph and should be carefully read in conjunction with them.
| 58
|
MainStay Growth ETF
Allocation Fund |
| Benchmark
Performance* |
Six
Months1 |
One
Year |
Since
Inception |
| S&P
500® Index2 |
-5.50%
|
-14.61%
|
11.68%
|
| MSCI
EAFE® Index (Net)3 |
-12.70
|
-23.00
|
1.68
|
| Bloomberg
U.S. Aggregate Bond Index4 |
-6.86
|
-15.68
|
-7.17
|
| Growth
Allocation Composite Index5 |
-7.10
|
-16.35
|
5.89
|
| Morningstar
Allocation-70% to 85% Equity Category Average6 |
-6.29
|
-15.93
|
6.20
|
| *
|
Returns
for indices reflect no deductions for fees, expenses or taxes, except for foreign withholding taxes where applicable. Results assume reinvestment of all dividends and capital gains. An investment cannot be made directly in an index.
|
| 1.
|
Not
annualized. |
| 2.
|
The
S&P 500® Index is the Fund’s primary broad-based securities market index for comparison purposes. S&P 500® is a trademark of The McGraw-Hill Companies, Inc. The S&P 500® Index is widely regarded as
the standard index for measuring large-cap U.S. stock market performance. |
| 3.
|
The MSCI
EAFE® Index (Net) is the Fund's secondary benchmark. The MSCI EAFE® Index (Net) consists of
international stocks representing the developed world outside of North America. |
| 4.
|
The Fund
has selected the Bloomberg U.S. Aggregate Bond Index as an additional benchmark. The Bloomberg U.S. Aggregate Bond Index is a broad-based benchmark that measures the performance of the investment grade, U.S. dollar-denominated, fixed-rate taxable
bond market, including Treasurys, government-related and corporate securities, mortgage-backed securities (agency fixed-rate and hybrid adjustable rate mortgage pass-throughs), asset-backed securities, and commercial mortgage-backed securities.
|
| 5.
|
The Fund
has selected the Growth Allocation Composite Index as an additional benchmark. The Growth Allocation Composite Index consists of the S&P 500® Index, the MSCI EAFE® Index and the Bloomberg U.S. Aggregate Bond Index weighted 60%, 20% and 20%, respectively. |
| 6.
|
The
Morningstar Allocation – 70% to 85% Equity Category Average is representative of funds that seek to provide both income and capital appreciation by investing in multiple asset classes, including stocks, bonds, and cash. These portfolios are
dominated by domestic holdings and have equity exposures between 70% and 85%. Results are based on average total returns of similar funds with all dividends and capital gain distributions reinvested. |
The
footnotes on the preceding page are an integral part of the table and graph and should be carefully read in conjunction with them.
Cost in Dollars of
a $1,000 Investment in MainStay Growth ETF Allocation Fund (Unaudited)
The example below is intended to describe the fees and expenses
borne by shareholders during the six-month period from May 1, 2022 to October 31, 2022, and the impact of those costs on your investment.
Example
As a shareholder of the Fund you incur two types of costs: (1)
transaction costs, including exchange fees and sales charges (loads) on purchases (as applicable), and (2) ongoing costs, including management fees, distribution and/or service (12b-1) fees and other Fund expenses (as applicable). This example is
intended to help you understand your ongoing costs (in dollars) of investing in the Fund and to compare these costs with the ongoing costs of investing in other mutual funds. The example is based on an investment of $1,000 made at the beginning of
the six-month period and held for the entire period from May 1, 2022 to October 31, 2022.
This example illustrates your Fund’s ongoing costs in two
ways:
Actual Expenses
The second and third data columns in the table below provide information about
actual account values and actual expenses. You may use the information in these columns, together with the amount you invested, to estimate the expenses that you paid during the six months ended October 31, 2022. Simply divide your account value by
$1,000 (for example, an
$8,600 account value divided by $1,000 = 8.6), then multiply the result by the
number under the heading entitled “Expenses Paid During Period” to estimate the expenses you paid on your account during this period.
Hypothetical Example for Comparison Purposes
The fourth and fifth data columns in the table below provide information about
hypothetical account values and hypothetical expenses based on the Fund’s actual expense ratio and an assumed rate of return of 5% per year before expenses, which is not the Fund’s actual return. The hypothetical account values and
expenses may not be used to estimate the actual ending account balances or expenses you paid for the six-month period shown. You may use this information to compare the ongoing costs of investing in the Fund with the ongoing costs of investing in
other mutual funds. To do so, compare this 5% hypothetical example with the 5% hypothetical examples that appear in the shareholder reports of the other mutual funds.
Please note that the expenses shown in the table are meant to
highlight your ongoing costs only and do not reflect any transactional costs, such as exchange fees or sales charges (loads). Therefore, the fourth and fifth data columns of the table are useful in comparing ongoing costs only and will not help you
determine the relative total costs of owning different funds. In addition, if these transactional costs were included, your costs would have been higher.
| Share
Class |
Beginning
Account
Value
5/1/22 |
Ending
Account
Value (Based
on Actual
Returns and
Expenses)
10/31/22 |
Expenses
Paid
During
Period1 |
Ending
Account
Value (Based
on Hypothetical
5% Annualized
Return and
Actual Expenses)
10/31/22 |
Expenses
Paid
During
Period1 |
Net
Expense
Ratio
During
Period2 |
| Class
A Shares |
$1,000.00
|
$943.80
|
$3.92
|
$1,021.17
|
$4.08
|
0.80%
|
| Class
C Shares |
$1,000.00
|
$941.00
|
$7.58
|
$1,017.39
|
$7.88
|
1.55%
|
| Class
I Shares |
$1,000.00
|
$945.30
|
$2.70
|
$1,022.43
|
$2.80
|
0.55%
|
| Class
R3 Shares |
$1,000.00
|
$942.90
|
$5.63
|
$1,019.41
|
$5.85
|
1.15%
|
| SIMPLE
Class Shares |
$1,000.00
|
$942.90
|
$5.14
|
$1,019.91
|
$5.35
|
1.05%
|
| 1.
|
Expenses are
equal to the Fund’s annualized expense ratio of each class multiplied by the average account value over the period, divided by 365 and multiplied by 184 (to reflect the six-month period). The table above represents the actual expenses incurred
during the six-month period. In addition to the fees and expenses which the Fund bears directly, it also indirectly bears a pro rata share of the fees and expenses of the underlying funds in which it invests. Such indirect expenses are not included
in the above-reported expense figures. |
| 2.
|
Expenses
are equal to the Fund's annualized expense ratio to reflect the six-month period. |
| 60
|
MainStay Growth ETF
Allocation Fund |
Asset Diversification as of October 31, 2022
(Unaudited)
| Equity
Funds |
81.0
% |
| Fixed
Income Funds |
13.2
|
| Short-Term
Investments |
18.8
|
| Other
Assets, Less Liabilities |
(13.0)
|
See Portfolio of Investments
beginning on page 65 for specific holdings within these categories. The Fund’s holdings are subject to change.
Portfolio
Management Discussion and Analysis (Unaudited)
Questions answered by portfolio managers Jae S. Yoon,
CFA, Jonathan Swaney, Poul Kristensen, CFA, and Amit Soni, CFA, of New York Life Investment Management LLC, the Fund’s Manager.
How did MainStay Growth ETF Allocation Fund perform relative to its
benchmarks and peer group during the six months ended October 31, 2022?
For the six months ended October 31, 2022, Class I shares of
MainStay Growth ETF Allocation Fund returned −5.47%, outperforming the −5.50% return of the Fund’s primary benchmark, the S&P 500® Index (the
"Index"), and the −12.70% return of the MSCI EAFE® Index (Net), which is the Fund’s secondary benchmark. Over the same period, Class I shares of the Fund also
outperformed the −6.86% return of the Bloomberg U.S. Aggregate Bond Index, and the −7.10% return of the Growth Allocation Composite Index, both of which are additional benchmarks of the Fund. For the six months ended October 31, 2022,
Class I shares of the Fund outperformed the −6.29% return of the Morningstar Allocation-70% to 85% Equity Category Average.1
What factors affected the Fund’s relative
performance during the reporting period?
The Fund is a
“fund of funds" that seeks to achieve its investment objective by investing in unaffiliated, passively-managed, exchange-traded funds (“Underlying ETFs”). The Underlying ETFs may invest in U.S. equities, international equities and
fixed-income instruments, making comparisons to any single index generally less suitable than a weighted combination of indices, which is a more useful yardstick by which to measure performance. During the reporting period, asset class policy was
the primary determinant of the Fund’s relative performance.
Fund management internally maintains a blend of indices that
are taken into consideration when managing the Fund. During the reporting period, the Fund materially outperformed the internally maintained blend of indices due to active positioning at the asset class level. The Fund’s outperformance was
driven by the following factors:
| •
|
Management of the stock/bond
blend: The Fund’s management of its stock/bond blend proved generally successful, reflecting tactical adjustments made throughout the reporting period. With both investment-grade bonds and U.S. stocks posting declines in the mid-teens, there
was little cost or benefit to being persistently overweight or underweight in equities, although adjusting that exposure over time (buying dips and selling rallies) added significant value. |
| •
|
Value
created within asset classes: The equity portion of the Fund emphasized value over growth, with specific focus on energy companies and defensive sectors that the market rewarded. |
Conditions also favored the Fund’s skew toward profitable small-cap
companies.
| •
|
Shorter duration:2 We shortened the average duration of the fixed-income portion of the Fund by holding cash and emphasizing exposure to iShares® 0-5 Year High Yield Corporate Bond ETF over its full duration counterpart, iShares® Broad USD
High Yield Corporate Bond ETF. Both moves lifted relative returns. |
The most significant detractor from the Fund’s relative
performance was exposure to gold miner equities. The price of gold, and thus gold miners, tends to move inversely to real bond yields. The combination of the Federal Reserve (the "Fed") pushing rates higher and emerging signs that inflation may be
peaking spelled trouble for this particular position.
While most ETF holdings track the performance of indices that
are components of the benchmark quite closely, that is not universally true. The Schwab® U.S. Small-Cap ETF trailed the performance of the Russell 2000® Index by close to 2%. As a large holding within the Fund, representing approximately 10% of total assets, that shortfall detracted materially from performance versus the
benchmark. In similar fashion, the Vanguard Mid-Cap ETF trailed the performance of the Russell Midcap® Index, further denting returns.
How did you allocate the Fund’s assets during the
reporting period and why?
Stock/bond blend: On average,
the Fund held a moderately overweight exposure to equities during the reporting period, with the magnitude of that bias managed tactically in response to swings in pricing, as described above. We are generally reluctant to position the Fund with an
underweight allocation to equities, as stocks have tended to perform well over time, and anticipating drawdowns is challenging. The opposite is less true; we are happy to increase the Fund’s allocation to equities when we believe they are well
supported fundamentally or when a correction has run further than we believe appropriate. This approach worked well during the reporting period. Although stocks declined by double digits, the Fund generated roughly 0.3% of excess return3 through tactical adjustments to its degree of overweight exposure to equities.
Duration: Believing inflationary pressures to be partially
structural in nature and likely to persist at elevated levels for the foreseeable future, we skewed the Fund’s fixed-income holdings to favor shorter maturity instruments less sensitive to rising bond yields, although we increased the
Fund’s duration as yields rose. By the end of the reporting period, the average duration of the
| 1.
|
See page 58 for other share
class returns, which may be higher or lower than Class I share returns. See page 59 for more information on benchmark and peer group returns. |
| 2.
|
Duration is a measure of the
price sensitivity of a fixed-income investment to changes in interest rates. Duration is expressed as a number of years and is considered a more accurate sensitivity gauge than average maturity. |
| 3.
|
The expression “excess
return” may refer to the return that a security or portfolio provides above (or below) an investment with the lowest perceived risk, such as comparable U.S. Treasury securities. The expression may also refer to the return that a security or
portfolio provides above (or below) an index or other benchmark. |
| 62
|
MainStay Growth ETF
Allocation Fund |
fixed-income portion of the Fund was only slightly shorter than that of the
benchmark. The Fund’s duration policy contributed positively to performance. (Contributions take weightings and total returns into account.)
Equity style: In the same way that inflation is threatening to
long-duration bonds, equities with values disproportionately reflected in more distant cash flows (i.e., growth stocks with high prices relative to current earnings) are likewise vulnerable. Accordingly, we tilted the Fund to emphasize value stocks
that offered more attractive near-term cash flows, placing particular focus on traditionally defensive sectors: real estate, utilities, consumer staples and (most of all) health care. The combined effect was a modest positive contribution to return
of approximately 0.1%.
Equity size: Small-company stocks
were more heavily owned in the Fund than in the Index. The thesis behind this positioning was based on attractive small-cap valuations, insulation from economic weakness abroad, less sensitivity to dollar strength and disproportionate exposure to
domestic demand, which remained healthy. The Fund’s active position in small-cap companies contributed approximately 0.25% to relative performance.
Geographic exposure: In light of Russia’s invasion of
Ukraine, the Fund held an underweight exposure to developed international markets, benefiting performance at the margin. That improvement in returns was fully offset, however, by a small overweight position in emerging market equities. We believed
that China’s economy would benefit from the country’s relaxation of its zero-COVID policy, as well as additional fiscal support ahead of the October 2022 Party Congress; however, neither development materialized.
Gold miners: The Fund maintained a varying position in gold
miners as a hedge against inflation and/or a monetary policy mistake. With month-over-month readings on inflation starting to improve, the Fed demonstrating their mettle in aggressively tightening monetary policy, and input costs for energy and
labor rising sharply, this proved to be an unfavorable environment for miners. The position subtracted almost 0.4% from the Fund’s return, making it by far the most significant detractor from Fund performance.
Energy: As with gold miners, the Fund maintained exposure to
upstream energy producers as a commodity play to provide an additional inflation hedge. Such holdings also positioned the Fund to take advantage of opportunities for domestic producers to benefit as Western nations revisit energy policy to source
supplies from stable and friendly jurisdictions, rather than autocratic petrostates that present national security risks. While the Fund’s position was small, it had a disproportionately positive impact on performance as oil and gas prices
soared, fully offsetting the adverse impact of the Fund’s exposure to gold miners.
How did the Fund’s allocations change over the
course of the reporting period?
We reduced the
Fund’s allocation most significantly to iShares® Core MSCI EAFE ETF to lessen non-U.S. market exposure in anticipation of a global recession. We also trimmed holdings
in iShares® 0-5 Year High Yield Corporate Bond ETF and iShares® Broad USD High Yield Corporate
Bond ETF, as exposure to sub-investment-grade credit was pulled back to benchmark levels. Another downward adjustment involved trimming holdings of VanEck Oil Services ETF and
SPDR® S&P® Oil & Gas Exploration ETF, which were reduced following a long period of
solid outperformance, with energy being the only sector to deliver positive returns during the reporting period.
The Fund’s cash position saw the largest increase, as we
parked proceeds from cutting back equity exposure. Allocations to defensive industries also grew via positions in Health Care Select Sector SPDR® ETF and Invesco S&P® 500 Low Volatility ETF. iShares® Core U.S. Aggregate Bond ETF, Schwab® U.S. Aggregate Bond ETF and iShares® Broad USD Investment Grade Corporate Bond ETF all saw
inflows resulting from the sale of high yield credits.
During the reporting period, which Underlying Equity
ETFs had the highest total returns and which Underlying Equity ETFs had the lowest total returns?
The Fund’s two top-performing Underlying Equity ETFs
were SPDR® S&P® Oil & Gas Exploration ETF and VanEck Oil Services ETF. Also posting
positive returns were Health Care Select Sector SPDR® ETF and Vanguard Mega Cap Value ETF. The largest declines were seen in VanEck Gold Miners ETF, iShares® Core MSCI Emerging Markets Equity ETF and iShares® Semiconductor ETF.
Which Underlying Equity ETFs were the strongest positive
contributors to the Fund’s performance and which Underlying Equity ETFs were particularly weak?
The Underlying Equity ETFs providing the highest total
returns—SPDR® S&P® Oil & Gas Exploration ETF and VanEck Oil Services
ETF—also produced the strongest positive contributions to performance, followed by the healthcare sector and iShares® Core S&P® Small Cap ETF. The most significant detractors were iShares® Core MSCI EAFE ETF, followed by
iShares® Core MSCI Emerging Markets ETF and Vanguard Mega Cap ETF.
During the reporting period, which Underlying
Fixed-Income ETFs had the highest total returns and which Underlying Fixed-Income ETFs had the lowest total returns?
Other than Underlying Money Market Funds, all Underlying
Fixed-Income ETFs generated negative returns. iShares® 0-5 Year High Yield Corporate Bond ETF,
iShares® Broad USD High Yield
Corporate Bond ETF and Invesco Senior Loan ETF registered the mildest losses.
The largest losses came from iShares® Core U.S. Aggregate Bond ETF, Schwab® U.S. Aggregate Bond
ETF and iShares® Broad USD Investment Grade Bond ETF.
Which Underlying Fixed-Income ETFs were the strongest
positive contributors to the Fund’s performance and which Underlying Fixed-Income ETFs were particularly weak?
With all Underlying Fixed-Income ETFs experiencing losses
during the reporting period, none contributed positively to performance. Those detracting the least included iShares® Core U.S. Aggregate Bond ETF, iShares® Broad USD Investment Grade Bond ETF and Schwab® U.S. Aggregate Bond ETF. The most significant
detractor was iShares® 20+ Year Treasury Bond ETF, followed by larger positions in iShares®
Broad USD High Yield Corporate Bond ETF and Invesco Senior Loan ETF.
How was the Fund positioned at the end of the reporting
period?
As the market rallied in October 2022, we
trimmed the Fund’s equity allocation, positioning the Fund very close to neutral as of October 31, 2022. We anticipate that the market will continue to move generally sideways within a very broad channel, presenting opportunities to trade
tactically, adding to equity holdings during periods of weakness and trimming them again as prices recover.
The bias we expect to have the largest impact on active return
is our preference for small- and mid-cap stocks. We believe that the large-cap space is potentially vulnerable to economic weakness abroad, a strong U.S. dollar, rich valuations and concentration in a relatively short list of very large companies
(mega-cap technology). Smaller companies, in contrast, cater primarily to what we view as a financially healthy domestic clientele and have historically been more successful than larger companies in protecting real earnings amid high
inflation.
Likewise, the Fund’s emphasis on value
stocks over growth stocks remains intact, with a particular emphasis on what we perceive to be the defensive “RUSH” sectors: real estate, utilities, consumer staples and health care. The thesis rests primarily on the idea that inflation
will prove persistent and jeopardize the high price multiples paid on fast-growing companies with current valuations that depend on distant earnings. We are also mindful of the economy’s progression in the business cycle and the possibility
that a recession may not be far away.
The Fund maintains a position in energy sector firms, as we
envision sustained supply constraints keeping commodity prices elevated, thus preserving meaty profit margins for several years to come. A small position in gold miner stocks also remains in the Fund's portfolio as an intended hedge against a
potential monetary policy mistake or as a safe harbor should the economy slide into recession.
Within fixed income, we have lessened the Fund’s
short-duration posture considerably as yields have climbed. As of October 31, 2022, the Fund’s duration is closer to the benchmark. We have also reduced the Fund’s exposure to credit as corporate fundamentals show signs of gradual
deterioration.
None of Schwab Strategic Trust, Schwab® U.S. Small-Cap ETF, Schwab® U.S. Aggregate Bond ETF, or Charles Schwab Investment Management,
Inc. make any representations regarding the advisability of investing in MainStay Growth ETF Allocation Fund.
iShares® is a registered trademark of BlackRock (BlackRock, Inc. and its subsidiaries). Neither BlackRock nor the iShares® Funds make any representations regarding the advisability of investing in MainStay Growth ETF Allocation Fund.
The opinions expressed are those of the portfolio
managers as of the date of this report and are subject to change. There is no guarantee that any forecasts will come to pass. This material does not constitute investment advice and is not intended as an endorsement of any specific investment.
| 64
|
MainStay Growth ETF
Allocation Fund |
Portfolio of
Investments October 31, 2022† (Unaudited)
| |
Shares
|
|
Value
|
| Investment
Companies 94.2% |
| Equity
Funds 81.0% |
| Health
Care Select Sector SPDR Fund (a) |
8,368
|
|
$ 1,110,852
|
| Invesco
S&P 500 Low Volatility ETF |
22,861
|
|
1,411,438 |
| iShares
Core MSCI EAFE ETF |
138,582
|
|
7,721,789 |
| iShares
Core MSCI Emerging Markets ETF |
50,182
|
|
2,125,208 |
| iShares
Core S&P Small-Cap ETF (a) |
32,629
|
|
3,195,032 |
| iShares
Semiconductor ETF (a) |
924
|
|
301,667 |
| Schwab
U.S. Mid-Cap ETF (a) |
55,940
|
|
3,688,684 |
| Schwab
U.S. Small-Cap ETF |
152,018
|
|
6,360,433 |
| SPDR
S&P Oil & Gas Exploration & Production ETF (a) |
2,099
|
|
317,558 |
| VanEck
Gold Miners ETF |
24,229
|
|
585,373 |
| VanEck
Oil Services ETF (a) |
1,275
|
|
380,842 |
| Vanguard
Mega Cap ETF |
118,045
|
|
15,864,067
|
| Vanguard
Mega Cap Value ETF (a) |
9,573
|
|
964,863 |
| Vanguard
Mid-Cap ETF (a) |
31,505
|
|
6,426,705
|
Total
Equity Funds
(Cost $52,122,170) |
|
|
50,454,511
|
| Fixed
Income Funds 13.2% |
| Invesco
Senior Loan ETF (a) |
145,632
|
|
3,017,495
|
| iShares
0-5 Year High Yield Corporate Bond ETF (a) |
32,910
|
|
1,344,373
|
| iShares
20+ Year Treasury Bond ETF |
6,703
|
|
644,225
|
| iShares
Broad USD High Yield Corporate Bond ETF (a) |
43,440
|
|
1,498,246
|
| iShares
Core U.S. Aggregate Bond ETF |
18,463
|
|
1,752,139
|
Total
Fixed Income Funds
(Cost $8,776,516) |
|
|
8,256,478
|
Total
Investment Companies
(Cost $60,898,686) |
|
|
58,710,989
|
| Short-Term
Investments 18.8% |
| Affiliated
Investment Company 5.9% |
| MainStay
U.S. Government Liquidity Fund, 2.905% (b) |
3,656,336
|
|
3,656,336
|
| Unaffiliated
Investment Companies 12.9% |
| Invesco
Government & Agency Portfolio, 3.163% (b)(c) |
5,051,832
|
|
5,051,832
|
| State
Street Institutional U.S. Government Money Market Fund, 3.064% (b)(c) |
3,000,000
|
|
3,000,000
|
Total
Unaffiliated Investment Companies
(Cost $8,051,832) |
|
|
8,051,832
|
Total
Short-Term Investments
(Cost $11,708,168) |
|
|
11,708,168
|
Total
Investments
(Cost $72,606,854) |
113.0%
|
|
70,419,157
|
| Other
Assets, Less Liabilities |
(13.0)
|
|
(8,102,329)
|
| Net
Assets |
100.0%
|
|
$ 62,316,828
|
The notes
to the financial statements are an integral part of, and should be read in conjunction with, the financial statements.
65
Portfolio of
Investments October 31, 2022† (Unaudited) (continued)
| †
|
Percentages
indicated are based on Fund net assets. |
| (a)
|
All or a
portion of this security was held on loan. As of October 31, 2022, the aggregate market value of securities on loan was $8,218,201; the total market value of collateral held by the Fund was $8,478,193. The market value of the collateral held
included non-cash collateral in the form of U.S. Treasury securities with a value of $426,361. The Fund received cash collateral with a value of $8,051,832. (See Note 2(G)) |
| (b)
|
Current
yield as of October 31, 2022. |
| (c)
|
Represents
a security purchased with cash collateral received for securities on loan. |
Investments in Affiliates (in 000's)
Investments in issuers considered to be affiliate(s) of the
Fund during the six-month period ended October 31, 2022 for purposes of Section 2(a)(3) of the Investment Company Act of 1940, as amended, were as follows:
| Affiliated
Investment Companies |
Value,
Beginning
of Period |
Purchases
at Cost |
Proceeds
from
Sales |
Net
Realized
Gain/(Loss)
on Sales |
Change
in
Unrealized
Appreciation/
(Depreciation) |
Value,
End of
Period |
Dividend
Income |
Other
Distributions |
Shares
End of
Period |
| MainStay
U.S. Government Liquidity Fund |
$ 1,514
|
$ 14,070
|
$ (11,928)
|
$ —
|
$ —
|
$ 3,656
|
$ 19
|
$ —
|
3,656
|
| Abbreviation(s):
|
| EAFE—Europe,
Australasia and Far East |
| ETF—Exchange-Traded
Fund |
| MSCI—Morgan
Stanley Capital International |
| SPDR—Standard
& Poor’s Depositary Receipt |
| USD—United
States Dollar |
The following is a
summary of the fair valuations according to the inputs used as of October 31, 2022, for valuing the Fund’s assets:
| Description
|
Quoted
Prices in
Active
Markets for
Identical
Assets
(Level 1) |
|
Significant
Other
Observable
Inputs
(Level 2) |
|
Significant
Unobservable
Inputs
(Level 3) |
|
Total
|
| Asset
Valuation Inputs |
|
|
|
|
|
|
|
| Investments
in Securities (a) |
|
|
|
|
|
|
|
| Investment
Companies |
|
|
|
|
|
|
|
| Equity
Funds |
$ 50,454,511
|
|
$ —
|
|
$ —
|
|
$ 50,454,511
|
| Fixed
Income Funds |
8,256,478
|
|
—
|
|
—
|
|
8,256,478
|
| Total
Investment Companies |
58,710,989
|
|
—
|
|
—
|
|
58,710,989
|
| Short-Term
Investments |
|
|
|
|
|
|
|
| Affiliated
Investment Company |
3,656,336
|
|
—
|
|
—
|
|
3,656,336
|
| Unaffiliated
Investment Companies |
8,051,832
|
|
—
|
|
—
|
|
8,051,832
|
| Total
Short-Term Investments |
11,708,168
|
|
—
|
|
—
|
|
11,708,168
|
| Total
Investments in Securities |
$ 70,419,157
|
|
$ —
|
|
$ —
|
|
$ 70,419,157
|
| (a)
|
For
a complete listing of investments, see the Portfolio of Investments. |
The notes to the financial statements are an integral part of,
and should be read in conjunction with, the financial statements.
| 66
|
MainStay Growth ETF
Allocation Fund |
Statement of
Assets and Liabilities as of October 31, 2022 (Unaudited)
| Assets
|
Investment
in unaffiliated securities, at value
(identified cost $68,950,518) including securities on loan of $8,218,201 |
$66,762,821
|
Investment
in affiliated investment companies, at value
(identified cost $3,656,336) |
3,656,336
|
| Cash
|
311
|
| Receivables:
|
|
| Fund
shares sold |
102,159
|
| Securities
lending |
23,878
|
| Dividends
|
6,665
|
| Other
assets |
57,034
|
| Total
assets |
70,609,204
|
| Liabilities
|
| Cash
collateral received for securities on loan |
8,051,832
|
| Payables:
|
|
| Fund
shares redeemed |
113,849
|
| Investment
securities purchased |
70,822
|
| Professional
fees |
16,243
|
| NYLIFE
Distributors (See Note 3) |
14,166
|
| Manager
(See Note 3) |
7,922
|
| Transfer
agent (See Note 3) |
7,845
|
| Custodian
|
4,080
|
| Shareholder
communication |
3,093
|
| Accrued
expenses |
2,524
|
| Total
liabilities |
8,292,376
|
| Net
assets |
$62,316,828
|
| Composition
of Net Assets |
| Shares
of beneficial interest outstanding (par value of $.001 per share) unlimited number of shares authorized |
$
5,539 |
| Additional
paid-in-capital |
66,462,752
|
| |
66,468,291
|
| Total
distributable earnings (loss) |
(4,151,463)
|
| Net
assets |
$62,316,828
|
| Class
A |
|
| Net
assets applicable to outstanding shares |
$55,375,207
|
| Shares
of beneficial interest outstanding |
4,920,356
|
| Net
asset value per share outstanding |
$
11.25 |
| Maximum
sales charge (3.00% of offering price) |
0.35
|
| Maximum
offering price per share outstanding |
$
11.60 |
| Class
C |
|
| Net
assets applicable to outstanding shares |
$
306,550 |
| Shares
of beneficial interest outstanding |
27,476
|
| Net
asset value and offering price per share outstanding |
$
11.16 |
| Class
I |
|
| Net
assets applicable to outstanding shares |
$
72,627 |
| Shares
of beneficial interest outstanding |
6,463
|
| Net
asset value and offering price per share outstanding |
$
11.24 |
| Class
R3 |
|
| Net
assets applicable to outstanding shares |
$
528,822 |
| Shares
of beneficial interest outstanding |
47,150
|
| Net
asset value and offering price per share outstanding |
$
11.22 |
| SIMPLE
Class |
|
| Net
assets applicable to outstanding shares |
$
6,033,622 |
| Shares
of beneficial interest outstanding |
537,171
|
| Net
asset value and offering price per share outstanding |
$
11.23 |
The notes to the financial statements are an
integral part of, and should be read in conjunction with, the financial statements.
67
Statement of
Operations for the six months ended October 31, 2022 (Unaudited)
| Investment
Income (Loss) |
| Income
|
|
| Dividends-unaffiliated
|
$
719,113 |
| Securities
lending, net |
98,850
|
| Dividends-affiliated
|
18,674
|
| Total
income |
836,637
|
| Expenses
|
|
| Distribution/Service—Class
A (See Note 3) |
66,800
|
| Distribution/Service—Class
C (See Note 3) |
1,535
|
| Distribution/Service—Class
R3 (See Note 3) |
1,233
|
| Distribution/Service—SIMPLE
Class (See Note 3) |
12,088
|
| Manager
(See Note 3) |
59,133
|
| Registration
|
42,198
|
| Transfer
agent (See Note 3) |
33,689
|
| Professional
fees |
17,252
|
| Custodian
|
10,164
|
| Shareholder
communication |
3,269
|
| Trustees
|
631
|
| Shareholder
service (See Note 3) |
247
|
| Miscellaneous
|
2,897
|
| Total
expenses before waiver/reimbursement |
251,136
|
| Expense
waiver/reimbursement from Manager (See Note 3) |
(6,616)
|
| Net
expenses |
244,520
|
| Net
investment income (loss) |
592,117
|
| Realized
and Unrealized Gain (Loss) |
| Net
realized gain (loss) on unaffiliated investments |
(2,266,590)
|
| Net
change in unrealized appreciation (depreciation) on unaffiliated investments |
(1,646,695)
|
| Net
realized and unrealized gain (loss) |
(3,913,285)
|
| Net
increase (decrease) in net assets resulting from operations |
$(3,321,168)
|
The notes to the financial statements are an integral part of,
and should be read in conjunction with, the financial statements.
| 68
|
MainStay Growth ETF
Allocation Fund |
Statements of
Changes in Net Assets
for the six months ended October 31, 2022 (Unaudited) and the year ended April 30, 2022
| |
Six months
ended
October 31,
2022 |
Year
ended
April 30,
2022 |
| Increase
(Decrease) in Net Assets |
| Operations:
|
|
|
| Net
investment income (loss) |
$
592,117 |
$
656,387 |
| Net
realized gain (loss) |
(2,266,590)
|
(352,275)
|
| Net
change in unrealized appreciation (depreciation) |
(1,646,695)
|
(4,308,393)
|
| Net
increase (decrease) in net assets resulting from operations |
(3,321,168)
|
(4,004,281)
|
| Distributions
to shareholders: |
|
|
| Class
A |
—
|
(591,463)
|
| Class
C |
—
|
(1,516)
|
| Class
I |
—
|
(635)
|
| Class
R3 |
—
|
(2,146)
|
| SIMPLE
Class |
—
|
(28,130)
|
| Total
distributions to shareholders |
—
|
(623,890)
|
| Capital
share transactions: |
|
|
| Net
proceeds from sales of shares |
12,342,618
|
36,077,108
|
| Net
asset value of shares issued to shareholders in reinvestment of distributions |
—
|
623,525
|
| Cost
of shares redeemed |
(3,854,624)
|
(6,073,472)
|
| Increase
(decrease) in net assets derived from capital share transactions |
8,487,994
|
30,627,161
|
| Net
increase (decrease) in net assets |
5,166,826
|
25,998,990
|
| Net
Assets |
| Beginning
of period |
57,150,002
|
31,151,012
|
| End
of period |
$62,316,828
|
$57,150,002
|
The notes to the financial statements are an integral part of,
and should be read in conjunction with, the financial statements.
69
Financial
Highlights selected per share data and ratios
| |
Six
months ended
October 31,
2022* |
|
Year
Ended April 30, |
|
June
30, 2020^ through
April 30, |
| Class
A |
2022
|
|
2021
|
| Net
asset value at beginning of period |
$
11.92 |
|
$
12.79 |
|
$
10.00 |
| Net
investment income (loss) (a) |
0.12
|
|
0.18
|
|
0.09
|
| Net
realized and unrealized gain (loss) |
(0.79)
|
|
(0.89)
|
|
2.76
|
| Total
from investment operations |
(0.67)
|
|
(0.71)
|
|
2.85
|
| Less
distributions: |
|
|
|
|
|
| From
net investment income |
—
|
|
(0.15)
|
|
(0.05)
|
| From
net realized gain on investments |
—
|
|
(0.01)
|
|
(0.01)
|
| Total
distributions |
—
|
|
(0.16)
|
|
(0.06)
|
| Net
asset value at end of period |
$
11.25 |
|
$
11.92 |
|
$
12.79 |
| Total
investment return (b) |
(5.62)%
|
|
(5.69)%
|
|
28.56%
|
| Ratios
(to average net assets)/Supplemental Data: |
|
|
|
|
|
| Net
investment income (loss) |
2.03%††
|
|
1.41%
|
|
0.90%††
|
| Net
expenses (c) |
0.80%††
|
|
0.80%
|
|
0.80%††
|
| Expenses
(before waiver/reimbursement) (c) |
0.82%††
|
|
0.85%
|
|
1.41%††
|
| Portfolio
turnover rate |
29%
|
|
54%
|
|
47%
|
| Net
assets at end of period (in 000’s) |
$
55,375 |
|
$
52,475 |
|
$
29,705 |
| *
|
Unaudited.
|
| ^
|
Inception
date. |
| ††
|
Annualized.
|
| (a)
|
Per share
data based on average shares outstanding during the period. |
| (b)
|
Total
investment return is calculated exclusive of sales charges and assumes the reinvestment of dividends and distributions. For periods of less than one year, total return is not annualized. |
| (c)
|
In
addition to the fees and expenses which the Fund bears directly, it also indirectly bears a pro-rata share of the fees and expenses of the underlying funds in which it invests. Such indirect expenses are not included in the above expense ratios.
|
The
notes to the financial statements are an integral part of, and should be read in conjunction with, the financial statements.
| 70
|
MainStay Growth ETF
Allocation Fund |
Financial
Highlights selected per share data and ratios
| |
Six
months ended
October 31,
2022* |
|
Year
Ended April 30, |
|
June
30, 2020^ through
April 30, |
| Class
C |
2022
|
|
2021
|
| Net
asset value at beginning of period |
$
11.86 |
|
$
12.73 |
|
$
10.00 |
| Net
investment income (loss) (a) |
0.07
|
|
0.09
|
|
0.03
|
| Net
realized and unrealized gain (loss) |
(0.77)
|
|
(0.90)
|
|
2.74
|
| Total
from investment operations |
(0.70)
|
|
(0.81)
|
|
2.77
|
| Less
distributions: |
|
|
|
|
|
| From
net investment income |
—
|
|
(0.05)
|
|
(0.03)
|
| From
net realized gain on investments |
—
|
|
(0.01)
|
|
(0.01)
|
| Total
distributions |
—
|
|
(0.06)
|
|
(0.04)
|
| Net
asset value at end of period |
$
11.16 |
|
$
11.86 |
|
$
12.73 |
| Total
investment return (b) |
(5.90)%
|
|
(6.40)%
|
|
27.72%
|
| Ratios
(to average net assets)/Supplemental Data: |
|
|
|
|
|
| Net
investment income (loss) |
1.29%††
|
|
0.67%
|
|
0.28%††
|
| Net
expenses (c) |
1.55%††
|
|
1.55%
|
|
1.55%††
|
| Expenses
(before waiver/reimbursement) (c) |
1.60%††
|
|
1.64%
|
|
2.12%††
|
| Portfolio
turnover rate |
29%
|
|
54%
|
|
47%
|
| Net
assets at end of period (in 000’s) |
$
307 |
|
$
310 |
|
$
288 |
| *
|
Unaudited.
|
| ^
|
Inception
date. |
| ††
|
Annualized.
|
| (a)
|
Per share
data based on average shares outstanding during the period. |
| (b)
|
Total
investment return is calculated exclusive of sales charges and assumes the reinvestment of dividends and distributions. For periods of less than one year, total return is not annualized. |
| (c)
|
In
addition to the fees and expenses which the Fund bears directly, it also indirectly bears a pro-rata share of the fees and expenses of the underlying funds in which it invests. Such indirect expenses are not included in the above expense ratios.
|
The
notes to the financial statements are an integral part of, and should be read in conjunction with, the financial statements.
71
Financial
Highlights selected per share data and ratios
| |
Six
months ended
October 31,
2022* |
|
Year
Ended April 30, |
|
June
30, 2020^ through
April 30, |
| Class
I |
2022
|
|
2021
|
| Net
asset value at beginning of period |
$
11.89 |
|
$
12.75 |
|
$
10.00 |
| Net
investment income (loss) (a) |
0.12
|
|
0.22
|
|
0.12
|
| Net
realized and unrealized gain (loss) |
(0.77)
|
|
(0.89)
|
|
2.75
|
| Total
from investment operations |
(0.65)
|
|
(0.67)
|
|
2.87
|
| Less
distributions: |
|
|
|
|
|
| From
net investment income |
—
|
|
(0.18)
|
|
(0.11)
|
| From
net realized gain on investments |
—
|
|
(0.01)
|
|
(0.01)
|
| Total
distributions |
—
|
|
(0.19)
|
|
(0.12)
|
| Net
asset value at end of period |
$
11.24 |
|
$
11.89 |
|
$
12.75 |
| Total
investment return (b) |
(5.47)%
|
|
(5.41)%
|
|
28.79%
|
| Ratios
(to average net assets)/Supplemental Data: |
|
|
|
|
|
| Net
investment income (loss) |
2.07%††
|
|
1.70%
|
|
1.23%††
|
| Net
expenses (c) |
0.55%††
|
|
0.55%
|
|
0.55%††
|
| Expenses
(before waiver/reimbursement) (c) |
0.57%††
|
|
0.60%
|
|
1.16%††
|
| Portfolio
turnover rate |
29%
|
|
54%
|
|
47%
|
| Net
assets at end of period (in 000’s) |
$
73 |
|
$
40 |
|
$
40 |
| *
|
Unaudited.
|
| ^
|
Inception
date. |
| ††
|
Annualized.
|
| (a)
|
Per share
data based on average shares outstanding during the period. |
| (b)
|
Total
investment return is calculated exclusive of sales charges and assumes the reinvestment of dividends and distributions. Class I shares are not subject to sales charges. For periods of less than one year, total return is not annualized. |
| (c)
|
In
addition to the fees and expenses which the Fund bears directly, it also indirectly bears a pro-rata share of the fees and expenses of the underlying funds in which it invests. Such indirect expenses are not included in the above expense ratios.
|
The
notes to the financial statements are an integral part of, and should be read in conjunction with, the financial statements.
| 72
|
MainStay Growth ETF
Allocation Fund |
Financial
Highlights selected per share data and ratios
| |
Six
months ended
October 31,
2022* |
|
Year
Ended April 30, |
|
June
30, 2020^ through
April 30, |
| Class
R3 |
2022
|
|
2021
|
| Net
asset value at beginning of period |
$
11.90 |
|
$
12.77 |
|
$
10.00 |
| Net
investment income (loss) (a) |
0.10
|
|
0.11
|
|
0.05
|
| Net
realized and unrealized gain (loss) |
(0.78)
|
|
(0.87)
|
|
2.76
|
| Total
from investment operations |
(0.68)
|
|
(0.76)
|
|
2.81
|
| Less
distributions: |
|
|
|
|
|
| From
net investment income |
—
|
|
(0.10)
|
|
(0.03)
|
| From
net realized gain on investments |
—
|
|
(0.01)
|
|
(0.01)
|
| Total
distributions |
—
|
|
(0.11)
|
|
(0.04)
|
| Net
asset value at end of period |
$
11.22 |
|
$
11.90 |
|
$
12.77 |
| Total
investment return (b) |
(5.71)%
|
|
(6.01)%
|
|
28.16%
|
| Ratios
(to average net assets)/Supplemental Data: |
|
|
|
|
|
| Net
investment income (loss) |
1.68%††
|
|
0.83%
|
|
0.48%††
|
| Net
expenses (c) |
1.15%††
|
|
1.15%
|
|
1.15%††
|
| Expenses
(before waiver/reimbursement) (c) |
1.17%††
|
|
1.20%
|
|
1.76%††
|
| Portfolio
turnover rate |
29%
|
|
54%
|
|
47%
|
| Net
assets at end of period (in 000’s) |
$
529 |
|
$
486 |
|
$
158 |
| *
|
Unaudited.
|
| ^
|
Inception
date. |
| ††
|
Annualized.
|
| (a)
|
Per share
data based on average shares outstanding during the period. |
| (b)
|
Total
investment return is calculated exclusive of sales charges and assumes the reinvestment of dividends and distributions. Class R3 shares are not subject to sales charges. For periods of less than one year, total return is not annualized. |
| (c)
|
In
addition to the fees and expenses which the Fund bears directly, it also indirectly bears a pro-rata share of the fees and expenses of the underlying funds in which it invests. Such indirect expenses are not included in the above expense ratios.
|
The
notes to the financial statements are an integral part of, and should be read in conjunction with, the financial statements.
73
Financial
Highlights selected per share data and ratios
| |
Six
months ended
October 31,
2022* |
|
Year
Ended April 30, |
|
August
31, 2020^ through
April 30, |
| SIMPLE
Class |
2022
|
|
2021
|
| Net
asset value at beginning of period |
$
11.91 |
|
$
12.78 |
|
$
10.86 |
| Net
investment income (loss) (a) |
0.10
|
|
0.14
|
|
0.07
|
| Net
realized and unrealized gain (loss) |
(0.78)
|
|
(0.89)
|
|
1.90
|
| Total
from investment operations |
(0.68)
|
|
(0.75)
|
|
1.97
|
| Less
distributions: |
|
|
|
|
|
| From
net investment income |
—
|
|
(0.11)
|
|
(0.04)
|
| From
net realized gain on investments |
—
|
|
(0.01)
|
|
(0.01)
|
| Total
distributions |
—
|
|
(0.12)
|
|
(0.05)
|
| Net
asset value at end of period |
$
11.23 |
|
$
11.91 |
|
$
12.78 |
| Total
investment return (b) |
(5.71)%
|
|
(5.92)%
|
|
18.11%
|
| Ratios
(to average net assets)/Supplemental Data: |
|
|
|
|
|
| Net
investment income (loss) |
1.72%††
|
|
1.11%
|
|
0.71%††
|
| Net
expenses (c) |
1.05%††
|
|
1.05%
|
|
1.05%††
|
| Expenses
(before waiver/reimbursement) (c) |
1.10%††
|
|
1.14%
|
|
1.62%††
|
| Portfolio
turnover rate |
29%
|
|
54%
|
|
47%
|
| Net
assets at end of period (in 000’s) |
$
6,034 |
|
$
3,838 |
|
$
962 |
| *
|
Unaudited.
|
| ^
|
Inception
date. |
| ††
|
Annualized.
|
| (a)
|
Per share
data based on average shares outstanding during the period. |
| (b)
|
Total
investment return is calculated exclusive of sales charges and assumes the reinvestment of dividends and distributions. SIMPLE Class shares are not subject to sales charges. For periods of less than one year, total return is not annualized.
|
| (c)
|
In
addition to the fees and expenses which the Fund bears directly, it also indirectly bears a pro-rata share of the fees and expenses of the underlying funds in which it invests. Such indirect expenses are not included in the above expense ratios.
|
The notes to the financial statements are an integral part of, and should be
read in conjunction with, the financial statements.
| 74
|
MainStay Growth ETF
Allocation Fund |
MainStay Equity
ETF Allocation Fund
Investment and Performance
Comparison (Unaudited)
Performance data quoted represents past performance. Past performance is no
guarantee of future results. Because of market volatility and other factors, current performance may be lower or higher than the figures shown. Investment return and principal value will fluctuate, and as a result, when shares are redeemed, they may
be worth more or less than their original cost. The graph below depicts the historical performance of Class I shares of the Fund. Performance will vary from class to class based on differences in class-specific expenses and sales charges. For performance information current to the most recent month-end, please call 800-624-6782 or visit newyorklifeinvestments.com.
The performance table and graph do not reflect the deduction
of taxes that a shareholder would pay on distributions or Fund share redemptions. Total returns reflect maximum applicable sales charges as indicated in the table below, if any, changes in share price, and reinvestment of dividend and capital gain
distributions. The graph assumes the initial investment amount shown below and reflects the deduction of all sales charges that would have applied for the period of investment. Performance figures may reflect certain fee waivers and/or expense
limitations, without which total returns may have been lower. For more information on share classes and current fee waivers and/or expense limitations (if any), please refer to the Notes to Financial Statements.
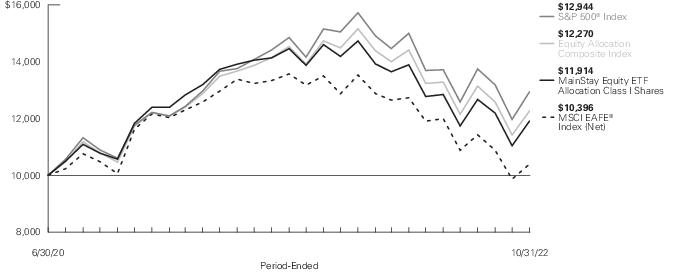
| Average
Annual Total Returns for the Period-Ended October 31, 2022 |
| Class
|
Sales
Charge |
|
Inception
Date |
Six
Months1 |
One
Year |
Since
Inception |
Gross
Expense
Ratio2 |
| Class
A Shares |
Maximum
3% Initial Sales Charge |
With
sales charges |
6/30/2020
|
-9.57%
|
-21.02%
|
6.15%
|
0.99%
|
| |
|
Excluding
sales charges |
|
-6.78
|
-18.57
|
7.55
|
0.99
|
| Class
C Shares |
Maximum
1% CDSC |
With
sales charges |
6/30/2020
|
-8.07
|
-20.01
|
6.71
|
1.82
|
| |
if
redeemed Within One Year of Purchase |
Excluding
sales charges |
|
-7.14
|
-19.20
|
6.71
|
1.82
|
| Class
I Shares |
No
Sales Charge |
|
6/30/2020
|
-6.74
|
-18.40
|
7.78
|
0.71
|
| Class
R3 Shares |
No
Sales Charge |
|
6/30/2020
|
-7.03
|
-18.87
|
7.15
|
1.34
|
| SIMPLE
Class Shares |
No
Sales Charge |
|
8/31/2020
|
-6.95
|
-18.78
|
2.85
|
1.32
|
| 1.
|
Not
annualized. |
| 2.
|
The
gross expense ratios presented reflect the Fund’s “Total Annual Fund Operating Expenses” from the most recent Prospectus, as supplemented, and may differ from other expense ratios disclosed in this report. |
The
footnotes on the next page are an integral part of the table and graph and should be carefully read in conjunction with them.
| Benchmark
Performance* |
Six
Months1 |
One
Year |
Since
Inception |
| S&P
500® Index2 |
-5.50%
|
-14.61%
|
11.68%
|
| MSCI
EAFE® Index (Net)3 |
-12.70
|
-23.00
|
1.68
|
| Equity
Allocation Composite Index4 |
-7.33
|
-16.75
|
9.15
|
| Morningstar
Allocation-85%+ Equity Category Average5 |
-7.37
|
-20.09
|
6.72
|
| *
|
Returns
for indices reflect no deductions for fees, expenses or taxes, except for foreign withholding taxes where applicable. Results assume reinvestment of all dividends and capital gains. An investment cannot be made directly in an index.
|
| 1.
|
Not
annualized. |
| 2.
|
The
S&P 500® Index is the Fund’s primary broad-based securities market index for comparison purposes. S&P 500® is a trademark of The McGraw-Hill Companies, Inc. The S&P 500® Index is widely regarded as
the standard index for measuring large-cap U.S. stock market performance. |
| 3.
|
The MSCI
EAFE® Index (Net) is the Fund's secondary benchmark. The MSCI EAFE® Index (Net) consists of
international stocks representing the developed world outside of North America. |
| 4.
|
The Fund
has selected the Equity Allocation Composite Index as an additional benchmark. The Equity Allocation Composite Index consists of the S&P 500® Index and the MSCI EAFE® Index weighted 75% and 25%, respectively. |
| 5.
|
The
Morningstar Allocation – 85%+ Equity Category Average is representative of funds that seek to provide both income and capital appreciation by investing in multiple asset classes, including stocks, bonds, and cash. These portfolios are
dominated by domestic holdings and have equity exposures of over 85%. These funds typically allocate at least 10% to equities of foreign companies and do not exclusively allocate between cash and equities. Results are based on average total returns
of similar funds with all dividends and capital gain distributions reinvested. |
The footnotes on the preceding page are an integral part of the
table and graph and should be carefully read in conjunction with them.
| 76
|
MainStay Equity ETF
Allocation Fund |
Cost in Dollars of
a $1,000 Investment in MainStay Equity ETF Allocation Fund (Unaudited)
The example below is intended to describe the fees and expenses
borne by shareholders during the six-month period from May 1, 2022 to October 31, 2022, and the impact of those costs on your investment.
Example
As a shareholder of the Fund you incur two types of costs: (1)
transaction costs, including exchange fees and sales charges (loads) on purchases (as applicable), and (2) ongoing costs, including management fees, distribution and/or service (12b-1) fees and other Fund expenses (as applicable). This example is
intended to help you understand your ongoing costs (in dollars) of investing in the Fund and to compare these costs with the ongoing costs of investing in other mutual funds. The example is based on an investment of $1,000 made at the beginning of
the six-month period and held for the entire period from May 1, 2022 to October 31, 2022.
This example illustrates your Fund’s ongoing costs in two
ways:
Actual Expenses
The second and third data columns in the table below provide information about
actual account values and actual expenses. You may use the information in these columns, together with the amount you invested, to estimate the expenses that you paid during the six months ended October 31, 2022. Simply divide your account value by
$1,000 (for example, an
$8,600 account value divided by $1,000 = 8.6), then multiply the result by the
number under the heading entitled “Expenses Paid During Period” to estimate the expenses you paid on your account during this period.
Hypothetical Example for Comparison Purposes
The fourth and fifth data columns in the table below provide information about
hypothetical account values and hypothetical expenses based on the Fund’s actual expense ratio and an assumed rate of return of 5% per year before expenses, which is not the Fund’s actual return. The hypothetical account values and
expenses may not be used to estimate the actual ending account balances or expenses you paid for the six-month period shown. You may use this information to compare the ongoing costs of investing in the Fund with the ongoing costs of investing in
other mutual funds. To do so, compare this 5% hypothetical example with the 5% hypothetical examples that appear in the shareholder reports of the other mutual funds.
Please note that the expenses shown in the table are meant to
highlight your ongoing costs only and do not reflect any transactional costs, such as exchange fees or sales charges (loads). Therefore, the fourth and fifth data columns of the table are useful in comparing ongoing costs only and will not help you
determine the relative total costs of owning different funds. In addition, if these transactional costs were included, your costs would have been higher.
| Share
Class |
Beginning
Account
Value
5/1/22 |
Ending
Account
Value (Based
on Actual
Returns and
Expenses)
10/31/22 |
Expenses
Paid
During
Period1 |
Ending
Account
Value (Based
on Hypothetical
5% Annualized
Return and
Actual Expenses)
10/31/22 |
Expenses
Paid
During
Period1 |
Net
Expense
Ratio
During
Period2 |
| Class
A Shares |
$1,000.00
|
$932.20
|
$3.90
|
$1,021.17
|
$4.08
|
0.80%
|
| Class
C Shares |
$1,000.00
|
$928.60
|
$7.53
|
$1,017.39
|
$7.88
|
1.55%
|
| Class
I Shares |
$1,000.00
|
$932.60
|
$2.68
|
$1,022.43
|
$2.80
|
0.55%
|
| Class
R3 Shares |
$1,000.00
|
$929.70
|
$5.59
|
$1,019.41
|
$5.85
|
1.15%
|
| SIMPLE
Class Shares |
$1,000.00
|
$930.50
|
$5.11
|
$1,019.91
|
$5.35
|
1.05%
|
| 1.
|
Expenses are
equal to the Fund’s annualized expense ratio of each class multiplied by the average account value over the period, divided by 365 and multiplied by 184 (to reflect the six-month period). The table above represents the actual expenses incurred
during the six-month period. In addition to the fees and expenses which the Fund bears directly, it also indirectly bears a pro rata share of the fees and expenses of the underlying funds in which it invests. Such indirect expenses are not included
in the above-reported expense figures. |
| 2.
|
Expenses
are equal to the Fund's annualized expense ratio to reflect the six-month period. |
Asset Diversification as of October 31, 2022
(Unaudited)
| Equity
Funds |
99.7
% |
| Short-Term
Investments |
3.7
|
| Other
Assets, Less Liabilities |
(3.4)
|
See Portfolio of Investments
beginning on page 81 for specific holdings within these categories. The Fund’s holdings are subject to change.
| 78
|
MainStay Equity ETF
Allocation Fund |
Portfolio
Management Discussion and Analysis (Unaudited)
Questions answered by portfolio managers Jae S. Yoon,
CFA, Jonathan Swaney, Poul Kristensen, CFA Amit Soni, CFA, of New York Life Investment Management LLC, the Fund’s Manager.
How did MainStay Equity ETF Allocation Fund perform relative to its
benchmarks and peer group during the six months ended October 31, 2022?
For the six months ended October 31, 2022, Class I shares of
MainStay Equity ETF Allocation Fund returned −6.74%, underperforming the −5.50% return of the Fund’s primary benchmark, the S&P 500® Index (the
"Index"), and outperforming the −12.70% return of the MSCI EAFE® Index (Net), which is the Fund’s secondary benchmark. Over the same period, Class I shares of
the Fund outperformed the −7.33% return of the Equity Allocation Composite Index, which is an additional benchmark of the Fund, and the −7.37% return of the Morningstar Allocation-85%+ Equity Category Average.1
What factors affected the Fund’s relative
performance during the reporting period?
The Fund is a
“fund of funds" that seeks to achieve its investment objective by investing in unaffiliated, passively-managed, exchange-traded funds (“Underlying ETFs”). The Underlying ETFs may invest in U.S. equities and international equities
that span a range of capitalizations and geographies, making comparisons to any single index generally less suitable than a weighted combination of indices, which is a more useful yardstick by which to measure performance. During the reporting
period, asset class policy was the primary determinant of the Fund’s relative performance.
Fund management internally maintains a blend of indices that
are taken into consideration when managing the Fund. During the reporting period, the Fund’s performance roughly matched that of the internally maintained blend of indices. Relative performance benefited from an emphasis on value-oriented
stocks over their growth-oriented counterparts, with specific focus on energy companies and defensive sectors that the market rewarded. Conditions also favored the Fund’s skew toward profitable small-cap companies. Conversely, the most
significant detractor from the Fund’s relative performance was exposure to gold miner equities. The price of gold, and thus gold miners, tends to move inversely to real bond yields. The combination of the Federal Reserve (the "Fed") pushing
rates higher and emerging signs that inflation may be peaking spelled trouble for this particular position.
While most ETF holdings track the performance of indices that
are components of the benchmark quite closely, that is not universally true. The Schwab® U.S. Small-Cap ETF trailed the performance of the Russell 2000® Index by close to 2%. As a large holding within the Fund, representing approximately 10% of total assets, that shortfall detracted materially from performance versus the
benchmark. In similar fashion, the Vanguard Mid-Cap ETF trailed
the performance of the Russell Midcap® Index, further undermining returns.
How did you allocate the Fund’s assets during the
reporting period and why?
Equity style: In the same way
that inflation is threatening to long-duration bonds, equities with values disproportionately reflected in more distant cash flows (i.e., growth stocks with high prices relative to current earnings) are likewise vulnerable. Accordingly, we tilted
the Fund to emphasize value stocks that offered more attractive near-term cash flows, placing particular focus on traditionally defensive sectors: real estate, utilities, consumer staples and (most of all) health care. The combined effect was a
modest positive contribution to return of approximately 0.1%. (Contributions take weightings and total returns into account.)
Equity size: Small-company stocks were more heavily owned in
the Fund than in the Index. The thesis behind this positioning was based on attractive small-cap valuations, insulation from economic weakness abroad, less sensitivity to dollar strength and disproportionate exposure to domestic demand, which
remained healthy. The Fund’s active position in small-cap companies contributed approximately 0.25% to relative performance.
Geographic exposure: In light of Russia’s invasion of
Ukraine, the Fund held an underweight exposure to developed international markets, benefiting performance at the margin. That improvement in returns was fully offset, however, by a small overweight position in emerging market equities. We believed
that China’s economy would benefit from the country’s relaxation of its zero-COVID policy, as well as additional fiscal support ahead of the October 2022 Party Congress; however, neither development materialized.
Gold miners: The Fund maintained a varying position in gold
miners as a hedge against inflation and/or a monetary policy mistake. With month-over-month readings on inflation starting to improve, the Fed demonstrating their mettle in aggressively tightening monetary policy and input costs for energy and labor
rising sharply, this proved to be an unfavorable environment for miners. The position subtracted almost 0.4% from the Fund’s return, making it by far the most significant detractor from Fund performance.
Energy: As with gold miners, the Fund maintained exposure to
upstream energy producers as a commodity play to provide an additional inflation hedge. These holdings also positioned the Fund to take advantage of opportunities for domestic producers to benefit as Western nations revisit energy policy to source
supplies from stable and friendly jurisdictions, rather than autocratic petrostates that present national security risks. While the Fund’s position was small, it had a disproportionately positive impact on
| 1.
|
See page 75 for other share
class returns, which may be higher or lower than Class I share returns. See page 76 for more information on benchmark and peer group returns. |
performance as oil and gas prices soared, fully offsetting the adverse impact
of the Fund’s exposure to gold miners.
How
did the Fund’s allocations change over the course of the reporting period?
We reduced the Fund’s allocation most significantly to
iShares® Core MSCI EAFE ETF to lessen non-U.S. market exposure in anticipation of a global recession. We also trimmed holdings of VanEck Oil Services ETF and SPDR® S&P® Oil & Gas Exploration ETF, which were reduced following a long period of solid
outperformance, with energy the only sector to deliver positive returns during the reporting period.
The Fund’s allocation to Vanguard Mega Cap ETF saw the
largest increased position size, as we parked proceeds from cutting back EAFE (Europe, Australasia and the Middle East) exposure. Allocations to defensive industries also grew via positions in Health Care Select Sector SPDR® ETF and Invesco S&P® 500 Low Volatility ETF.
During the reporting period, which Underlying ETFs had
the highest total returns and which Underlying ETFs had the lowest total returns?
The Fund’s two top-performing Underlying ETFs were SPDR® S&P® Oil & Gas Exploration ETF and VanEck Oil Services ETF. Also posting positive returns
were Health Care Select Sector SPDR® ETF and Vanguard Mega Cap Value ETF. The largest declines were seen in VanEck Gold Miners ETF, iShares® Core MSCI Emerging Markets Equity ETF and iShares® Semiconductor ETF.
Which Underlying ETFs were the strongest positive
contributors to the Fund’s performance and which Underlying ETFs were particularly weak?
The Underlying ETFs providing the highest total
returns—SPDR® S&P® Oil & Gas Exploration ETF and VanEck Oil Services
ETF—also produced the strongest positive contributions to performance, followed by the healthcare sector and iShares® Core S&P® Small Cap ETF. The most significant detractors were iShares® Core MSCI EAFE ETF, followed by
iShares® Core MSCI Emerging Markets ETF and Vanguard Mega Cap ETF.
How was the Fund positioned at the end of the reporting
period?
As of October 31, 2022, the positions described
above remain intact. The bias we expect to have the largest impact on active
return is our preference for small- and mid-cap stocks. We believe that the
large-cap space is potentially vulnerable to economic weakness abroad, a strong U.S. dollar, rich valuations and concentration in a relatively short list of very large companies (mega-cap technology). Smaller companies, in contrast, cater primarily
to what we view as a financially healthy domestic clientele and have historically been more successful than larger companies in protecting real earnings amid high inflation.
Likewise, the Fund’s emphasis on value stocks over
growth stocks remains intact, with a particular emphasis on what we perceive to be the defensive “RUSH” sectors: real estate, utilities, consumer staples and health care. The thesis rests primarily on the idea that inflation will prove
persistent and jeopardize the high price multiples paid on fast-growing companies with current valuations that depend on distant earnings. We are also mindful of the economy’s progression in the business cycle and the possibility that a
recession may not be far away.
The Fund maintains a
position in energy sector firms, as we envision sustained supply constraints keeping commodity prices elevated, thus preserving meaty profit margins for several years to come. A small position in gold miner stocks also remains in the Fund's
portfolio as an intended hedge against a potential monetary policy mistake or as a safe harbor should the economy slide into recession.
None of Schwab Strategic Trust, Schwab® U.S. Small-Cap ETF, or Charles Schwab Investment Management, Inc. make any representations regarding the advisability of investing in MainStay Moderate ETF Allocation
Fund.
iShares® is a registered trademark of BlackRock (BlackRock, Inc. and its subsidiaries). Neither BlackRock nor the iShares® Funds make any representations regarding the advisability of investing in MainStay Moderate ETF Allocation Fund.
The opinions expressed are those of the portfolio
managers as of the date of this report and are subject to change. There is no guarantee that any forecasts will come to pass. This material does not constitute investment advice and is not intended as an endorsement of any specific investment.
| 80
|
MainStay Equity ETF
Allocation Fund |
Portfolio of
Investments October 31, 2022† (Unaudited)
| |
Shares
|
|
Value
|
| Investment
Companies 99.7% |
| Equity
Funds 99.7% |
| Health
Care Select Sector SPDR Fund (a) |
6,088
|
|
$ 808,182
|
| Invesco
S&P 500 Low Volatility ETF |
16,652
|
|
1,028,094 |
| iShares
Core MSCI EAFE ETF |
130,109
|
|
7,249,674 |
| iShares
Core MSCI Emerging Markets ETF |
52,867
|
|
2,238,917 |
| iShares
Core S&P Small-Cap ETF (a) |
14,218
|
|
1,392,227 |
| iShares
Semiconductor ETF (a) |
673
|
|
219,721 |
| Schwab
U.S. Mid-Cap ETF |
40,756
|
|
2,687,451 |
| Schwab
U.S. Small-Cap ETF (a) |
166,487
|
|
6,965,816 |
| SPDR
S&P Oil & Gas Exploration & Production ETF |
1,524
|
|
230,566 |
| VanEck
Gold Miners ETF |
4,412
|
|
106,594 |
| VanEck
Oil Services ETF (a) |
926
|
|
276,596 |
| Vanguard
Mega Cap ETF |
127,152
|
|
17,087,957
|
| Vanguard
Mega Cap Value ETF |
6,973
|
|
702,809 |
| Vanguard
Mid-Cap ETF (a) |
22,965
|
|
4,684,630
|
Total
Investment Companies
(Cost $48,794,304) |
|
|
45,679,234
|
| Short-Term
Investments 3.7% |
| Affiliated
Investment Company 0.5% |
| MainStay
U.S. Government Liquidity Fund, 2.905% (b) |
240,765
|
|
240,765
|
| Unaffiliated
Investment Company 3.2% |
| Invesco
Government & Agency Portfolio, 3.163% (b)(c) |
1,477,220
|
|
1,477,220
|
Total
Short-Term Investments
(Cost $1,717,985) |
|
|
1,717,985
|
Total
Investments
(Cost $50,512,289) |
103.4%
|
|
47,397,219
|
| Other
Assets, Less Liabilities |
(3.4)
|
|
(1,568,672)
|
| Net
Assets |
100.0%
|
|
$ 45,828,547
|
| †
|
Percentages
indicated are based on Fund net assets. |
| (a)
|
All or a
portion of this security was held on loan. As of October 31, 2022, the aggregate market value of securities on loan was $2,498,501; the total market value of collateral held by the Fund was $2,616,027. The market value of the collateral held
included non-cash collateral in the form of U.S. Treasury securities with a value of $1,138,807. The Fund received cash collateral with a value of $1,477,220. (See Note 2(G)) |
| (b)
|
Current
yield as of October 31, 2022. |
| (c)
|
Represents
a security purchased with cash collateral received for securities on loan. |
The notes to the financial statements are an integral part of, and should be
read in conjunction with, the financial statements.
81
Portfolio of
Investments October 31, 2022† (Unaudited) (continued)
Investments in Affiliates (in 000's)
Investments in issuers considered to be affiliate(s) of the
Fund during the six-month period ended October 31, 2022 for purposes of Section 2(a)(3) of the Investment Company Act of 1940, as amended, were as follows:
| Affiliated
Investment Companies |
Value,
Beginning
of Period |
Purchases
at Cost |
Proceeds
from
Sales |
Net
Realized
Gain/(Loss)
on Sales |
Change
in
Unrealized
Appreciation/
(Depreciation) |
Value,
End of
Period |
Dividend
Income |
Other
Distributions |
Shares
End of
Period |
| MainStay
U.S. Government Liquidity Fund |
$ 342
|
$ 4,124
|
$ (4,225)
|
$ —
|
$ —
|
$ 241
|
$ 2
|
$ —
|
241
|
| Abbreviation(s):
|
| EAFE—Europe,
Australasia and Far East |
| ETF—Exchange-Traded
Fund |
| MSCI—Morgan
Stanley Capital International |
| SPDR—Standard
& Poor’s Depositary Receipt |
The following is a summary of the fair valuations according to
the inputs used as of October 31, 2022, for valuing the Fund’s assets:
| Description
|
Quoted
Prices in
Active
Markets for
Identical
Assets
(Level 1) |
|
Significant
Other
Observable
Inputs
(Level 2) |
|
Significant
Unobservable
Inputs
(Level 3) |
|
Total
|
| Asset
Valuation Inputs |
|
|
|
|
|
|
|
| Investments
in Securities (a) |
|
|
|
|
|
|
|
| Investment
Companies |
|
|
|
|
|
|
|
| Equity
Funds |
$ 45,679,234
|
|
$ —
|
|
$ —
|
|
$ 45,679,234
|
| Short-Term
Investments |
|
|
|
|
|
|
|
| Affiliated
Investment Company |
240,765
|
|
—
|
|
—
|
|
240,765
|
| Unaffiliated
Investment Company |
1,477,220
|
|
—
|
|
—
|
|
1,477,220
|
| Total
Short-Term Investments |
1,717,985
|
|
—
|
|
—
|
|
1,717,985
|
| Total
Investments in Securities |
$ 47,397,219
|
|
$ —
|
|
$ —
|
|
$ 47,397,219
|
| (a)
|
For
a complete listing of investments, see the Portfolio of Investments. |
The notes to the financial statements are an integral part of,
and should be read in conjunction with, the financial statements.
| 82
|
MainStay Equity ETF
Allocation Fund |
Statement of
Assets and Liabilities as of October 31, 2022 (Unaudited)
| Assets
|
Investment
in unaffiliated securities, at value
(identified cost $50,271,524) including securities on loan of $2,498,501 |
$47,156,454
|
Investment
in affiliated investment companies, at value
(identified cost $240,765) |
240,765
|
| Cash
|
2,405
|
| Receivables:
|
|
| Fund
shares sold |
52,938
|
| Securities
lending |
2,402
|
| Dividends
|
568
|
| Other
assets |
61,766
|
| Total
assets |
47,517,298
|
| Liabilities
|
| Cash
collateral received for securities on loan |
1,477,220
|
| Payables:
|
|
| Fund
shares redeemed |
112,959
|
| Investment
securities purchased |
56,832
|
| Professional
fees |
16,069
|
| NYLIFE
Distributors (See Note 3) |
10,349
|
| Transfer
agent (See Note 3) |
5,165
|
| Custodian
|
3,915
|
| Shareholder
communication |
3,355
|
| Manager
(See Note 3) |
1,051
|
| Accrued
expenses |
1,836
|
| Total
liabilities |
1,688,751
|
| Net
assets |
$45,828,547
|
| Composition
of Net Assets |
| Shares
of beneficial interest outstanding (par value of $.001 per share) unlimited number of shares authorized |
$
3,923 |
| Additional
paid-in-capital |
50,017,851
|
| |
50,021,774
|
| Total
distributable earnings (loss) |
(4,193,227)
|
| Net
assets |
$45,828,547
|
| Class
A |
|
| Net
assets applicable to outstanding shares |
$40,483,788
|
| Shares
of beneficial interest outstanding |
3,463,936
|
| Net
asset value per share outstanding |
$
11.69 |
| Maximum
sales charge (3.00% of offering price) |
0.36
|
| Maximum
offering price per share outstanding |
$
12.05 |
| Class
C |
|
| Net
assets applicable to outstanding shares |
$
160,624 |
| Shares
of beneficial interest outstanding |
13,880
|
| Net
asset value and offering price per share outstanding |
$
11.57 |
| Class
I |
|
| Net
assets applicable to outstanding shares |
$
141,878 |
| Shares
of beneficial interest outstanding |
12,194
|
| Net
asset value and offering price per share outstanding |
$
11.64 |
| Class
R3 |
|
| Net
assets applicable to outstanding shares |
$
465,744 |
| Shares
of beneficial interest outstanding |
40,032
|
| Net
asset value and offering price per share outstanding |
$
11.63 |
| SIMPLE
Class |
|
| Net
assets applicable to outstanding shares |
$
4,576,513 |
| Shares
of beneficial interest outstanding |
393,076
|
| Net
asset value and offering price per share outstanding |
$
11.64 |
The notes to the financial statements are an
integral part of, and should be read in conjunction with, the financial statements.
83
Statement of
Operations for the six months ended October 31, 2022 (Unaudited)
| Investment
Income (Loss) |
| Income
|
|
| Dividends-unaffiliated
|
$
454,176 |
| Securities
lending, net |
12,014
|
| Dividends-affiliated
|
1,693
|
| Total
income |
467,883
|
| Expenses
|
|
| Distribution/Service—Class
A (See Note 3) |
48,765
|
| Distribution/Service—Class
C (See Note 3) |
842
|
| Distribution/Service—Class
R3 (See Note 3) |
1,154
|
| Distribution/Service—SIMPLE
Class (See Note 3) |
9,160
|
| Registration
|
48,324
|
| Manager
(See Note 3) |
43,452
|
| Transfer
agent (See Note 3) |
23,851
|
| Professional
fees |
16,841
|
| Custodian
|
9,655
|
| Shareholder
communication |
3,055
|
| Trustees
|
462
|
| Shareholder
service (See Note 3) |
231
|
| Miscellaneous
|
2,272
|
| Total
expenses before waiver/reimbursement |
208,064
|
| Expense
waiver/reimbursement from Manager (See Note 3) |
(28,418)
|
| Net
expenses |
179,646
|
| Net
investment income (loss) |
288,237
|
| Realized
and Unrealized Gain (Loss) |
| Net
realized gain (loss) on unaffiliated investments |
(1,011,353)
|
| Net
change in unrealized appreciation (depreciation) on unaffiliated investments |
(2,262,761)
|
| Net
realized and unrealized gain (loss) |
(3,274,114)
|
| Net
increase (decrease) in net assets resulting from operations |
$(2,985,877)
|
The notes to the financial statements are an integral part of,
and should be read in conjunction with, the financial statements.
| 84
|
MainStay Equity ETF
Allocation Fund |
Statements of
Changes in Net Assets
for the six months ended October 31, 2022 (Unaudited) and the year ended April 30, 2022
| |
Six months
ended
October 31,
2022 |
Year
ended
April 30,
2022 |
| Increase
(Decrease) in Net Assets |
| Operations:
|
|
|
| Net
investment income (loss) |
$
288,237 |
$
363,970 |
| Net
realized gain (loss) |
(1,011,353)
|
(332,770)
|
| Net
change in unrealized appreciation (depreciation) |
(2,262,761)
|
(3,768,943)
|
| Net
increase (decrease) in net assets resulting from operations |
(2,985,877)
|
(3,737,743)
|
| Distributions
to shareholders: |
|
|
| Class
A |
—
|
(362,336)
|
| Class
C |
—
|
(590)
|
| Class
I |
—
|
(2,163)
|
| Class
R3 |
—
|
(3,445)
|
| SIMPLE
Class |
—
|
(17,161)
|
| Total
distributions to shareholders |
—
|
(385,695)
|
| Capital
share transactions: |
|
|
| Net
proceeds from sales of shares |
9,495,468
|
29,127,682
|
| Net
asset value of shares issued to shareholders in reinvestment of distributions |
—
|
381,517
|
| Cost
of shares redeemed |
(2,555,833)
|
(7,847,877)
|
| Increase
(decrease) in net assets derived from capital share transactions |
6,939,635
|
21,661,322
|
| Net
increase (decrease) in net assets |
3,953,758
|
17,537,884
|
| Net
Assets |
| Beginning
of period |
41,874,789
|
24,336,905
|
| End
of period |
$45,828,547
|
$41,874,789
|
The notes to the financial statements are an integral part of,
and should be read in conjunction with, the financial statements.
85
Financial
Highlights selected per share data and ratios
| |
Six
months ended
October 31,
2022* |
|
Year
Ended April 30, |
|
June
30, 2020^ through
April 30, |
| Class
A |
2022
|
|
2021
|
| Net
asset value at beginning of period |
$
12.54 |
|
$
13.64 |
|
$
10.00 |
| Net
investment income (loss) (a) |
0.08
|
|
0.15
|
|
0.07
|
| Net
realized and unrealized gain (loss) |
(0.93)
|
|
(1.10)
|
|
3.62
|
| Total
from investment operations |
(0.85)
|
|
(0.95)
|
|
3.69
|
| Less
distributions: |
|
|
|
|
|
| From
net investment income |
—
|
|
(0.14)
|
|
(0.04)
|
| From
net realized gain on investments |
—
|
|
(0.01)
|
|
(0.01)
|
| Total
distributions |
—
|
|
(0.15)
|
|
(0.05)
|
| Net
asset value at end of period |
$
11.69 |
|
$
12.54 |
|
$
13.64 |
| Total
investment return (b) |
(6.78)%
|
|
(7.21)%
|
|
37.04%
|
| Ratios
(to average net assets)/Supplemental Data: |
|
|
|
|
|
| Net
investment income (loss) |
1.36%††
|
|
1.08%
|
|
0.63%††
|
| Net
expenses (c) |
0.80%††
|
|
0.80%
|
|
0.80%††
|
| Expenses
(before waiver/reimbursement) (c) |
0.93%††
|
|
0.92%
|
|
1.90%††
|
| Portfolio
turnover rate |
12%
|
|
43%
|
|
24%
|
| Net
assets at end of period (in 000’s) |
$
40,484 |
|
$
38,162 |
|
$
20,221 |
| *
|
Unaudited.
|
| ^
|
Inception
date. |
| ††
|
Annualized.
|
| (a)
|
Per share
data based on average shares outstanding during the period. |
| (b)
|
Total
investment return is calculated exclusive of sales charges and assumes the reinvestment of dividends and distributions. For periods of less than one year, total return is not annualized. |
| (c)
|
In
addition to the fees and expenses which the Fund bears directly, it also indirectly bears a pro-rata share of the fees and expenses of the underlying funds in which it invests. Such indirect expenses are not included in the above expense ratios.
|
The
notes to the financial statements are an integral part of, and should be read in conjunction with, the financial statements.
| 86
|
MainStay Equity ETF
Allocation Fund |
Financial
Highlights selected per share data and ratios
| |
Six
months ended
October 31,
2022* |
|
Year
Ended April 30, |
|
June
30, 2020^ through
April 30, |
| Class
C |
2022
|
|
2021
|
| Net
asset value at beginning of period |
$
12.46 |
|
$
13.57 |
|
$
10.00 |
| Net
investment income (loss) (a) |
0.04
|
|
0.05
|
|
(0.02)
|
| Net
realized and unrealized gain (loss) |
(0.93)
|
|
(1.11)
|
|
3.63
|
| Total
from investment operations |
(0.89)
|
|
(1.06)
|
|
3.61
|
| Less
distributions: |
|
|
|
|
|
| From
net investment income |
—
|
|
(0.04)
|
|
(0.03)
|
| From
net realized gain on investments |
—
|
|
(0.01)
|
|
(0.01)
|
| Total
distributions |
—
|
|
(0.05)
|
|
(0.04)
|
| Net
asset value at end of period |
$
11.57 |
|
$
12.46 |
|
$
13.57 |
| Total
investment return (b) |
(7.14)%
|
|
(7.92)%
|
|
36.13%
|
| Ratios
(to average net assets)/Supplemental Data: |
|
|
|
|
|
| Net
investment income (loss) |
0.65%††
|
|
0.38%
|
|
(0.20)%††
|
| Net
expenses (c) |
1.55%††
|
|
1.55%
|
|
1.55%††
|
| Expenses
(before waiver/reimbursement) (c) |
1.73%††
|
|
1.75%
|
|
2.61%††
|
| Portfolio
turnover rate |
12%
|
|
43%
|
|
24%
|
| Net
assets at end of period (in 000’s) |
$
161 |
|
$
177 |
|
$
175 |
| *
|
Unaudited.
|
| ^
|
Inception
date. |
| ††
|
Annualized.
|
| (a)
|
Per share
data based on average shares outstanding during the period. |
| (b)
|
Total
investment return is calculated exclusive of sales charges and assumes the reinvestment of dividends and distributions. For periods of less than one year, total return is not annualized. |
| (c)
|
In
addition to the fees and expenses which the Fund bears directly, it also indirectly bears a pro-rata share of the fees and expenses of the underlying funds in which it invests. Such indirect expenses are not included in the above expense ratios.
|
The
notes to the financial statements are an integral part of, and should be read in conjunction with, the financial statements.
87
Financial
Highlights selected per share data and ratios
| |
Six
months ended
October 31,
2022* |
|
Year
Ended April 30, |
|
June
30, 2020^ through
April 30, |
| Class
I |
2022
|
|
2021
|
| Net
asset value at beginning of period |
$
12.47 |
|
$
13.56 |
|
$
10.00 |
| Net
investment income (loss) (a) |
0.10
|
|
0.07
|
|
0.08
|
| Net
realized and unrealized gain (loss) |
(0.93)
|
|
(0.98)
|
|
3.62
|
| Total
from investment operations |
(0.83)
|
|
(0.91)
|
|
3.70
|
| Less
distributions: |
|
|
|
|
|
| From
net investment income |
—
|
|
(0.17)
|
|
(0.13)
|
| From
net realized gain on investments |
—
|
|
(0.01)
|
|
(0.01)
|
| Total
distributions |
—
|
|
(0.18)
|
|
(0.14)
|
| Net
asset value at end of period |
$
11.64 |
|
$
12.47 |
|
$
13.56 |
| Total
investment return (b) |
(6.74)%
|
|
(6.96)%
|
|
37.30%
|
| Ratios
(to average net assets)/Supplemental Data: |
|
|
|
|
|
| Net
investment income (loss) |
1.64%††
|
|
0.49%
|
|
0.80%††
|
| Net
expenses (c) |
0.55%††
|
|
0.48%
|
|
0.55%††
|
| Expenses
(before waiver/reimbursement) (c) |
0.68%††
|
|
0.60%
|
|
1.65%††
|
| Portfolio
turnover rate |
12%
|
|
43%
|
|
24%
|
| Net
assets at end of period (in 000’s) |
$
142 |
|
$
152 |
|
$
2,684 |
| *
|
Unaudited.
|
| ^
|
Inception
date. |
| ††
|
Annualized.
|
| (a)
|
Per share
data based on average shares outstanding during the period. |
| (b)
|
Total
investment return is calculated exclusive of sales charges and assumes the reinvestment of dividends and distributions. Class I shares are not subject to sales charges. For periods of less than one year, total return is not annualized. |
| (c)
|
In
addition to the fees and expenses which the Fund bears directly, it also indirectly bears a pro-rata share of the fees and expenses of the underlying funds in which it invests. Such indirect expenses are not included in the above expense ratios.
|
The
notes to the financial statements are an integral part of, and should be read in conjunction with, the financial statements.
| 88
|
MainStay Equity ETF
Allocation Fund |
Financial
Highlights selected per share data and ratios
| |
Six
months ended
October 31,
2022* |
|
Year
Ended April 30, |
|
June
30, 2020^ through
April 30, |
| Class
R3 |
2022
|
|
2021
|
| Net
asset value at beginning of period |
$
12.51 |
|
$
13.61 |
|
$
10.00 |
| Net
investment income (loss) (a) |
0.06
|
|
0.10
|
|
0.04
|
| Net
realized and unrealized gain (loss) |
(0.94)
|
|
(1.10)
|
|
3.62
|
| Total
from investment operations |
(0.88)
|
|
(1.00)
|
|
3.66
|
| Less
distributions: |
|
|
|
|
|
| From
net investment income |
—
|
|
(0.09)
|
|
(0.04)
|
| From
net realized gain on investments |
—
|
|
(0.01)
|
|
(0.01)
|
| Total
distributions |
—
|
|
(0.10)
|
|
(0.05)
|
| Net
asset value at end of period |
$
11.63 |
|
$
12.51 |
|
$
13.61 |
| Total
investment return (b) |
(7.03)%
|
|
(7.47)%
|
|
36.62%
|
| Ratios
(to average net assets)/Supplemental Data: |
|
|
|
|
|
| Net
investment income (loss) |
1.04%††
|
|
0.74%
|
|
0.39%††
|
| Net
expenses (c) |
1.15%††
|
|
1.15%
|
|
1.15%††
|
| Expenses
(before waiver/reimbursement) (c) |
1.28%††
|
|
1.27%
|
|
2.25%††
|
| Portfolio
turnover rate |
12%
|
|
43%
|
|
24%
|
| Net
assets at end of period (in 000’s) |
$
466 |
|
$
472 |
|
$
445 |
| *
|
Unaudited.
|
| ^
|
Inception
date. |
| ††
|
Annualized.
|
| (a)
|
Per share
data based on average shares outstanding during the period. |
| (b)
|
Total
investment return is calculated exclusive of sales charges and assumes the reinvestment of dividends and distributions. Class R3 shares are not subject to sales charges. For periods of less than one year, total return is not annualized. |
| (c)
|
In
addition to the fees and expenses which the Fund bears directly, it also indirectly bears a pro-rata share of the fees and expenses of the underlying funds in which it invests. Such indirect expenses are not included in the above expense ratios.
|
The
notes to the financial statements are an integral part of, and should be read in conjunction with, the financial statements.
89
Financial
Highlights selected per share data and ratios
| |
Six
months ended
October 31,
2022* |
|
Year
Ended April 30, |
|
August
31, 2020^ through
April 30, |
| SIMPLE
Class |
2022
|
|
2021
|
| Net
asset value at beginning of period |
$
12.51 |
|
$
13.61 |
|
$
11.08 |
| Net
investment income (loss) (a) |
0.06
|
|
0.11
|
|
0.06
|
| Net
realized and unrealized gain (loss) |
(0.93)
|
|
(1.10)
|
|
2.52
|
| Total
from investment operations |
(0.87)
|
|
(0.99)
|
|
2.58
|
| Less
distributions: |
|
|
|
|
|
| From
net investment income |
—
|
|
(0.10)
|
|
(0.04)
|
| From
net realized gain on investments |
—
|
|
(0.01)
|
|
(0.01)
|
| Total
distributions |
—
|
|
(0.11)
|
|
(0.05)
|
| Net
asset value at end of period |
$
11.64 |
|
$
12.51 |
|
$
13.61 |
| Total
investment return (b) |
(6.95)%
|
|
(7.38)%
|
|
23.32%
|
| Ratios
(to average net assets)/Supplemental Data: |
|
|
|
|
|
| Net
investment income (loss) |
1.04%††
|
|
0.78%
|
|
0.51%††
|
| Net
expenses (c) |
1.05%††
|
|
1.05%
|
|
1.05%††
|
| Expenses
(before waiver/reimbursement) (c) |
1.23%††
|
|
1.25%
|
|
2.11%††
|
| Portfolio
turnover rate |
12%
|
|
43%
|
|
24%
|
| Net
assets at end of period (in 000’s) |
$
4,577 |
|
$
2,911 |
|
$
811 |
| *
|
Unaudited.
|
| ^
|
Inception
date. |
| ††
|
Annualized.
|
| (a)
|
Per share
data based on average shares outstanding during the period. |
| (b)
|
Total
investment return is calculated exclusive of sales charges and assumes the reinvestment of dividends and distributions. SIMPLE Class shares are not subject to sales charges. For periods of less than one year, total return is not annualized.
|
| (c)
|
In
addition to the fees and expenses which the Fund bears directly, it also indirectly bears a pro-rata share of the fees and expenses of the underlying funds in which it invests. Such indirect expenses are not included in the above expense ratios.
|
The notes to the financial statements are an integral part of, and should be
read in conjunction with, the financial statements.
| 90
|
MainStay Equity ETF
Allocation Fund |
MainStay ESG
Multi-Asset Allocation Fund
Investment and
Performance Comparison (Unaudited)
Performance data quoted represents past performance. Past performance is no
guarantee of future results. Because of market volatility and other factors, current performance may be lower or higher than the figures shown. Investment return and principal value will fluctuate, and as a result, when shares are redeemed, they may
be worth more or less than their original cost. The graph below depicts the historical performance of Class I shares of the Fund. Performance will vary from class to class based on differences in class-specific expenses and sales charges. For performance information current to the most recent month-end, please call 800-624-6782 or visit newyorklifeinvestments.com.
The performance table and graph do not reflect the deduction
of taxes that a shareholder would pay on distributions or Fund share redemptions. Total returns reflect maximum applicable sales charges as indicated in the table below, if any, changes in share price, and reinvestment of dividend and capital gain
distributions. The graph assumes the initial investment amount shown below and reflects the deduction of all sales charges that would have applied for the period of investment. Performance figures may reflect certain fee waivers and/or expense
limitations, without which total returns may have been lower. For more information on share classes and current fee waivers and/or expense limitations (if any), please refer to the Notes to Financial Statements.
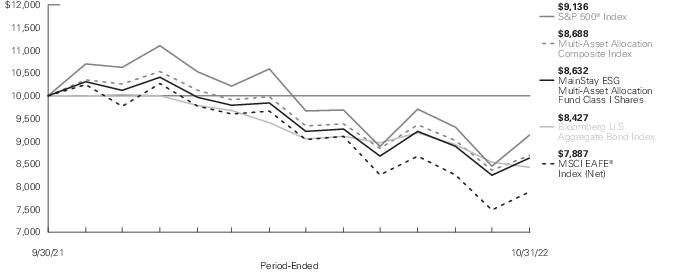
| Average
Annual Total Returns for the Period-Ended October 31, 2022 |
| Class
|
Sales
Charge |
|
Inception
Date |
Six
Months1 |
One
Year |
Since
Inception1 |
Gross
Expense
Ratio2 |
| Class
A Shares |
Maximum
3% Initial Sales Charge |
With
sales charges |
9/30/2021
|
-9.27%
|
-19.03%
|
-15.33%
|
2.53%
|
| |
|
Excluding
sales charges |
|
-6.47
|
-16.53
|
-12.92
|
2.53
|
| Class
C Shares |
Maximum
1% CDSC |
With
sales charges |
9/30/2021
|
-7.75
|
-17.91
|
-13.55
|
3.28
|
| |
if
redeemed Within One Year of Purchase |
Excluding
sales charges |
|
-6.82
|
-17.10
|
-13.55
|
3.28
|
| Class
I Shares |
No
Sales Charge |
|
9/30/2021
|
-6.35
|
-16.28
|
-12.68
|
2.28
|
| Class
R3 Shares |
No
Sales Charge |
|
9/30/2021
|
-6.58
|
-16.80
|
-13.18
|
2.88
|
| SIMPLE
Class Shares |
No
Sales Charge |
|
9/30/2021
|
-6.47
|
-16.68
|
-13.07
|
2.78
|
| 1.
|
Not
annualized. |
| 2.
|
The
gross expense ratios presented reflect the Fund’s “Total Annual Fund Operating Expenses” from the most recent Prospectus, as supplemented, and may differ from other expense ratios disclosed in this report. |
The
footnotes on the next page are an integral part of the table and graph and should be carefully read in conjunction with them.
| Benchmark
Performance* |
Six
Months1 |
One
Year |
Since
Inception |
| S&P
500® Index2 |
-5.50%
|
-14.61%
|
-7.99%
|
| MSCI
EAFE® Index (Net)3 |
-12.70
|
-23.00
|
-19.65
|
| Bloomberg
U.S. Aggregate Bond Index4 |
-6.86
|
-15.68
|
-14.59
|
| Multi-Asset
Allocation Composite Index5 |
-6.94
|
-16.04
|
-12.15
|
| Morningstar
Allocation-50% to 70% Equity Category Average6 |
-6.12
|
-14.40
|
-10.49
|
| *
|
Returns
for indices reflect no deductions for fees, expenses or taxes, except for foreign withholding taxes where applicable. Results assume reinvestment of all dividends and capital gains. An investment cannot be made directly in an index.
|
| 1.
|
Not
annualized. |
| 2.
|
The
S&P 500® Index is the Fund’s primary broad-based securities market index for comparison purposes. S&P 500® is a trademark of The McGraw-Hill Companies, Inc. The S&P 500® Index is widely regarded as
the standard index for measuring large-cap U.S. stock market performance. |
| 3.
|
The MSCI
EAFE® Index (Net) is the Fund's secondary benchmark. The MSCI EAFE® Index (Net) consists of
international stocks representing the developed world outside of North America. |
| 4.
|
The Fund
has selected the Bloomberg U.S. Aggregate Bond Index as an additional benchmark. The Bloomberg U.S. Aggregate Bond Index is a broad-based benchmark that measures the performance of the investment grade, U.S. dollar-denominated, fixed-rate taxable
bond market, including Treasurys, government-related and corporate securities, mortgage-backed securities (agency fixed-rate and hybrid adjustable rate mortgage pass-throughs), asset-backed securities, and commercial mortgage-backed securities.
|
| 5.
|
The Fund
has selected the Multi-Asset Allocation Composite Index as an additional benchmark. The Multi-Asset Allocation Composite Index consists of the S&P 500® Index, the MSCI
EAFE® Index (Net) and the Bloomberg U.S. Aggregate Bond Index weighted 45%, 15% and 40%, respectively. |
| 6.
|
The
Morningstar Allocation – 50% to 70% Equity Category Average is representative of funds that seek to provide both income and capital appreciation by investing in multiple asset classes, including stocks, bonds, and cash. These portfolios are
dominated by domestic holdings and have equity exposures between 50% and 70%. Results are based on average total returns of similar funds with all dividends and capital gain distributions reinvested. |
The
footnotes on the preceding page are an integral part of the table and graph and should be carefully read in conjunction with them.
| 92
|
MainStay ESG Multi-Asset
Allocation Fund |
Cost in Dollars of
a $1,000 Investment in MainStay ESG Multi-Asset Allocation Fund (Unaudited)
The example below is intended to describe the fees and expenses
borne by shareholders during the six-month period from May 1, 2022 to October 31, 2022, and the impact of those costs on your investment.
Example
As a shareholder of the Fund you incur two types of costs: (1)
transaction costs, including exchange fees and sales charges (loads) on purchases (as applicable), and (2) ongoing costs, including management fees, distribution and/or service (12b-1) fees and other Fund expenses (as applicable). This example is
intended to help you understand your ongoing costs (in dollars) of investing in the Fund and to compare these costs with the ongoing costs of investing in other mutual funds. The example is based on an investment of $1,000 made at the beginning of
the six-month period and held for the entire period from May 1, 2022 to October 31, 2022.
This example illustrates your Fund’s ongoing costs in two
ways:
Actual Expenses
The second and third data columns in the table below provide information about
actual account values and actual expenses. You may use the information in these columns, together with the amount you invested, to estimate the expenses that you paid during the six months ended October 31, 2022. Simply divide your account value by
$1,000 (for example, an
$8,600 account value divided by $1,000 = 8.6), then multiply the result by the
number under the heading entitled “Expenses Paid During Period” to estimate the expenses you paid on your account during this period.
Hypothetical Example for Comparison Purposes
The fourth and fifth data columns in the table below provide information about
hypothetical account values and hypothetical expenses based on the Fund’s actual expense ratio and an assumed rate of return of 5% per year before expenses, which is not the Fund’s actual return. The hypothetical account values and
expenses may not be used to estimate the actual ending account balances or expenses you paid for the six-month period shown. You may use this information to compare the ongoing costs of investing in the Fund with the ongoing costs of investing in
other mutual funds. To do so, compare this 5% hypothetical example with the 5% hypothetical examples that appear in the shareholder reports of the other mutual funds.
Please note that the expenses shown in the table are meant to
highlight your ongoing costs only and do not reflect any transactional costs, such as exchange fees or sales charges (loads). Therefore, the fourth and fifth data columns of the table are useful in comparing ongoing costs only and will not help you
determine the relative total costs of owning different funds. In addition, if these transactional costs were included, your costs would have been higher.
| Share
Class |
Beginning
Account
Value
5/1/22 |
Ending
Account
Value (Based
on Actual
Returns and
Expenses)
10/31/22 |
Expenses
Paid
During
Period1 |
Ending
Account
Value (Based
on Hypothetical
5% Annualized
Return and
Actual Expenses)
10/31/22 |
Expenses
Paid
During
Period1 |
Net
Expense
Ratio
During
Period2 |
| Class
A Shares |
$1,000.00
|
$935.30
|
$3.90
|
$1,021.17
|
$4.08
|
0.80%
|
| Class
C Shares |
$1,000.00
|
$931.80
|
$7.55
|
$1,017.39
|
$7.88
|
1.55%
|
| Class
I Shares |
$1,000.00
|
$936.50
|
$2.68
|
$1,022.43
|
$2.80
|
0.55%
|
| Class
R3 Shares |
$1,000.00
|
$934.20
|
$5.61
|
$1,019.41
|
$5.85
|
1.15%
|
| SIMPLE
Class Shares |
$1,000.00
|
$935.30
|
$5.12
|
$1,019.91
|
$5.35
|
1.05%
|
| 1.
|
Expenses are
equal to the Fund’s annualized expense ratio of each class multiplied by the average account value over the period, divided by 365 and multiplied by 184 (to reflect the six-month period). The table above represents the actual expenses incurred
during the six-month period. In addition to the fees and expenses which the Fund bears directly, it also indirectly bears a pro rata share of the fees and expenses of the underlying funds in which it invests. Such indirect expenses are not included
in the above-reported expense figures. |
| 2.
|
Expenses
are equal to the Fund's annualized expense ratio to reflect the six-month period. |
Asset Diversification as of October 31, 2022
(Unaudited)
| Unaffiliated
Investment Companies |
86.8
% |
| Affiliated
Investment Companies |
6.9
|
| Short-Term
Investments |
16.9
|
| Other
Assets, Less Liabilities |
(10.6)
|
See Portfolio of Investments
beginning on page 98 for specific holdings within these categories. The Fund’s holdings are subject to change.
| 94
|
MainStay ESG Multi-Asset
Allocation Fund |
Portfolio
Management Discussion and Analysis (Unaudited)
Questions answered by portfolio managers Jae S. Yoon,
CFA, Jonathan Swaney, Poul Kristensen, CFA, and Amit Soni, CFA, of New York Life Investment Management LLC, the Fund’s Manager.
How did MainStay ESG Multi-Asset Allocation Fund perform relative to its
benchmarks and peer group during the reporting period ended October 31, 2022?
For the six months ended October 31, 2022, Class I shares of
MainStay ESG Multi-Asset Allocation Fund returned −6.35%, underperforming the −5.50% return of the Fund’s primary benchmark, the S&P 500® Index (the
"Index"), and outperforming the −12.70% return of the MSCI EAFE® Index (Net), which is the Fund’s secondary benchmark. Over the same period, Class I shares of
the Fund outperformed the −6.86% return of the Bloomberg U.S. Aggregate Bond Index, and the −6.94% return of the Multi-Asset Allocation Composite Index, both of which are additional benchmarks of the Fund. For the six months ended
October 31, 2022, Class I shares underperformed the −6.12% return of the Morningstar Allocation -50% to 70% Equity Category Average.1
What factors affected the Fund’s relative
performance during the reporting period?
The Fund is a
“fund of funds" that seeks to achieve its investment objective by investing in both unaffiliated and affiliated exchange-traded funds (“Underlying ETFs”) where the consideration of environmental, social and governance
(“ESG”) factors is a significant part of the investment strategy and that meet the Fund’s overall investment criteria. The Underlying ETFs may invest in U.S. equities, international equities and fixed-income instruments, making
comparisons to any single index generally less suitable than a weighted combination of indices, which is a more useful yardstick by which to measure performance. The most influential factor affecting returns for the Fund during the reporting period
(versus the performance of a weighted combination of indices) is the net performance of the Underlying ETFs themselves, relative to their respective benchmarks. During the reporting period, asset class policy was the primary determinant of the
Fund’s relative performance.
Fund management
internally maintains a blend of indices that are taken into consideration when managing the Fund. During the reporting period, the Fund’s performance roughly matched that of the internally maintained blend of indices, with active positioning
at the asset class level adding to returns and Underlying ETF performance detracting in near equal measure.
The Fund’s asset class positioning benefited from the
following factors:
| •
|
Management of the stock/bond
blend: The Fund’s management of its stock/bond blend proved generally successful, reflecting |
tactical adjustments made throughout the reporting period. With both
investment-grade bonds and U.S. stocks posting declines in the mid-teens, there was little cost or benefit to being persistently overweight or underweight in equities, although adjusting that exposure over time (buying dips and selling rallies)
added significant value.
| •
|
Value created within asset
classes: The equity portion of the Fund emphasized value over growth, a position that the market rewarded. Conditions also favored the Fund’s skew toward profitable small-cap companies. |
| •
|
Shorter duration:2 We shortened the average duration of the fixed-income portion of the Fund, which further lifted relative returns. |
On the other hand, the reporting period did not provide a
conducive environment for ESG strategies generally, as traditional fossil fuel energy companies fared well, while other firms more typically associated with the ESG movement—such as emerging technology—lagged by a wide margin. But even
beyond the challenges faced by ESG strategies generally, a number of Underlying ETF holdings performed poorly versus the broad indices within their market segments. Notable examples include Nuveen ESG Small-Cap ETF, iShares® ESG Aware MSCI USA Small-Cap ETF and Xtrackers MSCI USA ESG Leaders Equity ETF.
How did you allocate the Fund’s assets during the
reporting period and why?
Stock/bond blend: On average,
the Fund held moderately overweight exposure to equities during the reporting period, with the magnitude of that bias managed tactically in response to swings in pricing, as described above. We are generally reluctant to position the Fund with an
underweight allocation to equities, as stocks have tended to perform well over time, and anticipating drawdowns is challenging. The opposite is less true; we are happy to increase the Fund’s allocation to equities when we believe they are well
supported fundamentally or when a correction has run further than we believe appropriate. This approach worked well during the reporting period. Although stocks declined by double digits, the Fund generated roughly 0.3% of excess return3 through tactical adjustments to its degree of overweight exposure to equities.
Duration: Believing inflationary pressures to be partially
structural in nature and likely to persist at elevated levels for the foreseeable future, we skewed the Fund’s fixed-income holdings to favor shorter maturity instruments less sensitive to rising bond yields, although we increased the
Fund’s duration as yields rose. By the
| 1.
|
See page 91 for other share
class returns, which may be higher or lower than Class I share returns. See page 92 for more information on benchmark and peer group returns. |
| 2.
|
Duration is a measure of the
price sensitivity of a fixed-income investment to changes in interest rates. Duration is expressed as a number of years and is considered a more accurate sensitivity gauge than average maturity. |
| 3.
|
The expression “excess
return” may refer to the return that a security or portfolio provides above (or below) an investment with the lowest perceived risk, such as comparable U.S. Treasury securities. The expression may also refer to the return that a security or
portfolio provides above (or below) an index or other benchmark. |
end of the reporting period, the average duration of the fixed-income portion
of the Fund was only slightly shorter than that of the benchmark. The Fund’s duration policy contributed positively to performance. (Contributions take weightings and total returns into account.)
Equity style: In the same way that inflation is threatening to
long-duration bonds, equities with values disproportionately reflected in more distant cash flows (i.e., growth stocks with high prices relative to current earnings) are likewise vulnerable. Accordingly, we tilted the Fund to emphasize value stocks
that offered more attractive near-term cash flows, placing particular focus on traditionally defensive sectors: real estate, utilities, consumer staples and (most of all) health care. The combined effect was a modest positive contribution to return
of approximately 0.1%.
Equity size: Small-company stocks
were more heavily owned in the Fund than in the Index. The thesis behind this positioning was based on attractive small-cap valuations, insulation from economic weakness abroad, less sensitivity to dollar strength and disproportionate exposure to
domestic demand, which remained healthy. The Fund’s active position in small-cap companies contributed approximately 0.35% to relative performance.
Geographic exposure: In light of Russia’s invasion of
Ukraine, we positioned the Fund with an underweight exposure to developed international markets, benefiting performance at the margin. That improvement in returns was fully offset, however, by a small overweight position in emerging market equities.
We believed that China’s economy would benefit from the country’s relaxation of its zero-COVID policy, as well as additional fiscal support ahead of the October 2022 Party Congress; however, neither development materialized.
How did the Fund’s allocations change over the
course of the reporting period?
Allocation adjustments
occur either in response to changing asset class preferences, or to switch between different ESG ETFs within an asset class. Examples of the former include reductions in the Fund’s positions in iShares® ESG Aware MSCI EAFE ETF and IQ Candriam ESG International Equity ETF, as we continued to lessen the Fund’s exposure to non-U.S. markets in anticipation of a global
recession. We also trimmed holdings in iShares® ESG Advanced High Yield ETF, reducing the Fund’s exposure to sub-investment-grade credit to benchmark levels.
Examples of ETFs seeing their position size reduced or closed
altogether, as the mix of vehicles used to represent the various asset classes evolved, included iShares® ESG Screened S&P® 500 ETF and Nuveen ESG U.S. Aggregate Bond ETF. Positions that grew in size, either as beneficiaries of asset class changes or due to their role in representing those asset
classes, included iShares® ESG Advanced Total USD Bond Market ETF, IQ Candriam
ESG U.S. Equity ETF and iShares® ESG Aware MSCI USA Small-Cap ETF.
During the reporting period, which Underlying Equity
ETFs had the highest total returns and which Underlying Equity ETFs had the lowest total returns?
No Underlying Equity ETF holdings delivered positive returns
during the reporting period. Those generating the smallest losses were iShares® ESG Aware MSCI USA Small-Cap ETF, Nuveen ESG Small-Cap ETF and Nuveen ESG Large-Cap Value
ETF. The largest losses were seen in iShares® ESG MSCI EM Leaders ETF, iShares® ESG Aware MSCI
EM ETF and Nuveen ESG Emerging Markets Equity ETF.
Which Underlying Equity ETFs were the strongest positive
contributors to the Fund’s performance and which Underlying Equity ETFs were particularly weak?
Despite generating negative returns over the duration of the
reporting period, two holdings did contribute positively to performance, by virtue of their weight having shifted over that span of time, with the Underlying Equity ETF’s position size larger when the ETF was appreciating than when it was
depreciating. Those two were Xtrackers MSCI USA ESG Leaders Equity ETF and iShares® ESG Aware MSCI USA Small-Cap ETF.
The most significant detractors from Fund performance were
iShares® ESG Aware MSCI EAFE ETF, iShares® ESG Aware MSCI EM ETF and Nuveen ESG Mid-Cap Value
ETF.
During the reporting period, which Underlying
Fixed-Income ETFs had the highest total returns and which Underlying Fixed-Income ETFs had the lowest total returns?
Other than Underlying Money Market Funds, all Underlying
Fixed-Income ETFs generated negative returns. iShares® ESG Aware 1-5 Year USD Corporate Bond ETF,
iShares® ESG Advanced High Yield ETF and Nuveen ESG High Yield Corporate Bond ETF registered the mildest losses. The largest losses came from Vanguard ESG U.S. Corporate
Bond ETF, iShares® ESG Aware U.S. Aggregate Bond ETF and Nuveen ESG U.S. Aggregate Bond ETF.
Which Underlying Fixed-Income ETFs were the strongest
positive contributors to the Fund’s performance and which Underlying Fixed-Income ETFs were particularly weak?
With all Underlying Fixed-Income ETFs experiencing losses
during the reporting period, none contributed positively to performance. Those detracting the least included Nuveen ESG U.S. Aggregate Bond ETF and Nuveen ESG High Yield Corporate Bond ETF. The most significant detractors were iShares® ESG Advanced Total
| 96
|
MainStay ESG Multi-Asset
Allocation Fund |
USD Bond Market ETF and iShares® ESG Aware U.S. Aggregate Bond ETF.
How was the Fund positioned at the end of the reporting
period?
As the market rallied in October 2022, we
trimmed the Fund’s equity allocation, positioning the Fund very close to neutral as of October 31, 2022. We anticipate that the market will continue to move generally sideways within a very broad channel, presenting opportunities to trade
tactically, adding to equity holdings during periods of weakness and trimming them again as prices recover.
The bias we expect to have the largest impact on active return
is our preference for small- and mid-cap stocks. We believe that the large-cap space is potentially vulnerable to economic weakness abroad, a strong U.S. dollar, rich valuations and concentration in a relatively short list of very large companies
(mega-cap technology). Smaller companies, in contrast, cater primarily to what we view as a financially healthy domestic clientele and have historically been more successful than larger companies in protecting real earnings amid high
inflation.
Likewise, the Fund’s emphasis on value
stocks over growth stocks remains intact. The thesis rests primarily on the idea that inflation will prove persistent and jeopardize the high price multiples paid on fast-growing companies with current valuations that depend on distant earnings. We
are also mindful of the economy’s progression in the business cycle and the possibility that a recession may not be far away.
Within fixed income, we have lessened the Fund’s
short-duration posture considerably as yields have climbed. As of October 31, 2022, the Fund’s duration is closer to the benchmark. We have also reduced the Fund’s exposure to credit as corporate fundamentals show signs of gradual
deterioration.
iShares® is a registered trademark of BlackRock (BlackRock, Inc. and its subsidiaries). Neither BlackRock nor the iShares® Funds make any representations regarding the advisability of investing in MainStay ESG Multi-Asset Allocation Fund.
The opinions expressed are those of the portfolio managers as of
the date of this report and are subject to change. There is no guarantee that any forecasts will come to pass. This material does not constitute investment advice and is not intended as an endorsement of any specific investment.
Portfolio of
Investments October 31, 2022† (Unaudited)
| |
Shares
|
Value
|
| Affiliated
Investment Companies 6.9% |
| Equity
Funds 6.9% |
| IQ
Candriam ESG International Equity ETF (a) |
1,480
|
$ 33,161
|
| IQ
Candriam ESG U.S. Large Cap Equity ETF |
22,118
|
725,692
|
Total
Affiliated Investment Companies
(Cost $798,251) |
|
758,853
|
| Unaffiliated
Investment Companies 86.8% |
| Equity
Funds 70.2% |
| iShares
ESG Advanced High Yield Corporate Bond ETF |
15,329
|
662,519 |
| iShares
ESG Advanced MSCI EAFE ETF (a) |
1,516
|
73,829 |
| iShares
ESG Aware 1-5 Year USD Corporate Bond ETF (a) |
14,553
|
340,249 |
| iShares
ESG Aware MSCI EAFE ETF (a) |
12,540
|
744,876 |
| iShares
ESG Aware MSCI EM ETF |
7,786
|
212,480 |
| iShares
ESG Aware MSCI USA Small-Cap ETF |
16,594
|
559,550 |
| iShares
ESG Aware U.S. Aggregate Bond ETF |
15,671
|
716,008 |
| iShares
ESG Screened S&P 500 ETF |
27,676
|
795,715 |
| iShares
MSCI USA ESG Select ETF (a) |
1,505
|
124,313 |
| Nuveen
ESG Emerging Markets Equity ETF |
796
|
18,073 |
| Nuveen
ESG High Yield Corporate Bond ETF (a) |
8,623
|
175,564 |
| Nuveen
ESG International Devel |
3,078
|
72,373
|
| Nuveen
ESG Large-Cap Value ETF (a) |
16,811
|
576,617
|
| Nuveen
ESG Mid-Cap Growth ETF |
13,262
|
456,478
|
| Nuveen
ESG Mid-Cap Value ETF |
24,755
|
769,881
|
| Nuveen
ESG Small-Cap ETF |
16,031
|
570,383
|
| SPDR
S&P 500 ESG ETF |
18,166
|
672,869
|
| Xtrackers
Emerging Markets Carbon Reduction and Climate Improvers ETF (a) |
1,413
|
32,598
|
| Xtrackers
MSCI USA ESG Leaders Equity ETF |
3,350
|
116,915
|
Total
Equity Funds
(Cost $8,528,709) |
|
7,691,290
|
| Fixed
Income Funds 16.6% |
| iShares
ESG Advanced Total USD Bond Market ETF (a) |
33,718
|
1,391,542
|
| Vanguard
ESG U.S. Corporate Bond ETF (a) |
7,268
|
426,486
|
Total
Fixed Income Funds
(Cost $1,936,046) |
|
1,818,028
|
Total
Unaffiliated Investment Companies
(Cost $10,464,755) |
|
9,509,318
|
| Short-Term
Investments 16.9% |
| Affiliated
Investment Company 6.1% |
| MainStay
U.S. Government Liquidity Fund, 2.905% (b) |
666,141
|
666,141
|
The notes to the financial statements are an integral part of, and should be
read in conjunction with, the financial statements.
| 98
|
MainStay ESG Multi-Asset
Allocation Fund |
| |
Shares
|
|
Value
|
| Short-Term
Investments (continued) |
| Unaffiliated
Investment Company 10.8% |
| Invesco
Government and Agency Portfolio, 3.154% (b)(c) |
1,184,395
|
|
$ 1,184,395
|
Total
Short-Term Investments
(Cost $1,850,536) |
16.9%
|
|
1,850,536
|
Total
Investments
(Cost $13,113,542) |
110.6%
|
|
12,118,707
|
| Other
Assets, Less Liabilities |
(10.6)
|
|
(1,161,192)
|
| Net
Assets |
100.0%
|
|
$ 10,957,515
|
| †
|
Percentages
indicated are based on Fund net assets. |
| (a)
|
All or a
portion of this security was held on loan. As of October 31, 2022, the aggregate market value of securities on loan was $1,152,396. The Fund received cash collateral with a value of $1,184,395. (See Note 2(G)) |
| (b)
|
Current
yield as of October 31, 2022. |
| (c)
|
Represents
a security purchased with cash collateral received for securities on loan. |
Investments in Affiliates (in 000's)
Investments in issuers considered to be affiliate(s) of the
Fund during the six-month period ended October 31, 2022 for purposes of Section 2(a)(3) of the Investment Company Act of 1940, as amended, were as follows:
| Affiliated
Investment Companies |
Value,
Beginning
of Period |
Purchases
at Cost |
Proceeds
from
Sales |
Net
Realized
Gain/(Loss)
on Sales |
Change
in
Unrealized
Appreciation/
(Depreciation) |
Value,
End of
Period |
Dividend
Income |
Other
Distributions |
Shares
End of
Period |
| IQ
Candriam ESG International Equity ETF |
$ 152
|
$
32 |
$
(147) |
$ (20)
|
$ 16
|
$
33 |
$ —
|
$ —
|
1
|
| IQ
Candriam ESG U.S. Large Cap Equity ETF (a) |
73
|
728
|
(38)
|
(1)
|
(36)
|
726
|
3
|
—
|
22
|
| MainStay
U.S. Government Liquidity Fund |
362
|
3,735
|
(3,431)
|
—
|
—
|
666
|
4
|
—
|
666
|
| |
$
587 |
$4,495
|
$(3,616)
|
$
(21) |
$
(20) |
$1,425
|
$
7 |
$
— |
|
| |
|
| (a)
|
Prior
to August 31, 2022, known as IQ Candriam ESG U.S. Equity ETF. |
| Abbreviation(s):
|
| EAFE—Europe,
Australasia and Far East |
| EM—Emerging
Markets |
| ETF—Exchange-Traded
Fund |
| MSCI—Morgan
Stanley Capital International |
| SPDR—Standard
& Poor’s Depositary Receipt |
| USD—United
States Dollar |
The notes to the financial statements are an integral part of, and should be
read in conjunction with, the financial statements.
99
Portfolio of
Investments October 31, 2022† (Unaudited) (continued)
The
following is a summary of the fair valuations according to the inputs used as of October 31, 2022, for valuing the Fund’s assets:
| Description
|
Quoted
Prices in
Active
Markets for
Identical
Assets
(Level 1) |
|
Significant
Other
Observable
Inputs
(Level 2) |
|
Significant
Unobservable
Inputs
(Level 3) |
|
Total
|
| Asset
Valuation Inputs |
|
|
|
|
|
|
|
| Investments
in Securities (a) |
|
|
|
|
|
|
|
| Affiliated
Investment Companies |
|
|
|
|
|
|
|
| Equity
Funds |
$
758,853 |
|
$ —
|
|
$ —
|
|
$
758,853 |
| Unaffiliated
Investment Companies |
|
|
|
|
|
|
|
| Equity
Funds |
7,691,290
|
|
—
|
|
—
|
|
7,691,290
|
| Fixed
Income Funds |
1,818,028
|
|
—
|
|
—
|
|
1,818,028
|
| Total
Unaffiliated Investment Companies |
9,509,318
|
|
—
|
|
—
|
|
9,509,318
|
| Short-Term
Investments |
|
|
|
|
|
|
|
| Affiliated
Investment Company |
666,141
|
|
—
|
|
—
|
|
666,141
|
| Unaffiliated
Investment Company |
1,184,395
|
|
—
|
|
—
|
|
1,184,395
|
| Total
Short-Term Investments |
1,850,536
|
|
—
|
|
—
|
|
1,850,536
|
| Total
Investments in Securities |
$ 12,118,707
|
|
$ —
|
|
$ —
|
|
$ 12,118,707
|
| (a)
|
For
a complete listing of investments, see the Portfolio of Investments. |
The notes to the financial statements are an integral part of,
and should be read in conjunction with, the financial statements.
| 100
|
MainStay ESG Multi-Asset
Allocation Fund |
Statement of
Assets and Liabilities as of October 31, 2022 (Unaudited)
| Assets
|
Investment
in unaffiliated securities, at value
(identified cost $11,649,150) including securities on loan of $1,152,396 |
$10,693,713
|
Investment
in affiliated investment companies, at value
(identified cost $1,464,392) |
1,424,994
|
| Cash
|
772
|
| Receivables:
|
|
| Manager
(See Note 3) |
4,119
|
| Fund
shares sold |
2,943
|
| Dividends
|
1,264
|
| Other
assets |
55,202
|
| Total
assets |
12,183,007
|
| Liabilities
|
| Cash
collateral received for securities on loan |
1,184,395
|
| Payables:
|
|
| Transfer
agent (See Note 3) |
13,680
|
| Investment
securities purchased |
8,885
|
| Professional
fees |
8,569
|
| Custodian
|
3,443
|
| Shareholder
communication |
3,151
|
| NYLIFE
Distributors (See Note 3) |
479
|
| Offering
costs |
291
|
| Trustees
|
81
|
| Accrued
expenses |
2,518
|
| Total
liabilities |
1,225,492
|
| Net
assets |
$10,957,515
|
| Composition
of Net Assets |
| Shares
of beneficial interest outstanding (par value of $.001 per share) unlimited number of shares authorized |
$
1,303 |
| Additional
paid-in-capital |
12,829,876
|
| |
12,831,179
|
| Total
distributable earnings (loss) |
(1,873,664)
|
| Net
assets |
$10,957,515
|
| Class
A |
|
| Net
assets applicable to outstanding shares |
$2,185,285
|
| Shares
of beneficial interest outstanding |
260,293
|
| Net
asset value per share outstanding |
$
8.40 |
| Maximum
sales charge (3.00% of offering price) |
0.26
|
| Maximum
offering price per share outstanding |
$
8.66 |
| Class
C |
|
| Net
assets applicable to outstanding shares |
$
21,358 |
| Shares
of beneficial interest outstanding |
2,560
|
| Net
asset value and offering price per share outstanding |
$
8.34 |
| Class
I |
|
| Net
assets applicable to outstanding shares |
$8,561,534
|
| Shares
of beneficial interest outstanding |
1,017,466
|
| Net
asset value and offering price per share outstanding |
$
8.41 |
| Class
R3 |
|
| Net
assets applicable to outstanding shares |
$
37,327 |
| Shares
of beneficial interest outstanding |
4,458
|
| Net
asset value and offering price per share outstanding |
$
8.37 |
| SIMPLE
Class |
|
| Net
assets applicable to outstanding shares |
$
152,011 |
| Shares
of beneficial interest outstanding |
18,141
|
| Net
asset value and offering price per share outstanding |
$
8.38 |
The notes to the financial statements are an
integral part of, and should be read in conjunction with, the financial statements.
101
Statement of
Operations for the six months ended October 31, 2022 (Unaudited)
| Investment
Income (Loss) |
| Income
|
|
| Dividends-unaffiliated
|
$
99,266 |
| Dividends-affiliated
|
7,412
|
| Securities
lending, net |
4,973
|
| Total
income |
111,651
|
| Expenses
|
|
| Offering
(See Note 2) |
44,964
|
| Registration
|
17,634
|
| Manager
(See Note 3) |
10,628
|
| Professional
fees |
6,933
|
| Custodian
|
6,701
|
| Shareholder
communication |
2,746
|
| Distribution/Service—Class
A (See Note 3) |
2,002
|
| Distribution/Service—Class
C (See Note 3) |
111
|
| Distribution/Service—Class
R3 (See Note 3) |
97
|
| Distribution/Service—SIMPLE
Class (See Note 3) |
264
|
| Transfer
agent (See Note 3) |
2,162
|
| Trustees
|
43
|
| Shareholder
service (See Note 3) |
19
|
| Miscellaneous
|
510
|
| Total
expenses before waiver/reimbursement |
94,814
|
| Expense
waiver/reimbursement from Manager (See Note 3) |
(63,096)
|
| Net
expenses |
31,718
|
| Net
investment income (loss) |
79,933
|
| Realized
and Unrealized Gain (Loss) |
| Net
realized gain (loss) on: |
|
| Unaffiliated
investments |
(667,881)
|
| Affiliated
investments |
(20,700)
|
| Net
realized gain (loss) |
(688,581)
|
| Net
change in unrealized appreciation (depreciation) on: |
|
| Unaffiliated
investments |
(60,032)
|
| Affiliated
investments |
(20,128)
|
| Net
change in unrealized appreciation (depreciation) |
(80,160)
|
| Net
realized and unrealized gain (loss) |
(768,741)
|
| Net
increase (decrease) in net assets resulting from operations |
$(688,808)
|
The notes to the financial statements are an integral part of,
and should be read in conjunction with, the financial statements.
| 102
|
MainStay ESG Multi-Asset
Allocation Fund |
Statements of
Changes in Net Assets
for the six months ended October 31, 2022 (Unaudited) and the period September 30, 2021 (inception date) through April 30, 2022
| |
Six months
ended
October 31,
2022 |
Period
ended
April 30,
2022 |
| Increase
(Decrease) in Net Assets |
| Operations:
|
|
|
| Net
investment income (loss) |
$
79,933 |
$
82,549 |
| Net
realized gain (loss) |
(688,581)
|
(66,802)
|
| Net
change in unrealized appreciation (depreciation) |
(80,160)
|
(914,675)
|
| Net
increase (decrease) in net assets resulting from operations |
(688,808)
|
(898,928)
|
| Distributions
to shareholders: |
|
|
| Class
A |
—
|
(18,787)
|
| Class
C |
—
|
(605)
|
| Class
I |
—
|
(265,161)
|
| Class
R3 |
—
|
(1,096)
|
| SIMPLE
Class |
—
|
(637)
|
| Total
distributions to shareholders |
—
|
(286,286)
|
| Capital
share transactions: |
|
|
| Net
proceeds from sales of shares |
1,239,767
|
11,393,208
|
| Net
asset value of shares issued to shareholders in reinvestment of distributions |
—
|
286,286
|
| Cost
of shares redeemed |
(25,920)
|
(61,804)
|
| Increase
(decrease) in net assets derived from capital share transactions |
1,213,847
|
11,617,690
|
| Net
increase (decrease) in net assets |
525,039
|
10,432,476
|
| Net
Assets |
| Beginning
of period |
10,432,476
|
—
|
| End
of period |
$10,957,515
|
$10,432,476
|
The notes to the financial statements are an integral part of,
and should be read in conjunction with, the financial statements.
103
Financial
Highlights selected per share data and ratios
| |
Six
months ended
October 31,
2022* |
|
September
30, 2021^ through
April 30, |
| Class
A |
2022
|
| Net
asset value at beginning of period |
$
8.97 |
|
$
10.00 |
| Net
investment income (loss) (a) |
0.06
|
|
0.05
|
| Net
realized and unrealized gain (loss) |
(0.63)
|
|
(0.82)
|
| Total
from investment operations |
(0.57)
|
|
(0.77)
|
| Less
distributions: |
|
|
|
| From
net investment income |
—
|
|
(0.26)
|
| From
net realized gain on investments |
—
|
|
(0.00)‡
|
| Net
asset value at end of period |
$
8.40 |
|
$
8.97 |
| Total
investment return (b) |
(6.47)%
|
|
(7.99)%
|
| Ratios
(to average net assets)/Supplemental Data: |
|
|
|
| Net
investment income (loss)†† |
1.28%
|
|
0.93%
|
| Net
expenses††(c) |
0.80%
|
|
0.80%
|
| Expenses
(before waiver/reimbursement)††(c) |
1.97%
|
|
2.40%
|
| Portfolio
turnover rate |
60%
|
|
70%
|
| Net
assets at end of period (in 000’s) |
$
2,185 |
|
$
1,161 |
| *
|
Unaudited.
|
| ^
|
Inception
date. |
| ‡
|
Less than
one cent per share. |
| ††
|
Annualized.
|
| (a)
|
Per share
data based on average shares outstanding during the period. |
| (b)
|
Total
investment return is calculated exclusive of sales charges and assumes the reinvestment of dividends and distributions. For periods of less than one year, total return is not annualized. |
| (c)
|
In
addition to the fees and expenses which the Fund bears directly, it also indirectly bears a pro-rata share of the fees and expenses of the underlying funds in which it invests. Such indirect expenses are not included in the above expense ratios.
|
| |
Six
months ended
October 31,
2022* |
|
September
30, 2021^ through
April 30, |
| Class
C |
2022
|
| Net
asset value at beginning of period |
$
8.95 |
|
$
10.00 |
| Net
investment income (loss) (a) |
0.02
|
|
0.02
|
| Net
realized and unrealized gain (loss) |
(0.63)
|
|
(0.83)
|
| Total
from investment operations |
(0.61)
|
|
(0.81)
|
| Less
distributions: |
|
|
|
| From
net investment income |
—
|
|
(0.24)
|
| From
net realized gain on investments |
—
|
|
(0.00)‡
|
| Net
asset value at end of period |
$
8.34 |
|
$
8.95 |
| Total
investment return (b) |
(6.82)%
|
|
(8.37)%
|
| Ratios
(to average net assets)/Supplemental Data: |
|
|
|
| Net
investment income (loss)†† |
0.56%
|
|
0.36%
|
| Net
expenses††(c) |
1.55%
|
|
1.55%
|
| Expenses
(before waiver/reimbursement)††(c) |
2.78%
|
|
3.15%
|
| Portfolio
turnover rate |
60%
|
|
70%
|
| Net
assets at end of period (in 000’s) |
$
21 |
|
$
23 |
| *
|
Unaudited.
|
| ^
|
Inception
date. |
| ‡
|
Less than
one cent per share. |
| ††
|
Annualized.
|
| (a)
|
Per share
data based on average shares outstanding during the period. |
| (b)
|
Total
investment return is calculated exclusive of sales charges and assumes the reinvestment of dividends and distributions. For periods of less than one year, total return is not annualized. |
| (c)
|
In
addition to the fees and expenses which the Fund bears directly, it also indirectly bears a pro-rata share of the fees and expenses of the underlying funds in which it invests. Such indirect expenses are not included in the above expense ratios.
|
The
notes to the financial statements are an integral part of, and should be read in conjunction with, the financial statements.
| 104
|
MainStay ESG Multi-Asset
Allocation Fund |
Financial
Highlights selected per share data and ratios
| |
Six
months ended
October 31,
2022* |
|
September
30, 2021^ through
April 30, |
| Class
I |
2022
|
| Net
asset value at beginning of period |
$
8.98 |
|
$
10.00 |
| Net
investment income (loss) (a) |
0.07
|
|
0.08
|
| Net
realized and unrealized gain (loss) |
(0.64)
|
|
(0.84)
|
| Total
from investment operations |
(0.57)
|
|
(0.76)
|
| Less
distributions: |
|
|
|
| From
net investment income |
—
|
|
(0.26)
|
| From
net realized gain on investments |
—
|
|
(0.00)‡
|
| Net
asset value at end of period |
$
8.41 |
|
$
8.98 |
| Total
investment return (b) |
(6.35)%
|
|
(7.83)%
|
| Ratios
(to average net assets)/Supplemental Data: |
|
|
|
| Net
investment income (loss)†† |
1.56%
|
|
1.36%
|
| Net
expenses††(c) |
0.55%
|
|
0.55%
|
| Expenses
(before waiver/reimbursement)††(c) |
1.74%
|
|
2.15%
|
| Portfolio
turnover rate |
60%
|
|
70%
|
| Net
assets at end of period (in 000’s) |
$
8,562 |
|
$
9,135 |
| *
|
Unaudited.
|
| ^
|
Inception
date. |
| ‡
|
Less than
one cent per share. |
| ††
|
Annualized.
|
| (a)
|
Per share
data based on average shares outstanding during the period. |
| (b)
|
Total
investment return is calculated exclusive of sales charges and assumes the reinvestment of dividends and distributions. Class I shares are not subject to sales charges. For periods of less than one year, total return is not annualized. |
| (c)
|
In
addition to the fees and expenses which the Fund bears directly, it also indirectly bears a pro-rata share of the fees and expenses of the underlying funds in which it invests. Such indirect expenses are not included in the above expense ratios.
|
The
notes to the financial statements are an integral part of, and should be read in conjunction with, the financial statements.
105
Financial
Highlights selected per share data and ratios
| |
Six
months ended
October 31,
2022* |
|
September
30, 2021^ through
April 30, |
| Class
R3 |
2022
|
| Net
asset value at beginning of period |
$
8.96 |
|
$
10.00 |
| Net
investment income (loss) (a) |
0.04
|
|
0.03
|
| Net
realized and unrealized gain (loss) |
(0.63)
|
|
(0.82)
|
| Total
from investment operations |
(0.59)
|
|
(0.79)
|
| Less
distributions: |
|
|
|
| From
net investment income |
—
|
|
(0.25)
|
| From
net realized gain on investments |
—
|
|
(0.00)‡
|
| Net
asset value at end of period |
$
8.37 |
|
$
8.96 |
| Total
investment return (b) |
(6.58)%
|
|
(8.17)%
|
| Ratios
(to average net assets)/Supplemental Data: |
|
|
|
| Net
investment income (loss)†† |
0.96%
|
|
0.52%
|
| Net
expenses††(c) |
1.15%
|
|
1.15%
|
| Expenses
(before waiver/reimbursement)††(c) |
2.34%
|
|
2.75%
|
| Portfolio
turnover rate |
60%
|
|
70%
|
| Net
assets at end of period (in 000’s) |
$
37 |
|
$
40 |
| *
|
Unaudited.
|
| ^
|
Inception
date. |
| ‡
|
Less than
one cent per share. |
| ††
|
Annualized.
|
| (a)
|
Per share
data based on average shares outstanding during the period. |
| (b)
|
Total
investment return is calculated exclusive of sales charges and assumes the reinvestment of dividends and distributions. Class R3 shares are not subject to sales charges. For periods of less than one year, total return is not annualized. |
| (c)
|
In
addition to the fees and expenses which the Fund bears directly, it also indirectly bears a pro-rata share of the fees and expenses of the underlying funds in which it invests. Such indirect expenses are not included in the above expense ratios.
|
The
notes to the financial statements are an integral part of, and should be read in conjunction with, the financial statements.
| 106
|
MainStay ESG Multi-Asset
Allocation Fund |
Financial
Highlights selected per share data and ratios
| |
Six
months ended
October 31,
2022* |
|
September
30, 2021^ through
April 30, |
| SIMPLE
Class |
2022
|
| Net
asset value at beginning of period |
$
8.96 |
|
$
10.00 |
| Net
investment income (loss) (a) |
0.04
|
|
0.03
|
| Net
realized and unrealized gain (loss) |
(0.62)
|
|
(0.82)
|
| Total
from investment operations |
(0.58)
|
|
(0.79)
|
| Less
distributions: |
|
|
|
| From
net investment income |
—
|
|
(0.25)
|
| From
net realized gain on investments |
—
|
|
(0.00)‡
|
| Net
asset value at end of period |
$
8.38 |
|
$
8.96 |
| Total
investment return (b) |
(6.47)%
|
|
(8.15)%
|
| Ratios
(to average net assets)/Supplemental Data: |
|
|
|
| Net
investment income (loss)†† |
0.95%
|
|
0.57%
|
| Net
expenses††(c) |
1.05%
|
|
1.05%
|
| Expenses
(before waiver/reimbursement)††(c) |
2.27%
|
|
2.65%
|
| Portfolio
turnover rate |
60%
|
|
70%
|
| Net
assets at end of period (in 000’s) |
$
152 |
|
$
74 |
| *
|
Unaudited.
|
| ^
|
Inception
date. |
| ‡
|
Less than
one cent per share. |
| ††
|
Annualized.
|
| (a)
|
Per share
data based on average shares outstanding during the period. |
| (b)
|
Total
investment return is calculated exclusive of sales charges and assumes the reinvestment of dividends and distributions. SIMPLE Class shares are not subject to sales charges. For periods of less than one year, total return is not annualized.
|
| (c)
|
In
addition to the fees and expenses which the Fund bears directly, it also indirectly bears a pro-rata share of the fees and expenses of the underlying funds in which it invests. Such indirect expenses are not included in the above expense ratios.
|
The notes to the financial statements are an integral part of, and should be
read in conjunction with, the financial statements.
107
Notes to Financial
Statements (Unaudited)
Note 1-Organization and Business
MainStay Funds Trust (the “Trust”) was organized as
a Delaware statutory trust on April 28, 2009. The Trust is registered under the Investment Company Act of 1940, as amended (the “1940 Act”), as an open-end management investment company, and is comprised of thirty-three funds
(collectively referred to as the “Funds” and each individually, referred to as a “Fund"). These financial statements and notes relate to the MainStay Defensive ETF Allocation Fund, MainStay Conservative ETF Allocation Fund,
MainStay Moderate ETF Allocation Fund, MainStay Growth ETF Allocation Fund, MainStay Equity ETF Allocation Fund and MainStay ESG Multi-Asset Allocation Fund (commenced operations September 30, 2021) (collectively referred to as the "ETF Allocation
Funds" and each individually referred to as an "ETF Allocation Fund"). Each is a “diversified” fund, as that term is defined in the 1940 Act, as interpreted or modified by regulatory authorities having jurisdiction, from time to
time.
The following table lists each ETF Allocation
Fund's share classes that have been registered and commenced operations:
| Fund
|
Share
Classes Commenced Operations1 |
| MainStay
Defensive ETF Allocation Fund |
Class
A, Class C, Class I, Class R3, SIMPLE Class |
| MainStay
Conservative ETF Allocation Fund |
Class
A, Class C, Class I, Class R3, SIMPLE Class |
| MainStay
Moderate ETF Allocation Fund |
Class
A, Class C, Class I, Class R3, SIMPLE Class |
| MainStay
Growth ETF Allocation Fund |
Class
A, Class C, Class I, Class R3, SIMPLE Class |
| MainStay
Equity ETF Allocation Fund |
Class
A, Class C, Class I, Class R3, SIMPLE Class |
| MainStay
ESG Multi-Asset Allocation Fund |
Class
A, Class C, Class I, Class R3, SIMPLE Class |
| 1.
|
For each ETF Allocation Fund,
other than MainStay ESG Multi-Asset Allocation Fund, Investor Class and Class R6 shares were registered for sale as of June 30, 2020, but as of October 31, 2022 were not yet offered for sale. For MainStay ESG Multi-Asset Allocation Fund, Investor
Class and Class R6 shares were registered for sale as of September 30, 2021, but as of October 31, 2022 were not yet offered for sale. |
Class A shares are offered at net asset value
(“NAV”) per share plus an initial sales charge. No initial sales charge applies to investments of $250,000 or more (and certain other qualified purchases) in Class A shares. However, a contingent deferred sales charge
(“CDSC”) of 0.50% may be imposed on certain redemptions made within 18 months of the date of purchase on shares that were purchased without an initial sales charge. Class C shares are offered at NAV without an initial sales charge,
although a CDSC of 1.00% may be imposed on certain redemptions of such shares made within one year of the date of purchase of Class C shares. Class I, Class R3 and SIMPLE Class shares are offered at NAV without a sales charge. Depending upon
eligibility, Class C shares convert to Class A shares at the end of the calendar quarter eight years after the date they were purchased. SIMPLE Class shares convert to Class A shares, or Investor Class shares if you are not eligible to hold Class A
shares, at the end of the calendar quarter, ten years after the date they were purchased. Share class conversions are based on the relevant NAVs of the two classes at the time of the conversion, and no sales load or
other charge is imposed. Under certain circumstances and as may be permitted
by the Trust’s multiple class plan pursuant to Rule 18f-3 under the 1940 Act, specified share classes of an ETF Allocation Fund may be converted to one or more other share classes of the ETF Allocation Fund as disclosed in the capital share
transactions within these Notes. The classes of shares have the same voting (except for issues that relate solely to one class), dividend, liquidation and other rights, and the same terms and conditions, except that under distribution plans pursuant
to Rule 12b-1 under the 1940 Act, Class C shares are subject to higher distribution and/or service fees than Class A, Class R3 and SIMPLE Class shares. Class I shares are not subject to a distribution and/or service fee. Class R3 shares are subject
to a shareholder service fee, which is in addition to fees paid under the distribution plans for Class R3 shares.
The investment objective for each of the ETF Allocation Funds
is as follows:
The
MainStay Defensive ETF Allocation Fund seeks current income.
The MainStay Conservative ETF
Allocation Fund seeks current income and, secondarily, long-term growth of capital.
The MainStay Moderate ETF
Allocation Fund seeks long-term growth of capital and, secondarily, current income.
The MainStay Growth ETF
Allocation Fund seeks long-term growth of capital and, secondarily, current income.
The MainStay Equity ETF
Allocation Fund seeks long-term growth of capital.
The MainStay ESG Multi-Asset
Allocation Fund seeks long-term growth of capital and, secondarily, current income.
The ETF Allocation Funds are "funds-of-funds" that seek to
achieve their investment objectives by investing in passively-managed exchange-traded funds (the “Underlying ETFs”).
Note 2–Significant Accounting Policies
The ETF Allocation Funds are investment companies and
accordingly follow the investment company accounting and reporting guidance of the Financial Accounting Standards Board (“FASB”) Accounting Standards Codification Topic 946 Financial
Services—Investment Companies. The ETF Allocation Funds prepare their financial statements in accordance with generally accepted accounting principles (“GAAP”) in the United States of
America and follow the significant accounting policies described below.
(A) Securities Valuation. Investments are usually valued as of the close of regular trading on the New York Stock Exchange (the "Exchange") (usually 4:00 p.m. Eastern time) on each day the ETF Allocation Funds are
open for business ("valuation date").
Effective
September 8, 2022, and pursuant to Rule 2a-5 under the 1940 Act, the Board of Trustees of the Trust (the "Board") designated New York Life Investment Management LLC (“New York Life Investments” or the
| 108
|
Mainstay ETF Asset
Allocation Funds |
"Manager") as its Valuation Designee (the "Valuation Designee"). The Valuation
Designee is responsible for performing fair valuations relating to all investments in each ETF Allocation Fund’s portfolio for which market quotations are not readily available; periodically assessing and managing material valuation risks;
establishing and applying fair value methodologies; testing fair valuation methodologies; evaluating and overseeing pricing services; segregation of valuation and portfolio management functions; providing quarterly, annual and prompt reporting to
the Board, as appropriate; identifying potential conflicts of interest; and maintaining appropriate records. The Valuation Designee has established a valuation committee ("Valuation Committee") to assist in carrying out the Valuation
Designee’s responsibilities and establish prices of securities for which market quotations are not readily available. The ETF Allocation Fund’s and the Valuation Designee's policies and procedures ("Valuation Procedures") govern the
Valuation Designee’s selection and application of methodologies for determining and calculating the fair value of ETF Allocation Fund investments. The Valuation Designee may value ETF Allocation Fund portfolio securities for which market
quotations are not readily available and other ETF Allocation Fund assets utilizing inputs from pricing services and other third-party sources (together, “Pricing Sources”). The Valuation Committee meets (in person, via electronic mail
or via teleconference) on an ad-hoc basis to determine fair valuations and on a quarterly basis to review fair value events (excluding fair valuations from pricing services), including valuation risks and back-testing results, and preview reports to
the Board.
The Valuation Committee establishes prices of
securities for which market quotations are not readily available based on such methodologies and measurements on a regular basis after considering information that is reasonably available and deemed relevant by the Valuation Committee. The Board
shall oversee the Valuation Designee and review fair valuation materials on a prompt, quarterly and annual basis and approve proposed revisions to the Valuation Procedures.
Investments for which market quotations are not readily
available are valued at fair value as determined in good faith pursuant to the Valuation Procedures. A market quotation is readily available only when that quotation is a quoted price (unadjusted) in active markets for identical investments that
each ETF Allocation Fund can access at the measurement date, provided that a quotation will not be readily available if it is not reliable. Fair value measurements are determined within a framework that establishes a three-tier hierarchy that
maximizes the use of observable market data and minimizes the use of unobservable inputs to establish a classification of fair value measurements for disclosure purposes. "Inputs" refer broadly to the assumptions that market participants would use
in pricing the asset or liability, including assumptions about risk, such as the risk inherent in a particular valuation technique used to measure fair value using a pricing model and/or the risk inherent in the inputs for the valuation technique.
Inputs may be observable or unobservable. Observable inputs reflect the assumptions market participants would use in pricing the asset or liability based on market data obtained from sources independent of each ETF Allocation Fund. Unobservable
inputs reflect each ETF Allocation Fund’s own
assumptions about the assumptions market participants would use in pricing the
asset or liability based on the information available. The inputs or methodology used for valuing assets or liabilities may not be an indication of the risks associated with investing in those assets or liabilities. The three-tier hierarchy of
inputs is summarized below.
| •
|
Level
1—quoted prices (unadjusted) in active markets for an identical asset or liability |
| •
|
Level
2—other significant observable inputs (including quoted prices for a similar asset or liability in active markets, interest rates and yield curves, prepayment speeds, credit risk, etc.) |
| •
|
Level
3—significant unobservable inputs (including each ETF Allocation Fund's own assumptions about the assumptions that market participants would use in measuring fair value of an asset or liability) |
The level of an asset or liability within the fair value
hierarchy is based on the lowest level of an input, both individually and in the aggregate, that is significant to the fair value measurement. The aggregate value by input level of each ETF Allocation Fund’s assets and liabilities as of
October 31, 2022, is included at the end of each ETF Allocation Fund’s Portfolio of Investments.
Exchange-traded funds (“ETFs”) are valued at the
last quoted sales prices as of the close of regular trading on the relevant exchange on each valuation date. Securities that are not traded on the valuation date are valued at the mean of the last quoted bid and ask prices. Prices are normally taken
from the principal market in which each security trades. These securities are generally categorized as Level 1 in the hierarchy.
Investments in mutual funds, including money market funds, are
valued at their respective NAVs at the close of business each day on the valuation date. These securities are generally categorized as Level 1 in the hierarchy.
Temporary cash investments acquired in excess of 60 days to
maturity at the time of purchase are valued using the latest bid prices or using valuations based on a matrix system (which considers such factors as security prices, yields, maturities and ratings), both as furnished by independent pricing
services. Temporary cash investments that mature in 60 days or less at the time of purchase ("Short-Term Investments") are valued using the amortized cost method of valuation, unless the use of such method would be inappropriate. The amortized cost
method involves valuing a security at its cost on the date of purchase and thereafter assuming a constant amortization to maturity of the difference between such cost and the value on maturity date. Amortized cost approximates the current fair value
of a security. Securities valued using the amortized cost method are not valued using quoted prices in an active market and are generally categorized as Level 2 in the hierarchy.
The information above is not intended to reflect an exhaustive
list of the methodologies that may be used to value portfolio investments. The Valuation Procedures permit the use of a variety of valuation methodologies in connection with valuing portfolio investments. The methodology used for a specific type of
investment may vary based on
Notes to Financial
Statements (Unaudited) (continued)
the market data available or other considerations. The methodologies
summarized above may not represent the specific means by which portfolio investments are valued on any particular business day.
(B) Income Taxes. Each ETF Allocation Fund is treated as a separate entity for federal income tax purposes. The ETF Allocation Funds' policy is to comply with the requirements of the Internal Revenue Code of
1986, as amended (the “Internal Revenue Code”), applicable to regulated investment companies and to distribute all of its taxable income to the shareholders of each ETF Allocation Fund within the allowable time limits. Therefore, no
federal, state and local income tax provisions are required.
Management evaluates each ETF Allocation Fund’s tax
positions to determine if the tax positions taken meet the minimum recognition threshold in connection with accounting for uncertainties in income tax positions taken or expected to be taken for the purposes of measuring and recognizing tax
liabilities in the financial statements. Recognition of tax benefits of an uncertain tax position is permitted only to the extent the position is “more likely than not” to be sustained assuming examination by taxing authorities.
Management has analyzed the ETF Allocation Funds' tax positions taken on federal, state and local income tax returns for all open tax years (for up to three tax years) and has concluded that no provisions for federal, state and local income tax are
required in the ETF Allocation Funds' financial statements. The ETF Allocation Funds' federal, state and local income tax and federal excise tax returns for tax years for which the applicable statutes of limitations have not expired are subject to
examination by the Internal Revenue Service and state and local departments of revenue.
(C) Dividends and Distributions to Shareholders. Dividends and distributions are recorded on the ex-dividend date. The MainStay Moderate ETF Allocation Fund, MainStay Growth ETF Allocation Fund and MainStay Equity ETF Allocation Fund and
MainStay ESG Multi-Asset Allocation Fund each intends to declare and pay dividends from net investment income, if any, at least annually. The MainStay Conservative ETF Allocation Fund and MainStay Defensive ETF Allocation Fund each intends to
declare and pay dividends from net investment income, if any, at least quarterly. Each MainStay ETF Allocation Fund declare and distribute capital gains, if any, at least annually. Unless a shareholder elects otherwise, all dividends and
distributions are reinvested in the same class of shares of the respective ETF Allocation Fund at NAV. Dividends and distributions to shareholders are determined in accordance with federal income tax regulations and may differ from determinations
using GAAP.
(D) Security Transactions and
Investment Income. The ETF Allocation Funds record security transactions on the trade date. Realized gains and losses on security transactions are determined using the identified
cost method. Dividends and distributions received by the ETF Allocation Funds from the Underlying ETFs are recorded on the ex-dividend date.
Investment income and realized and unrealized gains and losses
on investments of the ETF Allocation Funds are allocated pro rata to the
separate classes of shares based upon their relative net assets on the date
the income is earned or realized and unrealized gains and losses are incurred.
(E) Expenses. Expenses of the Trust are allocated to the individual Funds in proportion to the net assets of the respective Funds when the expenses are incurred, except where direct allocations of
expenses can be made. Expenses (other than transfer agent expenses and fees incurred under the shareholder services plans and/or the distribution plans further discussed in Note 3(B)) are allocated to separate classes of shares pro rata based upon
their relative net assets on the date the expenses are incurred. The expenses borne by the ETF Allocation Funds, including those of related parties to the ETF Allocation Funds, are shown in the Statement of Operations.
In addition, the ETF Allocation Funds bear a pro rata share of
the fees and expenses of the Underlying ETFs in which they invest. Because the Underlying ETFs have varied expense and fee levels and the ETF Allocation Funds may own different proportions of the Underlying ETFs at different times, the amount of
fees and expenses incurred indirectly by each ETF Allocation Fund may vary. Shares of the Underlying ETFs are subject to management fees and other fees that may cause the costs of investing in Underlying ETFs to be greater than the costs of owning
the underlying securities directly. These indirect expenses of the Underlying ETFs are not included in the amounts shown in the Statement of Operations or in the expense ratios included in the Financial Highlights.
(F) Use of Estimates. In preparing financial statements in conformity with GAAP, the Manager makes estimates and assumptions that affect the reported amounts and disclosures in the financial statements. Actual
results could differ from those estimates and assumptions.
(G) Securities Lending. In order to realize additional income, the ETF Allocation Funds may engage in securities lending, subject to the limitations set forth in the 1940 Act and relevant guidance by the staff of
the Securities and Exchange Commission (“SEC”). If the ETF Allocation Funds engage in securities lending, the ETF Allocation Funds will lend through their custodian, JPMorgan Chase Bank, N.A., ("JPMorgan"), acting as securities lending
agent on behalf of the ETF Allocation Funds. Under the current arrangement, JPMorgan will manage the ETF Allocation Funds' collateral in accordance with the securities lending agency agreement between the ETF Allocation Funds and JPMorgan, and
indemnify the ETF Allocation Funds against counterparty risk. The loans will be collateralized by cash (which may be invested in a money market fund) and/or non-cash collateral (which may include U.S. Treasury securities and/or U.S. government
agency securities issued or guaranteed by the United States government or its agencies or instrumentalities) at least equal at all times to the market value of the securities loaned. Non-cash collateral held at year end is segregated and cannot be
transferred by the ETF Allocation Funds. The ETF Allocation Funds bear the risk of delay in recovery of, or loss of rights in, the securities loaned. The ETF Allocation Funds may also record a realized gain or loss on securities deemed sold due to a
borrower’s inability to return securities on loan. The ETF Allocation Funds bear the risk of any loss on investment of
| 110
|
Mainstay ETF Asset
Allocation Funds |
cash collateral. The ETF Allocation Funds will receive compensation for
lending its securities in the form of fees or it will retain a portion of interest earned on the investment of any cash collateral. The ETF Allocation Funds will also continue to receive interest and dividends on the securities loaned and any gain
or loss in the market price of the securities loaned that may occur during the term of the loan will be for the account of the ETF Allocation Funds. Income earned from securities lending activities, if any, is reflected in the Statement of
Operations. Securities on loan as of October 31, 2022, are shown in the Portfolio of Investments.
(H) Indemnifications. Under the Trust’s organizational documents, its officers and trustees are indemnified against certain liabilities that may arise out of performance of their duties to the Trust.
Additionally, in the normal course of business, the ETF Allocation Funds enter into contracts with third-party service providers that contain a variety of representations and warranties and that may provide general indemnifications. The ETF
Allocation Funds' maximum exposure under these arrangements is unknown, as this would involve future claims that may be made against the ETF Allocation Funds that have not yet occurred. The Manager believes that the risk of loss in connection with
these potential indemnification obligations is remote. However, there can be no assurance that material liabilities related to such obligations will not arise in the future, which could adversely impact the ETF Allocation Funds.
Note 3–Fees and Related Party Transactions
(A) Manager. New York Life Investments, a registered investment adviser and an indirect, wholly-owned subsidiary of New York Life Insurance Company (“New York Life”), serves as the ETF
Allocation Funds' Manager pursuant to an Amended and Restated Management Agreement (“Management Agreement”) and is responsible for the day-to-day portfolio management of the ETF Allocation Funds. The Manager provides offices, conducts
clerical, recordkeeping and bookkeeping services, and keeps most of the financial and accounting records required to be maintained by the ETF Allocation Funds. Except for the portion of salaries and expenses that are the responsibility of the ETF
Allocation Funds, the Manager pays the salaries and expenses of all personnel affiliated with the ETF Allocation Funds and certain operational expenses of the ETF Allocation Funds. During a portion of the six-month period ended October 31, 2022, the
ETF Allocation Funds reimbursed New York Life Investments in an amount equal to the portion of the compensation of the Chief Compliance Officer attributable to the ETF Allocation Funds.
Pursuant to the Management Agreement, each ETF Allocation Fund
pays the Manager a monthly fee for the services performed and facilities furnished at an annual rate of 0.20% of each ETF Allocation Fund's average daily net assets.
Notes to Financial
Statements (Unaudited) (continued)
New York Life Investments has contractually agreed to waive
fees and/or reimburse expenses so that Total Annual Fund Operating Expenses (excluding taxes, interest, litigation, extraordinary expenses, brokerage and other transaction expenses relating to the purchase and sale of portfolio investments, and
acquired (underlying) fund fees and expenses) of a class do not exceed the following percentages of average daily net assets for each class:
| Fund
|
Class
A |
Class
C |
Class
I |
Class
R3 |
SIMPLE
Class |
| MainStay
Defensive ETF Allocation Fund |
0.80%
|
1.55%
|
0.55%
|
1.15%
|
1.05%
|
| MainStay
Conservative ETF Allocation Fund |
0.80
|
1.55
|
0.55
|
1.15
|
1.05
|
| MainStay
Moderate ETF Allocation Fund |
0.80
|
1.55
|
0.55
|
1.15
|
1.05
|
| MainStay
Growth ETF Allocation Fund |
0.80
|
1.55
|
0.55
|
1.15
|
1.05
|
| MainStay
Equity ETF Allocation Fund |
0.80
|
1.55
|
0.55
|
1.15
|
1.05
|
| MainStay
ESG Multi-Asset Allocation Fund |
0.80
|
1.55
|
0.55
|
1.15
|
1.05
|
This agreement will remain in effect until August 31, 2023, and shall renew
automatically for one-year terms unless New York Life Investments provides written notice of termination prior to the start of the next term or upon approval of the Board.
During the period ended October 31, 2022, New York Life
Investments earned fees from the ETF Allocation Funds and waived fees and/or reimbursed expenses as follows:
| Fund
|
Earned
|
Waived/Reimbursed
|
| MainStay
Defensive ETF Allocation Fund |
$
9,919 |
$(54,065)
|
| MainStay
Conservative ETF Allocation Fund |
34,733
|
(24,719)
|
| MainStay
Moderate ETF Allocation Fund |
91,041
|
—
|
| MainStay
Growth ETF Allocation Fund |
59,133
|
(6,616)
|
| MainStay
Equity ETF Allocation Fund |
43,452
|
(28,418)
|
| MainStay
ESG Multi-Asset Allocation Fund |
10,628
|
(63,096)
|
JPMorgan provides sub-administration
and sub-accounting services to the ETF Allocation Funds pursuant to an agreement with New York Life Investments. These services include calculating the daily NAVs of the ETF Allocation Funds, maintaining the general ledger and sub-ledger accounts
for the calculation of the ETF Allocation Funds' respective NAVs, and assisting New York Life Investments in conducting various aspects of the ETF Allocation Funds' administrative operations. For providing these services to the ETF Allocation Funds,
JPMorgan is compensated by New York Life Investments.
Pursuant to an agreement between the Trust and New York Life
Investments, New York Life Investments is responsible for providing or procuring certain regulatory reporting services for the ETF Allocation Funds. The ETF Allocation Funds will reimburse New York Life Investments for the actual costs incurred by
New York Life Investments in connection with providing or procuring these services for the ETF Allocation Funds.
(B) Distribution, Service and Shareholder Service Fees.
The Trust, on behalf of the ETF Allocation Funds, has entered into a distribution agreement with NYLIFE Distributors LLC (the “Distributor”), an affiliate of New York
Life Investments. The ETF Allocation Funds have adopted distribution plans (the “Plans”) in accordance with the provisions of Rule 12b-1 under the 1940 Act.
Pursuant to the Class A Plan, the Distributor receives a monthly fee from the
Class A shares at an annual rate of 0.25% of the average daily net assets of the Class A shares for distribution and/or service activities as designated by the Distributor. Pursuant to the Class C Plan, Class C shares pay the Distributor a monthly
distribution fee at an annual rate of 0.75% of the average daily net assets of the Class C shares, along with a service fee at an annual rate of 0.25% of the average daily net assets of the Class C shares, for a total 12b-1 fee of 1.00%. Pursuant to
the Class R3 and SIMPLE Class Plans, Class R3 and SIMPLE Class shares pay the Distributor a monthly distribution fee at an annual rate of 0.25% of the average daily net assets of the Class R3 and SIMPLE Class shares, along with a service fee at an
annual rate of 0.25% of the average daily net assets of the Class R3 and SIMPLE Class shares, for a total 12b-1 fee of 0.50%. Class I shares are not subject to a distribution and/or service fee.
The Plans provide that the distribution and service fees are
payable to the Distributor regardless of the amounts actually expended by the Distributor for distribution of the ETF Allocation Funds' shares and service activities.
In accordance with the Shareholder Services Plans for the Class
R3 shares, the Manager has agreed to provide, through its affiliates or independent third parties, various shareholder and administrative support services to shareholders of the Class R3 shares. For its services, the Manager, its affiliates or
independent third-party service providers are entitled to a shareholder service fee accrued daily and paid monthly at an annual rate of 0.10% of the average daily net assets of the Class R3 shares. This is in addition to any fees paid under the
Class R3 Plan.
During the six-month period ended October
31, 2022, shareholder service fees incurred by the Fund were as follows:
| MainStay
Defensive ETF Allocation Fund |
| Class
R3 |
$
19 |
| |
| MainStay
Conservative ETF Allocation Fund |
| Class
R3 |
$145
|
| |
| 112
|
Mainstay ETF Asset
Allocation Funds |
| MainStay
Moderate ETF Allocation Fund |
| Class
R3 |
$512
|
| |
| MainStay
Growth ETF Allocation Fund |
| Class
R3 |
$247
|
| |
| MainStay
Equity ETF Allocation Fund |
| Class
R3 |
$231
|
| |
| MainStay
ESG Multi-Asset Allocation Fund |
| Class
R3 |
$
19 |
(C) Sales Charges. The ETF Allocation Funds were advised by the Distributor that the amount of initial sales charges retained on sales of each class of shares during the six-month period ended October 31,
2022, was as follows:
| MainStay
Defensive ETF Allocation Fund |
|
| Class
A |
$
2,756 |
| |
| MainStay
Conservative ETF Allocation Fund |
|
| Class
A |
$
6,468 |
| |
| MainStay
Moderate ETF Allocation Fund |
|
| Class
A |
$
19,099 |
| |
| MainStay
Growth ETF Allocation Fund |
|
| Class
A |
$
18,920 |
| |
| MainStay
Equity ETF Allocation Fund |
|
| Class
A |
$
15,356 |
| |
| MainStay
ESG Multi-Asset Allocation Fund |
|
| Class
A |
$
472 |
The ETF Allocation Funds were also advised that the Distributor
retained CDSCs on redemptions of Class A shares during the six-month period ended October 31, 2022, as follows:
| MainStay
Defensive ETF Allocation Fund |
|
| Class
A |
$
150 |
| |
| MainStay
Moderate ETF Allocation Fund |
|
| Class
A |
$
272 |
| |
| MainStay
Growth ETF Allocation Fund |
|
| Class
A |
$
1,700 |
| |
| MainStay
Equity ETF Allocation Fund |
|
| Class
A |
$
84 |
(D) Transfer, Dividend Disbursing and Shareholder Servicing
Agent. NYLIM Service Company LLC, an affiliate of New York Life Investments, is the ETF Allocation Funds'transfer, dividend disbursing and shareholder servicing agent pursuant to
an agreement between NYLIM Service Company LLC and the Trust. NYLIM Service Company LLC has entered into an agreement with DST Asset Manager Solutions, Inc. ("DST"), pursuant to which DST performs certain transfer agent services on behalf of NYLIM
Service Company LLC. New York Life Investments has contractually agreed to limit the transfer agency expenses charged to each of the Fund’s share classes to a maximum of 0.35% of that share class’s average daily net assets on an annual
basis after deducting any applicable Fund or class-level expense reimbursement or small account fees. This agreement will remain in effect until August 31, 2023, and shall renew automatically for one-year terms unless New York Life Investments
provides written notice of termination prior to the start of the next term or upon approval of the Board. During the six-month period ended October 31, 2022, transfer agent expenses incurred by the ETF Allocation Funds and any reimbursements,
pursuant to the aforementioned Transfer Agency expense limitation agreement, were as follows:
| MainStay
Defensive ETF Allocation Fund |
Expense
|
Waived
|
| Class
A |
$
3,245 |
$
— |
| Class
C |
71
|
—
|
| Class
I |
13
|
—
|
| Class
R3 |
13
|
—
|
| SIMPLE
Class |
251
|
—
|
| MainStay
Conservative ETF Allocation Fund |
Expense
|
Waived
|
| Class
A |
$
12,435 |
$
— |
| Class
C |
254
|
—
|
| Class
I |
13
|
—
|
| Class
R3 |
104
|
—
|
| SIMPLE
Class |
794
|
—
|
| MainStay
Moderate ETF Allocation Fund |
Expense
|
Waived
|
| Class
A |
$
33,612 |
$
— |
| Class
C |
256
|
—
|
| Class
I |
28
|
—
|
| Class
R3 |
397
|
—
|
| SIMPLE
Class |
2,743
|
—
|
| MainStay
Growth ETF Allocation Fund |
Expense
|
Waived
|
| Class
A |
$
29,734 |
$
— |
| Class
C |
224
|
—
|
| Class
I |
31
|
—
|
| Class
R3 |
274
|
—
|
| SIMPLE
Class |
3,426
|
—
|
Notes to Financial
Statements (Unaudited) (continued)
| MainStay
Equity ETF Allocation Fund |
Expense
|
Waived
|
| Class
A |
$
20,607 |
$
— |
| Class
C |
133
|
—
|
| Class
I |
78
|
—
|
| Class
R3 |
245
|
—
|
| SIMPLE
Class |
2,788
|
—
|
| MainStay
ESG Multi-Asset Allocation Fund |
Expense
|
Waived
|
| Class
A |
$
268 |
$
— |
| Class
C |
10
|
—
|
| Class
I |
1,833
|
—
|
| Class
R3 |
8
|
—
|
| SIMPLE
Class |
43
|
—
|
Note 4-Federal Income Tax
As of October 31, 2022, the cost and unrealized appreciation
(depreciation) of each ETF Allocation Fund’s investment portfolio, including applicable derivative contracts and other financial instruments, as determined on a federal income tax basis, were as follows:
| MainStay
Defensive ETF Allocation Fund |
| |
Federal
Tax
Cost |
Gross
Unrealized
Appreciation |
Gross
Unrealized
(Depreciation) |
Net
Unrealized
Appreciation/
(Depreciation) |
| Investments
in Securities |
$12,995,408
|
$47,696
|
$(1,233,563)
|
$(1,185,867)
|
| MainStay
Conservative ETF Allocation Fund |
| |
Federal
Tax
Cost |
Gross
Unrealized
Appreciation |
Gross
Unrealized
(Depreciation) |
Net
Unrealized
Appreciation/
(Depreciation) |
| Investments
in Securities |
$45,742,092
|
$153,520
|
$(3,234,434)
|
$(3,080,914)
|
| MainStay
Moderate ETF Allocation Fund |
| |
Federal
Tax
Cost |
Gross
Unrealized
Appreciation |
Gross
Unrealized
(Depreciation) |
Net
Unrealized
Appreciation/
(Depreciation) |
| Investments
in Securities |
$111,461,137
|
$983,126
|
$(6,656,240)
|
$(5,673,114)
|
| MainStay
Growth ETF Allocation Fund |
| |
Federal
Tax
Cost |
Gross
Unrealized
Appreciation |
Gross
Unrealized
(Depreciation) |
Net
Unrealized
Appreciation/
(Depreciation) |
| Investments
in Securities |
$73,026,626
|
$629,266
|
$(3,236,735)
|
$(2,607,469)
|
| MainStay
Equity ETF Allocation Fund |
| |
Federal
Tax
Cost |
Gross
Unrealized
Appreciation |
Gross
Unrealized
(Depreciation) |
Net
Unrealized
Appreciation/
(Depreciation) |
| Investments
in Securities |
$50,872,359
|
$242,849
|
$(3,717,989)
|
$(3,475,140)
|
| MainStay
ESG Multi-Asset Allocation Fund |
| |
Federal
Tax
Cost |
Gross
Unrealized
Appreciation |
Gross
Unrealized
(Depreciation) |
Net
Unrealized
Appreciation/
(Depreciation) |
| Investments
in Securities |
$13,224,326
|
$40,546
|
$(1,146,165)
|
$(1,105,619)
|
As of April 30, 2022, for federal
income tax purposes, capital loss carryforwards of $76,357, as shown in the table below, were available to the extent provided by the regulations to offset future realized gains of the MainStay ESG Multi-Asset Allocation Fund. Accordingly, no
capital gains distributions are expected to be paid to shareholders until net gains have been realized in excess of such amounts.
Capital
Loss
Available Through |
Short-Term
Capital Loss
Amounts (000’s) |
Long-Term
Capital Loss
Amounts (000’s) |
| Unlimited
|
$76
|
$—
|
| 114
|
Mainstay ETF Asset
Allocation Funds |
During the period ended October 31, 2022 the tax character of
distributions paid as reflected in the Statements of Changes in Net Assets was as follows:
| |
2022
|
| Fund
|
Ordinary
Income |
Long-Term
Capital Gains |
Total
|
| MainStay
Defensive ETF Allocation Fund |
$
255,743 |
$
901 |
$
256,644 |
| MainStay
Conservative ETF Allocation Fund |
737,286
|
—
|
737,286
|
| MainStay
Moderate ETF Allocation Fund |
1,226,137
|
—
|
1,226,137
|
| MainStay
Growth ETF Allocation Fund |
623,890
|
—
|
623,890
|
| MainStay
Equity ETF Allocation Fund |
384,052
|
1,643
|
385,695
|
| MainStay
ESG Multi-Asset Allocation Fund |
286,286
|
—
|
286,286
|
Note 5–Custodian
JPMorgan is the custodian of cash and securities held by the
ETF Allocation Funds. Custodial fees are charged to each ETF Allocation Fund based on each ETF Allocation Fund's net assets and/or the market value of securities held by each ETF Allocation Fund and the number of certain transactions incurred by
each ETF Allocation Fund.
Note 6–Line of
Credit
The ETF Allocation Funds and certain other funds
managed by New York Life Investments maintain a line of credit with a syndicate of banks in order to secure a source of funds for temporary purposes to meet unanticipated or excessive redemption requests.
Effective July 26, 2022, under the credit agreement (the
“Credit Agreement”), the aggregate commitment amount is $600,000,000 with an additional uncommitted amount of $100,000,000. The commitment fee is an annual rate of 0.15% of the average commitment amount payable quarterly, regardless of
usage, to JPMorgan, who serves as the agent to the syndicate. The commitment fee is allocated among the ETF Allocation Funds and certain other funds managed by New York Life Investments based upon their respective net assets and other factors.
Interest on any revolving credit loan is charged based upon the Federal Funds Rate, Daily Simple Secured Overnight Financing Rate ("SOFR") + 0.10%, or the Overnight Bank Funding Rate, whichever is higher. The Credit Agreement expires on July 25,
2023, although the ETF Allocation Funds, certain other funds managed by New York Life Investments and the syndicate of banks may renew the Credit Agreement for an additional year on the same or different terms or enter into a credit agreement with a
different syndicate of banks. Prior to July 26, 2022, the aggregate commitment amount and the commitment fee were the same as those under the current Credit Agreement. During the six-month period ended October 31, 2022, there were no borrowings made
or outstanding with respect to the ETF Allocation Funds under the Credit Agreement.
Note 7–Interfund Lending Program
Pursuant to an exemptive order issued by the SEC, the ETF
Allocation Funds, along with certain other funds managed by New York Life Investments, may participate in an interfund lending program. The interfund lending program provides an alternative credit facility that permits the ETF Allocation Funds and
certain other funds managed by New York Life Investments to lend or borrow money for temporary purposes directly to or from one another, subject to the conditions of the exemptive order. During the six-month period ended October 31, 2022, there were
no interfund loans made or outstanding with respect to the ETF Allocation Funds.
Note 8–Purchases and Sales of Securities (in
000’s)
During the six-month period ended October
31, 2022, purchases and sales of securities were as follows:
| Fund
|
Purchases
|
Sales
|
| MainStay
Defensive ETF Allocation Fund |
$
3,605 |
$
3,411 |
| MainStay
Conservative ETF Allocation Fund |
11,973
|
11,612
|
| MainStay
Moderate ETF Allocation Fund |
31,539
|
28,569
|
| MainStay
Growth ETF Allocation Fund |
22,905
|
16,433
|
| MainStay
Equity ETF Allocation Fund |
12,426
|
5,043
|
| MainStay
ESG Multi-Asset Allocation Fund |
6,987
|
6,080
|
Note 9–Capital Share
Transactions
Transactions in capital shares for the
period ended October 31, 2022, were as follows:
MainStay
Defensive ETF Allocation Fund
| Class
A |
Shares
|
Amount
|
| Six-month
period ended October 31, 2022: |
|
|
| Shares
sold |
162,668
|
$
1,492,203 |
| Shares
issued to shareholders in reinvestment of distributions |
12,848
|
114,469
|
| Shares
redeemed |
(125,263)
|
(1,153,883)
|
| Net
increase (decrease) in shares outstanding before conversion |
50,253
|
452,789
|
| Shares
converted into Class A (See Note 1) |
396
|
3,634
|
| Net
increase (decrease) |
50,649
|
$
456,423 |
| Year
ended April 30, 2022: |
|
|
| Shares
sold |
467,406
|
$
4,822,274 |
| Shares
issued to shareholders in reinvestment of distributions |
23,782
|
246,509
|
| Shares
redeemed |
(328,586)
|
(3,404,083)
|
| Net
increase (decrease) in shares outstanding before conversion |
162,602
|
1,664,700
|
| Shares
converted into Class A (See Note 1) |
2,196
|
22,510
|
| Net
increase (decrease) |
164,798
|
$
1,687,210 |
| |
Notes to Financial
Statements (Unaudited) (continued)
| Class
C |
Shares
|
Amount
|
| Six-month
period ended October 31, 2022: |
|
|
| Shares
issued to shareholders in reinvestment of distributions |
88
|
$
790 |
| Shares
redeemed |
(2,084)
|
(18,996)
|
| Net
increase (decrease) in shares outstanding before conversion |
(1,996)
|
(18,206)
|
| Shares
converted from Class C (See Note 1) |
(397)
|
(3,634)
|
| Net
increase (decrease) |
(2,393)
|
$
(21,840) |
| Year
ended April 30, 2022: |
|
|
| Shares
sold |
115
|
$
1,200 |
| Shares
issued to shareholders in reinvestment of distributions |
252
|
2,623
|
| Shares
redeemed |
(1,322)
|
(13,767)
|
| Net
increase (decrease) in shares outstanding before conversion |
(955)
|
(9,944)
|
| Shares
converted from Class C (See Note 1) |
(2,198)
|
(22,510)
|
| Net
increase (decrease) |
(3,153)
|
$
(32,454) |
| |
| Class
I |
Shares
|
Amount
|
| Six-month
period ended October 31, 2022: |
|
|
| Shares
sold |
623
|
$
5,794 |
| Shares
issued to shareholders in reinvestment of distributions |
57
|
503
|
| Net
increase (decrease) |
680
|
$
6,297 |
| Year
ended April 30, 2022: |
|
|
| Shares
issued to shareholders in reinvestment of distributions |
108
|
$
1,116 |
| Shares
redeemed |
(191,795)
|
(2,002,016)
|
| Net
increase (decrease) |
(191,687)
|
$(2,000,900)
|
| |
| Class
R3 |
Shares
|
Amount
|
| Six-month
period ended October 31, 2022: |
|
|
| Shares
sold |
2,070
|
$
19,000 |
| Shares
issued to shareholders in reinvestment of distributions |
47
|
422
|
| Net
increase (decrease) |
2,117
|
$
19,422 |
| Year
ended April 30, 2022: |
|
|
| Shares
sold |
762
|
$
8,000 |
| Shares
issued to shareholders in reinvestment of distributions |
73
|
758
|
| Shares
redeemed |
—
|
(1)
|
| Net
increase (decrease) |
835
|
$
8,757 |
| |
| SIMPLE
Class |
Shares
|
Amount
|
| Six-month
period ended October 31, 2022: |
|
|
| Shares
sold |
19,788
|
$
184,359 |
| Shares
issued to shareholders in reinvestment of distributions |
443
|
3,941
|
| Shares
redeemed |
(843)
|
(7,694)
|
| Net
increase (decrease) |
19,388
|
$
180,606 |
| Year
ended April 30, 2022: |
|
|
| Shares
sold |
23,576
|
$
242,000 |
| Shares
issued to shareholders in reinvestment of distributions |
353
|
3,645
|
| Shares
redeemed |
(3,023)
|
(31,532)
|
| Net
increase (decrease) |
20,906
|
$
214,113 |
MainStay Conservative ETF Allocation Fund
| Class
A |
Shares
|
Amount
|
| Six-month
period ended October 31, 2022: |
|
|
| Shares
sold |
424,012
|
$
4,189,884 |
| Shares
issued to shareholders in reinvestment of distributions |
38,406
|
363,822
|
| Shares
redeemed |
(338,255)
|
(3,323,639)
|
| Net
increase (decrease) in shares outstanding before conversion |
124,163
|
1,230,067
|
| Shares
converted into Class A (See Note 1) |
360
|
3,520
|
| Net
increase (decrease) |
124,523
|
$
1,233,587 |
| Year
ended April 30, 2022: |
|
|
| Shares
sold |
1,692,280
|
$18,824,810
|
| Shares
issued to shareholders in reinvestment of distributions |
62,856
|
704,321
|
| Shares
redeemed |
(685,361)
|
(7,574,739)
|
| Net
increase (decrease) in shares outstanding before conversion |
1,069,775
|
11,954,392
|
| Shares
converted into Class A (See Note 1) |
408
|
4,556
|
| Net
increase (decrease) |
1,070,183
|
$11,958,948
|
| |
| 116
|
Mainstay ETF Asset
Allocation Funds |
| Class
C |
Shares
|
Amount
|
| Six-month
period ended October 31, 2022: |
|
|
| Shares
sold |
363
|
$
3,600 |
| Shares
issued to shareholders in reinvestment of distributions |
313
|
2,968
|
| Shares
redeemed |
(197)
|
(2,000)
|
| Net
increase (decrease) in shares outstanding before conversion |
479
|
4,568
|
| Shares
converted from Class C (See Note 1) |
(361)
|
(3,520)
|
| Net
increase (decrease) |
118
|
$
1,048 |
| Year
ended April 30, 2022: |
|
|
| Shares
sold |
2,366
|
$
26,521 |
| Shares
issued to shareholders in reinvestment of distributions |
608
|
6,833
|
| Shares
redeemed |
(4,591)
|
(51,480)
|
| Net
increase (decrease) in shares outstanding before conversion |
(1,617)
|
(18,126)
|
| Shares
converted from Class C (See Note 1) |
(409)
|
(4,556)
|
| Net
increase (decrease) |
(2,026)
|
$
(22,682) |
| |
| Class
I |
Shares
|
Amount
|
| Six-month
period ended October 31, 2022: |
|
|
| Shares
issued to shareholders in reinvestment of distributions |
44
|
$
407 |
| Net
increase (decrease) |
44
|
$
407 |
| Year
ended April 30, 2022: |
|
|
| Shares
issued to shareholders in reinvestment of distributions |
137
|
$
1,541 |
| Shares
redeemed |
(2,385)
|
(25,619)
|
| Net
increase (decrease) |
(2,248)
|
$
(24,078) |
| |
| Class
R3 |
Shares
|
Amount
|
| Six-month
period ended October 31, 2022: |
|
|
| Shares
sold |
28,516
|
$
275,869 |
| Shares
issued to shareholders in reinvestment of distributions |
370
|
3,497
|
| Net
increase (decrease) |
28,886
|
$
279,366 |
| Year
ended April 30, 2022: |
|
|
| Shares
sold |
2,565
|
$
28,919 |
| Shares
issued to shareholders in reinvestment of distributions |
149
|
1,667
|
| Net
increase (decrease) |
2,714
|
$
30,586 |
| |
| SIMPLE
Class |
Shares
|
Amount
|
| Six-month
period ended October 31, 2022: |
|
|
| Shares
sold |
54,328
|
$
534,633 |
| Shares
issued to shareholders in reinvestment of distributions |
1,387
|
13,103
|
| Shares
redeemed |
(8,036)
|
(78,344)
|
| Net
increase (decrease) |
47,679
|
$
469,392 |
| Year
ended April 30, 2022: |
|
|
| Shares
sold |
92,080
|
$
1,019,656 |
| Shares
issued to shareholders in reinvestment of distributions |
1,200
|
13,388
|
| Shares
redeemed |
(5,244)
|
(58,363)
|
| Net
increase (decrease) |
88,036
|
$
974,681 |
MainStay Moderate ETF Allocation Fund
| Class
A |
Shares
|
Amount
|
| Six-month
period ended October 31, 2022: |
|
|
| Shares
sold |
923,679
|
$
9,846,526 |
| Shares
redeemed |
(538,987)
|
(5,716,973)
|
| Net
increase (decrease) in shares outstanding before conversion |
384,692
|
4,129,553
|
| Shares
converted into Class A (See Note 1) |
3,157
|
33,053
|
| Net
increase (decrease) |
387,849
|
$
4,162,606 |
| Year
ended April 30, 2022: |
|
|
| Shares
sold |
4,186,889
|
$
50,473,072 |
| Shares
issued to shareholders in reinvestment of distributions |
96,219
|
1,188,297
|
| Shares
redeemed |
(1,080,298)
|
(13,019,569)
|
| Net
increase (decrease) in shares outstanding before conversion |
3,202,810
|
38,641,800
|
| Shares
converted into Class A (See Note 1) |
11,038
|
130,131
|
| Net
increase (decrease) |
3,213,848
|
$
38,771,931 |
| |
| Class
C |
Shares
|
Amount
|
| Six-month
period ended October 31, 2022: |
|
|
| Shares
sold |
1,663
|
$
17,550 |
| Shares
redeemed |
(970)
|
(9,855)
|
| Net
increase (decrease) in shares outstanding before conversion |
693
|
7,695
|
| Shares
converted from Class C (See Note 1) |
(3,179)
|
(33,053)
|
| Net
increase (decrease) |
(2,486)
|
$
(25,358) |
| Year
ended April 30, 2022: |
|
|
| Shares
sold |
14,807
|
$
177,884 |
| Shares
issued to shareholders in reinvestment of distributions |
288
|
3,546
|
| Shares
redeemed |
(11,428)
|
(135,584)
|
| Net
increase (decrease) in shares outstanding before conversion |
3,667
|
45,846
|
| Shares
converted from Class C (See Note 1) |
(11,079)
|
(130,131)
|
| Net
increase (decrease) |
(7,412)
|
$
(84,285) |
| |
Notes to Financial
Statements (Unaudited) (continued)
| Class
I(a) |
Shares
|
Amount
|
| Year
ended April 30, 2022: |
|
|
| Shares
sold |
2,979
|
$
36,029 |
| Shares
issued to shareholders in reinvestment of distributions |
91
|
1,128
|
| Shares
redeemed |
(850)
|
(10,430)
|
| Net
increase (decrease) |
2,220
|
$
26,727 |
| |
| Class
R3 |
Shares
|
Amount
|
| Six-month
period ended October 31, 2022: |
|
|
| Shares
sold |
44,138
|
$
458,577 |
| Net
increase (decrease) |
44,138
|
$
458,577 |
| Year
ended April 30, 2022: |
|
|
| Shares
sold |
42,794
|
$
519,787 |
| Shares
issued to shareholders in reinvestment of distributions |
733
|
9,056
|
| Shares
redeemed |
(141)
|
(1,748)
|
| Net
increase (decrease) |
43,386
|
$
527,095 |
| |
| SIMPLE
Class |
Shares
|
Amount
|
| Six-month
period ended October 31, 2022: |
|
|
| Shares
sold |
187,035
|
$
1,983,319 |
| Shares
redeemed |
(9,158)
|
(96,289)
|
| Net
increase (decrease) |
177,877
|
$
1,887,030 |
| Year
ended April 30, 2022: |
|
|
| Shares
sold |
258,797
|
$
3,089,423 |
| Shares
issued to shareholders in reinvestment of distributions |
1,785
|
22,031
|
| Shares
redeemed |
(13,574)
|
(159,897)
|
| Net
increase (decrease) |
247,008
|
$
2,951,557 |
| (a)
|
No
activity during the six-month period ended October 31, 2022. |
MainStay Growth ETF Allocation Fund
| Class
A |
Shares
|
Amount
|
| Six-month
period ended October 31, 2022: |
|
|
| Shares
sold |
850,148
|
$
9,706,026 |
| Shares
redeemed |
(331,778)
|
(3,773,125)
|
| Net
increase (decrease) in shares outstanding before conversion |
518,370
|
5,932,901
|
| Shares
converted into Class A (See Note 1) |
156
|
1,752
|
| Net
increase (decrease) |
518,526
|
$
5,934,653 |
| Year
ended April 30, 2022: |
|
|
| Shares
sold |
2,481,741
|
$32,173,386
|
| Shares
issued to shareholders in reinvestment of distributions |
43,915
|
591,099
|
| Shares
redeemed |
(446,604)
|
(5,771,438)
|
| Net
increase (decrease) in shares outstanding before conversion |
2,079,052
|
26,993,047
|
| Shares
converted into Class A (See Note 1) |
339
|
4,447
|
| Shares
converted from Class A (See Note 1) |
(283)
|
(3,802)
|
| Net
increase (decrease) |
2,079,108
|
$26,993,692
|
| |
| Class
C |
Shares
|
Amount
|
| Six-month
period ended October 31, 2022: |
|
|
| Shares
sold |
1,464
|
$
16,309 |
| Net
increase (decrease) in shares outstanding before conversion |
1,464
|
16,309
|
| Shares
converted from Class C (See Note 1) |
(157)
|
(1,752)
|
| Net
increase (decrease) |
1,307
|
$
14,557 |
| Year
ended April 30, 2022: |
|
|
| Shares
sold |
5,581
|
$
72,514 |
| Shares
issued to shareholders in reinvestment of distributions |
113
|
1,516
|
| Shares
redeemed |
(1,785)
|
(23,688)
|
| Net
increase (decrease) in shares outstanding before conversion |
3,909
|
50,342
|
| Shares
converted from Class C (See Note 1) |
(342)
|
(4,447)
|
| Net
increase (decrease) |
3,567
|
$
45,895 |
| |
| Class
I |
Shares
|
Amount
|
| Six-month
period ended October 31, 2022: |
|
|
| Shares
sold |
3,058
|
$
34,650 |
| Net
increase (decrease) |
3,058
|
$
34,650 |
| Year
ended April 30, 2022: |
|
|
| Shares
sold |
249
|
$
3,250 |
| Shares
issued to shareholders in reinvestment of distributions |
47
|
635
|
| Net
increase (decrease) |
296
|
$
3,885 |
| |
| Class
R3 |
Shares
|
Amount
|
| Six-month
period ended October 31, 2022: |
|
|
| Shares
sold |
6,321
|
$
70,299 |
| Net
increase (decrease) |
6,321
|
$
70,299 |
| Year
ended April 30, 2022: |
|
|
| Shares
sold |
28,331
|
$
367,189 |
| Shares
issued to shareholders in reinvestment of distributions |
160
|
2,146
|
| Net
increase (decrease) |
28,491
|
$
369,335 |
| |
| SIMPLE
Class |
Shares
|
Amount
|
| Six-month
period ended October 31, 2022: |
|
|
| Shares
sold |
222,155
|
$
2,515,334 |
| Shares
redeemed |
(7,223)
|
(81,499)
|
| Net
increase (decrease) |
214,932
|
$
2,433,835 |
| Year
ended April 30, 2022: |
|
|
| Shares
sold |
266,287
|
$
3,460,769 |
| Shares
issued to shareholders in reinvestment of distributions |
2,090
|
28,129
|
| Shares
redeemed |
(21,687)
|
(278,346)
|
| Net
increase (decrease) in shares outstanding before conversion |
246,690
|
3,210,552
|
| Shares
converted into SIMPLE Class (See Note 1) |
283
|
3,802
|
| Net
increase (decrease) |
246,973
|
$
3,214,354 |
| 118
|
Mainstay ETF Asset
Allocation Funds |
MainStay Equity ETF Allocation Fund
| Class
A |
Shares
|
Amount
|
| Six-month
period ended October 31, 2022: |
|
|
| Shares
sold |
626,852
|
$
7,479,646 |
| Shares
redeemed |
(206,811)
|
(2,464,713)
|
| Net
increase (decrease) in shares outstanding before conversion |
420,041
|
5,014,933
|
| Shares
converted into Class A (See Note 1) |
522
|
6,086
|
| Net
increase (decrease) |
420,563
|
$
5,021,019 |
| Year
ended April 30, 2022: |
|
|
| Shares
sold |
1,900,803
|
$26,331,795
|
| Shares
issued to shareholders in reinvestment of distributions |
24,833
|
360,078
|
| Shares
redeemed |
(366,165)
|
(5,060,167)
|
| Net
increase (decrease) in shares outstanding before conversion |
1,559,471
|
21,631,706
|
| Shares
converted into Class A (See Note 1) |
1,883
|
25,918
|
| Net
increase (decrease) |
1,561,354
|
$21,657,624
|
| |
| Class
C |
Shares
|
Amount
|
| Six-month
period ended October 31, 2022: |
|
|
| Shares
sold |
527
|
$
6,200 |
| Shares
redeemed |
(354)
|
(3,872)
|
| Net
increase (decrease) in shares outstanding before conversion |
173
|
2,328
|
| Shares
converted from Class C (See Note 1) |
(526)
|
(6,086)
|
| Net
increase (decrease) |
(353)
|
$
(3,758) |
| Year
ended April 30, 2022: |
|
|
| Shares
sold |
4,078
|
$
56,581 |
| Shares
issued to shareholders in reinvestment of distributions |
41
|
590
|
| Shares
redeemed |
(904)
|
(12,511)
|
| Net
increase (decrease) in shares outstanding before conversion |
3,215
|
44,660
|
| Shares
converted from Class C (See Note 1) |
(1,894)
|
(25,918)
|
| Net
increase (decrease) |
1,321
|
$
18,742 |
| |
| Class
I(a) |
Shares
|
Amount
|
| Year
ended April 30, 2022: |
|
|
| Shares
sold |
7,559
|
$
104,738 |
| Shares
issued to shareholders in reinvestment of distributions |
150
|
2,163
|
| Shares
redeemed |
(193,413)
|
(2,596,830)
|
| Net
increase (decrease) |
(185,704)
|
$
(2,489,929) |
| |
| Class
R3 |
Shares
|
Amount
|
| Six-month
period ended October 31, 2022: |
|
|
| Shares
sold |
2,260
|
$
26,774 |
| Net
increase (decrease) |
2,260
|
$
26,774 |
| Year
ended April 30, 2022: |
|
|
| Shares
sold |
4,977
|
$
70,234 |
| Shares
issued to shareholders in reinvestment of distributions |
106
|
1,525
|
| Shares
redeemed |
—
|
(13)
|
| Net
increase (decrease) |
5,083
|
$
71,746 |
| |
| SIMPLE
Class |
Shares
|
Amount
|
| Six-month
period ended October 31, 2022: |
|
|
| Shares
sold |
167,615
|
$
1,982,848 |
| Shares
redeemed |
(7,250)
|
(87,248)
|
| Net
increase (decrease) |
160,365
|
$
1,895,600 |
| Year
ended April 30, 2022: |
|
|
| Shares
sold |
184,935
|
$
2,564,334 |
| Shares
issued to shareholders in reinvestment of distributions |
1,185
|
17,161
|
| Shares
redeemed |
(13,008)
|
(178,356)
|
| Net
increase (decrease) |
173,112
|
$
2,403,139 |
| (a)
|
No
activity during the six-month period ended October 31, 2022. |
MainStay ESG Multi-Asset Allocation Fund
| Class
A |
Shares
|
Amount
|
| Six-month
period ended October 31, 2022: |
|
|
| Shares
sold |
133,894
|
$
1,155,352 |
| Shares
redeemed |
(3,030)
|
(25,888)
|
| Net
increase (decrease) |
130,864
|
$
1,129,464 |
| Period
ended April 30, 2022:(a) |
|
|
| Shares
sold |
134,088
|
$
1,332,493 |
| Shares
issued to shareholders in reinvestment of distributions |
1,853
|
18,787
|
| Shares
redeemed |
(6,512)
|
(61,804)
|
| Net
increase (decrease) |
129,429
|
$
1,289,476 |
| |
| Class
C(b) |
Shares
|
Amount
|
| Period
ended April 30, 2022:(a) |
|
|
| Shares
sold |
2,501
|
$
24,999 |
| Shares
issued to shareholders in reinvestment of distributions |
59
|
605
|
| Net
increase (decrease) |
2,560
|
$
25,604 |
| |
| Class
I(b) |
Shares
|
Amount
|
| Period
ended April 30, 2022:(a) |
|
|
| Shares
sold |
991,316
|
$
9,913,000 |
| Shares
issued to shareholders in reinvestment of distributions |
26,150
|
265,161
|
| Net
increase (decrease) |
1,017,466
|
$10,178,161
|
| |
Notes to Financial
Statements (Unaudited) (continued)
| Class
R3(b) |
Shares
|
Amount
|
| Period
ended April 30, 2022:(a) |
|
|
| Shares
sold |
4,350
|
$
43,898 |
| Shares
issued to shareholders in reinvestment of distributions |
108
|
1,096
|
| Net
increase (decrease) |
4,458
|
$
44,994 |
| |
| SIMPLE
Class |
Shares
|
Amount
|
| Six-month
period ended October 31, 2022: |
|
|
| Shares
sold |
9,858
|
$
84,415 |
| Shares
redeemed |
(4)
|
(32)
|
| Net
increase (decrease) |
9,854
|
$
84,383 |
| Period
ended April 30, 2022:(a) |
|
|
| Shares
sold |
8,224
|
$
78,818 |
| Shares
issued to shareholders in reinvestment of distributions |
63
|
637
|
| Net
increase (decrease) |
8,287
|
$
79,455 |
| (a)
|
The inception
date of the class was September 30, 2021. |
| (b)
|
No
activity during the six-month period ended October 31, 2022. |
Note 10–Other Matters
As of the date of this report, interest rates in the United
States and many parts of the world, including certain European countries, are ascending from historically low levels. Thus, the Fund currently faces a heightened level of risk associated with rising interest rates. This could be driven by a variety
of factors, including but not limited to central bank monetary policies, changing inflation or real growth rates, general economic conditions, increasing bond issuances or reduced market demand for low yielding investments.
An outbreak of COVID-19, first detected in December 2019, has
developed into a global pandemic and has resulted in travel restrictions, closure of international borders, certain businesses and securities markets, restrictions on securities trading activities, prolonged quarantines, supply chain disruptions,
and lower consumer demand, as well as general concern and uncertainty. In 2022, many countries lifted some or all restrictions related to COVID-19. However, the continued impact of COVID-19 and related variants is uncertain and could further
adversely affect the global economy, national economies, individual issuers and capital markets in unforeseeable ways and result in a substantial and extended economic downturn. Developments that disrupt global economies and financial markets, such
as COVID-19, may magnify factors that affect the ETF Allocation Funds' performance.
Note 11–Subsequent Events
In connection with the preparation of the financial statements
of the ETF Allocation Funds as of and for the six-month period ended October 31, 2022, events and transactions subsequent to October 31, 2022, through the date the financial statements were issued have been evaluated by the
Manager for possible adjustment and/or disclosure. No subsequent events
requiring financial statement adjustment or disclosure have been identified.
| 120
|
Mainstay ETF Asset
Allocation Funds |
Proxy Voting Policies and Procedures and Proxy Voting
Record
Each ETF Allocation Fund is required to file with
the SEC its proxy voting record for the 12-month period ending June 30 on Form N-PX. A description of the policies and procedures that are used to vote proxies relating to portfolio securities of each ETF Allocation Fund is available free of charge
upon request by calling 800-624-6782 or visiting the SEC’s website at www.sec.gov. The most recent Form N-PX or proxy voting record is available free of charge upon request by calling 800-624-6782;
visiting newyorklifeinvestments.com; or visiting the SEC’s website at www.sec.gov.
Shareholder Reports and Quarterly Portfolio Disclosure
Each ETF Allocation Fund is required to file its complete
schedule of portfolio holdings with the SEC 60 days after its first and third fiscal quarter on Form N-PORT. The ETF Allocation Funds' holdings report is available free of charge upon request by calling New York Life Investments at
800-624-6782.
This page intentionally left
blank.
Equity
U.S. Equity
MainStay Epoch U.S. Equity Yield Fund
MainStay S&P 500 Index Fund1
MainStay Winslow Large Cap Growth Fund
MainStay WMC Enduring Capital Fund
MainStay WMC Growth Fund
MainStay WMC Small Companies Fund
MainStay WMC Value Fund
International Equity
MainStay Epoch International Choice Fund
MainStay MacKay International Equity Fund
MainStay WMC International Research Equity Fund
Emerging Markets Equity
MainStay Candriam Emerging Markets Equity Fund
Global Equity
MainStay Epoch Capital Growth Fund
MainStay Epoch Global Equity Yield Fund
Fixed Income
Taxable Income
MainStay Candriam Emerging Markets Debt Fund
MainStay Floating Rate Fund
MainStay MacKay High Yield Corporate Bond Fund
MainStay MacKay Short Duration High Yield Fund
MainStay MacKay Strategic Bond Fund
MainStay MacKay Total Return Bond Fund
MainStay MacKay U.S. Infrastructure Bond Fund
MainStay Short Term Bond Fund
Tax-Exempt Income
MainStay MacKay California Tax Free Opportunities Fund2
MainStay MacKay High Yield Municipal Bond Fund
MainStay MacKay New York Tax Free Opportunities Fund3
MainStay MacKay Short Term Municipal Fund
MainStay MacKay Strategic Municipal Allocation Fund
MainStay MacKay Tax Free Bond Fund
Money Market
MainStay Money Market Fund
Mixed Asset
MainStay Balanced Fund
MainStay Income Builder Fund
MainStay MacKay Convertible Fund
Speciality
MainStay CBRE Global Infrastructure Fund
MainStay CBRE Real Estate Fund
MainStay Cushing MLP Premier Fund
Asset Allocation
MainStay Conservative Allocation Fund
MainStay Conservative ETF Allocation Fund
MainStay Defensive ETF Allocation Fund
MainStay Equity Allocation Fund
MainStay Equity ETF Allocation Fund
MainStay ESG Multi-Asset Allocation Fund
MainStay Growth Allocation Fund
MainStay Growth ETF Allocation Fund
MainStay Moderate Allocation Fund
MainStay Moderate ETF Allocation Fund
Manager
New York Life Investment Management LLC
New York, New York
Subadvisors
Candriam4
Strassen, Luxembourg
CBRE Investment Management Listed Real Assets LLC
Radnor, Pennsylvania
Cushing Asset Management, LP
Dallas, Texas
Epoch Investment Partners, Inc.
New York, New York
MacKay Shields LLC4
New York, New York
NYL Investors LLC4
New York, New York
Wellington Management Company LLP
Boston, Massachusetts
Winslow Capital Management, LLC
Minneapolis, Minnesota
Legal Counsel
Dechert LLP
Washington, District of Columbia
Independent Registered Public Accounting Firm
KPMG LLP
Philadelphia, Pennsylvania
Distributor
NYLIFE Distributors LLC4
Jersey City, New Jersey
Custodian
JPMorgan Chase Bank, N.A.
New York, New York
1.
Prior to February 28, 2022, the Fund's name was
MainStay MacKay S&P 500 Index Fund.
| 2. |
This Fund is registered for
sale in AZ, CA, NV, OR, TX, UT, WA and MI (Class A and Class I shares only), and CO, FL, GA, HI, ID, MA, MD, NH, NJ and NY (Class I shares only). |
| 3. |
This Fund is registered for
sale in CA, CT, DE, FL, MA, NJ, NY and VT. |
| 4. |
An affiliate of New York Life
Investment Management LLC. |
Not part of the Semiannual Report
For more information
800-624-6782
newyorklifeinvestments.com
“New York Life Investments” is both a service mark,
and the common trade name, of certain investment advisors affiliated with New York Life Insurance Company. The MainStay Funds® are managed by New York Life Investment
Management LLC and distributed by NYLIFE Distributors LLC, 30 Hudson Street, Jersey City, NJ 07302, a wholly owned subsidiary of New York Life Insurance Company. NYLIFE Distributors LLC is a Member FINRA/SIPC.
©2022 NYLIFE Distributors LLC. All rights reserved.
| 5013904.2MS229-22 |
MSAAETF10-12/22
|
(NYLIM) NL486
Item 2. Code of Ethics.
Not applicable.
| Item 3. |
Audit Committee Financial Expert. |
Not applicable.
| Item 4. |
Principal Accountant Fees and Services. |
Not applicable.
| Item 5. |
Audit Committee of Listed Registrants. |
Not applicable.
The Schedule of Investments is included as part of Item 1 of this report.
| Item 7. |
Disclosure of Proxy Voting Policies and Procedures for Closed-End
Management Investment Companies. |
Not applicable.
| Item 8. |
Portfolio Managers of Closed-End Management Investment Companies.
|
Not applicable.
| Item 9. |
Purchases of Equity Securities by Closed-End Management Investment
Company and Affiliated Purchasers. |
Not applicable.
| Item 10. |
Submission of Matters to a Vote of Security Holders. |
Since the Registrant’s last response to this Item, there have been no material changes to the procedures by which shareholders may recommend nominees to
the Registrant’s Board of Trustees.
Item 11. Controls and Procedures.
| (a) |
Based on an evaluation of the Registrant’s Disclosure Controls and Procedures (as defined in Rule 30a-3(c) under the Investment Company Act of 1940) (the “Disclosure Controls”), as of a date within 90 days prior to the filing date (the “Filing Date”) of this Form N-CSR (the “Report”), the Registrant’s principal executive officer and principal financial officer have concluded that the Disclosure Controls are reasonably designed to ensure that information
required to be disclosed by the Registrant in the Report is recorded, processed, summarized and reported by the Filing Date, including ensuring that information required to be disclosed in the Report is accumulated and communicated to the
Registrant’s management, including the Registrant’s principal executive officer and principal financial officer, as appropriate to allow timely decisions regarding required disclosure. |
| (b) |
There were no changes in the Registrant’s internal control over financial reporting (as defined in Rule 30a-3(d)) under the Investment Company Act of 1940 that occurred during the period covered by this report that has materially affected, or is reasonably likely to materially affect, the Registrant’s internal
control over financial reporting. |
| Item 12. |
Disclosure of Securities Lending Activities for Closed-End
Management Investment Companies. |
Not applicable.
SIGNATURES
Pursuant to the requirements of the Securities Exchange Act of 1934 and the Investment Company Act of 1940, the Registrant has duly caused this Report to be
signed on its behalf by the undersigned, thereunto duly authorized.
MAINSTAY FUNDS TRUST
|
|
|
| By: |
|
/s/ Kirk C.
Lehneis |
|
|
Kirk C. Lehneis |
|
|
President and Principal Executive Officer |
|
|
| Date: |
|
January 6, 2023 |
Pursuant to the requirements of the Securities Exchange Act of 1934 and the Investment Company Act of 1940, this Report has
been signed below by the following persons on behalf of the Registrant and in the capacities and on the dates indicated.
|
|
|
| By: |
|
/s/ Kirk C.
Lehneis |
|
|
Kirk C. Lehneis |
|
|
President and Principal Executive Officer |
|
|
| Date: |
|
January 6, 2023 |
|
|
| By: |
|
/s/ Jack R.
Benintende |
|
|
Jack R. Benintende |
|
|
Treasurer and Principal Financial and Accounting Officer |
|
|
| Date: |
|
January 6, 2023 |
Exhibit (a)
SECTION 302 CERTIFICATIONS
| I, |
Kirk C. Lehneis, President and Principal Executive Officer of MainStay Funds Trust, certify that:
|
| 1. |
I have reviewed this report on Form N-CSR of MainStay Funds Trust;
|
| 2. |
Based on my knowledge, this report does not contain any untrue statement of a material fact or omit to state a
material fact necessary to make the statements made, in light of the circumstances under which such statements were made, not misleading with respect to the period covered by this report; |
| 3. |
Based on my knowledge, the financial statements, and other financial information included in this report,
fairly present in all material respects the financial condition, results of operations, changes in net assets, and cash flows (if the financial statements are required to include a statement of cash flows) of the registrant as of, and for, the
periods presented in this report; |
| 4. |
The registrant’s other certifying officer(s) and I are responsible for establishing and maintaining
disclosure controls and procedures (as defined in Rule 30a-3(c) under the Investment Company Act of 1940) and internal control over financial reporting (as defined in Rule
30a-3(d) under the Investment Company Act of 1940) for the registrant and have: |
| |
(a) |
Designed such disclosure controls and procedures, or caused such disclosure controls and procedures to be
designed under our supervision, to ensure that material information relating to the registrant, including its consolidated subsidiaries, is made known to us by others within those entities, particularly during the period in which this report is
being prepared; |
| |
(b) |
Designed such internal control over financial reporting, or caused such internal control over financial
reporting to be designed under our supervision, to provide reasonable assurance regarding the reliability of financial reporting and the preparation of financial statements for external purposes in accordance with generally accepted accounting
principles; |
| |
(c) |
Evaluated the effectiveness of the registrant’s disclosure controls and procedures and presented in this
report our conclusions about the effectiveness of the disclosure controls and procedures, as of a date within 90 days prior to the filing date of this report based on such evaluation; and |
| |
(d) |
Disclosed in this report any change in the registrant’s internal control over financial reporting that
occurred during the period covered by this report that has materially affected, or is reasonably likely to materially affect, the registrant’s internal control over financial reporting; and |
| 5. |
The registrant’s other certifying officer and I have disclosed to the registrant’s auditors and the
audit committee of the registrant’s board of directors (or persons performing the equivalent functions): |
| |
(a) |
All significant deficiencies and material weaknesses in the design or operation of internal control over
financial reporting which are reasonably likely to adversely affect the registrant’s ability to record, process, summarize, and report financial information; and |
| |
(b) |
Any fraud, whether or not material, that involves management or other employees who have a significant role in
the registrant’s internal control over financial reporting. |
|
|
|
|
|
| By: |
|
/s/ Kirk C.
Lehneis |
|
|
|
|
Kirk C. Lehneis |
|
|
|
|
President and Principal Executive Officer, MainStay Funds Trust |
|
|
|
|
|
|
|
Date: January 6, 2023 |
|
|
SECTION 302 CERTIFICATIONS
| I, |
Jack R. Benintende, Treasurer and Principal Financial and Accounting Officer of MainStay Funds Trust, certify
that: |
| 1. |
I have reviewed this report on Form N-CSR of MainStay Funds Trust;
|
| 2. |
Based on my knowledge, this report does not contain any untrue statement of a material fact or omit to state a
material fact necessary to make the statements made, in light of the circumstances under which such statements were made, not misleading with respect to the period covered by this report; |
| 3. |
Based on my knowledge, the financial statements, and other financial information included in this report,
fairly present in all material respects the financial condition, results of operations, changes in net assets, and cash flows (if the financial statements are required to include a statement of cash flows) of the registrant as of, and for, the
periods presented in this report; |
| 4. |
The registrant’s other certifying officer(s) and I are responsible for establishing and maintaining
disclosure controls and procedures (as defined in Rule 30a-3(c) under the Investment Company Act of 1940) and internal control over financial reporting (as defined in Rule
30a-3(d) under the Investment Company Act of 1940) for the registrant and have: |
| |
(a) |
Designed such disclosure controls and procedures, or caused such disclosure controls and procedures to be
designed under our supervision, to ensure that material information relating to the registrant, including its consolidated subsidiaries, is made known to us by others within those entities, particularly during the period in which this report is
being prepared; |
| |
(b) |
Designed such internal control over financial reporting, or caused such internal control over financial
reporting to be designed under our supervision, to provide reasonable assurance regarding the reliability of financial reporting and the preparation of financial statements for external purposes in accordance with generally accepted accounting
principles; |
| |
(c) |
Evaluated the effectiveness of the registrant’s disclosure controls and procedures and presented in this
report our conclusions about the effectiveness of the disclosure controls and procedures, as of a date within 90 days prior to the filing date of this report based on such evaluation; and |
| |
(d) |
Disclosed in this report any change in the registrant’s internal control over financial reporting that
occurred during the period covered by this report that has materially affected, or is reasonably likely to materially affect, the registrant’s internal control over financial reporting; and |
| 5. |
The registrant’s other certifying officer and I have disclosed to the registrant’s auditors and the
audit committee of the registrant’s board of directors (or persons performing the equivalent functions): |
| |
(a) |
All significant deficiencies and material weaknesses in the design or operation of internal control over
financial reporting which are reasonably likely to adversely affect the registrant’s ability to record, process, summarize, and report financial information; and |
| |
(b) |
Any fraud, whether or not material, that involves management or other employees who have a significant role in
the registrant’s internal control over financial reporting. |
|
|
|
|
|
| By: |
|
/s/ Jack R. Benintende |
|
|
|
|
Jack R. Benintende |
|
|
|
|
Treasurer and Principal Financial and Accounting Officer, MainStay Funds Trust |
|
|
|
|
|
|
|
Date: January 6, 2023 |
|
|
Exhibit (b)
SECTION 906 CERTIFICATIONS
In connection with this report on Form N-CSR for the Registrant as furnished to the Securities and
Exchange Commission on the date hereof (the “Report”), the undersigned hereby certifies, pursuant to Section 906 of the Sarbanes-Oxley Act of 2002, that:
| |
(1) |
the Report fully complies with the requirements of Section 13(a) or 15(d) of the Securities Exchange Act
of 1934, as applicable; and |
| |
(2) |
the information contained in the Report fairly presents, in all material respects, the financial condition and
results of operations of the Registrant. |
|
|
|
| By: |
|
/s/ Kirk C.
Lehneis |
|
|
Kirk C. Lehneis |
|
|
President and Principal Executive Officer,
MainStay Funds Trust |
|
|
|
|
Date: January 6, 2023 |
SECTION 906 CERTIFICATIONS
In connection with this report on Form N-CSR for the Registrant as furnished to the Securities and
Exchange Commission on the date hereof (the “Report”), the undersigned hereby certifies, pursuant to Section 906 of the Sarbanes-Oxley Act of 2002, that:
| |
(1) |
the Report fully complies with the requirements of Section 13(a) or 15(d) of the Securities Exchange Act
of 1934, as applicable; and |
| |
(2) |
the information contained in the Report fairly presents, in all material respects, the financial condition and
results of operations of the Registrant. |
|
|
|
| By: |
|
/s/ Jack R. Benintende |
|
|
Jack R. Benintende |
|
|
Treasurer and Principal Financial and Accounting Officer, |
|
|
MainStay Funds Trust |
|
|
|
|
Date: January 6, 2023 |