SUMMARY PROSPECTUS
Third Avenue Small-Cap Value Fund
March 1, 2023
Third Avenue Small-Cap Value Fund
TASCX | TVSVX | TASZX
|
SUMMARY PROSPECTUS Third Avenue Small-Cap Value Fund March 1, 2023 Third Avenue Small-Cap Value Fund TASCX | TVSVX | TASZX
|
As with all mutual funds, the Securities and Exchange Commission has not approved or disapproved of these securities or determined if this Prospectus is truthful or complete. Any representation to the contrary is a criminal offense.
Investment Objective
Third Avenue Small-Cap Value Fund seeks long-term capital appreciation.
Fees and Expenses
This table describes the fees and expenses that you pay if you buy and hold shares of Third Avenue Small-Cap Value Fund. Investors transacting in Fund shares through a financial intermediary acting as a broker in an agency capacity may be required to pay a commission directly to the broker.
| Shareholder Fees (fees paid directly from your investment): | Institutional
Class | Investor
Class | Z Class | |||
| Maximum Sales Charge (Load) Imposed on Purchases | None | None | None | |||
| Maximum Deferred Sales Charge (Load) | None | None | None | |||
| Maximum Sales Charge (Load) Imposed on Reinvested Dividends and Other Distributions | None | None | None | |||
| Annual Fund Operating Expenses (expenses that you pay each year as a percentage of the value of your investment): | Institutional
Class | Investor
Class | Z Class | |||
| Management (Advisory) Fee | 0.90% | 0.90% | 0.90% | |||
| Distribution (12b-1) Fees | None | 0.25% | None | |||
| Other Expenses | 0.35% | 0.42% | 0.29% | |||
| Total Annual Fund Operating Expenses (as a percentage of net assets) | 1.25% | 1.57% | 1.19% | |||
| Fee Deferred/Expenses Reimbursed1 | (0.10)% | (0.17)% | (0.14)% | |||
| Net Annual Fund Operating Expenses1 | 1.15% | 1.40% | 1.05% |
| 1 | The Fund’s investment adviser, Third Avenue Management LLC (the “Adviser”) has contractually agreed, for a period of one year from the date of this Prospectus, to defer receipt of advisory fees and/or reimburse Fund expenses in order to limit Net Annual Fund Operating Expenses exclusive of taxes, interest, brokerage commissions, acquired fund fees and expenses, and extraordinary expenses) to 1.15%, 1.40% and 1.05% of the average daily net assets of the Institutional Class, Investor Class and Z Class, respectively, subject to later reimbursement by the respective classes in certain circumstances (the “Expense Limitation Agreement”). In general, for a period of up to 36 months from the time of any deferral, reimbursement, or payment pursuant to the above-described contractual expense limitations, the Adviser may recover from each class of the Fund fees deferred and expenses paid to the extent that such repayment would not cause the Net Annual Fund Operating Expenses of each class to exceed the contractual expense limitation amounts set forth above, but any repayment will not include interest. The Adviser’s recovery is limited to the lesser of the expense limitation at the time of the waiver and the time of recapture. |
| Example |
The following example is intended to help you compare the cost of investing in Third Avenue Small-Cap Value Fund with the cost of investing in other mutual funds. The example assumes that you invest $10,000 for the time periods indicated and then redeem all of your shares at the end of those periods. The example also assumes that your investment has a 5% return each year and that the Fund’s operating expenses remain the same. Although your actual costs may be higher or lower, based on these assumptions your costs would be:
| Year 1 | Year 3 | Year 5 | Year 10 | |||||
| Institutional Class | $117 | $387 | $677 | $1,502 | ||||
| Investor Class | $143 | $479 | $839 | $1,853 | ||||
| Z Class | $107 | $364 | $641 | $1,431 |
The Example reflects the impact of the Expense Limitation Agreement in year one only. The Example should not be considered a representation of past or future expenses, as actual expenses may be greater or lower than those shown.
Portfolio Turnover
The Fund pays transaction costs, such as commissions, when it buys and sells securities (or “turns over” its portfolio). A higher portfolio turnover may indicate higher transaction costs and may result in higher taxes when Fund shares are held in a taxable account. These costs, which are not reflected in Annual Fund Operating Expenses or in the Example, affect the Fund’s performance. During the most recent fiscal year, the Fund’s portfolio turnover rate was 17% of the average value of its portfolio.
Principal Investment Strategies
The Fund seeks to achieve its objective by acquiring equity securities, including common stocks and convertible securities, of well-financed (meaning companies with high quality assets and conservative levels of liabilities) small companies at a discount to what the Adviser believes is their intrinsic value. Adhering to this strict value discipline, the Fund generally seeks to construct a focused portfolio of high conviction opportunities. Under normal circumstances, the Fund expects to invest at least 80% of its net assets (plus the amount of any borrowing for investment purposes) in securities of companies that are considered small. The Fund considers a “small company” to be one whose market capitalization is between $50 million and the top range of capitalizations of companies in the Russell 2000 Index or the S&P Small Cap 600 Index at the time a new position is established (based on prior quarter-end data of the indexes). As of December 31, 2022, the top range of capitalization was $8.05 billion for the Russell 2000 Index and $6.28 billion for the S&P Small Cap 600 Index. The Fund may also acquire senior securities of small companies, such as preferred stocks and debt instruments (including high-yield and distressed securities, often referred to as “junk,” that may be in default and may have any or no credit rating) that the Adviser believes are undervalued. The Fund also invests in both domestic and foreign securities.
Principal Investment Risks
Small-Cap Risk. The Fund invests in smaller companies, whose securities tend to be more volatile and less liquid than securities of larger companies. This can adversely affect the prices at which the Fund can purchase and sell these securities and, thus, the value of the Fund’s shares.
Market Risk. Prices of securities (and stocks in particular) have historically fluctuated. The value of the Fund will similarly fluctuate and you could lose money. Markets may additionally be impacted by negative external and/or direct and indirect economic factors such as pandemics, natural disasters, global trade policies and political unrest or uncertainties. The adverse impact of any one or more of these events on market value of fund investments could be significant and cause losses.
Focused Investing Risk. Although the Fund is a diversified investment company under the Investment Company Act of 1940 (the “Act”), the Fund’s investments will normally be more focused than its peers and may emphasize investments in some issuers, industries, sectors or geographic regions more than others. To the extent that the Fund increases the relative emphasis of its investments in a particular issuer, industry, sector or geographic region, its share values may fluctuate in response to events affecting such issuer, industry, sector or geographic region. The Fund does not lose its status as a diversified investment company because of any subsequent discrepancy between the value of its various investments and the diversification requirements of the Act, so long as any such discrepancy existing immediately after the Fund’s acquisition of any security or other property is neither wholly nor partly the result of such acquisition. Therefore, the Fund from time to time may have an investment portfolio that is considered “non-diversified” by the Act despite its classification as a diversified investment company.
Commodities Risk. Prices of commodities such as timber and oil have historically been very volatile. Reductions in commodity prices will likely cause the prices of the securities of companies associated with the production of those commodities to decline.
Liquidity Risk. Liquidity risk exists when particular investments are difficult to sell. The Fund may not be able to sell these investments at the best prices or at the value the Fund places on them. In such a market, the value of such investments and the Fund’s share price may fall dramatically. Investments that are illiquid or that trade in lower volumes may be more difficult to value. The market for high-yield debt securities (“junk bonds”) may be less liquid and therefore these securities may be harder to value or sell at an acceptable price, especially during times of market volatility or decline. Investments in foreign securities tend to have greater exposure to liquidity risk than U.S. securities. Liquidity can decline unpredictably in response to
overall economic conditions or credit tightening. An unexpected increase in Fund redemption requests, including requests from shareholders who may own a significant percentage of the Fund’s shares, could cause the Fund to sell its holdings at a loss or at undesirable prices and adversely affect the Fund’s share price and increase the Fund’s liquidity risk, Fund expenses and/or taxable distributions.
Style Risk. Value securities involve the risk that they may never reach their expected full market value, either because the market fails to recognize the securities’ intrinsic value or the expected value was misgauged. The Adviser may identify opportunities in industries that appear to be temporarily depressed. The prices of securities in these industries may tend to go down more than those of companies in other industries. Since the Fund is not limited to investing in stocks, the Fund may own significant non-equity instruments in a rising stock market, thereby producing smaller gains than a fund invested solely in stocks. Because of the Fund’s disciplined and deliberate investing approach, there may be times when the Fund will have a significant cash position. A substantial cash position can adversely impact Fund performance in certain market conditions and may make it more difficult for the Fund to achieve its investment objective.
Debt Securities Risk. The market value of a debt security may decline due to general market conditions that are not specifically related to a particular company, such as real or perceived adverse economic conditions, changes in the outlook for corporate earnings, changes in interest or currency rates or adverse investor sentiment generally. The debt securities market can be susceptible to increases in volatility and decreases in liquidity. Increases in volatility and decreases in liquidity may be caused by a rise in interest rates (or the expectation of a rise in interest rates). Prices of bonds and other debt securities tend to move inversely with changes in interest rates. Typically, a rise in rates will adversely affect debt securities and, accordingly, will cause the value of the Fund’s investments in these securities to decline. When interest rates fall, the values of already-issued securities generally rise, although investments in new securities may be at lower yields. The prices of high-yield debt securities (“junk bonds”), unlike investment grade debt securities, may fluctuate unpredictably and not necessarily inversely with changes in interest rates. Economic and other developments can adversely affect debt securities markets.
High-Yield Risk. The Fund’s investments in high-yield debt securities (commonly known as “junk bonds”) may expose the Fund to greater risks than if the Fund only owned higher-grade securities. The value of high-yield, lower quality securities is affected by the creditworthiness of the issuers of the securities and by general economic and specific industry conditions. Issuers of high-yield securities are not as strong financially as issuers of securities with higher credit ratings, so the securities are usually considered speculative investments.
Insolvency and Bankruptcy Risk. The Fund’s investments in obligations of stressed, distressed and bankrupt issuers, including debt obligations that are in default, generally trade significantly below par and are considered speculative. There is even a potential risk of loss by the Fund of its entire investment in such securities. There are a number of significant risks inherent in the bankruptcy process. A bankruptcy filing by an issuer may adversely and permanently affect the market position and operations of the issuer. The Adviser, on behalf of the Fund, may also participate on committees formed by creditors to negotiate with debtors with respect to restructuring issues. There can be no assurance that the Adviser’s participation would yield favorable results for the Fund, and such participation may subject the Fund to additional duties, liabilities and trading restrictions in a particular investment.
Currency Risk. The Fund’s investments are usually denominated in or tied to the currencies of the countries in which they are primarily traded. Because the Fund may determine not to hedge its foreign currency risk, the U.S. Dollar value of the Fund’s investments may be harmed by declines in the value of foreign currencies in relation to the U.S. Dollar.
Currency Hedging Risk. The Adviser may seek to hedge all or a portion of the Fund’s foreign currency risk. However, the Adviser cannot guarantee that it will be practical to hedge these risks in certain markets or conditions or that any efforts to do so will be successful.
Foreign Securities and Emerging Markets Risk. Foreign securities from a particular country or region may be subject to currency fluctuations and controls, or adverse political, social, economic or other developments that are unique to that particular country or region. Therefore, the prices of foreign securities in particular countries or regions may, at times, move in a different direction than those of U.S. securities. Emerging market countries can generally have economic structures that are less diverse and mature, and political systems that are less stable, than those of developed countries, and, as a result, the securities markets of emerging markets countries can be more volatile than more developed markets may be. U.S.
2
securities and accounting regulatory agencies continue to express concern regarding information access and audit quality regarding issuers in China and other emerging market countries, which could present heightened risks associated with investments in these markets.
Performance
The following bar chart and table provide an indication of the risks of investing in Third Avenue Small-Cap Value Fund. The bar chart shows changes in the performance of the Fund’s Institutional Class shares from year to year over the past 10 calendar years. The table compares the average annual total returns of the Fund’s Institutional Class, Investor Class and Z Class shares to a broad measure of market performance. All returns assume reinvestment of dividends and distributions. As with all mutual funds, the Fund’s past performance, before and after taxes, is not necessarily an indication of how the Fund will perform in the future. Updated performance information is available at no cost by visiting www.thirdave.com or by calling (800) 443-1021.
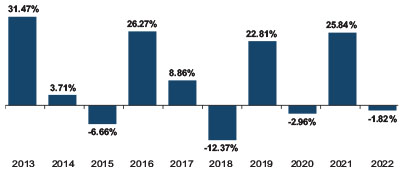
During the period shown in the above bar chart, the highest return for a quarter was 24.04% (quarter ended December 31, 2020) and the lowest return for a quarter was (29.59)% (quarter ended March 31, 2020).
After-tax returns are shown only for Institutional Class shares. After-tax returns of the Fund’s other share classes will vary from those of the Institutional Class. After-tax returns are calculated using the historical highest individual federal marginal income tax rates and do not reflect the impact of state and local taxes. Actual after-tax returns depend on the investor’s tax situation and may differ from those shown, and the after-tax returns shown are not relevant to investors who hold their Fund shares through tax-deferred arrangements, such as 401(k) plans or Individual Retirement Accounts (“IRAs”).
| Average Annual Total Returns For the periods ending 12/31/22 | Inception Date |
One Year |
Five Years |
Ten Years |
Since Inception | |
| Institutional Class Before Taxes | 4/1/97 | (1.82)% | 5.23% | 8.48% | 8.25% | |
| After Taxes on Distributions | (3.02)% | 3.56% | 6.06% | 6.94% | ||
| After Taxes on Distributions and Sale of Fund Shares | (0.23)%1 | 3.87%1 | 6.35%1 | 6.81% | ||
| Investor Class Before Taxes | 12/31/09 | (2.09)% | 4.96% | 8.21% | 8.32% | |
| Z Class Before Taxes | 3/1/18 | (1.77)% | — | — | 5.76% | |
| Russell 2000 Value Index (reflects no deductions for fees, expenses, or taxes) | (14.48)% | 4.13% | 8.48% | 8.65% (Institutional) 9.18% (Investor) 5.12% (Z Class) |
| 1 | The Return After Taxes on Distributions and Sale of Fund Shares is higher than the Return Before Taxes and/or Return After Taxes on Distributions because of realized losses that would have been sustained upon the sale of Fund shares immediately after the relevant periods. |
Portfolio Management
Investment Adviser
Third Avenue Management LLC serves as the Fund’s investment adviser.
Portfolio Manager
Victor Cunningham, CFA, Lead Portfolio Manager since September 2017.
Purchase and Sale of Fund Shares
The minimum initial investment for the Investor Class of the Fund is $2,500, the minimum initial investment for the Institutional Class is $10,000 and the minimum initial investment for Z Class is $25,000 for a regular account and $5,000 for an IRA. Additional investments for any class must be at least $1,000 for a regular account and $200 for an IRA, unless you use the Fund’s Automatic Investment Plan, in which case the monthly minimum for additional investments is $200. Broker-dealers or other financial intermediaries may impose higher initial or additional amounts for investment than those established by the Fund.
In general, you can buy or sell shares of the Fund by mail or telephone each day the New York Stock Exchange is open for trading. You may sell shares by making a redemption request of the Fund in writing or, if so elected on your account application, by telephone or Internet. The Fund’s shares can be purchased either directly from the Fund, or through certain broker-dealers or financial intermediaries, so long as they have a selling agreement with the Fund’s distributor. Purchase and sale transactions made through your broker-dealer or other financial intermediary may be subject to charges imposed by the broker-dealer or other financial intermediary. Investors transacting in the Fund’s shares through a financial intermediary acting as a broker in an agency capacity may be required to pay a commission directly to the broker.
Dividends, Capital Gains and Taxes
The Fund’s distributions may be taxable to you as ordinary income or capital gains, except when your investment is in an IRA, 401(k) or other tax-advantaged account.
Potential Conflicts of Interest — Financial Intermediary Compensation
If you purchase shares of the Fund through a broker-dealer or other financial intermediary (such as a bank), the Fund (other than shares of the Z Class), the Adviser and the Fund’s distributor may pay the intermediary for making shares of the Fund available on its platforms and other shareholder services. These payments may create a conflict of interest by influencing the broker- dealer or other intermediary and your salesperson to recommend the Fund over another investment. Ask your salesperson or visit your financial intermediary’s website for more information.
3
|
| ||||||
|
|
SUMMARY PROSPECTUS Third Avenue Small-Cap Value Fund March 1,
2023 |
| ||||
|
|
Before you invest, please review the Fund’s Statutory Prospectus, dated March 1, 2023, and the Statement of Additional Information, dated March 1, 2023. Each is incorporated by reference (is legally considered part of this Summary Prospectus). Each contains more information about the Fund and its risks. The Fund’s Statutory Prospectus, Statement of Additional Information and other information about the Fund are available online at www.thirdave.com. You can also get this information at no cost by calling 1-800-443-1021 or by contacting your financial intermediary. |
|||||
|
|
| |||||
|
www.thirdave.com | ||||||
FOR MORE INFORMATION
More information on the Third Avenue Funds is available free upon request, including the following:
| ● | Shareholder Reports — Additional information about the Funds’ investments is available in the Funds’ Annual and Semi-Annual Reports to Shareholders. The Funds’ Annual Report to Shareholders contains a discussion of the market conditions and investment strategies that significantly affected the Funds’ performances during the last fiscal year. |
| ● | Statement of Additional Information (SAI) — The SAI provides more detailed information about the Funds, is on file with the SEC, and is incorporated by reference (is legally considered part of this Prospectus). |
You can obtain the Funds’ SAI and Shareholder Reports without charge, upon request, and otherwise make inquiries to the Funds by writing or calling the Funds at 675 Third Avenue, Suite 2900-05, New York, NY 10017, (800) 443-1021 or (212) 888-5222.
The Funds’ Prospectus, SAI, Shareholder Reports and other additional information are available through the Funds’ website at www.thirdave.com.
Reports and other information about the Funds may be obtained, upon payment of a duplicating fee, by electronic request at the email address publicinfo@sec.gov. Reports and other information about the Funds are also available on the SEC’s Internet Web site http://www.sec.gov.
Third Avenue Trust’s SEC file number is 811-08039.
|
Third Avenue Funds |
|
675 Third Avenue, Suite 2900-05 | New York, NY 10017 | Phone (212) 888-5222 | Toll Free (800) 443-1021 | www.thirdave.com |