Principal Risks
The value of your investment in the Fund changes with the value of the Fund’s investments. Many factors affect that value, and it is possible to lose money by investing in the Fund. An investment in the Fund is not a deposit of a bank and is not insured or guaranteed by the Federal Deposit Insurance Corporation or any other government agency. The principal risks of investing in the Fund are listed below in alphabetical order and not in order of significance.
Principal Risks of Investing in a Fund of Funds
Fund of Funds Risk. Fund shareholders bear indirectly their proportionate share of the expenses of other investment companies (for example, other mutual funds or exchange-traded funds) in which the Fund invests (“underlying funds”). The Fund’s selection and weighting of asset classes and allocation of investments in underlying funds may cause it to underperform other funds with a similar investment objective. The Fund’s performance and risks correspond directly to the performance and risks of the underlying funds in which it invests, proportionately in accordance with the weightings of such investments, and there is no assurance that the underlying funds will achieve their investment objectives. Management of the Fund entails potential conflicts of interest: the Fund invests in affiliated underlying funds; and PGI and
its affiliates may earn different fees from different underlying funds and may have an incentive to allocate more Fund assets
to underlying funds from which they receive higher fees.
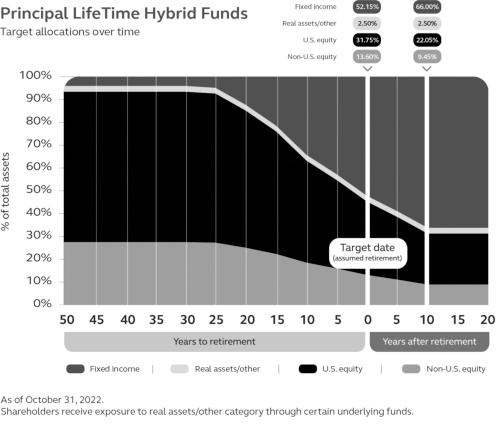
Target Date Fund Risk. A target date fund should not be selected based solely on age or retirement date because there is no guarantee that this Fund will provide adequate income at or through retirement.
Principal Risks due to the Fund’s Investments in Underlying Funds
Counterparty Risk. Counterparty risk is the risk that the counterparty to a contract or other obligation will be unable or unwilling to honor its obligations.
Derivatives Risk. Derivatives may not move in the direction anticipated by the portfolio manager. Transactions in derivatives may increase volatility, cause the liquidation of portfolio positions when not advantageous to do so, and result in disproportionate losses that may be substantially greater than a fund’s initial investment.
•
Futures. Futures contracts involve specific risks, including: the imperfect correlation between the change in market value of the instruments held by the fund and the price of the futures contract; possible lack of a liquid secondary market for a futures contract and the resulting inability to close a futures contract when desired; counterparty risk; and if the fund has insufficient cash, it may have to sell securities from its portfolio to meet daily variation margin requirements.
5