
UNITED STATES
SECURITIES AND EXCHANGE COMMISSION
Washington, D.C. 20549
FORM N-CSR
CERTIFIED SHAREHOLDER REPORT OF REGISTERED
MANAGEMENT INVESTMENT COMPANIES
Investment Company Act file number 811-01400
Fidelity Contrafund
(Exact name of registrant as specified in charter)
245 Summer St., Boston, Massachusetts 02210
(Address of principal executive offices) (Zip code)
Cynthia Lo Bessette, Secretary
245 Summer St.
Boston, Massachusetts 02210
(Name and address of agent for service)
Registrant's telephone number, including area code:
617-563-7000
|
Date of fiscal year end: |
December 31 |
|
|
|
|
Date of reporting period: |
December 31, 2022 |
Item 1.
Reports to Stockholders

Contents
|
Average Annual Total Returns
|
|||
|
Periods ended December 31, 2022
|
Past 1
year
|
Past 5
years
|
Past 10
years
|
|
Class A
(incl.5.75% sales charge)
|
-31.65%
|
5.33%
|
10.07%
|
|
Class M
(incl.3.50% sales charge)
|
-30.18%
|
5.57%
|
10.06%
|
|
Class C
(incl. contingent deferred sales charge)
|
-28.62%
|
5.79%
|
10.07%
|
|
Class I
|
-27.28%
|
6.87%
|
11.01%
|
|
Class Z
|
-27.21%
|
6.99%
|
11.14%
|
|
$10,000 Over 10 Years
|
|
Let's say hypothetically that $10,000 was invested in Fidelity Advisor® New Insights Fund - Class A, on December 31, 2012, and the current 5.75% sales charge was paid.
The chart shows how the value of your investment would have changed, and also shows how the S&P 500® Index performed over the same period.
|

|
|
Top Holdings (% of Fund's net assets)
|
||
|
Berkshire Hathaway, Inc. Class A
|
5.9
|
|
|
Microsoft Corp.
|
5.8
|
|
|
Alphabet, Inc. Class A
|
5.2
|
|
|
UnitedHealth Group, Inc.
|
4.6
|
|
|
Meta Platforms, Inc. Class A
|
4.5
|
|
|
Amazon.com, Inc.
|
3.8
|
|
|
Apple, Inc.
|
3.4
|
|
|
Eli Lilly & Co.
|
2.8
|
|
|
Exxon Mobil Corp.
|
1.9
|
|
|
NVIDIA Corp.
|
1.8
|
|
|
39.7
|
||
|
Market Sectors (% of Fund's net assets)
|
||
|
Information Technology
|
19.8
|
|
|
Health Care
|
17.8
|
|
|
Financials
|
13.9
|
|
|
Communication Services
|
12.9
|
|
|
Consumer Discretionary
|
10.7
|
|
|
Industrials
|
8.4
|
|
|
Energy
|
8.0
|
|
|
Materials
|
4.4
|
|
|
Consumer Staples
|
2.6
|
|
|
Utilities
|
1.0
|
|
|
Real Estate
|
0.1
|
|
|
Asset Allocation (% of Fund's net assets)
|

|
|
Foreign investments - 10.9%
|
|
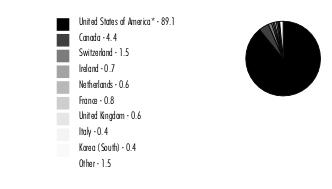
Geographic Diversification (% of Fund's net assets)
|
|
|
* Includes Short-Term investments and Net Other Assets (Liabilities).
Percentages are based on country or territory of incorporation and are adjusted for the effect of derivatives, if applicable.
|
|
Common Stocks - 97.5%
|
|||
|
Shares
|
Value ($)
(000s)
|
||
|
COMMUNICATION SERVICES - 12.7%
|
|||
|
Entertainment - 2.1%
|
|||
|
Activision Blizzard, Inc.
|
449,800
|
34,432
|
|
|
Liberty Media Corp. Liberty Formula One Series C (a)
|
382,933
|
22,892
|
|
|
Netflix, Inc. (a)
|
788,390
|
232,480
|
|
|
Universal Music Group NV
|
806,090
|
19,493
|
|
|
309,297
|
|||
|
Interactive Media & Services - 9.9%
|
|||
|
Alphabet, Inc. Class A (a)
|
8,688,920
|
766,623
|
|
|
Bumble, Inc. (a)
|
329,184
|
6,929
|
|
|
Epic Games, Inc. (a)(b)(c)
|
23,900
|
19,491
|
|
|
Meta Platforms, Inc. Class A (a)
|
5,536,516
|
666,264
|
|
|
Pinterest, Inc. Class A (a)
|
211,000
|
5,123
|
|
|
1,464,430
|
|||
|
Media - 0.1%
|
|||
|
Charter Communications, Inc. Class A (a)
|
19,400
|
6,579
|
|
|
Comcast Corp. Class A
|
352,400
|
12,323
|
|
|
18,902
|
|||
|
Wireless Telecommunication Services - 0.6%
|
|||
|
T-Mobile U.S., Inc. (a)
|
651,900
|
91,266
|
|
|
TOTAL COMMUNICATION SERVICES
|
1,883,895
|
||
|
CONSUMER DISCRETIONARY - 10.4%
|
|||
|
Automobiles - 0.3%
|
|||
|
General Motors Co.
|
322,040
|
10,833
|
|
|
Harley-Davidson, Inc.
|
113,800
|
4,734
|
|
|
Hyundai Motor Co.
|
77,337
|
9,275
|
|
|
Rad Power Bikes, Inc. (a)(b)(c)
|
474,452
|
1,755
|
|
|
Rivian Automotive, Inc. (a)
|
26,456
|
488
|
|
|
Tesla, Inc. (a)
|
4,252
|
524
|
|
|
Toyota Motor Corp.
|
1,347,202
|
18,379
|
|
|
45,988
|
|||
|
Diversified Consumer Services - 0.0%
|
|||
|
Duolingo, Inc. (a)
|
2,800
|
199
|
|
|
Hotels, Restaurants & Leisure - 0.8%
|
|||
|
Airbnb, Inc. Class A (a)
|
255,596
|
21,853
|
|
|
Caesars Entertainment, Inc. (a)
|
270,000
|
11,232
|
|
|
Chipotle Mexican Grill, Inc. (a)
|
3,627
|
5,032
|
|
|
Evolution AB (d)
|
12,200
|
1,188
|
|
|
Hilton Worldwide Holdings, Inc.
|
495,668
|
62,633
|
|
|
Hyatt Hotels Corp. Class A (a)
|
12,900
|
1,167
|
|
|
McDonald's Corp.
|
37,900
|
9,988
|
|
|
Sweetgreen, Inc. Class A (a)
|
247,700
|
2,123
|
|
|
115,216
|
|||
|
Household Durables - 0.2%
|
|||
|
Blu Investments LLC (a)(b)(c)
|
98,215,581
|
30
|
|
|
D.R. Horton, Inc.
|
110,675
|
9,866
|
|
|
Lennar Corp. Class A
|
200,618
|
18,156
|
|
|
28,052
|
|||
|
Internet & Direct Marketing Retail - 4.1%
|
|||
|
Amazon.com, Inc. (a)
|
6,739,600
|
566,126
|
|
|
Coupang, Inc. Class A (a)
|
954,265
|
14,037
|
|
|
Deliveroo PLC Class A (a)(d)
|
3,535,620
|
3,663
|
|
|
FSN E-Commerce Ventures Private Ltd.
|
10,674
|
20
|
|
|
Global-e Online Ltd. (a)
|
143,500
|
2,962
|
|
|
MercadoLibre, Inc. (a)
|
3,700
|
3,131
|
|
|
Uber Technologies, Inc. (a)
|
353,600
|
8,745
|
|
|
Wayfair LLC Class A (a)
|
96,078
|
3,160
|
|
|
Zomato Ltd. (a)
|
2,766,561
|
1,983
|
|
|
603,827
|
|||
|
Multiline Retail - 0.3%
|
|||
|
Dollar Tree, Inc. (a)
|
293,107
|
41,457
|
|
|
Dollarama, Inc.
|
48,472
|
2,835
|
|
|
44,292
|
|||
|
Specialty Retail - 3.5%
|
|||
|
Academy Sports & Outdoors, Inc.
|
599,806
|
31,514
|
|
|
Auto1 Group SE (a)(d)
|
51,600
|
431
|
|
|
AutoZone, Inc. (a)
|
10,850
|
26,758
|
|
|
Dick's Sporting Goods, Inc.
|
315,345
|
37,933
|
|
|
Fanatics, Inc. Class A (a)(b)(c)
|
372,921
|
28,405
|
|
|
Floor & Decor Holdings, Inc. Class A (a)(e)
|
217,500
|
15,145
|
|
|
Lowe's Companies, Inc.
|
494,100
|
98,444
|
|
|
National Vision Holdings, Inc. (a)
|
206,889
|
8,019
|
|
|
O'Reilly Automotive, Inc. (a)
|
47,171
|
39,814
|
|
|
The Home Depot, Inc.
|
401,213
|
126,727
|
|
|
TJX Companies, Inc.
|
694,303
|
55,267
|
|
|
Ulta Beauty, Inc. (a)
|
55,300
|
25,940
|
|
|
Williams-Sonoma, Inc.
|
231,332
|
26,585
|
|
|
520,982
|
|||
|
Textiles, Apparel & Luxury Goods - 1.2%
|
|||
|
Brunello Cucinelli SpA
|
885,100
|
65,469
|
|
|
Capri Holdings Ltd. (a)
|
343,300
|
19,678
|
|
|
China Hongxing Sports Ltd. (a)(c)
|
5,977,800
|
0
|
|
|
Deckers Outdoor Corp. (a)
|
21,282
|
8,495
|
|
|
Dr. Martens Ltd.
|
2,125,350
|
4,897
|
|
|
lululemon athletica, Inc. (a)
|
14,144
|
4,531
|
|
|
LVMH Moet Hennessy Louis Vuitton SE
|
42,500
|
30,927
|
|
|
NIKE, Inc. Class B
|
80,603
|
9,431
|
|
|
On Holding AG (a)
|
597,100
|
10,246
|
|
|
Ralph Lauren Corp. (e)
|
53,300
|
5,632
|
|
|
Tapestry, Inc.
|
597,129
|
22,739
|
|
|
182,045
|
|||
|
TOTAL CONSUMER DISCRETIONARY
|
1,540,601
|
||
|
CONSUMER STAPLES - 2.6%
|
|||
|
Beverages - 1.4%
|
|||
|
Anheuser-Busch InBev SA NV
|
121,324
|
7,307
|
|
|
Constellation Brands, Inc. Class A (sub. vtg.)
|
46,400
|
10,753
|
|
|
Diageo PLC
|
218,958
|
9,584
|
|
|
Keurig Dr. Pepper, Inc.
|
42,471
|
1,515
|
|
|
PepsiCo, Inc.
|
242,060
|
43,731
|
|
|
The Coca-Cola Co.
|
2,137,218
|
135,948
|
|
|
208,838
|
|||
|
Food & Staples Retailing - 0.7%
|
|||
|
Alimentation Couche-Tard, Inc. Class A (multi-vtg.)
|
129,100
|
5,673
|
|
|
Casey's General Stores, Inc.
|
20,800
|
4,666
|
|
|
Costco Wholesale Corp.
|
205,900
|
93,993
|
|
|
Performance Food Group Co. (a)
|
25,900
|
1,512
|
|
|
105,844
|
|||
|
Food Products - 0.1%
|
|||
|
Archer Daniels Midland Co.
|
26,800
|
2,488
|
|
|
General Mills, Inc.
|
24,700
|
2,071
|
|
|
Mondelez International, Inc.
|
120,000
|
7,998
|
|
|
Nestle SA (Reg. S)
|
19,982
|
2,308
|
|
|
14,865
|
|||
|
Household Products - 0.3%
|
|||
|
Procter & Gamble Co.
|
240,273
|
36,416
|
|
|
Personal Products - 0.1%
|
|||
|
L'Oreal SA (a)
|
29,812
|
10,676
|
|
|
Olaplex Holdings, Inc. (a)
|
749,146
|
3,903
|
|
|
14,579
|
|||
|
TOTAL CONSUMER STAPLES
|
380,542
|
||
|
ENERGY - 7.9%
|
|||
|
Energy Equipment & Services - 0.0%
|
|||
|
Halliburton Co.
|
133,000
|
5,234
|
|
|
Noble Corp. PLC (a)
|
4,432
|
167
|
|
|
5,401
|
|||
|
Oil, Gas & Consumable Fuels - 7.9%
|
|||
|
Antero Resources Corp. (a)
|
542,400
|
16,809
|
|
|
Birchcliff Energy Ltd.
|
169,400
|
1,180
|
|
|
Canadian Natural Resources Ltd. (e)
|
1,253,388
|
69,603
|
|
|
Cenovus Energy, Inc. (e)
|
1,267,000
|
24,592
|
|
|
Cenovus Energy, Inc. (Canada)
|
259,591
|
5,037
|
|
|
Cheniere Energy, Inc.
|
823,817
|
123,540
|
|
|
Chevron Corp.
|
433,005
|
77,720
|
|
|
ConocoPhillips Co.
|
869,011
|
102,543
|
|
|
Devon Energy Corp.
|
439,958
|
27,062
|
|
|
Diamondback Energy, Inc.
|
152,343
|
20,837
|
|
|
EOG Resources, Inc.
|
335,316
|
43,430
|
|
|
Equinor ASA
|
78,400
|
2,818
|
|
|
Excelerate Energy, Inc. (e)
|
14,126
|
354
|
|
|
Exxon Mobil Corp.
|
2,491,307
|
274,791
|
|
|
GoviEx Uranium, Inc. (a)
|
642,355
|
85
|
|
|
GoviEx Uranium, Inc. (a)(d)
|
23,200
|
3
|
|
|
GoviEx Uranium, Inc. Class A (a)(d)
|
2,625,135
|
349
|
|
|
Hess Corp.
|
1,313,290
|
186,251
|
|
|
Marathon Petroleum Corp.
|
49,200
|
5,726
|
|
|
Occidental Petroleum Corp.
|
654,761
|
41,243
|
|
|
Ovintiv, Inc.
|
140,700
|
7,135
|
|
|
Phillips 66 Co.
|
120,140
|
12,504
|
|
|
Pioneer Natural Resources Co.
|
148,065
|
33,817
|
|
|
Reliance Industries Ltd.
|
374,131
|
11,484
|
|
|
Suncor Energy, Inc. (e)
|
1,470,678
|
46,651
|
|
|
Tourmaline Oil Corp.
|
54,500
|
2,750
|
|
|
Valero Energy Corp.
|
256,200
|
32,502
|
|
|
1,170,816
|
|||
|
TOTAL ENERGY
|
1,176,217
|
||
|
FINANCIALS - 13.9%
|
|||
|
Banks - 3.6%
|
|||
|
AIB Group PLC
|
344,600
|
1,334
|
|
|
Banco Santander SA (Spain)
|
839,400
|
2,510
|
|
|
Bank of America Corp.
|
4,700,465
|
155,679
|
|
|
Bank of Ireland Group PLC
|
497,200
|
4,737
|
|
|
Citigroup, Inc.
|
58,400
|
2,641
|
|
|
HDFC Bank Ltd. sponsored ADR
|
669,971
|
45,833
|
|
|
JPMorgan Chase & Co.
|
460,959
|
61,815
|
|
|
Nu Holdings Ltd.
|
1,060,866
|
4,318
|
|
|
Royal Bank of Canada
|
514,460
|
48,368
|
|
|
Starling Bank Ltd. Series D (a)(b)(c)
|
3,787,848
|
14,333
|
|
|
The Toronto-Dominion Bank
|
182,367
|
11,808
|
|
|
Wells Fargo & Co.
|
4,283,616
|
176,871
|
|
|
530,247
|
|||
|
Capital Markets - 1.1%
|
|||
|
BlackRock, Inc. Class A
|
790
|
560
|
|
|
Brookfield Asset Management Ltd. Class A (a)
|
5,622
|
161
|
|
|
Brookfield Corp. (Canada) Class A
|
8,200
|
258
|
|
|
Charles Schwab Corp.
|
125,381
|
10,439
|
|
|
Goldman Sachs Group, Inc.
|
64,973
|
22,310
|
|
|
Morgan Stanley
|
1,152,347
|
97,973
|
|
|
MSCI, Inc.
|
35,419
|
16,476
|
|
|
TulCo LLC (a)(b)(c)(f)
|
17,377
|
13,123
|
|
|
161,300
|
|||
|
Consumer Finance - 0.4%
|
|||
|
American Express Co.
|
184,808
|
27,305
|
|
|
Capital One Financial Corp.
|
376,300
|
34,981
|
|
|
62,286
|
|||
|
Diversified Financial Services - 5.9%
|
|||
|
Berkshire Hathaway, Inc. Class A (a)
|
1,888
|
884,929
|
|
|
Insurance - 2.9%
|
|||
|
American International Group, Inc.
|
794,826
|
50,265
|
|
|
Aon PLC
|
8,770
|
2,632
|
|
|
Arthur J. Gallagher & Co.
|
226,400
|
42,685
|
|
|
Brookfield Asset Management Reinsurance Partners Ltd.
|
889
|
28
|
|
|
Chubb Ltd.
|
572,807
|
126,361
|
|
|
Fairfax Financial Holdings Ltd. (sub. vtg.)
|
44,267
|
26,222
|
|
|
Hartford Financial Services Group, Inc.
|
183,953
|
13,949
|
|
|
Hiscox Ltd.
|
2,665,843
|
35,113
|
|
|
Intact Financial Corp.
|
110,374
|
15,888
|
|
|
Marsh & McLennan Companies, Inc.
|
64,737
|
10,713
|
|
|
Progressive Corp.
|
445,710
|
57,813
|
|
|
The Travelers Companies, Inc.
|
246,838
|
46,280
|
|
|
W.R. Berkley Corp.
|
30,500
|
2,213
|
|
|
430,162
|
|||
|
TOTAL FINANCIALS
|
2,068,924
|
||
|
HEALTH CARE - 17.7%
|
|||
|
Biotechnology - 3.3%
|
|||
|
AbbVie, Inc.
|
73,589
|
11,893
|
|
|
Alnylam Pharmaceuticals, Inc. (a)
|
59,722
|
14,193
|
|
|
Argenx SE ADR (a)
|
93,085
|
35,263
|
|
|
Ascendis Pharma A/S sponsored ADR (a)
|
29,200
|
3,566
|
|
|
Biohaven Ltd. (a)
|
4,450
|
62
|
|
|
Erasca, Inc. (a)
|
18,459
|
80
|
|
|
Galapagos NV sponsored ADR (a)
|
161,969
|
7,188
|
|
|
Genmab A/S (a)
|
7,100
|
3,002
|
|
|
Gilead Sciences, Inc.
|
340,700
|
29,249
|
|
|
Instil Bio, Inc. (a)
|
338,600
|
213
|
|
|
Intarcia Therapeutics, Inc. warrants 12/31/24 (a)(c)
|
26,062
|
0
|
|
|
Intellia Therapeutics, Inc. (a)
|
39,714
|
1,386
|
|
|
Legend Biotech Corp. ADR (a)
|
123,300
|
6,155
|
|
|
Light Sciences Oncology, Inc. (a)(c)
|
2,708,254
|
0
|
|
|
Moderna, Inc. (a)
|
15,300
|
2,748
|
|
|
Neurocrine Biosciences, Inc. (a)
|
21,318
|
2,546
|
|
|
Nuvalent, Inc. Class A (a)
|
46,000
|
1,370
|
|
|
Regeneron Pharmaceuticals, Inc. (a)
|
360,499
|
260,096
|
|
|
Relay Therapeutics, Inc. (a)
|
167,800
|
2,507
|
|
|
United Therapeutics Corp. (a)
|
67,694
|
18,825
|
|
|
Vertex Pharmaceuticals, Inc. (a)
|
329,746
|
95,224
|
|
|
Zai Lab Ltd. (a)
|
838,520
|
2,595
|
|
|
498,161
|
|||
|
Health Care Equipment & Supplies - 0.8%
|
|||
|
Boston Scientific Corp. (a)
|
1,251,008
|
57,884
|
|
|
DexCom, Inc. (a)
|
16,700
|
1,891
|
|
|
Edwards Lifesciences Corp. (a)
|
40,550
|
3,025
|
|
|
Figs, Inc. Class A (a)(e)
|
439,494
|
2,958
|
|
|
Hologic, Inc. (a)
|
115,300
|
8,626
|
|
|
I-Pulse, Inc. (a)(b)(c)
|
58,562
|
184
|
|
|
Intuitive Surgical, Inc. (a)
|
148,651
|
39,445
|
|
|
Straumann Holding AG
|
25,745
|
2,952
|
|
|
116,965
|
|||
|
Health Care Providers & Services - 6.7%
|
|||
|
23andMe Holding Co. Class A (a)(e)
|
1,123,833
|
2,427
|
|
|
agilon health, Inc. (a)
|
831,900
|
13,427
|
|
|
AmerisourceBergen Corp.
|
72,820
|
12,067
|
|
|
Cardinal Health, Inc.
|
103,000
|
7,918
|
|
|
Centene Corp. (a)
|
574,000
|
47,074
|
|
|
Cigna Corp.
|
499,000
|
165,339
|
|
|
Elevance Health, Inc.
|
84,115
|
43,148
|
|
|
HCA Holdings, Inc.
|
46,057
|
11,052
|
|
|
Molina Healthcare, Inc. (a)
|
29,801
|
9,841
|
|
|
Option Care Health, Inc. (a)
|
160,938
|
4,843
|
|
|
P3 Health Partners, Inc. (a)(b)
|
395,420
|
728
|
|
|
UnitedHealth Group, Inc.
|
1,281,108
|
679,218
|
|
|
997,082
|
|||
|
Health Care Technology - 0.0%
|
|||
|
Doximity, Inc. (a)
|
61,500
|
2,064
|
|
|
Life Sciences Tools & Services - 1.7%
|
|||
|
Danaher Corp.
|
626,689
|
166,336
|
|
|
Mettler-Toledo International, Inc. (a)
|
8,254
|
11,931
|
|
|
Olink Holding AB ADR (a)
|
162,700
|
4,129
|
|
|
Sartorius Stedim Biotech
|
31,600
|
10,232
|
|
|
Seer, Inc. (a)
|
59,354
|
344
|
|
|
Thermo Fisher Scientific, Inc.
|
60,408
|
33,266
|
|
|
Veterinary Emergency Group LLC Class A (a)(b)(c)(f)
|
176,934
|
10,052
|
|
|
Waters Corp. (a)
|
28,074
|
9,618
|
|
|
245,908
|
|||
|
Pharmaceuticals - 5.2%
|
|||
|
AstraZeneca PLC:
|
|||
|
(United Kingdom)
|
270,800
|
36,644
|
|
|
sponsored ADR
|
34,700
|
2,353
|
|
|
Bristol-Myers Squibb Co.
|
433,482
|
31,189
|
|
|
DICE Therapeutics, Inc. (a)
|
71,800
|
2,240
|
|
|
Eli Lilly & Co.
|
1,145,383
|
419,027
|
|
|
Euroapi SASU (a)
|
23,468
|
348
|
|
|
Intra-Cellular Therapies, Inc. (a)
|
46,617
|
2,467
|
|
|
Johnson & Johnson
|
240,128
|
42,419
|
|
|
Merck & Co., Inc.
|
670,392
|
74,380
|
|
|
Nuvation Bio, Inc. (a)
|
212,427
|
408
|
|
|
Roche Holding AG (participation certificate)
|
222,120
|
69,798
|
|
|
Royalty Pharma PLC
|
897,050
|
35,451
|
|
|
Sanofi SA
|
539,800
|
52,051
|
|
|
UCB SA
|
15,667
|
1,234
|
|
|
Zoetis, Inc. Class A
|
37,300
|
5,466
|
|
|
775,475
|
|||
|
TOTAL HEALTH CARE
|
2,635,655
|
||
|
INDUSTRIALS - 7.0%
|
|||
|
Aerospace & Defense - 3.7%
|
|||
|
Lockheed Martin Corp.
|
121,214
|
58,969
|
|
|
Northrop Grumman Corp.
|
360,986
|
196,958
|
|
|
Space Exploration Technologies Corp.:
|
|||
|
Class A (a)(b)(c)
|
2,573,450
|
198,156
|
|
|
Class C (a)(b)(c)
|
45,460
|
3,500
|
|
|
The Boeing Co. (a)
|
237,800
|
45,299
|
|
|
TransDigm Group, Inc.
|
70,800
|
44,579
|
|
|
Woodward, Inc.
|
80,700
|
7,796
|
|
|
555,257
|
|||
|
Air Freight & Logistics - 0.6%
|
|||
|
Delhivery Private Ltd.
|
444,255
|
1,779
|
|
|
GXO Logistics, Inc. (a)
|
428,170
|
18,279
|
|
|
United Parcel Service, Inc. Class B
|
390,382
|
67,864
|
|
|
Zipline International, Inc. (a)(b)(c)
|
74,930
|
1,660
|
|
|
89,582
|
|||
|
Airlines - 0.0%
|
|||
|
Ryanair Holdings PLC sponsored ADR (a)
|
12,700
|
949
|
|
|
Building Products - 0.1%
|
|||
|
Carrier Global Corp.
|
22,100
|
912
|
|
|
Toto Ltd.
|
511,876
|
17,363
|
|
|
Trane Technologies PLC
|
6,000
|
1,009
|
|
|
19,284
|
|||
|
Commercial Services & Supplies - 0.1%
|
|||
|
Cintas Corp.
|
31,012
|
14,006
|
|
|
Clean Harbors, Inc. (a)
|
57,700
|
6,585
|
|
|
Clean TeQ Water Pty Ltd. (a)
|
3,189
|
1
|
|
|
20,592
|
|||
|
Construction & Engineering - 0.0%
|
|||
|
Willscot Mobile Mini Holdings (a)
|
20,700
|
935
|
|
|
Electrical Equipment - 0.2%
|
|||
|
Acuity Brands, Inc.
|
42,000
|
6,956
|
|
|
Eaton Corp. PLC
|
36,100
|
5,666
|
|
|
Emerson Electric Co.
|
9,800
|
941
|
|
|
Hubbell, Inc. Class B
|
34,700
|
8,143
|
|
|
21,706
|
|||
|
Industrial Conglomerates - 0.4%
|
|||
|
General Electric Co.
|
667,903
|
55,964
|
|
|
Machinery - 0.6%
|
|||
|
Caterpillar, Inc.
|
68,800
|
16,482
|
|
|
Deere & Co.
|
84,598
|
36,272
|
|
|
Fortive Corp.
|
48,300
|
3,103
|
|
|
Indutrade AB
|
42,800
|
866
|
|
|
PACCAR, Inc.
|
188,528
|
18,659
|
|
|
Parker Hannifin Corp.
|
47,400
|
13,793
|
|
|
89,175
|
|||
|
Professional Services - 0.3%
|
|||
|
CACI International, Inc. Class A (a)
|
81,000
|
24,348
|
|
|
Science Applications International Corp.
|
140,400
|
15,575
|
|
|
39,923
|
|||
|
Road & Rail - 0.9%
|
|||
|
Canadian Pacific Railway Ltd.
|
945,764
|
70,513
|
|
|
J.B. Hunt Transport Services, Inc.
|
104,376
|
18,199
|
|
|
Localiza Rent a Car SA
|
57,100
|
575
|
|
|
Localiza Rent a Car SA rights (a)
|
249
|
1
|
|
|
Old Dominion Freight Lines, Inc.
|
55,600
|
15,778
|
|
|
RXO, Inc. (a)
|
428,170
|
7,365
|
|
|
Vamos Locacao de Caminhoes Maquinas e Equipamentos SA
|
23,600
|
56
|
|
|
XPO, Inc. (a)
|
428,170
|
14,254
|
|
|
126,741
|
|||
|
Trading Companies & Distributors - 0.1%
|
|||
|
W.W. Grainger, Inc.
|
23,700
|
13,183
|
|
|
TOTAL INDUSTRIALS
|
1,033,291
|
||
|
INFORMATION TECHNOLOGY - 19.8%
|
|||
|
Communications Equipment - 0.1%
|
|||
|
Arista Networks, Inc. (a)
|
140,185
|
17,011
|
|
|
Motorola Solutions, Inc.
|
4,000
|
1,031
|
|
|
18,042
|
|||
|
Electronic Equipment & Components - 1.1%
|
|||
|
Amphenol Corp. Class A
|
1,975,438
|
150,410
|
|
|
CDW Corp.
|
44,279
|
7,907
|
|
|
Jabil, Inc.
|
43,400
|
2,960
|
|
|
161,277
|
|||
|
IT Services - 2.0%
|
|||
|
Accenture PLC Class A
|
343,711
|
91,716
|
|
|
Adyen BV (a)(d)
|
1,944
|
2,699
|
|
|
ASAC II LP (a)(b)(c)
|
9,408,021
|
1,581
|
|
|
Cloudflare, Inc. (a)
|
7,300
|
330
|
|
|
Dlocal Ltd. (a)
|
633,300
|
9,860
|
|
|
Gartner, Inc. (a)
|
55,000
|
18,488
|
|
|
MasterCard, Inc. Class A
|
465,700
|
161,938
|
|
|
MongoDB, Inc. Class A (a)
|
4,500
|
886
|
|
|
PayPal Holdings, Inc. (a)
|
64,000
|
4,558
|
|
|
Shopify, Inc. Class A (a)
|
19,208
|
667
|
|
|
Visa, Inc. Class A
|
4,600
|
956
|
|
|
X Holdings I, Inc. (b)(c)
|
9,710
|
3,852
|
|
|
297,531
|
|||
|
Semiconductors & Semiconductor Equipment - 4.6%
|
|||
|
Advanced Micro Devices, Inc. (a)
|
1,077,434
|
69,785
|
|
|
AEHR Test Systems (a)
|
87,709
|
1,763
|
|
|
Analog Devices, Inc.
|
151,692
|
24,882
|
|
|
Applied Materials, Inc.
|
320,200
|
31,181
|
|
|
ASML Holding NV (Netherlands)
|
32,900
|
17,939
|
|
|
Broadcom, Inc.
|
8,200
|
4,585
|
|
|
Enphase Energy, Inc. (a)
|
43,200
|
11,446
|
|
|
First Solar, Inc. (a)
|
39,000
|
5,842
|
|
|
Lam Research Corp.
|
65,500
|
27,530
|
|
|
Lattice Semiconductor Corp. (a)
|
156,605
|
10,161
|
|
|
Marvell Technology, Inc.
|
849,687
|
31,472
|
|
|
Monolithic Power Systems, Inc.
|
8,232
|
2,911
|
|
|
NVIDIA Corp.
|
1,792,386
|
261,939
|
|
|
NXP Semiconductors NV
|
194,513
|
30,739
|
|
|
onsemi (a)
|
555,700
|
34,659
|
|
|
Qualcomm, Inc.
|
570,704
|
62,743
|
|
|
SolarEdge Technologies, Inc. (a)
|
23,300
|
6,600
|
|
|
Synaptics, Inc. (a)
|
146,949
|
13,984
|
|
|
Taiwan Semiconductor Manufacturing Co. Ltd. sponsored ADR
|
420,900
|
31,353
|
|
|
681,514
|
|||
|
Software - 8.3%
|
|||
|
Adobe, Inc. (a)
|
387,656
|
130,458
|
|
|
Aspen Technology, Inc. (a)
|
7,000
|
1,438
|
|
|
Atlassian Corp. PLC (a)(e)
|
50,421
|
6,488
|
|
|
Autodesk, Inc. (a)
|
106,931
|
19,982
|
|
|
Cadence Design Systems, Inc. (a)
|
199,457
|
32,041
|
|
|
Check Point Software Technologies Ltd. (a)
|
46,023
|
5,806
|
|
|
Clear Secure, Inc. (e)
|
189,900
|
5,209
|
|
|
Fair Isaac Corp. (a)
|
2,626
|
1,572
|
|
|
Fortinet, Inc. (a)
|
151,365
|
7,400
|
|
|
HashiCorp, Inc.
|
7,000
|
191
|
|
|
Intuit, Inc.
|
96,362
|
37,506
|
|
|
Magic Leap, Inc.:
|
|||
|
Class A (a)(c)
|
30,863
|
309
|
|
|
warrants (a)(c)
|
46,794
|
469
|
|
|
Microsoft Corp.
|
3,615,215
|
867,001
|
|
|
Oracle Corp.
|
25,300
|
2,068
|
|
|
Roper Technologies, Inc.
|
23,000
|
9,938
|
|
|
Salesforce.com, Inc. (a)
|
495,893
|
65,750
|
|
|
Samsara, Inc. (e)
|
85,200
|
1,059
|
|
|
ServiceNow, Inc. (a)
|
13,299
|
5,164
|
|
|
Stripe, Inc. Class B (a)(b)(c)
|
83,200
|
1,865
|
|
|
Tanium, Inc. Class B (a)(b)(c)
|
1,259,978
|
9,173
|
|
|
Tenable Holdings, Inc. (a)
|
353,700
|
13,494
|
|
|
Volue A/S (a)
|
365,396
|
1,050
|
|
|
Zoom Video Communications, Inc. Class A (a)
|
13,000
|
881
|
|
|
1,226,312
|
|||
|
Technology Hardware, Storage & Peripherals - 3.7%
|
|||
|
Apple, Inc.
|
3,864,310
|
502,090
|
|
|
Dell Technologies, Inc.
|
22,471
|
904
|
|
|
Pure Storage, Inc. Class A (a)
|
40,900
|
1,094
|
|
|
Samsung Electronics Co. Ltd.
|
1,233,890
|
54,193
|
|
|
558,281
|
|||
|
TOTAL INFORMATION TECHNOLOGY
|
2,942,957
|
||
|
MATERIALS - 4.4%
|
|||
|
Chemicals - 1.1%
|
|||
|
Air Products & Chemicals, Inc.
|
27,400
|
8,446
|
|
|
Albemarle Corp.
|
56,300
|
12,209
|
|
|
CF Industries Holdings, Inc.
|
397,782
|
33,891
|
|
|
Corteva, Inc.
|
659,000
|
38,736
|
|
|
Linde PLC
|
9,000
|
2,936
|
|
|
Nutrien Ltd.
|
84,900
|
6,198
|
|
|
Sherwin-Williams Co.
|
178,769
|
42,427
|
|
|
The Mosaic Co.
|
350,500
|
15,376
|
|
|
Westlake Corp.
|
70,287
|
7,207
|
|
|
167,426
|
|||
|
Metals & Mining - 3.3%
|
|||
|
B2Gold Corp.
|
13,035,880
|
46,309
|
|
|
Barrick Gold Corp. (Canada)
|
463,269
|
7,941
|
|
|
Cleveland-Cliffs, Inc. (a)
|
403,970
|
6,508
|
|
|
Franco-Nevada Corp.
|
1,059,736
|
144,458
|
|
|
Freeport-McMoRan, Inc.
|
2,285,600
|
86,853
|
|
|
Glencore PLC
|
700,400
|
4,671
|
|
|
Ivanhoe Electric, Inc. (a)
|
76,997
|
936
|
|
|
Ivanhoe Mines Ltd. (a)
|
8,031,618
|
63,470
|
|
|
Novagold Resources, Inc. (a)
|
3,196,709
|
19,100
|
|
|
Nucor Corp.
|
380,625
|
50,170
|
|
|
POSCO sponsored ADR (e)
|
17,700
|
964
|
|
|
Steel Dynamics, Inc.
|
301,696
|
29,476
|
|
|
Wheaton Precious Metals Corp.
|
613,600
|
23,973
|
|
|
484,829
|
|||
|
TOTAL MATERIALS
|
652,255
|
||
|
REAL ESTATE - 0.1%
|
|||
|
Equity Real Estate Investment Trusts (REITs) - 0.1%
|
|||
|
Equity Commonwealth
|
255,024
|
6,368
|
|
|
Gaming & Leisure Properties
|
4,888
|
255
|
|
|
Prologis (REIT), Inc.
|
25,702
|
2,897
|
|
|
9,520
|
|||
|
UTILITIES - 1.0%
|
|||
|
Electric Utilities - 0.9%
|
|||
|
Constellation Energy Corp.
|
521,200
|
44,933
|
|
|
NextEra Energy, Inc.
|
219,462
|
18,347
|
|
|
PG&E Corp. (a)
|
2,762,100
|
44,912
|
|
|
Southern Co.
|
439,400
|
31,378
|
|
|
139,570
|
|||
|
Multi-Utilities - 0.1%
|
|||
|
Public Service Enterprise Group, Inc.
|
161,000
|
9,864
|
|
|
TOTAL UTILITIES
|
149,434
|
||
|
TOTAL COMMON STOCKS
(Cost $7,793,836)
|
14,473,291
|
||
|
Preferred Stocks - 2.1%
|
|||
|
Shares
|
Value ($)
(000s)
|
||
|
Convertible Preferred Stocks - 1.9%
|
|||
|
COMMUNICATION SERVICES - 0.2%
|
|||
|
Interactive Media & Services - 0.2%
|
|||
|
ByteDance Ltd. Series E1 (a)(b)(c)
|
130,945
|
23,562
|
|
|
Reddit, Inc.:
|
|||
|
Series E(a)(b)(c)
|
30,200
|
1,131
|
|
|
Series F(a)(b)(c)
|
127,549
|
4,778
|
|
|
29,471
|
|||
|
CONSUMER DISCRETIONARY - 0.2%
|
|||
|
Automobiles - 0.0%
|
|||
|
Rad Power Bikes, Inc.:
|
|||
|
Series A(a)(b)(c)
|
61,855
|
229
|
|
|
Series C(a)(b)(c)
|
243,394
|
901
|
|
|
Series D(a)(b)(c)
|
411,659
|
1,523
|
|
|
2,653
|
|||
|
Hotels, Restaurants & Leisure - 0.0%
|
|||
|
Discord, Inc. Series I (a)(b)(c)
|
2,800
|
994
|
|
|
Internet & Direct Marketing Retail - 0.0%
|
|||
|
Circle Internet Financial Ltd. Series F (b)(c)
|
68,639
|
1,802
|
|
|
Textiles, Apparel & Luxury Goods - 0.2%
|
|||
|
Bolt Threads, Inc.:
|
|||
|
Series D(a)(b)(c)
|
1,324,673
|
11,909
|
|
|
Series E(a)(b)(c)
|
627,820
|
5,644
|
|
|
17,553
|
|||
|
TOTAL CONSUMER DISCRETIONARY
|
23,002
|
||
|
CONSUMER STAPLES - 0.0%
|
|||
|
Food & Staples Retailing - 0.0%
|
|||
|
GoBrands, Inc.:
|
|||
|
Series G(a)(b)(c)
|
8,102
|
1,173
|
|
|
Series H(a)(b)(c)
|
10,223
|
1,480
|
|
|
2,653
|
|||
|
Food Products - 0.0%
|
|||
|
Bowery Farming, Inc. Series C1 (a)(b)(c)
|
82,543
|
1,676
|
|
|
TOTAL CONSUMER STAPLES
|
4,329
|
||
|
HEALTH CARE - 0.1%
|
|||
|
Biotechnology - 0.0%
|
|||
|
ElevateBio LLC Series C (a)(b)(c)
|
594,600
|
2,176
|
|
|
Intarcia Therapeutics, Inc. Series CC (a)(b)(c)
|
516,522
|
0
|
|
|
2,176
|
|||
|
Health Care Providers & Services - 0.1%
|
|||
|
Lyra Health, Inc.:
|
|||
|
Series E(a)(b)(c)
|
270,000
|
3,839
|
|
|
Series F(a)(b)(c)
|
10,070
|
143
|
|
|
Somatus, Inc. Series E (b)(c)
|
2,206
|
1,895
|
|
|
5,877
|
|||
|
TOTAL HEALTH CARE
|
8,053
|
||
|
INDUSTRIALS - 1.4%
|
|||
|
Aerospace & Defense - 1.4%
|
|||
|
Relativity Space, Inc. Series E (a)(b)(c)
|
308,359
|
5,726
|
|
|
Space Exploration Technologies Corp.:
|
|||
|
Series G(a)(b)(c)
|
145,254
|
111,846
|
|
|
Series H(a)(b)(c)
|
42,094
|
32,412
|
|
|
Series N(a)(b)(c)
|
66,208
|
50,980
|
|
|
200,964
|
|||
|
Air Freight & Logistics - 0.0%
|
|||
|
Zipline International, Inc. Series E (a)(b)(c)
|
208,789
|
4,627
|
|
|
Construction & Engineering - 0.0%
|
|||
|
Beta Technologies, Inc. Series B, 6.00% (b)(c)
|
52,096
|
3,405
|
|
|
TOTAL INDUSTRIALS
|
208,996
|
||
|
INFORMATION TECHNOLOGY - 0.0%
|
|||
|
Software - 0.0%
|
|||
|
Nuro, Inc.:
|
|||
|
Series C(a)(b)(c)
|
491,080
|
3,747
|
|
|
Series D(a)(b)(c)
|
94,265
|
719
|
|
|
Stripe, Inc. Series H (a)(b)(c)
|
34,900
|
782
|
|
|
Tenstorrent, Inc. Series C1 (a)(b)(c)
|
36,600
|
1,907
|
|
|
7,155
|
|||
|
TOTAL CONVERTIBLE PREFERRED STOCKS
|
281,006
|
||
|
Nonconvertible Preferred Stocks - 0.2%
|
|||
|
CONSUMER DISCRETIONARY - 0.1%
|
|||
|
Internet & Direct Marketing Retail - 0.1%
|
|||
|
Circle Internet Financial Ltd. Series E (b)(c)
|
615,508
|
16,157
|
|
|
ENERGY - 0.1%
|
|||
|
Oil, Gas & Consumable Fuels - 0.1%
|
|||
|
Petroleo Brasileiro SA - Petrobras sponsored ADR
|
1,111,147
|
11,834
|
|
|
INFORMATION TECHNOLOGY - 0.0%
|
|||
|
Software - 0.0%
|
|||
|
Magic Leap, Inc. Series AA (a)(c)
|
325,855
|
5,054
|
|
|
TOTAL NONCONVERTIBLE PREFERRED STOCKS
|
33,045
|
||
|
TOTAL PREFERRED STOCKS
(Cost $185,767)
|
314,051
|
||
|
Preferred Securities - 0.0%
|
|||
|
Principal
Amount (g)
(000s)
|
Value ($)
(000s)
|
||
|
HEALTH CARE - 0.0%
|
|||
|
Biotechnology - 0.0%
|
|||
|
Intarcia Therapeutics, Inc. 6% 7/18/23 (b)(c)(h)
|
2,280
|
0
|
|
|
INFORMATION TECHNOLOGY - 0.0%
|
|||
|
Software - 0.0%
|
|||
|
Tenstorrent, Inc. 0% (b)(c)(i)
|
2,040
|
1,787
|
|
|
TOTAL PREFERRED SECURITIES
(Cost $4,320)
|
1,787
|
||
|
Money Market Funds - 0.8%
|
|||
|
Shares
|
Value ($)
(000s)
|
||
|
Fidelity Cash Central Fund 4.37% (j)
|
68,569,059
|
68,583
|
|
|
Fidelity Securities Lending Cash Central Fund 4.37% (j)(k)
|
52,373,587
|
52,379
|
|
|
TOTAL MONEY MARKET FUNDS
(Cost $120,962)
|
120,962
|
||
|
TOTAL INVESTMENT IN SECURITIES - 100.4%
(Cost $8,104,885)
|
14,910,091
|
|
NET OTHER ASSETS (LIABILITIES) - (0.4)%
|
(65,414)
|
|
NET ASSETS - 100.0%
|
14,844,677
|
|
(a)
|
Non-income producing
|
|
(b)
|
Restricted securities (including private placements) - Investment in securities not registered under the Securities Act of 1933 (excluding 144A issues). At the end of the period, the value of restricted securities (excluding 144A issues) amounted to $606,838,000 or 4.1% of net assets.
|
|
(c)
|
Level 3 security
|
|
(d)
|
Security exempt from registration under Rule 144A of the Securities Act of 1933. These securities may be resold in transactions exempt from registration, normally to qualified institutional buyers. At the end of the period, the value of these securities amounted to $8,333,000 or 0.1% of net assets.
|
|
(e)
|
Security or a portion of the security is on loan at period end.
|
|
(f)
|
Investment is owned by a wholly-owned subsidiary (Subsidiary) that is treated as a corporation for U.S. tax purposes.
|
|
(g)
|
Amount is stated in United States dollars unless otherwise noted.
|
|
(h)
|
Non-income producing - Security is in default.
|
|
(i)
|
Security is perpetual in nature with no stated maturity date.
|
|
(j)
|
Affiliated fund that is generally available only to investment companies and other accounts managed by Fidelity Investments. The rate quoted is the annualized seven-day yield of the fund at period end. A complete unaudited listing of the fund's holdings as of its most recent quarter end is available upon request. In addition, each Fidelity Central Fund's financial statements, which are not covered by the Fund's Report of Independent Registered Public Accounting Firm, are available on the SEC's website or upon request.
|
|
(k)
|
Investment made with cash collateral received from securities on loan.
|
|
Additional information on each restricted holding is as follows:
|
||
|
Security
|
Acquisition Date
|
Acquisition Cost ($)
(000s)
|
|
ASAC II LP
|
10/10/13
|
725
|
|
Beta Technologies, Inc. Series B, 6.00%
|
4/04/22
|
5,375
|
|
Blu Investments LLC
|
5/21/20
|
170
|
|
Bolt Threads, Inc. Series D
|
12/13/17
|
21,247
|
|
Bolt Threads, Inc. Series E
|
2/07/20
|
9,657
|
|
Bowery Farming, Inc. Series C1
|
5/18/21
|
4,973
|
|
ByteDance Ltd. Series E1
|
11/18/20
|
14,348
|
|
Circle Internet Financial Ltd. Series E
|
5/11/21
|
9,990
|
|
Circle Internet Financial Ltd. Series F
|
5/09/22
|
2,892
|
|
Discord, Inc. Series I
|
9/15/21
|
1,542
|
|
ElevateBio LLC Series C
|
3/09/21
|
2,494
|
|
Epic Games, Inc.
|
7/13/20 - 7/30/20
|
13,743
|
|
Fanatics, Inc. Class A
|
8/13/20 - 12/15/21
|
12,264
|
|
GoBrands, Inc. Series G
|
3/02/21
|
2,023
|
|
GoBrands, Inc. Series H
|
7/22/21
|
3,972
|
|
I-Pulse, Inc.
|
3/18/10
|
81
|
|
Intarcia Therapeutics, Inc. Series CC
|
11/14/12
|
7,040
|
|
Intarcia Therapeutics, Inc. 6% 7/18/23
|
1/03/20
|
2,280
|
|
Lyra Health, Inc. Series E
|
1/14/21
|
2,472
|
|
Lyra Health, Inc. Series F
|
6/04/21
|
158
|
|
Nuro, Inc. Series C
|
10/30/20
|
6,411
|
|
Nuro, Inc. Series D
|
10/29/21
|
1,965
|
|
P3 Health Partners, Inc.
|
5/25/21
|
3,954
|
|
Rad Power Bikes, Inc.
|
1/21/21
|
2,289
|
|
Rad Power Bikes, Inc. Series A
|
1/21/21
|
298
|
|
Rad Power Bikes, Inc. Series C
|
1/21/21
|
1,174
|
|
Rad Power Bikes, Inc. Series D
|
9/17/21
|
3,945
|
|
Reddit, Inc. Series E
|
5/18/21
|
1,283
|
|
Reddit, Inc. Series F
|
8/11/21
|
7,882
|
|
Relativity Space, Inc. Series E
|
5/27/21
|
7,041
|
|
Somatus, Inc. Series E
|
1/31/22
|
1,925
|
|
Space Exploration Technologies Corp. Class A
|
10/16/15 - 2/16/21
|
29,628
|
|
Space Exploration Technologies Corp. Class C
|
9/11/17
|
614
|
|
Space Exploration Technologies Corp. Series G
|
1/20/15
|
11,251
|
|
Space Exploration Technologies Corp. Series H
|
8/04/17
|
5,683
|
|
Space Exploration Technologies Corp. Series N
|
8/04/20
|
17,876
|
|
Starling Bank Ltd. Series D
|
6/18/21 - 4/05/22
|
7,252
|
|
Stripe, Inc. Class B
|
5/18/21
|
3,339
|
|
Stripe, Inc. Series H
|
3/15/21
|
1,400
|
|
Tanium, Inc. Class B
|
4/21/17 - 9/18/20
|
9,907
|
|
Tenstorrent, Inc. Series C1
|
4/23/21
|
2,176
|
|
Tenstorrent, Inc. 0%
|
4/23/21
|
2,040
|
|
TulCo LLC
|
8/24/17
|
5,885
|
|
Veterinary Emergency Group LLC Class A
|
9/16/21 - 12/16/22
|
6,613
|
|
X Holdings I, Inc.
|
10/25/22
|
9,710
|
|
Zipline International, Inc.
|
10/12/21
|
2,697
|
|
Zipline International, Inc. Series E
|
12/21/20
|
6,813
|
|
Affiliate (Amounts in thousands)
|
Value,
beginning
of period ($)
|
Purchases ($)
|
Sales
Proceeds ($)
|
Dividend
Income ($)
|
Realized
Gain (loss) ($)
|
Change in
Unrealized
appreciation
(depreciation) ($)
|
Value,
end
of period ($)
|
% ownership,
end
of period
|
|
Fidelity Cash Central Fund 4.37%
|
218,233
|
5,851,716
|
6,001,366
|
8,284
|
-
|
-
|
68,583
|
0.2%
|
|
Fidelity Securities Lending Cash Central Fund 4.37%
|
23,793
|
836,294
|
807,708
|
1,952
|
-
|
-
|
52,379
|
0.2%
|
|
Total
|
242,026
|
6,688,010
|
6,809,074
|
10,236
|
-
|
-
|
120,962
|
|
|
Valuation Inputs at Reporting Date:
|
||||
|
Description
(Amounts in thousands)
|
Total ($)
|
Level 1 ($)
|
Level 2 ($)
|
Level 3 ($)
|
|
Investments in Securities:
|
||||
|
Equities:
|
||||
|
Communication Services
|
1,913,366
|
1,844,911
|
19,493
|
48,962
|
|
Consumer Discretionary
|
1,579,760
|
1,457,914
|
52,497
|
69,349
|
|
Consumer Staples
|
384,871
|
350,667
|
29,875
|
4,329
|
|
Energy
|
1,188,051
|
1,173,749
|
14,302
|
-
|
|
Financials
|
2,068,924
|
2,038,958
|
2,510
|
27,456
|
|
Health Care
|
2,643,708
|
2,458,377
|
167,042
|
18,289
|
|
Industrials
|
1,242,287
|
810,832
|
19,143
|
412,312
|
|
Information Technology
|
2,955,166
|
2,905,070
|
20,638
|
29,458
|
|
Materials
|
652,255
|
647,584
|
4,671
|
-
|
|
Real Estate
|
9,520
|
9,520
|
-
|
-
|
|
Utilities
|
149,434
|
149,434
|
-
|
-
|
|
Preferred Securities
|
1,787
|
-
|
-
|
1,787
|
|
Money Market Funds
|
120,962
|
120,962
|
-
|
-
|
|
Total Investments in Securities:
|
14,910,091
|
13,967,978
|
330,171
|
611,942
|
|
|
||||
|
Net Unrealized Depreciation on Unfunded Commitments
|
(1,477)
|
-
|
-
|
(1,477)
|
|
Total
|
(1,477)
|
-
|
-
|
(1,477)
|
|
(Amounts in thousands)
|
|||
|
Investments in Securities:
|
|||
|
Equities - Industrials
|
|||
|
Beginning Balance
|
$
|
332,694
|
|
|
Net Realized Gain (Loss) on Investment Securities
|
-
|
||
|
Net Unrealized Gain (Loss) on Investment Securities
|
79,304
|
||
|
Cost of Purchases
|
5,375
|
||
|
Proceeds of Sales
|
-
|
||
|
Amortization/Accretion
|
-
|
||
|
Transfers into Level 3
|
-
|
||
|
Transfers out of Level 3
|
(5,061)
|
||
|
Ending Balance
|
$
|
412,312
|
|
|
The change in unrealized gain (loss) for the period attributable to Level 3 securities held at December 31, 2022
|
$
|
79,304
|
|
|
Other Investments in Securities
|
|||
|
Beginning Balance
|
$
|
217,060
|
|
|
Net Realized Gain (Loss) on Investment Securities
|
(27,940)
|
||
|
Net Unrealized Gain (Loss) on Investment Securities
|
(1,281)
|
||
|
Cost of Purchases
|
18,138
|
||
|
Proceeds of Sales
|
(22,490)
|
||
|
Amortization/Accretion
|
-
|
||
|
Transfers into Level 3
|
16,157
|
||
|
Transfers out of Level 3
|
(14)
|
||
|
Ending Balance
|
$
|
199,630
|
|
|
The change in unrealized gain (loss) for the period attributable to Level 3 securities held at December 31, 2022
|
$
|
(38,554)
|
|
|
The information used in the above reconciliation represents fiscal year to date activity for any Investments in Securities identified as using Level 3 inputs at either the beginning or the end of the current fiscal period. Cost of purchases and proceeds of sales may include securities received and/or delivered through in-kind transactions. Transfers into Level 3 were attributable to a lack of observable market data resulting from decreases in market activity, decreases in liquidity, security restructurings or corporate actions. Transfers out of Level 3 were attributable to observable market data becoming available for those securities. Transfers in or out of Level 3 represent the beginning value of any Security or Instrument where a change in the pricing level occurred from the beginning to the end of the period. The cost of purchases and the proceeds of sales may include securities received or delivered through corporate actions or exchanges. Realized and unrealized gains (losses) disclosed in the reconciliation are included in Net Gain (Loss) on the Fund's Statement of Operations.
|
|||
|
Statement of Assets and Liabilities
|
||||
|
Amounts in thousands (except per-share amounts)
|
December 31, 2022
|
|||
|
Assets
|
||||
|
Investment in securities, at value (including securities loaned of $50,689) - See accompanying schedule:
|
||||
|
Unaffiliated issuers (cost $7,983,923)
|
$
|
14,789,129
|
||
|
Fidelity Central Funds (cost $120,962)
|
120,962
|
|||
|
Total Investment in Securities (cost $8,104,885)
|
$
|
14,910,091
|
||
|
Cash
|
1
|
|||
|
Restricted cash
|
3,049
|
|||
|
Foreign currency held at value (cost $91)
|
90
|
|||
|
Receivable for investments sold
|
||||
|
Regular delivery
|
$
|
32,489
|
||
|
Delayed delivery
|
14,519
|
|||
|
Receivable for fund shares sold
|
6,230
|
|||
|
Dividends receivable
|
8,417
|
|||
|
Distributions receivable from Fidelity Central Funds
|
747
|
|||
|
Prepaid expenses
|
21
|
|||
|
Other receivables
|
892
|
|||
|
Total assets
|
14,976,546
|
|||
|
Liabilities
|
||||
|
Unrealized depreciation on unfunded commitments
|
$1,477
|
|||
|
Payable for fund shares redeemed
|
67,431
|
|||
|
Accrued management fee
|
2,990
|
|||
|
Distribution and service plan fees payable
|
2,221
|
|||
|
Other affiliated payables
|
2,235
|
|||
|
Other payables and accrued expenses
|
3,166
|
|||
|
Collateral on securities loaned
|
52,349
|
|||
|
Total Liabilities
|
131,869
|
|||
|
Net Assets
|
$
|
14,844,677
|
||
|
Net Assets consist of:
|
||||
|
Paid in capital
|
$
|
7,939,337
|
||
|
Total accumulated earnings (loss)
|
6,905,340
|
|||
|
Net Assets
|
$
|
14,844,677
|
||
|
Net Asset Value and Maximum Offering Price
|
||||
|
Class A :
|
||||
|
Net Asset Value
and redemption price per share ($5,101,386 ÷ 200,049 shares)
(a)
|
$
|
25.50
|
||
|
Maximum offering price per share (100/94.25 of $25.50)
|
$
|
27.06
|
||
|
Class M :
|
||||
|
Net Asset Value
and redemption price per share ($1,254,016 ÷ 52,586 shares)
(a)
|
$
|
23.85
|
||
|
Maximum offering price per share (100/96.50 of $23.85)
|
$
|
24.72
|
||
|
Class C :
|
||||
|
Net Asset Value
and offering price per share ($672,129 ÷ 34,635 shares)
(a)
|
$
|
19.41
|
||
|
Class I :
|
||||
|
Net Asset Value
, offering price and redemption price per share ($6,584,612 ÷ 247,585 shares)
|
$
|
26.60
|
||
|
Class Z :
|
||||
|
Net Asset Value
, offering price and redemption price per share ($1,232,534 ÷ 46,163 shares)
|
$
|
26.70
|
||
|
(a)Redemption price per
share
is equal to net asset value less any applicable contingent deferred sales charge.
|
||||
|
Statement of Operations
|
||||
|
Amounts in thousands
|
Year ended
December 31, 2022
|
|||
|
Investment Income
|
||||
|
Dividends
|
$
|
183,952
|
||
|
Income from Fidelity Central Funds (including $1,952 from security lending)
|
10,236
|
|||
|
Total Income
|
194,188
|
|||
|
Expenses
|
||||
|
Management fee
|
||||
|
Basic fee
|
$
|
101,137
|
||
|
Performance adjustment
|
(48,829)
|
|||
|
Transfer agent fees
|
29,256
|
|||
|
Distribution and service plan fees
|
32,178
|
|||
|
Accounting fees
|
1,592
|
|||
|
Custodian fees and expenses
|
292
|
|||
|
Independent trustees' fees and expenses
|
69
|
|||
|
Registration fees
|
216
|
|||
|
Audit
|
164
|
|||
|
Legal
|
22
|
|||
|
Miscellaneous
|
98
|
|||
|
Total expenses before reductions
|
116,195
|
|||
|
Expense reductions
|
(694)
|
|||
|
Total expenses after reductions
|
115,501
|
|||
|
Net Investment income (loss)
|
78,687
|
|||
|
Realized and Unrealized Gain (Loss)
|
||||
|
Net realized gain (loss) on:
|
||||
|
Investment Securities:
|
||||
|
Unaffiliated issuers(net of foreign taxes of $910)
|
2,614,761
|
|||
|
Foreign currency transactions
|
(560)
|
|||
|
Total net realized gain (loss)
|
2,614,201
|
|||
|
Change in net unrealized appreciation (depreciation) on:
|
||||
|
Investment Securities:
|
||||
|
Unaffiliated issuers
(net of decrease in deferred foreign taxes of $1,842)
|
(9,618,317)
|
|||
|
Unfunded commitments
|
(1,350)
|
|||
|
Assets and liabilities in foreign currencies
|
(39)
|
|||
|
Total change in net unrealized appreciation (depreciation)
|
(9,619,706)
|
|||
|
Net gain (loss)
|
(7,005,505)
|
|||
|
Net increase (decrease) in net assets resulting from operations
|
$
|
(6,926,818)
|
||
|
Statement of Changes in Net Assets
|
||||
|
Amount in thousands
|
Year ended
December 31, 2022
|
Year ended
December 31, 2021
|
||
|
Increase (Decrease) in Net Assets
|
||||
|
Operations
|
||||
|
Net investment income (loss)
|
$
|
78,687
|
$
|
(81,474)
|
|
Net realized gain (loss)
|
2,614,201
|
3,366,658
|
||
|
Change in net unrealized appreciation (depreciation)
|
(9,619,706)
|
2,337,916
|
||
|
Net increase (decrease) in net assets resulting from operations
|
(6,926,818)
|
5,623,100
|
||
|
Distributions to shareholders
|
(2,142,096)
|
(3,135,641)
|
||
|
Share transactions - net increase (decrease)
|
(2,521,800)
|
(953,584)
|
||
|
Total increase (decrease) in net assets
|
(11,590,714)
|
1,533,875
|
||
|
Net Assets
|
||||
|
Beginning of period
|
26,435,391
|
24,901,516
|
||
|
End of period
|
$
|
14,844,677
|
$
|
26,435,391
|
|
Fidelity Advisor® New Insights Fund Class A
|
|
Years ended December 31,
|
2022
|
2021
|
2020
|
2019
|
2018
|
|||||
|
Selected Per-Share Data
|
||||||||||
|
Net asset value, beginning of period
|
$
|
40.22
|
$
|
36.57
|
$
|
32.08
|
$
|
26.50
|
$
|
31.38
|
|
Income from Investment Operations
|
||||||||||
|
Net investment income (loss)
A,B
|
.10
|
(.16)
|
(.10)
|
.06
|
.03
|
|||||
|
Net realized and unrealized gain (loss)
|
(10.99)
|
8.90
|
7.57
|
7.60
|
(1.26)
|
|||||
|
Total from investment operations
|
(10.89)
|
8.74
|
7.47
|
7.66
|
(1.23)
|
|||||
|
Distributions from net investment income
|
(.12)
|
-
|
-
C
|
(.04)
|
-
|
|||||
|
Distributions from net realized gain
|
(3.71)
|
(5.09)
|
(2.97)
|
(2.04)
|
(3.65)
|
|||||
|
Total distributions
|
(3.83)
|
(5.09)
|
(2.98)
D
|
(2.08)
|
(3.65)
|
|||||
|
Net asset value, end of period
|
$
|
25.50
|
$
|
40.22
|
$
|
36.57
|
$
|
32.08
|
$
|
26.50
|
|
Total Return
E,F
|
(27.48)%
|
24.30%
|
23.64%
|
29.15%
|
(4.42)%
|
|||||
|
Ratios to Average Net Assets
B,G,H
|
||||||||||
|
Expenses before reductions
|
.70%
|
.93%
|
1.10%
|
1.08%
|
1.04%
|
|||||
|
Expenses net of fee waivers, if any
|
.70%
|
.93%
|
1.10%
|
1.08%
|
1.04%
|
|||||
|
Expenses net of all reductions
|
.70%
|
.93%
|
1.10%
|
1.07%
|
1.04%
|
|||||
|
Net investment income (loss)
|
.32%
|
(.40)%
|
(.30)%
|
.20%
|
.08%
|
|||||
|
Supplemental Data
|
||||||||||
|
Net assets, end of period (in millions)
|
$
|
5,101
|
$
|
8,124
|
$
|
6,753
|
$
|
6,156
|
$
|
4,747
|
|
Portfolio turnover rate
I
|
32%
J
|
29%
|
53%
|
27%
J
|
36%
|
|
Fidelity Advisor® New Insights Fund Class M
|
|
Years ended December 31,
|
2022
|
2021
|
2020
|
2019
|
2018
|
|||||
|
Selected Per-Share Data
|
||||||||||
|
Net asset value, beginning of period
|
$
|
37.93
|
$
|
34.81
|
$
|
30.73
|
$
|
25.49
|
$
|
30.39
|
|
Income from Investment Operations
|
||||||||||
|
Net investment income (loss)
A,B
|
.02
|
(.25)
|
(.17)
|
(.01)
|
(.05)
|
|||||
|
Net realized and unrealized gain (loss)
|
(10.34)
|
8.46
|
7.22
|
7.29
|
(1.20)
|
|||||
|
Total from investment operations
|
(10.32)
|
8.21
|
7.05
|
7.28
|
(1.25)
|
|||||
|
Distributions from net investment income
|
(.05)
|
-
|
-
|
-
|
-
|
|||||
|
Distributions from net realized gain
|
(3.71)
|
(5.09)
|
(2.97)
|
(2.04)
|
(3.65)
|
|||||
|
Total distributions
|
(3.76)
|
(5.09)
|
(2.97)
|
(2.04)
|
(3.65)
|
|||||
|
Net asset value, end of period
|
$
|
23.85
|
$
|
37.93
|
$
|
34.81
|
$
|
30.73
|
$
|
25.49
|
|
Total Return
C,D
|
(27.64)%
|
24.00%
|
23.33%
|
28.79%
|
(4.64)%
|
|||||
|
Ratios to Average Net Assets
B,E,F
|
||||||||||
|
Expenses before reductions
|
.95%
|
1.18%
|
1.35%
|
1.32%
|
1.29%
|
|||||
|
Expenses net of fee waivers, if any
|
.94%
|
1.18%
|
1.35%
|
1.32%
|
1.29%
|
|||||
|
Expenses net of all reductions
|
.94%
|
1.18%
|
1.35%
|
1.32%
|
1.29%
|
|||||
|
Net investment income (loss)
|
.07%
|
(.65)%
|
(.54)%
|
(.05)%
|
(.17)%
|
|||||
|
Supplemental Data
|
||||||||||
|
Net assets, end of period (in millions)
|
$
|
1,254
|
$
|
2,027
|
$
|
1,856
|
$
|
1,844
|
$
|
1,638
|
|
Portfolio turnover rate
G
|
32%
H
|
29%
|
53%
|
27%
H
|
36%
|
|
Fidelity Advisor® New Insights Fund Class C
|
|
Years ended December 31,
|
2022
|
2021
|
2020
|
2019
|
2018
|
|||||
|
Selected Per-Share Data
|
||||||||||
|
Net asset value, beginning of period
|
$
|
31.89
|
$
|
30.09
|
$
|
27.03
|
$
|
22.73
|
$
|
27.63
|
|
Income from Investment Operations
|
||||||||||
|
Net investment income (loss)
A,B
|
(.11)
|
(.38)
|
(.29)
|
(.15)
|
(.19)
|
|||||
|
Net realized and unrealized gain (loss)
|
(8.66)
|
7.27
|
6.32
|
6.49
|
(1.06)
|
|||||
|
Total from investment operations
|
(8.77)
|
6.89
|
6.03
|
6.34
|
(1.25)
|
|||||
|
Distributions from net realized gain
|
(3.71)
|
(5.09)
|
(2.97)
|
(2.04)
|
(3.65)
|
|||||
|
Total distributions
|
(3.71)
|
(5.09)
|
(2.97)
|
(2.04)
|
(3.65)
|
|||||
|
Net asset value, end of period
|
$
|
19.41
|
$
|
31.89
|
$
|
30.09
|
$
|
27.03
|
$
|
22.73
|
|
Total Return
C,D
|
(28.02)%
|
23.36%
|
22.74%
|
28.15%
|
(5.11)%
|
|||||
|
Ratios to Average Net Assets
B,E,F
|
||||||||||
|
Expenses before reductions
|
1.46%
|
1.70%
|
1.86%
|
1.83%
|
1.79%
|
|||||
|
Expenses net of fee waivers, if any
|
1.46%
|
1.69%
|
1.86%
|
1.83%
|
1.79%
|
|||||
|
Expenses net of all reductions
|
1.46%
|
1.69%
|
1.86%
|
1.83%
|
1.79%
|
|||||
|
Net investment income (loss)
|
(.45)%
|
(1.17)%
|
(1.05)%
|
(.55)%
|
(.67)%
|
|||||
|
Supplemental Data
|
||||||||||
|
Net assets, end of period (in millions)
|
$
|
672
|
$
|
1,376
|
$
|
1,973
|
$
|
2,228
|
$
|
2,932
|
|
Portfolio turnover rate
G
|
32%
H
|
29%
|
53%
|
27%
H
|
36%
|
|
Fidelity Advisor® New Insights Fund Class I
|
|
Years ended December 31,
|
2022
|
2021
|
2020
|
2019
|
2018
|
|||||
|
Selected Per-Share Data
|
||||||||||
|
Net asset value, beginning of period
|
$
|
41.73
|
$
|
37.69
|
$
|
32.90
|
$
|
27.14
|
$
|
32.03
|
|
Income from Investment Operations
|
||||||||||
|
Net investment income (loss)
A,B
|
.19
|
(.06)
|
(.01)
|
.15
|
.11
|
|||||
|
Net realized and unrealized gain (loss)
|
(11.41)
|
9.19
|
7.78
|
7.77
|
(1.27)
|
|||||
|
Total from investment operations
|
(11.22)
|
9.13
|
7.77
|
7.92
|
(1.16)
|
|||||
|
Distributions from net investment income
|
(.20)
|
-
|
-
C
|
(.12)
|
(.07)
|
|||||
|
Distributions from net realized gain
|
(3.71)
|
(5.09)
|
(2.97)
|
(2.04)
|
(3.65)
|
|||||
|
Total distributions
|
(3.91)
|
(5.09)
|
(2.98)
D
|
(2.16)
|
(3.73)
D
|
|||||
|
Net asset value, end of period
|
$
|
26.60
|
$
|
41.73
|
$
|
37.69
|
$
|
32.90
|
$
|
27.14
|
|
Total Return
E
|
(27.28)%
|
24.62%
|
23.96%
|
29.42%
|
(4.14)%
|
|||||
|
Ratios to Average Net Assets
B,F,G
|
||||||||||
|
Expenses before reductions
|
.45%
|
.68%
|
.85%
|
.82%
|
.79%
|
|||||
|
Expenses net of fee waivers, if any
|
.44%
|
.68%
|
.85%
|
.82%
|
.79%
|
|||||
|
Expenses net of all reductions
|
.44%
|
.68%
|
.84%
|
.82%
|
.78%
|
|||||
|
Net investment income (loss)
|
.57%
|
(.15)%
|
(.04)%
|
.46%
|
.33%
|
|||||
|
Supplemental Data
|
||||||||||
|
Net assets, end of period (in millions)
|
$
|
6,585
|
$
|
12,335
|
$
|
12,219
|
$
|
13,870
|
$
|
12,581
|
|
Portfolio turnover rate
H
|
32%
I
|
29%
|
53%
|
27%
I
|
36%
|
|
Fidelity Advisor® New Insights Fund Class Z
|
|
Years ended December 31,
|
2022
|
2021
|
2020
|
2019
|
2018
|
|||||
|
Selected Per-Share Data
|
||||||||||
|
Net asset value, beginning of period
|
$
|
41.89
|
$
|
37.77
|
$
|
32.93
|
$
|
27.16
|
$
|
32.06
|
|
Income from Investment Operations
|
||||||||||
|
Net investment income (loss)
A,B
|
.23
|
(.01)
|
.03
|
.18
|
.15
|
|||||
|
Net realized and unrealized gain (loss)
|
(11.47)
|
9.22
|
7.79
|
7.79
|
(1.28)
|
|||||
|
Total from investment operations
|
(11.24)
|
9.21
|
7.82
|
7.97
|
(1.13)
|
|||||
|
Distributions from net investment income
|
(.24)
|
-
|
-
C
|
(.17)
|
(.12)
|
|||||
|
Distributions from net realized gain
|
(3.71)
|
(5.09)
|
(2.97)
|
(2.04)
|
(3.65)
|
|||||
|
Total distributions
|
(3.95)
|
(5.09)
|
(2.98)
D
|
(2.20)
D
|
(3.77)
|
|||||
|
Net asset value, end of period
|
$
|
26.70
|
$
|
41.89
|
$
|
37.77
|
$
|
32.93
|
$
|
27.16
|
|
Total Return
E
|
(27.21)%
|
24.79%
|
24.09%
|
29.60%
|
(4.03)%
|
|||||
|
Ratios to Average Net Assets
B,F,G
|
||||||||||
|
Expenses before reductions
|
.33%
|
.56%
|
.73%
|
.70%
|
.66%
|
|||||
|
Expenses net of fee waivers, if any
|
.32%
|
.56%
|
.73%
|
.70%
|
.66%
|
|||||
|
Expenses net of all reductions
|
.32%
|
.56%
|
.72%
|
.70%
|
.66%
|
|||||
|
Net investment income (loss)
|
.69%
|
(.03)%
|
.08%
|
.58%
|
.46%
|
|||||
|
Supplemental Data
|
||||||||||
|
Net assets, end of period (in millions)
|
$
|
1,233
|
$
|
2,572
|
$
|
2,101
|
$
|
2,306
|
$
|
1,741
|
|
Portfolio turnover rate
H
|
32%
I
|
29%
|
53%
|
27%
I
|
36%
|
|
Fidelity Central Fund
|
Investment Manager
|
Investment Objective
|
Investment Practices
|
Expense Ratio
A
|
|
Fidelity Money Market Central Funds
|
Fidelity Management & Research Company LLC (FMR)
|
Each fund seeks to obtain a high level of current income consistent with the preservation of capital and liquidity.
|
Short-term Investments
|
Less than .005%
|
|
Asset Type
|
Fair Value
|
Valuation Technique(s)
|
Unobservable Input
|
Amount or Range/Weighted Average
|
Impact to Valuation from an Increase in Input
A
|
|
Equities
|
$
610,155
|
Market comparable
|
Enterprise value/EBITDA multiple (EV/EBITDA)
|
5.5 - 21.2 / 11.8
|
Increase
|
|
|
|
|
Enterprise value/Revenue multiple (EV/R)
|
0.8 - 22.6 / 7.8
|
Increase
|
|
|
|
|
Enterprise value/Net income multiple (EV/NI)
|
15.5
|
Increase
|
|
|
|
Recovery value
|
Recovery value
|
$0.00 - $0.17 / $0.16
|
Increase
|
|
|
|
Market approach
|
Transaction price
|
59.45
|
Increase
|
|
|
|
|
Discount rate
|
15.0%
|
Decrease
|
|
|
|
Discounted cash flow
|
Weighted average cost of capital (WACC)
|
30.0%
|
Decrease
|
|
|
|
|
Exit multiple
|
2.0
|
Increase
|
|
|
|
Black scholes
|
Discount rate
|
3.8% - 4.2% / 3.9%
|
Increase
|
|
|
|
|
Probability rate
|
50.0%
|
Increase
|
|
|
|
|
Volatility
|
65.0% - 80.0% / 74.3%
|
Increase
|
|
|
|
|
Term
|
2.0 - 5.0 / 3.7
|
Increase
|
|
Preferred Securities
|
$
1,787
|
Recovery value
|
Recovery value
|
$0.00
|
Increase
|
|
|
|
Market approach
|
Transaction price
|
$100
|
Increase
|
|
|
|
|
Discount rate
|
15.0%
|
Decrease
|
|
|
|
Black scholes
|
Discount rate
|
4.2%
|
Increase
|
|
|
|
|
Volatility
|
70.0%
|
Increase
|
|
|
|
|
Term
|
2.0
|
Increase
|
|
|
|
|
|
|
|
|
Fidelity Advisor New Insights Fund
|
$778
|
|
Gross unrealized appreciation
|
$7,138,742
|
|
Gross unrealized depreciation
|
(459,135)
|
|
Net unrealized appreciation (depreciation)
|
$6,679,607
|
|
Tax Cost
|
$8,229,007
|
|
Undistributed ordinary income
|
$766
|
|
Undistributed long-term capital gain
|
$225,671
|
|
Net unrealized appreciation (depreciation) on securities and other investments
|
$6,679,582
|
|
|
December 31, 2022
|
December 31, 2021
|
|
Ordinary Income
|
$81,763
|
$-
|
|
Long-term Capital Gains
|
2,060,333
|
3,135,641
|
|
Total
|
$2,142,096
|
$3,135,641
|
|
|
Investment to be Acquired
|
Commitment Amount
|
Unrealized Appreciation (Depreciation)
|
|
Fidelity Advisor New Insights Fund
|
Stripe, Inc.
|
$1,477
|
$(1,477)
|
|
|
$ Amount
|
% of Net Assets
|
|
Fidelity Advisor New Insights Fund
|
26,224
|
.18
|
|
|
Purchases ($)
|
Sales ($)
|
|
Fidelity Advisor New Insights Fund
|
5,979,800
|
10,175,350
|
|
|
Shares
|
Total net realized gain or loss
($)
|
Total Proceeds
($)
|
Participating classes
|
|
Fidelity Advisor New Insights Fund
|
7,454
|
226,546
|
257,752
|
Class I
|
|
|
Distribution Fee
|
Service Fee
|
Total Fees
|
Retained by FDC
|
|
Class A
|
- %
|
.25%
|
$15,328
|
$83
|
|
Class M
|
.25%
|
.25%
|
7,588
|
23
|
|
Class C
|
.75%
|
.25%
|
9,262
|
494
|
|
|
|
|
$32,178
|
$600
|
|
|
Retained by FDC
|
|
Class A
|
$599
|
|
Class M
|
56
|
|
Class C
A
|
7
|
|
|
$662
|
|
|
Amount
|
% of Class-Level Average Net Assets
|
|
Class A
|
$9,983
|
.16
|
|
Class M
|
2,442
|
.16
|
|
Class C
|
1,606
|
.17
|
|
Class I
|
14,544
|
.16
|
|
Class Z
|
681
|
.04
|
|
|
$29,256
|
|
|
|
% of Average Net Assets
|
|
Fidelity Advisor New Insights Fund
|
.01
|
|
|
Amount
|
|
Fidelity Advisor New Insights Fund
|
$132
|
|
|
Purchases ($)
|
Sales ($)
|
Realized Gain (Loss) ($)
|
|
Fidelity Advisor New Insights Fund
|
300,711
|
752,484
|
131,349
|
|
|
Amount
|
|
Fidelity Advisor New Insights Fund
|
$37
|
|
|
Total Security Lending Fees Paid to NFS
|
Security Lending Income From Securities Loaned to NFS
|
Value of Securities Loaned to NFS at Period End
|
|
Fidelity Advisor New Insights Fund
|
$207
|
$45
|
$270
|
|
|
Year ended December 31, 2022
|
Year ended
December 31, 2021
|
|
Fidelity Advisor New Insights Fund
|
|
|
|
Distributions to shareholders
|
|
|
|
Class A
|
$711,262
|
$938,651
|
|
Class M
|
180,873
|
250,672
|
|
Class C
|
122,166
|
220,661
|
|
Class I
|
949,674
|
1,435,702
|
|
Class Z
|
178,121
|
289,955
|
|
Total
|
$2,142,096
|
$3,135,641
|
|
|
Shares
|
Shares
|
Dollars
|
Dollars
|
|
|
Year ended December 31, 2022
|
Year ended December 31, 2021
|
Year ended December 31, 2022
|
Year ended December 31, 2021
|
|
Fidelity Advisor New Insights Fund
|
|
|
|
|
|
Class A
|
|
|
|
|
|
Shares sold
|
14,534
|
27,998
|
$453,687
|
$1,105,291
|
|
Reinvestment of distributions
|
24,711
|
22,076
|
668,926
|
879,805
|
|
Shares redeemed
|
(41,188)
|
(32,747)
|
(1,253,113)
|
(1,304,741)
|
|
Net increase (decrease)
|
(1,943)
|
17,327
|
$(130,500)
|
$680,355
|
|
Class M
|
|
|
|
|
|
Shares sold
|
2,238
|
2,632
|
$66,425
|
$100,144
|
|
Reinvestment of distributions
|
6,959
|
6,501
|
176,641
|
244,606
|
|
Shares redeemed
|
(10,054)
|
(8,999)
|
(289,096)
|
(340,462)
|
|
Net increase (decrease)
|
(857)
|
134
|
$(46,030)
|
$4,288
|
|
Class C
|
|
|
|
|
|
Shares sold
|
2,448
|
2,799
|
$60,323
|
$91,154
|
|
Reinvestment of distributions
|
5,756
|
6,852
|
120,314
|
217,347
|
|
Shares redeemed
|
(16,733)
|
(32,074)
|
(408,395)
|
(1,026,544)
|
|
Net increase (decrease)
|
(8,529)
|
(22,423)
|
$(227,758)
|
$(718,043)
|
|
Class I
|
|
|
|
|
|
Shares sold
|
33,193
|
25,638
|
$1,080,944
|
$1,053,539
|
|
Reinvestment of distributions
|
30,686
|
31,697
|
869,015
|
1,307,410
|
|
Shares redeemed
|
(111,868)
|
(85,931)
|
(3,533,622)
|
(3,549,097)
|
|
Net increase (decrease)
|
(47,989)
|
(28,596)
|
$(1,583,663)
|
$(1,188,148)
|
|
Class Z
|
|
|
|
|
|
Shares sold
|
7,855
|
20,438
|
$262,400
|
$859,645
|
|
Reinvestment of distributions
|
5,259
|
6,053
|
149,168
|
251,120
|
|
Shares redeemed
|
(28,356)
|
(20,701)
|
(945,417)
|
(842,801)
|
|
Net increase (decrease)
|
(15,242)
|
5,790
|
$(533,849)
|
$267,964
|
|
The Example is based on an investment of $1,000 invested at the beginning of the period and held for the entire period (July 1, 2022 to December 31, 2022).
|
|
Annualized Expense Ratio-
A
|
Beginning Account Value July 1, 2022
|
Ending Account Value December 31, 2022
|
Expenses Paid During Period-
C
July 1, 2022 to December 31, 2022
|
|||||||
|
Fidelity Advisor® New Insights Fund
|
||||||||||
|
Class A
|
.67%
|
|||||||||
|
Actual
|
$ 1,000
|
$ 1,004.10
|
$ 3.38
|
|||||||
|
Hypothetical-
B
|
$ 1,000
|
$ 1,021.83
|
$ 3.41
|
|||||||
|
Class M
|
.92%
|
|||||||||
|
Actual
|
$ 1,000
|
$ 1,003.20
|
$ 4.65
|
|||||||
|
Hypothetical-
B
|
$ 1,000
|
$ 1,020.57
|
$ 4.69
|
|||||||
|
Class C
|
1.43%
|
|||||||||
|
Actual
|
$ 1,000
|
$ 1,000.30
|
$ 7.21
|
|||||||
|
Hypothetical-
B
|
$ 1,000
|
$ 1,018.00
|
$ 7.27
|
|||||||
|
Class I
|
.42%
|
|||||||||
|
Actual
|
$ 1,000
|
$ 1,005.50
|
$ 2.12
|
|||||||
|
Hypothetical-
B
|
$ 1,000
|
$ 1,023.09
|
$ 2.14
|
|||||||
|
Class Z
|
.30%
|
|||||||||
|
Actual
|
$ 1,000
|
$ 1,006.00
|
$ 1.52
|
|||||||
|
Hypothetical-
B
|
$ 1,000
|
$ 1,023.69
|
$ 1.53
|
|||||||
|
|


Contents
|
Average Annual Total Returns
|
|||
|
Periods ended December 31, 2022
|
Past 1
year
|
Past 5
years
|
Past 10
years
|
|
Fidelity® Series Opportunistic Insights Fund
|
-25.73%
|
9.27%
|
13.36%
|
|
$10,000 Over 10 Years
|
|
Let's say hypothetically that $10,000 was invested in Fidelity® Series Opportunistic Insights Fund on December 31, 2012.
The chart shows how the value of your investment would have changed, and also shows how the Russell 3000® Index performed over the same period.
|
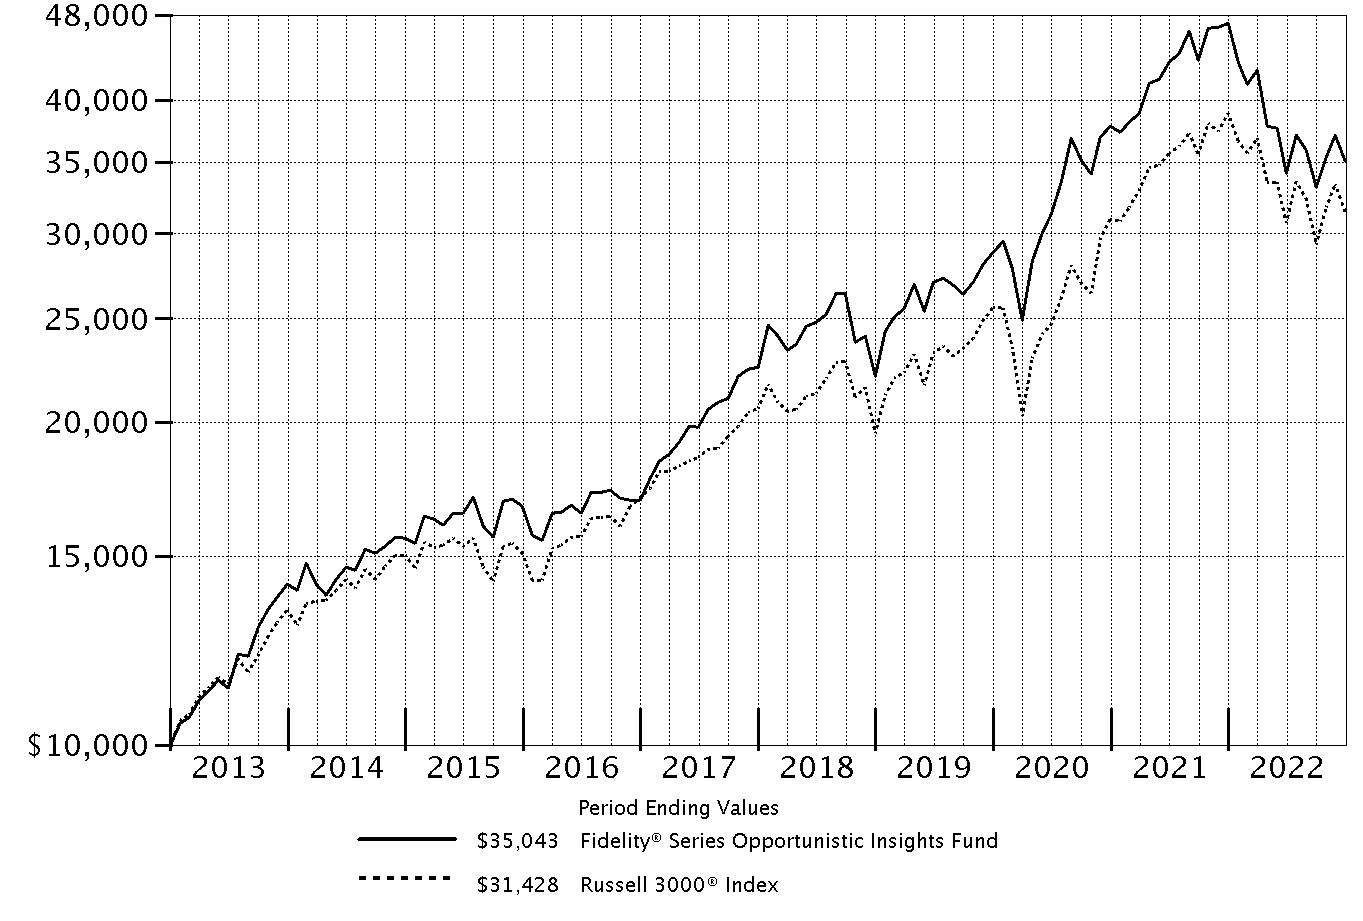
|
|
Top Holdings (% of Fund's net assets)
|
||
|
Berkshire Hathaway, Inc. Class A
|
6.0
|
|
|
Meta Platforms, Inc. Class A
|
4.0
|
|
|
Exxon Mobil Corp.
|
3.7
|
|
|
UnitedHealth Group, Inc.
|
3.7
|
|
|
Apple, Inc.
|
3.1
|
|
|
Amazon.com, Inc.
|
2.9
|
|
|
Microsoft Corp.
|
2.9
|
|
|
Regeneron Pharmaceuticals, Inc.
|
2.4
|
|
|
Chevron Corp.
|
2.2
|
|
|
Eli Lilly & Co.
|
2.2
|
|
|
33.1
|
||
|
Market Sectors (% of Fund's net assets)
|
||
|
Health Care
|
17.6
|
|
|
Information Technology
|
15.7
|
|
|
Financials
|
14.3
|
|
|
Energy
|
13.8
|
|
|
Communication Services
|
9.5
|
|
|
Consumer Discretionary
|
7.8
|
|
|
Industrials
|
6.1
|
|
|
Consumer Staples
|
3.6
|
|
|
Materials
|
3.3
|
|
|
Utilities
|
0.5
|
|
|
Real Estate
|
0.1
|
|
|
Asset Allocation (% of Fund's net assets)
|
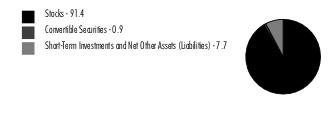
|
|
Foreign investments - 6.6%
|
|
Common Stocks - 91.2%
|
|||
|
Shares
|
Value ($)
|
||
|
COMMUNICATION SERVICES - 9.4%
|
|||
|
Entertainment - 1.8%
|
|||
|
Activision Blizzard, Inc.
|
115,600
|
8,849,180
|
|
|
Liberty Media Corp. Liberty Formula One Series C (a)
|
197,352
|
11,797,703
|
|
|
Netflix, Inc. (a)
|
370,509
|
109,255,694
|
|
|
Universal Music Group NV
|
713,089
|
17,244,410
|
|
|
147,146,987
|
|||
|
Interactive Media & Services - 7.3%
|
|||
|
Alphabet, Inc.:
|
|||
|
Class A (a)
|
1,208,512
|
106,627,014
|
|
|
Class C (a)
|
1,620,200
|
143,760,346
|
|
|
Bumble, Inc. (a)
|
163,700
|
3,445,885
|
|
|
Epic Games, Inc. (a)(b)(c)
|
7,100
|
5,790,192
|
|
|
Meta Platforms, Inc. Class A (a)
|
2,680,554
|
322,577,868
|
|
|
Pinterest, Inc. Class A (a)
|
159,000
|
3,860,520
|
|
|
586,061,825
|
|||
|
Wireless Telecommunication Services - 0.3%
|
|||
|
T-Mobile U.S., Inc. (a)
|
192,400
|
26,936,000
|
|
|
TOTAL COMMUNICATION SERVICES
|
760,144,812
|
||
|
CONSUMER DISCRETIONARY - 7.8%
|
|||
|
Automobiles - 0.7%
|
|||
|
General Motors Co.
|
198,972
|
6,693,418
|
|
|
Harley-Davidson, Inc.
|
402,300
|
16,735,680
|
|
|
Hyundai Motor Co.
|
86,200
|
10,337,743
|
|
|
Rad Power Bikes, Inc. (a)(b)(c)
|
145,919
|
539,900
|
|
|
Rivian Automotive, Inc. (a)
|
11,042
|
203,504
|
|
|
Tesla, Inc. (a)
|
9,500
|
1,170,210
|
|
|
Toyota Motor Corp.
|
1,591,300
|
21,709,383
|
|
|
57,389,838
|
|||
|
Hotels, Restaurants & Leisure - 1.0%
|
|||
|
Airbnb, Inc. Class A (a)
|
301,800
|
25,803,900
|
|
|
Chipotle Mexican Grill, Inc. (a)
|
4,654
|
6,457,378
|
|
|
Evolution AB (d)
|
9,100
|
886,380
|
|
|
Hilton Worldwide Holdings, Inc.
|
118,013
|
14,912,123
|
|
|
Hyatt Hotels Corp. Class A (a)
|
7,708
|
697,189
|
|
|
McDonald's Corp.
|
133,100
|
35,075,843
|
|
|
83,832,813
|
|||
|
Household Durables - 0.3%
|
|||
|
Blu Investments LLC (a)(b)(c)
|
21,093,998
|
6,539
|
|
|
Lennar Corp. Class A
|
223,248
|
20,203,944
|
|
|
20,210,483
|
|||
|
Internet & Direct Marketing Retail - 3.0%
|
|||
|
Amazon.com, Inc. (a)
|
2,769,840
|
232,666,560
|
|
|
Coupang, Inc. Class A (a)
|
428,526
|
6,303,617
|
|
|
Deliveroo PLC Class A (a)(d)
|
1,530,738
|
1,585,952
|
|
|
MercadoLibre, Inc. (a)
|
2,800
|
2,369,472
|
|
|
Uber Technologies, Inc. (a)
|
25,000
|
618,250
|
|
|
Wayfair LLC Class A (a)
|
6,160
|
202,602
|
|
|
243,746,453
|
|||
|
Multiline Retail - 0.3%
|
|||
|
Dollar Tree, Inc. (a)
|
147,551
|
20,869,613
|
|
|
Dollarama, Inc.
|
24,200
|
1,415,360
|
|
|
22,284,973
|
|||
|
Specialty Retail - 2.3%
|
|||
|
Academy Sports & Outdoors, Inc.
|
220,768
|
11,599,151
|
|
|
AutoZone, Inc. (a)
|
4,841
|
11,938,777
|
|
|
Dick's Sporting Goods, Inc.
|
206,485
|
24,838,081
|
|
|
Fanatics, Inc. Class A (a)(b)(c)
|
139,938
|
10,659,077
|
|
|
National Vision Holdings, Inc. (a)(e)
|
100,296
|
3,887,473
|
|
|
O'Reilly Automotive, Inc. (a)
|
44,646
|
37,682,563
|
|
|
The Home Depot, Inc.
|
92,066
|
29,079,967
|
|
|
TJX Companies, Inc.
|
45,000
|
3,582,000
|
|
|
Ulta Beauty, Inc. (a)
|
82,500
|
38,698,275
|
|
|
Williams-Sonoma, Inc.
|
127,814
|
14,688,385
|
|
|
186,653,749
|
|||
|
Textiles, Apparel & Luxury Goods - 0.2%
|
|||
|
China Hongxing Sports Ltd. (a)(c)
|
22,200
|
0
|
|
|
Deckers Outdoor Corp. (a)
|
13,284
|
5,302,441
|
|
|
Dr. Martens Ltd.
|
953,888
|
2,198,005
|
|
|
lululemon athletica, Inc. (a)
|
10,834
|
3,470,997
|
|
|
On Holding AG (a)
|
301,800
|
5,178,888
|
|
|
16,150,331
|
|||
|
TOTAL CONSUMER DISCRETIONARY
|
630,268,640
|
||
|
CONSUMER STAPLES - 3.6%
|
|||
|
Beverages - 2.1%
|
|||
|
Anheuser-Busch InBev SA NV
|
199,500
|
12,016,078
|
|
|
Constellation Brands, Inc. Class A (sub. vtg.)
|
79,000
|
18,308,250
|
|
|
Diageo PLC
|
99,506
|
4,355,564
|
|
|
Keurig Dr. Pepper, Inc.
|
16,000
|
570,560
|
|
|
PepsiCo, Inc.
|
385,900
|
69,716,694
|
|
|
The Coca-Cola Co.
|
1,022,150
|
65,018,962
|
|
|
169,986,108
|
|||
|
Food & Staples Retailing - 0.9%
|
|||
|
Alimentation Couche-Tard, Inc. Class A (multi-vtg.)
|
74,800
|
3,287,001
|
|
|
Casey's General Stores, Inc.
|
15,400
|
3,454,990
|
|
|
Costco Wholesale Corp.
|
146,337
|
66,802,841
|
|
|
Performance Food Group Co. (a)
|
17,800
|
1,039,342
|
|
|
74,584,174
|
|||
|
Food Products - 0.2%
|
|||
|
Archer Daniels Midland Co.
|
101,800
|
9,452,130
|
|
|
General Mills, Inc.
|
18,400
|
1,542,840
|
|
|
Mondelez International, Inc.
|
82,600
|
5,505,290
|
|
|
Nestle SA (Reg. S)
|
11,180
|
1,291,395
|
|
|
17,791,655
|
|||
|
Household Products - 0.2%
|
|||
|
Procter & Gamble Co.
|
101,100
|
15,322,716
|
|
|
Personal Products - 0.2%
|
|||
|
L'Oreal SA (a)
|
13,125
|
4,700,033
|
|
|
L'Oreal SA (a)
|
12,803
|
4,584,726
|
|
|
Olaplex Holdings, Inc. (a)
|
351,020
|
1,828,814
|
|
|
11,113,573
|
|||
|
TOTAL CONSUMER STAPLES
|
288,798,226
|
||
|
ENERGY - 13.7%
|
|||
|
Energy Equipment & Services - 0.1%
|
|||
|
Halliburton Co.
|
288,000
|
11,332,800
|
|
|
Oil, Gas & Consumable Fuels - 13.6%
|
|||
|
Antero Resources Corp. (a)
|
16,900
|
523,731
|
|
|
Birchcliff Energy Ltd.
|
75,900
|
528,609
|
|
|
Canadian Natural Resources Ltd.
|
345,500
|
19,186,222
|
|
|
Cenovus Energy, Inc. (Canada)
|
158,800
|
3,081,001
|
|
|
Cheniere Energy, Inc.
|
194,736
|
29,202,611
|
|
|
Chevron Corp.
|
1,000,500
|
179,579,745
|
|
|
ConocoPhillips Co.
|
1,339,277
|
158,034,686
|
|
|
Devon Energy Corp.
|
579,600
|
35,651,196
|
|
|
Diamondback Energy, Inc.
|
197,646
|
27,034,020
|
|
|
EOG Resources, Inc.
|
346,700
|
44,904,584
|
|
|
Equinor ASA
|
60,400
|
2,170,793
|
|
|
Excelerate Energy, Inc. (e)
|
7,924
|
198,496
|
|
|
Exxon Mobil Corp.
|
2,709,300
|
298,835,790
|
|
|
Hess Corp.
|
443,822
|
62,942,836
|
|
|
Marathon Petroleum Corp.
|
104,200
|
12,127,838
|
|
|
Occidental Petroleum Corp.
|
1,405,000
|
88,500,950
|
|
|
Ovintiv, Inc.
|
13,700
|
694,727
|
|
|
Phillips 66 Co.
|
289,600
|
30,141,568
|
|
|
Pioneer Natural Resources Co.
|
175,600
|
40,105,284
|
|
|
Suncor Energy, Inc.
|
259,200
|
8,222,038
|
|
|
Tourmaline Oil Corp.
|
32,700
|
1,649,973
|
|
|
Valero Energy Corp.
|
421,100
|
53,420,746
|
|
|
1,096,737,444
|
|||
|
TOTAL ENERGY
|
1,108,070,244
|
||
|
FINANCIALS - 14.3%
|
|||
|
Banks - 2.9%
|
|||
|
AIB Group PLC
|
263,600
|
1,020,329
|
|
|
Banco Santander SA (Spain)
|
540,200
|
1,615,260
|
|
|
Bank of America Corp.
|
3,221,862
|
106,708,069
|
|
|
Bank of Ireland Group PLC
|
343,600
|
3,273,479
|
|
|
Citigroup, Inc.
|
39,500
|
1,786,585
|
|
|
HDFC Bank Ltd. sponsored ADR
|
22,400
|
1,532,384
|
|
|
JPMorgan Chase & Co.
|
442,824
|
59,382,698
|
|
|
Nu Holdings Ltd. (e)
|
645,700
|
2,627,999
|
|
|
Royal Bank of Canada
|
266,300
|
25,036,920
|
|
|
Starling Bank Ltd. Series D (a)(b)(c)
|
1,611,012
|
6,096,091
|
|
|
The Toronto-Dominion Bank
|
171,500
|
11,104,435
|
|
|
Wells Fargo & Co.
|
400,300
|
16,528,387
|
|
|
236,712,636
|
|||
|
Capital Markets - 1.8%
|
|||
|
BlackRock, Inc. Class A
|
600
|
425,178
|
|
|
Brookfield Asset Management Ltd. Class A (a)
|
4,520
|
129,424
|
|
|
Brookfield Corp. (Canada) Class A
|
6,700
|
210,699
|
|
|
Charles Schwab Corp.
|
300
|
24,978
|
|
|
Goldman Sachs Group, Inc.
|
140,373
|
48,201,281
|
|
|
Morgan Stanley
|
1,075,800
|
91,464,516
|
|
|
MSCI, Inc.
|
1,011
|
470,287
|
|
|
TulCo LLC (a)(b)(c)(f)
|
7,549
|
5,701,156
|
|
|
146,627,519
|
|||
|
Diversified Financial Services - 6.0%
|
|||
|
Berkshire Hathaway, Inc. Class A (a)
|
1,022
|
479,022,607
|
|
|
Insurance - 3.6%
|
|||
|
American International Group, Inc.
|
450,000
|
28,458,000
|
|
|
Aon PLC
|
4,400
|
1,320,616
|
|
|
Arthur J. Gallagher & Co.
|
51,611
|
9,730,738
|
|
|
Brookfield Asset Management Reinsurance Partners Ltd.
|
480
|
15,006
|
|
|
Chubb Ltd.
|
210,168
|
46,363,061
|
|
|
Fairfax Financial Holdings Ltd. (sub. vtg.)
|
28,300
|
16,764,092
|
|
|
Hartford Financial Services Group, Inc.
|
99,400
|
7,537,502
|
|
|
Intact Financial Corp.
|
55,360
|
7,969,142
|
|
|
Marsh & McLennan Companies, Inc.
|
36,100
|
5,973,828
|
|
|
Progressive Corp.
|
619,900
|
80,407,229
|
|
|
The Travelers Companies, Inc.
|
454,608
|
85,234,454
|
|
|
W.R. Berkley Corp.
|
19,600
|
1,422,372
|
|
|
291,196,040
|
|||
|
TOTAL FINANCIALS
|
1,153,558,802
|
||
|
HEALTH CARE - 17.6%
|
|||
|
Biotechnology - 5.3%
|
|||
|
Alnylam Pharmaceuticals, Inc. (a)
|
91,100
|
21,649,915
|
|
|
Argenx SE ADR (a)
|
14,527
|
5,503,263
|
|
|
Biohaven Ltd. (a)
|
1,466
|
20,348
|
|
|
Galapagos NV sponsored ADR (a)
|
71,500
|
3,173,170
|
|
|
Genmab A/S (a)
|
4,100
|
1,733,459
|
|
|
Gilead Sciences, Inc.
|
85,400
|
7,331,590
|
|
|
Intellia Therapeutics, Inc. (a)
|
16,683
|
582,070
|
|
|
Legend Biotech Corp. ADR (a)
|
78,184
|
3,902,945
|
|
|
Moderna, Inc. (a)
|
12,400
|
2,227,288
|
|
|
Neurocrine Biosciences, Inc. (a)
|
57,700
|
6,891,688
|
|
|
Nuvalent, Inc. Class A (a)
|
21,700
|
646,226
|
|
|
Regeneron Pharmaceuticals, Inc. (a)
|
263,123
|
189,840,613
|
|
|
United Therapeutics Corp. (a)
|
48,874
|
13,591,371
|
|
|
Vertex Pharmaceuticals, Inc. (a)
|
570,500
|
164,748,990
|
|
|
Zai Lab Ltd. (a)
|
481,160
|
1,489,313
|
|
|
423,332,249
|
|||
|
Health Care Equipment & Supplies - 0.5%
|
|||
|
Boston Scientific Corp. (a)
|
86,400
|
3,997,728
|
|
|
DexCom, Inc. (a)
|
13,200
|
1,494,768
|
|
|
Edwards Lifesciences Corp. (a)
|
39,347
|
2,935,680
|
|
|
Figs, Inc. Class A (a)
|
35,100
|
236,223
|
|
|
Intuitive Surgical, Inc. (a)
|
127,850
|
33,924,998
|
|
|
Straumann Holding AG
|
13,083
|
1,500,243
|
|
|
44,089,640
|
|||
|
Health Care Providers & Services - 5.5%
|
|||
|
23andMe Holding Co. Class A (a)
|
290,780
|
628,085
|
|
|
AmerisourceBergen Corp.
|
35,700
|
5,915,847
|
|
|
Cardinal Health, Inc.
|
150,800
|
11,591,996
|
|
|
Cigna Corp.
|
146,300
|
48,475,042
|
|
|
Elevance Health, Inc.
|
85,000
|
43,602,450
|
|
|
HCA Holdings, Inc.
|
42,500
|
10,198,300
|
|
|
Molina Healthcare, Inc. (a)
|
67,600
|
22,322,872
|
|
|
Option Care Health, Inc. (a)
|
57,094
|
1,717,958
|
|
|
P3 Health Partners, Inc. (a)(b)
|
160,486
|
295,294
|
|
|
UnitedHealth Group, Inc.
|
559,678
|
296,730,082
|
|
|
441,477,926
|
|||
|
Health Care Technology - 0.0%
|
|||
|
Doximity, Inc. (a)
|
49,200
|
1,651,152
|
|
|
Life Sciences Tools & Services - 1.0%
|
|||
|
Danaher Corp.
|
162,635
|
43,166,582
|
|
|
Mettler-Toledo International, Inc. (a)
|
12,456
|
18,004,525
|
|
|
Thermo Fisher Scientific, Inc.
|
660
|
363,455
|
|
|
Veterinary Emergency Group LLC Class A (a)(b)(c)(f)
|
59,096
|
3,357,244
|
|
|
Waters Corp. (a)
|
37,508
|
12,849,491
|
|
|
77,741,297
|
|||
|
Pharmaceuticals - 5.3%
|
|||
|
AstraZeneca PLC sponsored ADR
|
279,400
|
18,943,320
|
|
|
Bristol-Myers Squibb Co.
|
722,200
|
51,962,290
|
|
|
DICE Therapeutics, Inc. (a)
|
54,300
|
1,694,160
|
|
|
Eli Lilly & Co.
|
488,252
|
178,622,112
|
|
|
Intra-Cellular Therapies, Inc. (a)
|
14,978
|
792,636
|
|
|
Johnson & Johnson
|
335,500
|
59,266,075
|
|
|
Merck & Co., Inc.
|
713,200
|
79,129,540
|
|
|
Nuvation Bio, Inc. (a)
|
82,324
|
158,062
|
|
|
Pfizer, Inc.
|
19,400
|
994,056
|
|
|
Roche Holding AG (participation certificate)
|
47,040
|
14,781,735
|
|
|
Royalty Pharma PLC
|
554,200
|
21,901,984
|
|
|
428,245,970
|
|||
|
TOTAL HEALTH CARE
|
1,416,538,234
|
||
|
INDUSTRIALS - 5.4%
|
|||
|
Aerospace & Defense - 2.3%
|
|||
|
Lockheed Martin Corp.
|
216,200
|
105,179,138
|
|
|
Northrop Grumman Corp.
|
115,600
|
63,072,516
|
|
|
Space Exploration Technologies Corp.:
|
|||
|
Class A (a)(b)(c)
|
212,910
|
16,394,070
|
|
|
Class C (a)(b)(c)
|
7,830
|
602,910
|
|
|
TransDigm Group, Inc.
|
1,300
|
818,545
|
|
|
186,067,179
|
|||
|
Air Freight & Logistics - 1.0%
|
|||
|
United Parcel Service, Inc. Class B
|
477,915
|
83,080,744
|
|
|
Zipline International, Inc. (a)(b)(c)
|
28,830
|
638,873
|
|
|
83,719,617
|
|||
|
Airlines - 0.1%
|
|||
|
Ryanair Holdings PLC sponsored ADR (a)
|
114,300
|
8,545,068
|
|
|
Building Products - 0.1%
|
|||
|
Carrier Global Corp.
|
19,100
|
787,875
|
|
|
Toto Ltd.
|
141,220
|
4,790,108
|
|
|
Trane Technologies PLC
|
4,700
|
790,023
|
|
|
6,368,006
|
|||
|
Commercial Services & Supplies - 0.2%
|
|||
|
Cintas Corp.
|
14,931
|
6,743,138
|
|
|
Clean Harbors, Inc. (a)
|
86,900
|
9,917,028
|
|
|
Clean TeQ Water Pty Ltd. (a)
|
2,653
|
700
|
|
|
16,660,866
|
|||
|
Construction & Engineering - 0.0%
|
|||
|
Willscot Mobile Mini Holdings (a)
|
11,970
|
540,685
|
|
|
Electrical Equipment - 0.2%
|
|||
|
Eaton Corp. PLC
|
77,700
|
12,195,015
|
|
|
Emerson Electric Co.
|
7,900
|
758,874
|
|
|
Hubbell, Inc. Class B
|
25,300
|
5,937,404
|
|
|
18,891,293
|
|||
|
Industrial Conglomerates - 0.4%
|
|||
|
General Electric Co.
|
378,537
|
31,717,615
|
|
|
Machinery - 0.5%
|
|||
|
Caterpillar, Inc.
|
6,600
|
1,581,096
|
|
|
Deere & Co.
|
51,100
|
21,909,636
|
|
|
Fortive Corp.
|
35,900
|
2,306,575
|
|
|
Indutrade AB
|
34,800
|
704,014
|
|
|
PACCAR, Inc.
|
124,127
|
12,284,849
|
|
|
38,786,170
|
|||
|
Road & Rail - 0.5%
|
|||
|
Canadian Pacific Railway Ltd.
|
259,400
|
19,340,052
|
|
|
J.B. Hunt Transport Services, Inc.
|
53,600
|
9,345,696
|
|
|
Localiza Rent a Car SA
|
25,700
|
258,959
|
|
|
Localiza Rent a Car SA rights (a)
|
112
|
228
|
|
|
Old Dominion Freight Lines, Inc.
|
24,400
|
6,924,232
|
|
|
Vamos Locacao de Caminhoes Maquinas e Equipamentos SA
|
10,600
|
25,377
|
|
|
35,894,544
|
|||
|
Trading Companies & Distributors - 0.1%
|
|||
|
W.W. Grainger, Inc.
|
17,519
|
9,744,944
|
|
|
TOTAL INDUSTRIALS
|
436,935,987
|
||
|
INFORMATION TECHNOLOGY - 15.5%
|
|||
|
Communications Equipment - 0.2%
|
|||
|
Arista Networks, Inc. (a)
|
126,028
|
15,293,498
|
|
|
Motorola Solutions, Inc.
|
3,100
|
798,901
|
|
|
16,092,399
|
|||
|
Electronic Equipment & Components - 1.7%
|
|||
|
Amphenol Corp. Class A
|
1,725,787
|
131,401,422
|
|
|
CDW Corp.
|
34,933
|
6,238,335
|
|
|
Jabil, Inc.
|
34,900
|
2,380,180
|
|
|
140,019,937
|
|||
|
IT Services - 1.2%
|
|||
|
Accenture PLC Class A
|
323,429
|
86,303,794
|
|
|
Adyen BV (a)(d)
|
2,295
|
3,186,033
|
|
|
ASAC II LP (a)(b)(c)
|
2,013,117
|
338,204
|
|
|
Cloudflare, Inc. (a)
|
7,480
|
338,171
|
|
|
Gartner, Inc. (a)
|
8,113
|
2,727,104
|
|
|
MasterCard, Inc. Class A
|
4,900
|
1,703,877
|
|
|
MongoDB, Inc. Class A (a)
|
3,900
|
767,676
|
|
|
Shopify, Inc. Class A (a)
|
8,168
|
283,588
|
|
|
Visa, Inc. Class A
|
3,700
|
768,712
|
|
|
X Holdings I, Inc. (b)(c)
|
3,251
|
1,289,769
|
|
|
97,706,928
|
|||
|
Semiconductors & Semiconductor Equipment - 4.2%
|
|||
|
Advanced Micro Devices, Inc. (a)
|
625,553
|
40,517,068
|
|
|
Analog Devices, Inc.
|
166,300
|
27,278,189
|
|
|
Broadcom, Inc.
|
7,000
|
3,913,910
|
|
|
Enphase Energy, Inc. (a)
|
90,500
|
23,978,880
|
|
|
First Solar, Inc. (a)
|
31,000
|
4,643,490
|
|
|
Lattice Semiconductor Corp. (a)
|
87,465
|
5,674,729
|
|
|
Marvell Technology, Inc.
|
22,475
|
832,474
|
|
|
Monolithic Power Systems, Inc.
|
3,700
|
1,308,357
|
|
|
NVIDIA Corp.
|
929,060
|
135,772,828
|
|
|
onsemi (a)
|
485,200
|
30,261,924
|
|
|
Qualcomm, Inc.
|
463,337
|
50,939,270
|
|
|
Synaptics, Inc. (a)
|
109,831
|
10,451,518
|
|
|
Taiwan Semiconductor Manufacturing Co. Ltd. sponsored ADR
|
49,900
|
3,717,051
|
|
|
339,289,688
|
|||
|
Software - 5.1%
|
|||
|
Adobe, Inc. (a)
|
83,266
|
28,021,507
|
|
|
Aspen Technology, Inc. (a)
|
1,600
|
328,640
|
|
|
Atlassian Corp. PLC (a)(e)
|
27,781
|
3,574,859
|
|
|
Cadence Design Systems, Inc. (a)
|
448,662
|
72,073,064
|
|
|
Check Point Software Technologies Ltd. (a)
|
25,700
|
3,242,312
|
|
|
Clear Secure, Inc. (e)
|
92,332
|
2,532,667
|
|
|
Fair Isaac Corp. (a)
|
1,800
|
1,077,444
|
|
|
Fortinet, Inc. (a)
|
195,227
|
9,544,648
|
|
|
Intuit, Inc.
|
2,083
|
810,745
|
|
|
Magic Leap, Inc.:
|
|||
|
Class A (a)(c)
|
72,297
|
724,416
|
|
|
warrants (a)(c)
|
39,573
|
396,521
|
|
|
Microsoft Corp.
|
963,649
|
231,102,303
|
|
|
Oracle Corp.
|
19,900
|
1,626,626
|
|
|
Salesforce.com, Inc. (a)
|
359,394
|
47,652,050
|
|
|
Samsara, Inc. (e)
|
64,900
|
806,707
|
|
|
Stripe, Inc. Class B (a)(b)(c)
|
26,700
|
598,614
|
|
|
Tanium, Inc. Class B (a)(b)(c)
|
408,212
|
2,971,783
|
|
|
Zoom Video Communications, Inc. Class A (a)
|
10,913
|
739,247
|
|
|
407,824,153
|
|||
|
Technology Hardware, Storage & Peripherals - 3.1%
|
|||
|
Apple, Inc.
|
1,934,000
|
251,284,620
|
|
|
Dell Technologies, Inc.
|
19,519
|
785,054
|
|
|
Pure Storage, Inc. Class A (a)
|
17,100
|
457,596
|
|
|
252,527,270
|
|||
|
TOTAL INFORMATION TECHNOLOGY
|
1,253,460,375
|
||
|
MATERIALS - 3.3%
|
|||
|
Chemicals - 1.0%
|
|||
|
Air Products & Chemicals, Inc.
|
21,600
|
6,658,416
|
|
|
Albemarle Corp.
|
101,000
|
21,902,860
|
|
|
CF Industries Holdings, Inc.
|
249,900
|
21,291,480
|
|
|
Corteva, Inc.
|
242,000
|
14,224,760
|
|
|
Linde PLC
|
7,000
|
2,283,260
|
|
|
Sherwin-Williams Co.
|
1,734
|
411,530
|
|
|
Westlake Corp.
|
88,852
|
9,110,884
|
|
|
75,883,190
|
|||
|
Metals & Mining - 2.3%
|
|||
|
B2Gold Corp.
|
1,646,929
|
5,850,612
|
|
|
Barrick Gold Corp. (Canada)
|
37,266
|
638,806
|
|
|
Cleveland-Cliffs, Inc. (a)
|
182,700
|
2,943,297
|
|
|
Franco-Nevada Corp.
|
299,817
|
40,869,441
|
|
|
Freeport-McMoRan, Inc.
|
668,000
|
25,384,000
|
|
|
Glencore PLC
|
452,400
|
3,016,896
|
|
|
Ivanhoe Electric, Inc. (a)
|
46,500
|
564,975
|
|
|
Ivanhoe Mines Ltd. (a)
|
3,314,587
|
26,193,560
|
|
|
Novagold Resources, Inc. (a)
|
493,634
|
2,949,408
|
|
|
Nucor Corp.
|
359,473
|
47,382,136
|
|
|
POSCO sponsored ADR
|
7,872
|
428,788
|
|
|
Steel Dynamics, Inc.
|
305,746
|
29,871,384
|
|
|
Wheaton Precious Metals Corp.
|
61,200
|
2,391,049
|
|
|
188,484,352
|
|||
|
TOTAL MATERIALS
|
264,367,542
|
||
|
REAL ESTATE - 0.1%
|
|||
|
Equity Real Estate Investment Trusts (REITs) - 0.1%
|
|||
|
Equity Commonwealth
|
136,691
|
3,413,174
|
|
|
UTILITIES - 0.5%
|
|||
|
Electric Utilities - 0.5%
|
|||
|
Constellation Energy Corp.
|
134,069
|
11,558,088
|
|
|
NextEra Energy, Inc.
|
28,400
|
2,374,240
|
|
|
PG&E Corp. (a)
|
346,500
|
5,634,090
|
|
|
Southern Co.
|
275,054
|
19,641,606
|
|
|
39,208,024
|
|||
|
TOTAL COMMON STOCKS
(Cost $5,215,840,395)
|
7,354,764,060
|
||
|
Preferred Stocks - 1.1%
|
|||
|
Shares
|
Value ($)
|
||
|
Convertible Preferred Stocks - 0.9%
|
|||
|
COMMUNICATION SERVICES - 0.1%
|
|||
|
Interactive Media & Services - 0.1%
|
|||
|
ByteDance Ltd. Series E1 (a)(b)(c)
|
37,932
|
6,825,484
|
|
|
Reddit, Inc.:
|
|||
|
Series E(a)(b)(c)
|
9,600
|
359,616
|
|
|
Series F(a)(b)(c)
|
49,896
|
1,869,104
|
|
|
9,054,204
|
|||
|
CONSUMER DISCRETIONARY - 0.0%
|
|||
|
Automobiles - 0.0%
|
|||
|
Rad Power Bikes, Inc.:
|
|||
|
Series A(a)(b)(c)
|
19,024
|
70,389
|
|
|
Series C(a)(b)(c)
|
74,857
|
276,971
|
|
|
Series D(a)(b)(c)
|
127,700
|
472,490
|
|
|
819,850
|
|||
|
Hotels, Restaurants & Leisure - 0.0%
|
|||
|
Discord, Inc. Series I (a)(b)(c)
|
800
|
283,976
|
|
|
Internet & Direct Marketing Retail - 0.0%
|
|||
|
Circle Internet Financial Ltd. Series F (b)(c)
|
38,025
|
998,156
|
|
|
TOTAL CONSUMER DISCRETIONARY
|
2,101,982
|
||
|
CONSUMER STAPLES - 0.0%
|
|||
|
Food & Staples Retailing - 0.0%
|
|||
|
GoBrands, Inc.:
|
|||
|
Series G(a)(b)(c)
|
3,340
|
483,432
|
|
|
Series H(a)(b)(c)
|
3,970
|
574,618
|
|
|
1,058,050
|
|||
|
Food Products - 0.0%
|
|||
|
Bowery Farming, Inc. Series C1 (a)(b)(c)
|
13,266
|
269,432
|
|
|
TOTAL CONSUMER STAPLES
|
1,327,482
|
||
|
HEALTH CARE - 0.0%
|
|||
|
Biotechnology - 0.0%
|
|||
|
ElevateBio LLC Series C (a)(b)(c)
|
194,500
|
711,870
|
|
|
Health Care Providers & Services - 0.0%
|
|||
|
Lyra Health, Inc.:
|
|||
|
Series E(a)(b)(c)
|
79,800
|
1,134,756
|
|
|
Series F(a)(b)(c)
|
4,099
|
58,288
|
|
|
Somatus, Inc. Series E (b)(c)
|
842
|
723,211
|
|
|
1,916,255
|
|||
|
TOTAL HEALTH CARE
|
2,628,125
|
||
|
INDUSTRIALS - 0.7%
|
|||
|
Aerospace & Defense - 0.7%
|
|||
|
Relativity Space, Inc. Series E (a)(b)(c)
|
125,290
|
2,326,635
|
|
|
Space Exploration Technologies Corp.:
|
|||
|
Series G(a)(b)(c)
|
36,460
|
28,074,200
|
|
|
Series H(a)(b)(c)
|
7,256
|
5,587,120
|
|
|
Series N(a)(b)(c)
|
24,552
|
18,905,040
|
|
|
54,892,995
|
|||
|
Air Freight & Logistics - 0.0%
|
|||
|
Zipline International, Inc. Series E (a)(b)(c)
|
66,084
|
1,464,421
|
|
|
Construction & Engineering - 0.0%
|
|||
|
Beta Technologies, Inc. Series B, 6.00% (b)(c)
|
15,787
|
1,031,838
|
|
|
TOTAL INDUSTRIALS
|
57,389,254
|
||
|
INFORMATION TECHNOLOGY - 0.1%
|
|||
|
Software - 0.1%
|
|||
|
Delphix Corp. Series D (a)(b)(c)
|
232,855
|
1,196,875
|
|
|
Nuro, Inc.:
|
|||
|
Series C(a)(b)(c)
|
190,290
|
1,451,913
|
|
|
Series D(a)(b)(c)
|
36,736
|
280,296
|
|
|
Stripe, Inc. Series H (a)(b)(c)
|
11,500
|
257,830
|
|
|
Tenstorrent, Inc. Series C1 (a)(b)(c)
|
12,300
|
640,953
|
|
|
3,827,867
|
|||
|
TOTAL CONVERTIBLE PREFERRED STOCKS
|
76,328,914
|
||
|
Nonconvertible Preferred Stocks - 0.2%
|
|||
|
CONSUMER DISCRETIONARY - 0.0%
|
|||
|
Internet & Direct Marketing Retail - 0.0%
|
|||
|
Circle Internet Financial Ltd. Series E (b)(c)
|
61,811
|
1,622,539
|
|
|
ENERGY - 0.1%
|
|||
|
Oil, Gas & Consumable Fuels - 0.1%
|
|||
|
Petroleo Brasileiro SA - Petrobras sponsored ADR
|
607,300
|
6,467,745
|
|
|
INFORMATION TECHNOLOGY - 0.1%
|
|||
|
Software - 0.1%
|
|||
|
Magic Leap, Inc. Series AA (a)(c)
|
275,569
|
4,274,075
|
|
|
TOTAL NONCONVERTIBLE PREFERRED STOCKS
|
12,364,359
|
||
|
TOTAL PREFERRED STOCKS
(Cost $54,561,320)
|
88,693,273
|
||
|
Preferred Securities - 0.0%
|
|||
|
Principal
Amount (g)
|
Value ($)
|
||
|
INFORMATION TECHNOLOGY - 0.0%
|
|||
|
Software - 0.0%
|
|||
|
Tenstorrent, Inc. 0% (b)(c)(h)
(Cost $680,000)
|
680,000
|
595,680
|
|
|
Money Market Funds - 5.5%
|
|||
|
Shares
|
Value ($)
|
||
|
Fidelity Cash Central Fund 4.37% (i)
|
440,602,199
|
440,690,320
|
|
|
Fidelity Securities Lending Cash Central Fund 4.37% (i)(j)
|
6,127,490
|
6,128,103
|
|
|
TOTAL MONEY MARKET FUNDS
(Cost $446,818,423)
|
446,818,423
|
||
|
TOTAL INVESTMENT IN SECURITIES - 97.8%
(Cost $5,717,900,138)
|
7,890,871,436
|
|
NET OTHER ASSETS (LIABILITIES) - 2.2%
|
177,361,804
|
|
NET ASSETS - 100.0%
|
8,068,233,240
|
|
(a)
|
Non-income producing
|
|
(b)
|
Restricted securities (including private placements) - Investment in securities not registered under the Securities Act of 1933 (excluding 144A issues). At the end of the period, the value of restricted securities (excluding 144A issues) amounted to $133,826,849 or 1.7% of net assets.
|
|
(c)
|
Level 3 security
|
|
(d)
|
Security exempt from registration under Rule 144A of the Securities Act of 1933. These securities may be resold in transactions exempt from registration, normally to qualified institutional buyers. At the end of the period, the value of these securities amounted to $5,658,365 or 0.1% of net assets.
|
|
(e)
|
Security or a portion of the security is on loan at period end.
|
|
(f)
|
Investment is owned by a wholly-owned subsidiary (Subsidiary) that is treated as a corporation for U.S. tax purposes.
|
|
(g)
|
Amount is stated in United States dollars unless otherwise noted.
|
|
(h)
|
Security is perpetual in nature with no stated maturity date.
|
|
(i)
|
Affiliated fund that is generally available only to investment companies and other accounts managed by Fidelity Investments. The rate quoted is the annualized seven-day yield of the fund at period end. A complete unaudited listing of the fund's holdings as of its most recent quarter end is available upon request. In addition, each Fidelity Central Fund's financial statements, which are not covered by the Fund's Report of Independent Registered Public Accounting Firm, are available on the SEC's website or upon request.
|
|
(j)
|
Investment made with cash collateral received from securities on loan.
|
|
Additional information on each restricted holding is as follows:
|
||
|
Security
|
Acquisition Date
|
Acquisition Cost ($)
|
|
ASAC II LP
|
10/10/13
|
155,030
|
|
Beta Technologies, Inc. Series B, 6.00%
|
4/04/22
|
1,628,745
|
|
Blu Investments LLC
|
5/21/20
|
36,484
|
|
Bowery Farming, Inc. Series C1
|
5/18/21
|
799,267
|
|
ByteDance Ltd. Series E1
|
11/18/20
|
4,156,368
|
|
Circle Internet Financial Ltd. Series E
|
5/11/21
|
1,003,200
|
|
Circle Internet Financial Ltd. Series F
|
5/09/22
|
1,602,374
|
|
Delphix Corp. Series D
|
7/10/15
|
2,095,695
|
|
Discord, Inc. Series I
|
9/15/21
|
440,500
|
|
ElevateBio LLC Series C
|
3/09/21
|
815,928
|
|
Epic Games, Inc.
|
7/13/20 - 7/30/20
|
4,082,500
|
|
Fanatics, Inc. Class A
|
8/13/20 - 12/15/21
|
4,645,244
|
|
GoBrands, Inc. Series G
|
3/02/21
|
834,056
|
|
GoBrands, Inc. Series H
|
7/22/21
|
1,542,308
|
|
Lyra Health, Inc. Series E
|
1/14/21
|
730,697
|
|
Lyra Health, Inc. Series F
|
6/04/21
|
64,372
|
|
Nuro, Inc. Series C
|
10/30/20
|
2,484,160
|
|
Nuro, Inc. Series D
|
10/29/21
|
765,788
|
|
P3 Health Partners, Inc.
|
5/25/21
|
1,604,860
|
|
Rad Power Bikes, Inc.
|
1/21/21
|
703,890
|
|
Rad Power Bikes, Inc. Series A
|
1/21/21
|
91,769
|
|
Rad Power Bikes, Inc. Series C
|
1/21/21
|
361,098
|
|
Rad Power Bikes, Inc. Series D
|
9/17/21
|
1,223,851
|
|
Reddit, Inc. Series E
|
5/18/21
|
407,752
|
|
Reddit, Inc. Series F
|
8/11/21
|
3,083,293
|
|
Relativity Space, Inc. Series E
|
5/27/21
|
2,861,010
|
|
Somatus, Inc. Series E
|
1/31/22
|
734,759
|
|
Space Exploration Technologies Corp. Class A
|
10/16/15 - 2/16/21
|
3,185,238
|
|
Space Exploration Technologies Corp. Class C
|
9/11/17
|
105,705
|
|
Space Exploration Technologies Corp. Series G
|
1/20/15
|
2,824,191
|
|
Space Exploration Technologies Corp. Series H
|
8/04/17
|
979,560
|
|
Space Exploration Technologies Corp. Series N
|
8/04/20
|
6,629,040
|
|
Starling Bank Ltd. Series D
|
6/18/21 - 4/05/22
|
3,151,959
|
|
Stripe, Inc. Class B
|
5/18/21
|
1,071,428
|
|
Stripe, Inc. Series H
|
3/15/21
|
461,438
|
|
Tanium, Inc. Class B
|
4/21/17 - 9/18/20
|
3,439,433
|
|
Tenstorrent, Inc. Series C1
|
4/23/21
|
731,288
|
|
Tenstorrent, Inc. 0%
|
4/23/21
|
680,000
|
|
TulCo LLC
|
8/24/17 - 12/14/17
|
2,643,700
|
|
Veterinary Emergency Group LLC Class A
|
9/16/21 - 12/16/22
|
2,307,320
|
|
X Holdings I, Inc.
|
10/25/22
|
3,251,000
|
|
Zipline International, Inc.
|
10/12/21
|
1,037,880
|
|
Zipline International, Inc. Series E
|
12/21/20
|
2,156,281
|
|
Affiliate
|
Value,
beginning
of period ($)
|
Purchases ($)
|
Sales
Proceeds ($)
|
Dividend
Income ($)
|
Realized
Gain (loss) ($)
|
Change in
Unrealized
appreciation
(depreciation) ($)
|
Value,
end
of period ($)
|
% ownership,
end
of period
|
|
Fidelity Cash Central Fund 4.37%
|
298,594,723
|
3,754,119,240
|
3,612,023,643
|
6,217,589
|
-
|
-
|
440,690,320
|
1.0%
|
|
Fidelity Securities Lending Cash Central Fund 4.37%
|
11,576,828
|
384,314,303
|
389,763,028
|
73,881
|
-
|
-
|
6,128,103
|
0.0%
|
|
Total
|
310,171,551
|
4,138,433,543
|
4,001,786,671
|
6,291,470
|
-
|
-
|
446,818,423
|
|
|
Valuation Inputs at Reporting Date:
|
||||
|
Description
|
Total ($)
|
Level 1 ($)
|
Level 2 ($)
|
Level 3 ($)
|
|
Investments in Securities:
|
||||
|
Equities:
|
||||
|
Communication Services
|
769,199,016
|
737,110,210
|
17,244,410
|
14,844,396
|
|
Consumer Discretionary
|
633,993,161
|
596,467,361
|
22,595,763
|
14,930,037
|
|
Consumer Staples
|
290,125,708
|
261,850,430
|
26,947,796
|
1,327,482
|
|
Energy
|
1,114,537,989
|
1,112,367,196
|
2,170,793
|
-
|
|
Financials
|
1,153,558,802
|
1,140,146,295
|
1,615,260
|
11,797,247
|
|
Health Care
|
1,419,166,359
|
1,393,676,240
|
19,504,750
|
5,985,369
|
|
Industrials
|
494,325,241
|
414,509,326
|
4,790,808
|
75,025,107
|
|
Information Technology
|
1,261,562,317
|
1,243,955,035
|
3,186,033
|
14,421,249
|
|
Materials
|
264,367,542
|
261,350,646
|
3,016,896
|
-
|
|
Real Estate
|
3,413,174
|
3,413,174
|
-
|
-
|
|
Utilities
|
39,208,024
|
39,208,024
|
-
|
-
|
|
Preferred Securities
|
595,680
|
-
|
-
|
595,680
|
|
Money Market Funds
|
446,818,423
|
446,818,423
|
-
|
-
|
|
Total Investments in Securities:
|
7,890,871,436
|
7,650,872,360
|
101,072,509
|
138,926,567
|
|
|
||||
|
Net Unrealized Depreciation on Unfunded Commitments
|
(309,148)
|
-
|
-
|
(309,148)
|
|
Total
|
(309,148)
|
-
|
-
|
(309,148)
|
|
Investments in Securities:
|
|||
|
Beginning Balance
|
$
|
128,061,917
|
|
|
Net Realized Gain (Loss) on Investment Securities
|
3,460,165
|
||
|
Net Unrealized Gain (Loss) on Investment Securities
|
1,851,936
|
||
|
Cost of Purchases
|
10,122,485
|
||
|
Proceeds of Sales
|
(4,631,019)
|
||
|
Amortization/Accretion
|
-
|
||
|
Transfers into Level 3
|
1,622,539
|
||
|
Transfers out of Level 3
|
(1,561,456)
|
||
|
Ending Balance
|
$
|
138,926,567
|
|
|
The change in unrealized gain (loss) for the period attributable to Level 3 securities held at December 31, 2022
|
$
|
1,851,936
|
|
|
The information used in the above reconciliation represents fiscal year to date activity for any Investments in Securities identified as using Level 3 inputs at either the beginning or the end of the current fiscal period. Cost of purchases and proceeds of sales may include securities received and/or delivered through in-kind transactions. Transfers into Level 3 were attributable to a lack of observable market data resulting from decreases in market activity, decreases in liquidity, security restructurings or corporate actions. Transfers out of Level 3 were attributable to observable market data becoming available for those securities. Transfers in or out of Level 3 represent the beginning value of any Security or Instrument where a change in the pricing level occurred from the beginning to the end of the period. The cost of purchases and the proceeds of sales may include securities received or delivered through corporate actions or exchanges. Realized and unrealized gains (losses) disclosed in the reconciliation are included in Net Gain (Loss) on the Fund's Statement of Operations.
|
|||
|
Statement of Assets and Liabilities
|
||||
|
December 31, 2022
|
||||
|
Assets
|
||||
|
Investment in securities, at value (including securities loaned of $5,944,792) - See accompanying schedule:
|
||||
|
Unaffiliated issuers (cost $5,271,081,715)
|
$7,444,053,013
|
|||
|
Fidelity Central Funds (cost $446,818,423)
|
446,818,423
|
|||
|
Total Investment in Securities (cost $5,717,900,138)
|
$
|
7,890,871,436
|
||
|
Restricted cash
|
16,158
|
|||
|
Foreign currency held at value (cost $1,382)
|
1,362
|
|||
|
Receivable for investments sold
|
859,443
|
|||
|
Receivable for fund shares sold
|
177,598,684
|
|||
|
Dividends receivable
|
4,929,002
|
|||
|
Distributions receivable from Fidelity Central Funds
|
1,357,554
|
|||
|
Other receivables
|
54,408
|
|||
|
Total assets
|
8,075,688,047
|
|||
|
Liabilities
|
||||
|
Payable to custodian bank
|
$25
|
|||
|
Unrealized depreciation on unfunded commitments
|
309,148
|
|||
|
Payable for fund shares redeemed
|
66,581
|
|||
|
Other payables and accrued expenses
|
953,928
|
|||
|
Collateral on securities loaned
|
6,125,125
|
|||
|
Total Liabilities
|
7,454,807
|
|||
|
Net Assets
|
$
|
8,068,233,240
|
||
|
Net Assets consist of:
|
||||
|
Paid in capital
|
$
|
5,944,482,274
|
||
|
Total accumulated earnings (loss)
|
2,123,750,966
|
|||
|
Net Assets
|
$
|
8,068,233,240
|
||
|
Net Asset Value
, offering price and redemption price per share ($8,068,233,240 ÷ 563,727,027 shares)
|
$
|
14.31
|
||
|
Statement of Operations
|
||||
|
Year ended
December 31, 2022
|
||||
|
Investment Income
|
||||
|
Dividends
|
$
|
85,741,503
|
||
|
Income from Fidelity Central Funds (including $73,881 from security lending)
|
6,291,470
|
|||
|
Total Income
|
92,032,973
|
|||
|
Expenses
|
||||
|
Custodian fees and expenses
|
152,473
|
|||
|
Independent trustees' fees and expenses
|
25,652
|
|||
|
Total expenses before reductions
|
178,125
|
|||
|
Expense reductions
|
(844)
|
|||
|
Total expenses after reductions
|
177,281
|
|||
|
Net Investment income (loss)
|
91,855,692
|
|||
|
Realized and Unrealized Gain (Loss)
|
||||
|
Net realized gain (loss) on:
|
||||
|
Investment Securities:
|
||||
|
Unaffiliated issuers(net of foreign taxes of $172,002)
|
321,769,949
|
|||
|
Foreign currency transactions
|
(30,205)
|
|||
|
Total net realized gain (loss)
|
321,739,744
|
|||
|
Change in net unrealized appreciation (depreciation) on:
|
||||
|
Investment Securities:
|
||||
|
Unaffiliated issuers
(net of decrease in deferred foreign taxes of $466,611)
|
(2,586,809,257)
|
|||
|
Unfunded commitments
|
(260,407)
|
|||
|
Assets and liabilities in foreign currencies
|
(23,870)
|
|||
|
Total change in net unrealized appreciation (depreciation)
|
(2,587,093,534)
|
|||
|
Net gain (loss)
|
(2,265,353,790)
|
|||
|
Net increase (decrease) in net assets resulting from operations
|
$
|
(2,173,498,098)
|
||
|
Statement of Changes in Net Assets
|
||||
|
Year ended
December 31, 2022
|
Year ended
December 31, 2021
|
|||
|
Increase (Decrease) in Net Assets
|
||||
|
Operations
|
||||
|
Net investment income (loss)
|
$
|
91,855,692
|
$
|
49,643,475
|
|
Net realized gain (loss)
|
321,739,744
|
1,384,487,067
|
||
|
Change in net unrealized appreciation (depreciation)
|
(2,587,093,534)
|
399,250,076
|
||
|
Net increase (decrease) in net assets resulting from operations
|
(2,173,498,098)
|
1,833,380,618
|
||
|
Distributions to shareholders
|
(568,513,318)
|
(1,459,118,632)
|
||
|
Share transactions
|
||||
|
Proceeds from sales of shares
|
3,429,424,120
|
1,161,106,204
|
||
|
Reinvestment of distributions
|
568,513,318
|
1,459,118,631
|
||
|
Cost of shares redeemed
|
(1,208,298,984)
|
(2,647,170,260)
|
||
|
Net increase (decrease) in net assets resulting from share transactions
|
2,789,638,454
|
(26,945,425)
|
||
|
Total increase (decrease) in net assets
|
47,627,038
|
347,316,561
|
||
|
Net Assets
|
||||
|
Beginning of period
|
8,020,606,202
|
7,673,289,641
|
||
|
End of period
|
$
|
8,068,233,240
|
$
|
8,020,606,202
|
|
Other Information
|
||||
|
Shares
|
||||
|
Sold
|
215,811,257
|
53,744,068
|
||
|
Issued in reinvestment of distributions
|
36,485,463
|
70,309,438
|
||
|
Redeemed
|
(75,287,602)
|
(116,279,469)
|
||
|
Net increase (decrease)
|
177,009,118
|
7,774,037
|
||
|
Fidelity® Series Opportunistic Insights Fund
|
|
Years ended December 31,
|
2022
|
2021
|
2020
|
2019
|
2018
|
|||||
|
Selected Per-Share Data
|
||||||||||
|
Net asset value, beginning of period
|
$
|
20.74
|
$
|
20.25
|
$
|
18.10
|
$
|
15.18
|
$
|
17.32
|
|
Income from Investment Operations
|
||||||||||
|
Net investment income (loss)
A,B
|
.20
|
.14
|
.12
|
.15
|
.15
|
|||||
|
Net realized and unrealized gain (loss)
|
(5.44)
|
4.79
|
5.36
|
4.43
|
(.42)
|
|||||
|
Total from investment operations
|
(5.24)
|
4.93
|
5.48
|
4.58
|
(.27)
|
|||||
|
Distributions from net investment income
|
(.18)
|
(.20)
|
(.16)
|
(.15)
|
(.13)
|
|||||
|
Distributions from net realized gain
|
(1.00)
|
(4.24)
|
(3.18)
|
(1.51)
|
(1.75)
|
|||||
|
Total distributions
|
(1.19)
C
|
(4.44)
|
(3.33)
C
|
(1.66)
|
(1.87)
C
|
|||||
|
Net asset value, end of period
|
$
|
14.31
|
$
|
20.74
|
$
|
20.25
|
$
|
18.10
|
$
|
15.18
|
|
Total Return
D
|
(25.73)%
|
24.81%
|
31.18%
|
30.53%
|
(1.87)%
|
|||||
|
Ratios to Average Net Assets
B,E,F
|
||||||||||
|
Expenses before reductions
G
|
-%
|
-%
|
-%
|
-%
|
-%
|
|||||
|
Expenses net of fee waivers, if any
G
|
-%
|
-%
|
-%
|
-%
|
-%
|
|||||
|
Expenses net of all reductions
G
|
-%
|
-%
|
-%
|
-%
|
-%
|
|||||
|
Net investment income (loss)
|
1.23%
|
.61%
|
.61%
|
.81%
|
.80%
|
|||||
|
Supplemental Data
|
||||||||||
|
Net assets, end of period (000 omitted)
|
$
|
8,068,233
|
$
|
8,020,606
|
$
|
7,673,290
|
$
|
6,899,733
|
$
|
6,419,232
|
|
Portfolio turnover rate
H
|
36%
|
43%
|
33%
|
27%
I
|
32%
J
|
|
Fidelity Central Fund
|
Investment Manager
|
Investment Objective
|
Investment Practices
|
Expense Ratio
A
|
|
Fidelity Money Market Central Funds
|
Fidelity Management & Research Company LLC (FMR)
|
Each fund seeks to obtain a high level of current income consistent with the preservation of capital and liquidity.
|
Short-term Investments
|
Less than .005%
|
|
Asset Type
|
Fair Value
|
Valuation Technique(s)
|
Unobservable Input
|
Amount or Range/Weighted Average
|
Impact to Valuation from an Increase in Input
A
|
|
|
|
|
|
|
|
|
Equities
|
$
138,330,887
|
Market comparable
|
Enterprise value/EBITDA multiple (EV/EBITDA)
|
5.5 - 21.2 / 11.5
|
Increase
|
|
|
|
|
Enterprise value/Revenue multiple (EV/R)
|
1.6 - 19.0 / 6.9
|
Increase
|
|
|
|
|
Enterprise value/Net income multiple (EV/NI)
|
15.5
|
Increase
|
|
|
|
Recovery value
|
Recovery value
|
$0.00 - $0.17 / $0.16
|
Increase
|
|
|
|
Market approach
|
Transaction price
|
$59.45
|
Increase
|
|
|
|
|
Discount rate
|
15.0%
|
Decrease
|
|
|
|
Discounted cash flow
|
Weighted average cost of capital (WACC)
|
30.0%
|
Decrease
|
|
|
|
|
Exit multiple
|
2.0
|
Increase
|
|
|
|
Black scholes
|
Discount rate
|
3.8% - 4.2% / 3.9%
|
Increase
|
|
|
|
|
Probability rate
|
50.0%
|
Increase
|
|
|
|
|
Volatility
|
65.0% - 80.0% / 72.8%
|
Increase
|
|
|
|
|
Term
|
2.0 - 5.0 / 3.5
|
Increase
|
|
Preferred Securities
|
$
595,680
|
Market approach
|
Transaction price
|
$100.00
|
Increase
|
|
|
|
|
Discount rate
|
15.0%
|
Decrease
|
|
|
|
Black scholes
|
Discount rate
|
4.2%
|
Increase
|
|
|
|
|
Volatility
|
70.0%
|
Increase
|
|
|
|
|
Term
|
2.0
|
Increase
|
|
Gross unrealized appreciation
|
$2,408,339,492
|
|
Gross unrealized depreciation
|
(270,147,470)
|
|
Net unrealized appreciation (depreciation)
|
$2,138,192,022
|
|
Tax Cost
|
$5,752,370,266
|
|
Net unrealized appreciation (depreciation) on securities and other investments
|
$2,138,175,393
|
|
|
December 31, 2022
|
December 31, 2021
|
|
Ordinary Income
|
$95,989,152
|
$158,912,657
|
|
Long-term Capital Gains
|
472,524,166
|
1,300,205,975
|
|
Total
|
$568,513,318
|
$1,459,118,632
|
|
|
Investment to be Acquired
|
Commitment Amount
|
Unrealized Appreciation (Depreciation)
|
|
Fidelity Series Opportunistic Insights Fund
|
Stripe, Inc.
|
$309,148
|
$(309,148)
|
|
|
$ Amount
|
% of Net Assets
|
|
Fidelity Series Opportunistic Insights Fund
|
9,074,558
|
.11
|
|
|
Purchases ($)
|
Sales ($)
|
|
Fidelity Series Opportunistic Insights Fund
|
4,605,310,345
|
2,604,388,908
|
|
|
Amount
|
|
Fidelity Series Opportunistic Insights Fund
|
$57,112
|
|
|
Purchases ($)
|
Sales ($)
|
Realized Gain (Loss) ($)
|
|
Fidelity Series Opportunistic Insights Fund
|
247,283,072
|
173,623,144
|
34,120,434
|
|
|
Total Security Lending Fees Paid to NFS
|
Security Lending Income From Securities Loaned to NFS
|
Value of Securities Loaned to NFS at Period End
|
|
Fidelity Series Opportunistic Insights Fund
|
$7,642
|
$1,979
|
$-
|
|
The Example is based on an investment of $1,000 invested at the beginning of the period and held for the entire period (July 1, 2022 to December 31, 2022).
|
|
Annualized Expense Ratio-
A
|
Beginning Account Value July 1, 2022
|
Ending Account Value December 31, 2022
|
Expenses Paid During Period-
C
July 1, 2022 to December 31, 2022
|
|||||||
|
Fidelity® Series Opportunistic Insights Fund
|
-%-
D
|
|||||||||
|
Actual
|
$ 1,000
|
$ 1,026.40
|
$-
E
|
|||||||
|
Hypothetical-
B
|
$ 1,000
|
$ 1,025.21
|
$-
E
|
|||||||
|
|


Contents
|
Average Annual Total Returns
|
|||
|
Periods ended December 31, 2022
|
Past 1
year
|
Past 5
years
|
Past 10
years
|
|
Fidelity® Contrafund®
|
-28.26%
|
8.52%
|
12.40%
|
|
Class K
|
-28.22%
|
8.60%
|
12.50%
|
|
$10,000 Over 10 Years
|
|
Let's say hypothetically that $10,000 was invested in Fidelity® Contrafund®, a class of the fund, on December 31, 2012.
The chart shows how the value of your investment would have changed, and also shows how the S&P 500® Index performed over the same period.
|
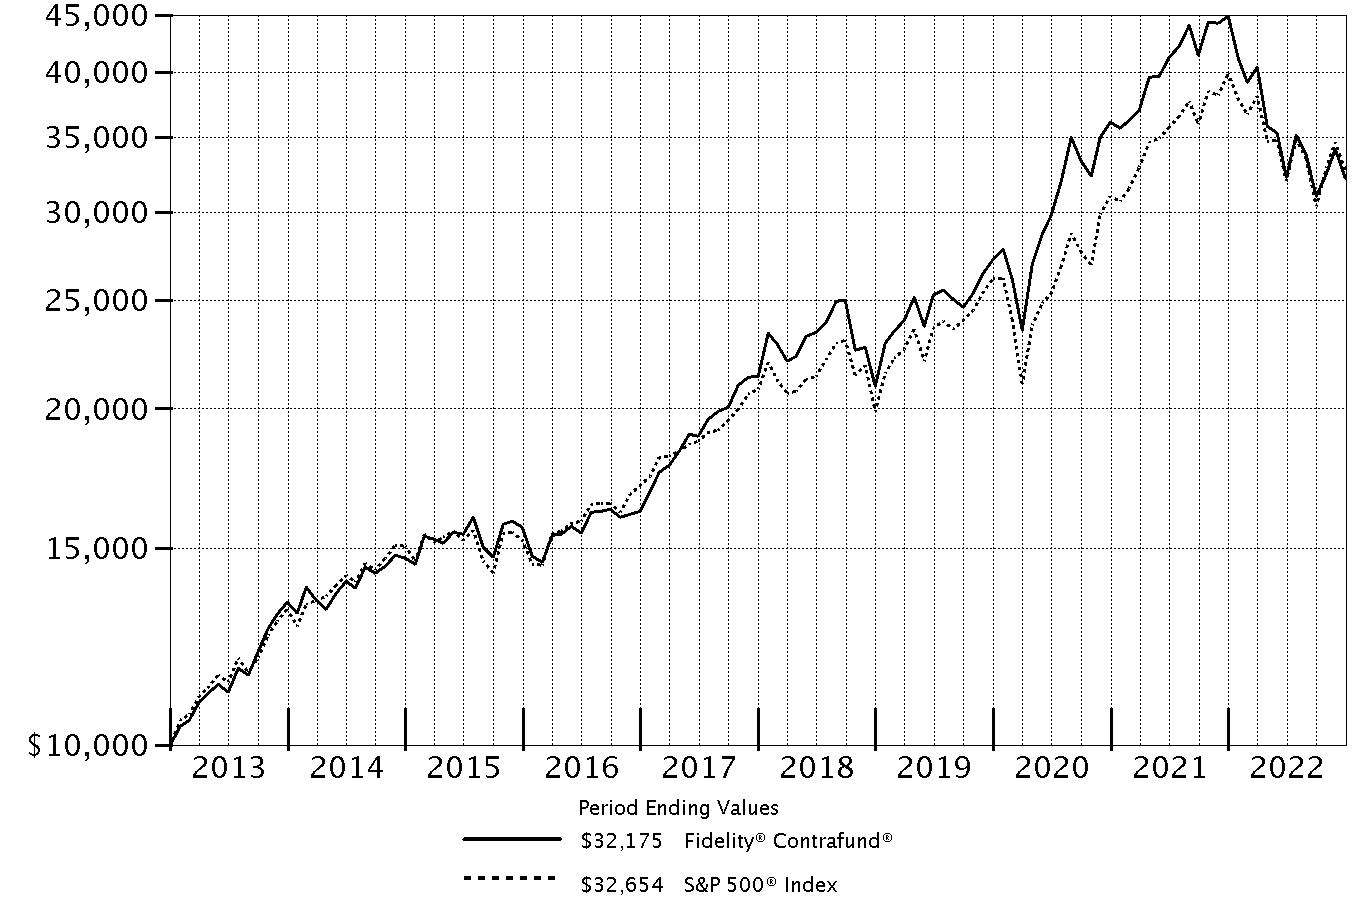
|
|
Top Holdings (% of Fund's net assets)
|
||
|
Berkshire Hathaway, Inc. Class A
|
9.8
|
|
|
UnitedHealth Group, Inc.
|
6.1
|
|
|
Microsoft Corp.
|
6.0
|
|
|
Meta Platforms, Inc. Class A
|
5.5
|
|
|
Amazon.com, Inc.
|
5.0
|
|
|
Apple, Inc.
|
4.0
|
|
|
Eli Lilly & Co.
|
2.6
|
|
|
Alphabet, Inc. Class A
|
2.5
|
|
|
Alphabet, Inc. Class C
|
2.2
|
|
|
Regeneron Pharmaceuticals, Inc.
|
2.1
|
|
|
45.8
|
||
|
Market Sectors (% of Fund's net assets)
|
||
|
Information Technology
|
21.0
|
|
|
Health Care
|
17.6
|
|
|
Financials
|
16.6
|
|
|
Communication Services
|
12.9
|
|
|
Consumer Discretionary
|
9.7
|
|
|
Energy
|
6.7
|
|
|
Industrials
|
5.7
|
|
|
Materials
|
3.5
|
|
|
Consumer Staples
|
3.4
|
|
|
Utilities
|
0.4
|
|
|
Real Estate
|
0.1
|
|
|
Asset Allocation (% of Fund's net assets)
|
|
|
Foreign investments - 7.1%
|
|
Common Stocks - 95.9%
|
|||
|
Shares
|
Value ($)
(000s)
|
||
|
COMMUNICATION SERVICES - 12.7%
|
|||
|
Entertainment - 1.9%
|
|||
|
Activision Blizzard, Inc.
|
2,103,035
|
160,987
|
|
|
Liberty Media Corp. Liberty Formula One Series C (a)
|
3,239,150
|
193,636
|
|
|
Netflix, Inc. (a)
|
4,135,672
|
1,219,527
|
|
|
The Walt Disney Co. (a)
|
355,276
|
30,866
|
|
|
Universal Music Group NV
|
7,154,395
|
173,013
|
|
|
1,778,029
|
|||
|
Interactive Media & Services - 10.5%
|
|||
|
Alphabet, Inc.:
|
|||
|
Class A (a)
|
25,680,674
|
2,265,806
|
|
|
Class C (a)
|
22,581,693
|
2,003,674
|
|
|
Bumble, Inc. (a)
|
2,763,774
|
58,177
|
|
|
Epic Games, Inc. (a)(b)(c)
|
123,700
|
100,880
|
|
|
Meta Platforms, Inc. Class A (a)
|
41,789,891
|
5,028,995
|
|
|
Pinterest, Inc. Class A (a)
|
2,002,554
|
48,622
|
|
|
9,506,154
|
|||
|
Wireless Telecommunication Services - 0.3%
|
|||
|
T-Mobile U.S., Inc. (a)
|
1,806,649
|
252,931
|
|
|
TOTAL COMMUNICATION SERVICES
|
11,537,114
|
||
|
CONSUMER DISCRETIONARY - 9.7%
|
|||
|
Automobiles - 0.4%
|
|||
|
General Motors Co.
|
2,967,756
|
99,835
|
|
|
Harley-Davidson, Inc.
|
1,017,105
|
42,312
|
|
|
Hyundai Motor Co.
|
651,600
|
78,145
|
|
|
Rad Power Bikes, Inc. (a)(b)(c)
|
2,588,458
|
9,577
|
|
|
Rivian Automotive, Inc. (a)
|
355,112
|
6,545
|
|
|
Tesla, Inc. (a)
|
27,561
|
3,395
|
|
|
Toyota Motor Corp.
|
11,242,775
|
153,380
|
|
|
393,189
|
|||
|
Hotels, Restaurants & Leisure - 0.6%
|
|||
|
Airbnb, Inc. Class A (a)
|
3,306,917
|
282,741
|
|
|
Chipotle Mexican Grill, Inc. (a)
|
17,518
|
24,306
|
|
|
Evolution AB (d)
|
115,689
|
11,269
|
|
|
Hilton Worldwide Holdings, Inc.
|
894,602
|
113,042
|
|
|
Hyatt Hotels Corp. Class A (a)
|
102,248
|
9,248
|
|
|
McDonald's Corp.
|
357,581
|
94,233
|
|
|
534,839
|
|||
|
Household Durables - 0.1%
|
|||
|
Lennar Corp. Class A
|
1,336,805
|
120,981
|
|
|
Internet & Direct Marketing Retail - 5.2%
|
|||
|
Amazon.com, Inc. (a)
|
53,652,806
|
4,506,836
|
|
|
Coupang, Inc. Class A (a)
|
10,194,115
|
149,955
|
|
|
Deliveroo PLC Class A (a)(d)
|
33,343,486
|
34,546
|
|
|
Doordash, Inc. (a)
|
1,000
|
49
|
|
|
MercadoLibre, Inc. (a)
|
34,937
|
29,565
|
|
|
Uber Technologies, Inc. (a)
|
304,177
|
7,522
|
|
|
Wayfair LLC Class A (a)
|
67,934
|
2,234
|
|
|
4,730,707
|
|||
|
Multiline Retail - 0.2%
|
|||
|
Dollar Tree, Inc. (a)
|
820,019
|
115,983
|
|
|
Dollarama, Inc.
|
396,873
|
23,212
|
|
|
139,195
|
|||
|
Specialty Retail - 2.7%
|
|||
|
Academy Sports & Outdoors, Inc.
|
3,510,344
|
184,433
|
|
|
AutoZone, Inc. (a)
|
103,937
|
256,327
|
|
|
Dick's Sporting Goods, Inc. (e)
|
2,361,405
|
284,053
|
|
|
Fanatics, Inc. Class A (a)(b)(c)
|
2,461,391
|
187,484
|
|
|
National Vision Holdings, Inc. (a)(e)
|
1,548,584
|
60,023
|
|
|
O'Reilly Automotive, Inc. (a)
|
390,289
|
329,416
|
|
|
The Home Depot, Inc.
|
2,018,448
|
637,547
|
|
|
TJX Companies, Inc.
|
718,207
|
57,169
|
|
|
Ulta Beauty, Inc. (a)
|
512,940
|
240,605
|
|
|
Williams-Sonoma, Inc. (e)
|
1,927,650
|
221,526
|
|
|
2,458,583
|
|||
|
Textiles, Apparel & Luxury Goods - 0.5%
|
|||
|
Deckers Outdoor Corp. (a)
|
116,215
|
46,388
|
|
|
Dr. Martens Ltd.
|
15,126,877
|
34,856
|
|
|
lululemon athletica, Inc. (a)
|
91,071
|
29,177
|
|
|
NIKE, Inc. Class B
|
1,540,149
|
180,213
|
|
|
On Holding AG (a)
|
8,273,857
|
141,979
|
|
|
432,613
|
|||
|
TOTAL CONSUMER DISCRETIONARY
|
8,810,107
|
||
|
CONSUMER STAPLES - 3.4%
|
|||
|
Beverages - 1.5%
|
|||
|
Anheuser-Busch InBev SA NV
|
1,059,478
|
63,813
|
|
|
Constellation Brands, Inc. Class A (sub. vtg.)
|
439,931
|
101,954
|
|
|
Diageo PLC
|
1,806,881
|
79,091
|
|
|
Keurig Dr. Pepper, Inc.
|
365,711
|
13,041
|
|
|
PepsiCo, Inc.
|
2,583,062
|
466,656
|
|
|
The Coca-Cola Co.
|
9,456,124
|
601,504
|
|
|
1,326,059
|
|||
|
Food & Staples Retailing - 1.3%
|
|||
|
Alimentation Couche-Tard, Inc. Class A (multi-vtg.)
|
1,138,970
|
50,051
|
|
|
Casey's General Stores, Inc.
|
187,461
|
42,057
|
|
|
Costco Wholesale Corp.
|
2,438,086
|
1,112,986
|
|
|
Performance Food Group Co. (a)
|
216,412
|
12,636
|
|
|
Walmart, Inc.
|
994
|
141
|
|
|
1,217,871
|
|||
|
Food Products - 0.2%
|
|||
|
Archer Daniels Midland Co.
|
228,646
|
21,230
|
|
|
General Mills, Inc.
|
233,075
|
19,543
|
|
|
Mondelez International, Inc.
|
1,125,673
|
75,026
|
|
|
Nestle SA (Reg. S)
|
183,594
|
21,207
|
|
|
137,006
|
|||
|
Household Products - 0.0%
|
|||
|
Procter & Gamble Co.
|
52,330
|
7,931
|
|
|
Personal Products - 0.4%
|
|||
|
Estee Lauder Companies, Inc. Class A
|
989,961
|
245,619
|
|
|
L'Oreal SA (a)
|
187,900
|
67,287
|
|
|
L'Oreal SA (a)
|
187,200
|
67,036
|
|
|
Olaplex Holdings, Inc. (a)
|
4,741,861
|
24,705
|
|
|
404,647
|
|||
|
TOTAL CONSUMER STAPLES
|
3,093,514
|
||
|
ENERGY - 6.6%
|
|||
|
Energy Equipment & Services - 0.0%
|
|||
|
Halliburton Co.
|
878,583
|
34,572
|
|
|
Oil, Gas & Consumable Fuels - 6.6%
|
|||
|
Birchcliff Energy Ltd.
|
945,069
|
6,582
|
|
|
Canadian Natural Resources Ltd.
|
5,077,141
|
281,943
|
|
|
Cenovus Energy, Inc. (Canada)
|
2,425,639
|
47,062
|
|
|
Cheniere Energy, Inc.
|
1,921,816
|
288,196
|
|
|
Chevron Corp.
|
4,013,885
|
720,452
|
|
|
ConocoPhillips Co.
|
7,996,712
|
943,612
|
|
|
Devon Energy Corp.
|
3,938,084
|
242,232
|
|
|
Diamondback Energy, Inc.
|
1,338,441
|
183,072
|
|
|
EOG Resources, Inc.
|
3,050,557
|
395,108
|
|
|
Equinor ASA
|
746,378
|
26,825
|
|
|
Excelerate Energy, Inc. (e)
|
83,577
|
2,094
|
|
|
Exxon Mobil Corp.
|
10,840,084
|
1,195,661
|
|
|
Hess Corp.
|
2,920,265
|
414,152
|
|
|
Marathon Petroleum Corp.
|
469,765
|
54,676
|
|
|
Occidental Petroleum Corp.
|
5,942,100
|
374,293
|
|
|
Ovintiv, Inc.
|
171,135
|
8,678
|
|
|
Phillips 66 Co.
|
1,124,034
|
116,989
|
|
|
Pioneer Natural Resources Co.
|
1,339,634
|
305,959
|
|
|
Reliance Industries Ltd.
|
1,531,739
|
47,017
|
|
|
Suncor Energy, Inc. (e)
|
283,614
|
8,996
|
|
|
Tourmaline Oil Corp.
|
436,374
|
22,019
|
|
|
Valero Energy Corp.
|
2,389,923
|
303,186
|
|
|
5,988,804
|
|||
|
TOTAL ENERGY
|
6,023,376
|
||
|
FINANCIALS - 16.6%
|
|||
|
Banks - 3.2%
|
|||
|
AIB Group PLC
|
3,290,215
|
12,736
|
|
|
Banco Santander SA (Spain)
|
7,822,922
|
23,391
|
|
|
Bank of America Corp.
|
29,887,440
|
989,872
|
|
|
Bank of Ireland Group PLC
|
4,197,783
|
39,992
|
|
|
Citigroup, Inc.
|
546,878
|
24,735
|
|
|
HDFC Bank Ltd. sponsored ADR
|
265,293
|
18,149
|
|
|
JPMorgan Chase & Co.
|
5,261,260
|
705,535
|
|
|
Nu Holdings Ltd. (e)
|
8,819,102
|
35,894
|
|
|
Royal Bank of Canada (e)
|
4,551,792
|
427,949
|
|
|
Starling Bank Ltd. Series D (a)(b)(c)
|
26,724,113
|
101,124
|
|
|
The Toronto-Dominion Bank
|
3,978,909
|
257,630
|
|
|
Wells Fargo & Co.
|
6,130,621
|
253,133
|
|
|
2,890,140
|
|||
|
Capital Markets - 1.0%
|
|||
|
BlackRock, Inc. Class A
|
7,416
|
5,255
|
|
|
Brookfield Asset Management Ltd. Class A (a)
|
55,254
|
1,582
|
|
|
Brookfield Corp. (Canada) Class A
|
81,168
|
2,553
|
|
|
Charles Schwab Corp.
|
1,276,752
|
106,302
|
|
|
Coinbase Global, Inc. (a)
|
998
|
35
|
|
|
Goldman Sachs Group, Inc.
|
107,908
|
37,053
|
|
|
Morgan Stanley
|
6,826,947
|
580,427
|
|
|
MSCI, Inc.
|
27,674
|
12,873
|
|
|
TulCo LLC (a)(b)(c)(f)
|
140,771
|
106,313
|
|
|
852,393
|
|||
|
Consumer Finance - 0.0%
|
|||
|
American Express Co.
|
135,272
|
19,986
|
|
|
Diversified Financial Services - 9.8%
|
|||
|
Berkshire Hathaway, Inc. Class A (a)(e)
|
18,917
|
8,866,609
|
|
|
Rapyd Financial Network 2016 Ltd. (a)(b)(c)
|
340,545
|
22,939
|
|
|
8,889,548
|
|||
|
Insurance - 2.6%
|
|||
|
American International Group, Inc.
|
7,335,252
|
463,881
|
|
|
Aon PLC
|
78,633
|
23,601
|
|
|
Arthur J. Gallagher & Co.
|
804,267
|
151,637
|
|
|
Brookfield Asset Management Reinsurance Partners Ltd.
|
7,601
|
238
|
|
|
Chubb Ltd.
|
2,210,173
|
487,564
|
|
|
Fairfax Financial Holdings Ltd. (sub. vtg.)
|
143,735
|
85,144
|
|
|
Hartford Financial Services Group, Inc.
|
1,494,462
|
113,325
|
|
|
Intact Financial Corp.
|
818,021
|
117,755
|
|
|
Marsh & McLennan Companies, Inc.
|
585,196
|
96,838
|
|
|
Progressive Corp.
|
3,573,918
|
463,573
|
|
|
The Travelers Companies, Inc.
|
1,994,365
|
373,923
|
|
|
W.R. Berkley Corp.
|
272,572
|
19,781
|
|
|
2,397,260
|
|||
|
TOTAL FINANCIALS
|
15,049,327
|
||
|
HEALTH CARE - 17.5%
|
|||
|
Biotechnology - 4.0%
|
|||
|
AbbVie, Inc.
|
1,173,476
|
189,645
|
|
|
Alnylam Pharmaceuticals, Inc. (a)
|
398,933
|
94,806
|
|
|
Argenx SE ADR (a)
|
216,124
|
81,874
|
|
|
Biohaven Ltd. (a)
|
24,580
|
341
|
|
|
Galapagos NV sponsored ADR (a)
|
1,184,327
|
52,560
|
|
|
Genmab A/S (a)
|
50,320
|
21,275
|
|
|
Gilead Sciences, Inc.
|
1,032,182
|
88,613
|
|
|
Intarcia Therapeutics, Inc. warrants 12/31/24 (a)(c)
|
105,983
|
0
|
|
|
Intellia Therapeutics, Inc. (a)
|
318,218
|
11,103
|
|
|
Legend Biotech Corp. ADR (a)
|
1,018,252
|
50,831
|
|
|
Moderna, Inc. (a)
|
149,540
|
26,860
|
|
|
Neurocrine Biosciences, Inc. (a)
|
160,877
|
19,215
|
|
|
Nuvalent, Inc. Class A (a)
|
259,749
|
7,735
|
|
|
Regeneron Pharmaceuticals, Inc. (a)
|
2,604,999
|
1,879,481
|
|
|
United Therapeutics Corp. (a)
|
528,448
|
146,956
|
|
|
Vertex Pharmaceuticals, Inc. (a)
|
3,175,033
|
916,886
|
|
|
Zai Lab Ltd. (a)(g)
|
6,652,524
|
20,591
|
|
|
3,608,772
|
|||
|
Health Care Equipment & Supplies - 0.4%
|
|||
|
Boston Scientific Corp. (a)
|
1,018,305
|
47,117
|
|
|
DexCom, Inc. (a)
|
160,589
|
18,185
|
|
|
Edwards Lifesciences Corp. (a)
|
164,014
|
12,237
|
|
|
Figs, Inc. Class A (a)
|
420,223
|
2,828
|
|
|
Intuitive Surgical, Inc. (a)
|
1,043,511
|
276,896
|
|
|
Straumann Holding AG
|
181,396
|
20,801
|
|
|
378,064
|
|||
|
Health Care Providers & Services - 7.3%
|
|||
|
23andMe Holding Co. Class A (a)(e)
|
6,535,539
|
14,117
|
|
|
AmerisourceBergen Corp.
|
580,389
|
96,176
|
|
|
Cardinal Health, Inc.
|
973,112
|
74,803
|
|
|
Cigna Corp.
|
1,050,289
|
348,003
|
|
|
Elevance Health, Inc.
|
761,602
|
390,679
|
|
|
HCA Holdings, Inc.
|
331,379
|
79,518
|
|
|
Molina Healthcare, Inc. (a)
|
271,360
|
89,608
|
|
|
Option Care Health, Inc. (a)
|
1,138,017
|
34,243
|
|
|
P3 Health Partners, Inc. (a)(b)(g)
|
2,735,364
|
5,033
|
|
|
UnitedHealth Group, Inc.
|
10,367,395
|
5,496,585
|
|
|
6,628,765
|
|||
|
Health Care Technology - 0.0%
|
|||
|
Doximity, Inc. (a)
|
597,059
|
20,037
|
|
|
Life Sciences Tools & Services - 1.1%
|
|||
|
Danaher Corp.
|
1,837,121
|
487,609
|
|
|
Mettler-Toledo International, Inc. (a)
|
159,174
|
230,078
|
|
|
Thermo Fisher Scientific, Inc.
|
256,166
|
141,068
|
|
|
Veterinary Emergency Group LLC Class A (a)(b)(c)(f)
|
1,038,192
|
58,980
|
|
|
Waters Corp. (a)
|
189,946
|
65,072
|
|
|
982,807
|
|||
|
Pharmaceuticals - 4.7%
|
|||
|
AstraZeneca PLC sponsored ADR
|
299,285
|
20,292
|
|
|
Bristol-Myers Squibb Co.
|
5,655,183
|
406,890
|
|
|
DICE Therapeutics, Inc. (a)
|
678,744
|
21,177
|
|
|
Eli Lilly & Co.
|
6,423,872
|
2,350,109
|
|
|
Intra-Cellular Therapies, Inc. (a)
|
317,204
|
16,786
|
|
|
Johnson & Johnson
|
2,198,392
|
388,346
|
|
|
Merck & Co., Inc.
|
6,264,776
|
695,077
|
|
|
Nuvation Bio, Inc. (a)
|
8,779,833
|
16,857
|
|
|
Pfizer, Inc.
|
337,252
|
17,281
|
|
|
Roche Holding AG (participation certificate)
|
267,931
|
84,194
|
|
|
Royalty Pharma PLC
|
6,301,961
|
249,053
|
|
|
4,266,062
|
|||
|
TOTAL HEALTH CARE
|
15,884,507
|
||
|
INDUSTRIALS - 4.7%
|
|||
|
Aerospace & Defense - 1.7%
|
|||
|
Lockheed Martin Corp.
|
1,117,138
|
543,476
|
|
|
Northrop Grumman Corp.
|
1,217,872
|
664,483
|
|
|
Space Exploration Technologies Corp.:
|
|||
|
Class A (a)(b)(c)
|
3,585,070
|
276,050
|
|
|
Class C (a)(b)(c)
|
129,910
|
10,003
|
|
|
TransDigm Group, Inc.
|
14,894
|
9,378
|
|
|
1,503,390
|
|||
|
Air Freight & Logistics - 0.9%
|
|||
|
United Parcel Service, Inc. Class B
|
4,749,707
|
825,689
|
|
|
Zipline International, Inc. (a)(b)(c)
|
515,816
|
11,430
|
|
|
837,119
|
|||
|
Airlines - 0.0%
|
|||
|
Ryanair Holdings PLC sponsored ADR (a)
|
121,351
|
9,072
|
|
|
Building Products - 0.1%
|
|||
|
Carrier Global Corp.
|
222,710
|
9,187
|
|
|
Toto Ltd.
|
1,725,804
|
58,538
|
|
|
Trane Technologies PLC
|
57,245
|
9,622
|
|
|
77,347
|
|||
|
Commercial Services & Supplies - 0.1%
|
|||
|
Aurora Innovation, Inc. (a)(e)
|
1,405,568
|
1,701
|
|
|
Cintas Corp.
|
126,444
|
57,105
|
|
|
Clean Harbors, Inc. (a)
|
517,250
|
59,029
|
|
|
Clean TeQ Water Pty Ltd. (a)(e)
|
2,102,868
|
555
|
|
|
118,390
|
|||
|
Construction & Engineering - 0.0%
|
|||
|
Willscot Mobile Mini Holdings (a)
|
136,479
|
6,165
|
|
|
Electrical Equipment - 0.2%
|
|||
|
Eaton Corp. PLC
|
349,459
|
54,848
|
|
|
Emerson Electric Co.
|
88,965
|
8,546
|
|
|
Hubbell, Inc. Class B
|
308,685
|
72,442
|
|
|
135,836
|
|||
|
Industrial Conglomerates - 0.5%
|
|||
|
General Electric Co.
|
5,055,369
|
423,589
|
|
|
Machinery - 0.6%
|
|||
|
Caterpillar, Inc.
|
80,968
|
19,397
|
|
|
Deere & Co.
|
819,510
|
351,373
|
|
|
Fortive Corp.
|
457,525
|
29,396
|
|
|
Indutrade AB
|
404,058
|
8,174
|
|
|
PACCAR, Inc.
|
1,725,161
|
170,739
|
|
|
579,079
|
|||
|
Road & Rail - 0.5%
|
|||
|
Canadian Pacific Railway Ltd.
|
2,606,806
|
194,355
|
|
|
J.B. Hunt Transport Services, Inc.
|
845,614
|
147,441
|
|
|
Localiza Rent a Car SA
|
321,700
|
3,242
|
|
|
Localiza Rent a Car SA rights (a)
|
1,406
|
3
|
|
|
Old Dominion Freight Lines, Inc.
|
391,393
|
111,070
|
|
|
Vamos Locacao de Caminhoes Maquinas e Equipamentos SA
|
132,800
|
318
|
|
|
456,429
|
|||
|
Trading Companies & Distributors - 0.1%
|
|||
|
W.W. Grainger, Inc.
|
220,186
|
122,478
|
|
|
TOTAL INDUSTRIALS
|
4,268,894
|
||
|
INFORMATION TECHNOLOGY - 20.8%
|
|||
|
Communications Equipment - 0.2%
|
|||
|
Arista Networks, Inc. (a)
|
1,262,840
|
153,246
|
|
|
Motorola Solutions, Inc.
|
36,984
|
9,531
|
|
|
162,777
|
|||
|
Electronic Equipment & Components - 1.9%
|
|||
|
Amphenol Corp. Class A
|
21,438,073
|
1,632,295
|
|
|
CDW Corp.
|
431,528
|
77,062
|
|
|
Jabil, Inc.
|
422,442
|
28,811
|
|
|
1,738,168
|
|||
|
IT Services - 2.7%
|
|||
|
Accenture PLC Class A
|
3,306,214
|
882,230
|
|
|
Adyen BV (a)(d)
|
25,683
|
35,654
|
|
|
ASAC II LP (a)(b)(c)
|
39,494,500
|
6,635
|
|
|
Cloudflare, Inc. (a)
|
529,682
|
23,947
|
|
|
Gartner, Inc. (a)
|
90,637
|
30,467
|
|
|
MasterCard, Inc. Class A
|
348,301
|
121,115
|
|
|
MongoDB, Inc. Class A (a)
|
46,682
|
9,189
|
|
|
Shopify, Inc. Class A (a)
|
117,399
|
4,076
|
|
|
Visa, Inc. Class A (e)
|
6,338,226
|
1,316,830
|
|
|
X Holdings I, Inc. (b)(c)
|
53,469
|
21,213
|
|
|
2,451,356
|
|||
|
Semiconductors & Semiconductor Equipment - 4.1%
|
|||
|
Advanced Micro Devices, Inc. (a)
|
5,843,393
|
378,477
|
|
|
Analog Devices, Inc.
|
1,202,677
|
197,275
|
|
|
Broadcom, Inc.
|
81,468
|
45,551
|
|
|
Enphase Energy, Inc. (a)
|
404,302
|
107,124
|
|
|
First Solar, Inc. (a)
|
373,407
|
55,933
|
|
|
Lattice Semiconductor Corp. (a)
|
1,146,743
|
74,401
|
|
|
Marvell Technology, Inc.
|
1,058,792
|
39,218
|
|
|
Monolithic Power Systems, Inc.
|
71,274
|
25,203
|
|
|
NVIDIA Corp.
|
10,383,330
|
1,517,420
|
|
|
onsemi (a)
|
4,902,967
|
305,798
|
|
|
Qualcomm, Inc.
|
7,768,727
|
854,094
|
|
|
Synaptics, Inc. (a)
|
1,232,961
|
117,329
|
|
|
Taiwan Semiconductor Manufacturing Co. Ltd. sponsored ADR
|
578,866
|
43,120
|
|
|
3,760,943
|
|||
|
Software - 7.9%
|
|||
|
Adobe, Inc. (a)
|
1,562,177
|
525,719
|
|
|
Aspen Technology, Inc. (a)
|
22,911
|
4,706
|
|
|
Atlassian Corp. PLC (a)(e)
|
348,124
|
44,797
|
|
|
Cadence Design Systems, Inc. (a)
|
1,617,602
|
259,852
|
|
|
Check Point Software Technologies Ltd. (a)
|
421,756
|
53,209
|
|
|
Clear Secure, Inc. (e)
|
1,346,921
|
36,946
|
|
|
Fair Isaac Corp. (a)
|
14,495
|
8,676
|
|
|
Fortinet, Inc. (a)
|
1,217,060
|
59,502
|
|
|
Intuit, Inc.
|
14,110
|
5,492
|
|
|
Microsoft Corp.
|
22,681,578
|
5,439,496
|
|
|
Oracle Corp.
|
241,435
|
19,735
|
|
|
Salesforce.com, Inc. (a)
|
5,123,816
|
679,367
|
|
|
Samsara, Inc. (e)
|
809,018
|
10,056
|
|
|
Stripe, Inc. Class B (a)(b)(c)
|
455,600
|
10,215
|
|
|
Tanium, Inc. Class B (a)(b)(c)
|
6,742,751
|
49,087
|
|
|
ZenPayroll, Inc. (a)(b)(c)
|
289,200
|
8,497
|
|
|
Zoom Video Communications, Inc. Class A (a)
|
126,366
|
8,560
|
|
|
7,223,912
|
|||
|
Technology Hardware, Storage & Peripherals - 4.0%
|
|||
|
Apple, Inc.
|
27,681,292
|
3,596,630
|
|
|
Dell Technologies, Inc.
|
183,136
|
7,366
|
|
|
Pure Storage, Inc. Class A (a)
|
243,555
|
6,518
|
|
|
3,610,514
|
|||
|
TOTAL INFORMATION TECHNOLOGY
|
18,947,670
|
||
|
MATERIALS - 3.4%
|
|||
|
Chemicals - 0.7%
|
|||
|
Air Products & Chemicals, Inc.
|
263,768
|
81,309
|
|
|
Albemarle Corp.
|
533,338
|
115,660
|
|
|
CF Industries Holdings, Inc.
|
2,314,821
|
197,223
|
|
|
Corteva, Inc.
|
1,806,148
|
106,165
|
|
|
Linde PLC
|
86,166
|
28,106
|
|
|
Sherwin-Williams Co.
|
43,643
|
10,358
|
|
|
Westlake Corp.
|
581,529
|
59,630
|
|
|
598,451
|
|||
|
Metals & Mining - 2.7%
|
|||
|
B2Gold Corp.
|
43,046,150
|
152,919
|
|
|
Barrick Gold Corp. (Canada)
|
3,633,225
|
62,280
|
|
|
Cleveland-Cliffs, Inc. (a)
|
3,315,211
|
53,408
|
|
|
Franco-Nevada Corp.
|
3,993,100
|
544,318
|
|
|
Freeport-McMoRan, Inc.
|
10,826,729
|
411,416
|
|
|
Glencore PLC
|
6,618,381
|
44,136
|
|
|
Ivanhoe Electric, Inc. (a)(g)
|
5,380,798
|
65,377
|
|
|
Ivanhoe Mines Ltd. (a)
|
40,488,678
|
319,962
|
|
|
Ivanhoe Mines Ltd. (a)(d)
|
11,924,516
|
94,234
|
|
|
Novagold Resources, Inc. (a)
|
7,049,393
|
42,119
|
|
|
Nucor Corp.
|
3,309,159
|
436,180
|
|
|
POSCO sponsored ADR (e)
|
98,671
|
5,375
|
|
|
Steel Dynamics, Inc.
|
2,425,397
|
236,961
|
|
|
Sunrise Energy Metals Ltd. (a)
|
2,697,436
|
3,512
|
|
|
Wheaton Precious Metals Corp.
|
713,512
|
27,877
|
|
|
2,500,074
|
|||
|
TOTAL MATERIALS
|
3,098,525
|
||
|
REAL ESTATE - 0.1%
|
|||
|
Equity Real Estate Investment Trusts (REITs) - 0.1%
|
|||
|
Equity Commonwealth
|
2,110,084
|
52,689
|
|
|
Prologis (REIT), Inc.
|
175,449
|
19,778
|
|
|
72,467
|
|||
|
UTILITIES - 0.4%
|
|||
|
Electric Utilities - 0.4%
|
|||
|
Constellation Energy Corp.
|
1,896,337
|
163,483
|
|
|
NextEra Energy, Inc.
|
505,136
|
42,229
|
|
|
PG&E Corp. (a)
|
6,079,760
|
98,857
|
|
|
Southern Co.
|
653,002
|
46,631
|
|
|
351,200
|
|||
|
TOTAL COMMON STOCKS
(Cost $41,657,032)
|
87,136,701
|
||
|
Preferred Stocks - 1.7%
|
|||
|
Shares
|
Value ($)
(000s)
|
||
|
Convertible Preferred Stocks - 1.6%
|
|||
|
COMMUNICATION SERVICES - 0.2%
|
|||
|
Interactive Media & Services - 0.2%
|
|||
|
ByteDance Ltd. Series E1 (a)(b)(c)
|
653,587
|
117,606
|
|
|
Reddit, Inc.:
|
|||
|
Series E(a)(b)(c)
|
165,300
|
6,192
|
|
|
Series F(a)(b)(c)
|
878,650
|
32,914
|
|
|
156,712
|
|||
|
CONSUMER DISCRETIONARY - 0.0%
|
|||
|
Automobiles - 0.0%
|
|||
|
Rad Power Bikes, Inc.:
|
|||
|
Series A(a)(b)(c)
|
337,463
|
1,249
|
|
|
Series C(a)(b)(c)
|
1,327,879
|
4,913
|
|
|
Series D(a)(b)(c)
|
2,329,100
|
8,618
|
|
|
14,780
|
|||
|
Hotels, Restaurants & Leisure - 0.0%
|
|||
|
Discord, Inc. Series I (a)(b)(c)
|
15,500
|
5,502
|
|
|
Internet & Direct Marketing Retail - 0.0%
|
|||
|
Circle Internet Financial Ltd. Series F (b)(c)
|
637,828
|
16,743
|
|
|
TOTAL CONSUMER DISCRETIONARY
|
37,025
|
||
|
CONSUMER STAPLES - 0.0%
|
|||
|
Food & Staples Retailing - 0.0%
|
|||
|
GoBrands, Inc.:
|
|||
|
Series G(a)(b)(c)
|
55,517
|
8,036
|
|
|
Series H(a)(b)(c)
|
69,898
|
10,117
|
|
|
18,153
|
|||
|
Food Products - 0.0%
|
|||
|
Bowery Farming, Inc. Series C1 (a)(b)(c)
|
226,491
|
4,600
|
|
|
TOTAL CONSUMER STAPLES
|
22,753
|
||
|
FINANCIALS - 0.0%
|
|||
|
Thrifts & Mortgage Finance - 0.0%
|
|||
|
Acrisure Holdings, Inc. Series B (a)(b)(c)
|
379,681
|
9,101
|
|
|
HEALTH CARE - 0.1%
|
|||
|
Biotechnology - 0.0%
|
|||
|
ElevateBio LLC Series C (a)(b)(c)
|
3,224,900
|
11,803
|
|
|
Intarcia Therapeutics, Inc. Series CC (a)(b)(c)
|
2,100,446
|
0
|
|
|
11,803
|
|||
|
Health Care Providers & Services - 0.1%
|
|||
|
Get Heal, Inc. Series B (a)(b)(c)
|
35,877,127
|
969
|
|
|
Lyra Health, Inc.:
|
|||
|
Series E(a)(b)(c)
|
1,478,100
|
21,019
|
|
|
Series F(a)(b)(c)
|
69,520
|
989
|
|
|
Somatus, Inc. Series E (b)(c)
|
15,253
|
13,101
|
|
|
36,078
|
|||
|
TOTAL HEALTH CARE
|
47,881
|
||
|
INDUSTRIALS - 1.0%
|
|||
|
Aerospace & Defense - 1.0%
|
|||
|
Relativity Space, Inc.:
|
|||
|
Series D(a)(b)(c)
|
1,673,085
|
26,903
|
|
|
Series E(a)(b)(c)
|
436,722
|
8,110
|
|
|
Space Exploration Technologies Corp.:
|
|||
|
Series G(a)(b)(c)
|
558,215
|
429,826
|
|
|
Series H(a)(b)(c)
|
120,282
|
92,617
|
|
|
Series N(a)(b)(c)
|
428,458
|
329,913
|
|
|
887,369
|
|||
|
Air Freight & Logistics - 0.0%
|
|||
|
Zipline International, Inc. Series E (a)(b)(c)
|
1,317,166
|
29,188
|
|
|
Construction & Engineering - 0.0%
|
|||
|
Beta Technologies, Inc. Series B, 6.00% (b)(c)
|
259,581
|
16,966
|
|
|
TOTAL INDUSTRIALS
|
933,523
|
||
|
INFORMATION TECHNOLOGY - 0.2%
|
|||
|
Software - 0.2%
|
|||
|
ASAPP, Inc. Series C (a)(b)(c)
|
1,300,504
|
5,462
|
|
|
Carbon, Inc.:
|
|||
|
Series D(a)(b)(c)
|
915,425
|
8,834
|
|
|
Series E(a)(b)(c)
|
81,735
|
941
|
|
|
Delphix Corp. Series D (a)(b)(c)
|
3,712,687
|
19,083
|
|
|
Nuro, Inc.:
|
|||
|
Series C(a)(b)(c)
|
3,293,118
|
25,126
|
|
|
Series D(a)(b)(c)
|
643,113
|
4,907
|
|
|
Stripe, Inc. Series H (a)(b)(c)
|
190,300
|
4,267
|
|
|
Tenstorrent, Inc. Series C1 (a)(b)(c)
|
200,200
|
10,432
|
|
|
ZenPayroll, Inc.:
|
|||
|
Series D(a)(b)(c)
|
2,436,137
|
71,574
|
|
|
Series E(a)(b)(c)
|
167,099
|
4,909
|
|
|
155,535
|
|||
|
MATERIALS - 0.1%
|
|||
|
Metals & Mining - 0.1%
|
|||
|
High Power Exploration, Inc. Series A (a)(b)(c)
|
14,154,085
|
60,155
|
|
|
TOTAL CONVERTIBLE PREFERRED STOCKS
|
1,422,685
|
||
|
Nonconvertible Preferred Stocks - 0.1%
|
|||
|
CONSUMER DISCRETIONARY - 0.0%
|
|||
|
Internet & Direct Marketing Retail - 0.0%
|
|||
|
Circle Internet Financial Ltd. Series E (b)(c)
|
1,059,433
|
27,810
|
|
|
ENERGY - 0.1%
|
|||
|
Oil, Gas & Consumable Fuels - 0.1%
|
|||
|
Petroleo Brasileiro SA - Petrobras sponsored ADR
|
10,065,844
|
107,201
|
|
|
TOTAL NONCONVERTIBLE PREFERRED STOCKS
|
135,011
|
||
|
TOTAL PREFERRED STOCKS
(Cost $1,029,521)
|
1,557,696
|
||
|
Preferred Securities - 0.0%
|
|||
|
Principal
Amount (h)
(000s)
|
Value ($)
(000s)
|
||
|
HEALTH CARE - 0.0%
|
|||
|
Biotechnology - 0.0%
|
|||
|
Intarcia Therapeutics, Inc. 6% 7/18/23 (b)(c)(i)
|
9,273
|
0
|
|
|
INFORMATION TECHNOLOGY - 0.0%
|
|||
|
Software - 0.0%
|
|||
|
Tenstorrent, Inc. 0% (b)(c)(j)
|
11,130
|
9,750
|
|
|
TOTAL PREFERRED SECURITIES
(Cost $20,403)
|
9,750
|
||
|
Money Market Funds - 3.3%
|
|||
|
Shares
|
Value ($)
(000s)
|
||
|
Fidelity Cash Central Fund 4.37% (k)
|
2,285,123,072
|
2,285,580
|
|
|
Fidelity Securities Lending Cash Central Fund 4.37% (k)(l)
|
710,631,936
|
710,703
|
|
|
TOTAL MONEY MARKET FUNDS
(Cost $2,996,282)
|
2,996,283
|
||
|
TOTAL INVESTMENT IN SECURITIES - 100.9%
(Cost $45,703,238)
|
91,700,430
|
|
NET OTHER ASSETS (LIABILITIES) - (0.9)%
|
(799,556)
|
|
NET ASSETS - 100.0%
|
90,900,874
|
|
(a)
|
Non-income producing
|
|
(b)
|
Restricted securities (including private placements) - Investment in securities not registered under the Securities Act of 1933 (excluding 144A issues). At the end of the period, the value of restricted securities (excluding 144A issues) amounted to $2,445,705,000 or 2.7% of net assets.
|
|
(c)
|
Level 3 security
|
|
(d)
|
Security exempt from registration under Rule 144A of the Securities Act of 1933. These securities may be resold in transactions exempt from registration, normally to qualified institutional buyers. At the end of the period, the value of these securities amounted to $175,703,000 or 0.2% of net assets.
|
|
(e)
|
Security or a portion of the security is on loan at period end.
|
|
(f)
|
Investment is owned by a wholly-owned subsidiary (Subsidiary) that is treated as a corporation for U.S. tax purposes.
|
|
(g)
|
Affiliated company
|
|
(h)
|
Amount is stated in United States dollars unless otherwise noted.
|
|
(i)
|
Non-income producing - Security is in default.
|
|
(j)
|
Security is perpetual in nature with no stated maturity date.
|
|
(k)
|
Affiliated fund that is generally available only to investment companies and other accounts managed by Fidelity Investments. The rate quoted is the annualized seven-day yield of the fund at period end. A complete unaudited listing of the fund's holdings as of its most recent quarter end is available upon request. In addition, each Fidelity Central Fund's financial statements, which are not covered by the Fund's Report of Independent Registered Public Accounting Firm, are available on the SEC's website or upon request.
|
|
(l)
|
Investment made with cash collateral received from securities on loan.
|
|
Additional information on each restricted holding is as follows:
|
||
|
Security
|
Acquisition Date
|
Acquisition Cost ($)
(000s)
|
|
Acrisure Holdings, Inc. Series B
|
3/22/21
|
6,918
|
|
ASAC II LP
|
10/10/13
|
3,041
|
|
ASAPP, Inc. Series C
|
4/30/21
|
8,580
|
|
Beta Technologies, Inc. Series B, 6.00%
|
4/04/22
|
26,781
|
|
Bowery Farming, Inc. Series C1
|
5/18/21
|
13,646
|
|
ByteDance Ltd. Series E1
|
11/18/20
|
71,616
|
|
Carbon, Inc. Series D
|
12/15/17
|
21,376
|
|
Carbon, Inc. Series E
|
3/22/19
|
2,288
|
|
Circle Internet Financial Ltd. Series E
|
5/11/21
|
17,195
|
|
Circle Internet Financial Ltd. Series F
|
5/09/22
|
26,878
|
|
Delphix Corp. Series D
|
7/10/15
|
33,414
|
|
Discord, Inc. Series I
|
9/15/21
|
8,535
|
|
ElevateBio LLC Series C
|
3/09/21
|
13,528
|
|
Epic Games, Inc.
|
7/13/20 - 7/30/20
|
71,128
|
|
Fanatics, Inc. Class A
|
8/13/20 - 12/15/21
|
82,369
|
|
Get Heal, Inc. Series B
|
11/07/16
|
10,944
|
|
GoBrands, Inc. Series G
|
3/02/21
|
13,864
|
|
GoBrands, Inc. Series H
|
7/22/21
|
27,155
|
|
High Power Exploration, Inc. Series A
|
11/15/19 - 3/04/21
|
74,592
|
|
Intarcia Therapeutics, Inc. Series CC
|
11/14/12
|
28,629
|
|
Intarcia Therapeutics, Inc. 6% 7/18/23
|
1/03/20
|
9,273
|
|
Lyra Health, Inc. Series E
|
1/14/21
|
13,534
|
|
Lyra Health, Inc. Series F
|
6/04/21
|
1,092
|
|
Nuro, Inc. Series C
|
10/30/20
|
42,990
|
|
Nuro, Inc. Series D
|
10/29/21
|
13,406
|
|
P3 Health Partners, Inc.
|
5/25/21
|
27,354
|
|
Rad Power Bikes, Inc.
|
1/21/21
|
12,486
|
|
Rad Power Bikes, Inc. Series A
|
1/21/21
|
1,628
|
|
Rad Power Bikes, Inc. Series C
|
1/21/21
|
6,405
|
|
Rad Power Bikes, Inc. Series D
|
9/17/21
|
22,322
|
|
Rapyd Financial Network 2016 Ltd.
|
3/30/21
|
25,000
|
|
Reddit, Inc. Series E
|
5/18/21
|
7,021
|
|
Reddit, Inc. Series F
|
8/11/21
|
54,296
|
|
Relativity Space, Inc. Series D
|
11/20/20
|
24,974
|
|
Relativity Space, Inc. Series E
|
5/27/21
|
9,973
|
|
Somatus, Inc. Series E
|
1/31/22
|
13,310
|
|
Space Exploration Technologies Corp. Class A
|
10/16/15 - 5/24/22
|
60,159
|
|
Space Exploration Technologies Corp. Class C
|
9/11/17
|
1,754
|
|
Space Exploration Technologies Corp. Series G
|
1/20/15
|
43,239
|
|
Space Exploration Technologies Corp. Series H
|
8/04/17
|
16,238
|
|
Space Exploration Technologies Corp. Series N
|
8/04/20
|
115,684
|
|
Starling Bank Ltd. Series D
|
6/18/21 - 4/05/22
|
52,246
|
|
Stripe, Inc. Class B
|
5/18/21
|
18,282
|
|
Stripe, Inc. Series H
|
3/15/21
|
7,636
|
|
Tanium, Inc. Class B
|
4/21/17 - 9/18/20
|
57,901
|
|
Tenstorrent, Inc. Series C1
|
4/23/21
|
11,903
|
|
Tenstorrent, Inc. 0%
|
4/23/21
|
11,130
|
|
TulCo LLC
|
8/24/17 - 9/07/18
|
51,985
|
|
Veterinary Emergency Group LLC Class A
|
9/16/21 - 12/16/22
|
39,966
|
|
X Holdings I, Inc.
|
10/25/22
|
53,469
|
|
ZenPayroll, Inc.
|
10/01/21
|
8,326
|
|
ZenPayroll, Inc. Series D
|
7/16/19
|
32,431
|
|
ZenPayroll, Inc. Series E
|
7/13/21
|
5,079
|
|
Zipline International, Inc.
|
10/12/21
|
18,569
|
|
Zipline International, Inc. Series E
|
12/21/20
|
42,978
|
|
Affiliate (Amounts in thousands)
|
Value,
beginning
of period ($)
|
Purchases ($)
|
Sales
Proceeds ($)
|
Dividend
Income ($)
|
Realized
Gain (loss) ($)
|
Change in
Unrealized
appreciation
(depreciation) ($)
|
Value,
end
of period ($)
|
% ownership,
end
of period
|
|
Fidelity Cash Central Fund 4.37%
|
1,364,187
|
14,910,838
|
13,989,445
|
40,070
|
-
|
-
|
2,285,580
|
5.3%
|
|
Fidelity Securities Lending Cash Central Fund 4.37%
|
435,183
|
5,256,682
|
4,981,162
|
1,673
|
-
|
-
|
710,703
|
2.3%
|
|
Total
|
1,799,370
|
20,167,520
|
18,970,607
|
41,743
|
-
|
-
|
2,996,283
|
|
|
Affiliate (Amounts in thousands)
|
Value,
beginning
of period ($)
|
Purchases ($)
|
Sales
Proceeds ($)
|
Dividend
Income ($)
|
Realized
Gain (loss) ($)
|
Change in
Unrealized
appreciation
(depreciation) ($)
|
Value,
end
of period ($)
|
|
Ivanhoe Electric, Inc.
|
-
|
-
|
-
|
-
|
-
|
-
|
-
|
|
Ivanhoe Electric, Inc.
|
-
|
7,859
|
64
|
-
|
14
|
45,821
|
65,377
|
|
P3 Health Partners, Inc.
|
18,294
|
-
|
-
|
-
|
-
|
(13,261)
|
5,033
|
|
Synaptics, Inc.
|
696,243
|
2,058
|
141,745
|
-
|
12,055
|
(451,282)
|
-
|
|
Zai Lab Ltd.
|
30,521
|
10,537
|
7,076
|
-
|
(2,726)
|
(10,665)
|
20,591
|
|
Total
|
745,058
|
20,454
|
148,885
|
-
|
9,343
|
(429,387)
|
91,001
|
|
Valuation Inputs at Reporting Date:
|
||||
|
Description
(Amounts in thousands)
|
Total ($)
|
Level 1 ($)
|
Level 2 ($)
|
Level 3 ($)
|
|
Investments in Securities:
|
||||
|
Equities:
|
||||
|
Communication Services
|
11,693,826
|
11,263,221
|
173,013
|
257,592
|
|
Consumer Discretionary
|
8,874,942
|
8,448,397
|
164,649
|
261,896
|
|
Consumer Staples
|
3,116,267
|
2,795,080
|
298,434
|
22,753
|
|
Energy
|
6,130,577
|
6,056,735
|
73,842
|
-
|
|
Financials
|
15,058,428
|
14,795,560
|
23,391
|
239,477
|
|
Health Care
|
15,932,388
|
15,678,666
|
146,861
|
106,861
|
|
Industrials
|
5,202,417
|
3,912,318
|
59,093
|
1,231,006
|
|
Information Technology
|
19,103,205
|
18,816,369
|
35,654
|
251,182
|
|
Materials
|
3,158,680
|
3,050,877
|
47,648
|
60,155
|
|
Real Estate
|
72,467
|
72,467
|
-
|
-
|
|
Utilities
|
351,200
|
351,200
|
-
|
-
|
|
Preferred Securities
|
9,750
|
-
|
-
|
9,750
|
|
Money Market Funds
|
2,996,283
|
2,996,283
|
-
|
-
|
|
Total Investments in Securities:
|
91,700,430
|
88,237,173
|
1,022,585
|
2,440,672
|
|
|
||||
|
Net Unrealized Depreciation on Unfunded Commitments
|
(5,103)
|
-
|
-
|
(5,103)
|
|
Total
|
(5,103)
|
-
|
-
|
(5,103)
|
|
(Amounts in thousands)
|
|||
|
Investments in Securities:
|
|||
|
Industrials
|
|||
|
Beginning Balance
|
$
|
1,226,738
|
|
|
Net Realized Gain (Loss) on Investment Securities
|
-
|
||
|
Net Unrealized Gain (Loss) on Investment Securities
|
(3,333)
|
||
|
Cost of Purchases
|
34,382
|
||
|
Proceeds of Sales
|
-
|
||
|
Amortization/Accretion
|
-
|
||
|
Transfers into Level 3
|
-
|
||
|
Transfers out of Level 3
|
(26,781)
|
||
|
Ending Balance
|
$
|
1,231,006
|
|
|
The change in unrealized gain (loss) for the period attributable to Level 3 securities held at December 31, 2022
|
$
|
(3,333)
|
|
|
Other Investments in Securities
|
|||
|
Beginning Balance
|
$
|
1,072,249
|
|
|
Net Realized Gain (Loss) on Investment Securities
|
64,565
|
||
|
Net Unrealized Gain (Loss) on Investment Securities
|
10,199
|
||
|
Cost of Purchases
|
121,771
|
||
|
Proceeds of Sales
|
(64,565)
|
||
|
Amortization/Accretion
|
-
|
||
|
Transfers into Level 3
|
17,195
|
||
|
Transfers out of Level 3
|
(11,748)
|
||
|
Ending Balance
|
$
|
1,209,666
|
|
|
The change in unrealized gain (loss) for the period attributable to Level 3 securities held at December 31, 2022
|
$
|
10,199
|
|
|
The information used in the above reconciliation represents fiscal year to date activity for any Investments in Securities identified as using Level 3 inputs at either the beginning or the end of the current fiscal period. Cost of purchases and proceeds of sales may include securities received and/or delivered through in-kind transactions. Transfers into Level 3 were attributable to a lack of observable market data resulting from decreases in market activity, decreases in liquidity, security restructurings or corporate actions. Transfers out of Level 3 were attributable to observable market data becoming available for those securities. Transfers in or out of Level 3 represent the beginning value of any Security or Instrument where a change in the pricing level occurred from the beginning to the end of the period. The cost of purchases and the proceeds of sales may include securities received or delivered through corporate actions or exchanges. Realized and unrealized gains (losses) disclosed in the reconciliation are included in Net Gain (Loss) on the Fund's Statement of Operations.
|
|||
|
Statement of Assets and Liabilities
|
||||
|
Amounts in thousands (except per-share amounts)
|
December 31, 2022
|
|||
|
Assets
|
||||
|
Investment in securities, at value (including securities loaned of $693,295) - See accompanying schedule:
|
||||
|
Unaffiliated issuers (cost $42,624,250)
|
$
|
88,613,146
|
||
|
Fidelity Central Funds (cost $2,996,282)
|
2,996,283
|
|||
|
Other affiliated issuers (cost $82,706)
|
91,001
|
|||
|
Total Investment in Securities (cost $45,703,238)
|
$
|
91,700,430
|
||
|
Cash
|
514
|
|||
|
Restricted cash
|
294
|
|||
|
Foreign currency held at value (cost $35)
|
34
|
|||
|
Receivable for investments sold
|
44,227
|
|||
|
Receivable for fund shares sold
|
20,155
|
|||
|
Dividends receivable
|
50,240
|
|||
|
Distributions receivable from Fidelity Central Funds
|
7,906
|
|||
|
Prepaid expenses
|
116
|
|||
|
Other receivables
|
4,957
|
|||
|
Total assets
|
91,828,873
|
|||
|
Liabilities
|
||||
|
Unrealized depreciation on unfunded commitments
|
$5,103
|
|||
|
Payable for fund shares redeemed
|
152,704
|
|||
|
Accrued management fee
|
26,862
|
|||
|
Other affiliated payables
|
9,086
|
|||
|
Other payables and accrued expenses
|
23,724
|
|||
|
Collateral on securities loaned
|
710,520
|
|||
|
Total Liabilities
|
927,999
|
|||
|
Net Assets
|
$
|
90,900,874
|
||
|
Net Assets consist of:
|
||||
|
Paid in capital
|
$
|
44,101,160
|
||
|
Total accumulated earnings (loss)
|
46,799,714
|
|||
|
Net Assets
|
$
|
90,900,874
|
||
|
Net Asset Value and Maximum Offering Price
|
||||
|
Contrafund :
|
||||
|
Net Asset Value
, offering price and redemption price per share ($82,278,716 ÷ 6,808,040 shares)
|
$
|
12.09
|
||
|
Class K :
|
||||
|
Net Asset Value
, offering price and redemption price per share ($8,622,158 ÷ 710,969 shares)
|
$
|
12.13
|
||
|
Statement of Operations
|
||||
|
Amounts in thousands
|
Year ended
December 31, 2022
|
|||
|
Investment Income
|
||||
|
Dividends
|
$
|
980,584
|
||
|
Income from Fidelity Central Funds (including $1,673 from security lending)
|
41,743
|
|||
|
Total Income
|
1,022,327
|
|||
|
Expenses
|
||||
|
Management fee
|
||||
|
Basic fee
|
$
|
567,539
|
||
|
Performance adjustment
|
(110,029)
|
|||
|
Transfer agent fees
|
117,309
|
|||
|
Accounting fees
|
3,403
|
|||
|
Custodian fees and expenses
|
832
|
|||
|
Independent trustees' fees and expenses
|
386
|
|||
|
Registration fees
|
261
|
|||
|
Audit
|
202
|
|||
|
Legal
|
90
|
|||
|
Miscellaneous
|
535
|
|||
|
Total expenses before reductions
|
580,528
|
|||
|
Expense reductions
|
(3,849)
|
|||
|
Total expenses after reductions
|
576,679
|
|||
|
Net Investment income (loss)
|
445,648
|
|||
|
Realized and Unrealized Gain (Loss)
|
||||
|
Net realized gain (loss) on:
|
||||
|
Investment Securities:
|
||||
|
Unaffiliated issuers(net of foreign taxes of $3,372)
|
11,417,235
|
|||
|
Affiliated issuers
|
9,343
|
|||
|
Foreign currency transactions
|
(1,352)
|
|||
|
Total net realized gain (loss)
|
11,425,226
|
|||
|
Change in net unrealized appreciation (depreciation) on:
|
||||
|
Investment Securities:
|
||||
|
Unaffiliated issuers
(net of decrease in deferred foreign taxes of $8,656)
|
(51,003,261)
|
|||
|
Affiliated issuers
|
(429,387)
|
|||
|
Unfunded commitments
|
(4,231)
|
|||
|
Assets and liabilities in foreign currencies
|
(409)
|
|||
|
Total change in net unrealized appreciation (depreciation)
|
(51,437,288)
|
|||
|
Net gain (loss)
|
(40,012,062)
|
|||
|
Net increase (decrease) in net assets resulting from operations
|
$
|
(39,566,414)
|
||
|
Statement of Changes in Net Assets
|
||||
|
Amount in thousands
|
Year ended
December 31, 2022
|
Year ended
December 31, 2021
|
||
|
Increase (Decrease) in Net Assets
|
||||
|
Operations
|
||||
|
Net investment income (loss)
|
$
|
445,648
|
$
|
(346,574)
|
|
Net realized gain (loss)
|
11,425,226
|
20,719,123
|
||
|
Change in net unrealized appreciation (depreciation)
|
(51,437,288)
|
10,179,892
|
||
|
Net increase (decrease) in net assets resulting from operations
|
(39,566,414)
|
30,552,441
|
||
|
Distributions to shareholders
|
(10,115,716)
|
(14,927,529)
|
||
|
Share transactions - net increase (decrease)
|
(4,582,140)
|
(6,755,026)
|
||
|
Total increase (decrease) in net assets
|
(54,264,270)
|
8,869,886
|
||
|
Net Assets
|
||||
|
Beginning of period
|
145,165,144
|
136,295,258
|
||
|
End of period
|
$
|
90,900,874
|
$
|
145,165,144
|
|
Fidelity® Contrafund®
|
|
Years ended December 31,
|
2022
|
2021
|
2020
|
2019
|
2018
A
|
|||||
|
Selected Per-Share Data
|
||||||||||
|
Net asset value, beginning of period
|
$
|
18.76
|
$
|
16.77
|
$
|
13.71
|
$
|
11.01
|
$
|
12.24
|
|
Income from Investment Operations
|
||||||||||
|
Net investment income (loss)
B,C
|
.06
|
(.05)
|
(.04)
|
-
D
|
-
D
|
|||||
|
Net realized and unrealized gain (loss)
|
(5.29)
|
4.07
|
4.44
|
3.27
|
(.22)
|
|||||
|
Total from investment operations
|
(5.23)
|
4.02
|
4.40
|
3.27
|
(.22)
|
|||||
|
Distributions from net investment income
|
(.08)
|
-
|
-
|
-
|
-
|
|||||
|
Distributions from net realized gain
|
(1.36)
|
(2.03)
|
(1.34)
|
(.57)
|
(1.01)
|
|||||
|
Total distributions
|
(1.44)
|
(2.03)
|
(1.34)
|
(.57)
|
(1.01)
|
|||||
|
Net asset value, end of period
|
$
|
12.09
|
$
|
18.76
|
$
|
16.77
|
$
|
13.71
|
$
|
11.01
|
|
Total Return
E
|
(28.26)%
|
24.36%
|
32.58%
|
29.98%
|
(2.13)%
|
|||||
|
Ratios to Average Net Assets
C,F,G
|
||||||||||
|
Expenses before reductions
|
.55%
|
.81%
|
.86%
|
.85%
|
.82%
|
|||||
|
Expenses net of fee waivers, if any
|
.54%
|
.81%
|
.86%
|
.85%
|
.81%
|
|||||
|
Expenses net of all reductions
|
.54%
|
.81%
|
.85%
|
.85%
|
.81%
|
|||||
|
Net investment income (loss)
|
.41%
|
(.26)%
|
(.23)%
|
(.02)%
|
.01%
|
|||||
|
Supplemental Data
|
||||||||||
|
Net assets, end of period (in millions)
|
$
|
82,279
|
$
|
128,577
|
$
|
113,100
|
$
|
97,098
|
$
|
82,628
|
|
Portfolio turnover rate
H
|
25%
I
|
27%
I
|
32%
I
|
26%
I
|
32%
I
|
|
Fidelity® Contrafund® Class K
|
|
Years ended December 31,
|
2022
|
2021
|
2020
|
2019
|
2018
A
|
|||||
|
Selected Per-Share Data
|
||||||||||
|
Net asset value, beginning of period
|
$
|
18.82
|
$
|
16.81
|
$
|
13.73
|
$
|
11.01
|
$
|
12.24
|
|
Income from Investment Operations
|
||||||||||
|
Net investment income (loss)
B,C
|
.07
|
(.03)
|
(.02)
|
.01
|
.01
|
|||||
|
Net realized and unrealized gain (loss)
|
(5.31)
|
4.07
|
4.44
|
3.28
|
(.23)
|
|||||
|
Total from investment operations
|
(5.24)
|
4.04
|
4.42
|
3.29
|
(.22)
|
|||||
|
Distributions from net investment income
|
(.09)
|
-
|
-
|
-
|
-
|
|||||
|
Distributions from net realized gain
|
(1.36)
|
(2.03)
|
(1.34)
|
(.57)
|
(1.01)
|
|||||
|
Total distributions
|
(1.45)
|
(2.03)
|
(1.34)
|
(.57)
|
(1.01)
|
|||||
|
Net asset value, end of period
|
$
|
12.13
|
$
|
18.82
|
$
|
16.81
|
$
|
13.73
|
$
|
11.01
|
|
Total Return
D
|
(28.22)%
|
24.42%
|
32.68%
|
30.17%
|
(2.07)%
|
|||||
|
Ratios to Average Net Assets
C,E,F
|
||||||||||
|
Expenses before reductions
|
.47%
|
.74%
|
.78%
|
.77%
|
.73%
|
|||||
|
Expenses net of fee waivers, if any
|
.47%
|
.74%
|
.78%
|
.76%
|
.73%
|
|||||
|
Expenses net of all reductions
|
.47%
|
.74%
|
.78%
|
.76%
|
.72%
|
|||||
|
Net investment income (loss)
|
.48%
|
(.18)%
|
(.16)%
|
.06%
|
.10%
|
|||||
|
Supplemental Data
|
||||||||||
|
Net assets, end of period (in millions)
|
$
|
8,622
|
$
|
16,588
|
$
|
23,196
|
$
|
22,626
|
$
|
25,502
|
|
Portfolio turnover rate
G
|
25%
H
|
27%
H
|
32%
H
|
26%
H
|
32%
H
|
|
Fidelity Central Fund
|
Investment Manager
|
Investment Objective
|
Investment Practices
|
Expense Ratio
A
|
|
Fidelity Money Market Central Funds
|
Fidelity Management & Research Company LLC (FMR)
|
Each fund seeks to obtain a high level of current income consistent with the preservation of capital and liquidity.
|
Short-term Investments
|
Less than .005%
|
|
Asset Type
|
Fair Value
|
Valuation Technique(s)
|
Unobservable Input
|
Amount or Range/Weighted Average
|
Impact to Valuation from an Increase in Input
A
|
|
Equities
|
$2,430,922
|
Market comparable
|
Enterprise value/EBITDA multiple (EV/EBITDA)
|
5.5 - 21.2 / 11.9
|
Increase
|
|
|
|
|
Enterprise value/Revenue multiple (EV/R)
|
1.6 - 19.0 / 7.6
|
Increase
|
|
|
|
|
Enterprise value/Net income multiple (EV/NI)
|
15.5
|
Increase
|
|
|
|
Recovery value
|
Recovery value
|
$0.00 - $0.17 / $0.17
|
Increase
|
|
|
|
Market approach
|
Transaction price
|
$0.03 - $59.45 / $54.41
|
Increase
|
|
|
|
|
Discount rate
|
6.1% - 15.0% / 14.2%
|
Decrease
|
|
|
|
Book value
|
Book value multiple
|
1.0
|
Increase
|
|
|
|
|
Discount rate
|
10.0%
|
Decrease
|
|
|
|
Discounted cash flow
|
Weighted average cost of capital (WACC)
|
30.0%
|
Decrease
|
|
|
|
|
Exit multiple
|
2.0
|
Increase
|
|
|
|
Black scholes
|
Discount rate
|
3.8% - 4.7% / 3.9%
|
Increase
|
|
|
|
|
Probability rate
|
50.0%
|
Increase
|
|
|
|
|
Volatility
|
65.0% - 85.0% / 77.9%
|
Increase
|
|
|
|
|
Term
|
0.6 - 5.0 / 4.0
|
Increase
|
|
|
|
|
|
|
|
|
Preferred Securities
|
$9,750
|
Recovery value
|
Recovery value
|
$0.00
|
Increase
|
|
|
|
Market approach
|
Transaction price
|
$100.00
|
Increase
|
|
|
|
|
Discount rate
|
15.0%
|
Decrease
|
|
|
|
Black scholes
|
Discount rate
|
4.2%
|
Increase
|
|
|
|
|
Volatility
|
70.0%
|
Increase
|
|
|
|
|
Term
|
2.0
|
Increase
|
|
Fidelity Contrafund
|
$3,866
|
|
Gross unrealized appreciation
|
$47,196,306
|
|
Gross unrealized depreciation
|
(1,758,975)
|
|
Net unrealized appreciation (depreciation)
|
$45,437,331)
|
|
Tax Cost
|
$46,257,996
|
|
Undistributed long-term capital gain
|
$1,364,654
|
|
Net unrealized appreciation (depreciation) on securities and other investments
|
$(45,437,151)
|
|
|
December 31, 2022
|
December 31, 2021
|
|
Ordinary Income
|
$541,463
|
$-
|
|
Long-term Capital Gains
|
9,574,253
|
14,927,529
|
|
Total
|
$10,115,716
|
$ 14,927,529
|
|
|
Investment to be Acquired
|
Commitment Amount
|
Unrealized Appreciation (Depreciation)
|
|
Fidelity Contrafund
|
Stripe, Inc.
|
$5,103
|
$(5,103)
|
|
|
$ Amount
|
% of Net Assets
|
|
Fidelity Contrafund
|
165,587
|
.18
|
|
|
Purchases ($)
|
Sales ($)
|
|
Fidelity Contrafund
|
26,303,113
|
39,996,822
|
|
|
Shares
|
Total net realized gain or loss
($)
|
Total Proceeds
($)
|
Participating classes
|
|
Fidelity Contrafund
|
103,972
|
964,453
|
1,619,588
|
Contrafund, Class K
|
|
|
Shares
|
Total net realized gain or loss
($)
|
Total Proceeds
($)
|
Participating classes
|
|
Fidelity Contrafund
|
407,509
|
5,049,090
|
7,291,329
|
Contrafund, Class K
|
|
|
Amount
|
% of Class-Level Average Net Assets
|
|
Contrafund
|
$112,798
|
.12
|
|
Class K
|
4,511
|
.04
|
|
|
$117,309
|
|
|
|
% of Average Net Assets
|
|
Fidelity Contrafund
|
-
A
|
|
|
Amount
|
|
Fidelity Contrafund
|
$529
|
|
|
Purchases ($)
|
Sales ($)
|
Realized Gain (Loss) ($)
|
|
Fidelity Contrafund
|
1,487,513
|
3,302,428
|
1,039,159
|
|
|
Amount
|
|
Fidelity Contrafund
|
$204
|
|
|
Total Security Lending Fees Paid to NFS
|
Security Lending Income From Securities Loaned to NFS
|
Value of Securities Loaned to NFS at Period End
|
|
Fidelity Contrafund
|
$175
|
$10
|
$-
|
|
|
Year ended
December 31, 2022
|
Year ended
December 31, 2021
|
|
Fidelity Contrafund
|
|
|
|
Distributions to shareholders
|
|
|
|
Contrafund
|
$9,128,177
|
$13,046,053
|
|
Class K
|
987,539
|
1,881,476
|
|
Total
|
$10,115,716
|
$14,927,529
|
|
|
Shares
|
Shares
|
Dollars
|
Dollars
|
|
|
Year ended December 31, 2022
|
Year ended December 31, 2021
|
Year ended December 31, 2022
|
Year ended December 31, 2021
|
|
Fidelity Contrafund
|
|
|
|
|
|
Contrafund
|
|
|
|
|
|
Shares sold
|
348,710
|
460,572
|
$5,094,513
|
$8,438,992
|
|
Reinvestment of distributions
|
657,388
|
659,076
|
8,457,516
|
12,171,042
|
|
Shares redeemed
|
(1,050,982)
|
(1,009,147)
|
(15,394,010)
|
(18,328,322)
|
|
Net increase (decrease)
|
(44,884)
|
110,501
|
$(1,841,981)
|
$2,281,712
|
|
Class K
|
|
|
|
|
|
Shares sold
|
63,881
|
121,469
|
$958,814
|
$2,200,613
|
|
Reinvestment of distributions
|
76,064
|
102,076
|
987,511
|
1,881,455
|
|
Shares redeemed
|
(310,293)
|
(722,074)
|
(4,686,484)
|
(13,118,806)
|
|
Net increase (decrease)
|
(170,348)
|
(498,529)
|
$(2,740,159)
|
$(9,036,738)
|
|
The Example is based on an investment of $1,000 invested at the beginning of the period and held for the entire period (July 1, 2022 to December 31, 2022).
|
|
Annualized Expense Ratio-
A
|
Beginning Account Value July 1, 2022
|
Ending Account Value December 31, 2022
|
Expenses Paid During Period-
C
July 1, 2022 to December 31, 2022
|
|||||||
|
Fidelity® Contrafund®
|
||||||||||
|
Fidelity® Contrafund®
|
.49%
|
|||||||||
|
Actual
|
$ 1,000
|
$ 999.00
|
$ 2.47
|
|||||||
|
Hypothetical-
B
|
$ 1,000
|
$ 1,022.74
|
$ 2.50
|
|||||||
|
Class K
|
.41%
|
|||||||||
|
Actual
|
$ 1,000
|
$ 999.10
|
$ 2.07
|
|||||||
|
Hypothetical-
B
|
$ 1,000
|
$ 1,023.14
|
$ 2.09
|
|||||||
|
|


Contents
|
Average Annual Total Returns
|
|||
|
Periods ended December 31, 2022
|
Past 1
year
|
Past 5
years
|
Life of
Fund
A
|
|
Fidelity® Contrafund® K6
|
-27.12%
|
8.70%
|
10.23%
|
|
$10,000 Over Life of Fund
|
|
Let's say hypothetically that $10,000 was invested in Fidelity® Contrafund® K6, on May 25, 2017, when the fund started.
The chart shows how the value of your investment would have changed, and also shows how the S&P 500® Index performed over the same period.
|
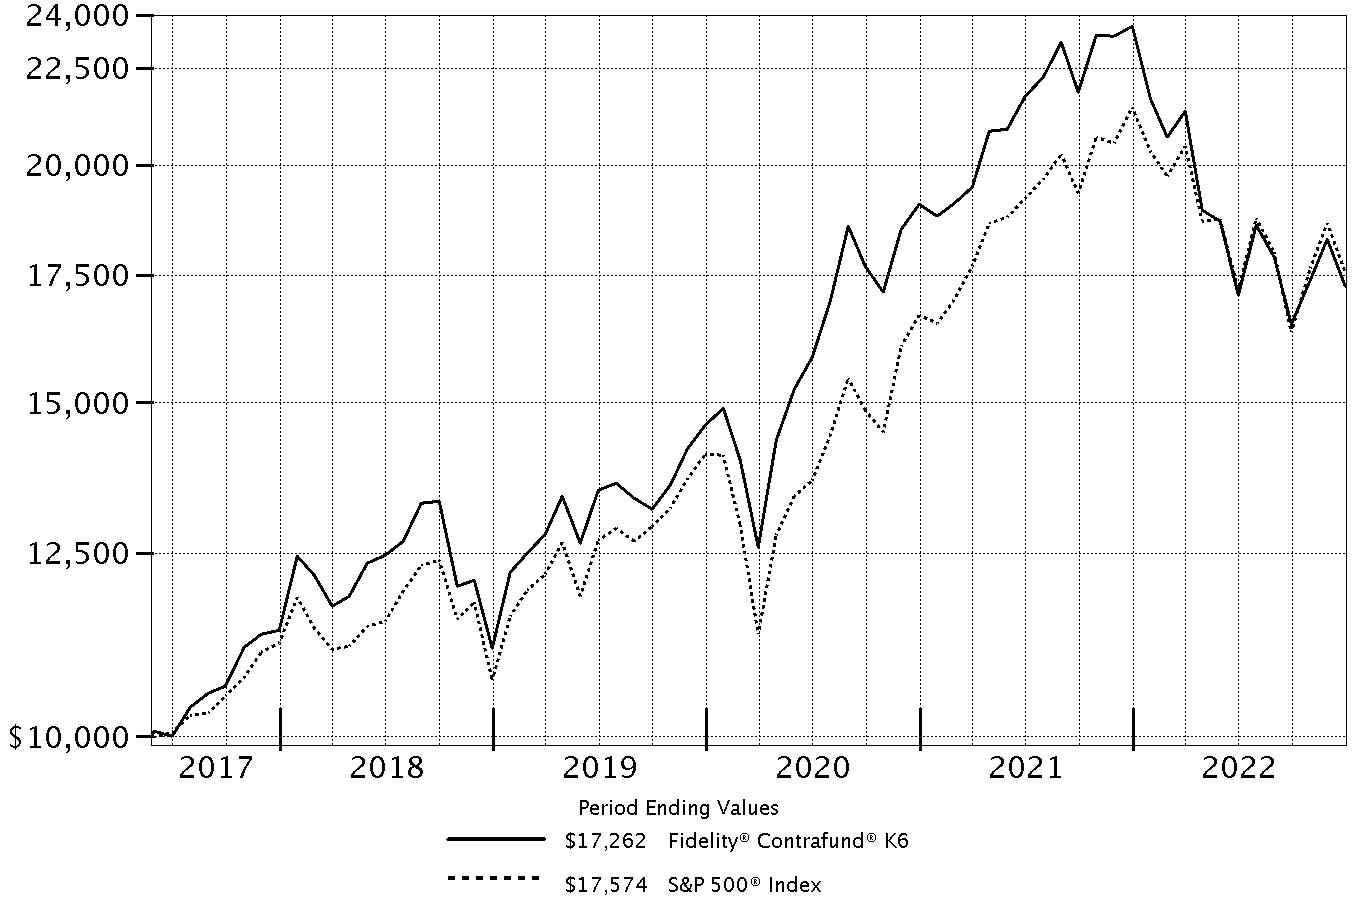
|
|
Top Holdings (% of Fund's net assets)
|
||
|
Berkshire Hathaway, Inc. Class A
|
7.8
|
|
|
UnitedHealth Group, Inc.
|
5.9
|
|
|
Meta Platforms, Inc. Class A
|
5.0
|
|
|
Microsoft Corp.
|
4.5
|
|
|
Amazon.com, Inc.
|
4.2
|
|
|
Apple, Inc.
|
4.0
|
|
|
Eli Lilly & Co.
|
2.9
|
|
|
Regeneron Pharmaceuticals, Inc.
|
2.3
|
|
|
Alphabet, Inc. Class A
|
2.0
|
|
|
Amphenol Corp. Class A
|
2.0
|
|
|
40.6
|
||
|
Market Sectors (% of Fund's net assets)
|
||
|
Information Technology
|
20.7
|
|
|
Health Care
|
18.5
|
|
|
Financials
|
15.0
|
|
|
Communication Services
|
11.5
|
|
|
Consumer Discretionary
|
9.3
|
|
|
Energy
|
7.4
|
|
|
Industrials
|
5.2
|
|
|
Consumer Staples
|
3.7
|
|
|
Materials
|
3.3
|
|
|
Utilities
|
0.4
|
|
|
Real Estate
|
0.1
|
|
|
Asset Allocation (% of Fund's net assets)
|

|
|
Foreign investments - 6.9%
|
|
Common Stocks - 94.4%
|
|||
|
Shares
|
Value ($)
|
||
|
COMMUNICATION SERVICES - 11.4%
|
|||
|
Entertainment - 2.2%
|
|||
|
Activision Blizzard, Inc.
|
475,810
|
36,423,256
|
|
|
Liberty Media Corp. Liberty Formula One Series C (a)
|
763,063
|
45,615,906
|
|
|
Netflix, Inc. (a)
|
944,524
|
278,521,237
|
|
|
The Walt Disney Co. (a)
|
81,671
|
7,095,576
|
|
|
Universal Music Group NV
|
1,687,226
|
40,801,663
|
|
|
408,457,638
|
|||
|
Interactive Media & Services - 8.9%
|
|||
|
Alphabet, Inc.:
|
|||
|
Class A (a)
|
4,270,145
|
376,754,893
|
|
|
Class C (a)
|
3,717,840
|
329,883,943
|
|
|
Bumble, Inc. (a)
|
618,604
|
13,021,614
|
|
|
Epic Games, Inc. (a)(b)(c)
|
14,010
|
11,425,435
|
|
|
Meta Platforms, Inc. Class A (a)
|
7,956,091
|
957,435,991
|
|
|
Pinterest, Inc. Class A (a)
|
489,048
|
11,874,085
|
|
|
1,700,395,961
|
|||
|
Wireless Telecommunication Services - 0.3%
|
|||
|
T-Mobile U.S., Inc. (a)
|
416,399
|
58,295,860
|
|
|
TOTAL COMMUNICATION SERVICES
|
2,167,149,459
|
||
|
CONSUMER DISCRETIONARY - 9.3%
|
|||
|
Automobiles - 0.5%
|
|||
|
General Motors Co.
|
706,206
|
23,756,770
|
|
|
Harley-Davidson, Inc.
|
254,598
|
10,591,277
|
|
|
Hyundai Motor Co.
|
154,980
|
18,586,350
|
|
|
Rad Power Bikes, Inc. (a)(b)(c)
|
331,574
|
1,226,824
|
|
|
Rivian Automotive, Inc. (a)
|
101,531
|
1,871,216
|
|
|
Tesla, Inc. (a)
|
17,709
|
2,181,395
|
|
|
Toyota Motor Corp.
|
2,628,609
|
35,860,918
|
|
|
94,074,750
|
|||
|
Hotels, Restaurants & Leisure - 0.7%
|
|||
|
Airbnb, Inc. Class A (a)
|
766,997
|
65,578,244
|
|
|
Chipotle Mexican Grill, Inc. (a)
|
4,264
|
5,916,257
|
|
|
Evolution AB (d)
|
23,396
|
2,278,874
|
|
|
Hilton Worldwide Holdings, Inc.
|
209,476
|
26,469,387
|
|
|
Hyatt Hotels Corp. Class A (a)
|
20,430
|
1,847,894
|
|
|
McDonald's Corp.
|
85,921
|
22,642,761
|
|
|
124,733,417
|
|||
|
Household Durables - 0.1%
|
|||
|
Lennar Corp. Class A
|
305,012
|
27,603,586
|
|
|
Internet & Direct Marketing Retail - 4.4%
|
|||
|
Amazon.com, Inc. (a)
|
9,479,947
|
796,315,548
|
|
|
Coupang, Inc. Class A (a)
|
2,330,988
|
34,288,833
|
|
|
Deliveroo PLC Class A (a)(d)
|
8,591,983
|
8,901,897
|
|
|
MercadoLibre, Inc. (a)
|
9,116
|
7,714,324
|
|
|
Uber Technologies, Inc. (a)
|
62,899
|
1,555,492
|
|
|
Wayfair LLC Class A (a)
|
10,813
|
355,640
|
|
|
849,131,734
|
|||
|
Multiline Retail - 0.2%
|
|||
|
Dollar Tree, Inc. (a)
|
191,236
|
27,048,420
|
|
|
Dollarama, Inc.
|
105,905
|
6,193,956
|
|
|
33,242,376
|
|||
|
Specialty Retail - 2.9%
|
|||
|
Academy Sports & Outdoors, Inc.
|
769,181
|
40,412,770
|
|
|
AutoZone, Inc. (a)
|
24,936
|
61,496,664
|
|
|
Dick's Sporting Goods, Inc. (e)
|
549,403
|
66,087,687
|
|
|
Fanatics, Inc. Class A (a)(b)(c)
|
332,480
|
25,325,002
|
|
|
National Vision Holdings, Inc. (a)(e)
|
394,754
|
15,300,665
|
|
|
O'Reilly Automotive, Inc. (a)
|
89,488
|
75,530,557
|
|
|
The Home Depot, Inc.
|
461,844
|
145,878,046
|
|
|
TJX Companies, Inc.
|
165,778
|
13,195,929
|
|
|
Ulta Beauty, Inc. (a)
|
118,252
|
55,468,466
|
|
|
Williams-Sonoma, Inc. (e)
|
445,884
|
51,240,989
|
|
|
549,936,775
|
|||
|
Textiles, Apparel & Luxury Goods - 0.5%
|
|||
|
Deckers Outdoor Corp. (a)
|
22,542
|
8,997,865
|
|
|
Dr. Martens Ltd.
|
3,946,584
|
9,093,950
|
|
|
lululemon athletica, Inc. (a)
|
16,203
|
5,191,117
|
|
|
NIKE, Inc. Class B
|
367,358
|
42,984,560
|
|
|
On Holding AG (a)
|
1,342,634
|
23,039,599
|
|
|
89,307,091
|
|||
|
TOTAL CONSUMER DISCRETIONARY
|
1,768,029,729
|
||
|
CONSUMER STAPLES - 3.7%
|
|||
|
Beverages - 1.6%
|
|||
|
Anheuser-Busch InBev SA NV
|
258,377
|
15,562,297
|
|
|
Constellation Brands, Inc. Class A (sub. vtg.)
|
103,189
|
23,914,051
|
|
|
Diageo PLC
|
451,905
|
19,780,729
|
|
|
Keurig Dr. Pepper, Inc.
|
111,177
|
3,964,572
|
|
|
PepsiCo, Inc.
|
592,755
|
107,087,118
|
|
|
The Coca-Cola Co.
|
2,174,832
|
138,341,064
|
|
|
308,649,831
|
|||
|
Food & Staples Retailing - 1.5%
|
|||
|
Alimentation Couche-Tard, Inc. Class A (multi-vtg.)
|
257,402
|
11,311,240
|
|
|
Casey's General Stores, Inc.
|
47,959
|
10,759,602
|
|
|
Costco Wholesale Corp.
|
556,490
|
254,037,685
|
|
|
Performance Food Group Co. (a)
|
44,742
|
2,612,485
|
|
|
278,721,012
|
|||
|
Food Products - 0.2%
|
|||
|
Archer Daniels Midland Co.
|
47,681
|
4,427,181
|
|
|
General Mills, Inc.
|
71,520
|
5,996,952
|
|
|
Mondelez International, Inc.
|
249,585
|
16,634,840
|
|
|
Nestle SA (Reg. S)
|
49,944
|
5,769,003
|
|
|
32,827,976
|
|||
|
Household Products - 0.0%
|
|||
|
Procter & Gamble Co.
|
31,843
|
4,826,125
|
|
|
Personal Products - 0.4%
|
|||
|
Estee Lauder Companies, Inc. Class A
|
244,219
|
60,593,176
|
|
|
L'Oreal SA (a)
|
23,678
|
8,479,039
|
|
|
L'Oreal SA (a)
|
32,604
|
11,675,419
|
|
|
Olaplex Holdings, Inc. (a)
|
1,056,348
|
5,503,573
|
|
|
86,251,207
|
|||
|
TOTAL CONSUMER STAPLES
|
711,276,151
|
||
|
ENERGY - 7.3%
|
|||
|
Energy Equipment & Services - 0.1%
|
|||
|
Halliburton Co.
|
257,941
|
10,149,978
|
|
|
Oil, Gas & Consumable Fuels - 7.2%
|
|||
|
Birchcliff Energy Ltd.
|
191,708
|
1,335,160
|
|
|
Canadian Natural Resources Ltd.
|
1,161,584
|
64,504,801
|
|
|
Cenovus Energy, Inc. (Canada)
|
559,730
|
10,859,754
|
|
|
Cheniere Energy, Inc.
|
435,335
|
65,282,837
|
|
|
Chevron Corp.
|
916,804
|
164,557,150
|
|
|
ConocoPhillips Co.
|
1,797,312
|
212,082,816
|
|
|
Devon Energy Corp.
|
917,498
|
56,435,302
|
|
|
Diamondback Energy, Inc.
|
305,448
|
41,779,177
|
|
|
EOG Resources, Inc.
|
706,415
|
91,494,871
|
|
|
Equinor ASA
|
204,100
|
7,335,410
|
|
|
Excelerate Energy, Inc. (e)
|
17,574
|
440,229
|
|
|
Exxon Mobil Corp.
|
2,383,030
|
262,848,209
|
|
|
Hess Corp.
|
667,011
|
94,595,500
|
|
|
Marathon Petroleum Corp.
|
115,902
|
13,489,834
|
|
|
Occidental Petroleum Corp.
|
1,370,093
|
86,302,158
|
|
|
Ovintiv, Inc.
|
34,748
|
1,762,071
|
|
|
Phillips 66 Co.
|
333,591
|
34,720,151
|
|
|
Pioneer Natural Resources Co.
|
304,223
|
69,481,491
|
|
|
Reliance Industries Ltd.
|
371,282
|
11,396,588
|
|
|
Suncor Energy, Inc.
|
304,203
|
9,649,571
|
|
|
Tourmaline Oil Corp.
|
122,695
|
6,190,932
|
|
|
Valero Energy Corp.
|
545,316
|
69,178,788
|
|
|
1,375,722,800
|
|||
|
TOTAL ENERGY
|
1,385,872,778
|
||
|
FINANCIALS - 15.0%
|
|||
|
Banks - 3.5%
|
|||
|
AIB Group PLC
|
674,725
|
2,611,690
|
|
|
Banco Santander SA (Spain)
|
2,427,327
|
7,257,987
|
|
|
Bank of America Corp.
|
6,825,882
|
226,073,212
|
|
|
Bank of Ireland Group PLC
|
1,073,055
|
10,223,000
|
|
|
Citigroup, Inc.
|
146,874
|
6,643,111
|
|
|
HDFC Bank Ltd. sponsored ADR
|
55,575
|
3,801,886
|
|
|
JPMorgan Chase & Co.
|
1,201,659
|
161,142,472
|
|
|
Nu Holdings Ltd. (e)
|
2,140,859
|
8,713,296
|
|
|
Royal Bank of Canada
|
1,039,615
|
97,742,237
|
|
|
Starling Bank Ltd. Series D (a)(b)(c)
|
4,139,223
|
15,662,876
|
|
|
The Toronto-Dominion Bank
|
933,269
|
60,428,134
|
|
|
Wells Fargo & Co.
|
1,396,122
|
57,645,877
|
|
|
657,945,778
|
|||
|
Capital Markets - 0.9%
|
|||
|
BlackRock, Inc. Class A
|
1,490
|
1,055,859
|
|
|
Brookfield Asset Management Ltd. Class A (a)
|
11,426
|
327,168
|
|
|
Brookfield Corp. (Canada) Class A
|
16,864
|
530,332
|
|
|
Charles Schwab Corp.
|
327,916
|
27,302,286
|
|
|
Goldman Sachs Group, Inc.
|
26,923
|
9,244,820
|
|
|
Morgan Stanley
|
1,564,347
|
133,000,782
|
|
|
MSCI, Inc.
|
11,834
|
5,504,822
|
|
|
TulCo LLC (a)(b)(c)(f)
|
1,552
|
1,172,101
|
|
|
178,138,170
|
|||
|
Consumer Finance - 0.0%
|
|||
|
American Express Co.
|
45,242
|
6,684,506
|
|
|
Diversified Financial Services - 7.8%
|
|||
|
Berkshire Hathaway, Inc. Class A (a)
|
3,181
|
1,490,969,552
|
|
|
Insurance - 2.8%
|
|||
|
American International Group, Inc.
|
1,671,179
|
105,685,360
|
|
|
Aon PLC
|
20,572
|
6,174,480
|
|
|
Arthur J. Gallagher & Co.
|
181,124
|
34,149,119
|
|
|
Brookfield Asset Management Reinsurance Partners Ltd.
|
1,372
|
42,893
|
|
|
Chubb Ltd.
|
442,519
|
97,619,691
|
|
|
Fairfax Financial Holdings Ltd. (sub. vtg.)
|
35,856
|
21,240,046
|
|
|
Hartford Financial Services Group, Inc.
|
356,649
|
27,044,694
|
|
|
Intact Financial Corp.
|
193,262
|
27,820,308
|
|
|
Marsh & McLennan Companies, Inc.
|
132,966
|
22,003,214
|
|
|
Progressive Corp.
|
818,226
|
106,132,094
|
|
|
The Travelers Companies, Inc.
|
450,796
|
84,519,742
|
|
|
W.R. Berkley Corp.
|
82,667
|
5,999,144
|
|
|
538,430,785
|
|||
|
TOTAL FINANCIALS
|
2,872,168,791
|
||
|
HEALTH CARE - 18.4%
|
|||
|
Biotechnology - 4.3%
|
|||
|
AbbVie, Inc.
|
285,746
|
46,179,411
|
|
|
Alnylam Pharmaceuticals, Inc. (a)
|
90,159
|
21,426,286
|
|
|
Argenx SE ADR (a)
|
46,322
|
17,548,163
|
|
|
Biohaven Ltd. (a)
|
4,495
|
62,391
|
|
|
Galapagos NV sponsored ADR (a)
|
285,410
|
12,666,496
|
|
|
Genmab A/S (a)
|
10,308
|
4,358,169
|
|
|
Gilead Sciences, Inc.
|
236,808
|
20,329,967
|
|
|
Intellia Therapeutics, Inc. (a)
|
96,325
|
3,360,779
|
|
|
Legend Biotech Corp. ADR (a)
|
245,070
|
12,233,894
|
|
|
Moderna, Inc. (a)
|
31,016
|
5,571,094
|
|
|
Neurocrine Biosciences, Inc. (a)
|
32,905
|
3,930,173
|
|
|
Nuvalent, Inc. Class A (a)
|
53,544
|
1,594,540
|
|
|
Regeneron Pharmaceuticals, Inc. (a)
|
594,942
|
429,244,704
|
|
|
United Therapeutics Corp. (a)
|
118,986
|
33,088,817
|
|
|
Vertex Pharmaceuticals, Inc. (a)
|
728,004
|
210,232,995
|
|
|
Zai Lab Ltd. (a)
|
1,351,518
|
4,183,294
|
|
|
826,011,173
|
|||
|
Health Care Equipment & Supplies - 0.5%
|
|||
|
Boston Scientific Corp. (a)
|
258,823
|
11,975,740
|
|
|
DexCom, Inc. (a)
|
33,041
|
3,741,563
|
|
|
Edwards Lifesciences Corp. (a)
|
67,306
|
5,021,701
|
|
|
Figs, Inc. Class A (a)
|
86,536
|
582,387
|
|
|
Intuitive Surgical, Inc. (a)
|
239,759
|
63,620,051
|
|
|
Straumann Holding AG
|
52,665
|
6,039,158
|
|
|
90,980,600
|
|||
|
Health Care Providers & Services - 7.2%
|
|||
|
23andMe Holding Co. Class A (a)
|
2,644
|
5,711
|
|
|
AmerisourceBergen Corp.
|
135,902
|
22,520,320
|
|
|
Cardinal Health, Inc.
|
223,559
|
17,184,980
|
|
|
Cigna Corp.
|
239,896
|
79,487,141
|
|
|
Elevance Health, Inc.
|
174,667
|
89,598,931
|
|
|
HCA Holdings, Inc.
|
90,826
|
21,794,607
|
|
|
Molina Healthcare, Inc. (a)
|
60,896
|
20,109,077
|
|
|
Option Care Health, Inc. (a)
|
306,604
|
9,225,714
|
|
|
P3 Health Partners, Inc. (a)(b)
|
450,620
|
829,141
|
|
|
UnitedHealth Group, Inc.
|
2,107,908
|
1,117,570,663
|
|
|
1,378,326,285
|
|||
|
Health Care Technology - 0.0%
|
|||
|
Doximity, Inc. (a)
|
123,760
|
4,153,386
|
|
|
Life Sciences Tools & Services - 1.2%
|
|||
|
Danaher Corp.
|
423,018
|
112,277,438
|
|
|
Lonza Group AG
|
22
|
10,799
|
|
|
Mettler-Toledo International, Inc. (a)
|
36,583
|
52,878,897
|
|
|
Thermo Fisher Scientific, Inc.
|
60,582
|
33,361,902
|
|
|
Veterinary Emergency Group LLC Class A (a)(b)(c)(f)
|
185,166
|
10,519,280
|
|
|
Waters Corp. (a)
|
47,801
|
16,375,667
|
|
|
225,423,983
|
|||
|
Pharmaceuticals - 5.2%
|
|||
|
AstraZeneca PLC sponsored ADR
|
74,723
|
5,066,219
|
|
|
Bristol-Myers Squibb Co.
|
1,300,061
|
93,539,389
|
|
|
DICE Therapeutics, Inc. (a)
|
190,614
|
5,947,157
|
|
|
Eli Lilly & Co.
|
1,479,588
|
541,292,474
|
|
|
Intra-Cellular Therapies, Inc. (a)
|
89,297
|
4,725,597
|
|
|
Johnson & Johnson
|
505,840
|
89,356,636
|
|
|
Merck & Co., Inc.
|
1,429,355
|
158,586,937
|
|
|
Nuvation Bio, Inc. (a)(e)
|
1,984,636
|
3,810,501
|
|
|
Pfizer, Inc.
|
295,879
|
15,160,840
|
|
|
Roche Holding AG (participation certificate)
|
63,944
|
20,093,606
|
|
|
Royalty Pharma PLC
|
1,460,438
|
57,716,510
|
|
|
995,295,866
|
|||
|
TOTAL HEALTH CARE
|
3,520,191,293
|
||
|
INDUSTRIALS - 4.9%
|
|||
|
Aerospace & Defense - 1.5%
|
|||
|
Lockheed Martin Corp.
|
254,891
|
124,001,923
|
|
|
Northrop Grumman Corp.
|
278,011
|
151,685,582
|
|
|
Space Exploration Technologies Corp. Class A (a)(b)(c)
|
73,000
|
5,621,000
|
|
|
TransDigm Group, Inc.
|
3,106
|
1,955,693
|
|
|
283,264,198
|
|||
|
Air Freight & Logistics - 1.0%
|
|||
|
United Parcel Service, Inc. Class B
|
1,085,513
|
188,705,580
|
|
|
Zipline International, Inc. (a)(b)(c)
|
87,466
|
1,938,247
|
|
|
190,643,827
|
|||
|
Airlines - 0.0%
|
|||
|
Ryanair Holdings PLC sponsored ADR (a)
|
25,180
|
1,882,457
|
|
|
Building Products - 0.1%
|
|||
|
Carrier Global Corp.
|
46,743
|
1,928,149
|
|
|
Toto Ltd.
|
408,100
|
13,842,537
|
|
|
Trane Technologies PLC
|
11,843
|
1,990,690
|
|
|
17,761,376
|
|||
|
Commercial Services & Supplies - 0.2%
|
|||
|
Aurora Innovation, Inc. (a)(e)
|
293,534
|
355,176
|
|
|
Cintas Corp.
|
32,364
|
14,616,230
|
|
|
Clean Harbors, Inc. (a)
|
121,771
|
13,896,507
|
|
|
Clean TeQ Water Pty Ltd. (a)(e)
|
307,553
|
81,175
|
|
|
28,949,088
|
|||
|
Construction & Engineering - 0.0%
|
|||
|
Willscot Mobile Mini Holdings (a)
|
29,186
|
1,318,332
|
|
|
Electrical Equipment - 0.2%
|
|||
|
Eaton Corp. PLC
|
85,089
|
13,354,719
|
|
|
Emerson Electric Co.
|
20,212
|
1,941,565
|
|
|
Hubbell, Inc. Class B
|
71,773
|
16,843,688
|
|
|
32,139,972
|
|||
|
Industrial Conglomerates - 0.5%
|
|||
|
General Electric Co.
|
1,182,491
|
99,080,921
|
|
|
Machinery - 0.7%
|
|||
|
Caterpillar, Inc.
|
16,819
|
4,029,160
|
|
|
Deere & Co.
|
188,013
|
80,612,454
|
|
|
Fortive Corp.
|
123,226
|
7,917,271
|
|
|
Indutrade AB
|
85,092
|
1,721,436
|
|
|
PACCAR, Inc.
|
402,261
|
39,811,771
|
|
|
134,092,092
|
|||
|
Road & Rail - 0.6%
|
|||
|
Canadian Pacific Railway Ltd.
|
611,932
|
45,623,734
|
|
|
J.B. Hunt Transport Services, Inc.
|
200,422
|
34,945,580
|
|
|
Localiza Rent a Car SA
|
66,000
|
665,031
|
|
|
Localiza Rent a Car SA rights (a)
|
288
|
587
|
|
|
Old Dominion Freight Lines, Inc.
|
116,106
|
32,948,561
|
|
|
Vamos Locacao de Caminhoes Maquinas e Equipamentos SA
|
27,300
|
65,358
|
|
|
114,248,851
|
|||
|
Trading Companies & Distributors - 0.1%
|
|||
|
W.W. Grainger, Inc.
|
51,524
|
28,660,225
|
|
|
TOTAL INDUSTRIALS
|
932,041,339
|
||
|
INFORMATION TECHNOLOGY - 20.6%
|
|||
|
Communications Equipment - 0.2%
|
|||
|
Arista Networks, Inc. (a)
|
287,934
|
34,940,791
|
|
|
Motorola Solutions, Inc.
|
7,583
|
1,954,215
|
|
|
36,895,006
|
|||
|
Electronic Equipment & Components - 2.1%
|
|||
|
Amphenol Corp. Class A
|
4,896,216
|
372,797,886
|
|
|
CDW Corp.
|
104,564
|
18,673,039
|
|
|
Jabil, Inc.
|
114,835
|
7,831,747
|
|
|
399,302,672
|
|||
|
IT Services - 2.9%
|
|||
|
Accenture PLC Class A
|
751,100
|
200,423,524
|
|
|
Adyen BV (a)(d)
|
6,843
|
9,499,794
|
|
|
Cloudflare, Inc. (a)
|
174,750
|
7,900,448
|
|
|
Gartner, Inc. (a)
|
19,076
|
6,412,207
|
|
|
MasterCard, Inc. Class A
|
84,477
|
29,375,187
|
|
|
MongoDB, Inc. Class A (a)
|
9,607
|
1,891,042
|
|
|
Shopify, Inc. Class A (a)
|
21,524
|
747,299
|
|
|
Visa, Inc. Class A
|
1,448,088
|
300,854,763
|
|
|
X Holdings I, Inc. (b)(c)
|
10,234
|
4,060,135
|
|
|
561,164,399
|
|||
|
Semiconductors & Semiconductor Equipment - 4.6%
|
|||
|
Advanced Micro Devices, Inc. (a)
|
1,337,661
|
86,640,303
|
|
|
Analog Devices, Inc.
|
279,004
|
45,765,026
|
|
|
Broadcom, Inc.
|
20,612
|
11,524,788
|
|
|
Enphase Energy, Inc. (a)
|
95,005
|
25,172,525
|
|
|
First Solar, Inc. (a)
|
89,131
|
13,350,932
|
|
|
Lattice Semiconductor Corp. (a)
|
263,109
|
17,070,512
|
|
|
Marvell Technology, Inc.
|
276,088
|
10,226,300
|
|
|
Monolithic Power Systems, Inc.
|
21,083
|
7,455,160
|
|
|
NVIDIA Corp.
|
2,374,703
|
347,039,096
|
|
|
onsemi (a)
|
1,138,898
|
71,033,068
|
|
|
Qualcomm, Inc.
|
1,824,256
|
200,558,705
|
|
|
Synaptics, Inc. (a)
|
298,455
|
28,400,978
|
|
|
Taiwan Semiconductor Manufacturing Co. Ltd. sponsored ADR
|
148,297
|
11,046,644
|
|
|
875,284,037
|
|||
|
Software - 6.8%
|
|||
|
Adobe, Inc. (a)
|
362,343
|
121,939,290
|
|
|
Aspen Technology, Inc. (a)
|
4,612
|
947,305
|
|
|
Atlassian Corp. PLC (a)(e)
|
89,953
|
11,575,152
|
|
|
Cadence Design Systems, Inc. (a)
|
568,945
|
91,395,325
|
|
|
Check Point Software Technologies Ltd. (a)
|
93,075
|
11,742,342
|
|
|
Clear Secure, Inc. (e)
|
344,769
|
9,457,014
|
|
|
Fair Isaac Corp. (a)
|
3,638
|
2,177,634
|
|
|
Fortinet, Inc. (a)
|
274,716
|
13,430,865
|
|
|
Intuit, Inc.
|
5,218
|
2,030,950
|
|
|
Microsoft Corp.
|
3,570,391
|
856,251,170
|
|
|
Oracle Corp.
|
49,960
|
4,083,730
|
|
|
Salesforce.com, Inc. (a)
|
1,170,239
|
155,161,989
|
|
|
Samsara, Inc. (e)
|
163,968
|
2,038,122
|
|
|
ServiceNow, Inc. (a)
|
4,117
|
1,598,508
|
|
|
Stripe, Inc. Class B (a)(b)(c)
|
75,100
|
1,683,742
|
|
|
Tanium, Inc. Class B (a)(b)(c)
|
449,538
|
3,272,637
|
|
|
ZenPayroll, Inc. (a)(b)(c)
|
50,300
|
1,477,814
|
|
|
Zoom Video Communications, Inc. Class A (a)
|
26,618
|
1,803,103
|
|
|
1,292,066,692
|
|||
|
Technology Hardware, Storage & Peripherals - 4.0%
|
|||
|
Apple, Inc.
|
5,916,556
|
768,738,121
|
|
|
Dell Technologies, Inc.
|
47,676
|
1,917,529
|
|
|
Pure Storage, Inc. Class A (a)
|
46,207
|
1,236,499
|
|
|
771,892,149
|
|||
|
TOTAL INFORMATION TECHNOLOGY
|
3,936,604,955
|
||
|
MATERIALS - 3.3%
|
|||
|
Chemicals - 0.8%
|
|||
|
Air Products & Chemicals, Inc.
|
60,453
|
18,635,242
|
|
|
Albemarle Corp.
|
121,195
|
26,282,348
|
|
|
CF Industries Holdings, Inc.
|
540,505
|
46,051,026
|
|
|
Corteva, Inc.
|
408,256
|
23,997,288
|
|
|
Linde PLC
|
23,847
|
7,778,414
|
|
|
Sherwin-Williams Co.
|
8,760
|
2,079,011
|
|
|
Westlake Corp.
|
145,400
|
14,909,316
|
|
|
139,732,645
|
|||
|
Metals & Mining - 2.5%
|
|||
|
B2Gold Corp.
|
5,845,068
|
20,764,237
|
|
|
Barrick Gold Corp. (Canada)
|
963,439
|
16,515,081
|
|
|
Cleveland-Cliffs, Inc. (a)
|
745,342
|
12,007,460
|
|
|
Franco-Nevada Corp.
|
679,198
|
92,584,620
|
|
|
Freeport-McMoRan, Inc.
|
2,506,819
|
95,259,122
|
|
|
Glencore PLC
|
1,595,415
|
10,639,260
|
|
|
Ivanhoe Electric, Inc. (a)
|
558,649
|
6,787,585
|
|
|
Ivanhoe Mines Ltd. (a)
|
5,740,943
|
45,367,866
|
|
|
Ivanhoe Mines Ltd. (a)(d)
|
1,400,665
|
11,068,771
|
|
|
Novagold Resources, Inc. (a)
|
1,557,941
|
9,308,525
|
|
|
Nucor Corp. (e)
|
755,056
|
99,523,931
|
|
|
POSCO sponsored ADR (e)
|
20,651
|
1,124,860
|
|
|
Steel Dynamics, Inc.
|
560,411
|
54,752,155
|
|
|
Sunrise Energy Metals Ltd. (a)
|
389,859
|
507,583
|
|
|
Wheaton Precious Metals Corp.
|
149,474
|
5,839,863
|
|
|
482,050,919
|
|||
|
TOTAL MATERIALS
|
621,783,564
|
||
|
REAL ESTATE - 0.1%
|
|||
|
Equity Real Estate Investment Trusts (REITs) - 0.1%
|
|||
|
Equity Commonwealth
|
493,443
|
12,321,272
|
|
|
Prologis (REIT), Inc.
|
69,831
|
7,872,049
|
|
|
20,193,321
|
|||
|
UTILITIES - 0.4%
|
|||
|
Electric Utilities - 0.4%
|
|||
|
Constellation Energy Corp.
|
444,023
|
38,279,223
|
|
|
NextEra Energy, Inc.
|
118,694
|
9,922,818
|
|
|
PG&E Corp. (a)
|
1,413,235
|
22,979,201
|
|
|
Southern Co.
|
164,396
|
11,739,518
|
|
|
82,920,760
|
|||
|
TOTAL COMMON STOCKS
(Cost $15,238,619,644)
|
18,018,232,140
|
||
|
Preferred Stocks - 0.7%
|
|||
|
Shares
|
Value ($)
|
||
|
Convertible Preferred Stocks - 0.6%
|
|||
|
COMMUNICATION SERVICES - 0.1%
|
|||
|
Interactive Media & Services - 0.1%
|
|||
|
ByteDance Ltd. Series E1 (a)(b)(c)
|
80,736
|
14,527,636
|
|
|
Reddit, Inc.:
|
|||
|
Series E(a)(b)(c)
|
27,300
|
1,022,658
|
|
|
Series F(a)(b)(c)
|
149,136
|
5,586,635
|
|
|
21,136,929
|
|||
|
CONSUMER DISCRETIONARY - 0.0%
|
|||
|
Automobiles - 0.0%
|
|||
|
Rad Power Bikes, Inc.:
|
|||
|
Series A(a)(b)(c)
|
43,228
|
159,944
|
|
|
Series C(a)(b)(c)
|
170,098
|
629,363
|
|
|
Series D(a)(b)(c)
|
404,900
|
1,498,130
|
|
|
2,287,437
|
|||
|
Hotels, Restaurants & Leisure - 0.0%
|
|||
|
Discord, Inc. Series I (a)(b)(c)
|
2,700
|
958,419
|
|
|
Internet & Direct Marketing Retail - 0.0%
|
|||
|
Circle Internet Financial Ltd. Series F (b)(c)
|
118,667
|
3,115,009
|
|
|
TOTAL CONSUMER DISCRETIONARY
|
6,360,865
|
||
|
CONSUMER STAPLES - 0.0%
|
|||
|
Food & Staples Retailing - 0.0%
|
|||
|
GoBrands, Inc.:
|
|||
|
Series G(a)(b)(c)
|
8,352
|
1,208,868
|
|
|
Series H(a)(b)(c)
|
11,788
|
1,706,195
|
|
|
2,915,063
|
|||
|
Food Products - 0.0%
|
|||
|
Bowery Farming, Inc. Series C1 (a)(b)(c)
|
37,316
|
757,888
|
|
|
TOTAL CONSUMER STAPLES
|
3,672,951
|
||
|
FINANCIALS - 0.0%
|
|||
|
Thrifts & Mortgage Finance - 0.0%
|
|||
|
Acrisure Holdings, Inc. Series B (a)(b)(c)
|
57,282
|
1,373,050
|
|
|
HEALTH CARE - 0.1%
|
|||
|
Biotechnology - 0.0%
|
|||
|
ElevateBio LLC Series C (a)(b)(c)
|
486,500
|
1,780,590
|
|
|
Health Care Providers & Services - 0.1%
|
|||
|
Lyra Health, Inc.:
|
|||
|
Series E(a)(b)(c)
|
190,800
|
2,713,176
|
|
|
Series F(a)(b)(c)
|
11,519
|
163,800
|
|
|
Somatus, Inc. Series E (b)(c)
|
2,766
|
2,375,773
|
|
|
5,252,749
|
|||
|
TOTAL HEALTH CARE
|
7,033,339
|
||
|
INDUSTRIALS - 0.3%
|
|||
|
Aerospace & Defense - 0.3%
|
|||
|
Relativity Space, Inc.:
|
|||
|
Series D(a)(b)(c)
|
207,384
|
3,334,735
|
|
|
Series E(a)(b)(c)
|
143,887
|
2,671,982
|
|
|
Space Exploration Technologies Corp. Series N (a)(b)(c)
|
49,490
|
38,107,300
|
|
|
44,114,017
|
|||
|
Air Freight & Logistics - 0.0%
|
|||
|
Zipline International, Inc. Series E (a)(b)(c)
|
178,019
|
3,944,901
|
|
|
Construction & Engineering - 0.0%
|
|||
|
Beta Technologies, Inc. Series B, 6.00% (b)(c)
|
47,990
|
3,136,626
|
|
|
TOTAL INDUSTRIALS
|
51,195,544
|
||
|
INFORMATION TECHNOLOGY - 0.1%
|
|||
|
Software - 0.1%
|
|||
|
ASAPP, Inc. Series C (a)(b)(c)
|
204,122
|
857,312
|
|
|
Carbon, Inc.:
|
|||
|
Series D(a)(b)(c)
|
9,678
|
93,393
|
|
|
Series E(a)(b)(c)
|
7,351
|
84,610
|
|
|
Nuro, Inc.:
|
|||
|
Series C(a)(b)(c)
|
405,967
|
3,097,528
|
|
|
Series D(a)(b)(c)
|
114,603
|
874,421
|
|
|
Stripe, Inc. Series H (a)(b)(c)
|
29,000
|
650,180
|
|
|
Tenstorrent, Inc. Series C1 (a)(b)(c)
|
33,000
|
1,719,630
|
|
|
ZenPayroll, Inc.:
|
|||
|
Series D(a)(b)(c)
|
184,203
|
5,411,884
|
|
|
Series E(a)(b)(c)
|
28,063
|
824,491
|
|
|
13,613,449
|
|||
|
MATERIALS - 0.0%
|
|||
|
Metals & Mining - 0.0%
|
|||
|
High Power Exploration, Inc. Series A (a)(b)(c)
|
1,289,012
|
5,478,301
|
|
|
TOTAL CONVERTIBLE PREFERRED STOCKS
|
109,864,428
|
||
|
Nonconvertible Preferred Stocks - 0.1%
|
|||
|
CONSUMER DISCRETIONARY - 0.0%
|
|||
|
Internet & Direct Marketing Retail - 0.0%
|
|||
|
Circle Internet Financial Ltd. Series E (b)(c)
|
175,323
|
4,602,229
|
|
|
ENERGY - 0.1%
|
|||
|
Oil, Gas & Consumable Fuels - 0.1%
|
|||
|
Petroleo Brasileiro SA - Petrobras sponsored ADR
|
2,320,768
|
24,716,179
|
|
|
TOTAL NONCONVERTIBLE PREFERRED STOCKS
|
29,318,408
|
||
|
TOTAL PREFERRED STOCKS
(Cost $134,981,784)
|
139,182,836
|
||
|
Preferred Securities - 0.0%
|
|||
|
Principal
Amount (g)
|
Value ($)
|
||
|
INFORMATION TECHNOLOGY - 0.0%
|
|||
|
Software - 0.0%
|
|||
|
Tenstorrent, Inc. 0% (b)(c)(h)
(Cost $1,840,000)
|
1,840,000
|
1,611,840
|
|
|
Money Market Funds - 5.7%
|
|||
|
Shares
|
Value ($)
|
||
|
Fidelity Cash Central Fund 4.37% (i)
|
961,815,747
|
962,008,110
|
|
|
Fidelity Securities Lending Cash Central Fund 4.37% (i)(j)
|
120,535,541
|
120,547,595
|
|
|
TOTAL MONEY MARKET FUNDS
(Cost $1,082,554,712)
|
1,082,555,705
|
||
|
TOTAL INVESTMENT IN SECURITIES - 100.8%
(Cost $16,457,996,140)
|
19,241,582,521
|
|
NET OTHER ASSETS (LIABILITIES) - (0.8)%
|
(157,352,425)
|
|
NET ASSETS - 100.0%
|
19,084,230,096
|
|
(a)
|
Non-income producing
|
|
(b)
|
Restricted securities (including private placements) - Investment in securities not registered under the Securities Act of 1933 (excluding 144A issues). At the end of the period, the value of restricted securities (excluding 144A issues) amounted to $200,292,731 or 1.0% of net assets.
|
|
(c)
|
Level 3 security
|
|
(d)
|
Security exempt from registration under Rule 144A of the Securities Act of 1933. These securities may be resold in transactions exempt from registration, normally to qualified institutional buyers. At the end of the period, the value of these securities amounted to $31,749,336 or 0.2% of net assets.
|
|
(e)
|
Security or a portion of the security is on loan at period end.
|
|
(f)
|
Investment is owned by a wholly-owned subsidiary (Subsidiary) that is treated as a corporation for U.S. tax purposes.
|
|
(g)
|
Amount is stated in United States dollars unless otherwise noted.
|
|
(h)
|
Security is perpetual in nature with no stated maturity date.
|
|
(i)
|
Affiliated fund that is generally available only to investment companies and other accounts managed by Fidelity Investments. The rate quoted is the annualized seven-day yield of the fund at period end. A complete unaudited listing of the fund's holdings as of its most recent quarter end is available upon request. In addition, each Fidelity Central Fund's financial statements, which are not covered by the Fund's Report of Independent Registered Public Accounting Firm, are available on the SEC's website or upon request.
|
|
(j)
|
Investment made with cash collateral received from securities on loan.
|
|
Additional information on each restricted holding is as follows:
|
||
|
Security
|
Acquisition Date
|
Acquisition Cost ($)
|
|
Acrisure Holdings, Inc. Series B
|
3/22/21
|
1,043,678
|
|
ASAPP, Inc. Series C
|
4/30/21
|
1,346,613
|
|
Beta Technologies, Inc. Series B, 6.00%
|
4/04/22
|
4,951,128
|
|
Bowery Farming, Inc. Series C1
|
5/18/21
|
2,248,263
|
|
ByteDance Ltd. Series E1
|
11/18/20
|
8,846,581
|
|
Carbon, Inc. Series D
|
12/15/17
|
225,990
|
|
Carbon, Inc. Series E
|
3/22/19
|
205,787
|
|
Circle Internet Financial Ltd. Series E
|
5/11/21
|
2,845,500
|
|
Circle Internet Financial Ltd. Series F
|
5/09/22
|
5,000,627
|
|
Discord, Inc. Series I
|
9/15/21
|
1,486,686
|
|
ElevateBio LLC Series C
|
3/09/21
|
2,040,868
|
|
Epic Games, Inc.
|
7/13/20 - 7/30/20
|
8,055,750
|
|
Fanatics, Inc. Class A
|
8/13/20 - 12/15/21
|
12,844,485
|
|
GoBrands, Inc. Series G
|
3/02/21
|
2,085,639
|
|
GoBrands, Inc. Series H
|
7/22/21
|
4,579,527
|
|
High Power Exploration, Inc. Series A
|
11/15/19 - 3/04/21
|
6,793,094
|
|
Lyra Health, Inc. Series E
|
1/14/21
|
1,747,079
|
|
Lyra Health, Inc. Series F
|
6/04/21
|
180,899
|
|
Nuro, Inc. Series C
|
10/30/20
|
5,299,737
|
|
Nuro, Inc. Series D
|
10/29/21
|
2,388,982
|
|
P3 Health Partners, Inc.
|
5/25/21
|
4,506,200
|
|
Rad Power Bikes, Inc.
|
1/21/21
|
1,599,460
|
|
Rad Power Bikes, Inc. Series A
|
1/21/21
|
208,525
|
|
Rad Power Bikes, Inc. Series C
|
1/21/21
|
820,526
|
|
Rad Power Bikes, Inc. Series D
|
9/17/21
|
3,880,481
|
|
Reddit, Inc. Series E
|
5/18/21
|
1,159,546
|
|
Reddit, Inc. Series F
|
8/11/21
|
9,215,770
|
|
Relativity Space, Inc. Series D
|
11/20/20
|
3,095,642
|
|
Relativity Space, Inc. Series E
|
5/27/21
|
3,285,674
|
|
Somatus, Inc. Series E
|
1/31/22
|
2,413,708
|
|
Space Exploration Technologies Corp. Class A
|
2/16/21
|
3,065,927
|
|
Space Exploration Technologies Corp. Series N
|
8/04/20
|
13,362,300
|
|
Starling Bank Ltd. Series D
|
6/18/21 - 4/05/22
|
8,226,276
|
|
Stripe, Inc. Class B
|
5/18/21
|
3,013,641
|
|
Stripe, Inc. Series H
|
3/15/21
|
1,163,625
|
|
Tanium, Inc. Class B
|
9/18/20
|
5,122,575
|
|
Tenstorrent, Inc. Series C1
|
4/23/21
|
1,961,992
|
|
Tenstorrent, Inc. 0%
|
4/23/21
|
1,840,000
|
|
TulCo LLC
|
8/24/17 - 9/07/18
|
651,224
|
|
Veterinary Emergency Group LLC Class A
|
9/16/21 - 12/16/22
|
7,182,374
|
|
X Holdings I, Inc.
|
10/25/22
|
10,234,000
|
|
ZenPayroll, Inc.
|
10/01/21
|
1,448,054
|
|
ZenPayroll, Inc. Series D
|
7/16/19
|
2,452,184
|
|
ZenPayroll, Inc. Series E
|
7/13/21
|
852,984
|
|
Zipline International, Inc.
|
10/12/21
|
3,148,776
|
|
Zipline International, Inc. Series E
|
12/21/20
|
5,808,653
|
|
Affiliate
|
Value,
beginning
of period ($)
|
Purchases ($)
|
Sales
Proceeds ($)
|
Dividend
Income ($)
|
Realized
Gain (loss) ($)
|
Change in
Unrealized
appreciation
(depreciation) ($)
|
Value,
end
of period ($)
|
% ownership,
end
of period
|
|
Fidelity Cash Central Fund 4.37%
|
557,157,321
|
4,976,927,093
|
4,572,076,304
|
16,854,359
|
-
|
-
|
962,008,110
|
2.2%
|
|
Fidelity Securities Lending Cash Central Fund 4.37%
|
69,004,697
|
1,505,358,553
|
1,453,815,655
|
321,241
|
-
|
-
|
120,547,595
|
0.4%
|
|
Total
|
626,162,018
|
6,482,285,646
|
6,025,891,959
|
17,175,600
|
-
|
-
|
1,082,555,705
|
|
|
Valuation Inputs at Reporting Date:
|
||||
|
Description
|
Total ($)
|
Level 1 ($)
|
Level 2 ($)
|
Level 3 ($)
|
|
Investments in Securities:
|
||||
|
Equities:
|
||||
|
Communication Services
|
2,188,286,388
|
2,114,922,361
|
40,801,663
|
32,562,364
|
|
Consumer Discretionary
|
1,778,992,823
|
1,703,338,111
|
38,139,792
|
37,514,920
|
|
Consumer Staples
|
714,949,102
|
650,009,664
|
61,266,487
|
3,672,951
|
|
Energy
|
1,410,588,957
|
1,391,856,959
|
18,731,998
|
-
|
|
Financials
|
2,873,541,841
|
2,848,075,827
|
7,257,987
|
18,208,027
|
|
Health Care
|
3,527,224,632
|
3,474,986,987
|
34,685,026
|
17,552,619
|
|
Industrials
|
983,236,883
|
910,558,380
|
13,923,712
|
58,754,791
|
|
Information Technology
|
3,950,218,404
|
3,916,610,833
|
9,499,794
|
24,107,777
|
|
Materials
|
627,261,865
|
610,636,721
|
11,146,843
|
5,478,301
|
|
Real Estate
|
20,193,321
|
20,193,321
|
-
|
-
|
|
Utilities
|
82,920,760
|
82,920,760
|
-
|
-
|
|
Preferred Securities
|
1,611,840
|
-
|
-
|
1,611,840
|
|
Money Market Funds
|
1,082,555,705
|
1,082,555,705
|
-
|
-
|
|
Total Investments in Securities:
|
19,241,582,521
|
18,806,665,629
|
235,453,302
|
199,463,590
|
|
|
||||
|
Net Unrealized Depreciation on Unfunded Commitments
|
(777,124)
|
-
|
-
|
(777,124)
|
|
Total
|
(777,124)
|
-
|
-
|
(777,124)
|
|
Investments in Securities:
|
|||
|
Beginning Balance
|
$
|
190,795,454
|
|
|
Net Realized Gain (Loss) on Investment Securities
|
711,583
|
||
|
Net Unrealized Gain (Loss) on Investment Securities
|
(18,203,330)
|
||
|
Cost of Purchases
|
27,737,666
|
||
|
Proceeds of Sales
|
(686,166)
|
||
|
Amortization/Accretion
|
-
|
||
|
Transfers into Level 3
|
4,602,229
|
||
|
Transfers out of Level 3
|
(5,493,846)
|
||
|
Ending Balance
|
$
|
199,463,590
|
|
|
The change in unrealized gain (loss) for the period attributable to Level 3 securities held at December 31, 2022
|
$
|
(18,203,330)
|
|
|
The information used in the above reconciliation represents fiscal year to date activity for any Investments in Securities identified as using Level 3 inputs at either the beginning or the end of the current fiscal period. Cost of purchases and proceeds of sales may include securities received and/or delivered through in-kind transactions. Transfers into Level 3 were attributable to a lack of observable market data resulting from decreases in market activity, decreases in liquidity, security restructurings or corporate actions. Transfers out of Level 3 were attributable to observable market data becoming available for those securities. Transfers in or out of Level 3 represent the beginning value of any Security or Instrument where a change in the pricing level occurred from the beginning to the end of the period. The cost of purchases and the proceeds of sales may include securities received or delivered through corporate actions or exchanges. Realized and unrealized gains (losses) disclosed in the reconciliation are included in Net Gain (Loss) on the Fund's Statement of Operations.
|
|||
|
Statement of Assets and Liabilities
|
||||
|
December 31, 2022
|
||||
|
Assets
|
||||
|
Investment in securities, at value (including securities loaned of $116,782,137) - See accompanying schedule:
|
$
|
|||
|
Unaffiliated issuers (cost $15,375,441,428)
|
18,159,026,816
|
|||
|
Fidelity Central Funds (cost $1,082,554,712)
|
1,082,555,705
|
|||
|
Total Investment in Securities (cost $16,457,996,140)
|
$
|
19,241,582,521
|
||
|
Restricted cash
|
5,263
|
|||
|
Foreign currency held at value (cost $302,808)
|
314,430
|
|||
|
Receivable for investments sold
|
1,275,801
|
|||
|
Receivable for fund shares sold
|
44,435,988
|
|||
|
Dividends receivable
|
10,592,797
|
|||
|
Distributions receivable from Fidelity Central Funds
|
3,801,814
|
|||
|
Other receivables
|
78,200
|
|||
|
Total assets
|
19,302,086,814
|
|||
|
Liabilities
|
||||
|
Payable for investments purchased
|
$34,893,843
|
|||
|
Unrealized depreciation on unfunded commitments
|
777,124
|
|||
|
Payable for fund shares redeemed
|
54,215,601
|
|||
|
Accrued management fee
|
7,313,772
|
|||
|
Other payables and accrued expenses
|
108,434
|
|||
|
Collateral on securities loaned
|
120,547,944
|
|||
|
Total Liabilities
|
217,856,718
|
|||
|
Net Assets
|
$
|
19,084,230,096
|
||
|
Net Assets consist of:
|
||||
|
Paid in capital
|
$
|
16,901,644,759
|
||
|
Total accumulated earnings (loss)
|
2,182,585,337
|
|||
|
Net Assets
|
$
|
19,084,230,096
|
||
|
Net Asset Value
, offering price and redemption price per share ($19,084,230,096 ÷ 1,134,174,623 shares)
|
$
|
16.83
|
||
|
Statement of Operations
|
||||
|
Year ended
December 31, 2022
|
||||
|
Investment Income
|
||||
|
Dividends
|
$
|
212,012,061
|
||
|
Income from Fidelity Central Funds (including $321,241 from security lending)
|
17,175,600
|
|||
|
Total Income
|
229,187,661
|
|||
|
Expenses
|
||||
|
Management fee
|
$
|
95,071,094
|
||
|
Independent trustees' fees and expenses
|
74,363
|
|||
|
Total expenses before reductions
|
95,145,457
|
|||
|
Expense reductions
|
(2,086)
|
|||
|
Total expenses after reductions
|
95,143,371
|
|||
|
Net Investment income (loss)
|
134,044,290
|
|||
|
Realized and Unrealized Gain (Loss)
|
||||
|
Net realized gain (loss) on:
|
||||
|
Investment Securities:
|
||||
|
Unaffiliated issuers (net of foreign taxes of $78,981)
|
(161,555,390)
|
|||
|
Foreign currency transactions
|
(188,758)
|
|||
|
Total net realized gain (loss)
|
(161,744,148)
|
|||
|
Change in net unrealized appreciation (depreciation) on:
|
||||
|
Investment Securities:
|
||||
|
Unaffiliated issuers
(net of decrease in deferred foreign taxes of $779,074)
|
(7,152,938,273)
|
|||
|
Unfunded commitments
|
(629,232)
|
|||
|
Assets and liabilities in foreign currencies
|
(10,518)
|
|||
|
Total change in net unrealized appreciation (depreciation)
|
(7,153,578,023)
|
|||
|
Net gain (loss)
|
(7,315,322,171)
|
|||
|
Net increase (decrease) in net assets resulting from operations
|
$
|
(7,181,277,881)
|
||
|
Statement of Changes in Net Assets
|
||||
|
Year ended
December 31, 2022
|
Year ended
December 31, 2021
|
|||
|
Increase (Decrease) in Net Assets
|
||||
|
Operations
|
||||
|
Net investment income (loss)
|
$
|
134,044,290
|
$
|
27,964,558
|
|
Net realized gain (loss)
|
(161,744,148)
|
975,461,106
|
||
|
Change in net unrealized appreciation (depreciation)
|
(7,153,578,023)
|
3,986,952,261
|
||
|
Net increase (decrease) in net assets resulting from operations
|
(7,181,277,881)
|
4,990,377,925
|
||
|
Distributions to shareholders
|
(224,884,344)
|
(121,152,368)
|
||
|
Share transactions
|
||||
|
Proceeds from sales of shares
|
5,373,501,397
|
9,804,987,986
|
||
|
Reinvestment of distributions
|
224,688,774
|
121,048,719
|
||
|
Cost of shares redeemed
|
(5,254,427,380)
|
(6,050,741,750)
|
||
|
Net increase (decrease) in net assets resulting from share transactions
|
343,762,791
|
3,875,294,955
|
||
|
Total increase (decrease) in net assets
|
(7,062,399,434)
|
8,744,520,512
|
||
|
Net Assets
|
||||
|
Beginning of period
|
26,146,629,530
|
17,402,109,018
|
||
|
End of period
|
$
|
19,084,230,096
|
$
|
26,146,629,530
|
|
Other Information
|
||||
|
Shares
|
||||
|
Sold
|
285,619,497
|
477,951,690
|
||
|
Issued in reinvestment of distributions
|
12,078,442
|
5,258,129
|
||
|
Redeemed
|
(283,595,105)
|
(284,504,628)
|
||
|
Net increase (decrease)
|
14,102,834
|
198,705,191
|
||
|
Fidelity® Contrafund® K6
|
|
Years ended December 31,
|
2022
|
2021
|
2020
|
2019
|
2018
|
|||||
|
Selected Per-Share Data
|
||||||||||
|
Net asset value, beginning of period
|
$
|
23.34
|
$
|
18.89
|
$
|
14.47
|
$
|
11.08
|
$
|
11.36
|
|
Income from Investment Operations
|
||||||||||
|
Net investment income (loss)
A,B
|
.12
|
.03
|
.03
|
.05
|
.05
|
|||||
|
Net realized and unrealized gain (loss)
|
(6.43)
|
4.53
|
4.43
|
3.38
|
(.29)
|
|||||
|
Total from investment operations
|
(6.31)
|
4.56
|
4.46
|
3.43
|
(.24)
|
|||||
|
Distributions from net investment income
|
(.11)
|
(.05)
|
(.04)
|
(.04)
|
(.04)
|
|||||
|
Distributions from net realized gain
|
(.09)
|
(.06)
|
-
|
-
|
-
|
|||||
|
Total distributions
|
(.20)
|
(.11)
|
(.04)
|
(.04)
|
(.04)
|
|||||
|
Net asset value, end of period
|
$
|
16.83
|
$
|
23.34
|
$
|
18.89
|
$
|
14.47
|
$
|
11.08
|
|
Total Return
C
|
(27.12)%
|
24.14%
|
30.83%
|
31.00%
|
(2.15)%
|
|||||
|
Ratios to Average Net Assets
B,D,E
|
||||||||||
|
Expenses before reductions
|
.45%
|
.45%
|
.45%
|
.45%
|
.45%
|
|||||
|
Expenses net of fee waivers, if any
|
.45%
|
.45%
|
.45%
|
.45%
|
.45%
|
|||||
|
Expenses net of all reductions
|
.45%
|
.45%
|
.45%
|
.45%
|
.45%
|
|||||
|
Net investment income (loss)
|
.64%
|
.12%
|
.18%
|
.39%
|
.39%
|
|||||
|
Supplemental Data
|
||||||||||
|
Net assets, end of period (000 omitted)
|
$
|
19,084,230
|
$
|
26,146,630
|
$
|
17,402,109
|
$
|
11,849,878
|
$
|
5,278,087
|
|
Portfolio turnover rate
F
|
38%
G
|
40%
G
|
45%
G
|
39%
G
|
54%
G
|
|
Fidelity Central Fund
|
Investment Manager
|
Investment Objective
|
Investment Practices
|
Expense Ratio
A
|
|
Fidelity Money Market Central Funds
|
Fidelity Management & Research Company LLC (FMR)
|
Each fund seeks to obtain a high level of current income consistent with the preservation of capital and liquidity.
|
Short-term Investments
|
Less than .005%
|
|
Asset Type
|
Fair Value
|
Valuation Technique(s)
|
Unobservable Input
|
Amount or Range/Weighted Average
|
Impact to Valuation from an Increase in Input
A
|
|
Equities
|
$197,851,750
|
Market comparable
|
Enterprise value/EBITDA multiple (EV/EBITDA)
|
5.5 - 21.2 / 8.7
|
Increase
|
|
|
|
|
Enterprise value/Revenue multiple (EV/R)
|
1.6 - 19.0 / 6.9
|
Increase
|
|
|
|
|
Enterprise value/Net income multiple (EV/NI)
|
15.5
|
Increase
|
|
|
|
Market approach
|
Transaction price
|
$59.45
|
Increase
|
|
|
|
|
Discount rate
|
15.0%
|
Decrease
|
|
|
|
Book value
|
Book value multiple
|
1.0
|
Increase
|
|
|
|
|
Discount rate
|
10.0%
|
Decrease
|
|
|
|
Discounted cash flow
|
Weighted average cost of capital (WACC)
|
30.0%
|
Decrease
|
|
|
|
|
Exit multiple
|
2.0
|
Increase
|
|
|
|
Black scholes
|
Discount rate
|
3.8% - 4.7% / 4.0%
|
Increase
|
|
|
|
|
Probability rate
|
50.0%
|
Increase
|
|
|
|
|
Volatility
|
65.0% - 85.0% / 78.3%
|
Increase
|
|
|
|
|
Term
|
0.6 - 5.0 / 3.9
|
Increase
|
|
Preferred Securities
|
$1,611,840
|
Market approach
|
Transaction price
|
$100.00
|
Increase
|
|
|
|
|
Discount rate
|
15.0%
|
Decrease
|
|
|
|
Black scholes
|
Discount rate
|
4.2%
|
Increase
|
|
|
|
|
Volatility
|
70.0%
|
Increase
|
|
|
|
|
Term
|
2.0
|
Increase
|
|
|
|
|
|
|
|
|
Gross unrealized appreciation
|
$3,924,408,518
|
|
Gross unrealized depreciation
|
(1,257,574,862)
|
|
Net unrealized appreciation (depreciation)
|
$2,666,833,656
|
|
Tax Cost
|
$16,573,971,741
|
|
Undistributed ordinary income
|
$15,585,707
|
|
Capital loss carryforward
|
$(499,921,123)
|
|
Net unrealized appreciation (depreciation) on securities and other investments
|
$2,666,841,749
|
|
Short-term
|
$(499,921,123)
|
|
|
December 31, 2022
|
December 31, 2021
|
|
Ordinary Income
|
$119,109,830
|
$ 51,884,688
|
|
Long-term Capital Gains
|
105,774,514
|
69,267,680
|
|
Total
|
$224,884,344
|
$ 121,152,368
|
|
|
Investment to be Acquired
|
Commitment Amount
|
Unrealized Appreciation (Depreciation)
|
|
Fidelity Contrafund K6
|
Stripe, Inc.
|
$777,124
|
$(777,124)
|
|
|
$ Amount
|
% of Net Assets
|
|
Fidelity Contrafund K6
|
11,696,644
|
.06
|
|
|
Purchases ($)
|
Sales ($)
|
|
Fidelity Contrafund K6
|
7,663,700,425
|
7,955,286,188
|
|
|
Shares
|
Total net realized gain or loss
($)
|
Total Proceeds
($)
|
|
Fidelity Contrafund K6
|
55,666,002
|
367,380,483
|
992,024,707
|
|
|
Shares
|
Total Proceeds
($)
|
|
Fidelity Contrafund K6
|
44,817,858
|
914,186,580
|
|
|
Shares
|
Total net realized gain or loss
($)
|
Total Proceeds
($)
|
|
Fidelity Contrafund K6
|
44,919,036
|
495,055,406
|
944,525,951
|
|
|
Shares
|
Total Proceeds
($)
|
|
Fidelity Contrafund K6
|
224,086,125
|
4,505,428,497
|
|
|
Amount
|
|
Fidelity Contrafund K6
|
$133,107
|
|
|
Purchases ($)
|
Sales ($)
|
Realized Gain (Loss) ($)
|
|
Fidelity Contrafund K6
|
500,235,585
|
653,974,630
|
(30,456,589)
|
|
|
Total Security Lending Fees Paid to NFS
|
Security Lending Income From Securities Loaned to NFS
|
Value of Securities Loaned to NFS at Period End
|
|
Fidelity Contrafund K6
|
$34,031
|
$5,639
|
$-
|
|
The Example is based on an investment of $1,000 invested at the beginning of the period and held for the entire period (July 1, 2022 to December 31, 2022).
|
|
Annualized Expense Ratio-
A
|
Beginning Account Value July 1, 2022
|
Ending Account Value December 31, 2022
|
Expenses Paid During Period-
C
July 1, 2022 to December 31, 2022
|
|||||||
|
Fidelity® Contrafund® K6
|
.45%
|
|||||||||
|
Actual
|
$ 1,000
|
$ 1,010.80
|
$ 2.28
|
|||||||
|
Hypothetical-
B
|
$ 1,000
|
$ 1,022.94
|
$ 2.29
|
|||||||
|
|
Item 2.
Code of Ethics
As of the end of the period, December 31, 2022, Fidelity Contrafund (the trust) has adopted a code of ethics, as defined in Item 2 of Form N-CSR, that applies to its President and Treasurer and its Chief Financial Officer. A copy of the code of ethics is filed as an exhibit to this Form N-CSR.
Item 3.
Audit Committee Financial Expert
The Board of Trustees of the trust has determined that Donald F. Donahue is an audit committee financial expert, as defined in Item 3 of Form N-CSR. Mr. Donahue is independent for purposes of Item 3 of Form N-CSR.
Item 4.
Principal Accountant Fees and Services
Fees and Services
The following table presents fees billed by PricewaterhouseCoopers LLP (“PwC”) in each of the last two fiscal years for services rendered to Fidelity Advisor New Insights Fund, Fidelity Contrafund, Fidelity Contrafund K6 and Fidelity Series Opportunistic Insights Fund (the “Funds”):
Services Billed by PwC
December 31, 2022 FeesA
| |
Audit Fees |
Audit-Related Fees |
Tax Fees |
All Other Fees |
| Fidelity Advisor New Insights Fund |
$69,100 |
$6,100 |
$71,400 |
$2,100 |
| Fidelity Contrafund |
$125,200 |
$7,200 |
$50,600 |
$2,500 |
| Fidelity Contrafund K6 |
$103,200 |
$5,700 |
$42,000 |
$2,000 |
| Fidelity Series Opportunistic Insights Fund |
$64,900 |
$5,700 |
$12,400 |
$2,000 |
| |
|
|
|
|
December 31, 2021 FeesA
| |
Audit Fees |
Audit-Related Fees |
Tax Fees |
All Other Fees |
| Fidelity Advisor New Insights Fund |
$67,100 |
$6,600 |
$13,400 |
$2,100 |
| Fidelity Contrafund |
$111,600 |
$7,700 |
$42,500 |
$2,500 |
| Fidelity Contrafund K6 |
$75,100 |
$6,200 |
$12,100 |
$2,000 |
| Fidelity Series Opportunistic Insights Fund |
$63,100 |
$6,200 |
$11,500 |
$2,000 |
| |
|
|
|
|
| |
|
|
|
|
A Amounts may reflect rounding.
The following table(s) present(s) fees billed by PwC that were required to be approved by the Audit Committee for services that relate directly to the operations and financial reporting of the Fund(s) and that are rendered on behalf of Fidelity Management & Research Company LLC ("FMR") and entities controlling, controlled by, or under common control with FMR (not including any sub-adviser whose role is primarily portfolio management and is subcontracted with or overseen by another investment adviser) that provide ongoing services to the Fund(s) (“Fund Service Providers”):
Services Billed by PwC
| |
December 31, 2022A |
December 31, 2021A |
| Audit-Related Fees |
$7,914,600 |
$8,522,600 |
| Tax Fees |
$1,000 |
$354,200 |
| All Other Fees |
$- |
$- |
A Amounts may reflect rounding.
“Audit-Related Fees” represent fees billed for assurance and related services that are reasonably related to the performance of the fund audit or the review of the fund's financial statements and that are not reported under Audit Fees.
“Tax Fees” represent fees billed for tax compliance, tax advice or tax planning that relate directly to the operations and financial reporting of the fund.
“All Other Fees” represent fees billed for services provided to the fund or Fund Service Provider, a significant portion of which are assurance related, that relate directly to the operations and financial reporting of the fund, excluding those services that are reported under Audit Fees, Audit-Related Fees or Tax Fees.
Assurance services must be performed by an independent public accountant.
* * *
The aggregate non-audit fees billed by PwC for services rendered to the Fund(s), FMR (not including any sub-adviser whose role is primarily portfolio management and is subcontracted with or overseen by another investment adviser), and any Fund Service Provider for each of the last two fiscal years of the Fund(s) are as follows:
| Billed By |
December 31, 2022A |
December 31, 2021A |
| PwC |
$13,112,500 |
$14,252,200 |
A Amounts may reflect rounding.
The trust's Audit Committee has considered non-audit services that were not pre-approved that were provided by PwC to Fund Service Providers to be compatible with maintaining the independence of PwC in its(their) audit of the Fund(s), taking into account representations from PwC, in accordance with Public Company Accounting Oversight Board rules, regarding its independence from the Fund(s) and its(their) related entities and FMR’s review of the appropriateness and permissibility under applicable law of such non-audit services prior to their provision to the Fund(s) Service Providers.
Audit Committee Pre-Approval Policies and Procedures
The trust’s Audit Committee must pre-approve all audit and non-audit services provided by a fund’s independent registered public accounting firm relating to the operations or financial reporting of the fund. Prior to the commencement of any audit or non-audit services to a fund, the Audit Committee reviews the services to determine whether they are appropriate and permissible under applicable law.
The Audit Committee has adopted policies and procedures to, among other purposes, provide a framework for the Committee’s consideration of non-audit services by the audit firms that audit the Fidelity funds. The policies and procedures require that any non-audit service provided by a fund audit firm to a Fidelity fund and any non-audit service provided by a fund auditor to a Fund Service Provider that relates directly to the operations and financial reporting of a Fidelity fund (“Covered Service”) are subject to approval by the Audit Committee before such service is provided.
All Covered Services must be approved in advance of provision of the service either: (i) by formal resolution of the Audit Committee, or (ii) by oral or written approval of the service by the Chair of the Audit Committee (or if the Chair is unavailable, such other member of the Audit Committee as may be designated by the Chair to act in the Chair’s absence). The approval contemplated by (ii) above is permitted where the Treasurer determines that action on such an engagement is necessary before the next meeting of the Audit Committee.
Non-audit services provided by a fund audit firm to a Fund Service Provider that do not relate directly to the operations and financial reporting of a Fidelity fund are reported to the Audit Committee periodically.
Non-Audit Services Approved Pursuant to Rule 2-01(c)(7)(i)(C) and (ii) of Regulation S-X (“De Minimis Exception”)
There were no non-audit services approved or required to be approved by the Audit Committee pursuant to the De Minimis Exception during the Fund’s(s’) last two fiscal years relating to services provided to (i) the Fund(s) or (ii) any Fund Service Provider that relate directly to the operations and financial reporting of the Fund(s).
Item 5.
Audit Committee of Listed Registrants
Not applicable.
Item 6.
Investments
(a)
Not applicable.
(b)
Not applicable.
Item 7.
Disclosure of Proxy Voting Policies and Procedures for Closed-End Management Investment Companies
Not applicable.
Item 8.
Portfolio Managers of Closed-End Management Investment Companies
Not applicable.
Item 9.
Purchase of Equity Securities by Closed-End Management Investment Company and Affiliated Purchasers
Not applicable.
Item 10.
Submission of Matters to a Vote of Security Holders
There were no material changes to the procedures by which shareholders may recommend nominees to the trust’s Board of Trustees.
Item 11.
Controls and Procedures
(a)(i) The President and Treasurer and the Chief Financial Officer have concluded that the trust’s disclosure controls and procedures (as defined in Rule 30a-3(c) under the Investment Company Act) provide reasonable assurances that material information relating to the trust is made known to them by the appropriate persons, based on their evaluation of these controls and procedures as of a date within 90 days of the filing date of this report.
(a)(ii) There was no change in the trust’s internal control over financial reporting (as defined in Rule 30a-3(d) under the Investment Company Act) that occurred during the
period covered by this report that has materially affected, or is reasonably likely to materially affect, the trust’s internal control over financial reporting.
Item 12.
Disclosure of Securities Lending Activities for Closed-End Management
Investment Companies
Not applicable.
Item 13.
Exhibits
| (a) |
(1) |
Code of Ethics pursuant to Item 2 of Form N-CSR is filed and attached hereto as EX-99.CODE ETH. |
| (a) |
(2) |
|
| (a) |
(3) |
Not applicable. |
| (b) |
|
SIGNATURES
Pursuant to the requirements of the Securities Exchange Act of 1934 and the Investment Company Act of 1940, the registrant has duly caused this report to be signed on its behalf by the undersigned, thereunto duly authorized.
Fidelity Contrafund
| By: |
/s/Stacie M. Smith |
| |
Stacie M. Smith |
| |
President and Treasurer |
| |
|
| Date: |
February 21, 2023 |
Pursuant to the requirements of the Securities Exchange Act of 1934 and the Investment Company Act of 1940, this report has been signed below by the following persons on behalf of the registrant and in the capacities and on the dates indicated.
| By: |
/s/Stacie M. Smith |
| |
Stacie M. Smith |
| |
President and Treasurer |
| |
|
| Date: |
February 21, 2023 |
| By: |
/s/John J. Burke III |
| |
John J. Burke III |
| |
Chief Financial Officer |
| |
|
| Date: |
February 21, 2023 |
Exhibit EX-99.CERT
I, Stacie M. Smith, certify that:
1.
I have reviewed this report on Form N-CSR of Fidelity Contrafund;
2.
Based on my knowledge, this report does not contain any untrue statement of a material fact or omit to state a material fact necessary to make the statements made, in light of the circumstances under which such statements were made, not misleading with respect to the period covered by this report;
3.
Based on my knowledge, the financial statements, and other financial information included in this report, fairly present in all material respects the financial condition, results of operations, changes in net assets, and cash flows (if the financial statements are required to include a statement of cash flows) of the registrant as of, and for, the periods presented in this report;
4.
The registrant's other certifying officer(s) and I are responsible for establishing and maintaining disclosure controls and procedures (as defined in Rule 30a-3(c) under the Investment Company Act of 1940) and internal control over financial reporting (as defined in Rule 30a-3(d) under the Investment Company Act of 1940) for the registrant and have:
a.
Designed such disclosure controls and procedures, or caused such disclosure controls and procedures to be designed under our supervision, to ensure that material information relating to the registrant, including its consolidated subsidiaries, is made known to us by others within those entities, particularly during the period in which this report is being prepared;
b.
Designed such internal control over financial reporting, or caused such internal control over financial reporting to be designed under our supervision, to provide reasonable assurance regarding the reliability of financial reporting and the preparation of financial statements for external purposes in accordance with generally accepted accounting principles;
c.
Evaluated the effectiveness of the registrant's disclosure controls and procedures and presented in this report our conclusions about the effectiveness of the disclosure controls and procedures, as of a date within 90 days prior to the filing date of this report based upon such evaluation; and
d.
Disclosed in this report any change in the registrant ’s internal control over financial reporting that occurred during the period covered by this report that has materially affected, or is reasonably likely to materially affect, the registrant ’s internal control over financial reporting; and
5.
The registrant's other certifying officer(s) and I have disclosed to the registrant's auditors and the audit committee of the registrant's board of directors (or persons performing the equivalent functions):
a.
All significant deficiencies and material weaknesses in the design or operation of internal control over financial reporting which are reasonably likely to adversely affect the registrant's ability to record, process, summarize, and report financial information; and
b.
Any fraud, whether or not material, that involves management or other employees who have a significant role in the registrant's internal control over financial reporting.
Date:
February 21, 2023
|
/s/Stacie M. Smith |
|
Stacie M. Smith |
|
President and Treasurer |
I, John J. Burke III, certify that:
1.
I have reviewed this report on Form N-CSR of Fidelity Contrafund;
2.
Based on my knowledge, this report does not contain any untrue statement of a material fact or omit to state a material fact necessary to make the statements made, in light of the circumstances under which such statements were made, not misleading with respect to the period covered by this report;
3.
Based on my knowledge, the financial statements, and other financial information included in this report, fairly present in all material respects the financial condition, results of operations, changes in net assets, and cash flows (if the financial statements are required to include a statement of cash flows) of the registrant as of, and for, the periods presented in this report;
4.
The registrant's other certifying officer(s) and I are responsible for establishing and maintaining disclosure controls and procedures (as defined in Rule 30a-3(c) under the Investment Company Act of 1940) and internal control over financial reporting (as defined in Rule 30a-3(d) under the Investment Company Act of 1940) for the registrant and have:
a.
Designed such disclosure controls and procedures, or caused such disclosure controls and procedures to be designed under our supervision, to ensure that material information relating to the registrant, including its consolidated subsidiaries, is made known to us by others within those entities, particularly during the period in which this report is being prepared;
b.
Designed such internal control over financial reporting, or caused such internal control over financial reporting to be designed under our supervision, to provide reasonable assurance regarding the reliability of financial reporting and the preparation of financial statements for external purposes in accordance with generally accepted accounting principles;
c.
Evaluated the effectiveness of the registrant's disclosure controls and procedures and presented in this report our conclusions about the effectiveness of the disclosure controls and procedures, as of a date within 90 days prior to the filing date of this report based upon such evaluation; and
d.
Disclosed in this report any change in the registrant ’s internal control over financial reporting that occurred during the period covered by this report that has materially affected, or is reasonably likely to materially affect, the registrant ’s internal control over financial reporting; and
5.
The registrant's other certifying officer(s) and I have disclosed to the registrant's auditors and the audit committee of the registrant's board of directors (or persons performing the equivalent functions):
a.
All significant deficiencies and material weaknesses in the design or operation of internal control over financial reporting which are reasonably likely to adversely affect the registrant's ability to record, process, summarize, and report financial information; and
b.
Any fraud, whether or not material, that involves management or other employees who have a significant role in the registrant's internal control over financial reporting.
Date:
February 21, 2023
|
/s/John J. Burke III |
|
John J. Burke III |
|
Chief Financial Officer |
Exhibit EX-99.906CERT
Certification Pursuant to Section 906 of the Sarbanes-Oxley Act of 2002 (subsections (a) and (b) of section 1350, chapter 63 of title 18, United States Code)
In connection with the attached Report of Fidelity Contrafund (the “Trust ”) on Form N-CSR to be filed with the Securities and Exchange Commission (the “Report ”), each of the undersigned officers of the Trust does hereby certify that, to the best of such officer ’s knowledge:
1.
The Report fully complies with the requirements of 13(a) or 15(d) of the Securities Exchange Act of 1934; and
2.
The information contained in the Report fairly presents, in all material respects, the financial condition and results of operations of the Trust as of, and for, the periods presented in the Report.
Dated: February 21, 2023
|
/s/Stacie M. Smith |
|
Stacie M. Smith |
|
President and Treasurer |
Dated: February 21, 2023
|
/s/John J. Burke III |
|
John J. Burke III |
|
Chief Financial Officer |
A signed original of this written statement required by Section 906, or other document authenticating, acknowledging, or otherwise adopting the signature that appears in typed form within the electronic version of this written statement required by Section 906, has been provided to the Trust and will be retained by the Trust and furnished to the Securities and Exchange Commission or its staff upon request.
EXHIBIT EX-99.CODE ETH
FIDELITY FUNDS’ CODE OF ETHICS FOR
PRESIDENT, TREASURER AND PRINCIPAL ACCOUNTING OFFICER
I. Purposes of the Code/Covered Officers
This document constitutes the Code of Ethics (Code) adopted by the Fidelity Funds (Funds) pursuant to the provisions of Rule 30b2-1(a) under the Investment Company Act of 1940), which Rule implements Sections 406 of the Sarbanes-Oxley Act of 2002 with respect to registered investment companies. The Code applies to the Fidelity Funds’ President and Treasurer, and Chief Financial Officer (Covered Officers). Fidelity’s Ethics Office, a part of Corporate Compliance Group within Core Compliance, administers the Code.
The purposes of the Code are to deter wrongdoing and to promote, on the part of the Covered Officers:
·
honest and ethical conduct, including the ethical handling of actual or apparent conflicts of interest between personal and professional relationships;
·
full, fair, accurate, timely and understandable disclosure in reports and documents that the Fidelity Funds submit to the Securities and Exchange Commission (SEC), and in other public communications by a Fidelity Fund;
·
compliance with applicable laws and governmental rules and regulations;
·
the prompt internal reporting to an appropriate person or persons identified in the Code of violations of the Code; and
·
accountability for adherence to the Code.
Each Covered Officer should adhere to a high standard of business ethics and should be sensitive to situations that may give rise to actual as well as apparent conflicts of interest.
II.
Covered Officers Should Handle Ethically
Actual and Apparent Conflicts of Interest
Overview. A “conflict of interest” occurs when a Covered Officer’s private interest interferes with the interests of, or his service to, the Fidelity Funds. For example, a conflict of interest would arise if a Covered Officer, or a member of his family, receives improper personal benefits as a result of his position with the Fidelity Funds.
Certain conflicts of interest arise out of the relationships between Covered Officers and the Fidelity Funds and already are subject to conflict of interest provisions in the Investment Company Act of 1940 (Investment Company Act) and the Investment Advisers Act of 1940 (Investment Advisers Act). For example, Covered Officers may not individually engage in certain transactions (such as the purchase or sale of securities or other property) with a Fidelity Fund because of their status as “affiliated persons” of the Fund. Separate compliance programs and procedures of the Fidelity Funds, Fidelity Management & Research Company (FMR) and the other Fidelity companies are designed to prevent, or identify and correct, violations of these provisions. This Code does not, and is not intended to, repeat or replace these programs and procedures, and such conflicts fall outside of the parameters of this Code.
Although typically not presenting an opportunity for improper personal benefit, conflicts arise from, or as a result of, the contractual relationship between the Fidelity Funds and FMR (or another Fidelity company) of which the Covered Officers are also officers or employees. As a result, this Code recognizes that the Covered Officers will, in the normal course of their duties (whether formally for the Fidelity Funds, FMR or another Fidelity company), be involved in establishing policies and implementing decisions that have different effects on the Fidelity Funds, FMR and other Fidelity companies. The participation of the Covered Officers in such activities is inherent in the contractual relationship between the Fidelity Funds and FMR (or another Fidelity company), and is consistent with the performance by the Covered Officers of their duties as officers of the Fidelity Funds. Thus, if performed in conformity with the provisions of the Investment Company Act and the Investment Advisers Act, such activities will be deemed to have been handled ethically. In addition, it is recognized by the Funds’ Board of Trustees (Board) that the Covered Officers also may be officers or employees of one or more other Fidelity Funds covered by this Code.
Other conflicts of interest are covered by the Code, even if such conflicts of interest are not subject to provisions in the Investment Company Act and the Investment Advisers Act. The following list provides examples of conflicts of interest under the Code, but Covered Officers should keep in mind that these examples are not exhaustive. The overarching principle is that the personal interest of a Covered Officer should not be placed improperly before the interest of a Fidelity Fund.
* * *
Each Covered Officer must:
·
not use his or her personal influence or personal relationships improperly to influence investment decisions or financial reporting by any Fidelity Fund whereby the Covered Officer would benefit personally to the detriment of any Fidelity Fund;
·
not cause a Fidelity Fund to take action, or fail to take action, for the individual personal benefit of the Covered Officer rather than the benefit of the Fidelity Fund;
·
not engage in any outside business activity, including serving as a director or trustee, that prevents the Covered Officer from devoting appropriate time and attention to the Covered Officer’s responsibilities with the Fidelity Funds;
·
not have a consulting or employment relationship with any of the Fidelity Funds’ service providers that are not affiliated with Fidelity; and
·
not retaliate against any employee or Covered Officer for reports of actual or potential misconduct, which are made in good faith.
With respect to other fact patterns, if a Covered Officer is in doubt, other potential conflict of interest situations should be described immediately to the Fidelity Ethics Office for resolution. Similarly, any questions a Covered Officer has generally regarding the application or interpretation of the Code should be directed to the Fidelity Ethics Office immediately.
III. Disclosure and Compliance
·
Each Covered Officer should familiarize himself with the disclosure requirements generally applicable to the Fidelity Funds.
·
Each Covered Officer should not knowingly misrepresent, or cause others to misrepresent, facts about any Fidelity Fund to others, whether within or outside Fidelity, including to the Board and auditors, and to governmental regulators and self-regulatory organizations;
·
Each Covered Officer should, to the extent appropriate within his area of responsibility, consult with other officers and employees of the Fidelity Funds, FMR and the Fidelity service providers, and with the Board’s Compliance Committee, with the goal of promoting full, fair, accurate, timely and understandable disclosure in the reports and documents the Fidelity Funds file with, or submit to, the SEC and in other public communications made by the Fidelity Funds; and
·
It is the responsibility of each Covered Officer to promote compliance with the standards and restrictions imposed by applicable laws, rules and regulations.
IV. Reporting and Accountability
Each Covered Officer must:
·
upon receipt of the Code, and annually thereafter, submit to the Fidelity Ethics Office an acknowledgement stating that he or she has received, read, and understands the Code; and
·
notify the Fidelity Ethics Office promptly if he or she knows of any violation of the Code. Failure to do so is itself a violation of this Code .
The Fidelity Ethics Office shall take all action it considers appropriate to investigate any actual or potential violations reported to it. Upon completion of the investigation, if necessary, the matter will be reviewed with senior management or other appropriate parties, and a determination will be made as to whether any action should be taken as detailed below. The Covered Officer will be informed of any action determined to be appropriate. The Fidelity Ethics Office will inform the Personal Trading Committee of all Code violations and actions taken in response. Without implied limitation, appropriate remedial, disciplinary or preventive action may include a written warning, a letter of censure, suspension, dismissal or, in the event of criminal or other serious violations of law, notification of the SEC or other appropriate law enforcement authorities. Additionally, other legal remedies may be pursued.
The policies and procedures described in the Code do not create any obligations to any person or entity other than the Fidelity Funds. The Code is intended solely for the internal use by the Fidelity Funds and does not constitute a promise, contract or an admission by or on behalf of any Fidelity Fund as to any fact, circumstance, or legal conclusion. The Fidelity Funds, the Fidelity companies and the Fidelity Chief Ethics Officer retain the discretion to decide whether the Code applies to a specific situation, and how it should be interpreted.
V. Oversight
Material violations of this Code will be reported promptly by FMR to the Board’s Compliance Committee. In addition, at least once each year, FMR will provide a written report to the Board, which describes any issues arising under the Code since the last report to the Board, including, but not limited to, information about material violations of the Code and action taken in response to the material violations.
VI. Other Policies and Procedures
This Code shall be the sole code of ethics adopted by the Fidelity Funds for purposes of Section 406 of the Sarbanes-Oxley Act and the rules and forms applicable to registered investment companies thereunder. Other Fidelity policies or procedures that cover the behavior or activities of Covered Officers are separate requirements applying to the Covered Officers (and others), and are not part of this Code.
VII. Amendments
Any material amendments or changes to this Code must be approved or ratified by a majority vote of the Board, including a majority of the Trustees who are not interested persons of the Fidelity Funds.
VIII. Records and Confidentiality
Records of any violation of the Code and of the actions taken as a result of such violations will be kept by the Fidelity Ethics Office. All reports and records prepared or maintained pursuant to this Code will be considered confidential and shall be maintained and protected accordingly. Except as otherwise required by law or this Code, such matters shall not be disclosed to anyone other than the Fidelity Ethics Office, the Personal Trading Committee, the Board, appropriate personnel at the relevant Fidelity company or companies and the legal counsel of any or all of the foregoing.