Exhibit 99.1
Link to searchable text of slide shown above
Link to searchable text of slide shown above
Link to searchable text of slide shown above
Link to searchable text of slide shown above
Link to searchable text of slide shown above
Link to searchable text of slide shown above
Link to searchable text of slide shown above
Link to searchable text of slide shown above
Link to searchable text of slide shown above
Link to searchable text of slide shown above
Link to searchable text of slide shown above
Link to searchable text of slide shown above
Link to searchable text of slide shown above
Link to searchable text of slide shown above
Link to searchable text of slide shown above
Link to searchable text of slide shown above
Link to searchable text of slide shown above
Link to searchable text of slide shown above
Link to searchable text of slide shown above
Link to searchable text of slide shown above
Link to searchable text of slide shown above
Link to searchable text of slide shown above
Link to searchable text of slide shown above
Link to searchable text of slide shown above
Link to searchable text of slide shown above
Link to searchable text of slide shown above
Link to searchable text of slide shown above
Link to searchable text of slide shown above
Link to searchable text of slide shown above
Link to searchable text of slide shown above
Link to searchable text of slide shown above
Link to searchable text of slide shown above
Link to searchable text of slide shown above

Link to searchable text of slide shown above
Link to searchable text of slide shown above
Link to searchable text of slide shown above
Link to searchable text of slide shown above
Link to searchable text of slide shown above
Link to searchable text of slide shown above

Link to searchable text of slide shown above
Link to searchable text of slide shown above
Link to searchable text of slide shown above
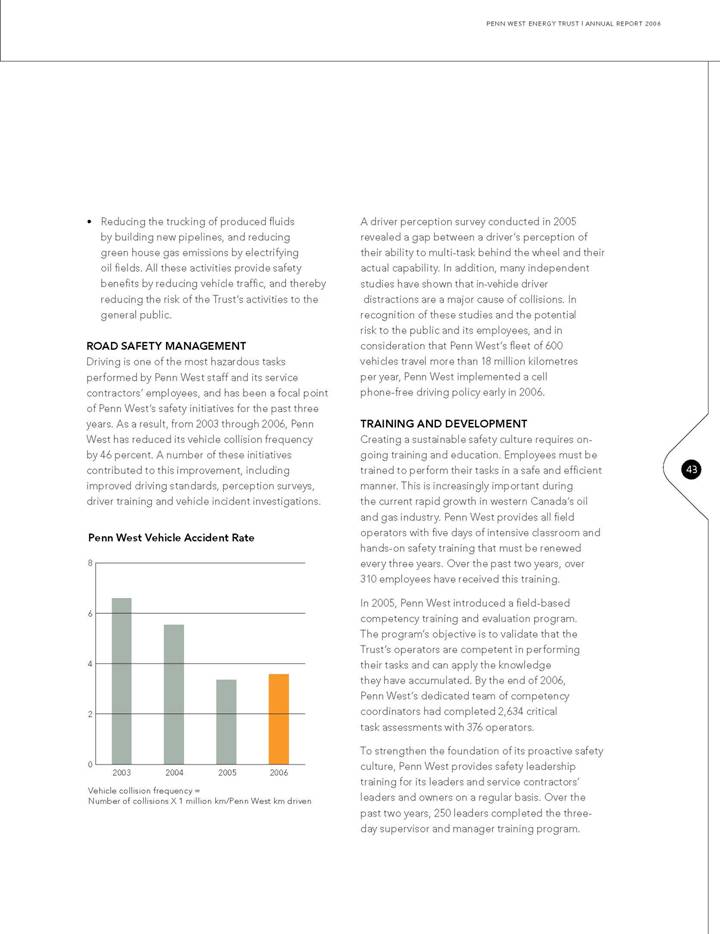
Link to searchable text of slide shown above
Link to searchable text of slide shown above
Link to searchable text of slide shown above

Link to searchable text of slide shown above
Link to searchable text of slide shown above
Link to searchable text of slide shown above
Link to searchable text of slide shown above
Link to searchable text of slide shown above
Link to searchable text of slide shown above
Link to searchable text of slide shown above
Link to searchable text of slide shown above
Link to searchable text of slide shown above
Link to searchable text of slide shown above
Link to searchable text of slide shown above

Link to searchable text of slide shown above
Link to searchable text of slide shown above
Link to searchable text of slide shown above
Link to searchable text of slide shown above
Link to searchable text of slide shown above
Link to searchable text of slide shown above
Link to searchable text of slide shown above
Searchable text section of graphics shown above
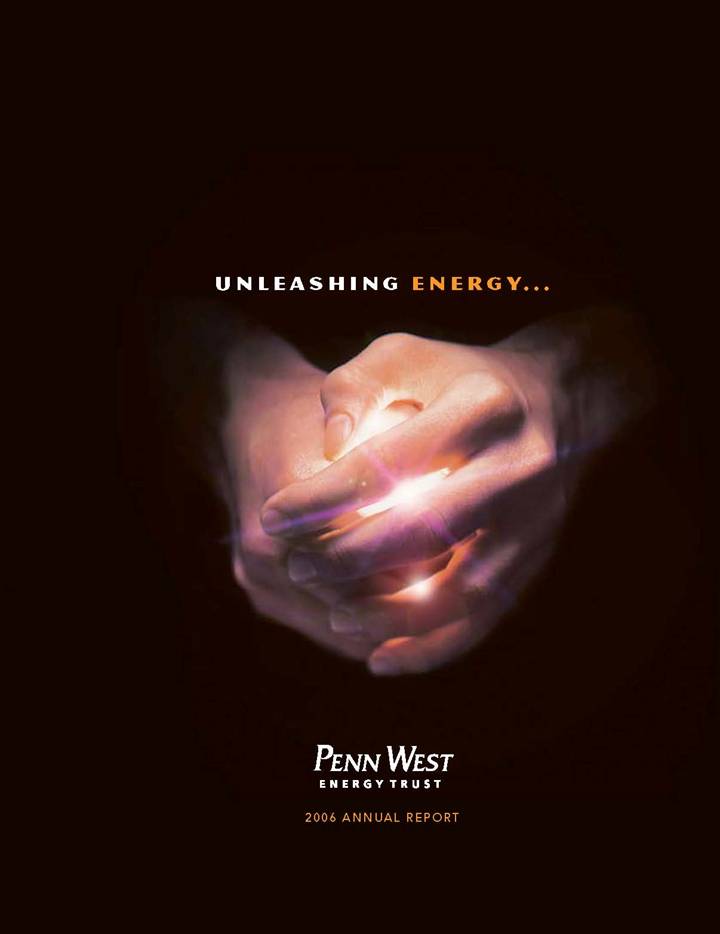
UNLEASHING ENERGY. . .
[GRAPHIC]
PENN WEST
ENERGY TRUST
2006 ANNUAL REPORT
CONTENTS
|
|
|
|
|
|
|
|
|
|
|
|
|
|
|
|
|
|
|
|
|
Management’s Discussion and Analysis |
|
|
|
|
Management’s Report |
|
|
|
|
Auditors’ Report to the Unitholders |
|
|
|
|
Consolidated Financial Statements |
|
|
|
|
Notes to the Consolidated Financial Statements |
|
|
|
|
|
|
|
|
|
|
|
|
|
|
|
|
|
|
|
|
|
|
|
|
|
|
|
|
|
Investor Information |
|
|
|
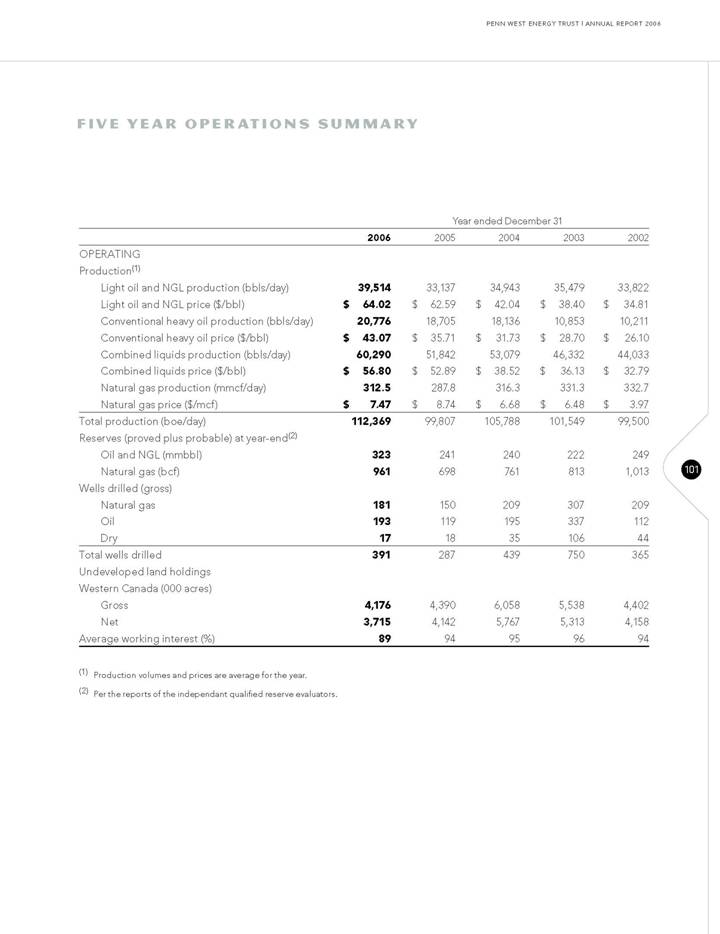
As the largest conventional oil and natural gas producing trust in North America, Penn West has a high quality base of production and long-life reserves diversified by geography, size, capital intensity, commodity and play type. Penn West’s large scale mitigates risks and contributes to stability and sustainability.
NYSE Disclosure of Governance Differences
As a Canadian trust listed on the New York Stock Exchange (“NYSE”), Penn West is not required to comply with most of the NYSE corporate governance standards, so long as it complies with Canadian corporate governance practices. In order to claim such an exemption, however, Penn West must disclose the significant difference between its corporate governance practices and those required to be followed by U.S. domestic companies under the NYSE corporate governance standards. Penn West’s Statement of Significant Governance Differences can be found on Penn West’s website at www.pennwest.com.
Executive Certifications
Penn West has included, as Exhibits to its Annual Report on Form 40-F for the fiscal year ended December 31, 2006 filed with the U.S. Securities and Exchange Commission, certificates of the President and Chief Executive Officer and the Senior Vice President and Chief Financial Officer regarding the quality of Penn West’s public disclosure. Penn West has also submitted to the New York Stock Exchange a certificate of the President and Chief Executive Officer certifying that he is not aware of any violation by Penn West of NYSE corporate governance listing standards.
[GRAPHIC]
FROM HIGH QUALITY, LONG-LIFE, DIVERSIFIED ASSETS
[GRAPHIC]
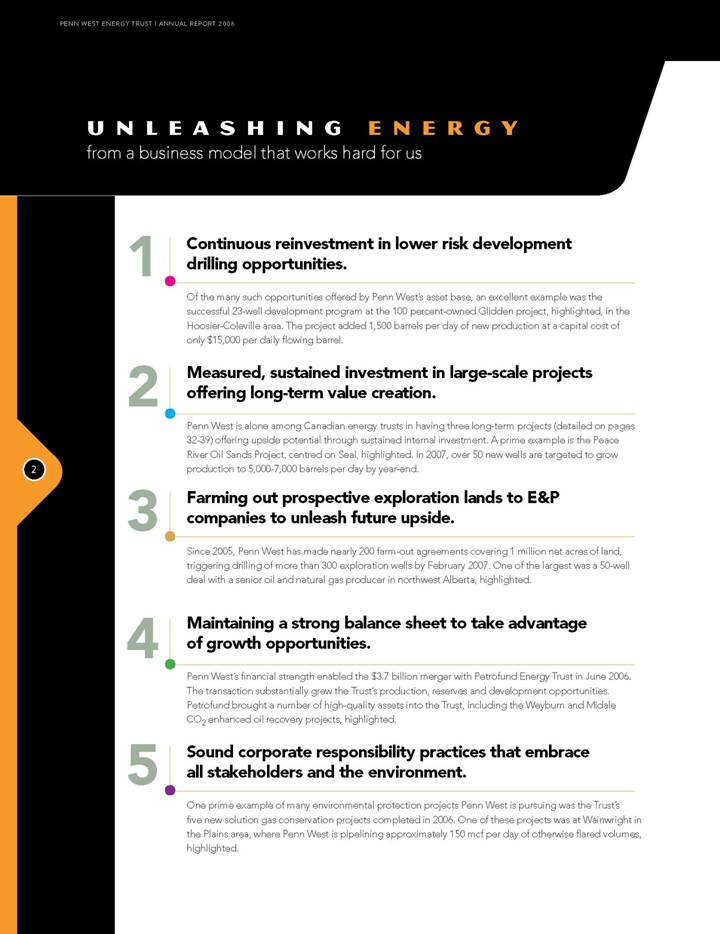
UNLEASHING ENERGY
from a business model that works hard for us
1. Continuous reinvestment in lower risk development drilling opportunities.
Of the many such opportunities offered by Penn West’s asset base, an excellent example was the successful 23-well development program at the 100 percent-owned Glidden project, highlighted, in the Hoosier-Coleville area. The project added 1,500 barrels per day of new production at a capital cost of only $15,000 per daily flowing barrel.
2. Measured, sustained investment in large-scale projects offering long-term value creation.
Penn West is alone among Canadian energy trusts in having three long-term projects (detailed on pages 32-39) offering upside potential through sustained internal investment. A prime example is the Peace River Oil Sands Project, centred on Seal, highlighted. In 2007, over 50 new wells are targeted to grow production to 5,000-7,000 barrels per day by year-end.
3. Farming out prospective exploration lands to E&P companies to unleash future upside.
Since 2005, Penn West has made nearly 200 farm-out agreements covering 1 million net acres of land, triggering drilling of more than 300 exploration wells by February 2007. One of the largest was a 50-well deal with a senior oil and natural gas producer in northwest Alberta, highlighted.
4. Maintaining a strong balance sheet to take advantage of growth opportunities.
Penn West’s financial strength enabled the $3.7 billion merger with Petrofund Energy Trust in June 2006. The transaction substantially grew the Trust’s production, reserves and development opportunities. Petrofund brought a number of high-quality assets into the Trust, including the Weyburn and Midale CO2 enhanced oil recovery projects, highlighted.
5. Sound corporate responsibility practices that embrace all stakeholders and the environment.
One prime example of many environmental protection projects Penn West is pursuing was the Trust’s five new solution gas conservation projects completed in 2006. One of these projects was at Wainwright in the Plains area, where Penn West is pipelining approximately 150 mcf per day of otherwise flared volumes, highlighted.
2
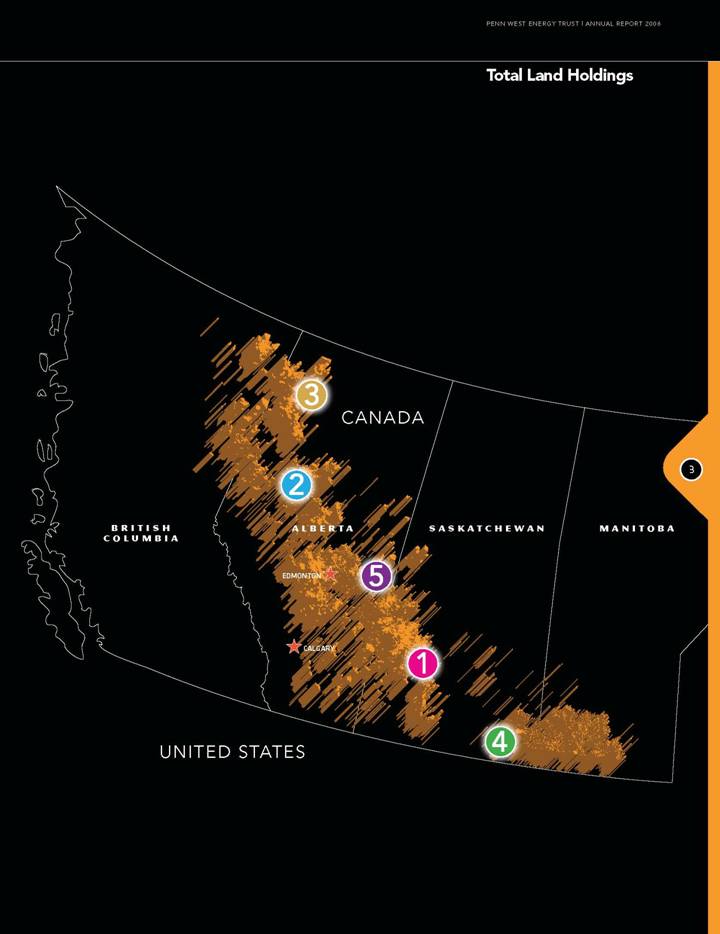
Total Land Holdings
[GRAPHIC]
3
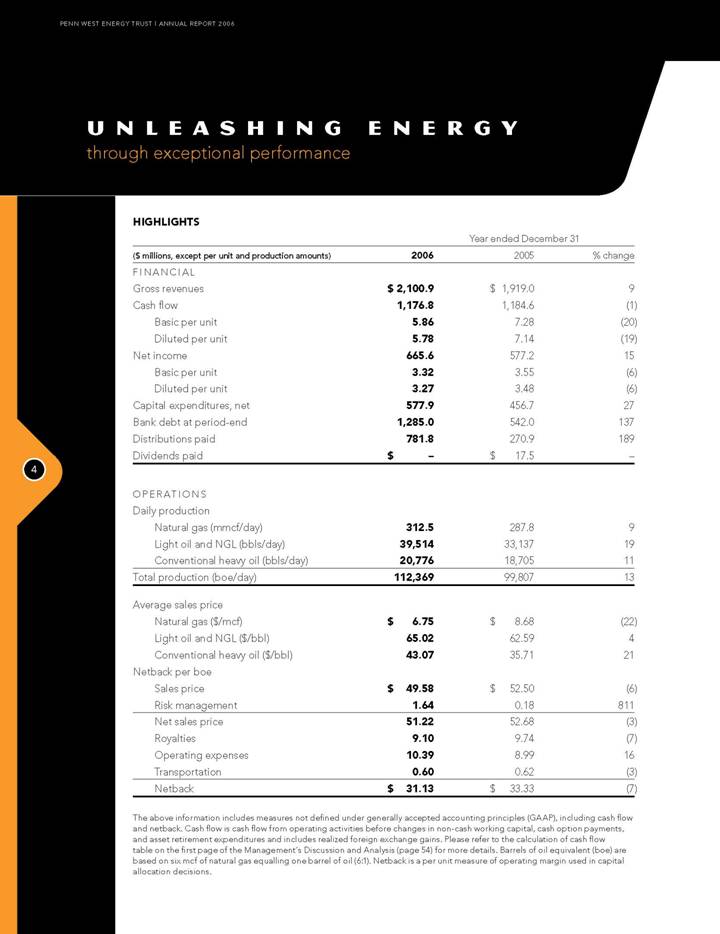
UNLEASHING ENERGY
through exceptional performance
|
|
|
Year ended December 31 |
|
||||||
|
($ millions, except per unit and production amounts) |
|
2006 |
|
2005 |
|
% change |
|
||
|
FINANCIAL |
|
|
|
|
|
|
|
||
|
Gross revenues |
|
$ |
2,100.9 |
|
$ |
1,919.0 |
|
9 |
|
|
Cash flow |
|
1,176.8 |
|
1,184.6 |
|
(1 |
) |
||
|
Basic per unit |
|
5.86 |
|
7.28 |
|
(20 |
) |
||
|
Diluted per unit |
|
5.78 |
|
7.14 |
|
(19 |
) |
||
|
Net income |
|
665.6 |
|
577.2 |
|
15 |
|
||
|
Basic per unit |
|
3.32 |
|
3.55 |
|
(6 |
) |
||
|
Diluted per unit |
|
3.27 |
|
3.48 |
|
(6 |
) |
||
|
Capital expenditures, net |
|
577.9 |
|
456.7 |
|
27 |
|
||
|
Bank debt at period-end |
|
1,285.0 |
|
542.0 |
|
137 |
|
||
|
Distributions paid |
|
781.8 |
|
270.9 |
|
189 |
|
||
|
Dividends paid |
|
$ |
— |
|
$ |
17.5 |
|
— |
|
|
|
|
|
|
|
|
|
|
||
|
OPERATIONS |
|
|
|
|
|
|
|
||
|
Daily production |
|
|
|
|
|
|
|
||
|
Natural gas (mmcf/day) |
|
312.5 |
|
287.8 |
|
9 |
|
||
|
Light oil and NGL (bbls/day) |
|
39,514 |
|
33,137 |
|
19 |
|
||
|
Conventional heavy oil (bbls/day) |
|
20,776 |
|
18,705 |
|
11 |
|
||
|
Total production (boe/day) |
|
112,369 |
|
99,807 |
|
13 |
|
||
|
|
|
|
|
|
|
|
|
||
|
Average sales price |
|
|
|
|
|
|
|
||
|
Natural gas ($/mcf) |
|
$ |
6.75 |
|
$ |
8.68 |
|
(22 |
) |
|
Light oil and NGL ($/bbl) |
|
65.02 |
|
62.59 |
|
4 |
|
||
|
Conventional heavy oil ($/bbl) |
|
43.07 |
|
35.71 |
|
21 |
|
||
|
Netback per boe |
|
|
|
|
|
|
|
||
|
Sales price |
|
$ |
49.58 |
|
$ |
52.50 |
|
(6 |
) |
|
Risk management |
|
1.64 |
|
0.18 |
|
811 |
|
||
|
Net sales price |
|
51.22 |
|
52.68 |
|
(3 |
) |
||
|
Royalties |
|
9.10 |
|
9.74 |
|
(7 |
) |
||
|
Operating expenses |
|
10.39 |
|
8.99 |
|
16 |
|
||
|
Transportation |
|
0.60 |
|
0.62 |
|
(3 |
) |
||
|
Netback |
|
$ |
31.13 |
|
$ |
33.33 |
|
(7 |
) |
The above information includes measures not defined under generally accepted accounting principles (GAAP), including cash flow and netback. Cash flow is cash flow from operating activities before changes in non-cash working capital, cash option payments, and asset retirement expenditures and includes realized foreign exchange gains. Please refer to the calculation of cash flow table on the first page of the Management’s Discussion and Analysis (page 54) for more details. Barrels of oil equivalent (boe) are based on six mcf of natural gas equalling one barrel of oil (6:1). Netback is a per unit measure of operating margin used in capital allocation decisions.
4
|
|
|
|
|
|
|
|
|
|
|
|
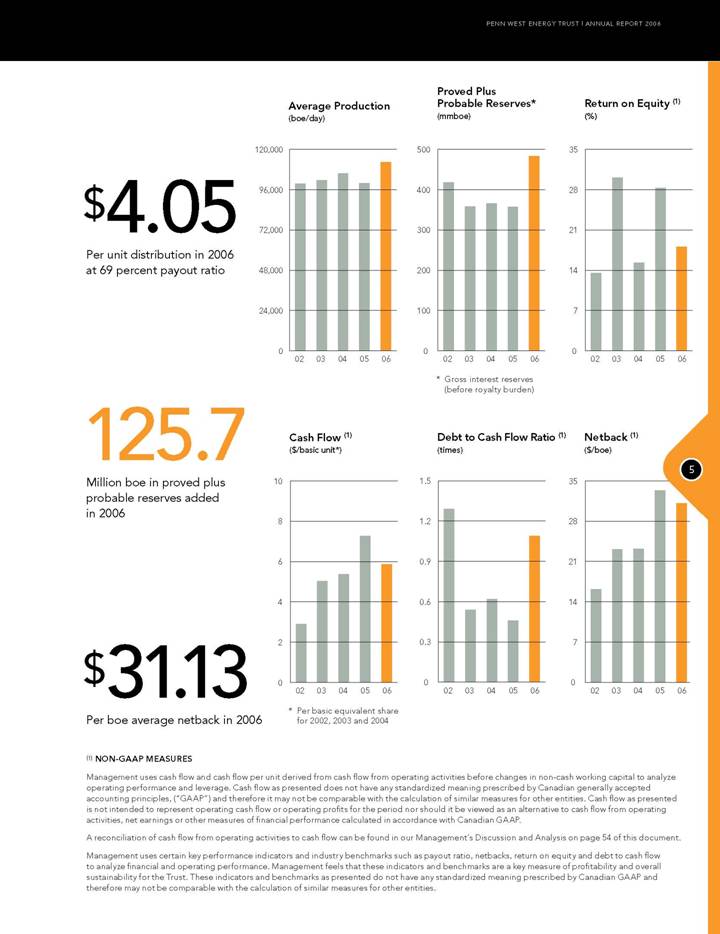
Average Production |
|
Probable Reserves* |
|
Return on Equity (1) |
|
|
|
|
(boe/day) |
|
(mmboe) |
|
(%) |
|
|
|
|
|
|
|
|
|
|
|
$4.05 |
|
[CHART] |
|
[CHART] |
|
[CHART] |
|
|
Per unit distribution in 2006 at 69 percent payout ratio |
|
|
|
|
|||
|
|
|
|
|
|
|
|
|
|
|
|||||||
|
|
|
|
|
* Gross interest reserves (before royalty burden) |
|
|
|
|
|
|
|
|
|
|
|
|
|
125.7 |
|
Cash Flow (1) |
|
Debt to Cash Flow Ratio (1) |
|
Netback (1) |
|
|
Million boe in proved plus probable reserves added in 2006 |
|
($/basic unit*) |
|
(times) |
|
($/boe) |
|
|
|
|
|
|
|
|
|
|
|
|
|
[CHART] |
|
[CHART] |
|
[CHART] |
|
|
|
|
|
|
|
|||
|
|
|
|
|
|
|
|
|
|
$31.13 |
|
|
|
|
|
|
|
|
Per boe average netback in 2006 |
|
|
|
|
|
|
|
|
|
|
|
|
|
|
|
|
|
|
|||||||
|
|
|
* Per basic equivalent share for 2002, 2003 and 2004 |
|
|
|
|
|
(1) NON-GAAP MEASURES
Management uses cash flow and cash flow per unit derived from cash flow from operating activities before changes in non-cash working capital to analyze operating performance and leverage. Cash flow as presented does not have any standardized meaning prescribed by Canadian generally accepted accounting principles, (“GAAP”) and therefore it may not be comparable with the calculation of similar measures for other entities. Cash flow as presented is not intended to represent operating cash flow or operating profits for the period nor should it be viewed as an alternative to cash flow from operating activities, net earnings or other measures of financial performance calculated in accordance with Canadian GAAP.
A reconciliation of cash flow from operating activities to cash flow can be found in our Management’s Discussion and Analysis on page 54 of this document.
Management uses certain key performance indicators and industry benchmarks such as payout ratio, netbacks, return on equity and debt to cash flow to analyze financial and operating performance. Management feels that these indicators and benchmarks are a key measure of profitability and overall sustainability for the Trust. These indicators and benchmarks as presented do not have any standardized meaning prescribed by Canadian GAAP and therefore may not be comparable with the calculation of similar measures for other entities.
5
PRESIDENT’S LETTER TO UNITHOLDERS
Fellow Unitholders
Penn West’s first full year as an energy trust was all about unleashing our energy. Penn West had converted to an energy trust in 2005 with three main competitive advantages: financial depth including a strong balance sheet, diversified and high-quality assets including extensive undeveloped lands, and a range of opportunities to maintain or enhance production and create additional value for our unitholders.
[GRAPHIC]
6
LAYING THE FOUNDATION TO UNLEASH OUR ENERGY
As an energy trust, our focus was guided by the primary goal of improving our capital efficiencies.
To achieve this goal, we first changed our structure to multi-discipline teams organized along geographical areas. This change gave team members greater input into developing an area’s operating plan, opened up a much better flow of ideas, and drove our performance goals down to the field level. This has proven successful. It has helped us improve capital efficiencies during a period of generally rising costs across the industry.
Second, we reviewed all producing properties and undeveloped lands. We listed and ranked lands having the largest inventory of current and planned activities. The rest were retained for future exploration or actively marketed as farm-in opportunities for other companies. By encouraging capital expenditures and imaginative thinking on these farm-out lands, our idea was to bring about successful drilling and generate a new stream of royalty revenues – all at no cost to our unitholders.
Third, we classified our assets according to the nature of their opportunities. These opportunities include everything from rationalizing facilities to adding production from new horizons within existing wellbores. Nearly all our properties also offer a conventional drilling focus, where Penn West can generate new production volumes while utilizing existing facilities.
The final category of opportunity is found with several large projects promising new value creation for our unitholders, following a sustained effort of exploration, operational research and capital investment. They include enhanced oil recovery (EOR) projects using carbon dioxide (CO2) flood, a large-scale underground or in situ project in the Peace River Oil Sands that can be initially produced with conventional methods, and unconventional natural gas plays focused on coalbed methane (CBM).
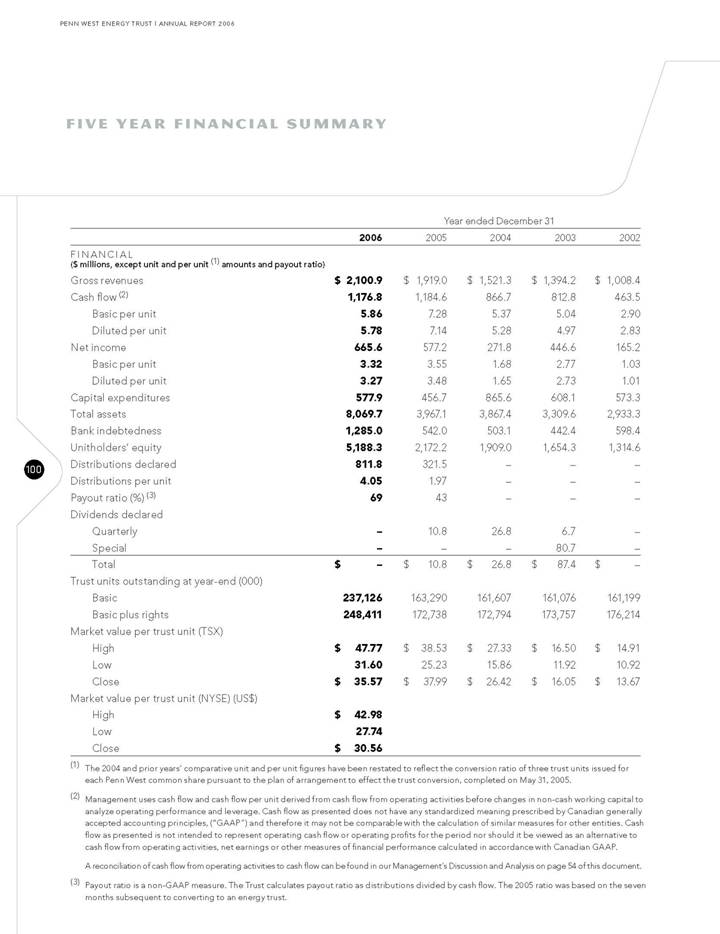
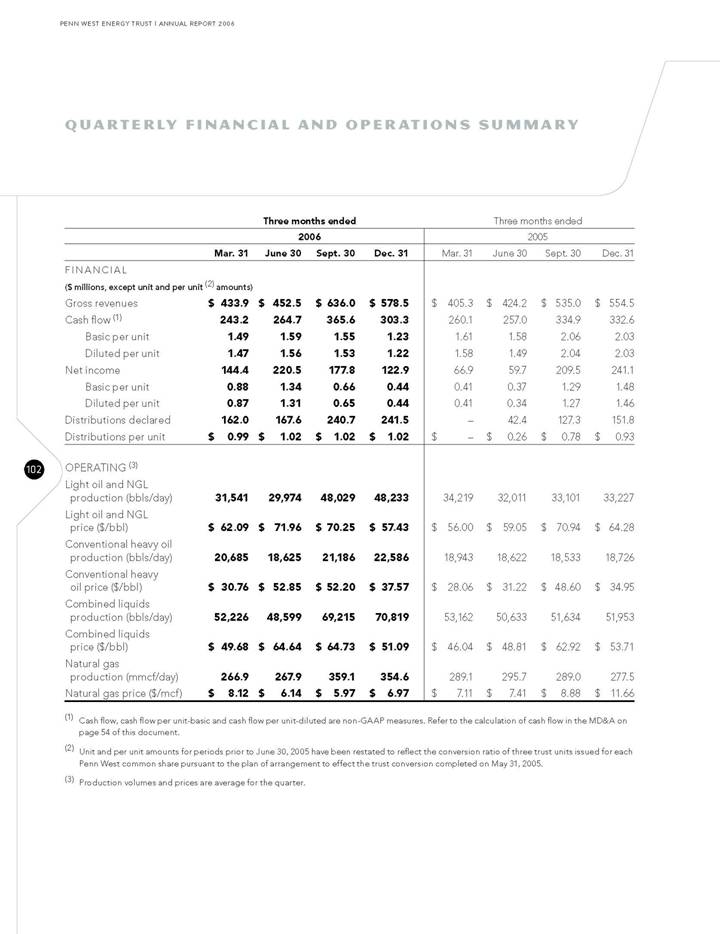
2006 FINANCIAL AND OPERATING RESULTS
Last year Penn West made strides in all opportunity categories. The results illustrate our competitive advantages at work: financial strength, high-quality assets and upside opportunities. Highlights from the year include:
• Penn West began 2006 as Canada’s largest conventional energy trust, with production of 97,900 boe per day;
• Following the Petrofund merger, we exited 2006 with record volumes of approximately 130,000 boe per day, balanced between natural gas and crude oil production;
• Cash flow of $1.18 billion, or $5.86 per unit, was approximately flat from 2005, and lower on a per unit basis. Cash flow was within range of the budget forecast. Natural gas prices were lower than forecast, while crude oil prices were higher;
• Capital efficiencies averaging $29,500 per new daily flowing boe were added through internal development, since the trust conversion, an improvement of 19 percent compared to the 18-month period preceding the conversion;
• Proved plus probable reserves were 483 million boe, or 2.04 boe per outstanding unit, at year-end 2006;
• Distributions totalling $812 million, or $4.05 per unit were declared for the year;
• The payout ratio was 69 percent in 2006;
• Capital expenditures were $578 million, excluding acquisitions, funding a total of 270 net wells;
• Approximately 20,000 boe per day in new production volumes were added through internal development; and
• Bank debt at year-end was $1.3 billion, for a pro forma debt-to-trailing cash flow ratio of 0.9 times, leaving available debt capacity of $0.6 billion going into 2007.
FINANCIAL STRENGTH
The trust sector’s evolution demonstrates that scale matters. But large size must be combined with financial strength, high-quality assets and operational excellence to create a successful, sustainable trust. Going into 2006, we had a strong cash flow stream and a robust unit price that made our equity a powerful currency to deploy in support of further growth.
7
In April, we saw the right growth opportunity. The $3.7 billion transaction with Petrofund Energy Trust increased Penn West by more than 40 percent in production and value. Petrofund had very attractive assets. These include interests in medium oil projects, some involving CO2-driven EOR such as Weyburn and Midale and interests in the light oil North Pembina Cardium Unit and Swan Hills Unit, the Berland River gas play and coalbed methane opportunities. Others are mature, long-life, unitized fields that flatten Penn West’s decline curve and increase our reserve-life-index.
Petrofund was a well-managed trust, and we have integrated a committed workforce that shares our vision of environmentally and socially responsible business. Following the merger, we integrated systems, working data and new employees, and merged standards in occupational health and safety, environmental awareness and community involvement. By year-end, land and accounting, including field data capture, were on one system. Field contractors have become full-time Penn West employees and are participating in our training programs. We commissioned environmental audits of acquired properties and are making improvements.
Financial strength was the key to executing this sizable transaction and gaining access to its long-term benefits. At year-end 2006, Penn West’s enterprise value approached $10 billion. During the year, we maintained a prudent payout ratio of 69 percent of cash flow. The retained cash provided capital for value-enhancing internal development as well as flexibility amid more volatile commodity prices.
Distributions are a significant aspect of Penn West’s return to unitholders. We deliberately began with a conservative payout ratio. Events have proved this to be the right course. Entering 2006, Penn West’s distribution rate was $0.31 per unit monthly. We raised this by 9.7 percent to $0.34 per unit monthly with the March payment, where it has remained. Since November, some trusts have reduced distributions. Penn West’s Board recently resolved to keep the distribution rate at $0.34 at the current forecasts of commodity prices, production and capital expenditures.
Going forward, there may be additional opportunities for mergers within the trust or E&P spaces. Under the proposed tax on income trusts announcement in late October, Penn West can grow its equity by approximately $10 billion over the next four years without prematurely triggering the proposed distribution tax. Market conditions should continue to favour financially strong acquirers with available debt capacity and access to traditional financing.
HIGH-QUALITY ASSETS
Sustainability demands high-quality assets. With asset acquisition metrics being expensive, most trusts can’t economically replace their natural production decline by buying assets alone. They require a range of opportunities for internal development. Penn West’s asset base is large in scale, high in quality and diversified by commodity, geographic location and maturity. Our assets have risk-offsetting characteristics. We have long-life, high-netback mature light-oil pools, heavy oil properties yielding relatively high capital efficiencies and low-cost reserve additions, and high-netback natural gas plays with years of drilling opportunities.
Diversification creates many value-enhancing opportunities. These range from engineering-focused, wellbore-by-wellbore optimization, to facility enhancements, to low-risk infill and horizontal drilling, all the way to carefully selected exploration. Penn West’s 2006 capital program of $578 million included drilling 270 net new wells. We added approximately 20,000 boe in new daily volumes internally. Successes included major volume growth at Seal and Glidden.
Pressures on the oilfield service industry, caused by high demand for services and tight supply of trained personnel, led to generally higher operating costs. We worked to limit increases wherever possible. Meanwhile, our push to improve capital efficiencies bore results. Coming out of the E&P environment, we had targeted a significant reduction from a typical investment of $37,000 to bring on one new boe of daily production.
8
[GRAPHIC]
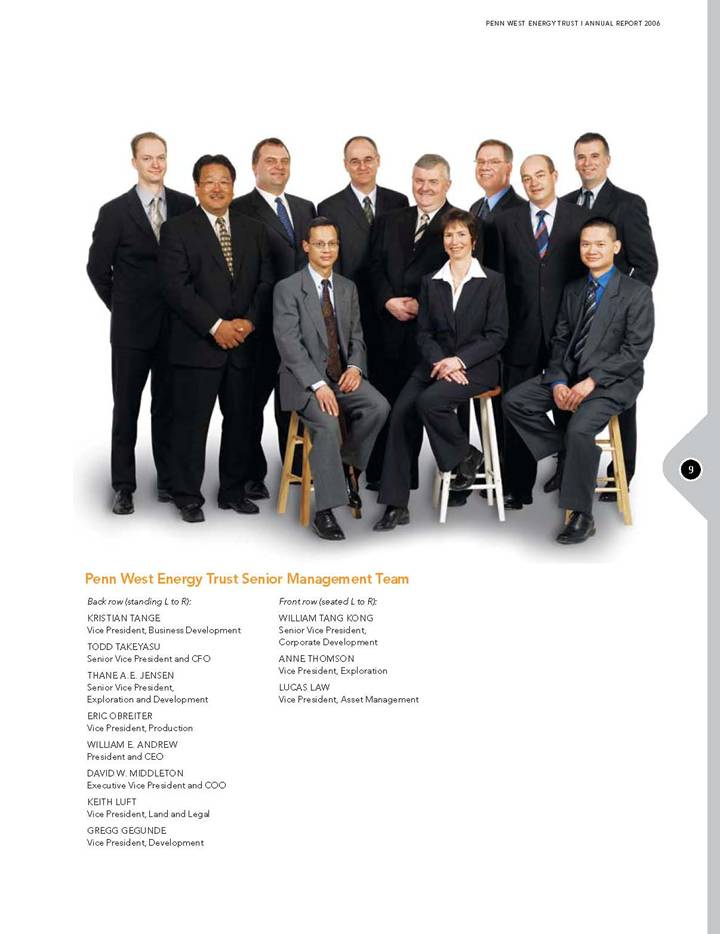
Penn West Energy Trust Senior Management Team
|
Back row (standing L to R): |
|
|
|
KRISTIAN TANGE |
|
Vice President, Business Development |
|
|
|
Senior Vice President and CFO |
|
|
|
THANE A.E. JENSEN |
|
Senior Vice President, |
|
Exploration and Development |
|
|
|
ERIC OBREITER |
|
Vice President, Production |
|
|
|
WILLIAM E. ANDREW |
|
President and CEO |
|
|
|
DAVID W. MIDDLETON |
|
Executive Vice President and COO |
|
|
|
KEITH LUFT |
|
Vice President, Land and Legal |
|
|
|
GREGG GEGUNDE |
|
Vice President, Development |
|
Front row (seated L to R): |
|
|
|
WILLIAM TANG KONG |
|
Senior Vice President, |
|
Corporate Development |
|
|
|
ANNE THOMSON |
|
Vice President, Exploration |
|
|
|
LUCAS LAW |
|
Vice President, Asset Management |
9
We averaged approximately $31,000 per daily boe in 2006 and $29,500 since the trust conversion. This was a satisfying result given that most industry operators experienced increased capital costs. These efficiencies maximize cash available for distribution, and increase the range of viable opportunities for internal development. We’re targeting further improvements in 2007.
As an E&P company, Penn West had amassed a huge undeveloped land position. By year-end 2006, Penn West still held 28.5 net acres of undeveloped land per producing boe of production – much higher than the energy trust sector’s average of 23.2 acres per producing boe. Our program to monetize up to two million net acres of these lands continued in 2006 with good results. Farm-out partners drilled 169 wells, making a number of discoveries.
By year-end 2006, Penn West still held 28.5 net acres of undeveloped land per boe of production – much higher than the energy trust sector’s average of 23.2 acres per boe.
LONG-TERM UPSIDE OPPORTUNITIES
More than anything, it’s the long-term projects with material upside that distinguish Penn West from most energy trusts.
The project with the fastest near-term growth is our Peace River Oil Sands play (currently centred on Seal Main, Seal Cadotte and Seal North). After spending several years confirming Seal’s technical attributes and positive economics, last year we ramped up the pace of development. Thirty-five new horizontal wells brought production to 3,200 barrels per day by year-end. In addition, 15 new exploratory wells were drilled over our 300,000 net acres of land and speak to the play’s further growth potential. We believe that continuous investment over the next four years has the potential to bring Seal to a planned 20,000 barrels per day using primary recovery techniques.
On February 9, 2007, we announced that we signed an agreement to acquire a package of assets that will significantly bolster our infrastructure and operating presence in the Peace River Oil Sands, including a sales line connected 10,000 barrel per day oil processing facility, a natural gas plant and compression facility with a design capacity of 33 mmcf per day, and associated all weather roads. Following this, there will be further opportunities for infill drilling on developed lands, plus exploration on significant undeveloped acreage. We are planning pilot projects to test enhanced recovery methods involving waterflood, polymer or steam and other thermal processes. Achieving Seal’s full potential will require expanded pipeline capacity running from this rapidly growing oil sands supply region to Edmonton. We’re examining industry interest and potential options. Looking five to 10 years out, we can also see capacity issues related to upgrading/refining bitumen into synthetic light oil. Penn West and other active regional operators may need to consider an upgrader in the producing region or around Edmonton.
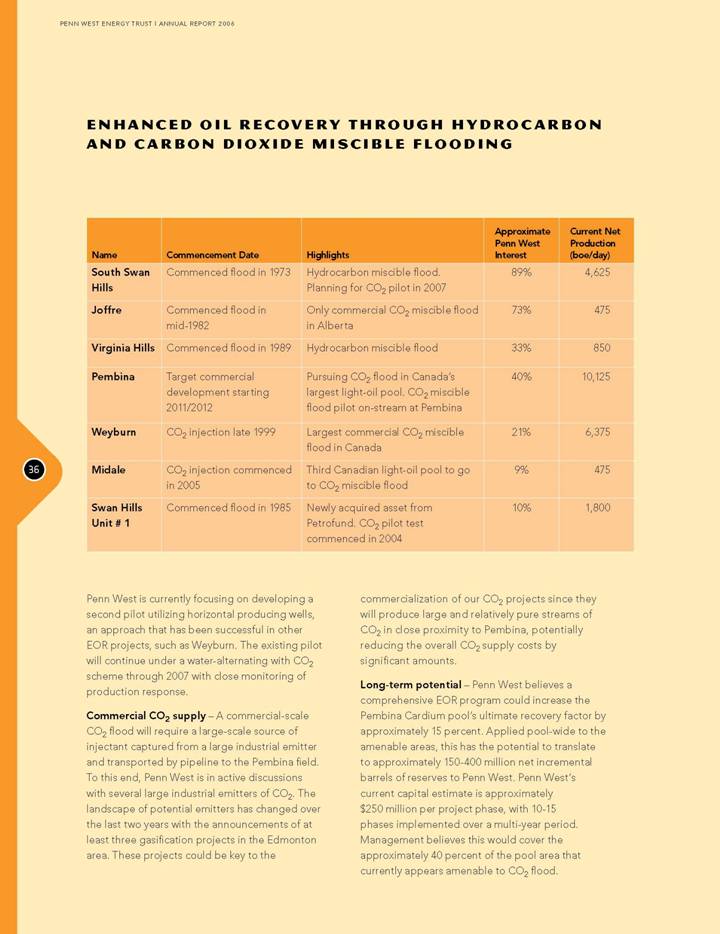
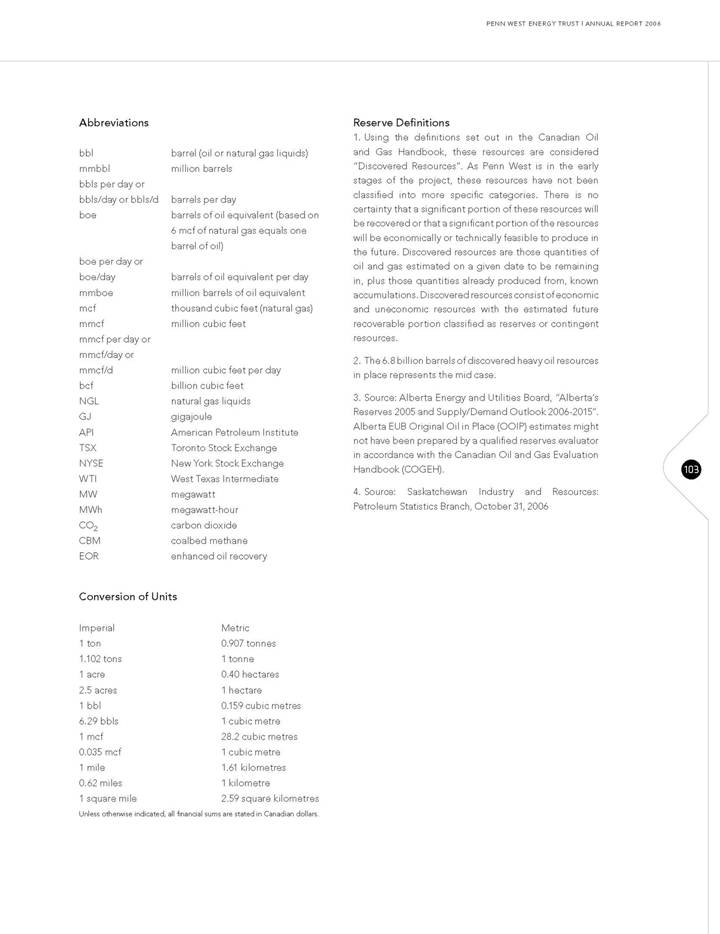
The Pembina Cardium is one of the largest conventional light-oil pools ever discovered in Canada, with discovered oil resources in place estimated at 7.8 billion barrels*. Penn West controls approximately 40 percent of the pool and produces substantial high-quality, high-netback, light crude oil under secondary recovery. For several years, we’ve been preparing a long-term program to transform more of the unrecovered resource into marketable reserves using CO2 miscible flooding. This could add to the productivity of this long-life field.
At our Pembina CO2 pilot project, we achieved good injection rates and containment within the target zone, a key technical point. While the pilot oil production using vertical wells continues to increase, we will be expanding our pilot project to apply horizontal well technology to accelerate the production response and improve the capital payout time period.
As a result of delays associated with securing an economic supply of CO2, we estimate that the commercial startup of the project will not occur until 2012.
The Petrofund transaction included participation in several new long-term projects. We gained a prominent working interest in the Weyburn project, the largest commercial CO2 flood in Canada, and an
* Refer to page 103 – Reserve Definitions; note 1.
10
increased interest in the Midale project, a recently launched CO2 flood that uses the same CO2 source as Weyburn (a coal gasification plant in North Dakota).
In 2006, we initiated a pilot project at South Swan Hills for horizontal CBM production from the Mannville coals. Petrofund also increased our unconventional natural gas exposure, a 50-well, commercial-scale CBM project at Three Hills focused on the Horseshoe Canyon coal seams. With our large land and infrastructure positions and ownership of shallower mineral rights, Penn West has a keen interest in the unconventional gas business. While we’re just beginning along the learning curve, we believe it could offer material long-term opportunities.
TAXATION OF INCOME TRUSTS
On October 31, 2006, the Government of Canada announced proposed changes to the taxation of income trusts, including a proposed tax on distributions by income trusts commencing in 2011. The market reaction to the announcement was swift. As an active member of the Canadian Coalition of Energy Trusts, we continue to be involved in informing the Canadian public about the negative impact and potential future consequences of the tax proposal.
UNLEASHING MORE ENERGY – 2007 PLANS AND OUTLOOK
In 2007, Penn West is using its competitive strengths to continue creating value for unitholders. Due to the promising 2007 exploration results in the Peace River Oil Sands, our Board approved an increase in the budgeted capital program in the area. With a capital program currently budgeted at $600-$700 million, excluding acquisitions, we’re pursuing a full range of opportunities. For the short term, we’re optimizing all areas of the conventional business. For the medium term, we’re developing the conventional properties with drilling focused in southern Saskatchewan, southern Alberta, Pembina, and Swan Hills. Work on the long-term projects will continue, with a particular focus on exploration and volume growth in the Peace River Oil Sands. Altogether we expect to drill 260-280 net wells in 2007. Further undeveloped lands will be farmed-out to exploration companies.
Looking forward, commodity prices appear more volatile than in the recent past. Penn West’s 2007 working assumptions are for average benchmark prices of US$59.00 per barrel of West Texas Intermediate crude oil and Cdn$7.25 per thousand cubic feet of natural gas at AECO, with a currency exchange rate averaging US$0.86 equals CAD$1.00. Since converting to an income trust, Penn West has maintained an active commodity risk management program, as summarized on our website at www.pennwest.com.
At these benchmarks and our planned rate of capital spending, Penn West’s production should be 131,000-135,000 boe per day in 2007. This would yield cash flow of $1.3-$1.5 billion using current forward strip prices. With a potentially more active market for the transaction of assets and companies or trusts, we will remain alert for opportunities that would lever our competitive advantages and enable Penn West to acquire strategic assets or dispose of non-core ones.
While our near-term focus is on the tax proposal, our long-term focus is on having a strong business plan that incorporates several of the possible outcomes of the proposal. Meanwhile, we will continue to execute plans for 2007 that will see Penn West work to maintain production volumes and improve capital efficiencies.
At a time when our industry faces greater challenges in attracting and retaining high-quality employees, it’s simply tremendous to witness the commitment, enthusiasm and loyalty of our growing team at Penn West. My thanks go out to all of you for delivering another year of excellent performance and returns for our unitholders. I look forward with optimism to the year ahead.
On behalf of the Board of Directors,
|
/s/ William E. Andrew |
|
|
William E. Andrew |
|
|
President and Chief Executive Officer |
|
|
|
|
|
February 28, 2007 |
|
11
Penn West’s area teams – maximizing efficiencies, pursuing opportunities
Penn West’s conversion to an energy trust included internal changes aimed at ensuring that Penn West realizes the full potential of its vast asset base while maintaining the risk profile, capital expenditure level and profitability suitable to a trust. The measures included:
RESTRUCTURING INTO MULTI-DISCIPLINE AREA TEAMS
Penn West reorganized from a senior management-driven structure with the various technical teams organized by discipline, to multi-discipline teams organized by geography and play type. The Trust drove performance goals down to the area team level, while providing team leaders with the technical tools and operating freedom to generate and implement ideas quickly and efficiently.
Penn West has nine development teams of eight to 20 people, each including the disciplines of engineering, geophysics, geology, land and other needed specialties. The teams are given overall objectives, from which they formulate plans and execute optimization and development and exploration projects. Management believes the reorganization has been popular and highly successful, encouraging innovation and helping the Trust achieve its key operating goal of higher capital efficiency. Further focus and improvement on finding and development costs is anticipated in 2007.
REVIEW OF PRODUCING PROPERTIES AND UNDEVELOPED LANDS
After ranking all properties with current and planned activities, Penn West began systematically marketing its undeveloped lands to exploration companies. By year-end 2006, Penn West had farmed-out more than 1.1 million net acres. As of February 2007, farm-out partners had drilled 317 wells and generated 360 boe per day in new production on Penn West lands – at no cost to the Trust’s unitholders.
RECLASSIFICATION OF ASSETS BY OPPORTUNITY
To maximize resource recovery and value creation, the Trust classified its assets according to three broad types of opportunity. Many assets offer short-term opportunity to maximize returns through engineering-driven optimization at high capital efficiency. Others can maintain a continuous development drilling focus, adding reserves, production and cash flow at low risk and good capital efficiency. Finally – and unusual for a trust – Penn West has several long-term projects management believes are capable of adding materially to the Trust’s net asset value through grass roots exploration, research, capital investment and development.
In 2006, Penn West fully implemented the area team operating structure and invested $578 million in all three opportunity categories. The 2007 capital budget is planned at $550-$650 million, prior to the approved $75 million increase at the Peace River Oil Sands, funding activity in all categories. The Trust’s main operating objectives are to add new production through internal reinvestment sufficient to largely offset natural production declines, and to achieve average capital efficiencies of $25,000- $30,000 per boe per day of new production.
Note: Disclosure of Less Than All Reserves
This section contains disclosure of reserves for individual properties. The estimates of reserves and future net revenue for individual properties may not reflect the same confidence level as estimates of reserves and future net revenue for all properties, due to the effects of aggregation.
12
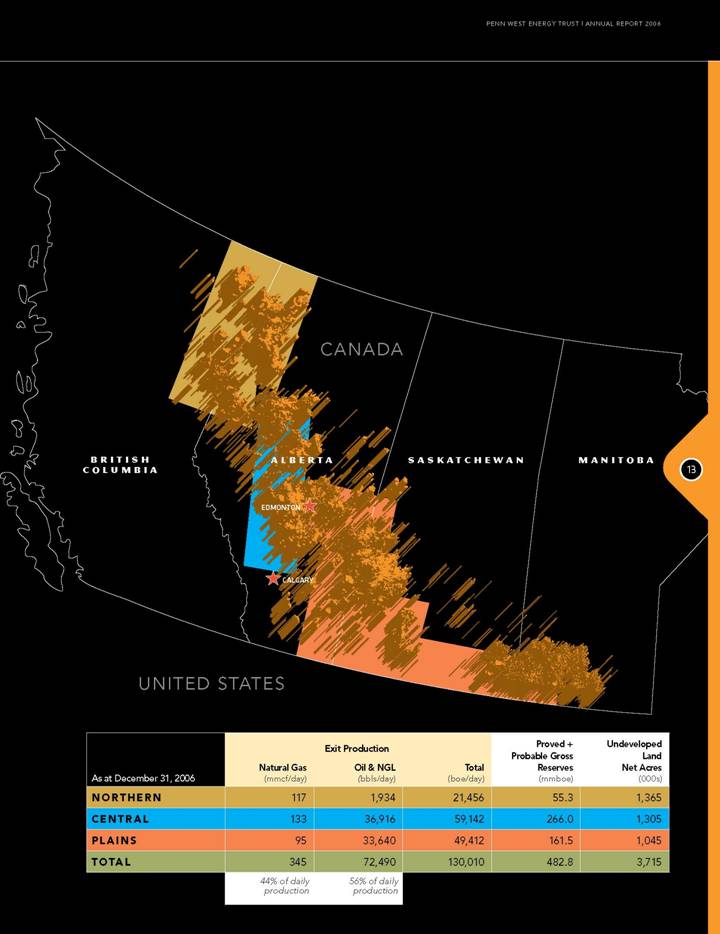
[GRAPHIC]
|
|
|
|
|
|
|
|
|
Proved + |
|
Undeveloped |
|
|
|
|
Exit Production |
|
Probable Gross |
|
Land |
|
||||
|
As at December 31, 2006 |
|
Natural Gas |
|
Oil & NGL |
|
Total |
|
Reserves |
|
Net Acres |
|
|
|
|
(mmcf/day) |
|
(bbls/day) |
|
(boe/day) |
|
(mmboe) |
|
(000s) |
|
|
NORTHERN |
|
117 |
|
1,934 |
|
21,456 |
|
55.3 |
|
1,365 |
|
|
CENTRAL |
|
133 |
|
36,916 |
|
59,142 |
|
266.0 |
|
1,305 |
|
|
PLAINS |
|
95 |
|
33,640 |
|
49,412 |
|
161.5 |
|
1,045 |
|
|
TOTAL |
|
345 |
|
72,490 |
|
130,010 |
|
482.8 |
|
3,715 |
|
|
|
|
44% of daily |
|
56% of daily |
|
|
|
|
|
|
|
13
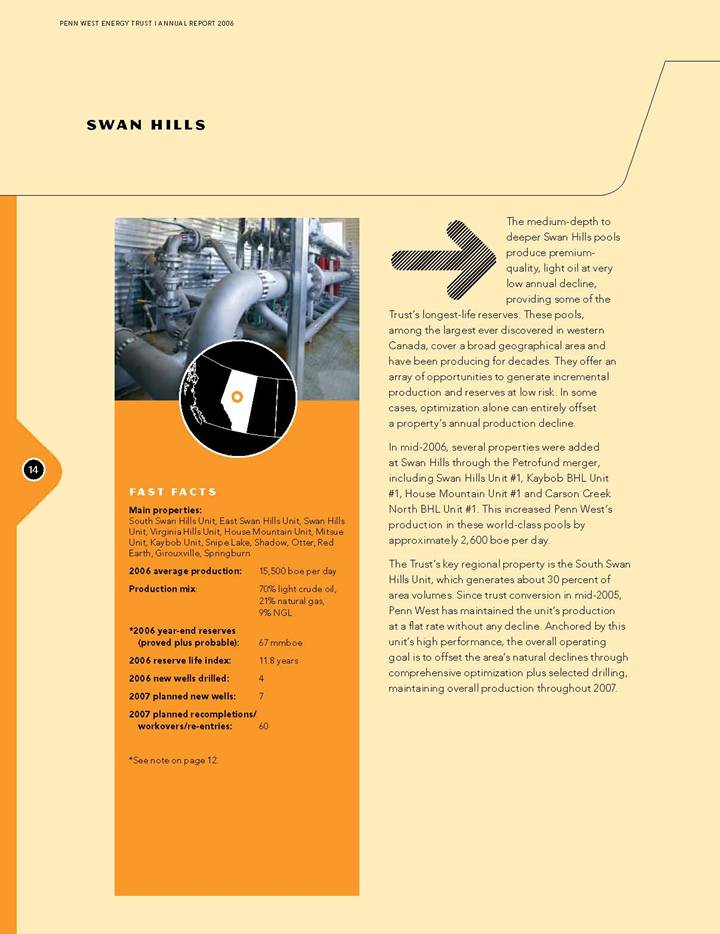
SWAN HILLS
[GRAPHIC]
FAST FACTS
Main properties:
South Swan Hills Unit, East Swan Hills Unit, Swan Hills Unit, Virginia Hills Unit, House Mountain Unit, Mitsue Unit, Kaybob Unit, Snipe Lake, Shadow, Otter, Red Earth, Girouxville, Springburn
|
2006 average production: |
15,500 boe per day |
|
|
|
|
Production mix: |
70% light crude oil, |
|
|
|
|
*2006 year-end reserves (proved plus probable): |
67 mmboe |
|
|
|
|
2006 reserve life index: |
11.8 years |
|
|
|
|
2006 new wells drilled: |
4 |
|
|
|
|
2007 planned new wells: |
7 |
|
|
|
|
2007 planned recompletions/ |
60 |
*See note on page 12.
[GRAPHIC]
The medium-depth to deeper Swan Hills pools produce premium-quality, light oil at very low annual decline, providing some of the Trust’s longest-life reserves. These pools, among the largest ever discovered in western Canada, cover a broad geographical area and have been producing for decades. They offer an array of opportunities to generate incremental production and reserves at low risk. In some cases, optimization alone can entirely offset a property’s annual production decline.
In mid-2006, several properties were added at Swan Hills through the Petrofund merger, including Swan Hills Unit #1, Kaybob BHL Unit #1, House Mountain Unit #1 and Carson Creek North BHL Unit #1. This increased Penn West’s production in these world-class pools by approximately 2,600 boe per day.
The Trust’s key regional property is the South Swan Hills Unit, which generates about 30 percent of area volumes. Since trust conversion in mid-2005, Penn West has maintained the unit’s production at a flat rate without any decline. Anchored by this unit’s high performance, the overall operating goal is to offset the area’s natural declines through comprehensive optimization plus selected drilling, maintaining overall production throughout 2007.
14
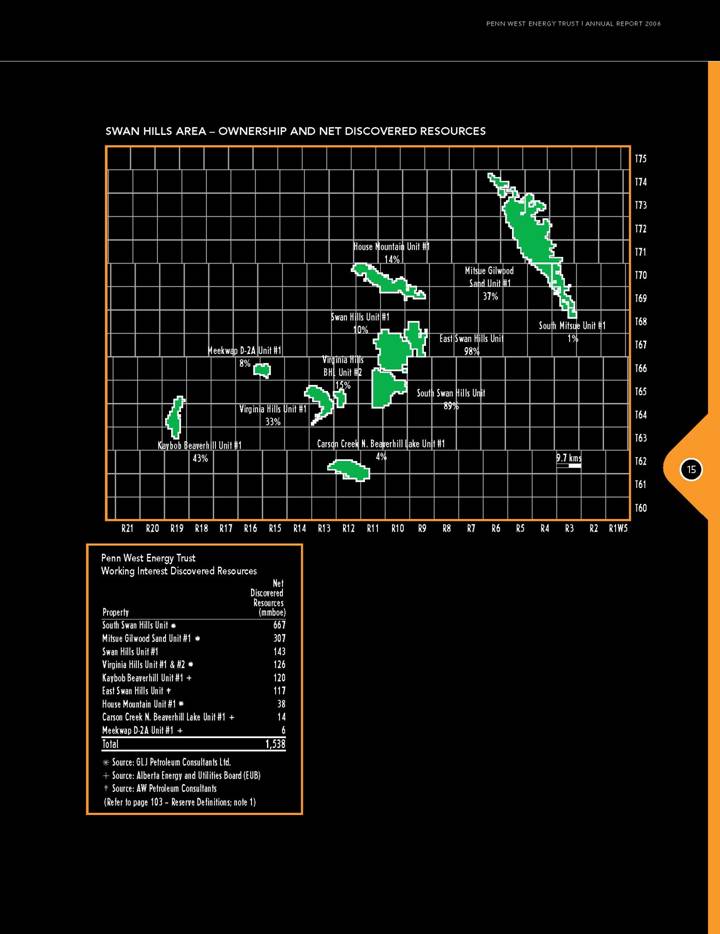
SWAN HILLS AREA – OWNERSHIP AND NET DISCOVERED RESOURCES
[CHART]
Penn West Energy Trust
Working Interest Discovered Resources
|
|
|
Net |
|
|
|
|
Discovered |
|
|
Property |
|
Resources |
|
|
|
|
(mmboe) |
|
|
South Swan Hills Unit * |
|
667 |
|
|
Mitsue Gilwood Sand Unit #1 * |
|
307 |
|
|
Swan Hills Unit #1 |
|
143 |
|
|
Virginia Hills Unit #1 & #2 * |
|
126 |
|
|
Kaybob Beaverhill Unit #1 + |
|
120 |
|
|
East Swan Hills Unit ‡ |
|
117 |
|
|
House Mountain Unit #1 * |
|
38 |
|
|
Carson Creek N. Beaverhill Lake Unit #1 + |
|
14 |
|
|
Meekwap D-2A Unit #1 + |
|
6 |
|
|
Total |
|
1,538 |
|
* Source: GLJ Petroleum Consultants Ltd.
+ Source: Alberta Energy and Utilities Board (EUB)
‡ Source: AW Petroleum Consultants
(Refer to page 103 – Reserve Definitions; note 1)
15
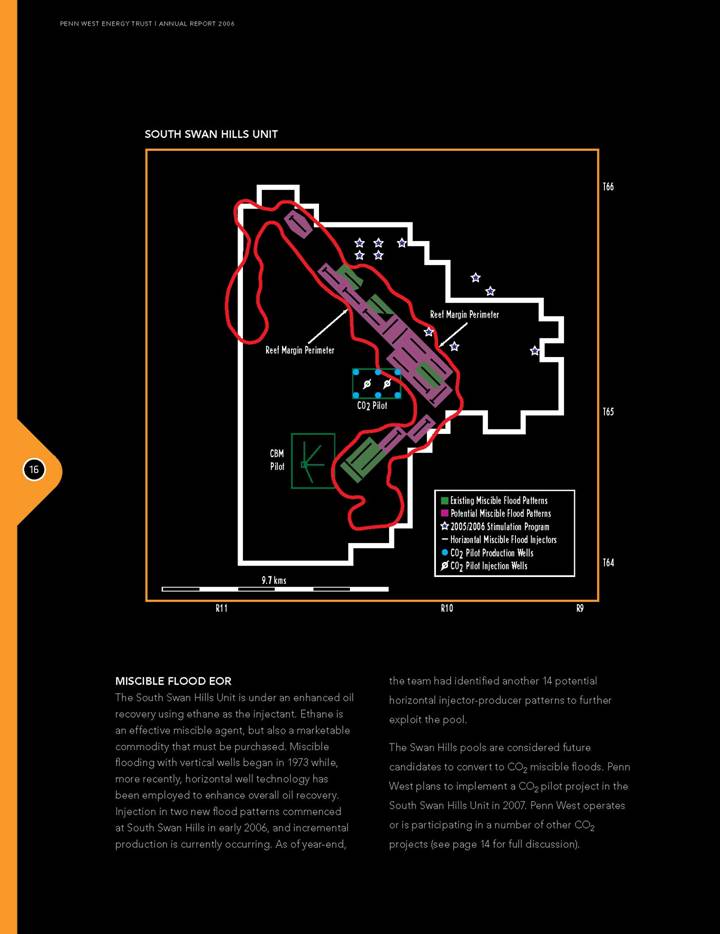
SOUTH SWAN HILLS UNIT
[GRAPHIC]
MISCIBLE FLOOD EOR
The South Swan Hills Unit is under an enhanced oil recovery using ethane as the injectant. Ethane is an effective miscible agent, but also a marketable commodity that must be purchased. Miscible flooding with vertical wells began in 1973 while, more recently, horizontal well technology has been employed to enhance overall oil recovery. Injection in two new flood patterns commenced at South Swan Hills in early 2006, and incremental production is currently occurring. As of year-end, the team had identified another 14 potential horizontal injector-producer patterns to further exploit the pool.
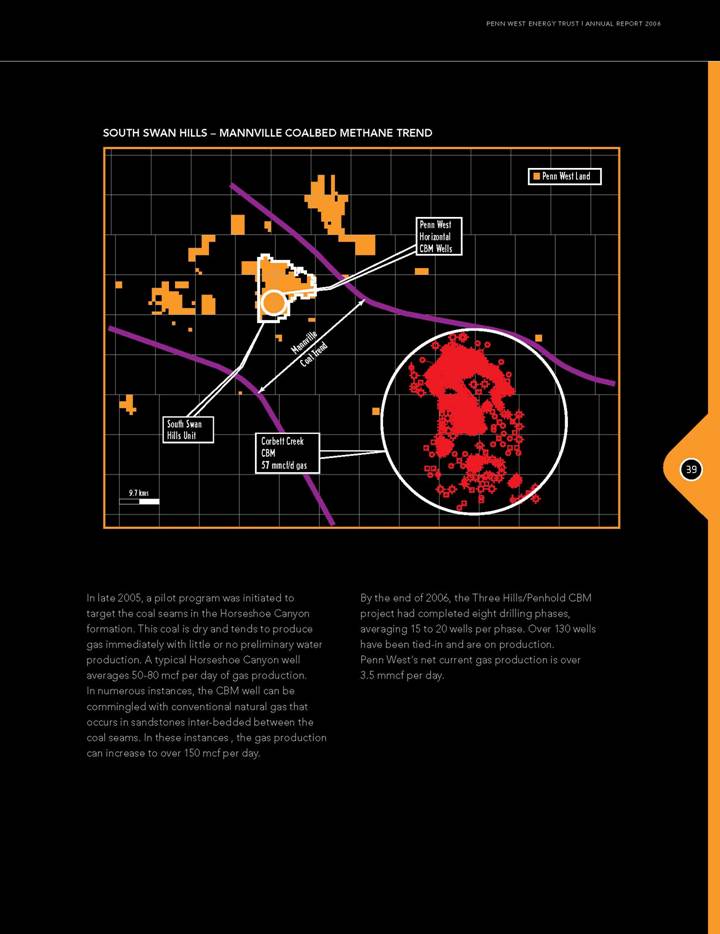
The Swan Hills pools are considered future candidates to convert to CO2 miscible floods. Penn West plans to implement a CO2 pilot project in the South Swan Hills Unit in 2007. Penn West operates or is participating in a number of other CO2 projects (see page 14 for full discussion).
16
CBM POTENTIAL
South Swan Hills is also the site of a coalbed methane (CBM) pilot project that Penn West intends to expand to commercial scale (see page 38 for details). The project overlies existing oil-producing reservoirs, levering Penn West’s extensive legacy infrastructure and experienced staff to limit development and operating costs. The first four CBM wells were on production at the beginning of 2007 and management believes that with success, full-scale development of 30 wells per year has the potential to eventually push production to a planned peak of 40-60 mmcf per day of natural gas. Penn West intends to use saline water produced during the CBM dewatering phase as injectant water for the ongoing secondary recovery waterflood program at Swan Hills, improving efficiencies and reducing unit costs for both projects.
OPTIMIZATION
Altogether Penn West has an inventory of approximately 75 optimization projects throughout the extensive Swan Hills properties. A program of stimulating approximately seven producing wells through acidization or refracturing met with great success in 2006.
In 2006, overall capital efficiencies at Swan Hills were $12,000 per daily boe of new production. There are further optimization opportunities going forward. Single-well batteries will be eliminated and production consolidated in centralized batteries to reduce operating costs, eliminate trucking and increase production ontime. Non-core properties may be rationalized to reduce costs.
DRILLING
Swan Hills holds opportunities to add value through the drillbit. Pools at Otter and Loon can be fully exploited through infill drilling. At Otter, the team sees potential to consolidate fragmented working interests, which would enable consolidation of facilities to improve efficiencies. At Snipe Lake and Shadow, the Gilwood oil potential will be fully realized through infill drilling and improvement of the waterflood. At Mitsue there are under-drilled shallow gas pools that can be infill-drilled to add incremental production.
[GRAPHIC]
17
PEMBINA
[GRAPHIC]
FAST FACTS
Main operated properties:
Pembina Cardium, Carrot Creek, Cherhill, Bigoray, Lobstick, Berland River, North Pembina Cardium Unit, Hanlan
|
2006 average production: |
20,700 boe per day |
|
|
|
|
Production mix: |
55% light crude oil, |
|
|
|
|
*2006 year-end reserves (proved plus probable): |
115 mmboe |
|
|
|
|
2006 reserve life index: |
15.2 years |
|
|
|
|
2006 new wells drilled: |
18 gross wells |
|
|
|
|
2007 planned new wells: |
15 gross wells |
|
|
|
|
2007 planned recompletions/workovers/re-entries: |
Target ~$15 million for projects |
*See note on page 12.
[GRAPHIC]
Pembina produces high-netback, long-life, low-decline light oil and liquids-rich natural gas. Approximately 1,150 operated producing wellbores accounted for 14,400 boe per day or 11 percent of the Trust’s 2006 production. The Petrofund merger further consolidated Penn West’s land position in the area, lifting the average working interest to approximately 87 percent and increasing overall operated volumes by about one-fifth or approximately 2,900 boe per day. Currently the Pembina area is producing approximately 20,700 boe per day when combining operated and non-operated volumes.
The group of properties is centred on the large, long-life Cardium oil pool. The pool’s secondary recovery phase is currently being optimized while the Trust’s EOR team prepares the plans to expand the CO2 flood to other areas (see page 35).
The Pembina field team’s overall focus is on low-risk drilling and low-cost optimization opportunities that are aimed at maximizing income for the Trust’s unitholders and reinvestment capital for Penn West’s long-term growth plays. Costs are kept down and returns maximized by exploiting Penn West’s extensive and dominant network of operated infrastructure, which includes seven gas plants, numerous oil batteries and over 3,000 kilometres of oil and gas gathering lines.
The Pembina Cardium pool is surrounded by lightly drilled lands that management believes have many years worth of opportunities for conventional exploration and development of shallow and deep targets. Pembina has an array of multi-zone potential throughout the area, including the Edmonton Sands, Belly River, Cardium, Glauconite, Ellerslie, Rock Creek, Pekisko, Banff and some deep Swan Hills zones.
18
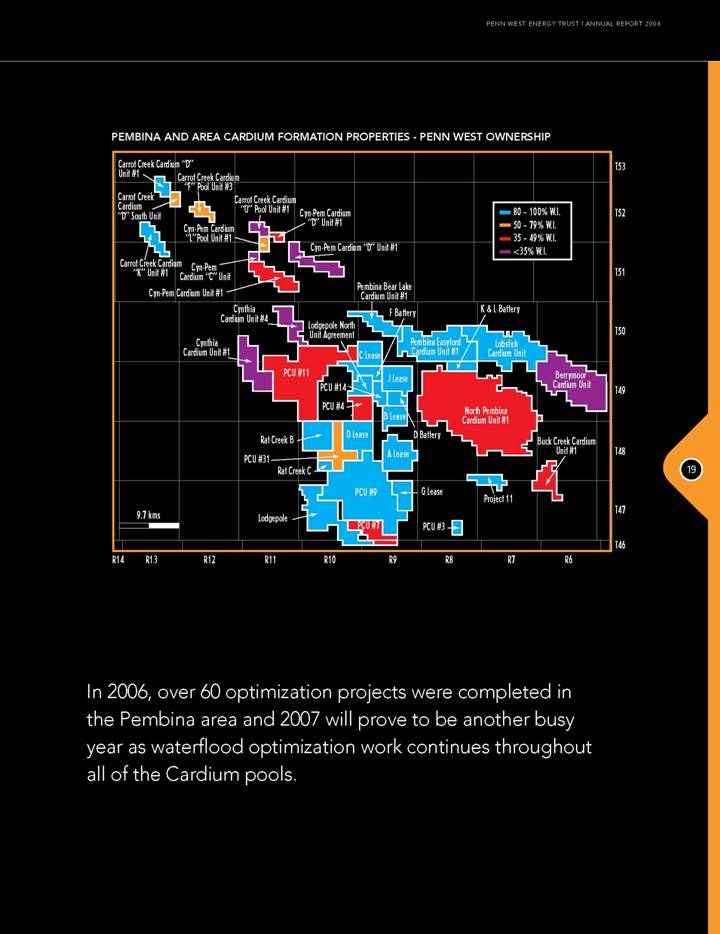
PEMBINA AND AREA CARDIUM FORMATION PROPERTIES - PENN WEST OWNERSHIP
[GRAPHIC]
In 2006, over 60 optimization projects were completed in the Pembina area and 2007 will prove to be another busy year as waterflood optimization work continues throughout all of the Cardium pools.
19
PEMBINA
DEVELOPMENT
Following up on the 18 gross wells drilled in 2006, the 2007 Pembina drilling program is a mix of nine low-risk Cardium infill wells on 40-acre spacing, which typically yield 25-30 barrels per day of long-life production, two Belly River development wells, one Rock Creek deep gas well and three gas wells in the Bigoray/Lobstick area to expand development in the Glauconite formation.
OPTIMIZATION
In 2006, over 60 optimization projects were completed in the Pembina area and 2007 will prove to be another busy year as waterflood optimization work continues throughout all of the Cardium pools. After 45 years of production, overall recovery is still only 15-17 percent of the discovered light oil-in-place*. Detailed geological and reservoir studies are being utilized to help determine the optimal placement of water injectors and improve the overall sweep efficiency to maximize oil recovery. Penn West believes that sound waterflood management has the potential to add to the pool’s reserves, extend its reserve-life-index, and offset the annual production decline to enable the pool’s production to be maintained at a nearly flat rate. A well-maintained reservoir, with good pressure support, will also help set the stage for the planned enhanced oil recovery programs using CO2.
Ongoing optimization tasks include the installation of plunger-lifts, upgrading pumps and de-bottlenecking facilities. These projects have a typical capital cost of $16,000 per boe per day of incremental production. Successful enhancements in 2006 included gas optimization of the large Lobstick Glauconite pool. This pool has produced over 170 billion cubic feet of liquids-rich natural gas since production began in the 1960s. By optimizing the wells using plunger lift systems and compression projects, Penn West has been able to maintain the property’s net volumes of approximately 4 mmcf per day by minimizing the production decline. Plans for 2007 include taking a similar approach to Berland River, where de-bottlenecking the gas gathering system, combined with reactivations, has the potential to increase production above Penn West’s current operated production in the area of 4.5 mmcf per day.
* Refer to Page 103 - Reserve Definitions; note 3.
20
WILLESDEN GREEN
[GRAPHIC]
FAST FACTS
Main properties:
Willesden Green, Minnehik-Buck Lake, Redwater, Alder Flats, Crystal, Three Hills, Leafland, Strachan/ Sunchild, Garrington, Fort Saskatchewan
|
2006 average production: |
22,400 boe per day |
|
|
|
|
Production mix: |
26% light crude oil, |
|
|
62% natural gas, |
|
|
12% NGL |
|
|
|
|
*2006 year-end reserves (proved plus probable): |
75 mmboe |
|
|
|
|
2006 reserve life index: |
9.2 years |
|
|
|
|
2006 new wells drilled: |
10 |
|
|
|
|
2007 planned new wells: |
17 |
|
|
|
|
2007 planned recompletions/workovers/re-entries: |
57 wells |
*See note on page 12.
[GRAPHIC]
Located south of Pembina, Willesden Green is also an area of long-life and low-decline light oil and liquids-rich natural gas produced from multiple zones. Control of key legacy infrastructure, including the Minnehik-Buck Lake sour gas processing plant, solidifies the Trust’s regional operating dominance.
The Willesden Green property is an active development area. The 17 new development and exploitation wells planned this year – up from 10 in 2006 – are intended to fully offset natural production declines. The Trust retains deep mineral rights nearly everywhere in the area, enhancing longer-term exploration potential for Penn West or our drilling partners.
The Willesden Green field team also achieved Penn West’s best capital efficiencies in 2006, adding new production through optimization at an average cost of $4,500 per daily boe. Accordingly, the area optimization budget has been doubled for 2007.
DEVELOPMENT
Over the past two years, the production from the Willesden Green property has remained relatively constant due to oil and natural gas well drilling and optimization of the area’s wells and infrastructure. The property has one of the highest netbacks due to its mix of light oil, liquids-rich natural gas, low royalty rates and extremely low operating costs. Penn West controls the area’s oil and natural gas gathering infrastructure that is centred on the 100 percent owned Willesden Green gas plant. In 2006, Penn West de-bottlenecked the plant’s gas gathering and gas processing infrastructure, increasing the capacity to process additional Penn West and third-party volumes. Custom processing of third-party gas generates approximately $3 million per year in revenue, after plant expenses, and results in top quartile operating costs.
21
In 2006, seven infill wells were drilled focusing on the 100 percent working interest Cardium oil and Belly River natural gas pools. Incremental production was more than 800 boe per day and reserves were added for only $10 per boe. Cardium wells are extremely long-life. For example, Penn West’s Cardium production at Willesden Green Cardium Unit #9 had a reserve-life-index of over 22 years at year-end 2006.
In 2007, the team will drill eight wells and will pursue a multi-year program to downspace the Cardium from one well per 80-160 acres to one per 40 acres. The long-term target is to increase recovery in this portion of the pool from 9 percent to 19 percent. A third-party reservoir study will help to optimize infill locations and waterflood performance.
EXPLORATION
At Minnehik-Buck Lake and Crystal, exploration partners are eager to drill the deeper, higher-risk and higher-reward Pekisko and Viking targets. At Strachan, Penn West is working to lever its land base and lower drilling density into a longer-term exploration and development inventory focused on Glauconitic and Mannville targets.
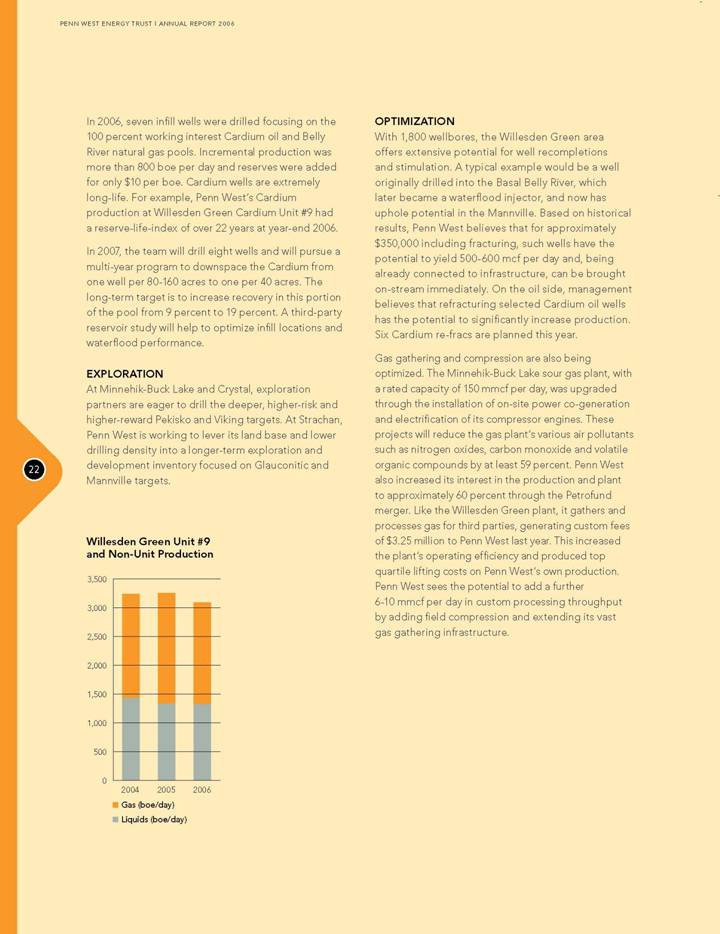
Willesden Green Unit #9 and Non-Unit Production
[CHART]
OPTIMIZATION
With 1,800 wellbores, the Willesden Green area offers extensive potential for well recompletions and stimulation. A typical example would be a well originally drilled into the Basal Belly River, which later became a waterflood injector, and now has uphole potential in the Mannville. Based on historical results, Penn West believes that for approximately $350,000 including fracturing, such wells have the potential to yield 500-600 mcf per day and, being already connected to infrastructure, can be brought on-stream immediately. On the oil side, management believes that refracturing selected Cardium oil wells has the potential to significantly increase production. Six Cardium re-fracs are planned this year.
Gas gathering and compression are also being optimized. The Minnehik-Buck Lake sour gas plant, with a rated capacity of 150 mmcf per day, was upgraded through the installation of on-site power co-generation and electrification of its compressor engines. These projects will reduce the gas plant’s various air pollutants such as nitrogen oxides, carbon monoxide and volatile organic compounds by at least 59 percent. Penn West also increased its interest in the production and plant to approximately 60 percent through the Petrofund merger. Like the Willesden Green plant, it gathers and processes gas for third parties, generating custom fees of $3.25 million to Penn West last year. This increased the plant’s operating efficiency and produced top quartile lifting costs on Penn West’s own production. Penn West sees the potential to add a further 6-10 mmcf per day in custom processing throughput by adding field compression and extending its vast gas gathering infrastructure.
22
WAINWRIGHT
[GRAPHIC]
FAST FACTS
Main properties:
Wainwright, Provost, Marwayne, Wildmere, Lloydminster, Marsden, Sugden
|
2006 average production: |
10,800 boe per day |
|
|
|
|
Production mix: |
6% light crude oil, |
|
|
55% heavy crude oil, |
|
|
39% natural gas |
|
|
|
|
* 2006 year-end reserves (proved plus probable): |
23 mmboe |
|
|
|
|
2006 reserve life index: |
6 years |
|
|
|
|
2006 new wells drilled and put on production: |
27 |
|
|
|
|
2007 planned new wells: |
25 |
|
|
|
|
2007 planned recompletions/workovers/re-entries: |
24 |
*See note on page 12.
[GRAPHIC]
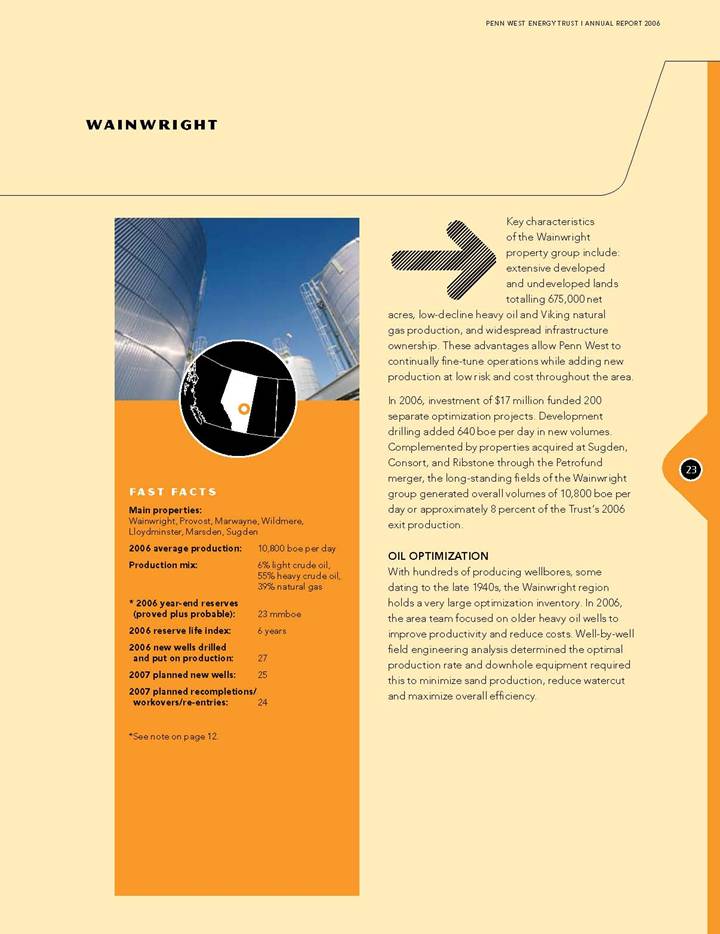
Key characteristics of the Wainwright property group include: extensive developed and undeveloped lands totalling 675,000 net acres, low-decline heavy oil and Viking natural gas production, and widespread infrastructure ownership. These advantages allow Penn West to continually fine-tune operations while adding new production at low risk and cost throughout the area.
In 2006, investment of $17 million funded 200 separate optimization projects. Development drilling added 640 boe per day in new volumes. Complemented by properties acquired at Sugden, Consort, and Ribstone through the Petrofund merger, the long-standing fields of the Wainwright group generated overall volumes of 10,800 boe per day or approximately 8 percent of the Trust’s 2006 exit production.
OIL OPTIMIZATION
With hundreds of producing wellbores, some dating to the late 1940s, the Wainwright region holds a very large optimization inventory. In 2006, the area team focused on older heavy oil wells to improve productivity and reduce costs. Well-by-well field engineering analysis determined the optimal production rate and downhole equipment required this to minimize sand production, reduce watercut and maximize overall efficiency.
23
Hayter, which produces approximately 625 barrels of heavy oil per day, is an optimization success story. Historically, this property had a production decline rate of 15 percent. In 2006, the decline rate was arrested by adding production of 95 barrels of oil per day through six well recompletions in the Sparky and Cummings zones and several reactivations and pump optimization projects. This was accomplished with an investment of $1.1 million resulting in an attractive capital efficiency of $11,500 per barrel of incremental oil production.
As in other regions, the Wainwright team is moving to consolidate single-well batteries. Centralized, pipeline-accessed batteries eliminate crude oil trucking, increase the Trust’s level of solution gas conservation and reduce flaring and venting of otherwise marginal gas production. Battery consolidation typically saves $1,600 per well in monthly trucking costs, making some otherwise marginal wells economical.
NATURAL GAS OPTIMIZATION
Multi-zone shallow gas formations combined with region-wide legacy infrastructure and hundreds of existing wellbores create a large inventory of natural gas optimization projects, well recompletions and low-risk drilling opportunities. Penn West has over 430 wellbores in the regionally extensive Viking Formation and over 290,000 gross acres of prospective Viking land. Based on past experience, Viking wells can produce for decades at low decline rates of typically 15 percent per year.
Historically, a well recompletion yielding production of 30-100 mcf per day can be performed for $75,000-$125,000, if the well is already tied into a gathering system. In addition to the Viking, the team focuses on Mannville, Colorado and Second White Specks zones uphole of the original producing pool. The Colorado is comparable to the “tight gas” plays that other resource players are aggressively pursuing.
At Misty/Monitor, “unloading” water from natural gas wells using small, low-cost pump-jacks raised natural gas production from 2.3 mmcf per day to 3.5 mmcf per day. At Acadia, the Trust relocated gas compressors to optimize field production and purchased rented compressors to cut operating costs. At Esther, a single, centralized, $2 million compressor replaced less efficient multiple compression sites and lifted liquids out of natural gas wellbores to optimize production.
DEVELOPMENT
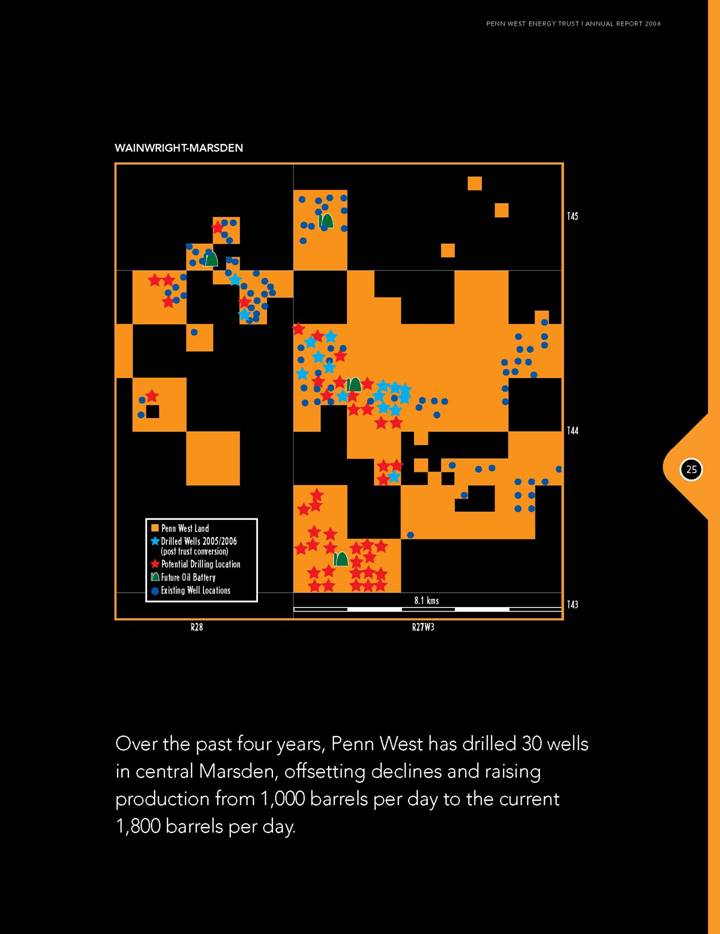
The Marsden field lies east of the Alberta- Saskatchewan border and consists of approximately 30 sections of mostly 100 percent interest land. In the past, low-risk, low-cost Sparky wells have averaged 30-40 barrels per day of 14° API oil, achieving average capital efficiencies below $20,000 per daily boe added. Over the past four years, Penn West has drilled 30 wells in central Marsden, offsetting declines and raising production from 1,000 barrels per day to the current 1,800 barrels per day. Penn West’s land is relatively underdeveloped and has the potential for 40-50 additional well locations. In 2007, 3-D seismic will be used to identify 15-20 well locations to further extend the pool and identify development well locations for 2008.
In order to reduce operating costs and prepare for secondary recovery employing proven waterflood technology, Penn West intends to undertake an extensive pipeline infrastructure project in 2007. The project is intended to eliminate over 100 individual well tanks and significantly reduce trucking expenses, reduce downtime associated with wet weather road restrictions and increase road safety. It is also intended that natural gas, currently vented, will be gathered and used as fuel at new central facilities or sold. Penn West plans to electrify all wells, reducing propane fuel and maintenance costs and improving reliability.
On the gas side, 10 low-cost gas wells to develop shallow Viking and Mannville gas are planned at Sugden. Success could generate a 100-well Mannville/Viking infill drilling program over the next five to 10 years. In addition, the Trust continues to drill carefully selected new prospects near existing pipelines.
24
WAINWRIGHT-MARSDEN
[GRAPHIC]
Over the past four years, Penn West has drilled 30 wells in central Marsden, offsetting declines and raising production from 1,000 barrels per day to the current 1,800 barrels per day.
25
HOOSIER-COLEVILLE
[GRAPHIC]
FAST FACTS
Main properties:
Hoosier, Milton, Denzil, Coleville Main, Coleville South, Dodsland, Esther, Kerrobert, Glidden
|
2006 average production: |
22,500 boe per day |
|
|
|
|
Production mix: |
8% light crude oil, |
|
|
58% heavy crude oil, |
|
|
34% natural gas |
|
|
|
|
*2006 year-end reserves (proved plus probable): |
58 mmboe |
|
|
|
|
2006 reserve life index: |
7.1 years |
|
|
|
|
2006 new wells drilled: |
97 |
|
|
|
|
2007 planned new wells: |
59 |
|
|
|
|
2007 planned recompletions/workovers/re-entries: |
100 |
*See note on page 12.
[GRAPHIC]
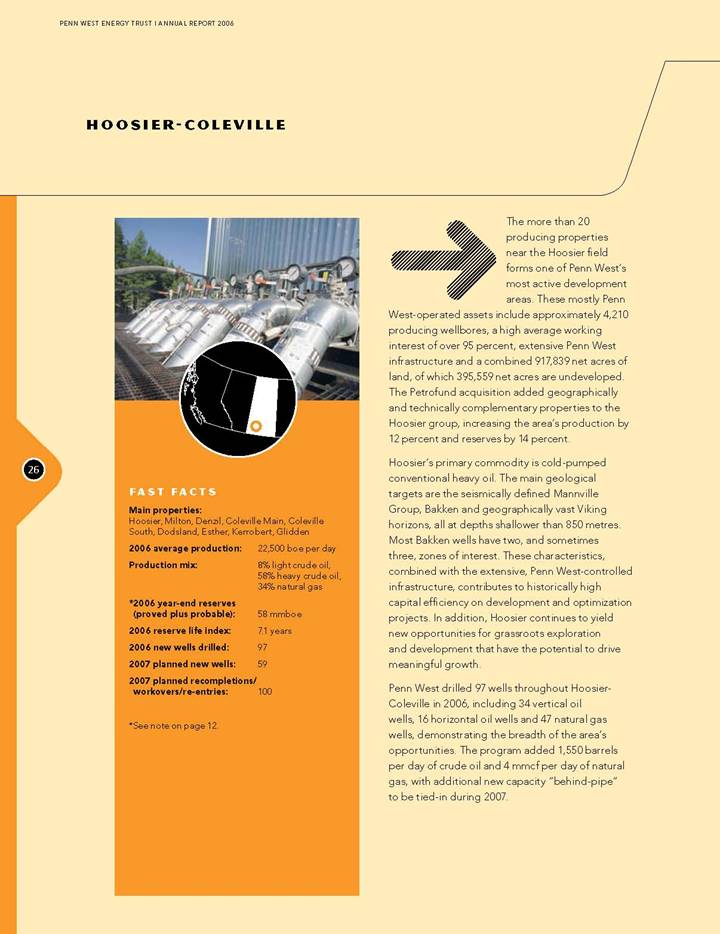
The more than 20 producing properties near the Hoosier field forms one of Penn West’s most active development areas. These mostly Penn West-operated assets include approximately 4,210 producing wellbores, a high average working interest of over 95 percent, extensive Penn West infrastructure and a combined 917,839 net acres of land, of which 395,559 net acres are undeveloped. The Petrofund acquisition added geographically and technically complementary properties to the Hoosier group, increasing the area’s production by 12 percent and reserves by 14 percent.
Hoosier’s primary commodity is cold-pumped conventional heavy oil. The main geological targets are the seismically defined Mannville Group, Bakken and geographically vast Viking horizons, all at depths shallower than 850 metres. Most Bakken wells have two, and sometimes three, zones of interest. These characteristics, combined with the extensive, Penn West-controlled infrastructure, contributes to historically high capital efficiency on development and optimization projects. In addition, Hoosier continues to yield new opportunities for grassroots exploration and development that have the potential to drive meaningful growth.
Penn West drilled 97 wells throughout Hoosier- Coleville in 2006, including 34 vertical oil wells, 16 horizontal oil wells and 47 natural gas wells, demonstrating the breadth of the area’s opportunities. The program added 1,550 barrels per day of crude oil and 4 mmcf per day of natural gas, with additional new capacity “behind-pipe” to be tied-in during 2007.
26
Hoosier continues to yield new opportunities for grassroots exploration and development that have the potential to drive meaningful growth.
EXPLORATION
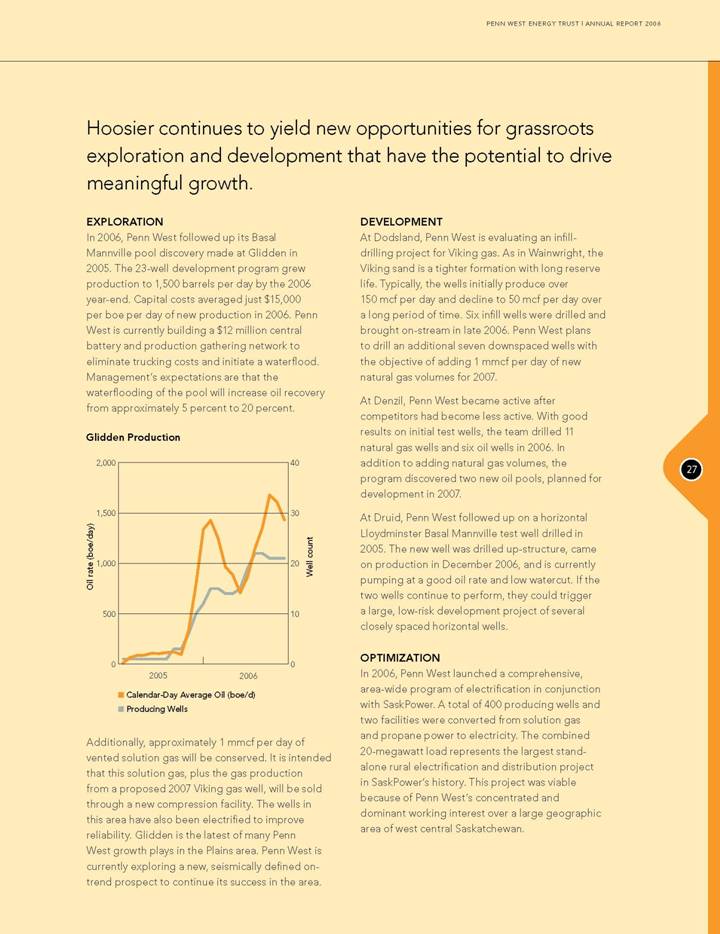
In 2006, Penn West followed up its Basal Mannville pool discovery made at Glidden in 2005. The 23-well development program grew production to 1,500 barrels per day by the 2006 year-end. Capital costs averaged just $15,000 per boe per day of new production in 2006. Penn West is currently building a $12 million central battery and production gathering network to eliminate trucking costs and initiate a waterflood. Management’s expectations are that the waterflooding of the pool will increase oil recovery from approximately 5 percent to 20 percent.
Glidden Production
[CHART]
Additionally, approximately 1 mmcf per day of vented solution gas will be conserved. It is intended that this solution gas, plus the gas production from a proposed 2007 Viking gas well, will be sold through a new compression facility. The wells in this area have also been electrified to improve reliability. Glidden is the latest of many Penn West growth plays in the Plains area. Penn West is currently exploring a new, seismically defined ont-rend prospect to continue its success in the area.
DEVELOPMENT
At Dodsland, Penn West is evaluating an infill-drilling project for Viking gas. As in Wainwright, the Viking sand is a tighter formation with long reserve life. Typically, the wells initially produce over 150 mcf per day and decline to 50 mcf per day over a long period of time. Six infill wells were drilled and brought on-stream in late 2006. Penn West plans to drill an additional seven downspaced wells with the objective of adding 1 mmcf per day of new natural gas volumes for 2007.
At Denzil, Penn West became active after competitors had become less active. With good results on initial test wells, the team drilled 11 natural gas wells and six oil wells in 2006. In addition to adding natural gas volumes, the program discovered two new oil pools, planned for development in 2007.
At Druid, Penn West followed up on a horizontal Lloydminster Basal Mannville test well drilled in 2005. The new well was drilled up-structure, came on production in December 2006, and is currently pumping at a good oil rate and low watercut. If the two wells continue to perform, they could trigger a large, low-risk development project of several closely spaced horizontal wells.
OPTIMIZATION
In 2006, Penn West launched a comprehensive, area-wide program of electrification in conjunction with SaskPower. A total of 400 producing wells and two facilities were converted from solution gas and propane power to electricity. The combined 20-megawatt load represents the largest stand-alone rural electrification and distribution project in SaskPower’s history. This project was viable because of Penn West’s concentrated and dominant working interest over a large geographic area of west central Saskatchewan.
27
HOOSIER-COLEVILLE
[GRAPHIC]
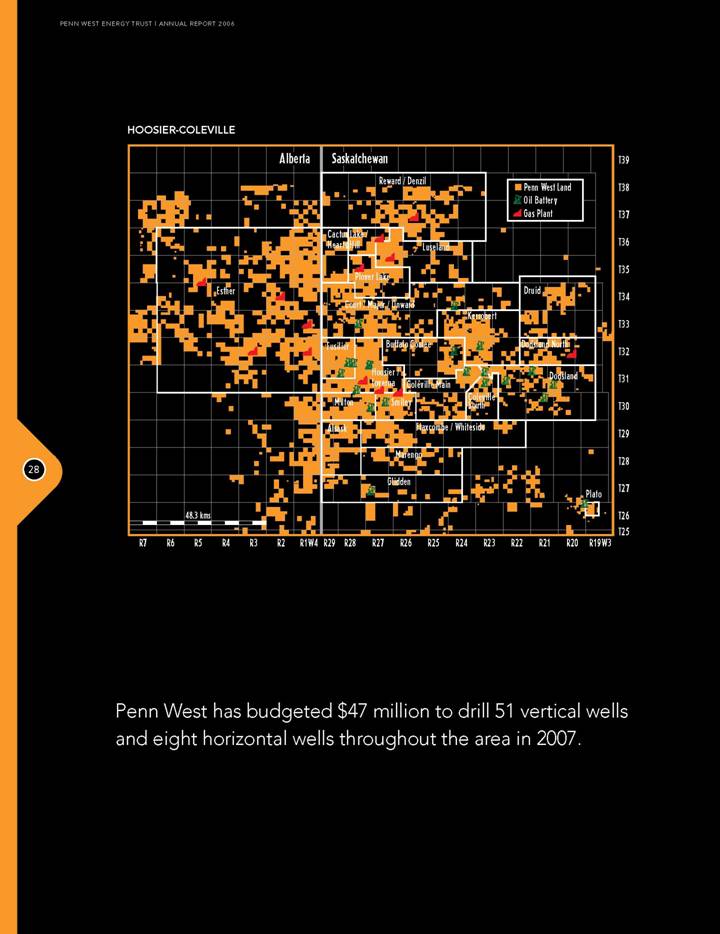
Penn West has budgeted $47 million to drill 51 vertical wells and eight horizontal wells throughout the area in 2007.
28
This project benefits Penn West and the environment. Electrification will reduce Penn West’s greenhouse gas emissions by an estimated 56,000 tonnes of carbon dioxide-equivalent per year, approximately equivalent to removing 10,000 cars from the road. Operating efficiencies should be improved through reduced downtime of operating equipment and removing the need to refuel individual well motors. Improved ontime alone is estimated to yield incremental production of 5 percent or 400 barrels per day.
In addition, Penn West intends that approximately 1.6 mmcf per day of solution gas, previously flared or burned to power inefficient gas motors, will ultimately be conserved, processed and marketed further reducing greenhouse gas emissions. Solution gas conservation and waterflood optimization will begin this year at Coleville Main under a two-phase, $12 million program.
In Coleville, a significant opportunity remains in the legacy, long-life, low-decline Bakken heavy oil pools. The Coleville Main and South pools are estimated to contain over 0.5 billion barrels* of discovered oil resources in place with only 15 percent recovered since the pools were discovered in 1951. The first task at hand is the fine-tuning of waterflood parameters to maximize production, minimize watercut and control costs. These two pools also offer potential new reserves through heavy oil enhanced recovery methods such as surfactant flooding.
At Kerrobert and Dodsland, long-life, high-netback Viking light oil production is being optimized using small, lower-cost pumpjacks. Penn West will reactivate waterfloods in some of the recently acquired properties in the area. Penn West is also participating in a study being conducted by the Saskatchewan Research Council into improved waterfloods.
2007 PROGRAM
Penn West has budgeted $47 million to drill 51 vertical wells and eight horizontal wells this year throughout the area. The main focus will be oil development, driven by the scope of medium-term opportunities.
Penn West will also continue a medium-term natural gas play begun at Luseland in 2006. Five new wells are planned in the area around a successful 2006 test well that was too far from infrastructure to justify a stand-alone tie-in. Success with this group of wells could open a multi-year natural gas development on an even larger area with current 3-D seismic coverage.
* Refer to page 103 – Reserve Definitions; note 4.
[GRAPHIC]
29
SOUTH PLAINS
[GRAPHIC]
FAST FACTS
Main properties:
Weyburn, Midale, Gull Lake, Butte West, Flat Lake, Hoffer, Waskada, Tyvan, Brooks, Taber, Hatton, Herronton
|
2006 average production: |
|
18,300 boe per day |
|
|
|
|
|
Production mix: |
|
57% light/medium |
|
|
|
crude oil, |
|
|
|
19% heavy crude oil, |
|
|
|
24% natural gas |
|
|
|
|
|
*2006 year-end reserves (proved plus probable): |
|
78 mmboe |
|
|
|
|
|
2006 reserve life index: |
|
11.7 years |
|
|
|
|
|
2006 new wells drilled: |
|
20 |
|
|
|
|
|
2007 planned new wells: |
|
14 |
|
|
|
|
|
2007 planned recompletions/ workovers/re-entries: |
|
80-100 |
*See note on page 12.
[GRAPHIC]
The South Plains properties stretch from the Rocky Mountains to western Manitoba and 200 kilometres north from the U.S. border, and contain over 600,000 net acres of Penn West land. This enormous region includes many opportunities for development and optimization. In 2006, the South Plains field team cut costs by four percent during a time of industry inflation. The average netback increased by 12 percent compared to 2005.
DEVELOPMENT
Penn West has assembled a multi-year low-risk development inventory in South Plains. The medium-gravity Cantuar and Shaunavon oil pools at Gull Lake and Butte West offer potential on over 100 sections of high-working-interest lands to downspace wells from the current 40-80 acres to 20 acres. Ten low-cost vertical wells drilled in 2006 yielded production of 25-30 barrels per day each.
At Flat Lake, six vertical light oil wells are planned this year. Penn West believes these can be completed at a high capital efficiency of $9,000-$11,000 per daily flowing boe. The netback averaged $40 per boe in 2006, the region’s highest. The vertical drilling planned for 2007 is expected to prove up horizontal development potential for 2008 and beyond.
Located further to the north are the non-operated properties of Weyburn and Midale. These properties are under commercial CO2 enhanced oil recovery and combined produce 6,700 barrels per day. They account for over $45 million of capital expenditures in 2007 (see page 37).
30
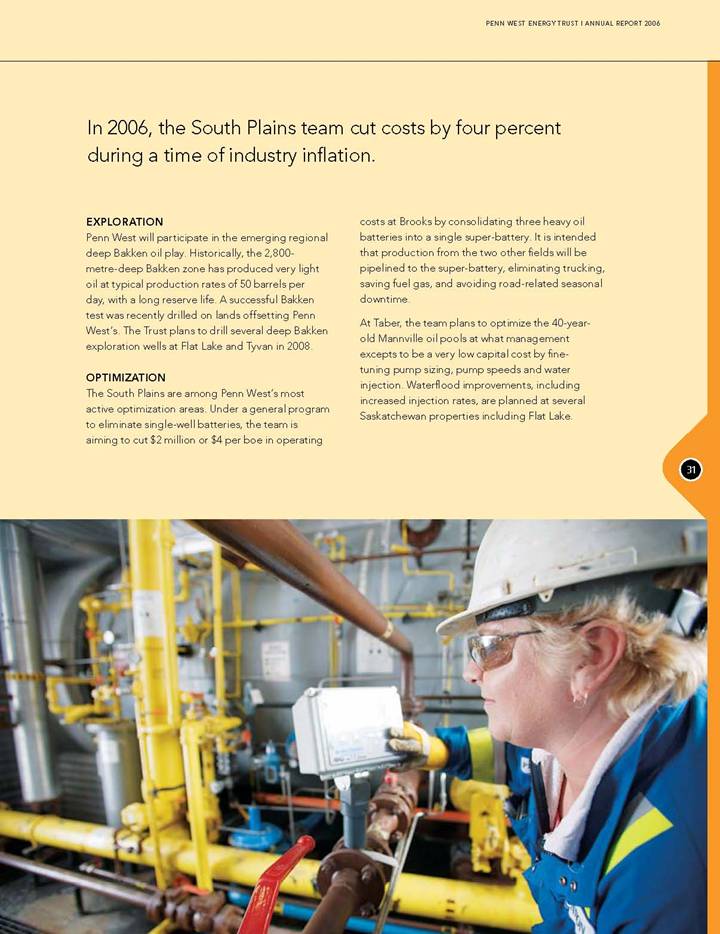
In 2006, the South Plains team cut costs by four percent during a time of industry inflation.
EXPLORATION
Penn West will participate in the emerging regional deep Bakken oil play. Historically, the 2,800-metre-deep Bakken zone has produced very light oil at typical production rates of 50 barrels per day, with a long reserve life. A successful Bakken test was recently drilled on lands offsetting Penn West’s. The Trust plans to drill several deep Bakken exploration wells at Flat Lake and Tyvan in 2008.
OPTIMIZATION
The South Plains are among Penn West’s most active optimization areas. Under a general program to eliminate single-well batteries, the team is aiming to cut $2 million or $4 per boe in operating costs at Brooks by consolidating three heavy oil batteries into a single super-battery. It is intended that production from the two other fields will be pipelined to the super-battery, eliminating trucking, saving fuel gas, and avoiding road-related seasonal downtime.
At Taber, the team plans to optimize the 40-year-old Mannville oil pools at what management excepts to be a very low capital cost by fine-tuning pump sizing, pump speeds and water injection. Waterflood improvements, including increased injection rates, are planned at several Saskatchewan properties including Flat Lake.
[GRAPHIC]
31
PEACE RIVER OIL SANDS PROJECT
[GRAPHIC]
FAST FACTS
|
*2006 year-end reserves (proved plus probable): |
|
8 million bbls |
|
|
|
|
|
2005 year-end production: |
|
800 bbls per day |
|
|
|
|
|
2006 year-end production: |
|
3,200 bbls per day |
|
|
|
|
|
2007 year-end production target: |
|
5,000-7,000 bbls per day |
|
|
|
|
|
Production mix: |
|
cold-producible heavy oil |
|
|
|
|
|
Development and optimization budget: |
|
$100-$150 million |
|
|
|
|
|
2007 planned new wells: |
|
60-90 horizontal production wells; 20-25 stratigraphic exploration wells |
*See note on page 12.
[GRAPHIC]
Five years ago, Penn West’s Peace River Oil Sands, or Seal, project was a foothold on a few sections of exploratory lands with no production. It is now Penn West’s most exciting project. Activity was ramped up in 2006; production was increased by four-fold and the area saw the completion of critical production facilities. The construction of all-weather access roads, additional exploratory drilling and further land acquisition was also completed in 2006.
Penn West’s Seal development team was formalized on July 1, 2006 when production was 800 barrels per day from 23 producing wells. By year-end, the team had drilled 30 new horizontal wells and production was increased to 3,200 barrels per day. Five stratigraphic wells were drilled to identify new pools for additional phases. Land purchases totalling $13.4 million added 176 sections, bringing Penn West’s land base to 475 sections of oil sands leases at 100 percent working interest. Capital efficiencies to date have averaged $23,000 per barrel per day of production added.
LONG-TERM SCOPE
The Peace River Oil Sands is one of Alberta’s emerging oil sands plays. The reservoir lies at 700 metres average depth. Oil recovery is in situ (not mined), generally using horizontal wells. The heavy oil around Seal is unique as it can be cold-pumped on primary recovery prior to the addition of steam or other modes of heat. The potential of the area was demonstrated when a competitor was recently acquired by an international major company at a price of approximately $180,000 per daily flowing barrel of production.
32
PEACE RIVER OIL SANDS PROJECT
[GRAPHIC]
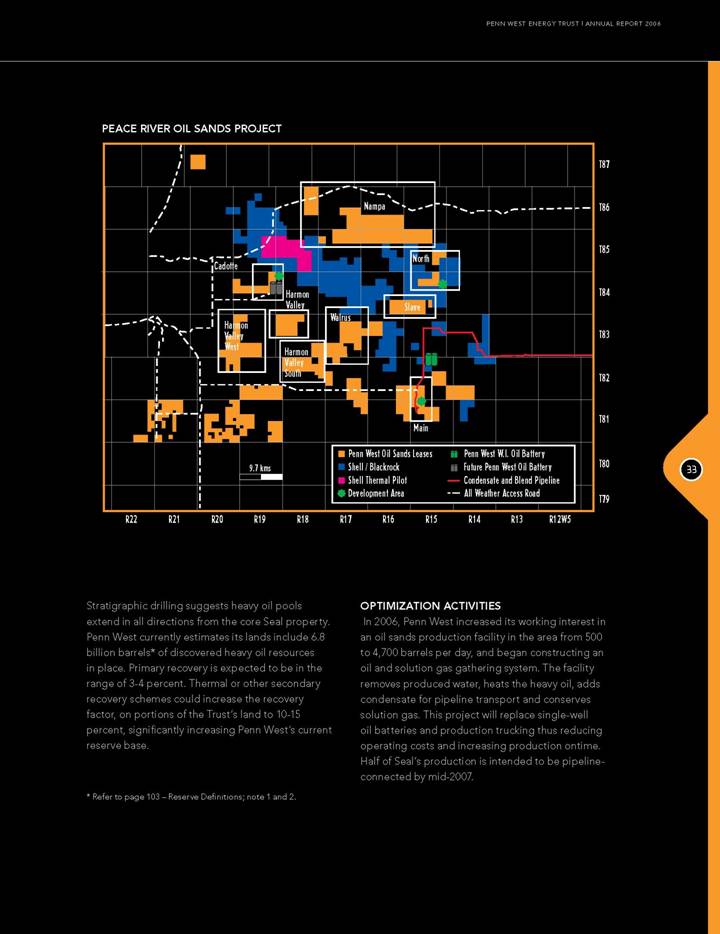
Stratigraphic drilling suggests heavy oil pools extend in all directions from the core Seal property. Penn West currently estimates its lands include 6.8 billion barrels* of discovered heavy oil resources in place. Primary recovery is expected to be in the range of 3-4 percent. Thermal or other secondary recovery schemes could increase the recovery factor, on portions of the Trust’s land to 10-15 percent, significantly increasing Penn West’s current reserve base.
* Refer to page 103 – Reserve Definitions; note 1 and 2.
OPTIMIZATION ACTIVITIES
In 2006, Penn West increased its working interest in an oil sands production facility in the area from 500 to 4,700 barrels per day, and began constructing an oil and solution gas gathering system. The facility removes produced water, heats the heavy oil, adds condensate for pipeline transport and conserves solution gas. This project will replace single-well oil batteries and production trucking thus reducing operating costs and increasing production ontime. Half of Seal’s production is intended to be pipeline-connected by mid-2007.
33
PEACE RIVER OIL SANDS PROJECT
Other optimization included electrifying operations and maximizing production from existing wells. The Seal team doubled the number of producing wells in 2006 – but quadrupled production. New wells are currently averaging 60 barrels per day, with some producing at 120 barrels per day.
MEDIUM-TERM DEVELOPMENT
Penn West has developed only five sections or 1 percent of the Seal play. Proved plus probable reserves are currently averaging about 170,000 barrels per producing well, based on the assumption of a primary recovery of 3 percent of the resource. The Seal team has one stratigraphic and two horizontal-capable drilling rigs permanently booked, enabling active drilling throughout 2007.
Penn West is targeting for 40-60 new wells to be on-production by year-end 2007, and a new oil battery is planned for early 2008. Further stratigraphic wells will help delineate and assess the resource quality of the various sand channels and barrier bars that make up this large hydrocarbon system underlying an estimated 2,300 square kilometres of land.
The Trust intends to grow its Peace River Oil Sands production to approximately 20,000 barrels per day over the next four to five years at seven properties including Seal Main, Seal North, Seal Cadotte, Harmon Valley, Walrus, Peace River and Slave. The pioneer properties may be candidates for down spacing from the current 150-metre distance between the 1,400 metre-long horizontal wells. Penn West believes that this has the potential to lift primary recovery to 5-6 percent.
Following primary production, management believes a cold waterflood has the potential to increase recovery by another 2.5 percentage points. For the longer term, Penn West intends to begin testing options for enhanced recovery such as a Polymer (gel) flood study with the Alberta Research Council. The Trust is evaluating a thermal pilot project to gather data on the optimum technical parameters to bolster production from the area in the future.
The Trust intends to grow its Peace River Oil Sands production to approximately 20,000 barrels per day of heavy oil over the next four to five years at seven properties.
34
ENHANCED OIL RECOVERY THROUGH HYDROCARBON AND CARBON DIOXIDE MISCIBLE FLOODING
[GRAPHIC]
Penn West believes in the potential to gain new, long-life reserves and production by maximizing recoveries from known resources of large-scale, mature conventional light-oil pools. Beginning with a series of transactions in the late 90s, Penn West now holds major working interests in six of western Canada’s 15 largest historical conventional light-oil fields, including the largest three.
Penn West intends to create value from these maturing pools through a combination of full development and optimization of secondary recovery (waterflood) schemes plus enhanced oil recovery (EOR) using CO2 as the miscible agent. Some pools could be amenable to absolute growth in daily production, while offsetting the annual production decline, and could extend the reserve life of other pools as they approach their conventional economic limits.
Alongside its growing interests in long-life light-oil fields, Penn West has actively worked to develop expertise in EOR techniques. The merger with Petrofund in the second quarter of 2006 provided working interests in the Weyburn field, Canada’s largest commercial CO2 flood, and increased working interests in the Midale, Swan Hills Units and other Pembina Cardium units and fields.
In addition to enhanced oil recovery, CO2 floods present the environmental opportunity of permanently storing or “sequestering” greenhouse gases that would otherwise be emitted into the atmosphere. Penn West currently believes that CO2 injected into commercial EOR projects would most likely be captured from the emissions stream of industrial plants, purified, compressed and shipped by pipeline for injection into the EOR projects. As a result, Penn West believes it is well positioned to mitigate its risk against potential greenhouse gas emission legislation while creating economic value for its unitholders.
PEMBINA CARDIUM
With discovered light oil resources in place estimated at 7.8 billion barrels*, of which Penn West controls approximately 40 percent, and a premium light oil product that commands some of the highest available netbacks, the Pembina Cardium pool is western Canada’s largest light oil prize.
The Trust continues to operate and expand the pool’s secondary recovery phases of infill drilling and waterflood optimization, while preparing for EOR activities. In 2002, Penn West began planning for a large commercial-scale CO2 miscible flood – a technical, multi-year, capital-intensive project. Construction of a pilot commenced in 2004, with injection of trucked-in CO2 beginning in March 2005.
Technical results – The pilot consists of two injectors and six vertical producing wells, with 2006 being the first full year of injection. Continuous monitoring indicates that the selected portions of the Pembina Cardium formation have provided good containment of the injectants due to the target zone’s reservoir characteristics and the overlying cap rock. This is key to high oil recoveries, which results from the CO2 contacting and mixing with a large percentage of the remaining oil, and sweeping it towards the producing wellbores.
By the 2006 year-end, Penn West had injected approximately 1 billion cubic feet of CO2 into the Pembina CO2 pilot, a greater amount than expected. The wells have maintained higher injection rates than expected and response has been observed at the pilot production wells. With the pilot illustrating good sweep efficiency, the next objective is to increase well productivity and accelerate the production response time to enhance project economics.
* Refer to page 103 – Reserve Definitions; note 3.
35
ENHANCED OIL RECOVERY THROUGH HYDROCARBON AND CARBON DIOXIDE MISCIBLE FLOODING
|
Name |
|
Commencement Date |
|
Highlights |
|
Approximate |
|
Current Net |
|
|
South Swan Hills |
|
Commenced flood in 1973 |
|
Hydrocarbon miscible flood. Planning for CO2 pilot in 2007 |
|
89 |
% |
4,625 |
|
|
Joffre |
|
Commenced flood in mid-1982 |
|
Only commercial CO2 miscible flood in Alberta |
|
73 |
% |
475 |
|
|
Virginia Hills |
|
Commenced flood in 1989 |
|
Hydrocarbon miscible flood |
|
33 |
% |
850 |
|
|
Pembina |
|
Target commercial development starting 2011/2012 |
|
Pursuing CO2 flood in Canada’s largest light-oil pool. CO2 miscible flood pilot on-stream at Pembina |
|
40 |
% |
10,125 |
|
|
Weyburn |
|
CO2 injection late 1999 |
|
Largest commercial CO2 miscible flood in Canada |
|
21 |
% |
6,375 |
|
|
Midale |
|
CO2 injection commenced in 2005 |
|
Third Canadian light-oil pool to go to CO2 miscible flood |
|
9 |
% |
475 |
|
|
Swan Hills Unit # 1 |
|
Commenced flood in 1985 |
|
Newly acquired asset from Petrofund. CO2 pilot test commenced in 2004 |
|
10 |
% |
1,800 |
|
Penn West is currently focusing on developing a second pilot utilizing horizontal producing wells, an approach that has been successful in other EOR projects, such as Weyburn. The existing pilot will continue under a water-alternating with CO2 scheme through 2007 with close monitoring of production response.
Commercial CO2 supply – A commercial-scale CO2 flood will require a large-scale source of injectant captured from a large industrial emitter and transported by pipeline to the Pembina field. To this end, Penn West is in active discussions with several large industrial emitters of CO2. The landscape of potential emitters has changed over the last two years with the announcements of at least three gasification projects in the Edmonton area. These projects could be key to the commercialization of our CO2 projects since they will produce large and relatively pure streams of CO2 in close proximity to Pembina, potentially reducing the overall CO2 supply costs by significant amounts.
Long-term potential – Penn West believes a comprehensive EOR program could increase the Pembina Cardium pool’s ultimate recovery factor by approximately 15 percent. Applied pool-wide to the amenable areas, this has the potential to translate to approximately 150-400 million net incremental barrels of reserves to Penn West. Penn West’s current capital estimate is approximately $250 million per project phase, with 10-15 phases implemented over a multi-year period. Management believes this would cover the approximately 40 percent of the pool area that currently appears amenable to CO2 flood.
36
SWAN HILLS (AND SOUTH SWAN HILLS)
Penn West has interests in several Swan Hills units that encompass proven miscible flood areas utilizing liquid ethane as the miscible agent. Portions of the pool remain under secondary recovery, providing future growth potential. The Petrofund merger included interests in a unit in which the operator has completed a CO2 miscible flood pilot. As a unit interest partner, Penn West is entitled to review the data from this pilot project, which has assisted in the progression of plans to initiate a CO2 miscible flood pilot in the operated South Swan Hills Unit by year-end 2007.
JOFFRE
This small, mature, light-oil field is Alberta’s first commercial CO2 miscible flood. Injectant is sourced from a nearby petrochemical complex, reducing greenhouse gas emissions. EOR production from the Viking sands averaged about 500 barrels per day in 2006. When CO2 flooding commenced in 1982, production was close to zero. Penn West added two new injector-producer patterns in 2006 with the aim to maintain production and extend the production life of the field. The field has room for further expansion and, over the longer term, surrounding pools may be amenable to CO2 flood.
WEYBURN
This southeast Saskatchewan field, operated by EnCana Corp., is Canada’s largest commercial CO2 flood. Penn West gained its 21.1 percent working interest in this pool, which has an estimated 1.4 billion barrels* of discovered oil resources in place, through the Petrofund merger. It is Penn West’s second largest property, producing over 6,300 barrels per day net to Penn West. Participation in this project provides both technical and management insights into planning and executing a major commercial EOR project.
Weyburn’s miscible flood performance has exceeded expectations. The recovery rate increased from an estimated 30 percent under secondary recovery to an estimated 46 percent under CO2 miscible flooding. The 50-year-old field has a reserve-life-index of 20 years. Operating costs in 2006 were only $6.60 per boe, very low for an EOR project, generating current netbacks of over $40 per boe.
In 2007, the working interest owners will roll out additional injector and producer well groups, or patterns, part of a multi-year process to expand the CO2 flood area from 68 to possibly 110 patterns. The current focus is on drilling horizontal producing wells and optimizing well-spacing to maximize the drainage area.
MIDALE
This southeast Saskatchewan property, in which Penn West holds a 9 percent interest, contained an estimated 0.7 billion barrels* of discovered oil resources in place. It is an oil pool that is geologically similar to Weyburn but at an earlier stage of EOR development.
It is intended that commercial development will commence in 2007 with the CO2 coming from the same large industrial source in North Dakota as for the Weyburn field, utilizing a pipeline extension. Penn West has committed $2.3 million to cover its share of planned 2007 activities. The partners are aiming to achieve a major increase of the pool’s recovery factor, possibly 15-20 percent of the discovered oil resources in place. This multi-year project is aiming beyond offsetting the field’s annual production decline and achieving growth in a similar fashion to the Weyburn property.
* Refer to page 103 – Reserve Definitions; note 4.
37
NON-CONVENTIONAL NATURAL GAS
[GRAPHIC]
Coalbed methane (CBM) is an unconventional form of natural gas, different from conventional natural gas. CBM is stored in coal deposits through adsorption. This gas is released when there is a decline in reservoir pressure. Most coal deposits are water-saturated and water needs to be removed to depressurize the reservoir in order for gas production to take place. In some instances, the coal is “dry” and the gas can be produced immediately without de-watering.
Penn West recognizes that any CBM development is a multi-year process, requiring a long-term commitment. Accordingly, Penn West’s CBM activities are not completely governed by short-term commodity price movements but by CBM’s long-term potential for economic productivity and long-life reserves.
SOUTH SWAN HILLS CBM PROJECT (ALBERTA)
Mannville coals, Penn West-operated
Several years ago, Penn West identified the Mannville Formation in South Swan Hills for CBM potential. This project lies in the southeast of western Canada’s first commercial Mannville CBM production, which was initiated in late 2001 at Corbett Creek. Since then, others have launched CBM projects that surround Penn West’s holdings. This Mannville CBM play extends over 60 sections of Penn West’s lands.
The industry activities in the area indicate that horizontal drilling is the key to commercial gas production. Experience has shown that a single-leg horizontal well will typically produce 200 - 300 mcf per day of gas for a significant period of time and a multi-lateral well can increase natural gas production to more than 750 mcf per day.
Since the Mannville is a wet coal, de-watering is required for gas production. Because of the depth of the Mannville coal, the water is saline and is unsuitable for domestic or agricultural consumption. A typical Mannville CBM well exhibits a profile of increasing gas production rates for a period of one to four years before showing any sign of decline.
In late 2006, Penn West initiated a four-well horizontal CBM pilot in South Swan Hills. The wells encountered between 400 and 1,000 horizontal metres of coal. Currently, the wells are in the de-watering phase, which will last to six months prior to initial gas production.
If the pilot project shows commercial-scale gas production, Penn West intends to initiate a full-scale development. This program, potentially consisting of over 150 horizontal CBM wells, would take place in stages over the next four to five years, beginning in 2008. Penn West believes this project’s extensive operating and capital costs can be reduced through the utilization of Penn West’s South Swan Hills saline water handling and gathering facilities.
THREE HILLS/PENHOLD CBM PROJECT (ALBERTA)
Horseshoe Canyon Coals
Penn West has a non-operated CBM project in Three Hills and Penhold. This asset was acquired in 2006 through the Petrofund merger. Penn West has an average 35 percent working interest in over 90 sections.
38
SOUTH SWAN HILLS – MANNVILLE COALBED METHANE TREND
[GRAPHIC]
In late 2005, a pilot program was initiated to target the coal seams in the Horseshoe Canyon formation. This coal is dry and tends to produce gas immediately with little or no preliminary water production. A typical Horseshoe Canyon well averages 50-80 mcf per day of gas production. In numerous instances, the CBM well can be commingled with conventional natural gas that occurs in sandstones inter-bedded between the coal seams. In these instances , the gas production can increase to over 150 mcf per day.
By the end of 2006, the Three Hills/Penhold CBM project had completed eight drilling phases, averaging 15 to 20 wells per phase. Over 130 wells have been tied-in and are on production. Penn West’s net current gas production is over 3.5 mmcf per day.
39
TRANSFORMING PENN WEST’S UNDEVELOPED LAND BASE INTO ADDED VALUE
[GRAPHIC]
When it converted to a trust in June 2005, Penn West faced the dilemma of allocating a significant portion of its cash flow to distributions, and away from capital programs. With in excess of 5 million net acres of undeveloped land at that time, Penn West realized the opportunity to create a new revenue stream to supplement its cash flows. Penn West began aggressively farming-out undeveloped lands that were less suited to a trust’s more conservative risk profile and its requirement for more capital-efficient production additions.
Shortly after conversion to an energy income trust, Penn West announced it was “open to do business” with the energy sector’s junior and large exploration and production companies eager for undeveloped lands to explore and drill, using their own capital resources. The farm-out program allowed Penn West to focus its capital expenditures on areas of core interest, where the Trust has substantial infrastructure and operational control. This approach helps to maximize the benefits from Penn West’s internal cash flow reinvestment.
|
|
|
2006 |
|
2005 |
|
|
Net acres committed under farm-out: |
|
323,498 |
|
721,245 |
|
|
|
|
|
|
|
|
|
Wells drilled/re-entered under farm-out: |
|
169 |
|
103 |
|
|
|
|
|
|
|
|
|
Farm-out GOR royalty production at year-end: |
|
360 boe |
|
230 boe |
|
FOCUS ON ROYALTY PRODUCTION
Penn West’s farm-outs are structured to create a simple, burden-free stream of royalty revenue at no capital cost to the Trust. The Trust makes undeveloped lands available to the farmee, often also providing significant geological and seismic data. The farmed-out lands typically don’t fit Penn West’s business model or are lands that the Trust isn’t in a position to prove up before the mineral leases expire. The interest held by Penn West in lands being farmed out is usually earned by the farmee drilling at least one well per standard spacing unit (generally, one section or 640 acres for natural gas wells).
Once earning occurs, Penn West retains a non-convertible, gross over-riding royalty with no deductions (typically 5 to 15 percent), on revenue resulting from the earning well and any future drilling on the farmed-out lands. The farm-out process is efficient for both parties for several reasons: it provides the farmee with the opportunity and latitude to pursue its own exploration concepts and development plans; it creates for Penn West an essentially risk free revenue stream from royalties payable on production from farmed out lands; and it allows Penn West to focus its technical and financial resources on internally generated prospects where it retains operational control.
FARM-OUT PROGRAM RESULTS
Monetization of Penn West’s undeveloped acreage under its farm-out program accelerated rapidly throughout 2005, with Penn West negotiating 85 farm-outs covering more than 700,000 net acres. In 2006, a further 97 farm-outs committed more than 300,000 additional net acres to exploration companies for evaluation and development. Over the first two years, farmees drilled or re-entered 287 wells on these lands.
40
Continued growth in revenue from farm-out royalty lands is expected in 2007.
Penn West has entered into farm-out agreements with leading exploration companies. In late 2005, a large oil and natural gas operator (the “Farmee”) made a commitment to drill 50 wells on a significant Penn West land block in northwest Alberta in an area where the Farmee has considerable expertise and infrastructure. The Farmee has shot over 492 square kilometres of new seismic on or in the vicinity of the Penn West farm-out lands and is focusing on three plays including Keg River oil, Sulphur Point natural gas and Bluesky natural gas. By late 2006, the Farmee had drilled 20 wells in the area, including a 400-barrel-per day oil discovery.
Other substantial farm-outs have been made on Penn West lands located in Wainright, Hoosier, Pembina and Neutral Hills, all in Alberta. In the Pembina area, an experienced exploration company is pursuing a multi-year, technically challenging Nisku oil project.
Penn West’s current undeveloped acreage inventory has been reduced to slightly less than four million net acres as a result of its farm-out program, its own development activities and the expiry of some of its leases. The Petrofund merger in 2006 added about 350,000 net undeveloped acres, as well as excellent farm-outs already in progress.
NEW PRODUCTION TO DATE
The full cycle process of identifying lands with farm-out potential, negotiating with prospective farmees, shooting seismic, selecting drillable locations, drilling new wells and constructing gathering and processing infrastructure can often take up to 12-24 months. Penn West began to see royalty revenue from farm-out lands towards the end of 2006 and continued growth in revenue from farm-out royalty lands is expected in 2007. Since the inception of its farm-out program, as of February 2007, farmees had drilled or re-entered a total of 317 wells, bringing the revenue on new volumes of 360 boe per day net to Penn West. Finding and development costs and operating costs attributable to Penn West’s share of these additional production volumes are zero. Farm-out royalty revenues were an estimated $500,000 in February 2007.
41
[GRAPHIC]
Safety is an integral part of Penn West’s operating philosophy and is supported by a proactive health and safety culture within the Trust. The Trust’s ultimate goal is to ensure that our employees and our service contractors’ workers return to their families at the end of the workday in the same condition as they arrived. A key message communicated throughout the organization is that production will not be placed ahead of safety.
As a foundation for continued improvement in our health and safety management system and our overall safety performance, Penn West has focused on increasing employee and service contractor participation in our safety program. Some of the key health and safety focus areas for 2006 were in the following areas:
COMMUNICATION AND COMMITMENT
Penn West strongly believes that a proactive safety culture requires leadership that provides a clear vision and demonstrates a genuine sincerity towards the health and safety of all its employees and service contractors’ employees.
Over the past four years, Penn West has used safety stand-downs as a forum for Penn West managers and executive to be available to field and office employees and service contractors in order to communicate their commitment and expectations. In 2006, Penn West conducted 12 town hall meetings as part of its safety stand-downs, with more than 1,600 service contractors and Penn West employees participating. Penn West also uses these forums to educate employees and service contractors on key initiatives, such as the Trust’s hazard assessment program, driving safety, fatigue management and drug and alcohol education. Through open discussions, and distribution of surveys, Penn West invited an open dialog on potential health and safety concerns and received direct feedback on its performance.
IMPLEMENTATION AND ACTION
Penn West’s safety commitment is implemented at the field level in numerous ways. The Trust cooperates with, and supports, service contractors in improving their safety and environmental performance. One of the focus areas is to hold contracting operators accountable for their conduct on the job site while helping them achieve Penn West’s safety objectives and technical standards. By the end of 2007, all service contractors working for Penn West must be accredited with a Certificate Of Recognition (COR) which is given to employers who develop health and safety programs that meet established standards and are co-signed by Alberta Human Resources and Employment.
As Penn West grows, the Health, Safety and Training team continues to work with operational managers, employees and contractors to align them with Penn West’ safety culture, continuously increasing their safety skills and knowledge. Our goal is to provide a work environment and culture where employees feel they have the responsibility and accountability to manage their individual health and safety, and that of their co-workers.
The following are examples demonstrating how individuals and teams, on a daily basis, are achieving this goal:
• Shutting down oil trucking operations when roads became too icy for safe travel;
• Suspending project construction when service contractors fail to meet the Trust’s operating and safety standards;
• Shutting down a pipeline and related gas processing facilities, after discovering a pipeline that had been exposed through natural river erosion, thus preventing potential harm to people or the environment; and
42
• Reducing the trucking of produced fluids by building new pipelines, and reducing green house gas emissions by electrifying oil fields. All these activities provide safety benefits by reducing vehicle traffic, and thereby reducing the risk of the Trust’s activities to the general public.
ROAD SAFETY MANAGEMENT
Driving is one of the most hazardous tasks performed by Penn West staff and its service contractors’ employees, and has been a focal point of Penn West’s safety initiatives for the past three years. As a result, from 2003 through 2006, Penn West has reduced its vehicle collision frequency by 46 percent. A number of these initiatives contributed to this improvement, including improved driving standards, perception surveys, driver training and vehicle incident investigations.
Penn West Vehicle Accident Rate
[CHART]
Vehicle collision frequency = Number of collisions X 1 million km/Penn West km driven
A driver perception survey conducted in 2005 revealed a gap between a driver’s perception of their ability to multi-task behind the wheel and their actual capability. In addition, many independent studies have shown that in-vehicle driver distractions are a major cause of collisions. In recognition of these studies and the potential risk to the public and its employees, and in consideration that Penn West’s fleet of 600 vehicles travel more than 18 million kilometres per year, Penn West implemented a cell phone-free driving policy early in 2006.
TRAINING AND DEVELOPMENT
Creating a sustainable safety culture requires on-going training and education. Employees must be trained to perform their tasks in a safe and efficient manner. This is increasingly important during the current rapid growth in western Canada’s oil and gas industry. Penn West provides all field operators with five days of intensive classroom and hands-on safety training that must be renewed every three years. Over the past two years, over 310 employees have received this training.
In 2005, Penn West introduced a field-based competency training and evaluation program. The program’s objective is to validate that the Trust’s operators are competent in performing their tasks and can apply the knowledge they have accumulated. By the end of 2006, Penn West’s dedicated team of competency coordinators had completed 2,634 critical task assessments with 376 operators.
To strengthen the foundation of its proactive safety culture, Penn West provides safety leadership training for its leaders and service contractors’ leaders and owners on a regular basis. Over the past two years, 250 leaders completed the three-day supervisor and manager training program.
43
HEALTH, SAFETY & TRAINING
MEASURING PERFORMANCE
The frequency of injuries resulting in at least one day off work (lost-time injury) by Penn West employees has decreased over the last three years. In 2005, Penn West’s employees achieved a rate of zero, and in 2006 achieved a rate of 0.11, as a result of one employee injury. Penn West’s current rate is about half of its peer group of oil and gas companies that are members of the Canadian Association of Petroleum Producers (CAPP). Although our rate is low, our goal is zero.
Lost-Time Injury Frequency
[CHART]
Penn West has also demonstrated a continual reduction in the frequency of recordable injuries (fatalities, lost workday, medical aid) over the last three years. Over the past three years, we have reduced our total recordable injury frequency by 37 percent and this is about half the rate of our peer oil and gas companies that are members of CAPP.
Total Recordable Injury Frequency
[CHART]
Penn West obtained a Certificate of Recognition (COR) in December 2004 and has successfully maintained the COR over the last two years. Penn West also participates in and contributes to CAPP’s Stewardship Program and has maintained the platinum level of reporting.
As a result of our safety performance in 2005, the Trust was recognized by Alberta Human Resources and Employment and received the Work Safe Alberta 2005 Best Safety Performer Award. Only three percent of Alberta’s 128,000 employers receive this award and this is a testament to Penn West’s commitment to a safe and healthy work place.
44
ENVIRONMENT
Penn West is an environmental leader and its commitment is demonstrated in meaningful and measurable action. Penn West is committed to the following:
• Minimizing the environmental impacts of its operations;
• Meeting or exceeding statutory and regulatory provisions concerning the environment; and
• Involving stakeholders throughout the exploration, development, production and abandonment/reclamation phases.
In 2006, Penn West continued environment-related initiatives throughout its operations. The environmental mandate focused on the following four areas.
SOLUTION GAS CONSERVATION
Penn West believes strongly in solution gas conservation. Technically and economically, it is much easier to flare or vent small volumes of natural gas that is released when oil is pumped to surface production facilities. The Canadian energy industry, including Penn West, is committed to minimizing flaring and venting, by installing gas gathering and compression systems in order to capture solution gas at oil facilities. Solution gas conservation delivers environmental benefits while conserving non-renewable natural resources.
The environmental team monitors and evaluates sites that currently do not have gas conservation systems in place in order to prioritize potential projects. In 2005, Penn West had a solution gas conservation rate of 96 percent. This matched the industry average but was lower than our prior year’s performance of 97 percent conservation. The lower conservation rate was due to the recent acquisition of properties with a lesser extent of gas conservation and some existing properties that underwent changes in reservoir characteristics that resulted in additional solution gas production.
Accordingly, the Trust implemented a number of projects to regain its leadership in gas conservation. By the 2006 year-end, five additional sites in our Pembina and Plains areas were conserving solution gas.
Going into 2007, the Trust has a bank of 12 gas conservation projects planned for the next 18 months. These 12 projects have the potential to eliminate 75 percent of the Trust’s currently flared or vented solution gas, thereby increasing its gas conservation rate to 98 percent, well above current average industry levels.
GREENHOUSE GAS (GHG) EMISSIONS
Penn West has participated in the Canadian GHG Challenge Registry (formerly Canada’s Voluntary Challenge Registry Inc.) since 1997 and has maintained Gold Level Status since 2000.
Penn West maintained its greenhouse gas emissions intensity (emissions per unit of production) from 1996 to 2002, a period of strong growth. In late 2002, Penn West purchased properties that significantly increased its electrical consumption and solution gas venting, which increased emissions intensity. Penn West is implementing measures, such as solution gas conservation and electricity consumption assessments, to reduce emissions intensity.
45
ENVIRONMENT
Penn West is an industry leader in CO2 enhanced oil recovery. When injected as a miscible agent to enhance oil production, a large proportion of the CO2 remains permanently sequestered in the reservoir, reducing GHG emissions. Since 2001 Penn West has been operating Alberta’s only commercial CO2 flood at Joffre, Alberta. In 2006 Penn West acquired interests in two commercial CO2 floods in Saskatchewan. At Pembina, Penn West is operating a CO2 pilot that could lead to commercial development and has the potential to sequester 25 megatonnes of CO2 over the project life. This is equivalent to 14 years worth of Penn West’s current GHG emissions. (Please see page 35 for full discussion of these projects.)
In 2006, through its interest in CO2 miscible floods, Penn West sequestered over 250,000 tonnes of CO2, which is equivalent to removing over 45,000 cars from the road.
Net CO2 Sequestration (tonnes C02e)
[CHART]
WELL SITE ABANDONMENT AND RECLAMATION
Penn West goes beyond the frequent industry practice of establishing a “reclamation fund” to fund future abandonment and reclamation. Instead, the Trust is dealing with the consequences of energy operations – right now.
The Trust’s policy is to retire approximately 10 percent of its opening net asset retirement obligations each year, funded by current cash flow. This is double the average level for Canadian energy trusts. In 2006, Penn West’s environmental spending totalled $26.9 million, representing 14 percent of its opening net asset retirement obligation. The prior year’s spending average for energy trusts was seven percent.
Penn West has 10,000 producing wells and several thousand suspended wellbores. Abandonment and reclamation is a multi-step process. Wells are first carefully evaluated for potential productive value through recompletion in the original producing zone or in uphole zones, and whether the rights could be farmed-out to an exploration company. If no potential value is identified, the wellbore is abandoned and reclamation activities begin. Finally, a government agency reviews the work that has been performed and Penn West receives a Reclamation Certificate or equivalent.
46
Responsible well abandonment is an ongoing process. Penn West understands its legal obligations but also considers it an ethical requirement to return land used for energy operations to its original capabilities for agriculture, pasturage, forestry or wildlife. In 2006, Penn West abandoned 58 suspended wellbores and received 101 Reclamation Certificates (or equivalent), double the rate of the previous year. In 2007 and beyond, the Trust will continue to perform a substantial number of reclamations, selected from a rolling inventory of about 500 candidate wells.
REGULATORY COMPLIANCE
Energy operations are regulated primarily at the provincial level. The majority of Penn West’s production is in Alberta, making the Alberta Energy and Utilities Board (EUB) the Trust’s main regulator. Regulatory compliance is a core value for Penn West employees and a corporate objective.
Penn West’s field operations are typically subjected to 400-500 inspections per year, each of which may cover up to 23 categories. Failure in a single category is deemed unsatisfactory, with deficiencies classified as low-risk or high-risk. The risk classification is based on the potential of an event, not upon an actual observed outcome.
In 2006, the energy industry’s overall high-risk non-compliance rate was 2.8 percent. Penn West demonstrated its industry leadership with a low rate of 0.9 percent. Penn West’s facilities were in compliance in 99.1 percent of cases. In addition, the Trust conducted almost 3,994 internal inspections in 2006 to bolster compliance.
This high performance is attributable to the Trust’s commitment to conduct safe, clean and regulatory-compliant operations. Ultimately, it is Penn West’s field personnel who operate the Trust’s facilities and wells at the highest performance standards. The Trust’s in-house compliance team, tracking system and monthly performance monitoring assists our employees to identify issues before they become regulatory or environmental concerns.
High-Risk Non-Compliance Inspection Rate (%)
[CHART]
47
COMMUNITY INVESTMENT
[GRAPHIC]
Our employees often volunteer their time and effort to help make local organizations and events in their communities successful and worthwhile.
Penn West and its employees believe we have a responsibility to contribute to the overall quality of life in communities in which we live and work. As a Trust with operations across western Canada, Penn West makes special efforts to ensure that our community investment efforts are carefully distributed throughout urban and rural communities in all four western provinces. We support these communities through direct financial contributions with emphasis on projects that will have a positive and significant impact in each community.
Our employees often volunteer their time and effort to help make local organizations and events in their communities successful and worthwhile. Penn West encourages the volunteer spirit and dedication of its employees by matching employee contributions, and by providing funding to charities or organizations in which our employees are directly involved.
Penn West’s community investment program is focused on organizations or institutions undertaking projects or events of educational, health, cultural or recreational importance to our communities.
EDUCATION
We realize that the health of the oil and gas industry, as well as our communities, is founded on a strong base of education. Last year, Penn West provided $87,500 in scholarships and bursaries to 20 students at six educational institutions. Additionally, we also made the following multi-year pledges to educational institutions:
• $10,000 to the Northern Lights College – Oil and Gas Centre of Excellence in Fort St. John, BC
• $15,000 to the University of Northern BC – Northern Medical Programs
• $25,000 to the University of Alberta – Engineering Space Needs and Requirements Fund
• $10,000 to SAIT – Aboriginal Futures Endowment Fund
• $12,000 to Medicine Hat College Foundation
• $10,000 to Mount Royal College Foundation
48
heALth
From a community investment perspective, size can make a difference. As the largest energy trust in Canada, Penn West is able to make significant impacts on health and wellness projects in our communities. In 2006, the new Alberta Children’s hospital opened; over the past five years employees contributed $150,000 and Penn West contributed $350,000 toward the 2nd Floor Inpatient Playroom. We can learn so much from children by providing creative outlets for them to express their thoughts, ideas and feelings. Creative play spaces at the new hospital also make it possible to be part of the healing process.
The Hoosier-Coleville operation is a major focus area for Penn West and is home to many of Penn West’s employees and businesses that provide services to our operations. As the surrounding area grows, so does the need for additional medical services and infrastructure. In 2006, Penn West made a five-year pledge of $100,000 to the KLD Wellness Foundation at Kerrobert, and a five-year pledge of $250,000 to the Kindersley Hospital for modernization of X-ray and ultrasound diagnostic equipment as well as paramedic training. Penn West believes that “anchor investments” such as these, provide momentum and the opportunity for smaller businesses and individuals to then participate thus enabling the completion of large capital projects.
coMMuNity services
The rapid growth rate in western Canada’s economy has placed some immediate demands on existing programs and services for those in our communities who, from time to time, need a helping hand. Penn West and its employees have been long-term supporters of the Calgary United Way and in 2006 raised $400,000, a 40 percent increase over the prior year’s fundraising. This year we initiated funding to the United Way in Saskatchewan by providing $15,000 each to the cities of Regina and Swift Current centres which provide support to our field operations.
In addition to the funding provided by Penn West, many employees take it upon themselves to champion a variety of charitable and community service organizations, with full support of the Trust. Our employees, including members of management, are regular volunteers at The Mustard Seed Street Ministry in Calgary, where once a month they help prepare and serve lunch to the Mustard Seed patrons. Also on a monthly basis, Penn West employees and management have committed to fill two Life Buses to take our staff to donate blood to Canadian Blood Services. The Trust sponsored seasonal, social and recreational events are popular venues for our employees to stage fundraising activities for a number of worthwhile organizations and charities.
Community investment is a fundamental part of our corporate culture. Penn West is committed to the well being of those communities and surrounding areas where we operate and where our employees and service providers live and raise their families. To that end Penn West will continue to support the efforts of local organizations and individuals who focus their vision, energy and dedication to make a positive difference in the educational opportunities and the health and community support services available to their families, friends and neighbors.
49
Drilling Program
|
|
|
Three months ended December 31 |
|
Year ended December 31 |
|
||||||||||||
|
|
|
2006 |
|
2005 |
|
2006 |
|
2005 |
|
||||||||
|
|
|
Gross |
|
Net |
|
Gross |
|
Net |
|
Gross |
|
Net |
|
Gross |
|
Net |
|
|
Natural gas |
|
34 |
|
12 |
|
13 |
|
13 |
|
181 |
|
105 |
|
150 |
|
148 |
|
|
Oil |
|
50 |
|
38 |
|
37 |
|
34 |
|
193 |
|
149 |
|
119 |
|
110 |
|
|
Dry |
|
3 |
|
2 |
|
4 |
|
4 |
|
17 |
|
16 |
|
18 |
|
18 |
|
|
Total wells |
|
87 |
|
52 |
|
54 |
|
51 |
|
391 |
|
270 |
|
287 |
|
276 |
|
|
Success rate |
|
|
|
96% |
|
|
|
92% |
|
|
|
94% |
|
|
|
93% |
|
Undeveloped Lands
|
|
|
As at December 31 |
|
||||
|
|
|
2006 |
|
2005 |
|
% change |
|
|
Gross acres (000) |
|
4,176 |
|
4,390 |
|
(5 |
) |
|
Net acres (000) |
|
3,715 |
|
4,142 |
|
(10 |
) |
|
Average working interest |
|
89% |
|
94% |
|
(5 |
) |
Farm-out Activity
|
|
|
Year ended December 31 |
|
||
|
|
|
2006 |
|
2005 |
|
|
Wells drilled on farm-out lands(1) |
|
169 |
|
103 |
|
|
(1) |
Wells drilled on Penn West lands, including re-completions and re-entries, by independent operators pursuant to farm-out agreements. |
Core Areas
|
|
|
Net wells drilled |
|
Undeveloped land |
|
|
|
|
for the year ended |
|
as at December 31, 2006 |
|
|
Core Area |
|
December 31, 2006 |
|
(thousands of net acres) |
|
|
Central |
|
89 |
|
1,305 |
|
|
Plains |
|
148 |
|
1,045 |
|
|
Northern |
|
33 |
|
1,365 |
|
|
|
|
270 |
|
3,715 |
|
50
Trust Unit Data
|
|
|
Year ended December 31 |
|
||||
|
(millions of units) |
|
2006 |
|
2005 |
|
% change |
|
|
Weighted average |
|
|
|
|
|
|
|
|
Basic |
|
200.8 |
|
162.6 |
|
23 |
|
|
Diluted |
|
203.5 |
|
165.9 |
|
23 |
|
|
Outstanding as at December 31 |
|
|
|
|
|
|
|
|
Basic |
|
237.1 |
|
163.3 |
|
45 |
|
|
Basic plus trust unit rights |
|
248.4 |
|
172.7 |
|
44 |
|
On June 30, 2006, Penn West issued approximately 70.7 million trust units on the closing of the Petrofund merger.
Reserve Category Splits Under Forecast Prices and Costs
|
Reserve Estimates Category (1)(2) |
|
Light and |
|
Heavy Oil |
|
Natural Gas |
|
NGL |
|
Barrels of |
|
|
Proved |
|
|
|
|
|
|
|
|
|
|
|
|
Developed producing |
|
146.9 |
|
40.9 |
|
667.6 |
|
17.1 |
|
316.2 |
|
|
Developed non-producing |
|
6.6 |
|
3.1 |
|
46.6 |
|
1.0 |
|
18.5 |
|
|
Undeveloped |
|
33.4 |
|
1.8 |
|
43.4 |
|
1.5 |
|
44.0 |
|
|
Total proved |
|
186.9 |
|
45.9 |
|
757.6 |
|
19.6 |
|
378.7 |
|
|
Probable |
|
50.9 |
|
14.0 |
|
203.2 |
|
5.3 |
|
104.1 |
|
|
Total proved plus probable |
|
237.8 |
|
59.9 |
|
960.8 |
|
24.9 |
|
482.8 |
|
(1) Gross interest reserves are before royalty burdens and exclude royalty interests.
(2) Columns may not add due to rounding.
Reconciliation of Gross Interest Reserves
(before royalty burdens and excluding royalty interests) (using forecast prices and costs)
|
|
|
Oil and NGL |
|
Natural Gas |
|
Barrels of Oil Equivalent |
|
||||||||||||
|
Reconciliation Items (1) |
|
Proved |
|
Probable |
|
Proved |
|
Proved |
|
Probable |
|
Proved |
|
Proved |
|
Probable |
|
Proved |
|
|
December 31, 2005 |
|
196.3 |
|
44.4 |
|
240.7 |
|
565.1 |
|
133.2 |
|
698.4 |
|
290.5 |
|
66.7 |
|
357.1 |
|
|
Extensions |
|
2.2 |
|
0.3 |
|
2.5 |
|
18.4 |
|
2.6 |
|
21.1 |
|
5.3 |
|
0.8 |
|
6.0 |
|
|
Improved recovery |
|
5.6 |
|
4.9 |
|
10.5 |
|
10.4 |
|
1.4 |
|
11.8 |
|
7.3 |
|
5.1 |
|
12.4 |
|
|
Technical revisions |
|
(3.2 |
) |
(2.4 |
) |
(5.6 |
) |
(4.9 |
) |
(15.4 |
) |
(20.3 |
) |
(4.0 |
) |
(5.0 |
) |
(9.0 |
) |
|
Discoveries |
|
— |
|
— |
|
— |
|
2.1 |
|
2.6 |
|
4.7 |
|
0.3 |
|
0.4 |
|
0.8 |
|
|
Acquisitions |
|
72.8 |
|
22.9 |
|
95.6 |
|
278.3 |
|
79.3 |
|
357.6 |
|
119.1 |
|
36.1 |
|
155.2 |
|
|
Dispositions |
|
(0.4 |
) |
(0.1 |
) |
(0.5 |
) |
(0.7 |
) |
(0.7 |
) |
(1.4 |
) |
(0.5 |
) |
(0.2 |
) |
(0.7 |
) |
|
Economic factors |
|
0.9 |
|
0.2 |
|
1.1 |
|
0.3 |
|
0.1 |
|
0.3 |
|
1.0 |
|
0.2 |
|
1.2 |
|
|
Production |
|
(21.7 |
) |
— |
|
(21.7 |
) |
(111.3 |
) |
— |
|
(111.3 |
) |
(40.3 |
) |
— |
|
(40.3 |
) |
|
December 31, 2006 |
|
252.4 |
|
70.2 |
|
322.6 |
|
757.6 |
|
203.2 |
|
960.8 |
|
378.7 |
|
104.1 |
|
482.8 |
|
(1) Columns may not add due to rounding.
51
Reconciliation of Net Interest Reserves
(after royalty burdens and including royalty interests) (using forecast prices and costs)
|
|
|
Oil and NGL |
|
Natural Gas |
|
Barrels of Oil Equivalent |
|
||||||||||||
|
Reconciliation Items (1) |
|
Proved |
|
Probable |
|
Proved |
|
Proved |
|
Probable |
|
Proved |
|
Proved |
|
Probable |
|
Proved |
|
|
December 31, 2005 |
|
177.1 |
|
39.4 |
|
216.5 |
|
462.8 |
|
109.8 |
|
572.6 |
|
254.2 |
|
57.7 |
|
312.0 |
|
|
Extensions |
|
2.0 |
|
0.3 |
|
2.2 |
|
14.9 |
|
2.2 |
|
17.1 |
|
4.5 |
|
0.6 |
|
5.1 |
|
|
Improved recovery |
|
3.8 |
|
4.5 |
|
8.3 |
|
8.8 |
|
1.5 |
|
10.2 |
|
5.3 |
|
4.7 |
|
10.0 |
|
|
Technical revisions |
|
(3.0 |
) |
(2.3 |
) |
(5.3 |
) |
(4.9 |
) |
(12.2 |
) |
(17.1 |
) |
(3.8 |
) |
(4.3 |
) |
(8.1 |
) |
|
Discoveries |
|
— |
|
— |
|
— |
|
1.6 |
|
1.9 |
|
3.5 |
|
0.3 |
|
0.3 |
|
0.6 |
|
|
Acquisitions |
|
61.7 |
|
19.3 |
|
81.0 |
|
223.1 |
|
64.2 |
|
287.3 |
|
98.8 |
|
30.0 |
|
128.9 |
|
|
Dispositions |
|
(0.3 |
) |
(0.1 |
) |
(0.4 |
) |
(0.7 |
) |
(0.3 |
) |
(1.0 |
) |
(0.5 |
) |
(0.2 |
) |
(0.6 |
) |
|
Economic factors |
|
0.8 |
|
0.2 |
|
1.0 |
|
0.2 |
|
0.1 |
|
0.3 |
|
0.9 |
|
0.2 |
|
1.1 |
|
|
Production |
|
(18.5 |
) |
— |
|
(18.5 |
) |
(87.8 |
) |
— |
|
(87.8 |
) |
(33.1 |
) |
— |
|
(33.1 |
) |
|
December 31, 2006 |
|
223.6 |
|
61.2 |
|
284.8 |
|
618.0 |
|
167.2 |
|
785.3 |
|
326.6 |
|
89.1 |
|
415.7 |
|
(1) Columns may not add due to rounding.
Total company interest proved plus probable reserves, which are before royalty burdens and include royalty interests, of 486 mmboe at the end of 2006 were 35 percent higher than proved plus probable reserves of 360 mmboe at the end of 2005.
Net Present Value of Future Net Revenue Under Forecast Prices and Costs
($ millions)
|
|
|
Net present value of future net revenue |
|
|||||||
|
Reserve Category |
|
5% |
|
10% |
|
15% |
|
|||
|
Proved |
|
|
|
|
|
|
|
|||
|
Developed producing |
|
$ |
6,568 |
|
$ |
5,174 |
|
$ |
4,333 |
|
|
Developed non-producing |
|
375 |
|
248 |
|
186 |
|
|||
|
Undeveloped |
|
784 |
|
475 |
|
308 |
|
|||
|
Total proved |
|
$ |
7,727 |
|
$ |
5,897 |
|
$ |
4,826 |
|
|
Probable |
|
1,891 |
|
1,152 |
|
793 |
|
|||
|
Total proved plus probable |
|
$ |
9,618 |
|
$ |
7,049 |
|
$ |
5,619 |
|
Net present values are net of producing wellbore abandonment liabilities and are based on the price assumptions that are
contained in the following table. The estimated future net revenues do not represent fair market value.
52
Summary of
Pricing and Inflation Rate Assumptions
as of December 31, 2006 Under Forecast Prices and Costs
|
|
|
Oil |
|
|
|
|
|
|
|
|
|
|
|
||||
|
|
|
WTI |
|
Edmonton |
|
Hardisty |
|
Cromer |
|
|
|
|
|
|
|
|
|
|
|
|
Cushing, |
|
Par |
|
Heavy |
|
Medium |
|
Natural Gas |
|
Edmonton |
|
Inflation |
|
Exchange |
|
|
Year |
|
Oklahoma |
|
40° API |
|
12° API |
|
29° API |
|
AECO |
|
Propane |
|
Rate |
|
Rate |
|
|
|
|
($ US/bbl) |
|
($ CAD/bbl) |
|
($ CAD/bbl) |
|
($ CAD/bbl) |
|
($ CAD/mcf) |
|
($ CAD/bbl) |
|
(%) |
|
(CAD/USD) |
|
|
Historical |
|
|
|
|
|
|
|
|
|
|
|
|
|
|
|
|
|
|
2002 |
|
26.08 |
|
40.33 |
|
26.57 |
|
35.48 |
|
4.04 |
|
21.39 |
|
2.2 |
|
0.637 |
|
|
2003 |
|
31.07 |
|
43.66 |
|
26.26 |
|
37.55 |
|
6.66 |
|
32.14 |
|
2.8 |
|
0.721 |
|
|
2004 |
|
41.38 |
|
52.96 |
|
29.11 |
|
45.75 |
|
6.88 |
|
34.70 |
|
1.8 |
|
0.768 |
|
|
2005 |
|
56.58 |
|
69.11 |
|
34.07 |
|
56.62 |
|
8.58 |
|
43.04 |
|
2.2 |
|
0.825 |
|
|
2006 |
|
66.22 |
|
73.16 |
|
41.87 |
|
62.24 |
|
7.02 |
|
43.97 |
|
2.1 |
|
0.882 |
|
|
Forecast |
|
|
|
|
|
|
|
|
|
|
|
|
|
|
|
|
|
|
2007 |
|
62.00 |
|
70.25 |
|
39.25 |
|
61.25 |
|
7.20 |
|
45.00 |
|
2.0 |
|
0.870 |
|
|
2008 |
|
60.00 |
|
68.00 |
|
40.00 |
|
59.25 |
|
7.45 |
|
43.50 |
|
2.0 |
|
0.870 |
|
|
2009 |
|
58.00 |
|
65.75 |
|
39.75 |
|
57.25 |
|
7.75 |
|
42.00 |
|
2.0 |
|
0.870 |
|
|
2010 |
|
57.00 |
|
64.50 |
|
39.75 |
|
56.00 |
|
7.80 |
|
41.25 |
|
2.0 |
|
0.870 |
|
|
2011 |
|
57.00 |
|
64.50 |
|
40.25 |
|
56.00 |
|
7.85 |
|
41.25 |
|
2.0 |
|
0.870 |
|
|
2012 |
|
57.50 |
|
65.00 |
|
41.50 |
|
56.50 |
|
8.15 |
|
41.50 |
|
2.0 |
|
0.870 |
|
|
2013 |
|
58.50 |
|
66.25 |
|
42.50 |
|
57.75 |
|
8.30 |
|
42.50 |
|
2.0 |
|
0.870 |
|
|
2014 |
|
59.75 |
|
67.75 |
|
43.50 |
|
59.00 |
|
8.50 |
|
43.25 |
|
2.0 |
|
0.870 |
|
|
2015 |
|
61.00 |
|
69.00 |
|
44.25 |
|
60.00 |
|
8.70 |
|
44.25 |
|
2.0 |
|
0.870 |
|
|
2016 |
|
62.25 |
|
70.50 |
|
45.25 |
|
61.25 |
|
8.90 |
|
45.00 |
|
2.0 |
|
0.870 |
|
|
2017 |
|
63.50 |
|
71.75 |
|
46.00 |
|
62.50 |
|
9.10 |
|
46.00 |
|
2.0 |
|
0.870 |
|
|
Thereafter |
|
2% |
|
2% |
|
2% |
|
2% |
|
2% |
|
2% |
|
2.0 |
|
0.870 |
|
Future Development Costs Under Forecast Prices and Costs
($ millions)
|
Year |
|
Proved Future Development Costs |
|
|
|
2007 |
|
$ |
148 |
|
|
2008 |
|
166 |
|
|
|
2009 |
|
98 |
|
|
|
2010 |
|
73 |
|
|
|
2011 |
|
57 |
|
|
|
2012 and subsequent |
|
176 |
|
|
|
Undiscounted total |
|
$ |
718 |
|
|
Discounted @ 10%/year |
|
$ |
518 |
|
53
|
Trevor Aadland |
Robert Bak |
Orysia Blahut |
Lynn Callsen |
Nadine Closs |
Florenciana |
|
Robert Abofsky |
Marjorie Baker |
Michael Blair |
Alison Cameron |
Cecil Coate |
De Souza |
|
Ray Abt |
Tim Bakos |
Ellen Blayshyn |
Brooke Campbell |
Carl Cocks |
Mark De Souza |
|
Lorraine Ahearn |
Ryan Balaski |
Evan Bloomfield |
Harvey Campbell |
Randy Coen |
Brent DeBusschere |
|
Sitaleki Akauola |
Christine Ball |
Jaclyn Bock |
Heather Campbell |
Paula Collard |
Gregory Dedora |
|
Nawras Akkad |
Rodney Ball |
Barbara Bogart |
Lionel Campbell |
Kyle Colling |
Daniel Deiana |
|
Lucas Alberts |
Leona Ballman |
Kyla Bohay |
Nadine Campbell |
Mark Colucci |
Angela Dejong |
|
John Alexander |
Glenn Bamber |
Gordon Borle |
Jumar Cancel |
Andrew Connolly |
Garrett Dell |
|
Bradley Alfred |
Debbie Baron |
Don Borton |
Jefferie Cannon |
Philip Connolly |
William Demers |
|
Ralph Allen |
Deanna Barrell |
Wayne Borton |
Kevin Carefoot |
Timothy Connolly |
Eugene Dennis |
|
Thomas Allsop |
Gina Barrell |
David Bosch |
Leslie Carlyle-Ebert |
Brian Cooke |
Lars DePauw |
|
Rosa R. Alolor |
Diego Barrenechea |
Kevin Bossert |
Neil Carnell |
Thomas Cookson |
Lynsey Devuyst |
|
Myron Andersen |
Michael Barry |
Bradley Bouchard |
Murrey Carpendale |
Jason Cooper |
Gregg Dickson |
|
Aaron Anderson |
Brent Basisky |
Brett Bouchard |
Philip Carpentier |
Kelly Cooper |
Donald Dillabaugh |
|
Craig Anderson |
Kelly Batten |
Evan Bouey |
Allan Carter |
Thomas Cooper |
Shirley Din |
|
David Anderson |
Kayla Baxter |
Jane Bouey |
Michael Carteri |
Dean Copley |
Abigail Diotay |
|
Lorne Anderson |
Curtis Bazylinski |
Maurice Bourgeois |
Craig Caseley |
Ameeta Cordell |
William Disney |
|
Robert Anderson |
Stephen Beairsto |
Antoinette Bowser |
Cory Cavener |
Colleen Cornish |
Isidora Dizon |
|
Valrie Anderson |
Allison Beaton |
Ryan Boyd |
Lindsay Cavers |
Donald Cote |
Patricia Docken |
|
Kyle Andrew |
David Becker |
Gloria Bradley |
Ann Ceccanese |
Rachel Cote |
Jason Dods |
|
William Andrew |
Ginnette Becker |
Scott Brand |
Rabih Chaar |
Wendy Couronne |
Darin Doetzel |
|
Janet Anstett |
Lynda Becker |
Calvin Bray |
Louis Chabot |
Dali Courtright |
Ji Gang Dong |
|
Brian Antoni |
Miguel Belarde |
Vivian Bredin |
Roger Chalmers |
Vicki Cowie |
Lorraine Douglas |
|
Joseph Aramunde |
Oktay Belek |
Krystal Brekkaas |
Barclay Charlton |
Darcy Crawford |
Andrea Draper |
|
Doug Arctander |
James Bell |
Michael Breward |
Kun Cheang |
Tammie Cretney |
Timothy Dreyer |
|
Edward Armagost |
Harold Bellerose |
Oren Brewer |
Tammy Chenard |
Douglas Cromer |
Darryl Drynan |
|
Allan Armstrong |
Monty Bender |
Clifford Brigley |
Thomas Chenard |
David Crosley |
Armand Dube |
|
Sharon Armstrong |
Shawn Bennett |
Rick Brigley |
Cheuk Cheng |
Jeffery Cross |
Gerard Dufault |
|
Kristine Arthur |
Jason Berger |
Laurence Broos |
Carla Cherrington |
Gregory Cunliffe |
Kim Dufort |
|
William Arthur |
Robert Berki |
Vance Brost |
Mitchell Chibri |
Tara Cybulsky |
Trevor Dufresne |
|
John Artym |
Alan Berry |
Carla Brown |
Dennis Choi |
Darren Cygan |
Robert Dumaine |
|
Kyle Atkinson |
Billie Berry |
Riley Brown |
Danny Chow |
Dawn Dack |
Christine Dunham |
|
Jessica Au-yeung |
Mayda Beylerian |
Terry Brown |
Gloria Choy |
Trevor Dales |
Alex Dunlop |
|
Shaun Axworthy |
Clinton Bezan |
Randy Buehler |
Kurtis Christianson |
Regan Daley |
Amanda Dunlop |
|
Anne Babala |
Paula Bica |
Garry Paul Bullock |
Linda Chu |
Noe Damian |
Carla Dunlop |
|
Henry Babayan |
Barry Bigford |
Carl Bur |
Jeffary Chung |
Randy Danais |
Susan Dunn |
|
Aaron Babiak |
Jeffrey Biggin |
James Burgess |
Barry Chykerda |
Terry Daniels |
Jesse Dupuis |
|
Kevin Bachman |
Kenneth Bills |
Lori Burland |
Audrey Clark |
Joel Darr |
Rachel Dupuis |
|
Paul Baglole |
Rhett Binding |
Janet Burns |
Larry Clark |
Jo-Elle Dauncey |
Alvin Dusterhoft |
|
August Baier |
Jenna Bingeman |
Ann Burrage |
Alan Clarke |
Charles Douglas |
David Dusterhoft |
|
James Baier |
Darrel Bird |
Zen Buss |
Eric Clarke |
Davey |
Dean Dusterhoft |
|
Jamie Baier |
Morley Birnie-Browne |
Radu Buzea |
Barry Clarkson |
Rosie David |
Bradley Dyck |
|
Mary Ann Bailey |
|
Rachel Caine |
Robert Clayson |
Sean David |
Joey Eaton |
|
Cory Bain |
Corey Bitzer |
Wayne Calahasen |
Wendy Clermont |
Dwayne Davison |
Roulette Edwards |
96
|
Debbie Friesen |
Robert Grue |
Sharlene Hopkins |
Michiko Kajita |
Dustin Kreiser |
|
|
Darrell Ekencrantz |
John Frison |
Wayne Gruhlke |
Camelia Horvath |
Raymond Karlson |
Phil Krishka |
|
Neamatalla Elashry |
Colin Frost |
Brian Guilfoyle |
David Houston |
Tara Kaupp |
Artem Krivorotov |
|
James Ell |
Brett Frostad |
Dale Guillemin |
Glennis Houston |
Chris Keenan |
Fatima Hannah |
|
Theresa Ellard |
Darryl Fruhstuk |
Leonard Gunderson |
Melissa Howard |
Frederick Keith |
Krtolica |
|
Clifford Ellis |
Fiona Fung |
James Gusek |
Barry Hrushka |
Michelle Keith |
Daisy Kwan |
|
Gavin Ellsworth |
Barrie Furlong |
Darrell Gylander |
Charolette Huber |
Robert Sean Keller |
Ben L’Hirondelle |
|
Salma Elmaghraby |
Neil Gallant |
Hilary Hahn |
David Hubschmid |
Chad Kellgren |
Jeremy Laclare |
|
Connie Emond |
Kevin Gallaway |
Denisa Haist |
William Huddlestun |
Cyril Kelly |
Anthony Laczo |
|
Agota English |
Yasmin Gangji |
Gary Hale |
Parker Hughes |
Elizabeth Kelly |
Clara Lai |
|
Stephen Ennis |
Kevin Gardiner |
Demitra Haliamalias |
Cash Huillery |
Cheryl Kennedy |
Magni Lake |
|
Darin Eno |
Ryan Gardner |
Crystal Hall |
Timothy Hulkovich |
Trevor Kennedy |
John Lambie |
|
Ron Enyedy |
Clayton Gates |
Ingrid Hall |
Justin Humenjuk |
Rodney Kerby |
Chad Lanctot |
|
Anastasia Epp |
Gregg Gegunde |
Ivor Haluszka |
Stacey Hunchak |
James Kesegic |
Andrew Lane |
|
Devan Erickson |
Timothy Geldreich |
Roberta Hancock |
James Hurd |
Michael Kinakin |
Tammy Langer |
|
Edwin Erickson |
Matthew George |
Patricia Hanley |
Donald Huston |
Anling King |
Lonnie Langford |
|
James Erker |
Kody Gerein |
Tara Hannon |
Jason Hutchins |
Richard King |
Roger Lanovaz |
|
Kenneth Erker |
Julien Gervais |
Christine Hansen |
Alexander Huttges |
Michael Kingsbury |
Norman Lapierre |
|
Anton Esterhuizen |
Janet Gervin |
Donald Hansen |
George Iancu |
Ayesha Kirmani |
Reuben Larsen |
|
Dale Evans |
Trevor Gettis |
Valerie Hansen |
Lara Imrou |
Tyler Kirsch |
Donald Larson |
|
Danielle |
Dale Gibb |
Mark Hardman |
Kevin Isert |
Brent Kissick |
Wade Larson |
|
Evashkevich |
Alison Gibbs |
Muriel Harkness |
Shimpei Ito |
Alan Kitagawa |
Joshua Lau |
|
Neil Evert |
Terrence Giesbrecht |
Shawn Harmacy |
Kevin Jack |
Gail Kittelson |
Gregory Lavergne |
|
Andrew Ewanuk |
Darryl Gill |
Brock Harrison |
Grant Jackson |
Jim Klap |
Lucas Law |
|
Carla Fallows |
Justine Gill |
David Harrison |
Jigna Jadeja |
Kent Klatchuk |
Allen Lawrence |
|
Keith Faye |
Moninder Gill |
Daniel Hartley |
Brad Jaffray |
Lorraine Klatt |
Robert Lawson |
|
Jiani Fei |
Paul Glabus |
Guillermina Hartley |
Cheryl James |
Mark Klink |
Tim Layton |
|
Trudy Feldmeyer |
Neil Glazebrook |
Gordon Harvey |
Robert Jamieson |
Dalton Klippert |
Tom Layton |
|
Tim Fenske |
Gregory Goddard |
Philip Hauck |
Jeremy Jansen |
James Kluczny |
Gary LeBlanc |
|
Melanie Fiddler |
Tracy Goddard |
Terry Haug |
Michael Jardine |
Michael Kluczny |
Stephen LeBlanc |
|
Barbara Finley |
Matthew Gomke |
Wesley Hayden |
Roland Jean |
Yvonne Knibbs |
Kevin Ledinski |
|
Clifford Finley |
Carl Gordon |
Terry Haydey |
TJ Jeethan |
Gordon Knight |
Joseph Lee |
|
Mervin Firkus |
Todd Gould |
Lorie Haydu |
Dean Jeffries |
Mark Knightly |
Sunni Lee |
|
Daniel Flick |
Wally Grab |
Stanley Hein |
Megan Jelly |
Sheryl Knock |
Tamara Lee |
|
Patty Flick |
Ruth Graca |
Trevor Hein |
John Jenkins |
Kelly Koch |
Wendy Lee |
|
Jaryn Flower |
Keith Grainger |
Kevin Henry |
Robin Jenn |
Ryan Koehn |
William Lee |
|
David Flynn |
Leonard Granson |
Daniel Herman |
Trevor Jennens |
Sherry Koftinoff |
Jeff LeFler |
|
Scott Flynn |
Alan Grant |
Jaclyn Hern |
Thane Jensen |
Keith Kohlman |
Robert Lemon |
|
Gregory Foofat |
Josephine Grant |
Darryl Herner |
Dean Jenson |
Iska Kolackovsky |
Dustan Lenstra |
|
Jackson Ford |
Gene Graves |
Debra Herold |
Xiaowei Jia |
Jason Kopec |
Nolan Lerner |
|
Dean Forrester |
David Gray |
Margaret Herr |
Crystal Johansen |
Richard Kopeechuk |
Robert Letourneau |
|
Leo Forseille |
Jason Gray |
Dean Herron |
Brett Johnson |
Donald Koppang |
Chad Leugner |
|
Stan Forsyth |
Ryan Gray |
Michael Hicke |
Wayne Johnson |
Robert Kosaka |
Ken Leuschen |
|
Harvey Foss |
William Gray |
Anne Higgins |
Clinton Johnston |
Grace Kostka |
Elaine Liddiard |
|
Shannon Foster |
Ken Grebinski |
Ellen Hill |
Kevin Johnston |
Carla Kostuik |
Dwayne Lingley |
|
Wilfred Foster |
Gloria Greenstein |
Kevin Hill |
Marguerite |
Randal Kovitch |
Dale Litke |
|
Bill Foth |
Russell Gregg |
Lois Hinz |
Johnston |
Addison Kowal |
John Littke |
|
Kevin Frankiw |
Jim Greik |
Kristin Hodgins |
Paul Johnston |
Brian Kowalko |
Scott Littke |
|
Lara Fredriksen |
Eliza Groeneveld |
Jack Hoffman |
Leighton Jones |
Duane Krahn |
Tina Liu |
|
Edward Freeman |
Lonny Grover |
Kevin Holowach |
Kristina Jovanovic |
Goldie Kramer |
Perry Livingstone |
|
Roger Freeman |
Trevor Grover |
Katrina Hong |
Donna Kada |
Martina Kranjcevic |
Elisabeta Loas |
97
|
Alan Martens |
Quenton McNutt |
Clancey Neill |
Paula Perry |
Derek Riewe |
|
|
Kevin Loehndorf |
Douglas Martens |
Rick Mcqueen |
Greg Nesom |
Jennifer Pery |
Leonel Rincon |
|
Clinton Long |
Duane Martens |
Pamela Mcquillen |
Kathryn Nettesheim |
Lindsay Peters |
William Rinehart |
|
Leanne Longpre |
Derek Martin |
Karen Meakin |
Brian Neumeier |
Agostino Pezzente |
Dianne Roberts |
|
Dennis Lonnberg |
Gale Martin |
Harry Mears |
Jason Neumeier |
Javeline Pfeffer |
Dean Rogers |
|
Bradley Lonsdale |
Perry Martin |
Sean Meehan |
Scott Neumeier |
Michael Picard |
Russell Rogers |
|
Derek Loomer |
Zuzana Martinez |
Tamara Melbourn |
Ross Neville |
Cory Picklyk |
James Rolston |
|
Jason Lougheed |
Debora |
Nelson Mendes |
Amy Newman |
Grant Pickrell |
Gary Ross |
|
Timothy Louis |
Martin-Fournier |
Anita Meneses |
Randolph Newton |
Darren Pietsch |
Geoffrey Rossos |
|
Wade Lourance |
Ryan Marx |
David Meston |
Long Nguyen |
Robert Pilz |
Eugene Roth |
|
Kirk Low |
Joel Massie |
Jonathan Metherell |
Harry Nibourg |
Loren Pinchin |
Claude Routheir |
|
Brent Lubeck |
Brent Mastre |
Tara Methuen |
James Nishida |
Aurelian Pirvulescu |
James Rowan |
|
Kenneth Lucas |
Ronald Matchett |
Jason Mevel |
Earl Nixon |
Gary Podesta |
Jade Rowe |
|
Keith Luft |
Charles Matters |
David Middleton |
Lana Nixon |
Kevin Polsfut |
Scott Rowley |
|
Carol Lupyczuk |
Jenna May |
Irena Milisic |
Shane Norgaard |
Denny Pon |
Garnet Roysum |
|
Le Luu |
David McBride |
Kristina Milisic |
Russell Norrish |
Susan Ponto |
Michael Rublee |
|
Brandi Lynch |
MarianneMcBride-Holmberg |
Alvin Miller |
Gary Noskiye |
Gabriela Pop |
Jamie Ruptash |
|
Barry Lyons |
Stanley McBurney |
Gregory Miller |
Marcel Noskiye |
Allan Post |
Wayne Ruptash |
|
Kyle Lyons |
Chris McCarthy |
Mandy Miller |
Michael Nydokus |
Sharon Potter |
Kathy Rurak |
|
Minh Ma |
Deborah McCarthy |
Randy Miller |
Eric Obreiter |
Bruce Powell |
Collin Ryberg |
|
Melissa MacAdam |
Shawn McConaghie |
Douglas Minchin |
Bruce O’Brien |
Elaine Powell |
Herbert Sadek |
|
Michael MacDonald |
Larry McCook |
Robert Mischuk |
Rick Ochs |
Michael Powell |
Michelle Sadowinski |
|
Jennifer MacFarlane |
Todd McCracken |
Amanda Mitchell |
Michael O’Connell |
Daryl Presakarchuk |
Majid Saeedi |
|
Brad Maciborski |
Denise McCrea |
Katherine Mitsch |
Arthur Odachowski |
Daniel Price |
Andrea Saini |
|
Robert Maciborski |
Paul McCreary |
Terry Mizen |
Les Oddan |
Matthew Price |
Deepak Saini |
|
Tom Maciborski |
Justin McDonald |
Cristian Moangher |
Janet O’Farrell |
Robert Prieston |
John Sallis |
|
Walter Maciborski |
Ronald McDonald |
Simona Moangher |
Terry O’How |
Kevin Proctor |
Margarita San Juan |
|
Robert MacInnis |
Steven McDonald |
Glen Mock |
Olena Osipov |
Donald Provencher |
J.T. Sandhu |
|
Andrew MacIsaac |
Colleen McDougall |
James Moi |
Scott Osterhold |
Randolph Pysar |
Sonia Sandhu |
|
Candice MacIsaac |
Daniel McEachern |
Melissa Mooney |
Austin Mark Otis |
Michael Quibell |
Randy Sather |
|
Catherine MacKenzie |
Wayne McEachern |
Noel Moore |
Kwame |
Kimberley Radcliffe |
Mairead Sattler |
|
Will MacKinaw |
Darren McGonigle |
Michael Moran |
Owusu-Boahene |
James Rae |
Brett Sautner |
|
Jesse MacKinnon |
Brendan McGowan |
Wade Morasch |
Rodney Pacholek |
Mohammed |
Craig Sawyer |
|
Lori MacLean |
Laura McGrath |
William Morgan |
Shaina Paluck |
Rahmath |
Robert Sawyer |
|
Jeffrey MacNevin |
Norm McGregor |
Sheryl Moroziuk |
Andrea Panakova |
David Raja |
Kenneth Sayers |
|
Laurel Macphail |
Tara McIndoe |
David Morrison |
Gina Pangia |
Michael Rankin |
Kevin Schaub |
|
Matthew Macquarrie |
Melanie McInnis |
Kevin Morrissette |
Neal Pangman |
Travis Rappel |
Pierre Schaub |
|
Rebecca Magiera |
Brett McIntosh |
Kevin Muchowski |
Annick Paquet |
Crystal Raymond |
Rick Schiller |
|
Patrick Magwood |
Shauna McIntosh |
Robert Muise |
Pearl Parchem |
Jeffrey Reader |
Karen Schmaus |
|
Justin Major |
Jennifer McIsaac |
Lisa Mulder |
William Park |
Don Rechenmacher |
Robert Schmidt |
|
Maria Malinis |
Christopher McKay |
Bonnie Mulville |
Donald Parker |
Brian Reed |
Jason Schneider |
|
Shawn Malone |
Randolph McKenzie |
Shelley Mundy |
Ellen Parker |
Kent Reed |
Ryan Schnitzler |
|
Ronald Mancini |
Angela McKinnon |
James Murphy |
Carlos Pascual |
Jay Reeser |
Timothy Scholl |
|
Linda Mann |
Clarke McLean |
Kevin Murphy |
Randall Pasemko |
Mitchell Reimer |
Darwin Schreiber |
|
David Mansfield |
Lee McLean |
Kathy Musfelt |
Gabriel Payne |
Michael Reinhart |
Sharon Schreiner |
|
Anthony Marchand |
Marcia McLean |
Kenneth Nagy |
Jillian Peck-Espinosa |
Doug Reid |
Jennifer Schroeder |
|
Brandon Marchand |
Peter McLelland |
Daniel Narkaus |
Trent Pelley |
Brian Reis |
Dawn Schubert |
|
Frank Marchesan |
Wade McLeod |
Aleksandra |
Lana Penman |
Martin Resch |
Kent Schurman |
|
Janet Marcotte |
Laurel McLure |
Naczk-Cameron |
Bernie Penner |
Chance Rich |
Gail Schwartz |
|
Kristian Marshall |
Erin McNichol |
Brian Nattress |
Paul Perrin |
Gary Richardson |
Roland Schwengler |
|
Mary Marsters |
Amanda McNiven |
Ysabel Nava |
Corey Perry |
Linda Richardson |
Leslie Scobey |
98
|
Carolyn Sloane |
Joy Stuckle |
David Thomson |
Richard Vaughan |
Jeffrey Wilson |
||
|
Raymond Scott |
Gary Smart |
Charlotte Sullivan |
Peter Thornton |
John Veldhuis |
Joshua Wilson |
|
|
Blair Sczebel |
Travis Smigelski |
Roger Sullivan |
James Thurston |
Eric Vert |
Kari Wilson |
|
|
Edwina Seath |
Adam Smith |
Timothy Sullivan |
Anthony Roy |
Kelly Vetter |
Daniel Wirstiuk |
|
|
Brent Seely |
Catherine Smith |
Berk Sumen |
Timmermans |
James Veysey |
Joseph Woitas |
|
|
Peggy Seely |
Coreen Smith |
Michael Sutherland |
Kevin Titanich |
Harley Vig |
Helen Wong |
|
|
Raman Seetal |
Ellen Smith |
Ralph Swaile |
Craig Tkach |
Janey Villiers |
Cortney Wood |
|
|
John Seffern |
Kenneth Smith |
Garett Swap |
Gary Tkacik |
Steven Vincent |
Dustin Wood |
|
|
Terry Sekulich |
Lyle Smith |
Stanley Sware |
Romeo Tobias |
Waylon Vipond |
Randolph Woods |
|
|
Pamela Sellar |
Marjorie Smith |
Wes Swelander |
Kimberley Toews |
Grant Vogel |
Michelle Wortley |
|
|
Lawrence Serfas |
Michael Smith |
Yvonne Switzer |
Tanya Tomlinson |
Leland Voll |
Bonna Wright |
|
|
Maryan Service |
Richard Smith |
Christine Symington |
Wesley Tomm |
Paulina Vrablik |
Peter Wuntke |
|
|
Ellen Seto |
Timothy Smith |
Darrel Szabo |
Douglas Townsend |
Jenny Vuong |
Eileen Xu |
|
|
Susan Seto |
Kirk Sortland |
Kathy Szeto |
Colin Traff |
Courtenay Wachtler |
Leigh Yakemchuk |
|
|
Gordon Shannon |
Dwayne Sparks |
Doug Sztym |
Phuong Tran |
Wesley Wakefield |
Cameron Yamada |
|
|
Carl Shantz |
Alice Spencer |
Michael Szwec |
Teresa Tran |
Dirk Walstra |
Geng Yan |
|
|
Kendra |
Roberta Spencer |
Josephine Taguibao |
Jack Trask |
Dwayne Ward |
Denis Yang |
|
|
Shaughnessy |
Kevin Sproule |
Barbara Tait |
Daniela Trastanetz |
Susan Warren |
Jennifer Yanke |
|
|
Nesha Shaw |
Eleanor Spurell |
Todd Takeyasu |
Susan Traviss |
Ryan Wasik |
Svetlana Yanova |
|
|
Elmer Sheflo |
Kevin St. John |
Femi Talabi |
Nolan Treble |
Wayne Wasmann |
Jeffrey Yarnold |
|
|
Hussain Sheika |
quinton St. Pierre |
Daniel Tall |
Norman Trelford |
Lloyd Waters |
Peter Yaro |
|
|
Diana Sheprak |
Albert Stabbler |
Richard Tanaka |
James Tremere |
Dwaine Watson |
Jeremy Yee |
|
|
Stephen Sherwick |
Clair Stafford |
William Tang Kong |
Nimisha Trivedi |
Travis Watts |
Lisa Yee |
|
|
Susan Shi |
Stephen Stang |
Cory Tang |
Patrick Tubbs |
Nicole Weatherly |
Katherine Yesensky |
|
|
Shane Shier |
Angie Stastook |
Eric Tang |
Terrance Tuffs |
Brian Webb |
Wunbing Yeung |
|
|
Kevin Shingoose |
Calvin Staudinger |
Kristian Tange |
Mohammad Tuhinuzzaman |
Marguerite |
George Yip |
|
|
Jessie Shire |
Jerry Stec |
Dani Tarditi |
Dallas Turcotte |
Weidmann |
Roland Young |
|
|
James Shukin |
Brenda Stecyk |
Gina Tarditi |
Cory Turk |
Ealaine West |
Clifford Younghans |
|
|
Daniel Sifert |
Clay Steeves |
Dennis Taylor |
Travis Turzanski |
April Wharton |
Luningning Yue |
|
|
Dean Sikorski |
Darrell Steeves |
Robert Temple |
Bryan Tutty |
Dwane Whelen |
Sonny Yuremchuk |
|
|
Shane Silverberg |
Bradley Steinke |
Eunice Terte |
Bruce Tweedle |
Rodney Whelen |
Corey Zadko |
|
|
Corey Simard |
Paul Steinke |
Tracy Theunissen |
Samantha Tweedle |
Terry Whittleton |
Rebecca Zhang |
|
|
Craig Simmers |
Oswald Steinwald |
Angela Thiessen |
Darlene Twietmeyer |
Gordon Wichert |
Perry Zich |
|
|
Richard Simmons |
Christopher |
Roger Thiessen |
Quinten Tye |
Kelly Widmeyer |
Mandy Zimmerman |
|
|
Kent Simon |
Stephens |
Sean Thomas |
Bassey Udoh |
Stacey Wiebe |
Melissa Zimmerman |
|
|
Michael Simpson |
Dave Stephenson |
Brett Thompson |
Gabriel Ukueku |
Danielle Wiess |
Travis Zubot |
|
|
Patricia Simpson |
Miles Stern |
Carol Thompson |
Geri Urch |
David Will |
Sean Zunti |
|
|
Les Sinclair |
Dan Stevens |
Christopher Thompson |
Stephen Ursulescu |
Shelsea Willett |
Terry Zunti |
|
|
Ryan Singer |
Timothy Stevenson |
Sheldon Thompson |
Carl Vallieres |
Daniel Williams |
Shaun Zygmunt |
|
|
Cindy Siska |
Bruce Stewart |
Paul Thorburn |
John Van Nieuwkerk |
Deedee Williams |
|
|
|
Eric Skelhorne |
Josh Stipanov |
Nicole Thoms |
Blake Vanberg |
Brian Wilson |
|
|
|
Kim Skirten |
Benjamin Stoodley |
Anne Thomson |
Carmen Vantu |
Garrett Wilson |
|
|
|
David Slack |
Alvin Stubel |
|
|
James Wilson |
|
|
In Memory
In the past year we were deeply saddened by the loss of Audrey Clark and Ralph Swaile. Our thoughts go out to their family and friends.
99
|
|
|
Year ended December 31 |
|
|||||||||||||
|
|
|
2006 |
|
2005 |
|
2004 |
|
2003 |
|
2002 |
|
|||||
|
FINANCIAL |
|
|
|
|
|
|
|
|
|
|
|
|||||
|
($millions, except unit and per unit (1) amounts and payout ratio) |
|
|
|
|
|
|
|
|
|
|
|
|||||
|
Gross revenues |
|
$ |
2,100.9 |
|
$ |
1,919.0 |
|
$ |
1,521.3 |
|
$ |
1,394.2 |
|
$ |
1,008.4 |
|
|
Cash flow (2) |
|
1,176.8 |
|
1,184.6 |
|
866.7 |
|
812.8 |
|
463.5 |
|
|||||
|
Basic per unit |
|
5.86 |
|
7.28 |
|
5.37 |
|
5.04 |
|
2.90 |
|
|||||
|
Diluted per unit |
|
5.78 |
|
7.14 |
|
5.28 |
|
4.97 |
|
2.83 |
|
|||||
|
Net income |
|
665.6 |
|
577.2 |
|
271.8 |
|
446.6 |
|
165.2 |
|
|||||
|
Basic per unit |
|
3.32 |
|
3.55 |
|
1.68 |
|
2.77 |
|
1.03 |
|
|||||
|
Diluted per unit |
|
3.27 |
|
3.48 |
|
1.65 |
|
2.73 |
|
1.01 |
|
|||||
|
Capital expenditures |
|
577.9 |
|
456.7 |
|
865.6 |
|
608.1 |
|
573.3 |
|
|||||
|
Total assets |
|
8,069.7 |
|
3,967.1 |
|
3,867.4 |
|
3,309.6 |
|
2,933.3 |
|
|||||
|
Bank indebtedness |
|
1,285.0 |
|
542.0 |
|
503.1 |
|
442.4 |
|
598.4 |
|
|||||
|
Unitholders’ equity |
|
5,188.3 |
|
2,172.2 |
|
1,909.0 |
|
1,654.3 |
|
1,314.6 |
|
|||||
|
Distributions declared |
|
811.8 |
|
321.5 |
|
— |
|
— |
|
— |
|
|||||
|
Distributions per unit |
|
4.05 |
|
1.97 |
|
— |
|
— |
|
— |
|
|||||
|
Payout ratio (%) (3) |
|
69 |
|
43 |
|
— |
|
— |
|
— |
|
|||||
|
Dividends declared |
|
|
|
|
|
|
|
|
|
|
|
|||||
|
Quarterly |
|
— |
|
10.8 |
|
26.8 |
|
6.7 |
|
— |
|
|||||
|
Special |
|
— |
|
— |
|
— |
|
80.7 |
|
— |
|
|||||
|
Total |
|
$ |
— |
|
$ |
10.8 |
|
$ |
26.8 |
|
$ |
87.4 |
|
$ |
— |
|
|
Trust units outstanding at year-end (000) |
|
|
|
|
|
|
|
|
|
|
|
|||||
|
Basic |
|
237,126 |
|
163,290 |
|
161,607 |
|
161,076 |
|
161,199 |
|
|||||
|
Basic plus rights |
|
248,411 |
|
172,738 |
|
172,794 |
|
173,757 |
|
176,214 |
|
|||||
|
Market value per trust unit (TSX) |
|
|
|
|
|
|
|
|
|
|
|
|||||
|
High |
|
$ |
47.77 |
|
$ |
38.53 |
|
$ |
27.33 |
|
$ |
16.50 |
|
$ |
14.91 |
|
|
Low |
|
31.60 |
|
25.23 |
|
15.86 |
|
11.92 |
|
10.92 |
|
|||||
|
Close |
|
$ |
35.57 |
|
$ |
37.99 |
|
$ |
26.42 |
|
$ |
16.05 |
|
$ |
13.67 |
|
|
Market value per trust unit (NYSE) (US$) |
|
|
|
|
|
|
|
|
|
|
|
|||||
|
High |
|
$ |
42.98 |
|
|
|
|
|
|
|
|
|
||||
|
Low |
|
27.74 |
|
|
|
|
|
|
|
|
|
|||||
|
Close |
|
$ |
30.56 |
|
|
|
|
|
|
|
|
|
||||
(1) The 2004 and prior years’ comparative unit and per unit figures have been restated to reflect the conversion ratio of three trust units issued for each Penn West common share pursuant to the plan of arrangement to effect the trust conversion, completed on May 31, 2005.
(2) Management uses cash flow and cash flow per unit derived from cash flow from operating activities before changes in non-cash working capital to analyze operating performance and leverage. Cash flow as presented does not have any standardized meaning prescribed by Canadian generally accepted accounting principles, (“GAAP”) and therefore it may not be comparable with the calculation of similar measures for other entities. Cash flow as presented is not intended to represent operating cash flow or operating profits for the period nor should it be viewed as an alternative to cash flow from operating activities, net earnings or other measures of financial performance calculated in accordance with Canadian GAAP.
A reconciliation of cash flow from operating activities to cash flow can be found in our Management’s Discussion and Analysis on page 54 of this document.
(3) Payout ratio is a non-GAAP measure. The Trust calculates payout ratio as distributions divided by cash flow. The 2005 ratio was based on the seven months subsequent to converting to an energy trust.
100
|
|
|
Year ended December 31 |
|
|||||||||||||
|
|
|
2006 |
|
2005 |
|
2004 |
|
2003 |
|
2002 |
|
|||||
|
OPERATING |
|
|
|
|
|
|
|
|
|
|
|
|||||
|
Production(1) |
|
|
|
|
|
|
|
|
|
|
|
|||||
|
Light oil and NGL production (bbls/day) |
|
39,514 |
|
33,137 |
|
34,943 |
|
35,479 |
|
33,822 |
|
|||||
|
Light oil and NGL price ($/bbl) |
|
$ |
64.02 |
|
$ |
62.59 |
|
$ |
42.04 |
|
$ |
38.40 |
|
$ |
34.81 |
|
|
Conventional heavy oil production (bbls/day) |
|
20,776 |
|
18,705 |
|
18,136 |
|
10,853 |
|
10,211 |
|
|||||
|
Conventional heavy oil price ($/bbl) |
|
$ |
43.07 |
|
$ |
35.71 |
|
$ |
31.73 |
|
$ |
28.70 |
|
$ |
26.10 |
|
|
Combined liquids production (bbls/day) |
|
60,290 |
|
51,842 |
|
53,079 |
|
46,332 |
|
44,033 |
|
|||||
|
Combined liquids price ($/bbl) |
|
$ |
56.80 |
|
$ |
52.89 |
|
$ |
38.52 |
|
$ |
36.13 |
|
$ |
32.79 |
|
|
Natural gas production (mmcf/day) |
|
312.5 |
|
287.8 |
|
316.3 |
|
331.3 |
|
332.7 |
|
|||||
|
Natural gas price ($/mcf) |
|
$ |
7.47 |
|
$ |
8.74 |
|
$ |
6.68 |
|
$ |
6.48 |
|
$ |
3.97 |
|
|
Total production (boe/day) |
|
112,369 |
|
99,807 |
|
105,788 |
|
101,549 |
|
99,500 |
|
|||||
|
Reserves (proved plus probable) at year-end(2) |
|
|
|
|
|
|
|
|
|
|
|
|||||
|
Oil and NGL (mmbbl) |
|
323 |
|
241 |
|
240 |
|
222 |
|
249 |
|
|||||
|
Natural gas (bcf) |
|
961 |
|
698 |
|
761 |
|
813 |
|
1,013 |
|
|||||
|
Wells drilled (gross) |
|
|
|
|
|
|
|
|
|
|
|
|||||
|
Natural gas |
|
181 |
|
150 |
|
209 |
|
307 |
|
209 |
|
|||||
|
Oil |
|
193 |
|
119 |
|
195 |
|
337 |
|
112 |
|
|||||
|
Dry |
|
17 |
|
18 |
|
35 |
|
106 |
|
44 |
|
|||||
|
Total wells drilled |
|
391 |
|
287 |
|
439 |
|
750 |
|
365 |
|
|||||
|
Undeveloped land holdings |
|
|
|
|
|
|
|
|
|
|
|
|||||
|
Western Canada (000 acres) |
|
|
|
|
|
|
|
|
|
|
|
|||||
|
Gross |
|
4,176 |
|
4,390 |
|
6,058 |
|
5,538 |
|
4,402 |
|
|||||
|
Net |
|
3,715 |
|
4,142 |
|
5,767 |
|
5,313 |
|
4,158 |
|
|||||
|
Average working interest (%) |
|
89 |
|
94 |
|
95 |
|
96 |
|
94 |
|
|||||
(1) Production volumes and prices are average for the year.
(2) Per the reports of the independant qualified reserve evaluators.
101
Quarterly Financial and operations summary
|
|
|
Three months ended |
|
Three months ended |
|
||||||||||||||||||||
|
|
|
2006 |
|
2005 |
|
||||||||||||||||||||
|
|
|
Mar. 31 |
|
June 30 |
|
Sept. 30 |
|
Dec. 31 |
|
Mar. 31 |
|
June 30 |
|
Sept. 30 |
|
Dec. 31 |
|
||||||||
|
FINANCIAL |
|
|
|
|
|
|
|
|
|
|
|
|
|
|
|
|
|
||||||||
|
($millions, except unit and per unit (2) amounts) |
|
|
|
|
|
|
|
|
|
|
|
|
|
|
|
|
|
||||||||
|
Gross revenues |
|
$ |
433.9 |
|
$ |
452.5 |
|
$ |
636.0 |
|
$ |
578.5 |
|
$ |
405.3 |
|
$ |
424.2 |
|
$ |
535.0 |
|
$ |
554.5 |
|
|
Cash flow (1) |
|
243.2 |
|
264.7 |
|
365.6 |
|
303.3 |
|
260.1 |
|
257.0 |
|
334.9 |
|
332.6 |
|
||||||||
|
Basic per unit |
|
1.49 |
|
1.59 |
|
1.55 |
|
1.23 |
|
1.61 |
|
1.58 |
|
2.06 |
|
2.03 |
|
||||||||
|
Diluted per unit |
|
1.47 |
|
1.56 |
|
1.53 |
|
1.22 |
|
1.58 |
|
1.49 |
|
2.04 |
|
2.03 |
|
||||||||
|
Net income |
|
144.4 |
|
220.5 |
|
177.8 |
|
122.9 |
|
66.9 |
|
59.7 |
|
209.5 |
|
241.1 |
|
||||||||
|
Basic per unit |
|
0.88 |
|
1.34 |
|
0.66 |
|
0.44 |
|
0.41 |
|
0.37 |
|
1.29 |
|
1.48 |
|
||||||||
|
Diluted per unit |
|
0.87 |
|
1.31 |
|
0.65 |
|
0.44 |
|
0.41 |
|
0.34 |
|
1.27 |
|
1.46 |
|
||||||||
|
Distributions declared |
|
162.0 |
|
167.6 |
|
240.7 |
|
241.5 |
|
— |
|
42.4 |
|
127.3 |
|
151.8 |
|
||||||||
|
Distributions per unit |
|
$ |
0.99 |
|
$ |
1.02 |
|
$ |
1.02 |
|
$ |
1.02 |
|
$ |
— |
|
$ |
0.26 |
|
$ |
0.78 |
|
$ |
0.93 |
|
|
|
|
|
|
|
|
|
|
|
|
|
|
|
|
|
|
|
|
||||||||
|
OPERATING (3) |
|
|
|
|
|
|
|
|
|
|
|
|
|
|
|
|
|
||||||||
|
Light oil and NGL production (bbls/day) |
|
31,541 |
|
29,974 |
|
48,029 |
|
48,233 |
|
34,219 |
|
32,011 |
|
33,101 |
|
33,227 |
|
||||||||
|
Light oil and NGL price ($/bbl) |
|
$ |
62.09 |
|
$ |
71.96 |
|
$ |
70.25 |
|
$ |
57.43 |
|
$ |
56.00 |
|
$ |
59.05 |
|
$ |
70.94 |
|
$ |
64.28 |
|
|
Conventional heavy oil production (bbls/day) |
|
20,685 |
|
18,625 |
|
21,186 |
|
22,586 |
|
18,943 |
|
18,622 |
|
18,533 |
|
18,726 |
|
||||||||
|
Conventional heavy oil price ($/bbl) |
|
$ |
30.76 |
|
$ |
52.85 |
|
$ |
52.20 |
|
$ |
37.57 |
|
$ |
28.06 |
|
$ |
31.22 |
|
$ |
48.60 |
|
$ |
34.95 |
|
|
Combined liquids production (bbls/day) |
|
52,226 |
|
48,599 |
|
69,215 |
|
70,819 |
|
53,162 |
|
50,633 |
|
51,634 |
|
51,953 |
|
||||||||
|
Combined liquids price ($/bbl) |
|
$ |
49.68 |
|
$ |
64.64 |
|
$ |
64.73 |
|
$ |
51.09 |
|
$ |
46.04 |
|
$ |
48.81 |
|
$ |
62.92 |
|
$ |
53.71 |
|
|
Natural gas production (mmcf/day) |
|
266.9 |
|
267.9 |
|
359.1 |
|
354.6 |
|
289.1 |
|
295.7 |
|
289.0 |
|
277.5 |
|
||||||||
|
Natural gas price ($/mcf) |
|
$ |
8.12 |
|
$ |
6.14 |
|
$ |
5.97 |
|
$ |
6.97 |
|
$ |
7.11 |
|
$ |
7.41 |
|
$ |
8.88 |
|
$ |
11.66 |
|
(1) Cash flow, cash flow per unit-basic and cash flow per unit-diluted are non-GAAP measures. Refer to the calculation of cash flow in the MD&A on page 54 of this document.
(2) Unit and per unit amounts for periods prior to June 30, 2005 have been restated to reflect the conversion ratio of three trust units issued for each Penn West common share pursuant to the plan of arrangement to effect the trust conversion completed on May 31, 2005.
(3) Production volumes and prices are average for the quarter.
102
|
bbl |
barrel (oil or natural gas liquids) |
|
mmbbl |
million barrels |
|
bbls per day or |
|
|
bbls/day or bbls/d |
barrels per day |
|
boe |
barrels of oil equivalent (based on 6 mcf of natural gas equals one barrel of oil) |
|
boe per day or |
|
|
boe/day |
barrels of oil equivalent per day |
|
mmboe |
million barrels of oil equivalent |
|
mcf |
thousand cubic feet (natural gas) |
|
mmcf |
million cubic feet |
|
mmcf per day or |
|
|
mmcf/day or |
|
|
mmcf/d |
million cubic feet per day |
|
bcf |
billion cubic feet |
|
NGL |
natural gas liquids |
|
GJ |
gigajoule |
|
API |
American Petroleum Institute |
|
TSX |
Toronto Stock Exchange |
|
NYSE |
New York Stock Exchange |
|
WTI |
West Texas Intermediate |
|
MW |
megawatt |
|
MWh |
megawatt-hour |
|
CO2 |
carbon dioxide |
|
CBM |
coalbed methane |
|
EOR |
enhanced oil recovery |
Conversion of Units
|
Imperial |
Metric |
|
1 ton |
0.907 tonnes |
|
1.102 tons |
1 tonne |
|
1 acre |
0.40 hectares |
|
2.5 acres |
1 hectare |
|
1 bbl |
0.159 cubic metres |
|
6.29 bbls |
1 cubic metre |
|
1 mcf |
28.2 cubic metres |
|
0.035 mcf |
1 cubic metre |
|
1 mile |
1.61 kilometres |
|
0.62 miles |
1 kilometre |
|
1 square mile |
2.59 square kilometres |
Unless otherwise indicated, all financial sums are stated in Canadian dollars.
Reserve Definitions
1. Using the definitions set out in the Canadian Oil and Gas Handbook, these resources are considered “Discovered Resources”. As Penn West is in the early stages of the project, these resources have not been classified into more specific categories. There is no certainty that a significant portion of these resources will be recovered or that a significant portion of the resources will be economically or technically feasible to produce in the future. Discovered resources are those quantities of oil and gas estimated on a given date to be remaining in, plus those quantities already produced from, known accumulations. Discovered resources consist of economic and uneconomic resources with the estimated future recoverable portion classified as reserves or contingent resources.
2. The 6.8 billion barrels of discovered heavy oil resources in place represents the mid case.
3. Source: Alberta Energy and Utilities Board, “Alberta’s Reserves 2005 and Supply/Demand Outlook 2006-2015”. Alberta EUB Original Oil in Place (OOIP) estimates might not have been prepared by a qualified reserves evaluator in accordance with the Canadian Oil and Gas Evaluation Handbook (COGEH).
4. Source: Saskatchewan Industry and Resources: Petroleum Statistics Branch, October 31, 2006
103