| Label |
Element |
Value |
| Risk Return Abstract |
rr_RiskReturnAbstract |
|
|
| Document Type |
dei_DocumentType |
485BPOS
|
|
| Document Period End Date |
dei_DocumentPeriodEndDate |
Mar. 31, 2020
|
|
| Registrant Name |
dei_EntityRegistrantName |
FORESTER FUNDS INC
|
|
| Central Index Key |
dei_EntityCentralIndexKey |
0001088323
|
|
| Amendment Flag |
dei_AmendmentFlag |
false
|
|
| Trading Symbol |
dei_TradingSymbol |
fvalx
|
|
| Document Creation Date |
dei_DocumentCreationDate |
Jul. 31, 2020
|
|
| Document Effective Date |
dei_DocumentEffectiveDate |
Jul. 31, 2020
|
|
| Prospectus Date |
rr_ProspectusDate |
Jul. 31, 2020
|
|
| Class N | Forester Value Fund |
|
|
|
| Risk Return Abstract |
rr_RiskReturnAbstract |
|
|
| Objective [Heading] |
rr_ObjectiveHeading |
Investment Objective
|
|
| Objective, Primary [Text Block] |
rr_ObjectivePrimaryTextBlock |
THE FORESTER VALUE FUND (the "Fund") seeks maximum long-term
capital growth.
|
|
| Expense [Heading] |
rr_ExpenseHeading |
Fees and Expenses of the Fund
|
|
| Expense Narrative [Text Block] |
rr_ExpenseNarrativeTextBlock |
The table below describes the fees and expenses that you may pay
if you buy and hold shares of the Forester Value Fund.
|
|
| Operating Expenses Caption [Text] |
rr_OperatingExpensesCaption |
ANNUAL FUND OPERATING EXPENSES (expenses that you pay each year as a percentage of the value of your investment)
|
|
| Management Fees |
rr_ManagementFeesOverAssets |
0.89%
|
|
| Distribution and/or Service (12b-1) Fees |
rr_DistributionAndService12b1FeesOverAssets |
0.25%
|
|
| Other Expenses |
rr_OtherExpensesOverAssets |
0.11%
|
|
| Acquired Fund Fees and Expenses |
rr_AcquiredFundFeesAndExpensesOverAssets |
0.02%
|
|
| Total Annual Fund Operating Expenses |
rr_ExpensesOverAssets |
1.27%
|
[1] |
| Portfolio Turnover [Heading] |
rr_PortfolioTurnoverHeading |
Portfolio Turnover
|
|
| Portfolio Turnover [Text Block] |
rr_PortfolioTurnoverTextBlock |
The Fund pays transaction costs, such as commissions,
when it buys and sells securities (or “turns over” its portfolio). A higher portfolio turnover rate may indicate higher
transaction costs and may result in higher taxes when Fund shares are held in a taxable account. These costs, which are not reflected
in annual operating expenses or in the Example affect the Fund’s performance. During the most recent fiscal year, the Fund’s
portfolio turnover rate was 21.80% of the average value of its portfolio.
|
|
| Portfolio Turnover, Rate |
rr_PortfolioTurnoverRate |
21.80%
|
|
| Expense Example [Heading] |
rr_ExpenseExampleHeading |
EXAMPLE
|
|
| Expense Example Narrative [Text Block] |
rr_ExpenseExampleNarrativeTextBlock |
This Example is intended to help you compare
the cost of investing in the Forester Value Fund with the cost of investing in other mutual funds.
The example assumes that you invest $10,000
in the Fund for the time periods indicated and then redeem all of your shares at the end of these periods. The Example also assumes
that your investment has a 5% return each year and that the Fund's operating expenses remain the same. Although your actual costs
may be higher or lower, based on these assumptions, your costs would be:
|
|
| One Year |
rr_ExpenseExampleYear01 |
$ 129
|
|
| Three Years |
rr_ExpenseExampleYear03 |
403
|
|
| Five Years |
rr_ExpenseExampleYear05 |
697
|
|
| Ten Years |
rr_ExpenseExampleYear10 |
$ 1,534
|
|
| Strategy [Heading] |
rr_StrategyHeading |
Principal Investment Strategies
|
|
| Strategy Narrative [Text Block] |
rr_StrategyNarrativeTextBlock |
THE FORESTER VALUE FUND invests in the stocks
of large U.S. companies that it believes are undervalued and have great appreciation potential. It may also take defensive positions
when the manager believes that the overall stock market is highly valued or that market conditions warrant it.
The Fund generally purchases a stock only at
a price Forester Capital Management ("Forester Capital"), the Fund’s investment manager (the “manager”),
deems significantly below the intrinsic value of the company - Forester Capital's estimate of the amount a buyer would pay to own
the entire company. Forester Capital performs its own fundamental analysis of the company.
The Fund places special focus on companies whose
current market prices are low in relation to earnings and have great appreciation potential. In addition to stocks with low prices
relative to earnings, Forester Capital also considers factors such as the following about the issuer:
Book-to-market value
Price-to-cash flow ratio
Price-to-sales ratio
Earnings estimates for the next 12 months
Five-year return on equity
Under normal market conditions, the fund invests
at least 65% of its net assets (at market value at the time of purchase) in the common stocks of large companies that have market
capitalizations greater than $5.0 billion. The fund may emphasize sectors more or less than the S&P 500. The Fund may also
invest in stock index options.
The Fund may sell a stock when Forester Capital
thinks the stock is too expensive compared to Forester Capital's estimate of the company's intrinsic value, changing circumstances
affect the original reasons for a company's purchase, a company exhibits deteriorating fundamentals or more attractive alternatives
exist.
MARKET EXPOSURE. In order to try to enhance
returns, the manager may vary the Fund's exposure to the overall stock market. The manager may reduce market exposure when the
manager believes that the overall stock market is highly valued or that market conditions warrant it. During these defensive periods,
the Fund may invest some or all of its assets in stock index options, money market funds, U.S. Treasury or U.S. Agency fixed income
instruments with a maturity of less than five years.
|
|
| Risk [Heading] |
rr_RiskHeading |
Principal Risks
|
|
| Risk Narrative [Text Block] |
rr_RiskNarrativeTextBlock |
Like all mutual funds that invest in stocks,
the Forester Funds take investment risks and it is possible for you to lose money by investing in the Fund. The manager's ability
to choose suitable investments for the Fund has a significant impact on the Fund's ability to achieve its investment objective.
The principal factors that might reduce the Fund's return include:
Stock Market Risk: The Fund invests primarily
in common stocks and other equity securities. Over time, stocks have shown greater growth than other types of securities. In the
short-term, however, stock prices fluctuate widely in response to company, market, economic or other news.
Value Investing Risk: From time to time
"value" investing falls out of favor with investors. When it does, there is the risk that the market will not recognize
a company's improving fundamentals as quickly as it normally would. During these periods, the Fund's relative performance may suffer.
Emphasize Sector Risk: If the Fund has
a higher percentage of its total assets invested in a particular sector, changes affecting that sector may have a significant impact
on the Fund's overall portfolio.
Varying Market Exposure Risk: If the
Fund is in a defensive or offensive position, the Fund may not go in the same direction as the market and the Fund's performance
may suffer.
Large-Size Company Risks: The Fund normally
invests the majority of its assets in larger companies. Larger, more established companies may be unable to respond quickly to
new competitive challenges like changes in consumer tastes or innovative smaller competitors. Also, larger companies are sometimes
unable to attain the high growth rates of successful, smaller companies, especially during extended periods of economic expansion.
Options Risk: The primary risks associated
with options investments are: (1) the risk that changes in the value of the investment will not correlate to changes in the value
of the underlying security, which may result in imperfect hedging of a portfolio position, (2) options are more volatile than stocks
and therefore may be subject to disproportionately larger gains or losses; and (3) the risk that the use of an option strategy
to enhance the return of a portfolio will fail, with negative consequences to the Fund. Put options may not go in the same direction
as the market and the Fund’s performance may suffer. Accordingly, the Fund will limit its exposure to options to 5% of the
value of the portfolio, based on the cost of the options, at any one time.
Fixed Income Risk: The primary risk associated
with fixed income are: (1) the fixed income instrument may not go in the same direction as the market and the Fund’s performance
may suffer; (2) interest rates may rise, reducing the principal value of the instrument; and (3) the credit rating of the U.S.
Agency instrument may materially differ from a similar U.S. Treasury.
Turnover Risk: Portfolio turnover refers
to the rate at which the securities held by the Fund are replaced. The higher the rate, the higher the transactional and brokerage
costs associated with the turnover which may reduce the Fund’s return, unless the securities traded can be bought and sold
without corresponding commission costs. Active trading of securities may also increase the Fund’s realized short-term capital
gains or losses, which may affect the taxes you pay as a Fund shareholder. Short-term capital gains are taxed as ordinary income
under federal income tax laws.
An investment in the Fund is not a bank deposit,
and is not insured or guaranteed by the Federal Deposit Insurance Corporation (FDIC) or any other Government agency.
Because of these risks the Fund is a suitable
investment only for those investors who have long-term investment goals. Prospective investors who are uncomfortable with an investment
that will increase and decrease in value should not invest in the Fund.
|
|
| Risk Lose Money [Text] |
rr_RiskLoseMoney |
Like all mutual funds that invest in stocks, the Forester Funds take investment risks and it is possible for you to lose money by investing in the Fund.
|
|
| Bar Chart and Performance Table [Heading] |
rr_BarChartAndPerformanceTableHeading |
FUND PERFORMANCE - Class N Share
|
|
| Performance Narrative [Text Block] |
rr_PerformanceNarrativeTextBlock |
The Bar Chart and Table set out below help show
the returns and risks of investing in the Fund. They show changes in the Fund’s calendar year performance over the last ten
years and compare the Fund’s average annual returns for periods of one year, five years and ten years to an appropriate index
during corresponding periods. You should be aware that the Fund’s past performance (before and after taxes) is no guarantee
or indication that the Fund will perform similarly in the future.
|
|
| Performance Past Does Not Indicate Future [Text] |
rr_PerformancePastDoesNotIndicateFuture |
The Fund’s past performance (before and after taxes) is not necessarily an indication of how the Fund will perform in the future.
|
|
| Bar Chart [Heading] |
rr_BarChartHeading |
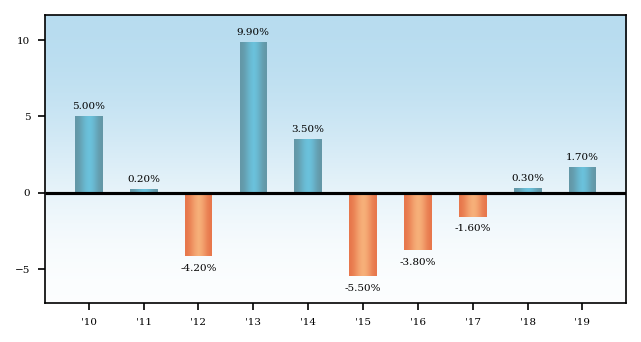
Annual Total Returns
|
|
| Annual Return 2010 |
rr_AnnualReturn2010 |
5.00%
|
|
| Annual Return 2011 |
rr_AnnualReturn2011 |
0.20%
|
|
| Annual Return 2012 |
rr_AnnualReturn2012 |
(4.20%)
|
|
| Annual Return 2013 |
rr_AnnualReturn2013 |
9.90%
|
|
| Annual Return 2014 |
rr_AnnualReturn2014 |
3.50%
|
|
| Annual Return 2015 |
rr_AnnualReturn2015 |
(5.50%)
|
|
| Annual Return 2016 |
rr_AnnualReturn2016 |
(3.80%)
|
|
| Annual Return 2017 |
rr_AnnualReturn2017 |
(1.60%)
|
|
| Annual Return 2018 |
rr_AnnualReturn2018 |
0.30%
|
|
| Annual Return 2019 |
rr_AnnualReturn2019 |
1.70%
|
|
| Bar Chart Closing [Text Block] |
rr_BarChartClosingTextBlock |
The year-to-date return for Class N shares as of June 30, 2020, was
1.72%
From 1/01/2000 through 12/31/2019, the Fund's Class N highest and
lowest quarterly returns were 22.10% and -10.15%, respectively, for the quarters ended September 30, 2004 and December 31, 2008.
|
|
| Highest Quarterly Return, Label |
rr_HighestQuarterlyReturnLabel |
highest quarterly return
|
|
| Highest Quarterly Return, Date |
rr_BarChartHighestQuarterlyReturnDate |
Sep. 30, 2004
|
|
| Highest Quarterly Return |
rr_BarChartHighestQuarterlyReturn |
22.10%
|
|
| Lowest Quarterly Return, Label |
rr_LowestQuarterlyReturnLabel |
lowest quarterly return
|
|
| Lowest Quarterly Return, Date |
rr_BarChartLowestQuarterlyReturnDate |
Dec. 31, 2008
|
|
| Lowest Quarterly Return |
rr_BarChartLowestQuarterlyReturn |
(10.15%)
|
|
| Performance Table Heading |
rr_PerformanceTableHeading |
Average Annual Total Returns (for periods ended December 31, 2019)
|
|
| Performance Table Uses Highest Federal Rate |
rr_PerformanceTableUsesHighestFederalRate |
After-tax returns are calculated using the highest individual federal marginal income tax rate in effect at the time of each distribution and assumed sale, but do not include the impact of state and local taxes.
|
|
| Performance Table Not Relevant to Tax Deferred |
rr_PerformanceTableNotRelevantToTaxDeferred |
After-tax returns reflect past tax effects and are not relevant to investors who hold their Fund shares in a tax-deferred account (including a 401(k) or IRA account), or to investors that are tax-exempt.
|
|
| Performance Table Narrative |
rr_PerformanceTableNarrativeTextBlock |
The table below shows the Fund's Class N shares
average annual total returns (before and after taxes) and the change in value of a broad-based market index over various periods
ended December 31, 2019. The information provides some indication of the risks of investing in the Fund by showing changes in the
Fund’s performance from year to year and by showing how the Fund’s average annual returns for 1, 5, and 10 years compare
with those of broad measure of market’s performance. The Fund’s past performance (before and after taxes) is not necessarily
an indication of how the Fund will perform in the future.
After-tax returns are calculated using the highest
individual federal marginal income tax rate in effect at the time of each distribution and assumed sale, but do not include the
impact of state and local taxes.
Your actual after-tax returns depend on your
own tax situation and may differ from those shown. After-tax returns reflect past tax effects and are not relevant to investors
who hold their Fund shares in a tax-deferred account (including a 401(k) or IRA account), or to investors that are tax-exempt.
|
|
| Class N | Forester Value Fund | Class N |
|
|
|
| Risk Return Abstract |
rr_RiskReturnAbstract |
|
|
| 1 Year |
rr_AverageAnnualReturnYear01 |
1.70%
|
|
| 5 Years |
rr_AverageAnnualReturnYear05 |
(1.98%)
|
|
| 10 Years |
rr_AverageAnnualReturnYear10 |
0.23%
|
|
| Class N | Forester Value Fund | After Taxes on Distributions | Class N |
|
|
|
| Risk Return Abstract |
rr_RiskReturnAbstract |
|
|
| 1 Year |
rr_AverageAnnualReturnYear01 |
(0.86%)
|
|
| 5 Years |
rr_AverageAnnualReturnYear05 |
(2.72%)
|
|
| 10 Years |
rr_AverageAnnualReturnYear10 |
(0.29%)
|
|
| Class N | Forester Value Fund | After Taxes on Distributions and Sales | Class N |
|
|
|
| Risk Return Abstract |
rr_RiskReturnAbstract |
|
|
| 1 Year |
rr_AverageAnnualReturnYear01 |
1.01%
|
|
| 5 Years |
rr_AverageAnnualReturnYear05 |
(1.80%)
|
|
| 10 Years |
rr_AverageAnnualReturnYear10 |
(0.03%)
|
|
| Class N | Forester Value Fund | S&P 500 Index (index reflects no deduction for fees, expenses or taxes) |
|
|
|
| Risk Return Abstract |
rr_RiskReturnAbstract |
|
|
| 1 Year |
rr_AverageAnnualReturnYear01 |
31.49%
|
|
| 5 Years |
rr_AverageAnnualReturnYear05 |
11.70%
|
|
| 10 Years |
rr_AverageAnnualReturnYear10 |
13.56%
|
|
| Class I | Forester Value Fund |
|
|
|
| Risk Return Abstract |
rr_RiskReturnAbstract |
|
|
| Objective [Heading] |
rr_ObjectiveHeading |
Investment Objective
|
|
| Objective, Primary [Text Block] |
rr_ObjectivePrimaryTextBlock |
THE FORESTER VALUE FUND (the "FUND") seeks maximum long-term
capital growth.
|
|
| Expense [Heading] |
rr_ExpenseHeading |
Fees and Expenses of the Fund
|
|
| Expense Narrative [Text Block] |
rr_ExpenseNarrativeTextBlock |
The table below describes the fees and expenses that you may pay
if you buy and hold shares of the Forester Value Fund.
|
|
| Operating Expenses Caption [Text] |
rr_OperatingExpensesCaption |
ANNUAL FUND OPERATING EXPENSES (expenses that you pay each year as a percentage of the value of your investment)
|
|
| Management Fees |
rr_ManagementFeesOverAssets |
0.89%
|
|
| Other Expenses |
rr_OtherExpensesOverAssets |
0.10%
|
|
| Acquired Fund Fees and Expenses |
rr_AcquiredFundFeesAndExpensesOverAssets |
0.02%
|
|
| Total Annual Fund Operating Expenses |
rr_ExpensesOverAssets |
1.01%
|
[1] |
| Portfolio Turnover [Heading] |
rr_PortfolioTurnoverHeading |
Portfolio Turnover
|
|
| Portfolio Turnover [Text Block] |
rr_PortfolioTurnoverTextBlock |
The Fund pays transaction costs, such as commissions,
when it buys and sells securities (or “turns over” its portfolio). A higher portfolio turnover rate may indicate higher
transaction costs and may result in higher taxes when Fund shares are held in a taxable account. These costs, which are not reflected
in annual operating expenses or in the Example affect the Fund’s performance. During the most recent fiscal year, the Fund’s
portfolio turnover rate was 21.80% of the average value of its portfolio.
|
|
| Portfolio Turnover, Rate |
rr_PortfolioTurnoverRate |
21.80%
|
|
| Expense Example [Heading] |
rr_ExpenseExampleHeading |
EXAMPLE
|
|
| Expense Example Narrative [Text Block] |
rr_ExpenseExampleNarrativeTextBlock |
This Example is intended to help you compare
the cost of investing in the Forester Value Fund with the cost of investing in other mutual funds.
The example assumes that you invest $10,000
in the Fund for the time periods indicated and then redeem all of your shares at the end of these periods. The Example also assumes
that your investment has a 5% return each year and that the Fund's operating expenses remain the same. Although your actual costs
may be higher or lower, based on these assumptions, your costs would be:
|
|
| One Year |
rr_ExpenseExampleYear01 |
$ 103
|
|
| Three Years |
rr_ExpenseExampleYear03 |
322
|
|
| Five Years |
rr_ExpenseExampleYear05 |
558
|
|
| Ten Years |
rr_ExpenseExampleYear10 |
$ 1,236
|
|
| Strategy [Heading] |
rr_StrategyHeading |
Principal Investment Strategies
|
|
| Strategy Narrative [Text Block] |
rr_StrategyNarrativeTextBlock |
THE FORESTER VALUE FUND invests in the stocks
of large U.S. companies that it believes are undervalued and have great appreciation potential. It may also take defensive positions
when the manager believes that the overall stock market is highly valued or that market conditions warrant it.
The Fund generally purchases a stock only at
a price Forester Capital Management ("Forester Capital"), the Fund’s investment manager (the “manager”),
deems significantly below the intrinsic value of the company - Forester Capital's estimate of the amount a buyer would pay to own
the entire company. Forester Capital performs its own fundamental analysis of the company.
The Fund places special focus on companies whose
current market prices are low in relation to earnings and have great appreciation potential. In addition to stocks with low prices
relative to earnings, Forester Capital also considers factors such as the following about the issuer:
Book-to-market value
Price-to-cash flow ratio
Price-to-sales ratio
Earnings estimates for the next 12 months
Five-year return on equity
Under normal market conditions, the fund invests
at least 65% of its net assets (at market value at the time of purchase) in the common stocks of large companies that have market
capitalizations greater than $5.0 billion. The fund may emphasize sectors more or less than the S&P 500. The Fund may also
invest in stock index options.
The Fund may sell a stock when Forester Capital
thinks the stock is too expensive compared to Forester Capital's estimate of the company's intrinsic value, changing circumstances
affect the original reasons for a company's purchase, a company exhibits deteriorating fundamentals or more attractive alternatives
exist.
MARKET EXPOSURE: In order to try to enhance
returns, the manager may vary the Fund's exposure to the overall stock market. The manager may reduce market exposure when the
manager believes that the overall stock market is highly valued or that market conditions warrant it. During these defensive periods,
the Fund may invest some or all of its assets in stock index options, money market funds, U.S. Treasury, or U.S. Agency fixed income
instruments with a maturity of less than five years.
|
|
| Risk [Heading] |
rr_RiskHeading |
Principal Risks
|
|
| Risk Narrative [Text Block] |
rr_RiskNarrativeTextBlock |
Like all mutual funds that invest in stocks,
the Forester Funds take investment risks and it is possible for you to lose money by investing in the Fund. The manager's ability
to choose suitable investments for the Fund has a significant impact on the Fund's ability to achieve its investment objective.
The principal factors that might reduce the Fund's return include:
Stock Market Risk: The Fund invests primarily
in common stocks and other equity securities. Over time, stocks have shown greater growth than other types of securities. In the
short-term, however, stock prices fluctuate widely in response to company, market, economic or other news.
Value Investing Risk: From time to time
"value" investing falls out of favor with investors. When it does, there is the risk that the market will not recognize
a company's improving fundamentals as quickly as it normally would. During these periods, the Fund's relative performance may suffer.
Emphasize Sector: If the Fund has a higher
percentage of its total assets invested in a particular sector, changes affecting that sector may have a significant impact on
the Fund's overall portfolio.
Varying Market Exposure: If the Fund is in a
defensive or offensive position, the Fund may not go in the same direction as the market and the Fund's performance may suffer.
Large-Size Company Risks: The Fund normally
invests the majority of its assets in larger companies. Larger, more established companies may be unable to respond quickly to
new competitive challenges like changes in consumer tastes or innovative smaller competitors. Also, larger companies are sometimes
unable to attain the high growth rates of successful, smaller companies, especially during extended periods of economic expansion.
Options Risk: The primary risks associated
with options investments are: (1) the risk that changes in the value of the investment will not correlate to changes in the value
of the underlying security, which may result in imperfect hedging of a portfolio position, (2) options are more volatile than stocks
and therefore may be subject to disproportionately larger gains or losses; and (3) the risk that the use of an option strategy
to enhance the return of a portfolio will fail, with negative consequences to the Fund. Put options may not go in the same direction
as the market and the Fund’s performance may suffer. Accordingly, the Fund will limit its exposure to options to 5% of the
value of the portfolio, based on the cost of the options, at any one time.
Fixed Income Risk: The primary risk associated
with fixed income are: (1) the fixed income instrument may not go in the same direction as the market and the Fund’s performance
may suffer; (2) interest rates may rise, reducing the principal value of the instrument; and (3) the credit rating of the U.S.
Agency instrument may materially differ from a similar U.S. Treasury.
Turnover Risk: Portfolio turnover refers
to the rate at which the securities held by the Fund are replaced. The higher the rate, the higher the transactional and brokerage
costs associated with the turnover which may reduce the Fund’s return, unless the securities traded can be bought and sold
without corresponding commission costs. Active trading of securities may also increase the Fund’s realized short-term capital
gains or losses, which may affect the taxes you pay as a Fund shareholder. Short-term capital gains are taxed as ordinary income
under federal income tax laws.
An investment in the Fund is not a bank deposit,
and is not insured or guaranteed by the Federal Deposit Insurance Corporation (FDIC) or any other Government agency.
Because of these risks the Fund is a suitable
investment only for those investors who have long-term investment goals. Prospective investors who are uncomfortable with an investment
that will increase and decrease in value should not invest in the Fund.
|
|
| Risk Lose Money [Text] |
rr_RiskLoseMoney |
Like all mutual funds that invest in stocks, the Forester Funds take investment risks and it is possible for you to lose money by investing in the Fund.
|
|
| Bar Chart and Performance Table [Heading] |
rr_BarChartAndPerformanceTableHeading |
FUND PERFORMANCE – Class I Shares
|
|
| Performance Narrative [Text Block] |
rr_PerformanceNarrativeTextBlock |
The Bar Chart and Table set out below help show
the returns and risks of investing in the Fund. They show changes in the Fund’s calendar year performance over the lifetime
of the Fund and compare the Fund’s average annual returns for periods of one year and since inception to an appropriate index
during corresponding periods. You should be aware that the Fund’s past performance (before and after taxes) is no guarantee
or indication that the Fund will perform similarly in the future.
|
|
| Performance Past Does Not Indicate Future [Text] |
rr_PerformancePastDoesNotIndicateFuture |
The Fund’s past performance (before and after taxes) is not necessarily an indication of how the Fund will perform in the future.
|
|
| Bar Chart [Heading] |
rr_BarChartHeading |
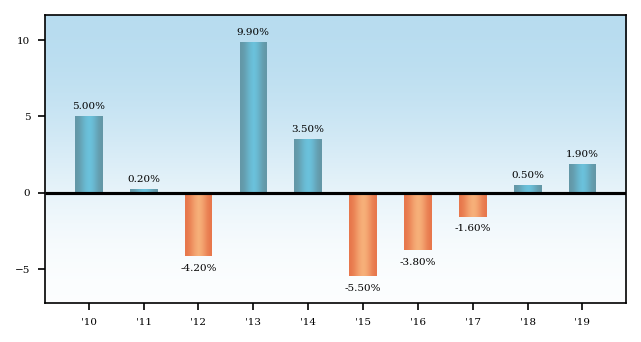
Annual Total Returns
|
|
| Annual Return 2010 |
rr_AnnualReturn2010 |
5.00%
|
|
| Annual Return 2011 |
rr_AnnualReturn2011 |
0.20%
|
|
| Annual Return 2012 |
rr_AnnualReturn2012 |
(4.20%)
|
|
| Annual Return 2013 |
rr_AnnualReturn2013 |
9.90%
|
|
| Annual Return 2014 |
rr_AnnualReturn2014 |
3.50%
|
|
| Annual Return 2015 |
rr_AnnualReturn2015 |
(5.50%)
|
|
| Annual Return 2016 |
rr_AnnualReturn2016 |
(3.80%)
|
|
| Annual Return 2017 |
rr_AnnualReturn2017 |
(1.60%)
|
|
| Annual Return 2018 |
rr_AnnualReturn2018 |
0.50%
|
|
| Annual Return 2019 |
rr_AnnualReturn2019 |
1.90%
|
|
| Bar Chart Closing [Text Block] |
rr_BarChartClosingTextBlock |
*For the period 6/8/09 (inception) to 12/31/09.
The year-to-date return for Class I shares as of June 30, 2020 was
1.78%. From 6/8/09 (the share class’s inception) to 12/31/18, the highest quarterly return was 11.42% for the quarter ended
9/30/09. The lowest quarterly return was -4.75% for the quarter ended 3/31/10).
|
|
| Highest Quarterly Return, Label |
rr_HighestQuarterlyReturnLabel |
highest quarterly return
|
|
| Highest Quarterly Return, Date |
rr_BarChartHighestQuarterlyReturnDate |
Sep. 30, 2009
|
|
| Highest Quarterly Return |
rr_BarChartHighestQuarterlyReturn |
11.42%
|
|
| Lowest Quarterly Return, Label |
rr_LowestQuarterlyReturnLabel |
lowest quarterly return
|
|
| Lowest Quarterly Return, Date |
rr_BarChartLowestQuarterlyReturnDate |
Mar. 31, 2010
|
|
| Lowest Quarterly Return |
rr_BarChartLowestQuarterlyReturn |
(4.75%)
|
|
| Performance Table Heading |
rr_PerformanceTableHeading |
Average Annual Total Returns (for periods ended December 31, 2019)
|
|
| Performance Table Uses Highest Federal Rate |
rr_PerformanceTableUsesHighestFederalRate |
After-tax returns are calculated using the highest individual federal marginal income tax rate in effect at the time of each distribution and assumed sale, but do not include the impact of state and local taxes.
|
|
| Performance Table Not Relevant to Tax Deferred |
rr_PerformanceTableNotRelevantToTaxDeferred |
After-tax returns reflect past tax effects and are not relevant to investors who hold their Fund shares in a tax-deferred account (including a 401(k) or IRA account), or to investors that are tax-exempt.
|
|
| Performance Table Narrative |
rr_PerformanceTableNarrativeTextBlock |
The table below shows the Fund's Class I shares
average annual total returns (before and after taxes) and the change in value of a broad-based market index over various periods
ended December 31, 2019. The information provides some indication of the risks of investing in the Fund by showing changes in the
Fund’s performance from year to year and by showing how the Fund’s average annual returns for one year and since inception
compare with those of a broad measure of the market’s performance. The Fund’s past performance (before and after taxes)
is not necessarily an indication of how the Fund will perform in the future.
After-tax returns are calculated using the highest
individual federal marginal income tax rate in effect at the time of each distribution and assumed sale, but do not include the
impact of state and local taxes.
Your actual after-tax returns depend on your
own tax situation and may differ from those shown. After-tax returns reflect past tax effects and are not relevant to investors
who hold their Fund shares in a tax-deferred account (including a 401(k) or IRA account), or to investors that are tax-exempt.
|
|
| Performance Table Closing [Text Block] |
rr_PerformanceTableClosingTextBlock |
* Inception 6/8/2009
|
|
| Class I | Forester Value Fund | Class I |
|
|
|
| Risk Return Abstract |
rr_RiskReturnAbstract |
|
|
| 1 Year |
rr_AverageAnnualReturnYear01 |
1.49%
|
|
| 5 Years |
rr_AverageAnnualReturnYear05 |
(1.73%)
|
|
| Since Inception |
rr_AverageAnnualReturnSinceInception |
0.49%
|
|
| Inception Date |
rr_AverageAnnualReturnInceptionDate |
Jun. 08, 2009
|
|
| Class I | Forester Value Fund | After Taxes on Distributions | Class I |
|
|
|
| Risk Return Abstract |
rr_RiskReturnAbstract |
|
|
| 1 Year |
rr_AverageAnnualReturnYear01 |
(0.68%)
|
|
| 5 Years |
rr_AverageAnnualReturnYear05 |
(2.62%)
|
|
| Since Inception |
rr_AverageAnnualReturnSinceInception |
(0.10%)
|
|
| Inception Date |
rr_AverageAnnualReturnInceptionDate |
Jun. 08, 2009
|
|
| Class I | Forester Value Fund | After Taxes on Distributions and Sales | Class I |
|
|
|
| Risk Return Abstract |
rr_RiskReturnAbstract |
|
|
| 1 Year |
rr_AverageAnnualReturnYear01 |
1.15%
|
|
| 5 Years |
rr_AverageAnnualReturnYear05 |
(1.68%)
|
|
| Since Inception |
rr_AverageAnnualReturnSinceInception |
0.13%
|
|
| Inception Date |
rr_AverageAnnualReturnInceptionDate |
Jun. 08, 2009
|
|
| Class I | Forester Value Fund | S&P 500 Index (index reflects no deduction for fees, expenses or taxes) |
|
|
|
| Risk Return Abstract |
rr_RiskReturnAbstract |
|
|
| 1 Year |
rr_AverageAnnualReturnYear01 |
31.49%
|
|
| 5 Years |
rr_AverageAnnualReturnYear05 |
11.70%
|
|
| Since Inception |
rr_AverageAnnualReturnSinceInception |
15.08%
|
|
| Inception Date |
rr_AverageAnnualReturnInceptionDate |
Jun. 08, 2009
|
|
| Class R | Forester Value Fund |
|
|
|
| Risk Return Abstract |
rr_RiskReturnAbstract |
|
|
| Objective [Heading] |
rr_ObjectiveHeading |
Investment Objective
|
|
| Objective, Primary [Text Block] |
rr_ObjectivePrimaryTextBlock |
THE FORESTER VALUE FUND (the "FUND") seeks maximum long-term
capital growth.
|
|
| Expense [Heading] |
rr_ExpenseHeading |
Fees and Expenses of the Fund
|
|
| Expense Narrative [Text Block] |
rr_ExpenseNarrativeTextBlock |
The table below describes the fees and expenses that you may pay
if you buy and hold shares of the Forester Value Fund.
|
|
| Operating Expenses Caption [Text] |
rr_OperatingExpensesCaption |
ANNUAL FUND OPERATING EXPENSES (expenses that you pay each year as a percentage of the value of your investment)
|
|
| Management Fees |
rr_ManagementFeesOverAssets |
0.89%
|
|
| Distribution and/or Service (12b-1) Fees |
rr_DistributionAndService12b1FeesOverAssets |
0.50%
|
|
| Other Expenses |
rr_OtherExpensesOverAssets |
0.11%
|
|
| Acquired Fund Fees and Expenses |
rr_AcquiredFundFeesAndExpensesOverAssets |
0.02%
|
|
| Total Annual Fund Operating Expenses |
rr_ExpensesOverAssets |
1.52%
|
[1] |
| Portfolio Turnover [Heading] |
rr_PortfolioTurnoverHeading |
Portfolio Turnover
|
|
| Portfolio Turnover [Text Block] |
rr_PortfolioTurnoverTextBlock |
The Fund pays transaction costs, such as commissions,
when it buys and sells securities (or “turns over” its portfolio). A higher portfolio turnover rate may indicate higher
transaction costs and may result in higher taxes when Fund shares are held in a taxable account. These costs, which are not reflected
in annual operating expenses or in the Example affect the Fund’s performance. During the most recent fiscal year, the Fund’s
portfolio turnover rate was 21.80% of the average value of its portfolio.
|
|
| Portfolio Turnover, Rate |
rr_PortfolioTurnoverRate |
21.80%
|
|
| Expense Example [Heading] |
rr_ExpenseExampleHeading |
EXAMPLE
|
|
| Expense Example Narrative [Text Block] |
rr_ExpenseExampleNarrativeTextBlock |
This Example is intended to help you compare
the cost of investing in the Forester Value Fund with the cost of investing in other mutual funds.
The example assumes that you invest $10,000
in the Fund for the time periods indicated and then redeem all of your shares at the end of these periods. The Example also assumes
that your investment has a 5% return each year and that the Fund's operating expenses remain the same. Although your actual costs
may be higher or lower, based on these assumptions, your costs would be:
|
|
| One Year |
rr_ExpenseExampleYear01 |
$ 155
|
|
| Three Years |
rr_ExpenseExampleYear03 |
480
|
|
| Five Years |
rr_ExpenseExampleYear05 |
829
|
|
| Ten Years |
rr_ExpenseExampleYear10 |
$ 1,813
|
|
| Strategy [Heading] |
rr_StrategyHeading |
Principal Investment Strategies
|
|
| Strategy Narrative [Text Block] |
rr_StrategyNarrativeTextBlock |
THE FORESTER VALUE FUND invests in the stocks
of large U.S. companies that it believes are undervalued and have great appreciation potential. It may also take defensive positions
when the manager believes that the overall stock market is highly valued or that market conditions warrant it.
The Fund generally purchases a stock only at
a price Forester Capital Management ("Forester Capital"), the Fund’s investment manager (the “manager”),
deems significantly below the intrinsic value of the company - Forester Capital's estimate of the amount a buyer would pay to own
the entire company. Forester Capital performs its own fundamental analysis of the company.
The Fund places special focus on companies whose
current market prices are low in relation to earnings and have great appreciation potential. In addition to stocks with low prices
relative to earnings, Forester Capital also considers factors such as the following about the issuer:
Book-to-market value
Price-to-cash flow ratio
Price-to-sales ratio
Earnings estimates for the next 12 months
Five-year return on equity
Under normal market conditions, the fund invests
at least 65% of its net assets (at market value at the time of purchase) in the common stocks of large companies that have market
capitalizations greater than $5.0 billion. The Fund may emphasize sectors more or less than the S&P 500. The Fund may also
invest in stock index options.
The Fund may sell a stock when Forester Capital
thinks the stock is too expensive compared to Forester Capital's estimate of the company's intrinsic value, changing circumstances
affect the original reasons for a company's purchase, a company exhibits deteriorating fundamentals or more attractive alternatives
exist.
MARKET EXPOSURE. In order to try to enhance
returns, the manager may vary the Fund's exposure to the overall stock market. The manager may reduce market exposure when the
manager believes that the overall stock market is highly valued or that market conditions warrant it. During these defensive periods,
the Fund may invest some or all of its assets in stock index options, money market funds, U.S. Treasury or U.S. Agency fixed income
instruments with a maturity of less than five years.
|
|
| Risk [Heading] |
rr_RiskHeading |
Principal Risks
|
|
| Risk Narrative [Text Block] |
rr_RiskNarrativeTextBlock |
Like all mutual funds that invest in stocks,
the Forester Funds take investment risks and it is possible for you to lose money by investing in the Fund. The manager's ability
to choose suitable investments for the Fund has a significant impact on the Fund's ability to achieve its investment objective.
The principal factors that might reduce the Fund's return include:
Stock Market Risk: The Fund invests primarily
in common stocks and other equity securities. Over time, stocks have shown greater growth than other types of securities. In the
short-term, however, stock prices fluctuate widely in response to company, market, economic or other news.
Value Investing Risk: From time to time
"value" investing falls out of favor with investors. When it does, there is the risk that the market will not recognize
a company's improving fundamentals as quickly as it normally would. During these periods, the Fund's relative performance may suffer.
Emphasize Sector Risk: If the Fund has
a higher percentage of its total assets invested in a particular sector, changes affecting that sector may have a significant impact
on the Fund's overall portfolio.
Varying Market Exposure Risk: If the
Fund is in a defensive or offensive position, the Fund may not go in the same direction as the market and the Fund's performance
may suffer.
Large-Size Company Risk: The Fund normally
invests the majority of its assets in larger companies. Larger, more established companies may be unable to respond quickly to
new competitive challenges like changes in consumer tastes or innovative smaller competitors. Also, larger companies are sometimes
unable to attain the high growth rates of successful, smaller companies, especially during extended periods of economic expansion.
Options Risk: The primary risks associated
with options investments are: (1) the risk that changes in the value of the investment will not correlate to changes in the value
of the underlying security, which may result in imperfect hedging of a portfolio position, (2) options are more volatile than stocks
and therefore may be subject to disproportionately larger gains or losses; and (3) the risk that the use of an option strategy
to enhance the return of a portfolio will fail, with negative consequences to the Fund. Put options may not go in the same direction
as the market and the Fund’s performance may suffer. Accordingly, the Fund will limit its exposure to options to 5% of the
value of the portfolio, based on the cost of the options, at any one time.
Fixed Income Risk: The primary risk associated
with fixed income are: (1) the fixed income instrument may not go in the same direction as the market and the Fund’s performance
may suffer; (2) interest rates may rise, reducing the principal value of the instrument; and (3) the credit rating of the U.S.
Agency instrument may materially differ from a similar U.S. Treasury.
Turnover Risk: Portfolio turnover refers
to the rate at which the securities held by the Fund are replaced. The higher the rate, the higher the transactional and brokerage
costs associated with the turnover which may reduce the Fund’s return, unless the securities traded can be bought and sold
without corresponding commission costs. Active trading of securities may also increase the Fund’s realized short-term capital
gains or losses, which may affect the taxes you pay as a Fund shareholder. Short-term capital gains are taxed as ordinary income
under federal income tax laws.
An investment in the Fund is not a bank deposit,
and is not insured or guaranteed by the Federal Deposit Insurance Corporation (FDIC) or any other Government agency.
Because of these risks the Fund is a suitable
investment only for those investors who have long-term investment goals. Prospective investors who are uncomfortable with an investment
that will increase and decrease in value should not invest in the Fund.
|
|
| Risk Lose Money [Text] |
rr_RiskLoseMoney |
Like all mutual funds that invest in stocks, the Forester Funds take investment risks and it is possible for you to lose money by investing in the Fund.
|
|
| Bar Chart and Performance Table [Heading] |
rr_BarChartAndPerformanceTableHeading |
FUND PERFORMANCE – Class R Share
|
|
| Performance Narrative [Text Block] |
rr_PerformanceNarrativeTextBlock |
The Bar Chart and Table set out below help show
the returns and risks of investing in the Fund. They show changes in the Fund’s calendar year performance over the lifetime
of the Fund and compare the Fund’s average annual returns for periods of one year and since inception (12/28/10) to an appropriate
index during corresponding periods. You should be aware that the Fund’s past performance (before and after taxes) is no guarantee
or indication that the Fund will perform similarly in the future.
|
|
| Performance Past Does Not Indicate Future [Text] |
rr_PerformancePastDoesNotIndicateFuture |
The Fund’s past performance (before and after taxes) is not necessarily an indication of how the Fund will perform in the future.
|
|
| Bar Chart [Heading] |
rr_BarChartHeading |
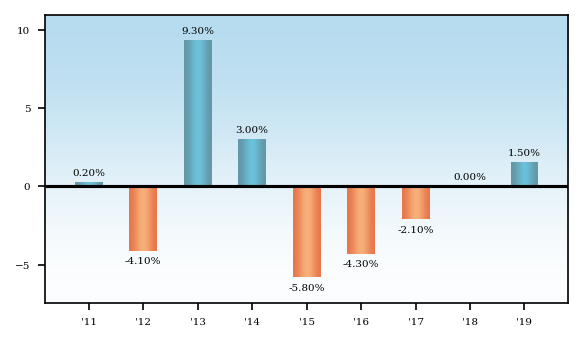
Annual Total Returns
|
|
| Annual Return 2011 |
rr_AnnualReturn2011 |
0.20%
|
|
| Annual Return 2012 |
rr_AnnualReturn2012 |
(4.10%)
|
|
| Annual Return 2013 |
rr_AnnualReturn2013 |
9.30%
|
|
| Annual Return 2014 |
rr_AnnualReturn2014 |
3.00%
|
|
| Annual Return 2015 |
rr_AnnualReturn2015 |
(5.80%)
|
|
| Annual Return 2016 |
rr_AnnualReturn2016 |
(4.30%)
|
|
| Annual Return 2017 |
rr_AnnualReturn2017 |
(2.10%)
|
|
| Annual Return 2018 |
rr_AnnualReturn2018 |
none
|
|
| Annual Return 2019 |
rr_AnnualReturn2019 |
1.50%
|
|
| Bar Chart Closing [Text Block] |
rr_BarChartClosingTextBlock |
The year-to-date return for Class R shares as of June 30, 2020, was
1.57%.
From 12/28/2010 (the share class’s inception) through 12/31/2018,
the highest and lowest quarterly returns were 6.45% and -4.43%, respectively, for the quarters ended March 30, 2013 and September
30, 2011.
|
|
| Highest Quarterly Return, Label |
rr_HighestQuarterlyReturnLabel |
highest quarterly return
|
|
| Highest Quarterly Return, Date |
rr_BarChartHighestQuarterlyReturnDate |
Mar. 30, 2013
|
|
| Highest Quarterly Return |
rr_BarChartHighestQuarterlyReturn |
6.45%
|
|
| Lowest Quarterly Return, Label |
rr_LowestQuarterlyReturnLabel |
lowest quarterly return
|
|
| Lowest Quarterly Return, Date |
rr_BarChartLowestQuarterlyReturnDate |
Sep. 30, 2011
|
|
| Lowest Quarterly Return |
rr_BarChartLowestQuarterlyReturn |
(4.43%)
|
|
| Performance Table Heading |
rr_PerformanceTableHeading |
Average Annual Total Returns (for periods ended December 31, 2019)
|
|
| Performance Table Uses Highest Federal Rate |
rr_PerformanceTableUsesHighestFederalRate |
After-tax returns are calculated using the highest individual federal marginal income tax rate in effect at the time of each distribution and assumed sale, but do not include the impact of state and local taxes.
|
|
| Performance Table Not Relevant to Tax Deferred |
rr_PerformanceTableNotRelevantToTaxDeferred |
After-tax returns reflect past tax effects and are not relevant to investors who hold their Fund shares in a tax-deferred account (including a 401(k) or IRA account), or to investors that are tax-exempt.
|
|
| Performance Table Narrative |
rr_PerformanceTableNarrativeTextBlock |
The table below shows the Fund's Class R shares
average annual total returns (before and after taxes) and the change in value of a broad-based market index over various periods
ended December 31, 2020. The information provides some indication of the risks of investing in the Fund by showing changes in the
Fund’s performance from year to year and by showing how the Fund’s average annual returns compare with those of broad
measure of the market’s performance. The Fund’s past performance (before and after taxes) is not necessarily an indication
of how the Fund will perform in the future.
After-tax returns are calculated using the highest
individual federal marginal income tax rate in effect at the time of each distribution and assumed sale, but do not include the
impact of state and local taxes.
Your actual after-tax returns depend on your
own tax situation and may differ from those shown. After-tax returns reflect past tax effects and are not relevant to investors
who hold their Fund shares in a tax-deferred account (including a 401(k) or IRA account), or to investors that are tax-exempt.
|
|
| Performance Table Closing [Text Block] |
rr_PerformanceTableClosingTextBlock |
* Inception 12/28/2010
|
|
| Class R | Forester Value Fund | Class R |
|
|
|
| Risk Return Abstract |
rr_RiskReturnAbstract |
|
|
| 1 Year |
rr_AverageAnnualReturnYear01 |
1.47%
|
|
| 5 Years |
rr_AverageAnnualReturnYear05 |
(2.17%)
|
|
| Since Inception |
rr_AverageAnnualReturnSinceInception |
(0.34%)
|
|
| Inception Date |
rr_AverageAnnualReturnInceptionDate |
Dec. 28, 2010
|
|
| Class R | Forester Value Fund | After Taxes on Distributions | Class R |
|
|
|
| Risk Return Abstract |
rr_RiskReturnAbstract |
|
|
| 1 Year |
rr_AverageAnnualReturnYear01 |
(0.90%)
|
|
| 5 Years |
rr_AverageAnnualReturnYear05 |
(2.75%)
|
|
| Since Inception |
rr_AverageAnnualReturnSinceInception |
(0.73%)
|
|
| Inception Date |
rr_AverageAnnualReturnInceptionDate |
Dec. 28, 2010
|
|
| Class R | Forester Value Fund | After Taxes on Distributions and Sales | Class R |
|
|
|
| Risk Return Abstract |
rr_RiskReturnAbstract |
|
|
| 1 Year |
rr_AverageAnnualReturnYear01 |
0.87%
|
|
| 5 Years |
rr_AverageAnnualReturnYear05 |
(1.87%)
|
|
| Since Inception |
rr_AverageAnnualReturnSinceInception |
(0.73%)
|
|
| Inception Date |
rr_AverageAnnualReturnInceptionDate |
Dec. 28, 2010
|
|
| Class R | Forester Value Fund | S&P 500 Index (index reflects no deduction for fees, expenses or taxes) |
|
|
|
| Risk Return Abstract |
rr_RiskReturnAbstract |
|
|
| 1 Year |
rr_AverageAnnualReturnYear01 |
31.49%
|
|
| 5 Years |
rr_AverageAnnualReturnYear05 |
11.70%
|
|
| Since Inception |
rr_AverageAnnualReturnSinceInception |
13.39%
|
|
| Inception Date |
rr_AverageAnnualReturnInceptionDate |
Dec. 28, 2010
|
|
| Discovery Fund | Forester Discovery Fund |
|
|
|
| Risk Return Abstract |
rr_RiskReturnAbstract |
|
|
| Objective [Heading] |
rr_ObjectiveHeading |
Investment Objective
|
|
| Objective, Primary [Text Block] |
rr_ObjectivePrimaryTextBlock |
THE FORESTER DISCOVERY FUND (the "Fund”) seeks maximum
long-term capital growth.
|
|
| Expense [Heading] |
rr_ExpenseHeading |
Fees and Expenses of the Fund
|
|
| Expense Narrative [Text Block] |
rr_ExpenseNarrativeTextBlock |
The table below describes the fees and expenses that you may pay
if you buy and hold shares of the Forester Discovery Fund.
|
|
| Operating Expenses Caption [Text] |
rr_OperatingExpensesCaption |
ANNUAL FUND OPERATING EXPENSES (expenses that you pay each year as a percentage of the value of your investment)
|
|
| Management Fees |
rr_ManagementFeesOverAssets |
1.00%
|
|
| Other Expenses |
rr_OtherExpensesOverAssets |
0.35%
|
|
| Acquired Fund Fees and Expenses |
rr_AcquiredFundFeesAndExpensesOverAssets |
0.04%
|
|
| Total Annual Fund Operating Expenses |
rr_ExpensesOverAssets |
1.39%
|
[1] |
| Portfolio Turnover [Heading] |
rr_PortfolioTurnoverHeading |
Portfolio Turnover
|
|
| Portfolio Turnover [Text Block] |
rr_PortfolioTurnoverTextBlock |
The Fund pays transaction costs, such as commissions,
when it buys and sells securities (or “turns over” its portfolio). A higher portfolio turnover rate may indicate higher
transaction costs and may result in higher taxes when Fund shares are held in a taxable account. These costs, which are not reflected
in annual operating expenses or in the Example affect the Fund’s performance. During the most recent fiscal year, the Fund’s
portfolio turnover rate was 17.44% of the average value of its portfolio.
|
|
| Portfolio Turnover, Rate |
rr_PortfolioTurnoverRate |
17.44%
|
|
| Expense Example [Heading] |
rr_ExpenseExampleHeading |
EXAMPLE
|
|
| Expense Example Narrative [Text Block] |
rr_ExpenseExampleNarrativeTextBlock |
This Example is intended to help you compare
the cost of investing in the Forester Discovery Fund with the cost of investing in other mutual funds.
The example assumes that you invest $10,000
in the Fund for the time periods indicated and then redeem all of your shares at the end of these periods. The Example also assumes
that your investment has a 5% return each year and that the Fund's operating expenses remain the same. Although your actual costs
may be higher or lower, based on these assumptions, your costs would be:
|
|
| One Year |
rr_ExpenseExampleYear01 |
$ 142
|
|
| Three Years |
rr_ExpenseExampleYear03 |
440
|
|
| Five Years |
rr_ExpenseExampleYear05 |
761
|
|
| Ten Years |
rr_ExpenseExampleYear10 |
$ 1,669
|
|
| Strategy [Heading] |
rr_StrategyHeading |
Principal Investment Strategies
|
|
| Strategy Narrative [Text Block] |
rr_StrategyNarrativeTextBlock |
THE DISCOVERY FUND is diversified and invests
in the common stocks of companies throughout the world that it believes are under-valued and have great appreciation potential.
The Fund generally invests at least 65% of its
net assets in the common stocks of non-U.S. companies. These companies may operate in developed countries, such as the Western
European countries, Japan and Canada, as well as in firms based in emerging markets, typically in the Far East, Latin America and
Eastern Europe. There are no restrictions on the size of the companies in which the Fund may invest. The fund was defensive from
inception through October 2008.
The Fund generally purchases a stock only at
a price Forester Capital Management ("Forester Capital" or “FCM”), the Fund's investment adviser, deems significantly
below the intrinsic value of the company - Forester Capital's estimate of the amount a buyer would pay to own the entire company.
Forester Capital performs its own fundamental analysis of the company.
The Fund uses a value approach to investing
- that is, it looks for common stocks that the investment manager believes are undervalued and have great appreciation potential.
The manager places special focus on companies whose market prices are low in relation to earnings. In addition, the manager also
considers factors such as the following about the issuer:
Book-to-market value
Price-to-cash flow ratio
Price-to-sales ratio
Earnings estimates for the next 12 months
Five-year return on equity
The Fund may sell a stock when Forester Capital
thinks the stock is too expensive compared to Forester Capital's estimate of the company's intrinsic value, changing circumstances
affect the original reasons for a company's purchase, a company exhibits deteriorating fundamentals or more attractive alternatives
exist.
RISK CONTROL. In order to enhance returns, by
avoiding the declines that follow bursting financial bubbles, at times, Forester Capital may determine that market or economic
conditions warrant a defensive position. During these defensive periods, the Fund may invest some or all of its assets in money
market funds and instruments (like U.S. Treasury Bills, commercial paper or repurchase agreements) or high-grade debt securities
(such as U.S. Treasury Notes and Bonds, U.S. Government Agency bonds or corporate bonds) giving up the potential for capital growth
to minimize potential losses. The Fund may also invest in stock index options.
|
|
| Risk [Heading] |
rr_RiskHeading |
Principal Risks
|
|
| Risk Narrative [Text Block] |
rr_RiskNarrativeTextBlock |
Like all mutual funds that invest in stocks,
the Forester Funds take investment risks and it is possible for you to lose money by investing in the Fund. The portfolio manager's
ability to choose suitable investments for the Fund has a significant impact on the Fund's ability to achieve its investment objective.
The principal factors that might reduce the Fund's return include:
Stock Market Risk: The Fund invests primarily
in common stocks and other equity securities. Over time, stocks have shown greater growth than other types of securities. In the
short-term, however, stock prices fluctuate widely in response to company, market, economic or other news.
Value Investing Risk: From time to time
"value" investing falls out of favor with investors. When it does, there is the risk that the market will not recognize
a company's improving fundamentals as quickly as it normally would. During these periods, the Fund's relative performance may suffer.
Emphasize Sector Risk: If the Fund has
a higher percentage of its total assets invested in a particular sector, changes affecting that sector may have a significant impact
on the Fund's overall portfolio.
Foreign Investment Risk: Foreign stocks
as an asset class may underperform U.S. stocks, and foreign stocks tend to be more volatile than U.S. stocks. Risks relating to
investments in foreign securities (including American Depositary Receipts or "ADRs") include: currency exchange rate fluctuation;
less available public information about the issuers of securities; less stringent regulatory standards; lack of uniform accounting,
auditing and financial reporting standards; and country risks including less liquidity, high inflation rates, unfavorable economic
practices, political instability, war, expropriation, and nationalization.
Currency Risk: Foreign securities are
usually denominated and traded in foreign currencies, while the Fund values its assets in U.S. dollars. The exchange rates between
foreign currencies and the U.S. dollar fluctuate daily. As a result, the values of the Fund's investments will be affected favorably
or unfavorably by changes in currency exchange rates relative to the U.S. dollar. The Fund may have a significant portion of its
assets invested in securities denominated in the euro or yen, so the exchange rate between the euro and/or the yen and the U.S.
dollar may have a significant impact on the value of the Fund's investments.
Emerging Market Risk: The risks of foreign
investments are typically increased in emerging markets. For example, political and economic structures in these less developed
countries may be new and changing rapidly, which may cause instability. Their securities markets may be less developed. These countries
are also more likely to experience high levels of inflation, deflation or currency devaluations, which could hurt their economies
and securities markets.
Smaller Capitalization Companies Risk:
Stocks of small companies tend to be more volatile and less liquid than stocks of large companies. Small companies may have a shorter
history of operations, less access to additional financing, and a less diversified product line, making them more susceptible to
market pressures.
Varying Market Exposure: If the Fund
is in a defensive or offensive position, the Fund may not go in the same direction as the market and the Fund's performance may
suffer.
Options Risk: The primary risks associated
with options investments are: (1) the risk that changes in the value of the investment will not correlate to changes in the value
of the underlying security, which may result in imperfect hedging of a portfolio position, (2) options are more volatile than stocks
and therefore may be subject to disproportionately larger gains or losses; and (3) the risk that the use of an option strategy
to enhance the return of a portfolio will fail, with negative consequences to the Fund. Put or call options may not go in the same
direction as the market and the Fund’s performance may suffer. Accordingly, the Fund will limit its exposure to options to
5% of the portfolio, based on the cost of the options, at any one time.
Fixed Income Risk: The primary risk associated
with fixed income are: (1) the fixed income instrument may not go in the same direction as the market and the Fund’s performance
may suffer; (2) interest rates may rise, reducing the principal value of the instrument; and (3) the credit rating of the U.S.
Agency instrument may materially differ from a similar U.S. Treasury.
An investment in the Fund is not a bank deposit,
and is not insured or guaranteed by the Federal Deposit Insurance Corporation (FDIC) or any other Government agency.
Because of these risks the Fund is a suitable
investment only for those investors who have long-term investment goals. Prospective investors who are uncomfortable with an investment
that will increase and decrease in value should not invest in the Fund.
|
|
| Risk Lose Money [Text] |
rr_RiskLoseMoney |
Like all mutual funds that invest in stocks, the Forester Funds take investment risks and it is possible for you to lose money by investing in the Fund.
|
|
| Bar Chart and Performance Table [Heading] |
rr_BarChartAndPerformanceTableHeading |
FUND PERFORMANCE - Discovery Fund
|
|
| Performance Narrative [Text Block] |
rr_PerformanceNarrativeTextBlock |
The following bar charts show the Fund’s
calendar year returns. This information shows how the Fund’s returns have varied over time. Please remember that the Fund's
past performance is not necessarily an indication of its future performance. It may perform better or worse in the future.
|
|
| Performance Past Does Not Indicate Future [Text] |
rr_PerformancePastDoesNotIndicateFuture |
Please remember that the Fund's past performance is not necessarily an indication of its future performance. It may perform better or worse in the future.
|
|
| Bar Chart [Heading] |
rr_BarChartHeading |
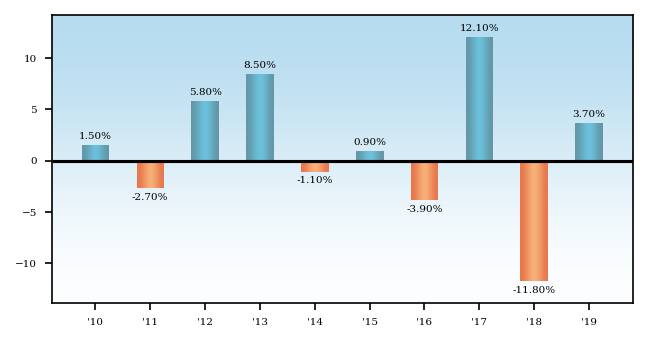
Annual Total Returns
|
|
| Annual Return 2010 |
rr_AnnualReturn2010 |
1.50%
|
|
| Annual Return 2011 |
rr_AnnualReturn2011 |
(2.70%)
|
|
| Annual Return 2012 |
rr_AnnualReturn2012 |
5.80%
|
|
| Annual Return 2013 |
rr_AnnualReturn2013 |
8.50%
|
|
| Annual Return 2014 |
rr_AnnualReturn2014 |
(1.10%)
|
|
| Annual Return 2015 |
rr_AnnualReturn2015 |
0.90%
|
|
| Annual Return 2016 |
rr_AnnualReturn2016 |
(3.90%)
|
|
| Annual Return 2017 |
rr_AnnualReturn2017 |
12.10%
|
|
| Annual Return 2018 |
rr_AnnualReturn2018 |
(11.80%)
|
|
| Annual Return 2019 |
rr_AnnualReturn2019 |
3.70%
|
|
| Bar Chart Closing [Text Block] |
rr_BarChartClosingTextBlock |
From inception (9/10/99) through 12/31/19, the
Fund's highest and lowest quarterly returns were 14.24% and -8.36%, respectively, for the quarters ended June 30, 2009 and September
30, 2011. The year-to-date return as of June 30, 2020, was -3.40%.
The tables below show the Fund's average annual
total returns (before and after taxes) and the change in value of a broad-based market index over various periods ended December
31, 2019. The information provides some indication of the risks of investing in the Fund by showing changes in the Fund’s
performance from year to year and by showing how the Fund’s average annual returns for 1, 5, and 10 years compare with those
of broad measure of market’s performance. The Fund’s past performance (before and after taxes) is not necessarily an
indication of how the Fund will perform in the future.
After-tax returns are calculated using the highest
individual federal marginal income tax rate in effect at the time of each distribution and assumed sale, but do not include the
impact of state and local taxes.
Your actual after-tax returns depend on your
own tax situation and may differ from those shown. After-tax returns reflect past tax effects and are not relevant to investors
who hold their Fund shares in a tax-deferred account (including a 401(k) or IRA account), or to investors that are tax-exempt.
|
|
| Highest Quarterly Return, Label |
rr_HighestQuarterlyReturnLabel |
highest quarterly return
|
|
| Highest Quarterly Return, Date |
rr_BarChartHighestQuarterlyReturnDate |
Jun. 30, 2009
|
|
| Highest Quarterly Return |
rr_BarChartHighestQuarterlyReturn |
14.24%
|
|
| Lowest Quarterly Return, Label |
rr_LowestQuarterlyReturnLabel |
lowest quarterly return
|
|
| Lowest Quarterly Return, Date |
rr_BarChartLowestQuarterlyReturnDate |
Sep. 30, 2011
|
|
| Lowest Quarterly Return |
rr_BarChartLowestQuarterlyReturn |
(8.36%)
|
|
| Performance Table Heading |
rr_PerformanceTableHeading |
Average Annual Total Returns (for periods ended December 31, 2019)
|
|
| Performance Table Uses Highest Federal Rate |
rr_PerformanceTableUsesHighestFederalRate |
After-tax returns are calculated using the highest individual federal marginal income tax rate in effect at the time of each distribution and assumed sale, but do not include the impact of state and local taxes.
|
|
| Performance Table Not Relevant to Tax Deferred |
rr_PerformanceTableNotRelevantToTaxDeferred |
Your actual after-tax returns depend on your own tax situation and may differ from those shown. After-tax returns reflect past tax effects and are not relevant to investors who hold their Fund shares in a tax-deferred account (including a 401(k) or IRA account), or to investors that are tax-exempt.
|
|
| Performance Table Closing [Text Block] |
rr_PerformanceTableClosingTextBlock |
The MSCI ACWI ex USA Value Index captures large
and mid cap representation across 22 of 23 Developed Markets (DM) countries (excluding the US) and 26 Emerging Markets (EM) countries.
The value investment style characteristics for index construction are defined using three variables: book value to price, 12-month
forward earnings to price and dividend yield.
|
|
| Discovery Fund | Forester Discovery Fund | Forester Discovery Fund |
|
|
|
| Risk Return Abstract |
rr_RiskReturnAbstract |
|
|
| 1 Year |
rr_AverageAnnualReturnYear01 |
3.74%
|
|
| 5 Years |
rr_AverageAnnualReturnYear05 |
(0.10%)
|
|
| 10 Years |
rr_AverageAnnualReturnYear10 |
1.10%
|
|
| Discovery Fund | Forester Discovery Fund | After Taxes on Distributions | Forester Discovery Fund |
|
|
|
| Risk Return Abstract |
rr_RiskReturnAbstract |
|
|
| 1 Year |
rr_AverageAnnualReturnYear01 |
2.94%
|
|
| 5 Years |
rr_AverageAnnualReturnYear05 |
(0.60%)
|
|
| 10 Years |
rr_AverageAnnualReturnYear10 |
0.70%
|
|
| Discovery Fund | Forester Discovery Fund | After Taxes on Distributions and Sales | Forester Discovery Fund |
|
|
|
| Risk Return Abstract |
rr_RiskReturnAbstract |
|
|
| 1 Year |
rr_AverageAnnualReturnYear01 |
2.21%
|
|
| 5 Years |
rr_AverageAnnualReturnYear05 |
(0.29%)
|
|
| 10 Years |
rr_AverageAnnualReturnYear10 |
0.71%
|
|
| Discovery Fund | Forester Discovery Fund | MSCI ACWI EX USA Value (index reflects no deduction for fees, expenses or taxes) |
|
|
|
| Risk Return Abstract |
rr_RiskReturnAbstract |
|
|
| 1 Year |
rr_AverageAnnualReturnYear01 |
15.71%
|
|
| 5 Years |
rr_AverageAnnualReturnYear05 |
3.65%
|
|
| 10 Years |
rr_AverageAnnualReturnYear10 |
3.64%
|
|
|
|