Exhibit (c)(9)
Project Cloud Supporting Materials 21 October 2022
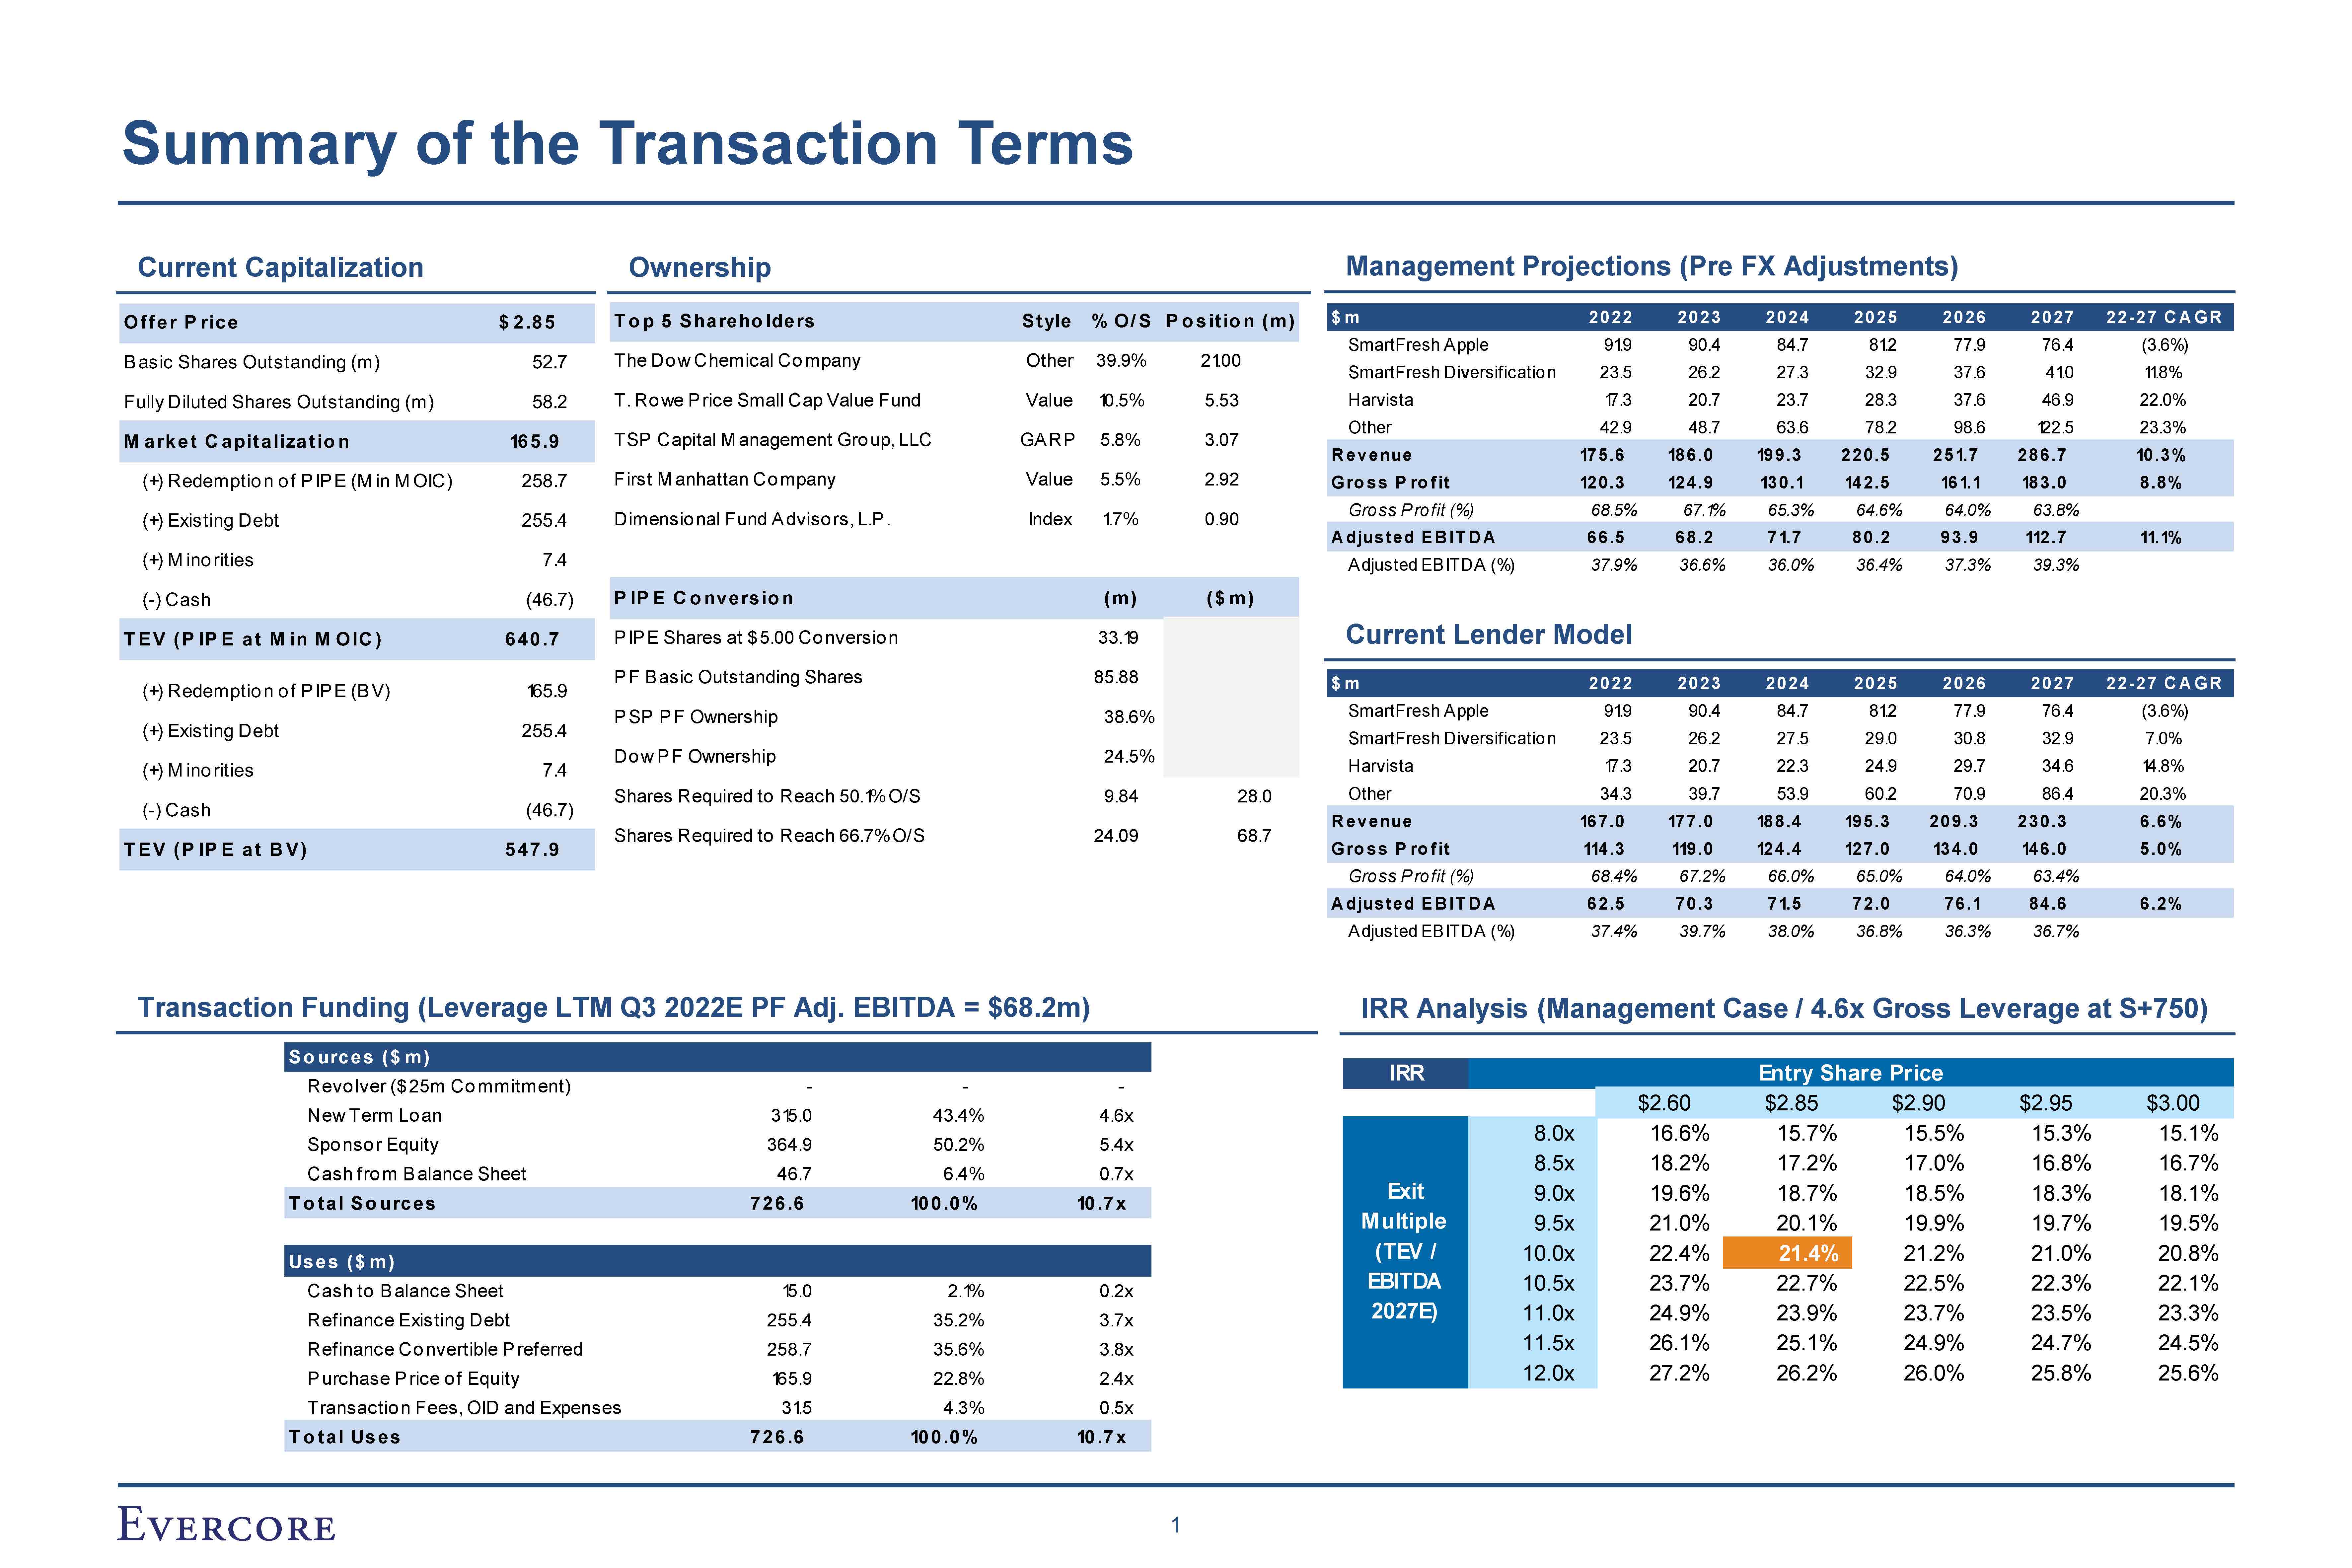
Summary of the Transaction Terms Current Capitalization Ownership Management
Projections (Pre FX Adjustments) Current Lender Model Transaction Funding (Leverage LTM Q3 2022E PF Adj. EBITDA = $68.2m) M (+) Existing Debt (+) M ino rities (-) Cash T EV ( P IP E at M in (+) Redemptio n (+) Existing (+) M ino (-)
C T Offer P rice $ 2 .85 T o p 5 Shareho lders St yle % O/ S P o sitio n ( m) $m 2022 2023 2024 2025 2026 2027 22 - 27 C A GR SmartFresh Apple 91.9 90.4 84.7 81.2 77.9 76.4 (3.6%) B asic Shares Outstanding
(m) 52 The Dow Chemical Company Other 39.9% 21.00 SmartFresh Diversificatio n 23.5 26.2 27.3 32.9 37.6 41.0 11.8% Fully Diluted Shares Outstanding (m) T. Rowe P rice Small Cap Value
Fund Value 10.5% 5.53 Harvista 17.3 20.7 23.7 28.3 37.6 46.9 22.0% TSP Capital M anagement Gro up, LLC GA RP 5.8% 3.07 Dimensio nal Fund A dviso rs, L.P . Index 1.7% 0.90 P IP E C o nversio n (m) ( $ m) PIPE Shares at $
5.00 Co nversio n 33.19 PF B asic Outstanding Shares P SP PF Ownership Dow PF Ownership 85.88 38.6% 24.5% Shares Required to Reach 50.1% O/S Shares Required to Reach 66.7% O/S 9.84 24.09 28.0 68.7 IRR Analysis (Management Case /
4.6x Gross Leverage at S+750) IRR Entry Share Price $2.60 $2.85 $2.90 $2.95
$3.00 1 8.0x 16.6% 15.7% 15.5% 15.3% 15.1% 8.5x 18.2% 17.2% 17.0% 16.8% 16.7% Exit 9.0x 19.6% 18.7% 18.5% 18.3% 18.1% Multiple 9.5x 21.0% 20.1% 19.9% 19.7% 19.5% (TEV
/ 10.0x 22.4% 21.4% 21.2% 21.0% 20.8% EBITDA 10.5x 23.7% 22.7% 22.5% 22.3% 22.1% 2027E) 11.0x 24.9% 23.9% 23.7% 23.5% 23.3% 11.5x 26.1% 25.1% 24.9% 24.7% 24.5% 12.0x 27.2% 26.2% 26.0% 25.8% 25.6% Other 42.9 48.7 63.6 78.2 98.6 122.5 23.3% arket
C apitalizatio n R evenue 175 .6 186 .0 199 .3 220 .5 251.7 286 .7 10 .3 % (+) Redemptio n of PIPE (M in M OIC First M anhattan Company Value 5.5% 2.92 Gro ss P ro f it 120 .3 124 .9 130 .1 142 .5 161.1 183 .0 8 .8 % Gross
Profit (%) 68.5% 67.1% 65.3% 64.6% 64.0% 63.8% A djusted EB IT D A 66 .5 68 .2 71.7 80 .2 93 .9 112 .7 11.1% Adjusted EBITDA (%) 37.9% 36.6% 36.0% 36.4% 37.3% 39.3% $m 2022 2023 2024 2025 2026 2027 22 - 27 C A GR SmartFresh Apple
SmartFresh Diversificatio n Harvista Other 91.9 23.5 17.3 34.3 90.4 26.2 20.7 39.7 84.7 27.5 22.3 53.9 81.2 29.0 24.9 60.2 77.9 30.8 29.7 70.9 76.4 32.9 34.6 86.4 (3.6%) 7.0% 14.8% 20.3% R evenue 167 .0 177
.0 188 .4 195 .3 209 .3 230 .3 6 .6 % Gro ss P ro f it 114 .3 119 .0 124 .4 127 .0 134 .0 146 .0 5 .0 % Gross Profit (%) 68.4% 67.2% 66.0% 65.0% 64.0% 63.4% A djusted EB IT D A 62 .5 70 .3 71.5 72 .0 76 .1 84 .6 6 .2
% Adjusted EBITDA (%) 37.4% 39.7% 38.0% 36.8% 36.3% 36.7% So urces ( $ m) Revo lver ($ 25m Commitment) - - - New Term Lo an 315.0 43.4% 4.6x Spo nso r Equity 364.9 50.2% 5.4x Cash fro m B alance Sheet 46.7 6.4% 0.7x T o
tal So urces 726 .6 100 .0 % 10 .7 x Uses ( $ m) Cash to B alance Sheet 15.0 2.1% 0.2x Refinance Existing Debt 255.4 35.2% 3.7x Refinance Co nvertible P referred 258.7 35.6% 3.8x P urchase P rice of
Equity 165.9 22.8% 2.4x Transactio n Fees, OID and Expenses 31.5 4.3% 0.5x T o tal Uses 726 .6 100 .0 % 10 .7 x
I Analysis at Various Prices
STRICTLY PRIVATE & CONFIDENTIAL Analysis at Various Prices: Management
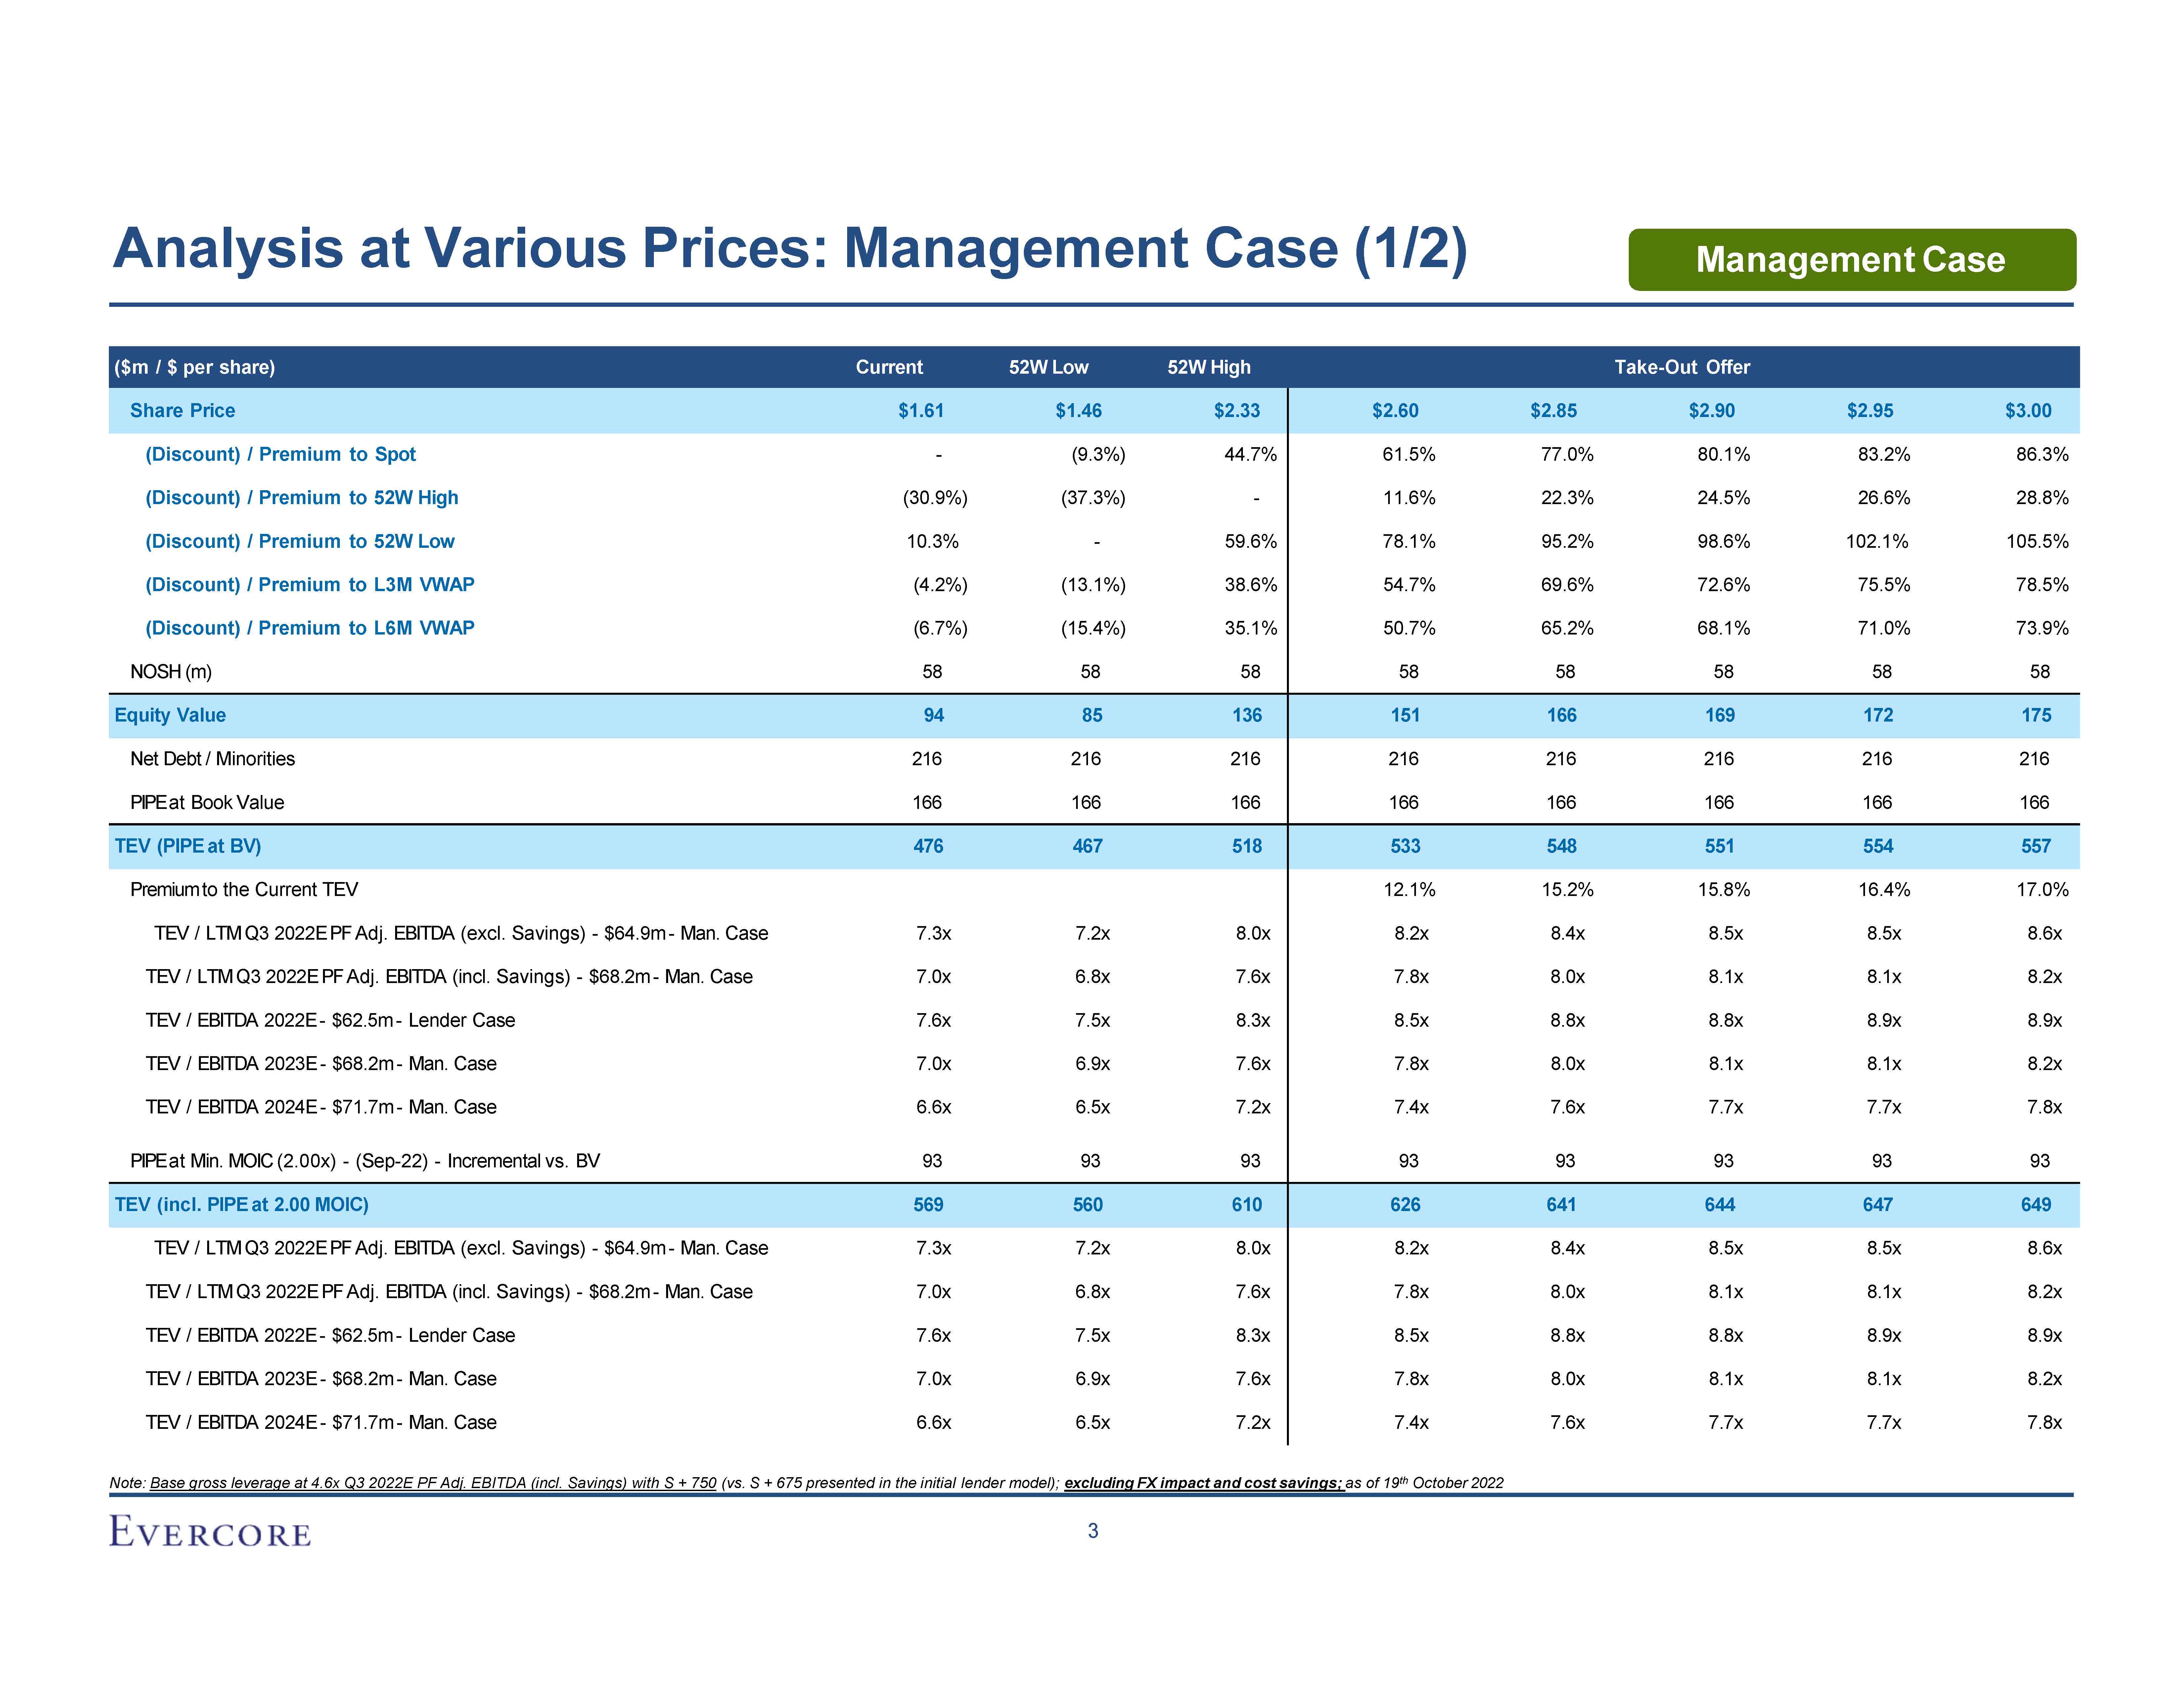
Case (1/2) Note: Base gross leverage at 4.6x Q3 2022E PF Adj. EBITDA (incl. Savings) with S + 750 (vs. S + 675 presented in the initial lender model); excluding FX impact and cost savings; as of 19th October 2022 3 Management Case ($m
/ $ per share) Current 52W Low 52W High Take-Out Offer Share Price $1.61 $1.46 $2.33 $2.60 $2.85 $2.90 $2.95 $3.00 (Discount) / Premium to Spot - (9.3%) 44.7% 61.5% 77.0% 80.1% 83.2% 86.3% (Discount) / Premium to 52W
High (30.9%) (37.3%) - 11.6% 22.3% 24.5% 26.6% 28.8% (Discount) / Premium to 52W Low 10.3% - 59.6% 78.1% 95.2% 98.6% 102.1% 105.5% (Discount) / Premium to L3M
VWAP (4.2%) (13.1%) 38.6% 54.7% 69.6% 72.6% 75.5% 78.5% (Discount) / Premium to L6M VWAP (6.7%) (15.4%) 35.1% 50.7% 65.2% 68.1% 71.0% 73.9% NOSH (m) 58 58 58 58 58 58 58 58 Equity
Value 94 85 136 151 166 169 172 175 Net Debt / Minorities 216 216 216 216 216 216 216 216 PIPE at Book Value 166 166 166 166 166 166 166 166 TEV (PIPE at BV) 476 467 518 533 548 551 554 557 Premium to
the Current TEV 12.1% 15.2% 15.8% 16.4% 17.0% TEV / LTM Q3 2022E PF Adj. EBITDA (excl. Savings) - $64.9m - Man. Case 7.3x 7.2x 8.0x 8.2x 8.4x 8.5x 8.5x 8.6x TEV / LTM Q3 2022E PF Adj. EBITDA (incl. Savings) - $68.2m - Man.
Case 7.0x 6.8x 7.6x 7.8x 8.0x 8.1x 8.1x 8.2x TEV / EBITDA 2022E - $62.5m - Lender Case 7.6x 7.5x 8.3x 8.5x 8.8x 8.8x 8.9x 8.9x TEV / EBITDA 2023E - $68.2m - Man. Case 7.0x 6.9x 7.6x 7.8x 8.0x 8.1x 8.1x 8.2x TEV
/ EBITDA 2024E - $71.7m - Man. Case 6.6x 6.5x 7.2x 7.4x 7.6x 7.7x 7.7x 7.8x PIPE at Min. MOIC (2.00x) - (Sep-22) - Incremental vs. BV 93 93 93 93 93 93 93 93 TEV (incl. PIPE at 2.00
MOIC) 569 560 610 626 641 644 647 649 TEV / LTM Q3 2022E PF Adj. EBITDA (excl. Savings) - $64.9m - Man. Case 7.3x 7.2x 8.0x 8.2x 8.4x 8.5x 8.5x 8.6x TEV / LTM Q3 2022E PF Adj. EBITDA (incl. Savings) - $68.2m - Man.
Case 7.0x 6.8x 7.6x 7.8x 8.0x 8.1x 8.1x 8.2x TEV / EBITDA 2022E - $62.5m - Lender Case 7.6x 7.5x 8.3x 8.5x 8.8x 8.8x 8.9x 8.9x TEV / EBITDA 2023E - $68.2m - Man. Case 7.0x 6.9x 7.6x 7.8x 8.0x 8.1x 8.1x 8.2x TEV
/ EBITDA 2024E - $71.7m - Man. Case 6.6x 6.5x 7.2x 7.4x 7.6x 7.7x 7.7x 7.8x
Analysis at Various Prices: Management Case (1/2) Management Case Note: Base
gross leverage at 4.6x Q3 2022E PF Adj. EBITDA (incl. Savings) with S + 750 (vs. S + 675 presented in the initial lender model); excluding FX impact and cost savings; as of 19th October 2022 3 ($m / $ per share) Current 52W Low 52W High
Take-Out Offer Share Price $1.61 $2.33 $1.46 $2.60 $2.85 $2.90 $2.95 $3.00 (Discount) / Premium to Spot - 44.7% (9.3%) 61.5% 77.0% 80.1% 83.2% 86.3% (Discount) / Premium to 52W
High (30.9%) - (37.3%) 11.6% 22.3% 24.5% 26.6% 28.8% (Discount) / Premium to 52W Low 10.3% 59.6% - 78.1% 95.2% 98.6% 102.1% 105.5% (Discount) / Premium to L3M
VWAP (4.2%) 38.6% (13.1%) 54.7% 69.6% 72.6% 75.5% 78.5% (Discount) / Premium to L6M VWAP (6.7%) 35.1% (15.4%) 50.7% 65.2% 68.1% 71.0% 73.9% NOSH (m) 58 58 58 58 58 58 58 58 Equity
Value 94 136 85 151 166 169 172 175 Net Debt / Minorities 216 216 216 216 216 216 216 216 PIPE at Book Value 166 166 166 166 166 166 166 166 TEV (PIPE at BV) 476 518 467 533 548 551 554 557 Premium to the
Current TEV 12.1% 15.2% 15.8% 16.4% 17.0% TEV / LTM Q3 2022E PF Adj. EBITDA (excl. Savings) - $64.9m - Man. Case 7.3x 8.0x 7.2x 8.2x 8.4x 8.5x 8.5x 8.6x TEV / LTM Q3 2022E PF Adj. EBITDA (incl. Savings) - $68.2m - Man.
Case 7.0x 7.6x 6.8x 7.8x 8.0x 8.1x 8.1x 8.2x TEV / EBITDA 2022E - $62.5m - Lender Case 7.6x 8.3x 7.5x 8.5x 8.8x 8.8x 8.9x 8.9x TEV / EBITDA 2023E - $68.2m - Man. Case 7.0x 7.6x 6.9x 7.8x 8.0x 8.1x 8.1x 8.2x TEV /
EBITDA 2024E - $71.7m - Man. Case 6.6x 7.2x 6.5x 7.4x 7.6x 7.7x 7.7x 7.8x PIPE at Min. MOIC (2.00x) - (Sep-22) - Incremental vs. BV 93 93 93 93 93 93 93 93 TEV (incl. PIPE at 2.00
MOIC) 569 610 560 626 641 644 647 649 TEV / LTM Q3 2022E PF Adj. EBITDA (excl. Savings) - $64.9m - Man. Case 7.3x 8.0x 7.2x 8.2x 8.4x 8.5x 8.5x 8.6x TEV / LTM Q3 2022E PF Adj. EBITDA (incl. Savings) - $68.2m - Man.
Case 7.0x 7.6x 6.8x 7.8x 8.0x 8.1x 8.1x 8.2x TEV / EBITDA 2022E - $62.5m - Lender Case 7.6x 8.3x 7.5x 8.5x 8.8x 8.8x 8.9x 8.9x TEV / EBITDA 2023E - $68.2m - Man. Case 7.0x 7.6x 6.9x 7.8x 8.0x 8.1x 8.1x 8.2x TEV /
EBITDA 2024E - $71.7m - Man. Case 6.6x 7.2x 6.5x 7.4x 7.6x 7.7x 7.7x 7.8x
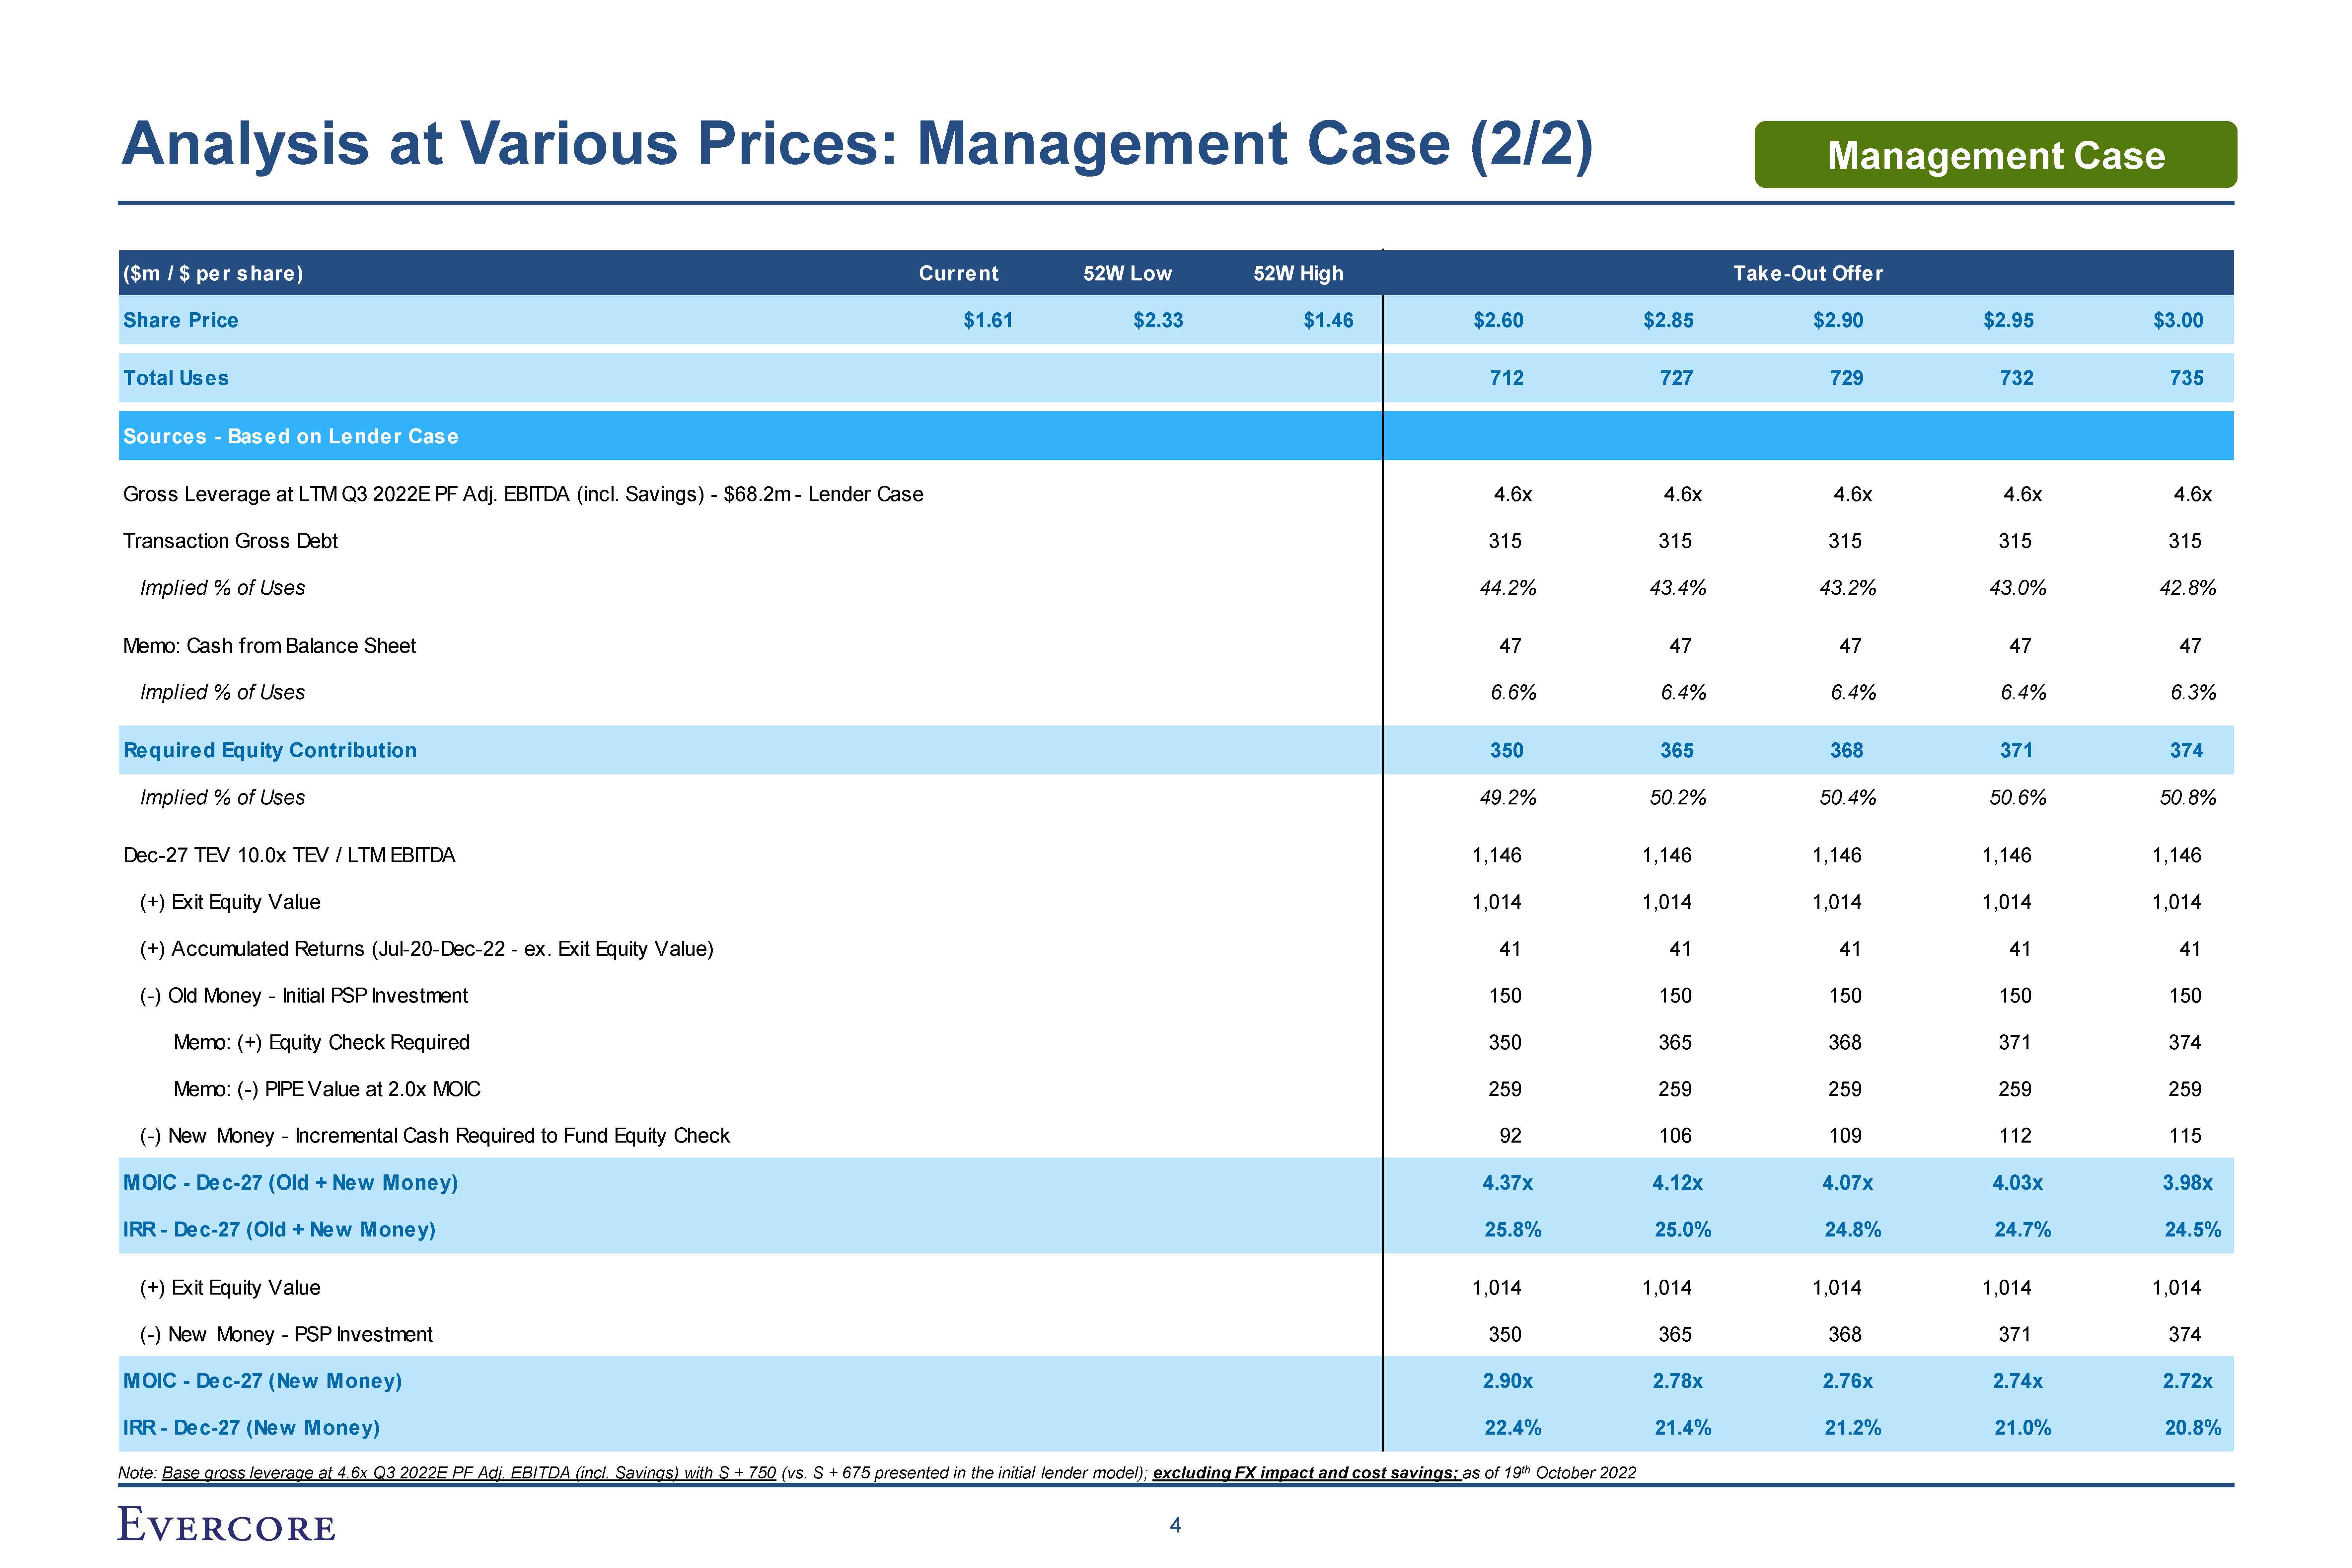
Analysis at Various Prices: Management Case (2/2) Management Case Note: Base
gross leverage at 4.6x Q3 2022E PF Adj. EBITDA (incl. Savings) with S + 750 (vs. S + 675 presented in the initial lender model); excluding FX impact and cost savings; as of 19th October 2022 4 ($m / $ per share) Current 52W Low 52W High
Take-Out Offer Share Price $1.61 $2.33 $1.46 $2.60 $2.85 $2.90 $2.95 $3.00 Total Uses 712 727 729 732 735 Sources - Based on Lender Case Gross Leverage at LTM Q3 2022E PF Adj. EBITDA (incl. Savings) - $68.2m - Lender
Case 4.6x 4.6x 4.6x 4.6x 4.6x Transaction Gross Debt 315 315 315 315 315 Implied % of Uses 44.2% 43.4% 43.2% 43.0% 42.8% Memo: Cash from Balance Sheet 47 47 47 47 47 Implied % of
Uses 6.6% 6.4% 6.4% 6.4% 6.3% Required Equity Contribution 350 365 368 371 374 Implied % of Uses 49.2% 50.2% 50.4% 50.6% 50.8% Dec-27 TEV 10.0x TEV / LTM EBITDA 1,146 1,146 1,146 1,146 1,146 (+) Exit Equity
Value 1,014 1,014 1,014 1,014 1,014 (+) Accumulated Returns (Jul-20-Dec-22 - ex. Exit Equity Value) 41 41 41 41 41 (-) Old Money - Initial PSP Investment 150 150 150 150 150 Memo: (+) Equity Check
Required 350 365 368 371 374 Memo: (-) PIPE Value at 2.0x MOIC 259 259 259 259 259 (-) New Money - Incremental Cash Required to Fund Equity Check 92 106 109 112 115 MOIC - Dec-27 (Old + New
Money) 4.37x 4.12x 4.07x 4.03x 3.98x IRR - Dec-27 (Old + New Money) 25.8% 25.0% 24.8% 24.7% 24.5% (+) Exit Equity Value 1,014 1,014 1,014 1,014 1,014 (-) New Money - PSP Investment 350 365 368 371 374 MOIC - Dec-27 (New
Money) 2.90x 2.78x 2.76x 2.74x 2.72x IRR - Dec-27 (New Money) 22.4% 21.4% 21.2% 21.0% 20.8%
II Trading Update + DCF Analysis
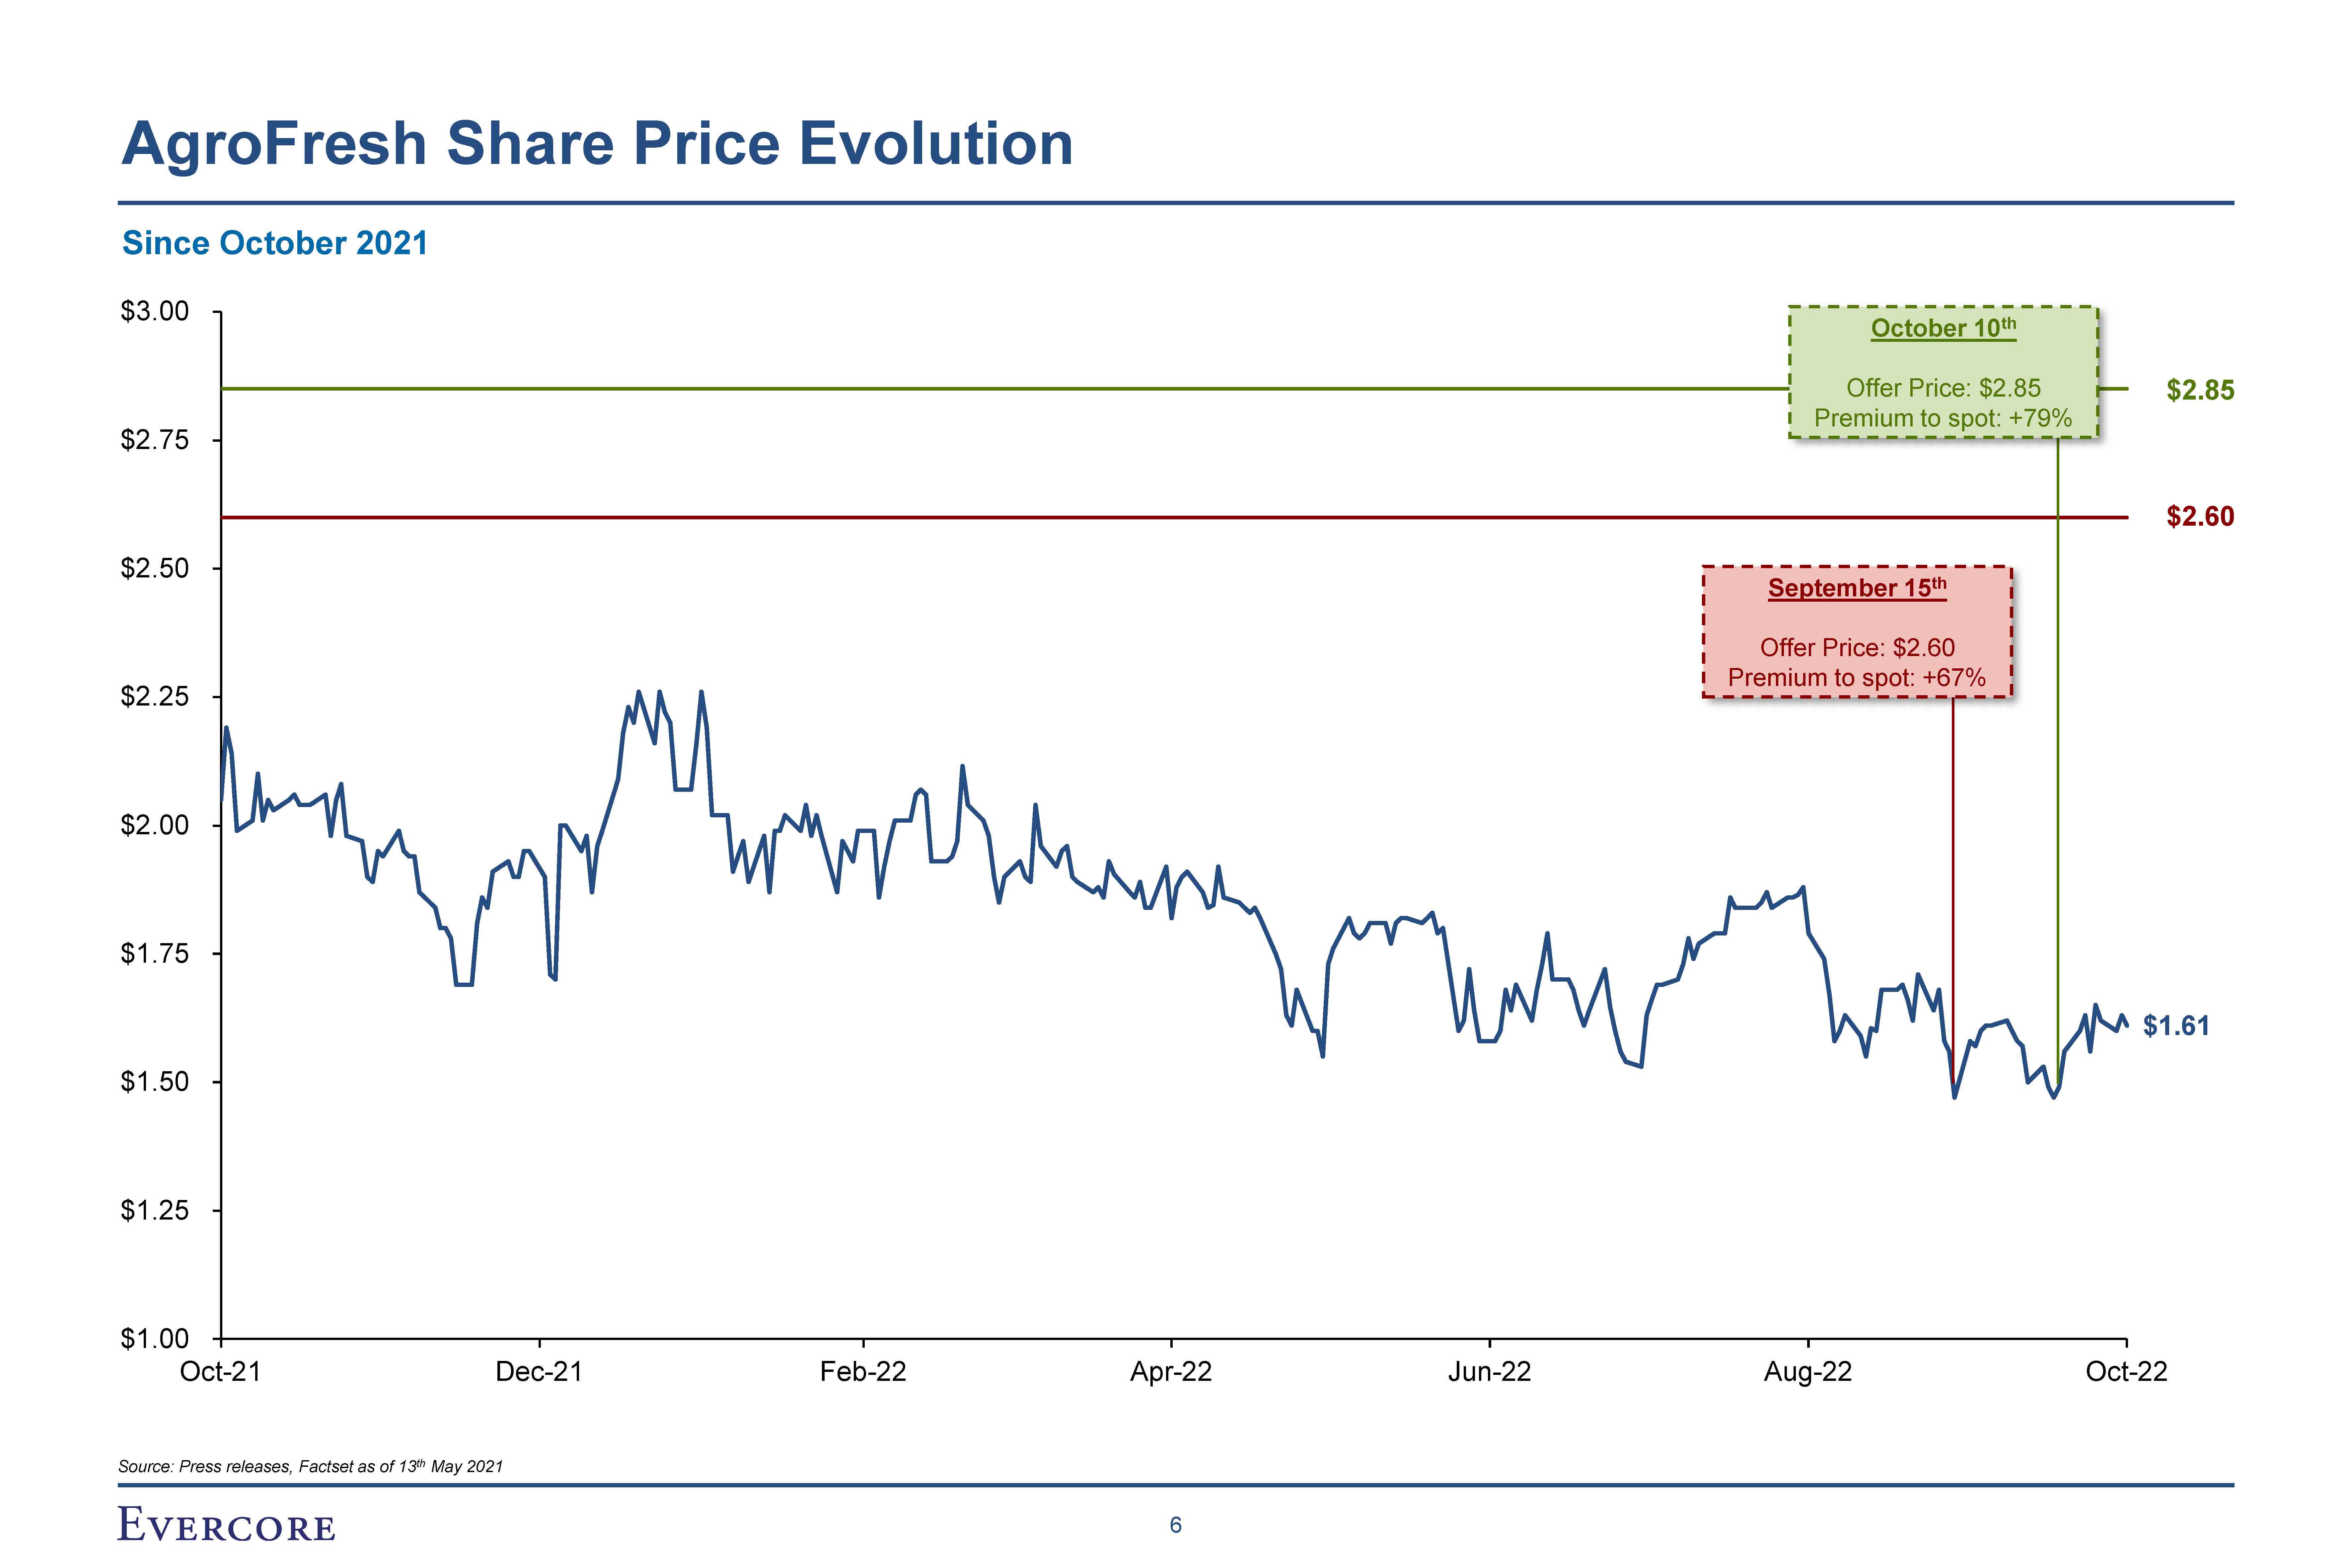
$1.61 $1.00 $1.25 $1.50 $1.75 $2.00 $2.25 $2.50 $2.75 $3.00 Oct-21 Dec-21 Feb-22 Apr-22 Jun-22 Aug-22 Oct-22 AgroFresh
Share Price Evolution Since October 2021 September 15th Offer Price: $2.60 Premium to spot: +67% $2.85 $2.60 October 10th Source: Press releases, Factset as of 13th May 2021 6 Offer Price: $2.85 Premium to spot: +79%
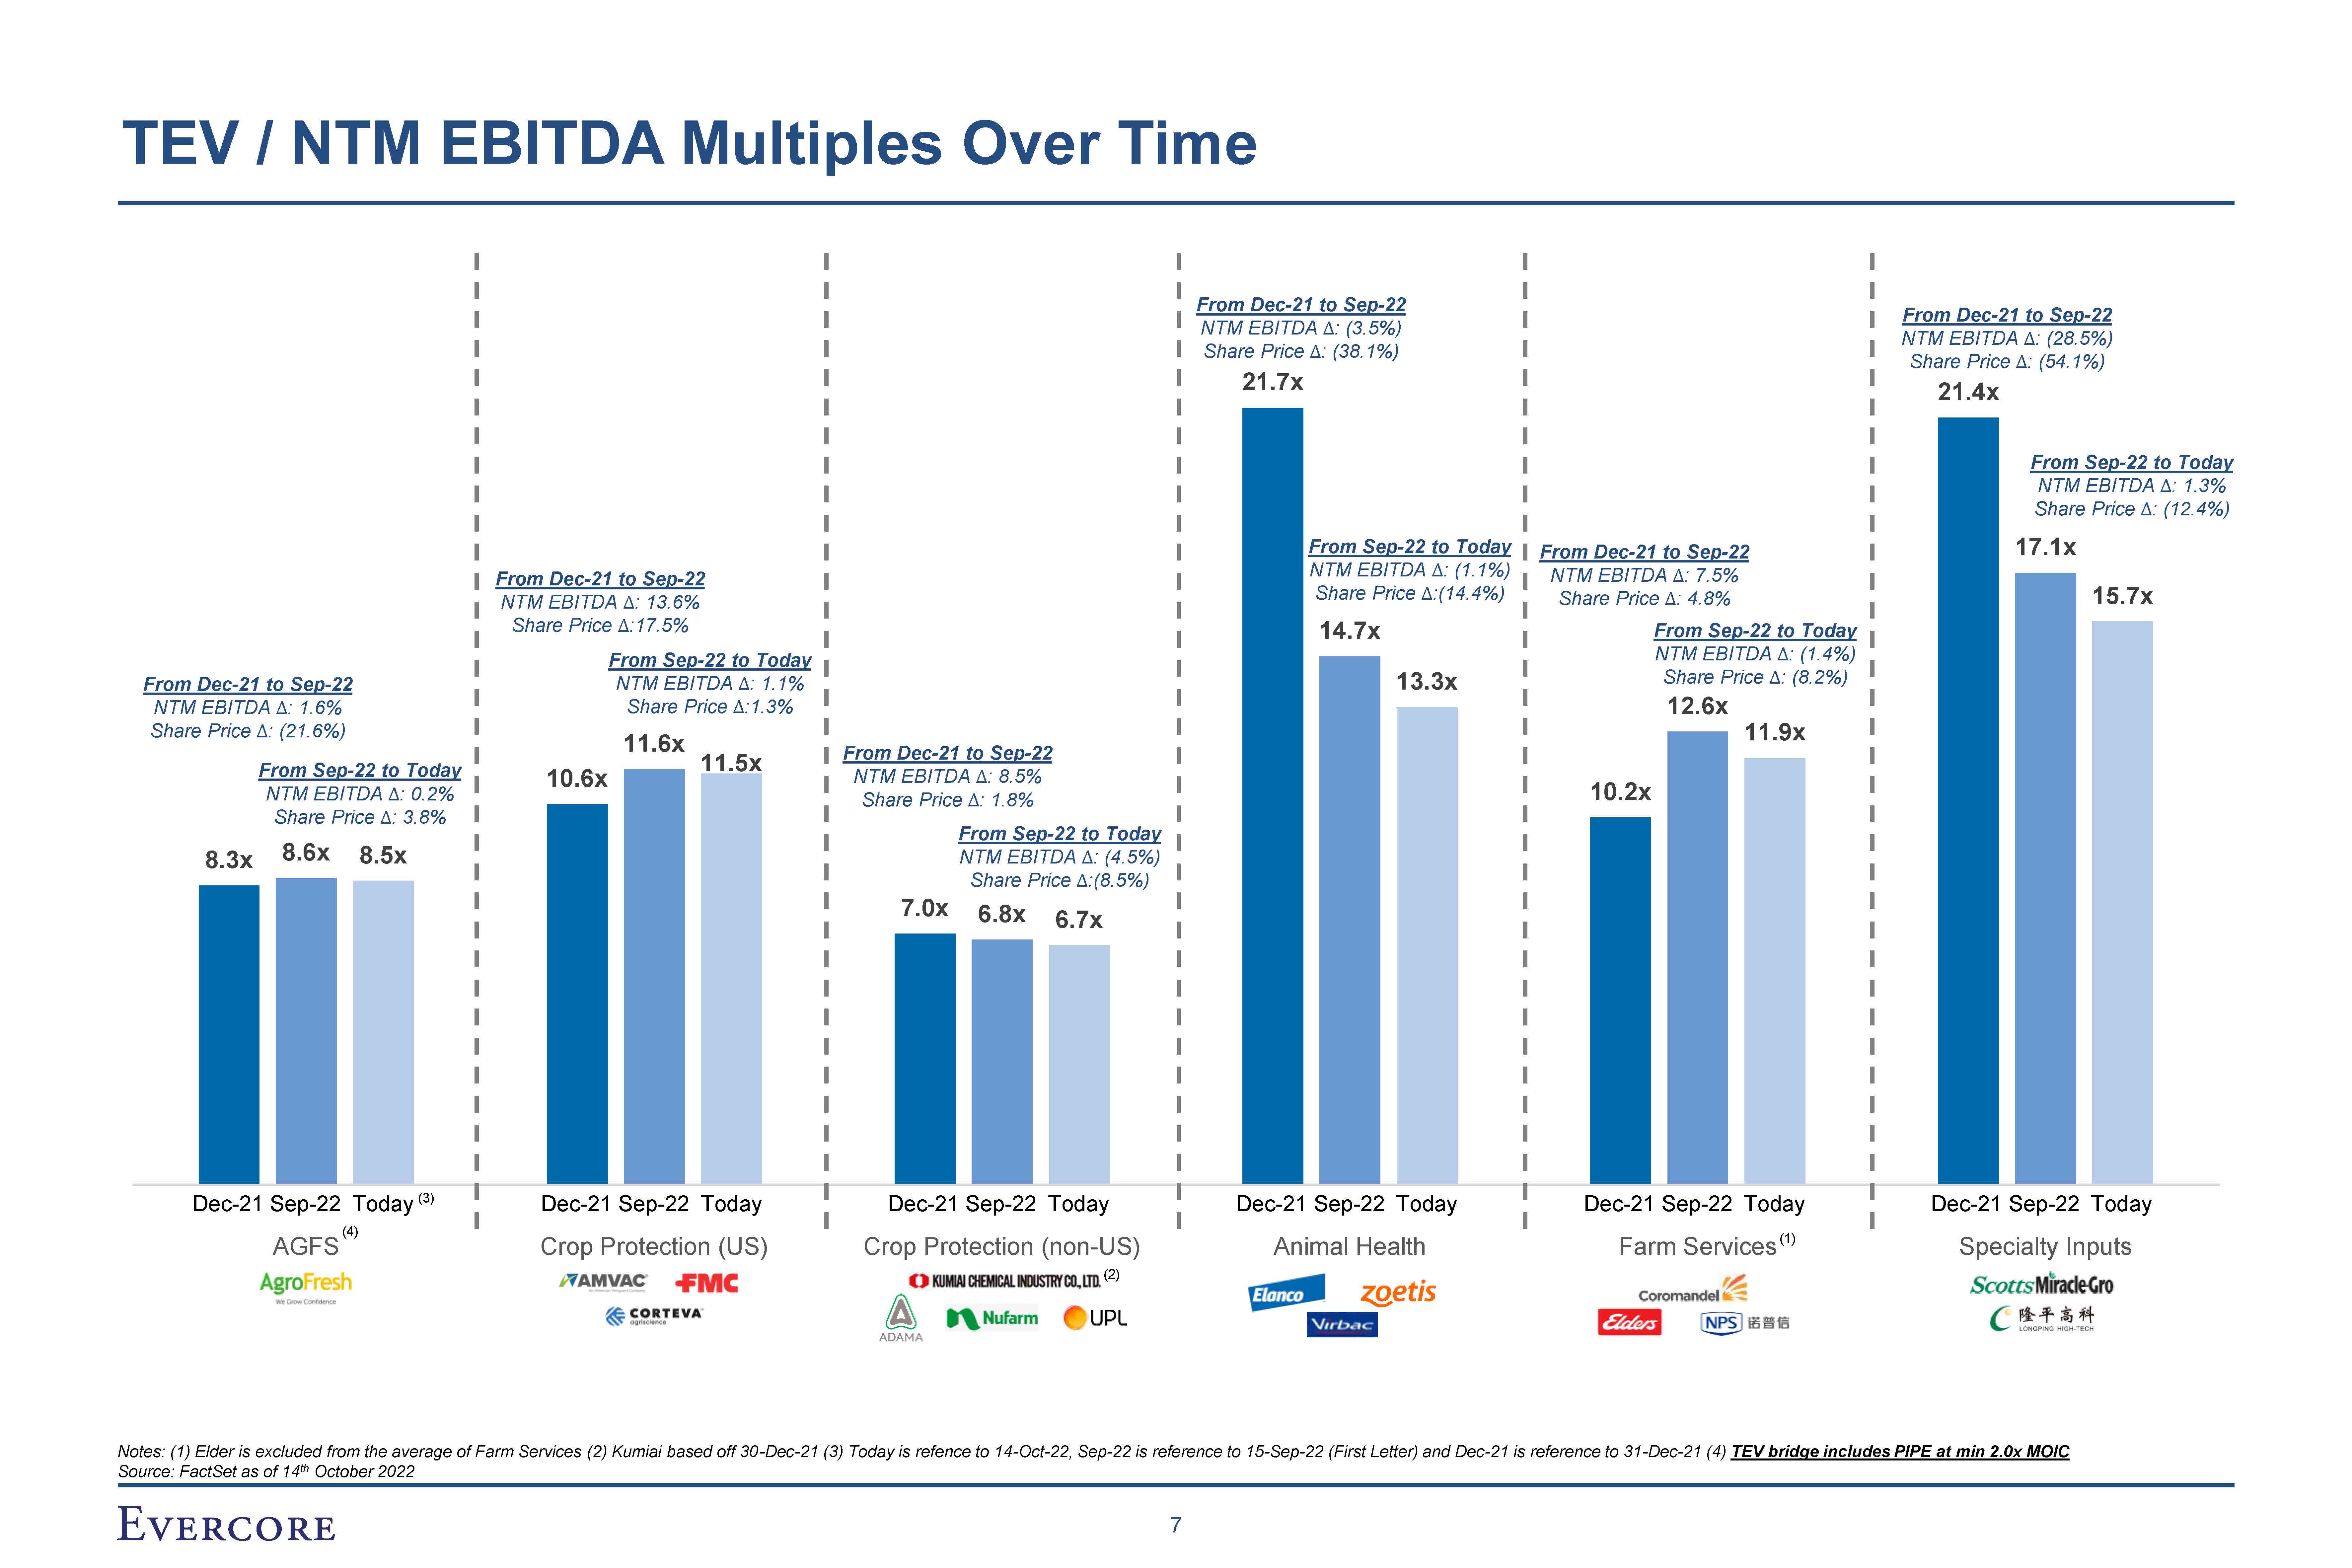
TEV / NTM EBITDA Multiples Over
Time 8.3x 10.6x 7.0x 10.2x 8.6x 6.8x 8.5x 11.5x 6.7x 13.3x 11.9x 15.7x From Dec-21 to Sep-22 NTM EBITDA ∆: (3.5%) Share Price ∆: (38.1%) 21.7x From Dec-21 to Sep-22 NTM EBITDA ∆: (28.5%) Share Price ∆: (54.1%) 21.4x Dec-21
Sep-22 Today Crop Protection (US) Dec-21 Sep-22 Today Animal Health Dec-21 Sep-22 Today Specialty Inputs Notes: (1) Elder is excluded from the average of Farm Services (2) Kumiai based off 30-Dec-21 (3) Today is refence to 14-Oct-22,
Sep-22 is reference to 15-Sep-22 (First Letter) and Dec-21 is reference to 31-Dec-21 (4) TEV bridge includes PIPE at min 2.0x MOIC From Sep-22 to Today NTM EBITDA ∆: (1.1%) Share Price ∆:(14.4%) 14.7x Source: FactSet as of 14th October
2022 7 From Sep-22 to Today NTM EBITDA ∆: 1.3% Share Price ∆: (12.4%) 17.1x From Dec-21 to Sep-22 NTM EBITDA ∆: 1.6% Share Price ∆: (21.6%) From Sep-22 to Today NTM EBITDA ∆: 0.2% Share Price ∆: 3.8% From Dec-21 to Sep-22 NTM
EBITDA ∆: 13.6% Share Price ∆:17.5% From Sep-22 to Today NTM EBITDA ∆: 1.1% Share Price ∆:1.3% 11.6x From Dec-21 to Sep-22 NTM EBITDA ∆: 8.5% Share Price ∆: 1.8% From Sep-22 to Today NTM EBITDA ∆: (4.5%) Share Price ∆:(8.5%) From
Dec-21 to Sep-22 NTM EBITDA ∆: 7.5% Share Price ∆: 4.8% From Sep-22 to Today NTM EBITDA ∆: (1.4%) Share Price ∆: (8.2%) 12.6x Dec-21 Sep-22 Today Farm Services(1) Dec-21 Sep-22 Today Crop Protection (non-US) (2) Dec-21 Sep-22 Today
(3) (4) AGFS
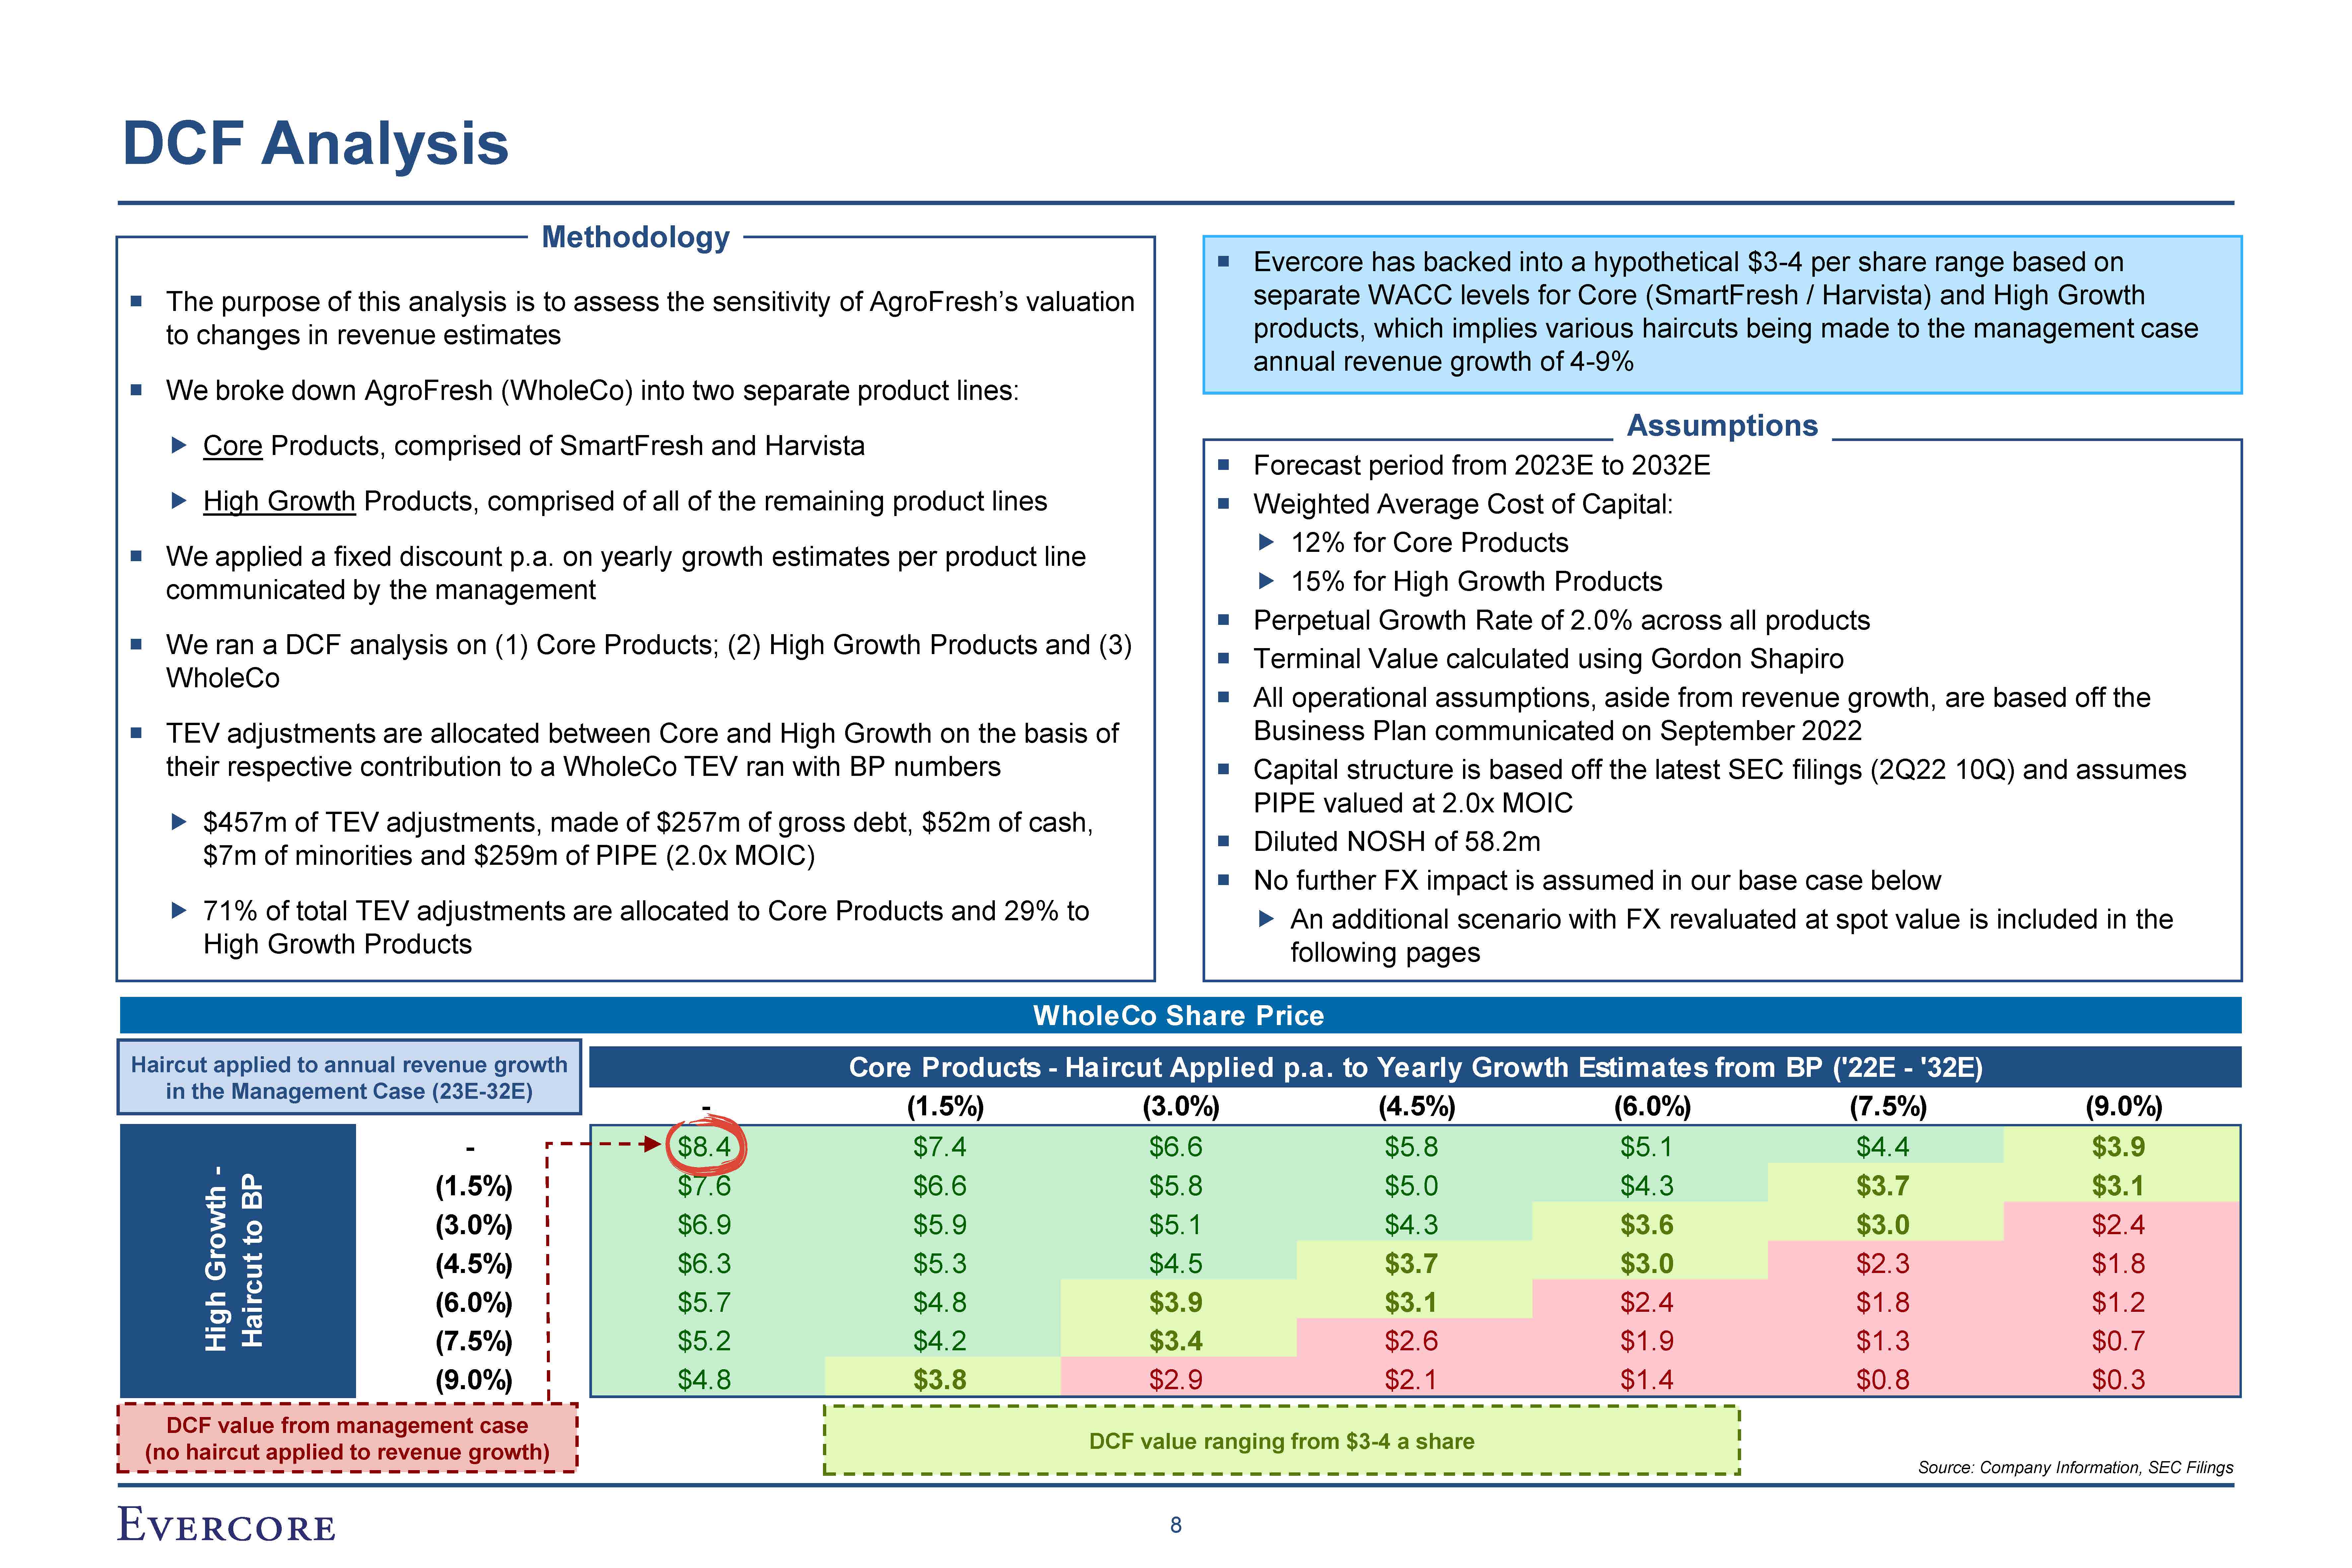
DCF Analysis The purpose of this analysis is to assess the sensitivity of
AgroFresh’s valuation to changes in revenue estimates We broke down AgroFresh (WholeCo) into two separate product lines: Core Products, comprised of SmartFresh and Harvista High Growth Products, comprised of all of the remaining product
lines We applied a fixed discount p.a. on yearly growth estimates per product line communicated by the management We ran a DCF analysis on (1) Core Products; (2) High Growth Products and (3) WholeCo TEV adjustments are allocated between Core
and High Growth on the basis of their respective contribution to a WholeCo TEV ran with BP numbers $457m of TEV adjustments, made of $257m of gross debt, $52m of cash, $7m of minorities and $259m of PIPE (2.0x MOIC) 71% of total TEV
adjustments are allocated to Core Products and 29% to High Growth Products Methodology Forecast period from 2023E to 2032E Weighted Average Cost of Capital: 12% for Core Products 15% for High Growth Products Perpetual Growth Rate of
2.0% across all products Terminal Value calculated using Gordon Shapiro All operational assumptions, aside from revenue growth, are based off the Business Plan communicated on September 2022 Capital structure is based off the latest SEC
filings (2Q22 10Q) and assumes PIPE valued at 2.0x MOIC Diluted NOSH of 58.2m No further FX impact is assumed in our base case below An additional scenario with FX revaluated at spot value is included in the following
pages Assumptions WholeCo Share Price - $6.6 $5.8 $5.8 $5.0 $5.1 $4.3 $4.4 $3.7 $3.9 $3.1 $8.4 $7.6 $6.9 $6.3 $7.4 $6.6 $5.9 $5.3 (1.5%) (3.0%) (4.5%) $5.1 $4.5 $4.3 $3.7 $3.6 $3.0 $3.0 $2.3 $2.4 $1.8 Growth
- ut to BP Haircut applied to annual revenue growth Core Products - Haircut Applied p.a. to Yearly Growth Estimates from BP ('22E - '32E) in the Management Case (23E-32E) - (1.5%) (3.0%) (4.5%) (6.0%) (7.5%) (9.0%) gh
airc (6.0%) $5.7 $4.8 $3.9 $3.1 $2.4 $1.8 $1.2 Hi H (7.5%) $5.2 $4.2 $3.4 $2.6 $1.9 $1.3 $0.7 (9.0%) $4.8 $3.8 $2.9 $2.1 $1.4 $0.8 $0.3 DCF value from m (no haircut applied t anagement case o revenue growth) DCF
value ranging from $3-4 a share Source: Company Information, SEC Filings 8 Evercore has backed into a hypothetical $3-4 per share range based on separate WACC levels for Core (SmartFresh / Harvista) and High Growth products, which implies
various haircuts being made to the management case annual revenue growth of 4-9%
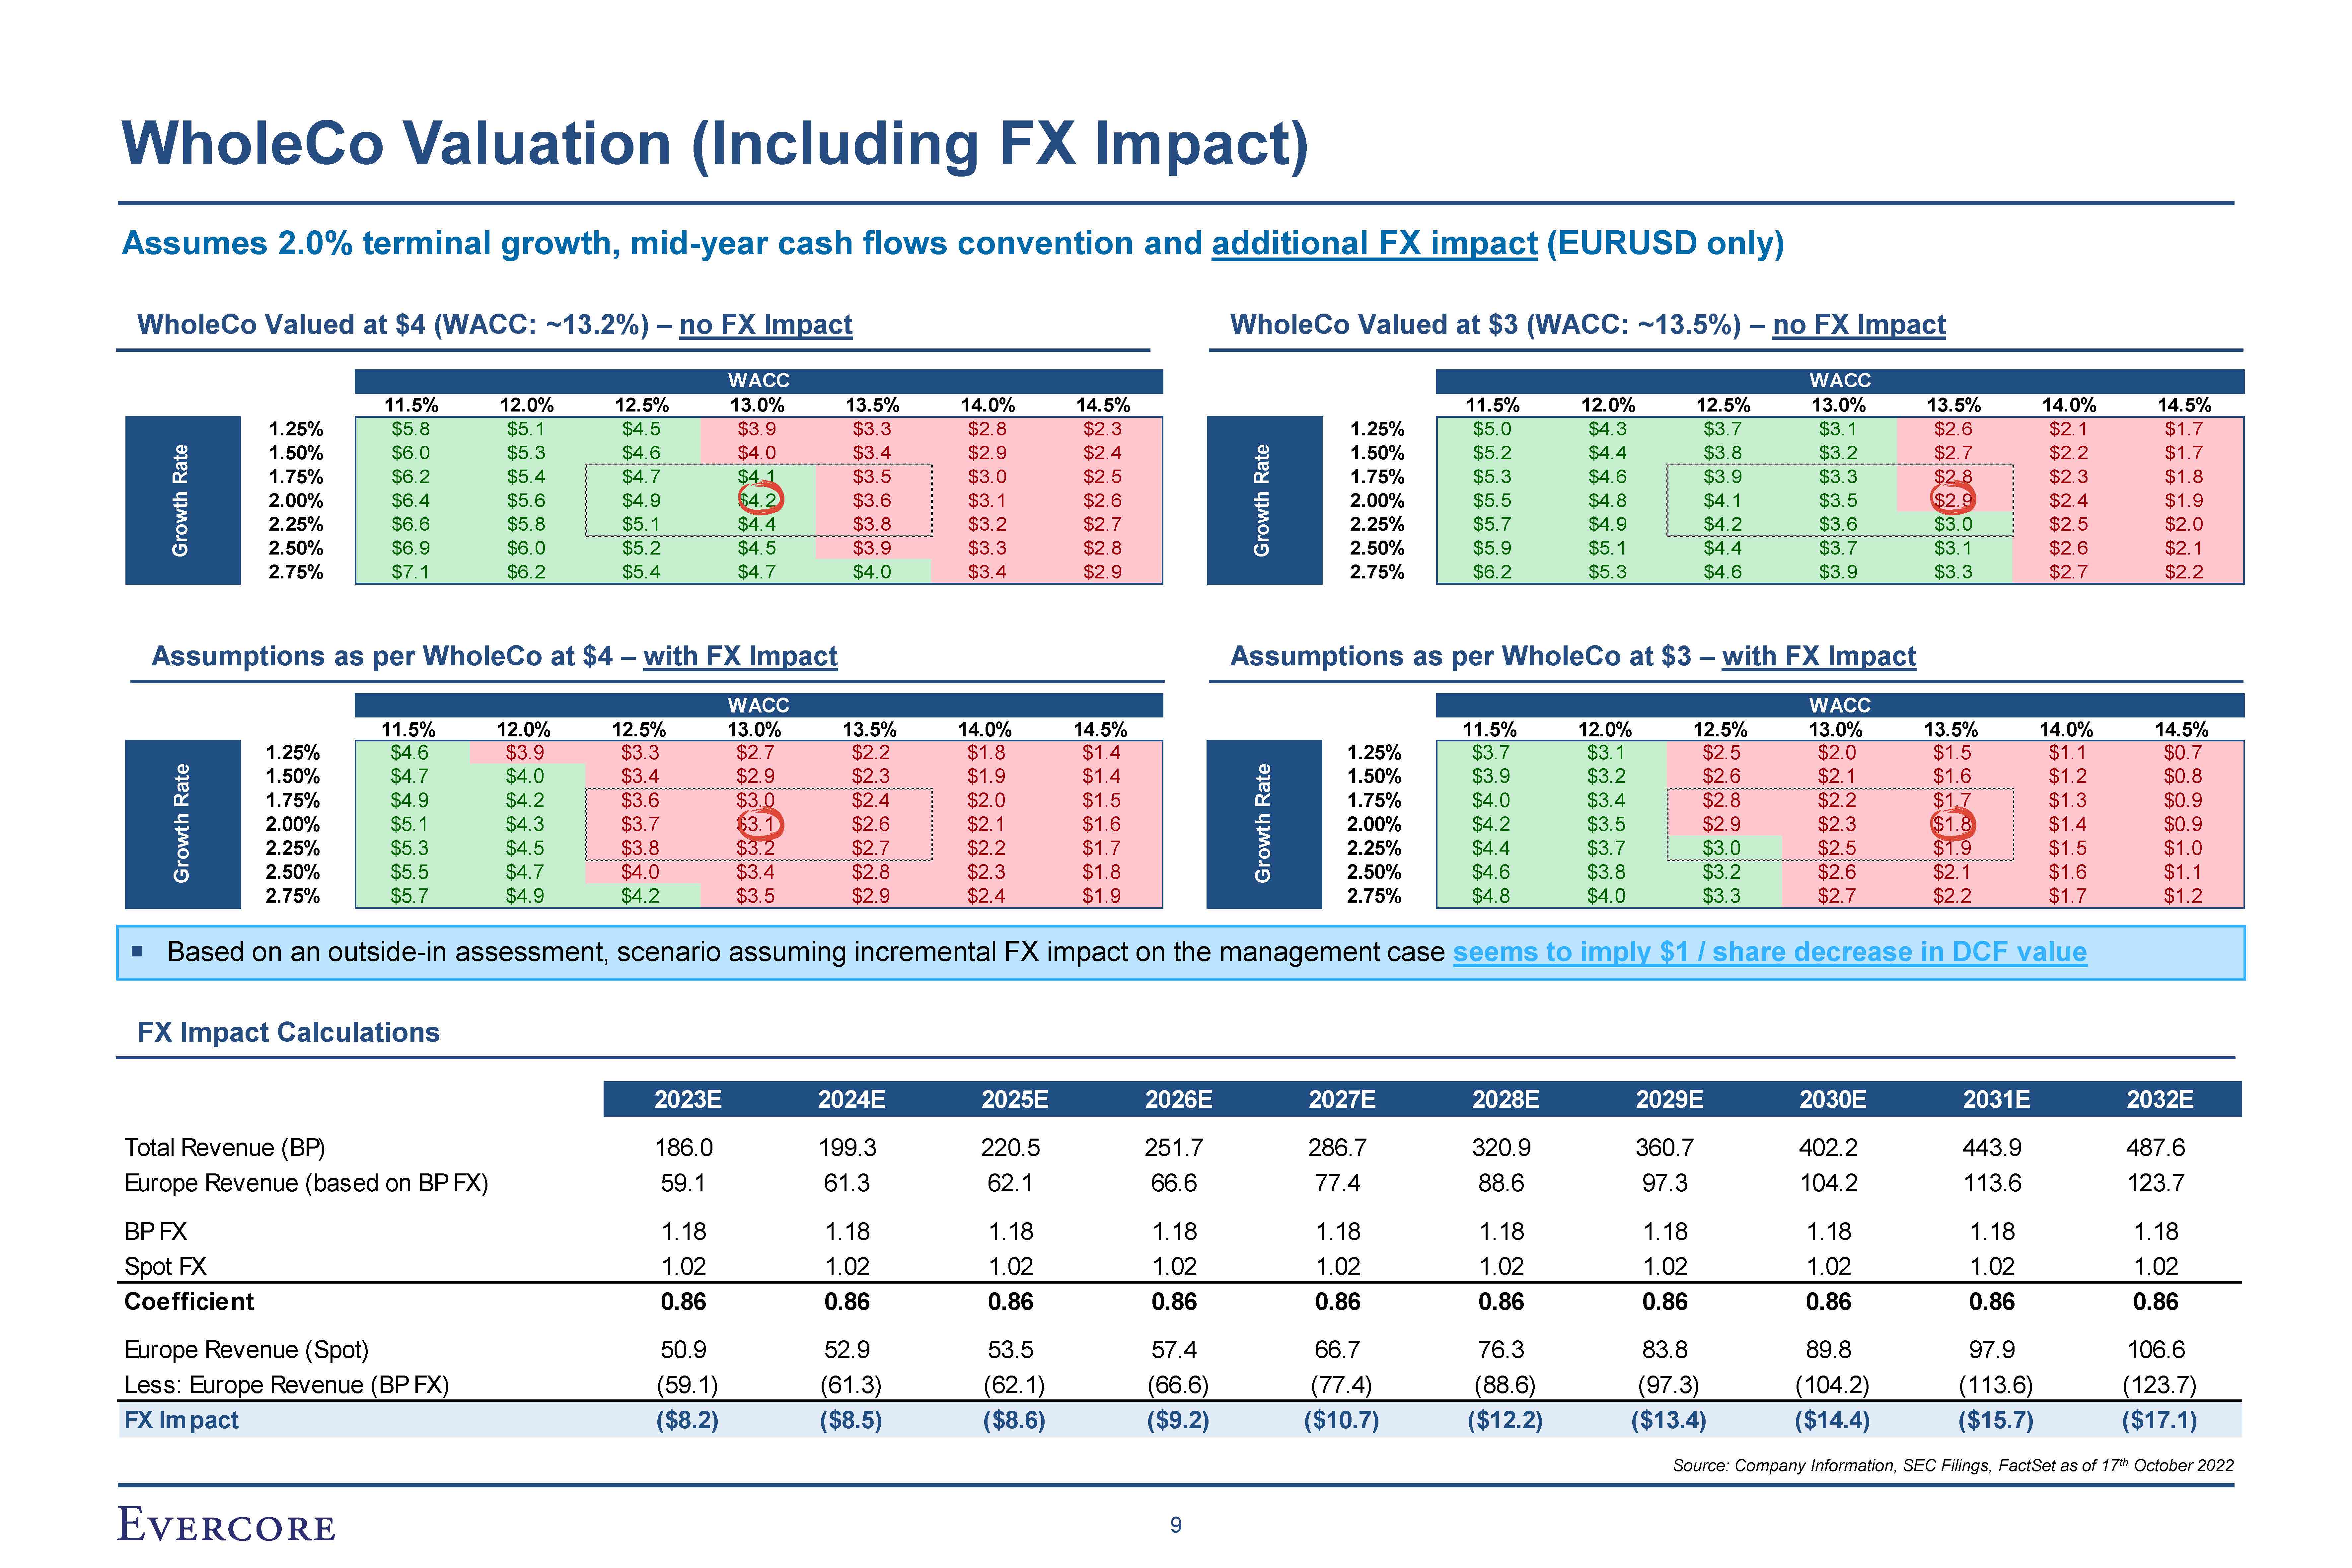
WholeCo Valuation (Including FX Impact) Assumes 2.0% terminal growth, mid-year
cash flows convention and additional FX impact (EURUSD only) WholeCo Valued at $4 (WACC: ~13.2%) – no FX Impact WholeCo Valued at $3 (WACC: ~13.5%) – no FX
Impact WACC WACC 11.5% 12.0% 12.5% 13.0% 13.5% 14.0% 14.5% 11.5% 12.0% 12.5% 13.0% 13.5% 14.0% 14.5% 1.25% $4.6 $3.9 $3.3 $2.7 $2.2 $1.8 $1.4 1.25% $3.7 $3.1 $2.5 $2.0 $1.5 $1.1 $0.7 ate 1.50% $4.7 $4.0 $3.4 $2.9 $2.3 $1.9 $1.4 ate 1.50% $3.9 $3.2 $2.6 $2.1 $1.6 $1.2 $0.8 R 1.75% $4.9 $4.2 $3.6 $3.0 $2.4 $2.0 $1.5 R 1.75% $4.0 $3.4 $2.8 $2.2 $1.7 $1.3 $0.9 th 2.00% $5.1 $4.3 $3.7 $3.1 $2.6 $2.1 $1.6 th 2.00% $4.2 $3.5 $2.9 $2.3 $1.8 $1.4 $0.9 ow 2.25% $5.3 $4.5 $3.8 $3.2 $2.7 $2.2 $1.7 ow 2.25% $4.4 $3.7 $3.0 $2.5 $1.9 $1.5 $1.0 Gr 2.50% $5.5 $4.7 $4.0 $3.4 $2.8 $2.3 $1.8 Gr 2.50% $4.6 $3.8 $3.2 $2.6 $2.1 $1.6 $1.1 2.75% $5.7 $4.9 $4.2 $3.5 $2.9 $2.4 $1.9 2.75% $4.8 $4.0 $3.3 $2.7 $2.2 $1.7 $1.2 Assumptions
as per WholeCo at $4 – with FX Impact Assumptions as per WholeCo at $3 – with FX Impact FX Impact Calculations 2023E 2024E 2025E 2026E 2027E 2028E 2029E 2030E 2031E 2032E Total Revenue
(BP) 186.0 199.3 220.5 251.7 286.7 320.9 360.7 402.2 443.9 487.6 Europe Revenue (based on BP FX) 59.1 61.3 62.1 66.6 77.4 88.6 97.3 104.2 113.6 123.7 BP FX 1.18 1.18 1.18 1.18 1.18 1.18 1.18 1.18 1.18 1.18 Spot
FX 1.02 1.02 1.02 1.02 1.02 1.02 1.02 1.02 1.02 1.02 Coefficient 0.86 0.86 0.86 0.86 0.86 0.86 0.86 0.86 0.86 0.86 Europe Revenue (Spot) 50.9 52.9 53.5 57.4 66.7 76.3 83.8 89.8 97.9 106.6 Less: Europe Revenue
(BP FX) (59.1) (61.3) (62.1) (66.6) (77.4) (88.6) (97.3) (104.2) (113.6) (123.7) FX
Impact ($8.2) ($8.5) ($8.6) ($9.2) ($10.7) ($12.2) ($13.4) ($14.4) ($15.7) ($17.1) WACC WACC 11.5% 12.0% 12.5% 13.0% 13.5% 14.0% 14.5% 11.5% 12.0% 12.5% 13.0% 13.5% 14.0% 14.5% 1.25% $5.8 $5.1 $4.5 $3.9 $3.3 $2.8 $2.3 1.25% $5.0 $4.3 $3.7 $3.1 $2.6 $2.1 $1.7 te 1.50% $6.0 $5.3 $4.6 $4.0 $3.4 $2.9 $2.4 te 1.50% $5.2 $4.4 $3.8 $3.2 $2.7 $2.2 $1.7 Ra 1.75% $6.2 $5.4 $4.7 $4.1 $3.5 $3.0 $2.5 Ra 1.75% $5.3 $4.6 $3.9 $3.3 $2.8 $2.3 $1.8 th 2.00% $6.4 $5.6 $4.9 $4.2 $3.6 $3.1 $2.6 th 2.00% $5.5 $4.8 $4.1 $3.5 $2.9 $2.4 $1.9 ow 2.25% $6.6 $5.8 $5.1 $4.4 $3.8 $3.2 $2.7 ow 2.25% $5.7 $4.9 $4.2 $3.6 $3.0 $2.5 $2.0 Gr 2.50% $6.9 $6.0 $5.2 $4.5 $3.9 $3.3 $2.8 Gr 2.50% $5.9 $5.1 $4.4 $3.7 $3.1 $2.6 $2.1 2.75% $7.1 $6.2 $5.4 $4.7 $4.0 $3.4 $2.9 2.75% $6.2 $5.3 $4.6 $3.9 $3.3 $2.7 $2.2 Based
on an outside-in assessment, scenario assuming incremental FX impact on the management case seems to imply $1 / share decrease in DCF value Source: Company Information, SEC Filings, FactSet as of 17th October 2022 9
III Future Share Price Calculations
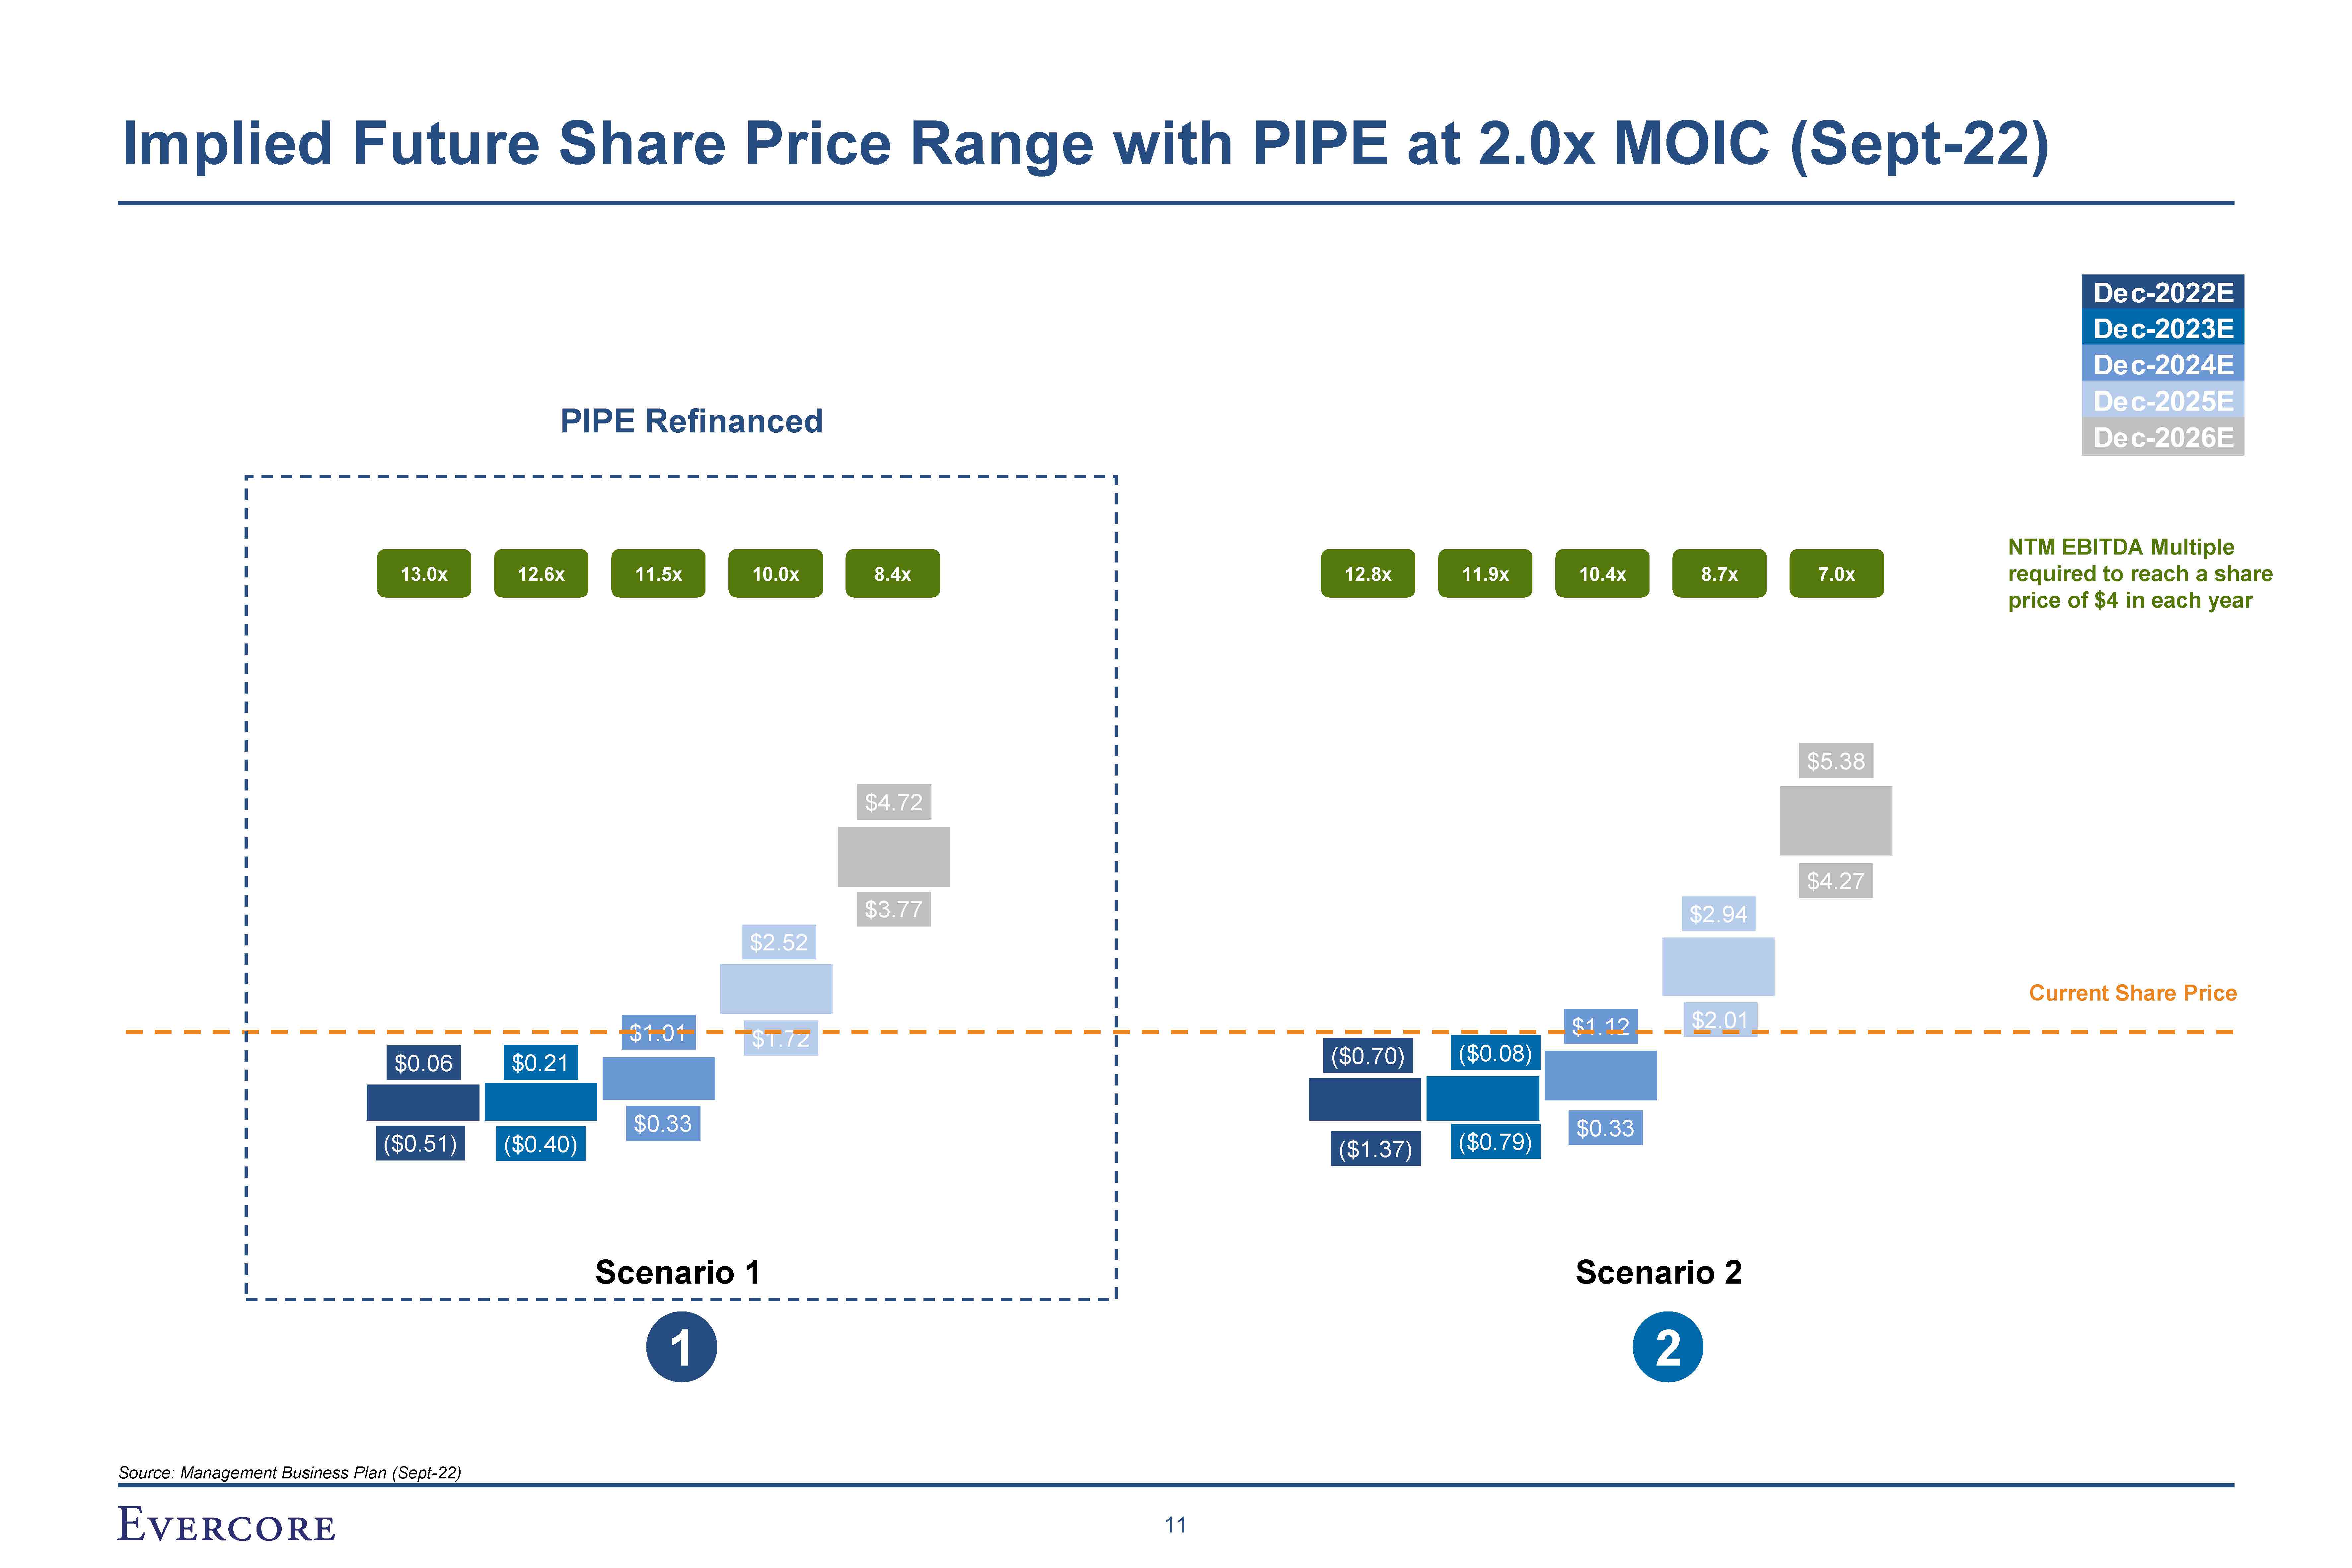
Implied Future Share Price Range with PIPE at 2.0x MOIC (Sept-22) Current Share
Price Dec-2022E Dec-2023E Dec-2024E Dec-2025E Dec-2026E 1 2 PIPE Refinanced NTM EBITDA Multiple required to reach a share price of $4 in each year 13.0x 12.6x 11.5x 10.0x 8.4x Scenario 1 Scenario
2 12.8x 11.9x 10.4x 8.7x 7.0x Source: Management Business Plan (Sept-22) 11
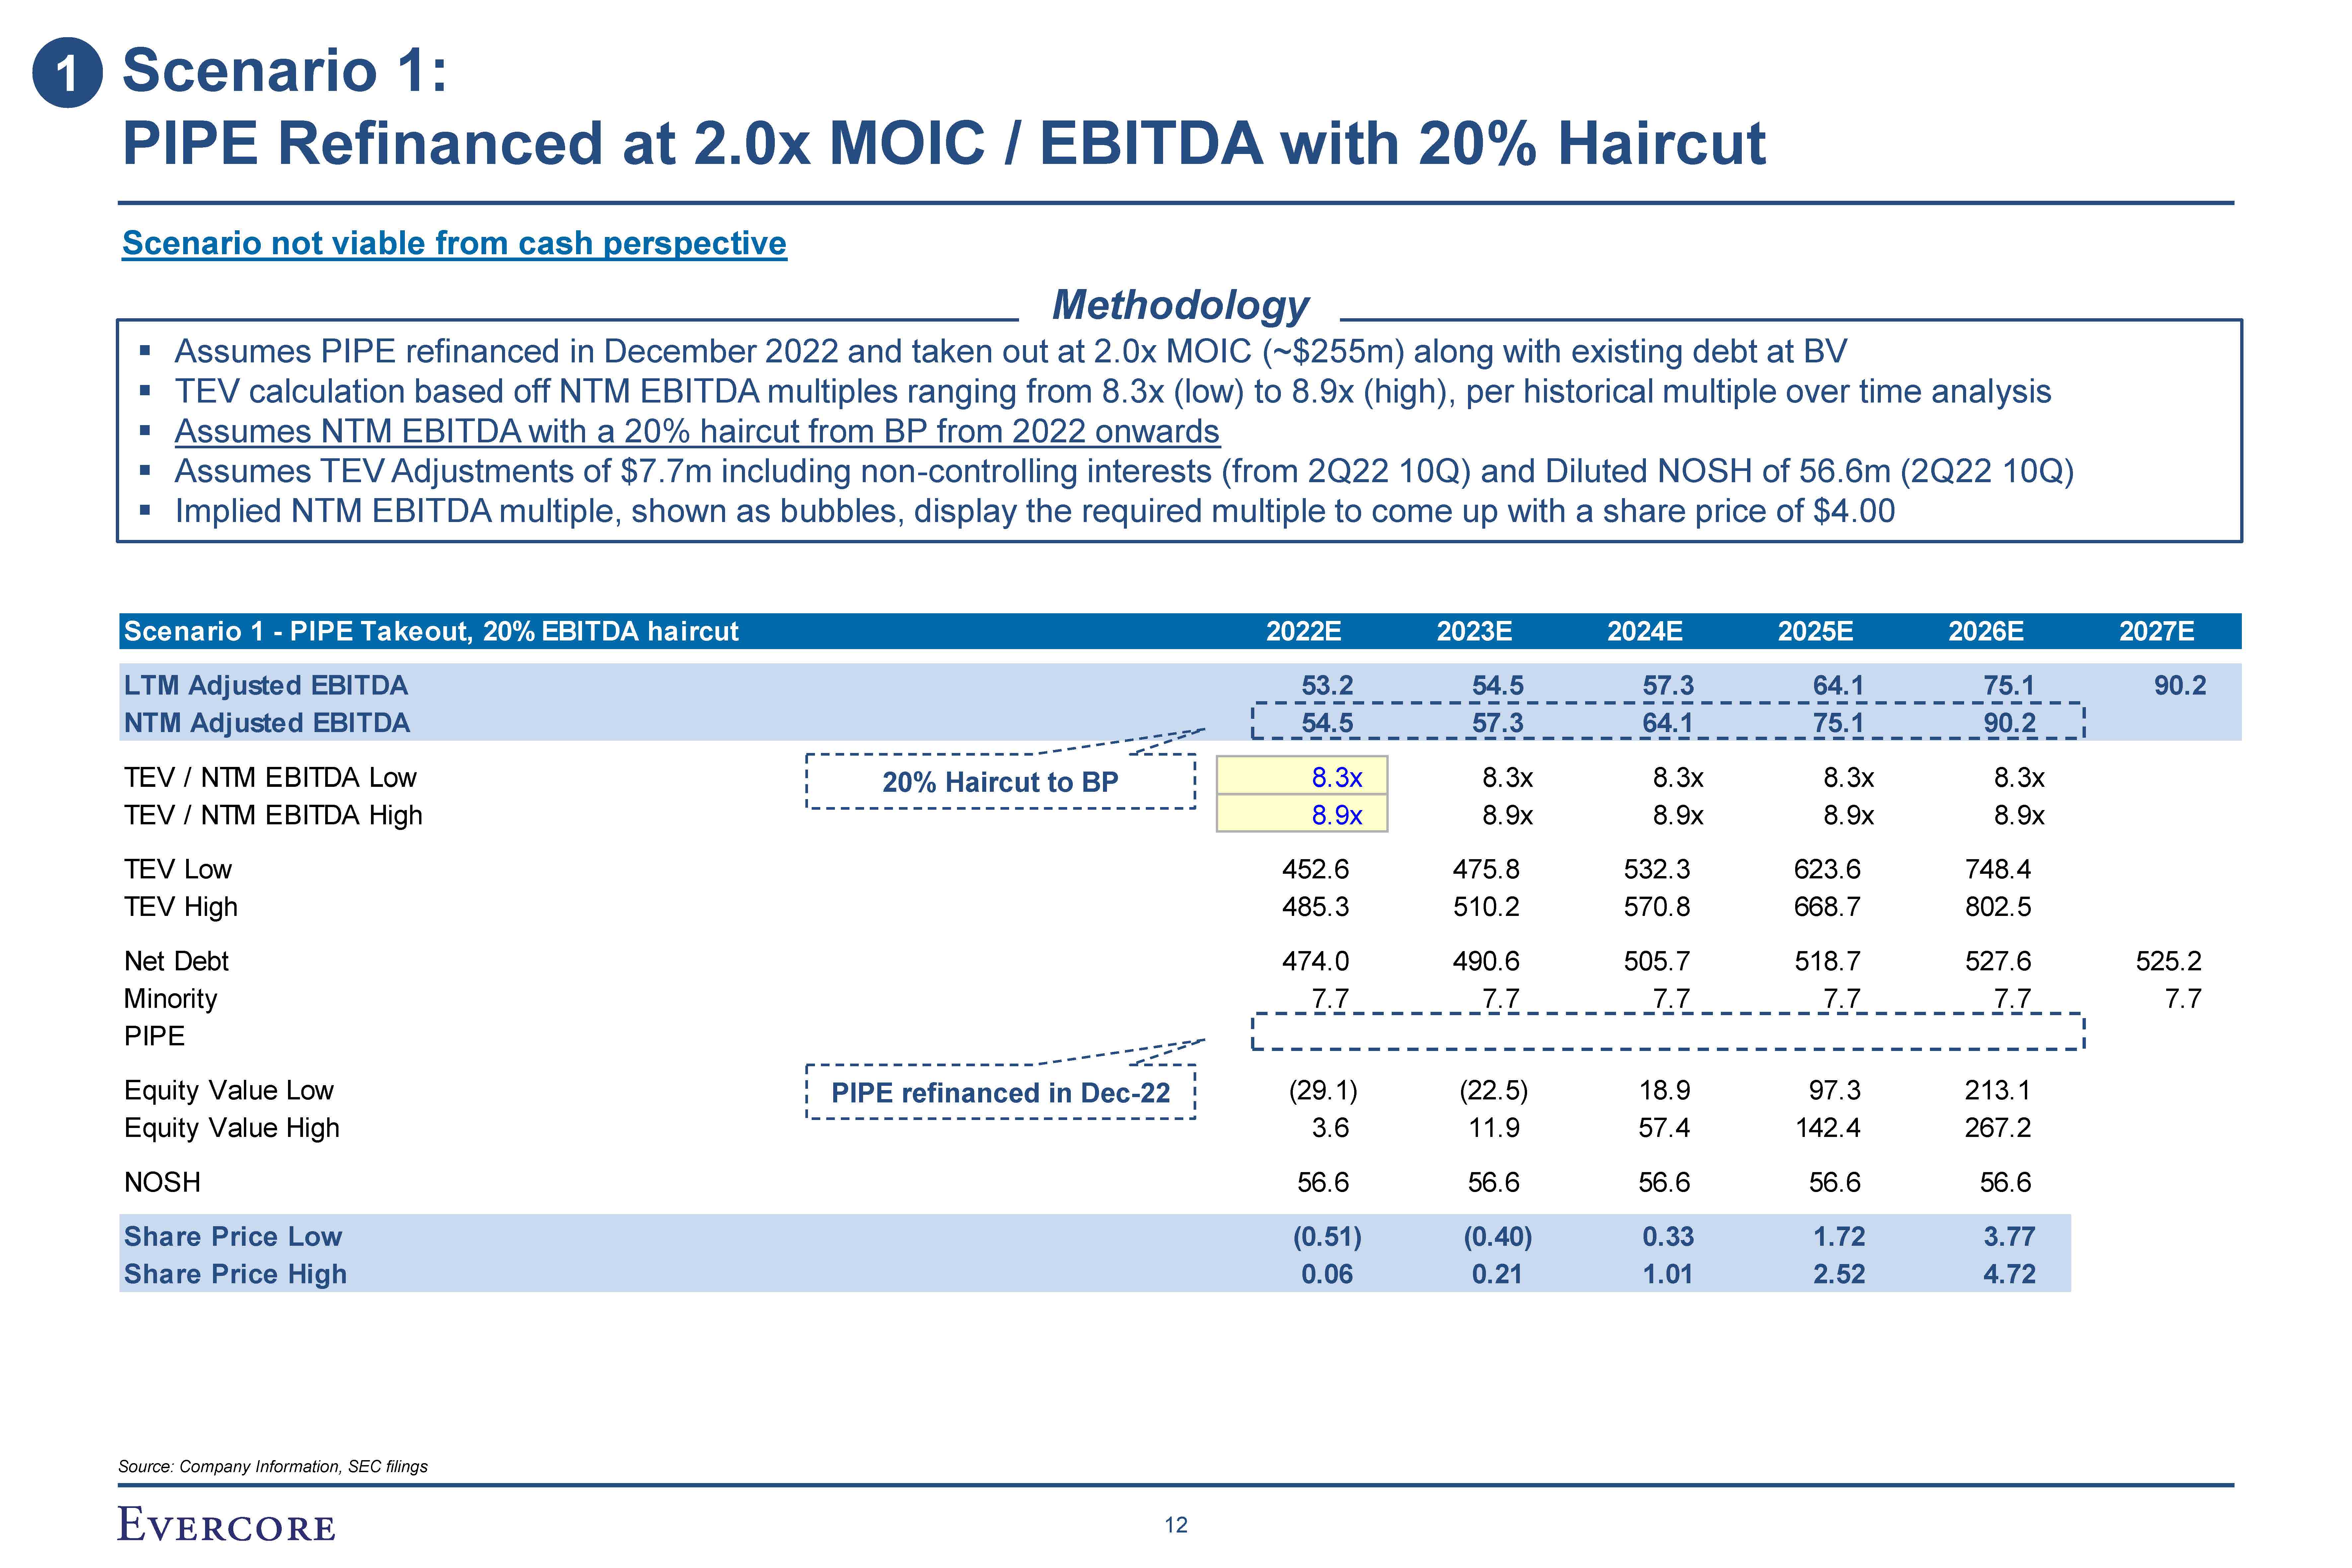
Scenario not viable from cash perspective Assumes PIPE refinanced in December
2022 and taken out at 2.0x MOIC (~$255m) along with existing debt at BV TEV calculation based off NTM EBITDA multiples ranging from 8.3x (low) to 8.9x (high), per historical multiple over time analysis Assumes NTM EBITDA with a 20% haircut
from BP from 2022 onwards Assumes TEV Adjustments of $7.7m including non-controlling interests (from 2Q22 10Q) and Diluted NOSH of 56.6m (2Q22 10Q) Implied NTM EBITDA multiple, shown as bubbles, display the required multiple to come up with a
share price of $4.00 Methodology Scenario 1 - PIPE Takeout, 20% EBITDA haircut 2022E 2023E 2024E 2025E 2026E 2027E LTM Adjusted EBITDA 53.2 54.5 57.3 64.1 75.1 90.2 NTM Adjusted EBITDA 54.5 57.3 64.1 75.1 90.2 TEV / NTM EBITDA
Low 20% Haircut to BP 8.3x 8.3x 8.3x 8.3x 8.3x TEV / NTM EBITDA High 8.9x 8.9x 8.9x 8.9x 8.9x TEV Low 452.6 475.8 532.3 623.6 748.4 TEV High 485.3 510.2 570.8 668.7 802.5 Net
Debt 474.0 490.6 505.7 518.7 527.6 525.2 Minority 7.7 7.7 7.7 7.7 7.7 7.7 PIPE Equity Value Low PIPE refinanced in Dec-22 (29.1) (22.5) 18.9 97.3 213.1 Equity Value
High 3.6 11.9 57.4 142.4 267.2 NOSH 56.6 56.6 56.6 56.6 56.6 Share Price Low (0.51) (0.40) 0.33 1.72 3.77 Share Price High 0.06 0.21 1.01 2.52 4.72 1 Scenario 1: PIPE Refinanced at 2.0x MOIC / EBITDA with 20%
Haircut Source: Company Information, SEC filings 12
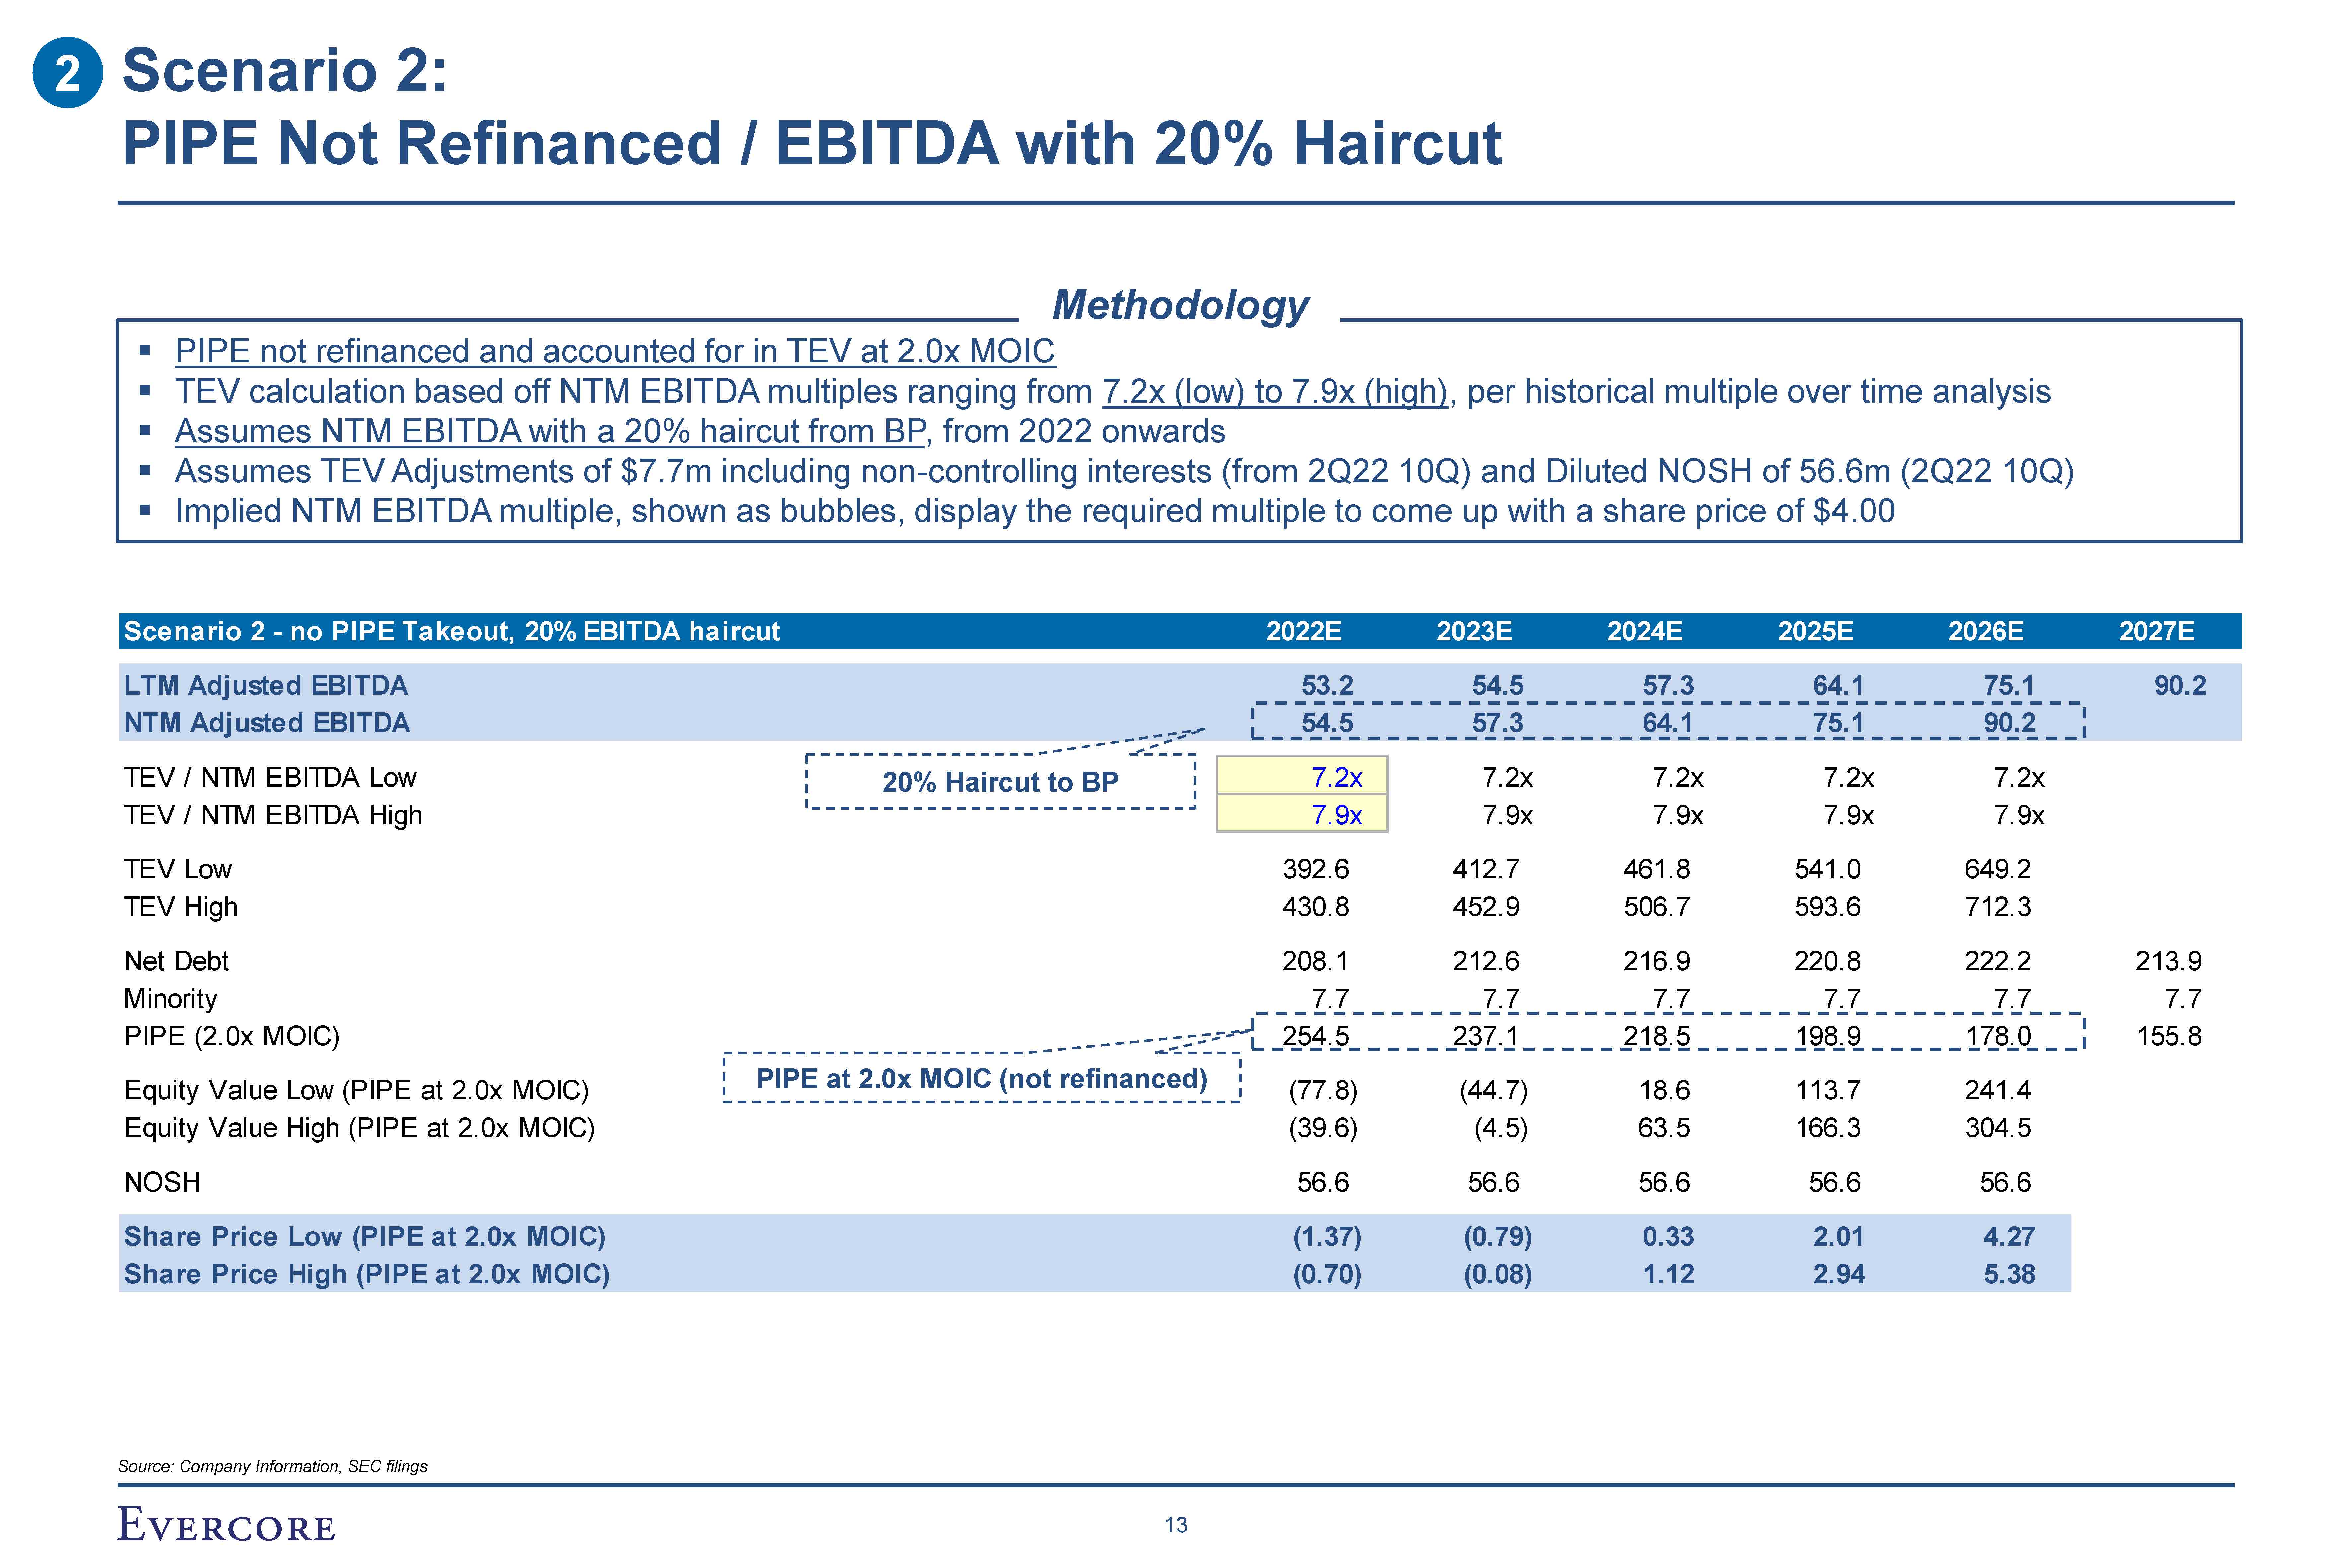
PIPE not refinanced and accounted for in TEV at 2.0x MOIC TEV calculation based
off NTM EBITDA multiples ranging from 7.2x (low) to 7.9x (high), per historical multiple over time analysis Assumes NTM EBITDA with a 20% haircut from BP, from 2022 onwards Assumes TEV Adjustments of $7.7m including non-controlling interests
(from 2Q22 10Q) and Diluted NOSH of 56.6m (2Q22 10Q) Implied NTM EBITDA multiple, shown as bubbles, display the required multiple to come up with a share price of $4.00 Methodology LTM Adjusted EBITDA 53.2 54.5 57.3 64.1 75.1 90.2 NTM
Adjusted EBITDA 54.5 57.3 64.1 75.1 90.2 Scenario 2 - no PIPE Takeout, 20% EBITDA haircut 2022E 2023E 2024E 2025E 2026E 2027E TEV / NTM EBITDA Low 20% Haircut to BP 7.2x 7.2x 7.2x 7.2x 7.2x TEV / NTM EBITDA
High 7.9x 7.9x 7.9x 7.9x 7.9x TEV Low 392.6 412.7 461.8 541.0 649.2 TEV High 430.8 452.9 506.7 593.6 712.3 Net Debt 208.1 212.6 216.9 220.8 222.2 213.9 Minority 7.7 7.7 7.7 7.7 7.7 7.7 PIPE (2.0x
MOIC) 254.5 237.1 218.5 198.9 178.0 155.8 Equity Value Low (PIPE at 2.0x MOIC) PIPE at 2.0x MOIC (not refinanced) (77.8) (44.7) 18.6 113.7 241.4 Equity Value High (PIPE at 2.0x
MOIC) (39.6) (4.5) 63.5 166.3 304.5 NOSH 56.6 56.6 56.6 56.6 56.6 Share Price Low (PIPE at 2.0x MOIC) (1.37) (0.79) 0.33 2.01 4.27 Share Price High (PIPE at 2.0x MOIC) (0.70) (0.08) 1.12 2.94 5.38 2 Scenario 2: PIPE Not
Refinanced / EBITDA with 20% Haircut Source: Company Information, SEC filings 13

IV U.S. Precedent All-Cash Deals
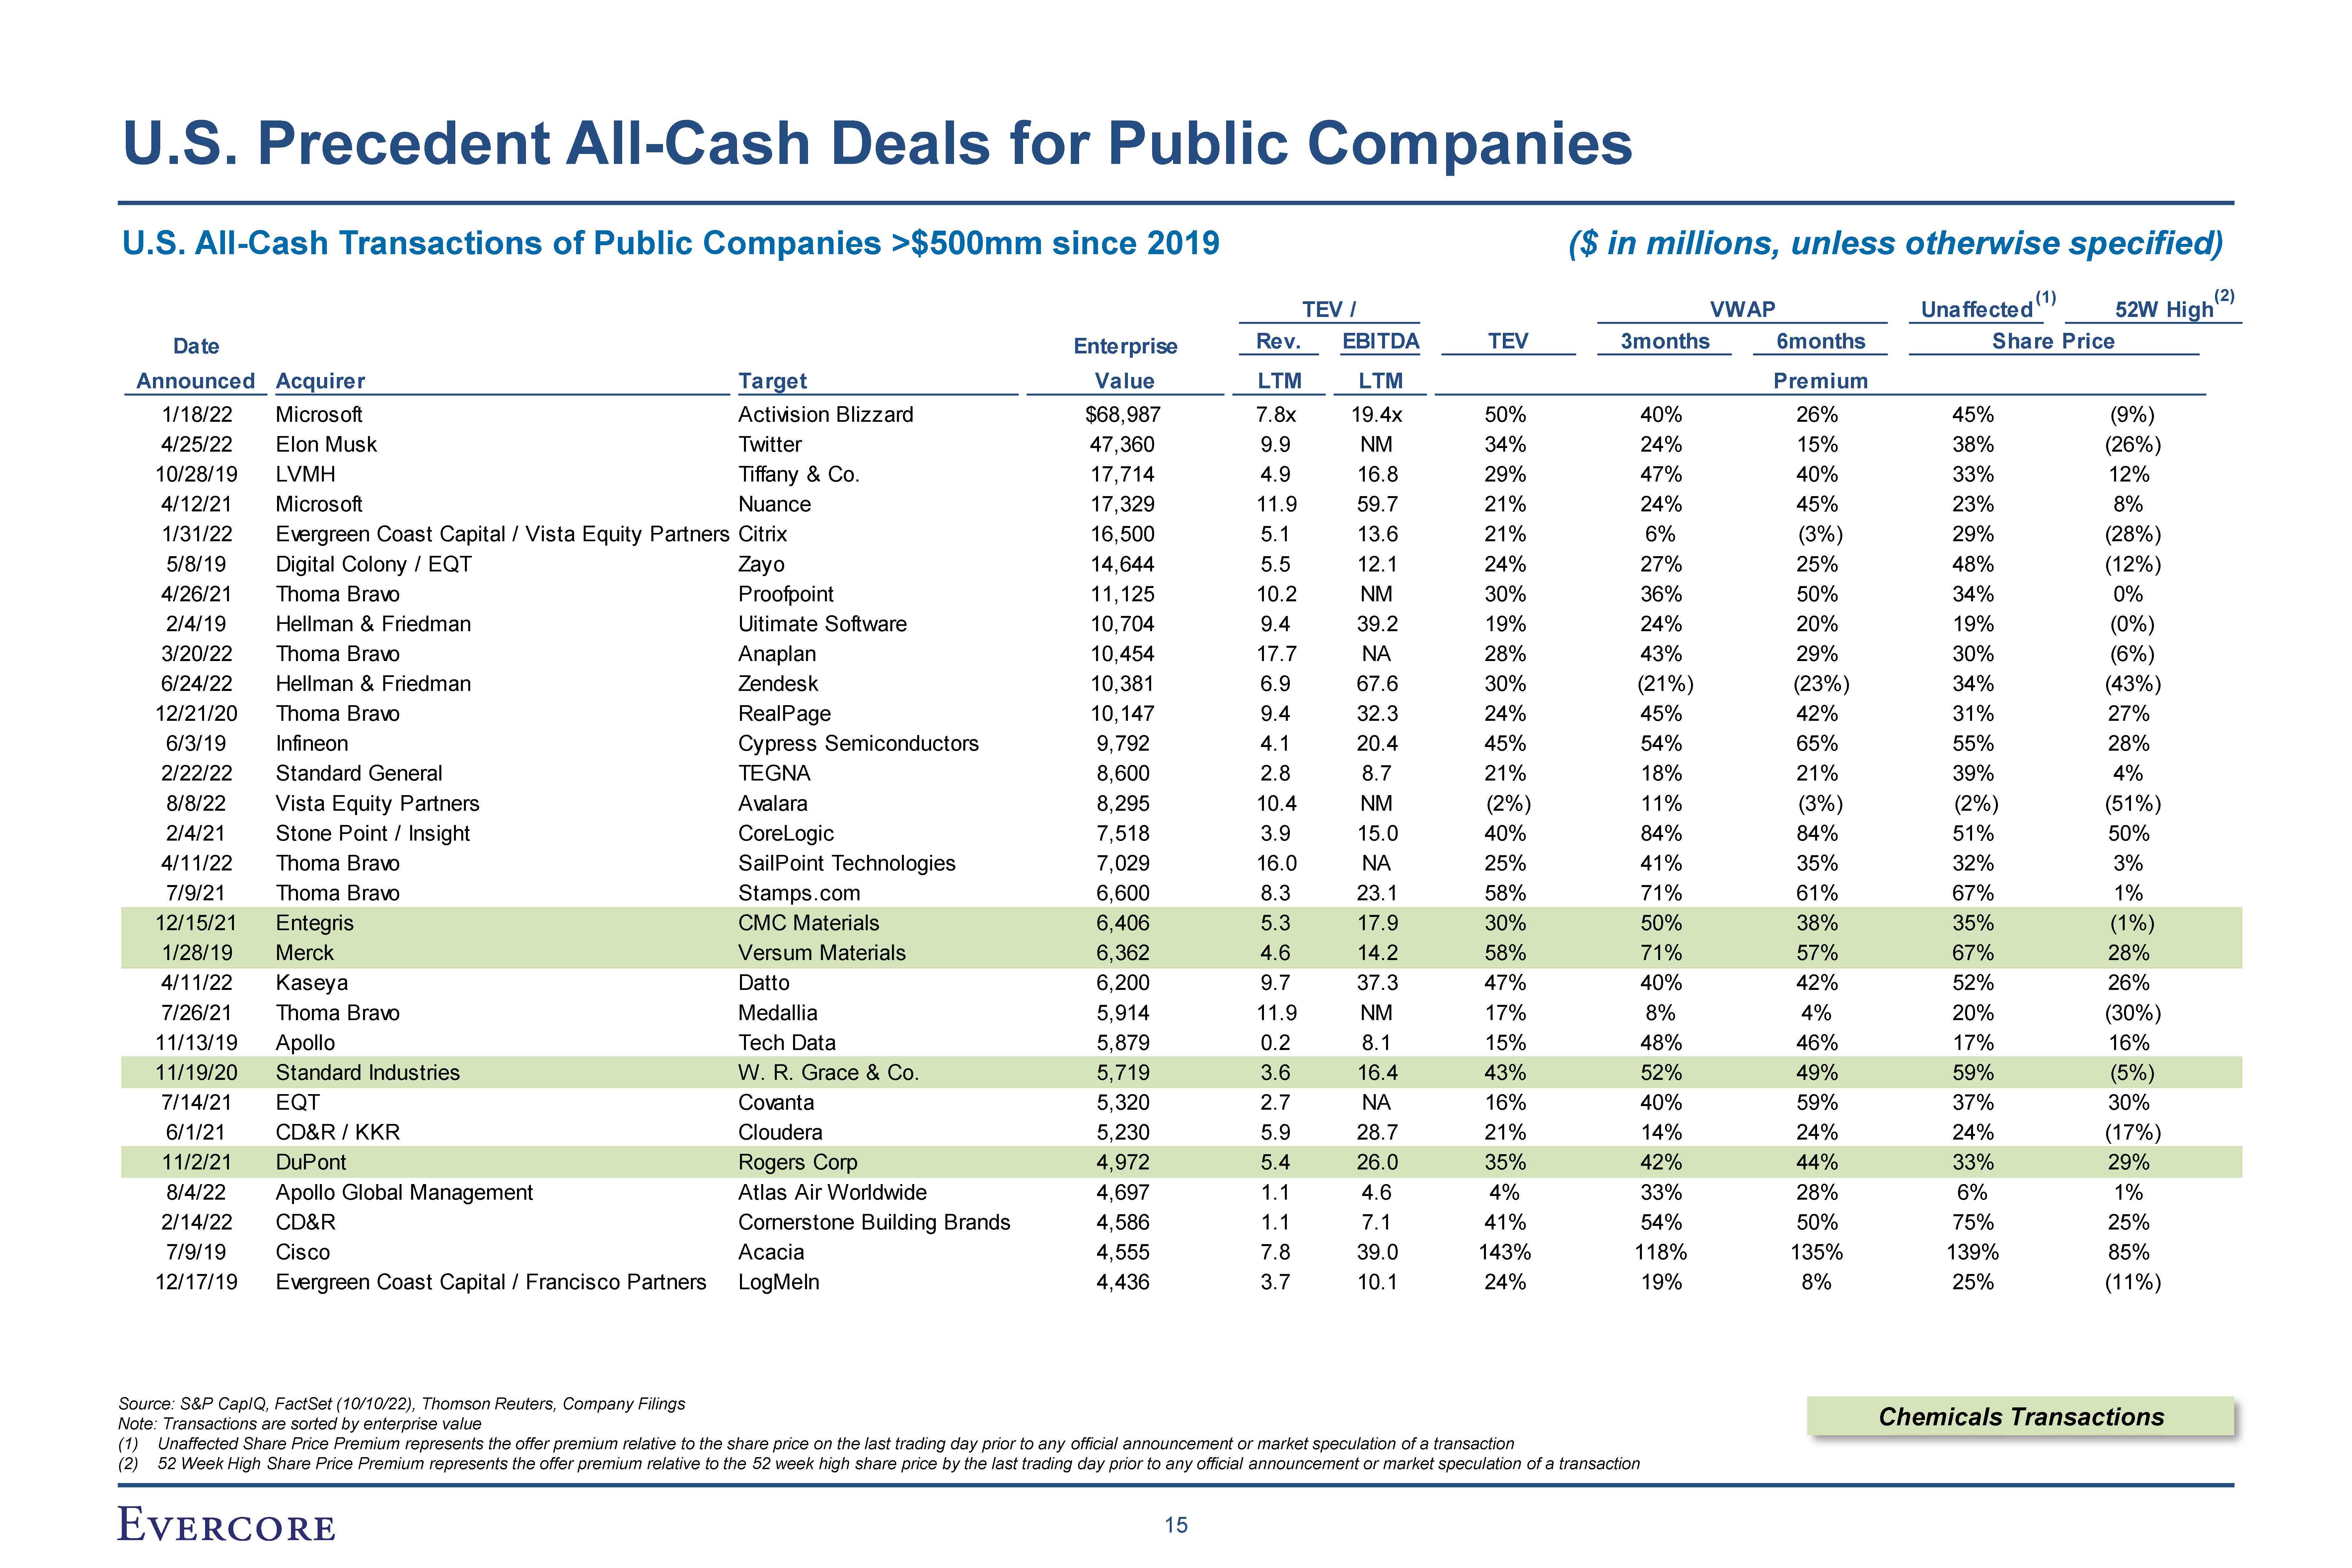
Date Announced Acquirer Target Enterprise Value Rev. LTM EBITDA LTM TEV
3months 6months Share Price Premium Microsoft Elon Musk LVMH Microsoft Activision Blizzard Twitter Tiffany & Co. Nuance 26% 15% 40% 4 45% Evergreen Coast Capital / Vista Equity Partners
Citrix 40% 24% 47% 24% 6% 27% 50% 34% 29% 21% 21% 24% 30% 19% 19.4x NM 16.8 59.7 13.6 12.1 NM 39.2 NA 67.6 3 7.8x 9.9 4.9 11.9 5.1 5.5 10.2 9.4 17.7 6.9 9.4 4.1 $68,987
47,360 17,714 17,329 16,500 14,644 11,125 10,704 10,454 10,381 10,147 9,792 8,600 8,295 7 Zayo Proofpoint Uitimate Software Anaplan Zendesk RealPage Cypress Semiconductors TEGNA Avalara CoreLogic SailPoint Technologies
Stamps.com CMC Materials Versum Mat Datto Digital Colony / EQT Thoma Bravo Hellman & Friedman Thoma Bravo Hellman & Friedman Thoma Bravo Infineon Standard General Vista Equity Partners Stone Point / Insight Thoma Bravo Thoma Bravo
Entegris Merck Kaseya Thoma Bravo Apollo Standard Industries EQT CD&R / KKR DuPont Apollo G
C 1/18/22 4/25/22 10/28/19 4/12/21 1/31/22 5/8/19 4/26/21 2/4/19 3/20/22 6/24/22 12/21/20 6/3/19 2/22/22 8/8/22 2/4/21 4/11/22 7/9/21 12/15/21 1/28/19 4/11/22 7/26/21 11/13/19 11/19/20 7/14/21 6/1/21 11/2/21 8/4/22 2/14/22 7/9/19
TEV / VWAP Unaffected(1) 52W High(2) U.S. All-Cash Transactions of Public Companies >$500mm since 2019 ($ in millions, unless otherwise specified) U.S. Precedent All-Cash Deals for Public Companies Source: S&P CapIQ, FactSet
(10/10/22), Thomson Reuters, Company Filings Note: Transactions are sorted by enterprise value (1) Unaffected Share Price Premium represents the offer premium relative to the share price on the last trading day prior to any official
announcement or market speculation of a transaction (2) 52 Week High Share Price Premium represents the offer premium relative to the 52 week high share price by the last trading day prior to any official announcement or market speculation of
a transaction Chemicals Transactions 15
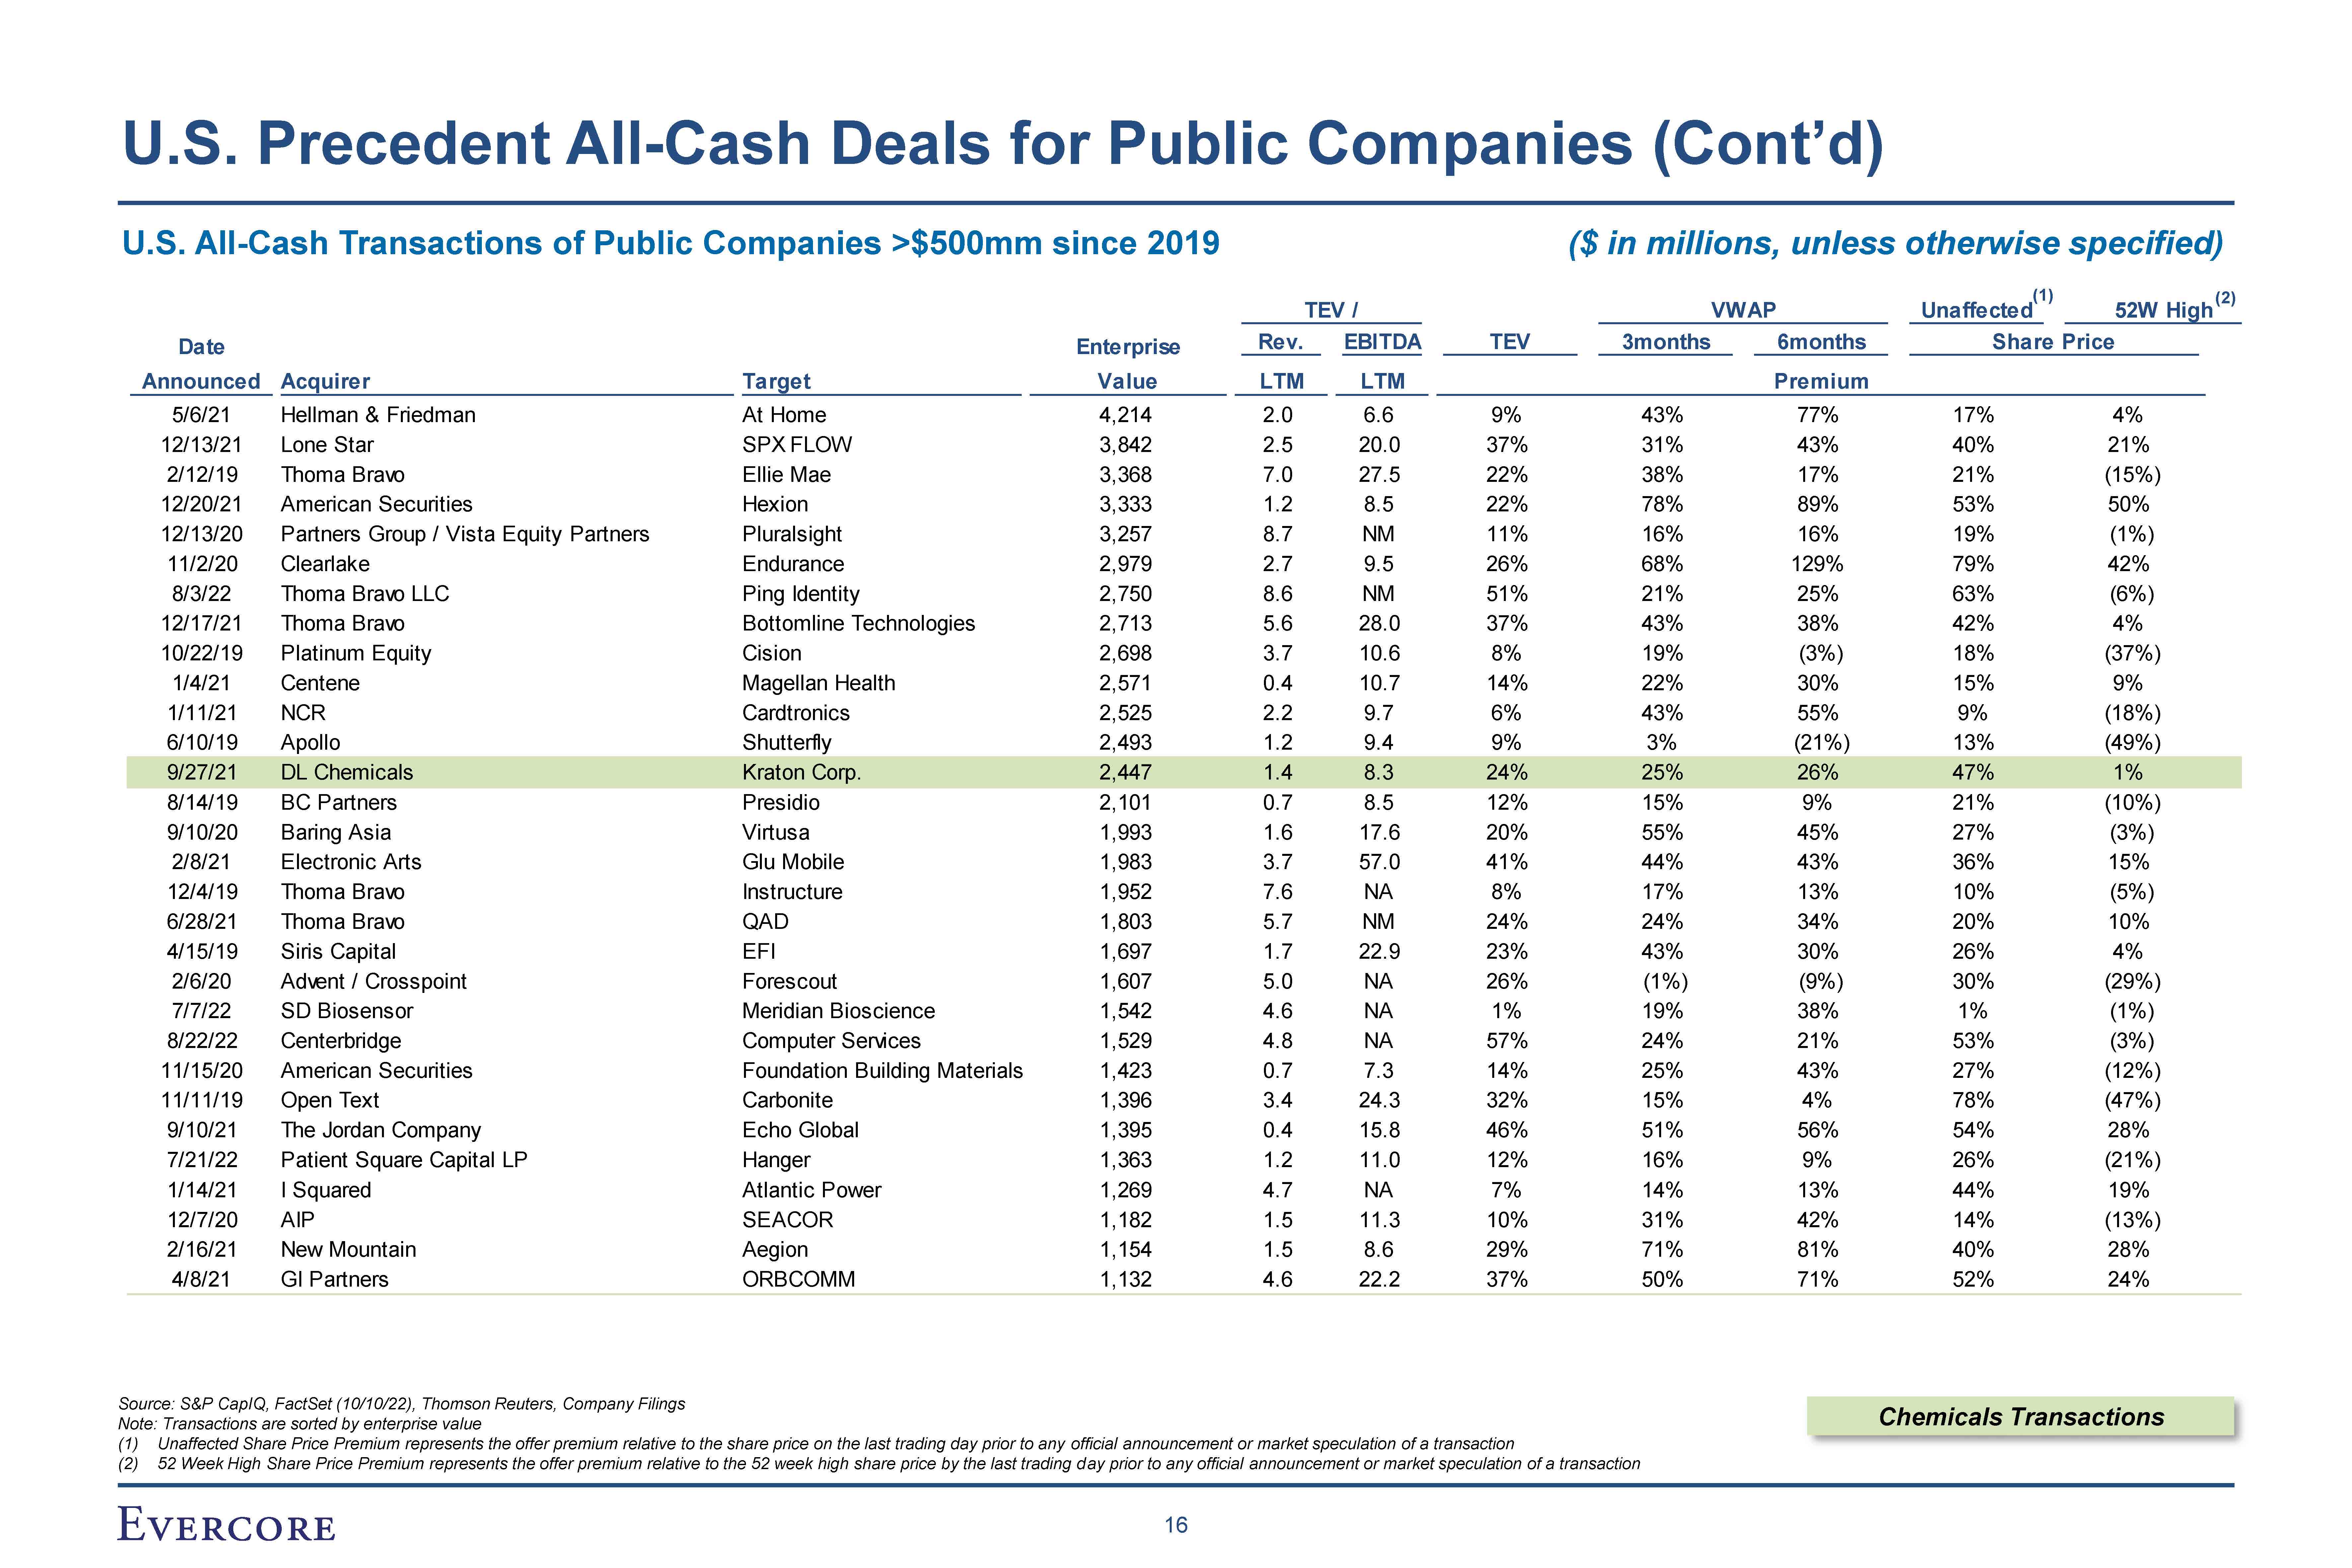
Announced Acquirer Target Value LTM LTM Premium 5/6/21 Hellman &
Friedman At Home 4,214 2.0 6.6 9% 43% 77% 17% 4% 12/13/21 Lone Star SPX FLOW 3,842 2.5 20.0 37% 31% 43% 40% 21% 2/12/19 Thoma Bravo Ellie Mae 3,368 7.0 27.5 22% 38% 17% 21% (15%) 12/20/21 American
Securities Hexion 3,333 1.2 8.5 22% 78% 89% 53% 50% 12/13/20 Partners Group / Vista Equity
Partners Pluralsight 3,257 8.7 NM 11% 16% 16% 19% (1%) 11/2/20 Clearlake Endurance 2,979 2.7 9.5 26% 68% 129% 79% 42% 8/3/22 Thoma Bravo LLC Ping Identity 2,750 8.6 NM 51% 21% 25% 63% (6%) 12/17/21 Thoma
Bravo Bottomline Technologies 2,713 5.6 28.0 37% 43% 38% 42% 4% 10/22/19 Platinum Equity Cision 2,698 3.7 10.6 8% 19% (3%) 18% (37%) 1/4/21 Centene Magellan
Health 2,571 0.4 10.7 14% 22% 30% 15% 9% 1/11/21 NCR Cardtronics 2,525 2.2 9.7 6% 43% 55% 9% (18%) 6/10/19 Apollo Shutterfly 2,493 1.2 9.4 9% 3% (21%) 13% (49%) 9/27/21 DL Chemicals Kraton
Corp. 2,447 1.4 8.3 24% 25% 26% 47% 1% 8/14/19 BC Partners Presidio 2,101 0.7 8.5 12% 15% 9% 21% (10%) 9/10/20 Baring Asia Virtusa 1,993 1.6 17.6 20% 55% 45% 27% (3%) 2/8/21 Electronic Arts Glu
Mobile 1,983 3.7 57.0 41% 44% 43% 36% 15% 12/4/19 Thoma Bravo Instructure 1,952 7.6 NA 8% 17% 13% 10% (5%) 6/28/21 Thoma Bravo QAD 1,803 5.7 NM 24% 24% 34% 20% 10% 4/15/19 Siris
Capital EFI 1,697 1.7 22.9 23% 43% 30% 26% 4% 2/6/20 Advent / Crosspoint Forescout 1,607 5.0 NA 26% (1%) (9%) 30% (29%) 7/7/22 SD Biosensor Meridian
Bioscience 1,542 4.6 NA 1% 19% 38% 1% (1%) 8/22/22 Centerbridge Computer Services 1,529 4.8 NA 57% 24% 21% 53% (3%) 11/15/20 American Securities Foundation Building
Materials 1,423 0.7 7.3 14% 25% 43% 27% (12%) 11/11/19 Open Text Carbonite 1,396 3.4 24.3 32% 15% 4% 78% (47%) 9/10/21 The Jordan Company Echo Global 1,395 0.4 15.8 46% 51% 56% 54% 28% 7/21/22 Patient Square
Capital LP Hanger 1,363 1.2 11.0 12% 16% 9% 26% (21%) 1/14/21 I Squared Atlantic Power 1,269 4.7 NA 7% 14% 13% 44% 19% 12/7/20 AIP SEACOR 1,182 1.5 11.3 10% 31% 42% 14% (13%) 2/16/21 New
Mountain Aegion 1,154 1.5 8.6 29% 71% 81% 40% 28% 4/8/21 GI Partners ORBCOMM 1,132 4.6 22.2 37% 50% 71% 52% 24% TEV / (1) (2) VWAP Unaffected 52W High Date Enterprise Rev. EBITDA TEV 3months 6months Share Price
U.S. All-Cash Transactions of Public Companies >$500mm since 2019 ($ in millions, unless otherwise specified) U.S. Precedent All-Cash Deals for Public Companies (Cont’d) Source: S&P CapIQ, FactSet (10/10/22), Thomson Reuters, Company
Filings Note: Transactions are sorted by enterprise value (1) Unaffected Share Price Premium represents the offer premium relative to the share price on the last trading day prior to any official announcement or market speculation of a
transaction (2) 52 Week High Share Price Premium represents the offer premium relative to the 52 week high share price by the last trading day prior to any official announcement or market speculation of a transaction Chemicals
Transactions 16
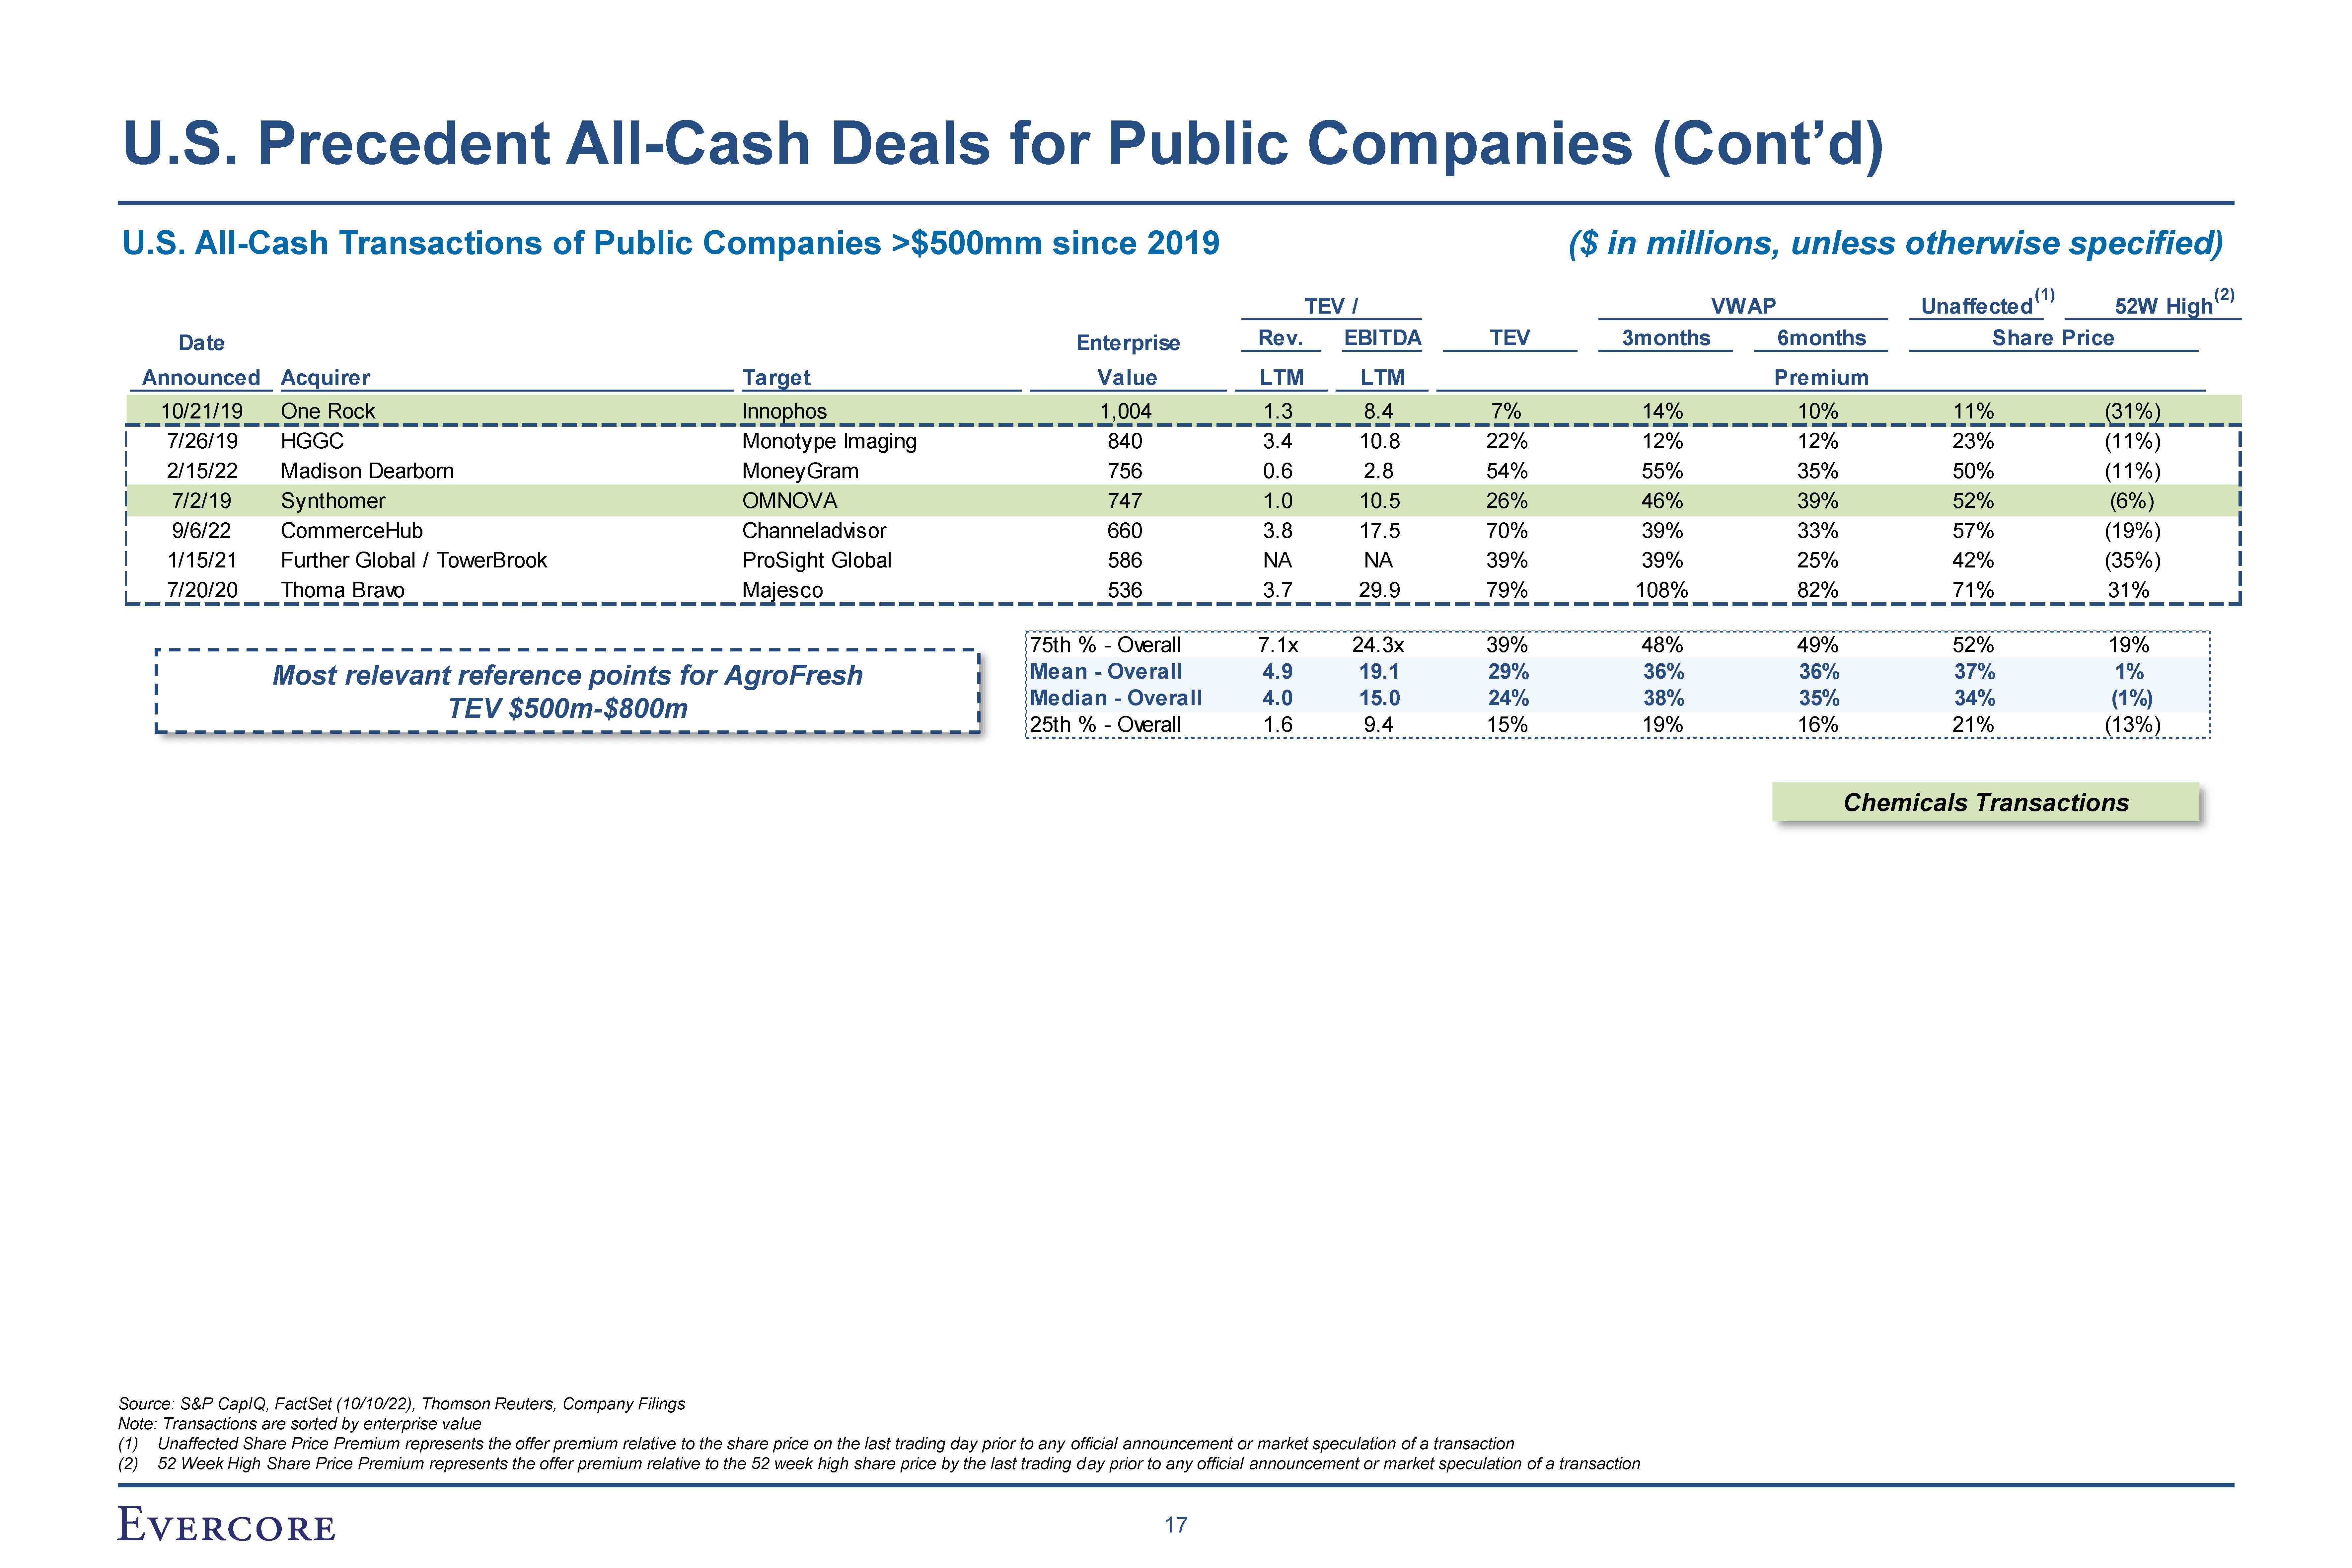
10/21/19 One
Rock Innophos 1,004 1.3 8.4 7% 14% 10% 11% (31%) 7/26/19 HGGC Monotype Imaging 840 3.4 10.8 22% 12% 12% 23% (11%) 2/15/22 Madison
Dearborn MoneyGram 756 0.6 2.8 54% 55% 35% 50% (11%) 7/2/19 Synthomer OMNOVA 747 1.0 10.5 26% 46% 39% 52% (6%) 9/6/22 CommerceHub Channeladvisor 660 3.8 17.5 70% 39% 33% 57% (19%) 1/15/21 Further Global /
TowerBrook ProSight Global 586 NA NA 39% 39% 25% 42% (35%) 7/20/20 Thoma Bravo Majesco 536 3.7 29.9 79% 108% 82% 71% 31% 75th % - Overall 7.1x 24.3x 39% 48% 49% 52% 19% Mean -
Overall 4.9 19.1 29% 36% 36% 37% 1% Median - Overall 4.0 15.0 24% 38% 35% 34% (1%) 25th % - Overall 1.6 9.4 15% 19% 16% 21% (13%) Date Enterprise Rev. EBITDA TEV 3months 6months Share Price Announced
Acquirer Target Value LTM LTM Premium U.S. All-Cash Transactions of Public Companies >$500mm since 2019 ($ in millions, unless otherwise specified) TEV / VWAP Unaffected(1) 52W High(2) U.S. Precedent All-Cash Deals for Public
Companies (Cont’d) Most relevant reference points for AgroFresh TEV $500m-$800m Chemicals Transactions Source: S&P CapIQ, FactSet (10/10/22), Thomson Reuters, Company Filings Note: Transactions are sorted by enterprise value (1)
Unaffected Share Price Premium represents the offer premium relative to the share price on the last trading day prior to any official announcement or market speculation of a transaction (2) 52 Week High Share Price Premium represents the offer
premium relative to the 52 week high share price by the last trading day prior to any official announcement or market speculation of a transaction 17
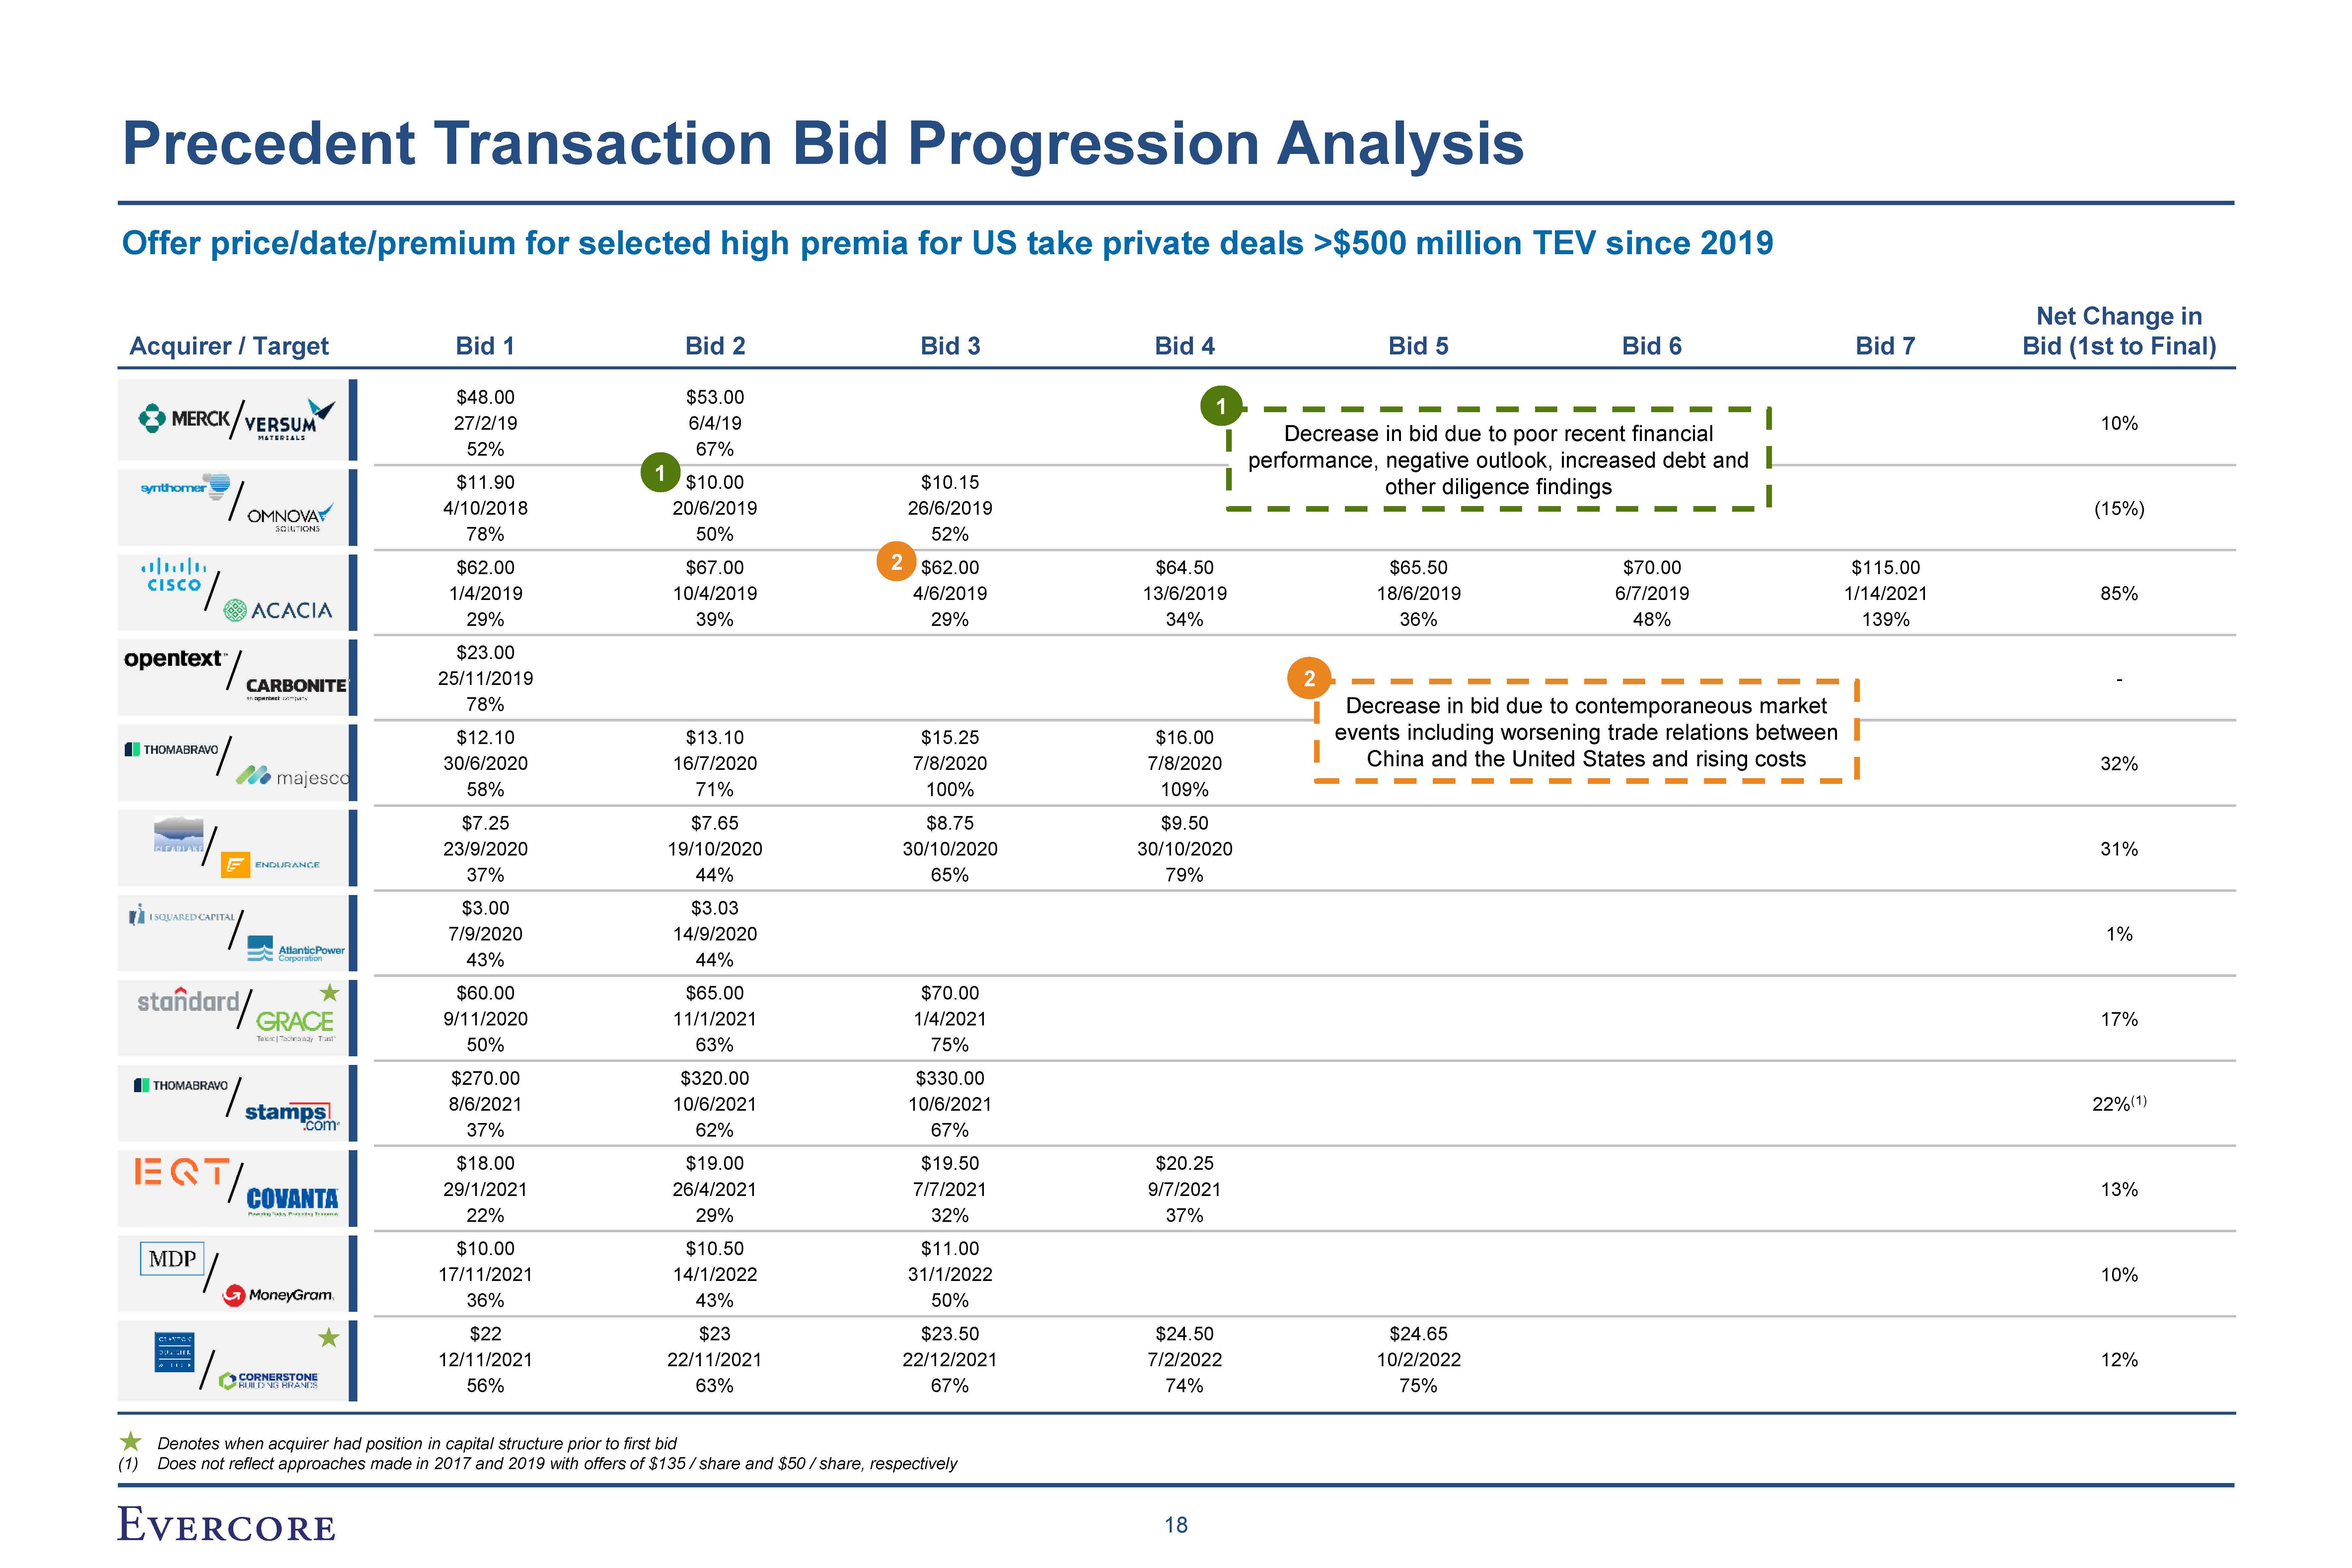
Offer price/date/premium for selected high premia for US take private deals
>$500 million TEV since 2019 Precedent Transaction Bid Progression Analysis Net Change in Acquirer / Target Bid 1 Bid 2 Bid 3 Bid 4 Bid 5 Bid 6 Bid 7 Bid (1st to Final) $48.00 27/2/19 52% $53.00 6/4/19 67% 10% Denotes when
acquirer had position in capital structure prior to first bid Decrease in bid due to poor recent financial performance, negative outlook, increased debt and 1 $11.90 1 $10.00 $10.15 other diligence
findings 4/10/2018 20/6/2019 26/6/2019 (15%) 78% 50% 52% $62.00 $67.00 2 $62.00 $64.50 $65.50 $70.00 $115.00 1/4/2019 10/4/2019 4/6/2019 13/6/2019 18/6/2019 6/7/2019 1/14/2021 85% 29% 39% 29% 34% 36%
48% 139% $23.00 25/11/2019 2 - 78% Decrease in bid due to contemporaneous market $12.10 $13.10 $15.25 $16.00 events including worsening trade relations between 30/6/2020 16/7/2020 7/8/2020 7/8/2020 China and the United States
and rising
costs 32% 58% 71% 100% 109% $7.25 $7.65 $8.75 $9.50 23/9/2020 19/10/2020 30/10/2020 30/10/2020 31% 37% 44% 65% 79% $3.00 $3.03 7/9/2020 14/9/2020 1% 43% 44% $60.00 $65.00 $70.00 9/11/2020 11/1/2021 1/4/2021 17% 50% 63% 75% $270.00 $320.00 $330.00 8/6/2021 10/6/2021 10/6/2021 22%(1) 37% 62% 67% $18.00 $19.00 $19.50 $20.25 29/1/2021 26/4/2021 7/7/2021 9/7/2021 13% 22% 29% 32% 37% $10.00 $10.50 $11.00 17/11/2021 14/1/2022 31/1/2022 10% 36% 43% 50% $22 $23 $23.50 $24.50 $24.65 12/11/2021 22/11/2021 22/12/2021 7/2/2022 10/2/2022 12% 56% 63% 67% 74% 75% (1)
Does not reflect approaches made in 2017 and 2019 with offers of $135 / share and $50 / share, respectively 18
V Supporting Calculations
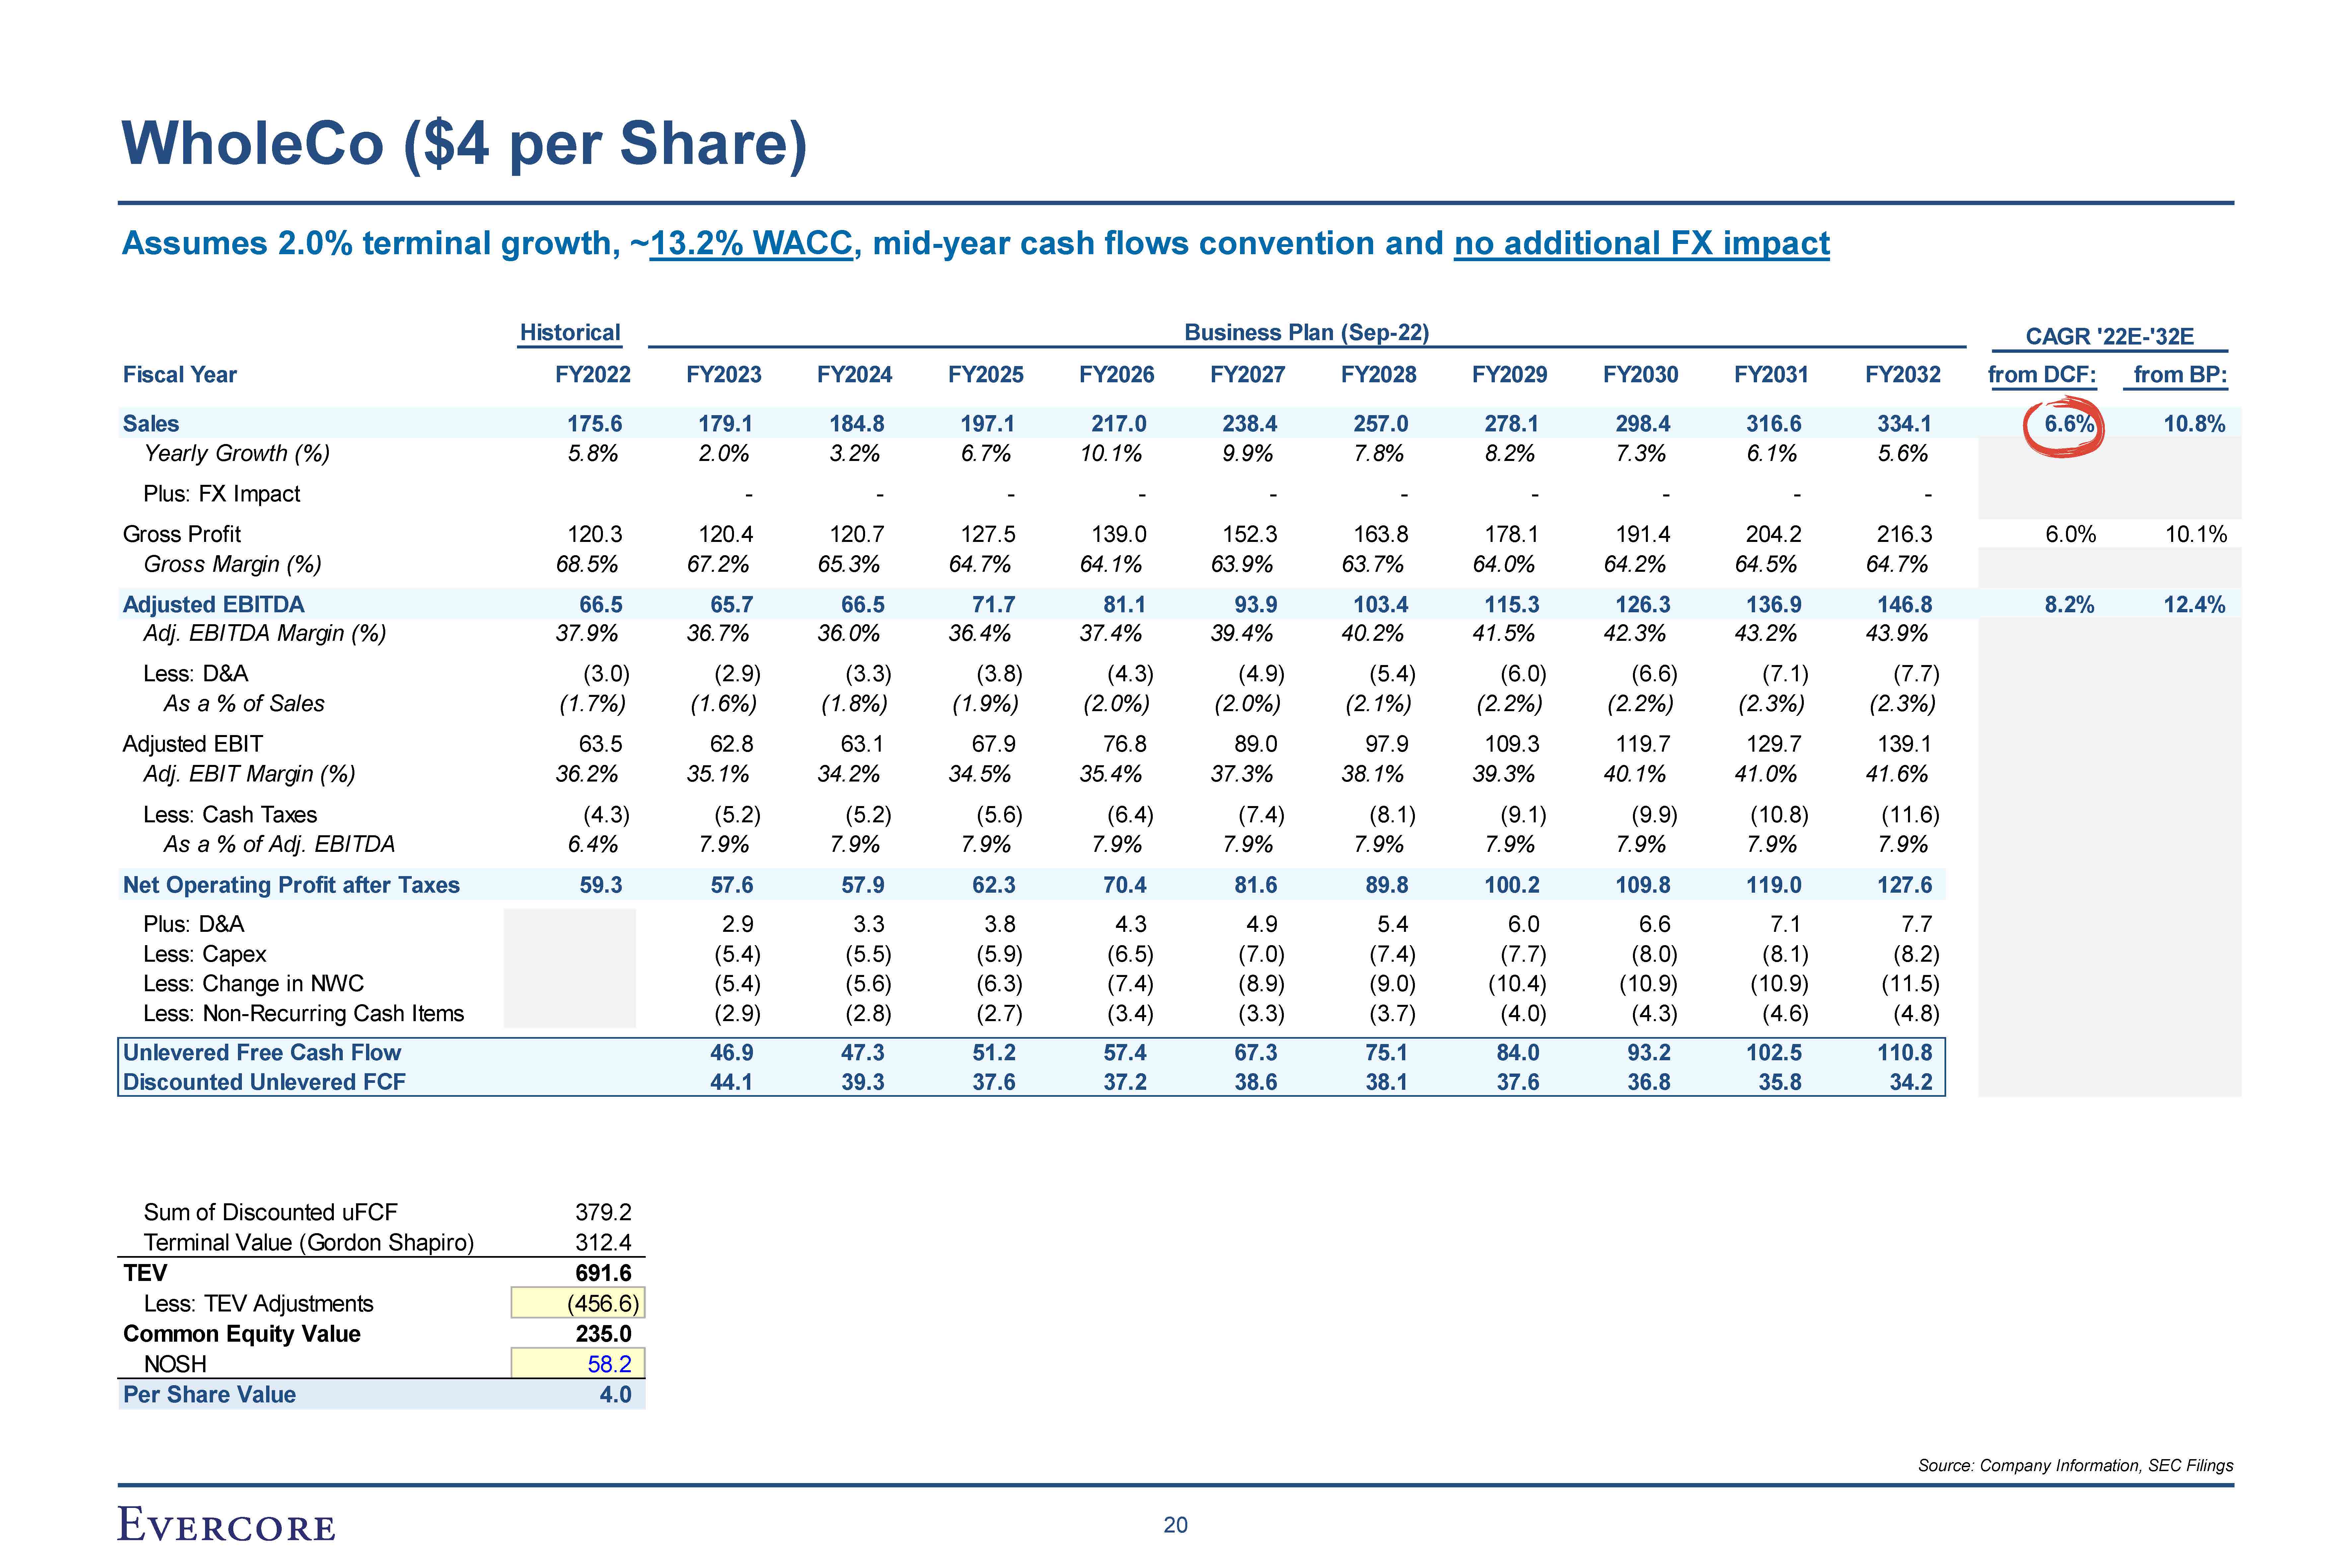
WholeCo ($4 per Share) Historical Business Plan (Sep-22) CAGR '22E-'32E
Fiscal Year FY2022 FY2023 FY2024 FY2025 FY2026 FY2027 FY2028 FY2029 FY2030 FY2031 FY2032 from DCF: from BP: Sales 175.6 179.1 184.8 197.1 217.0 238.4 257.0 278.1 298.4 316.6 334.1 6.6% 10.8% Yearly Growth
(%) 5.8% 2.0% 3.2% 6.7% 10.1% 9.9% 7.8% 8.2% 7.3% 6.1% 5.6% Plus: FX Impact - - - - - - - - - - Gross Profit 120.3 120.4 120.7 127.5 139.0 152.3 163.8 178.1 191.4 204.2 216.3 6.0% 10.1% Gross Margin
(%) 68.5% 67.2% 65.3% 64.7% 64.1% 63.9% 63.7% 64.0% 64.2% 64.5% 64.7% Adjusted EBITDA 66.5 65.7 66.5 71.7 81.1 93.9 103.4 115.3 126.3 136.9 146.8 8.2% 12.4% Adj. EBITDA Margin
(%) 37.9% 36.7% 36.0% 36.4% 37.4% 39.4% 40.2% 41.5% 42.3% 43.2% 43.9% Less: D&A (3.0) (2.9) (3.3) (3.8) (4.3) (4.9) (5.4) (6.0) (6.6) (7.1) (7.7) As a % of
Sales (1.7%) (1.6%) (1.8%) (1.9%) (2.0%) (2.0%) (2.1%) (2.2%) (2.2%) (2.3%) (2.3%) Adjusted EBIT 63.5 62.8 63.1 67.9 76.8 89.0 97.9 109.3 119.7 129.7 139.1 Adj. EBIT Margin
(%) 36.2% 35.1% 34.2% 34.5% 35.4% 37.3% 38.1% 39.3% 40.1% 41.0% 41.6% Less: Cash Taxes (4.3) (5.2) (5.2) (5.6) (6.4) (7.4) (8.1) (9.1) (9.9) (10.8) (11.6) As a % of Adj.
EBITDA 6.4% 7.9% 7.9% 7.9% 7.9% 7.9% 7.9% 7.9% 7.9% 7.9% 7.9% Net Operating Profit after Taxes 59.3 57.6 57.9 62.3 70.4 81.6 89.8 100.2 109.8 119.0 127.6 Plus:
D&A 2.9 3.3 3.8 4.3 4.9 5.4 6.0 6.6 7.1 7.7 Less: Capex (5.4) (5.5) (5.9) (6.5) (7.0) (7.4) (7.7) (8.0) (8.1) (8.2) Less: Change in NWC (5.4) (5.6) (6.3) (7.4) (8.9) (9.0) (10.4) (10.9) (10.9) (11.5) Less:
Non-Recurring Cash Items (2.9) (2.8) (2.7) (3.4) (3.3) (3.7) (4.0) (4.3) (4.6) (4.8) Unlevered Free Cash Flow 46.9 47.3 51.2 57.4 67.3 75.1 84.0 93.2 102.5 110.8 Discounted Unlevered
FCF 44.1 39.3 37.6 37.2 38.6 38.1 37.6 36.8 35.8 34.2 Sum of Discounted uFCF 379.2 Terminal Value (Gordon Shapiro) 312.4 TEV 691.6 Less: TEV Adjustments (456.6) Common Equity Value 235.0 NOSH 58.2 Per Share Value
4.0 Assumes 2.0% terminal growth, ~13.2% WACC, mid-year cash flows convention and no additional FX impact Source: Company Information, SEC Filings 20
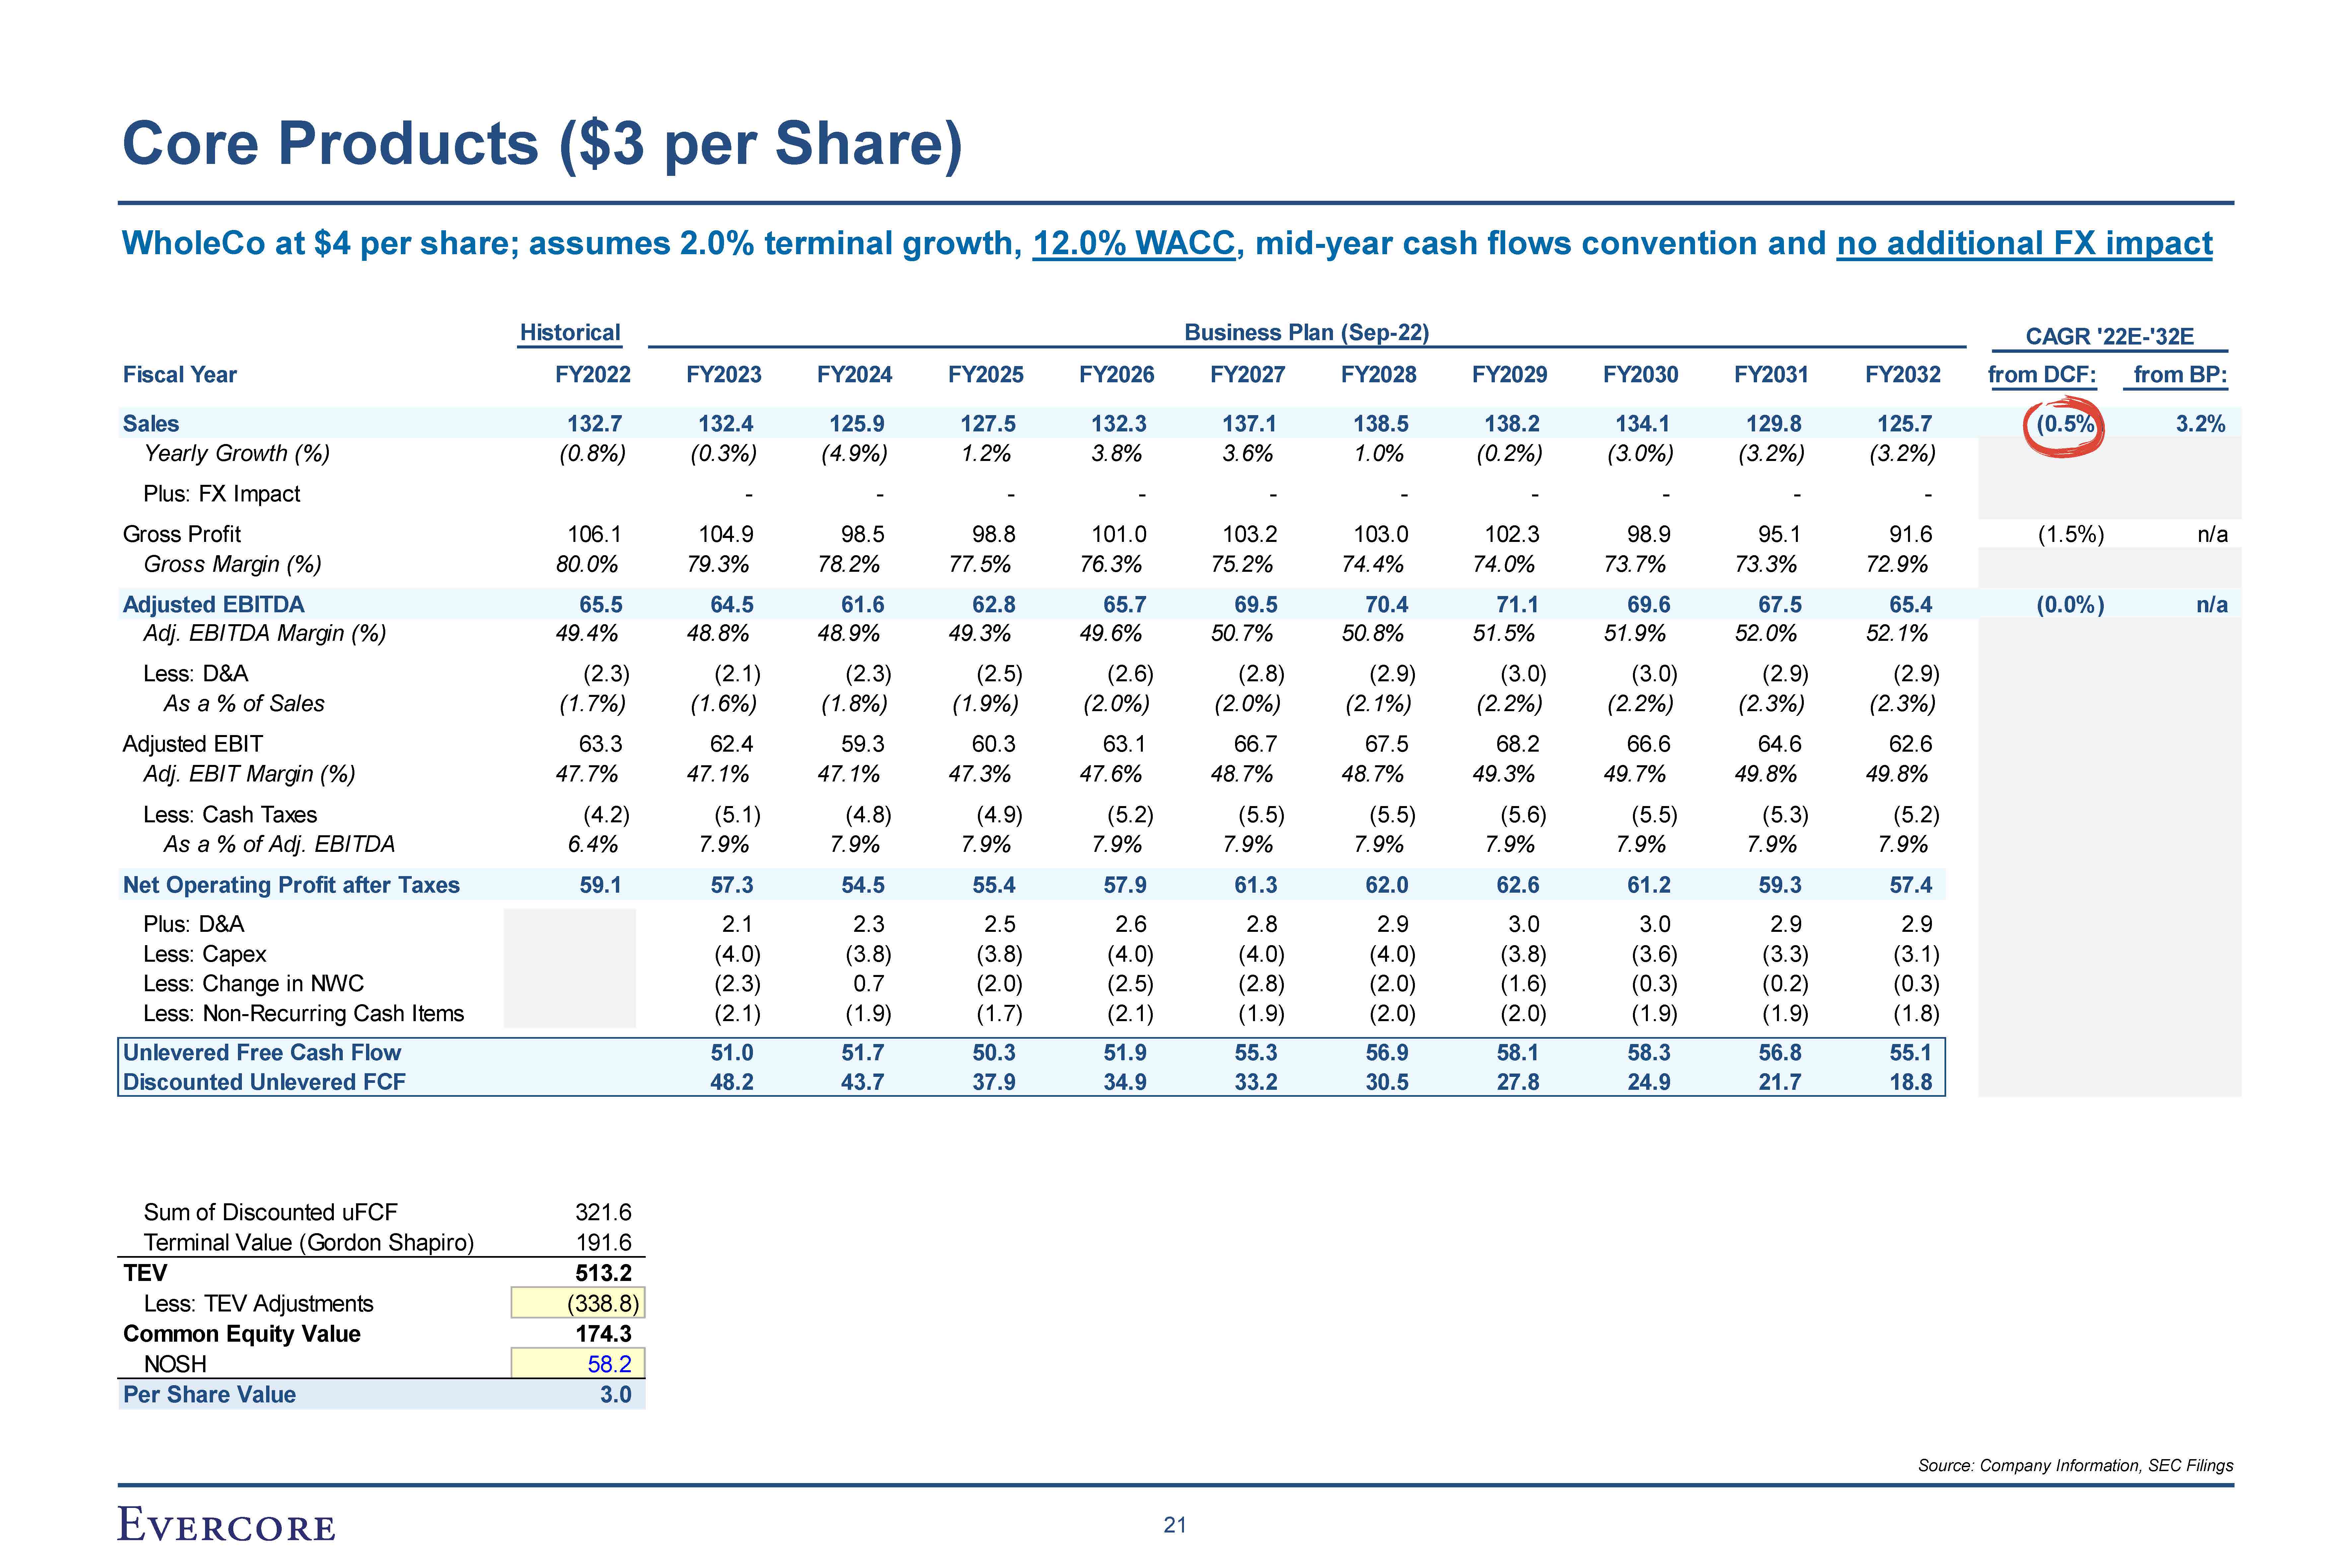
Core Products ($3 per Share) Historical Business Plan (Sep-22) CAGR '22E-'32E
Fiscal Year FY2022 FY2023 FY2024 FY2025 FY2026 FY2027 FY2028 FY2029 FY2030 FY2031 FY2032 from DCF: from BP: Sales 132.7 132.4 125.9 127.5 132.3 137.1 138.5 138.2 134.1 129.8 125.7 (0.5%) 3.2% Yearly Growth
(%) (0.8%) (0.3%) (4.9%) 1.2% 3.8% 3.6% 1.0% (0.2%) (3.0%) (3.2%) (3.2%) Plus: FX Impact - - - - - - - - - - Gross Profit 106.1 104.9 98.5 98.8 101.0 103.2 103.0 102.3 98.9 95.1 91.6 (1.5%) n/a Gross Margin
(%) 80.0% 79.3% 78.2% 77.5% 76.3% 75.2% 74.4% 74.0% 73.7% 73.3% 72.9% Adjusted EBITDA 65.5 64.5 61.6 62.8 65.7 69.5 70.4 71.1 69.6 67.5 65.4 (0.0%) n/a Adj. EBITDA Margin
(%) 49.4% 48.8% 48.9% 49.3% 49.6% 50.7% 50.8% 51.5% 51.9% 52.0% 52.1% Less: D&A (2.3) (2.1) (2.3) (2.5) (2.6) (2.8) (2.9) (3.0) (3.0) (2.9) (2.9) As a % of
Sales (1.7%) (1.6%) (1.8%) (1.9%) (2.0%) (2.0%) (2.1%) (2.2%) (2.2%) (2.3%) (2.3%) Adjusted EBIT 63.3 62.4 59.3 60.3 63.1 66.7 67.5 68.2 66.6 64.6 62.6 Adj. EBIT Margin
(%) 47.7% 47.1% 47.1% 47.3% 47.6% 48.7% 48.7% 49.3% 49.7% 49.8% 49.8% Less: Cash Taxes (4.2) (5.1) (4.8) (4.9) (5.2) (5.5) (5.5) (5.6) (5.5) (5.3) (5.2) As a % of Adj.
EBITDA 6.4% 7.9% 7.9% 7.9% 7.9% 7.9% 7.9% 7.9% 7.9% 7.9% 7.9% Net Operating Profit after Taxes 59.1 57.3 54.5 55.4 57.9 61.3 62.0 62.6 61.2 59.3 57.4 Plus: D&A 2.1 2.3 2.5 2.6 2.8 2.9 3.0 3.0 2.9 2.9 Less:
Capex (4.0) (3.8) (3.8) (4.0) (4.0) (4.0) (3.8) (3.6) (3.3) (3.1) Less: Change in NWC (2.3) 0.7 (2.0) (2.5) (2.8) (2.0) (1.6) (0.3) (0.2) (0.3) Less: Non-Recurring Cash
Items (2.1) (1.9) (1.7) (2.1) (1.9) (2.0) (2.0) (1.9) (1.9) (1.8) Unlevered Free Cash Flow 51.0 51.7 50.3 51.9 55.3 56.9 58.1 58.3 56.8 55.1 Discounted Unlevered
FCF 48.2 43.7 37.9 34.9 33.2 30.5 27.8 24.9 21.7 18.8 Sum of Discounted uFCF 321.6 Terminal Value (Gordon Shapiro) 191.6 TEV 513.2 Less: TEV Adjustments (338.8) Common Equity Value 174.3 NOSH 58.2 Per Share Value
3.0 WholeCo at $4 per share; assumes 2.0% terminal growth, 12.0% WACC, mid-year cash flows convention and no additional FX impact Source: Company Information, SEC Filings 21
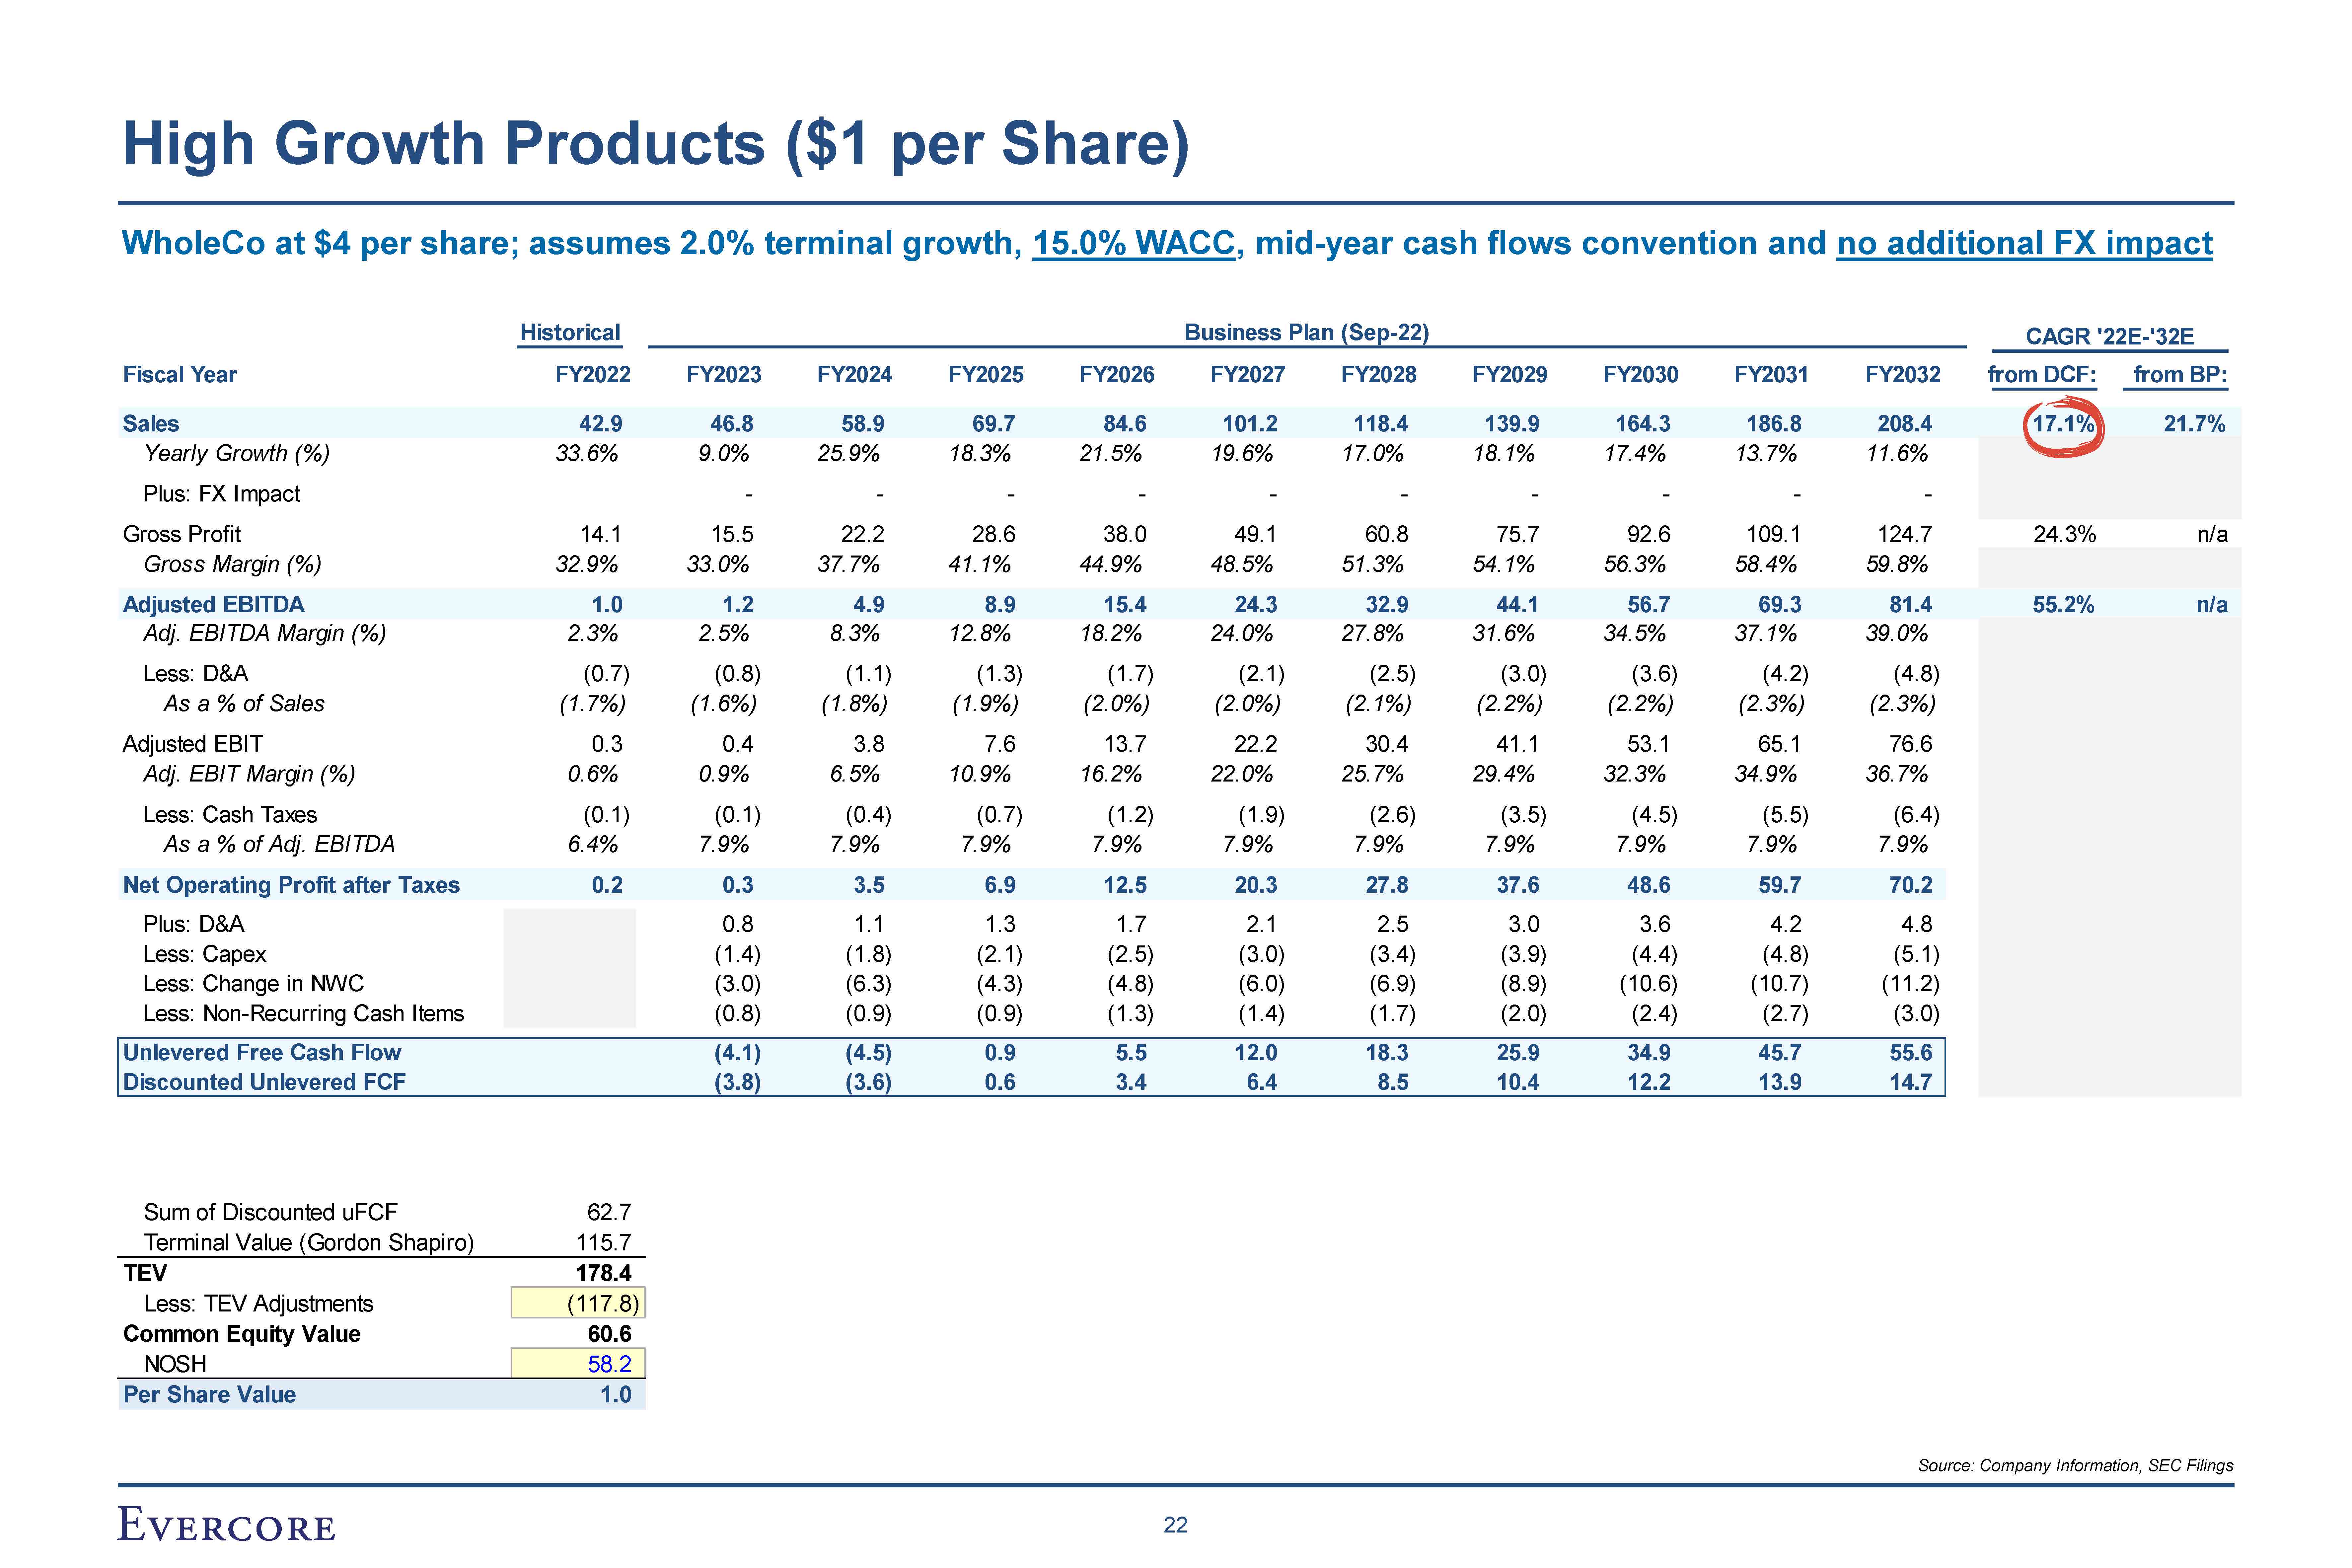
High Growth Products ($1 per Share) Historical Business Plan (Sep-22) CAGR
'22E-'32E Fiscal Year FY2022 FY2023 FY2024 FY2025 FY2026 FY2027 FY2028 FY2029 FY2030 FY2031 FY2032 from DCF: from BP: Sales 42.9 46.8 58.9 69.7 84.6 101.2 118.4 139.9 164.3 186.8 208.4 17.1% 21.7% Yearly Growth
(%) 33.6% 9.0% 25.9% 18.3% 21.5% 19.6% 17.0% 18.1% 17.4% 13.7% 11.6% Plus: FX Impact - - - - - - - - - - Gross Profit 14.1 15.5 22.2 28.6 38.0 49.1 60.8 75.7 92.6 109.1 124.7 24.3% n/a Gross Margin
(%) 32.9% 33.0% 37.7% 41.1% 44.9% 48.5% 51.3% 54.1% 56.3% 58.4% 59.8% Adjusted EBITDA 1.0 1.2 4.9 8.9 15.4 24.3 32.9 44.1 56.7 69.3 81.4 55.2% n/a Adj. EBITDA Margin
(%) 2.3% 2.5% 8.3% 12.8% 18.2% 24.0% 27.8% 31.6% 34.5% 37.1% 39.0% Less: D&A (0.7) (0.8) (1.1) (1.3) (1.7) (2.1) (2.5) (3.0) (3.6) (4.2) (4.8) As a % of
Sales (1.7%) (1.6%) (1.8%) (1.9%) (2.0%) (2.0%) (2.1%) (2.2%) (2.2%) (2.3%) (2.3%) Adjusted EBIT 0.3 0.4 3.8 7.6 13.7 22.2 30.4 41.1 53.1 65.1 76.6 Adj. EBIT Margin
(%) 0.6% 0.9% 6.5% 10.9% 16.2% 22.0% 25.7% 29.4% 32.3% 34.9% 36.7% Less: Cash Taxes (0.1) (0.1) (0.4) (0.7) (1.2) (1.9) (2.6) (3.5) (4.5) (5.5) (6.4) As a % of Adj.
EBITDA 6.4% 7.9% 7.9% 7.9% 7.9% 7.9% 7.9% 7.9% 7.9% 7.9% 7.9% Net Operating Profit after Taxes 0.2 0.3 3.5 6.9 12.5 20.3 27.8 37.6 48.6 59.7 70.2 Plus: D&A 0.8 1.1 1.3 1.7 2.1 2.5 3.0 3.6 4.2 4.8 Less:
Capex (1.4) (1.8) (2.1) (2.5) (3.0) (3.4) (3.9) (4.4) (4.8) (5.1) Less: Change in NWC (3.0) (6.3) (4.3) (4.8) (6.0) (6.9) (8.9) (10.6) (10.7) (11.2) Less: Non-Recurring Cash
Items (0.8) (0.9) (0.9) (1.3) (1.4) (1.7) (2.0) (2.4) (2.7) (3.0) Unlevered Free Cash Flow (4.1) (4.5) 0.9 5.5 12.0 18.3 25.9 34.9 45.7 55.6 Discounted Unlevered
FCF (3.8) (3.6) 0.6 3.4 6.4 8.5 10.4 12.2 13.9 14.7 Sum of Discounted uFCF 62.7 Terminal Value (Gordon Shapiro) 115.7 TEV 178.4 Less: TEV Adjustments (117.8) Common Equity Value 60.6 NOSH 58.2 Per Share Value
1.0 WholeCo at $4 per share; assumes 2.0% terminal growth, 15.0% WACC, mid-year cash flows convention and no additional FX impact Source: Company Information, SEC Filings 22
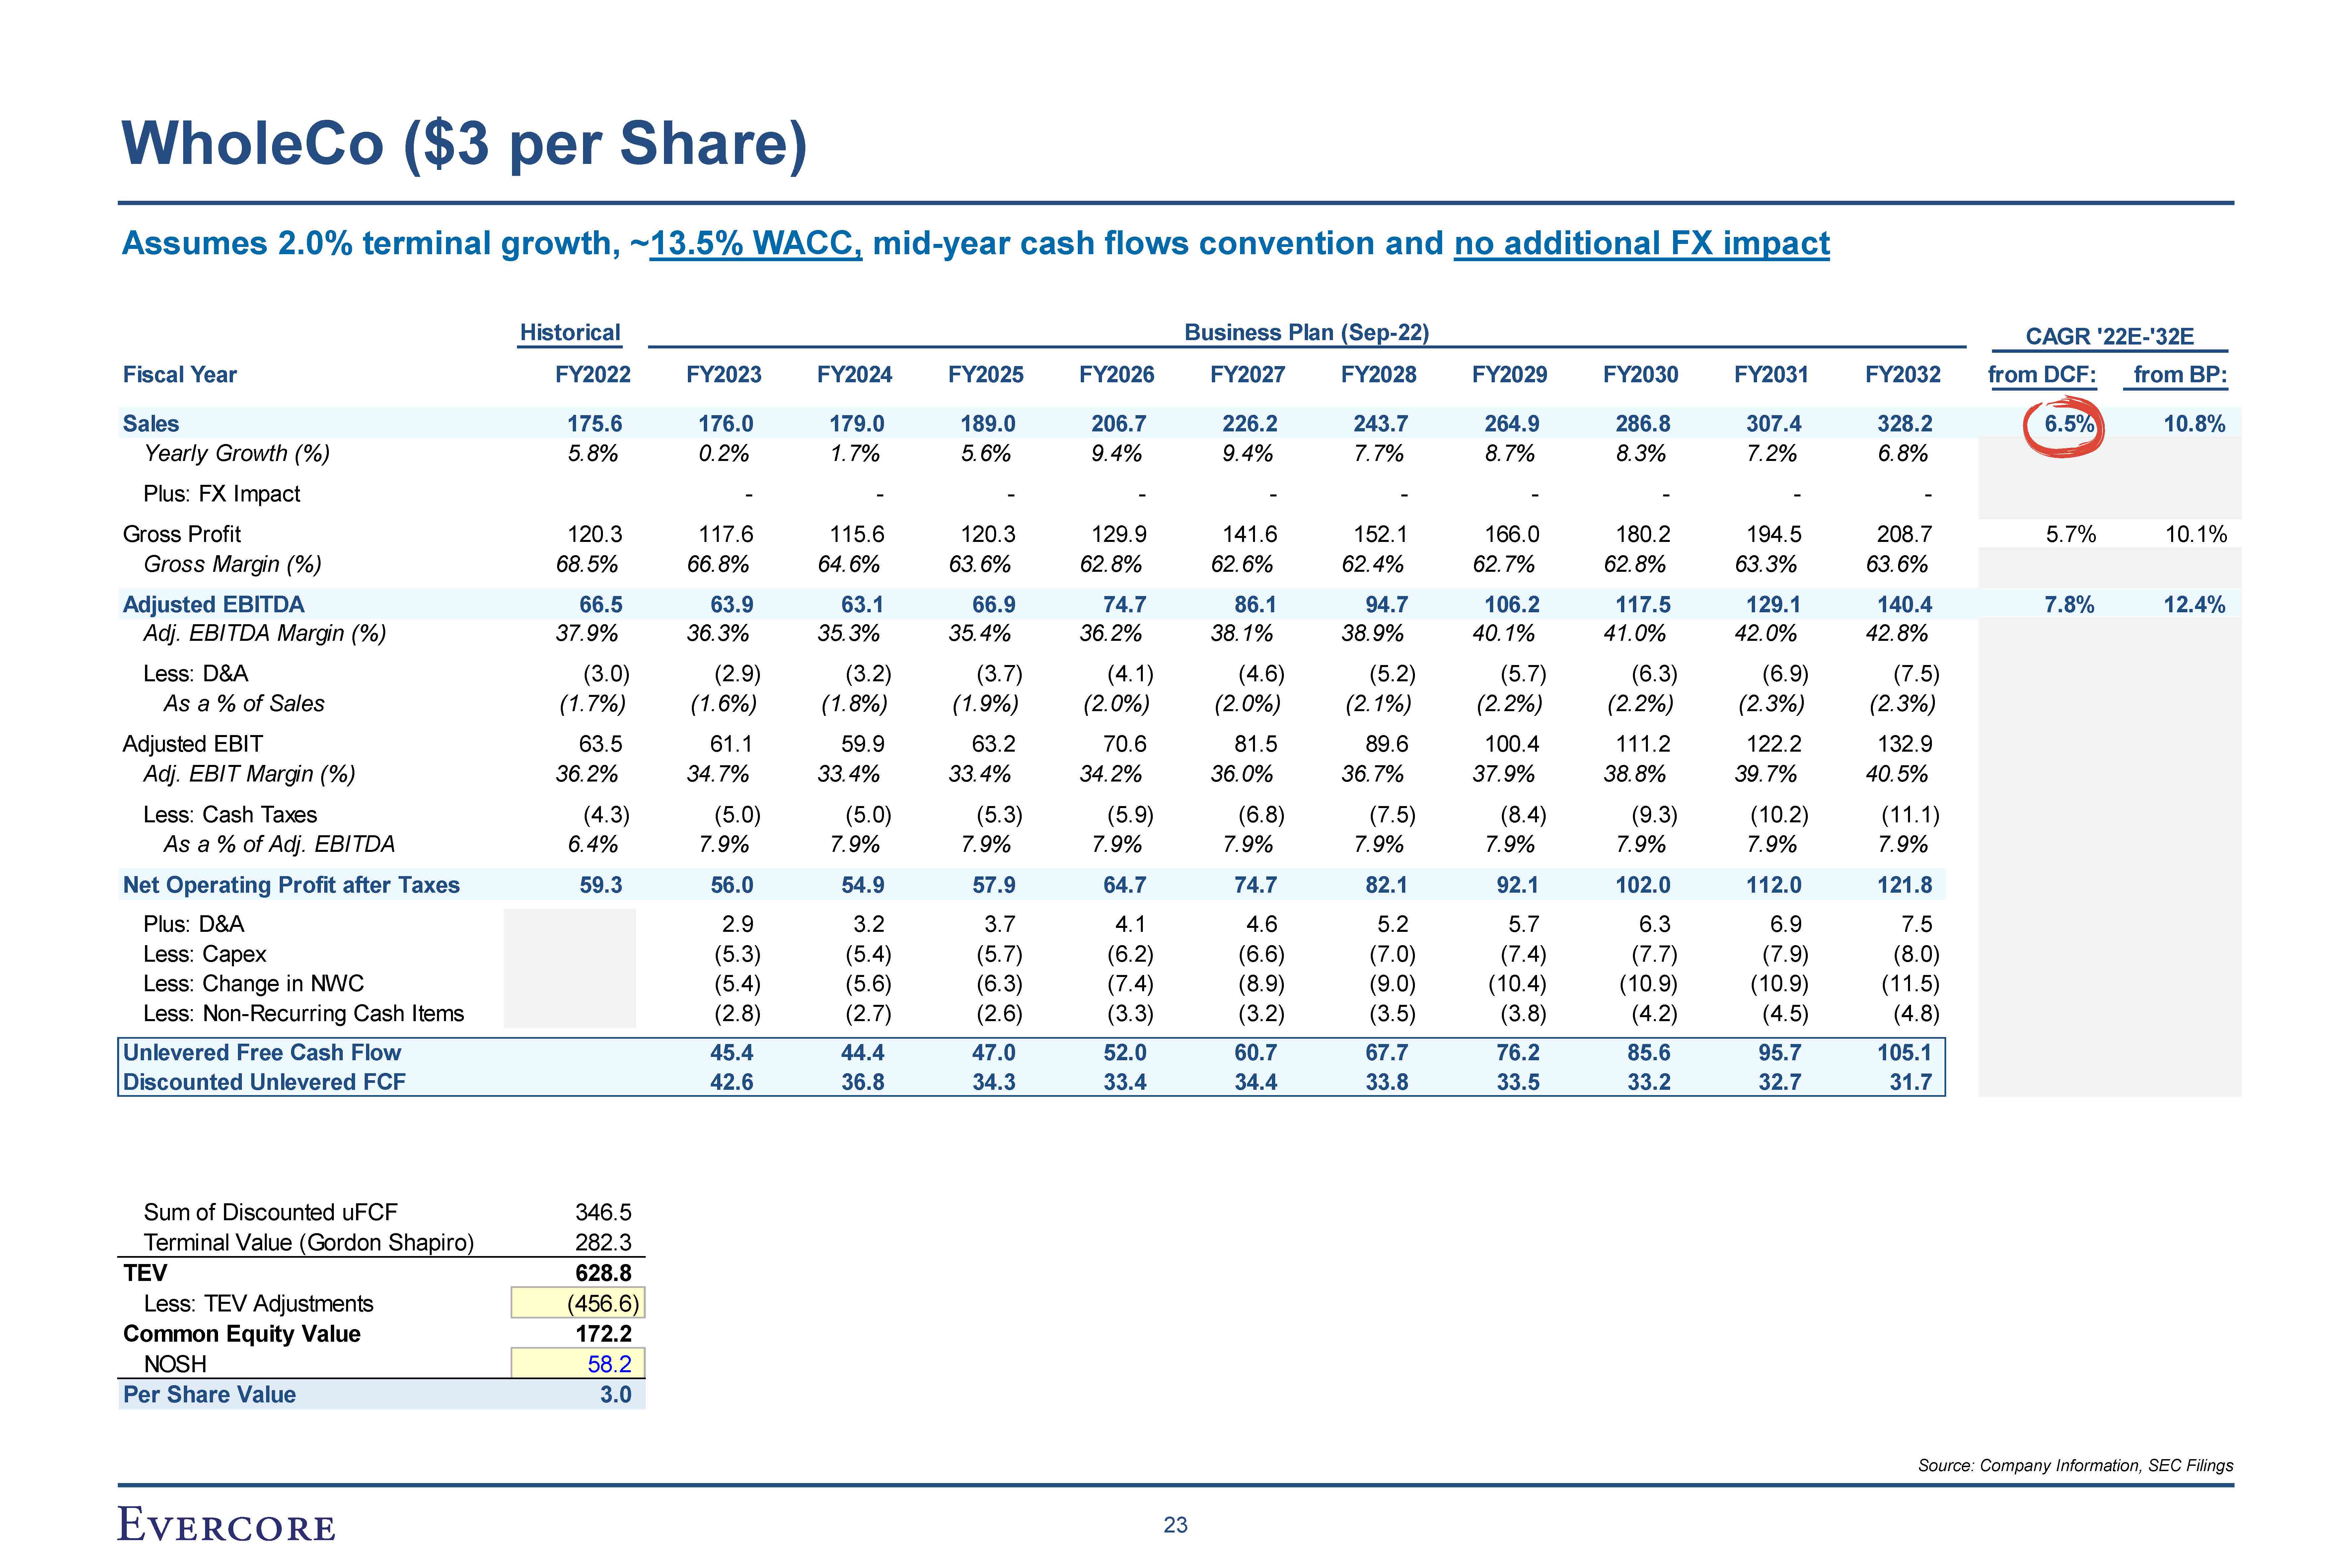
WholeCo ($3 per Share) Historical Business Plan (Sep-22) CAGR '22E-'32E
Fiscal Year FY2022 FY2023 FY2024 FY2025 FY2026 FY2027 FY2028 FY2029 FY2030 FY2031 FY2032 from DCF: from BP: Sales 175.6 176.0 179.0 189.0 206.7 226.2 243.7 264.9 286.8 307.4 328.2 6.5% 10.8% Yearly Growth
(%) 5.8% 0.2% 1.7% 5.6% 9.4% 9.4% 7.7% 8.7% 8.3% 7.2% 6.8% Plus: FX Impact - - - - - - - - - - Gross Profit 120.3 117.6 115.6 120.3 129.9 141.6 152.1 166.0 180.2 194.5 208.7 5.7% 10.1% Gross Margin
(%) 68.5% 66.8% 64.6% 63.6% 62.8% 62.6% 62.4% 62.7% 62.8% 63.3% 63.6% Adjusted EBITDA 66.5 63.9 63.1 66.9 74.7 86.1 94.7 106.2 117.5 129.1 140.4 7.8% 12.4% Adj. EBITDA Margin
(%) 37.9% 36.3% 35.3% 35.4% 36.2% 38.1% 38.9% 40.1% 41.0% 42.0% 42.8% Less: D&A (3.0) (2.9) (3.2) (3.7) (4.1) (4.6) (5.2) (5.7) (6.3) (6.9) (7.5) As a % of
Sales (1.7%) (1.6%) (1.8%) (1.9%) (2.0%) (2.0%) (2.1%) (2.2%) (2.2%) (2.3%) (2.3%) Adjusted EBIT 63.5 61.1 59.9 63.2 70.6 81.5 89.6 100.4 111.2 122.2 132.9 Adj. EBIT Margin
(%) 36.2% 34.7% 33.4% 33.4% 34.2% 36.0% 36.7% 37.9% 38.8% 39.7% 40.5% Less: Cash Taxes (4.3) (5.0) (5.0) (5.3) (5.9) (6.8) (7.5) (8.4) (9.3) (10.2) (11.1) As a % of Adj.
EBITDA 6.4% 7.9% 7.9% 7.9% 7.9% 7.9% 7.9% 7.9% 7.9% 7.9% 7.9% Net Operating Profit after Taxes 59.3 56.0 54.9 57.9 64.7 74.7 82.1 92.1 102.0 112.0 121.8 Plus:
D&A 2.9 3.2 3.7 4.1 4.6 5.2 5.7 6.3 6.9 7.5 Less: Capex (5.3) (5.4) (5.7) (6.2) (6.6) (7.0) (7.4) (7.7) (7.9) (8.0) Less: Change in NWC (5.4) (5.6) (6.3) (7.4) (8.9) (9.0) (10.4) (10.9) (10.9) (11.5) Less:
Non-Recurring Cash Items (2.8) (2.7) (2.6) (3.3) (3.2) (3.5) (3.8) (4.2) (4.5) (4.8) Unlevered Free Cash Flow 45.4 44.4 47.0 52.0 60.7 67.7 76.2 85.6 95.7 105.1 Discounted Unlevered
FCF 42.6 36.8 34.3 33.4 34.4 33.8 33.5 33.2 32.7 31.7 Sum of Discounted uFCF 346.5 Terminal Value (Gordon Shapiro) 282.3 TEV 628.8 Less: TEV Adjustments (456.6) Common Equity Value 172.2 NOSH 58.2 Per Share Value
3.0 Assumes 2.0% terminal growth, ~13.5% WACC, mid-year cash flows convention and no additional FX impact Source: Company Information, SEC Filings 23
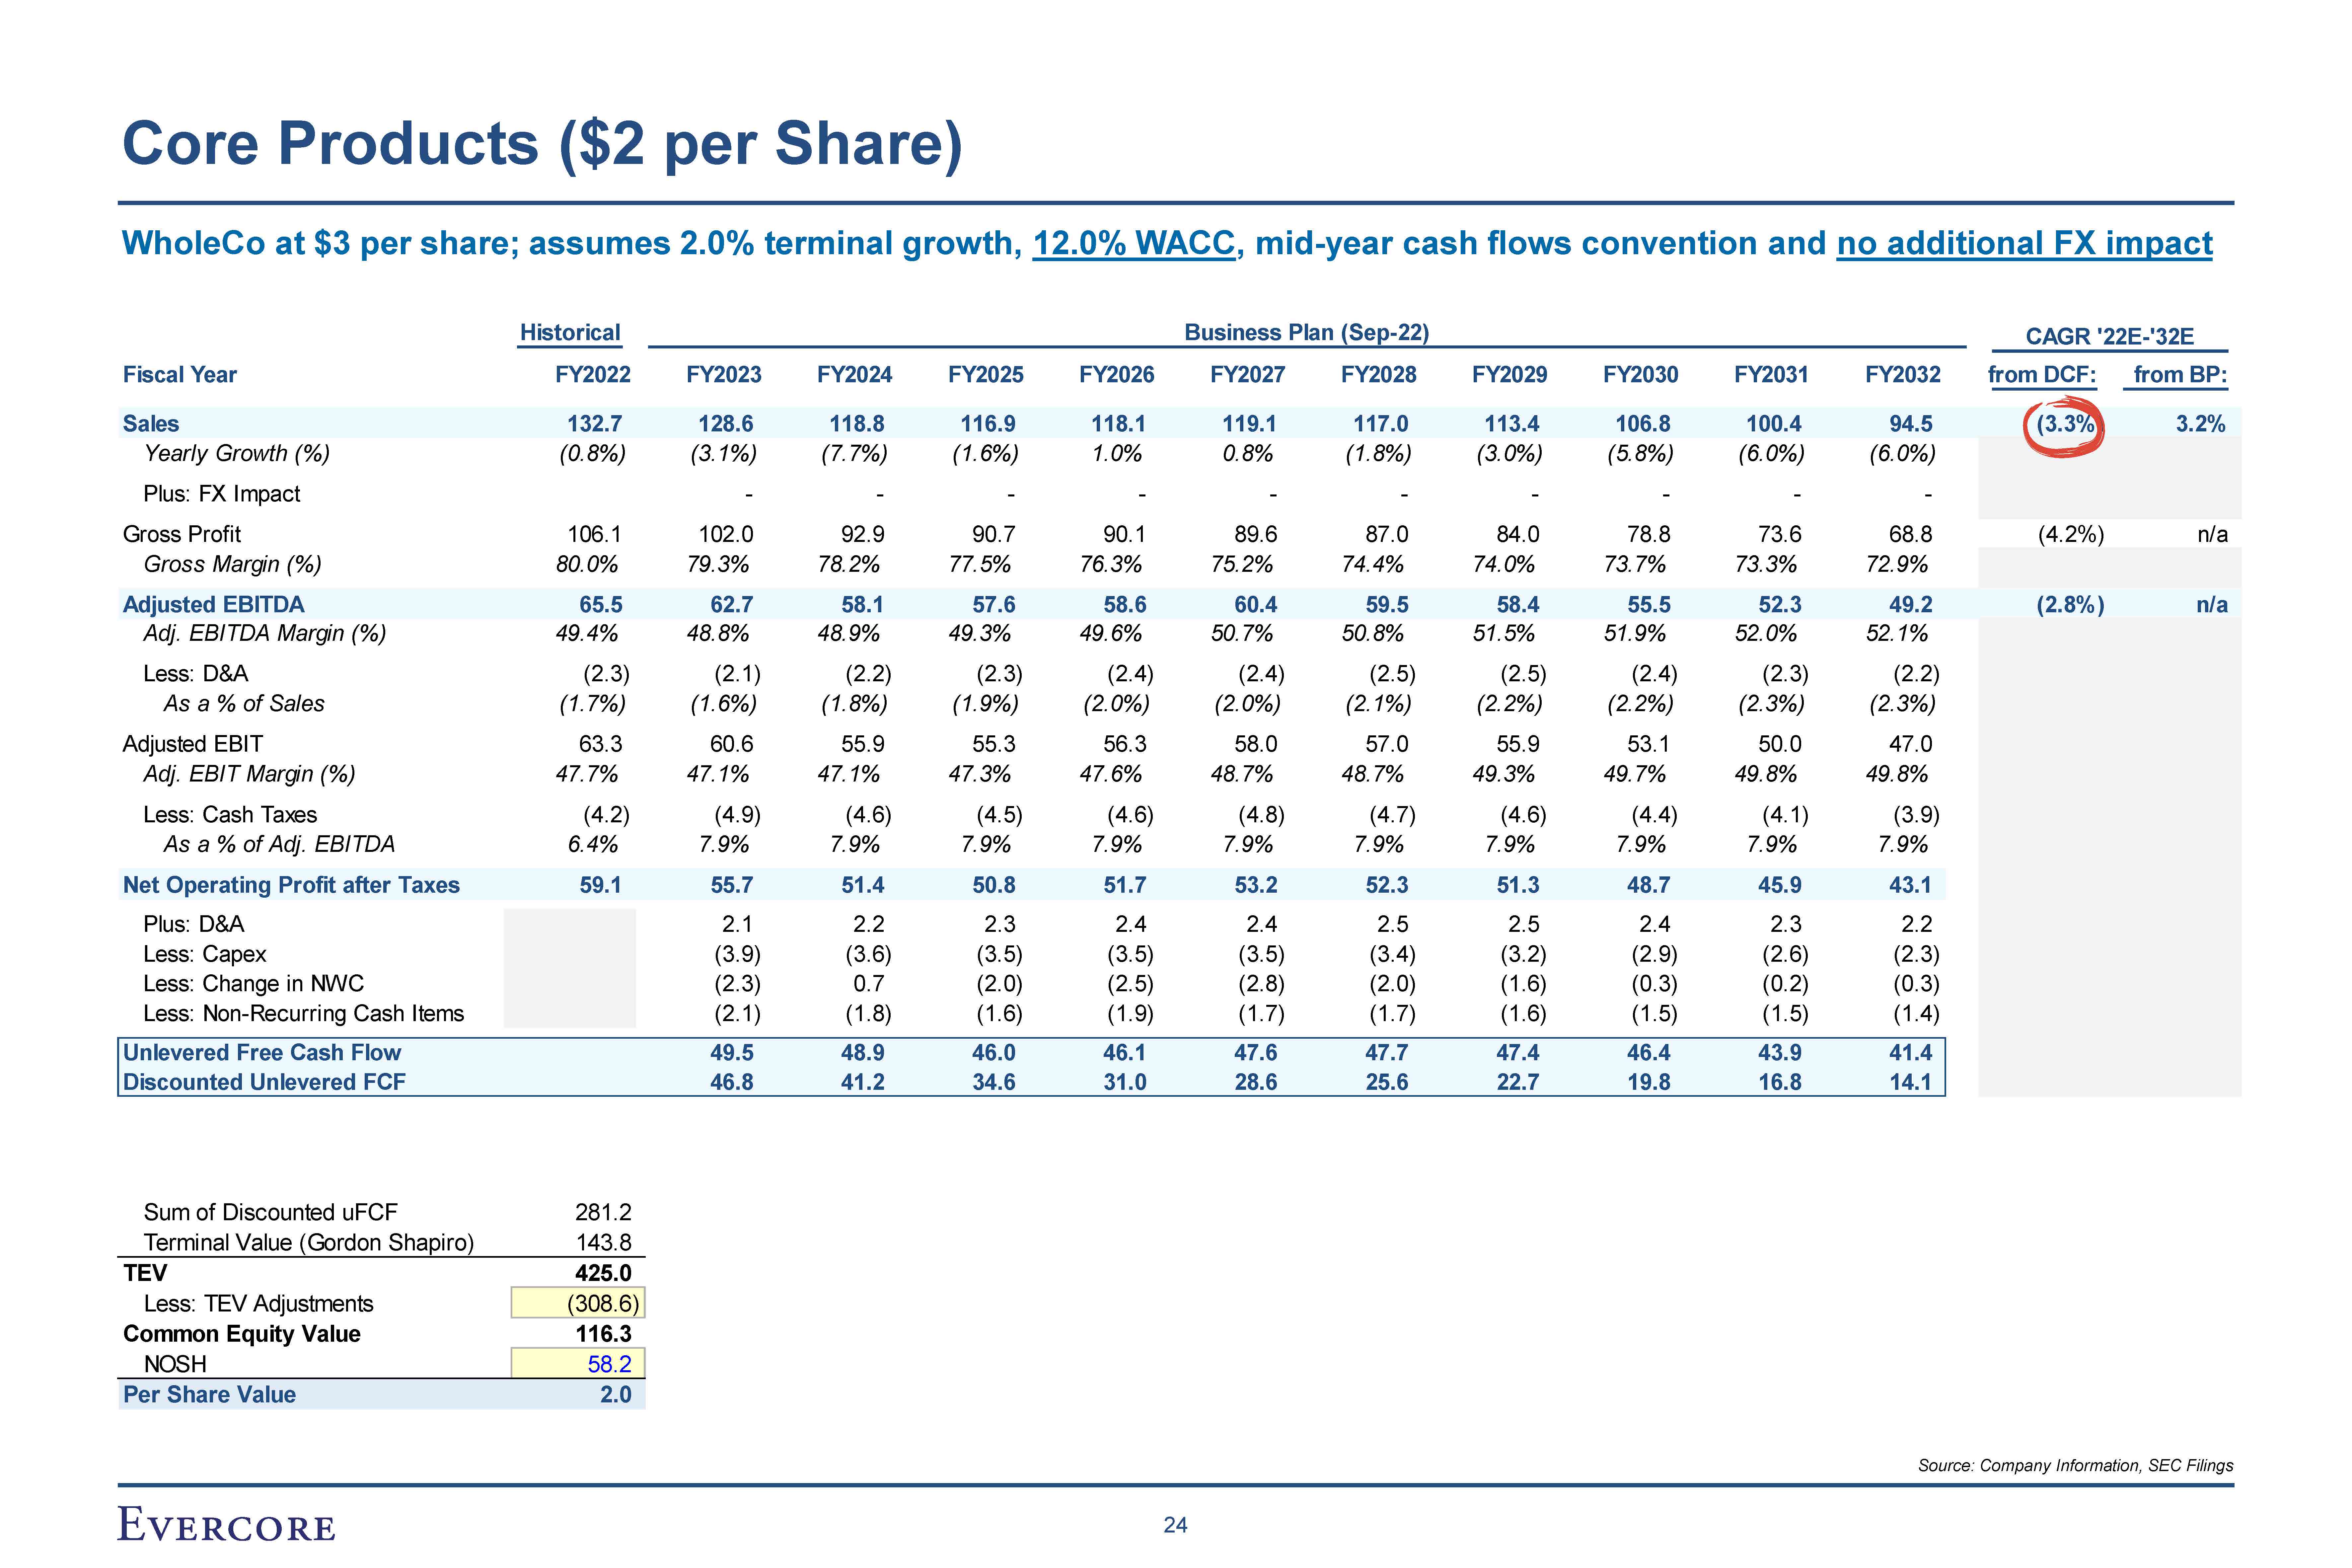
Core Products ($2 per Share) Historical Business Plan (Sep-22) CAGR '22E-'32E
Fiscal Year FY2022 FY2023 FY2024 FY2025 FY2026 FY2027 FY2028 FY2029 FY2030 FY2031 FY2032 from DCF: from BP: Sales 132.7 128.6 118.8 116.9 118.1 119.1 117.0 113.4 106.8 100.4 94.5 (3.3%) 3.2% Yearly Growth
(%) (0.8%) (3.1%) (7.7%) (1.6%) 1.0% 0.8% (1.8%) (3.0%) (5.8%) (6.0%) (6.0%) Plus: FX Impact - - - - - - - - - - Gross Profit 106.1 102.0 92.9 90.7 90.1 89.6 87.0 84.0 78.8 73.6 68.8 (4.2%) n/a Gross Margin
(%) 80.0% 79.3% 78.2% 77.5% 76.3% 75.2% 74.4% 74.0% 73.7% 73.3% 72.9% Adjusted EBITDA 65.5 62.7 58.1 57.6 58.6 60.4 59.5 58.4 55.5 52.3 49.2 (2.8%) n/a Adj. EBITDA Margin
(%) 49.4% 48.8% 48.9% 49.3% 49.6% 50.7% 50.8% 51.5% 51.9% 52.0% 52.1% Less: D&A (2.3) (2.1) (2.2) (2.3) (2.4) (2.4) (2.5) (2.5) (2.4) (2.3) (2.2) As a % of
Sales (1.7%) (1.6%) (1.8%) (1.9%) (2.0%) (2.0%) (2.1%) (2.2%) (2.2%) (2.3%) (2.3%) Adjusted EBIT 63.3 60.6 55.9 55.3 56.3 58.0 57.0 55.9 53.1 50.0 47.0 Adj. EBIT Margin
(%) 47.7% 47.1% 47.1% 47.3% 47.6% 48.7% 48.7% 49.3% 49.7% 49.8% 49.8% Less: Cash Taxes (4.2) (4.9) (4.6) (4.5) (4.6) (4.8) (4.7) (4.6) (4.4) (4.1) (3.9) As a % of Adj.
EBITDA 6.4% 7.9% 7.9% 7.9% 7.9% 7.9% 7.9% 7.9% 7.9% 7.9% 7.9% Net Operating Profit after Taxes 59.1 55.7 51.4 50.8 51.7 53.2 52.3 51.3 48.7 45.9 43.1 Plus: D&A 2.1 2.2 2.3 2.4 2.4 2.5 2.5 2.4 2.3 2.2 Less:
Capex (3.9) (3.6) (3.5) (3.5) (3.5) (3.4) (3.2) (2.9) (2.6) (2.3) Less: Change in NWC (2.3) 0.7 (2.0) (2.5) (2.8) (2.0) (1.6) (0.3) (0.2) (0.3) Less: Non-Recurring Cash
Items (2.1) (1.8) (1.6) (1.9) (1.7) (1.7) (1.6) (1.5) (1.5) (1.4) Unlevered Free Cash Flow 49.5 48.9 46.0 46.1 47.6 47.7 47.4 46.4 43.9 41.4 Discounted Unlevered
FCF 46.8 41.2 34.6 31.0 28.6 25.6 22.7 19.8 16.8 14.1 Sum of Discounted uFCF 281.2 Terminal Value (Gordon Shapiro) 143.8 TEV 425.0 Less: TEV Adjustments (308.6) Common Equity Value 116.3 NOSH 58.2 Per Share Value
2.0 WholeCo at $3 per share; assumes 2.0% terminal growth, 12.0% WACC, mid-year cash flows convention and no additional FX impact Source: Company Information, SEC Filings 24

High Growth Products ($1 per Share) Historical Business Plan (Sep-22) CAGR
'22E-'32 Fiscal Year FY2022 FY2023 FY2024 FY2025 FY2026 FY2027 FY2028 FY2029 FY2030 FY2031 FY2032 from DCF Sales 42.9 47.4 60.3 72.1 88.6 107.1 126.8 151.4 179.9 207.0 233.8 Yearly Growth
(%) 33.6% 10.4% 27.3% 19.6% 22.9% 21.0% 18.3% 19.5% 18.8% 15.0% Plus: FX Impact - - - - - - - - Gross Profit 14.1 15.6 22.7 29.6 39.7 52.0 65.1 82.0 101 Gross Margin
(%) 32.9% 33.0% 37.7% 41.1% 44.9% 48.5% 51.3% 54.1% Adjusted EBITDA 1.0 1.2 5.0 9.2 16.1 25.7 35.2 Adj. EBITDA Margin (%) 2.3% 2.5% 8.3% 12.8% 18.2% 24.0% 27.8 Less: D&A (0.7) (0.8) (1.1) (1.4) (1.8) (2. As a
% of Sales (1.7%) (1.6%) (1.8%) (1.9%) (2.0%) Adjusted EBIT 0.3 0.4 3.9 7.9 Adj. EBIT Margin (%) 0.6% 0.9% 6.5% 10.9% Less: Cash Taxes (0.1) (0.1) (0.4 As a % of Adj. EBITDA 6.4% 7.9% Net Operating Profit after
Taxes 0.2 Plus: D&A Less: Capex Less: Change in NWC Less: Non-Recurring Unlevered F Disc Sum of Discounted uFCF 71.2 Terminal Value (Gordon Shapiro) 132.6 203.8 (148.0) TEV Less: TEV Adjustments Common Equity
Value 55.8 NOSH 58.2 Per Share Value 1.0 WholeCo at $3 per share; assumes 2.0% terminal growth, 15.0% WACC, mid-year cash flows convention and no additional FX impact Source: Company Information, SEC Filings 25
VI Shareholding Information
Shareholding Structure (1/2) 10 Bridgeway Ultra-Small Company Market
Fund Fund Index 0.39% 204 $0.4m 11 BlackRock Institutional Trust Company, N.A. Institution Index 0.38% 198 $0.4m 12 Bridgeway Ultra-Small Company Fund Fund Growth 0.29% 155 $0.3m 13 Bridgeway Omni Small-Cap Value
Fund Fund Value 0.28% 148 $0.3m 14 Avantis Investors Institution Growth 0.24% 125 $0.2m 15 Avantis US Small Cap Value ETF Fund Other 0.24% 125 $0.2m 16 Fidelity Extended Market Index Fund Fund Index 0.22% 113 $0.2m 17
Bridgeway Omni Tax-Managed Small-Cap Value Fund Fund Value 0.15% 79 $0.1m 18 Dimensional Fund Advisors, Ltd. Institution Index 0.13% 68 $0.1m 19 Envestnet Asset Management, Inc. Institution Growth 0.12% 65 $0.1m 20 MML
Investors Services, LLC Institution Hedge Fund 0.12% 65 $0.1m 21 VALIC Co I Small Cap Fund Fund Growth 0.12% 62 $0.1m 22 Perritt Ultra MicroCap Fund Fund GARP 0.11% 60 $0.1m 23 Ergoteles Capital Institution Hedge
Fund 0.07% 38 $0.1m 24 Fidelity NASDAQ Composite Index Fund Fund Index 0.07% 34 $0.1m 25 Fidelity Total Market Index Fund Fund Index 0.06% 31 $0.1m 26 Accurate Wealth Management LLC Institution Other 0.06% 30 $0.1m 27
Morgan Stanley & Co. LLC Institution Broker Dealer 0.05% 27 $0.0m 28 Schwab Total Stock Market Index Fund Fund Index 0.05% 24 $0.0m 29 BNY Mellon Asset Management Institution GARP 0.04% 21 $0.0m 30 BofA Global Research
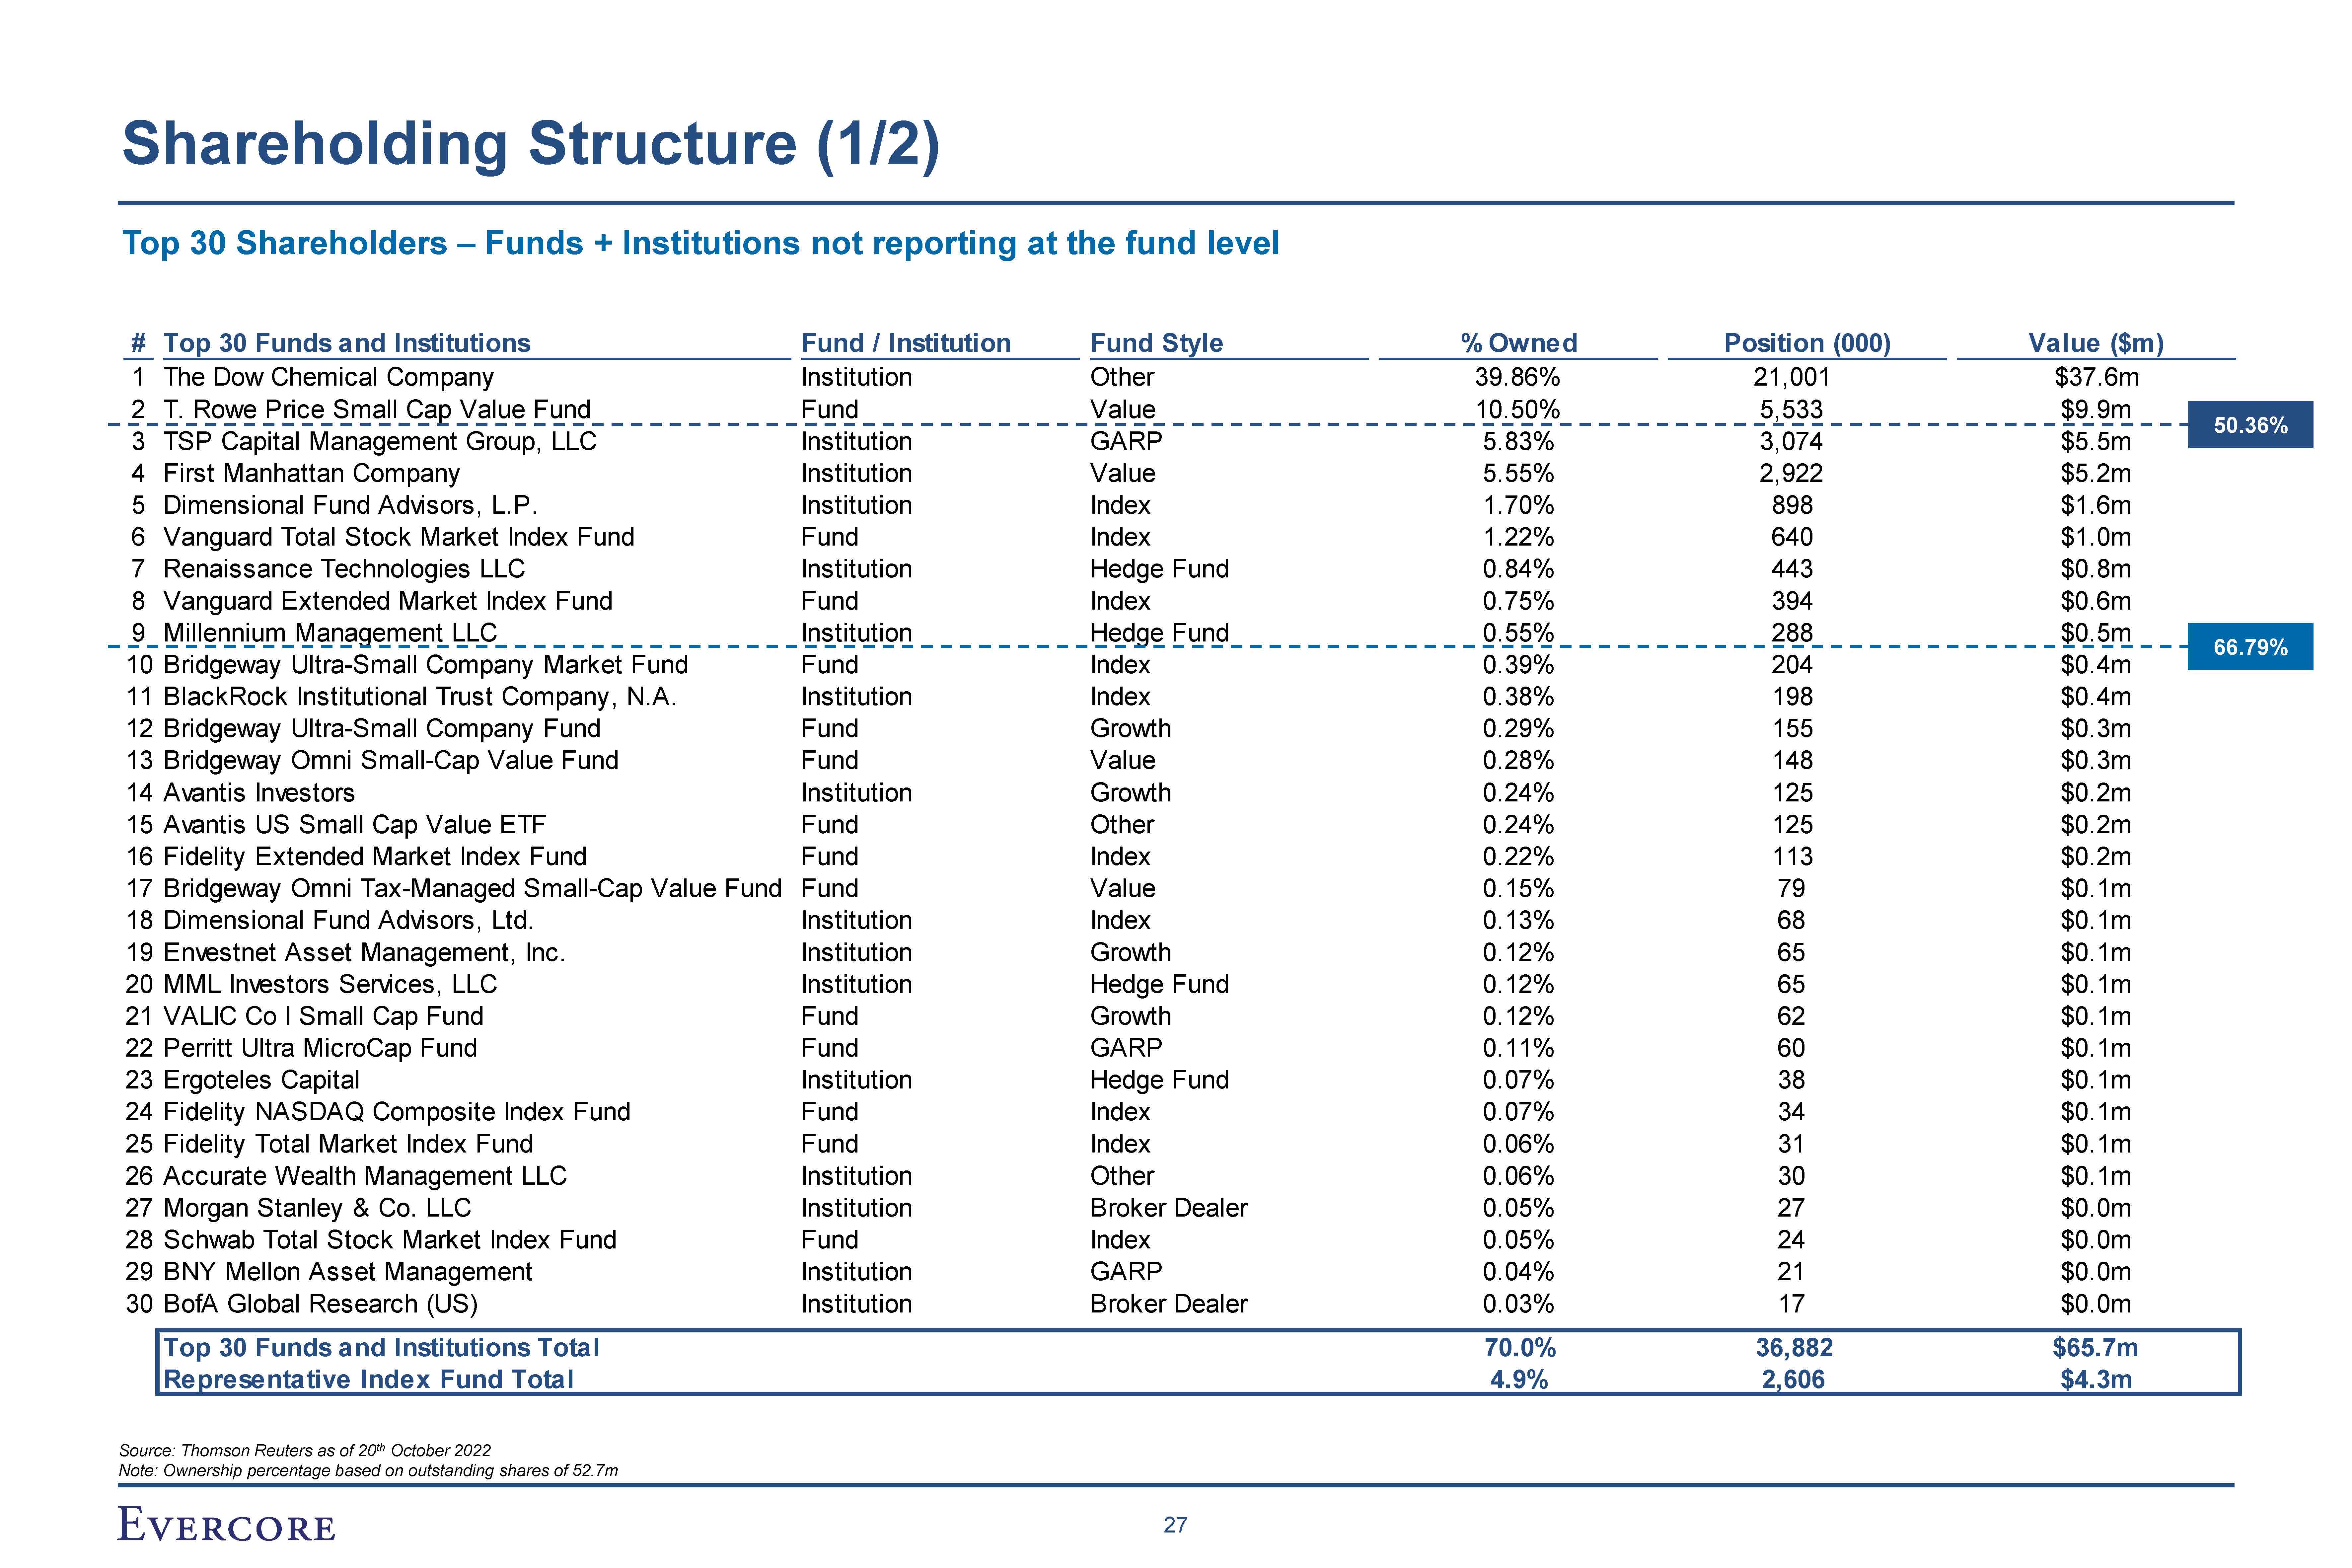
(US) Institution Broker Dealer 0.03% 17 $0.0m Top 30 Funds and Institutions Total 70.0% 36,882 $65.7m Representative Index Fund Total 4.9% 2,606 $4.3m Top 30 Shareholders – Funds + Institutions not reporting at the fund level #
Top 30 Funds and Institutions Fund / Institution Fund Style % Owned Position (000) Value ($m) 36% 1 The Dow Chemical Company Institution Other 39.86% 21,001 $37.6m 2 T. Rowe Price Small Cap Value Fund Fund Value 10.50% 5,533 $9.9m
50. 3 TSP Capital Management Group, LLC Institution GARP 5.83% 3,074 $5.5m 4 First Manhattan Company Institution Value 5.55% 2,922 $5.2m 5 Dimensional Fund Advisors, L.P. Institution Index 1.70% 898 $1.6m 6 Vanguard Total
Stock Market Index Fund Fund Index 1.22% 640 $1.0m 7 Renaissance Technologies LLC Institution Hedge Fund 0.84% 443 $0.8m 8 Vanguard Extended Market Index Fund Fund Index 0.75% 394 $0.6m 9 Millennium Management
LLC Institution Hedge Fund 0.55% 288 $0.5m 66. Source: Thomson Reuters as of 20th October 2022 Note: Ownership percentage based on outstanding shares of 52.7m 27 79%
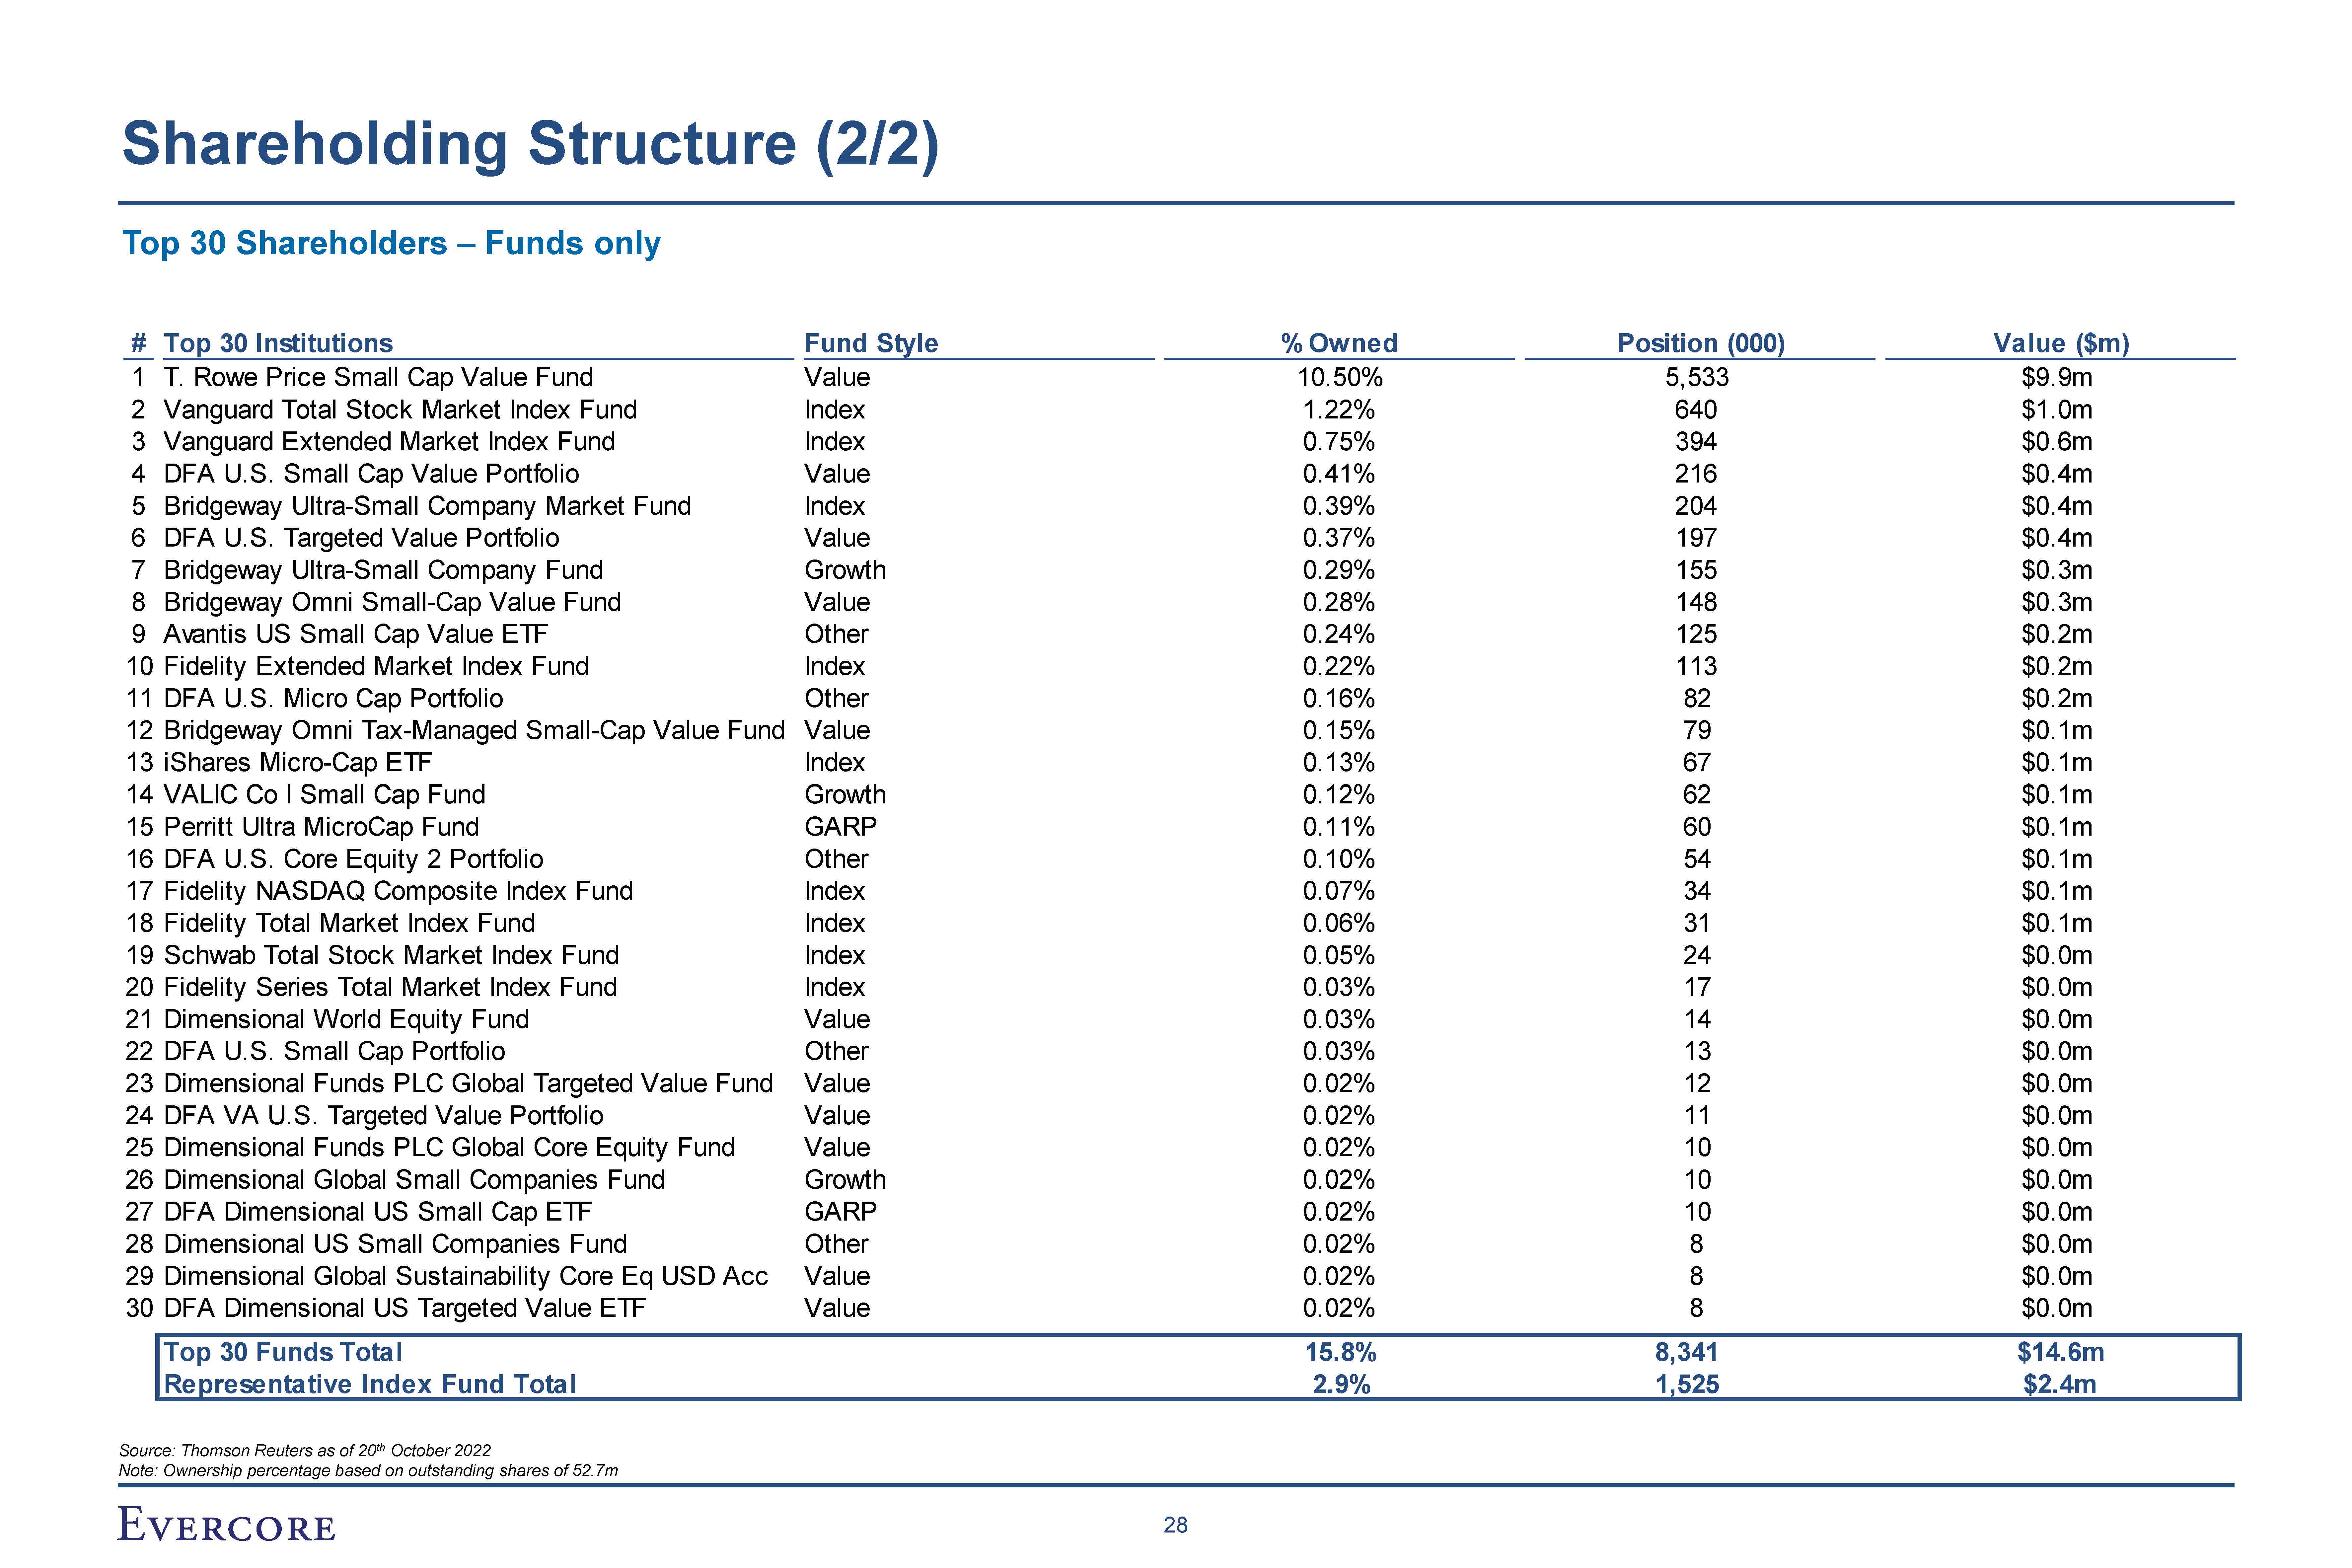
Top 30 Shareholders – Funds only # Top 30 Institutions Fund Style % Owned
Position (000) Value ($m) Shareholding Structure (2/2) 1 T. Rowe Price Small Cap Value Fund Value 10.50% 5,533 $9.9m 2 Vanguard Total Stock Market Index Fund Index 1.22% 640 $1.0m 3 Vanguard Extended Market Index
Fund Index 0.75% 394 $0.6m 4 DFA U.S. Small Cap Value Portfolio Value 0.41% 216 $0.4m 5 Bridgeway Ultra-Small Company Market Fund Index 0.39% 204 $0.4m 6 DFA U.S. Targeted Value Portfolio Value 0.37% 197 $0.4m 7 Bridgeway
Ultra-Small Company Fund Growth 0.29% 155 $0.3m 8 Bridgeway Omni Small-Cap Value Fund Value 0.28% 148 $0.3m 9 Avantis US Small Cap Value ETF Other 0.24% 125 $0.2m 10 Fidelity Extended Market Index
Fund Index 0.22% 113 $0.2m 11 DFA U.S. Micro Cap Portfolio Other 0.16% 82 $0.2m 12 Bridgeway Omni Tax-Managed Small-Cap Value Fund Value 0.15% 79 $0.1m 13 iShares Micro-Cap ETF Index 0.13% 67 $0.1m 14 VALIC Co I Small Cap
Fund Growth 0.12% 62 $0.1m 15 Perritt Ultra MicroCap Fund GARP 0.11% 60 $0.1m 16 DFA U.S. Core Equity 2 Portfolio Other 0.10% 54 $0.1m 17 Fidelity NASDAQ Composite Index Fund Index 0.07% 34 $0.1m 18 Fidelity Total Market
Index Fund Index 0.06% 31 $0.1m 19 Schwab Total Stock Market Index Fund Index 0.05% 24 $0.0m 20 Fidelity Series Total Market Index Fund Index 0.03% 17 $0.0m 21 Dimensional World Equity Fund Value 0.03% 14 $0.0m 22 DFA U.S.
Small Cap Portfolio Other 0.03% 13 $0.0m 23 Dimensional Funds PLC Global Targeted Value Fund Value 0.02% 12 $0.0m 24 DFA VA U.S. Targeted Value Portfolio Value 0.02% 11 $0.0m 25 Dimensional Funds PLC Global Core Equity
Fund Value 0.02% 10 $0.0m 26 Dimensional Global Small Companies Fund Growth 0.02% 10 $0.0m 27 DFA Dimensional US Small Cap ETF GARP 0.02% 10 $0.0m 28 Dimensional US Small Companies Fund Other 0.02% 8 $0.0m 29 Dimensional
Global Sustainability Core Eq USD Acc Value 0.02% 8 $0.0m 30 DFA Dimensional US Targeted Value ETF Value 0.02% 8 $0.0m Top 30 Funds Total 15.8% 8,341 $14.6m Representative Index Fund Total 2.9% 1,525 $2.4m Source: Thomson
Reuters as of 20th October 2022 Note: Ownership percentage based on outstanding shares of 52.7m 28
VII Summary of Analysts Price Targets

Summary of Analysts Price Targets BMO – Joel Jackson – HOLD at $2.25 (down from
$2.50 – Aug 10th) Views on Valuation Coverage Summary “Maintain Market Perform rating but lower our target price to $2.25 (~7-7.5x 2022E EV/ EBITDA) as we slightly lower 2022/23E EBITDA estimates”. This as we model higher topline and gross
margin growth, but this is offset by a higher R&D/SG&A spend as AGFS continues to invest for future disruptive/diversified growth “Meaningful growth and diversification to offset competitive pressures in post-harvest 1-MCP (following
loss of exclusivity) is under way but will take some time” Looking for more price now on SmartFresh Apple given inflationary environment. AGFS has not had pricing before and needed to defend against generics through locking in contracts or
keeping prices more constant. The company has to selectively get price on mix If AGFS is successful in its R&D and new product efforts to improve operating leverage, and achieve double digit EBITDA CAGRs, the stock could rise to $5.00,
PSP’s convertible preferred exercise price Estimates Updated o n 10 / 08 / 2022 2021A 2022E 2023E 2024E R evenue 166 .0 175 .0 186 .0 n/a 6.3% 0. - - - 5.4% (0.4%) 172.0 1.7% 117 .0 70.5% Gro wth (%) Δ vs. BP P rev. estimate
(31/05/2022) Δ vs. previo us estimate Gro ss P ro f it M argin (%) Δ vs. BP P rev. estimate (31/05/2022) Δ vs. previo us estimate A dj. EB IT D A M argin (%) Δ vs. BP P rev. es C o mpany N ame M arket C ap ( USD ) T gt P rice ( LC
Y) P rice ( LC Y) Implied R eturn ( %) R ating A gro Fresh So lutio ns, Inc. 101 2.3 1.7 34% Ho ld A lbemarle Co rpo ratio n 30,439 300.0 259.9 15% B uy A llkem Limited 5,764 13.0 13.5 (4%) Ho ld B ayer
AG 65,755 66.0 51.5 28% Ho ld CF Industries Ho ldings, Inc. 18,412 120.0 106.9 12% B uy Chemtrade Lo gistics Inco me Fund 673 9.0 8.4 7% Ho ld Compass M inerals Internatio nal, Inc. 1,337 50.0 39.1 28% Ho ld Co rteva
Inc 41,960 66.0 61.2 8% B uy FM C Co rpo ratio n 14,295 140.0 106.4 32% B uy ICL Gro up Ltd. 12,199 37.6 31.8 18% Ho ld Intrepid Potash, Inc. 620 50.0 45.5 10% Ho ld K+S AG 4,372 35.0 22.3 57% B uy Lithium Americas
Co rp. 3,699 30.0 36.0 (17%) Ho ld Livent Co rpo ratio n 5,473 30.0 30.5 (2%) Ho ld M ethanex Co rpo ratio n 2,554 60.0 36.3 65% B uy M osaic Company 18,934 70.0 54.8 28% B uy Nutrien Ltd. 47,867 115.0 92.0 25% B
uy So ciedad Quimica Y M inera De Chile S.A . S 14,466 125 101.3 23% B uy Superio r P lus Co rp 1,688 12.5 11.0 14% Ho ld Yara Internatio nal A SA 10,758 420.0 402.0 4% Ho ld Target and Share Price Evolution 30 Source:
FactSet as of September 2nd 2022, Equity Research, Company Information
Summary of Analysts Price Targets HCW – Amit Dayal – BUY at $5.00 Views on
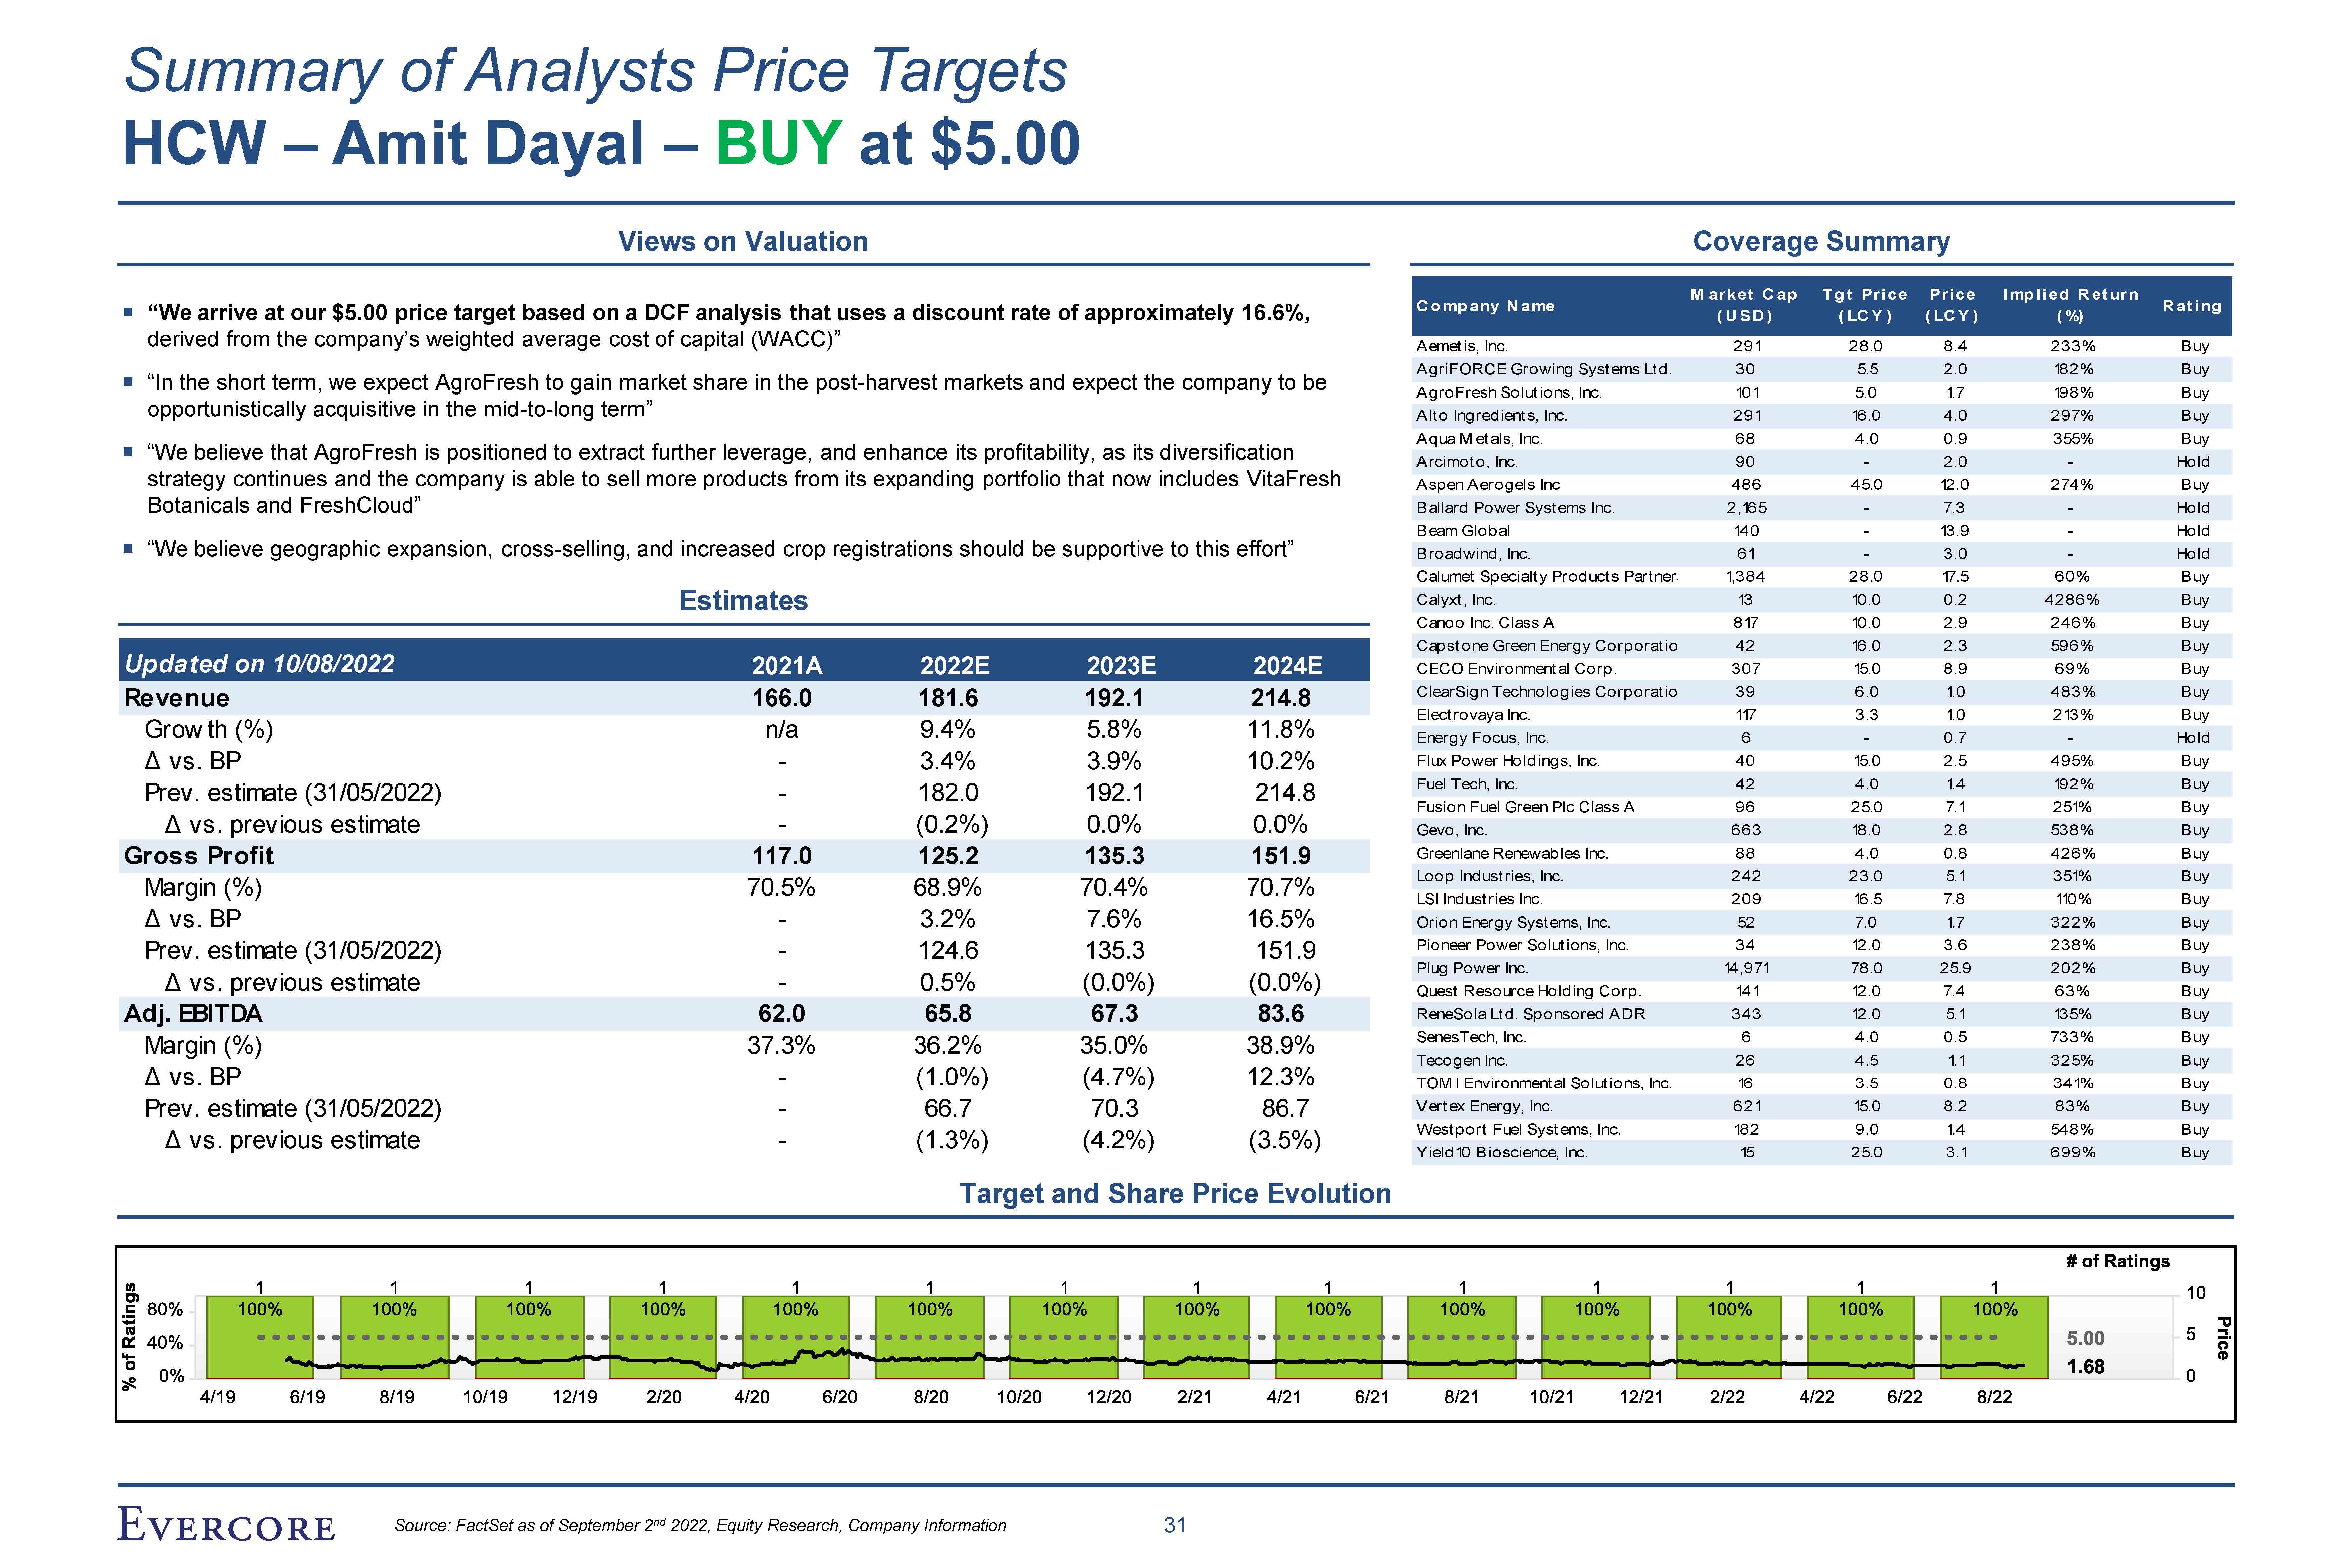
Valuation Coverage Summary Estimates Target and Share Price Evolution “We arrive at our $5.00 price target based on a DCF analysis that uses a discount rate of approximately 16.6%, derived from the company’s weighted average cost of
capital (WACC)” “In the short term, we expect AgroFresh to gain market share in the post-harvest markets and expect the company to be opportunistically acquisitive in the mid-to-long term” “We believe that AgroFresh is positioned to extract
further leverage, and enhance its profitability, as its diversification strategy continues and the company is able to sell more products from its expanding portfolio that now includes VitaFresh Botanicals and FreshCloud” “We believe geographic
expansion, cross-selling, and increased crop registrations should be supportive to this effort” C o mp any N ame M arket C ap T g t Price Price Imp l ied R et urn ( U SD ) ( LC Y ) ( LC Y ) ( %) R at ing Aemetis, Inc. 291 28.0 8.4 233%
Buy AgriFORCE Growing Syst ems Ltd. 30 5.5 2.0 182% Buy AgroFresh Solutions, Inc. 101 5.0 1.7 198% Buy Alto Ingredient s, Inc. 291 16.0 4.0 297% Buy Aqua M etals, Inc. 68 4.0 0.9 355% Buy Arcimot o, Inc. 90 - 2.0 - Hold Aspen Aerogels Inc
486 45.0 12.0 274% Buy Ballard Power Syst ems Inc. 2,165 - 7.3 - Hold Beam Global 140 - 13.9 - Hold Broadwind, Inc. 61 - 3.0 - Hold Calumet Specialt y Product s Partner 1,384 28.0 17.5 60% Buy Calyxt , Inc. 13 10.0 0.2 4286% Buy Canoo Inc.
Class A 817 10.0 2.9 246% Buy Capst one Green Energy Corporatio 42 16.0 2.3 596% Buy CECO Environment al Corp. 307 15.0 8.9 69% Buy ClearSign Technologies Corporatio 39 6.0 1.0 483% Buy Elect rovaya Inc. 117 3.3 1.0 213% Buy Energy Focus,
Inc. 6 - 0.7 - Hold Flux Power Holdings, Inc. 40 15.0 2.5 495% Buy Fuel Tech, Inc. 42 4.0 1.4 192% Buy Fusion Fuel Green Plc Class A 96 25.0 7.1 251% Buy Gevo, Inc. 663 18.0 2.8 538% Buy Greenlane Renewables Inc. 88 4.0 0.8 426% Buy Loop
Indust ries, Inc. 242 23.0 5.1 351% Buy LSI Indust ries Inc. 209 16.5 7.8 110% Buy Orion Energy Syst ems, Inc. 52 7.0 1.7 322% Buy Pioneer Power Solutions, Inc. 34 12.0 3.6 238% Buy Plug Power Inc. 14,971 78.0 25.9 202% Buy Quest Resource
Holding Corp. 141 12.0 7.4 63% Buy ReneSola Ltd. Sponsored ADR 343 12.0 5.1 135% Buy SenesTech, Inc. 6 4.0 0.5 733% Buy Tecogen Inc. 26 4.5 1.1 325% Buy TOM I Environment al Solutions, Inc. 16 3.5 0.8 341% Buy Vertex Energy, Inc. West
port Fuel Syst ems, Inc. 621 182 15.0 9.0 8.2 1.4 83% 548% Buy Buy Yield10 Bioscience, Inc. 15 25.0 3.1 699% Buy Updated on 10/08/2022 2021A 2022E 2023E 2024E Revenue 166.0 181.6 192.1 214.8 n/a Grow th (%) Δ vs.
BP Prev. estimate (31/05/2022) Δ vs. previous estimate - - - 9.4% 3.4% 182.0 (0.2%) 5.8% 3.9% 192.1 0.0% 11.8% 10.2% 214.8 0.0% Gross Profit 117.0 125.2 135.3 151.9 70.5% Margin (%) Δ vs. BP Prev. estimate (31/05/2022) Δ
vs. previous estimate - - - 68.9% 3.2% 124.6 0.5% 70.4% 7.6% 135.3 (0.0%) 70.7% 16.5% 151.9 (0.0%) Adj. EBITDA 62.0 65.8 67.3 83.6 37.3% Margin (%) Δ vs. BP Prev. estimate (31/05/2022) Δ vs. previous
estimate - - - 36.2% (1.0%) 66.7 (1.3%) 35.0% (4.7%) 70.3 (4.2%) 38.9% 12.3% 86.7 (3.5%) 31 Source: FactSet as of September 2nd 2022, Equity Research, Company Information
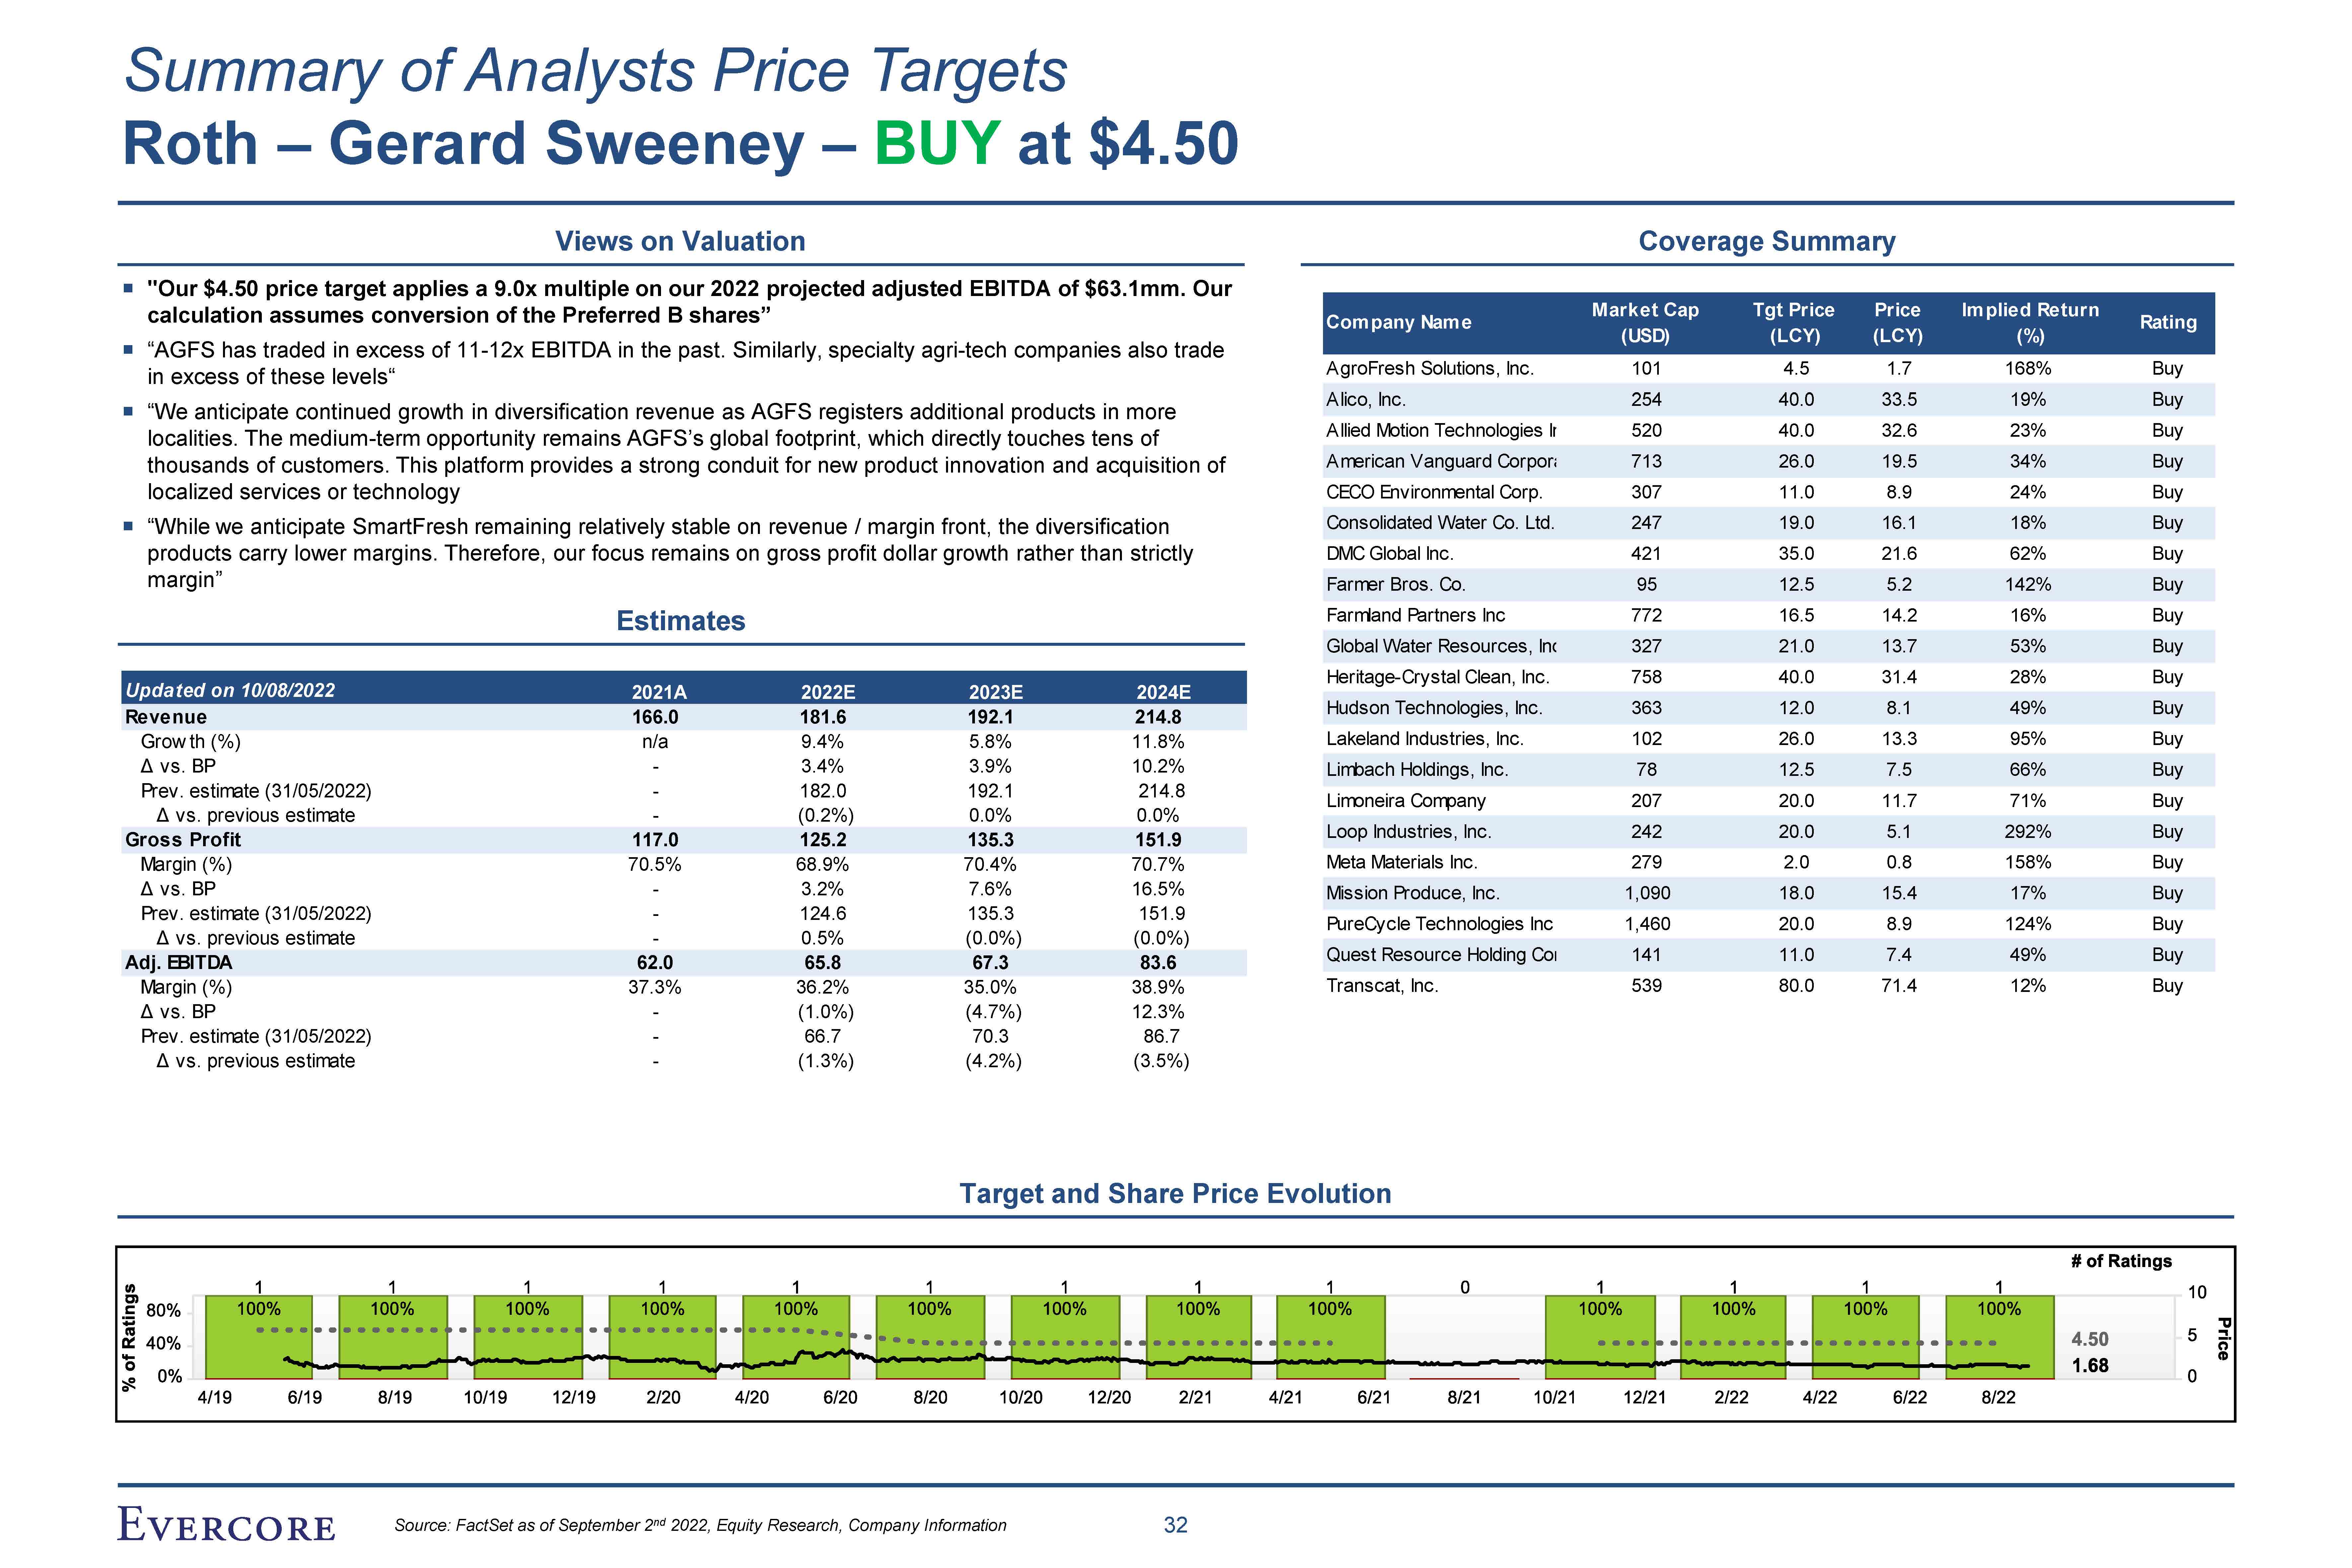
"Our $4.50 price target applies a 9.0x multiple on our 2022 projected adjusted
EBITDA of $63.1mm. Our calculation assumes conversion of the Preferred B shares” “AGFS has traded in excess of 11-12x EBITDA in the past. Similarly, specialty agri-tech companies also trade in excess of these levels“ “We anticipate continued
growth in diversification revenue as AGFS registers additional products in more localities. The medium-term opportunity remains AGFS’s global footprint, which directly touches tens of Summary of Analysts Price Targets Roth – Gerard Sweeney –
BUY at $4.50 Views on Valuation Coverage Summary Target and Share Price Evolution Updated on 10/08/2022 2021A 2022E 2023E 2024E Revenue 166.0 181.6 192.1 214.8 Company Name Market Cap Tgt Price Price Implied Return Rating (USD)
(LCY) (LCY) (%) AgroFresh Solutions, Inc. 101 4.5 1.7 168% Buy Alico, Inc. 254 40.0 33.5 19% Buy Allied Motion Technologies I 520 40.0 32.6 23% Buy thousands of customers. This platform provides a strong conduit for new
product innovation and acquisition of American Vanguard Corpor 713 26.0 19.5 34% Buy localized services or technology CECO Environmental Corp. 307 11.0 8.9 24% Buy “While we anticipate SmartFresh remaining relatively stable on
revenue / margin front, the diversification Consolidated Water Co. Ltd. 247 19.0 16.1 18% Buy products carry lower margins. Therefore, our focus remains on gross profit dollar growth rather than strictly DMC Global
Inc. 421 35.0 21.6 62% Buy margin” Farmer Bros. Co. 95 12.5 5.2 142% Buy Estimates Farmland Partners Inc 772 16.5 14.2 16% Buy Global Water Resources, In 327 21.0 13.7 53% Buy Heritage-Crystal Clean,
Inc. 758 40.0 31.4 28% Buy Hudson Technologies, Inc. 363 12.0 8.1 49% Buy Grow th (%) n/a 9.4% 5.8% 11.8% Lakeland Industries, Inc. 102 26.0 13.3 95% Buy Δ vs. BP - 3.4% 3.9% 10.2% Limbach Holdings,
Inc. 78 12.5 7.5 66% Buy Prev. estimate (31/05/2022) Δ vs. previous estimate - - 182.0 (0.2%) 192.1 0.0% 214.8 0.0% Limoneira Company 207 20.0 11.7 71% Buy Gross Profit 117.0 125.2 135.3 151.9 Loop Industries,
Inc. 242 20.0 5.1 292% Buy Margin (%) 70.5% 68.9% 70.4% 70.7% Meta Materials Inc. 279 2.0 0.8 158% Buy Δ vs. BP - 3.2% 7.6% 16.5% Mission Produce, Inc. 1,090 18.0 15.4 17% Buy Prev. estimate
(31/05/2022) - 124.6 135.3 151.9 PureCycle Technologies Inc 1,460 20.0 8.9 124% Buy Δ vs. previous estimate - 0.5% (0.0%) (0.0%) Adj. EBITDA 62.0 65.8 67.3 83.6 Quest Resource Holding Co 141 11.0 7.4 49% Buy Margin
(%) 37.3% 36.2% 35.0% 38.9% Transcat, Inc. 539 80.0 71.4 12% Buy Δ vs. BP - (1.0%) (4.7%) 12.3% Prev. estimate (31/05/2022) - 66.7 70.3 86.7 Δ vs. previous estimate - (1.3%) (4.2%) (3.5%) 32 Source: FactSet as of
September 2nd 2022, Equity Research, Company Information
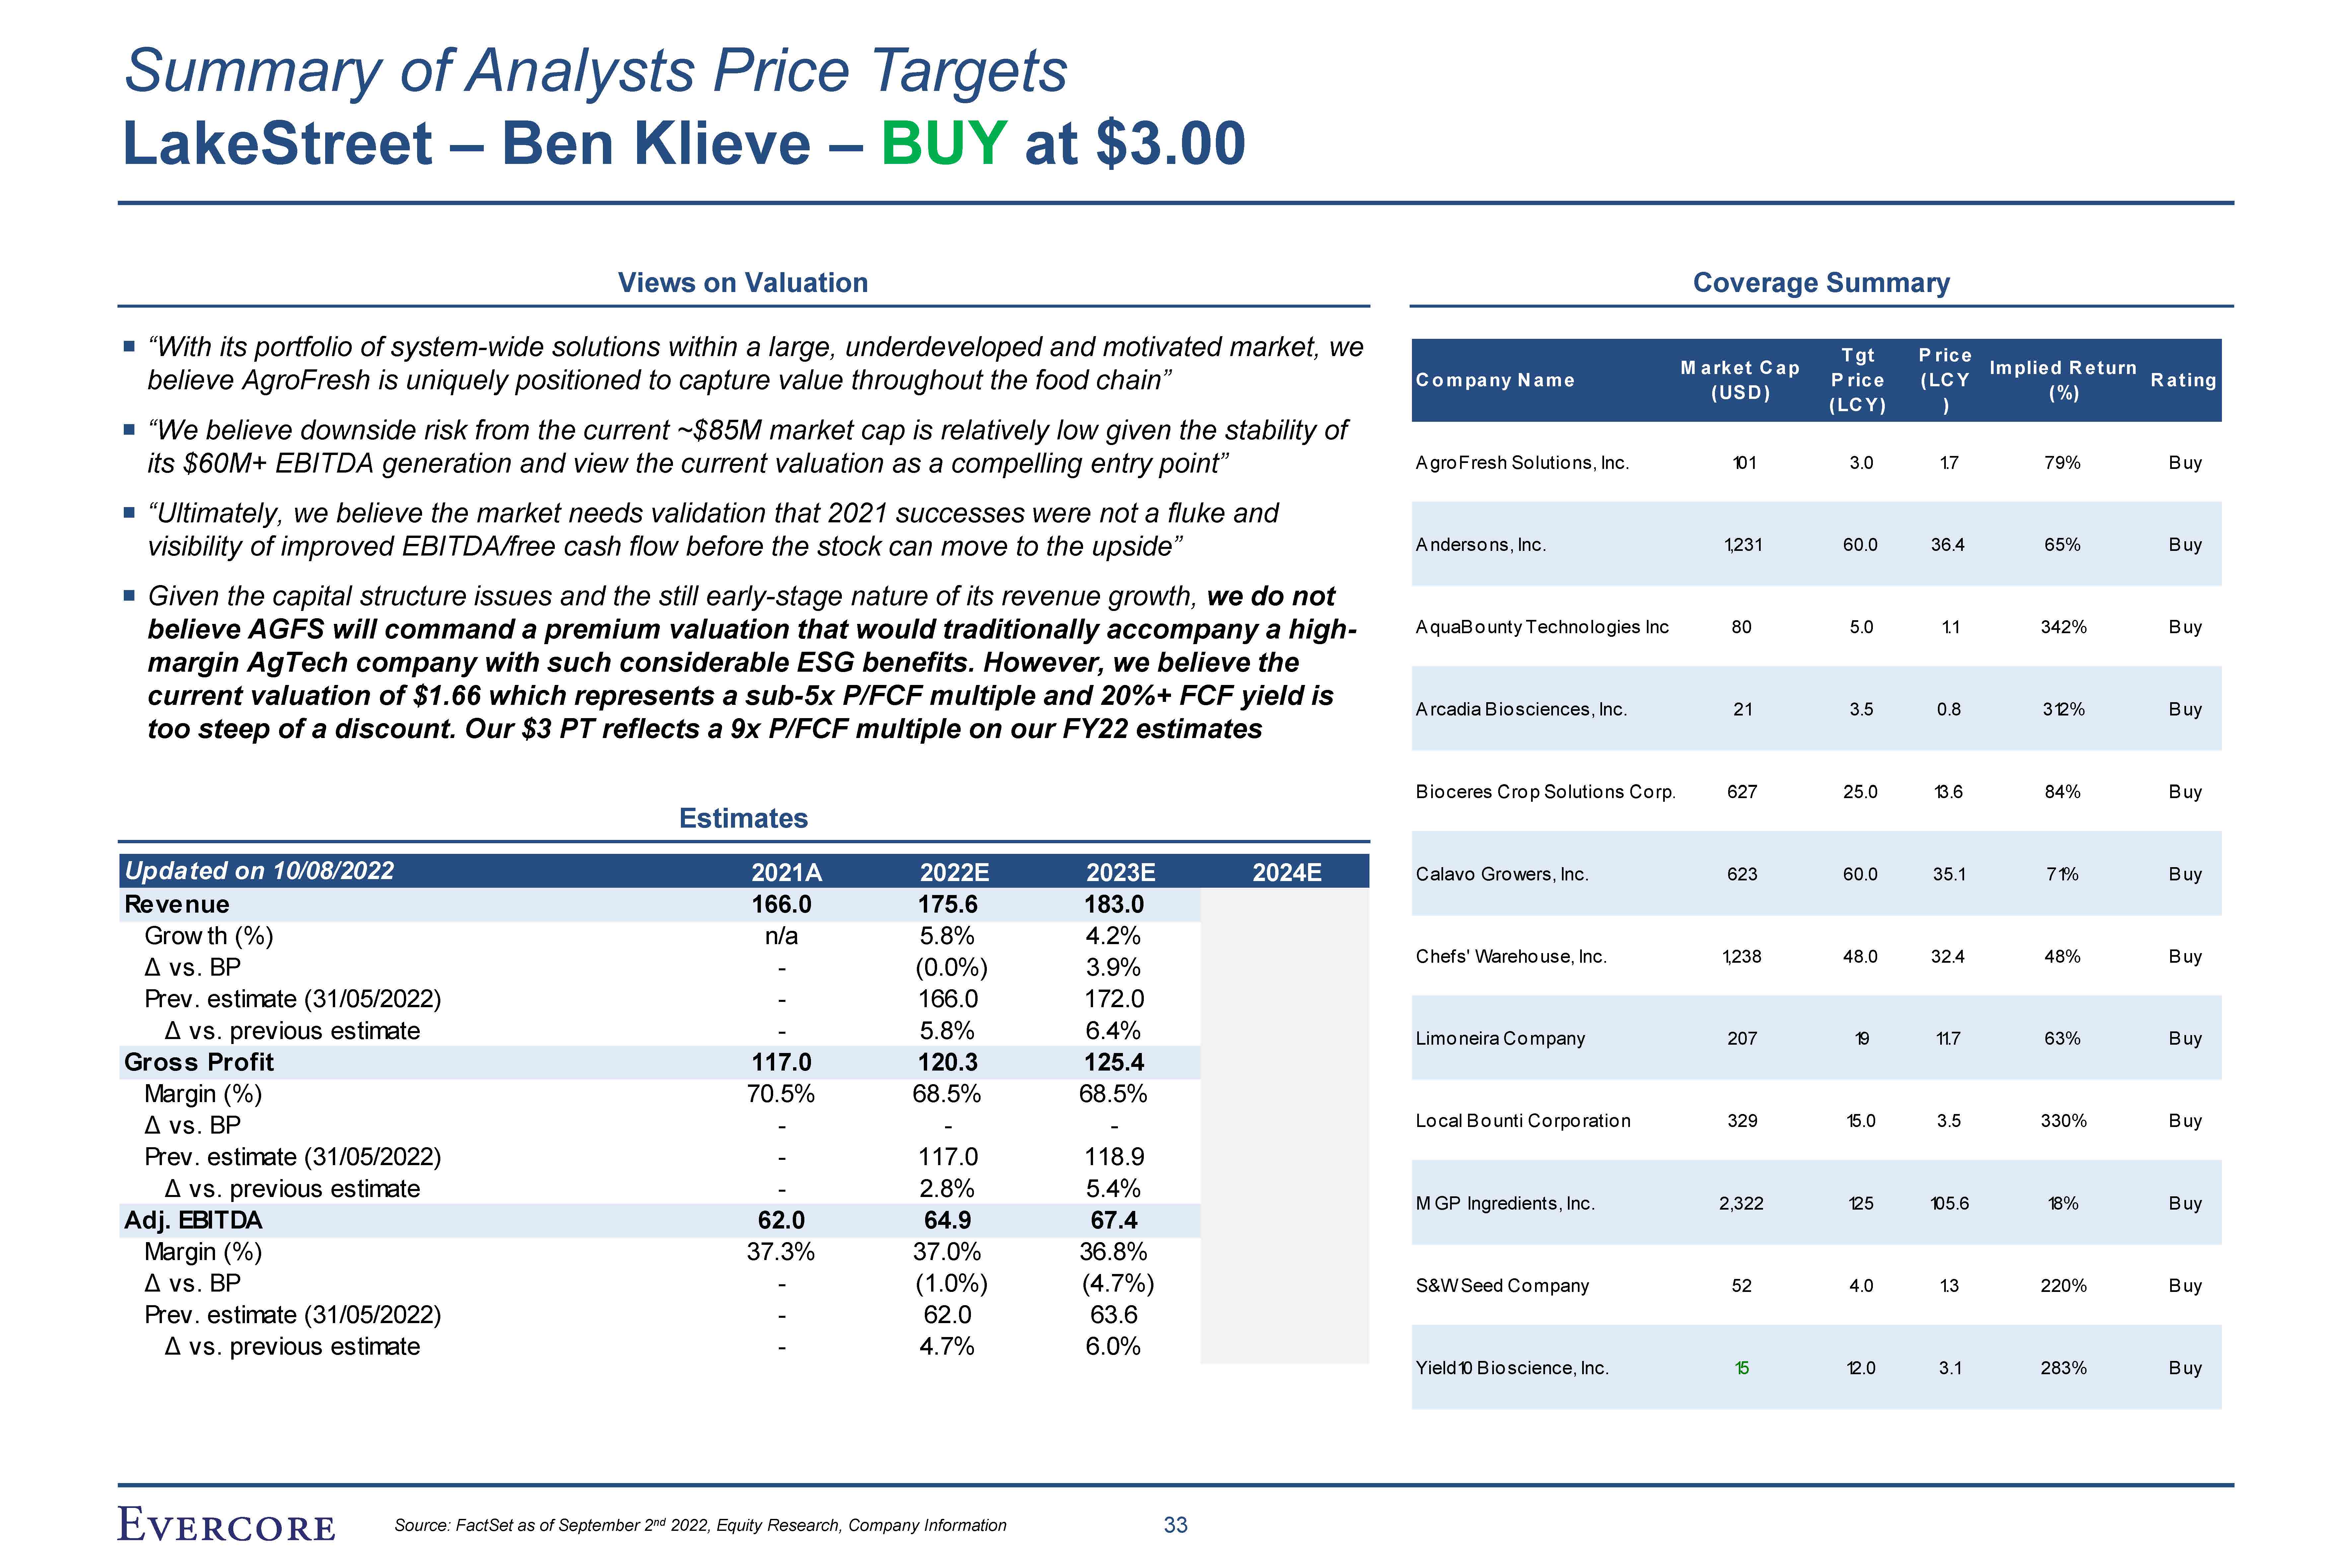
Summary of Analysts Price Targets LakeStreet – Ben Klieve – BUY at $3.00 Views
on Valuation Coverage Summary Estimates “With its portfolio of system-wide solutions within a large, underdeveloped and motivated market, we believe AgroFresh is uniquely positioned to capture value throughout the food chain” “We believe
downside risk from the current ~$85M market cap is relatively low given the stability of its $60M+ EBITDA generation and view the current valuation as a compelling entry point” “Ultimately, we believe the market needs validation that 2021
successes were not a fluke and visibility of improved EBITDA/free cash flow before the stock can move to the upside” Given the capital structure issues and the still early-stage nature of its revenue growth, we do not believe AGFS will command
a premium valuation that would traditionally accompany a high- margin AgTech company with such considerable ESG benefits. However, we believe the current valuation of $1.66 which represents a sub-5x P/FCF multiple and 20%+ FCF yield is too
steep of a discount. Our $3 PT reflects a 9x P/FCF multiple on our FY22 estimates Grow th (%) n/a 5.8% 4.2% Δ vs. BP - (0.0%) 3.9% Prev. estimate (31/05/2022) - 166.0 172.0 Prev. estimate (31/05/2022) - 117.0 118.9 Δ vs.
previous estimate - 2.8% 5.4% Updated on 10/08/2022 2021A 2022E 2023E 2024E Calavo Gro wers, Inc. 623 60.0 35.1 71% B uy Revenue 166.0 175.6 183.0 A rcadia B io sciences, Inc. 21 3.5 0.8 312% B uy B io ceres Cro p So
lutio ns Co rp. 627 25.0 13.6 84% B uy Δ vs. previous estimate - 5.8% 6.4% Limo neira Company 207 19 11.7 63% B uy Gross Profit 117.0 120.3 125.4 Margin (%) Δ vs. BP 70.5% - 68.5% - 68.5% - Lo cal Bo unti Co rpo
ratio n 329 15.0 3.5 330% B uy C o mpany N ame 33 Source: FactSet as of September 2nd 2022, Equity Research, Company Information M arket C ap T gt ( USD ) P rice ( LC Y) P rice ( LC Y ) ( %) Implied R eturn R ating A gro Fresh So
lutio ns, Inc. 101 3.0 1.7 79% B uy A nderso ns, Inc. 1,231 60.0 36.4 65% B uy A quaB o unty Techno lo gies Inc 80 5.0 1.1 342% B uy Chefs' Wareho use, Inc. 1,238 48.0 32.4 48% B uy M GP Ingredients, Inc. 2,322 125 105.6 18% B
uy Adj. EBITDA 62.0 64.9 67.4 Margin (%) 37.3% 37.0% 36.8% Δ vs. BP - (1.0%) (4.7%) S&W Seed Company 52 4.0 1.3 220% B uy Prev. estimate (31/05/2022) - 62.0 63.6 Δ vs. previous estimate - 4.7% 6.0% Yield10 B io
science, Inc. 15 12.0 3.1 283% B uy