0.3
7.5
73.9
6.2
2.2
17.4
0.6
86.7
0.2
1.9
11.4
9.0
2.1
0.0
0.9
76.3
5.6
0.1
5.1
61.1
0.5
13.4
13.3
4.7
0.3
3.7
7.1
69.7
0.2
19.0
4.3
4.8
0.1
7.2
19.4
5.6
5.9
3.4
0.5
90.5
1.1
0.1
3.3
2.0
0.9
10.0
90.3
10.3
12.7
52.2
5.4
6.1
15.4
28.2
1.0
0.7
56.7
12.0
97.1
10.7
0.1
27.9
34.5
14.9
19.2
76.2
11.0
6.6
2.3
1.8
2.0
5.6
3.0
11.2
3.1
98.0
6.3
3.5
22.6
77.0
0.6
45.5
26.0
39.5
16.5
15.6
0.3
7.9
24.6
26.0
5.6
2.0
3.4
1.3
2.9
0001418144
false
N-1A
CboeBZX
N-CSRS
NYSEArca
NYSEArca
NYSEArca
CboeBZX
CboeBZX
CboeBZX
NYSEArca
NASDAQ
NYSEArca
CboeBZX
NYSEArca
NASDAQ
NASDAQ
CboeBZX
NASDAQ
CboeBZX
0001418144
iametft:C000068414Member
2024-10-31
2025-04-30
0001418144
iametft:C000112015Member
2024-10-31
2025-04-30
0001418144
iametft:C000162616Member
2024-10-31
2025-04-30
0001418144
iametft:C000197599Member
2024-10-31
2025-04-30
0001418144
iametft:C000197600Member
2024-10-31
2025-04-30
0001418144
iametft:C000218086Member
2024-10-31
2025-04-30
0001418144
iametft:C000222994Member
2024-10-31
2025-04-30
0001418144
iametft:C000239743Member
2024-10-31
2025-04-30
0001418144
iametft:C000239744Member
2024-10-31
2025-04-30
0001418144
iametft:C000239745Member
2024-10-31
2025-04-30
0001418144
iametft:C000239746Member
2024-10-31
2025-04-30
0001418144
iametft:C000250918Member
2024-10-31
2025-04-30
0001418144
iametft:C000250919Member
2024-10-31
2025-04-30
0001418144
iametft:C000251085Member
2024-10-31
2025-04-30
0001418144
iametft:C000255210Member
2024-10-31
2025-04-30
0001418144
iametft:C000257059Member
2024-10-31
2025-04-30
0001418144
iametft:C000258361Member
2024-10-31
2025-04-30
0001418144
2024-10-31
2025-04-30
0001418144
iametft:C000197599Member
us-gaap:AssetBackedSecuritiesMember
2025-04-30
0001418144
iametft:C000197599Member
us-gaap:CertificatesOfDepositMember
2025-04-30
0001418144
iametft:C000197599Member
us-gaap:CommercialPaperMember
2025-04-30
0001418144
iametft:C000197599Member
us-gaap:ExchangeTradedFundsMember
2025-04-30
0001418144
iametft:C000197599Member
iametft:MoneyMarketFundsPlusOtherAssetsLessLiabilitiesMember
2025-04-30
0001418144
iametft:C000197599Member
us-gaap:RepurchaseAgreementsMember
2025-04-30
0001418144
iametft:C000197599Member
iametft:USDollarDenominatedBondsAndNotesMember
2025-04-30
0001418144
iametft:C000197600Member
iametft:AgencyCreditRiskTransferNotesMember
2025-04-30
0001418144
iametft:C000197600Member
us-gaap:AssetBackedSecuritiesMember
2025-04-30
0001418144
iametft:C000197600Member
us-gaap:ExchangeTradedFundsMember
2025-04-30
0001418144
iametft:C000197600Member
us-gaap:MoneyMarketFundsMember
2025-04-30
0001418144
iametft:C000197600Member
iametft:MunicipalObligationsMember
2025-04-30
0001418144
iametft:C000197600Member
us-gaap:PreferredStockMember
2025-04-30
0001418144
iametft:C000197600Member
iametft:UniformMortgageBackedSecuritiesTBA25006012055Member
2025-04-30
0001418144
iametft:C000197600Member
iametft:UniformMortgageBackedSecuritiesTBA30005012055Member
2025-04-30
0001418144
iametft:C000197600Member
iametft:UniformMortgageBackedSecuritiesTBA35005012055Member
2025-04-30
0001418144
iametft:C000197600Member
iametft:UniformMortgageBackedSecuritiesTBA50005012055Member
2025-04-30
0001418144
iametft:C000197600Member
iametft:UniformMortgageBackedSecuritiesTBA55005012055Member
2025-04-30
0001418144
iametft:C000197600Member
iametft:UniformMortgageBackedSecuritiesTBA60005012055Member
2025-04-30
0001418144
iametft:C000197600Member
iametft:USDollarDenominatedBondsAndNotesMember
2025-04-30
0001418144
iametft:C000197600Member
iametft:USTreasuryBonds45011152054Member
2025-04-30
0001418144
iametft:C000197600Member
iametft:USTreasuryNotes37504302027Member
2025-04-30
0001418144
iametft:C000197600Member
iametft:USTreasuryNotes38804302030Member
2025-04-30
0001418144
iametft:C000197600Member
iametft:USTreasuryNotes46302152035Member
2025-04-30
0001418144
iametft:C000197600Member
us-gaap:USTreasurySecuritiesMember
2025-04-30
0001418144
iametft:C000197600Member
iametft:VariableRateSeniorLoanInterestsMember
2025-04-30
0001418144
iametft:C000068414Member
2025-04-30
0001418144
iametft:C000068414Member
iametft:AmericanTowerCorpMember
2025-04-30
0001418144
iametft:C000068414Member
srt:ApartmentBuildingMember
2025-04-30
0001418144
iametft:C000068414Member
iametft:BrixmorPropertyGroupIncMember
2025-04-30
0001418144
iametft:C000068414Member
iametft:CubeSmartMember
2025-04-30
0001418144
iametft:C000068414Member
iametft:DataCentersMember
2025-04-30
0001418144
iametft:C000068414Member
iametft:DigitalRealtyTrustIncMember
2025-04-30
0001418144
iametft:C000068414Member
iametft:EastGroupPropertiesIncMember
2025-04-30
0001418144
iametft:C000068414Member
iametft:EquinixIncMember
2025-04-30
0001418144
iametft:C000068414Member
iametft:EquityResidentialMember
2025-04-30
0001418144
iametft:C000068414Member
iametft:FreeStandingMember
2025-04-30
0001418144
iametft:C000068414Member
iametft:GamingREITsMember
2025-04-30
0001418144
iametft:C000068414Member
us-gaap:HealthcareSectorMember
2025-04-30
0001418144
iametft:C000068414Member
iametft:HealthpeakPropertiesIncMember
2025-04-30
0001418144
iametft:C000068414Member
oef:IndustrialSectorMember
2025-04-30
0001418144
iametft:C000068414Member
iametft:InfrastructureREITsMember
2025-04-30
0001418144
iametft:C000068414Member
iametft:LodgingResortsMember
2025-04-30
0001418144
iametft:C000068414Member
iametft:ManufacturedHomesMember
2025-04-30
0001418144
iametft:C000068414Member
iametft:MoneyMarketFundsPlusOtherAssetsLessLiabilitiesMember
2025-04-30
0001418144
iametft:C000068414Member
iametft:OfficeMember
2025-04-30
0001418144
iametft:C000068414Member
iametft:RegionalMallsMember
2025-04-30
0001418144
iametft:C000068414Member
iametft:SelfStorageMember
2025-04-30
0001418144
iametft:C000068414Member
iametft:ShoppingCentersMember
2025-04-30
0001418144
iametft:C000068414Member
iametft:SimonPropertyGroupIncMember
2025-04-30
0001418144
iametft:C000068414Member
iametft:SingleFamilyHomesMember
2025-04-30
0001418144
iametft:C000068414Member
iametft:SpecialtyMember
2025-04-30
0001418144
iametft:C000068414Member
iametft:TimberREITsMember
2025-04-30
0001418144
iametft:C000068414Member
iametft:WelltowerIncMember
2025-04-30
0001418144
iametft:C000112015Member
2025-04-30
0001418144
iametft:C000112015Member
iametft:AlphabetIncClassAMember
2025-04-30
0001418144
iametft:C000112015Member
iametft:AlphabetIncClassCMember
2025-04-30
0001418144
iametft:C000112015Member
iametft:AmazonComIncMember
2025-04-30
0001418144
iametft:C000112015Member
iametft:AppleIncMember
2025-04-30
0001418144
iametft:C000112015Member
iametft:BerkshireHathawayIncClassBMember
2025-04-30
0001418144
iametft:C000112015Member
iametft:BroadcomIncMember
2025-04-30
0001418144
iametft:C000112015Member
oef:CommunicationsSectorMember
2025-04-30
0001418144
iametft:C000112015Member
oef:ConsumerDiscretionarySectorMember
2025-04-30
0001418144
iametft:C000112015Member
oef:ConsumerStaplesSectorMember
2025-04-30
0001418144
iametft:C000112015Member
us-gaap:FinancialServicesSectorMember
2025-04-30
0001418144
iametft:C000112015Member
us-gaap:HealthcareSectorMember
2025-04-30
0001418144
iametft:C000112015Member
oef:IndustrialSectorMember
2025-04-30
0001418144
iametft:C000112015Member
oef:InformationTechnologySectorMember
2025-04-30
0001418144
iametft:C000112015Member
iametft:MetaPlatformsIncClassAMember
2025-04-30
0001418144
iametft:C000112015Member
iametft:MicrosoftCorpMember
2025-04-30
0001418144
iametft:C000112015Member
iametft:MoneyMarketFundsPlusOtherAssetsLessLiabilitiesMember
2025-04-30
0001418144
iametft:C000112015Member
iametft:NVIDIACorpMember
2025-04-30
0001418144
iametft:C000112015Member
iametft:OtherSectorsEachLessThan2Member
2025-04-30
0001418144
iametft:C000112015Member
iametft:TeslaIncMember
2025-04-30
0001418144
iametft:C000162616Member
2025-04-30
0001418144
iametft:C000162616Member
iametft:ABNAMROBankNV53712032028Member
2025-04-30
0001418144
iametft:C000162616Member
iametft:AgencyCreditRiskTransferNotesMember
2025-04-30
0001418144
iametft:C000162616Member
us-gaap:AssetBackedSecuritiesMember
2025-04-30
0001418144
iametft:C000162616Member
iametft:FreddieMacREMICs58504252055Member
2025-04-30
0001418144
iametft:C000162616Member
iametft:FreddieMacSeries2024HQA1ClassA1STACR56003252044Member
2025-04-30
0001418144
iametft:C000162616Member
iametft:GeneralMotorsFinancialCoInc54102262027Member
2025-04-30
0001418144
iametft:C000162616Member
iametft:JPMorganChaseAndCo53004222028Member
2025-04-30
0001418144
iametft:C000162616Member
iametft:MoneyMarketFundsPlusOtherAssetsLessLiabilitiesMember
2025-04-30
0001418144
iametft:C000162616Member
iametft:MorganStanley54004132028Member
2025-04-30
0001418144
iametft:C000162616Member
iametft:SantanderHoldingsUSAInc59803202029Member
2025-04-30
0001418144
iametft:C000162616Member
iametft:USDollarDenominatedBondsAndNotesMember
2025-04-30
0001418144
iametft:C000162616Member
iametft:USTreasuryFloatingRateNotes43401312027Member
2025-04-30
0001418144
iametft:C000162616Member
iametft:USTreasuryFloatingRateNotes44510312026Member
2025-04-30
0001418144
iametft:C000162616Member
us-gaap:USTreasurySecuritiesMember
2025-04-30
0001418144
iametft:C000162616Member
iametft:VolkswagenGroupOfAmericaFinanceLLC54403252027Member
2025-04-30
0001418144
iametft:C000197599Member
2025-04-30
0001418144
iametft:C000197599Member
iametft:APACorp50505012025Member
2025-04-30
0001418144
iametft:C000197599Member
iametft:BostonPropertiesLP46906022025Member
2025-04-30
0001418144
iametft:C000197599Member
iametft:BrunswickCorp50651105012025Member
2025-04-30
0001418144
iametft:C000197599Member
iametft:ConagraBrandsInc50705192025Member
2025-04-30
0001418144
iametft:C000197599Member
iametft:CrownCastleInc49405012025Member
2025-04-30
0001418144
iametft:C000197599Member
iametft:EversourceEnergy48305122025Member
2025-04-30
0001418144
iametft:C000197599Member
iametft:JabilInc50851305052025Member
2025-04-30
0001418144
iametft:C000197599Member
iametft:KinderMorganInc43006012025Member
2025-04-30
0001418144
iametft:C000197599Member
iametft:QuantaServicesInc49005022025Member
2025-04-30
0001418144
iametft:C000197599Member
iametft:SonocoProductsCo52405282025Member
2025-04-30
0001418144
iametft:C000197600Member
2025-04-30
0001418144
iametft:C000218086Member
2025-04-30
0001418144
iametft:C000218086Member
iametft:BombardierInc60002152028Member
2025-04-30
0001418144
iametft:C000218086Member
iametft:CCOHoldingsLLCCCOHoldingsCapitalCorp45005012032Member
2025-04-30
0001418144
iametft:C000218086Member
iametft:ChurchillDownsInc55004012027Member
2025-04-30
0001418144
iametft:C000218086Member
iametft:CommonStocksAndOtherEquityInterestsMember
2025-04-30
0001418144
iametft:C000218086Member
iametft:GlobalAtlanticFinCo47010152051Member
2025-04-30
0001418144
iametft:C000218086Member
iametft:GoodyearTireAndRubberCoThe48803152027Member
2025-04-30
0001418144
iametft:C000218086Member
iametft:JefferiesFinanceLLCJFINCoIssuerCorp50008152028Member
2025-04-30
0001418144
iametft:C000218086Member
iametft:MoneyMarketFundsPlusOtherAssetsLessLiabilitiesMember
2025-04-30
0001418144
iametft:C000218086Member
iametft:NobleFinanceIILLC80004152030Member
2025-04-30
0001418144
iametft:C000218086Member
iametft:ParamountGlobal63803302062Member
2025-04-30
0001418144
iametft:C000218086Member
iametft:USDollarDenominatedBondsAndNotesMember
2025-04-30
0001418144
iametft:C000218086Member
us-gaap:USTreasurySecuritiesMember
2025-04-30
0001418144
iametft:C000218086Member
iametft:VentureGlobalLNGInc81306012028Member
2025-04-30
0001418144
iametft:C000218086Member
iametft:ViasatInc56304152027Member
2025-04-30
0001418144
iametft:C000222994Member
2025-04-30
0001418144
iametft:C000222994Member
iametft:AmericanTowerCorpMember
2025-04-30
0001418144
iametft:C000222994Member
iametft:CheniereEnergyIncMember
2025-04-30
0001418144
iametft:C000222994Member
oef:ConsumerStaplesSectorMember
2025-04-30
0001418144
iametft:C000222994Member
us-gaap:EnergySectorMember
2025-04-30
0001418144
iametft:C000222994Member
iametft:EquinixIncMember
2025-04-30
0001418144
iametft:C000222994Member
iametft:KinderMorganIncMember
2025-04-30
0001418144
iametft:C000222994Member
oef:MaterialsSectorMember
2025-04-30
0001418144
iametft:C000222994Member
iametft:MoneyMarketFundsPlusOtherAssetsLessLiabilitiesMember
2025-04-30
0001418144
iametft:C000222994Member
iametft:ONEOKIncMember
2025-04-30
0001418144
iametft:C000222994Member
iametft:PrologisIncMember
2025-04-30
0001418144
iametft:C000222994Member
us-gaap:RealEstateSectorMember
2025-04-30
0001418144
iametft:C000222994Member
iametft:SempraMember
2025-04-30
0001418144
iametft:C000222994Member
iametft:TargaResourcesCorpMember
2025-04-30
0001418144
iametft:C000222994Member
oef:UtilitiesSectorMember
2025-04-30
0001418144
iametft:C000222994Member
iametft:WelltowerIncMember
2025-04-30
0001418144
iametft:C000222994Member
iametft:WilliamsCosIncTheMember
2025-04-30
0001418144
iametft:C000239743Member
2025-04-30
0001418144
iametft:C000239743Member
iametft:CedarFundingIXCLOLtdSeries20189AClassAR56907202037Member
2025-04-30
0001418144
iametft:C000239743Member
iametft:CedarFundingXIVCLOLtdSeries202114AClassAR56410152037Member
2025-04-30
0001418144
iametft:C000239743Member
iametft:CIFCFundingLtdSeries20232AClassA60201212037Member
2025-04-30
0001418144
iametft:C000239743Member
iametft:ElmwoodCLOIIILtdSeries20193AClassA1RR56507182037Member
2025-04-30
0001418144
iametft:C000239743Member
iametft:GoldenTreeLoanManagementUSCLO9LtdSeries20219AClassAR57704202037Member
2025-04-30
0001418144
iametft:C000239743Member
iametft:MadisonParkFundingXXXVIILtdSeries201937AClassAR257904152037Member
2025-04-30
0001418144
iametft:C000239743Member
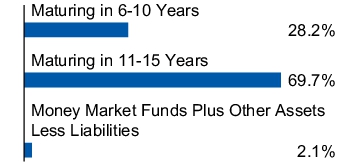
iametft:MaturingIn1115YearsMember
2025-04-30
0001418144
iametft:C000239743Member
iametft:MaturingIn610YearsMember
2025-04-30
0001418144
iametft:C000239743Member
iametft:MoneyMarketFundsPlusOtherAssetsLessLiabilitiesMember
2025-04-30
0001418144
iametft:C000239743Member
iametft:PalmerSquareCLO20231LtdSeries20231AClassAR55201202038Member
2025-04-30
0001418144
iametft:C000239743Member
iametft:ParkBlueCLOLtdSeries20221AClassA1R56910202037Member
2025-04-30
0001418144
iametft:C000239743Member
iametft:SignalPeakCLO11LtdSeries202411AClassA157207182037Member
2025-04-30
0001418144
iametft:C000239743Member
iametft:TICPCLOVIILtdSeries20177AClassASR255604152033Member
2025-04-30
0001418144
iametft:C000239744Member
2025-04-30
0001418144
iametft:C000239744Member
iametft:AircastleLtd525Member
2025-04-30
0001418144
iametft:C000239744Member
iametft:AshtonWoodsUSALLCAshtonWoodsFinanceCo66301152028Member
2025-04-30
0001418144
iametft:C000239744Member
iametft:EutelsatSA97504132029Member
2025-04-30
0001418144
iametft:C000239744Member
iametft:GFLEnvironmentalInc40008012028Member
2025-04-30
0001418144
iametft:C000239744Member
iametft:GGAMFinanceLtd68804152029Member
2025-04-30
0001418144
iametft:C000239744Member
iametft:IliadHoldingSASU85004152031Member
2025-04-30
0001418144
iametft:C000239744Member
iametft:MoneyMarketFundsPlusOtherAssetsLessLiabilitiesMember
2025-04-30
0001418144
iametft:C000239744Member
iametft:NonUSDollarDenominatedBondsAndNotesMember
2025-04-30
0001418144
iametft:C000239744Member
iametft:StudioCityFinanceLtd50001152029Member
2025-04-30
0001418144
iametft:C000239744Member
iametft:TenetHealthcareCorp67505152031Member
2025-04-30
0001418144
iametft:C000239744Member
iametft:USDollarDenominatedBondsAndNotesMember
2025-04-30
0001418144
iametft:C000239744Member
iametft:VMEDO2UKFinancingIPLC32501312031Member
2025-04-30
0001418144
iametft:C000239744Member
iametft:VodafoneGroupPLC41306042081Member
2025-04-30
0001418144
iametft:C000239745Member
2025-04-30
0001418144
iametft:C000239745Member
iametft:AllentownCityOfPANeighborhoodImprovementZoneDevelopmentAuthoritySeries2022RefRB50005012033Member
2025-04-30
0001418144
iametft:C000239745Member
iametft:CaliforniaStateOfPollutionControlFinancingAuthorityPoseidonResourcesLPSeries2023RB50007012038Member
2025-04-30
0001418144
iametft:C000239745Member
iametft:GeneralObligationBondsMember
2025-04-30
0001418144
iametft:C000239745Member
iametft:IowaStateOfFinanceAuthorityIowaFertilizerCoSeries2022RefRB40012012032Member
2025-04-30
0001418144
iametft:C000239745Member
iametft:LouisianaStateOfPublicFacilitiesAuthorityI10CalcasieuRiverBridgeSeries2024RB57509012064Member
2025-04-30
0001418144
iametft:C000239745Member
iametft:NewYorkTransportationDevelopmentCorpJohnFKennedyInternationalAirportNewTerminalOneGreenBondsSeries2023RB60006302054Member
2025-04-30
0001418144
iametft:C000239745Member
iametft:NewYorkTransportationDevelopmentCorpLaGuardiaAirportTerminalBRedevelopmentSeries2023RB60004012035Member
2025-04-30
0001418144
iametft:C000239745Member
iametft:PatriotsEnergyGroupFinancingAgencySeries2023A1RB52508012031Member
2025-04-30
0001418144
iametft:C000239745Member
iametft:PennsylvaniaCommonwealthOfEconomicDevelopmentFinancingAuthorityPenndotMajorBridgesTheSeries2022RB55006302038Member
2025-04-30
0001418144
iametft:C000239745Member
iametft:PortlandPortOfORGreenBondsTwentyNinthSeries2023RB52507012039Member
2025-04-30
0001418144
iametft:C000239745Member
iametft:PreRefundedBondsMember
2025-04-30
0001418144
iametft:C000239745Member
iametft:RevenueBondsMember
2025-04-30
0001418144
iametft:C000239745Member
iametft:VirginiaBeachDevelopmentAuthorityWestminsterCanterburyOnChesapeakeBaySeries2023B3RB53809012029Member
2025-04-30
0001418144
iametft:C000239746Member
2025-04-30
0001418144
iametft:C000239746Member
iametft:AerCapIrelandCapitalDACAerCapGlobalAviationTrust61001152027Member
2025-04-30
0001418144
iametft:C000239746Member
iametft:AgencyCreditRiskTransferNotesMember
2025-04-30
0001418144
iametft:C000239746Member
us-gaap:AssetBackedSecuritiesMember
2025-04-30
0001418144
iametft:C000239746Member
iametft:BarclaysPLC73311022026Member
2025-04-30
0001418144
iametft:C000239746Member
iametft:FordMotorCreditCoLLC73203062026Member
2025-04-30
0001418144
iametft:C000239746Member
iametft:MoneyMarketFundsPlusOtherAssetsLessLiabilitiesMember
2025-04-30
0001418144
iametft:C000239746Member
iametft:MorganStanleyBankNA58810302026Member
2025-04-30
0001418144
iametft:C000239746Member
iametft:MunicipalObligationsMember
2025-04-30
0001418144
iametft:C000239746Member
iametft:NatWestGroupPLC74711102026Member
2025-04-30
0001418144
iametft:C000239746Member
us-gaap:PreferredStockMember
2025-04-30
0001418144
iametft:C000239746Member
iametft:ProtectiveLifeGlobalFunding53701062026Member
2025-04-30
0001418144
iametft:C000239746Member
iametft:UBSAG58009112025Member
2025-04-30
0001418144
iametft:C000239746Member
iametft:USDollarDenominatedBondsAndNotesMember
2025-04-30
0001418144
iametft:C000239746Member
iametft:USTreasuryNotes37504152028Member
2025-04-30
0001418144
iametft:C000239746Member
iametft:USTreasuryNotes37504302027Member
2025-04-30
0001418144
iametft:C000239746Member
iametft:USTreasuryNotes38804302030Member
2025-04-30
0001418144
iametft:C000239746Member
us-gaap:USTreasurySecuritiesMember
2025-04-30
0001418144
iametft:C000250918Member
2025-04-30
0001418144
iametft:C000250918Member
iametft:AlphabetIncClassAMember
2025-04-30
0001418144
iametft:C000250918Member
iametft:AmazonComIncMember
2025-04-30
0001418144
iametft:C000250918Member
iametft:AppleIncMember
2025-04-30
0001418144
iametft:C000250918Member
iametft:BroadcomIncMember
2025-04-30
0001418144
iametft:C000250918Member
iametft:CommonStocksAndOtherEquityInterestsMember
2025-04-30
0001418144
iametft:C000250918Member
iametft:CostcoWholesaleCorpMember
2025-04-30
0001418144
iametft:C000250918Member
iametft:EquityLinkedNotesMember
2025-04-30
0001418144
iametft:C000250918Member
iametft:MetaPlatformsIncClassAMember
2025-04-30
0001418144
iametft:C000250918Member
iametft:MicrosoftCorpMember
2025-04-30
0001418144
iametft:C000250918Member
iametft:MoneyMarketFundsPlusOtherAssetsLessLiabilitiesMember
2025-04-30
0001418144
iametft:C000250918Member
iametft:NetflixIncMember
2025-04-30
0001418144
iametft:C000250918Member
iametft:NVIDIACorpMember
2025-04-30
0001418144
iametft:C000250918Member
iametft:TeslaIncMember
2025-04-30
0001418144
iametft:C000250919Member
2025-04-30
0001418144
iametft:C000250919Member
iametft:BNPParibasIssuanceBVInvescoSAndP500EqualWeightETFMember
2025-04-30
0001418144
iametft:C000250919Member
iametft:BNPParibasIssuanceBVInvescoSAndP500EqualWeightETFTopHoldingMember
2025-04-30
0001418144
iametft:C000250919Member
iametft:CanadianImperialBankOfCommerceInvescoSAndP500EqualWeightETFMember
2025-04-30
0001418144
iametft:C000250919Member
iametft:CitigroupGlobalMarketsHoldingsIncInvescoSAndP500EqualWeightETFMember
2025-04-30
0001418144
iametft:C000250919Member
iametft:CitigroupGlobalMarketsHoldingsIncInvescoSAndP500EqualWeightETFTopHoldingMember
2025-04-30
0001418144
iametft:C000250919Member
iametft:CommonStocksAndOtherEquityInterestsMember
2025-04-30
0001418144
iametft:C000250919Member
iametft:EquityLinkedNotesMember
2025-04-30
0001418144
iametft:C000250919Member
iametft:JPMorganChaseAndCoInvescoSAndP500EqualWeightETFMember
2025-04-30
0001418144
iametft:C000250919Member
iametft:MizuhoMarketsCaymanLPInvescoSAndP500EqualWeightETFMember
2025-04-30
0001418144
iametft:C000250919Member
iametft:MizuhoMarketsCaymanLPInvescoSAndP500EqualWeightETFTopHoldingMember
2025-04-30
0001418144
iametft:C000250919Member
iametft:MoneyMarketFundsPlusOtherAssetsLessLiabilitiesMember
2025-04-30
0001418144
iametft:C000250919Member
iametft:UBSAGInvescoSAndP500EqualWeightETFMember
2025-04-30
0001418144
iametft:C000250919Member
iametft:WellsFargoBankNAInvescoSAndP500EqualWeightETFMember
2025-04-30
0001418144
iametft:C000251085Member
2025-04-30
0001418144
iametft:C000251085Member
iametft:ASMLHoldingNVMember
2025-04-30
0001418144
iametft:C000251085Member
iametft:AstraZenecaPLCMember
2025-04-30
0001418144
iametft:C000251085Member
iametft:CommonStocksAndOtherEquityInterestsMember
2025-04-30
0001418144
iametft:C000251085Member
iametft:EquityLinkedNotesMember
2025-04-30
0001418144
iametft:C000251085Member
iametft:HSBCHoldingsPLCMember
2025-04-30
0001418144
iametft:C000251085Member
iametft:MoneyMarketFundsPlusOtherAssetsLessLiabilitiesMember
2025-04-30
0001418144
iametft:C000251085Member
iametft:NestleSAMember
2025-04-30
0001418144
iametft:C000251085Member
iametft:NovartisAGMember
2025-04-30
0001418144
iametft:C000251085Member
iametft:NovoNordiskASClassBMember
2025-04-30
0001418144
iametft:C000251085Member
iametft:RocheHoldingAGMember
2025-04-30
0001418144
iametft:C000251085Member
iametft:SAPSEMember
2025-04-30
0001418144
iametft:C000251085Member
iametft:ShellPLCMember
2025-04-30
0001418144
iametft:C000251085Member
iametft:ToyotaMotorCorpMember
2025-04-30
0001418144
iametft:C000255210Member
2025-04-30
0001418144
iametft:C000255210Member
iametft:AlphabetIncClassAMember
2025-04-30
0001418144
iametft:C000255210Member
iametft:AlphabetIncClassCMember
2025-04-30
0001418144
iametft:C000255210Member
iametft:AmazonComIncMember
2025-04-30
0001418144
iametft:C000255210Member
iametft:AppleIncMember
2025-04-30
0001418144
iametft:C000255210Member
iametft:BroadcomIncMember
2025-04-30
0001418144
iametft:C000255210Member
oef:CommunicationsSectorMember
2025-04-30
0001418144
iametft:C000255210Member
oef:ConsumerDiscretionarySectorMember
2025-04-30
0001418144
iametft:C000255210Member
oef:InformationTechnologySectorMember
2025-04-30
0001418144
iametft:C000255210Member
iametft:MetaPlatformsIncClassAMember
2025-04-30
0001418144
iametft:C000255210Member
iametft:MicrosoftCorpMember
2025-04-30
0001418144
iametft:C000255210Member
iametft:MoneyMarketFundsPlusOtherAssetsLessLiabilitiesMember
2025-04-30
0001418144
iametft:C000255210Member
iametft:NVIDIACorpMember
2025-04-30
0001418144
iametft:C000255210Member
iametft:TeslaIncMember
2025-04-30
0001418144
iametft:C000257059Member
2025-04-30
0001418144
iametft:C000257059Member
iametft:CheniereEnergyIncMember
2025-04-30
0001418144
iametft:C000257059Member
iametft:EnbridgeIncMember
2025-04-30
0001418144
iametft:C000257059Member
us-gaap:EnergySectorMember
2025-04-30
0001418144
iametft:C000257059Member
iametft:KinderMorganIncMember
2025-04-30
0001418144
iametft:C000257059Member
iametft:MoneyMarketFundsPlusOtherAssetsLessLiabilitiesMember
2025-04-30
0001418144
iametft:C000257059Member
iametft:ONEOKIncMember
2025-04-30
0001418144
iametft:C000257059Member
iametft:PembinaPipelineMember
2025-04-30
0001418144
iametft:C000257059Member
iametft:PlainsGPHoldingsLPClassAMember
2025-04-30
0001418144
iametft:C000257059Member
iametft:SouthBowCorpMember
2025-04-30
0001418144
iametft:C000257059Member
iametft:TargaResourcesCorpMember
2025-04-30
0001418144
iametft:C000257059Member
iametft:TCEnergyCorpMember
2025-04-30
0001418144
iametft:C000257059Member
oef:UtilitiesSectorMember
2025-04-30
0001418144
iametft:C000257059Member
iametft:WilliamsCosIncTheMember
2025-04-30
0001418144
iametft:C000258361Member
2025-04-30
0001418144
iametft:C000258361Member
iametft:CommodityRiskLongMember
2025-04-30
0001418144
iametft:C000258361Member
iametft:CommodityRiskShortMember
2025-04-30
0001418144
iametft:C000258361Member
iametft:CurrencyRiskLongMember
2025-04-30
0001418144
iametft:C000258361Member
iametft:CurrencyRiskShortMember
2025-04-30
0001418144
iametft:C000258361Member
iametft:EquityRiskLongMember
2025-04-30
0001418144
iametft:C000258361Member
iametft:EquityRiskShortMember
2025-04-30
0001418144
iametft:C000258361Member
iametft:FuturesContractsMember
2025-04-30
0001418144
iametft:C000258361Member
iametft:InterestRateRiskLongMember
2025-04-30
0001418144
iametft:C000258361Member
iametft:InterestRateRiskShortMember
2025-04-30
0001418144
iametft:C000258361Member
us-gaap:MoneyMarketFundsMember
2025-04-30
0001418144
iametft:C000258361Member
iametft:OtherAssetsLessLiabilitiesMember
2025-04-30
iso4217:USDiso4217:USDxbrli:sharesxbrli:purexbrli:sharesutr:Diametft:Holding
UNITED STATES
SECURITIES AND EXCHANGE COMMISSION
Washington, D.C. 20549
FORM N-CSR
CERTIFIED SHAREHOLDER REPORT OF REGISTERED MANAGEMENT INVESTMENT COMPANIES
Investment Company Act file number
Invesco Actively Managed Exchange-Traded Fund Trust
(Exact name of registrant as specified in charter)
3500 Lacey Road Downers Grove, IL 60515
(Address of principal executive offices) (Zip code)
Brian Hartigan, President
3500 Lacey Road
Downers Grove, IL 60515
Registrant's telephone number, including area code:
Date of reporting period:
Item 1. Reports to Stockholders.
(a) The Registrant's semi-annual report transmitted to shareholders pursuant to Rule 30e-1 under the Investment Company Act of 1940, as amended (the "Act") is as follows:
Invesco AAA CLO Floating Rate Note ETF
ICLO | Cboe BZX Exchange, Inc.
SEMI-ANNUAL SHAREHOLDER REPORT | April 30, 2025
This semi-annual shareholder report contains important information about Invesco AAA CLO Floating Rate Note ETF (the “Fund”) for the period November 1, 2024 to April 30, 2025. You can find additional information about the Fund at invesco.com/reports. You can also request this information by contacting us at (800) 983-0903.
What Were The Fund Costs For The Last Six Months ?
(Based on a hypothetical $10,000 investment)
| Fund |
Costs of a $10,000 investment |
Costs paid as a percentage
of a $10,000 investment* |
| Invesco AAA CLO Floating Rate Note ETF |
$10 |
0.19% |
What Are Key Statistics About The Fund?
(as of April 30, 2025)
| Fund net assets |
$304,432,594 |
| Total number of portfolio holdings |
144 |
| Portfolio turnover rate |
37% |
What Comprised The Fund's Holdings?
(as of April 30, 2025)
Top ten holdings*
(% of net assets)
| Signal Peak CLO 11 Ltd., Series 2024-11A, Class A1, 5.72%, 07/18/2037 |
3.19% |
| Park Blue CLO Ltd., Series 2022-1A, Class A1R, 5.69%, 10/20/2037 |
2.10% |
| GoldenTree Loan Management US CLO 9 Ltd., Series 2021-9A, Class AR, 5.77%, 04/20/2037 |
2.07% |
| Cedar Funding IX CLO Ltd., Series 2018-9A, Class AR, 5.69%, 07/20/2037 |
1.97% |
| Elmwood CLO III Ltd., Series 2019-3A, Class A1RR, 5.65%, 07/18/2037 |
1.97% |
| Madison Park Funding XXXVII Ltd., Series 2019-37A, Class AR2, 5.79%, 04/15/2037 |
1.76% |
| CIFC Funding Ltd., Series 2023-2A, Class A, 6.02%, 01/21/2037 |
1.65% |
| TICP CLO VII Ltd., Series 2017-7A, Class ASR2, 5.56%, 04/15/2033 |
1.64% |
| Cedar Funding XIV CLO Ltd., Series 2021-14A, Class AR, 5.64%, 10/15/2037 |
1.64% |
| Palmer Square CLO 2023-1 Ltd., Series 2023-1A, Class AR, 5.52%, 01/20/2038 |
1.64% |
| * Excluding money market fund holdings, if any. |
|
Duration allocation
(% of net assets)
Where Can I Find More Information?
You can find more information about the Fund, including the Fund's prospectus, financial information, and holdings at invesco.com/reports. Additionally, the Fund's proxy voting information can be found at invesco.com/proxy-voting.
What Should I Know About Delivery Of Important Regulatory Documents?
Only one copy of most shareholder documents may be mailed to shareholders with multiple accounts at the same address (Householding). Mailing of your shareholder documents may be householded indefinitely unless you instruct otherwise. If you do not want the mailing of these documents to be combined with those for other members of your household, please contact your broker-dealer.
For additional information, please scan the QR code at the left to navigate to additional material at invesco.com/reports.
P-ICLO-SAR
Invesco AAA CLO Floating Rate Note ETF
Invesco Active U.S. Real Estate ETF
PSR | NYSE Arca, Inc.
SEMI-ANNUAL SHAREHOLDER REPORT | April 30, 2025
This semi-annual shareholder report contains important information about Invesco Active U.S. Real Estate ETF (the “Fund”) for the period November 1, 2024 to April 30, 2025. You can find additional information about the Fund at invesco.com/reports. You can also request this information by contacting us at (800) 983-0903.
What Were The Fund Costs For The Last Six Months ?
(Based on a hypothetical $10,000 investment)
| Fund |
Costs of a $10,000 investment |
Costs paid as a percentage
of a $10,000 investment* |
| Invesco Active U.S. Real Estate ETF |
$17 |
0.35% |
What Are Key Statistics About The Fund?
(as of April 30, 2025)
| Fund net assets |
$58,327,144 |
| Total number of portfolio holdings |
37 |
| Portfolio turnover rate |
60% |
What Comprised The Fund's Holdings?
(as of April 30, 2025)
Top ten holdings*
(% of net assets)
| American Tower Corp. |
8.37% |
| Digital Realty Trust, Inc. |
8.06% |
| Welltower, Inc. |
7.93% |
| Equinix, Inc. |
4.66% |
| Healthpeak Properties, Inc. |
3.89% |
| CubeSmart |
3.72% |
| EastGroup Properties, Inc. |
3.60% |
| Simon Property Group, Inc. |
3.53% |
| Brixmor Property Group, Inc. |
3.46% |
| Equity Residential |
3.37% |
| * Excluding money market fund holdings, if any. |
|
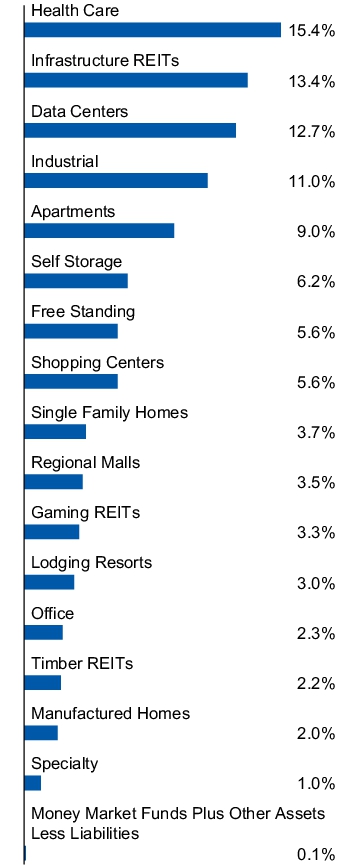
Property type
(% of net assets)
Where Can I Find More Information?
You can find more information about the Fund, including the Fund's prospectus, financial information, and holdings at invesco.com/reports. Additionally, the Fund's proxy voting information can be found at invesco.com/proxy-voting.
What Should I Know About Delivery Of Important Regulatory Documents?
Only one copy of most shareholder documents may be mailed to shareholders with multiple accounts at the same address (Householding). Mailing of your shareholder documents may be householded indefinitely unless you instruct otherwise. If you do not want the mailing of these documents to be combined with those for other members of your household, please contact your broker-dealer.
For additional information, please scan the QR code at the left to navigate to additional material at invesco.com/reports.
P-PSR-SAR
Invesco Active U.S. Real Estate ETF
Invesco High Yield Bond Factor ETF
IHYF | The Nasdaq Stock Market LLC
SEMI-ANNUAL SHAREHOLDER REPORT | April 30, 2025
This semi-annual shareholder report contains important information about Invesco High Yield Bond Factor ETF (the “Fund”) for the period November 1, 2024 to April 30, 2025. You can find additional information about the Fund at invesco.com/reports. You can also request this information by contacting us at (800) 983-0903.
What Were The Fund Costs For The Last Six Months ?
(Based on a hypothetical $10,000 investment)
| Fund |
Costs of a $10,000 investment |
Costs paid as a percentage
of a $10,000 investment* |
| Invesco High Yield Bond Factor ETF |
$19 |
0.39% |
What Are Key Statistics About The Fund?
(as of April 30, 2025)
| Fund net assets |
$45,298,868 |
| Total number of portfolio holdings |
308 |
| Portfolio turnover rate |
36% |
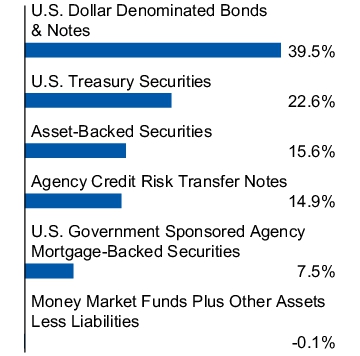
What Comprised The Fund's Holdings?
(as of April 30, 2025)
Top ten holdings*
(% of net assets)
| Goodyear Tire & Rubber Co. (The), 4.88%, 03/15/2027 |
0.94% |
| Viasat, Inc., 5.63%, 04/15/2027 |
0.91% |
| Churchill Downs, Inc., 5.50%, 04/01/2027 |
0.87% |
| Venture Global LNG, Inc., 8.13%, 06/01/2028 |
0.87% |
| Jefferies Finance LLC/JFIN Co-Issuer Corp., 5.00%, 08/15/2028 |
0.82% |
| Paramount Global, 6.38%, 03/30/2062 |
0.81% |
| CCO Holdings LLC/CCO Holdings Capital Corp., 4.50%, 05/01/2032 |
0.78% |
| Bombardier, Inc., 6.00%, 02/15/2028 |
0.72% |
| Global Atlantic (Fin) Co., 4.70%, 10/15/2051 |
0.70% |
| Noble Finance II LLC, 8.00%, 04/15/2030 |
0.69% |
| * Excluding money market fund holdings, if any. |
|
Security type allocation
(% of net assets)
Where Can I Find More Information?
You can find more information about the Fund, including the Fund's prospectus, financial information, and holdings at invesco.com/reports. Additionally, the Fund's proxy voting information can be found at invesco.com/proxy-voting.
What Should I Know About Delivery Of Important Regulatory Documents?
Only one copy of most shareholder documents may be mailed to shareholders with multiple accounts at the same address (Householding). Mailing of your shareholder documents may be householded indefinitely unless you instruct otherwise. If you do not want the mailing of these documents to be combined with those for other members of your household, please contact your broker-dealer.
For additional information, please scan the QR code at the left to navigate to additional material at invesco.com/reports.
P-IHYF-SAR
Invesco High Yield Bond Factor ETF
Invesco High Yield Select ETF
HIYS | Cboe BZX Exchange, Inc.
SEMI-ANNUAL SHAREHOLDER REPORT | April 30, 2025
This semi-annual shareholder report contains important information about Invesco High Yield Select ETF (the “Fund”) for the period November 1, 2024 to April 30, 2025. You can find additional information about the Fund at invesco.com/reports. You can also request this information by contacting us at (800) 983-0903.
What Were The Fund Costs For The Last Six Months ?
(Based on a hypothetical $10,000 investment)
| Fund |
Costs of a $10,000 investment |
Costs paid as a percentage
of a $10,000 investment* |
| Invesco High Yield Select ETF |
$22 |
0.44%† |
| * |
Annualized.
|
|
†
|
Reflects fee waivers and/or expense reimbursements, without which expenses would have been higher.
|
What Are Key Statistics About The Fund?
(as of April 30, 2025)
| Fund net assets |
$7,755,873 |
| Total number of portfolio holdings |
167 |
| Portfolio turnover rate |
87% |
What Comprised The Fund's Holdings?
(as of April 30, 2025)
Top ten holdings*
(% of net assets)
| Iliad Holding S.A.S.U., 8.50%, 04/15/2031 |
2.72% |
| Studio City Finance Ltd., 5.00%, 01/15/2029 |
2.27% |
| Eutelsat S.A., 9.75%, 04/13/2029 |
1.49% |
| Aircastle Ltd., 5.25% |
1.48% |
| VMED O2 UK Financing I PLC, 3.25%, 01/31/2031 |
1.36% |
| GFL Environmental, Inc., 4.00%, 08/01/2028 |
1.19% |
| Tenet Healthcare Corp., 6.75%, 05/15/2031 |
1.19% |
| Ashton Woods USA LLC/Ashton Woods Finance Co., 6.63%, 01/15/2028 |
1.17% |
| Vodafone Group PLC, 4.13%, 06/04/2081 |
1.16% |
| GGAM Finance Ltd., 6.88%, 04/15/2029 |
1.15% |
| * Excluding money market fund holdings, if any. |
|
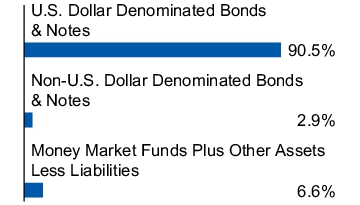
Security type allocation
(% of net assets)
Where Can I Find More Information?
You can find more information about the Fund, including the Fund's prospectus, financial information, and holdings at invesco.com/reports. Additionally, the Fund's proxy voting information can be found at invesco.com/proxy-voting.
What Should I Know About Delivery Of Important Regulatory Documents?
Only one copy of most shareholder documents may be mailed to shareholders with multiple accounts at the same address (Householding). Mailing of your shareholder documents may be householded indefinitely unless you instruct otherwise. If you do not want the mailing of these documents to be combined with those for other members of your household, please contact your broker-dealer.
For additional information, please scan the QR code at the left to navigate to additional material at invesco.com/reports.
P-HIYS-SAR
Invesco High Yield Select ETF
Invesco Managed Futures Strategy ETF
IMF | Cboe BZX Exchange, Inc.
SEMI-ANNUAL SHAREHOLDER REPORT | April 30, 2025
This semi-annual shareholder report contains important information about Invesco Managed Futures Strategy ETF (the “Fund”) for the period March 17, 2025 (commencement of operations) to April 30, 2025. You can find additional information about the Fund at invesco.com/reports. You can also request this information by contacting us at (800) 983-0903.
What Were The Fund Costs For The Last Six Months ?
(Based on a hypothetical $10,000 investment)
| Fund |
Costs of a $10,000 investment▼ |
Costs paid as a percentage
of a $10,000 investment* |
| Invesco Managed Futures Strategy ETF |
$6 |
0.50%† |
|
▼
|
The Fund commenced operations during the reporting period. Expenses for a full reporting period would be higher.
|
| * |
Annualized.
|
|
†
|
Reflects fee waivers and/or expense reimbursements, without which expenses would have been higher.
|
What Are Key Statistics About The Fund?
(as of April 30, 2025)
| Fund net assets |
$305,924,514 |
| Total number of portfolio holdings |
52 |
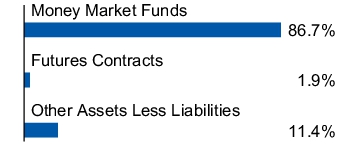
What Comprised The Fund's Holdings?
(as of April 30, 2025)
Futures exposure*
(% of total notional exposure)
| Commodity Risk (Long) |
6.4% |
| Commodity Risk (Short) |
12.1% |
| Currency Risk (Long) |
17.4% |
| Currency Risk (Short) |
3.1% |
| Equity Risk (Long) |
13.9% |
| Equity Risk (Short) |
4.7% |
| Interest Rate Risk (Long) |
29.9% |
| Interest Rate Risk (Short) |
12.5% |
| * Futures exposure is calculated on the notional value as a percentage of total notional exposure. |
|
Security type allocation
(% of net assets)
Where Can I Find More Information?
You can find more information about the Fund, including the Fund's prospectus, financial information, and holdings at invesco.com/reports. Additionally, the Fund's proxy voting information can be found at invesco.com/proxy-voting.
What Should I Know About Delivery Of Important Regulatory Documents?
Only one copy of most shareholder documents may be mailed to shareholders with multiple accounts at the same address (Householding). Mailing of your shareholder documents may be householded indefinitely unless you instruct otherwise. If you do not want the mailing of these documents to be combined with those for other members of your household, please contact your broker-dealer.
For additional information, please scan the QR code at the left to navigate to additional material at invesco.com/reports.
P-IMF-SAR
Invesco Managed Futures Strategy ETF
Invesco MSCI EAFE Income Advantage ETF
EFAA | NYSE Arca, Inc.
SEMI-ANNUAL SHAREHOLDER REPORT | April 30, 2025
This semi-annual shareholder report contains important information about Invesco MSCI EAFE Income Advantage ETF (the “Fund”) for the period November 1, 2024 to April 30, 2025. You can find additional information about the Fund at invesco.com/reports. You can also request this information by contacting us at (800) 983-0903.
What Were The Fund Costs For The Last Six Months ?
(Based on a hypothetical $10,000 investment)
| Fund |
Costs of a $10,000 investment |
Costs paid as a percentage
of a $10,000 investment* |
| Invesco MSCI EAFE Income Advantage ETF |
$0 |
0.00%† |
| * |
Annualized. |
|
† |
Reflects fee waivers and/or expense reimbursements, without which expenses would have been higher. |
What Are Key Statistics About The Fund?
(as of April 30, 2025)
| Fund net assets |
$136,592,755 |
| Total number of portfolio holdings |
713 |
| Portfolio turnover rate |
3% |
What Comprised The Fund's Holdings?
(as of April 30, 2025)
Top ten holdings*
(% of net assets)
| SAP SE |
1.32% |
| Nestle S.A. |
1.20% |
| ASML Holding N.V. |
1.14% |
| Roche Holding AG |
0.99% |
| Novartis AG |
0.97% |
| AstraZeneca PLC |
0.96% |
| Novo Nordisk A/S, Class B |
0.93% |
| HSBC Holdings PLC |
0.86% |
| Shell PLC |
0.85% |
| Toyota Motor Corp. |
0.78% |
| * Excluding money market fund holdings, if any. |
|
Security type allocation
(% of net assets)
Where Can I Find More Information?
You can find more information about the Fund, including the Fund's prospectus, financial information, and holdings at invesco.com/reports. Additionally, the Fund's proxy voting information can be found at invesco.com/proxy-voting.
What Should I Know About Delivery Of Important Regulatory Documents?
Only one copy of most shareholder documents may be mailed to shareholders with multiple accounts at the same address (Householding). Mailing of your shareholder documents may be householded indefinitely unless you instruct otherwise. If you do not want the mailing of these documents to be combined with those for other members of your household, please contact your broker-dealer.
For additional information, please scan the QR code at the left to navigate to additional material at invesco.com/reports.
P-EFAA-SAR
Invesco MSCI EAFE Income Advantage ETF
Invesco QQQ Income Advantage ETF
QQA | The Nasdaq Stock Market LLC
SEMI-ANNUAL SHAREHOLDER REPORT | April 30, 2025
This semi-annual shareholder report contains important information about Invesco QQQ Income Advantage ETF (the “Fund”) for the period November 1, 2024 to April 30, 2025. You can find additional information about the Fund at invesco.com/reports. You can also request this information by contacting us at (800) 983-0903.
What Were The Fund Costs For The Last Six Months ?
(Based on a hypothetical $10,000 investment)
| Fund |
Costs of a $10,000 investment |
Costs paid as a percentage
of a $10,000 investment* |
| Invesco QQQ Income Advantage ETF |
$0 |
0.00%† |
| * |
Annualized. |
|
† |
Reflects fee waivers and/or expense reimbursements, without which expenses would have been higher. |
What Are Key Statistics About The Fund?
(as of April 30, 2025)
| Fund net assets |
$209,275,038 |
| Total number of portfolio holdings |
121 |
| Portfolio turnover rate |
5% |
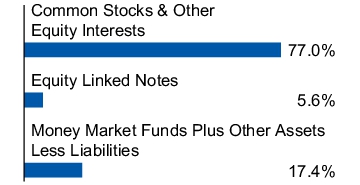
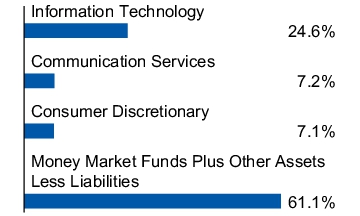
What Comprised The Fund's Holdings?
(as of April 30, 2025)
Top ten holdings*
(% of net assets)
| Apple, Inc. |
6.82% |
| Microsoft Corp. |
6.27% |
| NVIDIA Corp. |
5.68% |
| Amazon.com, Inc. |
4.17% |
| Broadcom, Inc. |
3.19% |
| Meta Platforms, Inc., Class A |
2.57% |
| Netflix, Inc. |
2.54% |
| Costco Wholesale Corp. |
2.31% |
| Tesla, Inc. |
2.19% |
| Alphabet, Inc., Class A |
1.98% |
| * Excluding money market fund holdings, if any. |
|
Security type allocation
(% of net assets)
Where Can I Find More Information?
You can find more information about the Fund, including the Fund's prospectus, financial information, and holdings at invesco.com/reports. Additionally, the Fund's proxy voting information can be found at invesco.com/proxy-voting.
What Should I Know About Delivery Of Important Regulatory Documents?
Only one copy of most shareholder documents may be mailed to shareholders with multiple accounts at the same address (Householding). Mailing of your shareholder documents may be householded indefinitely unless you instruct otherwise. If you do not want the mailing of these documents to be combined with those for other members of your household, please contact your broker-dealer.
For additional information, please scan the QR code at the left to navigate to additional material at invesco.com/reports.
P-QQA-SAR
Invesco QQQ Income Advantage ETF
Invesco Real Assets ESG ETF
IVRA | Cboe BZX Exchange, Inc.
SEMI-ANNUAL SHAREHOLDER REPORT | April 30, 2025
This semi-annual shareholder report contains important information about Invesco Real Assets ESG ETF (the “Fund”) for the period November 1, 2024 to April 30, 2025. You can find additional information about the Fund at invesco.com/reports. You can also request this information by contacting us at (800) 983-0903.
What Were The Fund Costs For The Last Six Months ?
(Based on a hypothetical $10,000 investment)
| Fund |
Costs of a $10,000 investment |
Costs paid as a percentage
of a $10,000 investment* |
| Invesco Real Assets ESG ETF |
$30 |
0.59% |
What Are Key Statistics About The Fund?
(as of April 30, 2025)
| Fund net assets |
$12,228,692 |
| Total number of portfolio holdings |
54 |
| Portfolio turnover rate |
49% |
What Comprised The Fund's Holdings?
(as of April 30, 2025)
Top ten holdings*
(% of net assets)
| Prologis, Inc. |
5.32% |
| American Tower Corp. |
4.85% |
| Sempra |
4.49% |
| Equinix, Inc. |
4.14% |
| Cheniere Energy, Inc. |
4.03% |
| ONEOK, Inc. |
3.69% |
| Welltower, Inc. |
3.60% |
| Williams Cos., Inc. (The) |
3.45% |
| Kinder Morgan, Inc. |
3.39% |
| Targa Resources Corp. |
3.21% |
| * Excluding money market fund holdings, if any. |
|
Sector allocation
(% of net assets)
Where Can I Find More Information?
You can find more information about the Fund, including the Fund's prospectus, financial information, and holdings at invesco.com/reports. Additionally, the Fund's proxy voting information can be found at invesco.com/proxy-voting.
What Should I Know About Delivery Of Important Regulatory Documents?
Only one copy of most shareholder documents may be mailed to shareholders with multiple accounts at the same address (Householding). Mailing of your shareholder documents may be householded indefinitely unless you instruct otherwise. If you do not want the mailing of these documents to be combined with those for other members of your household, please contact your broker-dealer.
For additional information, please scan the QR code at the left to navigate to additional material at invesco.com/reports.
P-IVRA-SAR
Invesco Real Assets ESG ETF
Invesco Rochester High Yield Municipal ETF
IROC | Cboe BZX Exchange, Inc.
SEMI-ANNUAL SHAREHOLDER REPORT | April 30, 2025
This semi-annual shareholder report contains important information about Invesco Rochester High Yield Municipal ETF (the “Fund”), formerly Invesco Municipal Strategic Income ETF, for the period November 1, 2024 to April 30, 2025. You can find additional information about the Fund at invesco.com/reports. You can also request this information by contacting us at (800) 983-0903.
What Were The Fund Costs For The Last Six Months ?
(Based on a hypothetical $10,000 investment)
| Fund |
Costs of a $10,000 investment |
Costs paid as a percentage
of a $10,000 investment* |
| Invesco Rochester High Yield Municipal ETF |
$19 |
0.39% |
What Are Key Statistics About The Fund?
(as of April 30, 2025)
| Fund net assets |
$30,056,046 |
| Total number of portfolio holdings |
64 |
| Portfolio turnover rate |
48% |
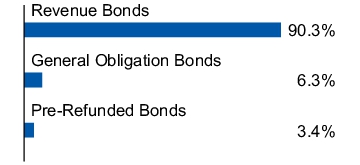
What Comprised The Fund's Holdings?
(as of April 30, 2025)
Top ten holdings*
(% of net assets)
| New York Transportation Development Corp. (LaGuardia Airport Terminal B Redevelopment), Series 2023, RB, 6.00%, 04/01/2035 |
3.63% |
| Virginia Beach Development Authority (Westminster-Canterbury on Chesapeake Bay), Series 2023 B-3, RB, 5.38%, 09/01/2029 |
3.35% |
| Louisiana (State of) Public Facilities Authority (I-10 Calcasieu River Bridge), Series 2024, RB, 5.75%, 09/01/2064 |
2.59% |
| Portland (Port of), OR (Green Bonds), Twenty Ninth Series 2023, RB, 5.25%, 07/01/2039 |
2.49% |
| Allentown (City of), PA Neighborhood Improvement Zone Development Authority, Series 2022, Ref. RB, 5.00%, 05/01/2033 |
1.83% |
| Pennsylvania (Commonwealth of) Economic Development Financing Authority (Penndot Major Bridges (The)), Series 2022, RB, 5.50%, 06/30/2038 |
1.77% |
| Iowa (State of) Finance Authority (Iowa Fertilizer Co.), Series 2022, Ref. RB, 4.00%, 12/01/2032 |
1.75% |
| New York Transportation Development Corp. (John F. Kennedy International Airport New Terminal One) (Green Bonds), Series 2023, RB, 6.00%, 06/30/2054 |
1.75% |
| Patriots Energy Group Financing Agency, Series 2023 A-1, RB, 5.25%, 08/01/2031 |
1.74% |
| California (State of) Pollution Control Financing Authority (Poseidon Resources L.P.), Series 2023, RB, 5.00%, 07/01/2038 |
1.72% |
| * Excluding money market fund holdings, if any. |
|
Credit sector allocation
(% of total investments)
Where Can I Find More Information?
You can find more information about the Fund, including the Fund's prospectus, financial information, and holdings at invesco.com/reports. Additionally, the Fund's proxy voting information can be found at invesco.com/proxy-voting.
What Should I Know About Delivery Of Important Regulatory Documents?
Only one copy of most shareholder documents may be mailed to shareholders with multiple accounts at the same address (Householding). Mailing of your shareholder documents may be householded indefinitely unless you instruct otherwise. If you do not want the mailing of these documents to be combined with those for other members of your household, please contact your broker-dealer.
For additional information, please scan the QR code at the left to navigate to additional material at invesco.com/reports.
P-IROC-SAR
Invesco Rochester High Yield Municipal ETF
Invesco S&P 500® Downside Hedged ETF
PHDG | NYSE Arca, Inc.
SEMI-ANNUAL SHAREHOLDER REPORT | April 30, 2025
This semi-annual shareholder report contains important information about Invesco S&P 500® Downside Hedged ETF (the “Fund”) for the period November 1, 2024 to April 30, 2025. You can find additional information about the Fund at invesco.com/reports. You can also request this information by contacting us at (800) 983-0903.
What Were The Fund Costs For The Last Six Months ?
(Based on a hypothetical $10,000 investment)
| Fund |
Costs of a $10,000 investment |
Costs paid as a percentage
of a $10,000 investment* |
| Invesco S&P 500® Downside Hedged ETF |
$15 |
0.33%† |
| * |
Annualized. |
|
† |
Reflects fee waivers and/or expense reimbursements, without which expenses would have been higher. |
What Are Key Statistics About The Fund?
(as of April 30, 2025)
| Fund net assets |
$99,222,128 |
| Total number of portfolio holdings |
508 |
| Portfolio turnover rate |
799% |
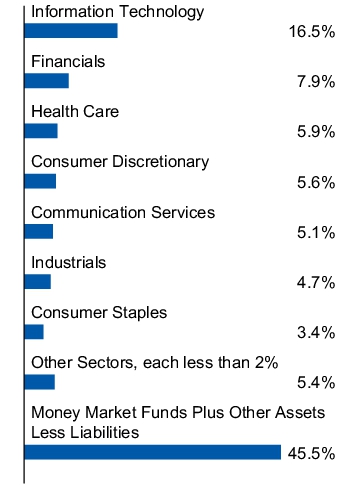
What Comprised The Fund's Holdings?
(as of April 30, 2025)
Top ten holdings*
(% of net assets)
| Apple, Inc. |
3.69% |
| Microsoft Corp. |
3.40% |
| NVIDIA Corp. |
3.08% |
| Amazon.com, Inc. |
2.01% |
| Meta Platforms, Inc., Class A |
1.39% |
| Berkshire Hathaway, Inc., Class B |
1.13% |
| Alphabet, Inc., Class A |
1.07% |
| Broadcom, Inc. |
1.04% |
| Tesla, Inc. |
0.91% |
| Alphabet, Inc., Class C |
0.88% |
| * Excluding money market fund holdings, if any. |
|
Sector allocation
(% of net assets)
Where Can I Find More Information?
You can find more information about the Fund, including the Fund's prospectus, financial information, and holdings at invesco.com/reports. Additionally, the Fund's proxy voting information can be found at invesco.com/proxy-voting.
What Should I Know About Delivery Of Important Regulatory Documents?
Only one copy of most shareholder documents may be mailed to shareholders with multiple accounts at the same address (Householding). Mailing of your shareholder documents may be householded indefinitely unless you instruct otherwise. If you do not want the mailing of these documents to be combined with those for other members of your household, please contact your broker-dealer.
For additional information, please scan the QR code at the left to navigate to additional material at invesco.com/reports.
P-PHDG-SAR
Invesco S&P 500® Downside Hedged ETF
Invesco S&P 500 Equal Weight Income Advantage ETF
RSPA | NYSE Arca, Inc.
SEMI-ANNUAL SHAREHOLDER REPORT | April 30, 2025
This semi-annual shareholder report contains important information about Invesco S&P 500 Equal Weight Income Advantage ETF (the “Fund”) for the period November 1, 2024 to April 30, 2025. You can find additional information about the Fund at invesco.com/reports. You can also request this information by contacting us at (800) 983-0903.
What Were The Fund Costs For The Last Six Months ?
(Based on a hypothetical $10,000 investment)
| Fund |
Costs of a $10,000 investment |
Costs paid as a percentage
of a $10,000 investment* |
| Invesco S&P 500 Equal Weight Income Advantage ETF |
$0 |
0.00%† |
| * |
Annualized. |
|
† |
Reflects fee waivers and/or expense reimbursements, without which expenses would have been higher. |
What Are Key Statistics About The Fund?
(as of April 30, 2025)
| Fund net assets |
$296,923,663 |
| Total number of portfolio holdings |
523 |
| Portfolio turnover rate |
12% |
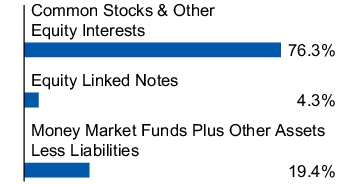
What Comprised The Fund's Holdings?
(as of April 30, 2025)
Top ten holdings*
(% of net assets)
| UBS AG (Invesco S&P 500 Equal Weight ETF) |
0.51% |
| Mizuho Markets Cayman L.P. (Invesco S&P 500 Equal Weight ETF) |
0.43% |
| BNP Paribas Issuance B.V. (Invesco S&P 500 Equal Weight ETF) |
0.37% |
| J.P. Morgan Chase & Co. (Invesco S&P 500 Equal Weight ETF) |
0.36% |
| Mizuho Markets Cayman L.P. (Invesco S&P 500 Equal Weight ETF) |
0.35% |
| Wells Fargo Bank N.A. (Invesco S&P 500 Equal Weight ETF) |
0.31% |
| BNP Paribas Issuance B.V. (Invesco S&P 500 Equal Weight ETF) |
0.31% |
| Citigroup Global Markets Holdings, Inc. (Invesco S&P 500 Equal Weight ETF) |
0.26% |
| Canadian Imperial Bank of Commerce (Invesco S&P 500 Equal Weight ETF) |
0.26% |
| Citigroup Global Markets Holdings, Inc. (Invesco S&P 500 Equal Weight ETF) |
0.26% |
| * Excluding money market fund holdings, if any. |
|
Security type allocation
(% of net assets)
Where Can I Find More Information?
You can find more information about the Fund, including the Fund's prospectus, financial information, and holdings at invesco.com/reports. Additionally, the Fund's proxy voting information can be found at invesco.com/proxy-voting.
What Should I Know About Delivery Of Important Regulatory Documents?
Only one copy of most shareholder documents may be mailed to shareholders with multiple accounts at the same address (Householding). Mailing of your shareholder documents may be householded indefinitely unless you instruct otherwise. If you do not want the mailing of these documents to be combined with those for other members of your household, please contact your broker-dealer.
For additional information, please scan the QR code at the left to navigate to additional material at invesco.com/reports.
P-RSPA-SAR
Invesco S&P 500 Equal Weight Income Advantage ETF
Invesco Short Duration Total Return Bond ETF
GTOS | Cboe BZX Exchange, Inc.
SEMI-ANNUAL SHAREHOLDER REPORT | April 30, 2025
This semi-annual shareholder report contains important information about Invesco Short Duration Total Return Bond ETF (the “Fund”), formerly Invesco Short Duration Bond ETF, for the period November 1, 2024 to April 30, 2025. You can find additional information about the Fund at invesco.com/reports. You can also request this information by contacting us at (800) 983-0903.
What Were The Fund Costs For The Last Six Months ?
(Based on a hypothetical $10,000 investment)
| Fund |
Costs of a $10,000 investment |
Costs paid as a percentage
of a $10,000 investment* |
| Invesco Short Duration Total Return Bond ETF |
$17 |
0.33% |
What Are Key Statistics About The Fund?
(as of April 30, 2025)
| Fund net assets |
$9,980,509 |
| Total number of portfolio holdings |
283 |
| Portfolio turnover rate |
182% |
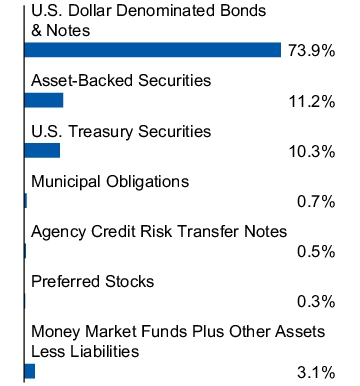
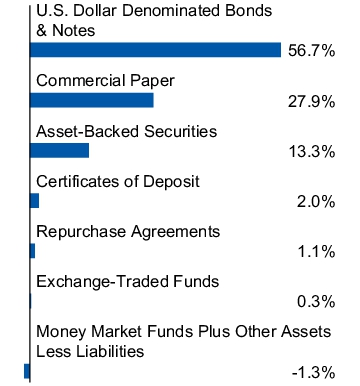
What Comprised The Fund's Holdings?
(as of April 30, 2025)
Top ten holdings*
(% of net assets)
| U.S. Treasury Notes, 3.75%, 04/30/2027 |
5.85% |
| Morgan Stanley Bank N.A., 5.88%, 10/30/2026 |
2.57% |
| U.S. Treasury Notes, 3.88%, 04/30/2030 |
2.37% |
| NatWest Group PLC, 7.47%, 11/10/2026 |
2.03% |
| Barclays PLC, 7.33%, 11/02/2026 |
2.03% |
| Ford Motor Credit Co. LLC, 7.32%, 03/06/2026 |
2.02% |
| UBS AG, 5.80%, 09/11/2025 |
2.01% |
| U.S. Treasury Notes, 3.75%, 04/15/2028 |
1.68% |
| AerCap Ireland Capital DAC/AerCap Global Aviation Trust, 6.10%, 01/15/2027 |
1.54% |
| Protective Life Global Funding, 5.37%, 01/06/2026 |
1.51% |
| * Excluding money market fund holdings, if any. |
|
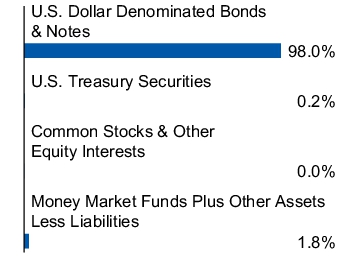
Security type allocation
(% of net assets)
Where Can I Find More Information?
You can find more information about the Fund, including the Fund's prospectus, financial information, and holdings at invesco.com/reports. Additionally, the Fund's proxy voting information can be found at invesco.com/proxy-voting.
What Should I Know About Delivery Of Important Regulatory Documents?
Only one copy of most shareholder documents may be mailed to shareholders with multiple accounts at the same address (Householding). Mailing of your shareholder documents may be householded indefinitely unless you instruct otherwise. If you do not want the mailing of these documents to be combined with those for other members of your household, please contact your broker-dealer.
For additional information, please scan the QR code at the left to navigate to additional material at invesco.com/reports.
P-GTOS-SAR
Invesco Short Duration Total Return Bond ETF
Invesco SteelPath MLP & Energy Infrastructure ETF
PIPE | Cboe BZX Exchange, Inc.
SEMI-ANNUAL SHAREHOLDER REPORT | April 30, 2025
This semi-annual shareholder report contains important information about Invesco SteelPath MLP & Energy Infrastructure ETF (the “Fund”) for the period February 18, 2025 (commencement of operations) to April 30, 2025. You can find additional information about the Fund at invesco.com/reports. You can also request this information by contacting us at (800) 983-0903.
What Were The Fund Costs For The Last Six Months ?
(Based on a hypothetical $10,000 investment)
| Fund |
Costs of a $10,000 investment▼ |
Costs paid as a percentage
of a $10,000 investment* |
| Invesco SteelPath MLP & Energy Infrastructure ETF |
$14 |
0.75% |
|
▼
|
The Fund commenced operations during the reporting period. Expenses for a full reporting period would be higher.
|
| * |
Annualized.
|
What Are Key Statistics About The Fund?
(as of April 30, 2025)
| Fund net assets |
$15,249,479 |
| Total number of portfolio holdings |
26 |
| Portfolio turnover rate |
1% |
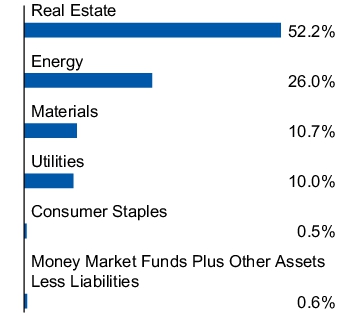
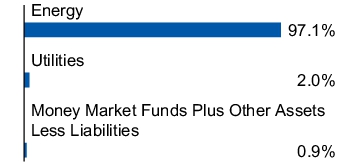
What Comprised The Fund's Holdings?
(as of April 30, 2025)
Top ten holdings*
(% of net assets)
| Williams Cos., Inc. (The) |
6.47% |
| Targa Resources Corp. |
6.46% |
| TC Energy Corp. |
5.79% |
| Plains GP Holdings L.P., Class A |
5.51% |
| ONEOK, Inc. |
5.33% |
| Cheniere Energy, Inc. |
5.20% |
| Pembina Pipeline Corp. |
4.88% |
| Enbridge, Inc. |
4.87% |
| South Bow Corp. |
4.81% |
| Kinder Morgan, Inc. |
4.71% |
| * Excluding money market fund holdings, if any. |
|
Sector allocation
(% of net assets)
Where Can I Find More Information?
You can find more information about the Fund, including the Fund's prospectus, financial information, and holdings at invesco.com/reports. Additionally, the Fund's proxy voting information can be found at invesco.com/proxy-voting.
What Should I Know About Delivery Of Important Regulatory Documents?
Only one copy of most shareholder documents may be mailed to shareholders with multiple accounts at the same address (Householding). Mailing of your shareholder documents may be householded indefinitely unless you instruct otherwise. If you do not want the mailing of these documents to be combined with those for other members of your household, please contact your broker-dealer.
For additional information, please scan the QR code at the left to navigate to additional material at invesco.com/reports.
P-PIPE-SAR
Invesco SteelPath MLP & Energy Infrastructure ETF
Invesco Top QQQ ETF
QBIG | The Nasdaq Stock Market LLC
SEMI-ANNUAL SHAREHOLDER REPORT | April 30, 2025
This semi-annual shareholder report contains important information about Invesco Top QQQ ETF (the “Fund”) for the period December 2, 2024 (commencement of operations) to April 30, 2025. You can find additional information about the Fund at invesco.com/reports. You can also request this information by contacting us at (800) 983-0903.
What Were The Fund Costs For The Last Six Months ?
(Based on a hypothetical $10,000 investment)
| Fund |
Costs of a $10,000 investment▼ |
Costs paid as a percentage
of a $10,000 investment* |
| Invesco Top QQQ ETF |
$9 |
0.23%† |
|
▼ |
The Fund commenced operations during the reporting period. Expenses for a full reporting period would be higher. |
| * |
Annualized. |
|
† |
Reflects fee waivers and/or expense reimbursements, without which expenses would have been higher. |
What Are Key Statistics About The Fund?
(as of April 30, 2025)
| Fund net assets |
$22,734,617 |
| Total number of portfolio holdings |
13 |
| Portfolio turnover rate |
81% |
What Comprised The Fund's Holdings?
(as of April 30, 2025)
Top ten holdings*
(% of net assets)
| Apple, Inc. |
7.63% |
| Microsoft Corp. |
7.02% |
| NVIDIA Corp. |
6.35% |
| Amazon.com, Inc. |
4.67% |
| Broadcom, Inc. |
3.57% |
| Meta Platforms, Inc., Class A |
2.88% |
| Tesla, Inc. |
2.45% |
| Alphabet, Inc., Class A |
2.21% |
| Alphabet, Inc., Class C |
2.11% |
| * Excluding money market fund holdings, if any. |
|
Sector allocation
(% of net assets)
Where Can I Find More Information?
You can find more information about the Fund, including the Fund's prospectus, financial information, and holdings at invesco.com/reports. Additionally, the Fund's proxy voting information can be found at invesco.com/proxy-voting.
What Should I Know About Delivery Of Important Regulatory Documents?
Only one copy of most shareholder documents may be mailed to shareholders with multiple accounts at the same address (Householding). Mailing of your shareholder documents may be householded indefinitely unless you instruct otherwise. If you do not want the mailing of these documents to be combined with those for other members of your household, please contact your broker-dealer.
For additional information, please scan the QR code at the left to navigate to additional material at invesco.com/reports.
P-QBIG-SAR
Invesco Top QQQ ETF
Invesco Total Return Bond ETF
GTO | NYSE Arca, Inc.
SEMI-ANNUAL SHAREHOLDER REPORT | April 30, 2025
This semi-annual shareholder report contains important information about Invesco Total Return Bond ETF (the “Fund”) for the period November 1, 2024 to April 30, 2025. You can find additional information about the Fund at invesco.com/reports. You can also request this information by contacting us at (800) 983-0903.
What Were The Fund Costs For The Last Six Months ?
(Based on a hypothetical $10,000 investment)
| Fund |
Costs of a $10,000 investment |
Costs paid as a percentage
of a $10,000 investment* |
| Invesco Total Return Bond ETF |
$13 |
0.25%† |
| * |
Annualized.
|
|
†
|
Reflects fee waivers and/or expense reimbursements, without which expenses would have been higher.
|
What Are Key Statistics About The Fund?
(as of April 30, 2025)
| Fund net assets |
$1,887,146,731 |
| Total number of portfolio holdings |
1,275 |
| Portfolio turnover rate |
308% |
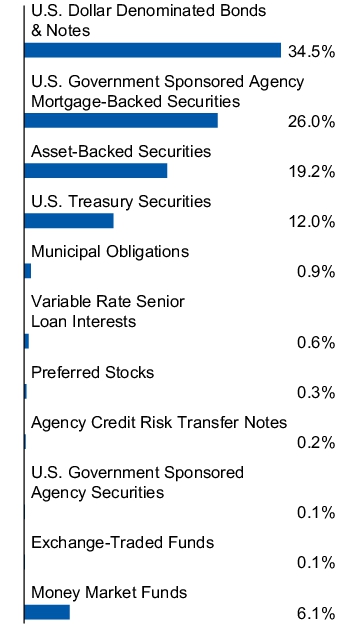
What Comprised The Fund's Holdings?
(as of April 30, 2025)
Top ten holdings*
(% of net assets)
| U.S. Treasury Bonds, 4.50%, 11/15/2054 |
4.28% |
| Uniform Mortgage-Backed Securities, TBA, 5.50%, 05/01/2055 |
4.17% |
| U.S. Treasury Notes, 3.88%, 04/30/2030 |
3.49% |
| Uniform Mortgage-Backed Securities, TBA, 2.50%, 06/01/2055 |
3.45% |
| U.S. Treasury Notes, 4.63%, 02/15/2035 |
2.77% |
| Uniform Mortgage-Backed Securities, TBA, 3.00%, 05/01/2055 |
2.69% |
| Uniform Mortgage-Backed Securities, TBA, 5.00%, 05/01/2055 |
2.64% |
| Uniform Mortgage-Backed Securities, TBA, 6.00%, 05/01/2055 |
2.56% |
| U.S. Treasury Notes, 3.75%, 04/30/2027 |
2.33% |
| Uniform Mortgage-Backed Securities, TBA, 3.50%, 05/01/2055 |
1.77% |
| * Excluding money market fund holdings, if any. |
|
Security type allocation
(% of total investments)
Where Can I Find More Information?
You can find more information about the Fund, including the Fund's prospectus, financial information, and holdings at invesco.com/reports. Additionally, the Fund's proxy voting information can be found at invesco.com/proxy-voting.
What Should I Know About Delivery Of Important Regulatory Documents?
Only one copy of most shareholder documents may be mailed to shareholders with multiple accounts at the same address (Householding). Mailing of your shareholder documents may be householded indefinitely unless you instruct otherwise. If you do not want the mailing of these documents to be combined with those for other members of your household, please contact your broker-dealer.
For additional information, please scan the QR code at the left to navigate to additional material at invesco.com/reports.
P-GTO-SAR
Invesco Total Return Bond ETF
Invesco Ultra Short Duration ETF
GSY | NYSE Arca, Inc.
SEMI-ANNUAL SHAREHOLDER REPORT | April 30, 2025
This semi-annual shareholder report contains important information about Invesco Ultra Short Duration ETF (the “Fund”) for the period November 1, 2024 to April 30, 2025. You can find additional information about the Fund at invesco.com/reports. You can also request this information by contacting us at (800) 983-0903.
What Were The Fund Costs For The Last Six Months ?
(Based on a hypothetical $10,000 investment)
| Fund |
Costs of a $10,000 investment |
Costs paid as a percentage
of a $10,000 investment* |
| Invesco Ultra Short Duration ETF |
$11 |
0.22% |
What Are Key Statistics About The Fund?
(as of April 30, 2025)
| Fund net assets |
$2,770,718,250 |
| Total number of portfolio holdings |
330 |
| Portfolio turnover rate |
23% |
What Comprised The Fund's Holdings?
(as of April 30, 2025)
Top ten holdings*
(% of net assets)
| APA Corp., 5.05%, 05/01/2025 |
1.11% |
| Jabil, Inc., 5.08%-5.13%, 05/05/2025 |
1.08% |
| Boston Properties L.P., 4.69%, 06/02/2025 |
0.93% |
| Kinder Morgan, Inc., 4.30%, 06/01/2025 |
0.93% |
| Crown Castle, Inc., 4.94%, 05/01/2025 |
0.90% |
| Conagra Brands, Inc., 5.07%, 05/19/2025 |
0.90% |
| Brunswick Corp., 5.06%-5.11%, 05/01/2025 |
0.75% |
| Eversource Energy, 4.83%, 05/12/2025 |
0.72% |
| Sonoco Products Co., 5.24%, 05/28/2025 |
0.72% |
| Quanta Services, Inc., 4.90%, 05/02/2025 |
0.70% |
| * Excluding money market fund holdings, if any. |
|
Security type allocation
(% of net assets)
Where Can I Find More Information?
You can find more information about the Fund, including the Fund's prospectus, financial information, and holdings at invesco.com/reports. Additionally, the Fund's proxy voting information can be found at invesco.com/proxy-voting.
What Should I Know About Delivery Of Important Regulatory Documents?
Only one copy of most shareholder documents may be mailed to shareholders with multiple accounts at the same address (Householding). Mailing of your shareholder documents may be householded indefinitely unless you instruct otherwise. If you do not want the mailing of these documents to be combined with those for other members of your household, please contact your broker-dealer.
For additional information, please scan the QR code at the left to navigate to additional material at invesco.com/reports.
P-GSY-SAR
Invesco Ultra Short Duration ETF
Invesco Variable Rate Investment Grade ETF
VRIG | The Nasdaq Stock Market LLC
SEMI-ANNUAL SHAREHOLDER REPORT | April 30, 2025
This semi-annual shareholder report contains important information about Invesco Variable Rate Investment Grade ETF (the “Fund”) for the period November 1, 2024 to April 30, 2025. You can find additional information about the Fund at invesco.com/reports. You can also request this information by contacting us at (800) 983-0903.
What Were The Fund Costs For The Last Six Months ?
(Based on a hypothetical $10,000 investment)
| Fund |
Costs of a $10,000 investment |
Costs paid as a percentage
of a $10,000 investment* |
| Invesco Variable Rate Investment Grade ETF |
$15 |
0.30% |
What Are Key Statistics About The Fund?
(as of April 30, 2025)
| Fund net assets |
$1,266,364,679 |
| Total number of portfolio holdings |
385 |
| Portfolio turnover rate |
37% |
What Comprised The Fund's Holdings?
(as of April 30, 2025)
Top ten holdings*
(% of net assets)
| U.S. Treasury Floating Rate Notes, 4.34%, 01/31/2027 |
14.90% |
| U.S. Treasury Floating Rate Notes, 4.45%, 10/31/2026 |
7.68% |
| Freddie Mac, Series 2024-HQA1, Class A1, STACR®, 5.60%, 03/25/2044 |
0.79% |
| Freddie Mac REMICs, 5.85%, 04/25/2055 |
0.66% |
| Volkswagen Group of America Finance LLC, 5.44%, 03/25/2027 |
0.63% |
| ABN AMRO Bank N.V., 5.37%, 12/03/2028 |
0.60% |
| Santander Holdings USA, Inc., 5.98%, 03/20/2029 |
0.60% |
| Morgan Stanley, 5.40%, 04/13/2028 |
0.59% |
| General Motors Financial Co., Inc., 5.41%, 02/26/2027 |
0.59% |
| JPMorgan Chase & Co., 5.30%, 04/22/2028 |
0.59% |
| * Excluding money market fund holdings, if any. |
|
Security type allocation
(% of net assets)
Where Can I Find More Information?
You can find more information about the Fund, including the Fund's prospectus, financial information, and holdings at invesco.com/reports. Additionally, the Fund's proxy voting information can be found at invesco.com/proxy-voting.
What Should I Know About Delivery Of Important Regulatory Documents?
Only one copy of most shareholder documents may be mailed to shareholders with multiple accounts at the same address (Householding). Mailing of your shareholder documents may be householded indefinitely unless you instruct otherwise. If you do not want the mailing of these documents to be combined with those for other members of your household, please contact your broker-dealer.
For additional information, please scan the QR code at the left to navigate to additional material at invesco.com/reports.
P-VRIG-SAR
Invesco Variable Rate Investment Grade ETF
Not applicable for a semi-annual report.
Item 3. Audit Committee Financial Expert.
Not applicable for a semi-annual report.
Item 4. Principal Accountant Fees and Services.
Not applicable for a semi-annual report.
Item 5. Audit Committee of Listed Registrants.
Not applicable for a semi-annual report.
(a) Investments in securities of unaffiliated issuers is filed under Item 7 of this Form N-CSR.
(b) Not applicable.
Item 7. Financial Statements and Financial Highlights for Open-End Management Investment Companies.
Invesco Semi-Annual Financial Statements and Other Information
|
|
Invesco AAA CLO Floating Rate Note ETF
|
|
|
Invesco Active U.S. Real Estate ETF
|
|
|
Invesco High Yield Bond Factor ETF
|
|
|
Invesco High Yield Select ETF
|
|
|
Invesco MSCI EAFE Income Advantage ETF
|
|
|
Invesco QQQ Income Advantage ETF
|
|
|
Invesco S&P 500® Downside Hedged ETF
|
|
|
Invesco S&P 500 Equal Weight Income Advantage ETF
|
|
|
Invesco Short Duration Total Return Bond ETF (formerly, Invesco Short Duration Bond
ETF)
|
|
|
Invesco SteelPath MLP & Energy Infrastructure ETF
|
|
|
|
|
|
Invesco Total Return Bond ETF
|
|
|
Invesco Ultra Short Duration ETF
|
|
|
Invesco Variable Rate Investment Grade ETF
|
Invesco AAA CLO Floating Rate Note ETF (ICLO)
April 30, 2025
(Unaudited)
|
|
|
|
Asset-Backed Securities-97.95%
|
|
|
|
|
|
Series 2019-5A, Class BR, 6.11% (3 mo.
Term SOFR + 1.85%), 04/15/2035(a)(b)
|
|
|
|
Series 2020-6A, Class A1R2, 5.48% (3
mo. Term SOFR + 1.20%),
10/23/2034(a)(b)
|
|
|
|
ABPCI Direct Lending Fund CLO V Ltd.
(Cayman Islands)
|
|
|
|
Series 2019-5A, Class A1RR, 6.47% (3
mo. Term SOFR + 2.20%),
01/20/2036(a)(b)
|
|
|
|
Series 2019-5A, Class A1Z, 6.27% (3 mo.
Term SOFR + 2.00%), 01/20/2036(a)(b)
|
|
|
|
AGL CLO 13 Ltd. (Cayman Islands),
Series 2021-13A, Class A1, 5.69% (3 mo.
Term SOFR + 1.42%), 10/20/2034(a)(b)
|
|
|
|
AGL CLO 14 Ltd. (Cayman Islands),
Series 2021-14A, Class AR, 5.40% (3 mo.
Term SOFR + 1.13%), 12/02/2034(a)(b)
|
|
|
|
AGL CLO 20 Ltd. (Jersey), Series 2022-20A,
Class BR, 6.02% (3 mo. Term SOFR +
1.75%), 10/20/2037(a)(b)
|
|
|
|
AGL Clo 28 Ltd. (Jersey), Series 2023-28A,
Class AL2, 5.97% (3 mo. Term SOFR +
1.70%), 01/21/2037(a)(b)
|
|
|
|
AGL CLO 29 Ltd. (Jersey), Series 2024-29A,
Class A1, 5.84% (3 mo. Term SOFR +
1.57%), 04/21/2037(a)(b)
|
|
|
|
AGL Core CLO 27 Ltd. (Cayman Islands),
Series 2023-27A, Class A, 6.00% (3 mo.
Term SOFR + 1.73%), 10/21/2036(a)(b)
|
|
|
|
AGL Core CLO 31 Ltd. (Cayman Islands),
Series 2024-31A, Class A, 5.67% (3 mo.
Term SOFR + 1.40%), 07/20/2037(a)(b)
|
|
|
|
AGL Core CLO 4 Ltd. (Cayman Islands),
Series 2020-4A, Class AR2, 5.65% (3 mo.
Term SOFR + 1.38%), 10/20/2037(a)(b)
|
|
|
|
AIMCO CLO Ltd. (Cayman Islands)
|
|
|
|
Series 2019-10A, Class ARR, 5.68% (3
mo. Term SOFR + 1.41%),
07/22/2037(a)(b)
|
|
|
|
Series 2020-11A, Class A2R, 5.78% (3
mo. Term SOFR + 1.50%),
07/17/2037(a)(b)
|
|
|
|
Series 2021-16A, Class AR, 5.68% (3 mo.
Term SOFR + 1.40%), 07/17/2037(a)(b)
|
|
|
|
Antares CLO Ltd. (Cayman Islands)
|
|
|
|
Series 2018-3A, Class A2R, 6.07% (3 mo.
Term SOFR + 1.80%), 07/20/2036(a)(b)
|
|
|
|
Series 2020-1A, Class A1R, 6.00% (3 mo.
Term SOFR + 1.72%), 10/23/2033(a)(b)
|
|
|
|
Series 2021-1A, Class A1, 6.07% (3 mo.
Term SOFR + 1.79%), 07/25/2033(a)(b)
|
|
|
|
Apidos CLO XXVIII (Cayman Islands),
Series 2017-28A, Class A1B, 5.68% (3
mo. Term SOFR + 1.41%),
01/20/2031(a)(b)
|
|
|
|
|
|
|
|
Apidos CLO XXXIX Ltd. (Cayman Islands),
Series 2022-39A, Class A1, 5.57% (3 mo.
Term SOFR + 1.30%), 04/21/2035(a)(b)
|
|
|
|
Apidos Loan Fund Ltd. (Cayman Islands),
Series 2024-1A, Class A1, 5.55% (3 mo.
Term SOFR + 1.27%), 04/25/2035(a)(b)
|
|
|
|
Bain Capital Credit CLO Ltd. (Cayman
Islands), Series 2022-1A, Class A1, 5.59%
(3 mo. Term SOFR + 1.32%),
04/18/2035(a)(b)
|
|
|
|
Ballyrock CLO 14 Ltd. (Cayman Islands),
Series 2020-14A, Class A1A, 5.65% (3
mo. Term SOFR + 1.38%),
07/20/2037(a)(b)
|
|
|
|
Barings CLO Ltd. (Cayman Islands)
|
|
|
|
Series 2019-1A, Class AR, 5.65% (3 mo.
Term SOFR + 1.39%), 04/15/2035(a)(b)
|
|
|
|
Series 2022-3A, Class BR, 6.02% (3 mo.
Term SOFR + 1.75%), 10/20/2037(a)(b)
|
|
|
|
Series 2023-1A, Class A, 6.02% (3 mo.
Term SOFR + 1.75%), 04/20/2036(a)(b)
|
|
|
|
Series 2023-3A, Class A, 5.96% (3 mo.
Term SOFR + 1.70%), 10/15/2036(a)(b)
|
|
|
|
BCRED BSL CLO Ltd. (Cayman Islands),
Series 2021-1A, Class B, 6.33% (3 mo.
Term SOFR + 2.06%), 07/20/2034(a)(b)
|
|
|
|
Benefit Street Partners CLO XXIX Ltd.
(Jersey), Series 2022-29A, Class AR,
5.46% (3 mo. Term SOFR + 1.18%),
01/25/2038(a)(b)
|
|
|
|
Benefit Street Partners CLO XXVII Ltd.
(Jersey), Series 2022-27A, Class AR,
5.64% (3 mo. Term SOFR + 1.37%),
10/20/2037(a)(b)
|
|
|
|
Benefit Street Partners Clo XXXVII Ltd.
(Cayman Islands), Series 2024-37A,
Class A, 5.70% (3 mo. Term SOFR +
1.35%), 01/25/2038(a)(b)
|
|
|
|
Blueberry Park CLO Ltd. (Jersey),
Series 2024-1A, Class A, 5.62% (3 mo.
Term SOFR + 1.35%), 10/20/2037(a)(b)
|
|
|
|
Broad River Bsl Funding CLO Ltd. (Cayman
Islands), Series 2020-1A, Class AR, 5.70%
(3 mo. Term SOFR + 1.43%),
07/20/2034(a)(b)
|
|
|
|
Carlyle Global Market Strategies CLO Ltd.
(Cayman Islands)
|
|
|
|
Series 2012-3A, Class A1B2, 5.90% (3
mo. Term SOFR + 1.66%),
01/14/2032(a)(b)
|
|
|
|
Series 2014-1A, Class A2R2, 5.67% (3
mo. Term SOFR + 1.39%),
04/17/2031(a)(b)
|
|
|
|
Series 2014-2RA, Class A2, 5.91% (3 mo.
Term SOFR + 1.59%), 05/15/2031(a)(b)
|
|
|
|
See accompanying Notes to Financial Statements which are an integral part of the financial
statements.
Invesco AAA CLO Floating Rate Note ETF (ICLO)—(continued)
April 30, 2025
(Unaudited)
|
|
|
|
Carlyle US CLO 2022-3 Ltd. (Cayman
Islands), Series 2022-3A, Class AR, 5.82%
(3 mo. Term SOFR + 1.55%),
04/20/2037(a)(b)
|
|
|
|
Carlyle US CLO Ltd. (Cayman Islands)
|
|
|
|
Series 2019-3A, Class A2RR, 6.32% (3
mo. Term SOFR + 2.05%),
04/20/2037(a)(b)
|
|
|
|
Series 2021-4A, Class A1, 5.64% (3 mo.
Term SOFR + 1.37%), 04/20/2034(a)(b)
|
|
|
|
Series 2021-4A, Class B1, 6.18% (3 mo.
Term SOFR + 1.91%), 04/20/2034(a)(b)
|
|
|
|
Series 2021-6A, Class A1R, 5.55% (3 mo.
Term SOFR + 1.29%), 01/15/2038(a)(b)
|
|
|
|
Series 2024-1A, Class A, 5.79% (3 mo.
Term SOFR + 1.53%), 04/15/2037(a)(b)
|
|
|
|
CBAMR Ltd. (Cayman Islands), Series 2019-
9A, Class AR, 5.89% (3 mo. Term SOFR +
1.63%), 07/15/2037(a)(b)
|
|
|
|
Cedar Funding II CLO Ltd. (Cayman Islands)
|
|
|
|
Series 2013-1A, Class ARR, 5.61% (3 mo.
Term SOFR + 1.34%), 04/20/2034(a)(b)
|
|
|
|
Series 2013-1A, Class BRR, 5.88% (3 mo.
Term SOFR + 1.61%), 04/20/2034(a)(b)
|
|
|
|
Cedar Funding IX CLO Ltd. (Cayman Islands),
Series 2018-9A, Class AR, 5.69% (3 mo.
Term SOFR + 1.42%), 07/20/2037(a)(b)
|
|
|
|
Cedar Funding XI CLO Ltd. (Cayman Islands),
Series 2019-11A, Class A1R2, 5.38% (3
mo. Term SOFR + 1.06%),
05/29/2032(a)(b)
|
|
|
|
Cedar Funding XII CLO Ltd. (Cayman
Islands), Series 2020-12A, Class ARR,
5.46% (3 mo. Term SOFR + 1.20%),
01/25/2038(a)(b)
|
|
|
|
Cedar Funding XIV CLO Ltd. (Cayman
Islands), Series 2021-14A, Class AR,
5.64% (3 mo. Term SOFR + 1.38%),
10/15/2037(a)(b)
|
|
|
|
Cerberus Loan Funding XL LLC,
Series 2023-1A, Class A, 6.66% (3 mo.
Term SOFR + 2.40%), 03/22/2035(a)(b)
|
|
|
|
Cerberus Loan Funding XLI LLC,
Series 2023-2A, Class A1, 6.81% (3 mo.
Term SOFR + 2.55%), 07/15/2035(a)(b)
|
|
|
|
CIFC Funding Ltd. (Cayman Islands)
|
|
|
|
Series 2013-2A, Class A2L2, 6.03% (3
mo. Term SOFR + 1.76%),
10/18/2030(a)(b)
|
|
|
|
Series 2014-4RA, Class A1A2, 5.27% (3
mo. Term SOFR + 0.99%),
01/17/2035(a)(b)
|
|
|
|
Series 2014-5A, Class A1R3, 5.66% (3
mo. Term SOFR + 1.38%),
07/17/2037(a)(b)
|
|
|
|
Series 2016-1A, Class AR3, 5.27% (3 mo.
Term SOFR + 1.00%), 10/21/2031(a)(b)
|
|
|
|
Series 2017-1A, Class ARR, 5.82% (3 mo.
Term SOFR + 1.55%), 04/21/2037(a)(b)
|
|
|
|
|
|
|
|
Series 2017-5A, Class AR, 5.69% (3 mo.
Term SOFR + 1.41%), 07/17/2037(a)(b)
|
|
|
|
Series 2020-3A, Class A2R, 5.88% (3 mo.
Term SOFR + 1.61%), 10/20/2034(a)(b)
|
|
|
|
Series 2023-2A, Class A, 6.02% (3 mo.
Term SOFR + 1.75%), 01/21/2037(a)(b)
|
|
|
|
Eaton Vance CLO Ltd. (Cayman Islands),
Series 2013-1A, Class A13R, 5.77% (3
mo. Term SOFR + 1.51%),
01/15/2034(a)(b)
|
|
|
|
Elmwood CLO 19 Ltd. (Cayman Islands),
Series 2022-6A, Class AR, 5.98% (3 mo.
Term SOFR + 1.70%), 10/17/2036(a)(b)
|
|
|
|
Elmwood CLO 21 Ltd. (Cayman Islands),
Series 2022-8A, Class AR, 5.92% (3 mo.
Term SOFR + 1.65%), 10/20/2036(a)(b)
|
|
|
|
Elmwood CLO 26 Ltd. (Cayman Islands),
Series 2024-1A, Class B, 6.27% (3 mo.
Term SOFR + 2.00%), 04/18/2037(a)(b)
|
|
|
|
Elmwood CLO 29 Ltd. (Cayman Islands),
Series 2024-5A, Class AR1, 5.79% (3 mo.
Term SOFR + 1.52%), 04/20/2037(a)(b)
|
|
|
|
Elmwood CLO III Ltd. (Cayman Islands)
|
|
|
|
Series 2019-3A, Class A1RR, 5.65% (3
mo. Term SOFR + 1.38%),
07/18/2037(a)(b)
|
|
|
|
Series 2019-3A, Class A2RR, 5.87% (3
mo. Term SOFR + 1.60%),
07/18/2037(a)(b)
|
|
|
|
Elmwood CLO VI Ltd. (Cayman Islands),
Series 2020-3A, Class ARR, 5.65% (3 mo.
Term SOFR + 1.38%), 07/18/2037(a)(b)
|
|
|
|
Elmwood CLO VIII Ltd. (Cayman Islands),
Series 2021-1A, Class AR, 5.82% (3 mo.
Term SOFR + 1.55%), 04/20/2037(a)(b)
|
|
|
|
Elmwood CLO X Ltd. (Cayman Islands),
Series 2021-3A, Class BR, 6.02% (3 mo.
Term SOFR + 1.75%), 04/20/2034(a)(b)
|
|
|
|
Empower CLO 2025-1 Ltd. (Cayman Islands)
|
|
|
|
Series 2025-1A, Class A, (3 mo. Term
SOFR + 1.31%)07/20/2038(a)(b)
|
|
|
|
Series 2025-1A, Class B, (3 mo. Term
SOFR + 1.80%)07/20/2038(a)(b)
|
|
|
|
Empower CLO Ltd. (Cayman Islands)
|
|
|
|
Series 2022-1A, Class A1R, 5.66% (3 mo.
Term SOFR + 1.39%), 10/20/2037(a)(b)
|
|
|
|
Series 2024-1A, Class A1, 5.88% (3 mo.
Term SOFR + 1.60%), 04/25/2037(a)(b)
|
|
|
|
Flatiron CLO 21 Ltd. (Cayman Islands),
Series 2021-1A, Class A1R, 5.63% (3 mo.
Term SOFR + 1.36%), 10/19/2037(a)(b)
|
|
|
|
Flatiron CLO 25 Ltd. (Cayman Islands),
Series 2024-2A, Class A, 5.63% (3 mo.
Term SOFR + 1.35%), 10/17/2037(a)(b)
|
|
|
|
Galaxy XXI CLO Ltd. (Cayman Islands),
Series 2015-21A, Class AR, 5.55% (3 mo.
Term SOFR + 1.28%), 04/20/2031(a)(b)
|
|
|
|
See accompanying Notes to Financial Statements which are an integral part of the financial
statements.
Invesco AAA CLO Floating Rate Note ETF (ICLO)—(continued)
April 30, 2025
(Unaudited)
|
|
|
|
Galaxy XXII CLO Ltd. (Cayman Islands),
Series 2016-22A, Class ARR, 5.50% (3
mo. Term SOFR + 1.24%),
04/16/2034(a)(b)
|
|
|
|
Galaxy XXIV CLO Ltd. (Cayman Islands),
Series 2017-24A, Class AR, 5.80% (3 mo.
Term SOFR + 1.54%), 04/15/2037(a)(b)
|
|
|
|
GoldenTree Loan Management US CLO 12
Ltd. (Cayman Islands), Series 2022-12A,
Class AJR, 5.80% (3 mo. Term SOFR +
1.53%), 07/20/2037(a)(b)
|
|
|
|
GoldenTree Loan Management US CLO 9
Ltd., Series 2021-9A, Class AR, 5.77% (3
mo. Term SOFR + 1.50%),
04/20/2037(a)(b)
|
|
|
|
Golub Capital Partners CLO 49(M) Ltd.
(Cayman Islands), Series 2020-49A,
Class AR, 6.06% (3 mo. Term SOFR +
1.79%), 08/26/2033(a)(b)
|
|
|
|
Golub Capital Partners CLO 54(M) L.P.
(Cayman Islands), Series 2021-54A,
Class A, 6.05% (3 mo. Term SOFR +
1.79%), 08/05/2033(a)(b)
|
|
|
|
Golub Capital Partners CLO 61(M),
Series 2022-61A, Class A1A, 5.51% (3
mo. Term SOFR + 1.23%),
07/25/2035(a)(b)
|
|
|
|
Golub Capital Partners CLO 68B Ltd.
(Jersey), Series 2023-68A, Class B,
7.08% (3 mo. Term SOFR + 2.80%),
07/25/2036(a)(b)
|
|
|
|
Golub Capital Partners CLO 71(M),
Series 2024-71A, Class A, 6.25% (3 mo.
Term SOFR + 1.95%), 02/09/2037(a)(b)
|
|
|
|
Golub Capital Partners Static Ltd. (Cayman
Islands), Series 2024-1A, Class A1, 5.50%
(3 mo. Term SOFR + 1.23%),
04/20/2033(a)(b)
|
|
|
|
Ivy Hill Middle Market Credit Fund IX Ltd.
(Cayman Islands), Series 9A, Class A1,
5.89% (3 mo. Term SOFR + 1.62%),
04/23/2034(a)(b)
|
|
|
|
Ivy Hill Middle Market Credit Fund VII Ltd.
(Cayman Islands), 5.86% (3 mo. Term
SOFR + 1.60%), 10/15/2036(a)(b)
|
|
|
|
Madison Park Funding LXII Ltd. (Cayman
Islands), Series 2022-62A, Class AR,
6.13% (3 mo. Term SOFR + 1.85%),
07/17/2036(a)(b)
|
|
|
|
Madison Park Funding XIX Ltd. (Cayman
Islands), Series 2015-19A, Class AR3,
5.87% (3 mo. Term SOFR + 1.60%),
01/22/2037(a)(b)
|
|
|
|
Madison Park Funding XXXVII Ltd. (Cayman
Islands), Series 2019-37A, Class AR2,
5.79% (3 mo. Term SOFR + 1.53%),
04/15/2037(a)(b)
|
|
|
|
Magnetite XL Ltd. (Cayman Islands),
Series 2024-40A, Class A1, 5.71% (3 mo.
Term SOFR + 1.45%), 07/15/2037(a)(b)
|
|
|
|
|
|
|
|
Magnetite XVII Ltd. (Cayman Islands),
Series 2016-17A, Class AR2, 5.77% (3
mo. Term SOFR + 1.50%),
04/20/2037(a)(b)
|
|
|
|
Magnetite XXI Ltd. (Cayman Islands),
Series 2019-21A, Class AR, 5.55% (3 mo.
Term SOFR + 1.28%), 04/20/2034(a)(b)
|
|
|
|
Magnetite XXVII Ltd. (Cayman Islands)
|
|
|
|
Series 2020-27A, Class AR, 5.67% (3 mo.
Term SOFR + 1.40%), 10/20/2034(a)(b)
|
|
|
|
Series 2020-27A, Class BR, 6.08% (3 mo.
Term SOFR + 1.81%), 10/20/2034(a)(b)
|
|
|
|
Magnetite XXXVII Ltd. (Cayman Islands),
Series 2023-37A, Class A, 5.92% (3 mo.
Term SOFR + 1.65%), 10/20/2036(a)(b)
|
|
|
|
Morgan Stanley Eaton Vance CLO Ltd.
(Cayman Islands), Series 2022-16A,
Class B, 6.21% (3 mo. Term SOFR +
1.95%), 04/15/2035(a)(b)
|
|
|
|
Neuberger Berman Loan Advisers CLO 32
Ltd. (Cayman Islands), Series 2019-32A,
Class BR, 5.93% (3 mo. Term SOFR +
1.66%), 01/20/2032(a)(b)
|
|
|
|
Neuberger Berman Loan Advisers CLO 39
Ltd. (Cayman Islands), Series 2020-39A,
Class A1R, 5.80% (3 mo. Term SOFR +
1.53%), 04/20/2038(a)(b)
|
|
|
|
Neuberger Berman Loan Advisers CLO 40
Ltd. (Cayman Islands), Series 2021-40A,
Class A, 5.58% (3 mo. Term SOFR +
1.32%), 04/16/2033(a)(b)
|
|
|
|
Neuberger Berman Loan Advisers CLO 47
Ltd. (Cayman Islands), Series 2022-47A,
Class A, 5.54% (3 mo. Term SOFR +
1.30%), 04/14/2035(a)(b)
|
|
|
|
Neuberger Berman Loan Advisers NBLA CLO
52 Ltd. (Jersey), Series 2022-52A,
Class AR, 5.63% (3 mo. Term SOFR +
1.35%), 10/24/2038(a)(b)
|
|
|
|
OCP CLO Ltd. (Cayman Islands)
|
|
|
|
Series 2015-9A, Class AR3, 5.36% (3 mo.
Term SOFR + 1.10%), 01/15/2037(a)(b)
|
|
|
|
Series 2016-12A, Class A1R3, 5.64% (3
mo. Term SOFR + 1.37%),
10/18/2037(a)(b)
|
|
|
|
Series 2017-13A, Class AR2, 5.61% (3
mo. Term SOFR + 1.34%),
11/26/2037(a)(b)
|
|
|
|
Series 2019-17A, Class AR2, 5.67% (3
mo. Term SOFR + 1.40%),
07/20/2037(a)(b)
|
|
|
|
Series 2020-20A, Class A1R, 5.80% (3
mo. Term SOFR + 1.53%),
04/18/2037(a)(b)
|
|
|
|
Series 2024-31A, Class A1, 5.90% (3 mo.
Term SOFR + 1.63%), 04/20/2037(a)(b)
|
|
|
|
OHA Credit Funding 17 Ltd. (Bermuda),
Series 2024-17A, Class A, 5.75% (3 mo.
Term SOFR + 1.48%), 04/20/2037(a)(b)
|
|
|
|
See accompanying Notes to Financial Statements which are an integral part of the financial
statements.
Invesco AAA CLO Floating Rate Note ETF (ICLO)—(continued)
April 30, 2025
(Unaudited)
|
|
|
|
OHA Credit Funding 4 Ltd. (Cayman Islands),
Series 2019-4A, Class AR2, 5.56% (3 mo.
Term SOFR + 1.29%), 01/22/2038(a)(b)
|
|
|
|
Palmer Square CLO 2023-1 Ltd. (Cayman
Islands), Series 2023-1A, Class AR, 5.52%
(3 mo. Term SOFR + 1.25%),
01/20/2038(a)(b)
|
|
|
|
Palmer Square CLO Ltd. (Cayman Islands),
Series 2015-1A, Class A1A5, 5.38% (3
mo. Term SOFR + 1.05%),
05/21/2034(a)(b)
|
|
|
|
Park Blue CLO Ltd. (Cayman Islands)
|
|
|
|
Series 2022-1A, Class A1R, 5.69% (3 mo.
Term SOFR + 1.42%), 10/20/2037(a)(b)
|
|
|
|
Series 2022-2A, Class A1R, 5.69% (3 mo.
Term SOFR + 1.42%), 07/20/2037(a)(b)
|
|
|
|
Peace Park CLO Ltd. (Cayman Islands),
Series 2021-1A, Class B1, 6.13% (3 mo.
Term SOFR + 1.86%), 10/20/2034(a)(b)
|
|
|
|
Peebles Park CLO Ltd. (Jersey),
Series 2024-1A, Class A, 5.77% (3 mo.
Term SOFR + 1.50%), 04/21/2037(a)(b)
|
|
|
|
Pikes Peak CLO 4 (Cayman Islands),
Series 2019-4A, Class ARR, 5.47% (3 mo.
Term SOFR + 1.21%), 07/15/2034(a)(b)
|
|
|
|
Rad CLO 5 Ltd. (Cayman Islands),
Series 2019-5A, Class BR, 6.24% (3 mo.
Term SOFR + 1.96%), 07/24/2032(a)(b)
|
|
|
|
Regatta 30 Funding Ltd. (Cayman Islands),
Series 2024-4A, Class A2, 5.86% (3 mo.
Term SOFR + 1.55%), 01/25/2038(a)(b)
|
|
|
|
Regatta X Funding Ltd. (Cayman Islands),
Series 2017-3A, Class AR, 5.76% (3 mo.
Term SOFR + 1.48%), 07/17/2037(a)(b)
|
|
|
|
Regatta XVII Funding Ltd. (Cayman Islands),
Series 2020-1A, Class AR, 5.64% (3 mo.
Term SOFR + 1.38%), 10/15/2037(a)(b)
|
|
|
|
Regatta XX Funding Ltd. (Cayman Islands),
Series 2021-2A, Class AR, 5.44% (3 mo.
Term SOFR + 1.18%), 01/15/2038(a)(b)
|
|
|
|
Regatta XXII Funding Ltd. (Cayman Islands),
Series 2022-2A, Class AR, 5.52% (3 mo.
Term SOFR + 1.25%), 07/20/2035(a)(b)
|
|
|
|
RR 15 Ltd. (Cayman Islands), Series 2021-
15A, Class A2, 5.97% (3 mo. Term SOFR
+ 1.71%), 04/15/2036(a)(b)
|
|
|
|
RR 24 Ltd. (Bermuda), Series 2022-24A,
Class A1A2, 5.57% (3 mo. Term SOFR +
1.31%), 01/15/2037(a)(b)
|
|
|
|
RR 29 Ltd. (Cayman Islands), Series 2024-
29RA, Class A1R, 5.65% (3 mo. Term
SOFR + 1.39%), 07/15/2039(a)(b)
|
|
|
|
RR 38 Ltd. (Cayman Islands), Series 2025-
38A, Class A1A, 5.47% (3 mo. Term SOFR
+ 1.15%), 04/15/2040(a)(b)
|
|
|
|
RR 5 Ltd. (Cayman Islands), Series 2018-5A,
Class A1R, 5.76% (3 mo. Term SOFR +
1.50%), 07/15/2039(a)(b)
|
|
|
|
|
|
|
|
Shackleton CLO Ltd. (Cayman Islands),
Series 2019-14A, Class A1R, 5.73% (3
mo. Term SOFR + 1.46%),
07/20/2034(a)(b)
|
|
|
|
Signal Peak CLO 11 Ltd. (Cayman Islands),
Series 2024-11A, Class A1, 5.72% (3 mo.
Term SOFR + 1.45%), 07/18/2037(a)(b)
|
|
|
|
Signal Peak CLO 14 Ltd. (Cayman Islands),
Series 2024-14A, Class A, 5.59% (3 mo.
Term SOFR + 1.30%), 01/22/2038(a)(b)
|
|
|
|
Signal Peak CLO 9 Ltd. (Cayman Islands),
Series 2021-9A, Class A1R, 5.63% (3 mo.
Term SOFR + 1.36%), 01/21/2038(a)(b)
|
|
|
|
Symphony CLO 40 Ltd. (Bermuda),
Series 2023-40A, Class AR, 5.55% (3 mo.
Term SOFR + 1.31%), 01/05/2038(a)(b)
|
|
|
|
Symphony CLO XIX Ltd. (Cayman Islands)
|
|
|
|
Series 2018-19A, Class A, 5.48% (3 mo.
Term SOFR + 1.22%), 04/16/2031(a)(b)
|
|
|
|
Series 2018-19A, Class B, 5.87% (3 mo.
Term SOFR + 1.61%), 04/16/2031(a)(b)
|
|
|
|
Symphony CLO XX Ltd. (Cayman Islands),
Series 2018-20A, Class AR2, 5.36% (3
mo. Term SOFR + 1.10%),
01/16/2032(a)(b)
|
|
|
|
Symphony CLO XXII Ltd. (Cayman Islands),
Series 2020-22A, Class BR, 5.95% (3 mo.
Term SOFR + 1.68%), 04/18/2033(a)(b)
|
|
|
|
Symphony CLO XXV Ltd. (Cayman Islands),
Series 2021-25A, Class B, 5.88% (3 mo.
Term SOFR + 1.61%), 04/19/2034(a)(b)
|
|
|
|
Symphony CLO XXXII Ltd. (Cayman Islands),
Series 2022-32A, Class B, 6.13% (3 mo.
Term SOFR + 1.85%), 04/23/2035(a)(b)
|
|
|
|
TCI-Flatiron CLO Ltd. (Cayman Islands),
Series 2018-1A, Class BR, 5.94% (3 mo.
Term SOFR + 1.66%), 01/29/2032(a)(b)
|
|
|
|
Texas Debt Capital CLO Ltd. (Cayman
Islands), Series 2023-1A, Class A, 6.07%
(3 mo. Term SOFR + 1.80%),
04/20/2036(a)(b)
|
|
|
|
TICP CLO VII Ltd. (Cayman Islands),
Series 2017-7A, Class ASR2, 5.56% (3
mo. Term SOFR + 1.30%),
04/15/2033(a)(b)
|
|
|
|
Total Asset-Backed Securities
(Cost $299,658,407)
|
|
|
|
|
|
|
|
Invesco Premier U.S. Government Money
Portfolio, Institutional Class, 4.26%(c)(d)
(Cost $12,314,165)
|
|
|
|
TOTAL INVESTMENTS IN SECURITIES-102.00%
(Cost $311,972,572)
|
|
OTHER ASSETS LESS LIABILITIES-(2.00)%
|
|
|
|
|
See accompanying Notes to Financial Statements which are an integral part of the financial
statements.
Invesco AAA CLO Floating Rate Note ETF (ICLO)—(continued)
April 30, 2025
(Unaudited)
Investment Abbreviations:
|
|
|
|
|
|
-Secured Overnight Financing Rate
|
Notes to Schedule of Investments:
|
|
|
Security purchased or received in a transaction exempt from registration under the Securities Act of 1933, as amended (the “1933 Act”). The security may be
resold pursuant to an exemption from registration under the 1933 Act, typically to
qualified institutional buyers. The aggregate value of these securities at
April 30, 2025 was $298,194,404, which represented 97.95% of the Fund’s Net Assets.
|
|
|
Interest or dividend rate is redetermined periodically. Rate shown is the rate in
effect on April 30, 2025.
|
|
|
Affiliated holding. Affiliated holdings are investments in entities which are under
common ownership or control of Invesco Ltd. or are investments in entities in
which the Fund owns 5% or more of the outstanding voting securities. The table below shows the Fund’s transactions in, and earnings from, its investments in
affiliates for the six months ended April 30, 2025.
|
|
|
|
|
|
Change in
Unrealized
Appreciation
|
|
|
|
Investments in Affiliated
Money Market Funds:
|
|
|
|
|
|
|
|
Invesco Government & Agency
Portfolio, Institutional Class
|
|
|
|
|
|
|
|
Invesco Premier
U.S. Government Money
Portfolio, Institutional Class
|
|
|
|
|
|
|
|
|
|
|
|
|
|
|
|
|
|
|
The rate shown is the 7-day SEC standardized yield as of April 30, 2025.
|
See accompanying Notes to Financial Statements which are an integral part of the financial
statements.
Invesco Active U.S. Real Estate ETF (PSR)
April 30, 2025
(Unaudited)
Schedule of Investments(a)
|
|
|
|
Common Stocks & Other Equity Interests-99.93%
|
|
|
AvalonBay Communities, Inc.
|
|
|
|
|
|
|
|
|
|
|
|
|
|
|
|
|
|
|
|
|
Digital Realty Trust, Inc.
|
|
|
|
|
|
|
|
|
|
|
|
|
|
|
|
|
|
|
|
|
Essential Properties Realty Trust, Inc.
|
|
|
|
|
|
|
|
|
|
|
|
|
|
|
|
Gaming and Leisure Properties, Inc.
|
|
|
|
|
|
|
|
|
|
|
Healthpeak Properties, Inc.
|
|
|
|
|
|
|
|
|
|
|
|
|
|
|
|
|
|
|
|
|
EastGroup Properties, Inc.(b)
|
|
|
|
First Industrial Realty Trust, Inc.
|
|
|
|
|
|
|
|
|
Rexford Industrial Realty, Inc.
|
|
|
|
|
|
|
|
|
Infrastructure REITs-13.37%
|
|
|
|
|
|
|
|
|
|
|
SBA Communications Corp., Class A(b)
|
|
|
|
|
|
|
|
|
|
|
Hilton Worldwide Holdings, Inc.
|
|
|
|
Host Hotels & Resorts, Inc.
|
|
|
|
|
|
|
|
|
|
|
Equity LifeStyle Properties, Inc.
|
|
|
|
|
|
|
|
|
|
|
|
|
Simon Property Group, Inc.
|
|
|
|
|
|
|
|
|
|
|
|
|
|
|
|
|
|
|
|
|
|
|
|
|
|
|
Brixmor Property Group, Inc.
|
|
|
|
|
|
|
|
|
Phillips Edison & Co., Inc.(b)
|
|
|
|
|
|
|
|
|
Single Family Homes-3.75%
|
American Homes 4 Rent, Class A
|
|
|
|
|
|
|
|
|
|
|
|
|
|
|
|
|
|
|
|
|
|
|
|
|
|
|
|
Total Common Stocks & Other Equity Interests
(Cost $57,003,018)
|
|
|
|
|
|
Invesco Government & Agency Portfolio,
Institutional Class, 4.26%(c)(d)
(Cost $41,683)
|
|
|
|
TOTAL INVESTMENTS IN SECURITIES
(excluding investments purchased with cash collateral from
securities on loan)-100.00%
(Cost $57,044,701)
|
|
Investments Purchased with Cash Collateral
from Securities on Loan
|
|
|
Invesco Private Government Fund,
4.32%(c)(d)(e)
|
|
|
|
Invesco Private Prime Fund, 4.46%(c)(d)(e)
|
|
|
|
Total Investments Purchased with Cash Collateral from
Securities on Loan
(Cost $3,658,631)
|
|
TOTAL INVESTMENTS IN SECURITIES-106.27%
(Cost $60,703,332)
|
|
OTHER ASSETS LESS LIABILITIES-(6.27)%
|
|
|
|
|
Investment Abbreviations:
|
|
|
-Real Estate Investment Trust
|
See accompanying Notes to Financial Statements which are an integral part of the financial
statements.
Invesco Active U.S. Real Estate ETF (PSR)—(continued)
April 30, 2025
(Unaudited)
Notes to Schedule of Investments:
|
|
|
Property type classifications used in this report are generally according to FTSE
National Association of Real Estate Investment Trusts ("NAREIT") Equity REITs
Index, which is exclusively owned by NAREIT.
|
|
|
All or a portion of this security was out on loan at April 30, 2025.
|
|
|
Affiliated holding. Affiliated holdings are investments in entities which are under
common ownership or control of Invesco Ltd. or are investments in entities in
which the Fund owns 5% or more of the outstanding voting securities. The table below shows the Fund’s transactions in, and earnings from, its investments in
affiliates for the six months ended April 30, 2025.
|
|
|
|
|
|
Change in
Unrealized
Appreciation
|
|
|
|
Investments in Affiliated
Money Market Funds:
|
|
|
|
|
|
|
|
Invesco Government & Agency
Portfolio, Institutional Class
|
|
|
|
|
|
|
|
Investments Purchased with
Cash Collateral from
Securities on Loan:
|
|
|
|
|
|
|
|
Invesco Private Government
Fund
|
|
|
|
|
|
|
|
Invesco Private Prime Fund
|
|
|
|
|
|
|
|
|
|
|
|
|
|
|
|
|
|
|
Represents the income earned on the investment of cash collateral, which is included
in securities lending income on the Statements of Operations. Does not
include rebates and fees paid to lending agent or premiums received from borrowers,
if any.
|
|
|
The rate shown is the 7-day SEC standardized yield as of April 30, 2025.
|
|
|
The security has been segregated to satisfy the commitment to return the cash collateral received in securities lending transactions upon the borrower’s return
of the securities loaned. See Note 2P.
|
See accompanying Notes to Financial Statements which are an integral part of the financial
statements.
Invesco High Yield Bond Factor ETF (IHYF)
April 30, 2025
(Unaudited)
Schedule of Investments(a)
|
|
|
|
U.S. Dollar Denominated Bonds & Notes-97.98%
|
|
|
Advantage Sales & Marketing, Inc., 6.50%,
11/15/2028(b)
|
|
|
|
Belo Corp., 7.25%, 09/15/2027
|
|
|
|
|
|
|
|
|
Aerospace & Defense-0.72%
|
Bombardier, Inc. (Canada), 6.00%,
02/15/2028(b)(c)
|
|
|
|
Agricultural & Farm Machinery-0.32%
|
Titan International, Inc., 7.00%, 04/30/2028
|
|
|
|
Air Freight & Logistics-0.77%
|
Clue Opco LLC, 9.50%, 10/15/2031(b)(c)
|
|
|
|
Rand Parent LLC, 8.50%, 02/15/2030(b)
|
|
|
|
|
|
|
|
|
Alternative Carriers-0.42%
|
Intelsat Jackson Holdings S.A. (Luxembourg),
6.50%, 03/15/2030(b)
|
|
|
|
Zayo Group Holdings, Inc., 4.00%,
03/01/2027, (Acquired 11/02/2022;
Cost $89,123)(b)(d)
|
|
|
|
|
|
|
|
|
|
|
Arsenal AIC Parent LLC, 11.50%,
10/01/2031(b)
|
|
|
|
|
|
Foot Locker, Inc., 4.00%, 10/01/2029(b)
|
|
|
|
Gap, Inc. (The), 3.88%, 10/01/2031(b)
|
|
|
|
Victoria’s Secret & Co., 4.63%,
07/15/2029(b)(c)
|
|
|
|
|
|
|
|
|
Apparel, Accessories & Luxury Goods-0.26%
|
Under Armour, Inc., 3.25%, 06/15/2026
|
|
|
|
Application Software-0.99%
|
Cloud Software Group, Inc., 9.00%,
09/30/2029(b)
|
|
|
|
Open Text Holdings, Inc. (Canada), 4.13%,
02/15/2030(b)
|
|
|
|
SS&C Technologies, Inc., 5.50%,
09/30/2027(b)(c)
|
|
|
|
|
|
|
|
|
Asset Management & Custody Banks-0.78%
|
Acadian Asset Management, Inc., 4.80%,
07/27/2026
|
|
|
|
|
|
|
|
|
|
|
|
|
|
|
|
|
|
|
|
|
|
|
|
Automotive Parts & Equipment-2.03%
|
American Axle & Manufacturing, Inc., 6.50%,
04/01/2027
|
|
|
|
ANGI Group LLC, 3.88%, 08/15/2028(b)
|
|
|
|
Dana, Inc., 5.38%, 11/15/2027
|
|
|
|
|
|
|
|
Automotive Parts & Equipment-(continued)
|
Tenneco, Inc., 8.00%, 11/17/2028(b)
|
|
|
|
United Rentals (North America), Inc.
|
|
|
|
|
|
|
|
|
|
|
|
|
|
ZF North America Capital, Inc. (Germany)
|
|
|
|
|
|
|
|
|
|
|
|
|
|
|
|
|
|
|
|
|
Advance Auto Parts, Inc., 3.50%, 03/15/2032
|
|
|
|
Sonic Automotive, Inc., 4.63%, 11/15/2029(b)
|
|
|
|
|
|
|
|
|
|
|
AMC Networks, Inc., 10.25%, 01/15/2029(b)
|
|
|
|
|
|
|
|
|
|
|
|
|
|
|
|
|
|
|
iHeartCommunications, Inc., 5.25%,
08/15/2027(b)
|
|
|
|
Liberty Interactive LLC, 8.25%, 02/01/2030
|
|
|
|
Paramount Global, 6.38%, 03/30/2062(c)(e)
|
|
|
|
Sirius XM Radio LLC, 5.00%, 08/01/2027(b)
|
|
|
|
Univision Communications, Inc.
|
|
|
|
|
|
|
|
|
|
|
|
|
|
Urban One, Inc., 7.38%, 02/01/2028(b)
|
|
|
|
|
|
|
|
|
|
|
GrubHub Holdings, Inc., 5.50%, 07/01/2027(b)
|
|
|
|
Macy’s Retail Holdings LLC
|
|
|
|
|
|
|
|
|
|
|
|
|
|
|
|
|
|
|
|
|
|
|
|
|
|
|
|
|
|
|
|
|
|
QVC, Inc., 4.38%, 09/01/2028
|
|
|
|
Rakuten Group, Inc. (Japan)
|
|
|
|
|
|
|
|
|
|
|
|
|
|
|
|
|
|
|
|
|
Adams Homes, Inc., 9.25%, 10/15/2028(b)
|
|
|
|
Builders FirstSource, Inc., 4.25%,
02/01/2032(b)
|
|
|
|
Griffon Corp., 5.75%, 03/01/2028
|
|
|
|
JELD-WEN, Inc., 4.88%, 12/15/2027(b)(c)
|
|
|
|
MIWD Holdco II LLC/MIWD Finance Corp.,
5.50%, 02/01/2030(b)(c)
|
|
|
|
See accompanying Notes to Financial Statements which are an integral part of the financial
statements.
Invesco High Yield Bond Factor ETF (IHYF)—(continued)
April 30, 2025
(Unaudited)
|
|
|
|
Building Products-(continued)
|
Standard Industries, Inc.
|
|
|
|
|
|
|
|
|
|
|
|
|
|
|
|
|
|
|
|
|
|
|
|
STL Holding Co. LLC, 8.75%, 02/15/2029(b)
|
|
|
|
|
|
|
|
|
|
|
CCO Holdings LLC/CCO Holdings Capital Corp.
|
|
|
|
|
|
|
|
|
|
|
|
|
|
|
|
|
|
|
|
|
|
|
|
|
|
|
|
|
|
|
|
|
|
|
|
|
|
|
Directv Financing LLC, 8.88%,
02/01/2030(b)(c)
|
|
|
|
Directv Financing LLC/Directv Financing
Co-Obligor, Inc., 5.88%, 08/15/2027(b)(c)
|
|
|
|
|
|
|
|
|
|
|
|
|
|
|
|
|
|
|
|
|
|
|
|
DISH Network Corp., 11.75%, 11/15/2027(b)
|
|
|
|
Radiate Holdco LLC/Radiate Finance, Inc.,
6.50%, 09/15/2028(b)
|
|
|
|
|
|
|
|
|
|
|
|
|
|
|
|
|
|
|
VZ Secured Financing B.V. (Netherlands),
5.00%, 01/15/2032(b)
|
|
|
|
|
|
|
|
|
|
|
Affinity Interactive, 6.88%, 12/15/2027(b)
|
|
|
|
Churchill Downs, Inc., 5.50%, 04/01/2027(b)(c)
|
|
|
|
International Game Technology PLC, 6.25%,
01/15/2027(b)
|
|
|
|
Melco Resorts Finance Ltd. (Hong Kong),
5.38%, 12/04/2029(b)
|
|
|
|
MGM Resorts International, 4.63%,
09/01/2026
|
|
|
|
Wynn Las Vegas LLC/Wynn Las Vegas Capital
Corp., 5.25%, 05/15/2027(b)
|
|
|
|
|
|
|
|
|
Commercial & Residential Mortgage Finance-0.10%
|
Rocket Mortgage LLC/Rocket Mortgage
Co-Issuer, Inc., 2.88%, 10/15/2026(b)
|
|
|
|
Commercial Printing-1.21%
|
Deluxe Corp., 8.13%, 09/15/2029(b)
|
|
|
|
R.R. Donnelley & Sons Co., 9.50%,
08/01/2029(b)
|
|
|
|
|
|
|
|
|
Commodity Chemicals-0.48%
|
Methanex Corp. (Canada), 5.13%,
10/15/2027
|
|
|
|
|
|
|
|
Communications Equipment-1.11%
|
Viasat, Inc., 5.63%, 04/15/2027(b)
|
|
|
|
Viavi Solutions, Inc., 3.75%, 10/01/2029(b)(c)
|
|
|
|
|
|
|
|
|
Construction & Engineering-0.60%
|
Brand Industrial Services, Inc., 10.38%,
08/01/2030(b)
|
|
|
|
Brookfield Residential Properties, Inc./
Brookfield Residential U.S. LLC (Canada)
|
|
|
|
|
|
|
|
|
|
|
|
|
|
|
|
|
|
|
Construction Materials-0.78%
|
Smyrna Ready Mix Concrete LLC
|
|
|
|
|
|
|
|
|
|
|
|
|
|
|
|
|
|
|
Consumer Electronics-0.41%
|
Sensata Technologies B.V., 4.00%,
04/15/2029(b)
|
|
|
|
|
|
Bread Financial Holdings, Inc., 9.75%,
03/15/2029(b)
|
|
|
|
Global Aircraft Leasing Co. Ltd. (Cayman
Islands), 8.75%, 09/01/2027(b)
|
|
|
|
LFS Topco LLC, 5.88%, 10/15/2026(b)
|
|
|
|
|
|
|
|
|
|
|
|
|
|
|
|
|
|
|
|
|
|
|
|
OneMain Finance Corp., 6.63%, 01/15/2028
|
|
|
|
|
|
|
|
|
|
|
APH Somerset Investor 2 LLC/APH2 Somerset
Investor 2 LLC/APH3 Somerset Investor 2
LLC, 7.88%, 11/01/2029(b)(c)
|
|
|
|
|
|
|
|
|
|
|
|
|
|
|
|
|
|
|
|
|
|
|
|
Diversified Chemicals-0.98%
|
|
|
|
|
|
|
|
|
|
|
|
|
|
|
|
|
|
|
|
|
INEOS Finance PLC (Luxembourg), 7.50%,
04/15/2029(b)
|
|
|
|
|
|
|
|
|
Diversified Financial Services-3.45%
|
Albion Financing 1 S.a.r.l./Aggreko Holdings,
Inc. (Luxembourg), 6.13%, 10/15/2026(b)
|
|
|
|
eG Global Finance PLC (United Kingdom),
12.00%, 11/30/2028(b)
|
|
|
|
Freedom Mortgage Holdings LLC, 9.25%,
02/01/2029(b)
|
|
|
|
See accompanying Notes to Financial Statements which are an integral part of the financial
statements.
Invesco High Yield Bond Factor ETF (IHYF)—(continued)
April 30, 2025
(Unaudited)
|
|
|
|
Diversified Financial Services-(continued)
|
Jefferies Finance LLC/JFIN Co-Issuer Corp.,
5.00%, 08/15/2028(b)
|
|
|
|
Midcap Financial Issuer Trust, 6.50%,
05/01/2028(b)
|
|
|
|
Resorts World Las Vegas LLC/RWLV Capital,
Inc.
|
|
|
|
|
|
|
|
|
|
|
|
|
|
United Wholesale Mortgage LLC, 5.75%,
06/15/2027(b)
|
|
|
|
|
|
|
|
|
Diversified Metals & Mining-1.51%
|
Algoma Steel, Inc. (Canada), 9.13%,
04/15/2029(b)
|
|
|
|
Compass Minerals International, Inc., 6.75%,
12/01/2027(b)
|
|
|
|
Mineral Resources Ltd. (Australia), 9.25%,
10/01/2028(b)
|
|
|
|
Perenti Finance Pty Ltd. (Australia), 7.50%,
04/26/2029(b)
|
|
|
|
|
|
|
|
|
Diversified Real Estate Activities-0.11%
|
Five Point Operating Co. L.P./Five Point Capital
Corp., 7.88%, 11/15/2025(b)
|
|
|
|
|
|
Iron Mountain Information Management
Services, Inc., 5.00%, 07/15/2032(b)
|
|
|
|
Uniti Group L.P./Uniti Group Finance 2019,
Inc./CSL Capital LLC, 4.75%, 04/15/2028(b)
|
|
|
|
|
|
|
|
|
Diversified Support Services-1.85%
|
Crown Americas LLC/Crown Americas Capital
Corp. V, 4.25%, 09/30/2026
|
|
|
|
Neptune Bidco US, Inc., 9.29%,
04/15/2029(b)(c)
|
|
|
|
Prime Security Services Borrower LLC/Prime
Finance, Inc., 3.38%, 08/31/2027(b)
|
|
|
|
|
|
|
|
|
|
|
|
|
|
|
|
|
|
|
|
|
|
|
|
Saks Global Enterprises LLC, 11.00%,
12/15/2029(b)
|
|
|
|
|
|
|
|
|
|
|
Walgreens Boots Alliance, Inc.
|
|
|
|
|
|
|
|
|
|
|
|
|
|
|
|
|
|
|
|
|
Adtalem Global Education, Inc., 5.50%,
03/01/2028(b)
|
|
|
|
Grand Canyon University, 5.13%, 10/01/2028
|
|
|
|
|
|
|
|
|
|
|
|
|
|
|
Edison International, 7.88%, 06/15/2054(e)
|
|
|
|
Mallinckrodt International Finance S.A.,
14.75%, 11/14/2028(b)
|
|
|
|
Pattern Energy Operations L.P./Pattern Energy
Operations, Inc., 4.50%, 08/15/2028(b)(c)
|
|
|
|
Vistra Operations Co. LLC
|
|
|
|
|
|
|
|
|
|
|
|
|
|
XPLR Infrastructure Operating Partners L.P.
|
|
|
|
|
|
|
|
|
|
|
|
|
|
|
|
|
|
|
Electrical Components & Equipment-1.34%
|
Atkore, Inc., 4.25%, 06/01/2031(b)
|
|
|
|
EnerSys, 4.38%, 12/15/2027(b)
|
|
|
|
Nissan Motor Acceptance Co. LLC, 6.95%,
09/15/2026(b)
|
|
|
|
|
|
|
|
|
Electronic Components-0.46%
|
Sensata Technologies, Inc.
|
|
|
|
|
|
|
|
|
|
|
|
|
|
|
|
|
|
|
Electronic Manufacturing Services-0.36%
|
EMRLD Borrower L.P./Emerald Co-Issuer, Inc.,
6.63%, 12/15/2030(b)
|
|
|
|
Fertilizers & Agricultural Chemicals-0.69%
|
Consolidated Energy Finance S.A. (Switzerland)
|
|
|
|
|
|
|
|
|
|
|
|
|
|
|
|
|
|
|
|
|
C&S Group Enterprises LLC, 5.00%,
12/15/2028(b)(c)
|
|
|
|
|
|
Albertson’s Cos., Inc./Safeway, Inc./New
Albertson’s L.P./Albertson’s LLC
|
|
|
|
|
|
|
|
|
|
|
|
|
|
|
|
|
|
|
|
|
AmeriGas Partners L.P./AmeriGas Finance
Corp., 9.38%, 06/01/2028(b)
|
|
|
|
Health Care Equipment-0.28%
|
Varex Imaging Corp., 7.88%, 10/15/2027(b)
|
|
|
|
Health Care Facilities-0.79%
|
|
|
|
|
|
|
|
|
|
|
|
|
|
|
|
Tenet Healthcare Corp., 4.63%, 06/15/2028
|
|
|
|
|
|
|
|
|
See accompanying Notes to Financial Statements which are an integral part of the financial
statements.
Invesco High Yield Bond Factor ETF (IHYF)—(continued)
April 30, 2025
(Unaudited)
|
|
|
|
|
|
MPT Operating Partnership L.P./MPT Finance
Corp.
|
|
|
|
|
|
|
|
|
|
|
|
|
|
|
|
|
|
|
Health Care Services-2.84%
|
Community Health Systems, Inc.
|
|
|
|
|
|
|
|
|
|
|
|
|
|
|
|
|
|
|
CVS Health Corp., 7.00%, 03/10/2055(e)
|
|
|
|
DaVita, Inc., 4.63%, 06/01/2030(b)(c)
|
|
|
|
Global Medical Response, Inc., 6.50%,
10/01/2025(b)
|
|
|
|
ModivCare, Inc., 5.00%, 10/01/2029(b)
|
|
|
|
MPH Acquisition Holdings LLC
|
|
|
|
|
|
|
|
|
5% PIK Rate, 6.5% Cash Rate, ,
12/31/2030(b)(f)
|
|
|
|
|
|
|
|
|
Health Care Technology-0.52%
|
athenahealth Group, Inc., 6.50%,
02/15/2030(b)
|
|
|
|
|
|
Somnigroup International, Inc.
|
|
|
|
|
|
|
|
|
|
|
|
|
|
|
|
|
|
|
|
|
Beazer Homes USA, Inc., 5.88%, 10/15/2027
|
|
|
|
|
|
|
|
|
|
|
|
|
|
|
|
|
|
|
Tri Pointe Homes, Inc., 5.25%, 06/01/2027
|
|
|
|
|
|
|
|
|
Hotel & Resort REITs-0.31%
|
Service Properties Trust, 4.95%, 02/15/2027
|
|
|
|
Hotels, Resorts & Cruise Lines-1.43%
|
Marriott Ownership Resorts, Inc., 4.75%,
01/15/2028(c)
|
|
|
|
Royal Caribbean Cruises Ltd., 4.25%,
07/01/2026(b)
|
|
|
|
Travel + Leisure Co., Series J, 6.00%,
04/01/2027
|
|
|
|
|
|
|
|
|
Housewares & Specialties-0.89%
|
|
|
|
|
|
|
|
|
|
|
|
|
|
|
|
|
|
|
|
|
|
|
|
|
|
|
|
|
|
Human Resource & Employment Services-0.52%
|
|
|
|
|
|
|
|
|
|
|
|
|
|
|
|
|
|
|
|
|
Independent Power Producers & Energy Traders-0.59%
|
AES Corp. (The), 6.95%, 07/15/2055(e)
|
|
|
|
Calpine Corp., 4.50%, 02/15/2028(b)
|
|
|
|
|
|
|
|
|
|
|
Alliant Holdings Intermediate LLC/Alliant
Holdings Co-Issuer, 7.00%, 01/15/2031(b)
|
|
|
|
HUB International Ltd., 7.38%, 01/31/2032(b)
|
|
|
|
|
|
|
|
|
Integrated Telecommunication Services-0.73%
|
Altice France S.A. (France)
|
|
|
|
|
|
|
|
|
|
|
|
|
|
|
|
|
|
|
Interactive Media & Services-0.28%
|
Cumulus Media New Holdings, Inc., 6.75%,
07/01/2026(b)
|
|
|
|
Nexstar Media, Inc., 5.63%, 07/15/2027(b)
|
|
|
|
|
|
|
|
|
Internet Services & Infrastructure-0.72%
|
Arches Buyer, Inc., 4.25%, 06/01/2028(b)(c)
|
|
|
|
Cogent Communications Group, Inc., 3.50%,
05/01/2026(b)
|
|
|
|
|
|
|
|
|
Investment Banking & Brokerage-1.51%
|
Icahn Enterprises L.P./Icahn Enterprises
Finance Corp.
|
|
|
|
|
|
|
|
|
|
|
|
|
|
|
|
|
|
|
StoneX Group, Inc., 7.88%, 03/01/2031(b)
|
|
|
|
|
|
|
|
|
IT Consulting & Other Services-1.02%
|
Conduent Business Services LLC/Conduent
State & Local Solutions, Inc., 6.00%,
11/01/2029(b)
|
|
|
|
EquipmentShare.com, Inc., 9.00%,
05/15/2028(b)
|
|
|
|
Unisys Corp., 6.88%, 11/01/2027(b)
|
|
|
|
|
|
|
|
|
|
|
Six Flags Entertainment Corp./Canada’s
Wonderland Co./Magnum Management Corp.,
5.38%, 04/15/2027
|
|
|
|
VOC Escrow Ltd., 5.00%, 02/15/2028(b)
|
|
|
|
|
|
|
|
|
Life Sciences Tools & Services-0.19%
|
Fortrea Holdings, Inc., 7.50%, 07/01/2030(b)
|
|
|
|
See accompanying Notes to Financial Statements which are an integral part of the financial
statements.
Invesco High Yield Bond Factor ETF (IHYF)—(continued)
April 30, 2025
(Unaudited)
|
|
|
|
Marine Transportation-0.67%
|
Seaspan Corp. (Hong Kong), 5.50%,
08/01/2029(b)
|
|
|
|
Metal, Glass & Plastic Containers-1.40%
|
Ardagh Metal Packaging Finance USA LLC/
Ardagh Metal Packaging Finance PLC, 6.00%,
06/15/2027(b)
|
|
|
|
Ardagh Packaging Finance PLC/Ardagh
Holdings USA, Inc., 4.13%, 08/15/2026(b)
|
|
|
|
Owens-Brockway Glass Container, Inc.
|
|
|
|
|
|
|
|
|
|
|
|
|
|
|
|
|
|
|
|
|
Blackstone Mortgage Trust, Inc., 7.75%,
12/01/2029(b)
|
|
|
|
Movies & Entertainment-0.17%
|
Live Nation Entertainment, Inc., 6.50%,
05/15/2027(b)
|
|
|
|
|
|
Algonquin Power & Utilities Corp. (Canada),
4.75%, 01/18/2082(e)
|
|
|
|
|
|
Brandywine Operating Partnership L.P.
|
|
|
|
|
|
|
|
|
|
|
|
|
|
Hudson Pacific Properties L.P., 3.95%,
11/01/2027
|
|
|
|
Office Properties Income Trust, 9.00%,
09/30/2029(b)
|
|
|
|
|
|
|
|
|
Office Services & Supplies-0.83%
|
ACCO Brands Corp., 4.25%, 03/15/2029(b)
|
|
|
|
|
|
|
|
|
|
|
|
|
|
|
|
|
|
|
|
|
|
|
|
|
|
Delek Logistics Partners L.P./Delek Logistics
Finance Corp., 8.63%, 03/15/2029(b)
|
|
|
|
Harvest Midstream I L.P., 7.50%,
09/01/2028(b)
|
|
|
|
Nabors Industries, Inc., 7.38%, 05/15/2027(b)
|
|
|
|
Noble Finance II LLC, 8.00%, 04/15/2030(b)(c)
|
|
|
|
Rockies Express Pipeline LLC, 6.88%,
04/15/2040(b)
|
|
|
|
Seadrill Finance Ltd. (Norway), 8.38%,
08/01/2030(b)
|
|
|
|
Valaris Ltd., 8.38%, 04/30/2030(b)
|
|
|
|
|
|
|
|
|
Oil & Gas Equipment & Services-1.14%
|
Enerflex Ltd. (Canada), 9.00%, 10/15/2027(b)
|
|
|
|
Oceaneering International, Inc., 6.00%,
02/01/2028
|
|
|
|
|
|
|
|
|
|
|
|
|
Oil & Gas Exploration & Production-3.12%
|
Baytex Energy Corp. (Canada), 8.50%,
04/30/2030(b)(c)
|
|
|
|
Civitas Resources, Inc., 8.75%,
07/01/2031(b)(c)
|
|
|
|
Comstock Resources, Inc., 6.75%,
03/01/2029(b)
|
|
|
|
Crescent Energy Finance LLC
|
|
|
|
|
|
|
|
|
|
|
|
|
|
|
|
|
|
|
Hilcorp Energy I L.P./Hilcorp Finance Co.
|
|
|
|
|
|
|
|
|
|
|
|
|
|
|
|
|
|
|
Murphy Oil Corp., 5.88%, 12/01/2042
|
|
|
|
Talos Production, Inc., 9.38%, 02/01/2031(b)
|
|
|
|
|
|
|
|
|
Oil & Gas Refining & Marketing-0.71%
|
|
|
|
|
|
|
|
|
|
|
|
|
|
|
|
PBF Holding Co. LLC/PBF Finance Corp.,
6.00%, 02/15/2028
|
|
|
|
|
|
|
|
|
Oil & Gas Storage & Transportation-2.61%
|
Buckeye Partners L.P., 3.95%, 12/01/2026
|
|
|
|
Hess Midstream Operations L.P., 5.88%,
03/01/2028(b)
|
|
|
|
ITT Holdings LLC, 6.50%, 08/01/2029(b)
|
|
|
|
New Fortress Energy, Inc., 6.50%,
09/30/2026(b)(c)
|
|
|
|
Tallgrass Energy Partners L.P./Tallgrass Energy
Finance Corp.
|
|
|
|
|
|
|
|
|
|
|
|
|
|
|
|
|
|
|
|
|
|
|
|
|
|
|
|
|
|
|
|
|
|
|
|
|
|
|
Other Specialized REITs-0.13%
|
Iron Mountain, Inc., 4.88%, 09/15/2027(b)
|
|
|
|
Other Specialty Retail-0.98%
|
Bath & Body Works, Inc., 6.69%, 01/15/2027
|
|
|
|
PetSmart, Inc./PetSmart Finance Corp., 4.75%,
02/15/2028(b)(c)
|
|
|
|
|
|
|
|
|
Packaged Foods & Meats-0.22%
|
B&G Foods, Inc., 8.00%, 09/15/2028(b)
|
|
|
|
Paper & Plastic Packaging Products & Materials-0.80%
|
Mauser Packaging Solutions Holding Co.,
7.88%, 08/15/2026(b)
|
|
|
|
See accompanying Notes to Financial Statements which are an integral part of the financial
statements.
Invesco High Yield Bond Factor ETF (IHYF)—(continued)
April 30, 2025
(Unaudited)
|
|
|
|
Paper & Plastic Packaging Products & Materials-(continued)
|
|
|
|
|
|
|
|
|
|
|
|
|
|
|
|
|
|
|
|
|
|
|
Domtar Corp., 6.75%, 10/01/2028(b)
|
|
|
|
|
|
Air Canada (Canada), 3.88%, 08/15/2026(b)
|
|
|
|
Allegiant Travel Co., 7.25%, 08/15/2027(b)
|
|
|
|
American Airlines, Inc., 7.25%, 02/15/2028(b)
|
|
|
|
American Airlines, Inc./AAdvantage Loyalty IP
Ltd., 5.50%, 04/20/2026(b)
|
|
|
|
JetBlue Airways Corp./JetBlue Loyalty L.P.,
9.88%, 09/20/2031(b)(c)
|
|
|
|
|
|
|
|
|
Personal Care Products-0.25%
|
Edgewell Personal Care Co., 4.13%,
04/01/2029(b)
|
|
|
|
|
|
|
|
|
|
|
|
|
|
|
|
|
|
|
|
|
HLF Financing S.a.r.l. LLC/Herbalife
International, Inc., 4.88%, 06/01/2029(b)
|
|
|
|
Organon & Co./Organon Foreign Debt Co-Issuer
B.V.
|
|
|
|
|
|
|
|
|
|
|
|
|
|
P&L Development LLC/PLD Finance Corp.,
3.50% PIK Rate, 9.00% Cash Rate,
05/15/2029(b)(f)
|
|
|
|
|
|
|
|
|
Real Estate Development-0.32%
|
Cushman & Wakefield U.S. Borrower LLC,
8.88%, 09/01/2031(b)
|
|
|
|
Real Estate Services-0.98%
|
Anywhere Real Estate Group LLC/Anywhere
Co-Issuer Corp., 7.00%, 04/15/2030(b)(c)
|
|
|
|
Newmark Group, Inc., 7.50%, 01/12/2029
|
|
|
|
|
|
|
|
|
|
|
Veritiv Operating Co., 10.50%, 11/30/2030(b)
|
|
|
|
|
|
Alliance Resource Operating Partners
L.P./Alliance Resource Finance Corp., 8.63%,
06/15/2029(b)
|
|
|
|
Global Atlantic (Fin) Co., 4.70%,
10/15/2051(b)(e)
|
|
|
|
|
|
|
|
|
Research & Consulting Services-0.42%
|
Clarivate Science Holdings Corp., 3.88%,
07/01/2028(b)
|
|
|
|
|
|
|
|
|
|
Brookfield Property REIT, Inc./BPR
Cumulus LLC/BPR Nimbus LLC/GGSI
Sellco LLC, 5.75%, 05/15/2026(b)
|
|
|
|
Necessity Retail REIT, Inc. (The)/American
Finance Operating Partner L.P., 4.50%,
09/30/2028(b)
|
|
|
|
|
|
|
|
|
Security & Alarm Services-0.63%
|
Garda World Security Corp. (Canada), 4.63%,
02/15/2027(b)
|
|
|
|
GEO Group, Inc. (The), 8.63%, 04/15/2029
|
|
|
|
|
|
|
|
|
|
|
ams-OSRAM AG (Austria), 12.25%,
03/30/2029(b)
|
|
|
|
Specialized Consumer Services-0.42%
|
Sotheby’s, 7.38%, 10/15/2027(b)
|
|
|
|
Specialty Chemicals-0.79%
|
Wayfair LLC, 7.25%, 10/31/2029(b)
|
|
|
|
|
|
|
|
|
|
|
|
|
|
|
|
|
|
|
|
|
|
|
|
|
|
|
|
|
|
|
|
|
|
|
|
|
|
|
|
|
|
|
|
|
|
|
|
|
|
|
|
|
|
|
|
|
|
Gen Digital, Inc., 6.75%, 09/30/2027(b)
|
|
|
|
McAfee Corp., 7.38%, 02/15/2030(b)
|
|
|
|
|
|
|
|
|
Technology Hardware, Storage & Peripherals-0.14%
|
Seagate HDD Cayman, 4.88%, 06/01/2027
|
|
|
|
|
|
Goodyear Tire & Rubber Co. (The), 4.88%,
03/15/2027(c)
|
|
|
|
Trading Companies & Distributors-0.44%
|
Herc Holdings, Inc., 5.50%, 07/15/2027(b)
|
|
|
|
Transaction & Payment Processing Services-0.48%
|
Block, Inc., 2.75%, 06/01/2026
|
|
|
|
NCR Atleos Corp., 9.50%, 04/01/2029(b)
|
|
|
|
|
|
|
|
|
|
|
S&S Holdings LLC, 8.38%, 10/01/2031(b)
|
|
|
|
Total U.S. Dollar Denominated Bonds & Notes
(Cost $45,100,347)
|
|
See accompanying Notes to Financial Statements which are an integral part of the financial
statements.
Invesco High Yield Bond Factor ETF (IHYF)—(continued)
April 30, 2025
(Unaudited)
|
|
|
|
U.S. Treasury Securities-0.26%
|
U.S. Treasury Bills-0.26%
|
4.23%–4.26%, 05/29/2025(g)(h)
(Cost $114,623)
|
|
|
|
|
|
|
|
Common Stocks & Other Equity Interests-0.00%
|
Oil & Gas Exploration & Production-0.00%
|
|
|
|
|
|
|
|
|
|
|
|
|
Total Common Stocks & Other Equity Interests
(Cost $2,303)
|
|
|
|
Invesco Government & Agency Portfolio,
Institutional Class, 4.26%(k)(l)
(Cost $59,680)
|
|
|
|
TOTAL INVESTMENTS IN SECURITIES
(excluding investments purchased with cash collateral from
securities on loan)-98.37%
(Cost $45,276,953)
|
|
|
|
|
|
Investments Purchased with Cash Collateral
from Securities on Loan
|
Money Market Funds-16.18%
|
Invesco Private Government Fund,
4.32%(k)(l)(m)
|
|
|
|
Invesco Private Prime Fund, 4.46%(k)(l)(m)
|
|
|
|
Total Investments Purchased with Cash Collateral from
Securities on Loan
(Cost $7,329,813)
|
|
TOTAL INVESTMENTS IN SECURITIES-114.55%
(Cost $52,606,766)
|
|
OTHER ASSETS LESS LIABILITIES-(14.55)%
|
|
|
|
|
Investment Abbreviations:
|
|
|
|
|
|
-Real Estate Investment Trust
|
Notes to Schedule of Investments:
|
|
|
Industry and/or sector classifications used in this report are generally according
to the Global Industry Classification Standard, which was developed by and is
the exclusive property and a service mark of MSCI Inc. and Standard & Poor’s.
|
|
|
Security purchased or received in a transaction exempt from registration under the Securities Act of 1933, as amended (the “1933 Act”). The security may be
resold pursuant to an exemption from registration under the 1933 Act, typically to
qualified institutional buyers. The aggregate value of these securities at
April 30, 2025 was $34,457,072, which represented 76.07% of the Fund’s Net Assets.
|
|
|
All or a portion of this security was out on loan at April 30, 2025.
|
|
|
Restricted security. The value of this security at April 30, 2025 represented less than 1% of the Fund’s Net Assets.
|
|
|
Security issued at a fixed rate for a specific period of time, after which it will
convert to a variable rate.
|
|
|
All or a portion of this security is Pay-in-Kind. Pay-in-Kind securities pay interest
income in the form of securities.
|
|
|
$109,639 was pledged as collateral to cover margin requirements for open futures contracts.
See Note 2S.
|
|
|
Security traded on a discount basis. The interest rate shown represents the discount
rate at the time of purchase by the Fund.
|
|
|
Non-income producing security.
|
|
|
Security valued using significant unobservable inputs (Level 3). See Note 4.
|
|
|
Affiliated holding. Affiliated holdings are investments in entities which are under
common ownership or control of Invesco Ltd. or are investments in entities in
which the Fund owns 5% or more of the outstanding voting securities. The table below shows the Fund’s transactions in, and earnings from, its investments in
affiliates for the six months ended April 30, 2025.
|
|
|
|
|
|
Change in
Unrealized
Appreciation
|
|
|
|
Investments in Affiliated
Money Market Funds:
|
|
|
|
|
|
|
|
Invesco Government & Agency
Portfolio, Institutional Class
|
|
|
|
|
|
|
|
See accompanying Notes to Financial Statements which are an integral part of the financial
statements.
Invesco High Yield Bond Factor ETF (IHYF)—(continued)
April 30, 2025
(Unaudited)
|
|
|
|
|
Change in
Unrealized
Appreciation
|
|
|
|
Investments Purchased with
Cash Collateral from
Securities on Loan:
|
|
|
|
|
|
|
|
Invesco Private Government
Fund
|
|
|
|
|
|
|
|
Invesco Private Prime Fund
|
|
|
|
|
|
|
|
|
|
|
|
|
|
|
|
|
|
|
Represents the income earned on the investment of cash collateral, which is included
in securities lending income on the Statements of Operations. Does not
include rebates and fees paid to lending agent or premiums received from borrowers,
if any.
|
|
|
The rate shown is the 7-day SEC standardized yield as of April 30, 2025.
|
|
|
The security has been segregated to satisfy the commitment to return the cash collateral received in securities lending transactions upon the borrower’s return
of the securities loaned. See Note 2P.
|
|
|
|
|
|
|
|
|
Unrealized
Appreciation
(Depreciation)
|
|
|
|
|
|
|
|
U.S. Treasury 10 Year Notes
|
|
|
|
|
|
U.S. Treasury 10 Year Ultra
|
|
|
|
|
|
U.S. Treasury 5 Year Notes
|
|
|
|
|
|
U.S. Treasury Ultra Bonds
|
|
|
|
|
|
Subtotal—Long Futures Contracts
|
|
|
|
|
|
|
|
|
|
|
|
|
|
|
|
|
|
|
|
U.S. Treasury 2 Year Notes
|
|
|
|
|
|
|
|
|
|
See accompanying Notes to Financial Statements which are an integral part of the financial
statements.
Invesco High Yield Select ETF (HIYS)
April 30, 2025
(Unaudited)
Schedule of Investments(a)
|
|
|
|
U.S. Dollar Denominated Bonds & Notes-90.54%
|
|
|
Clear Channel Outdoor Holdings, Inc., 5.13%,
08/15/2027(b)
|
|
|
|
Aerospace & Defense-1.14%
|
TransDigm, Inc., 6.38%, 03/01/2029(b)
|
|
|
|
Alternative Carriers-0.62%
|
Lumen Technologies, Inc., 10.00%,
10/15/2032(b)
|
|
|
|
Windstream Services LLC/Windstream Escrow
Finance Corp., 8.25%, 10/01/2031(b)
|
|
|
|
|
|
|
|
|
|
|
Victoria’s Secret & Co., 4.63%,
07/15/2029(b)(c)
|
|
|
|
Application Software-1.15%
|
Cloud Software Group, Inc.
|
|
|
|
|
|
|
|
|
|
|
|
|
|
|
|
|
|
|
|
|
|
|
|
|
|
|
|
|
|
|
|
|
|
Automobile Manufacturers-1.04%
|
Allison Transmission, Inc., 3.75%,
01/30/2031(b)
|
|
|
|
Automotive Parts & Equipment-2.78%
|
Clarios Global L.P./Clarios US Finance Co.,
6.75%, 02/15/2030(b)
|
|
|
|
Cougar JV Subsidiary LLC, 8.00%,
05/15/2032(b)
|
|
|
|
Forvia SE (France), 8.00%, 06/15/2030(b)(c)
|
|
|
|
NESCO Holdings II, Inc., 5.50%, 04/15/2029(b)
|
|
|
|
|
|
|
|
|
|
|
|
|
|
|
|
|
|
|
|
|
|
|
|
|
|
Carvana Co., 14.00% PIK Rate, 9.00% Cash
Rate, 06/01/2031(b)(d)
|
|
|
|
|
|
|
|
|
|
|
|
|
|
|
|
|
|
|
LCM Investments Holdings II LLC
|
|
|
|
|
|
|
|
|
|
|
|
|
|
|
|
|
|
|
|
|
|
|
|
|
|
|
|
|
Velocity Vehicle Group LLC, 8.00%,
06/01/2029(b)
|
|
|
|
|
|
|
|
|
|
|
Gray Media, Inc., 10.50%, 07/15/2029(b)(c)
|
|
|
|
|
|
|
|
|
|
Sirius XM Radio LLC, 5.00%, 08/01/2027(b)
|
|
|
|
Univision Communications, Inc.
|
|
|
|
|
|
|
|
|
|
|
|
|
|
|
|
|
|
|
|
|
Kohl’s Corp., 5.13%, 05/01/2031
|
|
|
|
Macy’s Retail Holdings LLC, 6.70%,
07/15/2034(b)
|
|
|
|
|
|
|
|
|
|
|
CCO Holdings LLC/CCO Holdings Capital Corp.
|
|
|
|
|
|
|
|
|
|
|
|
|
|
|
|
|
|
|
|
|
|
|
|
|
|
|
|
|
Directv Financing LLC/Directv Financing
Co-Obligor, Inc., 10.00%, 02/15/2031(b)
|
|
|
|
|
|
|
|
|
|
|
Studio City Finance Ltd. (Macau), 5.00%,
01/15/2029(b)
|
|
|
|
Commercial & Residential Mortgage Finance-0.76%
|
PennyMac Financial Services, Inc., 4.25%,
02/15/2029(b)
|
|
|
|
Walker & Dunlop, Inc., 6.63%, 04/01/2033(b)
|
|
|
|
|
|
|
|
|
Construction Machinery & Heavy Transportation Equipment-0.53%
|
Northriver Midstream Finance L.P. (Canada),
6.75%, 07/15/2032(b)
|
|
|
|
|
|
EZCORP, Inc., 7.38%, 04/01/2032(b)
|
|
|
|
FirstCash, Inc., 6.88%, 03/01/2032(b)
|
|
|
|
|
|
|
|
|
|
|
|
|
|
|
|
|
|
|
|
|
|
|
|
|
|
|
|
|
|
|
|
|
|
|
|
|
|
|
|
|
|
|
|
Diversified Capital Markets-0.50%
|
Icahn Enterprises L.P./Icahn Enterprises
Finance Corp., 9.00%, 06/15/2030
|
|
|
|
Diversified Financial Services-5.00%
|
Freedom Mortgage Holdings LLC, 8.38%,
04/01/2032(b)(c)
|
|
|
|
GGAM Finance Ltd. (Ireland), 6.88%,
04/15/2029(b)
|
|
|
|
See accompanying Notes to Financial Statements which are an integral part of the financial
statements.
Invesco High Yield Select ETF (HIYS)—(continued)
April 30, 2025
(Unaudited)
|
|
|
|
Diversified Financial Services-(continued)
|
Jane Street Group/JSG Finance, Inc.
|
|
|
|
|
|
|
|
|
|
|
|
|
|
|
|
|
|
|
|
|
|
|
|
Nationstar Mortgage Holdings, Inc., 7.13%,
02/01/2032(b)
|
|
|
|
Provident Funding Associates L.P./PFG Finance
Corp., 9.75%, 09/15/2029(b)
|
|
|
|
|
|
|
|
|
|
|
Iron Mountain Information Management
Services, Inc., 5.00%, 07/15/2032(b)
|
|
|
|
Uniti Group L.P./Uniti Group Finance 2019,
Inc./CSL Capital LLC, 10.50%,
02/15/2028(b)
|
|
|
|
|
|
|
|
|
Diversified Support Services-1.94%
|
RB Global Holdings, Inc. (Canada)
|
|
|
|
|
|
|
|
|
|
|
|
|
|
Saks Global Enterprises LLC, 11.00%,
12/15/2029(b)
|
|
|
|
|
|
|
|
|
|
|
California Buyer Ltd./Atlantica Sustainable
Infrastructure PLC (United Kingdom), 6.38%,
02/15/2032(b)
|
|
|
|
Vistra Operations Co. LLC
|
|
|
|
|
|
|
|
|
|
|
|
|
|
|
|
|
|
|
Electrical Components & Equipment-0.80%
|
|
|
|
|
|
|
|
|
|
|
|
|
|
|
|
|
|
|
|
|
Electronic Components-0.55%
|
Sensata Technologies, Inc., 3.75%,
02/15/2031(b)
|
|
|
|
Electronic Manufacturing Services-0.80%
|
EMRLD Borrower L.P./Emerald Co-Issuer, Inc.,
6.63%, 12/15/2030(b)
|
|
|
|
Environmental & Facilities Services-1.77%
|
|
|
|
|
|
|
|
|
|
|
|
|
|
|
|
|
|
|
|
|
|
|
New Gold, Inc. (Canada), 6.88%,
04/01/2032(b)
|
|
|
|
Health Care Facilities-2.04%
|
Select Medical Corp., 6.25%, 12/01/2032(b)(c)
|
|
|
|
|
|
|
|
Health Care Facilities-(continued)
|
|
|
|
|
|
|
|
|
|
|
|
|
|
|
|
|
|
|
|
|
|
|
Diversified Healthcare Trust, 0.00%,
01/15/2026(b)(e)
|
|
|
|
Health Care Services-2.16%
|
Community Health Systems, Inc.
|
|
|
|
|
|
|
|
|
|
|
|
|
|
|
|
|
|
|
|
|
|
|
|
|
|
|
|
|
|
|
|
|
|
|
|
|
|
|
DaVita, Inc., 6.88%, 09/01/2032(b)
|
|
|
|
|
|
|
|
|
|
|
Taylor Morrison Communities, Inc., 5.13%,
08/01/2030(b)
|
|
|
|
Hotel & Resort REITs-2.12%
|
RLJ Lodging Trust L.P., 4.00%, 09/15/2029(b)
|
|
|
|
|
|
|
|
|
|
|
|
|
|
|
|
|
|
|
|
|
|
|
|
|
|
|
|
|
Hotels, Resorts & Cruise Lines-2.52%
|
|
|
|
|
|
|
|
|
|
|
|
|
|
|
|
|
|
|
|
|
Hilton Domestic Operating Co., Inc., 5.88%,
03/15/2033(b)
|
|
|
|
Royal Caribbean Cruises Ltd., 6.00%,
02/01/2033(b)
|
|
|
|
|
|
|
|
|
|
|
Energizer Holdings, Inc., 4.38%,
03/31/2029(b)
|
|
|
|
Housewares & Specialties-0.50%
|
Newell Brands, Inc., 5.70%, 04/01/2026
|
|
|
|
Independent Power Producers & Energy Traders-2.10%
|
Calpine Corp., 5.13%, 03/15/2028(b)
|
|
|
|
|
|
|
|
|
|
|
|
|
|
|
|
|
|
|
|
|
|
|
|
Industrial Machinery & Supplies & Components-1.18%
|
ESAB Corp., 6.25%, 04/15/2029(b)
|
|
|
|
Roller Bearing Co. of America, Inc., 4.38%,
10/15/2029(b)
|
|
|
|
|
|
|
|
|
See accompanying Notes to Financial Statements which are an integral part of the financial
statements.
Invesco High Yield Select ETF (HIYS)—(continued)
April 30, 2025
(Unaudited)
|
|
|
|
|
|
Alliant Holdings Intermediate LLC/Alliant
Holdings Co-Issuer, 7.00%, 01/15/2031(b)
|
|
|
|
HUB International Ltd., 7.25%, 06/15/2030(b)
|
|
|
|
|
|
|
|
|
Integrated Telecommunication Services-4.53%
|
Iliad Holding S.A.S.U. (France), 8.50%,
04/15/2031(b)
|
|
|
|
|
|
|
|
|
|
|
|
|
|
|
|
|
|
|
|
|
|
|
|
Telecom Italia Capital S.A. (Italy)
|
|
|
|
|
|
|
|
|
|
|
|
|
|
|
|
|
|
|
|
|
Amer Sports Co. (Finland), 6.75%,
02/16/2031(b)
|
|
|
|
Metal, Glass & Plastic Containers-0.59%
|
OI European Group B.V., 4.75%,
02/15/2030(b)(c)
|
|
|
|
Movies & Entertainment-1.05%
|
Lions Gate Capital Holdings 1, Inc., 5.50%,
04/15/2029(b)
|
|
|
|
WMG Acquisition Corp., 3.75%, 12/01/2029(b)
|
|
|
|
|
|
|
|
|
Multi-line Insurance-0.72%
|
Acrisure LLC/Acrisure Finance, Inc., 7.50%,
11/06/2030(b)
|
|
|
|
|
|
CenterPoint Energy, Inc., 6.70%,
05/15/2055(f)
|
|
|
|
|
|
Office Properties Income Trust, 9.00%,
03/31/2029(b)
|
|
|
|
|
|
Delek Logistics Partners L.P./Delek Logistics
Finance Corp.
|
|
|
|
|
|
|
|
|
|
|
|
|
|
Summit Midstream Holdings LLC, 8.63%,
10/31/2029(b)
|
|
|
|
|
|
|
|
|
Oil & Gas Exploration & Production-1.93%
|
Aethon United BR L.P./Aethon United Finance
Corp., 7.50%, 10/01/2029(b)
|
|
|
|
Comstock Resources, Inc., 6.75%,
03/01/2029(b)
|
|
|
|
Kimmeridge Texas Gas LLC, 8.50%,
02/15/2030(b)
|
|
|
|
|
|
|
|
|
Oil & Gas Refining & Marketing-0.58%
|
Sunoco L.P., 6.25%, 07/01/2033(b)
|
|
|
|
|
|
|
|
Oil & Gas Storage & Transportation-5.01%
|
Antero Midstream Partners L.P./Antero
Midstream Finance Corp., 6.63%,
02/01/2032(b)
|
|
|
|
Excelerate Energy L.P., 8.00%, 05/15/2030(b)
|
|
|
|
Genesis Energy L.P./Genesis Energy Finance
Corp.
|
|
|
|
|
|
|
|
|
|
|
|
|
|
Howard Midstream Energy Partners LLC,
7.38%, 07/15/2032(b)
|
|
|
|
NGL Energy Operating LLC/NGL Energy Finance
Corp., 8.38%, 02/15/2032(b)
|
|
|
|
Prairie Acquiror L.P., 9.00%, 08/01/2029(b)
|
|
|
|
Tallgrass Energy Partners L.P./Tallgrass Energy
Finance Corp., 7.38%, 02/15/2029(b)
|
|
|
|
|
|
|
|
|
|
|
|
|
|
|
|
|
|
|
|
|
|
|
|
Other Specialized REITs-0.59%
|
Iron Mountain, Inc., 4.50%, 02/15/2031(b)
|
|
|
|
Packaged Foods & Meats-0.63%
|
Lamb Weston Holdings, Inc., 4.38%,
01/31/2032(b)
|
|
|
|
Paper & Plastic Packaging Products & Materials-1.02%
|
Clydesdale Acquisition Holdings, Inc., 6.75%,
04/15/2032(b)
|
|
|
|
|
|
American Airlines, Inc./AAdvantage Loyalty IP
Ltd., 5.75%, 04/20/2029(b)
|
|
|
|
Passenger Ground Transportation-0.05%
|
Hertz Corp. (The), 12.63%, 07/15/2029(b)
|
|
|
|
|
|
1261229 BC Ltd., 10.00%, 04/15/2032(b)
|
|
|
|
Bausch Health Cos., Inc., 11.00%,
09/30/2028(b)
|
|
|
|
Endo Finance Holdings, Inc., 8.50%,
04/15/2031(b)
|
|
|
|
|
|
|
|
|
Real Estate Development-1.12%
|
Cushman & Wakefield U.S. Borrower LLC,
8.88%, 09/01/2031(b)
|
|
|
|
Greystar Real Estate Partners LLC, 7.75%,
09/01/2030(b)
|
|
|
|
|
|
|
|
|
|
|
Global Atlantic (Fin) Co., 4.70%,
10/15/2051(b)(f)
|
|
|
|
Security & Alarm Services-0.61%
|
Brink’s Co. (The), 6.75%, 06/15/2032(b)
|
|
|
|
Semiconductor Materials & Equipment-0.60%
|
Entegris, Inc., 4.75%, 04/15/2029(b)
|
|
|
|
Single-Family Residential REITs-1.17%
|
Ashton Woods USA LLC/Ashton Woods Finance
Co., 6.63%, 01/15/2028(b)
|
|
|
|
See accompanying Notes to Financial Statements which are an integral part of the financial
statements.
Invesco High Yield Select ETF (HIYS)—(continued)
April 30, 2025
(Unaudited)
|
|
|
|
Specialized Consumer Services-0.81%
|
Carriage Services, Inc., 4.25%, 05/15/2029(b)
|
|
|
|
Specialized Finance-1.62%
|
Jefferson Capital Holdings LLC
|
|
|
|
|
|
|
|
|
|
|
|
|
|
TrueNoord Capital DAC (Ireland), 8.75%,
03/01/2030(b)
|
|
|
|
|
|
|
|
|
Specialty Chemicals-0.83%
|
Celanese US Holdings LLC, 6.95%,
11/15/2033
|
|
|
|
|
|
|
|
|
|
|
|
|
|
|
|
|
|
|
|
|
|
|
|
|
|
|
|
|
|
|
|
|
Camelot Finance S.A., 4.50%, 11/01/2026(b)
|
|
|
|
Technology Hardware, Storage & Peripherals-0.04%
|
Xerox Holdings Corp., 5.50%, 08/15/2028(b)
|
|
|
|
Trading Companies & Distributors-4.15%
|
Air Lease Corp., Series B, 4.65%(f)(g)
|
|
|
|
Aircastle Ltd., 5.25%(b)(f)(g)
|
|
|
|
BlueLinx Holdings, Inc., 6.00%, 11/15/2029(b)
|
|
|
|
H&E Equipment Services, Inc., 3.88%,
12/15/2028(b)
|
|
|
|
|
|
|
|
|
Transaction & Payment Processing Services-0.56%
|
WEX, Inc., 6.50%, 03/15/2033(b)
|
|
|
|
Wireless Telecommunication Services-1.16%
|
Vodafone Group PLC (United Kingdom), 4.13%,
06/04/2081(f)
|
|
|
|
Total U.S. Dollar Denominated Bonds & Notes
(Cost $6,998,668)
|
|
|
|
|
|
Non-U.S. Dollar Denominated Bonds & Notes-2.85%(h)
|
Integrated Telecommunication Services-1.49%
|
Eutelsat S.A. (France), 9.75%, 04/13/2029(b)
|
|
|
|
Wireless Telecommunication Services-1.36%
|
VMED O2 UK Financing I PLC (United Kingdom),
3.25%, 01/31/2031(b)
|
|
|
|
Total Non-U.S. Dollar Denominated Bonds & Notes
(Cost $200,820)
|
|
|
|
|
|
|
|
Invesco Premier U.S. Government Money
Portfolio, Institutional Class, 4.26%(i)(j)
(Cost $330,262)
|
|
|
|
TOTAL INVESTMENTS IN SECURITIES
(excluding investments purchased with cash collateral from
securities on loan)-97.65%
(Cost $7,529,750)
|
|
Investments Purchased with Cash Collateral
from Securities on Loan
|
|
|
Invesco Private Government Fund, 4.32%(i)(j)(k)
|
|
|
|
Invesco Private Prime Fund, 4.46%(i)(j)(k)
|
|
|
|
Total Investments Purchased with Cash Collateral from
Securities on Loan
(Cost $435,830)
|
|
TOTAL INVESTMENTS IN SECURITIES-103.27%
(Cost $7,965,580)
|
|
OTHER ASSETS LESS LIABILITIES-(3.27)%
|
|
|
|
|
Investment Abbreviations:
|
|
|
|
|
|
|
|
|
|
|
|
-Real Estate Investment Trust
|
See accompanying Notes to Financial Statements which are an integral part of the financial
statements.
Invesco High Yield Select ETF (HIYS)—(continued)
April 30, 2025
(Unaudited)
Notes to Schedule of Investments:
|
|
|
Industry and/or sector classifications used in this report are generally according
to the Global Industry Classification Standard, which was developed by and is
the exclusive property and a service mark of MSCI Inc. and Standard & Poor’s.
|
|
|
Security purchased or received in a transaction exempt from registration under the Securities Act of 1933, as amended (the “1933 Act”). The security may be
resold pursuant to an exemption from registration under the 1933 Act, typically to
qualified institutional buyers. The aggregate value of these securities at
April 30, 2025 was $6,268,782, which represented 80.83% of the Fund’s Net Assets.
|
|
|
All or a portion of this security was out on loan at April 30, 2025.
|
|
|
All or a portion of this security is Pay-in-Kind. Pay-in-Kind securities pay interest
income in the form of securities.
|
|
|
Denotes a zero coupon security issued at a substantial discount from its value at
maturity.
|
|
|
Security issued at a fixed rate for a specific period of time, after which it will
convert to a variable rate.
|
|
|
Perpetual bond with no specified maturity date.
|
|
|
Foreign denominated security. Principal amount is denominated in the currency indicated.
|
|
|
Affiliated holding. Affiliated holdings are investments in entities which are under
common ownership or control of Invesco Ltd. or are investments in entities in
which the Fund owns 5% or more of the outstanding voting securities. The table below shows the Fund’s transactions in, and earnings from, its investments in
affiliates for the six months ended April 30, 2025.
|
|
|
|
|
|
Change in
Unrealized
Appreciation
|
|
|
|
|
|
|
|
|
|
|
|
|
Investments in Affiliated
Money Market Funds:
|
|
|
|
|
|
|
|
Invesco Government &
Agency Portfolio, Institutional
Class
|
|
|
|
|
|
|
|
Invesco Premier
U.S. Government Money
Portfolio, Institutional Class
|
|
|
|
|
|
|
|
Investments Purchased
with Cash Collateral from
Securities on Loan:
|
|
|
|
|
|
|
|
Invesco Private Government
Fund
|
|
|
|
|
|
|
|
Invesco Private Prime Fund
|
|
|
|
|
|
|
|
|
|
|
|
|
|
|
|
|
|
|
Represents the income earned on the investment of cash collateral, which is included
in securities lending income on the Statements of Operations. Does not
include rebates and fees paid to lending agent or premiums received from borrowers,
if any.
|
|
|
The rate shown is the 7-day SEC standardized yield as of April 30, 2025.
|
|
|
The security has been segregated to satisfy the commitment to return the cash collateral received in securities lending transactions upon the borrower’s return
of the securities loaned. See Note 2P.
|
Open Forward Foreign Currency Contracts
|
|
|
|
|
|
|
|
|
|
|
|
|
|
|
|
|
|
|
|
|
|
|
|
|
See accompanying Notes to Financial Statements which are an integral part of the financial
statements.
Invesco MSCI EAFE Income Advantage ETF (EFAA)
April 30, 2025
(Unaudited)
|
|
|
|
Common Stocks & Other Equity Interests-76.25%
|
|
|
|
|
|
|
|
|
|
|
|
|
|
|
|
|
|
|
|
|
|
|
|
|
|
|
|
|
|
|
|
|
|
|
|
|
|
|
|
|
|
|
|
|
|
|
|
|
|
|
|
|
Commonwealth Bank of Australia
|
|
|
|
|
|
|
|
|
|
|
|
|
|
|
|
|
|
|
|
|
|
|
|
|
|
|
|
|
|
|
|
|
|
Insurance Australia Group Ltd.
|
|
|
|
James Hardie Industries PLC, CDI(a)(b)
|
|
|
|
|
|
|
|
|
|
|
|
|
|
|
|
|
|
|
National Australia Bank Ltd.(a)
|
|
|
|
Northern Star Resources Ltd.
|
|
|
|
|
|
|
|
|
|
|
|
|
|
|
|
|
|
|
|
|
|
|
|
|
|
|
|
|
|
|
|
|
|
|
|
|
|
|
|
|
|
|
|
|
|
|
|
|
|
|
|
|
|
|
|
|
|
|
|
|
|
|
|
|
|
|
|
|
|
|
|
|
|
|
|
|
|
|
|
|
|
|
|
|
|
|
|
|
Treasury Wine Estates Ltd.(a)
|
|
|
|
|
|
|
|
|
Washington H Soul Pattinson & Co. Ltd.(a)
|
|
|
|
|
|
|
|
|
|
|
|
|
|
|
|
|
|
|
Woodside Energy Group Ltd.
|
|
|
|
|
|
|
|
|
|
|
|
|
|
|
|
|
|
|
|
|
|
|
|
|
|
|
|
|
|
|
|
|
|
|
|
|
|
|
|
|
|
|
|
|
|
|
|
|
|
|
|
Anheuser-Busch InBev S.A./N.V.
|
|
|
|
|
|
|
|
|
Groupe Bruxelles Lambert N.V.
|
|
|
|
|
|
|
|
|
|
|
|
|
|
|
|
|
|
|
|
|
|
|
|
|
|
|
|
|
|
|
|
|
|
|
|
|
|
|
|
|
|
|
|
|
|
|
|
|
|
BOC Hong Kong (Holdings) Ltd.
|
|
|
|
SITC International Holdings Co. Ltd.
|
|
|
|
Wharf (Holdings) Ltd. (The)
|
|
|
|
Wilmar International Ltd.
|
|
|
|
Yangzijiang Shipbuilding Holdings Ltd.
|
|
|
|
|
|
|
|
|
|
|
A.P. Moller - Maersk A/S, Class A
|
|
|
|
A.P. Moller - Maersk A/S, Class B
|
|
|
|
|
|
|
|
|
|
|
|
|
|
|
|
|
|
|
|
|
|
|
|
|
|
|
|
|
|
|
|
|
|
Novo Nordisk A/S, Class B
|
|
|
|
Novonesis (Novozymes) B, Class B
|
|
|
|
|
|
|
|
|
|
|
|
|
|
|
|
|
|
|
|
|
|
|
|
|
|
|
|
|
|
|
|
|
|
|
|
|
|
|
|
|
|
|
|
|
|
|
|
|
|
|
|
|
|
|
|
|
|
|
|
|
|
|
|
|
|
|
|
|
|
|
|
|
|
|
|
|
|
|
|
|
|
|
|
|
|
|
|
|
|
|
Stora Enso OYJ, Class R(a)
|
|
|
|
|
|
|
|
|
|
|
|
|
|
|
|
|
|
|
See accompanying Notes to Financial Statements which are an integral part of the financial
statements.
Invesco MSCI EAFE Income Advantage ETF (EFAA)—(continued)
April 30, 2025
(Unaudited)
|
|
|
|
|
|
|
|
|
|
|
|
|
|
|
|
|
|
|
|
|
|
|
|
|
|
|
|
|
|
|
|
|
|
|
|
|
|
|
|
|
|
|
|
|
|
|
|
|
|
|
|
|
|
|
|
|
|
|
|
|
|
|
|
|
|
|
|
|
|
|
|
|
|
|
|
|
|
|
|
|
|
|
|
|
|
Cie Generale des Etablissements Michelin
S.C.A.
|
|
|
|
|
|
|
|
|
|
|
|
|
|
|
|
|
|
|
|
|
|
|
|
|
|
|
|
|
|
|
|
|
|
|
|
|
|
|
|
|
|
|
|
|
|
|
|
|
|
|
|
|
|
|
|
|
|
|
|
|
|
|
|
|
|
|
|
|
Hermes International S.C.A.
|
|
|
|
|
|
|
|
|
|
|
|
|
|
|
|
|
|
|
|
|
|
|
|
|
|
|
|
|
LVMH Moet Hennessy Louis Vuitton SE
|
|
|
|
|
|
|
|
|
|
|
|
|
|
|
|
|
|
|
|
|
|
|
|
|
|
|
|
|
|
|
|
|
|
|
|
|
|
|
|
|
|
|
|
|
|
|
|
|
|
|
|
|
|
|
|
|
|
|
|
|
|
|
|
|
|
|
|
|
|
|
|
|
|
Unibail-Rodamco-Westfield
|
|
|
|
Veolia Environnement S.A.
|
|
|
|
|
|
|
|
|
|
|
|
|
|
|
|
|
|
|
|
|
|
|
|
|
|
|
|
|
|
|
|
|
|
|
|
|
|
|
|
|
|
Bayerische Motoren Werke AG
|
|
|
|
Bayerische Motoren Werke AG, Preference
Shares
|
|
|
|
|
|
|
|
|
|
|
|
|
|
|
|
|
|
|
|
|
|
|
|
|
|
|
|
|
CTS Eventim AG & Co. KGaA
|
|
|
|
|
|
|
|
|
|
|
|
|
|
|
|
|
|
|
|
|
|
|
|
|
|
|
|
|
|
|
|
|
|
Dr. Ing. h.c. F. Porsche AG, Preference
Shares(c)
|
|
|
|
|
|
|
|
|
|
|
|
|
|
Fresenius Medical Care AG
|
|
|
|
Fresenius SE & Co. KGaA(b)
|
|
|
|
|
|
|
|
|
|
|
|
|
|
|
|
|
|
|
|
|
|
|
|
Henkel AG & Co. KGaA, Preference Shares
|
|
|
|
|
|
|
|
|
|
|
|
|
|
|
|
|
|
|
|
|
|
|
|
|
|
|
|
|
|
|
|
|
|
Muenchener Rueckversicherungs-Gesellschaft
AG in Muenchen, Class R
|
|
|
|
|
|
|
|
|
Porsche Automobil Holding SE, Preference
Shares
|
|
|
|
|
|
|
|
|
|
|
|
|
|
|
|
|
|
|
|
|
|
|
|
|
|
|
|
|
Sartorius AG, Preference Shares
|
|
|
|
|
|
|
|
|
|
|
|
|
|
Siemens Energy AG, Class A(b)
|
|
|
|
Siemens Healthineers AG(c)
|
|
|
|
|
|
|
|
|
|
|
|
|
|
Volkswagen AG, Preference Shares
|
|
|
|
|
|
|
|
|
|
|
|
|
|
|
|
|
|
|
|
|
|
|
|
|
|
|
|
|
|
|
CK Hutchison Holdings Ltd.
|
|
|
|
See accompanying Notes to Financial Statements which are an integral part of the financial
statements.
Invesco MSCI EAFE Income Advantage ETF (EFAA)—(continued)
April 30, 2025
(Unaudited)
|
|
|
|
|
|
CK Infrastructure Holdings Ltd.
|
|
|
|
|
|
|
|
|
|
|
|
|
|
|
|
|
|
|
Henderson Land Development Co. Ltd.
|
|
|
|
|
|
|
|
|
Hong Kong & China Gas Co. Ltd. (The)
|
|
|
|
Hong Kong Exchanges & Clearing Ltd.
|
|
|
|
Hongkong Land Holdings Ltd.
|
|
|
|
Jardine Matheson Holdings Ltd.
|
|
|
|
|
|
|
|
|
|
|
|
|
|
Power Assets Holdings Ltd.
|
|
|
|
|
|
|
|
|
|
|
|
|
|
Sun Hung Kai Properties Ltd.
|
|
|
|
Swire Pacific Ltd., Class A(a)
|
|
|
|
Techtronic Industries Co. Ltd.
|
|
|
|
|
|
|
|
|
Wharf Real Estate Investment Co. Ltd.(a)
|
|
|
|
|
|
|
|
|
|
|
|
|
|
|
|
|
|
|
|
|
Bank of Ireland Group PLC
|
|
|
|
|
|
|
|
|
|
|
|
|
|
|
|
|
|
|
|
|
|
|
|
|
|
|
|
|
|
|
Bank Leumi le-Israel B.M.
|
|
|
|
Check Point Software Technologies Ltd.(b)
|
|
|
|
|
|
|
|
|
|
|
|
|
|
|
|
|
|
|
Israel Discount Bank Ltd., Class A
|
|
|
|
Mizrahi Tefahot Bank Ltd.
|
|
|
|
|
|
|
|
|
|
|
|
|
|
Teva Pharmaceutical Industries Ltd., ADR(b)
|
|
|
|
|
|
|
|
|
|
|
|
|
|
|
|
|
|
|
|
|
Assicurazioni Generali S.p.A.(a)
|
|
|
|
|
|
|
|
|
|
|
|
|
|
|
|
|
|
|
Davide Campari-Milano N.V.(a)
|
|
|
|
|
|
|
|
|
|
|
|
|
|
|
|
|
|
|
|
|
|
|
|
FinecoBank Banca Fineco S.p.A.
|
|
|
|
Infrastrutture Wireless Italiane S.p.A.(a)(c)
|
|
|
|
|
|
|
|
|
|
|
|
|
|
|
|
|
|
|
|
Mediobanca Banca di Credito Finanziario
S.p.A.
|
|
|
|
|
|
|
|
|
|
|
|
|
|
|
|
|
|
|
|
|
|
|
|
Recordati Industria Chimica e Farmaceutica
S.p.A.
|
|
|
|
|
|
|
|
|
Telecom Italia S.p.A.(a)(b)
|
|
|
|
|
|
|
|
|
|
|
|
|
|
Unipol Assicurazioni S.p.A.
|
|
|
|
|
|
|
|
|
|
|
|
|
|
|
|
|
|
|
|
|
|
|
|
|
|
|
|
|
|
|
|
|
|
|
|
|
|
|
|
|
Asahi Group Holdings Ltd.
|
|
|
|
|
|
|
|
|
|
|
|
|
|
|
|
|
|
|
Bandai Namco Holdings, Inc.
|
|
|
|
|
|
|
|
|
|
|
|
|
|
|
|
|
|
|
Central Japan Railway Co.
|
|
|
|
|
|
|
|
|
Chubu Electric Power Co., Inc.
|
|
|
|
Chugai Pharmaceutical Co. Ltd.
|
|
|
|
Concordia Financial Group Ltd.
|
|
|
|
Dai Nippon Printing Co. Ltd.
|
|
|
|
|
|
|
|
|
Dai-ichi Life Holdings, Inc.
|
|
|
|
|
|
|
|
|
|
|
|
|
|
Daito Trust Construction Co. Ltd.
|
|
|
|
Daiwa House Industry Co. Ltd.
|
|
|
|
Daiwa Securities Group, Inc.
|
|
|
|
|
|
|
|
|
|
|
|
|
|
|
|
|
|
|
|
|
|
|
|
|
|
|
|
|
|
|
|
|
|
|
|
|
|
|
|
|
|
|
|
|
|
|
|
|
|
|
|
|
|
|
|
|
|
|
|
|
|
|
|
Hankyu Hanshin Holdings, Inc.
|
|
|
|
|
|
|
|
|
|
|
|
|
|
|
|
|
|
|
|
|
|
|
|
See accompanying Notes to Financial Statements which are an integral part of the financial
statements.
Invesco MSCI EAFE Income Advantage ETF (EFAA)—(continued)
April 30, 2025
(Unaudited)
|
|
|
|
|
|
|
|
|
|
|
|
|
|
|
|
|
|
|
|
|
|
|
|
|
|
|
|
|
|
|
|
|
|
|
|
|
|
|
|
|
Japan Exchange Group, Inc.
|
|
|
|
|
|
|
|
|
Japan Post Holdings Co. Ltd.
|
|
|
|
Japan Post Insurance Co. Ltd.
|
|
|
|
|
|
|
|
|
|
|
|
|
|
|
|
|
|
|
Kansai Electric Power Co., Inc. (The)
|
|
|
|
|
|
|
|
|
Kawasaki Kisen Kaisha Ltd.(a)
|
|
|
|
|
|
|
|
|
|
|
|
|
|
|
|
|
|
|
|
|
|
|
|
|
|
|
|
|
|
|
|
|
|
|
|
|
|
|
|
|
|
|
|
|
|
|
|
|
|
|
|
|
|
|
|
|
|
|
|
|
|
|
|
|
|
|
|
|
|
|
|
|
|
|
|
|
|
|
|
|
|
|
|
|
|
|
|
|
|
|
|
|
|
Mitsubishi Chemical Group Corp.
|
|
|
|
|
|
|
|
|
Mitsubishi Electric Corp.
|
|
|
|
Mitsubishi Estate Co. Ltd.
|
|
|
|
Mitsubishi HC Capital, Inc.(a)
|
|
|
|
Mitsubishi Heavy Industries Ltd.
|
|
|
|
Mitsubishi UFJ Financial Group, Inc.
|
|
|
|
|
|
|
|
|
|
|
|
|
|
|
|
|
|
|
Mizuho Financial Group, Inc.
|
|
|
|
|
|
|
|
|
MS&AD Insurance Group Holdings, Inc.
|
|
|
|
Murata Manufacturing Co. Ltd.
|
|
|
|
|
|
|
|
|
|
|
|
|
|
|
|
|
|
|
|
|
|
|
|
Nippon Building Fund, Inc.
|
|
|
|
Nippon Paint Holdings Co. Ltd.
|
|
|
|
Nippon Sanso Holdings Corp.
|
|
|
|
|
|
|
|
|
Nippon Telegraph & Telephone Corp.
|
|
|
|
|
|
|
|
|
Nissan Motor Co. Ltd.(a)(b)
|
|
|
|
|
|
|
|
|
|
Nissin Foods Holdings Co. Ltd.
|
|
|
|
Nitori Holdings Co. Ltd.(a)
|
|
|
|
|
|
|
|
|
|
|
|
|
|
Nomura Research Institute Ltd.
|
|
|
|
|
|
|
|
|
|
|
|
|
|
|
|
|
|
|
|
|
|
|
|
|
|
|
|
|
Ono Pharmaceutical Co. Ltd.
|
|
|
|
|
|
|
|
|
|
|
|
|
|
|
|
|
|
|
|
|
|
|
|
|
|
|
|
|
Pan Pacific International Holdings Corp.
|
|
|
|
|
|
|
|
|
|
|
|
|
|
Recruit Holdings Co. Ltd.
|
|
|
|
Renesas Electronics Corp.
|
|
|
|
|
|
|
|
|
|
|
|
|
|
|
|
|
|
|
SCREEN Holdings Co. Ltd.(a)
|
|
|
|
|
|
|
|
|
|
|
|
|
|
|
|
|
|
|
Sekisui Chemical Co. Ltd.
|
|
|
|
|
|
|
|
|
Seven & i Holdings Co. Ltd.
|
|
|
|
|
|
|
|
|
|
|
|
|
|
|
|
|
|
|
Shin-Etsu Chemical Co. Ltd.
|
|
|
|
|
|
|
|
|
|
|
|
|
|
|
|
|
|
|
|
|
|
|
|
|
|
|
|
|
|
|
|
|
|
|
|
|
|
|
|
|
|
|
|
|
|
|
|
|
Sumitomo Electric Industries Ltd.
|
|
|
|
Sumitomo Metal Mining Co. Ltd.
|
|
|
|
Sumitomo Mitsui Financial Group, Inc.
|
|
|
|
Sumitomo Mitsui Trust Group, Inc.
|
|
|
|
Sumitomo Realty & Development Co. Ltd.(a)
|
|
|
|
Suntory Beverage & Food Ltd.
|
|
|
|
|
|
|
|
|
|
|
|
|
|
|
|
|
|
|
|
|
|
|
|
Takeda Pharmaceutical Co. Ltd.
|
|
|
|
|
|
|
|
|
|
|
|
|
|
|
|
|
|
|
|
|
|
|
|
Tokio Marine Holdings, Inc.
|
|
|
|
See accompanying Notes to Financial Statements which are an integral part of the financial
statements.
Invesco MSCI EAFE Income Advantage ETF (EFAA)—(continued)
April 30, 2025
(Unaudited)
|
|
|
|
|
|
|
|
|
|
|
|
|
|
|
|
|
|
|
|
|
|
|
|
|
|
|
|
|
|
|
|
|
|
|
|
|
|
|
|
|
|
|
|
|
|
|
|
|
|
|
|
|
|
|
|
|
|
|
|
|
|
|
|
|
|
|
|
|
|
|
|
|
|
|
|
|
|
|
|
|
|
|
|
|
|
|
|
|
|
|
|
|
|
|
|
|
|
|
|
|
|
|
Hikma Pharmaceuticals PLC
|
|
|
|
|
|
|
|
|
|
|
CVC Capital Partners PLC(b)(c)
|
|
|
|
|
|
|
|
|
|
|
|
|
|
|
|
Galaxy Entertainment Group Ltd.(a)
|
|
|
|
|
|
|
|
|
|
|
|
|
|
|
|
ABN AMRO Bank N.V., CVA(c)
|
|
|
|
|
|
|
|
|
|
|
|
|
|
|
|
|
|
|
|
|
|
|
|
|
|
|
|
|
|
|
|
|
|
|
|
|
|
|
BE Semiconductor Industries N.V.
|
|
|
|
|
|
|
|
|
|
|
|
|
|
|
|
|
|
|
|
|
|
|
|
|
|
|
|
|
|
|
|
|
|
|
|
|
|
|
Koninklijke Ahold Delhaize N.V.
|
|
|
|
|
|
|
|
|
Koninklijke Philips N.V.(b)
|
|
|
|
|
|
|
|
|
|
|
|
|
|
|
|
|
|
|
Universal Music Group N.V.
|
|
|
|
|
|
|
|
|
|
|
|
|
|
|
|
|
|
|
|
Auckland International Airport Ltd.
|
|
|
|
|
|
|
|
|
Fisher & Paykel Healthcare Corp. Ltd.
|
|
|
|
|
|
|
|
|
|
|
|
|
|
|
|
|
|
|
|
|
|
|
|
|
|
|
|
|
|
|
|
|
|
|
|
|
|
|
|
|
Gjensidige Forsikring ASA
|
|
|
|
|
|
|
|
|
|
|
|
|
|
|
|
|
|
|
|
|
|
|
|
|
|
|
|
|
|
|
|
|
|
|
|
|
|
|
|
|
|
|
|
|
|
|
|
|
|
|
|
|
|
|
|
|
|
Jeronimo Martins SGPS S.A.
|
|
|
|
|
|
|
|
|
|
|
|
|
|
|
|
CapitaLand Integrated Commercial Trust
|
|
|
|
CapitaLand Investment Ltd.
|
|
|
|
|
|
|
|
|
|
|
|
|
|
Grab Holdings Ltd., Class A(b)
|
|
|
|
|
|
|
|
|
Oversea-Chinese Banking Corp. Ltd.
|
|
|
|
|
|
|
|
|
|
|
|
|
|
|
|
|
|
|
|
|
|
|
|
Singapore Technologies Engineering Ltd.
|
|
|
|
Singapore Telecommunications Ltd.
|
|
|
|
United Overseas Bank Ltd.
|
|
|
|
|
|
|
|
|
|
|
|
|
|
|
|
|
|
|
|
|
|
|
|
|
|
|
|
|
|
ACS Actividades de Construccion y Servicios
S.A.
|
|
|
|
|
|
|
|
|
|
|
|
|
|
Banco Bilbao Vizcaya Argentaria S.A.
|
|
|
|
|
|
|
|
|
|
|
|
|
|
See accompanying Notes to Financial Statements which are an integral part of the financial
statements.
Invesco MSCI EAFE Income Advantage ETF (EFAA)—(continued)
April 30, 2025
(Unaudited)
|
|
|
|
|
|
|
|
|
|
|
|
|
|
|
|
|
|
|
|
|
EDP Renovaveis S.A., Rts., expiring
05/05/2025(a)(b)
|
|
|
|
|
|
|
|
|
|
|
|
|
|
|
|
|
|
|
Industria de Diseno Textil S.A.
|
|
|
|
|
|
|
|
|
|
|
|
|
|
|
|
|
|
|
|
|
|
|
|
|
|
|
|
|
|
|
|
|
|
|
|
|
|
|
|
|
|
|
|
|
|
|
|
|
|
|
|
|
|
|
|
|
|
|
|
|
|
|
|
|
|
|
|
|
|
|
|
|
|
|
|
|
|
|
|
|
|
|
|
|
|
Fastighets AB Balder, Class B(a)(b)
|
|
|
|
H & M Hennes & Mauritz AB, Class B(a)
|
|
|
|
|
|
|
|
|
|
|
|
|
|
Industrivarden AB, Class A
|
|
|
|
Industrivarden AB, Class C(a)
|
|
|
|
|
|
|
|
|
Investment AB Latour, Class B(a)
|
|
|
|
|
|
|
|
|
L E Lundbergforetagen AB, Class B
|
|
|
|
|
|
|
|
|
NIBE Industrier AB, Class B(a)
|
|
|
|
|
|
|
|
|
|
|
|
|
|
|
|
|
|
|
|
|
|
|
|
Skandinaviska Enskilda Banken AB,
Class A(a)
|
|
|
|
|
|
|
|
|
|
|
|
|
|
Spotify Technology S.A.(b)
|
|
|
|
Svenska Cellulosa AB S.C.A., Class B(a)
|
|
|
|
Svenska Handelsbanken AB, Class A
|
|
|
|
|
|
|
|
|
Swedish Orphan Biovitrum AB, Class B(b)
|
|
|
|
|
|
|
|
|
Telefonaktiebolaget LM Ericsson, Class B
|
|
|
|
|
|
|
|
|
|
|
|
|
|
|
|
|
|
|
|
|
|
|
|
|
|
|
|
|
|
|
|
|
|
|
|
|
|
|
|
|
|
|
|
|
|
|
Banque Cantonale Vaudoise(a)
|
|
|
|
|
|
|
|
|
|
|
|
|
|
Chocoladefabriken Lindt & Spruengli AG,
PC(a)
|
|
|
|
Cie Financiere Richemont S.A.
|
|
|
|
|
|
|
|
|
|
|
|
|
|
Galderma Group AG, Class A
|
|
|
|
|
|
|
|
|
|
|
|
|
|
|
|
|
|
|
|
|
|
|
|
Kuehne + Nagel International AG, Class R
|
|
|
|
Logitech International S.A., Class R
|
|
|
|
|
|
|
|
|
|
|
|
|
|
Partners Group Holding AG
|
|
|
|
|
|
|
|
|
|
|
|
|
|
|
|
|
|
|
|
|
|
|
|
|
|
|
|
|
|
|
|
|
|
|
|
|
|
|
|
|
|
|
|
Sonova Holding AG, Class A
|
|
|
|
|
|
|
|
|
Swatch Group AG (The), BR(a)
|
|
|
|
|
|
|
|
|
|
|
|
|
|
|
|
|
|
|
|
|
|
|
|
|
|
|
|
|
|
|
|
|
|
Zurich Insurance Group AG
|
|
|
|
|
|
|
|
|
|
|
|
|
|
|
|
|
|
|
|
|
|
|
|
|
|
Associated British Foods PLC
|
|
|
|
|
|
|
|
|
|
|
|
|
|
|
|
|
|
|
|
|
|
|
|
|
|
|
|
|
|
|
|
|
|
British American Tobacco PLC
|
|
|
|
|
|
|
|
|
|
|
|
|
|
|
|
|
|
|
Coca-Cola Europacific Partners PLC(a)
|
|
|
|
|
|
|
|
|
|
|
|
|
|
|
|
|
|
|
|
|
|
|
|
See accompanying Notes to Financial Statements which are an integral part of the financial
statements.
Invesco MSCI EAFE Income Advantage ETF (EFAA)—(continued)
April 30, 2025
(Unaudited)
|
|
|
|
United Kingdom-(continued)
|
|
|
|
|
|
|
|
|
|
|
|
|
|
|
|
|
|
|
|
|
|
|
|
|
|
|
|
|
|
|
InterContinental Hotels Group PLC
|
|
|
|
|
|
|
|
|
|
|
|
|
|
|
|
|
|
|
|
|
|
|
|
Land Securities Group PLC
|
|
|
|
Legal & General Group PLC
|
|
|
|
|
|
|
|
|
London Stock Exchange Group PLC
|
|
|
|
|
|
|
|
|
Marks & Spencer Group PLC
|
|
|
|
|
|
|
|
|
|
|
|
|
|
|
|
|
|
|
|
|
|
|
|
|
|
|
|
|
Phoenix Group Holdings PLC
|
|
|
|
Reckitt Benckiser Group PLC
|
|
|
|
|
|
|
|
|
|
|
|
|
|
|
|
|
|
|
|
|
|
|
|
|
|
|
|
|
|
|
|
|
|
|
|
|
|
|
|
|
|
|
|
|
|
|
|
|
|
|
|
|
|
|
|
|
|
|
|
|
|
|
|
|
|
|
|
|
|
|
|
|
|
|
|
|
|
|
United Utilities Group PLC
|
|
|
|
|
|
|
|
|
|
|
|
|
|
|
|
|
|
|
|
|
|
|
|
|
|
|
|
|
|
|
|
|
|
|
|
|
|
|
|
|
CyberArk Software Ltd.(b)
|
|
|
|
|
|
|
|
|
|
|
|
|
|
|
|
|
|
|
|
|
|
|
|
|
|
|
|
|
|
|
|
|
|
|
|
|
|
|
|
|
|
|
|
|
|
|
|
|
|
|
|
|
|
|
|
|
|
United States-(continued)
|
|
|
|
|
|
|
|
|
|
|
|
|
|
|
|
Total Common Stocks & Other Equity Interests
(Cost $97,981,539)
|
|
|
|
|
|
|
Equity Linked Notes-4.28%
|
|
|
|
|
|
|
|
|
Bank of Montreal (iShares MSCI EAFE ETF),
154.29%, 05/08/2025(c)
|
|
|
|
Bank of Montreal (iShares MSCI EAFE ETF),
147.27%, 05/21/2025(c)
|
|
|
|
Royal Bank of Canada (iShares MSCI EAFE
ETF), 161.86%, 05/09/2025(c)
|
|
|
|
Royal Bank of Canada (iShares MSCI EAFE
ETF), 129.38%, 05/16/2025(c)
|
|
|
|
Toronto-Dominion Bank (The) (iShares MSCI
EAFE ETF), 145.00%, 05/23/2025(c)
|
|
|
|
|
|
|
|
|
|
|
|
|
|
Citigroup Global Markets Holdings, Inc.
(iShares MSCI EAFE ETF), 130.45%,
05/15/2025(c)
|
|
|
|
Citigroup Global Markets Holdings, Inc.
(iShares MSCI EAFE ETF), 119.95%,
05/19/2025(c)
|
|
|
|
Citigroup Global Markets Holdings, Inc.
(iShares MSCI EAFE ETF), 176.00%,
05/20/2025(c)
|
|
|
|
Citigroup Global Markets Holdings, Inc.
(iShares MSCI EAFE ETF), 129.31%,
05/28/2025(c)
|
|
|
|
Goldman Sachs Group, Inc. (The) (iShares
MSCI EAFE ETF), 141.39%,
05/12/2025(c)
|
|
|
|
Goldman Sachs Group, Inc. (The) (iShares
MSCI EAFE ETF), 140.23%,
05/13/2025(c)
|
|
|
|
J.P. Morgan Chase & Co. (iShares MSCI EAFE
ETF), 135.52%, 05/07/2025
|
|
|
|
J.P. Morgan Chase & Co. (iShares MSCI EAFE
ETF), 154.67%, 05/22/2025
|
|
|
|
J.P. Morgan Structured Products B.V.
(iShares MSCI EAFE ETF), 114.22%,
05/29/2025(c)
|
|
|
|
Wells Fargo Bank N.A. (iShares MSCI EAFE
ETF), 154.29%, 05/14/2025(c)
|
|
|
|
Wells Fargo Bank N.A. (iShares MSCI EAFE
ETF), 131.07%, 05/27/2025(c)
|
|
|
|
|
|
|
|
|
Total Equity Linked Notes
(Cost $6,218,000)
|
|
See accompanying Notes to Financial Statements which are an integral part of the financial
statements.
Invesco MSCI EAFE Income Advantage ETF (EFAA)—(continued)
April 30, 2025
(Unaudited)
|
|
|
|
Money Market Funds-16.41%
|
Invesco Premier U.S. Government Money
Portfolio, Institutional Class, 4.26%(d)(e)
(Cost $22,410,493)
|
|
|
|
TOTAL INVESTMENTS IN SECURITIES
(excluding investments purchased with cash collateral
from securities on loan)-96.94%
(Cost $126,610,032)
|
|
Investments Purchased with Cash Collateral from Securities
on Loan
|
|
|
Invesco Private Government Fund,
4.32%(d)(e)(f)
|
|
|
|
|
|
|
|
Money Market Funds-(continued)
|
Invesco Private Prime Fund, 4.46%(d)(e)(f)
|
|
|
|
Total Investments Purchased with Cash Collateral from
Securities on Loan
(Cost $3,452,008)
|
|
TOTAL INVESTMENTS IN SECURITIES-99.47%
(Cost $130,062,040)
|
|
OTHER ASSETS LESS LIABILITIES-0.53%
|
|
|
|
|
Investment Abbreviations:
|
ADR-American Depositary Receipt
|
|
|
CDI-CREST Depository Interest
|
|
|
|
|
PC-Participation Certificate
|
REIT-Real Estate Investment Trust
|
|
|
Notes to Schedule of Investments:
|
|
|
All or a portion of this security was out on loan at April 30, 2025.
|
|
|
Non-income producing security.
|
|
|
Security purchased or received in a transaction exempt from registration under the Securities Act of 1933, as amended (the “1933 Act”). The security may be
resold pursuant to an exemption from registration under the 1933 Act, typically to
qualified institutional buyers. The aggregate value of these securities at
April 30, 2025 was $6,637,184, which represented 4.86% of the Fund’s Net Assets.
|
|
|
Affiliated holding. Affiliated holdings are investments in entities which are under
common ownership or control of Invesco Ltd. or are investments in entities in
which the Fund owns 5% or more of the outstanding voting securities. The table below shows the Fund’s transactions in, and earnings from, its investments in
affiliates for the six months ended April 30, 2025.
|
|
|
|
|
|
Change in
Unrealized
Appreciation
(Depreciation)
|
|
|
|
Investments in Affiliated
Money Market Funds:
|
|
|
|
|
|
|
|
Invesco Government &
Agency Portfolio,
Institutional Class
|
|
|
|
|
|
|
|
Invesco Premier
U.S. Government Money
Portfolio, Institutional Class
|
|
|
|
|
|
|
|
Investments Purchased
with Cash Collateral from
Securities on Loan:
|
|
|
|
|
|
|
|
Invesco Private Government
Fund
|
|
|
|
|
|
|
|
Invesco Private Prime Fund
|
|
|
|
|
|
|
|
|
|
|
|
|
|
|
|
|
|
|
Represents the income earned on the investment of cash collateral, which is included
in securities lending income on the Statements of Operations. Does not
include rebates and fees paid to lending agent or premiums received from borrowers,
if any.
|
See accompanying Notes to Financial Statements which are an integral part of the financial
statements.
Invesco MSCI EAFE Income Advantage ETF (EFAA)—(continued)
April 30, 2025
(Unaudited)
|
|
The rate shown is the 7-day SEC standardized yield as of April 30, 2025.
|
|
|
The security has been segregated to satisfy the commitment to return the cash collateral received in securities lending transactions upon the borrower’s return
of the securities loaned. See Note 2P.
|
See accompanying Notes to Financial Statements which are an integral part of the financial
statements.
Invesco QQQ Income Advantage ETF (QQA)
April 30, 2025
(Unaudited)
Schedule of Investments(a)
|
|
|
|
Common Stocks & Other Equity Interests-76.98%
|
|
|
Trade Desk, Inc. (The), Class A(b)
|
|
|
|
Aerospace & Defense-0.25%
|
|
|
|
|
|
|
|
|
|
|
|
|
Apparel, Accessories & Luxury Goods-0.17%
|
lululemon athletica, inc.(b)
|
|
|
|
Application Software-6.32%
|
|
|
|
|
|
|
|
|
|
|
AppLovin Corp., Class A(b)
|
|
|
|
Atlassian Corp., Class A(b)
|
|
|
|
|
|
|
|
|
Cadence Design Systems, Inc.(b)
|
|
|
|
Datadog, Inc., Class A(b)
|
|
|
|
|
|
|
|
|
MicroStrategy, Inc., Class A(b)
|
|
|
|
Palantir Technologies, Inc., Class A(b)
|
|
|
|
|
|
|
|
|
|
|
|
|
|
Workday, Inc., Class A(b)
|
|
|
|
|
|
|
|
|
Automobile Manufacturers-2.19%
|
|
|
|
|
|
|
|
O’Reilly Automotive, Inc.(b)
|
|
|
|
|
|
|
|
|
|
|
|
|
|
|
|
|
|
|
|
|
Regeneron Pharmaceuticals, Inc.
|
|
|
|
Vertex Pharmaceuticals, Inc.(b)
|
|
|
|
|
|
|
|
|
|
|
|
|
|
|
|
MercadoLibre, Inc. (Brazil)(b)
|
|
|
|
PDD Holdings, Inc., ADR (China)(b)
|
|
|
|
|
|
|
|
|
|
|
Charter Communications, Inc., Class A(b)
|
|
|
|
|
|
|
|
|
|
|
|
|
|
Cargo Ground Transportation-0.17%
|
Old Dominion Freight Line, Inc.
|
|
|
|
Communications Equipment-1.21%
|
|
|
|
|
|
Construction Machinery & Heavy Transportation Equipment-0.25%
|
|
|
|
|
|
Consumer Staples Merchandise Retail-2.32%
|
|
|
|
|
|
|
|
|
|
Diversified Support Services-0.76%
|
|
|
|
|
|
|
|
|
|
|
|
|
|
|
|
|
|
American Electric Power Co., Inc.(c)
|
|
|
|
Constellation Energy Corp.
|
|
|
|
|
|
|
|
|
|
|
|
|
|
|
|
|
|
|
Health Care Equipment-1.47%
|
|
|
|
|
|
GE HealthCare Technologies, Inc.
|
|
|
|
IDEXX Laboratories, Inc.(b)
|
|
|
|
Intuitive Surgical, Inc.(b)
|
|
|
|
|
|
|
|
|
Hotels, Resorts & Cruise Lines-1.50%
|
|
|
|
|
|
|
|
|
|
|
Marriott International, Inc., Class A
|
|
|
|
|
|
|
|
|
Human Resource & Employment Services-0.92%
|
Automatic Data Processing, Inc.(c)
|
|
|
|
|
|
|
|
|
|
|
|
|
|
Industrial Conglomerates-0.72%
|
Honeywell International, Inc.
|
|
|
|
|
|
|
|
|
|
|
Interactive Home Entertainment-0.41%
|
|
|
|
|
|
Take-Two Interactive Software, Inc.(b)
|
|
|
|
|
|
|
|
|
Interactive Media & Services-6.43%
|
|
|
|
|
|
|
|
|
|
|
Meta Platforms, Inc., Class A
|
|
|
|
|
|
|
|
|
Internet Services & Infrastructure-0.07%
|
|
|
|
|
|
IT Consulting & Other Services-0.19%
|
Cognizant Technology Solutions Corp.,
Class A
|
|
|
|
Movies & Entertainment-2.65%
|
|
|
|
|
|
Warner Bros. Discovery, Inc.(b)
|
|
|
|
|
|
|
|
|
Oil & Gas Equipment & Services-0.18%
|
Baker Hughes Co., Class A(c)
|
|
|
|
Oil & Gas Exploration & Production-0.20%
|
|
|
|
|
|
See accompanying Notes to Financial Statements which are an integral part of the financial
statements.
Invesco QQQ Income Advantage ETF (QQA)—(continued)
April 30, 2025
(Unaudited)
|
|
|
|
Packaged Foods & Meats-0.64%
|
|
|
|
|
|
Mondelez International, Inc., Class A
|
|
|
|
|
|
|
|
|
|
|
AstraZeneca PLC, ADR (United Kingdom)
|
|
|
|
Rail Transportation-0.28%
|
|
|
|
|
|
Real Estate Services-0.16%
|
|
|
|
|
|
Research & Consulting Services-0.22%
|
|
|
|
|
|
|
|
DoorDash, Inc., Class A(b)
|
|
|
|
|
|
|
|
|
|
|
|
|
|
Semiconductor Materials & Equipment-1.94%
|
|
|
|
|
|
ASML Holding N.V., New York Shares
(Netherlands)
|
|
|
|
|
|
|
|
|
|
|
|
|
|
|
|
|
|
|
|
|
Advanced Micro Devices, Inc.(b)
|
|
|
|
|
|
|
|
|
ARM Holdings PLC, ADR(b)(c)
|
|
|
|
|
|
|
|
|
|
|
|
|
|
|
|
|
|
|
|
|
|
|
|
Microchip Technology, Inc.
|
|
|
|
Micron Technology, Inc.(c)
|
|
|
|
|
|
|
|
|
NXP Semiconductors N.V. (Netherlands)
|
|
|
|
ON Semiconductor Corp.(b)
|
|
|
|
|
|
|
|
|
|
|
|
|
|
|
|
|
|
|
Soft Drinks & Non-alcoholic Beverages-1.75%
|
Coca-Cola Europacific Partners PLC (United
Kingdom)
|
|
|
|
Keurig Dr Pepper, Inc.(c)
|
|
|
|
Monster Beverage Corp.(b)
|
|
|
|
|
|
|
|
|
|
|
|
|
|
|
|
CrowdStrike Holdings, Inc., Class A(b)
|
|
|
|
|
|
|
|
|
|
|
|
|
|
Palo Alto Networks, Inc.(b)(c)
|
|
|
|
|
|
|
|
|
|
|
|
|
|
Technology Distributors-0.11%
|
|
|
|
|
|
|
|
|
|
Technology Hardware, Storage & Peripherals-6.82%
|
|
|
|
|
|
Trading Companies & Distributors-0.24%
|
|
|
|
|
|
Transaction & Payment Processing Services-0.34%
|
|
|
|
|
|
Wireless Telecommunication Services-1.48%
|
|
|
|
|
|
Total Common Stocks & Other Equity Interests
(Cost $161,626,561)
|
|
|
|
|
|
|
Equity Linked Notes-5.58%
|
|
|
|
|
|
|
|
|
Bank of Montreal (NASDAQ 100 Stock
Index), 197.14%, 05/12/2025
|
|
|
|
Bank of Montreal (NASDAQ 100 Stock
Index), 210.00%, 05/15/2025
|
|
|
|
Bank of Montreal (NASDAQ 100 Stock
Index), 207.23%, 05/16/2025
|
|
|
|
Bank of Montreal (NASDAQ 100 Stock
Index), 0.00%, 05/27/2025(d)
|
|
|
|
Bank of Montreal (NASDAQ 100 Stock
Index), 201.91%, 05/28/2025(e)
|
|
|
|
Barclays Bank PLC (NASDAQ 100 Stock
Index), 232.00%, 05/21/2025(e)
|
|
|
|
BNP Paribas Issuance B.V. (NASDAQ 100
Stock Index), 253.87%, 05/09/2025
|
|
|
|
BNP Paribas Issuance B.V. (NASDAQ 100
Stock Index), 217.91%, 05/06/2025(e)
|
|
|
|
BNP Paribas Issuance B.V. (NASDAQ 100
Stock Index), 257.11%, 05/08/2025(e)
|
|
|
|
Citigroup Global Markets Holdings, Inc.
(NASDAQ 100 Stock Index), 182.95%,
05/07/2025(e)
|
|
|
|
Citigroup Global Markets Holdings, Inc.
(NASDAQ 100 Stock Index), 203.23%,
05/29/2025(e)
|
|
|
|
J.P. Morgan Chase & Co. (NASDAQ 100
Stock Index), 0.00%, 05/13/2025(d)
|
|
|
|
J.P. Morgan Chase & Co. (NASDAQ 100
Stock Index), 0.00%, 05/20/2025(d)
|
|
|
|
J.P. Morgan Structured Products B.V.
(NASDAQ 100 Stock Index), 164.80%,
05/19/2025(e)
|
|
|
|
Mizuho Markets Cayman L.P. (NASDAQ 100
Stock Index), 209.70%, 05/23/2025(e)
|
|
|
|
Royal Bank of Canada (NASDAQ 100 Stock
Index), 171.19%, 05/14/2025
|
|
|
|
Royal Bank of Canada (NASDAQ 100 Stock
Index), 216.95%, 05/22/2025(e)
|
|
|
|
|
|
|
|
|
Total Equity Linked Notes
(Cost $12,014,000)
|
|
See accompanying Notes to Financial Statements which are an integral part of the financial
statements.
Invesco QQQ Income Advantage ETF (QQA)—(continued)
April 30, 2025
(Unaudited)
|
|
|
|
Money Market Funds-18.12%
|
Invesco Premier U.S. Government Money
Portfolio, Institutional Class, 4.26%(f)(g)
(Cost $37,921,414)
|
|
|
|
TOTAL INVESTMENTS IN SECURITIES
(excluding investments purchased with cash collateral
from securities on loan)-100.68%
(Cost $211,561,975)
|
|
Investments Purchased with Cash Collateral
from Securities on Loan
|
|
|
Invesco Private Government Fund,
4.32%(f)(g)(h)
|
|
|
|
|
|
|
|
Money Market Funds-(continued)
|
Invesco Private Prime Fund, 4.46%(f)(g)(h)
|
|
|
|
Total Investments Purchased with Cash Collateral from
Securities on Loan
(Cost $5,267,048)
|
|
TOTAL INVESTMENTS IN SECURITIES-103.20%
(Cost $216,829,023)
|
|
OTHER ASSETS LESS LIABILITIES-(3.20)%
|
|
|
|
|
Investment Abbreviations:
|
|
|
-American Depositary Receipt
|
Notes to Schedule of Investments:
|
|
|
Industry and/or sector classifications used in this report are generally according
to the Global Industry Classification Standard, which was developed by and is
the exclusive property and a service mark of MSCI Inc. and Standard & Poor’s.
|
|
|
Non-income producing security.
|
|
|
All or a portion of this security was out on loan at April 30, 2025.
|
|
|
Denotes a zero coupon security issued at a substantial discount from its value at
maturity.
|
|
|
Security purchased or received in a transaction exempt from registration under the Securities Act of 1933, as amended (the “1933 Act”). The security may be
resold pursuant to an exemption from registration under the 1933 Act, typically to
qualified institutional buyers. The aggregate value of these securities at
April 30, 2025 was $5,420,289, which represented 2.59% of the Fund’s Net Assets.
|
|
|
Affiliated holding. Affiliated holdings are investments in entities which are under
common ownership or control of Invesco Ltd. or are investments in entities in
which the Fund owns 5% or more of the outstanding voting securities. The table below shows the Fund’s transactions in, and earnings from, its investments in
affiliates for the six months ended April 30, 2025.
|
|
|
|
|
|
Change in
Unrealized
Appreciation
|
|
|
|
Investments in Affiliated
Money Market Funds:
|
|
|
|
|
|
|
|
Invesco Government &
Agency Portfolio,
Institutional Class
|
|
|
|
|
|
|
|
Invesco Premier
U.S. Government Money
Portfolio, Institutional Class
|
|
|
|
|
|
|
|
Investments Purchased
with Cash Collateral from
Securities on Loan:
|
|
|
|
|
|
|
|
Invesco Private Government
Fund
|
|
|
|
|
|
|
|
Invesco Private Prime Fund
|
|
|
|
|
|
|
|
|
|
|
|
|
|
|
|
|
|
|
Represents the income earned on the investment of cash collateral, which is included
in securities lending income on the Statements of Operations. Does not
include rebates and fees paid to lending agent or premiums received from borrowers,
if any.
|
|
|
The rate shown is the 7-day SEC standardized yield as of April 30, 2025.
|
|
|
The security has been segregated to satisfy the commitment to return the cash collateral received in securities lending transactions upon the borrower’s return
of the securities loaned. See Note 2P.
|
See accompanying Notes to Financial Statements which are an integral part of the financial
statements.
Invesco S&P 500® Downside Hedged ETF (PHDG)
April 30, 2025
(Unaudited)
Schedule of Investments(a)
|
|
|
|
Common Stocks & Other Equity Interests-54.54%
|
Communication Services-5.08%
|
|
|
|
|
|
|
|
|
|
|
|
|
|
|
|
Charter Communications, Inc., Class A(b)
|
|
|
|
|
|
|
|
|
|
|
|
|
|
|
|
|
|
|
|
|
|
|
|
Interpublic Group of Cos., Inc. (The)
|
|
|
|
Live Nation Entertainment, Inc.(b)
|
|
|
|
|
|
|
|
|
Meta Platforms, Inc., Class A
|
|
|
|
|
|
|
|
|
|
|
|
|
|
|
|
|
|
|
|
|
|
|
|
Paramount Global, Class B
|
|
|
|
Take-Two Interactive Software, Inc.(b)
|
|
|
|
|
|
|
|
|
|
|
|
|
|
Verizon Communications, Inc.
|
|
|
|
|
|
|
|
|
Warner Bros. Discovery, Inc.(b)
|
|
|
|
|
|
|
|
|
Consumer Discretionary-5.64%
|
|
|
|
|
|
|
|
|
|
|
|
|
|
|
|
|
|
|
|
|
|
|
|
|
|
|
|
|
|
|
Caesars Entertainment, Inc.(b)
|
|
|
|
|
|
|
|
|
|
|
|
|
|
Chipotle Mexican Grill, Inc.(b)
|
|
|
|
|
|
|
|
|
|
|
|
|
|
|
|
|
|
|
|
|
|
|
|
DoorDash, Inc., Class A(b)
|
|
|
|
|
|
|
|
|
|
|
|
|
|
|
|
|
|
|
|
|
|
|
|
|
|
|
|
|
|
|
|
|
|
|
|
|
|
|
Hilton Worldwide Holdings, Inc.
|
|
|
|
|
|
|
|
|
|
|
|
|
|
|
|
|
|
|
|
|
|
|
|
|
|
|
|
|
lululemon athletica, inc.(b)
|
|
|
|
Marriott International, Inc., Class A
|
|
|
|
|
|
|
|
|
|
|
|
|
Consumer Discretionary-(continued)
|
MGM Resorts International(b)
|
|
|
|
Mohawk Industries, Inc.(b)
|
|
|
|
|
|
|
|
|
Norwegian Cruise Line Holdings Ltd.(b)
|
|
|
|
|
|
|
|
|
O’Reilly Automotive, Inc.(b)
|
|
|
|
|
|
|
|
|
|
|
|
|
|
|
|
|
|
|
|
|
|
|
|
Royal Caribbean Cruises Ltd.
|
|
|
|
|
|
|
|
|
|
|
|
|
|
|
|
|
|
|
|
|
|
|
|
|
|
|
|
|
|
|
|
|
|
|
|
|
|
|
|
|
|
|
|
|
|
|
|
|
|
|
|
|
|
|
|
|
|
|
|
|
Archer-Daniels-Midland Co.
|
|
|
|
Brown-Forman Corp., Class B
|
|
|
|
|
|
|
|
|
Church & Dwight Co., Inc.
|
|
|
|
|
|
|
|
|
|
|
|
|
|
|
|
|
|
|
|
|
|
|
|
Constellation Brands, Inc., Class A
|
|
|
|
|
|
|
|
|
|
|
|
|
|
|
|
|
|
|
Estee Lauder Cos., Inc. (The), Class A
|
|
|
|
|
|
|
|
|
|
|
|
|
|
|
|
|
|
|
|
|
|
|
|
|
|
|
|
|
|
|
|
|
|
|
|
|
|
|
|
|
|
|
|
|
|
|
|
|
|
|
|
|
|
Lamb Weston Holdings, Inc.
|
|
|
|
|
|
|
|
|
Molson Coors Beverage Co., Class B
|
|
|
|
Mondelez International, Inc., Class A
|
|
|
|
Monster Beverage Corp.(b)
|
|
|
|
|
|
|
|
|
Philip Morris International, Inc.
|
|
|
|
Procter & Gamble Co. (The)
|
|
|
|
|
|
|
|
|
|
|
|
|
|
|
|
|
|
|
See accompanying Notes to Financial Statements which are an integral part of the financial
statements.
Invesco S&P 500® Downside Hedged ETF (PHDG)—(continued)
April 30, 2025
(Unaudited)
|
|
|
|
Consumer Staples-(continued)
|
Tyson Foods, Inc., Class A
|
|
|
|
Walgreens Boots Alliance, Inc.
|
|
|
|
|
|
|
|
|
|
|
|
|
|
|
|
|
|
|
|
|
Baker Hughes Co., Class A
|
|
|
|
|
|
|
|
|
|
|
|
|
|
|
|
|
|
|
|
|
|
|
|
|
|
|
|
|
|
|
|
|
|
|
|
|
|
|
|
|
|
|
|
|
|
|
|
|
|
|
|
|
|
|
|
|
|
|
|
|
|
|
|
|
|
|
|
|
Occidental Petroleum Corp.
|
|
|
|
|
|
|
|
|
|
|
|
|
|
|
|
|
|
|
|
|
|
|
|
|
|
|
|
|
|
|
|
|
|
Williams Cos., Inc. (The)
|
|
|
|
|
|
|
|
|
|
|
|
|
|
|
|
|
|
|
|
|
|
|
|
|
|
American International Group, Inc.
|
|
|
|
Ameriprise Financial, Inc.
|
|
|
|
|
|
|
|
|
Apollo Global Management, Inc.
|
|
|
|
|
|
|
|
|
Arthur J. Gallagher & Co.
|
|
|
|
|
|
|
|
|
|
|
|
|
|
Bank of New York Mellon Corp. (The)
|
|
|
|
Berkshire Hathaway, Inc., Class B(b)
|
|
|
|
|
|
|
|
|
Blackstone, Inc., Class A
|
|
|
|
|
|
|
|
|
Capital One Financial Corp.
|
|
|
|
Cboe Global Markets, Inc.
|
|
|
|
Charles Schwab Corp. (The)
|
|
|
|
|
|
|
|
|
Cincinnati Financial Corp.
|
|
|
|
|
|
|
|
|
Citizens Financial Group, Inc.
|
|
|
|
|
|
|
|
|
|
|
|
|
|
Discover Financial Services
|
|
|
|
Erie Indemnity Co., Class A
|
|
|
|
|
|
|
|
|
FactSet Research Systems, Inc.
|
|
|
|
|
|
|
|
|
|
Fidelity National Information Services, Inc.
|
|
|
|
|
|
|
|
|
|
|
|
|
|
|
|
|
|
|
|
|
|
|
|
|
|
|
|
|
Goldman Sachs Group, Inc. (The)
|
|
|
|
Hartford Insurance Group, Inc. (The)
|
|
|
|
Huntington Bancshares, Inc.
|
|
|
|
Intercontinental Exchange, Inc.
|
|
|
|
|
|
|
|
|
Jack Henry & Associates, Inc.
|
|
|
|
|
|
|
|
|
|
|
|
|
|
|
|
|
|
|
|
|
|
|
|
|
|
|
|
|
MarketAxess Holdings, Inc.
|
|
|
|
Marsh & McLennan Cos., Inc.
|
|
|
|
Mastercard, Inc., Class A
|
|
|
|
|
|
|
|
|
|
|
|
|
|
|
|
|
|
|
|
|
|
|
|
|
|
|
|
|
|
|
|
|
|
|
|
|
|
|
PNC Financial Services Group, Inc. (The)
|
|
|
|
Principal Financial Group, Inc.
|
|
|
|
|
|
|
|
|
Prudential Financial, Inc.
|
|
|
|
Raymond James Financial, Inc.
|
|
|
|
|
|
|
|
|
|
|
|
|
|
|
|
|
|
|
|
|
|
|
|
T. Rowe Price Group, Inc.
|
|
|
|
Travelers Cos., Inc. (The)
|
|
|
|
|
|
|
|
|
|
|
|
|
|
|
|
|
|
|
|
|
|
|
|
|
|
|
|
|
|
|
|
|
|
|
|
|
|
|
|
|
|
|
|
|
|
|
|
|
|
|
Agilent Technologies, Inc.
|
|
|
|
Align Technology, Inc.(b)
|
|
|
|
|
|
|
|
|
Baxter International, Inc.
|
|
|
|
Becton, Dickinson and Co.
|
|
|
|
|
|
|
|
|
|
|
|
|
|
Boston Scientific Corp.(b)
|
|
|
|
|
|
|
|
|
|
|
|
|
|
|
|
|
|
|
See accompanying Notes to Financial Statements which are an integral part of the financial
statements.
Invesco S&P 500® Downside Hedged ETF (PHDG)—(continued)
April 30, 2025
(Unaudited)
|
|
|
|
|
|
|
|
|
|
|
Charles River Laboratories International,
Inc.(b)
|
|
|
|
|
|
|
|
|
Cooper Cos., Inc. (The)(b)
|
|
|
|
|
|
|
|
|
|
|
|
|
|
|
|
|
|
|
|
|
|
|
|
Edwards Lifesciences Corp.(b)
|
|
|
|
|
|
|
|
|
|
|
|
|
|
GE HealthCare Technologies, Inc.
|
|
|
|
|
|
|
|
|
|
|
|
|
|
|
|
|
|
|
|
|
|
|
|
|
|
|
|
|
IDEXX Laboratories, Inc.(b)
|
|
|
|
|
|
|
|
|
|
|
|
|
|
Intuitive Surgical, Inc.(b)
|
|
|
|
|
|
|
|
|
|
|
|
|
|
|
|
|
|
|
|
|
|
|
|
|
|
|
|
|
|
|
|
|
|
Mettler-Toledo International, Inc.(b)
|
|
|
|
|
|
|
|
|
Molina Healthcare, Inc.(b)
|
|
|
|
|
|
|
|
|
|
|
|
|
|
Regeneron Pharmaceuticals, Inc.
|
|
|
|
|
|
|
|
|
|
|
|
|
|
|
|
|
|
|
|
|
|
|
|
|
|
|
|
|
Thermo Fisher Scientific, Inc.
|
|
|
|
|
|
|
|
|
Universal Health Services, Inc., Class B
|
|
|
|
Vertex Pharmaceuticals, Inc.(b)
|
|
|
|
|
|
|
|
|
|
|
|
|
|
West Pharmaceutical Services, Inc.
|
|
|
|
Zimmer Biomet Holdings, Inc.
|
|
|
|
|
|
|
|
|
|
|
|
|
|
|
|
|
|
|
|
|
|
|
|
|
|
|
|
|
|
|
|
|
|
|
|
Automatic Data Processing, Inc.
|
|
|
|
|
|
|
|
|
|
|
|
|
|
Broadridge Financial Solutions, Inc.
|
|
|
|
Builders FirstSource, Inc.(b)
|
|
|
|
|
|
|
|
|
|
C.H. Robinson Worldwide, Inc.
|
|
|
|
|
|
|
|
|
|
|
|
|
|
|
|
|
|
|
|
|
|
|
|
|
|
|
|
|
|
|
|
|
|
|
|
|
|
|
|
|
|
|
|
|
|
|
|
|
|
|
|
|
|
|
|
|
|
|
|
|
|
|
|
|
|
|
|
|
Expeditors International of Washington, Inc.
|
|
|
|
|
|
|
|
|
|
|
|
|
|
|
|
|
|
|
|
|
|
|
|
Generac Holdings, Inc.(b)
|
|
|
|
|
|
|
|
|
|
|
|
|
|
Honeywell International, Inc.
|
|
|
|
|
|
|
|
|
|
|
|
|
|
Huntington Ingalls Industries, Inc.
|
|
|
|
|
|
|
|
|
Illinois Tool Works, Inc.
|
|
|
|
|
|
|
|
|
J.B. Hunt Transport Services, Inc.
|
|
|
|
|
|
|
|
|
Johnson Controls International PLC
|
|
|
|
L3Harris Technologies, Inc.
|
|
|
|
|
|
|
|
|
Lennox International, Inc.
|
|
|
|
|
|
|
|
|
|
|
|
|
|
|
|
|
|
|
|
|
|
|
|
|
|
|
|
|
Old Dominion Freight Line, Inc.
|
|
|
|
|
|
|
|
|
|
|
|
|
|
|
|
|
|
|
|
|
|
|
|
|
|
|
|
|
|
|
|
|
|
|
|
|
|
|
|
|
|
|
|
Rockwell Automation, Inc.
|
|
|
|
|
|
|
|
|
|
|
|
|
|
|
|
|
|
|
|
|
|
|
|
Stanley Black & Decker, Inc.
|
|
|
|
|
|
|
|
|
|
|
|
|
|
|
|
|
|
|
Uber Technologies, Inc.(b)
|
|
|
|
|
|
|
|
|
See accompanying Notes to Financial Statements which are an integral part of the financial
statements.
Invesco S&P 500® Downside Hedged ETF (PHDG)—(continued)
April 30, 2025
(Unaudited)
|
|
|
|
|
|
United Airlines Holdings, Inc.(b)
|
|
|
|
United Parcel Service, Inc., Class B
|
|
|
|
|
|
|
|
|
|
|
|
|
|
|
|
|
|
|
|
|
|
|
|
|
|
|
|
|
|
|
|
|
|
|
|
|
|
|
|
|
|
|
|
Information Technology-16.54%
|
Accenture PLC, Class A (Ireland)
|
|
|
|
|
|
|
|
|
Advanced Micro Devices, Inc.(b)
|
|
|
|
Akamai Technologies, Inc.(b)
|
|
|
|
|
|
|
|
|
|
|
|
|
|
|
|
|
|
|
|
|
|
|
|
|
|
|
|
|
|
|
|
|
|
|
|
|
|
|
|
|
|
|
|
Cadence Design Systems, Inc.(b)
|
|
|
|
|
|
|
|
|
|
|
|
|
|
Cognizant Technology Solutions Corp.,
Class A
|
|
|
|
|
|
|
|
|
CrowdStrike Holdings, Inc., Class A(b)
|
|
|
|
Dell Technologies, Inc., Class C
|
|
|
|
|
|
|
|
|
|
|
|
|
|
|
|
|
|
|
|
|
|
|
|
|
|
|
|
|
|
|
|
|
|
|
|
|
|
|
|
|
|
|
|
GoDaddy, Inc., Class A(b)
|
|
|
|
Hewlett Packard Enterprise Co.
|
|
|
|
|
|
|
|
|
|
|
|
|
|
International Business Machines Corp.
|
|
|
|
|
|
|
|
|
|
|
|
|
|
|
|
|
|
|
Keysight Technologies, Inc.(b)
|
|
|
|
|
|
|
|
|
|
|
|
|
|
Microchip Technology, Inc.
|
|
|
|
|
|
|
|
|
|
|
|
|
|
Monolithic Power Systems, Inc.
|
|
|
|
|
|
|
|
|
|
|
|
|
|
|
|
|
|
|
NXP Semiconductors N.V. (Netherlands)
|
|
|
|
ON Semiconductor Corp.(b)
|
|
|
|
|
|
|
|
Information Technology-(continued)
|
|
|
|
|
|
Palantir Technologies, Inc., Class A(b)
|
|
|
|
Palo Alto Networks, Inc.(b)
|
|
|
|
|
|
|
|
|
|
|
|
|
|
|
|
|
|
|
|
|
|
|
|
Seagate Technology Holdings PLC
|
|
|
|
|
|
|
|
|
|
|
|
|
|
Super Micro Computer, Inc.(b)
|
|
|
|
|
|
|
|
|
TE Connectivity PLC (Switzerland)
|
|
|
|
Teledyne Technologies, Inc.(b)
|
|
|
|
|
|
|
|
|
|
|
|
|
|
|
|
|
|
|
Tyler Technologies, Inc.(b)
|
|
|
|
|
|
|
|
|
|
|
|
|
|
Workday, Inc., Class A(b)
|
|
|
|
Zebra Technologies Corp., Class A(b)
|
|
|
|
|
|
|
|
|
|
|
Air Products and Chemicals, Inc.
|
|
|
|
|
|
|
|
|
|
|
|
|
|
|
|
|
|
|
|
|
|
|
|
CF Industries Holdings, Inc.
|
|
|
|
|
|
|
|
|
|
|
|
|
|
|
|
|
|
|
|
|
|
|
|
|
|
|
|
|
|
|
|
|
|
International Flavors & Fragrances, Inc.
|
|
|
|
|
|
|
|
|
|
|
|
|
|
LyondellBasell Industries N.V., Class A
|
|
|
|
Martin Marietta Materials, Inc.
|
|
|
|
|
|
|
|
|
|
|
|
|
|
|
|
|
|
|
Packaging Corp. of America
|
|
|
|
|
|
|
|
|
Sherwin-Williams Co. (The)
|
|
|
|
|
|
|
|
|
|
|
|
|
|
|
|
|
|
|
|
|
|
|
|
|
|
Alexandria Real Estate Equities, Inc.
|
|
|
|
|
|
|
|
|
AvalonBay Communities, Inc.
|
|
|
|
|
|
|
|
|
|
|
|
|
|
CBRE Group, Inc., Class A(b)
|
|
|
|
|
|
|
|
|
See accompanying Notes to Financial Statements which are an integral part of the financial
statements.
Invesco S&P 500® Downside Hedged ETF (PHDG)—(continued)
April 30, 2025
(Unaudited)
|
|
|
|
|
|
|
|
|
|
|
Digital Realty Trust, Inc.
|
|
|
|
|
|
|
|
|
|
|
|
|
|
Essex Property Trust, Inc.
|
|
|
|
Extra Space Storage, Inc.
|
|
|
|
Federal Realty Investment Trust
|
|
|
|
Healthpeak Properties, Inc.
|
|
|
|
Host Hotels & Resorts, Inc.
|
|
|
|
|
|
|
|
|
|
|
|
|
|
|
|
|
|
|
Mid-America Apartment Communities, Inc.
|
|
|
|
|
|
|
|
|
|
|
|
|
|
|
|
|
|
|
|
|
|
|
|
SBA Communications Corp., Class A
|
|
|
|
Simon Property Group, Inc.
|
|
|
|
|
|
|
|
|
|
|
|
|
|
|
|
|
|
|
|
|
|
|
|
|
|
|
|
|
|
|
|
|
|
|
|
|
|
|
|
|
|
|
|
|
|
|
|
|
|
|
American Electric Power Co., Inc.
|
|
|
|
American Water Works Co., Inc.
|
|
|
|
|
|
|
|
|
|
|
|
|
|
|
|
|
|
|
Consolidated Edison, Inc.
|
|
|
|
Constellation Energy Corp.
|
|
|
|
|
|
|
|
|
|
|
|
|
|
|
|
|
|
|
|
|
|
|
|
|
|
|
|
|
|
|
|
|
|
|
|
|
|
|
|
|
|
|
|
|
|
|
|
|
|
|
|
|
|
|
|
|
|
|
|
|
|
|
|
|
|
|
|
|
|
|
|
|
|
|
Pinnacle West Capital Corp.
|
|
|
|
|
|
|
|
|
Public Service Enterprise Group, Inc.
|
|
|
|
|
|
|
|
|
|
|
|
|
|
|
|
|
|
|
|
|
|
|
|
|
|
|
|
|
|
|
|
|
|
Total Common Stocks & Other Equity Interests
(Cost $54,117,425)
|
|
Money Market Funds-99.84%
|
Invesco Premier U.S. Government Money
Portfolio, Institutional Class, 4.26%(c)(d)
(Cost $99,068,839)
|
|
|
|
TOTAL INVESTMENTS IN SECURITIES-154.38%
(Cost $153,186,264)
|
|
OTHER ASSETS LESS LIABILITIES-(54.38)%
|
|
|
|
|
Notes to Schedule of Investments:
|
|
|
Industry and/or sector classifications used in this report are generally according
to the Global Industry Classification Standard, which was developed by and is
the exclusive property and a service mark of MSCI Inc. and Standard & Poor’s.
|
|
|
Non-income producing security.
|
|
|
Affiliated holding. Affiliated holdings are investments in entities which are under
common ownership or control of Invesco Ltd. or are investments in entities in
which the Fund owns 5% or more of the outstanding voting securities. The table below shows the Fund’s transactions in, and earnings from, its investments in
affiliates for the six months ended April 30, 2025.
|
|
|
|
|
|
Change in
Unrealized
Appreciation
(Depreciation)
|
|
|
|
|
|
|
|
|
|
|
|
|
Investments in
Affiliated Money Market
Funds:
|
|
|
|
|
|
|
|
Invesco Premier
U.S. Government Money
Portfolio, Institutional
Class
|
|
|
|
|
|
|
|
See accompanying Notes to Financial Statements which are an integral part of the financial
statements.
Invesco S&P 500® Downside Hedged ETF (PHDG)—(continued)
April 30, 2025
(Unaudited)
|
|
|
|
|
Change in
Unrealized
Appreciation
(Depreciation)
|
|
|
|
Investments Purchased
with Cash Collateral
from Securities on
Loan:
|
|
|
|
|
|
|
|
Invesco Private
Government Fund
|
|
|
|
|
|
|
|
Invesco Private Prime
Fund
|
|
|
|
|
|
|
|
|
|
|
|
|
|
|
|
|
|
|
Represents the income earned on the investment of cash collateral, which is included
in securities lending income on the Statements of Operations. Does not
include rebates and fees paid to lending agent or premiums received from borrowers,
if any.
|
|
|
The rate shown is the 7-day SEC standardized yield as of April 30, 2025.
|
Open Futures Contracts(a)
|
|
|
|
|
|
|
Unrealized
Appreciation
(Depreciation)
|
|
|
|
|
|
|
|
|
|
|
|
|
|
|
|
|
|
|
|
|
|
|
|
|
|
|
|
|
|
|
|
|
|
|
|
|
|
|
|
|
|
Futures contracts collateralized by $3,980 cash held with Merrill Lynch International,
the futures commission merchant.
|
See accompanying Notes to Financial Statements which are an integral part of the financial
statements.
Invesco S&P 500 Equal Weight Income Advantage ETF (RSPA)
April 30, 2025
(Unaudited)
Schedule of Investments(a)
|
|
|
|
Common Stocks & Other Equity Interests-76.17%
|
|
|
Interpublic Group of Cos., Inc. (The)
|
|
|
|
|
|
|
|
|
|
|
|
|
|
Aerospace & Defense-1.96%
|
|
|
|
|
|
|
|
|
|
|
|
|
|
|
|
|
|
|
|
|
|
|
|
|
|
Huntington Ingalls Industries, Inc.
|
|
|
|
L3Harris Technologies, Inc.
|
|
|
|
|
|
|
|
|
|
|
|
|
|
|
|
|
|
|
|
|
|
|
|
|
|
|
|
|
|
|
|
|
|
Agricultural & Farm Machinery-0.15%
|
|
|
|
|
|
Agricultural Products & Services-0.32%
|
Archer-Daniels-Midland Co.
|
|
|
|
|
|
|
|
|
|
|
|
|
|
Air Freight & Logistics-0.55%
|
C.H. Robinson Worldwide, Inc.
|
|
|
|
Expeditors International of Washington, Inc.
|
|
|
|
|
|
|
|
|
United Parcel Service, Inc., Class B
|
|
|
|
|
|
|
|
|
|
|
|
|
|
|
|
|
|
|
|
|
|
|
|
|
|
Apparel, Accessories & Luxury Goods-0.44%
|
lululemon athletica, inc.(b)(c)
|
|
|
|
|
|
|
|
|
|
|
|
|
|
|
|
|
|
|
Application Software-2.11%
|
|
|
|
|
|
|
|
|
|
|
|
|
|
|
|
Cadence Design Systems, Inc.(c)
|
|
|
|
|
|
|
|
|
|
|
|
|
|
Palantir Technologies, Inc., Class A(c)
|
|
|
|
|
|
|
|
|
|
|
|
|
|
|
|
|
|
|
|
|
|
|
|
Tyler Technologies, Inc.(c)
|
|
|
|
Workday, Inc., Class A(c)
|
|
|
|
|
|
|
|
|
|
|
|
|
Asset Management & Custody Banks-1.50%
|
Ameriprise Financial, Inc.
|
|
|
|
Bank of New York Mellon Corp. (The)
|
|
|
|
|
|
|
|
|
Blackstone, Inc., Class A
|
|
|
|
Franklin Resources, Inc.(b)
|
|
|
|
|
|
|
|
|
|
|
|
|
|
|
|
|
|
|
|
|
|
|
|
T. Rowe Price Group, Inc.
|
|
|
|
|
|
|
|
|
Automobile Manufacturers-0.48%
|
|
|
|
|
|
|
|
|
|
|
|
|
|
|
|
|
|
|
|
|
Automotive Parts & Equipment-0.14%
|
|
|
|
|
|
|
|
|
|
|
|
|
|
|
|
|
|
O’Reilly Automotive, Inc.(c)
|
|
|
|
|
|
|
|
|
|
|
|
|
|
|
|
|
|
|
|
|
|
|
|
|
|
|
|
|
|
|
|
|
|
|
|
|
|
|
|
|
Regeneron Pharmaceuticals, Inc.
|
|
|
|
Vertex Pharmaceuticals, Inc.(c)
|
|
|
|
|
|
|
|
|
|
|
Molson Coors Beverage Co., Class B(b)
|
|
|
|
|
|
|
|
|
|
|
|
|
|
|
|
Paramount Global, Class B(b)
|
|
|
|
|
|
|
|
|
|
|
|
|
|
|
|
|
|
|
|
|
|
|
|
|
|
|
|
|
|
|
|
|
|
|
|
|
|
Builders FirstSource, Inc.(c)
|
|
|
|
|
|
|
|
|
Johnson Controls International PLC
|
|
|
|
Lennox International, Inc.
|
|
|
|
See accompanying Notes to Financial Statements which are an integral part of the financial
statements.
Invesco S&P 500 Equal Weight Income Advantage ETF (RSPA)—(continued)
April 30, 2025
(Unaudited)
|
|
|
|
Building Products-(continued)
|
|
|
|
|
|
|
|
|
|
|
|
|
|
|
|
|
|
Charter Communications, Inc., Class A(c)
|
|
|
|
|
|
|
|
|
|
|
|
|
|
Cargo Ground Transportation-0.27%
|
J.B. Hunt Transport Services, Inc.
|
|
|
|
Old Dominion Freight Line, Inc.
|
|
|
|
|
|
|
|
|
|
|
Caesars Entertainment, Inc.(b)(c)
|
|
|
|
|
|
|
|
|
MGM Resorts International(b)(c)
|
|
|
|
|
|
|
|
|
|
|
|
|
|
Commodity Chemicals-0.25%
|
|
|
|
|
|
LyondellBasell Industries N.V., Class A
|
|
|
|
|
|
|
|
|
Communications Equipment-0.78%
|
|
|
|
|
|
|
|
|
|
|
|
|
|
|
|
|
|
|
|
|
|
|
|
|
|
|
|
|
|
|
Computer & Electronics Retail-0.14%
|
|
|
|
|
|
Construction & Engineering-0.18%
|
|
|
|
|
|
Construction Machinery & Heavy Transportation Equipment-0.57%
|
|
|
|
|
|
|
|
|
|
|
|
|
|
|
|
|
|
|
|
|
|
|
|
|
|
Construction Materials-0.35%
|
Martin Marietta Materials, Inc.
|
|
|
|
|
|
|
|
|
|
|
|
|
|
Consumer Electronics-0.13%
|
|
|
|
|
|
|
|
|
|
|
|
|
Capital One Financial Corp.
|
|
|
|
Discover Financial Services
|
|
|
|
|
|
|
|
|
|
|
|
|
|
Consumer Staples Merchandise Retail-0.87%
|
|
|
|
|
|
|
|
|
|
|
|
|
|
|
Consumer Staples Merchandise Retail-(continued)
|
|
|
|
|
|
|
|
|
|
|
|
|
|
|
|
|
|
|
|
|
|
|
|
|
|
|
|
|
|
Digital Realty Trust, Inc.
|
|
|
|
|
|
|
|
|
|
|
|
|
|
Data Processing & Outsourced Services-0.17%
|
Broadridge Financial Solutions, Inc.
|
|
|
|
Distillers & Vintners-0.31%
|
Brown-Forman Corp., Class B(b)
|
|
|
|
Constellation Brands, Inc., Class A
|
|
|
|
|
|
|
|
|
|
|
|
|
|
|
|
|
|
|
|
|
|
|
|
|
|
|
|
|
|
|
|
|
|
|
|
|
|
|
|
|
|
|
|
|
|
|
|
|
|
|
|
|
|
|
|
|
|
PNC Financial Services Group, Inc. (The)
|
|
|
|
|
|
|
|
|
|
|
|
|
|
|
|
|
|
|
Diversified Financial Services-0.15%
|
Apollo Global Management, Inc.(b)
|
|
|
|
Diversified Support Services-0.35%
|
|
|
|
|
|
|
|
|
|
|
|
|
|
|
|
|
|
Walgreens Boots Alliance, Inc.
|
|
|
|
|
|
|
|
|
|
|
American Electric Power Co., Inc.
|
|
|
|
Constellation Energy Corp.
|
|
|
|
|
|
|
|
|
|
|
|
|
|
|
|
|
|
|
|
|
|
|
|
|
|
|
|
|
|
|
|
|
|
|
|
|
|
|
|
|
|
|
|
|
|
|
|
|
|
|
|
|
|
Pinnacle West Capital Corp.(b)
|
|
|
|
|
|
|
|
|
See accompanying Notes to Financial Statements which are an integral part of the financial
statements.
Invesco S&P 500 Equal Weight Income Advantage ETF (RSPA)—(continued)
April 30, 2025
(Unaudited)
|
|
|
|
Electric Utilities-(continued)
|
|
|
|
|
|
|
|
|
|
|
|
|
|
|
|
Electrical Components & Equipment-0.89%
|
|
|
|
|
|
|
|
|
|
|
|
|
|
|
|
Generac Holdings, Inc.(c)
|
|
|
|
|
|
|
|
|
Rockwell Automation, Inc.
|
|
|
|
|
|
|
|
|
Electronic Components-0.34%
|
|
|
|
|
|
|
|
|
|
|
|
|
|
|
|
Electronic Equipment & Instruments-0.58%
|
Keysight Technologies, Inc.(c)
|
|
|
|
Teledyne Technologies, Inc.(c)
|
|
|
|
|
|
|
|
|
Zebra Technologies Corp., Class A(c)
|
|
|
|
|
|
|
|
|
Electronic Manufacturing Services-0.32%
|
|
|
|
|
|
TE Connectivity PLC (Switzerland)
|
|
|
|
|
|
|
|
|
Environmental & Facilities Services-0.66%
|
|
|
|
|
|
|
|
|
|
|
|
|
|
|
|
|
|
|
|
|
|
|
|
|
|
Fertilizers & Agricultural Chemicals-0.51%
|
CF Industries Holdings, Inc.
|
|
|
|
|
|
|
|
|
|
|
|
|
|
|
|
|
|
|
Financial Exchanges & Data-1.43%
|
Cboe Global Markets, Inc.
|
|
|
|
|
|
|
|
|
FactSet Research Systems, Inc.(b)
|
|
|
|
Intercontinental Exchange, Inc.
|
|
|
|
MarketAxess Holdings, Inc.
|
|
|
|
|
|
|
|
|
|
|
|
|
|
|
|
|
|
|
|
|
|
|
|
|
|
|
|
|
|
|
|
|
|
|
|
|
|
|
|
|
|
|
|
|
|
|
|
|
|
|
|
|
|
|
|
|
|
|
|
|
|
|
|
|
|
|
|
|
|
|
|
|
|
|
|
|
|
Health Care Distributors-0.66%
|
|
|
|
|
|
|
|
|
|
|
|
|
|
|
|
|
|
|
|
|
|
|
|
|
|
Health Care Equipment-2.45%
|
|
|
|
|
|
Baxter International, Inc.
|
|
|
|
Becton, Dickinson and Co.
|
|
|
|
Boston Scientific Corp.(c)
|
|
|
|
|
|
|
|
|
Edwards Lifesciences Corp.(c)
|
|
|
|
GE HealthCare Technologies, Inc.
|
|
|
|
|
|
|
|
|
IDEXX Laboratories, Inc.(c)
|
|
|
|
|
|
|
|
|
Intuitive Surgical, Inc.(c)
|
|
|
|
|
|
|
|
|
|
|
|
|
|
|
|
|
|
|
|
|
|
|
|
Zimmer Biomet Holdings, Inc.
|
|
|
|
|
|
|
|
|
Health Care Facilities-0.33%
|
|
|
|
|
|
Universal Health Services, Inc., Class B
|
|
|
|
|
|
|
|
|
|
|
Alexandria Real Estate Equities, Inc.(b)
|
|
|
|
Healthpeak Properties, Inc.
|
|
|
|
|
|
|
|
|
|
|
|
|
|
|
|
|
|
|
Health Care Services-0.80%
|
|
|
|
|
|
|
|
|
|
|
|
|
|
|
|
|
|
|
|
|
Quest Diagnostics, Inc.(b)
|
|
|
|
|
|
|
|
|
Health Care Supplies-0.46%
|
Align Technology, Inc.(c)
|
|
|
|
Cooper Cos., Inc. (The)(c)
|
|
|
|
|
|
|
|
|
|
|
|
|
|
Heavy Electrical Equipment-0.19%
|
|
|
|
|
|
See accompanying Notes to Financial Statements which are an integral part of the financial
statements.
Invesco S&P 500 Equal Weight Income Advantage ETF (RSPA)—(continued)
April 30, 2025
(Unaudited)
|
|
|
|
|
|
Mohawk Industries, Inc.(c)
|
|
|
|
Home Improvement Retail-0.30%
|
|
|
|
|
|
|
|
|
|
|
|
|
|
|
|
|
|
|
|
|
|
|
|
|
|
|
|
|
|
|
|
|
|
|
|
|
|
|
|
|
|
|
Homefurnishing Retail-0.14%
|
|
|
|
|
|
Hotel & Resort REITs-0.14%
|
Host Hotels & Resorts, Inc.
|
|
|
|
Hotels, Resorts & Cruise Lines-1.21%
|
|
|
|
|
|
|
|
|
|
|
|
|
|
|
|
|
|
|
|
|
Hilton Worldwide Holdings, Inc.
|
|
|
|
Marriott International, Inc., Class A
|
|
|
|
Norwegian Cruise Line Holdings Ltd.(c)
|
|
|
|
Royal Caribbean Cruises Ltd.
|
|
|
|
|
|
|
|
|
|
|
Church & Dwight Co., Inc.
|
|
|
|
|
|
|
|
|
|
|
|
|
|
|
|
|
|
|
Procter & Gamble Co. (The)
|
|
|
|
|
|
|
|
|
Human Resource & Employment Services-0.65%
|
Automatic Data Processing, Inc.
|
|
|
|
|
|
|
|
|
|
|
|
|
|
|
|
|
|
|
|
|
|
|
|
Independent Power Producers & Energy Traders-0.29%
|
|
|
|
|
|
|
|
|
|
|
|
|
|
|
|
Industrial Conglomerates-0.30%
|
|
|
|
|
|
Honeywell International, Inc.
|
|
|
|
|
|
|
|
|
|
|
Air Products and Chemicals, Inc.
|
|
|
|
|
|
|
|
|
|
|
|
|
|
Industrial Machinery & Supplies & Components-1.74%
|
|
|
|
|
|
|
|
|
|
|
|
|
|
|
|
|
|
|
|
Industrial Machinery & Supplies & Components-(continued)
|
Illinois Tool Works, Inc.
|
|
|
|
|
|
|
|
|
|
|
|
|
|
|
|
|
|
|
|
|
|
|
|
|
|
|
|
|
|
|
|
|
|
Stanley Black & Decker, Inc.(b)
|
|
|
|
|
|
|
|
|
|
|
|
|
|
|
|
|
|
|
|
|
|
|
|
|
|
|
|
Arthur J. Gallagher & Co.
|
|
|
|
|
|
|
|
|
Marsh & McLennan Cos., Inc.
|
|
|
|
|
|
|
|
|
|
|
|
|
|
Integrated Oil & Gas-0.42%
|
|
|
|
|
|
|
|
|
|
|
Occidental Petroleum Corp.(b)
|
|
|
|
|
|
|
|
|
Integrated Telecommunication Services-0.32%
|
|
|
|
|
|
Verizon Communications, Inc.
|
|
|
|
|
|
|
|
|
Interactive Home Entertainment-0.34%
|
|
|
|
|
|
Take-Two Interactive Software, Inc.(c)
|
|
|
|
|
|
|
|
|
Interactive Media & Services-0.43%
|
|
|
|
|
|
|
|
|
|
|
|
|
|
|
|
Meta Platforms, Inc., Class A
|
|
|
|
|
|
|
|
|
Internet Services & Infrastructure-0.50%
|
Akamai Technologies, Inc.(c)
|
|
|
|
GoDaddy, Inc., Class A(c)
|
|
|
|
|
|
|
|
|
|
|
|
|
|
Investment Banking & Brokerage-0.63%
|
Charles Schwab Corp. (The)
|
|
|
|
Goldman Sachs Group, Inc. (The)
|
|
|
|
|
|
|
|
|
Raymond James Financial, Inc.
|
|
|
|
|
|
|
|
|
IT Consulting & Other Services-0.70%
|
Accenture PLC, Class A (Ireland)
|
|
|
|
Cognizant Technology Solutions Corp.,
Class A
|
|
|
|
|
|
|
|
|
See accompanying Notes to Financial Statements which are an integral part of the financial
statements.
Invesco S&P 500 Equal Weight Income Advantage ETF (RSPA)—(continued)
April 30, 2025
(Unaudited)
|
|
|
|
IT Consulting & Other Services-(continued)
|
|
|
|
|
|
International Business Machines Corp.
|
|
|
|
|
|
|
|
|
|
|
|
|
|
|
|
Life & Health Insurance-0.75%
|
|
|
|
|
|
|
|
|
|
|
|
|
|
|
|
Principal Financial Group, Inc.
|
|
|
|
Prudential Financial, Inc.
|
|
|
|
|
|
|
|
|
Life Sciences Tools & Services-1.33%
|
Agilent Technologies, Inc.
|
|
|
|
|
|
|
|
|
Charles River Laboratories International,
Inc.(c)
|
|
|
|
|
|
|
|
|
|
|
|
|
|
Mettler-Toledo International, Inc.(c)
|
|
|
|
|
|
|
|
|
Thermo Fisher Scientific, Inc.
|
|
|
|
|
|
|
|
|
West Pharmaceutical Services, Inc.
|
|
|
|
|
|
|
|
|
Managed Health Care-0.77%
|
|
|
|
|
|
|
|
|
|
|
|
|
|
|
|
Molina Healthcare, Inc.(c)
|
|
|
|
UnitedHealth Group, Inc.(b)
|
|
|
|
|
|
|
|
|
Metal, Glass & Plastic Containers-0.16%
|
|
|
|
|
|
Movies & Entertainment-0.79%
|
Live Nation Entertainment, Inc.(c)
|
|
|
|
|
|
|
|
|
|
|
|
|
|
|
|
|
|
|
Warner Bros. Discovery, Inc.(c)
|
|
|
|
|
|
|
|
|
Multi-Family Residential REITs-0.91%
|
AvalonBay Communities, Inc.
|
|
|
|
|
|
|
|
|
|
|
|
|
|
Essex Property Trust, Inc.
|
|
|
|
Mid-America Apartment Communities, Inc.
|
|
|
|
|
|
|
|
|
|
|
|
|
|
Multi-line Insurance-0.16%
|
American International Group, Inc.
|
|
|
|
Multi-Sector Holdings-0.16%
|
Berkshire Hathaway, Inc., Class B(c)
|
|
|
|
|
|
|
|
|
|
|
|
|
|
|
Multi-Utilities-(continued)
|
CenterPoint Energy, Inc.(b)
|
|
|
|
|
|
|
|
|
Consolidated Edison, Inc.
|
|
|
|
|
|
|
|
|
|
|
|
|
|
|
|
|
|
|
Public Service Enterprise Group, Inc.
|
|
|
|
|
|
|
|
|
|
|
|
|
|
|
|
|
|
|
|
|
|
|
|
|
|
Oil & Gas Equipment & Services-0.38%
|
Baker Hughes Co., Class A
|
|
|
|
|
|
|
|
|
|
|
|
|
|
|
|
|
|
|
Oil & Gas Exploration & Production-1.41%
|
|
|
|
|
|
|
|
|
|
|
|
|
|
|
|
|
|
|
|
|
|
|
|
|
|
|
|
|
|
|
|
|
|
|
|
|
|
|
|
|
|
|
|
|
|
Texas Pacific Land Corp.(b)
|
|
|
|
|
|
|
|
|
Oil & Gas Refining & Marketing-0.42%
|
|
|
|
|
|
|
|
|
|
|
|
|
|
|
|
|
|
|
|
|
Oil & Gas Storage & Transportation-0.59%
|
|
|
|
|
|
|
|
|
|
|
|
|
|
|
|
Williams Cos., Inc. (The)
|
|
|
|
|
|
|
|
|
Other Specialized REITs-0.31%
|
|
|
|
|
|
|
|
|
|
|
|
|
|
|
|
Other Specialty Retail-0.33%
|
|
|
|
|
|
|
|
|
|
|
|
|
|
|
|
Packaged Foods & Meats-1.83%
|
|
|
|
|
|
|
|
|
|
|
|
|
|
|
|
|
|
|
|
|
|
|
|
|
|
|
|
|
|
|
See accompanying Notes to Financial Statements which are an integral part of the financial
statements.
Invesco S&P 500 Equal Weight Income Advantage ETF (RSPA)—(continued)
April 30, 2025
(Unaudited)
|
|
|
|
Packaged Foods & Meats-(continued)
|
|
|
|
|
|
Lamb Weston Holdings, Inc.
|
|
|
|
|
|
|
|
|
Mondelez International, Inc., Class A
|
|
|
|
The Campbell’s Company(b)
|
|
|
|
Tyson Foods, Inc., Class A
|
|
|
|
|
|
|
|
|
Paper & Plastic Packaging Products & Materials-0.72%
|
|
|
|
|
|
|
|
|
|
|
|
|
|
|
|
Packaging Corp. of America
|
|
|
|
|
|
|
|
|
|
|
|
|
|
|
|
|
|
|
|
|
Southwest Airlines Co.(b)
|
|
|
|
United Airlines Holdings, Inc.(c)
|
|
|
|
|
|
|
|
|
Passenger Ground Transportation-0.17%
|
Uber Technologies, Inc.(c)
|
|
|
|
Personal Care Products-0.30%
|
Estee Lauder Cos., Inc. (The), Class A
|
|
|
|
|
|
|
|
|
|
|
|
|
|
|
|
|
|
|
|
|
|
|
|
|
|
|
|
|
|
|
|
|
|
|
|
|
|
|
|
|
|
|
|
|
|
|
|
|
|
|
|
|
|
|
|
Property & Casualty Insurance-1.71%
|
|
|
|
|
|
|
|
|
|
|
|
|
|
|
|
|
|
|
|
|
Cincinnati Financial Corp.
|
|
|
|
Erie Indemnity Co., Class A(b)
|
|
|
|
Hartford Insurance Group, Inc. (The)
|
|
|
|
|
|
|
|
|
|
|
|
|
|
Travelers Cos., Inc. (The)
|
|
|
|
|
|
|
|
|
|
|
|
|
|
|
|
|
|
|
|
|
|
|
|
|
|
|
|
|
|
|
Rail Transportation-0.43%
|
|
|
|
|
|
|
|
|
|
Rail Transportation-(continued)
|
|
|
|
|
|
|
|
|
|
|
|
|
|
|
|
Real Estate Services-0.30%
|
CBRE Group, Inc., Class A(c)
|
|
|
|
|
|
|
|
|
|
|
|
|
|
|
|
Citizens Financial Group, Inc.
|
|
|
|
Huntington Bancshares, Inc.
|
|
|
|
|
|
|
|
|
|
|
|
|
|
|
|
|
|
|
|
|
|
|
|
|
|
|
|
|
|
|
Research & Consulting Services-0.65%
|
|
|
|
|
|
|
|
|
|
|
|
|
|
|
|
|
|
|
|
|
|
|
|
|
|
|
|
Chipotle Mexican Grill, Inc.(b)(c)
|
|
|
|
Darden Restaurants, Inc.(b)
|
|
|
|
|
|
|
|
|
DoorDash, Inc., Class A(c)
|
|
|
|
|
|
|
|
|
|
|
|
|
|
|
|
|
|
|
|
|
|
|
|
|
|
Federal Realty Investment Trust
|
|
|
|
|
|
|
|
|
|
|
|
|
|
|
|
|
|
|
Simon Property Group, Inc.
|
|
|
|
|
|
|
|
|
|
|
Extra Space Storage, Inc.
|
|
|
|
|
|
|
|
|
|
|
|
|
|
Semiconductor Materials & Equipment-0.71%
|
|
|
|
|
|
|
|
|
|
|
|
|
|
|
|
|
|
|
|
|
|
|
|
|
|
|
|
|
|
|
|
|
Advanced Micro Devices, Inc.(c)
|
|
|
|
|
|
|
|
|
|
|
|
|
|
|
|
|
|
|
|
|
|
|
|
See accompanying Notes to Financial Statements which are an integral part of the financial
statements.
Invesco S&P 500 Equal Weight Income Advantage ETF (RSPA)—(continued)
April 30, 2025
(Unaudited)
|
|
|
|
Semiconductors-(continued)
|
Microchip Technology, Inc.
|
|
|
|
Micron Technology, Inc.(b)
|
|
|
|
Monolithic Power Systems, Inc.(b)
|
|
|
|
|
|
|
|
|
NXP Semiconductors N.V. (Netherlands)
|
|
|
|
ON Semiconductor Corp.(c)
|
|
|
|
|
|
|
|
|
Skyworks Solutions, Inc.(b)
|
|
|
|
|
|
|
|
|
|
|
|
|
|
Single-Family Residential REITs-0.16%
|
|
|
|
|
|
Soft Drinks & Non-alcoholic Beverages-0.63%
|
|
|
|
|
|
|
|
|
|
|
Monster Beverage Corp.(c)
|
|
|
|
|
|
|
|
|
|
|
|
|
|
Specialty Chemicals-0.99%
|
|
|
|
|
|
|
|
|
|
|
|
|
|
|
|
|
|
|
|
|
International Flavors & Fragrances, Inc.
|
|
|
|
|
|
|
|
|
Sherwin-Williams Co. (The)
|
|
|
|
|
|
|
|
|
|
|
|
|
|
|
|
|
|
|
|
|
|
|
|
|
|
|
|
CrowdStrike Holdings, Inc., Class A(c)
|
|
|
|
|
|
|
|
|
|
|
|
|
|
|
|
|
|
|
|
|
|
|
|
Palo Alto Networks, Inc.(c)
|
|
|
|
|
|
|
|
|
|
|
|
|
|
Technology Distributors-0.15%
|
|
|
|
|
|
Technology Hardware, Storage & Peripherals-1.19%
|
|
|
|
|
|
Dell Technologies, Inc., Class C
|
|
|
|
Hewlett Packard Enterprise Co.
|
|
|
|
|
|
|
|
|
|
|
|
|
|
Seagate Technology Holdings PLC
|
|
|
|
Super Micro Computer, Inc.(b)(c)
|
|
|
|
Western Digital Corp.(b)(c)
|
|
|
|
|
|
|
|
|
Telecom Tower REITs-0.51%
|
|
|
|
|
|
|
|
|
|
Telecom Tower REITs-(continued)
|
|
|
|
|
|
SBA Communications Corp., Class A
|
|
|
|
|
|
|
|
|
|
|
|
|
|
|
|
|
|
|
|
|
|
|
Philip Morris International, Inc.
|
|
|
|
|
|
|
|
|
Trading Companies & Distributors-0.49%
|
|
|
|
|
|
|
|
|
|
|
|
|
|
|
|
|
|
|
|
|
Transaction & Payment Processing Services-1.21%
|
|
|
|
|
|
Fidelity National Information Services, Inc.
|
|
|
|
|
|
|
|
|
|
|
|
|
|
Jack Henry & Associates, Inc.(b)
|
|
|
|
Mastercard, Inc., Class A
|
|
|
|
|
|
|
|
|
|
|
|
|
|
|
|
|
|
|
|
|
American Water Works Co., Inc.
|
|
|
|
Wireless Telecommunication Services-0.15%
|
|
|
|
|
|
Total Common Stocks & Other Equity Interests
(Cost $228,618,720)
|
|
|
|
|
|
|
Equity Linked Notes-4.78%
|
|
|
|
|
|
|
|
|
BNP Paribas Issuance B.V. (Invesco S&P 500
Equal Weight ETF), 177.68%,
05/13/2025(e)
|
|
|
|
BNP Paribas Issuance B.V. (Invesco S&P 500
Equal Weight ETF), 245.99%,
05/20/2025(e)
|
|
|
|
Canadian Imperial Bank of Commerce
(Invesco S&P 500 Equal Weight ETF),
177.75%, 05/15/2025
|
|
|
|
Canadian Imperial Bank of Commerce
(Invesco S&P 500 Equal Weight ETF),
173.00%, 05/19/2025
|
|
|
|
Citigroup Global Markets Holdings, Inc.
(Invesco S&P 500 Equal Weight ETF),
163.88%, 05/08/2025(e)
|
|
|
|
Citigroup Global Markets Holdings, Inc.
(Invesco S&P 500 Equal Weight ETF),
160.89%, 05/09/2025(e)
|
|
|
|
J.P. Morgan Chase & Co. (Invesco S&P 500
Equal Weight ETF), 0.00%, 05/14/2025(f)
|
|
|
|
J.P. Morgan Chase & Co. (Invesco S&P 500
Equal Weight ETF), 0.00%, 05/23/2025(f)
|
|
|
|
See accompanying Notes to Financial Statements which are an integral part of the financial
statements.
Invesco S&P 500 Equal Weight Income Advantage ETF (RSPA)—(continued)
April 30, 2025
(Unaudited)
|
|
|
|
|
Diversified Banks-(continued)
|
|
|
|
Mizuho Markets Cayman L.P. (Invesco
S&P 500 Equal Weight ETF), 194.40%,
05/06/2025(e)
|
|
|
|
Mizuho Markets Cayman L.P. (Invesco
S&P 500 Equal Weight ETF), 137.70%,
05/07/2025(e)
|
|
|
|
Royal Bank of Canada (Invesco S&P 500
Equal Weight ETF), 209.76%,
05/21/2025(e)
|
|
|
|
Societe Generale S.A. (Invesco S&P 500
Equal Weight ETF), 206.30%,
05/28/2025(e)
|
|
|
|
Toronto-Dominion Bank (The) (Invesco
S&P 500 Equal Weight ETF), 172.00%,
05/27/2025(e)
|
|
|
|
Toronto-Dominion Bank (The) (Invesco
S&P 500 Equal Weight ETF), 170.00%,
05/29/2025(e)
|
|
|
|
Wells Fargo Bank N.A. (Invesco S&P 500
Equal Weight ETF), 242.80%,
05/16/2025(e)
|
|
|
|
Wells Fargo Bank N.A. (Invesco S&P 500
Equal Weight ETF), 209.44%,
05/22/2025(e)
|
|
|
|
|
|
|
|
|
Diversified Capital Markets-0.51%
|
|
|
|
UBS AG (Invesco S&P 500 Equal Weight ETF),
191.70%, 05/12/2025(e)
|
|
|
|
Total Equity Linked Notes
(Cost $14,439,000)
|
|
|
|
|
|
Money Market Funds-19.23%
|
Invesco Premier U.S. Government Money
Portfolio, Institutional Class, 4.26%(d)(g)
(Cost $57,102,317)
|
|
|
|
TOTAL INVESTMENTS IN SECURITIES
(excluding investments purchased with cash collateral
from securities on loan)-100.18%
(Cost $300,160,037)
|
|
Investments Purchased with Cash Collateral
from Securities on Loan
|
|
|
Invesco Private Government Fund,
4.32%(d)(g)(h)
|
|
|
|
Invesco Private Prime Fund, 4.46%(d)(g)(h)
|
|
|
|
Total Investments Purchased with Cash Collateral from
Securities on Loan
(Cost $20,124,796)
|
|
TOTAL INVESTMENTS IN SECURITIES-106.96%
(Cost $320,284,833)
|
|
OTHER ASSETS LESS LIABILITIES-(6.96)%
|
|
|
|
|
Investment Abbreviations:
|
|
|
|
|
|
-Real Estate Investment Trust
|
Notes to Schedule of Investments:
|
|
|
Industry and/or sector classifications used in this report are generally according
to the Global Industry Classification Standard, which was developed by and is
the exclusive property and a service mark of MSCI Inc. and Standard & Poor’s.
|
|
|
All or a portion of this security was out on loan at April 30, 2025.
|
|
|
Non-income producing security.
|
|
|
Affiliated holding. Affiliated holdings are investments in entities which are under
common ownership or control of Invesco Ltd. or are investments in entities in
which the Fund owns 5% or more of the outstanding voting securities. The table below shows the Fund’s transactions in, and earnings from, its investments in
affiliates for the six months ended April 30, 2025.
|
|
|
|
|
|
Change in
Unrealized
Appreciation
(Depreciation)
|
|
|
|
|
|
|
|
|
|
|
|
|
See accompanying Notes to Financial Statements which are an integral part of the financial
statements.
Invesco S&P 500 Equal Weight Income Advantage ETF (RSPA)—(continued)
April 30, 2025
(Unaudited)
|
|
|
|
|
Change in
Unrealized
Appreciation
(Depreciation)
|
|
|
|
Investments in Affiliated
Money Market Funds:
|
|
|
|
|
|
|
|
Invesco Government &
Agency Portfolio,
Institutional Class
|
|
|
|
|
|
|
|
Invesco Premier
U.S. Government Money
Portfolio, Institutional
Class
|
|
|
|
|
|
|
|
Investments Purchased
with Cash Collateral
from Securities on Loan:
|
|
|
|
|
|
|
|
Invesco Private
Government Fund
|
|
|
|
|
|
|
|
Invesco Private Prime
Fund
|
|
|
|
|
|
|
|
|
|
|
|
|
|
|
|
|
|
|
Represents the income earned on the investment of cash collateral, which is included
in securities lending income on the Statements of Operations. Does not
include rebates and fees paid to lending agent or premiums received from borrowers,
if any.
|
|
|
Security purchased or received in a transaction exempt from registration under the Securities Act of 1933, as amended (the “1933 Act”). The security may be
resold pursuant to an exemption from registration under the 1933 Act, typically to
qualified institutional buyers. The aggregate value of these securities at
April 30, 2025 was $11,012,356, which represented 3.71% of the Fund’s Net Assets.
|
|
|
Denotes a zero coupon security issued at a substantial discount from its value at
maturity.
|
|
|
The rate shown is the 7-day SEC standardized yield as of April 30, 2025.
|
|
|
The security has been segregated to satisfy the commitment to return the cash collateral received in securities lending transactions upon the borrower’s return
of the securities loaned. See Note 2P.
|
See accompanying Notes to Financial Statements which are an integral part of the financial
statements.
Invesco Short Duration Total Return Bond ETF (GTOS)
April 30, 2025
(Unaudited)
Schedule of Investments(a)
|
|
|
|
U.S. Dollar Denominated Bonds & Notes-73.88%
|
|
|
Lamar Media Corp., 4.88%, 01/15/2029
|
|
|
|
Aerospace & Defense-1.30%
|
|
|
|
|
|
|
|
|
|
|
|
|
|
|
|
L3Harris Technologies, Inc., 5.40%, 01/15/2027
|
|
|
|
|
|
|
|
|
|
|
|
|
|
|
|
|
|
|
|
|
|
|
|
|
|
|
|
|
|
|
|
|
|
|
|
|
|
|
Agricultural & Farm Machinery-0.40%
|
AGCO Corp., 5.45%, 03/21/2027
|
|
|
|
CNH Industrial Capital LLC
|
|
|
|
|
|
|
|
|
|
|
|
|
|
|
|
|
|
|
|
|
Gap, Inc. (The), 3.63%, 10/01/2029(b)
|
|
|
|
Application Software-0.84%
|
|
|
|
|
|
|
|
|
|
|
|
|
|
|
|
Roper Technologies, Inc., 4.50%, 10/15/2029
|
|
|
|
SS&C Technologies, Inc., 5.50%, 09/30/2027(b)
|
|
|
|
Synopsys, Inc., 4.85%, 04/01/2030
|
|
|
|
|
|
|
|
|
Asset Management & Custody Banks-1.34%
|
Bank of New York Mellon Corp. (The), 4.98%,
03/14/2030(c)(d)
|
|
|
|
Blackstone Secured Lending Fund, 5.88%,
11/15/2027
|
|
|
|
New Mountain Finance Corp., 6.20%,
10/15/2027
|
|
|
|
|
|
|
|
|
|
|
|
|
|
|
|
|
|
|
5.33% (SOFR + 0.95%), 04/24/2028(e)
|
|
|
|
|
|
|
|
|
|
|
|
|
|
|
|
|
|
|
Automobile Manufacturers-4.78%
|
Allison Transmission, Inc., 4.75%,
10/01/2027(b)
|
|
|
|
American Honda Finance Corp., 5.80%,
10/03/2025
|
|
|
|
Daimler Truck Finance North America LLC
(Germany), 4.95%, 01/13/2028(b)
|
|
|
|
Ford Motor Credit Co. LLC
|
|
|
|
7.32% (SOFR + 2.95%), 03/06/2026(e)
|
|
|
|
|
|
|
|
|
|
|
|
|
Automobile Manufacturers-(continued)
|
|
|
|
|
|
|
|
|
|
|
|
|
|
|
|
|
|
|
|
|
|
|
|
|
|
|
|
|
|
|
|
|
|
|
|
Toyota Motor Credit Corp.
|
|
|
|
|
|
|
|
|
|
|
|
|
|
|
|
|
|
|
Automotive Parts & Equipment-0.27%
|
Clarios Global L.P./Clarios US Finance Co.,
6.75%, 02/15/2030(b)
|
|
|
|
PHINIA, Inc., 6.75%, 04/15/2029(b)
|
|
|
|
|
|
|
|
|
|
|
Advance Auto Parts, Inc., 5.90%, 03/09/2026
|
|
|
|
Asbury Automotive Group, Inc., 4.50%,
03/01/2028
|
|
|
|
Group 1 Automotive, Inc., 4.00%, 08/15/2028(b)
|
|
|
|
O’Reilly Automotive, Inc., 5.75%, 11/20/2026
|
|
|
|
|
|
|
|
|
|
|
|
|
|
|
|
|
|
|
|
|
|
|
|
|
|
|
|
|
|
|
|
|
Macy’s Retail Holdings LLC, 5.88%,
04/01/2029(b)
|
|
|
|
|
|
CCO Holdings LLC/CCO Holdings Capital Corp.,
5.50%, 05/01/2026(b)
|
|
|
|
Charter Communications Operating LLC/Charter
Communications Operating Capital Corp.,
6.15%, 11/10/2026
|
|
|
|
|
|
|
|
|
Cargo Ground Transportation-0.63%
|
Penske Truck Leasing Co. L.P./PTL Finance Corp.
|
|
|
|
|
|
|
|
|
|
|
|
|
|
|
|
|
|
|
|
|
|
|
|
|
|
|
|
|
|
|
|
|
|
|
|
|
|
|
|
|
|
|
|
Construction Machinery & Heavy Transportation Equipment-0.24%
|
Caterpillar Financial Services Corp., 5.15%,
08/11/2025
|
|
|
|
See accompanying Notes to Financial Statements which are an integral part of the financial
statements.
Invesco Short Duration Total Return Bond ETF (GTOS)—(continued)
April 30, 2025
(Unaudited)
|
|
|
|
|
|
|
|
|
|
|
|
|
|
|
|
|
|
|
|
|
5.64% (SOFR + 1.26%), 04/25/2029(e)
|
|
|
|
Capital One Financial Corp., 7.15%,
10/29/2027(d)
|
|
|
|
General Motors Financial Co., Inc., 5.40%,
04/06/2026
|
|
|
|
|
|
|
|
|
Consumer Staples Merchandise Retail-0.24%
|
Walmart, Inc., 4.81% (SOFR + 0.43%),
04/28/2027(e)
|
|
|
|
|
|
Genuine Parts Co., 6.50%, 11/01/2028
|
|
|
|
|
|
Bank of America Corp., 5.82%, 09/15/2029(d)
|
|
|
|
|
|
|
|
|
|
|
|
|
|
|
|
|
|
|
Bank of Montreal (Canada), 5.92%, 09/25/2025
|
|
|
|
Barclays PLC (United Kingdom), 7.33%,
11/02/2026(d)
|
|
|
|
|
|
|
|
|
|
|
|
|
|
|
|
|
|
|
|
|
|
|
|
Fifth Third Bancorp, 6.34%, 07/27/2029(c)(d)
|
|
|
|
Goldman Sachs Bank USA, 5.28%,
03/18/2027(d)
|
|
|
|
|
|
|
|
|
|
|
|
|
|
|
|
|
|
|
|
|
|
|
|
|
|
|
|
|
|
|
|
|
|
|
|
|
|
|
Series CC, 7.12% (3 mo. Term SOFR +
2.84%)(c)(e)(f)
|
|
|
|
Macquarie Bank Ltd. (Australia), 5.39%,
12/07/2026(b)
|
|
|
|
Manufacturers & Traders Trust Co., 4.65%,
01/27/2026
|
|
|
|
Morgan Stanley Bank N.A., 5.88%, 10/30/2026
|
|
|
|
NatWest Group PLC (United Kingdom), 7.47%,
11/10/2026(d)
|
|
|
|
PNC Financial Services Group, Inc. (The)
|
|
|
|
|
|
|
|
|
|
|
|
|
|
Royal Bank of Canada (Canada), 4.88%,
01/19/2027
|
|
|
|
Toronto-Dominion Bank (The) (Canada), 4.99%
(SOFR + 0.62%), 12/17/2026(e)
|
|
|
|
U.S. Bancorp, 6.79%, 10/26/2027(d)
|
|
|
|
UBS AG (Switzerland), 5.80%, 09/11/2025
|
|
|
|
|
|
|
|
Diversified Banks-(continued)
|
|
|
|
|
|
|
|
|
|
|
|
|
|
|
|
5.75% (SOFR + 1.37%), 04/23/2029(e)
|
|
|
|
|
|
|
|
|
|
|
|
|
|
|
|
|
|
|
|
|
|
|
|
|
|
|
|
|
|
|
|
|
|
Westpac Banking Corp. (Australia), 4.84% (SOFR
+ 0.46%), 10/20/2026(e)
|
|
|
|
|
|
|
|
|
Diversified Financial Services-3.36%
|
AerCap Ireland Capital DAC/AerCap Global
Aviation Trust (Ireland)
|
|
|
|
|
|
|
|
|
|
|
|
|
|
|
|
|
|
|
|
|
|
|
|
|
|
|
|
|
Macquarie Airfinance Holdings Ltd. (United
Kingdom), 5.15%, 03/17/2030(b)
|
|
|
|
|
|
|
|
|
Diversified Metals & Mining-0.61%
|
BHP Billiton Finance (USA) Ltd. (Australia),
5.25%, 09/08/2026
|
|
|
|
Glencore Funding LLC (Australia)
|
|
|
|
|
|
|
|
|
|
|
|
|
|
Rio Tinto Finance (USA) PLC (Australia)
|
|
|
|
|
|
|
|
|
|
|
|
|
|
|
|
|
|
|
Diversified Support Services-0.84%
|
Element Fleet Management Corp. (Canada),
5.04%, 03/25/2030(b)
|
|
|
|
RB Global Holdings, Inc. (Canada), 6.75%,
03/15/2028(b)
|
|
|
|
|
|
|
|
|
|
|
|
|
|
|
|
|
|
|
|
|
|
|
|
|
|
|
|
|
|
|
|
|
|
|
|
|
|
|
|
|
|
|
|
|
|
FirstEnergy Transmission LLC, 4.55%,
01/15/2030
|
|
|
|
Georgia Power Co., 5.11% (SOFR + 0.75%),
05/08/2025(e)
|
|
|
|
See accompanying Notes to Financial Statements which are an integral part of the financial
statements.
Invesco Short Duration Total Return Bond ETF (GTOS)—(continued)
April 30, 2025
(Unaudited)
|
|
|
|
Electric Utilities-(continued)
|
National Rural Utilities Cooperative Finance Corp.
|
|
|
|
|
|
|
|
|
5.18% (SOFR + 0.80%), 02/05/2027(e)
|
|
|
|
|
|
|
|
|
|
|
|
|
|
NextEra Energy Capital Holdings, Inc.
|
|
|
|
|
|
|
|
|
|
|
|
|
|
Oncor Electric Delivery Co. LLC, 4.65%,
11/01/2029
|
|
|
|
PacifiCorp, 5.10%, 02/15/2029
|
|
|
|
Vistra Operations Co. LLC
|
|
|
|
|
|
|
|
|
|
|
|
|
|
Wisconsin Public Service Corp., 5.35%,
11/10/2025
|
|
|
|
Xcel Energy, Inc., 4.75%, 03/21/2028
|
|
|
|
|
|
|
|
|
Electrical Components & Equipment-1.11%
|
EnerSys, 4.38%, 12/15/2027(b)
|
|
|
|
Regal Rexnord Corp., 6.05%, 02/15/2026
|
|
|
|
Vertiv Group Corp., 4.13%, 11/15/2028(b)
|
|
|
|
|
|
|
|
|
Electronic Equipment & Instruments-0.16%
|
Keysight Technologies, Inc., 5.35%, 07/30/2030
|
|
|
|
Environmental & Facilities Services-0.53%
|
|
|
|
|
|
|
|
|
|
|
|
|
|
|
|
|
|
|
|
|
Financial Exchanges & Data-0.10%
|
Nasdaq, Inc., 5.65%, 06/28/2025
|
|
|
|
Health Care Equipment-0.72%
|
Smith & Nephew PLC (United Kingdom), 5.15%,
03/20/2027
|
|
|
|
|
|
|
|
|
|
|
|
|
|
|
|
|
|
|
|
|
|
|
|
Health Care Facilities-0.20%
|
HCA, Inc., 5.00%, 03/01/2028(c)
|
|
|
|
Health Care Services-0.58%
|
CVS Health Corp., 7.00%, 03/10/2055(d)
|
|
|
|
Health Care Supplies-0.66%
|
|
|
|
|
|
|
|
|
|
|
|
|
|
|
|
|
|
|
|
|
Hotels, Resorts & Cruise Lines-1.26%
|
Carnival Corp., 5.75%, 03/15/2030(b)(c)
|
|
|
|
Hilton Domestic Operating Co., Inc.
|
|
|
|
|
|
|
|
|
|
|
|
|
|
|
|
|
|
Hotels, Resorts & Cruise Lines-(continued)
|
Marriott International, Inc.
|
|
|
|
|
|
|
|
|
|
|
|
|
|
Royal Caribbean Cruises Ltd., 5.50%,
04/01/2028(b)
|
|
|
|
|
|
|
|
|
Housewares & Specialties-0.07%
|
Newell Brands, Inc., 6.38%, 05/15/2030
|
|
|
|
Independent Power Producers & Energy Traders-0.25%
|
Clearway Energy Operating LLC, 4.75%,
03/15/2028(b)
|
|
|
|
Industrial Machinery & Supplies & Components-0.44%
|
ESAB Corp., 6.25%, 04/15/2029(b)
|
|
|
|
Ingersoll Rand, Inc., 5.20%, 06/15/2027
|
|
|
|
Nordson Corp., 5.60%, 09/15/2028
|
|
|
|
|
|
|
|
|
|
|
LXP Industrial Trust, 6.75%, 11/15/2028
|
|
|
|
|
|
Arthur J. Gallagher & Co., 4.60%, 12/15/2027
|
|
|
|
Integrated Oil & Gas-1.64%
|
|
|
|
|
|
4.73% (SOFR + 0.36%), 02/26/2027(e)
|
|
|
|
4.84% (SOFR + 0.47%), 02/26/2028(c)(e)
|
|
|
|
Occidental Petroleum Corp.
|
|
|
|
|
|
|
|
|
|
|
|
|
|
Petroleos Mexicanos (Mexico), 6.88%,
10/16/2025
|
|
|
|
|
|
|
|
|
Integrated Telecommunication Services-0.09%
|
T-Mobile USA, Inc., 4.95%, 03/15/2028
|
|
|
|
Interactive Media & Services-0.34%
|
Match Group Holdings II LLC, 5.00%,
12/15/2027(b)
|
|
|
|
Meta Platforms, Inc., 4.30%, 08/15/2029
|
|
|
|
|
|
|
|
|
Investment Banking & Brokerage-1.34%
|
Charles Schwab Corp. (The), 5.88%,
08/24/2026
|
|
|
|
Goldman Sachs Group, Inc. (The)
|
|
|
|
|
|
|
|
|
5.67% (SOFR + 1.29%), 04/23/2028(e)
|
|
|
|
|
|
|
|
|
|
|
|
|
|
|
|
|
|
|
|
|
|
|
|
Life & Health Insurance-3.46%
|
|
|
|
|
|
|
|
|
|
|
|
|
|
|
|
|
|
|
|
|
See accompanying Notes to Financial Statements which are an integral part of the financial
statements.
Invesco Short Duration Total Return Bond ETF (GTOS)—(continued)
April 30, 2025
(Unaudited)
|
|
|
|
Life & Health Insurance-(continued)
|
Corebridge Global Funding
|
|
|
|
5.68% (SOFR + 1.30%), 09/25/2026(b)(e)
|
|
|
|
|
|
|
|
|
|
|
|
|
|
|
|
|
|
|
Pacific Life Global Funding II
|
|
|
|
5.43% (SOFR + 1.05%), 07/28/2026(b)(e)
|
|
|
|
|
|
|
|
|
|
|
|
|
|
Protective Life Global Funding, 5.37%,
01/06/2026(b)
|
|
|
|
|
|
|
|
|
Managed Health Care-0.36%
|
Elevance Health, Inc., 5.35%, 10/15/2025(c)
|
|
|
|
UnitedHealth Group, Inc., 4.75%, 07/15/2026
|
|
|
|
|
|
|
|
|
Metal, Glass & Plastic Containers-0.26%
|
Ball Corp., 6.88%, 03/15/2028
|
|
|
|
Multi-Family Residential REITs-0.45%
|
Camden Property Trust, 5.85%, 11/03/2026
|
|
|
|
|
|
Algonquin Power & Utilities Corp. (Canada),
5.37%, 06/15/2026
|
|
|
|
DTE Energy Co., 4.95%, 07/01/2027
|
|
|
|
Sempra, 6.63%, 04/01/2055(d)
|
|
|
|
|
|
|
|
|
|
|
Brandywine Operating Partnership L.P., 8.88%,
04/12/2029
|
|
|
|
Oil & Gas Exploration & Production-1.63%
|
|
|
|
|
|
|
|
|
|
|
|
|
|
|
|
EQT Corp., 6.50%, 07/01/2027(b)
|
|
|
|
Hilcorp Energy I L.P./Hilcorp Finance Co., 5.75%,
02/01/2029(b)
|
|
|
|
Pioneer Natural Resources Co., 5.10%,
03/29/2026
|
|
|
|
Transocean Titan Financing Ltd., 8.38%,
02/01/2028(b)
|
|
|
|
|
|
|
|
|
Oil & Gas Storage & Transportation-2.78%
|
Columbia Pipelines Holding Co. LLC, 6.06%,
08/15/2026(b)
|
|
|
|
Energy Transfer L.P., 6.05%, 12/01/2026
|
|
|
|
Kinder Morgan, Inc., 5.10%, 08/01/2029
|
|
|
|
|
|
|
|
|
|
|
|
|
|
|
|
|
|
|
|
|
|
|
|
Plains All American Pipeline L.P., Series B, 8.70%
(3 mo. Term SOFR + 4.37%)(e)(f)
|
|
|
|
|
|
|
|
Oil & Gas Storage & Transportation-(continued)
|
South Bow USA Infrastructure Holdings LLC
(Canada)
|
|
|
|
|
|
|
|
|
|
|
|
|
|
Transcanada Trust (Canada), 5.63%,
05/20/2075(d)
|
|
|
|
Venture Global LNG, Inc., 7.00%, 01/15/2030(b)
|
|
|
|
Williams Cos., Inc. (The), 4.80%, 11/15/2029
|
|
|
|
|
|
|
|
|
Packaged Foods & Meats-1.24%
|
Lamb Weston Holdings, Inc., 4.13%,
01/31/2030(b)
|
|
|
|
|
|
|
|
|
|
|
|
|
|
|
|
|
|
|
|
|
|
|
|
The Campbell’s Company, 5.30%, 03/20/2026
|
|
|
|
|
|
|
|
|
Paper & Plastic Packaging Products & Materials-1.07%
|
Cascades, Inc./Cascades USA, Inc. (Canada),
5.13%, 01/15/2026(b)
|
|
|
|
|
|
|
|
|
|
|
|
|
|
|
|
|
|
|
|
|
|
|
|
|
|
Delta Air Lines, Inc./SkyMiles IP Ltd., 4.50%,
10/20/2025(b)
|
|
|
|
Personal Care Products-0.25%
|
Coty, Inc./HFC Prestige Products, Inc./HFC
Prestige International US LLC, 4.75%,
01/15/2029(b)(c)
|
|
|
|
Kenvue, Inc., 5.35%, 03/22/2026
|
|
|
|
|
|
|
|
|
|
|
AstraZeneca Finance LLC (United Kingdom)
|
|
|
|
|
|
|
|
|
|
|
|
|
|
Bristol-Myers Squibb Co., 4.95%, 02/20/2026
|
|
|
|
Johnson & Johnson, 4.70%, 03/01/2030
|
|
|
|
Novartis Capital Corp., 3.80%, 09/18/2029
|
|
|
|
Zoetis, Inc., 5.40%, 11/14/2025
|
|
|
|
|
|
|
|
|
Real Estate Development-0.70%
|
Piedmont Operating Partnership L.P., 9.25%,
07/20/2028
|
|
|
|
|
|
Santander Holdings USA, Inc., 6.12%,
05/31/2027(d)
|
|
|
|
Synovus Financial Corp., 5.20%, 08/11/2025
|
|
|
|
|
|
|
|
|
|
|
Raising Cane’s Restaurants LLC, 9.38%,
05/01/2029(b)
|
|
|
|
See accompanying Notes to Financial Statements which are an integral part of the financial
statements.
Invesco Short Duration Total Return Bond ETF (GTOS)—(continued)
April 30, 2025
(Unaudited)
|
|
|
|
|
|
Realty Income Corp., 5.05%, 01/13/2026
|
|
|
|
|
|
Public Storage Operating Co.
|
|
|
|
5.08% (SOFR + 0.70%), 04/16/2027(e)
|
|
|
|
|
|
|
|
|
|
|
|
|
|
|
|
|
|
|
|
|
|
|
|
|
|
|
|
|
|
|
|
|
|
|
|
Soft Drinks & Non-alcoholic Beverages-0.47%
|
Keurig Dr Pepper, Inc., 4.97% (SOFR + 0.58%),
11/15/2026(e)
|
|
|
|
|
|
Romanian Government International Bond
(Romania)
|
|
|
|
|
|
|
|
|
|
|
|
|
|
|
|
|
|
|
Specialty Chemicals-0.28%
|
Wayfair LLC, 7.25%, 10/31/2029(b)
|
|
|
|
|
|
Cleveland-Cliffs, Inc., 6.88%, 11/01/2029(b)
|
|
|
|
|
|
CrowdStrike Holdings, Inc., 3.00%, 02/15/2029
|
|
|
|
Oracle Corp., 5.80%, 11/10/2025
|
|
|
|
|
|
|
|
|
Telecom Tower REITs-0.49%
|
SBA Communications Corp., 3.88%,
02/15/2027
|
|
|
|
|
|
Altria Group, Inc., 4.88%, 02/04/2028
|
|
|
|
Philip Morris International, Inc.
|
|
|
|
|
|
|
|
|
|
|
|
|
|
|
|
|
|
|
Trading Companies & Distributors-0.19%
|
|
|
|
|
|
|
|
|
|
|
|
|
|
|
|
|
|
|
|
|
Transaction & Payment Processing Services-1.19%
|
Block, Inc., 2.75%, 06/01/2026
|
|
|
|
Fiserv, Inc., 5.15%, 03/15/2027
|
|
|
|
|
|
|
|
|
Total U.S. Dollar Denominated Bonds & Notes
(Cost $7,312,517)
|
|
|
|
Asset-Backed Securities-11.26%
|
Avis Budget Rental Car Funding (AESOP) LLC
|
|
|
|
Series 2022-3A, Class A, 4.62%,
02/20/2027(b)
|
|
|
|
|
|
|
|
|
|
Series 2023-2A, Class A, 5.20%,
10/20/2027(b)
|
|
|
|
Series 2023-4A, Class A, 5.49%,
06/20/2029(b)
|
|
|
|
|
|
|
|
|
Series 2025-VLT6, Class A, 5.77% (1 mo.
Term SOFR + 1.44%), 03/15/2042(b)(e)
|
|
|
|
Series 2025-VLT6, Class B, 6.21% (1 mo.
Term SOFR + 1.89%), 03/15/2042(b)(e)
|
|
|
|
Extended Stay America Trust, Series 2021-ESH,
Class B, 5.82% (1 mo. Term SOFR + 1.49%),
07/15/2038(b)(e)
|
|
|
|
Frontier Issuer LLC, Series 2023-1, Class A2,
6.60%, 08/20/2053(b)
|
|
|
|
GCAT Trust, Series 2024-INV1, Class 2A2,
6.50%, 01/25/2054(b)(g)
|
|
|
|
Morgan Stanley Residential Mortgage Loan Trust,
Series 2025-NQM1, Class A1, 5.74%,
11/25/2069(b)(g)
|
|
|
|
OBX Trust, Series 2023-NQM1, Class A1, 6.12%,
11/25/2062(b)(g)
|
|
|
|
PRKCM Trust, Series 2023-AFC4, Class A1,
7.23%, 11/25/2058(b)
|
|
|
|
Qdoba Funding LLC, Series 2023-1A, Class A2,
8.50%, 09/14/2053(b)
|
|
|
|
|
|
|
|
|
Series 2024-1A, Class A2I, 6.03%,
07/30/2054(b)
|
|
|
|
Series 2024-3A, Class A2I, 5.25%,
07/30/2054(b)
|
|
|
|
Synchrony Card Funding LLC, Series 2024-A2,
Class A, 4.93%, 07/15/2030
|
|
|
|
|
|
|
|
|
Series 2023-1A, Class A2, 6.00%,
06/25/2053(b)
|
|
|
|
Series 2025-1A, Class A2, 6.15%,
04/26/2055(b)
|
|
|
|
UBS Commercial Mortgage Trust, Series 2017-
C6, Class AS, 3.93%, 12/15/2050(g)
|
|
|
|
Verus Securitization Trust, Series 2021-R3,
Class A1, 1.02%, 04/25/2064(b)(g)
|
|
|
|
WEST Trust 2025-ROSE, Series 2025-ROSE,
Class A, 5.45%, 04/10/2030(b)(g)
|
|
|
|
Ziply Fiber Issuer LLC, Series 2024-1A, Class A2,
6.64%, 04/20/2054(b)
|
|
|
|
Total Asset-Backed Securities
(Cost $1,105,249)
|
|
U.S. Treasury Securities-10.27%
|
U.S. Treasury Bills-0.37%
|
4.21%–4.27%, 05/29/2025(h)(i)
|
|
|
|
U.S. Treasury Notes-9.90%
|
|
|
|
|
|
|
|
|
|
|
|
|
|
|
|
|
|
|
|
|
Total U.S. Treasury Securities
(Cost $1,022,628)
|
|
See accompanying Notes to Financial Statements which are an integral part of the financial
statements.
Invesco Short Duration Total Return Bond ETF (GTOS)—(continued)
April 30, 2025
(Unaudited)
|
|
|
|
|
|
Municipal Obligations-0.70%
|
New Jersey (State of) Transportation Trust Fund
Authority, Series 2024 BB, Ref. RB, 5.09%,
06/15/2025
(Cost $70,000)
|
|
|
|
|
|
Agency Credit Risk Transfer Notes-0.54%
|
Fannie Mae Connecticut Avenue Securities,
Series 2023-R02, Class 1M1, 6.65% (30 Day
Average SOFR + 2.30%), 01/25/2043(b)(e)(j)
|
|
|
|
Freddie Mac, Series 2023-DNA1, Class M1,
STACR®, 6.45% (30 Day Average SOFR +
2.10%), 03/25/2043(b)(e)(k)
|
|
|
|
Total Agency Credit Risk Transfer Notes
(Cost $52,534)
|
|
|
|
|
|
|
|
Diversified Financial Services-0.29%
|
Apollo Global Management, Inc., Pfd., 7.63%,
(Cost $27,500)
|
|
|
|
|
|
Invesco Premier U.S. Government Money
Portfolio, Institutional Class, 4.26%(l)(m)
(Cost $307,132)
|
|
|
|
TOTAL INVESTMENTS IN SECURITIES
(excluding investments purchased with cash collateral from
securities on loan)-100.02%
(Cost $9,897,560)
|
|
|
|
|
|
Investments Purchased with Cash Collateral
from Securities on Loan
|
|
|
Invesco Private Government Fund, 4.32%(l)(m)(n)
|
|
|
|
Invesco Private Prime Fund, 4.46%(l)(m)(n)
|
|
|
|
Total Investments Purchased with Cash Collateral from
Securities on Loan
(Cost $310,987)
|
|
TOTAL INVESTMENTS IN SECURITIES-103.13%
(Cost $10,208,547)
|
|
OTHER ASSETS LESS LIABILITIES-(3.13)%
|
|
|
|
|
Investment Abbreviations:
|
|
|
|
|
|
|
|
|
|
|
|
-Real Estate Investment Trust
|
|
|
-Secured Overnight Financing Rate
|
|
|
-Structured Agency Credit Risk
|
See accompanying Notes to Financial Statements which are an integral part of the financial
statements.
Invesco Short Duration Total Return Bond ETF (GTOS)—(continued)
April 30, 2025
(Unaudited)
Notes to Schedule of Investments:
|
|
|
Industry and/or sector classifications used in this report are generally according
to the Global Industry Classification Standard, which was developed by and is
the exclusive property and a service mark of MSCI Inc. and Standard & Poor’s.
|
|
|
Security purchased or received in a transaction exempt from registration under the Securities Act of 1933, as amended (the “1933 Act”). The security may be
resold pursuant to an exemption from registration under the 1933 Act, typically to
qualified institutional buyers. The aggregate value of these securities at
April 30, 2025 was $3,117,705, which represented 31.24% of the Fund’s Net Assets.
|
|
|
All or a portion of this security was out on loan at April 30, 2025.
|
|
|
Security issued at a fixed rate for a specific period of time, after which it will
convert to a variable rate.
|
|
|
Interest or dividend rate is redetermined periodically. Rate shown is the rate in
effect on April 30, 2025.
|
|
|
Perpetual bond with no specified maturity date.
|
|
|
Interest rate is redetermined periodically based on the cash flows generated by the
pool of assets backing the security, less any applicable fees. The rate shown
is the rate in effect on April 30, 2025.
|
|
|
Security traded on a discount basis. The interest rate shown represents the discount
rate at the time of purchase by the Fund.
|
|
|
$33,888 was pledged as collateral to cover margin requirements for open futures contracts.
See Note 2S.
|
|
|
CAS notes are bonds issued by Fannie Mae. The amount of periodic principal and ultimate
principal paid by Fannie Mae is determined by the performance of a
large and diverse reference pool.
|
|
|
Principal payments are determined by the delinquency and principal payment experience on the STACR® reference pool. Freddie Mac transfers credit risk from
the mortgages in the reference pool to credit investors who invest in the STACR® debt notes.
|
|
|
Affiliated holding. Affiliated holdings are investments in entities which are under
common ownership or control of Invesco Ltd. or are investments in entities in
which the Fund owns 5% or more of the outstanding voting securities. The table below shows the Fund’s transactions in, and earnings from, its investments in
affiliates for the six months ended April 30, 2025.
|
|
|
|
|
|
Change in
Unrealized
Appreciation
|
|
|
|
Investments in Affiliated
Money Market Funds:
|
|
|
|
|
|
|
|
Invesco Government & Agency
Portfolio, Institutional Class
|
|
|
|
|
|
|
|
Invesco Premier
U.S. Government Money
Portfolio, Institutional Class
|
|
|
|
|
|
|
|
Investments Purchased with
Cash Collateral from Securities
on Loan:
|
|
|
|
|
|
|
|
Invesco Private Government
Fund
|
|
|
|
|
|
|
|
Invesco Private Prime Fund
|
|
|
|
|
|
|
|
|
|
|
|
|
|
|
|
|
|
|
Represents the income earned on the investment of cash collateral, which is included
in securities lending income on the Statements of Operations. Does not
include rebates and fees paid to lending agent or premiums received from borrowers,
if any.
|
|
|
The rate shown is the 7-day SEC standardized yield as of April 30, 2025.
|
|
|
The security has been segregated to satisfy the commitment to return the cash collateral received in securities lending transactions upon the borrower’s return
of the securities loaned. See Note 2P.
|
|
|
|
|
|
|
|
|
Unrealized
Appreciation
(Depreciation)
|
|
|
|
|
|
|
|
U.S. Treasury 2 Year Notes
|
|
|
|
|
|
See accompanying Notes to Financial Statements which are an integral part of the financial
statements.
Invesco Short Duration Total Return Bond ETF (GTOS)—(continued)
April 30, 2025
(Unaudited)
Open Futures Contracts—(continued)
|
|
|
|
|
|
|
Unrealized
Appreciation
(Depreciation)
|
|
|
|
|
|
|
|
U.S. Treasury 5 Year Notes
|
|
|
|
|
|
U.S. Treasury 10 Year Notes
|
|
|
|
|
|
Subtotal—Short Futures Contracts
|
|
|
|
|
|
|
|
|
|
See accompanying Notes to Financial Statements which are an integral part of the financial
statements.
Invesco SteelPath MLP & Energy Infrastructure ETF (PIPE)
April 30, 2025
(Unaudited)
|
|
|
|
Common Stocks & Other Equity Interests-70.88%(a)
|
|
|
|
|
|
|
|
Oil & Gas Equipment & Services-4.93%
|
|
|
|
|
|
Kodiak Gas Services, Inc.
|
|
|
|
|
|
|
|
|
Oil & Gas Storage & Transportation-64.00%
|
|
|
|
|
|
|
|
|
|
|
|
|
|
|
|
|
|
|
|
|
Gibson Energy, Inc. (Canada)
|
|
|
|
Hess Midstream L.P., Class A
|
|
|
|
|
|
|
|
|
|
|
|
|
|
Kinetik Holdings, Inc., Class A
|
|
|
|
|
|
|
|
|
Pembina Pipeline Corp. (Canada)
|
|
|
|
|
|
|
|
|
|
|
|
|
|
|
|
|
|
|
Williams Cos., Inc. (The)
|
|
|
|
|
|
|
|
|
Total Common Stocks & Other Equity Interests
(Cost $11,143,023)
|
|
|
|
|
|
Master Limited Partnerships &
Related Entities-28.18%
|
|
|
|
Oil & Gas Storage & Transportation-25.00%
|
|
|
|
|
|
|
|
|
|
|
|
|
|
|
|
|
|
|
Enterprise Products Partners L.P.
|
|
|
|
Western Midstream Partners L.P.
|
|
|
|
Plains GP Holdings L.P., Class A(b)
|
|
|
|
|
|
|
|
|
Oil & Gas Refining & Marketing-3.18%
|
|
|
|
|
|
|
|
|
Total Master Limited Partnerships & Related Entities
(Cost $4,554,411)
|
|
|
|
Invesco Government & Agency Portfolio,
Institutional Class, 4.26%(c)(d)
(Cost $51,175)
|
|
|
|
TOTAL INVESTMENTS IN SECURITIES-99.40%
(Cost $15,748,609)
|
|
OTHER ASSETS LESS LIABILITIES-0.60%
|
|
|
|
|
Notes to Schedule of Investments:
|
|
|
Industry and/or sector classifications used in this report are generally according
to the Global Industry Classification Standard, which was developed by and is
the exclusive property and a service mark of MSCI Inc. and Standard & Poor’s.
|
|
|
Non-income producing security.
|
|
|
Affiliated holding. Affiliated holdings are investments in entities which are under
common ownership or control of Invesco Ltd. or are investments in entities in
which the Fund owns 5% or more of the outstanding voting securities. The table below shows the Fund’s transactions in, and earnings from, its investments in
affiliates for the period ended April 30, 2025.
|
|
|
|
|
|
Change in
Unrealized
Appreciation
|
|
|
|
Investments in Affiliated
Money Market Funds:
|
|
|
|
|
|
|
|
Invesco Government & Agency
Portfolio, Institutional Class
|
|
|
|
|
|
|
|
Investments Purchased with
Cash Collateral from Securities
on Loan:
|
|
|
|
|
|
|
|
Invesco Private Government
Fund ˂˂No Caption Available˃˃
|
|
|
|
|
|
|
|
Invesco Private Prime Fund
˂˂No Caption Available˃˃
|
|
|
|
|
|
|
|
|
|
|
|
|
|
|
|
|
|
|
Represents the income earned on the investment of cash collateral, which is included
in securities lending income on the Statements of Operations. Does not
include rebates and fees paid to lending agent or premiums received from borrowers,
if any.
|
|
|
The rate shown is the 7-day SEC standardized yield as of April 30, 2025.
|
See accompanying Notes to Financial Statements which are an integral part of the financial
statements.
Invesco Top QQQ ETF (QBIG)
April 30, 2025
(Unaudited)
Schedule of Investments(a)
|
|
|
|
Common Stocks & Other Equity Interests-38.89%
|
Communication Services-7.20%
|
|
|
|
|
|
|
|
|
|
|
Meta Platforms, Inc., Class A
|
|
|
|
|
|
|
|
|
Consumer Discretionary-7.12%
|
|
|
|
|
|
|
|
|
|
|
|
|
|
|
|
Information Technology-24.57%
|
|
|
|
|
|
|
|
|
|
|
|
|
|
|
|
|
|
|
|
|
|
|
|
|
|
Total Common Stocks & Other Equity Interests
(Cost $10,101,444)
|
|
|
|
|
|
Money Market Funds-59.15%
|
Invesco Premier U.S. Government Money
Portfolio, Institutional Class, 4.26%(c)(d)
(Cost $13,448,593)
|
|
|
|
TOTAL INVESTMENTS IN SECURITIES-98.04%
(Cost $23,550,037)
|
|
OTHER ASSETS LESS LIABILITIES-1.96%
|
|
|
|
|
Notes to Schedule of Investments:
|
|
|
Industry and/or sector classifications used in this report are generally according
to the Global Industry Classification Standard, which was developed by and is
the exclusive property and a service mark of MSCI Inc. and Standard & Poor’s.
|
|
|
Non-income producing security.
|
|
|
Affiliated holding. Affiliated holdings are investments in entities which are under
common ownership or control of Invesco Ltd. or are investments in entities in
which the Fund owns 5% or more of the outstanding voting securities. The table below shows the Fund’s transactions in, and earnings from, its investments in
affiliates for the period ended April 30, 2025.
|
|
|
|
|
|
Change in
Unrealized
Appreciation
|
|
|
|
Investments in Affiliated
Money Market Funds:
|
|
|
|
|
|
|
|
Invesco Government & Agency
Portfolio, Institutional Class
|
|
|
|
|
|
|
|
Invesco Premier
U.S. Government Money
Portfolio, Institutional Class
|
|
|
|
|
|
|
|
|
|
|
|
|
|
|
|
|
|
|
The rate shown is the 7-day SEC standardized yield as of April 30, 2025.
|
Open Over-The-Counter Total Return Swap Agreements(a)
|
|
|
|
|
|
|
|
|
Upfront
Payments
Paid
(Received)
|
|
Unrealized
Appreciation
(Depreciation)
|
|
|
|
|
|
|
|
|
|
|
|
|
|
Bank of America MLQBIGG5R
Index
|
|
|
|
|
|
|
|
|
Goldman
Sachs
International
|
|
Goldman Sachs GSQBIGG5R
Index
|
|
|
|
|
|
|
|
|
See accompanying Notes to Financial Statements which are an integral part of the financial
statements.
Invesco Top QQQ ETF (QBIG)—(continued)
April 30, 2025
(Unaudited)
Open Over-The-Counter Total Return Swap Agreements(a)—(continued)
|
|
|
|
|
|
|
|
|
Upfront
Payments
Paid
(Received)
|
|
Unrealized
Appreciation
(Depreciation)
|
Morgan
Stanley
Capital
Services LLC
|
|
Morgan Stanley MSQBIGG5R
Index
|
|
|
|
|
|
|
|
|
Total Over-The-Counter Total Return Swap Agreements
|
|
|
|
|
|
|
|
|
|
|
-Secured Overnight Financing Rate
|
|
|
The Fund receives or pays payments based on any positive or negative return on the
Reference Entity, respectively.
|
|
|
Notional Value is denominated in U.S. Dollars unless otherwise noted.
|
See accompanying Notes to Financial Statements which are an integral part of the financial
statements.
Invesco Total Return Bond ETF (GTO)
April 30, 2025
(Unaudited)
Schedule of Investments(a)
|
|
|
|
U.S. Dollar Denominated Bonds & Notes-40.71%
|
Aerospace & Defense-0.57%
|
BAE Systems PLC (United Kingdom)
|
|
|
|
|
|
|
|
|
|
|
|
|
|
|
|
|
|
|
|
|
|
|
|
|
|
|
|
|
|
|
|
|
|
|
|
|
|
|
|
|
|
|
|
|
|
|
|
|
General Dynamics Corp., 4.95%,
08/15/2035
|
|
|
|
Howmet Aerospace, Inc., 4.85%,
10/15/2031
|
|
|
|
Huntington Ingalls Industries, Inc.
|
|
|
|
|
|
|
|
|
|
|
|
|
|
L3Harris Technologies, Inc., 5.40%,
07/31/2033
|
|
|
|
|
|
|
|
|
|
|
|
|
|
|
|
|
|
|
|
|
|
|
|
|
|
|
|
|
|
|
|
|
|
|
|
|
|
|
|
|
|
|
|
|
|
|
|
|
|
|
|
|
|
|
|
|
|
|
|
|
|
|
|
|
|
|
|
|
Agricultural & Farm Machinery-0.12%
|
|
|
|
|
|
|
|
|
|
|
|
|
|
|
|
CNH Industrial Capital LLC, 4.75%,
03/21/2028(c)
|
|
|
|
Deere & Co., 5.45%, 01/16/2035
|
|
|
|
|
|
|
|
|
|
|
|
|
|
|
|
|
|
|
|
|
|
|
|
Air Freight & Logistics-0.09%
|
|
|
|
|
|
|
|
|
|
|
|
|
|
|
|
United Parcel Service, Inc.
|
|
|
|
|
|
|
|
|
|
|
|
|
|
|
|
|
|
|
|
|
|
|
|
|
|
Gap, Inc. (The), 3.63%, 10/01/2029(b)
|
|
|
|
|
|
|
|
Application Software-0.16%
|
Cadence Design Systems, Inc., 4.70%,
09/10/2034(c)
|
|
|
|
Intuit, Inc., 5.20%, 09/15/2033
|
|
|
|
|
|
|
|
|
|
|
|
|
|
|
|
|
|
|
|
|
|
|
|
|
|
|
|
|
|
|
|
|
|
|
|
|
|
|
Synopsys, Inc., 5.70%, 04/01/2055
|
|
|
|
|
|
|
|
|
Asset Management & Custody Banks-0.91%
|
Affiliated Managers Group, Inc., 5.50%,
08/20/2034
|
|
|
|
Ameriprise Financial, Inc.
|
|
|
|
|
|
|
|
|
|
|
|
|
|
|
|
|
|
|
Bank of New York Mellon Corp. (The)
|
|
|
|
|
|
|
|
|
|
|
|
|
|
|
|
|
|
|
|
|
|
|
|
|
|
|
|
|
|
|
|
|
|
Series J, 4.97%, 04/26/2034(d)
|
|
|
|
Blackstone Secured Lending Fund
|
|
|
|
|
|
|
|
|
|
|
|
|
|
Brookfield Asset Management Ltd.
(Canada), 5.80%, 04/24/2035
|
|
|
|
|
|
|
|
|
|
|
|
|
|
|
|
|
|
|
Northern Trust Corp., 6.13%,
11/02/2032
|
|
|
|
|
|
|
|
|
5.33% (SOFR + 0.95%), 04/24/2028(f)
|
|
|
|
|
|
|
|
|
|
|
|
|
|
|
|
|
|
|
|
|
|
|
|
|
|
|
|
|
|
|
|
|
|
Automobile Manufacturers-1.33%
|
American Honda Finance Corp.
|
|
|
|
5.09% (SOFR + 0.71%), 01/09/2026(f)
|
|
|
|
|
|
|
|
|
Daimler Truck Finance North America LLC
(Germany)
|
|
|
|
|
|
|
|
|
|
|
|
|
|
|
|
|
|
|
See accompanying Notes to Financial Statements which are an integral part of the financial
statements.
Invesco Total Return Bond ETF (GTO)—(continued)
April 30, 2025
(Unaudited)
|
|
|
|
Automobile Manufacturers-(continued)
|
Ford Motor Credit Co. LLC
|
|
|
|
|
|
|
|
|
|
|
|
|
|
|
|
|
|
|
|
|
|
|
|
|
|
|
|
|
|
|
|
|
|
|
|
|
|
|
|
|
|
|
|
|
|
|
|
|
|
|
|
|
|
|
|
|
|
|
|
|
|
|
|
|
|
|
|
|
|
|
|
|
|
Hyundai Capital Services, Inc. (South
Korea), 5.25%, 01/22/2028(b)(c)
|
|
|
|
Mercedes-Benz Finance North America LLC
(Germany)
|
|
|
|
|
|
|
|
|
|
|
|
|
|
|
|
|
|
|
|
|
|
|
|
|
|
|
|
|
PACCAR Financial Corp., 4.00%,
09/26/2029
|
|
|
|
Toyota Motor Credit Corp.
|
|
|
|
|
|
|
|
|
|
|
|
|
|
Volkswagen Group of America Finance LLC
(Germany)
|
|
|
|
|
|
|
|
|
|
|
|
|
|
|
|
|
|
|
|
|
|
|
|
|
|
|
|
|
Automotive Parts & Equipment-0.49%
|
Clarios Global L.P./Clarios US Finance Co.,
6.75%, 02/15/2030(b)(c)
|
|
|
|
|
|
|
|
|
|
|
|
|
|
|
|
|
|
|
PHINIA, Inc., 6.75%, 04/15/2029(b)
|
|
|
|
ZF North America Capital, Inc. (Germany)
|
|
|
|
|
|
|
|
|
|
|
|
|
|
|
|
|
|
|
|
|
|
|
|
|
|
|
|
|
|
|
AutoZone, Inc., 5.20%, 08/01/2033
|
|
|
|
O’Reilly Automotive, Inc., 5.00%,
08/19/2034
|
|
|
|
|
|
|
|
|
|
|
|
|
|
|
|
|
|
|
|
|
|
|
|
|
|
|
|
|
|
|
|
|
|
|
|
|
|
|
|
|
|
|
|
|
|
|
|
|
|
|
|
|
|
|
|
|
|
|
|
|
|
|
|
|
|
|
|
|
|
|
|
|
|
|
|
|
|
|
|
|
|
|
|
|
|
|
|
|
|
|
|
|
|
|
|
|
|
|
El Puerto de Liverpool S.A.B. de C.V.
(Mexico), 6.66%, 01/22/2037(b)
|
|
|
|
|
|
Carrier Global Corp., 5.90%, 03/15/2034
|
|
|
|
Holcim Finance US LLC (Switzerland)
|
|
|
|
|
|
|
|
|
|
|
|
|
|
|
|
|
|
|
|
|
|
|
|
|
|
|
|
|
|
|
|
|
|
|
|
|
|
|
Lennox International, Inc., 5.50%,
09/15/2028
|
|
|
|
|
|
|
|
|
|
|
CCO Holdings LLC/CCO Holdings Capital
Corp.
|
|
|
|
|
|
|
|
|
|
|
|
|
|
Charter Communications Operating LLC/
Charter Communications Operating
Capital Corp., 6.65%, 02/01/2034
|
|
|
|
Comcast Corp., 5.50%, 11/15/2032
|
|
|
|
Cox Communications, Inc., 5.70%,
06/15/2033(b)
|
|
|
|
|
|
|
|
|
Cargo Ground Transportation-0.17%
|
Penske Truck Leasing Co. L.P./PTL Finance
Corp.
|
|
|
|
|
|
|
|
|
|
|
|
|
|
|
|
|
|
|
|
|
|
|
|
|
|
|
|
|
|
|
|
|
|
See accompanying Notes to Financial Statements which are an integral part of the financial
statements.
Invesco Total Return Bond ETF (GTO)—(continued)
April 30, 2025
(Unaudited)
|
|
|
|
Cargo Ground Transportation-(continued)
|
|
|
|
|
|
|
|
|
|
|
|
|
|
|
|
|
|
|
|
|
Commercial & Residential Mortgage Finance-0.06%
|
Aviation Capital Group LLC
|
|
|
|
|
|
|
|
|
|
|
|
|
|
Nationwide Building Society (United
Kingdom), 6.56%, 10/18/2027(b)(d)
|
|
|
|
Radian Group, Inc., 6.20%, 05/15/2029
|
|
|
|
|
|
|
|
|
Computer & Electronics Retail-0.00%
|
Leidos, Inc., 5.75%, 03/15/2033
|
|
|
|
Construction Machinery & Heavy Transportation Equipment-0.01%
|
Northriver Midstream Finance L.P.
(Canada), 6.75%, 07/15/2032(b)
|
|
|
|
Consumer Electronics-0.08%
|
LG Electronics, Inc. (South Korea), 5.63%,
04/24/2029(b)(c)
|
|
|
|
Sensata Technologies B.V., 4.00%,
04/15/2029(b)(c)
|
|
|
|
|
|
|
|
|
|
|
|
|
|
|
|
|
|
|
|
|
|
|
|
|
|
5.64% (SOFR + 1.26%),
04/25/2029(c)(f)
|
|
|
|
|
|
|
|
|
|
|
|
|
|
|
|
|
|
|
|
|
|
|
|
Capital One Financial Corp., 7.15%,
10/29/2027(d)
|
|
|
|
|
|
|
|
|
|
|
|
|
|
|
|
|
|
|
General Motors Financial Co., Inc., 5.40%,
04/06/2026
|
|
|
|
|
|
|
|
|
Consumer Staples Merchandise Retail-0.26%
|
Dollar General Corp., 5.50%, 11/01/2052
|
|
|
|
Target Corp., 5.00%, 04/15/2035
|
|
|
|
Walmart, Inc., 4.90%, 04/28/2035
|
|
|
|
|
|
|
|
|
Distillers & Vintners-0.00%
|
Constellation Brands, Inc., 4.90%,
05/01/2033
|
|
|
|
|
|
|
|
|
|
|
|
|
|
|
|
|
|
|
|
|
|
|
|
|
|
|
|
|
|
|
|
|
|
|
|
|
Africa Finance Corp. (Supranational)
|
|
|
|
|
|
|
|
|
|
|
|
|
|
Australia and New Zealand Banking Group
Ltd. (Australia)
|
|
|
|
|
|
|
|
|
|
|
|
|
|
|
|
|
|
|
Banco Bilbao Vizcaya Argentaria S.A.
(Spain), 9.38%(d)(e)
|
|
|
|
Banco Santander S.A. (Spain)
|
|
|
|
|
|
|
|
|
|
|
|
|
|
|
|
|
|
|
|
|
|
|
|
5.43% (SOFR + 1.05%), 02/04/2028(f)
|
|
|
|
|
|
|
|
|
|
|
|
|
|
5.21% (SOFR + 0.83%),
01/24/2029(c)(f)
|
|
|
|
|
|
|
|
|
|
|
|
|
|
5.39% (SOFR + 1.01%), 01/24/2031(f)
|
|
|
|
|
|
|
|
|
|
|
|
|
|
|
|
|
|
|
Bank of Montreal (Canada)
|
|
|
|
|
|
|
|
|
|
|
|
|
|
|
|
|
|
|
Bank of New York Mellon (The)
|
|
|
|
|
|
|
|
|
5.09% (SOFR + 0.71%), 04/20/2027(f)
|
|
|
|
Bank of New Zealand (New Zealand),
5.70%, 01/28/2035(b)(d)
|
|
|
|
Bank of Nova Scotia (The) (Canada)
|
|
|
|
|
|
|
|
|
|
|
|
|
|
Barclays PLC (United Kingdom)
|
|
|
|
|
|
|
|
|
|
|
|
|
|
BBVA Mexico, S.A., Institucion de Banca
Multiple, Grupo Financiero BBVA Mexico
(Mexico), 8.13%, 01/08/2039(b)(d)
|
|
|
|
BNP Paribas S.A. (France)
|
|
|
|
|
|
|
|
|
5.84% (SOFR + 1.43%),
05/09/2029(b)(f)
|
|
|
|
|
|
|
|
|
|
|
|
|
|
|
|
|
|
|
6.92%, 01/14/2046(b)(c)(d)
|
|
|
|
Canadian Imperial Bank of Commerce
(Canada), 6.95%, 01/28/2085(d)
|
|
|
|
Citibank N.A., 4.93%, 08/06/2026
|
|
|
|
See accompanying Notes to Financial Statements which are an integral part of the financial
statements.
Invesco Total Return Bond ETF (GTO)—(continued)
April 30, 2025
(Unaudited)
|
|
|
|
Diversified Banks-(continued)
|
|
|
|
|
|
|
|
|
|
|
|
|
|
|
|
|
|
|
|
|
|
|
|
|
|
|
|
|
|
|
|
|
|
|
|
Series AA, 7.63%(c)(d)(e)
|
|
|
|
|
|
|
|
|
Series DD, 7.00%(c)(d)(e)
|
|
|
|
|
|
|
|
|
|
|
|
|
|
Comerica, Inc., 5.98%, 01/30/2030(d)
|
|
|
|
Cooperatieve Rabobank U.A.
(Netherlands), 3.65%,
04/06/2028(b)(c)(d)
|
|
|
|
Corporacion Financiera de Desarrollo S.A.
(Peru), 5.95%, 04/30/2029(b)(c)
|
|
|
|
Federation des caisses Desjardins du
Quebec (Canada), 4.55%,
08/23/2027(b)
|
|
|
|
|
|
|
|
|
|
|
|
|
|
|
|
|
|
|
|
|
|
|
|
|
|
|
|
|
Goldman Sachs Bank USA, 5.28%,
03/18/2027(d)
|
|
|
|
HSBC Holdings PLC (United Kingdom)
|
|
|
|
|
|
|
|
|
|
|
|
|
|
|
|
|
|
|
|
|
|
|
|
|
|
|
|
|
|
|
|
|
|
|
|
|
|
|
|
|
|
|
|
ING Groep N.V. (Netherlands), 5.34%,
03/19/2030(c)(d)
|
|
|
|
|
|
|
|
|
|
|
|
|
|
|
|
|
|
|
|
|
|
|
|
|
|
|
|
|
|
|
|
|
|
|
|
|
|
|
|
|
|
|
|
|
|
|
|
|
|
|
|
|
|
|
|
|
|
|
|
|
|
|
|
|
|
|
|
|
|
|
|
|
|
|
|
|
|
|
|
|
|
|
|
|
|
|
|
|
|
|
|
|
|
|
|
|
|
Diversified Banks-(continued)
|
|
|
|
|
|
|
|
|
|
|
|
|
|
|
|
|
|
|
|
|
KeyCorp, 2.55%, 10/01/2029
|
|
|
|
Manufacturers & Traders Trust Co., 4.70%,
01/27/2028
|
|
|
|
Mitsubishi UFJ Financial Group, Inc.
(Japan)
|
|
|
|
|
|
|
|
|
|
|
|
|
|
|
|
|
|
|
5.86% (SOFR + 1.48%),
04/24/2031(c)(f)
|
|
|
|
|
|
|
|
|
|
|
|
|
|
|
|
|
|
|
|
|
|
|
|
|
|
|
|
|
Mizuho Financial Group, Inc. (Japan)
|
|
|
|
|
|
|
|
|
|
|
|
|
|
|
|
|
|
|
|
|
|
|
|
|
|
|
|
|
|
|
|
|
|
|
|
|
|
|
National Australia Bank Ltd. (Australia),
5.90%, 01/14/2036(b)(c)(d)
|
|
|
|
National Securities Clearing Corp.
|
|
|
|
|
|
|
|
|
|
|
|
|
|
Nordea Bank Abp (Finland), 6.30%(b)(d)(e)
|
|
|
|
Norinchukin Bank (The) (Japan), 5.09%,
10/16/2029(b)
|
|
|
|
PNC Financial Services Group, Inc. (The)
|
|
|
|
|
|
|
|
|
|
|
|
|
|
|
|
|
|
|
|
|
|
|
|
|
|
|
|
|
|
|
|
|
|
|
|
|
|
|
Royal Bank of Canada (Canada)
|
|
|
|
5.09% (SOFR + 0.71%), 01/21/2027(f)
|
|
|
|
|
|
|
|
|
|
|
|
|
|
|
|
|
|
|
Standard Chartered PLC (United Kingdom)
|
|
|
|
|
|
|
|
|
6.75%, 02/08/2028(b)(c)(d)
|
|
|
|
7.02%, 02/08/2030(b)(c)(d)
|
|
|
|
5.01%, 10/15/2030(b)(c)(d)
|
|
|
|
|
|
|
|
|
|
|
|
|
|
Sumitomo Mitsui Financial Group, Inc.
(Japan), 6.60%(c)(d)(e)
|
|
|
|
See accompanying Notes to Financial Statements which are an integral part of the financial
statements.
Invesco Total Return Bond ETF (GTO)—(continued)
April 30, 2025
(Unaudited)
|
|
|
|
Diversified Banks-(continued)
|
Sumitomo Mitsui Trust Bank Ltd. (Japan)
|
|
|
|
|
|
|
|
|
|
|
|
|
|
|
|
|
|
|
|
|
|
|
|
|
|
|
|
|
Synovus Bank, 5.63%, 02/15/2028
|
|
|
|
Toronto-Dominion Bank (The) (Canada)
|
|
|
|
|
|
|
|
|
|
|
|
|
|
|
|
|
|
|
|
|
|
|
|
|
|
|
|
|
|
|
|
|
|
UBS AG (Switzerland), 5.65%,
09/11/2028
|
|
|
|
|
|
|
|
|
|
|
|
|
|
|
|
|
|
|
5.75% (SOFR + 1.37%), 04/23/2029(f)
|
|
|
|
|
|
|
|
|
|
|
|
|
|
|
|
|
|
|
|
|
|
|
|
|
|
|
|
|
|
|
|
|
|
|
|
|
|
|
|
|
|
|
|
|
|
|
|
|
|
|
|
|
|
|
|
|
|
|
Westpac Banking Corp. (Australia)
|
|
|
|
|
|
|
|
|
|
|
|
|
|
|
|
|
|
|
Diversified Capital Markets-0.26%
|
Ares Strategic Income Fund, 5.70%,
03/15/2028(b)(c)
|
|
|
|
Credit Suisse Group AG (Switzerland)
|
|
|
|
|
|
|
|
|
|
|
|
|
|
UBS Group AG (Switzerland)
|
|
|
|
5.71%, 01/12/2027(b)(c)(d)
|
|
|
|
|
|
|
|
|
|
|
|
|
|
Series 28, 9.25%(b)(d)(e)
|
|
|
|
Series 33, 9.25%(b)(d)(e)
|
|
|
|
|
|
|
|
|
Diversified Chemicals-0.05%
|
Sasol Financing USA LLC (South Africa),
8.75%, 05/03/2029(b)
|
|
|
|
Diversified Financial Services-1.40%
|
AerCap Ireland Capital DAC/AerCap Global
Aviation Trust (Ireland)
|
|
|
|
|
|
|
|
|
|
|
|
|
|
|
|
|
|
Diversified Financial Services-(continued)
|
AMC East Communities LLC, 6.01%,
01/15/2053(b)
|
|
|
|
Apollo Global Management, Inc., 6.38%,
11/15/2033
|
|
|
|
Avolon Holdings Funding Ltd. (Ireland)
|
|
|
|
|
|
|
|
|
|
|
|
|
|
BlackRock Funding, Inc., 4.90%,
01/08/2035
|
|
|
|
Corebridge Financial, Inc.
|
|
|
|
|
|
|
|
|
|
|
|
|
|
Gabon Blue Bond Master Trust (Gabon),
Series 2, 6.10%, 08/01/2038(b)
|
|
|
|
Horizon Mutual Holdings, Inc., 6.20%,
11/15/2034(b)
|
|
|
|
Jane Street Group/JSG Finance, Inc.
|
|
|
|
|
|
|
|
|
|
|
|
|
|
|
|
|
|
|
|
|
|
|
|
|
|
|
|
|
|
|
|
|
|
|
|
|
|
|
|
|
|
|
|
Mid-Atlantic Military Family
Communities LLC, 5.30%,
08/01/2050(b)
|
|
|
|
OPEC Fund for International Development
(The) (Supranational), 4.50%,
01/26/2026(b)
|
|
|
|
|
|
|
|
|
|
|
|
|
|
|
|
|
|
|
Pershing Square Holdings Ltd., 3.25%,
10/01/2031(b)
|
|
|
|
|
|
|
|
|
Diversified Metals & Mining-0.92%
|
BHP Billiton Finance (USA) Ltd. (Australia)
|
|
|
|
|
|
|
|
|
|
|
|
|
|
|
|
|
|
|
Corporacion Nacional del Cobre de Chile
(Chile), 5.13%, 02/02/2033(b)
|
|
|
|
Glencore Funding LLC (Australia)
|
|
|
|
5.44% (SOFR + 1.06%),
04/04/2027(b)(f)
|
|
|
|
|
|
|
|
|
|
|
|
|
|
|
|
|
|
|
|
|
|
|
|
|
|
|
|
|
|
|
|
|
|
|
|
|
|
|
Hudbay Minerals, Inc. (Canada), 6.13%,
04/01/2029(b)
|
|
|
|
See accompanying Notes to Financial Statements which are an integral part of the financial
statements.
Invesco Total Return Bond ETF (GTO)—(continued)
April 30, 2025
(Unaudited)
|
|
|
|
Diversified Metals & Mining-(continued)
|
Rio Tinto Finance (USA) PLC (Australia)
|
|
|
|
|
|
|
|
|
|
|
|
|
|
|
|
|
|
|
|
|
|
|
|
|
|
|
|
|
|
|
|
|
|
|
|
|
|
|
|
|
|
|
|
|
|
Fort Moore Family Communities LLC,
5.81%, 01/15/2051(b)
|
|
|
|
|
|
|
|
|
|
|
|
|
|
|
|
|
|
|
|
|
|
|
|
Diversified Support Services-0.16%
|
Element Fleet Management Corp. (Canada)
|
|
|
|
|
|
|
|
|
|
|
|
|
|
RB Global Holdings, Inc. (Canada)
|
|
|
|
|
|
|
|
|
|
|
|
|
|
|
|
|
|
|
|
|
CK Hutchison International (23) Ltd.
(United Kingdom), 4.88%,
04/21/2033(b)
|
|
|
|
|
|
Alabama Power Co., 5.85%, 11/15/2033
|
|
|
|
Alexander Funding Trust II, 7.47%,
07/31/2028(b)
|
|
|
|
American Electric Power Co., Inc.
|
|
|
|
|
|
|
|
|
|
|
|
|
|
CenterPoint Energy Houston Electric LLC
|
|
|
|
|
|
|
|
|
|
|
|
|
|
|
|
|
|
|
Series AJ, 4.85%, 10/01/2052
|
|
|
|
Chile Electricity Lux MPC II S.a.r.l. (Chile),
5.58%, 10/20/2035(b)
|
|
|
|
Consolidated Edison Co. of New York, Inc.
|
|
|
|
|
|
|
|
|
|
|
|
|
|
Constellation Energy Generation LLC
|
|
|
|
|
|
|
|
|
|
|
|
|
|
|
|
|
|
|
Duke Energy Carolinas LLC
|
|
|
|
|
|
|
|
|
|
|
|
|
|
|
|
|
|
|
|
|
|
|
|
|
|
|
|
|
|
|
|
|
|
|
|
|
|
Electric Utilities-(continued)
|
Duke Energy Indiana LLC, 5.40%,
04/01/2053
|
|
|
|
Electricite de France S.A. (France)
|
|
|
|
|
|
|
|
|
|
|
|
|
|
|
|
|
|
|
Enel Finance International N.V. (Italy),
7.05%, 10/14/2025(b)
|
|
|
|
Entergy Corp., 7.13%, 12/01/2054(d)
|
|
|
|
|
|
|
|
|
|
|
|
|
|
|
|
|
|
|
|
|
|
|
|
|
|
|
|
|
|
|
|
|
|
Evergy Metro, Inc., 4.95%, 04/15/2033
|
|
|
|
|
|
|
|
|
|
|
|
|
|
|
|
|
|
|
|
|
|
|
|
|
|
|
|
|
|
|
|
|
|
FirstEnergy Pennsylvania Electric Co.,
5.20%, 04/01/2028(b)
|
|
|
|
FirstEnergy Transmission LLC
|
|
|
|
|
|
|
|
|
|
|
|
|
|
Florida Power & Light Co., 4.80%,
05/15/2033
|
|
|
|
Georgia Power Co., 4.95%, 05/17/2033
|
|
|
|
|
|
|
|
|
|
|
|
|
|
|
|
|
|
|
|
|
|
|
|
National Rural Utilities Cooperative Finance
Corp.
|
|
|
|
|
|
|
|
|
|
|
|
|
|
|
|
|
|
|
|
|
|
|
|
|
|
|
|
|
NextEra Energy Capital Holdings, Inc.
|
|
|
|
|
|
|
|
|
|
|
|
|
|
|
|
|
|
|
|
|
|
|
|
|
|
|
|
|
Niagara Mohawk Power Corp., 5.29%,
01/17/2034(b)
|
|
|
|
Northern States Power Co.
|
|
|
|
|
|
|
|
|
|
|
|
|
|
Oglethorpe Power Corp., 5.90%,
02/01/2055(b)
|
|
|
|
Ohio Power Co., 5.65%, 06/01/2034
|
|
|
|
Oklahoma Gas and Electric Co., 5.60%,
04/01/2053(c)
|
|
|
|
See accompanying Notes to Financial Statements which are an integral part of the financial
statements.
Invesco Total Return Bond ETF (GTO)—(continued)
April 30, 2025
(Unaudited)
|
|
|
|
Electric Utilities-(continued)
|
Oncor Electric Delivery Co. LLC
|
|
|
|
|
|
|
|
|
|
|
|
|
|
|
|
|
|
|
|
|
|
|
|
Pacific Gas and Electric Co.
|
|
|
|
|
|
|
|
|
|
|
|
|
|
|
|
|
|
|
|
|
|
|
|
|
|
|
|
|
|
|
|
|
|
|
|
|
|
|
PPL Capital Funding, Inc., 5.25%,
09/01/2034
|
|
|
|
Public Service Co. of Colorado, 5.25%,
04/01/2053
|
|
|
|
Public Service Co. of New Hampshire,
5.35%, 10/01/2033
|
|
|
|
San Diego Gas & Electric Co.
|
|
|
|
|
|
|
|
|
|
|
|
|
|
Sierra Pacific Power Co., 5.90%,
03/15/2054
|
|
|
|
|
|
|
|
|
|
|
|
|
|
|
|
|
|
|
Series B, 4.00%, 01/15/2051(d)
|
|
|
|
Southwestern Electric Power Co., 5.30%,
04/01/2033
|
|
|
|
Trans-Allegheny Interstate Line Co.,
5.00%, 01/15/2031(b)
|
|
|
|
|
|
|
|
|
|
|
|
|
|
|
|
|
|
|
|
|
|
|
|
Virginia Electric & Power Co., 5.00%,
04/01/2033
|
|
|
|
Vistra Operations Co. LLC
|
|
|
|
|
|
|
|
|
|
|
|
|
|
|
|
|
|
|
|
|
|
|
|
|
|
|
|
|
|
|
|
|
|
|
|
|
|
|
Xcel Energy, Inc., 4.75%, 03/21/2028
|
|
|
|
|
|
|
|
|
Electrical Components & Equipment-0.28%
|
EnerSys, 4.38%, 12/15/2027(b)
|
|
|
|
|
|
|
|
|
|
|
|
|
|
|
|
|
|
|
|
|
|
|
|
|
|
|
|
Electronic Components-0.05%
|
|
|
|
|
|
|
|
|
|
|
|
|
|
|
|
|
|
|
|
|
Electronic Equipment & Instruments-0.09%
|
Keysight Technologies, Inc., 5.35%,
07/30/2030
|
|
|
|
Electronic Manufacturing Services-0.03%
|
EMRLD Borrower L.P./Emerald Co-Issuer,
Inc., 6.63%, 12/15/2030(b)
|
|
|
|
Environmental & Facilities Services-0.10%
|
|
|
|
|
|
|
|
|
|
|
|
|
|
|
|
|
|
|
|
|
|
|
|
|
|
|
|
|
|
|
|
|
|
|
|
Waste Management, Inc., 5.35%,
10/15/2054(c)
|
|
|
|
|
|
|
|
|
Financial Exchanges & Data-0.01%
|
Intercontinental Exchange, Inc.
|
|
|
|
|
|
|
|
|
|
|
|
|
|
|
|
|
|
|
|
|
|
|
|
|
|
|
|
|
|
|
|
|
|
|
|
|
|
|
|
|
|
|
|
|
|
Sysco Corp., 5.10%, 09/23/2030
|
|
|
|
|
|
|
|
|
|
|
|
|
|
|
|
|
|
|
|
|
|
|
|
|
|
|
|
|
|
|
|
|
|
|
|
|
|
|
|
|
|
|
|
|
|
|
|
Piedmont Natural Gas Co., Inc., 5.40%,
06/15/2033
|
|
|
|
Southwest Gas Corp., 5.45%, 03/23/2028
|
|
|
|
Venture Global Plaquemines LNG LLC
|
|
|
|
|
|
|
|
|
|
|
|
|
|
|
|
|
|
|
|
|
New Gold, Inc. (Canada), 6.88%,
04/01/2032(b)
|
|
|
|
Health Care Distributors-0.04%
|
Cardinal Health, Inc., 5.45%, 02/15/2034
|
|
|
|
See accompanying Notes to Financial Statements which are an integral part of the financial
statements.
Invesco Total Return Bond ETF (GTO)—(continued)
April 30, 2025
(Unaudited)
|
|
|
|
Health Care Distributors-(continued)
|
Cencora, Inc., 5.13%, 02/15/2034
|
|
|
|
McKesson Corp., 4.25%, 09/15/2029(c)
|
|
|
|
|
|
|
|
|
Health Care Equipment-0.28%
|
Smith & Nephew PLC (United Kingdom)
|
|
|
|
|
|
|
|
|
|
|
|
|
|
|
|
|
|
|
|
|
|
|
|
|
|
|
|
|
|
|
|
|
|
|
|
|
|
|
|
|
|
|
|
Health Care Facilities-0.24%
|
Adventist Health System, 5.76%,
12/01/2034
|
|
|
|
|
|
|
|
|
|
|
|
|
|
|
|
|
|
|
|
|
|
|
|
|
|
|
|
|
|
|
|
|
|
Universal Health Services, Inc.
|
|
|
|
|
|
|
|
|
|
|
|
|
|
|
|
|
|
|
|
|
|
|
|
|
|
|
|
|
|
|
|
|
|
|
|
Alexandria Real Estate Equities, Inc.
|
|
|
|
|
|
|
|
|
|
|
|
|
|
|
|
|
|
|
Health Care Services-0.87%
|
|
|
|
|
|
|
|
|
|
|
|
|
|
|
|
|
|
|
|
|
|
|
|
|
|
|
|
|
|
|
|
|
|
|
|
|
|
|
|
|
|
|
|
|
|
DaVita, Inc., 6.88%, 09/01/2032(b)
|
|
|
|
|
|
|
|
|
|
|
|
|
|
|
|
|
|
|
|
|
|
|
|
Laboratory Corp. of America Holdings,
4.35%, 04/01/2030
|
|
|
|
Piedmont Healthcare, Inc., 2.86%,
01/01/2052
|
|
|
|
Quest Diagnostics, Inc., 6.40%,
11/30/2033
|
|
|
|
|
|
|
|
|
|
|
|
|
Health Care Supplies-0.05%
|
|
|
|
|
|
|
|
|
|
|
|
|
|
|
|
|
|
|
|
|
|
|
|
|
|
Highways & Railtracks-0.02%
|
TransJamaican Highway Ltd. (Jamaica),
5.75%, 10/10/2036(b)
|
|
|
|
Home Improvement Retail-0.05%
|
Americold Realty Operating Partnership
L.P., 5.41%, 09/12/2034(c)
|
|
|
|
Home Depot, Inc. (The), 4.90%,
04/15/2029
|
|
|
|
|
|
|
|
|
|
|
|
|
|
|
|
|
|
|
|
|
|
|
|
|
|
D.R. Horton, Inc., 5.00%, 10/15/2034
|
|
|
|
Hotel & Resort REITs-0.03%
|
Phillips Edison Grocery Center Operating
Partnership I L.P.
|
|
|
|
|
|
|
|
|
|
|
|
|
|
|
|
|
|
|
Hotels, Resorts & Cruise Lines-0.31%
|
|
|
|
|
|
|
|
|
|
|
|
|
|
|
|
|
|
|
|
|
Expedia Group, Inc., 5.40%, 02/15/2035
|
|
|
|
Hilton Domestic Operating Co., Inc.
|
|
|
|
|
|
|
|
|
|
|
|
|
|
Marriott International, Inc.
|
|
|
|
|
|
|
|
|
|
|
|
|
|
|
|
|
|
|
|
|
|
|
|
Royal Caribbean Cruises Ltd.
|
|
|
|
|
|
|
|
|
|
|
|
|
|
|
|
|
|
|
Human Resource & Employment Services-0.08%
|
|
|
|
|
|
|
|
|
|
|
|
|
|
|
|
|
|
|
|
|
Independent Power Producers & Energy Traders-0.35%
|
|
|
|
|
|
|
|
|
|
|
|
|
|
|
|
FIEMEX Energia - Banco Actinver S.A.
Institucion de Banca Multiple (Mexico),
7.25%, 01/31/2041(b)
|
|
|
|
See accompanying Notes to Financial Statements which are an integral part of the financial
statements.
Invesco Total Return Bond ETF (GTO)—(continued)
April 30, 2025
(Unaudited)
|
|
|
|
Independent Power Producers & Energy Traders-(continued)
|
|
|
|
|
|
|
|
|
|
|
|
|
|
|
|
|
|
|
|
|
Industrial Conglomerates-0.06%
|
Honeywell International, Inc.
|
|
|
|
|
|
|
|
|
|
|
|
|
|
|
|
|
|
|
|
|
|
|
|
|
|
|
|
|
Industrial Machinery & Supplies & Components-0.07%
|
|
|
|
|
|
|
|
|
|
|
|
|
|
|
|
|
|
|
|
|
|
|
|
|
|
|
|
|
|
|
nVent Finance S.a.r.l. (United Kingdom),
5.65%, 05/15/2033
|
|
|
|
Weir Group, Inc. (United Kingdom), 5.35%,
05/06/2030(b)
|
|
|
|
|
|
|
|
|
|
|
LXP Industrial Trust, 6.75%, 11/15/2028
|
|
|
|
|
|
Arthur J. Gallagher & Co.
|
|
|
|
|
|
|
|
|
|
|
|
|
|
|
|
|
|
|
|
|
|
|
|
AssuredPartners, Inc., 7.50%,
02/15/2032(b)
|
|
|
|
Marsh & McLennan Cos., Inc.
|
|
|
|
|
|
|
|
|
|
|
|
|
|
|
|
|
|
|
|
|
|
|
|
Integrated Oil & Gas-0.57%
|
BP Capital Markets PLC, 6.13%(c)(d)(e)
|
|
|
|
Ecopetrol S.A. (Colombia)
|
|
|
|
|
|
|
|
|
|
|
|
|
|
Eni S.p.A. (Italy), 5.50%, 05/15/2034(b)(c)
|
|
|
|
Occidental Petroleum Corp.
|
|
|
|
|
|
|
|
|
|
|
|
|
|
|
|
|
|
|
|
|
|
|
|
|
|
|
|
|
|
|
|
|
|
|
|
|
|
|
|
|
|
|
Integrated Telecommunication Services-0.49%
|
|
|
|
|
|
|
|
|
|
|
|
|
|
|
|
British Telecommunications PLC (United
Kingdom), 4.25%, 11/23/2081(b)(c)(d)
|
|
|
|
Iliad Holding S.A.S.U. (France), 8.50%,
04/15/2031(b)
|
|
|
|
|
|
|
|
|
|
|
|
|
|
|
|
|
|
|
|
|
|
|
|
Verizon Communications, Inc., 5.25%,
04/02/2035
|
|
|
|
Zegona Finance PLC (United Kingdom),
8.63%, 07/15/2029(b)
|
|
|
|
|
|
|
|
|
Interactive Media & Services-0.37%
|
|
|
|
|
|
|
|
|
|
|
|
|
|
|
|
|
|
|
|
|
|
|
|
|
|
|
|
|
|
|
|
|
|
|
|
|
|
|
|
|
|
|
|
|
|
|
|
|
|
|
|
|
|
|
|
Investment Banking & Brokerage-2.18%
|
Brookfield Finance, Inc. (Canada), 5.97%,
03/04/2054
|
|
|
|
Charles Schwab Corp. (The)
|
|
|
|
|
|
|
|
|
|
|
|
|
|
|
|
|
|
|
Goldman Sachs Group, Inc. (The)
|
|
|
|
5.16% (SOFR + 0.79%), 12/09/2026(f)
|
|
|
|
5.67% (SOFR + 1.29%), 04/23/2028(f)
|
|
|
|
|
|
|
|
|
|
|
|
|
|
|
|
|
|
|
|
|
|
|
|
|
|
|
|
|
|
|
|
|
|
|
|
|
|
|
|
|
|
|
|
|
|
|
|
|
|
|
|
|
|
|
|
|
|
|
|
|
|
|
|
|
|
|
|
|
See accompanying Notes to Financial Statements which are an integral part of the financial
statements.
Invesco Total Return Bond ETF (GTO)—(continued)
April 30, 2025
(Unaudited)
|
|
|
|
Investment Banking & Brokerage-(continued)
|
|
|
|
|
|
|
|
|
|
|
|
|
|
|
|
|
|
|
|
|
|
|
|
|
|
|
|
|
|
|
|
|
|
|
|
|
|
|
|
|
|
|
|
|
|
|
|
|
|
|
|
|
|
|
|
|
|
|
|
|
|
|
|
|
|
|
|
|
|
|
|
|
|
|
|
|
|
|
|
|
|
|
|
|
|
|
|
|
|
|
|
|
|
|
|
|
|
|
|
|
IT Consulting & Other Services-0.70%
|
International Business Machines Corp.
|
|
|
|
|
|
|
|
|
|
|
|
|
|
|
|
|
|
|
|
|
|
|
|
|
|
Brunswick Corp., 5.85%, 03/18/2029
|
|
|
|
Life & Health Insurance-1.55%
|
200 Park Funding Trust, 5.74%,
02/15/2055(b)(c)
|
|
|
|
AIA Group Ltd. (Hong Kong)
|
|
|
|
|
|
|
|
|
|
|
|
|
|
|
|
|
|
|
Amazon Conservation DAC (Ecuador),
6.03%, 01/16/2042(b)
|
|
|
|
American National Global Funding, 5.55%,
01/28/2030(b)
|
|
|
|
Athene Global Funding, 5.58%,
01/09/2029(b)
|
|
|
|
Athene Holding Ltd., 6.25%, 04/01/2054
|
|
|
|
Corebridge Global Funding
|
|
|
|
|
|
|
|
|
|
|
|
|
|
|
|
|
|
|
Dai-ichi Life Insurance Co. Ltd. (The)
(Japan), 6.20%(b)(d)(e)
|
|
|
|
Delaware Life Global Funding, Series 21-1,
2.66%, 06/29/2026(b)
|
|
|
|
F&G Annuities & Life, Inc., 7.40%,
01/13/2028
|
|
|
|
GA Global Funding Trust, 5.50%,
01/08/2029(b)
|
|
|
|
High Street Funding Trust III, 5.81%,
02/15/2055(b)(c)
|
|
|
|
|
|
|
|
Life & Health Insurance-(continued)
|
MAG Mutual Holding Co., 4.75%,
04/30/2041(b)(h)
|
|
|
|
|
|
|
|
|
|
|
|
|
|
Series G, 6.35%, 03/15/2055(c)(d)
|
|
|
|
|
|
|
|
|
Nippon Life Insurance Co. (Japan)
|
|
|
|
|
|
|
|
|
|
|
|
|
|
Penn Mutual Life Insurance Co. (The),
3.80%, 04/29/2061(b)
|
|
|
|
Pricoa Global Funding I, 4.65%,
08/27/2031(b)
|
|
|
|
Prudential Financial, Inc., 5.20%,
03/14/2035
|
|
|
|
Sumitomo Life Insurance Co. (Japan),
5.88%(b)(d)(e)
|
|
|
|
|
|
|
|
|
Managed Health Care-0.04%
|
Humana, Inc., 5.75%, 12/01/2028
|
|
|
|
|
|
|
|
|
|
|
|
|
|
|
|
|
|
|
|
|
|
|
|
|
|
|
|
|
|
|
|
|
|
|
|
|
|
|
|
|
|
|
|
Marine Transportation-0.09%
|
A.P. Moller - Maersk A/S (Denmark),
5.88%, 09/14/2033(b)
|
|
|
|
Stena International S.A. (Sweden), 7.63%,
02/15/2031(b)
|
|
|
|
|
|
|
|
|
Movies & Entertainment-0.05%
|
Netflix, Inc., 5.40%, 08/15/2054
|
|
|
|
WarnerMedia Holdings, Inc.
|
|
|
|
|
|
|
|
|
|
|
|
|
|
|
|
|
|
|
|
|
|
|
|
|
|
|
|
|
Multi-Family Residential REITs-0.07%
|
AvalonBay Communities, Inc., 5.30%,
12/07/2033
|
|
|
|
Essex Portfolio L.P., 5.50%, 04/01/2034
|
|
|
|
Invitation Homes Operating Partnership
L.P., 4.88%, 02/01/2035
|
|
|
|
Mid-America Apartments L.P., 5.30%,
02/15/2032
|
|
|
|
UDR, Inc., 5.13%, 09/01/2034
|
|
|
|
|
|
|
|
|
See accompanying Notes to Financial Statements which are an integral part of the financial
statements.
Invesco Total Return Bond ETF (GTO)—(continued)
April 30, 2025
(Unaudited)
|
|
|
|
Multi-line Insurance-0.15%
|
Allianz SE (Germany), 3.50%(b)(d)(e)
|
|
|
|
Metropolitan Life Global Funding I, 5.15%,
03/28/2033(b)
|
|
|
|
|
|
|
|
|
|
|
Algonquin Power & Utilities Corp. (Canada),
5.37%, 06/15/2026
|
|
|
|
Ameren Illinois Co., 4.95%, 06/01/2033
|
|
|
|
Black Hills Corp., 6.15%, 05/15/2034
|
|
|
|
CMS Energy Corp., 6.50%, 06/01/2055(d)
|
|
|
|
Dominion Energy, Inc., 5.38%,
11/15/2032
|
|
|
|
|
|
|
|
|
|
|
|
|
|
|
|
|
|
|
|
|
|
|
|
|
|
|
|
|
|
|
|
|
|
|
|
|
|
|
|
|
|
|
|
|
|
|
|
|
|
|
|
|
|
|
|
|
|
|
Public Service Enterprise Group, Inc.,
5.88%, 10/15/2028
|
|
|
|
|
|
|
|
|
|
|
|
|
|
|
|
|
|
|
|
|
|
|
|
WEC Energy Group, Inc., 5.15%,
10/01/2027
|
|
|
|
|
|
|
|
|
|
|
Brandywine Operating Partnership L.P.
|
|
|
|
|
|
|
|
|
|
|
|
|
|
|
|
|
|
|
|
|
|
|
|
|
|
|
|
|
|
|
|
|
|
Oil & Gas Equipment & Services-0.00%
|
Northern Natural Gas Co., 5.63%,
02/01/2054(b)
|
|
|
|
Oil & Gas Exploration & Production-0.18%
|
Aethon United BR L.P./Aethon United
Finance Corp., 7.50%, 10/01/2029(b)
|
|
|
|
ConocoPhillips Co., 5.70%, 09/15/2063
|
|
|
|
|
|
|
|
|
|
|
|
|
|
|
|
|
|
|
|
|
|
|
|
Expand Energy Corp., 5.38%,
03/15/2030
|
|
|
|
Hilcorp Energy I L.P./Hilcorp Finance Co.
|
|
|
|
|
|
|
|
|
|
|
|
|
|
|
|
|
|
Oil & Gas Exploration & Production-(continued)
|
Transocean Titan Financing Ltd., 8.38%,
02/01/2028(b)
|
|
|
|
Uzbekneftegaz JSC (Uzbekistan), 4.75%,
11/16/2028(b)
|
|
|
|
|
|
|
|
|
Oil & Gas Refining & Marketing-0.17%
|
Empresa Nacional del Petroleo (Chile),
5.95%, 07/30/2034(b)
|
|
|
|
Phillips 66 Co., 5.30%, 06/30/2033
|
|
|
|
Raizen Fuels Finance S.A. (Brazil)
|
|
|
|
|
|
|
|
|
|
|
|
|
|
|
|
|
|
|
|
|
|
|
|
Oil & Gas Storage & Transportation-1.79%
|
Antero Midstream Partners L.P./Antero
Midstream Finance Corp., 6.63%,
02/01/2032(b)
|
|
|
|
Cheniere Energy Partners L.P., 5.95%,
06/30/2033
|
|
|
|
Columbia Pipelines Holding Co. LLC
|
|
|
|
|
|
|
|
|
|
|
|
|
|
Columbia Pipelines Operating Co. LLC,
5.70%, 10/01/2054(b)
|
|
|
|
Eastern Energy Gas Holdings LLC, 5.65%,
10/15/2054(c)
|
|
|
|
|
|
|
|
|
|
|
|
|
|
|
|
|
|
|
|
|
|
|
|
|
|
|
|
|
|
|
|
|
|
|
|
|
|
|
|
|
|
|
|
|
|
|
|
|
|
|
|
|
|
|
|
|
|
|
|
|
|
|
|
|
|
|
|
|
GreenSaif Pipelines Bidco S.a.r.l. (Saudi
Arabia)
|
|
|
|
|
|
|
|
|
|
|
|
|
|
|
|
|
|
|
|
|
|
|
|
|
|
|
|
|
|
|
|
|
|
|
|
|
|
|
|
|
|
|
|
MPLX L.P., 4.95%, 03/14/2052
|
|
|
|
NGL Energy Operating LLC/NGL Energy
Finance Corp., 8.38%, 02/15/2032(b)
|
|
|
|
See accompanying Notes to Financial Statements which are an integral part of the financial
statements.
Invesco Total Return Bond ETF (GTO)—(continued)
April 30, 2025
(Unaudited)
|
|
|
|
Oil & Gas Storage & Transportation-(continued)
|
|
|
|
|
|
|
|
|
|
|
|
|
|
|
|
|
|
|
|
|
|
|
|
|
|
|
|
|
|
|
|
|
|
|
|
Plains All American Pipeline L.P., 5.95%,
06/15/2035
|
|
|
|
South Bow Canadian Infrastructure
Holdings Ltd. (Canada)
|
|
|
|
7.50%, 03/01/2055(b)(c)(d)
|
|
|
|
|
|
|
|
|
South Bow USA Infrastructure
Holdings LLC (Canada)
|
|
|
|
|
|
|
|
|
|
|
|
|
|
|
|
|
|
|
|
|
|
|
|
Southern Co. Gas Capital Corp., 5.75%,
09/15/2033
|
|
|
|
Tallgrass Energy Partners L.P./Tallgrass
Energy Finance Corp., 7.38%,
02/15/2029(b)
|
|
|
|
|
|
|
|
|
|
|
|
|
|
|
|
|
|
|
|
|
|
|
|
|
|
|
|
|
|
|
|
|
|
|
|
|
|
|
Western Midstream Operating L.P.
|
|
|
|
|
|
|
|
|
|
|
|
|
|
|
|
|
|
|
Williams Cos., Inc. (The)
|
|
|
|
|
|
|
|
|
|
|
|
|
|
|
|
|
|
|
|
|
|
|
|
|
|
|
|
|
|
|
|
|
|
|
|
|
|
|
Other Specialized REITs-0.07%
|
Simon Property Group L.P., 4.75%,
09/26/2034
|
|
|
|
Other Specialty Retail-0.00%
|
Tractor Supply Co., 5.25%, 05/15/2033
|
|
|
|
Packaged Foods & Meats-0.91%
|
General Mills, Inc., 5.50%, 10/17/2028
|
|
|
|
J.M. Smucker Co. (The), 6.20%,
11/15/2033
|
|
|
|
Lamb Weston Holdings, Inc., 4.13%,
01/31/2030(b)(c)
|
|
|
|
|
|
|
|
Packaged Foods & Meats-(continued)
|
|
|
|
|
|
|
|
|
|
|
|
|
|
|
|
|
|
|
|
|
|
|
|
|
|
|
|
|
|
|
|
|
|
|
|
|
|
|
|
|
McCormick & Co., Inc., 4.70%,
10/15/2034
|
|
|
|
Minerva (Luxembourg) S.A. (Brazil),
8.88%, 09/13/2033(b)
|
|
|
|
Post Holdings, Inc., 6.25%,
10/15/2034(b)(c)
|
|
|
|
|
|
|
|
|
|
|
|
|
|
|
|
|
|
|
|
|
|
|
|
|
|
|
|
|
|
|
|
|
|
Paper & Plastic Packaging Products & Materials-0.28%
|
Graphic Packaging International LLC,
6.38%, 07/15/2032(b)
|
|
|
|
Sealed Air Corp., 7.25%, 02/15/2031(b)(c)
|
|
|
|
Smurfit Kappa Treasury Unlimited Co.
(Ireland)
|
|
|
|
|
|
|
|
|
|
|
|
|
|
|
|
|
|
|
|
|
Magnera Corp., 7.25%, 11/15/2031(b)(c)
|
|
|
|
|
|
American Airlines Pass-Through Trust
|
|
|
|
Series 2021-1, Class A, 2.88%,
07/11/2034
|
|
|
|
Series 2021-1, Class B, 3.95%,
07/11/2030
|
|
|
|
American Airlines, Inc./AAdvantage
Loyalty IP Ltd., 5.50%, 04/20/2026(b)
|
|
|
|
|
|
|
|
|
|
|
|
|
|
|
|
|
|
|
British Airways Pass-Through Trust (United
Kingdom), Series 2021-1, Class A,
2.90%, 03/15/2035(b)
|
|
|
|
Delta Air Lines, Inc./SkyMiles IP Ltd.
|
|
|
|
|
|
|
|
|
|
|
|
|
|
United Airlines Pass-Through Trust
|
|
|
|
Series 2020-1, Class A, 5.88%,
10/15/2027
|
|
|
|
Series 24-A, 5.88%, 02/15/2037
|
|
|
|
Series AA, 5.45%, 02/15/2037
|
|
|
|
|
|
|
|
|
See accompanying Notes to Financial Statements which are an integral part of the financial
statements.
Invesco Total Return Bond ETF (GTO)—(continued)
April 30, 2025
(Unaudited)
|
|
|
|
Passenger Ground Transportation-0.16%
|
|
|
|
|
|
|
|
|
|
|
|
|
|
|
|
|
|
|
|
|
|
|
|
|
|
Personal Care Products-0.07%
|
Coty, Inc., 5.00%, 04/15/2026(b)
|
|
|
|
|
|
|
|
|
|
|
|
|
|
|
|
|
|
|
|
|
|
|
|
|
|
|
|
|
|
|
|
|
|
|
|
AstraZeneca Finance LLC (United Kingdom)
|
|
|
|
|
|
|
|
|
|
|
|
|
|
|
|
|
|
|
|
|
|
|
|
|
|
|
|
|
|
|
|
|
|
|
|
|
|
|
|
|
|
|
|
|
|
|
|
|
|
|
|
|
|
|
|
|
|
|
|
|
|
|
|
|
|
|
|
|
Johnson & Johnson, 4.70%, 03/01/2030
|
|
|
|
|
|
|
|
|
|
|
|
|
|
|
|
|
|
|
|
|
|
|
|
|
|
|
|
|
|
|
|
|
|
|
|
|
|
|
|
|
|
|
|
|
|
|
|
|
|
|
|
|
|
Property & Casualty Insurance-0.09%
|
Fairfax Financial Holdings Ltd. (Canada),
6.10%, 03/15/2055
|
|
|
|
Markel Group, Inc., 6.00%(d)(e)
|
|
|
|
Travelers Cos., Inc. (The), 5.45%,
05/25/2053
|
|
|
|
|
|
|
|
|
Rail Transportation-0.16%
|
Canadian Pacific Railway Co. (Canada),
5.20%, 03/30/2035
|
|
|
|
|
|
|
|
|
|
|
|
|
|
|
|
|
|
|
|
|
|
|
|
|
|
|
|
|
|
|
|
|
Rail Transportation-(continued)
|
TTX Co., 5.05%, 11/15/2034(b)
|
|
|
|
Union Pacific Corp., 5.15%, 01/20/2063
|
|
|
|
|
|
|
|
|
Real Estate Development-0.06%
|
Piedmont Operating Partnership L.P.
|
|
|
|
|
|
|
|
|
|
|
|
|
|
|
|
|
|
|
|
|
Citizens Financial Group, Inc., 5.64%,
05/21/2037(d)
|
|
|
|
Regions Financial Corp., 5.72%,
06/06/2030(c)(d)
|
|
|
|
Synovus Financial Corp., 6.17%,
11/01/2030(d)
|
|
|
|
Truist Financial Corp., Series P,
4.95%(c)(d)(e)
|
|
|
|
Zions Bancorporation N.A., 6.82%,
11/19/2035(d)
|
|
|
|
|
|
|
|
|
|
|
Global Atlantic (Fin) Co.
|
|
|
|
|
|
|
|
|
|
|
|
|
|
RenaissanceRe Holdings Ltd. (Bermuda),
5.75%, 06/05/2033
|
|
|
|
|
|
|
|
|
Renewable Electricity-0.01%
|
DTE Electric Co., 5.20%, 03/01/2034
|
|
|
|
Idaho Power Co., 5.20%, 08/15/2034
|
|
|
|
|
|
|
|
|
|
|
1011778 BC ULC/New Red Finance, Inc.
(Canada), 5.63%, 09/15/2029(b)
|
|
|
|
Arcos Dorados B.V. (Brazil), 6.38%,
01/29/2032(b)
|
|
|
|
|
|
|
|
|
|
|
|
|
|
|
|
|
|
|
|
|
|
|
|
|
|
|
|
|
Raising Cane’s Restaurants LLC, 9.38%,
05/01/2029(b)
|
|
|
|
|
|
|
|
|
|
|
Agree L.P., 5.63%, 06/15/2034
|
|
|
|
Brixmor Operating Partnership L.P.,
5.75%, 02/15/2035
|
|
|
|
Kimco Realty OP LLC, 4.85%,
03/01/2035
|
|
|
|
|
|
|
|
|
|
|
|
|
|
|
|
|
|
|
See accompanying Notes to Financial Statements which are an integral part of the financial
statements.
Invesco Total Return Bond ETF (GTO)—(continued)
April 30, 2025
(Unaudited)
|
|
|
|
|
|
|
|
|
|
|
|
|
|
|
|
|
|
|
|
|
|
|
|
|
|
|
|
|
|
|
|
|
|
|
|
|
|
|
|
|
|
|
|
|
|
|
|
|
|
|
|
|
|
|
|
|
|
|
|
|
|
|
|
|
|
|
|
|
|
|
|
|
|
|
|
|
|
|
|
|
|
|
Goodman US Finance Six LLC (Australia),
5.13%, 10/07/2034(b)
|
|
|
|
|
|
|
|
|
|
|
|
|
|
|
|
|
|
|
|
|
|
|
|
|
|
|
|
|
|
|
|
|
|
Public Storage Operating Co.
|
|
|
|
|
|
|
|
|
|
|
|
|
|
|
|
|
|
|
|
|
|
|
|
|
|
|
|
|
|
|
|
|
|
|
|
|
|
|
|
|
|
|
|
|
|
|
|
|
|
|
|
|
|
|
|
|
|
|
|
|
|
|
|
|
|
|
|
|
|
|
|
|
|
|
|
|
|
|
|
|
|
|
|
|
|
|
|
|
|
|
|
|
|
|
|
|
|
|
|
|
|
|
|
|
|
|
|
|
|
|
|
|
|
|
|
|
|
|
|
|
Single-Family Residential REITs-0.05%
|
American Homes 4 Rent L.P.
|
|
|
|
|
|
|
|
|
|
|
|
|
|
|
|
|
|
|
|
|
|
|
|
|
|
|
|
Soft Drinks & Non-alcoholic Beverages-0.43%
|
Coca-Cola Co. (The), 5.40%, 05/13/2064
|
|
|
|
|
|
|
|
|
|
|
|
|
|
|
|
|
|
|
|
|
|
|
|
|
|
|
|
|
|
|
|
|
|
|
|
|
|
|
|
|
Brazilian Government International Bond
(Brazil), 6.13%, 03/15/2034(c)
|
|
|
|
Costa Rica Government International Bond
(Costa Rica), 7.30%, 11/13/2054(b)
|
|
|
|
Dominican Republic International Bond
(Dominican Republic)
|
|
|
|
|
|
|
|
|
|
|
|
|
|
Guatemala Government Bond (Guatemala)
|
|
|
|
|
|
|
|
|
|
|
|
|
|
Peruvian Government International Bond
(Peru), 5.38%, 02/08/2035
|
|
|
|
Republic of Kenya Government
International Bond (Kenya), 9.50%,
03/05/2036(b)
|
|
|
|
Republic of Poland Government
International Bond (Poland), 5.38%,
02/12/2035
|
|
|
|
Romanian Government International Bond
(Romania)
|
|
|
|
|
|
|
|
|
|
|
|
|
|
|
|
|
|
|
|
|
|
|
|
Trinidad & Tobago Government
International Bond (Trinidad), 6.40%,
06/26/2034(b)
|
|
|
|
|
|
|
|
|
Specialized Consumer Services-0.51%
|
Rentokil Terminix Funding LLC
|
|
|
|
|
|
|
|
|
|
|
|
|
|
|
|
|
|
|
Specialized Finance-0.16%
|
Blackstone Private Credit Fund, 4.95%,
09/26/2027(b)
|
|
|
|
Jefferson Capital Holdings LLC
|
|
|
|
|
|
|
|
|
|
|
|
|
|
|
|
|
|
|
See accompanying Notes to Financial Statements which are an integral part of the financial
statements.
Invesco Total Return Bond ETF (GTO)—(continued)
April 30, 2025
(Unaudited)
|
|
|
|
Specialty Chemicals-0.18%
|
|
|
|
|
|
|
|
|
|
|
|
|
|
|
|
Sociedad Quimica y Minera de Chile S.A.
(Chile), 6.50%, 11/07/2033(b)(c)
|
|
|
|
|
|
|
|
|
|
|
|
|
|
|
|
|
|
|
|
|
|
|
|
|
|
POSCO (South Korea), 5.63%,
01/17/2026(b)
|
|
|
|
POSCO Holdings, Inc. (South Korea)
|
|
|
|
|
|
|
|
|
|
|
|
|
|
|
|
|
|
|
|
|
|
|
|
|
|
|
|
|
|
|
|
|
|
|
|
|
|
|
|
|
|
|
|
|
|
|
|
|
|
|
|
|
|
|
|
|
|
|
|
|
|
|
|
|
|
|
|
|
|
|
Technology Hardware, Storage & Peripherals-0.31%
|
Dell International LLC/EMC Corp., 5.50%,
04/01/2035
|
|
|
|
Hewlett Packard Enterprise Co.
|
|
|
|
|
|
|
|
|
|
|
|
|
|
|
|
|
|
|
|
|
B.A.T Capital Corp. (United Kingdom)
|
|
|
|
|
|
|
|
|
|
|
|
|
|
|
|
|
|
|
|
|
|
|
|
|
|
|
|
|
|
Philip Morris International, Inc.
|
|
|
|
|
|
|
|
|
|
|
|
|
|
|
|
|
|
|
|
|
|
|
|
|
|
|
|
|
|
|
|
|
|
|
|
|
|
|
|
|
|
|
|
|
|
|
|
|
|
|
|
|
|
|
|
|
|
|
|
|
|
|
|
|
|
|
|
|
|
|
|
|
|
|
|
|
|
|
|
|
|
|
|
|
|
|
|
|
Trading Companies & Distributors-0.25%
|
Air Lease Corp., Series B, 4.65%(d)(e)
|
|
|
|
Ferguson Enterprises, Inc., 5.00%,
10/03/2034
|
|
|
|
GATX Corp., 6.05%, 06/05/2054
|
|
|
|
|
|
|
|
|
|
|
|
|
|
|
|
|
|
|
|
|
|
|
|
Transaction & Payment Processing Services-0.03%
|
|
|
|
|
|
|
|
|
|
|
|
|
|
|
|
|
|
|
|
|
Mastercard, Inc., 4.85%, 03/09/2033
|
|
|
|
|
|
|
|
|
Wireless Telecommunication Services-0.03%
|
Vodafone Group PLC (United Kingdom),
5.13%, 06/04/2081(d)
|
|
|
|
Total U.S. Dollar Denominated Bonds & Notes
(Cost $769,072,921)
|
|
U.S. Government Sponsored Agency Mortgage-Backed
Securities-30.72%
|
Collateralized Mortgage Obligations-1.89%
|
Freddie Mac Military Housing Bonds
Resecuritization Trust Ctfs.,
Series 2015-R1, Class B1, 5.25%,
11/25/2055(b)(i)
|
|
|
|
Freddie Mac Multifamily Structured
Pass-Through Ctfs.
|
|
|
|
Series 2017-K066, Class AM, 3.20%,
06/25/2027
|
|
|
|
Series 2017-KGX1, Class AFX, 3.00%,
10/25/2027
|
|
|
|
Series 2018-K074, Class AM, 3.60%,
02/25/2028
|
|
|
|
Series 2018-K154, Class A3, 3.46%,
11/25/2032(i)
|
|
|
|
See accompanying Notes to Financial Statements which are an integral part of the financial
statements.
Invesco Total Return Bond ETF (GTO)—(continued)
April 30, 2025
(Unaudited)
|
|
|
|
Collateralized Mortgage Obligations-(continued)
|
Series K-161, Class A2, 4.90%,
10/25/2033(i)
|
|
|
|
Series K-162, Class A2, 5.15%,
12/25/2033(i)
|
|
|
|
Series K-164, Class A2, 5.00%,
05/25/2034
|
|
|
|
Freddie Mac STRIPS, 0.00%,
09/15/2030(j)
|
|
|
|
Seasoned Credit Risk Transfer Trust
|
|
|
|
Series 2017-3, Class HT, 3.25%,
07/25/2056
|
|
|
|
Series 2017-4, Class HT, 3.25%,
06/25/2057
|
|
|
|
|
|
|
|
|
Federal Home Loan Mortgage Corp. (FHLMC)-1.36%
|
|
|
|
|
|
|
|
|
|
|
|
|
|
|
|
4.00%, 11/01/2048 to 07/01/2049
|
|
|
|
|
|
|
|
|
6.00%, 06/01/2053 to 08/01/2054
|
|
|
|
|
|
|
|
|
|
|
|
|
|
Federal National Mortgage Association (FNMA)-0.77%
|
|
|
|
|
|
|
|
|
|
|
|
|
|
|
|
|
|
|
|
|
2.50%, 10/01/2034 to 12/01/2034
|
|
|
|
3.50%, 05/01/2047 to 06/01/2047
|
|
|
|
|
|
|
|
|
3.00%, 09/01/2049 to 10/01/2049
|
|
|
|
|
|
|
|
|
|
|
|
|
|
Government National Mortgage Association (GNMA)-7.28%
|
|
|
|
|
|
TBA, 2.00%, 05/01/2055(k)
|
|
|
|
TBA, 2.50%, 05/01/2055(k)
|
|
|
|
TBA, 4.50%, 05/01/2055(k)
|
|
|
|
TBA, 5.00%, 05/01/2055(k)
|
|
|
|
TBA, 5.50%, 05/01/2055(k)
|
|
|
|
TBA, 6.00%, 05/01/2055(k)
|
|
|
|
|
|
|
|
|
Uniform Mortgage-Backed Securities-19.42%
|
TBA, 1.50%, 05/01/2040(k)
|
|
|
|
TBA, 2.00%, 05/01/2040(k)
|
|
|
|
TBA, 3.00%, 05/01/2055(k)
|
|
|
|
TBA, 3.50%, 05/01/2055(k)
|
|
|
|
TBA, 4.00%, 05/01/2055(k)
|
|
|
|
TBA, 4.50%, 05/01/2055(k)
|
|
|
|
TBA, 5.00%, 05/01/2055(k)
|
|
|
|
TBA, 5.50%, 05/01/2055(k)
|
|
|
|
|
|
|
|
Uniform Mortgage-Backed Securities-(continued)
|
TBA, 6.00%, 05/01/2055(k)
|
|
|
|
TBA, 2.50%, 06/01/2055(k)
|
|
|
|
|
|
|
|
|
Total U.S. Government Sponsored Agency Mortgage-
Backed Securities
(Cost $580,007,108)
|
|
|
|
Asset-Backed Securities-22.70%
|
AGL CLO 17 Ltd. (Cayman Islands),
Series 2022-17A, Class AR, 5.22% (3
mo. Term SOFR + 0.95%),
01/21/2035(b)(f)
|
|
|
|
AGL CLO 29 Ltd. (Jersey), Series 2024-
29A, Class A1, 5.84% (3 mo. Term
SOFR + 1.57%), 04/21/2037(b)(f)
|
|
|
|
AMSR Trust, Series 2021-SFR3, Class B,
1.73%, 10/17/2038(b)
|
|
|
|
|
|
|
|
|
Series 2020-1, Class A1, 2.16%,
12/25/2059(b)(i)
|
|
|
|
Series 2020-3, Class A1, 1.69%,
04/25/2065(b)(i)
|
|
|
|
Series 2020-5, Class A1, 1.37%,
05/25/2065(b)(i)
|
|
|
|
Series 2021-3, Class A1, 1.07%,
05/25/2066(b)(i)
|
|
|
|
Series 2022-1, Class A1, 2.88%,
12/25/2066(b)
|
|
|
|
Series 2023-6, Class A1, 6.50%,
12/25/2067(b)
|
|
|
|
Series 2024-10, Class A1, 5.35%,
10/25/2069(b)
|
|
|
|
Series 2024-2, Class A1, 5.99%,
01/25/2069(b)
|
|
|
|
Series 2024-8, Class A1, 5.34%,
05/27/2069(b)
|
|
|
|
Series 2025-HB1, Class A1, 6.15%
(30 Day Average SOFR + 1.80%),
02/25/2055(b)(f)
|
|
|
|
Apidos CLO XII (Cayman Islands),
Series 2013-12A, Class ARR, 5.34% (3
mo. Term SOFR + 1.08%),
04/15/2031(b)(f)
|
|
|
|
Apidos CLO XXV (Cayman Islands),
Series 2016-25A, Class A1R3, 5.41% (3
mo. Term SOFR + 1.14%),
01/20/2037(b)(f)
|
|
|
|
Avis Budget Rental Car Funding (AESOP)
LLC
|
|
|
|
Series 2023-1A, Class A, 5.25%,
04/20/2029(b)
|
|
|
|
Series 2023-4A, Class A, 5.49%,
06/20/2029(b)
|
|
|
|
See accompanying Notes to Financial Statements which are an integral part of the financial
statements.
Invesco Total Return Bond ETF (GTO)—(continued)
April 30, 2025
(Unaudited)
|
|
|
|
|
|
Bain Capital Credit CLO Ltd. (Cayman
Islands)
|
|
|
|
Series 2021-1A, Class AR, 5.21% (3
mo. Term SOFR + 0.94%),
04/18/2034(b)(f)
|
|
|
|
Series 2022-1A, Class A1, 5.59% (3 mo.
Term SOFR + 1.32%), 04/18/2035(b)(f)
|
|
|
|
Bank5, Series 2024-5YR10, Class A,
5.64%, 10/15/2057
|
|
|
|
Bayview MSR Opportunity Master Fund
Trust
|
|
|
|
Series 2021-4, Class A3, 3.00%,
10/25/2051(b)(i)
|
|
|
|
Series 2021-4, Class A4, 2.50%,
10/25/2051(b)(i)
|
|
|
|
Series 2021-4, Class A8, 2.50%,
10/25/2051(b)(i)
|
|
|
|
Series 2021-5, Class A1, 3.00%,
11/25/2051(b)(i)
|
|
|
|
Series 2021-5, Class A2, 2.50%,
11/25/2051(b)(i)
|
|
|
|
Bear Stearns Asset Backed Securities I
Trust, Series 2006-HE9, Class 2A,
4.72% (1 mo. Term SOFR + 0.39%),
11/25/2036(f)
|
|
|
|
|
|
|
|
|
Series 2018-B3, Class C, 4.71%,
04/10/2051(i)
|
|
|
|
Series 2019-B15, Class B, 3.56%,
12/15/2072
|
|
|
|
Benefit Street Partners CLO XXV Ltd.
(Cayman Islands), Series 2021-25A,
Class A1R, 5.26% (3 mo. Term SOFR +
1.00%), 01/15/2035(b)(f)
|
|
|
|
BMO Mortgage Trust, Series 2024-5C5,
Class AS, 6.36%, 02/15/2057(i)
|
|
|
|
BRAVO Residential Funding Trust
|
|
|
|
Series 2021-NQM2, Class A1, 0.97%,
03/25/2060(b)(i)
|
|
|
|
Series 2021-NQM2, Class A2, 1.28%,
03/25/2060(b)(i)
|
|
|
|
Buckhorn Park CLO Ltd. (Cayman Islands),
Series 2019-1A, Class ARR, 5.34% (3
mo. Term SOFR + 1.07%),
07/18/2034(b)(f)
|
|
|
|
BX Commercial Mortgage Trust
|
|
|
|
Series 2021-VOLT, Class C, 5.54% (1
mo. Term SOFR + 1.21%),
09/15/2036(b)(f)
|
|
|
|
Series 2021-VOLT, Class D, 6.09% (1
mo. Term SOFR + 1.76%),
09/15/2036(b)(f)
|
|
|
|
Series 2024-VLT5, Class A, 5.59%,
11/13/2046(b)(i)
|
|
|
|
Series 2024-VLT5, Class B, 6.00%,
11/13/2046(b)(i)
|
|
|
|
|
|
|
|
|
Series 2021-LGCY, Class B, 5.29% (1
mo. Term SOFR + 0.97%),
10/15/2036(b)(f)
|
|
|
|
|
|
|
|
|
|
Series 2022-LBA6, Class A, 5.32% (1
mo. Term SOFR + 1.00%),
01/15/2039(b)(f)
|
|
|
|
Series 2022-LBA6, Class B, 5.62% (1
mo. Term SOFR + 1.30%),
01/15/2039(b)(f)
|
|
|
|
Series 2022-LBA6, Class C, 5.92% (1
mo. Term SOFR + 1.60%),
01/15/2039(b)(f)
|
|
|
|
Series 2025-VLT6, Class A, 5.77% (1
mo. Term SOFR + 1.44%),
03/15/2042(b)(f)
|
|
|
|
Series 2025-VLT6, Class B, 6.21% (1
mo. Term SOFR + 1.89%),
03/15/2042(b)(f)
|
|
|
|
Carlyle Global Market Strategies CLO Ltd.
(Cayman Islands)
|
|
|
|
Series 2015-4A, Class A1RR, 5.49% (3
mo. Term SOFR + 1.22%),
07/20/2032(b)(f)
|
|
|
|
Series 2015-5A, Class A1R3, 5.37% (3
mo. Term SOFR + 1.10%),
01/20/2032(b)(f)
|
|
|
|
CarMax Auto Owner Trust, Series 2024-1,
Class A3, 4.92%, 10/16/2028
|
|
|
|
Cedar Funding XI CLO Ltd. (Cayman
Islands), Series 2019-11A, Class A1R2,
5.38% (3 mo. Term SOFR + 1.06%),
05/29/2032(b)(f)
|
|
|
|
Chase Home Lending Mortgage Trust
|
|
|
|
Series 2019-ATR2, Class A3, 3.50%,
07/25/2049(b)(i)
|
|
|
|
Series 2024-9, Class A4, 5.50%,
09/25/2055(b)(i)
|
|
|
|
Series 2024-9, Class A6, 5.50%,
09/25/2055(b)(i)
|
|
|
|
CIFC Funding Ltd. (Cayman Islands),
Series 2016-1A, Class AR3, 5.27% (3
mo. Term SOFR + 1.00%),
10/21/2031(b)(f)
|
|
|
|
Citigroup Mortgage Loan Trust, Inc.
|
|
|
|
Series 2021-INV3, Class A3, 2.50%,
05/25/2051(b)(i)
|
|
|
|
Series 2024-1, Class A3A, 6.00%,
07/25/2054(b)(i)
|
|
|
|
Clover CLO LLC, Series 2021-3A,
Class AR, 5.35% (3 mo. Term SOFR +
1.07%), 01/25/2035(b)(f)
|
|
|
|
|
|
|
|
|
Series 2022-1, Class A1, 2.28%,
12/27/2066(b)(i)
|
|
|
|
Series 2022-2, Class A1, 2.99%,
02/25/2067(b)
|
|
|
|
Commercial Mortgage Trust, Series 2015-
CR25, Class B, 4.66%, 08/10/2048(i)
|
|
|
|
Credit Suisse Mortgage Capital Trust
|
|
|
|
Series 2021-NQM1, Class A1, 0.81%,
05/25/2065(b)(i)
|
|
|
|
Series 2021-NQM2, Class A1, 1.18%,
02/25/2066(b)(i)
|
|
|
|
See accompanying Notes to Financial Statements which are an integral part of the financial
statements.
Invesco Total Return Bond ETF (GTO)—(continued)
April 30, 2025
(Unaudited)
|
|
|
|
|
|
Series 2022-ATH1, Class A1A, 2.87%,
01/25/2067(b)(i)
|
|
|
|
Series 2022-ATH1, Class A1B, 3.35%,
01/25/2067(b)(i)
|
|
|
|
|
|
|
|
|
Series 2024-H2, Class A1, 6.09%,
04/25/2069(b)
|
|
|
|
Series 2024-H8, Class A1, 5.55%,
12/25/2069(b)(i)
|
|
|
|
CSAIL Commercial Mortgage Trust,
Series 2020-C19, Class A3, 2.56%,
03/15/2053
|
|
|
|
DLLST LLC, Series 2024-1A, Class A3,
5.05%, 08/20/2027(b)
|
|
|
|
Domino’s Pizza Master Issuer LLC,
Series 2019-1A, Class A2, 3.67%,
10/25/2049(b)
|
|
|
|
Ellington Financial Mortgage Trust
|
|
|
|
Series 2019-2, Class A1, 2.74%,
11/25/2059(b)(i)
|
|
|
|
Series 2020-1, Class A1, 2.01%,
05/25/2065(b)(i)
|
|
|
|
Series 2021-1, Class A1, 0.80%,
02/25/2066(b)(i)
|
|
|
|
Series 2022-1, Class A1, 2.21%,
01/25/2067(b)(i)
|
|
|
|
Series 2024-INV2, Class A1, 5.04%,
10/25/2069(b)
|
|
|
|
Empower CLO Ltd. (Cayman Islands),
Series 2024-1A, Class A1, 5.88% (3 mo.
Term SOFR + 1.60%), 04/25/2037(b)(f)
|
|
|
|
Enterprise Fleet Financing LLC
|
|
|
|
Series 2024-2, Class A2, 5.74%,
12/20/2026(b)
|
|
|
|
Series 2024-2, Class A3, 5.61%,
04/20/2028(b)
|
|
|
|
Series 2024-2, Class A4, 5.69%,
12/20/2030(b)
|
|
|
|
Series 2024-4, Class A3, 4.56%,
11/20/2028(b)
|
|
|
|
Extended Stay America Trust,
Series 2021-ESH, Class B, 5.82% (1 mo.
Term SOFR + 1.49%), 07/15/2038(b)(f)
|
|
|
|
|
|
|
|
|
Series 2021-11IN, Class A6, 3.70%,
11/25/2051(b)(i)
|
|
|
|
Series 2021-8INV, Class A6, 2.50%,
09/25/2051(b)(i)
|
|
|
|
Fort Greene Park CLO LLC, Series 2025-
2A, Class AR, 5.22% (3 mo. Term SOFR
+ 0.95%), 04/22/2034(b)(f)
|
|
|
|
Frontier Issuer LLC, Series 2023-1,
Class A2, 6.60%, 08/20/2053(b)
|
|
|
|
|
|
|
|
|
Series 2019-NQM3, Class A1, 3.69%,
11/25/2059(b)(i)
|
|
|
|
Series 2024-INV1, Class 2A2, 6.50%,
01/25/2054(b)(i)
|
|
|
|
|
|
|
|
|
|
Goldentree Loan Management US CLO 1
Ltd. (Cayman Islands), Series 2017-1A,
Class A1R3, 5.24% (3 mo. Term SOFR +
0.97%), 04/20/2034(b)(f)
|
|
|
|
GoldenTree Loan Management US CLO 5
Ltd. (Cayman Islands), Series 2019-5A,
Class ARR, 5.34% (3 mo. Term SOFR +
1.07%), 10/20/2032(b)(f)
|
|
|
|
GoldenTree Loan Management US CLO 8
Ltd. (Cayman Islands), Series 2020-8A,
Class ARR, 5.42% (3 mo. Term SOFR +
1.15%), 10/20/2034(b)(f)
|
|
|
|
Golub Capital Partners CLO 53(B) Ltd.
(Cayman Islands), Series 2021-53A,
Class AR, 5.29% (3 mo. Term SOFR +
0.98%), 07/20/2034(b)(f)
|
|
|
|
GS Mortgage Securities Trust
|
|
|
|
Series 2020-GC45, Class A5, 2.91%,
02/13/2053
|
|
|
|
Series 2020-GC47, Class A5, 2.38%,
05/12/2053
|
|
|
|
GS Mortgage-Backed Securities Trust,
Series 2021-INV1, Class A6, 2.50%,
12/25/2051(b)(i)
|
|
|
|
Hertz Vehicle Financing III L.P.
|
|
|
|
Series 2021-2A, Class A, 1.68%,
12/27/2027(b)
|
|
|
|
Series 2021-2A, Class B, 2.12%,
12/27/2027(b)
|
|
|
|
HPEFS Equipment Trust, Series 2023-2A,
Class A2, 6.04%, 01/21/2031(b)
|
|
|
|
Invitation Homes Trust, Series 2024-SFR1,
Class A, 4.00%, 09/17/2041(b)
|
|
|
|
|
|
|
|
|
Series 2021-LTV2, Class A1, 2.52%,
05/25/2052(b)(i)
|
|
|
|
Series 2024-8, Class A3, 5.50%,
01/25/2055(b)(i)
|
|
|
|
Series 2024-VIS1, Class A1, 5.99%,
07/25/2064(b)(i)
|
|
|
|
JPMDB Commercial Mortgage Securities
Trust, Series 2020-COR7, Class C,
3.86%, 05/13/2053(i)
|
|
|
|
KKR CLO 15 Ltd. (Cayman Islands),
Series 15, Class A1R2, 5.37% (3 mo.
Term SOFR + 1.10%), 01/18/2032(b)(f)
|
|
|
|
KKR Financial CLO Ltd. (Cayman Islands),
Series 2013-1A, Class A1R2, 5.36% (3
mo. Term SOFR + 1.10%),
04/15/2029(b)(f)
|
|
|
|
Life Mortgage Trust, Series 2021-BMR,
Class C, 5.54% (1 mo. Term SOFR +
1.21%), 03/15/2038(b)(f)
|
|
|
|
Madison Park Funding XXXIII Ltd. (Cayman
Islands), Series 2019-33A, Class AR,
5.55% (3 mo. Term SOFR + 1.29%),
10/15/2032(b)(f)
|
|
|
|
See accompanying Notes to Financial Statements which are an integral part of the financial
statements.
Invesco Total Return Bond ETF (GTO)—(continued)
April 30, 2025
(Unaudited)
|
|
|
|
|
|
Mello Mortgage Capital Acceptance Trust
|
|
|
|
Series 2021-INV2, Class A4, 2.50%,
08/25/2051(b)(i)
|
|
|
|
Series 2021-INV3, Class A4, 2.50%,
10/25/2051(b)(i)
|
|
|
|
MFA Trust, Series 2021-INV2, Class A1,
1.91%, 11/25/2056(b)(i)
|
|
|
|
MHP Commercial Mortgage Trust,
Series 2021-STOR, Class B, 5.34% (1
mo. Term SOFR + 1.01%),
07/15/2038(b)(f)
|
|
|
|
Morgan Stanley Bank of America Merrill
Lynch Trust, Series 2015-C25, Class B,
4.67%, 10/15/2048(i)
|
|
|
|
Morgan Stanley Capital I Trust,
Series 2019-L3, Class AS, 3.49%,
11/15/2052
|
|
|
|
Morgan Stanley Residential Mortgage Loan
Trust
|
|
|
|
Series 2024-3, Class A1, 6.00%,
07/25/2054(b)(i)
|
|
|
|
Series 2024-NQM5, Class A1, 5.65%,
10/25/2069(b)(i)
|
|
|
|
Series 2025-NQM1, Class A1, 5.74%,
11/25/2069(b)(i)
|
|
|
|
MSC Trust, Series 2021-ILP, Class A,
5.21% (1 mo. Term SOFR + 0.89%),
11/15/2036(b)(f)
|
|
|
|
Navient Refinance Loan Trust,
Series 2025-A, Class A, 5.15%,
02/16/2055(b)
|
|
|
|
Neuberger Berman Loan Advisers CLO 40
Ltd. (Cayman Islands), Series 2021-40A,
Class A, 5.58% (3 mo. Term SOFR +
1.32%), 04/16/2033(b)(f)
|
|
|
|
Neuberger Berman Loan Advisers CLO 49
Ltd. (Cayman Islands), Series 2022-49A,
Class AR, 5.43% (3 mo. Term SOFR +
1.15%), 07/25/2035(b)(f)
|
|
|
|
New Residential Mortgage Loan Trust
|
|
|
|
Series 2019-NQM4, Class A1, 2.49%,
09/25/2059(b)(i)
|
|
|
|
Series 2020-NQM1, Class A1, 2.46%,
01/26/2060(b)(i)
|
|
|
|
Series 2022-NQM2, Class A1, 3.08%,
03/27/2062(b)(i)
|
|
|
|
Series 2024-NQM3, Class A1, 5.47%,
11/25/2064(b)
|
|
|
|
Oaktree CLO Ltd. (Cayman Islands),
Series 2021-2A, Class AR, 5.23% (3
mo. Term SOFR + 0.97%),
01/15/2035(b)(f)
|
|
|
|
|
|
|
|
|
Series 2021-NQM4, Class A1, 1.96%,
10/25/2061(b)(i)
|
|
|
|
Series 2022-NQM1, Class A1, 2.31%,
11/25/2061(b)(i)
|
|
|
|
Series 2022-NQM2, Class A1B, 3.38%,
01/25/2062(b)
|
|
|
|
|
|
|
|
|
|
Series 2024-NQM14, Class A1, 4.94%,
09/25/2064(b)
|
|
|
|
Series 2024-NQM18, Class A1, 5.41%,
10/25/2064(b)(i)
|
|
|
|
Oceanview Mortgage Trust, Series 2021-3,
Class A5, 2.50%, 07/25/2051(b)(i)
|
|
|
|
OCP CLO Ltd. (Cayman Islands),
Series 2020-8RA, Class AR, 5.53% (3
mo. Term SOFR + 1.25%),
10/17/2036(b)(f)
|
|
|
|
One Bryant Park Trust, Series 2019-OBP,
Class A, 2.52%, 09/15/2054(b)
|
|
|
|
Pikes Peak CLO 6 (Cayman Islands),
Series 2020-6A, Class ARR, 5.26% (3
mo. Term SOFR + 0.94%),
05/18/2034(b)(f)
|
|
|
|
PMT Loan Trust, Series 2025-INV1,
Class A7, 6.00%, 01/25/2060(b)(i)
|
|
|
|
PPM CLO 3 Ltd., Series 2019-3A,
Class AR, 5.63% (3 mo. Term SOFR +
1.35%), 04/17/2034(b)(f)
|
|
|
|
Qdoba Funding LLC, Series 2023-1A,
Class A2, 8.50%, 09/14/2053(b)
|
|
|
|
|
|
|
|
|
Series 2024-J4, Class A1, 6.00%,
12/25/2054(b)(i)
|
|
|
|
Series 2025-J1, Class A4, 6.00%,
03/25/2055(b)(i)
|
|
|
|
Regatta XIII Funding Ltd. (Cayman Islands),
Series 2018-2A, Class A1R, 5.36% (3
mo. Term SOFR + 1.10%),
07/15/2031(b)(f)
|
|
|
|
Residential Mortgage Loan Trust,
Series 2020-1, Class A1, 2.38%,
01/26/2060(b)(i)
|
|
|
|
SG Residential Mortgage Trust,
Series 2022-1, Class A1, 3.17%,
03/27/2062(b)(i)
|
|
|
|
Shackleton CLO Ltd. (Cayman Islands),
Series 2015-7RA, Class ARR, 5.36% (3
mo. Term SOFR + 1.10%),
07/15/2031(b)(f)
|
|
|
|
Signal Peak CLO 1 Ltd., Series 2014-1A,
Class AR4, 5.36% (3 mo. Term SOFR +
1.08%), 04/17/2034(b)(f)
|
|
|
|
|
|
|
|
|
Series 2020-1A, Class A2I, 3.85%,
01/20/2050(b)
|
|
|
|
Series 2021-1A, Class A2I, 2.19%,
08/20/2051(b)
|
|
|
|
Series 2021-1A, Class A2II, 2.64%,
08/20/2051(b)
|
|
|
|
STAR Trust, Series 2021-1, Class A1,
1.22%, 05/25/2065(b)(i)
|
|
|
|
Starwood Mortgage Residential Trust
|
|
|
|
Series 2020-1, Class A1, 2.28%,
02/25/2050(b)(i)
|
|
|
|
Series 2020-INV1, Class A1, 1.03%,
11/25/2055(b)(i)
|
|
|
|
See accompanying Notes to Financial Statements which are an integral part of the financial
statements.
Invesco Total Return Bond ETF (GTO)—(continued)
April 30, 2025
(Unaudited)
|
|
|
|
|
|
Series 2021-6, Class A1, 1.92%,
11/25/2066(b)(i)
|
|
|
|
Series 2022-1, Class A1, 2.45%,
12/25/2066(b)(i)
|
|
|
|
Store Master Funding I-VII, Series 2016-
1A, Class A2, 4.32%, 10/20/2046(b)
|
|
|
|
|
|
|
|
|
Series 2024-1A, Class A23, 6.51%,
07/30/2054(b)
|
|
|
|
Series 2024-1A, Class A2I, 6.03%,
07/30/2054(b)
|
|
|
|
Series 2024-1A, Class A2I, 6.27%,
07/30/2054(b)
|
|
|
|
Series 2024-3A, Class A23, 5.91%,
07/30/2054(b)
|
|
|
|
Series 2024-3A, Class A2I, 5.25%,
07/30/2054(b)
|
|
|
|
Series 2024-3A, Class A2I, 5.57%,
07/30/2054(b)
|
|
|
|
Symphony CLO XVI Ltd. (Cayman Islands),
Series 2015-16A, Class ARR, 5.46% (3
mo. Term SOFR + 1.20%),
10/15/2031(b)(f)
|
|
|
|
Symphony CLO XX Ltd. (Cayman Islands),
Series 2018-20A, Class AR2, 5.36% (3
mo. Term SOFR + 1.10%),
01/16/2032(b)(f)
|
|
|
|
Symphony CLO XXI Ltd. (Cayman Islands),
Series 2019-21A, Class AR2, 5.16% (3
mo. Term SOFR + 0.90%),
07/15/2032(b)(f)
|
|
|
|
Symphony CLO XXII Ltd. (Cayman Islands),
Series 2020-22A, Class A1AR, 5.45% (3
mo. Term SOFR + 1.18%),
04/18/2033(b)(f)
|
|
|
|
Synchrony Card Funding LLC,
Series 2024-A2, Class A, 4.93%,
07/15/2030
|
|
|
|
Taco Bell Funding LLC, Series 2016-1A,
Class A23, 4.97%, 05/25/2046(b)
|
|
|
|
Textainer Marine Containers VII Ltd.
(China), Series 2021-2A, Class A,
2.23%, 04/20/2046(b)
|
|
|
|
|
|
|
|
|
Series 2023-1A, Class A2, 6.00%,
06/25/2053(b)
|
|
|
|
Series 2025-1A, Class A2, 6.15%,
04/26/2055(b)
|
|
|
|
Series 2025-2A, Class A2, 6.40%,
04/26/2055(b)
|
|
|
|
Tricon American Homes Trust,
Series 2020-SFR2, Class A, 1.48%,
11/17/2039(b)
|
|
|
|
Tricon Residential Trust, Series 2025-
SFR1, Class A, 5.42% (1 mo. Term
SOFR + 1.10%), 03/17/2042(b)(f)
|
|
|
|
Verus Securitization Trust
|
|
|
|
Series 2021-1, Class A1B, 0.82%,
01/25/2066(b)(i)
|
|
|
|
|
|
|
|
|
|
Series 2021-2, Class A1, 1.03%,
02/25/2066(b)(i)
|
|
|
|
Series 2021-7, Class A1, 1.83%,
10/25/2066(b)
|
|
|
|
Series 2021-R1, Class A1, 0.82%,
10/25/2063(b)(i)
|
|
|
|
Series 2022-1, Class A1, 2.72%,
01/25/2067(b)
|
|
|
|
Series 2024-7, Class A1, 5.10%,
09/25/2069(b)(i)
|
|
|
|
Visio Trust, Series 2020-1R, Class A1,
1.31%, 11/25/2055(b)
|
|
|
|
Wells Fargo Commercial Mortgage Trust,
Series 2016-NXS5, Class XA, IO, 1.51%,
01/15/2059(l)
|
|
|
|
Wendy’s Funding LLC, Series 2019-1A,
Class A2II, 4.08%, 06/15/2049(b)
|
|
|
|
WEST Trust 2025-ROSE, Series 2025-
ROSE, Class A, 5.45%, 04/10/2030(b)(i)
|
|
|
|
WF Card Issuance Trust, Series 2024-A1,
Class A, 4.94%, 02/15/2029
|
|
|
|
WFRBS Commercial Mortgage Trust,
Series 2014-C23, Class B, 4.43%,
10/15/2057(i)
|
|
|
|
|
|
|
|
|
Series 2021-1A, Class A2, 3.24%,
07/30/2051(b)
|
|
|
|
Series 2024-1A, Class A2I, 6.59%,
04/30/2054(b)
|
|
|
|
Ziply Fiber Issuer LLC, Series 2024-1A,
Class A2, 6.64%, 04/20/2054(b)
|
|
|
|
Total Asset-Backed Securities
(Cost $438,726,247)
|
|
U.S. Treasury Securities-14.22%
|
U.S. Treasury Bills-0.37%(m)
|
|
|
|
|
|
U.S. Treasury Bonds-4.38%
|
|
|
|
|
|
|
|
|
|
|
|
|
|
|
|
U.S. Treasury Notes-9.47%
|
|
|
|
|
|
|
|
|
|
|
|
|
|
|
|
|
|
|
|
|
|
|
|
|
|
|
|
|
|
|
Total U.S. Treasury Securities
(Cost $266,450,601)
|
|
|
|
Municipal Obligations-1.09%
|
Illinois (State of), Series 2010-1, GO
Bonds, (INS - AGM), 6.63%,
02/01/2035(o)
|
|
|
|
Los Angeles (City of), CA Department of
Water & Power, Series 2010, RB,
6.57%, 07/01/2045
|
|
|
|
See accompanying Notes to Financial Statements which are an integral part of the financial
statements.
Invesco Total Return Bond ETF (GTO)—(continued)
April 30, 2025
(Unaudited)
|
|
|
|
|
|
New Jersey (State of) Transportation
Trust Fund Authority, Series 2024 BB,
Ref. RB, 5.09%, 06/15/2025
|
|
|
|
Virgin Islands Public Finance Authority,
Series 2024 B, RB, 9.00%,
04/01/2053(b)(p)
|
|
|
|
Total Municipal Obligations(q)
(Cost $21,099,539)
|
|
Variable Rate Senior Loan Interests-0.68%(r)(s)
|
|
|
Raising Cane’s Restaurants LLC, Term
Loan B, 6.32% (1 mo. SOFR + 2.00%),
09/10/2031
|
|
|
|
Wireless Telecommunication Services-0.41%
|
|
|
|
|
|
Term Loan B, 9.50% (3 mo. SOFR +
6.50%), 10/27/2029
|
|
|
|
Term Loan B, 10.95% (3 mo. SOFR +
6.50%), 10/27/2029
|
|
|
|
|
|
|
|
|
Total Variable Rate Senior Loan Interests
(Cost $12,992,258)
|
|
|
|
|
|
|
|
Aerospace & Defense-0.04%
|
Boeing Co. (The), Conv. Pfd., 6.00%,
10/15/2027
|
|
|
|
Diversified Financial Services-0.16%
|
Apollo Global Management, Inc., Pfd.,
7.63%, 09/15/2053(d)
|
|
|
|
|
|
M&T Bank Corp., Series J, Pfd., 7.50%
|
|
|
|
Total Preferred Stocks
(Cost $5,676,050)
|
|
|
|
|
|
Agency Credit Risk Transfer Notes-0.23%
|
Fannie Mae Connecticut Avenue Securities
|
|
|
|
Series 2022-R03, Class 1M1, 6.45%
(30 Day Average SOFR + 2.10%),
03/25/2042(b)(f)(t)
|
|
|
|
Series 2022-R04, Class 1M1, 6.35%
(30 Day Average SOFR + 2.00%),
03/25/2042(b)(f)(t)
|
|
|
|
Series 2023-R02, Class 1M1, 6.65%
(30 Day Average SOFR + 2.30%),
01/25/2043(b)(f)(t)
|
|
|
|
|
|
|
|
|
Series 2022-DNA3, Class M1A, STACR®,
6.35% (30 Day Average SOFR +
2.00%), 04/25/2042(b)(f)(u)
|
|
|
|
|
|
|
|
Series 2022-HQA3, Class M1, STACR®,
6.65% (30 Day Average SOFR +
2.30%), 08/25/2042(b)(f)(u)
|
|
|
|
Series 2023-DNA1, Class M1, STACR®,
6.45% (30 Day Average SOFR +
2.10%), 03/25/2043(b)(f)(u)
|
|
|
|
Total Agency Credit Risk Transfer Notes
(Cost $4,326,858)
|
|
|
|
U.S. Government Sponsored Agency Securities-0.13%
|
|
|
|
|
|
|
|
|
|
|
|
|
|
|
|
|
|
|
|
|
Tennessee Valley Authority
|
|
|
|
|
|
|
|
|
|
|
|
|
|
Total U.S. Government Sponsored Agency Securities
(Cost $2,189,816)
|
|
|
|
|
|
Exchange-Traded Funds-0.10%
|
Invesco High Yield Bond Factor ETF(v)
|
|
|
|
Invesco High Yield Select ETF(c)(v)
|
|
|
|
Invesco Short Duration Total Return Bond
ETF(c)(v)
|
|
|
|
Total Exchange-Traded Funds
(Cost $1,993,358)
|
|
|
|
|
|
|
TOTAL INVESTMENTS IN SECURITIES
(excluding investments purchased with cash collateral
from securities on loan)-110.99%
(Cost $2,103,912,454)
|
|
Investments Purchased with Cash Collateral
from Securities on Loan
|
|
|
Invesco Private Government Fund,
4.32%(v)(w)(x)
|
|
|
|
Invesco Private Prime Fund, 4.46%(v)(w)(x)
|
|
|
|
Total Investments Purchased with Cash Collateral from
Securities on Loan
(Cost $135,282,492)
|
|
TOTAL INVESTMENTS IN SECURITIES-118.16%
(Cost $2,239,194,946)
|
|
OTHER ASSETS LESS LIABILITIES-(18.16)%
|
|
|
|
|
See accompanying Notes to Financial Statements which are an integral part of the financial
statements.
Invesco Total Return Bond ETF (GTO)—(continued)
April 30, 2025
(Unaudited)
Investment Abbreviations:
|
|
|
-Assured Guaranty Municipal Corp.
|
|
|
|
|
|
|
|
|
|
|
|
|
|
|
|
|
|
|
|
|
|
|
|
|
|
|
|
|
|
-Real Estate Investment Trust
|
|
|
-Secured Overnight Financing Rate
|
|
|
-Structured Agency Credit Risk
|
|
|
-Separately Traded Registered Interest and Principal Security
|
|
|
|
See accompanying Notes to Financial Statements which are an integral part of the financial
statements.
Invesco Total Return Bond ETF (GTO)—(continued)
April 30, 2025
(Unaudited)
Notes to Schedule of Investments:
|
|
|
Industry and/or sector classifications used in this report are generally according
to the Global Industry Classification Standard, which was developed by and is
the exclusive property and a service mark of MSCI Inc. and Standard & Poor’s.
|
|
|
Security purchased or received in a transaction exempt from registration under the Securities Act of 1933, as amended (the “1933 Act”). The security may be
resold pursuant to an exemption from registration under the 1933 Act, typically to
qualified institutional buyers. The aggregate value of these securities at
April 30, 2025 was $725,982,873, which represented 38.47% of the Fund’s Net Assets.
|
|
|
All or a portion of this security was out on loan at April 30, 2025.
|
|
|
Security issued at a fixed rate for a specific period of time, after which it will
convert to a variable rate.
|
|
|
Perpetual bond with no specified maturity date.
|
|
|
Interest or dividend rate is redetermined periodically. Rate shown is the rate in
effect on April 30, 2025.
|
|
|
Defaulted security. Currently, the issuer is in default with respect to principal
and/or interest payments. The aggregate value of these securities at April 30,
2025 was $36,180, which represented less than 1% of the Fund’s Net Assets.
|
|
|
Security valued using significant unobservable inputs (Level 3). See Note 4.
|
|
|
Interest rate is redetermined periodically based on the cash flows generated by the
pool of assets backing the security, less any applicable fees. The rate
shown is the rate in effect on April 30, 2025.
|
|
|
Denotes a zero coupon security issued at a substantial discount from its value at
maturity.
|
|
|
Security purchased on a forward commitment basis. This security is subject to dollar
roll transactions. See Note 2K.
|
|
|
Interest only security. Principal amount shown is the notional principal and does
not reflect the maturity value of the security. Interest rate is redetermined
periodically based on the cash flows generated by the pool of assets backing the security,
less any applicable fees. The rate shown is the rate in effect on
April 30, 2025.
|
|
|
Security traded on a discount basis. The interest rate shown represents the discount
rate at the time of purchase by the Fund.
|
|
|
$6,959,112 was pledged as collateral to cover margin requirements for open futures
contracts. See Note 2S.
|
|
|
Principal and/or interest payments are secured by the bond insurance company listed.
|
|
|
All or a portion of the security position is when-issued or delayed delivery to be
delivered and settled after period end.
|
|
|
Entities may either issue, guarantee, back or otherwise enhance the credit quality of a security. The entities are not primarily responsible for the issuer’s
obligations but may be called upon to satisfy the issuer’s obligations. No concentration of any single entity was greater than 5% each.
|
|
|
Variable rate senior loan interests often require prepayments from excess cash flow
or permit the borrower to repay at its election. The degree to which
borrowers repay, whether as a contractual requirement or at their election, cannot
be predicted with any accuracy. As a result, the actual remaining maturity
may be substantially less than the stated maturities shown. However, it is anticipated
that the variable rate senior loan interests will have an expected average
life of three to five years.
|
|
|
Variable rate senior loan interests are, at present, not readily marketable, not registered
under the 1933 Act and may be subject to contractual and legal
restrictions on sale. Variable rate senior loan interests in the Fund’s portfolio generally have variable rates which adjust to a base, such as the Secured
Overnight Financing Rate ("SOFR"), on set dates, typically every 30 days, but not
greater than one year, and/or have interest rates that float at margin above
a widely recognized base lending rate such as the Prime Rate of a designated U.S.
bank.
|
|
|
CAS notes are bonds issued by Fannie Mae. The amount of periodic principal and ultimate
principal paid by Fannie Mae is determined by the performance of a
large and diverse reference pool.
|
|
|
Principal payments are determined by the delinquency and principal payment experience on the STACR® reference pool. Freddie Mac transfers credit risk from
the mortgages in the reference pool to credit investors who invest in the STACR® debt notes.
|
|
|
Affiliated holding. Affiliated holdings are investments in entities which are under
common ownership or control of Invesco Ltd. or are investments in entities in
which the Fund owns 5% or more of the outstanding voting securities. The table below shows the Fund’s transactions in, and earnings from, its investments in
affiliates for the six months ended April 30, 2025.
|
|
|
|
|
|
Change in
Unrealized
Appreciation
(Depreciation)
|
|
|
|
Invesco High Yield Bond
Factor ETF
|
|
|
|
|
|
|
|
Invesco High Yield Select
ETF
|
|
|
|
|
|
|
|
Invesco Short Duration
Total Return Bond ETF
|
|
|
|
|
|
|
|
See accompanying Notes to Financial Statements which are an integral part of the financial
statements.
Invesco Total Return Bond ETF (GTO)—(continued)
April 30, 2025
(Unaudited)
|
|
|
|
|
Change in
Unrealized
Appreciation
(Depreciation)
|
|
|
|
Investments Purchased
with Cash Collateral
from Securities on
Loan:
|
|
|
|
|
|
|
|
Invesco Private
Government Fund
|
|
|
|
|
|
|
|
Invesco Private Prime
Fund
|
|
|
|
|
|
|
|
|
|
|
|
|
|
|
|
|
|
|
Represents the income earned on the investment of cash collateral, which is included
in securities lending income on the Statements of Operations. Does not
include rebates and fees paid to lending agent or premiums received from borrowers,
if any.
|
|
|
The rate shown is the 7-day SEC standardized yield as of April 30, 2025.
|
|
|
The security has been segregated to satisfy the commitment to return the cash collateral received in securities lending transactions upon the borrower’s return
of the securities loaned. See Note 2P.
|
|
|
The table below details options purchased.
|
Open Exchange-Traded Index Options Purchased*
|
|
|
|
|
|
|
|
|
|
|
|
|
|
|
|
|
|
|
|
|
|
|
|
|
|
|
Open Exchange-Traded Index Options Written*
|
|
|
|
|
|
|
|
|
|
|
|
|
|
|
|
|
|
|
|
|
|
|
|
|
|
|
|
|
Open Exchange-Traded Index Options Purchased collateralized by $1,773,857 cash held
with Counterparties.
|
|
|
Notional Value is calculated by multiplying the Number of Contracts by the Exercise
Price by the multiplier.
|
Open Over-The-Counter Foreign Currency Options Purchased
|
|
|
|
|
|
|
|
|
|
|
|
|
|
|
|
|
|
|
|
Goldman Sachs International
|
|
|
|
|
|
|
Open Over-The-Counter Foreign Currency Options Written
|
|
|
|
|
|
|
|
|
|
|
|
|
|
|
|
|
|
|
|
Goldman Sachs International
|
|
|
|
|
|
|
|
|
|
|
|
|
|
|
Unrealized
Appreciation
(Depreciation)
|
|
|
|
|
|
|
|
U.S. Treasury 10 Year Notes
|
|
|
|
|
|
U.S. Treasury 2 Year Notes
|
|
|
|
|
|
See accompanying Notes to Financial Statements which are an integral part of the financial
statements.
Invesco Total Return Bond ETF (GTO)—(continued)
April 30, 2025
(Unaudited)
Open Futures Contracts—(continued)
|
Long Futures Contracts—(continued)
|
|
|
|
|
Unrealized
Appreciation
(Depreciation)
|
|
|
|
|
|
|
|
U.S. Treasury Ultra Bonds
|
|
|
|
|
|
Subtotal—Long Futures Contracts
|
|
|
|
|
|
|
|
|
|
|
|
|
|
|
|
|
|
|
|
U.S. Treasury 5 Year Notes
|
|
|
|
|
|
U.S. Treasury 10 Year Ultra Notes
|
|
|
|
|
|
Subtotal—Short Futures Contracts
|
|
|
|
|
|
|
|
|
|
See accompanying Notes to Financial Statements which are an integral part of the financial
statements.
Invesco Ultra Short Duration ETF (GSY)
April 30, 2025
(Unaudited)
Schedule of Investments(a)
|
|
|
|
U.S. Dollar Denominated Bonds & Notes-56.70%
|
Aerospace & Defense-0.41%
|
L3Harris Technologies, Inc., 5.40%,
01/15/2027
|
|
|
|
Agricultural & Farm Machinery-1.18%
|
|
|
|
|
|
4.88% (SOFR + 0.50%), 07/03/2025(b)
|
|
|
|
4.81% (SOFR + 0.44%), 03/06/2026(b)
|
|
|
|
4.87% (SOFR + 0.50%), 03/06/2028(b)
|
|
|
|
|
|
|
|
|
Agricultural Products & Services-0.43%
|
Cargill, Inc., 4.97% (SOFR + 0.61%),
02/11/2028(b)(c)
|
|
|
|
Application Software-0.11%
|
Synopsys, Inc., 4.55%, 04/01/2027
|
|
|
|
Asset Management & Custody Banks-1.71%
|
|
|
|
|
|
|
|
|
|
|
|
|
|
|
|
|
|
|
|
|
|
|
|
|
|
|
|
|
|
|
|
|
|
|
|
State Street Corp., 4.54%, 04/24/2028(d)
|
|
|
|
|
|
|
|
|
Automobile Manufacturers-4.46%
|
American Honda Finance Corp.
|
|
|
|
4.88% (SOFR + 0.50%),
01/12/2026(b)(e)
|
|
|
|
5.10% (SOFR + 0.72%), 10/05/2026(b)
|
|
|
|
5.19% (SOFR + 0.82%), 03/03/2028(b)
|
|
|
|
BMW US Capital LLC (Germany), 5.16%
(SOFR + 0.80%), 08/13/2026(b)(c)
|
|
|
|
Daimler Truck Finance North America LLC
(Germany), 5.13%, 09/25/2027(c)
|
|
|
|
Ford Motor Credit Co. LLC, 5.13%,
06/16/2025
|
|
|
|
Mercedes-Benz Finance North America LLC
(Germany), 5.16% (SOFR + 0.78%),
04/01/2027(b)(c)(e)
|
|
|
|
Toyota Motor Credit Corp.
|
|
|
|
5.03% (SOFR + 0.65%), 01/05/2026(b)
|
|
|
|
4.83% (SOFR + 0.45%), 04/10/2026(b)
|
|
|
|
5.13% (SOFR + 0.77%), 08/07/2026(b)
|
|
|
|
Volkswagen Group of America Finance LLC
(Germany)
|
|
|
|
|
|
|
|
|
5.20% (SOFR + 0.83%),
03/20/2026(b)(c)
|
|
|
|
5.42% (SOFR + 1.06%),
08/14/2026(b)(c)
|
|
|
|
|
|
|
|
|
|
|
Amgen, Inc., 3.13%, 05/01/2025
|
|
|
|
|
|
|
|
|
|
eBay, Inc., 1.40%, 05/10/2026
|
|
|
|
Commercial & Residential Mortgage Finance-0.10%
|
Aviation Capital Group LLC, 4.75%,
04/14/2027(c)
|
|
|
|
Computer & Electronics Retail-0.32%
|
Leidos, Inc., 3.63%, 05/15/2025
|
|
|
|
|
|
General Motors Financial Co., Inc., 5.55%
(SOFR + 1.17%), 04/04/2028(b)
|
|
|
|
Synchrony Financial, 4.50%, 07/23/2025
|
|
|
|
|
|
|
|
|
|
|
Bank of America N.A., 5.53%,
08/18/2026
|
|
|
|
Bank of Montreal (Canada)
|
|
|
|
5.33% (SOFR + 0.95%), 09/25/2025(b)
|
|
|
|
5.53% (SOFR + 1.16%), 12/11/2026(b)
|
|
|
|
Bank of New York Mellon (The), 5.09%
(SOFR + 0.71%), 04/20/2027(b)
|
|
|
|
Bank of Nova Scotia (The) (Canada)
|
|
|
|
5.46% (SOFR + 1.09%), 06/12/2025(b)
|
|
|
|
|
|
|
|
|
Barclays Bank PLC (United Kingdom),
4.95% (SOFR + 0.58%), 08/14/2026(b)
|
|
|
|
Barclays PLC (United Kingdom)
|
|
|
|
|
|
|
|
|
|
|
|
|
|
BPCE S.A. (France), 5.33% (SOFR +
0.96%), 09/25/2025(b)(c)
|
|
|
|
Canadian Imperial Bank of Commerce
(Canada)
|
|
|
|
5.60% (SOFR + 1.22%), 10/02/2026(b)
|
|
|
|
5.30% (SOFR + 0.93%), 09/11/2027(b)
|
|
|
|
|
|
|
|
|
5.18% (SOFR + 0.81%), 09/29/2025(b)
|
|
|
|
|
|
|
|
|
Cooperatieve Rabobank U.A.
(Netherlands), 4.99% (SOFR + 0.62%),
08/28/2026(b)
|
|
|
|
Credit Agricole S.A. (France), 5.58%
(SOFR + 1.21%), 09/11/2028(b)(c)(e)
|
|
|
|
|
|
|
|
|
|
|
|
|
|
5.19% (SOFR + 0.81%), 01/28/2028(b)
|
|
|
|
HSBC Holdings PLC (United Kingdom),
2.10%, 06/04/2026(d)
|
|
|
|
Huntington National Bank (The), 5.10%
(SOFR + 0.72%), 04/12/2028(b)
|
|
|
|
ING Groep N.V. (Netherlands), 1.73%,
04/01/2027(d)
|
|
|
|
|
|
|
|
|
5.58% (SOFR + 1.20%), 01/23/2028(b)
|
|
|
|
5.30% (SOFR + 0.92%), 04/22/2028(b)
|
|
|
|
See accompanying Notes to Financial Statements which are an integral part of the financial
statements.
Invesco Ultra Short Duration ETF (GSY)—(continued)
April 30, 2025
(Unaudited)
|
|
|
|
Diversified Banks-(continued)
|
Lloyds Banking Group PLC (United
Kingdom), 5.92% (SOFR + 1.56%),
08/07/2027(b)
|
|
|
|
Macquarie Bank Ltd. (Australia), 5.57%
(SOFR + 1.20%), 12/07/2026(b)(c)
|
|
|
|
Mizuho Markets Cayman L.P. (Japan),
5.21% (SOFR + 0.85%), 08/14/2026(b)
|
|
|
|
|
|
|
|
|
5.06% (SOFR + 0.69%), 10/15/2027(b)
|
|
|
|
5.46% (SOFR + 1.08%), 01/14/2028(b)
|
|
|
|
National Bank of Canada (Canada)
|
|
|
|
5.17% (SOFR + 0.80%), 08/20/2026(b)
|
|
|
|
5.41% (SOFR + 1.03%), 07/02/2027(b)
|
|
|
|
|
|
|
|
|
PNC Bank N.A., 4.78%, 01/15/2027(d)
|
|
|
|
PNC Financial Services Group, Inc. (The),
5.81%, 06/12/2026(d)
|
|
|
|
Royal Bank of Canada (Canada)
|
|
|
|
5.33% (SOFR + 0.95%), 01/19/2027(b)
|
|
|
|
5.10% (SOFR + 0.72%), 10/18/2027(b)
|
|
|
|
Sumitomo Mitsui Trust Bank Ltd. (Japan),
5.20%, 03/07/2027(c)
|
|
|
|
|
|
|
|
|
5.75% (SOFR + 1.38%),
06/15/2026(b)(c)
|
|
|
|
|
|
|
|
|
Toronto-Dominion Bank (The) (Canada)
|
|
|
|
5.46% (SOFR + 1.08%), 07/17/2026(b)
|
|
|
|
5.38% (SOFR + 1.00%), 10/20/2026(b)
|
|
|
|
5.21% (SOFR + 0.82%),
01/31/2028(b)(e)
|
|
|
|
|
|
|
|
|
5.16% (SOFR + 0.78%), 01/24/2028(b)
|
|
|
|
5.45% (SOFR + 1.07%), 04/22/2028(b)
|
|
|
|
|
|
|
|
|
5.19% (SOFR + 0.80%), 08/01/2025(b)
|
|
|
|
5.09% (SOFR + 0.71%), 01/15/2026(b)
|
|
|
|
|
|
|
|
|
Diversified Capital Markets-0.53%
|
UBS Group AG (Switzerland), 1.36%,
01/30/2027(c)(d)
|
|
|
|
Diversified Financial Services-0.85%
|
AerCap Ireland Capital DAC/AerCap Global
Aviation Trust (Ireland), 4.45%,
10/01/2025
|
|
|
|
USAA Capital Corp., 5.25%,
06/01/2027(c)
|
|
|
|
|
|
|
|
|
Diversified Metals & Mining-1.06%
|
BHP Billiton Finance (USA) Ltd. (Australia),
5.25%, 09/08/2026
|
|
|
|
|
|
|
|
Diversified Metals & Mining-(continued)
|
Glencore Funding LLC (Australia)
|
|
|
|
5.13% (SOFR + 0.75%),
10/01/2026(b)(c)
|
|
|
|
5.44% (SOFR + 1.06%),
04/04/2027(b)(c)
|
|
|
|
Rio Tinto Finance (USA) PLC (Australia),
4.38%, 03/12/2027(e)
|
|
|
|
|
|
|
|
|
|
|
Georgia Power Co., 5.11% (SOFR +
0.75%), 05/08/2025(b)
|
|
|
|
National Rural Utilities Cooperative Finance
Corp., 5.19% (SOFR + 0.82%),
09/16/2027(b)
|
|
|
|
NextEra Energy Capital Holdings, Inc.
|
|
|
|
|
|
|
|
|
5.14% (SOFR + 0.76%),
01/29/2026(b)(e)
|
|
|
|
5.18% (SOFR + 0.80%), 02/04/2028(b)
|
|
|
|
Pinnacle West Capital Corp., 5.19% (SOFR
+ 0.82%), 06/10/2026(b)
|
|
|
|
State Street Bank and Trust Co., 4.83%
(SOFR + 0.46%), 11/25/2026(b)
|
|
|
|
|
|
|
|
|
Fertilizers & Agricultural Chemicals-0.26%
|
Nutrien Ltd. (Canada), 4.50%,
03/12/2027
|
|
|
|
|
|
Whole Foods Market, Inc., 5.20%,
12/03/2025
|
|
|
|
Home Improvement Retail-0.16%
|
Home Depot, Inc. (The), 5.15%,
06/25/2026
|
|
|
|
Integrated Oil & Gas-0.28%
|
Chevron USA, Inc., 4.73% (SOFR +
0.36%), 02/26/2027(b)
|
|
|
|
Integrated Telecommunication Services-0.37%
|
Verizon Communications, Inc., 5.16%
(SOFR + 0.79%), 03/20/2026(b)
|
|
|
|
Interactive Home Entertainment-0.28%
|
Electronic Arts, Inc., 4.80%, 03/01/2026
|
|
|
|
Investment Banking & Brokerage-2.94%
|
Charles Schwab Corp. (The), 4.88% (SOFR
+ 0.52%), 05/13/2026(b)
|
|
|
|
Goldman Sachs Group, Inc. (The)
|
|
|
|
5.43% (SOFR + 1.07%),
08/10/2026(b)(e)
|
|
|
|
|
|
|
|
|
|
|
|
|
|
Jefferies Financial Group, Inc.
|
|
|
|
|
|
|
|
|
|
|
|
|
|
See accompanying Notes to Financial Statements which are an integral part of the financial
statements.
Invesco Ultra Short Duration ETF (GSY)—(continued)
April 30, 2025
(Unaudited)
|
|
|
|
Investment Banking & Brokerage-(continued)
|
|
|
|
|
|
5.40% (SOFR + 1.02%), 04/13/2028(b)
|
|
|
|
5.76% (SOFR + 1.38%), 04/12/2029(b)
|
|
|
|
|
|
|
|
|
Life & Health Insurance-8.42%
|
|
|
|
|
|
|
|
|
|
|
5.40% (SOFR + 1.03%),
08/27/2026(b)(c)
|
|
|
|
|
|
|
|
|
5.21% (SOFR + 0.83%),
01/07/2027(b)(c)
|
|
|
|
|
|
|
|
|
Brighthouse Financial Global Funding,
5.55%, 04/09/2027(c)
|
|
|
|
Corebridge Global Funding
|
|
|
|
|
|
|
|
|
5.68% (SOFR + 1.30%),
09/25/2026(b)(c)
|
|
|
|
5.13% (SOFR + 0.75%),
01/07/2028(b)(c)
|
|
|
|
GA Global Funding Trust, 4.40%,
09/23/2027(c)
|
|
|
|
Jackson National Life Global Funding
|
|
|
|
|
|
|
|
|
|
|
|
|
|
MassMutual Global Funding II
|
|
|
|
5.15% (SOFR + 0.77%),
01/29/2027(b)(c)
|
|
|
|
5.12% (SOFR + 0.74%),
04/09/2027(b)(c)
|
|
|
|
Met Tower Global Funding, 5.40%,
06/20/2026(c)
|
|
|
|
New York Life Global Funding
|
|
|
|
5.01% (SOFR + 0.65%),
05/02/2025(b)(c)
|
|
|
|
5.05% (SOFR + 0.67%),
04/02/2027(b)(c)(e)
|
|
|
|
|
|
|
|
|
Pacific Life Global Funding II
|
|
|
|
4.98% (SOFR + 0.60%),
03/27/2026(b)(c)
|
|
|
|
4.99% (SOFR + 0.62%),
06/04/2026(b)(c)
|
|
|
|
5.43% (SOFR + 1.05%),
07/28/2026(b)(c)
|
|
|
|
|
|
|
|
|
Principal Life Global Funding II, 5.00%,
01/16/2027(c)
|
|
|
|
Protective Life Global Funding, 5.37%,
01/06/2026(c)
|
|
|
|
Reliance Standard Life Global Funding II,
5.24%, 02/02/2026(c)
|
|
|
|
|
|
|
|
|
Movies & Entertainment-0.43%
|
Netflix, Inc., 3.63%, 06/15/2025(c)
|
|
|
|
|
|
|
|
Oil & Gas Exploration & Production-0.99%
|
Canadian Natural Resources Ltd. (Canada),
2.05%, 07/15/2025
|
|
|
|
CNO Global Funding, 4.88%,
12/10/2027(c)
|
|
|
|
Pioneer Natural Resources Co., 1.13%,
01/15/2026
|
|
|
|
|
|
|
|
|
Oil & Gas Refining & Marketing-0.32%
|
Phillips 66, 1.30%, 02/15/2026
|
|
|
|
Oil & Gas Storage & Transportation-3.11%
|
Enbridge, Inc. (Canada), 5.25%,
04/05/2027
|
|
|
|
Energy Transfer L.P., 2.90%, 05/15/2025
|
|
|
|
|
|
|
|
|
|
|
|
|
|
|
|
|
|
|
MPLX L.P., 1.75%, 03/01/2026
|
|
|
|
Plains All American Pipeline L.P./PAA
Finance Corp.
|
|
|
|
|
|
|
|
|
|
|
|
|
|
Williams Cos., Inc. (The), 5.40%,
03/02/2026
|
|
|
|
|
|
|
|
|
Packaged Foods & Meats-0.65%
|
Mars, Inc., 4.45%, 03/01/2027(c)
|
|
|
|
The Campbell’s Company, 5.30%,
03/20/2026
|
|
|
|
|
|
|
|
|
|
|
Bristol-Myers Squibb Co., 4.85% (SOFR +
0.49%), 02/20/2026(b)
|
|
|
|
GlaxoSmithKline Capital PLC (United
Kingdom), 4.87% (SOFR + 0.50%),
03/12/2027(b)(e)
|
|
|
|
|
|
|
|
|
|
|
|
|
|
|
|
|
|
|
|
|
|
|
|
|
|
|
|
|
|
|
|
|
Starbucks Corp., 4.75%, 02/15/2026
|
|
|
|
|
|
Realty Income Corp., 5.05%, 01/13/2026
|
|
|
|
|
|
Public Storage Operating Co., 5.08%
(SOFR + 0.70%), 04/16/2027(b)
|
|
|
|
Semiconductor Materials & Equipment-0.36%
|
NXP B.V./NXP Funding LLC/NXP USA, Inc.
(Multinational), 2.70%, 05/01/2025
|
|
|
|
|
|
Advanced Micro Devices, Inc., 4.21%,
09/24/2026
|
|
|
|
See accompanying Notes to Financial Statements which are an integral part of the financial
statements.
Invesco Ultra Short Duration ETF (GSY)—(continued)
April 30, 2025
(Unaudited)
|
|
|
|
Soft Drinks & Non-alcoholic Beverages-0.97%
|
|
|
|
|
|
|
|
|
|
|
4.97% (SOFR + 0.58%), 11/15/2026(b)
|
|
|
|
5.25% (SOFR + 0.88%),
03/15/2027(b)(e)
|
|
|
|
|
|
|
|
|
Specialized Finance-0.22%
|
Blackstone Private Credit Fund, 2.63%,
12/15/2026
|
|
|
|
Specialty Chemicals-0.52%
|
Sherwin-Williams Co. (The)
|
|
|
|
|
|
|
|
|
|
|
|
|
|
|
|
|
|
|
|
|
|
|
|
|
|
|
|
|
|
|
|
|
|
|
|
|
|
|
|
|
|
|
|
|
|
|
|
|
|
|
|
|
|
|
|
Telecom Tower REITs-1.16%
|
|
|
|
|
|
|
|
|
|
|
|
|
|
|
|
Crown Castle, Inc., 1.35%, 07/15/2025
|
|
|
|
|
|
|
|
|
Trading Companies & Distributors-0.75%
|
|
|
|
|
|
|
|
|
|
|
|
|
|
|
|
|
|
|
|
|
Transaction & Payment Processing Services-0.07%
|
PayPal Holdings, Inc., 5.04% (SOFR +
0.67%), 03/06/2028(b)(e)
|
|
|
|
Total U.S. Dollar Denominated Bonds & Notes
(Cost $1,566,075,155)
|
|
|
|
Asset-Backed Securities-13.33%
|
Amur Equipment Finance Receivables
XII LLC, Series 2023-1A, Class A2,
6.09%, 12/20/2029(c)
|
|
|
|
|
|
|
|
|
Series 2020-1, Class A1, 2.16%,
12/25/2059(c)(f)
|
|
|
|
Series 2020-5, Class A1, 1.37%,
05/25/2065(c)(f)
|
|
|
|
Series 2024-8, Class A1, 5.34%,
05/27/2069(c)
|
|
|
|
Series 2025-2, Class A1, 5.64%,
02/25/2070(c)
|
|
|
|
AUF Funding LLC, Series 2022-1A,
Class A1LN, 6.77% (3 mo. Term SOFR +
2.50%), 01/20/2031(b)(c)
|
|
|
|
|
|
|
|
|
|
Barclays Dryrock Issuance Trust,
Series 2023-2, Class A, 5.25% (30 Day
Average SOFR + 0.90%),
08/15/2028(b)
|
|
|
|
Bear Stearns Asset Backed Securities I
Trust, Series 2006-HE9, Class 2A,
4.72% (1 mo. Term SOFR + 0.39%),
11/25/2036(b)
|
|
|
|
BINOM Securitization Trust, Series 2021-
INV1, Class A1, 2.03%,
06/25/2056(c)(f)
|
|
|
|
BMW Vehicle Lease Trust, Series 2024-2,
Class A2B, 4.77% (30 Day Average
SOFR + 0.42%), 01/25/2027(b)
|
|
|
|
BRAVO Residential Funding Trust,
Series 2021-NQM2, Class A1, 0.97%,
03/25/2060(c)(f)
|
|
|
|
CarMax Auto Owner Trust, Series 2025-2,
Class A2A, 4.59%, 07/17/2028
|
|
|
|
CBAM Ltd. (Cayman Islands), Series 2018-
5A, Class A, 5.56% (3 mo. Term SOFR +
1.28%), 04/17/2031(b)(c)
|
|
|
|
CCG Receivables Trust, Series 2025-1,
Class A2, 4.48%, 10/14/2032(c)
|
|
|
|
Chase Auto Owner Trust, Series 2024-3A,
Class A2, 5.53%, 09/27/2027(c)
|
|
|
|
Chesapeake Funding II LLC (Canada)
|
|
|
|
Series 2023-1A, Class A2, 5.60%
(30 Day Average SOFR + 1.25%),
05/15/2035(b)(c)
|
|
|
|
Series 2023-2A, Class A2, 5.45%
(30 Day Average SOFR + 1.10%),
10/15/2035(b)(c)
|
|
|
|
Series 2024-1A, Class A2, 5.12%
(30 Day Average SOFR + 0.77%),
05/15/2036(b)(c)
|
|
|
|
Citizens Auto Receivables Trust
|
|
|
|
Series 2023-2, Class A2B, 5.08%
(30 Day Average SOFR + 0.73%),
10/15/2026(b)(c)
|
|
|
|
Series 2024-2, Class A3, 5.33%,
08/15/2028(c)
|
|
|
|
COLT Mortgage Loan Trust, Series 2020-
2R, Class A1, 1.33%, 10/26/2065(c)(f)
|
|
|
|
|
|
|
|
|
Series 2023-H1, Class A1, 6.62%,
03/25/2068(c)
|
|
|
|
Series 2024-H5, Class A1, 5.85%,
08/26/2069(c)
|
|
|
|
CWABS, Inc. Asset-Backed Ctfs. Trust,
Series 2004-4, Class M1, 5.16% (1 mo.
Term SOFR + 0.83%), 07/25/2034(b)
|
|
|
|
Deephaven Residential Mortgage Trust,
Series 2021-2, Class A1, 0.90%,
04/25/2066(c)(f)
|
|
|
|
Dell Equipment Finance Trust
|
|
|
|
Series 2024-1, Class A3, 5.39%,
03/22/2030(c)
|
|
|
|
Series 2025-1, Class A3, 4.61%,
02/24/2031(c)
|
|
|
|
See accompanying Notes to Financial Statements which are an integral part of the financial
statements.
Invesco Ultra Short Duration ETF (GSY)—(continued)
April 30, 2025
(Unaudited)
|
|
|
|
|
|
DLLST LLC, Series 2024-1A, Class A3,
5.05%, 08/20/2027(c)
|
|
|
|
Dryden 30 Senior Loan Fund (Cayman
Islands), Series 2013-30A, Class AR,
5.41% (3 mo. Term SOFR + 1.08%),
11/15/2028(b)(c)
|
|
|
|
Ellington Financial Mortgage Trust
|
|
|
|
Series 2019-2, Class A1, 2.74%,
11/25/2059(c)(f)
|
|
|
|
Series 2020-2, Class A1, 1.18%,
10/25/2065(c)(f)
|
|
|
|
Enterprise Fleet Financing LLC
|
|
|
|
Series 2023-3, Class A2, 6.40%,
03/20/2030(c)
|
|
|
|
Series 2024-1, Class A2, 5.23%,
03/20/2030(c)
|
|
|
|
Series 2024-3, Class A2, 5.31%,
04/20/2027(c)
|
|
|
|
Series 2024-4, Class A2, 4.69%,
07/20/2027(c)
|
|
|
|
Series 2025-2, Class A2, 4.51%,
02/22/2028(c)
|
|
|
|
First National Master Note Trust,
Series 2024-1, Class A, 5.34%,
05/15/2030
|
|
|
|
FS KKR MM CLO 1 LLC, Series 2019-1A,
Class A1R, 6.37% (3 mo. Term SOFR +
2.11%), 01/15/2031(b)(c)
|
|
|
|
GMF Floorplan Owner Revolving Trust,
Series 2023-1, Class A2, 5.50% (30 Day
Average SOFR + 1.15%),
06/15/2028(b)(c)
|
|
|
|
Golub Capital Partners CLO 36(M) Ltd.
(Cayman Islands), Series 2018-36A,
Class A, 5.82% (3 mo. Term SOFR +
1.56%), 02/05/2031(b)(c)
|
|
|
|
GreatAmerica Leasing Receivables
Funding LLC
|
|
|
|
Series 2024-2, Class A2, 5.28%,
03/15/2027(c)
|
|
|
|
Series 2025-1, Class A2, 4.52%,
10/15/2027(c)
|
|
|
|
GS Mortgage-Backed Securities Trust
|
|
|
|
Series 2020-NQM1, Class A1, 1.38%,
09/27/2060(c)(f)
|
|
|
|
Series 2025-PJ1, Class A7, 6.00%,
06/25/2055(c)(f)
|
|
|
|
Harley-Davidson Motorcycle Trust,
Series 2024-B, Class A2, 4.62%,
08/16/2027
|
|
|
|
HPEFS Equipment Trust, Series 2024-2A,
Class A2, 5.50%, 10/20/2031(c)
|
|
|
|
HSI Asset Securitization Corp. Trust,
Series 2006-OPT2, Class M2, 5.03% (1
mo. Term SOFR + 0.70%),
01/25/2036(b)
|
|
|
|
|
|
|
|
|
|
Hyundai Auto Lease Securitization Trust
|
|
|
|
Series 2024-C, Class A2B, 4.85%
(30 Day Average SOFR + 0.50%),
03/15/2027(b)(c)
|
|
|
|
Series 2025-B, Class A3, 4.53%,
04/17/2028(c)
|
|
|
|
Hyundai Auto Receivables Trust,
Series 2025-A, Class A2B, 4.69%
(30 Day Average SOFR + 0.34%),
12/15/2027(b)
|
|
|
|
J.P. Morgan Mortgage Trust, Series 2024-
INV1, Class A4, 6.00%,
04/25/2055(c)(f)
|
|
|
|
John Deere Owner Trust, Series 2025-A,
Class A2B, 4.64% (30 Day Average
SOFR + 0.29%), 03/15/2028(b)
|
|
|
|
KKR CLO 21 Ltd. (Cayman Islands),
Series A, 5.52% (3 mo. Term SOFR +
1.26%), 04/15/2031(b)(c)
|
|
|
|
Madison Park Funding XLII Ltd. (Cayman
Islands), Series 2024-13A, Class AR,
5.43% (3 mo. Term SOFR + 1.15%),
11/21/2030(b)(c)
|
|
|
|
Mercedes-Benz Auto Lease Trust,
Series 2024-A, Class A2A, 5.44%,
02/16/2027
|
|
|
|
Morgan Stanley Residential Mortgage Loan
Trust
|
|
|
|
Series 2023-NQM1, Class A1, 7.28%,
09/25/2068(c)
|
|
|
|
Series 2024-NQM3, Class A1, 5.04%,
07/25/2069(c)(f)
|
|
|
|
Series 2025-NQM1, Class A1, 5.74%,
11/25/2069(c)(f)
|
|
|
|
Navient Private Education Refi Loan Trust
|
|
|
|
Series 2020-FA, Class A, 1.22%,
07/15/2069(c)
|
|
|
|
Series 2021-FA, Class A, 1.11%,
02/18/2070(c)
|
|
|
|
New Residential Mortgage Loan Trust
|
|
|
|
Series 2017-5A, Class A1, 5.94% (1 mo.
Term SOFR + 1.61%), 06/25/2057(b)(c)
|
|
|
|
Series 2019-NQM4, Class A1, 2.49%,
09/25/2059(c)(f)
|
|
|
|
Series 2020-NQM1, Class A1, 2.46%,
01/26/2060(c)(f)
|
|
|
|
|
|
|
|
|
Series 2024-NQM12, Class A1, 5.48%,
07/25/2064(c)
|
|
|
|
Series 2024-NQM18, Class A1, 5.41%,
10/25/2064(c)(f)
|
|
|
|
Series 2024-NQM6, Class A1, 6.45%,
02/25/2064(c)
|
|
|
|
Octagon Investment Partners XVII Ltd.
(Cayman Islands), Series 2013-1A,
Class A1R2, 5.54% (3 mo. Term SOFR +
1.26%), 01/25/2031(b)(c)
|
|
|
|
PMT Loan Trust, Series 2025-INV1,
Class A7, 6.00%, 01/25/2060(c)(f)
|
|
|
|
See accompanying Notes to Financial Statements which are an integral part of the financial
statements.
Invesco Ultra Short Duration ETF (GSY)—(continued)
April 30, 2025
(Unaudited)
|
|
|
|
|
|
Porsche Innovative Lease Owner Trust
|
|
|
|
Series 2024-1A, Class A2A, 4.84%,
01/20/2027(c)
|
|
|
|
Series 2024-2A, Class A2B, 4.79%
(30 Day Average SOFR + 0.44%),
12/21/2026(b)(c)
|
|
|
|
PRKCM Trust, Series 2023-AFC4,
Class A1, 7.23%, 11/25/2058(c)
|
|
|
|
Residential Mortgage Loan Trust,
Series 2020-1, Class A1, 2.38%,
01/26/2060(c)(f)
|
|
|
|
|
|
|
|
|
Series 2023-A, Class A3, 6.51%,
04/20/2027(c)
|
|
|
|
Series 2024-C, Class A3, 4.56%,
02/22/2028(c)
|
|
|
|
Starwood Mortgage Residential Trust
|
|
|
|
Series 2020-1, Class A1, 2.28%,
02/25/2050(c)(f)
|
|
|
|
Series 2020-INV1, Class A1, 1.03%,
11/25/2055(c)(f)
|
|
|
|
Series 2021-2, Class A1, 0.94%,
05/25/2065(c)(f)
|
|
|
|
Synchrony Card Funding LLC
|
|
|
|
Series 2023-A2, Class A, 5.74%,
10/15/2029
|
|
|
|
Series 2024-A1, Class A, 5.04%,
03/15/2030
|
|
|
|
Toyota Auto Receivables 2025-B Owner
Trust, Series 2025-B, Class A2A, 4.46%,
03/15/2028
|
|
|
|
Verus Securitization Trust
|
|
|
|
Series 2020-1, Class A1, 3.42%,
01/25/2060(c)
|
|
|
|
Series 2020-5, Class A1, 2.22%,
05/25/2065(c)
|
|
|
|
Series 2022-INV2, Class A1, 6.79%,
10/25/2067(c)
|
|
|
|
Series 2023-7, Class A1, 7.07%,
10/25/2068(c)
|
|
|
|
Series 2023-INV2, Class A1, 6.44%,
08/25/2068(c)
|
|
|
|
Visio Trust, Series 2020-1R, Class A1,
1.31%, 11/25/2055(c)
|
|
|
|
Volvo Financial Equipment LLC,
Series 2025-1A, Class A2, 4.41%,
11/15/2027(c)
|
|
|
|
Wheels Fleet Lease Funding 1 LLC
|
|
|
|
Series 2024-1A, Class A2, 5.15% (1 mo.
Term SOFR + 0.83%), 02/18/2039(b)(c)
|
|
|
|
Series 2024-2A, Class A2, 5.32% (1 mo.
Term SOFR + 1.00%), 06/21/2039(b)(c)
|
|
|
|
Series 2025-1A, Class A1, 4.57%,
01/18/2040(c)
|
|
|
|
|
|
|
|
|
|
World Omni Automobile Lease
Securitization Trust, Series 2025-A,
Class A2B, 4.74% (30 Day Average
SOFR + 0.39%), 12/15/2027(b)
|
|
|
|
Total Asset-Backed Securities
(Cost $369,139,157)
|
|
|
|
|
|
Exchange-Traded Funds-0.25%
|
Invesco AAA CLO Floating Rate Note ETF(g)
(Cost $7,059,850)
|
|
|
|
|
|
|
|
Commercial Paper-27.91%(h)
|
APA Corp., 5.05%, 05/01/2025(c)
|
|
|
|
|
|
|
|
|
|
|
|
|
|
|
|
|
|
|
BAT International Finance PLC
|
|
|
|
|
|
|
|
|
|
|
|
|
|
|
|
|
|
|
|
|
|
|
|
4.69%–4.69%, 06/02/2025(c)
|
|
|
|
|
|
|
|
|
Broadcom, Inc., 4.86%, 05/09/2025(c)
|
|
|
|
Brookfield BRP Holdings Canada, Inc.
|
|
|
|
|
|
|
|
|
|
|
|
|
|
|
|
|
|
|
Brookfield Infrastructure Holdings Canada,
Inc.
|
|
|
|
|
|
|
|
|
|
|
|
|
|
Brunswick Corp., 5.06%–5.11%,
05/01/2025(c)
|
|
|
|
Brunswick Corp./DE, 5.11%,
05/06/2025(c)
|
|
|
|
Canadian Natural Resources Ltd.
|
|
|
|
|
|
|
|
|
|
|
|
|
|
Charles Schwab Corp. (The), 4.57%,
08/26/2025(c)
|
|
|
|
|
|
|
|
|
|
|
|
|
|
|
|
|
|
|
Constellation Brands, Inc.
|
|
|
|
|
|
|
|
|
|
|
|
|
|
Crown Castle, Inc., 4.94%, 05/01/2025(c)
|
|
|
|
Discovery Communications LLC, 5.26%,
05/08/2025(c)
|
|
|
|
Eversource Energy, 4.83%,
05/12/2025(c)
|
|
|
|
Genuine Parts Co., 4.88%, 05/21/2025(c)
|
|
|
|
|
|
|
|
|
|
|
|
|
|
|
|
|
|
|
See accompanying Notes to Financial Statements which are an integral part of the financial
statements.
Invesco Ultra Short Duration ETF (GSY)—(continued)
April 30, 2025
(Unaudited)
|
|
|
|
|
|
|
|
|
|
|
|
|
|
|
|
|
|
|
|
|
|
|
|
|
|
|
|
|
|
|
|
|
|
Harley-Davidson Financial Services, Inc.
|
|
|
|
|
|
|
|
|
|
|
|
|
|
|
|
|
|
|
|
|
|
|
|
|
|
|
|
|
|
|
|
|
|
|
|
|
|
|
|
|
|
|
|
|
|
|
|
|
Jabil, Inc., 5.08%–5.13%, 05/05/2025(c)
|
|
|
|
National Fuel Gas Co., 5.12%,
05/13/2025
|
|
|
|
Quanta Services, Inc., 4.90%,
05/02/2025(c)
|
|
|
|
|
|
|
|
|
|
|
|
|
|
|
|
|
|
|
|
|
|
|
|
|
|
|
|
|
Stanley Black & Decker, Inc.
|
|
|
|
|
|
|
|
|
|
|
|
|
|
|
|
|
|
|
|
|
|
|
|
|
|
|
|
|
|
|
|
|
|
WGL Holdings, Inc., 5.01%, 05/06/2025(c)
|
|
|
|
White Plains Capital Co. LLC
|
|
|
|
|
|
|
|
|
|
|
|
|
|
|
|
|
|
|
|
|
|
|
|
|
|
|
|
|
Total Commercial Paper
(Cost $773,308,104)
|
|
Certificates of Deposit-1.99%
|
|
|
Natixis S.A. (France), 4.96% (SOFR +
0.60%), 08/04/2025(b)
|
|
|
|
Bank of America N.A., 5.50%,
05/08/2025
|
|
|
|
Intesa Sanpaolo S.p.A. (Italy)
|
|
|
|
|
|
|
|
|
|
|
|
|
|
5.33% (SOFR + 1.00%), 10/16/2026(b)
|
|
|
|
|
|
|
|
|
Total Certificates of Deposit
(Cost $55,000,000)
|
|
|
|
|
|
Repurchase Agreements-1.08%(i)
|
CF Secured LLC, joint open agreement
dated 02/07/2025 (collateralized by
agency mortgage-backed securities and
agency and non-agency asset-backed
securities valued at $26,652,392;
1.12% - 11.00%; 05/25/2036 -
03/26/2068), 5.11%, 05/01/2025(j)
|
|
|
|
Nomura Securities International, Inc., joint
term agreement dated 04/16/2025,
aggregate maturing value of
$30,004,233 (collateralized by
non-agency mortgage-backed securities
and non-agency asset-backed securities
valued at $33,000,001; 0.84% -
10.03%; 09/25/2029 - 08/25/2069),
5.08%, 05/01/2025(k)
|
|
|
|
Santander US Capital Markets LLC, joint
term agreement dated 04/07/2025,
aggregate maturing value of
$30,004,217 (collateralized by agency
and non-agency mortgage-backed
securities and agency and non-agency
asset-backed securities valued at
$33,421,444; 0.00% - 10.60%;
12/25/2030 - 07/25/2067), 5.06%,
05/01/2025(k)
|
|
|
|
Total Repurchase Agreements
(Cost $30,000,000)
|
|
TOTAL INVESTMENTS IN SECURITIES
(excluding investments purchased with cash collateral
from securities on loan)-101.26%
(Cost $2,800,582,266)
|
|
|
|
|
|
Investments Purchased with Cash Collateral
from Securities on Loan
|
|
|
Invesco Private Government Fund,
4.32%(g)(l)(m)
|
|
|
|
Invesco Private Prime Fund, 4.46%(g)(l)(m)
|
|
|
|
Total Investments Purchased with Cash Collateral from
Securities on Loan
(Cost $18,020,618)
|
|
TOTAL INVESTMENTS IN SECURITIES-101.91%
(Cost $2,818,602,884)
|
|
OTHER ASSETS LESS LIABILITIES-(1.91)%
|
|
|
|
|
See accompanying Notes to Financial Statements which are an integral part of the financial
statements.
Invesco Ultra Short Duration ETF (GSY)—(continued)
April 30, 2025
(Unaudited)
Investment Abbreviations:
|
|
|
|
|
|
|
|
|
|
|
|
-Real Estate Investment Trust
|
|
|
-Secured Overnight Financing Rate
|
Notes to Schedule of Investments:
|
|
|
Industry and/or sector classifications used in this report are generally according
to the Global Industry Classification Standard, which was developed by and is
the exclusive property and a service mark of MSCI Inc. and Standard & Poor’s.
|
|
|
Interest or dividend rate is redetermined periodically. Rate shown is the rate in
effect on April 30, 2025.
|
|
|
Security purchased or received in a transaction exempt from registration under the Securities Act of 1933, as amended (the “1933 Act”). The security may be
resold pursuant to an exemption from registration under the 1933 Act, typically to
qualified institutional buyers. The aggregate value of these securities at
April 30, 2025 was $1,309,182,470, which represented 47.25% of the Fund’s Net Assets.
|
|
|
Security issued at a fixed rate for a specific period of time, after which it will
convert to a variable rate.
|
|
|
All or a portion of this security was out on loan at April 30, 2025.
|
|
|
Interest rate is redetermined periodically based on the cash flows generated by the
pool of assets backing the security, less any applicable fees. The rate shown
is the rate in effect on April 30, 2025.
|
|
|
Affiliated holding. Affiliated holdings are investments in entities which are under
common ownership or control of Invesco Ltd. or are investments in entities in
which the Fund owns 5% or more of the outstanding voting securities. The table below shows the Fund’s transactions in, and earnings from, its investments in
affiliates for the six months ended April 30, 2025.
|
|
|
|
|
|
Change in
Unrealized
Appreciation
(Depreciation)
|
|
|
|
Invesco AAA CLO Floating
Rate Note ETF
|
|
|
|
|
|
|
|
Investments Purchased
with Cash Collateral
from Securities on Loan:
|
|
|
|
|
|
|
|
Invesco Private
Government Fund
|
|
|
|
|
|
|
|
Invesco Private Prime
Fund
|
|
|
|
|
|
|
|
|
|
|
|
|
|
|
|
|
|
|
Represents the income earned on the investment of cash collateral, which is included
in securities lending income on the Statements of Operations. Does not
include rebates and fees paid to lending agent or premiums received from borrowers,
if any.
|
|
|
Security traded on a discount basis. The interest rate shown represents the discount
rate at the time of purchase by the Fund.
|
|
|
Principal amount equals value at period end. See Note 2L.
|
|
|
Either party may terminate the agreement upon demand. Interest rate, principal amount
and collateral are redetermined periodically. The Maturity Date
represents the next reset date, and the Repurchase Amount is calculated based on the
next reset date.
|
|
|
Interest rate is redetermined periodically. The Maturity Date represents the next
reset date, and the Repurchase Amount is calculated based on the next reset
date.
|
|
|
The rate shown is the 7-day SEC standardized yield as of April 30, 2025.
|
|
|
The security has been segregated to satisfy the commitment to return the cash collateral received in securities lending transactions upon the borrower’s return
of the securities loaned. See Note 2P.
|
See accompanying Notes to Financial Statements which are an integral part of the financial
statements.
Invesco Variable Rate Investment Grade ETF (VRIG)
April 30, 2025
(Unaudited)
Schedule of Investments(a)
|
|
|
|
U.S. Dollar Denominated Bonds & Notes-39.52%
|
Agricultural & Farm Machinery-0.03%
|
|
|
|
|
|
4.86% (SOFR + 0.48%),
10/22/2025(b)
|
|
|
|
4.98% (SOFR + 0.60%),
04/19/2027(b)
|
|
|
|
|
|
|
|
|
Asset Management & Custody Banks-0.02%
|
Bank of New York Mellon Corp. (The),
5.21% (SOFR + 0.83%),
07/21/2028(b)
|
|
|
|
State Street Corp., 5.23% (SOFR +
0.85%), 08/03/2026(b)
|
|
|
|
|
|
|
|
|
Automobile Manufacturers-5.51%
|
American Honda Finance Corp., 4.91%
(SOFR + 0.55%), 05/11/2026(b)(c)
|
|
|
|
BMW US Capital LLC (Germany)
|
|
|
|
4.98% (SOFR + 0.62%),
08/11/2025(b)(d)
|
|
|
|
5.28% (SOFR + 0.92%),
08/13/2027(b)(d)
|
|
|
|
Daimler Truck Finance North America LLC
(Germany)
|
|
|
|
5.33% (SOFR + 0.96%),
09/25/2027(b)(d)
|
|
|
|
5.22% (SOFR + 0.84%),
01/13/2028(b)(d)
|
|
|
|
Ford Motor Credit Co. LLC
|
|
|
|
7.32% (SOFR + 2.95%),
03/06/2026(b)(c)
|
|
|
|
5.83% (SOFR + 1.45%),
11/05/2026(b)
|
|
|
|
|
|
|
|
|
5.70% (SOFR + 1.32%),
11/03/2025(b)(d)
|
|
|
|
5.88% (SOFR + 1.50%),
01/08/2027(b)(d)
|
|
|
|
5.41% (SOFR + 1.04%),
03/19/2027(b)(d)
|
|
|
|
5.37% (SOFR + 0.99%),
03/25/2027(b)(c)(d)
|
|
|
|
5.42% (SOFR + 1.04%),
06/24/2027(b)(d)
|
|
|
|
5.30% (SOFR + 0.92%),
01/07/2028(b)(d)
|
|
|
|
Mercedes-Benz Finance North
America LLC (Germany)
|
|
|
|
4.95% (SOFR + 0.57%),
08/01/2025(b)(d)
|
|
|
|
5.05% (SOFR + 0.67%),
01/09/2026(b)(d)
|
|
|
|
|
|
|
|
Automobile Manufacturers-(continued)
|
Toyota Motor Credit Corp.
|
|
|
|
5.02% (SOFR + 0.65%),
09/11/2025(b)
|
|
|
|
5.25% (SOFR + 0.89%),
05/18/2026(b)
|
|
|
|
5.02% (SOFR + 0.65%),
03/19/2027(b)
|
|
|
|
Volkswagen Group of America
Finance LLC (Germany)
|
|
|
|
5.30% (SOFR + 0.93%),
09/12/2025(b)(d)
|
|
|
|
5.20% (SOFR + 0.83%),
03/20/2026(b)(d)
|
|
|
|
5.42% (SOFR + 1.06%),
08/14/2026(b)(d)
|
|
|
|
5.44% (SOFR + 1.06%),
03/25/2027(b)(d)
|
|
|
|
|
|
|
|
|
Commercial & Residential Mortgage Finance-0.32%
|
Nationwide Building Society (United
Kingdom), 5.65% (SOFR + 1.29%),
02/16/2028(b)(d)
|
|
|
|
Construction Machinery & Heavy Transportation Equipment-0.01%
|
Caterpillar Financial Services Corp.
|
|
|
|
4.83% (SOFR + 0.46%),
02/27/2026(b)
|
|
|
|
4.88% (SOFR + 0.52%),
05/14/2027(b)
|
|
|
|
|
|
|
|
|
|
|
|
|
|
|
|
5.12% (SOFR + 0.76%),
02/13/2026(b)
|
|
|
|
5.73% (SOFR + 1.35%),
10/30/2026(b)
|
|
|
|
5.35% (SOFR + 0.97%),
07/28/2027(b)
|
|
|
|
5.31% (SOFR + 0.93%),
07/26/2028(b)
|
|
|
|
General Motors Financial Co., Inc.
|
|
|
|
5.41% (SOFR + 1.04%),
02/26/2027(b)(c)
|
|
|
|
5.71% (SOFR + 1.35%),
05/08/2027(b)
|
|
|
|
5.43% (SOFR + 1.05%),
07/15/2027(b)
|
|
|
|
5.55% (SOFR + 1.17%),
04/04/2028(b)(c)
|
|
|
|
|
|
|
|
|
|
|
ABN AMRO Bank N.V. (Netherlands)
|
|
|
|
6.15% (SOFR + 1.78%),
09/18/2027(b)(d)
|
|
|
|
5.37% (SOFR + 1.00%),
12/03/2028(b)(d)
|
|
|
|
See accompanying Notes to Financial Statements which are an integral part of the financial
statements.
Invesco Variable Rate Investment Grade ETF (VRIG)—(continued)
April 30, 2025
(Unaudited)
|
|
|
|
Diversified Banks-(continued)
|
Banco Santander S.A. (Spain)
|
|
|
|
5.75% (SOFR + 1.38%),
03/14/2028(b)(c)
|
|
|
|
5.50% (SOFR + 1.12%),
07/15/2028(b)
|
|
|
|
|
|
|
|
|
5.32% (3 mo. Term SOFR + 1.02%),
09/15/2026(b)
|
|
|
|
5.35% (SOFR + 0.97%),
07/22/2027(b)(c)
|
|
|
|
5.43% (SOFR + 1.05%),
02/04/2028(b)(c)
|
|
|
|
5.21% (SOFR + 0.83%),
01/24/2029(b)
|
|
|
|
Bank of America N.A., 5.14% (SOFR +
0.78%), 08/18/2025(b)
|
|
|
|
Bank of Montreal (Canada)
|
|
|
|
5.70% (SOFR + 1.33%),
06/05/2026(b)
|
|
|
|
5.53% (SOFR + 1.16%),
12/11/2026(b)
|
|
|
|
5.24% (SOFR + 0.86%),
01/27/2029(b)
|
|
|
|
Bank of Nova Scotia (The) (Canada)
|
|
|
|
5.15% (SOFR + 0.78%),
06/04/2027(b)
|
|
|
|
|
|
|
|
|
5.26% (SOFR + 0.89%),
02/14/2029(b)(c)
|
|
|
|
Banque Federative du Credit Mutuel
(France), 5.51% (SOFR + 1.13%),
01/23/2027(b)(d)
|
|
|
|
Banque Federative du Credit Mutuel S.A.
(France), 5.61% (SOFR + 1.23%),
01/22/2030(b)(d)
|
|
|
|
Barclays PLC (United Kingdom)
|
|
|
|
6.25% (SOFR + 1.88%),
09/13/2027(b)
|
|
|
|
5.86% (SOFR + 1.49%),
03/12/2028(b)(c)
|
|
|
|
BNP Paribas S.A. (France), 5.84% (SOFR
+ 1.43%), 05/09/2029(b)(d)
|
|
|
|
BPCE S.A. (France), 6.36% (SOFR +
1.98%), 10/19/2027(b)(c)(d)
|
|
|
|
Canadian Imperial Bank of Commerce
(Canada)
|
|
|
|
5.32% (SOFR + 0.94%),
06/28/2027(b)
|
|
|
|
5.10% (SOFR + 0.72%),
01/13/2028(b)
|
|
|
|
5.41% (SOFR + 1.03%),
03/30/2029(b)(c)
|
|
|
|
|
|
|
|
|
5.18% (SOFR + 0.81%),
09/29/2025(b)
|
|
|
|
5.43% (SOFR + 1.06%),
12/04/2026(b)
|
|
|
|
|
|
|
|
Diversified Banks-(continued)
|
|
|
|
|
|
5.81% (3 mo. Term SOFR + 1.51%),
07/01/2026(b)
|
|
|
|
5.14% (SOFR + 0.77%),
06/09/2027(b)
|
|
|
|
5.65% (SOFR + 1.28%),
02/24/2028(b)
|
|
|
|
5.24% (SOFR + 0.87%),
03/04/2029(b)
|
|
|
|
Commonwealth Bank of Australia
(Australia), 4.78% (SOFR + 0.40%),
07/07/2025(b)(d)
|
|
|
|
Cooperatieve Rabobank U.A.
(Netherlands), 5.28% (SOFR + 0.90%),
10/05/2026(b)
|
|
|
|
Credit Agricole S.A. (France)
|
|
|
|
5.67% (SOFR + 1.29%),
07/05/2026(b)(d)
|
|
|
|
5.58% (SOFR + 1.21%),
09/11/2028(b)(d)
|
|
|
|
Fifth Third Bank N.A., 5.19% (SOFR +
0.81%), 01/28/2028(b)(c)
|
|
|
|
HSBC Holdings PLC (United Kingdom)
|
|
|
|
5.94% (3 mo. Term SOFR + 1.64%),
09/12/2026(b)
|
|
|
|
5.93% (SOFR + 1.57%),
08/14/2027(b)
|
|
|
|
5.40% (SOFR + 1.03%),
03/03/2029(b)
|
|
|
|
5.65% (SOFR + 1.29%),
11/19/2030(b)
|
|
|
|
HSBC USA, Inc., 5.33% (SOFR + 0.96%),
03/04/2027(b)(c)
|
|
|
|
Huntington National Bank (The), 5.10%
(SOFR + 0.72%), 04/12/2028(b)
|
|
|
|
ING Groep N.V. (Netherlands)
|
|
|
|
5.93% (SOFR + 1.56%),
09/11/2027(b)
|
|
|
|
5.39% (SOFR + 1.01%),
03/25/2029(b)
|
|
|
|
|
|
|
|
|
5.26% (SOFR + 0.89%),
04/22/2027(b)
|
|
|
|
5.58% (SOFR + 1.20%),
01/23/2028(b)
|
|
|
|
5.55% (SOFR + 1.18%),
02/24/2028(b)(c)
|
|
|
|
5.30% (SOFR + 0.92%),
04/22/2028(b)(c)
|
|
|
|
5.31% (SOFR + 0.93%),
07/22/2028(b)
|
|
|
|
5.18% (SOFR + 0.80%),
01/24/2029(b)(c)
|
|
|
|
See accompanying Notes to Financial Statements which are an integral part of the financial
statements.
Invesco Variable Rate Investment Grade ETF (VRIG)—(continued)
April 30, 2025
(Unaudited)
|
|
|
|
Diversified Banks-(continued)
|
Lloyds Banking Group PLC (United
Kingdom)
|
|
|
|
5.92% (SOFR + 1.56%),
08/07/2027(b)
|
|
|
|
5.96% (SOFR + 1.58%),
01/05/2028(b)
|
|
|
|
5.43% (SOFR + 1.06%),
11/26/2028(b)
|
|
|
|
Macquarie Bank Ltd. (Australia)
|
|
|
|
5.57% (SOFR + 1.20%),
12/07/2026(b)(d)
|
|
|
|
5.30% (SOFR + 0.92%),
07/02/2027(b)(c)(d)
|
|
|
|
Mitsubishi UFJ Financial Group, Inc.
(Japan), 5.86% (SOFR + 1.48%),
04/24/2031(b)(c)
|
|
|
|
Mizuho Financial Group, Inc. (Japan)
|
|
|
|
5.32% (SOFR + 0.96%),
05/22/2026(b)
|
|
|
|
5.44% (SOFR + 1.08%),
05/13/2031(b)(c)
|
|
|
|
|
|
|
|
|
5.16% (SOFR + 0.78%),
07/16/2025(b)
|
|
|
|
5.55% (SOFR + 1.17%),
10/30/2026(b)
|
|
|
|
5.46% (SOFR + 1.08%),
01/14/2028(b)
|
|
|
|
5.23% (SOFR + 0.87%),
05/26/2028(b)
|
|
|
|
5.32% (SOFR + 0.94%),
07/14/2028(b)
|
|
|
|
National Australia Bank Ltd. (Australia)
|
|
|
|
5.12% (SOFR + 0.76%),
05/13/2025(b)(d)
|
|
|
|
5.02% (SOFR + 0.65%),
12/10/2025(b)(d)
|
|
|
|
4.99% (SOFR + 0.62%),
06/11/2027(b)(c)(d)
|
|
|
|
NatWest Group PLC (United Kingdom),
5.66% (SOFR + 1.30%),
11/15/2028(b)
|
|
|
|
Royal Bank of Canada (Canada)
|
|
|
|
4.90% (SOFR + 0.53%),
01/20/2026(b)
|
|
|
|
4.95% (SOFR + 0.57%),
04/27/2026(b)
|
|
|
|
5.46% (SOFR + 1.08%),
07/20/2026(b)
|
|
|
|
5.33% (SOFR + 0.95%),
01/19/2027(b)
|
|
|
|
5.24% (SOFR + 0.86%),
10/18/2028(b)
|
|
|
|
Societe Generale S.A. (France)
|
|
|
|
5.46% (SOFR + 1.10%),
02/19/2027(b)(d)
|
|
|
|
6.04% (SOFR + 1.66%),
01/19/2028(b)(d)
|
|
|
|
|
|
|
|
Diversified Banks-(continued)
|
Standard Chartered Bank (United
Kingdom), 5.03% (SOFR + 0.65%),
10/08/2026(b)(c)
|
|
|
|
Standard Chartered PLC (United
Kingdom)
|
|
|
|
6.39% (SOFR + 2.03%),
02/08/2028(b)(d)
|
|
|
|
5.53% (SOFR + 1.17%),
05/14/2028(b)(d)
|
|
|
|
5.62% (SOFR + 1.24%),
01/21/2029(b)(d)
|
|
|
|
Sumitomo Mitsui Financial Group, Inc.
(Japan), 5.81% (SOFR + 1.43%),
01/13/2026(b)
|
|
|
|
Sumitomo Mitsui Trust Bank Ltd. (Japan),
5.35% (SOFR + 0.98%),
09/10/2027(b)(d)
|
|
|
|
Svenska Handelsbanken AB (Sweden)
|
|
|
|
5.62% (SOFR + 1.25%),
06/15/2026(b)(d)
|
|
|
|
5.03% (SOFR + 0.66%),
05/28/2027(b)(c)(d)
|
|
|
|
Swedbank AB (Sweden), 5.75% (SOFR +
1.38%), 06/15/2026(b)(d)
|
|
|
|
Toronto-Dominion Bank (The) (Canada)
|
|
|
|
5.39% (SOFR + 1.02%),
06/06/2025(b)
|
|
|
|
5.46% (SOFR + 1.08%),
07/17/2026(b)
|
|
|
|
UBS AG (Switzerland), 5.30% (SOFR +
0.93%), 09/11/2025(b)
|
|
|
|
USB Realty Corp., 5.67% (3 mo. Term
SOFR + 1.41%)(b)(d)(e)
|
|
|
|
|
|
|
|
|
5.16% (SOFR + 0.78%),
01/24/2028(b)
|
|
|
|
5.45% (SOFR + 1.07%),
04/22/2028(b)
|
|
|
|
5.75% (SOFR + 1.37%),
04/23/2029(b)(c)
|
|
|
|
|
|
|
|
|
5.19% (SOFR + 0.80%),
08/01/2025(b)
|
|
|
|
5.09% (SOFR + 0.71%),
01/15/2026(b)
|
|
|
|
5.42% (SOFR + 1.06%),
08/07/2026(b)
|
|
|
|
5.44% (SOFR + 1.07%),
12/11/2026(b)
|
|
|
|
See accompanying Notes to Financial Statements which are an integral part of the financial
statements.
Invesco Variable Rate Investment Grade ETF (VRIG)—(continued)
April 30, 2025
(Unaudited)
|
|
|
|
Diversified Banks-(continued)
|
Westpac Banking Corp. (Australia)
|
|
|
|
5.37% (SOFR + 1.00%),
08/26/2025(b)
|
|
|
|
5.08% (SOFR + 0.72%),
11/17/2025(b)
|
|
|
|
4.89% (SOFR + 0.52%),
06/03/2026(b)
|
|
|
|
5.19% (SOFR + 0.81%),
04/16/2029(b)
|
|
|
|
|
|
|
|
|
Diversified Capital Markets-0.84%
|
Deutsche Bank AG (Germany)
|
|
|
|
5.58% (SOFR + 1.22%),
11/16/2027(b)
|
|
|
|
5.59% (SOFR + 1.21%),
01/10/2029(b)
|
|
|
|
Macquarie Group Ltd. (Australia), 5.29%
(SOFR + 0.92%), 09/23/2027(b)(d)
|
|
|
|
|
|
|
|
|
Diversified Financial Services-0.13%
|
LPL Holdings, Inc., 4.90%,
04/03/2028(c)
|
|
|
|
Diversified Metals & Mining-0.96%
|
Glencore Funding LLC (Australia)
|
|
|
|
5.13% (SOFR + 0.75%),
10/01/2026(b)(d)
|
|
|
|
5.44% (SOFR + 1.06%),
04/04/2027(b)(d)
|
|
|
|
Rio Tinto Finance (USA) PLC (Australia),
5.21% (SOFR + 0.84%),
03/14/2028(b)
|
|
|
|
|
|
|
|
|
|
|
Consolidated Edison Co. of New York,
Inc., 4.88% (SOFR + 0.52%),
11/18/2027(b)
|
|
|
|
Georgia Power Co., 4.65% (SOFR +
0.28%), 09/15/2026(b)
|
|
|
|
National Rural Utilities Cooperative
Finance Corp.
|
|
|
|
5.18% (SOFR + 0.80%),
02/05/2027(b)
|
|
|
|
5.19% (SOFR + 0.82%),
09/16/2027(b)
|
|
|
|
Pacific Gas and Electric Co., 5.32% (SOFR
+ 0.95%), 09/04/2025(b)
|
|
|
|
Pinnacle West Capital Corp., 5.19%
(SOFR + 0.82%), 06/10/2026(b)
|
|
|
|
|
|
|
|
|
|
|
Marsh & McLennan Cos., Inc., 5.06%
(SOFR + 0.70%), 11/08/2027(b)(c)
|
|
|
|
|
|
|
|
Investment Banking & Brokerage-2.70%
|
Charles Schwab Corp. (The)
|
|
|
|
4.88% (SOFR + 0.52%),
05/13/2026(b)
|
|
|
|
5.42% (SOFR + 1.05%),
03/03/2027(b)(c)
|
|
|
|
Goldman Sachs Group, Inc. (The)
|
|
|
|
5.43% (SOFR + 1.07%),
08/10/2026(b)
|
|
|
|
5.18% (SOFR + 0.81%),
03/09/2027(b)
|
|
|
|
5.19% (SOFR + 0.82%),
09/10/2027(b)(c)
|
|
|
|
5.30% (SOFR + 0.92%),
10/21/2027(b)
|
|
|
|
6.29% (3 mo. Term SOFR + 2.01%),
10/28/2027(b)
|
|
|
|
6.22% (SOFR + 1.85%),
03/15/2028(b)
|
|
|
|
5.67% (SOFR + 1.29%),
04/23/2028(b)(c)
|
|
|
|
|
|
|
|
|
5.40% (SOFR + 1.02%),
04/13/2028(b)
|
|
|
|
5.76% (SOFR + 1.38%),
04/12/2029(b)(c)
|
|
|
|
|
|
|
|
|
Life & Health Insurance-4.48%
|
|
|
|
|
|
5.21% (SOFR + 0.85%),
05/08/2026(b)(d)
|
|
|
|
5.40% (SOFR + 1.03%),
08/27/2026(b)(d)
|
|
|
|
5.59% (SOFR + 1.21%),
03/25/2027(b)(d)
|
|
|
|
5.32% (SOFR + 0.95%),
03/06/2028(b)(d)
|
|
|
|
Corebridge Global Funding
|
|
|
|
5.68% (SOFR + 1.30%),
09/25/2026(b)(d)
|
|
|
|
5.13% (SOFR + 0.75%),
01/07/2028(b)(d)
|
|
|
|
Jackson National Life Global Funding,
5.35% (SOFR + 0.97%),
01/14/2028(b)(d)
|
|
|
|
MassMutual Global Funding II
|
|
|
|
5.15% (SOFR + 0.77%),
01/29/2027(b)(d)
|
|
|
|
5.12% (SOFR + 0.74%),
04/09/2027(b)(d)
|
|
|
|
New York Life Global Funding, 4.85%
(SOFR + 0.48%), 06/09/2026(b)(d)
|
|
|
|
See accompanying Notes to Financial Statements which are an integral part of the financial
statements.
Invesco Variable Rate Investment Grade ETF (VRIG)—(continued)
April 30, 2025
(Unaudited)
|
|
|
|
Life & Health Insurance-(continued)
|
Pacific Life Global Funding II
|
|
|
|
4.99% (SOFR + 0.62%),
06/04/2026(b)(d)
|
|
|
|
5.43% (SOFR + 1.05%),
07/28/2026(b)(d)
|
|
|
|
5.23% (SOFR + 0.85%),
02/05/2027(b)(d)
|
|
|
|
Protective Life Global Funding, 5.08%
(SOFR + 0.70%), 04/10/2026(b)(d)
|
|
|
|
|
|
|
|
|
Managed Health Care-0.01%
|
UnitedHealth Group, Inc., 4.88% (SOFR +
0.50%), 07/15/2026(b)
|
|
|
|
|
|
Bristol-Myers Squibb Co., 4.85% (SOFR +
0.49%), 02/20/2026(b)
|
|
|
|
|
|
Santander Holdings USA, Inc., 5.98%
(SOFR + 1.61%), 03/20/2029(b)
|
|
|
|
Soft Drinks & Non-alcoholic Beverages-0.88%
|
|
|
|
|
|
4.97% (SOFR + 0.58%),
11/15/2026(b)
|
|
|
|
5.25% (SOFR + 0.88%),
03/15/2027(b)(c)
|
|
|
|
PepsiCo, Inc., 4.76% (SOFR + 0.40%),
02/13/2026(b)
|
|
|
|
|
|
|
|
|
Transaction & Payment Processing Services-0.04%
|
PayPal Holdings, Inc., 5.04% (SOFR +
0.67%), 03/06/2028(b)
|
|
|
|
Total U.S. Dollar Denominated Bonds & Notes
(Cost $500,409,702)
|
|
U.S. Treasury Securities-22.58%
|
U.S. Treasury Floating Rate Notes-22.58%
|
4.45% (3 mo. U.S. Treasury Bill Money
Market Yield Rate + 0.21%),
10/31/2026(b)
|
|
|
|
4.34% (3 mo. U.S. Treasury Bill Money
Market Yield Rate + 0.10%),
01/31/2027(b)
|
|
|
|
Total U.S. Treasury Securities
(Cost $285,996,063)
|
|
|
|
Asset-Backed Securities-15.60%
|
Adjustable Rate Mortgage Trust,
Series 2004-2, Class 6A1, 0.71%,
02/25/2035(f)
|
|
|
|
Amur Equipment Finance Receivables
XIII LLC, Series 2024-1A, Class A2,
5.38%, 01/21/2031(d)
|
|
|
|
Angel Oak Mortgage Trust, Series 2025-
HB1, Class A1, 6.15% (30 Day
Average SOFR + 1.80%),
02/25/2055(b)(d)
|
|
|
|
|
|
|
|
|
|
Avis Budget Rental Car Funding (AESOP)
LLC, Series 2020-2A, Class C, 4.25%,
02/20/2027(d)
|
|
|
|
BAMLL Commercial Mortgage Securities
Trust, Series 2022-DKLX, Class A,
5.47% (1 mo. Term SOFR + 1.15%),
01/15/2039(b)(d)
|
|
|
|
BBCMS Mortgage Trust, Series 2019-
BWAY, Class B, 5.75% (1 mo. Term
SOFR + 1.42%), 11/15/2034(b)(d)
|
|
|
|
Bear Stearns Adjustable Rate Mortgage
Trust
|
|
|
|
Series 2003-7, Class 6A, 6.37%,
10/25/2033(f)
|
|
|
|
Series 2003-8, Class 4A1, 6.95%,
01/25/2034(f)
|
|
|
|
BIG Commercial Mortgage Trust,
Series 2022, Class A, 5.66% (1 mo.
Term SOFR + 1.34%),
02/15/2039(b)(d)
|
|
|
|
BX Commercial Mortgage Trust
|
|
|
|
Series 2021-ACNT, Class B, 5.69% (1
mo. Term SOFR + 1.36%),
11/15/2038(b)(d)
|
|
|
|
Series 2021-VINO, Class B, 5.29% (1
mo. Term SOFR + 0.97%),
05/15/2038(b)(d)
|
|
|
|
Series 2021-VOLT, Class A, 5.14% (1
mo. Term SOFR + 0.81%),
09/15/2036(b)(d)
|
|
|
|
Series 2021-VOLT, Class B, 5.39% (1
mo. Term SOFR + 1.06%),
09/15/2036(b)(d)
|
|
|
|
Series 2021-VOLT, Class C, 5.54% (1
mo. Term SOFR + 1.21%),
09/15/2036(b)(d)
|
|
|
|
Series 2021-VOLT, Class D, 6.09% (1
mo. Term SOFR + 1.76%),
09/15/2036(b)(d)
|
|
|
|
|
|
|
|
|
Series 2021-LGCY, Class B, 5.29% (1
mo. Term SOFR + 0.97%),
10/15/2036(b)(d)
|
|
|
|
Series 2022-IND, Class C, 6.61% (1
mo. Term SOFR + 2.29%),
04/15/2037(b)(d)
|
|
|
|
Series 2022-LBA6, Class B, 5.62% (1
mo. Term SOFR + 1.30%),
01/15/2039(b)(d)
|
|
|
|
CarMax Auto Owner Trust, Series 2024-
1, Class C, 5.47%, 08/15/2029
|
|
|
|
Carmax Select Receivables Trust 2024-A,
Series 2024-A, Class C, 5.62%,
01/15/2030
|
|
|
|
CCG Receivables Trust, Series 2023-2,
Class A2, 6.28%, 04/14/2032(d)
|
|
|
|
Chase Home Lending Mortgage Trust
|
|
|
|
Series 2024-6, Class A11, 5.60%
(30 Day Average SOFR + 1.25%),
05/25/2055(b)(d)
|
|
|
|
See accompanying Notes to Financial Statements which are an integral part of the financial
statements.
Invesco Variable Rate Investment Grade ETF (VRIG)—(continued)
April 30, 2025
(Unaudited)
|
|
|
|
|
|
Series 2024-7, Class A11, 5.65%
(30 Day Average SOFR + 1.30%),
06/25/2055(b)(d)
|
|
|
|
Series 2025-1, Class A11, 5.55%
(30 Day Average SOFR + 1.20%),
11/25/2055(b)(d)
|
|
|
|
Citigroup Mortgage Loan Trust,
Series 2024-1, Class A11, 5.70%
(30 Day Average SOFR + 1.35%),
07/25/2054(b)(d)
|
|
|
|
Commonbond Student Loan Trust
|
|
|
|
Series 2017-BGS, Class A2, 5.09% (1
mo. Term SOFR + 0.76%),
09/25/2042(b)(d)
|
|
|
|
Series 2018-AGS, Class A2, 4.94% (1
mo. Term SOFR + 0.61%),
02/25/2044(b)(d)
|
|
|
|
Series 2018-CGS, Class A2, 5.24% (1
mo. Term SOFR + 0.91%),
02/25/2046(b)(d)
|
|
|
|
CPS Auto Receivables Trust
|
|
|
|
Series 2023-D, Class C, 7.17%,
01/15/2030(d)
|
|
|
|
Series 2024-D, Class C, 4.76%,
01/15/2031(d)
|
|
|
|
Edsouth Indenture No. 9 LLC,
Series 2015-1, Class A, 5.27% (30 Day
Average SOFR + 0.91%),
10/25/2056(b)(d)
|
|
|
|
Extended Stay America Trust,
Series 2021-ESH, Class B, 5.82% (1
mo. Term SOFR + 1.49%),
07/15/2038(b)(d)
|
|
|
|
Ford Credit Auto Lease Trust,
Series 2024-B, Class B, 5.18%,
02/15/2028
|
|
|
|
Ford Credit Floorplan Master Owner
Trust, Series 2023-1, Class A2, 5.60%
(30 Day Average SOFR + 1.25%),
05/15/2028(b)(d)
|
|
|
|
GMF Floorplan Owner Revolving Trust,
Series 2023-1, Class A2, 5.50%
(30 Day Average SOFR + 1.15%),
06/15/2028(b)(d)
|
|
|
|
GS Mortgage-Backed Securities Trust,
Series 2024-HE1, Class A1, 5.95%
(30 Day Average SOFR + 1.60%),
08/25/2054(b)(d)
|
|
|
|
HPEFS Equipment Trust, Series 2023-2A,
Class D, 6.97%, 07/21/2031(d)
|
|
|
|
J.P. Morgan Mortgage Trust
|
|
|
|
Series 2024-11, Class A11, 5.60%
(30 Day Average SOFR + 1.25%),
04/25/2055(b)(d)
|
|
|
|
Series 2024-9, Class A11, 5.70%
(30 Day Average SOFR + 1.35%),
02/25/2055(b)(d)
|
|
|
|
|
|
|
|
|
|
JP Morgan Chase Commercial Mortgage
Securities Trust, Series 2018-PHH,
Class B, 5.83% (1 mo. Term SOFR +
1.51%), 06/15/2035(b)(d)
|
|
|
|
|
|
|
|
|
Series 2019-6, Class A11, 5.34% (1
mo. Term SOFR + 1.01%),
12/25/2049(b)(d)
|
|
|
|
Series 2019-INV2, Class A1, 5.34% (1
mo. Term SOFR + 1.01%),
02/25/2050(b)(d)
|
|
|
|
Series 2019-INV3, Class A11, 5.44%
(1 mo. Term SOFR + 1.11%),
05/25/2050(b)(d)
|
|
|
|
Series 2019-LTV3, Class A1, 5.29% (1
mo. Term SOFR + 0.96%),
03/25/2050(b)(d)
|
|
|
|
Series 2020-8, Class A11, 5.24%
(30 Day Average SOFR + 0.90%),
03/25/2051(b)(d)
|
|
|
|
Series 2020-LTV1, Class A11, 5.44%
(1 mo. Term SOFR + 1.11%),
06/25/2050(b)(d)
|
|
|
|
Series 2021-1, Class A11, 4.99%
(30 Day Average SOFR + 0.65%),
06/25/2051(b)(d)
|
|
|
|
Series 2024-5, Class A11, 5.60%
(30 Day Average SOFR + 1.25%),
11/25/2054(b)(d)
|
|
|
|
MED Commercial Mortgage Trust,
Series 2024-MOB, Class A, 5.91% (1
mo. Term SOFR + 1.59%),
05/15/2041(b)(d)
|
|
|
|
Mello Mortgage Capital Acceptance Trust,
Series 2021-INV2, Class A1, 5.00%
(30 Day Average SOFR + 0.95%),
08/25/2051(b)(d)
|
|
|
|
Merchants Fleet Funding LLC,
Series 2023-1A, Class A, 7.21%,
05/20/2036(d)
|
|
|
|
Merrill Lynch Mortgage Investors Trust
|
|
|
|
Series 2003-F, Class A1, 5.08% (1 mo.
Term SOFR + 0.75%), 10/25/2028(b)
|
|
|
|
Series 2005-A2, Class A5, 5.54%,
02/25/2035(f)
|
|
|
|
MHC Commercial Mortgage Trust,
Series 2021-MHC, Class B, 5.54% (1
mo. Term SOFR + 1.22%),
04/15/2038(b)(d)
|
|
|
|
MHP, Series 2021-STOR, Class C, 5.49%
(1 mo. Term SOFR + 1.16%),
07/15/2038(b)(d)
|
|
|
|
MHP Commercial Mortgage Trust,
Series 2021-STOR, Class B, 5.34% (1
mo. Term SOFR + 1.01%),
07/15/2038(b)(d)
|
|
|
|
Morgan Stanley Residential Mortgage
Loan Trust, Series 2024-4, Class AF,
5.70% (30 Day Average SOFR +
1.35%), 09/25/2054(b)(d)
|
|
|
|
See accompanying Notes to Financial Statements which are an integral part of the financial
statements.
Invesco Variable Rate Investment Grade ETF (VRIG)—(continued)
April 30, 2025
(Unaudited)
|
|
|
|
|
|
MSC Trust, Series 2021-ILP, Class A,
5.21% (1 mo. Term SOFR + 0.89%),
11/15/2036(b)(d)
|
|
|
|
Navient Student Loan Trust
|
|
|
|
Series 2021-1A, Class A1B, 5.07%
(30 Day Average SOFR + 0.71%),
12/26/2069(b)(d)
|
|
|
|
Series 2021-2A, Class A1B, 5.02%
(30 Day Average SOFR + 0.66%),
02/25/2070(b)(d)
|
|
|
|
Navistar Financial Dealer Note Master
Owner Trust
|
|
|
|
Series 2024-1, Class B, 5.79%,
04/25/2029(d)
|
|
|
|
Series 2024-1, Class C, 6.13%,
04/25/2029(d)
|
|
|
|
Nelnet Student Loan Trust
|
|
|
|
Series 2006-2, Class A7, 5.21%
(90 Day Average SOFR + 0.84%),
01/26/2037(b)(d)
|
|
|
|
Series 2014-3A, Class A, 5.05%
(30 Day Average SOFR + 0.69%),
06/25/2041(b)(d)
|
|
|
|
Series 2020-5A, Class A, 5.32% (1 mo.
Term SOFR + 0.99%),
10/25/2068(b)(d)
|
|
|
|
Series 2021-A, Class A2, 5.46% (1 mo.
Term SOFR + 1.14%),
04/20/2062(b)(d)
|
|
|
|
Nelnet Student Loan Trust 2025-A,
Series 2025-AA, Class A1B, 0.00%
(30 Day Average SOFR + 1.10%),
03/15/2057(b)(d)
|
|
|
|
NextGear Floorplan Master Owner Trust,
Series 2024-1A, Class A1, 5.25%
(30 Day Average SOFR + 0.90%),
03/15/2029(b)(d)
|
|
|
|
|
|
|
|
|
Series 2018-EXP2, Class 2A2, 5.39%
(1 mo. Term SOFR + 1.06%),
07/25/2058(b)(d)
|
|
|
|
Series 2019-EXP1, Class 2A1B, 5.39%
(1 mo. Term SOFR + 1.06%),
01/25/2059(b)(d)
|
|
|
|
Series 2019-EXP1, Class 2A2, 5.59%
(1 mo. Term SOFR + 1.26%),
01/25/2059(b)(d)
|
|
|
|
Series 2019-EXP2, Class 2A2, 5.64%
(1 mo. Term SOFR + 1.31%),
06/25/2059(b)(d)
|
|
|
|
Series 2019-INV2, Class A11, 5.39%
(1 mo. Term SOFR + 1.06%),
05/27/2049(b)(d)
|
|
|
|
Series 2020-EXP1, Class 2A2, 5.39%
(1 mo. Term SOFR + 1.06%),
02/25/2060(b)(d)
|
|
|
|
Series 2020-EXP3, Class 2A2, 5.64%
(1 mo. Term SOFR + 1.31%),
01/25/2060(b)(d)
|
|
|
|
|
|
|
|
|
|
Series 2020-INV1, Class A11, 5.34%
(1 mo. Term SOFR + 1.01%),
12/25/2049(b)(d)
|
|
|
|
Series 2024-NQM5, Class A1, 5.99%,
01/25/2064(d)
|
|
|
|
Series 2025-HE1, Class A1, 5.95%
(30 Day Average SOFR + 1.60%),
02/25/2055(b)(d)
|
|
|
|
OneMain Financial Issuance Trust,
Series 2023-2A, Class A2, 5.84%
(30 Day Average SOFR + 1.50%),
09/15/2036(b)(d)
|
|
|
|
RLGH Trust, Series 2021-TROT, Class B,
5.60% (1 mo. Term SOFR + 1.28%),
04/15/2036(b)(d)
|
|
|
|
SMB Private Education Loan Trust
|
|
|
|
Series 2019-B, Class A2B, 5.44% (1
mo. Term SOFR + 1.11%),
06/15/2037(b)(d)
|
|
|
|
Series 2020-A, Class A2B, 5.27% (1
mo. Term SOFR + 0.94%),
09/15/2037(b)(d)
|
|
|
|
Series 2021-A, Class A2A2, 5.17% (1
mo. Term SOFR + 0.84%),
01/15/2053(b)(d)
|
|
|
|
Series 2022-B, Class A1B, 5.80%
(30 Day Average SOFR + 1.45%),
02/16/2055(b)(d)
|
|
|
|
Series 2022-C, Class A1B, 6.20%
(30 Day Average SOFR + 1.85%),
05/16/2050(b)(d)
|
|
|
|
Series 2023-C, Class A1B, 5.90%
(30 Day Average SOFR + 1.55%),
11/15/2052(b)(d)
|
|
|
|
Series 2024-D, Class A1B, 5.45%
(30 Day Average SOFR + 1.10%),
07/15/2053(b)(d)
|
|
|
|
Series 2024-F, Class A1B, 5.35%
(30 Day Average SOFR + 1.00%),
03/16/2054(b)(d)
|
|
|
|
SMRT, Series 2022-MINI, Class B, 5.67%
(1 mo. Term SOFR + 1.35%),
01/15/2039(b)(d)
|
|
|
|
SREIT Trust, Series 2021-PALM, Class A,
5.03% (1 mo. Term SOFR + 0.70%),
10/15/2034(b)(d)
|
|
|
|
Tesla Auto Lease Trust, Series 2023-A,
Class B, 6.41%, 07/20/2027(d)
|
|
|
|
WaMu Mortgage Pass-Through Ctfs.
Trust, Series 2004-AR3, Class A2,
4.52%, 06/25/2034(f)
|
|
|
|
Wells Fargo Commercial Mortgage Trust,
Series 2016-NXS5, Class A6FL, 5.99%
(1 mo. Term SOFR + 1.66%),
01/15/2059(b)(d)
|
|
|
|
Westlake Automobile Receivables Trust,
Series 2023-4A, Class C, 6.64%,
11/15/2028(d)
|
|
|
|
See accompanying Notes to Financial Statements which are an integral part of the financial
statements.
Invesco Variable Rate Investment Grade ETF (VRIG)—(continued)
April 30, 2025
(Unaudited)
|
|
|
|
|
|
Wheels Fleet Lease Funding 1 LLC,
Series 2025-1A, Class A1, 4.57%,
01/18/2040(d)
|
|
|
|
Total Asset-Backed Securities
(Cost $200,799,847)
|
|
|
|
Agency Credit Risk Transfer Notes-14.84%
|
Fannie Mae Connecticut Avenue
Securities
|
|
|
|
Series 2021-R03, Class 1M1, 5.20%
(30 Day Average SOFR + 0.85%),
12/25/2041(b)(d)(g)
|
|
|
|
Series 2022-R01, Class 1M1, 5.35%
(30 Day Average SOFR + 1.00%),
12/25/2041(b)(d)(g)
|
|
|
|
Series 2022-R01, Class 1M2, 6.25%
(30 Day Average SOFR + 1.90%),
12/25/2041(b)(d)(g)
|
|
|
|
Series 2022-R02, Class 2M1, 5.55%
(30 Day Average SOFR + 1.20%),
01/25/2042(b)(d)(g)
|
|
|
|
Series 2022-R02, Class 2M2, 7.35%
(30 Day Average SOFR + 3.00%),
01/25/2042(b)(d)(g)
|
|
|
|
Series 2022-R03, Class 1M1, 6.45%
(30 Day Average SOFR + 2.10%),
03/25/2042(b)(d)(g)
|
|
|
|
Series 2022-R04, Class 1M1, 6.35%
(30 Day Average SOFR + 2.00%),
03/25/2042(b)(d)(g)
|
|
|
|
Series 2022-R04, Class 1M2, 7.45%
(30 Day Average SOFR + 3.10%),
03/25/2042(b)(d)(g)
|
|
|
|
Series 2022-R05, Class 2M1, 6.25%
(30 Day Average SOFR + 1.90%),
04/25/2042(b)(d)(g)
|
|
|
|
Series 2022-R05, Class 2M2, 7.35%
(30 Day Average SOFR + 3.00%),
04/25/2042(b)(d)(g)
|
|
|
|
Series 2022-R06, Class 1M1, 7.10%
(30 Day Average SOFR + 2.75%),
05/25/2042(b)(d)(g)
|
|
|
|
Series 2022-R07, Class 1M1, 7.30%
(30 Day Average SOFR + 2.95%),
06/25/2042(b)(d)(g)
|
|
|
|
Series 2022-R08, Class 1M1, 6.90%
(30 Day Average SOFR + 2.55%),
07/25/2042(b)(d)(g)
|
|
|
|
Series 2023-R01, Class 1M1, 6.75%
(30 Day Average SOFR + 2.40%),
12/25/2042(b)(d)(g)
|
|
|
|
Series 2023-R01, Class 1M2, 8.10%
(30 Day Average SOFR + 3.75%),
12/25/2042(b)(d)(g)
|
|
|
|
Series 2023-R02, Class 1M1, 6.65%
(30 Day Average SOFR + 2.30%),
01/25/2043(b)(d)(g)
|
|
|
|
|
|
|
|
|
|
Series 2023-R02, Class 1M2, 7.70%
(30 Day Average SOFR + 3.35%),
01/25/2043(b)(d)(g)
|
|
|
|
Series 2023-R03, Class 2M1, 6.85%
(30 Day Average SOFR + 2.50%),
04/25/2043(b)(d)(g)
|
|
|
|
Series 2023-R03, Class 2M2, 8.25%
(30 Day Average SOFR + 3.90%),
04/25/2043(b)(d)(g)
|
|
|
|
Series 2023-R04, Class 1M1, 6.65%
(30 Day Average SOFR + 2.30%),
05/25/2043(b)(d)(g)
|
|
|
|
Series 2023-R04, Class 1M2, 7.90%
(30 Day Average SOFR + 3.55%),
05/25/2043(b)(d)(g)
|
|
|
|
Series 2023-R05, Class 1M1, 6.25%
(30 Day Average SOFR + 1.90%),
06/25/2043(b)(d)(g)
|
|
|
|
Series 2023-R05, Class 1M2, 7.45%
(30 Day Average SOFR + 3.10%),
06/25/2043(b)(d)(g)
|
|
|
|
Series 2023-R06, Class 1M1, 6.05%
(30 Day Average SOFR + 1.70%),
07/25/2043(b)(d)(g)
|
|
|
|
Series 2023-R06, Class 1M2, 7.05%
(30 Day Average SOFR + 2.70%),
07/25/2043(b)(d)(g)
|
|
|
|
Series 2023-R07, Class 2M2, 7.60%
(30 Day Average SOFR + 3.25%),
09/25/2043(b)(d)(g)
|
|
|
|
Series 2023-R08, Class 1M1, 5.85%
(30 Day Average SOFR + 1.50%),
10/25/2043(b)(d)(g)
|
|
|
|
Series 2023-R08, Class 1M2, 6.85%
(30 Day Average SOFR + 2.50%),
10/25/2043(b)(d)(g)
|
|
|
|
Series 2024-R03, Class 2M2, 6.30%
(30 Day Average SOFR + 1.95%),
03/25/2044(b)(d)(g)
|
|
|
|
Series 2024-R04, Class 1M1, 5.45%
(30 Day Average SOFR + 1.10%),
05/25/2044(b)(d)(g)
|
|
|
|
Series 2025-R02, Class 1M1, 5.50%
(30 Day Average SOFR + 1.15%),
02/25/2045(b)(d)(g)
|
|
|
|
Series 2025-R03, Class 2M2, 6.60%
(30 Day Average SOFR + 2.25%),
03/25/2045(b)(d)(g)
|
|
|
|
|
|
|
|
|
Series 2021-DNA5, Class M2, STACR®,
6.00% (30 Day Average SOFR +
1.65%), 01/25/2034(b)(d)(h)
|
|
|
|
Series 2021-DNA6, Class M2, STACR®,
5.85% (30 Day Average SOFR +
1.50%), 10/25/2041(b)(d)(h)
|
|
|
|
Series 2021-HQA4, Class M1, STACR®,
5.30% (30 Day Average SOFR +
0.95%), 12/25/2041(b)(d)(h)
|
|
|
|
See accompanying Notes to Financial Statements which are an integral part of the financial
statements.
Invesco Variable Rate Investment Grade ETF (VRIG)—(continued)
April 30, 2025
(Unaudited)
|
|
|
|
|
|
Series 2022-DNA2, Class M1A,
STACR®, 5.65% (30 Day Average
SOFR + 1.30%), 02/25/2042(b)(d)(h)
|
|
|
|
Series 2022-DNA2, Class M1B,
STACR®, 6.75% (30 Day Average
SOFR + 2.40%), 02/25/2042(b)(d)(h)
|
|
|
|
Series 2022-DNA3, Class M1A,
STACR®, 6.35% (30 Day Average
SOFR + 2.00%), 04/25/2042(b)(d)(h)
|
|
|
|
Series 2022-DNA3, Class M1B,
STACR®, 7.25% (30 Day Average
SOFR + 2.90%), 04/25/2042(b)(d)(h)
|
|
|
|
Series 2022-DNA4, Class M1, STACR®,
7.70% (30 Day Average SOFR +
3.35%), 05/25/2042(b)(d)(h)
|
|
|
|
Series 2022-DNA4, Class M1A,
STACR®, 6.55% (30 Day Average
SOFR + 2.20%), 05/25/2042(b)(d)(h)
|
|
|
|
Series 2022-DNA5, Class M1A,
STACR®, 7.30% (30 Day Average
SOFR + 2.95%), 06/25/2042(b)(d)(h)
|
|
|
|
Series 2022-DNA6, Class M1, STACR®,
8.05% (30 Day Average SOFR +
3.70%), 09/25/2042(b)(d)(h)
|
|
|
|
Series 2022-HQA1, Class M1A,
STACR®, 6.45% (30 Day Average
SOFR + 2.10%), 03/25/2042(b)(d)(h)
|
|
|
|
Series 2022-HQA2, Class M1A,
STACR®, 7.00% (30 Day Average
SOFR + 2.65%), 07/25/2042(b)(d)(h)
|
|
|
|
Series 2022-HQA3, Class M1,
STACR®, 6.65% (30 Day Average
SOFR + 2.30%), 08/25/2042(b)(d)(h)
|
|
|
|
Series 2023-DNA1, Class M1, STACR®,
7.45% (30 Day Average SOFR +
3.10%), 03/25/2043(b)(d)(h)
|
|
|
|
Series 2023-DNA1, Class M1, STACR®,
6.45% (30 Day Average SOFR +
2.10%), 03/25/2043(b)(d)(h)
|
|
|
|
Series 2023-DNA2, Class M1, STACR®,
6.45% (30 Day Average SOFR +
2.10%), 04/25/2043(b)(d)(h)
|
|
|
|
Series 2023-DNA2, Class M1, STACR®,
7.60% (30 Day Average SOFR +
3.25%), 04/25/2043(b)(d)(h)
|
|
|
|
Series 2023-HQA1, Class M1, STACR®,
6.35% (30 Day Average SOFR +
2.00%), 05/25/2043(b)(d)(h)
|
|
|
|
Series 2023-HQA2, Class M1, STACR®,
6.35% (30 Day Average SOFR +
2.00%), 06/25/2043(b)(d)(h)
|
|
|
|
Series 2023-HQA2, Class M1, STACR®,
7.70% (30 Day Average SOFR +
3.35%), 06/25/2043(b)(d)(h)
|
|
|
|
Series 2023-HQA3, Class M2, STACR®,
6.20% (30 Day Average SOFR +
1.85%), 11/25/2043(b)(d)(h)
|
|
|
|
Series 2023-HQA3, Class M2, STACR®,
7.70% (30 Day Average SOFR +
3.35%), 11/25/2043(b)(d)(h)
|
|
|
|
|
|
|
|
|
|
Series 2024-DNA2, Class A1, STACR®,
5.60% (30 Day Average SOFR +
1.25%), 05/25/2044(b)(d)(h)
|
|
|
|
Series 2024-DNA2, Class M1, STACR®,
5.55% (30 Day Average SOFR +
1.20%), 05/25/2044(b)(d)(h)
|
|
|
|
Series 2024-DNA3, Class A1, STACR®,
5.40% (30 Day Average SOFR +
1.05%), 10/25/2044(b)(d)(h)
|
|
|
|
Series 2024-HQA1, Class A1, STACR®,
5.60% (30 Day Average SOFR +
1.25%), 03/25/2044(b)(d)(h)
|
|
|
|
Series 2024-HQA1, Class M2, STACR®,
6.35% (30 Day Average SOFR +
2.00%), 03/25/2044(b)(d)(h)
|
|
|
|
Series 2024-HQA2, Class M1, STACR®,
5.55% (30 Day Average SOFR +
1.20%), 08/25/2044(b)(d)(h)
|
|
|
|
Series 2025-DNA1, Class A1, STACR®,
5.30% (30 Day Average SOFR +
0.95%), 01/25/2045(b)(d)(h)
|
|
|
|
Series 2025-HQA1, Class A1, STACR®,
5.30% (30 Day Average SOFR +
0.95%), 02/25/2045(b)(d)(h)
|
|
|
|
Series 2025-HQA1, Class M1, STACR®,
5.50% (30 Day Average SOFR +
1.15%), 02/25/2045(b)(d)(h)
|
|
|
|
Total Agency Credit Risk Transfer Notes
(Cost $186,416,055)
|
|
U.S. Government Sponsored Agency Mortgage-Backed
Securities-7.51%
|
Collateralized Mortgage Obligations-6.42%
|
|
|
|
|
|
4.77% (30 Day Average SOFR +
0.41%), 04/25/2035(b)
|
|
|
|
4.79%, (30 Day Average SOFR +
0.43%), 01/25/45 to 12/25/47(b)
|
|
|
|
4.97% (30 Day Average SOFR +
0.61%), 05/25/2046(b)
|
|
|
|
4.77% (30 Day Average SOFR +
0.41%), 09/25/2047(b)
|
|
|
|
5.45%, (30 Day Average SOFR +
1.10%), 07/25/54 to 02/25/55(b)
|
|
|
|
5.55% (30 Day Average SOFR +
1.20%), 07/25/2054(b)
|
|
|
|
5.50%, (30 Day Average SOFR +
1.15%), 10/25/54 to 01/25/55(b)
|
|
|
|
Freddie Mac Multifamily Structured Credit
Risk, Series 2021-MN2, Class M1,
6.15% (30 Day Average SOFR +
1.80%), 07/25/2041(b)(d)
|
|
|
|
Freddie Mac Multifamily Structured
Pass-Through Ctfs.
|
|
|
|
Series KF151, Class AS, 4.84%
(30 Day Average SOFR + 0.51%),
12/25/2032(b)
|
|
|
|
See accompanying Notes to Financial Statements which are an integral part of the financial
statements.
Invesco Variable Rate Investment Grade ETF (VRIG)—(continued)
April 30, 2025
(Unaudited)
|
|
|
|
Collateralized Mortgage Obligations-(continued)
|
Series KF158, Class AS, 5.05% (30 Day
Average SOFR + 0.72%),
07/25/2033(b)
|
|
|
|
Series KF35, Class A, 4.84% (30 Day
Average SOFR + 0.50%),
10/25/2025(b)
|
|
|
|
Series KF65, Class A, 4.97% (30 Day
Average SOFR + 0.63%),
07/25/2029(b)
|
|
|
|
Series KF81, Class AS, 4.73% (30 Day
Average SOFR + 0.40%),
06/25/2027(b)
|
|
|
|
|
|
|
|
|
4.82% (30 Day Average SOFR +
0.46%), 09/15/2038(b)
|
|
|
|
4.92% (30 Day Average SOFR +
0.56%), 09/15/2040(b)
|
|
|
|
4.96% (30 Day Average SOFR +
0.61%), 06/15/2041(b)
|
|
|
|
4.79% (30 Day Average SOFR +
0.43%), 08/15/2043(b)
|
|
|
|
4.81% (30 Day Average SOFR +
0.46%), 01/15/2048(b)
|
|
|
|
5.45% (30 Day Average SOFR +
1.10%), 07/25/2054(b)
|
|
|
|
5.40% (30 Day Average SOFR +
1.05%), 10/25/2054(b)
|
|
|
|
5.50% (30 Day Average SOFR +
1.15%), 11/25/2054(b)
|
|
|
|
5.25% (30 Day Average SOFR +
0.90%), 02/25/2055(b)
|
|
|
|
5.55% (30 Day Average SOFR +
1.20%), 04/25/2055(b)
|
|
|
|
5.85% (30 Day Average SOFR +
1.50%), 04/25/2055(b)
|
|
|
|
|
|
|
|
|
Federal Home Loan Mortgage Corp. (FHLMC)-0.67%
|
ARM, 6.59% (1 yr. Refinitiv USD IBOR
Consumer Cash Fallbacks + 1.57%),
06/01/2037(b)
|
|
|
|
ARM, 7.22% (1 yr. Refinitiv USD IBOR
Consumer Cash Fallbacks + 1.73%),
11/01/2038(b)
|
|
|
|
ARM, 6.99% (1 yr. Refinitiv USD IBOR
Consumer Cash Fallbacks + 1.72%),
03/01/2043(b)
|
|
|
|
ARM, 7.04% (1 yr. Refinitiv USD IBOR
Consumer Cash Fallbacks + 1.76%),
11/01/2047(b)
|
|
|
|
ARM, 5.10% (1 yr. U.S. Treasury Yield
Curve Rate + 2.16%), 11/01/2048(b)
|
|
|
|
ARM, 6.93% (1 yr. Refinitiv USD IBOR
Consumer Cash Fallbacks + 1.63%),
01/01/2049(b)
|
|
|
|
|
|
|
|
|
|
|
|
|
Federal National Mortgage Association (FNMA)-0.21%
|
ARM, 6.64% (1 yr. Refinitiv USD IBOR
Consumer Cash Fallbacks + 1.64%),
02/01/2035(b)
|
|
|
|
ARM, 6.38% (6 mo. Refinitiv USD IBOR
Consumer Cash Fallbacks + 1.57%),
07/01/2035(b)
|
|
|
|
ARM, 7.17% (1 yr. U.S. Treasury Yield
Curve Rate + 2.38%), 07/01/2035(b)
|
|
|
|
ARM, 7.16% (1 yr. Refinitiv USD IBOR
Consumer Cash Fallbacks + 1.66%),
10/01/2036(b)
|
|
|
|
ARM, 6.75% (1 yr. Refinitiv USD IBOR
Consumer Cash Fallbacks + 1.75%),
03/01/2037(b)
|
|
|
|
ARM, 6.72% (1 yr. Refinitiv USD IBOR
Consumer Cash Fallbacks + 1.54%),
11/01/2037(b)
|
|
|
|
ARM, 6.80% (1 yr. Refinitiv USD IBOR
Consumer Cash Fallbacks + 1.58%),
04/01/2045(b)
|
|
|
|
|
|
|
|
|
Government National Mortgage Association (GNMA)-0.21%
|
ARM, 5.00% (1 yr. U.S. Treasury Yield
Curve Rate + 1.50%), 08/20/2049(b)
|
|
|
|
Total U.S. Government Sponsored Agency Mortgage-
Backed Securities
(Cost $95,174,058)
|
|
|
|
|
|
|
|
Invesco Government & Agency Portfolio,
Institutional Class, 4.26%(i)(j)
(Cost $9,597,268)
|
|
|
|
TOTAL INVESTMENTS IN SECURITIES
(excluding investments purchased with cash collateral
from securities on loan)-100.81%
(Cost $1,278,392,993)
|
|
Investments Purchased with Cash Collateral
from Securities on Loan
|
|
|
Invesco Private Government Fund,
4.32%(i)(j)(k)
|
|
|
|
Invesco Private Prime Fund, 4.46%(i)(j)(k)
|
|
|
|
Total Investments Purchased with Cash Collateral from
Securities on Loan
(Cost $31,154,169)
|
|
TOTAL INVESTMENTS IN SECURITIES-103.27%
(Cost $1,309,547,162)
|
|
OTHER ASSETS LESS LIABILITIES-(3.27)%
|
|
|
|
|
See accompanying Notes to Financial Statements which are an integral part of the financial
statements.
Invesco Variable Rate Investment Grade ETF (VRIG)—(continued)
April 30, 2025
(Unaudited)
Investment Abbreviations:
|
|
|
-Adjustable Rate Mortgage
|
|
|
|
|
|
|
|
|
-Real Estate Mortgage Investment Conduits
|
|
|
-Secured Overnight Financing Rate
|
|
|
-Structured Agency Credit Risk
|
|
|
|
Notes to Schedule of Investments:
|
|
|
Industry and/or sector classifications used in this report are generally according
to the Global Industry Classification Standard, which was developed by and is
the exclusive property and a service mark of MSCI Inc. and Standard & Poor’s.
|
|
|
Interest or dividend rate is redetermined periodically. Rate shown is the rate in
effect on April 30, 2025.
|
|
|
All or a portion of this security was out on loan at April 30, 2025.
|
|
|
Security purchased or received in a transaction exempt from registration under the Securities Act of 1933, as amended (the “1933 Act”). The security may be
resold pursuant to an exemption from registration under the 1933 Act, typically to
qualified institutional buyers. The aggregate value of these securities at
April 30, 2025 was $568,444,631, which represented 44.89% of the Fund’s Net Assets.
|
|
|
Perpetual bond with no specified maturity date.
|
|
|
Interest rate is redetermined periodically based on the cash flows generated by the
pool of assets backing the security, less any applicable fees. The rate shown
is the rate in effect on April 30, 2025.
|
|
|
CAS notes are bonds issued by Fannie Mae. The amount of periodic principal and ultimate
principal paid by Fannie Mae is determined by the performance of a
large and diverse reference pool.
|
|
|
Principal payments are determined by the delinquency and principal payment experience on the STACR® reference pool. Freddie Mac transfers credit risk from
the mortgages in the reference pool to credit investors who invest in the STACR® debt notes.
|
|
|
Affiliated holding. Affiliated holdings are investments in entities which are under
common ownership or control of Invesco Ltd. or are investments in entities in
which the Fund owns 5% or more of the outstanding voting securities. The table below shows the Fund’s transactions in, and earnings from, its investments in
affiliates for the six months ended April 30, 2025.
|
|
|
|
|
|
Change in
Unrealized
Appreciation
|
|
|
|
Investments in Affiliated
Money Market Funds:
|
|
|
|
|
|
|
|
Invesco Government &
Agency Portfolio,
Institutional Class
|
|
|
|
|
|
|
|
Investments Purchased
with Cash Collateral from
Securities on Loan:
|
|
|
|
|
|
|
|
Invesco Private
Government Fund
|
|
|
|
|
|
|
|
Invesco Private Prime Fund
|
|
|
|
|
|
|
|
|
|
|
|
|
|
|
|
|
|
|
Represents the income earned on the investment of cash collateral, which is included
in securities lending income on the Statements of Operations. Does not
include rebates and fees paid to lending agent or premiums received from borrowers,
if any.
|
|
|
The rate shown is the 7-day SEC standardized yield as of April 30, 2025.
|
|
|
The security has been segregated to satisfy the commitment to return the cash collateral received in securities lending transactions upon the borrower’s return
of the securities loaned. See Note 2P.
|
See accompanying Notes to Financial Statements which are an integral part of the financial
statements.
Statements of Assets and Liabilities
April 30, 2025
(Unaudited)
|
|
Invesco
AAA CLO
Floating
Rate Note
ETF (ICLO)
|
Invesco
Active
U.S. Real
Estate
ETF (PSR)
|
Invesco High Yield
Bond Factor
ETF (IHYF)
|
|
|
|
|
|
Unaffiliated investments in securities, at value(a)
|
|
|
|
Affiliated investments in securities, at value
|
|
|
|
|
|
|
|
|
Unrealized appreciation on forward foreign currency contracts outstanding
|
|
|
|
|
|
|
|
|
Foreign currencies, at value
|
|
|
|
|
|
|
|
|
|
|
|
|
|
|
|
|
|
|
|
|
|
|
|
Investments sold - affiliated broker
|
|
|
|
|
|
|
|
|
|
|
|
|
|
|
|
|
|
|
|
|
|
|
|
|
|
|
|
|
|
|
|
|
|
|
|
|
|
|
Variation margin on futures contracts
|
|
|
|
|
|
|
|
|
Collateral upon return of securities loaned
|
|
|
|
Accrued unitary management fees
|
|
|
|
|
|
|
|
|
|
|
|
|
|
|
|
|
|
|
|
|
|
|
|
Shares of beneficial interest
|
|
|
|
Distributable earnings (loss)
|
|
|
|
|
|
|
|
|
Shares outstanding (unlimited amount authorized, $0.01 par value)
|
|
|
|
|
|
|
|
|
|
|
|
|
|
Unaffiliated investments in securities, at cost
|
|
|
|
Affiliated investments in securities, at cost
|
|
|
|
Foreign currencies (due to foreign custodian), at cost
|
|
|
|
(a)Includes securities on loan with an aggregate value of:
|
|
|
|
See accompanying Notes to Financial Statements which are an integral part of the financial
statements.
Invesco
High Yield Select
ETF (HIYS)
|
Invesco
MSCI EAFE Income
Advantage ETF (EFAA)
|
Invesco
QQQ Income
Advantage
ETF (QQA)
|
|
|
|
|
|
|
|
|
|
|
|
|
|
|
|
|
|
|
|
|
|
|
|
|
|
|
|
|
|
|
|
|
|
|
|
|
|
|
|
|
|
|
|
|
|
|
|
|
|
|
|
|
|
|
|
|
|
|
|
|
|
|
|
|
|
|
|
|
|
|
|
|
|
|
|
|
|
|
|
|
|
|
|
|
|
|
|
|
|
|
|
|
|
|
|
|
|
|
|
|
|
|
|
|
|
|
|
|
|
|
|
|
|
|
|
|
|
|
|
|
|
|
|
|
|
|
|
|
|
|
|
|
|
|
|
|
|
|
|
|
|
|
|
|
|
|
|
|
Statements of Assets and Liabilities—(continued)
April 30, 2025
(Unaudited)
|
|
Invesco
S&P 500®
Downside Hedged
ETF (PHDG)
|
Invesco
S&P 500 Equal Weight Income
Advantage
ETF (RSPA)
|
Invesco
Short Duration
Total Return
Bond ETF (GTOS)
|
|
|
|
|
|
Unaffiliated investments in securities, at value(a)
|
|
|
|
Affiliated investments in securities, at value
|
|
|
|
|
|
|
|
|
Unrealized appreciation on futures contracts
|
|
|
|
|
|
|
|
|
|
|
|
|
|
Foreign currencies, at value
|
|
|
|
|
|
|
|
|
Cash collateral-futures contracts
|
|
|
|
Cash collateral-centrally cleared swap agreements
|
|
|
|
|
|
|
|
|
|
|
|
|
|
|
|
|
|
|
|
|
|
|
|
Variation margin on futures contracts
|
|
|
|
|
|
|
|
|
|
|
|
|
|
Investments sold - affiliated broker
|
|
|
|
|
|
|
|
|
Investments matured, at value
|
|
|
|
|
|
|
|
|
|
|
|
|
|
|
|
|
|
|
Unrealized depreciation on swap agreements — OTC
|
|
|
|
Open written options, at value
|
|
|
|
|
|
|
|
|
|
|
|
|
|
|
|
|
|
|
Variation margin on futures contracts
|
|
|
|
|
|
|
|
|
Investments purchased - affiliated broker
|
|
|
|
Collateral upon return of securities loaned
|
|
|
|
Accrued unitary management fees
|
|
|
|
|
|
|
|
|
|
|
|
|
|
|
|
|
|
|
|
|
|
|
|
Shares of beneficial interest
|
|
|
|
Distributable earnings (loss)
|
|
|
|
|
|
|
|
|
Shares outstanding (unlimited amount authorized, $0.01 par value)
|
|
|
|
|
|
|
|
|
|
|
|
|
|
Unaffiliated investments in securities, at cost
|
|
|
|
Affiliated investments in securities, at cost
|
|
|
|
Foreign currencies (due to foreign custodian), at cost
|
|
|
|
Investments matured, at cost
|
|
|
|
Premium received on written options
|
|
|
|
(a)Includes securities on loan with an aggregate value of:
|
|
|
|
See accompanying Notes to Financial Statements which are an integral part of the financial
statements.
Invesco
SteelPath MLP & Energy
Infrastructure ETF (PIPE)
|
Invesco Top QQQ ETF (QBIG)
|
Invesco Total Return
Bond ETF (GTO)
|
|
|
|
|
|
|
|
|
|
|
|
|
|
|
|
|
|
|
|
|
|
|
|
|
|
|
|
|
|
|
|
|
|
|
|
|
|
|
|
|
|
|
|
|
|
|
|
|
|
|
|
|
|
|
|
|
|
|
|
|
|
|
|
|
|
|
|
|
|
|
|
|
|
|
|
|
|
|
|
|
|
|
|
|
|
|
|
|
|
|
|
|
|
|
|
|
|
|
|
|
|
|
|
|
|
|
|
|
|
|
|
|
|
|
|
|
|
|
|
|
|
|
|
|
|
|
|
|
|
|
|
|
|
|
|
|
|
|
|
|
|
|
|
|
|
|
|
|
|
|
|
|
|
|
|
|
|
|
|
|
|
|
|
|
|
|
|
|
|
|
|
|
|
|
|
|
|
|
|
|
|
|
|
|
|
|
|
|
|
|
|
|
|
|
|
|
|
|
|
|
Statements of Assets and Liabilities—(continued)
April 30, 2025
(Unaudited)
|
|
Invesco Ultra Short
Duration ETF (GSY)
|
Invesco
Variable Rate
Investment Grade
ETF (VRIG)
|
|
|
|
|
Unaffiliated investments in securities, at value(a)
|
|
|
Affiliated investments in securities, at value
|
|
|
|
|
|
|
Foreign currencies, at value
|
|
|
|
|
|
|
|
|
|
|
|
|
|
|
|
|
|
|
|
|
|
|
|
|
|
|
|
|
|
|
|
|
|
|
|
|
|
|
|
|
|
|
Collateral upon return of securities loaned
|
|
|
|
|
|
|
Accrued unitary management fees
|
|
|
|
|
|
|
Accrued trustees’ and officer’s fees
|
|
|
|
|
|
|
|
|
|
|
|
|
|
|
|
|
|
|
Shares of beneficial interest
|
|
|
Distributable earnings (loss)
|
|
|
|
|
|
|
Shares outstanding (unlimited amount authorized, $0.01 par value)
|
|
|
|
|
|
|
|
|
|
|
Unaffiliated investments in securities, at cost
|
|
|
Affiliated investments in securities, at cost
|
|
|
Foreign currencies (due to foreign custodian), at cost
|
|
|
(a)Includes securities on loan with an aggregate value of:
|
|
|
See accompanying Notes to Financial Statements which are an integral part of the financial
statements.
Statements of Operations
For the six months ended April 30, 2025
(Unaudited)
|
|
Invesco
AAA CLO
Floating
Rate Note
ETF (ICLO)
|
Invesco
Active
U.S. Real
Estate
ETF (PSR)
|
Invesco High Yield
Bond Factor
ETF (IHYF)
|
Invesco
High Yield Select
ETF (HIYS)
|
|
|
|
|
|
|
Unaffiliated interest income
|
|
|
|
|
Unaffiliated dividend income
|
|
|
|
|
Affiliated dividend income
|
|
|
|
|
Securities lending income, net
|
|
|
|
|
|
|
|
|
|
|
|
|
|
|
|
|
|
|
|
|
|
|
|
|
|
|
|
|
|
|
|
|
|
|
|
|
|
|
|
|
|
|
|
|
|
|
|
|
|
|
|
|
|
|
|
|
|
|
Realized and unrealized gain (loss) from:
|
|
|
|
|
Net realized gain (loss) from:
|
|
|
|
|
Unaffiliated investment securities
|
|
|
|
|
Affiliated investment securities
|
|
|
|
|
Unaffiliated in-kind redemptions
|
|
|
|
|
Affiliated in-kind redemptions
|
|
|
|
|
|
|
|
|
|
|
Forward foreign currency contracts
|
|
|
|
|
|
|
|
|
|
|
|
|
|
|
|
|
Change in net unrealized appreciation (depreciation) of:
|
|
|
|
|
Unaffiliated investment securities
|
|
|
|
|
Affiliated investment securities
|
|
|
|
|
|
|
|
|
|
|
Forward foreign currency contracts
|
|
|
|
|
|
|
|
|
|
|
Change in net unrealized appreciation (depreciation)
|
|
|
|
|
Net realized and unrealized gain (loss)
|
|
|
|
|
Net increase (decrease) in net assets resulting from operations
|
|
|
|
|
|
|
For the period February 18, 2025 (commencement of investment operations) through April
30, 2025.
|
See accompanying Notes to Financial Statements which are an integral part of the financial
statements.
Invesco
MSCI EAFE Income
Advantage ETF (EFAA)
|
Invesco
QQQ Income
Advantage
ETF (QQA)
|
Invesco
S&P 500®
Downside Hedged
ETF (PHDG)
|
Invesco
S&P 500 Equal Weight Income
Advantage
ETF (RSPA)
|
Invesco
Short Duration
Total Return
Bond ETF (GTOS)
|
Invesco
SteelPath MLP & Energy
Infrastructure ETF (PIPE)(a)
|
|
|
|
|
|
|
|
|
|
|
|
|
|
|
|
|
|
|
|
|
|
|
|
|
|
|
|
|
|
|
|
|
|
|
|
|
|
|
|
|
|
|
|
|
|
|
|
|
|
|
|
|
|
|
|
|
|
|
|
|
|
|
|
|
|
|
|
|
|
|
|
|
|
|
|
|
|
|
|
|
|
|
|
|
|
|
|
|
|
|
|
|
|
|
|
|
|
|
|
|
|
|
|
|
|
|
|
|
|
|
|
|
|
|
|
|
|
|
|
|
|
|
|
|
|
|
|
|
|
|
|
|
|
|
|
|
|
|
|
|
|
|
|
|
|
|
|
|
|
|
|
|
|
|
|
|
|
|
|
|
|
|
|
|
|
|
|
|
|
|
|
|
|
|
|
|
|
|
|
|
|
|
|
|
|
|
|
|
|
|
|
|
|
|
|
|
|
|
|
|
|
|
|
|
|
|
|
|
|
|
|
|
|
|
|
|
|
|
|
|
|
|
|
|
|
|
|
|
|
|
|
Statements of Operations—(continued)
For the six months ended April 30, 2025
(Unaudited)
|
|
Invesco Top QQQ ETF (QBIG)(b)
|
Invesco Total Return
Bond ETF (GTO)
|
Invesco Ultra Short
Duration ETF (GSY)
|
Invesco
Variable Rate
Investment Grade
ETF (VRIG)
|
|
|
|
|
|
|
Unaffiliated interest income
|
|
|
|
|
Unaffiliated dividend income
|
|
|
|
|
Affiliated dividend income
|
|
|
|
|
Securities lending income, net
|
|
|
|
|
|
|
|
|
|
|
|
|
|
|
|
|
|
|
|
|
|
|
|
|
|
|
|
|
Accounting & administration fees
|
|
|
|
|
Custodian & transfer agent fees
|
|
|
|
|
Trustees’ and officer’s fees
|
|
|
|
|
|
|
|
|
|
|
|
|
|
|
|
|
|
|
|
|
|
|
|
|
|
|
|
|
|
|
|
|
|
|
Realized and unrealized gain (loss)
from:
|
|
|
|
|
Net realized gain (loss) from:
|
|
|
|
|
Unaffiliated investment securities
|
|
|
|
|
Affiliated investment securities
|
|
|
|
|
|
|
|
|
|
|
|
|
|
|
|
|
|
|
|
|
|
|
|
|
|
|
|
|
|
|
|
|
|
|
Change in net unrealized appreciation
(depreciation) of:
|
|
|
|
|
Unaffiliated investment securities
|
|
|
|
|
Affiliated investment securities
|
|
|
|
|
|
|
|
|
|
|
|
|
|
|
|
|
|
|
|
|
|
|
|
|
|
|
|
|
Change in net unrealized appreciation
(depreciation)
|
|
|
|
|
Net realized and unrealized gain (loss)
|
|
|
|
|
Net increase (decrease) in net assets resulting
from operations
|
|
|
|
|
|
|
For the period December 2, 2024 (commencement of investment operations) through April
30, 2025.
|
See accompanying Notes to Financial Statements which are an integral part of the financial
statements.
Statements of Changes in Net Assets
For the six months ended April 30, 2025 and the year ended October 31, 2024
(Unaudited)
|
|
Invesco AAA
CLO Floating Rate
Note ETF (ICLO)
|
Invesco Active U.S. Real Estate
ETF (PSR)
|
|
|
Six Months Ended
April 30,
2025
|
Year Ended
October 31,
2024
|
Six Months Ended
April 30,
2025
|
Year Ended
October 31,
2024
|
|
|
|
|
|
|
|
|
|
|
|
|
|
|
|
|
|
|
Change in net unrealized appreciation (depreciation)
|
|
|
|
|
Net increase (decrease) in net assets resulting from operations
|
|
|
|
|
Distributions to Shareholders from:
|
|
|
|
|
|
|
|
|
|
|
Shareholder Transactions:
|
|
|
|
|
Proceeds from shares sold
|
|
|
|
|
Value of shares repurchased
|
|
|
|
|
|
|
|
|
|
|
Net increase (decrease) in net assets resulting from share transactions
|
|
|
|
|
Net increase (decrease) in net assets
|
|
|
|
|
|
|
|
|
|
|
|
|
|
|
|
|
|
|
|
|
|
|
Changes in Shares Outstanding:
|
|
|
|
|
|
|
|
|
|
|
|
|
|
|
|
|
Shares outstanding, beginning of period
|
|
|
|
|
Shares outstanding, end of period
|
|
|
|
|
|
|
For the period July 15, 2024 (commencement of investment operations) through October
31, 2024.
|
See accompanying Notes to Financial Statements which are an integral part of the financial
statements.
Invesco High Yield
Bond Factor ETF (IHYF)
|
Invesco High Yield Select
ETF (HIYS)
|
Invesco MSCI EAFE Income
Advantage ETF (EFAA)
|
Invesco QQQ
Income Advantage
ETF (QQA)
|
Six Months Ended
April 30,
2025
|
Year Ended
October 31,
2024
|
Six Months Ended
April 30,
2025
|
Year Ended
October 31,
2024
|
Six Months Ended
April 30,
2025
|
|
Six Months Ended
April 30,
2025
|
|
|
|
|
|
|
|
|
|
|
|
|
|
|
|
|
|
|
|
|
|
|
|
|
|
|
|
|
|
|
|
|
|
|
|
|
|
|
|
|
|
|
|
|
|
|
|
|
|
|
|
|
|
|
|
|
|
|
|
|
|
|
|
|
|
|
|
|
|
|
|
|
|
|
|
|
|
|
|
|
|
|
|
|
|
|
|
|
|
|
|
|
|
|
|
|
|
|
|
|
|
|
|
|
|
|
|
|
|
|
|
|
|
|
|
|
|
|
|
|
|
|
|
|
|
|
|
|
|
|
|
|
|
|
|
|
|
|
|
|
|
|
|
|
|
|
|
|
|
|
|
|
|
|
|
|
|
|
|
|
|
|
|
|
|
|
|
|
|
|
|
|
|
|
|
|
|
|
|
|
|
|
|
|
|
|
|
|
|
|
Statements of Changes in Net Assets—(continued)
For the six months ended April 30, 2025 and the year ended October 31, 2024
(Unaudited)
|
|
Invesco S&P 500® Downside
Hedged ETF (PHDG)
|
Invesco S&P 500
Equal Weight Income Advantage
ETF (RSPA)
|
|
|
Six Months Ended
April 30,
2025
|
Year Ended
October 31,
2024
|
Six Months Ended
April 30,
2025
|
|
|
|
|
|
|
|
|
|
|
|
|
|
|
|
|
|
|
|
Change in net unrealized appreciation (depreciation)
|
|
|
|
|
Net increase (decrease) in net assets resulting from operations
|
|
|
|
|
Distributions to Shareholders from:
|
|
|
|
|
|
|
|
|
|
|
Shareholder Transactions:
|
|
|
|
|
Proceeds from shares sold
|
|
|
|
|
Value of shares repurchased
|
|
|
|
|
Net increase (decrease) in net assets resulting from share transactions
|
|
|
|
|
Net increase (decrease) in net assets
|
|
|
|
|
|
|
|
|
|
|
|
|
|
|
|
|
|
|
|
|
|
|
Changes in Shares Outstanding:
|
|
|
|
|
|
|
|
|
|
|
|
|
|
|
|
|
Shares outstanding, beginning of period
|
|
|
|
|
Shares outstanding, end of period
|
|
|
|
|
|
|
For the period July 15, 2024 (commencement of investment operations) through October
31, 2024.
|
|
|
For the period February 18, 2025 (commencement of investment operations) through April
30, 2025.
|
|
|
For the period December 2, 2024 (commencement of investment operations) through April
30, 2025.
|
See accompanying Notes to Financial Statements which are an integral part of the financial
statements.
Invesco Short Duration
Total Return Bond ETF (GTOS)
|
Invesco
SteelPath MLP & Energy
Infrastructure ETF (PIPE)
|
Invesco Top QQQ ETF (QBIG)
|
Invesco Total Return Bond ETF (GTO)
|
Six Months Ended
April 30,
2025
|
Year Ended
October 31,
2024
|
|
|
Six Months Ended
April 30,
2025
|
Year Ended
October 31,
2024
|
|
|
|
|
|
|
|
|
|
|
|
|
|
|
|
|
|
|
|
|
|
|
|
|
|
|
|
|
|
|
|
|
|
|
|
|
|
|
|
|
|
|
|
|
|
|
|
|
|
|
|
|
|
|
|
|
|
|
|
|
|
|
|
|
|
|
|
|
|
|
|
|
|
|
|
|
|
|
|
|
|
|
|
|
|
|
|
|
|
|
|
|
|
|
|
|
|
|
|
|
|
|
|
|
|
|
|
|
|
|
|
|
|
|
|
|
|
|
|
|
|
|
|
|
|
|
|
|
|
|
|
|
|
|
|
|
|
|
|
|
Statements of Changes in Net Assets—(continued)
For the six months ended April 30, 2025 and the year ended October 31, 2024
(Unaudited)
|
|
Invesco Ultra Short Duration ETF (GSY)
|
Invesco Variable Rate Investment
Grade ETF (VRIG)
|
|
|
Six Months Ended
April 30,
2025
|
Year Ended
October 31,
2024
|
Six Months Ended
April 30,
2025
|
Year Ended
October 31,
2024
|
|
|
|
|
|
|
|
|
|
|
|
|
|
|
|
|
|
|
Change in net unrealized appreciation (depreciation)
|
|
|
|
|
Net increase in net assets resulting from operations
|
|
|
|
|
Distributions to Shareholders from:
|
|
|
|
|
|
|
|
|
|
|
Shareholder Transactions:
|
|
|
|
|
Proceeds from shares sold
|
|
|
|
|
Value of shares repurchased
|
|
|
|
|
Net increase in net assets resulting from share transactions
|
|
|
|
|
Net increase in net assets
|
|
|
|
|
|
|
|
|
|
|
|
|
|
|
|
|
|
|
|
|
|
|
Changes in Shares Outstanding:
|
|
|
|
|
|
|
|
|
|
|
|
|
|
|
|
|
Shares outstanding, beginning of period
|
|
|
|
|
Shares outstanding, end of period
|
|
|
|
|
See accompanying Notes to Financial Statements which are an integral part of the financial
statements.
Invesco AAA CLO Floating Rate Note ETF (ICLO)
|
|
Six Months Ended
April 30,
2025
(Unaudited)
|
Year ended October 31,
2024
|
For the Period
December 7, 2022(a)
Through
October 31,
2023
|
Per Share Operating Performance:
|
|
|
|
Net asset value at beginning of period
|
|
|
|
|
|
|
|
|
Net realized and unrealized gain (loss) on investments
|
|
|
|
Total from investment operations
|
|
|
|
Distributions to shareholders from:
|
|
|
|
|
|
|
|
|
|
|
|
|
|
Net asset value at end of period
|
|
|
|
Market price at end of period(c)
|
|
|
|
Net Asset Value Total Return(d)
|
|
|
|
Market Price Total Return(d)
|
|
|
|
Ratios/Supplemental Data:
|
|
|
|
Net assets at end of period (000’s omitted)
|
|
|
|
Ratio to average net assets of:
|
|
|
|
|
|
|
|
|
Expenses, prior to Waivers
|
|
|
|
|
|
|
|
|
Portfolio turnover rate(g)
|
|
|
|
|
|
Commencement of investment operations.
|
|
|
Based on average shares outstanding.
|
|
|
The mean between the last bid and ask prices.
|
|
|
Net asset value total return is calculated assuming an initial investment made at
the net asset value at the beginning of the period, reinvestment of all dividends
and distributions at net asset value during the period, and redemption at net asset
value on the last day of the period. Net asset value total return includes
adjustments in accordance with accounting principles generally accepted in the United
States of America and as such, the net asset value for financial reporting
purposes and the returns based upon those net asset values may differ from the net
asset value and returns for shareholder transactions. Market price total return
is calculated assuming an initial investment made at the market price at the beginning
of the period, reinvestment of all dividends and distributions at market price
during the period, and sale at the market price on the last day of the period. Total
investment returns calculated for a period of less than one year are not
annualized.
|
|
|
The net asset value total return from Fund Inception (December 9, 2022, the first
day of trading on the exchange) to October 31, 2023 was 7.51%. The market
price total return from Fund Inception to October 31, 2023 was 7.25%.
|
|
|
|
|
|
Portfolio turnover rate is not annualized for periods less than one year, if applicable,
and does not include securities received or delivered from processing
creations or redemptions.
|
See accompanying Notes to Financial Statements which are an integral part of the financial
statements.
Financial Highlights—(continued)
Invesco Active U.S. Real Estate ETF (PSR)
|
|
Six Months Ended
April 30,
2025
(Unaudited)
|
|
|
|
|
|
|
|
|
Per Share Operating Performance:
|
|
|
|
|
|
|
Net asset value at beginning of period
|
|
|
|
|
|
|
|
|
|
|
|
|
|
|
Net realized and unrealized gain (loss) on investments
|
|
|
|
|
|
|
Total from investment operations
|
|
|
|
|
|
|
Distributions to shareholders from:
|
|
|
|
|
|
|
|
|
|
|
|
|
|
|
Net asset value at end of period
|
|
|
|
|
|
|
Market price at end of period(b)
|
|
|
|
|
|
|
Net Asset Value Total Return(c)
|
|
|
|
|
|
|
Market Price Total Return(c)
|
|
|
|
|
|
|
Ratios/Supplemental Data:
|
|
|
|
|
|
|
Net assets at end of period (000’s omitted)
|
|
|
|
|
|
|
Ratio to average net assets of:
|
|
|
|
|
|
|
|
|
|
|
|
|
|
|
|
|
|
|
|
|
|
|
Portfolio turnover rate(e)
|
|
|
|
|
|
|
|
|
Based on average shares outstanding.
|
|
|
The mean between the last bid and ask prices.
|
|
|
Net asset value total return is calculated assuming an initial investment made at
the net asset value at the beginning of the period, reinvestment of all dividends
and distributions at net asset value during the period, and redemption at net asset
value on the last day of the period. Net asset value total return includes
adjustments in accordance with accounting principles generally accepted in the United
States of America and as such, the net asset value for financial reporting
purposes and the returns based upon those net asset values may differ from the net
asset value and returns for shareholder transactions. Market price total return
is calculated assuming an initial investment made at the market price at the beginning
of the period, reinvestment of all dividends and distributions at market price
during the period, and sale at the market price on the last day of the period. Total
investment returns calculated for a period of less than one year are not
annualized.
|
|
|
|
|
|
Portfolio turnover rate is not annualized for periods less than one year, if applicable,
and does not include securities received or delivered from processing
creations or redemptions.
|
See accompanying Notes to Financial Statements which are an integral part of the financial
statements.
Financial Highlights—(continued)
Invesco High Yield Bond Factor ETF (IHYF)
|
|
Six Months Ended
April 30,
2025
(Unaudited)
|
|
For the Period
November 30, 2020(a)
Through
October 31,
2021
|
|
|
|
|
|
Per Share Operating Performance:
|
|
|
|
|
|
Net asset value at beginning of period
|
|
|
|
|
|
|
|
|
|
|
|
|
Net realized and unrealized gain (loss) on investments
|
|
|
|
|
|
Total from investment operations
|
|
|
|
|
|
Distributions to shareholders from:
|
|
|
|
|
|
|
|
|
|
|
|
|
|
|
|
|
|
|
|
|
|
|
|
|
|
|
|
|
|
|
|
|
|
|
|
|
|
|
|
|
Net asset value at end of period
|
|
|
|
|
|
Market price at end of period(c)
|
|
|
|
|
|
Net Asset Value Total Return(d)
|
|
|
|
|
|
Market Price Total Return(d)
|
|
|
|
|
|
Ratios/Supplemental Data:
|
|
|
|
|
|
Net assets at end of period (000’s omitted)
|
|
|
|
|
|
Ratio to average net assets of:
|
|
|
|
|
|
|
|
|
|
|
|
|
|
|
|
|
|
|
|
Portfolio turnover rate(g)
|
|
|
|
|
|
|
|
Commencement of investment operations.
|
|
|
Based on average shares outstanding.
|
|
|
The mean between the last bid and ask prices.
|
|
|
Net asset value total return is calculated assuming an initial investment made at
the net asset value at the beginning of the period, reinvestment of all dividends
and distributions at net asset value during the period, and redemption at net asset
value on the last day of the period. Net asset value total return includes
adjustments in accordance with accounting principles generally accepted in the United
States of America and as such, the net asset value for financial reporting
purposes and the returns based upon those net asset values may differ from the net
asset value and returns for shareholder transactions. Market price total return
is calculated assuming an initial investment made at the market price at the beginning
of the period, reinvestment of all dividends and distributions at market price
during the period, and sale at the market price on the last day of the period. Total
investment returns calculated for a period of less than one year are not
annualized.
|
|
|
The net asset value total return from Fund Inception (December 2, 2020, the first
day of trading on the exchange) to October 31, 2021 was 5.39%. The market
price total return from Fund Inception to October 31, 2021 was 5.30%.
|
|
|
|
|
|
Portfolio turnover rate is not annualized for periods less than one year, if applicable,
and does not include securities received or delivered from processing
creations or redemptions.
|
See accompanying Notes to Financial Statements which are an integral part of the financial
statements.
Financial Highlights—(continued)
Invesco High Yield Select ETF (HIYS)
|
|
Six Months Ended
April 30,
2025
(Unaudited)
|
Year ended October 31,
2024
|
For the Period
December 7, 2022(a)
Through
October 31,
2023
|
Per Share Operating Performance:
|
|
|
|
Net asset value at beginning of period
|
|
|
|
|
|
|
|
|
Net realized and unrealized gain (loss) on investments
|
|
|
|
Total from investment operations
|
|
|
|
Distributions to shareholders from:
|
|
|
|
|
|
|
|
|
|
|
|
|
|
|
|
|
|
|
Net asset value at end of period
|
|
|
|
Market price at end of period(c)
|
|
|
|
Net Asset Value Total Return(d)
|
|
|
|
Market Price Total Return(d)
|
|
|
|
Ratios/Supplemental Data:
|
|
|
|
Net assets at end of period (000’s omitted)
|
|
|
|
Ratio to average net assets of:
|
|
|
|
|
|
|
|
|
Expenses, prior to Waivers
|
|
|
|
|
|
|
|
|
Portfolio turnover rate(g)
|
|
|
|
|
|
Commencement of investment operations.
|
|
|
Based on average shares outstanding.
|
|
|
The mean between the last bid and ask prices.
|
|
|
Net asset value total return is calculated assuming an initial investment made at
the net asset value at the beginning of the period, reinvestment of all dividends
and distributions at net asset value during the period, and redemption at net asset
value on the last day of the period. Net asset value total return includes
adjustments in accordance with accounting principles generally accepted in the United
States of America and as such, the net asset value for financial reporting
purposes and the returns based upon those net asset values may differ from the net
asset value and returns for shareholder transactions. Market price total return
is calculated assuming an initial investment made at the market price at the beginning
of the period, reinvestment of all dividends and distributions at market price
during the period, and sale at the market price on the last day of the period. Total
investment returns calculated for a period of less than one year are not
annualized.
|
|
|
The net asset value total return from Fund Inception (December 9, 2022, the first
day of trading on the exchange) to October 31, 2023 was 2.45%. The market
price total return from Fund Inception to October 31, 2023 was 2.61%.
|
|
|
|
|
|
Portfolio turnover rate is not annualized for periods less than one year, if applicable,
and does not include securities received or delivered from processing
creations or redemptions.
|
See accompanying Notes to Financial Statements which are an integral part of the financial
statements.
Financial Highlights—(continued)
Invesco MSCI EAFE Income Advantage ETF (EFAA)
|
|
Six Months Ended
April 30,
2025
(Unaudited)
|
For the Period
July 15, 2024(a)
Through
October 31,
2024
|
Per Share Operating Performance:
|
|
|
Net asset value at beginning of period
|
|
|
|
|
|
|
Net realized and unrealized gain (loss) on investments
|
|
|
Total from investment operations
|
|
|
Distributions to shareholders from:
|
|
|
|
|
|
|
Net asset value at end of period
|
|
|
Market price at end of period(c)
|
|
|
Net Asset Value Total Return(d)
|
|
|
Market Price Total Return(d)
|
|
|
Ratios/Supplemental Data:
|
|
|
Net assets at end of period (000’s omitted)
|
|
|
Ratio to average net assets of:
|
|
|
|
|
|
|
Expenses, prior to Waivers
|
|
|
|
|
|
|
Portfolio turnover rate(g)
|
|
|
|
|
Commencement of investment operations.
|
|
|
Based on average shares outstanding.
|
|
|
The mean between the last bid and ask prices.
|
|
|
Net asset value total return is calculated assuming an initial investment made at
the net asset value at the beginning of the period, reinvestment of all dividends
and distributions at net asset value during the period, and redemption at net asset
value on the last day of the period. Net asset value total return includes
adjustments in accordance with accounting principles generally accepted in the United
States of America and as such, the net asset value for financial reporting
purposes and the returns based upon those net asset values may differ from the net
asset value and returns for shareholder transactions. Market price total return
is calculated assuming an initial investment made at the market price at the beginning
of the period, reinvestment of all dividends and distributions at market price
during the period, and sale at the market price on the last day of the period. Total
investment returns calculated for a period of less than one year are not
annualized.
|
|
|
The net asset value total return from Fund Inception (July 17, 2024, the first day
of trading on the exchange) to October 31, 2024 was (1.35)%. The market price
total return from Fund Inception to October 31, 2024 was (1.26)%.
|
|
|
|
|
|
Portfolio turnover rate is not annualized for periods less than one year, if applicable,
and does not include securities received or delivered from processing
creations or redemptions.
|
See accompanying Notes to Financial Statements which are an integral part of the financial
statements.
Financial Highlights—(continued)
Invesco QQQ Income Advantage ETF (QQA)
|
|
Six Months Ended
April 30,
2025
(Unaudited)
|
For the Period
July 15, 2024(a)
Through
October 31,
2024
|
Per Share Operating Performance:
|
|
|
Net asset value at beginning of period
|
|
|
|
|
|
|
Net realized and unrealized gain (loss) on investments
|
|
|
Total from investment operations
|
|
|
Distributions to shareholders from:
|
|
|
|
|
|
|
Net asset value at end of period
|
|
|
Market price at end of period(d)
|
|
|
Net Asset Value Total Return(e)
|
|
|
Market Price Total Return(e)
|
|
|
Ratios/Supplemental Data:
|
|
|
Net assets at end of period (000’s omitted)
|
|
|
Ratio to average net assets of:
|
|
|
|
|
|
|
Expenses, prior to Waivers
|
|
|
|
|
|
|
Portfolio turnover rate(h)
|
|
|
|
|
Commencement of investment operations.
|
|
|
Based on average shares outstanding.
|
|
|
Net realized and unrealized gain (loss) on investments per share may not correlate with the Fund’s net realized and unrealized gain (loss) due to timing of
shareholder transactions in relation to the fluctuating market values of the Fund’s investments.
|
|
|
The mean between the last bid and ask prices.
|
|
|
Net asset value total return is calculated assuming an initial investment made at
the net asset value at the beginning of the period, reinvestment of all dividends
and distributions at net asset value during the period, and redemption at net asset
value on the last day of the period. Net asset value total return includes
adjustments in accordance with accounting principles generally accepted in the United
States of America and as such, the net asset value for financial reporting
purposes and the returns based upon those net asset values may differ from the net
asset value and returns for shareholder transactions. Market price total return
is calculated assuming an initial investment made at the market price at the beginning
of the period, reinvestment of all dividends and distributions at market price
during the period, and sale at the market price on the last day of the period. Total
investment returns calculated for a period of less than one year are not
annualized.
|
|
|
The net asset value total return from Fund Inception (July 17, 2024, the first day
of trading on the exchange) to October 31, 2024 was 1.68%. The market price
total return from Fund Inception to October 31, 2024 was 1.72%.
|
|
|
|
|
|
Portfolio turnover rate is not annualized for periods less than one year, if applicable,
and does not include securities received or delivered from processing
creations or redemptions.
|
See accompanying Notes to Financial Statements which are an integral part of the financial
statements.
Financial Highlights—(continued)
Invesco S&P 500® Downside Hedged ETF (PHDG)
|
|
Six Months Ended
April 30,
2025
(Unaudited)
|
|
|
|
|
|
|
|
|
Per Share Operating Performance:
|
|
|
|
|
|
|
Net asset value at beginning of period
|
|
|
|
|
|
|
|
|
|
|
|
|
|
|
Net realized and unrealized gain (loss) on investments
|
|
|
|
|
|
|
Total from investment operations
|
|
|
|
|
|
|
Distributions to shareholders from:
|
|
|
|
|
|
|
|
|
|
|
|
|
|
|
Net asset value at end of period
|
|
|
|
|
|
|
Market price at end of period(b)
|
|
|
|
|
|
|
Net Asset Value Total Return(c)
|
|
|
|
|
|
|
Market Price Total Return(c)
|
|
|
|
|
|
|
Ratios/Supplemental Data:
|
|
|
|
|
|
|
Net assets at end of period (000’s omitted)
|
|
|
|
|
|
|
Ratio to average net assets of:
|
|
|
|
|
|
|
Expenses, after Waivers(d)
|
|
|
|
|
|
|
Expenses, prior to Waivers(d)
|
|
|
|
|
|
|
|
|
|
|
|
|
|
|
Portfolio turnover rate(f)
|
|
|
|
|
|
|
|
|
Based on average shares outstanding.
|
|
|
The mean between the last bid and ask prices.
|
|
|
Net asset value total return is calculated assuming an initial investment made at
the net asset value at the beginning of the period, reinvestment of all dividends
and distributions at net asset value during the period, and redemption at net asset
value on the last day of the period. Net asset value total return includes
adjustments in accordance with accounting principles generally accepted in the United
States of America and as such, the net asset value for financial reporting
purposes and the returns based upon those net asset values may differ from the net
asset value and returns for shareholder transactions. Market price total return
is calculated assuming an initial investment made at the market price at the beginning
of the period, reinvestment of all dividends and distributions at market price
during the period, and sale at the market price on the last day of the period. Total
investment returns calculated for a period of less than one year are not
annualized.
|
|
|
In addition to the fees and expenses which the Fund bears directly, the Fund indirectly
bears a pro rata share of the fees and expenses of the investment
companies in which the Fund invests. Estimated investment companies’ expenses are not expenses that are incurred directly by the Fund. They are expenses that
are incurred directly by the investment companies and are deducted from the value
of the investment companies the Fund invests in. The effect of the estimated
investment companies’ expenses that the Fund bears indirectly is included in the Fund’s total return.
|
|
|
|
|
|
Portfolio turnover rate is not annualized for periods less than one year, if applicable,
and does not include securities received or delivered from processing
creations or redemptions.
|
See accompanying Notes to Financial Statements which are an integral part of the financial
statements.
Financial Highlights—(continued)
Invesco S&P 500 Equal Weight Income Advantage ETF (RSPA)
|
|
Six Months Ended
April 30,
2025
(Unaudited)
|
For the Period
July 15, 2024(a)
Through
October 31,
2024
|
Per Share Operating Performance:
|
|
|
Net asset value at beginning of period
|
|
|
|
|
|
|
Net realized and unrealized gain (loss) on investments
|
|
|
Total from investment operations
|
|
|
Distributions to shareholders from:
|
|
|
|
|
|
|
Net asset value at end of period
|
|
|
Market price at end of period(c)
|
|
|
Net Asset Value Total Return(d)
|
|
|
Market Price Total Return(d)
|
|
|
Ratios/Supplemental Data:
|
|
|
Net assets at end of period (000’s omitted)
|
|
|
Ratio to average net assets of:
|
|
|
|
|
|
|
Expenses, prior to Waivers
|
|
|
|
|
|
|
Portfolio turnover rate(g)
|
|
|
|
|
Commencement of investment operations.
|
|
|
Based on average shares outstanding.
|
|
|
The mean between the last bid and ask prices.
|
|
|
Net asset value total return is calculated assuming an initial investment made at
the net asset value at the beginning of the period, reinvestment of all dividends
and distributions at net asset value during the period, and redemption at net asset
value on the last day of the period. Net asset value total return includes
adjustments in accordance with accounting principles generally accepted in the United
States of America and as such, the net asset value for financial reporting
purposes and the returns based upon those net asset values may differ from the net
asset value and returns for shareholder transactions. Market price total return
is calculated assuming an initial investment made at the market price at the beginning
of the period, reinvestment of all dividends and distributions at market price
during the period, and sale at the market price on the last day of the period. Total
investment returns calculated for a period of less than one year are not
annualized.
|
|
|
The net asset value total return from Fund Inception (July 17, 2024, the first day
of trading on the exchange) to October 31, 2024 was 3.62%. The market price
total return from Fund Inception to October 31, 2024 was 3.49%.
|
|
|
|
|
|
Portfolio turnover rate is not annualized for periods less than one year, if applicable,
and does not include securities received or delivered from processing
creations or redemptions.
|
See accompanying Notes to Financial Statements which are an integral part of the financial
statements.
Financial Highlights—(continued)
Invesco Short Duration Total Return Bond ETF (GTOS)
|
|
Six Months Ended
April 30,
2025
(Unaudited)
|
Year ended October 31,
2024
|
For the Period
December 7, 2022(a)
Through
October 31,
2023
|
Per Share Operating Performance:
|
|
|
|
Net asset value at beginning of period
|
|
|
|
|
|
|
|
|
Net realized and unrealized gain (loss) on investments
|
|
|
|
Total from investment operations
|
|
|
|
Distributions to shareholders from:
|
|
|
|
|
|
|
|
|
Net asset value at end of period
|
|
|
|
Market price at end of period(c)
|
|
|
|
Net Asset Value Total Return(d)
|
|
|
|
Market Price Total Return(d)
|
|
|
|
Ratios/Supplemental Data:
|
|
|
|
Net assets at end of period (000’s omitted)
|
|
|
|
Ratio to average net assets of:
|
|
|
|
|
|
|
|
|
|
|
|
|
|
Portfolio turnover rate(g)
|
|
|
|
|
|
Commencement of investment operations.
|
|
|
Based on average shares outstanding.
|
|
|
The mean between the last bid and ask prices.
|
|
|
Net asset value total return is calculated assuming an initial investment made at
the net asset value at the beginning of the period, reinvestment of all dividends
and distributions at net asset value during the period, and redemption at net asset
value on the last day of the period. Net asset value total return includes
adjustments in accordance with accounting principles generally accepted in the United
States of America and as such, the net asset value for financial reporting
purposes and the returns based upon those net asset values may differ from the net
asset value and returns for shareholder transactions. Market price total return
is calculated assuming an initial investment made at the market price at the beginning
of the period, reinvestment of all dividends and distributions at market price
during the period, and sale at the market price on the last day of the period. Total
investment returns calculated for a period of less than one year are not
annualized.
|
|
|
The net asset value total return from Fund Inception (December 9, 2022, the first
day of trading on the exchange) to October 31, 2023 was 2.47%. The market
price total return from Fund Inception to October 31, 2023 was 2.39%.
|
|
|
|
|
|
Portfolio turnover rate is not annualized for periods less than one year, if applicable,
and does not include securities received or delivered from processing
creations or redemptions.
|
See accompanying Notes to Financial Statements which are an integral part of the financial
statements.
Financial Highlights—(continued)
Invesco SteelPath MLP & Energy Infrastructure ETF (PIPE)
|
|
For the Period
February 18, 2025(a)
Through
April 30,
2025
(Unaudited)
|
Per Share Operating Performance:
|
|
Net asset value at beginning of period
|
|
|
|
|
Net realized and unrealized gain on investments
|
|
Total from investment operations
|
|
Distributions to shareholders from:
|
|
|
|
|
Net asset value at end of period
|
|
Market price at end of period(c)
|
|
Net Asset Value Total Return(d)
|
|
Market Price Total Return(d)
|
|
Ratios/Supplemental Data:
|
|
Net assets at end of period (000’s omitted)
|
|
Ratio to average net assets of:
|
|
|
|
|
|
|
|
Portfolio turnover rate(g)
|
|
|
|
Commencement of investment operations.
|
|
|
Based on average shares outstanding.
|
|
|
The mean between the last bid and ask prices.
|
|
|
Net asset value total return is calculated assuming an initial investment made at
the net asset value at the beginning of the period, reinvestment of all dividends
and distributions at net asset value during the period, and redemption at net asset
value on the last day of the period. Net asset value total return includes
adjustments in accordance with accounting principles generally accepted in the United
States of America and as such, the net asset value for financial reporting
purposes and the returns based upon those net asset values may differ from the net
asset value and returns for shareholder transactions. Market price total return
is calculated assuming an initial investment made at the market price at the beginning
of the period, reinvestment of all dividends and distributions at market price
during the period, and sale at the market price on the last day of the period. Total
investment returns calculated for a period of less than one year are not
annualized.
|
|
|
The net asset value total return from Fund Inception (February 20, 2025, the first
day of trading on the exchange) to April 30, 2025 was (5.19)%. The market
price total return from Fund Inception to April 30, 2025 was (5.23)%.
|
|
|
|
|
|
Portfolio turnover rate is not annualized for periods less than one year, if applicable,
and does not include securities received or delivered from processing
creations or redemptions.
|
See accompanying Notes to Financial Statements which are an integral part of the financial
statements.
Financial Highlights—(continued)
Invesco Top QQQ ETF (QBIG)
|
|
For the Period
December 2, 2024(a)
Through
April 30,
2025
(Unaudited)
|
Per Share Operating Performance:
|
|
Net asset value at beginning of period
|
|
|
|
|
Net realized and unrealized gain (loss) on investments
|
|
Total from investment operations
|
|
Distributions to shareholders from:
|
|
|
|
|
Net asset value at end of period
|
|
Market price at end of period(c)
|
|
Net Asset Value Total Return(d)
|
|
Market Price Total Return(d)
|
|
Ratios/Supplemental Data:
|
|
Net assets at end of period (000’s omitted)
|
|
Ratio to average net assets of:
|
|
|
|
|
Expenses, prior to Waivers
|
|
|
|
|
Portfolio turnover rate(g)
|
|
|
|
Commencement of investment operations.
|
|
|
Based on average shares outstanding.
|
|
|
The mean between the last bid and ask prices.
|
|
|
Net asset value total return is calculated assuming an initial investment made at
the net asset value at the beginning of the period, reinvestment of all dividends
and distributions at net asset value during the period, and redemption at net asset
value on the last day of the period. Net asset value total return includes
adjustments in accordance with accounting principles generally accepted in the United
States of America and as such, the net asset value for financial reporting
purposes and the returns based upon those net asset values may differ from the net
asset value and returns for shareholder transactions. Market price total return
is calculated assuming an initial investment made at the market price at the beginning
of the period, reinvestment of all dividends and distributions at market price
during the period, and sale at the market price on the last day of the period. Total
investment returns calculated for a period of less than one year are not
annualized.
|
|
|
The net asset value total return from Fund Inception (December 4, 2024, the first
day of trading on the exchange) to April 30, 2025 was (12.96)%. The market
price total return from Fund Inception to April 30, 2025 was (13.17)%.
|
|
|
|
|
|
Portfolio turnover rate is not annualized for periods less than one year, if applicable,
and does not include securities received or delivered from processing
creations or redemptions.
|
See accompanying Notes to Financial Statements which are an integral part of the financial
statements.
Financial Highlights—(continued)
Invesco Total Return Bond ETF (GTO)
|
|
Six Months Ended
April 30,
2025
(Unaudited)
|
|
|
|
|
|
|
|
|
Per Share Operating Performance:
|
|
|
|
|
|
|
Net asset value at beginning of period
|
|
|
|
|
|
|
|
|
|
|
|
|
|
|
Net realized and unrealized gain (loss) on investments
|
|
|
|
|
|
|
Total from investment operations
|
|
|
|
|
|
|
Distributions to shareholders from:
|
|
|
|
|
|
|
|
|
|
|
|
|
|
|
|
|
|
|
|
|
|
|
|
|
|
|
|
|
|
|
Net asset value at end of period
|
|
|
|
|
|
|
Market price at end of period(b)
|
|
|
|
|
|
|
Net Asset Value Total Return(c)
|
|
|
|
|
|
|
Market Price Total Return(c)
|
|
|
|
|
|
|
Ratios/Supplemental Data:
|
|
|
|
|
|
|
Net assets at end of period (000’s omitted)
|
|
|
|
|
|
|
Ratio to average net assets of:
|
|
|
|
|
|
|
|
|
|
|
|
|
|
|
Expenses, prior to Waivers
|
|
|
|
|
|
|
|
|
|
|
|
|
|
|
Portfolio turnover rate(e)
|
|
|
|
|
|
|
|
|
Based on average shares outstanding.
|
|
|
The mean between the last bid and ask prices.
|
|
|
Net asset value total return is calculated assuming an initial investment made at
the net asset value at the beginning of the period, reinvestment of all dividends
and distributions at net asset value during the period, and redemption at net asset
value on the last day of the period. Net asset value total return includes
adjustments in accordance with accounting principles generally accepted in the United
States of America and as such, the net asset value for financial reporting
purposes and the returns based upon those net asset values may differ from the net
asset value and returns for shareholder transactions. Market price total return
is calculated assuming an initial investment made at the market price at the beginning
of the period, reinvestment of all dividends and distributions at market price
during the period, and sale at the market price on the last day of the period. Total
investment returns calculated for a period of less than one year are not
annualized.
|
|
|
|
|
|
Portfolio turnover rate is not annualized for periods less than one year, if applicable,
and does not include securities received or delivered from processing
creations or redemptions.
|
See accompanying Notes to Financial Statements which are an integral part of the financial
statements.
Financial Highlights—(continued)
Invesco Ultra Short Duration ETF (GSY)
|
|
Six Months Ended
April 30,
2025
(Unaudited)
|
|
|
|
|
|
|
|
|
Per Share Operating Performance:
|
|
|
|
|
|
|
Net asset value at beginning of period
|
|
|
|
|
|
|
|
|
|
|
|
|
|
|
Net realized and unrealized gain (loss) on
investments
|
|
|
|
|
|
|
Total from investment operations
|
|
|
|
|
|
|
Distributions to shareholders from:
|
|
|
|
|
|
|
|
|
|
|
|
|
|
|
|
|
|
|
|
|
|
|
|
|
|
|
|
|
|
|
Net asset value at end of period
|
|
|
|
|
|
|
Market price at end of period(b)
|
|
|
|
|
|
|
Net Asset Value Total Return(c)
|
|
|
|
|
|
|
Market Price Total Return(c)
|
|
|
|
|
|
|
Ratios/Supplemental Data:
|
|
|
|
|
|
|
Net assets at end of period (000’s omitted)
|
|
|
|
|
|
|
Ratio to average net assets of:
|
|
|
|
|
|
|
|
|
|
|
|
|
|
|
|
|
|
|
|
|
|
|
Portfolio turnover rate(e)
|
|
|
|
|
|
|
|
|
Based on average shares outstanding.
|
|
|
The mean between the last bid and ask prices.
|
|
|
Net asset value total return is calculated assuming an initial investment made at
the net asset value at the beginning of the period, reinvestment of all dividends
and distributions at net asset value during the period, and redemption at net asset
value on the last day of the period. Net asset value total return includes
adjustments in accordance with accounting principles generally accepted in the United
States of America and as such, the net asset value for financial reporting
purposes and the returns based upon those net asset values may differ from the net
asset value and returns for shareholder transactions. Market price total return
is calculated assuming an initial investment made at the market price at the beginning
of the period, reinvestment of all dividends and distributions at market price
during the period, and sale at the market price on the last day of the period. Total
investment returns calculated for a period of less than one year are not
annualized.
|
|
|
|
|
|
Portfolio turnover rate is not annualized for periods less than one year, if applicable,
and does not include securities received or delivered from processing
creations or redemptions.
|
See accompanying Notes to Financial Statements which are an integral part of the financial
statements.
Financial Highlights—(continued)
Invesco Variable Rate Investment Grade ETF (VRIG)
|
|
Six Months Ended
April 30,
2025
(Unaudited)
|
|
|
|
|
|
|
|
|
Per Share Operating Performance:
|
|
|
|
|
|
|
Net asset value at beginning of period
|
|
|
|
|
|
|
|
|
|
|
|
|
|
|
Net realized and unrealized gain (loss) on investments
|
|
|
|
|
|
|
Total from investment operations
|
|
|
|
|
|
|
Distributions to shareholders from:
|
|
|
|
|
|
|
|
|
|
|
|
|
|
|
|
|
|
|
|
|
|
|
|
|
|
|
|
|
|
|
Net asset value at end of period
|
|
|
|
|
|
|
Market price at end of period(b)
|
|
|
|
|
|
|
Net Asset Value Total Return(c)
|
|
|
|
|
|
|
Market Price Total Return(c)
|
|
|
|
|
|
|
Ratios/Supplemental Data:
|
|
|
|
|
|
|
Net assets at end of period (000’s omitted)
|
|
|
|
|
|
|
Ratio to average net assets of:
|
|
|
|
|
|
|
|
|
|
|
|
|
|
|
Expenses, prior to Waivers
|
|
|
|
|
|
|
|
|
|
|
|
|
|
|
Portfolio turnover rate(e)
|
|
|
|
|
|
|
|
|
Based on average shares outstanding.
|
|
|
The mean between the last bid and ask prices.
|
|
|
Net asset value total return is calculated assuming an initial investment made at
the net asset value at the beginning of the period, reinvestment of all dividends
and distributions at net asset value during the period, and redemption at net asset
value on the last day of the period. Net asset value total return includes
adjustments in accordance with accounting principles generally accepted in the United
States of America and as such, the net asset value for financial reporting
purposes and the returns based upon those net asset values may differ from the net
asset value and returns for shareholder transactions. Market price total return
is calculated assuming an initial investment made at the market price at the beginning
of the period, reinvestment of all dividends and distributions at market price
during the period, and sale at the market price on the last day of the period. Total
investment returns calculated for a period of less than one year are not
annualized.
|
|
|
|
|
|
Portfolio turnover rate is not annualized for periods less than one year, if applicable,
and does not include securities received or delivered from processing
creations or redemptions.
|
See accompanying Notes to Financial Statements which are an integral part of the financial
statements.
Notes to Financial Statements
Invesco Actively Managed Exchange-Traded Fund Trust
April 30, 2025
(Unaudited)
Invesco Actively Managed Exchange-Traded Fund Trust (the “Trust”) was organized as a Delaware statutory trust and is authorized to have multiple series of portfolios. The Trust is an open-end management
investment company registered under the Investment Company Act of 1940, as amended (the “1940 Act”). This report includes the following portfolios:
|
|
|
Invesco AAA CLO Floating Rate Note ETF (ICLO)
|
"AAA CLO Floating Rate Note ETF"
|
Invesco Active U.S. Real Estate ETF (PSR)
|
"Active U.S. Real Estate ETF"
|
Invesco High Yield Bond Factor ETF (IHYF)
|
"High Yield Bond Factor ETF"
|
Invesco High Yield Select ETF (HIYS)
|
|
Invesco MSCI EAFE Income Advantage ETF (EFAA)
|
"MSCI EAFE Income Advantage ETF"
|
Invesco QQQ Income Advantage ETF (QQA)
|
"QQQ Income Advantage ETF"
|
Invesco S&P 500® Downside Hedged ETF (PHDG)
|
"S&P 500® Downside Hedged ETF"
|
Invesco S&P 500 Equal Weight Income Advantage ETF (RSPA)
|
"S&P 500 Equal Weight Income Advantage ETF"
|
Invesco Short Duration Total Return Bond ETF (GTOS)(a)
|
"Short Duration Total Return Bond ETF"
|
Invesco SteelPath MLP & Energy Infrastructure ETF (PIPE)
|
"SteelPath MLP & Energy Infrastructure ETF"
|
Invesco Top QQQ ETF (QBIG)
|
|
Invesco Total Return Bond ETF (GTO)
|
|
Invesco Ultra Short Duration ETF (GSY)
|
"Ultra Short Duration ETF"
|
Invesco Variable Rate Investment Grade ETF (VRIG)
|
"Variable Rate Investment Grade ETF"
|
|
|
Effective February 24, 2025, the Fund’s name changed from Invesco Short Duration Bond ETF to Invesco Short Duration Total Return Bond ETF.
|
Each portfolio (each, a “Fund”, and collectively, the “Funds”) represents a separate series of the Trust. The shares of the Funds are referred to herein as “Shares” or “Fund’s Shares.” Each Fund’s Shares are listed and traded on the following exchanges:
|
|
|
AAA CLO Floating Rate Note ETF
|
|
Active U.S. Real Estate ETF
|
|
High Yield Bond Factor ETF
|
The Nasdaq Stock Market LLC
|
|
|
|
MSCI EAFE Income Advantage ETF
|
|
|
|
The Nasdaq Stock Market LLC
|
S&P 500® Downside Hedged ETF
|
|
S&P 500 Equal Weight Income Advantage ETF
|
|
Short Duration Total Return Bond ETF
|
|
SteelPath MLP & Energy Infrastructure ETF
|
|
|
|
The Nasdaq Stock Market LLC
|
|
|
|
|
|
|
Variable Rate Investment Grade ETF
|
The Nasdaq Stock Market LLC
|
The market price of each Share may differ to some degree from a Fund’s net asset value (“NAV”). Unlike conventional mutual funds, each Fund issues and redeems Shares on a continuous basis, at NAV, only in
a large specified number of Shares, each called a “Creation Unit”, as set forth in each Fund’s prospectus. Creation Units of each Fund (except for Active U.S. Real Estate ETF, MSCI EAFE Income Advantage ETF, QQQ Income Advantage ETF, S&P 500® Downside Hedged ETF, S&P 500 Equal Weight Income Advantage ETF, SteelPath MLP & Energy Infrastructure ETF and Top QQQ ETF) are
issued and redeemed principally in exchange for the deposit or delivery of cash, though each Fund reserves the right
to issue and redeem Creation Units in exchange for a basket of securities (“Deposit Securities”). Creation Units of Active U.S. Real Estate ETF and SteelPath MLP & Energy Infrastructure ETF are issued and redeemed principally in exchange for the deposit
or delivery of Deposit Securities, though each Fund reserves the right to issue and redeem Creation Units in exchange for cash. Creation
Units of MSCI EAFE Income Advantage
ETF, QQQ Income Advantage ETF, S&P 500® Downside Hedged ETF, S&P 500 Equal Weight Income Advantage ETF and Top QQQ ETF are issued and redeemed partially in exchange for the deposit or delivery of cash
and partially in exchange for Deposit Securities, though each Fund reserves the right to issue and redeem Creation Units
principally in exchange for cash or for Deposit Securities. Except when aggregated in Creation Units by authorized participants (“APs”), the Shares are not individually redeemable securities of the Funds.
The investment objective of each Fund is listed below.
|
|
|
AAA CLO Floating Rate Note ETF
|
To seek current income and capital preservation.
|
Active U.S. Real Estate ETF
|
To seek to achieve high total return through growth of capital and current
income.
|
High Yield Bond Factor ETF
|
|
|
|
|
MSCI EAFE Income Advantage ETF
|
To seek total return through current income and long-term growth of capital.
|
|
|
To seek total return through current income and long-term growth of capital.
|
S&P 500® Downside Hedged ETF
|
To seek to achieve positive total returns in rising or falling markets that are
not directly correlated to broad equity or fixed income market returns.
|
S&P 500 Equal Weight Income Advantage ETF
|
To seek total return through current income and long-term growth of capital.
|
Short Duration Total Return Bond ETF
|
To seek total return, comprised of income and capital appreciation.
|
SteelPath MLP & Energy Infrastructure ETF
|
|
|
|
To seek total return through long-term growth of capital.
|
|
|
To seek maximum total return, comprised of income and capital appreciation.
|
|
|
To seek maximum current income, consistent with preservation of capital and
daily liquidity.
|
Variable Rate Investment Grade ETF
|
To seek to generate current income while maintaining low portfolio duration as
a primary objective and capital appreciation as a secondary objective.
|
NOTE 2—Significant Accounting Policies
The following is a summary of the significant accounting policies followed by the
Funds in preparation of their financial statements.
Each Fund is an investment company and accordingly follows the investment company
accounting and reporting guidance in accordance with Financial Accounting Standards Board ("FASB") Accounting Standards
Codification Topic 946, Financial Services—Investment Companies.
A.
Security Valuation - Securities, including restricted securities, are valued according to the following
policies:
A security listed or traded on an exchange is generally valued at its trade price
or official closing price that day as of the close of the exchange where the security is principally traded or, lacking any trades
or official closing price on a particular day, the security may be valued at the closing bid or ask price on that day. Securities
traded in the over-the-counter ("OTC") market are valued based on prices furnished by independent pricing services
or market makers. When such securities are valued using prices provided by an independent pricing service they may be considered
fair valued. Futures contracts are valued at the daily settlement price set by an exchange on which they are principally
traded. Where a final settlement price exists, exchange-traded options are valued at the final settlement price from the
exchange where the option principally trades. Where a final settlement price does not exist, exchange-traded options are valued
at the mean between the last bid and ask price generally from the exchange where the option principally trades.
Securities of investment companies that are not exchange-traded (e.g., open-end mutual
funds) are valued using such company’s end-of-business-day NAV per share.
Deposits, other obligations of U.S. and non-U.S. banks and financial institutions
are valued at their daily account value.
Fixed income securities (including convertible debt securities) generally are valued
on the basis of prices provided by independent pricing services. Prices provided by the pricing service may be determined
without exclusive reliance on quoted prices, and may reflect appropriate factors such as institution-size trading in similar
groups of securities, developments related to specific securities, dividend rate (for unlisted equities), yield (for debt obligations),
quality, type of issue, coupon rate (for debt obligations), maturity (for debt obligations), individual trading characteristics
and other market data. Securities with a demand feature exercisable within one to seven days are valued at par. Pricing services
generally value debt obligations assuming orderly transactions of institutional round lot size, but a Fund may hold
or transact in the same securities in smaller, odd lot sizes. Odd lots often trade at lower prices than institutional round lots,
and their value may be adjusted accordingly. Debt obligations are subject to interest rate and credit risks. In addition, all debt
obligations involve some risk of default with respect to interest and/or principal payments.
Foreign securities’ (including foreign exchange contracts’) prices are converted into U.S. dollar amounts using the applicable exchange rates as of the close of the London world markets. If market quotations are
available and reliable for foreign
exchange-traded equity securities, the securities will be valued at the market quotations.
Invesco Capital Management LLC (the “Adviser”) may use various pricing services to obtain market quotations as well as fair value prices. Because trading hours for certain foreign securities end before the close of the New York Stock Exchange (“NYSE”), closing market quotations may become not representative of market value in the Adviser’s judgment ("unreliable"). If, between the time trading ends on a particular security and the close of the customary trading session on the NYSE, a
significant event occurs that makes the closing price of the security unreliable, the Adviser may fair value the security.
If the event is likely to have affected the closing price of the security, the security will be valued at fair value in good faith in
accordance with Board-approved policies and related Adviser procedures (“Valuation Procedures”). Adjustments to closing prices to reflect fair value may also be based on a screening process of an independent pricing service to indicate the degree of certainty,
based on historical data, that the closing price in the principal market where a foreign security trades is not the current
value as of the close of the NYSE. Foreign securities’ prices meeting the degree of certainty that the price is not reflective of current value will be priced at the indication of fair value from the independent pricing service. Multiple factors may
be considered by the independent pricing service in determining adjustments to reflect fair value and may include information
relating to sector indices, American depositary receipts and domestic and foreign index futures. Foreign securities may
have additional risks including exchange rate changes, the potential for sharply devalued currencies and high inflation, political
and economic upheaval, the relative lack of issuer information, relatively low market liquidity and the potential lack of strict
financial and accounting controls and standards.
Swap agreements are fair valued using an evaluated quote, if available, provided by
an independent pricing service. Evaluated quotes provided by the pricing service are valued based on a model which
may include end-of-day net present values, spreads, ratings, industry, company performance and returns of referenced
assets. Centrally cleared swap agreements are valued at the daily settlement price determined by the relevant exchange or clearinghouse.
Equity-linked notes are valued using an independent pricing service provider whose
calculations are based on various data points that are included in the trade terms.
Unlisted securities will be valued using prices provided by independent pricing services
or by another method that the Adviser, in its judgment, believes better reflects the security’s fair value in accordance with the Valuation Procedures.
Non-traded rights and warrants shall be valued at intrinsic value if the terms of
the rights and warrants are available, specifically the subscription or exercise price and the ratio. Intrinsic value is
calculated as the daily market closing price of the security to be received less the subscription price, which is then adjusted by the
exercise ratio. In the case of warrants, an option pricing model supplied by an independent pricing service may be used based
on market data such as volatility, stock price and interest rate from the independent pricing service and strike price and
exercise period from verified terms.
Securities for which market prices are not provided by any of the above methods may
be valued based upon quotes furnished by independent sources. The mean between the last bid and ask prices may
be used to value debt obligations, including corporate loans, and unlisted equity securities.
Securities for which market quotations are not readily available are fair valued by
the Adviser in accordance with the Valuation Procedures. If a fair value price provided by a pricing service is unreliable,
the Adviser will fair value the security using the Valuation Procedures. Issuer-specific events, market trends, bid/ask quotes
of brokers and information providers and other market data may be reviewed in the course of making a good faith determination of a security’s fair value.
Each Fund may invest in securities that are subject to interest rate risk, meaning
the risk that the prices will generally fall as interest rates rise and, conversely, the prices will generally rise as interest rates
fall. Specific securities differ in their sensitivity to changes in interest rates depending on their individual characteristics. Changes
in interest rates may result in increased market volatility, which may affect the value and/or liquidity of certain Fund investments.
Valuations change in response to many factors, including the historical and prospective
earnings of the issuer, the value of the issuer’s assets, general market conditions which are not specifically related to the particular issuer, such as real or perceived adverse economic conditions, changes in the general outlook for revenues
or corporate earnings, changes in interest or currency rates, regional or global instability, natural or environmental
disasters, widespread disease or other public health issues, war, military conflicts, acts of terrorism, economic crises, economic
sanctions and tariffs, significant governmental actions or adverse investor sentiment generally and market liquidity.
Because of the inherent uncertainties of valuation, the values reflected in the financial statements may materially differ
from the value received upon actual sale of those investments.
The price a Fund could receive upon the sale of any investment may differ from the Adviser’s valuation of the investment, particularly for securities that are valued using a fair valuation technique. When
fair valuation techniques are applied, the Adviser uses available information, including both observable and unobservable inputs
and assumptions, to determine a methodology that will result in a valuation that the Adviser believes approximates
market value. Fund securities that are fair valued may be subject to greater fluctuation in their value from one day to the next
than would be the case if market quotations were used. Because of the inherent uncertainties of valuation, and the
degree of subjectivity in such decisions, a Fund could realize a greater or lesser than expected gain or loss upon the sale of
the investment.
B.
Investment Transactions and Investment Income - Investment transactions are accounted for on a trade date basis. Realized gains and losses from the sale or disposition of securities are computed
on the specific identified cost basis. Interest income is recorded on an accrual basis from settlement date and includes coupon interest
and amortization of premium and
accretion of discount on debt securities as applicable. Pay-in-kind interest income
and non-cash dividend income received in the form of securities in lieu of cash are recorded at the fair value of the securities
received. Dividend income (net of withholding tax, if any) is recorded on the ex-dividend date. Dividend income from
REITs is recorded based on the income included in the distributions received from the REIT investments using published REIT
classifications, including some management estimates when actual amounts are not available. Distributions received
in excess of this estimated amount are recorded as a reduction of the cost of investments or reclassified to capital gains.
The actual amounts of income, return of capital, and capital gains are only determined by each REIT after its fiscal year-end,
and may differ from the estimated amounts. Realized gains, dividends and interest received by a Fund may give rise to
withholding and other taxes imposed by foreign countries. Tax conventions between certain countries and the United States
may reduce or eliminate such taxes.
The Funds may periodically participate in litigation related to a Fund’s investments. As such, the Funds may receive proceeds from litigation settlements. Any proceeds received are included in the Statements
of Operations as realized gain (loss) for investments no longer held and as unrealized gain (loss) for investments
still held.
Brokerage commissions and mark ups are considered transaction costs and are recorded
as an increase to the cost basis of securities purchased and/or a reduction of proceeds on a sale of securities. Such
transaction costs are included in the determination of net realized and unrealized gain (loss) from investment securities
reported in the Statements of Operations and the Statements of Changes in Net Assets and the net realized and unrealized gains
(losses) on securities per share in the Financial Highlights. Transaction costs are included in the calculation of a Fund’s NAV and, accordingly, they reduce a Fund’s total returns. These transaction costs are not considered operating expenses and are
not reflected in net investment income reported in the Statements of Operations and the Statements of Changes in Net Assets,
or the net investment income per share and the ratios of expenses and net investment income reported in the Financial
Highlights, nor are they limited by any expense limitation arrangements between each Fund and the Adviser.
C.
Country Determination - For the purposes of presentation in the Schedules of Investments, the Adviser may
determine the country in which an issuer is located and/or credit risk exposure based on various
factors. These factors may include the laws of the country under which the issuer is organized, where the issuer maintains a principal
office, the country in which the issuer derives 50% or more of its total revenues, the country that has the primary market for the issuer’s securities and its "country of risk" as determined by a third party service provider, as well as other
criteria. Among the other criteria that may be evaluated for making this determination are the country in which the issuer maintains
50% or more of its assets, the type of security, financial guarantees and enhancements, the nature of the collateral and
the sponsor organization. Country of issuer and/or credit risk exposure has been determined to be the United States of
America, unless otherwise noted.
D.
Dividends and Distributions to Shareholders - Each Fund (except Active U.S. Real Estate ETF, S&P 500® Downside Hedged ETF and Top QQQ ETF) declares and pays dividends from net investment income, if any,
to its shareholders monthly and records such dividends on the ex-dividend date. Active U.S. Real Estate ETF and S&P
500® Downside Hedged ETF each declares and pays dividends from net investment income, if any, to its shareholders
quarterly and records such dividends on the ex-dividend date. Top QQQ ETF declares and pays dividends from net investment
income, if any, to its shareholders annually and records such dividends on the ex-dividend date. Generally, each Fund
distributes net realized taxable capital gains, if any, annually in cash and records them on the ex-dividend date. Such distributions
on a tax basis are determined in conformity with federal income tax regulations, which may differ from accounting principles
generally accepted in the United States of America (“GAAP”). Distributions in excess of tax basis earnings and profits, if any, are reported in such Fund’s financial statements as a tax return of capital at fiscal year-end.
E.
Federal Income Taxes - Each Fund intends to comply with the provisions of the Internal Revenue Code of
1986, as amended (the “Internal Revenue Code”), applicable to regulated investment companies and to distribute substantially all of the Fund’s taxable earnings to its shareholders. As such, the Funds will not be subject to federal
income taxes on otherwise taxable income (including net realized gains) that is distributed to the shareholders. Therefore,
no provision for federal income taxes is recorded in the financial statements.
Each Fund recognizes the tax benefits of uncertain tax positions only when the position
is more likely than not to be sustained. Management has analyzed each Fund’s uncertain tax positions and concluded that no liability for unrecognized tax benefits should be recorded related to uncertain tax positions. Management is not
aware of any tax positions for which it is reasonably possible that the total amounts of unrecognized tax benefits will change
materially in the next 12 months.
Income and capital gain distributions are determined in accordance with federal income
tax regulations, which may differ from GAAP. These differences are primarily due to differing book and tax treatments
for in-kind transactions, losses deferred due to wash sales, and passive foreign investment company adjustments, if any.
The Funds file U.S. federal tax returns and tax returns in certain other jurisdictions.
Generally, a Fund is subject to examinations by such taxing authorities for up to three years after the filing of
the return for the tax period.
F.
Expenses - Each Fund (except for Ultra Short Duration ETF) has agreed to pay an annual unitary
management fee to the Adviser. Out of the unitary management fee, the Adviser pays for substantially all
expenses of the Funds, including payments to the Affiliated Sub-Advisers (as defined below) for each Fund (except S&P 500® Downside Hedged ETF and Top QQQ ETF), and for each Fund, the costs of transfer agency, custody, fund administration, legal,
audit and other services, except for distribution fees, if any, brokerage expenses, taxes, interest (including, for AAA
CLO Floating Rate Note ETF, interest expenses associated with the line of credit), acquired fund fees and expenses, if any, litigation
expenses and other extraordinary
expenses, including proxy expenses (except for such proxies related to: (i) changes
to the Investment Advisory Agreement, (ii) the election of any Board member who is an “interested person” of the Trust or the Adviser (an "Interested Trustee"), or (iii) any other matters that directly benefit the Adviser). For AAA CLO Floating Rate
Note ETF, the Adviser also pays out of the unitary management fee the set-up fees and commitment fees associated with the line
of credit.
Ultra Short Duration ETF is responsible for all of its own expenses, including, but
not limited to, the investment advisory fees, costs of transfer agency, custody, fund administration, legal, audit and other
services, interest, taxes, acquired fund fees and expenses, if any, brokerage commissions and other expenses connected with executions
of portfolio transactions, any distribution fees or expenses, litigation expenses, fees payable to the Trust’s Board members and officers who are not “interested persons” (as defined in the 1940 Act) of the Trust or the Adviser (the “Independent Trustees”), expenses incurred in connection with the Board members’ services, including travel expenses and legal fees of counsel for the Independent Trustees, and extraordinary expenses, including proxy expenses (except for such proxies
related to: (i) changes to the Investment Advisory Agreement, (ii) the election of an Interested Trustee, or (iii)
any other matters that directly benefit the Adviser).
Expenses of the Trust that are directly identifiable to a specific Fund, including expenses that are excluded from a Fund’s unitary management fee (if applicable), are applied to that Fund. Expenses of the
Trust that are not readily identifiable to a specific Fund, including expenses that are excluded from a Fund’s unitary management fee (if applicable), are allocated in such a manner as deemed equitable, taking into consideration the nature and type of expense
and the relative net assets of each Fund.
To the extent a Fund invests in other investment companies, the expenses shown in
the accompanying financial statements reflect the expenses of the Fund and do not include any expenses of the investment
companies in which it invests. The effects of such investment companies’ expenses are included in the realized and unrealized gain or loss on the investments in the investment companies.
G.
Accounting Estimates - The preparation of the financial statements in accordance with GAAP requires management
to make estimates and assumptions that affect the reported amounts and disclosures in the
financial statements, including estimates and assumptions related to taxation. Actual results could differ from these estimates.
In addition, the Funds monitor for material events or transactions that may occur or become known after the period-end
date and before the date the financial statements are released to print.
H.
Indemnifications - Under the Trust’s organizational documents, its Officers and Trustees are indemnified against certain liabilities arising out of the performance of their duties to the Trust. Each Independent
Trustee is also indemnified against certain liabilities arising out of the performance of their duties to the Trust pursuant
to an Indemnification Agreement between such trustee and the Trust. Additionally, in the normal course of business, the Trust
enters into contracts with service providers that contain general indemnification clauses. The Trust’s maximum exposure under these arrangements is unknown, as this would involve future claims that may be made against the Trust that have not
yet occurred. The risk of material loss as a result of such indemnification claims is considered remote.
I.
Segment Reporting — In November 2023, the FASB issued Accounting Standards Update 2023-07, Segment Reporting (Topic 280): Improvements to Reportable Segment Disclosures (“ASU 2023-07”), with the intent of improving reportable segment disclosure requirements, primarily through enhanced disclosures about significant
segment expenses, allowing financial statement users to better understand the components of a segment’s profit or loss and assess potential future cash flows for each reportable segment and the entity as a whole, thereby enabling better understanding of how an entity’s segments impact overall performance. Each Fund represents a single operating segment.
Subject to the oversight and, when applicable, approval of the Board of Trustees, the Adviser acts as the Funds’ chief operating decision maker (“CODM”), assessing performance and making decisions about resource allocation within each Fund.
The CODM monitors the operating results as a whole, and each Fund’s long-term strategic asset allocation is determined in accordance with the terms of its prospectus based on a defined investment strategy. The financial information provided
to and reviewed by the CODM is consistent with that presented in the Funds’ financial statements. Adoption of the new standard impacted the Funds’ financial statement note disclosures only and did not affect the Funds’ financial position or the results of its operations.
J.
Commercial Mortgage-Backed Securities - Certain Funds may invest in both single and multi-issuer Commercial Mortgage-Backed Securities (“CMBS”). This includes both investment grade and non-investment grade CMBS as well as other non-rated CMBS. A CMBS is a type of mortgage-backed security that is secured by one
or more mortgage loans on interests in commercial real estate property. CMBS differ from conventional debt securities because
principal is paid back over the life of the security rather than at maturity. Investments in CMBS are subject to the various
risks which relate to the pool of underlying assets in which the CMBS represents an interest. Securities backed by commercial
real estate assets are subject to securities market risks as well as risks similar to those of direct ownership of commercial
real estate loans. Risks include the ability of a borrower to meet its obligations on the loan which could lead to default
or foreclosure of the property. Such actions may impact the amount of proceeds ultimately derived from the loan, and the timing
of receipt of such proceeds.
Management estimates future expected cash flows at the time of purchase based on the
anticipated repayment dates on the CMBS. Subsequent changes in expected cash flow projection may result in a prospective
change in the timing or character of income recognized on these securities, or the amortized cost of these securities.
Each Fund amortizes premiums and/or accretes discounts based on the projected cash flows. Realized and unrealized gains
and losses on CMBS are included in the
Statements of Operations as Net realized gain (loss) from investment securities and Change in net unrealized appreciation (depreciation) of investment securities, respectively.
K.
Securities Purchased on a When-Issued and Delayed Delivery Basis - The Funds may purchase and sell interests in corporate loans and corporate debt securities and other portfolio securities on a
when issued and delayed delivery basis, with payment and delivery scheduled for a future date. No income accrues to the Fund on
such interests or securities in connection with such transactions prior to the date the Fund actually takes delivery of such
interests or securities. These transactions are subject to market fluctuations and are subject to the risk that the value of the interests
or securities at delivery may be more or less than the trade date purchase price. Although the Fund will generally purchase
these securities with the intention of acquiring such securities, it may sell such securities prior to the settlement date.
L.
Repurchase Agreements - The Funds may enter into repurchase agreements. Collateral on repurchase agreements,
including each Fund’s pro-rata interest in joint repurchase agreements, is taken into possession by such Funds upon entering into the repurchase agreement. Collateral consisting of U.S. Government Securities and U.S.
Government Sponsored Agency Securities is marked to market daily to ensure its market value is typically at least 102% of
the sales price of the repurchase agreement. Collateral consisting of non-government securities is marked to market daily to ensure
its market value is typically at least 105% of the sales price of the repurchase agreement. The investments in some repurchase
agreements, pursuant to procedures approved by the Board of Trustees, are through participation with other
mutual funds, private accounts and certain non-registered investment companies managed by the investment advisor or its affiliates (“Joint repurchase agreements”). The principal amount of the repurchase agreement is equal to the value at period-end. If the seller of a repurchase agreement fails to repurchase the security in accordance with the terms
of the agreement, the Funds might incur expenses in enforcing their rights, and could experience losses, including a decline
in the value of the collateral and loss of income.
M.
Master Limited Partnerships (“MLPs”) - SteelPath MLP & Energy Infrastructure ETF invests in MLPs, which are generally
publicly traded limited partnerships or limited liability companies. Investments in
MLPs involve risks that differ from investments in common stock, including risks related to limited control and limited
rights to vote on matters affecting the MLP, risks related to potential conflicts of interest between the MLP and the MLP’s general partner, cash flow risks, dilution risks and risks related to the general partner’s right to require unit-holders to sell their common units at an undesirable time or price. Certain MLP securities may trade in lower volumes due to their smaller capitalizations,
and may be subject to more abrupt or erratic price movements and lower market liquidity. MLPs are generally considered
interest-rate sensitive investments. During periods of interest rate volatility, these investments may not
provide attractive returns.
MLPs taxed as partnerships do not pay U.S. federal income tax at the partnership level,
subject to the application of certain partnership audit rules. Rather, each partner is allocated a share of the partnership’s income, gains, losses, deductions and expenses. A change in current tax law or a change in the underlying business mix of
a given MLP could result in an MLP being treated as a corporation for U.S. federal income tax purposes, which would have the
effect of reducing the amount of cash available for distribution by the MLP and, as a result, could result in a reduction of the value of the Fund’s investment, and consequently your investment in the Fund and lower income. Also, to the extent a distribution
received by the Fund from an MLP is treated as a return of capital, the Fund’s adjusted tax basis in the interests of the MLP will be reduced, which may increase the Fund’s tax liability upon the sale of the interests in the MLP or upon subsequent distributions in respect of such interests.
In certain circumstances, creditors of an MLP would have the right to seek return
of capital distributed to the Fund, which right would continue after the Fund sold its investment in the MLP.
N.
Return of Capital - Distributions received from SteelPath MLP & Energy Infrastructure ETF’s investments in MLPs generally are comprised of income and return of capital. The Fund records investment income
and return of capital based on estimates made at the time such distributions are received. The return of capital portion of
the distribution is a reduction to investment income that results in an equivalent reduction in the cost basis of the associated
investments and increases net realized gains (losses) and change in unrealized appreciation (depreciation). Such estimates are
based on historical information available from each MLP and other industry sources. These estimates will subsequently be revised
and may materially differ primarily based on information received from the MLPs after their tax reporting periods are
concluded.
O.
Equity-Linked Notes - Certain Funds may invest in Equity-Linked Notes (ELNs). ELNs are hybrid derivative-type
instruments, in a single note form, that are specially designed to combine the characteristics
of one or more reference securities (such as a single stock, an exchange traded fund or an index or basket of securities (underlying
securities)) and one or more related equity derivatives, such as put or call options, or a combination thereof. Unlike
a direct investment in equity securities, ELNs have a maturity date, potentially increasing a Fund’s turnover rate, transaction costs and tax liability. Upon the maturity of an ELN, a Fund generally receives an interest coupon payment and the par value of the
note plus or minus a return based on the performance of the underlying securities and the related equity derivatives. If the
underlying securities have depreciated in value or if their price appreciates or depreciates outside of a preset range, depending
on the type of ELN, a Fund may receive only the principal amount of the note or less than the principal amount of the note,
or may even lose the entire principal invested in the ELN. Investments in ELNs possess the risks associated with the underlying
securities, such as management risk, market risk and, as applicable, foreign securities and currency risks. In addition,
as a note, ELNs are also subject to certain debt securities risks, such as interest rate and credit risk. An investment
in an ELN also bears the risk that the ELN
issuer will default or become bankrupt. In such an event, a Fund may have difficulty
being repaid, or fail to be repaid, the principal amount of, or income from, its investment. As the holder of an ELN, a Fund
generally has no rights to the underlying securities, including no voting rights or rights to receive dividends.
ELNs utilized by a Fund may involve synthetic exposure to options that can create
economic leverage risk which, depending on the performance of the underlying securities, could magnify or otherwise increase
investment losses to such Fund and result in losses on the ELN that exceed the losses on the underlying securities. The
economic leverage associated with investments in ELNs is distinguishable from indebtedness leverage in that it does
not expose a Fund to losing more than the principal amount of the ELN. Should the prices of the underlying securities move in
an unexpected manner, a Fund may not achieve the anticipated benefits of its ELN investments, and it may realize losses,
which could be significant and could include a Fund’s entire principal investment. In addition, investments in ELNs allow for enhanced yield but are subject to limited upside appreciation potential based on movements of the underlying securities. Investing
in ELNs may be more costly to a Fund than if the Fund had invested in the underlying securities directly.
P.
Securities Lending - Each Fund may participate in securities lending and may loan portfolio securities
having a market value up to one-third of each Fund’s total assets. Such loans are secured by cash collateral equal to no less than 102% (105% for international securities) of the market value of the loaned securities determined
daily by the securities lending provider. Cash collateral received in connection with these loans is invested in short-term money
market instruments or affiliated, unregistered investment companies that comply with Rule 2a-7 under the 1940 Act and
money market funds (collectively, "affiliated money market funds") and is shown as such on the Schedules of Investments.
Each Fund bears the risk of loss with respect to the investment of collateral. It is the policy of these Funds to obtain
additional collateral from or return excess collateral to the borrower by the end of the next business day, following the valuation
date of the securities loaned. Therefore, the value of the collateral held may be temporarily less than the value of the securities
on loan. When loaning securities, each Fund retains certain benefits of owning the securities, including the economic equivalent
of dividends or interest generated by the security. Lending securities entails a risk of loss to each Fund if, and to the
extent that, the market value of the securities loaned were to increase, and the borrower did not increase the collateral accordingly,
and the borrower failed to return the securities. The securities loaned are subject to termination at the option of the
borrower or each Fund. Upon termination, the borrower will return to each Fund the securities loaned and each Fund will return
the collateral. Upon the failure of the borrower to return the securities, collateral may be liquidated and the securities
may be purchased on the open market to replace the loaned securities. Each Fund could experience delays and costs in gaining
access to the collateral and the securities may lose value during the delay which could result in potential losses
to each Fund. Some of these losses may be indemnified by the lending agent. Each Fund bears the risk of any deficiency in the
amount of the collateral available for return to the borrower due to any loss on the collateral invested. For Funds that
participated in securities lending, dividends received on cash collateral investments for securities lending transactions, which
are net of compensation to counterparties, are included in Securities lending income, net on the Statements of Operations. The aggregate value of securities out on loan, if any, is shown on the Statements of Assets and Liabilities.
Invesco Advisers, Inc. (“Invesco”), an affiliate of the Adviser, serves as an affiliated securities lending agent for each Fund participating in the securities lending program. The Bank of New York Mellon (“BNYM”) also serves as a securities lending agent. To the extent a Fund utilizes Invesco as an affiliated securities lending agent,
the Fund conducts its securities lending in accordance with, and in reliance upon, no-action letters issued by the SEC staff that
provide guidance on how an affiliate may act as a direct agent lender and receive compensation for those services in a manner
consistent with the federal securities laws. For the six months ended April 30, 2025, each Fund (except for AAA CLO Floating
Rate Note ETF, High Yield Bond Factor ETF, High Yield Select ETF, Short Duration Total Return Bond ETF, Top QQQ ETF
and Variable Rate Investment Grade ETF) had affiliated securities lending transactions with Invesco. Fees paid to Invesco
for securities lending agent services, which are included in Securities lending income, net on the Statements of Operations, were incurred by each applicable Fund as listed below:
|
|
|
Active U.S. Real Estate ETF
|
|
MSCI EAFE Income Advantage ETF
|
|
|
|
|
S&P 500® Downside Hedged ETF
|
|
S&P 500 Equal Weight Income Advantage ETF
|
|
SteelPath MLP & Energy Infrastructure ETF(a)
|
|
|
|
|
|
|
|
|
|
For the period February 18, 2025 (commencement of investment operations) through April
30, 2025.
|
Q.
Foreign Currency Translations - Foreign currency is valued at the close of the NYSE based on quotations posted
by banks and major currency dealers. Portfolio securities and other assets and liabilities
denominated in foreign currencies are translated into U.S. dollar amounts at the date of valuation. Purchases and sales
of portfolio securities (net of foreign taxes
withheld on disposition) and income items denominated in foreign currencies are translated
into U.S. dollar amounts on the respective dates of such transactions. Each Fund does not separately account for the
portion of the results of operations resulting from changes in foreign exchange rates on investments and the fluctuations
arising from changes in market prices of securities held. The combined results of changes in foreign exchange rates and the
fluctuation of market prices on investments (net of estimated foreign tax withholding) are included with the net realized
and unrealized gain or loss from investments in the Statements of Operations. Reported net realized foreign currency
gains or losses arise from (1) sales of foreign currencies, (2) currency gains or losses realized between the trade and settlement
dates on securities transactions, and (3) the difference between the amounts of dividends, interest, and foreign withholding taxes recorded on a Fund’s books and the U.S. dollar equivalent of the amounts actually received or paid. Net unrealized
foreign currency gains and losses arise from changes in the fair values of assets and liabilities, other than investments
in securities at fiscal period-end, resulting from changes in exchange rates.
Each Fund may invest in foreign securities, which may be subject to foreign taxes
on income, gains on investments or currency repatriation, a portion of which may be recoverable. Foreign taxes, if any,
are recorded based on the tax regulations and rates that exist in the foreign markets in which a Fund invests.
The performance of a Fund may be materially affected positively or negatively by foreign
currency strength or weakness relative to the U.S. dollar. Currency rates in foreign countries may fluctuate for
a number of reasons, including changes in interest rates, political, economic, or social instability and development, and imposition
of currency controls. Currency controls in certain foreign jurisdictions may cause a Fund to experience significant delays
in its ability to repatriate its assets in U.S. dollars at quoted spot rates, and it is possible that a Fund’s ability to convert certain foreign currencies into U.S. dollars may be limited and may occur at discounts to quoted rates. As a result, the value of a Fund’s assets and liabilities denominated in such currencies that would ultimately be realized could differ from those reported
on the Statements of Assets and Liabilities. Certain foreign companies may be subject to sanctions, embargoes, or other governmental
actions that may limit the ability to invest in, receive, hold, or sell the securities of such companies, all of which affect
the market and/or credit risk of the investments. Because of the inherent uncertainties of valuation, the values reflected
in the financial statements may materially differ from the value received upon actual sale of those investments.
R.
Forward Foreign Currency Contracts - Certain Funds may engage in foreign currency transactions either on a spot (i.e.
for prompt delivery and settlement) basis at the rate prevailing in the currency exchange
market at the time or through forward foreign currency contracts to manage or minimize currency or exchange rate risk.
A Fund may also enter into forward foreign currency contracts for the purchase or
sale of a security denominated in a foreign currency in order to “lock in” the U.S. dollar price of that security, or the Fund may enter into forward foreign currency contracts that do not provide for physical exchange of the two currencies
on the settlement date, but instead are settled by a single cash payment calculated as the difference between the agreed upon
exchange rate and the spot rate at settlement based upon an agreed upon notional amount (non-deliverable forwards).
A forward foreign currency contract is an obligation between two parties (“Counterparties”) to purchase or sell a specific currency for an agreed-upon price at a future date. The use of forward foreign currency
contracts for hedging does not eliminate fluctuations in the price of the underlying securities the Fund owns or
intends to acquire but establishes a rate of exchange in advance. Fluctuations in the value of these contracts are measured by
the difference in the contract date and reporting date exchange rates and are recorded as unrealized appreciation (depreciation)
until the contracts are closed. When the contracts are closed, realized gains (losses) are recorded. Realized and unrealized
gains (losses) on the contracts are included in the Statements of Operations. The primary risks associated with forward
foreign currency contracts include failure of the Counterparty to meet the terms of the contract and the value of the foreign
currency changing unfavorably. These risks may be in excess of the amounts reflected in the Statements of Assets and Liabilities.
S.
Futures Contracts - Certain Funds may enter into futures contracts to simulate full investment in securities
or manage exposure to equity, interest rate, and market price movements and/or currency risks
and provide exposure to markets and indexes.
A futures contract is an agreement between Counterparties to purchase or sell a specified
underlying security or index for a specified price at a future date. Certain Funds will only enter into exchange-traded
futures contracts that are standardized as to maturity date and underlying instrument or asset. Initial margin deposits required
upon entering into futures contracts are satisfied by the segregation of specific securities or cash as collateral at the futures
commission merchant broker. During the period the futures contracts are open, changes in the value of the contracts are recognized
as unrealized gains or losses by recalculating the value of the contracts on a daily basis. Subsequent or variation
margin payments are received or made depending upon whether unrealized gains or losses are incurred. These amounts are
reflected as a receivable or payable on the Statements of Assets and Liabilities. The Fund may utilize excess cash or otherwise
transfer cash to the broker to satisfy variation margin requirements. When the contracts are closed or expire, each Fund
recognizes a realized gain or loss equal to the difference between the proceeds from, or cost of, the closing transaction and the Fund’s basis in the contract. The net realized gain (loss) and the change in unrealized gain (loss) on futures contracts
held during the period is included on the Statements of Operations.
The primary risks associated with futures contracts are market risk, leverage risk
and the absence of a liquid secondary market. If a Fund were unable to liquidate a futures contract and/or enter into an
offsetting closing transaction, the Fund
would continue to be subject to market risk with respect to the value of the contracts
and may be required to continue to maintain the margin deposits on the futures contracts until the position expired or
matured. Unlike equities, which typically entitle the holder to a continuing stake in a corporation, futures contracts normally
specify a certain date for delivery of the underlying asset for settlement in cash based on the level of the underlying asset.
As futures contracts approach expiration, they may be replaced by similar contracts that have a later expiration. This process is referred to as “rolling." If the market for these contracts is in “contango,” meaning that the prices of futures contracts in the nearer months are lower than the price of contracts in the distant months, the sale of the near-term month contract would be
at a lower price than the longer-term contract, resulting in a cost to “roll” the futures contract. The actual realization of a potential roll cost will depend on the difference in price of the near and distant contracts. The contracts included in the
VIX Index historically have traded in “contango” markets, resulting in a roll cost, which could adversely affect the value of Shares of the S&P 500® Downside Hedged ETF. In addition, futures contracts may be subject to contractual or other
restrictions on resale and may lack readily available markets for resale. Futures have minimal Counterparty risk since the exchange’s clearinghouse, as Counterparty to all exchange-traded futures contracts, guarantees the futures against default. Risks
may exceed amounts recognized in the Statements of Assets and Liabilities.
T.
Call Options Purchased and Written - Certain Funds may write call options and/or buy call options. A covered call option
gives the purchaser of such option the right to buy, and the writer the obligation
to sell, the underlying security or foreign currency at the stated exercise price during the option period. An uncovered call
option exists without the ownership of the underlying security. Options written by the Fund normally will have expiration dates
between three and nine months from the date written. The exercise price of a call option may be below, equal to, or above
the current market value of the underlying security at the time the option is written.
When the Fund writes a covered call option, an amount equal to the premium received
by the Fund is recorded as an asset and an equivalent liability in the Statements of Assets and Liabilities. The amount of the liability is subsequently “marked-to-market” to reflect the current market value of the option written. If a written covered call
option expires on the stipulated expiration date, or if the Fund enters into a closing purchase transaction, the Fund
realizes a gain (or a loss if the closing purchase transaction exceeds the premium received when the option was written) without
regard to any unrealized gain or loss on the underlying security, and the liability related to such option is extinguished.
If a written covered call option is exercised, the Fund realizes a gain or a loss from the sale of the underlying security and the
proceeds of the sale are increased by the premium originally received. Realized and unrealized gains and losses on call options
written are included in the Statements of Operations as Net realized gain (loss) from and Change in net unrealized appreciation
(depreciation) of option contracts written. A risk in writing a covered call option is that the Fund gives up the opportunity
for profit if the market price of the security increases and the option is exercised. The risk in writing an uncovered call
option is that the Fund may incur significant losses if the value of the written security exceeds the exercise price
of the option.
When the Fund buys a call option, an amount equal to the premium paid by the Fund
is recorded as an investment on the Statements of Assets and Liabilities. The amount of the investment is subsequently “marked-to-market” to reflect the current value of the option purchased. Realized and unrealized gains and losses on call options
purchased are included in the Statements of Operations as Net realized gain (loss) from and Change in net unrealized
appreciation (depreciation) of Investment securities. A risk in buying an option is that the Fund pays a premium
whether or not the option is exercised. In addition, there can be no assurance that a liquid secondary market will exist for
any option purchased.
U.
Put Options Purchased and Written - Certain Funds may purchase and write put options including options on securities
indexes, or foreign currency and/or futures contracts. By purchasing a put option,
the Fund obtains the right (but not the obligation) to sell the option’s underlying instrument at a fixed strike price. In return for this right, the Fund pays an option premium. The option’s underlying instrument may be a security, securities index, or a futures contract.
Put options may be used by the Fund to hedge securities it owns by locking in a minimum
price at which the Fund can sell. If security prices fall, the put option could be exercised to offset all or a portion of the Fund’s resulting losses. At the same time, because the maximum the Fund has at risk is the cost of the option, purchasing put
options does not eliminate the potential for the Fund to profit from an increase in the value of the underlying portfolio securities.
The Fund may write put options to earn additional income in the form of option premiums if it expects the price of the
underlying instrument to remain stable or rise during the option period so that the option will not be exercised. The risk in
this strategy is that the price of the underlying portfolio securities may decline by an amount greater than the premium received. Put
options written are reported as a liability in the Statements of Assets and Liabilities. Realized and unrealized gains
and losses on put options purchased and put options written are included in the Statements of Operations as Net realized gain
(loss) from and Change in net unrealized appreciation (depreciation) of Investment securities and option contracts written,
respectively.
A risk in buying an option is that the Fund pays a premium whether or not the option
is exercised. In addition, there can be no assurance that a liquid secondary market will exist for any option purchased.
V.
Swap Agreements - Certain Funds may enter into various swap transactions, including interest rate,
total return, index, currency exchange rate and credit default swap contracts (“CDS”) for investment purposes or to manage interest rate, currency or credit risk. Such transactions are agreements between Counterparties.
These agreements may contain, among other conditions, events of default and termination events, and various covenants
and representations such as provisions that require each Fund to maintain a pre-determined level of net assets, and/or provide limits regarding the decline of each Fund’s
NAV over specific periods of time. If each Fund were to trigger such provisions and
have open derivative positions at that time, the Counterparty may be able to terminate such agreement and request immediate payment
in an amount equal to the net liability positions, if any.
Interest rate, total return, index and currency exchange rate swap agreements are
two-party contracts entered into primarily to exchange the returns (or differentials in rates of returns) earned or
realized on particular predetermined investments or instruments. The gross returns to be exchanged or “swapped” between the parties are calculated with respect to a notional amount, i.e., the return on or increase in value of a particular dollar
amount invested at a particular interest rate or return of an underlying asset, in a particular foreign currency, or in a “basket” of securities representing a particular index.
In a centrally cleared swap, the Fund’s ultimate Counterparty is a central clearinghouse. The Fund initially will enter into centrally cleared swaps through an executing broker. When a fund enters into a centrally
cleared swap, it must deliver to the central Counterparty (via the futures commission merchant ("FCM")) an amount referred to as “initial margin.” Initial margin requirements are determined by the central Counterparty, but an FCM may require additional
initial margin above the amount required by the central Counterparty. Initial margin deposits required upon entering
into centrally cleared swaps are satisfied by cash or securities as collateral at the FCM. Securities deposited as initial margin
are designated on the Schedule of Investments and cash deposited is recorded on the Statements of Assets and Liabilities.
During the term of a cleared swap agreement, a “variation margin” amount may be required to be paid by the Fund or may be received by the Fund, based on the daily change in price of the underlying reference instrument subject to the swap
agreement and is recorded as a receivable or payable for variation margin in the Statements of Assets and Liabilities
until the centrally cleared swap is terminated at which time a realized gain or loss is recorded.
Changes in the value of swap agreements are recognized as unrealized gains (losses)
in the Statements of Operations by “marking to market” on a daily basis to reflect the value of the swap agreement at the end of each trading day. Payments received or paid at the beginning of the agreement are reflected as such on the Statements
of Assets and Liabilities and may be referred to as upfront payments. The Fund accrues for the fixed payment stream
and amortizes upfront payments, if any, on swap agreements on a daily basis with the net amount, recorded as a component of
realized gain (loss) on the Statements of Operations. A liquidation payment received or made at the termination of a swap
agreement is recorded as realized gain (loss) on the Statements of Operations. Cash held as collateral is recorded as deposits
with brokers on the Statements of Assets and Liabilities. Entering into these agreements involves, to varying degrees,
lack of liquidity and elements of credit, market, and counterparty risk in excess of amounts recognized on the Statements of
Assets and Liabilities. Such risks involve the possibility that a swap is difficult to sell or liquidate, the Counterparty does
not honor its obligations under the agreement and unfavorable interest rates and market fluctuations, which could result in the Fund
accruing additional expenses. It is possible that developments in the swaps market, including potential government regulation, could adversely affect the Fund’s ability to terminate existing swap agreements or to realize amounts to be received
under such agreements. Additionally, an International Swaps and Derivatives Association Master Agreement (“ISDA Master Agreement”) includes credit related contingent features which allow Counterparties to OTC derivatives to terminate derivative
contracts prior to maturity in the event that, for example, the Fund’s net assets decline by a stated percentage or the Fund fails to meet the terms of its ISDA Master Agreements, which would cause the Fund to accelerate payment of any net liability
owed to the Counterparty.
ADR and GDR Risk. Certain Funds may invest in American depositary receipts (“ADRs”) and global depositary receipts (“GDRs”). ADRs are certificates that evidence ownership of shares of a foreign issuer and are alternatives to purchasing the underlying foreign securities directly in their national markets and currencies. GDRs
are certificates issued by an international bank that generally are traded and denominated in the currencies of countries other
than the home country of the issuer of the underlying shares. ADRs and GDRs may be subject to certain of the risks associated
with direct investments in the securities of foreign companies, such as currency, political, economic and market
risks, because their values depend on the performance of the non-dollar denominated underlying foreign securities. Moreover,
ADRs and GDRs may not track the price of the underlying foreign securities on which they are based, and their value may
change materially at times when U.S. markets are not open for trading.
Agency Debt Risk. Certain Funds may invest in debt issued by government agencies, including the Federal
National Mortgage Association (“Fannie Mae”) and the Federal Home Loan Mortgage Corporation (“Freddie Mac”). Instruments issued by government agencies generally are backed only by the general creditworthiness and
reputation of the government agency issuing the instrument and are not backed by the full faith and credit of the U.S.
Government. As a result, there is uncertainty as to the current status of many obligations of Fannie Mae, Freddie Mac and other
agencies that are placed under conservatorship of the federal government.
AP Concentration Risk. Only APs may engage in creation or redemption transactions directly with each Fund.
Each Fund has a limited number of institutions that may act as APs, and such APs have no obligation
to submit creation or redemption orders. Consequently, there is no assurance that APs will establish or maintain an
active trading market for the Shares. This risk may be heightened to the extent that securities held by each Fund are traded
outside a collateralized settlement system. In that case, APs may be required to post collateral on certain trades on
an agency basis (i.e., on behalf of other market participants), which only a limited number of APs may be able to do. In addition,
to the extent that APs exit the business or are unable to proceed with creation and/or redemption orders with respect
to each Fund and no other AP is able
to step forward to create or redeem Creation Units, this may result in a significantly
diminished trading market for Fund Shares, and Shares may be more likely to trade at a premium or discount to a Fund’s NAV and to face trading halts and/or delisting. Additionally, to the extent that a Fund holds non-U.S. securities, such
securities may have lower trading volumes or could experience extended market closures or trading halts. To the extent that a Fund
invests in non-U.S. securities, it may face increased risks that APs may not be able to effectively create or redeem Creation
Units, or that the Shares may be halted and/or delisted.
Call Risk. If interest rates fall, it is possible that issuers of callable securities with high interest coupons will “call” (or prepay) their bonds before their maturity date. If an issuer exercises such a call during
a period of declining interest rates, a Fund may have to replace such called security with a lower yielding security. If that were to happen, such Fund’s net investment income could fall.
Cash Transaction Risk. Most exchange-traded funds ("ETFs") generally make in-kind redemptions to avoid
being taxed on gains on the distributed portfolio securities at the fund level. However, unlike most
ETFs, certain Funds currently intend to effect creations and redemptions principally for cash, rather than principally in-kind, due to the nature of the Fund’s investments. As such, each Fund may be required to sell portfolio securities to obtain
the cash needed to distribute redemption proceeds. Therefore, a Fund may recognize a capital gain on these sales
and/or incur brokerage fees that might not have been incurred if the Fund had made a redemption in-kind. To the extent any
transaction costs are not offset by transaction fees imposed on APs, such costs may decrease a Fund’s net asset value. These costs may also decrease the tax efficiency of each Fund compared to ETFs that utilize an in-kind redemption process
and there may be a substantial difference in the after-tax rate of return between each Fund and conventional ETFs.
Collateralized Loan Obligations (“CLOs”) and Collateralized Debt Obligations (“CDOs”) Risk. Certain Funds may invest in CLOs and CDOs. CLOs bear many of the same risks as other forms of asset-backed securities (“ABS”), including interest rate risk, credit risk and default risk. As they are backed by pools of loans, CLOs also bear
similar risks to investing in loans directly. CLOs issue classes or “tranches’’ that vary in risk and yield. CLOs may experience substantial losses attributable to loan defaults. Losses caused by defaults on underlying assets are borne first by the holders of subordinate tranches. Each Fund’s investment in CLOs may decrease in market value when the CLO experiences loan defaults
or credit impairment, the disappearance of a subordinate tranche, or market anticipation of defaults and investor
aversion to CLO securities as a class.
Commercial Paper Risk. Certain Funds may invest in commercial paper. The value of the Fund’s investment in commercial paper, which is an unsecured promissory note that generally has a maturity date between
one and 270 days and is issued by a U.S. or foreign entity, is susceptible to changes in the issuer’s financial condition or credit quality. Investments in commercial paper are usually discounted from their value at maturity. Commercial paper can be
fixed-rate or variable rate and can be adversely affected by changes in interest rates.
Commodity Pool Risk. S&P 500® Downside Hedged ETF’s investments in futures contracts have caused it to be deemed a commodity pool, thereby subjecting it to regulation under the Commodity Exchange Act
and Commodity Futures Trading Commission ("CFTC") rules. The Adviser is registered as a commodity pool operator (“CPO”) and as a commodity trading advisor (“CTA”), and will manage the Fund in accordance with CFTC rules, as well as the rules that apply to registered investment companies. Registration as a CPO or CTA subjects the Adviser to additional
laws, regulations and enforcement policies, which could increase compliance costs and may affect the operations and
financial performance of the Fund. Registration as a commodity pool may have negative effects on the ability of the Fund
to engage in its planned investment program. Additionally, the Fund’s positions in futures contracts may have to be liquidated at disadvantageous times or prices to prevent the Fund from exceeding any applicable position limits established by the
CFTC. Such actions may subject the Fund to substantial losses.
Currency Risk. Because each Fund’s NAV is determined in U.S. dollars, a Fund’s NAV could decline if the currency of a non-U.S. market in which the Fund invests depreciates against the U.S. dollar. Generally,
an increase in the value of the U.S. dollar against a foreign currency will reduce the value of a security denominated
in that foreign currency, thereby decreasing a Fund’s overall NAV. Exchange rates may be volatile and may change quickly and unpredictably in response to both global economic developments and economic conditions, causing an adverse impact on a Fund.
As a result, investors have the potential for losses regardless of the length of time they intend to hold Shares.
Emerging Markets Investment Risk. For certain Funds, investments in the securities of issuers in emerging market countries
involve risks often not associated with investments in the securities of issuers in
developed countries. Securities in emerging markets may be subject to greater price fluctuations than securities in more developed
markets. Companies in emerging market countries generally may be subject to less stringent regulatory, disclosure,
financial reporting, accounting, auditing and recordkeeping standards than companies in more developed countries. In addition,
information about such companies may be less available and reliable. Emerging markets usually are subject to greater
market volatility, political, social and economic instability, uncertainty regarding the existence of trading markets and more
governmental limitations on foreign investment than are more developed markets. Securities law in many emerging market
countries is relatively new and unsettled. Therefore, laws regarding foreign investment in emerging market securities,
securities regulation, title to securities, and shareholder rights may change quickly and unpredictably, and the ability to bring
and enforce actions, or to obtain information needed to pursue or enforce such actions, may be limited. In addition,
the enforcement of systems of taxation at federal, regional and local levels in emerging market countries may be inconsistent
and subject to sudden change. Investments
in emerging market securities may be subject to additional transaction costs, delays
in settlement procedures, unexpected market closures, and lack of timely information.
Environmental, Social and Governance ("ESG") Considerations Risk. The ESG considerations that may be assessed as part of a credit research process to implement certain Funds’ investment strategies in pursuit of their investment objectives may vary across types of eligible investments and issuers, and not every ESG factor may be
identified or evaluated for every investment, and not every investment or issuer may be evaluated for ESG considerations. The incorporation
of ESG factors as part of a credit analysis may affect a Fund’s exposure to certain issuers or industries and may not work as intended. Information used to evaluate such factors may not be readily available, complete or accurate, and may
vary across providers and issuers. There is no guarantee that the incorporation of ESG considerations will be additive to a Fund’s performance.
Equity Risk. Equity risk is the risk that the value of equity securities, including common stocks,
may fall due to both changes in general economic conditions that impact the market as a whole, as well as factors
that directly relate to a specific company or its industry. Such general economic conditions include changes in interest rates,
periods of market turbulence or instability, or general and prolonged periods of economic decline and cyclical change. It is possible
that a drop in the stock market may depress the price of most or all of the common stocks that each Fund holds. In addition,
equity risk includes the risk that investor sentiment toward one or more industries will become negative, resulting in
those investors exiting their investments in those industries, which could cause a reduction in the value of companies in those
industries more broadly. The value of a company’s common stock may fall solely because of factors, such as an increase in production costs that negatively impact other companies in the same region, industry or sector of the market. A company’s common stock also may decline significantly in price over a short period of time due to factors specific to that
company, including decisions made by its management or lower demand for the company’s products or services. For example, an adverse event, such as an unfavorable earnings report or the failure to make anticipated dividend payments, may depress
the value of common stock.
Fixed-Income Securities Risk. Fixed-income securities are subject to interest rate risk and credit risk. Interest
rate risk refers to fluctuations in the value of a fixed-income security resulting from changes in
the general level of interest rates. When the general level of interest rates goes up, the prices of most fixed-income securities
go down. When the general level of interest rates goes down, the prices of most fixed-income securities go up. Fixed-income securities
with longer maturities typically are more sensitive to changes in interest rates, making them more volatile than securities
with shorter maturities. Credit risk refers to the possibility that the issuer of a security will be unable and/or unwilling
to make timely interest payments and/or repay the principal on its debt. Debt instruments are subject to varying degrees of
credit risk, which may be reflected in credit ratings. There is a possibility that the credit rating of a fixed-income security
may be downgraded after purchase, which may occur quickly and without advance warning following sudden market downturns or unexpected
developments involving an issuer, and which may adversely affect the liquidity and value of the security.
Foreign Fixed-Income Investment Risk. For certain Funds, investments in fixed-income securities of non-U.S. issuers are
subject to the same risks as other debt securities, notably credit risk, market risk,
interest rate risk and liquidity risk, while also facing risks beyond those associated with investments in U.S. securities. For example,
foreign securities may have relatively low market liquidity, greater market volatility, decreased publicly available information,
and less reliable financial information about issuers, and inconsistent and potentially less stringent accounting, auditing
and financial reporting requirements and standards of practice, including recordkeeping standards, comparable to those applicable
to domestic issuers. Foreign securities also are subject to the risks of expropriation, nationalization, political
instability or other adverse political or economic developments and the difficulty of enforcing obligations in other countries.
Investments in foreign securities also may be subject to dividend withholding or confiscatory taxes, currency blockage and/or
transfer restrictions and higher transactional costs.
Foreign Investment Risk. Investments in the securities of non-U.S. issuers involve risks beyond those associated
with investments in U.S. securities. Foreign securities may have relatively low market
liquidity, greater market volatility, decreased publicly available information and less reliable financial information about issuers
and inconsistent and potentially less stringent accounting, auditing and financial reporting requirements and standards
of practice, including recordkeeping standards, comparable to those applicable to domestic issuers. Foreign securities
are also subject to the risks of expropriation, nationalization, political instability or other adverse political or economic developments
and the difficulty of enforcing obligations in other countries. Investments in foreign securities also may be subject
to dividend withholding or confiscatory taxes, currency blockage and/or transfer restrictions and higher transactional costs.
To the extent a Fund invests in securities denominated in foreign currencies, fluctuations in the value of the U.S. dollar relative
to the values of other currencies may adversely affect investments in foreign securities and may negatively impact the Fund’s returns. From time to time, certain companies in which the Funds invest may operate in, or have dealings with, countries
subject to sanctions or embargoes imposed by the U.S. Government and the United Nations and/or in countries the U.S.
Government identified as state sponsors of terrorism. One or more of these companies may be subject to constraints under U.S.
law or regulations that could negatively affect the company’s performance. Additionally, one or more of these companies could suffer damage to its reputation if the market identifies it as a company that invests or deals with countries
that the U.S. Government identifies as state sponsors of terrorism or subjects to sanctions.
High Yield Securities (Junk Bond) Risk. Compared to higher quality debt securities, high yield debt securities (commonly
referred to as “junk bonds”) involve a greater risk of default or price changes due to changes in the credit quality of the issuer
because they are generally unsecured and may be subordinated to other creditors’ claims. They are considered speculative with respect to the issuer’s capacity to pay interest and repay principal. High yield debt securities often are issued by smaller, less creditworthy companies or by highly leveraged (indebted) firms, which generally
are less able than more financially stable firms to make scheduled payments of interest and principal. The values of junk bonds
often fluctuate more in response to company, political, regulatory or economic developments than higher quality bonds,
and their values can decline significantly over short periods of time or during periods of economic difficulty when the bonds
could be difficult to value or sell at a fair price.
Industry Concentration Risk. Certain Funds are concentrated to a significant degree in securities of issuers
operating in a single industry or industry group. By concentrating their investments in an industry
or industry group, such Funds may face more risks than if they were diversified broadly over numerous industries or industry
groups. Such industry-based risks, any of which may adversely affect the companies in which some Funds invest, may include,
but are not limited to, the following: general economic conditions or cyclical market patterns that could negatively
affect supply and demand in a particular industry; competition for resources, adverse labor relations, political
or world events; obsolescence of technologies; and increased competition or new product introductions that may affect the profitability
or viability of companies in an industry. In addition, at times, such industry or industry group may be out of favor
and underperform other industries or the market as a whole.
Interest Rate Risk. Interest rate risk refers to the risk that fixed income securities’ prices generally fall as interest rates rise; conversely, fixed income securities’ prices generally rise as interest rates fall. Specific fixed income securities differ in their sensitivity to changes in interest rates depending on their individual characteristics, including duration. “Duration risk” is related to interest rate risk; it refers to the risks associated with the sensitivity of a fixed income security’s price to a one percent change in interest rates. Fixed income securities with longer durations (i.e.,
a greater length of time until they reach maturity) face greater duration risk, meaning that they tend to exhibit greater volatility
and are more sensitive to changes in interest rates than fixed income securities with shorter durations.
Leverage Risk. Leverage occurs when a Fund’s market exposure exceeds amounts invested. A Fund’s exposure to derivatives and other investment techniques can create a leveraging effect on the portfolio. This
leverage will vary over time and may at times be significant. Engaging in transactions using leverage or those having a leveraging
effect subjects a Fund to certain risks. Leverage can magnify the effect of any gains or losses, causing a Fund to be
more volatile than if it had not used leverage. A Fund may have a substantial cash position due to margin and collateral requirements related to a Fund’s use of derivatives. Such margin and collateral requirements may limit a Fund’s ability to take advantage of other investment opportunities, and a Fund also may have to sell or liquidate a portion of its assets
at inopportune times to satisfy these requirements. This may negatively affect a Fund’s ability to achieve its investment objective. In addition, a Fund’s assets that are used as collateral to secure these transactions may decrease in value while the
positions are outstanding, which may force a Fund to use its other assets to increase collateral. The use of leverage is considered
to be a speculative investment practice and may result in the loss of a substantial amount of a Fund’s assets. There is no assurance that a leveraging strategy will be successful.
Liquidity Risk. Liquidity risk exists when a particular investment is difficult to purchase or sell.
If a Fund invests in illiquid securities or current portfolio securities become illiquid, it may reduce the returns
of the Fund because the Fund may be unable to sell the illiquid securities at an advantageous time or price.
Management Risk. The Funds are subject to management risk because they are actively managed portfolios.
In managing a Fund’s portfolio holdings, the Adviser or a sub-adviser (as applicable and as set forth below) applies investment techniques and risk analyses in making investment decisions for the Funds, but there can be no guarantee
that these actions will produce the desired results.
Market Risk. Securities held by the Funds are subject to market fluctuations. You should anticipate
that the value of the Shares will decline more or less, in correlation with any decline in value of the securities in a Fund’s portfolio. Additionally, natural or environmental disasters, widespread disease or other public health issues,
war, military conflicts, acts of terrorism, economic crises or other events could result in increased premiums or discounts to each Fund’s NAV. Certain changes in the U.S. economy in particular, such as when the U.S. economy weakens or when its financial
markets decline, may have a material adverse effect on global financial markets as a whole, and on the securities
to which a Fund has exposure. Increasingly strained relations between the U.S. and foreign countries, including
as a result of economic sanctions and tariffs, may also adversely affect U.S. issuers, as well as non-U.S. issuers.
During a general downturn in the financial markets, multiple asset classes may decline
in value. When markets perform well, there can be no assurance that specific investments held by a Fund will rise in value.
Mortgage-Backed and Asset-Backed Securities Risk. For certain Funds, investments in mortgage- and asset-backed securities are subject to call (prepayment) risk, reinvestment risk and extension risk. In addition,
these securities are susceptible to an unexpectedly high rate of defaults on the mortgages held by a mortgage pool, which
may adversely affect their value. The risk of such defaults depends on the quality of the mortgages underlying such security,
the credit quality of its issuer or guarantor, and the nature and structure of its credit support. For example, the risk of default
generally is higher in the case of mortgage pools that include subprime mortgages, which are loans made to borrowers with weakened
credit histories or with lower capacity to make timely mortgage payments.
Non-Diversified Fund Risk. Because AAA CLO Floating Rate Note ETF, High Yield Select ETF, MSCI EAFE Income
Advantage ETF, QQQ Income Advantage ETF, S&P 500 Equal Weight Income Advantage ETF, Short Duration
Total Return Bond ETF, SteelPath MLP & Energy Infrastructure ETF and Top QQQ ETF are non-diversified
and can invest a greater portion of their assets in securities of individual issuers than can a diversified fund, changes
in the market value of a single investment could cause greater fluctuations in Share price than would occur in a diversified fund. This may increase a Fund’s volatility and cause the performance of a relatively small number of issuers to have a greater impact on a Fund’s performance.
Portfolio Turnover Risk. Certain Funds may engage in frequent trading of their respective portfolio securities,
which may result in a high portfolio turnover rate. A portfolio turnover rate of 200%, for example,
is equivalent to a Fund buying and selling all of its securities two times during the course of a year. A high portfolio
turnover rate (such as 100% or more) could result in high brokerage costs for a Fund.
REIT Risk. REITs are pooled investment vehicles that trade like stocks and invest substantially
all of their assets in real estate and may qualify for special tax considerations. REITs are subject to certain risks
inherent in the direct ownership of real estate, including without limitation, a possible lack of mortgage funds and associated interest
rate risks, overbuilding, property vacancies, increases in property taxes and operating expenses, changes in zoning laws,
losses due to environmental damages and changes in neighborhood values and appeal to purchasers. Further, failure of a
company to qualify as a REIT under federal tax law may have adverse consequences to the REIT’s shareholders. In addition, REITs may have expenses, including advisory and administration expenses, and REIT shareholders will incur a proportionate share
of the underlying expenses.
Risk of Investing in Loans. Investments in loans, including loan syndicates and other direct lending opportunities,
involve special types of risks, including credit risk, interest rate risk, counterparty risk
and prepayment risk. Loans may offer a fixed or floating interest rate. Loans are often generally below investment grade and may be unrated. A Fund’s investments in loans can be difficult to value accurately and may be more susceptible to liquidity risk
than fixed-income instruments of similar credit quality and/or maturity. A Fund is also subject to the risk that the value of the
collateral for the loan may be insufficient to cover the borrower’s obligations should the borrower fail to make payments or become insolvent. Participations in loans may subject the Fund to the credit risk of both the borrower and the issuer of the participation
and may make enforcement of loan covenants more difficult for the Fund as legal action may have to go through the issuer
of the participations. Transactions in loans are often subject to long settlement periods, thus potentially limiting the
ability of a Fund to invest sale proceeds in other investments and to use proceeds to meet its current redemption obligations. Thus,
to the extent a Fund effects redemptions in cash, the Fund is subject to the risk of selling other investments or taking other
actions necessary to raise cash to meet its redemption obligations.
Small- and Mid-Capitalization Company Risk. For certain Funds, investing in securities of small- and mid-capitalization companies involves greater risk than customarily is associated with investing in larger,
more established companies. These companies’ securities may be more volatile and less liquid than those of more established companies. These securities may have returns that vary, sometimes significantly, from the overall securities market.
Often small- and mid-capitalization companies and the industries in which they focus are still evolving and, as a result,
they may be more sensitive to changing market conditions.
To-be-Announced ("TBA") Transactions Risk. TBA purchase commitments involve a risk of loss if the value of the securities to be purchased declines prior to the settlement date or if the counterparty may not
deliver the securities as promised. Selling a TBA involves a risk of loss if the value of the securities to be sold goes up prior
to the settlement date. TBA transactions involve counterparty risk. Default or bankruptcy of a counterparty to a TBA transaction
would expose a Fund to potential loss and could affect the Fund’s returns. In addition, TBA transactions may significantly increase a Fund’s portfolio turnover rate.
U.S. Government Obligations Risk. Certain Funds may invest in U.S. Government obligations issued or guaranteed by
the U.S. Government, its agencies and instrumentalities, including bills, notes and bonds
issued by the U.S. Treasury. U.S. Government securities include securities that are issued or guaranteed by the
U.S. Treasury, by various agencies of the U.S. Government, or by various instrumentalities which have been established or sponsored
by the U.S. Government. U.S. Treasury securities are backed by the “full faith and credit” of the United States, which may be negatively affected by an actual or threatened failure of the U.S. Government to pay its obligation. Securities
issued or guaranteed by federal agencies and U.S. Government-sponsored instrumentalities may or may not be backed by the full
faith and credit of the United States. In the case of those U.S. Government securities not backed by the full faith and credit
of the United States, the investor must look principally to the agency or instrumentality issuing or guaranteeing the security
for ultimate repayment, and may not be able to assert a claim against the United States itself in the event that the agency
or instrumentality does not meet its commitment. The U.S. Government, its agencies and instrumentalities do not guarantee
the market value of their securities, and consequently, the value of such securities may fluctuate.
Valuation Risk. Financial information related to securities of non-U.S. issuers may be less reliable
than information related to securities of U.S. issuers, which may make it difficult to obtain a current price
for a non-U.S. security held by a Fund. In certain circumstances, market quotations may not be readily available for some Fund securities,
and those securities may be fair valued. The value established for a security through fair valuation may be different
from what would be produced if the security had been valued using market quotations. Fund securities that are valued
using techniques other than market quotations, including “fair valued” securities, may be subject to greater fluctuations in their value from one day to the next than would be the case if market quotations were used. In addition, there is no assurance
that a Fund could sell a portfolio
security for the value established for it at any time, and it is possible that a Fund
would incur a loss because a security is sold at a discount to its established value.
Valuation Time Risk. Because foreign exchanges may be open on days when a Fund does not price its Shares,
the value of the non-U.S. securities in a Fund’s portfolio may change on days when you will not be able to purchase or sell your Shares. As a result, trading spreads and the resulting premium or discount on the Shares may
widen, and, therefore, increase the difference between the market price of the Shares and the NAV of such Shares.
NOTE 3—Investment Advisory Agreements and Other Agreements
The Trust has entered into Investment Advisory Agreements with the Adviser on behalf
of each Fund, pursuant to which the Adviser has overall responsibility for the selection and ongoing monitoring of the Funds’ investments, managing the Funds’ business affairs, providing certain clerical, bookkeeping and other administrative
services, and for each Fund (except S&P 500® Downside Hedged ETF and Top QQQ ETF), oversight of Invesco, Invesco Asset Management
Deutschland GmbH, Invesco Asset Management Limited, Invesco Asset Management (Japan) Limited, Invesco Hong Kong Limited,
Invesco Senior Secured Management, Inc. and Invesco Canada Ltd. (collectively, the “Affiliated Sub-Advisers”).
Pursuant to an Investment Advisory Agreement, each Fund (except Ultra Short Duration
ETF) accrues daily and pays monthly to the Adviser an annual unitary management fee. Out of the unitary management fee,
the Adviser pays for substantially all expenses of the Funds, including payments to the Affiliated Sub-Advisers for each
Fund (except S&P 500® Downside Hedged ETF and Top QQQ ETF), and for each Fund the costs of transfer agency, custody, fund administration,
legal, audit and other services, except for distribution fees, if any, brokerage expenses, taxes, interest (including,
for AAA CLO Floating Rate Note ETF, interest expenses associated with the line of credit), acquired fund fees and expenses, if
any, litigation expenses and other extraordinary expenses, including proxy expenses (except for such proxies related to: (i) changes
to the Investment Advisory Agreement, (ii) the election of an Interested Trustee, or (iii) any other matters that directly benefit
the Adviser). For AAA CLO Floating Rate Note ETF, the Adviser also pays out of the unitary management fee the set-up fees
and commitment fees associated with the line of credit. The unitary management fee is paid by each Fund to the Adviser at the following
annual rates:
|
|
Unitary Management Fees
(as a % of average daily net assets)
|
AAA CLO Floating Rate Note ETF
|
|
Active U.S. Real Estate ETF
|
|
High Yield Bond Factor ETF
|
|
|
|
|
MSCI EAFE Income Advantage ETF(a)
|
|
QQQ Income Advantage ETF(a)
|
|
S&P 500® Downside Hedged ETF
|
|
S&P 500 Equal Weight Income Advantage ETF(a)
|
|
Short Duration Total Return Bond ETF(b)
|
|
SteelPath MLP & Energy Infrastructure ETF
|
|
|
|
|
|
|
|
Variable Rate Investment Grade ETF
|
|
|
|
The Adviser has agreed to waive 100% of its unitary management fee for the Fund through
June 30, 2025.
|
|
|
Effective February 24, 2025, the Fund’s unitary management fee was reduced from 0.35% to 0.30%.
|
|
|
Effective February 24, 2025, the Fund’s unitary management fee was reduced from 0.50% to 0.35%. However, the Adviser has agreed to waive a portion of
its unitary management fee for the Fund, resulting in a net unitary management fee
of 0.25%, through August 31, 2025. The Adviser may not terminate the
agreement prior to August 31, 2025.
|
Pursuant to another Investment Advisory Agreement, Ultra Short Duration ETF accrues
daily and pays monthly to the Adviser an annual management fee equal to 0.20% of the Fund’s average daily net assets. Ultra Short Duration ETF is responsible for all of its own expenses, including its management fee, costs of transfer agency, custody,
fund administration, legal, audit and other services, interest, taxes, Acquired Fund Fees and Expenses, if any, brokerage commissions
and other expenses connected with executions of portfolio transactions, any distribution fees or expenses, litigation expenses, fees payable to the Trust’s Independent Trustees and officers, expenses incurred in connection with the Board members’ services, including travel expenses and legal fees of counsel for the Independent Trustees and extraordinary expenses, including proxy
expenses (except for such proxies related to: (i) changes to the Investment Advisory Agreement, (ii) the election of an Interested
Trustee, or (iii) any other matters that directly benefit the Adviser).
The Adviser has entered into an Investment Sub-Advisory Agreement with the Affiliated
Sub-Advisers for each Fund (except S&P 500® Downside Hedged ETF and Top QQQ ETF). The sub-advisory fee for these Funds is paid
by the Adviser to the Affiliated Sub-Advisers at 40% of the Adviser’s compensation of the sub-advised assets of each Fund.
The Adviser has contractually agreed to waive fees and/or pay Fund expenses for Ultra
Short Duration ETF to the extent necessary to prevent the operating expenses of the Fund (excluding interest expenses,
offering costs, brokerage commissions and other trading expenses, taxes, acquired fund fees and expenses, if any, and extraordinary
expenses) from exceeding 0.27% of the Fund’s average daily net assets per year (the “Expense Cap”), through at least August 31, 2027. The Adviser did not waive fees and/or pay Fund expenses during the period under this Expense Cap.
Further, the Adviser has contractually agreed to waive the management fee payable
by each Fund (except for Total Return Bond ETF and Ultra Short Duration ETF) in an amount equal to the lesser of: (i) 100%
of the net advisory fees earned by the Adviser or an affiliate of the Adviser that are attributable to the Fund’s investments in money market funds that are managed by affiliates of the Adviser and other funds (including ETFs) managed by the Adviser
or affiliates of the Adviser (collectively, “Underlying Affiliated Investments”) or (ii) the management fee available to be waived. For Total Return Bond ETF and Ultra Short Duration ETF, the Adviser has contractually agreed to waive a portion of the management
fee payable and/or reimburse Fund expenses in an amount equal to 100% of the net advisory fees earned by the Adviser
or an affiliate of the Adviser that are attributable to the Fund’s Underlying Affiliated Investments. These waivers do not apply to a Fund’s investment of cash collateral received for securities lending. These waivers (except for Total Return Bond ETF and
Ultra Short Duration ETF) are in place through at least August 31, 2027, and there is no guarantee that the Adviser will
extend them past that date. These waivers are not subject to recapture by the Adviser.
For the six months ended April 30, 2025, the Adviser waived fees and/or paid Fund
expenses for each Fund in the following amounts:
AAA CLO Floating Rate Note ETF
|
|
Active U.S. Real Estate ETF
|
|
High Yield Bond Factor ETF
|
|
|
|
|
MSCI EAFE Income Advantage ETF
|
|
|
|
|
S&P 500® Downside Hedged ETF
|
|
S&P 500 Equal Weight Income Advantage ETF
|
|
Short Duration Total Return Bond ETF
|
|
SteelPath MLP & Energy Infrastructure ETF(a)
|
|
|
|
|
|
|
|
|
|
|
Variable Rate Investment Grade ETF
|
|
|
|
For the period February 18, 2025 (commencement of investment operations) through April
30, 2025.
|
|
|
For the period December 2, 2024 (commencement of investment operations) through April
30, 2025.
|
The fees waived and/or expenses borne by the Adviser for Ultra Short Duration ETF
pursuant to the Expense Cap are subject to recapture by the Adviser for up to three years from the date the fees were waived
or the expenses were incurred, but no recapture payment will be made by the Fund if it would result in the Fund exceeding
(i) the Expense Cap or (ii) the expense cap in effect at the time the fees and/or expenses subject to recapture were waived and/or
borne by the Adviser.
There are no amounts available for potential recapture by the Adviser as of April
30, 2025.
The Trust has entered into a Distribution Agreement with Invesco Distributors, Inc. (the “Distributor”), which serves as the distributor of Creation Units for each Fund. The Distributor does not maintain a secondary
market in the Shares. The Funds are not charged any fees pursuant to the Distribution Agreement. The Distributor is
an affiliate of the Adviser.
The Trust has entered into service agreements whereby BNYM, a wholly-owned subsidiary
of The Bank of New York Mellon Corporation, serves as the administrator, custodian, fund accountant and transfer
agent for each Fund.
For the six months ended April 30, 2025, the following Funds incurred brokerage commissions
with Invesco Capital Markets, Inc. ("ICMI"), an affiliate of the Adviser and Distributor, for portfolio transactions
executed on behalf of the Funds, as listed below:
Active U.S. Real Estate ETF
|
|
MSCI EAFE Income Advantage ETF
|
|
|
|
|
S&P 500® Downside Hedged ETF
|
|
S&P 500 Equal Weight Income Advantage ETF
|
|
|
|
|
|
|
For the period December 2, 2024 (commencement of investment operations) through April
30, 2025.
|
Portfolio transactions with ICMI that have not settled at period-end, if any, are
shown in the Statements of Assets and Liabilities under the receivable caption Investments sold - affiliated broker and/or payable caption Investments purchased - affiliated broker.
NOTE 4—Additional Valuation Information
GAAP defines fair value as the price that would be received to sell an asset or paid
to transfer a liability in an orderly transaction between market participants at the measurement date, under current market conditions.
GAAP establishes a hierarchy that prioritizes the inputs to valuation methods, giving the highest priority to readily
available unadjusted quoted prices in an active market for identical assets (Level 1) and the lowest priority to significant unobservable
inputs (Level 3), generally when market prices are not readily available. Based on the valuation inputs, the securities or
other investments are tiered into one of three levels. Changes in valuation methods may result in transfers in or out of an investment’s assigned level:
Level 1 — Prices are determined using quoted prices in an active market for identical assets.
Level 2 — Prices are determined using other significant observable inputs. Observable inputs are inputs that other market participants may use in pricing a security. These may include quoted prices for similar
securities, interest rates, prepayment speeds, credit risk, yield curves, loss severities, default rates, discount
rates, volatilities and others. When market movements occur after the close of the relevant foreign securities markets,
foreign securities may be fair valued utilizing an independent pricing service.
Level 3 — Prices are determined using significant unobservable inputs. In situations where quoted prices or observable inputs are unavailable (for example, when there is little or no market activity for an investment
at the end of the period), unobservable inputs may be used. Unobservable inputs reflect the Adviser’s assumptions about the factors market participants would use in determining fair value of the securities or instruments
and would be based on the best available information.
The following is a summary of the tiered valuation input levels, as of April 30, 2025,
for each Fund (except for SteelPath MLP & Energy Infrastructure ETF). As of April 30, 2025, all of the securities in SteelPath
MLP & Energy Infrastructure ETF were valued based on Level 1 inputs (see the Schedules of Investments for security categories). The
level assigned to the securities valuations may not be an indication of the risk or liquidity associated with investing in those
securities. Because of the inherent uncertainties of valuation, the values reflected in the financial statements may materially differ
from the value received upon actual sale of those investments.
|
|
|
|
|
|
AAA CLO Floating Rate Note ETF
|
|
|
|
|
Investments in Securities
|
|
|
|
|
|
|
|
|
|
|
|
|
|
|
|
|
|
|
|
|
|
|
Active U.S. Real Estate ETF
|
|
|
|
|
Investments in Securities
|
|
|
|
|
Common Stocks & Other Equity Interests
|
|
|
|
|
|
|
|
|
|
|
|
|
|
|
|
|
High Yield Bond Factor ETF
|
|
|
|
|
Investments in Securities
|
|
|
|
|
U.S. Dollar Denominated Bonds & Notes
|
|
|
|
|
|
|
|
|
|
|
Common Stocks & Other Equity Interests
|
|
|
|
|
|
|
|
|
|
|
Total Investments in Securities
|
|
|
|
|
Other Investments - Assets*
|
|
|
|
|
|
|
|
|
|
|
Other Investments - Liabilities*
|
|
|
|
|
|
|
|
|
|
|
|
|
|
|
|
|
|
|
|
|
|
|
|
|
|
|
|
|
|
|
|
|
|
|
Investments in Securities
|
|
|
|
|
U.S. Dollar Denominated Bonds & Notes
|
|
|
|
|
Non-U.S. Dollar Denominated Bonds & Notes
|
|
|
|
|
|
|
|
|
|
|
Total Investments in Securities
|
|
|
|
|
Other Investments - Assets*
|
|
|
|
|
Forward Foreign Currency Contracts
|
|
|
|
|
|
|
|
|
|
|
MSCI EAFE Income Advantage ETF
|
|
|
|
|
Investments in Securities
|
|
|
|
|
Common Stocks & Other Equity Interests
|
|
|
|
|
|
|
|
|
|
|
|
|
|
|
|
|
|
|
|
|
|
|
|
|
|
|
|
|
Investments in Securities
|
|
|
|
|
Common Stocks & Other Equity Interests
|
|
|
|
|
|
|
|
|
|
|
|
|
|
|
|
|
|
|
|
|
|
|
S&P 500® Downside Hedged ETF
|
|
|
|
|
Investments in Securities
|
|
|
|
|
Common Stocks & Other Equity Interests
|
|
|
|
|
|
|
|
|
|
|
Total Investments in Securities
|
|
|
|
|
Other Investments - Assets*
|
|
|
|
|
|
|
|
|
|
|
Other Investments - Liabilities*
|
|
|
|
|
|
|
|
|
|
|
|
|
|
|
|
|
|
|
|
|
|
|
S&P 500 Equal Weight Income Advantage ETF
|
|
|
|
|
Investments in Securities
|
|
|
|
|
Common Stocks & Other Equity Interests
|
|
|
|
|
|
|
|
|
|
|
|
|
|
|
|
|
|
|
|
|
|
|
|
|
|
|
|
|
Short Duration Total Return Bond ETF
|
|
|
|
|
Investments in Securities
|
|
|
|
|
U.S. Dollar Denominated Bonds & Notes
|
|
|
|
|
|
|
|
|
|
|
|
|
|
|
|
|
|
|
|
|
|
|
Agency Credit Risk Transfer Notes
|
|
|
|
|
|
|
|
|
|
|
|
|
|
|
|
|
Total Investments in Securities
|
|
|
|
|
Other Investments - Assets*
|
|
|
|
|
|
|
|
|
|
|
Other Investments - Liabilities*
|
|
|
|
|
|
|
|
|
|
|
|
|
|
|
|
|
|
|
|
|
|
|
|
|
|
|
|
|
Investments in Securities
|
|
|
|
|
Common Stocks & Other Equity Interests
|
|
|
|
|
|
|
|
|
|
|
Total Investments in Securities
|
|
|
|
|
Other Investments - Liabilities*
|
|
|
|
|
|
|
|
|
|
|
|
|
|
|
|
|
|
|
|
|
|
|
Investments in Securities
|
|
|
|
|
U.S. Dollar Denominated Bonds & Notes
|
|
|
|
|
U.S. Government Sponsored Agency Mortgage-Backed Securities
|
|
|
|
|
|
|
|
|
|
|
|
|
|
|
|
|
|
|
|
|
|
|
Variable Rate Senior Loan Interests
|
|
|
|
|
|
|
|
|
|
|
Agency Credit Risk Transfer Notes
|
|
|
|
|
U.S. Government Sponsored Agency Securities
|
|
|
|
|
|
|
|
|
|
|
|
|
|
|
|
|
|
|
|
|
|
|
Total Investments in Securities
|
|
|
|
|
Other Investments - Assets*
|
|
|
|
|
|
|
|
|
|
|
|
|
|
|
|
|
|
|
|
|
|
|
Other Investments - Liabilities*
|
|
|
|
|
|
|
|
|
|
|
|
|
|
|
|
|
|
|
|
|
|
|
|
|
|
|
|
|
|
|
|
|
|
|
|
|
|
|
|
|
|
|
|
|
|
|
Investments in Securities
|
|
|
|
|
U.S. Dollar Denominated Bonds & Notes
|
|
|
|
|
|
|
|
|
|
|
|
|
|
|
|
|
|
|
|
|
|
|
|
|
|
|
|
|
|
|
|
|
|
|
|
|
|
|
|
|
|
|
|
|
|
|
Variable Rate Investment Grade ETF
|
|
|
|
|
Investments in Securities
|
|
|
|
|
U.S. Dollar Denominated Bonds & Notes
|
|
|
|
|
|
|
|
|
|
|
|
|
|
|
|
|
Agency Credit Risk Transfer Notes
|
|
|
|
|
U.S. Government Sponsored Agency Mortgage-Backed Securities
|
|
|
|
|
|
|
|
|
|
|
|
|
|
|
|
|
|
|
Forward foreign currency contracts, futures contracts and swap agreements are valued
at unrealized appreciation (depreciation). Investments matured and
options written are shown at value.
|
NOTE 5—Derivative Investments
The Funds may enter into an ISDA Master Agreement under which a Fund may trade OTC
derivatives. An OTC transaction entered into under an ISDA Master Agreement typically involves a collateral posting arrangement,
payment netting provisions and close-out netting provisions. These netting provisions allow for reduction of credit
risk through netting of contractual obligations. The enforceability of the netting provisions of the ISDA Master Agreement depends
on the governing law of the ISDA Master Agreement, among other factors.
For financial reporting purposes, the Funds do not offset OTC derivative assets or
liabilities that are subject to ISDA Master Agreements in the Statements of Assets and Liabilities.
Value of Derivative Investments at Period-End
The table below summarizes the value of each Fund’s derivative investments, detailed by primary risk exposure, held as of April 30, 2025:
|
|
|
|
|
High Yield
Bond Factor ETF
|
|
S&P 500®
Downside
Hedged ETF
|
|
|
|
|
|
|
|
|
|
|
|
|
|
Unrealized appreciation on
forward foreign currency
contracts outstanding
|
|
|
|
|
|
|
|
|
Unrealized appreciation on
futures contracts—Exchange-
|
|
|
|
|
|
|
|
|
Purchased options, at value -
Exchange-Traded
|
|
|
|
|
|
|
|
|
Purchased options, at value —
OTC
|
|
|
|
|
|
|
|
|
|
|
|
|
|
|
|
|
|
|
Derivatives not subject to
master netting agreements
|
|
|
|
|
|
|
|
|
Total Derivative Assets
subject to master netting
agreements
|
|
|
|
|
|
|
|
|
|
|
|
|
|
|
|
|
|
|
Unrealized depreciation on
futures contracts—Exchange-
|
|
|
|
|
|
|
|
|
Unrealized depreciation on
swap agreements—OTC
|
|
|
|
|
|
|
|
|
Options written, at value -
Exchange-Traded
|
|
|
|
|
|
|
|
|
Options written, at value —
OTC
|
|
|
|
|
|
|
|
|
Total Derivative Liabilities
|
|
|
|
|
|
|
|
|
Derivatives not subject to
master netting agreements
|
|
|
|
|
|
|
|
|
Total Derivative Liabilities
subject to master netting
agreements
|
|
|
|
|
|
|
|
|
|
|
Except for Total Return Bond ETF, values are disclosed on the Statements of Assets
and Liabilities under the caption Unrealized appreciation on futures
contracts and Unrealized depreciation on futures contracts. For Total Return Bond
ETF, values include cumulative appreciation (depreciation) on futures
contracts. Only current day’s variation margin is reported within the Statements of Assets and Liabilities.
|
Offsetting Assets and Liabilities
The table below reflects the Funds’ exposure to Counterparties subject to either an ISDA Master Agreement or other agreement for OTC derivative transactions as of April 30, 2025:
|
|
Financial Derivative
Assets
|
Financial Derivative
Liabilities
|
|
Collateral
(Received)/Pledged
|
|
|
|
Forward foreign
currency contracts
|
Forward foreign
currency contracts
|
|
|
|
|
|
|
|
|
|
|
|
|
|
|
Financial Derivative
Assets
|
Financial Derivative
Liabilities
|
|
Collateral
(Received)/Pledged
|
|
|
|
|
|
|
|
|
|
|
|
|
|
|
|
|
|
Goldman Sachs International
|
|
|
|
|
|
|
Morgan Stanley Capital Services LLC
|
|
|
|
|
|
|
|
|
|
|
|
|
|
|
|
|
Financial Derivative
Assets
|
Financial Derivative
Liabilities
|
|
Collateral
(Received)/Pledged
|
|
|
|
|
|
|
|
|
|
Goldman Sachs International
|
|
|
|
|
|
|
Effect of Derivative Investments for the Six-Month Period Ended April 30, 2025
The table below summarizes each Fund’s gains (losses) on derivative investments, detailed by primary risk exposure, recognized in earnings during the period:
|
|
Location of Gain (Loss) on Statements of Operations
|
|
|
High Yield
Bond Factor ETF
|
|
S&P 500®
Downside
Hedged ETF
|
|
|
|
|
|
|
|
|
|
|
|
|
|
Forward foreign currency contracts
|
|
|
|
|
|
|
|
|
|
|
Change in Net Unrealized Appreciation (Depreciation):
|
|
|
|
|
Forward foreign currency contracts
|
|
|
|
|
|
|
|
|
|
|
|
|
|
|
|
|
|
|
Location of Gain (Loss) on Statements of Operations
|
|
|
|
|
|
|
|
|
|
|
|
|
|
|
|
|
|
|
|
|
|
|
|
|
|
|
|
|
|
|
|
|
|
|
|
|
|
|
|
Change in Net Unrealized Appreciation (Depreciation):
|
|
|
|
|
|
|
|
|
|
|
|
|
|
|
|
|
|
|
|
|
|
|
|
|
|
|
|
|
|
|
|
|
|
|
|
|
|
|
|
|
|
|
Options purchased are included in the net realized gain (loss) from investment securities
and the change in net unrealized appreciation (depreciation) on
investment securities.
|
The table below summarizes the average notional value of derivatives held during the
period.
|
|
|
|
|
High Yield
Bond Factor ETF
|
|
S&P 500®
Downside
Hedged ETF
|
|
|
|
Forward foreign currency contracts
|
|
|
|
|
|
|
|
|
|
|
|
|
|
|
|
|
|
|
|
|
|
|
|
|
|
|
|
|
|
|
|
|
|
|
|
|
|
|
The amount and character of income and gains to be distributed are determined in accordance
with federal income tax regulations, which may differ from GAAP. Reclassifications are made to the Funds’ capital accounts to reflect income and gains available for distribution (or available capital loss carryforwards) under federal
income tax regulations. The tax character of distributions paid during the year and the tax components of net assets will be reported at the Funds’ fiscal year-end.
Capital loss carryforwards are calculated and reported as of a specific date. Results
of transactions and other activity after that date may affect the amount of capital loss carryforwards actually available for the
Funds to utilize. The ability to utilize capital loss carryforwards in the future may be limited under the Internal Revenue Code and related
regulations based on the results of future transactions.
The Funds had capital loss carryforwards as of October 31, 2024, as follows:
|
|
|
|
|
|
|
|
|
Active U.S. Real Estate ETF
|
|
|
|
High Yield Bond Factor ETF
|
|
|
|
|
|
|
|
|
MSCI EAFE Income Advantage ETF
|
|
|
|
|
|
|
|
|
S&P 500® Downside Hedged ETF
|
|
|
|
S&P 500 Equal Weight Income Advantage ETF
|
|
|
|
Short Duration Total Return Bond ETF
|
|
|
|
|
|
|
|
|
|
|
|
|
|
Variable Rate Investment Grade ETF
|
|
|
|
|
|
Capital loss carryforwards are reduced for limitations, if any, to the extent required
by the Internal Revenue Code and may be further limited depending upon a
variety of factors, including the realization of net unrealized gains or losses as
of the date of any reorganization.
|
NOTE 7—Investment Transactions
For the six months ended April 30, 2025, the cost of securities purchased and the
proceeds from sales of securities (other than short-term securities, U.S. Government obligations, money market funds and in-kind
transactions, if any) were as follows:
|
|
|
|
AAA CLO Floating Rate Note ETF
|
|
|
Active U.S. Real Estate ETF
|
|
|
High Yield Bond Factor ETF
|
|
|
|
|
|
|
MSCI EAFE Income Advantage ETF
|
|
|
|
|
|
|
S&P 500® Downside Hedged ETF
|
|
|
S&P 500 Equal Weight Income Advantage ETF
|
|
|
Short Duration Total Return Bond ETF
|
|
|
SteelPath MLP & Energy Infrastructure ETF(a)
|
|
|
|
|
|
|
|
|
|
|
|
|
|
|
Variable Rate Investment Grade ETF
|
|
|
|
|
For the period February 18, 2025 (commencement of investment operations) through April
30, 2025.
|
|
|
For the period December 2, 2024 (commencement of investment operations) through April
30, 2025.
|
For the six months ended April 30, 2025, in-kind transactions associated with creations
and redemptions were as follows:
|
|
|
|
AAA CLO Floating Rate Note ETF
|
|
|
Active U.S. Real Estate ETF
|
|
|
High Yield Bond Factor ETF
|
|
|
|
|
|
|
MSCI EAFE Income Advantage ETF
|
|
|
|
|
|
|
S&P 500® Downside Hedged ETF
|
|
|
S&P 500 Equal Weight Income Advantage ETF
|
|
|
Short Duration Total Return Bond ETF
|
|
|
SteelPath MLP & Energy Infrastructure ETF(a)
|
|
|
|
|
|
|
|
|
|
|
|
|
|
|
|
|
|
|
Variable Rate Investment Grade ETF
|
|
|
|
|
For the period February 18, 2025 (commencement of investment operations) through April
30, 2025.
|
|
|
For the period December 2, 2024 (commencement of investment operations) through April
30, 2025.
|
Gains (losses) on in-kind transactions are generally not considered taxable gains
(losses) for federal income tax purposes.
As of April 30, 2025, the aggregate cost of investments, including any derivatives,
on a tax basis listed below includes adjustments for financial reporting purposes as of the most recently completed federal
income tax reporting period-end:
|
|
Gross
Unrealized
Appreciation
|
Gross
Unrealized
(Depreciation)
|
Net
Unrealized
Appreciation
(Depreciation)
|
|
AAA CLO Floating Rate Note ETF
|
|
|
|
|
Active U.S. Real Estate ETF
|
|
|
|
|
High Yield Bond Factor ETF
|
|
|
|
|
|
|
|
|
|
|
MSCI EAFE Income Advantage ETF
|
|
|
|
|
|
|
|
|
|
|
S&P 500® Downside Hedged ETF
|
|
|
|
|
S&P 500 Equal Weight Income Advantage ETF
|
|
|
|
|
Short Duration Total Return Bond ETF
|
|
|
|
|
SteelPath MLP & Energy Infrastructure ETF
|
|
|
|
|
|
|
|
|
|
|
|
|
|
|
|
|
|
|
|
|
|
|
Variable Rate Investment Grade ETF
|
|
|
|
|
NOTE 8—Trustees’ and Officer’s Fees
Trustees’ and Officer’s Fees include amounts accrued by the Funds to pay remuneration to the Independent Trustees and an Officer of the Trust. The Adviser, as a result of each Fund’s unitary management fee (except for Ultra Short Duration ETF), pays for such compensation for each Fund. Interested Trustees do not receive any Trustees’ fees.
The Trust has adopted a deferred compensation plan (the “Plan”). Under the Plan, each Independent Trustee who has executed a Deferred Fee Agreement (a “Participating Trustee”) may defer receipt of all or a portion of their compensation (“Deferral Fees”). Such Deferral Fees are deemed to be invested in select Invesco ETFs. The Deferral Fees payable to a Participating Trustee are valued as of the date such Deferral Fees would have been paid to the Participating
Trustee. The value increases with contributions or with increases in the value of the Shares selected, and the value
decreases with distributions or with declines in the value of the Shares selected. Obligations under the Plan represent unsecured claims
against the general assets of the Funds.
AAA CLO Floating Rate Note ETF is a party to a committed line of credit facility with
a syndicate administered by State Street Bank and Trust Company, which will expire on April 7, 2026. The Fund currently participates
in this line of credit with another Invesco ETF on a several and not joint basis. The Fund may borrow up to the lesser
of (1) $300,000,000, (2) 20% of the value of the Fund’s net assets or (3) the limits set by its prospectus for borrowings. The Adviser, on behalf of the Fund, pays an upfront fee of 0.10% on the commitment amount and a commitment fee of 0.15% on the amount
of the commitment that has not been utilized. In case of borrowings from the line of credit, the Fund pays the associated
interest expenses.
During the six months ended April 30, 2025, there were no borrowings from the line
of credit.
Shares are issued and redeemed by each Fund only in Creation Units as discussed in
Note 1. Only APs are permitted to purchase or redeem Creation Units from the Funds.
To the extent that the Funds permit transactions in exchange for Deposit Securities,
each Fund may issue Shares in advance of receipt of Deposit Securities subject to various conditions, including a requirement
to maintain on deposit with the Trust cash at least equal to 105% of the market value of the missing Deposit Securities. In accordance with the Trust’s Participant Agreement, Creation Units will be issued to an AP, notwithstanding the fact that the corresponding
Deposit Securities have not been received in part or in whole, in reliance on the undertaking of the AP to deliver the missing
Deposit Securities as soon as possible, which
undertaking shall be secured by the AP’s delivery and maintenance of collateral consisting of cash in the form of U.S. dollars in immediately available funds having a value (marked-to-market daily) at least equal
to 105%, which the Adviser may change from time to time, of the value of the missing Deposit Securities.
Certain transaction fees may be charged by the Funds for creations and redemptions,
which are treated as increases in capital.
Transactions in each Fund’s Shares are disclosed in detail in the Statements of Changes in Net Assets.
At a meeting held on March 13, 2025, the Board of Trustees of the Trust approved,
and has recommended that shareholders approve, changing the Active U.S. Real Estate ETF’s sub-classification under the 1940 Act from “diversified” to “non-diversified” and the elimination of related fundamental investment restrictions (the “Proposal”). The Proposal requires approval by the shareholders of the Fund and will be submitted to shareholders at a Special Meeting
of Shareholders to be held on or about July 10, 2025. If approved, the Proposal is anticipated to become effective in July
2025.
Approval of Investment Advisory and Sub-Advisory Contracts
At a meeting held on September 19, 2024, the Board of Trustees of the Invesco Actively
Managed Exchange-Traded Fund Trust (the “Trust”), including the Independent Trustees, approved the Investment Advisory Agreement between Invesco Capital Management LLC (the “Adviser”) and the Trust for Invesco Mega QQQ ETF (subsequently renamed Invesco Top QQQ ETF) (the “Fund”).
The Trustees reviewed information from the Adviser describing: (i) the nature, extent
and quality of services to be provided, (ii) the proposed unitary advisory fee for the Fund and comparisons to amounts paid by
other comparable registered investment companies, (iii) the extent to which economies of scale may be realized as the Fund
grows and whether the fee levels reflect any possible economies of scale for the benefit of Fund shareholders, and (iv) any further
benefits to be realized by the Adviser or its affiliates from the Adviser’s relationship with the Fund.
Nature, Extent and Quality of Services. In evaluating the nature, extent and quality of the Adviser’s services, the Trustees reviewed information concerning the functions to be performed by the Adviser for the
Fund, including the identity of the persons who will be responsible for the day-to-day management of the Fund, and they considered
the quality of services provided by the Adviser to other exchange-traded funds (“ETFs”). The Trustees noted that the portfolio managers of the Fund also manage other ETFs on behalf of the Adviser that are overseen by the Board and that the Board is
familiar with the background and experience of the portfolio managers of the Fund. The Trustees considered information regarding the Fund’s investment objective, strategies and process. The Trustees also noted other information the Board received and considered
in connection with its March 14, 2024 and April 18, 2024 meetings describing the Adviser’s current organization and staffing, including operational support provided by the Adviser’s parent organization, Invesco Ltd. The Trustees reviewed information related to the Adviser’s portfolio transaction policies and procedures. Because the Fund had not yet commenced operations,
the Trustees noted that no performance information for the Fund could be provided.
The Trustees considered the services to be provided by the Adviser in its oversight of the Fund’s administrator, custodian and transfer agent. They noted the significant amount of time, effort and resources that
had been devoted to this oversight function for the other ETFs managed by the Adviser and that was expected to be provided for
the Fund.
Based on its review, the Board concluded that the nature, extent and quality of the
services to be provided by the Adviser to the Fund under the Investment Advisory Agreement were expected to be appropriate and reasonable.
Fees, Expenses and Profitability. The Trustees reviewed and discussed the information provided by the Adviser on the Fund’s proposed unitary advisory fee, as compared to information compiled by the Adviser from Lipper Inc. (“Lipper”) databases on the median net expense ratios of comparable passive ETFs, open-end (non-ETF) index funds,
open-end (non-ETF) actively managed funds and to Adviser-identified select peer funds. The Trustees noted that the proposed
annual advisory fee to be charged to the Fund was a unitary fee, and that the Adviser has agreed to pay all other operating
expenses of the Fund except for brokerage expenses, taxes, interest, acquired fund fees and expenses, if any, litigation expenses,
costs incurred in connection with proxies (except certain proxies) and other extraordinary expenses. The Trustees noted the Fund’s proposed unitary advisory fee as compared to the median net expense ratios of its Lipper peer groups and a select peer
group as shown below:
|
|
Passive
ETF Peer
Group
(Number of Peers)
|
Open-End
Index Fund
Peer Group
(Number of Peers)
|
Open-End
Active Fund
Peer Group
(Number of Peers)
|
Select
Peer Group
(Number of Peers)
|
|
|
|
|
|
|
Based on all of the information provided, the Board concluded that the Fund’s proposed unitary advisory fee was reasonable and appropriate in light of the services to be provided, the distinguishing factors of
the Fund, and the administrative, operational and management oversight services to be provided by the Adviser and the related costs
in providing such services.
In conjunction with their review of the unitary advisory fee, the Trustees also considered
that the Adviser did not provide a profitability analysis for the Adviser in managing the Fund because the Fund had not
yet commenced operations. However, the Trustees noted other information the Board received and considered in connection with
its March 14, 2024 and April 18, 2024 meetings regarding the Adviser’s overall profitability from its relationship with other ETFs for which it serves as investment adviser.
Approval of Investment Advisory Contracts—(continued)
Economies of Scale and Whether Fee Levels Reflect These Economies of Scale. The Trustees
reviewed the information provided by the Adviser as to the extent to which economies of scale may be realized as the Fund
grows and whether fee levels reflect economies of scale for the benefit of the Fund’s shareholders. The Trustees noted that any reduction in fixed costs associated with the management of the Fund would be enjoyed by the Adviser, but a unitary advisory
fee provides a level of certainty in expenses for the Fund. The Board considered whether the proposed unitary advisory
fee rate for the Fund was reasonable in relation to the proposed services and product strategy of the Fund, and it concluded
that the unitary advisory fee rate was reasonable and appropriate.
Fall-out Benefits. The Trustees considered that the Adviser identified no additional benefits that it
will receive from its relationship with the Fund, and noted that the Adviser will not be a party to any soft-dollar,
commission recapture or directed brokerage arrangements with respect to the Fund. The Trustees considered benefits to be received
by affiliates of the Adviser that may be directly or indirectly attributed to the Adviser’s relationship with the Fund, including brokerage fees, advisory fees from affiliated money market cash management vehicles and fees as the Fund’s securities lending agent. The Trustees also considered that Invesco Distributors, Inc., an affiliate of the Adviser, will serve as the Fund’s distributor and will be paid a distribution fee by the Adviser. The Board concluded that the Fund’s proposed unitary advisory fee was reasonable, taking into account any ancillary benefits to be received by affiliates of the Adviser.
Based on all of the information considered and the conclusions reached, the Board,
including the Independent Trustees, determined to approve the Investment Advisory Agreement for the Fund. No single factor was determinative in the Board’s analysis.
Approval of Investment Advisory and Sub-Advisory Contracts
At a meeting held on December 13, 2024, the Board of Trustees of the Invesco Actively
Managed Exchange-Traded Fund Trust (the “Trust”), including the Independent Trustees, approved the Investment Advisory Agreement (the “Advisory Agreement”) between Invesco Capital Management LLC (the “Adviser”) and the Trust for Invesco SteelPath MLP & Energy Infrastructure ETF (the “Fund”) and the Investment Sub-Advisory Agreement for the Fund, between the Adviser and the following seven affiliated sub-advisers (the “Sub-Advisory Agreement”): Invesco Advisers, Inc. (as the initial sub-adviser for the Fund); Invesco Asset Management Deutschland GmbH; Invesco Asset Management Limited; Invesco Asset Management
(Japan) Limited; Invesco Hong Kong Limited; Invesco Senior Secured Management, Inc.; and Invesco Canada Ltd. (each, a “Sub-Adviser” and collectively, the “Sub-Advisers”).
The Trustees reviewed information from the Adviser describing: (i) the nature, extent
and quality of services to be provided, (ii) the proposed unitary advisory fee for the Fund and comparisons to amounts paid
by other comparable registered investment companies, (iii) the extent to which economies of scale may be realized as the Fund
grows and whether the fee level reflects any possible economies of scale for the benefit of Fund shareholders, and (iv) any further
benefits to be realized by the Adviser or its affiliates from the Adviser’s relationship with the Fund.
Nature, Extent and Quality of Services. In evaluating the nature, extent and quality of the Adviser’s services, the Trustees reviewed information concerning the functions to be performed by the Adviser for the
Fund, including the identities of the persons who will be responsible for the day-to-day management of the Fund, and they
considered the quality of services provided by the Adviser to other exchange-traded funds (“ETFs”). The Trustees considered information regarding the Fund’s investment objective, strategies and process. The Trustees noted other information the Board
received and considered in connection with its March 14, 2024 and April 18, 2024 meetings describing the Adviser’s current organization and staffing, including operational support provided by the Adviser’s parent organization, Invesco Ltd. The Trustees reviewed information related to the Adviser’s and Sub-Advisers’ portfolio transaction policies and procedures. Because the Fund had not yet commenced operations, the Trustees noted that no performance information for the Fund could be provided.
The Trustees considered the services to be provided by the Adviser in its oversight of the Fund’s administrator, custodian, transfer agent and the Sub-Advisers. They noted the significant amount of time, effort
and resources that had been devoted to this oversight function for the other ETFs managed by the Adviser and that was expected
to be provided for the Fund.
Based on its review, the Board concluded that the nature, extent and quality of the
services to be provided by the Adviser to the Fund under the Advisory Agreement were expected to be appropriate and reasonable.
Fees, Expenses and Profitability. The Trustees reviewed and discussed the information provided by the Adviser on the Fund’s proposed unitary advisory fee, as compared to information compiled by the Adviser from Lipper Inc. (“Lipper”) databases on the median net expense ratios of comparable active ETFs, open-end (non-ETF) actively managed
funds and to Adviser-identified select peer funds. The Trustees noted that the proposed annual advisory fee to be charged
to the Fund was a unitary fee, and that the Adviser has agreed to pay all other operating expenses of the Fund, including the
fees payable to the Sub-Advisers, except for brokerage expenses, taxes, interest, acquired fund fees and expenses, if any, litigation
expenses, costs incurred in connection with proxies (except certain proxies) and other extraordinary expenses. The Trustees also noted the Fund’s proposed unitary advisory fee as compared to the median net expense ratios of its Lipper peer groups and a select
peer group as shown below:
|
|
Active ETF
Peer Group
(Number of Peers)
|
Open-End
Active Fund
Peer Group
(Number of Peers)
|
Select
Peer Group
(Number of Peers)
|
Invesco SteelPath MLP & Energy Infrastructure ETF
|
|
|
|
Based on all of the information provided, the Board concluded that the Fund’s proposed unitary advisory fee was reasonable and appropriate in light of the services to be provided, the distinguishing factors of
the Fund, and the administrative, operational and management oversight services to be provided by the Adviser and the related costs
in providing such services.
In conjunction with their review of the unitary advisory fee, the Trustees also considered
the sub-advisory fees to be paid by the Adviser for the Fund. The Adviser did not provide a profitability analysis for the
Adviser in managing the Fund because the Fund
Approval of Investment Advisory and Sub-Advisory Contracts—(continued)
had not yet commenced operations. However, the Trustees noted other information the
Board received and considered in connection with its March 14, 2024 and April 18, 2024 meetings regarding the Adviser’s overall profitability from its relationship with other ETFs for which it serves as investment adviser.
Economies of Scale and Whether Fee Levels Reflect These Economies of Scale. The Trustees reviewed the information provided by the Adviser as to the extent to which economies of scale may be realized as the
Fund grows and whether fee levels reflect economies of scale for the benefit of the Fund’s shareholders. The Trustees noted that any reduction in fixed costs associated with the management of the Fund would be enjoyed by the Adviser, but a unitary advisory
fee provides a level of certainty in expenses for the Fund. The Board considered whether the proposed unitary advisory
fee rate for the Fund was reasonable in relation to the proposed services and product strategy of the Fund, and it concluded
that the unitary advisory fee rate was reasonable and appropriate.
Fall-out Benefits. The Trustees considered that the Adviser identified no additional benefits that it
will receive from its relationship with the Fund, and noted that the Adviser will not be a party to any soft-dollar,
commission recapture or directed brokerage arrangements with respect to the Fund. The Trustees considered benefits to be received
by affiliates of the Adviser that may be directly or indirectly attributed to the Adviser’s relationship with the Fund, including brokerage fees, advisory fees from affiliated money market cash management vehicles and fees as the Fund’s securities lending agent. The Trustees also considered that Invesco Distributors, Inc., an affiliate of the Adviser, will serve as the Fund’s distributor and will be paid a distribution fee by the Adviser. The Board concluded that the Fund’s proposed unitary advisory fee was reasonable, taking into account any ancillary benefits to be received by affiliates of the Adviser.
Based on all of the information considered and the conclusions reached, the Board,
including the Independent Trustees, determined to approve the Advisory Agreement for the Fund. No single factor was determinative in the Board’s analysis.
As noted above, the Board of Trustees of the Trust, including the Independent Trustees,
approved the Sub-Advisory Agreement for the Fund at a meeting held on December 13, 2024. The review process followed
by the Board is described in detail above. In connection with the review of the Sub-Advisory Agreement, the Board considered the
factors described below, among others.
Nature, Extent and Quality of Services. The Trustees considered the nature, extent and quality of services to be provided
to the Fund under the Sub-Advisory Agreement. The Trustees reviewed the qualifications and
background of each Sub-Adviser, the services to be provided by each Sub-Adviser, the investment approach of each Sub-Adviser
whose investment personnel manage the Fund, and the investment personnel responsible for the day-to-day management of
the Fund. The Board considered additional information it received regarding the Fund’s investment strategy during presentations from the initial sub-adviser’s portfolio managers for the Fund at the Board’s September 19, 2024 meeting.
Based on its review, the Board concluded that the nature, extent and quality of services
to be provided by the Sub-Advisers to the Fund under the Sub-Advisory Agreement were expected to be appropriate and reasonable.
Fees and Expenses. The Trustees reviewed and discussed the information provided by the Adviser and the
Sub-Advisers on the sub-advisory fee rates under the Sub-Advisory Agreement. The Trustees noted that
the sub-advisory fees to be charged by the Sub-Advisers under the Sub-Advisory Agreement are consistent with the compensation
structure used throughout Invesco when Invesco’s affiliates provide sub-advisory services for funds managed by other Invesco affiliates. The Trustees considered how the sub-advisory fees relate to the overall advisory fee for the Fund and noted that the
Adviser will compensate the Sub-Advisers from its fee.
Economies of Scale and Whether Fee Levels Reflect These Economies of Scale. As part of their review of the Advisory Agreement for the Fund, the Trustees considered the extent to which economies of scale may be
realized as the Fund grows and whether fee levels reflect economies of scale for the benefit of the Fund’s shareholders. The Board considered whether the sub-advisory fee rate for the Fund is reasonable in relation to the proposed services and product strategy
of the Fund, and they concluded that the flat sub-advisory fee rates were reasonable and appropriate.
Fall-out Benefits. The Trustees noted that Invesco Advisers, Inc. will receive management fees from
affiliated money market funds into which the Fund’s and other Invesco ETFs’ excess cash and securities lending collateral may be invested, and that the Adviser
Approval of Investment Advisory and Sub-Advisory Contracts—(continued)
will waive its fees with respect to the Fund in an amount equal to the fees received by Invesco Advisers, Inc. on the Fund’s excess cash invested in the affiliated money market funds. The Trustees also noted the fees
received by Invesco Advisers, Inc. in its capacity as securities lending agent for the Invesco ETFs. The Board concluded that
the sub-advisory fee with respect to the Fund was reasonable, taking into account any ancillary benefits expected to be received
by the Sub-Advisers.
Based on all of the information considered and the conclusions reached, the Board,
including the Independent Trustees, determined to approve the Sub-Advisory Agreement for the Fund. No single factor was determinative in the Board’s analysis.
Approval of Investment Advisory and Sub-Advisory Contracts
At a meeting held on April 24, 2025, the Board of Trustees of the Invesco Actively
Managed Exchange-Traded Fund Trust (the “Trust”), including the Independent Trustees, approved the continuation of the Investment Advisory Agreement between Invesco Capital Management LLC (the “Adviser”) and the Trust for the following series (each, a “Fund” and collectively, the “Funds”):
Invesco AAA CLO Floating Rate Note ETF
Invesco Active U.S. Real Estate ETF
Invesco High Yield Bond Factor ETF
Invesco High Yield Select ETF
Invesco Real Assets ESG ETF
Invesco Rochester High Yield Municipal ETF
Invesco S&P 500® Downside Hedged ETF
Invesco Short Duration Total Return Bond ETF
Invesco Total Return Bond ETF
Invesco Variable Rate Investment Grade ETF
Also at the April 24, 2025 meeting, the Board of Trustees of the Trust, including
the Independent Trustees, approved the continuation of the Investment Sub-Advisory Agreement between the Adviser and the
following seven affiliated sub-advisers: Invesco Advisers, Inc.; Invesco Asset Management Deutschland GmbH; Invesco Asset
Management Limited; Invesco Asset Management (Japan) Limited; Invesco Hong Kong Limited; Invesco Senior Secured
Management, Inc.; and Invesco Canada Ltd. (each, a “Sub-Adviser” and collectively, the “Sub-Advisers”); with respect to each of the following Funds (the “Sub-Advisory Agreement”):
Invesco AAA CLO Floating Rate Note ETF
Invesco Active U.S. Real Estate ETF
Invesco High Yield Bond Factor ETF
Invesco High Yield Select ETF
Invesco Real Assets ESG ETF
Invesco Rochester High Yield Municipal ETF
Invesco Short Duration Total Return Bond ETF
Invesco Total Return Bond ETF
Invesco Variable Rate Investment Grade ETF
Investment Advisory Agreement
The Trustees reviewed information from the Adviser describing: (i) the nature, extent
and quality of services provided, (ii) the investment performance of each Fund and the Adviser, (iii) the fees paid by the Funds
and comparisons to amounts paid by other comparable registered investment companies, (iv) the costs of services provided and
estimated profits realized by the Adviser, (v) the extent to which economies of scale may be realized as a Fund grows and whether
fee levels reflect any possible economies of scale for the benefit of Fund shareholders and (vi) any further benefits realized
by the Adviser or its affiliates from the Adviser’s relationship with the Funds.
Nature, Extent and Quality of Services. In evaluating the nature, extent and quality of the Adviser’s services, the Trustees reviewed information concerning the functions performed by the Adviser for the Funds, information describing the Adviser’s current organization and staffing, including operational support provided by the Adviser’s parent organization, Invesco Ltd. (“Invesco”), and the background and experience of the persons responsible for the day-to-day management of the Funds. The Trustees reviewed matters related to the Adviser’s execution and/or oversight of execution of portfolio transactions on behalf of the Funds. The Trustees noted that, unlike most of the other exchange-traded funds (“ETFs”) for which the Adviser serves as investment adviser, the Funds are not designed to track the performance of an index,
and investment decisions are the primary responsibility of the Adviser or Sub-Advisers, as applicable.
The Trustees reviewed information on the performance of Invesco AAA CLO Floating Rate
Note ETF, its benchmark indexes (Bloomberg U.S. Aggregate Bond Index and JP Morgan CLOIE AAA Total Return Index) and the Fund’s Lipper Inc. (“Lipper”) peer group rankings (the 1st quartile being the best performers and the 4th quartile being
the worst performers) for the one-year and since-inception (December 9, 2022) periods ended December 31, 2024. Based on the
information provided, the Trustees noted that the Fund outperformed the Bloomberg U.S. Aggregate Bond Index for each period,
performed the same as the JP Morgan CLOIE AAA Total Return Index for the one-year period and outperformed the JP Morgan
CLOIE AAA Total Return Index for the since-inception period. The Trustees also noted that the Fund ranked in the 4th quartile
of its Lipper peer group for each period. In response to questions from the Independent Trustees, the Adviser provided supplemental
information regarding the performance of Invesco AAA CLO Floating Rate Note ETF for the one-year period ended
December 31, 2024. The Adviser explained the factors that detracted from the Fund’s performance during the period.
The Trustees reviewed information on the performance of Invesco Active U.S. Real Estate
ETF, its benchmark indexes (FTSE NAREIT All Equity REITs Index and S&P 500® Index) and the Fund’s Lipper peer group rankings for the one-year, three-year, five-year, ten-year and since-inception (November 20, 2008) periods ended December 31,
2024. Based on the information
Approval of Investment Advisory and Sub-Advisory Contracts—(continued)
provided, the Trustees noted that the Fund underperformed both benchmark indexes for
each period. The Trustees also noted that the Fund ranked in the 4th quartile of its Lipper peer group for the one-year,
three-year and five-year periods, and the Fund ranked in the 3rd quartile of its Lipper peer group for the ten-year and since-inception
periods. In response to questions from the Independent Trustees, the Adviser provided supplemental information regarding the
performance of Invesco Active U.S. Real Estate ETF for the one-year period ended December 31, 2024. The Adviser explained the factors that detracted from the Fund’s performance during the period.
The Trustees reviewed information on the performance of Invesco High Yield Bond Factor
ETF, its benchmark indexes (Bloomberg U.S. Aggregate Bond Index and Bloomberg U.S. Corporate High Yield 2% Issuer Cap Index) and the Fund’s Lipper peer group rankings for the one-year, three-year and since-inception (December 2, 2020) periods
ended December 31, 2024. Based on the information provided, the Trustees noted that the Fund outperformed the Bloomberg
U.S. Aggregate Bond Index for each period, outperformed the Bloomberg U.S. Corporate High Yield 2% Issuer Cap Index for the one-year
period and underperformed the Bloomberg U.S. Corporate High Yield 2% Issuer Cap Index for the three-year and since-inception
periods. The Trustees also noted that the Fund ranked in the 2nd quartile of its Lipper peer group for each period.
The Trustees reviewed information on the performance of Invesco High Yield Select
ETF, its benchmark indexes (Bloomberg U.S. Aggregate Bond Index and Bloomberg U.S. Corporate High Yield Ba/B 2% Issuer Cap Index) and the Fund’s Lipper peer group rankings for the one-year and since-inception (December 9, 2022) periods ended
December 31, 2024. Based on the information provided, the Trustees noted that the Fund outperformed the Bloomberg
U.S. Aggregate Bond Index for each period, outperformed the Bloomberg U.S. Corporate High Yield Ba/B 2% Issuer Cap Index for
the one-year period and underperformed the Bloomberg U.S. Corporate High Yield Ba/B 2% Issuer Cap Index for the since-inception
period. The Trustees also noted that the Fund ranked in the 3rd quartile of its Lipper peer group for the one-year period
and in the 4th quartile of its Lipper peer group for the since-inception period.
The Trustees reviewed information on the performance of Invesco Rochester High Yield
Municipal ETF, its benchmark indexes (S&P Municipal Bond 50% Investment Grade/50% High Yield Index, S&P Municipal Bond
High Yield Index and S&P Municipal Bond Index) and the Fund’s Lipper peer group rankings for the one-year and since-inception (December 9, 2022) periods ended December 31, 2024. Based on the information provided, the Trustees noted that the
Fund outperformed the S&P Municipal Bond 50% Investment Grade/50% High Yield Index for the one-year period, underperformed
the S&P Municipal Bond 50% Investment Grade/50% High Yield Index for the since-inception period, underperformed
the S&P Municipal Bond High Yield Index for each period and outperformed the S&P Municipal Bond Index for each period. The
Trustees also noted that the Fund ranked in the 3rd quartile of its Lipper peer group for each period.
The Trustees reviewed information on the performance of Invesco Real Assets ESG ETF,
its benchmark indexes (S&P U.S., Canada & Mexico Real Assets Equity Index and S&P 500® Index) and the Fund’s Lipper peer group rankings for the one-year, three-year and since-inception (December 22, 2020) periods ended December 31, 2024.
Based on the information provided, the Trustees noted that the Fund outperformed the S&P U.S., Canada & Mexico Real Assets
Equity Index for the one-year and three-year periods, underperformed the S&P U.S., Canada & Mexico Real Assets Equity
Index for the since-inception period, underperformed the S&P 500® Index for the one-year and three-year periods and outperformed the S&P 500® Index for the since-inception period. The Trustees also noted that the Fund ranked in the 1st quartile
of its Lipper peer group for each period.
The Trustees reviewed information on the performance of Invesco S&P 500® Downside Hedged ETF, its benchmark indexes (S&P 500® Dynamic VEQTOR Index, S&P 500® Index and U.S. 3-Month Treasury Bill Index) and the Fund’s Lipper peer group rankings for the one-year, three-year, five-year, ten-year and since-inception (December 6,
2012) periods ended December 31, 2024. Based on the information provided, the Trustees noted that the Fund underperformed the S&P 500® Dynamic VEQTOR Index and the S&P 500® Index for each period, outperformed the U.S. 3-Month Treasury Bill Index for the one-year, five-year, ten-year and since-inception periods and underperformed the U.S. 3-Month Treasury
Bill Index for the three-year period. The Trustees also noted that the Fund ranked in the 1st quartile of its Lipper peer group
for the one-year, five-year, ten-year and since-inception periods and ranked in the 3rd quartile of its Lipper peer group for
the three-year period.
The Trustees reviewed information on the performance of Invesco Short Duration Total
Return Bond ETF, its benchmark indexes (Bloomberg U.S. Aggregate Bond Index and Bloomberg U.S. Government and Credit 1-3 Year Index) and the Fund’s Lipper peer group rankings for the one-year and since-inception (December 9, 2022) periods ended
December 31, 2024. Based on the
Approval of Investment Advisory and Sub-Advisory Contracts—(continued)
information provided, the Trustees noted that the Fund outperformed both benchmark
indexes for each period. The Trustees also noted that the Fund ranked in the 2nd quartile of its Lipper peer group for each
period.
The Trustees reviewed information on the performance of Invesco Total Return Bond
ETF, its benchmark index (Bloomberg U.S. Aggregate Bond Index) and the Fund’s Lipper peer group rankings for the one-year, three-year, five-year and since-inception (February 10, 2016) periods ended December 31, 2024. Based on the information provided,
the Trustees noted that the Fund outperformed its benchmark for the one-year, five-year and since-inception periods
and underperformed its benchmark for the three-year period. The Trustees also noted that the Fund ranked in the 1st quartile
of its Lipper peer group for the one-year, five-year and since-inception periods, and in the 3rd quartile of its Lipper peer
group for the three-year period. The Trustees considered that the Fund was created in connection with the purchase by Invesco of
the ETFs business of Guggenheim Capital LLC (“Guggenheim”) (the “Transaction”) and that the Fund’s performance prior to the closing of the Transaction on April 6, 2018 is that of its predecessor Guggenheim ETF.
The Trustees reviewed information on the performance of Invesco Variable Rate Investment
Grade ETF, its benchmark indexes (Bloomberg U.S. Aggregate Bond Index and Bloomberg US Floating Rate Note Index) and the Fund’s Lipper peer group rankings for the one-year, three-year, five-year and since-inception (September 22, 2016) periods
ended December 31, 2024. Based on the information provided, the Trustees noted that the Fund outperformed both benchmark
indexes for each period. The Trustees also noted that the Fund ranked in the 1st quartile of its Lipper peer group for each
period.
The Trustees considered the services provided by the Adviser in its oversight of the Funds’ administrator, custodian, transfer agent and, for all Funds except Invesco S&P 500® Downside Hedged ETF, the Sub-Advisers. The Trustees noted the significant amount of time, effort and resources that had been devoted to this oversight function.
Based on its review, the Board concluded that the nature, extent and quality of services
provided by the Adviser to the Funds under the Investment Advisory Agreement were appropriate and reasonable.
Fees, Expenses and Profitability. The Trustees reviewed and discussed the information provided by the Adviser on each Fund’s net expense ratio and unitary advisory fee. The Trustees noted that the annual advisory
fee charged to each Fund, as set forth below, is a unitary advisory fee and that the Adviser compensates each Sub-Adviser
(as applicable) from its unitary advisory fee and pays all other operating expenses of each Fund, except that each Fund pays its
brokerage expenses, taxes, interest (including, for Invesco AAA CLO Floating Rate Note ETF, interest expenses associated with any
draws on its line of credit), acquired fund fees and expenses, if any, litigation expenses, costs incurred in connection with proxies
(except certain proxies) and other extraordinary expenses:
●
0.19% of the Fund’s average daily net assets for Invesco AAA CLO Floating Rate Note ETF;
●
0.30% of the Fund’s average daily net assets for Invesco Short Duration Total Return Bond ETF and Invesco Variable Rate Investment Grade ETF;
●
0.35% of the Fund’s average daily net assets for Invesco Active U.S. Real Estate ETF and Invesco Total Return Bond ETF;
●
0.39% of the Fund’s average daily net assets for Invesco S&P 500® Downside Hedged ETF, Invesco High Yield Bond Factor ETF and Invesco Rochester High Yield Municipal ETF;
●
0.48% of the Fund’s average daily net assets for Invesco High Yield Select ETF; and
●
0.59% of the Fund’s average daily net assets for Invesco Real Assets ESG ETF.
The Trustees considered that on March 13, 2025 the Adviser proposed and the Board
of Trustees approved a permanent reduction in the annual unitary advisory fee rate for Invesco Real Assets ESG ETF from 0.59% to 0.58% of the Fund’s average daily net assets, effective May 13, 2025.
The Trustees compared each Fund’s net expense ratio to information compiled by the Adviser from Lipper databases on the net expense ratios of comparable ETFs, open-end (non-ETF) index funds and open-end (non-ETF)
actively-managed funds, as applicable. The Trustees noted that the net expense ratios for certain Funds were
equal to or lower than the median net expense ratios of their ETF peers and open-end index peer funds, as illustrated in the table
below. The Trustees also noted that the net
Approval of Investment Advisory and Sub-Advisory Contracts—(continued)
expense ratios for all Funds were equal to or lower than the median net expense ratios
of their open-end actively-managed peer funds.
|
|
Equal
to/Lower
than ETF
Peer
Median*
|
Equal to/Lower
than Open-End
Index Fund
Peer Median*
|
Equal to/
Lower than
Open-End
Active Fund
Peer Median
|
Invesco AAA CLO Floating Rate Note ETF
|
|
|
|
Invesco Active U.S. Real Estate ETF
|
|
|
|
Invesco High Yield Bond Factor ETF
|
|
|
|
Invesco High Yield Select ETF
|
|
|
|
Invesco Real Assets ESG ETF
|
|
|
|
Invesco Rochester High Yield Municipal ETF
|
|
|
|
Invesco S&P 500® Downside Hedged ETF
|
|
|
|
Invesco Short Duration Total Return Bond ETF
|
|
|
|
Invesco Total Return Bond ETF
|
|
|
|
Invesco Variable Rate Investment Grade ETF
|
|
|
|
|
|
The information provided by the Adviser indicated that certain Funds did not have
any open-end index fund peers. Those Funds have been designated in this
column with an “N/A” for not available.
|
The Trustees noted information, including fee information, provided by the Adviser
regarding other investment products to which it provides investment advisory services, noting that the Adviser indicated that none
of the other investment products have investment strategies comparable to those of the Funds. The Trustees considered the Adviser’s explanation of the differences between the services provided to the Funds and to the other investment products it advises, noting the Adviser’s statement that the management and oversight of the Funds requires substantially more labor and expense.
Based on all of the information provided, the Board concluded that each Fund’s unitary advisory was reasonable and appropriate in light of the services provided, the distinguishing factors of the Fund, and the
administrative, operational and management oversight costs for the Adviser.
In conjunction with their review of the unitary advisory fees, the Trustees considered
information provided by the Adviser on the revenues received by the Adviser under the Investment Advisory Agreement for the Funds.
The Trustees reviewed information provided by the Adviser regarding its overall profitability, as well as the estimated
profitability to the Adviser from its relationship to each Fund. With respect to the Adviser’s profitability information, the Trustees considered that there is no recognized standard or uniform methodology for determining profitability for this purpose. Furthermore,
the Trustees noted that there are limitations inherent in allocating costs and calculating profitability for an organization such as the Adviser’s. Based on the information provided, the Board concluded that the overall and estimated profitability to the
Adviser was not unreasonable.
Economies of Scale and Whether Fee Levels Reflect These Economies of Scale. The Trustees reviewed the information provided by the Adviser as to the extent to which economies of scale may be realized as each
Fund grows and whether fee levels reflect economies of scale for the benefit of the Fund’s shareholders. The Trustees reviewed each Fund’s asset size and unitary advisory fee. The Trustees noted that any reduction in fixed costs associated with the management
of the Funds would be enjoyed by the Adviser, but a unitary advisory fee provides a level of certainty in expenses for
the Funds. The Trustees also noted that the Adviser has reduced advisory fees for the Invesco ETFs numerous times since 2011,
including through permanent advisory fee reductions and various advisory fee waivers. The Board considered whether the unitary
advisory fee rate for each Fund was reasonable in relation to the asset size of that Fund and concluded that the unitary
advisory fee rates were reasonable and appropriate.
Fall-out Benefits. The Trustees considered that the Adviser identified no additional benefits it receives
from its relationship with the Funds, and noted that the Adviser is not a party to any soft-dollar, commission
recapture or directed brokerage arrangements with respect to the Funds. The Trustees also considered benefits received by affiliates
of the Adviser that may be directly or indirectly attributed to the Adviser’s relationship with the Funds, including brokerage fees, advisory fees from affiliated money market cash management vehicles and fees as the Funds’ securities lending agent. The Trustees also considered that Invesco
Approval of Investment Advisory and Sub-Advisory Contracts—(continued)
Distributors, Inc., an affiliate of the Adviser, serves as each Fund’s distributor and is paid a distribution fee by the Adviser. The Board concluded that each Fund’s unitary advisory fee was reasonable, taking into account any ancillary benefits received by affiliates of the Adviser.Based on all of the information considered and the conclusions
reached, the Board, including the Independent Trustees, determined to approve the continuation of the Investment Advisory
Agreement for each Fund. No single factor was determinative in the Board’s analysis.
Investment Sub-Advisory Agreement
As noted above, the Board of Trustees of the Trust, including the Independent Trustees,
approved the continuation of the Sub-Advisory Agreement for each of Invesco AAA CLO Floating Rate Note ETF, Invesco
Active U.S. Real Estate ETF, Invesco High Yield Bond Factor ETF, Invesco High Yield Select ETF, Invesco Real Assets ESG ETF,
Invesco Rochester High Yield Municipal ETF, Invesco Short Duration Total Return Bond ETF, Invesco Total Return Bond ETF and Invesco
Variable Rate Investment Grade ETF (each such Fund, a “Sub-Advised Fund” and collectively, the “Sub-Advised Funds”) at a meeting held on April 24, 2025. The review process followed by the Board is described in detail above. In connection
with the review of the Sub-Advisory Agreement, the Board considered the factors described below, among others.
Nature, Extent and Quality of Services. The Trustees considered the nature, extent and quality of services provided to each
Sub-Advised Fund under the Sub-Advisory Agreement. The Trustees reviewed the qualifications
and background of each Sub-Adviser, the services provided by each Sub-Adviser, the investment approach of
the Sub-Adviser whose investment personnel manage Invesco AAA CLO Floating Rate Note ETF’s, Invesco Active U.S. Real Estate ETF’s, Invesco High Yield Bond Factor ETF’s, Invesco High Yield Select ETF’s, Invesco Real Assets ESG ETF’s, Invesco Rochester High Yield Municipal ETF, Invesco Short Duration Total Return Bond ETF’s, Invesco Total Return Bond ETF’s and Invesco Variable Rate Investment Grade ETF’s assets and the experience and skills of the investment personnel responsible for the day-to-day
management of such Sub-Advised Funds.
Based on its review, the Board concluded that the nature, extent and quality of services
provided by the Sub-Advisers to each Sub-Advised Fund under the Sub-Advisory Agreement were appropriate and reasonable.
Fees, Expenses and Profitability. The Trustees reviewed and discussed the information provided by the Adviser and the
Sub-Advisers on the sub-advisory fee rate under the Sub-Advisory Agreement. The Trustees
noted that the sub-advisory fee charged by the Sub-Advisers under the Sub-Advisory Agreement is consistent with the
compensation structure used throughout Invesco when Invesco’s affiliates provide sub-advisory services for funds managed by other Invesco affiliates. The Trustees considered how the sub-advisory fee relates to the overall advisory fee for each Sub-Advised
Fund and noted that the Adviser compensates each Sub-Adviser from its fee.
The Trustees also reviewed the financial statements provided by Invesco Senior Secured
Management, Inc. in connection with the March 13 and April 24, 2025 Board Meetings, and Invesco Advisers, Inc. in connection
with the April 24, 2025 meeting, and they noted the net income generated by each firm. The Trustees noted that the Adviser
compensates each Sub-Adviser from its fee and that the Adviser provided profitability information with respect to each Sub-Advised
Fund.
Economies of Scale and Whether Fee Levels Reflect These Economies of Scale. As part of their review of the Investment Advisory Agreement for each Sub-Advised Fund, the Trustees considered the extent to which economies
of scale may be realized as each Sub-Advised Fund grows and whether fee levels reflect economies of scale for the benefit of the Sub-Advised Fund’s shareholders. The Board considered whether the sub-advisory fee rate for each Sub-Advised
Fund was reasonable in relation to the asset size (if any) of the Sub-Advised Funds and concluded that the flat sub-advisory
fee rate was reasonable and appropriate.
Fall-out Benefits. The Trustees noted that Invesco Advisers, Inc. receives management fees from affiliated
money market funds into which the Sub-Advised Funds’ and other Invesco ETFs’ excess cash and securities lending collateral may be invested, and that the Adviser waives its fees with respect to each Sub-Advised Fund in an amount equal
to the fees received by Invesco Advisers, Inc. on the Sub-Advised Fund’s excess cash invested in the affiliated money market funds. The Trustees also noted the fees received by Invesco Advisers, Inc. in its capacity as securities lending agent for
the Invesco ETFs. The Trustees considered that Invesco Advisers, Inc. may participate in soft-dollar arrangements for Invesco Real
Assets ESG ETF, but that the Sub-Advisers otherwise generally do not use or generate soft-dollars with respect to the Sub-Advised
Funds. The Trustees noted that the Sub-Advisers had not identified any further benefits that they received from their
relationships with the Sub-Advised Funds. The Board concluded that the sub-advisory fee with respect to each Sub-Advised Fund was
reasonable, taking into account any ancillary benefits received by the Sub-Advisers.
Approval of Investment Advisory and Sub-Advisory Contracts—(continued)
Based on all of the information considered and the conclusions reached, the Board,
including the Independent Trustees, determined to approve the continuation of the Sub-Advisory Agreement for each Sub-Advised
Fund. No single factor was determinative in the Board’s analysis.
Approval of Investment Advisory and Sub-Advisory Contracts
At a meeting held on April 24, 2025, the Board of Trustees of the Invesco Actively
Managed Exchange-Traded Fund Trust (the “Trust”), including the Independent Trustees, approved the continuation of the Investment Advisory Agreement between Invesco Capital Management LLC (the “Adviser”) and the Trust for Invesco Ultra Short Duration ETF (the “Fund”) and the Investment Sub-Advisory Agreement between the Adviser and the following seven affiliated sub-advisers for the Fund (the “Sub-Advisory Agreement”): Invesco Advisers, Inc.; Invesco Asset Management Deutschland GmbH; Invesco Asset Management Limited; Invesco Asset Management (Japan) Limited; Invesco Hong Kong Limited; Invesco Senior
Secured Management, Inc.; and Invesco Canada Ltd. (each, a “Sub-Adviser” and collectively, the “Sub-Advisers”).
Investment Advisory Agreement
The Trustees reviewed information from the Adviser describing: (i) the nature, extent
and quality of services provided, (ii) the investment performance of the Fund and the Adviser, (iii) the fees paid by the Fund
and comparisons to amounts paid by other comparable registered investment companies, (iv) the costs of services provided and
estimated profits realized by the Adviser, (v) the extent to which economies of scale may be realized as the Fund grows and whether
fee levels reflect any possible economies of scale for the benefit of Fund shareholders and (vi) any further benefits
realized by the Adviser or its affiliates from the Adviser’s relationship with the Fund.
Nature, Extent and Quality of Services. In evaluating the nature, extent and quality of the Adviser’s services, the Trustees reviewed information concerning the functions performed by the Adviser for the Fund, information describing the Adviser’s current organization and staffing, including operational support provided by the Adviser’s parent organization, Invesco Ltd. (“Invesco”), and the background and experience of the persons responsible for the day-to-day management of the Fund. The Trustees reviewed matters related to the Adviser’s execution and/or oversight of execution of portfolio transactions on behalf of the Fund. The Trustees noted that, unlike most of the other exchange-traded funds (“ETFs”) for which the Adviser serves as investment adviser, the Fund is not designed to track the performance of an index,
and investment decisions are the primary responsibility of the Sub-Advisers.
The Trustees reviewed information on the performance of the Fund, its benchmark indexes
(Bloomberg U.S. Aggregate Bond Index and ICE BofA US Treasury Bill Index) and the Fund’s Lipper Inc. (“Lipper”) peer group rankings (the 1st quartile being the best performers and the 4th quartile being the worst performers) for the one-year,
three-year, five-year, ten-year and since-inception (February 12, 2008) periods ended December 31, 2024. Based on the
information provided, the Trustees noted that the Fund outperformed the Bloomberg U.S. Aggregate Bond Index for the one-year,
three-year, five-year and ten-year periods, and underperformed the Bloomberg U.S. Aggregate Bond Index for the since-inception
period. The Trustees also noted that the Fund outperformed the ICE BofA US Treasury Bill Index for each period. The
Trustees further noted that the Fund ranked in the 2nd quartile of its Lipper peer group for the one-year, three-year and
five-year periods, in the 1st quartile of its Lipper peer group for the ten-year period and ranked in the 3rd quartile of its Lipper
peer group for the since-inception period. The Trustees considered that the Fund was created in connection with the purchase
by Invesco of the ETFs business of Guggenheim Capital LLC (“Guggenheim”) (the “Transaction”) and that the Fund’s performance prior to the closing of the Transaction on April 6, 2018 is that of its predecessor Guggenheim ETF.
The Trustees considered the services provided by the Adviser in its oversight of the Fund’s administrator, custodian and transfer agent and the Sub-Advisers. They noted the significant amount of time, effort and
resources that had been devoted to this oversight function.
Based on its review, the Board concluded that the nature, extent and quality of services
provided by the Adviser to the Fund under the Investment Advisory Agreement were appropriate and reasonable.
Fees, Expenses and Profitability. The Trustees reviewed and discussed the information provided by the Adviser on the Fund’s contractual advisory fee, net advisory fee and gross and net expense ratios. The
Trustees noted that the annual contractual advisory fee charged to the Fund is 0.20% and that the Adviser has agreed to waive
a portion of its contractual advisory fee and/or pay expenses (an “Expense Cap”) to the extent necessary to prevent the annual operating expenses of the Fund (excluding interest expenses, offering costs, brokerage commissions and other trading expenses,
taxes, acquired fund fees and expenses, if any, and extraordinary expenses) from exceeding 0.27% of the Fund’s average daily net assets, until at least August 31, 2027.
The Trustees compared the Fund’s contractual advisory fee and net expense ratio to information compiled by the Adviser from Lipper databases on the net advisory fees and net expense ratios of comparable ETFs,
an open-end (non-ETF) index fund and
Approval of Investment Advisory and Sub-Advisory Contracts—(continued)
open-end (non-ETF) actively-managed funds. The Trustees noted that the Fund’s contractual advisory fee was higher than the median net advisory fees of its ETF, open-end index and open-end actively managed
peer funds. The Trustees also noted that the Fund’s net expense ratio was higher than the median net expense ratios of its ETF peer funds and open-end index peer fund and lower than the median net expense ratio of its open-end actively-managed peer funds.
The Trustees noted information, including fee information, provided by the Adviser
regarding other investment products to which it provides investment advisory services, noting that the Adviser indicated that none
of the other investment products have investment strategies comparable to that of the Fund. The Trustees considered the Adviser’s explanation of the differences between the services provided to the Fund and to the other investment products it advises, noting the Adviser’s statement that the management and oversight of the Fund requires substantially more labor and expense.
Based on all of the information provided, the Board determined that the contractual
advisory fee and net expense ratio of the Fund were reasonable and appropriate in light of the services provided, the distinguishing
factors of the Fund, and the administrative, operational and management oversight costs for the Adviser.
In conjunction with their review of fees, the Trustees considered information provided
by the Adviser on the revenues received by the Adviser under the Investment Advisory Agreement for the Fund. The Trustees reviewed
information provided by the Adviser regarding its overall profitability, as well as the estimated profitability to the
Adviser from its relationship to the Fund. With respect to the Adviser’s profitability information, the Trustees considered that there is no recognized standard or uniform methodology for determining profitability for this purpose. Furthermore, the Trustees
noted that there are limitations inherent in allocating costs and calculating profitability for an organization such as the Adviser’s. Based on the information provided, the Board concluded that the overall and estimated profitability to the Adviser was not
unreasonable.
Economies of Scale and Whether Fee Levels Reflect These Economies of Scale. The Trustees reviewed the information provided by the Adviser as to the extent to which economies of scale may be realized as the
Fund grows and whether fee levels reflect economies of scale for the benefit of the Fund’s shareholders. The Trustees reviewed the Fund’s asset size, advisory fee, expense ratio and Expense Cap agreed to by the Adviser. The Trustees noted that the Expense
Cap agreement with the Trust provides that the Adviser is entitled to be reimbursed by the Fund for fees waived or expenses
absorbed pursuant to the Expense Cap for a period of three years from the date the fee or expense was incurred, provided that
no reimbursement would be made that would result in the Fund exceeding its Expense Cap then in effect or in effect at the time
the fees and/or expenses subject to reimbursement were waived and/or borne by the Adviser. The Trustees also noted that
the Adviser has reduced advisory fees for the Invesco ETFs numerous times since 2011, including through permanent advisory fee
reductions and various advisory fee waivers. The Board considered whether the advisory fee rate for the Fund was reasonable
in relation to the asset size of the Fund and concluded that the flat advisory fee rate was reasonable and appropriate.
Fall-out Benefits. The Trustees considered that the Adviser identified no additional benefits it receives
from its relationship with the Fund, and noted that the Adviser is not a party to any soft-dollar, commission
recapture or directed brokerage arrangements with respect to the Fund. The Trustees also considered benefits received by affiliates
of the Adviser that may be directly or indirectly attributed to the Adviser’s relationship with the Fund, including brokerage fees, advisory fees from affiliated money market cash management vehicles and fees as the Fund’s securities lending agent. The Trustees also considered that Invesco Distributors, Inc., an affiliate of the Adviser, serves as the Fund’s distributor and is paid a distribution fee by the Adviser. The Board concluded that the Fund’s advisory fee was reasonable, taking into account any ancillary benefits received by affiliates of the Adviser.
Based on all of the information considered and the conclusions reached, the Board,
including the Independent Trustees, determined to approve the continuation of the Investment Advisory Agreement for the
Fund. No single factor was determinative in the Board’s analysis.
Investment Sub-Advisory Agreement
As noted above, the Board of Trustees of the Trust, including the Independent Trustees,
approved the continuation of the Sub-Advisory Agreement for the Fund at a meeting held on April 24, 2025. The review
process followed by the Board is described in detail above. In connection with the review of the Sub-Advisory Agreement,
the Board considered the factors described below, among others.
Approval of Investment Advisory and Sub-Advisory Contracts—(continued)
Nature, Extent and Quality of Services. The Trustees considered the nature, extent and quality of services provided or to
be provided under the Sub-Advisory Agreement. The Trustees reviewed the qualifications
and background of each Sub-Adviser, the services provided or to be provided by each Sub-Adviser, the investment approach of
the Sub-Adviser whose investment personnel manage the Fund’s assets, and the experience and skills of the investment personnel responsible for the day-to-day management of the Fund.
Based on its review, the Board concluded that the nature, extent and quality of services
provided or to be provided by each Sub-Adviser to the Fund under the Sub-Advisory Agreement were appropriate and reasonable.
Fees, Expenses and Profitability. The Trustees reviewed and discussed the information provided by the Adviser and the
Sub-Advisers on the sub-advisory fee rate under the Sub-Advisory Agreement. The Trustees
noted that the sub-advisory fee charged by the Sub-Advisers under the Sub-Advisory Agreement is consistent with the
compensation structure used throughout Invesco when Invesco’s affiliates provide sub-advisory services for funds managed by other Invesco affiliates. The Trustees considered how the sub-advisory fee relates to the overall advisory fee for the Fund
and noted that the Adviser compensates each Sub-Adviser from its fee.
The Trustees reviewed the financial statements provided by Invesco Advisers, Inc.
in connection with the April 24, 2025 meeting, and they noted the net income generated by the firm. The Trustees noted that the
Adviser compensates the Sub-Adviser from its fee and that the Adviser provided profitability information with respect to the Fund.
Economies of Scale and Whether Fee Levels Reflect These Economies of Scale. As part of their review of the Investment Advisory Agreement for the Fund, the Trustees considered the extent to which economies of scale
may be realized as the Fund grows and whether fee levels reflect economies of scale for the benefit of the Fund’s shareholders. The Board considered whether the sub-advisory fee rate for the Fund was reasonable in relation to the asset size of
the Fund and concluded that the flat sub-advisory fee rate was reasonable and appropriate.
Fall-out Benefits. The Trustees noted that Invesco Advisers, Inc. receives management fees from affiliated
money market funds into which the Fund’s and other Invesco ETFs’ excess cash and securities lending collateral may be invested, and that the Adviser waives its fees with respect to the Fund in an amount equal to the fees received by Invesco Advisers, Inc. on the Fund’s excess cash invested in the affiliated money market funds. The Trustees also noted the fees
received by Invesco Advisers, Inc. in its capacity as securities lending agent for the Invesco ETFs. The Trustees noted that
the Sub-Advisers had not identified any further benefits that they received from their relationships with the Fund and that the Sub-Advisers
generally do not use or generate soft-dollars with respect to the Fund. The Board concluded that the sub-advisory
fee with respect to the Fund was reasonable, taking into account any ancillary benefits received by the Sub-Advisers.
Based on all of the information considered and the conclusions reached, the Board,
including the Independent Trustees, determined to approve the continuation of the Sub-Advisory Agreement for the Fund.
No single factor was determinative in the Board’s analysis.
Other Information Required in Form N-CSR (Items 8-11)
Changes in and Disagreements with Accountants for Open-End Management Investment Companies
Proxy Disclosures for Open-End Management Investment Companies
Remuneration Paid to Directors, Officers, and Others of Open-End Management Investment
Companies
Remuneration paid to the Funds’ trustees or officers and others, if any, is disclosed within the financial statements.
Statement Regarding Basis for Approval of Investment Advisory Contracts
The statement regarding basis for approval of investment advisory contracts can be
found in the Approval of Investment Advisory and Sub-Advisory Contracts section of this report.
©2025 Invesco Capital Management LLC
3500 Lacey Road, Suite 700
Downers Grove, IL 60515
P-AM-NCSRS
invesco.com/ETFs
Invesco Semi-Annual Financial Statements and Other Information
|
|
Invesco Real Assets ESG ETF
|
Invesco Real Assets ESG ETF (IVRA)
April 30, 2025
(Unaudited)
Schedule of Investments(a)
|
|
|
|
Common Stocks & Other Equity Interests-99.43%
|
|
|
Archer-Daniels-Midland Co.
|
|
|
|
|
|
|
|
|
|
|
Enbridge, Inc. (Canada)(b)
|
|
|
|
|
|
|
|
|
|
|
|
|
|
|
|
|
|
|
Pembina Pipeline Corp. (Canada)
|
|
|
|
|
|
|
|
|
|
|
|
|
|
Williams Cos., Inc. (The)
|
|
|
|
|
|
|
|
|
|
|
Agnico Eagle Mines Ltd. (Canada)
|
|
|
|
|
|
|
|
|
|
|
|
|
|
|
|
|
|
|
Lundin Mining Corp. (Chile)(b)
|
|
|
|
|
|
|
|
|
|
|
|
|
|
|
|
|
|
|
West Fraser Timber Co. Ltd. (Canada)
|
|
|
|
|
|
|
|
|
|
|
Alexandria Real Estate Equities, Inc.(b)
|
|
|
|
American Homes 4 Rent, Class A
|
|
|
|
|
|
|
|
|
AvalonBay Communities, Inc.
|
|
|
|
Brixmor Property Group, Inc.
|
|
|
|
|
|
|
|
|
|
|
|
|
|
Digital Realty Trust, Inc.
|
|
|
|
EastGroup Properties, Inc.(b)
|
|
|
|
|
|
|
|
|
Equity LifeStyle Properties, Inc.
|
|
|
|
|
|
|
|
|
Extra Space Storage, Inc.
|
|
|
|
Federal Realty Investment Trust
|
|
|
|
Healthpeak Properties, Inc.
|
|
|
|
Host Hotels & Resorts, Inc.
|
|
|
|
|
|
|
|
|
|
|
|
|
|
|
|
|
|
|
|
|
|
|
|
|
|
|
|
|
|
|
|
|
|
|
|
|
|
|
|
Rexford Industrial Realty, Inc.
|
|
|
|
SBA Communications Corp., Class A
|
|
|
|
Simon Property Group, Inc.
|
|
|
|
|
|
|
|
|
|
|
|
|
|
|
|
|
|
|
|
|
American Water Works Co., Inc.
|
|
|
|
|
|
|
|
|
Consolidated Edison, Inc.
|
|
|
|
Essential Utilities, Inc.
|
|
|
|
|
|
|
|
|
|
|
|
|
|
Total Common Stocks & Other Equity Interests
(Cost $11,445,878)
|
|
|
|
Invesco Government & Agency Portfolio,
Institutional Class, 4.26%(c)(d)
(Cost $56,814)
|
|
|
|
TOTAL INVESTMENTS IN SECURITIES
(excluding investments purchased with cash collateral from
securities on loan)-99.89%
(Cost $11,502,692)
|
|
Investments Purchased with Cash Collateral from Securities
on Loan
|
|
|
Invesco Private Government Fund, 4.32%(c)(d)(e)
|
|
|
|
Invesco Private Prime Fund, 4.46%(c)(d)(e)
|
|
|
|
Total Investments Purchased with Cash Collateral from
Securities on Loan
(Cost $896,980)
|
|
TOTAL INVESTMENTS IN SECURITIES-107.23%
(Cost $12,399,672)
|
|
OTHER ASSETS LESS LIABILITIES-(7.23)%
|
|
|
|
|
See accompanying Notes to Financial Statements which are an integral part of the financial
statements.
Invesco Real Assets ESG ETF (IVRA)—(continued)
April 30, 2025
(Unaudited)
Notes to Schedule of Investments:
|
|
|
Industry and/or sector classifications used in this report are generally according
to the Global Industry Classification Standard, which was developed by and is
the exclusive property and a service mark of MSCI Inc. and Standard & Poor’s.
|
|
|
All or a portion of this security was out on loan at April 30, 2025.
|
|
|
Affiliated holding. Affiliated holdings are investments in entities which are under
common ownership or control of Invesco Ltd. or are investments in entities in
which the Fund owns 5% or more of the outstanding voting securities. The table below shows the Fund’s transactions in, and earnings from, its investments in
affiliates for the six months ended April 30, 2025.
|
|
|
|
|
|
Change in
Unrealized
Appreciation
|
|
|
|
Investments in Affiliated
Money Market Funds:
|
|
|
|
|
|
|
|
Invesco Government & Agency
Portfolio, Institutional Class
|
|
|
|
|
|
|
|
Investments Purchased with
Cash Collateral from
Securities on Loan:
|
|
|
|
|
|
|
|
Invesco Private Government
Fund
|
|
|
|
|
|
|
|
Invesco Private Prime Fund
|
|
|
|
|
|
|
|
|
|
|
|
|
|
|
|
|
|
|
Represents the income earned on the investment of cash collateral, which is included
in securities lending income on the Statement of Operations. Does not
include rebates and fees paid to lending agent or premiums received from borrowers,
if any.
|
|
|
The rate shown is the 7-day SEC standardized yield as of April 30, 2025.
|
|
|
The security has been segregated to satisfy the commitment to return the cash collateral received in securities lending transactions upon the borrower’s return
of the securities loaned. See Note 2J.
|
This Fund has holdings greater than 10% of net assets in the following country:
|
|
|
|
|
See accompanying Notes to Financial Statements which are an integral part of the financial
statements.
Statement of Assets and Liabilities
April 30, 2025
(Unaudited)
|
|
Invesco Real Assets
ESG ETF (IVRA)
|
|
|
|
Unaffiliated investments in securities, at value(a)
|
|
Affiliated investments in securities, at value
|
|
|
|
|
|
|
|
|
|
|
|
|
|
|
|
|
Investments sold - affiliated broker
|
|
|
|
|
|
|
|
|
|
|
|
|
|
|
|
|
Collateral upon return of securities loaned
|
|
Accrued unitary management fees
|
|
|
|
|
|
|
|
|
|
|
|
|
|
Shares of beneficial interest
|
|
|
|
|
|
|
|
Shares outstanding (unlimited amount authorized, $0.01 par value)
|
|
|
|
|
|
|
|
Unaffiliated investments in securities, at cost
|
|
Affiliated investments in securities, at cost
|
|
Foreign currencies (due to foreign custodian), at cost
|
|
(a)Includes securities on loan with an aggregate value of:
|
|
See accompanying Notes to Financial Statements which are an integral part of the financial
statements.
Statement of Operations
For the six months ended April 30, 2025
(Unaudited)
|
|
Invesco Real Assets
ESG ETF (IVRA)
|
|
|
|
Unaffiliated dividend income
|
|
Affiliated dividend income
|
|
Securities lending income, net
|
|
|
|
|
|
|
|
|
|
|
|
|
|
|
|
|
|
|
|
|
|
|
Realized and unrealized gain (loss) from:
|
|
Net realized gain (loss) from:
|
|
Unaffiliated investment securities
|
|
Affiliated investment securities
|
|
|
|
|
|
|
|
|
|
|
Change in net unrealized appreciation (depreciation) of:
|
|
Unaffiliated investment securities
|
|
|
|
|
Change in net unrealized appreciation (depreciation)
|
|
Net realized and unrealized gain
|
|
Net increase in net assets resulting from operations
|
|
See accompanying Notes to Financial Statements which are an integral part of the financial
statements.
Statement of Changes in Net Assets
For the six months ended April 30, 2025 and the year ended October 31, 2024
(Unaudited)
|
|
Invesco Real Assets
ESG ETF (IVRA)
|
|
|
Six Months Ended
April 30,
2025
|
Year Ended
October 31,
2024
|
|
|
|
|
|
|
|
|
|
|
|
|
Change in net unrealized appreciation (depreciation)
|
|
|
Net increase in net assets resulting from operations
|
|
|
Distributions to Shareholders from:
|
|
|
|
|
|
|
Shareholder Transactions:
|
|
|
Proceeds from shares sold
|
|
|
Value of shares repurchased
|
|
|
Net increase in net assets resulting from share transactions
|
|
|
Net increase in net assets
|
|
|
|
|
|
|
|
|
|
|
|
|
|
|
Changes in Shares Outstanding:
|
|
|
|
|
|
|
|
|
|
|
Shares outstanding, beginning of period
|
|
|
Shares outstanding, end of period
|
|
|
See accompanying Notes to Financial Statements which are an integral part of the financial
statements.
Invesco Real Assets ESG ETF (IVRA)
|
|
Six Months Ended
April 30,
2025
(Unaudited)
|
|
For the Period
December 17, 2020(a)
Through
October 31,
2021
|
|
|
|
|
|
Per Share Operating Performance:
|
|
|
|
|
|
Net asset value at beginning of period
|
|
|
|
|
|
|
|
|
|
|
|
|
Net realized and unrealized gain (loss) on investments
|
|
|
|
|
|
Total from investment operations
|
|
|
|
|
|
Distributions to shareholders from:
|
|
|
|
|
|
|
|
|
|
|
|
|
|
|
|
|
|
|
|
|
|
|
|
|
|
|
Net asset value at end of period
|
|
|
|
|
|
Market price at end of period(d)
|
|
|
|
|
|
Net Asset Value Total Return(e)
|
|
|
|
|
|
Market Price Total Return(e)
|
|
|
|
|
|
Ratios/Supplemental Data:
|
|
|
|
|
|
Net assets at end of period (000’s omitted)
|
|
|
|
|
|
Ratio to average net assets of:
|
|
|
|
|
|
|
|
|
|
|
|
|
|
|
|
|
|
|
|
Portfolio turnover rate(h)
|
|
|
|
|
|
|
|
Commencement of investment operations.
|
|
|
Based on average shares outstanding.
|
|
|
Net realized and unrealized gain (loss) on investments per share may not correlate with the Fund’s net realized and unrealized gain (loss) due to timing of
shareholder transactions in relation to the fluctuating market values of the Fund’s investments.
|
|
|
The mean between the last bid and ask prices.
|
|
|
Net asset value total return is calculated assuming an initial investment made at
the net asset value at the beginning of the period, reinvestment of all dividends
and distributions at net asset value during the period, and redemption at net asset
value on the last day of the period. Net asset value total return includes
adjustments in accordance with accounting principles generally accepted in the United
States of America and as such, the net asset value for financial reporting
purposes and the returns based upon those net asset values may differ from the net
asset value and returns for shareholder transactions. Market price total return
is calculated assuming an initial investment made at the market price at the beginning
of the period, reinvestment of all dividends and distributions at market price
during the period, and sale at the market price on the last day of the period. Total
investment returns calculated for a period of less than one year are not
annualized.
|
|
|
The net asset value total return from Fund Inception (December 22, 2020, the first
day of trading on the exchange) to October 31, 2021 was 32.40%. The market
price total return from Fund Inception to October 31, 2021 was 32.53%.
|
|
|
|
|
|
Portfolio turnover rate is not annualized for periods less than one year, if applicable,
and does not include securities received or delivered from processing
creations or redemptions.
|
See accompanying Notes to Financial Statements which are an integral part of the financial
statements.
Notes to Financial Statements
Invesco Actively Managed Exchange-Traded Fund Trust
April 30, 2025
(Unaudited)
Invesco Actively Managed Exchange-Traded Fund Trust (the “Trust”) was organized as a Delaware statutory trust and is authorized to have multiple series of portfolios. The Trust is an open-end management
investment company registered under the Investment Company Act of 1940, as amended (the “1940 Act”). This report includes Invesco Real Assets ESG ETF (IVRA) (the "Fund").
The Fund represents a separate series of the Trust. The shares of the Fund are referred to herein as "Shares" or "Fund’s Shares." The Fund’s Shares are listed and traded on the Cboe BZX Exchange, Inc.
The market price of a Share may differ to some degree from the Fund’s net asset value (“NAV”). Unlike conventional mutual funds, the Fund issues and redeems Shares on a continuous basis, at NAV, only in a
large specified number of Shares, each called a “Creation Unit”, as set forth in the Fund’s prospectus. Creation Units are issued and redeemed principally in exchange for (1) select recently disclosed portfolio holdings ("Strategy Components"), (2) an amount
of cash corresponding to the value of ETFs that convey information about the types of instruments in which the Fund invests ("Representative
ETFs") and (3) cash and cash equivalents, which, together with the Strategy Components and Representative ETFs, constitute the “Tracking Basket.” However, the Fund reserves the right to issue and redeem Creation Units in exchange solely
for cash and/or cash equivalents. Except when aggregated in Creation Units by authorized participants (“APs”), Shares are not individually redeemable securities of the Fund.
The investment objective of the Fund is to seek capital appreciation with a secondary
objective of current income.
NOTE 2—Significant Accounting Policies
The following is a summary of the significant accounting policies followed by the
Fund in preparation of its financial statements.
The Fund is an investment company and accordingly follows the investment company accounting
and reporting guidance in accordance with Financial Accounting Standards Board ("FASB") Accounting Standards
Codification Topic 946, Financial Services—Investment Companies.
A.
Security Valuation - Securities, including restricted securities, are valued according to the following
policies:
A security listed or traded on an exchange is generally valued at its trade price
or official closing price that day as of the close of the exchange where the security is principally traded or, lacking any trades
or official closing price on a particular day, the security may be valued at the closing bid or ask price on that day. Securities
traded in the over-the-counter market are valued based on prices furnished by independent pricing services or market makers.
When such securities are valued using prices provided by an independent pricing service they may be considered fair valued.
Futures contracts are valued at the daily settlement price set by an exchange on which they are principally traded. Where a
final settlement price exists, exchange-traded options are valued at the final settlement price from the exchange where the option
principally trades. Where a final settlement price does not exist, exchange-traded options are valued at the mean between
the last bid and ask price generally from the exchange where the option principally trades.
Securities of investment companies that are not exchange-traded (e.g., open-end mutual
funds) are valued using such company’s end-of-business-day NAV per share.
Deposits, other obligations of U.S. and non-U.S. banks and financial institutions
are valued at their daily account value.
Fixed income securities (including convertible debt securities) generally are valued
on the basis of prices provided by independent pricing services. Prices provided by the pricing service may be determined
without exclusive reliance on quoted prices, and may reflect appropriate factors such as institution-size trading in similar
groups of securities, developments related to specific securities, dividend rate (for unlisted equities), yield (for debt obligations),
quality, type of issue, coupon rate (for debt obligations), maturity (for debt obligations), individual trading characteristics
and other market data. Securities with a demand feature exercisable within one to seven days are valued at par. Pricing services
generally value debt obligations assuming orderly transactions of institutional round lot size, but the Fund may hold
or transact in the same securities in smaller, odd lot sizes. Odd lots often trade at lower prices than institutional round
lots, and their value may be adjusted accordingly. Debt obligations are subject to interest rate and credit risks. In addition,
all debt obligations involve some risk of default with respect to interest and/or principal payments.
Foreign securities’ (including foreign exchange contracts’) prices are converted into U.S. dollar amounts using the applicable exchange rates as of the close of the London world markets. If market quotations are
available and reliable for foreign exchange-traded equity securities, the securities will be valued at the market quotations.
Invesco Capital Management LLC (the “Adviser”) may use various pricing services to obtain market quotations as well as fair value prices. Because trading hours for certain foreign securities end before the close of the New York Stock Exchange (“NYSE”), closing market quotations may become not representative of market value in the Adviser’s judgment ("unreliable"). If, between the time trading ends on a
particular security and the close of the customary trading session on the NYSE, a
significant event occurs that makes the closing price of the security unreliable, the Adviser may fair value the security.
If the event is likely to have affected the closing price of the security, the security will be valued at fair value in good faith in
accordance with Board-approved policies and related Adviser procedures (“Valuation Procedures”). Adjustments to closing prices to reflect fair value may also be based on a screening process of an independent pricing service to indicate the degree of certainty,
based on historical data, that the closing price in the principal market where a foreign security trades is not the current
value as of the close of the NYSE. Foreign securities’ prices meeting the degree of certainty that the price is not reflective of current value will be priced at the indication of fair value from the independent pricing service. Multiple factors may
be considered by the independent pricing service in determining adjustments to reflect fair value and may include information
relating to sector indices, American depositary receipts and domestic and foreign index futures. Foreign securities may
have additional risks including exchange rate changes, the potential for sharply devalued currencies and high inflation, political
and economic upheaval, the relative lack of issuer information, relatively low market liquidity and the potential lack of strict
financial and accounting controls and standards.
Unlisted securities will be valued using prices provided by independent pricing services
or by another method that the Adviser, in its judgment, believes better reflects the security’s fair value in accordance with the Valuation Procedures.
Non-traded rights and warrants shall be valued at intrinsic value if the terms of
the rights and warrants are available, specifically the subscription or exercise price and the ratio. Intrinsic value is
calculated as the daily market closing price of the security to be received less the subscription price, which is then adjusted by the
exercise ratio. In the case of warrants, an option pricing model supplied by an independent pricing service may be used based
on market data such as volatility, stock price and interest rate from the independent pricing service and strike price and
exercise period from verified terms.
Securities for which market prices are not provided by any of the above methods may
be valued based upon quotes furnished by independent sources. The mean between the last bid and ask prices may
be used to value debt obligations, including corporate loans, and unlisted equity securities.
Securities for which market quotations are not readily available are fair valued by
the Adviser in accordance with the Valuation Procedures. If a fair value price provided by a pricing service is unreliable,
the Adviser will fair value the security using the Valuation Procedures. Issuer-specific events, market trends, bid/ask quotes
of brokers and information providers and other market data may be reviewed in the course of making a good faith determination of a security’s fair value.
The Fund may invest in securities that are subject to interest rate risk, meaning
the risk that the prices will generally fall as interest rates rise and, conversely, the prices will generally rise as interest rates
fall. Specific securities differ in their sensitivity to changes in interest rates depending on their individual characteristics. Changes
in interest rates may result in increased market volatility, which may affect the value and/or liquidity of certain Fund investments.
Valuations change in response to many factors, including the historical and prospective
earnings of the issuer, the value of the issuer’s assets, general market conditions which are not specifically related to the particular issuer, such as real or perceived adverse economic conditions, changes in the general outlook for revenues
or corporate earnings, changes in interest or currency rates, regional or global instability, natural or environmental
disasters, widespread disease or other public health issues, war, military conflicts, acts of terrorism, economic crises, economic
sanctions and tariffs, significant governmental actions or adverse investor sentiment generally and market liquidity.
Because of the inherent uncertainties of valuation, the values reflected in the financial statements may materially differ
from the value received upon actual sale of those investments.
The price the Fund could receive upon the sale of any investment may differ from the Adviser’s valuation of the investment, particularly for securities that are valued using a fair valuation technique. When
fair valuation techniques are applied, the Adviser uses available information, including both observable and unobservable inputs
and assumptions, to determine a methodology that will result in a valuation that the Adviser believes approximates
market value. Fund securities that are fair valued may be subject to greater fluctuation in their value from one day to the next
than would be the case if market quotations were used. Because of the inherent uncertainties of valuation, and the
degree of subjectivity in such decisions, the Fund could realize a greater or lesser than expected gain or loss upon the sale
of the investment.
B.
Investment Transactions and Investment Income - Investment transactions are accounted for on a trade date basis. Realized gains and losses from the sale or disposition of securities are computed
on the specific identified cost basis. Interest income is recorded on an accrual basis from settlement date and includes coupon interest
and amortization of premium and accretion of discount on debt securities as applicable. Pay-in-kind interest income
and non-cash dividend income received in the form of securities in lieu of cash are recorded at the fair value of the securities
received. Dividend income (net of withholding tax, if any) is recorded on the ex-dividend date. Dividend income from
REITs is recorded based on the income included in the distributions received from the REIT investments using published REIT
classifications, including some management estimates when actual amounts are not available. Distributions received
in excess of this estimated amount are recorded as a reduction of the cost of investments or reclassified to capital gains.
The actual amounts of income, return of
capital, and capital gains are only determined by each REIT after its fiscal year-end,
and may differ from the estimated amounts. Realized gains, dividends and interest received by the Fund may give rise
to withholding and other taxes imposed by foreign countries. Tax conventions between certain countries and the United States
may reduce or eliminate such taxes.
The Fund may periodically participate in litigation related to the Fund’s investments. As such, the Fund may receive proceeds from litigation settlements. Any proceeds received are included in the Statement
of Operations as realized gain (loss) for investments no longer held and as unrealized gain (loss) for investments still
held.
Brokerage commissions and mark ups are considered transaction costs and are recorded
as an increase to the cost basis of securities purchased and/or a reduction of proceeds on a sale of securities. Such
transaction costs are included in the determination of net realized and unrealized gain (loss) from investment securities
reported in the Statement of Operations and the Statement of Changes in Net Assets and the net realized and unrealized gains
(losses) on securities per share in the Financial Highlights. Transaction costs are included in the calculation of the Fund’s NAV and, accordingly, they reduce the Fund’s total returns. These transaction costs are not considered operating expenses and are not reflected in net investment income reported in the Statement of Operations and the Statement of Changes in Net
Assets, or the net investment income per share and the ratios of expenses and net investment income reported in the Financial
Highlights, nor are they limited by any expense limitation arrangements between the Fund and the Adviser.
C.
Country Determination - For the purposes of presentation in the Schedule of Investments, the Adviser may
determine the country in which an issuer is located and/or credit risk exposure based on various
factors. These factors may include the laws of the country under which the issuer is organized, where the issuer maintains a principal
office, the country in which the issuer derives 50% or more of its total revenues, the country that has the primary market for the issuer’s securities and its "country of risk" as determined by a third party service provider, as well as other
criteria. Among the other criteria that may be evaluated for making this determination are the country in which the issuer maintains
50% or more of its assets, the type of security, financial guarantees and enhancements, the nature of the collateral and
the sponsor organization. Country of issuer and/or credit risk exposure has been determined to be the United States of
America, unless otherwise noted.
D.
Dividends and Distributions to Shareholders - The Fund declares and pays dividends from net investment income, if any, to its shareholders monthly and records such dividends on the ex-dividend date. Generally,
the Fund distributes net realized taxable capital gains, if any, annually in cash and records them on the ex-dividend
date. Such distributions on a tax basis are determined in conformity with federal income tax regulations, which may differ from
accounting principles generally accepted in the United States of America ("GAAP"). Distributions in excess of tax basis earnings
and profits, if any, are reported in the Fund’s financial statements as a tax return of capital at fiscal year-end.
E.
Federal Income Taxes - The Fund intends to comply with the provisions of the Internal Revenue Code of
1986, as amended (the “Internal Revenue Code”), applicable to regulated investment companies and to distribute substantially all of the Fund’s taxable earnings to its shareholders. As such, the Fund will not be subject to federal
income taxes on otherwise taxable income (including net realized gains) that is distributed to the shareholders. Therefore,
no provision for federal income taxes is recorded in the financial statements.
The Fund recognizes the tax benefits of uncertain tax positions only when the position
is more likely than not to be sustained. Management has analyzed the Fund’s uncertain tax positions and concluded that no liability for unrecognized tax benefits should be recorded related to uncertain tax positions. Management is not
aware of any tax positions for which it is reasonably possible that the total amounts of unrecognized tax benefits will change
materially in the next 12 months.
Income and capital gain distributions are determined in accordance with federal income
tax regulations, which may differ from GAAP. These differences are primarily due to differing book and tax treatments
for in-kind transactions, losses deferred due to wash sales, and passive foreign investment company adjustments, if any.
The Fund files U.S. federal tax returns and tax returns in certain other jurisdictions.
Generally, the Fund is subject to examinations by such taxing authorities for up to three years after the filing of
the return for the tax period.
F.
Expenses - The Fund has agreed to pay an annual unitary management fee to the Adviser. Out
of the unitary management fee, the Adviser pays Invesco Advisers, Inc.’s (the "Affiliated Sub-Adviser" or "Invesco") fees and substantially all expenses of the Fund, including the costs of transfer agency, custody, fund administration, legal,
audit and other services, except for distribution fees, if any, brokerage expenses, taxes, interest, acquired fund fees
and expenses, if any, litigation expenses and other extraordinary expenses, including proxy expenses (except for such proxies related
to: (i) changes to the Investment Advisory Agreement, (ii) the election of any Board member who is an “interested person” of the Trust or the Adviser (an "Interested Trustee"), or (iii) any other matters that directly benefit the Adviser).
Expenses of the Trust that are excluded from the Fund’s unitary management fee and are directly identifiable to the Fund are applied to the Fund. Expenses of the Trust that are excluded from the Fund’s unitary management fee and are not readily identifiable to the Fund are allocated in such a manner as deemed equitable, taking
into consideration the nature and type of expense and the relative net assets of the Fund.
To the extent the Fund invests in other investment companies, the expenses shown in
the accompanying financial statements reflect the expenses of the Fund and do not include any expenses of the
investment companies in which it invests. The effects of such investment companies’ expenses are included in the realized and unrealized gain or loss on the investments in the investment companies.
G.
Accounting Estimates - The preparation of the financial statements in accordance with GAAP requires management
to make estimates and assumptions that affect the reported amounts and disclosures in the
financial statements, including estimates and assumptions related to taxation. Actual results could differ from these estimates.
In addition, the Fund monitors for material events or transactions that may occur or become known after the period-end
date and before the date the financial statements are released to print.
H.
Indemnifications - Under the Trust’s organizational documents, its Officers and Trustees are indemnified against certain liabilities arising out of the performance of their duties to the Trust. Each Board
member who is not an "interested person" (as defined in the 1940 Act) of the Trust or the Adviser (each, an "Independent Trustee")
is also indemnified against certain liabilities arising out of the performance of their duties to the Trust pursuant to
an Indemnification Agreement between such trustee and the Trust. Additionally, in the normal course of business, the Trust enters
into contracts with service providers that contain general indemnification clauses. The Trust’s maximum exposure under these arrangements is unknown, as this would involve future claims that may be made against the Trust that have not yet occurred.
The risk of material loss as a result of such indemnification claims is considered remote.
I.
Segment Reporting — In November 2023, the FASB issued Accounting Standards Update 2023-07, Segment Reporting (Topic 280): Improvements to Reportable Segment Disclosures (“ASU 2023-07”), with the intent of improving reportable segment disclosure requirements, primarily through enhanced disclosures about significant
segment expenses, allowing financial statement users to better understand the components of a segment’s profit or loss and assess potential future cash flows for each reportable segment and the entity as a whole, thereby enabling better understanding of how an entity’s segments impact overall performance. The Fund represents a single operating segment.
Subject to the oversight and, when applicable, approval of the Board of Trustees, the Adviser acts as the Fund’s chief operating decision maker (“CODM”), assessing performance and making decisions about resource allocation within the Fund.
The CODM monitors the operating results as a whole, and the Fund’s long-term strategic asset allocation is determined in accordance with the terms of its prospectus based on a defined investment strategy. The financial information provided
to and reviewed by the CODM is consistent with that presented in the Fund’s financial statements. Adoption of the new standard impacted the Fund’s financial statement note disclosures only and did not affect the Fund’s financial position or the results of its operations.
J.
Securities Lending - The Fund may participate in securities lending and may loan portfolio securities
having a market value up to one-third of the Fund’s total assets. Such loans are secured by cash collateral equal to no less than 102% (105% for international securities) of the market value of the loaned securities determined
daily by the securities lending provider. Cash collateral received in connection with these loans is invested in short-term money
market instruments or affiliated, unregistered investment companies that comply with Rule 2a-7 under the 1940 Act and
money market funds (collectively, "affiliated money market funds") and is shown as such on the Schedule of Investments.
The Fund bears the risk of loss with respect to the investment of collateral. It is the policy of the Fund to obtain additional
collateral from or return excess collateral to the borrower by the end of the next business day, following the valuation
date of the securities loaned. Therefore, the value of the collateral held may be temporarily less than the value of the securities
on loan. When loaning securities, the Fund retains certain benefits of owning the securities, including the economic equivalent
of dividends or interest generated by the security. Lending securities entails a risk of loss to the Fund if, and to the
extent that, the market value of the securities loaned were to increase, and the borrower did not increase the collateral accordingly,
and the borrower failed to return the securities. The securities loaned are subject to termination at the option of the
borrower or the Fund. Upon termination, the borrower will return to the Fund the securities loaned and the Fund will return the
collateral. Upon the failure of the borrower to return the securities, collateral may be liquidated and the securities may be purchased
on the open market to replace the loaned securities. The Fund could experience delays and costs in gaining access to
the collateral and the securities may lose value during the delay which could result in potential losses to the Fund. Some of
these losses may be indemnified by the lending agent. The Fund bears the risk of any deficiency in the amount of the collateral
available for return to the borrower due to any loss on the collateral invested. Dividends received on cash collateral
investments for securities lending transactions, which are net of compensation to counterparties, are included in Securities lending income, net on the Statement of Operations. The aggregate value of securities out on loan, if any, is shown on
the Statement of Assets and Liabilities.
Invesco, an affiliate of the Adviser, serves as an affiliated securities lending agent
for the Fund. The Bank of New York Mellon (“BNYM”) also serves as a securities lending agent. To the extent the Fund utilizes Invesco as an affiliated securities lending agent, the Fund conducts its securities lending in accordance with, and in
reliance upon, no-action letters issued by the SEC staff that provide guidance on how an affiliate may act as a direct agent lender
and receive compensation for those services in a manner consistent with the federal securities laws. For the six months
ended April 30, 2025, the Fund paid Invesco $39 in fees for securities lending agent services. Fees paid to Invesco for
securities lending agent services are included in Securities lending income, net on the Statement of Operations.
K.
Foreign Currency Translations - Foreign currency is valued at the close of the NYSE based on quotations posted
by banks and major currency dealers. Portfolio securities and other assets and liabilities
denominated in foreign currencies are translated into U.S. dollar amounts at the date of valuation. Purchases and sales
of portfolio securities (net of foreign taxes withheld on disposition) and income items denominated in foreign currencies are translated
into U.S. dollar amounts on the respective dates of such transactions. The Fund does not separately account for the
portion of the results of operations resulting from changes in foreign exchange rates on investments and the fluctuations
arising from changes in market prices of
securities held. The combined results of changes in foreign exchange rates and the
fluctuation of market prices on investments (net of estimated foreign tax withholding) are included with the net realized
and unrealized gain or loss from investments in the Statement of Operations. Reported net realized foreign currency
gains or losses arise from (1) sales of foreign currencies, (2) currency gains or losses realized between the trade and settlement
dates on securities transactions, and (3) the difference between the amounts of dividends, interest, and foreign withholding taxes recorded on the Fund’s books and the U.S. dollar equivalent of the amounts actually received or paid. Net
unrealized foreign currency gains and losses arise from changes in the fair values of assets and liabilities, other than investments
in securities at fiscal period-end, resulting from changes in exchange rates.
The Fund may invest in foreign securities, which may be subject to foreign taxes on
income, gains on investments or currency repatriation, a portion of which may be recoverable. Foreign taxes, if any,
are recorded based on the tax regulations and rates that exist in the foreign markets in which the Fund invests.
The performance of the Fund may be materially affected positively or negatively by
foreign currency strength or weakness relative to the U.S. dollar. Currency rates in foreign countries may fluctuate for
a number of reasons, including changes in interest rates, political, economic, or social instability and development, and imposition
of currency controls. Currency controls in certain foreign jurisdictions may cause the Fund to experience significant delays
in its ability to repatriate its assets in U.S. dollars at quoted spot rates, and it is possible that the Fund’s ability to convert certain foreign currencies into U.S. dollars may be limited and may occur at discounts to quoted rates. As a result, the value of the Fund’s assets and liabilities denominated in such currencies that would ultimately be realized could differ from those reported
on the Statement of Assets and Liabilities. Certain foreign companies may be subject to sanctions, embargoes, or other governmental
actions that may limit the ability to invest in, receive, hold, or sell the securities of such companies, all of which affect
the market and/or credit risk of the investments. Because of the inherent uncertainties of valuation, the values reflected
in the financial statements may materially differ from the value received upon actual sale of those investments.
ADR Risk. The Fund may invest in American depositary receipts (“ADRs”). ADRs are certificates that evidence ownership of shares of a foreign issuer and are alternatives to purchasing the underlying foreign
securities directly in their national markets and currencies. ADRs may be subject to certain of the risks associated with direct
investments in the securities of foreign companies, such as currency, political, economic and market risks, because their values
depend on the performance of the non-dollar denominated underlying foreign securities. Moreover, ADRs may not track
the price of the underlying foreign securities on which they are based, and their value may change materially at times
when U.S. markets are not open for trading.
AP Concentration Risk. Only APs may engage in creation or redemption transactions directly with the Fund.
The Fund has a limited number of institutions that may act as APs, and such APs have no obligation
to submit creation or redemption orders. Consequently, there is no assurance that APs will establish or maintain an active
trading market for the Shares. This risk may be heightened due to the fact that the Fund does not disclose its portfolio holdings
daily, unlike certain other actively managed ETFs, and could be greater during market disruptions or periods of volatility. Also,
this risk may be heightened to the extent that securities held by the Fund are traded outside a collateralized settlement system.
In that case, APs may be required to post collateral on certain trades on an agency basis (i.e., on behalf of other market
participants), which only a limited number of APs may be able to do. In addition, to the extent that APs exit the business or
are unable to proceed with creation and/or redemption orders with respect to the Fund and no other AP is able to step forward
to create or redeem Creation Units, this may result in a significantly diminished trading market for Fund Shares, and Shares
may be more likely to trade at a premium or discount to the Fund’s NAV and to face trading halts and/or delisting. Additionally, to the extent that the Fund holds non-U.S. securities, such securities may have lower trading volumes or could experience
extended market closures or trading halts. To the extent that the Fund invests in non-U.S. securities, it may face increased
risks that APs may not be able to effectively create or redeem Creation Units, or that the Shares may be halted and/or
delisted.
Emerging Markets Investment Risk. Investments in the securities of issuers in emerging market countries involve risks
often not associated with investments in the securities of issuers in developed countries.
Securities in emerging markets may be subject to greater price fluctuations than securities in more developed markets. Companies
in emerging market countries generally may be subject to less stringent regulatory, disclosure, financial reporting,
accounting, auditing and recordkeeping standards than companies in more developed countries. In addition, information about
such companies may be less available and reliable. Emerging markets usually are subject to greater market volatility, political,
social and economic instability, uncertainty regarding the existence of trading markets and more governmental limitations
on foreign investment than are more developed markets. Securities law in many emerging market countries is relatively
new and unsettled. Therefore, laws regarding foreign investment in emerging market securities, securities regulation,
title to securities, and shareholder rights may change quickly and unpredictably, and the ability to bring and enforce actions,
or to obtain information needed to pursue or enforce such actions, may be limited. In addition, the enforcement of systems of
taxation at federal, regional and local levels in emerging market countries may be inconsistent and subject to sudden change.
Investments in emerging market securities may be subject to additional transaction costs, delays in settlement procedures,
unexpected market closures, and lack of timely information.
Environmental, Social and Governance ("ESG") Risk. Because the Affiliated Sub-Adviser evaluates ESG factors to assess and exclude certain investments for non-financial reasons, the Fund may forego some market
opportunities available to funds that do not use these factors. The securities of companies that score favorably under the Affiliated Sub-Adviser’s ESG scoring methodology may underperform similar companies that do not score as well or may underperform
the stock market as a whole. As a result, the Fund may underperform funds that do not screen or score companies
based on ESG factors or funds that use a different ESG methodology. Information used by the Affiliated Sub-Adviser
to evaluate such factors may not be readily available, complete or accurate, which could negatively impact the Affiliated Sub-Adviser’s ability to apply its methodology, which in turn could negatively impact the Fund’s performance. In addition, the assessment of an issuer, based on the issuer’s level of involvement in a particular industry or the issuer’s ESG score, may differ from that of other funds or an investor. As a result, the issuers deemed eligible for inclusion in the Fund’s portfolio may not reflect the beliefs or values of any particular investor and may not be deemed to exhibit positive or favorable ESG characteristics
if different metrics were used to evaluate them.
Equity Risk. Equity risk is the risk that the value of equity securities, including common stocks,
may fall due to both changes in general economic conditions that impact the market as a whole, as well as factors
that directly relate to a specific company or its industry. Such general economic conditions include changes in interest rates,
periods of market turbulence or instability, or general and prolonged periods of economic decline and cyclical change. It is possible
that a drop in the stock market may depress the price of most or all of the common stocks that the Fund holds. In addition,
equity risk includes the risk that investor sentiment toward one or more industries will become negative, resulting in
those investors exiting their investments in those industries, which could cause a reduction in the value of companies in those
industries more broadly. The value of a company’s common stock may fall solely because of factors, such as an increase in production costs that negatively impact other companies in the same region, industry or sector of the market. A company’s common stock also may decline significantly in price over a short period of time due to factors specific to that
company, including decisions made by its management or lower demand for the company’s products or services. For example, an adverse event, such as an unfavorable earnings report or the failure to make anticipated dividend payments, may depress
the value of common stock.
Fluctuation of Net Asset Value and Share Price Risk. Shares may trade at a larger premium or discount to the NAV than shares of other ETFs. The NAV of the Fund will generally fluctuate with changes in the market value of the Fund’s holdings. The Shares can be bought and sold in the secondary market at market prices. Disruptions
to creations and redemptions, the existence of extreme market volatility or potential lack of an active trading market
for the Shares may result in the Shares trading significantly above (at a premium) or below (at a discount) NAV. In addition,
in stressed market conditions or periods of market disruption or volatility, the market for Shares may become less liquid in
response to deteriorating liquidity in the markets for the Fund’s underlying portfolio holdings.
Foreign Investment Risk. Investments in the securities of non-U.S. issuers involve risks beyond those associated
with investments in U.S. securities. Foreign securities may have relatively low market
liquidity, greater market volatility, decreased publicly available information and less reliable financial information about issuers
and inconsistent and potentially less stringent accounting, auditing and financial reporting requirements and standards
of practice, including recordkeeping standards, comparable to those applicable to domestic issuers. Foreign securities
are also subject to the risks of expropriation, nationalization, political instability or other adverse political or economic developments
and the difficulty of enforcing obligations in other countries. Investments in foreign securities also may be subject
to dividend withholding or confiscatory taxes, currency blockage and/or transfer restrictions and higher transactional costs.
To the extent the Fund invests in securities denominated in foreign currencies, fluctuations in the value of the U.S.
dollar relative to the values of other currencies may adversely affect investments in foreign securities and may negatively impact the Fund’s returns. From time to time, certain companies in which the Fund invests may operate in, or have dealings
with, countries subject to sanctions or embargoes imposed by the U.S. Government and the United Nations and/or in countries
the U.S. Government identified as state sponsors of terrorism. One or more of these companies may be subject to constraints
under U.S. law or regulations that could negatively affect the company’s performance. Additionally, one or more of these companies could suffer damage to its reputation if the market identifies it as a company that invests or deals with countries
that the U.S. Government identifies as state sponsors of terrorism or subjects to sanctions.
Industry Concentration Risk. The Fund concentrates in securities of companies principally engaged in the U.S.
real estate and infrastructure industries. By concentrating its investments in an industry or
industry group, the Fund faces more risks than if it were diversified broadly over numerous industries or industry groups. Such
industry-based risks, any of which may adversely affect the companies in which the Fund invests, may include, but are not
limited to, the following: general economic conditions or cyclical market patterns that could negatively affect supply and demand
in a particular industry; competition for resources, adverse labor relations, political or world events; obsolescence of technologies;
and increased competition or new product introductions that may affect the profitability or viability of companies
in an industry. In addition, at times, such industry or industry group may be out of favor and underperform other industries or
the market as a whole.
Management Risk. The Fund is subject to management risk because it is an actively managed portfolio.
In managing the Fund’s portfolio holdings, the Affiliated Sub-Adviser applies investment techniques and risk analyses in making investment decisions for the Fund, but there can be no guarantee that these actions will produce
the desired results.
Market Risk. Securities held by the Fund are subject to market fluctuations. You should anticipate
that the value of the Shares will decline more or less, in correlation with any decline in value of the securities in the Fund’s portfolio. Additionally, natural or environmental disasters, widespread disease or other public health issues,
war, military conflicts, acts of terrorism, economic crises or other events could result in increased premiums or discounts to the Fund’s NAV. Certain changes in the U.S. economy in particular, such as when the U.S. economy weakens or when its financial
markets decline, may have a material adverse effect on global financial markets as a whole, and on the securities
to which the Fund has exposure. Increasingly strained relations between the U.S. and foreign countries, including
as a result of economic sanctions and tariffs, may also adversely affect U.S. issuers, as well as non-U.S. issuers.
During a general downturn in the financial markets, multiple asset classes may decline
in value. When markets perform well, there can be no assurance that specific investments held by the Fund will rise in
value.
Portfolio Turnover Risk. The Fund may engage in frequent trading of its respective portfolio securities,
which may result in a high portfolio turnover rate. A portfolio turnover rate of 200%, for example, is equivalent
to the Fund buying and selling all of its securities two times during the course of a year. A high portfolio turnover rate
(such as 100% or more) could result in high brokerage costs for the Fund.
Real Assets Companies Risk. Investments in real assets companies may involve a higher degree of risk, including
significant financial, operating, and competitive risks, and may expose the Fund to adverse macroeconomic
conditions, such as changes and volatility in commodity prices, a rise in interest rates or a downturn in the
economy in which the asset is located, elevating the risk of loss.
REIT Risk. REITs are pooled investment vehicles that trade like stocks and invest substantially
all of their assets in real estate and may qualify for special tax considerations. REITs are subject to certain risks
inherent in the direct ownership of real estate, including without limitation, a possible lack of mortgage funds and associated interest
rate risks, overbuilding, property vacancies, increases in property taxes and operating expenses, changes in zoning laws,
losses due to environmental damages and changes in neighborhood values and appeal to purchasers. Further, failure of a
company to qualify as a REIT under federal tax law may have adverse consequences to the REIT’s shareholders. In addition, REITs may have expenses, including advisory and administration expenses, and REIT shareholders will incur a proportionate share
of the underlying expenses.
Small- and Mid-Capitalization Company Risk. Investing in securities of small- and mid-capitalization companies involves greater risk than customarily is associated with investing in larger, more established companies. These companies’ securities may be more volatile and less liquid than those of more established companies. These
securities may have returns that vary, sometimes significantly, from the overall securities market. Often small- and mid-capitalization
companies and the industries in which they focus are still evolving and, as a result, they may be more sensitive to
changing market conditions.
NOTE 3—Investment Advisory Agreement and Other Agreements
The Trust has entered into an Investment Advisory Agreement with the Adviser on behalf
of the Fund, pursuant to which the Adviser has overall responsibility for the selection and ongoing monitoring of the Fund’s investments, managing the Fund’s business affairs, providing certain clerical, bookkeeping and other administrative
services, and oversight of the Affiliated Sub-Adviser.
Pursuant to the Investment Advisory Agreement, the Fund accrued daily and paid monthly
to the Adviser an annual unitary management fee of 0.59% of the Fund’s average daily net assets during the period ended April 30, 2025. Effective May 13, 2025, the Fund’s annual unitary management fee was reduced to 0.58%. Out of the unitary management fee, the Adviser pays the Affiliated Sub-Adviser’s fees and substantially all expenses of the Fund, including the costs of transfer agency, custody, fund administration, legal, audit and other services, except for distribution fees, if
any, brokerage expenses, taxes, interest, acquired fund fees and expenses, if any, litigation expenses and other extraordinary expenses,
including proxy expenses (except for such proxies related to: (i) changes to the Investment Advisory Agreement, (ii) the election
of an Interested Trustee, or (iii) any other matters that directly benefit the Adviser).
The Adviser has entered into an Investment Sub-Advisory Agreement with the Affiliated
Sub-Adviser. The sub-advisory fee for the Fund is paid by the Adviser to the Affiliated Sub-Adviser at 40% of the Adviser’s compensation of the sub-advised assets of the Fund.
Through at least August 31, 2027, the Adviser has contractually agreed to waive the
management fee payable by the Fund in an amount equal to the lesser of: (i) 100% of the net advisory fees earned by the
Adviser or an affiliate of the Adviser that are attributable to the Fund’s investments in money market funds that are managed by affiliates of the Adviser and other funds (including ETFs) managed by the Adviser or affiliates of the Adviser or (ii) the management
fee available to be waived. This waiver does not apply to the Fund’s investment of cash collateral received for securities lending. There is no guarantee that the Adviser will extend the waiver of these fees past that date.
For the six months ended April 30, 2025, the Adviser waived fees of $22.
The Trust has entered into a Distribution Agreement with Invesco Distributors, Inc. (the “Distributor”), which serves as the distributor of Creation Units for the Fund. The Distributor does not maintain a secondary
market in the Shares. The Fund is not charged any fees pursuant to the Distribution Agreement. The Distributor is an affiliate
of the Adviser.
The Trust has entered into service agreements whereby BNYM, a wholly-owned subsidiary
of The Bank of New York Mellon Corporation, serves as the administrator, custodian, fund accountant and transfer
agent for the Fund.
NOTE 4—Additional Valuation Information
GAAP defines fair value as the price that would be received to sell an asset or paid
to transfer a liability in an orderly transaction between market participants at the measurement date, under current market conditions.
GAAP establishes a hierarchy that prioritizes the inputs to valuation methods, giving the highest priority to readily
available unadjusted quoted prices in an active market for identical assets (Level 1) and the lowest priority to significant unobservable
inputs (Level 3), generally when market prices are not readily available. Based on the valuation inputs, the securities or
other investments are tiered into one of three levels. Changes in valuation methods may result in transfers in or out of an investment’s assigned level:
Level 1 — Prices are determined using quoted prices in an active market for identical assets.
Level 2 — Prices are determined using other significant observable inputs. Observable inputs are inputs that other market participants may use in pricing a security. These may include quoted prices for similar
securities, interest rates, prepayment speeds, credit risk, yield curves, loss severities, default rates, discount
rates, volatilities and others. When market movements occur after the close of the relevant foreign securities markets,
foreign securities may be fair valued utilizing an independent pricing service.
Level 3 — Prices are determined using significant unobservable inputs. In situations where quoted prices or observable inputs are unavailable (for example, when there is little or no market activity for an investment
at the end of the period), unobservable inputs may be used. Unobservable inputs reflect the Adviser’s assumptions about the factors market participants would use in determining fair value of the securities or instruments
and would be based on the best available information.
The following is a summary of the tiered valuation input levels, as of April 30, 2025.
The level assigned to the securities valuations may not be an indication of the risk or liquidity associated with investing
in those securities. Because of the inherent uncertainties of valuation, the values reflected in the financial statements may materially
differ from the value received upon actual sale of those investments.
|
|
|
|
|
|
Investments in Securities
|
|
|
|
|
Common Stocks & Other Equity Interests
|
|
|
|
|
|
|
|
|
|
|
|
|
|
|
|
|
The amount and character of income and gains to be distributed are determined in accordance
with federal income tax regulations, which may differ from GAAP. Reclassifications are made to the Fund’s capital accounts to reflect income and gains available for distribution (or available capital loss carryforwards) under federal
income tax regulations. The tax character of distributions paid during the year and the tax components of net assets will be reported at the Fund’s fiscal year-end.
Capital loss carryforwards are calculated and reported as of a specific date. Results
of transactions and other activity after that date may affect the amount of capital loss carryforwards actually available for the
Fund to utilize. The ability to utilize capital loss carryforwards in the future may be limited under the Internal Revenue Code and related
regulations based on the results of future transactions.
The Fund had a capital loss carryforward as of October 31, 2024, as follows:
|
|
Capital loss carryforwards are reduced for limitations, if any, to the extent required
by the Internal Revenue Code and may be further limited depending upon a
variety of factors, including the realization of net unrealized gains or losses as
of the date of any reorganization.
|
NOTE 6—Investment Transactions
For the six months ended April 30, 2025, the cost of securities purchased and the
proceeds from sales of securities (other than short-term securities, U.S. Government obligations, money market funds and in-kind
transactions, if any) were $5,770,867 and $5,615,963, respectively.
For the six months ended April 30, 2025, in-kind transactions associated with creations
and redemptions were $2,090,051 and $120,377, respectively.
Gains (losses) on in-kind transactions are generally not considered taxable gains
(losses) for federal income tax purposes.
As of April 30, 2025, the aggregate cost of investments, including any derivatives,
on a tax basis listed below includes adjustments for financial reporting purposes as of the most recently completed federal
income tax reporting period-end:
Aggregate unrealized appreciation of investments
|
|
Aggregate unrealized (depreciation) of investments
|
|
Net unrealized appreciation of investments
|
|
Cost of investments for tax purposes is $12,446,437.
NOTE 7—Trustees’ and Officer’s Fees
The Adviser, as a result of the Fund’s unitary management fee, pays remuneration to the Independent Trustees and an Officer of the Trust on behalf of the Fund. Interested Trustees do not receive any Trustees’ fees.
The Trust has adopted a deferred compensation plan (the “Plan”). Under the Plan, each Independent Trustee who has executed a Deferred Fee Agreement (a “Participating Trustee”) may defer receipt of all or a portion of their compensation (“Deferral Fees”). Such Deferral Fees are deemed to be invested in select Invesco ETFs. The Deferral Fees payable to a Participating Trustee are valued as of the date such Deferral Fees would have been paid to a Participating
Trustee. The value increases with contributions or with increases in the value of the Shares selected, and the value
decreases with distributions or with declines in the value of the Shares selected. Obligations under the Plan represent unsecured claims
against the general assets of the Fund.
Shares are issued and redeemed by the Fund only in Creation Units as discussed in
Note 1. Only APs are permitted to purchase or redeem Creation Units from the Fund.
To the extent that the Fund issues or redeems Creation Units in-kind, the Fund may
issue Shares in advance of receipt of the underlying securities subject to various conditions, including a requirement to maintain
on deposit with the Trust cash at least equal to 105% of the market value of the missing securities. In accordance with the Trust’s Participant Agreement, Creation Units will be issued to an AP, notwithstanding the fact that the corresponding securities
have not been received in part or in whole, in reliance on the undertaking of the AP to deliver the missing securities as soon as
possible, which undertaking shall be secured by the AP’s delivery and maintenance of collateral consisting of cash in the form of U.S. dollars in immediately available funds having a value (marked-to-market daily) at least equal to 105%, which the Adviser may change
from time to time, of the value of the missing securities.
Certain transaction fees may be charged by the Fund for creations and redemptions,
which are treated as increases in capital.
Transactions in the Fund’s Shares are disclosed in detail in the Statement of Changes in Net Assets.
The Fund previously operated as a “non-transparent” ETF, meaning it did not publicly disclose its portfolio holdings on a daily basis pursuant to an exemptive order from the U.S. Securities and Exchange Commission (the “Order”). At a meeting held on March 13, 2025, the Board of Trustees of the Trust approved a change to the Fund’s structure from a “non-transparent” ETF to a “transparent” ETF that discloses its portfolio holdings daily and operates in reliance on Rule 6c-11 under the 1940 Act. This change in the Fund’s structure became effective on May 13, 2025 (the “Effective Date”).
In connection with this change to a fully “transparent” structure, the Fund changed as follows on the Effective Date:
The Fund no longer publishes on its website a “Tracking Basket” (comprised of Strategy Components, Representative ETFs, and cash and cash equivalents) and “Tracking Basket Weight Overlap”, which is the percentage weight overlap between the holdings of the prior business day’s Tracking Basket compared to the holdings of the Fund that formed the basis for the Fund’s calculation of NAV per share at the end of the prior business day.
The Fund issues and redeems Creation Units generally in exchange for the deposit or
delivery of a basket of securities. However, the Fund also continues to reserve the right to permit or require Creation
Units to be issued or redeemed in exchange for cash.
The Fund no longer operates in reliance on the Order, which had restricted its investments
to exchange-traded instruments, cash and cash equivalents and prohibited the Fund from investing in securities that
were considered illiquid investments and penny stocks. These limitations required by the Order have been removed.
The Fund’s investment objective and principal investment strategies did not change as a result of these changes.
Approval of Investment Advisory and Sub-Advisory Contracts
At a meeting held on April 24, 2025, the Board of Trustees of the Invesco Actively
Managed Exchange-Traded Fund Trust (the “Trust”), including the Independent Trustees, approved the continuation of the Investment Advisory Agreement between Invesco Capital Management LLC (the “Adviser”) and the Trust for the following series (each, a “Fund” and collectively, the “Funds”):
Invesco AAA CLO Floating Rate Note ETF
Invesco Active U.S. Real Estate ETF
Invesco High Yield Bond Factor ETF
Invesco High Yield Select ETF
Invesco Real Assets ESG ETF
Invesco Rochester High Yield Municipal ETF
Invesco S&P 500® Downside Hedged ETF
Invesco Short Duration Total Return Bond ETF
Invesco Total Return Bond ETF
Invesco Variable Rate Investment Grade ETF
Also at the April 24, 2025 meeting, the Board of Trustees of the Trust, including
the Independent Trustees, approved the continuation of the Investment Sub-Advisory Agreement between the Adviser and the
following seven affiliated sub-advisers: Invesco Advisers, Inc.; Invesco Asset Management Deutschland GmbH; Invesco Asset
Management Limited; Invesco Asset Management (Japan) Limited; Invesco Hong Kong Limited; Invesco Senior Secured
Management, Inc.; and Invesco Canada Ltd. (each, a “Sub-Adviser” and collectively, the “Sub-Advisers”); with respect to each of the following Funds (the “Sub-Advisory Agreement”):
Invesco AAA CLO Floating Rate Note ETF
Invesco Active U.S. Real Estate ETF
Invesco High Yield Bond Factor ETF
Invesco High Yield Select ETF
Invesco Real Assets ESG ETF
Invesco Rochester High Yield Municipal ETF
Invesco Short Duration Total Return Bond ETF
Invesco Total Return Bond ETF
Invesco Variable Rate Investment Grade ETF
Investment Advisory Agreement
The Trustees reviewed information from the Adviser describing: (i) the nature, extent
and quality of services provided, (ii) the investment performance of each Fund and the Adviser, (iii) the fees paid by the Funds
and comparisons to amounts paid by other comparable registered investment companies, (iv) the costs of services provided and
estimated profits realized by the Adviser, (v) the extent to which economies of scale may be realized as a Fund grows and whether
fee levels reflect any possible economies of scale for the benefit of Fund shareholders and (vi) any further benefits realized
by the Adviser or its affiliates from the Adviser’s relationship with the Funds.
Nature, Extent and Quality of Services. In evaluating the nature, extent and quality of the Adviser’s services, the Trustees reviewed information concerning the functions performed by the Adviser for the Funds, information describing the Adviser’s current organization and staffing, including operational support provided by the Adviser’s parent organization, Invesco Ltd. (“Invesco”), and the background and experience of the persons responsible for the day-to-day management of the Funds. The Trustees reviewed matters related to the Adviser’s execution and/or oversight of execution of portfolio transactions on behalf of the Funds. The Trustees noted that, unlike most of the other exchange-traded funds (“ETFs”) for which the Adviser serves as investment adviser, the Funds are not designed to track the performance of an index,
and investment decisions are the primary responsibility of the Adviser or Sub-Advisers, as applicable.
The Trustees reviewed information on the performance of Invesco AAA CLO Floating Rate
Note ETF, its benchmark indexes (Bloomberg U.S. Aggregate Bond Index and JP Morgan CLOIE AAA Total Return Index) and the Fund’s Lipper Inc. (“Lipper”) peer group rankings (the 1st quartile being the best performers and the 4th quartile being
the worst performers) for the one-year and since-inception (December 9, 2022) periods ended December 31, 2024. Based on the
information provided, the Trustees noted that the Fund outperformed the Bloomberg U.S. Aggregate Bond Index for each period,
performed the same as the JP Morgan CLOIE AAA Total Return Index for the one-year period and outperformed the JP Morgan
CLOIE AAA Total Return Index for the since-inception period. The Trustees also noted that the Fund ranked in the 4th quartile
of its Lipper peer group for each period. In response to questions from the Independent Trustees, the Adviser provided supplemental
information regarding the performance of Invesco AAA CLO Floating Rate Note ETF for the one-year period ended
December 31, 2024. The Adviser explained the factors that detracted from the Fund’s performance during the period.
The Trustees reviewed information on the performance of Invesco Active U.S. Real Estate
ETF, its benchmark indexes (FTSE NAREIT All Equity REITs Index and S&P 500® Index) and the Fund’s Lipper peer group rankings for the one-year, three-year, five-year, ten-year and since-inception (November 20, 2008) periods ended December 31,
2024. Based on the information
Approval of Investment Advisory and Sub-Advisory Contracts—(continued)
provided, the Trustees noted that the Fund underperformed both benchmark indexes for
each period. The Trustees also noted that the Fund ranked in the 4th quartile of its Lipper peer group for the one-year,
three-year and five-year periods, and the Fund ranked in the 3rd quartile of its Lipper peer group for the ten-year and since-inception
periods. In response to questions from the Independent Trustees, the Adviser provided supplemental information regarding the
performance of Invesco Active U.S. Real Estate ETF for the one-year period ended December 31, 2024. The Adviser explained the factors that detracted from the Fund’s performance during the period.
The Trustees reviewed information on the performance of Invesco High Yield Bond Factor
ETF, its benchmark indexes (Bloomberg U.S. Aggregate Bond Index and Bloomberg U.S. Corporate High Yield 2% Issuer Cap Index) and the Fund’s Lipper peer group rankings for the one-year, three-year and since-inception (December 2, 2020) periods
ended December 31, 2024. Based on the information provided, the Trustees noted that the Fund outperformed the Bloomberg
U.S. Aggregate Bond Index for each period, outperformed the Bloomberg U.S. Corporate High Yield 2% Issuer Cap Index for the one-year
period and underperformed the Bloomberg U.S. Corporate High Yield 2% Issuer Cap Index for the three-year and since-inception
periods. The Trustees also noted that the Fund ranked in the 2nd quartile of its Lipper peer group for each period.
The Trustees reviewed information on the performance of Invesco High Yield Select
ETF, its benchmark indexes (Bloomberg U.S. Aggregate Bond Index and Bloomberg U.S. Corporate High Yield Ba/B 2% Issuer Cap Index) and the Fund’s Lipper peer group rankings for the one-year and since-inception (December 9, 2022) periods ended
December 31, 2024. Based on the information provided, the Trustees noted that the Fund outperformed the Bloomberg
U.S. Aggregate Bond Index for each period, outperformed the Bloomberg U.S. Corporate High Yield Ba/B 2% Issuer Cap Index for
the one-year period and underperformed the Bloomberg U.S. Corporate High Yield Ba/B 2% Issuer Cap Index for the since-inception
period. The Trustees also noted that the Fund ranked in the 3rd quartile of its Lipper peer group for the one-year period
and in the 4th quartile of its Lipper peer group for the since-inception period.
The Trustees reviewed information on the performance of Invesco Rochester High Yield
Municipal ETF, its benchmark indexes (S&P Municipal Bond 50% Investment Grade/50% High Yield Index, S&P Municipal Bond
High Yield Index and S&P Municipal Bond Index) and the Fund’s Lipper peer group rankings for the one-year and since-inception (December 9, 2022) periods ended December 31, 2024. Based on the information provided, the Trustees noted that the
Fund outperformed the S&P Municipal Bond 50% Investment Grade/50% High Yield Index for the one-year period, underperformed
the S&P Municipal Bond 50% Investment Grade/50% High Yield Index for the since-inception period, underperformed
the S&P Municipal Bond High Yield Index for each period and outperformed the S&P Municipal Bond Index for each period. The
Trustees also noted that the Fund ranked in the 3rd quartile of its Lipper peer group for each period.
The Trustees reviewed information on the performance of Invesco Real Assets ESG ETF,
its benchmark indexes (S&P U.S., Canada & Mexico Real Assets Equity Index and S&P 500® Index) and the Fund’s Lipper peer group rankings for the one-year, three-year and since-inception (December 22, 2020) periods ended December 31, 2024.
Based on the information provided, the Trustees noted that the Fund outperformed the S&P U.S., Canada & Mexico Real Assets
Equity Index for the one-year and three-year periods, underperformed the S&P U.S., Canada & Mexico Real Assets Equity
Index for the since-inception period, underperformed the S&P 500® Index for the one-year and three-year periods and outperformed the S&P 500® Index for the since-inception period. The Trustees also noted that the Fund ranked in the 1st quartile
of its Lipper peer group for each period.
The Trustees reviewed information on the performance of Invesco S&P 500® Downside Hedged ETF, its benchmark indexes (S&P 500® Dynamic VEQTOR Index, S&P 500® Index and U.S. 3-Month Treasury Bill Index) and the Fund’s Lipper peer group rankings for the one-year, three-year, five-year, ten-year and since-inception (December 6,
2012) periods ended December 31, 2024. Based on the information provided, the Trustees noted that the Fund underperformed the S&P 500® Dynamic VEQTOR Index and the S&P 500® Index for each period, outperformed the U.S. 3-Month Treasury Bill Index for the one-year, five-year, ten-year and since-inception periods and underperformed the U.S. 3-Month Treasury
Bill Index for the three-year period. The Trustees also noted that the Fund ranked in the 1st quartile of its Lipper peer group
for the one-year, five-year, ten-year and since-inception periods and ranked in the 3rd quartile of its Lipper peer group for
the three-year period.
The Trustees reviewed information on the performance of Invesco Short Duration Total
Return Bond ETF, its benchmark indexes (Bloomberg U.S. Aggregate Bond Index and Bloomberg U.S. Government and Credit 1-3 Year Index) and the Fund’s Lipper peer group rankings for the one-year and since-inception (December 9, 2022) periods ended
December 31, 2024. Based on the
Approval of Investment Advisory and Sub-Advisory Contracts—(continued)
information provided, the Trustees noted that the Fund outperformed both benchmark
indexes for each period. The Trustees also noted that the Fund ranked in the 2nd quartile of its Lipper peer group for each
period.
The Trustees reviewed information on the performance of Invesco Total Return Bond
ETF, its benchmark index (Bloomberg U.S. Aggregate Bond Index) and the Fund’s Lipper peer group rankings for the one-year, three-year, five-year and since-inception (February 10, 2016) periods ended December 31, 2024. Based on the information provided,
the Trustees noted that the Fund outperformed its benchmark for the one-year, five-year and since-inception periods
and underperformed its benchmark for the three-year period. The Trustees also noted that the Fund ranked in the 1st quartile
of its Lipper peer group for the one-year, five-year and since-inception periods, and in the 3rd quartile of its Lipper peer
group for the three-year period. The Trustees considered that the Fund was created in connection with the purchase by Invesco of
the ETFs business of Guggenheim Capital LLC (“Guggenheim”) (the “Transaction”) and that the Fund’s performance prior to the closing of the Transaction on April 6, 2018 is that of its predecessor Guggenheim ETF.
The Trustees reviewed information on the performance of Invesco Variable Rate Investment
Grade ETF, its benchmark indexes (Bloomberg U.S. Aggregate Bond Index and Bloomberg US Floating Rate Note Index) and the Fund’s Lipper peer group rankings for the one-year, three-year, five-year and since-inception (September 22, 2016) periods
ended December 31, 2024. Based on the information provided, the Trustees noted that the Fund outperformed both benchmark
indexes for each period. The Trustees also noted that the Fund ranked in the 1st quartile of its Lipper peer group for each
period.
The Trustees considered the services provided by the Adviser in its oversight of the Funds’ administrator, custodian, transfer agent and, for all Funds except Invesco S&P 500® Downside Hedged ETF, the Sub-Advisers. The Trustees noted the significant amount of time, effort and resources that had been devoted to this oversight function.
Based on its review, the Board concluded that the nature, extent and quality of services
provided by the Adviser to the Funds under the Investment Advisory Agreement were appropriate and reasonable.
Fees, Expenses and Profitability. The Trustees reviewed and discussed the information provided by the Adviser on each Fund’s net expense ratio and unitary advisory fee. The Trustees noted that the annual advisory
fee charged to each Fund, as set forth below, is a unitary advisory fee and that the Adviser compensates each Sub-Adviser
(as applicable) from its unitary advisory fee and pays all other operating expenses of each Fund, except that each Fund pays its
brokerage expenses, taxes, interest (including, for Invesco AAA CLO Floating Rate Note ETF, interest expenses associated with any
draws on its line of credit), acquired fund fees and expenses, if any, litigation expenses, costs incurred in connection with proxies
(except certain proxies) and other extraordinary expenses:
●
0.19% of the Fund’s average daily net assets for Invesco AAA CLO Floating Rate Note ETF;
●
0.30% of the Fund’s average daily net assets for Invesco Short Duration Total Return Bond ETF and Invesco Variable Rate Investment Grade ETF;
●
0.35% of the Fund’s average daily net assets for Invesco Active U.S. Real Estate ETF and Invesco Total Return Bond ETF;
●
0.39% of the Fund’s average daily net assets for Invesco S&P 500® Downside Hedged ETF, Invesco High Yield Bond Factor ETF and Invesco Rochester High Yield Municipal ETF;
●
0.48% of the Fund’s average daily net assets for Invesco High Yield Select ETF; and
●
0.59% of the Fund’s average daily net assets for Invesco Real Assets ESG ETF.
The Trustees considered that on March 13, 2025 the Adviser proposed and the Board
of Trustees approved a permanent reduction in the annual unitary advisory fee rate for Invesco Real Assets ESG ETF from 0.59% to 0.58% of the Fund’s average daily net assets, effective May 13, 2025.
The Trustees compared each Fund’s net expense ratio to information compiled by the Adviser from Lipper databases on the net expense ratios of comparable ETFs, open-end (non-ETF) index funds and open-end (non-ETF)
actively-managed funds, as applicable. The Trustees noted that the net expense ratios for certain Funds were
equal to or lower than the median net expense ratios of their ETF peers and open-end index peer funds, as illustrated in the table
below. The Trustees also noted that the net
Approval of Investment Advisory and Sub-Advisory Contracts—(continued)
expense ratios for all Funds were equal to or lower than the median net expense ratios
of their open-end actively-managed peer funds.
|
|
Equal
to/Lower
than ETF
Peer
Median*
|
Equal to/Lower
than Open-End
Index Fund
Peer Median*
|
Equal to/
Lower than
Open-End
Active Fund
Peer Median
|
Invesco AAA CLO Floating Rate Note ETF
|
|
|
|
Invesco Active U.S. Real Estate ETF
|
|
|
|
Invesco High Yield Bond Factor ETF
|
|
|
|
Invesco High Yield Select ETF
|
|
|
|
Invesco Real Assets ESG ETF
|
|
|
|
Invesco Rochester High Yield Municipal ETF
|
|
|
|
Invesco S&P 500® Downside Hedged ETF
|
|
|
|
Invesco Short Duration Total Return Bond ETF
|
|
|
|
Invesco Total Return Bond ETF
|
|
|
|
Invesco Variable Rate Investment Grade ETF
|
|
|
|
|
|
The information provided by the Adviser indicated that certain Funds did not have
any open-end index fund peers. Those Funds have been designated in this
column with an “N/A” for not available.
|
The Trustees noted information, including fee information, provided by the Adviser
regarding other investment products to which it provides investment advisory services, noting that the Adviser indicated that none
of the other investment products have investment strategies comparable to those of the Funds. The Trustees considered the Adviser’s explanation of the differences between the services provided to the Funds and to the other investment products it advises, noting the Adviser’s statement that the management and oversight of the Funds requires substantially more labor and expense.
Based on all of the information provided, the Board concluded that each Fund’s unitary advisory was reasonable and appropriate in light of the services provided, the distinguishing factors of the Fund, and the
administrative, operational and management oversight costs for the Adviser.
In conjunction with their review of the unitary advisory fees, the Trustees considered
information provided by the Adviser on the revenues received by the Adviser under the Investment Advisory Agreement for the Funds.
The Trustees reviewed information provided by the Adviser regarding its overall profitability, as well as the estimated
profitability to the Adviser from its relationship to each Fund. With respect to the Adviser’s profitability information, the Trustees considered that there is no recognized standard or uniform methodology for determining profitability for this purpose. Furthermore,
the Trustees noted that there are limitations inherent in allocating costs and calculating profitability for an organization such as the Adviser’s. Based on the information provided, the Board concluded that the overall and estimated profitability to the
Adviser was not unreasonable.
Economies of Scale and Whether Fee Levels Reflect These Economies of Scale. The Trustees reviewed the information provided by the Adviser as to the extent to which economies of scale may be realized as each
Fund grows and whether fee levels reflect economies of scale for the benefit of the Fund’s shareholders. The Trustees reviewed each Fund’s asset size and unitary advisory fee. The Trustees noted that any reduction in fixed costs associated with the management
of the Funds would be enjoyed by the Adviser, but a unitary advisory fee provides a level of certainty in expenses for
the Funds. The Trustees also noted that the Adviser has reduced advisory fees for the Invesco ETFs numerous times since 2011,
including through permanent advisory fee reductions and various advisory fee waivers. The Board considered whether the unitary
advisory fee rate for each Fund was reasonable in relation to the asset size of that Fund and concluded that the unitary
advisory fee rates were reasonable and appropriate.
Fall-out Benefits. The Trustees considered that the Adviser identified no additional benefits it receives
from its relationship with the Funds, and noted that the Adviser is not a party to any soft-dollar, commission
recapture or directed brokerage arrangements with respect to the Funds. The Trustees also considered benefits received by affiliates
of the Adviser that may be directly or indirectly attributed to the Adviser’s relationship with the Funds, including brokerage fees, advisory fees from affiliated money market cash management vehicles and fees as the Funds’ securities lending agent. The Trustees also considered that Invesco
Approval of Investment Advisory and Sub-Advisory Contracts—(continued)
Distributors, Inc., an affiliate of the Adviser, serves as each Fund’s distributor and is paid a distribution fee by the Adviser. The Board concluded that each Fund’s unitary advisory fee was reasonable, taking into account any ancillary benefits received by affiliates of the Adviser.Based on all of the information considered and the conclusions
reached, the Board, including the Independent Trustees, determined to approve the continuation of the Investment Advisory
Agreement for each Fund. No single factor was determinative in the Board’s analysis.
Investment Sub-Advisory Agreement
As noted above, the Board of Trustees of the Trust, including the Independent Trustees,
approved the continuation of the Sub-Advisory Agreement for each of Invesco AAA CLO Floating Rate Note ETF, Invesco
Active U.S. Real Estate ETF, Invesco High Yield Bond Factor ETF, Invesco High Yield Select ETF, Invesco Real Assets ESG ETF,
Invesco Rochester High Yield Municipal ETF, Invesco Short Duration Total Return Bond ETF, Invesco Total Return Bond ETF and Invesco
Variable Rate Investment Grade ETF (each such Fund, a “Sub-Advised Fund” and collectively, the “Sub-Advised Funds”) at a meeting held on April 24, 2025. The review process followed by the Board is described in detail above. In connection
with the review of the Sub-Advisory Agreement, the Board considered the factors described below, among others.
Nature, Extent and Quality of Services. The Trustees considered the nature, extent and quality of services provided to each
Sub-Advised Fund under the Sub-Advisory Agreement. The Trustees reviewed the qualifications
and background of each Sub-Adviser, the services provided by each Sub-Adviser, the investment approach of
the Sub-Adviser whose investment personnel manage Invesco AAA CLO Floating Rate Note ETF’s, Invesco Active U.S. Real Estate ETF’s, Invesco High Yield Bond Factor ETF’s, Invesco High Yield Select ETF’s, Invesco Real Assets ESG ETF’s, Invesco Rochester High Yield Municipal ETF, Invesco Short Duration Total Return Bond ETF’s, Invesco Total Return Bond ETF’s and Invesco Variable Rate Investment Grade ETF’s assets and the experience and skills of the investment personnel responsible for the day-to-day
management of such Sub-Advised Funds.
Based on its review, the Board concluded that the nature, extent and quality of services
provided by the Sub-Advisers to each Sub-Advised Fund under the Sub-Advisory Agreement were appropriate and reasonable.
Fees, Expenses and Profitability. The Trustees reviewed and discussed the information provided by the Adviser and the
Sub-Advisers on the sub-advisory fee rate under the Sub-Advisory Agreement. The Trustees
noted that the sub-advisory fee charged by the Sub-Advisers under the Sub-Advisory Agreement is consistent with the
compensation structure used throughout Invesco when Invesco’s affiliates provide sub-advisory services for funds managed by other Invesco affiliates. The Trustees considered how the sub-advisory fee relates to the overall advisory fee for each Sub-Advised
Fund and noted that the Adviser compensates each Sub-Adviser from its fee.
The Trustees also reviewed the financial statements provided by Invesco Senior Secured
Management, Inc. in connection with the March 13 and April 24, 2025 Board Meetings, and Invesco Advisers, Inc. in connection
with the April 24, 2025 meeting, and they noted the net income generated by each firm. The Trustees noted that the Adviser
compensates each Sub-Adviser from its fee and that the Adviser provided profitability information with respect to each Sub-Advised
Fund.
Economies of Scale and Whether Fee Levels Reflect These Economies of Scale. As part of their review of the Investment Advisory Agreement for each Sub-Advised Fund, the Trustees considered the extent to which economies
of scale may be realized as each Sub-Advised Fund grows and whether fee levels reflect economies of scale for the benefit of the Sub-Advised Fund’s shareholders. The Board considered whether the sub-advisory fee rate for each Sub-Advised
Fund was reasonable in relation to the asset size (if any) of the Sub-Advised Funds and concluded that the flat sub-advisory
fee rate was reasonable and appropriate.
Fall-out Benefits. The Trustees noted that Invesco Advisers, Inc. receives management fees from affiliated
money market funds into which the Sub-Advised Funds’ and other Invesco ETFs’ excess cash and securities lending collateral may be invested, and that the Adviser waives its fees with respect to each Sub-Advised Fund in an amount equal
to the fees received by Invesco Advisers, Inc. on the Sub-Advised Fund’s excess cash invested in the affiliated money market funds. The Trustees also noted the fees received by Invesco Advisers, Inc. in its capacity as securities lending agent for
the Invesco ETFs. The Trustees considered that Invesco Advisers, Inc. may participate in soft-dollar arrangements for Invesco Real
Assets ESG ETF, but that the Sub-Advisers otherwise generally do not use or generate soft-dollars with respect to the Sub-Advised
Funds. The Trustees noted that the Sub-Advisers had not identified any further benefits that they received from their
relationships with the Sub-Advised Funds. The Board concluded that the sub-advisory fee with respect to each Sub-Advised Fund was
reasonable, taking into account any ancillary benefits received by the Sub-Advisers.
Approval of Investment Advisory and Sub-Advisory Contracts—(continued)
Based on all of the information considered and the conclusions reached, the Board,
including the Independent Trustees, determined to approve the continuation of the Sub-Advisory Agreement for each Sub-Advised
Fund. No single factor was determinative in the Board’s analysis.
Other Information Required in Form N-CSR (Items 8-11)
Changes in and Disagreements with Accountants for Open-End Management Investment Companies
Proxy Disclosures for Open-End Management Investment Companies
Remuneration Paid to Directors, Officers, and Others of Open-End Management Investment
Companies
Remuneration paid to the Fund’s trustees or officers and others, if any, is disclosed within the financial statements.
Statement Regarding Basis for Approval of Investment Advisory Contracts
The statement regarding basis for approval of investment advisory contracts can be
found in the Approval of Investment Advisory and Sub-Advisory Contracts section of this report.
©2025 Invesco Capital Management LLC
3500 Lacey Road, Suite 700
Downers Grove, IL 60515
P-AMNT-NCSRS
invesco.com/ETFs
Invesco Semi-Annual Financial Statements and Other Information
|
|
Invesco Managed Futures Strategy ETF
|
Invesco Managed Futures Strategy ETF (IMF)
April 30, 2025
(Unaudited)
Consolidated Schedule of Investments(a)
|
|
|
|
Money Market Funds-86.68%
|
Invesco Premier U.S. Government Money
Portfolio, Institutional Class, 4.26%(b)(c)
|
|
|
|
Invesco Liquidity Funds PLC, Invesco US
Dollar Liquidity Portfolio, Institutional
Class, 4.14%(b)(c)
|
|
|
|
TOTAL INVESTMENTS IN SECURITIES-86.68%
(Cost $265,179,582)
|
|
OTHER ASSETS LESS LIABILITIES-13.32%
|
|
|
|
|
Notes to Consolidated Schedule of Investments:
|
|
|
The Consolidated Schedule of Investments includes the accounts of the wholly-owned
subsidiary. All inter-company accounts and transactions have been
eliminated in consolidations.
|
|
|
Affiliated holding. Affiliated holdings are investments in entities which are under
common ownership or control of Invesco Ltd. or are investments in entities in
which the Fund owns 5% or more of the outstanding voting securities. The table below shows the Fund’s transactions in, and earnings from, its investments in
affiliates for the period ended April 30, 2025.
|
|
|
|
|
|
Change in
Unrealized
Appreciation
|
|
|
|
Investments in Affiliated
Money Market Funds:
|
|
|
|
|
|
|
|
Invesco Premier
U.S. Government Money
Portfolio, Institutional Class
|
|
|
|
|
|
|
|
Invesco Liquidity Funds
PLC, Invesco US Dollar
Liquidity Portfolio,
Institutional Class
|
|
|
|
|
|
|
|
|
|
|
|
|
|
|
|
|
|
|
The rate shown is the 7-day SEC standardized yield as of April 30, 2025.
|
Open Futures Contracts(a)
|
|
|
|
|
|
|
Unrealized
Appreciation
(Depreciation)
|
|
|
|
|
|
|
|
|
|
|
|
|
|
|
|
|
|
|
|
|
|
|
|
|
|
|
|
|
|
|
|
|
|
|
|
|
|
|
|
|
|
|
|
|
|
|
|
|
|
CME British Pound Currency
|
|
|
|
|
|
CME Euro Foreign Exchange Currency
|
|
|
|
|
|
CME Japanese Yen Currency
|
|
|
|
|
|
CME New Zealand Dollar Currency
|
|
|
|
|
|
|
|
|
|
|
|
|
|
|
|
|
|
|
|
See accompanying Notes to Consolidated Financial Statements which are an integral
part of the financial statements.
Invesco Managed Futures Strategy ETF (IMF)—(continued)
April 30, 2025
(Unaudited)
Open Futures Contracts(a)—(continued)
|
Long Futures Contracts—(continued)
|
|
|
|
|
Unrealized
Appreciation
(Depreciation)
|
|
|
|
|
|
|
|
|
|
|
|
|
|
|
|
|
|
|
|
|
|
|
|
|
|
|
|
|
|
|
|
|
|
|
|
|
|
|
|
|
|
|
MEFF Madrid IBEX 35 Index
|
|
|
|
|
|
MSCI Emerging Markets Index
|
|
|
|
|
|
|
|
|
|
|
|
|
|
|
|
|
|
|
|
|
|
|
|
|
|
|
|
|
|
|
|
|
|
|
|
|
|
|
|
|
|
|
|
|
|
|
|
|
|
|
|
|
|
|
|
|
|
|
|
|
|
|
|
|
|
|
|
|
SFE 3 Year Australian Bonds
|
|
|
|
|
|
U.S. Treasury 10 Year Notes
|
|
|
|
|
|
U.S. Treasury 2 Year Notes
|
|
|
|
|
|
U.S. Treasury 5 Year Notes
|
|
|
|
|
|
Subtotal—Interest Rate Risk
|
|
|
|
|
|
Subtotal—Long Futures Contracts
|
|
|
|
|
|
|
|
|
|
|
|
|
|
|
|
|
|
|
|
|
|
|
|
|
|
|
|
|
|
|
|
|
|
|
|
|
|
|
|
|
|
|
|
|
|
|
|
|
|
|
|
|
|
|
|
|
|
|
|
|
|
New York Harbor Ultra-Low Sulfur Diesel
|
|
|
|
|
|
|
|
|
|
|
|
|
|
|
|
|
|
|
|
|
|
|
|
|
|
|
|
|
|
|
|
|
|
|
|
|
|
|
|
|
|
|
|
|
|
|
|
|
|
|
|
|
|
|
|
|
|
|
|
|
|
|
|
|
|
|
|
|
|
|
|
|
|
|
|
|
|
|
|
|
|
|
Subtotal—Interest Rate Risk
|
|
|
|
|
|
See accompanying Notes to Consolidated Financial Statements which are an integral
part of the financial statements.
Invesco Managed Futures Strategy ETF (IMF)—(continued)
April 30, 2025
(Unaudited)
Open Futures Contracts(a)—(continued)
|
Short Futures Contracts—(continued)
|
|
|
|
|
Unrealized
Appreciation
(Depreciation)
|
|
|
|
|
|
|
|
|
|
|
|
|
|
|
CME Australian Dollar Currency
|
|
|
|
|
|
|
|
|
|
|
|
|
|
|
|
|
|
|
|
E-Mini Russell 2000 Index
|
|
|
|
|
|
|
|
|
|
|
|
|
|
|
|
|
|
|
|
OML Stockholm OMXS30 Index
|
|
|
|
|
|
|
|
|
|
|
|
|
|
|
|
|
|
|
|
Subtotal—Short Futures Contracts
|
|
|
|
|
|
|
|
|
|
|
|
Futures contracts collateralized by $46,467,617 cash held with Morgan Stanley & Co.
LLC, the futures commission merchant.
|
See accompanying Notes to Consolidated Financial Statements which are an integral
part of the financial statements.
Consolidated Statement of Assets and Liabilities
April 30, 2025
(Unaudited)
|
|
Invesco
Managed Futures
Strategy ETF (IMF)
|
|
|
|
Affiliated investments in securities, at value
|
|
|
|
|
Unrealized appreciation on LME futures contracts
|
|
|
|
|
|
|
|
Cash collateral-futures contracts
|
|
|
|
|
|
|
|
|
|
|
|
|
|
|
|
|
|
|
|
Variation margin on non-LME futures contracts
|
|
|
|
|
Accrued unitary management fees
|
|
|
|
|
|
|
|
|
|
|
Shares of beneficial interest
|
|
Distributable earnings (loss)
|
|
|
|
|
Shares outstanding (unlimited amount authorized, $0.01 par value)
|
|
|
|
|
|
|
|
Affiliated investments in securities, at cost
|
|
See accompanying Notes to Consolidated Financial Statements which are an integral
part of the financial statements.
Consolidated Statement of Operations
For the period ended April 30, 2025
(Unaudited)
|
|
|
|
|
|
Unaffiliated interest income
|
|
Affiliated dividend income
|
|
|
|
|
|
|
|
|
|
|
|
|
|
|
|
|
|
|
|
Realized and unrealized gain (loss) from:
|
|
Net realized gain (loss) from:
|
|
Unaffiliated investment securities
|
|
|
|
|
|
|
|
|
|
|
Change in net unrealized appreciation (depreciation) of:
|
|
|
|
|
|
|
|
Change in net unrealized appreciation
|
|
Net realized and unrealized gain (loss)
|
|
Net increase (decrease) in net assets resulting from operations
|
|
|
|
For the period March 17, 2025 (commencement of investment operations) through April
30, 2025.
|
See accompanying Notes to Consolidated Financial Statements which are an integral
part of the financial statements.
Consolidated Statement of Changes in Net Assets
For the period ended April 30, 2025
(Unaudited)
|
|
Invesco
Managed Futures
Strategy ETF (IMF)
|
|
|
|
|
|
|
|
|
|
|
|
|
Change in net unrealized appreciation
|
|
Net increase (decrease) in net assets resulting from operations
|
|
Shareholder Transactions:
|
|
Proceeds from shares sold
|
|
Net increase in net assets resulting from share transactions
|
|
Net increase in net assets
|
|
|
|
|
|
|
|
|
|
|
Changes in Shares Outstanding:
|
|
|
|
|
Shares outstanding, beginning of period
|
|
Shares outstanding, end of period
|
|
|
|
For the period March 17, 2025 (commencement of investment operations) through April
30, 2025.
|
See accompanying Notes to Consolidated Financial Statements which are an integral
part of the financial statements.
Consolidated Financial Highlights
Invesco Managed Futures Strategy ETF (IMF)
|
|
For the Period
March 17, 2025(a)
Through
April 30,
2025
(Unaudited)
|
Per Share Operating Performance:
|
|
Net asset value at beginning of period
|
|
|
|
|
Net realized and unrealized gain (loss) on investments
|
|
Total from investment operations
|
|
Net asset value at end of period
|
|
Market price at end of period(c)
|
|
Net Asset Value Total Return(d)
|
|
Market Price Total Return(d)
|
|
Ratios/Supplemental Data:
|
|
Net assets at end of period (000’s omitted)
|
|
Ratio to average net assets of:
|
|
Expenses, after Waivers(f)
|
|
Expenses, prior to Waivers(f)
|
|
|
|
|
|
|
Commencement of investment operations.
|
|
|
Based on average shares outstanding.
|
|
|
The mean between the last bid and ask prices.
|
|
|
Net asset value total return is calculated assuming an initial investment made at
the net asset value at the beginning of the period, reinvestment of all dividends
and distributions at net asset value during the period, and redemption at net asset
value on the last day of the period. Net asset value total return includes
adjustments in accordance with accounting principles generally accepted in the United
States of America and as such, the net asset value for financial reporting
purposes and the returns based upon those net asset values may differ from the net
asset value and returns for shareholder transactions. Market price total return
is calculated assuming an initial investment made at the market price at the beginning
of the period, reinvestment of all dividends and distributions at market price
during the period, and sale at the market price on the last day of the period. Total
investment returns calculated for a period of less than one year are not
annualized.
|
|
|
The net asset value total return from Fund Inception (March 19, 2025, the first day
of trading on the exchange) to April 30, 2025 was (13.85)%. The market price
total return from Fund Inception to April 30, 2025 was (13.61)%.
|
|
|
In addition to the fees and expenses which the Fund bears directly; the Fund indirectly
bears a pro rata share of the fees and expenses of the underlying fund in
which the Fund invests. Indirect expenses are not expenses that are incurred directly
by the Fund. They are expenses that are incurred directly by the underlying
fund and are deducted from the value of the fund your Fund invests in. The effect
of the underlying fund expenses that you bear indirectly is included in your
Fund’s total return. For the period ended April 30, 2025, indirect net expenses paid were 0.10%.
|
|
|
|
See accompanying Notes to Consolidated Financial Statements which are an integral
part of the financial statements.
Notes to Consolidated Financial Statements
Invesco Actively Managed Exchange-Traded Fund Trust
April 30, 2025
(Unaudited)
Invesco Actively Managed Exchange-Traded Fund Trust (the “Trust”) was organized as a Delaware statutory trust and is authorized to have multiple series of portfolios. The Trust is an open-end management
investment company registered under the Investment Company Act of 1940, as amended (the “1940 Act”). This report includes Invesco Managed Futures Strategy ETF (IMF) (the "Fund") and the Invesco Managed Futures Strategy Cayman Ltd. (the "Subsidiary"),
a wholly-owned subsidiary of the Fund organized under the laws of the Cayman Islands.
The Fund represents a separate series of the Trust. The shares of the Fund are referred to herein as "Shares" or "Fund’s Shares." The Fund’s Shares are listed and traded on the Cboe BZX Exchange, Inc.
The market price of a Share may differ to some degree from the Fund’s net asset value (“NAV”). Unlike conventional mutual funds, the Fund issues and redeems Shares on a continuous basis, at NAV, only in a
large specified number of Shares, each called a “Creation Unit”, as set forth in the Fund’s prospectus. Creation Units are issued and redeemed principally in exchange for the deposit or delivery of cash, though the Fund reserves the right to issue and redeem
Creation Units in exchange for a basket of securities ("Deposit Securities"). Except when aggregated in Creation Units by authorized participants (“APs”), Shares are not individually redeemable securities of the Fund.
The investment objective of the Fund is to seek long term capital appreciation. The Fund’s investment in its Subsidiary is expected to provide the Fund with exposure to commodity-linked derivatives. The Fund
may invest up to 25% of its total assets in the Subsidiary.
NOTE 2—Significant Accounting Policies
The following is a summary of the significant accounting policies followed by the
Fund in preparation of its consolidated financial statements.
The Fund is an investment company and accordingly follows the investment company accounting
and reporting guidance in accordance with Financial Accounting Standards Board ("FASB") Accounting Standards
Codification Topic 946, Financial Services—Investment Companies.
A.
Security Valuation - Securities, including restricted securities, are valued according to the following
policies:
A security listed or traded on an exchange is generally valued at its trade price
or official closing price that day as of the close of the exchange where the security is principally traded or, lacking any trades
or official closing price on a particular day, the security may be valued at the closing bid or ask price on that day. Securities
traded in the over-the-counter ("OTC") market are valued based on prices furnished by independent pricing services or market
makers. When such securities are valued using prices provided by an independent pricing service they may be considered
fair valued. Futures contracts are valued at the daily settlement price set by an exchange on which they are principally
traded. Where a final settlement price exists, exchange-traded options are valued at the final settlement price from the
exchange where the option principally trades. Where a final settlement price does not exist, exchange-traded options are valued
at the mean between the last bid and ask price generally from the exchange where the option principally trades.
Securities of investment companies that are not exchange-traded (e.g., open-end mutual
funds) are valued using such company’s end-of-business-day NAV per share.
Deposits, other obligations of U.S. and non-U.S. banks and financial institutions
are valued at their daily account value.
Fixed income securities (including convertible debt securities) generally are valued
on the basis of prices provided by independent pricing services. Prices provided by the pricing service may be determined
without exclusive reliance on quoted prices, and may reflect appropriate factors such as institution-size trading in similar
groups of securities, developments related to specific securities, dividend rate (for unlisted equities), yield (for debt obligations),
quality, type of issue, coupon rate (for debt obligations), maturity (for debt obligations), individual trading characteristics
and other market data. Securities with a demand feature exercisable within one to seven days are valued at par. Pricing services
generally value debt obligations assuming orderly transactions of institutional round lot size, but the Fund may hold
or transact in the same securities in smaller, odd lot sizes. Odd lots often trade at lower prices than institutional round
lots, and their value may be adjusted accordingly. Debt obligations are subject to interest rate and credit risks. In addition,
all debt obligations involve some risk of default with respect to interest and/or principal payments.
Foreign securities’ (including foreign exchange contracts’) prices are converted into U.S. dollar amounts using the applicable exchange rates as of the close of the London world markets. If market quotations are
available and reliable for foreign exchange-traded equity securities, the securities will be valued at the market quotations.
Invesco Capital Management LLC (the “Adviser”) may use various pricing services to obtain market quotations as well as fair value prices. Because trading hours for
certain foreign securities end before the close of the New York Stock Exchange (“NYSE”), closing market quotations may become not representative of market value in the Adviser’s judgment ("unreliable"). If, between the time trading ends on a particular security and the close of the customary trading session on the NYSE, a
significant event occurs that makes the closing price of the security unreliable, the Adviser may fair value the security.
If the event is likely to have affected the closing price of the security, the security will be valued at fair value in good faith in
accordance with Board-approved policies and related Adviser procedures (“Valuation Procedures”). Adjustments to closing prices to reflect fair value may also be based on a screening process of an independent pricing service to indicate the degree of certainty,
based on historical data, that the closing price in the principal market where a foreign security trades is not the current
value as of the close of the NYSE. Foreign securities’ prices meeting the degree of certainty that the price is not reflective of current value will be priced at the indication of fair value from the independent pricing service. Multiple factors may
be considered by the independent pricing service in determining adjustments to reflect fair value and may include information
relating to sector indices, American depositary receipts and domestic and foreign index futures. Foreign securities may
have additional risks including exchange rate changes, the potential for sharply devalued currencies and high inflation, political
and economic upheaval, the relative lack of issuer information, relatively low market liquidity and the potential lack of strict
financial and accounting controls and standards.
Unlisted securities will be valued using prices provided by independent pricing services
or by another method that the Adviser, in its judgment, believes better reflects the security’s fair value in accordance with the Valuation Procedures.
Non-traded rights and warrants shall be valued at intrinsic value if the terms of
the rights and warrants are available, specifically the subscription or exercise price and the ratio. Intrinsic value is
calculated as the daily market closing price of the security to be received less the subscription price, which is then adjusted by the
exercise ratio. In the case of warrants, an option pricing model supplied by an independent pricing service may be used based
on market data such as volatility, stock price and interest rate from the independent pricing service and strike price and
exercise period from verified terms.
Securities for which market prices are not provided by any of the above methods may
be valued based upon quotes furnished by independent sources. The mean between the last bid and ask prices may
be used to value debt obligations, including corporate loans, and unlisted equity securities.
Securities for which market quotations are not readily available are fair valued by
the Adviser in accordance with the Valuation Procedures. If a fair value price provided by a pricing service is unreliable,
the Adviser will fair value the security using the Valuation Procedures. Issuer-specific events, market trends, bid/ask quotes
of brokers and information providers and other market data may be reviewed in the course of making a good faith determination of a security’s fair value.
The Fund may invest in securities that are subject to interest rate risk, meaning
the risk that the prices will generally fall as interest rates rise and, conversely, the prices will generally rise as interest rates
fall. Specific securities differ in their sensitivity to changes in interest rates depending on their individual characteristics. Changes
in interest rates may result in increased market volatility, which may affect the value and/or liquidity of certain Fund investments.
Valuations change in response to many factors, including the historical and prospective
earnings of the issuer, the value of the issuer’s assets, general market conditions which are not specifically related to the particular issuer, such as real or perceived adverse economic conditions, changes in the general outlook for revenues
or corporate earnings, changes in interest or currency rates, regional or global instability, natural or environmental
disasters, widespread disease or other public health issues, war, military conflicts, acts of terrorism, economic crises, economic
sanctions and tariffs, significant governmental actions or adverse investor sentiment generally and market liquidity.
Because of the inherent uncertainties of valuation, the values reflected in the consolidated financial statements may materially
differ from the value received upon actual sale of those investments.
The price the Fund could receive upon the sale of any investment may differ from the Adviser’s valuation of the investment, particularly for securities that are valued using a fair valuation technique. When
fair valuation techniques are applied, the Adviser uses available information, including both observable and unobservable inputs
and assumptions, to determine a methodology that will result in a valuation that the Adviser believes approximates
market value. Fund securities that are fair valued may be subject to greater fluctuation in their value from one day to the next
than would be the case if market quotations were used. Because of the inherent uncertainties of valuation, and the
degree of subjectivity in such decisions, the Fund could realize a greater or lesser than expected gain or loss upon the sale
of the investment.
B.
Investment Transactions and Investment Income - Investment transactions are accounted for on a trade date basis. Realized gains and losses from the sale or disposition of securities are computed
on the specific identified cost basis. Interest income is recorded on an accrual basis from settlement date and includes coupon interest
and amortization of premium and accretion of discount on debt securities as applicable. Pay-in-kind interest income
and non-cash dividend income received in the form of securities in lieu of cash are recorded at the fair value of the securities
received. Dividend income (net of withholding tax, if any) is recorded on the ex-dividend date. Realized gains, dividends
and interest received by a Fund may give rise to withholding and other taxes imposed by foreign countries. Tax conventions
between certain countries and the United States may reduce or eliminate such taxes.
The Fund may periodically participate in litigation related to the Fund’s investments. As such, the Fund may receive proceeds from litigation settlements. Any proceeds received are included in the Consolidated
Statement of Operations as realized gain (loss) for investments no longer held and as unrealized gain (loss)
for investments still held.
C.
Country Determination - For the purposes of presentation in the Consolidated Schedule of Investments, the
Adviser may determine the country in which an issuer is located and/or credit risk exposure based
on various factors. These factors may include the laws of the country under which the issuer is organized, where the issuer
maintains a principal office, the country in which the issuer derives 50% or more of its total revenues, the country that has the primary market for the issuer’s securities and its "country of risk" as determined by a third party service provider,
as well as other criteria. Among the other criteria that may be evaluated for making this determination are the country in which
the issuer maintains 50% or more of its assets, the type of security, financial guarantees and enhancements, the nature of
the collateral and the sponsor organization. Country of issuer and/or credit risk exposure has been determined to be the United
States of America, unless otherwise noted.
D.
Dividends and Distributions to Shareholders - The Fund declares and pays dividends from net investment income, if any, to its shareholders annually and records such dividends on the ex-dividend date. Generally,
the Fund distributes net realized taxable capital gains, if any, annually in cash and records them on the ex-dividend
date. Such distributions on a tax basis are determined in conformity with federal income tax regulations, which may differ from
accounting principles generally accepted in the United States of America ("GAAP"). Distributions in excess of tax basis earnings
and profits, if any, are reported in the Fund’s consolidated financial statements as a tax return of capital at fiscal year-end.
E.
Federal Income Taxes - The Fund intends to comply with the provisions of the Internal Revenue Code of
1986, as amended (the “Internal Revenue Code”), applicable to regulated investment companies and to distribute substantially all of the Fund’s taxable earnings to its shareholders. As such, the Fund will not be subject to federal
income taxes on otherwise taxable income (including net realized gains) that is distributed to the shareholders. Therefore,
no provision for federal income taxes is recorded in the consolidated financial statements.
The Fund recognizes the tax benefits of uncertain tax positions only when the position
is more likely than not to be sustained. Management has analyzed the Fund’s uncertain tax positions and concluded that no liability for unrecognized tax benefits should be recorded related to uncertain tax positions. Management is not
aware of any tax positions for which it is reasonably possible that the total amounts of unrecognized tax benefits will change
materially in the next 12 months.
The Subsidiary is classified as a controlled foreign corporation under Subchapter
N of the Internal Revenue Code. Therefore, the Fund is required to increase its taxable income by its share of the Subsidiary’s income. Net investment losses of the Subsidiary cannot be deducted by the Fund in the current period nor carried forward
to offset taxable income in future periods.
Income and capital gain distributions are determined in accordance with federal income
tax regulations, which may differ from GAAP. These differences are primarily due to differing book and tax treatments
for in-kind transactions, losses deferred due to wash sales, and passive foreign investment company adjustments, if any.
The Fund files U.S. federal tax returns and tax returns in certain other jurisdictions.
Generally, the Fund is subject to examinations by such taxing authorities for up to three years after the filing of
the return for the tax period.
F.
Expenses - The Fund has agreed to pay an annual unitary management fee to the Adviser. Out
of the unitary management fee, the Adviser pays Invesco Advisers, Inc.’s (the "Affiliated Sub-Adviser" or "Invesco") fees and substantially all expenses of the Fund, including the costs of transfer agency, custody, fund administration, legal,
audit and other services, except for distribution fees, if any, brokerage expenses, taxes, interest, acquired fund fees
and expenses, if any, litigation expenses and other extraordinary expenses, including proxy expenses (except for such proxies related
to: (i) changes to the Investment Advisory Agreement, (ii) the election of any Board member who is an “interested person” of the Trust or the Adviser (an "Interested Trustee"), or (iii) any other matters that directly benefit the Adviser).
Expenses of the Trust that are excluded from the Fund’s unitary management fee and are directly identifiable to the Fund are applied to the Fund. Expenses of the Trust that are excluded from the Fund’s unitary management fee and are not readily identifiable to the Fund are allocated in such a manner as deemed equitable, taking
into consideration the nature and type of expense and the relative net assets of the Fund.
To the extent the Fund invests in other investment companies, the expenses shown in
the accompanying consolidated financial statements reflect the expenses of the Fund and do not include any expenses
of the investment companies in which it invests. The effects of such investment companies’ expenses are included in the realized and unrealized gain or loss on the investments in the investment companies.
G.
Accounting Estimates - The preparation of the consolidated financial statements in accordance with GAAP
requires management to make estimates and assumptions that affect the reported amounts and
disclosures in the consolidated financial statements, including estimates and assumptions related to taxation. Actual
results could differ from these estimates. All inter-company accounts and transactions have been eliminated in consolidation.
In addition, the Fund monitors for material events or transactions that may occur or become known after the period-end date and
before the date the consolidated financial statements are released to print.
H.
Indemnifications - Under the Trust’s organizational documents, its Officers and Trustees are indemnified against certain liabilities arising out of the performance of their duties to the Trust. Also, under the Subsidiary’s organizational documents, the directors and officers of the Subsidiary are indemnified against certain liabilities
that may arise out of the performance of their duties to the Fund and/or the Subsidiary, respectively. Each Board member who is not an “interested person” (as defined in the 1940 Act) of the Trust or the Adviser (each, an “Independent Trustee”) is also indemnified against certain liabilities arising out of the performance of their duties to the Trust pursuant to an Indemnification
Agreement between such trustee
and the Trust. Additionally, in the normal course of business, the Trust enters into
contracts with service providers that contain general indemnification clauses. The Trust’s maximum exposure under these arrangements is unknown, as this would involve future claims that may be made against the Trust that have not yet occurred.
The risk of material loss as a result of such indemnification claims is considered remote.
I.
Segment Reporting — In November 2023, the FASB issued Accounting Standards Update 2023-07, Segment Reporting (Topic 280): Improvements to Reportable Segment Disclosures (“ASU 2023-07”), with the intent of improving reportable segment disclosure requirements, primarily through enhanced disclosures about significant
segment expenses, allowing financial statement users to better understand the components of a segment’s profit or loss and assess potential future cash flows for each reportable segment and the entity as a whole, thereby enabling better understanding of how an entity’s segments impact overall performance. The Fund represents a single operating segment.
Subject to the oversight and, when applicable, approval of the Board of Trustees, the Adviser acts as the Fund’s chief operating decision maker (“CODM”), assessing performance and making decisions about resource allocation within the Fund.
The CODM monitors the operating results as a whole, and the Fund’s long-term strategic asset allocation is determined in accordance with the terms of its prospectus based on a defined investment strategy. The financial information provided
to and reviewed by the CODM is consistent with that presented in the Fund’s financial statements. Adoption of the new standard impacted the Fund’s financial statement note disclosures only and did not affect the Fund’s financial position or the results of its operations.
J.
Foreign Currency Translations - Foreign currency is valued at the close of the NYSE based on quotations posted
by banks and major currency dealers. Portfolio securities and other assets and liabilities
denominated in foreign currencies are translated into U.S. dollar amounts at the date of valuation. Purchases and sales
of portfolio securities (net of foreign taxes withheld on disposition) and income items denominated in foreign currencies are translated
into U.S. dollar amounts on the respective dates of such transactions. The Fund does not separately account for the
portion of the results of operations resulting from changes in foreign exchange rates on investments and the fluctuations
arising from changes in market prices of securities held. The combined results of changes in foreign exchange rates and the
fluctuation of market prices on investments (net of estimated foreign tax withholding) are included with the net realized
and unrealized gain or loss from investments in the Consolidated Statement of Operations. Reported net realized foreign
currency gains or losses arise from (1) sales of foreign currencies, (2) currency gains or losses realized between the
trade and settlement dates on securities transactions, and (3) the difference between the amounts of dividends, interest, and
foreign withholding taxes recorded on the Fund’s books and the U.S. dollar equivalent of the amounts actually received or paid. Net unrealized foreign currency gains and losses arise from changes in the fair values of assets and liabilities, other
than investments in securities at fiscal period-end, resulting from changes in exchange rates.
The Fund may invest in foreign securities, which may be subject to foreign taxes on
income, gains on investments or currency repatriation, a portion of which may be recoverable. Foreign taxes, if any,
are recorded based on the tax regulations and rates that exist in the foreign markets in which the Fund invests.
The performance of the Fund may be materially affected positively or negatively by
foreign currency strength or weakness relative to the U.S. dollar. Currency rates in foreign countries may fluctuate for
a number of reasons, including changes in interest rates, political, economic, or social instability and development, and imposition
of currency controls. Currency controls in certain foreign jurisdictions may cause the Fund to experience significant delays
in its ability to repatriate its assets in U.S. dollars at quoted spot rates, and it is possible that the Fund’s ability to convert certain foreign currencies into U.S. dollars may be limited and may occur at discounts to quoted rates. As a result, the value of the Fund’s assets and liabilities denominated in such currencies that would ultimately be realized could differ from those reported
on the Consolidated Statement of Assets and Liabilities. Certain foreign companies may be subject to sanctions, embargoes,
or other governmental actions that may limit the ability to invest in, receive, hold, or sell the securities of such companies,
all of which affect the market and/or credit risk of the investments. Because of the inherent uncertainties of valuation, the values
reflected in the consolidated financial statements may materially differ from the value received upon actual sale of those
investments.
K.
Futures Contracts - The Fund will enter into futures contracts to simulate full investment in securities
or manage exposure to equity, interest rate, commodities, and market price movements and/or currency risks
and provide exposure to markets and indexes.
A futures contract is an agreement between two parties ("Counterparties") to purchase
or sell a specified underlying security, index, commodity or financial instrument for a specified price at a future
date. Initial margin deposits required upon entering into futures contracts are satisfied by the segregation of specific securities
or cash as collateral at the futures commission merchant broker. During the period the futures contracts are open, changes
in the value of the contracts are recognized as unrealized gains or losses by recalculating the value of the contracts
on a daily basis. Subsequent or variation margin payments are received or made on commodity futures contracts that do not trade
on the London Metals Exchange (the "LME"), depending upon whether unrealized gains or losses are incurred. These
amounts are reflected as a receivable or payable on the Consolidated Statement of Assets and Liabilities. The Fund may utilize
excess cash or otherwise transfer cash to the broker to satisfy variation margin requirements. For LME contracts, subsequent
variation margin payments are not made and the value of the contracts is presented as net unrealized appreciation (depreciation)
on the Consolidated Statement of Assets and Liabilities. When the contracts are closed or expire, the Fund recognizes
a realized gain or loss equal to the difference between the proceeds from, or cost of, the closing transaction and the Fund’s basis in the contract. The net
realized gain (loss) and the change in unrealized gain (loss) on futures contracts
held during the period is included on the Consolidated Statement of Operations.
For settlement of LME commodity futures contracts, cash is not transferred until the
settled futures contracts expire. Net realized gains or losses on LME contracts which have been closed out but for which
the contract has not yet expired are reflected as a receivable or payable on the Consolidated Statement of Assets and Liabilities.
The primary risks associated with futures contracts are market risk, leverage risk
and the absence of a liquid secondary market. If the Fund were unable to liquidate a futures contract and/or enter into
an offsetting closing transaction, the Fund would continue to be subject to market risk with respect to the value of the contracts
and may be required to continue to maintain the margin deposits on the futures contracts until the position expired or
matured. Unlike equities, which typically entitle the holder to a continuing stake in a corporation, futures contracts normally
specify a certain date for delivery of the underlying asset for settlement in cash based on the level of the underlying asset.
As futures contracts approach expiration, they may be replaced by similar contracts that have a later expiration. This process is referred to as “rolling." If the market for these contracts is in “contango,” meaning that the prices of futures contracts in the nearer months are lower than the price of contracts in the distant months, the sale of the near-term month contract would be
at a lower price than the longer-term contract, resulting in a cost to “roll” the futures contract. The actual realization of a potential roll cost will depend on the difference in price of the near and distant contracts. In addition, futures contracts
may be subject to contractual or other restrictions on resale and may lack readily available markets for resale. Futures
have minimal Counterparty risk since the exchange’s clearinghouse, as Counterparty to all exchange-traded futures contracts, guarantees the futures against default. Risks may exceed amounts recognized in the Consolidated Statement of Assets and Liabilities.
AP Concentration Risk. Only APs may engage in creation or redemption transactions directly with the Fund.
The Fund has a limited number of institutions that may act as APs, and such APs have no obligation
to submit creation or redemption orders. Consequently, there is no assurance that APs will establish or maintain an active
trading market for the Shares. This risk may be heightened to the extent that securities held by the Fund are traded outside a
collateralized settlement system. In that case, APs may be required to post collateral on certain trades on an agency basis
(i.e., on behalf of other market participants), which only a limited number of APs may be able to do. In addition,
to the extent that APs exit the business or are unable to proceed with creation and/or redemption orders with respect to the Fund
and no other AP is able to step forward to create or redeem Creation Units, this may result in a significantly diminished trading
market for Fund Shares, and Shares may be more likely to trade at a premium or discount to the Fund’s NAV and to face trading halts and/or delisting. Additionally, to the extent that the Fund holds non-U.S. securities, such securities may have lower
trading volumes or could experience extended market closures or trading halts. To the extent that the Fund invests in
non-U.S. securities, it may face increased risks that APs may not be able to effectively create or redeem Creation Units, or
that the Shares may be halted and/or delisted.
Cash Transaction Risk. Most exchange-traded funds ("ETFs") generally make in-kind redemptions to avoid
being taxed on gains on the distributed portfolio securities at the fund level. However, unlike most
ETFs, the Fund currently intends to effect creations and redemptions principally for cash, rather than principally in-kind, due to the nature of the Fund’s investments. As such, the Fund may be required to sell portfolio securities to obtain the cash needed
to distribute redemption proceeds. Therefore, the Fund may recognize a capital gain on these sales and/or incur brokerage
fees that might not have been incurred if the Fund had made a redemption in-kind. To the extent any transaction
costs are not offset by transaction fees imposed on APs, such costs may decrease the Fund’s net asset value. These costs may also decrease the tax efficiency of the Fund compared to ETFs that utilize an in-kind redemption process and there may be
a substantial difference in the after-tax rate of return between the Fund and conventional ETFs.
Commodity-Linked Derivatives Risk. Investments linked to the prices of commodities may be considered speculative. The Fund’s significant investment exposure to commodities may subject the Fund to greater volatility than investments in traditional securities. Therefore, the value of such instruments may be volatile and
fluctuate widely based on a variety of macroeconomic factors or commodity-specific factors. At times, price fluctuations
may be quick and significant and may not correlate to price movements in other asset classes, such as stocks, bonds and cash.
Commodity Pool Risk. The Subsidiary’s investments in futures contracts have caused it and the Fund to be deemed commodity pools, thereby subjecting the Subsidiary and the Fund to regulation under
the Commodity Exchange Act and Commodity Futures Trading Commission ("CFTC") rules. The Adviser is registered as a commodity pool operator (“CPO”) and as a commodity trading advisor (“CTA”), and will manage both the Fund and the Subsidiary in accordance with CFTC rules, as well as the rules that apply to registered investment companies. Registration as a
CPO or CTA subjects the Adviser to additional laws, regulations and enforcement policies, which could increase compliance
costs and may affect the operations and financial performance of the Fund or the Subsidiary. Registration as a commodity
pool may have negative effects on the ability of the Fund or the Subsidiary to engage in its planned investment program. Additionally, the Subsidiary’s positions in futures contracts may have to be liquidated at disadvantageous times or prices to
prevent the Fund from exceeding any applicable position limits established by the CFTC. Such actions may subject the Fund
to substantial losses.
Futures Contracts Risk. Risks of futures contracts include: (i) an imperfect correlation between the value
of the futures contract and the underlying reference asset; (ii) possible lack of a liquid secondary
market; (iii) the inability to close a futures
contract when desired; (iv) losses caused by unanticipated market movements, which
may be unlimited; (v) an obligation for the Fund to make daily cash payments to maintain its required margin, particularly
at times when the Fund may have insufficient cash or must sell securities to meet those margin requirements; (vi)
the possibility that a failure to close a position may result in the Fund receiving an illiquid asset; and (vii) unfavorable execution
prices from rapid selling.
Interest Rate Risk. The Fund’s investments in U.S. Government securities and commercial paper will change in value in response to interest rate changes and other factors, such as the perception of an issuer’s creditworthiness. For example, the value of fixed-income securities generally decrease when interest rates rise, which may cause the Fund’s value to decrease. Also, investments in fixed-income securities with longer maturities fluctuate more
in response to interest rate changes.
Leveraging Risk. The Fund’s use of futures contracts will have the economic effect of financial leverage. Financial leverage magnifies exposure to the swings in prices of the reference asset underlying an instrument,
which means the Fund will have the potential for greater losses than if the Fund did not use instruments with a leveraging
effect. Leveraging may cause the Fund’s net asset value to experience heightened volatility.
Liquidity Risk. Liquidity risk exists when a particular investment is difficult to purchase or sell.
If the Fund invests in illiquid securities or current portfolio securities become illiquid, it may reduce the returns
of the Fund because the Fund may be unable to sell the illiquid securities at an advantageous time or price. There is
no assurance that a liquid secondary market will exist for any particular futures contract at any particular time, which may make it
difficult for the Fund to sell them at an acceptable price, purchase a sufficient quantity at an acceptable price, or to accurately
value them.
Management Risk. The Fund is subject to management risk because it is an actively managed portfolio.
In managing the Fund’s portfolio holdings, the Affiliated Sub-Adviser applies investment techniques and risk analyses in making investment decisions for the Fund, but there can be no guarantee that these actions will produce
the desired results.
Market Risk. Securities held by the Fund are subject to market fluctuations. You should anticipate
that the value of the Shares will decline more or less, in correlation with any decline in value of the securities in the Fund’s portfolio. Additionally, natural or environmental disasters, widespread disease or other public health issues,
war, military conflicts, acts of terrorism, economic crises or other events could result in increased premiums or discounts to the Fund’s NAV. Certain changes in the U.S. economy in particular, such as when the U.S. economy weakens or when its financial
markets decline, may have a material adverse effect on global financial markets as a whole, and on the securities
to which the Fund has exposure. Increasingly strained relations between the U.S. and foreign countries, including
as a result of economic sanctions and tariffs, may also adversely affect U.S. issuers, as well as non-U.S. issuers.
During a general downturn in the financial markets, multiple asset classes may decline
in value. When markets perform well, there can be no assurance that specific investments held by the Fund will rise in
value.
Non-Diversified Fund Risk. Because the Fund is non-diversified and can invest a greater portion of its assets
in securities of individual issuers than can a diversified fund, changes in the market value of a single
investment could cause greater fluctuations in Share price than would occur in a diversified fund. This may increase the Fund’s volatility and cause the performance of a relatively small number of issuers to have a greater impact on the Fund’s performance.
Subsidiary Investment Risk. By investing in the Subsidiary, the Fund is indirectly exposed to the risks associated
with its Subsidiary’s investments. The Subsidiary is not registered under the 1940 Act; therefore the Fund will not receive all of the protections offered to investors in registered investment companies. Changes in the
laws of the United States and/or the Cayman Islands could result in the inability of the Fund and/or the Subsidiary to
operate as intended, which may negatively affect the Fund and its shareholders.
Tax Risk. The tax treatment of commodity-linked derivative instruments may be adversely affected
by changes in legislation, regulations or other legally binding authority. If, as a result of any such adverse
action, the income of the Fund from certain commodity-linked derivatives was treated as non-qualifying income, the Fund might
fail to qualify as a regulated investment company (“RIC”) and be subject to federal income tax at the Fund level. As a RIC, the Fund must derive at least 90% of its gross income for each taxable year from sources treated as qualifying income under
the Internal Revenue Code. The IRS has issued a number of private letter rulings to other RICs (upon which only the Fund
that received the private letter ruling can rely), which indicate that income from the Fund’s investment in certain commodity-linked notes and a wholly owned foreign subsidiary that invests in commodity-linked derivatives, such as the Subsidiary, constitutes
qualifying income. However, the portion of such rulings relating to the treatment of a corporation as a RIC that require
a determination of whether a financial instrument or position is a security under section 2(a)(36) of the 1940 Act was revoked because of changes in the IRS’s position. (A financial instrument or position that constitutes a security under section
2(a)(36) of the 1940 Act generates qualifying income for a corporation taxed as a RIC.) Accordingly, the Fund may invest
in certain commodity-linked notes: (a) directly, relying on an opinion of counsel confirming that income from such investments
should be qualifying income because such commodity-linked notes constitute securities under section 2(a)(36) of the 1940
Act or (b) indirectly through the Subsidiary. Should the IRS issue further guidance, or Congress enact legislation,
that adversely affects the tax treatment of the Fund’s use of the Subsidiary (which guidance might be applied to the Fund retroactively), it could limit the Fund’s ability to pursue its investment strategy and the Fund might not qualify as a RIC for one or more years. In this event, the Fund’s Board may authorize a significant change in investment strategy or other action. In lieu
of potential disqualification, the Fund is permitted to pay a tax for certain failures to satisfy the income requirement, which,
in general, are limited to those due to
reasonable cause and not willful neglect. The Fund also may incur transaction and
other costs to comply with any new or additional guidance from the IRS.
Valuation Risk. Financial information related to securities of non-U.S. issuers may be less reliable
than information related to securities of U.S. issuers, which may make it difficult to obtain a current price
for a non-U.S. security held by the Fund. In certain circumstances, market quotations may not be readily available for some Fund
securities, and those securities may be fair valued. The value established for a security through fair valuation may be different
from what would be produced if the security had been valued using market quotations. Fund securities that are valued
using techniques other than market quotations, including “fair valued” securities, may be subject to greater fluctuations in their value from one day to the next than would be the case if market quotations were used. In addition, there is no assurance
that the Fund could sell a portfolio security for the value established for it at any time, and it is possible that the
Fund would incur a loss because a security is sold at a discount to its established value.
Valuation Time Risk. Because foreign exchanges may be open on days when a Fund does not price its Shares,
the value of the non-U.S. securities in a Fund’s portfolio may change on days when you will not be able to purchase or sell your Shares. As a result, trading spreads and the resulting premium or discount on the Shares may
widen, and, therefore, increase the difference between the market price of the Shares and the NAV of such Shares.
NOTE 3—Investment Advisory Agreement and Other Agreements
The Trust has entered into an Investment Advisory Agreement with the Adviser on behalf
of the Fund, pursuant to which the Adviser has overall responsibility for the selection and ongoing monitoring of the Fund’s investments, managing the Fund’s business affairs, providing certain clerical, bookkeeping and other administrative
services, and oversight of the Affiliated Sub-Adviser.
Pursuant to the Investment Advisory Agreement, the Fund accrues daily and pays monthly
to the Adviser an annual unitary management fee of 0.65% of the Fund’s average daily net assets. Out of the unitary management fee, the Adviser pays the Affiliated Sub-Adviser’s fees and substantially all expenses of the Fund, including the costs of transfer agency, custody, fund administration, legal, audit and other services, except for distribution fees, if
any, brokerage expenses, taxes, interest, acquired fund fees and expenses, if any, litigation expenses and other extraordinary expenses,
including proxy expenses (except for such proxies related to: (i) changes to the Investment Advisory Agreement, (ii) the election
of an Interested Trustee, or (iii) any other matters that directly benefit the Adviser).
The Adviser has entered into an Investment Sub-Advisory Agreement with the Affiliated
Sub-Adviser. The sub-advisory fee for the Fund is paid by the Adviser to the Affiliated Sub-Adviser at 40% of the Adviser’s compensation of the sub-advised assets of the Fund.
Through at least August 31, 2027, the Adviser has contractually agreed to waive the
management fee payable by the Fund in an amount equal to the lesser of: (i) 100% of the net advisory fees earned by the
Adviser or an affiliate of the Adviser that are attributable to the Fund’s investments in money market funds that are managed by affiliates of the Adviser and other funds (including ETFs) managed by the Adviser or affiliates of the Adviser or (ii) the management
fee available to be waived. There is no guarantee that the Adviser will extend the waiver of these fees past that date.
For the period March 17, 2025 (commencement of investment operations) through April
30, 2025, the Adviser waived fees of $35,419.
The Trust has entered into a Distribution Agreement with Invesco Distributors, Inc. (the “Distributor”), which serves as the distributor of Creation Units for the Fund. The Distributor does not maintain a secondary
market in the Shares. The Fund is not charged any fees pursuant to the Distribution Agreement. The Distributor is an affiliate
of the Adviser.
The Trust has entered into service agreements whereby BNYM, a wholly-owned subsidiary
of The Bank of New York Mellon Corporation, serves as the administrator, custodian, fund accountant and transfer
agent for the Fund.
NOTE 4—Additional Valuation Information
GAAP defines fair value as the price that would be received to sell an asset or paid
to transfer a liability in an orderly transaction between market participants at the measurement date, under current market conditions.
GAAP establishes a hierarchy that prioritizes the inputs to valuation methods, giving the highest priority to readily
available unadjusted quoted prices in an active market for identical assets (Level 1) and the lowest priority to significant unobservable
inputs (Level 3), generally when market prices are not readily available. Based on the valuation inputs, the securities or
other investments are tiered into one of three levels. Changes in valuation methods may result in transfers in or out of an investment’s assigned level:
Level 1 – Prices are determined using quoted prices in an active market for identical assets.
Level 2 – Prices are determined using other significant observable inputs. Observable inputs are inputs that other market participants may use in pricing a security. These may include quoted prices for similar
securities, interest rates, prepayment speeds, credit risk, yield curves, loss severities, default rates, discount
rates, volatilities and others.
Level 3 – Prices are determined using significant unobservable inputs. In situations where quoted prices or observable inputs are unavailable (for example, when there is little or no market activity for an investment
at the end of the period), unobservable inputs may be used. Unobservable inputs reflect the Adviser’s assumptions about the factors market participants would use in determining fair value of the securities or instruments
and would be based on the best available information.
As of April 30, 2025, all of the securities in the Fund were valued based on Level
1 inputs (see the Consolidated Schedule of Investments for security categories). The level assigned to the securities valuations
may not be an indication of the risk or liquidity associated with investing in those securities. Because of the inherent uncertainties
of valuation, the values reflected in the consolidated financial statements may materially differ from the value received upon
actual sale of those investments.
NOTE 5—Derivative Investments
The Fund may enter into an International Swaps and Derivatives Association Master
Agreement ("ISDA Master Agreement") under which the Fund may trade OTC derivatives. An OTC transaction entered
into under an ISDA Master Agreement typically involves a collateral posting arrangement, payment netting provisions
and close-out netting provisions. These netting provisions allow for reduction of credit risk through netting of contractual
obligations. The enforceability of the netting provisions of the ISDA Master Agreement depends on the governing law of the ISDA Master
Agreement, among other factors.
For financial reporting purposes, the Fund does not offset OTC derivative assets or
liabilities that are subject to ISDA Master Agreements in the Consolidated Statement of Assets and Liabilities.
Value of Derivative Investments at Period-End
The table below summarizes the value of the Fund’s derivative investments, detailed by primary risk exposure, held as of April 30, 2025:
|
|
|
|
|
|
|
|
|
Unrealized appreciation on futures contracts—Exchange-Traded(a)
|
|
|
|
|
Derivatives not subject to master netting agreements
|
|
|
|
|
Total Derivative Assets subject to master netting agreements
|
|
|
|
|
|
|
|
|
|
|
|
|
|
Unrealized depreciation on futures contracts—Exchange-Traded(a)
|
|
|
|
|
Derivatives not subject to master netting agreements
|
|
|
|
|
Total Derivative Liabilities subject to master netting agreements
|
|
|
|
|
|
|
Includes cumulative appreciation (depreciation) on futures contracts. Only current day’s variation margin receivable (payable) is reported within the
Consolidated Statement of Assets and Liabilities for non-LME futures contracts.
|
Effect of Derivative Investments for the period March 17, 2025 (commencement of investment
operations) through April 30, 2025
The table below summarizes the Fund’s gains (losses) on derivative investments, detailed by primary risk exposure, recognized in earnings during the period:
|
|
Location of Gain
on Consolidated
Statement of Operations
|
|
|
|
|
|
|
|
|
|
|
|
|
|
|
|
|
|
|
|
|
|
Change in Net Unrealized Appreciation (Depreciation):
|
|
|
|
|
|
|
|
|
|
|
|
|
|
|
|
|
|
|
|
The table below summarizes the average notional value of derivatives held during the
period.
NOTE 6—Investment Transactions
There were no securities (other than short-term securities, U.S. Government obligations,
money market funds and in-kind transactions, if any) purchased or sold by the Fund during the period March 17, 2025
(commencement of investment operations) through April 30, 2025.
In the Fund’s initial year of operations, the cost of investments for tax purposes will not reflect any tax adjustments until its fiscal year-end reporting period. As of April 30, 2025, the cost of investments is
the same for tax and financial reporting purposes. The net unrealized appreciation (depreciation) was $4,377,418 consisting
of gross appreciation of $10,194,940 and gross depreciation of $(5,817,522).
NOTE 7—Trustees’ and Officer’s Fees
The Adviser, as a result of the Fund’s unitary management fee, pays remuneration to the Independent Trustees and an Officer of the Trust on behalf of the Fund. Interested Trustees do not receive any Trustees’ fees.
The Trust has adopted a deferred compensation plan (the “Plan”). Under the Plan, each Independent Trustee who has executed a Deferred Fee Agreement (a “Participating Trustee”) may defer receipt of all or a portion of their compensation (“Deferral Fees”). Such Deferral Fees are deemed to be invested in select Invesco ETFs. The Deferral Fees payable to a Participating Trustee are valued as of the date such Deferral Fees would have been paid to a Participating
Trustee. The value increases with contributions or with increases in the value of the Shares selected, and the value
decreases with distributions or with declines in the value of the Shares selected. Obligations under the Plan represent unsecured claims
against the general assets of the Fund.
Shares are issued and redeemed by the Fund only in Creation Units as discussed in
Note 1. Only APs are permitted to purchase or redeem Creation Units from the Fund.
To the extent that the Fund permits transactions in exchange for Deposit Securities,
the Fund may issue Shares in advance of receipt of Deposit Securities subject to various conditions, including a requirement
to maintain on deposit with the Trust cash at least equal to 105% of the market value of the missing Deposit Securities. In accordance with the Trust’s Participant Agreement, Creation Units will be issued to an AP, notwithstanding the fact that the corresponding
Deposit Securities have not been received in part or in whole, in reliance on the undertaking of the AP to deliver the missing
Deposit Securities as soon as possible, which undertaking shall be secured by the AP’s delivery and maintenance of collateral consisting of cash in the form of U.S. dollars in immediately available funds having a value (marked-to-market daily) at least equal
to 105%, which the Adviser may change from time to time, of the value of the missing Deposit Securities.
Certain transaction fees may be charged by the Fund for creations and redemptions,
which are treated as increases in capital.
Transactions in the Fund’s Shares are disclosed in detail in the Consolidated Statement of Changes in Net Assets.
Approval of Investment Advisory and Sub-Advisory Contracts
At a meeting held on March 13, 2025, the Board of Trustees of the Invesco Actively
Managed Exchange-Traded Fund Trust (the “Trust”), including the Independent Trustees, approved the Investment Advisory Agreement (the “Advisory Agreement”) between Invesco Capital Management LLC (the “Adviser”) and the Trust for Invesco Managed Futures Strategy ETF, Invesco International Growth Focus ETF, Invesco QQQ Hedged Advantage ETF and Invesco Comstock Contrarian Equity ETF (each, a “Fund” and collectively, the “Funds”) and the Investment Sub-Advisory Agreement for each Fund, between the Adviser and the following seven affiliated sub-advisers (the “Sub-Advisory Agreement”): Invesco Advisers, Inc. (as the initial sub-adviser for each Fund); Invesco Asset Management Deutschland GmbH; Invesco Asset Management Limited; Invesco
Asset Management (Japan) Limited; Invesco Hong Kong Limited; Invesco Senior Secured Management, Inc.; and Invesco Canada Ltd. (each, a “Sub-Adviser” and collectively, the “Sub-Advisers”).
The Trustees reviewed information from the Adviser describing: (i) the nature, extent
and quality of services to be provided, (ii) the proposed unitary advisory fee for each Fund and comparisons to amounts paid by
other comparable registered investment companies, (iii) the extent to which economies of scale may be realized as each Fund
grows and whether the fee levels reflect any possible economies of scale for the benefit of Fund shareholders, and (iv) any further
benefits to be realized by the Adviser or its affiliates from the Adviser’s relationship with each Fund.
Nature, Extent and Quality of Services. In evaluating the nature, extent and quality of the Adviser’s services, the Trustees reviewed information concerning the functions to be performed by the Adviser for each
Fund, including the persons who will be responsible for the day-to-day management of the Funds, and they considered the quality
of services provided by the Adviser to other exchange-traded funds (“ETFs”). The Trustees considered information regarding each Fund’s investment objective, strategies and process. The Trustees noted other information the Board received and considered describing the Adviser’s current organization and staffing, including operational support provided by the Adviser’s parent organization, Invesco Ltd. The Trustees reviewed information related to the Adviser’s and Sub-Advisers’ portfolio transaction policies and procedures. Because the Funds had not yet commenced operations, the Trustees noted that no performance information
for the Funds could be provided.
The Trustees considered the services to be provided by the Adviser in its oversight of the Funds’ administrator, custodian, transfer agent and the Sub-Advisers. They noted the significant amount of time, effort
and resources that had been devoted to this oversight function for the other ETFs managed by the Adviser and that was expected
to be provided for each Fund.
Based on its review, the Board concluded that the nature, extent and quality of the
services to be provided by the Adviser to each Fund under the Advisory Agreement were expected to be appropriate and reasonable.
Fees, Expenses and Profitability. The Trustees reviewed and discussed the information provided by the Adviser on each Fund’s proposed unitary advisory fee, as compared to information compiled by the Adviser from Lipper Inc. (“Lipper”) databases on the median net expense ratios of comparable passive ETFs, open-end (non-ETF) index funds,
open-end (non-ETF) actively managed funds and to Adviser-identified select peer funds, as applicable. The Trustees noted
that the proposed annual advisory fee to be charged to each Fund was a unitary fee, and that the Adviser has agreed to pay all
other operating expenses of each Fund, including the fees payable to the Sub-Advisers, except for brokerage expenses, taxes,
interest, acquired fund fees and expenses, if any, litigation expenses, costs incurred in connection with proxies (except certain
proxies) and other extraordinary expenses. The Trustees noted each Fund’s proposed unitary advisory fee as compared to the median net expense ratios of its Lipper peer groups and a select peer group as shown below:
|
|
Passive ETF
Peer Group
(Number of Peers)
|
Open-End
Index Fund
Peer Group
(Number of Peers)
|
Open-End
Active Fund
Peer Group
(Number of Peers)
|
Select
Peer Group
(Number of Peers)
|
Invesco Managed Futures Strategy ETF
|
|
|
|
|
Invesco International Growth Focus ETF
|
|
|
|
|
Approval of Investment Advisory and Sub-Advisory Contracts—(continued)
|
|
Passive ETF
Peer Group
(Number of Peers)
|
Open-End
Index Fund
Peer Group
(Number of Peers)
|
Open-End
Active Fund
Peer Group
(Number of Peers)
|
Select
Peer Group
(Number of Peers)
|
Invesco QQQ Hedged Advantage ETF
|
|
|
|
|
Invesco Comstock Contrarian Equity ETF
|
|
|
|
|
Based on all of the information provided, the Board concluded that each Fund’s proposed unitary advisory fee was reasonable and appropriate in light of the services to be provided, the distinguishing factors of
the Fund, and the administrative, operational and management oversight services to be provided by the Adviser and the related costs
in providing such services.
In conjunction with their review of the unitary advisory fees, the Trustees also considered
the sub-advisory fees to be paid by the Adviser for each Fund. The Adviser did not provide a profitability analysis for the
Adviser in managing the Funds because the Funds had not yet commenced operations. However, the Trustees noted other information
the Board received and considered regarding the Adviser’s overall profitability from its relationship with other ETFs for which it serves as investment adviser.
Economies of Scale and Whether Fee Levels Reflect These Economies of Scale. The Trustees reviewed the information provided by the Adviser as to the extent to which economies of scale may be realized as each
Fund grows and whether fee levels reflect economies of scale for the benefit of the Fund’s shareholders. The Trustees noted that any reduction in fixed costs associated with the management of each Fund would be enjoyed by the Adviser, but a unitary advisory
fee provides a level of certainty in expenses for each Fund. The Board considered whether the proposed unitary advisory
fee rate for each Fund was reasonable in relation to the proposed services and product strategy of each Fund, and it concluded
that the unitary advisory fee rates were reasonable and appropriate.
Fall-out Benefits. The Trustees considered that the Adviser identified no additional benefits that it
will receive from its relationship with the Funds, and noted that the Adviser will not be a party to any soft-dollar,
commission recapture or directed brokerage arrangements with respect to the Funds. The Trustees considered benefits to be received
by affiliates of the Adviser that may be directly or indirectly attributed to the Adviser’s relationship with the Funds, including brokerage fees, advisory fees from affiliated money market cash management vehicles and fees as the Funds’ securities lending agent. The Trustees also considered that Invesco Distributors, Inc., an affiliate of the Adviser, will serve as each Fund’s distributor and will be paid a distribution fee by the Adviser. The Board concluded that each Fund’s proposed unitary advisory fee was reasonable, taking into account any ancillary benefits to be received by affiliates of the Adviser.
Based on all of the information considered and the conclusions reached, the Board,
including the Independent Trustees, determined to approve the Advisory Agreement for each Fund. No single factor was determinative in the Board’s analysis.
As noted above, the Board of Trustees of the Trust, including the Independent Trustees,
approved the Sub-Advisory Agreement for each Fund at a meeting held on March 13, 2025. The review process followed by
the Board is described in detail above. In connection with the review of the Sub-Advisory Agreement, the Board considered the
factors described below, among others.
Nature, Extent and Quality of Services. The Trustees considered the nature, extent and quality of services to be provided
to each Fund under the Sub-Advisory Agreement. The Trustees reviewed the qualifications and
background of each Sub-Adviser, the services to be provided by each Sub-Adviser, the investment approach of each Sub-Adviser
whose investment personnel will manage the Funds, and the investment personnel who will be responsible for the day-to-day
management of each Fund. The Board considered additional information it received regarding each Fund’s investment strategy during presentations from certain of the initial sub-adviser’s portfolio managers for the Funds at the Board’s December 12, 2024 meeting.
Based on its review, the Board concluded that the nature, extent and quality of services
to be provided by the Sub-Advisers to each Fund under the Sub-Advisory Agreement were expected to be appropriate and reasonable.
Fees and Expenses. The Trustees reviewed and discussed the information provided by the Adviser and the
Sub-Advisers on the sub-advisory fee rates under the Sub-Advisory Agreement. The Trustees noted that
the sub-advisory fees to be charged by the
Approval of Investment Advisory and Sub-Advisory Contracts—(continued)
Sub-Advisers under the Sub-Advisory Agreement are consistent with the compensation
structure used throughout Invesco when Invesco’s affiliates provide sub-advisory services for funds managed by other Invesco affiliates. The Trustees considered how the sub-advisory fees relate to the overall advisory fee for each Fund and noted that
the Adviser will compensate the Sub-Advisers from its fee.
Economies of Scale and Whether Fee Levels Reflect These Economies of Scale. As part of their review of the Advisory Agreement for each Fund, the Trustees considered the extent to which economies of scale may
be realized as each Fund grows and whether fee levels reflect economies of scale for the benefit of the Fund’s shareholders. The Board considered whether the sub-advisory fee rate for each Fund is reasonable in relation to the proposed services and product
strategy of the Fund, and they concluded that the flat sub-advisory fee rates were reasonable and appropriate.
Fall-out Benefits. The Trustees noted that Invesco Advisers, Inc. will receive management fees from affiliated
money market funds into which the Funds’ and other Invesco ETFs’ excess cash and securities lending collateral may be invested, and that the Adviser will waive its fees with respect to each Fund in an amount equal to the fees
received by Invesco Advisers, Inc. on the Fund’s excess cash invested in the affiliated money market funds. The Trustees also noted the fees received by Invesco Advisers, Inc. in its capacity as securities lending agent for the Invesco ETFs. The Trustees
considered that Invesco Advisers, Inc. may use or generate soft-dollars with respect to the Invesco International Growth Focus ETF
and the Invesco Comstock Contrarian Equity ETF. The Trustees noted that the Sub-Advisers had not identified any further benefits
that they would derive from their relationships with the Funds. The Board concluded that the sub-advisory fee with
respect to each Fund was reasonable, taking into account any ancillary benefits expected to be received by the Sub-Advisers.
Based on all of the information considered and the conclusions reached, the Board,
including the Independent Trustees, determined to approve the Sub-Advisory Agreement for each Fund. No single factor was determinative in the Board’s analysis.
Other Information Required in Form N-CSR (Items 8-11)
Changes in and Disagreements with Accountants for Open-End Management Investment Companies
Proxy Disclosures for Open-End Management Investment Companies
Remuneration Paid to Directors, Officers, and Others of Open-End Management Investment
Companies
Remuneration paid to the Fund’s trustees or officers and others, if any, is disclosed within the financial statements.
Statement Regarding Basis for Approval of Investment Advisory Contracts
The statement regarding basis for approval of investment advisory contracts can be
found in the Approval of Investment Advisory and Sub-Advisory Contracts section of this report.
©2025 Invesco Capital Management LLC
3500 Lacey Road, Suite 700
Downers Grove, IL 60515
P-MF-NCSRS
invesco.com/ETFs
Invesco Semi-Annual Financial Statements and Other Information
|
|
Invesco Rochester High Yield Municipal ETF (formerly, Invesco Municipal Strategic
Income
ETF)
|
Invesco Rochester High Yield Municipal ETF (IROC)
April 30, 2025
(Unaudited)
Schedule of Investments
|
|
|
|
|
|
Municipal Obligations-97.34%
|
|
|
|
|
|
|
|
|
|
|
|
|
Mobile (County of), AL Industrial Development Authority (AM/NS Calvert LLC), Series
2024, RB(a)
|
|
|
|
|
|
|
|
|
|
|
|
|
Pima (County of), AZ Industrial Development Authority (American Leadership Academy)
(The),
Series 2022, Ref. RB(b)
|
|
|
|
|
|
|
|
|
|
|
|
|
Arkansas (State of) Development Finance Authority (U.S. Steel Corp.) (Green Bonds),
Series 2023,
RB(a)
|
|
|
|
|
|
|
|
|
|
|
|
|
California (State of) Infrastructure & Economic Development Bank (Brightline West
Passenger Rail)
(Green Bonds), Series 2025 B, Ref. RB(a)(b)(c)
|
|
|
|
|
|
California (State of) Pollution Control Financing Authority (Poseidon Resources L.P.),
Series 2023,
RB(a)(b)
|
|
|
|
|
|
California (State of) Public Finance Authority (California University of Science and
Medicine),
Series 2019 A, RB(b)
|
|
|
|
|
|
California (State of) Statewide Communities Development Authority (Loma Linda University
Medical
Center), Series 2014, RB
|
|
|
|
|
|
|
|
|
|
|
|
|
|
|
|
|
|
|
|
Centerra Metropolitan District No. 1 (In the City of Loveland), Series 2017, RB(b)
|
|
|
|
|
|
District of Columbia-1.08%
|
|
|
|
|
|
District of Columbia (Provident Group - Howard Properties LLC), Series 2013, RB
|
|
|
|
|
|
|
|
|
|
|
|
|
Capital Projects Finance Authority (Millenia Orlando), Series 2025 A, RB(b)
|
|
|
|
|
|
Capital Trust Authority (St.Johns Classical Academy, Inc.), Series 2025, Ref. RB(b)
|
|
|
|
|
|
Florida Development Finance Corp. (Brightline Florida Passenger Rail Expansion), Series
2024, Ref.
RB(a)(b)(c)
|
|
|
|
|
|
Florida Development Finance Corp. (Brightline Florida Passenger Rail Expansion), Series
2024, Ref.
RB(a)
|
|
|
|
|
|
Lee (County of), FL Industrial Development Authority (Shell Point Obligated Group),
Series 2024 B-3,
RB
|
|
|
|
|
|
Miami Beach (City of), FL, Series 2017, Ref. RB
|
|
|
|
|
|
|
|
|
|
|
|
|
|
|
|
|
|
|
|
Chicago (City of), IL Board of Education, Series 2012 B, Ref. GO Bonds
|
|
|
|
|
|
Chicago (City of), IL Board of Education, Series 2015 C, GO Bonds
|
|
|
|
|
|
Illinois (State of) Finance Authority (Rush University Medical Center), Series 2015
A, Ref. RB
|
|
|
|
|
|
Marion (City of), IL (Star Bond District Project Area No. 1), Series 2025, RB
|
|
|
|
|
|
|
|
|
|
|
|
|
|
|
|
|
|
|
|
Indiana (State of) Finance Authority (U.S. Steel Corp.), Series 2021 A, Ref. RB
|
|
|
|
|
|
Whiting (City of), IN (BP Products North America, Inc.), Series 2015, RB(a)(c)
|
|
|
|
|
|
|
|
|
|
|
|
|
|
|
|
|
|
|
|
Iowa (State of) Finance Authority (Iowa Fertilizer Co.), Series 2022, Ref. RB(c)(d)
|
|
|
|
|
|
|
|
|
|
|
|
|
Kentucky (Commonwealth of) Economic Development Finance Authority (Next Generation
Kentucky
Information Highway), Series 2015 A, RB
|
|
|
|
|
|
|
|
|
|
|
|
|
Louisiana (State of) Public Facilities Authority (I-10 Calcasieu River Bridge), Series
2024, RB(a)
|
|
|
|
|
|
See accompanying Notes to Financial Statements which are an integral part of the financial
statements.
Invesco Rochester High Yield Municipal ETF (IROC)—(continued)
April 30, 2025
(Unaudited)
|
|
|
|
|
|
|
|
|
|
|
|
|
Maryland Economic Development Corp. (Purple Line) (Green Bonds), Series 2022 A, RB(a)
|
|
|
|
|
|
Rockville (City of), MD (Ingleside at King Farm), Series 2017 A-1, Ref. RB
|
|
|
|
|
|
|
|
|
|
|
|
|
|
|
|
|
|
|
|
Massachusetts (Commonwealth of) Development Finance Agency (Lasell Village, Inc.),
Series 2025,
RB
|
|
|
|
|
|
|
|
|
|
|
|
|
Michigan (State of) Strategic Fund (Green Bonds), Series 2021, RB(a)(c)
|
|
|
|
|
|
|
|
|
|
|
|
|
Tobacco Settlement Financing Corp., Series 2018 B, Ref. RB
|
|
|
|
|
|
|
|
|
|
|
|
|
Build NYC Resource Corp. (Brooklyn Navy Yard), Series 2019, Ref. RB,
(LOC - Santander Bank N.A.)(a)(b)(e)
|
|
|
|
|
|
New York Transportation Development Corp. (American Airlines, Inc. John F. Kennedy
International
Airport), Series 2021, Ref. RB(a)
|
|
|
|
|
|
New York Transportation Development Corp. (John F. Kennedy International Airport New
Terminal
One) (Green Bonds), Series 2023, RB(a)
|
|
|
|
|
|
New York Transportation Development Corp. (LaGuardia Airport Terminal B Redevelopment),
Series 2023, RB(a)
|
|
|
|
|
|
New York Transportation Development Corp. (Terminal 4 JFK International Airport) (Green
Bonds),
Series 2024, Ref. RB(a)
|
|
|
|
|
|
|
|
|
|
|
|
|
|
|
|
|
|
|
|
Ward (County of), ND (Trinity Obligated Group), Series 2017 C, RB
|
|
|
|
|
|
|
|
|
|
|
|
|
Buckeye Tobacco Settlement Financing Authority, Series 2020 B-2, Ref. RB
|
|
|
|
|
|
Ohio (State of) Housing Finance Agency (Haven’s Edge Apartments), Series 2025, RB(b)
|
|
|
|
|
|
|
|
|
|
|
|
|
|
|
|
|
|
|
|
Portland (Port of), OR (Green Bonds), Twenty Ninth Series 2023, RB(a)
|
|
|
|
|
|
|
|
|
|
|
|
|
Allentown (City of), PA Neighborhood Improvement Zone Development Authority, Series
2022, Ref.
RB
|
|
|
|
|
|
Montgomery (County of), PA Industrial Development Authority (Constellation Energy
Generation LLC),
Series 2023 B, Ref. RB
|
|
|
|
|
|
Pennsylvania (Commonwealth of) Economic Development Financing Authority (Penndot Major
Bridges
(The)), Series 2022, RB(a)
|
|
|
|
|
|
|
|
|
|
|
|
|
|
|
|
|
|
|
|
Puerto Rico (Commonwealth of), Series 2021 A-1, GO Bonds
|
|
|
|
|
|
Puerto Rico (Commonwealth of) Aqueduct & Sewer Authority, Series 2022 A, Ref. RB(b)
|
|
|
|
|
|
|
|
|
|
|
|
|
|
|
|
|
|
|
|
Patriots Energy Group Financing Agency, Series 2023 A-1, RB(c)
|
|
|
|
|
|
|
|
|
|
|
|
|
Arlington Higher Education Finance Corp. (Newman International Academy), Series 2021,
RB
|
|
|
|
|
|
Harris County Industrial Development Corp. (Energy Transfer L.P.), Series 2023, Ref.
RB(c)
|
|
|
|
|
|
Houston (City of), TX, Series 2023 A, Ref. RB, (INS - AGM)(a)(f)
|
|
|
|
|
|
Houston (City of), TX (United Airlines, Inc.), Series 2021 B-1, RB(a)
|
|
|
|
|
|
Houston (City of), TX (United Airlines, Inc.), Series 2024 B, RB(a)
|
|
|
|
|
|
Mission Economic Development Corp. (Natgasoline), Series 2018, Ref. RB(a)(b)
|
|
|
|
|
|
New Hope Cultural Education Facilities Finance Corp., Series 2025 A, RB
|
|
|
|
|
|
|
|
|
|
|
|
|
See accompanying Notes to Financial Statements which are an integral part of the financial
statements.
Invesco Rochester High Yield Municipal ETF (IROC)—(continued)
April 30, 2025
(Unaudited)
|
|
|
|
|
|
|
|
|
|
|
|
|
Black Desert Public Infrastructure District, Series 2021 A, GO Bonds(b)
|
|
|
|
|
|
|
|
|
|
|
|
|
Virgin Islands (Government of) Public Finance Authority (Frenchman’s Reef Hotel Development),
Series 2024 A, RB(b)
|
|
|
|
|
|
|
|
|
|
|
|
|
Norfolk (City of), VA Redevelopment & Housing Authority (Fort Norfolk Retirement Community,
Inc. -
Harbor’s Edge), Series 2019 A, RB
|
|
|
|
|
|
Virginia Beach Development Authority (Westminster-Canterbury on Chesapeake Bay), Series
2023
B-3, RB
|
|
|
|
|
|
|
|
|
|
|
|
|
|
|
|
|
|
|
|
Washington (State of) Convention Center Public Facilities District, Series 2018, RB
|
|
|
|
|
|
Washington (State of) Convention Center Public Facilities District, Series 2018, RB
|
|
|
|
|
|
Washington (State of) Health Care Facilities Authority (Providence Health & Services),
Series 2012 A,
RB
|
|
|
|
|
|
|
|
|
|
|
|
|
|
|
|
|
|
|
|
West Virginia (State of) Economic Development Authority (Core Natural Resources, Inc.),
Series 2025, Ref. RB(a)(b)(c)
|
|
|
|
|
|
|
|
|
|
|
|
|
Public Finance Authority (KSU Bixby Real Estate Foundation LLC), Series 2025, RB
|
|
|
|
|
|
Wisconsin (State of) Health & Educational Facilities Authority (Camillus Health System),
Series 2019,
Ref. RB
|
|
|
|
|
|
Wisconsin (State of) Public Finance Authority, Series 2024, RB(c)(d)
|
|
|
|
|
|
Wisconsin (State of) Public Finance Authority (Prime Healthcare Foundation, Inc.),
Series 2018 A, RB
|
|
|
|
|
|
|
|
|
|
|
|
|
Total Municipal Obligations
(Cost $29,046,571)
|
|
|
|
|
|
|
|
|
|
|
|
|
|
|
Invesco Premier U.S. Government Money Portfolio, Institutional Class, 4.26%(g)(h)
(Cost $1,354,973)
|
|
|
|
TOTAL INVESTMENTS IN SECURITIES(i)-101.85%
(Cost $30,401,544)
|
|
OTHER ASSETS LESS LIABILITIES-(1.85%)
|
|
|
|
|
Investment Abbreviations:
|
|
|
-Assured Guaranty Municipal Corp.
|
|
|
|
|
|
|
|
|
|
|
|
|
|
|
|
See accompanying Notes to Financial Statements which are an integral part of the financial
statements.
Invesco Rochester High Yield Municipal ETF (IROC)—(continued)
April 30, 2025
(Unaudited)
Notes to Schedule of Investments:
|
|
|
Security subject to the alternative minimum tax.
|
|
|
Security purchased or received in a transaction exempt from registration under the Securities Act of 1933, as amended (the “1933 Act”). The security may be
resold pursuant to an exemption from registration under the 1933 Act, typically to
qualified institutional buyers. The aggregate value of these securities at
April 30, 2025 was $6,185,069, which represented 20.58% of the Fund’s Net Assets.
|
|
|
Security has an irrevocable call by the issuer or mandatory put by the holder. Maturity
date reflects such call or put.
|
|
|
Advance refunded; secured by an escrow fund of U.S. Government obligations or other
highly rated collateral.
|
|
|
Principal and interest payments are fully enhanced by a letter of credit from the
bank listed or a predecessor bank, branch or subsidiary.
|
|
|
Principal and/or interest payments are secured by the bond insurance company listed.
|
|
|
Affiliated holding. Affiliated holdings are investments in entities which are under
common ownership or control of Invesco Ltd. or are investments in entities in
which the Fund owns 5% or more of the outstanding voting securities. The table below shows the Fund’s transactions in, and earnings from, its investments in
affiliates for the six months ended April 30, 2025.
|
|
|
|
|
|
Change in
Unrealized
Appreciation
|
|
|
|
Investments in Affiliated
Money Market Funds:
|
|
|
|
|
|
|
|
Invesco Premier
U.S. Government Money
Portfolio, Institutional Class
|
|
|
|
|
|
|
|
|
|
The rate shown is the 7-day SEC standardized yield as of April 30, 2025.
|
|
|
Entities may either issue, guarantee, back or otherwise enhance the credit quality of a security. The entities are not primarily responsible for the issuer’s
obligations but may be called upon to satisfy issuer’s obligations. No concentration of any single entity was greater than 5% each.
|
See accompanying Notes to Financial Statements which are an integral part of the financial
statements.
Statement of Assets and Liabilities
|
|
Invesco Rochester
High YieldMunicipal ETF (IROC)
|
|
|
|
Unaffiliated investments in securities, at value
|
|
Affiliated investments in securities, at value
|
|
|
|
|
|
|
|
|
|
|
|
|
|
|
|
|
|
|
|
|
|
|
Accrued unitary management fees
|
|
|
|
|
|
|
|
|
|
|
|
|
|
Shares of beneficial interest
|
|
|
|
|
|
|
|
Shares outstanding (unlimited amount authorized, $0.01 par value)
|
|
|
|
|
|
|
|
Unaffiliated investments in securities, at cost
|
|
Affiliated investments in securities, at cost
|
|
See accompanying Notes to Financial Statements which are an integral part of the financial
statements.
Statement of Operations
For the six months ended April 30, 2025
|
|
Invesco Rochester
High YieldMunicipal ETF (IROC)
|
|
|
|
Unaffiliated interest income
|
|
Affiliated dividend income
|
|
|
|
|
|
|
|
|
|
|
|
|
|
|
|
|
|
|
|
Realized and unrealized gain (loss) from:
|
|
Net realized gain (loss) from unaffiliated investments
|
|
Change in net unrealized appreciation (depreciation) on unaffiliated investment securities
|
|
Net realized and unrealized gain (loss)
|
|
Net increase (decrease) in net assets resulting from operations
|
|
See accompanying Notes to Financial Statements which are an integral part of the financial
statements.
Statement of Changes in Net Assets
For the six months ended April 30, 2025 and the year ended October 31, 2024
|
|
Invesco Rochester High Yield Municipal ETF (IROC)
|
|
|
Six Months Ended
April 30,
2025
|
Year Ended
October 31,
2024
|
|
|
|
|
|
|
|
|
|
|
|
|
Change in net unrealized appreciation (depreciation)
|
|
|
Net increase (decrease) in net assets resulting from operations
|
|
|
Distributions to Shareholders from:
|
|
|
|
|
|
|
Shareholder Transactions:
|
|
|
Proceeds from shares sold
|
|
|
Value of shares repurchased
|
|
|
Net increase in net assets resulting from share transactions
|
|
|
Net increase (decrease) in net assets
|
|
|
|
|
|
|
|
|
|
|
|
|
|
|
Changes in Shares Outstanding:
|
|
|
|
|
|
|
|
|
|
|
Shares outstanding, beginning of period
|
|
|
Shares outstanding, end of period
|
|
|
See accompanying Notes to Financial Statements which are an integral part of the financial
statements.
Invesco Rochester High Yield Municipal ETF (IROC)
|
|
Six Months Ended
April 30,
2025
(Unaudited)
|
Year ended October 31,
2024
|
For the Period
December 7, 2022(a)
Through
October 31,
2023
|
Per Share Operating Performance:
|
|
|
|
Net asset value at beginning of period
|
|
|
|
|
|
|
|
|
Net realized and unrealized gain (loss) on investments
|
|
|
|
Total from investment operations
|
|
|
|
Distributions to shareholders from:
|
|
|
|
|
|
|
|
|
Net asset value at end of period
|
|
|
|
Market price at end of period(c)
|
|
|
|
Net Asset Value Total Return(d)
|
|
|
|
Market Price Total Return(d)
|
|
|
|
Ratios/Supplemental Data:
|
|
|
|
Net assets at end of period (000’s omitted)
|
|
|
|
Ratio to average net assets of:
|
|
|
|
|
|
|
|
|
|
|
|
|
|
Portfolio turnover rate(g)
|
|
|
|
|
|
Commencement of investment operations.
|
|
|
Based on average shares outstanding.
|
|
|
The mean between the last bid and ask prices.
|
|
|
Net asset value total return is calculated assuming an initial investment made at
the net asset value at the beginning of the period, reinvestment of all dividends
and distributions at net asset value during the period, and redemption at net asset
value on the last day of the period. Net asset value total return includes
adjustments in accordance with accounting principles generally accepted in the United
States of America and as such, the net asset value for financial reporting
purposes and the returns based upon those net asset values may differ from the net
asset value and returns for shareholder transactions. Market price total return
is calculated assuming an initial investment made at the market price at the beginning
of the period, reinvestment of all dividends and distributions at market price
during the period, and sale at the market price on the last day of the period. Total
investment returns calculated for a period of less than one year are not
annualized.
|
|
|
The net asset value total return from Fund Inception (December 9, 2022, the first
day of trading on the exchange) to October 31, 2023 was (1.67)%. The market
price total return from Fund Inception to October 31, 2023 was (2.08)%.
|
|
|
|
|
|
Portfolio turnover rate is not annualized for periods less than one year, if applicable,
and does not include securities received or delivered from processing
creations or redemptions.
|
See accompanying Notes to Financial Statements which are an integral part of the financial
statements.
Notes to Financial Statements
Invesco Actively Managed Exchange-Traded Fund Trust
April 30, 2025
(Unaudited)
Invesco Actively Managed Exchange-Traded Fund Trust (the “Trust”) was organized as a Delaware statutory trust and is authorized to have multiple series of portfolios. The Trust is an open-end management
investment company registered under the Investment Company Act of 1940, as amended (the “1940 Act”). This report includes Invesco Rochester High Yield Municipal ETF (IROC) (the "Fund"). Prior to February 24, 2025, the Fund’s name was Invesco Municipal Strategic Income ETF.
The Fund represents a separate series of the Trust. The shares of the Fund are referred to herein as "Shares" or "Fund’s Shares." The Fund’s Shares are listed and traded on the Cboe BZX Exchange, Inc.
The market price of a Share may differ to some degree from the Fund’s net asset value (“NAV”). Unlike conventional mutual funds, the Fund issues and redeems Shares on a continuous basis, at NAV, only in a
large specified number of Shares, each called a “Creation Unit”, as set forth in the Fund’s prospectus. Creation Units are issued and redeemed principally in exchange for the deposit or delivery of cash, though the Fund reserves the right to issue and redeem
Creation Units in exchange for a basket of securities ("Deposit Securities"). Except when aggregated in Creation Units by authorized participants (“APs”), Shares are not individually redeemable securities of the Fund.
The investment objective of the Fund is to seek current income exempt from federal
income tax.
NOTE 2—Significant Accounting Policies
The following is a summary of the significant accounting policies followed by the
Fund in preparation of its financial statements.
The Fund is an investment company and accordingly follows the investment company accounting
and reporting guidance in accordance with Financial Accounting Standards Board ("FASB") Accounting Standards
Codification Topic 946, Financial Services—Investment Companies.
A.
Security Valuation - Securities, including restricted securities, are valued according to the following
policies:
A security listed or traded on an exchange is generally valued at its trade price
or official closing price that day as of the close of the exchange where the security is principally traded or, lacking any trades
or official closing price on a particular day, the security may be valued at the closing bid or ask price on that day. Securities
traded in the over-the-counter market are valued based on prices furnished by independent pricing services or market makers.
When such securities are valued using prices provided by an independent pricing service they may be considered fair valued.
Futures contracts are valued at the daily settlement price set by an exchange on which they are principally traded. Where a
final settlement price exists, exchange-traded options are valued at the final settlement price from the exchange where the option
principally trades. Where a final settlement price does not exist, exchange-traded options are valued at the mean between
the last bid and ask price generally from the exchange where the option principally trades.
Securities of investment companies that are not exchange-traded (e.g., open-end mutual
funds) are valued using such company’s end-of-business-day NAV per share.
Deposits, other obligations of U.S. and non-U.S. banks and financial institutions
are valued at their daily account value.
Fixed income securities (including convertible debt securities) generally are valued
on the basis of prices provided by independent pricing services. Prices provided by the pricing service may be determined
without exclusive reliance on quoted prices, and may reflect appropriate factors such as institution-size trading in similar
groups of securities, developments related to specific securities, dividend rate (for unlisted equities), yield (for debt obligations),
quality, type of issue, coupon rate (for debt obligations), maturity (for debt obligations), individual trading characteristics
and other market data. Securities with a demand feature exercisable within one to seven days are valued at par. Pricing services
generally value debt obligations assuming orderly transactions of institutional round lot size, but the Fund may hold
or transact in the same securities in smaller, odd lot sizes. Odd lots often trade at lower prices than institutional round
lots, and their value may be adjusted accordingly. Debt obligations are subject to interest rate and credit risks. In addition,
all debt obligations involve some risk of default with respect to interest and/or principal payments.
Foreign securities’ (including foreign exchange contracts’) prices are converted into U.S. dollar amounts using the applicable exchange rates as of the close of the London world markets. If market quotations are
available and reliable for foreign exchange-traded equity securities, the securities will be valued at the market quotations.
Invesco Capital Management LLC (the “Adviser”) may use various pricing services to obtain market quotations as well as fair value prices. Because trading hours for certain foreign securities end before the close of the New York Stock Exchange (“NYSE”), closing market quotations may become not representative of market value in the Adviser’s judgment ("unreliable"). If, between the time trading ends on a particular security and the close of the customary trading session on the NYSE, a
significant event occurs that makes the closing price of the security unreliable, the Adviser may fair value the security.
If the event is likely to have affected the closing
price of the security, the security will be valued at fair value in good faith in
accordance with Board-approved policies and related Adviser procedures (“Valuation Procedures”). Adjustments to closing prices to reflect fair value may also be based on a screening process of an independent pricing service to indicate the degree of certainty,
based on historical data, that the closing price in the principal market where a foreign security trades is not the current
value as of the close of the NYSE. Foreign securities’ prices meeting the degree of certainty that the price is not reflective of current value will be priced at the indication of fair value from the independent pricing service. Multiple factors may
be considered by the independent pricing service in determining adjustments to reflect fair value and may include information
relating to sector indices, American depositary receipts and domestic and foreign index futures. Foreign securities may
have additional risks including exchange rate changes, the potential for sharply devalued currencies and high inflation, political
and economic upheaval, the relative lack of issuer information, relatively low market liquidity and the potential lack of strict
financial and accounting controls and standards.
Unlisted securities will be valued using prices provided by independent pricing services
or by another method that the Adviser, in its judgment, believes better reflects the security’s fair value in accordance with the Valuation Procedures.
Non-traded rights and warrants shall be valued at intrinsic value if the terms of
the rights and warrants are available, specifically the subscription or exercise price and the ratio. Intrinsic value is
calculated as the daily market closing price of the security to be received less the subscription price, which is then adjusted by the
exercise ratio. In the case of warrants, an option pricing model supplied by an independent pricing service may be used based
on market data such as volatility, stock price and interest rate from the independent pricing service and strike price and
exercise period from verified terms.
Securities for which market prices are not provided by any of the above methods may
be valued based upon quotes furnished by independent sources. The mean between the last bid and ask prices may
be used to value debt obligations, including corporate loans, and unlisted equity securities.
Securities for which market quotations are not readily available are fair valued by
the Adviser in accordance with the Valuation Procedures. If a fair value price provided by a pricing service is unreliable,
the Adviser will fair value the security using the Valuation Procedures. Issuer-specific events, market trends, bid/ask quotes
of brokers and information providers and other market data may be reviewed in the course of making a good faith determination of a security’s fair value.
The Fund may invest in securities that are subject to interest rate risk, meaning
the risk that the prices will generally fall as interest rates rise and, conversely, the prices will generally rise as interest rates
fall. Specific securities differ in their sensitivity to changes in interest rates depending on their individual characteristics. Changes
in interest rates may result in increased market volatility, which may affect the value and/or liquidity of certain Fund investments.
Valuations change in response to many factors, including the historical and prospective
earnings of the issuer, the value of the issuer’s assets, general market conditions which are not specifically related to the particular issuer, such as real or perceived adverse economic conditions, changes in the general outlook for revenues
or corporate earnings, changes in interest or currency rates, regional or global instability, natural or environmental
disasters, widespread disease or other public health issues, war, military conflicts, acts of terrorism, economic crises, economic
sanctions and tariffs, significant governmental actions or adverse investor sentiment generally and market liquidity.
Because of the inherent uncertainties of valuation, the values reflected in the financial statements may materially differ
from the value received upon actual sale of those investments.
The price the Fund could receive upon the sale of any investment may differ from the Adviser’s valuation of the investment, particularly for securities that are valued using a fair valuation technique. When
fair valuation techniques are applied, the Adviser uses available information, including both observable and unobservable inputs
and assumptions, to determine a methodology that will result in a valuation that the Adviser believes approximates
market value. Fund securities that are fair valued may be subject to greater fluctuation in their value from one day to the next
than would be the case if market quotations were used. Because of the inherent uncertainties of valuation, and the
degree of subjectivity in such decisions, the Fund could realize a greater or lesser than expected gain or loss upon the sale
of the investment.
B.
Investment Transactions and Investment Income - Investment transactions are accounted for on a trade date basis. Realized gains and losses from the sale or disposition of securities are computed
on the specific identified cost basis. Interest income is recorded on an accrual basis from settlement date and includes coupon interest
and amortization of premium and accretion of discount on debt securities as applicable. Pay-in-kind interest income
and non-cash dividend income received in the form of securities in lieu of cash are recorded at the fair value of the securities
received. Dividend income (net of withholding tax, if any) is recorded on the ex-dividend date. Realized gains, dividends
and interest received by the Fund may give rise to withholding and other taxes imposed by foreign countries. Tax conventions
between certain countries and the United States may reduce or eliminate such taxes.
The Fund may periodically participate in litigation related to the Fund’s investments. As such, the Fund may receive proceeds from litigation settlements. Any proceeds received are included in the Statement of
Operations as realized gain (loss) for investments no longer held and as unrealized gain (loss) for investments still
held.
Brokerage commissions and mark ups are considered transaction costs and are recorded
as an increase to the cost basis of securities purchased and/or a reduction of proceeds on a sale of securities. Such
transaction costs are included in the determination of net realized and unrealized gain (loss) from investment securities
reported in the Statement of Operations and the Statement of Changes in Net Assets and the net realized and unrealized gains
(losses) on securities per share in the
Financial Highlights. Transaction costs are included in the calculation of the Fund’s NAV and, accordingly, they reduce the Fund’s total returns. These transaction costs are not considered operating expenses and are not reflected in net investment income reported in the Statement of Operations and the Statement of Changes in Net
Assets, or the net investment income per share and the ratios of expenses and net investment income reported in the Financial
Highlights, nor are they limited by any expense limitation arrangements between the Fund and the Adviser.
C.
Country Determination - For the purposes of presentation in the Schedule of Investments, the Adviser may
determine the country in which an issuer is located and/or credit risk exposure based on various
factors. These factors may include the laws of the country under which the issuer is organized, where the issuer maintains a principal
office, the country in which the issuer derives 50% or more of its total revenues, the country that has the primary market for the issuer’s securities and its "country of risk" as determined by a third party service provider, as well as other
criteria. Among the other criteria that may be evaluated for making this determination are the country in which the issuer maintains
50% or more of its assets, the type of security, financial guarantees and enhancements, the nature of the collateral and
the sponsor organization. Country of issuer and/or credit risk exposure has been determined to be the United States of
America, unless otherwise noted.
D.
Dividends and Distributions to Shareholders - The Fund declares and pays dividends from net investment income, if any, to its shareholders monthly and records such dividends on the ex-dividend date. Generally,
the Fund distributes net realized taxable capital gains, if any, annually in cash and records them on the ex-dividend
date. Such distributions on a tax basis are determined in conformity with federal income tax regulations, which may differ from
accounting principles generally accepted in the United States of America ("GAAP"). Distributions in excess of tax basis earnings
and profits, if any, are reported in the Fund’s financial statements as a tax return of capital at fiscal year-end.
E.
Federal Income Taxes - The Fund intends to comply with the provisions of the Internal Revenue Code of
1986, as amended (the “Internal Revenue Code”), applicable to regulated investment companies and to distribute substantially all of the Fund’s taxable earnings to its shareholders. As such, the Fund will not be subject to federal
income taxes on otherwise taxable income (including net realized gains) that is distributed to the shareholders. Therefore,
no provision for federal income taxes is recorded in the financial statements.
The Fund recognizes the tax benefits of uncertain tax positions only when the position
is more likely than not to be sustained. Management has analyzed the Fund’s uncertain tax positions and concluded that no liability for unrecognized tax benefits should be recorded related to uncertain tax positions. Management is not
aware of any tax positions for which it is reasonably possible that the total amounts of unrecognized tax benefits will change
materially in the next 12 months.
Income and capital gain distributions are determined in accordance with federal income
tax regulations, which may differ from GAAP. These differences are primarily due to differing book and tax treatments
for in-kind transactions, losses deferred due to wash sales, and passive foreign investment company adjustments, if any.
The Fund files U.S. federal tax returns and tax returns in certain other jurisdictions.
Generally, the Fund is subject to examinations by such taxing authorities for up to three years after the filing of
the return for the tax period.
F.
Expenses - The Fund has agreed to pay an annual unitary management fee to the Adviser. Out
of the unitary management fee, the Adviser pays Invesco Advisers, Inc.’s (the "Affiliated Sub-Adviser" or "Invesco") fees and substantially all expenses of the Fund, including the costs of transfer agency, custody, fund administration, legal,
audit and other services, except for distribution fees, if any, brokerage expenses, taxes, interest, acquired fund fees
and expenses, if any, litigation expenses and other extraordinary expenses, including proxy expenses (except for such proxies related
to: (i) changes to the Investment Advisory Agreement, (ii) the election of any Board member who is an “interested person” of the Trust or the Adviser (an "Interested Trustee"), or (iii) any other matters that directly benefit the Adviser).
Expenses of the Trust that are excluded from the Fund’s unitary management fee and are directly identifiable to the Fund are applied to the Fund. Expenses of the Trust that are excluded from the Fund’s unitary management fee and are not readily identifiable to the Fund are allocated in such a manner as deemed equitable, taking
into consideration the nature and type of expense and the relative net assets of the Fund.
To the extent the Fund invests in other investment companies, the expenses shown in
the accompanying financial statements reflect the expenses of the Fund and do not include any expenses of the
investment companies in which it invests. The effects of such investment companies’ expenses are included in the realized and unrealized gain or loss on the investments in the investment companies.
G.
Accounting Estimates - The preparation of the financial statements in accordance with GAAP requires management
to make estimates and assumptions that affect the reported amounts and disclosures in the
financial statements, including estimates and assumptions related to taxation. Actual results could differ from these estimates.
In addition, the Fund monitors for material events or transactions that may occur or become known after the period-end
date and before the date the financial statements are released to print.
H.
Indemnifications - Under the Trust’s organizational documents, its Officers and Trustees are indemnified against certain liabilities arising out of the performance of their duties to the Trust. Each Board
member who is not an "interested person" (as defined in the 1940 Act) of the Trust or the Adviser (each, an "Independent Trustee")
is also indemnified against certain liabilities arising out of the performance of their duties to the Trust pursuant to
an Indemnification Agreement between such trustee and the Trust. Additionally, in the normal course of business, the Trust enters
into contracts with service providers
that contain general indemnification clauses. The Trust’s maximum exposure under these arrangements is unknown, as this would involve future claims that may be made against the Trust that have not yet occurred.
The risk of material loss as a result of such indemnification claims is considered remote.
I.
Segment Reporting — In November 2023, the FASB issued Accounting Standards Update 2023-07, Segment Reporting (Topic 280): Improvements to Reportable Segment Disclosures (“ASU 2023-07”), with the intent of improving reportable segment disclosure requirements, primarily through enhanced disclosures about significant
segment expenses, allowing financial statement users to better understand the components of a segment’s profit or loss and assess potential future cash flows for each reportable segment and the entity as a whole, thereby enabling better understanding of how an entity’s segments impact overall performance. The Fund represents a single operating segment.
Subject to the oversight and, when applicable, approval of the Board of Trustees, the Adviser acts as the Fund’s chief operating decision maker (“CODM”), assessing performance and making decisions about resource allocation within the Fund.
The CODM monitors the operating results as a whole, and the Fund’s long-term strategic asset allocation is determined in accordance with the terms of its prospectus based on a defined investment strategy. The financial information provided
to and reviewed by the CODM is consistent with that presented in the Fund’s financial statements. Adoption of the new standard impacted the Fund’s financial statement note disclosures only and did not affect the Fund’s financial position or the results of its operations.
J.
Securities Purchased on a When-Issued and Delayed Delivery Basis - The Fund may purchase and sell interests in corporate and municipal fixed-income securities and other portfolio securities on
a when issued and delayed delivery basis, with payment and delivery scheduled for a future date. No income accrues to the Fund
on such interests or securities in connection with such transactions prior to the date the Fund actually takes delivery
of such interests or securities. These transactions are subject to market fluctuations and are subject to the risk that the
value of the interests or securities at delivery may be more or less than the trade date purchase price. Although the Fund
will generally purchase these securities with the intention of acquiring such securities, it may sell such securities prior
to the settlement date.
Alternative Minimum Tax Risk. Although the interest received from municipal securities generally is exempt from
federal income tax, the Fund may invest a portion of its total assets in municipal securities
subject to the federal alternative minimum tax. Accordingly, investment in the Fund could cause shareholders to be subject to,
or result in an increased liability under, the federal alternative minimum tax.
AP Concentration Risk. Only APs may engage in creation or redemption transactions directly with the Fund.
The Fund has a limited number of institutions that may act as APs, and such APs have no obligation
to submit creation or redemption orders. Consequently, there is no assurance that APs will establish or maintain an active
trading market for the Shares. This risk may be heightened to the extent that securities held by the Fund are traded outside a
collateralized settlement system. In that case, APs may be required to post collateral on certain trades on an agency basis
(i.e., on behalf of other market participants), which only a limited number of APs may be able to do. In addition,
to the extent that APs exit the business or are unable to proceed with creation and/or redemption orders with respect to the Fund
and no other AP is able to step forward to create or redeem Creation Units, this may result in a significantly diminished trading
market for Fund Shares, and Shares may be more likely to trade at a premium or discount to the Fund’s NAV and to face trading halts and/or delisting. Additionally, to the extent that the Fund holds non-U.S. securities, such securities may have lower
trading volumes or could experience extended market closures or trading halts. To the extent that the Fund invests in
non-U.S. securities, it may face increased risks that APs may not be able to effectively create or redeem Creation Units, or
that the Shares may be halted and/or delisted.
Call Risk. If interest rates fall, it is possible that issuers of callable securities with high interest coupons will “call” (or prepay) their bonds before their maturity date. If an issuer exercises such a call during
a period of declining interest rates, the Fund may have to replace such called security with a lower yielding security. If that were to happen, the Fund’s net investment income could fall.
Cash Transaction Risk. Most exchange-traded funds ("ETFs") generally make in-kind redemptions to avoid
being taxed on gains on the distributed portfolio securities at the fund level. However, unlike most
ETFs, the Fund currently intends to effect creations and redemptions principally for cash, rather than principally in-kind, due to the nature of the Fund’s investments. As such, the Fund may be required to sell portfolio securities to obtain the cash needed
to distribute redemption proceeds. Therefore, the Fund may recognize a capital gain on these sales and/or incur brokerage
fees that might not have been incurred if the Fund had made a redemption in-kind. To the extent any transaction
costs are not offset by transaction fees imposed on APs, such costs may decrease the Fund’s net asset value. These costs may also decrease the tax efficiency of the Fund compared to ETFs that utilize an in-kind redemption process and there may be
a substantial difference in the after-tax rate of return between the Fund and conventional ETFs.
Changing Fixed-Income Market Conditions Risk. Fluctuations in the federal funds and equivalent foreign interest rates or other changes to monetary policy or regulatory actions may expose fixed-income markets
to heightened volatility, perhaps suddenly and to a significant degree, and to reduced liquidity for certain fixed-income
investments, particularly those with longer maturities, when rates increase. Such changes and resulting increased volatility
may adversely impact the Fund, including its operations and return potential. It is difficult to predict the impact
of interest rate changes on various markets. In addition, decreases in fixed-income dealer market-making capacity may also potentially
lead to heightened volatility and
reduced liquidity in the fixed-income markets. As a result, the value of the Fund’s investments and share price may decline. Changes in central bank policies and other governmental actions and political events
within the U.S. and abroad may also, among other things, affect investor and consumer expectations and confidence in the
financial markets. This could result in higher than normal redemptions by APs, which could potentially increase the Fund’s portfolio turnover rate and transaction costs.
Fixed-Income Securities Risk. Fixed-income securities are subject to interest rate risk and credit risk. Interest
rate risk refers to fluctuations in the value of a fixed-income security resulting from changes in
the general level of interest rates. When the general level of interest rates goes up, the prices of most fixed-income securities
go down. When the general level of interest rates goes down, the prices of most fixed-income securities go up. Fixed-income securities
with longer maturities typically are more sensitive to changes in interest rates, making them more volatile than securities
with shorter maturities. Credit risk refers to the possibility that the issuer of a security will be unable and/or unwilling
to make timely interest payments and/or repay the principal on its debt. Debt instruments are subject to varying degrees of
credit risk, which may be reflected in credit ratings. There is a possibility that the credit rating of a fixed-income security
may be downgraded after purchase, which may occur quickly and without advance warning following sudden market downturns or unexpected
developments involving an issuer, and which may adversely affect the liquidity and value of the security.
High Yield Securities (Junk Bond) Risk. Compared to higher quality debt securities, high yield debt securities (commonly
referred to as “junk bonds”) involve a greater risk of default or price changes due to changes in the credit quality of the issuer because they are generally unsecured and may be subordinated to other creditors’ claims. They are considered speculative with respect to the issuer’s capacity to pay interest and repay principal. High yield debt securities often are issued by smaller, less creditworthy companies or by highly leveraged (indebted) firms, which generally
are less able than more financially stable firms to make scheduled payments of interest and principal. The values of junk bonds
often fluctuate more in response to company, political, regulatory or economic developments than higher quality bonds,
and their values can decline significantly over short periods of time or during periods of economic difficulty when the bonds
could be difficult to value or sell at a fair price.
Interest Rate Risk. Interest rate risk refers to the risk that fixed income securities’ prices generally fall as interest rates rise; conversely, fixed income securities’ prices generally rise as interest rates fall. Specific fixed income securities differ in their sensitivity to changes in interest rates depending on their individual characteristics, including duration. “Duration risk” is related to interest rate risk; it refers to the risks associated with the sensitivity of a fixed income security’s price to a one percent change in interest rates. Fixed income securities with longer durations (i.e.,
a greater length of time until they reach maturity) face greater duration risk, meaning that they tend to exhibit greater volatility
and are more sensitive to changes in interest rates than fixed income securities with shorter durations.
Liquidity Risk. Liquidity risk exists when a particular investment is difficult to purchase or sell.
If the Fund invests in illiquid securities or current portfolio securities become illiquid, it may reduce the returns
of the Fund because the Fund may be unable to sell the illiquid securities at an advantageous time or price.
Management Risk. The Fund is subject to management risk because it is an actively managed portfolio.
In managing the Fund’s portfolio holdings, the Affiliated Sub-Adviser applies investment techniques and risk analyses in making investment decisions for the Fund, but there can be no guarantee that these actions will produce
the desired results.
Market Risk. Securities held by the Fund are subject to market fluctuations. You should anticipate
that the value of the Shares will decline more or less, in correlation with any decline in value of the securities in the Fund’s portfolio. Additionally, natural or environmental disasters, widespread disease or other public health issues,
war, military conflicts, acts of terrorism, economic crises or other events could result in increased premiums or discounts to the Fund’s NAV. Certain changes in the U.S. economy in particular, such as when the U.S. economy weakens or when its financial
markets decline, may have a material adverse effect on global financial markets as a whole, and on the securities
to which the Fund has exposure. Increasingly strained relations between the U.S. and foreign countries, including
as a result of economic sanctions and tariffs, may also adversely affect U.S. issuers, as well as non-U.S. issuers.
During a general downturn in the financial markets, multiple asset classes may decline
in value. When markets perform well, there can be no assurance that specific investments held by the Fund will rise in
value.
Municipal Issuer Focus Risk. The municipal issuers in which the Fund invests may be located in the same geographic
area or may pay their interest obligations from revenue of similar projects, such as hospitals,
airports, utility systems and housing finance agencies. This may make the Fund’s investments more susceptible to similar social, economic, political or regulatory occurrences, making the Fund more susceptible to experience a drop in its share price
than if the Fund had been more diversified across issuers that did not have similar characteristics.
Municipal Securities Risk. The Fund invests in municipal securities. Municipal securities are subject to the
risk that litigation, legislation or other political events, local business or economic conditions or the
bankruptcy of the issuer could have a significant effect on the ability of an issuer of municipal securities to make payments
of principal and/or interest. Political changes and uncertainties in the municipal market related to taxation, legislative
changes or the rights of municipal security holders can significantly affect municipal securities. Because many securities are
issued to finance similar projects, especially those relating to education, health care, transportation and utilities, conditions
in those sectors can affect the overall municipal market. In addition, changes in the financial condition of an individual municipal
issuer can affect the overall municipal market.
If the Internal Revenue Service (“IRS”) determines that an issuer of a municipal security has not complied with applicable tax requirements, interest from the security could become taxable and the security could
decline significantly in value.
Non-Diversified Fund Risk. Because the Fund is non-diversified and can invest a greater portion of its assets
in securities of individual issuers than can a diversified fund, changes in the market value of a single
investment could cause greater fluctuations in Share price than would occur in a diversified fund. This may increase the Fund’s volatility and cause the performance of a relatively small number of issuers to have a greater impact on the Fund’s performance.
NOTE 3—Investment Advisory Agreement and Other Agreements
The Trust has entered into an Investment Advisory Agreement with the Adviser on behalf
of the Fund, pursuant to which the Adviser has overall responsibility for the selection and ongoing monitoring of the Fund’s investments, managing the Fund’s business affairs, providing certain clerical, bookkeeping and other administrative
services, and oversight of the Affiliated Sub-Adviser.
Pursuant to the Investment Advisory Agreement, the Fund accrues daily and pays monthly
to the Adviser an annual unitary management fee of 0.39% of the Fund’s average daily net assets. Effective July 1, 2025, the Adviser has agreed to waive 100% of its unitary management fee for the Fund through June 30, 2026. Out of the unitary
management fee, the Adviser pays the Affiliated Sub-Adviser’s fees and substantially all expenses of the Fund, including the costs of transfer agency, custody, fund administration, legal, audit and other services, except for distribution fees, if
any, brokerage expenses, taxes, interest, acquired fund fees and expenses, if any, litigation expenses and other extraordinary expenses,
including proxy expenses (except for such proxies related to: (i) changes to the Investment Advisory Agreement, (ii) the election
of an Interested Trustee, or (iii) any other matters that directly benefit the Adviser).
The Adviser has entered into an Investment Sub-Advisory Agreement with the Affiliated
Sub-Adviser. The sub-advisory fee for the Fund is paid by the Adviser to the Affiliated Sub-Adviser at 40% of the Adviser’s compensation of the sub-advised assets of the Fund.
Through at least August 31, 2027, the Adviser has contractually agreed to waive the
management fee payable by the Fund in an amount equal to the lesser of: (i) 100% of the net advisory fees earned by the
Adviser or an affiliate of the Adviser that are attributable to the Fund’s investments in money market funds that are managed by affiliates of the Adviser and other funds (including ETFs) managed by the Adviser or affiliates of the Adviser or (ii) the management
fee available to be waived. There is no guarantee that the Adviser will extend the waiver of these fees past that date.
For the six months ended April 30, 2025, the Adviser waived fees of $204.
The Trust has entered into a Distribution Agreement with Invesco Distributors, Inc. (the “Distributor”), which serves as the distributor of Creation Units for the Fund. The Distributor does not maintain a secondary
market in the Shares. The Fund is not charged any fees pursuant to the Distribution Agreement. The Distributor is an affiliate
of the Adviser.
The Trust has entered into service agreements whereby BNYM, a wholly-owned subsidiary
of The Bank of New York Mellon Corporation, serves as the administrator, custodian, fund accountant and transfer
agent for the Fund.
NOTE 4—Additional Valuation Information
GAAP defines fair value as the price that would be received to sell an asset or paid
to transfer a liability in an orderly transaction between market participants at the measurement date, under current market conditions.
GAAP establishes a hierarchy that prioritizes the inputs to valuation methods, giving the highest priority to readily
available unadjusted quoted prices in an active market for identical assets (Level 1) and the lowest priority to significant unobservable
inputs (Level 3), generally when market prices are not readily available. Based on the valuation inputs, the securities or
other investments are tiered into one of three levels. Changes in valuation methods may result in transfers in or out of an investment’s assigned level:
Level 1 — Prices are determined using quoted prices in an active market for identical assets.
Level 2 — Prices are determined using other significant observable inputs. Observable inputs are inputs that other market participants may use in pricing a security. These may include quoted prices for similar
securities, interest rates, prepayment speeds, credit risk, yield curves, loss severities, default rates, discount
rates, volatilities and others.
Level 3 — Prices are determined using significant unobservable inputs. In situations where quoted prices or observable inputs are unavailable (for example, when there is little or no market activity for an investment
at the end of the period), unobservable inputs may be used. Unobservable inputs reflect the Adviser’s assumptions about the factors market participants would use in determining fair value of the securities or instruments
and would be based on the best available information.
The following is a summary of the tiered valuation input levels, as of April 30, 2025.
The level assigned to the securities valuations may not be an indication of the risk or liquidity associated with investing
in those securities. Because of the inherent
uncertainties of valuation, the values reflected in the financial statements may materially
differ from the value received upon actual sale of those investments.
|
|
|
|
|
|
Investments in Securities
|
|
|
|
|
|
|
|
|
|
|
|
|
|
|
|
|
|
|
|
|
|
|
The amount and character of income and gains to be distributed are determined in accordance
with federal income tax regulations, which may differ from GAAP. Reclassifications are made to the Fund’s capital accounts to reflect income and gains available for distribution (or available capital loss carryforwards) under federal
income tax regulations. The tax character of distributions paid during the year and the tax components of net assets will be reported at the Fund’s fiscal year-end.
Capital loss carryforwards are calculated and reported as of a specific date. Results
of transactions and other activity after that date may affect the amount of capital loss carryforwards actually available for the
Fund to utilize. The ability to utilize capital loss carryforwards in the future may be limited under the Internal Revenue Code and related
regulations based on the results of future transactions.
The Fund had a capital loss carryforward as of October 31, 2024, as follows:
NOTE 6—Investment Transactions
For the six months ended April 30, 2025, the cost of securities purchased and the
proceeds from sales of securities (other than short-term securities, U.S. Government obligations, money market funds and in-kind
transactions, if any) were $14,403,146 and $13,606,836, respectively.
As of April 30, 2025, the aggregate cost of investments, including any derivatives,
on a tax basis listed below includes adjustments for financial reporting purposes as of the most recently completed federal
income tax reporting period-end:
Aggregate unrealized appreciation of investments
|
|
Aggregate unrealized (depreciation) of investments
|
|
Net unrealized appreciation of investments
|
|
Cost of investments for tax purposes is $30,401,544.
NOTE 7—Trustees’ and Officer’s Fees
The Adviser, as a result of the Fund’s unitary management fee, pays remuneration to the Independent Trustees and an Officer of the Trust on behalf of the Fund. Interested Trustees do not receive any Trustees’ fees.
The Trust has adopted a deferred compensation plan (the “Plan”). Under the Plan, each Independent Trustee who has executed a Deferred Fee Agreement (a “Participating Trustee”) may defer receipt of all or a portion of their compensation (“Deferral Fees”). Such Deferral Fees are deemed to be invested in select Invesco ETFs. The Deferral Fees payable to a Participating Trustee are valued as of the date such Deferral Fees would have been paid to a Participating
Trustee. The value increases with contributions or with increases in the value of the Shares selected, and the value
decreases with distributions or with declines in the value of the Shares selected. Obligations under the Plan represent unsecured claims
against the general assets of the Fund.
Shares are issued and redeemed by the Fund only in Creation Units as discussed in
Note 1. Only APs are permitted to purchase or redeem Creation Units from the Fund.
To the extent that the Fund permits transactions in exchange for Deposit Securities,
the Fund may issue Shares in advance of receipt of Deposit Securities subject to various conditions, including a requirement
to maintain on deposit with the Trust cash at least equal to 105% of the market value of the missing Deposit Securities. In accordance with the Trust’s Participant Agreement, Creation Units will be issued to an AP, notwithstanding the fact that the corresponding
Deposit Securities have not been received in part or in whole, in reliance on the undertaking of the AP to deliver the missing
Deposit Securities as soon as possible, which undertaking shall be secured by the AP’s delivery and maintenance of collateral consisting of cash in the form of U.S. dollars in immediately available funds having a value (marked-to-market daily) at least equal
to 105%, which the Adviser may change from time to time, of the value of the missing Deposit Securities.
Certain transaction fees may be charged by the Fund for creations and redemptions,
which are treated as increases in capital.
Transactions in the Fund’s Shares are disclosed in detail in the Statement of Changes in Net Assets.
Approval of Investment Advisory and Sub-Advisory Contracts
At a meeting held on April 24, 2025, the Board of Trustees of the Invesco Actively
Managed Exchange-Traded Fund Trust (the “Trust”), including the Independent Trustees, approved the continuation of the Investment Advisory Agreement between Invesco Capital Management LLC (the “Adviser”) and the Trust for the following series (each, a “Fund” and collectively, the “Funds”):
Invesco AAA CLO Floating Rate Note ETF
Invesco Active U.S. Real Estate ETF
Invesco High Yield Bond Factor ETF
Invesco High Yield Select ETF
Invesco Real Assets ESG ETF
Invesco Rochester High Yield Municipal ETF
Invesco S&P 500® Downside Hedged ETF
Invesco Short Duration Total Return Bond ETF
Invesco Total Return Bond ETF
Invesco Variable Rate Investment Grade ETF
Also at the April 24, 2025 meeting, the Board of Trustees of the Trust, including
the Independent Trustees, approved the continuation of the Investment Sub-Advisory Agreement between the Adviser and the
following seven affiliated sub-advisers: Invesco Advisers, Inc.; Invesco Asset Management Deutschland GmbH; Invesco Asset
Management Limited; Invesco Asset Management (Japan) Limited; Invesco Hong Kong Limited; Invesco Senior Secured
Management, Inc.; and Invesco Canada Ltd. (each, a “Sub-Adviser” and collectively, the “Sub-Advisers”); with respect to each of the following Funds (the “Sub-Advisory Agreement”):
Invesco AAA CLO Floating Rate Note ETF
Invesco Active U.S. Real Estate ETF
Invesco High Yield Bond Factor ETF
Invesco High Yield Select ETF
Invesco Real Assets ESG ETF
Invesco Rochester High Yield Municipal ETF
Invesco Short Duration Total Return Bond ETF
Invesco Total Return Bond ETF
Invesco Variable Rate Investment Grade ETF
Investment Advisory Agreement
The Trustees reviewed information from the Adviser describing: (i) the nature, extent
and quality of services provided, (ii) the investment performance of each Fund and the Adviser, (iii) the fees paid by the Funds
and comparisons to amounts paid by other comparable registered investment companies, (iv) the costs of services provided and
estimated profits realized by the Adviser, (v) the extent to which economies of scale may be realized as a Fund grows and whether
fee levels reflect any possible economies of scale for the benefit of Fund shareholders and (vi) any further benefits realized
by the Adviser or its affiliates from the Adviser’s relationship with the Funds.
Nature, Extent and Quality of Services. In evaluating the nature, extent and quality of the Adviser’s services, the Trustees reviewed information concerning the functions performed by the Adviser for the Funds, information describing the Adviser’s current organization and staffing, including operational support provided by the Adviser’s parent organization, Invesco Ltd. (“Invesco”), and the background and experience of the persons responsible for the day-to-day management of the Funds. The Trustees reviewed matters related to the Adviser’s execution and/or oversight of execution of portfolio transactions on behalf of the Funds. The Trustees noted that, unlike most of the other exchange-traded funds (“ETFs”) for which the Adviser serves as investment adviser, the Funds are not designed to track the performance of an index,
and investment decisions are the primary responsibility of the Adviser or Sub-Advisers, as applicable.
The Trustees reviewed information on the performance of Invesco AAA CLO Floating Rate
Note ETF, its benchmark indexes (Bloomberg U.S. Aggregate Bond Index and JP Morgan CLOIE AAA Total Return Index) and the Fund’s Lipper Inc. (“Lipper”) peer group rankings (the 1st quartile being the best performers and the 4th quartile being
the worst performers) for the one-year and since-inception (December 9, 2022) periods ended December 31, 2024. Based on the
information provided, the Trustees noted that the Fund outperformed the Bloomberg U.S. Aggregate Bond Index for each period,
performed the same as the JP Morgan CLOIE AAA Total Return Index for the one-year period and outperformed the JP Morgan
CLOIE AAA Total Return Index for the since-inception period. The Trustees also noted that the Fund ranked in the 4th quartile
of its Lipper peer group for each period. In response to questions from the Independent Trustees, the Adviser provided supplemental
information regarding the performance of Invesco AAA CLO Floating Rate Note ETF for the one-year period ended
December 31, 2024. The Adviser explained the factors that detracted from the Fund’s performance during the period.
The Trustees reviewed information on the performance of Invesco Active U.S. Real Estate
ETF, its benchmark indexes (FTSE NAREIT All Equity REITs Index and S&P 500® Index) and the Fund’s Lipper peer group rankings for the one-year, three-year, five-year, ten-year and since-inception (November 20, 2008) periods ended December 31,
2024. Based on the information
Approval of Investment Advisory and Sub-Advisory Contracts—(continued)
provided, the Trustees noted that the Fund underperformed both benchmark indexes for
each period. The Trustees also noted that the Fund ranked in the 4th quartile of its Lipper peer group for the one-year,
three-year and five-year periods, and the Fund ranked in the 3rd quartile of its Lipper peer group for the ten-year and since-inception
periods. In response to questions from the Independent Trustees, the Adviser provided supplemental information regarding the
performance of Invesco Active U.S. Real Estate ETF for the one-year period ended December 31, 2024. The Adviser explained the factors that detracted from the Fund’s performance during the period.
The Trustees reviewed information on the performance of Invesco High Yield Bond Factor
ETF, its benchmark indexes (Bloomberg U.S. Aggregate Bond Index and Bloomberg U.S. Corporate High Yield 2% Issuer Cap Index) and the Fund’s Lipper peer group rankings for the one-year, three-year and since-inception (December 2, 2020) periods
ended December 31, 2024. Based on the information provided, the Trustees noted that the Fund outperformed the Bloomberg
U.S. Aggregate Bond Index for each period, outperformed the Bloomberg U.S. Corporate High Yield 2% Issuer Cap Index for the one-year
period and underperformed the Bloomberg U.S. Corporate High Yield 2% Issuer Cap Index for the three-year and since-inception
periods. The Trustees also noted that the Fund ranked in the 2nd quartile of its Lipper peer group for each period.
The Trustees reviewed information on the performance of Invesco High Yield Select
ETF, its benchmark indexes (Bloomberg U.S. Aggregate Bond Index and Bloomberg U.S. Corporate High Yield Ba/B 2% Issuer Cap Index) and the Fund’s Lipper peer group rankings for the one-year and since-inception (December 9, 2022) periods ended
December 31, 2024. Based on the information provided, the Trustees noted that the Fund outperformed the Bloomberg
U.S. Aggregate Bond Index for each period, outperformed the Bloomberg U.S. Corporate High Yield Ba/B 2% Issuer Cap Index for
the one-year period and underperformed the Bloomberg U.S. Corporate High Yield Ba/B 2% Issuer Cap Index for the since-inception
period. The Trustees also noted that the Fund ranked in the 3rd quartile of its Lipper peer group for the one-year period
and in the 4th quartile of its Lipper peer group for the since-inception period.
The Trustees reviewed information on the performance of Invesco Rochester High Yield
Municipal ETF, its benchmark indexes (S&P Municipal Bond 50% Investment Grade/50% High Yield Index, S&P Municipal Bond
High Yield Index and S&P Municipal Bond Index) and the Fund’s Lipper peer group rankings for the one-year and since-inception (December 9, 2022) periods ended December 31, 2024. Based on the information provided, the Trustees noted that the
Fund outperformed the S&P Municipal Bond 50% Investment Grade/50% High Yield Index for the one-year period, underperformed
the S&P Municipal Bond 50% Investment Grade/50% High Yield Index for the since-inception period, underperformed
the S&P Municipal Bond High Yield Index for each period and outperformed the S&P Municipal Bond Index for each period. The
Trustees also noted that the Fund ranked in the 3rd quartile of its Lipper peer group for each period.
The Trustees reviewed information on the performance of Invesco Real Assets ESG ETF,
its benchmark indexes (S&P U.S., Canada & Mexico Real Assets Equity Index and S&P 500® Index) and the Fund’s Lipper peer group rankings for the one-year, three-year and since-inception (December 22, 2020) periods ended December 31, 2024.
Based on the information provided, the Trustees noted that the Fund outperformed the S&P U.S., Canada & Mexico Real Assets
Equity Index for the one-year and three-year periods, underperformed the S&P U.S., Canada & Mexico Real Assets Equity
Index for the since-inception period, underperformed the S&P 500® Index for the one-year and three-year periods and outperformed the S&P 500® Index for the since-inception period. The Trustees also noted that the Fund ranked in the 1st quartile
of its Lipper peer group for each period.
The Trustees reviewed information on the performance of Invesco S&P 500® Downside Hedged ETF, its benchmark indexes (S&P 500® Dynamic VEQTOR Index, S&P 500® Index and U.S. 3-Month Treasury Bill Index) and the Fund’s Lipper peer group rankings for the one-year, three-year, five-year, ten-year and since-inception (December 6,
2012) periods ended December 31, 2024. Based on the information provided, the Trustees noted that the Fund underperformed the S&P 500® Dynamic VEQTOR Index and the S&P 500® Index for each period, outperformed the U.S. 3-Month Treasury Bill Index for the one-year, five-year, ten-year and since-inception periods and underperformed the U.S. 3-Month Treasury
Bill Index for the three-year period. The Trustees also noted that the Fund ranked in the 1st quartile of its Lipper peer group
for the one-year, five-year, ten-year and since-inception periods and ranked in the 3rd quartile of its Lipper peer group for
the three-year period.
The Trustees reviewed information on the performance of Invesco Short Duration Total
Return Bond ETF, its benchmark indexes (Bloomberg U.S. Aggregate Bond Index and Bloomberg U.S. Government and Credit 1-3 Year Index) and the Fund’s Lipper peer group rankings for the one-year and since-inception (December 9, 2022) periods ended
December 31, 2024. Based on the
Approval of Investment Advisory and Sub-Advisory Contracts—(continued)
information provided, the Trustees noted that the Fund outperformed both benchmark
indexes for each period. The Trustees also noted that the Fund ranked in the 2nd quartile of its Lipper peer group for each
period.
The Trustees reviewed information on the performance of Invesco Total Return Bond
ETF, its benchmark index (Bloomberg U.S. Aggregate Bond Index) and the Fund’s Lipper peer group rankings for the one-year, three-year, five-year and since-inception (February 10, 2016) periods ended December 31, 2024. Based on the information provided,
the Trustees noted that the Fund outperformed its benchmark for the one-year, five-year and since-inception periods
and underperformed its benchmark for the three-year period. The Trustees also noted that the Fund ranked in the 1st quartile
of its Lipper peer group for the one-year, five-year and since-inception periods, and in the 3rd quartile of its Lipper peer
group for the three-year period. The Trustees considered that the Fund was created in connection with the purchase by Invesco of
the ETFs business of Guggenheim Capital LLC (“Guggenheim”) (the “Transaction”) and that the Fund’s performance prior to the closing of the Transaction on April 6, 2018 is that of its predecessor Guggenheim ETF.
The Trustees reviewed information on the performance of Invesco Variable Rate Investment
Grade ETF, its benchmark indexes (Bloomberg U.S. Aggregate Bond Index and Bloomberg US Floating Rate Note Index) and the Fund’s Lipper peer group rankings for the one-year, three-year, five-year and since-inception (September 22, 2016) periods
ended December 31, 2024. Based on the information provided, the Trustees noted that the Fund outperformed both benchmark
indexes for each period. The Trustees also noted that the Fund ranked in the 1st quartile of its Lipper peer group for each
period.
The Trustees considered the services provided by the Adviser in its oversight of the Funds’ administrator, custodian, transfer agent and, for all Funds except Invesco S&P 500® Downside Hedged ETF, the Sub-Advisers. The Trustees noted the significant amount of time, effort and resources that had been devoted to this oversight function.
Based on its review, the Board concluded that the nature, extent and quality of services
provided by the Adviser to the Funds under the Investment Advisory Agreement were appropriate and reasonable.
Fees, Expenses and Profitability. The Trustees reviewed and discussed the information provided by the Adviser on each Fund’s net expense ratio and unitary advisory fee. The Trustees noted that the annual advisory
fee charged to each Fund, as set forth below, is a unitary advisory fee and that the Adviser compensates each Sub-Adviser
(as applicable) from its unitary advisory fee and pays all other operating expenses of each Fund, except that each Fund pays its
brokerage expenses, taxes, interest (including, for Invesco AAA CLO Floating Rate Note ETF, interest expenses associated with any
draws on its line of credit), acquired fund fees and expenses, if any, litigation expenses, costs incurred in connection with proxies
(except certain proxies) and other extraordinary expenses:
●
0.19% of the Fund’s average daily net assets for Invesco AAA CLO Floating Rate Note ETF;
●
0.30% of the Fund’s average daily net assets for Invesco Short Duration Total Return Bond ETF and Invesco Variable Rate Investment Grade ETF;
●
0.35% of the Fund’s average daily net assets for Invesco Active U.S. Real Estate ETF and Invesco Total Return Bond ETF;
●
0.39% of the Fund’s average daily net assets for Invesco S&P 500® Downside Hedged ETF, Invesco High Yield Bond Factor ETF and Invesco Rochester High Yield Municipal ETF;
●
0.48% of the Fund’s average daily net assets for Invesco High Yield Select ETF; and
●
0.59% of the Fund’s average daily net assets for Invesco Real Assets ESG ETF.
The Trustees considered that on March 13, 2025 the Adviser proposed and the Board
of Trustees approved a permanent reduction in the annual unitary advisory fee rate for Invesco Real Assets ESG ETF from 0.59% to 0.58% of the Fund’s average daily net assets, effective May 13, 2025.
The Trustees compared each Fund’s net expense ratio to information compiled by the Adviser from Lipper databases on the net expense ratios of comparable ETFs, open-end (non-ETF) index funds and open-end (non-ETF)
actively-managed funds, as applicable. The Trustees noted that the net expense ratios for certain Funds were
equal to or lower than the median net expense ratios of their ETF peers and open-end index peer funds, as illustrated in the table
below. The Trustees also noted that the net expense ratios for all Funds were equal to or lower than the median net expense ratios
of their open-end actively-managed peer funds.
Approval of Investment Advisory and Sub-Advisory Contracts—(continued)
|
|
Equal
to/Lower
than ETF
Peer
Median*
|
Equal to/Lower
than Open-End
Index Fund
Peer Median*
|
Equal to/
Lower than
Open-End
Active Fund
Peer Median
|
Invesco AAA CLO Floating Rate Note ETF
|
|
|
|
Invesco Active U.S. Real Estate ETF
|
|
|
|
Invesco High Yield Bond Factor ETF
|
|
|
|
Invesco High Yield Select ETF
|
|
|
|
Invesco Real Assets ESG ETF
|
|
|
|
Invesco Rochester High Yield Municipal ETF
|
|
|
|
Invesco S&P 500® Downside Hedged ETF
|
|
|
|
Invesco Short Duration Total Return Bond ETF
|
|
|
|
Invesco Total Return Bond ETF
|
|
|
|
Invesco Variable Rate Investment Grade ETF
|
|
|
|
|
|
The information provided by the Adviser indicated that certain Funds did not have
any open-end index fund peers. Those Funds have been designated in this
column with an “N/A” for not available.
|
The Trustees noted information, including fee information, provided by the Adviser
regarding other investment products to which it provides investment advisory services, noting that the Adviser indicated that none
of the other investment products have investment strategies comparable to those of the Funds. The Trustees considered the Adviser’s explanation of the differences between the services provided to the Funds and to the other investment products it advises, noting the Adviser’s statement that the management and oversight of the Funds requires substantially more labor and expense.
Based on all of the information provided, the Board concluded that each Fund’s unitary advisory was reasonable and appropriate in light of the services provided, the distinguishing factors of the Fund, and the
administrative, operational and management oversight costs for the Adviser.
In conjunction with their review of the unitary advisory fees, the Trustees considered
information provided by the Adviser on the revenues received by the Adviser under the Investment Advisory Agreement for the Funds.
The Trustees reviewed information provided by the Adviser regarding its overall profitability, as well as the estimated
profitability to the Adviser from its relationship to each Fund. With respect to the Adviser’s profitability information, the Trustees considered that there is no recognized standard or uniform methodology for determining profitability for this purpose. Furthermore,
the Trustees noted that there are limitations inherent in allocating costs and calculating profitability for an organization such as the Adviser’s. Based on the information provided, the Board concluded that the overall and estimated profitability to the
Adviser was not unreasonable.
Economies of Scale and Whether Fee Levels Reflect These Economies of Scale. The Trustees reviewed the information provided by the Adviser as to the extent to which economies of scale may be realized as each
Fund grows and whether fee levels reflect economies of scale for the benefit of the Fund’s shareholders. The Trustees reviewed each Fund’s asset size and unitary advisory fee. The Trustees noted that any reduction in fixed costs associated with the management
of the Funds would be enjoyed by the Adviser, but a unitary advisory fee provides a level of certainty in expenses for
the Funds. The Trustees also noted that the Adviser has reduced advisory fees for the Invesco ETFs numerous times since 2011,
including through permanent advisory fee reductions and various advisory fee waivers. The Board considered whether the unitary
advisory fee rate for each Fund was reasonable in relation to the asset size of that Fund and concluded that the unitary
advisory fee rates were reasonable and appropriate.
Fall-out Benefits. The Trustees considered that the Adviser identified no additional benefits it receives
from its relationship with the Funds, and noted that the Adviser is not a party to any soft-dollar, commission
recapture or directed brokerage arrangements with respect to the Funds. The Trustees also considered benefits received by affiliates
of the Adviser that may be directly or indirectly attributed to the Adviser’s relationship with the Funds, including brokerage fees, advisory fees from affiliated money market cash management vehicles and fees as the Funds’ securities lending agent. The Trustees also considered that Invesco Distributors, Inc., an affiliate of the Adviser, serves as each Fund’s distributor and is paid a distribution fee by the Adviser. The Board concluded that each Fund’s unitary advisory fee was reasonable, taking into account any ancillary benefits received by affiliates of the Adviser.Based on all of the information considered and the conclusions
reached, the Board, including the
Approval of Investment Advisory and Sub-Advisory Contracts—(continued)
Independent Trustees, determined to approve the continuation of the Investment Advisory
Agreement for each Fund. No single factor was determinative in the Board’s analysis.
Investment Sub-Advisory Agreement
As noted above, the Board of Trustees of the Trust, including the Independent Trustees,
approved the continuation of the Sub-Advisory Agreement for each of Invesco AAA CLO Floating Rate Note ETF, Invesco
Active U.S. Real Estate ETF, Invesco High Yield Bond Factor ETF, Invesco High Yield Select ETF, Invesco Real Assets ESG ETF,
Invesco Rochester High Yield Municipal ETF, Invesco Short Duration Total Return Bond ETF, Invesco Total Return Bond ETF and Invesco
Variable Rate Investment Grade ETF (each such Fund, a “Sub-Advised Fund” and collectively, the “Sub-Advised Funds”) at a meeting held on April 24, 2025. The review process followed by the Board is described in detail above. In connection
with the review of the Sub-Advisory Agreement, the Board considered the factors described below, among others.
Nature, Extent and Quality of Services. The Trustees considered the nature, extent and quality of services provided to each
Sub-Advised Fund under the Sub-Advisory Agreement. The Trustees reviewed the qualifications
and background of each Sub-Adviser, the services provided by each Sub-Adviser, the investment approach of
the Sub-Adviser whose investment personnel manage Invesco AAA CLO Floating Rate Note ETF’s, Invesco Active U.S. Real Estate ETF’s, Invesco High Yield Bond Factor ETF’s, Invesco High Yield Select ETF’s, Invesco Real Assets ESG ETF’s, Invesco Rochester High Yield Municipal ETF, Invesco Short Duration Total Return Bond ETF’s, Invesco Total Return Bond ETF’s and Invesco Variable Rate Investment Grade ETF’s assets and the experience and skills of the investment personnel responsible for the day-to-day
management of such Sub-Advised Funds.
Based on its review, the Board concluded that the nature, extent and quality of services
provided by the Sub-Advisers to each Sub-Advised Fund under the Sub-Advisory Agreement were appropriate and reasonable.
Fees, Expenses and Profitability. The Trustees reviewed and discussed the information provided by the Adviser and the
Sub-Advisers on the sub-advisory fee rate under the Sub-Advisory Agreement. The Trustees
noted that the sub-advisory fee charged by the Sub-Advisers under the Sub-Advisory Agreement is consistent with the
compensation structure used throughout Invesco when Invesco’s affiliates provide sub-advisory services for funds managed by other Invesco affiliates. The Trustees considered how the sub-advisory fee relates to the overall advisory fee for each Sub-Advised
Fund and noted that the Adviser compensates each Sub-Adviser from its fee.
The Trustees also reviewed the financial statements provided by Invesco Senior Secured
Management, Inc. in connection with the March 13 and April 24, 2025 Board Meetings, and Invesco Advisers, Inc. in connection
with the April 24, 2025 meeting, and they noted the net income generated by each firm. The Trustees noted that the Adviser
compensates each Sub-Adviser from its fee and that the Adviser provided profitability information with respect to each Sub-Advised
Fund.
Economies of Scale and Whether Fee Levels Reflect These Economies of Scale. As part of their review of the Investment Advisory Agreement for each Sub-Advised Fund, the Trustees considered the extent to which economies
of scale may be realized as each Sub-Advised Fund grows and whether fee levels reflect economies of scale for the benefit of the Sub-Advised Fund’s shareholders. The Board considered whether the sub-advisory fee rate for each Sub-Advised
Fund was reasonable in relation to the asset size (if any) of the Sub-Advised Funds and concluded that the flat sub-advisory
fee rate was reasonable and appropriate.
Fall-out Benefits. The Trustees noted that Invesco Advisers, Inc. receives management fees from affiliated
money market funds into which the Sub-Advised Funds’ and other Invesco ETFs’ excess cash and securities lending collateral may be invested, and that the Adviser waives its fees with respect to each Sub-Advised Fund in an amount equal
to the fees received by Invesco Advisers, Inc. on the Sub-Advised Fund’s excess cash invested in the affiliated money market funds. The Trustees also noted the fees received by Invesco Advisers, Inc. in its capacity as securities lending agent for
the Invesco ETFs. The Trustees considered that Invesco Advisers, Inc. may participate in soft-dollar arrangements for Invesco Real
Assets ESG ETF, but that the Sub-Advisers otherwise generally do not use or generate soft-dollars with respect to the Sub-Advised
Funds. The Trustees noted that the Sub-Advisers had not identified any further benefits that they received from their
relationships with the Sub-Advised Funds. The Board concluded that the sub-advisory fee with respect to each Sub-Advised Fund was
reasonable, taking into account any ancillary benefits received by the Sub-Advisers.
Approval of Investment Advisory and Sub-Advisory Contracts—(continued)
Based on all of the information considered and the conclusions reached, the Board,
including the Independent Trustees, determined to approve the continuation of the Sub-Advisory Agreement for each Sub-Advised
Fund. No single factor was determinative in the Board’s analysis.
Other Information Required in Form N-CSR (Items 8-11)
Changes in and Disagreements with Accountants for Open-End Management Investment Companies
Proxy Disclosures for Open-End Management Investment Companies
Remuneration Paid to Directors, Officers, and Others of Open-End Management Investment
Companies
Remuneration paid to the Fund’s trustees or officers and others, if any, is disclosed within the financial statements.
Statement Regarding Basis for Approval of Investment Advisory Contracts
The statement regarding basis for approval of investment advisory contracts can be
found in the Approval of Investment Advisory and Sub-Advisory Contracts section of this report.
©2025 Invesco Capital Management LLC
3500 Lacey Road, Suite 700
Downers Grove, IL 60515
P-MS-NCSRS
invesco.com/ETFs
Item 8. Changes in and Disagreements with Accountants for Open-End Management Investment Companies.
Item 9. Proxy Disclosures for Open-End Management Investment Companies.
Item 10. Remuneration Paid to Directors, Officers, and Others for Open-End Management Investment Companies.
This information is filed under Item 7 of this Form N-CSR.
Item 11. Statement Regarding Basis for Approval of Investment Advisory Contract.
This information is filed under Item 7 of this Form N-CSR.
Item 12. Disclosure of Proxy Voting Policies and Procedures for Closed-End Management Investment Companies.
Item 13. Portfolio Managers of Closed-End Management Investment Companies.
Item 14. Purchases of Equity Securities by Closed-End Management Investment Company and Affiliated Purchasers.
Item 15. Submission of Matters to a Vote of Security Holders.
There have been no material changes to the procedures by which shareholders may recommend nominees to the Board that would require disclosure herein.
Item 16. Controls and Procedures.
(a) Based on their evaluation of the Registrant's disclosure controls and procedures (as defined in Rule 30a-3(c) under the Act) as of a date within 90 days of the filing date of this report, the Registrant's Principal Executive Officer ("PEO") and Principal Financial Officer ("PFO") have concluded that such disclosure controls and procedures are effective.
(b) There were no changes in the Registrant's internal control over financial reporting (as defined in Rule 30a-3(d) under the Act) that occurred during the period covered by this report that have materially affected, or are reasonably likely to materially affect, the Registrant's internal control over financial reporting.
Item 17. Disclosure of Securities Lending Activity for Closed-End Management Investment Companies.
Item 18. Recovery of Erroneously Awarded Compensation.
SIGNATURES
Pursuant to the requirements of the Securities Exchange Act of 1934 and the Investment Company Act of 1940, the Registrant has duly caused this report to be signed on its behalf by the undersigned, thereunto duly authorized.
(Registrant) Invesco Actively Managed Exchange-Traded Fund Trust
By: /s/ Brian Hartigan .
Name: Brian Hartigan
Title:Principal Executive Officer
Date: July 3, 2025
Pursuant to the requirements of the Securities Exchange Act of 1934 and the Investment Company Act of 1940, this report has been signed below by the following persons on behalf of the Registrant and in the capacities and on the dates indicated.
By: /s/ Brian Hartigan ..
Name:Brian Hartigan
Title:Principal Executive Officer
Date: July 3, 2025
By: /s/ Kelli Gallegos ____
Name:Kelli Gallegos
Title:Principal Financial Officer
Date:July 3, 2025
Exhibit 99.CERT
EXHIBIT (a)(3)
CERTIFICATIONS PURSUANT TO RULE 30A-2(A) UNDER THE 1940 ACT AND SECTION 302 OF
THE SARBANES-OXLEY ACT OF 2002
I, Brian Hartigan, certify that:
|
1. |
I have reviewed this report on Form N-CSR of Invesco Actively Managed Exchange-Traded Fund Trust; |
|
2. |
Based on my knowledge, this report does not contain any untrue statement of a material fact or omit to state a material fact necessary to make the statements made, in light of the circumstances under which such statements were made, not misleading with respect to the period covered by this report; |
|
3. |
Based on my knowledge, the financial statements, and other financial information included in this report, fairly present in all material respects the financial condition, results of operations, changes in net assets, and cash flows (if the financial statements are required to include a statement of cash flows) of the Registrant as of, and for, the periods presented in this report; |
|
4. |
The Registrant's other certifying officer and I are responsible for establishing and maintaining disclosure controls and procedures (as defined in Rule 30a-3(c) under the Investment Company Act of 1940) and internal control over financial reporting (as defined in Rule 30a-3(d) under the Investment Company Act of 1940) for the Registrant and have: |
|
(a) |
Designed such disclosure controls and procedures, or caused such disclosure controls and procedures to be designed under our supervision, to ensure that material information relating to the Registrant, including its consolidated subsidiaries, is made known to us by others within those entities, particularly during the period in which this report is being prepared; |
|
(b) |
Designed such internal control over financial reporting, or caused such internal control over financial reporting to be designed under our supervision, to provide reasonable assurance regarding the reliability of financial reporting and the preparation of financial statements for external purposes in accordance with generally accepted accounting principles; |
|
(c) |
Evaluated the effectiveness of the Registrant's disclosure controls and procedures and presented in this report our conclusions about the effectiveness of the disclosure controls and procedures, as of a date within 90 days prior to the filing date of this report based on such evaluation; |
|
(d) |
Disclosed in this report any change in the Registrant's internal control over financial reporting that occurred during the period covered by this report that has materially affected, or is reasonably likely to materially affect, the Registrant's internal control over financial reporting; and |
|
5. |
The Registrant's other certifying officer and I have disclosed to the Registrant's auditors and the audit committee of the Registrant's board of directors (or persons performing the equivalent functions): |
|
(a) |
All significant deficiencies and material weaknesses in the design or operation of internal control over financial reporting which are reasonably likely to adversely affect the Registrant's ability to record, process, summarize, and report financial information; and |
|
(b) |
Any fraud, whether or not material, that involves management or other employees who have a significant role in the Registrant's internal control over financial reporting. |
Date: July 3, 2025/s/ Brian Hartigan
Brian Hartigan
Principal Executive Officer
Exhibit 99.CERT
EXHIBIT (a)(3)
CERTIFICATIONS PURSUANT TO RULE 30A-2(A) UNDER THE 1940 ACT AND SECTION 302 OF
THE SARBANES-OXLEY ACT OF 2002
I, Kelli Gallegos, certify that:
|
1. |
I have reviewed this report on Form N-CSR of Invesco Actively Managed Exchange-Traded Fund Trust; |
|
2. |
Based on my knowledge, this report does not contain any untrue statement of a material fact or omit to state a material fact necessary to make the statements made, in light of the circumstances under which such statements were made, not misleading with respect to the period covered by this report; |
|
3. |
Based on my knowledge, the financial statements, and other financial information included in this report, fairly present in all material respects the financial condition, results of operations, changes in net assets, and cash flows (if the financial statements are required to include a statement of cash flows) of the Registrant as of, and for, the periods presented in this report; |
|
4. |
The Registrant's other certifying officer and I are responsible for establishing and maintaining disclosure controls and procedures (as defined in Rule 30a-3(c) under the Investment Company Act of 1940) and internal control over financial reporting (as defined in Rule 30a-3(d) under the Investment Company Act of 1940) for the Registrant and have: |
|
(a) |
Designed such disclosure controls and procedures, or caused such disclosure controls and procedures to be designed under our supervision, to ensure that material information relating to the Registrant, including its consolidated subsidiaries, is made known to us by others within those entities, particularly during the period in which this report is being prepared; |
|
(b) |
Designed such internal control over financial reporting, or caused such internal control over financial reporting to be designed under our supervision, to provide reasonable assurance regarding the reliability of financial reporting and the preparation of financial statements for external purposes in accordance with generally accepted accounting principles; |
|
(c) |
Evaluated the effectiveness of the Registrant's disclosure controls and procedures and presented in this report our conclusions about the effectiveness of the disclosure controls and procedures, as of a date within 90 days prior to the filing date of this report based on such evaluation; |
|
(d) |
Disclosed in this report any change in the Registrant's internal control over financial reporting that occurred during the period covered by this report that has materially affected, or is reasonably likely to materially affect, the Registrant's internal control over financial reporting; and |
|
5. |
The Registrant's other certifying officer and I have disclosed to the Registrant's auditors and the audit committee of the Registrant's board of directors (or persons performing the equivalent functions): |
|
(a) |
All significant deficiencies and material weaknesses in the design or operation of internal control over financial reporting which are reasonably likely to adversely affect the Registrant's ability to record, process, summarize, and report financial information; and |
|
(b) |
Any fraud, whether or not material, that involves management or other employees who have a significant role in the Registrant's internal control over financial reporting. |
Date:July 3, 2025 /s/ Kelli Gallegos
Kelli Gallegos
Principal Financial Officer
Exhibit 99.906
EXHIBIT (b)
CERTIFICATIONS PURSUANT TO RULE 30A-2(B) UNDER THE 1940 ACT AND SECTION 906 OF THE SARBANES-OXLEY ACT OF 2002
In connection with the report of Invesco Actively Managed Exchange-Traded Fund Trust (the “Registrant”) on Form N-CSR for the period ended April 30, 2025 (the “Report”), each of the undersigned officers of the Registrant hereby certifies, pursuant to 18 U.S.C. ss. 1350, as adopted pursuant to SS. 906 of the Sarbanes-Oxley Act of 2002, that, to the best of his/her knowledge:
(1) The Report fully complies with the requirements of Section 13(a) or 15(d) of the Securities Exchange Act of 1934; and
(2) The information contained in the Report fairly presents, in all material respects, the financial condition and results of operations of the Registrant.
Dated: July 3, 2025
/s/ Brian Hartigan
Name:Brian Hartigan
Title: Principal Executive Officer
Dated: July 3, 2025
/s/ Kelli Gallegos
Name: Kelli Gallegos
Title: Principal Financial Officer
This certification is being furnished solely pursuant to 18 U.S.C. ss. 1350 and is not being filed as part of the Report or as a separate disclosure document.
v3.25.2
| X |
- DefinitionBoolean flag that is true when the XBRL content amends previously-filed or accepted submission.
| Name: |
dei_AmendmentFlag |
| Namespace Prefix: |
dei_ |
| Data Type: |
xbrli:booleanItemType |
| Balance Type: |
na |
| Period Type: |
duration |
|
| X |
- DefinitionFor the EDGAR submission types of Form 8-K: the date of the report, the date of the earliest event reported; for the EDGAR submission types of Form N-1A: the filing date; for all other submission types: the end of the reporting or transition period. The format of the date is YYYY-MM-DD.
| Name: |
dei_DocumentPeriodEndDate |
| Namespace Prefix: |
dei_ |
| Data Type: |
xbrli:dateItemType |
| Balance Type: |
na |
| Period Type: |
duration |
|
| X |
- DefinitionThe type of document being provided (such as 10-K, 10-Q, 485BPOS, etc). The document type is limited to the same value as the supporting SEC submission type, or the word 'Other'.
| Name: |
dei_DocumentType |
| Namespace Prefix: |
dei_ |
| Data Type: |
dei:submissionTypeItemType |
| Balance Type: |
na |
| Period Type: |
duration |
|
| X |
- DefinitionA unique 10-digit SEC-issued value to identify entities that have filed disclosures with the SEC. It is commonly abbreviated as CIK. Reference 1: http://www.xbrl.org/2003/role/presentationRef
-Publisher SEC
-Name Exchange Act
-Number 240
-Section 12
-Subsection b-2
| Name: |
dei_EntityCentralIndexKey |
| Namespace Prefix: |
dei_ |
| Data Type: |
dei:centralIndexKeyItemType |
| Balance Type: |
na |
| Period Type: |
duration |
|
| X |
- DefinitionOne of: N-1A (Mutual Fund), N-1 (Open-End Separate Account with No Variable Annuities), N-2 (Closed-End Investment Company), N-3 (Separate Account Registered as Open-End Management Investment Company), N-4 (Variable Annuity UIT Separate Account), N-5 (Small Business Investment Company), N-6 (Variable Life UIT Separate Account), S-1 or S-3 (Face Amount Certificate Company), S-6 (UIT, Non-Insurance Product). Reference 1: http://www.xbrl.org/2003/role/presentationRef
-Publisher SEC
-Name Regulation S-T
-Number 232
-Section 313
| Name: |
dei_EntityInvCompanyType |
| Namespace Prefix: |
dei_ |
| Data Type: |
dei:invCompanyType |
| Balance Type: |
na |
| Period Type: |
duration |
|
| X |
- DefinitionThe exact name of the entity filing the report as specified in its charter, which is required by forms filed with the SEC. Reference 1: http://www.xbrl.org/2003/role/presentationRef
-Publisher SEC
-Name Exchange Act
-Number 240
-Section 12
-Subsection b-2
| Name: |
dei_EntityRegistrantName |
| Namespace Prefix: |
dei_ |
| Data Type: |
xbrli:normalizedStringItemType |
| Balance Type: |
na |
| Period Type: |
duration |
|
| X |
- ReferencesReference 1: http://www.xbrl.org/2003/role/presentationRef
-Publisher SEC
-Name Form N-1A
-Section 27A
-Subsection d
-Paragraph 2
-Subparagraph instruction
-Clause 7
| Name: |
oef_ShareholderReportLineItems |
| Namespace Prefix: |
oef_ |
| Data Type: |
xbrli:stringItemType |
| Balance Type: |
na |
| Period Type: |
duration |
|
v3.25.2
Shareholder Report
|
6 Months Ended |
|
Apr. 30, 2025
USD ($)
Holding
|
|---|
| Shareholder Report [Line Items] |
|
|
| Document Type |
N-CSRS
|
|
| Amendment Flag |
false
|
|
| Registrant Name |
Invesco Actively Managed Exchange-Traded Fund Trust
|
|
| Entity Central Index Key |
0001418144
|
|
| Entity Investment Company Type |
N-1A
|
|
| Document Period End Date |
Apr. 30, 2025
|
|
| C000068414 [Member] |
|
|
| Shareholder Report [Line Items] |
|
|
| Fund Name |
Invesco Active U.S. Real Estate ETF
|
|
| Class Name |
Invesco Active U.S. Real Estate ETF
|
|
| Trading Symbol |
PSR
|
|
| Security Exchange Name |
NYSEArca
|
|
| Annual or Semi-Annual Statement [Text Block] |
This semi-annual shareholder report contains important information about Invesco Active U.S. Real Estate ETF (the “Fund”) for the period November 1, 2024 to April 30, 2025.
|
|
| Shareholder Report Annual or Semi-Annual |
semi-annual shareholder report
|
|
| Additional Information [Text Block] |
You can find additional information about the Fund at invesco.com/reports. You can also request this information by contacting us at (800) 983-0903.
|
|
| Additional Information Phone Number |
(800) 983-0903
|
|
| Additional Information Website |
invesco.com/reports
|
|
| Expenses [Text Block] |
What Were The Fund Costs For The Last Six Months ? (Based on a hypothetical $10,000 investment)
| Fund |
Costs of a $10,000 investment |
Costs paid as a percentage
of a $10,000 investment* |
| Invesco Active U.S. Real Estate ETF |
$17 |
0.35% |
|
|
| Expenses Paid, Amount |
$ 17
|
|
| Expense Ratio, Percent |
0.35%
|
[1] |
| Net Assets |
$ 58,327,144
|
|
| Holdings Count | Holding |
37
|
|
| Investment Company Portfolio Turnover |
60.00%
|
|
| Additional Fund Statistics [Text Block] |
What Are Key Statistics About The Fund? (as of April 30, 2025)
| Fund net assets |
$58,327,144 |
| Total number of portfolio holdings |
37 |
| Portfolio turnover rate |
60% |
|
|
| Holdings [Text Block] |
What Comprised The Fund's Holdings? (as of April 30, 2025) Top ten holdings*
(% of net assets)
| American Tower Corp. |
8.37% |
| Digital Realty Trust, Inc. |
8.06% |
| Welltower, Inc. |
7.93% |
| Equinix, Inc. |
4.66% |
| Healthpeak Properties, Inc. |
3.89% |
| CubeSmart |
3.72% |
| EastGroup Properties, Inc. |
3.60% |
| Simon Property Group, Inc. |
3.53% |
| Brixmor Property Group, Inc. |
3.46% |
| Equity Residential |
3.37% |
| * Excluding money market fund holdings, if any. |
| Property type
(% of net assets)
|
|
| Largest Holdings [Text Block] |
Top ten holdings*
(% of net assets)
| American Tower Corp. |
8.37% |
| Digital Realty Trust, Inc. |
8.06% |
| Welltower, Inc. |
7.93% |
| Equinix, Inc. |
4.66% |
| Healthpeak Properties, Inc. |
3.89% |
| CubeSmart |
3.72% |
| EastGroup Properties, Inc. |
3.60% |
| Simon Property Group, Inc. |
3.53% |
| Brixmor Property Group, Inc. |
3.46% |
| Equity Residential |
3.37% |
| * Excluding money market fund holdings, if any. |
|
|
|
| C000112015 [Member] |
|
|
| Shareholder Report [Line Items] |
|
|
| Fund Name |
Invesco S&P 500® Downside Hedged ETF
|
|
| Class Name |
Invesco S&P 500® Downside Hedged ETF
|
|
| Trading Symbol |
PHDG
|
|
| Security Exchange Name |
NYSEArca
|
|
| Annual or Semi-Annual Statement [Text Block] |
This semi-annual shareholder report contains important information about Invesco S&P 500® Downside Hedged ETF (the “Fund”) for the period November 1, 2024 to April 30, 2025.
|
|
| Shareholder Report Annual or Semi-Annual |
semi-annual shareholder report
|
|
| Additional Information [Text Block] |
You can find additional information about the Fund at invesco.com/reports. You can also request this information by contacting us at (800) 983-0903.
|
|
| Additional Information Phone Number |
(800) 983-0903
|
|
| Additional Information Website |
invesco.com/reports
|
|
| Expenses [Text Block] |
What Were The Fund Costs For The Last Six Months ? (Based on a hypothetical $10,000 investment)
| Fund |
Costs of a $10,000 investment |
Costs paid as a percentage
of a $10,000 investment* |
| Invesco S&P 500® Downside Hedged ETF |
$15 |
0.33%† |
| * |
Annualized. |
|
† |
Reflects fee waivers and/or expense reimbursements, without which expenses would have been higher. |
|
|
| Expenses Paid, Amount |
$ 15
|
|
| Expense Ratio, Percent |
0.33%
|
[2],[3] |
| Net Assets |
$ 99,222,128
|
|
| Holdings Count | Holding |
508
|
|
| Investment Company Portfolio Turnover |
799.00%
|
|
| Additional Fund Statistics [Text Block] |
What Are Key Statistics About The Fund? (as of April 30, 2025)
| Fund net assets |
$99,222,128 |
| Total number of portfolio holdings |
508 |
| Portfolio turnover rate |
799% |
|
|
| Holdings [Text Block] |
What Comprised The Fund's Holdings? (as of April 30, 2025) Top ten holdings*
(% of net assets)
| Apple, Inc. |
3.69% |
| Microsoft Corp. |
3.40% |
| NVIDIA Corp. |
3.08% |
| Amazon.com, Inc. |
2.01% |
| Meta Platforms, Inc., Class A |
1.39% |
| Berkshire Hathaway, Inc., Class B |
1.13% |
| Alphabet, Inc., Class A |
1.07% |
| Broadcom, Inc. |
1.04% |
| Tesla, Inc. |
0.91% |
| Alphabet, Inc., Class C |
0.88% |
| * Excluding money market fund holdings, if any. |
| Sector allocation
(% of net assets)
|
|
| Largest Holdings [Text Block] |
Top ten holdings*
(% of net assets)
| Apple, Inc. |
3.69% |
| Microsoft Corp. |
3.40% |
| NVIDIA Corp. |
3.08% |
| Amazon.com, Inc. |
2.01% |
| Meta Platforms, Inc., Class A |
1.39% |
| Berkshire Hathaway, Inc., Class B |
1.13% |
| Alphabet, Inc., Class A |
1.07% |
| Broadcom, Inc. |
1.04% |
| Tesla, Inc. |
0.91% |
| Alphabet, Inc., Class C |
0.88% |
| * Excluding money market fund holdings, if any. |
|
|
|
| C000162616 [Member] |
|
|
| Shareholder Report [Line Items] |
|
|
| Fund Name |
Invesco Variable Rate Investment Grade ETF
|
|
| Class Name |
Invesco Variable Rate Investment Grade ETF
|
|
| Trading Symbol |
VRIG
|
|
| Security Exchange Name |
NASDAQ
|
|
| Annual or Semi-Annual Statement [Text Block] |
This semi-annual shareholder report contains important information about Invesco Variable Rate Investment Grade ETF (the “Fund”) for the period November 1, 2024 to April 30, 2025.
|
|
| Shareholder Report Annual or Semi-Annual |
semi-annual shareholder report
|
|
| Additional Information [Text Block] |
You can find additional information about the Fund at invesco.com/reports. You can also request this information by contacting us at (800) 983-0903.
|
|
| Additional Information Phone Number |
(800) 983-0903
|
|
| Additional Information Website |
invesco.com/reports
|
|
| Expenses [Text Block] |
What Were The Fund Costs For The Last Six Months ?
(Based on a hypothetical $10,000 investment)
| Fund |
Costs of a $10,000 investment |
Costs paid as a percentage
of a $10,000 investment* |
| Invesco Variable Rate Investment Grade ETF |
$15 |
0.30% |
|
|
| Expenses Paid, Amount |
$ 15
|
|
| Expense Ratio, Percent |
0.30%
|
[4] |
| Net Assets |
$ 1,266,364,679
|
|
| Holdings Count | Holding |
385
|
|
| Investment Company Portfolio Turnover |
37.00%
|
|
| Additional Fund Statistics [Text Block] |
What Are Key Statistics About The Fund?
(as of April 30, 2025)
| Fund net assets |
$1,266,364,679 |
| Total number of portfolio holdings |
385 |
| Portfolio turnover rate |
37% |
|
|
| Holdings [Text Block] |
What Comprised The Fund's Holdings?
(as of April 30, 2025)
Top ten holdings*
(% of net assets)
| U.S. Treasury Floating Rate Notes, 4.34%, 01/31/2027 |
14.90% |
| U.S. Treasury Floating Rate Notes, 4.45%, 10/31/2026 |
7.68% |
| Freddie Mac, Series 2024-HQA1, Class A1, STACR®, 5.60%, 03/25/2044 |
0.79% |
| Freddie Mac REMICs, 5.85%, 04/25/2055 |
0.66% |
| Volkswagen Group of America Finance LLC, 5.44%, 03/25/2027 |
0.63% |
| ABN AMRO Bank N.V., 5.37%, 12/03/2028 |
0.60% |
| Santander Holdings USA, Inc., 5.98%, 03/20/2029 |
0.60% |
| Morgan Stanley, 5.40%, 04/13/2028 |
0.59% |
| General Motors Financial Co., Inc., 5.41%, 02/26/2027 |
0.59% |
| JPMorgan Chase & Co., 5.30%, 04/22/2028 |
0.59% |
| * Excluding money market fund holdings, if any. |
|
Security type allocation
(% of net assets)
|
|
| Largest Holdings [Text Block] |
Top ten holdings*
(% of net assets)
| U.S. Treasury Floating Rate Notes, 4.34%, 01/31/2027 |
14.90% |
| U.S. Treasury Floating Rate Notes, 4.45%, 10/31/2026 |
7.68% |
| Freddie Mac, Series 2024-HQA1, Class A1, STACR®, 5.60%, 03/25/2044 |
0.79% |
| Freddie Mac REMICs, 5.85%, 04/25/2055 |
0.66% |
| Volkswagen Group of America Finance LLC, 5.44%, 03/25/2027 |
0.63% |
| ABN AMRO Bank N.V., 5.37%, 12/03/2028 |
0.60% |
| Santander Holdings USA, Inc., 5.98%, 03/20/2029 |
0.60% |
| Morgan Stanley, 5.40%, 04/13/2028 |
0.59% |
| General Motors Financial Co., Inc., 5.41%, 02/26/2027 |
0.59% |
| JPMorgan Chase & Co., 5.30%, 04/22/2028 |
0.59% |
| * Excluding money market fund holdings, if any. |
|
|
|
| C000197599 [Member] |
|
|
| Shareholder Report [Line Items] |
|
|
| Fund Name |
Invesco Ultra Short Duration ETF
|
|
| Class Name |
Invesco Ultra Short Duration ETF
|
|
| Trading Symbol |
GSY
|
|
| Security Exchange Name |
NYSEArca
|
|
| Annual or Semi-Annual Statement [Text Block] |
This semi-annual shareholder report contains important information about Invesco Ultra Short Duration ETF (the “Fund”) for the period November 1, 2024 to April 30, 2025.
|
|
| Shareholder Report Annual or Semi-Annual |
semi-annual shareholder report
|
|
| Additional Information [Text Block] |
You can find additional information about the Fund at invesco.com/reports. You can also request this information by contacting us at (800) 983-0903.
|
|
| Additional Information Phone Number |
(800) 983-0903
|
|
| Additional Information Website |
invesco.com/reports
|
|
| Expenses [Text Block] |
What Were The Fund Costs For The Last Six Months ?
(Based on a hypothetical $10,000 investment)
| Fund |
Costs of a $10,000 investment |
Costs paid as a percentage
of a $10,000 investment* |
| Invesco Ultra Short Duration ETF |
$11 |
0.22% |
|
|
| Expenses Paid, Amount |
$ 11
|
|
| Expense Ratio, Percent |
0.22%
|
[5] |
| Net Assets |
$ 2,770,718,250
|
|
| Holdings Count | Holding |
330
|
|
| Investment Company Portfolio Turnover |
23.00%
|
|
| Additional Fund Statistics [Text Block] |
What Are Key Statistics About The Fund?
(as of April 30, 2025)
| Fund net assets |
$2,770,718,250 |
| Total number of portfolio holdings |
330 |
| Portfolio turnover rate |
23% |
|
|
| Holdings [Text Block] |
What Comprised The Fund's Holdings?
(as of April 30, 2025)
Top ten holdings*
(% of net assets)
| APA Corp., 5.05%, 05/01/2025 |
1.11% |
| Jabil, Inc., 5.08%-5.13%, 05/05/2025 |
1.08% |
| Boston Properties L.P., 4.69%, 06/02/2025 |
0.93% |
| Kinder Morgan, Inc., 4.30%, 06/01/2025 |
0.93% |
| Crown Castle, Inc., 4.94%, 05/01/2025 |
0.90% |
| Conagra Brands, Inc., 5.07%, 05/19/2025 |
0.90% |
| Brunswick Corp., 5.06%-5.11%, 05/01/2025 |
0.75% |
| Eversource Energy, 4.83%, 05/12/2025 |
0.72% |
| Sonoco Products Co., 5.24%, 05/28/2025 |
0.72% |
| Quanta Services, Inc., 4.90%, 05/02/2025 |
0.70% |
| * Excluding money market fund holdings, if any. |
|
Security type allocation
(% of net assets)
|
|
| Largest Holdings [Text Block] |
Top ten holdings*
(% of net assets)
| APA Corp., 5.05%, 05/01/2025 |
1.11% |
| Jabil, Inc., 5.08%-5.13%, 05/05/2025 |
1.08% |
| Boston Properties L.P., 4.69%, 06/02/2025 |
0.93% |
| Kinder Morgan, Inc., 4.30%, 06/01/2025 |
0.93% |
| Crown Castle, Inc., 4.94%, 05/01/2025 |
0.90% |
| Conagra Brands, Inc., 5.07%, 05/19/2025 |
0.90% |
| Brunswick Corp., 5.06%-5.11%, 05/01/2025 |
0.75% |
| Eversource Energy, 4.83%, 05/12/2025 |
0.72% |
| Sonoco Products Co., 5.24%, 05/28/2025 |
0.72% |
| Quanta Services, Inc., 4.90%, 05/02/2025 |
0.70% |
| * Excluding money market fund holdings, if any. |
|
|
|
| C000197600 [Member] |
|
|
| Shareholder Report [Line Items] |
|
|
| Fund Name |
Invesco Total Return Bond ETF
|
|
| Class Name |
Invesco Total Return Bond ETF
|
|
| Trading Symbol |
GTO
|
|
| Security Exchange Name |
NYSEArca
|
|
| Annual or Semi-Annual Statement [Text Block] |
This semi-annual shareholder report contains important information about Invesco Total Return Bond ETF (the “Fund”) for the period November 1, 2024 to April 30, 2025.
|
|
| Shareholder Report Annual or Semi-Annual |
semi-annual shareholder report
|
|
| Additional Information [Text Block] |
You can find additional information about the Fund at invesco.com/reports. You can also request this information by contacting us at (800) 983-0903.
|
|
| Additional Information Phone Number |
(800) 983-0903
|
|
| Additional Information Website |
invesco.com/reports
|
|
| Expenses [Text Block] |
What Were The Fund Costs For The Last Six Months ?
(Based on a hypothetical $10,000 investment)
| Fund |
Costs of a $10,000 investment |
Costs paid as a percentage
of a $10,000 investment* |
| Invesco Total Return Bond ETF |
$13 |
0.25%† |
| * |
Annualized.
|
|
†
|
Reflects fee waivers and/or expense reimbursements, without which expenses would have been higher.
|
|
|
| Expenses Paid, Amount |
$ 13
|
|
| Expense Ratio, Percent |
0.25%
|
[6],[7] |
| Net Assets |
$ 1,887,146,731
|
|
| Holdings Count | Holding |
1,275
|
|
| Investment Company Portfolio Turnover |
308.00%
|
|
| Additional Fund Statistics [Text Block] |
What Are Key Statistics About The Fund?
(as of April 30, 2025)
| Fund net assets |
$1,887,146,731 |
| Total number of portfolio holdings |
1,275 |
| Portfolio turnover rate |
308% |
|
|
| Holdings [Text Block] |
What Comprised The Fund's Holdings?
(as of April 30, 2025)
Top ten holdings*
(% of net assets)
| U.S. Treasury Bonds, 4.50%, 11/15/2054 |
4.28% |
| Uniform Mortgage-Backed Securities, TBA, 5.50%, 05/01/2055 |
4.17% |
| U.S. Treasury Notes, 3.88%, 04/30/2030 |
3.49% |
| Uniform Mortgage-Backed Securities, TBA, 2.50%, 06/01/2055 |
3.45% |
| U.S. Treasury Notes, 4.63%, 02/15/2035 |
2.77% |
| Uniform Mortgage-Backed Securities, TBA, 3.00%, 05/01/2055 |
2.69% |
| Uniform Mortgage-Backed Securities, TBA, 5.00%, 05/01/2055 |
2.64% |
| Uniform Mortgage-Backed Securities, TBA, 6.00%, 05/01/2055 |
2.56% |
| U.S. Treasury Notes, 3.75%, 04/30/2027 |
2.33% |
| Uniform Mortgage-Backed Securities, TBA, 3.50%, 05/01/2055 |
1.77% |
| * Excluding money market fund holdings, if any. |
|
Security type allocation
(% of total investments)
|
|
| Largest Holdings [Text Block] |
Top ten holdings*
(% of net assets)
| U.S. Treasury Bonds, 4.50%, 11/15/2054 |
4.28% |
| Uniform Mortgage-Backed Securities, TBA, 5.50%, 05/01/2055 |
4.17% |
| U.S. Treasury Notes, 3.88%, 04/30/2030 |
3.49% |
| Uniform Mortgage-Backed Securities, TBA, 2.50%, 06/01/2055 |
3.45% |
| U.S. Treasury Notes, 4.63%, 02/15/2035 |
2.77% |
| Uniform Mortgage-Backed Securities, TBA, 3.00%, 05/01/2055 |
2.69% |
| Uniform Mortgage-Backed Securities, TBA, 5.00%, 05/01/2055 |
2.64% |
| Uniform Mortgage-Backed Securities, TBA, 6.00%, 05/01/2055 |
2.56% |
| U.S. Treasury Notes, 3.75%, 04/30/2027 |
2.33% |
| Uniform Mortgage-Backed Securities, TBA, 3.50%, 05/01/2055 |
1.77% |
| * Excluding money market fund holdings, if any. |
|
|
|
| C000218086 [Member] |
|
|
| Shareholder Report [Line Items] |
|
|
| Fund Name |
Invesco High Yield Bond Factor ETF
|
|
| Class Name |
Invesco High Yield Bond Factor ETF
|
|
| Trading Symbol |
IHYF
|
|
| Security Exchange Name |
NASDAQ
|
|
| Annual or Semi-Annual Statement [Text Block] |
This semi-annual shareholder report contains important information about Invesco High Yield Bond Factor ETF (the “Fund”) for the period November 1, 2024 to April 30, 2025.
|
|
| Shareholder Report Annual or Semi-Annual |
semi-annual shareholder report
|
|
| Additional Information [Text Block] |
You can find additional information about the Fund at invesco.com/reports. You can also request this information by contacting us at (800) 983-0903.
|
|
| Additional Information Phone Number |
(800) 983-0903
|
|
| Additional Information Website |
invesco.com/reports
|
|
| Expenses [Text Block] |
What Were The Fund Costs For The Last Six Months ? (Based on a hypothetical $10,000 investment)
| Fund |
Costs of a $10,000 investment |
Costs paid as a percentage
of a $10,000 investment* |
| Invesco High Yield Bond Factor ETF |
$19 |
0.39% |
|
|
| Expenses Paid, Amount |
$ 19
|
|
| Expense Ratio, Percent |
0.39%
|
[8] |
| Net Assets |
$ 45,298,868
|
|
| Holdings Count | Holding |
308
|
|
| Investment Company Portfolio Turnover |
36.00%
|
|
| Additional Fund Statistics [Text Block] |
What Are Key Statistics About The Fund? (as of April 30, 2025)
| Fund net assets |
$45,298,868 |
| Total number of portfolio holdings |
308 |
| Portfolio turnover rate |
36% |
|
|
| Holdings [Text Block] |
What Comprised The Fund's Holdings? (as of April 30, 2025) Top ten holdings*
(% of net assets)
| Goodyear Tire & Rubber Co. (The), 4.88%, 03/15/2027 |
0.94% |
| Viasat, Inc., 5.63%, 04/15/2027 |
0.91% |
| Churchill Downs, Inc., 5.50%, 04/01/2027 |
0.87% |
| Venture Global LNG, Inc., 8.13%, 06/01/2028 |
0.87% |
| Jefferies Finance LLC/JFIN Co-Issuer Corp., 5.00%, 08/15/2028 |
0.82% |
| Paramount Global, 6.38%, 03/30/2062 |
0.81% |
| CCO Holdings LLC/CCO Holdings Capital Corp., 4.50%, 05/01/2032 |
0.78% |
| Bombardier, Inc., 6.00%, 02/15/2028 |
0.72% |
| Global Atlantic (Fin) Co., 4.70%, 10/15/2051 |
0.70% |
| Noble Finance II LLC, 8.00%, 04/15/2030 |
0.69% |
| * Excluding money market fund holdings, if any. |
| Security type allocation
(% of net assets)
|
|
| Largest Holdings [Text Block] |
Top ten holdings*
(% of net assets)
| Goodyear Tire & Rubber Co. (The), 4.88%, 03/15/2027 |
0.94% |
| Viasat, Inc., 5.63%, 04/15/2027 |
0.91% |
| Churchill Downs, Inc., 5.50%, 04/01/2027 |
0.87% |
| Venture Global LNG, Inc., 8.13%, 06/01/2028 |
0.87% |
| Jefferies Finance LLC/JFIN Co-Issuer Corp., 5.00%, 08/15/2028 |
0.82% |
| Paramount Global, 6.38%, 03/30/2062 |
0.81% |
| CCO Holdings LLC/CCO Holdings Capital Corp., 4.50%, 05/01/2032 |
0.78% |
| Bombardier, Inc., 6.00%, 02/15/2028 |
0.72% |
| Global Atlantic (Fin) Co., 4.70%, 10/15/2051 |
0.70% |
| Noble Finance II LLC, 8.00%, 04/15/2030 |
0.69% |
| * Excluding money market fund holdings, if any. |
|
|
|
| C000222994 [Member] |
|
|
| Shareholder Report [Line Items] |
|
|
| Fund Name |
Invesco Real Assets ESG ETF
|
|
| Class Name |
Invesco Real Assets ESG ETF
|
|
| Trading Symbol |
IVRA
|
|
| Security Exchange Name |
CboeBZX
|
|
| Annual or Semi-Annual Statement [Text Block] |
This semi-annual shareholder report contains important information about Invesco Real Assets ESG ETF (the “Fund”) for the period November 1, 2024 to April 30, 2025.
|
|
| Shareholder Report Annual or Semi-Annual |
semi-annual shareholder report
|
|
| Additional Information [Text Block] |
You can find additional information about the Fund at invesco.com/reports. You can also request this information by contacting us at (800) 983-0903.
|
|
| Additional Information Phone Number |
(800) 983-0903
|
|
| Additional Information Website |
invesco.com/reports
|
|
| Expenses [Text Block] |
What Were The Fund Costs For The Last Six Months ? (Based on a hypothetical $10,000 investment)
| Fund |
Costs of a $10,000 investment |
Costs paid as a percentage
of a $10,000 investment* |
| Invesco Real Assets ESG ETF |
$30 |
0.59% |
|
|
| Expenses Paid, Amount |
$ 30
|
|
| Expense Ratio, Percent |
0.59%
|
[9] |
| Net Assets |
$ 12,228,692
|
|
| Holdings Count | Holding |
54
|
|
| Investment Company Portfolio Turnover |
49.00%
|
|
| Additional Fund Statistics [Text Block] |
What Are Key Statistics About The Fund? (as of April 30, 2025)
| Fund net assets |
$12,228,692 |
| Total number of portfolio holdings |
54 |
| Portfolio turnover rate |
49% |
|
|
| Holdings [Text Block] |
What Comprised The Fund's Holdings? (as of April 30, 2025) Top ten holdings*
(% of net assets)
| Prologis, Inc. |
5.32% |
| American Tower Corp. |
4.85% |
| Sempra |
4.49% |
| Equinix, Inc. |
4.14% |
| Cheniere Energy, Inc. |
4.03% |
| ONEOK, Inc. |
3.69% |
| Welltower, Inc. |
3.60% |
| Williams Cos., Inc. (The) |
3.45% |
| Kinder Morgan, Inc. |
3.39% |
| Targa Resources Corp. |
3.21% |
| * Excluding money market fund holdings, if any. |
| Sector allocation
(% of net assets)
|
|
| Largest Holdings [Text Block] |
Top ten holdings*
(% of net assets)
| Prologis, Inc. |
5.32% |
| American Tower Corp. |
4.85% |
| Sempra |
4.49% |
| Equinix, Inc. |
4.14% |
| Cheniere Energy, Inc. |
4.03% |
| ONEOK, Inc. |
3.69% |
| Welltower, Inc. |
3.60% |
| Williams Cos., Inc. (The) |
3.45% |
| Kinder Morgan, Inc. |
3.39% |
| Targa Resources Corp. |
3.21% |
| * Excluding money market fund holdings, if any. |
|
|
|
| C000239743 [Member] |
|
|
| Shareholder Report [Line Items] |
|
|
| Fund Name |
Invesco AAA CLO Floating Rate Note ETF
|
|
| Class Name |
Invesco AAA CLO Floating Rate Note ETF
|
|
| Trading Symbol |
ICLO
|
|
| Security Exchange Name |
CboeBZX
|
|
| Annual or Semi-Annual Statement [Text Block] |
This semi-annual shareholder report contains important information about Invesco AAA CLO Floating Rate Note ETF (the “Fund”) for the period November 1, 2024 to April 30, 2025.
|
|
| Shareholder Report Annual or Semi-Annual |
semi-annual shareholder report
|
|
| Additional Information [Text Block] |
You can find additional information about the Fund at invesco.com/reports. You can also request this information by contacting us at (800) 983-0903.
|
|
| Additional Information Phone Number |
(800) 983-0903
|
|
| Additional Information Website |
invesco.com/reports
|
|
| Expenses [Text Block] |
What Were The Fund Costs For The Last Six Months ?
(Based on a hypothetical $10,000 investment)
| Fund |
Costs of a $10,000 investment |
Costs paid as a percentage
of a $10,000 investment* |
| Invesco AAA CLO Floating Rate Note ETF |
$10 |
0.19% |
|
|
| Expenses Paid, Amount |
$ 10
|
|
| Expense Ratio, Percent |
0.19%
|
[10] |
| Net Assets |
$ 304,432,594
|
|
| Holdings Count | Holding |
144
|
|
| Investment Company Portfolio Turnover |
37.00%
|
|
| Additional Fund Statistics [Text Block] |
What Are Key Statistics About The Fund?
(as of April 30, 2025)
| Fund net assets |
$304,432,594 |
| Total number of portfolio holdings |
144 |
| Portfolio turnover rate |
37% |
|
|
| Holdings [Text Block] |
What Comprised The Fund's Holdings?
(as of April 30, 2025)
Top ten holdings*
(% of net assets)
| Signal Peak CLO 11 Ltd., Series 2024-11A, Class A1, 5.72%, 07/18/2037 |
3.19% |
| Park Blue CLO Ltd., Series 2022-1A, Class A1R, 5.69%, 10/20/2037 |
2.10% |
| GoldenTree Loan Management US CLO 9 Ltd., Series 2021-9A, Class AR, 5.77%, 04/20/2037 |
2.07% |
| Cedar Funding IX CLO Ltd., Series 2018-9A, Class AR, 5.69%, 07/20/2037 |
1.97% |
| Elmwood CLO III Ltd., Series 2019-3A, Class A1RR, 5.65%, 07/18/2037 |
1.97% |
| Madison Park Funding XXXVII Ltd., Series 2019-37A, Class AR2, 5.79%, 04/15/2037 |
1.76% |
| CIFC Funding Ltd., Series 2023-2A, Class A, 6.02%, 01/21/2037 |
1.65% |
| TICP CLO VII Ltd., Series 2017-7A, Class ASR2, 5.56%, 04/15/2033 |
1.64% |
| Cedar Funding XIV CLO Ltd., Series 2021-14A, Class AR, 5.64%, 10/15/2037 |
1.64% |
| Palmer Square CLO 2023-1 Ltd., Series 2023-1A, Class AR, 5.52%, 01/20/2038 |
1.64% |
| * Excluding money market fund holdings, if any. |
|
Duration allocation
(% of net assets)
|
|
| Largest Holdings [Text Block] |
Top ten holdings*
(% of net assets)
| Signal Peak CLO 11 Ltd., Series 2024-11A, Class A1, 5.72%, 07/18/2037 |
3.19% |
| Park Blue CLO Ltd., Series 2022-1A, Class A1R, 5.69%, 10/20/2037 |
2.10% |
| GoldenTree Loan Management US CLO 9 Ltd., Series 2021-9A, Class AR, 5.77%, 04/20/2037 |
2.07% |
| Cedar Funding IX CLO Ltd., Series 2018-9A, Class AR, 5.69%, 07/20/2037 |
1.97% |
| Elmwood CLO III Ltd., Series 2019-3A, Class A1RR, 5.65%, 07/18/2037 |
1.97% |
| Madison Park Funding XXXVII Ltd., Series 2019-37A, Class AR2, 5.79%, 04/15/2037 |
1.76% |
| CIFC Funding Ltd., Series 2023-2A, Class A, 6.02%, 01/21/2037 |
1.65% |
| TICP CLO VII Ltd., Series 2017-7A, Class ASR2, 5.56%, 04/15/2033 |
1.64% |
| Cedar Funding XIV CLO Ltd., Series 2021-14A, Class AR, 5.64%, 10/15/2037 |
1.64% |
| Palmer Square CLO 2023-1 Ltd., Series 2023-1A, Class AR, 5.52%, 01/20/2038 |
1.64% |
| * Excluding money market fund holdings, if any. |
|
|
|
| C000239744 [Member] |
|
|
| Shareholder Report [Line Items] |
|
|
| Fund Name |
Invesco High Yield Select ETF
|
|
| Class Name |
Invesco High Yield Select ETF
|
|
| Trading Symbol |
HIYS
|
|
| Security Exchange Name |
CboeBZX
|
|
| Annual or Semi-Annual Statement [Text Block] |
This semi-annual shareholder report contains important information about Invesco High Yield Select ETF (the “Fund”) for the period November 1, 2024 to April 30, 2025.
|
|
| Shareholder Report Annual or Semi-Annual |
semi-annual shareholder report
|
|
| Additional Information [Text Block] |
You can find additional information about the Fund at invesco.com/reports. You can also request this information by contacting us at (800) 983-0903.
|
|
| Additional Information Phone Number |
(800) 983-0903
|
|
| Additional Information Website |
invesco.com/reports
|
|
| Expenses [Text Block] |
What Were The Fund Costs For The Last Six Months ?
(Based on a hypothetical $10,000 investment)
| Fund |
Costs of a $10,000 investment |
Costs paid as a percentage
of a $10,000 investment* |
| Invesco High Yield Select ETF |
$22 |
0.44%† |
| * |
Annualized.
|
|
†
|
Reflects fee waivers and/or expense reimbursements, without which expenses would have been higher.
|
|
|
| Expenses Paid, Amount |
$ 22
|
|
| Expense Ratio, Percent |
0.44%
|
[11],[12] |
| Net Assets |
$ 7,755,873
|
|
| Holdings Count | Holding |
167
|
|
| Investment Company Portfolio Turnover |
87.00%
|
|
| Additional Fund Statistics [Text Block] |
What Are Key Statistics About The Fund?
(as of April 30, 2025)
| Fund net assets |
$7,755,873 |
| Total number of portfolio holdings |
167 |
| Portfolio turnover rate |
87% |
|
|
| Holdings [Text Block] |
What Comprised The Fund's Holdings?
(as of April 30, 2025)
Top ten holdings*
(% of net assets)
| Iliad Holding S.A.S.U., 8.50%, 04/15/2031 |
2.72% |
| Studio City Finance Ltd., 5.00%, 01/15/2029 |
2.27% |
| Eutelsat S.A., 9.75%, 04/13/2029 |
1.49% |
| Aircastle Ltd., 5.25% |
1.48% |
| VMED O2 UK Financing I PLC, 3.25%, 01/31/2031 |
1.36% |
| GFL Environmental, Inc., 4.00%, 08/01/2028 |
1.19% |
| Tenet Healthcare Corp., 6.75%, 05/15/2031 |
1.19% |
| Ashton Woods USA LLC/Ashton Woods Finance Co., 6.63%, 01/15/2028 |
1.17% |
| Vodafone Group PLC, 4.13%, 06/04/2081 |
1.16% |
| GGAM Finance Ltd., 6.88%, 04/15/2029 |
1.15% |
| * Excluding money market fund holdings, if any. |
|
Security type allocation
(% of net assets)
|
|
| Largest Holdings [Text Block] |
Top ten holdings*
(% of net assets)
| Iliad Holding S.A.S.U., 8.50%, 04/15/2031 |
2.72% |
| Studio City Finance Ltd., 5.00%, 01/15/2029 |
2.27% |
| Eutelsat S.A., 9.75%, 04/13/2029 |
1.49% |
| Aircastle Ltd., 5.25% |
1.48% |
| VMED O2 UK Financing I PLC, 3.25%, 01/31/2031 |
1.36% |
| GFL Environmental, Inc., 4.00%, 08/01/2028 |
1.19% |
| Tenet Healthcare Corp., 6.75%, 05/15/2031 |
1.19% |
| Ashton Woods USA LLC/Ashton Woods Finance Co., 6.63%, 01/15/2028 |
1.17% |
| Vodafone Group PLC, 4.13%, 06/04/2081 |
1.16% |
| GGAM Finance Ltd., 6.88%, 04/15/2029 |
1.15% |
| * Excluding money market fund holdings, if any. |
|
|
|
| C000239745 [Member] |
|
|
| Shareholder Report [Line Items] |
|
|
| Fund Name |
Invesco Rochester High Yield Municipal ETF
|
|
| Class Name |
Invesco Rochester High Yield Municipal ETF
|
|
| Trading Symbol |
IROC
|
|
| Security Exchange Name |
CboeBZX
|
|
| Annual or Semi-Annual Statement [Text Block] |
This semi-annual shareholder report contains important information about Invesco Rochester High Yield Municipal ETF (the “Fund”), formerly Invesco Municipal Strategic Income ETF, for the period November 1, 2024 to April 30, 2025.
|
|
| Shareholder Report Annual or Semi-Annual |
semi-annual shareholder report
|
|
| Additional Information [Text Block] |
You can find additional information about the Fund at invesco.com/reports. You can also request this information by contacting us at (800) 983-0903.
|
|
| Additional Information Phone Number |
(800) 983-0903
|
|
| Additional Information Website |
invesco.com/reports
|
|
| Expenses [Text Block] |
What Were The Fund Costs For The Last Six Months ?
(Based on a hypothetical $10,000 investment)
| Fund |
Costs of a $10,000 investment |
Costs paid as a percentage
of a $10,000 investment* |
| Invesco Rochester High Yield Municipal ETF |
$19 |
0.39% |
|
|
| Expenses Paid, Amount |
$ 19
|
|
| Expense Ratio, Percent |
0.39%
|
[13] |
| Net Assets |
$ 30,056,046
|
|
| Holdings Count | Holding |
64
|
|
| Investment Company Portfolio Turnover |
48.00%
|
|
| Additional Fund Statistics [Text Block] |
What Are Key Statistics About The Fund?
(as of April 30, 2025)
| Fund net assets |
$30,056,046 |
| Total number of portfolio holdings |
64 |
| Portfolio turnover rate |
48% |
|
|
| Holdings [Text Block] |
What Comprised The Fund's Holdings?
(as of April 30, 2025)
Top ten holdings*
(% of net assets)
| New York Transportation Development Corp. (LaGuardia Airport Terminal B Redevelopment), Series 2023, RB, 6.00%, 04/01/2035 |
3.63% |
| Virginia Beach Development Authority (Westminster-Canterbury on Chesapeake Bay), Series 2023 B-3, RB, 5.38%, 09/01/2029 |
3.35% |
| Louisiana (State of) Public Facilities Authority (I-10 Calcasieu River Bridge), Series 2024, RB, 5.75%, 09/01/2064 |
2.59% |
| Portland (Port of), OR (Green Bonds), Twenty Ninth Series 2023, RB, 5.25%, 07/01/2039 |
2.49% |
| Allentown (City of), PA Neighborhood Improvement Zone Development Authority, Series 2022, Ref. RB, 5.00%, 05/01/2033 |
1.83% |
| Pennsylvania (Commonwealth of) Economic Development Financing Authority (Penndot Major Bridges (The)), Series 2022, RB, 5.50%, 06/30/2038 |
1.77% |
| Iowa (State of) Finance Authority (Iowa Fertilizer Co.), Series 2022, Ref. RB, 4.00%, 12/01/2032 |
1.75% |
| New York Transportation Development Corp. (John F. Kennedy International Airport New Terminal One) (Green Bonds), Series 2023, RB, 6.00%, 06/30/2054 |
1.75% |
| Patriots Energy Group Financing Agency, Series 2023 A-1, RB, 5.25%, 08/01/2031 |
1.74% |
| California (State of) Pollution Control Financing Authority (Poseidon Resources L.P.), Series 2023, RB, 5.00%, 07/01/2038 |
1.72% |
| * Excluding money market fund holdings, if any. |
|
Credit sector allocation
(% of total investments)
|
|
| Largest Holdings [Text Block] |
Top ten holdings*
(% of net assets)
| New York Transportation Development Corp. (LaGuardia Airport Terminal B Redevelopment), Series 2023, RB, 6.00%, 04/01/2035 |
3.63% |
| Virginia Beach Development Authority (Westminster-Canterbury on Chesapeake Bay), Series 2023 B-3, RB, 5.38%, 09/01/2029 |
3.35% |
| Louisiana (State of) Public Facilities Authority (I-10 Calcasieu River Bridge), Series 2024, RB, 5.75%, 09/01/2064 |
2.59% |
| Portland (Port of), OR (Green Bonds), Twenty Ninth Series 2023, RB, 5.25%, 07/01/2039 |
2.49% |
| Allentown (City of), PA Neighborhood Improvement Zone Development Authority, Series 2022, Ref. RB, 5.00%, 05/01/2033 |
1.83% |
| Pennsylvania (Commonwealth of) Economic Development Financing Authority (Penndot Major Bridges (The)), Series 2022, RB, 5.50%, 06/30/2038 |
1.77% |
| Iowa (State of) Finance Authority (Iowa Fertilizer Co.), Series 2022, Ref. RB, 4.00%, 12/01/2032 |
1.75% |
| New York Transportation Development Corp. (John F. Kennedy International Airport New Terminal One) (Green Bonds), Series 2023, RB, 6.00%, 06/30/2054 |
1.75% |
| Patriots Energy Group Financing Agency, Series 2023 A-1, RB, 5.25%, 08/01/2031 |
1.74% |
| California (State of) Pollution Control Financing Authority (Poseidon Resources L.P.), Series 2023, RB, 5.00%, 07/01/2038 |
1.72% |
| * Excluding money market fund holdings, if any. |
|
|
|
| C000239746 [Member] |
|
|
| Shareholder Report [Line Items] |
|
|
| Fund Name |
Invesco Short Duration Total Return Bond ETF
|
|
| Class Name |
Invesco Short Duration Total Return Bond ETF
|
|
| Trading Symbol |
GTOS
|
|
| Security Exchange Name |
CboeBZX
|
|
| Annual or Semi-Annual Statement [Text Block] |
This semi-annual shareholder report contains important information about Invesco Short Duration Total Return Bond ETF (the “Fund”), formerly Invesco Short Duration Bond ETF, for the period November 1, 2024 to April 30, 2025.
|
|
| Shareholder Report Annual or Semi-Annual |
semi-annual shareholder report
|
|
| Additional Information [Text Block] |
You can find additional information about the Fund at invesco.com/reports. You can also request this information by contacting us at (800) 983-0903.
|
|
| Additional Information Phone Number |
(800) 983-0903
|
|
| Additional Information Website |
invesco.com/reports
|
|
| Expenses [Text Block] |
What Were The Fund Costs For The Last Six Months ?
(Based on a hypothetical $10,000 investment)
| Fund |
Costs of a $10,000 investment |
Costs paid as a percentage
of a $10,000 investment* |
| Invesco Short Duration Total Return Bond ETF |
$17 |
0.33% |
|
|
| Expenses Paid, Amount |
$ 17
|
|
| Expense Ratio, Percent |
0.33%
|
[14] |
| Net Assets |
$ 9,980,509
|
|
| Holdings Count | Holding |
283
|
|
| Investment Company Portfolio Turnover |
182.00%
|
|
| Additional Fund Statistics [Text Block] |
What Are Key Statistics About The Fund?
(as of April 30, 2025)
| Fund net assets |
$9,980,509 |
| Total number of portfolio holdings |
283 |
| Portfolio turnover rate |
182% |
|
|
| Holdings [Text Block] |
What Comprised The Fund's Holdings?
(as of April 30, 2025)
Top ten holdings*
(% of net assets)
| U.S. Treasury Notes, 3.75%, 04/30/2027 |
5.85% |
| Morgan Stanley Bank N.A., 5.88%, 10/30/2026 |
2.57% |
| U.S. Treasury Notes, 3.88%, 04/30/2030 |
2.37% |
| NatWest Group PLC, 7.47%, 11/10/2026 |
2.03% |
| Barclays PLC, 7.33%, 11/02/2026 |
2.03% |
| Ford Motor Credit Co. LLC, 7.32%, 03/06/2026 |
2.02% |
| UBS AG, 5.80%, 09/11/2025 |
2.01% |
| U.S. Treasury Notes, 3.75%, 04/15/2028 |
1.68% |
| AerCap Ireland Capital DAC/AerCap Global Aviation Trust, 6.10%, 01/15/2027 |
1.54% |
| Protective Life Global Funding, 5.37%, 01/06/2026 |
1.51% |
| * Excluding money market fund holdings, if any. |
|
Security type allocation
(% of net assets)
|
|
| Largest Holdings [Text Block] |
Top ten holdings*
(% of net assets)
| U.S. Treasury Notes, 3.75%, 04/30/2027 |
5.85% |
| Morgan Stanley Bank N.A., 5.88%, 10/30/2026 |
2.57% |
| U.S. Treasury Notes, 3.88%, 04/30/2030 |
2.37% |
| NatWest Group PLC, 7.47%, 11/10/2026 |
2.03% |
| Barclays PLC, 7.33%, 11/02/2026 |
2.03% |
| Ford Motor Credit Co. LLC, 7.32%, 03/06/2026 |
2.02% |
| UBS AG, 5.80%, 09/11/2025 |
2.01% |
| U.S. Treasury Notes, 3.75%, 04/15/2028 |
1.68% |
| AerCap Ireland Capital DAC/AerCap Global Aviation Trust, 6.10%, 01/15/2027 |
1.54% |
| Protective Life Global Funding, 5.37%, 01/06/2026 |
1.51% |
| * Excluding money market fund holdings, if any. |
|
|
|
| C000250918 [Member] |
|
|
| Shareholder Report [Line Items] |
|
|
| Fund Name |
Invesco QQQ Income Advantage ETF
|
|
| Class Name |
Invesco QQQ Income Advantage ETF
|
|
| Trading Symbol |
QQA
|
|
| Security Exchange Name |
NASDAQ
|
|
| Annual or Semi-Annual Statement [Text Block] |
This semi-annual shareholder report contains important information about Invesco QQQ Income Advantage ETF (the “Fund”) for the period November 1, 2024 to April 30, 2025.
|
|
| Shareholder Report Annual or Semi-Annual |
semi-annual shareholder report
|
|
| Additional Information [Text Block] |
You can find additional information about the Fund at invesco.com/reports. You can also request this information by contacting us at (800) 983-0903.
|
|
| Additional Information Phone Number |
(800) 983-0903
|
|
| Additional Information Website |
invesco.com/reports
|
|
| Expenses [Text Block] |
What Were The Fund Costs For The Last Six Months ? (Based on a hypothetical $10,000 investment)
| Fund |
Costs of a $10,000 investment |
Costs paid as a percentage
of a $10,000 investment* |
| Invesco QQQ Income Advantage ETF |
$0 |
0.00%† |
| * |
Annualized. |
|
† |
Reflects fee waivers and/or expense reimbursements, without which expenses would have been higher. |
|
|
| Expenses Paid, Amount |
$ 0
|
|
| Expense Ratio, Percent |
0.00%
|
[15],[16] |
| Net Assets |
$ 209,275,038
|
|
| Holdings Count | Holding |
121
|
|
| Investment Company Portfolio Turnover |
5.00%
|
|
| Additional Fund Statistics [Text Block] |
What Are Key Statistics About The Fund? (as of April 30, 2025)
| Fund net assets |
$209,275,038 |
| Total number of portfolio holdings |
121 |
| Portfolio turnover rate |
5% |
|
|
| Holdings [Text Block] |
What Comprised The Fund's Holdings? (as of April 30, 2025) Top ten holdings*
(% of net assets)
| Apple, Inc. |
6.82% |
| Microsoft Corp. |
6.27% |
| NVIDIA Corp. |
5.68% |
| Amazon.com, Inc. |
4.17% |
| Broadcom, Inc. |
3.19% |
| Meta Platforms, Inc., Class A |
2.57% |
| Netflix, Inc. |
2.54% |
| Costco Wholesale Corp. |
2.31% |
| Tesla, Inc. |
2.19% |
| Alphabet, Inc., Class A |
1.98% |
| * Excluding money market fund holdings, if any. |
| Security type allocation
(% of net assets)
|
|
| Largest Holdings [Text Block] |
Top ten holdings*
(% of net assets)
| Apple, Inc. |
6.82% |
| Microsoft Corp. |
6.27% |
| NVIDIA Corp. |
5.68% |
| Amazon.com, Inc. |
4.17% |
| Broadcom, Inc. |
3.19% |
| Meta Platforms, Inc., Class A |
2.57% |
| Netflix, Inc. |
2.54% |
| Costco Wholesale Corp. |
2.31% |
| Tesla, Inc. |
2.19% |
| Alphabet, Inc., Class A |
1.98% |
| * Excluding money market fund holdings, if any. |
|
|
|
| C000250919 [Member] |
|
|
| Shareholder Report [Line Items] |
|
|
| Fund Name |
Invesco S&P 500 Equal Weight Income Advantage ETF
|
|
| Class Name |
Invesco S&P 500 Equal Weight Income Advantage ETF
|
|
| Trading Symbol |
RSPA
|
|
| Security Exchange Name |
NYSEArca
|
|
| Annual or Semi-Annual Statement [Text Block] |
This semi-annual shareholder report contains important information about Invesco S&P 500 Equal Weight Income Advantage ETF (the “Fund”) for the period November 1, 2024 to April 30, 2025.
|
|
| Shareholder Report Annual or Semi-Annual |
semi-annual shareholder report
|
|
| Additional Information [Text Block] |
You can find additional information about the Fund at invesco.com/reports. You can also request this information by contacting us at (800) 983-0903.
|
|
| Additional Information Phone Number |
(800) 983-0903
|
|
| Additional Information Website |
invesco.com/reports
|
|
| Expenses [Text Block] |
What Were The Fund Costs For The Last Six Months ? (Based on a hypothetical $10,000 investment)
| Fund |
Costs of a $10,000 investment |
Costs paid as a percentage
of a $10,000 investment* |
| Invesco S&P 500 Equal Weight Income Advantage ETF |
$0 |
0.00%† |
| * |
Annualized. |
|
† |
Reflects fee waivers and/or expense reimbursements, without which expenses would have been higher. |
|
|
| Expenses Paid, Amount |
$ 0
|
|
| Expense Ratio, Percent |
0.00%
|
[17],[18] |
| Net Assets |
$ 296,923,663
|
|
| Holdings Count | Holding |
523
|
|
| Investment Company Portfolio Turnover |
12.00%
|
|
| Additional Fund Statistics [Text Block] |
What Are Key Statistics About The Fund? (as of April 30, 2025)
| Fund net assets |
$296,923,663 |
| Total number of portfolio holdings |
523 |
| Portfolio turnover rate |
12% |
|
|
| Holdings [Text Block] |
What Comprised The Fund's Holdings? (as of April 30, 2025) Top ten holdings*
(% of net assets)
| UBS AG (Invesco S&P 500 Equal Weight ETF) |
0.51% |
| Mizuho Markets Cayman L.P. (Invesco S&P 500 Equal Weight ETF) |
0.43% |
| BNP Paribas Issuance B.V. (Invesco S&P 500 Equal Weight ETF) |
0.37% |
| J.P. Morgan Chase & Co. (Invesco S&P 500 Equal Weight ETF) |
0.36% |
| Mizuho Markets Cayman L.P. (Invesco S&P 500 Equal Weight ETF) |
0.35% |
| Wells Fargo Bank N.A. (Invesco S&P 500 Equal Weight ETF) |
0.31% |
| BNP Paribas Issuance B.V. (Invesco S&P 500 Equal Weight ETF) |
0.31% |
| Citigroup Global Markets Holdings, Inc. (Invesco S&P 500 Equal Weight ETF) |
0.26% |
| Canadian Imperial Bank of Commerce (Invesco S&P 500 Equal Weight ETF) |
0.26% |
| Citigroup Global Markets Holdings, Inc. (Invesco S&P 500 Equal Weight ETF) |
0.26% |
| * Excluding money market fund holdings, if any. |
| Security type allocation
(% of net assets)
|
|
| Largest Holdings [Text Block] |
Top ten holdings*
(% of net assets)
| UBS AG (Invesco S&P 500 Equal Weight ETF) |
0.51% |
| Mizuho Markets Cayman L.P. (Invesco S&P 500 Equal Weight ETF) |
0.43% |
| BNP Paribas Issuance B.V. (Invesco S&P 500 Equal Weight ETF) |
0.37% |
| J.P. Morgan Chase & Co. (Invesco S&P 500 Equal Weight ETF) |
0.36% |
| Mizuho Markets Cayman L.P. (Invesco S&P 500 Equal Weight ETF) |
0.35% |
| Wells Fargo Bank N.A. (Invesco S&P 500 Equal Weight ETF) |
0.31% |
| BNP Paribas Issuance B.V. (Invesco S&P 500 Equal Weight ETF) |
0.31% |
| Citigroup Global Markets Holdings, Inc. (Invesco S&P 500 Equal Weight ETF) |
0.26% |
| Canadian Imperial Bank of Commerce (Invesco S&P 500 Equal Weight ETF) |
0.26% |
| Citigroup Global Markets Holdings, Inc. (Invesco S&P 500 Equal Weight ETF) |
0.26% |
| * Excluding money market fund holdings, if any. |
|
|
|
| C000251085 [Member] |
|
|
| Shareholder Report [Line Items] |
|
|
| Fund Name |
Invesco MSCI EAFE Income Advantage ETF
|
|
| Class Name |
Invesco MSCI EAFE Income Advantage ETF
|
|
| Trading Symbol |
EFAA
|
|
| Security Exchange Name |
NYSEArca
|
|
| Annual or Semi-Annual Statement [Text Block] |
This semi-annual shareholder report contains important information about Invesco MSCI EAFE Income Advantage ETF (the “Fund”) for the period November 1, 2024 to April 30, 2025.
|
|
| Shareholder Report Annual or Semi-Annual |
semi-annual shareholder report
|
|
| Additional Information [Text Block] |
You can find additional information about the Fund at invesco.com/reports. You can also request this information by contacting us at (800) 983-0903.
|
|
| Additional Information Phone Number |
(800) 983-0903
|
|
| Additional Information Website |
invesco.com/reports
|
|
| Expenses [Text Block] |
What Were The Fund Costs For The Last Six Months ? (Based on a hypothetical $10,000 investment)
| Fund |
Costs of a $10,000 investment |
Costs paid as a percentage
of a $10,000 investment* |
| Invesco MSCI EAFE Income Advantage ETF |
$0 |
0.00%† |
| * |
Annualized. |
|
† |
Reflects fee waivers and/or expense reimbursements, without which expenses would have been higher. |
|
|
| Expenses Paid, Amount |
$ 0
|
|
| Expense Ratio, Percent |
0.00%
|
[19],[20] |
| Net Assets |
$ 136,592,755
|
|
| Holdings Count | Holding |
713
|
|
| Investment Company Portfolio Turnover |
3.00%
|
|
| Additional Fund Statistics [Text Block] |
What Are Key Statistics About The Fund? (as of April 30, 2025)
| Fund net assets |
$136,592,755 |
| Total number of portfolio holdings |
713 |
| Portfolio turnover rate |
3% |
|
|
| Holdings [Text Block] |
What Comprised The Fund's Holdings? (as of April 30, 2025) Top ten holdings*
(% of net assets)
| SAP SE |
1.32% |
| Nestle S.A. |
1.20% |
| ASML Holding N.V. |
1.14% |
| Roche Holding AG |
0.99% |
| Novartis AG |
0.97% |
| AstraZeneca PLC |
0.96% |
| Novo Nordisk A/S, Class B |
0.93% |
| HSBC Holdings PLC |
0.86% |
| Shell PLC |
0.85% |
| Toyota Motor Corp. |
0.78% |
| * Excluding money market fund holdings, if any. |
| Security type allocation
(% of net assets)
|
|
| Largest Holdings [Text Block] |
Top ten holdings*
(% of net assets)
| SAP SE |
1.32% |
| Nestle S.A. |
1.20% |
| ASML Holding N.V. |
1.14% |
| Roche Holding AG |
0.99% |
| Novartis AG |
0.97% |
| AstraZeneca PLC |
0.96% |
| Novo Nordisk A/S, Class B |
0.93% |
| HSBC Holdings PLC |
0.86% |
| Shell PLC |
0.85% |
| Toyota Motor Corp. |
0.78% |
| * Excluding money market fund holdings, if any. |
|
|
|
| C000255210 [Member] |
|
|
| Shareholder Report [Line Items] |
|
|
| Fund Name |
Invesco Top QQQ ETF
|
|
| Class Name |
Invesco Top QQQ ETF
|
|
| Trading Symbol |
QBIG
|
|
| Security Exchange Name |
NASDAQ
|
|
| Annual or Semi-Annual Statement [Text Block] |
This semi-annual shareholder report contains important information about Invesco Top QQQ ETF (the “Fund”) for the period December 2, 2024 (commencement of operations) to April 30, 2025.
|
|
| Shareholder Report Annual or Semi-Annual |
semi-annual shareholder report
|
|
| Additional Information [Text Block] |
You can find additional information about the Fund at invesco.com/reports. You can also request this information by contacting us at (800) 983-0903.
|
|
| Additional Information Phone Number |
(800) 983-0903
|
|
| Additional Information Website |
invesco.com/reports
|
|
| Expenses [Text Block] |
What Were The Fund Costs For The Last Six Months ? (Based on a hypothetical $10,000 investment)
| Fund |
Costs of a $10,000 investment▼ |
Costs paid as a percentage
of a $10,000 investment* |
| Invesco Top QQQ ETF |
$9 |
0.23%† |
|
▼ |
The Fund commenced operations during the reporting period. Expenses for a full reporting period would be higher. |
| * |
Annualized. |
|
† |
Reflects fee waivers and/or expense reimbursements, without which expenses would have been higher. |
|
|
| Expenses Paid, Amount |
$ 9
|
[21] |
| Expense Ratio, Percent |
0.23%
|
[22],[23] |
| Net Assets |
$ 22,734,617
|
|
| Holdings Count | Holding |
13
|
|
| Investment Company Portfolio Turnover |
81.00%
|
|
| Additional Fund Statistics [Text Block] |
What Are Key Statistics About The Fund? (as of April 30, 2025)
| Fund net assets |
$22,734,617 |
| Total number of portfolio holdings |
13 |
| Portfolio turnover rate |
81% |
|
|
| Holdings [Text Block] |
What Comprised The Fund's Holdings? (as of April 30, 2025) Top ten holdings*
(% of net assets)
| Apple, Inc. |
7.63% |
| Microsoft Corp. |
7.02% |
| NVIDIA Corp. |
6.35% |
| Amazon.com, Inc. |
4.67% |
| Broadcom, Inc. |
3.57% |
| Meta Platforms, Inc., Class A |
2.88% |
| Tesla, Inc. |
2.45% |
| Alphabet, Inc., Class A |
2.21% |
| Alphabet, Inc., Class C |
2.11% |
| * Excluding money market fund holdings, if any. |
| Sector allocation
(% of net assets)
|
|
| Largest Holdings [Text Block] |
Top ten holdings*
(% of net assets)
| Apple, Inc. |
7.63% |
| Microsoft Corp. |
7.02% |
| NVIDIA Corp. |
6.35% |
| Amazon.com, Inc. |
4.67% |
| Broadcom, Inc. |
3.57% |
| Meta Platforms, Inc., Class A |
2.88% |
| Tesla, Inc. |
2.45% |
| Alphabet, Inc., Class A |
2.21% |
| Alphabet, Inc., Class C |
2.11% |
| * Excluding money market fund holdings, if any. |
|
|
|
| C000257059 [Member] |
|
|
| Shareholder Report [Line Items] |
|
|
| Fund Name |
Invesco SteelPath MLP & Energy Infrastructure ETF
|
|
| Class Name |
Invesco SteelPath MLP & Energy Infrastructure ETF
|
|
| Trading Symbol |
PIPE
|
|
| Security Exchange Name |
CboeBZX
|
|
| Annual or Semi-Annual Statement [Text Block] |
This semi-annual shareholder report contains important information about Invesco SteelPath MLP & Energy Infrastructure ETF (the “Fund”) for the period February 18, 2025 (commencement of operations) to April 30, 2025.
|
|
| Shareholder Report Annual or Semi-Annual |
semi-annual shareholder report
|
|
| Additional Information [Text Block] |
You can find additional information about the Fund at invesco.com/reports. You can also request this information by contacting us at (800) 983-0903.
|
|
| Additional Information Phone Number |
(800) 983-0903
|
|
| Additional Information Website |
invesco.com/reports
|
|
| Expenses [Text Block] |
What Were The Fund Costs For The Last Six Months ?
(Based on a hypothetical $10,000 investment)
| Fund |
Costs of a $10,000 investment▼ |
Costs paid as a percentage
of a $10,000 investment* |
| Invesco SteelPath MLP & Energy Infrastructure ETF |
$14 |
0.75% |
|
▼
|
The Fund commenced operations during the reporting period. Expenses for a full reporting period would be higher.
|
| * |
Annualized.
|
|
|
| Expenses Paid, Amount |
$ 14
|
[24] |
| Expense Ratio, Percent |
0.75%
|
[25] |
| Net Assets |
$ 15,249,479
|
|
| Holdings Count | Holding |
26
|
|
| Investment Company Portfolio Turnover |
1.00%
|
|
| Additional Fund Statistics [Text Block] |
What Are Key Statistics About The Fund?
(as of April 30, 2025)
| Fund net assets |
$15,249,479 |
| Total number of portfolio holdings |
26 |
| Portfolio turnover rate |
1% |
|
|
| Holdings [Text Block] |
What Comprised The Fund's Holdings?
(as of April 30, 2025)
Top ten holdings*
(% of net assets)
| Williams Cos., Inc. (The) |
6.47% |
| Targa Resources Corp. |
6.46% |
| TC Energy Corp. |
5.79% |
| Plains GP Holdings L.P., Class A |
5.51% |
| ONEOK, Inc. |
5.33% |
| Cheniere Energy, Inc. |
5.20% |
| Pembina Pipeline Corp. |
4.88% |
| Enbridge, Inc. |
4.87% |
| South Bow Corp. |
4.81% |
| Kinder Morgan, Inc. |
4.71% |
| * Excluding money market fund holdings, if any. |
|
Sector allocation
(% of net assets)
|
|
| Largest Holdings [Text Block] |
Top ten holdings*
(% of net assets)
| Williams Cos., Inc. (The) |
6.47% |
| Targa Resources Corp. |
6.46% |
| TC Energy Corp. |
5.79% |
| Plains GP Holdings L.P., Class A |
5.51% |
| ONEOK, Inc. |
5.33% |
| Cheniere Energy, Inc. |
5.20% |
| Pembina Pipeline Corp. |
4.88% |
| Enbridge, Inc. |
4.87% |
| South Bow Corp. |
4.81% |
| Kinder Morgan, Inc. |
4.71% |
| * Excluding money market fund holdings, if any. |
|
|
|
| C000258361 [Member] |
|
|
| Shareholder Report [Line Items] |
|
|
| Fund Name |
Invesco Managed Futures Strategy ETF
|
|
| Class Name |
Invesco Managed Futures Strategy ETF
|
|
| Trading Symbol |
IMF
|
|
| Security Exchange Name |
CboeBZX
|
|
| Annual or Semi-Annual Statement [Text Block] |
This semi-annual shareholder report contains important information about Invesco Managed Futures Strategy ETF (the “Fund”) for the period March 17, 2025 (commencement of operations) to April 30, 2025.
|
|
| Shareholder Report Annual or Semi-Annual |
semi-annual shareholder report
|
|
| Additional Information [Text Block] |
You can find additional information about the Fund at invesco.com/reports. You can also request this information by contacting us at (800) 983-0903.
|
|
| Additional Information Phone Number |
(800) 983-0903
|
|
| Additional Information Website |
invesco.com/reports
|
|
| Expenses [Text Block] |
What Were The Fund Costs For The Last Six Months ?
(Based on a hypothetical $10,000 investment)
| Fund |
Costs of a $10,000 investment▼ |
Costs paid as a percentage
of a $10,000 investment* |
| Invesco Managed Futures Strategy ETF |
$6 |
0.50%† |
|
▼
|
The Fund commenced operations during the reporting period. Expenses for a full reporting period would be higher.
|
| * |
Annualized.
|
|
†
|
Reflects fee waivers and/or expense reimbursements, without which expenses would have been higher.
|
|
|
| Expenses Paid, Amount |
$ 6
|
[26] |
| Expense Ratio, Percent |
0.50%
|
[27],[28] |
| Net Assets |
$ 305,924,514
|
|
| Holdings Count | Holding |
52
|
|
| Additional Fund Statistics [Text Block] |
What Are Key Statistics About The Fund?
(as of April 30, 2025)
| Fund net assets |
$305,924,514 |
| Total number of portfolio holdings |
52 |
|
|
| Holdings [Text Block] |
What Comprised The Fund's Holdings? (as of April 30, 2025) Futures exposure*
(% of total notional exposure)
| Commodity Risk (Long) |
6.4% |
| Commodity Risk (Short) |
12.1% |
| Currency Risk (Long) |
17.4% |
| Currency Risk (Short) |
3.1% |
| Equity Risk (Long) |
13.9% |
| Equity Risk (Short) |
4.7% |
| Interest Rate Risk (Long) |
29.9% |
| Interest Rate Risk (Short) |
12.5% |
| * Futures exposure is calculated on the notional value as a percentage of total notional exposure. |
|
Security type allocation
(% of net assets)
|
|
|
|
| X |
- DefinitionBoolean flag that is true when the XBRL content amends previously-filed or accepted submission.
| Name: |
dei_AmendmentFlag |
| Namespace Prefix: |
dei_ |
| Data Type: |
xbrli:booleanItemType |
| Balance Type: |
na |
| Period Type: |
duration |
|
| X |
- DefinitionFor the EDGAR submission types of Form 8-K: the date of the report, the date of the earliest event reported; for the EDGAR submission types of Form N-1A: the filing date; for all other submission types: the end of the reporting or transition period. The format of the date is YYYY-MM-DD.
| Name: |
dei_DocumentPeriodEndDate |
| Namespace Prefix: |
dei_ |
| Data Type: |
xbrli:dateItemType |
| Balance Type: |
na |
| Period Type: |
duration |
|
| X |
- DefinitionThe type of document being provided (such as 10-K, 10-Q, 485BPOS, etc). The document type is limited to the same value as the supporting SEC submission type, or the word 'Other'.
| Name: |
dei_DocumentType |
| Namespace Prefix: |
dei_ |
| Data Type: |
dei:submissionTypeItemType |
| Balance Type: |
na |
| Period Type: |
duration |
|
| X |
- DefinitionA unique 10-digit SEC-issued value to identify entities that have filed disclosures with the SEC. It is commonly abbreviated as CIK. Reference 1: http://www.xbrl.org/2003/role/presentationRef
-Publisher SEC
-Name Exchange Act
-Number 240
-Section 12
-Subsection b-2
| Name: |
dei_EntityCentralIndexKey |
| Namespace Prefix: |
dei_ |
| Data Type: |
dei:centralIndexKeyItemType |
| Balance Type: |
na |
| Period Type: |
duration |
|
| X |
- DefinitionOne of: N-1A (Mutual Fund), N-1 (Open-End Separate Account with No Variable Annuities), N-2 (Closed-End Investment Company), N-3 (Separate Account Registered as Open-End Management Investment Company), N-4 (Variable Annuity UIT Separate Account), N-5 (Small Business Investment Company), N-6 (Variable Life UIT Separate Account), S-1 or S-3 (Face Amount Certificate Company), S-6 (UIT, Non-Insurance Product). Reference 1: http://www.xbrl.org/2003/role/presentationRef
-Publisher SEC
-Name Regulation S-T
-Number 232
-Section 313
| Name: |
dei_EntityInvCompanyType |
| Namespace Prefix: |
dei_ |
| Data Type: |
dei:invCompanyType |
| Balance Type: |
na |
| Period Type: |
duration |
|
| X |
- DefinitionThe exact name of the entity filing the report as specified in its charter, which is required by forms filed with the SEC. Reference 1: http://www.xbrl.org/2003/role/presentationRef
-Publisher SEC
-Name Exchange Act
-Number 240
-Section 12
-Subsection b-2
| Name: |
dei_EntityRegistrantName |
| Namespace Prefix: |
dei_ |
| Data Type: |
xbrli:normalizedStringItemType |
| Balance Type: |
na |
| Period Type: |
duration |
|
| X |
- DefinitionName of the Exchange on which a security is registered. Reference 1: http://www.xbrl.org/2003/role/presentationRef
-Publisher SEC
-Name Exchange Act
-Number 240
-Section 12
-Subsection d1-1
| Name: |
dei_SecurityExchangeName |
| Namespace Prefix: |
dei_ |
| Data Type: |
dei:edgarExchangeCodeItemType |
| Balance Type: |
na |
| Period Type: |
duration |
|
| X |
- DefinitionTrading symbol of an instrument as listed on an exchange.
| Name: |
dei_TradingSymbol |
| Namespace Prefix: |
dei_ |
| Data Type: |
dei:tradingSymbolItemType |
| Balance Type: |
na |
| Period Type: |
duration |
|
| X |
- ReferencesReference 1: http://www.xbrl.org/2003/role/presentationRef
-Publisher SEC
-Name Form N-1A
-Section 27A
-Subsection e
| Name: |
oef_AddlFundStatisticsTextBlock |
| Namespace Prefix: |
oef_ |
| Data Type: |
dtr-types:textBlockItemType |
| Balance Type: |
na |
| Period Type: |
duration |
|
| X |
- ReferencesReference 1: http://www.xbrl.org/2003/role/presentationRef
-Publisher SEC
-Name Form N-1A
-Section 27A
-Subsection b
-Paragraph instruction
-Subparagraph 2
| Name: |
oef_AddlInfoPhoneNumber |
| Namespace Prefix: |
oef_ |
| Data Type: |
xbrli:stringItemType |
| Balance Type: |
na |
| Period Type: |
duration |
|
| X |
- ReferencesReference 1: http://www.xbrl.org/2003/role/presentationRef
-Publisher SEC
-Name Form N-1A
-Section 27A
-Subsection b
-Paragraph 4
| Name: |
oef_AddlInfoTextBlock |
| Namespace Prefix: |
oef_ |
| Data Type: |
dtr-types:textBlockItemType |
| Balance Type: |
na |
| Period Type: |
duration |
|
| X |
- ReferencesReference 1: http://www.xbrl.org/2003/role/presentationRef
-Publisher SEC
-Name Form N-1A
-Section 27A
-Subsection b
-Paragraph instruction
-Subparagraph 2
| Name: |
oef_AddlInfoWebsite |
| Namespace Prefix: |
oef_ |
| Data Type: |
xbrli:stringItemType |
| Balance Type: |
na |
| Period Type: |
duration |
|
| X |
- ReferencesReference 1: http://www.xbrl.org/2003/role/presentationRef
-Publisher SEC
-Name Form N-1A
-Section 27A
-Subsection b
-Paragraph 3
| Name: |
oef_AnnlOrSemiAnnlStatementTextBlock |
| Namespace Prefix: |
oef_ |
| Data Type: |
dtr-types:textBlockItemType |
| Balance Type: |
na |
| Period Type: |
duration |
|
| X |
- ReferencesReference 1: http://www.xbrl.org/2003/role/presentationRef
-Publisher SEC
-Name Form N-1A
-Section 27A
-Subsection b
-Paragraph instruction
-Subparagraph 2
| Name: |
oef_ClassName |
| Namespace Prefix: |
oef_ |
| Data Type: |
dei:securityTitleItemType |
| Balance Type: |
na |
| Period Type: |
duration |
|
| X |
- ReferencesReference 1: http://www.xbrl.org/2003/role/presentationRef
-Publisher SEC
-Name Form N-1A
-Section 27A
-Subsection c
-Paragraph iii
| Name: |
oef_ExpenseRatioPct |
| Namespace Prefix: |
oef_ |
| Data Type: |
dtr-types:percentItemType |
| Balance Type: |
na |
| Period Type: |
duration |
|
| X |
- ReferencesReference 1: http://www.xbrl.org/2003/role/presentationRef
-Publisher SEC
-Name Form N-1A
-Section 27A
-Subsection c
-Paragraph ii
| Name: |
oef_ExpensesPaidAmt |
| Namespace Prefix: |
oef_ |
| Data Type: |
xbrli:monetaryItemType |
| Balance Type: |
na |
| Period Type: |
duration |
|
| X |
- ReferencesReference 1: http://www.xbrl.org/2003/role/presentationRef
-Publisher SEC
-Name Form N-1A
-Section 27A
-Subsection c
| Name: |
oef_ExpensesTextBlock |
| Namespace Prefix: |
oef_ |
| Data Type: |
dtr-types:textBlockItemType |
| Balance Type: |
na |
| Period Type: |
duration |
|
| X |
- ReferencesReference 1: http://www.xbrl.org/2003/role/presentationRef
-Publisher SEC
-Name Form N-1A
-Section 27A
-Subsection b
-Paragraph 1
| Name: |
oef_FundName |
| Namespace Prefix: |
oef_ |
| Data Type: |
xbrli:normalizedStringItemType |
| Balance Type: |
na |
| Period Type: |
duration |
|
| X |
- ReferencesReference 1: http://www.xbrl.org/2003/role/presentationRef
-Publisher SEC
-Name Form N-1A
-Section 27A
-Subsection e
| Name: |
oef_HoldingsCount |
| Namespace Prefix: |
oef_ |
| Data Type: |
xbrli:integerItemType |
| Balance Type: |
na |
| Period Type: |
instant |
|
| X |
- ReferencesReference 1: http://www.xbrl.org/2003/role/presentationRef
-Publisher SEC
-Name Form N-1A
-Section 27A
-Subsection f
| Name: |
oef_HoldingsTableTextBlock |
| Namespace Prefix: |
oef_ |
| Data Type: |
dtr-types:textBlockItemType |
| Balance Type: |
na |
| Period Type: |
duration |
|
| X |
- ReferencesReference 1: http://www.xbrl.org/2003/role/presentationRef
-Publisher SEC
-Name Form N-1A
-Section 27A
-Subsection f
| Name: |
oef_LargestHoldingsTableTextBlock |
| Namespace Prefix: |
oef_ |
| Data Type: |
dtr-types:textBlockItemType |
| Balance Type: |
na |
| Period Type: |
duration |
|
| X |
- ReferencesReference 1: http://www.xbrl.org/2003/role/presentationRef
-Publisher SEC
-Name Form N-1A
-Section 27A
-Subsection b
-Paragraph 3
| Name: |
oef_ShareholderReportAnnualOrSemiAnnual |
| Namespace Prefix: |
oef_ |
| Data Type: |
oef:shareholderReportTypeItemType |
| Balance Type: |
na |
| Period Type: |
duration |
|
| X |
- ReferencesReference 1: http://www.xbrl.org/2003/role/presentationRef
-Publisher SEC
-Name Form N-1A
-Section 27A
-Subsection d
-Paragraph 2
-Subparagraph instruction
-Clause 7
| Name: |
oef_ShareholderReportLineItems |
| Namespace Prefix: |
oef_ |
| Data Type: |
xbrli:stringItemType |
| Balance Type: |
na |
| Period Type: |
duration |
|
| X |
- DefinitionAmount of net assets (liabilities). Reference 1: http://fasb.org/us-gaap/role/ref/legacyRef
-Name Accounting Standards Codification
-Section 50
-Paragraph 1
-SubTopic 30
-Topic 205
-Publisher FASB
-URI https://asc.fasb.org/1943274/2147479910/205-30-50-1
| Name: |
us-gaap_AssetsNet |
| Namespace Prefix: |
us-gaap_ |
| Data Type: |
xbrli:monetaryItemType |
| Balance Type: |
debit |
| Period Type: |
instant |
|
| X |
- DefinitionPercentage of lesser of purchase or sale of portfolio securities to average value of portfolio securities owned. Reference 1: http://www.xbrl.org/2009/role/commonPracticeRef
-Topic 946
-SubTopic 205
-Name Accounting Standards Codification
-Section 50
-Paragraph 27
-Publisher FASB
-URI https://asc.fasb.org/1943274/2147478494/946-205-50-27
| Name: |
us-gaap_InvestmentCompanyPortfolioTurnover |
| Namespace Prefix: |
us-gaap_ |
| Data Type: |
dtr-types:percentItemType |
| Balance Type: |
na |
| Period Type: |
duration |
|
| X |
- Details
| Name: |
oef_ClassAxis=iametft_C000068414Member |
| Namespace Prefix: |
|
| Data Type: |
na |
| Balance Type: |
|
| Period Type: |
|
|
| X |
- Details
| Name: |
oef_ClassAxis=iametft_C000112015Member |
| Namespace Prefix: |
|
| Data Type: |
na |
| Balance Type: |
|
| Period Type: |
|
|
| X |
- Details
| Name: |
oef_ClassAxis=iametft_C000162616Member |
| Namespace Prefix: |
|
| Data Type: |
na |
| Balance Type: |
|
| Period Type: |
|
|
| X |
- Details
| Name: |
oef_ClassAxis=iametft_C000197599Member |
| Namespace Prefix: |
|
| Data Type: |
na |
| Balance Type: |
|
| Period Type: |
|
|
| X |
- Details
| Name: |
oef_ClassAxis=iametft_C000197600Member |
| Namespace Prefix: |
|
| Data Type: |
na |
| Balance Type: |
|
| Period Type: |
|
|
| X |
- Details
| Name: |
oef_ClassAxis=iametft_C000218086Member |
| Namespace Prefix: |
|
| Data Type: |
na |
| Balance Type: |
|
| Period Type: |
|
|
| X |
- Details
| Name: |
oef_ClassAxis=iametft_C000222994Member |
| Namespace Prefix: |
|
| Data Type: |
na |
| Balance Type: |
|
| Period Type: |
|
|
| X |
- Details
| Name: |
oef_ClassAxis=iametft_C000239743Member |
| Namespace Prefix: |
|
| Data Type: |
na |
| Balance Type: |
|
| Period Type: |
|
|
| X |
- Details
| Name: |
oef_ClassAxis=iametft_C000239744Member |
| Namespace Prefix: |
|
| Data Type: |
na |
| Balance Type: |
|
| Period Type: |
|
|
| X |
- Details
| Name: |
oef_ClassAxis=iametft_C000239745Member |
| Namespace Prefix: |
|
| Data Type: |
na |
| Balance Type: |
|
| Period Type: |
|
|
| X |
- Details
| Name: |
oef_ClassAxis=iametft_C000239746Member |
| Namespace Prefix: |
|
| Data Type: |
na |
| Balance Type: |
|
| Period Type: |
|
|
| X |
- Details
| Name: |
oef_ClassAxis=iametft_C000250918Member |
| Namespace Prefix: |
|
| Data Type: |
na |
| Balance Type: |
|
| Period Type: |
|
|
| X |
- Details
| Name: |
oef_ClassAxis=iametft_C000250919Member |
| Namespace Prefix: |
|
| Data Type: |
na |
| Balance Type: |
|
| Period Type: |
|
|
| X |
- Details
| Name: |
oef_ClassAxis=iametft_C000251085Member |
| Namespace Prefix: |
|
| Data Type: |
na |
| Balance Type: |
|
| Period Type: |
|
|
| X |
- Details
| Name: |
oef_ClassAxis=iametft_C000255210Member |
| Namespace Prefix: |
|
| Data Type: |
na |
| Balance Type: |
|
| Period Type: |
|
|
| X |
- Details
| Name: |
oef_ClassAxis=iametft_C000257059Member |
| Namespace Prefix: |
|
| Data Type: |
na |
| Balance Type: |
|
| Period Type: |
|
|
| X |
- Details
| Name: |
oef_ClassAxis=iametft_C000258361Member |
| Namespace Prefix: |
|
| Data Type: |
na |
| Balance Type: |
|
| Period Type: |
|
|
v3.25.2
| X |
- ReferencesReference 1: http://www.xbrl.org/2003/role/presentationRef
-Publisher SEC
-Name Form N-1A
-Section 27A
-Subsection f
| Name: |
oef_HoldingsLineItems |
| Namespace Prefix: |
oef_ |
| Data Type: |
xbrli:stringItemType |
| Balance Type: |
na |
| Period Type: |
duration |
|
| X |
- ReferencesReference 1: http://www.xbrl.org/2003/role/presentationRef
-Publisher SEC
-Name Form N-1A
-Section 27A
-Subsection f
| Name: |
oef_PctOfNav |
| Namespace Prefix: |
oef_ |
| Data Type: |
dtr-types:percentItemType |
| Balance Type: |
na |
| Period Type: |
instant |
|
| X |
- ReferencesReference 1: http://www.xbrl.org/2003/role/presentationRef
-Publisher SEC
-Name Form N-1A
-Section 27A
-Subsection f
| Name: |
oef_PctOfTotalInv |
| Namespace Prefix: |
oef_ |
| Data Type: |
dtr-types:percentItemType |
| Balance Type: |
na |
| Period Type: |
instant |
|
| X |
- ReferencesReference 1: http://www.xbrl.org/2003/role/presentationRef
-Publisher SEC
-Name Form N-1A
-Section 27A
-Subsection f
| Name: |
oef_PctOfTotalLongExposure |
| Namespace Prefix: |
oef_ |
| Data Type: |
dtr-types:percentItemType |
| Balance Type: |
na |
| Period Type: |
instant |
|
| X |
- ReferencesReference 1: http://www.xbrl.org/2003/role/presentationRef
-Publisher SEC
-Name Form N-1A
-Section 27A
-Subsection f
| Name: |
oef_PctOfTotalShortExposure |
| Namespace Prefix: |
oef_ |
| Data Type: |
dtr-types:percentItemType |
| Balance Type: |
na |
| Period Type: |
instant |
|
| X |
- Details
| Name: |
oef_ClassAxis=iametft_C000068414Member |
| Namespace Prefix: |
|
| Data Type: |
na |
| Balance Type: |
|
| Period Type: |
|
|
| X |
- Details
| Name: |
oef_LargestHoldingAxis=iametft_AmericanTowerCorpMember |
| Namespace Prefix: |
|
| Data Type: |
na |
| Balance Type: |
|
| Period Type: |
|
|
| X |
- Details
| Name: |
oef_LargestHoldingAxis=iametft_DigitalRealtyTrustIncMember |
| Namespace Prefix: |
|
| Data Type: |
na |
| Balance Type: |
|
| Period Type: |
|
|
| X |
- Details
| Name: |
oef_LargestHoldingAxis=iametft_WelltowerIncMember |
| Namespace Prefix: |
|
| Data Type: |
na |
| Balance Type: |
|
| Period Type: |
|
|
| X |
- Details
| Name: |
oef_LargestHoldingAxis=iametft_EquinixIncMember |
| Namespace Prefix: |
|
| Data Type: |
na |
| Balance Type: |
|
| Period Type: |
|
|
| X |
- Details
| Name: |
oef_LargestHoldingAxis=iametft_HealthpeakPropertiesIncMember |
| Namespace Prefix: |
|
| Data Type: |
na |
| Balance Type: |
|
| Period Type: |
|
|
| X |
- Details
| Name: |
oef_LargestHoldingAxis=iametft_CubeSmartMember |
| Namespace Prefix: |
|
| Data Type: |
na |
| Balance Type: |
|
| Period Type: |
|
|
| X |
- Details
| Name: |
oef_LargestHoldingAxis=iametft_EastGroupPropertiesIncMember |
| Namespace Prefix: |
|
| Data Type: |
na |
| Balance Type: |
|
| Period Type: |
|
|
| X |
- Details
| Name: |
oef_LargestHoldingAxis=iametft_SimonPropertyGroupIncMember |
| Namespace Prefix: |
|
| Data Type: |
na |
| Balance Type: |
|
| Period Type: |
|
|
| X |
- Details
| Name: |
oef_LargestHoldingAxis=iametft_BrixmorPropertyGroupIncMember |
| Namespace Prefix: |
|
| Data Type: |
na |
| Balance Type: |
|
| Period Type: |
|
|
| X |
- Details
| Name: |
oef_LargestHoldingAxis=iametft_EquityResidentialMember |
| Namespace Prefix: |
|
| Data Type: |
na |
| Balance Type: |
|
| Period Type: |
|
|
| X |
- Details
| Name: |
oef_IndustrySectorAxis=us-gaap_HealthcareSectorMember |
| Namespace Prefix: |
|
| Data Type: |
na |
| Balance Type: |
|
| Period Type: |
|
|
| X |
- Details
| Name: |
oef_IndustrySectorAxis=iametft_InfrastructureREITsMember |
| Namespace Prefix: |
|
| Data Type: |
na |
| Balance Type: |
|
| Period Type: |
|
|
| X |
- Details
| Name: |
oef_IndustrySectorAxis=iametft_DataCentersMember |
| Namespace Prefix: |
|
| Data Type: |
na |
| Balance Type: |
|
| Period Type: |
|
|
| X |
- Details
| Name: |
oef_IndustrySectorAxis=oef_IndustrialSectorMember |
| Namespace Prefix: |
|
| Data Type: |
na |
| Balance Type: |
|
| Period Type: |
|
|
| X |
- Details
| Name: |
oef_IndustrySectorAxis=srt_ApartmentBuildingMember |
| Namespace Prefix: |
|
| Data Type: |
na |
| Balance Type: |
|
| Period Type: |
|
|
| X |
- Details
| Name: |
oef_IndustrySectorAxis=iametft_SelfStorageMember |
| Namespace Prefix: |
|
| Data Type: |
na |
| Balance Type: |
|
| Period Type: |
|
|
| X |
- Details
| Name: |
oef_IndustrySectorAxis=iametft_FreeStandingMember |
| Namespace Prefix: |
|
| Data Type: |
na |
| Balance Type: |
|
| Period Type: |
|
|
| X |
- Details
| Name: |
oef_IndustrySectorAxis=iametft_SingleFamilyHomesMember |
| Namespace Prefix: |
|
| Data Type: |
na |
| Balance Type: |
|
| Period Type: |
|
|
| X |
- Details
| Name: |
oef_IndustrySectorAxis=iametft_RegionalMallsMember |
| Namespace Prefix: |
|
| Data Type: |
na |
| Balance Type: |
|
| Period Type: |
|
|
| X |
- Details
| Name: |
oef_IndustrySectorAxis=iametft_GamingREITsMember |
| Namespace Prefix: |
|
| Data Type: |
na |
| Balance Type: |
|
| Period Type: |
|
|
| X |
- Details
| Name: |
oef_IndustrySectorAxis=iametft_LodgingResortsMember |
| Namespace Prefix: |
|
| Data Type: |
na |
| Balance Type: |
|
| Period Type: |
|
|
| X |
- Details
| Name: |
oef_IndustrySectorAxis=iametft_OfficeMember |
| Namespace Prefix: |
|
| Data Type: |
na |
| Balance Type: |
|
| Period Type: |
|
|
| X |
- Details
| Name: |
oef_IndustrySectorAxis=iametft_TimberREITsMember |
| Namespace Prefix: |
|
| Data Type: |
na |
| Balance Type: |
|
| Period Type: |
|
|
| X |
- Details
| Name: |
oef_IndustrySectorAxis=iametft_ManufacturedHomesMember |
| Namespace Prefix: |
|
| Data Type: |
na |
| Balance Type: |
|
| Period Type: |
|
|
| X |
- Details
| Name: |
oef_IndustrySectorAxis=iametft_SpecialtyMember |
| Namespace Prefix: |
|
| Data Type: |
na |
| Balance Type: |
|
| Period Type: |
|
|
| X |
- Details
| Name: |
us-gaap_InvestmentTypeAxis=iametft_MoneyMarketFundsPlusOtherAssetsLessLiabilitiesMember |
| Namespace Prefix: |
|
| Data Type: |
na |
| Balance Type: |
|
| Period Type: |
|
|
| X |
- Details
| Name: |
oef_ClassAxis=iametft_C000112015Member |
| Namespace Prefix: |
|
| Data Type: |
na |
| Balance Type: |
|
| Period Type: |
|
|
| X |
- Details
| Name: |
oef_LargestHoldingAxis=iametft_AppleIncMember |
| Namespace Prefix: |
|
| Data Type: |
na |
| Balance Type: |
|
| Period Type: |
|
|
| X |
- Details
| Name: |
oef_LargestHoldingAxis=iametft_MicrosoftCorpMember |
| Namespace Prefix: |
|
| Data Type: |
na |
| Balance Type: |
|
| Period Type: |
|
|
| X |
- Details
| Name: |
oef_LargestHoldingAxis=iametft_NVIDIACorpMember |
| Namespace Prefix: |
|
| Data Type: |
na |
| Balance Type: |
|
| Period Type: |
|
|
| X |
- Details
| Name: |
oef_LargestHoldingAxis=iametft_AmazonComIncMember |
| Namespace Prefix: |
|
| Data Type: |
na |
| Balance Type: |
|
| Period Type: |
|
|
| X |
- Details
| Name: |
oef_LargestHoldingAxis=iametft_BerkshireHathawayIncClassBMember |
| Namespace Prefix: |
|
| Data Type: |
na |
| Balance Type: |
|
| Period Type: |
|
|
| X |
- Details
| Name: |
oef_LargestHoldingAxis=iametft_AlphabetIncClassAMember |
| Namespace Prefix: |
|
| Data Type: |
na |
| Balance Type: |
|
| Period Type: |
|
|
| X |
- Details
| Name: |
oef_LargestHoldingAxis=iametft_BroadcomIncMember |
| Namespace Prefix: |
|
| Data Type: |
na |
| Balance Type: |
|
| Period Type: |
|
|
| X |
- Details
| Name: |
oef_LargestHoldingAxis=iametft_TeslaIncMember |
| Namespace Prefix: |
|
| Data Type: |
na |
| Balance Type: |
|
| Period Type: |
|
|
| X |
- Details
| Name: |
oef_LargestHoldingAxis=iametft_AlphabetIncClassCMember |
| Namespace Prefix: |
|
| Data Type: |
na |
| Balance Type: |
|
| Period Type: |
|
|
| X |
- Details
| Name: |
oef_IndustrySectorAxis=us-gaap_FinancialServicesSectorMember |
| Namespace Prefix: |
|
| Data Type: |
na |
| Balance Type: |
|
| Period Type: |
|
|
| X |
- Details
| Name: |
oef_IndustrySectorAxis=oef_ConsumerDiscretionarySectorMember |
| Namespace Prefix: |
|
| Data Type: |
na |
| Balance Type: |
|
| Period Type: |
|
|
| X |
- Details
| Name: |
oef_IndustrySectorAxis=oef_CommunicationsSectorMember |
| Namespace Prefix: |
|
| Data Type: |
na |
| Balance Type: |
|
| Period Type: |
|
|
| X |
- Details
| Name: |
oef_IndustrySectorAxis=oef_ConsumerStaplesSectorMember |
| Namespace Prefix: |
|
| Data Type: |
na |
| Balance Type: |
|
| Period Type: |
|
|
| X |
- Details
| Name: |
oef_IndustrySectorAxis=iametft_OtherSectorsEachLessThan2Member |
| Namespace Prefix: |
|
| Data Type: |
na |
| Balance Type: |
|
| Period Type: |
|
|
| X |
- Details
| Name: |
oef_ClassAxis=iametft_C000162616Member |
| Namespace Prefix: |
|
| Data Type: |
na |
| Balance Type: |
|
| Period Type: |
|
|
| X |
- Details
| Name: |
oef_LargestHoldingAxis=iametft_FreddieMacSeries2024HQA1ClassA1STACR56003252044Member |
| Namespace Prefix: |
|
| Data Type: |
na |
| Balance Type: |
|
| Period Type: |
|
|
| X |
- Details
| Name: |
oef_LargestHoldingAxis=iametft_VolkswagenGroupOfAmericaFinanceLLC54403252027Member |
| Namespace Prefix: |
|
| Data Type: |
na |
| Balance Type: |
|
| Period Type: |
|
|
| X |
- Details
| Name: |
oef_LargestHoldingAxis=iametft_ABNAMROBankNV53712032028Member |
| Namespace Prefix: |
|
| Data Type: |
na |
| Balance Type: |
|
| Period Type: |
|
|
| X |
- Details
| Name: |
oef_LargestHoldingAxis=iametft_SantanderHoldingsUSAInc59803202029Member |
| Namespace Prefix: |
|
| Data Type: |
na |
| Balance Type: |
|
| Period Type: |
|
|
| X |
- Details
| Name: |
oef_LargestHoldingAxis=iametft_MorganStanley54004132028Member |
| Namespace Prefix: |
|
| Data Type: |
na |
| Balance Type: |
|
| Period Type: |
|
|
| X |
- Details
| Name: |
oef_LargestHoldingAxis=iametft_GeneralMotorsFinancialCoInc54102262027Member |
| Namespace Prefix: |
|
| Data Type: |
na |
| Balance Type: |
|
| Period Type: |
|
|
| X |
- Details
| Name: |
oef_LargestHoldingAxis=iametft_JPMorganChaseAndCo53004222028Member |
| Namespace Prefix: |
|
| Data Type: |
na |
| Balance Type: |
|
| Period Type: |
|
|
| X |
- Details
| Name: |
oef_LargestHoldingAxis=iametft_FreddieMacREMICs58504252055Member |
| Namespace Prefix: |
|
| Data Type: |
na |
| Balance Type: |
|
| Period Type: |
|
|
| X |
- Details
| Name: |
oef_LargestHoldingAxis=iametft_USTreasuryFloatingRateNotes43401312027Member |
| Namespace Prefix: |
|
| Data Type: |
na |
| Balance Type: |
|
| Period Type: |
|
|
| X |
- Details
| Name: |
oef_LargestHoldingAxis=iametft_USTreasuryFloatingRateNotes44510312026Member |
| Namespace Prefix: |
|
| Data Type: |
na |
| Balance Type: |
|
| Period Type: |
|
|
| X |
- Details
| Name: |
us-gaap_InvestmentTypeAxis=iametft_USDollarDenominatedBondsAndNotesMember |
| Namespace Prefix: |
|
| Data Type: |
na |
| Balance Type: |
|
| Period Type: |
|
|
| X |
- Details
| Name: |
us-gaap_InvestmentTypeAxis=us-gaap_USTreasurySecuritiesMember |
| Namespace Prefix: |
|
| Data Type: |
na |
| Balance Type: |
|
| Period Type: |
|
|
| X |
- Details
| Name: |
us-gaap_InvestmentTypeAxis=us-gaap_AssetBackedSecuritiesMember |
| Namespace Prefix: |
|
| Data Type: |
na |
| Balance Type: |
|
| Period Type: |
|
|
| X |
- Details
| Name: |
us-gaap_InvestmentTypeAxis=iametft_AgencyCreditRiskTransferNotesMember |
| Namespace Prefix: |
|
| Data Type: |
na |
| Balance Type: |
|
| Period Type: |
|
|
| X |
- Details
| Name: |
oef_ClassAxis=iametft_C000197599Member |
| Namespace Prefix: |
|
| Data Type: |
na |
| Balance Type: |
|
| Period Type: |
|
|
| X |
- Details
| Name: |
oef_LargestHoldingAxis=iametft_APACorp50505012025Member |
| Namespace Prefix: |
|
| Data Type: |
na |
| Balance Type: |
|
| Period Type: |
|
|
| X |
- Details
| Name: |
oef_LargestHoldingAxis=iametft_JabilInc50851305052025Member |
| Namespace Prefix: |
|
| Data Type: |
na |
| Balance Type: |
|
| Period Type: |
|
|
| X |
- Details
| Name: |
oef_LargestHoldingAxis=iametft_BostonPropertiesLP46906022025Member |
| Namespace Prefix: |
|
| Data Type: |
na |
| Balance Type: |
|
| Period Type: |
|
|
| X |
- Details
| Name: |
oef_LargestHoldingAxis=iametft_KinderMorganInc43006012025Member |
| Namespace Prefix: |
|
| Data Type: |
na |
| Balance Type: |
|
| Period Type: |
|
|
| X |
- Details
| Name: |
oef_LargestHoldingAxis=iametft_CrownCastleInc49405012025Member |
| Namespace Prefix: |
|
| Data Type: |
na |
| Balance Type: |
|
| Period Type: |
|
|
| X |
- Details
| Name: |
oef_LargestHoldingAxis=iametft_ConagraBrandsInc50705192025Member |
| Namespace Prefix: |
|
| Data Type: |
na |
| Balance Type: |
|
| Period Type: |
|
|
| X |
- Details
| Name: |
oef_LargestHoldingAxis=iametft_BrunswickCorp50651105012025Member |
| Namespace Prefix: |
|
| Data Type: |
na |
| Balance Type: |
|
| Period Type: |
|
|
| X |
- Details
| Name: |
oef_LargestHoldingAxis=iametft_EversourceEnergy48305122025Member |
| Namespace Prefix: |
|
| Data Type: |
na |
| Balance Type: |
|
| Period Type: |
|
|
| X |
- Details
| Name: |
oef_LargestHoldingAxis=iametft_SonocoProductsCo52405282025Member |
| Namespace Prefix: |
|
| Data Type: |
na |
| Balance Type: |
|
| Period Type: |
|
|
| X |
- Details
| Name: |
oef_LargestHoldingAxis=iametft_QuantaServicesInc49005022025Member |
| Namespace Prefix: |
|
| Data Type: |
na |
| Balance Type: |
|
| Period Type: |
|
|
| X |
- Details
| Name: |
us-gaap_InvestmentTypeAxis=us-gaap_CommercialPaperMember |
| Namespace Prefix: |
|
| Data Type: |
na |
| Balance Type: |
|
| Period Type: |
|
|
| X |
- Details
| Name: |
us-gaap_InvestmentTypeAxis=us-gaap_CertificatesOfDepositMember |
| Namespace Prefix: |
|
| Data Type: |
na |
| Balance Type: |
|
| Period Type: |
|
|
| X |
- Details
| Name: |
us-gaap_InvestmentTypeAxis=us-gaap_RepurchaseAgreementsMember |
| Namespace Prefix: |
|
| Data Type: |
na |
| Balance Type: |
|
| Period Type: |
|
|
| X |
- Details
| Name: |
us-gaap_InvestmentTypeAxis=us-gaap_ExchangeTradedFundsMember |
| Namespace Prefix: |
|
| Data Type: |
na |
| Balance Type: |
|
| Period Type: |
|
|
| X |
- Details
| Name: |
oef_ClassAxis=iametft_C000197600Member |
| Namespace Prefix: |
|
| Data Type: |
na |
| Balance Type: |
|
| Period Type: |
|
|
| X |
- Details
| Name: |
oef_LargestHoldingAxis=iametft_USTreasuryBonds45011152054Member |
| Namespace Prefix: |
|
| Data Type: |
na |
| Balance Type: |
|
| Period Type: |
|
|
| X |
- Details
| Name: |
oef_LargestHoldingAxis=iametft_USTreasuryNotes38804302030Member |
| Namespace Prefix: |
|
| Data Type: |
na |
| Balance Type: |
|
| Period Type: |
|
|
| X |
- Details
| Name: |
oef_LargestHoldingAxis=iametft_USTreasuryNotes46302152035Member |
| Namespace Prefix: |
|
| Data Type: |
na |
| Balance Type: |
|
| Period Type: |
|
|
| X |
- Details
| Name: |
oef_LargestHoldingAxis=iametft_USTreasuryNotes37504302027Member |
| Namespace Prefix: |
|
| Data Type: |
na |
| Balance Type: |
|
| Period Type: |
|
|
| X |
- Details
| Name: |
us-gaap_InvestmentTypeAxis=us-gaap_MoneyMarketFundsMember |
| Namespace Prefix: |
|
| Data Type: |
na |
| Balance Type: |
|
| Period Type: |
|
|
| X |
- Details
| Name: |
us-gaap_InvestmentTypeAxis=iametft_MunicipalObligationsMember |
| Namespace Prefix: |
|
| Data Type: |
na |
| Balance Type: |
|
| Period Type: |
|
|
| X |
- Details
| Name: |
us-gaap_InvestmentTypeAxis=iametft_VariableRateSeniorLoanInterestsMember |
| Namespace Prefix: |
|
| Data Type: |
na |
| Balance Type: |
|
| Period Type: |
|
|
| X |
- Details
| Name: |
us-gaap_InvestmentTypeAxis=us-gaap_PreferredStockMember |
| Namespace Prefix: |
|
| Data Type: |
na |
| Balance Type: |
|
| Period Type: |
|
|
| X |
- Details
| Name: |
oef_ClassAxis=iametft_C000218086Member |
| Namespace Prefix: |
|
| Data Type: |
na |
| Balance Type: |
|
| Period Type: |
|
|
| X |
- Details
| Name: |
oef_LargestHoldingAxis=iametft_GoodyearTireAndRubberCoThe48803152027Member |
| Namespace Prefix: |
|
| Data Type: |
na |
| Balance Type: |
|
| Period Type: |
|
|
| X |
- Details
| Name: |
oef_LargestHoldingAxis=iametft_ViasatInc56304152027Member |
| Namespace Prefix: |
|
| Data Type: |
na |
| Balance Type: |
|
| Period Type: |
|
|
| X |
- Details
| Name: |
oef_LargestHoldingAxis=iametft_ChurchillDownsInc55004012027Member |
| Namespace Prefix: |
|
| Data Type: |
na |
| Balance Type: |
|
| Period Type: |
|
|
| X |
- Details
| Name: |
oef_LargestHoldingAxis=iametft_VentureGlobalLNGInc81306012028Member |
| Namespace Prefix: |
|
| Data Type: |
na |
| Balance Type: |
|
| Period Type: |
|
|
| X |
- Details
| Name: |
oef_LargestHoldingAxis=iametft_JefferiesFinanceLLCJFINCoIssuerCorp50008152028Member |
| Namespace Prefix: |
|
| Data Type: |
na |
| Balance Type: |
|
| Period Type: |
|
|
| X |
- Details
| Name: |
oef_LargestHoldingAxis=iametft_ParamountGlobal63803302062Member |
| Namespace Prefix: |
|
| Data Type: |
na |
| Balance Type: |
|
| Period Type: |
|
|
| X |
- Details
| Name: |
oef_LargestHoldingAxis=iametft_CCOHoldingsLLCCCOHoldingsCapitalCorp45005012032Member |
| Namespace Prefix: |
|
| Data Type: |
na |
| Balance Type: |
|
| Period Type: |
|
|
| X |
- Details
| Name: |
oef_LargestHoldingAxis=iametft_BombardierInc60002152028Member |
| Namespace Prefix: |
|
| Data Type: |
na |
| Balance Type: |
|
| Period Type: |
|
|
| X |
- Details
| Name: |
oef_LargestHoldingAxis=iametft_GlobalAtlanticFinCo47010152051Member |
| Namespace Prefix: |
|
| Data Type: |
na |
| Balance Type: |
|
| Period Type: |
|
|
| X |
- Details
| Name: |
oef_LargestHoldingAxis=iametft_NobleFinanceIILLC80004152030Member |
| Namespace Prefix: |
|
| Data Type: |
na |
| Balance Type: |
|
| Period Type: |
|
|
| X |
- Details
| Name: |
us-gaap_InvestmentTypeAxis=iametft_CommonStocksAndOtherEquityInterestsMember |
| Namespace Prefix: |
|
| Data Type: |
na |
| Balance Type: |
|
| Period Type: |
|
|
| X |
- Details
| Name: |
oef_ClassAxis=iametft_C000222994Member |
| Namespace Prefix: |
|
| Data Type: |
na |
| Balance Type: |
|
| Period Type: |
|
|
| X |
- Details
| Name: |
oef_LargestHoldingAxis=iametft_PrologisIncMember |
| Namespace Prefix: |
|
| Data Type: |
na |
| Balance Type: |
|
| Period Type: |
|
|
| X |
- Details
| Name: |
oef_LargestHoldingAxis=iametft_SempraMember |
| Namespace Prefix: |
|
| Data Type: |
na |
| Balance Type: |
|
| Period Type: |
|
|
| X |
- Details
| Name: |
oef_LargestHoldingAxis=iametft_CheniereEnergyIncMember |
| Namespace Prefix: |
|
| Data Type: |
na |
| Balance Type: |
|
| Period Type: |
|
|
| X |
- Details
| Name: |
oef_LargestHoldingAxis=iametft_ONEOKIncMember |
| Namespace Prefix: |
|
| Data Type: |
na |
| Balance Type: |
|
| Period Type: |
|
|
| X |
- Details
| Name: |
oef_LargestHoldingAxis=iametft_WilliamsCosIncTheMember |
| Namespace Prefix: |
|
| Data Type: |
na |
| Balance Type: |
|
| Period Type: |
|
|
| X |
- Details
| Name: |
oef_LargestHoldingAxis=iametft_KinderMorganIncMember |
| Namespace Prefix: |
|
| Data Type: |
na |
| Balance Type: |
|
| Period Type: |
|
|
| X |
- Details
| Name: |
oef_LargestHoldingAxis=iametft_TargaResourcesCorpMember |
| Namespace Prefix: |
|
| Data Type: |
na |
| Balance Type: |
|
| Period Type: |
|
|
| X |
- Details
| Name: |
oef_IndustrySectorAxis=us-gaap_RealEstateSectorMember |
| Namespace Prefix: |
|
| Data Type: |
na |
| Balance Type: |
|
| Period Type: |
|
|
| X |
- Details
| Name: |
oef_IndustrySectorAxis=us-gaap_EnergySectorMember |
| Namespace Prefix: |
|
| Data Type: |
na |
| Balance Type: |
|
| Period Type: |
|
|
| X |
- Details
| Name: |
oef_IndustrySectorAxis=oef_UtilitiesSectorMember |
| Namespace Prefix: |
|
| Data Type: |
na |
| Balance Type: |
|
| Period Type: |
|
|
| X |
- Details
| Name: |
oef_IndustrySectorAxis=oef_MaterialsSectorMember |
| Namespace Prefix: |
|
| Data Type: |
na |
| Balance Type: |
|
| Period Type: |
|
|
| X |
- Details
| Name: |
oef_ClassAxis=iametft_C000239743Member |
| Namespace Prefix: |
|
| Data Type: |
na |
| Balance Type: |
|
| Period Type: |
|
|
| X |
- Details
| Name: |
oef_LargestHoldingAxis=iametft_SignalPeakCLO11LtdSeries202411AClassA157207182037Member |
| Namespace Prefix: |
|
| Data Type: |
na |
| Balance Type: |
|
| Period Type: |
|
|
| X |
- Details
| Name: |
oef_LargestHoldingAxis=iametft_ParkBlueCLOLtdSeries20221AClassA1R56910202037Member |
| Namespace Prefix: |
|
| Data Type: |
na |
| Balance Type: |
|
| Period Type: |
|
|
| X |
- Details
| Name: |
oef_LargestHoldingAxis=iametft_GoldenTreeLoanManagementUSCLO9LtdSeries20219AClassAR57704202037Member |
| Namespace Prefix: |
|
| Data Type: |
na |
| Balance Type: |
|
| Period Type: |
|
|
| X |
- Details
| Name: |
oef_LargestHoldingAxis=iametft_CedarFundingIXCLOLtdSeries20189AClassAR56907202037Member |
| Namespace Prefix: |
|
| Data Type: |
na |
| Balance Type: |
|
| Period Type: |
|
|
| X |
- Details
| Name: |
oef_LargestHoldingAxis=iametft_ElmwoodCLOIIILtdSeries20193AClassA1RR56507182037Member |
| Namespace Prefix: |
|
| Data Type: |
na |
| Balance Type: |
|
| Period Type: |
|
|
| X |
- Details
| Name: |
oef_LargestHoldingAxis=iametft_MadisonParkFundingXXXVIILtdSeries201937AClassAR257904152037Member |
| Namespace Prefix: |
|
| Data Type: |
na |
| Balance Type: |
|
| Period Type: |
|
|
| X |
- Details
| Name: |
oef_LargestHoldingAxis=iametft_CIFCFundingLtdSeries20232AClassA60201212037Member |
| Namespace Prefix: |
|
| Data Type: |
na |
| Balance Type: |
|
| Period Type: |
|
|
| X |
- Details
| Name: |
oef_LargestHoldingAxis=iametft_TICPCLOVIILtdSeries20177AClassASR255604152033Member |
| Namespace Prefix: |
|
| Data Type: |
na |
| Balance Type: |
|
| Period Type: |
|
|
| X |
- Details
| Name: |
oef_LargestHoldingAxis=iametft_CedarFundingXIVCLOLtdSeries202114AClassAR56410152037Member |
| Namespace Prefix: |
|
| Data Type: |
na |
| Balance Type: |
|
| Period Type: |
|
|
| X |
- Details
| Name: |
oef_LargestHoldingAxis=iametft_PalmerSquareCLO20231LtdSeries20231AClassAR55201202038Member |
| Namespace Prefix: |
|
| Data Type: |
na |
| Balance Type: |
|
| Period Type: |
|
|
| X |
- Details
| Name: |
oef_MaturityAxis=iametft_MaturingIn610YearsMember |
| Namespace Prefix: |
|
| Data Type: |
na |
| Balance Type: |
|
| Period Type: |
|
|
| X |
- Details
| Name: |
oef_MaturityAxis=iametft_MaturingIn1115YearsMember |
| Namespace Prefix: |
|
| Data Type: |
na |
| Balance Type: |
|
| Period Type: |
|
|
| X |
- Details
| Name: |
oef_ClassAxis=iametft_C000239744Member |
| Namespace Prefix: |
|
| Data Type: |
na |
| Balance Type: |
|
| Period Type: |
|
|
| X |
- Details
| Name: |
oef_LargestHoldingAxis=iametft_EutelsatSA97504132029Member |
| Namespace Prefix: |
|
| Data Type: |
na |
| Balance Type: |
|
| Period Type: |
|
|
| X |
- Details
| Name: |
oef_LargestHoldingAxis=iametft_VMEDO2UKFinancingIPLC32501312031Member |
| Namespace Prefix: |
|
| Data Type: |
na |
| Balance Type: |
|
| Period Type: |
|
|
| X |
- Details
| Name: |
oef_LargestHoldingAxis=iametft_IliadHoldingSASU85004152031Member |
| Namespace Prefix: |
|
| Data Type: |
na |
| Balance Type: |
|
| Period Type: |
|
|
| X |
- Details
| Name: |
oef_LargestHoldingAxis=iametft_StudioCityFinanceLtd50001152029Member |
| Namespace Prefix: |
|
| Data Type: |
na |
| Balance Type: |
|
| Period Type: |
|
|
| X |
- Details
| Name: |
oef_LargestHoldingAxis=iametft_AircastleLtd525Member |
| Namespace Prefix: |
|
| Data Type: |
na |
| Balance Type: |
|
| Period Type: |
|
|
| X |
- Details
| Name: |
oef_LargestHoldingAxis=iametft_GFLEnvironmentalInc40008012028Member |
| Namespace Prefix: |
|
| Data Type: |
na |
| Balance Type: |
|
| Period Type: |
|
|
| X |
- Details
| Name: |
oef_LargestHoldingAxis=iametft_TenetHealthcareCorp67505152031Member |
| Namespace Prefix: |
|
| Data Type: |
na |
| Balance Type: |
|
| Period Type: |
|
|
| X |
- Details
| Name: |
oef_LargestHoldingAxis=iametft_AshtonWoodsUSALLCAshtonWoodsFinanceCo66301152028Member |
| Namespace Prefix: |
|
| Data Type: |
na |
| Balance Type: |
|
| Period Type: |
|
|
| X |
- Details
| Name: |
oef_LargestHoldingAxis=iametft_VodafoneGroupPLC41306042081Member |
| Namespace Prefix: |
|
| Data Type: |
na |
| Balance Type: |
|
| Period Type: |
|
|
| X |
- Details
| Name: |
oef_LargestHoldingAxis=iametft_GGAMFinanceLtd68804152029Member |
| Namespace Prefix: |
|
| Data Type: |
na |
| Balance Type: |
|
| Period Type: |
|
|
| X |
- Details
| Name: |
us-gaap_InvestmentTypeAxis=iametft_NonUSDollarDenominatedBondsAndNotesMember |
| Namespace Prefix: |
|
| Data Type: |
na |
| Balance Type: |
|
| Period Type: |
|
|
| X |
- Details
| Name: |
oef_ClassAxis=iametft_C000239745Member |
| Namespace Prefix: |
|
| Data Type: |
na |
| Balance Type: |
|
| Period Type: |
|
|
| X |
- Details
| Name: |
oef_LargestHoldingAxis=iametft_NewYorkTransportationDevelopmentCorpLaGuardiaAirportTerminalBRedevelopmentSeries2023RB60004012035Member |
| Namespace Prefix: |
|
| Data Type: |
na |
| Balance Type: |
|
| Period Type: |
|
|
| X |
- Details
| Name: |
oef_LargestHoldingAxis=iametft_VirginiaBeachDevelopmentAuthorityWestminsterCanterburyOnChesapeakeBaySeries2023B3RB53809012029Member |
| Namespace Prefix: |
|
| Data Type: |
na |
| Balance Type: |
|
| Period Type: |
|
|
| X |
- Details
| Name: |
oef_LargestHoldingAxis=iametft_LouisianaStateOfPublicFacilitiesAuthorityI10CalcasieuRiverBridgeSeries2024RB57509012064Member |
| Namespace Prefix: |
|
| Data Type: |
na |
| Balance Type: |
|
| Period Type: |
|
|
| X |
- Details
| Name: |
oef_LargestHoldingAxis=iametft_PortlandPortOfORGreenBondsTwentyNinthSeries2023RB52507012039Member |
| Namespace Prefix: |
|
| Data Type: |
na |
| Balance Type: |
|
| Period Type: |
|
|
| X |
- Details
| Name: |
oef_LargestHoldingAxis=iametft_AllentownCityOfPANeighborhoodImprovementZoneDevelopmentAuthoritySeries2022RefRB50005012033Member |
| Namespace Prefix: |
|
| Data Type: |
na |
| Balance Type: |
|
| Period Type: |
|
|
| X |
- Details
| Name: |
oef_LargestHoldingAxis=iametft_PennsylvaniaCommonwealthOfEconomicDevelopmentFinancingAuthorityPenndotMajorBridgesTheSeries2022RB55006302038Member |
| Namespace Prefix: |
|
| Data Type: |
na |
| Balance Type: |
|
| Period Type: |
|
|
| X |
- Details
| Name: |
oef_LargestHoldingAxis=iametft_IowaStateOfFinanceAuthorityIowaFertilizerCoSeries2022RefRB40012012032Member |
| Namespace Prefix: |
|
| Data Type: |
na |
| Balance Type: |
|
| Period Type: |
|
|
| X |
- Details
| Name: |
oef_LargestHoldingAxis=iametft_NewYorkTransportationDevelopmentCorpJohnFKennedyInternationalAirportNewTerminalOneGreenBondsSeries2023RB60006302054Member |
| Namespace Prefix: |
|
| Data Type: |
na |
| Balance Type: |
|
| Period Type: |
|
|
| X |
- Details
| Name: |
oef_LargestHoldingAxis=iametft_PatriotsEnergyGroupFinancingAgencySeries2023A1RB52508012031Member |
| Namespace Prefix: |
|
| Data Type: |
na |
| Balance Type: |
|
| Period Type: |
|
|
| X |
- Details
| Name: |
oef_LargestHoldingAxis=iametft_CaliforniaStateOfPollutionControlFinancingAuthorityPoseidonResourcesLPSeries2023RB50007012038Member |
| Namespace Prefix: |
|
| Data Type: |
na |
| Balance Type: |
|
| Period Type: |
|
|
| X |
- Details
| Name: |
us-gaap_InvestmentTypeAxis=iametft_RevenueBondsMember |
| Namespace Prefix: |
|
| Data Type: |
na |
| Balance Type: |
|
| Period Type: |
|
|
| X |
- Details
| Name: |
us-gaap_InvestmentTypeAxis=iametft_GeneralObligationBondsMember |
| Namespace Prefix: |
|
| Data Type: |
na |
| Balance Type: |
|
| Period Type: |
|
|
| X |
- Details
| Name: |
us-gaap_InvestmentTypeAxis=iametft_PreRefundedBondsMember |
| Namespace Prefix: |
|
| Data Type: |
na |
| Balance Type: |
|
| Period Type: |
|
|
| X |
- Details
| Name: |
oef_ClassAxis=iametft_C000239746Member |
| Namespace Prefix: |
|
| Data Type: |
na |
| Balance Type: |
|
| Period Type: |
|
|
| X |
- Details
| Name: |
oef_LargestHoldingAxis=iametft_MorganStanleyBankNA58810302026Member |
| Namespace Prefix: |
|
| Data Type: |
na |
| Balance Type: |
|
| Period Type: |
|
|
| X |
- Details
| Name: |
oef_LargestHoldingAxis=iametft_NatWestGroupPLC74711102026Member |
| Namespace Prefix: |
|
| Data Type: |
na |
| Balance Type: |
|
| Period Type: |
|
|
| X |
- Details
| Name: |
oef_LargestHoldingAxis=iametft_BarclaysPLC73311022026Member |
| Namespace Prefix: |
|
| Data Type: |
na |
| Balance Type: |
|
| Period Type: |
|
|
| X |
- Details
| Name: |
oef_LargestHoldingAxis=iametft_FordMotorCreditCoLLC73203062026Member |
| Namespace Prefix: |
|
| Data Type: |
na |
| Balance Type: |
|
| Period Type: |
|
|
| X |
- Details
| Name: |
oef_LargestHoldingAxis=iametft_UBSAG58009112025Member |
| Namespace Prefix: |
|
| Data Type: |
na |
| Balance Type: |
|
| Period Type: |
|
|
| X |
- Details
| Name: |
oef_LargestHoldingAxis=iametft_AerCapIrelandCapitalDACAerCapGlobalAviationTrust61001152027Member |
| Namespace Prefix: |
|
| Data Type: |
na |
| Balance Type: |
|
| Period Type: |
|
|
| X |
- Details
| Name: |
oef_LargestHoldingAxis=iametft_ProtectiveLifeGlobalFunding53701062026Member |
| Namespace Prefix: |
|
| Data Type: |
na |
| Balance Type: |
|
| Period Type: |
|
|
| X |
- Details
| Name: |
oef_LargestHoldingAxis=iametft_USTreasuryNotes37504152028Member |
| Namespace Prefix: |
|
| Data Type: |
na |
| Balance Type: |
|
| Period Type: |
|
|
| X |
- Details
| Name: |
oef_ClassAxis=iametft_C000250918Member |
| Namespace Prefix: |
|
| Data Type: |
na |
| Balance Type: |
|
| Period Type: |
|
|
| X |
- Details
| Name: |
oef_LargestHoldingAxis=iametft_NetflixIncMember |
| Namespace Prefix: |
|
| Data Type: |
na |
| Balance Type: |
|
| Period Type: |
|
|
| X |
- Details
| Name: |
oef_LargestHoldingAxis=iametft_CostcoWholesaleCorpMember |
| Namespace Prefix: |
|
| Data Type: |
na |
| Balance Type: |
|
| Period Type: |
|
|
| X |
- Details
| Name: |
us-gaap_InvestmentTypeAxis=iametft_EquityLinkedNotesMember |
| Namespace Prefix: |
|
| Data Type: |
na |
| Balance Type: |
|
| Period Type: |
|
|
| X |
- Details
| Name: |
oef_ClassAxis=iametft_C000250919Member |
| Namespace Prefix: |
|
| Data Type: |
na |
| Balance Type: |
|
| Period Type: |
|
|
| X |
- Details
| Name: |
oef_LargestHoldingAxis=iametft_UBSAGInvescoSAndP500EqualWeightETFMember |
| Namespace Prefix: |
|
| Data Type: |
na |
| Balance Type: |
|
| Period Type: |
|
|
| X |
- Details
| Name: |
oef_LargestHoldingAxis=iametft_MizuhoMarketsCaymanLPInvescoSAndP500EqualWeightETFMember |
| Namespace Prefix: |
|
| Data Type: |
na |
| Balance Type: |
|
| Period Type: |
|
|
| X |
- Details
| Name: |
oef_LargestHoldingAxis=iametft_BNPParibasIssuanceBVInvescoSAndP500EqualWeightETFMember |
| Namespace Prefix: |
|
| Data Type: |
na |
| Balance Type: |
|
| Period Type: |
|
|
| X |
- Details
| Name: |
oef_LargestHoldingAxis=iametft_JPMorganChaseAndCoInvescoSAndP500EqualWeightETFMember |
| Namespace Prefix: |
|
| Data Type: |
na |
| Balance Type: |
|
| Period Type: |
|
|
| X |
- Details
| Name: |
oef_LargestHoldingAxis=iametft_MizuhoMarketsCaymanLPInvescoSAndP500EqualWeightETFTopHoldingMember |
| Namespace Prefix: |
|
| Data Type: |
na |
| Balance Type: |
|
| Period Type: |
|
|
| X |
- Details
| Name: |
oef_LargestHoldingAxis=iametft_WellsFargoBankNAInvescoSAndP500EqualWeightETFMember |
| Namespace Prefix: |
|
| Data Type: |
na |
| Balance Type: |
|
| Period Type: |
|
|
| X |
- Details
| Name: |
oef_LargestHoldingAxis=iametft_BNPParibasIssuanceBVInvescoSAndP500EqualWeightETFTopHoldingMember |
| Namespace Prefix: |
|
| Data Type: |
na |
| Balance Type: |
|
| Period Type: |
|
|
| X |
- Details
| Name: |
oef_LargestHoldingAxis=iametft_CitigroupGlobalMarketsHoldingsIncInvescoSAndP500EqualWeightETFMember |
| Namespace Prefix: |
|
| Data Type: |
na |
| Balance Type: |
|
| Period Type: |
|
|
| X |
- Details
| Name: |
oef_LargestHoldingAxis=iametft_CanadianImperialBankOfCommerceInvescoSAndP500EqualWeightETFMember |
| Namespace Prefix: |
|
| Data Type: |
na |
| Balance Type: |
|
| Period Type: |
|
|
| X |
- Details
| Name: |
oef_LargestHoldingAxis=iametft_CitigroupGlobalMarketsHoldingsIncInvescoSAndP500EqualWeightETFTopHoldingMember |
| Namespace Prefix: |
|
| Data Type: |
na |
| Balance Type: |
|
| Period Type: |
|
|
| X |
- Details
| Name: |
oef_ClassAxis=iametft_C000251085Member |
| Namespace Prefix: |
|
| Data Type: |
na |
| Balance Type: |
|
| Period Type: |
|
|
| X |
- Details
| Name: |
oef_LargestHoldingAxis=iametft_SAPSEMember |
| Namespace Prefix: |
|
| Data Type: |
na |
| Balance Type: |
|
| Period Type: |
|
|
| X |
- Details
| Name: |
oef_LargestHoldingAxis=iametft_NestleSAMember |
| Namespace Prefix: |
|
| Data Type: |
na |
| Balance Type: |
|
| Period Type: |
|
|
| X |
- Details
| Name: |
oef_LargestHoldingAxis=iametft_ASMLHoldingNVMember |
| Namespace Prefix: |
|
| Data Type: |
na |
| Balance Type: |
|
| Period Type: |
|
|
| X |
- Details
| Name: |
oef_LargestHoldingAxis=iametft_RocheHoldingAGMember |
| Namespace Prefix: |
|
| Data Type: |
na |
| Balance Type: |
|
| Period Type: |
|
|
| X |
- Details
| Name: |
oef_LargestHoldingAxis=iametft_NovartisAGMember |
| Namespace Prefix: |
|
| Data Type: |
na |
| Balance Type: |
|
| Period Type: |
|
|
| X |
- Details
| Name: |
oef_LargestHoldingAxis=iametft_AstraZenecaPLCMember |
| Namespace Prefix: |
|
| Data Type: |
na |
| Balance Type: |
|
| Period Type: |
|
|
| X |
- Details
| Name: |
oef_LargestHoldingAxis=iametft_NovoNordiskASClassBMember |
| Namespace Prefix: |
|
| Data Type: |
na |
| Balance Type: |
|
| Period Type: |
|
|
| X |
- Details
| Name: |
oef_LargestHoldingAxis=iametft_HSBCHoldingsPLCMember |
| Namespace Prefix: |
|
| Data Type: |
na |
| Balance Type: |
|
| Period Type: |
|
|
| X |
- Details
| Name: |
oef_LargestHoldingAxis=iametft_ShellPLCMember |
| Namespace Prefix: |
|
| Data Type: |
na |
| Balance Type: |
|
| Period Type: |
|
|
| X |
- Details
| Name: |
oef_LargestHoldingAxis=iametft_ToyotaMotorCorpMember |
| Namespace Prefix: |
|
| Data Type: |
na |
| Balance Type: |
|
| Period Type: |
|
|
| X |
- Details
| Name: |
oef_ClassAxis=iametft_C000255210Member |
| Namespace Prefix: |
|
| Data Type: |
na |
| Balance Type: |
|
| Period Type: |
|
|
| X |
- Details
| Name: |
oef_ClassAxis=iametft_C000257059Member |
| Namespace Prefix: |
|
| Data Type: |
na |
| Balance Type: |
|
| Period Type: |
|
|
| X |
- Details
| Name: |
oef_LargestHoldingAxis=iametft_TCEnergyCorpMember |
| Namespace Prefix: |
|
| Data Type: |
na |
| Balance Type: |
|
| Period Type: |
|
|
| X |
- Details
| Name: |
oef_LargestHoldingAxis=iametft_PembinaPipelineMember |
| Namespace Prefix: |
|
| Data Type: |
na |
| Balance Type: |
|
| Period Type: |
|
|
| X |
- Details
| Name: |
oef_LargestHoldingAxis=iametft_EnbridgeIncMember |
| Namespace Prefix: |
|
| Data Type: |
na |
| Balance Type: |
|
| Period Type: |
|
|
| X |
- Details
| Name: |
oef_LargestHoldingAxis=iametft_SouthBowCorpMember |
| Namespace Prefix: |
|
| Data Type: |
na |
| Balance Type: |
|
| Period Type: |
|
|
| X |
- Details
| Name: |
oef_LargestHoldingAxis=iametft_PlainsGPHoldingsLPClassAMember |
| Namespace Prefix: |
|
| Data Type: |
na |
| Balance Type: |
|
| Period Type: |
|
|
| X |
- Details
| Name: |
oef_ClassAxis=iametft_C000258361Member |
| Namespace Prefix: |
|
| Data Type: |
na |
| Balance Type: |
|
| Period Type: |
|
|
| X |
- Details
| Name: |
us-gaap_InvestmentTypeAxis=iametft_FuturesContractsMember |
| Namespace Prefix: |
|
| Data Type: |
na |
| Balance Type: |
|
| Period Type: |
|
|
| X |
- Details
| Name: |
us-gaap_InvestmentTypeAxis=iametft_OtherAssetsLessLiabilitiesMember |
| Namespace Prefix: |
|
| Data Type: |
na |
| Balance Type: |
|
| Period Type: |
|
|
| X |
- Details
| Name: |
us-gaap_InvestmentTypeAxis=iametft_CommodityRiskLongMember |
| Namespace Prefix: |
|
| Data Type: |
na |
| Balance Type: |
|
| Period Type: |
|
|
| X |
- Details
| Name: |
us-gaap_InvestmentTypeAxis=iametft_CommodityRiskShortMember |
| Namespace Prefix: |
|
| Data Type: |
na |
| Balance Type: |
|
| Period Type: |
|
|
| X |
- Details
| Name: |
us-gaap_InvestmentTypeAxis=iametft_CurrencyRiskLongMember |
| Namespace Prefix: |
|
| Data Type: |
na |
| Balance Type: |
|
| Period Type: |
|
|
| X |
- Details
| Name: |
us-gaap_InvestmentTypeAxis=iametft_CurrencyRiskShortMember |
| Namespace Prefix: |
|
| Data Type: |
na |
| Balance Type: |
|
| Period Type: |
|
|
| X |
- Details
| Name: |
us-gaap_InvestmentTypeAxis=iametft_EquityRiskLongMember |
| Namespace Prefix: |
|
| Data Type: |
na |
| Balance Type: |
|
| Period Type: |
|
|
| X |
- Details
| Name: |
us-gaap_InvestmentTypeAxis=iametft_EquityRiskShortMember |
| Namespace Prefix: |
|
| Data Type: |
na |
| Balance Type: |
|
| Period Type: |
|
|
| X |
- Details
| Name: |
us-gaap_InvestmentTypeAxis=iametft_InterestRateRiskLongMember |
| Namespace Prefix: |
|
| Data Type: |
na |
| Balance Type: |
|
| Period Type: |
|
|
| X |
- Details
| Name: |
us-gaap_InvestmentTypeAxis=iametft_InterestRateRiskShortMember |
| Namespace Prefix: |
|
| Data Type: |
na |
| Balance Type: |
|
| Period Type: |
|
|
{
"version": "2.2",
"instance": {
"8ddb7f2675b1a89.htm": {
"nsprefix": "iametft",
"nsuri": "http://invesco.com/20250610",
"dts": {
"inline": {
"local": [
"8ddb7f2675b1a89.htm"
]
},
"schema": {
"local": [
"iametft-20250610.xsd"
],
"remote": [
"http://www.xbrl.org/2003/xbrl-instance-2003-12-31.xsd",
"http://www.xbrl.org/2003/xbrl-linkbase-2003-12-31.xsd",
"http://www.xbrl.org/2003/xl-2003-12-31.xsd",
"http://www.xbrl.org/2003/xlink-2003-12-31.xsd",
"http://www.xbrl.org/2005/xbrldt-2005.xsd",
"http://www.xbrl.org/2006/ref-2006-02-27.xsd",
"http://www.xbrl.org/lrr/arcrole/deprecated-2009-12-16.xsd",
"http://www.xbrl.org/lrr/role/negated-2009-12-16.xsd",
"http://www.xbrl.org/lrr/role/reference-2009-12-16.xsd",
"https://www.xbrl.org/2020/extensible-enumerations-2.0.xsd",
"https://www.xbrl.org/dtr/type/2020-01-21/types.xsd",
"https://www.xbrl.org/dtr/type/2024-01-31/types.xsd",
"https://xbrl.fasb.org/srt/2025/elts/srt-2025.xsd",
"https://xbrl.fasb.org/srt/2025/elts/srt-roles-2025.xsd",
"https://xbrl.fasb.org/srt/2025/elts/srt-types-2025.xsd",
"https://xbrl.fasb.org/us-gaap/2025/elts/us-gaap-2025.xsd",
"https://xbrl.fasb.org/us-gaap/2025/elts/us-roles-2025.xsd",
"https://xbrl.fasb.org/us-gaap/2025/elts/us-types-2025.xsd",
"https://xbrl.sec.gov/country/2025/country-2025.xsd",
"https://xbrl.sec.gov/country/2025/country-2025_def.xsd",
"https://xbrl.sec.gov/dei/2025/dei-2025.xsd",
"https://xbrl.sec.gov/oef/2025/oef-2025.xsd",
"https://xbrl.sec.gov/oef/2025/oef-2025_lab.xsd",
"https://xbrl.sec.gov/oef/2025/oef-sr-2025.xsd",
"https://xbrl.sec.gov/stpr/2025/stpr-2025.xsd"
]
}
},
"keyStandard": 28,
"keyCustom": 0,
"axisStandard": 5,
"axisCustom": 0,
"memberStandard": 20,
"memberCustom": 188,
"hidden": {
"total": 116,
"http://xbrl.sec.gov/oef/2025": 95,
"http://xbrl.sec.gov/dei/2025": 21
},
"contextCount": 297,
"entityCount": 1,
"segmentCount": 208,
"elementCount": 332,
"unitCount": 6,
"baseTaxonomies": {
"http://xbrl.sec.gov/oef/2025": 499,
"http://xbrl.sec.gov/dei/2025": 40,
"http://fasb.org/us-gaap/2025": 33
},
"report": {
"R1": {
"role": "http://xbrl.sec.gov/oef/role/NcsrCover",
"longName": "030000 - Disclosure - Form N-CSR Cover",
"shortName": "Form N-CSR Cover",
"isDefault": "true",
"groupType": "disclosure",
"subGroupType": "",
"menuCat": "Cover",
"order": "1",
"firstAnchor": {
"contextRef": "DefaultContext",
"name": "dei:EntityRegistrantName",
"unitRef": null,
"xsiNil": "false",
"lang": "en-US",
"decimals": null,
"ancestors": [
"div",
"div",
"div",
"div",
"div",
"div",
"div",
"div",
"body",
"html"
],
"reportCount": 1,
"baseRef": "8ddb7f2675b1a89.htm",
"first": true
},
"uniqueAnchor": null
},
"R2": {
"role": "http://xbrl.sec.gov/oef/role/ShareholderReport",
"longName": "030001 - Disclosure - Shareholder Report",
"shortName": "Shareholder Report",
"isDefault": "false",
"groupType": "disclosure",
"subGroupType": "",
"menuCat": "Notes",
"order": "2",
"firstAnchor": {
"contextRef": "DefaultContext",
"name": "dei:EntityRegistrantName",
"unitRef": null,
"xsiNil": "false",
"lang": "en-US",
"decimals": null,
"ancestors": [
"div",
"div",
"div",
"div",
"div",
"div",
"div",
"div",
"body",
"html"
],
"reportCount": 1,
"baseRef": "8ddb7f2675b1a89.htm",
"first": true
},
"uniqueAnchor": {
"contextRef": "D20241031_20250430_C000068414Member",
"name": "oef:FundName",
"unitRef": null,
"xsiNil": "false",
"lang": "en-US",
"decimals": null,
"ancestors": [
"oef:ClassName",
"div",
"div",
"div",
"div",
"div",
"div",
"div",
"div",
"body",
"html"
],
"reportCount": 1,
"baseRef": "8ddb7f2675b1a89.htm",
"unique": true
}
},
"R3": {
"role": "http://xbrl.sec.gov/oef/role/ShareholderReportHoldingsDetails",
"longName": "040020 - Disclosure - Shareholder Report, Holdings (Details)",
"shortName": "Shareholder Report, Holdings (Details)",
"isDefault": "false",
"groupType": "disclosure",
"subGroupType": "details",
"menuCat": "Details",
"order": "3",
"firstAnchor": {
"contextRef": "TI20250430_C000068414Member_AmericanTowerCorpMember",
"name": "oef:PctOfNav",
"unitRef": "pure",
"xsiNil": "false",
"lang": null,
"decimals": "4",
"ancestors": [
"td",
"tr",
"table",
"ix:continuation",
"ix:continuation",
"div",
"div",
"div",
"div",
"div",
"div",
"div",
"div",
"div",
"div",
"body",
"html"
],
"reportCount": 1,
"baseRef": "8ddb7f2675b1a89.htm",
"first": true,
"unique": true
},
"uniqueAnchor": {
"contextRef": "TI20250430_C000068414Member_AmericanTowerCorpMember",
"name": "oef:PctOfNav",
"unitRef": "pure",
"xsiNil": "false",
"lang": null,
"decimals": "4",
"ancestors": [
"td",
"tr",
"table",
"ix:continuation",
"ix:continuation",
"div",
"div",
"div",
"div",
"div",
"div",
"div",
"div",
"div",
"div",
"body",
"html"
],
"reportCount": 1,
"baseRef": "8ddb7f2675b1a89.htm",
"first": true,
"unique": true
}
}
},
"tag": {
"iametft_ABNAMROBankNV53712032028Member": {
"xbrltype": "domainItemType",
"nsuri": "http://invesco.com/20250610",
"localname": "ABNAMROBankNV53712032028Member",
"presentation": [
"http://xbrl.sec.gov/oef/role/ShareholderReportHoldingsDetails"
],
"lang": {
"en-us": {
"role": {
"label": "ABN AMRO Bank N V 5 37 12 03 2028 [Member]"
}
}
},
"auth_ref": []
},
"iametft_APACorp50505012025Member": {
"xbrltype": "domainItemType",
"nsuri": "http://invesco.com/20250610",
"localname": "APACorp50505012025Member",
"presentation": [
"http://xbrl.sec.gov/oef/role/ShareholderReportHoldingsDetails"
],
"lang": {
"en-us": {
"role": {
"label": "APA Corp 5 05 05 01 2025 [Member]"
}
}
},
"auth_ref": []
},
"iametft_ASMLHoldingNVMember": {
"xbrltype": "domainItemType",
"nsuri": "http://invesco.com/20250610",
"localname": "ASMLHoldingNVMember",
"presentation": [
"http://xbrl.sec.gov/oef/role/ShareholderReportHoldingsDetails"
],
"lang": {
"en-us": {
"role": {
"label": "ASML Holding N V [Member]"
}
}
},
"auth_ref": []
},
"oef_AccmVal": {
"xbrltype": "monetaryItemType",
"nsuri": "http://xbrl.sec.gov/oef/2025",
"localname": "AccmVal",
"presentation": [
"http://xbrl.sec.gov/oef/role/ShareholderReportLineGraphDetails"
],
"lang": {
"en-us": {
"role": {
"label": "Accumulated Value"
}
}
},
"auth_ref": [
"r55"
]
},
"oef_AccountValueLineItems": {
"xbrltype": "stringItemType",
"nsuri": "http://xbrl.sec.gov/oef/2025",
"localname": "AccountValueLineItems",
"presentation": [
"http://xbrl.sec.gov/oef/role/ShareholderReportLineGraphDetails"
],
"lang": {
"en-us": {
"role": {
"label": "Account Value [Line Items]"
}
}
},
"auth_ref": [
"r54"
]
},
"oef_AccountValueTable": {
"xbrltype": "stringItemType",
"nsuri": "http://xbrl.sec.gov/oef/2025",
"localname": "AccountValueTable",
"presentation": [
"http://xbrl.sec.gov/oef/role/ShareholderReportLineGraphDetails"
],
"lang": {
"en-us": {
"role": {
"label": "Account Value [Table]"
}
}
},
"auth_ref": [
"r54"
]
},
"oef_AccountValueTableAbstract": {
"xbrltype": "stringItemType",
"nsuri": "http://xbrl.sec.gov/oef/2025",
"localname": "AccountValueTableAbstract",
"lang": {
"en-us": {
"role": {
"label": "Account Value Table [Abstract]"
}
}
},
"auth_ref": [
"r54"
]
},
"oef_AccountantChngDate": {
"xbrltype": "dateItemType",
"nsuri": "http://xbrl.sec.gov/oef/2025",
"localname": "AccountantChngDate",
"presentation": [
"http://xbrl.sec.gov/oef/role/ShareholderReport"
],
"lang": {
"en-us": {
"role": {
"label": "Accountant Change Date"
}
}
},
"auth_ref": [
"r78"
]
},
"oef_AccountantChngDisagreementsTextBlock": {
"xbrltype": "textBlockItemType",
"nsuri": "http://xbrl.sec.gov/oef/2025",
"localname": "AccountantChngDisagreementsTextBlock",
"presentation": [
"http://xbrl.sec.gov/oef/role/ShareholderReport"
],
"lang": {
"en-us": {
"role": {
"label": "Accountant Change Disagreements [Text Block]"
}
}
},
"auth_ref": [
"r79"
]
},
"oef_AccountantChngStatementTextBlock": {
"xbrltype": "textBlockItemType",
"nsuri": "http://xbrl.sec.gov/oef/2025",
"localname": "AccountantChngStatementTextBlock",
"presentation": [
"http://xbrl.sec.gov/oef/role/ShareholderReport"
],
"lang": {
"en-us": {
"role": {
"label": "Accountant Change Statement [Text Block]"
}
}
},
"auth_ref": [
"r78"
]
},
"oef_AdditionalIndexAxis": {
"xbrltype": "stringItemType",
"nsuri": "http://xbrl.sec.gov/oef/2025",
"localname": "AdditionalIndexAxis",
"presentation": [
"http://xbrl.sec.gov/oef/role/ShareholderReportAverageAnnualReturnDetails",
"http://xbrl.sec.gov/oef/role/ShareholderReportLineGraphDetails"
],
"lang": {
"en-us": {
"role": {
"label": "Additional Index [Axis]"
}
}
},
"auth_ref": [
"r54"
]
},
"oef_AdditionalIndexDomain": {
"xbrltype": "domainItemType",
"nsuri": "http://xbrl.sec.gov/oef/2025",
"localname": "AdditionalIndexDomain",
"presentation": [
"http://xbrl.sec.gov/oef/role/ShareholderReportAverageAnnualReturnDetails",
"http://xbrl.sec.gov/oef/role/ShareholderReportLineGraphDetails"
],
"lang": {
"en-us": {
"role": {
"label": "Additional Index [Domain]"
}
}
},
"auth_ref": [
"r54"
]
},
"oef_AddlFundStatisticsSignificanceOrLimitsTextBlock": {
"xbrltype": "textBlockItemType",
"nsuri": "http://xbrl.sec.gov/oef/2025",
"localname": "AddlFundStatisticsSignificanceOrLimitsTextBlock",
"presentation": [
"http://xbrl.sec.gov/oef/role/ShareholderReport"
],
"lang": {
"en-us": {
"role": {
"label": "Additional Fund Statistics Significance or Limits [Text Block]"
}
}
},
"auth_ref": [
"r68"
]
},
"oef_AddlFundStatisticsTextBlock": {
"xbrltype": "textBlockItemType",
"nsuri": "http://xbrl.sec.gov/oef/2025",
"localname": "AddlFundStatisticsTextBlock",
"presentation": [
"http://xbrl.sec.gov/oef/role/ShareholderReport"
],
"lang": {
"en-us": {
"role": {
"label": "Additional Fund Statistics [Text Block]"
}
}
},
"auth_ref": [
"r67"
]
},
"oef_AddlInfoEmail": {
"xbrltype": "stringItemType",
"nsuri": "http://xbrl.sec.gov/oef/2025",
"localname": "AddlInfoEmail",
"presentation": [
"http://xbrl.sec.gov/oef/role/ShareholderReport"
],
"lang": {
"en-us": {
"role": {
"label": "Additional Information Email"
}
}
},
"auth_ref": [
"r46"
]
},
"oef_AddlInfoPhoneNumber": {
"xbrltype": "stringItemType",
"nsuri": "http://xbrl.sec.gov/oef/2025",
"localname": "AddlInfoPhoneNumber",
"presentation": [
"http://xbrl.sec.gov/oef/role/ShareholderReport"
],
"lang": {
"en-us": {
"role": {
"label": "Additional Information Phone Number"
}
}
},
"auth_ref": [
"r46"
]
},
"oef_AddlInfoTextBlock": {
"xbrltype": "textBlockItemType",
"nsuri": "http://xbrl.sec.gov/oef/2025",
"localname": "AddlInfoTextBlock",
"presentation": [
"http://xbrl.sec.gov/oef/role/ShareholderReport"
],
"lang": {
"en-us": {
"role": {
"label": "Additional Information [Text Block]"
}
}
},
"auth_ref": [
"r44"
]
},
"oef_AddlInfoWebsite": {
"xbrltype": "stringItemType",
"nsuri": "http://xbrl.sec.gov/oef/2025",
"localname": "AddlInfoWebsite",
"presentation": [
"http://xbrl.sec.gov/oef/role/ShareholderReport"
],
"lang": {
"en-us": {
"role": {
"label": "Additional Information Website"
}
}
},
"auth_ref": [
"r46"
]
},
"oef_AdvisoryFeesPaidAmt": {
"xbrltype": "monetaryItemType",
"nsuri": "http://xbrl.sec.gov/oef/2025",
"localname": "AdvisoryFeesPaidAmt",
"presentation": [
"http://xbrl.sec.gov/oef/role/ShareholderReport"
],
"lang": {
"en-us": {
"role": {
"label": "Advisory Fees Paid, Amount"
}
}
},
"auth_ref": [
"r67"
]
},
"iametft_AerCapIrelandCapitalDACAerCapGlobalAviationTrust61001152027Member": {
"xbrltype": "domainItemType",
"nsuri": "http://invesco.com/20250610",
"localname": "AerCapIrelandCapitalDACAerCapGlobalAviationTrust61001152027Member",
"presentation": [
"http://xbrl.sec.gov/oef/role/ShareholderReportHoldingsDetails"
],
"lang": {
"en-us": {
"role": {
"label": "AerCap Ireland Capital DAC AerCap Global Aviation Trust 6 10 01 15 2027 [Member]"
}
}
},
"auth_ref": []
},
"iametft_AgencyCreditRiskTransferNotesMember": {
"xbrltype": "domainItemType",
"nsuri": "http://invesco.com/20250610",
"localname": "AgencyCreditRiskTransferNotesMember",
"presentation": [
"http://xbrl.sec.gov/oef/role/ShareholderReportHoldingsDetails"
],
"lang": {
"en-us": {
"role": {
"label": "Agency Credit Risk Transfer Notes [Member]"
}
}
},
"auth_ref": []
},
"iametft_AircastleLtd525Member": {
"xbrltype": "domainItemType",
"nsuri": "http://invesco.com/20250610",
"localname": "AircastleLtd525Member",
"presentation": [
"http://xbrl.sec.gov/oef/role/ShareholderReportHoldingsDetails"
],
"lang": {
"en-us": {
"role": {
"label": "Aircastle Ltd 5 25 [Member]"
}
}
},
"auth_ref": []
},
"iametft_AllentownCityOfPANeighborhoodImprovementZoneDevelopmentAuthoritySeries2022RefRB50005012033Member": {
"xbrltype": "domainItemType",
"nsuri": "http://invesco.com/20250610",
"localname": "AllentownCityOfPANeighborhoodImprovementZoneDevelopmentAuthoritySeries2022RefRB50005012033Member",
"presentation": [
"http://xbrl.sec.gov/oef/role/ShareholderReportHoldingsDetails"
],
"lang": {
"en-us": {
"role": {
"label": "Allentown City of PA Neighborhood Improvement Zone Development Authority Series 2022 Ref RB 5 00 05 01 2033 [Member]"
}
}
},
"auth_ref": []
},
"iametft_AlphabetIncClassAMember": {
"xbrltype": "domainItemType",
"nsuri": "http://invesco.com/20250610",
"localname": "AlphabetIncClassAMember",
"presentation": [
"http://xbrl.sec.gov/oef/role/ShareholderReportHoldingsDetails"
],
"lang": {
"en-us": {
"role": {
"label": "Alphabet Inc Class A [Member]"
}
}
},
"auth_ref": []
},
"iametft_AlphabetIncClassCMember": {
"xbrltype": "domainItemType",
"nsuri": "http://invesco.com/20250610",
"localname": "AlphabetIncClassCMember",
"presentation": [
"http://xbrl.sec.gov/oef/role/ShareholderReportHoldingsDetails"
],
"lang": {
"en-us": {
"role": {
"label": "Alphabet Inc Class C [Member]"
}
}
},
"auth_ref": []
},
"iametft_AmazonComIncMember": {
"xbrltype": "domainItemType",
"nsuri": "http://invesco.com/20250610",
"localname": "AmazonComIncMember",
"presentation": [
"http://xbrl.sec.gov/oef/role/ShareholderReportHoldingsDetails"
],
"lang": {
"en-us": {
"role": {
"label": "Amazon com Inc [Member]"
}
}
},
"auth_ref": []
},
"dei_AmendmentDescription": {
"xbrltype": "stringItemType",
"nsuri": "http://xbrl.sec.gov/dei/2025",
"localname": "AmendmentDescription",
"presentation": [
"http://xbrl.sec.gov/oef/role/NcsrCover",
"http://xbrl.sec.gov/oef/role/ShareholderReport"
],
"lang": {
"en-us": {
"role": {
"label": "Amendment Description",
"documentation": "Description of changes contained within amended document."
}
}
},
"auth_ref": []
},
"dei_AmendmentFlag": {
"xbrltype": "booleanItemType",
"nsuri": "http://xbrl.sec.gov/dei/2025",
"localname": "AmendmentFlag",
"presentation": [
"http://xbrl.sec.gov/oef/role/NcsrCover",
"http://xbrl.sec.gov/oef/role/ShareholderReport"
],
"lang": {
"en-us": {
"role": {
"label": "Amendment Flag",
"documentation": "Boolean flag that is true when the XBRL content amends previously-filed or accepted submission."
}
}
},
"auth_ref": []
},
"iametft_AmericanTowerCorpMember": {
"xbrltype": "domainItemType",
"nsuri": "http://invesco.com/20250610",
"localname": "AmericanTowerCorpMember",
"presentation": [
"http://xbrl.sec.gov/oef/role/ShareholderReportHoldingsDetails"
],
"lang": {
"en-us": {
"role": {
"label": "American Tower Corp [Member]"
}
}
},
"auth_ref": []
},
"oef_AnnlOrSemiAnnlStatementTextBlock": {
"xbrltype": "textBlockItemType",
"nsuri": "http://xbrl.sec.gov/oef/2025",
"localname": "AnnlOrSemiAnnlStatementTextBlock",
"presentation": [
"http://xbrl.sec.gov/oef/role/ShareholderReport"
],
"lang": {
"en-us": {
"role": {
"label": "Annual or Semi-Annual Statement [Text Block]"
}
}
},
"auth_ref": [
"r43"
]
},
"srt_ApartmentBuildingMember": {
"xbrltype": "domainItemType",
"nsuri": "http://fasb.org/srt/2025",
"localname": "ApartmentBuildingMember",
"presentation": [
"http://xbrl.sec.gov/oef/role/ShareholderReportHoldingsDetails"
],
"lang": {
"en-us": {
"role": {
"label": "Apartment Building [Member]"
}
}
},
"auth_ref": [
"r38",
"r98",
"r99",
"r100",
"r101"
]
},
"iametft_AppleIncMember": {
"xbrltype": "domainItemType",
"nsuri": "http://invesco.com/20250610",
"localname": "AppleIncMember",
"presentation": [
"http://xbrl.sec.gov/oef/role/ShareholderReportHoldingsDetails"
],
"lang": {
"en-us": {
"role": {
"label": "Apple Inc [Member]"
}
}
},
"auth_ref": []
},
"iametft_AshtonWoodsUSALLCAshtonWoodsFinanceCo66301152028Member": {
"xbrltype": "domainItemType",
"nsuri": "http://invesco.com/20250610",
"localname": "AshtonWoodsUSALLCAshtonWoodsFinanceCo66301152028Member",
"presentation": [
"http://xbrl.sec.gov/oef/role/ShareholderReportHoldingsDetails"
],
"lang": {
"en-us": {
"role": {
"label": "Ashton Woods USA LLC Ashton Woods Finance Co 6 63 01 15 2028 [Member]"
}
}
},
"auth_ref": []
},
"us-gaap_AssetBackedSecuritiesMember": {
"xbrltype": "domainItemType",
"nsuri": "http://fasb.org/us-gaap/2025",
"localname": "AssetBackedSecuritiesMember",
"presentation": [
"http://xbrl.sec.gov/oef/role/ShareholderReportHoldingsDetails"
],
"lang": {
"en-us": {
"role": {
"label": "Asset-Backed Securities [Member]",
"documentation": "Securities that are primarily serviced by the cash flows of a discrete pool of receivables or other financial assets for example, but not limited to, credit card receivables, car loans, recreational vehicle loans, and mobile home loans."
}
}
},
"auth_ref": [
"r24",
"r25",
"r30",
"r84",
"r85",
"r86"
]
},
"us-gaap_AssetsNet": {
"xbrltype": "monetaryItemType",
"nsuri": "http://fasb.org/us-gaap/2025",
"localname": "AssetsNet",
"crdr": "debit",
"presentation": [
"http://xbrl.sec.gov/oef/role/ShareholderReport"
],
"lang": {
"en-us": {
"role": {
"label": "Net Assets",
"documentation": "Amount of net assets (liabilities)."
}
}
},
"auth_ref": [
"r0"
]
},
"iametft_AstraZenecaPLCMember": {
"xbrltype": "domainItemType",
"nsuri": "http://invesco.com/20250610",
"localname": "AstraZenecaPLCMember",
"presentation": [
"http://xbrl.sec.gov/oef/role/ShareholderReportHoldingsDetails"
],
"lang": {
"en-us": {
"role": {
"label": "AstraZeneca PLC [Member]"
}
}
},
"auth_ref": []
},
"oef_AverageAnnualReturnAbstract": {
"xbrltype": "stringItemType",
"nsuri": "http://xbrl.sec.gov/oef/2025",
"localname": "AverageAnnualReturnAbstract",
"lang": {
"en-us": {
"role": {
"label": "Average Annual Return:"
}
}
},
"auth_ref": [
"r82"
]
},
"oef_AverageAnnualReturnLineItems": {
"xbrltype": "stringItemType",
"nsuri": "http://xbrl.sec.gov/oef/2025",
"localname": "AverageAnnualReturnLineItems",
"presentation": [
"http://xbrl.sec.gov/oef/role/ShareholderReportAverageAnnualReturnDetails"
],
"lang": {
"en-us": {
"role": {
"label": "Average Annual Return [Line Items]"
}
}
},
"auth_ref": [
"r82"
]
},
"oef_AverageAnnualReturnTable": {
"xbrltype": "stringItemType",
"nsuri": "http://xbrl.sec.gov/oef/2025",
"localname": "AverageAnnualReturnTable",
"presentation": [
"http://xbrl.sec.gov/oef/role/ShareholderReportAverageAnnualReturnDetails"
],
"lang": {
"en-us": {
"role": {
"label": "Average Annual Return [Table]"
}
}
},
"auth_ref": [
"r82"
]
},
"oef_AvgAnnlRtrPct": {
"xbrltype": "percentItemType",
"nsuri": "http://xbrl.sec.gov/oef/2025",
"localname": "AvgAnnlRtrPct",
"presentation": [
"http://xbrl.sec.gov/oef/role/ShareholderReportAverageAnnualReturnDetails"
],
"lang": {
"en-us": {
"role": {
"label": "Average Annual Return, Percent"
}
}
},
"auth_ref": [
"r61"
]
},
"oef_AvgAnnlRtrTableTextBlock": {
"xbrltype": "textBlockItemType",
"nsuri": "http://xbrl.sec.gov/oef/2025",
"localname": "AvgAnnlRtrTableTextBlock",
"presentation": [
"http://xbrl.sec.gov/oef/role/ShareholderReport"
],
"lang": {
"en-us": {
"role": {
"label": "Average Annual Return [Table Text Block]"
}
}
},
"auth_ref": [
"r61"
]
},
"iametft_BNPParibasIssuanceBVInvescoSAndP500EqualWeightETFMember": {
"xbrltype": "domainItemType",
"nsuri": "http://invesco.com/20250610",
"localname": "BNPParibasIssuanceBVInvescoSAndP500EqualWeightETFMember",
"presentation": [
"http://xbrl.sec.gov/oef/role/ShareholderReportHoldingsDetails"
],
"lang": {
"en-us": {
"role": {
"label": "BNP Paribas Issuance B V Invesco S And P 500 Equal Weight ETF [Member]"
}
}
},
"auth_ref": []
},
"iametft_BNPParibasIssuanceBVInvescoSAndP500EqualWeightETFTopHoldingMember": {
"xbrltype": "domainItemType",
"nsuri": "http://invesco.com/20250610",
"localname": "BNPParibasIssuanceBVInvescoSAndP500EqualWeightETFTopHoldingMember",
"presentation": [
"http://xbrl.sec.gov/oef/role/ShareholderReportHoldingsDetails"
],
"lang": {
"en-us": {
"role": {
"label": "BNP Paribas Issuance B V Invesco S And P 500 Equal Weight ETF Top Holding [Member]"
}
}
},
"auth_ref": []
},
"iametft_BarclaysPLC73311022026Member": {
"xbrltype": "domainItemType",
"nsuri": "http://invesco.com/20250610",
"localname": "BarclaysPLC73311022026Member",
"presentation": [
"http://xbrl.sec.gov/oef/role/ShareholderReportHoldingsDetails"
],
"lang": {
"en-us": {
"role": {
"label": "Barclays PLC 7 33 11 02 2026 [Member]"
}
}
},
"auth_ref": []
},
"iametft_BerkshireHathawayIncClassBMember": {
"xbrltype": "domainItemType",
"nsuri": "http://invesco.com/20250610",
"localname": "BerkshireHathawayIncClassBMember",
"presentation": [
"http://xbrl.sec.gov/oef/role/ShareholderReportHoldingsDetails"
],
"lang": {
"en-us": {
"role": {
"label": "Berkshire Hathaway Inc Class B [Member]"
}
}
},
"auth_ref": []
},
"iametft_BombardierInc60002152028Member": {
"xbrltype": "domainItemType",
"nsuri": "http://invesco.com/20250610",
"localname": "BombardierInc60002152028Member",
"presentation": [
"http://xbrl.sec.gov/oef/role/ShareholderReportHoldingsDetails"
],
"lang": {
"en-us": {
"role": {
"label": "Bombardier Inc 6 00 02 15 2028 [Member]"
}
}
},
"auth_ref": []
},
"iametft_BostonPropertiesLP46906022025Member": {
"xbrltype": "domainItemType",
"nsuri": "http://invesco.com/20250610",
"localname": "BostonPropertiesLP46906022025Member",
"presentation": [
"http://xbrl.sec.gov/oef/role/ShareholderReportHoldingsDetails"
],
"lang": {
"en-us": {
"role": {
"label": "Boston Properties L P 4 69 06 02 2025 [Member]"
}
}
},
"auth_ref": []
},
"iametft_BrixmorPropertyGroupIncMember": {
"xbrltype": "domainItemType",
"nsuri": "http://invesco.com/20250610",
"localname": "BrixmorPropertyGroupIncMember",
"presentation": [
"http://xbrl.sec.gov/oef/role/ShareholderReportHoldingsDetails"
],
"lang": {
"en-us": {
"role": {
"label": "Brixmor Property Group Inc [Member]"
}
}
},
"auth_ref": []
},
"oef_BroadBasedIndexAxis": {
"xbrltype": "stringItemType",
"nsuri": "http://xbrl.sec.gov/oef/2025",
"localname": "BroadBasedIndexAxis",
"presentation": [
"http://xbrl.sec.gov/oef/role/ShareholderReportAverageAnnualReturnDetails",
"http://xbrl.sec.gov/oef/role/ShareholderReportLineGraphDetails"
],
"lang": {
"en-us": {
"role": {
"label": "Broad Based Index [Axis]"
}
}
},
"auth_ref": [
"r54"
]
},
"oef_BroadBasedIndexDomain": {
"xbrltype": "domainItemType",
"nsuri": "http://xbrl.sec.gov/oef/2025",
"localname": "BroadBasedIndexDomain",
"presentation": [
"http://xbrl.sec.gov/oef/role/ShareholderReportAverageAnnualReturnDetails",
"http://xbrl.sec.gov/oef/role/ShareholderReportLineGraphDetails"
],
"lang": {
"en-us": {
"role": {
"label": "Broad Based Index [Domain]"
}
}
},
"auth_ref": [
"r54"
]
},
"iametft_BroadcomIncMember": {
"xbrltype": "domainItemType",
"nsuri": "http://invesco.com/20250610",
"localname": "BroadcomIncMember",
"presentation": [
"http://xbrl.sec.gov/oef/role/ShareholderReportHoldingsDetails"
],
"lang": {
"en-us": {
"role": {
"label": "Broadcom Inc [Member]"
}
}
},
"auth_ref": []
},
"iametft_BrunswickCorp50651105012025Member": {
"xbrltype": "domainItemType",
"nsuri": "http://invesco.com/20250610",
"localname": "BrunswickCorp50651105012025Member",
"presentation": [
"http://xbrl.sec.gov/oef/role/ShareholderReportHoldingsDetails"
],
"lang": {
"en-us": {
"role": {
"label": "Brunswick Corp 5 06 5 11 05 01 2025 [Member]"
}
}
},
"auth_ref": []
},
"iametft_C000068414Member": {
"xbrltype": "domainItemType",
"nsuri": "http://invesco.com/20250610",
"localname": "C000068414Member",
"presentation": [
"http://xbrl.sec.gov/oef/role/ShareholderReport",
"http://xbrl.sec.gov/oef/role/ShareholderReportAverageAnnualReturnDetails",
"http://xbrl.sec.gov/oef/role/ShareholderReportHoldingsDetails",
"http://xbrl.sec.gov/oef/role/ShareholderReportLineGraphDetails"
],
"lang": {
"en-us": {
"role": {
"label": "C000068414 [Member]",
"terseLabel": "Class Composite"
}
}
},
"auth_ref": []
},
"iametft_C000112015Member": {
"xbrltype": "domainItemType",
"nsuri": "http://invesco.com/20250610",
"localname": "C000112015Member",
"presentation": [
"http://xbrl.sec.gov/oef/role/ShareholderReport",
"http://xbrl.sec.gov/oef/role/ShareholderReportAverageAnnualReturnDetails",
"http://xbrl.sec.gov/oef/role/ShareholderReportHoldingsDetails",
"http://xbrl.sec.gov/oef/role/ShareholderReportLineGraphDetails"
],
"lang": {
"en-us": {
"role": {
"label": "C000112015 [Member]"
}
}
},
"auth_ref": []
},
"iametft_C000162616Member": {
"xbrltype": "domainItemType",
"nsuri": "http://invesco.com/20250610",
"localname": "C000162616Member",
"presentation": [
"http://xbrl.sec.gov/oef/role/ShareholderReport",
"http://xbrl.sec.gov/oef/role/ShareholderReportAverageAnnualReturnDetails",
"http://xbrl.sec.gov/oef/role/ShareholderReportHoldingsDetails",
"http://xbrl.sec.gov/oef/role/ShareholderReportLineGraphDetails"
],
"lang": {
"en-us": {
"role": {
"label": "C000162616 [Member]"
}
}
},
"auth_ref": []
},
"iametft_C000197599Member": {
"xbrltype": "domainItemType",
"nsuri": "http://invesco.com/20250610",
"localname": "C000197599Member",
"presentation": [
"http://xbrl.sec.gov/oef/role/ShareholderReport",
"http://xbrl.sec.gov/oef/role/ShareholderReportAverageAnnualReturnDetails",
"http://xbrl.sec.gov/oef/role/ShareholderReportHoldingsDetails",
"http://xbrl.sec.gov/oef/role/ShareholderReportLineGraphDetails"
],
"lang": {
"en-us": {
"role": {
"label": "C000197599 [Member]"
}
}
},
"auth_ref": []
},
"iametft_C000197600Member": {
"xbrltype": "domainItemType",
"nsuri": "http://invesco.com/20250610",
"localname": "C000197600Member",
"presentation": [
"http://xbrl.sec.gov/oef/role/ShareholderReport",
"http://xbrl.sec.gov/oef/role/ShareholderReportAverageAnnualReturnDetails",
"http://xbrl.sec.gov/oef/role/ShareholderReportHoldingsDetails",
"http://xbrl.sec.gov/oef/role/ShareholderReportLineGraphDetails"
],
"lang": {
"en-us": {
"role": {
"label": "C000197600 [Member]"
}
}
},
"auth_ref": []
},
"iametft_C000218086Member": {
"xbrltype": "domainItemType",
"nsuri": "http://invesco.com/20250610",
"localname": "C000218086Member",
"presentation": [
"http://xbrl.sec.gov/oef/role/ShareholderReport",
"http://xbrl.sec.gov/oef/role/ShareholderReportAverageAnnualReturnDetails",
"http://xbrl.sec.gov/oef/role/ShareholderReportHoldingsDetails",
"http://xbrl.sec.gov/oef/role/ShareholderReportLineGraphDetails"
],
"lang": {
"en-us": {
"role": {
"label": "C000218086 [Member]"
}
}
},
"auth_ref": []
},
"iametft_C000222994Member": {
"xbrltype": "domainItemType",
"nsuri": "http://invesco.com/20250610",
"localname": "C000222994Member",
"presentation": [
"http://xbrl.sec.gov/oef/role/ShareholderReport",
"http://xbrl.sec.gov/oef/role/ShareholderReportAverageAnnualReturnDetails",
"http://xbrl.sec.gov/oef/role/ShareholderReportHoldingsDetails",
"http://xbrl.sec.gov/oef/role/ShareholderReportLineGraphDetails"
],
"lang": {
"en-us": {
"role": {
"label": "C000222994 [Member]"
}
}
},
"auth_ref": []
},
"iametft_C000239743Member": {
"xbrltype": "domainItemType",
"nsuri": "http://invesco.com/20250610",
"localname": "C000239743Member",
"presentation": [
"http://xbrl.sec.gov/oef/role/ShareholderReport",
"http://xbrl.sec.gov/oef/role/ShareholderReportAverageAnnualReturnDetails",
"http://xbrl.sec.gov/oef/role/ShareholderReportHoldingsDetails",
"http://xbrl.sec.gov/oef/role/ShareholderReportLineGraphDetails"
],
"lang": {
"en-us": {
"role": {
"label": "C000239743 [Member]"
}
}
},
"auth_ref": []
},
"iametft_C000239744Member": {
"xbrltype": "domainItemType",
"nsuri": "http://invesco.com/20250610",
"localname": "C000239744Member",
"presentation": [
"http://xbrl.sec.gov/oef/role/ShareholderReport",
"http://xbrl.sec.gov/oef/role/ShareholderReportAverageAnnualReturnDetails",
"http://xbrl.sec.gov/oef/role/ShareholderReportHoldingsDetails",
"http://xbrl.sec.gov/oef/role/ShareholderReportLineGraphDetails"
],
"lang": {
"en-us": {
"role": {
"label": "C000239744 [Member]"
}
}
},
"auth_ref": []
},
"iametft_C000239745Member": {
"xbrltype": "domainItemType",
"nsuri": "http://invesco.com/20250610",
"localname": "C000239745Member",
"presentation": [
"http://xbrl.sec.gov/oef/role/ShareholderReport",
"http://xbrl.sec.gov/oef/role/ShareholderReportAverageAnnualReturnDetails",
"http://xbrl.sec.gov/oef/role/ShareholderReportHoldingsDetails",
"http://xbrl.sec.gov/oef/role/ShareholderReportLineGraphDetails"
],
"lang": {
"en-us": {
"role": {
"label": "C000239745 [Member]"
}
}
},
"auth_ref": []
},
"iametft_C000239746Member": {
"xbrltype": "domainItemType",
"nsuri": "http://invesco.com/20250610",
"localname": "C000239746Member",
"presentation": [
"http://xbrl.sec.gov/oef/role/ShareholderReport",
"http://xbrl.sec.gov/oef/role/ShareholderReportAverageAnnualReturnDetails",
"http://xbrl.sec.gov/oef/role/ShareholderReportHoldingsDetails",
"http://xbrl.sec.gov/oef/role/ShareholderReportLineGraphDetails"
],
"lang": {
"en-us": {
"role": {
"label": "C000239746 [Member]"
}
}
},
"auth_ref": []
},
"iametft_C000250918Member": {
"xbrltype": "domainItemType",
"nsuri": "http://invesco.com/20250610",
"localname": "C000250918Member",
"presentation": [
"http://xbrl.sec.gov/oef/role/ShareholderReport",
"http://xbrl.sec.gov/oef/role/ShareholderReportAverageAnnualReturnDetails",
"http://xbrl.sec.gov/oef/role/ShareholderReportHoldingsDetails",
"http://xbrl.sec.gov/oef/role/ShareholderReportLineGraphDetails"
],
"lang": {
"en-us": {
"role": {
"label": "C000250918 [Member]"
}
}
},
"auth_ref": []
},
"iametft_C000250919Member": {
"xbrltype": "domainItemType",
"nsuri": "http://invesco.com/20250610",
"localname": "C000250919Member",
"presentation": [
"http://xbrl.sec.gov/oef/role/ShareholderReport",
"http://xbrl.sec.gov/oef/role/ShareholderReportAverageAnnualReturnDetails",
"http://xbrl.sec.gov/oef/role/ShareholderReportHoldingsDetails",
"http://xbrl.sec.gov/oef/role/ShareholderReportLineGraphDetails"
],
"lang": {
"en-us": {
"role": {
"label": "C000250919 [Member]"
}
}
},
"auth_ref": []
},
"iametft_C000251085Member": {
"xbrltype": "domainItemType",
"nsuri": "http://invesco.com/20250610",
"localname": "C000251085Member",
"presentation": [
"http://xbrl.sec.gov/oef/role/ShareholderReport",
"http://xbrl.sec.gov/oef/role/ShareholderReportAverageAnnualReturnDetails",
"http://xbrl.sec.gov/oef/role/ShareholderReportHoldingsDetails",
"http://xbrl.sec.gov/oef/role/ShareholderReportLineGraphDetails"
],
"lang": {
"en-us": {
"role": {
"label": "C000251085 [Member]"
}
}
},
"auth_ref": []
},
"iametft_C000255210Member": {
"xbrltype": "domainItemType",
"nsuri": "http://invesco.com/20250610",
"localname": "C000255210Member",
"presentation": [
"http://xbrl.sec.gov/oef/role/ShareholderReport",
"http://xbrl.sec.gov/oef/role/ShareholderReportAverageAnnualReturnDetails",
"http://xbrl.sec.gov/oef/role/ShareholderReportHoldingsDetails",
"http://xbrl.sec.gov/oef/role/ShareholderReportLineGraphDetails"
],
"lang": {
"en-us": {
"role": {
"label": "C000255210 [Member]"
}
}
},
"auth_ref": []
},
"iametft_C000257059Member": {
"xbrltype": "domainItemType",
"nsuri": "http://invesco.com/20250610",
"localname": "C000257059Member",
"presentation": [
"http://xbrl.sec.gov/oef/role/ShareholderReport",
"http://xbrl.sec.gov/oef/role/ShareholderReportAverageAnnualReturnDetails",
"http://xbrl.sec.gov/oef/role/ShareholderReportHoldingsDetails",
"http://xbrl.sec.gov/oef/role/ShareholderReportLineGraphDetails"
],
"lang": {
"en-us": {
"role": {
"label": "C000257059 [Member]"
}
}
},
"auth_ref": []
},
"iametft_C000258361Member": {
"xbrltype": "domainItemType",
"nsuri": "http://invesco.com/20250610",
"localname": "C000258361Member",
"presentation": [
"http://xbrl.sec.gov/oef/role/ShareholderReport",
"http://xbrl.sec.gov/oef/role/ShareholderReportAverageAnnualReturnDetails",
"http://xbrl.sec.gov/oef/role/ShareholderReportHoldingsDetails",
"http://xbrl.sec.gov/oef/role/ShareholderReportLineGraphDetails"
],
"lang": {
"en-us": {
"role": {
"label": "C000258361 [Member]"
}
}
},
"auth_ref": []
},
"iametft_CCOHoldingsLLCCCOHoldingsCapitalCorp45005012032Member": {
"xbrltype": "domainItemType",
"nsuri": "http://invesco.com/20250610",
"localname": "CCOHoldingsLLCCCOHoldingsCapitalCorp45005012032Member",
"presentation": [
"http://xbrl.sec.gov/oef/role/ShareholderReportHoldingsDetails"
],
"lang": {
"en-us": {
"role": {
"label": "CCO Holdings LLC CCO Holdings Capital Corp 4 50 05 01 2032 [Member]"
}
}
},
"auth_ref": []
},
"iametft_CIFCFundingLtdSeries20232AClassA60201212037Member": {
"xbrltype": "domainItemType",
"nsuri": "http://invesco.com/20250610",
"localname": "CIFCFundingLtdSeries20232AClassA60201212037Member",
"presentation": [
"http://xbrl.sec.gov/oef/role/ShareholderReportHoldingsDetails"
],
"lang": {
"en-us": {
"role": {
"label": "CIFC Funding Ltd Series 2023 2A Class A 6 02 01 21 2037 [Member]"
}
}
},
"auth_ref": []
},
"iametft_CaliforniaStateOfPollutionControlFinancingAuthorityPoseidonResourcesLPSeries2023RB50007012038Member": {
"xbrltype": "domainItemType",
"nsuri": "http://invesco.com/20250610",
"localname": "CaliforniaStateOfPollutionControlFinancingAuthorityPoseidonResourcesLPSeries2023RB50007012038Member",
"presentation": [
"http://xbrl.sec.gov/oef/role/ShareholderReportHoldingsDetails"
],
"lang": {
"en-us": {
"role": {
"label": "California State of Pollution Control Financing Authority Poseidon Resources L P Series 2023 RB 5 00 07 01 2038 [Member]"
}
}
},
"auth_ref": []
},
"iametft_CanadianImperialBankOfCommerceInvescoSAndP500EqualWeightETFMember": {
"xbrltype": "domainItemType",
"nsuri": "http://invesco.com/20250610",
"localname": "CanadianImperialBankOfCommerceInvescoSAndP500EqualWeightETFMember",
"presentation": [
"http://xbrl.sec.gov/oef/role/ShareholderReportHoldingsDetails"
],
"lang": {
"en-us": {
"role": {
"label": "Canadian Imperial Bank of Commerce Invesco S And P 500 Equal Weight ETF [Member]"
}
}
},
"auth_ref": []
},
"iametft_CedarFundingIXCLOLtdSeries20189AClassAR56907202037Member": {
"xbrltype": "domainItemType",
"nsuri": "http://invesco.com/20250610",
"localname": "CedarFundingIXCLOLtdSeries20189AClassAR56907202037Member",
"presentation": [
"http://xbrl.sec.gov/oef/role/ShareholderReportHoldingsDetails"
],
"lang": {
"en-us": {
"role": {
"label": "Cedar Funding IX CLO Ltd Series 2018 9A Class AR 5 69 07 20 2037 [Member]"
}
}
},
"auth_ref": []
},
"iametft_CedarFundingXIVCLOLtdSeries202114AClassAR56410152037Member": {
"xbrltype": "domainItemType",
"nsuri": "http://invesco.com/20250610",
"localname": "CedarFundingXIVCLOLtdSeries202114AClassAR56410152037Member",
"presentation": [
"http://xbrl.sec.gov/oef/role/ShareholderReportHoldingsDetails"
],
"lang": {
"en-us": {
"role": {
"label": "Cedar Funding XIV CLO Ltd Series 2021 14A Class AR 5 64 10 15 2037 [Member]"
}
}
},
"auth_ref": []
},
"us-gaap_CertificatesOfDepositMember": {
"xbrltype": "domainItemType",
"nsuri": "http://fasb.org/us-gaap/2025",
"localname": "CertificatesOfDepositMember",
"presentation": [
"http://xbrl.sec.gov/oef/role/ShareholderReportHoldingsDetails"
],
"lang": {
"en-us": {
"role": {
"label": "Certificates of Deposit [Member]",
"documentation": "Short to medium-term investment available at banks and savings and loan institutions where a customer agrees to lend money to the institution for a certain amount of time and is paid a predetermined rate of interest. Certificates of deposit (CD) are typically Federal Deposit Insurance Corporation (FDIC) insured."
}
}
},
"auth_ref": [
"r1",
"r34",
"r35",
"r36",
"r37"
]
},
"iametft_CheniereEnergyIncMember": {
"xbrltype": "domainItemType",
"nsuri": "http://invesco.com/20250610",
"localname": "CheniereEnergyIncMember",
"presentation": [
"http://xbrl.sec.gov/oef/role/ShareholderReportHoldingsDetails"
],
"lang": {
"en-us": {
"role": {
"label": "Cheniere Energy Inc [Member]"
}
}
},
"auth_ref": []
},
"iametft_ChurchillDownsInc55004012027Member": {
"xbrltype": "domainItemType",
"nsuri": "http://invesco.com/20250610",
"localname": "ChurchillDownsInc55004012027Member",
"presentation": [
"http://xbrl.sec.gov/oef/role/ShareholderReportHoldingsDetails"
],
"lang": {
"en-us": {
"role": {
"label": "Churchill Downs Inc 5 50 04 01 2027 [Member]"
}
}
},
"auth_ref": []
},
"iametft_CitigroupGlobalMarketsHoldingsIncInvescoSAndP500EqualWeightETFMember": {
"xbrltype": "domainItemType",
"nsuri": "http://invesco.com/20250610",
"localname": "CitigroupGlobalMarketsHoldingsIncInvescoSAndP500EqualWeightETFMember",
"presentation": [
"http://xbrl.sec.gov/oef/role/ShareholderReportHoldingsDetails"
],
"lang": {
"en-us": {
"role": {
"label": "Citigroup Global Markets Holdings Inc Invesco S And P 500 Equal Weight ETF [Member]"
}
}
},
"auth_ref": []
},
"iametft_CitigroupGlobalMarketsHoldingsIncInvescoSAndP500EqualWeightETFTopHoldingMember": {
"xbrltype": "domainItemType",
"nsuri": "http://invesco.com/20250610",
"localname": "CitigroupGlobalMarketsHoldingsIncInvescoSAndP500EqualWeightETFTopHoldingMember",
"presentation": [
"http://xbrl.sec.gov/oef/role/ShareholderReportHoldingsDetails"
],
"lang": {
"en-us": {
"role": {
"label": "Citigroup Global Markets Holdings Inc Invesco S And P 500 Equal Weight ETF Top Holding [Member]"
}
}
},
"auth_ref": []
},
"oef_ClassAxis": {
"xbrltype": "stringItemType",
"nsuri": "http://xbrl.sec.gov/oef/2025",
"localname": "ClassAxis",
"presentation": [
"http://xbrl.sec.gov/oef/role/ShareholderReport",
"http://xbrl.sec.gov/oef/role/ShareholderReportAverageAnnualReturnDetails",
"http://xbrl.sec.gov/oef/role/ShareholderReportHoldingsDetails",
"http://xbrl.sec.gov/oef/role/ShareholderReportLineGraphDetails"
],
"lang": {
"en-us": {
"role": {
"label": "Class [Axis]"
}
}
},
"auth_ref": [
"r41"
]
},
"oef_ClassName": {
"xbrltype": "securityTitleItemType",
"nsuri": "http://xbrl.sec.gov/oef/2025",
"localname": "ClassName",
"presentation": [
"http://xbrl.sec.gov/oef/role/ShareholderReport"
],
"lang": {
"en-us": {
"role": {
"label": "Class Name"
}
}
},
"auth_ref": [
"r46"
]
},
"us-gaap_CommercialPaperMember": {
"xbrltype": "domainItemType",
"nsuri": "http://fasb.org/us-gaap/2025",
"localname": "CommercialPaperMember",
"presentation": [
"http://xbrl.sec.gov/oef/role/ShareholderReportHoldingsDetails"
],
"lang": {
"en-us": {
"role": {
"label": "Commercial Paper [Member]",
"documentation": "Unsecured promissory note (generally negotiable) that provides institutions with short-term funds."
}
}
},
"auth_ref": [
"r2",
"r3",
"r34",
"r35",
"r36",
"r37"
]
},
"iametft_CommodityRiskLongMember": {
"xbrltype": "domainItemType",
"nsuri": "http://invesco.com/20250610",
"localname": "CommodityRiskLongMember",
"presentation": [
"http://xbrl.sec.gov/oef/role/ShareholderReportHoldingsDetails"
],
"lang": {
"en-us": {
"role": {
"label": "Commodity Risk Long [Member]"
}
}
},
"auth_ref": []
},
"iametft_CommodityRiskShortMember": {
"xbrltype": "domainItemType",
"nsuri": "http://invesco.com/20250610",
"localname": "CommodityRiskShortMember",
"presentation": [
"http://xbrl.sec.gov/oef/role/ShareholderReportHoldingsDetails"
],
"lang": {
"en-us": {
"role": {
"label": "Commodity Risk Short [Member]"
}
}
},
"auth_ref": []
},
"iametft_CommonStocksAndOtherEquityInterestsMember": {
"xbrltype": "domainItemType",
"nsuri": "http://invesco.com/20250610",
"localname": "CommonStocksAndOtherEquityInterestsMember",
"presentation": [
"http://xbrl.sec.gov/oef/role/ShareholderReportHoldingsDetails"
],
"lang": {
"en-us": {
"role": {
"label": "Common Stocks And Other Equity Interests [Member]"
}
}
},
"auth_ref": []
},
"oef_CommunicationsSectorMember": {
"xbrltype": "domainItemType",
"nsuri": "http://xbrl.sec.gov/oef/2025",
"localname": "CommunicationsSectorMember",
"presentation": [
"http://xbrl.sec.gov/oef/role/ShareholderReportHoldingsDetails"
],
"lang": {
"en-us": {
"role": {
"label": "Communications Sector [Member]"
}
}
},
"auth_ref": [
"r69"
]
},
"iametft_ConagraBrandsInc50705192025Member": {
"xbrltype": "domainItemType",
"nsuri": "http://invesco.com/20250610",
"localname": "ConagraBrandsInc50705192025Member",
"presentation": [
"http://xbrl.sec.gov/oef/role/ShareholderReportHoldingsDetails"
],
"lang": {
"en-us": {
"role": {
"label": "Conagra Brands Inc 5 07 05 19 2025 [Member]"
}
}
},
"auth_ref": []
},
"oef_ConsumerDiscretionarySectorMember": {
"xbrltype": "domainItemType",
"nsuri": "http://xbrl.sec.gov/oef/2025",
"localname": "ConsumerDiscretionarySectorMember",
"presentation": [
"http://xbrl.sec.gov/oef/role/ShareholderReportHoldingsDetails"
],
"lang": {
"en-us": {
"role": {
"label": "Consumer Discretionary Sector [Member]"
}
}
},
"auth_ref": [
"r69"
]
},
"oef_ConsumerStaplesSectorMember": {
"xbrltype": "domainItemType",
"nsuri": "http://xbrl.sec.gov/oef/2025",
"localname": "ConsumerStaplesSectorMember",
"presentation": [
"http://xbrl.sec.gov/oef/role/ShareholderReportHoldingsDetails"
],
"lang": {
"en-us": {
"role": {
"label": "Consumer Staples Sector [Member]"
}
}
},
"auth_ref": [
"r69"
]
},
"iametft_CostcoWholesaleCorpMember": {
"xbrltype": "domainItemType",
"nsuri": "http://invesco.com/20250610",
"localname": "CostcoWholesaleCorpMember",
"presentation": [
"http://xbrl.sec.gov/oef/role/ShareholderReportHoldingsDetails"
],
"lang": {
"en-us": {
"role": {
"label": "Costco Wholesale Corp [Member]"
}
}
},
"auth_ref": []
},
"dei_CoverAbstract": {
"xbrltype": "stringItemType",
"nsuri": "http://xbrl.sec.gov/dei/2025",
"localname": "CoverAbstract",
"lang": {
"en-us": {
"role": {
"documentation": "Cover page."
}
}
},
"auth_ref": []
},
"oef_CreditQualityAxis": {
"xbrltype": "stringItemType",
"nsuri": "http://xbrl.sec.gov/oef/2025",
"localname": "CreditQualityAxis",
"presentation": [
"http://xbrl.sec.gov/oef/role/ShareholderReportHoldingsDetails"
],
"lang": {
"en-us": {
"role": {
"label": "Credit Quality [Axis]"
}
}
},
"auth_ref": [
"r69"
]
},
"oef_CreditQualityDomain": {
"xbrltype": "domainItemType",
"nsuri": "http://xbrl.sec.gov/oef/2025",
"localname": "CreditQualityDomain",
"presentation": [
"http://xbrl.sec.gov/oef/role/ShareholderReportHoldingsDetails"
],
"lang": {
"en-us": {
"role": {
"label": "Credit Quality [Domain]"
}
}
},
"auth_ref": [
"r69"
]
},
"oef_CreditQualityExplanationTextBlock": {
"xbrltype": "textBlockItemType",
"nsuri": "http://xbrl.sec.gov/oef/2025",
"localname": "CreditQualityExplanationTextBlock",
"presentation": [
"http://xbrl.sec.gov/oef/role/ShareholderReport"
],
"lang": {
"en-us": {
"role": {
"label": "Credit Quality Explanation [Text Block]"
}
}
},
"auth_ref": [
"r69"
]
},
"srt_CreditRatingAMBestDomain": {
"xbrltype": "domainItemType",
"nsuri": "http://fasb.org/srt/2025",
"localname": "CreditRatingAMBestDomain",
"presentation": [
"http://xbrl.sec.gov/oef/role/ShareholderReportHoldingsDetails"
],
"auth_ref": [
"r23",
"r87"
]
},
"oef_CreditRatingsSelectionTextBlock": {
"xbrltype": "textBlockItemType",
"nsuri": "http://xbrl.sec.gov/oef/2025",
"localname": "CreditRatingsSelectionTextBlock",
"presentation": [
"http://xbrl.sec.gov/oef/role/ShareholderReport"
],
"lang": {
"en-us": {
"role": {
"label": "Credit Ratings Selection [Text Block]"
}
}
},
"auth_ref": [
"r69"
]
},
"iametft_CrownCastleInc49405012025Member": {
"xbrltype": "domainItemType",
"nsuri": "http://invesco.com/20250610",
"localname": "CrownCastleInc49405012025Member",
"presentation": [
"http://xbrl.sec.gov/oef/role/ShareholderReportHoldingsDetails"
],
"lang": {
"en-us": {
"role": {
"label": "Crown Castle Inc 4 94 05 01 2025 [Member]"
}
}
},
"auth_ref": []
},
"iametft_CubeSmartMember": {
"xbrltype": "domainItemType",
"nsuri": "http://invesco.com/20250610",
"localname": "CubeSmartMember",
"presentation": [
"http://xbrl.sec.gov/oef/role/ShareholderReportHoldingsDetails"
],
"lang": {
"en-us": {
"role": {
"label": "CubeSmart [Member]"
}
}
},
"auth_ref": []
},
"iametft_CurrencyRiskLongMember": {
"xbrltype": "domainItemType",
"nsuri": "http://invesco.com/20250610",
"localname": "CurrencyRiskLongMember",
"presentation": [
"http://xbrl.sec.gov/oef/role/ShareholderReportHoldingsDetails"
],
"lang": {
"en-us": {
"role": {
"label": "Currency Risk Long [Member]"
}
}
},
"auth_ref": []
},
"iametft_CurrencyRiskShortMember": {
"xbrltype": "domainItemType",
"nsuri": "http://invesco.com/20250610",
"localname": "CurrencyRiskShortMember",
"presentation": [
"http://xbrl.sec.gov/oef/role/ShareholderReportHoldingsDetails"
],
"lang": {
"en-us": {
"role": {
"label": "Currency Risk Short [Member]"
}
}
},
"auth_ref": []
},
"iametft_DataCentersMember": {
"xbrltype": "domainItemType",
"nsuri": "http://invesco.com/20250610",
"localname": "DataCentersMember",
"presentation": [
"http://xbrl.sec.gov/oef/role/ShareholderReportHoldingsDetails"
],
"lang": {
"en-us": {
"role": {
"label": "Data Centers [Member]"
}
}
},
"auth_ref": []
},
"iametft_DigitalRealtyTrustIncMember": {
"xbrltype": "domainItemType",
"nsuri": "http://invesco.com/20250610",
"localname": "DigitalRealtyTrustIncMember",
"presentation": [
"http://xbrl.sec.gov/oef/role/ShareholderReportHoldingsDetails"
],
"lang": {
"en-us": {
"role": {
"label": "Digital Realty Trust Inc [Member]"
}
}
},
"auth_ref": []
},
"oef_DistOfCapitalTextBlock": {
"xbrltype": "textBlockItemType",
"nsuri": "http://xbrl.sec.gov/oef/2025",
"localname": "DistOfCapitalTextBlock",
"presentation": [
"http://xbrl.sec.gov/oef/role/ShareholderReport"
],
"lang": {
"en-us": {
"role": {
"label": "Distribution of Capital [Text Block]"
}
}
},
"auth_ref": [
"r63"
]
},
"dei_DocumentPeriodEndDate": {
"xbrltype": "dateItemType",
"nsuri": "http://xbrl.sec.gov/dei/2025",
"localname": "DocumentPeriodEndDate",
"presentation": [
"http://xbrl.sec.gov/oef/role/NcsrCover",
"http://xbrl.sec.gov/oef/role/ShareholderReport"
],
"lang": {
"en-us": {
"role": {
"label": "Document Period End Date",
"documentation": "For the EDGAR submission types of Form 8-K: the date of the report, the date of the earliest event reported; for the EDGAR submission types of Form N-1A: the filing date; for all other submission types: the end of the reporting or transition period. The format of the date is YYYY-MM-DD."
}
}
},
"auth_ref": []
},
"dei_DocumentType": {
"xbrltype": "submissionTypeItemType",
"nsuri": "http://xbrl.sec.gov/dei/2025",
"localname": "DocumentType",
"presentation": [
"http://xbrl.sec.gov/oef/role/NcsrCover",
"http://xbrl.sec.gov/oef/role/ShareholderReport"
],
"lang": {
"en-us": {
"role": {
"label": "Document Type",
"documentation": "The type of document being provided (such as 10-K, 10-Q, 485BPOS, etc). The document type is limited to the same value as the supporting SEC submission type, or the word 'Other'."
}
}
},
"auth_ref": []
},
"iametft_EastGroupPropertiesIncMember": {
"xbrltype": "domainItemType",
"nsuri": "http://invesco.com/20250610",
"localname": "EastGroupPropertiesIncMember",
"presentation": [
"http://xbrl.sec.gov/oef/role/ShareholderReportHoldingsDetails"
],
"lang": {
"en-us": {
"role": {
"label": "EastGroup Properties Inc [Member]"
}
}
},
"auth_ref": []
},
"iametft_ElmwoodCLOIIILtdSeries20193AClassA1RR56507182037Member": {
"xbrltype": "domainItemType",
"nsuri": "http://invesco.com/20250610",
"localname": "ElmwoodCLOIIILtdSeries20193AClassA1RR56507182037Member",
"presentation": [
"http://xbrl.sec.gov/oef/role/ShareholderReportHoldingsDetails"
],
"lang": {
"en-us": {
"role": {
"label": "Elmwood CLO III Ltd Series 2019 3A Class A1RR 5 65 07 18 2037 [Member]"
}
}
},
"auth_ref": []
},
"iametft_EnbridgeIncMember": {
"xbrltype": "domainItemType",
"nsuri": "http://invesco.com/20250610",
"localname": "EnbridgeIncMember",
"presentation": [
"http://xbrl.sec.gov/oef/role/ShareholderReportHoldingsDetails"
],
"lang": {
"en-us": {
"role": {
"label": "Enbridge Inc [Member]"
}
}
},
"auth_ref": []
},
"us-gaap_EnergySectorMember": {
"xbrltype": "domainItemType",
"nsuri": "http://fasb.org/us-gaap/2025",
"localname": "EnergySectorMember",
"presentation": [
"http://xbrl.sec.gov/oef/role/ShareholderReportHoldingsDetails"
],
"lang": {
"en-us": {
"role": {
"label": "Energy Sector [Member]",
"documentation": "Sector of economy consisting of companies engaged in business activity related to energy."
}
}
},
"auth_ref": [
"r27",
"r28",
"r29",
"r94",
"r95",
"r96",
"r97"
]
},
"dei_EntityCentralIndexKey": {
"xbrltype": "centralIndexKeyItemType",
"nsuri": "http://xbrl.sec.gov/dei/2025",
"localname": "EntityCentralIndexKey",
"presentation": [
"http://xbrl.sec.gov/oef/role/NcsrCover",
"http://xbrl.sec.gov/oef/role/ShareholderReport"
],
"lang": {
"en-us": {
"role": {
"label": "Entity Central Index Key",
"documentation": "A unique 10-digit SEC-issued value to identify entities that have filed disclosures with the SEC. It is commonly abbreviated as CIK."
}
}
},
"auth_ref": [
"r39"
]
},
"dei_EntityDomain": {
"xbrltype": "domainItemType",
"nsuri": "http://xbrl.sec.gov/dei/2025",
"localname": "EntityDomain",
"presentation": [
"http://xbrl.sec.gov/oef/role/ShareholderReportAverageAnnualReturnDetails"
],
"lang": {
"en-us": {
"role": {
"label": "Series",
"documentation": "All the names of the entities being reported upon in a document. Any legal structure used to conduct activities or to hold assets. Some examples of such structures are corporations, partnerships, limited liability companies, grantor trusts, and other trusts. This item does not include business and geographical segments which are included in the geographical or business segments domains."
}
}
},
"auth_ref": []
},
"dei_EntityInvCompanyType": {
"xbrltype": "invCompanyType",
"nsuri": "http://xbrl.sec.gov/dei/2025",
"localname": "EntityInvCompanyType",
"presentation": [
"http://xbrl.sec.gov/oef/role/NcsrCover",
"http://xbrl.sec.gov/oef/role/ShareholderReport"
],
"lang": {
"en-us": {
"role": {
"label": "Entity Investment Company Type",
"documentation": "One of: N-1A (Mutual Fund), N-1 (Open-End Separate Account with No Variable Annuities), N-2 (Closed-End Investment Company), N-3 (Separate Account Registered as Open-End Management Investment Company), N-4 (Variable Annuity UIT Separate Account), N-5 (Small Business Investment Company), N-6 (Variable Life UIT Separate Account), S-1 or S-3 (Face Amount Certificate Company), S-6 (UIT, Non-Insurance Product)."
}
}
},
"auth_ref": [
"r83"
]
},
"dei_EntityRegistrantName": {
"xbrltype": "normalizedStringItemType",
"nsuri": "http://xbrl.sec.gov/dei/2025",
"localname": "EntityRegistrantName",
"presentation": [
"http://xbrl.sec.gov/oef/role/NcsrCover",
"http://xbrl.sec.gov/oef/role/ShareholderReport"
],
"lang": {
"en-us": {
"role": {
"label": "Registrant Name",
"documentation": "The exact name of the entity filing the report as specified in its charter, which is required by forms filed with the SEC."
}
}
},
"auth_ref": [
"r39"
]
},
"iametft_EquinixIncMember": {
"xbrltype": "domainItemType",
"nsuri": "http://invesco.com/20250610",
"localname": "EquinixIncMember",
"presentation": [
"http://xbrl.sec.gov/oef/role/ShareholderReportHoldingsDetails"
],
"lang": {
"en-us": {
"role": {
"label": "Equinix Inc [Member]"
}
}
},
"auth_ref": []
},
"iametft_EquityLinkedNotesMember": {
"xbrltype": "domainItemType",
"nsuri": "http://invesco.com/20250610",
"localname": "EquityLinkedNotesMember",
"presentation": [
"http://xbrl.sec.gov/oef/role/ShareholderReportHoldingsDetails"
],
"lang": {
"en-us": {
"role": {
"label": "Equity Linked Notes [Member]"
}
}
},
"auth_ref": []
},
"iametft_EquityResidentialMember": {
"xbrltype": "domainItemType",
"nsuri": "http://invesco.com/20250610",
"localname": "EquityResidentialMember",
"presentation": [
"http://xbrl.sec.gov/oef/role/ShareholderReportHoldingsDetails"
],
"lang": {
"en-us": {
"role": {
"label": "Equity Residential [Member]"
}
}
},
"auth_ref": []
},
"iametft_EquityRiskLongMember": {
"xbrltype": "domainItemType",
"nsuri": "http://invesco.com/20250610",
"localname": "EquityRiskLongMember",
"presentation": [
"http://xbrl.sec.gov/oef/role/ShareholderReportHoldingsDetails"
],
"lang": {
"en-us": {
"role": {
"label": "Equity Risk Long [Member]"
}
}
},
"auth_ref": []
},
"iametft_EquityRiskShortMember": {
"xbrltype": "domainItemType",
"nsuri": "http://invesco.com/20250610",
"localname": "EquityRiskShortMember",
"presentation": [
"http://xbrl.sec.gov/oef/role/ShareholderReportHoldingsDetails"
],
"lang": {
"en-us": {
"role": {
"label": "Equity Risk Short [Member]"
}
}
},
"auth_ref": []
},
"oef_EtfDiscountNumDays": {
"xbrltype": "integerItemType",
"nsuri": "http://xbrl.sec.gov/oef/2025",
"localname": "EtfDiscountNumDays",
"presentation": [
"http://xbrl.sec.gov/oef/role/ShareholderReport"
],
"lang": {
"en-us": {
"role": {
"label": "ETF Discount, Number of Days"
}
}
},
"auth_ref": [
"r64"
]
},
"oef_EtfPastPerfTextBlock": {
"xbrltype": "textBlockItemType",
"nsuri": "http://xbrl.sec.gov/oef/2025",
"localname": "EtfPastPerfTextBlock",
"presentation": [
"http://xbrl.sec.gov/oef/role/ShareholderReport"
],
"lang": {
"en-us": {
"role": {
"label": "ETF Past Performance [Text Block]"
}
}
},
"auth_ref": [
"r66"
]
},
"oef_EtfPremiumDiscountTextBlock": {
"xbrltype": "textBlockItemType",
"nsuri": "http://xbrl.sec.gov/oef/2025",
"localname": "EtfPremiumDiscountTextBlock",
"presentation": [
"http://xbrl.sec.gov/oef/role/ShareholderReport"
],
"lang": {
"en-us": {
"role": {
"label": "ETF Premium Discount [Text Block]"
}
}
},
"auth_ref": [
"r64"
]
},
"oef_EtfPremiumNumDays": {
"xbrltype": "integerItemType",
"nsuri": "http://xbrl.sec.gov/oef/2025",
"localname": "EtfPremiumNumDays",
"presentation": [
"http://xbrl.sec.gov/oef/role/ShareholderReport"
],
"lang": {
"en-us": {
"role": {
"label": "ETF Premium, Number of Days"
}
}
},
"auth_ref": [
"r64"
]
},
"oef_EtfPurchaseExplanationTextBlock": {
"xbrltype": "textBlockItemType",
"nsuri": "http://xbrl.sec.gov/oef/2025",
"localname": "EtfPurchaseExplanationTextBlock",
"presentation": [
"http://xbrl.sec.gov/oef/role/ShareholderReport"
],
"lang": {
"en-us": {
"role": {
"label": "ETF Purchase Explanation [Text Block]"
}
}
},
"auth_ref": [
"r65"
]
},
"iametft_EutelsatSA97504132029Member": {
"xbrltype": "domainItemType",
"nsuri": "http://invesco.com/20250610",
"localname": "EutelsatSA97504132029Member",
"presentation": [
"http://xbrl.sec.gov/oef/role/ShareholderReportHoldingsDetails"
],
"lang": {
"en-us": {
"role": {
"label": "Eutelsat S A 9 75 04 13 2029 [Member]"
}
}
},
"auth_ref": []
},
"iametft_EversourceEnergy48305122025Member": {
"xbrltype": "domainItemType",
"nsuri": "http://invesco.com/20250610",
"localname": "EversourceEnergy48305122025Member",
"presentation": [
"http://xbrl.sec.gov/oef/role/ShareholderReportHoldingsDetails"
],
"lang": {
"en-us": {
"role": {
"label": "Eversource Energy 4 83 05 12 2025 [Member]"
}
}
},
"auth_ref": []
},
"us-gaap_ExchangeTradedFundsMember": {
"xbrltype": "domainItemType",
"nsuri": "http://fasb.org/us-gaap/2025",
"localname": "ExchangeTradedFundsMember",
"presentation": [
"http://xbrl.sec.gov/oef/role/ShareholderReportHoldingsDetails"
],
"lang": {
"en-us": {
"role": {
"label": "Exchange Traded Funds [Member]",
"documentation": "Investment that follows an index, commodity or basket of assets that trades similar to a stock on an exchange."
}
}
},
"auth_ref": [
"r88",
"r89"
]
},
"oef_ExpenseRatioPct": {
"xbrltype": "percentItemType",
"nsuri": "http://xbrl.sec.gov/oef/2025",
"localname": "ExpenseRatioPct",
"presentation": [
"http://xbrl.sec.gov/oef/role/ShareholderReport"
],
"lang": {
"en-us": {
"role": {
"label": "Expense Ratio, Percent"
}
}
},
"auth_ref": [
"r49"
]
},
"oef_ExpensesExclExtraordinaryExpensesPct": {
"xbrltype": "percentItemType",
"nsuri": "http://xbrl.sec.gov/oef/2025",
"localname": "ExpensesExclExtraordinaryExpensesPct",
"presentation": [
"http://xbrl.sec.gov/oef/role/ShareholderReport"
],
"lang": {
"en-us": {
"role": {
"label": "Expenses Excluding Extraordinary Expenses, Percent"
}
}
},
"auth_ref": [
"r52"
]
},
"oef_ExpensesPaidAmt": {
"xbrltype": "monetaryItemType",
"nsuri": "http://xbrl.sec.gov/oef/2025",
"localname": "ExpensesPaidAmt",
"presentation": [
"http://xbrl.sec.gov/oef/role/ShareholderReport"
],
"lang": {
"en-us": {
"role": {
"label": "Expenses Paid, Amount"
}
}
},
"auth_ref": [
"r48"
]
},
"oef_ExpensesRepresentBothMasterAndFeeder": {
"xbrltype": "stringItemType",
"nsuri": "http://xbrl.sec.gov/oef/2025",
"localname": "ExpensesRepresentBothMasterAndFeeder",
"presentation": [
"http://xbrl.sec.gov/oef/role/ShareholderReport"
],
"lang": {
"en-us": {
"role": {
"label": "Expenses Represent Both Master and Feeder [Text]"
}
}
},
"auth_ref": [
"r50",
"r80"
]
},
"oef_ExpensesShortPeriodFnTextBlock": {
"xbrltype": "textBlockItemType",
"nsuri": "http://xbrl.sec.gov/oef/2025",
"localname": "ExpensesShortPeriodFnTextBlock",
"presentation": [
"http://xbrl.sec.gov/oef/role/ShareholderReport"
],
"lang": {
"en-us": {
"role": {
"label": "Expenses Short Period Footnote [Text Block]"
}
}
},
"auth_ref": [
"r51"
]
},
"oef_ExpensesTextBlock": {
"xbrltype": "textBlockItemType",
"nsuri": "http://xbrl.sec.gov/oef/2025",
"localname": "ExpensesTextBlock",
"presentation": [
"http://xbrl.sec.gov/oef/role/ShareholderReport"
],
"lang": {
"en-us": {
"role": {
"label": "Expenses [Text Block]"
}
}
},
"auth_ref": [
"r47"
]
},
"oef_ExposureBasisExplanationTextBlock": {
"xbrltype": "textBlockItemType",
"nsuri": "http://xbrl.sec.gov/oef/2025",
"localname": "ExposureBasisExplanationTextBlock",
"presentation": [
"http://xbrl.sec.gov/oef/role/ShareholderReport"
],
"lang": {
"en-us": {
"role": {
"label": "Exposure Basis Explanation [Text Block]"
}
}
},
"auth_ref": [
"r69"
]
},
"srt_ExternalCreditRatingFitchMember": {
"xbrltype": "domainItemType",
"nsuri": "http://fasb.org/srt/2025",
"localname": "ExternalCreditRatingFitchMember",
"presentation": [
"http://xbrl.sec.gov/oef/role/ShareholderReportHoldingsDetails"
],
"auth_ref": [
"r23",
"r87"
]
},
"srt_ExternalCreditRatingMoodysMember": {
"xbrltype": "domainItemType",
"nsuri": "http://fasb.org/srt/2025",
"localname": "ExternalCreditRatingMoodysMember",
"presentation": [
"http://xbrl.sec.gov/oef/role/ShareholderReportHoldingsDetails"
],
"auth_ref": [
"r23",
"r87"
]
},
"srt_ExternalCreditRatingStandardPoorsMember": {
"xbrltype": "domainItemType",
"nsuri": "http://fasb.org/srt/2025",
"localname": "ExternalCreditRatingStandardPoorsMember",
"presentation": [
"http://xbrl.sec.gov/oef/role/ShareholderReportHoldingsDetails"
],
"auth_ref": [
"r23",
"r87"
]
},
"oef_ExtraordinaryExpensesFnTextBlock": {
"xbrltype": "textBlockItemType",
"nsuri": "http://xbrl.sec.gov/oef/2025",
"localname": "ExtraordinaryExpensesFnTextBlock",
"presentation": [
"http://xbrl.sec.gov/oef/role/ShareholderReport"
],
"lang": {
"en-us": {
"role": {
"label": "Extraordinary Expenses Footnote [Text Block]"
}
}
},
"auth_ref": [
"r52"
]
},
"oef_FactorsAffectingPerfTextBlock": {
"xbrltype": "textBlockItemType",
"nsuri": "http://xbrl.sec.gov/oef/2025",
"localname": "FactorsAffectingPerfTextBlock",
"presentation": [
"http://xbrl.sec.gov/oef/role/ShareholderReport"
],
"lang": {
"en-us": {
"role": {
"label": "Factors Affecting Performance [Text Block]"
}
}
},
"auth_ref": [
"r53"
]
},
"us-gaap_FinancialServicesSectorMember": {
"xbrltype": "domainItemType",
"nsuri": "http://fasb.org/us-gaap/2025",
"localname": "FinancialServicesSectorMember",
"presentation": [
"http://xbrl.sec.gov/oef/role/ShareholderReportHoldingsDetails"
],
"lang": {
"en-us": {
"role": {
"label": "Financial Services Sector [Member]",
"documentation": "Sector of the economy consisting of companies engaged in financial services."
}
}
},
"auth_ref": [
"r27",
"r33",
"r94",
"r95",
"r96",
"r97"
]
},
"iametft_FordMotorCreditCoLLC73203062026Member": {
"xbrltype": "domainItemType",
"nsuri": "http://invesco.com/20250610",
"localname": "FordMotorCreditCoLLC73203062026Member",
"presentation": [
"http://xbrl.sec.gov/oef/role/ShareholderReportHoldingsDetails"
],
"lang": {
"en-us": {
"role": {
"label": "Ford Motor Credit Co LLC 7 32 03 06 2026 [Member]"
}
}
},
"auth_ref": []
},
"iametft_FreddieMacREMICs58504252055Member": {
"xbrltype": "domainItemType",
"nsuri": "http://invesco.com/20250610",
"localname": "FreddieMacREMICs58504252055Member",
"presentation": [
"http://xbrl.sec.gov/oef/role/ShareholderReportHoldingsDetails"
],
"lang": {
"en-us": {
"role": {
"label": "Freddie Mac REMICs 5 85 04 25 2055 [Member]"
}
}
},
"auth_ref": []
},
"iametft_FreddieMacSeries2024HQA1ClassA1STACR56003252044Member": {
"xbrltype": "domainItemType",
"nsuri": "http://invesco.com/20250610",
"localname": "FreddieMacSeries2024HQA1ClassA1STACR56003252044Member",
"presentation": [
"http://xbrl.sec.gov/oef/role/ShareholderReportHoldingsDetails"
],
"lang": {
"en-us": {
"role": {
"label": "Freddie Mac Series 2024 HQA1 Class A1 STACR 5 60 03 25 2044 [Member]"
}
}
},
"auth_ref": []
},
"iametft_FreeStandingMember": {
"xbrltype": "domainItemType",
"nsuri": "http://invesco.com/20250610",
"localname": "FreeStandingMember",
"presentation": [
"http://xbrl.sec.gov/oef/role/ShareholderReportHoldingsDetails"
],
"lang": {
"en-us": {
"role": {
"label": "Free Standing [Member]"
}
}
},
"auth_ref": []
},
"oef_FundName": {
"xbrltype": "normalizedStringItemType",
"nsuri": "http://xbrl.sec.gov/oef/2025",
"localname": "FundName",
"presentation": [
"http://xbrl.sec.gov/oef/role/ShareholderReport"
],
"lang": {
"en-us": {
"role": {
"label": "Fund Name"
}
}
},
"auth_ref": [
"r42"
]
},
"iametft_FuturesContractsMember": {
"xbrltype": "domainItemType",
"nsuri": "http://invesco.com/20250610",
"localname": "FuturesContractsMember",
"presentation": [
"http://xbrl.sec.gov/oef/role/ShareholderReportHoldingsDetails"
],
"lang": {
"en-us": {
"role": {
"label": "Futures Contracts [Member]"
}
}
},
"auth_ref": []
},
"iametft_GFLEnvironmentalInc40008012028Member": {
"xbrltype": "domainItemType",
"nsuri": "http://invesco.com/20250610",
"localname": "GFLEnvironmentalInc40008012028Member",
"presentation": [
"http://xbrl.sec.gov/oef/role/ShareholderReportHoldingsDetails"
],
"lang": {
"en-us": {
"role": {
"label": "GFL Environmental Inc 4 00 08 01 2028 [Member]"
}
}
},
"auth_ref": []
},
"iametft_GGAMFinanceLtd68804152029Member": {
"xbrltype": "domainItemType",
"nsuri": "http://invesco.com/20250610",
"localname": "GGAMFinanceLtd68804152029Member",
"presentation": [
"http://xbrl.sec.gov/oef/role/ShareholderReportHoldingsDetails"
],
"lang": {
"en-us": {
"role": {
"label": "GGAM Finance Ltd 6 88 04 15 2029 [Member]"
}
}
},
"auth_ref": []
},
"iametft_GamingREITsMember": {
"xbrltype": "domainItemType",
"nsuri": "http://invesco.com/20250610",
"localname": "GamingREITsMember",
"presentation": [
"http://xbrl.sec.gov/oef/role/ShareholderReportHoldingsDetails"
],
"lang": {
"en-us": {
"role": {
"label": "Gaming REITs [Member]"
}
}
},
"auth_ref": []
},
"iametft_GeneralMotorsFinancialCoInc54102262027Member": {
"xbrltype": "domainItemType",
"nsuri": "http://invesco.com/20250610",
"localname": "GeneralMotorsFinancialCoInc54102262027Member",
"presentation": [
"http://xbrl.sec.gov/oef/role/ShareholderReportHoldingsDetails"
],
"lang": {
"en-us": {
"role": {
"label": "General Motors Financial Co Inc 5 41 02 26 2027 [Member]"
}
}
},
"auth_ref": []
},
"iametft_GeneralObligationBondsMember": {
"xbrltype": "domainItemType",
"nsuri": "http://invesco.com/20250610",
"localname": "GeneralObligationBondsMember",
"presentation": [
"http://xbrl.sec.gov/oef/role/ShareholderReportHoldingsDetails"
],
"lang": {
"en-us": {
"role": {
"label": "General Obligation Bonds [Member]"
}
}
},
"auth_ref": []
},
"oef_GeographicRegionAxis": {
"xbrltype": "stringItemType",
"nsuri": "http://xbrl.sec.gov/oef/2025",
"localname": "GeographicRegionAxis",
"presentation": [
"http://xbrl.sec.gov/oef/role/ShareholderReportHoldingsDetails"
],
"lang": {
"en-us": {
"role": {
"label": "Geographic Region [Axis]"
}
}
},
"auth_ref": [
"r69"
]
},
"oef_GeographicRegionDomain": {
"xbrltype": "domainItemType",
"nsuri": "http://xbrl.sec.gov/oef/2025",
"localname": "GeographicRegionDomain",
"presentation": [
"http://xbrl.sec.gov/oef/role/ShareholderReportHoldingsDetails"
],
"lang": {
"en-us": {
"role": {
"label": "Geographic Region [Domain]"
}
}
},
"auth_ref": [
"r69"
]
},
"iametft_GlobalAtlanticFinCo47010152051Member": {
"xbrltype": "domainItemType",
"nsuri": "http://invesco.com/20250610",
"localname": "GlobalAtlanticFinCo47010152051Member",
"presentation": [
"http://xbrl.sec.gov/oef/role/ShareholderReportHoldingsDetails"
],
"lang": {
"en-us": {
"role": {
"label": "Global Atlantic Fin Co 4 70 10 15 2051 [Member]"
}
}
},
"auth_ref": []
},
"iametft_GoldenTreeLoanManagementUSCLO9LtdSeries20219AClassAR57704202037Member": {
"xbrltype": "domainItemType",
"nsuri": "http://invesco.com/20250610",
"localname": "GoldenTreeLoanManagementUSCLO9LtdSeries20219AClassAR57704202037Member",
"presentation": [
"http://xbrl.sec.gov/oef/role/ShareholderReportHoldingsDetails"
],
"lang": {
"en-us": {
"role": {
"label": "GoldenTree Loan Management US CLO 9 Ltd Series 2021 9A Class AR 5 77 04 20 2037 [Member]"
}
}
},
"auth_ref": []
},
"iametft_GoodyearTireAndRubberCoThe48803152027Member": {
"xbrltype": "domainItemType",
"nsuri": "http://invesco.com/20250610",
"localname": "GoodyearTireAndRubberCoThe48803152027Member",
"presentation": [
"http://xbrl.sec.gov/oef/role/ShareholderReportHoldingsDetails"
],
"lang": {
"en-us": {
"role": {
"label": "Goodyear Tire And Rubber Co The 4 88 03 15 2027 [Member]"
}
}
},
"auth_ref": []
},
"iametft_HSBCHoldingsPLCMember": {
"xbrltype": "domainItemType",
"nsuri": "http://invesco.com/20250610",
"localname": "HSBCHoldingsPLCMember",
"presentation": [
"http://xbrl.sec.gov/oef/role/ShareholderReportHoldingsDetails"
],
"lang": {
"en-us": {
"role": {
"label": "HSBC Holdings PLC [Member]"
}
}
},
"auth_ref": []
},
"us-gaap_HealthcareSectorMember": {
"xbrltype": "domainItemType",
"nsuri": "http://fasb.org/us-gaap/2025",
"localname": "HealthcareSectorMember",
"presentation": [
"http://xbrl.sec.gov/oef/role/ShareholderReportHoldingsDetails"
],
"lang": {
"en-us": {
"role": {
"label": "Healthcare Sector [Member]",
"documentation": "Sector of the economy consisting of companies engaged in healthcare-related business activities."
}
}
},
"auth_ref": [
"r27",
"r28",
"r29",
"r33",
"r94",
"r95",
"r96",
"r97"
]
},
"iametft_HealthpeakPropertiesIncMember": {
"xbrltype": "domainItemType",
"nsuri": "http://invesco.com/20250610",
"localname": "HealthpeakPropertiesIncMember",
"presentation": [
"http://xbrl.sec.gov/oef/role/ShareholderReportHoldingsDetails"
],
"lang": {
"en-us": {
"role": {
"label": "Healthpeak Properties Inc [Member]"
}
}
},
"auth_ref": []
},
"oef_HoldingsAbstract": {
"xbrltype": "stringItemType",
"nsuri": "http://xbrl.sec.gov/oef/2025",
"localname": "HoldingsAbstract",
"lang": {
"en-us": {
"role": {
"label": "Holdings [Abstract]"
}
}
},
"auth_ref": [
"r69"
]
},
"oef_HoldingsCount": {
"xbrltype": "integerItemType",
"nsuri": "http://xbrl.sec.gov/oef/2025",
"localname": "HoldingsCount",
"presentation": [
"http://xbrl.sec.gov/oef/role/ShareholderReport"
],
"lang": {
"en-us": {
"role": {
"label": "Holdings Count"
}
}
},
"auth_ref": [
"r67"
]
},
"oef_HoldingsLineItems": {
"xbrltype": "stringItemType",
"nsuri": "http://xbrl.sec.gov/oef/2025",
"localname": "HoldingsLineItems",
"presentation": [
"http://xbrl.sec.gov/oef/role/ShareholderReportHoldingsDetails"
],
"lang": {
"en-us": {
"role": {
"label": "Holdings [Line Items]"
}
}
},
"auth_ref": [
"r69"
]
},
"oef_HoldingsTable": {
"xbrltype": "stringItemType",
"nsuri": "http://xbrl.sec.gov/oef/2025",
"localname": "HoldingsTable",
"presentation": [
"http://xbrl.sec.gov/oef/role/ShareholderReportHoldingsDetails"
],
"lang": {
"en-us": {
"role": {
"label": "Holdings [Table]"
}
}
},
"auth_ref": [
"r69"
]
},
"oef_HoldingsTableTextBlock": {
"xbrltype": "textBlockItemType",
"nsuri": "http://xbrl.sec.gov/oef/2025",
"localname": "HoldingsTableTextBlock",
"presentation": [
"http://xbrl.sec.gov/oef/role/ShareholderReport"
],
"lang": {
"en-us": {
"role": {
"label": "Holdings [Text Block]"
}
}
},
"auth_ref": [
"r69"
]
},
"iametft_IliadHoldingSASU85004152031Member": {
"xbrltype": "domainItemType",
"nsuri": "http://invesco.com/20250610",
"localname": "IliadHoldingSASU85004152031Member",
"presentation": [
"http://xbrl.sec.gov/oef/role/ShareholderReportHoldingsDetails"
],
"lang": {
"en-us": {
"role": {
"label": "Iliad Holding S A S U 8 50 04 15 2031 [Member]"
}
}
},
"auth_ref": []
},
"oef_InabilityToMeetDistLevelTextBlock": {
"xbrltype": "textBlockItemType",
"nsuri": "http://xbrl.sec.gov/oef/2025",
"localname": "InabilityToMeetDistLevelTextBlock",
"presentation": [
"http://xbrl.sec.gov/oef/role/ShareholderReport"
],
"lang": {
"en-us": {
"role": {
"label": "Inability to Meet Distribution Level [Text Block]"
}
}
},
"auth_ref": [
"r63"
]
},
"oef_IndustrialSectorMember": {
"xbrltype": "domainItemType",
"nsuri": "http://xbrl.sec.gov/oef/2025",
"localname": "IndustrialSectorMember",
"presentation": [
"http://xbrl.sec.gov/oef/role/ShareholderReportHoldingsDetails"
],
"lang": {
"en-us": {
"role": {
"label": "Industrial Sector [Member]"
}
}
},
"auth_ref": [
"r69"
]
},
"oef_IndustrySectorAxis": {
"xbrltype": "stringItemType",
"nsuri": "http://xbrl.sec.gov/oef/2025",
"localname": "IndustrySectorAxis",
"presentation": [
"http://xbrl.sec.gov/oef/role/ShareholderReportHoldingsDetails"
],
"lang": {
"en-us": {
"role": {
"label": "Industry Sector [Axis]"
}
}
},
"auth_ref": [
"r69"
]
},
"oef_IndustrySectorDomain": {
"xbrltype": "domainItemType",
"nsuri": "http://xbrl.sec.gov/oef/2025",
"localname": "IndustrySectorDomain",
"presentation": [
"http://xbrl.sec.gov/oef/role/ShareholderReportHoldingsDetails"
],
"lang": {
"en-us": {
"role": {
"label": "Industry Sector [Domain]"
}
}
},
"auth_ref": [
"r69"
]
},
"oef_InformationTechnologySectorMember": {
"xbrltype": "domainItemType",
"nsuri": "http://xbrl.sec.gov/oef/2025",
"localname": "InformationTechnologySectorMember",
"presentation": [
"http://xbrl.sec.gov/oef/role/ShareholderReportHoldingsDetails"
],
"lang": {
"en-us": {
"role": {
"label": "Information Technology Sector [Member]"
}
}
},
"auth_ref": [
"r69"
]
},
"iametft_InfrastructureREITsMember": {
"xbrltype": "domainItemType",
"nsuri": "http://invesco.com/20250610",
"localname": "InfrastructureREITsMember",
"presentation": [
"http://xbrl.sec.gov/oef/role/ShareholderReportHoldingsDetails"
],
"lang": {
"en-us": {
"role": {
"label": "Infrastructure REITs [Member]"
}
}
},
"auth_ref": []
},
"iametft_InterestRateRiskLongMember": {
"xbrltype": "domainItemType",
"nsuri": "http://invesco.com/20250610",
"localname": "InterestRateRiskLongMember",
"presentation": [
"http://xbrl.sec.gov/oef/role/ShareholderReportHoldingsDetails"
],
"lang": {
"en-us": {
"role": {
"label": "Interest Rate Risk Long [Member]"
}
}
},
"auth_ref": []
},
"iametft_InterestRateRiskShortMember": {
"xbrltype": "domainItemType",
"nsuri": "http://invesco.com/20250610",
"localname": "InterestRateRiskShortMember",
"presentation": [
"http://xbrl.sec.gov/oef/role/ShareholderReportHoldingsDetails"
],
"lang": {
"en-us": {
"role": {
"label": "Interest Rate Risk Short [Member]"
}
}
},
"auth_ref": []
},
"us-gaap_InvestmentCompanyPortfolioTurnover": {
"xbrltype": "percentItemType",
"nsuri": "http://fasb.org/us-gaap/2025",
"localname": "InvestmentCompanyPortfolioTurnover",
"presentation": [
"http://xbrl.sec.gov/oef/role/ShareholderReport"
],
"lang": {
"en-us": {
"role": {
"label": "Investment Company Portfolio Turnover",
"documentation": "Percentage of lesser of purchase or sale of portfolio securities to average value of portfolio securities owned."
}
}
},
"auth_ref": [
"r92"
]
},
"us-gaap_InvestmentTypeAxis": {
"xbrltype": "stringItemType",
"nsuri": "http://fasb.org/us-gaap/2025",
"localname": "InvestmentTypeAxis",
"presentation": [
"http://xbrl.sec.gov/oef/role/ShareholderReportHoldingsDetails"
],
"lang": {
"en-us": {
"role": {
"label": "Investment Type [Axis]",
"documentation": "Information by type of investments."
}
}
},
"auth_ref": [
"r4",
"r5",
"r6",
"r7",
"r8",
"r9",
"r10",
"r11",
"r12",
"r13",
"r14",
"r15",
"r16",
"r17",
"r18",
"r19",
"r33"
]
},
"us-gaap_InvestmentTypeCategorizationMember": {
"xbrltype": "domainItemType",
"nsuri": "http://fasb.org/us-gaap/2025",
"localname": "InvestmentTypeCategorizationMember",
"presentation": [
"http://xbrl.sec.gov/oef/role/ShareholderReportHoldingsDetails"
],
"lang": {
"en-us": {
"role": {
"documentation": "Asset obtained to generate income or appreciate in value."
}
}
},
"auth_ref": [
"r4",
"r5",
"r6",
"r7",
"r8",
"r9",
"r10",
"r11",
"r12",
"r13",
"r14",
"r15",
"r16",
"r17",
"r18",
"r19",
"r33"
]
},
"iametft_IowaStateOfFinanceAuthorityIowaFertilizerCoSeries2022RefRB40012012032Member": {
"xbrltype": "domainItemType",
"nsuri": "http://invesco.com/20250610",
"localname": "IowaStateOfFinanceAuthorityIowaFertilizerCoSeries2022RefRB40012012032Member",
"presentation": [
"http://xbrl.sec.gov/oef/role/ShareholderReportHoldingsDetails"
],
"lang": {
"en-us": {
"role": {
"label": "Iowa State of Finance Authority Iowa Fertilizer Co Series 2022 Ref RB 4 00 12 01 2032 [Member]"
}
}
},
"auth_ref": []
},
"iametft_JPMorganChaseAndCo53004222028Member": {
"xbrltype": "domainItemType",
"nsuri": "http://invesco.com/20250610",
"localname": "JPMorganChaseAndCo53004222028Member",
"presentation": [
"http://xbrl.sec.gov/oef/role/ShareholderReportHoldingsDetails"
],
"lang": {
"en-us": {
"role": {
"label": "JPMorgan Chase And Co 5 30 04 22 2028 [Member]"
}
}
},
"auth_ref": []
},
"iametft_JPMorganChaseAndCoInvescoSAndP500EqualWeightETFMember": {
"xbrltype": "domainItemType",
"nsuri": "http://invesco.com/20250610",
"localname": "JPMorganChaseAndCoInvescoSAndP500EqualWeightETFMember",
"presentation": [
"http://xbrl.sec.gov/oef/role/ShareholderReportHoldingsDetails"
],
"lang": {
"en-us": {
"role": {
"label": "J P Morgan Chase And Co Invesco S And P 500 Equal Weight ETF [Member]"
}
}
},
"auth_ref": []
},
"iametft_JabilInc50851305052025Member": {
"xbrltype": "domainItemType",
"nsuri": "http://invesco.com/20250610",
"localname": "JabilInc50851305052025Member",
"presentation": [
"http://xbrl.sec.gov/oef/role/ShareholderReportHoldingsDetails"
],
"lang": {
"en-us": {
"role": {
"label": "Jabil Inc 5 08 5 13 05 05 2025 [Member]"
}
}
},
"auth_ref": []
},
"iametft_JefferiesFinanceLLCJFINCoIssuerCorp50008152028Member": {
"xbrltype": "domainItemType",
"nsuri": "http://invesco.com/20250610",
"localname": "JefferiesFinanceLLCJFINCoIssuerCorp50008152028Member",
"presentation": [
"http://xbrl.sec.gov/oef/role/ShareholderReportHoldingsDetails"
],
"lang": {
"en-us": {
"role": {
"label": "Jefferies Finance LLC JFIN Co Issuer Corp 5 00 08 15 2028 [Member]"
}
}
},
"auth_ref": []
},
"iametft_KinderMorganInc43006012025Member": {
"xbrltype": "domainItemType",
"nsuri": "http://invesco.com/20250610",
"localname": "KinderMorganInc43006012025Member",
"presentation": [
"http://xbrl.sec.gov/oef/role/ShareholderReportHoldingsDetails"
],
"lang": {
"en-us": {
"role": {
"label": "Kinder Morgan Inc 4 30 06 01 2025 [Member]"
}
}
},
"auth_ref": []
},
"iametft_KinderMorganIncMember": {
"xbrltype": "domainItemType",
"nsuri": "http://invesco.com/20250610",
"localname": "KinderMorganIncMember",
"presentation": [
"http://xbrl.sec.gov/oef/role/ShareholderReportHoldingsDetails"
],
"lang": {
"en-us": {
"role": {
"label": "Kinder Morgan Inc [Member]"
}
}
},
"auth_ref": []
},
"oef_LargestHoldingAxis": {
"xbrltype": "stringItemType",
"nsuri": "http://xbrl.sec.gov/oef/2025",
"localname": "LargestHoldingAxis",
"presentation": [
"http://xbrl.sec.gov/oef/role/ShareholderReportHoldingsDetails"
],
"lang": {
"en-us": {
"role": {
"label": "Largest Holding [Axis]"
}
}
},
"auth_ref": [
"r69"
]
},
"oef_LargestHoldingsDomain": {
"xbrltype": "domainItemType",
"nsuri": "http://xbrl.sec.gov/oef/2025",
"localname": "LargestHoldingsDomain",
"presentation": [
"http://xbrl.sec.gov/oef/role/ShareholderReportHoldingsDetails"
],
"lang": {
"en-us": {
"role": {
"label": "Largest Holdings [Domain]"
}
}
},
"auth_ref": [
"r69"
]
},
"oef_LargestHoldingsTableTextBlock": {
"xbrltype": "textBlockItemType",
"nsuri": "http://xbrl.sec.gov/oef/2025",
"localname": "LargestHoldingsTableTextBlock",
"presentation": [
"http://xbrl.sec.gov/oef/role/ShareholderReport"
],
"lang": {
"en-us": {
"role": {
"label": "Largest Holdings [Text Block]"
}
}
},
"auth_ref": [
"r69"
]
},
"dei_LegalEntityAxis": {
"xbrltype": "stringItemType",
"nsuri": "http://xbrl.sec.gov/dei/2025",
"localname": "LegalEntityAxis",
"presentation": [
"http://xbrl.sec.gov/oef/role/ShareholderReportAverageAnnualReturnDetails"
],
"lang": {
"en-us": {
"role": {
"label": "Series [Axis]",
"documentation": "The set of legal entities associated with a report."
}
}
},
"auth_ref": []
},
"oef_LineGraphAndTableMeasureName": {
"xbrltype": "stringItemType",
"nsuri": "http://xbrl.sec.gov/oef/2025",
"localname": "LineGraphAndTableMeasureName",
"presentation": [
"http://xbrl.sec.gov/oef/role/ShareholderReportAverageAnnualReturnDetails",
"http://xbrl.sec.gov/oef/role/ShareholderReportLineGraphDetails"
],
"lang": {
"en-us": {
"role": {
"label": "Line Graph and Table Measure Name"
}
}
},
"auth_ref": [
"r55"
]
},
"oef_LineGraphTableTextBlock": {
"xbrltype": "textBlockItemType",
"nsuri": "http://xbrl.sec.gov/oef/2025",
"localname": "LineGraphTableTextBlock",
"presentation": [
"http://xbrl.sec.gov/oef/role/ShareholderReport"
],
"lang": {
"en-us": {
"role": {
"label": "Line Graph [Table Text Block]"
}
}
},
"auth_ref": [
"r54"
]
},
"iametft_LodgingResortsMember": {
"xbrltype": "domainItemType",
"nsuri": "http://invesco.com/20250610",
"localname": "LodgingResortsMember",
"presentation": [
"http://xbrl.sec.gov/oef/role/ShareholderReportHoldingsDetails"
],
"lang": {
"en-us": {
"role": {
"label": "Lodging Resorts [Member]"
}
}
},
"auth_ref": []
},
"iametft_LouisianaStateOfPublicFacilitiesAuthorityI10CalcasieuRiverBridgeSeries2024RB57509012064Member": {
"xbrltype": "domainItemType",
"nsuri": "http://invesco.com/20250610",
"localname": "LouisianaStateOfPublicFacilitiesAuthorityI10CalcasieuRiverBridgeSeries2024RB57509012064Member",
"presentation": [
"http://xbrl.sec.gov/oef/role/ShareholderReportHoldingsDetails"
],
"lang": {
"en-us": {
"role": {
"label": "Louisiana State of Public Facilities Authority I 10 Calcasieu River Bridge Series 2024 RB 5 75 09 01 2064 [Member]"
}
}
},
"auth_ref": []
},
"iametft_MadisonParkFundingXXXVIILtdSeries201937AClassAR257904152037Member": {
"xbrltype": "domainItemType",
"nsuri": "http://invesco.com/20250610",
"localname": "MadisonParkFundingXXXVIILtdSeries201937AClassAR257904152037Member",
"presentation": [
"http://xbrl.sec.gov/oef/role/ShareholderReportHoldingsDetails"
],
"lang": {
"en-us": {
"role": {
"label": "Madison Park Funding XXXVII Ltd Series 2019 37A Class AR2 5 79 04 15 2037 [Member]"
}
}
},
"auth_ref": []
},
"iametft_ManufacturedHomesMember": {
"xbrltype": "domainItemType",
"nsuri": "http://invesco.com/20250610",
"localname": "ManufacturedHomesMember",
"presentation": [
"http://xbrl.sec.gov/oef/role/ShareholderReportHoldingsDetails"
],
"lang": {
"en-us": {
"role": {
"label": "Manufactured Homes [Member]"
}
}
},
"auth_ref": []
},
"oef_MaterialChngDate": {
"xbrltype": "dateItemType",
"nsuri": "http://xbrl.sec.gov/oef/2025",
"localname": "MaterialChngDate",
"presentation": [
"http://xbrl.sec.gov/oef/role/ShareholderReport"
],
"lang": {
"en-us": {
"role": {
"label": "Material Change Date"
}
}
},
"auth_ref": [
"r59"
]
},
"oef_MaterialChngDescriptionTextBlock": {
"xbrltype": "textBlockItemType",
"nsuri": "http://xbrl.sec.gov/oef/2025",
"localname": "MaterialChngDescriptionTextBlock",
"presentation": [
"http://xbrl.sec.gov/oef/role/ShareholderReport"
],
"lang": {
"en-us": {
"role": {
"label": "Material Change Description [Text Block]"
}
}
},
"auth_ref": [
"r59"
]
},
"oef_MaterialFundChngAdviserTextBlock": {
"xbrltype": "textBlockItemType",
"nsuri": "http://xbrl.sec.gov/oef/2025",
"localname": "MaterialFundChngAdviserTextBlock",
"presentation": [
"http://xbrl.sec.gov/oef/role/ShareholderReport"
],
"lang": {
"en-us": {
"role": {
"label": "Material Fund Change Adviser [Text Block]"
}
}
},
"auth_ref": [
"r76"
]
},
"oef_MaterialFundChngExpensesTextBlock": {
"xbrltype": "textBlockItemType",
"nsuri": "http://xbrl.sec.gov/oef/2025",
"localname": "MaterialFundChngExpensesTextBlock",
"presentation": [
"http://xbrl.sec.gov/oef/role/ShareholderReport"
],
"lang": {
"en-us": {
"role": {
"label": "Material Fund Change Expenses [Text Block]"
}
}
},
"auth_ref": [
"r73"
]
},
"oef_MaterialFundChngNameTextBlock": {
"xbrltype": "textBlockItemType",
"nsuri": "http://xbrl.sec.gov/oef/2025",
"localname": "MaterialFundChngNameTextBlock",
"presentation": [
"http://xbrl.sec.gov/oef/role/ShareholderReport"
],
"lang": {
"en-us": {
"role": {
"label": "Material Fund Change Name [Text Block]"
}
}
},
"auth_ref": [
"r71"
]
},
"oef_MaterialFundChngNoticeTextBlock": {
"xbrltype": "textBlockItemType",
"nsuri": "http://xbrl.sec.gov/oef/2025",
"localname": "MaterialFundChngNoticeTextBlock",
"presentation": [
"http://xbrl.sec.gov/oef/role/ShareholderReport"
],
"lang": {
"en-us": {
"role": {
"label": "Material Fund Change Notice [Text Block]"
}
}
},
"auth_ref": [
"r45"
]
},
"oef_MaterialFundChngObjectivesTextBlock": {
"xbrltype": "textBlockItemType",
"nsuri": "http://xbrl.sec.gov/oef/2025",
"localname": "MaterialFundChngObjectivesTextBlock",
"presentation": [
"http://xbrl.sec.gov/oef/role/ShareholderReport"
],
"lang": {
"en-us": {
"role": {
"label": "Material Fund Change Objectives [Text Block]"
}
}
},
"auth_ref": [
"r72"
]
},
"oef_MaterialFundChngRisksChngTextBlock": {
"xbrltype": "textBlockItemType",
"nsuri": "http://xbrl.sec.gov/oef/2025",
"localname": "MaterialFundChngRisksChngTextBlock",
"presentation": [
"http://xbrl.sec.gov/oef/role/ShareholderReport"
],
"lang": {
"en-us": {
"role": {
"label": "Material Fund Change Risks Change [Text Block]"
}
}
},
"auth_ref": [
"r75"
]
},
"oef_MaterialFundChngStrategiesTextBlock": {
"xbrltype": "textBlockItemType",
"nsuri": "http://xbrl.sec.gov/oef/2025",
"localname": "MaterialFundChngStrategiesTextBlock",
"presentation": [
"http://xbrl.sec.gov/oef/role/ShareholderReport"
],
"lang": {
"en-us": {
"role": {
"label": "Material Fund Change Strategies [Text Block]"
}
}
},
"auth_ref": [
"r74"
]
},
"oef_MaterialFundChngTextBlock": {
"xbrltype": "textBlockItemType",
"nsuri": "http://xbrl.sec.gov/oef/2025",
"localname": "MaterialFundChngTextBlock",
"presentation": [
"http://xbrl.sec.gov/oef/role/ShareholderReport"
],
"lang": {
"en-us": {
"role": {
"label": "Material Fund Change [Text Block]"
}
}
},
"auth_ref": [
"r70"
]
},
"oef_MaterialsSectorMember": {
"xbrltype": "domainItemType",
"nsuri": "http://xbrl.sec.gov/oef/2025",
"localname": "MaterialsSectorMember",
"presentation": [
"http://xbrl.sec.gov/oef/role/ShareholderReportHoldingsDetails"
],
"lang": {
"en-us": {
"role": {
"label": "Materials Sector [Member]"
}
}
},
"auth_ref": [
"r69"
]
},
"iametft_MaturingIn1115YearsMember": {
"xbrltype": "domainItemType",
"nsuri": "http://invesco.com/20250610",
"localname": "MaturingIn1115YearsMember",
"presentation": [
"http://xbrl.sec.gov/oef/role/ShareholderReportHoldingsDetails"
],
"lang": {
"en-us": {
"role": {
"label": "Maturing in 11 15 Years [Member]"
}
}
},
"auth_ref": []
},
"iametft_MaturingIn610YearsMember": {
"xbrltype": "domainItemType",
"nsuri": "http://invesco.com/20250610",
"localname": "MaturingIn610YearsMember",
"presentation": [
"http://xbrl.sec.gov/oef/role/ShareholderReportHoldingsDetails"
],
"lang": {
"en-us": {
"role": {
"label": "Maturing in 6 10 Years [Member]"
}
}
},
"auth_ref": []
},
"oef_MaturityAxis": {
"xbrltype": "stringItemType",
"nsuri": "http://xbrl.sec.gov/oef/2025",
"localname": "MaturityAxis",
"presentation": [
"http://xbrl.sec.gov/oef/role/ShareholderReportHoldingsDetails"
],
"lang": {
"en-us": {
"role": {
"label": "Maturity [Axis]"
}
}
},
"auth_ref": [
"r69"
]
},
"oef_MaturityDomain": {
"xbrltype": "domainItemType",
"nsuri": "http://xbrl.sec.gov/oef/2025",
"localname": "MaturityDomain",
"presentation": [
"http://xbrl.sec.gov/oef/role/ShareholderReportHoldingsDetails"
],
"lang": {
"en-us": {
"role": {
"label": "Maturity [Domain]"
}
}
},
"auth_ref": [
"r69"
]
},
"iametft_MetaPlatformsIncClassAMember": {
"xbrltype": "domainItemType",
"nsuri": "http://invesco.com/20250610",
"localname": "MetaPlatformsIncClassAMember",
"presentation": [
"http://xbrl.sec.gov/oef/role/ShareholderReportHoldingsDetails"
],
"lang": {
"en-us": {
"role": {
"label": "Meta Platforms Inc Class A [Member]"
}
}
},
"auth_ref": []
},
"iametft_MicrosoftCorpMember": {
"xbrltype": "domainItemType",
"nsuri": "http://invesco.com/20250610",
"localname": "MicrosoftCorpMember",
"presentation": [
"http://xbrl.sec.gov/oef/role/ShareholderReportHoldingsDetails"
],
"lang": {
"en-us": {
"role": {
"label": "Microsoft Corp [Member]"
}
}
},
"auth_ref": []
},
"iametft_MizuhoMarketsCaymanLPInvescoSAndP500EqualWeightETFMember": {
"xbrltype": "domainItemType",
"nsuri": "http://invesco.com/20250610",
"localname": "MizuhoMarketsCaymanLPInvescoSAndP500EqualWeightETFMember",
"presentation": [
"http://xbrl.sec.gov/oef/role/ShareholderReportHoldingsDetails"
],
"lang": {
"en-us": {
"role": {
"label": "Mizuho Markets Cayman L P Invesco S And P 500 Equal Weight ETF [Member]"
}
}
},
"auth_ref": []
},
"iametft_MizuhoMarketsCaymanLPInvescoSAndP500EqualWeightETFTopHoldingMember": {
"xbrltype": "domainItemType",
"nsuri": "http://invesco.com/20250610",
"localname": "MizuhoMarketsCaymanLPInvescoSAndP500EqualWeightETFTopHoldingMember",
"presentation": [
"http://xbrl.sec.gov/oef/role/ShareholderReportHoldingsDetails"
],
"lang": {
"en-us": {
"role": {
"label": "Mizuho Markets Cayman L P Invesco S And P 500 Equal Weight ETF Top Holding [Member]"
}
}
},
"auth_ref": []
},
"us-gaap_MoneyMarketFundsMember": {
"xbrltype": "domainItemType",
"nsuri": "http://fasb.org/us-gaap/2025",
"localname": "MoneyMarketFundsMember",
"presentation": [
"http://xbrl.sec.gov/oef/role/ShareholderReportHoldingsDetails"
],
"lang": {
"en-us": {
"role": {
"label": "Money Market Funds [Member]",
"documentation": "Fund that invests in short-term money-market instruments, for example, but not limited to, commercial paper, banker's acceptances, repurchase agreements, government securities, certificates of deposit, and other highly liquid securities."
}
}
},
"auth_ref": [
"r88",
"r89"
]
},
"iametft_MoneyMarketFundsPlusOtherAssetsLessLiabilitiesMember": {
"xbrltype": "domainItemType",
"nsuri": "http://invesco.com/20250610",
"localname": "MoneyMarketFundsPlusOtherAssetsLessLiabilitiesMember",
"presentation": [
"http://xbrl.sec.gov/oef/role/ShareholderReportHoldingsDetails"
],
"lang": {
"en-us": {
"role": {
"label": "Money Market Funds Plus Other Assets Less Liabilities [Member]"
}
}
},
"auth_ref": []
},
"iametft_MoneyMarketFundsSecuritiesMember": {
"xbrltype": "domainItemType",
"nsuri": "http://invesco.com/20250610",
"localname": "MoneyMarketFundsSecuritiesMember",
"presentation": [
"http://xbrl.sec.gov/oef/role/ShareholderReportHoldingsDetails"
],
"lang": {
"en-us": {
"role": {
"label": "Money Market Funds Securities [Member]"
}
}
},
"auth_ref": []
},
"iametft_MorganStanley54004132028Member": {
"xbrltype": "domainItemType",
"nsuri": "http://invesco.com/20250610",
"localname": "MorganStanley54004132028Member",
"presentation": [
"http://xbrl.sec.gov/oef/role/ShareholderReportHoldingsDetails"
],
"lang": {
"en-us": {
"role": {
"label": "Morgan Stanley 5 40 04 13 2028 [Member]"
}
}
},
"auth_ref": []
},
"iametft_MorganStanleyBankNA58810302026Member": {
"xbrltype": "domainItemType",
"nsuri": "http://invesco.com/20250610",
"localname": "MorganStanleyBankNA58810302026Member",
"presentation": [
"http://xbrl.sec.gov/oef/role/ShareholderReportHoldingsDetails"
],
"lang": {
"en-us": {
"role": {
"label": "Morgan Stanley Bank N A 5 88 10 30 2026 [Member]"
}
}
},
"auth_ref": []
},
"iametft_MunicipalObligationsMember": {
"xbrltype": "domainItemType",
"nsuri": "http://invesco.com/20250610",
"localname": "MunicipalObligationsMember",
"presentation": [
"http://xbrl.sec.gov/oef/role/ShareholderReportHoldingsDetails"
],
"lang": {
"en-us": {
"role": {
"label": "Municipal Obligations [Member]"
}
}
},
"auth_ref": []
},
"iametft_NVIDIACorpMember": {
"xbrltype": "domainItemType",
"nsuri": "http://invesco.com/20250610",
"localname": "NVIDIACorpMember",
"presentation": [
"http://xbrl.sec.gov/oef/role/ShareholderReportHoldingsDetails"
],
"lang": {
"en-us": {
"role": {
"label": "NVIDIA Corp [Member]"
}
}
},
"auth_ref": []
},
"iametft_NatWestGroupPLC74711102026Member": {
"xbrltype": "domainItemType",
"nsuri": "http://invesco.com/20250610",
"localname": "NatWestGroupPLC74711102026Member",
"presentation": [
"http://xbrl.sec.gov/oef/role/ShareholderReportHoldingsDetails"
],
"lang": {
"en-us": {
"role": {
"label": "NatWest Group PLC 7 47 11 10 2026 [Member]"
}
}
},
"auth_ref": []
},
"iametft_NestleSAMember": {
"xbrltype": "domainItemType",
"nsuri": "http://invesco.com/20250610",
"localname": "NestleSAMember",
"presentation": [
"http://xbrl.sec.gov/oef/role/ShareholderReportHoldingsDetails"
],
"lang": {
"en-us": {
"role": {
"label": "Nestle S A [Member]"
}
}
},
"auth_ref": []
},
"iametft_NetflixIncMember": {
"xbrltype": "domainItemType",
"nsuri": "http://invesco.com/20250610",
"localname": "NetflixIncMember",
"presentation": [
"http://xbrl.sec.gov/oef/role/ShareholderReportHoldingsDetails"
],
"lang": {
"en-us": {
"role": {
"label": "Netflix Inc [Member]"
}
}
},
"auth_ref": []
},
"iametft_NewYorkTransportationDevelopmentCorpJohnFKennedyInternationalAirportNewTerminalOneGreenBondsSeries2023RB60006302054Member": {
"xbrltype": "domainItemType",
"nsuri": "http://invesco.com/20250610",
"localname": "NewYorkTransportationDevelopmentCorpJohnFKennedyInternationalAirportNewTerminalOneGreenBondsSeries2023RB60006302054Member",
"presentation": [
"http://xbrl.sec.gov/oef/role/ShareholderReportHoldingsDetails"
],
"lang": {
"en-us": {
"role": {
"label": "New York Transportation Development Corp John F Kennedy International Airport New Terminal One Green Bonds Series 2023 RB 6 00 06 30 2054 [Member]"
}
}
},
"auth_ref": []
},
"iametft_NewYorkTransportationDevelopmentCorpLaGuardiaAirportTerminalBRedevelopmentSeries2023RB60004012035Member": {
"xbrltype": "domainItemType",
"nsuri": "http://invesco.com/20250610",
"localname": "NewYorkTransportationDevelopmentCorpLaGuardiaAirportTerminalBRedevelopmentSeries2023RB60004012035Member",
"presentation": [
"http://xbrl.sec.gov/oef/role/ShareholderReportHoldingsDetails"
],
"lang": {
"en-us": {
"role": {
"label": "New York Transportation Development Corp LaGuardia Airport Terminal B Redevelopment Series 2023 RB 6 00 04 01 2035 [Member]"
}
}
},
"auth_ref": []
},
"oef_NoDeductionOfTaxesTextBlock": {
"xbrltype": "textBlockItemType",
"nsuri": "http://xbrl.sec.gov/oef/2025",
"localname": "NoDeductionOfTaxesTextBlock",
"presentation": [
"http://xbrl.sec.gov/oef/role/ShareholderReport"
],
"lang": {
"en-us": {
"role": {
"label": "No Deduction of Taxes [Text Block]"
}
}
},
"auth_ref": [
"r56"
]
},
"dei_NoTradingSymbolFlag": {
"xbrltype": "trueItemType",
"nsuri": "http://xbrl.sec.gov/dei/2025",
"localname": "NoTradingSymbolFlag",
"presentation": [
"http://xbrl.sec.gov/oef/role/ShareholderReport"
],
"lang": {
"en-us": {
"role": {
"label": "No Trading Symbol Flag",
"documentation": "Boolean flag that is true only for a security having no trading symbol."
}
}
},
"auth_ref": []
},
"iametft_NobleFinanceIILLC80004152030Member": {
"xbrltype": "domainItemType",
"nsuri": "http://invesco.com/20250610",
"localname": "NobleFinanceIILLC80004152030Member",
"presentation": [
"http://xbrl.sec.gov/oef/role/ShareholderReportHoldingsDetails"
],
"lang": {
"en-us": {
"role": {
"label": "Noble Finance II LLC 8 00 04 15 2030 [Member]"
}
}
},
"auth_ref": []
},
"iametft_NonUSDollarDenominatedBondsAndNotesMember": {
"xbrltype": "domainItemType",
"nsuri": "http://invesco.com/20250610",
"localname": "NonUSDollarDenominatedBondsAndNotesMember",
"presentation": [
"http://xbrl.sec.gov/oef/role/ShareholderReportHoldingsDetails"
],
"lang": {
"en-us": {
"role": {
"label": "Non U S Dollar Denominated Bonds And Notes [Member]"
}
}
},
"auth_ref": []
},
"iametft_NovartisAGMember": {
"xbrltype": "domainItemType",
"nsuri": "http://invesco.com/20250610",
"localname": "NovartisAGMember",
"presentation": [
"http://xbrl.sec.gov/oef/role/ShareholderReportHoldingsDetails"
],
"lang": {
"en-us": {
"role": {
"label": "Novartis AG [Member]"
}
}
},
"auth_ref": []
},
"iametft_NovoNordiskASClassBMember": {
"xbrltype": "domainItemType",
"nsuri": "http://invesco.com/20250610",
"localname": "NovoNordiskASClassBMember",
"presentation": [
"http://xbrl.sec.gov/oef/role/ShareholderReportHoldingsDetails"
],
"lang": {
"en-us": {
"role": {
"label": "Novo Nordisk A S Class B [Member]"
}
}
},
"auth_ref": []
},
"iametft_ONEOKIncMember": {
"xbrltype": "domainItemType",
"nsuri": "http://invesco.com/20250610",
"localname": "ONEOKIncMember",
"presentation": [
"http://xbrl.sec.gov/oef/role/ShareholderReportHoldingsDetails"
],
"lang": {
"en-us": {
"role": {
"label": "ONEOK Inc [Member]"
}
}
},
"auth_ref": []
},
"iametft_OfficeMember": {
"xbrltype": "domainItemType",
"nsuri": "http://invesco.com/20250610",
"localname": "OfficeMember",
"presentation": [
"http://xbrl.sec.gov/oef/role/ShareholderReportHoldingsDetails"
],
"lang": {
"en-us": {
"role": {
"label": "Office [Member]"
}
}
},
"auth_ref": []
},
"iametft_OtherAssetsLessLiabilitiesMember": {
"xbrltype": "domainItemType",
"nsuri": "http://invesco.com/20250610",
"localname": "OtherAssetsLessLiabilitiesMember",
"presentation": [
"http://xbrl.sec.gov/oef/role/ShareholderReportHoldingsDetails"
],
"lang": {
"en-us": {
"role": {
"label": "Other Assets Less Liabilities [Member]"
}
}
},
"auth_ref": []
},
"oef_OtherCategory1Axis": {
"xbrltype": "stringItemType",
"nsuri": "http://xbrl.sec.gov/oef/2025",
"localname": "OtherCategory1Axis",
"presentation": [
"http://xbrl.sec.gov/oef/role/ShareholderReportHoldingsDetails"
],
"lang": {
"en-us": {
"role": {
"label": "Other Category 1 [Axis]"
}
}
},
"auth_ref": [
"r69"
]
},
"oef_OtherCategory1Domain": {
"xbrltype": "domainItemType",
"nsuri": "http://xbrl.sec.gov/oef/2025",
"localname": "OtherCategory1Domain",
"presentation": [
"http://xbrl.sec.gov/oef/role/ShareholderReportHoldingsDetails"
],
"lang": {
"en-us": {
"role": {
"label": "Other Category 1 [Domain]"
}
}
},
"auth_ref": [
"r69"
]
},
"oef_OtherCategory2Axis": {
"xbrltype": "stringItemType",
"nsuri": "http://xbrl.sec.gov/oef/2025",
"localname": "OtherCategory2Axis",
"presentation": [
"http://xbrl.sec.gov/oef/role/ShareholderReportHoldingsDetails"
],
"lang": {
"en-us": {
"role": {
"label": "Other Category 2 [Axis]"
}
}
},
"auth_ref": [
"r69"
]
},
"oef_OtherCategory2Domain": {
"xbrltype": "domainItemType",
"nsuri": "http://xbrl.sec.gov/oef/2025",
"localname": "OtherCategory2Domain",
"presentation": [
"http://xbrl.sec.gov/oef/role/ShareholderReportHoldingsDetails"
],
"lang": {
"en-us": {
"role": {
"label": "Other Category 2 [Domain]"
}
}
},
"auth_ref": [
"r69"
]
},
"iametft_OtherSectorsEachLessThan2Member": {
"xbrltype": "domainItemType",
"nsuri": "http://invesco.com/20250610",
"localname": "OtherSectorsEachLessThan2Member",
"presentation": [
"http://xbrl.sec.gov/oef/role/ShareholderReportHoldingsDetails"
],
"lang": {
"en-us": {
"role": {
"label": "Other Sectors each less than 2 [Member]"
}
}
},
"auth_ref": []
},
"iametft_PalmerSquareCLO20231LtdSeries20231AClassAR55201202038Member": {
"xbrltype": "domainItemType",
"nsuri": "http://invesco.com/20250610",
"localname": "PalmerSquareCLO20231LtdSeries20231AClassAR55201202038Member",
"presentation": [
"http://xbrl.sec.gov/oef/role/ShareholderReportHoldingsDetails"
],
"lang": {
"en-us": {
"role": {
"label": "Palmer Square CLO 2023 1 Ltd Series 2023 1A Class AR 5 52 01 20 2038 [Member]"
}
}
},
"auth_ref": []
},
"iametft_ParamountGlobal63803302062Member": {
"xbrltype": "domainItemType",
"nsuri": "http://invesco.com/20250610",
"localname": "ParamountGlobal63803302062Member",
"presentation": [
"http://xbrl.sec.gov/oef/role/ShareholderReportHoldingsDetails"
],
"lang": {
"en-us": {
"role": {
"label": "Paramount Global 6 38 03 30 2062 [Member]"
}
}
},
"auth_ref": []
},
"iametft_ParkBlueCLOLtdSeries20221AClassA1R56910202037Member": {
"xbrltype": "domainItemType",
"nsuri": "http://invesco.com/20250610",
"localname": "ParkBlueCLOLtdSeries20221AClassA1R56910202037Member",
"presentation": [
"http://xbrl.sec.gov/oef/role/ShareholderReportHoldingsDetails"
],
"lang": {
"en-us": {
"role": {
"label": "Park Blue CLO Ltd Series 2022 1A Class A1R 5 69 10 20 2037 [Member]"
}
}
},
"auth_ref": []
},
"iametft_PatriotsEnergyGroupFinancingAgencySeries2023A1RB52508012031Member": {
"xbrltype": "domainItemType",
"nsuri": "http://invesco.com/20250610",
"localname": "PatriotsEnergyGroupFinancingAgencySeries2023A1RB52508012031Member",
"presentation": [
"http://xbrl.sec.gov/oef/role/ShareholderReportHoldingsDetails"
],
"lang": {
"en-us": {
"role": {
"label": "Patriots Energy Group Financing Agency Series 2023 A 1 RB 5 25 08 01 2031 [Member]"
}
}
},
"auth_ref": []
},
"oef_PctOfNav": {
"xbrltype": "percentItemType",
"nsuri": "http://xbrl.sec.gov/oef/2025",
"localname": "PctOfNav",
"presentation": [
"http://xbrl.sec.gov/oef/role/ShareholderReportHoldingsDetails"
],
"lang": {
"en-us": {
"role": {
"label": "Percent of Net Asset Value"
}
}
},
"auth_ref": [
"r69"
]
},
"oef_PctOfNetLongExposure": {
"xbrltype": "percentItemType",
"nsuri": "http://xbrl.sec.gov/oef/2025",
"localname": "PctOfNetLongExposure",
"presentation": [
"http://xbrl.sec.gov/oef/role/ShareholderReportHoldingsDetails"
],
"lang": {
"en-us": {
"role": {
"label": "Percent of Net Long Exposure"
}
}
},
"auth_ref": [
"r69"
]
},
"oef_PctOfNetShortExposure": {
"xbrltype": "percentItemType",
"nsuri": "http://xbrl.sec.gov/oef/2025",
"localname": "PctOfNetShortExposure",
"presentation": [
"http://xbrl.sec.gov/oef/role/ShareholderReportHoldingsDetails"
],
"lang": {
"en-us": {
"role": {
"label": "Percent of Net Short Exposure"
}
}
},
"auth_ref": [
"r69"
]
},
"oef_PctOfTotalInv": {
"xbrltype": "percentItemType",
"nsuri": "http://xbrl.sec.gov/oef/2025",
"localname": "PctOfTotalInv",
"presentation": [
"http://xbrl.sec.gov/oef/role/ShareholderReportHoldingsDetails"
],
"lang": {
"en-us": {
"role": {
"label": "Percent of Total Investments"
}
}
},
"auth_ref": [
"r69"
]
},
"oef_PctOfTotalLongExposure": {
"xbrltype": "percentItemType",
"nsuri": "http://xbrl.sec.gov/oef/2025",
"localname": "PctOfTotalLongExposure",
"presentation": [
"http://xbrl.sec.gov/oef/role/ShareholderReportHoldingsDetails"
],
"lang": {
"en-us": {
"role": {
"label": "Percent of Total Long Exposure"
}
}
},
"auth_ref": [
"r69"
]
},
"oef_PctOfTotalShortExposure": {
"xbrltype": "percentItemType",
"nsuri": "http://xbrl.sec.gov/oef/2025",
"localname": "PctOfTotalShortExposure",
"presentation": [
"http://xbrl.sec.gov/oef/role/ShareholderReportHoldingsDetails"
],
"lang": {
"en-us": {
"role": {
"label": "Percent of Total Short Exposure"
}
}
},
"auth_ref": [
"r69"
]
},
"iametft_PembinaPipelineMember": {
"xbrltype": "domainItemType",
"nsuri": "http://invesco.com/20250610",
"localname": "PembinaPipelineMember",
"presentation": [
"http://xbrl.sec.gov/oef/role/ShareholderReportHoldingsDetails"
],
"lang": {
"en-us": {
"role": {
"label": "Pembina Pipeline [Member]"
}
}
},
"auth_ref": []
},
"iametft_PennsylvaniaCommonwealthOfEconomicDevelopmentFinancingAuthorityPenndotMajorBridgesTheSeries2022RB55006302038Member": {
"xbrltype": "domainItemType",
"nsuri": "http://invesco.com/20250610",
"localname": "PennsylvaniaCommonwealthOfEconomicDevelopmentFinancingAuthorityPenndotMajorBridgesTheSeries2022RB55006302038Member",
"presentation": [
"http://xbrl.sec.gov/oef/role/ShareholderReportHoldingsDetails"
],
"lang": {
"en-us": {
"role": {
"label": "Pennsylvania Commonwealth of Economic Development Financing Authority Penndot Major Bridges The Series 2022 RB 5 50 06 30 2038 [Member]"
}
}
},
"auth_ref": []
},
"oef_PerfInceptionDate": {
"xbrltype": "dateItemType",
"nsuri": "http://xbrl.sec.gov/oef/2025",
"localname": "PerfInceptionDate",
"presentation": [
"http://xbrl.sec.gov/oef/role/ShareholderReport"
],
"lang": {
"en-us": {
"role": {
"label": "Performance Inception Date"
}
}
},
"auth_ref": [
"r55"
]
},
"oef_PerfTableMarketIndexChngdTextBlock": {
"xbrltype": "textBlockItemType",
"nsuri": "http://xbrl.sec.gov/oef/2025",
"localname": "PerfTableMarketIndexChngdTextBlock",
"presentation": [
"http://xbrl.sec.gov/oef/role/ShareholderReport"
],
"lang": {
"en-us": {
"role": {
"label": "Performance Table Market Index Changed [Text Block]"
}
}
},
"auth_ref": [
"r62"
]
},
"oef_PerformancePastDoesNotIndicateFuture": {
"xbrltype": "stringItemType",
"nsuri": "http://xbrl.sec.gov/oef/2025",
"localname": "PerformancePastDoesNotIndicateFuture",
"presentation": [
"http://xbrl.sec.gov/oef/role/ShareholderReport"
],
"lang": {
"en-us": {
"role": {
"label": "Performance Past Does Not Indicate Future [Text]"
}
}
},
"auth_ref": [
"r57",
"r81"
]
},
"iametft_PlainsGPHoldingsLPClassAMember": {
"xbrltype": "domainItemType",
"nsuri": "http://invesco.com/20250610",
"localname": "PlainsGPHoldingsLPClassAMember",
"presentation": [
"http://xbrl.sec.gov/oef/role/ShareholderReportHoldingsDetails"
],
"lang": {
"en-us": {
"role": {
"label": "Plains GP Holdings L P Class A [Member]"
}
}
},
"auth_ref": []
},
"iametft_PortlandPortOfORGreenBondsTwentyNinthSeries2023RB52507012039Member": {
"xbrltype": "domainItemType",
"nsuri": "http://invesco.com/20250610",
"localname": "PortlandPortOfORGreenBondsTwentyNinthSeries2023RB52507012039Member",
"presentation": [
"http://xbrl.sec.gov/oef/role/ShareholderReportHoldingsDetails"
],
"lang": {
"en-us": {
"role": {
"label": "Portland Port of OR Green Bonds Twenty Ninth Series 2023 RB 5 25 07 01 2039 [Member]"
}
}
},
"auth_ref": []
},
"iametft_PreRefundedBondsMember": {
"xbrltype": "domainItemType",
"nsuri": "http://invesco.com/20250610",
"localname": "PreRefundedBondsMember",
"presentation": [
"http://xbrl.sec.gov/oef/role/ShareholderReportHoldingsDetails"
],
"lang": {
"en-us": {
"role": {
"label": "Pre Refunded Bonds [Member]"
}
}
},
"auth_ref": []
},
"us-gaap_PreferredStockMember": {
"xbrltype": "domainItemType",
"nsuri": "http://fasb.org/us-gaap/2025",
"localname": "PreferredStockMember",
"presentation": [
"http://xbrl.sec.gov/oef/role/ShareholderReportHoldingsDetails"
],
"lang": {
"en-us": {
"role": {
"label": "Preferred Stock [Member]",
"documentation": "Preferred shares may provide a preferential dividend to the dividend on common stock and may take precedence over common stock in the event of a liquidation. Preferred shares typically represent an ownership interest in the company."
}
}
},
"auth_ref": [
"r31",
"r32",
"r34",
"r35",
"r36",
"r37",
"r91",
"r93"
]
},
"oef_PreviousInvestmentAdviserTextBlock": {
"xbrltype": "textBlockItemType",
"nsuri": "http://xbrl.sec.gov/oef/2025",
"localname": "PreviousInvestmentAdviserTextBlock",
"presentation": [
"http://xbrl.sec.gov/oef/role/ShareholderReport"
],
"lang": {
"en-us": {
"role": {
"label": "Previous Investment Adviser [Text Block]"
}
}
},
"auth_ref": [
"r58"
]
},
"oef_PriorMarketIndexComparisonTextBlock": {
"xbrltype": "textBlockItemType",
"nsuri": "http://xbrl.sec.gov/oef/2025",
"localname": "PriorMarketIndexComparisonTextBlock",
"presentation": [
"http://xbrl.sec.gov/oef/role/ShareholderReport"
],
"lang": {
"en-us": {
"role": {
"label": "Prior Market Index Comparison [Text Block]"
}
}
},
"auth_ref": [
"r62"
]
},
"iametft_PrologisIncMember": {
"xbrltype": "domainItemType",
"nsuri": "http://invesco.com/20250610",
"localname": "PrologisIncMember",
"presentation": [
"http://xbrl.sec.gov/oef/role/ShareholderReportHoldingsDetails"
],
"lang": {
"en-us": {
"role": {
"label": "Prologis Inc [Member]"
}
}
},
"auth_ref": []
},
"iametft_ProtectiveLifeGlobalFunding53701062026Member": {
"xbrltype": "domainItemType",
"nsuri": "http://invesco.com/20250610",
"localname": "ProtectiveLifeGlobalFunding53701062026Member",
"presentation": [
"http://xbrl.sec.gov/oef/role/ShareholderReportHoldingsDetails"
],
"lang": {
"en-us": {
"role": {
"label": "Protective Life Global Funding 5 37 01 06 2026 [Member]"
}
}
},
"auth_ref": []
},
"iametft_QuantaServicesInc49005022025Member": {
"xbrltype": "domainItemType",
"nsuri": "http://invesco.com/20250610",
"localname": "QuantaServicesInc49005022025Member",
"presentation": [
"http://xbrl.sec.gov/oef/role/ShareholderReportHoldingsDetails"
],
"lang": {
"en-us": {
"role": {
"label": "Quanta Services Inc 4 90 05 02 2025 [Member]"
}
}
},
"auth_ref": []
},
"us-gaap_RealEstateSectorMember": {
"xbrltype": "domainItemType",
"nsuri": "http://fasb.org/us-gaap/2025",
"localname": "RealEstateSectorMember",
"presentation": [
"http://xbrl.sec.gov/oef/role/ShareholderReportHoldingsDetails"
],
"lang": {
"en-us": {
"role": {
"label": "Real Estate Sector [Member]",
"documentation": "Sector of the economy consisting of companies engaged in real estate business activities."
}
}
},
"auth_ref": [
"r22",
"r27",
"r94",
"r95",
"r96",
"r97"
]
},
"iametft_RegionalMallsMember": {
"xbrltype": "domainItemType",
"nsuri": "http://invesco.com/20250610",
"localname": "RegionalMallsMember",
"presentation": [
"http://xbrl.sec.gov/oef/role/ShareholderReportHoldingsDetails"
],
"lang": {
"en-us": {
"role": {
"label": "Regional Malls [Member]"
}
}
},
"auth_ref": []
},
"us-gaap_RepurchaseAgreementsMember": {
"xbrltype": "domainItemType",
"nsuri": "http://fasb.org/us-gaap/2025",
"localname": "RepurchaseAgreementsMember",
"presentation": [
"http://xbrl.sec.gov/oef/role/ShareholderReportHoldingsDetails"
],
"lang": {
"en-us": {
"role": {
"label": "Repurchase Agreements [Member]",
"documentation": "Investments represented by an agreement between the entity and another party for the sale and repurchase of identical or substantially the same securities at a date certain for a specified price. Such agreements are generally short-term in nature."
}
}
},
"auth_ref": []
},
"iametft_RevenueBondsMember": {
"xbrltype": "domainItemType",
"nsuri": "http://invesco.com/20250610",
"localname": "RevenueBondsMember",
"presentation": [
"http://xbrl.sec.gov/oef/role/ShareholderReportHoldingsDetails"
],
"lang": {
"en-us": {
"role": {
"label": "Revenue Bonds [Member]"
}
}
},
"auth_ref": []
},
"iametft_RocheHoldingAGMember": {
"xbrltype": "domainItemType",
"nsuri": "http://invesco.com/20250610",
"localname": "RocheHoldingAGMember",
"presentation": [
"http://xbrl.sec.gov/oef/role/ShareholderReportHoldingsDetails"
],
"lang": {
"en-us": {
"role": {
"label": "Roche Holding AG [Member]"
}
}
},
"auth_ref": []
},
"iametft_SAPSEMember": {
"xbrltype": "domainItemType",
"nsuri": "http://invesco.com/20250610",
"localname": "SAPSEMember",
"presentation": [
"http://xbrl.sec.gov/oef/role/ShareholderReportHoldingsDetails"
],
"lang": {
"en-us": {
"role": {
"label": "SAP SE [Member]"
}
}
},
"auth_ref": []
},
"oef_SalesLoadAxis": {
"xbrltype": "stringItemType",
"nsuri": "http://xbrl.sec.gov/oef/2025",
"localname": "SalesLoadAxis",
"presentation": [
"http://xbrl.sec.gov/oef/role/ShareholderReportAverageAnnualReturnDetails"
],
"lang": {
"en-us": {
"role": {
"label": "Sales Load [Axis]"
}
}
},
"auth_ref": [
"r61"
]
},
"iametft_SantanderHoldingsUSAInc59803202029Member": {
"xbrltype": "domainItemType",
"nsuri": "http://invesco.com/20250610",
"localname": "SantanderHoldingsUSAInc59803202029Member",
"presentation": [
"http://xbrl.sec.gov/oef/role/ShareholderReportHoldingsDetails"
],
"lang": {
"en-us": {
"role": {
"label": "Santander Holdings USA Inc 5 98 03 20 2029 [Member]"
}
}
},
"auth_ref": []
},
"dei_SecurityExchangeName": {
"xbrltype": "edgarExchangeCodeItemType",
"nsuri": "http://xbrl.sec.gov/dei/2025",
"localname": "SecurityExchangeName",
"presentation": [
"http://xbrl.sec.gov/oef/role/ShareholderReport"
],
"lang": {
"en-us": {
"role": {
"label": "Security Exchange Name",
"terseLabel": "Exchange",
"documentation": "Name of the Exchange on which a security is registered."
}
}
},
"auth_ref": [
"r40"
]
},
"iametft_SelfStorageMember": {
"xbrltype": "domainItemType",
"nsuri": "http://invesco.com/20250610",
"localname": "SelfStorageMember",
"presentation": [
"http://xbrl.sec.gov/oef/role/ShareholderReportHoldingsDetails"
],
"lang": {
"en-us": {
"role": {
"label": "Self Storage [Member]"
}
}
},
"auth_ref": []
},
"iametft_SempraMember": {
"xbrltype": "domainItemType",
"nsuri": "http://invesco.com/20250610",
"localname": "SempraMember",
"presentation": [
"http://xbrl.sec.gov/oef/role/ShareholderReportHoldingsDetails"
],
"lang": {
"en-us": {
"role": {
"label": "Sempra [Member]"
}
}
},
"auth_ref": []
},
"oef_ShareClassDomain": {
"xbrltype": "domainItemType",
"nsuri": "http://xbrl.sec.gov/oef/2025",
"localname": "ShareClassDomain",
"presentation": [
"http://xbrl.sec.gov/oef/role/ShareholderReport",
"http://xbrl.sec.gov/oef/role/ShareholderReportAverageAnnualReturnDetails",
"http://xbrl.sec.gov/oef/role/ShareholderReportHoldingsDetails",
"http://xbrl.sec.gov/oef/role/ShareholderReportLineGraphDetails"
],
"lang": {
"en-us": {
"role": {
"label": "Share Classes"
}
}
},
"auth_ref": [
"r41"
]
},
"oef_ShareholderReportAbstract": {
"xbrltype": "stringItemType",
"nsuri": "http://xbrl.sec.gov/oef/2025",
"localname": "ShareholderReportAbstract",
"lang": {
"en-us": {
"role": {
"label": "Shareholder Report [Abstract]"
}
}
},
"auth_ref": [
"r61"
]
},
"oef_ShareholderReportAnnualOrSemiAnnual": {
"xbrltype": "shareholderReportTypeItemType",
"nsuri": "http://xbrl.sec.gov/oef/2025",
"localname": "ShareholderReportAnnualOrSemiAnnual",
"presentation": [
"http://xbrl.sec.gov/oef/role/ShareholderReport"
],
"lang": {
"en-us": {
"role": {
"label": "Shareholder Report Annual or Semi-Annual"
}
}
},
"auth_ref": [
"r43"
]
},
"oef_ShareholderReportLineItems": {
"xbrltype": "stringItemType",
"nsuri": "http://xbrl.sec.gov/oef/2025",
"localname": "ShareholderReportLineItems",
"presentation": [
"http://xbrl.sec.gov/oef/role/NcsrCover",
"http://xbrl.sec.gov/oef/role/ShareholderReport"
],
"lang": {
"en-us": {
"role": {
"label": "Shareholder Report [Line Items]"
}
}
},
"auth_ref": [
"r61"
]
},
"oef_ShareholderReportTable": {
"xbrltype": "stringItemType",
"nsuri": "http://xbrl.sec.gov/oef/2025",
"localname": "ShareholderReportTable",
"presentation": [
"http://xbrl.sec.gov/oef/role/NcsrCover",
"http://xbrl.sec.gov/oef/role/ShareholderReport"
],
"lang": {
"en-us": {
"role": {
"label": "Shareholder Report [Table]"
}
}
},
"auth_ref": [
"r61"
]
},
"iametft_ShellPLCMember": {
"xbrltype": "domainItemType",
"nsuri": "http://invesco.com/20250610",
"localname": "ShellPLCMember",
"presentation": [
"http://xbrl.sec.gov/oef/role/ShareholderReportHoldingsDetails"
],
"lang": {
"en-us": {
"role": {
"label": "Shell PLC [Member]"
}
}
},
"auth_ref": []
},
"iametft_ShoppingCentersMember": {
"xbrltype": "domainItemType",
"nsuri": "http://invesco.com/20250610",
"localname": "ShoppingCentersMember",
"presentation": [
"http://xbrl.sec.gov/oef/role/ShareholderReportHoldingsDetails"
],
"lang": {
"en-us": {
"role": {
"label": "Shopping Centers [Member]"
}
}
},
"auth_ref": []
},
"iametft_SignalPeakCLO11LtdSeries202411AClassA157207182037Member": {
"xbrltype": "domainItemType",
"nsuri": "http://invesco.com/20250610",
"localname": "SignalPeakCLO11LtdSeries202411AClassA157207182037Member",
"presentation": [
"http://xbrl.sec.gov/oef/role/ShareholderReportHoldingsDetails"
],
"lang": {
"en-us": {
"role": {
"label": "Signal Peak CLO 11 Ltd Series 2024 11A Class A1 5 72 07 18 2037 [Member]"
}
}
},
"auth_ref": []
},
"iametft_SimonPropertyGroupIncMember": {
"xbrltype": "domainItemType",
"nsuri": "http://invesco.com/20250610",
"localname": "SimonPropertyGroupIncMember",
"presentation": [
"http://xbrl.sec.gov/oef/role/ShareholderReportHoldingsDetails"
],
"lang": {
"en-us": {
"role": {
"label": "Simon Property Group Inc [Member]"
}
}
},
"auth_ref": []
},
"iametft_SingleFamilyHomesMember": {
"xbrltype": "domainItemType",
"nsuri": "http://invesco.com/20250610",
"localname": "SingleFamilyHomesMember",
"presentation": [
"http://xbrl.sec.gov/oef/role/ShareholderReportHoldingsDetails"
],
"lang": {
"en-us": {
"role": {
"label": "Single Family Homes [Member]"
}
}
},
"auth_ref": []
},
"iametft_SonocoProductsCo52405282025Member": {
"xbrltype": "domainItemType",
"nsuri": "http://invesco.com/20250610",
"localname": "SonocoProductsCo52405282025Member",
"presentation": [
"http://xbrl.sec.gov/oef/role/ShareholderReportHoldingsDetails"
],
"lang": {
"en-us": {
"role": {
"label": "Sonoco Products Co 5 24 05 28 2025 [Member]"
}
}
},
"auth_ref": []
},
"iametft_SouthBowCorpMember": {
"xbrltype": "domainItemType",
"nsuri": "http://invesco.com/20250610",
"localname": "SouthBowCorpMember",
"presentation": [
"http://xbrl.sec.gov/oef/role/ShareholderReportHoldingsDetails"
],
"lang": {
"en-us": {
"role": {
"label": "South Bow Corp [Member]"
}
}
},
"auth_ref": []
},
"iametft_SpecialtyMember": {
"xbrltype": "domainItemType",
"nsuri": "http://invesco.com/20250610",
"localname": "SpecialtyMember",
"presentation": [
"http://xbrl.sec.gov/oef/role/ShareholderReportHoldingsDetails"
],
"lang": {
"en-us": {
"role": {
"label": "Specialty [Member]"
}
}
},
"auth_ref": []
},
"iametft_StudioCityFinanceLtd50001152029Member": {
"xbrltype": "domainItemType",
"nsuri": "http://invesco.com/20250610",
"localname": "StudioCityFinanceLtd50001152029Member",
"presentation": [
"http://xbrl.sec.gov/oef/role/ShareholderReportHoldingsDetails"
],
"lang": {
"en-us": {
"role": {
"label": "Studio City Finance Ltd 5 00 01 15 2029 [Member]"
}
}
},
"auth_ref": []
},
"oef_SummaryOfChngLegendTextBlock": {
"xbrltype": "textBlockItemType",
"nsuri": "http://xbrl.sec.gov/oef/2025",
"localname": "SummaryOfChngLegendTextBlock",
"presentation": [
"http://xbrl.sec.gov/oef/role/ShareholderReport"
],
"lang": {
"en-us": {
"role": {
"label": "Summary of Change Legend [Text Block]"
}
}
},
"auth_ref": [
"r77"
]
},
"iametft_TCEnergyCorpMember": {
"xbrltype": "domainItemType",
"nsuri": "http://invesco.com/20250610",
"localname": "TCEnergyCorpMember",
"presentation": [
"http://xbrl.sec.gov/oef/role/ShareholderReportHoldingsDetails"
],
"lang": {
"en-us": {
"role": {
"label": "TC Energy Corp [Member]"
}
}
},
"auth_ref": []
},
"iametft_TICPCLOVIILtdSeries20177AClassASR255604152033Member": {
"xbrltype": "domainItemType",
"nsuri": "http://invesco.com/20250610",
"localname": "TICPCLOVIILtdSeries20177AClassASR255604152033Member",
"presentation": [
"http://xbrl.sec.gov/oef/role/ShareholderReportHoldingsDetails"
],
"lang": {
"en-us": {
"role": {
"label": "TICP CLO VII Ltd Series 2017 7A Class ASR2 5 56 04 15 2033 [Member]"
}
}
},
"auth_ref": []
},
"iametft_TargaResourcesCorpMember": {
"xbrltype": "domainItemType",
"nsuri": "http://invesco.com/20250610",
"localname": "TargaResourcesCorpMember",
"presentation": [
"http://xbrl.sec.gov/oef/role/ShareholderReportHoldingsDetails"
],
"lang": {
"en-us": {
"role": {
"label": "Targa Resources Corp [Member]"
}
}
},
"auth_ref": []
},
"iametft_TenetHealthcareCorp67505152031Member": {
"xbrltype": "domainItemType",
"nsuri": "http://invesco.com/20250610",
"localname": "TenetHealthcareCorp67505152031Member",
"presentation": [
"http://xbrl.sec.gov/oef/role/ShareholderReportHoldingsDetails"
],
"lang": {
"en-us": {
"role": {
"label": "Tenet Healthcare Corp 6 75 05 15 2031 [Member]"
}
}
},
"auth_ref": []
},
"iametft_TeslaIncMember": {
"xbrltype": "domainItemType",
"nsuri": "http://invesco.com/20250610",
"localname": "TeslaIncMember",
"presentation": [
"http://xbrl.sec.gov/oef/role/ShareholderReportHoldingsDetails"
],
"lang": {
"en-us": {
"role": {
"label": "Tesla Inc [Member]"
}
}
},
"auth_ref": []
},
"iametft_TimberREITsMember": {
"xbrltype": "domainItemType",
"nsuri": "http://invesco.com/20250610",
"localname": "TimberREITsMember",
"presentation": [
"http://xbrl.sec.gov/oef/role/ShareholderReportHoldingsDetails"
],
"lang": {
"en-us": {
"role": {
"label": "Timber REITs [Member]"
}
}
},
"auth_ref": []
},
"iametft_ToyotaMotorCorpMember": {
"xbrltype": "domainItemType",
"nsuri": "http://invesco.com/20250610",
"localname": "ToyotaMotorCorpMember",
"presentation": [
"http://xbrl.sec.gov/oef/role/ShareholderReportHoldingsDetails"
],
"lang": {
"en-us": {
"role": {
"label": "Toyota Motor Corp [Member]"
}
}
},
"auth_ref": []
},
"dei_TradingSymbol": {
"xbrltype": "tradingSymbolItemType",
"nsuri": "http://xbrl.sec.gov/dei/2025",
"localname": "TradingSymbol",
"presentation": [
"http://xbrl.sec.gov/oef/role/ShareholderReport"
],
"lang": {
"en-us": {
"role": {
"label": "Trading Symbol",
"terseLabel": "Ticker",
"documentation": "Trading symbol of an instrument as listed on an exchange."
}
}
},
"auth_ref": []
},
"iametft_UBSAG58009112025Member": {
"xbrltype": "domainItemType",
"nsuri": "http://invesco.com/20250610",
"localname": "UBSAG58009112025Member",
"presentation": [
"http://xbrl.sec.gov/oef/role/ShareholderReportHoldingsDetails"
],
"lang": {
"en-us": {
"role": {
"label": "UBS AG 5 80 09 11 2025 [Member]"
}
}
},
"auth_ref": []
},
"iametft_UBSAGInvescoSAndP500EqualWeightETFMember": {
"xbrltype": "domainItemType",
"nsuri": "http://invesco.com/20250610",
"localname": "UBSAGInvescoSAndP500EqualWeightETFMember",
"presentation": [
"http://xbrl.sec.gov/oef/role/ShareholderReportHoldingsDetails"
],
"lang": {
"en-us": {
"role": {
"label": "UBS AG Invesco S And P 500 Equal Weight ETF [Member]"
}
}
},
"auth_ref": []
},
"iametft_USDollarDenominatedBondsAndNotesMember": {
"xbrltype": "domainItemType",
"nsuri": "http://invesco.com/20250610",
"localname": "USDollarDenominatedBondsAndNotesMember",
"presentation": [
"http://xbrl.sec.gov/oef/role/ShareholderReportHoldingsDetails"
],
"lang": {
"en-us": {
"role": {
"label": "U S Dollar Denominated Bonds And Notes [Member]"
}
}
},
"auth_ref": []
},
"iametft_USGovernmentSponsoredAgencyMortgageBackedSecuritiesMember": {
"xbrltype": "domainItemType",
"nsuri": "http://invesco.com/20250610",
"localname": "USGovernmentSponsoredAgencyMortgageBackedSecuritiesMember",
"presentation": [
"http://xbrl.sec.gov/oef/role/ShareholderReportHoldingsDetails"
],
"lang": {
"en-us": {
"role": {
"label": "U S Government Sponsored Agency Mortgage Backed Securities [Member]"
}
}
},
"auth_ref": []
},
"iametft_USGovernmentSponsoredAgencySecuritiesMember": {
"xbrltype": "domainItemType",
"nsuri": "http://invesco.com/20250610",
"localname": "USGovernmentSponsoredAgencySecuritiesMember",
"presentation": [
"http://xbrl.sec.gov/oef/role/ShareholderReportHoldingsDetails"
],
"lang": {
"en-us": {
"role": {
"label": "U S Government Sponsored Agency Securities [Member]"
}
}
},
"auth_ref": []
},
"iametft_USTreasuryBonds45011152054Member": {
"xbrltype": "domainItemType",
"nsuri": "http://invesco.com/20250610",
"localname": "USTreasuryBonds45011152054Member",
"presentation": [
"http://xbrl.sec.gov/oef/role/ShareholderReportHoldingsDetails"
],
"lang": {
"en-us": {
"role": {
"label": "U S Treasury Bonds 4 50 11 15 2054 [Member]"
}
}
},
"auth_ref": []
},
"iametft_USTreasuryFloatingRateNotes43401312027Member": {
"xbrltype": "domainItemType",
"nsuri": "http://invesco.com/20250610",
"localname": "USTreasuryFloatingRateNotes43401312027Member",
"presentation": [
"http://xbrl.sec.gov/oef/role/ShareholderReportHoldingsDetails"
],
"lang": {
"en-us": {
"role": {
"label": "U S Treasury Floating Rate Notes 4 34 01 31 2027 [Member]"
}
}
},
"auth_ref": []
},
"iametft_USTreasuryFloatingRateNotes44510312026Member": {
"xbrltype": "domainItemType",
"nsuri": "http://invesco.com/20250610",
"localname": "USTreasuryFloatingRateNotes44510312026Member",
"presentation": [
"http://xbrl.sec.gov/oef/role/ShareholderReportHoldingsDetails"
],
"lang": {
"en-us": {
"role": {
"label": "U S Treasury Floating Rate Notes 4 45 10 31 2026 [Member]"
}
}
},
"auth_ref": []
},
"iametft_USTreasuryNotes37504152028Member": {
"xbrltype": "domainItemType",
"nsuri": "http://invesco.com/20250610",
"localname": "USTreasuryNotes37504152028Member",
"presentation": [
"http://xbrl.sec.gov/oef/role/ShareholderReportHoldingsDetails"
],
"lang": {
"en-us": {
"role": {
"label": "U S Treasury Notes 3 75 04 15 2028 [Member]"
}
}
},
"auth_ref": []
},
"iametft_USTreasuryNotes37504302027Member": {
"xbrltype": "domainItemType",
"nsuri": "http://invesco.com/20250610",
"localname": "USTreasuryNotes37504302027Member",
"presentation": [
"http://xbrl.sec.gov/oef/role/ShareholderReportHoldingsDetails"
],
"lang": {
"en-us": {
"role": {
"label": "U S Treasury Notes 3 75 04 30 2027 [Member]"
}
}
},
"auth_ref": []
},
"iametft_USTreasuryNotes38804302030Member": {
"xbrltype": "domainItemType",
"nsuri": "http://invesco.com/20250610",
"localname": "USTreasuryNotes38804302030Member",
"presentation": [
"http://xbrl.sec.gov/oef/role/ShareholderReportHoldingsDetails"
],
"lang": {
"en-us": {
"role": {
"label": "U S Treasury Notes 3 88 04 30 2030 [Member]"
}
}
},
"auth_ref": []
},
"iametft_USTreasuryNotes46302152035Member": {
"xbrltype": "domainItemType",
"nsuri": "http://invesco.com/20250610",
"localname": "USTreasuryNotes46302152035Member",
"presentation": [
"http://xbrl.sec.gov/oef/role/ShareholderReportHoldingsDetails"
],
"lang": {
"en-us": {
"role": {
"label": "U S Treasury Notes 4 63 02 15 2035 [Member]"
}
}
},
"auth_ref": []
},
"us-gaap_USTreasurySecuritiesMember": {
"xbrltype": "domainItemType",
"nsuri": "http://fasb.org/us-gaap/2025",
"localname": "USTreasurySecuritiesMember",
"presentation": [
"http://xbrl.sec.gov/oef/role/ShareholderReportHoldingsDetails"
],
"lang": {
"en-us": {
"role": {
"label": "US Treasury Securities [Member]",
"documentation": "This category includes information about debt securities issued by the United States Department of the Treasury and backed by the United States government. Such securities primarily consist of treasury bills (short-term maturities - one year or less), treasury notes (intermediate term maturities - two to ten years), and treasury bonds (long-term maturities - ten to thirty years)."
}
}
},
"auth_ref": [
"r20",
"r21",
"r24",
"r25",
"r26",
"r27",
"r90"
]
},
"iametft_UniformMortgageBackedSecuritiesTBA25006012055Member": {
"xbrltype": "domainItemType",
"nsuri": "http://invesco.com/20250610",
"localname": "UniformMortgageBackedSecuritiesTBA25006012055Member",
"presentation": [
"http://xbrl.sec.gov/oef/role/ShareholderReportHoldingsDetails"
],
"lang": {
"en-us": {
"role": {
"label": "Uniform Mortgage Backed Securities TBA 2 50 06 01 2055 [Member]"
}
}
},
"auth_ref": []
},
"iametft_UniformMortgageBackedSecuritiesTBA30005012055Member": {
"xbrltype": "domainItemType",
"nsuri": "http://invesco.com/20250610",
"localname": "UniformMortgageBackedSecuritiesTBA30005012055Member",
"presentation": [
"http://xbrl.sec.gov/oef/role/ShareholderReportHoldingsDetails"
],
"lang": {
"en-us": {
"role": {
"label": "Uniform Mortgage Backed Securities TBA 3 00 05 01 2055 [Member]"
}
}
},
"auth_ref": []
},
"iametft_UniformMortgageBackedSecuritiesTBA35005012055Member": {
"xbrltype": "domainItemType",
"nsuri": "http://invesco.com/20250610",
"localname": "UniformMortgageBackedSecuritiesTBA35005012055Member",
"presentation": [
"http://xbrl.sec.gov/oef/role/ShareholderReportHoldingsDetails"
],
"lang": {
"en-us": {
"role": {
"label": "Uniform Mortgage Backed Securities TBA 3 50 05 01 2055 [Member]"
}
}
},
"auth_ref": []
},
"iametft_UniformMortgageBackedSecuritiesTBA50005012055Member": {
"xbrltype": "domainItemType",
"nsuri": "http://invesco.com/20250610",
"localname": "UniformMortgageBackedSecuritiesTBA50005012055Member",
"presentation": [
"http://xbrl.sec.gov/oef/role/ShareholderReportHoldingsDetails"
],
"lang": {
"en-us": {
"role": {
"label": "Uniform Mortgage Backed Securities TBA 5 00 05 01 2055 [Member]"
}
}
},
"auth_ref": []
},
"iametft_UniformMortgageBackedSecuritiesTBA55005012055Member": {
"xbrltype": "domainItemType",
"nsuri": "http://invesco.com/20250610",
"localname": "UniformMortgageBackedSecuritiesTBA55005012055Member",
"presentation": [
"http://xbrl.sec.gov/oef/role/ShareholderReportHoldingsDetails"
],
"lang": {
"en-us": {
"role": {
"label": "Uniform Mortgage Backed Securities TBA 5 50 05 01 2055 [Member]"
}
}
},
"auth_ref": []
},
"iametft_UniformMortgageBackedSecuritiesTBA60005012055Member": {
"xbrltype": "domainItemType",
"nsuri": "http://invesco.com/20250610",
"localname": "UniformMortgageBackedSecuritiesTBA60005012055Member",
"presentation": [
"http://xbrl.sec.gov/oef/role/ShareholderReportHoldingsDetails"
],
"lang": {
"en-us": {
"role": {
"label": "Uniform Mortgage Backed Securities TBA 6 00 05 01 2055 [Member]"
}
}
},
"auth_ref": []
},
"oef_UpdPerfInfoLocationTextBlock": {
"xbrltype": "textBlockItemType",
"nsuri": "http://xbrl.sec.gov/oef/2025",
"localname": "UpdPerfInfoLocationTextBlock",
"presentation": [
"http://xbrl.sec.gov/oef/role/ShareholderReport"
],
"lang": {
"en-us": {
"role": {
"label": "Updated Performance Information Location [Text Block]"
}
}
},
"auth_ref": [
"r60"
]
},
"oef_UpdProspectusEmailAddress": {
"xbrltype": "stringItemType",
"nsuri": "http://xbrl.sec.gov/oef/2025",
"localname": "UpdProspectusEmailAddress",
"presentation": [
"http://xbrl.sec.gov/oef/role/ShareholderReport"
],
"lang": {
"en-us": {
"role": {
"label": "Updated Prospectus Email Address"
}
}
},
"auth_ref": [
"r77"
]
},
"oef_UpdProspectusPhoneNumber": {
"xbrltype": "stringItemType",
"nsuri": "http://xbrl.sec.gov/oef/2025",
"localname": "UpdProspectusPhoneNumber",
"presentation": [
"http://xbrl.sec.gov/oef/role/ShareholderReport"
],
"lang": {
"en-us": {
"role": {
"label": "Updated Prospectus Phone Number"
}
}
},
"auth_ref": [
"r77"
]
},
"oef_UpdProspectusWebAddress": {
"xbrltype": "stringItemType",
"nsuri": "http://xbrl.sec.gov/oef/2025",
"localname": "UpdProspectusWebAddress",
"presentation": [
"http://xbrl.sec.gov/oef/role/ShareholderReport"
],
"lang": {
"en-us": {
"role": {
"label": "Updated Prospectus Web Address"
}
}
},
"auth_ref": [
"r77"
]
},
"oef_UtilitiesSectorMember": {
"xbrltype": "domainItemType",
"nsuri": "http://xbrl.sec.gov/oef/2025",
"localname": "UtilitiesSectorMember",
"presentation": [
"http://xbrl.sec.gov/oef/role/ShareholderReportHoldingsDetails"
],
"lang": {
"en-us": {
"role": {
"label": "Utilities Sector [Member]"
}
}
},
"auth_ref": [
"r69"
]
},
"iametft_VMEDO2UKFinancingIPLC32501312031Member": {
"xbrltype": "domainItemType",
"nsuri": "http://invesco.com/20250610",
"localname": "VMEDO2UKFinancingIPLC32501312031Member",
"presentation": [
"http://xbrl.sec.gov/oef/role/ShareholderReportHoldingsDetails"
],
"lang": {
"en-us": {
"role": {
"label": "VMED O2 UK Financing I PLC 3 25 01 31 2031 [Member]"
}
}
},
"auth_ref": []
},
"iametft_VariableRateSeniorLoanInterestsMember": {
"xbrltype": "domainItemType",
"nsuri": "http://invesco.com/20250610",
"localname": "VariableRateSeniorLoanInterestsMember",
"presentation": [
"http://xbrl.sec.gov/oef/role/ShareholderReportHoldingsDetails"
],
"lang": {
"en-us": {
"role": {
"label": "Variable Rate Senior Loan Interests [Member]"
}
}
},
"auth_ref": []
},
"iametft_VentureGlobalLNGInc81306012028Member": {
"xbrltype": "domainItemType",
"nsuri": "http://invesco.com/20250610",
"localname": "VentureGlobalLNGInc81306012028Member",
"presentation": [
"http://xbrl.sec.gov/oef/role/ShareholderReportHoldingsDetails"
],
"lang": {
"en-us": {
"role": {
"label": "Venture Global LNG Inc 8 13 06 01 2028 [Member]"
}
}
},
"auth_ref": []
},
"iametft_ViasatInc56304152027Member": {
"xbrltype": "domainItemType",
"nsuri": "http://invesco.com/20250610",
"localname": "ViasatInc56304152027Member",
"presentation": [
"http://xbrl.sec.gov/oef/role/ShareholderReportHoldingsDetails"
],
"lang": {
"en-us": {
"role": {
"label": "Viasat Inc 5 63 04 15 2027 [Member]"
}
}
},
"auth_ref": []
},
"iametft_VirginiaBeachDevelopmentAuthorityWestminsterCanterburyOnChesapeakeBaySeries2023B3RB53809012029Member": {
"xbrltype": "domainItemType",
"nsuri": "http://invesco.com/20250610",
"localname": "VirginiaBeachDevelopmentAuthorityWestminsterCanterburyOnChesapeakeBaySeries2023B3RB53809012029Member",
"presentation": [
"http://xbrl.sec.gov/oef/role/ShareholderReportHoldingsDetails"
],
"lang": {
"en-us": {
"role": {
"label": "Virginia Beach Development Authority Westminster Canterbury on Chesapeake Bay Series 2023 B 3 RB 5 38 09 01 2029 [Member]"
}
}
},
"auth_ref": []
},
"iametft_VodafoneGroupPLC41306042081Member": {
"xbrltype": "domainItemType",
"nsuri": "http://invesco.com/20250610",
"localname": "VodafoneGroupPLC41306042081Member",
"presentation": [
"http://xbrl.sec.gov/oef/role/ShareholderReportHoldingsDetails"
],
"lang": {
"en-us": {
"role": {
"label": "Vodafone Group PLC 4 13 06 04 2081 [Member]"
}
}
},
"auth_ref": []
},
"iametft_VolkswagenGroupOfAmericaFinanceLLC54403252027Member": {
"xbrltype": "domainItemType",
"nsuri": "http://invesco.com/20250610",
"localname": "VolkswagenGroupOfAmericaFinanceLLC54403252027Member",
"presentation": [
"http://xbrl.sec.gov/oef/role/ShareholderReportHoldingsDetails"
],
"lang": {
"en-us": {
"role": {
"label": "Volkswagen Group of America Finance LLC 5 44 03 25 2027 [Member]"
}
}
},
"auth_ref": []
},
"iametft_WellsFargoBankNAInvescoSAndP500EqualWeightETFMember": {
"xbrltype": "domainItemType",
"nsuri": "http://invesco.com/20250610",
"localname": "WellsFargoBankNAInvescoSAndP500EqualWeightETFMember",
"presentation": [
"http://xbrl.sec.gov/oef/role/ShareholderReportHoldingsDetails"
],
"lang": {
"en-us": {
"role": {
"label": "Wells Fargo Bank N A Invesco S And P 500 Equal Weight ETF [Member]"
}
}
},
"auth_ref": []
},
"iametft_WelltowerIncMember": {
"xbrltype": "domainItemType",
"nsuri": "http://invesco.com/20250610",
"localname": "WelltowerIncMember",
"presentation": [
"http://xbrl.sec.gov/oef/role/ShareholderReportHoldingsDetails"
],
"lang": {
"en-us": {
"role": {
"label": "Welltower Inc [Member]"
}
}
},
"auth_ref": []
},
"iametft_WilliamsCosIncTheMember": {
"xbrltype": "domainItemType",
"nsuri": "http://invesco.com/20250610",
"localname": "WilliamsCosIncTheMember",
"presentation": [
"http://xbrl.sec.gov/oef/role/ShareholderReportHoldingsDetails"
],
"lang": {
"en-us": {
"role": {
"label": "Williams Cos Inc The [Member]"
}
}
},
"auth_ref": []
},
"oef_WithSalesLoadMember": {
"xbrltype": "domainItemType",
"nsuri": "http://xbrl.sec.gov/oef/2025",
"localname": "WithSalesLoadMember",
"presentation": [
"http://xbrl.sec.gov/oef/role/ShareholderReportAverageAnnualReturnDetails"
],
"lang": {
"en-us": {
"role": {
"label": "With Sales Load [Member]"
}
}
},
"auth_ref": [
"r61"
]
},
"oef_WithoutSalesLoadMember": {
"xbrltype": "domainItemType",
"nsuri": "http://xbrl.sec.gov/oef/2025",
"localname": "WithoutSalesLoadMember",
"presentation": [
"http://xbrl.sec.gov/oef/role/ShareholderReportAverageAnnualReturnDetails"
],
"lang": {
"en-us": {
"role": {
"label": "Without Sales Load [Member]"
}
}
},
"auth_ref": [
"r61"
]
}
}
}
},
"std_ref": {
"r0": {
"role": "http://fasb.org/us-gaap/role/ref/legacyRef",
"Name": "Accounting Standards Codification",
"Section": "50",
"Paragraph": "1",
"SubTopic": "30",
"Topic": "205",
"Publisher": "FASB",
"URI": "https://asc.fasb.org/1943274/2147479910/205-30-50-1"
},
"r1": {
"role": "http://fasb.org/us-gaap/role/ref/legacyRef",
"Name": "Accounting Standards Codification",
"Section": "50",
"Paragraph": "1",
"SubTopic": "405",
"Topic": "942",
"Publisher": "FASB",
"URI": "https://asc.fasb.org/1943274/2147478353/942-405-50-1"
},
"r2": {
"role": "http://fasb.org/us-gaap/role/ref/legacyRef",
"Topic": "470",
"SubTopic": "10",
"Name": "Accounting Standards Codification",
"Section": "45",
"Paragraph": "12A",
"Publisher": "FASB",
"URI": "https://asc.fasb.org/1943274/2147481573/470-10-45-12A"
},
"r3": {
"role": "http://www.xbrl.org/2003/role/disclosureRef",
"Topic": "470",
"SubTopic": "10",
"Name": "Accounting Standards Codification",
"Section": "50",
"Paragraph": "6",
"Subparagraph": "(b)",
"Publisher": "FASB",
"URI": "https://asc.fasb.org/1943274/2147481544/470-10-50-6"
},
"r4": {
"role": "http://www.xbrl.org/2003/role/disclosureRef",
"Topic": "946",
"SubTopic": "210",
"Name": "Accounting Standards Codification",
"Section": "50",
"Paragraph": "1",
"Subparagraph": "(b)(1)",
"Publisher": "FASB",
"URI": "https://asc.fasb.org/1943274/2147478795/946-210-50-1"
},
"r5": {
"role": "http://www.xbrl.org/2003/role/disclosureRef",
"Topic": "946",
"SubTopic": "210",
"Name": "Accounting Standards Codification",
"Section": "50",
"Paragraph": "1",
"Subparagraph": "(c)(1)",
"Publisher": "FASB",
"URI": "https://asc.fasb.org/1943274/2147478795/946-210-50-1"
},
"r6": {
"role": "http://www.xbrl.org/2003/role/disclosureRef",
"Topic": "946",
"SubTopic": "210",
"Name": "Accounting Standards Codification",
"Section": "50",
"Paragraph": "1",
"Subparagraph": "(c)(2)",
"Publisher": "FASB",
"URI": "https://asc.fasb.org/1943274/2147478795/946-210-50-1"
},
"r7": {
"role": "http://www.xbrl.org/2003/role/disclosureRef",
"Topic": "946",
"SubTopic": "210",
"Name": "Accounting Standards Codification",
"Section": "50",
"Paragraph": "6",
"Subparagraph": "(a)(1)",
"Publisher": "FASB",
"URI": "https://asc.fasb.org/1943274/2147478795/946-210-50-6"
},
"r8": {
"role": "http://www.xbrl.org/2003/role/disclosureRef",
"Topic": "946",
"SubTopic": "210",
"Name": "Accounting Standards Codification",
"Section": "50",
"Paragraph": "6",
"Subparagraph": "(c)",
"Publisher": "FASB",
"URI": "https://asc.fasb.org/1943274/2147478795/946-210-50-6"
},
"r9": {
"role": "http://www.xbrl.org/2003/role/disclosureRef",
"Topic": "946",
"SubTopic": "320",
"Name": "Accounting Standards Codification",
"Section": "S99",
"Paragraph": "1",
"Subparagraph": "(SX 210.12-12(Column A)(Footnote 1))",
"Publisher": "FASB",
"URI": "https://asc.fasb.org/1943274/2147477271/946-320-S99-1"
},
"r10": {
"role": "http://www.xbrl.org/2003/role/disclosureRef",
"Topic": "946",
"SubTopic": "320",
"Name": "Accounting Standards Codification",
"Section": "S99",
"Paragraph": "1",
"Subparagraph": "(SX 210.12-12(Column C)(Footnote 5))",
"Publisher": "FASB",
"URI": "https://asc.fasb.org/1943274/2147477271/946-320-S99-1"
},
"r11": {
"role": "http://www.xbrl.org/2003/role/disclosureRef",
"Topic": "946",
"SubTopic": "320",
"Name": "Accounting Standards Codification",
"Section": "S99",
"Paragraph": "2",
"Subparagraph": "(SX 210.12-12A(Column C)(Footnote 4))",
"Publisher": "FASB",
"URI": "https://asc.fasb.org/1943274/2147477271/946-320-S99-2"
},
"r12": {
"role": "http://www.xbrl.org/2003/role/disclosureRef",
"Topic": "946",
"SubTopic": "320",
"Name": "Accounting Standards Codification",
"Section": "S99",
"Paragraph": "3",
"Subparagraph": "(SX 210.12-12B(Column A)(Footnote 7))",
"Publisher": "FASB",
"URI": "https://asc.fasb.org/1943274/2147477271/946-320-S99-3"
},
"r13": {
"role": "http://www.xbrl.org/2003/role/disclosureRef",
"Topic": "946",
"SubTopic": "320",
"Name": "Accounting Standards Codification",
"Section": "S99",
"Paragraph": "3",
"Subparagraph": "(SX 210.12-12B(Column C)(Footnote 2))",
"Publisher": "FASB",
"URI": "https://asc.fasb.org/1943274/2147477271/946-320-S99-3"
},
"r14": {
"role": "http://www.xbrl.org/2003/role/disclosureRef",
"Topic": "946",
"SubTopic": "320",
"Name": "Accounting Standards Codification",
"Section": "S99",
"Paragraph": "5D",
"Subparagraph": "(SX 210.12-13D(Column A)(Footnote 2)(i))",
"Publisher": "FASB",
"URI": "https://asc.fasb.org/1943274/2147477271/946-320-S99-5D"
},
"r15": {
"role": "http://www.xbrl.org/2003/role/disclosureRef",
"Topic": "946",
"SubTopic": "320",
"Name": "Accounting Standards Codification",
"Section": "S99",
"Paragraph": "6",
"Subparagraph": "(SX 210.12-14(Column F)(Footnote 7))",
"Publisher": "FASB",
"URI": "https://asc.fasb.org/1943274/2147477271/946-320-S99-6"
},
"r16": {
"role": "http://www.xbrl.org/2003/role/disclosureRef",
"Topic": "946",
"SubTopic": "320",
"Name": "Accounting Standards Codification",
"Section": "S99",
"Paragraph": "7",
"Subparagraph": "(SX 210.12-15(Column A))",
"Publisher": "FASB",
"URI": "https://asc.fasb.org/1943274/2147477271/946-320-S99-7"
},
"r17": {
"role": "http://www.xbrl.org/2003/role/disclosureRef",
"Topic": "946",
"SubTopic": "320",
"Name": "Accounting Standards Codification",
"Section": "S99",
"Paragraph": "7",
"Subparagraph": "(SX 210.12-15(Column B))",
"Publisher": "FASB",
"URI": "https://asc.fasb.org/1943274/2147477271/946-320-S99-7"
},
"r18": {
"role": "http://www.xbrl.org/2003/role/disclosureRef",
"Topic": "946",
"SubTopic": "320",
"Name": "Accounting Standards Codification",
"Section": "S99",
"Paragraph": "7",
"Subparagraph": "(SX 210.12-15(Column C))",
"Publisher": "FASB",
"URI": "https://asc.fasb.org/1943274/2147477271/946-320-S99-7"
},
"r19": {
"role": "http://www.xbrl.org/2003/role/disclosureRef",
"Topic": "946",
"SubTopic": "320",
"Name": "Accounting Standards Codification",
"Section": "S99",
"Paragraph": "7",
"Subparagraph": "(SX 210.12-15(Column D))",
"Publisher": "FASB",
"URI": "https://asc.fasb.org/1943274/2147477271/946-320-S99-7"
},
"r20": {
"role": "http://www.xbrl.org/2003/role/exampleRef",
"Topic": "235",
"SubTopic": "10",
"Name": "Accounting Standards Codification",
"Section": "S50",
"Paragraph": "1",
"Publisher": "FASB",
"URI": "https://asc.fasb.org/1943274/2147480738/235-10-S50-1"
},
"r21": {
"role": "http://www.xbrl.org/2003/role/exampleRef",
"Topic": "235",
"SubTopic": "10",
"Name": "Accounting Standards Codification",
"Section": "S99",
"Paragraph": "1",
"Subparagraph": "(SX 210.4-08(m)(1)(ii)(A))",
"Publisher": "FASB",
"URI": "https://asc.fasb.org/1943274/2147480678/235-10-S99-1"
},
"r22": {
"role": "http://www.xbrl.org/2003/role/exampleRef",
"Topic": "326",
"SubTopic": "20",
"Name": "Accounting Standards Codification",
"Section": "55",
"Paragraph": "12",
"Subparagraph": "(c)(1)",
"Publisher": "FASB",
"URI": "https://asc.fasb.org/1943274/2147479294/326-20-55-12"
},
"r23": {
"role": "http://www.xbrl.org/2003/role/exampleRef",
"Topic": "326",
"SubTopic": "20",
"Name": "Accounting Standards Codification",
"Section": "55",
"Paragraph": "15",
"Subparagraph": "(b)",
"Publisher": "FASB",
"URI": "https://asc.fasb.org/1943274/2147479294/326-20-55-15"
},
"r24": {
"role": "http://www.xbrl.org/2003/role/exampleRef",
"Topic": "715",
"SubTopic": "20",
"Name": "Accounting Standards Codification",
"Section": "50",
"Paragraph": "1",
"Subparagraph": "(d)(ii)",
"Publisher": "FASB",
"URI": "https://asc.fasb.org/1943274/2147480506/715-20-50-1"
},
"r25": {
"role": "http://www.xbrl.org/2003/role/exampleRef",
"Topic": "715",
"SubTopic": "20",
"Name": "Accounting Standards Codification",
"Section": "50",
"Paragraph": "5",
"Subparagraph": "(c)(ii)",
"Publisher": "FASB",
"URI": "https://asc.fasb.org/1943274/2147480506/715-20-50-5"
},
"r26": {
"role": "http://www.xbrl.org/2003/role/exampleRef",
"Topic": "715",
"SubTopic": "20",
"Name": "Accounting Standards Codification",
"Section": "55",
"Paragraph": "17",
"Publisher": "FASB",
"URI": "https://asc.fasb.org/1943274/2147480482/715-20-55-17"
},
"r27": {
"role": "http://www.xbrl.org/2003/role/exampleRef",
"Topic": "820",
"SubTopic": "10",
"Name": "Accounting Standards Codification",
"Section": "55",
"Paragraph": "100",
"Publisher": "FASB",
"URI": "https://asc.fasb.org/1943274/2147482078/820-10-55-100"
},
"r28": {
"role": "http://www.xbrl.org/2003/role/exampleRef",
"Topic": "820",
"SubTopic": "10",
"Name": "Accounting Standards Codification",
"Section": "55",
"Paragraph": "101",
"Publisher": "FASB",
"URI": "https://asc.fasb.org/1943274/2147482078/820-10-55-101"
},
"r29": {
"role": "http://www.xbrl.org/2003/role/exampleRef",
"Topic": "820",
"SubTopic": "10",
"Name": "Accounting Standards Codification",
"Section": "55",
"Paragraph": "103",
"Publisher": "FASB",
"URI": "https://asc.fasb.org/1943274/2147482078/820-10-55-103"
},
"r30": {
"role": "http://www.xbrl.org/2003/role/exampleRef",
"Topic": "860",
"SubTopic": "30",
"Name": "Accounting Standards Codification",
"Section": "55",
"Paragraph": "4",
"Publisher": "FASB",
"URI": "https://asc.fasb.org/1943274/2147481395/860-30-55-4"
},
"r31": {
"role": "http://www.xbrl.org/2003/role/exampleRef",
"Topic": "946",
"SubTopic": "210",
"Name": "Accounting Standards Codification",
"Section": "50",
"Paragraph": "1",
"Subparagraph": "(b)(1)",
"Publisher": "FASB",
"URI": "https://asc.fasb.org/1943274/2147478795/946-210-50-1"
},
"r32": {
"role": "http://www.xbrl.org/2003/role/exampleRef",
"Topic": "946",
"SubTopic": "210",
"Name": "Accounting Standards Codification",
"Section": "50",
"Paragraph": "6",
"Subparagraph": "(a)(1)",
"Publisher": "FASB",
"URI": "https://asc.fasb.org/1943274/2147478795/946-210-50-6"
},
"r33": {
"role": "http://www.xbrl.org/2003/role/exampleRef",
"Topic": "946",
"SubTopic": "210",
"Name": "Accounting Standards Codification",
"Section": "55",
"Paragraph": "1",
"Publisher": "FASB",
"URI": "https://asc.fasb.org/1943274/2147477439/946-210-55-1"
},
"r34": {
"role": "http://www.xbrl.org/2003/role/exampleRef",
"Topic": "946",
"SubTopic": "320",
"Name": "Accounting Standards Codification",
"Section": "S99",
"Paragraph": "1",
"Subparagraph": "(SX 210.12-12(Column A)(Footnote 2)(i))",
"Publisher": "FASB",
"URI": "https://asc.fasb.org/1943274/2147477271/946-320-S99-1"
},
"r35": {
"role": "http://www.xbrl.org/2003/role/exampleRef",
"Topic": "946",
"SubTopic": "320",
"Name": "Accounting Standards Codification",
"Section": "S99",
"Paragraph": "2",
"Subparagraph": "(SX 210.12-12A(Column A)(Footnote 2))",
"Publisher": "FASB",
"URI": "https://asc.fasb.org/1943274/2147477271/946-320-S99-2"
},
"r36": {
"role": "http://www.xbrl.org/2003/role/exampleRef",
"Topic": "946",
"SubTopic": "320",
"Name": "Accounting Standards Codification",
"Section": "S99",
"Paragraph": "3",
"Subparagraph": "(SX 210.12-12B(Column A)(Footnote 1)(a))",
"Publisher": "FASB",
"URI": "https://asc.fasb.org/1943274/2147477271/946-320-S99-3"
},
"r37": {
"role": "http://www.xbrl.org/2003/role/exampleRef",
"Topic": "946",
"SubTopic": "320",
"Name": "Accounting Standards Codification",
"Section": "S99",
"Paragraph": "6",
"Subparagraph": "(SX 210.12-14(Column A)(Footnote 2))",
"Publisher": "FASB",
"URI": "https://asc.fasb.org/1943274/2147477271/946-320-S99-6"
},
"r38": {
"role": "http://www.xbrl.org/2003/role/exampleRef",
"Topic": "970",
"SubTopic": "360",
"Name": "Accounting Standards Codification",
"Section": "S99",
"Paragraph": "1",
"Subparagraph": "(SX 210.12-28(Column A)(Footnote 2))",
"Publisher": "FASB",
"URI": "https://asc.fasb.org/1943274/2147478979/970-360-S99-1"
},
"r39": {
"role": "http://www.xbrl.org/2003/role/presentationRef",
"Publisher": "SEC",
"Name": "Exchange Act",
"Number": "240",
"Section": "12",
"Subsection": "b-2"
},
"r40": {
"role": "http://www.xbrl.org/2003/role/presentationRef",
"Publisher": "SEC",
"Name": "Exchange Act",
"Number": "240",
"Section": "12",
"Subsection": "d1-1"
},
"r41": {
"role": "http://www.xbrl.org/2003/role/presentationRef",
"Publisher": "SEC",
"Name": "Form N-1A",
"Section": "1",
"Subsection": "a",
"Paragraph": "1"
},
"r42": {
"role": "http://www.xbrl.org/2003/role/presentationRef",
"Publisher": "SEC",
"Name": "Form N-1A",
"Section": "27A",
"Subsection": "b",
"Paragraph": "1"
},
"r43": {
"role": "http://www.xbrl.org/2003/role/presentationRef",
"Publisher": "SEC",
"Name": "Form N-1A",
"Section": "27A",
"Subsection": "b",
"Paragraph": "3"
},
"r44": {
"role": "http://www.xbrl.org/2003/role/presentationRef",
"Publisher": "SEC",
"Name": "Form N-1A",
"Section": "27A",
"Subsection": "b",
"Paragraph": "4"
},
"r45": {
"role": "http://www.xbrl.org/2003/role/presentationRef",
"Publisher": "SEC",
"Name": "Form N-1A",
"Section": "27A",
"Subsection": "b",
"Paragraph": "5"
},
"r46": {
"role": "http://www.xbrl.org/2003/role/presentationRef",
"Publisher": "SEC",
"Name": "Form N-1A",
"Section": "27A",
"Subsection": "b",
"Paragraph": "instruction",
"Subparagraph": "2"
},
"r47": {
"role": "http://www.xbrl.org/2003/role/presentationRef",
"Publisher": "SEC",
"Name": "Form N-1A",
"Section": "27A",
"Subsection": "c"
},
"r48": {
"role": "http://www.xbrl.org/2003/role/presentationRef",
"Publisher": "SEC",
"Name": "Form N-1A",
"Section": "27A",
"Subsection": "c",
"Paragraph": "ii"
},
"r49": {
"role": "http://www.xbrl.org/2003/role/presentationRef",
"Publisher": "SEC",
"Name": "Form N-1A",
"Section": "27A",
"Subsection": "c",
"Paragraph": "iii"
},
"r50": {
"role": "http://www.xbrl.org/2003/role/presentationRef",
"Publisher": "SEC",
"Name": "Form N-1A",
"Section": "27A",
"Subsection": "c",
"Paragraph": "instruction",
"Sentence": "1",
"Clause": "b"
},
"r51": {
"role": "http://www.xbrl.org/2003/role/presentationRef",
"Publisher": "SEC",
"Name": "Form N-1A",
"Section": "27A",
"Subsection": "c",
"Paragraph": "instruction",
"Subparagraph": "1",
"Clause": "c"
},
"r52": {
"role": "http://www.xbrl.org/2003/role/presentationRef",
"Publisher": "SEC",
"Name": "Form N-1A",
"Section": "27A",
"Subsection": "c",
"Paragraph": "instruction",
"Subparagraph": "1",
"Clause": "d"
},
"r53": {
"role": "http://www.xbrl.org/2003/role/presentationRef",
"Publisher": "SEC",
"Name": "Form N-1A",
"Section": "27A",
"Subsection": "d",
"Paragraph": "1"
},
"r54": {
"role": "http://www.xbrl.org/2003/role/presentationRef",
"Publisher": "SEC",
"Name": "Form N-1A",
"Section": "27A",
"Subsection": "d",
"Paragraph": "2"
},
"r55": {
"role": "http://www.xbrl.org/2003/role/presentationRef",
"Publisher": "SEC",
"Name": "Form N-1A",
"Section": "27A",
"Subsection": "d",
"Paragraph": "2",
"Subparagraph": "i"
},
"r56": {
"role": "http://www.xbrl.org/2003/role/presentationRef",
"Publisher": "SEC",
"Name": "Form N-1A",
"Section": "27A",
"Subsection": "d",
"Paragraph": "2",
"Subparagraph": "iii",
"Clause": "B"
},
"r57": {
"role": "http://www.xbrl.org/2003/role/presentationRef",
"Publisher": "SEC",
"Name": "Form N-1A",
"Section": "27A",
"Subsection": "d",
"Paragraph": "2",
"Subparagraph": "iiii",
"Clause": "A"
},
"r58": {
"role": "http://www.xbrl.org/2003/role/presentationRef",
"Publisher": "SEC",
"Name": "Form N-1A",
"Section": "27A",
"Subsection": "d",
"Paragraph": "2",
"Subparagraph": "instruction",
"Clause": "12"
},
"r59": {
"role": "http://www.xbrl.org/2003/role/presentationRef",
"Publisher": "SEC",
"Name": "Form N-1A",
"Section": "27A",
"Subsection": "d",
"Paragraph": "2",
"Subparagraph": "instruction",
"Clause": "14"
},
"r60": {
"role": "http://www.xbrl.org/2003/role/presentationRef",
"Publisher": "SEC",
"Name": "Form N-1A",
"Section": "27A",
"Subsection": "d",
"Paragraph": "2",
"Subparagraph": "instruction",
"Clause": "15"
},
"r61": {
"role": "http://www.xbrl.org/2003/role/presentationRef",
"Publisher": "SEC",
"Name": "Form N-1A",
"Section": "27A",
"Subsection": "d",
"Paragraph": "2",
"Subparagraph": "instruction",
"Clause": "7"
},
"r62": {
"role": "http://www.xbrl.org/2003/role/presentationRef",
"Publisher": "SEC",
"Name": "Form N-1A",
"Section": "27A",
"Subsection": "d",
"Paragraph": "2",
"Subparagraph": "instruction",
"Clause": "8"
},
"r63": {
"role": "http://www.xbrl.org/2003/role/presentationRef",
"Publisher": "SEC",
"Name": "Form N-1A",
"Section": "27A",
"Subsection": "d",
"Paragraph": "3"
},
"r64": {
"role": "http://www.xbrl.org/2003/role/presentationRef",
"Publisher": "SEC",
"Name": "Form N-1A",
"Section": "27A",
"Subsection": "d",
"Paragraph": "4"
},
"r65": {
"role": "http://www.xbrl.org/2003/role/presentationRef",
"Publisher": "SEC",
"Name": "Form N-1A",
"Section": "27A",
"Subsection": "d",
"Paragraph": "4",
"Subparagraph": "instruction",
"Clause": "3"
},
"r66": {
"role": "http://www.xbrl.org/2003/role/presentationRef",
"Publisher": "SEC",
"Name": "Form N-1A",
"Section": "27A",
"Subsection": "d",
"Paragraph": "4",
"Subparagraph": "instruction",
"Clause": "4"
},
"r67": {
"role": "http://www.xbrl.org/2003/role/presentationRef",
"Publisher": "SEC",
"Name": "Form N-1A",
"Section": "27A",
"Subsection": "e"
},
"r68": {
"role": "http://www.xbrl.org/2003/role/presentationRef",
"Publisher": "SEC",
"Name": "Form N-1A",
"Section": "27A",
"Subsection": "e",
"Paragraph": "instruction",
"Subparagraph": "6"
},
"r69": {
"role": "http://www.xbrl.org/2003/role/presentationRef",
"Publisher": "SEC",
"Name": "Form N-1A",
"Section": "27A",
"Subsection": "f"
},
"r70": {
"role": "http://www.xbrl.org/2003/role/presentationRef",
"Publisher": "SEC",
"Name": "Form N-1A",
"Section": "27A",
"Subsection": "g"
},
"r71": {
"role": "http://www.xbrl.org/2003/role/presentationRef",
"Publisher": "SEC",
"Name": "Form N-1A",
"Section": "27A",
"Subsection": "g",
"Paragraph": "1"
},
"r72": {
"role": "http://www.xbrl.org/2003/role/presentationRef",
"Publisher": "SEC",
"Name": "Form N-1A",
"Section": "27A",
"Subsection": "g",
"Paragraph": "2"
},
"r73": {
"role": "http://www.xbrl.org/2003/role/presentationRef",
"Publisher": "SEC",
"Name": "Form N-1A",
"Section": "27A",
"Subsection": "g",
"Paragraph": "3"
},
"r74": {
"role": "http://www.xbrl.org/2003/role/presentationRef",
"Publisher": "SEC",
"Name": "Form N-1A",
"Section": "27A",
"Subsection": "g",
"Paragraph": "4"
},
"r75": {
"role": "http://www.xbrl.org/2003/role/presentationRef",
"Publisher": "SEC",
"Name": "Form N-1A",
"Section": "27A",
"Subsection": "g",
"Paragraph": "5"
},
"r76": {
"role": "http://www.xbrl.org/2003/role/presentationRef",
"Publisher": "SEC",
"Name": "Form N-1A",
"Section": "27A",
"Subsection": "g",
"Paragraph": "6"
},
"r77": {
"role": "http://www.xbrl.org/2003/role/presentationRef",
"Publisher": "SEC",
"Name": "Form N-1A",
"Section": "27A",
"Subsection": "g",
"Paragraph": "instruction",
"Subparagraph": "2"
},
"r78": {
"role": "http://www.xbrl.org/2003/role/presentationRef",
"Publisher": "SEC",
"Name": "Form N-1A",
"Section": "27A",
"Subsection": "h",
"Paragraph": "1"
},
"r79": {
"role": "http://www.xbrl.org/2003/role/presentationRef",
"Publisher": "SEC",
"Name": "Form N-1A",
"Section": "27A",
"Subsection": "h",
"Paragraph": "2"
},
"r80": {
"role": "http://www.xbrl.org/2003/role/presentationRef",
"Publisher": "SEC",
"Name": "Form N-1A",
"Section": "3",
"Subsection": "instruction",
"Paragraph": "1",
"Subparagraph": "d",
"Sentence": "i"
},
"r81": {
"role": "http://www.xbrl.org/2003/role/presentationRef",
"Publisher": "SEC",
"Name": "Form N-1A",
"Section": "4",
"Subsection": "b",
"Paragraph": "2",
"Subparagraph": "i"
},
"r82": {
"role": "http://www.xbrl.org/2003/role/presentationRef",
"Publisher": "SEC",
"Name": "Form N-1A",
"Section": "4",
"Subsection": "b",
"Paragraph": "2",
"Subparagraph": "iii"
},
"r83": {
"role": "http://www.xbrl.org/2003/role/presentationRef",
"Publisher": "SEC",
"Name": "Regulation S-T",
"Number": "232",
"Section": "313"
},
"r84": {
"role": "http://www.xbrl.org/2009/role/commonPracticeRef",
"Topic": "320",
"SubTopic": "10",
"Name": "Accounting Standards Codification",
"Section": "50",
"Paragraph": "3",
"Publisher": "FASB",
"URI": "https://asc.fasb.org/1943274/2147481800/320-10-50-3"
},
"r85": {
"role": "http://www.xbrl.org/2009/role/commonPracticeRef",
"Topic": "320",
"SubTopic": "10",
"Name": "Accounting Standards Codification",
"Section": "50",
"Paragraph": "5",
"Subparagraph": "(f)",
"Publisher": "FASB",
"URI": "https://asc.fasb.org/1943274/2147481800/320-10-50-5"
},
"r86": {
"role": "http://www.xbrl.org/2009/role/commonPracticeRef",
"Topic": "320",
"SubTopic": "10",
"Name": "Accounting Standards Codification",
"Section": "50",
"Paragraph": "5B",
"Publisher": "FASB",
"URI": "https://asc.fasb.org/1943274/2147481800/320-10-50-5B"
},
"r87": {
"role": "http://www.xbrl.org/2009/role/commonPracticeRef",
"Topic": "326",
"SubTopic": "20",
"Name": "Accounting Standards Codification",
"Section": "50",
"Paragraph": "5",
"Subparagraph": "(b)",
"Publisher": "FASB",
"URI": "https://asc.fasb.org/1943274/2147479319/326-20-50-5"
},
"r88": {
"role": "http://www.xbrl.org/2009/role/commonPracticeRef",
"Topic": "715",
"SubTopic": "20",
"Name": "Accounting Standards Codification",
"Section": "50",
"Paragraph": "1",
"Subparagraph": "(d)(ii)",
"Publisher": "FASB",
"URI": "https://asc.fasb.org/1943274/2147480506/715-20-50-1"
},
"r89": {
"role": "http://www.xbrl.org/2009/role/commonPracticeRef",
"Topic": "715",
"SubTopic": "20",
"Name": "Accounting Standards Codification",
"Section": "50",
"Paragraph": "5",
"Subparagraph": "(c)(ii)",
"Publisher": "FASB",
"URI": "https://asc.fasb.org/1943274/2147480506/715-20-50-5"
},
"r90": {
"role": "http://www.xbrl.org/2009/role/commonPracticeRef",
"Topic": "942",
"SubTopic": "320",
"Name": "Accounting Standards Codification",
"Section": "50",
"Paragraph": "2",
"Subparagraph": "(b)",
"Publisher": "FASB",
"URI": "https://asc.fasb.org/1943274/2147477268/942-320-50-2"
},
"r91": {
"role": "http://www.xbrl.org/2009/role/commonPracticeRef",
"Topic": "946",
"SubTopic": "205",
"Name": "Accounting Standards Codification",
"Section": "45",
"Paragraph": "4",
"Subparagraph": "(a)",
"Publisher": "FASB",
"URI": "https://asc.fasb.org/1943274/2147478009/946-205-45-4"
},
"r92": {
"role": "http://www.xbrl.org/2009/role/commonPracticeRef",
"Topic": "946",
"SubTopic": "205",
"Name": "Accounting Standards Codification",
"Section": "50",
"Paragraph": "27",
"Publisher": "FASB",
"URI": "https://asc.fasb.org/1943274/2147478494/946-205-50-27"
},
"r93": {
"role": "http://www.xbrl.org/2009/role/commonPracticeRef",
"Topic": "946",
"SubTopic": "220",
"Name": "Accounting Standards Codification",
"Section": "S99",
"Paragraph": "3",
"Subparagraph": "(SX 210.6-09(4)(b))",
"Publisher": "FASB",
"URI": "https://asc.fasb.org/1943274/2147479134/946-220-S99-3"
},
"r94": {
"role": "http://www.xbrl.org/2009/role/commonPracticeRef",
"Topic": "946",
"SubTopic": "320",
"Name": "Accounting Standards Codification",
"Section": "S99",
"Paragraph": "1",
"Subparagraph": "(SX 210.12-12(Column A)(Footnote 2)(ii))",
"Publisher": "FASB",
"URI": "https://asc.fasb.org/1943274/2147477271/946-320-S99-1"
},
"r95": {
"role": "http://www.xbrl.org/2009/role/commonPracticeRef",
"Topic": "946",
"SubTopic": "320",
"Name": "Accounting Standards Codification",
"Section": "S99",
"Paragraph": "2",
"Subparagraph": "(SX 210.12-12A(Column A)(Footnote 2))",
"Publisher": "FASB",
"URI": "https://asc.fasb.org/1943274/2147477271/946-320-S99-2"
},
"r96": {
"role": "http://www.xbrl.org/2009/role/commonPracticeRef",
"Topic": "946",
"SubTopic": "320",
"Name": "Accounting Standards Codification",
"Section": "S99",
"Paragraph": "3",
"Subparagraph": "(SX 210.12-12B(Column A)(Footnote 1)(b))",
"Publisher": "FASB",
"URI": "https://asc.fasb.org/1943274/2147477271/946-320-S99-3"
},
"r97": {
"role": "http://www.xbrl.org/2009/role/commonPracticeRef",
"Topic": "946",
"SubTopic": "320",
"Name": "Accounting Standards Codification",
"Section": "S99",
"Paragraph": "6",
"Subparagraph": "(SX 210.12-14(Column A)(Footnote 2))",
"Publisher": "FASB",
"URI": "https://asc.fasb.org/1943274/2147477271/946-320-S99-6"
},
"r98": {
"role": "http://www.xbrl.org/2009/role/commonPracticeRef",
"Topic": "948",
"SubTopic": "310",
"Name": "Accounting Standards Codification",
"Section": "S50",
"Paragraph": "2",
"Publisher": "FASB",
"URI": "https://asc.fasb.org/1943274/2147478322/948-310-S50-2"
},
"r99": {
"role": "http://www.xbrl.org/2009/role/commonPracticeRef",
"Topic": "948",
"SubTopic": "310",
"Name": "Accounting Standards Codification",
"Section": "S99",
"Paragraph": "1",
"Subparagraph": "(SX 210.12-29(Column A)(Footnote 4))",
"Publisher": "FASB",
"URI": "https://asc.fasb.org/1943274/2147479628/948-310-S99-1"
},
"r100": {
"role": "http://www.xbrl.org/2009/role/commonPracticeRef",
"Topic": "948",
"SubTopic": "310",
"Name": "Accounting Standards Codification",
"Section": "S99",
"Paragraph": "1",
"Subparagraph": "(SX 210.12-29(Column B))",
"Publisher": "FASB",
"URI": "https://asc.fasb.org/1943274/2147479628/948-310-S99-1"
},
"r101": {
"role": "http://www.xbrl.org/2009/role/commonPracticeRef",
"Topic": "948",
"SubTopic": "310",
"Name": "Accounting Standards Codification",
"Section": "S99",
"Paragraph": "1",
"Subparagraph": "(SX 210.12-29(Column C))",
"Publisher": "FASB",
"URI": "https://asc.fasb.org/1943274/2147479628/948-310-S99-1"
}
}
}