UNITED STATES
SECURITIES AND EXCHANGE COMMISSION
Washington, D.C. 20549
FORM N-CSR
CERTIFIED SHAREHOLDER REPORT OF REGISTERED
MANAGEMENT INVESTMENT COMPANIES
Investment Company Act file number 811-02741
Fidelity Court Street Trust
(Exact name of registrant as specified in charter)
245 Summer St., Boston, Massachusetts 02210
(Address of principal executive offices) (Zip code)
Margaret Carey, Secretary
245 Summer St.
Boston, Massachusetts 02210
(Name and address of agent for service)
Registrant's telephone number, including area code:
617-563-7000
| |
Date of fiscal year end:
| November 30
|
|
|
Date of reporting period:
| November 30, 2023
|
Item 1.
Reports to Stockholders
Fidelity® Connecticut Municipal Income Fund
Annual Report
November 30, 2023
Contents
To view a fund's proxy voting guidelines and proxy voting record for the 12-month period ended June 30, visit http://www.fidelity.com/proxyvotingresults or visit the Securities and Exchange Commission's (SEC) web site at http://www.sec.gov.
You may also call 1-800-544-8544 to request a free copy of the proxy voting guidelines.
Standard & Poor's, S&P and S&P 500 are registered service marks of The McGraw-Hill Companies, Inc. and have been licensed for use by Fidelity Distributors Corporation.
Other third-party marks appearing herein are the property of their respective owners.
All other marks appearing herein are registered or unregistered trademarks or service marks of FMR LLC or an affiliated company. © 2024 FMR LLC. All rights reserved.
This report and the financial statements contained herein are submitted for the general information of the shareholders of the Fund. This report is not authorized for distribution to prospective investors in the Fund unless preceded or accompanied by an effective prospectus.
A fund files its complete schedule of portfolio holdings with the SEC for the first and third quarters of each fiscal year on Form N-PORT. Forms N-PORT are available on the SEC's web site at http://www.sec.gov. A fund's Forms N-PORT may be reviewed and copied at the SEC's Public Reference Room in Washington, DC. Information regarding the operation of the SEC's Public Reference Room may be obtained by calling 1-800-SEC-0330.
For a complete list of a fund's portfolio holdings, view the most recent holdings listing, semiannual report, or annual report on Fidelity's web site at http://www.fidelity.com, http://www.institutional.fidelity.com, or http://www.401k.com, as applicable.
NOT FDIC INSURED •MAY LOSE VALUE •NO BANK GUARANTEE
Neither the Fund nor Fidelity Distributors Corporation is a bank.
Average annual total return reflects the change in the value of an investment, assuming reinvestment of distributions from dividend income and capital gains (the profits earned upon the sale of securities that have grown in value, if any) and assuming a constant rate of performance each year. The hypothetical investment and the average annual total returns do not reflect the deduction of taxes that a shareholder would pay on fund distributions or the redemption of fund shares. During periods of reimbursement by Fidelity, a fund's total return will be greater than it would be had the reimbursement not occurred. How a fund did yesterday is no guarantee of how it will do tomorrow.
Average Annual Total Returns
|
|
|
|
|
|
Periods ended November 30, 2023
|
Past 1
year
|
Past 5
years
|
Past 10
years
|
Fidelity® Connecticut Municipal Income Fund
|
3.67%
|
1.96%
|
2.48%
|
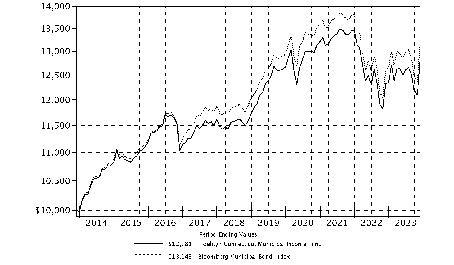
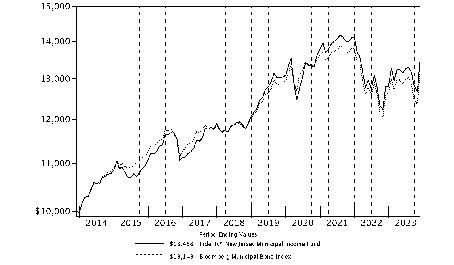
$10,000 Over 10 Years
|
|
|
Let's say hypothetically that $10,000 was invested in Fidelity® Connecticut Municipal Income Fund on November 30, 2013.
The chart shows how the value of your investment would have changed, and also shows how the Bloomberg Municipal Bond Index performed over the same period.
|
|
|
Market Recap:
Tax-exempt municipal bonds gained 4.28% for the 12 months ending November 30, 2023, according to the Bloomberg Municipal Bond Index, buoyed in good part by outsized gains in the final month of the period. Overall, munis charted a rocky path through the 12-month period. They posted notable advances in the first months and early summer of 2023, when the bond market reacted positively to a slowdown in the pace of the U.S. Federal Reserve's campaign to bring down inflation by raising interest rates. But munis retreated in February when mixed economic data - lower inflation but resilient jobs and consumer spending - fueled worries that the central bank would continue its hiking cycle for longer than the market expected at the beginning of the year, then declined again in August and September when the Fed explicitly adopted a "higher for longer" message on interest rates. In November, however, munis had one of their best months since the 1980s, rising 6.35%, as yields fell sharply in response to a mild inflation report that eased pressure on the Fed. The central bank held steady on rates at its November committee meeting, the second consecutive meeting it chose to do so. For the full 12 months, muni tax-backed credit fundamentals remained solid, and the risk of credit-rating downgrades appeared low for most issuers. Lower-quality investment-grade bonds (rated BAA) and longer-term securities (15+ years) delivered the muni market's best returns.
Comments from Co-Portfolio Managers Cormac Cullen, Michael Maka and Elizah McLaughlin:
For the fiscal year ending November 30, 2023, the fund gained 3.67%, net of fees, versus 3.89% for the state-specific Bloomberg Connecticut 2+ Year Enhanced Municipal Linked 08/01/2018 Index, and 4.28% for the benchmark, the Bloomberg Municipal Bond Index. The past 12 months, we focused on long-term objectives and sought to generate attractive tax-exempt income and a competitive risk-adjusted return. The fund's overweight in lower-quality investment-grade munis contributed to performance versus the state index, as these securities outpaced higher-quality bonds. An overweight in health care bonds also boosted the relative result, as the group's credit quality improved and investor demand for higher-yielding securities strengthened. The fund had more interest rate sensitivity, as measured by its longer duration, than the index, which was advantageous in the final month of the period when muni yields sharply declined. The fund's carry advantage, meaning its larger-than-index exposure to high-coupon bonds, also helped, as these securities were somewhat cushioned from rising interest rates. In contrast, differences in the way fund holdings and state index components were priced notably detracted from relative performance. Fund holdings are priced by a third-party pricing service and validated daily by Fidelity Management and Research's fair-value processes. Securities within the index, however, are priced by the index provider.
The views expressed above reflect those of the portfolio manager(s) only through the end of the period as stated on the cover of this report and do not necessarily represent the views of Fidelity or any other person in the Fidelity organization. Any such views are subject to change at any time based upon market or other conditions and Fidelity disclaims any responsibility to update such views. These views may not be relied on as investment advice and, because investment decisions for a Fidelity fund are based on numerous factors, may not be relied on as an indication of trading intent on behalf of any Fidelity fund.
Revenue Sources (% of Fund's net assets)
|
General Obligations
|
41.6
|
|
Education
|
18.1
|
|
Health Care
|
16.3
|
|
Special Tax
|
7.2
|
|
Housing
|
6.7
|
|
Others* (Individually Less Than 5%)
|
10.1
|
|
|
|
100.0
|
|
|
|
*Includes net other assets
|
|
|
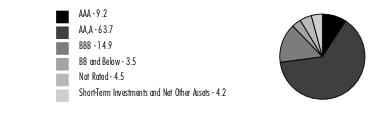
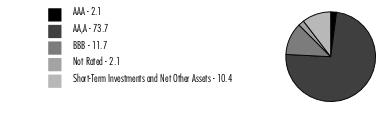
Quality Diversification (% of Fund's net assets)
|
|
|
|
|
We have used ratings from Moody's Investors Service, Inc. Where Moody's® ratings are not available, we have used S&P® ratings. All ratings are as of the date indicated and do not reflect subsequent changes.
|
Showing Percentage of Net Assets
Municipal Bonds - 95.8%
|
|
|
|
Principal
Amount (a)
|
Value ($)
|
Connecticut - 94.4%
|
|
|
|
Bridgeport Gen. Oblig.:
|
|
|
|
Series 2016 D:
|
|
|
|
5% 8/15/31 (Assured Guaranty Muni. Corp. Insured)
|
|
1,000,000
|
1,039,240
|
5% 8/15/32 (Assured Guaranty Muni. Corp. Insured)
|
|
3,090,000
|
3,206,075
|
Series 2019 A:
|
|
|
|
5% 2/1/32 (Build America Mutual Assurance Insured)
|
|
1,000,000
|
1,094,010
|
5% 2/1/37 (Build America Mutual Assurance Insured)
|
|
1,000,000
|
1,068,137
|
5% 2/1/39 (Build America Mutual Assurance Insured)
|
|
1,000,000
|
1,056,265
|
Series 2021 A:
|
|
|
|
4% 8/1/38
|
|
800,000
|
795,505
|
4% 8/1/41
|
|
1,050,000
|
1,022,364
|
4% 8/1/46
|
|
375,000
|
349,061
|
4% 8/1/51
|
|
575,000
|
525,909
|
5% 8/1/35
|
|
450,000
|
495,417
|
Brookfield Gen. Oblig. Series 2020, 2% 8/15/35
|
|
365,000
|
297,831
|
Connecticut Arpt. Auth. Customer Facility Charge Rev. (Ground Trans. Ctr. Proj.) Series 2019 A:
|
|
|
|
4% 7/1/49 (b)
|
|
2,000,000
|
1,681,618
|
5% 7/1/49 (b)
|
|
2,925,000
|
2,928,612
|
Connecticut Gen. Oblig.:
|
|
|
|
Series 2015 B:
|
|
|
|
5% 6/15/27
|
|
4,825,000
|
4,959,709
|
5% 6/15/30
|
|
1,290,000
|
1,322,058
|
Series 2015 F, 5% 11/15/31
|
|
4,000,000
|
4,124,013
|
Series 2018 A, 5% 4/15/30
|
|
2,500,000
|
2,713,866
|
Series 2018 C, 5% 6/15/31
|
|
725,000
|
787,110
|
Series 2019 A:
|
|
|
|
5% 4/15/25
|
|
1,140,000
|
1,171,012
|
5% 4/15/35
|
|
2,000,000
|
2,190,408
|
5% 4/15/36
|
|
2,300,000
|
2,502,205
|
5% 4/15/39
|
|
2,450,000
|
2,613,853
|
Series 2020 A, 3% 1/15/39
|
|
5,500,000
|
4,799,441
|
Series 2020 C, 3% 6/1/40
|
|
3,380,000
|
2,856,903
|
Series 2021 A:
|
|
|
|
3% 1/15/32
|
|
335,000
|
322,426
|
3% 1/15/35
|
|
1,850,000
|
1,733,239
|
3% 1/15/36
|
|
9,130,000
|
8,425,985
|
3% 1/15/37
|
|
2,875,000
|
2,591,158
|
3% 1/15/38
|
|
1,000,000
|
871,960
|
Series 2021 B, 3% 6/1/39
|
|
1,400,000
|
1,201,208
|
Series 2022 A, 4% 1/15/34
|
|
400,000
|
423,312
|
Series 2022 B, 2% 1/15/38
|
|
320,000
|
229,972
|
Series 2023 A:
|
|
|
|
5% 5/15/26
|
|
2,400,000
|
2,521,224
|
5% 5/15/27
|
|
900,000
|
966,975
|
Series 2023 B:
|
|
|
|
5% 8/1/26
|
|
3,000,000
|
3,166,865
|
5% 8/1/27
|
|
1,835,000
|
1,980,475
|
Connecticut Health & Edl. Facilities Auth. Rev.:
|
|
|
|
(Fairfield Univ.):
|
|
|
|
Series 2017 R:
|
|
|
|
5% 7/1/31
|
|
1,825,000
|
1,933,994
|
5% 7/1/32
|
|
1,000,000
|
1,060,619
|
Series 2017, 5% 7/1/30
|
|
2,400,000
|
2,542,051
|
(Sacred Heart Univ., CT. Proj.) Series 2017 I-1:
|
|
|
|
5% 7/1/27
|
|
80,000
|
84,759
|
5% 7/1/28
|
|
1,150,000
|
1,214,427
|
5% 7/1/29
|
|
350,000
|
369,501
|
5% 7/1/30
|
|
1,100,000
|
1,158,642
|
5% 7/1/31
|
|
1,300,000
|
1,366,416
|
5% 7/1/32
|
|
1,050,000
|
1,102,772
|
5% 7/1/33
|
|
700,000
|
734,313
|
5% 7/1/34
|
|
750,000
|
784,761
|
Bonds Series 2017 B2, 3.2%, tender 7/1/26 (c)
|
|
7,000,000
|
6,930,503
|
Series 2013 N:
|
|
|
|
5% 7/1/24
|
|
400,000
|
400,623
|
5% 7/1/25
|
|
300,000
|
300,284
|
Series 2014 E:
|
|
|
|
5% 7/1/28
|
|
3,260,000
|
3,283,861
|
5% 7/1/29
|
|
3,840,000
|
3,867,694
|
Series 2015 L, 5% 7/1/29
|
|
1,500,000
|
1,532,688
|
Series 2016 K, 4% 7/1/46
|
|
7,000,000
|
6,193,690
|
Series 2018 K3, 5% 7/1/38
|
|
985,000
|
975,524
|
Series 2019 A:
|
|
|
|
4% 7/1/49
|
|
1,365,000
|
1,114,120
|
5% 7/1/26
|
|
310,000
|
315,555
|
5% 7/1/29
|
|
1,290,000
|
1,345,636
|
5% 7/1/49 (d)
|
|
6,000,000
|
4,973,065
|
Series 2019 Q1, 3% 11/1/33
|
|
1,000,000
|
950,527
|
Series 2020 A, 4% 7/1/40
|
|
1,250,000
|
1,204,917
|
Series 2020 C, 4% 7/1/45
|
|
1,800,000
|
1,662,947
|
Series 2020 K:
|
|
|
|
5% 7/1/36
|
|
1,000,000
|
1,074,523
|
5% 7/1/37
|
|
1,750,000
|
1,862,226
|
5% 7/1/39
|
|
2,830,000
|
2,974,070
|
Series 2020 R, 4% 6/1/45
|
|
2,200,000
|
2,133,630
|
Series 2021 A, 3% 7/1/39
|
|
5,000,000
|
3,978,157
|
Series 2021 G, 4% 3/1/51
|
|
3,000,000
|
2,823,453
|
Series 2021 L, 3% 7/1/41
|
|
1,340,000
|
1,087,724
|
Series 2022 M:
|
|
|
|
4% 7/1/36
|
|
250,000
|
253,334
|
4% 7/1/37
|
|
260,000
|
260,950
|
4% 7/1/39
|
|
2,600,000
|
2,464,928
|
4% 7/1/40
|
|
3,300,000
|
3,099,473
|
4% 7/1/41
|
|
1,195,000
|
1,154,254
|
4% 7/1/42
|
|
1,750,000
|
1,609,108
|
Series 2023 E:
|
|
|
|
5% 7/15/38
|
|
900,000
|
957,590
|
5% 7/15/39
|
|
1,060,000
|
1,120,492
|
5% 7/15/40
|
|
1,300,000
|
1,362,789
|
Series E, 5% 7/1/28
|
|
1,250,000
|
1,255,818
|
Series G:
|
|
|
|
5% 7/1/29 (d)
|
|
1,055,000
|
1,068,497
|
5% 7/1/30 (d)
|
|
275,000
|
275,771
|
5% 7/1/34 (d)
|
|
695,000
|
689,914
|
5% 7/1/39 (d)
|
|
2,600,000
|
2,479,115
|
5% 7/1/50 (d)
|
|
1,000,000
|
887,522
|
Series K1:
|
|
|
|
5% 7/1/24
|
|
600,000
|
601,776
|
5% 7/1/25
|
|
1,240,000
|
1,241,122
|
5% 7/1/27
|
|
250,000
|
255,783
|
Series K3, 5% 7/1/48
|
|
3,695,000
|
3,419,740
|
Series L:
|
|
|
|
5% 7/1/26
|
|
1,000,000
|
1,022,676
|
5% 7/1/27
|
|
2,000,000
|
2,043,753
|
Series L1:
|
|
|
|
4% 7/1/24
|
|
650,000
|
649,125
|
4% 7/1/25
|
|
600,000
|
599,015
|
4% 7/1/26
|
|
1,175,000
|
1,183,944
|
4% 7/1/27
|
|
700,000
|
708,732
|
Series N:
|
|
|
|
4% 7/1/39
|
|
1,850,000
|
1,488,522
|
5% 7/1/24
|
|
375,000
|
374,251
|
5% 7/1/25
|
|
340,000
|
338,413
|
5% 7/1/27
|
|
430,000
|
428,594
|
5% 7/1/31
|
|
500,000
|
496,561
|
5% 7/1/32
|
|
550,000
|
544,316
|
5% 7/1/33
|
|
720,000
|
709,217
|
5% 7/1/34
|
|
675,000
|
661,947
|
Series R:
|
|
|
|
5% 6/1/37
|
|
1,000,000
|
1,077,341
|
5% 6/1/38
|
|
1,045,000
|
1,114,117
|
5% 6/1/39
|
|
1,595,000
|
1,690,041
|
5% 6/1/40
|
|
1,125,000
|
1,182,798
|
Connecticut Higher Ed. Supplemental Ln. Auth. Rev.:
|
|
|
|
(Chesla Ln. Prog.):
|
|
|
|
Series 2017 B, 5% 11/15/24 (Escrowed to Maturity) (b)
|
|
1,065,000
|
1,081,984
|
Series B:
|
|
|
|
5% 11/15/24 (b)
|
|
300,000
|
303,371
|
5% 11/15/25 (b)
|
|
400,000
|
408,680
|
5% 11/15/26 (b)
|
|
600,000
|
622,038
|
5% 11/15/27 (b)
|
|
610,000
|
641,213
|
5% 11/15/28 (b)
|
|
525,000
|
557,496
|
5% 11/15/29 (b)
|
|
530,000
|
566,148
|
(Chesla Loan Prog.):
|
|
|
|
Series C:
|
|
|
|
5% 11/15/24 (Escrowed to Maturity)
|
|
225,000
|
229,011
|
5% 11/15/25 (Escrowed to Maturity)
|
|
240,000
|
249,343
|
5% 11/15/26 (Escrowed to Maturity)
|
|
200,000
|
212,595
|
5% 11/15/27 (Pre-Refunded to 11/15/26 @ 100)
|
|
125,000
|
132,872
|
Series D:
|
|
|
|
5% 11/15/24 (Escrowed to Maturity)
|
|
425,000
|
432,376
|
5% 11/15/25 (Escrowed to Maturity)
|
|
250,000
|
259,491
|
5% 11/15/26 (Escrowed to Maturity)
|
|
180,000
|
191,073
|
Connecticut Hsg. Fin. Auth.:
|
|
|
|
Series 2016 F, 3.5% 5/15/39 (b)
|
|
455,000
|
448,028
|
Series 2018 E1, 4.25% 5/15/42
|
|
1,160,000
|
1,156,768
|
Series 2019 B1, 4% 5/15/49
|
|
2,350,000
|
2,334,849
|
Series 2019 F, 3.5% 11/15/43
|
|
2,300,000
|
2,256,084
|
Series 2020 A2, 2.2% 5/15/31 (b)
|
|
1,350,000
|
1,168,466
|
Series 2021 B1, 3% 11/15/49
|
|
2,335,000
|
2,244,354
|
Series 2022 A1, 3.5% 11/15/51
|
|
975,000
|
950,050
|
Series A2:
|
|
|
|
5% 11/15/26 (b)
|
|
840,000
|
868,716
|
5% 5/15/27 (b)
|
|
1,890,000
|
1,964,254
|
5% 11/15/27 (b)
|
|
860,000
|
899,492
|
5% 5/15/28 (b)
|
|
615,000
|
644,198
|
5% 11/15/28 (b)
|
|
225,000
|
236,843
|
Series C:
|
|
|
|
5% 5/15/26 (b)
|
|
1,820,000
|
1,879,231
|
5% 5/15/27 (b)
|
|
800,000
|
835,377
|
5% 11/15/28 (b)
|
|
580,000
|
611,064
|
5% 5/15/29 (b)
|
|
1,115,000
|
1,186,450
|
Connecticut Spl. Tax Oblig. Trans. Infrastructure Rev.:
|
|
|
|
Series 2021 A, 5% 5/1/35
|
|
1,000,000
|
1,135,880
|
Series 2021 C:
|
|
|
|
5% 1/1/28
|
|
1,600,000
|
1,742,150
|
5% 1/1/30
|
|
3,500,000
|
3,934,851
|
5% 1/1/31
|
|
3,410,000
|
3,893,508
|
5% 1/1/32
|
|
2,500,000
|
2,892,453
|
Series A:
|
|
|
|
5% 5/1/28
|
|
1,000,000
|
1,095,885
|
5% 9/1/33
|
|
1,000,000
|
1,007,767
|
East Lyme Gen. Oblig. Series 2020, 3% 7/15/38
|
|
530,000
|
443,738
|
Greater New Haven Wtr. Poll. Cont. Auth. Reg'l. Wastewtr. Sys. Rev.:
|
|
|
|
Series 2005 A, 5% 8/15/35 (Nat'l. Pub. Fin. Guarantee Corp. Insured)
|
|
10,000
|
10,005
|
Series 2014 B:
|
|
|
|
5% 8/15/25
|
|
450,000
|
456,086
|
5% 8/15/26
|
|
700,000
|
710,498
|
5% 8/15/27
|
|
750,000
|
761,562
|
5% 8/15/28
|
|
385,000
|
390,909
|
Hartford County Metropolitan District (Connecticut Clean Wtr. Proj.) Series 2014 A, 5% 11/1/28 (Pre-Refunded to 11/1/24 @ 100)
|
|
1,000,000
|
1,017,092
|
Hartford County Metropolitan District Gen. Oblig. Series 2018:
|
|
|
|
5% 7/15/31
|
|
1,000,000
|
1,095,536
|
5% 7/15/32
|
|
1,250,000
|
1,366,918
|
5% 7/15/33
|
|
1,000,000
|
1,089,014
|
5% 7/15/34
|
|
1,000,000
|
1,085,639
|
Hartford Gen. Oblig.:
|
|
|
|
Series 2014 C, 5% 8/15/24 (Build America Mutual Assurance Insured)
|
|
1,835,000
|
1,858,104
|
Series 2015 A:
|
|
|
|
5% 7/1/28 (Assured Guaranty Muni. Corp. Insured)
|
|
1,000,000
|
1,029,053
|
5% 7/1/29 (Assured Guaranty Muni. Corp. Insured)
|
|
1,000,000
|
1,027,142
|
Hbr. Point Infrastructure Impt. District Series 2017, 5% 4/1/39 (d)
|
|
2,000,000
|
2,006,539
|
Meriden Gen. Oblig.:
|
|
|
|
Series 2020 B, 2% 7/1/36
|
|
680,000
|
530,342
|
Series 2023:
|
|
|
|
3% 6/15/35
|
|
1,165,000
|
1,063,524
|
3.25% 6/15/36
|
|
565,000
|
520,558
|
Milford Gen. Oblig. Series 2021 A, 2% 11/1/33
|
|
330,000
|
281,161
|
Naugatuck Ctfs. of Prtn. (Naugatuck Incineration Facilities Proj.) Series 2021 A, 4% 8/15/38 (b)
|
|
3,330,000
|
3,176,024
|
New Britain Gen. Oblig.:
|
|
|
|
Series 2015 A:
|
|
|
|
5% 3/1/27 (Build America Mutual Assurance Insured)
|
|
1,605,000
|
1,643,060
|
5% 3/1/29 (Build America Mutual Assurance Insured)
|
|
1,770,000
|
1,812,823
|
5% 3/1/30
|
|
600,000
|
613,577
|
5% 3/1/30 (Pre-Refunded to 3/1/25 @ 100)
|
|
1,260,000
|
1,288,476
|
5% 3/1/31 (Pre-Refunded to 3/1/25 @ 100)
|
|
1,955,000
|
1,999,183
|
Series 2017 C:
|
|
|
|
5% 3/1/32 (Assured Guaranty Muni. Corp. Insured)
|
|
1,635,000
|
1,725,360
|
5% 3/1/33 (Assured Guaranty Muni. Corp. Insured)
|
|
1,900,000
|
2,004,269
|
New Haven Gen. Oblig.:
|
|
|
|
Series 2015 B:
|
|
|
|
5% 8/15/26 (Build America Mutual Assurance Insured)
|
|
615,000
|
632,123
|
5% 8/15/27 (Build America Mutual Assurance Insured)
|
|
765,000
|
786,302
|
Series 2015:
|
|
|
|
5% 9/1/29 (Assured Guaranty Muni. Corp. Insured)
|
|
2,655,000
|
2,732,133
|
5% 9/1/31 (Assured Guaranty Muni. Corp. Insured)
|
|
1,430,000
|
1,471,159
|
Series 2016 A:
|
|
|
|
5% 8/15/27 (Pre-Refunded to 8/15/26 @ 100)
|
|
35,000
|
36,983
|
5% 8/15/28 (Assured Guaranty Muni. Corp. Insured)
|
|
1,500,000
|
1,566,947
|
5% 8/15/30 (Assured Guaranty Muni. Corp. Insured)
|
|
1,000,000
|
1,044,424
|
5% 8/15/34 (Assured Guaranty Muni. Corp. Insured)
|
|
1,000,000
|
1,040,002
|
5% 8/15/35 (Assured Guaranty Muni. Corp. Insured)
|
|
1,000,000
|
1,037,613
|
Series 2017 B, 5% 8/1/25
|
|
500,000
|
513,874
|
Series 2021 A, 4% 8/1/32
|
|
950,000
|
955,425
|
Series 2023:
|
|
|
|
5% 8/1/36 (Build America Mutual Assurance Insured)
|
|
400,000
|
440,971
|
5% 8/1/37 (Build America Mutual Assurance Insured)
|
|
550,000
|
600,340
|
5% 8/1/38 (Build America Mutual Assurance Insured)
|
|
300,000
|
324,475
|
5.25% 8/1/43 (Build America Mutual Assurance Insured)
|
|
1,900,000
|
2,048,330
|
South Central Reg'l. Wtr. Auth. Wtr. Sys. Rev. Series 32 B:
|
|
|
|
5% 8/1/32
|
|
1,000,000
|
1,051,368
|
5% 8/1/33
|
|
1,150,000
|
1,206,974
|
South Windsor Gen. Oblig. Series 2023, 3% 2/1/36
|
|
765,000
|
706,688
|
Steelpointe Hbr. Infrastructure Impt. District (Steelpointe Hbr. Proj.) Series 2021:
|
|
|
|
4% 4/1/31 (d)
|
|
390,000
|
366,662
|
4% 4/1/36 (d)
|
|
485,000
|
431,103
|
4% 4/1/41 (d)
|
|
660,000
|
554,849
|
4% 4/1/51 (d)
|
|
1,225,000
|
959,459
|
Stratford Gen. Oblig.:
|
|
|
|
Series 2017, 5% 7/1/30 (Assured Guaranty Muni. Corp. Insured)
|
|
1,000,000
|
1,031,321
|
Series 2019, 5% 1/1/27
|
|
1,990,000
|
2,100,036
|
Univ. of Connecticut Gen. Oblig.:
|
|
|
|
Series 2018 A, 5% 4/15/28
|
|
4,400,000
|
4,791,230
|
Series 2023 A:
|
|
|
|
5% 8/15/29
|
|
1,500,000
|
1,669,213
|
5% 8/15/30
|
|
1,325,000
|
1,494,686
|
Series A, 5% 8/15/27
|
|
1,335,000
|
1,339,537
|
West Haven Gen. Oblig.:
|
|
|
|
Series 2017 A:
|
|
|
|
5% 11/1/25
|
|
635,000
|
654,932
|
5% 11/1/26
|
|
635,000
|
667,569
|
Series 2017 B, 5% 11/1/32
|
|
400,000
|
415,153
|
Series 2021, 4% 9/15/41
|
|
1,125,000
|
1,040,962
|
TOTAL CONNECTICUT
|
|
|
282,137,876
|
Puerto Rico - 1.4%
|
|
|
|
Puerto Rico Commonwealth Aqueduct & Swr. Auth. Series 2021 B, 5% 7/1/37 (d)
|
|
835,000
|
834,966
|
Puerto Rico Commonwealth Pub. Impt. Gen. Oblig. Series 2021 A1:
|
|
|
|
0% 7/1/33
|
|
863,283
|
525,484
|
5.625% 7/1/27
|
|
100,000
|
104,411
|
5.625% 7/1/29
|
|
310,000
|
327,641
|
5.75% 7/1/31
|
|
735,000
|
790,465
|
Puerto Rico Sales Tax Fing. Corp. Sales Tax Rev.:
|
|
|
|
Series 2018 A1, 0% 7/1/31
|
|
855,000
|
615,767
|
Series 2019 A2, 4.329% 7/1/40
|
|
1,105,000
|
1,045,934
|
TOTAL PUERTO RICO
|
|
|
4,244,668
|
|
TOTAL MUNICIPAL BONDS
(Cost $298,700,692)
|
|
|
286,382,544
|
|
|
|
|
|
Money Market Funds - 3.1%
|
|
|
|
Shares
|
Value ($)
|
Fidelity Municipal Cash Central Fund 3.41% (e)(f)
(Cost $9,228,001)
|
|
9,226,155
|
9,227,996
|
|
|
|
|
|
|
TOTAL INVESTMENT IN SECURITIES - 98.9%
(Cost $307,928,693)
|
295,610,540
|
NET OTHER ASSETS (LIABILITIES) - 1.1%
|
3,147,544
|
NET ASSETS - 100.0%
|
298,758,084
|
|
|
|
Legend
(a)
|
Amount is stated in United States dollars unless otherwise noted.
|
(b)
|
Private activity obligations whose interest is subject to the federal alternative minimum tax for individuals.
|
(c)
|
Coupon rates for floating and adjustable rate securities reflect the rates in effect at period end.
|
(d)
|
Security exempt from registration under Rule 144A of the Securities Act of 1933. These securities may be resold in transactions exempt from registration, normally to qualified institutional buyers. At the end of the period, the value of these securities amounted to $15,527,462 or 5.2% of net assets.
|
(e)
|
Information in this report regarding holdings by state and security types does not reflect the holdings of the Fidelity Municipal Cash Central Fund.
|
(f)
|
Affiliated fund that is generally available only to investment companies and other accounts managed by Fidelity Investments. The rate quoted is the annualized seven-day yield of the fund at period end. A complete unaudited listing of the fund's holdings as of its most recent quarter end is available upon request. In addition, each Fidelity Central Fund's financial statements, which are not covered by the Fund's Report of Independent Registered Public Accounting Firm, are available on the SEC's website or upon request.
|
Affiliated Central Funds
Fiscal year to date information regarding the Fund's investments in Fidelity Central Funds, including the ownership percentage, is presented below.
Affiliate
|
Value,
beginning
of period ($)
|
Purchases ($)
|
Sales
Proceeds ($)
|
Dividend
Income ($)
|
Realized
Gain (loss) ($)
|
Change in
Unrealized
appreciation
(depreciation) ($)
|
Value,
end
of period ($)
|
% ownership,
end
of period
|
Fidelity Municipal Cash Central Fund 3.41%
|
-
|
56,826,996
|
47,599,000
|
301,154
|
-
|
-
|
9,227,996
|
0.4%
|
Total
|
-
|
56,826,996
|
47,599,000
|
301,154
|
-
|
-
|
9,227,996
|
|
|
|
|
|
|
|
|
|
|
|
Amounts in the dividend income column in the above table include any capital gain distributions from underlying funds, which are presented in the corresponding line item in the Statement of Operations, if applicable.
Amounts included in the purchases and sales proceeds columns may include in-kind transactions, if applicable.
Investment Valuation
The following is a summary of the inputs used, as of November 30, 2023, involving the Fund's assets and liabilities carried at fair value. The inputs or methodology used for valuing securities may not be an indication of the risk associated with investing in those securities. For more information on valuation inputs, and their aggregation into the levels used below, please refer to the Investment Valuation section in the accompanying Notes to Financial Statements.
Valuation Inputs at Reporting Date:
|
Description
|
Total ($)
|
Level 1 ($)
|
Level 2 ($)
|
Level 3 ($)
|
Investments in Securities:
|
|
|
|
|
|
|
Municipal Securities
|
286,382,544
|
-
|
286,382,544
|
-
|
|
|
Money Market Funds
|
9,227,996
|
9,227,996
|
-
|
-
|
Total Investments in Securities:
|
295,610,540
|
9,227,996
|
286,382,544
|
-
|
Statement of Assets and Liabilities
|
|
|
|
|
November 30, 2023
|
|
|
|
|
|
|
Assets
|
|
|
|
|
Investment in securities, at value - See accompanying schedule:
|
|
|
|
|
Unaffiliated issuers (cost $298,700,692)
|
$
|
286,382,544
|
|
|
Fidelity Central Funds (cost $9,228,001)
|
|
9,227,996
|
|
|
|
|
|
|
|
|
|
|
|
|
|
|
Total Investment in Securities (cost $307,928,693)
|
|
|
$
|
295,610,540
|
Cash
|
|
|
|
100,018
|
Receivable for fund shares sold
|
|
|
|
34,570
|
Interest receivable
|
|
|
|
4,030,994
|
Distributions receivable from Fidelity Central Funds
|
|
|
|
19,734
|
Prepaid expenses
|
|
|
|
327
|
Other receivables
|
|
|
|
1,014
|
Total assets
|
|
|
|
299,797,197
|
Liabilities
|
|
|
|
|
Payable for fund shares redeemed
|
$
|
735,060
|
|
|
Distributions payable
|
|
141,128
|
|
|
Accrued management fee
|
|
83,711
|
|
|
Other affiliated payables
|
|
27,970
|
|
|
Other payables and accrued expenses
|
|
51,244
|
|
|
Total Liabilities
|
|
|
|
1,039,113
|
Net Assets
|
|
|
$
|
298,758,084
|
Net Assets consist of:
|
|
|
|
|
Paid in capital
|
|
|
$
|
313,067,372
|
Total accumulated earnings (loss)
|
|
|
|
(14,309,288)
|
Net Assets
|
|
|
$
|
298,758,084
|
Net Asset Value, offering price and redemption price per share ($298,758,084 ÷ 27,660,294 shares)
|
|
|
$
|
10.80
|
Statement of Operations
|
|
|
|
|
Year ended
November 30, 2023
|
Investment Income
|
|
|
|
|
Interest
|
|
|
$
|
8,963,163
|
Income from Fidelity Central Funds
|
|
|
|
301,154
|
Total Income
|
|
|
|
9,264,317
|
Expenses
|
|
|
|
|
Management fee
|
$
|
1,055,238
|
|
|
Transfer agent fees
|
|
273,541
|
|
|
Accounting fees and expenses
|
|
78,823
|
|
|
Custodian fees and expenses
|
|
4,918
|
|
|
Independent trustees' fees and expenses
|
|
1,053
|
|
|
Registration fees
|
|
26,645
|
|
|
Audit
|
|
54,457
|
|
|
Legal
|
|
6,610
|
|
|
Miscellaneous
|
|
2,525
|
|
|
Total expenses before reductions
|
|
1,503,810
|
|
|
Expense reductions
|
|
(13,832)
|
|
|
Total expenses after reductions
|
|
|
|
1,489,978
|
Net Investment income (loss)
|
|
|
|
7,774,339
|
Realized and Unrealized Gain (Loss)
|
|
|
|
|
Net realized gain (loss) on:
|
|
|
|
|
Investment Securities:
|
|
|
|
|
Unaffiliated issuers
|
|
(1,581,508)
|
|
|
Total net realized gain (loss)
|
|
|
|
(1,581,508)
|
Change in net unrealized appreciation (depreciation) on:
|
|
|
|
|
Investment Securities:
|
|
|
|
|
Unaffiliated issuers
|
|
4,266,303
|
|
|
Affiliated issuers
|
|
(5)
|
|
|
Total change in net unrealized appreciation (depreciation)
|
|
|
|
4,266,298
|
Net gain (loss)
|
|
|
|
2,684,790
|
Net increase (decrease) in net assets resulting from operations
|
|
|
$
|
10,459,129
|
Statement of Changes in Net Assets
|
|
|
|
|
Year ended
November 30, 2023
|
|
Year ended
November 30, 2022
|
Increase (Decrease) in Net Assets
|
|
|
|
|
Operations
|
|
|
|
|
Net investment income (loss)
|
$
|
7,774,339
|
$
|
7,159,890
|
Net realized gain (loss)
|
|
(1,581,508)
|
|
(689,343)
|
Change in net unrealized appreciation (depreciation)
|
|
4,266,298
|
|
(35,527,060)
|
Net increase (decrease) in net assets resulting from operations
|
|
10,459,129
|
|
(29,056,513)
|
Distributions to shareholders
|
|
(7,563,399)
|
|
(8,014,941)
|
|
|
|
|
|
|
Share transactions
|
|
|
|
|
Proceeds from sales of shares
|
|
57,343,626
|
|
55,551,642
|
Reinvestment of distributions
|
|
5,784,378
|
|
5,786,014
|
Cost of shares redeemed
|
|
(73,627,936)
|
|
(76,487,612)
|
|
|
|
|
|
|
Net increase (decrease) in net assets resulting from share transactions
|
|
(10,499,932)
|
|
(15,149,956)
|
Total increase (decrease) in net assets
|
|
(7,604,202)
|
|
(52,221,410)
|
|
|
|
|
|
|
Net Assets
|
|
|
|
|
Beginning of period
|
|
306,362,286
|
|
358,583,696
|
End of period
|
$
|
298,758,084
|
$
|
306,362,286
|
|
|
|
|
|
|
Other Information
|
|
|
|
|
Shares
|
|
|
|
|
Sold
|
|
5,340,689
|
|
5,114,174
|
Issued in reinvestment of distributions
|
|
541,660
|
|
523,425
|
Redeemed
|
|
(6,916,326)
|
|
(6,975,028)
|
Net increase (decrease)
|
|
(1,033,977)
|
|
(1,337,429)
|
|
|
|
|
|
|
Financial Highlights
Fidelity® Connecticut Municipal Income Fund
|
|
|
Years ended November 30,
|
|
2023
|
|
2022
|
|
2021
|
|
2020
|
|
2019
|
Selected Per-Share Data
|
|
|
|
|
|
|
|
|
|
|
Net asset value, beginning of period
|
$
|
10.68
|
$
|
11.94
|
$
|
11.96
|
$
|
11.78
|
$
|
11.10
|
Income from Investment Operations
|
|
|
|
|
|
|
|
|
|
|
Net investment income (loss) A,B
|
|
.274
|
|
.246
|
|
.247
|
|
.279
|
|
.292
|
Net realized and unrealized gain (loss)
|
|
.112
|
|
(1.232)
|
|
.035
|
|
.190
|
|
.680
|
Total from investment operations
|
|
.386
|
|
(.986)
|
|
.282
|
|
.469
|
|
.972
|
Distributions from net investment income
|
|
(.266)
|
|
(.244)
|
|
(.247)
|
|
(.279)
|
|
(.292)
|
Distributions from net realized gain
|
|
-
|
|
(.030)
|
|
(.055)
|
|
(.010)
|
|
-
|
Total distributions
|
|
(.266)
|
|
(.274)
|
|
(.302)
|
|
(.289)
|
|
(.292)
|
Net asset value, end of period
|
$
|
10.80
|
$
|
10.68
|
$
|
11.94
|
$
|
11.96
|
$
|
11.78
|
Total Return C
|
|
3.67%
|
|
(8.31)%
|
|
2.39%
|
|
4.04%
|
|
8.83%
|
Ratios to Average Net Assets B,D,E
|
|
|
|
|
|
|
|
|
|
|
Expenses before reductions
|
|
.49%
|
|
.49%
|
|
.48%
|
|
.49%
|
|
.48%
|
Expenses net of fee waivers, if any
|
|
.49%
|
|
.49%
|
|
.48%
|
|
.49%
|
|
.48%
|
Expenses net of all reductions
|
|
.49%
|
|
.49%
|
|
.48%
|
|
.49%
|
|
.48%
|
Net investment income (loss)
|
|
2.56%
|
|
2.23%
|
|
2.07%
|
|
2.37%
|
|
2.53%
|
Supplemental Data
|
|
|
|
|
|
|
|
|
|
|
Net assets, end of period (000 omitted)
|
$
|
298,758
|
$
|
306,362
|
$
|
358,584
|
$
|
354,094
|
$
|
352,073
|
Portfolio turnover rate F
|
|
15%
|
|
13%
|
|
13%
|
|
16%
|
|
20%
|
ACalculated based on average shares outstanding during the period.
BNet investment income (loss) is affected by the timing of the declaration of dividends by any underlying mutual funds or exchange-traded funds (ETFs). Net investment income (loss) of any mutual funds or ETFs is not included in the Fund's net investment income (loss) ratio.
CTotal returns would have been lower if certain expenses had not been reduced during the applicable periods shown.
DFees and expenses of any underlying mutual funds or exchange-traded funds (ETFs) are not included in the Fund's expense ratio. The Fund indirectly bears its proportionate share of these expenses. For additional expense information related to investments in Fidelity Central Funds, please refer to the "Investments in Fidelity Central Funds" note found in the Notes to Financial Statements section of the most recent Annual or Semi-Annual report.
EExpense ratios reflect operating expenses of the class. Expenses before reductions do not reflect amounts reimbursed, waived, or reduced through arrangements with the investment adviser, brokerage services, or other offset arrangements, if applicable, and do not represent the amount paid by the class during periods when reimbursements, waivers or reductions occur.
FAmount does not include the portfolio activity of any underlying mutual funds or exchange-traded funds (ETFs).
For the period ended November 30, 2023
1. Organization.
Fidelity Connecticut Municipal Income Fund (the Fund) is a non-diversified fund of Fidelity Court Street Trust (the Trust) and is authorized to issue an unlimited number of shares. Share transactions on the Statement of Changes in Net Assets may contain exchanges between affiliated funds. The Trust is registered under the Investment Company Act of 1940, as amended (the 1940 Act), as an open-end management investment company organized as a Massachusetts business trust. The Fund may be affected by economic and political developments in the state of Connecticut.
2. Investments in Fidelity Central Funds.
Funds may invest in Fidelity Central Funds, which are open-end investment companies generally available only to other investment companies and accounts managed by the investment adviser and its affiliates. The Schedule of Investments lists any Fidelity Central Funds held as an investment as of period end, but does not include the underlying holdings of each Fidelity Central Fund. An investing fund indirectly bears its proportionate share of the expenses of the underlying Fidelity Central Funds.
Based on its investment objective, each Fidelity Central Fund may invest or participate in various investment vehicles or strategies that are similar to those of the investing fund. These strategies are consistent with the investment objectives of the investing fund and may involve certain economic risks which may cause a decline in value of each of the Fidelity Central Funds and thus a decline in the value of the investing fund.
Fidelity Central Fund
|
Investment Manager
|
Investment Objective
|
Investment Practices
|
Expense RatioA
|
Fidelity Money Market Central Funds
|
Fidelity Management & Research Company LLC (FMR)
|
Each fund seeks to obtain a high level of current income consistent with the preservation of capital and liquidity.
|
Short-term Investments
|
Less than .005%
|
A Expenses expressed as a percentage of average net assets and are as of each underlying Central Fund's most recent annual or semi-annual shareholder report.
A complete unaudited list of holdings for each Fidelity Central Fund is available upon request or at the Securities and Exchange Commission website at www.sec.gov. In addition, the financial statements of the Fidelity Central Funds which contain the significant accounting policies (including investment valuation policies) of those funds, and are not covered by the Report of Independent Registered Public Accounting Firm, are available on the Securities and Exchange Commission website or upon request.
3. Significant Accounting Policies.
The Fund is an investment company and applies the accounting and reporting guidance of the Financial Accounting Standards Board (FASB) Accounting Standards Codification Topic 946 Financial Services - Investment Companies. The financial statements have been prepared in conformity with accounting principles generally accepted in the United States of America (GAAP), which require management to make certain estimates and assumptions at the date of the financial statements. Actual results could differ from those estimates. Subsequent events, if any, through the date that the financial statements were issued have been evaluated in the preparation of the financial statements. The Fund's Schedule of Investments lists any underlying mutual funds or exchange-traded funds (ETFs) but does not include the underlying holdings of these funds. The following summarizes the significant accounting policies of the Fund:
Investment Valuation. Investments are valued as of 4:00 p.m. Eastern time on the last calendar day of the period. The Board of Trustees (the Board) has designated the Fund's investment adviser as the valuation designee responsible for the fair valuation function and performing fair value determinations as needed. The investment adviser has established a Fair Value Committee (the Committee) to carry out the day-to-day fair valuation responsibilities and has adopted policies and procedures to govern the fair valuation process and the activities of the Committee. In accordance with these fair valuation policies and procedures, which have been approved by the Board, the Fund attempts to obtain prices from one or more third party pricing services or brokers to value its investments. When current market prices, quotations or currency exchange rates are not readily available or reliable, investments will be fair valued in good faith by the Committee, in accordance with the policies and procedures. Factors used in determining fair value vary by investment type and may include market or investment specific events, transaction data, estimated cash flows, and market observations of comparable investments. The frequency that the fair valuation procedures are used cannot be predicted and they may be utilized to a significant extent. The Committee manages the Fund's fair valuation practices and maintains the fair valuation policies and procedures. The Fund's investment adviser reports to the Board information regarding the fair valuation process and related material matters.
The Fund categorizes the inputs to valuation techniques used to value its investments into a disclosure hierarchy consisting of three levels as shown below:
Level 1 - unadjusted quoted prices in active markets for identical investments
Level 2 - other significant observable inputs (including quoted prices for similar investments, interest rates, prepayment speeds, etc.)
Level 3 - unobservable inputs (including the Fund's own assumptions based on the best information available)
Valuation techniques used to value the Fund's investments by major category are as follows:
Debt securities, including restricted securities, are valued based on evaluated prices received from third party pricing services or from brokers who make markets in such securities. Municipal securities are valued by pricing services who utilize matrix pricing which considers yield or price of bonds of comparable quality, coupon, maturity and type or by broker-supplied prices. When independent prices are unavailable or unreliable, debt securities may be valued utilizing pricing methodologies which consider similar factors that would be used by third party pricing services. Debt securities are generally categorized as Level 2 in the hierarchy but may be Level 3 depending on the circumstances.
Investments in open-end mutual funds, including the Fidelity Central Funds, are valued at their closing net asset value (NAV) each business day and are categorized as Level 1 in the hierarchy.
Changes in valuation techniques may result in transfers in or out of an assigned level within the disclosure hierarchy. The aggregate value of investments by input level as of November 30, 2023, is included at the end of the Fund's Schedule of Investments.
Investment Transactions and Income. For financial reporting purposes, the Fund's investment holdings and NAV include trades executed through the end of the last business day of the period. The NAV per share for processing shareholder transactions is calculated as of the close of business of the New York Stock Exchange (NYSE), normally 4:00 p.m. Eastern time and includes trades executed through the end of the prior business day. Gains and losses on securities sold are determined on the basis of identified cost. Income and capital gain distributions from Fidelity Central Funds, if any, are recorded on the ex-dividend date. Interest income is accrued as earned and includes coupon interest and amortization of premium and accretion of discount on debt securities as applicable. Debt obligations may be placed on non-accrual status and related interest income may be reduced by ceasing current accruals and writing off interest receivables when the collection of all or a portion of interest has become doubtful based on consistently applied procedures. A debt obligation is removed from non-accrual status when the issuer resumes interest payments or when collectability of interest is reasonably assured.
Expenses. Expenses directly attributable to a fund are charged to that fund. Expenses attributable to more than one fund are allocated among the respective funds on the basis of relative net assets or other appropriate methods. Expenses included in the accompanying financial statements reflect the expenses of that fund and do not include any expenses associated with any underlying mutual funds or exchange-traded funds. Although not included in a fund's expenses, a fund indirectly bears its proportionate share of these expenses through the net asset value of each underlying mutual fund or exchange-traded fund. Expense estimates are accrued in the period to which they relate and adjustments are made when actual amounts are known.
Income Tax Information and Distributions to Shareholders. Each year, the Fund intends to qualify as a regulated investment company under Subchapter M of the Internal Revenue Code, including distributing substantially all of its taxable income and realized gains. As a result, no provision for U.S. Federal income taxes is required. As of November 30, 2023, the Fund did not have any unrecognized tax benefits in the financial statements; nor is the Fund aware of any tax positions for which it is reasonably possible that the total amounts of unrecognized tax benefits will significantly change in the next twelve months. The Fund files a U.S. federal tax return, in addition to state and local tax returns as required. The Fund's federal income tax returns are subject to examination by the Internal Revenue Service (IRS) for a period of three fiscal years after they are filed. State and local tax returns may be subject to examination for an additional fiscal year depending on the jurisdiction.
Distributions are declared and recorded daily and paid monthly from net investment income. Distributions from realized gains, if any, are declared and recorded on the ex-dividend date. Income and capital gain distributions are determined in accordance with income tax regulations, which may differ from GAAP.
Capital accounts within the financial statements are adjusted for permanent book-tax differences. These adjustments have no impact on net assets or the results of operations. Capital accounts are not adjusted for temporary book-tax differences which will reverse in a subsequent period.
Book-tax differences are primarily due to market discount and capital loss carryforwards.
The Fund purchases municipal securities whose interest, in the opinion of the issuer, is free from federal income tax. There is no assurance that the IRS will agree with this opinion. In the event the IRS determines that the issuer does not comply with relevant tax requirements, interest payments from a security could become federally taxable, possibly retroactively to the date the security was issued.
As of period end, the cost and unrealized appreciation (depreciation) in securities, and derivatives if applicable, for federal income tax purposes were as follows:
Gross unrealized appreciation
|
$1,927,107
|
Gross unrealized depreciation
|
(13,992,771)
|
Net unrealized appreciation (depreciation)
|
$(12,065,664)
|
Tax Cost
|
$307,676,204
|
The tax-based components of distributable earnings as of period end were as follows:
Undistributed tax-exempt income
|
$27,211
|
Capital loss carryforward
|
$(2,270,836)
|
Net unrealized appreciation (depreciation) on securities and other investments
|
$(12,065,664)
|
Capital loss carryforwards are only available to offset future capital gains of the Fund to the extent provided by regulations and may be limited. The capital loss carryforward information presented below, including any applicable limitation, is estimated as of fiscal period end and is subject to adjustment.
Short-term
|
$(384,655)
|
Long-term
|
(1,886,181)
|
Total capital loss carryforward
|
$(2,270,836)
|
The tax character of distributions paid was as follows:
|
November 30, 2023
|
November 30, 2022
|
Tax-exempt Income
|
$7,563,399
|
$7,117,317
|
Long-term Capital Gains
|
-
|
897,624
|
Total
|
$7,563,399
|
$8,014,941
|
Restricted Securities (including Private Placements). Funds may invest in securities that are subject to legal or contractual restrictions on resale. These securities generally may be resold in transactions exempt from registration or to the public if the securities are registered. Disposal of these securities may involve time-consuming negotiations and expense, and prompt sale at an acceptable price may be difficult. Information regarding restricted securities held at period end is included at the end of the Schedule of Investments, if applicable.
4. Purchases and Sales of Investments.
Purchases and sales of securities, other than short-term securities and in-kind transactions, as applicable, are noted in the table below.
|
Purchases ($)
|
Sales ($)
|
Fidelity Connecticut Municipal Income Fund
|
42,739,134
|
40,344,738
|
5. Fees and Other Transactions with Affiliates.
Management Fee. Fidelity Management & Research Company LLC (the investment adviser) and its affiliates provide the Fund with investment management related services for which the Fund pays a monthly management fee. The management fee is the sum of an individual fund fee rate that is based on an annual rate of .25% of the Fund's average net assets and an annualized group fee rate that averaged .10% during the period. The group fee rate is based upon the monthly average net assets of a group of registered investment companies with which the investment adviser has management contracts. The group fee rate decreases as assets under management increase and increases as assets under management decrease. For the reporting period, the total annual management fee rate was .35% of the Fund's average net assets.
Transfer Agent Fees. Fidelity Investments Institutional Operations Company LLC (FIIOC), an affiliate of the investment adviser, is the transfer, dividend disbursing and shareholder servicing agent for the Fund. FIIOC receives account fees and asset-based fees that vary according to account size and type of account. FIIOC pays for typesetting, printing and mailing of shareholder reports, except proxy statements. For the period, transfer agent fees were equivalent to an annual rate of .09% of average net assets.
During November 2023, the Board approved a change in the transfer agent fees effective December 1, 2023 to a fixed annual rate of 0.0900% of average net assets.
Accounting Fees. Fidelity Service Company, Inc. (FSC), an affiliate of the investment adviser, maintains the Fund's accounting records. The accounting fee is based on the level of average net assets for each month. For the period, the fees were equivalent to the following annual rates:
|
% of Average Net Assets
|
Fidelity Connecticut Municipal Income Fund
|
.03
|
During November 2023, the Board approved a change in the accounting fees effective December 1, 2023 to a fixed annual rate of average net assets as follows:
|
|
|
% of Average Net Assets
|
Fidelity Connecticut Municipal Income Fund
|
.0259
|
|
|
Interfund Trades. Funds may purchase from or sell securities to other Fidelity Funds under procedures adopted by the Board. The procedures have been designed to ensure these interfund trades are executed in accordance with Rule 17a-7 of the 1940 Act. Any interfund trades are included within the respective purchases and sales amounts shown in the Purchases and Sales of Investments note. During the period, there were no interfund trades.
6. Committed Line of Credit.
Certain Funds participate with other funds managed by the investment adviser or an affiliate in a $4.25 billion credit facility (the "line of credit") to be utilized for temporary or emergency purposes to fund shareholder redemptions or for other short-term liquidity purposes. The participating funds have agreed to pay commitment fees on their pro-rata portion of the line of credit, which are reflected in Miscellaneous expenses on the Statement of Operations, and are listed below. During the period, there were no borrowings on this line of credit.
|
Amount
|
Fidelity Connecticut Municipal Income Fund
|
$556
|
7. Expense Reductions.
Through arrangements with the Fund's custodian, credits realized as a result of certain uninvested cash balances were used to reduce the Fund's expenses by $4,010.
In addition, during the period the investment adviser or an affiliate reimbursed and/or waived a portion of operating expenses in the amount of $9,822.
8. Other.
A fund's organizational documents provide former and current trustees and officers with a limited indemnification against liabilities arising in connection with the performance of their duties to the fund. In the normal course of business, a fund may also enter into contracts that provide general indemnifications. A fund's maximum exposure under these arrangements is unknown as this would be dependent on future claims that may be made against a fund. The risk of material loss from such claims is considered remote.
9. Risk and Uncertainties.
Many factors affect a fund's performance. Developments that disrupt global economies and financial markets, such as pandemics, epidemics, outbreaks of infectious diseases, war, terrorism, and environmental disasters, may significantly affect a fund's investment performance. The effects of these developments to a fund will be impacted by the types of securities in which a fund invests, the financial condition, industry, economic sector, and geographic location of an issuer, and a fund's level of investment in the securities of that issuer. Significant concentrations in security types, issuers, industries, sectors, and geographic locations may magnify the factors that affect a fund's performance.
To the Board of Trustees of Fidelity Court Street Trust and Shareholders of Fidelity Connecticut Municipal Income Fund
Opinion on the Financial Statements
We have audited the accompanying statement of assets and liabilities, including the schedule of investments, of Fidelity Connecticut Municipal Income Fund (one of the funds constituting Fidelity Court Street Trust, referred to hereafter as the "Fund") as of November 30, 2023, the related statement of operations for the year ended November 30, 2023, the statement of changes in net assets for each of the two years in the period ended November 30, 2023, including the related notes, and the financial highlights for each of the five years in the period ended November 30, 2023 (collectively referred to as the "financial statements"). In our opinion, the financial statements present fairly, in all material respects, the financial position of the Fund as of November 30, 2023, the results of its operations for the year then ended, the changes in its net assets for each of the two years in the period ended November 30, 2023 and the financial highlights for each of the five years in the period ended November 30, 2023 in conformity with accounting principles generally accepted in the United States of America.
Basis for Opinion
These financial statements are the responsibility of the Fund's management. Our responsibility is to express an opinion on the Fund's financial statements based on our audits. We are a public accounting firm registered with the Public Company Accounting Oversight Board (United States) (PCAOB) and are required to be independent with respect to the Fund in accordance with the U.S. federal securities laws and the applicable rules and regulations of the Securities and Exchange Commission and the PCAOB.
We conducted our audits of these financial statements in accordance with the standards of the PCAOB. Those standards require that we plan and perform the audit to obtain reasonable assurance about whether the financial statements are free of material misstatement, whether due to error or fraud.
Our audits included performing procedures to assess the risks of material misstatement of the financial statements, whether due to error or fraud, and performing procedures that respond to those risks. Such procedures included examining, on a test basis, evidence regarding the amounts and disclosures in the financial statements. Our audits also included evaluating the accounting principles used and significant estimates made by management, as well as evaluating the overall presentation of the financial statements. Our procedures included confirmation of securities owned as of November 30, 2023 by correspondence with the custodian. We believe that our audits provide a reasonable basis for our opinion.
/s/ PricewaterhouseCoopers LLP
Boston, Massachusetts
January 12, 2024
We have served as the auditor of one or more investment companies in the Fidelity group of funds since 1932.
The Trustees, Members of the Advisory Board (if any), and officers of the trust and fund, as applicable, are listed below. The Board of Trustees governs the fund and is responsible for protecting the interests of shareholders. The Trustees are experienced executives who meet periodically throughout the year to oversee the fund's activities, review contractual arrangements with companies that provide services to the fund, oversee management of the risks associated with such activities and contractual arrangements, and review the fund's performance. Except for Laura M. Bishop, Robert W. Helm, Christine J. Thompson, and Carol J. Zierhoffer, each of the Trustees oversees 314 funds. Ms. Bishop, Mr. Helm, Ms. Thompson, and Ms. Zierhoffer each oversees 230 funds.
The Trustees hold office without limit in time except that (a) any Trustee may resign; (b) any Trustee may be removed by written instrument, signed by at least two-thirds of the number of Trustees prior to such removal; (c) any Trustee who requests to be retired or who has become incapacitated by illness or injury may be retired by written instrument signed by a majority of the other Trustees; and (d) any Trustee may be removed at any special meeting of shareholders by a two-thirds vote of the outstanding voting securities of the trust. Each Trustee who is not an interested person (as defined in the 1940 Act) of the trust and the fund is referred to herein as an Independent Trustee. Each Independent Trustee shall retire not later than the last day of the calendar year in which his or her 75th birthday occurs. The Independent Trustees may waive this mandatory retirement age policy with respect to individual Trustees. Officers and Advisory Board Members hold office without limit in time, except that any officer or Advisory Board Member may resign or may be removed by a vote of a majority of the Trustees at any regular meeting or any special meeting of the Trustees. Except as indicated, each individual has held the office shown or other offices in the same company for the past five years.
The fund's Statement of Additional Information (SAI) includes more information about the Trustees. To request a free copy, call Fidelity at 1-800-544-8544.
Experience, Skills, Attributes, and Qualifications of the Trustees. The Governance and Nominating Committee has adopted a statement of policy that describes the experience, qualifications, attributes, and skills that are necessary and desirable for potential Independent Trustee candidates (Statement of Policy). The Board believes that each Trustee satisfied at the time he or she was initially elected or appointed a Trustee, and continues to satisfy, the standards contemplated by the Statement of Policy. The Governance and Nominating Committee also engages professional search firms to help identify potential Independent Trustee candidates who have the experience, qualifications, attributes, and skills consistent with the Statement of Policy. From time to time, additional criteria based on the composition and skills of the current Independent Trustees, as well as experience or skills that may be appropriate in light of future changes to board composition, business conditions, and regulatory or other developments, have also been considered by the professional search firms and the Governance and Nominating Committee. In addition, the Board takes into account the Trustees' commitment and participation in Board and committee meetings, as well as their leadership of standing and ad hoc committees throughout their tenure.
In determining that a particular Trustee was and continues to be qualified to serve as a Trustee, the Board has considered a variety of criteria, none of which, in isolation, was controlling. The Board believes that, collectively, the Trustees have balanced and diverse experience, qualifications, attributes, and skills, which allow the Board to operate effectively in governing the fund and protecting the interests of shareholders. Information about the specific experience, skills, attributes, and qualifications of each Trustee, which in each case led to the Board's conclusion that the Trustee should serve (or continue to serve) as a trustee of the fund, is provided below.
Board Structure and Oversight Function. Abigail P. Johnson is an interested person and currently serves as Chairman. The Trustees have determined that an interested Chairman is appropriate and benefits shareholders because an interested Chairman has a personal and professional stake in the quality and continuity of services provided to the fund. Independent Trustees exercise their informed business judgment to appoint an individual of their choosing to serve as Chairman, regardless of whether the Trustee happens to be independent or a member of management. The Independent Trustees have determined that they can act independently and effectively without having an Independent Trustee serve as Chairman and that a key structural component for assuring that they are in a position to do so is for the Independent Trustees to constitute a substantial majority for the Board. The Independent Trustees also regularly meet in executive session. Michael E. Kenneally serves as Chairman of the Independent Trustees and as such (i) acts as a liaison between the Independent Trustees and management with respect to matters important to the Independent Trustees and (ii) with management prepares agendas for Board meetings.
Fidelity® funds are overseen by different Boards of Trustees. The fund's Board oversees Fidelity's investment-grade bond, money market, asset allocation and certain equity funds, and other Boards oversee Fidelity's alternative investment, high income and other equity funds. The asset allocation funds may invest in Fidelity® funds that are overseen by such other Boards. The use of separate Boards, each with its own committee structure, allows the Trustees of each group of Fidelity® funds to focus on the unique issues of the funds they oversee, including common research, investment, and operational issues. On occasion, the separate Boards establish joint committees to address issues of overlapping consequences for the Fidelity® funds overseen by each Board.
The Trustees operate using a system of committees to facilitate the timely and efficient consideration of all matters of importance to the Trustees, the fund, and fund shareholders and to facilitate compliance with legal and regulatory requirements and oversight of the fund's activities and associated risks. The Board, acting through its committees, has charged FMR and its affiliates with (i) identifying events or circumstances the occurrence of which could have demonstrably adverse effects on the fund's business and/or reputation; (ii) implementing processes and controls to lessen the possibility that such events or circumstances occur or to mitigate the effects of such events or circumstances if they do occur; and (iii) creating and maintaining a system designed to evaluate continuously business and market conditions in order to facilitate the identification and implementation processes described in (i) and (ii) above. Because the day-to-day operations and activities of the fund are carried out by or through FMR, its affiliates, and other service providers, the fund's exposure to risks is mitigated but not eliminated by the processes overseen by the Trustees. While each of the Board's committees has responsibility for overseeing different aspects of the fund's activities, oversight is exercised primarily through the Operations and Audit Committees. In addition, an ad hoc Board committee of Independent Trustees has worked with FMR to enhance the Board's oversight of investment and financial risks, legal and regulatory risks, technology risks, and operational risks, including the development of additional risk reporting to the Board. Appropriate personnel, including but not limited to the fund's Chief Compliance Officer (CCO), FMR's internal auditor, the independent accountants, the fund's Treasurer and portfolio management personnel, make periodic reports to the Board's committees, as appropriate, including an annual review of Fidelity's risk management program for the Fidelity® funds. The responsibilities of each standing committee, including their oversight responsibilities, are described further under "Standing Committees of the Trustees."
Interested Trustees*:
Correspondence intended for a Trustee who is an interested person may be sent to Fidelity Investments, 245 Summer Street, Boston, Massachusetts 02210.
Name, Year of Birth; Principal Occupations and Other Relevant Experience+
Abigail P. Johnson (1961)
Year of Election or Appointment: 2009
Trustee
Chairman of the Board of Trustees
Ms. Johnson also serves as Trustee of other Fidelity® funds. Ms. Johnson serves as Chairman (2016-present), Chief Executive Officer (2014-present), and Director (2007-present) of FMR LLC (diversified financial services company), President of Fidelity Financial Services (2012-present) and President of Personal, Workplace and Institutional Services (2005-present). Ms. Johnson is Chairman and Director of Fidelity Management & Research Company LLC (investment adviser firm, 2011-present). Previously, Ms. Johnson served as Chairman and Director of FMR Co., Inc. (investment adviser firm, 2011-2019), Vice Chairman (2007-2016) and President (2013-2016) of FMR LLC, President and a Director of Fidelity Management & Research Company (2001-2005), a Trustee of other investment companies advised by Fidelity Management & Research Company, Fidelity Investments Money Management, Inc. (investment adviser firm), and FMR Co., Inc. (2001-2005), Senior Vice President of the Fidelity® funds (2001-2005), and managed a number of Fidelity® funds. Ms. Abigail P. Johnson and Mr. Arthur E. Johnson are not related.
Jennifer Toolin McAuliffe (1959)
Year of Election or Appointment: 2016
Trustee
Ms. McAuliffe also serves as Trustee of other Fidelity® funds and as Trustee of Fidelity Charitable (2020-present). Previously, Ms. McAuliffe served as Co-Head of Fixed Income of Fidelity Investments Limited (now known as FIL Limited (FIL)) (diversified financial services company), Director of Research for FIL's credit and quantitative teams in London, Hong Kong and Tokyo and Director of Research for taxable and municipal bonds at Fidelity Investments Money Management, Inc. Ms. McAuliffe previously served as a member of the Advisory Board of certain Fidelity® funds (2016). Ms. McAuliffe was previously a lawyer at Ropes & Gray LLP and an international banker at Chemical Bank NA (now JPMorgan Chase & Co.). Ms. McAuliffe also currently serves as director or trustee of several not-for-profit entities.
Christine J. Thompson (1958)
Year of Election or Appointment: 2023
Trustee
Ms. Thompson also serves as a Trustee of other Fidelity® funds. Ms. Thompson serves as Leader of Advanced Technologies for Investment Management at Fidelity Investments (2018-present). Previously, Ms. Thompson served as Chief Investment Officer in the Bond group at Fidelity Management & Research Company (2010-2018) and held various other roles including Director of municipal bond portfolio managers and Portfolio Manager of certain Fidelity® funds.
* Determined to be an "Interested Trustee" by virtue of, among other things, his or her affiliation with the trust or various entities under common control with FMR.
+ The information includes the Trustee's principal occupation during the last five years and other information relating to the experience, attributes, and skills relevant to the Trustee's qualifications to serve as a Trustee, which led to the conclusion that the Trustee should serve as a Trustee for the fund.
Independent Trustees:
Correspondence intended for an Independent Trustee may be sent to Fidelity Investments, P.O. Box 55235, Boston, Massachusetts 02205-5235.
Name, Year of Birth; Principal Occupations and Other Relevant Experience+
Elizabeth S. Acton (1951)
Year of Election or Appointment: 2015
Trustee
Ms. Acton also serves as Trustee of other Fidelity® funds. Prior to her retirement, Ms. Acton served as Executive Vice President, Finance (2011-2012), Executive Vice President, Chief Financial Officer (2002-2011) and Treasurer (2004-2005) of Comerica Incorporated (financial services). Prior to joining Comerica, Ms. Acton held a variety of positions at Ford Motor Company (1983-2002), including Vice President and Treasurer (2000-2002) and Executive Vice President and Chief Financial Officer of Ford Motor Credit Company (1998-2000). Ms. Acton currently serves as a member of the Board and Audit and Finance Committees of Beazer Homes USA, Inc. (homebuilding, 2012-present). Ms. Acton previously served as a member of the Advisory Board of certain Fidelity® funds (2013-2016).
Laura M. Bishop (1961)
Year of Election or Appointment: 2023
Trustee
Ms. Bishop also serves as Trustee or Member of the Advisory Board of other Fidelity® funds. Prior to her retirement, Ms. Bishop held a variety of positions at United Services Automobile Association (2001-2020), including Executive Vice President and Chief Financial Officer (2014-2020) and Senior Vice President and Deputy Chief Financial Officer (2012-2014). Ms. Bishop currently serves as a member of the Audit Committee and Compensation and Personnel Committee (2021-present) of the Board of Directors of Korn Ferry (global organizational consulting). Previously, Ms. Bishop served as a Member of the Advisory Board of certain Fidelity® funds (2022-2023).
Ann E. Dunwoody (1953)
Year of Election or Appointment: 2018
Trustee
General Dunwoody also serves as Trustee of other Fidelity® funds. General Dunwoody (United States Army, Retired) was the first woman in U.S. military history to achieve the rank of four-star general and prior to her retirement in 2012 held a variety of positions within the U.S. Army, including Commanding General, U.S. Army Material Command (2008-2012). General Dunwoody currently serves as a member of the Board, Chair of Nomination Committee and a member of the Corporate Governance Committee of Kforce Inc. (professional staffing services, 2016-present) and a member of the Board of Automattic Inc. (software engineering, 2018-present). Previously, General Dunwoody served as President of First to Four LLC (leadership and mentoring services, 2012-2022), a member of the Advisory Board and Nominating and Corporate Governance Committee of L3 Technologies, Inc. (communication, electronic, sensor and aerospace systems, 2013-2019) and a member of the Board and Audit and Sustainability and Corporate Responsibility Committees of Republic Services, Inc. (waste collection, disposal and recycling, 2013-2016). General Dunwoody also serves on several boards for non-profit organizations, including as a member of the Board, Chair of the Nomination and Governance Committee and a member of the Audit Committee of the Noble Reach Foundation (formerly Logistics Management Institute) (consulting non-profit, 2012-present) and a member of the Board of ThanksUSA (military family education non-profit, 2014-present). Previously, General Dunwoody served as a member of the Board of Florida Institute of Technology (2015-2022) and a member of the Council of Trustees for the Association of the United States Army (advocacy non-profit, 2013-2021). General Dunwoody previously served as a member of the Advisory Board of certain Fidelity® funds (2018).
John Engler (1948)
Year of Election or Appointment: 2015
Trustee
Mr. Engler also serves as Trustee of other Fidelity® funds. Previously, Mr. Engler served as Governor of Michigan (1991-2003), President of the Business Roundtable (2011-2017) and interim President of Michigan State University (2018-2019). Previously, Mr. Engler served as a member of the Board of Stride, Inc. (formerly K12 Inc.) (technology-based education company, 2012-2022), a member of the Board of Universal Forest Products (manufacturer and distributor of wood and wood-alternative products, 2003-2019) and Trustee of The Munder Funds (2003-2014). Mr. Engler previously served as a member of the Advisory Board of certain Fidelity® funds (2014-2016).
Robert F. Gartland (1951)
Year of Election or Appointment: 2010
Trustee
Mr. Gartland also serves as Trustee of other Fidelity® funds. Prior to his retirement, Mr. Gartland held a variety of positions at Morgan Stanley (financial services, 1979-2007), including Managing Director (1987-2007) and Chase Manhattan Bank (1975-1978). Mr. Gartland previously served as Chairman and an investor in Gartland & Mellina Group Corp. (consulting, 2009-2019), as a member of the Board of National Securities Clearing Corporation (1993-1996) and as Chairman of TradeWeb (2003-2004).
Robert W. Helm (1957)
Year of Election or Appointment: 2023
Trustee
Mr. Helm also serves as Trustee or Member of the Advisory Board of other Fidelity® funds. Mr. Helm was formerly Deputy Chairman (2003-2020), partner (1991-2020) and an associate (1984-1991) of Dechert LLP (formerly Dechert Price & Rhoads). Mr. Helm currently serves on boards and committees of several not-for-profit organizations, including as a Trustee and member of the Executive Committee of the Baltimore Council on Foreign Affairs, a member of the Board of Directors of the St. Vincent de Paul Society of Baltimore and a member of the Life Guard Society of Mt. Vernon. Previously, Mr. Helm served as a Member of the Advisory Board of certain Fidelity® funds (2021-2023).
Michael E. Kenneally (1954)
Year of Election or Appointment: 2009
Trustee
Chairman of the Independent Trustees
Mr. Kenneally also serves as Trustee of other Fidelity® funds and was Vice Chairman (2018-2021) of the Independent Trustees of certain Fidelity® funds. Prior to retirement in 2005, he was Chairman and Global Chief Executive Officer of Credit Suisse Asset Management, the worldwide fund management and institutional investment business of Credit Suisse Group. Previously, Mr. Kenneally was an Executive Vice President and the Chief Investment Officer for Bank of America. In this role, he was responsible for the investment management, strategy and products delivered to the bank's institutional, high-net-worth and retail clients. Earlier, Mr. Kenneally directed the organization's equity and quantitative research groups. He began his career as a research analyst and then spent more than a dozen years as a portfolio manager for endowments, pension plans and mutual funds. He earned the Chartered Financial Analyst (CFA) designation in 1991.
Mark A. Murray (1954)
Year of Election or Appointment: 2016
Trustee
Mr. Murray also serves as Trustee of other Fidelity® funds. Previously, Mr. Murray served as Co-Chief Executive Officer (2013-2016), President (2006-2013) and Vice Chairman (2013-2020) of Meijer, Inc. Mr. Murray serves as a member of the Board (2009-present) and Public Policy and Responsibility Committee (2009-present) and Chair of the Nuclear Review Committee (2019-present) of DTE Energy Company (diversified energy company). Mr. Murray previously served as a member of the Board of Spectrum Health (not-for-profit health system, 2015-2019) and as a member of the Board and Audit Committee and Chairman of the Nominating and Corporate Governance Committee of Universal Forest Products, Inc. (manufacturer and distributor of wood and wood-alternative products, 2004-2016). Mr. Murray also serves as a member of the Board of many community and professional organizations. Mr. Murray previously served as a member of the Advisory Board of certain Fidelity® funds (2016).
Carol J. Zierhoffer (1960)
Year of Election or Appointment: 2023
Trustee
Ms. Zierhoffer also serves as Trustee or Member of the Advisory Board of other Fidelity® funds. Prior to her retirement, Ms. Zierhoffer held a variety of positions at Bechtel Corporation (engineering company, 2013-2019), including Principal Vice President and Chief Information Officer (2013-2016) and Senior Vice President and Chief Information Officer (2016-2019). Ms. Zierhoffer currently serves as a member of the Board of Directors, Audit Committee and Compensation Committee of Allscripts Healthcare Solutions, Inc. (healthcare technology, 2020-present) and as a member of the Board of Directors, Audit and Finance Committee and Nominating and Governance Committee of Atlas Air Worldwide Holdings, Inc. (aviation operating services, 2021-present). Previously, Ms. Zierhoffer served as a member of the Board of Directors and Audit Committee and as the founding Chair of the Information Technology Committee of MedAssets, Inc. (healthcare technology, 2013-2016), and as a Member of the Advisory Board of certain Fidelity® funds (2023).
+ The information includes the Trustee's principal occupation during the last five years and other information relating to the experience, attributes, and skills relevant to the Trustee's qualifications to serve as a Trustee, which led to the conclusion that the Trustee should serve as a Trustee for the fund.
Advisory Board Members and Officers:
Correspondence intended for a Member of the Advisory Board (if any) may be sent to Fidelity Investments, P.O. Box 55235, Boston, Massachusetts 02205-5235. Correspondence intended for an officer may be sent to Fidelity Investments, 245 Summer Street, Boston, Massachusetts 02210.
Name, Year of Birth; Principal Occupation
Heather Bonner (1977)
Year of Election or Appointment: 2023
Assistant Treasurer
Ms. Bonner also serves as an officer of other funds. Ms. Bonner is a Senior Vice President (2022-present) and is an employee of Fidelity Investments (2022-present). Ms. Bonner serves as Vice President, Treasurer, or Assistant Treasurer of certain Fidelity entities. Prior to joining Fidelity, Ms. Bonner served as Managing Director at AQR Capital Management (2013-2022) and was the Treasurer and Principal Financial Officer of the AQR Funds (2013-2022).
Craig S. Brown (1977)
Year of Election or Appointment: 2019
Assistant Treasurer
Mr. Brown also serves as an officer of other funds. Mr. Brown is a Vice President (2015-present) and is an employee of Fidelity Investments. Mr. Brown serves as Assistant Treasurer of FIMM, LLC (2021-present). Previously, Mr. Brown served as Assistant Treasurer of certain Fidelity® funds (2019-2022).
John J. Burke III (1964)
Year of Election or Appointment: 2018
Chief Financial Officer
Mr. Burke also serves as Chief Financial Officer of other funds. Mr. Burke is Head of Fidelity Fund and Investment Operations (2018-present) and is an employee of Fidelity Investments. Mr. Burke serves as President, Executive Vice President, or Director of certain Fidelity entities. Previously Mr. Burke served as head of Asset Management Investment Operations (2012-2018).
Margaret Carey (1973)
Year of Election or Appointment: 2023
Secretary and Chief Legal Officer (CLO)
Ms. Carey also serves as an officer of other funds and as CLO of certain Fidelity entities. Ms. Carey is a Senior Vice President, Deputy General Counsel (2019-present) and is an employee of Fidelity Investments.
David J. Carter (1973)
Year of Election or Appointment: 2020
Assistant Secretary
Mr. Carter also serves as Assistant Secretary of other funds. Mr. Carter is a Senior Vice President, Deputy General Counsel (2022-present) and is an employee of Fidelity Investments. Mr. Carter serves as Chief Legal Officer of Fidelity Investments Institutional Operations Company LLC - Shareholder Division (transfer agent, 2020-present).
Jonathan Davis (1968)
Year of Election or Appointment: 2010
Assistant Treasurer
Mr. Davis also serves as an officer of other funds. Mr. Davis is a Vice President (2006-present) and is an employee of Fidelity Investments. Mr. Davis serves as Assistant Treasurer of certain Fidelity entities.
Laura M. Del Prato (1964)
Year of Election or Appointment: 2018
President and Treasurer
Ms. Del Prato also serves as an officer of other funds. Ms. Del Prato is a Senior Vice President (2017-present) and is an employee of Fidelity Investments. Ms. Del Prato serves as Vice President or Assistant Treasurer of certain Fidelity entities. Previously, Ms. Del Prato served as President and Treasurer of The North Carolina Capital Management Trust: Cash Portfolio and Term Portfolio (2018-2020).
Robin Foley (1964)
Year of Election or Appointment: 2023
Vice President
Ms. Foley also serves as Vice President of other funds. Ms. Foley serves as Head of Fidelity's Fixed Income division (2023-present) and is an employee of Fidelity Investments. Previously, Ms. Foley served as Chief Investment Officer of Bonds (2017-2023).
Christopher M. Gouveia (1973)
Year of Election or Appointment: 2023
Chief Compliance Officer
Mr. Gouveia also serves as Chief Compliance Officer of other funds. Mr. Gouveia is a Senior Vice President of Asset Management Compliance (2019-present) and is an employee of Fidelity Investments. Mr. Gouveia serves as Compliance Officer of Fidelity Management Trust Company (2023-present). Previously, Mr. Gouveia served as Chief Compliance Officer of the North Carolina Capital Management Trust (2016-2019).
Colm A. Hogan (1973)
Year of Election or Appointment: 2016
Assistant Treasurer
Mr. Hogan also serves as an officer of other funds. Mr. Hogan is a Vice President (2016-present) and is an employee of Fidelity Investments. Mr. Hogan serves as Assistant Treasurer of certain Fidelity entities. Previously, Mr. Hogan served as Deputy Treasurer of certain Fidelity® funds (2016-2020) and Assistant Treasurer of certain Fidelity® funds (2016-2018).
Chris Maher (1972)
Year of Election or Appointment: 2013
Assistant Treasurer
Mr. Maher also serves as an officer of other funds. Mr. Maher is a Vice President (2008-present) and is an employee of Fidelity Investments. Mr. Maher serves as Assistant Treasurer of certain Fidelity entities. Previously, Mr. Maher served as Assistant Treasurer of certain funds (2013-2020).
Brett Segaloff (1972)
Year of Election or Appointment: 2021
Anti-Money Laundering (AML) Officer
Mr. Segaloff also serves as AML Officer of other funds. Mr. Segaloff is a Vice President (2022-present) and is an employee of Fidelity Investments. Mr. Segaloff serves as Anti Money Laundering Compliance Officer or Anti Money Laundering/Bank Secrecy Act Compliance Officer of certain Fidelity entities.
Stacie M. Smith (1974)
Year of Election or Appointment: 2013
Assistant Treasurer
Ms. Smith also serves as an officer of other funds. Ms. Smith is a Senior Vice President (2016-present) and is an employee of Fidelity Investments. Ms. Smith serves as Assistant Treasurer of certain Fidelity entities and has served in other fund officer roles.
Jim Wegmann (1979)
Year of Election or Appointment: 2021
Deputy Treasurer
Mr. Wegmann also serves as an officer of other funds. Mr. Wegmann is a Vice President (2016-present) and is an employee of Fidelity Investments. Mr. Wegmann serves as Assistant Treasurer of FIMM, LLC (2021-present). Previously, Mr. Wegmann served as Assistant Treasurer of certain Fidelity® funds (2019-2021).
As a shareholder, you incur two types of costs: (1) transaction costs, which may include sales charges (loads) on purchase payments or redemption proceeds, as applicable and (2) ongoing costs, which generally include management fees, distribution and/or service (12b-1) fees and other Fund expenses. This Example is intended to help you understand your ongoing costs (in dollars) of investing in a fund and to compare these costs with the ongoing costs of investing in other mutual funds.
The Example is based on an investment of $1,000 invested at the beginning of the period and held for the entire period (June 1, 2023 to November 30, 2023).
|
Actual Expenses
The first line of the accompanying table provides information about actual account values and actual expenses. You may use the information in this line, together with the amount you invested, to estimate the expenses that you paid over the period. Simply divide your account value by $1,000.00 (for example, an $8,600 account value divided by $1,000.00 = 8.6), then multiply the result by the number in the first line for a class/Fund under the heading entitled "Expenses Paid During Period" to estimate the expenses you paid on your account during this period. If any fund is a shareholder of any underlying mutual funds or exchange-traded funds (ETFs) (the Underlying Funds), such fund indirectly bears its proportional share of the expenses of the Underlying Funds in addition to the direct expenses incurred presented in the table. These fees and expenses are not included in the annualized expense ratio used to calculate the expense estimate in the table below.
Hypothetical Example for Comparison Purposes
The second line of the accompanying table provides information about hypothetical account values and hypothetical expenses based on the actual expense ratio and an assumed rate of return of 5% per year before expenses, which is not the actual return. The hypothetical account values and expenses may not be used to estimate the actual ending account balance or expenses you paid for the period. You may use this information to compare the ongoing costs of investing in the Fund and other funds. To do so, compare this 5% hypothetical example with the 5% hypothetical examples that appear in the shareholder reports of the other funds. If any fund is a shareholder of any Underlying Funds, such fund indirectly bears its proportional share of the expenses of the Underlying Funds in addition to the direct expenses as presented in the table. These fees and expenses are not included in the annualized expense ratio used to calculate the expense estimate in the table below.
Please note that the expenses shown in the table are meant to highlight your ongoing costs only and do not reflect any transaction costs. Therefore, the second line of the table is useful in comparing ongoing costs only, and will not help you determine the relative total costs of owning different funds. In addition, if these transactional costs were included, your costs would have been higher.
|
|
|
|
|
Annualized Expense Ratio- A
|
|
Beginning Account Value June 1, 2023
|
|
Ending Account Value November 30, 2023
|
|
Expenses Paid During Period- C June 1, 2023 to November 30, 2023
|
|
|
|
|
|
|
|
|
|
|
|
Fidelity® Connecticut Municipal Income Fund
|
|
|
|
.48%
|
|
|
|
|
|
|
Actual
|
|
|
|
|
|
$ 1,000
|
|
$ 1,022.80
|
|
$ 2.43
|
Hypothetical-B
|
|
|
|
|
|
$ 1,000
|
|
$ 1,022.66
|
|
$ 2.43
|
|
|
A Annualized expense ratio reflects expenses net of applicable fee waivers.
B 5% return per year before expenses
C Expenses are equal to the annualized expense ratio, multiplied by the average account value over the period, multiplied by 183/ 365 (to reflect the one-half year period). The fees and expenses of any Underlying Funds are not included in each annualized expense ratio.
The dividend and capital gains distributions for the fund(s) are available on Fidelity.com or Institutional.Fidelity.com.
During fiscal year ended 2023, 100% of the fund's income dividends was free from federal income tax, and 7.36% of the fund's income dividends was subject to the federal alternative minimum tax.
The fund will notify shareholders in January 2024 of amounts for use in preparing 2023 income tax returns.
Board Approval of Investment Advisory Contracts and Management Fees
Fidelity Connecticut Municipal Income Fund
Each year, the Board of Trustees, including the Independent Trustees (together, the Board), considers the renewal of the fund's management contract with Fidelity Management & Research Company LLC (FMR) and the sub-advisory agreements (together, the Advisory Contracts) for the fund. FMR and the sub-advisers are referred to herein as the Investment Advisers. The Board, assisted by the advice of fund counsel and Independent Trustees' counsel, requests and considers a broad range of information relevant to the renewal of the Advisory Contracts throughout the year.
The Board meets regularly and, at each of its meetings, covers an extensive agenda of topics and materials and considers factors that are relevant to its annual consideration of the renewal of the fund's Advisory Contracts, including the services and support provided to the fund and its shareholders. The Board's Operations Committee, of which all the Independent Trustees are members, meets regularly throughout the year and requests, receives and considers, among other matters, information related to the annual consideration of the renewal of the fund's Advisory Contracts before making its recommendation to the Board. The Board also meets as needed to review matters specifically related to the Board's annual consideration of the renewal of the Advisory Contracts. Members of the Board may also meet from time to time with trustees of other Fidelity funds through joint ad hoc committees to discuss certain matters relevant to all of the Fidelity funds.
At its September 2023 meeting, the Board unanimously determined to renew the fund's Advisory Contracts. In reaching its determination, the Board considered all factors it believed relevant, including (i) the nature, extent, and quality of the services provided to the fund and its shareholders (including the investment performance of the fund); (ii) the competitiveness relative to peer funds of the fund's management fee and total expense ratio; (iii) the total costs of the services provided by and the profits realized by FMR and its affiliates (Fidelity) from its relationships with the fund; and (iv) the extent to which, if any, economies of scale exist and are realized as the fund grows, and whether any economies of scale are appropriately shared with fund shareholders. The Board also considered the broad range of investment choices available to shareholders from FMR's competitors and that the fund's shareholders have chosen to invest in the fund, which is part of the Fidelity family of funds. The Board's decision to renew the Advisory Contracts was not based on any single factor.
The Board reached a determination, with the assistance of fund counsel and Independent Trustees' counsel and through the exercise of its business judgment, that the renewal of the Advisory Contracts was in the best interests of the fund and its shareholders and that the compensation payable under the Advisory Contracts was fair and reasonable in light of all of the surrounding circumstances.
Nature, Extent, and Quality of Services Provided. The Board considered the Investment Advisers' staffing as it relates to the fund, including the backgrounds and experience of investment personnel, and also considered the Investment Advisers' implementation of the fund's investment program. The Independent Trustees also had discussions with senior management of Fidelity's investment operations and investment groups. The Board considered the structure of the investment personnel compensation program and whether this structure provides appropriate incentives to act in the best interests of the fund. Additionally, the Board considered the portfolio managers' investments, if any, in the funds that they manage.
Resources Dedicated to Investment Management and Support Services. The Board reviewed the general qualifications and capabilities of Fidelity's investment staff, including its size, education, experience, and resources, as well as Fidelity's approach to recruiting, managing, training, and compensating investment personnel. The Board noted the resources devoted to Fidelity's global investment organization, and that Fidelity's analysts have extensive resources, tools and capabilities that allow them to conduct quantitative and fundamental analysis, as well as credit analysis of issuers, counterparties and guarantors. Further, the Board considered that Fidelity's investment professionals have sufficient access to global information and data so as to provide competitive investment results over time, and that those professionals also have access to sophisticated tools that permit them to assess portfolio construction and risk and performance attribution characteristics continuously, as well as to transmit new information and research conclusions rapidly around the world. Additionally, in its deliberations, the Board considered Fidelity's trading, risk management, compliance, cybersecurity, and technology and operations capabilities and resources, which are integral parts of the investment management process.
Shareholder and Administrative Services. The Board considered (i) the nature, extent, quality, and cost of advisory, administrative, and shareholder services performed by the Investment Advisers and their affiliates under the Advisory Contracts and under separate agreements covering transfer agency and pricing and bookkeeping services for the fund; (ii) the nature and extent of Fidelity's supervision of third party service providers, principally custodians, subcustodians, and pricing vendors; and (iii) the resources devoted by Fidelity to, and the record of compliance with, the fund's compliance policies and procedures.
The Board noted that the growth of fund assets over time across the complex allows Fidelity to reinvest in the development of services designed to enhance the value and convenience of the Fidelity funds as investment vehicles. These services include 24-hour access to account information and market information over the Internet and through telephone representatives, investor education materials and asset allocation tools. The Board also considered that it reviews customer service metrics such as telephone response times, continuity of services on the website and metrics addressing services at Fidelity Investor Centers.
Investment in a Large Fund Family. The Board considered the benefits to shareholders of investing in a fund that is part of a large family of funds offering a variety of investment disciplines and providing a large variety of fund investor services. The Board noted that Fidelity had taken, or had made recommendations to the Board that resulted in the Fidelity funds taking, a number of actions over the previous year that benefited particular funds and/or the Fidelity funds in general.
Investment Performance. The Board took into account discussions that occur with representatives of the Investment Advisers, and reports that it receives, at Board meetings throughout the year relating to fund investment performance. In this regard the Board noted that as part of regularly scheduled fund reviews and other reports to the Board on fund performance, the Board considered annualized return information for the fund for different time periods, measured against an appropriate securities market index (benchmark index) and an appropriate peer group of funds with similar objectives (peer group). The Board also considered information about performance attribution. In its evaluation of fund investment performance at meetings throughout the year, the Board gave particular attention to information indicating underperformance of certain Fidelity funds over different time periods and discussed with the Investment Advisers the reasons for such underperformance.
In addition to reviewing absolute and relative fund performance, the Independent Trustees periodically consider the appropriateness of fund performance metrics in evaluating the results achieved. The Independent Trustees generally give greater weight to fund performance over longer time periods than over shorter time periods. Depending on the circumstances, the Independent Trustees may be satisfied with a fund's performance notwithstanding that it lags its benchmark index or peer group for certain periods.
Based on its review, the Board concluded that the nature, extent, and quality of services provided to the fund under the Advisory Contracts should continue to benefit the shareholders of the fund.
Competitiveness of Management Fee and Total Expense Ratio. The Board was provided with information regarding industry trends in management fees and expenses. In its review of the fund's management fee and total expense ratio, the Board considered the fund's management fee rate as well as other fund or class expenses, as applicable, such as transfer agent fees, pricing and bookkeeping fees, and custodial, legal, and audit fees. The Board also noted that Fidelity may agree to waive fees or reimburse expenses from time to time, and the extent to which, if any, it has done so for the fund.
Comparisons of Management Fees and Total Expense Ratios. Among other things, the Board reviewed data for selected groups of competitive funds and classes (referred to as "mapped groups") that were compiled by Fidelity based on combining similar investment objective categories (as classified by Lipper) that have comparable investment mandates. The data reviewed by the Board included (i) gross management fee comparisons (before taking into account expense reimbursements or caps) relative to the total universe of funds within the mapped group; (ii) gross management fee comparisons relative to a subset of non-Fidelity funds in the mapped group that are similar in size and management fee structure to the fund (referred to as the "asset size peer group"); (iii) total expense comparisons of the fund relative to funds and classes in the mapped group that have a similar sales load structure to the fund (referred to as the "similar sales load structure group"); and (iv) total expense comparisons of the fund relative to funds and classes in the similar sales load structure group that are similar in size and management fee structure to the fund (referred to as the "total expense asset size peer group").
The information provided to the Board indicated that the fund's management fee rate ranked below the competitive median of the mapped group for 2022 and below the competitive median of the asset size peer group for 2022. Further, the information provided to the Board indicated that the total expense ratio of the fund ranked below the competitive median of the similar sales load structure group for 2022 and above the competitive median of the total expense asset size peer group for 2022.
Fees Charged to Other Fidelity Clients. The Board also considered Fidelity fee structures and other information with respect to clients of Fidelity, such as other funds advised or subadvised by Fidelity, pension plan clients, and other institutional clients with similar mandates. The Board noted that a joint ad hoc committee created by it and the boards of other Fidelity funds periodically reviews and compares Fidelity's institutional investment advisory business with its business of providing services to the Fidelity funds and also noted the most recent findings of the committee. The Board noted that the committee's review included a consideration of the differences in services provided, fees charged, and costs incurred, as well as competition in the markets serving the different categories of clients.
Based on its review, the Board concluded that the fund's management fee is fair and reasonable in light of the services that the fund receives and the other factors considered. Further, based on its review of total expense ratios and fees charged to other Fidelity clients, the Board concluded that the fund's total expense ratio was reasonable in light of the services that the fund and its shareholders receive and the other factors considered.
Costs of the Services and Profitability. The Board considered the revenues earned and the expenses incurred by Fidelity in conducting the business of developing, marketing, distributing, managing, administering and servicing the fund and servicing the fund's shareholders. The Board also considered the level of Fidelity's profits in respect of all the Fidelity funds.
On an annual basis, Fidelity presents to the Board information about the profitability of its relationships with the fund. Fidelity calculates profitability information for each fund, as well as aggregate profitability information for groups of Fidelity funds and all Fidelity funds, using a series of detailed revenue and cost allocation methodologies which originate with the books and records of Fidelity on which Fidelity's audited financial statements are based. The Audit Committee of the Board reviews any significant changes from the prior year's methodologies and the full Board approves such changes.
A public accounting firm has been engaged annually by the Board as part of the Board's assessment of Fidelity's profitability analysis. The engagement includes the review and assessment of the methodologies used by Fidelity in determining the revenues and expenses attributable to Fidelity's fund business, and completion of agreed-upon procedures in respect of the mathematical accuracy of certain fund profitability information and its conformity to established allocation methodologies. After considering the reports issued under the engagement and information provided by Fidelity, the Board concluded that while other allocation methods may also be reasonable, Fidelity's profitability methodologies are reasonable in all material respects.
The Board also reviewed Fidelity's non-fund businesses and potential indirect benefits such businesses may have received as a result of their association with Fidelity's fund business (i.e., fall-out benefits) as well as cases where Fidelity's affiliates may benefit from the funds' business. The Board considered areas where potential indirect benefits to the Fidelity funds from their relationships with Fidelity may exist. The Board's consideration of these matters was informed by the findings of a joint ad hoc committee created by it and the boards of other Fidelity funds to evaluate potential fall-out benefits.
The Board considered the costs of the services provided by and the profits realized by Fidelity in connection with the operation of the fund and was satisfied that the profitability was not excessive.
Economies of Scale. The Board considered whether there have been economies of scale in respect of the management of the Fidelity funds, whether the Fidelity funds (including the fund) have appropriately benefited from any such economies of scale, and whether there is potential for realization of any further economies of scale. The Board considered the extent to which the fund will benefit from economies of scale as assets grow through increased services to the fund, through waivers or reimbursements, or through fee or expense ratio reductions. The Board also noted that a committee created by it and the boards of other Fidelity funds periodically analyzes whether Fidelity attains economies of scale in respect of the management and servicing of the Fidelity funds, whether the Fidelity funds have appropriately benefited from such economies of scale, and whether there is potential for realization of any further economies of scale.
The Board recognized that the fund's management contract incorporates a "group fee" structure, which provides for lower group fee rates as total "group assets" increase, and for higher group fee rates as total "group assets" decrease ("group assets" as defined in the management contract). FMR calculates the group fee rates based on a tiered asset "breakpoint" schedule that varies based on asset class. The Board considered that the group fee is designed to deliver the benefits of economies of scale to fund shareholders when total Fidelity fund assets increase, even if assets of any particular fund are unchanged or have declined, because some portion of Fidelity's costs are attributable to services provided to all Fidelity funds, and all funds benefit if those costs can be allocated among more assets. The Board also considered that Fidelity agreed to impose a temporary fee waiver in the form of additional breakpoints to the current breakpoint schedule. The Board concluded that, given the group fee structure, fund shareholders will benefit from lower management fees as "group assets" increase at the fund complex level, regardless of whether Fidelity achieves any such economies of scale.
The Board concluded, taking into account the analysis of the committee, that economies of scale, if any, are being appropriately shared between fund shareholders and Fidelity.
Additional Information Requested by the Board. In order to develop fully the factual basis for consideration of the Fidelity funds' advisory contracts, the Board requested and received additional information on certain topics, including: (i) Fidelity's fund profitability methodology, profitability trends for certain funds, the allocation of various costs to different funds, and the impact of certain factors on fund profitability results; (ii) portfolio manager changes that have occurred during the past year and Fidelity's views regarding portfolio manager investment in the Fidelity funds that they manage; (iii) hiring, training, and retaining personnel; (iv) the arrangements with and compensation paid to certain fund sub-advisers and the treatment of such compensation within Fidelity's fund profitability methodology; (v) the terms of the funds' various management fee structures, including the basic group fee and the terms of Fidelity's voluntary expense limitation arrangements; (vi) Fidelity's transfer agent, pricing and bookkeeping fees, expense and service structures for different funds and classes relative to competitive trends and market conditions; (vii) the impact on fund profitability of recent industry trends, such as the growth in passively managed funds and the changes in flows for different types of funds; (viii) the types of management fee and total expense comparisons provided, and the challenges and limitations associated with such information; (ix) explanations regarding the relative total expense ratios and management fees of certain funds and classes, total expense and management fee competitive trends, and methodologies for total expense and management fee competitive comparisons; (x) information concerning expense limitations applicable to certain funds; and (xi) matters related to money market funds, exchange-traded funds, and target date funds.
Conclusion. Based on its evaluation of all of the conclusions noted above, and after considering all factors it believed relevant, the Board, including the Independent Trustees, concluded that the advisory and sub-advisory fee arrangements are fair and reasonable in light of all of the surrounding circumstances and that the fund's Advisory Contracts should be renewed through September 30, 2024.
A special meeting of shareholders was held on October 18, 2023. The results of votes taken among shareholders on the proposal before them are reported below. Each vote reported represents one dollar of net asset value held on the record date for the meeting.
|
Proposal 1
|
To elect a Board of Trustees.
|
|
|
# of
Votes
|
% of
Votes
|
Abigail P. Johnson
|
Affirmative
|
727,421,969.830
|
96.000
|
Withheld
|
29,519,334.160
|
4.000
|
TOTAL
|
756,941,303.990
|
100.000
|
Jennifer Toolin McAuliffe
|
Affirmative
|
727,427,727.900
|
96.000
|
Withheld
|
29,513,576.090
|
4.000
|
TOTAL
|
756,941,303.990
|
100.000
|
Christine J. Thompson
|
Affirmative
|
726,275,025.910
|
96.000
|
Withheld
|
30,666,278.080
|
4.000
|
TOTAL
|
756,941,303.990
|
100.000
|
Elizabeth S. Acton
|
Affirmative
|
726,233,446.320
|
96.000
|
Withheld
|
30,707,857.670
|
4.000
|
TOTAL
|
756,941,303.990
|
100.000
|
Laura M. Bishop
|
Affirmative
|
726,275,025.910
|
96.000
|
Withheld
|
30,666,278.080
|
4.000
|
TOTAL
|
756,941,303.990
|
100.000
|
Ann E. Dunwoody
|
Affirmative
|
727,427,727.900
|
96.000
|
Withheld
|
29,513,576.090
|
4.000
|
TOTAL
|
756,941,303.990
|
100.000
|
John Engler
|
Affirmative
|
725,125,734.640
|
96.000
|
Withheld
|
31,815,569.350
|
4.000
|
TOTAL
|
756,941,303.990
|
100.000
|
Robert F. Gartland
|
Affirmative
|
729,069,579.200
|
96.000
|
Withheld
|
27,871,724.790
|
4.000
|
TOTAL
|
756,941,303.990
|
100.000
|
Robert W. Helm
|
Affirmative
|
729,368,128.290
|
96.000
|
Withheld
|
27,573,175.700
|
4.000
|
TOTAL
|
756,941,303.990
|
100.000
|
Arthur E. Johnson
|
Affirmative
|
724,989,059.520
|
96.000
|
Withheld
|
31,952,244.470
|
4.000
|
TOTAL
|
756,941,303.990
|
100.000
|
Michael E. Kenneally
|
Affirmative
|
725,652,104.730
|
96.000
|
Withheld
|
31,289,199.260
|
4.000
|
TOTAL
|
756,941,303.990
|
100.000
|
Mark A. Murray
|
Affirmative
|
729,236,421.490
|
96.000
|
Withheld
|
27,704,882.500
|
4.000
|
TOTAL
|
756,941,303.990
|
100.000
|
Carol J. Zierhoffer
|
Affirmative
|
726,647,665.370
|
96.000
|
Withheld
|
30,293,638.620
|
4.000
|
TOTAL
|
756,941,303.990
|
100.000
|
|
|
|
|
Proposal 1 reflects trust wide proposal and voting results.
|
1.539232.126
CTF-ANN-0124
Fidelity® New Jersey Municipal Income Fund
Annual Report
November 30, 2023
Contents
To view a fund's proxy voting guidelines and proxy voting record for the 12-month period ended June 30, visit http://www.fidelity.com/proxyvotingresults or visit the Securities and Exchange Commission's (SEC) web site at http://www.sec.gov.
You may also call 1-800-544-8544 to request a free copy of the proxy voting guidelines.
Standard & Poor's, S&P and S&P 500 are registered service marks of The McGraw-Hill Companies, Inc. and have been licensed for use by Fidelity Distributors Corporation.
Other third-party marks appearing herein are the property of their respective owners.
All other marks appearing herein are registered or unregistered trademarks or service marks of FMR LLC or an affiliated company. © 2024 FMR LLC. All rights reserved.
This report and the financial statements contained herein are submitted for the general information of the shareholders of the Fund. This report is not authorized for distribution to prospective investors in the Fund unless preceded or accompanied by an effective prospectus.
A fund files its complete schedule of portfolio holdings with the SEC for the first and third quarters of each fiscal year on Form N-PORT. Forms N-PORT are available on the SEC's web site at http://www.sec.gov. A fund's Forms N-PORT may be reviewed and copied at the SEC's Public Reference Room in Washington, DC. Information regarding the operation of the SEC's Public Reference Room may be obtained by calling 1-800-SEC-0330.
For a complete list of a fund's portfolio holdings, view the most recent holdings listing, semiannual report, or annual report on Fidelity's web site at http://www.fidelity.com, http://www.institutional.fidelity.com, or http://www.401k.com, as applicable.
NOT FDIC INSURED •MAY LOSE VALUE •NO BANK GUARANTEE
Neither the Fund nor Fidelity Distributors Corporation is a bank.
Average annual total return reflects the change in the value of an investment, assuming reinvestment of distributions from dividend income and capital gains (the profits earned upon the sale of securities that have grown in value, if any) and assuming a constant rate of performance each year. The hypothetical investment and the average annual total returns do not reflect the deduction of taxes that a shareholder would pay on fund distributions or the redemption of fund shares. During periods of reimbursement by Fidelity, a fund's total return will be greater than it would be had the reimbursement not occurred. How a fund did yesterday is no guarantee of how it will do tomorrow.
Average Annual Total Returns
|
|
|
|
|
|
Periods ended November 30, 2023
|
Past 1
year
|
Past 5
years
|
Past 10
years
|
Fidelity® New Jersey Municipal Income Fund
|
5.25%
|
2.51%
|
3.02%
|
$10,000 Over 10 Years
|
|
|
Let's say hypothetically that $10,000 was invested in Fidelity® New Jersey Municipal Income Fund on November 30, 2013.
The chart shows how the value of your investment would have changed, and also shows how the Bloomberg Municipal Bond Index performed over the same period.
|
|
|
Market Recap:
Tax-exempt municipal bonds gained 4.28% for the 12 months ending November 30, 2023, according to the Bloomberg Municipal Bond Index, buoyed in good part by outsized gains in the final month of the period. Overall, munis charted a rocky path through the 12-month period. They posted notable advances in the first months and early summer of 2023, when the bond market reacted positively to a slowdown in the pace of the U.S. Federal Reserve's campaign to bring down inflation by raising interest rates. But munis retreated in February when mixed economic data - lower inflation but resilient jobs and consumer spending - fueled worries that the central bank would continue its hiking cycle for longer than the market expected at the beginning of the year, then declined again in August and September when the Fed explicitly adopted a "higher for longer" message on interest rates. In November, however, munis had one of their best months since the 1980s, rising 6.35%, as yields fell sharply in response to a mild inflation report that eased pressure on the Fed. The central bank held steady on rates at its November committee meeting, the second consecutive meeting it chose to do so. For the full 12 months, muni tax-backed credit fundamentals remained solid, and the risk of credit-rating downgrades appeared low for most issuers. Lower-quality investment-grade bonds (rated BAA) and longer-term securities (15+ years) delivered the muni market's best returns.
Comments from Co-Portfolio Managers Cormac Cullen, Michael Maka and Elizah McLaughlin:
For the fiscal year, the fund gained 5.25%, net of fees, versus 5.18% for the state-specific Bloomberg New Jersey Enhanced Modified Municipal Bond Index and 4.28% for the benchmark, the Bloomberg Municipal Bond Index. The past 12 months, we focused on long-term objectives and sought to generate attractive tax-exempt income and a competitive risk-adjusted return. The fund's overweight in lower-quality investment-grade and select below-investment grade munis contributed to performance versus the state index as these securities outpaced higher-quality bonds. Overweights in the health care and higher education sectors also contributed to relative performance, as the groups' credit quality improved and investor demand for higher-yielding securities strengthened. The fund had more interest rate sensitivity, as measured by its longer duration, than the index, which boosted the relative result in the final month of the period when muni yields sharply declined. To a lesser extent, the fund's carry advantage, meaning its larger-than-index exposure to high-coupon bonds, also helped, as these securities were somewhat cushioned from rising interest rates. In contrast, an underweight in bonds backed by the New Jersey Turnpike Authority was a modest drag on relative performance, given the bonds' outsized gains this period. Differences in the way fund holdings and state index components were priced also hurt relative performance. Fund holdings are priced by a third-party pricing service and validated daily by Fidelity Management and Research's fair-value processes. Securities within the index, however, are priced by the index provider.
The views expressed above reflect those of the portfolio manager(s) only through the end of the period as stated on the cover of this report and do not necessarily represent the views of Fidelity or any other person in the Fidelity organization. Any such views are subject to change at any time based upon market or other conditions and Fidelity disclaims any responsibility to update such views. These views may not be relied on as investment advice and, because investment decisions for a Fidelity fund are based on numerous factors, may not be relied on as an indication of trading intent on behalf of any Fidelity fund.
Revenue Sources (% of Fund's net assets)
|
General Obligations
|
35.1
|
|
Transportation
|
18.1
|
|
Health Care
|
14.1
|
|
Education
|
13.7
|
|
Other*
|
5.4
|
|
Others (Individually Less Than 5%)
|
13.6
|
|
|
|
100.0
|
|
|
|
*Includes net other assets
|
|
|
Quality Diversification (% of Fund's net assets)
|
|
|
|
|
We have used ratings from Moody's Investors Service, Inc. Where Moody's® ratings are not available, we have used S&P® ratings. All ratings are as of the date indicated and do not reflect subsequent changes.
|
Showing Percentage of Net Assets
Municipal Bonds - 89.6%
|
|
|
|
Principal
Amount (a)
|
Value ($)
|
Delaware, New Jersey - 0.5%
|
|
|
|
Delaware River & Bay Auth. Rev. Series 2022:
|
|
|
|
5% 1/1/38
|
|
410,000
|
453,103
|
5% 1/1/42
|
|
2,075,000
|
2,218,576
|
TOTAL DELAWARE, NEW JERSEY
|
|
|
2,671,679
|
New Jersey - 73.0%
|
|
|
|
Audubon Scd Series 2022, 2.75% 8/15/33 (Assured Guaranty Muni. Corp. Insured)
|
|
1,160,000
|
1,057,527
|
Bergen County Gen. Oblig. Series 2021 ABC, 2% 6/1/28
|
|
285,000
|
262,625
|
Berkely Township Series 2023, 3.25% 8/15/35
|
|
1,255,000
|
1,181,233
|
Camden County Impt. Auth. Health Care Redev. Rev. Series 2014 A:
|
|
|
|
5% 2/15/25 (Pre-Refunded to 2/15/24 @ 100)
|
|
1,020,000
|
1,023,214
|
5% 2/15/26 (Pre-Refunded to 2/15/24 @ 100)
|
|
1,500,000
|
1,504,727
|
5% 2/15/27 (Pre-Refunded to 2/15/24 @ 100)
|
|
1,000,000
|
1,003,151
|
5% 2/15/28 (Pre-Refunded to 2/15/24 @ 100)
|
|
1,000,000
|
1,003,151
|
5% 2/15/29 (Pre-Refunded to 2/15/24 @ 100)
|
|
1,000,000
|
1,003,151
|
5% 2/15/32 (Pre-Refunded to 2/15/24 @ 100)
|
|
1,000,000
|
1,003,151
|
5% 2/15/33 (Pre-Refunded to 2/15/24 @ 100)
|
|
1,000,000
|
1,003,151
|
5% 2/15/34 (Pre-Refunded to 2/15/24 @ 100)
|
|
1,200,000
|
1,203,782
|
5% 2/15/35 (Pre-Refunded to 2/15/24 @ 100)
|
|
1,000,000
|
1,003,151
|
Englewood Gen. Oblig. Series 2021, 2% 2/1/29
|
|
560,000
|
503,554
|
Essex County Gen. Oblig. Series 2020, 2% 9/1/31
|
|
995,000
|
875,799
|
Hanover Park Reg'l. High School Series 2023, 3.5% 3/15/31
|
|
1,120,000
|
1,111,291
|
Hillsborough Township Scd Series 2020, 2% 7/15/40
|
|
1,240,000
|
856,546
|
Hudson County Gen. Oblig. Series 2020, 3% 11/15/32
|
|
485,000
|
457,259
|
Hudson County Impt. Auth. (Hudson County Courthouse Proj.) Series 2020, 3% 10/1/36
|
|
2,950,000
|
2,670,007
|
Jersey City Gen. Oblig. Series 2022 A, 3% 2/15/37
|
|
1,000,000
|
910,010
|
Mercer County Gen. Oblig. Series 2021, 2.375% 2/15/30
|
|
2,280,000
|
2,113,568
|
Monmouth County Impt. Auth. Rev. Series 2021 A, 3% 3/1/33
|
|
385,000
|
372,260
|
Montclair Township N J Board Ed. Series 2023, 3.25% 1/15/38 (Build America Mutual Assurance Insured)
|
|
1,825,000
|
1,624,704
|
Morris County Gen. Oblig. Series 2021, 2% 2/1/29
|
|
1,085,000
|
989,045
|
New Jersey Econ. Dev. Auth.:
|
|
|
|
(White Horse HMT Urban Renewal LLC Proj.) Series 2020, 5% 1/1/40 (b)
|
|
1,000,000
|
694,836
|
Series 2015, 5.25% 6/15/27
|
|
1,395,000
|
1,435,397
|
Series 2024 SSS:
|
|
|
|
5% 6/15/33 (c)
|
|
1,725,000
|
1,895,333
|
5% 6/15/34 (c)
|
|
4,710,000
|
5,203,408
|
5.25% 6/15/37 (c)
|
|
1,570,000
|
1,720,238
|
5.25% 6/15/38 (c)
|
|
2,000,000
|
2,166,005
|
5.25% 6/15/39 (c)
|
|
3,000,000
|
3,230,463
|
Series A, 5% 11/1/35
|
|
5,000,000
|
5,410,172
|
Series QQQ:
|
|
|
|
4% 6/15/46
|
|
1,250,000
|
1,165,333
|
4% 6/15/50
|
|
1,000,000
|
919,179
|
Series WW, 5.25% 6/15/40 (Pre-Refunded to 6/15/25 @ 100)
|
|
105,000
|
108,588
|
New Jersey Econ. Dev. Auth. Lease Rev. (Health Dept. and Taxation Division Office Proj.) Series 2018 A, 5% 6/15/31
|
|
2,555,000
|
2,727,581
|
New Jersey Econ. Dev. Auth. Motor Vehicle Rev.:
|
|
|
|
Series 2017 A, 3.375% 7/1/30
|
|
3,705,000
|
3,621,235
|
Series 2017 B, 3.125% 7/1/29
|
|
1,335,000
|
1,281,391
|
New Jersey Econ. Dev. Auth. Rev.:
|
|
|
|
(Black Horse EHT Urban Renewal LLC Proj.) Series 2019 A, 5% 10/1/39 (b)
|
|
1,250,000
|
810,536
|
(Goethals Bridge Replacement Proj.) Series 2013, 5.125% 1/1/34 (d)
|
|
1,500,000
|
1,500,224
|
(Provident Montclair Proj.) Series 2017:
|
|
|
|
5% 6/1/30 (Assured Guaranty Muni. Corp. Insured)
|
|
1,500,000
|
1,577,383
|
5% 6/1/31 (Assured Guaranty Muni. Corp. Insured)
|
|
1,500,000
|
1,576,649
|
5% 6/1/37 (Assured Guaranty Muni. Corp. Insured)
|
|
4,000,000
|
4,151,463
|
New Jersey Econ. Dev. Auth. Spl. Facilities Rev. (Port Newark Container Term. LLC. Proj.) Series 2017, 5% 10/1/37 (d)
|
|
1,000,000
|
1,009,977
|
New Jersey Econ. Dev. Auth. Wtr. Facilities Rev.:
|
|
|
|
(Middlesex Wtr. Co. Proj.) Series 2019:
|
|
|
|
4% 8/1/59 (d)
|
|
1,000,000
|
853,390
|
5% 8/1/59 (d)
|
|
1,000,000
|
1,019,256
|
Bonds (New Jersey- American Wtr. Co., INC. Proj.) Series 2020 B, 3.75%, tender 6/1/28 (d)(e)
|
|
5,000,000
|
4,962,254
|
New Jersey Edl. Facility:
|
|
|
|
(Stevens Institute of Techonolgy Proj.) Series 2017 A:
|
|
|
|
5% 7/1/24
|
|
690,000
|
694,228
|
5% 7/1/25
|
|
600,000
|
609,630
|
5% 7/1/26
|
|
945,000
|
980,145
|
5% 7/1/29
|
|
865,000
|
909,844
|
Series 2015 B, 5% 7/1/31
|
|
3,000,000
|
3,061,401
|
Series 2016 A:
|
|
|
|
5% 7/1/27
|
|
2,875,000
|
2,981,125
|
5% 7/1/29
|
|
1,000,000
|
1,029,316
|
5% 7/1/32
|
|
600,000
|
616,634
|
Series 2016 E, 5% 7/1/32 (Build America Mutual Assurance Insured)
|
|
3,335,000
|
3,468,625
|
Series A:
|
|
|
|
4% 7/1/50
|
|
3,000,000
|
2,675,595
|
5% 7/1/32
|
|
420,000
|
453,636
|
5% 7/1/33
|
|
675,000
|
727,170
|
5% 7/1/34
|
|
540,000
|
579,651
|
5% 7/1/35
|
|
570,000
|
609,481
|
5% 7/1/36
|
|
1,095,000
|
1,162,659
|
5% 7/1/37
|
|
1,095,000
|
1,152,993
|
5% 7/1/38
|
|
985,000
|
1,029,031
|
5% 7/1/39
|
|
1,040,000
|
1,082,109
|
5% 7/1/40
|
|
1,035,000
|
1,073,389
|
5% 7/1/45
|
|
3,500,000
|
3,581,820
|
New Jersey Gen. Oblig. Series 2021:
|
|
|
|
2% 6/1/26
|
|
6,300,000
|
6,058,933
|
2% 6/1/29
|
|
3,110,000
|
2,837,786
|
New Jersey Health Care Facilities Fing. Auth. Rev.:
|
|
|
|
(Inspira Health Proj.) Series 2017 A, 5% 7/1/42
|
|
5,325,000
|
5,420,920
|
(St Joseph Hosp. & Med. Ctr., Proj.) Series 2016, 5% 7/1/25
|
|
700,000
|
708,032
|
Series 2014 A, 4% 7/1/45
|
|
1,300,000
|
1,205,133
|
Series 2015 A, 4.125% 7/1/38 (Assured Guaranty Muni. Corp. Insured)
|
|
1,000,000
|
974,929
|
Series 2016 A:
|
|
|
|
5% 7/1/26 (Escrowed to Maturity)
|
|
1,575,000
|
1,651,806
|
5% 7/1/27
|
|
100,000
|
104,965
|
5% 7/1/39
|
|
11,000,000
|
11,261,870
|
5% 7/1/43
|
|
2,500,000
|
2,528,341
|
Series 2016:
|
|
|
|
4% 7/1/48
|
|
425,000
|
369,080
|
5% 7/1/26
|
|
800,000
|
817,470
|
5% 7/1/31
|
|
400,000
|
420,948
|
5% 7/1/35
|
|
950,000
|
958,887
|
5% 7/1/36
|
|
565,000
|
569,943
|
5% 7/1/41
|
|
6,085,000
|
6,094,801
|
Series 2017 A, 5% 7/1/25
|
|
110,000
|
113,071
|
Series 2019:
|
|
|
|
3% 7/1/49
|
|
9,640,000
|
7,282,596
|
5% 7/1/34
|
|
960,000
|
1,035,072
|
Series 2021:
|
|
|
|
3% 7/1/46
|
|
7,140,000
|
5,222,409
|
4% 7/1/35
|
|
750,000
|
769,180
|
4% 7/1/37
|
|
700,000
|
704,849
|
5% 7/1/33
|
|
1,420,000
|
1,586,045
|
5% 7/1/34
|
|
1,250,000
|
1,395,821
|
New Jersey Higher Ed. Student Assistance Auth. Student Ln. Rev.:
|
|
|
|
Series 2016 1A, 5% 12/1/25 (d)
|
|
1,400,000
|
1,432,590
|
Series 2017 1A:
|
|
|
|
5% 12/1/25 (d)
|
|
3,000,000
|
3,069,836
|
5% 12/1/27 (d)
|
|
2,500,000
|
2,587,940
|
Series 2018 B:
|
|
|
|
5% 12/1/26 (d)
|
|
255,000
|
263,386
|
5% 12/1/28 (d)
|
|
950,000
|
997,156
|
Series 2019 A:
|
|
|
|
5% 12/1/27
|
|
2,000,000
|
2,142,851
|
5% 12/1/28
|
|
700,000
|
751,485
|
Series 2020, 5% 12/1/23 (d)
|
|
2,375,000
|
2,375,000
|
Series 2021 A:
|
|
|
|
5% 12/1/26 (d)
|
|
325,000
|
335,688
|
5% 12/1/27 (d)
|
|
325,000
|
339,509
|
5% 12/1/28 (d)
|
|
400,000
|
421,801
|
5% 12/1/29 (d)
|
|
1,050,000
|
1,114,482
|
Series 2021 B:
|
|
|
|
5% 12/1/27 (d)
|
|
1,325,000
|
1,384,151
|
5% 12/1/28 (d)
|
|
1,450,000
|
1,529,028
|
5% 12/1/29 (d)
|
|
1,415,000
|
1,500,343
|
Series 2023 A:
|
|
|
|
5% 12/1/25 (d)
|
|
575,000
|
588,385
|
5% 12/1/26 (d)
|
|
1,275,000
|
1,316,931
|
Series 2023 B:
|
|
|
|
5% 12/1/25 (d)
|
|
1,850,000
|
1,893,066
|
5% 12/1/26 (d)
|
|
7,000,000
|
7,230,211
|
New Jersey Hsg. & Mtg. Fin. Agcy. Multi-family Rev. Series 2023 C:
|
|
|
|
5% 11/1/28 (d)
|
|
1,875,000
|
1,930,596
|
5% 5/1/29 (d)
|
|
1,885,000
|
1,939,884
|
5% 11/1/29 (d)
|
|
1,950,000
|
2,009,263
|
5% 5/1/30 (d)
|
|
2,000,000
|
2,060,817
|
5% 11/1/30 (d)
|
|
2,045,000
|
2,109,236
|
New Jersey Hsg. & Mtg. Fin. Agcy. Rev.:
|
|
|
|
Series 2019 D, 4% 10/1/24 (d)
|
|
2,370,000
|
2,370,083
|
Series 2020 E, 1.75% 4/1/30
|
|
900,000
|
778,958
|
Series 2021 H:
|
|
|
|
5% 4/1/28
|
|
300,000
|
321,261
|
5% 10/1/28
|
|
480,000
|
517,806
|
5% 4/1/29
|
|
500,000
|
540,286
|
Series 2022 I, 5% 10/1/53
|
|
3,455,000
|
3,558,830
|
New Jersey Institute of Technology Series A:
|
|
|
|
5% 7/1/31
|
|
375,000
|
411,065
|
5% 7/1/32
|
|
375,000
|
411,182
|
5% 7/1/33
|
|
170,000
|
186,255
|
New Jersey Tobacco Settlement Fing. Corp.:
|
|
|
|
Series 2018 A:
|
|
|
|
5% 6/1/26
|
|
5,000,000
|
5,137,715
|
5% 6/1/27
|
|
1,000,000
|
1,040,223
|
5% 6/1/28
|
|
2,000,000
|
2,103,724
|
Series 2018 B, 5% 6/1/46
|
|
5,965,000
|
5,979,231
|
New Jersey Trans. Trust Fund Auth.:
|
|
|
|
(Trans. Prog.) Series 2019 AA, 5.25% 6/15/43
|
|
520,000
|
545,187
|
Series 2006 C:
|
|
|
|
0% 12/15/26 (AMBAC Insured)
|
|
10,000,000
|
9,017,150
|
0% 12/15/34
|
|
4,000,000
|
2,692,071
|
Series 2008 A, 0% 12/15/36
|
|
25,000,000
|
14,631,585
|
Series 2009 A:
|
|
|
|
0% 12/15/33
|
|
1,135,000
|
783,033
|
0% 12/15/38
|
|
13,900,000
|
7,222,045
|
Series 2010 A:
|
|
|
|
0% 12/15/27
|
|
3,000,000
|
2,609,103
|
0% 12/15/28
|
|
9,800,000
|
8,233,308
|
0% 12/15/30
|
|
14,795,000
|
11,538,332
|
0% 12/15/32
|
|
355,000
|
255,706
|
Series 2010 A3, 0% 12/15/34
|
|
10,775,000
|
7,088,720
|
Series 2014 AA:
|
|
|
|
5% 6/15/38
|
|
770,000
|
771,561
|
5% 6/15/44
|
|
555,000
|
555,674
|
Series 2016 A, 5% 6/15/29
|
|
750,000
|
781,790
|
Series 2019 BB, 4% 6/15/38
|
|
1,035,000
|
1,039,410
|
Series 2020 AA, 3% 6/15/50
|
|
7,500,000
|
5,628,184
|
Series 2022 AA:
|
|
|
|
5% 6/15/37
|
|
10,000,000
|
11,115,955
|
5% 6/15/38
|
|
6,440,000
|
7,119,208
|
Series 2023 BB, 5.25% 6/15/50
|
|
10,000,000
|
10,726,859
|
Series A:
|
|
|
|
0% 12/15/31
|
|
365,000
|
274,015
|
5% 12/15/33
|
|
2,850,000
|
3,111,012
|
Series AA:
|
|
|
|
4% 6/15/50
|
|
7,300,000
|
6,769,892
|
5% 6/15/50
|
|
1,000,000
|
1,039,224
|
Newark Port Auth. Hsg. Auth. Rev. Series 2007, 5.25% 1/1/25 (Nat'l. Pub. Fin. Guarantee Corp. Insured)
|
|
200,000
|
202,639
|
Ocean City Gen. Oblig. Series 2019, 2.25% 9/15/32
|
|
400,000
|
349,232
|
Passaic County Gen. Oblig.:
|
|
|
|
Series 2020 C, 2% 11/1/33
|
|
685,000
|
585,685
|
Series 2021 AB:
|
|
|
|
2% 11/1/34
|
|
1,840,000
|
1,539,593
|
2% 11/1/36
|
|
1,230,000
|
969,142
|
Passaic County N J Impt. Auth. Cha:
|
|
|
|
(Paterson Arts & Science Charter School Proj.) Series 2023, 4.25% 7/1/33
|
|
620,000
|
624,277
|
(Paterson Arts and Science Charter School Proj.) Series 2023:
|
|
|
|
5.25% 7/1/43
|
|
670,000
|
680,427
|
5.375% 7/1/53
|
|
1,000,000
|
1,007,686
|
5.5% 7/1/58
|
|
635,000
|
642,810
|
Princeton Borough Gen. Oblig. Series 2021, 2.5% 9/15/32
|
|
835,000
|
751,671
|
Rahway Board of Ed. Series 2021:
|
|
|
|
2.125% 7/15/37 (Build America Mutual Assurance Insured)
|
|
1,110,000
|
843,478
|
2.125% 7/15/38 (Build America Mutual Assurance Insured)
|
|
1,400,000
|
1,027,930
|
Salem County Indl. Poll. Cont. Fing. Auth. Poll. Cont. Rev. Bonds (Philadelphia Elec. Co. Proj.) Series 1993 A, 4.45%, tender 3/1/25 (d)(e)(f)
|
|
3,200,000
|
3,192,541
|
South Jersey Port Corp. Rev. (New Jersey Gen. Oblig. Proj.) Series 2017 B:
|
|
|
|
5% 1/1/29 (d)
|
|
955,000
|
1,004,072
|
5% 1/1/31 (d)
|
|
1,950,000
|
2,046,517
|
5% 1/1/33 (d)
|
|
750,000
|
783,929
|
5% 1/1/35 (d)
|
|
2,000,000
|
2,079,026
|
South Jersey Trans. Auth. Trans. Sys. Rev.:
|
|
|
|
Series 2019 A:
|
|
|
|
5% 11/1/28 (Assured Guaranty Muni. Corp. Insured)
|
|
200,000
|
214,702
|
5% 11/1/31 (Assured Guaranty Muni. Corp. Insured)
|
|
1,500,000
|
1,622,390
|
5% 11/1/32 (Assured Guaranty Muni. Corp. Insured)
|
|
1,230,000
|
1,331,461
|
5% 11/1/33 (Assured Guaranty Muni. Corp. Insured)
|
|
750,000
|
811,139
|
Series 2020 A:
|
|
|
|
5% 11/1/45
|
|
7,000,000
|
7,199,898
|
5% 11/1/45 (Build America Mutual Assurance Insured)
|
|
2,000,000
|
2,073,934
|
The Board of Ed. of Newark Series 2021:
|
|
|
|
4% 7/15/36 (Build America Mutual Assurance Insured)
|
|
775,000
|
788,397
|
4% 7/15/37 (Build America Mutual Assurance Insured)
|
|
725,000
|
733,573
|
5% 7/15/24
|
|
400,000
|
403,763
|
5% 7/15/28 (Build America Mutual Assurance Insured)
|
|
300,000
|
323,302
|
5% 7/15/29 (Build America Mutual Assurance Insured)
|
|
300,000
|
326,457
|
5% 7/15/30 (Build America Mutual Assurance Insured)
|
|
300,000
|
330,228
|
5% 7/15/31 (Build America Mutual Assurance Insured)
|
|
375,000
|
417,432
|
5% 7/15/32 (Build America Mutual Assurance Insured)
|
|
400,000
|
447,714
|
5% 7/15/33 (Build America Mutual Assurance Insured)
|
|
500,000
|
559,417
|
Washington Township N J Board Ed. Morr Series 2023, 3.125% 8/15/35
|
|
1,515,000
|
1,397,675
|
TOTAL NEW JERSEY
|
|
|
377,889,132
|
New York - 0.2%
|
|
|
|
Port Auth. of New York & New Jersey Series 2020 221, 4% 7/15/50 (d)
|
|
1,215,000
|
1,123,520
|
New York And New Jersey - 13.2%
|
|
|
|
Port Auth. of New York & New Jersey:
|
|
|
|
Series 2014 185, 5% 9/1/30 (d)
|
|
1,105,000
|
1,112,740
|
Series 2015 189, 3.25% 5/1/33
|
|
500,000
|
468,631
|
Series 2016, 5% 11/15/32 (d)
|
|
5,000,000
|
5,157,000
|
Series 2018, 5% 9/15/34 (d)
|
|
5,000,000
|
5,232,827
|
Series 2022 236, 5% 1/15/47 (d)
|
|
6,000,000
|
6,211,828
|
Series 2023 238:
|
|
|
|
5% 7/15/35 (d)
|
|
3,525,000
|
3,856,170
|
5% 7/15/36 (d)
|
|
2,940,000
|
3,187,206
|
5% 7/15/37 (d)
|
|
1,765,000
|
1,901,865
|
5% 7/15/38 (d)
|
|
1,770,000
|
1,897,783
|
5% 7/15/39 (d)
|
|
1,685,000
|
1,795,287
|
Series 207, 5% 9/15/29 (d)
|
|
1,750,000
|
1,848,850
|
Series 214:
|
|
|
|
5% 9/1/30 (d)
|
|
250,000
|
268,351
|
5% 9/1/36 (d)
|
|
6,785,000
|
7,140,421
|
Series 218, 5% 11/1/44 (d)
|
|
1,420,000
|
1,453,770
|
Series 221:
|
|
|
|
4% 7/15/37 (d)
|
|
1,000,000
|
989,708
|
4% 7/15/45 (d)
|
|
1,500,000
|
1,429,003
|
5% 7/15/35 (d)
|
|
2,500,000
|
2,670,499
|
Series 223:
|
|
|
|
4% 7/15/34 (d)
|
|
2,000,000
|
2,029,083
|
4% 7/15/35 (d)
|
|
2,250,000
|
2,274,232
|
4% 7/15/36 (d)
|
|
1,350,000
|
1,353,778
|
4% 7/15/37 (d)
|
|
2,750,000
|
2,724,529
|
4% 7/15/38 (d)
|
|
6,000,000
|
5,905,794
|
4% 7/15/39 (d)
|
|
4,000,000
|
3,924,431
|
5% 7/15/56 (d)
|
|
3,500,000
|
3,578,009
|
TOTAL NEW YORK AND NEW JERSEY
|
|
|
68,411,795
|
Pennsylvania, New Jersey - 1.0%
|
|
|
|
Delaware River Joint Toll Bridge Commission Pennsylvania-New Jersey Bridge Rev. Series 2019 A, 5% 7/1/44
|
|
700,000
|
725,831
|
Delaware River Port Auth. Pennsylvania & New Jersey Rev. Series 2018 A:
|
|
|
|
5% 1/1/37
|
|
1,200,000
|
1,290,999
|
5% 1/1/38
|
|
1,450,000
|
1,550,762
|
5% 1/1/39
|
|
1,190,000
|
1,271,062
|
TOTAL PENNSYLVANIA, NEW JERSEY
|
|
|
4,838,654
|
Puerto Rico - 1.7%
|
|
|
|
Puerto Rico Commonwealth Aqueduct & Swr. Auth. Series 2021 B, 5% 7/1/37 (b)
|
|
1,395,000
|
1,394,943
|
Puerto Rico Commonwealth Pub. Impt. Gen. Oblig. Series 2021 A1:
|
|
|
|
0% 7/1/33
|
|
1,552,650
|
945,104
|
5.625% 7/1/27
|
|
175,000
|
182,720
|
5.625% 7/1/29
|
|
545,000
|
576,014
|
5.75% 7/1/31
|
|
1,300,000
|
1,398,101
|
Puerto Rico Indl., Tourist, Edl., Med. And Envir. Cont. Facilities Fing. Auth. Series 2021:
|
|
|
|
4% 7/1/41
|
|
195,000
|
174,665
|
5% 7/1/30
|
|
860,000
|
922,567
|
5% 7/1/32
|
|
125,000
|
134,791
|
5% 7/1/34
|
|
110,000
|
118,241
|
5% 7/1/35
|
|
120,000
|
128,427
|
Puerto Rico Sales Tax Fing. Corp. Sales Tax Rev.:
|
|
|
|
Series 2018 A1, 0% 7/1/31
|
|
1,465,000
|
1,055,086
|
Series 2019 A2:
|
|
|
|
4.329% 7/1/40
|
|
914,000
|
865,144
|
4.55% 7/1/40
|
|
1,050,000
|
1,020,259
|
TOTAL PUERTO RICO
|
|
|
8,916,062
|
|
TOTAL MUNICIPAL BONDS
(Cost $466,889,363)
|
|
|
463,850,842
|
|
|
|
|
|
Municipal Notes - 5.0%
|
|
|
|
Principal
Amount (a)
|
Value ($)
|
New Jersey - 5.0%
|
|
|
|
Mercer County Gen. Oblig. Participating VRDN Series Floater 005, 3.28% 12/1/23 (Liquidity Facility Barclays Bank PLC) (e)(f)(g)
|
|
4,400,000
|
4,400,000
|
New Jersey Health Care Facilities Fing. Auth. Rev. (Virtua Health Proj.):
|
|
|
|
Series 2009 B, 2.55% 12/1/23, LOC JPMorgan Chase Bank, VRDN (e)
|
|
11,600,000
|
11,600,000
|
Series 2009 C, 2.6% 12/1/23, LOC JPMorgan Chase Bank, VRDN (e)
|
|
10,000,000
|
10,000,000
|
|
|
|
|
|
|
TOTAL MUNICIPAL NOTES
(Cost $26,000,000)
|
|
|
26,000,000
|
|
|
|
|
|
Money Market Funds - 6.0%
|
|
|
|
Shares
|
Value ($)
|
Fidelity Municipal Cash Central Fund 3.41% (h)(i)
(Cost $31,013,997)
|
|
31,007,798
|
31,014,001
|
|
|
|
|
|
|
TOTAL INVESTMENT IN SECURITIES - 100.6%
(Cost $523,903,360)
|
520,864,843
|
NET OTHER ASSETS (LIABILITIES) - (0.6)%
|
(3,339,969)
|
NET ASSETS - 100.0%
|
517,524,874
|
|
|
|
Security Type Abbreviations
VRDN
|
-
|
VARIABLE RATE DEMAND NOTE (A debt instrument that is payable upon demand, either daily, weekly or monthly)
|
Legend
(a)
|
Amount is stated in United States dollars unless otherwise noted.
|
(b)
|
Security exempt from registration under Rule 144A of the Securities Act of 1933. These securities may be resold in transactions exempt from registration, normally to qualified institutional buyers. At the end of the period, the value of these securities amounted to $2,900,315 or 0.6% of net assets.
|
(c)
|
Security or a portion of the security purchased on a delayed delivery or when-issued basis.
|
(d)
|
Private activity obligations whose interest is subject to the federal alternative minimum tax for individuals.
|
(e)
|
Coupon rates for floating and adjustable rate securities reflect the rates in effect at period end.
|
(f)
|
Coupon rates are determined by re-marketing agents based on current market conditions.
|
(g)
|
Provides evidence of ownership in one or more underlying municipal bonds.
|
(h)
|
Information in this report regarding holdings by state and security types does not reflect the holdings of the Fidelity Municipal Cash Central Fund.
|
(i)
|
Affiliated fund that is generally available only to investment companies and other accounts managed by Fidelity Investments. The rate quoted is the annualized seven-day yield of the fund at period end. A complete unaudited listing of the fund's holdings as of its most recent quarter end is available upon request. In addition, each Fidelity Central Fund's financial statements, which are not covered by the Fund's Report of Independent Registered Public Accounting Firm, are available on the SEC's website or upon request.
|
Affiliated Central Funds
Fiscal year to date information regarding the Fund's investments in Fidelity Central Funds, including the ownership percentage, is presented below.
Affiliate
|
Value,
beginning
of period ($)
|
Purchases ($)
|
Sales
Proceeds ($)
|
Dividend
Income ($)
|
Realized
Gain (loss) ($)
|
Change in
Unrealized
appreciation
(depreciation) ($)
|
Value,
end
of period ($)
|
% ownership,
end
of period
|
Fidelity Municipal Cash Central Fund 3.41%
|
-
|
91,960,997
|
60,947,000
|
576,992
|
-
|
4
|
31,014,001
|
1.4%
|
Total
|
-
|
91,960,997
|
60,947,000
|
576,992
|
-
|
4
|
31,014,001
|
|
|
|
|
|
|
|
|
|
|
|
Amounts in the dividend income column in the above table include any capital gain distributions from underlying funds, which are presented in the corresponding line item in the Statement of Operations, if applicable.
Amounts included in the purchases and sales proceeds columns may include in-kind transactions, if applicable.
Investment Valuation
The following is a summary of the inputs used, as of November 30, 2023, involving the Fund's assets and liabilities carried at fair value. The inputs or methodology used for valuing securities may not be an indication of the risk associated with investing in those securities. For more information on valuation inputs, and their aggregation into the levels used below, please refer to the Investment Valuation section in the accompanying Notes to Financial Statements.
Valuation Inputs at Reporting Date:
|
Description
|
Total ($)
|
Level 1 ($)
|
Level 2 ($)
|
Level 3 ($)
|
Investments in Securities:
|
|
|
|
|
|
|
Municipal Securities
|
489,850,842
|
-
|
489,850,842
|
-
|
|
|
Money Market Funds
|
31,014,001
|
31,014,001
|
-
|
-
|
Total Investments in Securities:
|
520,864,843
|
31,014,001
|
489,850,842
|
-
|
Statement of Assets and Liabilities
|
|
|
|
|
November 30, 2023
|
|
|
|
|
|
|
Assets
|
|
|
|
|
Investment in securities, at value - See accompanying schedule:
|
|
|
|
|
Unaffiliated issuers (cost $492,889,363)
|
$
|
489,850,842
|
|
|
Fidelity Central Funds (cost $31,013,997)
|
|
31,014,001
|
|
|
|
|
|
|
|
|
|
|
|
|
|
|
Total Investment in Securities (cost $523,903,360)
|
|
|
$
|
520,864,843
|
Cash
|
|
|
|
99,988
|
Receivable for investments sold
|
|
|
|
4,145,389
|
Receivable for fund shares sold
|
|
|
|
625,042
|
Interest receivable
|
|
|
|
6,455,805
|
Distributions receivable from Fidelity Central Funds
|
|
|
|
99,664
|
Prepaid expenses
|
|
|
|
539
|
Other receivables
|
|
|
|
2,070
|
Total assets
|
|
|
|
532,293,340
|
Liabilities
|
|
|
|
|
Payable for investments purchased on a delayed delivery basis
|
$
|
14,004,476
|
|
|
Payable for fund shares redeemed
|
|
83,482
|
|
|
Distributions payable
|
|
441,139
|
|
|
Accrued management fee
|
|
143,746
|
|
|
Other affiliated payables
|
|
46,478
|
|
|
Other payables and accrued expenses
|
|
49,145
|
|
|
Total Liabilities
|
|
|
|
14,768,466
|
Net Assets
|
|
|
$
|
517,524,874
|
Net Assets consist of:
|
|
|
|
|
Paid in capital
|
|
|
$
|
527,779,335
|
Total accumulated earnings (loss)
|
|
|
|
(10,254,461)
|
Net Assets
|
|
|
$
|
517,524,874
|
Net Asset Value, offering price and redemption price per share ($517,524,874 ÷ 45,341,037 shares)
|
|
|
$
|
11.41
|
Statement of Operations
|
|
|
|
|
Year ended
November 30, 2023
|
Investment Income
|
|
|
|
|
Interest
|
|
|
$
|
15,932,171
|
Income from Fidelity Central Funds
|
|
|
|
576,992
|
Total Income
|
|
|
|
16,509,163
|
Expenses
|
|
|
|
|
Management fee
|
$
|
1,745,048
|
|
|
Transfer agent fees
|
|
433,570
|
|
|
Accounting fees and expenses
|
|
129,781
|
|
|
Custodian fees and expenses
|
|
6,691
|
|
|
Independent trustees' fees and expenses
|
|
1,745
|
|
|
Registration fees
|
|
33,408
|
|
|
Audit
|
|
50,531
|
|
|
Legal
|
|
12,698
|
|
|
Miscellaneous
|
|
4,396
|
|
|
Total expenses before reductions
|
|
2,417,868
|
|
|
Expense reductions
|
|
(22,905)
|
|
|
Total expenses after reductions
|
|
|
|
2,394,963
|
Net Investment income (loss)
|
|
|
|
14,114,200
|
Realized and Unrealized Gain (Loss)
|
|
|
|
|
Net realized gain (loss) on:
|
|
|
|
|
Investment Securities:
|
|
|
|
|
Unaffiliated issuers
|
|
(1,645,447)
|
|
|
Total net realized gain (loss)
|
|
|
|
(1,645,447)
|
Change in net unrealized appreciation (depreciation) on:
|
|
|
|
|
Investment Securities:
|
|
|
|
|
Unaffiliated issuers
|
|
13,728,601
|
|
|
Fidelity Central Funds
|
|
4
|
|
|
Total change in net unrealized appreciation (depreciation)
|
|
|
|
13,728,605
|
Net gain (loss)
|
|
|
|
12,083,158
|
Net increase (decrease) in net assets resulting from operations
|
|
|
$
|
26,197,358
|
Statement of Changes in Net Assets
|
|
|
|
|
Year ended
November 30, 2023
|
|
Year ended
November 30, 2022
|
Increase (Decrease) in Net Assets
|
|
|
|
|
Operations
|
|
|
|
|
Net investment income (loss)
|
$
|
14,114,200
|
$
|
13,320,664
|
Net realized gain (loss)
|
|
(1,645,447)
|
|
(6,055,908)
|
Change in net unrealized appreciation (depreciation)
|
|
13,728,605
|
|
(70,380,118)
|
Net increase (decrease) in net assets resulting from operations
|
|
26,197,358
|
|
(63,115,362)
|
Distributions to shareholders
|
|
(13,704,010)
|
|
(16,833,658)
|
|
|
|
|
|
|
Share transactions
|
|
|
|
|
Proceeds from sales of shares
|
|
123,066,423
|
|
330,846,118
|
Reinvestment of distributions
|
|
8,787,843
|
|
10,396,284
|
Cost of shares redeemed
|
|
(134,151,204)
|
|
(471,930,206)
|
|
|
|
|
|
|
Net increase (decrease) in net assets resulting from share transactions
|
|
(2,296,938)
|
|
(130,687,804)
|
Total increase (decrease) in net assets
|
|
10,196,410
|
|
(210,636,824)
|
|
|
|
|
|
|
Net Assets
|
|
|
|
|
Beginning of period
|
|
507,328,464
|
|
717,965,288
|
End of period
|
$
|
517,524,874
|
$
|
507,328,464
|
|
|
|
|
|
|
Other Information
|
|
|
|
|
Shares
|
|
|
|
|
Sold
|
|
11,026,048
|
|
29,219,835
|
Issued in reinvestment of distributions
|
|
781,524
|
|
893,169
|
Redeemed
|
|
(12,023,702)
|
|
(41,446,898)
|
Net increase (decrease)
|
|
(216,130)
|
|
(11,333,894)
|
|
|
|
|
|
|
Financial Highlights
Fidelity® New Jersey Municipal Income Fund
|
|
|
Years ended November 30,
|
|
2023
|
|
2022
|
|
2021
|
|
2020
|
|
2019
|
Selected Per-Share Data
|
|
|
|
|
|
|
|
|
|
|
Net asset value, beginning of period
|
$
|
11.14
|
$
|
12.62
|
$
|
12.48
|
$
|
12.33
|
$
|
11.56
|
Income from Investment Operations
|
|
|
|
|
|
|
|
|
|
|
Net investment income (loss) A,B
|
|
.316
|
|
.263
|
|
.249
|
|
.299
|
|
.333
|
Net realized and unrealized gain (loss)
|
|
.261
|
|
(1.417)
|
|
.194
|
|
.216
|
|
.773
|
Total from investment operations
|
|
.577
|
|
(1.154)
|
|
.443
|
|
.515
|
|
1.106
|
Distributions from net investment income
|
|
(.307)
|
|
(.263)
|
|
(.249)
|
|
(.299)
|
|
(.333)
|
Distributions from net realized gain
|
|
-
|
|
(.063)
|
|
(.054)
|
|
(.066)
|
|
(.003)
|
Total distributions
|
|
(.307)
|
|
(.326)
|
|
(.303)
|
|
(.365)
|
|
(.336)
|
Net asset value, end of period
|
$
|
11.41
|
$
|
11.14
|
$
|
12.62
|
$
|
12.48
|
$
|
12.33
|
Total Return C
|
|
5.25%
|
|
(9.22)%
|
|
3.58%
|
|
4.28%
|
|
9.66%
|
Ratios to Average Net Assets B,D,E
|
|
|
|
|
|
|
|
|
|
|
Expenses before reductions
|
|
.48%
|
|
.48%
|
|
.47%
|
|
.47%
|
|
.47%
|
Expenses net of fee waivers, if any
|
|
.48%
|
|
.47%
|
|
.47%
|
|
.47%
|
|
.47%
|
Expenses net of all reductions
|
|
.48%
|
|
.47%
|
|
.47%
|
|
.47%
|
|
.47%
|
Net investment income (loss)
|
|
2.81%
|
|
2.28%
|
|
1.97%
|
|
2.45%
|
|
2.75%
|
Supplemental Data
|
|
|
|
|
|
|
|
|
|
|
Net assets, end of period (000 omitted)
|
$
|
517,525
|
$
|
507,328
|
$
|
717,965
|
$
|
616,308
|
$
|
585,664
|
Portfolio turnover rate F
|
|
29%
|
|
14%
|
|
12%
|
|
15%
|
|
12%
|
ACalculated based on average shares outstanding during the period.
BNet investment income (loss) is affected by the timing of the declaration of dividends by any underlying mutual funds or exchange-traded funds (ETFs). Net investment income (loss) of any mutual funds or ETFs is not included in the Fund's net investment income (loss) ratio.
CTotal returns would have been lower if certain expenses had not been reduced during the applicable periods shown.
DFees and expenses of any underlying mutual funds or exchange-traded funds (ETFs) are not included in the Fund's expense ratio. The Fund indirectly bears its proportionate share of these expenses. For additional expense information related to investments in Fidelity Central Funds, please refer to the "Investments in Fidelity Central Funds" note found in the Notes to Financial Statements section of the most recent Annual or Semi-Annual report.
EExpense ratios reflect operating expenses of the class. Expenses before reductions do not reflect amounts reimbursed, waived, or reduced through arrangements with the investment adviser, brokerage services, or other offset arrangements, if applicable, and do not represent the amount paid by the class during periods when reimbursements, waivers or reductions occur.
FAmount does not include the portfolio activity of any underlying mutual funds or exchange-traded funds (ETFs).
For the period ended November 30, 2023
1. Organization.
Fidelity New Jersey Municipal Income Fund (the Fund) is a non-diversified fund of Fidelity Court Street Trust (the Trust) and is authorized to issue an unlimited number of shares. Share transactions on the Statement of Changes in Net Assets may contain exchanges between affiliated funds. The Trust is registered under the Investment Company Act of 1940, as amended (the 1940 Act), as an open-end management investment company organized as a Massachusetts business trust. The Fund may be affected by economic and political developments in the state of New Jersey.
2. Investments in Fidelity Central Funds.
Funds may invest in Fidelity Central Funds, which are open-end investment companies generally available only to other investment companies and accounts managed by the investment adviser and its affiliates. The Schedule of Investments lists any Fidelity Central Funds held as an investment as of period end, but does not include the underlying holdings of each Fidelity Central Fund. An investing fund indirectly bears its proportionate share of the expenses of the underlying Fidelity Central Funds.
Based on its investment objective, each Fidelity Central Fund may invest or participate in various investment vehicles or strategies that are similar to those of the investing fund. These strategies are consistent with the investment objectives of the investing fund and may involve certain economic risks which may cause a decline in value of each of the Fidelity Central Funds and thus a decline in the value of the investing fund.
Fidelity Central Fund
|
Investment Manager
|
Investment Objective
|
Investment Practices
|
Expense RatioA
|
Fidelity Money Market Central Funds
|
Fidelity Management & Research Company LLC (FMR)
|
Each fund seeks to obtain a high level of current income consistent with the preservation of capital and liquidity.
|
Short-term Investments
|
Less than .005%
|
A Expenses expressed as a percentage of average net assets and are as of each underlying Central Fund's most recent annual or semi-annual shareholder report.
A complete unaudited list of holdings for each Fidelity Central Fund is available upon request or at the Securities and Exchange Commission website at www.sec.gov. In addition, the financial statements of the Fidelity Central Funds which contain the significant accounting policies (including investment valuation policies) of those funds, and are not covered by the Report of Independent Registered Public Accounting Firm, are available on the Securities and Exchange Commission website or upon request.
3. Significant Accounting Policies.
The Fund is an investment company and applies the accounting and reporting guidance of the Financial Accounting Standards Board (FASB) Accounting Standards Codification Topic 946 Financial Services - Investment Companies. The financial statements have been prepared in conformity with accounting principles generally accepted in the United States of America (GAAP), which require management to make certain estimates and assumptions at the date of the financial statements. Actual results could differ from those estimates. Subsequent events, if any, through the date that the financial statements were issued have been evaluated in the preparation of the financial statements. The Fund's Schedule of Investments lists any underlying mutual funds or exchange-traded funds (ETFs) but does not include the underlying holdings of these funds. The following summarizes the significant accounting policies of the Fund:
Investment Valuation. Investments are valued as of 4:00 p.m. Eastern time on the last calendar day of the period. The Board of Trustees (the Board) has designated the Fund's investment adviser as the valuation designee responsible for the fair valuation function and performing fair value determinations as needed. The investment adviser has established a Fair Value Committee (the Committee) to carry out the day-to-day fair valuation responsibilities and has adopted policies and procedures to govern the fair valuation process and the activities of the Committee. In accordance with these fair valuation policies and procedures, which have been approved by the Board, the Fund attempts to obtain prices from one or more third party pricing services or brokers to value its investments. When current market prices, quotations or currency exchange rates are not readily available or reliable, investments will be fair valued in good faith by the Committee, in accordance with the policies and procedures. Factors used in determining fair value vary by investment type and may include market or investment specific events, transaction data, estimated cash flows, and market observations of comparable investments. The frequency that the fair valuation procedures are used cannot be predicted and they may be utilized to a significant extent. The Committee manages the Fund's fair valuation practices and maintains the fair valuation policies and procedures. The Fund's investment adviser reports to the Board information regarding the fair valuation process and related material matters.
The Fund categorizes the inputs to valuation techniques used to value its investments into a disclosure hierarchy consisting of three levels as shown below:
Level 1 - unadjusted quoted prices in active markets for identical investments
Level 2 - other significant observable inputs (including quoted prices for similar investments, interest rates, prepayment speeds, etc.)
Level 3 - unobservable inputs (including the Fund's own assumptions based on the best information available)
Valuation techniques used to value the Fund's investments by major category are as follows:
Debt securities, including restricted securities, are valued based on evaluated prices received from third party pricing services or from brokers who make markets in such securities. Municipal securities are valued by pricing services who utilize matrix pricing which considers yield or price of bonds of comparable quality, coupon, maturity and type or by broker-supplied prices. When independent prices are unavailable or unreliable, debt securities may be valued utilizing pricing methodologies which consider similar factors that would be used by third party pricing services. Debt securities are generally categorized as Level 2 in the hierarchy but may be Level 3 depending on the circumstances.
Investments in open-end mutual funds, including the Fidelity Central Funds, are valued at their closing net asset value (NAV) each business day and are categorized as Level 1 in the hierarchy.
Changes in valuation techniques may result in transfers in or out of an assigned level within the disclosure hierarchy. The aggregate value of investments by input level as of November 30, 2023 is included at the end of the Fund's Schedule of Investments.
Investment Transactions and Income. For financial reporting purposes, the Fund's investment holdings and NAV include trades executed through the end of the last business day of the period. The NAV per share for processing shareholder transactions is calculated as of the close of business of the New York Stock Exchange (NYSE), normally 4:00 p.m. Eastern time and includes trades executed through the end of the prior business day. Gains and losses on securities sold are determined on the basis of identified cost. Income and capital gain distributions from Fidelity Central Funds, if any, are recorded on the ex-dividend date. Interest income is accrued as earned and includes coupon interest and amortization of premium and accretion of discount on debt securities as applicable.
Expenses. Expenses directly attributable to a fund are charged to that fund. Expenses attributable to more than one fund are allocated among the respective funds on the basis of relative net assets or other appropriate methods. Expenses included in the accompanying financial statements reflect the expenses of that fund and do not include any expenses associated with any underlying mutual funds or exchange-traded funds. Although not included in a fund's expenses, a fund indirectly bears its proportionate share of these expenses through the net asset value of each underlying mutual fund or exchange-traded fund. Expense estimates are accrued in the period to which they relate and adjustments are made when actual amounts are known.
Income Tax Information and Distributions to Shareholders. Each year, the Fund intends to qualify as a regulated investment company under Subchapter M of the Internal Revenue Code, including distributing substantially all of its taxable income and realized gains. As a result, no provision for U.S. Federal income taxes is required. As of November 30, 2023, the Fund did not have any unrecognized tax benefits in the financial statements; nor is the Fund aware of any tax positions for which it is reasonably possible that the total amounts of unrecognized tax benefits will significantly change in the next twelve months. The Fund files a U.S. federal tax return, in addition to state and local tax returns as required. The Fund's federal income tax returns are subject to examination by the Internal Revenue Service (IRS) for a period of three fiscal years after they are filed. State and local tax returns may be subject to examination for an additional fiscal year depending on the jurisdiction.
Distributions are declared and recorded daily and paid monthly from net investment income. Distributions from realized gains, if any, are declared and recorded on the ex-dividend date. Income and capital gain distributions are determined in accordance with income tax regulations, which may differ from GAAP.
Capital accounts within the financial statements are adjusted for permanent book-tax differences. These adjustments have no impact on net assets or the results of operations. Capital accounts are not adjusted for temporary book-tax differences which will reverse in a subsequent period.
Book-tax differences are primarily due to market discount and capital loss carryforwards.
The Fund purchases municipal securities whose interest, in the opinion of the issuer, is free from federal income tax. There is no assurance that the IRS will agree with this opinion. In the event the IRS determines that the issuer does not comply with relevant tax requirements, interest payments from a security could become federally taxable, possibly retroactively to the date the security was issued.
As of period end, the cost and unrealized appreciation (depreciation) in securities, and derivatives if applicable, for federal income tax purposes were as follows:
Gross unrealized appreciation
|
$14,508,711
|
Gross unrealized depreciation
|
(17,071,041)
|
Net unrealized appreciation (depreciation)
|
$(2,562,330)
|
Tax Cost
|
$523,427,173
|
The tax-based components of distributable earnings as of period end were as follows:
Undistributed ordinary income
|
$13,754
|
Capital loss carryforward
|
$(7,701,340)
|
Net unrealized appreciation (depreciation) on securities and other investments
|
$(2,562,330)
|
Capital loss carryforwards are only available to offset future capital gains of the Fund to the extent provided by regulations and may be limited. The capital loss carryforward information presented below, including any applicable limitation, is estimated as of fiscal period end and is subject to adjustment.
Short-term
|
$(279,879)
|
Long-term
|
(7,421,461)
|
Total capital loss carryforward
|
$(7,701,340)
|
The tax character of distributions paid was as follows:
|
November 30, 2023
|
November 30, 2022
|
Tax-exempt Income
|
$13,704,010
|
$13,257,319
|
Ordinary Income
|
-
|
1,078,578
|
Long-term Capital Gains
|
-
|
2,497,761
|
Total
|
$13,704,010
|
$16,833,658
|
Delayed Delivery Transactions and When-Issued Securities. During the period, certain Funds transacted in securities on a delayed delivery or when-issued basis. Payment and delivery may take place after the customary settlement period for that security. The price of the underlying securities and the date when the securities will be delivered and paid for are fixed at the time the transaction is negotiated. Securities purchased on a delayed delivery or when-issued basis are identified as such in the Schedule of Investments. Compensation for interest forgone in the purchase of a delayed delivery or when-issued debt security may be received. With respect to purchase commitments, each applicable Fund identifies securities as segregated in its records with a value at least equal to the amount of the commitment. Payables and receivables associated with the purchases and sales of delayed delivery securities having the same coupon, settlement date and broker are offset. Delayed delivery or when-issued securities that have been purchased from and sold to different brokers are reflected as both payables and receivables in the Statement of Assets and Liabilities under the caption "Delayed delivery", as applicable. Losses may arise due to changes in the value of the underlying securities or if the counterparty does not perform under the contract's terms, or if the issuer does not issue the securities due to political, economic, or other factors.
Restricted Securities (including Private Placements). Funds may invest in securities that are subject to legal or contractual restrictions on resale. These securities generally may be resold in transactions exempt from registration or to the public if the securities are registered. Disposal of these securities may involve time-consuming negotiations and expense, and prompt sale at an acceptable price may be difficult. Information regarding restricted securities held at period end is included at the end of the Schedule of Investments, if applicable.
4. Purchases and Sales of Investments.
Purchases and sales of securities, other than short-term securities and in-kind transactions, as applicable, are noted in the table below.
|
Purchases ($)
|
Sales ($)
|
Fidelity New Jersey Municipal Income Fund
|
132,409,561
|
142,160,484
|
5. Fees and Other Transactions with Affiliates.
Management Fee. Fidelity Management & Research Company LLC (the investment adviser) and its affiliates provide the Fund with investment management related services for which the Fund pays a monthly management fee. The management fee is the sum of an individual fund fee rate that is based on an annual rate of .25% of the Fund's average net assets and an annualized group fee rate that averaged .10% during the period. The group fee rate is based upon the monthly average net assets of a group of registered investment companies with which the investment adviser has management contracts. The group fee rate decreases as assets under management increase and increases as assets under management decrease. For the reporting period, the total annual management fee rate was .35% of the Fund's average net assets.
Transfer Agent Fees. Fidelity Investments Institutional Operations Company LLC (FIIOC), an affiliate of the investment adviser, is the transfer, dividend disbursing and shareholder servicing agent for the Fund. FIIOC receives account fees and asset-based fees that vary according to account size and type of account. FIIOC pays for typesetting, printing and mailing of shareholder reports, except proxy statements. For the period, transfer agent fees were equivalent to an annual rate of .09% of average net assets.
During November 2023, the Board approved a change in the transfer agent fees effective December 1, 2023 to a fixed annual rate of .0857% of average net assets.
Accounting Fees. Fidelity Service Company, Inc. (FSC), an affiliate of the investment adviser, maintains the Fund's accounting records. The accounting fee is based on the level of average net assets for each month. For the period, the fees were equivalent to the following annual rates:
|
% of Average Net Assets
|
Fidelity New Jersey Municipal Income Fund
|
.03
|
During November 2023, the Board approved a change in the accounting fees effective December 1, 2023 to a fixed annual rate of average net assets as follows:
|
% of Average Net Assets
|
Fidelity New Jersey Municipal Income Fund
|
.0256%
|
Interfund Trades. Funds may purchase from or sell securities to other Fidelity Funds under procedures adopted by the Board. The procedures have been designed to ensure these interfund trades are executed in accordance with Rule 17a-7 of the 1940 Act. Any interfund trades are included within the respective purchases and sales amounts shown in the Purchases and Sales of Investments note. Interfund trades during the period are noted in the table below.
|
Purchases ($)
|
Sales ($)
|
Realized Gain (Loss) ($)
|
Fidelity New Jersey Municipal Income Fund
|
8,800,000
|
-
|
-
|
6. Committed Line of Credit.
Certain Funds participate with other funds managed by the investment adviser or an affiliate in a $4.25 billion credit facility (the "line of credit") to be utilized for temporary or emergency purposes to fund shareholder redemptions or for other short-term liquidity purposes. The participating funds have agreed to pay commitment fees on their pro-rata portion of the line of credit, which are reflected in Miscellaneous expenses on the Statement of Operations, and are listed below. During the period, there were no borrowings on this line of credit.
|
Amount
|
Fidelity New Jersey Municipal Income Fund
|
$919
|
7. Expense Reductions.
Through arrangements with the Fund's custodian, credits realized as a result of certain uninvested cash balances were used to reduce the Fund's expenses by $6,691.
In addition, during the period the investment adviser or an affiliate reimbursed and/or waived a portion of operating expenses in the amount of $16,214.
8. Other.
A fund's organizational documents provide former and current trustees and officers with a limited indemnification against liabilities arising in connection with the performance of their duties to the fund. In the normal course of business, a fund may also enter into contracts that provide general indemnifications. A fund's maximum exposure under these arrangements is unknown as this would be dependent on future claims that may be made against a fund. The risk of material loss from such claims is considered remote.
9. Risk and Uncertainties.
Many factors affect a fund's performance. Developments that disrupt global economies and financial markets, such as pandemics, epidemics, outbreaks of infectious diseases, war, terrorism, and environmental disasters, may significantly affect a fund's investment performance. The effects of these developments to a fund will be impacted by the types of securities in which a fund invests, the financial condition, industry, economic sector, and geographic location of an issuer, and a fund's level of investment in the securities of that issuer. Significant concentrations in security types, issuers, industries, sectors, and geographic locations may magnify the factors that affect a fund's performance.
To the Board of Trustees of Fidelity Court Street Trust and Shareholders of Fidelity New Jersey Municipal Income Fund
Opinion on the Financial Statements
We have audited the accompanying statement of assets and liabilities, including the schedule of investments, of Fidelity New Jersey Municipal Income Fund (one of the funds constituting Fidelity Court Street Trust, referred to hereafter as the "Fund") as of November 30, 2023, the related statement of operations for the year ended November 30, 2023, the statement of changes in net assets for each of the two years in the period ended November 30, 2023, including the related notes, and the financial highlights for each of the five years in the period ended November 30, 2023 (collectively referred to as the "financial statements"). In our opinion, the financial statements present fairly, in all material respects, the financial position of the Fund as of November 30, 2023, the results of its operations for the year then ended, the changes in its net assets for each of the two years in the period ended November 30, 2023 and the financial highlights for each of the five years in the period ended November 30, 2023 in conformity with accounting principles generally accepted in the United States of America.
Basis for Opinion
These financial statements are the responsibility of the Fund's management. Our responsibility is to express an opinion on the Fund's financial statements based on our audits. We are a public accounting firm registered with the Public Company Accounting Oversight Board (United States) (PCAOB) and are required to be independent with respect to the Fund in accordance with the U.S. federal securities laws and the applicable rules and regulations of the Securities and Exchange Commission and the PCAOB.
We conducted our audits of these financial statements in accordance with the standards of the PCAOB. Those standards require that we plan and perform the audit to obtain reasonable assurance about whether the financial statements are free of material misstatement, whether due to error or fraud.
Our audits included performing procedures to assess the risks of material misstatement of the financial statements, whether due to error or fraud, and performing procedures that respond to those risks. Such procedures included examining, on a test basis, evidence regarding the amounts and disclosures in the financial statements. Our audits also included evaluating the accounting principles used and significant estimates made by management, as well as evaluating the overall presentation of the financial statements. Our procedures included confirmation of securities owned as of November 30, 2023 by correspondence with the custodian and broker. We believe that our audits provide a reasonable basis for our opinion.
/s/ PricewaterhouseCoopers LLP
Boston, Massachusetts
January 12, 2024
We have served as the auditor of one or more investment companies in the Fidelity group of funds since 1932.
The Trustees, Members of the Advisory Board (if any), and officers of the trust and fund, as applicable, are listed below. The Board of Trustees governs the fund and is responsible for protecting the interests of shareholders. The Trustees are experienced executives who meet periodically throughout the year to oversee the fund's activities, review contractual arrangements with companies that provide services to the fund, oversee management of the risks associated with such activities and contractual arrangements, and review the fund's performance. Except for Laura M. Bishop, Robert W. Helm, Christine J. Thompson, and Carol J. Zierhoffer, each of the Trustees oversees 314 funds. Ms. Bishop, Mr. Helm, Ms. Thompson, and Ms. Zierhoffer each oversees 230 funds.
The Trustees hold office without limit in time except that (a) any Trustee may resign; (b) any Trustee may be removed by written instrument, signed by at least two-thirds of the number of Trustees prior to such removal; (c) any Trustee who requests to be retired or who has become incapacitated by illness or injury may be retired by written instrument signed by a majority of the other Trustees; and (d) any Trustee may be removed at any special meeting of shareholders by a two-thirds vote of the outstanding voting securities of the trust. Each Trustee who is not an interested person (as defined in the 1940 Act) of the trust and the fund is referred to herein as an Independent Trustee. Each Independent Trustee shall retire not later than the last day of the calendar year in which his or her 75th birthday occurs. The Independent Trustees may waive this mandatory retirement age policy with respect to individual Trustees. Officers and Advisory Board Members hold office without limit in time, except that any officer or Advisory Board Member may resign or may be removed by a vote of a majority of the Trustees at any regular meeting or any special meeting of the Trustees. Except as indicated, each individual has held the office shown or other offices in the same company for the past five years.
The fund's Statement of Additional Information (SAI) includes more information about the Trustees. To request a free copy, call Fidelity at 1-800-544-8544.
Experience, Skills, Attributes, and Qualifications of the Trustees. The Governance and Nominating Committee has adopted a statement of policy that describes the experience, qualifications, attributes, and skills that are necessary and desirable for potential Independent Trustee candidates (Statement of Policy). The Board believes that each Trustee satisfied at the time he or she was initially elected or appointed a Trustee, and continues to satisfy, the standards contemplated by the Statement of Policy. The Governance and Nominating Committee also engages professional search firms to help identify potential Independent Trustee candidates who have the experience, qualifications, attributes, and skills consistent with the Statement of Policy. From time to time, additional criteria based on the composition and skills of the current Independent Trustees, as well as experience or skills that may be appropriate in light of future changes to board composition, business conditions, and regulatory or other developments, have also been considered by the professional search firms and the Governance and Nominating Committee. In addition, the Board takes into account the Trustees' commitment and participation in Board and committee meetings, as well as their leadership of standing and ad hoc committees throughout their tenure.
In determining that a particular Trustee was and continues to be qualified to serve as a Trustee, the Board has considered a variety of criteria, none of which, in isolation, was controlling. The Board believes that, collectively, the Trustees have balanced and diverse experience, qualifications, attributes, and skills, which allow the Board to operate effectively in governing the fund and protecting the interests of shareholders. Information about the specific experience, skills, attributes, and qualifications of each Trustee, which in each case led to the Board's conclusion that the Trustee should serve (or continue to serve) as a trustee of the fund, is provided below.
Board Structure and Oversight Function. Abigail P. Johnson is an interested person and currently serves as Chairman. The Trustees have determined that an interested Chairman is appropriate and benefits shareholders because an interested Chairman has a personal and professional stake in the quality and continuity of services provided to the fund. Independent Trustees exercise their informed business judgment to appoint an individual of their choosing to serve as Chairman, regardless of whether the Trustee happens to be independent or a member of management. The Independent Trustees have determined that they can act independently and effectively without having an Independent Trustee serve as Chairman and that a key structural component for assuring that they are in a position to do so is for the Independent Trustees to constitute a substantial majority for the Board. The Independent Trustees also regularly meet in executive session. Michael E. Kenneally serves as Chairman of the Independent Trustees and as such (i) acts as a liaison between the Independent Trustees and management with respect to matters important to the Independent Trustees and (ii) with management prepares agendas for Board meetings.
Fidelity® funds are overseen by different Boards of Trustees. The fund's Board oversees Fidelity's investment-grade bond, money market, asset allocation and certain equity funds, and other Boards oversee Fidelity's alternative investment, high income and other equity funds. The asset allocation funds may invest in Fidelity® funds that are overseen by such other Boards. The use of separate Boards, each with its own committee structure, allows the Trustees of each group of Fidelity® funds to focus on the unique issues of the funds they oversee, including common research, investment, and operational issues. On occasion, the separate Boards establish joint committees to address issues of overlapping consequences for the Fidelity® funds overseen by each Board.
The Trustees operate using a system of committees to facilitate the timely and efficient consideration of all matters of importance to the Trustees, the fund, and fund shareholders and to facilitate compliance with legal and regulatory requirements and oversight of the fund's activities and associated risks. The Board, acting through its committees, has charged FMR and its affiliates with (i) identifying events or circumstances the occurrence of which could have demonstrably adverse effects on the fund's business and/or reputation; (ii) implementing processes and controls to lessen the possibility that such events or circumstances occur or to mitigate the effects of such events or circumstances if they do occur; and (iii) creating and maintaining a system designed to evaluate continuously business and market conditions in order to facilitate the identification and implementation processes described in (i) and (ii) above. Because the day-to-day operations and activities of the fund are carried out by or through FMR, its affiliates, and other service providers, the fund's exposure to risks is mitigated but not eliminated by the processes overseen by the Trustees. While each of the Board's committees has responsibility for overseeing different aspects of the fund's activities, oversight is exercised primarily through the Operations and Audit Committees. In addition, an ad hoc Board committee of Independent Trustees has worked with FMR to enhance the Board's oversight of investment and financial risks, legal and regulatory risks, technology risks, and operational risks, including the development of additional risk reporting to the Board. Appropriate personnel, including but not limited to the fund's Chief Compliance Officer (CCO), FMR's internal auditor, the independent accountants, the fund's Treasurer and portfolio management personnel, make periodic reports to the Board's committees, as appropriate, including an annual review of Fidelity's risk management program for the Fidelity® funds. The responsibilities of each standing committee, including their oversight responsibilities, are described further under "Standing Committees of the Trustees."
Interested Trustees*:
Correspondence intended for a Trustee who is an interested person may be sent to Fidelity Investments, 245 Summer Street, Boston, Massachusetts 02210.
Name, Year of Birth; Principal Occupations and Other Relevant Experience+
Abigail P. Johnson (1961)
Year of Election or Appointment: 2009
Trustee
Chairman of the Board of Trustees
Ms. Johnson also serves as Trustee of other Fidelity® funds. Ms. Johnson serves as Chairman (2016-present), Chief Executive Officer (2014-present), and Director (2007-present) of FMR LLC (diversified financial services company), President of Fidelity Financial Services (2012-present) and President of Personal, Workplace and Institutional Services (2005-present). Ms. Johnson is Chairman and Director of Fidelity Management & Research Company LLC (investment adviser firm, 2011-present). Previously, Ms. Johnson served as Chairman and Director of FMR Co., Inc. (investment adviser firm, 2011-2019), Vice Chairman (2007-2016) and President (2013-2016) of FMR LLC, President and a Director of Fidelity Management & Research Company (2001-2005), a Trustee of other investment companies advised by Fidelity Management & Research Company, Fidelity Investments Money Management, Inc. (investment adviser firm), and FMR Co., Inc. (2001-2005), Senior Vice President of the Fidelity® funds (2001-2005), and managed a number of Fidelity® funds. Ms. Abigail P. Johnson and Mr. Arthur E. Johnson are not related.
Jennifer Toolin McAuliffe (1959)
Year of Election or Appointment: 2016
Trustee
Ms. McAuliffe also serves as Trustee of other Fidelity® funds and as Trustee of Fidelity Charitable (2020-present). Previously, Ms. McAuliffe served as Co-Head of Fixed Income of Fidelity Investments Limited (now known as FIL Limited (FIL)) (diversified financial services company), Director of Research for FIL's credit and quantitative teams in London, Hong Kong and Tokyo and Director of Research for taxable and municipal bonds at Fidelity Investments Money Management, Inc. Ms. McAuliffe previously served as a member of the Advisory Board of certain Fidelity® funds (2016). Ms. McAuliffe was previously a lawyer at Ropes & Gray LLP and an international banker at Chemical Bank NA (now JPMorgan Chase & Co.). Ms. McAuliffe also currently serves as director or trustee of several not-for-profit entities.
Christine J. Thompson (1958)
Year of Election or Appointment: 2023
Trustee
Ms. Thompson also serves as a Trustee of other Fidelity® funds. Ms. Thompson serves as Leader of Advanced Technologies for Investment Management at Fidelity Investments (2018-present). Previously, Ms. Thompson served as Chief Investment Officer in the Bond group at Fidelity Management & Research Company (2010-2018) and held various other roles including Director of municipal bond portfolio managers and Portfolio Manager of certain Fidelity® funds.
* Determined to be an "Interested Trustee" by virtue of, among other things, his or her affiliation with the trust or various entities under common control with FMR.
+ The information includes the Trustee's principal occupation during the last five years and other information relating to the experience, attributes, and skills relevant to the Trustee's qualifications to serve as a Trustee, which led to the conclusion that the Trustee should serve as a Trustee for the fund.
Independent Trustees:
Correspondence intended for an Independent Trustee may be sent to Fidelity Investments, P.O. Box 55235, Boston, Massachusetts 02205-5235.
Name, Year of Birth; Principal Occupations and Other Relevant Experience+
Elizabeth S. Acton (1951)
Year of Election or Appointment: 2015
Trustee
Ms. Acton also serves as Trustee of other Fidelity® funds. Prior to her retirement, Ms. Acton served as Executive Vice President, Finance (2011-2012), Executive Vice President, Chief Financial Officer (2002-2011) and Treasurer (2004-2005) of Comerica Incorporated (financial services). Prior to joining Comerica, Ms. Acton held a variety of positions at Ford Motor Company (1983-2002), including Vice President and Treasurer (2000-2002) and Executive Vice President and Chief Financial Officer of Ford Motor Credit Company (1998-2000). Ms. Acton currently serves as a member of the Board and Audit and Finance Committees of Beazer Homes USA, Inc. (homebuilding, 2012-present). Ms. Acton previously served as a member of the Advisory Board of certain Fidelity® funds (2013-2016).
Laura M. Bishop (1961)
Year of Election or Appointment: 2023
Trustee
Ms. Bishop also serves as Trustee or Member of the Advisory Board of other Fidelity® funds. Prior to her retirement, Ms. Bishop held a variety of positions at United Services Automobile Association (2001-2020), including Executive Vice President and Chief Financial Officer (2014-2020) and Senior Vice President and Deputy Chief Financial Officer (2012-2014). Ms. Bishop currently serves as a member of the Audit Committee and Compensation and Personnel Committee (2021-present) of the Board of Directors of Korn Ferry (global organizational consulting). Previously, Ms. Bishop served as a Member of the Advisory Board of certain Fidelity® funds (2022-2023).
Ann E. Dunwoody (1953)
Year of Election or Appointment: 2018
Trustee
General Dunwoody also serves as Trustee of other Fidelity® funds. General Dunwoody (United States Army, Retired) was the first woman in U.S. military history to achieve the rank of four-star general and prior to her retirement in 2012 held a variety of positions within the U.S. Army, including Commanding General, U.S. Army Material Command (2008-2012). General Dunwoody currently serves as a member of the Board, Chair of Nomination Committee and a member of the Corporate Governance Committee of Kforce Inc. (professional staffing services, 2016-present) and a member of the Board of Automattic Inc. (software engineering, 2018-present). Previously, General Dunwoody served as President of First to Four LLC (leadership and mentoring services, 2012-2022), a member of the Advisory Board and Nominating and Corporate Governance Committee of L3 Technologies, Inc. (communication, electronic, sensor and aerospace systems, 2013-2019) and a member of the Board and Audit and Sustainability and Corporate Responsibility Committees of Republic Services, Inc. (waste collection, disposal and recycling, 2013-2016). General Dunwoody also serves on several boards for non-profit organizations, including as a member of the Board, Chair of the Nomination and Governance Committee and a member of the Audit Committee of the Noble Reach Foundation (formerly Logistics Management Institute) (consulting non-profit, 2012-present) and a member of the Board of ThanksUSA (military family education non-profit, 2014-present). Previously, General Dunwoody served as a member of the Board of Florida Institute of Technology (2015-2022) and a member of the Council of Trustees for the Association of the United States Army (advocacy non-profit, 2013-2021). General Dunwoody previously served as a member of the Advisory Board of certain Fidelity® funds (2018).
John Engler (1948)
Year of Election or Appointment: 2015
Trustee
Mr. Engler also serves as Trustee of other Fidelity® funds. Previously, Mr. Engler served as Governor of Michigan (1991-2003), President of the Business Roundtable (2011-2017) and interim President of Michigan State University (2018-2019). Previously, Mr. Engler served as a member of the Board of Stride, Inc. (formerly K12 Inc.) (technology-based education company, 2012-2022), a member of the Board of Universal Forest Products (manufacturer and distributor of wood and wood-alternative products, 2003-2019) and Trustee of The Munder Funds (2003-2014). Mr. Engler previously served as a member of the Advisory Board of certain Fidelity® funds (2014-2016).
Robert F. Gartland (1951)
Year of Election or Appointment: 2010
Trustee
Mr. Gartland also serves as Trustee of other Fidelity® funds. Prior to his retirement, Mr. Gartland held a variety of positions at Morgan Stanley (financial services, 1979-2007), including Managing Director (1987-2007) and Chase Manhattan Bank (1975-1978). Mr. Gartland previously served as Chairman and an investor in Gartland & Mellina Group Corp. (consulting, 2009-2019), as a member of the Board of National Securities Clearing Corporation (1993-1996) and as Chairman of TradeWeb (2003-2004).
Robert W. Helm (1957)
Year of Election or Appointment: 2023
Trustee
Mr. Helm also serves as Trustee or Member of the Advisory Board of other Fidelity® funds. Mr. Helm was formerly Deputy Chairman (2003-2020), partner (1991-2020) and an associate (1984-1991) of Dechert LLP (formerly Dechert Price & Rhoads). Mr. Helm currently serves on boards and committees of several not-for-profit organizations, including as a Trustee and member of the Executive Committee of the Baltimore Council on Foreign Affairs, a member of the Board of Directors of the St. Vincent de Paul Society of Baltimore and a member of the Life Guard Society of Mt. Vernon. Previously, Mr. Helm served as a Member of the Advisory Board of certain Fidelity® funds (2021-2023).
Michael E. Kenneally (1954)
Year of Election or Appointment: 2009
Trustee
Chairman of the Independent Trustees
Mr. Kenneally also serves as Trustee of other Fidelity® funds and was Vice Chairman (2018-2021) of the Independent Trustees of certain Fidelity® funds. Prior to retirement in 2005, he was Chairman and Global Chief Executive Officer of Credit Suisse Asset Management, the worldwide fund management and institutional investment business of Credit Suisse Group. Previously, Mr. Kenneally was an Executive Vice President and the Chief Investment Officer for Bank of America. In this role, he was responsible for the investment management, strategy and products delivered to the bank's institutional, high-net-worth and retail clients. Earlier, Mr. Kenneally directed the organization's equity and quantitative research groups. He began his career as a research analyst and then spent more than a dozen years as a portfolio manager for endowments, pension plans and mutual funds. He earned the Chartered Financial Analyst (CFA) designation in 1991.
Mark A. Murray (1954)
Year of Election or Appointment: 2016
Trustee
Mr. Murray also serves as Trustee of other Fidelity® funds. Previously, Mr. Murray served as Co-Chief Executive Officer (2013-2016), President (2006-2013) and Vice Chairman (2013-2020) of Meijer, Inc. Mr. Murray serves as a member of the Board (2009-present) and Public Policy and Responsibility Committee (2009-present) and Chair of the Nuclear Review Committee (2019-present) of DTE Energy Company (diversified energy company). Mr. Murray previously served as a member of the Board of Spectrum Health (not-for-profit health system, 2015-2019) and as a member of the Board and Audit Committee and Chairman of the Nominating and Corporate Governance Committee of Universal Forest Products, Inc. (manufacturer and distributor of wood and wood-alternative products, 2004-2016). Mr. Murray also serves as a member of the Board of many community and professional organizations. Mr. Murray previously served as a member of the Advisory Board of certain Fidelity® funds (2016).
Carol J. Zierhoffer (1960)
Year of Election or Appointment: 2023
Trustee
Ms. Zierhoffer also serves as Trustee or Member of the Advisory Board of other Fidelity® funds. Prior to her retirement, Ms. Zierhoffer held a variety of positions at Bechtel Corporation (engineering company, 2013-2019), including Principal Vice President and Chief Information Officer (2013-2016) and Senior Vice President and Chief Information Officer (2016-2019). Ms. Zierhoffer currently serves as a member of the Board of Directors, Audit Committee and Compensation Committee of Allscripts Healthcare Solutions, Inc. (healthcare technology, 2020-present) and as a member of the Board of Directors, Audit and Finance Committee and Nominating and Governance Committee of Atlas Air Worldwide Holdings, Inc. (aviation operating services, 2021-present). Previously, Ms. Zierhoffer served as a member of the Board of Directors and Audit Committee and as the founding Chair of the Information Technology Committee of MedAssets, Inc. (healthcare technology, 2013-2016), and as a Member of the Advisory Board of certain Fidelity® funds (2023).
+ The information includes the Trustee's principal occupation during the last five years and other information relating to the experience, attributes, and skills relevant to the Trustee's qualifications to serve as a Trustee, which led to the conclusion that the Trustee should serve as a Trustee for the fund.
Advisory Board Members and Officers:
Correspondence intended for a Member of the Advisory Board (if any) may be sent to Fidelity Investments, P.O. Box 55235, Boston, Massachusetts 02205-5235. Correspondence intended for an officer may be sent to Fidelity Investments, 245 Summer Street, Boston, Massachusetts 02210.
Name, Year of Birth; Principal Occupation
Heather Bonner (1977)
Year of Election or Appointment: 2023
Assistant Treasurer
Ms. Bonner also serves as an officer of other funds. Ms. Bonner is a Senior Vice President (2022-present) and is an employee of Fidelity Investments (2022-present). Ms. Bonner serves as Vice President, Treasurer, or Assistant Treasurer of certain Fidelity entities. Prior to joining Fidelity, Ms. Bonner served as Managing Director at AQR Capital Management (2013-2022) and was the Treasurer and Principal Financial Officer of the AQR Funds (2013-2022).
Craig S. Brown (1977)
Year of Election or Appointment: 2019
Assistant Treasurer
Mr. Brown also serves as an officer of other funds. Mr. Brown is a Vice President (2015-present) and is an employee of Fidelity Investments. Mr. Brown serves as Assistant Treasurer of FIMM, LLC (2021-present). Previously, Mr. Brown served as Assistant Treasurer of certain Fidelity® funds (2019-2022).
John J. Burke III (1964)
Year of Election or Appointment: 2018
Chief Financial Officer
Mr. Burke also serves as Chief Financial Officer of other funds. Mr. Burke is Head of Fidelity Fund and Investment Operations (2018-present) and is an employee of Fidelity Investments. Mr. Burke serves as President, Executive Vice President, or Director of certain Fidelity entities. Previously Mr. Burke served as head of Asset Management Investment Operations (2012-2018).
Margaret Carey (1973)
Year of Election or Appointment: 2023
Secretary and Chief Legal Officer (CLO)
Ms. Carey also serves as an officer of other funds and as CLO of certain Fidelity entities. Ms. Carey is a Senior Vice President, Deputy General Counsel (2019-present) and is an employee of Fidelity Investments.
David J. Carter (1973)
Year of Election or Appointment: 2020
Assistant Secretary
Mr. Carter also serves as Assistant Secretary of other funds. Mr. Carter is a Senior Vice President, Deputy General Counsel (2022-present) and is an employee of Fidelity Investments. Mr. Carter serves as Chief Legal Officer of Fidelity Investments Institutional Operations Company LLC - Shareholder Division (transfer agent, 2020-present).
Jonathan Davis (1968)
Year of Election or Appointment: 2010
Assistant Treasurer
Mr. Davis also serves as an officer of other funds. Mr. Davis is a Vice President (2006-present) and is an employee of Fidelity Investments. Mr. Davis serves as Assistant Treasurer of certain Fidelity entities.
Laura M. Del Prato (1964)
Year of Election or Appointment: 2018
President and Treasurer
Ms. Del Prato also serves as an officer of other funds. Ms. Del Prato is a Senior Vice President (2017-present) and is an employee of Fidelity Investments. Ms. Del Prato serves as Vice President or Assistant Treasurer of certain Fidelity entities. Previously, Ms. Del Prato served as President and Treasurer of The North Carolina Capital Management Trust: Cash Portfolio and Term Portfolio (2018-2020).
Robin Foley (1964)
Year of Election or Appointment: 2023
Vice President
Ms. Foley also serves as Vice President of other funds. Ms. Foley serves as Head of Fidelity's Fixed Income division (2023-present) and is an employee of Fidelity Investments. Previously, Ms. Foley served as Chief Investment Officer of Bonds (2017-2023).
Christopher M. Gouveia (1973)
Year of Election or Appointment: 2023
Chief Compliance Officer
Mr. Gouveia also serves as Chief Compliance Officer of other funds. Mr. Gouveia is a Senior Vice President of Asset Management Compliance (2019-present) and is an employee of Fidelity Investments. Mr. Gouveia serves as Compliance Officer of Fidelity Management Trust Company (2023-present). Previously, Mr. Gouveia served as Chief Compliance Officer of the North Carolina Capital Management Trust (2016-2019).
Colm A. Hogan (1973)
Year of Election or Appointment: 2016
Assistant Treasurer
Mr. Hogan also serves as an officer of other funds. Mr. Hogan is a Vice President (2016-present) and is an employee of Fidelity Investments. Mr. Hogan serves as Assistant Treasurer of certain Fidelity entities. Previously, Mr. Hogan served as Deputy Treasurer of certain Fidelity® funds (2016-2020) and Assistant Treasurer of certain Fidelity® funds (2016-2018).
Chris Maher (1972)
Year of Election or Appointment: 2013
Assistant Treasurer
Mr. Maher also serves as an officer of other funds. Mr. Maher is a Vice President (2008-present) and is an employee of Fidelity Investments. Mr. Maher serves as Assistant Treasurer of certain Fidelity entities. Previously, Mr. Maher served as Assistant Treasurer of certain funds (2013-2020).
Brett Segaloff (1972)
Year of Election or Appointment: 2021
Anti-Money Laundering (AML) Officer
Mr. Segaloff also serves as AML Officer of other funds. Mr. Segaloff is a Vice President (2022-present) and is an employee of Fidelity Investments. Mr. Segaloff serves as Anti Money Laundering Compliance Officer or Anti Money Laundering/Bank Secrecy Act Compliance Officer of certain Fidelity entities.
Stacie M. Smith (1974)
Year of Election or Appointment: 2013
Assistant Treasurer
Ms. Smith also serves as an officer of other funds. Ms. Smith is a Senior Vice President (2016-present) and is an employee of Fidelity Investments. Ms. Smith serves as Assistant Treasurer of certain Fidelity entities and has served in other fund officer roles.
Jim Wegmann (1979)
Year of Election or Appointment: 2021
Deputy Treasurer
Mr. Wegmann also serves as an officer of other funds. Mr. Wegmann is a Vice President (2016-present) and is an employee of Fidelity Investments. Mr. Wegmann serves as Assistant Treasurer of FIMM, LLC (2021-present). Previously, Mr. Wegmann served as Assistant Treasurer of certain Fidelity® funds (2019-2021).
As a shareholder, you incur two types of costs: (1) transaction costs, which may include sales charges (loads) on purchase payments or redemption proceeds, as applicable and (2) ongoing costs, which generally include management fees, distribution and/or service (12b-1) fees and other Fund expenses. This Example is intended to help you understand your ongoing costs (in dollars) of investing in a fund and to compare these costs with the ongoing costs of investing in other mutual funds.
The Example is based on an investment of $1,000 invested at the beginning of the period and held for the entire period (June 1, 2023 to November 30, 2023).
|
Actual Expenses
The first line of the accompanying table provides information about actual account values and actual expenses. You may use the information in this line, together with the amount you invested, to estimate the expenses that you paid over the period. Simply divide your account value by $1,000.00 (for example, an $8,600 account value divided by $1,000.00 = 8.6), then multiply the result by the number in the first line for a class/Fund under the heading entitled "Expenses Paid During Period" to estimate the expenses you paid on your account during this period. If any fund is a shareholder of any underlying mutual funds or exchange-traded funds (ETFs) (the Underlying Funds), such fund indirectly bears its proportional share of the expenses of the Underlying Funds in addition to the direct expenses incurred presented in the table. These fees and expenses are not included in the annualized expense ratio used to calculate the expense estimate in the table below.
Hypothetical Example for Comparison Purposes
The second line of the accompanying table provides information about hypothetical account values and hypothetical expenses based on the actual expense ratio and an assumed rate of return of 5% per year before expenses, which is not the actual return. The hypothetical account values and expenses may not be used to estimate the actual ending account balance or expenses you paid for the period. You may use this information to compare the ongoing costs of investing in the Fund and other funds. To do so, compare this 5% hypothetical example with the 5% hypothetical examples that appear in the shareholder reports of the other funds. If any fund is a shareholder of any Underlying Funds, such fund indirectly bears its proportional share of the expenses of the Underlying Funds in addition to the direct expenses as presented in the table. These fees and expenses are not included in the annualized expense ratio used to calculate the expense estimate in the table below.
Please note that the expenses shown in the table are meant to highlight your ongoing costs only and do not reflect any transaction costs. Therefore, the second line of the table is useful in comparing ongoing costs only, and will not help you determine the relative total costs of owning different funds. In addition, if these transactional costs were included, your costs would have been higher.
|
|
|
|
|
Annualized Expense Ratio- A
|
|
Beginning Account Value June 1, 2023
|
|
Ending Account Value November 30, 2023
|
|
Expenses Paid During Period- C June 1, 2023 to November 30, 2023
|
|
|
|
|
|
|
|
|
|
|
|
Fidelity® New Jersey Municipal Income Fund
|
|
|
|
.47%
|
|
|
|
|
|
|
Actual
|
|
|
|
|
|
$ 1,000
|
|
$ 1,024.60
|
|
$ 2.39
|
Hypothetical-B
|
|
|
|
|
|
$ 1,000
|
|
$ 1,022.71
|
|
$ 2.38
|
|
|
A Annualized expense ratio reflects expenses net of applicable fee waivers.
B 5% return per year before expenses
C Expenses are equal to the annualized expense ratio, multiplied by the average account value over the period, multiplied by 183/ 365 (to reflect the one-half year period). The fees and expenses of any Underlying Funds are not included in each annualized expense ratio.
The dividend and capital gains distributions for the fund(s) are available on Fidelity.com or Institutional.Fidelity.com.
During fiscal year ended 2023, 100% of the fund's income dividends was free from federal income tax, and 20.47% of the fund's income dividends was subject to the federal alternative minimum tax.
The fund will notify shareholders in January 2024 of amounts for use in preparing 2023 income tax returns.
Board Approval of Investment Advisory Contracts and Management Fees
Fidelity New Jersey Municipal Income Fund
Each year, the Board of Trustees, including the Independent Trustees (together, the Board), considers the renewal of the fund's management contract with Fidelity Management & Research Company LLC (FMR) and the sub-advisory agreements (together, the Advisory Contracts) for the fund. FMR and the sub-advisers are referred to herein as the Investment Advisers. The Board, assisted by the advice of fund counsel and Independent Trustees' counsel, requests and considers a broad range of information relevant to the renewal of the Advisory Contracts throughout the year.
The Board meets regularly and, at each of its meetings, covers an extensive agenda of topics and materials and considers factors that are relevant to its annual consideration of the renewal of the fund's Advisory Contracts, including the services and support provided to the fund and its shareholders. The Board's Operations Committee, of which all the Independent Trustees are members, meets regularly throughout the year and requests, receives and considers, among other matters, information related to the annual consideration of the renewal of the fund's Advisory Contracts before making its recommendation to the Board. The Board also meets as needed to review matters specifically related to the Board's annual consideration of the renewal of the Advisory Contracts. Members of the Board may also meet from time to time with trustees of other Fidelity funds through joint ad hoc committees to discuss certain matters relevant to all of the Fidelity funds.
At its September 2023 meeting, the Board unanimously determined to renew the fund's Advisory Contracts. In reaching its determination, the Board considered all factors it believed relevant, including (i) the nature, extent, and quality of the services provided to the fund and its shareholders (including the investment performance of the fund); (ii) the competitiveness relative to peer funds of the fund's management fee and total expense ratio; (iii) the total costs of the services provided by and the profits realized by FMR and its affiliates (Fidelity) from its relationships with the fund; and (iv) the extent to which, if any, economies of scale exist and are realized as the fund grows, and whether any economies of scale are appropriately shared with fund shareholders. The Board also considered the broad range of investment choices available to shareholders from FMR's competitors and that the fund's shareholders have chosen to invest in the fund, which is part of the Fidelity family of funds. The Board's decision to renew the Advisory Contracts was not based on any single factor.
The Board reached a determination, with the assistance of fund counsel and Independent Trustees' counsel and through the exercise of its business judgment, that the renewal of the Advisory Contracts was in the best interests of the fund and its shareholders and that the compensation payable under the Advisory Contracts was fair and reasonable in light of all of the surrounding circumstances.
Nature, Extent, and Quality of Services Provided. The Board considered the Investment Advisers' staffing as it relates to the fund, including the backgrounds and experience of investment personnel, and also considered the Investment Advisers' implementation of the fund's investment program. The Independent Trustees also had discussions with senior management of Fidelity's investment operations and investment groups. The Board considered the structure of the investment personnel compensation program and whether this structure provides appropriate incentives to act in the best interests of the fund. Additionally, the Board considered the portfolio managers' investments, if any, in the funds that they manage.
Resources Dedicated to Investment Management and Support Services. The Board reviewed the general qualifications and capabilities of Fidelity's investment staff, including its size, education, experience, and resources, as well as Fidelity's approach to recruiting, managing, training, and compensating investment personnel. The Board noted the resources devoted to Fidelity's global investment organization, and that Fidelity's analysts have extensive resources, tools and capabilities that allow them to conduct quantitative and fundamental analysis, as well as credit analysis of issuers, counterparties and guarantors. Further, the Board considered that Fidelity's investment professionals have sufficient access to global information and data so as to provide competitive investment results over time, and that those professionals also have access to sophisticated tools that permit them to assess portfolio construction and risk and performance attribution characteristics continuously, as well as to transmit new information and research conclusions rapidly around the world. Additionally, in its deliberations, the Board considered Fidelity's trading, risk management, compliance, cybersecurity, and technology and operations capabilities and resources, which are integral parts of the investment management process.
Shareholder and Administrative Services. The Board considered (i) the nature, extent, quality, and cost of advisory, administrative, and shareholder services performed by the Investment Advisers and their affiliates under the Advisory Contracts and under separate agreements covering transfer agency and pricing and bookkeeping services for the fund; (ii) the nature and extent of Fidelity's supervision of third party service providers, principally custodians, subcustodians, and pricing vendors; and (iii) the resources devoted by Fidelity to, and the record of compliance with, the fund's compliance policies and procedures.
The Board noted that the growth of fund assets over time across the complex allows Fidelity to reinvest in the development of services designed to enhance the value and convenience of the Fidelity funds as investment vehicles. These services include 24-hour access to account information and market information over the Internet and through telephone representatives, investor education materials and asset allocation tools. The Board also considered that it reviews customer service metrics such as telephone response times, continuity of services on the website and metrics addressing services at Fidelity Investor Centers.
Investment in a Large Fund Family. The Board considered the benefits to shareholders of investing in a fund that is part of a large family of funds offering a variety of investment disciplines and providing a large variety of fund investor services. The Board noted that Fidelity had taken, or had made recommendations to the Board that resulted in the Fidelity funds taking, a number of actions over the previous year that benefited particular funds and/or the Fidelity funds in general.
Investment Performance. The Board took into account discussions that occur with representatives of the Investment Advisers, and reports that it receives, at Board meetings throughout the year relating to fund investment performance. In this regard the Board noted that as part of regularly scheduled fund reviews and other reports to the Board on fund performance, the Board considered annualized return information for the fund for different time periods, measured against an appropriate securities market index (benchmark index) and an appropriate peer group of funds with similar objectives (peer group). The Board also considered information about performance attribution. In its evaluation of fund investment performance at meetings throughout the year, the Board gave particular attention to information indicating underperformance of certain Fidelity funds over different time periods and discussed with the Investment Advisers the reasons for such underperformance.
In addition to reviewing absolute and relative fund performance, the Independent Trustees periodically consider the appropriateness of fund performance metrics in evaluating the results achieved. The Independent Trustees generally give greater weight to fund performance over longer time periods than over shorter time periods. Depending on the circumstances, the Independent Trustees may be satisfied with a fund's performance notwithstanding that it lags its benchmark index or peer group for certain periods.
Based on its review, the Board concluded that the nature, extent, and quality of services provided to the fund under the Advisory Contracts should continue to benefit the shareholders of the fund.
Competitiveness of Management Fee and Total Expense Ratio. The Board was provided with information regarding industry trends in management fees and expenses. In its review of the fund's management fee and total expense ratio, the Board considered the fund's management fee rate as well as other fund or class expenses, as applicable, such as transfer agent fees, pricing and bookkeeping fees, and custodial, legal, and audit fees. The Board also noted that Fidelity may agree to waive fees or reimburse expenses from time to time, and the extent to which, if any, it has done so for the fund.
Comparisons of Management Fees and Total Expense Ratios. Among other things, the Board reviewed data for selected groups of competitive funds and classes (referred to as "mapped groups") that were compiled by Fidelity based on combining similar investment objective categories (as classified by Lipper) that have comparable investment mandates. The data reviewed by the Board included (i) gross management fee comparisons (before taking into account expense reimbursements or caps) relative to the total universe of funds within the mapped group; (ii) gross management fee comparisons relative to a subset of non-Fidelity funds in the mapped group that are similar in size and management fee structure to the fund (referred to as the "asset size peer group"); (iii) total expense comparisons of the fund relative to funds and classes in the mapped group that have a similar sales load structure to the fund (referred to as the "similar sales load structure group"); and (iv) total expense comparisons of the fund relative to funds and classes in the similar sales load structure group that are similar in size and management fee structure to the fund (referred to as the "total expense asset size peer group").
The information provided to the Board indicated that the fund's management fee rate ranked below the competitive median of the mapped group for 2022 and below the competitive median of the asset size peer group for 2022. Further, the information provided to the Board indicated that the total expense ratio of the fund ranked below the competitive median of the similar sales load structure group for 2022 and above the competitive median of the total expense asset size peer group for 2022.
Fees Charged to Other Fidelity Clients. The Board also considered Fidelity fee structures and other information with respect to clients of Fidelity, such as other funds advised or subadvised by Fidelity, pension plan clients, and other institutional clients with similar mandates. The Board noted that a joint ad hoc committee created by it and the boards of other Fidelity funds periodically reviews and compares Fidelity's institutional investment advisory business with its business of providing services to the Fidelity funds and also noted the most recent findings of the committee. The Board noted that the committee's review included a consideration of the differences in services provided, fees charged, and costs incurred, as well as competition in the markets serving the different categories of clients.
Based on its review, the Board concluded that the fund's management fee is fair and reasonable in light of the services that the fund receives and the other factors considered. Further, based on its review of total expense ratios and fees charged to other Fidelity clients, the Board concluded that the fund's total expense ratio was reasonable in light of the services that the fund and its shareholders receive and the other factors considered.
Costs of the Services and Profitability. The Board considered the revenues earned and the expenses incurred by Fidelity in conducting the business of developing, marketing, distributing, managing, administering and servicing the fund and servicing the fund's shareholders. The Board also considered the level of Fidelity's profits in respect of all the Fidelity funds.
On an annual basis, Fidelity presents to the Board information about the profitability of its relationships with the fund. Fidelity calculates profitability information for each fund, as well as aggregate profitability information for groups of Fidelity funds and all Fidelity funds, using a series of detailed revenue and cost allocation methodologies which originate with the books and records of Fidelity on which Fidelity's audited financial statements are based. The Audit Committee of the Board reviews any significant changes from the prior year's methodologies and the full Board approves such changes.
A public accounting firm has been engaged annually by the Board as part of the Board's assessment of Fidelity's profitability analysis. The engagement includes the review and assessment of the methodologies used by Fidelity in determining the revenues and expenses attributable to Fidelity's fund business, and completion of agreed-upon procedures in respect of the mathematical accuracy of certain fund profitability information and its conformity to established allocation methodologies. After considering the reports issued under the engagement and information provided by Fidelity, the Board concluded that while other allocation methods may also be reasonable, Fidelity's profitability methodologies are reasonable in all material respects.
The Board also reviewed Fidelity's non-fund businesses and potential indirect benefits such businesses may have received as a result of their association with Fidelity's fund business (i.e., fall-out benefits) as well as cases where Fidelity's affiliates may benefit from the funds' business. The Board considered areas where potential indirect benefits to the Fidelity funds from their relationships with Fidelity may exist. The Board's consideration of these matters was informed by the findings of a joint ad hoc committee created by it and the boards of other Fidelity funds to evaluate potential fall-out benefits.
The Board considered the costs of the services provided by and the profits realized by Fidelity in connection with the operation of the fund and was satisfied that the profitability was not excessive.
Economies of Scale. The Board considered whether there have been economies of scale in respect of the management of the Fidelity funds, whether the Fidelity funds (including the fund) have appropriately benefited from any such economies of scale, and whether there is potential for realization of any further economies of scale. The Board considered the extent to which the fund will benefit from economies of scale as assets grow through increased services to the fund, through waivers or reimbursements, or through fee or expense ratio reductions. The Board also noted that a committee created by it and the boards of other Fidelity funds periodically analyzes whether Fidelity attains economies of scale in respect of the management and servicing of the Fidelity funds, whether the Fidelity funds have appropriately benefited from such economies of scale, and whether there is potential for realization of any further economies of scale.
The Board recognized that the fund's management contract incorporates a "group fee" structure, which provides for lower group fee rates as total "group assets" increase, and for higher group fee rates as total "group assets" decrease ("group assets" as defined in the management contract). FMR calculates the group fee rates based on a tiered asset "breakpoint" schedule that varies based on asset class. The Board considered that the group fee is designed to deliver the benefits of economies of scale to fund shareholders when total Fidelity fund assets increase, even if assets of any particular fund are unchanged or have declined, because some portion of Fidelity's costs are attributable to services provided to all Fidelity funds, and all funds benefit if those costs can be allocated among more assets. The Board also considered that Fidelity agreed to impose a temporary fee waiver in the form of additional breakpoints to the current breakpoint schedule. The Board concluded that, given the group fee structure, fund shareholders will benefit from lower management fees as "group assets" increase at the fund complex level, regardless of whether Fidelity achieves any such economies of scale.
The Board concluded, taking into account the analysis of the committee, that economies of scale, if any, are being appropriately shared between fund shareholders and Fidelity.
Additional Information Requested by the Board. In order to develop fully the factual basis for consideration of the Fidelity funds' advisory contracts, the Board requested and received additional information on certain topics, including: (i) Fidelity's fund profitability methodology, profitability trends for certain funds, the allocation of various costs to different funds, and the impact of certain factors on fund profitability results; (ii) portfolio manager changes that have occurred during the past year and Fidelity's views regarding portfolio manager investment in the Fidelity funds that they manage; (iii) hiring, training, and retaining personnel; (iv) the arrangements with and compensation paid to certain fund sub-advisers and the treatment of such compensation within Fidelity's fund profitability methodology; (v) the terms of the funds' various management fee structures, including the basic group fee and the terms of Fidelity's voluntary expense limitation arrangements; (vi) Fidelity's transfer agent, pricing and bookkeeping fees, expense and service structures for different funds and classes relative to competitive trends and market conditions; (vii) the impact on fund profitability of recent industry trends, such as the growth in passively managed funds and the changes in flows for different types of funds; (viii) the types of management fee and total expense comparisons provided, and the challenges and limitations associated with such information; (ix) explanations regarding the relative total expense ratios and management fees of certain funds and classes, total expense and management fee competitive trends, and methodologies for total expense and management fee competitive comparisons; (x) information concerning expense limitations applicable to certain funds; and (xi) matters related to money market funds, exchange-traded funds, and target date funds.
Conclusion. Based on its evaluation of all of the conclusions noted above, and after considering all factors it believed relevant, the Board, including the Independent Trustees, concluded that the advisory and sub-advisory fee arrangements are fair and reasonable in light of all of the surrounding circumstances and that the fund's Advisory Contracts should be renewed through September 30, 2024.
A special meeting of shareholders was held on October 18, 2023. The results of votes taken among shareholders on the proposal before them are reported below. Each vote reported represents one dollar of net asset value held on the record date for the meeting.
|
Proposal 1
|
To elect a Board of Trustees.
|
|
|
# of
Votes
|
% of
Votes
|
Abigail P. Johnson
|
Affirmative
|
727,421,969.830
|
96.000
|
Withheld
|
29,519,334.160
|
4.000
|
TOTAL
|
756,941,303.990
|
100.000
|
Jennifer Toolin McAuliffe
|
Affirmative
|
727,427,727.900
|
96.000
|
Withheld
|
29,513,576.090
|
4.000
|
TOTAL
|
756,941,303.990
|
100.000
|
Christine J. Thompson
|
Affirmative
|
726,275,025.910
|
96.000
|
Withheld
|
30,666,278.080
|
4.000
|
TOTAL
|
756,941,303.990
|
100.000
|
Elizabeth S. Acton
|
Affirmative
|
726,233,446.320
|
96.000
|
Withheld
|
30,707,857.670
|
4.000
|
TOTAL
|
756,941,303.990
|
100.000
|
Laura M. Bishop
|
Affirmative
|
726,275,025.910
|
96.000
|
Withheld
|
30,666,278.080
|
4.000
|
TOTAL
|
756,941,303.990
|
100.000
|
Ann E. Dunwoody
|
Affirmative
|
727,427,727.900
|
96.000
|
Withheld
|
29,513,576.090
|
4.000
|
TOTAL
|
756,941,303.990
|
100.000
|
John Engler
|
Affirmative
|
725,125,734.640
|
96.000
|
Withheld
|
31,815,569.350
|
4.000
|
TOTAL
|
756,941,303.990
|
100.000
|
Robert F. Gartland
|
Affirmative
|
729,069,579.200
|
96.000
|
Withheld
|
27,871,724.790
|
4.000
|
TOTAL
|
756,941,303.990
|
100.000
|
Robert W. Helm
|
Affirmative
|
729,368,128.290
|
96.000
|
Withheld
|
27,573,175.700
|
4.000
|
TOTAL
|
756,941,303.990
|
100.000
|
Arthur E. Johnson
|
Affirmative
|
724,989,059.520
|
96.000
|
Withheld
|
31,952,244.470
|
4.000
|
TOTAL
|
756,941,303.990
|
100.000
|
Michael E. Kenneally
|
Affirmative
|
725,652,104.730
|
96.000
|
Withheld
|
31,289,199.260
|
4.000
|
TOTAL
|
756,941,303.990
|
100.000
|
Mark A. Murray
|
Affirmative
|
729,236,421.490
|
96.000
|
Withheld
|
27,704,882.500
|
4.000
|
TOTAL
|
756,941,303.990
|
100.000
|
Carol J. Zierhoffer
|
Affirmative
|
726,647,665.370
|
96.000
|
Withheld
|
30,293,638.620
|
4.000
|
TOTAL
|
756,941,303.990
|
100.000
|
|
|
|
|
Proposal 1 reflects trust wide proposal and voting results.
|
1.539150.126
NJN-ANN-0124
Item 2.
Code of Ethics
As of the end of the period, November 30, 2023, Fidelity Court Street Trust (the trust) has adopted a code of ethics, as defined in Item 2 of Form N-CSR, that applies to its President and Treasurer and its Chief Financial Officer. A copy of the code of ethics is filed as an exhibit to this Form N-CSR.
Item 3.
Audit Committee Financial Expert
The Board of Trustees of the trust has determined that Elizabeth S. Acton is an audit committee financial expert, as defined in Item 3 of Form N-CSR. Ms. Acton is independent for purposes of Item 3 of Form N-CSR.
Item 4.
Principal Accountant Fees and Services
Fees and Services
The following table presents fees billed by PricewaterhouseCoopers LLP (“PwC”) in each of the last two fiscal years for services rendered to Fidelity Connecticut Municipal Income Fund and Fidelity New Jersey Municipal Income Fund (the “Funds”):
Services Billed by PwC
November 30, 2023 FeesA
| | | | | |
|
| Audit Fees | Audit-Related Fees | Tax Fees | All Other Fees |
| Fidelity Connecticut Municipal Income Fund | $45,700 | $3,800 | $5,500 | $1,600 |
| Fidelity New Jersey Municipal Income Fund | $42,200 | $3,500 | $5,500 | $1,500 |
| | | | | |
|
| Audit Fees | Audit-Related Fees | Tax Fees | All Other Fees |
| Fidelity Connecticut Municipal Income Fund | $43,600 | $3,500 | $5,200 | $1,600 |
| Fidelity New Jersey Municipal Income Fund | $40,300 | $3,300 | $5,200 | $1,500 |
A Amounts may reflect rounding.
The following table(s) present(s) fees billed by PwC that were required to be approved by the Audit Committee for services that relate directly to the operations and financial reporting of the Fund(s) and that are rendered on behalf of Fidelity Management & Research Company LLC ("FMR") and entities controlling, controlled by, or under common control with FMR (not including any sub-adviser whose role is primarily portfolio management and is subcontracted with or overseen by another investment adviser) that provide ongoing services to the Fund(s) (“Fund Service Providers”):
Services Billed by PwC
| | | |
|
| November 30, 2023A | November 30, 2022A |
| Audit-Related Fees | $8,284,200 | $7,914,600 |
| Tax Fees | $1,000 | $1,000 |
| All Other Fees | $- | $- |
A Amounts may reflect rounding
“Audit-Related Fees” represent fees billed for assurance and related services that are reasonably related to the performance of the fund audit or the review of the fund's financial statements and that are not reported under Audit Fees.
“Tax Fees” represent fees billed for tax compliance, tax advice or tax planning that relate directly to the operations and financial reporting of the fund.
“All Other Fees” represent fees billed for services provided to the fund or Fund Service Provider, a significant portion of which are assurance related, that relate directly to the operations and financial reporting of the fund, excluding those services that are reported under Audit Fees, Audit-Related Fees or Tax Fees.
Assurance services must be performed by an independent public accountant.
* * *
The aggregate non-audit fees billed by PwC for services rendered to the Fund(s), FMR (not including any sub-adviser whose role is primarily portfolio management and is subcontracted with or overseen by another investment adviser), and any Fund Service Provider for each of the last two fiscal years of the Fund(s) are as follows:
| | | |
| Billed By | November 30, 2023A | November 30, 2022A |
| PwC | $13,609,200 | $12,903,300 |
A Amounts may reflect rounding.
The trust's Audit Committee has considered non-audit services that were not pre-approved that were provided by PwC to Fund Service Providers to be compatible with maintaining the independence of PwC in its(their) audit of the Fund(s), taking into account representations from PwC, in accordance with Public Company Accounting Oversight Board rules, regarding its independence from the Fund(s) and its(their) related entities and FMR’s review of the appropriateness and permissibility under applicable law of such non-audit services prior to their provision to the Fund(s) Service Providers.
Audit Committee Pre-Approval Policies and Procedures
The trust’s Audit Committee must pre-approve all audit and non-audit services provided by a fund’s independent registered public accounting firm relating to the operations or financial reporting of the fund. Prior to the commencement of any audit or non-audit services to a fund, the Audit Committee reviews the services to determine whether they are appropriate and permissible under applicable law.
The Audit Committee has adopted policies and procedures to, among other purposes, provide a framework for the Committee’s consideration of non-audit services by the audit firms that audit the Fidelity funds. The policies and procedures require that any non-audit service provided by a fund audit firm to a Fidelity fund and any non-audit service provided by a fund auditor to a Fund Service Provider that relates directly to the operations and financial reporting of a Fidelity fund (“Covered Service”) are subject to approval by the Audit Committee before such service is provided.
All Covered Services must be approved in advance of provision of the service either: (i) by formal resolution of the Audit Committee, or (ii) by oral or written approval of the service by the Chair of the Audit Committee (or if the Chair is unavailable, such other member of the Audit Committee as may be designated by the Chair to act in the Chair’s absence). The approval contemplated by (ii) above is permitted where the Treasurer determines that action on such an engagement is necessary before the next meeting of the Audit Committee.
Non-audit services provided by a fund audit firm to a Fund Service Provider that do not relate directly to the operations and financial reporting of a Fidelity fund are reported to the Audit Committee periodically.
Non-Audit Services Approved Pursuant to Rule 2-01(c)(7)(i)(C) and (ii) of Regulation S-X (“De Minimis Exception”)
There were no non-audit services approved or required to be approved by the Audit Committee pursuant to the De Minimis Exception during the Fund’s(s’) last two fiscal years relating to services provided to (i) the Fund(s) or (ii) any Fund Service Provider that relate directly to the operations and financial reporting of the Fund(s).
The Registrant has not retained, for the preparation of the audit report on the financial statements included in the Form N-CSR, a registered public accounting firm that has a branch or office that is located in a foreign jurisdiction and that the Public Company Accounting Oversight Board (the “PCAOB”) has determined that the PCAOB is unable to inspect or investigate completely because of a position taken by an authority in the foreign jurisdiction.
The Registrant is not a “foreign issuer,” as defined in 17 CFR 240.3b-4.
Item 5.
Audit Committee of Listed Registrants
Not applicable.
Item 6.
Investments
(a)
Not applicable.
(b)
Not applicable.
Item 7.
Disclosure of Proxy Voting Policies and Procedures for Closed-End Management Investment Companies
Not applicable.
Item 8.
Portfolio Managers of Closed-End Management Investment Companies
Not applicable.
Item 9.
Purchase of Equity Securities by Closed-End Management Investment Company and Affiliated Purchasers
Not applicable.
Item 10.
Submission of Matters to a Vote of Security Holders
There were no material changes to the procedures by which shareholders may recommend nominees to the trust’s Board of Trustees.
Item 11.
Controls and Procedures
(a)(i) The President and Treasurer and the Chief Financial Officer have concluded that the trust’s disclosure controls and procedures (as defined in Rule 30a-3(c) under the Investment Company Act) provide reasonable assurances that material information relating to the trust is made known to them by the appropriate persons, based on their evaluation of these controls and procedures as of a date within 90 days of the filing date of this report.
(a)(ii) There was no change in the trust’s internal control over financial reporting (as defined in Rule 30a-3(d) under the Investment Company Act) that occurred during the
period covered by this report that has materially affected, or is reasonably likely to materially affect, the trust’s internal control over financial reporting.
Item 12.
Disclosure of Securities Lending Activities for Closed-End Management
Investment Companies
Not applicable.
Item 18.
Recovery of Erroneously Awarded Compensation
(a)
Not applicable.
(b)
Not applicable.
Item 19.
Exhibits
SIGNATURES
Pursuant to the requirements of the Securities Exchange Act of 1934 and the Investment Company Act of 1940, the registrant has duly caused this report to be signed on its behalf by the undersigned, thereunto duly authorized.
Fidelity Court Street Trust
| | |
| By: | /s/Laura M. Del Prato |
|
| Laura M. Del Prato |
|
| President and Treasurer |
|
|
|
| Date: | January 22, 2024 |
Pursuant to the requirements of the Securities Exchange Act of 1934 and the Investment Company Act of 1940, this report has been signed below by the following persons on behalf of the registrant and in the capacities and on the dates indicated.
| | |
| By: | /s/Laura M. Del Prato |
|
| Laura M. Del Prato |
|
| President and Treasurer |
|
|
|
| Date: | January 22, 2024 |
| | |
| By: | /s/John J. Burke III |
|
| John J. Burke III |
|
| Chief Financial Officer |
|
|
|
| Date: | January 22, 2024 |
Exhibit EX-99.CERT
I, Laura M. Del Prato, certify that:
1.
I have reviewed this report on Form N-CSR of Fidelity Court Street Trust;
2.
Based on my knowledge, this report does not contain any untrue statement of a material fact or omit to state a material fact necessary to make the statements made, in light of the circumstances under which such statements were made, not misleading with respect to the period covered by this report;
3.
Based on my knowledge, the financial statements, and other financial information included in this report, fairly present in all material respects the financial condition, results of operations, changes in net assets, and cash flows (if the financial statements are required to include a statement of cash flows) of the registrant as of, and for, the periods presented in this report;
4.
The registrant's other certifying officer(s) and I are responsible for establishing and maintaining disclosure controls and procedures (as defined in Rule 30a-3(c) under the Investment Company Act of 1940) and internal control over financial reporting (as defined in Rule 30a-3(d) under the Investment Company Act of 1940) for the registrant and have:
a.
Designed such disclosure controls and procedures, or caused such disclosure controls and procedures to be designed under our supervision, to ensure that material information relating to the registrant, including its consolidated subsidiaries, is made known to us by others within those entities, particularly during the period in which this report is being prepared;
b.
Designed such internal control over financial reporting, or caused such internal control over financial reporting to be designed under our supervision, to provide reasonable assurance regarding the reliability of financial reporting and the preparation of financial statements for external purposes in accordance with generally accepted accounting principles;
c.
Evaluated the effectiveness of the registrant's disclosure controls and procedures and presented in this report our conclusions about the effectiveness of the disclosure controls and procedures, as of a date within 90 days prior to the filing date of this report based upon such evaluation; and
d.
Disclosed in this report any change in the registrant’s internal control over financial reporting that occurred during the period covered by this report that has materially affected, or is reasonably likely to materially affect, the registrant’s internal control over financial reporting; and
5.
The registrant's other certifying officer(s) and I have disclosed to the registrant's auditors and the audit committee of the registrant's board of directors (or persons performing the equivalent functions):
a.
All significant deficiencies and material weaknesses in the design or operation of internal control over financial reporting which are reasonably likely to adversely affect the registrant's ability to record, process, summarize, and report financial information; and
b.
Any fraud, whether or not material, that involves management or other employees who have a significant role in the registrant's internal control over financial reporting.
Date:
January 22, 2024
|
/s/Laura M. Del Prato
|
Laura M. Del Prato
|
President and Treasurer
|
I, John J. Burke III, certify that:
1.
I have reviewed this report on Form N-CSR of Fidelity Court Street Trust;
2.
Based on my knowledge, this report does not contain any untrue statement of a material fact or omit to state a material fact necessary to make the statements made, in light of the circumstances under which such statements were made, not misleading with respect to the period covered by this report;
3.
Based on my knowledge, the financial statements, and other financial information included in this report, fairly present in all material respects the financial condition, results of operations, changes in net assets, and cash flows (if the financial statements are required to include a statement of cash flows) of the registrant as of, and for, the periods presented in this report;
4.
The registrant's other certifying officer(s) and I are responsible for establishing and maintaining disclosure controls and procedures (as defined in Rule 30a-3(c) under the Investment Company Act of 1940) and internal control over financial reporting (as defined in Rule 30a-3(d) under the Investment Company Act of 1940) for the registrant and have:
a.
Designed such disclosure controls and procedures, or caused such disclosure controls and procedures to be designed under our supervision, to ensure that material information relating to the registrant, including its consolidated subsidiaries, is made known to us by others within those entities, particularly during the period in which this report is being prepared;
b.
Designed such internal control over financial reporting, or caused such internal control over financial reporting to be designed under our supervision, to provide reasonable assurance regarding the reliability of financial reporting and the preparation of financial statements for external purposes in accordance with generally accepted accounting principles;
c.
Evaluated the effectiveness of the registrant's disclosure controls and procedures and presented in this report our conclusions about the effectiveness of the disclosure controls and procedures, as of a date within 90 days prior to the filing date of this report based upon such evaluation; and
d.
Disclosed in this report any change in the registrant’s internal control over financial reporting that occurred during the period covered by this report that has materially affected, or is reasonably likely to materially affect, the registrant’s internal control over financial reporting; and
5.
The registrant's other certifying officer(s) and I have disclosed to the registrant's auditors and the audit committee of the registrant's board of directors (or persons performing the equivalent functions):
a.
All significant deficiencies and material weaknesses in the design or operation of internal control over financial reporting which are reasonably likely to adversely affect the registrant's ability to record, process, summarize, and report financial information; and
b.
Any fraud, whether or not material, that involves management or other employees who have a significant role in the registrant's internal control over financial reporting.
Date:
January 22, 2024
|
/s/John J. Burke III
|
John J. Burke III
|
Chief Financial Officer
|
Exhibit EX-99.906CERT
Certification Pursuant to Section 906 of the Sarbanes-Oxley Act of 2002 (subsections (a) and (b) of section 1350, chapter 63 of title 18, United States Code)
In connection with the attached Report of Fidelity Court Street Trust (the “Trust”) on Form N-CSR to be filed with the Securities and Exchange Commission (the “Report”), each of the undersigned officers of the Trust does hereby certify that, to the best of such officer’s knowledge:
1.
The Report fully complies with the requirements of 13(a) or 15(d) of the Securities Exchange Act of 1934; and
2.
The information contained in the Report fairly presents, in all material respects, the financial condition and results of operations of the Trust as of, and for, the periods presented in the Report.
Dated: January 22, 2024
|
/s/Laura M. Del Prato
|
Laura M. Del Prato
|
President and Treasurer
|
Dated: January 22, 2024
|
/s/John J. Burke III
|
John J. Burke III
|
Chief Financial Officer
|
A signed original of this written statement required by Section 906, or other document authenticating, acknowledging, or otherwise adopting the signature that appears in typed form within the electronic version of this written statement required by Section 906, has been provided to the Trust and will be retained by the Trust and furnished to the Securities and Exchange Commission or its staff upon request.
Fidelity Investments
FIDELITY FUNDS’
CODE OF ETHICS
FOR PRESIDENT, TREASURER
AND PRINCIPAL ACCOUNTING OFFICER
2023
FIDELITY FUNDS’ CODE OF ETHICS FOR
PRESIDENT, TREASURER AND PRINCIPAL ACCOUNTING OFFICER
I. Purposes of the Code/Covered Officers
This document constitutes the Code of Ethics (Code) adopted by the Fidelity Funds (Funds) pursuant to Section 406 of the Sarbanes-Oxley Act of 2002. The Code applies to the Fidelity Funds’ President and Treasurer, and Chief Financial Officer (Covered Officers). Fidelity’s Ethics Office, within Enterprise Compliance, administers the Code.
The purposes of the Code are to deter wrongdoing and to promote, on the part of the Covered Officers:
·
honest and ethical conduct, including the ethical handling of actual or apparent conflicts of interest between personal and professional relationships;
·
full, fair, accurate, timely and understandable disclosure in reports and documents that the Fidelity Funds submit to the Securities and Exchange Commission (SEC), and in other public communications by a Fidelity Fund;
·
compliance with applicable laws and governmental rules and regulations;
·
the prompt internal reporting to an appropriate person or persons identified in the Code of violations of the Code; and
·
accountability for adherence to the Code.
Each Covered Officer should adhere to a high standard of business ethics and should be sensitive to situations that may give rise to actual as well as apparent conflicts of interest.
II.
Covered Officers Should Handle Ethically
Actual and Apparent Conflicts of Interest
Overview. A “conflict of interest” occurs when a Covered Officer’s private interest interferes with the interests of, or their service to, the Fidelity Funds. For example, a conflict of interest would arise if a Covered Officer, or a member of their family, receives improper personal benefits as a result of their position with the Fidelity Funds.
Certain conflicts of interest arise out of the relationships between Covered Officers and the Fidelity Funds and already are subject to conflict of interest provisions in the Investment Company Act of 1940 (Investment Company Act) and the Investment Advisers Act of 1940 (Investment Advisers Act). For example, Covered Officers may not individually engage in certain transactions (such as the purchase or sale of securities or other property) with a Fidelity Fund because of their status as “affiliated persons” of the Fund. Separate compliance programs and procedures of the Fidelity Funds, Fidelity Management & Research Company (FMR) and the other Fidelity companies are designed to prevent, or identify and correct, violations of these provisions. This Code does not, and is not intended to, repeat or replace these programs and procedures, and such conflicts fall outside of the parameters of this Code.
Although typically not presenting an opportunity for improper personal benefit, conflicts arise from, or as a result of, the contractual relationship between the Fidelity Funds and FMR (or another Fidelity company) of which the Covered Officers are also officers or employees. As a result, this Code recognizes that the Covered Officers will, in the normal course of their duties (whether formally for the Fidelity Funds, FMR or another Fidelity company), be involved in establishing policies and implementing decisions that have different effects on the Fidelity Funds, FMR and other Fidelity companies. The participation of the Covered Officers in such activities is inherent in the contractual relationship between the Fidelity Funds and FMR (or another Fidelity company) and is consistent with the performance by the Covered Officers of their duties as officers of the Fidelity Funds. Thus, if performed in conformity with the provisions of the Investment Company Act and the Investment Advisers Act, such activities will be deemed to have been handled ethically. In addition, it is recognized by the Funds’ Board of Trustees (Board) that the Covered Officers also may be officers or employees of one or more other Fidelity Funds covered by this Code.
Other conflicts of interest are covered by the Code, even if such conflicts of interest are not subject to provisions in the Investment Company Act and the Investment Advisers Act. The following list provides examples of conflicts of interest under the Code, but Covered Officers should keep in mind that these examples are not exhaustive. The overarching principle is that the personal interest of a Covered Officer should not be placed improperly before the interest of a Fidelity Fund.
* * *
Each Covered Officer must:
·
not use their personal influence or personal relationships improperly to influence investment decisions or financial reporting by any Fidelity Fund whereby the Covered Officer would benefit personally to the detriment of any Fidelity Fund;
·
not cause a Fidelity Fund to take action, or fail to take action, for the individual personal benefit of the Covered Officer rather than the benefit of the Fidelity Fund;
·
not engage in any outside business activity, including serving as a director or trustee, that prevents the Covered Officer from devoting appropriate time and attention to the Covered Officer’s responsibilities with the Fidelity Funds;
·
not have a consulting or employment relationship with any of the Fidelity Funds’ service providers that are not affiliated with Fidelity; and
·
not retaliate against any employee or Covered Officer for reports of actual or potential misconduct, which are made in good faith.
With respect to other fact patterns, if a Covered Officer is in doubt, other potential conflict of interest situations should be described immediately to the Fidelity Ethics Office for resolution. Similarly, any questions a Covered Officer has generally regarding the application or interpretation of the Code should be directed to the Fidelity Ethics Office immediately.
III. Disclosure and Compliance
·
Each Covered Officer should familiarize themself with the disclosure requirements generally applicable to the Fidelity Funds.
·
Each Covered Officer should not knowingly misrepresent, or cause others to misrepresent, facts about any Fidelity Fund to others, whether within or outside Fidelity, including to the Board and auditors, and to governmental regulators and self-regulatory organizations;
·
Each Covered Officer should, to the extent appropriate within their area of responsibility, consult with other officers and employees of the Fidelity Funds, FMR and the Fidelity service providers, and with the Board’s Compliance Committee, with the goal of promoting full, fair, accurate, timely and understandable disclosure in the reports and documents the Fidelity Funds file with, or submit to, the SEC and in other public communications made by the Fidelity Funds; and
·
It is the responsibility of each Covered Officer to promote compliance with the standards and restrictions imposed by applicable laws, rules and regulations.
IV. Reporting and Accountability
Each Covered Officer must:
·
upon receipt of the Code, and annually thereafter, submit to the Fidelity Ethics Office an acknowledgement stating that they have received, read, and understand the Code; and
·
notify the Fidelity Ethics Office promptly if they know of any violation of the Code. Failure to do so is itself a violation of this Code.
The Fidelity Ethics Office shall take all action it considers appropriate to investigate any actual or potential violations reported to it. Upon completion of the investigation, if necessary, the matter will be reviewed with senior management or other appropriate parties, and a determination will be made as to whether any action should be taken as detailed below. The Covered Officer will be informed of any action determined to be appropriate. The Fidelity Ethics Office will inform the Personal Trading Committee of all Code violations and actions taken in response. Without implied limitation, appropriate remedial, disciplinary or preventive action may include a written warning, a letter of censure, suspension, dismissal or, in the event of criminal or other serious violations of law, notification of the SEC or other appropriate law enforcement authorities. Additionally, other legal remedies may be pursued.
The policies and procedures described in the Code do not create any obligations to any person or entity other than the Fidelity Funds. The Code is intended solely for the internal use by the Fidelity Funds and does not constitute a promise, contract or an admission by or on behalf of any Fidelity Fund as to any fact, circumstance, or legal conclusion. The Fidelity Funds, the Fidelity companies and the Fidelity Head of Ethics retain the discretion to decide whether the Code applies to a specific situation, and how it should be interpreted.
V. Oversight
Material violations of this Code will be reported promptly by FMR (or another Fidelity company) to the Board’s Compliance Committee. In addition, at least once each year, FMR (or another Fidelity company) will provide a written report to the Board, which describes any issues arising under the Code since the last report to the Board, including, but not limited to, information about material violations of the Code and action taken in response to the material violations.
VI. Other Policies and Procedures
This Code shall be the sole code of ethics adopted by the Fidelity Funds for purposes of Section 406 of the Sarbanes-Oxley Act. Other Fidelity policies or procedures that cover the behavior or activities of Covered Officers are separate requirements applying to the Covered Officers (and others) and are not part of this Code.
VII. Amendments
Any material amendments or changes to this Code must be approved or ratified by a majority vote of the Board, including a majority of the Trustees who are not interested persons of the Fidelity Funds.
VIII. Records and Confidentiality
Records of any violation of the Code and of the actions taken as a result of such violations will be kept by the Fidelity Ethics Office. All reports and records prepared or maintained pursuant to this Code will be considered confidential and shall be maintained and protected accordingly. Except as otherwise required by law or this Code, such matters shall not be disclosed to anyone other than the Fidelity Ethics Office, the Personal Trading Committee, the Board, appropriate personnel at the relevant Fidelity company or companies and the legal counsel of any or all of the foregoing.
2023