Exhibit 99.7
BUDGET 2023

Fiscal Plan
Securing Alberta’s
Future
2023–26

UNITED STATES
SECURITIES AND EXCHANGE COMMISSION
Washington, D.C. 20549
FORM 18-K/A
For Foreign Governments and Political Subdivisions Thereof
AMENDMENT NO. 3
TO
ANNUAL REPORT
of
PROVINCE OF ALBERTA
CANADA
(Name of Registrant)
Date of end of last fiscal year: March 31, 2022
SECURITIES REGISTERED *
(As of close of fiscal year)
|
| ||||
| Title of Issue | Amounts as to which registration is effective |
Names of exchanges on which registered | ||
| N/A |
N/A | N/A | ||
|
| ||||
|
| ||||
Names and addresses of persons authorized to receive notices
and communications from the Securities and Exchange Commission:
James Rajotte
Alberta’s Senior Representative to the United States
Alberta Washington D.C. Office
Canadian Embassy
501 Pennsylvania Avenue N.W.
Washington, D.C. 20001
Phone: 202-448-6475
Copies to:
| LOWELL EPP Assistant Deputy Minister, Treasury and Risk Management Treasury Board and Finance 8th fl Federal Building, 9820 — 107 Street Edmonton, Alberta T5K 1E7 (780) 422-4052 |
CHRISTOPHER J. CUMMINGS Paul, Weiss, Rifkind, Wharton & Garrison LLP Toronto-Dominion Centre 77 King Street West, Suite 3100 Toronto, ON Canada M5K 1J3 (416) 504-0520 |
| * | The Registrant is filing this annual report on a voluntary basis. |
PROVINCE OF ALBERTA
The undersigned registrant hereby amends the following items, financial statements, exhibits or other portions of its Annual Report (the “Annual Report”) for the fiscal year ended March 31, 2022 on Form 18-K as set forth below:
The following additional exhibit is added to the Annual Report:
| 99.7 | Budget 2023 (Fiscal Plan 2023-26). | |
| 99.8 | 2023-24 Government Estimates. | |
| 99.9 | 2023-24 Offices of the Legislative Assembly Estimates. | |
SIGNATURE
Pursuant to the requirements of the Securities Exchange Act of 1934, the registrant has duly caused this amendment to be signed on its behalf by the undersigned, thereunto duly authorized, at Edmonton, Alberta, Canada on the 7th day of March, 2023.
| Province of Alberta | ||
| By: | /s/ Lowell Epp | |
| Name: | Lowell Epp | |
| Title: | Assistant Deputy Minister, Treasury and Risk Management, Treasury Board and Finance | |
EXHIBIT INDEX
| Exhibit Number |
Description | |
| 99.7 | Budget 2023 (Fiscal Plan 2023-26). | |
| 99.8 | 2023-24 Government Estimates. | |
| 99.9 | 2023-24 Offices of the Legislative Assembly Estimates. | |
Exhibit 99.7
BUDGET 2023
Fiscal Plan
Securing Alberta’s
Future
2023–26
Alberta Treasury Board and Finance
Communications
9th floor, Edmonton Queen Elizabeth II Building
9820 – 107 Street NW
Edmonton, Alberta, T5K 1E7
Telephone: 780 427-5364
Toll-free within Alberta: 310-0000 then 780-427-5364
TBF.Communications@gov.ab.ca
For electronic copies of Budget 2023: Fiscal Plan visit our website at:
alberta.ca/budget-documents.aspx
ISBN 978-1-4601-5633-9
ISSN 2369-0127
Copyright © 2023 President of Treasury Board and Minister of Finance and its licensors. All rights reserved.
BUDGET 2023
GOVERNMENT OF ALBERTA | 2023–26
2023–26
Fiscal Plan
PRESENTED BY
TRAVIS TOEWS
PRESIDENT OF TREASURY BOARD
AND MINISTER OF FINANCE
in the Legislative Assembly of Alberta
February 28, 2023
Accountability Statement
The government’s Fiscal Plan for the three years commencing April 1, 2023 was prepared under my direction in accordance with the Fiscal Planning and Transparency Act and the government’s accounting policies. All of the government’s policy decisions as of February 13, 2023 with material economic or fiscal implications have been considered in preparing the three year Fiscal Plan.
Original signed by
Travis Toews
President of Treasury Board and Minister of Finance
February 13, 2023
| 2 | Fiscal Plan 2023 – 26 |
Fiscal Plan 2023 – 26
| Overview |
5 | |||
| Economic Outlook |
23 | |||
| Revenue |
55 | |||
| Expense |
75 | |||
| Capital Plan |
99 | |||
| Tax Plan |
119 | |||
| Debt |
137 | |||
| Fiscal Plan Tables |
147 | |||
| Response to the Auditor General |
165 | |||
Note: Amounts presented in tables may not add to totals due to rounding.
| Fiscal Plan 2023 – 26 | 3 |
BLANK PAGE
| 4 |
BUDGET 2023
GOVERNMENT OF ALBERTA | 2023–26
Fiscal Plan
Overview
| 5 |
Table of Contents
| Overview |
7 | |||
| Securing Alberta’s Future |
7 | |||
| Boosting Alberta’s Advantage |
8 | |||
| Strengthening Health Care |
8 | |||
| Supporting Albertans |
9 | |||
| Keeping Albertans and Communities Safe |
9 | |||
| Fiscal Management |
9 | |||
| Energy and Economic Assumptions |
10 | |||
| Revenue |
11 | |||
| Expense |
12 | |||
| Capital Plan |
13 | |||
| Debt and Debt Servicing |
14 | |||
| Fiscal Summary |
15 | |||
| Fiscal Framework |
17 | |||
| Alberta Context |
17 | |||
| Sustainable Fiscal Planning and Reporting |
17 | |||
Note: Amounts presented in tables may not add to totals due to rounding.
| 6 | Overview | Fiscal Plan 2023 – 26 |
Overview
Securing Alberta’s Future
Alberta is the best place to live, work and raise a family. We have come through some challenging years and our economy has momentum. Budget 2023 is securing Alberta’s future by strengthening health care, addressing affordability, growing the economy, supporting job creation, and keeping Albertans and communities safe.
Alberta’s government is committed to responsible fiscal management. Budget 2023 introduces a new fiscal framework to help deal with Alberta’s unique economic and revenue volatility. The framework will secure Alberta’s future by requiring balanced budgets, limiting operating expense growth, and setting out rules to pay down maturing debt, save for the future, and invest in areas and services important to Albertans.
Amendments will also be introduced for the Alberta Heritage Savings Trust Fund to retain 100 per cent of its net income instead of the current requirement to retain only an amount for inflation proofing. This will result in significant increases to the annual growth in Heritage Fund assets. Fiscal responsibility matters and these impacts will be felt by current and future Albertans.
Budget 2023 – Key Fiscal Metrics
(billions of dollars)
| 2021-22 | 2022-23 | 2023-24 | 2024-25 | 2025-26 | ||||||||||||||||||
| Actual | Budget | Forecast | Estimate | Target | Target | |||||||||||||||||
| Revenue |
68.3 | 62.6 | 76.0 | 70.7 | 71.7 | 72.6 | ||||||||||||||||
| Expense |
||||||||||||||||||||||
| Operating expense |
52.3 | 51.5 | 55.4 | 57.0 | 58.0 | 59.2 | ||||||||||||||||
| Other expense |
9.0 | 8.9 | 8.9 | 9.7 | 10.1 | 10.5 | ||||||||||||||||
| Total Expense (before provisions and allowances) |
61.3 | 60.3 | 64.3 | 66.8 | 68.2 | 69.7 | ||||||||||||||||
| Contingency / disaster assistance / COVID-19 |
3.1 | 1.8 | 1.3 | 1.5 | 1.5 | 1.5 | ||||||||||||||||
| Surplus / (Deficit) |
3.9 | 0.5 | 10.4 | 2.4 | 2.0 | 1.4 | ||||||||||||||||
| Other Key Metrics: |
||||||||||||||||||||||
| Capital / Other Non-financial assets |
58.6 | 60.5 | 59.5 | 61.2 | 62.4 | 62.2 | ||||||||||||||||
| Heritage Fund Year-end Balances |
17.1 | 17.5 | 18.9 | 20.0 | 21.3 | 22.8 | ||||||||||||||||
| Taxpayer Supported Debt |
93.1 | 94.7 | 79.7 | 78.3 | 78.3 | 79.7 | ||||||||||||||||
| Net Financial Debt |
57.0 | 65.1 | 47.4 | 46.5 | 45.6 | 44.1 | ||||||||||||||||
| Net Debt to GDP |
15.2% | 16.7% | 10.2% | 10.2% | 9.7% | 9.1% | ||||||||||||||||
Note: See table on page 15 for amounts in millions.
| Overview | Fiscal Plan 2023 – 26 | 7 |
| Boosting Alberta’s Advantage | ||
| Alberta has the best economic fundamentals in the country. We have a young, highly skilled workforce, the highest weekly earnings among provinces, some of the lowest home prices and rents of large Canadian urban centres, and the lowest overall taxes in Canada. With one of the lowest corporate tax rates in North America, more businesses across many sectors are choosing Alberta, creating family supporting jobs, further diversifying the economy, and maintaining our high quality of life. | ||
|
Budget 2023 creates opportunities for Albertans by supporting economic growth and job creation. |
Alberta’s long-term prosperity is dependent on improving competitiveness, attracting business investment, and creating jobs. Alberta’s government continues to support key and emerging sectors, reduce unnecessary government oversight to save time and money for Albertans and Alberta businesses, and eliminate barriers for job creators. Budget 2023 builds on the success of the Alberta at Work initiatives introduced in Budget 2022 to assist Albertans – no matter where they are on their career path – in participating in the labour market with jobs that support their aspirations and improve their lives. | |
| Budget 2023 also includes targeted investments to address critical shortages in key areas such as health care, non-trade construction, energy, technology, business, and the aviation sector. | ||
| Strengthening Health Care | ||
|
Budget 2023 invests in strengthening Alberta’s health care system to provide the right supports when and where Albertans need them. |
Alberta’s government is building a stronger health-care system that has the right supports in place for Albertans to get the care they need, when and where they need it.
Budget 2023 supports the Healthcare Action Plan with investments to strengthen the Emergency Medical Services (EMS) system and reduce surgical and emergency department wait times. At the same time, government is empowering frontline workers to provide improved services to Albertans. A targeted, measured approach will be followed to evaluate the outcomes of the Healthcare Action Plan.
Alberta has the best front line health care workers in the world. Budget 2023 includes funding to address health care staffing challenges through initiatives to train, recruit, and retain more health care professionals, including specific challenges in remote and rural communities. Budget 2023 will fund additional seats for physician training at Alberta’s medical schools, and the government will attract internationally educated nurses by addressing barriers they face including navigating complex regulatory requirements, assessment and licensing processes, and access to clinical placements. | |
| 8 | Overview | Fiscal Plan 2023 – 26 |
Supporting Albertans
The government is taking immediate action to make life more affordable for Albertans. Alberta’s government is delivering targeted relief for families, seniors and the most vulnerable through the Affordability Action Plan. Assistance is being provided to seniors, families, low income, and vulnerable Albertans through direct affordability payments and the indexation of core benefits programs to inflation.
Alberta’s government is indexing personal income taxes to inflation and fully pausing the collection of the 13-cent provincial fuel tax until June 30, 2023. We are also helping all Albertans with the rising costs of everyday necessities through electricity and heating rebates, and pausing passenger vehicle insurance rate increases.
Budget 2023 makes post-secondary education more affordable by capping tuition at two per cent annually effective 2024-25, reducing interest rates on student loans, and providing more support for former students repaying their loans.
Keeping Albertans and Communities Safe
All Albertans have the right to safety and security in their homes, at school, or at work, whether they live in large cities or on farms, in smaller, rural, or Indigenous communities. The government is taking a fair, firm, and compassionate approach to keeping communities safe while also treating mental health and addiction as health care issues. We are securing Alberta’s future by building safe, resilient communities supported by strong police services, crisis response teams, mental health, addictions and social services, and emergency responders.
Budget 2023 includes increases for the Ministry of Public Safety and Emergency Services for community policing, correctional services, custody operations, victims’ services, and Alberta Sheriffs. The budget also adds more funding to increase capacity and ensure timely access to the justice system for Albertans.
Fiscal Management
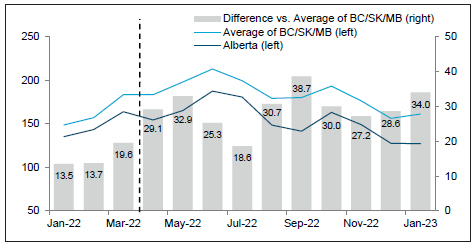
Alberta’s government remains committed to fiscal responsibility. In 2019 the MacKinnon Panel identified that Alberta spent more than Canada’s three largest provinces on a per capita basis but did not achieve better outcomes. The government has worked to bring spending in-line with the average of British Columbia, Ontario and Quebec, and Budget 2023 shows that Alberta’s will be at or below the range of the three comparator province average on a per capita basis.
| Overview | Fiscal Plan 2023 – 26 | 9 |
Per Capita Total Expense excluding Debt Servicing Costs: Alberta Versus Big-3 Provincial Average (ON, QB, BC)
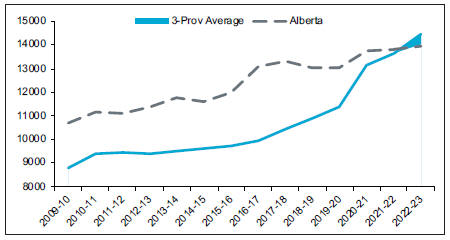
| ‘Source: | Statistics Canada Government Finance Statistics to 2021-22 (preliminary). Alberta Budget 2023 used to derive growth rates for the projection years. For other provinces, range reflects a variety of possible spending growth trajectories. Program expense calculated as total expense less debt servicing cost. Not adjusted for COVID-19 related expense. In Alberta, expense excludes Crude-by-rail. |
Energy and Economic Assumptions
Alberta’s economy is continuing to expand following two years of robust post-pandemic recovery, albeit at a more moderate pace. Real GDP growth is forecast to rise 2.8 per cent and lead the country in 2023. With last year’s strong pace of 4.8 per cent, real GDP fully recovered from the COVID-19 downturn and surpassed the 2014 peak, while incomes in the province hit a record high. This puts the province in a good position to face the challenges coming from last year’s rapid rise in prices, interest rates, and slower global growth.
The oil and gas sector will take the lead in 2023, underpinned by solid energy prices and strong cash flows from last year. With more people choosing to call Alberta home, population growth is projected to rise to its fastest pace since 2006, which should support residential construction activity. However, rising borrowing costs and elevated prices will continue to weigh on consumer spending and non-energy business investment. Inflation will continue to abate this year but will be slow to return to pre-pandemic levels.
Growth is forecast to accelerate over the medium term and become more broad-based as business investment and consumer spending pick up. Alberta’s competitive taxes, regulatory environment and access to abundant and low-cost natural resources will continue to encourage investment in the province. Consumer spending and residential construction activity are also expected to gain traction as inflation subsides further and interest rates come down. Solid fundamentals – such as strong population growth, a relatively young population and lower cost of living – will support Alberta’s continued expansion.
| 10 | Overview | Fiscal Plan 2023 – 26 |
| Energy and Economic Assumptionsa | ||||||||||||||||||||||||||||
|
2020-21
Actuals |
2021-22
Actuals |
2022-23
Estimate |
2023-24
Forecast |
2024-25
Forecast |
2025-26
Forecast |
|||||||||||||||||||||||
| WTI Oil (US$/bbl)b |
42.32 | 77.03 | 90.50 | 79.00 | 76.00 | 73.50 | ||||||||||||||||||||||
| Light-Heavy Differential (US$/bbl)b |
10.58 | 13.56 | 20.00 | 19.50 | 16.80 | 16.40 | ||||||||||||||||||||||
| WCS@Hardisty (Cdn$/bbl)b |
41.42 | 79.63 | 92.60 | 78.00 | 75.90 | 72.10 | ||||||||||||||||||||||
| Natural Gas (Cdn$/GJ)b |
2.10 | 3.48 | 5.10 | 4.10 | 3.60 | 3.80 | ||||||||||||||||||||||
| Conventional Crude Oil Production (000s barrels/day) |
401 | 444 | 497 | 497 | 497 | 490 | ||||||||||||||||||||||
| Raw Bitumen Production (000s barrels/day) |
2,969 | 3,197 | 3,281 | 3,345 | 3,436 | 3,529 | ||||||||||||||||||||||
| Exchange Rate (US¢/Cdn$)b |
75.7 | 79.8 | 75.7 | 76.2 | 78.2 | 79.5 | ||||||||||||||||||||||
| Interest Rate (10-year Canada bonds, %) |
0.74 | 1.56 | 3.10 | 3.60 | 3.40 | 3.40 | ||||||||||||||||||||||
| 2020
Actuals |
2021
Actuals |
2022
Estimate |
2023
Forecast |
2024
Forecast |
2025
Forecast |
2026
Forecast |
||||||||||||||||||||||
| Real GDP (% change) |
(8.0 | ) | 4.8 | 4.8 | 2.8 | 3.0 | 2.9 | 2.8 | ||||||||||||||||||||
| Employment (% change)c |
(7.1 | ) | 5.4 | 5.2 | 2.3 | 2.7 | 2.5 | 2.3 | ||||||||||||||||||||
| Unemployment Rate (%)c |
11.3 | 8.6 | 5.8 | 6.4 | 6.3 | 6.1 | 5.7 | |||||||||||||||||||||
| Primary Household Income (% change) |
(4.8 | ) | 5.8 | 8.8 | 5.9 | 6.7 | 6.4 | 6.1 | ||||||||||||||||||||
| Net Corporate Operating Surplus (% change) |
(60.3 | ) | 284.9 | 54.9 | (13.9 | ) | 7.9 | 6.9 | 4.4 | |||||||||||||||||||
| Alberta Consumer Price Index (% change)c |
1.1 | 3.2 | 6.4 | 3.3 | 2.2 | 2.2 | 2.2 | |||||||||||||||||||||
| Population (% change)c |
1.2 | 0.6 | 2.2 | 2.9 | 2.2 | 2.1 | 1.7 | |||||||||||||||||||||
a Forecast was finalized on January 30, 2023
b Forecasts have been rounded
c Actual
| Revenue | ||
| Total revenue is estimated at $70.7 billion in 2023-24, $5.4 billion lower than the record $76 billion forecast for 2022-23. | ||
| Alberta government revenue has increased substantially over the last two years, after the global impacts of COVID-19 on economic activity and energy prices caused a sharp drop in 2020-21. As pandemic restrictions began easing in 2021, energy prices began rising. Revenue reached a record $68 billion in 2021-22. Oil and natural gas prices were unexpectedly high in 2022-23 mainly due to Russia’s invasion of Ukraine in February of 2022. Alberta government revenue reached a new record of $76 billion as a result. At the same time, the global economy has been hit with severe inflation, interest rate hikes, and the risk of recession. This has dampened energy prices and weighted down financial markets. | ||
| The Budget 2023 revenue forecast is based on many of these issues gradually easing during 2023 and 2024. Energy prices trend down and financial markets recover. Resource revenue is forecast to decline $9.2 billion in 2023-24, while investment income is expected to increase by $2.1 billion. Alberta’s government provided significant assistance to help Albertans with inflation pressures, sharing the boost in energy revenue. Fuel tax relief in 2022-23 and for part of 2023-24 and full indexation of the personal income tax system in 2022 restrain revenue growth in 2023-24. Federal transfers increase mainly due to re-profiling a one-time $707 million Fiscal Stabilization payment from 2022-23 into 2023-24. Revenue is forecast to grow by $2 billion by 2025-26, reaching $72.6 billion. Energy prices and resource revenue trend down |
Corporate income tax revenue is down $0.5 billion from its 2022-23 record level, but remains higher than ever before. | |
| Overview | Fiscal Plan 2023 – 26 | 11 |
| while income and other tax revenue climbs, and investment income recovers. Recent negotiations on federal contributions to health care funding have so far resulted in a small one time payment in 2023-24 and an adjustment to the Canada Health Care formula that impacts revenue in 2025-26, both of which are included in Budget 2023. Further federally-directed transfers were still being discussed during the finalization of this budget therefore only agreed to funding has been incorporated.
The forecast is based on a moderate decline in energy prices, with improving global economic growth, but a great deal of uncertainty remains. The West Texas Intermediate oil price is expected to average US$79 per barrel (/bbl) in 2023-24, and US$73.50/bbl by 2025-26, while the Alberta Reference natural gas price is forecast to average Cdn$4.10 per gigajoule in 2023-24 and Cdn$3.80 by 2025-26. |
Budget 2023 Revenue
(millions of dollars)
| 2021-22 | 2022-23 | 2023-24 | 2024-25 | 2025-26 | ||||||||||||||||||||
| Actual | Budget | Forecast | Estimate | Target | Target | |||||||||||||||||||
| Personal Income Tax |
13,335 | 13,382 | 13,806 | 14,069 | 15,034 | 16,071 | ||||||||||||||||||
| Corporate Income Tax |
4,718 | 4,040 | 6,413 | 5,911 | 6,254 | 6,590 | ||||||||||||||||||
| Other Taxes |
5,453 | 5,612 | 4,361 | 5,012 | 5,767 | 5,948 | ||||||||||||||||||
| Resource revenue – Bitumen royalties |
11,605 | 10,349 | 18,750 | 12,555 | 12,028 | 10,736 | ||||||||||||||||||
| Resource revenue – Other |
4,565 | 3,491 | 8,794 | 5,806 | 5,256 | 5,006 | ||||||||||||||||||
| Transfers from Government of Canada |
11,595 | 12,054 | 11,765 | 12,552 | 12,475 | 13,113 | ||||||||||||||||||
| Investment Income |
3,579 | 3,173 | 1,035 | 3,154 | 3,273 | 3,407 | ||||||||||||||||||
| Net Income from Government Business Enterprises |
4,810 | 2,435 | 2,449 | 2,727 | 2,422 | 2,647 | ||||||||||||||||||
| Premiums, Fees and Licences |
4,520 | 4,490 | 4,796 | 5,040 | 5,289 | 5,360 | ||||||||||||||||||
| Other |
4,142 | 3,581 | 3,856 | 3,827 | 3,926 | 3,730 | ||||||||||||||||||
| Total Revenue |
68,322 | 62,607 | 76,025 | 70,653 | 71,724 | 72,608 | ||||||||||||||||||
| Expense
In 2023-24, operating expense will be three per cent, or $1.7 billion, higher than the 2022-23 forecast and will grow by approximately two per cent per year over the following two years. These targeted increases fund important investments to strengthen health care, grow the economy and support job creation, address affordability and keep Albertans and communities safe.
In 2022-23, the total expense forecast increased by $3.5 billion from Budget 2022 mainly due to measures to help Albertans deal with the rising cost of living, funding for the Alberta Medical Association (AMA) Agreement and collective bargaining agreements with teachers and other public sector unions, justice system and public safety enhancements, disaster expense related to wildfire fighting and agriculture indemnities and income support, and health care costs. |
| 12 | Overview | Fiscal Plan 2023 – 26 |
| With the introduction of the new fiscal framework in Budget 2023, the contingency will increase to $1.5 billion per year. The contingency amount is intended to address unanticipated spending, including disasters and emergencies, and emerging priorities that may arise during the year and that are not practical to delay until the next budget. |
Budget 2023 Expense
(millions of dollars)
| 2021-22 | 2022-23 | 2023-24 | 2024-25 | 2025-26 | ||||||||||||||||||||
| Actual | Budget | Forecast | Estimate | Target | Target | |||||||||||||||||||
| Operating expense |
52,343 | 51,487 | 55,384 | 57,038 | 58,049 | 59,200 | ||||||||||||||||||
| Capital grants |
2,503 | 2,429 | 1,845 | 2,821 | 3,209 | 3,274 | ||||||||||||||||||
| Amortization / disposal loss / inventory consumption |
4,186 | 4,057 | 4,480 | 4,397 | 4,460 | 4,509 | ||||||||||||||||||
| Debt servicing costs |
2,641 | 2,662 | 2,715 | 2,848 | 2,805 | 3,103 | ||||||||||||||||||
| Pension provisions |
(365 | ) | (289 | ) | (111 | ) | (322 | ) | (336 | ) | (347 | ) | ||||||||||||
| Contingency / disaster assistance / COVID-19 |
3,076 | 1,750 | 1,322 | 1,500 | 1,500 | 1,500 | ||||||||||||||||||
| Total Expense |
64,378 | 62,096 | 65,635 | 68,282 | 69,687 | 71,239 | ||||||||||||||||||
| Capital Plan
The Budget 2023 Capital Plan invests almost $23 billion to build and maintain public infrastructure that Albertans, communities, and businesses need and that contribute to the high standard of living that Albertans enjoy. This includes investments in infrastructure projects that help strengthen our health care system, attract private sector investment, enhance Albertans’ safety and security, and provide essential services.
The Budget 2023 Capital Plan includes:
• $6.5 billion for municipal infrastructure;
• $3.5 billion for capital maintenance and renewal;
• $3.1 billion for health facilities;
• $2.3 billion for roads and bridges;
• $1.6 billion for schools;
• $1.1 billion for agriculture and natural resources;
• $3.2 billion for other Capital Plan envelopes; and
• $1.7 billion in SUCH sector self-financed capital spending.
Alberta has vibrant communities that are a key factor in Alberta’s Advantage and reflect our high standard of living. Budget 2023 includes important infrastructure priorities in communities all across the province. Budget 2023 amends the Local Government Fiscal Framework so that municipalities share fully in both increases and decreases in provincial revenues. The government will continue to work with municipalities to finalize the allocation formula and consider ways to facilitate a smooth transition to the new framework. |
| Overview | Fiscal Plan 2023 – 26 | 13 |
Taxpayer-support debt is
estimated to be lower than what
was estimated in Budget 2022 by
$15 billion in 2022-23 and
$17.3 billion in 2023-24.
The Budget 2023 Capital Plan also increases the Community Facility Enhancement Program to $50 million per year. This important program works in partnership with eligible non-profit organizations to provide funding for sports, recreational, cultural, or other related public-use community facility enhancement needs.
The Capital Plan provides funding for the design and construction of new and modernized schools, as well as planning funds for 14 potential schools across the province. The government continues to invest in charter and collegiate schools to support choice and create clear pathways to post-secondary education and careers.
Budget 2023 invests $2.3 billion to enhance and expand Alberta’s road and bridge network. Key highlights include: $117 million for the twinning of Highway 63 north of Fort McMurray, $51 million to replace the interchange at the Queen Elizabeth II Highway and Highway 566 at Balzac, $75 million for 23 engineering projects all across the province, $60 million for the Vinca Bridge Replacement, and $22 million to address safety concerns at the intersection of Highway 16A and Range Road 20.
Recovery communities offer long term residential addiction treatment and are an important part of the government’s recovery-oriented system of care. Budget 2023 includes $155 million over three years for these important projects. Recovery communities in Red Deer and Lethbridge are expected to open in early 2023. Additional facilities are planned in Gunn, on the Blood Tribe First Nation, in Edmonton and Calgary. Budget 2023 includes funding for three new recovery communities; two in Northern Alberta and one in Central Alberta.
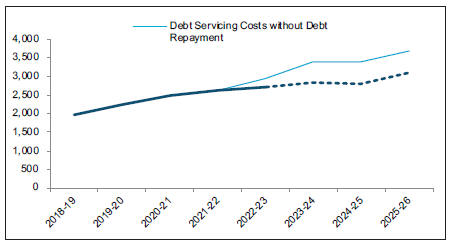
Debt and Debt Servicing
Taxpayer-supported debt outstanding is estimated to total $79.7 billion at the end of 2022-23 and $78.3 billion at the end of 2023-24.
Debt servicing costs are expected to be $2.8 billion in 2023-24. Until the debt is eliminated, resources will continue to be used to pay interest costs rather than being directed to delivering government programs and services that Albertans rely on.
The new fiscal framework sets out rules for using surplus cash to pay down debt as it matures. In 2022-23, $13.4 billion of maturing debt was repaid using surplus cash and $1.4 billion is expected to be repaid in 2023-24.
| 14 | Overview | Fiscal Plan 2023 – 26 |
Debt Servicing Costs
(millions of dollars)
Fiscal Summary
| Budget 2023 Fiscal Summary | ||||||||||||||||||||||||
| (millions of dollars) | ||||||||||||||||||||||||
| 2021-22 | 2022-23 | 2023-24 | 2024-25 | 2025-26 | ||||||||||||||||||||
| Actual | Budget | Forecast | Estimate | Target | Target | |||||||||||||||||||
| Revenue |
||||||||||||||||||||||||
| Income and Other Taxes |
23,506 | 23,034 | 24,580 | 24,992 | 27,055 | 28,609 | ||||||||||||||||||
| Resource revenue – Bitumen royalties |
11,605 | 10,349 | 18,750 | 12,555 | 12,028 | 10,736 | ||||||||||||||||||
| Resource revenue – other |
4,565 | 3,491 | 8,794 | 5,806 | 5,256 | 5,006 | ||||||||||||||||||
| Transfers from Government of Canada |
11,595 | 12,054 | 11,765 | 12,552 | 12,475 | 13,113 | ||||||||||||||||||
| Investment Income |
3,579 | 3,173 | 1,035 | 3,154 | 3,273 | 3,407 | ||||||||||||||||||
| Net Income from Government Business Enterprises |
4,810 | 2,435 | 2,449 | 2,727 | 2,422 | 2,647 | ||||||||||||||||||
| Premiums, Fees and Licences |
4,520 | 4,490 | 4,796 | 5,040 | 5,289 | 5,360 | ||||||||||||||||||
| Other |
4,142 | 3,581 | 3,856 | 3,827 | 3,926 | 3,730 | ||||||||||||||||||
| Total Revenue |
68,322 | 62,607 | 76,025 | 70,653 | 71,724 | 72,608 | ||||||||||||||||||
| Expense |
||||||||||||||||||||||||
| Operating expense |
52,343 | 51,487 | 55,384 | 57,038 | 58,049 | 59,200 | ||||||||||||||||||
| % change from prior year |
3.2% | (1.6)% | 5.8 % | 3.0 % | 1.8 % | 2.0 % | ||||||||||||||||||
| Capital grants |
2,503 | 2,429 | 1,845 | 2,821 | 3,209 | 3,274 | ||||||||||||||||||
| Amortization / disposal loss / inventory consumption |
4,186 | 4,057 | 4,480 | 4,397 | 4,460 | 4,509 | ||||||||||||||||||
| Debt servicing costs |
2,641 | 2,662 | 2,715 | 2,848 | 2,805 | 3,103 | ||||||||||||||||||
| Pension provisions |
(365 | ) | (289 | ) | (111 | ) | (322 | ) | (336 | ) | (347 | ) | ||||||||||||
| Contingency / disaster assistance / COVID-19 |
3,076 | 1,750 | 1,322 | 1,500 | 1,500 | 1,500 | ||||||||||||||||||
| Total Expense |
64,378 | 62,096 | 65,635 | 68,282 | 69,687 | 71,239 | ||||||||||||||||||
| Surplus / (deficit) |
3,944 | 511 | 10,390 | 2,371 | 2,037 | 1,369 | ||||||||||||||||||
| Overview | Fiscal Plan 2023 – 26 | 15 |
Overview
Fiscal Framework
| 16 | Overview | Fiscal Plan 2023 – 26 |
Fiscal Framework
Alberta Context
The historical volatility of Alberta’s economy and government revenues have long created unique fiscal planning challenges for the province. The tendency to move operational spending well in excess of sustainable levels during years of high commodity prices and robust government revenues is well documented. Now that we have returned to balanced budgets, it is timely and prudent to implement a fiscal framework. We are securing Alberta’s future by implementing fiscal rules to guide decision making and ensure spending growth is sustainable in the long run.
Alberta, along with the rest of the world, has emerged from some difficult years. Resource revenue has hit record levels, accentuated by the Russian invasion of Ukraine, global oil and gas shortages, the unwinding of COVID-19 health restrictions, and uncertainty related to climate concerns. It is timely and prudent to introduce a new fiscal framework. Fiscal rules help secure Alberta’s future by preventing short-term, temporary spikes in resource revenue from leading to permanent increases to spending.
Fiscal responsibility matters and the impacts of fiscal decisions are felt by all Albertans, now and into the future. Taxpayer-supported debt is expected to be $78.3 billion on March 31, 2024 and debt servicing costs are expected to be $2.8 billion in 2023-24 diverting resources away from important programs.
Sustainable Fiscal Planning and Reporting
Alberta’s current Fiscal Planning and Transparency Act includes rules for the budget and fiscal plan, strategic plan, business plans, quarterly fiscal updates, annual report, and Alberta Infrastructure Report.
In Budget 2023, Alberta’s government is introducing a new fiscal framework with four key components:
| • | Require annual balanced budgets, with certain exceptions; |
| • | Limit year-over-year increases in operating expense to population growth and inflation; |
| • | Limit in-year expense growth to a budgeted and voted contingency; and |
| • | Set out policies for the allocation of surplus cash to repayment of maturing debt, saving for the future, or one-time initiatives that do not lead to permanent increases in government spending. |
Amendments will also be introduced for the Alberta Heritage Savings Trust Fund to retain 100 per cent of its net income instead of the current requirement to retain only an amount for inflation proofing. This will result in significant increases to the annual growth in Heritage Fund assets. In 2022-23, $1.8 billion will have been added to the Heritage Fund.
| Overview | Fiscal Plan 2023 – 26 | 17 |
Balanced Budgets
The new fiscal framework will require annual balanced budgets with certain exceptions.
In the consolidated fiscal plan, the budget will only be permitted to be in deficit if:
| • | Revenue declines by $1 billion or more from the prior-year third quarter (Q3) revenue forecast; or |
| • | Revenue is expected to decline to an amount that is below the prior-year Q3 total expense forecast. |
At year-end, a deficit is only allowed in the consolidated financial statements if:
| • | A deficit is forecast in the budget as permitted by the exceptions; |
| • | Actual revenue has declined by $500 million or more from the current year budget amount; or |
| • | The budgeted, voted contingency is exceeded due to unanticipated costs beyond the government’s control due to disasters or emergencies declared by Cabinet; expense increases required under the Alberta Petrochemicals Incentive Program (APIP); non-cash, non-recurring expense increases required under accounting standards; and/or expense increases by $500 million or more for payments related to litigation or settlements not anticipated in the budget. |
When a year-end deficit is permitted under the exceptions, the government will have two full years to return to balance. The framework will prohibit deficits for year-end actual results in the audited consolidated financial statements for more than three consecutive years.
For the purposes of the framework, adjusted total revenue and expense excludes changes when government receives dedicated revenue that automatically requires a related increase to expense (dedicated revenue-expense). For example, this would include revenue from the federal government that is required to be spent on a specific initiative or program. It also excludes non-cash, non-recurring expense variations required by accounting standards. These are one-time adjustments required by accounting standards that impact the government’s surplus or deficit but do not require cash. For example, the expense impact of the write-down of the value of an asset would be excluded from the balanced budget requirement.
Year-over-Year Expense Growth
The second component of the framework is to limit year-over-year adjusted operating expense increases to population plus inflation. Adjusted operating expense excludes dedicated revenue-expense items and non-recurring, non-cash expense variations required by accounting standards.
In Budget 2023, operating expense in 2023-24 is limited to the 2022-23 Q3 operating expense forecast adjusted for the previous year’s population growth plus the change in the Alberta Consumer Price Index (CPI) as reported at Q3. For 2024-25 and subsequent fiscal years, the projected operating expense
| 18 | Overview | Fiscal Plan 2023 – 26 |
ceiling in the consolidated fiscal plan must not exceed the prior year’s operating expense ceiling adjusted for population growth plus inflation as set out in the Q3 fiscal outlook for the previous calendar year.
Since November 2020, Alberta’s government has used the fiscal anchor of maintaining per capita expense at or below the range of the average of British Columbia, Ontario and Quebec. This fiscal anchor has served government well and will remain as a guiding policy for government decision-making.
In-Year Expense Growth
The third component of the framework is to limit in-year adjusted operating expense increases to the budgeted and voted contingency except when increases are due to:
| • | Dedicated revenue-expense increases; |
| • | Non-recurring, non-cash expense variations required by accounting standards; |
| • | Emergencies or disasters declared by Cabinet; |
| • | Expenses under the Alberta Petrochemicals Incentive Program (APIP); and |
| • | Payments related to litigation or settlements of $500 million or more not projected in the budget. |
In Budget 2023, the budgeted and voted contingency is increased to $1.5 billion per year to allow the government the flexibility to address issues as they arise during the year while upholding the new fiscal framework.
The dedicated revenue-expense table below outlines the main dedicated revenue-expense programs and initiatives for the purposes of calculating the operating expense ceiling and for total expense under the new framework, by excluding revenue received by government entities directly or revenue received for specific programs / initiatives.
The operating expense ceiling limits year-over-year increases to operating expense, adjusted to exclude dedicated revenue-expense, to the prior-calendar-year population growth plus rate of inflation. The 2022-23 forecast for Q3 operating expense is the initial base, after deducting $1.3 billion in non-continuing affordability operating expense measures and $8 billion in dedicated revenue. Population growth plus inflation in 2022 is estimated at 8.7 per cent, resulting in a $50.1 billion 2023-24 operating expense base. The annual ceiling is calculated by adding the current-year (2023-24) forecast for dedicated revenue-operating expense to the base.
| Overview | Fiscal Plan 2023 – 26 | 19 |
Budget 2023 Dedicated Revenue and Related Expense
(millions of dollars)
| 2022-23 Q3 | 2023-24 Estimate | 2024-25 Target | 2025-26 Target | |||||||||||||||||||||||||||||
| Operating | Other | Operating | Other | Operating | Other | Operating | Other | |||||||||||||||||||||||||
| expense | expense | expense | expense | expense | expense | expense | expense | |||||||||||||||||||||||||
| Transfers from Government of Canada |
||||||||||||||||||||||||||||||||
| Infrastructure support (capital grant expense) |
- | 709 | - | 858 | - | 1,085 | - | 1,000 | ||||||||||||||||||||||||
| Labour market agreements |
324 | - | 325 | - | 325 | - | 325 | - | ||||||||||||||||||||||||
| Early learning child care agreements |
734 | - | 937 | - | 1,062 | - | 1,226 | - | ||||||||||||||||||||||||
| SUCH sector / Alberta Innovates Corporation |
624 | - | 617 | - | 623 | - | 635 | - | ||||||||||||||||||||||||
| Other |
259 | - | 239 | - | 233 | - | 233 | - | ||||||||||||||||||||||||
| Investment Income |
||||||||||||||||||||||||||||||||
| Loans to local authorities (debt servicing costs) |
- | 424 | - | 659 | - | 555 | - | 493 | ||||||||||||||||||||||||
| SUCH sector |
307 | - | 326 | - | 342 | - | 352 | - | ||||||||||||||||||||||||
| Premiums, Fees and Licences |
||||||||||||||||||||||||||||||||
| SUCH sector |
2,372 | - | 2,525 | - | 2,658 | - | 2,734 | - | ||||||||||||||||||||||||
| Energy industry levies (AER, AUC) |
313 | - | 384 | - | 392 | - | 399 | - | ||||||||||||||||||||||||
| Other |
113 | - | 113 | - | 113 | - | 113 | - | ||||||||||||||||||||||||
| Other |
||||||||||||||||||||||||||||||||
| SUCH sector |
1,553 | - | 1,577 | - | 1,590 | - | 1,617 | - | ||||||||||||||||||||||||
| AIMCO investment management charges |
765 | - | 877 | - | 904 | - | 931 | - | ||||||||||||||||||||||||
| Tech. Innov. & Emiss. Reduction Fund |
571 | 61 | 460 | 58 | 505 | 58 | 174 | 129 | ||||||||||||||||||||||||
| Alberta Innovates Corporation / other |
63 | - | 62 | - | 62 | - | 62 | - | ||||||||||||||||||||||||
| Total dedicated revenue - related expense |
7,998 | 1,194 | 8,442 | 1,575 | 8,809 | 1,698 | 8,801 | 1,622 | ||||||||||||||||||||||||
| Note: | For the in-year rules, dedicated revenue must automatically cause changes in the related expense, either up or down, mirroring the change in revenue, so that there is no impact on the surplus /.deficit. In instances where the revenue and related expense are not exactly matching, the lesser of the revenue or expense is used. |
Operating Expense Ceiling - 2023-24 and Future Years
| 2022-23 | 2023-24 | 2024-25 | 2025-26 | |||||||||||||||||||||||||
| 2022-23 third quarter operating expense (less $1,329 million affordability measures expense) |
54,055 | |||||||||||||||||||||||||||
| Less dedicated revenue - related expense |
(7,998 | ) | ||||||||||||||||||||||||||
| 46,057 | ||||||||||||||||||||||||||||
| 2023-24 and future years operating expense ceiling |
46,057 | |||||||||||||||||||||||||||
| 2022-23 base |
||||||||||||||||||||||||||||
| Adjusted for prior-year population plus inflation |
8.7 | % (2022) | 50,064 | 6.2 | % | 53,168 | 4.4 | % | 55,507 | |||||||||||||||||||
| Plus dedicated revenue - related expense |
8,442 | 8,809 | 8,801 | |||||||||||||||||||||||||
| 2023-24 and future years operating expense ceiling | 58,506 | 61,977 | 64,308 | |||||||||||||||||||||||||
| Allocation of Surplus Cash
The final component of the framework sets out policies for the allocation of surplus cash available from fiscal results. At least 50 per cent of the available surplus cash must go to the repayment of debt maturing in that fiscal year with the remaining cash allocated to the new Alberta Fund. The Alberta Fund allows the government to set aside surplus cash while it decides the best use of this cash. There are three allowable uses of cash from the Alberta Fund:
• Debt repayment;
• Additional deposits into the Heritage Fund; or
• One-time initiatives that do not lead to permanent increases in government spending. |
| 20 | Overview | Fiscal Plan 2023 – 26 |
| Since the government follows accounting standards that are on an accrual basis, the surplus has to be adjusted to determine the surplus cash available from fiscal results. Some examples of these adjustments include excluding income retained by agencies and funds, changes in pension obligations, and for capital cash requirements. A list of cash adjustments can be found on page 157.
Budget 2023 is securing Alberta’s future by legislating a set of fiscal rules that work together by providing prudence and flexibility to guide government decision-making in both good times and bad so Alberta’s finances remain sustainable now and in the future. |
Annual Debt Maturities
(millions of dollars)
| 2021-22 | 2022-23 | 2023-24 | 2024-25 | 2025-26 | 2026-27 | |||||||||||||||||||
| Long-term debt maturities |
4,922 | 5,292 | 7,522 | 5,971 | 13,199 | 5,825 | ||||||||||||||||||
| Short-term debt maturities |
- | 8,062 | - | - | - | - | ||||||||||||||||||
| Total Annual Debt Maturities |
4,922 | 13,354 | 7,522 | 5,971 | 13,199 | 5,825 | ||||||||||||||||||
| Overview | Fiscal Plan 2023 – 26 | 21 |
BLANK PAGE
| 22 | Overview | Fiscal Plan 2023 – 26 |
BUDGET 2023
GOVERNMENT OF ALBERTA | 2023–26
Fiscal Plan
Economic Outlook
| 23 |
Table of Contents
| Key Energy and Economic Assumptions |
26 | |||
| Economic Outlook 2023–26 |
27 | |||
| Chart 1: Income gains to support activity |
27 | |||
| Chart 2: Real GDP to grow at a solid pace |
28 | |||
| Global economy |
29 | |||
| Chart 3: Core inflation remains elevated in advanced economies |
29 | |||
| Chart 4: Bank of Canada’s monetary tightening is downshifting |
30 | |||
| Chart 5: Growth to slow in advanced economies this year |
31 | |||
| Chart 6: Tight global oil market to support prices |
32 | |||
| Alberta Economy |
33 | |||
| Chart 7: Light-heavy differential to improve over the medium term |
33 | |||
| Chart 8: Investment and production set to rise in 2023 |
34 | |||
| Chart 9: Business investment continues to diversify |
36 | |||
| Chart 10: Non-energy exports to advance |
38 | |||
| Chart 11: Lower corporate profits weighing on income this year |
39 | |||
| Chart 12: Strong population growth to continue in 2023 |
40 | |||
| Chart 13: Job vacancies remain high |
41 | |||
| Chart 14: Unemployment rate to tick up this year |
41 | |||
| Chart 15: Housing starts strong amid low inventories |
42 | |||
| Chart 16: Consumer prices remain high even as inflation eases |
43 | |||
| Chart 17: Household spending subdued in 2023 |
44 | |||
| Table 1: Scenario Impacts |
46 | |||
| 24 | Economic Outlook | Fiscal Plan 2023 – 26 |
Table of Contents, continued
| Annex |
47 | |||
| Oil Price Benchmark |
48 | |||
| How Oil Price Forecasters Fared in Budget 2022 |
48 | |||
| Light-Heavy Oil Price Differential Benchmark |
49 | |||
| Natural Gas Price Benchmark |
50 | |||
| How Natural Gas Price Forecasters Did in Budget 2022 |
50 | |||
| United States / Canada Exchange Rate Benchmark |
51 | |||
| Canadian Long-Term Interest Rate Benchmark |
51 | |||
| Alberta Real Gross Domestic Product Benchmark |
52 | |||
| Alberta Nominal Gross Domestic Product Benchmark |
52 | |||
| Alberta Employment Benchmark |
53 | |||
| Alberta Unemployment Rate Benchmark |
53 | |||
| Alberta Housing Starts Benchmark |
54 | |||
| Economic Outlook | Fiscal Plan 2023 – 26 | 25 |
Key Energy and Economic Assumptions
| Fiscal Year Assumptionsa | 2020-21 Actuals |
2021-22 Actuals |
2022-23 Estimate |
2023-24 Forecast |
2024-25 Forecast |
2025-26 Forecast | ||||||||||||||||||||||||||
| Crude Oil Pricesb |
||||||||||||||||||||||||||||||||
| WTI (US$/bbl) |
42.32 | 77.03 | 90.50 | 79.00 | 76.00 | 73.50 | ||||||||||||||||||||||||||
| Light-Heavy Differential (US$/bbl) |
10.58 | 13.56 | 20.00 | 19.50 | 16.80 | 16.40 | ||||||||||||||||||||||||||
| WCS @ Hardisty (Cdn$/bbl) |
41.42 | 79.63 | 92.60 | 78.00 | 75.90 | 72.10 | ||||||||||||||||||||||||||
| Natural Gas Priceb |
||||||||||||||||||||||||||||||||
| Alberta Reference Price (Cdn$/GJ) |
2.10 | 3.48 | 5.10 | 4.10 | 3.60 | 3.80 | ||||||||||||||||||||||||||
| Production |
||||||||||||||||||||||||||||||||
| Conventional Crude Oil (thousands of barrels/day) |
401 | 444 | 497 | 497 | 497 | 490 | ||||||||||||||||||||||||||
| Raw Bitumen (thousands of barrels/day) |
2,969 | 3,197 | 3,281 | 3,345 | 3,436 | 3,529 | ||||||||||||||||||||||||||
| Natural Gas (billions of cubic feet) |
3,857 | 4,027 | 4,226 | 4,275 | 4,304 | 4,347 | ||||||||||||||||||||||||||
| Interest Rates |
||||||||||||||||||||||||||||||||
| 3-month Canada Treasury Bills (%) |
0.14 | 0.19 | 3.20 | 4.20 | 2.90 | 2.80 | ||||||||||||||||||||||||||
| 10-year Canada Bonds (%) |
0.74 | 1.56 | 3.10 | 3.60 | 3.40 | 3.40 | ||||||||||||||||||||||||||
| Exchange Rate (US¢/Cdn$) |
75.7 | 79.8 | 75.7 | 76.2 | 78.2 | 79.5 | ||||||||||||||||||||||||||
| Calendar Year Assumptionsa | 2020 Actuals |
2021 Actuals |
2022 Estimate |
2023 Forecast |
2024 Forecast |
2025 Forecast |
2026 Forecast | |||||||||||||||||||||
| Gross Domestic Product |
||||||||||||||||||||||||||||
| Nominal (billions of dollars) |
296.7 | 374.5 | 464.3 | 454.0 | 470.1 | 487.1 | 507.5 | |||||||||||||||||||||
| % change |
-15.7 | 26.2 | 24.0 | -2.2 | 3.5 | 3.6 | 4.2 | |||||||||||||||||||||
| Real (billions of 2012 dollars) |
320.3 | 335.6 | 351.6 | 361.4 | 372.3 | 383.2 | 393.9 | |||||||||||||||||||||
| % change |
-8.0 | 4.8 | 4.8 | 2.8 | 3.0 | 2.9 | 2.8 | |||||||||||||||||||||
| Other Indicators |
||||||||||||||||||||||||||||
| Employment (thousands) |
2,144 | 2,260 | 2,376c | 2,431 | 2,497 | 2,560 | 2,619 | |||||||||||||||||||||
| % change |
-7.1 | 5.4 | 5.2c | 2.3 | 2.7 | 2.5 | 2.3 | |||||||||||||||||||||
| Unemployment Rate (%) |
11.3 | 8.6 | 5.8c | 6.4 | 6.3 | 6.1 | 5.7 | |||||||||||||||||||||
| Average Weekly Earnings (% change) |
3.2 | 2.1 | 2.4 | 3.3 | 3.7 | 3.7 | 3.5 | |||||||||||||||||||||
| Primary Household Income (% change) |
-4.8 | 5.8 | 8.8 | 5.9 | 6.7 | 6.4 | 6.1 | |||||||||||||||||||||
| Net Corporate Operating Surplus (% change) |
-60.3 | 284.9 | 54.9 | -13.9 | 7.9 | 6.9 | 4.4 | |||||||||||||||||||||
| Housing Starts (thousands of units) |
24.0 | 31.9 | 36.5c | 38.1 | 37.7 | 36.4 | 36.7 | |||||||||||||||||||||
| Alberta Consumer Price Index (% change) |
1.1 | 3.2 | 6.4 | 3.3 | 2.2 | 2.2 | 2.2 | |||||||||||||||||||||
| Retail Sales (% change) |
-2.1 | 11.5 | 6.4 | 4.2 | 4.8 | 4.8 | 5.0 | |||||||||||||||||||||
| Population (thousands) |
4,417 | 4,444 | 4,543c | 4,674 | 4,777 | 4,875 | 4,957 | |||||||||||||||||||||
| % change |
1.2 | 0.6 | 2.2c | 2.9 | 2.2 | 2.1 | 1.7 | |||||||||||||||||||||
| Net Migration (thousands) |
30.5 | 8.2 | 81.7c | 112.3 | 83.1 | 77.1 | 60.2 | |||||||||||||||||||||
| a | Forecast was finalized on January 30, 2023. |
| b | Forecasts have been rounded |
| c | Actual |
| 26 | Economic Outlook | Fiscal Plan 2023 – 26 |
Economic Outlook 2023–26
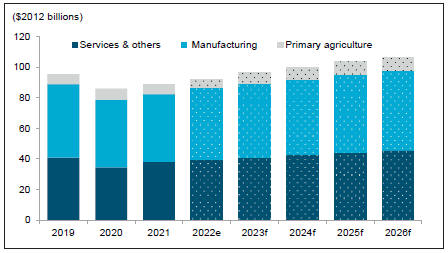
Alberta is well-positioned to face the challenges coming from last year’s rapid rise in prices, higher interest rates, and slowing global growth. Following two years of robust post-pandemic recovery, Alberta’s real gross domestic product (GDP) growth will moderate to a solid clip of 2.8 per cent this year and lead the country. With last year’s strong pace of 4.8 per cent, real GDP fully recovered from the COVID-19 downturn and surpassed the 2014 peak. Soaring energy prices and strong economic activity propelled incomes to a record high and boosted provincial government revenues. This is expected to support business and household spending this year, even as incomes pull back from last year’s record high (Chart 1).
Chart 1: Income gains to support activity
Nominal GDP, actual and forecast
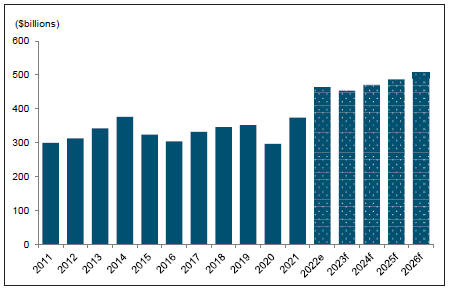
| Sources: | Statistics Canada, Haver Analytics and Alberta Treasury Board and Finance; e-estimate, f-forecast |
Alberta’s oil and gas sector is expected to take the lead in 2023. Solid energy prices and strong cash flows from 2022 will support drilling activity, production and investment in the sector. The province’s population is expected to rise at its highest pace since 2006, which will provide relief to Alberta’s tight labour market and support employment. Residential construction activity will also benefit from rising in-migration and a healthy labour market. However, slowing momentum in the global economy will weigh on non-energy manufacturing and service exports. High interest rates and elevated prices will continue to keep a lid on household spending. Rising borrowing costs, slower export demand and higher construction costs may also limit expansion and investment plans by some companies outside the oil and gas sector.
Nominal GDP, a broad measure of
income in the province, is expected
to retreat this year but remain high
over the forecast period.
| Economic Outlook | Fiscal Plan 2023 – 26 | 27 |
Alberta’s economy to expand over
the medium term on the back of
accelerating business investment
and a rebound in consumer
spending.
Alberta’s economic growth will become more broad-based over the medium term. Real GDP is forecast to rise to 3.0 per cent in 2024 and average 2.9 per cent between 2025 and 2026 (Chart 2). Business investment is set to accelerate and grow around 10 per cent per year in nominal terms. It will be underpinned by rising investment in the energy sector and large-scale investments in clean technology, manufacturing and other emerging sectors. Alberta’s competitive taxes, regulatory environment, and access to abundant and low-cost natural resources will continue to encourage investment in the province. Construction activity will also get a boost from higher capital spending by the provincial government. Consumer spending and residential construction activity are expected to gain traction as inflation subsides further and interest rates come down. A pick up in global growth should fuel gains in manufacturing and services exports. Solid fundamentals – including strong population growth, a relatively young population, lower cost of living, and high wages – will support Alberta’s continued expansion.
Chart 2: Real GDP to grow at a solid pace
Real GDP, level and growth

| Sources: | Statistics Canada, Haver Analytics and Alberta Treasury Board and Finance; e-estimate, f-forecast |
With business investment and consumer spending gathering momentum, Alberta’s growth will become increasingly driven by domestic demand. This marks a shift in the composition of Alberta’s real GDP compared with the years prior to the pandemic. From 2016 to 2019, exports accounted for nearly all of Alberta’s real GDP growth. This was driven by a period of exceptional growth in oil production as several large oil sands projects ramped up. More modest gains in oil production means the contribution of real exports to GDP growth will decline from around 85 per cent in 2023 to 57 per cent by 2026.
| 28 | Economic Outlook | Fiscal Plan 2023 – 26 |
Global economy
Inflation abating but still elevated
Consumer prices appear to be levelling off in most advanced economies following sharp increases over the past year. In Canada and the U.S., headline inflation – measured as the year-over-year percentage change in the consumer price index – has cooled significantly after hitting 40-year highs in mid-2022. Inflation in the euro area and the U.K. has also moderated in recent months. Goods inflation, which was a significant driver of inflation last year, has retreated amid a steep pullback in energy prices, easing supply chain disruptions and shifting demand from goods to services. This trend is expected to continue in 2023 as consumer demand for goods weakens further.
While pressures are easing, inflation and consumer prices remain high in most advanced economies. Core inflation, which excludes the volatile components of food and energy, has yet to show signs of peaking (Chart 3). Shelter costs continue to increase, particularly in Canada, as higher interest rates add to owned accommodation costs. Tight labour market conditions and rising wages have also pushed up core inflation. As a result, headline inflation is expected to decline gradually over the next two years in advanced economies.
Chart 3: Core inflation remains elevated in advanced economies
Annual rate of core inflation, selected countries
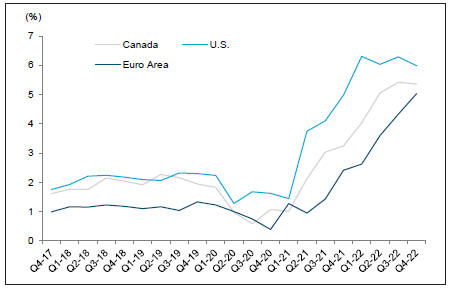
| Sources: | Statistics Canada, Bureau of Labor Statistics, Statistical Office of the European Communities and Haver Analytics |
Core inflation remains stubbornly
high as elevated shelter costs and
rising wages put upward pressure
on prices.
| Economic Outlook | Fiscal Plan 2023 – 26 | 29 |
Some central banks are
approaching the end of the
monetary tightening cycle, with
the Bank of Canada announcing a
conditional pause on rate hikes.
Monetary policy shifting gears
With headline inflation turning a corner, some central banks have begun to slow the pace of rate increases. The Bank of Canada (BoC) raised its overnight target rate by a quarter of percentage point in January – the smallest rate hike since March 2022 – and indicated that it is taking a conditional pause to assess the full impact of cumulative rate hikes on the economy (Chart 4). The Bank of England implemented a half of a percentage point hike in early February, but signaled that further tightening will depend on whether price pressures remain persistent. The U.S. Federal Reserve lifted its key policy rate in February by a quarter-point after aggressive hikes through 2022. The Fed anticipates more increases are needed to bring inflation back to target, albeit at a slower pace than last year. In contrast, the European Central Bank, which began to raise interest rates later than other central banks, is expected to continue with aggressive increases given ongoing elevated inflation in Europe. While the pace of monetary tightening is slowing in some countries, interest rates will stay high until inflation falls to levels targeted by central banks. The BoC is not expected to begin cutting interest rates until early 2024, when inflation returns to its mid-point target of 2 per cent and the economy improves.
Chart 4: Bank of Canada’s monetary tightening is downshifting
Policy rate and change by BoC meeting date
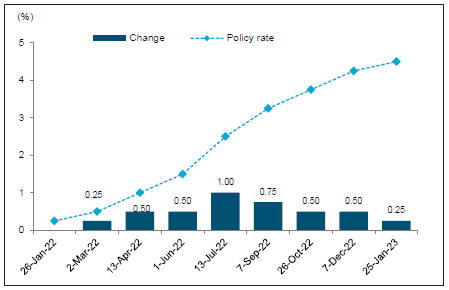
Sources: Bank of Canada and Haver Analytics
Global growth to slow in the near term
Global economic activity is forecast to pull back considerably this year before improving in 2024 and over the medium term. Central banks’ efforts are helping to quell inflation. However, the lagged effects of higher interest rates and increasing borrowing costs for businesses and consumers are expected to cool demand further this year. In addition, persistently high prices and ongoing geopolitical tensions will continue to weigh on global growth. After advancing
| 30 | Economic Outlook | Fiscal Plan 2023 – 26 |
an estimated 3.4 per cent in 2022, the International Monetary Fund (IMF) is projecting global growth to decelerate to 2.9 per cent in 2023.
The slowdown in growth will be led by advanced economies (Chart 5). It will be most notable in the euro area, where aggressive monetary tightening and the ongoing impact of the energy shock exacerbated by Russia’s invasion of Ukraine will remain a drag on activity. The U.S. economy is expected to see muted growth this year as the impact of rising interest rates and high consumer prices restrain houshold spending. A strong labour market and healthy balance sheets will cushion the impact. In China, growth is set to pick up this year after posting its weakest expansion in four decades in 2022 due to COVID-19 lockdowns.
Chart 5: Growth to slow in advanced economies this year
Actual and IMF forecast for real GDP growth

| Source: | IMF World Economic Outlook, January 2023 Update; e-estimate, f-forecast |
As the impact of monetary tightening fades, global economic growth is forecast to rise slightly to 3.1 per cent in 2024, although it will remain weak by historical standards.
Momentum slowing in the Canadian economy
The Canadian economy will face similar headwinds as other advanced economies in 2023. Momentum slowed considerably at the end of last year as consumer spending, residential investment, and the housing market weakened. As a result, Canada’s real GDP growth in the fourth quarter fell to an estimated annualized rate of 1.6 per cent. The weakness will carry through into this year and restrict GDP growth to 0.6 per cent before it improves in 2024. Lower energy prices will reduce the value of Canada’s energy exports and be a drag on incomes this year. Following extremely tight conditions last year, the labour market is projected to become more balanced in 2023 and 2024 as demand cools and immigration normalizes.
Rising interest rates and elevated
consumer prices will weigh on
growth in advanced economies this
year.
| Economic Outlook | Fiscal Plan 2023 – 26 | 31 |
Limited supply increases will keep
the oil supply-demand balance
tight over the medium term.
The Canadian dollar is forecast to strengthen over the forecast horizon. It persistently underperformed the U.S. dollar in 2022, as global economic uncertainties and actions by the U.S. Federal Reserve led to a surge in demand for safe-haven U.S. dollar. This is expected to reverse gradually in 2023, with the Loonie projected to rise to an average US¢76.20/Cdn$ in 2023-24 and US¢78.20/Cdn$ in 2024-25.
Global oil prices to moderate
The backdrop of slower world economic growth and a tight oil market is creating a lot of uncertainty and price volatility. West Texas Intermediate (WTI) tumbled in early December after the G7 and its allies imposed sanctions and a price cap on Russian oil supplies. Fears of a looming global recession and a surge in COVID-19 cases in China further depressed prices heading into the new year. WTI dipped to a low of US$71 per barrel (/bbl) in early December before bouncing back to around US$80/bbl more recently.
Against this backdrop, global oil prices are forecast to soften this year but remain at solid levels. Slower global growth is expected to dampen petroleum demand, although a tight supply-demand balance will continue to buoy oil prices (Chart 6). WTI is forecast to average US$79.00/bbl in 2023-24, down from US$90.50/bbl in 2022-23. Price volatility is expected to persist this year amid ongoing geopolitical tensions.
Chart 6: Tight global oil market to support prices
Global oil supply and demand, actual and forecast
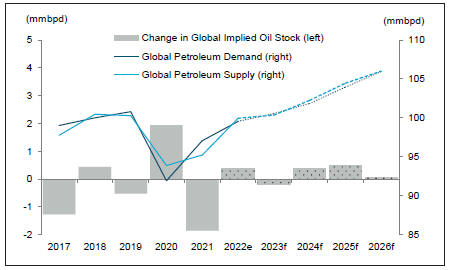
| Sources: | U.S. EIA, Haver Analytics and Alberta Treasury Board and Finance calculations; e-estimate and f-forecast |
The medium term outlook for oil prices is higher compared with previous budget expectations following Russia’s invasion of Ukraine last year. Petroleum demand is expected to improve alongside a pick up in global growth, while restrained investment in the oil and gas sector worldwide will limit supply increases. This will keep prices above US$70/bbl over the forecast period.
| 32 | Economic Outlook | Fiscal Plan 2023 – 26 |
Alberta Economy
Increased export capacity to buoy Alberta energy prices
The spread between WTI and Western Canadian Select (WCS) oil prices is expected to narrow as factors that weighed on the differential in late 2022 dissipate and additional pipeline capacity comes online later this year. Higher processing costs at the U.S. Gulf Coast (USGC) due to spiking natural gas prices and a heavy refinery maintenance season in the U.S. reduced demand for Alberta’s heavy oil last year. The release of heavy oil barrels from the U.S. Strategic Petroleum Reserve (SPR) also weighed on prices. The full restart of the Keystone pipeline in late December, along with improving U.S. refinery demand, have already led to an improvement in the differential so far this year. With natural gas prices coming down, heavy oil should become more economic to refine at the USGC. Additional support to prices will also come from U.S. government’s decision to begin rebuilding its strategic reserves by purchasing crude off the market. After widening to a monthly average of $29.00/bbl in December, the WTI-WCS differential is forecast to average US$19.50/bbl in 2023-24 (Chart 7).
Chart 7: Light-heavy differential to improve over the medium term
Oil prices
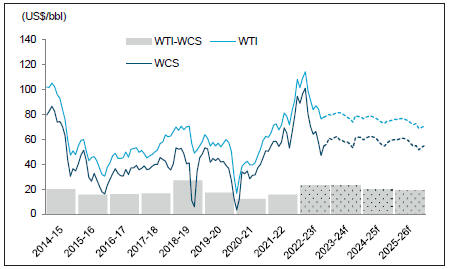
| Sources: | Alberta Energy and Alberta Treasury Board and Finance, f-forecast |
The completion of Trans Mountain Expansion (TMX) in late 2023 will boost the province’s takeaway capacity by 590,000 barrels per day. This will help reduce the light-heavy differential to around US$16-17/bbl in the next three fiscal years, in line with pipeline transportation costs. A narrower differential, along with solid global oil prices, will keep WCS above C$70/bbl over the medium term.
The WTI-WCS differential is
expected to return to pipeline
transportation costs in 2024
following TMX completion.
| Economic Outlook | Fiscal Plan 2023 – 26 | 33 |
Oil and gas investment will continue
to advance this year, underpinned
by solid energy prices and more
tempered cost increases.
Strong fundamentals are expected to support natural gas prices in Western Canada. North American natural gas prices have retreated from elevated 2022 levels, with prices at Henry Hub trading below US$4.00/MMBtu since late December. Mild winter weather in the U.S. and Europe, strong U.S. gas production and the delayed restart of the Freeport LNG export facility all contributed to weaker exports and rising inventories. However, some of these temporary factors are expected to fade and should translate to an improvement in the price of Western Canadian natural gas. The Alberta Reference Price (ARP) is forecast to average C$4.10/GJ in 2023-24 before moderating to C$3.80/GJ in 2025-26. Even so, ARP is expected to remain above pre-pandemic levels. Growing oil sands production along with increasing demand from coal-to-gas power plant conversions and new gas-fired power plants will continue to buoy demand and price for natural gas in the province.
Solid prospects for oil and gas extraction
Oil and gas producers are poised to increase spending, supported by healthy cash flows and balance sheets. Drilling activity in the province ramped up to an eight-year high last year in response to elevated energy prices and strong demand. This, coupled with escalating input costs, propelled investment in the conventional oil and gas extraction sector to rise by more than 36 per cent to an estimated $14.3 billion in 2022. With strong momentum expected to carry through this year, investment is forecast to increase at a solid pace amid favourable oil prices. Conventional investment is forecast to grow 19 per cent (or $2.7 billion) in 2023 before moderating to an average of about 7 per cent in the next three years (Chart 8). Rising costs will also continue to drive spending higher for oil and gas producers this year, although the pace of increase will be slower compared to 2022.
Chart 8: Investment and production set to rise in 2023
Nominal oil and gas investment and crude oil production in Alberta
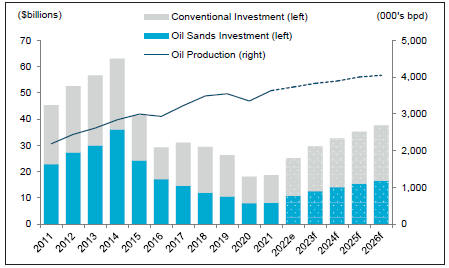
| Sources: | Statistics Canada and Alberta Treasury Board and Finance, e-estimate, f-forecast |
| 34 | Economic Outlook | Fiscal Plan 2023 – 26 |
Rising bitumen production and moderate growth in costs are also expected to lift oil sands investment higher this year. After increasing by an estimated 31 per cent in 2022, non-conventional investment is forecast to grow nearly 17 per cent (or $2.7 billion) in 2023 before rising at an average of about 9 per cent over the medium term. However, without any greenfield projects on the horizon, oil sands producers will continue to focus spending on clean energy projects, debottlenecking, and optimizing existing infrastructure. In particular, the Pathways Alliance – a group of Canada’s largest oil sands producers – announced plans to collectively invest $16.5 billion by 2030 to build carbon capture, utilization and storage (CCUS) facilities. Detailed engineering evaluation and regulatory work on the project will be underway this year.
Oil exports to grow moderately over the medium term
While investment is set to gain momentum over the next few years, growth in exports is anticipated to slow on the back of more modest gains in oil production. After reaching an all-time high of 3.7 million barrels per day (bpd) in 2022, Alberta’s oil production is forecast to grow 100,000 bpd (or 2.7 per cent) this year and 220,000 bpd between 2023 and 2026. This represents annual average growth of 1.9 per cent, a more moderate pace compared to the last decade when oil production rose at an annual rate of 4.0 per cent. As a result, real exports are forecast to slow from 3.9 per cent in 2023 to 2.6 per cent in 2026. With production reaching almost 4.1 million bpd by the end of the forecast period, however, oil exports will continue to be an important driver of incomes in the province and maintain Alberta’s position as one of the largest oil-producing jurisdictions globally. The completion of TMX in late 2023 will pave the way for further expansion in oil production in the coming years. Natural gas will continue to be a source of growth for exports, supported by robust demand and expanding export pipeline capacity.
Business investment looking up
Investment outside oil and gas extraction is expected to moderate this year before gaining momentum over the medium term. Non-energy investment rose by an estimated 14 per cent (or $4.4 billion) last year on the back of soaring construction costs and progress on large-scale industrial projects in renewable energy, transportation, petrochemicals and telecommunications. As some of these projects wind down and cost pressures ease further, growth in non-energy investment is forecast to moderate at 5.6 per cent (or $2 billion) this year. Higher borrowing costs may also limit expansion plans in some sectors. Over the medium term, however, growth is anticipated to accelerate to 9.4 per cent (or $3.6 billion in 2024) and about 10 per cent on average in 2025 and 2026. The share of non-energy to total business investment is expected to remain above its 10-year historical average of about 47 per cent (Chart 9).
| Economic Outlook | Fiscal Plan 2023 – 26 | 35 |
Investment outside oil and gas
extraction is expected to get a
boost from increased spending on
clean technology and emissions-
reduction initiatives.
Chart 9: Business investment continues to diversify
Alberta nominal non-residential investment by category

| Sources: | Statistics Canada and Alberta Treasury Board and Finance; e-estimate, f-forecast |
Clean Technology
Alberta’s positive investment climate and abundant natural resources are paving the way for strong investment intentions in clean technology. In addition to the Pathways Alliance, a wave of CCUS projects have been proposed over the past year. A total of 25 projects have been selected by the Alberta government for further evaluation in the development of storage hubs. Among these is the Atlas Carbon Sequestration Hub that builds on the success of the Quest Carbon Capture and Storage project, which has now stored seven million tonnes of CO2 since late 2015. The first phase of the project will capture and store 750,000 tonnes of carbon from Shell’s Scotford refinery and chemical plant.
In addition, a number of industrial projects will rely on CCUS to lower emissions. Capital Power is adding carbon capture to its existing Genesee power plant station. Construction is already underway on Air Products $1.6-billion new net-zero hydrogen energy complex, which is expected to come on stream in 2024. Once completed, the facility will be supplying low-carbon hydrogen to Imperial Oil’s recently announced renewable diesel production facility, the largest of its kind in Canada. The $720-million facility is expected to become operational in 2025 and will produce a billion litres of diesel using biofeedstock and hydrogen. In addition to providing 600 construction jobs over the next two years, this project is anticipated to create spinoffs for other industries. A number of investment projects announced over last two years may also provide significant potential upside to investment, including Dow Chemicals $10 billion net-zero emissions ethylene and derivatives facility.
| 36 | Economic Outlook | Fiscal Plan 2023 – 26 |
Technology and aviation sectors
Alberta’s economy is diversifying with investments in emerging industries such as tech and aviation. De Havilland is set to build a new aircraft manufacturing facility near Calgary, with construction to commence in late 2023. Dura-line, a U.S. based tech firm that specializes in developing Internet connection systems, is investing in a new state-of-the-art manufacturing facility in the province that will come online in spring 2023. While Alberta has not been immune to the global layoffs in the tech sector, some companies in the province are choosing to expand their workforce. Garmin Canada is planning to double its staffing size and grow operations in its Cochrane headquarters, while Amazon Web Services is slated to open a cloud computing hub in Calgary in late 2023 or early 2024. Meanwhile, TELUS announced last year that it is investing $17.0 billion in network infrastructure and operations across Alberta over the next four years.
Commercial building construction
The industrial real estate market is expected to lend support to Alberta’s non-residential construction sector. Construction activity for warehousing, distribution and other industrial spaces in both Edmonton and Calgary is anticipated to remain strong, as vacancy rates in this segment are at multi-year lows following last year’s record-setting positive net absorption. According to CBRE Canada, Edmonton and Calgary were among the cities leading activity in Canada at the end of 2022, with positive net absorption at 2.9 million square feet and one million square feet, respectively. Alberta’s higher levels of available space and lower average market rents compared to other provinces will continue to boost demand. Industrial activity will help to offset ongoing challenges in the office market segment, where elevated vacancies in Edmonton and Calgary continue to persist.
Food processing sector
The agri-food sector continues to be a source of strength for the province. Several investment projects announced over the past year are expected to boost Alberta’s value-added agricultural processing capacity. PIP International successfully commissioned its $20 million pilot plant and commercial testing facility in Lethbridge. The company also announced plans to build a second, larger $150 million yellow pea protein facility, which will handle 126,000 tonnes of yellow peas annually from local and regional growers. The new Alberta Agri-processing Investment Tax Credit is expected to spur additional, large-scale investment projects that will help grow the province’s value-added agriculture sector and make the province a preferred destination for these types of investments.
| Economic Outlook | Fiscal Plan 2023 – 26 | 37 |
Manufacturing and services exports
to expand at a softer pace this year
amid slower global growth.
Capacity expansions to support non-energy exports
Export growth outside of oil and gas is expected to pick up following a near-term slowdown. Alberta’s real manufacturing exports are forecast to decelerate from an estimated 5.2 per cent in 2022 to 2.6 per cent in 2023. Continued weakness in residential construction activity in North America will weigh on wood manufacturing sales, while a slowdown in global industrial activity will dampen export demand for durable goods manufacturing in the near term. Demand for machinery and equipment, however, is expected to hold up better as it benefits from solid drilling activity in the U.S. and across Canada. Services exports are also forecast to slow, from an estimated 5 per cent in 2022 to 3.5 per cent in 2023 before easing further to 2.9 per cent by 2026. Travel and tourism-related services should continue recovering following last year’s post-pandemic rebound, although growth will likely be constrained as high interest rates continue to dampen consumer demand. In addition, staffing shortages in the U.S. airline industry, which hampered the recovery in air capacity from the U.S. to Canada last year, could linger in the short term.
Chart 10: Non-energy exports to advance
Alberta real non-energy exports by component
Sources: Statistics Canada and Alberta Treasury Board and Finance; e-estimate, f-forecast
Recent and upcoming capacity expansions in petrochemicals and other emerging sectors should support manufacturing exports as global demand improves (Chart 10). Inter Pipeline’s Heartland Polymers – Canada’s first integrated propane dehydrogenation and polypropylene facility – began commercial production in the third quarter of last year. It is expected to produce 525,000 tonnes of polypropylene annually. Real manufacturing exports are expected to accelerate to around 3 per cent between 2024 and 2026. Meanwhile, growing service exports will be supported by enhanced air capacity and connectivity in Alberta’s major airports, which should bolster domestic and
| 38 | Economic Outlook | Fiscal Plan 2023 – 26 |
international visits to and from the province. Demand for Alberta’s engineering and technical services are also expected to benefit from rising business investment. Employment in professional, scientific, and technical services rose steadily to record highs last year and led the recovery in job gains.
Alberta’s agri-food sector will be a bright spot this year. Better growing and harvesting conditions contributed to above-average yields and higher crop production in 2022. Although crop prices have moderated from the record highs of last spring, historically strong prices continue for most crops. Domestic and export crop demand remains solid, and despite high crop input costs, the crop sector is expected to experience another year of high net returns. Live cattle exports are also expected to benefit from robust prices and tighter supply in the U.S. Meanwhile, prospects for Alberta’s food manufacturing sector remain positive, buoyed by a growing global population and improving demand.
Corporate profits slide from elevated levels
Corporate profits are expected to decline after reaching a record high last year. Alberta’s net corporate operating surplus – a measure of corporate profits and driver of corporate income tax revenues – is forecast to fall nearly 14 per cent to $101 billion this year amid softer energy prices and moderating economic growth (Chart 11). Costs are also expected to rise, albeit at a more moderate pace than last year, which will also weigh on profits. Despite the pullback, net operating surplus will remain elevated by historical standards. It is forecast to resume growth in 2024 as economic activity picks up and cost pressures ease further.
Chart 11: Lower corporate profits weighing on income this year
Contribution to change in Alberta’s nominal GDP by income
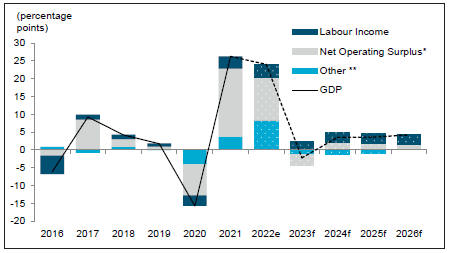
| Sources: | Statistics Canada, Haver Analytics and Alberta Treasury Board and Finance; e-estimate, f-forecast |
| * | Includes net operating surplus of corporations and net mixed income |
| ** | Includes consumption of fixed capital and taxes less subsidies |
Corporate profits are expected to
retreat from last year’s record high,
in line with softer energy prices and
moderating economic activity.
| Economic Outlook | Fiscal Plan 2023 – 26 | 39 |
Alberta’s population growth is
projected to rise to 2.9 per cent in
the 2023 census year, the fastest
pace since 2006.
Strong migration to bolster population growth
Alberta’s population is poised to surge this year, driven mainly by net migration. Immigration will get a boost from higher national targets set by the federal government, while strong levels of temporary foreign workers and international students coming into the province will continue to buoy non-permanent residents in combination with refugee claimants due to Russia’s invasion of Ukraine. With activity slowing more sharply in the rest of the country, Alberta is also expected to see robust inflows of interprovincial migrants given its relatively strong economic conditions, favorable housing affordability, and lower cost of living. Alberta’s population growth rate is forecast to rise to 2.9 per cent before moderating to 1.6 per cent by 2026 (Chart 12).
Chart 12: Strong population growth to continue in 2023
Annual change in Alberta’s population by component
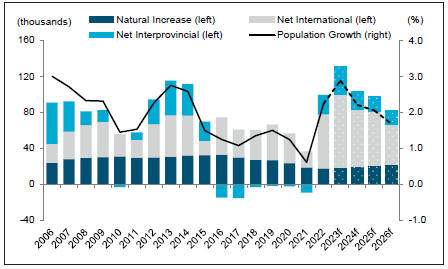
| Sources: | Statistics Canada, Haver Analytics and Alberta Treasury Board and Finance; f-forecast |
Momentum to support job gains
Employment in the province is expected to grow at a solid pace this year. 2023 started on a positive note as the province added more than 20,000 jobs in January, bolstered by hiring in the private sector and full-time positions. With more people moving into the province and looking for work, employers are now having an easier time filling vacant positions (Chart 13). This is in contrast to last year, when hiring in industries such as accommodation and food services, construction, and health care was limited by labour shortages. Many businesses remain optimistic about their outlook over the next year, while some may be keen to hold onto existing workers following labour shortages and the challenges with high rates of illness-related workplace absences over the past year. This should help buoy employment growth at 2.3 per cent this year. Over the medium term, employment growth is expected to rise to an average of 2.5 per cent as interest rates fall, business investment in the province gains momentum, and global economic growth picks up.
| 40 | Economic Outlook | Fiscal Plan 2023 – 26 |
Chart 13: Job vacancies remain high
Alberta’s job vacancies and vacancy rate, quarterly
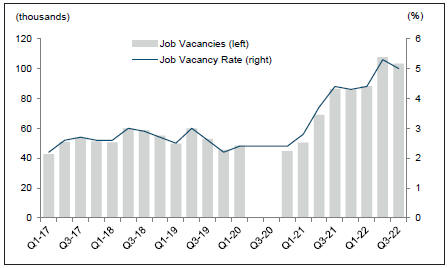
| Sources: | Statistics Canada and Haver Analytics |
Labour market adjusting
The province is expected to see more balanced labour market conditions this year as job gains are matched by more people looking for work. Alberta’s labour force is forecast to expand by 3.0 per cent (over 74,000 people) this year – the fastest pace since 2008 – amid a surge in the working-age population and improving labour force participation. After remaining subdued in 2022, the labour force participation rate is forecast to increase 0.1 percentage point to 69.9 per cent in 2023 (Chart 14). This will lift the unemployment rate up from 5.8 per cent
Chart 14: Unemployment rate to tick up this year
Labour market indicators
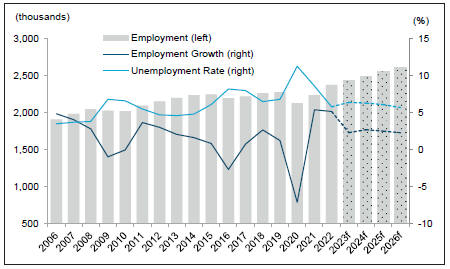
| Sources: | Statistics Canada, Haver Analytics and Alberta Treasury Board and Finance; f-forecast |
Elevated job vacancies are
supporting a solid pace of job
creation in the province.
Unemployment rate to decline
gradually as employment growth is
expected to outpace labour force
expansion.
| Economic Outlook | Fiscal Plan 2023 – 26 | 41 |
Low inventories should support
strong pace of housing starts.
in 2022 to 6.4 per cent this year. Despite the uptick, the unemployment rate is expected to remain below the annual levels seen in 2016-2021.
The participation rate is expected to improve slightly in the coming years, although population ageing will limit the gains. It is forecast to remain below pre-pandemic (2019) levels throughout the forecast period, reaching 70.0 per cent by 2026. The share of people aged 65 and over is projected to rise to 16 per cent by 2026, up from 12 per cent in 2016. With the slow improvement in the participation rate, employment growth is expected to outpace the expansion in the labour force. This should lead to a gradual decline in the unemployment rate, which is forecast to reach 5.7 per cent by 2026.
After remaining muted last year, growth in average weekly earnings is expected to accelerate to 3.3 per cent in 2023, and around 3.6 per cent thereafter. Increases in wage and employment growth are anticipated to lift growth in primary household income from 5.9 per cent in 2023 to an average of 6.4 per cent over the medium term.
Housing market to stay resilient
Strong fundamentals will keep the province’s housing market on solid footing. With Alberta’s healthy labour market and strong population growth, housing starts are expected to remain strong. They are forecast to average 38,000 units this year, up slightly from 36,500 units in 2022 (Chart 15). A strong bounce back in residential building permits in late 2022 bodes well for activity in the near term. Falling rental vacancy rates and low inventories in the new housing market should continue to support construction activity particularly in the multi-family segment. At the same time, strong housing starts in the latter half of 2022 will boost investment in new housing construction throughout 2023. This will be somewhat offset by muted renovation spending and resale activity, both of which
Chart 15: Housing starts strong amid low inventories
Alberta housing starts and completed & unabsorbed units in Edmonton & Calgary
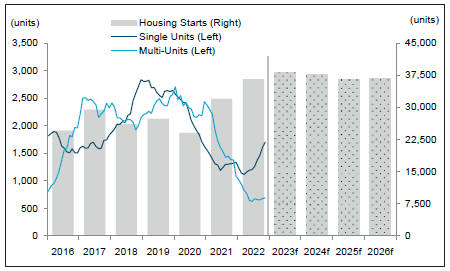
| Sources: | Canada Mortgage and Housing Corporation and Alberta Treasury Board and Finance; f-forecast |
| 42 | Economic Outlook | Fiscal Plan 2023 – 26 |
will continue to feel the impact of higher interest rates. Over the medium term, housing starts are forecast to be around 36,900 units annually by 2026, in line with household formations.
Inflation to subside gradually
Consumer inflation will continue to abate this year but will be slow to return to pre-pandemic levels. Headline inflation cooled to 6.0 per cent year-over-year in December 2022 after peaking at over 8.0 per cent last June. The moderation was largely due to goods inflation, which retreated sharply in the second half of last year due to a slowdown in energy prices. Alberta’s affordability measures, such as the fuel tax relief and electricity rebate program, also contributed to the decline. Easing supply chain disruptions, declining shipping costs, and slowing consumer demand are helping to cool inflation for durable goods such as furniture, household appliances, and vehicles. Although food prices are still elevated compared to last year, they fell in December for the first time since July 2021. In contrast, services inflation remains stubbornly high as soaring interest rates have driven up mortgage interest cost and homeowners’ replacement cost. This has kept core inflation near its 14-year high.
Despite softer growth, consumer prices remain high (Chart 16). Aggressive interest rate hikes by the Bank of Canada over the past year are expected to further decelerate consumer spending and put downward pressure on prices this year. This, coupled with moderating energy prices and smaller base year effects, should help bring inflation down to an average of 3.3 per cent in 2023. Inflation is not expected to return to pre-pandemic levels until 2024, when it returns to about 2.0 per cent.
Chart 16: Consumer prices remain high even as inflation eases
Alberta’s inflation rate, CPI and core CPI indexed to 2018
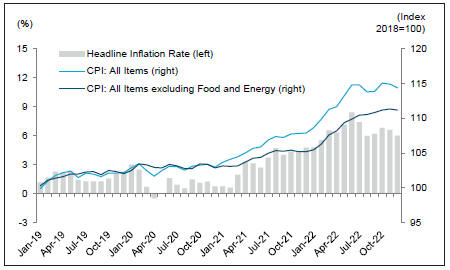
Sources: Statistics Canada and Haver Analytics
Core inflation (excluding food and
energy) is still a significant source
of price pressure.
| Economic Outlook | Fiscal Plan 2023 – 26 | 43 |
Weakness in consumer spending
this year will be concentrated in
goods.
Consumers to remain cautious
Higher interest rates and inflationary pressures will continue to keep a lid on consumer spending in the near term. The weakness will be more pronounced on discretionary items such as durables and semi-durable goods. After pulling back sharply in 2022, spending on durable goods is expected to fall again in 2023 although the pace of decline will be smaller. There are tentative signs that new vehicle sales are bottoming out after being hampered by chip shortages through most of 2022. Spending on semi-durable goods is also anticipated to remain muted following last year’s post-pandemic rebound. Growth in services spending is expected to slow further after surpassing pre-pandemic levels last year, although this will benefit from rising population growth. Overall, growth in real consumer spending is forecast to be 2.1 per cent in 2023 (Chart 17), down from an estimated 4.2 per cent last year. As inflation eases further, interest rates decline and wage growth picks up, real consumer spending is set to accelerate. It is forecast to expand around 3 per cent in the coming years and outpace population growth.
Chart 17: Household spending subdued in 2023
Annual change in Alberta real consumer spending by component
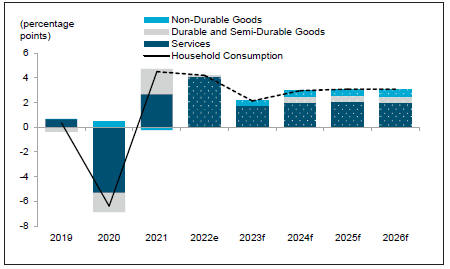
| Sources: | Statistics Canada, Haver Analytics and Alberta Treasury Board and Finance; e-estimate, f-forecast |
| 44 | Economic Outlook | Fiscal Plan 2023 – 26 |
Risks to the Economic Outlook
The uncertainty surround the global economic slowdown, tighter financial conditions, and ongoing geopolitical events creates a number of risks to the Alberta economy. In Budget 2023, the high and low scenarios demonstrate the risks and volatility associated with Alberta’s economy and revenue. These alternate scenarios are illustrative of a range of potential outcomes, as opposed to being likely outcomes.
The Budget 2023 low scenario assumes that oil prices drop well below the base forecast starting in the second quarter of 2023. This is due to weaker global energy demand driven by weak economic growth in China and Japan and a deeper-than-expected contraction in the U.S., Europe and Canada. Following this oil price shock, prices gradually recover but do not return to base forecast levels within the forecast horizon. In addition, services inflation is more entrenched than in the base forecast and contributes to weaker economic growth around the world through 2025. In Alberta, lower oil prices lead to significantly less investment in the oil and gas sector and lower oil production, particularly oil sands, resulting in a weaker provincial economy. The combined effects of the oil price shock and a weak global economy in 2023 and beyond are lower Canadian interest rates and a weaker Canadian dollar. In Alberta, these translate to lower consumption, lower employment, lower investment, and a lower rate of population growth. A weaker economy has commensurately negative impacts on Alberta’s corporate and personal tax revenue, and the low oil prices negatively affect Alberta’s natural resource revenue.
The high scenario assumes oil prices rise well above the base forecast starting in the second quarter of 2023 on the back of strong global petroleum demand growth amid tight supplies. Petroleum demand is propelled by robust growth in major economies globally, despite persistently high interest rates and inflation. High oil prices drive stronger energy sector investment and oil production in Alberta, though companies remain disciplined in their capital allocation decisions. The increased price of oil fuels inflation and leads to moderate increases in Canadian interest rates and the Canadian dollar. These are a modest drag on the robust economic growth and resulting increases in corporate profits, business investment, and exports that Alberta experiences. The stronger economic performance in the province leads to higher net interprovincial migration, higher wage growth, higher employment growth, and an unemployment rate declining more than in the base forecast. This economic strength translates into substantial increases in Alberta’s corporate and personal tax revenue, and higher energy prices lead to even faster growth in Alberta’s natural resource revenue.
Neither scenario includes additional fiscal policy responses from the federal or provincial governments beyond what is included in the base forecast that would buffer the downside to the economy in the low scenario nor that would temper the upside to the economy in the high scenario.
| Economic Outlook | Fiscal Plan 2023 – 26 | 45 |
|
Table 1: Scenario Impacts |
||||||||||||||||||||||||
| Fiscal Year Assumptions | 2023-24 | 2024-25 | 2025-26 | |||||||||||||||||||||
| WTI (US$/bbl) |
||||||||||||||||||||||||
| Base |
79.00 | 76.00 | 73.50 | |||||||||||||||||||||
| High |
107.00 | 93.00 | 87.00 | |||||||||||||||||||||
| Low |
52.50 | 61.50 | 62.50 | |||||||||||||||||||||
| Light-Heavy Differential (US$/bbl) |
||||||||||||||||||||||||
| Base |
19.50 | 16.80 | 16.40 | |||||||||||||||||||||
| High |
23.40 | 19.80 | 18.20 | |||||||||||||||||||||
| Low |
18.10 | 16.10 | 15.50 | |||||||||||||||||||||
| Exchange Rate (US¢/Cdn$) |
||||||||||||||||||||||||
| Base |
76.2 | 78.2 | 79.5 | |||||||||||||||||||||
| High |
78.7 | 79.7 | 80.5 | |||||||||||||||||||||
| Low |
73.7 | 76.9 | 78.4 | |||||||||||||||||||||
| Tax and Resource Revenue ($ billions) |
||||||||||||||||||||||||
| Base |
40.8 | 41.7 | 41.6 | |||||||||||||||||||||
| Variance from base |
||||||||||||||||||||||||
| High |
14.2 | 11.5 | 10.3 | |||||||||||||||||||||
| Low |
-14.5 | -12.3 | -10.6 | |||||||||||||||||||||
| Calendar Year Assumptions | 2023 | 2024 | 2025 | 2026 | ||||||||||||||||||||||||||||||||||||
| Real GDP (%) |
||||||||||||||||||||||||||||||||||||||||
| Base |
2.8 | 3.0 | 2.9 | 2.8 | ||||||||||||||||||||||||||||||||||||
| High |
4.9 | 4.1 | 3.1 | 2.5 | ||||||||||||||||||||||||||||||||||||
| Low |
0.8 | 2.1 | 2.4 | 2.7 | ||||||||||||||||||||||||||||||||||||
| Nominal GDP (%) |
||||||||||||||||||||||||||||||||||||||||
| Base |
-2.2 | 3.5 | 3.6 | 4.2 | ||||||||||||||||||||||||||||||||||||
| High |
7.6 | 2.9 | 2.3 | 3.1 | ||||||||||||||||||||||||||||||||||||
| Low |
-12.0 | 3.9 | 3.9 | 5.0 | ||||||||||||||||||||||||||||||||||||
| Employment (thousands) |
||||||||||||||||||||||||||||||||||||||||
| Base |
2,431 | 2,497 | 2,560 | 2,619 | ||||||||||||||||||||||||||||||||||||
| High |
2,466 | 2,560 | 2,622 | 2,671 | ||||||||||||||||||||||||||||||||||||
| Low |
2,407 | 2,446 | 2,501 | 2,561 | ||||||||||||||||||||||||||||||||||||
| 46 | Economic Outlook | Fiscal Plan 2023 – 26 |
Economic Outlook
Annex
| 47 |
Benchmarking Tables
| Oil Price Benchmark | ||||||||||||||||
| West Texas Intermediate (US$/bbl) | ||||||||||||||||
| Organization | 2023 | 2024 | 2025 | 2026 | ||||||||||||
| National Forecasting Agencies |
||||||||||||||||
| Conference Board of Canada (December 19, 2022) |
80.78 | 83.67 | 82.49 | 79.55 | ||||||||||||
| Stokes Economics (January 17, 2023) |
80.00 | 75.00 | 72.00 | 71.00 | ||||||||||||
| Banks and Investment Dealers |
||||||||||||||||
| Credit Suisse (January 2023) |
82.00 | 77.00 | 72.00 | 67.00 | ||||||||||||
| Deloitte (December 31, 2022) |
80.00 | 77.25 | 73.55 | 75.00 | ||||||||||||
| Goldman Sachs (January 2023) |
85.00 | 85.00 | n/a | n/a | ||||||||||||
| Laurentian Bank (January 2023) |
76.25 | 80.00 | n/a | n/a | ||||||||||||
| National Bank (December 2022) |
77.25 | 75.00 | n/a | n/a | ||||||||||||
| RBC Capital Markets (January 2023) |
92.01 | 98.45 | 84.07 | 65.00 | ||||||||||||
| Scotiabank (December 8, 2022) |
94.00 | 75.00 | n/a | n/a | ||||||||||||
| TD Bank (December 13, 2022) |
88.25 | 87.50 | n/a | n/a | ||||||||||||
| Industry Analysts |
||||||||||||||||
| U.S. Energy Information Administration (January 2023) |
77.18 | 71.57 | n/a | n/a | ||||||||||||
| GLJ Petroleum Consultants (January 1, 2023) |
75.00 | 75.00 | 75.43 | 76.94 | ||||||||||||
| Sproule Associates Limited (January 31, 2023) |
85.35 | 84.00 | 80.00 | 81.60 | ||||||||||||
| Confidential Forecasts Provided to the Government of Albertaa |
||||||||||||||||
| Average |
84.00 | 82.50 | 81.50 | 76.00 | ||||||||||||
| High |
94.00 | 100.00 | 95.00 | 85.00 | ||||||||||||
| Low |
75.00 | 70.46 | 64.35 | 57.53 | ||||||||||||
| Average of All Private Forecasts |
86.00 | 81.50 | 79.50 | 77.00 | ||||||||||||
| Government of Alberta (calendar year) |
79.00 | 77.00 | 75.00 | 70.00 | ||||||||||||
Includes forecasts finalized on or before January 31, 2023.
| a | The Government of Alberta surveys, on a confidential basis, private sector forecasts from PIRA, the Bank of Montreal, IHS Markit, Rystad, and Wood Mackenzie. The annual figures presented here are an average of the forecast prices from these sources. High/Low forecasts may represent one of the confidential forecasts. The private sector average and the consultant average have been rounded to the nearest 50 cents. |
Both the Government of
Alberta and the private sector
underestimated the WTI oil price
by 22.5% for 2022.
| How Oil Price Forecasters Fared in Budget 2022 | ||
| West Texas Intermediate (US$/bbl) | ||
| Organization (#) | How did they do in Budget 2022? | |
| National Forecasting Agencies (2) |
71.90 | |
| Banks and Investment Dealers (9) |
79.19 | |
| Industry Analysts (3) |
72.79 | |
| Confidential Forecasts (5) |
65.00 | |
| Average |
73.00 | |
| Government of Alberta (calendar year) |
73.00 | |
| 2022 Actual |
94.23 | |
| Sources: Alberta Treasury Board and Finance and Alberta Energy | ||
| 48 | Economic Outlook | Fiscal Plan 2023 – 26 |
| Light-Heavy Oil Price Differential Benchmark | ||||||||||||||||
| WTI-WCS Price Differential (US$/bbl) | ||||||||||||||||
| Organization | 2023 | 2024 | 2025 | 2026 | ||||||||||||
| National Forecasting Agencies |
||||||||||||||||
| Conference Board of Canada (December 19, 2022) |
18.85 | 15.48 | 15.71 | 16.03 | ||||||||||||
| Banks and Industry Analysts |
||||||||||||||||
| GLJ Petroleum Consultants (January 1, 2023) |
26.75 | 24.00 | 20.00 | 16.00 | ||||||||||||
| Goldman Sachs (January 2023) |
23.75 | 15.00 | n/a | n/a | ||||||||||||
| RBC Capital Markets (January 2023) |
23.56 | 18.24 | 13.43 | 12.00 | ||||||||||||
| Scotiabank (December 8, 2022) |
19.00 | 16.00 | n/a | n/a | ||||||||||||
| Sproule Associates Limited (January 31, 2022) |
20.25 | 12.50 | 12.75 | 13.01 | ||||||||||||
| Confidential Forecasts Provided to the Government of Albertaa |
||||||||||||||||
| Average |
21.70 | 18.60 | 16.60 | 16.40 | ||||||||||||
| High |
26.75 | 24.00 | 21.66 | 21.45 | ||||||||||||
| Low |
18.85 | 12.50 | 12.65 | 12.00 | ||||||||||||
| Average of All Private Forecasts |
21.90 | 17.60 | 16.00 | 15.30 | ||||||||||||
| Government of Alberta (calendar year) |
20.70 | 16.90 | 16.40 | 16.30 | ||||||||||||
Includes forecasts finalized on or before January 31, 2023.
| a | The Government of Alberta also surveys, on a confidential basis, private sector forecasts from PIRA, the Bank of Montreal, IHS Markit, and Wood Mackenzie. The annual figures presented here are the average forecast prices from these sources. High/Low forecasts may represent one of the confidential forecasts. The private sector average, consultant average and Government of Alberta forecasts have been rounded to the nearest ten cents. |
| Economic Outlook | Fiscal Plan 2023 – 26 | 49 |
| Natural Gas Price Benchmark | ||||||||||||||||
| Henry Hub (US$/MMBtu)a | ||||||||||||||||
| Organization | 2023 | 2024 | 2025 | 2026 | ||||||||||||
| National Forecasting Agencies |
||||||||||||||||
| Conference Board of Canada (December 19, 2022) |
5.84 | 5.27 | 4.54 | 4.08 | ||||||||||||
| Stokes Economics (January 17, 2023) |
5.75 | 4.75 | 4.50 | 4.50 | ||||||||||||
| Banks and Investment Dealers |
||||||||||||||||
| Deloitte (December 31, 2022)b |
5.30 | 4.97 | 4.58 | 4.63 | ||||||||||||
| Goldman Sachs (January 2023) |
4.44 | 3.45 | n/a | n/a | ||||||||||||
| RBC Capital Markets (January 2023) |
4.75 | 4.25 | 4.00 | 3.75 | ||||||||||||
| Scotiabank (December 8, 2022) |
5.00 | 4.25 | n/a | n/a | ||||||||||||
| TD Bank (December 13, 2022) |
5.80 | 6.04 | n/a | n/a | ||||||||||||
| Industry Analysts |
||||||||||||||||
| U.S. Energy Information Administration (January 2023) |
4.90 | 4.80 | n/a | n/a | ||||||||||||
| GLJ Petroleum Consultants (January 1, 2023) |
4.71 | 4.50 | 4.27 | 4.35 | ||||||||||||
| Sproule Associates Limited (January 31, 2023) |
4.41 | 4.50 | 4.25 | 4.34 | ||||||||||||
| Confidential Forecasts Provided to the Government of Albertac |
||||||||||||||||
| Average |
4.70 | 4.20 | 3.90 | 4.10 | ||||||||||||
| High |
5.88 | 6.04 | 5.00 | 5.19 | ||||||||||||
| Low |
3.58 | 3.45 | 3.00 | 2.98 | ||||||||||||
| Average of All Private Forecasts |
4.90 | 4.50 | 4.10 | 4.20 | ||||||||||||
| Government of Alberta (calendar year) |
5.00 | 4.40 | 3.90 | 4.00 | ||||||||||||
Includes forecasts finalized on or before January 31, 2023.
| a | The natural gas price at Henry Hub Louisiana (in US$/MMBtu) is the US benchmark while the AECO natural gas price (in CAD$/GJ) is the Western Canada benchmark. While both benchmarks are widely used in North America, the difference between Henry Hub and AECO price reflects transportation costs and regional supply/demand impacts as well as exchange rate and unit conversion. The Alberta Reference Price (used in natural gas royalty calculations) represents the average field price of all Alberta gas sales which normally follows the Western Canada regional benchmark. |
| b | Converted from US$/Mcf to US$/MMBtu. |
| c | The Government of Alberta also surveys, on a confidential basis, private sector forecasts from Rystad, Petral, IHS Markit, PIRA, Wood McKenzie, and the Bank of Montreal. The annual figures presented here are the average forecast prices from these sources. High/Low forecasts may represent one of the confidential forecasts. The private sector average, consultant average and Government of Alberta forecasts have been rounded to the nearest ten cents. |
Both the Government of
Alberta and the private sector
underestimated the natural gas
prices by 40.1% and 46.3%
respectively for 2022.
| How Natural Gas Price Forecasters Did in Budget 2022 | ||
| Henry Hub (US$/MMBtu) | ||
| Organization (#) | How did they do in Budget 2022? | |
| National Forecasting Agencies (2) | 3.58 | |
| Banks and Investment Dealers (5) |
3.72 | |
| Industry Analysts (3) |
3.86 | |
| Confidential Forecasts (6) |
3.10 | |
| Average |
3.50 | |
| Government of Alberta (calendar year) |
3.90 | |
| 2022 Actual |
6.51 | |
| Sources: Alberta Treasury Board and Finance and Alberta Energy
| ||
| 50 | Economic Outlook | Fiscal Plan 2023 – 26 |
| United States / Canada Exchange Rate Benchmark | ||||||||||||||||
| (US¢/Cdn$) | ||||||||||||||||
| Organization | 2023 | 2024 | 2025 | 2026 | ||||||||||||
| National Forecasting Agencies |
||||||||||||||||
| Conference Board of Canada (December 19, 2022) |
73.0 | 75.2 | 75.2 | 74.5 | ||||||||||||
| Stokes Economics (January 17, 2023) |
74.3 | 76.8 | 77.4 | 78.4 | ||||||||||||
| Banks |
||||||||||||||||
| BMO Capital Markets (January 27, 2023) |
75.4 | 77.7 | n/a | n/a | ||||||||||||
| CIBC Capital Markets (January 23, 2023) |
75.6 | 77.2 | n/a | n/a | ||||||||||||
| Deloitte (December 31, 2022) |
74.0 | 75.0 | 75.0 | 75.0 | ||||||||||||
| Laurentian Bank (January 25, 2023) |
75.0 | 80.0 | n/a | n/a | ||||||||||||
| National Bank (December 2022) |
77.9 | 78.7 | n/a | n/a | ||||||||||||
| RBC Royal Bank (January, 2023) |
73.0 | 76.4 | n/a | n/a | ||||||||||||
| Scotiabank (December 8, 2022) |
75.5 | 79.5 | n/a | n/a | ||||||||||||
| TD Bank (December 13, 2022) |
72.8 | 75.3 | n/a | n/a | ||||||||||||
| High |
77.9 | 80.0 | 77.4 | 78.4 | ||||||||||||
| Low |
72.8 | 75.0 | 75.0 | 74.5 | ||||||||||||
| Average of All Private Forecasts |
74.6 | 77.2 | 75.9 | 76.0 | ||||||||||||
| Government of Alberta (calendar year) |
75.5 | 77.8 | 79.2 | 80.1 | ||||||||||||
| Includes forecasts finalized on or before January 31, 2023. |
| |||||||||||||||
| Canadian Long-Term Interest Rate Benchmark | ||||||||||||||||
| 10-Year Government of Canada Bonds (%) | ||||||||||||||||
| Organization | 2023 | 2024 | 2025 | 2026 | ||||||||||||
| National Forecasting Agencies |
||||||||||||||||
| Conference Board of Canada (December 19, 2022) |
3.35 | 3.26 | 3.17 | 3.17 | ||||||||||||
| Stokes Economics (January 17, 2023) |
3.25 | 3.20 | 3.30 | 3.65 | ||||||||||||
| Banks |
||||||||||||||||
| BMO Capital Markets (January 27, 2023) |
3.11 | 2.90 | n/a | n/a | ||||||||||||
| CIBC Capital Markets (January 11, 2023) |
3.36 | 2.65 | n/a | n/a | ||||||||||||
| Deloitte (January 2023) |
4.01 | 3.79 | n/a | n/a | ||||||||||||
| Laurentian Bank (January 2023) |
2.85 | 3.00 | n/a | n/a | ||||||||||||
| National Bank (December 2022) |
2.70 | 2.85 | n/a | n/a | ||||||||||||
| RBC Royal Bank (January, 2022) |
2.80 | 2.61 | n/a | n/a | ||||||||||||
| Scotiabank (December 8, 2022) |
3.14 | 3.50 | n/a | n/a | ||||||||||||
| TD Bank (December 13, 2022) |
2.78 | 2.61 | n/a | n/a | ||||||||||||
| High |
4.01 | 3.79 | 3.30 | 3.65 | ||||||||||||
| Low |
2.70 | 2.61 | 3.17 | 3.17 | ||||||||||||
| Average of All Private Forecasts |
3.10 | 3.00 | 3.20 | 3.40 | ||||||||||||
| Government of Alberta (calendar year) |
3.50 | 3.40 | 3.40 | 3.40 | ||||||||||||
Includes forecasts finalized on or before January 31, 2023.
| Economic Outlook | Fiscal Plan 2023 – 26 | 51 |
| Alberta Real Gross Domestic Product Benchmark | ||||||||||||||||||||
| (% change) | ||||||||||||||||||||
| Organization | 2022 | 2023 | 2024 | 2025 | 2026 | |||||||||||||||
| National Forecasting Agencies |
||||||||||||||||||||
| Conference Board of Canada (December 2022) |
4.7 | 2.8 | 2.7 | 2.2 | n/a | |||||||||||||||
| Stokes Economics (January 17, 2023) |
4.7 | 1.7 | 1.8 | 1.8 | 2.0 | |||||||||||||||
| Banks |
||||||||||||||||||||
| BMO (January 27, 2023) |
4.5 | 1.5 | 1.7 | n/a | n/a | |||||||||||||||
| CIBC World Markets (January 2022) |
4.6 | 2.0 | 1.8 | n/a | n/a | |||||||||||||||
| Laurentian Bank (December 2022) |
4.9 | 2.4 | 1.9 | n/a | n/a | |||||||||||||||
| National Bank (December 2022) |
4.5 | 1.2 | 1.7 | n/a | n/a | |||||||||||||||
| RBC Royal Bank (December 2022) |
4.9 | 1.9 | 2.1 | n/a | n/a | |||||||||||||||
| Scotiabank (December 8, 2022) |
4.7 | 1.6 | 1.7 | n/a | n/a | |||||||||||||||
| TD Bank (December 19, 2022) |
5.1 | 1.9 | 0.9 | n/a | n/a | |||||||||||||||
| High |
5.1 | 2.8 | 2.7 | 2.2 | 2.0 | |||||||||||||||
| Low |
4.5 | 1.2 | 0.9 | 1.8 | 2.0 | |||||||||||||||
| Average of All Private Forecasts |
4.7 | 1.9 | 1.8 | 2.0 | 2.0 | |||||||||||||||
| Government of Alberta (calendar year) |
4.8 | 2.8 | 3.0 | 2.9 | 2.8 | |||||||||||||||
| Includes forecasts finalized on or before January 31, 2023. |
| |||||||||||||||||||
| Alberta Nominal Gross Domestic Product Benchmark | ||||||||||||||||||||
| (% change) | ||||||||||||||||||||
| Organization | 2022 | 2023 | 2024 | 2025 | 2026 | |||||||||||||||
| National Forecasting Agencies |
||||||||||||||||||||
| Conference Board of Canada (December 2022) |
23.4 | 1.3 | 1.2 | 1.5 | n/a | |||||||||||||||
| Stokes Economics (January 17, 2023) |
20.4 | 1.1 | 2.5 | 4.2 | 4.1 | |||||||||||||||
| Banks |
||||||||||||||||||||
| CIBC World Markets (January 2023) |
20.1 | -0.5 | 4.8 | n/a | n/a | |||||||||||||||
| Laurentian Bank (December 2022) |
19.9 | 1.9 | 4.2 | n/a | n/a | |||||||||||||||
| National Bank (December 2022) |
17.4 | -2.9 | 0.5 | n/a | n/a | |||||||||||||||
| RBC Royal Bank (December 2022) |
22.2 | 0.7 | 1.8 | n/a | n/a | |||||||||||||||
| Scotiabank (December 8, 2022) |
19.8 | 2.5 | 1.0 | n/a | n/a | |||||||||||||||
| TD Bank (December 19, 2022) |
22.9 | 1.3 | 2.6 | n/a | n/a | |||||||||||||||
| High |
23.4 | 2.5 | 4.8 | 4.2 | 4.1 | |||||||||||||||
| Low |
17.4 | -2.9 | 0.5 | 1.5 | 4.1 | |||||||||||||||
| Average of All Private Forecasts |
20.8 | 0.7 | 2.3 | 2.8 | 4.1 | |||||||||||||||
| Government of Alberta (calendar year) |
24.0 | -2.2 | 3.5 | 3.6 | 4.2 | |||||||||||||||
Includes forecasts finalized on or before January 31, 2023.
| 52 | Economic Outlook | Fiscal Plan 2023 – 26 |
| Alberta Employment Benchmark | ||||||||||||||||
| (% change) | ||||||||||||||||
| Organization | 2023 | 2024 | 2025 | 2026 | ||||||||||||
| National Forecasting Agencies |
||||||||||||||||
| Conference Board of Canada (December 2022) |
1.5 | 1.7 | 1.5 | n/a | ||||||||||||
| Stokes Economics (January 17, 2023) |
1.5 | 1.6 | 1.8 | 1.5 | ||||||||||||
| Banks |
||||||||||||||||
| BMO (January 27, 2023) |
1.6 | 1.2 | n/a | n/a | ||||||||||||
| Laurentian Bank (December 2022) |
1.7 | 1.3 | n/a | n/a | ||||||||||||
| National Bank (December 2022) |
1.0 | 1.0 | n/a | n/a | ||||||||||||
| RBC Royal Bank (December 2022) |
0.8 | 1.1 | n/a | n/a | ||||||||||||
| Scotiabank (December 8, 2022) |
1.3 | 1.6 | n/a | n/a | ||||||||||||
| TD Bank (December 19, 2022) |
0.8 | 0.3 | n/a | n/a | ||||||||||||
| High |
1.7 | 1.7 | 1.8 | 1.5 | ||||||||||||
| Low |
0.8 | 0.3 | 1.5 | 1.5 | ||||||||||||
| Average of All Private Forecasts |
1.3 | 1.2 | 1.6 | 1.5 | ||||||||||||
| Government of Alberta (calendar year) |
2.3 | 2.7 | 2.5 | 2.3 | ||||||||||||
| Includes forecasts finalized on or before January 31, 2023. |
| |||||||||||||||
| Alberta Unemployment Rate Benchmark | ||||||||||||||||
| (%) | ||||||||||||||||
| Organization | 2023 | 2024 | 2025 | 2026 | ||||||||||||
| National Forecasting Agencies |
||||||||||||||||
| Conference Board of Canada (December 2022) |
5.8 | 5.7 | 5.7 | n/a | ||||||||||||
| Stokes Economics (January 17, 2023) |
6.3 | 6.4 | 6.4 | 6.4 | ||||||||||||
| Banks |
||||||||||||||||
| BMO (January 27, 2023) |
6.2 | 6.7 | n/a | n/a | ||||||||||||
| CIBC World Markets (January 2023) |
5.7 | 5.4 | n/a | n/a | ||||||||||||
| Laurentian Bank (December 2022) |
6.2 | 6.3 | n/a | n/a | ||||||||||||
| National Bank (December 2022) |
6.0 | 6.4 | n/a | n/a | ||||||||||||
| RBC Royal Bank (December 2022) |
5.9 | 5.6 | n/a | n/a | ||||||||||||
| Scotiabank (December 8, 2022) |
5.9 | 6.1 | n/a | n/a | ||||||||||||
| TD Bank (December 19, 2022) |
6.1 | 6.4 | n/a | n/a | ||||||||||||
| High |
6.3 | 6.7 | 6.4 | 6.4 | ||||||||||||
| Low |
5.7 | 5.4 | 5.7 | 6.4 | ||||||||||||
| Average of All Private Forecasts |
6.0 | 6.1 | 6.1 | 6.4 | ||||||||||||
| Government of Alberta (calendar year) |
6.4 | 6.3 | 6.1 | 5.7 | ||||||||||||
Includes forecasts finalized on or before January 31, 2023.
| Economic Outlook | Fiscal Plan 2023 – 26 | 53 |
| Alberta Housing Starts Benchmark | ||||||||||||||||
| (thousands) | ||||||||||||||||
| Organization | 2023 | 2024 | 2025 | 2026 | ||||||||||||
| National Forecasting Agencies |
||||||||||||||||
| Conference Board of Canada (December, 2022) |
32.9 | 32.9 | 33.8 | n/a | ||||||||||||
| Stokes Economics (January 17, 2023) |
33.7 | 35.5 | 36.8 | 36.4 | ||||||||||||
| Banks |
||||||||||||||||
| BMO (January 27, 2023) |
40.0 | 42.0 | n/a | n/a | ||||||||||||
| Laurentian Bank (December 2022) |
37.0 | 36.0 | n/a | n/a | ||||||||||||
| National Bank (December 2022) |
30.3 | 29.8 | n/a | n/a | ||||||||||||
| RBC Royal Bank (December 2022) |
43.8 | 45.0 | n/a | n/a | ||||||||||||
| Scotiabank (December 8, 2022) |
26.0 | 22.0 | n/a | n/a | ||||||||||||
| TD Bank (December 19, 2022) |
35.4 | 29.3 | n/a | n/a | ||||||||||||
| High |
43.8 | 45.0 | 36.8 | 36.4 | ||||||||||||
| Low |
26.0 | 22.0 | 33.8 | 36.4 | ||||||||||||
| Average of All Private Forecasts |
34.9 | 34.1 | 35.3 | 36.4 | ||||||||||||
| Government of Alberta (calendar year) |
38.1 | 37.7 | 36.4 | 36.7 | ||||||||||||
Includes forecasts finalized on or before January 31, 2023.
| 54 | Economic Outlook | Fiscal Plan 2023 – 26 |
BUDGET 2023
GOVERNMENT OF ALBERTA | 2023–26

Fiscal Plan
Revenue
| 55 |
Table of Contents
| Revenue Outlook |
57 | |||
| 2022-23 Third Quarter Revenue Forecast |
59 | |||
| Non-Renewable Resource Revenue |
63 | |||
| Tax Revenue |
65 | |||
| Federal Transfers |
67 | |||
| Investment Income |
68 | |||
| Revenue from Other Sources |
69 | |||
| Risks |
71 | |||
| Alberta’s Resource Revenue Royalty Structure |
74 | |||
Note: Amounts presented in tables may not add to totals due to rounding.
| 56 | Revenue | Fiscal Plan 2023 – 26 |
Revenue Outlook
Total revenue in 2023-24 is forecast at $70.7 billion, a decrease of $5.4 billion from the record-high 2022-23 third quarter forecast of $76 billion. The decrease is due mainly to a $9.2 billion drop in resource revenue, as oil prices are anticipated to decline, partly offset by increases of $2.1 billion in investment income, $0.6 billion in fuel tax revenue, and a net $1.1 billion in other revenue. Revenue is expected to grow $2 billion by 2025-26, to $72.6 billion, with a $2.6 billion decline in resource revenue, as oil prices continue to trend down, offset by increases of $3.6 billion in income and other taxes and a net $1 billion in other revenue.
The swings in Alberta’s government revenue have been much more dramatic and larger than ever before: revenue jumped by $25.2 billion and $7.7 billion in 2021-22 and 2022-23 respectively, leading to the substantial $5.4 billion drop in 2023-24, the largest decline in revenue since the $6.9 billion drop following the global recession in 2015. Revenue was $68.3 billion in 2021-22 and is forecast to be over $70 billion in 2022-23 and the next three years; the previous highest total revenue was $49.5 billion in 2014-15 and 2018-19.
The elevation in volatility was exacerbated in spring 2020 with the onset of the global pandemic, as COVID-19 suffocated the global economy. Activities and travel were restricted to prevent the spread of the virus, which cratered financial markets, oil demand and prices. In response, producers held back investment in expanding oil supplies. Rising climate-concerns and commitments to transition to alternative energy production further contributed to discourage investment. As recovery began, energy demand rose without sufficient supply growth, causing energy prices to rise significantly. The Russian invasion of Ukraine in February 2022, and subsequent economic sanctions against one of the world’s largest energy producers, boosted oil and natural gas prices. COVID-19 also caused serious supply-chain issues, creating the perfect storm for major inflation across the world, prompting interest rate hikes that threaten global economic prospects. Financial markets have slumped. China only recently lifted pandemic restrictions, which affected economic and energy demand forecasts. Many global factors and events impact Alberta’s government revenue.
| Total Revenue
|
||||||||||||||||||||||||
| (millions of dollars) | 2021-22 | 2022-23 | 2023-24 | 2024-25 | 2025-26 | |||||||||||||||||||
| Actual | Budget | Forecast | Estimate | Target | Target | |||||||||||||||||||
| Personal income tax |
13,335 | 13,382 | 13,806 | 14,069 | 15,034 | 16,071 | ||||||||||||||||||
| Corporate income tax |
4,718 | 4,040 | 6,413 | 5,911 | 6,254 | 6,590 | ||||||||||||||||||
| Other tax revenue |
5,453 | 5,612 | 4,361 | 5,012 | 5,767 | 5,948 | ||||||||||||||||||
| Resource revenue – bitumen |
11,605 | 10,349 | 18,750 | 12,555 | 12,028 | 10,736 | ||||||||||||||||||
| Resource revenue – other |
4,565 | 3,491 | 8,794 | 5,806 | 5,256 | 5,006 | ||||||||||||||||||
| Federal transfers |
11,595 | 12,054 | 11,765 | 12,552 | 12,475 | 13,113 | ||||||||||||||||||
| Investment income |
3,579 | 3,173 | 1,035 | 3,154 | 3,273 | 3,407 | ||||||||||||||||||
| Net income from bus. enterprises |
4,810 | 2,435 | 2,449 | 2,727 | 2,422 | 2,647 | ||||||||||||||||||
| Premiums, fees and licences |
4,520 | 4,490 | 4,796 | 5,040 | 5,289 | 5,360 | ||||||||||||||||||
| Other revenue | 4,142 | 3,581 | 3,856 | 3,827 | 3,926 | 3,730 | ||||||||||||||||||
| Total Revenue | 68,322 | 62,607 | 76,025 | 70,653 | 71,724 | 72,608 | ||||||||||||||||||
Total revenue in 2023-24 is forecast
at $70.7 billion, $5.4 billion lower
than the record high of $76 billion
in 2022-23, with oil prices expected
to decline.
The swings in Alberta’s government
revenue are larger than ever before.
Total revenue forecast to be over
$70 billion in 2022-23 through to
2025-26.
| Revenue | Fiscal Plan 2023 – 26 | 57 |
Alberta’s low taxes and fiscal
responsibility attract investment
and jobs.
WTI forecast at US$90.50/bbl in
2022-23, US$79/bbl in 2023-24
and US$73.50 by 2025-26.
Alberta’s economy follows gyrations in energy markets and the global economy, so the spike in prices that commenced at the beginning of 2022 assisted Alberta’s economic outlook. Population growth, employment, exports and conventional oil and natural gas production increased. Alberta’s competitive tax regime, entrepreneurial culture and business-friendly environment, supported by government’s commitment to fiscal responsibility, have helped to attract investment, largely in non-oil and gas sectors such as technology and innovation, manufacturing, petrochemicals, agri-food, aerospace and finance. Inflation has dampened consumer spending, and that is expected to continue in the immediate time-frame. Labour markets are also facing challenges as employers are unable to find workers with the appropriate skills. The short-term global economic outlook has deteriorated with inflation concerns, higher interest rates and the impact of China’s delayed pandemic recovery.
The Budget 2023 revenue outlook assumes the volatility in the global economy, financial and energy markets, spurred by geopolitics, supply chain issues, inflation and interest rate hikes, will begin to settle toward the end of 2023 and into 2024. As geopolitical and other tensions ease, energy prices are expected to cool. The West Texas Intermediate oil price is forecast to average US$90.50 per barrel (/bbl) in 2022-23, $79/bbl in 2023-24, and $73.50/bbl by 2025-26.
| Evolution of Revenue Forecast since Budget 2022
|
||||||||||||||||||||
| (millions of dollars) | ||||||||||||||||||||
| Fiscal Year |
Budget
2022 |
2022-23
Mid-year |
Budget
2023 |
Change fr
Bud 2022 |
Change fr
Mid-year |
|||||||||||||||
| 2022-23: |
||||||||||||||||||||
| Personal income tax |
13,382 | 13,299 | 13,806 | 424 | 507 | |||||||||||||||
| Corporate income tax |
4,040 | 6,252 | 6,413 | 2,373 | 161 | |||||||||||||||
| Other taxes |
5,612 | 4,620 | 4,361 | (1,251 | ) | (259 | ) | |||||||||||||
| Resource revenue |
13,840 | 28,124 | 27,544 | 13,704 | (580 | ) | ||||||||||||||
| Federal govt. transfers |
12,054 | 12,487 | 11,765 | (289 | ) | (722 | ) | |||||||||||||
| Investment income |
3,173 | 1,195 | 1,035 | (2,138 | ) | (160 | ) | |||||||||||||
| Revenue fr. other sources |
10,506 | 10,924 | 11,101 | 595 | 177 | |||||||||||||||
| Total 2022-23 revenue |
62,607 | 76,901 | 76,025 | 13,418 | (876 | ) | ||||||||||||||
| 2023-24: |
||||||||||||||||||||
| Personal income tax |
14,442 | 13,751 | 14,069 | (373 | ) | 318 | ||||||||||||||
| Corporate income tax |
4,517 | 6,224 | 5,911 | 1,394 | (313 | ) | ||||||||||||||
| Other taxes |
5,778 | 5,465 | 5,012 | (766 | ) | (453 | ) | |||||||||||||
| Resource revenue |
12,328 | 19,189 | 18,361 | 6,033 | (828 | ) | ||||||||||||||
| Federal govt. transfers |
11,641 | 11,524 | 12,552 | 911 | 1,028 | |||||||||||||||
| Investment income |
3,492 | 2,332 | 3,154 | (338 | ) | 822 | ||||||||||||||
| Revenue fr. other sources |
10,936 | 11,066 | 11,594 | 658 | 528 | |||||||||||||||
| Total 2023-24 revenue |
63,134 | 69,551 | 70,653 | 7,519 | 1,102 | |||||||||||||||
| 2024-25: |
||||||||||||||||||||
| Personal income tax |
15,455 | 14,683 | 15,034 | (421 | ) | 351 | ||||||||||||||
| Corporate income tax |
4,896 | 6,623 | 6,254 | 1,358 | (369 | ) | ||||||||||||||
| Other taxes |
5,913 | 5,817 | 5,767 | (146 | ) | (50 | ) | |||||||||||||
| Resource revenue |
10,916 | 15,968 | 17,284 | 6,368 | 1,316 | |||||||||||||||
| Federal govt. transfers |
11,895 | 12,291 | 12,475 | 580 | 184 | |||||||||||||||
| Investment income |
3,699 | 3,358 | 3,273 | (426 | ) | (85 | ) | |||||||||||||
| Revenue fr. other sources |
11,077 | 11,124 | 11,637 | 560 | 513 | |||||||||||||||
| Total 2024-25 revenue |
63,852 | 69,864 | 71,724 | 7,872 | 1,860 | |||||||||||||||
| 58 | Revenue | Fiscal Plan 2023 – 26 |
The revenue forecast has changed substantially relative to the forecast presented in Budget 2022, prepared prior to the Russian invasion of Ukraine which sparked higher energy prices, and marginally since the 2022-23 Mid-year Fiscal Update and Economic Statement, released at the end of November 2022.
Total revenue relative to Budget 2022 has increased $13.4 billion in 2022-23, $7.5 billion in 2023-24 and $7.9 billion in 2024-25, mainly due to higher resource and corporate income tax revenue, partially offset by lower investment income and personal income and other tax revenue (from indexation, additional fuel tax relief this year and next, and lower tobacco consumption).
Relative to the mid-year forecast, revenue is down $876 million in 2022-23, but has increased $1.1 billion and $1.9 billion in 2023-24 and 2024-25. Slower global growth and lower prices in the near-term have dampened the forecast, reducing corporate income taxes and resource revenue, although resource revenue bounces back in 2024-25 as the current turmoil around inflation and interest rates stabilizes and the global economy rebounds. Stronger-than-expected population growth and a robust labour market contribute to a higher personal income tax forecast, while investment income is weaker in 2022-23 but recovers well in 2023-24. Federal transfers in 2022-23 are lower mainly due to re-profiling of infrastructure transfers to future years and moving the expected Fiscal Stabilization payment for the 2020-21 revenue decline into 2023-24. Federal transfers have increased in 2023-24 and 2024-25 for these reasons, and also due to additions to the Canada Health Transfer and necessary increases in agriculture insurance premiums (to replenish the crop insurance fund which funded significant indemnity payments in 2021-22 and 2022- 23). Revenue from other sources is stronger mainly from similar increases to producer agriculture insurance premiums and adjustments to the Technology Innovation and Emissions Reduction regulatory regime, causing a temporary bump to estimated compliance payments in 2023-24 and 2024-25.
2022-23 Third Quarter Revenue Forecast
Total revenue in 2022-23 is forecast at $76 billion, the highest ever for Alberta’s government. Revenue has increased $13.4 billion from Budget 2022, mainly due to a $13.7 billion jump in resource revenue. Total 2022-23 revenue is $0.9 billion lower than the mid-year forecast. Following are the main changes in 2022-23 revenue:
| • | Personal income tax (PIT) revenue in 2022-23 is forecast at $13.8 billion, $471 million higher than 2021-22 revenue, $424 million greater than budget, and $507 million more than mid-year. This is mainly due to population and household income growth. Household income in 2021 was stronger than expected, elevating the base used to forecast subsequent years, and requiring a prior-years’ adjustment (PYA) of $338 million in 2022-23 to incorporate underreporting of audited PIT revenue in the 2020-21 and 2021-22 consolidated financial statements. As assessments of 2021 personal income tax are only finalized in early 2023, the PIT reported in the prior two year-end statements were still estimates, and actual assessments were higher. The increased revenue is partly offset by the impact of indexing the PIT system to inflation, beginning in 2022. |
Revenue forecast and energy
prices significantly impacted
by Russian invasion of Ukraine,
impacting global inflation, interest
rates and economic outlook.
| Revenue | Fiscal Plan 2023 – 26 | 59 |
Corporate profits are estimated to
have increased by 285% in 2021
relative to 2020, and are expected
to be another 55% higher in 2022.
Fuel tax relief provided to assist
with affordability and mitigate
inflation.
The WTI oil price is forecast at
US$90.50/bbl in 2022-23, $20/
bbl more than budget and $13/bbl
more than the 2021-22 average.
Early Learning Child Care transfers
jumped $537 million in 2022-23.
| • | 2022-23 corporate income tax revenue is forecast at $6.4 billion, the most ever, due to the impact of higher commodity prices. This is an increase of $1.7 billion from 2021-22, $2.4 billion more than the Budget 2022 estimate, and $161 million more than the mid-year forecast. Net corporate operating surplus (corporate profits) is now forecast to have grown 55% in 2022, a substantial amount given it follows the significant rebound in 2021 of 285% growth from the negative 60% drop in 2020. Revenue volatility impacts Alberta’s government revenue broadly. |
| • | Other tax revenue in 2022-23 is estimated at $4.4 billion. This is a decrease of $1.1 billion from 2021-22, $1.3 billion from budget, and $259 million from the 2022-23 mid-year forecast, due primarily to the impact on fuel tax revenue of the affordability relief provided. Tobacco tax revenue continues to decline, due to lower consumption, likely from COVID impacts and vaping and cannabis substitution. This decrease is basically offset by higher revenue from the tourism levy, as activity has picked up, and freehold mineral rights tax revenue, with the elevation in oil prices. |
| • | Resource revenue is forecast at a record $27.5 billion in 2022-23, reflecting the surge in global energy prices as demand recovered from the pandemic and after the Russian invasion of Ukraine. This record revenue is $11.4 billion greater than resource revenue in 2021-22, $13.7 billion higher than budget, but $580 million lower than the mid-year estimate. The WTI oil price is expected to average US$90.50 per barrel (/bbl) in 2022-23, $13/ bbl more than the 2021-22 fiscal year average, over $20/bbl more than the Budget 2022 estimate, but $1/bbl less than the mid-year forecast. The Alberta Reference Price, used to calculate natural gas royalties, is forecast at $5.10 per gigajoule (/GJ), $1.60/GJ greater than last year, $1.90/GJ more than budget, but thirty cents/GJ down from the mid-year forecast. |
| • | Federal government transfers of $11.8 billion are forecast for 2022-23. This is $170 million more than in 2021-22, but $289 million lower than estimated in Budget 2022, and $723 million less than forecast in the mid-year report. |
| – | The increase from 2021-22 largely reflects: $537 million for the early learning child care agreements (ELCC), primarily due to the ramping up of funding intended to support $10 a day child care; an increase of $146 million in direct transfers to school boards, universities, colleges and health entities (the SUCH sector), mainly to post-secondary institutions, with Alberta Health Services also receiving a donation of personal protective equipment; a net $532 million decrease in labour market and other federal transfers, mainly due to various COVID-19 supports ending, including for health care, the K-12 education system, employment programs, workers’ benefits and others, partly offset by higher funding for the site rehabilitation program; and a net $21 million increase in the Canada Health Transfer (CHT), Canada Social Transfer (CST), infrastructure and agriculture support transfers. |
| – | The $289 million decrease from budget reflects: a net $168 million increase in the CHT, with $232 million provided one-time to help address the backlog of surgeries due to COVID-19, partly offset by a |
| 60 | Revenue | Fiscal Plan 2023 – 26 |
| reduction to the CHT based on a lower Alberta share of the national population; $196 million increase in agriculture support mainly due to higher insurance premiums necessary to replenish the crop insurance fund; $511 million decrease from re-profiling municipal capital projects to future years; a net $141 million reduction in various other federal transfers, from delaying the budgeted $750 million Fiscal Stabilization payment related to the 2020-21 revenue drop to 2023-24, partially offset by re-profiling $279 million of Site Rehabilitation funding from 2023-24 into 2022-23, and increased transfers of $144 million for rapid test kits and $80 million for municipal transit support. |
| – | The $723 million decrease from mid-year mainly consists of the delayed Fiscal Stabilization payment, re-profiling of capital projects and associated federal funding to future years, the negative impact of revisions to Alberta’s population share for the CHT and CST, partly offset by higher revenue from increased agriculture insurance premiums. |
| • | Investment income in 2022-23 is forecast at $1 billion, $2.5 billion lower than in 2021-22, $2.1 billion lower than Budget 2022, and $160 million less than the mid-year forecast. Financial market returns have been weak this year, resulting in negative investment income for the Heritage and endowment funds. Income from Agriculture Financial Services Corporation crop insurance fund is lower as its balance declined with the significant withdrawals required for substantial indemnity payments after the severe 2021 drought. Income from various other accounts and funds has increased with higher interest rates, which also enhances income from local authority lending as it results in swaps being in favourable positions (and debt servicing swaps become unfavourable, causing debt servicing cost expense to increase). |
| • | Revenue from other sources includes net income from government business enterprises (GBEs), premiums, fees and licences, and various other sources. These revenue sources have decreased by $2.4 billion from 2021-22, but have increased $595 million from the Budget 2022 forecast, and by $177 million from mid-year. |
| – | GBE net income is forecast at $2.4 billion, $2.4 million less than in 2021-22, when the ownership restructuring of the Sturgeon Refinery within Alberta Petroleum Marketing Commission resulted in a revenue increase of $2.2 billion to partially reverse the 2019-20 $2.5 billion write-down (negative revenue) in the value of the refinery. Alberta Gaming, Liquor and Cannabis Commission net income from gaming and lotteries has increased $297 million from 2021-22, while ATB Financial net income is down $304 million due to higher credit losses from the impacts on small and medium-sized Alberta businesses of supply chain and inflation challenges. GBE net income is on track relative to Budget 2022 and mid-year forecasts. |
| – | Premiums, fees and licences revenue is forecast at $4.8 billion in 2022-23. This is $276 million greater than 2021-22, $306 million higher than budget and $40 million more than the 2022-23 mid-year forecast. The increase from 2021-22 comprises: $202 million from post-secondary |
Fiscal Stabilization payment related
to 2020-21 revenue decline now
not expected until 2023-24.
Financial market returns very
weak in 2022, resulting in negative
income in the Heritage Fund
in 2022-23.
| Revenue | Fiscal Plan 2023 – 26 | 61 |
Alberta Health Services and school
board fee revenue declined by
$118 million from budget
in 2021-22.
TIER compliance payments
strong in 2021-22.
| institution tuition fees and $102 million increase in Alberta Health Services and school board fees, with students returning to in-person learning and due to the impacts on various accommodation, inpatient and other fees of significant inflation; $190 million from higher agriculture insurance premiums; partly offset by a net decrease of $218 million in other premiums, fees and licences, mainly from lower timber royalties and fees, as the strong lumber prices in 2020 and 2021 have waned, lower ATB Financial payment-in-lieu of taxes with reduced net income, but slightly offset by higher revenue driven by population growth and increased volumes in areas such as registries and motor vehicles. The $306 million increase from Budget 2022 is mainly from higher agriculture insurance premiums ($155 million), timber royalties ($76 million) and SUCH sector and other volume-driven fees, partly offset by lower ATB Financial payment-in-lieu of taxes. The change from mid-year mainly reflects the higher agriculture insurance premiums, but reduced timber royalties and fees. |
| – | Other revenue of $3.9 billion is forecast for 2022-23, $286 million lower than in 2021-22, but $275 million higher than budget and an increase of $163 million from the mid-year forecast. The decline from 2021-22 mainly relates to: a $173 million drop in “refunds of expense” revenue, which is used to reverse overestimates of expense reported in prior year actuals, and also includes the aggregate assessment charged to automobile insurers for health care costs caused by uninsured drivers. Refunds of expense revenue in 2021-22 included a $42 million reversal for prior-year reported disaster recovery program expense, $68 million related to the Small and Medium Enterprise Relaunch Grant and a net $57 million in other prior-year expense reversals, while estimated 2022-23 refunds of expense only include $31 million in reversals. The aggregate assessment decreased by $36 million, as traffic volumes have decreased. Investment management fees recovered from external clients like WCB and pension plans, relating to their assets, are forecast to have declined by $82 million based on much weaker investment returns in 2022-23. Compliance payments made to the Technology Innovation and Emissions Reduction Fund (TIER) are $68 million lower this year as the jump in energy prices encouraged greater industrial activity late in the 2021-22 fiscal year. SUCH sector sales and donations revenue is a net $6 million higher while fines and penalties and other miscellaneous revenue have increased by a net $32 million. The increase from budget is mainly due to continued recovering of activity, travel and higher energy prices, with TIER compliance payments up $216 million and SUCH sector sales and fundraising revenue up $37 million. The remaining net $22 million increase mainly relates to the recovery of higher external investment management fees. The change from the mid-year revenue forecast mainly reflects higher TIER compliance payments, improved SUCH sector revenue and recovery of higher external investment management fees. |
| 62 | Revenue | Fiscal Plan 2023 – 26 |
Non-Renewable Resource Revenue
Non-renewable resource revenue in 2023-24 is estimated at $18.4 billion, $9.2 billion less than the $27.5 billion forecast for 2022-23, which would be the highest ever for Alberta. The 2023-24 estimate would be the second highest resource revenue in Alberta’s government history, substantially more than the $14.3 billion recorded in 2005-06. Revenue is being driven by the current high oil and natural gas prices, elevated due to the uncertain global economic outlook and tight oil demand-supply balance, with the war in Ukraine, high inflation and interest rate hikes. The forecast assumes prices will begin to decline in 2023-24, and bitumen, conventional crude oil and natural gas and by-products royalties also trend down. By 2025-26, resource revenue is forecast to be $15.7 billion, with bitumen royalties making up just under 70%. The WTI price is expected to average US$79 per barrel (/bbl) in 2023-24, $11.50/bbl lower than forecast for 2022-23. Prices continue to fall, dropping to US$73.50/bbl by 2025-26.
The light-heavy oil price differential narrowed noticeably over the last several years, as COVID-19 impacts on oil demand and production meant egress issues retrenched, before expanding in 2022-23 with higher WTI prices and lower heavy-oil demand from refinery maintenance and release of heavy oil barrels from the US Strategic Petroleum Reserves. The forecast assumes the differential widened by about US$6.50/bbl in 2022-23 from 2021-22, to almost US$20/bbl, and then remains at US$19.50 in 2023-24 before trending down to about US$16.40/bbl by 2025-26, with growing production met by additional pipeline capacity. Even with a higher differential anticipated, the relatively strong global oil prices mean Alberta producers remain profitable.
Factors affecting royalties are the WTI price, the differential, US-Canadian dollar exchange rate, production, oil sands project status and producer costs:
| • | The Western Canadian Select price (WCS), a benchmark price for heavy oil (blended bitumen), is determined by the WTI US dollar price less a “light-heavy differential.” The differential is linked to costs of transporting Alberta |
Prices of Oil and Natural Gas, 1999-00 to 2025-26
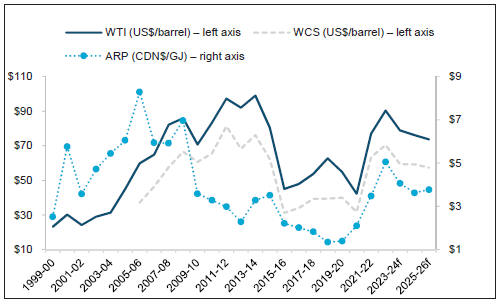
Resource revenue forecast in
2022-23 of $27.5 billion by far the
most ever; 2023-24 estimate of
$18.4 billion would be
second highest.
Oil prices expected to fall over
medium-term.
| Revenue | Fiscal Plan 2023 – 26 | 63 |
A forecast strengthening of the
Canadian dollar exchange rate
lowers royalty revenue.
Oil sands royalties increase after
projects recover initial capital and
operating costs.
| production to Gulf Coast refineries or coastal ports for export, and to the different properties of heavy oil relative to light sweet crude. Sufficient pipeline capacity lowers costs and the differential, increasing prices for Alberta producers; insufficient capacity means moving product by other means, increasing costs and the differential, lowering WCS prices. |
| • | A weaker Canadian dollar supports royalty revenue. The bitumen royalty rate is based on the WTI price expressed in Canadian dollars, so the rate is higher with a lower Canadian dollar. A lower Canadian dollar also increases oil prices when they are converted from US into Canadian dollars, elevating producers’ revenue in Canadian dollars. The exchange rate forecast decreased from budget in 2022-23 by almost three and a half cents, to 75.7US¢/ Cdn$, but is expected to strengthen over the next few years. It is forecast at 76.2US¢/Cdn$ in 2023-24 and then 79.5US¢/Cdn$ by 2025-26. |
| • | Bitumen production is growing, although the forecast growth has not changed materially from Budget 2022 even with the spike in prices in 2022. On the other hand, conventional crude oil and natural gas production are now estimated to be slightly higher over the next several years. Bitumen production is forecast to grow by 7.6% or 248 thousand barrels per day, between 2022-23 third quarter forecast and 2025-26, while natural gas production expands 2.9% or 121 billion cubic feet over the three years. Conventional production has increased in 2022-23, but remains flat at the higher level and then decreases slightly in 2025-26. |
| • | Oil sands royalties change when projects reach post-payout status (total project revenue exceeds total capital and operating costs). Prior to payout, royalties are 1–9% of gross revenue, while after payout, they are the greater of 1–9% of gross revenue or 25–40% of net revenue. The higher oil prices have accelerated payout for some projects. |
| • | The energy industry continues to seek efficiencies, improve productivity, lower emissions intensity per barrel produced, and reduce costs. Oil sands companies continue to examine their processes to optimize their operations. |
| Oil and Natural Gas Assumptions | ||||||||||||||||||||||||
| 2021-22 | 2022-23 | 2023-24 | 2024-25 | 2025-26 | ||||||||||||||||||||
| Actual | Budget | Forecast | Estimate | Target | Target | |||||||||||||||||||
| Revenue (millions of dollars) |
||||||||||||||||||||||||
| Bitumen royalty |
11,605 | 10,349 | 18,750 | 12,555 | 12,028 | 10,736 | ||||||||||||||||||
| Crude oil royalty |
1,947 | 1,670 | 3,965 | 2,905 | 2,633 | 2,442 | ||||||||||||||||||
| Natural gas / by-products royalties |
2,227 | 1,458 | 4,221 | 2,465 | 2,208 | 2,155 | ||||||||||||||||||
| Prices |
||||||||||||||||||||||||
| West Texas Intermediate (US$/bbl) |
77.03 | 70.00 | 90.50 | 79.00 | 76.00 | 73.50 | ||||||||||||||||||
| WCS @ Hardisty (Cdn$/bbl) |
79.63 | 70.30 | 92.60 | 78.00 | 75.90 | 72.10 | ||||||||||||||||||
| Differential (US$/bbl) |
(13.56 | ) | (14.30 | ) | (20.00 | ) | (19.50 | ) | (16.80 | ) | (16.40 | ) | ||||||||||||
| Ab. Refererence Price (Cdn$/GJ) |
3.48 | 3.20 | 5.10 | 4.10 | 3.60 | 3.80 | ||||||||||||||||||
| Production (thousands of barrels / day) |
||||||||||||||||||||||||
| Conventional |
444 | 441 | 497 | 497 | 497 | 490 | ||||||||||||||||||
| Raw bitumen |
3,197 | 3,296 | 3,281 | 3,345 | 3,436 | 3,529 | ||||||||||||||||||
| Natural gas (billion cubic feet / yr) |
4,027 | 4,118 | 4,226 | 4,275 | 4,304 | 4,347 | ||||||||||||||||||
| Exchange rate |
||||||||||||||||||||||||
| (US¢/Cdn$) |
79.8 | 79.0 | 75.7 | 76.2 | 78.2 | 79.5 | ||||||||||||||||||
| 64 | Revenue | Fiscal Plan 2023 – 26 |
| Bitumen royalties are estimated at $12.6 billion in 2023-24, $6.2 billion less than in 2022-23, due primarily to the lower oil price forecast. Royalties are forecast to decrease a further $1.8 billion over the next two years as prices continue to fall, reaching $10.7 billion in 2025-26. | ||
| Conventional oil royalties are estimated at $2.9 billion in 2023-24, a decrease of $1.1 billion from 2022-23. Again weakening oil prices mean royalties fall by $463 million, to $2.4 billion by 2025-26. | ||
| Natural gas and by-product royalties in 2023-24 of $2.5 billion are estimated, $1.8 billion lower than in 2022-23, due primarily to decreasing natural gas and natural gas liquid prices (i.e. natural gas by-products). The natural gas Alberta Reference Price (ARP) climbed an estimated $1.90 per gigajoule (/GJ) relative to budget in 2022-23, to $5.10/GJ, the highest price since 2008-09, when it averaged $6.97/GJ. ARP is anticipated to fall to $4.10/ GJ in 2023-24, and then to trend down to $3.80/GJ by 2025-26. Revenue also falls, by $310 million to $2.2 billion by 2025-26. Prices for natural gas by-products, such as propane, butane and pentanes plus, follow oil prices, which are also retrenching from current highs. | ||
|
The outlook for natural gas and by-products has improved, with upside demand from oil sands projects and power generation, and with Alberta’s low corporate taxes and overall attractive business climate supporting expansion in the petrochemical sector. Steady production growth in Alberta is forecast. |
Outlook for natural gas prices has improved, with higher global demand and from oil sands operators. | |
| Bonuses and sales of Crown land leases revenue in 2023-24 is estimated at $307 million, a decrease of $102 million from 2022-23 when strong commodity prices led to both higher prices per hectare and number of hectares sold. Revenue trends down slightly to $289 million by 2025-26, following energy prices, but remains quite strong. | ||
Non-Renewable Resource Revenue
(millions of dollars)
| 2021-22 | 2022-23 | 2023-24 | 2024-25 | 2025-26 | ||||||||||||||||||||
| Actual | Budget | Forecast | Estimate | Target | Target | |||||||||||||||||||
| Bitumen royalty |
11,605 | 10,349 | 18,750 | 12,555 | 12,028 | 10,736 | ||||||||||||||||||
| Crude oil royalty |
1,947 | 1,670 | 3,965 | 2,905 | 2,633 | 2,442 | ||||||||||||||||||
| Natural gas & by-products royalty |
2,227 | 1,458 | 4,221 | 2,465 | 2,208 | 2,155 | ||||||||||||||||||
| Bonuses & sales of Crown leases |
228 | 236 | 409 | 307 | 293 | 289 | ||||||||||||||||||
| Rentals and fees / coal royalty |
163 | 127 | 199 | 129 | 122 | 120 | ||||||||||||||||||
| Total Resource Revenue |
16,170 | 13,840 | 27,544 | 18,361 | 17,284 | 15,742 | ||||||||||||||||||
| Tax Revenue | ||
|
Tax revenue is forecast at $25 billion in 2023-24, 35% of total revenue. This is $412 million, or only 1.7% higher than in 2022-23. Personal income tax (PIT) revenue growth is forecast at $263 million as indexation of the system reduces revenue, while corporate income tax (CIT) is down $502 million from the record $6.4 billion forecast for 2022-23, as the spike in energy prices and activity subside. Fuel tax revenue is $635 million higher as collection was paused for most of 2022-23. The pause was extended until June 30, 2023, but as the program is now tied to quarterly WTI prices, partial tax relief is forecast until December 2023. Revenue grows another $600 million in 2024-25. |
Alberta’s economic growth leads to increased jobs and activity, improving household income. |
| Revenue | Fiscal Plan 2023 – 26 | 65 |
| Tax revenue is forecast to grow by an average of 7% for the following two years, reaching $28.6 billion by 2025-26. This mainly reflects strong growth in income taxes. Of the $3.6 billion increase in tax revenue between 2023-24 and 2025-26, $2.7 billion, or 74%, is from income taxes, while $638 million, or 18% is from fuel taxes. | ||
| ____
Charitable donations tax credit enhanced in 2022, lowering tax revenue by about $60 million per year. |
Personal income tax revenue in 2023-24 is estimated at $14.1 billion, an increase of $263 million from 2022-23. PIT in 2022-23 is now expected to be $424 million higher than the Budget 2022 forecast, due mainly to revised, higher 2021 assessment data. This requires a positive $338 million prior-years’ adjustment in 2022-23 to reverse understated revenue reported in 2020-21 and 2021-22 financial statements, and increases the base used to forecast future years. Further growth in household income in 2022, due to the rebounding economy, job creation and population growth propelled by higher energy prices, is partially offset by the impact of indexing the PIT system to inflation effective January 1, 2022, which reduces revenue by $680 million in 2023-24 and $1.2 billion by 2025-26. PIT is forecast to increase by $2 billion, or an average of 6.9% per year between 2023-24 and 2025-26, to $16.1 billion, from improving employment, wages and household income growth. Included in the forecast are enhancements to the charitable donations and adoption expense tax credits, reducing revenue by about $60 million per year (almost entirely due to the charitable donations tax credit change). | |
| ____
Corporate income tax revenue of $6.4 billion in 2022-23 the highest ever, and revenue forecast to grow to $6.6 billion by 2025-26. |
Corporate income tax is estimated at $5.9 billion in 2023-24, $502 million less than the $6.4 billion forecast for 2022-23, the highest ever. CIT rose dramatically in both 2021-22 and 2022-23, increasing by almost $2.4 billion in 2022-23 relative to Budget 2022, as energy prices strengthened materially and Alberta economic activity broadened. The decision to lower the corporate income tax rate, in addition to red tape reduction, Recovery Plan initiatives and government fiscal prudence, has attracted investment and spurred diversification in Alberta, with numerous major projects announced in sectors such as petrochemicals, renewable energy, aerospace, agrifood and innovation and technology. The medium-term forecast has been revised down slightly relative to mid-year, as the 2023 global economic outlook has deteriorated, lowering the base used to forecast subsequent years. CIT revenue is expected to average 5.6% growth between 2023-24 and 2025-26, reaching $6.6 billion. This incorporates the new agri-processing investment tax credit, reducing CIT by $5 million in 2024-25 and $10 million in 2025-26. | |
| ____
2023 education property tax requisition frozen for the third time in four years. |
Education property tax revenue is forecast at $2.5 billion in 2023-24, the same as in 2022-23, as the requisition has been frozen for the third time in four years. The requisition will continue to be reviewed annually, but the forecast for future years is based on increasing the requisition by population growth plus inflation. Revenue rises by about $100 million per year, to $2.7 billion by 2025-26. Included in 2022-23 and 2023-24 revenue are $15 million in credits under the provincial education requisition credit (PERC). PERC provides an equivalent education tax credit for municipalities who are unable to collect education property tax on delinquent oil and gas properties. The 2023 residential / farm mill rate is $2.56 per $1,000 of equalized assessment, and the non-residential rate is $3.76 per $1,000 of equalized assessment. |
| 66 | Revenue | Fiscal Plan 2023 – 26 |
| Other tax revenue is forecast at $2.5 billion in 2023-24, $651 million higher than in 2022-23, primarily from a $635 million increase in fuel tax revenue after the substantial affordability relief provided by pausing collection in most of 2022-23, and a $53 million increase in insurance tax revenue, mainly due to population growth and inflation. These are partly offset by lower revenue from tobacco and freehold mineral rights taxes, due to lower consumption and substitution with other products, and the forecast drop in oil prices, respectively. Other tax revenue is forecast to reach $3.2 billion by 2025-26, mainly from further increases of $638 million in the fuel tax as the relief measures continue for part of 2023-24, and $118 million in insurance taxes, again partly offset by declining tobacco and freehold mineral rights taxes. |
Fuel tax relief extended to June 30 2023, and continues after, depending on quarterly WTI oil prices. | |
Tax Revenue
(millions of dollars)
| 2021-22 | 2022-23 | 2023-24 | 2024-25 | 2025-26 | ||||||||||||||||||||
| Actual | Budget | Forecast | Estimate | Target | Target | |||||||||||||||||||
| Personal income tax |
13,335 | 13,382 | 13,806 | 14,069 | 15,034 | 16,071 | ||||||||||||||||||
| Corporate income tax |
4,718 | 4,040 | 6,413 | 5,911 | 6,254 | 6,590 | ||||||||||||||||||
| Education property tax |
2,478 | 2,504 | 2,504 | 2,504 | 2,604 | 2,703 | ||||||||||||||||||
| Other taxes |
2,975 | 3,108 | 1,857 | 2,508 | 3,163 | 3,245 | ||||||||||||||||||
| Total Tax Revenue |
23,506 | 23,034 | 24,580 | 24,992 | 27,055 | 28,609 | ||||||||||||||||||
| Federal Transfers | ||
| Federal transfers are forecast at $12.6 billion in 2023-24, $787 million, or 6.7% higher than the 2022-23 forecast. Main increases in 2023-24 include: | ||
| • $637 million in the Canada Health (CHT) and Canada Social Transfers (CST). A one-time $233 million CHT top-up in 2023-24 following recent negotiations between Canadian provinces and territories and the federal government is offset in the year-over-year change by a one-time CHT top-up of $232 million for surgery backlogs in 2022-23. The CHT covers about 23% of Alberta’s health expense; |
||
| • a one-time $707 million Fiscal Stabilization payment, re-profiled from 2022-23, for the 2020-21 revenue decline relative to 2019-20, based on the program’s revised, but insufficient $170 per person cap; |
$707 million Fiscal Stabilization Payment in 2023-24 for revenue decline in 2020-21. | |
| • a net $153 million in re-profiled infrastructure support; |
||
| • $203 million additional funding under the early learning child care agreements (ELCC), primarily as the more recent agreement targeted to achieve $10-a-day child care ramps up; |
||
| • these are partly offset by a net $913 million in decreases, mainly from transfers for site rehabilitation ($574 million), municipal transit support ($80 million), rapid test kits ($144 million) and other COVID-19 transfers included in 2022-23 revenue, not continuing in 2023-24. |
||
| Federal transfers increase $561 million by 2025-26, led by $668 million in regular increases to the CHT and CST and $289 million under ELCC, partially offset by the $707 million fiscal stabilization payment not continuing. Other changes include: an estimated $121 million relatively minor addition to CHT in 2025-26 based on increasing the annual escalator following the |
Special federal transfers for COVID-19 winding down. | |
| Revenue | Fiscal Plan 2023 – 26 | 67 |
| recent negotiations; $148 million increase in infrastructure transfers, mainly related to Investing in Canada Infrastructure Program funding for Calgary and Edmonton LRT projects; $84 million in higher agriculture transfers primarily due to the 60% increase in premium rates needed to replenish the crop insurance fund after the significant withdrawals in 2021-22 and forecast for 2022-23; a net $42 million decrease in various other transfers. Revenue in 2025-26 is forecast at $13.1 billion, or 18.1% of total revenue, only slightly more than the 17.8% forecast for 2023-24. | ||
| ____
Growth rate in federal transfers for health has been insufficient relative to rising health care costs. |
The CST and CHT grow in line with changes to Alberta’s share of the national population, which is expected to continue increasing, and federal annual escalators. For CST, the escalator is 3%. For CHT, the escalator is based on the higher of the three-year average of national nominal GDP growth, or, effective for 2023-24 and the next four years after recent negotiations, 5% (previously 3%). Since national GDP growth has recently averaged over 5%, the escalator is based on the higher GDP growth rate until 2025-26. CHT revenue does increase $121 million in 2025-26 based on the new 5% minimum escalator. The recent negotiations included discussions about a variety of individual health care transfers for federally-defined initiatives that may require provincial matching. Nothing has been included in Budget 2023 for these. | |
| The forecast includes funding for various other specific programs, including: | ||
| • Labour market agreements for employment and training, which were enhanced temporarily in 2021-22 and now include annual funding of about $325 million beginning in 2022-23; | ||
| • Transfers for housing under the new national program; | ||
| • The 2017-18 ten-year home care and mental health care agreement. | ||
|
| ||
| Transfers from Government of Canada
(millions of dollars) | ||
| 2021-22 | 2022-23 | 2023-24 | 2024-25 | 2025-26 | ||||||||||||||||||||
| Actual | Budget | Forecast | Estimate | Target | Target | |||||||||||||||||||
| Canada Health Transfer |
5,503 | 5,352 | 5,520 | 6,079 | 6,287 | 6,708 | ||||||||||||||||||
| Canada Social Transfer |
1,796 | 1,868 | 1,864 | 1,942 | 2,022 | 2,102 | ||||||||||||||||||
| Transfers to SUCH sector |
478 | 579 | 624 | 617 | 623 | 635 | ||||||||||||||||||
| Infrastructure support |
808 | 1,293 | 782 | 935 | 1,166 | 1,083 | ||||||||||||||||||
| Agriculture support programs |
531 | 296 | 491 | 480 | 517 | 564 | ||||||||||||||||||
| Labour market agreements |
485 | 322 | 324 | 325 | 325 | 325 | ||||||||||||||||||
| Early learning child care agreements |
197 | 734 | 734 | 937 | 1,062 | 1,226 | ||||||||||||||||||
| Other transfers |
1,797 | 1,610 | 1,426 | 1,237 | 473 | 470 | ||||||||||||||||||
| Total Federal Transfers |
11,595 | 12,054 | 11,765 | 12,552 | 12,475 | 13,113 | ||||||||||||||||||
| Investment Income | ||
| ____
Investment income weak in 2022- 23 but expected to recover over next few years. |
Investment income is forecast at $3.2 billion in 2023-24, $2.1 billion more than in 2022-23. Global financial markets tumbled in 2022, with inflation and subsequent interest rate hikes, Russia’s invasion of Ukraine, geopolitical uncertainty, and lingering COVID-19 impacts in China all threatening economic growth and in turn, investment performance. The Heritage and endowment funds are forecast to have lost $150 million in 2022-23. On the | |
| 68 | Revenue | Fiscal Plan 2023 – 26 |
| other hand, simple interest-bearing investments have benefitted from the string of rate hikes central banks have imposed to quell surging inflation, as has net income from loans to local authorities as derivative costs decline (though derivative costs on swapped associated local authority debt reported in debt servicing cost expense rise commensurately). As the current inflationary, geopolitical and economic uncertainty is expected to begin to subside during 2023 and 2024, investment income is forecast to recover. Assets in the crop insurance fund in Agriculture Financial Services Corporation dropped in 2021-22 and 2022-23 with substantial withdrawals for insurance claims related to drought, hail and other events, lowering investment income, but the fund is being re-capitalized and earns greater income over the forecast. Investment income is estimated to increase by a net $253 million between 2023-24 and 2025-26, reaching $3.4 billion. Heritage Fund investment income increases by $406 million, as it will now retain all net investment income, instead of just an amount for inflation-proofing, under proposed legislative changes, while income from student loans following reductions to the rates charged to students, and from local authority lending, decline. |
The Alberta Heritage Savings Trust Fund to retain all of its net investment income under proposed legislative amendments, boosting its assets and potential income. | |
| Fund Assets / Investment Income |
|
|||||||||||||||||||||||||||
| (millions of dollars) | Investment Income | |||||||||||||||||||||||||||
| Assets as at | 2021-22 | 2022-23 | 2023-24 | 2024-25 | 2025-26 | |||||||||||||||||||||||
| Mar. 31, 2022 | Actual | Budget | Forecast | Estimate | Target | Target | ||||||||||||||||||||||
| Heritage Savings Trust Fund |
17,094 | 2,128 | 1,976 | (74 | ) | 1,226 | 1,458 | 1,632 | ||||||||||||||||||||
| Endowment funds a |
4,790 | 514 | 440 | (76 | ) | 352 | 369 | 401 | ||||||||||||||||||||
| Loans to local authorities |
14,424 | 329 | 185 | 450 | 734 | 612 | 543 | |||||||||||||||||||||
| Ag. Financial Services Corp. |
3,967 | 126 | 113 | 91 | 126 | 130 | 139 | |||||||||||||||||||||
| SUCH sector |
n.a. | 430 | 287 | 301 | 318 | 326 | 334 | |||||||||||||||||||||
| Other b |
9,487 | 52 | 172 | 343 | 398 | 378 | 358 | |||||||||||||||||||||
| Total Assets / Inv. Income |
49,762 | 3,579 | 3,173 | 1,035 | 3,154 | 3,273 | 3,407 | |||||||||||||||||||||
| a Includes Alberta Heritage Foundation for Medical Research Endowment Fund, Alberta Heritage Scholarship Fund and Alberta Heritage Science and Engineering Research Fund.
b Assets include General Revenue Fund cash, Alberta Enterprise Corporation and Technology Innovation and Emissions Reduction Fund. Income includes earnings from cash, and from a variety of smaller funds and accounts and student loans.
Revenue from Other Sources
Revenue from other sources is forecast at $11.6 billion in 2023-24, an increase of $493 million from 2022-23. Revenue increases by $143 million between 2023-24 and 2025-26, to $11.7 billion.
Alberta Gaming, Liquor and Cannabis Commission (AGLC) net income from gaming and lottery activities, liquor and cannabis is expected to remain relatively constant at $2.3 billion over 2022-23 to 2024-25, after recovering in 2022-23 from pandemic restrictions. Net income then increases $78 million in 2025-26 when it reaches $2.4 billion.
ATB Financial net income is forecast at $279 million in 2023-24, $3 million lower than in 2022-23, but grows $79 million to $358 million by 2025-26. Net income increased significantly in 2021-22, due mainly to a sizeable reversal in the prior-year provision for loan losses and to higher revenue due to stronger economic activity. In 2022-23, increased credit losses and higher operating |
| Revenue | Fiscal Plan 2023 – 26 | 69 |
Post-secondary institution tuition
fee hikes to be capped at 2%
beginning in 2024-25.
Agriculture insurance premium
rates increasing 60% to raise the
crop insurance fund balance back
to level recommended by
actuarial evaluations.
costs reduce net income. This continues in 2023-24, before revenue growth and lower credit losses outstrip rising operating costs and net income increases.
Alberta Petroleum Marketing Commission (APMC) is forecasting a net loss of $18 million in 2023-24, $300 million better than the 2022-23 net loss. The Sturgeon Refinery underwent maintenance and was not operating for portions of 2022-23, reducing cash flow. The bi-annual maintenance results in increased cash flow and net income in the following year, 2023-24. Prices for diesel, the refinery’s main output, have also declined, and are forecast to remain low. APMC’s net loss increases in 2024-25 when maintenance is scheduled, but then falls moderately in 2025-26 to $263 million.
Post-secondary institution tuition fees are estimated at $1,771 million in 2023-24, an increase of $104 million from 2022-23, as enrolment and fee rates increase. Tuition fees are projected to grow a further $131 million, to $1,902 million by 2025-26, primarily due to enrolment growth, as the government has imposed a 2% cap on tuition rate increases beginning in 2024-25.
School board and Alberta Health Services (AHS) fees began recovering in 2022-23 as in-person learning returned, and hospital parking fees and out-of-province patient billings increased with pandemic health restrictions unwinding. These fees are expected to continue recovering relatively robustly, increasing by $49 million in 2023-24, to $754 million, and by $78 million over the following two years, reaching $832 million by 2025-26, due mainly to enrolment growth and the impact of inflation on various fees and charges.
Other premiums, fees and licences revenue is forecast at $2,515 million in 2023-24, an increase of $91 million from 2022-23. Revenue grows another $111 million to $2,626 million by 2025-26. The increase in 2023-24 is due mainly to: $99 million for a 60% rise in agriculture insurance premium rates necessary to replenish the crop insurance fund depleted by sizeable withdrawals for indemnity payments in 2021-22 and 2022-23; $73 million for Alberta Energy Regulator (AER) levies for orphan well funding and for AER’s own operations; $14 million from higher demand and volumes at registries and land titles; a $90 million reduction in timber royalties and fees, following several years of strong revenue from high North American lumber prices. Over the next two years, increases of $128 million in agriculture insurance premiums, $24 million in ATB Financial payment-in-lieu of taxes and $13 million in AER levies are partially offset by a drop of $53 million in timber royalties and fees.
School jurisdiction, post-secondary institution and health entity (the SUCH sector) sales, rentals and services revenue is expected to continue rebounding from the decreases caused by pandemic restrictions, and as activity expands with the growing economy. Revenue rises $20 million to $915 million in 2023-24, and to $942 million by 2025-26. Fundraising and donations revenue is not forecast to increase as strongly however, rising by $17 million between the 2022-23 third quarter and 2025-26 forecasts. These types of revenue are linked to economic conditions, and SUCH sector entities employ a relatively conservative approach to forecasting the revenue.
| 70 | Revenue | Fiscal Plan 2023 – 26 |
Compliance payments from large industrial emitters to the Technology Innovation and Emissions Reduction Fund jumped $216 million in 2022-23 relative to budget, to $637 million, with the rebound in economic activity, higher energy prices and industrial output, as well as decisions regarding offset credit usage versus compliance payments in light of the federal government’s future and ongoing carbon tax increases. The regulatory regime also underwent a review and was adjusted for 2023. It is anticipated this will encourage elevated compliance payments earlier, in 2023-24 and 2024-25, but then reduce payments in favour of emissions reduction and credit usage going forward. Revenue is forecast to decline by $114 million in 2023-24, to $523 million, grow to $563 million in 2024-25, before falling $260 million to $303 million in 2025-26.
Other notable changes include: increases of $112 million in 2023-24, and then $54 million over the following two years, for external investment management charges that are based on investment income outperforming market benchmarks, and are billed to clients such as pension plans for their share; a decrease in fines and penalties in 2023-24 of $27 million as 2022-23 included an individual fine of $31 million; a $46 million reduction in refunds of expense, due to the lower aggregate assessment charged to automobile insurers as occurred in 2022-23 with reduced traffic, followed by a $20 million increase over the next two years as traffic volumes grow.
| Revenue from Other Sources
|
|
|||||||||||||||||||||||
| (millions of dollars) | ||||||||||||||||||||||||
| 2021-22 | 2022-23 | 2023-24 | 2024-25 | 2025-26 | ||||||||||||||||||||
| Actual | Budget | Forecast | Estimate | Target | Target | |||||||||||||||||||
| AGLC - gaming / lottery |
1,205 | 1,468 | 1,502 | 1,515 | 1,509 | 1,573 | ||||||||||||||||||
| AGLC - liquor |
854 | 850 | 832 | 830 | 836 | 845 | ||||||||||||||||||
| AGLC - cannabis |
(4 | ) | 7 | 13 | 5 | 9 | 14 | |||||||||||||||||
| ATB Financial |
586 | 313 | 282 | 279 | 324 | 358 | ||||||||||||||||||
| Balancing Pool |
96 | 112 | 120 | 103 | 103 | 103 | ||||||||||||||||||
| Alberta Petroleum Marketing Comm. |
2,059 | (329 | ) | (318 | ) | (18 | ) | (376 | ) | (263 | ) | |||||||||||||
| Post-secondary tuition fees |
1,465 | 1,645 | 1,667 | 1,771 | 1,865 | 1,902 | ||||||||||||||||||
| Health / school board fees |
603 | 661 | 705 | 754 | 793 | 832 | ||||||||||||||||||
| Other premiums, fees and licences |
2,452 | 2,184 | 2,424 | 2,515 | 2,631 | 2,626 | ||||||||||||||||||
| SUCH sales, rentals, services |
806 | 876 | 895 | 915 | 920 | 942 | ||||||||||||||||||
| SUCH fundraising, donations, gifts |
741 | 640 | 658 | 662 | 670 | 675 | ||||||||||||||||||
| TIER Fund |
705 | 421 | 637 | 523 | 563 | 303 | ||||||||||||||||||
| Other |
1,904 | 1,659 | 1,684 | 1,740 | 1,790 | 1,827 | ||||||||||||||||||
| Total Revenue fr. Other Sources |
13,472 | 10,506 | 11,101 | 11,594 | 11,637 | 11,737 | ||||||||||||||||||
Risks
As a small, open economy with a sizeable resource sector, Alberta is highly impacted by developments beyond its borders. Fluctuations in global supply and demand can translate into large price swings for Alberta commodity exports and substantial shifts in corporate investment and economic activity. When the global impacts of the COVID-19 pandemic dissipated, the resulting rapid increase in global demand without a sufficient and timely supply response, in part due to pandemic and climate-related underinvestment over several years, coupled with Russia’s invasion of Ukraine and other geopolitical events, increased energy prices dramatically. This caused global inflation,
| Revenue | Fiscal Plan 2023 – 26 | 71 |
Alberta government revenue is
volatile and unpredictable.
A renewed, legislated fiscal
framework is being introduced to
guide fiscal planning.
exacerbated supply-chain issues, prompted numerous interest rate hikes across the world, threatened economic growth and hammered financial markets.
These all heavily impact Alberta and Alberta’s government. Alberta government revenue is much more volatile and unpredictable than the broader economy, especially non-renewable resource revenue, corporate income tax and investment income, making fiscal planning challenging.
These challenges have never been more evident than in the last several years. As noted earlier, Alberta’s government revenue in 2022-23 reached record heights, increasing $7.7 billion from 2021-22, and by $32.9 billion from 2020-21. Revenue is forecast to remain at these elevated levels for the medium term. The associated economic boom attracts job-seekers and investment, impacting demand for social, education and health programs, and infrastructure needs.
To help deal with these challenges and guide fiscal planning, the government is introducing a renewed legislated fiscal framework, or set of rules around budgeting and fiscal planning. A core element of the rules is a balanced budget requirement. Balanced budget laws have been enacted previously in Alberta, but have been quickly amended as they have been too inflexible relative to Alberta’s government revenue swings and their implications for expense decisions. The proposed set of rules is designed to balance simplicity and rigour, but also provide several exemptions: first, for uncontrollable spending requirements, such as those caused by dedicated revenue or disasters and emergencies, and second, for significant swings in revenue, either during the year or when preparing the budget, relative to prior-year revenue. More details are provided in the Overview chapter on pages 17-21.
In order to highlight the risks and volatility, alternative forecast scenarios have been presented in budgets since Budget 2019. For Budget 2023, the impact on non-renewable resource revenue, income tax and other taxes from low and high scenarios have been developed, and are outlined on pages 45-46 in the Economic Outlook chapter.
Some of the main factors impacting Alberta government revenue and their sensitivities, which show the impact of small changes to key variables, follow. The sensitivities have increased significantly over the last several years.
Global and US Economies
Budget 2023 assumes tepid global economic growth of 2.9% in 2023, rising to 3.1% in 2024, as inflationary pressures and economic uncertainty settles. The recent dislocation between energy supply and demand, coupled with sanctions against Russia for its aggression against Ukraine, are also assumed to resolve. Substantial risks remain, as weaker global growth would keep oil prices lower, harming Alberta’s revenue forecast.
Energy Prices
Price forecasts depend on assumptions about demand and supply. Factors influencing demand include global economic growth, pipeline or refinery outages, and storage and speculative market activities by traders. On the supply side are OPEC compliance, US production, and Russia’s ability to thwart
| 72 | Revenue | Fiscal Plan 2023 – 26 |
| sanctions and sell its output. Other factors include investment and drilling decisions by other producers, geopolitical events, civil unrest or terrorist strikes, economic sanctions, or simple weather-related production disruptions. | ||
| Interest Rates | ||
| Interest rates have risen dramatically in the last year to deal with inflation. Higher rates generally harm government investment income, as is evident in the 2022-23 Heritage Fund’s negative investment income. While market values of bonds with lower rates drop, short-term interest-bearing investments benefit. Higher rates also typically discourage business investment, economic activity and consumer spending. Rising rates also pose risks for indebted households, consumer spending and the government. The government repaid $13.4 billion in debt during 2022-23, taking advantage of the spike in energy prices and revenue, and the new fiscal framework continues emphasis on debt repayment by requiring at least 50% of surplus cash be used to retire maturing debt, alleviating re-financing risk and creating future fiscal flexibility. |
New fiscal framework contains | |
| Exchange Rates | ||
| A stronger Canadian dollar decreases the value of exports and the demand for exports priced in Canadian dollars. Changes in the exchange rate affect the profitability of energy producers, which can affect investment and government resource revenue as energy prices and contracts are mainly in US dollars. Investment income is also impacted due to significant foreign holdings. | ||
| Equity Markets | ||
| Equity markets can be affected by a wide range of factors, such as the strength of the US, European and developing economies, or fluctuations in commodity prices and interest rates. Alberta has significant assets invested globally. | ||
| Net Corporate Operating Surplus
Corporate profits in Alberta were hit hard in 2020, but bounced back exceptionally in 2021 and 2022. It is difficult to predict how net corporate operating surplus translates to corporate income tax revenue. Taxable income can differ significantly from corporate profits, due to tax changes or discretionary deductions such as depreciation or prior-year losses which can be carried forward or back and affect corporate income tax revenue for years. |
Corporate income tax hard to | |
| Sensitivities to Fiscal Year Assumptions, 2023-24a | ||||||
| (millions of dollars) | Change | Net Impact | ||||
| Oil price (WTI US$/bbl) |
-$1 | -630 | ||||
| Light-heavy oil price differential (US$/bbl) |
+$1 | -600 | ||||
| Natural gas price (Cdn$/GJ) |
-10¢ | -15 | ||||
| Exchange rate (US¢/Cdn$) |
+ 1¢ | -490 | ||||
| Interest rates |
+1% | -146 | ||||
| Primary household income |
-1% | -160 | ||||
|
a Sensitivities are based on current assumptions of prices and rates, displaying impacts over a 12 month period. They can vary significantly at different price and rate levels. Energy price sensitivities do not include potential impacts of price changes on land lease sales revenue.
|
| |||||
| Revenue | Fiscal Plan 2023 – 26 | 73 |
|
Alberta’s Resource Revenue Royalty Structure | ||
| The Alberta government has substantial non-renewable resource revenue (NRR), including royalties from bitumen, crude oil, natural gas and by-products and coal, as well as revenue from bonuses and sales of Crown leases, and rentals and fees.
Alberta’s royalty regimes follow a concession system where mineral rights are owned by the Crown. Companies earn the right to explore mineral rights through land sale auctions, and then pay royalties to the Crown for a share of the resulting production. The share is calculated by applying a royalty formula, which is unique to each commodity.
• The generic oil sands royalty
regime is based on the revenue of individual projects. The royalty rate is determined by oil prices and whether the project is in pre- or post-payout. Royalty rates are calculated based on the West Texas Intermediate (WTI) oil price expressed in
Canadian dollars. An oil sands project reaches payout when its cumulative revenue exceeds its cumulative eligible costs for the first time. Prior to payout, royalties are
• Royalties for natural gas and by-products, and conventional oil, are well-based, and are calculated based on two systems: the former Alberta Royalty Framework (ARF), and the current Modernized Royalty Framework (MRF). Since January 2017, new wells drilled pay under MRF, while most producing wells drilled before then pay under ARF (scheduled to fully transition to MRF by end of 2026). The MRF regime is a revenue minus cost system similar to the oil sands regime, but with a standardized cost (C*) based on an industry average to drill and complete a well. This benefits companies that reduce costs below the industry average. MRF also has a payout feature where pre-payout wells pay a lower royalty rate which increases once the well has recovered its C* costs.
Three main factors drive royalty revenue: price, cost to produce, and quantity. The exchange rate is also a driver as most commodities are priced in US dollars. Energy prices, like prices for other goods, are determined by supply and demand. The Alberta government uses information and advice from energy
|
analysts, and compares the forecast with those from investment houses, banks and private forecasters.
• The most important oil prices to Alberta are WTI and Western Canadian Select (WCS). WTI is the North American price benchmark for light sweet crude oil, which broadly captures global oil pricing trends. WCS is the Western Canadian price benchmark for heavy oil - a heavy Alberta-produced crude composed largely of bitumen blended with diluents. Alberta oil prices trade at a differential to WTI to reflect local market fundamentals, adjustments in quality relative to WTI, and transportation costs.
• The most important natural gas and natural gas liquid prices are: Henry Hub, AECO, Alberta Reference Price (ARP) and natural gas liquid prices. Henry Hub is the US and North American price benchmark for natural gas, while AECO is the Western Canadian price benchmark. ARP is the monthly weighted average field price of all Alberta natural gas sales, and is used to calculate royalties. Natural gas by-product or liquid prices, such as propane, butane, and pentanes plus, closely follow WTI prices but with regional discounts reflecting local supply and demand fundamentals. Alberta natural gas prices have remained depressed and volatile, while natural gas by-product prices have provided some relief to natural gas operators as they follow WTI prices.
Bitumen production and costs are based on project forecasts submitted annually by oil sands operators, and compared with internal and external forecasts for reasonableness. Forecasts for conventional oil and natural gas production use Alberta Energy Regulator estimates, current market trends and industry activity. Costs are based on C* (the industry average).
All these drivers can impact payout status, affecting royalties dramatically. This is especially the case for bitumen. Changes to project costs or revenue may delay pre-payout projects from reaching post-payout status and paying higher royalties on net revenue, while royalties from post-payout projects could be much lower, especially if they are pushed into paying based on gross revenue. | |
| 74 | Revenue | Fiscal Plan 2023 – 26 |
BUDGET 2023
GOVERNMENT OF ALBERTA | 2023–26
Fiscal Plan
Expense
| 75 |
Table of Contents
| Expense |
77 | |||
| Addressing Affordability and Delivering Efficient Government Services |
77 | |||
| Expense Highlights |
77 | |||
| A Health Care System that Works For Albertans |
78 | |||
| Affordability for Albertans |
81 | |||
| Support for Vulnerable Albertans |
84 | |||
| Kindergarten to Post-Secondary Education |
86 | |||
| Support for Ukrainian Evacuees |
90 | |||
| Keeping Albertans Safe and Secure |
90 | |||
| Boosting Alberta’s Advantage – Jobs and Economy |
93 | |||
| General Government / Other |
95 | |||
Note: Amounts presented in tables may not add to totals due to rounding.
| 76 | Expense | Fiscal Plan 2023 – 26 |
| Expense
Addressing Affordability and Delivering Efficient Government Services |
||
| Albertans are resilient. Despite the significant challenges of recent years including a global pandemic and the resulting closure of economies, supply chain disruptions, Russian aggression in Ukraine, natural disasters and increased cost of living, there are many reasons to be optimistic about our future. Budget 2023 is focused on securing Alberta’s future by strengthening health care, addressing affordability and delivering efficient government programs and services, growing the economy and supporting job creation, and keeping Albertans and communities safe. | ||
| Budget 2023 is built upon principles of fiscal responsibility and managing within our means. A new fiscal framework, including balanced budget legislation, will help government make spending decisions that support long-term sustainability of government programs and services that are important to Albertans. |
A new fiscal framework will | |
| Budget 2023 is investing in our health care system by increasing operating expense by $965 million from the 2022-23 forecast and putting forward a Healthcare Action Plan for the future of health care in Alberta. Affordability for Albertans is front and centre with $2.3 billion in measures included in 2023-24 to help offset rising prices. Since Alberta businesses are hiring, we must focus on training an effective workforce, including expanding access to training opportunities for rural Albertans. Budget 2023 also focuses on our justice system and public safety with additional investments to deliver a fair and accessible justice system for Albertans, and provide more funding for correctional services, sheriffs, and policing. |
Affordability for Albertans is front | |
| Expense Highlights
In 2023-24, operating expense will be 3 per cent, or $1.7 billion higher than the 2022-23 forecast and will grow by approximately 2 per cent over the following two years. These targeted increases fund important investments to ensure that Alberta continues to be the best place to live, work and raise a family.
The 2022-23 total expense forecast increased by $3.5 billion from Budget 2022 mainly due to measures announced in the Affordability Action Plan to help Albertans deal with the rising cost of living. Additional funding was also provided for the Alberta Medical Association (AMA) agreement and collective bargaining agreements with teachers and other public sector unions, justice system and public safety enhancements, disaster expense related to wildfire fighting and agriculture indemnities and income support, and health care costs related to COVID-19 and other communicable diseases such as respiratory syncytial virus (RSV). |
||
| Expense | Fiscal Plan 2023 – 26 | 77 |
Budget 2023 – Expense Summary
| (millions of dollars) | ||||||||||||||||||||
| 2022-23 | 2023-24 | 2024-25 | 2025-26 | |||||||||||||||||
| Budget | Forecast | Estimate | Target | Target | ||||||||||||||||
| Operating Expense: |
||||||||||||||||||||
| Health |
21,927 | 23,568 | 24,533 | 25,443 | 26,041 | |||||||||||||||
| Education |
||||||||||||||||||||
| Kindergarten to Grade 12 |
8,403 | 8,477 | 8,836 | 9,036 | 9,162 | |||||||||||||||
| Post-Secondary |
5,346 | 5,422 | 5,604 | 5,730 | 5,862 | |||||||||||||||
| Social Service Ministries |
8,561 | 9,263 | 10,081 | 9,908 | 10,282 | |||||||||||||||
| Other Ministries / Legislative Assembly |
7,250 | 8,654 | 7,984 | 7,932 | 7,853 | |||||||||||||||
| Operating Expense |
51,487 | 55,384 | 57,038 | 58,049 | 59,200 | |||||||||||||||
| Capital Grants |
2,429 | 1,845 | 2,821 | 3,209 | 3,274 | |||||||||||||||
| Amortization / Inventory Consumption / Loss on Disposals |
4,057 | 4,480 | 4,397 | 4,460 | 4,509 | |||||||||||||||
| Debt Servicing |
2,662 | 2,715 | 2,848 | 2,805 | 3,103 | |||||||||||||||
| Pension Provisions |
(289 | ) | (111 | ) | (322 | ) | (336 | ) | (347 | ) | ||||||||||
| Contingency / disaster and emergency assistance / COVID -19 |
1,750 | 1,322 | 1,500 | 1,500 | 1,500 | |||||||||||||||
| Total Expense |
62,096 | 65,635 | 68,282 | 69,687 | 71,239 | |||||||||||||||
| A Health Care System that Works For Albertans | ||
| Health | ||
| _____
Budget 2023 includes another record-high health care investment. |
Budget 2023 secures Alberta’s future by building a better health care system that works for all Albertans, with urgent reforms underway supporting patients to access world-class care when and where they need it. Budget 2023 includes another record-high health care investment to provide for increasing health care costs from an aging and growing population, inflation, and other system pressures. Initiatives under the new Health Workforce Strategy will help ensure Alberta has the health care professionals needed both now and for the future. Budget 2023 provides $24.5 billion for Health operating expense in 2023-24, an increase of 4.1 per cent or $965 million from the 2022-23 forecast. Operating expense will further increase by 3.7 per cent in 2024-25 and 2.4 per cent in 2025-26.
Increased operating expense is partly offset by an increase in the Canada Health Transfer (CHT), which is allocated by the federal government on a per capita basis with no strings attached. Alberta’s government is working to address immediate challenges facing our health care system and to achieve longer-term improvements, and will continue to work with the federal government to develop targeted bilateral agreements that are in the best interests of Albertans. | |
| 78 | Expense | Fiscal Plan 2023 – 26 |
Healthcare Action Plan
Budget 2023 supports the Healthcare Action Plan with investments to strengthen the Emergency Medical Services (EMS) system, and reduce surgical and emergency department wait times. At the same time, government is empowering frontline workers to provide improved services to Albertans. A targeted, measured approach will be followed to evaluate the outcomes of the Healthcare Action Plan. EMS response times will be improved by fast tracking ambulance transfers to hospitals and alternative levels of care, using other modes of transportation for non-emergency inter-facility transfers, empowering EMS to transfer / step down calls from 911 to Health Link and empower paramedics to triage and determine when a patient needs to be transferred to an Emergency Room (ER) by ambulance. ER wait times are being addressed by bringing in additional health professionals to deliver better on-site patient care, improve patient flow and shorten transfer times. Surgical wait times will be reduced by significantly increasing surgeries at underutilized facilities in rural communities and performing more publicly funded surgeries at chartered surgical facilities. All of this will be sustained by long-term reforms including restoring decision-making to local health care professionals to help incentivize regional innovation.
Alberta Health Services
Alberta Health Services’ (AHS) operating budget will increase to over $16.7 billion in 2023-24, a 3.8 per cent or $608 million increase from the 2022-23 forecast. Budget 2023 will help build health care system capacity as AHS is expected to add nearly 3,600 net new full-time equivalent positions in 2023-24. These staffing resources will strengthen the EMS system, support key priorities such as the Alberta Surgical Initiative, the Continuing Care Capacity Plan and the CT and MRI Action Plan, as well as helping address the health care deficit as health system activity returns to pre-pandemic levels.
AHS is currently preparing the Calgary Cancer Centre to open in 2024. This $1.4 billion centre will have 160 inpatient beds and will provide a wide range of services for cancer patients, as well as serving as a hub for medical education and research activities.
Physician Compensation and Development
Budget 2023 fully funds the new agreement with the Alberta Medical Association (AMA). There is $6.2 billion budgeted in 2023-24, increasing to over $6.4 billion by 2025-26 for physician compensation and development programs (including grants to post-secondary institutions for academic medicine which are reported in Advanced Education).
Under the AMA agreement, more than $250 million over four years (beginning in 2022-23) is targeted to recruitment and retention programs so more Albertans can access family doctors, and to provide more support for physician practice viability. Among other initiatives, this includes $15 million annually for recruitment and retention of physicians who practice full-time in underserved areas, a $12 million increase for the existing Rural Remote Northern Program, and $12 million annually to enhance physician support
Healthcare Action Plan investments
will strengthen the EMS system,
and reduce surgical and emergency
department wait times.
Calgary Cancer Centre delivers an
additional 160 inpatient beds and
provides a wide range of services
for cancer patients, while serving
as a research and education hub.
| Expense | Fiscal Plan 2023 – 26 | 79 |
Budget 2023 invests $1 billion over
three years for continuing care
system transformation.
programs. Physician practice viability is enhanced through the Business Costs Program, with support for these costs increasing to $20 million per year, with the greatest impact for office-based practices.
Primary Health Care
Budget 2023 will strengthen the primary care system in Alberta. As part of Modernizing Alberta’s Primary Health Care System (MAPS), three advisory panels were established in fall 2022 to identify improvements in the short-term and over the next 5 to 10 years. These panels will provide recommendations to the Minister of Health in spring 2023. Budget 2023 allocates $125 million over three years as an initial investment, providing funding for early opportunities to improve primary care. As part of the AMA agreement, Budget 2023 includes $40 million over two years in lump sum payments to Primary Care Networks to provide additional support while the MAPS work takes place.
Care in the Community
Budget 2023 includes nearly $4.3 billion in combined operating support for Community Care, Continuing Care and Home Care programs, an increase of 15.3 per cent or $570 million from the 2022-23 forecast. The government is investing a total of $1 billion over three years to begin transformation of the continuing care system in response to the Facility-Based Continuing Care Review. These strategic investments will support initiatives that will shift care to the community, enhance workforce capacity, increase choice and innovation, and improve the quality of care within the continuing care sector.
Additional funding for Home Care will increase the number of home care hours provided and the number of unique / individual clients served, supporting more seniors to stay in their homes for as long as possible.
Budget 2023 will continue to support programs to improve access to palliative care and caregiver support for Albertans and their families. This includes addressing the four priority recommendations in the Advancing Palliative and End-of-Life Care in Alberta report, providing earlier access to care upon diagnosis, as well as additional education and training, community services and supports, and research and innovation.
Drugs and Supplemental Health Benefits
Budget 2023 includes over $2 billion per year for Drugs and Supplemental Health benefit programs. The Seniors Drug program budget is the largest component of this suite of programs, with $693 million budgeted in 2023-24, supporting over 700,000 seniors.
| 80 | Expense | Fiscal Plan 2023 – 26 |
Ministry of Health – Operating Expense
(millions of dollars)
| 2022-23 | 2023-24 | 2024-25 | 2025-26 | |||||||||||||||||
| Budget | Forecast | Estimate | Target | Target | ||||||||||||||||
| Ministry Support Services |
65 | 65 | 67 | 67 | 67 | |||||||||||||||
| Physician Compensation and Development |
5,351 | 5,857 | 6,052 | 6,283 | 6,273 | |||||||||||||||
| Acute Care |
3,881 | 3,984 | 4,318 | 4,497 | 4,614 | |||||||||||||||
| Diagnostic, Therapeutic and Other Patient Services |
2,457 | 2,474 | 2,717 | 2,793 | 2,892 | |||||||||||||||
| Drugs and Supplemental Health Benefits |
2,033 | 1,923 | 2,027 | 2,116 | 2,222 | |||||||||||||||
| Community Care |
1,719 | 1,701 | 2,002 | 2,119 | 2,180 | |||||||||||||||
| Continuing Care |
1,238 | 1,273 | 1,393 | 1,425 | 1,476 | |||||||||||||||
| Home Care |
750 | 744 | 893 | 974 | 1,061 | |||||||||||||||
| Population and Public Health |
567 | 589 | 733 | 756 | 784 | |||||||||||||||
| Emergency Medical Services |
588 | 585 | 723 | 770 | 781 | |||||||||||||||
| Support Services |
1,992 | 2,116 | 2,228 | 2,252 | 2,305 | |||||||||||||||
| Information Technology |
672 | 690 | 733 | 724 | 707 | |||||||||||||||
| Administration |
486 | 463 | 530 | 549 | 561 | |||||||||||||||
| Research and Education |
106 | 107 | 108 | 109 | 108 | |||||||||||||||
| Cancer Research and Prevention Investment |
11 | 11 | 10 | 10 | 10 | |||||||||||||||
| COVID-19 / Recovery Plan |
10 | 983 | - | - | - | |||||||||||||||
| Total Operating Expense |
21,927 | 23,568 | 24,533 | 25,443 | 26,041 | |||||||||||||||
| Mental Health and Addiction
The Ministry of Mental Health and Addiction is focused on supporting Albertans’ overall wellness and establishing and enhancing recovery-oriented services across the continuum of care for those at risk of, or experiencing mental health and addiction challenges. The ministry is responsible for establishing recovery as the primary policy of government, as well as increasing access to evidence-based recovery-oriented services and supports based on need, funding community-based programs and services, developing legislation and policy to ensure safe and quality care, and licensing mental health and addiction service providers.
Budget 2023 includes operating expense of $148 million in 2023-24, $157 million in 2024-25 and $191 million in 2025-26, with additional funding for Alberta Health Services to address system gaps and reduce wait times for mental health and addiction services. Alberta spends over $1 billion per year on mental health and addiction programs and services, excluding physician billings.
Affordability for Albertans
Affordability is a considerable concern for Alberta as inflation is easing but remains elevated here in Canada and across the world. The Affordability Action Plan includes measures supporting Albertans including indexation of the personal income tax system, pausing private passenger vehicle insurance rate increases, providing energy price relief through the fuel tax relief and electricity rebate programs, direct payments for children, seniors and social services recipients, reducing the costs associated with K-12 and post-secondary |
| Expense | Fiscal Plan 2023 – 26 | 81 |
Albertans will receive larger refunds
or owe less tax when they file their
2022 tax returns.
Budget 2023 provides fuel tax
relief to Albertans when oil prices
are high.
education, and increasing wages for social services workers along with various other measures.
Indexation of the Personal Income Tax system
In Budget 2019, our government made a commitment to resume indexation once the economic and fiscal situation could support it. As our spending on a per capita basis is now in line with that of comparator provinces and we will have a new fiscal framework in place to guide future spending decisions, it is appropriate to resume full indexation of personal income taxes to inflation. Indexation will be effective for the 2022 tax year with tax bracket thresholds and credit amounts increasing by 2.3 per cent for 2022 and by an additional 6 per cent for 2023, over their 2021 value. Many Albertans saw the benefit of indexation through lower tax withholdings on their first paycheques of 2023. In addition, since indexation will be effective for the 2022 tax year, Albertans will receive larger refunds or owe less tax when they file their 2022 tax returns in spring 2023. Budget 2023 includes a revenue reduction of $3.2 billion over four years as a result of this change.
Taking action on insurance
Alberta’s government is pausing private passenger vehicle insurance rate increases until the end of 2023 and is requiring insurance companies provide most Albertans with an option to pay premiums through payment plans rather than annually. Alberta’s insurance market is being closely monitored and the government will continue developing short and long-term solutions to stabilize and lower auto insurance rates.
Energy affordability programs
Alberta’s government has announced $2.7 billion in energy affordability initiatives that will cut costs for Albertans and businesses.
Fuel tax relief
The fuel tax relief program will result in $1.7 billion in forgone revenue over 2022-23 and 2023-24 due to pausing the provincial fuel tax for Alberta drivers. Budget 2023 includes the continuation of fuel tax relief from January 1 to June 30, 2023, suspending the entire fuel tax of 13 cents per litre on gasoline and 4 cents per litre on marked gasoline. After June 30, 2023, fuel tax rates will be determined quarterly based on average WTI prices, providing fuel tax relief to Albertans when oil prices are high.
Electricity and natural gas rebates
The electricity rebate program provides electricity customers currently connected to the system who consumed less than 250 megawatt hours within the past year. Monthly rebates are being applied directly to eligible electricity bills from July 2022 to April 2023, comprising rebates of $50/month from July to December 2022, $75/month in January and February 2023 and $25/month in March and April 2023. Almost $1 billion in operating expense over 2021-22 to 2023-24 will be provided for electricity rebates. Electricity
| 82 | Expense | Fiscal Plan 2023 – 26 |
consumers on the regulated rate option will not be charged more than 13.5 cents per kilowatt hour in January, February, and March 2023. Any costs above the 13.5 cent price ceiling will be deferred until rates drop and will be repaid over 21 months (April 2023 to December 2024). This is a temporary measure while government explores longer-term solutions to help keep energy affordable for Alberta families. Alberta’s Natural Gas Rebate program will also be made permanent with rebates provided when natural gas prices exceed $6.50 per gigajoule. Based on current forecasts of natural gas prices and utility rates, the trigger price is not expected to be reached over the next three years.
Affordability payments and other social supports
The government is providing more assistance to seniors, low income and disabled Albertans. Budget 2023 includes $904 million in operating expense over four years to index the Alberta Child and Family Benefit, Income Support, Assured Income for the Severely Handicapped (AISH), and Alberta Seniors Benefit to inflation on an ongoing basis. Seniors with an adjusted household income below $180,000 are eligible for six monthly payments of $100. Similarly, parents or guardians are also eligible for monthly payments of $100 for six months for each child under 18 if their adjusted household income is below $180,000. Albertans on these core programs were automatically enrolled to receive affordability payments.
Alberta’s government is committed to keeping continuing care accommodation rates affordable with an investment of $25 million between 2022-23 and 2023-24. A 5.5 per cent increase in the continuing care accommodation rates was deferred from July 1, 2022 to October 31, 2022, and a 2.3 per cent increase in the continuing care accommodation rates is being deferred from November 1, 2022 until June 30, 2023.
Budget 2023 includes additional funding to compensate those who care for our most vulnerable with $356 million in operating expense over four years. This includes increased wages for social services sector workers and addresses administration costs for Persons with Developmental Disabilities (PDD) and Family Support for Children with Disabilities (FSCD). Front-line workers in disability services, homeless shelters and family violence prevention programs support thousands of Albertans every day and the government is helping the social services sector in retaining and attracting critical frontline staff.
To further address the inflationary challenges, Alberta’s government allocated $42 million over two years from 2022-24 to support food banks and extended the low-income transit pass pilot program in Edmonton and Calgary to include other municipalities. This will help to offset some costs and reduce mobility barriers for Albertans.
Affordable K-12 and post-secondary education
Budget 2023 includes operating expense increases of $84 million in Education for the Student Transportation Fuel Price Contingency Program announced in 2022-23. This initiative will help offset the impact of fuel price increases for
Budget 2023 includes additional
funding for those who care for our
most vulnerable.
| Expense | Fiscal Plan 2023 – 26 | 83 |
| school authorities from April 1, 2022 to March 31, 2026 by keeping fuel prices at a base rate of $1.25 per litre.
Budget 2023 includes revenue reductions of $178 million over three years to make post-secondary more affordable for Albertans by reducing interest rates on student loans from prime plus 1 per cent to prime, extending the loan grace period from six months to one year following graduation, increasing the threshold for repayment assistance plans for student loan borrowers from $25,000 to $40,000, and capping tuition increases at 2 per cent annually effective 2024-25. |
Affordability / Inflation Relief - Fiscal Impact
(millions of dollars)
| 2021-22 | 2022-23 | 2022-23 | 2023-24 | 2024-25 | 2025-26 | |||||||||||||||||||||||
| Actual | Budget | Forecast | Estimate | Target | Target | Total | ||||||||||||||||||||||
| Revenue |
||||||||||||||||||||||||||||
| Indexation of Personal Income Tax system |
- | - | 304 | 676 | 980 | 1,224 | 3,184 | |||||||||||||||||||||
| Fuel Tax Relief program |
- | - | 1,170 | 570 | - | - | 1,740 | |||||||||||||||||||||
| Supports for post-secondary students |
- | - | - | 38 | 70 | 70 | 178 | |||||||||||||||||||||
| Other |
- | - | - | 7 | 5 | - | 12 | |||||||||||||||||||||
| Total Revenue |
- | - | 1,474 | 1,291 | 1,055 | 1,294 | 5,114 | |||||||||||||||||||||
| Operating Expense |
||||||||||||||||||||||||||||
| Electricity and natural gas rebates |
296 | - | 648 | 48 | - | - | 991 | |||||||||||||||||||||
| Indexation of social programs |
- | - | 45 | 193 | 293 | 373 | 904 | |||||||||||||||||||||
| Affordability payments |
- | - | 546 | 547 | - | - | 1,093 | |||||||||||||||||||||
| Continuing care accommodation rates |
- | - | 21 | 4 | - | - | 25 | |||||||||||||||||||||
| Social sector worker wage increase and administrative support |
- | - | 26 | 110 | 110 | 110 | 356 | |||||||||||||||||||||
| Student transportation fuel price contingency program |
- | - | 19 | 18 | 24 | 24 | 84 | |||||||||||||||||||||
| Supports for post-secondary students |
- | - | 9 | 18 | 15 | 18 | 60 | |||||||||||||||||||||
| Other |
- | - | 16 | 26 | - | - | 42 | |||||||||||||||||||||
| Total Operating Expense |
296 | - | 1,329 | 964 | 442 | 525 | 3,554 | |||||||||||||||||||||
| Capital Investment |
||||||||||||||||||||||||||||
| Development and system costs for affordability payments |
- | - | 3 | - | - | - | 3 | |||||||||||||||||||||
| Total Affordability Measures |
296 | - | 2,806 | 2,255 | 1,497 | 1,818 | 8,672 | |||||||||||||||||||||
| Support for Vulnerable Albertans | ||
| Children’s Services | ||
| The Ministry of Children’s Services is committed to the safety, well-being and development of children and youth. Through child care, child intervention services and early learning programming, the ministry works to provide children, youth and families the support they need to thrive and help create vibrant, growing communities. | ||
| _____
Alberta Child and Family Benefit payments increased 6 per cent in 2023 and future years will be indexed to inflation. |
Operating expense for Children’s Services will be $2.9 billion in 2023-24, increasing by about 1.5 per cent per year to $3 billion by 2025-26. The 2022-23 forecast is $2.7 billion, $261 million more than Budget 2022, mainly for affordability initiatives. Budget 2023 includes $361 million in additional operating expense over three years in support of the Affordability Action Plan. The Plan includes indexing the Alberta Child and Family Benefit by 6 per cent | |
| 84 | Expense | Fiscal Plan 2023 – 26 |
| and providing a total of $600 in affordability payments for eligible children under 18. In addition, operating expense of $143 million over three years will address the increasing complexity of children receiving child intervention services. Budget 2023 includes additional funding of $26 million over three years to support youth and young adults in care transitioning to adulthood. | ||
| Budget 2023 continues with the important work of creating access to high-quality, affordable child care so parents can participate in training, education or the workforce. There is $1.3 billion budgeted in 2023-24 increasing to $1.6 billion in 2025-26 for child care from provincial funding and Alberta federal-provincial child care agreements. The roll out of the new child care program has been successful and childcare fees for children up to kindergarten age have been reduced by an average of 50 per cent. Demand for licensed child care spaces is the highest the province has ever seen, with enrolment exceeding 90 per cent. Enrolment is anticipated to continue to increase as spaces are created and lower child care fees encourage more parents to enter the workforce. Alberta’s government is committed to further reducing fees to an average of $15 per day in 2023-24 and $10 per day by 2026.
The government is investing an additional $12 million over three years to increase the number of adoptions of children in government care into family homes. This includes extending supplementary health benefits to children adopted domestically from government care or through a licensed adoption agency and providing $6,000 in grant funding to prospective adoptive parents making less than $180,000 a year. In 2023, the provincial adoption expense tax credit will also increase from $14,365 to $18,210 to match the federal threshold. |
Child care fees reducing to an average of $15 per day in 2023-2024. | |
Ministry of Children’s Services – Operating Expense
(millions of dollars)
| 2022-23 | 2023-24 | 2024-25 | 2025-26 | |||||||||||||||||
| Budget | Forecast | Estimate | Target | Target | ||||||||||||||||
| Ministry Support Services |
6 | 6 | 6 | 6 | 6 | |||||||||||||||
| Child Intervention |
829 | 825 | 868 | 888 | 905 | |||||||||||||||
| Child Care |
1,069 | 1,064 | 1,262 | 1,387 | 1,557 | |||||||||||||||
| Early Intervention Services for Children and Youth |
139 | 139 | 144 | 148 | 151 | |||||||||||||||
| Indigenous Partnerships and Strategic Services |
10 | 10 | 10 | 10 | 10 | |||||||||||||||
| Alberta Child and Family Benefit |
335 | 335 | 345 | 355 | 365 | |||||||||||||||
| Affordability Support and Inflation Relief - Families with Children |
- | 271 | 271 | - | - | |||||||||||||||
| Total Operating Expense |
2,389 | 2,650 | 2,907 | 2,794 | 2,994 | |||||||||||||||
Seniors, Community and Social Services
The Ministry of Seniors, Community and Social Services provides social service programs to assist seniors and promote their safety and well-being, provide services to Albertans with disabilities, those who are facing homelessness, or require access to women’s shelters, and support for developing affordable housing so Albertans in need have access to housing options. The ministry also provides employment services and financial supports to help Albertans find jobs and live independently.
| Expense | Fiscal Plan 2023 – 26 | 85 |
| _____
AISH, Income Support and Seniors benefits increased 6 per cent in 2023 and future years will be indexed to inflation. |
Budget 2023 includes $5.3 billion in operating expense in 2023-24, increasing by about 1 per cent per year to $5.4 billion by 2025-26. The 2022-23 forecast is $5 billion, $322 million more than Budget 2022 mainly for initiatives under the Affordability Action Plan. Under the plan, Budget 2023 includes $1.1 billion in operating expense over three years in support for indexing seniors, Assured Income for Severely Handicapped (AISH), and Income Support benefits to inflation, providing $100 direct payments to seniors, AISH, PDD, and Income Support clients, increasing wages for social services sector and disability administration costs, food banks, and low-income transit passes. The ministry is continuing to support the Alberta at Work initiative through career and employment services. | |
| _____
Budget 2023 includes an additional $105 million over three years to address homelessness. |
Budget 2023 includes additional operating expense of $105 million over three years to address homelessness. Implementation of the Stronger Foundations: Alberta’s 10-year strategy to improve and expand affordable housing continues in Budget 2023, with increased funding of $23 million over three years. This includes expanding and enhancing the functionality of the digital portal services for housing operators to streamline the process, collect timely and accurate data, reduce red tape, and to support small communities with developing housing needs assessments. |
Ministry of Seniors, Community and Social Services - Operating Expense
(millions of dollars)
| 2022-23 | 2023-24 | 2024-25 | 2025-26 | |||||||||||||||||
| Budget | Forecast | Estimate | Target | Target | ||||||||||||||||
| Ministry Support Services |
18 | 18 | 21 | 21 | 21 | |||||||||||||||
| Employment and Income Support |
813 | 811 | 801 | 801 | 802 | |||||||||||||||
| Assured Income for the Severely Handicapped |
1,371 | 1,408 | 1,538 | 1,650 | 1,751 | |||||||||||||||
| Disability Services |
1,392 | 1,374 | 1,531 | 1,591 | 1,655 | |||||||||||||||
| Homeless and Outreach Support Services |
193 | 224 | 244 | 244 | 244 | |||||||||||||||
| Community Supports and Family Safety |
138 | 154 | 162 | 136 | 136 | |||||||||||||||
| Seniors Services |
27 | 22 | 28 | 28 | 28 | |||||||||||||||
| Alberta Seniors Benefit |
476 | 430 | 494 | 521 | 546 | |||||||||||||||
| Housing |
10 | 10 | 11 | 11 | 11 | |||||||||||||||
| Public Guardian and Trustee Services |
23 | 25 | 27 | 27 | 27 | |||||||||||||||
| Affordability Support and Inflation Relief |
- | 275 | 276 | - | - | |||||||||||||||
| Alberta Social Housing Corporation |
184 | 191 | 200 | 209 | 194 | |||||||||||||||
| COVID-19 / Recovery Plan |
- | 25 | - | - | - | |||||||||||||||
| Total Operating Expense |
4,646 | 4,968 | 5,332 | 5,239 | 5,415 | |||||||||||||||
| Kindergarten to Post-Secondary Education
K–12 Education
Alberta’s government is increasing its investment in the K-12 education system in Budget 2023 by providing $8.8 billion in operating expense in 2023-24 growing to $9.2 billion by 2025-26, an increase of more than $1.8 billion over the next three years. The increase of 5.2 per cent in operating expense in 2023-24 will support Alberta students, teachers, education administrators, parents, |
| 86 | Expense | Fiscal Plan 2023 – 26 |
| and families and help address the emerging needs of the system and build a pathway to maintain long-term high-quality education services. In 2022-23, operating expense increased by $74 million from Budget 2022 primarily reflecting additional funding provided for the teachers’ collective agreement, to address affordability under the Student Transportation Fuel Price Contingency Program and to provide educational support for Ukrainian evacuee students.
In Budget 2023, funding will be provided to address enrolment growth and strengthen choice in education so parents are able to select the path they feel will best help their children reach their full potential. This will support hiring up to 3,000 education staff including teachers, educational assistants, bus drivers and school support staff over the next three years. The operating expense increase will also address growing complexity in classrooms to meet students’ unique needs and combat the affordability crisis facing Alberta parents and school authorities. |
Support to the Education System
(millions of dollars)
| 2022-23 | 2023-24 | 2024-25 | 2025-26 | |||||||||||||||||
| Budget | Forecast | Estimate | Target | Target | ||||||||||||||||
| Department of Education Funding to School Jurisdictions A |
7,670 | 7,744 | 8,126 | 8,334 | 8,461 | |||||||||||||||
| Department of Education Operations |
93 | 93 | 94 | 95 | 95 | |||||||||||||||
| Department of Education Funding and Operations |
7,763 | 7,837 | 8,220 | 8,429 | 8,555 | |||||||||||||||
| School Jurisdictions funded from Own-Source / Reserves |
627 | 619 | 615 | 607 | 607 | |||||||||||||||
| One-time Federal Government funding for COVID-19 |
13 | 21 | - | - | - | |||||||||||||||
| Total Support to the Education System |
8,403 | 8,477 | 8,836 | 9,036 | 9,162 | |||||||||||||||
| A | Includes Education Property Tax revenue received directly by opted-out School Authorities and Curriculum Implementation funding |
| Strong population growth in Alberta has resulted in record enrolment in the Education system. Budget 2023 will provide more than $820 million over the next three years to ensure school authorities are well prepared to welcome new students. | ||
| In Budget 2023, the government will increase funding for school bus transportation by $414 million over the next three years to make systemic improvements and offset rising costs while supporting parental choice. The changes in funding will mean about 80,000 additional students will be eligible for provincial funding support, and the parents of 47,000 students who are currently paying a fee to use bus services will save more than $20 million in transportation costs. The increase in student transportation funding will help reduce rural ride times and address inflationary pressures including rising costs for driver training. | ||
| Budget 2023 provides $1.5 billion in learning support in 2023-24 to support our most vulnerable students and children with specialized learning needs and groups of students who may require additional assistance. This includes Specialized Learning Supports, Program Unit Funding, English as an Additional Language, Refugee Students, First Nations, Métis and Inuit. Funding is also provided for the School Nutrition Grant, which will increase by |
School Nutrition Grant increases 20 per cent in 2023-24 to recognize the significant inflationary cost pressures on food. | |
| Expense | Fiscal Plan 2023 – 26 | 87 |
| 20 per cent in 2023-24 to recognize the significant inflationary cost pressures on food.
Government is committed to ensuring that all students and children with specialized learning needs receive the support necessary to build a solid foundation for future learning and success. Additional targeted funding of $126 million over the next three years will address classroom complexity by providing support for increased staffing, such as more educational assistants in classrooms, increasing educational assistants’ hours, providing more training opportunities for staff and hiring specialists such as counsellors, psychologists, interpreters, and more teachers. This will enhance the quality of student’s learning experiences and have positive effects on their personal and social development. | ||
|
Budget 2023 provides |
Government is committing $110 million over the next three years to support students experiencing academic challenges and create school environments supporting student well-being and mental health. As part of this commitment, targeted funding of $40 million in 2023-24 will provide additional learning loss support, fund mental health projects in schools and ensure children and students can access specialized assessments by qualified professionals.
School authorities will receive $18 million in 2023-24 and $31 million in each of the following two years, which is an increase of 5 per cent in the operations and maintenance grant to ensure safe and well-maintained schools for students. This funding will address the significant inflationary pressures impacting school operations, such as increases in utilities, insurance and supplies. | |
Ministry of Education – Operating Expense
(millions of dollars)
| 2022-23 | 2023-24 | 2024-25 | 2025-26 | |||||||||||||||||
| Budget | Forecast | Estimate | Target | Target | ||||||||||||||||
| Ministry Support Services |
6 | 6 | 6 | 6 | 6 | |||||||||||||||
| Instruction - Early Childhood Service to Grade 12 |
6,553 | 6,601 | 6,857 | 6,970 | 7,081 | |||||||||||||||
| Operations and Maintenance |
737 | 737 | 760 | 774 | 776 | |||||||||||||||
| Student Transportation |
386 | 405 | 476 | 529 | 534 | |||||||||||||||
| School Facilities |
6 | 6 | 6 | 6 | 6 | |||||||||||||||
| Governance and System Administration |
276 | 276 | 276 | 276 | 276 | |||||||||||||||
| Program Support Services |
109 | 109 | 110 | 110 | 110 | |||||||||||||||
| Accredited Private Schools and Early Childhood Service Operators |
317 | 317 | 345 | 365 | 373 | |||||||||||||||
| COVID-19 / Recovery Plan |
13 | 21 | - | - | - | |||||||||||||||
| Total Operating Expense |
8,403 | 8,477 | 8,836 | 9,036 | 9,162 | |||||||||||||||
| Advanced Education
An affordable, accessible, and high-quality post-secondary education system that supports the development of the future workforce and meets the needs of our evolving labour market is a driving factor in securing Alberta’s economic future. The Ministry of Advanced Education is addressing affordability for students with changes to the Student Aid program to reduce the cost of student loans and limit tuition increases to 2 per cent starting in the 2024-25 school year. |
| 88 | Expense | Fiscal Plan 2023 – 26 |
| Budget 2023 provides $5.6 billion in operating expense in 2023-24 for Advanced Education, an increase of $182 million from the 2022-23 forecast and growing by 2 per cent per year to $5.9 billion by 2025-26. In 2022-23, $76 million was added to the forecast primarily for targeted workforce expansions including health care, and for Post-Secondary Institutions (PSI) to address inflation.
PSIs continue to deliver the core mandates of teaching and research to enhance the student experience while focusing on revenue generation. PSI own-source revenue is projected to increase from 53 per cent of operating expense in 2022-23 to 55 per cent in 2025-26. |
Post-Secondary Institutions - Funding Sources
(millions of dollars)
| 2022-23 | 2023-24 | 2024-25 | 2025-26 | |||||||||||||||||
| Budget | Forecast | Estimate | Target | Target | ||||||||||||||||
| Operating Expense funded by Government of Alberta |
2,379 | 2,431 | 2,446 | 2,467 | 2,488 | |||||||||||||||
| Operating Expense funded by Own-Source / Reserves |
2,635 | 2,702 | 2,843 | 2,950 | 3,070 | |||||||||||||||
| Total PSI Operating Expense |
5,014 | 5,133 | 5,289 | 5,417 | 5,558 | |||||||||||||||
| Operating Expense funded by Own-Source / Reserves |
53% | 53% | 54% | 54% | 55% | |||||||||||||||
| The ministry is continuing work on its ten-year strategy, Alberta 2030: Building Skills for Jobs, through actions such as extending Alberta at Work initiatives to 2025-26 through targeted funding to PSIs for seats in health care, non-trade construction, energy, technology, business, and aviation. | ||
| Targeted enrolment for health care expansion continues with government’s commitment to address critical shortages for physicians and nurses and will increase the number of seats available for medical degrees at the University of Alberta and University of Calgary by 20 in 2023-24, 60 in 2024-25 and 120 in 2025-26. Targeted health care enrolment will also add 1,800 new seats for health care aids, licensed practical nurses, and registered nurses over the next three years. Budget 2023 includes $20 million over three years to address the shortage of rural physicians and $30 million over three years for targeted health care enrolment. Recruitment of internationally educated nurses is an important part of the targeted enrolment health care expansion strategy. To support this, Advanced Education has committed to adding 1,500 seats in bridging programs. Bridging programs provide opportunities to learn about nursing in Canada and acquire the nursing knowledge necessary to meet the entry practice competencies in Alberta and Canada. Return to service bursaries ranging from $8,000 to $30,000 based on program of study will be available through Student Aid Alberta to assist with achieving a nursing license. Return to service requires eligible recipients of this assistance to complete one year of nursing service in Alberta for every $6,000 in funding accessed. Budget 2023 includes $46 million over the next three years to recruit internationally educated nurses. |
New seats added for targeted | |
| Expense | Fiscal Plan 2023 – 26 | 89 |
Ministry of Advanced Education – Operating Expense
(millions of dollars)
| 2022-23 | 2023-24 | 2024-25 | 2025-26 | |||||||||||||||||
| Budget | Forecast | Estimate | Target | Target | ||||||||||||||||
| Ministry Support Services |
8 | 8 | 11 | 10 | 10 | |||||||||||||||
| Support for Adult Learning |
58 | 56 | 59 | 61 | 61 | |||||||||||||||
| Student Aid |
259 | 270 | 297 | 294 | 284 | |||||||||||||||
| Post-Secondary Operations |
4,959 | 5,025 | 5,237 | 5,365 | 5,506 | |||||||||||||||
| COVID-19 / Recovery Plan |
62 | 64 | - | - | - | |||||||||||||||
| Total Operating Expense |
5,346 | 5,422 | 5,604 | 5,730 | 5,862 | |||||||||||||||
| Support for Ukrainian Evacuees
In 2021-22 and 2022-23, Alberta’s government contributed more than $23 million in support for Ukraine, including $16 million for humanitarian aid, $5 million to provide 5,000 members of the Ukrainian Territorial Defence Force with defensive equipment, and $2 million for settlement and language services for those displaced to Alberta by Russia’s invasion. As well in 2022-23, $12 million was provided to school authorities for language, social, and educational programs for newly enrolled students from Ukraine. | ||
|
Premier’s Advisory Task Force |
As of February 2023, over 21,600 evacuees from Ukraine have arrived in Alberta. The Premier’s Advisory Task Force on Ukraine was created in November 2022 to identify ways to continue to support evacuees and assess potential gaps in the available programs. The members met with over 200 key organizations between November 14th and December 16th, 2022, including Ukrainian community groups, faith-based groups, and municipalities. The Task Force identified immediate and longer-term recommendations ranging from expanding English as an Additional Language services, to creating streamlined communications to assist evacuees in navigating available resources. To support the implementation of recommendations from the Task Force and help fill identified gaps in support, an increase of $10 million over the next three years is reflected in Budget 2023.
In addition, Ukrainian evacuees will continue to be able to access over $20 million annually in government services, such as health care, finding licensed child care, income support and help finding work. | |
| Keeping Albertans Safe and Secure
Public Safety and Emergency Services
Alberta’s government is focused on making Alberta a role model for safe and secure communities across the country and North America. The Ministry of Public Safety and Emergency Services helps provide for the safety and security of all Alberta communities and assists the province to prepare for and be resilient to the impacts of disasters. The 2022-23 operating expense forecast for Public Safety and Emergency Services is $1.1 billion, an increase of | ||
| 90 | Expense | Fiscal Plan 2023 – 26 |
| $27 million from Budget 2022. Increases are mainly for correctional services, Alberta Sheriffs and to fight organized and serious crime. Operating expense will increase to $1.2 billion annually in Budget 2023. Increases are mainly from increased costs for community policing, custody operations, law enforcement oversight, and Alberta Sheriffs. | ||
| Alberta’s government will collaborate with municipalities, police services and community-based organizations to make mental health and addiction recovery a central component of corrections and community policing. A total of $709 million will be provided for Public Security in 2023-24, an increase of $84 million over the 2022-23 forecast to fund contract policing and the sheriff’s branch, assist municipalities, and address organized and serious crime. Funding for correctional services, including the continuing creation and expansion of therapeutic livings spaces, will be supported by increases of $34 million in 2023-24, $37 million in 2024-25, and $40 million in 2025-26. | ||
| Through consultations with First Nations, Alberta’s government has committed to strengthen First Nations policing by addressing the unique needs of these communities. Over the next three years, $65 million will be provided for First Nations policing to improve community and officer safety and enhance service delivery for Lakeshore Regional Police Service, Blood Tribe Police Service and Tsuut’ina Nation Police Service as well as to jointly fund a new First Nation police service for Siksika Nation. Up to 35 new policing positions will be added across the province. In addition, a Memorandum of Understanding with Siksika Nation to determine a funding framework for their police service will be developed and a business case subsidy program that would assist First Nations and municipalities in exploring the possibility of setting up their own First Nation police services, regionalization or standing up a municipal police service will be available. |
Up to 35 new First Nations policing positions will be added across | |
| In order to protect and assist vulnerable Albertans, $5 million in 2023-24, $7 million in 2024-25, and $8 million in 2025-26 is being provided to combat human trafficking in the province and allow survivors and victims of human trafficking to receive the specialized services they need to commence their healing journey, and reduce the risk of re-exploitation. Increased funding will enable a multidisciplinary response in Alberta on awareness, education, and training while prioritizing Indigenous-led and culturally appropriate services and supports. This includes the creation of an Alberta Office to Combat Trafficking in Persons and a Centre of Excellence for research and data collection. |
An Alberta Office to Combat | |
| Funding for the Alberta Emergency Management Agency is being increased to $77 million in 2023-24 to improve access to critical emergency management supports. This will continue the education and building of resilient and prepared communities, and meeting the growing demand for consistent, responsive, and effective emergency management support to municipalities across Alberta. | ||
| Expense | Fiscal Plan 2023 – 26 | 91 |
Ministry of Public Safety and Emergency Services - Operating Expense
(millions of dollars)
| 2022-23 | 2023-24 | 2024-25 | 2025-26 | |||||||||||||||||
| Budget | Forecast | Estimate | Target | Target | ||||||||||||||||
| Ministry Support Services |
8 | 8 | 25 | 27 | 27 | |||||||||||||||
| Public Security |
595 | 625 | 709 | 733 | 725 | |||||||||||||||
| Correctional Services |
284 | 302 | 336 | 339 | 342 | |||||||||||||||
| Alberta Emergency Management Agency |
75 | 75 | 77 | 77 | 76 | |||||||||||||||
| Victims of Crime and Public Safety Fund |
63 | 39 | 39 | 40 | 40 | |||||||||||||||
| Total Operating Expense |
1,024 | 1,051 | 1,187 | 1,216 | 1,209 | |||||||||||||||
| Justice
The Ministry of Justice is responsible for delivering a fair and innovative justice system where the rule of law is upheld, and government undertakings are administered according to law. Operating expense forecast for Justice is $594 million in 2022-23, an increase of $92 million from Budget 2022. Operating expense will increase to over $650 million annually in Budget 2023. Increases are mainly for judicial and crown prosecutor compensation.
To address the growth in the volume of incoming court cases and the increased demand for new judicial positions, as well as contend with criminal matters in a timely and appropriate manner, $259 million is included annually for court and justice services. Approximately $30 million is added to Alberta Crown Prosecution Services to maintain and attract high quality staffing. This will provide strong and modernized provincial court services to rural Albertans. To support key government initiatives, Budget 2023 includes an additional $20 million annually to expand government’s capacity to draft, review and provide advice on legislation. | ||
|
Legal Aid funding is being |
Legal Aid Alberta provides a range of services related to criminal (adult and youth), family, child welfare, refugee / immigration legal matters, and civil matters involving adult guardianship / trusteeship applications. Increased Legal Aid funding of $24 million in 2023-24, $31 million in 2024-25, and $35 million in 2025-26 will maintain highly quality legal counsel and provide all Albertans with access to the services they need.
To enhance public safety and preserve a firearms heritage that reflects Alberta’s values of safety, responsibility, and respect for individual rights, $15 million has been committed over the next two years to operate the newly created Chief Provincial Firearms Office. This office will ensure timely investigations of licence eligibility for Alberta firearms owners, including rigorous background checks and continuous eligibility assessments, as well as provide proactive outreach and education to communities while also focusing on special investigations and law enforcement liaison targeting firearms trafficking and 3D-printed firearms. | |
| 92 | Expense | Fiscal Plan 2023 – 26 |
Ministry of Justice - Operating Expense
(millions of dollars)
| 2022-23 | 2023-24 | 2024-25 | 2025-26 | |||||||||||||||||
| Budget | Forecast | Estimate | Target | Target | ||||||||||||||||
| Ministry Support Services |
8 | 8 | 9 | 9 | 9 | |||||||||||||||
| Court and Justice Services |
215 | 246 | 258 | 259 | 259 | |||||||||||||||
| Legal Services |
46 | 46 | 66 | 66 | 66 | |||||||||||||||
| Alberta Crown Prosecution Services |
99 | 128 | 129 | 130 | 130 | |||||||||||||||
| Strategy, Support and Integrated Initiatives |
129 | 160 | 185 | 188 | 193 | |||||||||||||||
| Alberta Human Rights |
7 | 7 | 7 | 7 | 7 | |||||||||||||||
| Total Operating Expense |
502 | 594 | 655 | 659 | 664 | |||||||||||||||
| Boosting Alberta’s Advantage – Jobs and Economy
Jobs and economic prosperity, diversification and investment attraction
Job creation and strengthening Alberta’s economy across all industries through diversification and investment attraction so every Alberta family can prosper is a top priority for Alberta’s government. Budget 2023 maintains funding under the Alberta Technology and Innovation Strategy and the Investment and Growth Fund first included in Alberta’s Recovery Plan and continued in the Alberta at Work initiative in Budget 2022. |
||
| Alberta’s Investment and Growth Plan has set the stage for an even stronger and more diverse Alberta. To support the plan and strategies, the province has implemented a number of labour market development strategies to provide the workers and skills necessary to prepare Alberta’s labour force for the future. This includes the Alberta 2030: Building Skills for Jobs initiative, which will transform the adult learning system to focus on providing high quality education, skills and training and the Alberta Advantage Immigration Strategy, which will attract and support skilled newcomers to help diversify the economy and create jobs. |
Alberta’s Investment and Growth | |
| Alberta at Work
Labour shortages in key sectors, barriers to entry for under-represented groups and long-term unemployment continue to be challenges for Alberta. Introduced in Budget 2022, the Alberta at Work initiative is designed to build and develop education and career pathways for learners, employees and employers, bridge skills gaps, reduce barriers to employment and prepare for the future labour market. Budget 2022 included more than $600 million in operating expense and capital investment over three years and Budget 2023 extends Alberta at Work with $176 million in 2025-26.
In Budget 2023, workforce planning will be expanded to areas with the most demand and critical shortages with new funding of $95 million over three years in targeted health care expansion to address health care shortages including |
||
| Expense | Fiscal Plan 2023 – 26 | 93 |
| funding for additional seats for physicians and nurses, as well as bridging programs for internationally educated nurses. Other targeted workforce planning funding includes $35 million over three years for targeted enrolment expansion in non-trade construction, energy, technology, business and the aviation sector. | ||
| Targeted Workforce Planning
The Alberta 2030: Building Skills for Jobs strategy, released in April 2021, establishes a 10-year vision and strategic direction for post-secondary education. The strategy enhances the connections between post-secondary programs and the needs of employers and industry. Budget 2023 targeted workforce planning funding is driven by the goals of this strategy. | ||
|
Budget 2023 adds $111 million |
Budget 2023 adds $111 million over three years for targeted enrolment expansion adding seats in areas with the highest student demand including non-trade construction, energy, technology, and business. To help meet the labour market demand for pilots, Budget 2023 includes $11 million over three years for government’s commitment to add 40 seats to the Bachelor of Aviation program at Mount Royal University (MRU) and new bursaries of $10,000 for approximately 150 aviation students in the MRU diploma program and proposed degree program. In addition, starting in 2022-23, $15 million is provided over three years to offset training costs for aviation jobs created as a result of signing a memorandum of understanding with WestJet Airlines. This funding will support the aviation strategy to grow and diversify the aerospace and aviation and logistic sectors. | |
| Labour Market agreements provide over $300 million annually for occupation related skills training, work and employment assistance for unemployed workers, support to employers for hiring and training and support for under-represented groups and persons with disabilities. Foundational work programs and employment services offer assistance to Albertans providing them with the basic skills required to become employed such as soft skills to build foundational competencies in English as an Additional language, literacy and numeracy. The Training for Work program provides short-term occupation related skills, work experience, placement services, employability, and essential skills training to unemployed Albertans. The program also aids bridge employment skills for immigrants. Career and Employment Information Services provides a suite of employment services including job placement employment counseling and a variety of self-serve and easily accessible employment services, supporting all Albertans including those who experience barriers to employment. The Canada-Alberta Job Grant enables employers to apply on behalf of their present or future employees for funding for eligible training costs. | ||
| 94 | Expense | Fiscal Plan 2023 – 26 |
| Rural Economic Development
The Economic Development in Rural Alberta Plan, released in December 2022, demonstrates government’s commitment to drive economic growth and address challenges unique to rural and Indigenous communities. The plan complements current government initiatives such as the Alberta Broadband Strategy, expansion and modernization of irrigation infrastructure, rural investment attraction through the Investment Growth Fund, and expansion of veterinary medicine at the University of Calgary to address a critical shortage of large animal veterinarians in rural Alberta. The plan focuses on five key strategic directions: economic development enabling infrastructure; rural business supports and entrepreneurship; support for the labour force and skills development; marketing rural and promoting rural tourism; and rural economic development and capacity building. |
||
| Budget 2023 invests $10 million over three years in Agriculture and Irrigation for rural business supports and economic development capacity building initiatives, and $10 million over two years in Travel Alberta for rural tourism investment programming. The Northern and Regional Economic Development program will receive $9 million over the next three years to provide Alberta municipalities, Indigenous communities and non-profit organizations across the province with projects that promote regional economic growth and diversification. Budget 2023 also introduces a new agri-processing tax credit, to be launched in spring 2023, that will help attract large-scale investment, grow the economy and create jobs for Albertans. The Alberta Agri-Processing Investment Tax Credit will provide a 12 per cent non-refundable tax credit against eligible capital expenditures for corporations investing $10 million or more to build or expand agri-processing facilities in Alberta. |
Budget 2023 invests | |
General Government / Other
| Municipal Support
Alberta’s government values the mutual respect and cooperative relationship with municipalities that provide important services to Albertans. In 2022-23, the province contributed almost $2.5 billion in operating and capital funding to municipalities and community organizations to support local priorities. This support is projected to increase to $3.4 billion in 2025-26. This includes broad support through the Municipal Sustainability Initiative (MSI) / Local Government Fiscal Framework (LGFF) operating and capital grants, as well as targeted operating support for policing, libraries, Family and Community Social Support Services (FCSS) and targeted capital grants for transit, water / wastewater, and affordable housing. |
||
| Budget 2023 doubles annual operating grants under the MSI / LGFF from $30 million to $60 million. This additional funding will help to address rising costs due to inflation and other external factors as well as recent government policy decisions. MSI operating grants support the long-term sustainability of communities, and help local governments continue to provide and improve the services Albertans depend on every day. Government will continue to work |
Budget 2023 doubles MSI / LGFF annual operating grants to help
municipalities address rising costs | |
| Expense | Fiscal Plan 2023 – 26 | 95 |
| with municipalities to finalize the allocation formula for the new LGFF, and is committed to provide additional top up funding to ensure no municipality receives a year-over-year decrease in municipal funding under the new LGFF.
Budget 2023 also increases the program budget that provides funding to municipalities for provincial properties that are exempt from municipal taxes. The Grants in Place of Taxes program acknowledges that the province benefits from municipal services, such as roadwork, snow clearing, transit and emergency services, provided to government properties. Budget 2023 funding for this program will increase from $36 million in 2023-24 to $40 million in 2025-26, which will allow payments to municipalities to be maintained at current levels given rising property values and construction of new government infrastructure. | ||
| Tourism Spending | ||
|
Budget 2023 investments in |
Alberta’s government continues to support a prosperous visitor economy through investments in tourism related initiatives, spending an average of over $200 million above what is collected from tourism levy revenue annually. Budget 2023 invests $10 million over two years for rural tourism investment programming, supporting new product development and marketing of experiences to grow the visitor economy in rural and Indigenous communities, and provides an increase of $15 million over three years for enhanced marketing and promotional initiatives in Travel Alberta. An additional $8 million per year is allocated to Alberta Parks to expand access and provide high quality experiences for visitors. Building on the tourism related success of HBO’s The Last of Us, Budget 2023 also provides an increase of $100 million over the next three years for the Film and Television Tax Credit, to attract more productions to the province that will create jobs, diversify the economy and showcase Alberta as a world-class travel destination. | |
| Technology Innovation and Emissions Reduction
Alberta continues to protect the competitiveness of our major industries and reflect our role as a responsible energy supplier through the Technology Innovation and Emissions Reduction (TIER) Regulation and Alberta Methane Emission Reduction Regulation. These provincial systems achieve similar environmental outcomes as federal policies but significantly lower the cost burden.
The TIER Regulation is Alberta’s industrial carbon pricing and emissions trading system and is a centrepiece of Alberta’s effective approach to emissions management. The TIER Regulation applies to large industrial emitters and voluntarily participating facilities like small oil and gas operations. The TIER system covers about 60 per cent of Alberta’s total emissions. The system design drives industry innovation to reduce emissions and invest in clean technology to save money and stay competitive. The system incents voluntary emission reductions across a variety of sectors, including agriculture, as it also enables the use of carbon offsets. | ||
| 96 | Expense | Fiscal Plan 2023 – 26 |
| The TIER regulatory system was amended, effective January 1, 2023, for the 2023 to 2030 period. Amendments include: increasing the carbon price schedule at the minimum mandated federal carbon price; tightening the emission reduction benchmarks at 2 per cent annually and also tightening the oil sands sector benchmarks at a rate of 4 per cent in 2029 and 2030; reducing the opt in threshold to enable more industry to voluntarily be regulated under TIER and thereby not be subject to the federal carbon tax; encouraging credit usage through shorter credit expiry lengths and increased credit use limits; and increasing support for carbon capture, use and storage through new credit classes that provide incentives for deployment. | ||
| The TIER Fund is a compliance option for regulated industry to pay into if they do not meet emissions targets and if they opt not to use emission reduction credits (emission performance credits or carbon offsets). The first $100 million in annual revenue – and 50 per cent of the remaining revenue paid into the fund – is available for programs supporting emission reductions and initiatives that help Alberta communities become more resilient to a changing climate. The remaining TIER funds support Alberta’s deficit and debt reduction and the Canadian Energy Centre. | ||
| Budget 2023 includes an investment of nearly $800 million over three years from the fund to support a suite of programs to reduce emissions, support technology development, and create jobs and investment opportunities across all sectors. Included in this are continued investments in programs delivered by key partners, including Emissions Reduction Alberta, Alberta Innovates and the Municipal Climate Change Action Centre. An additional $387 million over five years is being reserved in the TIER Fund for investments in future carbon capture, utilization and storage projects. |
Budget 2023 includes an | |
Technology Innovation and Emissions Reduction
(millions of dollars)
| 2022-23 | 2023-24 | 2024-25 | 2025-26 | |||||||||||||||||
| Budget | Forecast | Estimate | Target | Target | ||||||||||||||||
| Revenue |
||||||||||||||||||||
| TIER Fund |
421 | 637 | 523 | 563 | 303 | |||||||||||||||
| Federal Low Carbon Economy Leadership Fund and |
||||||||||||||||||||
| Other Dedicated Revenue |
44 | 51 | 10 | - | - | |||||||||||||||
| Total |
464 | 688 | 533 | 563 | 303 | |||||||||||||||
| Allocations |
||||||||||||||||||||
| Innovation and Technology and Carbon Capture and Storage Projects |
162 | 189 | 262 | 273 | 198 | |||||||||||||||
| Low Carbon Economy Leadership Fund Projects |
44 | 51 | 10 | - | - | |||||||||||||||
| Regulatory and Operations |
11 | 11 | 11 | 11 | 11 | |||||||||||||||
| Coal Workforce Transition |
9 | 3 | 5 | 11 | 5 | |||||||||||||||
| Climate Resilience Projects |
4 | 4 | - | - | - | |||||||||||||||
| Deficit and Debt Reduction / Canadian Energy Centre |
159 | 267 | 210 | 230 | 101 | |||||||||||||||
| Total Allocations |
389 | 526 | 499 | 527 | 314 | |||||||||||||||
| Amount Available for Future Carbon Capture Projects (Cumulative) |
149 | 149 | 226 | 306 | 387 | |||||||||||||||
| Expense | Fiscal Plan 2023 – 26 | 97 |
| Public Sector Compensation | ||
|
Alberta has made significant |
Since the release of the MacKinnon Panel Report, Alberta has made significant progress in aligning total expense, net of debt servicing costs, with the comparator provinces of Ontario, Quebec and British Columbia. The MacKinnon report found that from 2008 to 2017, the total provincial core government compensation expenses grew by 49 per cent, which was the highest across the comparator provinces. Operational efficiencies have been implemented to ensure that resources are focused on providing services in the most efficient and effective manner. | |
| During the last year, the Alberta Government and its Public Sector Employer partners have reached settlements with several public sector unions such as the United Nurses Association (direct nursing), the Alberta Union of Provincial Employees (government workers), and the Alberta Teachers’ Association (teachers). These agreements have reasonable wage increases that are fair to both taxpayers and bargaining unit members. In September 2022, the province and the Alberta Medical Association (AMA) reached a milestone agreement that includes an average rate increase of four per cent over the four-year term which is in line with other recent public sector agreements. Actions like this have resulted in government spending moving in line with comparator provinces. | ||
| Because of Alberta’s growing economy, lower cost of living, and abundant opportunities, significant population growth has been experienced. This record growth means expanded government services such as education and health care are required. As a result, total public sector compensation is increasing over the next three years to ensure these much-needed supports are available. | ||
Compensation for Alberta’s Public Sector
(millions of dollars)
| 2018-19 | 2019-20 | 2020-21 | 2021-22 | 2022-23 | 2023-24 | 2024-25 | 2025-26 | |||||||||||||||||||||||||||||
| Actual | Actual | Actual | Actual | Budget | Forecast | Estimate | Target | Target | ||||||||||||||||||||||||||||
| Alberta Health Services |
8,321 | 8,531 | 8,836 | 9,137 | 8,707 | 9,253 | 9,409 | 9,702 | 9,901 | |||||||||||||||||||||||||||
| School Jurisdictions |
6,262 | 6,228 | 6,105 | 6,212 | 6,421 | 6,472 | 6,715 | 6,832 | 6,999 | |||||||||||||||||||||||||||
| Post-Secondary Institutions |
3,505 | 3,532 | 3,374 | 3,390 | 3,499 | 3,537 | 3,704 | 3,784 | 3,910 | |||||||||||||||||||||||||||
| Alberta Public Service (Departments) |
2,904 | 2,903 | 2,723 | 2,582 | 2,730 | 2,846 | 3,032 | 3,064 | 3,065 | |||||||||||||||||||||||||||
| Other Government Agencies |
645 | 618 | 558 | 695 | 672 | 679 | 776 | 800 | 817 | |||||||||||||||||||||||||||
| Sub-total |
21,637 | 21,811 | 21,595 | 22,016 | 22,029 | 22,787 | 23,637 | 24,181 | 24,693 | |||||||||||||||||||||||||||
| Physician Compensation and Development A |
5,213 | 5,268 | 4,872 | 5,311 | 5,244 | 5,735 | 5,943 | 6,172 | 6,159 | |||||||||||||||||||||||||||
| Total |
26,850 | 27,079 | 26,468 | 27,327 | 27,273 | 28,522 | 29,580 | 30,353 | 30,852 | |||||||||||||||||||||||||||
| A | Excludes non-compensation expense included in the Ministry of Health’s operating expense on page 81. |
| 98 | Expense | Fiscal Plan 2023 – 26 |
BUDGET 2023
GOVERNMENT OF ALBERTA | 2023–26
Fiscal Plan
Capital Plan
99
Table of Contents
| 2023 Capital Plan |
101 | |||
| Securing Alberta’s Future |
101 | |||
| Growing the Economy |
102 | |||
| Protecting and Supporting Health Care |
108 | |||
| Keeping Albertans Safe and Secure |
109 | |||
| Capital Maintenance and Renewal (CMR) |
110 | |||
| Other Capital Plan Priorities |
110 | |||
| Capital Planning |
111 | |||
| Capital Plan Details |
112 | |||
Note: Amounts presented in tables may not add to totals due to rounding.
| 100 | Capital Plan | Fiscal Plan 2023 – 26 |
2023 Capital Plan
Securing Alberta’s Future
Alberta’s Budget 2023 Capital Plan plays a significant role in securing Albertans’ future by supporting jobs and the economy, investing in infrastructure projects that help strengthen our health care system, enhancing Albertans’ safety and security, and providing essential services that contributes to our high standard of living.
The Budget 2023 Capital Plan of nearly $23 billion over three years will create opportunities for private sector participation and support an average of over 20,000 direct and 12,000 indirect jobs per year through to 2025-26. Capital projects and programs provide quality jobs during the planning, design, construction, operation and maintenance phases. Capital spending also provides the infrastructure needed to support economic growth that will generate jobs over the long term.
The Capital Plan delivers on government’s existing project and program commitments and funds new priorities. The plan also enhances the maintenance and longevity of existing assets through increases to Capital Maintenance and Renewal.
The Budget 2023 Capital Plan invests more than $12 billion over three years in projects to ensure an efficient and effective road system; provide training opportunities for current and future workers; create vibrant communities that will attract and retain workers, and provide critical infrastructure for key industries and social systems.
Budget 2023 – Capital Plan
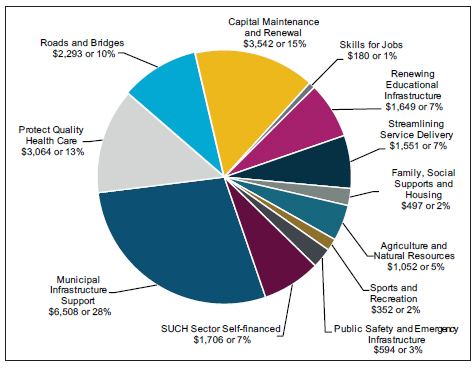
The Capital Plan is securing
Alberta’s future by investing in
imporant infrastucture across
the province.
| Capital Plan | Fiscal Plan 2023 – 26 | 101 |
$12.6 billion includes
infrastructure for roads, bridges,
municipal support, sports,
recreation, education, agriculture,
natural resources, housing and
other supports.
A total of $3.1 billion over three years will help protect healthcare services across the province. The healthcare projects will increase capacity for services such as Emergency Medical Services, mental health and addiction, and surgical procedures.
A further $594 million over three years is devoted to keeping Albertans safe and secure with investments in the justice and correctional systems and measures to mitigate the effect of natural disasters.
Existing capital assets will be protected by investing over $3 billion in Capital Maintenance and Renewal (CMR) to secure the province’s key infrastructure. This funding is for assets such as roads and bridges, health facilities, information and technology infrastructure, seniors facilities and other housing.
The Budget 2023 Capital Plan also funds additional investments that streamline the delivery of government services. For example, modernizing the province’s registry systems increases efficiencies for users and developing health information technology systems support health care workers in delivering services to Albertans
The 2023-26 Capital Plan provides approximately $145 million in planning funding in areas such as roads and bridges, health facilities, schools, public transit, recreation facilities and courthouses. Using a phased approach by first providing planning funding in advance of funding design and construction helps define the scope of the projects and aids in developing reasonable cost and schedule estimates for future capital decisions, particulary in a high cost escalation environment.
Growing the Economy
Alberta’s economic growth and future prosperity is underpinned by a strong backbone of infrastructure. A well built system of roads and bridges moves goods and people efficiently and effectively; municipal funding helps develop vibrant communities that attract skilled workers; a strong education system cultivates our current and future workforce. The Budget 2023 Capital Plan provides $12.6 billion in 2023-26 to fund infrastructure that enables economic growth.
Roads and Bridges
Roads and bridges are key to enabling economic growth and contributing to Albertans’ standard of living through the provision of efficient and effective access to markets, employment and leisure destinations. They are the arteries that connect municipalities and communities throughout Alberta that support jobs and improve the safe and efficient flow of industrial, commercial and passenger traffic. Each year, hundreds of kilometres of roadways are built and maintained to allow for new and improved connections. Roads and bridges are key infrastructure assets that enable economic growth and attract investment to the province.
| 102 | Capital Plan | Fiscal Plan 2023 – 26 |
The 2023 Capital Plan invests $2.3 billion over the next three years for key projects and programs that expand and enhance Alberta’s road and bridge network including:
| • | $117 million over three years for the twinning of Highway 63 north of Fort McMurray. This project will improve access to oil sands resources and services on which development depends, aiding economic activity in the area. |
| • | $51 million over three years to replace the interchange at the Queen Elizabeth II Highway and Highway 566 at Balzac. The improvements will address capacity issues resulting from the development and expansion of the surrounding areas. |
| • | $75 million over three years for 23 engineering projects to address future growth. The funding provides for engineering or planning on numerous projects to progress designs and refine cost estimates. Many of the projects are located along economic corridors, such as twinning Highway 3 from the British Columbia border to Medicine Hat. |
| • | $60 million over three years for the Vinca Bridge Replacement. The project will establish a critical link in Alberta’s High Load Corridor, saving heavily loaded trucks more than 200 kilometres of travel and save time and money for those travelling in the area. |
| • | $22 million over three years to address safety concerns at the intersection of Highway 16A and Range Road 20. This project will provide both improved safety and the long term plans for this network. |
Municipal Support to Create Vibrant Communities
The Budget 2023 Capital Plan provides $6.9 billion over three years, to assist municipalities in creating vibrant communities, with $6.5 billion in municipal infrastructure support and a further $352 million in sports and recreation funding. Strong municipalities with effective and efficient public transit, transportation systems, water and wastewater infrastructure and leisure facilities can help attract and retain the workers that will enable economic growth and prosperity.
Municipal Infrastructure Support
Total three year funding in the Budget 2023 Capital Plan is $6.5 billion for Municipal Infrastructure Support. Programs include grants to municipalities under the Municipal Sustainability Initiative (MSI) and its successor the Local Government Fiscal Framework (LGFF), funding for the Light Rail Transit (LRT) systems in Edmonton and Calgary and water and wastewater support.
Funding under the Municipal Sustainability Initiative (MSI) and the Local Government Fiscal Framework (LGFF) will total $2 billion over the next three years, with funding of $485 million in 2023-24 under MSI, and increasing to $722 million in 2024-25 and to $813 million in 2025-26. As part of the transition from MSI to the LGFF funding formula, the Government of Alberta is committed to providing additional top up funding to ensure that no municipality will receive a year-over-year decrease in funding in the shift to
| Capital Plan | Fiscal Plan 2023 – 26 | 103 |
the LGFF. In Budget 2023 the Local Government Fiscal Framework Act will be amended to allow for a true partnership with municipalities by increasing the Revenue Index Factor from 50 to 100 per cent, so that municipalities share fully in both increases and decreases in provincial revenues.
Government will continue to work with municipalities to finalize the allocation formula for the LGFF, and consider ways to facilitate a smooth transition from MSI to the new program.
The availability of clean water and wastewater disposal is crucial for Alberta’s communities. Budget 2023 increases the funding for the Municipal Water and Wastewater Program to $211 million over the next three years. This program provides up to 75 per cent of the funding for eligible water and wastewater projects.
The Budget 2023 Capital Plan provides $5 million in new grant funding in 2023-24 to allow the City of Calgary to proceed with needed engineering work for extending the LRT Blue Line north to enable connection with the Calgary International Airport. This year’s funding will also be used to determine the optimal connections to move passengers from the airport to downtown Calgary including: a people mover, LRT, and heavy rail. Once the Blue Line study is complete, further funding to this LRT project is anticipated in partnership with the City and federal government.
The plan also provides $30 million in 2023-24 for the Red Deer Airport Expansion. The funding is for upgrades to the airport such as widening the main runway, strengthening taxi-ways and aprons and constructing a terminal. These upgrades will enable additional services to the region to provide economic benefits, job creation and potential future investments.
Sports and Recreation
Sports and Recreation infrastructure provides communities with tourism opportunities and enhanced quality of life for their residents. The Budget 2023 Capital Plan provides $352 million over three years for projects that will help attract and retain people to live and work in Alberta.
The Community Facility Enhancement Program (CFEP) provides financial assistance to acquire, build, purchase, repair, renovate, upgrade or expand sports, recreational, cultural or other related public-use community facilities. This important program responds to local facility enhancement needs and works in partnership with eligible non-profit organizations to assist communities in addressing those needs. In Budget 2023, CFEP funding is increased by over $11 million annually to $50 million per year.
Alberta’s parks and trails provide recreation and tourism opportunities that support economic growth and quality of life. They provide opportunities and jobs in hospitality and tourism while drawing visitors to all parts of the province.
The Budget 2023 Capital Plan is investing in the parks by providing funding of $12 million over three years for new campground developments. The funding is for a strategy that will expand camping capacity and ensure environmental
| 104 | Capital Plan | Fiscal Plan 2023 – 26 |
sustainability in camping areas. Sites with potential for immediate expansion have been identified and include the Blue Rapids Provincial Recreation Area, Castle Provincial Park and Lesser Slave Lake Provincial Park.
An additional $14 million over three years will allow developments on Crown land trails to ensure they are safe and environmentally sustainable. The funding will develop purpose-built trails with safe parking and staging areas, wayfinding, and associated waste management. The work will be done primarily on Alberta’s Eastern Slopes. The investment will enhance the growth of Crown recreation and help attract out of province visitors.
New funding of $1 million in 2023-24 is provided for planning an artifact storage facility at the Reynolds Museum in Wetaskiwin. The project will address capacity issues in order to prevent the deterioration and devaluation of artifacts and will help the museum contribute to a diversified tourism experience.
An additional $4 million in new funding in 2023-24 is provided for repairs and upgrades to the Citadel Theatre that will help ensure it can operate safely and efficiently. The funding will also contribute to planning for future work to increase the theatre’s capacity, The theatre currently presents over 300 performances in a year and is used by numerous arts organizations, schools, corporate entities and community groups.
Education to Support our Workforce
Investing in schools and post-secondary facilities is crucial to ensuring all Alberta students have access to high quality education to develop skills and knowledge that lead to good jobs and drive economic growth. The three-year Capital Plan provides funding of $1.6 billion for school projects and an additional $180 million for post-secondary projects.
Renewing Educational Infrastructure
New funding in Budget 2023 provides for future schools’ planning and design work to facilitate school facility priorities and for new, replacement and modernized schools. These projects will address larger than anticipated enrolment growth, particularly in metro areas, preserve and modernize existing facilities and consolidate underutilized space, thereby reducing maintenance costs.
The 2023-26 Capital Plan provides new planning funds for 14 potential schools. Planning is provided for schools in areas across the province, including Stettler, Okotoks, High Prairie, Coalhurst, Edmonton and Calgary. Planning projects include potential modernizations as well as new and replacement schools.
The Budget 2023 Capital Plan provides $372 million for the design and construction of new and modernized schools. Project funding is included for the design of a new school in Glenridding Heights in Edmonton and construction of a replacement school in Valleyview. Other locations supported by this funding include Taber, Airdrie, Lethbridge, Red Earth Creek, Breton, and Calgary.
| Capital Plan | Fiscal Plan 2023 – 26 | 105 |
Charter and collegiate schools are supported in this Capital Plan with new funding of $117 million over three years, bringing total 3-year funding to $137 million.
Additional charter school spaces will be created in Calgary and Edmonton that will improve capacity to reduce constraints on charter school growth. New funding of $42 million over three years will be used for an expansion to the Charter Hub. The expansion will create approximately 2,000 new student spaces that can be used by start-up or expanding charters until they can identify and establish a permanent location. An additional $32 million in new funding will allow for the acquisition and renovation of school buildings for charter schools.
A collegiate school model was introduced in May 2022 to allow student choices and to develop clear pathways to post-secondary education and careers. New funding of $43 million over three years will allow facility upgrades to facilitate collegiate school implementation in multiple locations across the province.
Skills for Jobs
The Capital Plan investment of $180 million over three years for post-secondary institution projects will provide additional capacity to assist students in meeting their career goals. An educated workforce contributes to economic prosperity by helping to ensure we have Albertans with the skills, knowledge and training to fill jobs in key sectors.
The Budget 2023 Capital Plan provides new funding of $35 million in 2024-26 for MacEwan University’s new building for the School of Business. The project provides additional capacity in programs that serve economic sectors that are in high demand in the province such as science, technology and business entrepreneurship.
New funding in Budget 2023 for the University of Calgary – Faculty of Veterinary Medicine Lab will further help Alberta’s agricultural industry by ensuring critical diagnostic capacity at a lower cost. These services will now be provided in Alberta rather than having to send samples out of the province.
Ongoing funding for the University of Calgary – Veterinary Medicine Expansion will provide additional seats for veterinary medicine students which will also help Alberta’s agricultural industry.
Agriculture and Natural Resources
Budget 2023 provides $1.1 billion over three years for agricultural production, rural communities, petrochemical development and environmental sustainability.
Budget 2023 provides rural communities with new funding for the facilities owned by agricultural societies. $8 million over three years for the Agricultural Societies Infrastructure Revitalization program will help fund major repairs, renovations and energy efficiency upgrades at facilities such as trade and exhibition centres, fairgrounds and multi/agri-plexes.
| 106 | Capital Plan | Fiscal Plan 2023 – 26 |
Irrigation projects are an ongoing investment in improved water conveyance efficiency and increased water storage capacity. Capital Plan 2023-26 will provide $140 million in funding to the Agriculture Sector Strategy - Irrigation Projects program and $43 million to the Irrigation Rehabilitation program, which goes to ten Irrigation Districts. This funding will aid agricultural production and attract value-added processing by expanding Alberta’s irrigated areas.
The petrochemical resource industry is key to Alberta’s economic growth. The Alberta Petrochemical Incentive Program (APIP) and Hydrogen Centre of Excellence are programs that encourage economic diversification by supporting petrochemical producers and hydrogen innovation and technology.
APIP provides grants to attract investment in petrochemical facilities. This program is supporting projects such as the Inter Pipelines propane-to-polypropylene plastic facility, Dow’s Fort Saskatchewan furnace expansion at its ethylene production facility and Air Products’ new natural gas to hydrogen production facility. These three projects have encouraged business investment of more than $5 billion and are expected to create more than 20,000 construction jobs over the projects’ construction periods. The Budget 2023 Capital Plan provides the APIP program with $484 million over three years.
Grants to the Hydrogen Centre of Excellence of $5 million in 2023-24 will encourage hydrogen innovation and technology in Alberta, which can expand opportunities for hydrogen production, use and export.
Funding of $246 million over three years for the Carbon Capture and Storage Initiative is supporting the construction and operation of projects that will capture, compress and store carbon which contributes to our economy by increasing environmental sustainability. Additional Technology Innovation and Emissions Reduction (TIER) funding is reserved for future carbon capture and storage projects, which may be included in an expansion of APIP.
Family, Social Supports and Housing
The Budget 2023 Capital Plan provides $497 million over three years to provide housing and other social supports in communities across the province. This funding assists Alberta children and families that need housing.
The Capital Plan provides $316 million over three years for ongoing funding for affordable housing, including $202 for the Affordable Housing Partnership Program, $68 million for the Affordable Housing Strategy and $46 million for Affordable and Specialized Housing. An additional $54 million is included for the Indigenous Housing Capital Program. This funding will address demand, increase long-term financial sustainability and improve access for Albertans in housing need. These programs contribute to the growth of affordable housing supply and housing supports. Projects are ongoing in locations such as Edmonton, Calgary, Lethbridge, High Level, Manning, Debolt and Fort Chipewayan with additional projects planned in locations that include Conklin, Edmonton, Calgary and Janvier.
| Capital Plan | Fiscal Plan 2023 – 26 | 107 |
Protecting and Supporting Health Care
The government is continuing to invest in health infrastructure to protect quality health care and expand health system capacity. Alberta’s Government is investing $3.1 billion over three years in health capital projects and programs. The Budget 2023 Capital Plan includes new or increased investments to strengthen the Emergency Medical Services (EMS) system, decrease emergency department wait times and help reduce surgical wait times, in support of the Healthcare Action Plan.
Acute Care
Some of the key investments in acute care in Budget 2023 include:
| • | $237 million over three years for the Alberta Surgical Initiative Capital Program, including $120 million in new funding that will allow for additional projects in Brooks, Calgary, Camrose, Crowsnest Pass, Edmonton, Fort Saskatchewan, Grande Prairie, Innisfail, Olds, Pincher Creek, Ponoka, Red Deer, St. Albert, Stettler and Taber that will increase surgical capacity and help reduce surgical wait times. |
| • | $105 million over three years for Medical Device Reprocessing (MDR) upgrades, including $96 million in new funding which will provide needed MDR upgrades in Calgary, Edmonton, Ft. McMurray, St. Albert and Westlock. MDR areas are an essential clinical support service for surgery. |
| • | $105 million over three years for the Rural Health Facilities Revitalization Program. This includes $75 million in additional funding for new capital projects in rural Alberta. To date, about $65 million has been committed to 22 projects across the province, including Emergency Department renovations, upgrades to EMS stations, improvements to MDR areas and new dialysis spaces. |
| • | $54 million over three years for a new program to renovate and upgrade 33 pharmacies in 20 AHS facilities to meet new standards for sterile compounding adopted by the Alberta College of Pharmacists. |
| • | $18 million over three years is for further planning for proposed health capital projects across the province, including the stand-alone Stollery Children’s Hospital in Edmonton, a North Calgary/Airdrie Regional Health Centre, expansion of the Strathcona Community Hospital, and new or upgraded facilities in Bassano, Cardston, and Whitecourt. |
| • | $155 million over three years for Recovery Communities that offer long-term residential addiction treatment. The Red Deer Recovery Community will open in March 2023 and the Lethbridge Recovery Community is expected to be completed in spring 2023. Additional facilities are planned in Gunn, on the Blood Tribe First Nation, in Edmonton and Calgary. Three additional recovery communities are also planned; one will be located in Grande Prairie, one in Northern Alberta, and one in Central Alberta. |
| 108 | Capital Plan | Fiscal Plan 2023 – 26 |
| • | $15 million over three years is for a new program to purchase new EMS vehicles and upgrade related equipment to help strengthen the EMS system throughout the province. |
| • | $11 million over three years to expand the renal dialysis program at the Chinook Regional Hospital in Lethbridge. This project will relocate the dialysis unit to provide additional treatment spaces and address patient and staff safety concerns with the current site. |
| • | $1 million in 2023-24 for the Beaverlodge Municipal Hospital. The facility, built in 1956, is the oldest Alberta Health Services (AHS) operated site and the second oldest hospital facility in the province. AHS is proceeding with a partnership arrangement to provide a community health facility to replace the aging health centre. |
Continuing Care
Key investments in continuing care in Budget 2023 include:
| • | $310 million over three years for the Continuing Care Capital Program which supports the four program streams that will: modernize continuing care facilities; develop innovative small homes; provide culturally appropriate care for Indigenous residents located both on and off reserves and Metis settlements, and add new spaces in priority communities having the greatest need. |
| • | $120 million in 2024-25 for two significant continuing care modernization projects in Calgary (Bethany Care) and Edmonton (Good Samaritan Society). Combined, these two projects will modernize 700 spaces upon completion. |
Keeping Albertans Safe and Secure
Albertans need to feel safe and secure in their communities, which means they need to be protected against disasters and know that there is a strong justice and correctional system to support law and order in the province. Through the Capital Plan in Budget 2023, $594 million over three years is provided to enhance safety and security. Key investments in this area include:
| • | $282 million over three years for the Springbank – Off-Stream Reservoir (SR1) which will provide flood protection along the Elbow River in Calgary and downstream communities. |
| • | $83 million over two years for continued investment in the Red Deer Justice Centre, which will provide a new courthouse in the city. |
| • | $27 million in 2023-24 for flood mitigation for the town of Drumheller to protect vulnerable communities from flood events. |
| • | $22 million for the Office of the Chief Medical Examiner in Calgary for a new facility to address population growth. |
| Capital Plan | Fiscal Plan 2023 – 26 | 109 |
| • | $4 million in additional funding for the Edmonton Law Courts (ELC) and the Sherwood Park Courthouse facilities. The additional funding will supplement planning funds previously provided by allowing functional programming to occur. The ELC funding will address capacity issues, the ability to update technology and safety and security of the judiciary, staff and Albertans. Funding for the Sherwood Park Courthouse will address issues such as demand for services exceeding capacity, layout, security, prisoner circulation and the ability to use new technology. The funding will support future capital decisions for these facility upgrades. |
Capital Maintenance and Renewal (CMR)
CMR funding helps secure our future by ensuring that the capital infrastructure is available to allow the provision of the many services we require in a thriving province.
The Budget 2023 Capital Plan will invest $3.5 billion over three years for Capital Maintenance and Renewal, an increase of over $257 million from Budget 2022. The CMR funding supports thousands of projects for schools, hospitals, roads, information technology infrastructure, and other key assets. CMR funding preserves and extends the useful life of existing infrastructure, maintains their long-term value and enables proactive asset management to ensure they are well-maintained and functioning when Albertans need them.
A total of $1.7 billion over three years is provided for Roads and Bridges which will maintain the condition of the highway network and extend the life of existing roads and bridges, including for the Calgary and Edmonton ring roads. An additional $529 million is provided for Health Facilities Support.
Other Capital Plan Priorities
The Capital Plan will facilitate the efficient delivery of government services by funding initiatives such as modern information technology systems to aid in the delivery of services required by residents, businesses and investors. Over three years, the Capital Plan will provide $1.6 billion for enhancements to service delivery.
Albertans need to rely on systems, such as the Land Titles Registry System, to conduct business with confidence. The Budget 2023 Capital Plan provides $100 million over three years for the modernization of registry systems. The Land Titles registry is experiencing volume increases and a backlog of transactions. The additional funding will be used to replace paper-based manual processes with new technology to automate processes. This automation will reduce backlogs, eliminate excessive delays and reduce maintenance costs. Modernization of the motor vehicles registry is essential to ensuring drivers and vehicles can be registered so they can access employment and engage in commerce, which also supports economic activity. The existing motor vehicle registry is near the end of its life and will be replaced to ensure continued functioning of the system and to reduce wait times for registry services.
| 110 | Capital Plan | Fiscal Plan 2023 – 26 |
New funding is provided in Budget 2023 for the Digital Accelerator Program. A total of $120 million over three years will be used to deliver simpler, faster and more efficient services by replacing paper-based transactions with digital transformation and automation. The program will provide Albertans with digital services that are easier and more convenient, improve government efficiency and. reduce the costs of developing and maintaining information technology systems.
The Capital Plan also continues funding the Alberta Broadband Strategy by providing $369 million in funding over three years. The funding will be used to build high-speed network access for all Albertans, which will strengthen healthcare and education delivery and support business activity in remote areas.
Capital Planning
The government is committed to transparency and rigorous decision-making based on long-term strategic capital planning. The Infrastructure Accountability Act ensures prudent decision-making on capital projects by legislating prioritization criteria to guide how projects are evaluated, a governance framework for developing the annual Capital Plan, and the development and regular update of a 20-Year Strategic Capital Plan.
Projects in the 2023 Capital Plan were evaluated based on the criteria outlined in the Infrastructure Accountability Act, and fit in to the broader strategic context of Building Forward: Alberta’s 20-Year Strategic Capital Plan.
| Capital Plan | Fiscal Plan 2023 – 26 | 111 |
Capital Plan Details
(millions of dollars)
| 2022-23 | 2023-24 | 2024-25 | 2025-26 | 3-Year | ||||||||||||||||||||
| Budget | Forecast | Estimate | Target | Target | Total | |||||||||||||||||||
| Municipal Infrastructure Support |
||||||||||||||||||||||||
| Clean Water and Wastewater Fund |
13 | 17 | - | - | - | - | ||||||||||||||||||
| Canada Community – Building Fund |
255 | 259 | 266 | 266 | 266 | 799 | ||||||||||||||||||
| Edmonton and Calgary LRT (Provincial and Federal) |
707 | 392 | 694 | 1,176 | 1,136 | 3,006 | ||||||||||||||||||
| First Nations Water Tie-In Program |
30 | - | 28 | - | - | 28 | ||||||||||||||||||
| GreenTRIP |
18 | 22 | 1 | - | - | 1 | ||||||||||||||||||
| Investing in Canada Infrastructure Program (ICIP) |
152 | 113 | 103 | 23 | 12 | 137 | ||||||||||||||||||
| Local Government Fiscal Framework |
- | - | - | 722 | 813 | 1,535 | ||||||||||||||||||
| Municipal Sustainability Initiative |
485 | 486 | 485 | - | - | 485 | ||||||||||||||||||
| Municipal Water and Wastewater Program |
62 | 35 | 86 | 63 | 62 | 211 | ||||||||||||||||||
| New Building Canada – Small Communities Fund |
- | - | 1 | - | - | 1 | ||||||||||||||||||
| Public Transit Infrastructure Fund |
8 | 4 | - | - | - | - | ||||||||||||||||||
| Red Deer Airport Expansion |
- | 8 | 30 | - | - | 30 | ||||||||||||||||||
| Regional Water/Wastewater Projects - Water for Life |
37 | 22 | 69 | 50 | 50 | 169 | ||||||||||||||||||
| Strategic Transportation Infrastructure Program |
35 | 25 | 43 | 25 | 25 | 93 | ||||||||||||||||||
| Sundre Wastewater Treatment Plant |
8 | - | 8 | - | - | 8 | ||||||||||||||||||
| YYC Rail Connection |
- | - | 5 | - | - | 5 | ||||||||||||||||||
| Total Municipal Support |
1,809 | 1,383 | 1,819 | 2,325 | 2,363 | 6,508 | ||||||||||||||||||
| Capital Maintenance and Renewal |
||||||||||||||||||||||||
| Environment, Forestry and Parks |
36 | 44 | 61 | 77 | 28 | 167 | ||||||||||||||||||
| Government-Owned Facilities |
173 | 98 | 137 | 89 | 91 | 317 | ||||||||||||||||||
| Health Facilities Support |
189 | 149 | 223 | 169 | 138 | 529 | ||||||||||||||||||
| Information and Technology |
17 | 19 | 20 | 18 | 16 | 53 | ||||||||||||||||||
| Innovation Infrastructure Maintenance |
2 | 2 | 5 | 7 | 7 | 19 | ||||||||||||||||||
| Post-Secondary Facilities |
109 | 109 | 149 | 122 | 119 | 390 | ||||||||||||||||||
| Roads and Bridges |
597 | 631 | 727 | 549 | 418 | 1,694 | ||||||||||||||||||
| School Facilities |
91 | 91 | 59 | 110 | 110 | 279 | ||||||||||||||||||
| Seniors Facilities and Housing |
38 | 37 | 32 | 32 | 29 | 94 | ||||||||||||||||||
| Total Capital Maintenance and Renewal |
1,252 | 1,180 | 1,413 | 1,173 | 956 | 3,542 | ||||||||||||||||||
...continues next page
| 112 | Capital Plan | Fiscal Plan 2023 – 26 |
Capital Plan Details, continued
(millions of dollars)
| 2022-23 | 2023-24 | 2024-25 | 2025-26 | 3-Year | ||||||||||||||||||||
| Budget | Forecast | Estimate | Target | Target | Total | |||||||||||||||||||
| Protect Quality Health Care |
||||||||||||||||||||||||
| Addressing Addiction Crisis |
- | 10 | 8 | - | - | 8 | ||||||||||||||||||
| Alberta Surgical Initiative Capital Program |
37 | 33 | 72 | 114 | 50 | 237 | ||||||||||||||||||
| Beaverlodge Health Centre Replacement Planning |
- | - | 1 | - | - | 1 | ||||||||||||||||||
| Bethany Continuing Care Centre (Calgary) |
- | - | - | 57 | - | 57 | ||||||||||||||||||
| Bridgeland Riverside Continuing Care Centre (Calgary) |
53 | 20 | 41 | 32 | - | 74 | ||||||||||||||||||
| Calgary Cancer Centre |
172 | 138 | 156 | 10 | - | 166 | ||||||||||||||||||
| CASA Expansion |
- | - | 10 | 15 | - | 25 | ||||||||||||||||||
| Chinook Regional Hospital – Renal Dialysis (Lethbridge) |
- | - | - | 2 | 9 | 11 | ||||||||||||||||||
| Continuing Care Capital Program |
51 | 12 | 89 | 120 | 100 | 310 | ||||||||||||||||||
| Cyclotron Facility (Calgary) |
2 | 1 | 4 | 27 | 25 | 56 | ||||||||||||||||||
| Edmonton hospital |
49 | 12 | 34 | 300 | 300 | 634 | ||||||||||||||||||
| EMS Vehicles Capital Program |
- | - | 5 | 5 | 5 | 15 | ||||||||||||||||||
| Foothills Medical Centre Neonatal Intensive Care Unit (Calgary) |
15 | 1 | 2 | 29 | 22 | 52 | ||||||||||||||||||
| Foothills Medical Centre Urgent Power Plant Capacity (Calgary) |
22 | 21 | 11 | - | 11 | |||||||||||||||||||
| Gene Zwozdesky Centre at Norwood (Edmonton) |
124 | 75 | 44 | 32 | 15 | 91 | ||||||||||||||||||
| Good Samaritan Society Continuing Care (Edmonton) |
- | - | - | 63 | - | 63 | ||||||||||||||||||
| Pandemic Response |
- | 35 | - | - | - | - | ||||||||||||||||||
| Health System Capacity – Intensive Care Unit Expansions |
- | 3 | 15 | 19 | - | 34 | ||||||||||||||||||
| La Crete Maternity and Community Health Centre |
5 | 1 | 9 | 21 | 34 | 64 | ||||||||||||||||||
| Medical Device Reprocessing Upgrades Program – Phase 1 |
1 | 4 | 27 | 42 | 36 | 105 | ||||||||||||||||||
| Medical Equipment Replacement and Upgrade Program |
30 | 30 | 30 | 30 | 30 | 90 | ||||||||||||||||||
| Misericordia Community Hospital Modernization Program (Edmonton) |
24 | 28 | 8 | - | - | 8 | ||||||||||||||||||
| National Association of Pharmacy Regulatory Authorities Capital Program |
- | - | 15 | 15 | 24 | 54 | ||||||||||||||||||
| North Calgary/Airdrie Regional Health Centre Planning |
- | - | 1 | 1 | 1 | 3 | ||||||||||||||||||
| Other Health Facilities Projects |
13 | 24 | 5 | - | - | 5 | ||||||||||||||||||
| Other Proposed Health Capital Initiatives Planning |
3 | - | 3 | 3 | 3 | 9 | ||||||||||||||||||
| Peter Lougheed Centre Emergency Department, Mental Health Intensive Care Unit and Laboratory Redevelopment (Calgary) |
49 | 30 | 33 | 35 | 17 | 85 | ||||||||||||||||||
| Provincial Pharmacy Central Drug Production and Distribution Centre |
13 | 1 | 27 | 31 | 11 | 70 | ||||||||||||||||||
| Recovery Communities |
50 | 42 | 46 | 81 | 28 | 155 | ||||||||||||||||||
| Red Deer Regional Hospital Centre Redevelopment |
25 | 1 | 21 | 100 | 200 | 321 | ||||||||||||||||||
| Rockyview General Hospital ICU/CCU/GI Redevelopment (Calgary) |
22 | 15 | 51 | 27 | - | 78 | ||||||||||||||||||
| Rural Health Facilities Revitalization Program |
15 | 15 | 40 | 40 | 25 | 105 | ||||||||||||||||||
| Stollery Children’s Hospital (Edmonton) Planning |
- | - | 1 | 1 | 1 | 3 | ||||||||||||||||||
| Strathcona Community Hospital Expansion Planning |
- | - | 1 | 1 | 1 | 3 | ||||||||||||||||||
| University of Alberta Hospital Brain Centre – Neurosciences Intensive Care Unit |
8 | 4 | 13 | 22 | 28 | 63 | ||||||||||||||||||
| Total Protect Quality Health Care |
783 | 555 | 824 | 1,276 | 964 | 3,064 | ||||||||||||||||||
...continues next page
| Capital Plan | Fiscal Plan 2023 – 26 | 113 |
Capital Plan Details, continued
(millions of dollars)
| 2022-23 | 2023-24 | 2024-25 | 2025-26 | 3-Year | ||||||||||||||||||||
| Budget | Forecast | Estimate | Target | Target | Total | |||||||||||||||||||
| Roads and Bridges |
||||||||||||||||||||||||
| City of Edmonton – 50th Street |
14 | 6 | 14 | 8 | - | 22 | ||||||||||||||||||
| Deerfoot Trail Upgrades (Calgary) |
73 | 8 | 187 | 142 | 100 | 430 | ||||||||||||||||||
| Edmonton / Calgary Ring Roads |
266 | 288 | 127 | 11 | - | 138 | ||||||||||||||||||
| Highway 11 Twinning from Red Deer west to Rocky Mountain House |
- | 18 | 28 | 76 | 4 | 108 | ||||||||||||||||||
| Highway 16A and Range Road 20 Intersection |
- | - | 3 | 20 | - | 22 | ||||||||||||||||||
| Highway 19 (East and West ends) |
43 | 17 | 10 | - | - | 10 | ||||||||||||||||||
| Highway 1A Upgrade (Stoney First Nation) |
2 | 9 | 15 | 15 | 27 | 57 | ||||||||||||||||||
| Highway 2 Balzac Interchange Replacement |
- | - | 1 | 10 | 40 | 51 | ||||||||||||||||||
| Highway 201 Bow River Bridge on SE Stoney Trail |
42 | 27 | 15 | - | - | 15 | ||||||||||||||||||
| Highway 3 Twinning (From Taber to Burdett) |
28 | 28 | 31 | 48 | 15 | 94 | ||||||||||||||||||
| Highway 40 grade widening between Grande Cache and Hinton |
1 | 1 | 34 | 34 | 9 | 77 | ||||||||||||||||||
| Highway 40 Twinning south of Grande Prairie |
5 | 88 | 74 | 10 | - | 84 | ||||||||||||||||||
| Highway 60 Capital Improvements |
6 | 5 | 11 | 21 | 29 | 61 | ||||||||||||||||||
| Highway 63 Twinning North of Fort McMurray |
- | - | 48 | 48 | 22 | 117 | ||||||||||||||||||
| Highway 881 safety and roadway improvements |
1 | 28 | 23 | 51 | ||||||||||||||||||||
| Highway Twinning, Widening and Expansion |
200 | 124 | 232 | 131 | 41 | 403 | ||||||||||||||||||
| La Crete Bridge |
50 | 15 | 43 | 71 | 48 | 162 | ||||||||||||||||||
| Multiple Engineering Projects |
- | - | 25 | 28 | 23 | 75 | ||||||||||||||||||
| QEII and 40th Avenue Interim Ramp (near Airdrie) |
27 | 51 | 11 | 9 | - | 21 | ||||||||||||||||||
| Ray Gibbon Drive Upgrade Project |
- | 14 | - | - | 3 | 3 | ||||||||||||||||||
| Terwillegar Expansion |
31 | - | 37 | 24 | 32 | 92 | ||||||||||||||||||
| Yellowhead Trail |
- | 60 | 37 | 50 | 52 | 139 | ||||||||||||||||||
| Vinca Bridge Replacement |
1 | 1 | 4 | 8 | 48 | 60 | ||||||||||||||||||
| Total Roads and Bridges |
789 | 761 | 986 | 791 | 515 | 2,293 | ||||||||||||||||||
| Renewing Educational Infrastructure |
||||||||||||||||||||||||
| Collegiates and Charter School Expansion |
27 | 103 | 85 | 52 | - | 137 | ||||||||||||||||||
| Modular Classroom Program |
48 | 48 | 43 | 25 | 25 | 93 | ||||||||||||||||||
| Previously Announced School Projects |
670 | 487 | 433 | 399 | 213 | 1,045 | ||||||||||||||||||
| Schools Capital Projects Budget 2023 – Planning |
- | - | 4 | - | - | 4 | ||||||||||||||||||
| Schools Capital Projects Budget 2023 |
- | - | 68 | 126 | 178 | 372 | ||||||||||||||||||
| Total Renewing Educational Infrastructure |
744 | 637 | 631 | 603 | 416 | 1,649 | ||||||||||||||||||
...continues next page
| 114 | Capital Plan | Fiscal Plan 2023 – 26 |
Capital Plan Details, continued
(millions of dollars)
| 2022-23 | 2023-24 | 2024-25 | 2025-26 | 3-Year | ||||||||||||||||||||
| Budget | Forecast | Estimate | Target | Target | Total | |||||||||||||||||||
| Streamlining Service Delivery |
||||||||||||||||||||||||
| Agrivalue Processing Business Incubator (Leduc) |
11 | 9 | 2 | - | - | 2 | ||||||||||||||||||
| Alberta Broadband Strategy |
150 | 21 | 229 | 70 | 70 | 369 | ||||||||||||||||||
| Alberta Business Portal |
3 | 2 | 1 | - | - | 1 | ||||||||||||||||||
| Digital Accelerator Program |
- | - | 40 | 40 | 40 | 120 | ||||||||||||||||||
| Government Facilities and Accommodation |
77 | 37 | 80 | 83 | 79 | 242 | ||||||||||||||||||
| Government Vehicle Fleet |
13 | 13 | 13 | 16 | 13 | 41 | ||||||||||||||||||
| Health IT Systems Development |
31 | 30 | 34 | 29 | 28 | 90 | ||||||||||||||||||
| Information Technology and Other Capital |
81 | 102 | 101 | 96 | 84 | 281 | ||||||||||||||||||
| Justice Digital |
11 | 13 | 11 | 1 | - | 12 | ||||||||||||||||||
| Justice Transformation Initiative |
2 | 2 | 1 | 1 | 1 | 2 | ||||||||||||||||||
| Land Purchases |
8 | 4 | 14 | 8 | 8 | 31 | ||||||||||||||||||
| Modernization of Registry Systems |
10 | 19 | 29 | 36 | 36 | 100 | ||||||||||||||||||
| Office of the Public Guardian Information System |
5 | 4 | 4 | 4 | 4 | 11 | ||||||||||||||||||
| One Information Management and Technology Enterprise Priorities |
50 | 33 | 51 | 51 | 51 | 154 | ||||||||||||||||||
| Water Management Infrastructure |
36 | 39 | 35 | 30 | 30 | 95 | ||||||||||||||||||
| Total Streamlining Service Delivery |
488 | 328 | 644 | 464 | 443 | 1,551 | ||||||||||||||||||
| Public Safety and Emergency Infrastructure |
||||||||||||||||||||||||
| Alberta Community Safety Analytics Lab Planning |
- | - | 1 | - | - | 1 | ||||||||||||||||||
| Alberta First Responders Radio Communications System |
2 | 5 | 2 | 2 | 2 | 7 | ||||||||||||||||||
| Court of Appeal (Calgary) |
7 | 1 | 2 | 21 | 40 | 64 | ||||||||||||||||||
| Disaster Recovery Program Redesign |
2 | - | - | - | - | |||||||||||||||||||
| Edmonton Law Courts Planning |
1 | 0 | 3 | - | - | 3 | ||||||||||||||||||
| Eyremore Dam |
- | - | 5 | - | - | 5 | ||||||||||||||||||
| Flood Mitigation – Town of Drumheller |
- | - | 27 | - | - | 27 | ||||||||||||||||||
| Grande Prairie Courthouse Expansion / New Build Planning |
- | - | 1 | - | - | 1 | ||||||||||||||||||
| Highwood River Mitigation Program |
- | 0 | 10 | - | - | 10 | ||||||||||||||||||
| Investing in Canada Infrastructure Program (ICIP) Projects |
28 | 33 | 7 | - | - | 7 | ||||||||||||||||||
| Justice and Correctional Facilities Planning and Upgrades |
17 | 15 | 21 | 10 | 4 | 35 | ||||||||||||||||||
| Kananaskis Emergency Services Centre |
1 | 0 | 1 | - | - | 1 | ||||||||||||||||||
| Office of the Chief Medical Examiner (Edmonton) Planning |
- | - | 1 | - | - | 1 | ||||||||||||||||||
| Office of the Chief Medical Examiner (Calgary) |
7 | - | 1 | 8 | 13 | 22 | ||||||||||||||||||
| Other Flood Mitigation Projects |
10 | 9 | 12 | 4 | 4 | 19 | ||||||||||||||||||
| Red Deer Justice Centre |
63 | 60 | 52 | 32 | - | 83 | ||||||||||||||||||
| Sherwood Park Courthouse Planning |
1 | 1 | 1 | - | - | 1 | ||||||||||||||||||
| Springbank - Off-Stream Reservoir (SR1) |
209 | 192 | 184 | 81 | 17 | 282 | ||||||||||||||||||
| Wildfire Facility Upgrade Program |
6 | 6 | 6 | 6 | 6 | 19 | ||||||||||||||||||
| Wildfire Management Readiness |
- | - | 2 | 2 | 2 | 6 | ||||||||||||||||||
| Total Public Safety and Emergency Infrastructure |
351 | 323 | 339 | 166 | 89 | 594 | ||||||||||||||||||
...continues next page
| Capital Plan | Fiscal Plan 2023 – 26 | 115 |
Capital Plan Details, continued
(millions of dollars)
| 2022-23 | 2023-24 | 2024-25 | 2025-26 | 3-Year | ||||||||||||||||||||
| Budget | Forecast | Estimate | Target | Target | Total | |||||||||||||||||||
| Agriculture and Natural Resources |
||||||||||||||||||||||||
| Agricultural Societies Infrastructure Revitalization |
- | - | 3 | 3 | 3 | 8 | ||||||||||||||||||
| Agriculture Sector Strategy – Irrigation Projects |
31 | 31 | 31 | 54 | 55 | 140 | ||||||||||||||||||
| Alberta Petrochemical Incentive Program |
- | 11 | 147 | 147 | 190 | 484 | ||||||||||||||||||
| Cold Lake Fish Hatchery |
7 | 5 | 7 | - | - | 7 | ||||||||||||||||||
| Carbon Capture and Storage Initiative |
58 | 58 | 58 | 58 | 129 | 246 | ||||||||||||||||||
| Fractionation Equipment at the Food Processing Centre in Leduc |
- | 1 | - | - | - | - | ||||||||||||||||||
| Hydrogen Centre of Excellence |
5 | 5 | 5 | - | - | 5 | ||||||||||||||||||
| Investing in Canada Infrastructure Program (ICIP) Projects |
- | - | - | 2 | 2 | 4 | ||||||||||||||||||
| Irrigation Rehabilitation Program |
12 | 12 | 14 | 14 | 16 | 43 | ||||||||||||||||||
| Installation of the Pressure Reaction Tower System at Innotech Alberta |
1 | 1 | 1 | - | - | 1 | ||||||||||||||||||
| Kainai Forage Natural Gas Pipeline |
1 | - | 1 | - | - | 1 | ||||||||||||||||||
| Kids Can Catch Trout Pond Rehabilitation |
- | - | 1 | - | - | 1 | ||||||||||||||||||
| Lethbridge Irrigation Planning |
- | - | 5 | - | - | 5 | ||||||||||||||||||
| Land Stewardship Fund |
15 | 15 | 10 | 10 | 10 | 30 | ||||||||||||||||||
| Natural Gas Pipeline Joint Project |
- | 5 | - | - | - | - | ||||||||||||||||||
| Raven Creek Brood Trout Station |
22 | 1 | 28 | 18 | 3 | 49 | ||||||||||||||||||
| Rural Utilities Program |
6 | 6 | 6 | 6 | 4 | 17 | ||||||||||||||||||
| Watercourse Crossing Program |
7 | 7 | 8 | 7 | - | 15 | ||||||||||||||||||
| Total Agriculture and Natural Resources |
165 | 158 | 323 | 318 | 411 | 1,052 | ||||||||||||||||||
| Family, Social Supports and Housing |
||||||||||||||||||||||||
| Aboriginal Business Investment Fund |
5 | 5 | 8 | 8 | 8 | 23 | ||||||||||||||||||
| Affordable and Specialized Housing |
11 | 6 | 10 | 17 | 19 | 46 | ||||||||||||||||||
| Affordable Housing Partnership Program |
7 | 7 | 34 | 40 | 127 | 202 | ||||||||||||||||||
| Affordable Housing Strategy |
9 | 9 | 10 | 15 | 43 | 68 | ||||||||||||||||||
| Central Alberta Child Advocacy Centre |
3 | 0 | 3 | - | - | 3 | ||||||||||||||||||
| Children’s Cottage Society – Child and Family Centre and Crisis Nursery |
1 | 1 | 1 | - | - | 1 | ||||||||||||||||||
| Family and Community Housing Development and Renewal |
2 | 3 | 1 | - | - | 1 | ||||||||||||||||||
| Indigenous Housing Capital Program |
14 | 14 | 18 | 15 | 20 | 54 | ||||||||||||||||||
| ICIP Projects |
- | 5 | - | - | 5 | |||||||||||||||||||
| Lethbridge Supportive Housing for the Chronically Homeless |
9 | 1 | 9 | - | - | 9 | ||||||||||||||||||
| Long Term Governance and Funding Agreement (LTA) – Infrastructure and Housing for Metis Settlements |
2 | 2 | - | - | - | - | ||||||||||||||||||
| Seniors Housing Development and Renewal |
26 | 31 | 28 | 2 | - | 29 | ||||||||||||||||||
| Red Deer Integrated Emergency Shelter |
2 | - | 2 | 6 | - | 7 | ||||||||||||||||||
| Yellowhead Youth Centre |
5 | 2 | 10 | 17 | 21 | 49 | ||||||||||||||||||
| Total Family, Social Supports and Housing |
96 | 82 | 139 | 119 | 239 | 497 | ||||||||||||||||||
...continues next page
| 116 | Capital Plan | Fiscal Plan 2023 – 26 |
Capital Plan Details, continued
(millions of dollars)
| 2022-23 | 2023-24 | 2024-25 | 2025-26 | 3-Year | ||||||||||||||||||||
| Budget | Forecast | Estimate | Target | Target | Total | |||||||||||||||||||
| Skills for Jobs |
||||||||||||||||||||||||
| Alberta at Work – Classroom Retrofits and Refurbishments |
- | 7 | 1 | - | 1 | |||||||||||||||||||
| Alberta Centre for Toxicology |
- | 1 | - | - | - | - | ||||||||||||||||||
| Investing in Canada Infrastructure Program (ICIP) Projects |
1 | 2 | 4 | 1 | - | 4 | ||||||||||||||||||
| MacEwan University – School of Business |
- | - | 15 | 20 | 35 | |||||||||||||||||||
| Mount Royal University – Aviation Capital |
- | 5 | 2 | - | - | 2 | ||||||||||||||||||
| Mount Royal University – Repurposing Existing Facilities |
25 | 10 | 20 | 15 | - | 35 | ||||||||||||||||||
| Northwestern Polytechnic Power Engineering and Instrumentation Lab Development |
- | - | 2 | 9 | - | 11 | ||||||||||||||||||
| SAIT – John Ware Redevelopment |
8 | 8 | 16 | 16 | - | 33 | ||||||||||||||||||
| University of Alberta – Dentistry Pharmacy – Functional Renewal of Building |
56 | 56 | - | - | - | - | ||||||||||||||||||
| University of Alberta – Upgrading Campus Saint-Jean to Foster Transdisciplinarity, Inclusion and Innovation |
- | 3 | - | - | - | - | ||||||||||||||||||
| University of Calgary – Multidisciplinary Hub |
- | - | 5 | - | - | 5 | ||||||||||||||||||
| University of Calgary – Veterinary Medicine Expansion |
10 | 10 | 21 | 27 | - | 49 | ||||||||||||||||||
| University of Calgary – Faculty of Veterinary Medicine Lab |
- | - | 1 | - | - | 1 | ||||||||||||||||||
| University of Lethbridge – Destination Project Phase 2 Planning |
- | - | 3 | - | - | 3 | ||||||||||||||||||
| Total Skills for Jobs |
100 | 102 | 75 | 84 | 20 | 180 | ||||||||||||||||||
| Sports and Recreation |
||||||||||||||||||||||||
| Active Communities Alberta |
4 | 4 | - | - | - | - | ||||||||||||||||||
| Badlands Amphitheatre |
- | - | 2 | - | - | 2 | ||||||||||||||||||
| Calgary Zoo – Canadian Wilds Redevelopment |
8 | 8 | 3 | - | - | 3 | ||||||||||||||||||
| Canmore Nordic Centre Infrastructure Upgrades |
11 | 7 | 11 | 4 | - | 15 | ||||||||||||||||||
| Citadel Theatre Renewal (Edmonton) |
- | - | 4 | - | - | 4 | ||||||||||||||||||
| Community Facility Enhancement Program |
39 | 37 | 50 | 50 | 50 | 150 | ||||||||||||||||||
| Crown Land Trails |
- | - | 2 | 6 | 6 | 14 | ||||||||||||||||||
| Crown Land North Recreation Program Vehicles |
- | - | 1 | - | 1 | |||||||||||||||||||
| David Thompson Corridor Upgrades |
5 | 4 | 4 | - | - | 4 | ||||||||||||||||||
| Glenbow Revitalization (Calgary) |
36 | 21 | 38 | 22 | - | 59 | ||||||||||||||||||
| Medicine Hat Event Centre and Grandstand Development |
1 | 1 | - | - | - | - | ||||||||||||||||||
| McMurray Métis Cultural Centre |
5 | 5 | - | - | - | - | ||||||||||||||||||
| ICIP Projects |
15 | 15 | 24 | 7 | - | 32 | ||||||||||||||||||
| New Campgrounds Development |
- | - | 1 | 3 | 9 | 12 | ||||||||||||||||||
| Other Sports and Recreation Projects |
9 | 5 | 9 | 2 | 11 | |||||||||||||||||||
| Parks Lower Athabasca Regional Plan Implementation |
1 | 3 | 3 | - | 5 | |||||||||||||||||||
| Parks South Saskatchewan Regional Plan Implementation |
3 | 2 | 2 | 4 | - | 6 | ||||||||||||||||||
| Repsol Sport Centre |
5 | 5 | 9 | 6 | - | 15 | ||||||||||||||||||
| Reynolds Alberta Museum – Storage Warehouse (Wetaskiwin) |
- | - | 1 | - | - | 1 | ||||||||||||||||||
| SAM Centre – Calgary Stampede Foundation |
3 | 3 | 2 | - | - | 2 | ||||||||||||||||||
| Telus Spark – World Class Gallery Development |
- | - | 3 | 4 | 2 | 10 | ||||||||||||||||||
| Winsport Day Lodge Renovation |
- | - | 8 | - | - | 8 | ||||||||||||||||||
| Total Sports and Recreation |
144 | 117 | 176 | 109 | 67 | 352 | ||||||||||||||||||
| Total Capital Plan – Core Government |
6,722 | 5,624 | 7,370 | 7,429 | 6,483 | 21,282 | ||||||||||||||||||
| Schools, Universities, Colleges, Hospitals (SUCH) Sector – Self-financed Investment |
811 | 821 | 634 | 547 | 525 | 1,706 | ||||||||||||||||||
| Total Capital Plan – Fully Consolidated Basis |
7,534 | 6,446 | 8,005 | 7,976 | 7,008 | 22,988 | ||||||||||||||||||
| Capital Plan | Fiscal Plan 2023 – 26 | 117 |
BLANK PAGE
| 118 | Capital Plan | Fiscal Plan 2023 – 26 |
BUDGET 2023
GOVERNMENT OF ALBERTA | 2023–26
Fiscal Plan
Tax Plan
| 119 |
Table of Contents
| Tax Plan |
121 | |||
| Introduction |
121 | |||
| Competitive Tax Environment |
122 | |||
| Affordability Action Plan |
124 | |||
| Budget 2023 Initiatives |
127 | |||
| Education Property Tax |
128 | |||
| Annex |
129 | |||
| Tax Revenue, 2023-24 |
130 | |||
| Tax Revenue Sources, 2023-24 |
131 | |||
| Non-Refundable Tax Credits |
132 | |||
| Personal Income Tax Brackets |
132 | |||
| Tax Expenditure Estimates, 2023 |
133 | |||
| Interprovincial Tax Comparison, 2023 |
134 | |||
| Major Provincial Tax Rates, 2023 |
135 | |||
| 120 | Tax Plan | Fiscal Plan 2023 – 26 |
Tax Plan
| Introduction
|
||
| Albertans and Alberta businesses continue to benefit from Alberta’s low tax environment. With low personal income tax, low fuel tax and no sales tax or health premium, Albertans generally pay lower overall taxes than residents of any other province. Alberta’s competitive corporate tax regime continues to encourage new investment and create jobs for Albertans. In 2023-24, Albertans and Alberta businesses would pay at least $19.7 billion more in taxes if Alberta had the same tax system as any other province. |
Alberta has a tax advantage of at | |
| Alberta’s economy is poised to lead the country in growth this year, even as it continues to face challenges due to higher interest rates and rapidly rising prices. With more people coming to the province and investment set to accelerate over the next few years, the government will continue to focus on maintaining a competitive tax environment while taking action to reduce the impacts of rising costs on Albertans. | ||
| Over the past year, Albertans have been affected by high inflation as a result of rising costs. The government has acted to ease these pressures, including implementing fuel tax relief and indexing the personal income tax system and the Alberta Child and Family Benefit. | ||
Alberta’s Tax Advantage, 2023-24
($ billions)
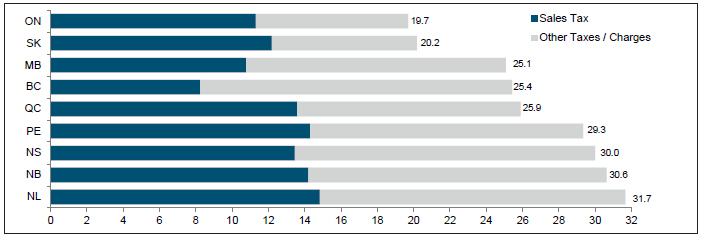
Source: Alberta Treasury Board and Finance
| * | This graph shows the total additional provincial tax and carbon charges that individuals and businesses would pay if Alberta had the same tax system and carbon charges as other provinces. This information reflects tax rates for other provinces known as of February 3, 2023. This comparison includes personal and corporate income tax, sales tax, fuel tax, carbon charges (excluding the federal carbon pricing backstop), tobacco tax, health premium, payroll tax, liquor tax and markups, land transfer tax and other minor taxes. |
| Tax Plan | Fiscal Plan 2023 – 26 | 121 |
| In Budget 2023, the government will implement an investment tax credit that will encourage large-scale investment in the value-added agricultural manufacturing sector. Enhancements to the charitable donations tax credit and the adoption expenses tax credit will also be introduced. The education property tax requisition will be frozen, easing cost pressures on Alberta property owners. | ||
| Competitive Tax Environment | ||
| _____
Alberta’s corporate income tax rate |
The Job Creation Tax Cut and continued efforts to reduce red tape are making Alberta one of the most competitive business environments in North America. Alberta is seeing new investments in aviation, technology and other emerging industries, helping to strengthen and diversify the provincial economy and create new jobs for thousands of Albertans. | |
| At eight per cent, Alberta’s general corporate income tax rate is 30 per cent lower than the next lowest province and Alberta’s combined federal-provincial general corporate tax rate is lower than the combined federal-state rate of 44 U.S. jurisdictions. In addition to a low corporate income tax rate, Alberta’s corporate tax advantage includes no payroll tax and no capital tax.
| ||
|
Provincial General Corporate Income Tax Rates (%)
* Corporate income tax rates known as of February 3, 2023.
| ||
| _____
In 2023, a family earning $75,000 |
Albertans also enjoy the lowest overall taxes among provinces. Alberta’s advantage includes low personal income taxes, with basic personal and spousal amounts that are higher than in any other province and high tax bracket thresholds that do not start until taxable income exceeds $142,292. Albertans also benefit from no sales tax, no health premium and no payroll tax. A family with two children earning $75,000 would pay over $1,900 more in taxes in British Columbia and nearly $4,100 more in Ontario. A similar family earning $150,000 would pay nearly $5,200 more in taxes in British Columbia and about $8,800 more in Ontario. | |
| 122 | Tax Plan | Fiscal Plan 2023 – 26 |
|
Basic Personal and Spousal Amounts, 2023
Alberta’s Personal Tax Advantage, 2023 ($ thousands)
Source: Alberta Treasury Board and Finance * Assumes a single income family with two children, with RRSP/RPP contributions of $6,000, $15,000 and $30,780 for the families with incomes of $75,000, $150,000 and $300,000, respectively. Includes personal income tax, sales tax, health premium, payroll tax, fuel tax and net provincial carbon tax.
|
|
| Tax Plan | Fiscal Plan 2023 – 26 | 123 |
|
Affordability Action Plan
Fuel Tax Relief
Over the past year, high oil prices have led to elevated fuel prices. In addition to increased costs for drivers, high fuel prices also raise the price of other goods, affecting all Albertans. To help with these higher costs of living, the government has paused the collection of fuel taxes on gasoline and diesel until at least June 30, 2023.
In July 2023, fuel tax rates for gasoline and diesel will once again be determined quarterly based on average oil prices. This provides fuel tax relief to Albertans when oil prices are high and will be more than offset by additional government revenue. This new approach to setting fuel tax rates was first established by the government on April 1, 2022. Under this approach, fuel tax rates are based on the average price of West Texas Intermediate (WTI) oil. Tax rates start to be reduced once the average WTI price exceeds US$80, and are completely eliminated when the average price exceeds US$90 (see following table). With average oil prices above the $90 threshold for the quarters beginning in April and July 2022, the fuel tax was fully paused during these periods. With the average oil price falling below $90, fuel tax rates were 4.5 cents per litre for the quarter beginning in October 2022.
|
| Fuel Tax Relief Stages
|
||||
|
| ||||
| WTI Price (Average US$ per Barrel) | Fuel Tax Rate | |||
|
| ||||
| $90.00 or more | 0 cents/litre | |||
| $85.00 – $89.99 | 4.5 cents/litre | |||
| $80.00 – $84.99 | 9 cents/litre | |||
| $79.99 or less | 13 cents/litre | |||
|
* Fuel tax relief applies to gasoline, diesel, marked gasoline and marked diesel. Average oil prices are calculated based on the 20 trading days immediately preceding the 16th day of the last month prior to the start of the quarter.
| ||
| _____
Fuel tax relief is estimated to save drivers a total of $1.7 billion. |
As a result of these fuel tax measures, Albertans and Alberta businesses saved around $850 million in 2022 and are expected to save another $875 million in 2023. Albertans and Alberta businesses have continued to pay the lowest gasoline prices in the country, with the gap between Alberta and other provinces widening since April 1, 2022 when the program was first introduced. | |
| 124 | Tax Plan | Fiscal Plan 2023 – 26 |
|
Monthly Average Retail Gasoline Prices, AB vs. Other Western Provinces (cents per litre)
Sources: Alberta Treasury Board and Finance, Kalibrate and Statistics Canada
|
||
| Indexation | ||
|
Now that Alberta has returned to balanced budgets, the government has fulfilled its Budget 2019 commitment to resume indexation of the personal income tax system, effective January 1, 2022. Personal income tax credit amounts and tax bracket thresholds are higher, by 2.3 per cent in 2022 and 6.0 per cent in 2023. Resuming indexation of the personal income tax system is expected to save Albertans about $300 million in 2022-23, $680 million in 2023-24 and $980 million in 2024-25. |
_____
Resuming indexation of the | |
| The Alberta Child and Family Benefit (ACFB) program, which provides support to lower income families, was also indexed by 6.0 per cent starting on January 1, 2023. Benefit amounts will rise by as much as $121 for families with one child, $198 for families with two children, $260 for families with three children and $307 for families with four or more children. Families will also benefit from the increase to phase-out thresholds, as the maximum benefit begins to be reduced at a higher income level. The ACFB will be indexed annually starting in July 2024 for the 2024-25 benefit year. In total, the ACFB will provide an estimated $345 million in benefits to about 180,000 to 190,000 families in 2023-24, including an additional $20 million as a result of indexation. | ||
| Tax Plan | Fiscal Plan 2023 – 26 | 125 |
Alberta Child and Family Benefit Program Parameters
| 2022 | 2023 | |||||||
| Program | Base | Working | Base | Working | ||||
| Parameters | Component | Component | Component | Component | ||||
| Benefit Amounts |
||||||||
| 1 child |
$1,330 | $681 | $1,410 | $722 | ||||
| 2 children |
$1,995 | $1,301 | $2,115 | $1,379 | ||||
| 3 children |
$2,660 | $1,672 | $2,820 | $1,772 | ||||
|
4 or more children |
$3,325 | $1,795 | $3,525 | $1,902 | ||||
| Income Phase-out Threshold | $24,467 | $41,000 | $25,935 | $43,460 | ||||
| * | Working component benefits are phased in on family working income. Base component and working component benefits are both phased out on family net income. |
Benefit of Indexation for Four Typical Alberta Households, 2023
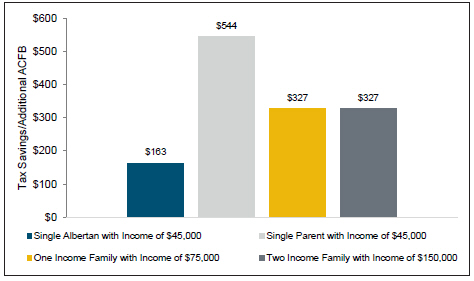
Source: Alberta Treasury Board and Finance
| * | Includes the benefit of indexing both the personal income tax system and the Alberta Child and Family Benefit (ACFB). |
| * | Assumes all families (excluding the single Albertan) have two children, and RRSP/RPP contributions of $0, $6,000 and $15,000 for the families with incomes of $45,000, $75,000 and $150,000, respectively. |
| * | For the two-income family, the income and RRSP/RPP contributions are split 60/40 between the couple. |
| 126 | Tax Plan | Fiscal Plan 2023 – 26 |
| Budget 2023 Initiatives | ||
| Agri-Processing Investment Tax Credit
In addition to low corporate tax rates, the government is providing targeted supports to sectors and activities that present major opportunities for employment, growth and diversification.
As previously announced, Alberta is moving forward with a tax credit that will help attract large-scale investment and foster growth and diversification in the agri-food sector. Creating the right conditions for this sector to do business in Alberta promotes investment and increases our competitiveness against other jurisdictions. The new incentive program will build on our competitive advantages and maximize opportunities that help create more jobs for Albertans. |
____
The Agri-Processing Investment | |
| The Agri-Processing Investment Tax Credit will be worth 12 per cent of eligible capital investments of at least $10 million made on or after February 7, 2023. As a non-refundable tax credit, the incentive will offset corporate income taxes payable in Alberta, meaning that corporations will only benefit from the credit once their facility is operational and the corporation is profitable. Corporations will be able to carry forward unused credits for 10 years. | ||
| Applications will be accepted starting in spring 2023. More information on eligible expenditures and how to apply will be made available once program regulations are brought forward. | ||
| This measure is estimated to be worth $52 million over the next five years, with costs expected to increase after this period as more projects become operational. | ||
| Charitable Donations Tax Credit | ||
| Bill 202, the Alberta Personal Income Tax (Charitable and Other Gifts) Amendment Act, 2022 was passed by the Legislative Assembly in December 2022. The Bill increases the charitable donations tax credit rate on the first $200 of contributions from 10 per cent to 60 per cent, encouraging more Albertans to contribute to charitable causes. This change will come into effect for 2023 and will provide an additional $56 million in tax savings to Albertans in 2023-24. | ||
| Adoption Expenses Tax Credit | ||
| Adoption can be a costly process for parents looking to start or grow their families. This includes agency, legal and administrative fees and travel-related costs. To help with these expenses, the government offers a non-refundable tax credit equal to 10 per cent of eligible adoption expenses up to an annual maximum. | ||
| As part of a broader government strategy to ease the financial burden of adopting a child, the maximum allowable expenses for the credit will be increased to $18,210 for 2023, matching the federal expense threshold. After 2023, this amount will be indexed annually at the same rate as the rest of the personal income tax system. | ||
| Tax Plan | Fiscal Plan 2023 – 26 | 127 |
Education Property Tax
The education property tax is a stable source of funding for Alberta’s education system, which supports the development of a skilled workforce that benefits all Albertans. The tax provides equitable funding to all public and separate school students and helps pay for instructional costs, including teacher salaries, textbooks and other classroom resources. The tax has covered about 30 per cent of educational operating costs in recent years, with the remainder funded through general revenue.
To improve affordability, the government has limited the increase in the total education property tax requisition in recent years. The total requisition was frozen for 2020-21 and 2021-22 and increased by a modest 1.5 per cent in 2022-23. As costs have continued to rise due to high inflation, the government will freeze the education property tax requisition at the 2022-23 level of $2.5 billion for 2023-24.
The mill rates used to calculate the education property tax will decline in 2023 due to an increase in the overall equalized assessment. The residential/farmland rate will decrease from $2.65 to $2.56 per $1,000 of equalized assessment, while the non-residential rate will drop from $3.90 to $3.76.
The province continues to receive a lower share of the revenue from the property tax base than municipalities. Since the province assumed responsibility for education property tax in 1994, the province’s share of total provincial-municipal property tax revenue collected fell from 51 per cent to under 25 per cent in 2021.
Provincial and Municipal Property Tax Revenue, 1994 to 2021
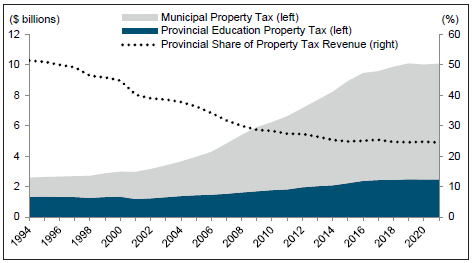
Sources: Alberta Treasury Board and Finance and Alberta Municipal Affairs
| 128 | Tax Plan | Fiscal Plan 2023 – 26 |
Tax Plan
Annex
| Tax Plan | Fiscal Plan 2023 – 26 | 129 |
Tax Revenue, 2023-24
(millions of dollars)
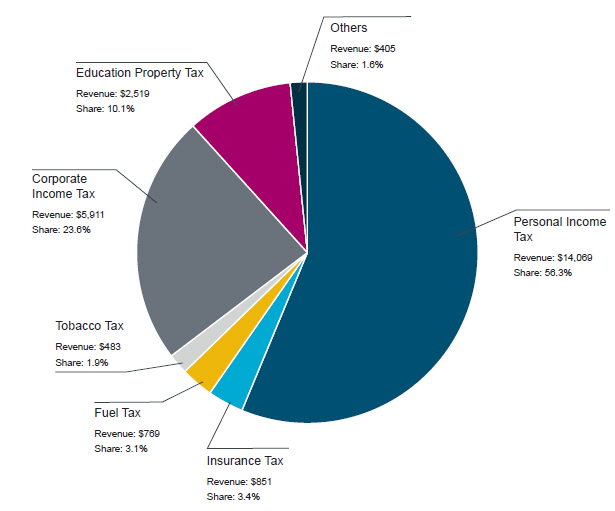
Total Tax Revenue: $25,007 million
| 130 | Tax Plan | Fiscal Plan 2023 – 26 |
Tax Revenue Sources, 2023-24
(millions of dollars)
| Tax | Total Revenue | Rate | Revenue per Unit | |||||||
| 1. Personal Income Tax |
14,069 | |||||||||
| All taxable income |
12,870 | 10% of all taxable income | 1,287.0 per point | |||||||
| Taxable income > $142,292a |
1,199 | multiple rates | n/a | |||||||
| 2. Corporate Income Tax |
5,911 | |||||||||
| General |
5,604 | 8.0% | 700.5 per point | |||||||
| Small business |
307 | 2.0% | 153.5 per point | |||||||
| 3. Education Property Taxb |
2,519 | |||||||||
| Residential/farmland property |
1,641 | $2.56 / $1,000 of assessment | 641.0 per mill | |||||||
| Non-residential property |
878 | $3.76 / $1,000 of assessment | 233.5 per mill | |||||||
| 4. Tobacco Tax |
483 | $55/carton | 8.8 per $/carton | |||||||
| 5. Fuel Tax |
769 | |||||||||
| Gasoline |
438 | 0 ¢/litre | 56.5 per ¢/litrec | |||||||
| Diesel |
297 | 0 ¢/litre | 38.4 per ¢/litrec | |||||||
| Locomotive |
17 | 5.5 ¢/litre | 3.1 per ¢/litre | |||||||
| Aviation |
13 | 1.5 ¢/litre | 8.8 per ¢/litre | |||||||
| Propane |
4 | 9.4 ¢/litre | 0.4 per ¢/litre | |||||||
| 6. Freehold Mineral Rights Tax |
129 | n/a | n/a | |||||||
| 7. Insurance Tax |
851 | |||||||||
| Life, accident, sickness |
220 | 3.0% of premium | 73.5 per point | |||||||
| Other |
631 | 4.0% of premium | 157.6 per point | |||||||
| 8. Tourism Levy |
97 | 4.0% | 24.3 per point | |||||||
| 9. Cannabis Tax |
173 | multiple rates | n/a | |||||||
| 10. Vaping Products Tax |
6 | n/a | n/a | |||||||
| * | Numbers may not add due to rounding. The revenue per unit amounts are linear calculations and cannot be used to accurately estimate the revenue impact of rate changes, as these calculations do not account for the impact rate changes have on taxpayer behaviour. |
| a | This amount estimates revenue attributable to the 12%, 13%, 14% and 15% tax rates. |
| b | This amount reflects the total requisition requested to be collected by municipalities, but does not include any amounts deducted for the Provincial Education Requisition Credit Program (estimated cost of $15 million for 2023-24). |
| c | As the fuel tax rate for gasoline and diesel is expected to change during the 2023-24 fiscal year due to the fuel tax relief program, these calculations reflect the forecast average tax rate, 7.75 ¢/litre, for the fiscal year. |
| Tax Plan | Fiscal Plan 2023 – 26 | 131 |
Non-Refundable Tax Credits
(dollars)
| 2022 | 2023 | |||||||||||||||||
| Maximum Amount | Reduction in Alberta Tax |
Maximum Amount | Reduction in Alberta Tax |
| ||||||||||||||
| Basic personal amount |
19,814 | 1,981 | 21,003 | 2,100 | ||||||||||||||
| Spousal amount |
19,814 | 1,981 | 21,003 | 2,100 | ||||||||||||||
| Eligible dependant amount |
19,814 | 1,981 | 21,003 | 2,100 | ||||||||||||||
| Age amount |
5,521 | 552 | 5,853 | 585 | ||||||||||||||
| Infirm dependant amount |
11,470 | 1,147 | 12,158 | 1,216 | ||||||||||||||
| CPP contributions |
3,500 | 350 | 3,754 | 375 | ||||||||||||||
| EI premiums |
953 | 95 | 1,002 | 100 | ||||||||||||||
| Pension income amount |
1,526 | 153 | 1,617 | 162 | ||||||||||||||
| Disability amount |
15,284 | 1,528 | 16,201 | 1,620 | ||||||||||||||
| Disability supplement |
11,470 | 1,147 | 12,158 | 1,216 | ||||||||||||||
| Adoption expenses |
13,552 | 1,355 | 18,210 | 1,821 | ||||||||||||||
| Medical expenses |
Variable | Variable | Variable | Variable | ||||||||||||||
| Medical expenses (other dependants) |
Variable | Variable | Variable | Variable | ||||||||||||||
| Caregiver amount |
11,470 | 1,147 | 12,158 | 1,216 | ||||||||||||||
| Interest on student loans |
Variable | Variable | Variable | Variable | ||||||||||||||
| Donations and gifts |
||||||||||||||||||
| first $200 |
200 | 20 | 200 | 120 | ||||||||||||||
| over $200 |
75% of income | Variable | 75% of income | Variable | ||||||||||||||
| * | In general, credit amounts are multiplied by 10% to arrive at the reduction in Alberta tax. In the case of donations and gifts, the credit rate for the first $200 of donations was 10% for years prior to 2023 and 60% for 2023 and subsequent years. The credit rate for total donations over $200 is 21%. |
|
| ||||||||
| Personal Income Tax Brackets | ||||||||
| Bracket | Tax Rate (%) |
Income Bracket | ||||||
| 2022 | 2023 | |||||||
|
| ||||||||
|
|
1 |
10 | Up to $134,238 | Up to $142,292 | ||||
| 2 |
12 | $134,238.01 to $161,086 | $142,292.01 to $170,751 | |||||
| 3 |
13 | $161,086.01 to $214,781 | $170,751.01 to $227,668 | |||||
| 4 |
14 | $214,781.01 to $322,171 | $227,668.01 to $341,502 | |||||
| 5 |
15 | $322,171.01 and up | $341,502.01 and up | |||||
|
| ||||||||
| 132 | Tax Plan | Fiscal Plan 2023 – 26 |
Tax Expenditure Estimates, 2023
(millions of dollars)
| Personal Income Tax |
||||||||
| Federal Measures Paralleled by Alberta |
||||||||
| Workers’ compensation payments exemption |
27.1 | |||||||
| Social assistance payments exemption |
9.0 | |||||||
| Union and professional dues deduction |
47.9 | |||||||
| Child care expense deduction |
31.6 | |||||||
| Flow-through share deduction |
11.6 | |||||||
| Capital gains inclusion rate (50%) |
409.5 | |||||||
| Lifetime capital gains exemption |
142.2 | |||||||
| Security options deduction |
51.9 | |||||||
| Northern residents deduction |
38.1 | |||||||
| Provincial Measures |
||||||||
| Basic personal amount |
5,447.6 | |||||||
| Spousal amount |
362.0 | |||||||
| Eligible dependant amount |
110.2 | |||||||
| Age amount |
141.1 | |||||||
| Pension income amount |
61.1 | |||||||
| Caregiver amount |
24.1 | |||||||
| Disability amount |
62.4 | |||||||
| Disability amount transferred from a dependant |
56.0 | |||||||
| Interest paid on student loans |
4.2 | |||||||
| Amounts transferred from a spouse or common-law partner |
24.3 | |||||||
| Medical expenses |
82.7 | |||||||
| Donations and gifts |
363.0 | |||||||
| Political contributions |
5.0 | |||||||
| Corporate Income Tax |
||||||||
| Small business rate |
921.0 | |||||||
| Donations and gifts |
25.5 | |||||||
| Agri-Processing Investment Tax Credit (APITC)a |
0.0 | |||||||
| Fuel Tax |
||||||||
| Tax Exempt Fuel User program (marked fuel for off-road use) |
151.0 | |||||||
| Alberta Farm Fuel Benefit (marked fuel) |
42.0 | |||||||
| Reduced rate for locomotive fuel |
24.0 | |||||||
| Exemption for aviation fuel used on international flights |
3.5 | |||||||
| Education Property Tax |
||||||||
| Community Revitalization Levy |
18.0 | |||||||
| Transfers Through the Tax Systemb |
||||||||
| Innovation Employment Grant (IEG) |
77.0 | |||||||
| Alberta Child and Family Benefit (ACFB) |
345.0 | |||||||
| Film and Television Tax Credit (FTTC) |
125.0 | |||||||
| * | Due to interactions between tax expenditures, they cannot generally be added together to determine the fiscal impacts of concurrently eliminating multiple tax expenditures. |
| * | Personal income tax and education property tax expenditures are reported on a calendar year basis. The remaining expenditures are reported on a fiscal year (2023-24) basis. |
| a | The Agri-Processing Investment Tax Credit is only available to a company once their facility is operational, therefore the tax credit is not expected to be claimed until the 2024-25 fiscal year at the earliest. |
| b | Transfers through the tax system are reported in ministries’ operating expense. The amount for the ACFB is reported by Children’s Services and the amounts for the IEG and FTTC are reported by Jobs, Economy and Northern Development. |
| Tax Plan | Fiscal Plan 2023 – 26 | 133 |
Interprovincial Tax Comparison, 2023
(dollars)
| AB | BC | SK | MB | ON | QC | NB | NS | PE | NL | |||||||||||||||||||||||||||||||
| Employment Income of $35,000 – One Income Couple with Two Children |
|
|||||||||||||||||||||||||||||||||||||||
| Provincial income tax |
(2,400 | ) | (1,895 | ) | (1,312 | ) | (1 | ) | (3,320 | ) | (7,753 | ) | - | 1,157 | 586 | - | ||||||||||||||||||||||||
| Provincial sales tax |
- | 905 | 936 | 1,492 | 535 | 967 | 1,538 | 2,266 | 2,104 | 1,344 | ||||||||||||||||||||||||||||||
| Health premium |
- | - | - | - | 300 | - | - | - | - | - | ||||||||||||||||||||||||||||||
| Payroll tax |
- | 349 | - | 326 | 417 | 968 | - | - | - | 341 | ||||||||||||||||||||||||||||||
| Fuel tax & net carbon tax |
135 | 554 | 450 | 420 | 270 | 576 | 795 | 465 | 545 | 630 | ||||||||||||||||||||||||||||||
| Total |
(2,265 | ) | (87 | ) | 74 | 2,237 | (1,798 | ) | (5,242 | ) | 2,333 | 3,888 | 3,235 | 2,315 | ||||||||||||||||||||||||||
| Alberta Tax Advantage |
2,178 | 2,339 | 4,502 | 467 | (2,977 | ) | 4,598 | 6,153 | 5,500 | 4,580 | ||||||||||||||||||||||||||||||
| Employment Income of $75,000 – One Income Couple with Two Children |
|
|||||||||||||||||||||||||||||||||||||||
| Provincial income tax |
2,224 | 1,362 | 1,926 | 4,471 | 2,526 | 9 | 4,898 | 6,689 | 5,748 | 5,545 | ||||||||||||||||||||||||||||||
| Provincial sales tax |
- | 1,145 | 1,188 | 1,881 | 2,135 | 3,085 | 2,802 | 2,855 | 2,888 | 2,895 | ||||||||||||||||||||||||||||||
| Health premium |
- | - | - | - | 600 | - | - | - | - | - | ||||||||||||||||||||||||||||||
| Payroll tax |
- | 748 | - | 698 | 894 | 2,074 | - | - | - | 732 | ||||||||||||||||||||||||||||||
| Fuel tax & net carbon tax |
135 | 1,029 | 450 | 420 | 270 | 576 | 795 | 465 | 545 | 630 | ||||||||||||||||||||||||||||||
| Total |
2,359 | 4,284 | 3,564 | 7,470 | 6,425 | 5,744 | 8,495 | 10,009 | 9,181 | 9,802 | ||||||||||||||||||||||||||||||
| Alberta Tax Advantage |
1,925 | 1,205 | 5,111 | 4,066 | 3,385 | 6,136 | 7,650 | 6,822 | 7,443 | |||||||||||||||||||||||||||||||
| Employment Income of $100,000 – Two Income Couple with Two Children |
|
|||||||||||||||||||||||||||||||||||||||
| Provincial income tax |
4,083 | 1,953 | 3,668 | 6,078 | 2,684 | 2,962 | 5,734 | 7,372 | 6,807 | 6,128 | ||||||||||||||||||||||||||||||
| Provincial sales tax |
- | 1,358 | 1,394 | 2,226 | 2,566 | 3,618 | 3,505 | 3,450 | 3,469 | 3,492 | ||||||||||||||||||||||||||||||
| Health premium |
- | - | - | - | 900 | - | - | - | - | - | ||||||||||||||||||||||||||||||
| Payroll tax |
- | 998 | - | 930 | 1,192 | 2,765 | - | - | - | 975 | ||||||||||||||||||||||||||||||
| Fuel tax & net carbon tax |
203 | 1,587 | 675 | 630 | 405 | 864 | 1,160 | 698 | 767 | 916 | ||||||||||||||||||||||||||||||
| Total |
4,286 | 5,896 | 5,737 | 9,864 | 7,747 | 10,209 | 10,399 | 11,520 | 11,043 | 11,511 | ||||||||||||||||||||||||||||||
| Alberta Tax Advantage |
1,610 | 1,451 | 5,578 | 3,461 | 5,923 | 6,113 | 7,234 | 6,757 | 7,225 | |||||||||||||||||||||||||||||||
| Employment Income of $200,000 – Two Income Couple with Two Children |
|
|||||||||||||||||||||||||||||||||||||||
| Provincial income tax |
12,348 | 9,757 | 13,771 | 18,117 | 10,770 | 18,858 | 17,065 | 21,237 | 19,698 | 18,219 | ||||||||||||||||||||||||||||||
| Provincial sales tax |
- | 2,205 | 2,246 | 3,542 | 4,233 | 5,784 | 5,641 | 5,502 | 5,554 | 5,603 | ||||||||||||||||||||||||||||||
| Health premium |
- | - | - | - | 1,350 | - | - | - | - | - | ||||||||||||||||||||||||||||||
| Payroll tax |
- | 1,995 | - | 1,860 | 2,384 | 5,530 | - | - | - | 1,951 | ||||||||||||||||||||||||||||||
| Fuel tax & net carbon tax |
203 | 1,587 | 675 | 630 | 405 | 864 | 1,160 | 698 | 767 | 916 | ||||||||||||||||||||||||||||||
| Total |
12,551 | 15,544 | 16,692 | 24,149 | 19,142 | 31,036 | 23,866 | 27,437 | 26,019 | 26,689 | ||||||||||||||||||||||||||||||
| Alberta Tax Advantage |
2,993 | 4,141 | 11,598 | 6,591 | 18,485 | 11,315 | 14,886 | 13,468 | 14,138 | |||||||||||||||||||||||||||||||
Calculations are based on other provinces’ tax parameters known as of February 3, 2023.
| * | Health premiums are assumed to be borne by individuals. In provinces that impose payroll taxes, 75% is assumed to be borne by employees and 25% by employers. |
| * | Fuel tax is based on estimated consumption of 3,000 litres of gasoline per year for one-income families and 4,500 litres of gasoline for two-income families. |
| * | Net carbon tax reflects direct provincial taxes and rebates only and is based on the fuel tax gasoline consumption assumptions and base natural gas consumption of 135 GJ/year for a family of four, adjusted based on provincial home heating consumption patterns. The cap-and-trade systems in Quebec and Nova Scotia, as well as the fuel charge and rebate under the federal carbon pricing backstop, are excluded. |
| * | RRSP/RPP contributions of $0, $6,000, $10,000 and $25,000 are included in the calculation of personal income tax for the families with incomes of $35,000, $75,000, $100,000 and $200,000, respectively. |
| * | For two-income families, income and RRSP/RPP contributions are split 60/40 between the couple. |
| * | The children are assumed to be 6 and 12 years old. |
| 134 | Tax Plan | Fiscal Plan 2023 – 26 |
Major Provincial Tax Rates, 2023
| AB | BC | SK | MB | ON | QC | NB | NS | PE | NL | |||||||||||||||||||||||||||||||||
| Personal Income Tax |
||||||||||||||||||||||||||||||||||||||||||
| Statutory rate range |
||||||||||||||||||||||||||||||||||||||||||
| lowest rate |
(%) | 10.00 | 5.06 | 10.50 | 10.80 | 5.05 | 15.00a | 9.40 | 8.79 | 9.80 | 8.70 | |||||||||||||||||||||||||||||||
| highest rate |
(%) | 15.00 | 20.50 | 14.50 | 17.40 | 13.16 | 25.75a | 19.50 | 21.00 | 16.70 | 21.80 | |||||||||||||||||||||||||||||||
| Surtax |
(%) | - | - | - | - | 20/36b | - | - | - | 10.00 | - | |||||||||||||||||||||||||||||||
| Combined federal/provincial top marginal ratec |
(%) | 48.00 | 53.50 | 47.50 | 50.40 | 53.53 | 53.31 | 52.50 | 54.00 | 51.37 | 54.80 | |||||||||||||||||||||||||||||||
| Personal amount |
($) | 21,003 | 11,981 | 17,661 | 10,855 | 11,865 | 17,183 | 12,458 | 11,481d | 12,000 | 10,382 | |||||||||||||||||||||||||||||||
| Spousal amount |
(max.$) | 21,003 | 10,259 | 17,661 | 9,134 | 10,075 | 17,183e | 9,764 | 11,481d | 10,192 | 8,483 | |||||||||||||||||||||||||||||||
| Corporate Income Tax |
||||||||||||||||||||||||||||||||||||||||||
| General rate |
(%) | 8.0 | 12.0 | 12.0 | 12.0 | 11.5 | 11.5 | 14.0 | 14.0 | 16.0 | 15.0 | |||||||||||||||||||||||||||||||
| M&P rate |
(%) | 8.0 | 12.0 | 10.0 | 12.0 | 10.0 | 11.5 | 14.0 | 14.0 | 16.0 | 15.0 | |||||||||||||||||||||||||||||||
| Small business |
||||||||||||||||||||||||||||||||||||||||||
| rate |
(%) | 2.0 | 2.0 | 0.0f | 0.0 | 3.2 | 3.2 | 2.5 | 2.5 | 1.0 | 3.0 | |||||||||||||||||||||||||||||||
| threshold |
($000) | 500 | 500 | 600 | 500 | 500 | 500 | 500 | 500 | 500 | 500 | |||||||||||||||||||||||||||||||
| Capital Tax |
||||||||||||||||||||||||||||||||||||||||||
| Financial institutions |
(max.%) | - | - | 4.0 | 6.0 | - | - | 5.0 | 4.0 | 5.0 | 6.0 | |||||||||||||||||||||||||||||||
| Sales Tax |
(%) | - | 7.0 | 6.0 | 7.0 | 8.0 | 9.975 | 10.0 | 10.0 | 10.0 | 10.0 | |||||||||||||||||||||||||||||||
| Taxes on Gasolineg |
(¢/litre) | 0.00h | 25.55i | 15.00 | 14.00 | 9.00j,k | 19.20j,l | 21.92j,m | 15.50j | 19.52m | 18.55j,m,n | |||||||||||||||||||||||||||||||
| Tobacco Tax |
($/carton) | 55.00 | 65.00j | 58.00j | 60.00j | 36.95j | 29.80 | 51.04j | 59.04j | 59.04j | 65.00 | |||||||||||||||||||||||||||||||
| Payroll Tax |
(max.%) | - | 1.95 | - | 2.15 | 1.95 | 4.26 | - | - | - | 2.00 | |||||||||||||||||||||||||||||||
Other provinces’ rates and amounts known as of February 3, 2023.
| a | Quebec residents receive an abatement of 16.5% of basic federal tax because of the province’s decision to opt out of federal cash transfers in support of provincial programs. |
| b | Ontario levies a two-tiered surtax, collecting 20% of basic tax in excess of $5,315 and an additional 36% of basic tax in excess of $6,802. |
| c | The top federal personal income tax rate is 33%, except in Quebec where the top federal rate is 27.56% because of the federal abatement. |
| d | Nova Scotia includes a supplemental amount of $3,000, which phases out by 6% on income above $25,000 and reaches $0 at an income of $75,000. |
| e | After accounting for non-refundable tax credits in the calculation of the individual’s income tax, unused tax credits may be transferred from one spouse to another. |
| f | Saskatchewan’s small business tax rate was temporarily lowered from 2% to 0% on October 1, 2020. The rate will remain at 0% until June 30, 2023. It will be raised to 1% on July 1, 2023 and return to 2% on July 1, 2024. |
| g | Taxes on gasoline include provincial gasoline and carbon taxes. The cap-and-trade system in Quebec and Nova Scotia, as well as the fuel charge under the federal carbon pricing backstop (imposed in Alberta, Saskatchewan, Manitoba, and Ontario), are excluded. Nova Scotia, Prince Edward Island, and Newfoundland and Labrador will join the federal carbon pricing backstop on July 1, 2023. |
| h | Alberta has fully paused fuel tax collection until at least June 30, 2023. After June 2023, fuel tax rates will be determined quarterly based on average oil prices. |
| i | BC’s rate includes its 11.05 ¢/litre carbon tax on gasoline. Additional gasoline taxes of 18.5 ¢/litre and 5.5 ¢/litre are imposed in the greater Vancouver and Victoria areas, respectively, but are not included in the rate shown. |
| j | These provinces apply their PST or the provincial portion of their HST on the retail price of the good inclusive of excise taxes. |
| k | Ontario temporarily reduced their gasoline tax rate to 9 ¢/litre. It is set to return to 14.7 ¢/litre on January 1, 2024. |
| l | Different rates based on region are not included in the rate shown, such as a 3 ¢/litre increase in the Montreal area. |
| m | The rates for New Brunswick, Prince Edward Island and Newfoundland and Labrador include their 11.05 ¢/litre provincial carbon taxes on gasoline. |
| n | Newfoundland and Labrador temporarily reduced their gasoline portion of their tax to 7.5 ¢/litre. It is set to return to 14.5 ¢/litre on April 1, 2023. |
| Tax Plan | Fiscal Plan 2023 – 26 | 135 |
BLANK PAGE
| 136 |
BUDGET 2023
GOVERNMENT OF ALBERTA | 2023–26
Fiscal Plan
Debt
| 137 |
Table of Contents
| Debt |
139 | |||
| Provincial Debt Outstanding |
139 | |||
| Debt and Borrowing Projections |
142 | |||
| Reducing Alberta’s Outstanding Debt |
144 | |||
| Fiscal Anchors |
145 | |||
| 138 | Debt | Fiscal Plan 2023 – 26 |
Debt
Provincial Debt Outstanding
The province borrows money for a number of reasons: to support its fiscal and capital plans, to manage short-term cash movements, to maintain its cash reserve, to refinance maturing debt, and to lend money to various provincial corporations and to local authorities.
On March 31, 2022, Alberta had $117.7 billion in total debt outstanding. This includes all debt issued by the Province of Alberta, money borrowed directly by the Alberta Capital Finance Authority prior to 2011, and P3 contracts.
Of the total, $7.6 billion is lent to government-business enterprises (or GBEs). GBEs’ debt is listed on their financial statements and is not consolidated with provincial debt on the government’s financial statements. The remainder of $110.1 billion is shown in the consolidated statement of financial position. It is comprised of $93.1 billion in taxpayer supported debt and $17.0 billion in self-supported loans.
Currently, there are three government business enterprises that borrow from the government: ATB Financial, the Alberta Petroleum Marketing Commission, and the Balancing Pool. The debt held by one consolidated entity, the Agriculture Financial Services Corporation, and the loans to local authorities program are considered self supported debt as there are income producing assets used to make payments on this debt.
Management of the debt aims to minimize interest costs while prudently managing interest rate, refinancing, liquidity, and other risks. There are three key strategies. Maintaining access to multiple markets reduces interest costs and enhances liquidity. Managing the maturities of the debt minimizes the amount of debt maturing in any year which reduces refinancing risk and interest rate risk. Liquidity risk is reduced further by holding a prudent amount of cash needed to meet expected near-term cash flows which also helps to avoid issuing debt in unfavourable market conditions.
Alberta issues debt with maturities ranging from one day to over 30 years. Much of the short-term debt (maturity of one day to one year) is issued with an initial term to maturity of three months or less. Long-term debt (maturity greater than one year) is most commonly issued in terms of five, 10, and 30 years. While other terms to maturity are available, bonds with five, 10, or 30 year terms to maturity have the greatest demand among bond market investors.
As of March 31, 2022, outstanding short-term debt was $13.4 billion, and outstanding long-term debt was $100.9 billion. The province also had $3.0 billion in P3 liabilities at that time.
Composition of Alberta Debt
March 31, 2022
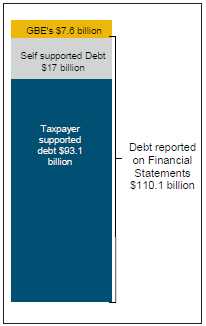
Composition of Alberta Debt
March 31, 2022
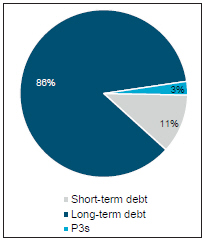
| Debt | Fiscal Plan 2023 – 26 | 139 |
Short-Term Debt by Market
March 31, 2022
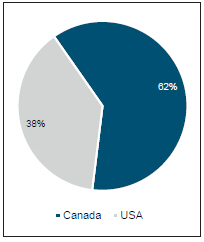
Long-Term Debt by Market
March 31, 2022
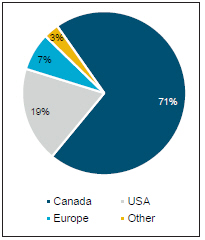
The province issues short-term debt for two purposes. First, short-term debt is often issued for roughly one to 15 days to manage fluctuating cash balances. Second, short-term debt is often issued and re-financed regularly upon maturity to mimic debt with a floating interest rate. This method of achieving a floating interest rate exposure is usually more cost-effective than issuing floating rate bonds. Long-term debt is raised in Canadian and global capital markets through the sale of bonds to investors, including pension funds, insurance companies, banks, central banks, and other institutional investment managers.
Selling bonds is less costly than other forms of long-term borrowing, such as bank loans. Bonds typically have a fixed interest rate, but floating interest rate bonds can also be issued. The Province primarily issues bullet bonds meaning that payments before the maturity of the bond are most often interest-only payments, leaving the entire principal amount, or par value, to be repaid on the bond’s maturity date. The province uses long-term debt for most of its financing requirements as well as the financing needed to make loans to provincial corporations and local authorities.
The Province borrows from multiple markets across the globe to lower costs and maintain strong access to liquidity. While most long-term debt is issued in Canadian markets, the government will raise long-term debt in foreign markets when it is more cost-effective to do so or when Canadian markets are difficult to access. It is important to note that the government takes no currency-related risks when issuing debt in foreign currencies.
Short-term debt is issued in both Canada and the United States, while long-term debt is issued in Canada and other markets. Bonds have been issued in nine different foreign currencies to date (American dollars, Euros, British pounds, Australian dollars, Swiss francs, Swedish krona, Norwegian kroner, South African rand and New Zealand dollars). The Province will also look at issuing debt in other currencies if it reduces borrowing costs. Investors around the world buy Alberta’s debt, regardless of currency.
|
A surplus occurs when a government’s expenses are lower than its revenues during the fiscal year. The surplus is an accounting measure and is not a measure of cash received less cash spent.
Debt is the money that is owed to lenders. Debt is required when government’s cash outflows exceed its cash inflows. Debt can only be repaid if there is cash available when the debt comes due. Otherwise, the debt must be refinanced.
|
| 140 | Debt | Fiscal Plan 2023 – 26 |
Short-Term Debt Maturities
March 31, 2022
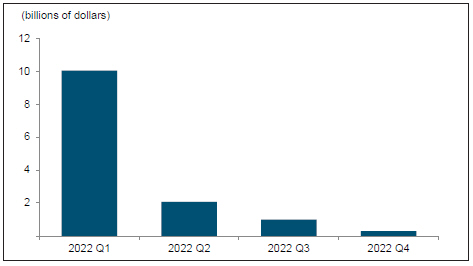
On March 31, 2022, outstanding taxpayer supported short-term debt had an average term to maturity of 69 days and an average cost of 0.47 per cent. The average term to maturity of taxpayer supported long-term debt on March 31, 2022, was 12.2 years and the average cost was 2.58 per cent. The average term to maturity for all taxpayer supported debt was 11.3 years and the average cost was 2.41 per cent on March 31, 2022. For March 31, 2023, it is estimated that the average term to maturity for all taxpayer supported debt will be 11.7 years with an average cost of 2.78 per cent.
Long-Term Debt Maturities
March 31, 2022
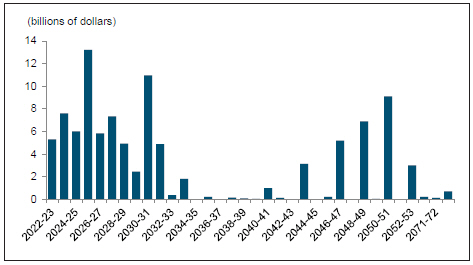
| Debt | Fiscal Plan 2023 – 26 | 141 |
Debt and Borrowing Projections
Taxpayer supported debt outstanding is estimated to total $79.7 billion at the end of 2022-23 and $78.3 billion at the end of 2023-24. These estimates are $15.0 billion and $17.3 billion lower than what was estimated in Budget 2022.
Taxpayer supported debt of $78.3 billion is equal to 21.7 per cent of GDP and 110.8 per cent of total revenue. Taxpayer supported debt per capita is forecasted to be $16,751. Net financial liabilities are projected to be $46.5 billion at fiscal 2023-24 year’s end. In relative terms, this is 12.9 per cent of GDP and 65.8 per cent of revenue. On a per capita basis, net financial liabilities are expected to be $9,950.
Taxpayer Supported Debt
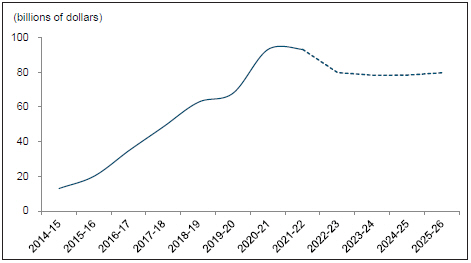
The Province is projected to borrow $6.7 billion for 2023-24, mainly for refinancing maturing debt and to finance the capital plan. This is a decrease of $1.2 billion from what was estimated in Budget 2022. The decreased borrowing requirements result primarily from the fiscal position continuing to be in surplus.
The Province is forecasting to borrow $6.1 billion in 2024-25 and $15.0 billion in 2025-26 mainly to refinance existing debt as the budget is expected to remain in surplus throughout this period. Most of the borrowing will be completed using long-term debt. The borrowing strategy will be adapted as the Province’s requirements are expected to be considerably lower than in recent years. Term debt issuance will be focused on maintaining liquid benchmark bonds in the Canadian bond market where possible. The Province will maintain access to foreign markets and will issue debt offshore if there are cost-saving opportunities to do so.
| 142 | Debt | Fiscal Plan 2023 – 26 |
Taxpayer Supported Debt Per Capita
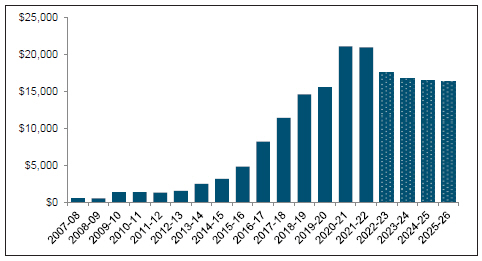
Debt Servicing Costs
Consolidated debt servicing costs are estimated to be $2.7 billion in 2022-23 and $2.8 billion in 2023-24. Debt servicing costs on taxpayer supported debt are projected to be $2.2 billion in 2022-23 and $2.1 billion in 2023-24. This represents 2.9 per cent of estimated total revenue in 2022-23 and 3.0 per cent in 2023-24.
Debt Servicing Costs
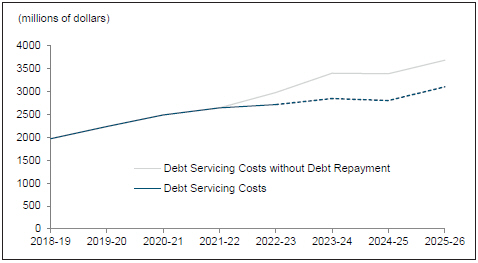
| Debt | Fiscal Plan 2023 – 26 | 143 |
The repayment of $13.4 billion of the Province’s debt has resulted in an estimated reduction in taxpayer supported debt servicing costs of $260 million in 2022-23, and combined with the planned repayment of $1.4 billion in 2023-24, is expected to result in debt servicing costs being $551 million lower in 2023-24 and $581 million lower in 2024-25 and beyond than the Province would have incurred through re-financing the debt based on current estimates of borrowing costs. The consolidated debt servicing costs for 2022-23 does reflect an increase, however, for two reasons. Firstly, the debt repaid in 2022-23 was taxpayer supported debt and not self-supported debt. Secondly, the Province’s $12.3 billion debt swap portfolio associated with loans to local authorities related debt (self supported debt) was negatively impacted by the significant rise in short-term rates over the fiscal year. This results in increased debt servicing costs but also results in higher income from the loan portfolio.
Reducing Alberta’s Outstanding Debt
Reducing and eventually eliminating the province’s debt requires that the budget be in a surplus position. Since debt is also used to finance capital spending, the government will need to continue to produce surpluses while prudently managing capital budgets in order to eliminate the need for capital borrowing and to pay down debt. Now that the budget is projected to continue in surplus, the Province will continue to pay some of its debts with cash as they mature. In fiscal 2022-23, $13.4 billion of maturing debt was repaid using surplus cash and $1.4 billion is expected to be repaid in 2023-24.
| 144 | Debt | Fiscal Plan 2023 – 26 |
Fiscal Anchors
In Budget 2021, Alberta’s government introduced several indicators to help evaluate the province’s fiscal sustainability – that is, the ability to continue providing core services to all Albertans. These metrics have helped guide work to address the debt, improve the efficiency of government, and secure Alberta’s future.
Since their introduction, these fiscal anchors have seen steady improvements with sucessive budgets achieving balance or surplus, per capita spending becoming more aligned with comparator provinces, and taxpayer supported debt to GDP steadily declining below the target of 30%. Financial stakeholders including investors and credit rating agencies monitor this ratio and have reacted favourably to Alberta’s progress, with improvements seen in Alberta’s credit ratings and relative borrowing costs.
Net Debt to GDP
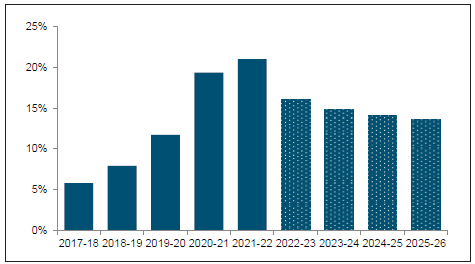
| Debt | Fiscal Plan 2023 – 26 | 145 |
Borrowing Requirements
(millions of dollars)
| 2022-23 | 2023-24 | 2024-25 | 2025-26 | |||||||||||||||||
| Forecast | Estimate | Target | Target | |||||||||||||||||
| Taxpayer supported debt |
- | 5,464 | 5,776 | 14,443 | ||||||||||||||||
| Self supported debt* |
2,251 | 469 | 250 | 250 | ||||||||||||||||
| Government business enterprises |
1,003 | 733 | 39 | 350 | ||||||||||||||||
| Total borrowing requirements |
3,254 | 6,666 | 6,065 | 15,043 | ||||||||||||||||
| * | Debt incurred to lend to Agriculture Financial Services Corporation and debt incurred to make loans to local authorities |
Borrowing Sources
(millions of dollars)
| 2022-23 | 2023-24 | 2024-25 | 2025-26 | |||||||||||||||||
| Forecast | Estimate | Target | Target | |||||||||||||||||
| Money market (net change) |
782 | - | - | 4,000 | ||||||||||||||||
| Public private partnerships |
56 | 64 | 1 | - | ||||||||||||||||
| Long-term debt |
2,416 | 6,602 | 6,064 | 11,043 | ||||||||||||||||
| Total |
3,254 | 6,666 | 6,065 | 15,043 | ||||||||||||||||
Debt Servicing Costs
(millions of dollars)
| 2022-23 | 2023-24 | 2024-25 | 2025-26 | ||||||||||||||||||||||||||||||||
| ($millions) | Forecast | Estimate | Target | Target | |||||||||||||||||||||||||||||||
| Direct debt |
2,088 | 1,972 | 2,032 | 2,408 | |||||||||||||||||||||||||||||||
| Public private partnerships |
129 | 125 | 124 | 104 | |||||||||||||||||||||||||||||||
| Taxpayer supported debt servicing costs |
2,217 | 2,097 | 2,156 | 2,512 | |||||||||||||||||||||||||||||||
| Self supported debt |
498 | 751 | 649 | 591 | |||||||||||||||||||||||||||||||
| Total consolidated debt servicing costs |
2,715 | 2,848 | 2,805 | 3,103 | |||||||||||||||||||||||||||||||
| 146 | Debt | Fiscal Plan 2023 – 26 |
BUDGET 2023
GOVERNMENT OF ALBERTA | 2023–26
Fiscal Plan
Tables
| 147 |
Table of Contents
| Summary Statement of Operations |
149 | |||
| Summary Statement of Financial Position |
149 | |||
| Schedule 1: Consolidated Fiscal Summary |
150 | |||
| Schedule 2: Statement of Financial Position |
151 | |||
| Schedule 3: Capital Assets |
151 | |||
| Schedule 4: Statement of Operations |
152 | |||
| Schedule 5: Revenue |
153 | |||
| Schedule 6: Operating Expense |
154 | |||
| Schedule 7: Capital Amortization |
155 | |||
| Schedule 8: Inventory Consumption |
155 | |||
| Schedule 9: Inventory Acquisition |
155 | |||
| Schedule 10: Debt Servicing Costs |
156 | |||
| Schedule 11: Contingency / Disaster and Emergency Assistance / COVID-19 / Recovery Plan |
156 | |||
| Schedule 12: Pension Liabilities |
156 | |||
| Schedule 13: Annual Debt Maturities |
157 | |||
| Schedule 14: Cash Adjustments |
157 | |||
| Schedule 15: Capital Plan |
158 | |||
| Schedule 16: Capital Grants |
158 | |||
| Schedule 17: Capital Investment |
159 | |||
| Schedule 18: Capital Plan Funding Sources |
159 | |||
| Schedule 19: Borrowing Requirements |
160 | |||
| Schedule 20: Borrowing Sources |
160 | |||
| Schedule 21: Allocation of 2023-24 Net Gaming / Lottery Revenue |
160 | |||
| Schedule 22: Full-Time Equivalents |
161 | |||
| Schedule 23: Expense by Object |
162 | |||
| Schedule 24: Expense by Function |
163 | |||
| Schedule 25: Historical Fiscal Summary, 2008–09 to 2025–26 |
164 | |||
Note on accounting policy changes:
The Public Sector Accounting Board has released updates to standards that are effective for the 2022-23 fiscal year, for Asset Retirement Obligations and Financial Instruments, and for the 2023-24 fiscal year, for Revenue and Public Private Partnerships. The impact of the changes are not included in Budget 2023 but will be incorporated in the 2022-23 and 2023-24 audited year-end financial statements, as required.
| • | Asset Retirement Obligations: accounting for liabilities related to retirement of capital assets, as some will need decommissioning and remediation work, and resources available. The standard requires recognition of future costs when the asset is added via initial recognition of a liability, and annual updates as disposal approaches. |
| • | Financial Instruments: recognition, measurement and reporting changes for financial assets and liabilities, including derivatives, foreign currency translation, recognizing fair market value instead of amortized book value and using current exchange rates rather than locked-in hedge rates, resulting in remeasurement gains and losses and improved risk disclosure. |
| • | Revenue: impacts to revenue recognition arising from exchange transactions versus non-exchange transactions, including performance obligations. |
| • | Public-Private Partnerships (P3s): updated and more distinct accounting treatment based on the degree and form of private sector partner involvement, as P3 contracts have become more complex and varied. |
Note: Amounts presented in tables may not add to totals due to rounding.
| 148 | Tables | Fiscal Plan 2023 – 26 |
Summary Statement of Operations
(millions of dollars)
| 2021-22 | 2022-23 | 2023-24 | 2024-25 | 2025-26 | ||||||||||||||||||||
| Actual | Budget | Forecast | Estimate | Target | Target | |||||||||||||||||||
| Revenue |
||||||||||||||||||||||||
| Tax revenue |
23,506 | 23,034 | 24,580 | 24,992 | 27,055 | 28,609 | ||||||||||||||||||
| Non-renewable resource revenue |
16,170 | 13,840 | 27,544 | 18,361 | 17,284 | 15,742 | ||||||||||||||||||
| Federal transfers |
11,595 | 12,054 | 11,765 | 12,552 | 12,475 | 13,113 | ||||||||||||||||||
| Investment income |
3,579 | 3,173 | 1,035 | 3,154 | 3,273 | 3,407 | ||||||||||||||||||
| Other |
13,472 | 10,506 | 11,101 | 11,594 | 11,637 | 11,737 | ||||||||||||||||||
| Total Revenue |
68,322 | 62,607 | 76,025 | 70,653 | 71,724 | 72,608 | ||||||||||||||||||
| Expense |
||||||||||||||||||||||||
| Operating expense |
52,343 | 51,487 | 55,384 | 57,038 | 58,049 | 59,200 | ||||||||||||||||||
| Capital grants |
2,503 | 2,429 | 1,845 | 2,821 | 3,209 | 3,274 | ||||||||||||||||||
| Amortization / inventory consumption / loss on disposals |
4,186 | 4,057 | 4,480 | 4,397 | 4,460 | 4,509 | ||||||||||||||||||
| Debt servicing costs |
2,641 | 2,662 | 2,715 | 2,848 | 2,805 | 3,103 | ||||||||||||||||||
| Pension provisions |
(365 | ) | (289 | ) | (111 | ) | (322 | ) | (336 | ) | (347 | ) | ||||||||||||
| Contingency / disaster and emergency assistance / COVID-19 |
3,076 | 1,750 | 1,322 | 1,500 | 1,500 | 1,500 | ||||||||||||||||||
| Total Expense |
64,378 | 62,096 | 65,635 | 68,282 | 69,687 | 71,239 | ||||||||||||||||||
| Surplus / (deficit) |
3,944 | 511 | 10,390 | 2,371 | 2,037 | 1,369 | ||||||||||||||||||
Summary Statement of Financial Position
(millions of dollars)
| At March 31 |
||||||||||||||||||||
| 2022 Actual |
2023 Forecast |
2024 Estimate |
2025 Target |
2026 Target |
||||||||||||||||
|
|
||||||||||||||||||||
| Financial Assets |
78,126 | 71,533 | 71,851 | 72,782 | 75,506 | |||||||||||||||
| Liabilities |
135,092 | 118,902 | 118,356 | 118,375 | 119,612 | |||||||||||||||
|
|
|
|||||||||||||||||||
| Net Financial Assets / (Debt) |
(56,966) | (47,369) | (46,505) | (45,593) | (44,106) | |||||||||||||||
|
|
|
|||||||||||||||||||
| Capital / Other Non-financial Assets |
58,576 | 59,549 | 61,197 | 62,362 | 62,244 | |||||||||||||||
| Deferred capital contributions |
(3,523) | (3,703) | (3,844) | (3,884) | (3,884) | |||||||||||||||
|
|
||||||||||||||||||||
| Net Assets |
(1,913) | 8,477 | 10,848 | 12,885 | 14,254 | |||||||||||||||
|
|
||||||||||||||||||||
| Net assets at the beginning of the year |
(5,761) | (1,913) | 8,477 | 10,848 | 12,885 | |||||||||||||||
| Surplus / (Deficit) |
3,944 | 10,390 | 2,371 | 2,037 | 1,369 | |||||||||||||||
| Adjustment to net assets a |
(96) | - | - | - | - | |||||||||||||||
|
|
||||||||||||||||||||
| Net assets at end of year |
(1,913) | 8,477 | 10,848 | 12,885 | 14,254 | |||||||||||||||
|
|
||||||||||||||||||||
| Net debt to GDP |
-15.2% | -10.2% | -10.2% | -9.7% | -9.1% | |||||||||||||||
|
|
||||||||||||||||||||
| a | The change in net assets differs from the surplus / (deficit) in 2021-22 due to a negative $96 million adjustment, as reported in Schedule 15 (page 68) of the Consolidated Financial Statements in the 2021-22 Government of Alberta Annual Report. |
| Tables | Fiscal Plan 2023 – 26 | 149 |
Schedule 1: Consolidated Fiscal Summary
(millions of dollars)
| 2021-22 | 2022-23 | 2023-24 | 2024-25 | 2025-26 | ||||||||||||||||||||||
| Statement of Operations | Actual | Budget | Forecast | Estimate | Target | Target | ||||||||||||||||||||
| 1 Total Revenue |
68,322 | 62,607 | 76,025 | 70,653 | 71,724 | 72,608 | ||||||||||||||||||||
| Expense |
||||||||||||||||||||||||||
| 2 |
Operating expense |
52,343 | 51,487 | 55,384 | 57,038 | 58,049 | 59,200 | |||||||||||||||||||
| 3 |
% change from prior year |
3.2 | (1.6 | ) | 5.8 | 3.0 | 1.8 | 2.0 | ||||||||||||||||||
| 4 |
Capital grants |
2,503 | 2,429 | 1,845 | 2,821 | 3,209 | 3,274 | |||||||||||||||||||
| 5 |
Amortization / inventory consumption / loss on disposals |
4,186 | 4,057 | 4,480 | 4,397 | 4,460 | 4,509 | |||||||||||||||||||
| 6 |
Taxpayer-supported debt servicing costs |
2,278 | 2,443 | 2,217 | 2,097 | 2,156 | 2,513 | |||||||||||||||||||
| 7 |
Self-supported debt servicing costs |
363 | 219 | 498 | 751 | 649 | 590 | |||||||||||||||||||
| 8 |
Pension provisions |
(365 | ) | (289 | ) | (111 | ) | (322 | ) | (336 | ) | (347) | ||||||||||||||
| 9 |
Contingency / disaster and emergency assistance / COVID -19 |
3,076 | 1,750 | 1,322 | 1,500 | 1,500 | 1,500 | |||||||||||||||||||
| 10 Total Expense |
64,378 | 62,096 | 65,635 | 68,282 | 69,687 | 71,239 | ||||||||||||||||||||
| 11 Surplus / (Deficit) |
3,944 | 511 | 10,390 | 2,371 | 2,037 | 1,369 | ||||||||||||||||||||
| Capital Plan | ||||||||||||||||||||||||||
| 12 |
Capital grants |
2,503 | 2,429 | 1,845 | 2,821 | 3,209 | 3,274 | |||||||||||||||||||
| 13 |
Capital investment |
4,119 | 5,105 | 4,601 | 5,184 | 4,767 | 3,733 | |||||||||||||||||||
| 14 Total Capital Plan |
6,622 | 7,534 | 6,446 | 8,005 | 7,976 | 7,008 | ||||||||||||||||||||
| Cash adjustments / borrowing requirements | (at March 31) | |||||||||||||||||||||||||
| 15 Cash at start of year / Alberta Fund |
7,429 | 7,241 | 8,858 | 3,644 | 1,443 | - | ||||||||||||||||||||
| 16 Surplus / (deficit) |
3,944 | 511 | 10,390 | 2,371 | 2,037 | 1,369 | ||||||||||||||||||||
| Cash adjustments (for details, see table on page 209) |
||||||||||||||||||||||||||
| Retained income of funds and agencies: |
||||||||||||||||||||||||||
| 17 |
Alberta Heritage Savings Trust Fund |
(705 | ) | (494 | ) | (1,813 | ) | (1,096 | ) | (1,324 | ) | (1,494) | ||||||||||||||
| 18 |
Other fund and agencies |
(1,236 | ) | (941 | ) | 120 | (1,629 | ) | (1,528 | ) | (1,720) | |||||||||||||||
| 19 |
Other cash adjustments |
(2,268 | ) | 917 | 1,364 | 2,080 | 1,421 | 1,663 | ||||||||||||||||||
| Capital cash adjustments: |
||||||||||||||||||||||||||
| 20 |
Capital investment (excl. SUCH self-financed; net of 10% contingency) |
(3,492 | ) | (3,547 | ) | (3,139 | ) | (3,759 | ) | (3,428 | ) | (2,516) | ||||||||||||||
| 21 |
Capital amortization (excluding SUCH; non-cash expense) |
1,118 | 1,304 | 1,249 | 1,302 | 1,360 | 1,400 | |||||||||||||||||||
| 22 |
Other capital cash adjustments |
(36 | ) | (7 | ) | (31 | ) | (28 | ) | (97 | ) | (103) | ||||||||||||||
| 23 Total cash available / (requirements) |
4,754 | 4,983 | 16,998 | 2,885 | (116 | ) | (1,401) | |||||||||||||||||||
| 24 |
Cash for debt repayment |
(708 | ) | (3,207 | ) | (13,354 | ) | (1,442 | ) | - | - | |||||||||||||||
| 25 |
Direct borrowing required |
4,812 | 224 | - | - | 116 | 1,401 | |||||||||||||||||||
| 26 |
Allocation to Alberta Fund |
- | - | - | (1,443 | ) | - | - | ||||||||||||||||||
| 27 Cash at end of year |
8,858 | 2,000 | 3,644 | - | - | - | ||||||||||||||||||||
| Taxpayer-supported Liabilities / Borrowing | (at March 31) | |||||||||||||||||||||||||
| Liabilities for Capital Projects |
||||||||||||||||||||||||||
| 28 |
Opening balance |
42,733 | 47,381 | 47,529 | 45,828 | 45,815 | 45,849 | |||||||||||||||||||
| 29 |
Alternative financing (P3s – public-private partnerships) |
43 | 81 | 56 | 64 | 1 | - | |||||||||||||||||||
| 30 |
P3 principal repayments |
(83 | ) | (89 | ) | (89 | ) | (92 | ) | (98 | ) | (103) | ||||||||||||||
| 31 |
Net borrowing / principal repay. / amort. issue costs |
4,836 | (1,355 | ) | (1,668 | ) | 15 | 131 | 1,415 | |||||||||||||||||
| 32 Total Liabilities for Capital Projects |
47,529 | 46,018 | 45,828 | 45,815 | 45,849 | 47,161 | ||||||||||||||||||||
| Borrowing for the Fiscal Plan |
||||||||||||||||||||||||||
| 33 Opening balance |
50,303 | 50,303 | 45,595 | 33,909 | 32,477 | 32,487 | ||||||||||||||||||||
| 34 |
Net borrowing / principal repay. / amort. issue costs |
(4,708 | ) | (1,603 | ) | (11,686 | ) | (1,432 | ) | 10 | 10 | |||||||||||||||
| 35 |
Total Borrowing for the Fiscal Plan / Other |
45,595 | 48,700 | 33,909 | 32,477 | 32,487 | 32,497 | |||||||||||||||||||
| 36 |
Total Taxpayer-supported Debt - Capital Projects / Fiscal Plan |
93,124 | 94,718 | 79,737 | 78,292 | 78,336 | 79,658 | |||||||||||||||||||
| 150 | Tables | Fiscal Plan 2023 – 26 |
Schedule 2: Statement of Financial Position
(millions of dollars)
| At March 31 | ||||||||||||||||||||
| 2022 | 2023 | 2024 | 2025 | 2026 | ||||||||||||||||
| Actual | Forecast | Estimate | Target | Target | ||||||||||||||||
| Financial Assets |
||||||||||||||||||||
| Alberta Heritage Savings Trust Fund |
17,094 | 18,907 | 20,003 | 21,327 | 22,821 | |||||||||||||||
| Endowment funds: |
||||||||||||||||||||
| Alberta Heritage Foundation for Medical Research |
2,094 | 2,018 | 2,120 | 2,228 | 2,352 | |||||||||||||||
| Alberta Heritage Science and Engineering Research |
1,249 | 1,195 | 1,232 | 1,286 | 1,350 | |||||||||||||||
| Alberta Heritage Scholarship |
1,447 | 1,333 | 1,375 | 1,408 | 1,447 | |||||||||||||||
| Alberta Enterprise Corporation |
292 | 339 | 335 | 332 | 329 | |||||||||||||||
| General Revenue Fund cash / Alberta Fund |
8,858 | 3,644 | 1,443 | - | - | |||||||||||||||
| Self-supporting lending organizations / activities: |
||||||||||||||||||||
| Local authority loans |
14,424 | 14,690 | 14,583 | 14,430 | 14,246 | |||||||||||||||
| Agriculture Financial Services Corporation |
3,967 | 3,864 | 4,833 | 6,033 | 7,373 | |||||||||||||||
| Equity in commercial enterprises |
1,766 | 1,898 | 2,300 | 2,393 | 2,628 | |||||||||||||||
| Student loans |
3,647 | 4,204 | 4,749 | 5,319 | 5,855 | |||||||||||||||
| Technology Innovation and Emissions Reduction Fund |
337 | 499 | 533 | 569 | 558 | |||||||||||||||
| Other financial assets (including SUCH sector / Alberta Innovates Corp.) |
22,951 | 18,942 | 18,345 | 17,457 | 16,547 | |||||||||||||||
| Total Financial Assets |
78,126 | 71,533 | 71,851 | 72,782 | 75,506 | |||||||||||||||
| Liabilities |
||||||||||||||||||||
| Taxpayer-supported debt: |
||||||||||||||||||||
| Direct borrowing for the Capital Plan |
44,482 | 42,814 | 42,829 | 42,960 | 44,375 | |||||||||||||||
| Alternative financing (P3s - public-private partnerships - Capital Plan) |
3,047 | 3,014 | 2,986 | 2,889 | 2,786 | |||||||||||||||
| Debt issued to reduce pre-1992 TPP unfunded liability |
594 | 594 | 594 | 594 | 594 | |||||||||||||||
| Direct borrowing for the Fiscal Plan |
45,001 | 33,315 | 31,883 | 31,893 | 31,903 | |||||||||||||||
| Total taxpayer-supported debt |
93,124 | 79,737 | 78,292 | 78,336 | 79,658 | |||||||||||||||
| Self-supporting lending organization / activities debt: |
||||||||||||||||||||
| Debt issued to finance local authority loans |
14,424 | 14,690 | 14,583 | 14,430 | 14,246 | |||||||||||||||
| Agriculture Financial Services Corporation |
2,604 | 2,772 | 3,077 | 3,207 | 3,337 | |||||||||||||||
| Total debt |
110,152 | 97,199 | 95,952 | 95,973 | 97,241 | |||||||||||||||
| Coal phase-out liabilities |
761 | 686 | 609 | 530 | 448 | |||||||||||||||
| Pension liabilities |
8,271 | 8,160 | 7,838 | 7,502 | 7,155 | |||||||||||||||
| Other liabilities (including SUCH sector / Alberta Innovates Corp.) |
15,908 | 12,857 | 13,957 | 14,370 | 14,768 | |||||||||||||||
| Total Liabilities |
135,092 | 118,902 | 118,356 | 118,375 | 119,612 | |||||||||||||||
| Net Financial Assets / (Debt) |
(56,966) | (47,369) | (46,505) | (45,593) | (44,106) | |||||||||||||||
| Capital / Other Non-financial Assets |
58,576 | 59,549 | 61,197 | 62,362 | 62,244 | |||||||||||||||
| Deferred capital contributions |
(3,523) | (3,703) | (3,844) | (3,884) | (3,884) | |||||||||||||||
| Net Assets |
(1,913) | 8,477 | 10,848 | 12,885 | 14,254 | |||||||||||||||
| Net financial debt / GDP (calendar year, nominal) |
-15.2% | -10.2% | -10.2% | -9.7% | -9.1% | |||||||||||||||
|
|
||||||||||||||||||||
| Schedule 3: Capital Assets | ||||||||||||||||||||
| (millions of dollars) | ||||||||||||||||||||
| At March 31 | ||||||||||||||||||||
| 2022 | 2023 | 2024 | 2025 | 2026 | ||||||||||||||||
| Actual | Forecast | Estimate | Target | Target | ||||||||||||||||
| Net book value at start of the year |
55,855 | 57,322 | 58,530 | 60,052 | 61,091 | |||||||||||||||
| Additions (capital investment) |
4,119 | 4,601 | 5,184 | 4,767 | 3,733 | |||||||||||||||
| 10% cash flow adjustment (rounded) |
- | (650) | (800) | (800) | (700) | |||||||||||||||
| Amortization |
(2,586) | (2,741) | (2,862) | (2,928) | (2,941) | |||||||||||||||
| Net book value of capital asset disposals / adjustments |
(66) | (2) | - | - | - | |||||||||||||||
| Net Book Value at End of Year |
57,322 | 58,530 | 60,052 | 61,091 | 61,183 | |||||||||||||||
| Tables | Fiscal Plan 2023 – 26 | 151 |
Schedule 4: Statement of Operations
(millions of dollars)
| 2021-22 | 2022-23 | 2023-24 | 2024-25 | 2025-26 | ||||||||||||||||||||
| Actual | Budget | Forecast | Estimate | Target | Target | |||||||||||||||||||
| Revenue |
||||||||||||||||||||||||
| Personal income tax |
13,335 | 13,382 | 13,806 | 14,069 | 15,034 | 16,071 | ||||||||||||||||||
| Corporate income tax |
4,718 | 4,040 | 6,413 | 5,911 | 6,254 | 6,590 | ||||||||||||||||||
| Other taxes |
5,453 | 5,612 | 4,361 | 5,012 | 5,767 | 5,948 | ||||||||||||||||||
| Non-renewable resource revenue |
16,170 | 13,840 | 27,544 | 18,361 | 17,284 | 15,742 | ||||||||||||||||||
| Transfers from Government of Canada |
11,595 | 12,054 | 11,765 | 12,552 | 12,475 | 13,113 | ||||||||||||||||||
| Investment income |
3,579 | 3,173 | 1,035 | 3,154 | 3,273 | 3,407 | ||||||||||||||||||
| Net income from govt. business enterprises |
4,810 | 2,435 | 2,449 | 2,727 | 2,422 | 2,647 | ||||||||||||||||||
| Premiums, fees and licences |
4,520 | 4,490 | 4,796 | 5,040 | 5,289 | 5,360 | ||||||||||||||||||
| Other |
4,142 | 3,581 | 3,856 | 3,827 | 3,926 | 3,730 | ||||||||||||||||||
| Total Revenue |
68,322 | 62,607 | 76,025 | 70,653 | 71,724 | 72,608 | ||||||||||||||||||
| Expense |
||||||||||||||||||||||||
| Advanced Education |
5,731 | 6,065 | 6,154 | 6,339 | 6,471 | 6,618 | ||||||||||||||||||
| Affordability and Utilities |
380 | 86 | 740 | 140 | 92 | 91 | ||||||||||||||||||
| Agriculture and Irrigation |
3,661 | 793 | 1,919 | 892 | 909 | 920 | ||||||||||||||||||
| Children’s Services |
1,742 | 2,389 | 2,653 | 2,917 | 2,803 | 3,003 | ||||||||||||||||||
| Culture |
214 | 269 | 269 | 307 | 257 | 221 | ||||||||||||||||||
| Education |
8,541 | 8,883 | 8,956 | 9,317 | 9,525 | 9,651 | ||||||||||||||||||
| Energy |
1,793 | 878 | 1,464 | 984 | 958 | 1,068 | ||||||||||||||||||
| Environment and Protected Areas |
452 | 449 | 523 | 554 | 499 | 357 | ||||||||||||||||||
| Executive Council |
21 | 25 | 31 | 35 | 37 | 38 | ||||||||||||||||||
| Forestry, Parks and Tourism |
527 | 427 | 581 | 435 | 416 | 408 | ||||||||||||||||||
| Health |
24,585 | 23,484 | 25,563 | 26,446 | 27,494 | 27,942 | ||||||||||||||||||
| Indigenous Relations |
179 | 184 | 207 | 230 | 220 | 220 | ||||||||||||||||||
| Infrastructure |
574 | 582 | 580 | 613 | 630 | 637 | ||||||||||||||||||
| Jobs, Economy and Northern Development |
576 | 419 | 407 | 374 | 355 | 342 | ||||||||||||||||||
| Justice |
460 | 506 | 598 | 658 | 663 | 668 | ||||||||||||||||||
| Mental Health and Addiction |
85 | 101 | 114 | 166 | 172 | 191 | ||||||||||||||||||
| Municipal Affairs |
1,890 | 968 | 957 | 1,014 | 1,239 | 1,324 | ||||||||||||||||||
| Public Safety and Emergency Services |
1,178 | 1,053 | 1,099 | 1,217 | 1,246 | 1,239 | ||||||||||||||||||
| Seniors, Community and Social Services |
4,527 | 4,760 | 5,061 | 5,466 | 5,368 | 5,652 | ||||||||||||||||||
| Service Alberta and Red Tape Reduction |
98 | 112 | 116 | 135 | 133 | 127 | ||||||||||||||||||
| Skilled Trades and Professions |
142 | 162 | 158 | 175 | 175 | 176 | ||||||||||||||||||
| Technology and Innovation |
649 | 890 | 803 | 1,012 | 839 | 840 | ||||||||||||||||||
| Trade, Immigration and Multiculturalism |
87 | 77 | 72 | 86 | 85 | 83 | ||||||||||||||||||
| Transportation and Economic Corridors |
1,828 | 2,368 | 1,973 | 2,519 | 2,863 | 2,864 | ||||||||||||||||||
| Treasury Board and Finance |
2,062 | 1,875 | 1,897 | 2,043 | 2,085 | 2,120 | ||||||||||||||||||
| Legislative Assembly |
119 | 172 | 137 | 180 | 183 | 186 | ||||||||||||||||||
| Total Program Expense |
62,102 | 57,973 | 63,031 | 64,256 | 65,718 | 66,983 | ||||||||||||||||||
| Debt servicing costs |
2,641 | 2,662 | 2,715 | 2,848 | 2,805 | 3,103 | ||||||||||||||||||
| Pension provisions |
(365 | ) | (289 | ) | (111 | ) | (322 | ) | (336 | ) | (347 | ) | ||||||||||||
| Expense before contingency |
64,378 | 60,346 | 65,635 | 66,782 | 68,187 | 69,739 | ||||||||||||||||||
| Surplus / (deficit) before contingency |
3,944 | 2,261 | 10,390 | 3,871 | 3,537 | 2,869 | ||||||||||||||||||
| Unallocated contingency (disast. and emerg. assist. / COVID-19) |
- | 1,750 | - | 1,500 | 1,500 | 1,500 | ||||||||||||||||||
| Total Expense |
64,378 | 62,096 | 65,635 | 68,282 | 69,687 | 71,239 | ||||||||||||||||||
| Surplus / (deficit) |
3,944 | 511 | 10,390 | 2,371 | 2,037 | 1,369 | ||||||||||||||||||
| Beginning net assets (+ adjustments) |
(5,857 | ) | (1,913 | ) | (1,913 | ) | 8,477 | 10,848 | 12,885 | |||||||||||||||
| Net assets at end of year |
(1,913 | ) | (1,402 | ) | 8,477 | 10,848 | 12,885 | 14,254 | ||||||||||||||||
| 152 | Tables | Fiscal Plan 2023 – 26 |
Schedule 5: Revenue
(millions of dollars)
| 2021-22 | 2022-23 | 2023-24 | 2024-25 | 2025-26 | ||||||||||||||||||||||||||
| Actual | Budget | Forecast | Estimate | Target | Target | |||||||||||||||||||||||||
| Income Taxes |
||||||||||||||||||||||||||||||
| Personal income tax |
13,335 | 13,382 | 13,806 | 14,069 | 15,034 | 16,071 | ||||||||||||||||||||||||
| Corporate income tax |
4,718 | 4,040 | 6,413 | 5,911 | 6,254 | 6,590 | ||||||||||||||||||||||||
| 18,053 | 17,422 | 20,219 | 19,980 | 21,288 | 22,661 | |||||||||||||||||||||||||
| Other Taxes |
||||||||||||||||||||||||||||||
| Education property tax (includes opted-out boards) |
2,478 | 2,504 | 2,504 | 2,504 | 2,604 | 2,703 | ||||||||||||||||||||||||
| Fuel tax |
1,275 | 1,319 | 134 | 769 | 1,369 | 1,407 | ||||||||||||||||||||||||
| Tobacco / vaping taxes |
617 | 644 | 510 | 489 | 485 | 463 | ||||||||||||||||||||||||
| Insurance taxes |
753 | 819 | 798 | 851 | 908 | 969 | ||||||||||||||||||||||||
| Cannabis tax |
164 | 157 | 168 | 173 | 177 | 181 | ||||||||||||||||||||||||
| Tourism levy |
59 | 73 | 95 | 97 | 105 | 109 | ||||||||||||||||||||||||
| Freehold mineral rights tax |
107 | 96 | 152 | 129 | 119 | 116 | ||||||||||||||||||||||||
| 5,453 | 5,612 | 4,361 | 5,012 | 5,767 | 5,948 | |||||||||||||||||||||||||
| Non-Renewable Resource Revenue |
||||||||||||||||||||||||||||||
| Bitumen royalty |
11,605 | 10,349 | 18,750 | 12,555 | 12,028 | 10,736 | ||||||||||||||||||||||||
| Crude oil royalty |
1,947 | 1,670 | 3,965 | 2,905 | 2,633 | 2,442 | ||||||||||||||||||||||||
| Natural gas and by-products royalty |
2,227 | 1,458 | 4,221 | 2,465 | 2,208 | 2,155 | ||||||||||||||||||||||||
| Bonuses and sales of Crown leases |
228 | 236 | 409 | 307 | 293 | 289 | ||||||||||||||||||||||||
| Rentals and fees / coal royalty |
163 | 127 | 199 | 129 | 122 | 120 | ||||||||||||||||||||||||
| 16,170 | 13,840 | 27,544 | 18,361 | 17,284 | 15,742 | |||||||||||||||||||||||||
| Transfers from Government of Canada |
||||||||||||||||||||||||||||||
| Canada Health Transfer |
5,503 | 5,352 | 5,520 | 6,079 | 6,287 | 6,708 | ||||||||||||||||||||||||
| Canada Social Transfer |
1,796 | 1,868 | 1,864 | 1,942 | 2,022 | 2,102 | ||||||||||||||||||||||||
| Direct transfers to SUCH sector / Alberta Innovates Corporation |
478 | 579 | 624 | 617 | 623 | 635 | ||||||||||||||||||||||||
| Infrastructure support |
808 | 1,293 | 782 | 935 | 1,166 | 1,083 | ||||||||||||||||||||||||
| Agriculture support programs |
531 | 296 | 491 | 480 | 517 | 564 | ||||||||||||||||||||||||
| Labour market agreements |
485 | 322 | 324 | 325 | 325 | 325 | ||||||||||||||||||||||||
| Early learning child care agreements |
197 | 734 | 734 | 937 | 1,062 | 1,226 | ||||||||||||||||||||||||
| Other (includes Fiscal Stabilization payment in 2023-24) |
1,797 | 1,610 | 1,426 | 1,237 | 473 | 470 | ||||||||||||||||||||||||
| 11,595 | 12,054 | 11,765 | 12,552 | 12,475 | 13,113 | |||||||||||||||||||||||||
| Investment Income |
||||||||||||||||||||||||||||||
| Alberta Heritage Savings Trust Fund |
2,128 | 1,976 | (74 | ) | 1,226 | 1,458 | 1,632 | |||||||||||||||||||||||
| Endowment funds |
514 | 440 | (76 | ) | 352 | 369 | 401 | |||||||||||||||||||||||
| Income from local authority loans |
329 | 185 | 450 | 734 | 612 | 543 | ||||||||||||||||||||||||
| Agriculture Financial Services Corporation |
126 | 113 | 91 | 126 | 130 | 139 | ||||||||||||||||||||||||
| Other (includes SUCH sector) |
482 | 459 | 644 | 716 | 704 | 692 | ||||||||||||||||||||||||
| 3,579 | 3,173 | 1,035 | 3,154 | 3,273 | 3,407 | |||||||||||||||||||||||||
| Net Income from Government Business Enterprises |
||||||||||||||||||||||||||||||
| AGLC – Gaming / lottery |
1,205 | 1,468 | 1,502 | 1,515 | 1,509 | 1,573 | ||||||||||||||||||||||||
| AGLC – Liquor |
854 | 850 | 832 | 830 | 836 | 845 | ||||||||||||||||||||||||
| AGLC – Cannabis |
(4 | ) | 7 | 13 | 5 | 9 | 14 | |||||||||||||||||||||||
| ATB Financial |
586 | 313 | 282 | 279 | 324 | 358 | ||||||||||||||||||||||||
| Balancing Pool |
96 | 112 | 120 | 103 | 103 | 103 | ||||||||||||||||||||||||
| Other (CUDGCo / APMC / PSIs) |
2,073 | (315 | ) | (300 | ) | (5 | ) | (359 | ) | (246 | ) | |||||||||||||||||||
| 4,810 | 2,435 | 2,449 | 2,727 | 2,422 | 2,647 | |||||||||||||||||||||||||
| Premiums, Fees and Licences |
||||||||||||||||||||||||||||||
| Post-secondary institution tuition fees |
1,465 | 1,645 | 1,667 | 1,771 | 1,865 | 1,902 | ||||||||||||||||||||||||
| Health / school board fees and charges |
603 | 661 | 705 | 754 | 793 | 832 | ||||||||||||||||||||||||
| Motor vehicle licences |
566 | 548 | 586 | 580 | 593 | 605 | ||||||||||||||||||||||||
| Crop, hail and livestock insurance premiums |
324 | 359 | 514 | 613 | 683 | 741 | ||||||||||||||||||||||||
| Energy industry levies |
313 | 309 | 313 | 384 | 392 | 399 | ||||||||||||||||||||||||
| Other |
1,249 | 968 | 1,011 | 938 | 964 | 881 | ||||||||||||||||||||||||
| 4,520 | 4,490 | 4,796 | 5,040 | 5,289 | 5,360 | |||||||||||||||||||||||||
| Other |
||||||||||||||||||||||||||||||
| SUCH sector sales, rentals and services |
806 | 876 | 895 | 915 | 920 | 942 | ||||||||||||||||||||||||
| SUCH sector fundraising, donations, gifts and contributions |
741 | 640 | 658 | 662 | 670 | 675 | ||||||||||||||||||||||||
| AIMCo investment management charges |
847 | 729 | 765 | 877 | 904 | 931 | ||||||||||||||||||||||||
| Fines and penalties |
187 | 273 | 253 | 226 | 226 | 226 | ||||||||||||||||||||||||
| Refunds of expense |
326 | 182 | 153 | 108 | 113 | 128 | ||||||||||||||||||||||||
| Technology Innovation and Emissions Reduction Fund |
705 | 421 | 637 | 523 | 563 | 303 | ||||||||||||||||||||||||
| Miscellaneous (includes Alberta Innovates Corporation) |
530 | 460 | 495 | 516 | 530 | 525 | ||||||||||||||||||||||||
| 4,142 | 3,581 | 3,856 | 3,827 | 3,926 | 3,730 | |||||||||||||||||||||||||
| Total Revenue |
68,322 | 62,607 | 76,025 | 70,653 | 71,724 | 72,608 | ||||||||||||||||||||||||
| Tables | Fiscal Plan 2023 – 26 | 153 |
Schedule 6: Operating Expense
(millions of dollars)
| 2021-22 | 2022-23 | 2023-24 | 2024-25 | 2025-26 | ||||||||||||||||||||
| Actual | Budget | Forecast | Estimate | Target | Target | |||||||||||||||||||
| Advanced Education |
5,138 | 5,283 | 5,358 | 5,604 | 5,730 | 5,862 | ||||||||||||||||||
| Affordability and Utilities |
356 | 78 | 732 | 131 | 84 | 85 | ||||||||||||||||||
| Agriculture and Irrigation |
665 | 700 | 710 | 804 | 801 | 806 | ||||||||||||||||||
| Children’s Services |
1,706 | 2,389 | 2,650 | 2,907 | 2,794 | 2,994 | ||||||||||||||||||
| Culture |
161 | 150 | 162 | 162 | 163 | 161 | ||||||||||||||||||
| Education |
7,846 | 8,390 | 8,456 | 8,836 | 9,036 | 9,162 | ||||||||||||||||||
| Energy (incl. crude-by-rail expense of $866 million in 2021-22) |
1,419 | 491 | 782 | 766 | 740 | 736 | ||||||||||||||||||
| Environment and Protected Areas |
373 | 364 | 444 | 497 | 486 | 344 | ||||||||||||||||||
| Executive Council |
21 | 25 | 31 | 35 | 37 | 38 | ||||||||||||||||||
| Forestry, Parks and Tourism |
311 | 341 | 344 | 385 | 369 | 365 | ||||||||||||||||||
| Health |
21,238 | 21,917 | 22,585 | 24,533 | 25,443 | 26,041 | ||||||||||||||||||
| Indigenous Relations |
153 | 165 | 175 | 214 | 212 | 212 | ||||||||||||||||||
| Infrastructure |
430 | 408 | 437 | 462 | 468 | 466 | ||||||||||||||||||
| Jobs, Economy and Northern Development |
197 | 312 | 300 | 373 | 354 | 341 | ||||||||||||||||||
| Justice |
459 | 502 | 594 | 655 | 659 | 664 | ||||||||||||||||||
| Mental Health and Addiction |
64 | 101 | 104 | 148 | 157 | 191 | ||||||||||||||||||
| Municipal Affairs |
187 | 186 | 185 | 228 | 230 | 232 | ||||||||||||||||||
| Public Safety and Emergency Services |
1,060 | 1,024 | 1,051 | 1,187 | 1,216 | 1,209 | ||||||||||||||||||
| Seniors, Community and Social Services |
4,353 | 4,646 | 4,943 | 5,332 | 5,239 | 5,415 | ||||||||||||||||||
| Service Alberta and Red Tape Reduction |
80 | 88 | 92 | 112 | 109 | 104 | ||||||||||||||||||
| Skilled Trades and Professions |
142 | 162 | 158 | 175 | 175 | 176 | ||||||||||||||||||
| Technology and Innovation |
497 | 540 | 582 | 704 | 690 | 691 | ||||||||||||||||||
| Trade, Immigration and Multiculturalism |
85 | 67 | 62 | 86 | 85 | 83 | ||||||||||||||||||
| Transportation and Economic Corridors |
437 | 461 | 460 | 507 | 532 | 546 | ||||||||||||||||||
| Treasury Board and Finance |
2,035 | 1,847 | 1,869 | 2,018 | 2,059 | 2,093 | ||||||||||||||||||
| Legislative Assembly |
117 | 170 | 135 | 178 | 181 | 184 | ||||||||||||||||||
| COVID-19 / Recovery Plan: |
||||||||||||||||||||||||
| Advanced Education |
15 | 62 | 64 | - | - | - | ||||||||||||||||||
| Children’s Services |
36 | - | - | - | - | - | ||||||||||||||||||
| Culture |
12 | - | - | - | - | - | ||||||||||||||||||
| Education |
130 | 13 | 21 | - | - | - | ||||||||||||||||||
| Energy |
318 | 310 | 600 | - | - | - | ||||||||||||||||||
| Environment and Protected Areas |
39 | 27 | 27 | - | - | - | ||||||||||||||||||
| Forestry, Parks and Tourism |
37 | 22 | 22 | - | - | - | ||||||||||||||||||
| Health |
1,508 | 10 | 983 | - | - | - | ||||||||||||||||||
| Infrastructure |
6 | 5 | 5 | - | - | - | ||||||||||||||||||
| Jobs, Economy and Northern Development |
377 | 106 | 106 | - | - | - | ||||||||||||||||||
| Mental Health and Addiction |
20 | - | - | - | - | - | ||||||||||||||||||
| Public Safety and Emergency Services |
24 | - | - | - | - | - | ||||||||||||||||||
| Seniors, Community and Social Services |
60 | - | 25 | - | - | - | ||||||||||||||||||
| Skilled Trades and Professions |
2 | - | - | - | - | - | ||||||||||||||||||
| Technology and Innovation |
68 | 122 | 122 | - | - | - | ||||||||||||||||||
| Trade, Immigration and Multiculturalism |
2 | 10 | 10 | - | - | - | ||||||||||||||||||
| Transportation and Economic Corridors |
159 | - | - | - | - | - | ||||||||||||||||||
| Total Operating Expense |
52,343 | 51,487 | 55,384 | 57,038 | 58,049 | 59,200 | ||||||||||||||||||
| 154 | Tables | Fiscal Plan 2023 – 26 |
Schedule 7: Capital Amortization
(millions of dollars)
| 2021-22 | 2022-23 | 2023-24 | 2024-25 | 2025-26 | ||||||||||||||||||||
| Actual | Budget | Forecast | Estimate | Target | Target | |||||||||||||||||||
| Advanced Education |
530 | 557 | 526 | 556 | 559 | 570 | ||||||||||||||||||
| Affordability and Utilities |
2 | 2 | 2 | 2 | 2 | 2 | ||||||||||||||||||
| Agriculture and Irrigation |
37 | 49 | 34 | 36 | 39 | 41 | ||||||||||||||||||
| Children’s Services |
- | - | - | 1 | 1 | 1 | ||||||||||||||||||
| Culture |
7 | 8 | 8 | 8 | 7 | 7 | ||||||||||||||||||
| Education |
471 | 472 | 469 | 479 | 488 | 488 | ||||||||||||||||||
| Energy |
14 | 19 | 14 | 13 | 13 | 13 | ||||||||||||||||||
| Environment and Protected Areas |
7 | 15 | 5 | 4 | 5 | 5 | ||||||||||||||||||
| Forestry, Parks and Tourism |
32 | 56 | 37 | 38 | 40 | 41 | ||||||||||||||||||
| Health |
472 | 518 | 518 | 546 | 542 | 503 | ||||||||||||||||||
| Infrastructure |
126 | 151 | 136 | 146 | 160 | 169 | ||||||||||||||||||
| Jobs, Economy and Northern Development |
2 | 1 | 1 | 1 | 1 | 1 | ||||||||||||||||||
| Justice |
1 | 4 | 4 | 4 | 4 | 4 | ||||||||||||||||||
| Municipal Affairs |
1 | 4 | 4 | 4 | 4 | 4 | ||||||||||||||||||
| Public Safety and Emergency Services |
28 | 29 | 29 | 29 | 29 | 29 | ||||||||||||||||||
| Seniors, Community and Social Services |
44 | 46 | 48 | 48 | 48 | 48 | ||||||||||||||||||
| Service Alberta and Red Tape Reduction |
14 | 18 | 18 | 18 | 18 | 18 | ||||||||||||||||||
| Technology and Innovation |
68 | 78 | 78 | 79 | 79 | 79 | ||||||||||||||||||
| Transportation and Economic Corridors |
700 | 780 | 780 | 823 | 861 | 889 | ||||||||||||||||||
| Treasury Board and Finance |
27 | 28 | 28 | 25 | 26 | 27 | ||||||||||||||||||
| Legislative Assembly |
2 | 2 | 2 | 2 | 2 | 2 | ||||||||||||||||||
| Total Amortization Expense |
2,586 | 2,839 | 2,741 | 2,862 | 2,928 | 2,941 | ||||||||||||||||||
|
|
||||||||||||||||||||||||
|
Schedule 8: Inventory Consumption
(millions of dollars) |
||||||||||||||||||||||||
| 2021-22 | 2022-23 | 2023-24 | 2024-25 | 2025-26 | ||||||||||||||||||||
| Actual | Budget | Forecast | Estimate | Target | Target | |||||||||||||||||||
| Advanced Education |
48 | 163 | 205 | 180 | 183 | 186 | ||||||||||||||||||
| Culture |
- | 1 | 1 | 1 | 1 | 1 | ||||||||||||||||||
| Education |
83 | - | - | - | - | - | ||||||||||||||||||
| Forestry, Parks and Tourism |
1 | 1 | 1 | 1 | 1 | 1 | ||||||||||||||||||
| Health |
1,359 | 988 | 1,465 | 1,278 | 1,269 | 1,297 | ||||||||||||||||||
| Infrastructure |
2 | 2 | 2 | 2 | 2 | 2 | ||||||||||||||||||
| Public Safety and Emergency Services |
34 | - | 1 | 1 | 1 | 1 | ||||||||||||||||||
| Service Alberta and Red Tape Reduction |
4 | 6 | 6 | 6 | 6 | 6 | ||||||||||||||||||
| Transportation and Economic Corridors |
60 | 57 | 57 | 62 | 65 | 66 | ||||||||||||||||||
| Total Inventory Consumption |
1,591 | 1,217 | 1,738 | 1,530 | 1,527 | 1,560 | ||||||||||||||||||
|
|
||||||||||||||||||||||||
|
Schedule 9: Inventory Acquisition
(millions of dollars) |
||||||||||||||||||||||||
| 2021-22 | 2022-23 | 2023-24 | 2024-25 | 2025-26 | ||||||||||||||||||||
| Actual | Budget | Forecast | Estimate | Target | Target | |||||||||||||||||||
| Advanced Education |
45 | 181 | 181 | 181 | 181 | 181 | ||||||||||||||||||
| Culture |
1 | 1 | 1 | 1 | 1 | 1 | ||||||||||||||||||
| Education |
79 | - | - | - | - | - | ||||||||||||||||||
| Forestry, Parks and Tourism |
1 | 1 | 1 | 1 | 1 | 1 | ||||||||||||||||||
| Health |
1,257 | 1,148 | 1,293 | 1,404 | 1,398 | 1,094 | ||||||||||||||||||
| Infrastructure |
2 | 2 | 2 | 2 | 2 | 2 | ||||||||||||||||||
| Municipal Affairs |
- | - | - | - | - | - | ||||||||||||||||||
| Public Safety and Emergency Services |
2 | - | 1 | - | - | - | ||||||||||||||||||
| Service Alberta and Red Tape Reduction |
4 | 6 | 5 | 6 | 6 | 6 | ||||||||||||||||||
| Transportation and Economic Corridors |
54 | 57 | 57 | 62 | 65 | 66 | ||||||||||||||||||
| Total Inventory Acquisition |
1,446 | 1,396 | 1,542 | 1,656 | 1,653 | 1,350 | ||||||||||||||||||
| Tables | Fiscal Plan 2023 – 26 | 155 |
Schedule 10: Debt Servicing Costs
(millions of dollars)
| 2021-22 | 2022-23 | 2023-24 | 2024-25 | 2025-26 | ||||||||||||||||||||
| Actual | Budget | Forecast | Estimate | Target | Target | |||||||||||||||||||
| Taxpayer-supported general debt servicing costs |
||||||||||||||||||||||||
| Education – school boards |
9 | 9 | 9 | 9 | 9 | 9 | ||||||||||||||||||
| Treasury Board and Finance |
1,154 | 1,150 | 940 | 850 | 797 | 929 | ||||||||||||||||||
| Total |
1,163 | 1,159 | 949 | 859 | 806 | 938 | ||||||||||||||||||
| Taxpayer-supported Capital Plan debt servicing costs |
||||||||||||||||||||||||
| Education – Alberta Schools Alternative Procurement P3s |
26 | 25 | 25 | 24 | 27 | 27 | ||||||||||||||||||
| Transportation – ring road P3s |
103 | 103 | 103 | 101 | 97 | 94 | ||||||||||||||||||
| Treasury Board and Finance – direct borrowing |
987 | 1,156 | 1,140 | 1,113 | 1,226 | 1,454 | ||||||||||||||||||
| Total |
1,116 | 1,284 | 1,268 | 1,238 | 1,350 | 1,575 | ||||||||||||||||||
| Total taxpayer-supported debt servicing costs |
2,278 | 2,443 | 2,217 | 2,097 | 2,156 | 2,513 | ||||||||||||||||||
| Self-supported debt servicing costs |
||||||||||||||||||||||||
| Treasury Board and Finance – for loans to local authorities |
298 | 155 | 424 | 659 | 555 | 493 | ||||||||||||||||||
| Treasury Board and Finance – Ag. Financial Services Corp. |
65 | 64 | 74 | 92 | 94 | 97 | ||||||||||||||||||
| Total |
363 | 219 | 498 | 751 | 649 | 590 | ||||||||||||||||||
| Total Debt Servicing Costs |
2,641 | 2,662 | 2,715 | 2,848 | 2,805 | 3,103 | ||||||||||||||||||
Schedule 11: Contingency / Disaster and Emergency Assistance / COVID-19 / Recovery Plan
(millions of dollars)
| 2021-22 | 2022-23 | 2023-24 | 2024-25 | 2025-26 | ||||||||||||||||||||
| Actual | Budget | Forecast | Estimate | Target | Target | |||||||||||||||||||
| Agriculture and Irrigation – agric. support |
2,886 | - | 1,131 | - | - | - | ||||||||||||||||||
| Forestry, Parks and Tourism - wildfire fighting |
144 | - | 173 | - | - | - | ||||||||||||||||||
| Public Safety and Emergency Services – wildfire / flood support |
32 | - | 18 | - | - | - | ||||||||||||||||||
| Technology and Innovation – 1GX costs |
14 | - | - | - | - | - | ||||||||||||||||||
| Treasury Board and Fin. – disaster and emerg. assist. contingency |
- | 1,000 | - | 1,500 | 1,500 | 1,500 | ||||||||||||||||||
| Treasury Board and Fin. – COVID-19 / Recovery Plan contingency |
- | 750 | - | - | - | - | ||||||||||||||||||
| Total Contingency / Dis. & Emerg. Assist. / COVID-19 / Rec. Plan |
3,076 | 1,750 | 1,322 | 1,500 | 1,500 | 1,500 | ||||||||||||||||||
Schedule 12: Pension Liabilities a
(millions of dollars)
| At March 31 | ||||||||||||||||||||
| 2022 | 2023 | 2024 | 2025 | 2026 | ||||||||||||||||
| Actual | Forecast | Estimate | Target | Target | ||||||||||||||||
| Teachers’ Pension Plan (pre-1992) |
7,244 | 7,208 | 6,943 | 6,668 | 6,385 | |||||||||||||||
| Public Service Management Pension Plan (pre-1992; closed) b |
386 | 354 | 322 | 288 | 254 | |||||||||||||||
| Universities Academic Pension Plan (pre-1992) |
226 | 225 | 225 | 225 | 225 | |||||||||||||||
| Special Forces Pension Plan (pre-1992) |
85 | 74 | 76 | 77 | 75 | |||||||||||||||
| Members of the Legislative Assembly Pension Plan (closed) b |
35 | 33 | 31 | 28 | 26 | |||||||||||||||
| Public Service Supplementary Retirement Plan |
25 | 24 | 24 | 24 | 24 | |||||||||||||||
| Provincial Judges and Masters in Chambers Pension Plan |
1 | 1 | 1 | 1 | 1 | |||||||||||||||
| SUCH sector – Universities Academic / Supp. Exec. Retirement Plans |
269 | 241 | 216 | 191 | 165 | |||||||||||||||
| Total Pension Liabilities |
8,271 | 8,160 | 7,838 | 7,502 | 7,155 | |||||||||||||||
| Annual Non-cash Change in Pension Liabilities |
(365 | ) | (111 | ) | (322 | ) | (336 | ) | (347 | ) | ||||||||||
| a | The following public service pension plans are fully funded, and thus not included above: the Local Authorities Pension Plan, the Public Service Pension Plan and the Management Employees Pension Plan. |
| b | Membership closed and pensionable service no longer being accrued. |
| 156 | Tables | Fiscal Plan 2023 – 26 |
Schedule 13: Annual Debt Maturities
(millions of dollars)
| 2021-22 | 2022-23 | 2023-24 | 2024-25 | 2025-26 | 2026-27 | |||||||||||||||||||
| Long-term debt maturities |
4,922 | 5,292 | 7,522 | 5,971 | 13,199 | 5,825 | ||||||||||||||||||
| Short-term debt maturities |
- | 8,062 | - | - | - | - | ||||||||||||||||||
| Total Annual Debt Maturities |
4,922 | 13,354 | 7,522 | 5,971 | 13,199 | 5,825 | ||||||||||||||||||
Schedule 14: Cash Adjustments a
(millions of dollars)
| 2021-22 | 2022-23 | 2023-24 | 2024-25 | 2025-26 | ||||||||||||||||||||
| Actual | Budget | Forecast | Estimate | Target | Target | |||||||||||||||||||
| Retained Income of Funds and Agencies |
||||||||||||||||||||||||
| Alberta Heritage Savings Trust Fund |
(705 | ) | (494 | ) | (1,813 | ) | (1,096 | ) | (1,324 | ) | (1,494 | ) | ||||||||||||
| ATB Financial |
(586 | ) | (313 | ) | (282 | ) | (279 | ) | (324 | ) | (358 | ) | ||||||||||||
| Agriculture Financial Services Corporation |
2,074 | (392 | ) | 243 | (910 | ) | (1,061 | ) | (1,199 | ) | ||||||||||||||
| Heritage Foundation for Medical Research Endowment Fund |
(153 | ) | (106 | ) | 76 | (102 | ) | (108 | ) | (124 | ) | |||||||||||||
| Heritage Science and Engineering Research Endowment Fund |
(88 | ) | (81 | ) | 54 | (37 | ) | (54 | ) | (64 | ) | |||||||||||||
| Heritage Scholarship Fund |
(87 | ) | (78 | ) | 114 | (42 | ) | (33 | ) | (39 | ) | |||||||||||||
| Alberta Social Housing Corporation |
(3 | ) | (28 | ) | 9 | (95 | ) | (141 | ) | (67 | ) | |||||||||||||
| Credit Union Deposit Guarantee Corporation |
(11 | ) | (15 | ) | (18 | ) | (13 | ) | (17 | ) | (17 | ) | ||||||||||||
| Alberta Petroleum Marketing Commission |
(2,059 | ) | 329 | 318 | 18 | 376 | 263 | |||||||||||||||||
| Technology Innovation and Emissions Reduction Fund |
(196 | ) | (75 | ) | (162 | ) | (34 | ) | (36 | ) | 11 | |||||||||||||
| Balancing Pool |
(96 | ) | (112 | ) | (120 | ) | (103 | ) | (103 | ) | (103 | ) | ||||||||||||
| Other |
(31 | ) | (71 | ) | (112 | ) | (32 | ) | (27 | ) | (23 | ) | ||||||||||||
| Total Retained Income of Funds and Agencies |
(1,941 | ) | (1,435 | ) | (1,693 | ) | (2,725 | ) | (2,852 | ) | (3,214 | ) | ||||||||||||
| Other Cash Adjustments |
||||||||||||||||||||||||
| SUCH sector own-source revenue |
(4,910 | ) | (4,979 | ) | (5,101 | ) | (5,292 | ) | (5,458 | ) | (5,590 | ) | ||||||||||||
| SUCH sector own-source expense |
5,500 | 6,413 | 6,866 | 7,087 | 7,400 | 7,525 | ||||||||||||||||||
| Net deferred capital contribution cash adjustment |
249 | 118 | 120 | 81 | (19 | ) | (60 | ) | ||||||||||||||||
| Energy royalties (difference between accrued revenue & cash) |
(2,418 | ) | 430 | 170 | 545 | 878 | 804 | |||||||||||||||||
| Student loans |
(271 | ) | (502 | ) | (557 | ) | (545 | ) | (570 | ) | (536 | ) | ||||||||||||
| Other cash adjustments |
(264 | ) | (129 | ) | (334 | ) | 95 | (462 | ) | (132 | ) | |||||||||||||
| 2013 Alberta flood assistance revenue / expense |
(22 | ) | (12 | ) | (12 | ) | 375 | - | - | |||||||||||||||
| Wood Buffalo wildfire revenue / expense |
(20 | ) | (51 | ) | (37 | ) | 57 | (4 | ) | - | ||||||||||||||
| Pension provisions (non-cash expense) |
(365 | ) | (289 | ) | (111 | ) | (322 | ) | (336 | ) | (347 | ) | ||||||||||||
| Inventory acquisition (excluding SUCH sector; non-cash expense) |
(148 | ) | (227 | ) | (248 | ) | (160 | ) | (166 | ) | (162 | ) | ||||||||||||
| Inventory consumption (excluding SUCH sector; non-cash expense) |
401 | 144 | 608 | 158 | 159 | 161 | ||||||||||||||||||
| Total Other Cash Adjustments |
(2,268 | ) | 917 | 1,364 | 2,080 | 1,421 | 1,663 | |||||||||||||||||
| Capital cash adjustments |
||||||||||||||||||||||||
| Capital investment (excluding SUCH sector self-financed) |
(3,492 | ) | (4,297 | ) | (3,789 | ) | (4,559 | ) | (4,228 | ) | (3,216 | ) | ||||||||||||
| Capital Plan contingency |
- | 750 | 650 | 800 | 800 | 700 | ||||||||||||||||||
| Current principal repayments (P3s – public-private partnerships) |
(83 | ) | (89 | ) | (89 | ) | (92 | ) | (98 | ) | (103 | ) | ||||||||||||
| Alternative financing (P3s – public-private partnerships) |
43 | 81 | 56 | 64 | 1 | - | ||||||||||||||||||
| Amortization (excluding SUCH sector; non-cash expense) |
1,118 | 1,304 | 1,249 | 1,302 | 1,360 | 1,400 | ||||||||||||||||||
| Book value of asset disposals (net non-cash expense / revenue) |
4 | 1 | 2 | - | - | - | ||||||||||||||||||
| Total Capital Cash Adjustments |
(2,410 | ) | (2,250 | ) | (1,921 | ) | (2,485 | ) | (2,165 | ) | (1,219 | ) | ||||||||||||
| a | Negative cash adjustments are a cash requirement; positive cash adjustments are a cash source. |
| Tables | Fiscal Plan 2023 – 26 | 157 |
Schedule 15: Capital Plan a
(millions of dollars)
| 2021-22 | 2022-23 | 2023-24 | 2024-25 | 2025-26 | ||||||||||||||||||||
| Actual | Budget | Forecast | Estimate | Target | Target | |||||||||||||||||||
| Advanced Education |
583 | 616 | 617 | 492 | 394 | 326 | ||||||||||||||||||
| Affordability and Utilities |
22 | 8 | 8 | 7 | 7 | 5 | ||||||||||||||||||
| Agriculture and Irrigation |
77 | 51 | 49 | 64 | 76 | 80 | ||||||||||||||||||
| Children’s Services |
- | 9 | 18 | 19 | 18 | 13 | ||||||||||||||||||
| Culture |
35 | 112 | 99 | 138 | 88 | 54 | ||||||||||||||||||
| Education |
758 | 937 | 753 | 765 | 797 | 627 | ||||||||||||||||||
| Energy |
56 | 73 | 79 | 221 | 220 | 334 | ||||||||||||||||||
| Environment and Protected Areas |
43 | 91 | 77 | 112 | 36 | 19 | ||||||||||||||||||
| Forestry, Parks and Tourism |
62 | 62 | 65 | 96 | 112 | 55 | ||||||||||||||||||
| Health |
921 | 1,296 | 989 | 1,273 | 1,624 | 1,330 | ||||||||||||||||||
| Indigenous Relations |
26 | 19 | 32 | 16 | 8 | 8 | ||||||||||||||||||
| Infrastructure |
221 | 402 | 357 | 423 | 392 | 302 | ||||||||||||||||||
| Jobs, Economy and Northern Development |
1 | 4 | 4 | 2 | 1 | 1 | ||||||||||||||||||
| Justice |
12 | 17 | 19 | 18 | 6 | 5 | ||||||||||||||||||
| Mental Health and Addiction |
5 | - | 10 | 18 | 15 | - | ||||||||||||||||||
| Municipal Affairs |
1,704 | 779 | 773 | 783 | 1,006 | 1,088 | ||||||||||||||||||
| Public Safety and Emergency Services |
6 | 4 | 8 | 6 | 5 | 5 | ||||||||||||||||||
| Seniors, Community and Social Services |
139 | 118 | 114 | 142 | 114 | 224 | ||||||||||||||||||
| Service Alberta and Red Tape Reduction |
11 | 13 | 33 | 46 | 55 | 52 | ||||||||||||||||||
| Technology and Innovation |
65 | 249 | 100 | 361 | 196 | 194 | ||||||||||||||||||
| Transportation and Economic Corridors |
1,856 | 2,656 | 2,222 | 2,973 | 2,775 | 2,258 | ||||||||||||||||||
| Treasury Board and Finance |
14 | 18 | 17 | 28 | 27 | 27 | ||||||||||||||||||
| Legislative Assembly |
3 | 2 | 3 | 2 | 2 | 2 | ||||||||||||||||||
| Total Capital Plan |
6,622 | 7,534 | 6,446 | 8,005 | 7,976 | 7,008 | ||||||||||||||||||
| a | The Capital Plan comprises capital grants included in expense plus capital investment in government-owned assets not included in expense. Capital investment adds to government capital assets, and those assets are depreciated over time through amortization expense included in total expense. |
Schedule 16: Capital Grants
(millions of dollars)
| 2021-22 | 2022-23 | 2023-24 | 2024-25 | 2025-26 | ||||||||||||||||||||
| Actual | Budget | Forecast | Estimate | Target | Target | |||||||||||||||||||
| Affordability and Utilities |
22 | 6 | 6 | 7 | 6 | 4 | ||||||||||||||||||
| Agriculture and Irrigation |
73 | 44 | 44 | 52 | 70 | 73 | ||||||||||||||||||
| Children’s Services |
- | 1 | 3 | 9 | 8 | 8 | ||||||||||||||||||
| Culture |
34 | 110 | 98 | 136 | 86 | 52 | ||||||||||||||||||
| Education |
11 | 8 | 10 | 3 | - | 1 | ||||||||||||||||||
| Energy |
43 | 58 | 69 | 205 | 205 | 319 | ||||||||||||||||||
| Environment and Protected Areas |
33 | 43 | 48 | 52 | 9 | 9 | ||||||||||||||||||
| Forestry, Parks and Tourism |
2 | 7 | 4 | 11 | 6 | 1 | ||||||||||||||||||
| Health |
4 | 51 | 12 | 89 | 240 | 100 | ||||||||||||||||||
| Indigenous Relations |
26 | 19 | 32 | 16 | 8 | 8 | ||||||||||||||||||
| Infrastructure |
10 | 16 | - | 3 | - | - | ||||||||||||||||||
| Mental Health and Addiction |
1 | - | 10 | 18 | 15 | - | ||||||||||||||||||
| Municipal Affairs |
1,702 | 778 | 768 | 782 | 1,005 | 1,088 | ||||||||||||||||||
| Seniors, Community and Social Services |
70 | 68 | 45 | 81 | 76 | 181 | ||||||||||||||||||
| Technology and Innovation |
- | 150 | 21 | 229 | 70 | 70 | ||||||||||||||||||
| Transportation and Economic Corridors |
472 | 1,070 | 676 | 1,127 | 1,405 | 1,363 | ||||||||||||||||||
| Total Capital Grants |
2,503 | 2,429 | 1,845 | 2,821 | 3,209 | 3,274 | ||||||||||||||||||
| 158 | Tables | Fiscal Plan 2023 – 26 |
Schedule 17: Capital Investment a
(millions of dollars)
| 2021-22 | 2022-23 | 2023-24 | 2024-25 | 2025-26 | ||||||||||||||||||||
| Actual | Budget | Forecast | Estimate | Target | Target | |||||||||||||||||||
| Advanced Education |
583 | 616 | 617 | 492 | 394 | 326 | ||||||||||||||||||
| Affordability and Utilities |
- | 2 | 2 | 1 | 1 | 1 | ||||||||||||||||||
| Agriculture and Irrigation |
4 | 7 | 5 | 11 | 7 | 7 | ||||||||||||||||||
| Children’s Services |
- | 8 | 15 | 10 | 10 | 5 | ||||||||||||||||||
| Culture |
1 | 2 | 1 | 2 | 2 | 2 | ||||||||||||||||||
| Education |
747 | 929 | 743 | 762 | 797 | 626 | ||||||||||||||||||
| Energy |
13 | 15 | 10 | 16 | 15 | 15 | ||||||||||||||||||
| Environment and Protected Areas |
10 | 48 | 29 | 59 | 28 | 11 | ||||||||||||||||||
| Forestry, Parks and Tourism |
60 | 55 | 61 | 85 | 106 | 54 | ||||||||||||||||||
| Health |
917 | 1,245 | 977 | 1,184 | 1,384 | 1,230 | ||||||||||||||||||
| Infrastructure |
211 | 386 | 357 | 420 | 392 | 302 | ||||||||||||||||||
| Jobs, Economy and Northern Development |
1 | 4 | 4 | 2 | 1 | 1 | ||||||||||||||||||
| Justice |
12 | 17 | 19 | 18 | 6 | 5 | ||||||||||||||||||
| Mental Health and Addiction |
4 | - | - | - | - | - | ||||||||||||||||||
| Municipal Affairs |
2 | 1 | 5 | 1 | 1 | 1 | ||||||||||||||||||
| Public Safety and Emergency Services |
6 | 4 | 8 | 6 | 5 | 5 | ||||||||||||||||||
| Seniors, Community and Social Services |
69 | 50 | 69 | 61 | 38 | 44 | ||||||||||||||||||
| Service Alberta and Red Tape Reduction |
11 | 13 | 33 | 46 | 55 | 52 | ||||||||||||||||||
| Technology and Innovation |
65 | 99 | 79 | 132 | 126 | 124 | ||||||||||||||||||
| Transportation and Economic Corridors |
1,384 | 1,586 | 1,546 | 1,846 | 1,370 | 895 | ||||||||||||||||||
| Treasury Board and Finance |
14 | 18 | 17 | 28 | 27 | 27 | ||||||||||||||||||
| Legislative Assembly |
3 | 2 | 3 | 2 | 2 | 2 | ||||||||||||||||||
| Total Capital Investment |
4,119 | 5,105 | 4,601 | 5,184 | 4,767 | 3,733 | ||||||||||||||||||
| a | Capital investment is not included in expense. Rather, the assets are added to government capital assets and depreciated over time through amortization expense. |
Schedule 18: Capital Plan Funding Sources
(millions of dollars)
| 2021-22 | 2022-23 | 2023-24 | 2024-25 | 2025-26 | ||||||||||||||||||||
| Actual | Budget | Forecast | Estimate | Target | Target | |||||||||||||||||||
| Capital Plan, less |
6,622 | 7,534 | 6,446 | 8,005 | 7,976 | 7,008 | ||||||||||||||||||
| 10% cash flow adjustment (rounded) |
- | (750 | ) | (650 | ) | (800 | ) | (800 | ) | (700 | ) | |||||||||||||
| Capital Plan funding requirements |
6,622 | 6,784 | 5,796 | 7,205 | 7,176 | 6,308 | ||||||||||||||||||
| Source of funding: |
||||||||||||||||||||||||
| Cash received (primarily federal govt.) / donations / disposals |
1,065 | 1,455 | 921 | 1,031 | 1,170 | 1,048 | ||||||||||||||||||
| Retained income of funds and agencies (primarily ASHC) |
33 | 35 | 110 | 35 | 74 | 102 | ||||||||||||||||||
| SUCH sector self-financed |
627 | 808 | 812 | 625 | 539 | 517 | ||||||||||||||||||
| TIER Fund |
46 | 66 | 66 | 63 | 58 | 129 | ||||||||||||||||||
| Alternative financing (P3s – public-private partnerships) |
43 | 81 | 56 | 64 | 1 | - | ||||||||||||||||||
| GRF cash / direct borrowing |
4,812 | 4,339 | 3,831 | 5,387 | 5,334 | 4,512 | ||||||||||||||||||
| Total Capital Plan Funding Sources |
6,622 | 6,784 | 5,796 | 7,205 | 7,177 | 6,308 | ||||||||||||||||||
| Tables | Fiscal Plan 2023 – 26 | 159 |
Schedule 19: Borrowing Requirements a
(millions of dollars)
| 2021-22 | 2022-23 | 2023-24 | 2024-25 | 2025-26 | ||||||||||||||||||||
| Actual | Budget | Forecast | Estimate | Target | Target | |||||||||||||||||||
| Taxpayer-supported debt |
8,667 | 2,249 | - | 5,464 | 5,776 | 14,443 | ||||||||||||||||||
| Self-supported debt |
319 | 226 | 2,251 | 469 | 250 | 250 | ||||||||||||||||||
| Government business enterprises |
- | 1,003 | 1,003 | 733 | 39 | 350 | ||||||||||||||||||
| Total Borrowing Requirements |
8,986 | 3,478 | 3,254 | 6,666 | 6,065 | 15,043 | ||||||||||||||||||
| a | Includes re-financing of debt maturities. |
Schedule 20: Borrowing Sources
(millions of dollars)
| 2021-22 | 2022-23 | 2023-24 | 2024-25 | 2025-26 | ||||||||||||||||||||
| Actual | Budget | Forecast | Estimate | Target | Target | |||||||||||||||||||
| Money market (net change) |
4,059 | 782 | 782 | - | - | 4,000 | ||||||||||||||||||
| Public-private partnerships (P3s) |
43 | 81 | 56 | 64 | 1 | - | ||||||||||||||||||
| Term debt |
4,884 | 2,615 | 2,416 | 6,602 | 6,064 | 11,043 | ||||||||||||||||||
| Total Borrowing Sources |
8,986 | 3,478 | 3,254 | 6,666 | 6,065 | 15,043 | ||||||||||||||||||
Schedule 21: Allocation of 2023-24 Net Gaming / Lottery Revenue
(thousands of dollars)
| Net gaming / lottery revenue |
1,514,605 | |||||||||
| Agriculture and Irrigation |
Indigenous Relations | |||||||||
| Primary Agriculture |
11,896 | First Nations and Métis Relations |
147,250 | |||||||
| Rural programming and Agricultural Societies |
13,962 | First Nations Development Fund |
200 | |||||||
| Culture |
Jobs, Economy and Northern Development | |||||||||
| Assistance - Alberta Foundation for Arts |
25,585 | Skills and Training Support |
400 | |||||||
| Assistance - Provincial Heritage Organizations |
1,705 | |||||||||
| Assistance - Sport, Phys. Activity and Recreat. |
22,605 | Seniors, Community and Social Services | ||||||||
| Community Facility Enhancement Program |
50,000 | Family and Community Support Services |
52,000 | |||||||
| Community Initiatives Program |
20,025 | Family and Community Safety |
6,500 | |||||||
| Heritage Preservation Partnership |
1,450 | Fetal Alcohol Spectrum Disorder Initiatives |
12,000 | |||||||
| Other Initiatives |
1,000 | |||||||||
| Trade, Immigration and Multiculturalism | ||||||||||
| Education |
Settlement and Integration |
4,574 | ||||||||
| Operations and Maintenance |
150,000 | |||||||||
| Transportation |
150,000 | Transportation | ||||||||
| Provincial Highway Maintenance |
40,000 | |||||||||
| Environment and Protected Areas |
||||||||||
| Resource Management |
500 | Treasury Board and Finance | ||||||||
| Airport Entertainment Centres |
1,000 | |||||||||
| Health |
Gaming Research |
1,600 | ||||||||
| Continuing Care |
756,603 | Horse Racing and Breeding Renewal Program |
43,750 | |||||||
| Total Allocation | 1,514,605 | |||||||||
The Lottery Fund was dissolved with Budget 2019, reducing organizational complexity, clarifying accountability and decision-making, and enhancing cash management with outcomes of reduced borrowing requirements and debt servicing costs. This did not impact program spending incorporated in ministry budgets. Under the provincial gaming model, net income from VLTs, slot machines and lottery tickets are deposited into the General Revenue Fund. While these funds are not directed to the programs listed above, the list illustrates how net gaming revenue was notionally allocated under the former Lottery Fund. The charitable gaming model was not impacted by the dissolution of the Lottery Fund and charitable organizations continue to deliver their services with proceeds from paper bingo, casino table games and pull tickets.
| 160 | Tables | Fiscal Plan 2023 – 26 |
Schedule 22: Full-Time Equivalents a
| 2022-23 | 2023-24 | |||||||||||
| Budget | Estimate | Change | ||||||||||
| Departments |
||||||||||||
| Advanced Education |
281 | 291 | 10 | |||||||||
| Affordability and Utilities |
75 | 86 | 11 | |||||||||
| Agriculture and Irrigation |
622 | 625 | 3 | |||||||||
| Children’s Services |
3,015 | 3,026 | 11 | |||||||||
| Culture |
498 | 499 | 1 | |||||||||
| Education |
507 | 566 | 59 | |||||||||
| Energy |
448 | 451 | 3 | |||||||||
| Environment and Protected Areas |
1,221 | 1,219 | (2 | ) | ||||||||
| Executive Council |
150 | 162 | 12 | |||||||||
| Forestry, Parks and Tourism |
1,562 | 1,666 | 104 | |||||||||
| Health |
802 | 850 | 48 | |||||||||
| Indigenous Relations |
175 | 176 | 1 | |||||||||
| Infrastructure |
809 | 816 | 7 | |||||||||
| Jobs, Economy and Northern Development |
882 | 858 | (24 | ) | ||||||||
| Justice |
2,834 | 3,197 | 363 | |||||||||
| Mental Health and Addiction |
71 | 87 | 16 | |||||||||
| Municipal Affairs |
442 | 441 | (1 | ) | ||||||||
| Public Safety and Emergency Services |
3,832 | 4,530 | 698 | |||||||||
| Seniors, Community and Social Services |
3,009 | 3,050 | 41 | |||||||||
| Service Alberta and Red Tape Reduction |
959 | 1,077 | 118 | |||||||||
| Skilled Trades and Professions |
221 | 226 | 5 | |||||||||
| Technology and Innovation |
1,197 | 1,201 | 4 | |||||||||
| Trade, Immigration and Multiculturalism |
208 | 242 | 34 | |||||||||
| Transportation and Economic Corridors |
775 | 742 | (33 | ) | ||||||||
| Treasury Board and Finance – department |
562 | 591 | 29 | |||||||||
| Treasury Board and Finance – Communications and Public Engagement |
270 | 270 | - | |||||||||
| Treasury Board and Finance – Public Service Commission |
554 | 627 | 73 | |||||||||
| Departments |
25,981 | 27,572 | 1,591 | |||||||||
| Agencies / SUCH sector / other operationally-independent entities |
||||||||||||
| Advanced Education – post-secondary institutions |
32,140 | 32,403 | 263 | |||||||||
| Affordability and Utilities – Alberta Utilities Commission |
132 | 132 | - | |||||||||
| Agriculture and Irrigation – Agriculture Financial Services Corporation |
561 | 570 | 9 | |||||||||
| Education – school boards (including Francophone / charter) |
- | |||||||||||
| Certificated Staff |
37,038 | 37,688 | 650 | |||||||||
| Non-certificated Staff |
26,026 | 27,401 | 1,375 | |||||||||
| Energy – Alberta Energy Regulator |
1,048 | 1,048 | - | |||||||||
| Energy – Canadian Energy Centre |
10 | 10 | - | |||||||||
| Environment and Protected Areas – Natural Resources Conservation Board |
34 | 34 | - | |||||||||
| Forestry, Parks and Tourism – Travel Alberta Corporation |
80 | 80 | - | |||||||||
| Health – Alberta Health Services |
84,360 | 87,930 | 3,570 | |||||||||
| Health – Health Quality Council of Alberta |
36 | 45 | 9 | |||||||||
| Indigenous Relations – Alberta Indigenous Opportunities Corporation |
15 | 15 | - | |||||||||
| Municipal Affairs – Safety Codes Council |
60 | 60 | - | |||||||||
| Public Safety and Emergency Services – Victims of Crime and Public Safety Fund |
54 | 54 | - | |||||||||
| Technology and Innovation – Alberta Enterprise Corporation |
11 | 12 | 1 | |||||||||
| Technology and Innovation – Alberta Innovates Corporation |
589 | 596 | 7 | |||||||||
| Trade, Immigration and Multiculturalism – Invest Alberta Corporation |
50 | 50 | - | |||||||||
| Treasury Board and Finance – Alberta Insurance Council |
24 | 24 | - | |||||||||
| Treasury Board and Finance – Alberta Investment Management Corporation |
621 | 697 | 76 | |||||||||
| Treasury Board and Finance – Alberta Pensions Services Corporation |
333 | 346 | 13 | |||||||||
| Treasury Board and Finance – Alberta Securities Commission |
232 | 253 | 21 | |||||||||
| Legislative Assembly |
748 | 764 | 16 | |||||||||
| Agencies / SUCH sector / other operationally-independent entities |
184,202 | 190,212 | 6,010 | |||||||||
| Total Full-Time Equivalents |
210,183 | 217,784 | 7,601 | |||||||||
| a | 2022-23 budget numbers restated on 2023-24 basis, incorporating ministry re-organizations, and for updated information where applicable. |
| Tables | Fiscal Plan 2023 – 26 | 161 |
Schedule 23: Expense by Object a
(millions of dollars)
| Salaries, Benefits |
Supplies and Services |
Grants to Others |
Capital Grants |
Amortization of Capital Assets |
Consumption of Inventory |
Pension Provisions |
Debt Servicing Costs |
Other / assistance |
Total 2023-24 Expense | |||||||||||||||||||||||||||||||
| Legislative Assembly |
88 | 74 | - | - | 2 | - | - | - | 16 | 180 | ||||||||||||||||||||||||||||||
| Advanced Education |
3,734 | 1,294 | 475 | - | 556 | 180 | (25 | ) | - | 101 | 6,314 | |||||||||||||||||||||||||||||
| Affordability and Utilities |
36 | 14 | 62 | 7 | 2 | - | - | - | 19 | 140 | ||||||||||||||||||||||||||||||
| Agriculture and Irrigation |
125 | 558 | 112 | 52 | 36 | - | - | - | 9 | 892 | ||||||||||||||||||||||||||||||
| Children’s Services |
339 | 650 | 1,919 | 9 | 1 | - | - | - | - | 2,917 | ||||||||||||||||||||||||||||||
| Culture |
55 | 22 | 83 | 136 | 8 | 1 | - | - | 1 | 307 | ||||||||||||||||||||||||||||||
| Education |
6,780 | 1,655 | 399 | 3 | 479 | - | - | 33 | - | 9,351 | ||||||||||||||||||||||||||||||
| Energy |
209 | 557 | - | 205 | 13 | - | - | - | - | 984 | ||||||||||||||||||||||||||||||
| Environment and Protected Areas |
153 | 96 | 248 | 52 | 4 | - | - | - | 1 | 554 | ||||||||||||||||||||||||||||||
| Executive Council |
24 | 11 | - | - | - | - | - | - | - | 35 | ||||||||||||||||||||||||||||||
| Forestry, Parks and Tourism |
160 | 179 | 47 | 11 | 38 | 1 | - | - | - | 435 | ||||||||||||||||||||||||||||||
| Health |
9,516 | 7,434 | 7,580 | 89 | 546 | 1,278 | - | - | 3 | 26,446 | ||||||||||||||||||||||||||||||
| Indigenous Relations |
23 | 11 | 179 | 16 | - | - | - | - | - | 230 | ||||||||||||||||||||||||||||||
| Infrastructure |
62 | 394 | - | 3 | 146 | 2 | - | - | 6 | 613 | ||||||||||||||||||||||||||||||
| Jobs, Economy and Northern Development |
109 | 64 | 199 | - | 1 | - | - | - | - | 374 | ||||||||||||||||||||||||||||||
| Justice |
442 | 66 | 141 | - | 4 | - | - | - | 6 | 658 | ||||||||||||||||||||||||||||||
| Mental Health and Addiction |
10 | 9 | 130 | 18 | - | - | - | - | - | 166 | ||||||||||||||||||||||||||||||
| Municipal Affairs |
56 | 26 | 146 | 782 | 4 | - | - | - | - | 1,014 | ||||||||||||||||||||||||||||||
| Public Safety and Emergency Services |
470 | 481 | 236 | - | 29 | 1 | - | - | - | 1,217 | ||||||||||||||||||||||||||||||
| Seniors, Community and Social Services |
299 | 1,175 | 3,591 | 81 | 48 | - | - | - | 272 | 5,466 | ||||||||||||||||||||||||||||||
| Service Alberta and Red Tape Reduction |
96 | 15 | - | - | 18 | 6 | - | - | 1 | 135 | ||||||||||||||||||||||||||||||
| Skilled Trades and Professions |
23 | 8 | 144 | - | - | - | - | - | - | 175 | ||||||||||||||||||||||||||||||
| Technology and Innovation |
218 | 319 | 166 | 229 | 79 | - | - | - | 1 | 1,012 | ||||||||||||||||||||||||||||||
| Trade, Immigration and Multiculturalism |
34 | 17 | 35 | - | - | - | - | - | - | 86 | ||||||||||||||||||||||||||||||
| Transportation and Economic Corridors |
64 | 421 | 10 | 1,127 | 823 | 62 | - | 101 | 12 | 2,620 | ||||||||||||||||||||||||||||||
| Treasury Board and Finance |
512 | 841 | 617 | - | 25 | - | (297 | ) | 2,714 | 48 | 4,460 | |||||||||||||||||||||||||||||
| Contingency (voted in TBF) |
- | - | - | - | - | - | - | - | 1,500 | 1,500 | ||||||||||||||||||||||||||||||
| Total 2023-24 Expense |
23,637 | 16,392 | 16,517 | 2,821 | 2,862 | 1,530 | (322 | ) | 2,848 | 1,997 | 68,282 | |||||||||||||||||||||||||||||
| a | Total expense includes a provision of $1,500 million in contingency for disaster / emergency assistance (voted in Treasury Board and Finance). |
| 162 | Tables | Fiscal Plan 2023 – 26 |
Schedule 24: Expense by Function a
(millions of dollars)
| Health | Education | Social Services |
Agriculture, Management Development |
Protection Property and |
Transportation, and Utilities |
Regional Development |
Environment | Recreation and Culture |
Housing | General pension |
Debt Servicing Costs |
Total 2023-24 Expense |
||||||||||||||||||||||||||||||||||||||||
| Legislative Assembly |
- | - | 16 | - | - | - | - | - | - | - | 164 | - | 180 | |||||||||||||||||||||||||||||||||||||||
| Advanced Education |
- | 6,339 | - | - | - | - | - | - | - | - | (25 | ) | - | 6,314 | ||||||||||||||||||||||||||||||||||||||
| Affordability and Utilities |
- | - | - | - | - | - | - | - | - | - | 140 | - | 140 | |||||||||||||||||||||||||||||||||||||||
| Agriculture and Irrigation |
- | - | - | 843 | - | - | - | 49 | - | - | - | - | 892 | |||||||||||||||||||||||||||||||||||||||
| Children’s Services |
- | - | 2,917 | - | - | - | - | - | - | - | - | - | 2,917 | |||||||||||||||||||||||||||||||||||||||
| Culture |
- | - | - | 20 | - | - | - | - | 287 | - | - | - | 307 | |||||||||||||||||||||||||||||||||||||||
| Education |
- | 9,317 | - | - | - | - | - | - | - | - | - | 33 | 9,351 | |||||||||||||||||||||||||||||||||||||||
| Energy |
- | - | - | 826 | - | - | - | 135 | - | - | 22 | - | 984 | |||||||||||||||||||||||||||||||||||||||
| Environment and Protected Areas |
- | - | - | 119 | - | - | - | 435 | - | - | - | - | 554 | |||||||||||||||||||||||||||||||||||||||
| Executive Council |
- | - | - | 14 | - | - | - | - | - | 21 | - | 35 | ||||||||||||||||||||||||||||||||||||||||
| Forestry, Parks and Tourism |
- | - | - | 211 | 103 | - | - | - | 122 | - | - | - | 435 | |||||||||||||||||||||||||||||||||||||||
| Health |
26,446 | - | - | - | - | - | - | - | - | - | - | - | 26,446 | |||||||||||||||||||||||||||||||||||||||
| Indigenous Relations |
- | - | - | 9 | - | - | 222 | - | - | - | - | - | 230 | |||||||||||||||||||||||||||||||||||||||
| Infrastructure |
5 | 1 | - | - | - | 2 | - | 24 | - | 1 | 580 | - | 613 | |||||||||||||||||||||||||||||||||||||||
| Jobs, Economy and Northern Development |
- | 100 | - | 188 | 86 | - | - | - | - | - | - | - | 374 | |||||||||||||||||||||||||||||||||||||||
| Justice |
- | - | 135 | - | 524 | - | - | - | - | - | - | - | 658 | |||||||||||||||||||||||||||||||||||||||
| Mental Health and Addiction |
166 | - | - | - | - | - | - | - | - | - | - | - | 166 | |||||||||||||||||||||||||||||||||||||||
| Municipal Affairs |
- | - | - | - | 28 | - | 880 | - | 69 | - | 36 | - | 1,014 | |||||||||||||||||||||||||||||||||||||||
| Public Safety and Emergency Services |
- | - | 39 | - | 1,177 | - | - | - | - | - | - | - | 1,217 | |||||||||||||||||||||||||||||||||||||||
| Seniors, Community and Social Services |
- | 92 | 5,109 | - | - | - | - | - | - | 265 | - | - | 5,466 | |||||||||||||||||||||||||||||||||||||||
| Service Alberta and Red Tape Reduction |
- | - | - | - | 80 | - | - | - | - | - | 55 | - | 135 | |||||||||||||||||||||||||||||||||||||||
| Skilled Trades and Professions |
- | 173 | - | 2 | - | - | - | - | - | - | - | - | 175 | |||||||||||||||||||||||||||||||||||||||
| Technology and Innovation |
48 | - | 4 | 283 | 32 | - | - | - | - | - | 645 | - | 1,012 | |||||||||||||||||||||||||||||||||||||||
| Trade, Immigration and Multiculturalism |
- | - | - | 86 | - | - | - | - | - | - | - | - | 86 | |||||||||||||||||||||||||||||||||||||||
| Transportation and Economic Corridors |
- | - | - | - | 44 | 2,463 | - | 12 | - | - | - | 101 | 2,620 | |||||||||||||||||||||||||||||||||||||||
| Treasury Board and Finance |
15 | 11 | 38 | 54 | 58 | - | - | 2 | 2 | - | 1,568 | 2,714 | 4,460 | |||||||||||||||||||||||||||||||||||||||
| Contingency (voted in TBF) |
- | - | - | - | 1,500 | - | - | - | - | - | - | 1,500 | ||||||||||||||||||||||||||||||||||||||||
| Total 2023-24 Expense |
26,681 | 16,033 | 8,259 | 2,654 | 3,632 | 2,465 | 1,101 | 657 | 481 | 266 | 3,205 | 2,848 | 68,282 | |||||||||||||||||||||||||||||||||||||||
| a | Total expense includes a provision of $1,500 million in contingency for disaster / emergency assistance (voted in Treasury Board and Finance). |
| Tables | Fiscal Plan 2023 – 26 | 163 |
Schedule 25: Historical Fiscal Summary, 2008–09 to 2025–26 a
(millions of dollars)
| 1 | 2 | 3 | 4 | 5 | 6 | 7 | 8 | 9 | 10 | 11 | 12 | 13 | 14 | 15 | 16 | 17 | 18 | |||||||||||||||||||||||||||||||||||||||||||||||||||||||||
| 2008-09 | 2009-10 | 2010-11 | 2011-12 | 2012-13 | 2013-14 | 2014-15 | 2015-16 | 2016-17 | 2017-18 | 2018-19 | 2019-20 | 2020-21 | 2021-22 | 2022-23 | 2023-24 | 2024-25 | 2025-26 | |||||||||||||||||||||||||||||||||||||||||||||||||||||||||
| Statement of Operations |
Actual | Forecast | Estimate | Target | Target | |||||||||||||||||||||||||||||||||||||||||||||||||||||||||||||||||||||
| Revenue |
||||||||||||||||||||||||||||||||||||||||||||||||||||||||||||||||||||||||||
| 1 Personal income tax |
8,708 | 7,877 | 7,631 | 8,563 | 9,621 | 10,537 | 11,042 | 11,357 | 10,763 | 10,775 | 11,874 | 11,244 | 11,257 | 13,335 | 13,806 | 14,069 | 15,034 | 16,071 | ||||||||||||||||||||||||||||||||||||||||||||||||||||||||
| 2 Corporate income tax |
4,252 | 4,754 | 3,334 | 3,678 | 4,756 | 5,488 | 5,796 | 4,195 | 3,769 | 3,448 | 4,871 | 4,107 | 3,037 | 4,718 | 6,413 | 5,911 | 6,254 | 6,590 | ||||||||||||||||||||||||||||||||||||||||||||||||||||||||
| 3 Other tax revenue |
3,817 | 3,746 | 3,820 | 4,099 | 4,333 | 4,500 | 4,598 | 5,168 | 5,649 | 6,538 | 6,833 | 5,747 | 5,285 | 5,453 | 4,361 | 5,012 | 5,767 | 5,948 | ||||||||||||||||||||||||||||||||||||||||||||||||||||||||
| 4 Resource revenue |
11,915 | 6,768 | 8,428 | 11,636 | 7,779 | 9,578 | 8,948 | 2,789 | 3,097 | 4,980 | 5,429 | 5,937 | 3,091 | 16,170 | 27,544 | 18,361 | 17,284 | 15,742 | ||||||||||||||||||||||||||||||||||||||||||||||||||||||||
| 5 Investment income |
(1,888 | ) | 3,541 | 2,486 | 2,168 | 2,595 | 3,423 | 3,113 | 2,544 | 3,698 | 3,126 | 2,349 | 2,828 | 2,643 | 3,579 | 1,035 | 3,154 | 3,273 | 3,407 | |||||||||||||||||||||||||||||||||||||||||||||||||||||||
| 6 Premiums, fees and licences |
3,356 | 2,857 | 2,922 | 2,931 | 3,184 | 3,437 | 3,564 | 3,574 | 3,701 | 3,839 | 3,911 | 3,929 | 4,021 | 4,520 | 4,796 | 5,040 | 5,289 | 5,360 | ||||||||||||||||||||||||||||||||||||||||||||||||||||||||
| 7 Other own-source revenue |
4,587 | 4,627 | 4,903 | 5,128 | 5,234 | 5,412 | 6,438 | 5,850 | 3,637 | 6,983 | 6,292 | 3,360 | 3,272 | 8,952 | 6,305 | 6,554 | 6,348 | 6,377 | ||||||||||||||||||||||||||||||||||||||||||||||||||||||||
| 8 Total own-source revenue |
34,747 | 34,170 | 33,524 | 38,203 | 37,502 | 42,375 | 43,499 | 35,477 | 34,314 | 39,689 | 41,559 | 37,152 | 32,605 | 56,727 | 64,260 | 58,101 | 59,249 | 59,495 | ||||||||||||||||||||||||||||||||||||||||||||||||||||||||
| 9 Federal transfers |
4,578 | 5,342 | 5,452 | 5,192 | 5,042 | 7,059 | 5,982 | 7,142 | 7,979 | 7,606 | 8,013 | 9,072 | 10,532 | 11,595 | 11,765 | 12,552 | 12,475 | 13,113 | ||||||||||||||||||||||||||||||||||||||||||||||||||||||||
| 10 Total Revenue |
39,325 | 39,512 | 38,976 | 43,395 | 42,544 | 49,434 | 49,481 | 42,619 | 42,293 | 47,295 | 49,572 | 46,224 | 43,137 | 68,322 | 76,025 | 70,653 | 71,724 | 72,608 | ||||||||||||||||||||||||||||||||||||||||||||||||||||||||
| Expense by Function |
||||||||||||||||||||||||||||||||||||||||||||||||||||||||||||||||||||||||||
| 11 Health |
13,674 | 14,636 | 15,393 | 16,284 | 17,254 | 17,967 | 19,366 | 20,115 | 20,687 | 21,239 | 21,921 | 22,408 | 23,984 | 25,131 | 24,421 | 26,681 | 27,733 | 28,199 | ||||||||||||||||||||||||||||||||||||||||||||||||||||||||
| 12 Basic / advanced education |
10,438 | 11,067 | 11,362 | 11,951 | 12,394 | 12,782 | 13,103 | 13,673 | 14,110 | 14,471 | 14,848 | 14,971 | 14,134 | 14,296 | 15,360 | 16,033 | 16,335 | 16,601 | ||||||||||||||||||||||||||||||||||||||||||||||||||||||||
| 13 Social services |
3,417 | 3,807 | 4,129 | 4,278 | 4,641 | 4,668 | 4,548 | 4,752 | 5,198 | 5,592 | 5,867 | 6,203 | 5,919 | 5,989 | 6,961 | 8,259 | 8,059 | 8,443 | ||||||||||||||||||||||||||||||||||||||||||||||||||||||||
| 14 Other program expense |
10,386 | 9,834 | 9,443 | 9,853 | 10,528 | 12,970 | 11,031 | 10,375 | 12,607 | 13,189 | 11,866 | 12,893 | 13,858 | 16,686 | 16,289 | 14,783 | 15,091 | 15,240 | ||||||||||||||||||||||||||||||||||||||||||||||||||||||||
| 15 Total program expense |
37,915 | 39,344 | 40,327 | 42,366 | 44,817 | 48,387 | 48,048 | 48,915 | 52,602 | 54,491 | 54,502 | 56,475 | 57,895 | 62,102 | 63,031 | 65,756 | 67,218 | 68,483 | ||||||||||||||||||||||||||||||||||||||||||||||||||||||||
| 16 Debt servicing costs |
208 | 214 | 472 | 509 | 530 | 601 | 722 | 776 | 1,018 | 1,420 | 1,971 | 2,235 | 2,486 | 2,641 | 2,715 | 2,848 | 2,805 | 3,103 | ||||||||||||||||||||||||||||||||||||||||||||||||||||||||
| 17 Pension provisions |
2,133 | 430 | 439 | 634 | 296 | 748 | (404 | ) | (630 | ) | (543 | ) | (593 | ) | (190 | ) | (334 | ) | (282 | ) | (365 | ) | (111 | ) | (322 | ) | (336 | ) | (347 | ) | ||||||||||||||||||||||||||||||||||||||||||||
| 18 Total Expense |
40,256 | 39,988 | 41,238 | 43,509 | 45,643 | 49,736 | 48,366 | 49,061 | 53,077 | 55,318 | 56,283 | 58,376 | 60,099 | 64,378 | 65,635 | 68,282 | 69,687 | 71,239 | ||||||||||||||||||||||||||||||||||||||||||||||||||||||||
| 19 Surplus / (Deficit) |
(931 | ) | (476 | ) | (2,262 | ) | (114 | ) | (3,099 | ) | (302 | ) | 1,115 | (6,442 | ) | (10,784 | ) | (8,023 | ) | (6,711 | ) | (12,152 | ) | (16,962 | ) | 3,944 | 10,390 | 2,371 | 2,037 | 1,369 | ||||||||||||||||||||||||||||||||||||||||||||
| Capital Plan b |
7,943 | 8,000 | 7,544 | 6,884 | 6,062 | 5,770 | 6,181 | 6,558 | 6,578 | 9,021 | 6,057 | 5,545 | 6,896 | 6,622 | 6,446 | 8,005 | 7,976 | 7,008 | ||||||||||||||||||||||||||||||||||||||||||||||||||||||||
| Statement of Financial Position (at March 31) |
|
|||||||||||||||||||||||||||||||||||||||||||||||||||||||||||||||||||||||||
| 20 Heritage / endowment funds |
16,900 | 17,077 | 17,500 | 17,936 | 18,176 | 18,562 | 18,860 | 19,262 | 19,836 | 20,306 | 20,700 | 20,670 | 21,090 | 22,176 | 23,792 | 25,065 | 26,581 | 28,299 | ||||||||||||||||||||||||||||||||||||||||||||||||||||||||
| 21 Contingency Account |
16,822 | 14,983 | 11,192 | 7,497 | 3,326 | 4,658 | 6,529 | 3,625 | 2,299 | 1,661 | 6,342 | - | - | - | - | - | - | - | ||||||||||||||||||||||||||||||||||||||||||||||||||||||||
| 22 Other financial assets |
28,868 | 30,338 | 30,799 | 32,972 | 34,734 | 40,039 | 40,688 | 40,990 | 44,152 | 49,010 | 48,701 | 55,711 | 56,996 | 55,950 | 47,741 | 46,786 | 46,201 | 47,207 | ||||||||||||||||||||||||||||||||||||||||||||||||||||||||
| 23 Taxpayer-supported Capital Plan liabilities |
(880 | ) | (2,888 | ) | (3,199 | ) | (3,442 | ) | (4,594 | ) | (8,724 | ) | (11,922 | ) | (19,040 | ) | (23,769 | ) | (29,339 | ) | (33,597 | ) | (37,188 | ) | (42,733 | ) | (47,529 | ) | (45,828 | ) | (45,815 | ) | (45,849 | ) | (47,161 | ) | ||||||||||||||||||||||||||||||||||||||
| 24 Taxpayer-supported general / pre-1992 TPP debt |
(1,160 | ) | (2,279 | ) | (2,015 | ) | (1,676 | ) | (1,426 | ) | (1,333 | ) | (1,053 | ) | (1,024 | ) | (10,751 | ) | (19,227 | ) | (29,060 | ) | (36,954 | ) | (50,303 | ) | (45,595 | ) | (33,909 | ) | (32,477 | ) | (32,487 | ) | (32,497 | ) | ||||||||||||||||||||||||||||||||||||||
| 25 Self-supported debt |
(7,921 | ) | (9,300 | ) | (11,010 | ) | (12,707 | ) | (14,116 | ) | (15,775 | ) | (16,592 | ) | (17,373 | ) | (17,822 | ) | (17,848 | ) | (18,134 | ) | (18,066 | ) | (18,389 | ) | (17,028 | ) | (17,462 | ) | (17,660 | ) | (17,637 | ) | (17,583 | ) | ||||||||||||||||||||||||||||||||||||||
| 26 |
Total Debt c | (9,961 | ) | (14,467 | ) | (16,224 | ) | (17,825 | ) | (20,136 | ) | (25,832 | ) | (29,567 | ) | (37,437 | ) | (52,342 | ) | (66,414 | ) | (80,791 | ) | (92,208 | ) | (111,425 | ) | (110,152 | ) | (97,199 | ) | (95,952 | ) | (95,973 | ) | (97,241 | ) | |||||||||||||||||||||||||||||||||||||
| 27 Pension liabilities |
(10,239 | ) | (9,483 | ) | (9,922 | ) | (10,556 | ) | (10,852 | ) | (11,600 | ) | (11,196 | ) | (10,566 | ) | (10,023 | ) | (9,430 | ) | (9,240 | ) | (8,918 | ) | (8,636 | ) | (8,271 | ) | (8,160 | ) | (7,838 | ) | (7,502 | ) | (7,155 | ) | ||||||||||||||||||||||||||||||||||||||
| 28 Other liabilities |
(10,689 | ) | (11,131 | ) | (11,692 | ) | (11,033 | ) | (10,793 | ) | (12,795 | ) | (12,260 | ) | (11,955 | ) | (12,823 | ) | (14,477 | ) | (13,189 | ) | (15,399 | ) | (17,553 | ) | (16,669 | ) | (13,543 | ) | (14,566 | ) | (14,900 | ) | (15,216 | ) | ||||||||||||||||||||||||||||||||||||||
| 29 Net Financial Assets / (Debt) |
31,701 | 27,317 | 21,653 | 18,991 | 14,455 | 13,032 | 13,054 | 3,919 | (8,901 | ) | (19,344 | ) | (27,477 | ) | (40,144 | ) | (59,528 | ) | (56,966 | ) | (47,369 | ) | (46,505 | ) | (45,593 | ) | (44,106 | ) | ||||||||||||||||||||||||||||||||||||||||||||||
| 30 Capital / non-financial assets |
30,275 | 34,217 | 37,607 | 40,122 | 39,517 | 40,839 | 42,197 | 44,623 | 46,622 | 49,015 | 50,744 | 51,570 | 53,767 | 55,053 | 55,846 | 57,353 | 58,478 | 58,360 | ||||||||||||||||||||||||||||||||||||||||||||||||||||||||
| 31 Net Assets d |
61,976 | 61,534 | 59,260 | 59,113 | 53,972 | 53,871 | 55,251 | 48,542 | 37,721 | 29,671 | 23,267 | 11,426 | (5,761 | ) | (1,913 | ) | 8,477 | 10,848 | 12,885 | 14,254 | ||||||||||||||||||||||||||||||||||||||||||||||||||||||
| Energy prices and exchange rate |
|
|||||||||||||||||||||||||||||||||||||||||||||||||||||||||||||||||||||||||
| 32 Oil price (WTI US$/bbl) |
85.94 | 70.71 | 83.38 | 97.33 | 92.07 | 99.05 | 80.48 | 45.00 | 47.93 | 53.69 | 62.77 | 54.85 | 42.32 | 77.03 | 90.50 | 79.00 | 76.00 | 73.50 | ||||||||||||||||||||||||||||||||||||||||||||||||||||||||
| 33 Heavy oil price (WCS @ Hardisty; Cdn$/bbl) |
74.36 | 66.08 | 66.70 | 80.72 | 68.48 | 80.11 | 70.78 | 40.86 | 44.67 | 50.38 | 51.65 | 53.14 | 41.42 | 79.63 | 92.60 | 78.00 | 75.90 | 72.10 | ||||||||||||||||||||||||||||||||||||||||||||||||||||||||
| 34 Natural gas price (ARP; Cdn$/GJ) |
6.97 | 3.58 | 3.28 | 2.98 | 2.28 | 3.28 | 3.51 | 2.21 | 2.01 | 1.82 | 1.34 | 1.39 | 2.10 | 3.48 | 5.10 | 4.10 | 3.60 | 3.80 | ||||||||||||||||||||||||||||||||||||||||||||||||||||||||
| 35 Exchange rate (US¢/Cdn$) |
89.6 | 91.9 | 98.4 | 100.7 | 99.9 | 95.0 | 88.0 | 76.5 | 76.2 | 78.0 | 76.3 | 75.2 | 75.7 | 79.8 | 75.7 | 76.2 | 78.2 | 79.5 | ||||||||||||||||||||||||||||||||||||||||||||||||||||||||
| a | Numbers are not strictly comparable due to numerous accounting policy changes over time. 2019-20 expense by function have been re-classified following re-organizations and other adjustments. |
| b | Reflects capital grants and other support included in expense, and capital investment in government-owned assets not included in expense. Capital investment adds to capital assets, which are depreciated over time through amortization expense. Numbers for 2008-09 to 2013-14 are estimates as details required to consolidate SUCH capital spending with full accuracy are not readily available. |
| c | Does not include capital lease liabilities, or debt issued on behalf of government business enterprises which is reported on a net equity basis in Other Financial Assets. |
| d | The change in net assets / (debt) year over year does not match the surplus / (deficit) exactly in most years, due to various balance sheet adjustments, most of which are minor. A significant adjustment reducing net assets by $2 billion was made in 2012-13, to recognize the accumulated deferred capital contribution liability when the accounting standard was adopted. |
| 164 | Tables | Fiscal Plan 2023 – 26 |
BUDGET 2023
GOVERNMENT OF ALBERTA | 2023 – 26
Fiscal Plan
Response to the
Auditor General of Alberta
|
|
February 2022 | |
|
|
March 2022 | |
|
|
May 2022 | |
|
|
June 2022 | |
|
|
December 2022 | |
| 165 |
Table of Contents
| February 2022 |
167 | |||
| March 2022 |
168 | |||
| May 2022 |
172 | |||
| June 2022 |
175 | |||
| December 2022 |
177 | |||
| 166 | Response to the Auditor General | Fiscal Plan 2023–26 |
Response to the Auditor General – February 2022
The Auditor General reports on the scope and findings of the work carried out by the Office of the Auditor General. The following is the recommendation in the Auditor General’s report titled – Report on Post-secondary Institutions 2021 - February 2022 and the government’s response to the recommendation.
| AUDITOR GENERAL’S RECOMMENDATION | GOVERNMENT’S RESPONSE | |
| Alberta Advanced Education – Lakeland College | ||
| Improve user access controls | ||
| We recommend that Lakeland College improve its process to promptly remove terminated employees’ access to its network and Enterprise Resource Planning (ERP) system. | Accepted. Lakeland College will centralize the process to manage system access. Upon termination or resignation, employee access will be removed.
This recommendation is expected to be implemented by April 2023.
| |
| Response to the Auditor General | Fiscal Plan 2023–26 | 167 |
Response to the Auditor General – March 2022
The Auditor General reports on the scope and findings of the work carried out by the Office of the Auditor General. The following is the recommendation in the Auditor General’s report titled – Site Rehabilitation Program - March 2022 and the government’s response to the recommendation.
| AUDITOR GENERAL’S RECOMMENDATIONS | GOVERNMENT’S RESPONSE | |
| Alberta Energy | ||
| Formalize risk management process | ||
| We recommend that the Department of Energy formalize its process to identify, analyze and respond to key risks to the SRP. | Accepted. The Department of Energy has been actively managing program risks since inception through various forums and approval processes. By March 2022, the department formalized and implemented its risk management process and risk register to respond to key Site Rehabilitation Program (SRP) risks.
| |
| 168 | Response to the Auditor General | Fiscal Plan 2023–26 |
Response to the Auditor General – March 2022
The Auditor General reports on the scope and findings of the work carried out by the Office of the Auditor General. The following are the recommendations in the Auditor General’s report titled – Pesticide Management - March 2022 and the government’s response to each of them.
| AUDITOR GENERAL’S RECOMMENDATION | GOVERNMENT’S RESPONSE | |
| Alberta Environment and Parks | ||
| Assess risks and employ compliance monitoring to mitigate them | ||
| We recommend that the Department of Environment and Parks regularly assess risks from non-compliance with pesticide laws and employ compliance monitoring processes to mitigate the identified risks. | Accepted. The Department of Environment and Protected Areas (formerly the Department of Environment and Parks) is undertaking transformational regulatory reform and system modernization. | |
| The Regulatory Assurance Framework is the department’s foundational approach to enabling economic development activity while ensuring environmental standards are maintained. | ||
| To support the implementation of the Regulatory Assurance Framework, a Digital Regulatory Assurance System is being built for the management, conservation and preservation of Alberta’s natural resources. | ||
| This recommendation is expected to be implemented by March 2025. | ||
| Ensure public information is current and accurate | ||
| We recommend that the Department of Environment and Parks ensure that public information on pesticide products and conditions for their use is current and accurate. | Accepted. The Department of Environment and Protected Areas (formerly the Department of Environment and Parks) updated the pesticide product listing website in 2022 to ensure alignment with the federal listing. | |
| Develop performance metrics and evaluate the pesticide program | ||
| We recommend that the Department of Environment and Parks establish performance metrics and regularly evaluate the effectiveness of the pesticide program. | Accepted. The Department of Environment and Protected Areas (formerly the Department of Environment and Parks) plans to establish service standards and performance metrics as part of the upcoming work in regulatory transformation. This work will be initiated after business process improvements and the transition to the new digital system. | |
| This recommendation is expected to be implemented by March 2024. | ||
| Response to the Auditor General | Fiscal Plan 2023–26 | 169 |
Response to the Auditor General – March 2022
The Auditor General reports on the scope and findings of the work carried out by the Office of the Auditor General. The following is the recommendation in the Auditor General’s report titled – Grant Management Processes – March 2022 and the government’s response to the recommendation.
| AUDITOR GENERAL’S RECOMMENDATIONS | GOVERNMENT’S RESPONSE | |
| Alberta Health | ||
| Improve grant monitoring processes | ||
| We recommend that the Department of Health improve its grant monitoring processes by:
• improving its grant policy and procedures to ensure monitoring and evaluation requirements are followed and documented
• establishing timelines for completing the grant evaluation checklist
• assessing whether third-party assurance should be required on large-dollar-value or high-risk grants |
Accepted. The Department of Health has implemented the recommendation by updating the Grant Policies and Procedures. Updates include:
• checklist for periodic monitoring of multi-year and complex grants, and enhanced evaluation checklist for all grants at the end of the term;
• evaluation checklist to be completed within 90 days of all grant requirements being met which can be extended, in extenuating circumstances, subject to Assistant Deputy Minister approval; and
• third party assurance on financial reporting for new grant recipients as defined (non-Government of Alberta entities) if approved annual funding exceeds $2 million.
| |
| 170 | Response to the Auditor General | Fiscal Plan 2023–26 |
Response to the Auditor General – March 2022
The Auditor General reports on the scope and findings of the work carried out by the Office of the Auditor General. The following is the recommendation in the Auditor General’s report titled – Assessment of Implementation Reports - March 2022 and the government’s response to the recommendation.
| AUDITOR GENERAL’S RECOMMENDATIONS | GOVERNMENT’S RESPONSE | |
| Alberta Justice and Solicitor General – Office of the Public Guardian and Trustee | ||
| Improve and follow policies and procedures - Repeated | ||
| We recommend that the Office of the Public Guardian and Trustee:
• review and assess whether its policies are appropriate, and procedures are adequate to mitigate the risk that client assets could be mismanaged
• improve its processes for ensuring compliance with policies and procedures |
Accepted. The Office of the Public Guardian and Trustee (OPGT) (transferred to the Department of Seniors, Community and Social Services) will undertake the following corrective actions to ensure that compliance to procedures meets the desired threshold identified by the Public Trustee:
• implement a replacement for the Public Trustee Information System Replacement System, which will focus on management oversight, monitoring, budgeting and inventory management;
• implement the Electronic Document Management and Business Management Software Systems that focuses on document management and controls;
• implement root cause analysis as part of the process of determining control effectiveness within the Enterprise Risk Management Framework (formerly OPGT Controls Framework); and
• develop a formal delegation framework and a competency framework to demonstrate both the commitment to a competent workforce and an environment that holds people accountable.
This recommendation is expected to be implemented by December 2025.
| |
| Response to the Auditor General | Fiscal Plan 2023–26 | 171 |
Response to the Auditor General – May 2022
The Auditor General reports on the scope and findings of the work carried out by the Office of the Auditor General. The following are the recommendations in the Auditor General’s report titled – Family Support for Children with Disabilities - May 2022 and the government’s response to each of them.
| AUDITOR GENERAL’S RECOMMENDATION | GOVERNMENT’S RESPONSE | |
| Alberta Community and Social Services | ||
| Review and update guides to increase consistency | ||
| We recommend the Department of Community and Social Services review and update its guides to promote clarity and increase consistency when staff use judgment to assess needs and complete support planning. | Accepted. The Department of Seniors, Community and Social Services (formerly the Department of Community and Social Services) will:
• update the Family Support for Children with Disabilities policy manual and training modules to reference all the assessment guides;
• update assessment guides to outline what documentation is required for support and where it should be stored; and
• develop a formal process to review and update assessment and rate decision guides, and the program policy manual.
This recommendation is expected to be implemented by September 2023. | |
| Further develop training processes to ensure staff have the necessary skills and knowledge | ||
| We recommend the Department of Community and Social Services further develop the program training and oversight processes to ensure staff obtain the necessary skills and knowledge to complete the assessment of needs and support planning consistently. | Accepted. The Department of Seniors, Community and Social Services (formerly the Department of Community and Social Services) will:
• create a repository of signed delegation instruments;
• implement the Training Accountability Framework;
• confirm that staff complete performance agreements and that the agreements are filed appropriately; and
• implement a training compliance reporting tool accessible to authorized program supervisors and management.
This recommendation is expected to be implemented by June 2023.
| |
| 172 | Response to the Auditor General | Fiscal Plan 2023–26 |
| AUDITOR GENERAL’S RECOMMENDATIONS | GOVERNMENT’S RESPONSE | |
| Alberta Community and Social Services | ||
| Increase consistency through effective oversight of caseworkers | ||
| We recommend the Department of Community and Social Services improve caseworker oversight processes to increase the consistency of the assessment of needs and support planning process. | Accepted. The Department of Seniors, Community and Social Services (formerly the Department of Community and Social Services) will:
• implement a systems-based approach to generate performance results on program standards to enable more efficient and effective caseworker oversight;
• establish a monthly reporting schedule and an accessible SharePoint site to improve caseworker and supervisor access to program performance results; and
• update processes to address performance issues and monitor that actions are developed and implemented.
This recommendation is expected to be implemented by March 2023.
| |
| Response to the Auditor General | Fiscal Plan 2023–26 | 173 |
Response to the Auditor General – May 2022
The Auditor General reports on the scope and findings of the work carried out by the Office of the Auditor General. The following are the recommendations in the Auditor General’s report titled – Indigenous Economic Participation - May 2022 and the government’s response to each of them.
| AUDITOR GENERAL’S RECOMMENDATIONS | GOVERNMENT’S RESPONSE | |
| Alberta Indigenous Relations | ||
| Improve performance reporting process | ||
| We recommend that the Department of Indigenous Relations improve its performance reporting process for its programs to achieve increased Indigenous economic participation by:
• implementing performance measures and targets for all programs
• analyzing program performance, including the reporting it receives from funding recipients, to compare to user needs, planned results and program costs
• reporting its analysis of program results and achievement of the ministry desired outcome, including lessons learned |
Accepted. The Department of Indigenous Relations will:
• implement performance measures and targets;
• analyze program performance, including the reporting it receives from funding recipients, to compare to user needs and planned results; and
• report on program results and achievements of the ministry desired outcome.
This recommendation is expected to be implemented during the 2023-24 fiscal year. | |
| Alberta Labour and Immigration | ||
| Improve performance reporting process | ||
| We recommend that the Department of Labour and Immigration improve its performance reporting process for its First Nations Training to Employment and Aboriginal Training to Employment programs by:
• updating program performance measures and targets
• analyzing program performance, including the reporting it receives from funding recipients, to compare to user needs, planned results and program costs
• reporting its analysis of program results and achievement of the ministry desired outcome, including lessons learned |
Accepted. The Department of Jobs, Economy and Northern Development (formerly a part of the Department of Labour and Immigration) will:
• establish an information technology system to capture, manage and report information related to the delivery and assessment of First Nations Training to Employment (FNTEP) and Aboriginal Training to Employment (ATEP);
• develop a performance management framework for the two programs, to include a logic model, performance measures and targets; and
• conduct an internal evaluation of FNTEP and ATEP, to assess the programs’ results achieved and lessons learned.
This recommendation is expected to be implemented by March 2024. | |
| 174 | Response to the Auditor General | Fiscal Plan 2023–26 |
Response to the Auditor General – June 2022
The Auditor General reports on the scope and findings of the work carried out by the Office of the Auditor General. The following are the recommendations in the Auditor General’s report titled – Procurement Processes - June 2022 and the government’s response to each of them.
| AUDITOR GENERAL’S RECOMMENDATION | GOVERNMENT’S RESPONSE | |
| Alberta Infrastructure | ||
| Improve controls for ensuring compliance with trade agreements | ||
| We recommend the Department of Infrastructure improve its controls to ensure solicitation documents and posting periods comply with trade agreements. | Accepted. The Department of Infrastructure will:
• develop training programs to ensure project teams and consultants understand trade agreement requirements in solicitation documents; and
• investigate further controls to ensure solicitation-posting periods comply with trade agreements.
This recommendation is expected to be implemented during the 2023-24 fiscal year. | |
| Improve controls for receiving submissions | ||
| We recommend the Department of Infrastructure ensure its controls for verifying that it receives electronic submissions on or before the procurement close are operating appropriately. | Accepted. The Department of Infrastructure will:
• enhance existing controls to verify receipt time of electronic submissions are operating appropriately; and
• investigate the possibility of automated auditing systems for the email system.
This recommendation is expected to be implemented during the 2024-25 fiscal year. | |
| Improve access controls for procurement information systems | ||
| We recommend the Department of Infrastructure improve its access controls for its procurement information systems. | Accepted. The Department of Infrastructure established processes to manage access controls for its systems.
The department will investigate options to limit access to the three main procurement systems: Integrated Contracting and Procurement System, email account and procurement network folders.
This recommendation is expected to be implemented during the 2023-24 fiscal year.
| |
| Response to the Auditor General | Fiscal Plan 2023–26 | 175 |
| AUDITOR GENERAL’S RECOMMENDATIONS | GOVERNMENT’S RESPONSE | |
| Alberta Infrastructure | ||
| Improve submission evaluation controls | ||
| We recommend the Department of Infrastructure improve its controls for:
• verifying compliance with request for proposal requirements
• identifying potential conflicts of interest
• ensuring evaluation comments are adequately documented |
Accepted. The Department of Infrastructure established a process in 2020 to review vendor proposal compliance issues, including conflicts of interest. To fully implement this recommendation, the department will:
• explore options to audit proposals to meet requirements;
• explore utilizing declarations of potential conflicts as a requirement in vendor proposal submissions;
• enhance the documentation of comments on vendor evaluation by providing training to evaluation committees; and
• explore implementing a review process for documentation of evaluation committee assessments.
This recommendation is expected to be implemented during the 2023-24 fiscal year.
| |
| 176 | Response to the Auditor General | Fiscal Plan 2023–26 |
Response to the Auditor General – December 2022
The Auditor General reports on the scope and findings of the work carried out by the Office of the Auditor General. The following is the recommendation in the Auditor General’s report titled – Report of the Auditor General – November 2022 and the government’s response to the recommendation.
| AUDITOR GENERAL’S RECOMMENDATIONS | GOVERNMENT’S RESPONSE | |
| Alberta Jobs, Economy and Innovation | ||
| Complete eligibility verification of approved applications | ||
| We recommend the Department of Jobs, Economy and Innovation complete processes to verify the eligibility of approved applications. | Accepted. The Department of Jobs, Economy, and Northern Development (formerly part of the Department of Jobs, Economy and Innovation) will complete eligibility verification on a sample of approved applications that were assessed as lower risk.
This recommendation is expected to be implemented by February 2023.
| |
| Response to the Auditor General | Fiscal Plan 2023–26 | 177 |
BLANK PAGE
| 178 |
Exhibit 99.8

2023-24
Government Estimates
General Revenue Fund
2023-24
Government Estimates
General Revenue Fund
Presented by the Honourable Travis Toews
President of Treasury Board and Minister of Finance
in the Legislative Assembly of Alberta
February 28, 2023
ISBN 978-1-4601-5621-6 (print)
ISBN 978-1-4601-5616-2 (PDF)
ISSN 2562-9166 (print)
ISSN 2562-9174 (online)
| TABLE OF CONTENTS |
||||
| INTRODUCTION AND SUMMARY TABLES |
||||
| Preface |
i | |||
| Schedule of Amounts to be Voted |
1 | |||
| Total Government Estimates by Type of Vote |
5 | |||
| Reconciliation of Supply Vote Amounts to the Consolidated Fiscal Plan |
6 | |||
| Voted Amounts by Department |
10 | |||
| Statutory Amounts by Department |
14 | |||
| Non-Cash Amounts by Department |
15 | |||
| Entity Statutory Amounts by Ministry |
17 | |||
| DETAILS OF 2023-24 GOVERNMENT ESTIMATES BY DEPARTMENT |
||||
| Advanced Education |
21 | |||
| Affordability and Utilities |
29 | |||
| Agriculture and Irrigation |
37 | |||
| Children’s Services |
47 | |||
| Culture |
55 | |||
| Education |
65 | |||
| Energy |
73 | |||
| Environment and Protected Areas |
81 | |||
| Executive Council |
91 | |||
| Forestry, Parks and Tourism |
97 | |||
| Health |
105 | |||
| Indigenous Relations |
121 | |||
| Infrastructure |
129 | |||
| Jobs, Economy and Northern Development |
139 | |||
| Justice |
147 | |||
| Mental Health and Addiction |
157 | |||
| Municipal Affairs |
163 | |||
| Public Safety and Emergency Services |
171 | |||
| Seniors, Community and Social Services |
181 | |||
| Service Alberta and Red Tape Reduction |
193 | |||
| Skilled Trades and Professions |
201 | |||
| Technology and Innovation |
207 | |||
| Trade, Immigration and Multiculturalism |
215 | |||
| Transportation and Economic Corridors |
223 | |||
| Treasury Board and Finance |
235 | |||
PREFACE
The 2023-24 Government Estimates reports the requirements for public monies from the General Revenue Fund to fund the operations of the Government of Alberta for the year commencing April 1, 2023. Together with the 2023-24 Offices of the Legislative Assembly Estimates, the estimates identify the total requirements for public monies from the General Revenue Fund for the year.
The estimates documents focus on the specific legislative requirements set out in section 24 of the Financial Administration Act. Further supplementary information on related financial entities and consolidation adjustments will be found in the 2023-24 Entity Financial Information published in electronic form on the Budget 2023 website, and on the government’s open data portal at https://open.alberta.ca/opendata.
This Preface provides a summary of the information presented in the 2023-24 Government Estimates, an overview of the appropriations process, a summary of major changes in organization structure and financial reporting policy, and definitions of supply votes and selected terms.
The Schedule of Amounts to be Voted illustrates how the supply votes will be presented in the bill for the Appropriation Act, 2023 to be tabled in the Legislative Assembly.
Summaries of the Government Estimates are provided in the following tables:
| ◾ | Total Government Estimates by Type of Vote; |
| ◾ | Reconciliation of Supply Votes to Consolidated Government Estimate; |
| ◾ | Voted Amounts by Department; |
| ◾ | Statutory Amounts by Department; |
| ◾ | Non-cash Amounts by Department; and |
| ◾ | Entity Statutory Amounts by Ministry. |
The Details of the 2023-24 Government Estimates presents information on amounts for each department to be drawn from the General Revenue Fund as required by section 24 of the Financial Administration Act. The details include the following information, as applicable:
| ◾ | Amounts to be Voted; |
| ◾ | Description of Supply Vote Programs; |
| ◾ | Supply Votes by Type and Program; |
| ◾ | Voted Amounts Funded by Credit or Recovery; and |
| ◾ | Amounts Not Required to be Voted. |
In addition to the information specifically required by the Financial Administration Act, the details presented include supplementary financial information showing the relation between each ministry’s supply vote amounts and the consolidated fiscal plan:
| ◾ | Reconciliation of Supply Vote to the Consolidated Government Estimate by program and by type of Fiscal Plan spending category; and |
| ◾ | Statement of Operations, Change in Capital Assets, and Change in Inventory Assets, as appropriate, for the ministry. |
Appropriations from the General Revenue Fund
In Alberta, the supply process is governed by the conventions and legal requirements of the Canadian Constitution, Alberta’s Financial Administration Act, and the Standing Orders of the Legislative Assembly of Alberta.
When the 2023-24 Government Estimates is tabled in the Legislative Assembly, the government makes a motion to refer the report to Legislative Policy Committees for consideration. After the Legislative Policy Committees’ discussions, the Committee of Supply will pass a resolution affirming certain estimate amounts as allocated to each supply vote. Finally, the supply votes as approved by the resolutions of Committee of Supply will be drafted into the Appropriation Act, 2023 Bill and introduced to the Legislative Assembly. Once this bill is enacted by royal assent, the government will have the authority to draw cash from the General Revenue Fund up to the limits of the supply votes set out in the Act.
| i | Preface |
The 2023-24 Government Estimates details the estimated amounts required by each department for the fiscal year (April 1 to March 31). Each department’s estimate amounts are divided into:
| ◾ | those that require authority to draw cash from the General Revenue Fund under a supply vote pursuant to an appropriation act; and |
| ◾ | those that do not require a supply vote either because the amounts already have disbursement authority under a statute other than an appropriation act, or because no cash disbursement is required. |
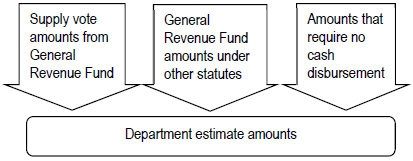
|
Non-cash amounts do not require a supply vote, an appropriation act or any other statutory authority because these amounts do not require any expenditure or payment of public money. Most non-cash amounts are for expenses related to cash disbursed under a supply vote in a previous fiscal year. For example, amortization expense is related to the cash disbursements authorized under a capital investment vote when the capital asset was built or acquired. Other non-cash amounts are for transactions that will not require cash, such as the year-over-year changes in vacation benefit liabilities. |
Budget Presentation and Government Organization Methodology
Budget 2023 documents present the fully consolidated financial reporting entity of the Alberta Government including all entities financially controlled by the Province under Public Sector Accounting Board (PSAB) standards and guidance. These 2023-24 Government Estimates reflect the Province’s budget presentation methodology and the organization of government ministries as of February 28, 2023. This includes the program and organization structure changes implemented in the Designation and Transfer of Responsibility Regulations made in October and November 2022.
As in past budgets, the comparable amounts presented in these estimates may not match the amounts originally presented in the Budget 2022 documents tabled on February 24, 2022. Any such differences are the result of adjustments applied to maintain the comparability of prior year amounts with the 2023-24 estimate amounts. Unlike past budgets, the comparable amounts presented in these estimates do not include a column of the most recently published actual results.
In addition to the October and November reorganization, Budget 2023 itself will make one notable change in program responsibilities. The Ministry of Forestry, Parks and Tourism will be made responsible for hunting and angling programs which were formerly the responsibility of the Ministry of Environment and Protected Areas.
Definitions of Supply Votes and Other Terms
An Estimate is the amount requested by the government to meet each of its planned commitments for the fiscal year commencing April 1, 2023. The Financial Administration Act requires the 2023-24 Government Estimates to report estimates of any amount that will require a cash withdrawal from the General Revenue Fund.
An Appropriation is an authorization to withdraw and expend public money from the General Revenue Fund or another provincial fund. Following parliamentary tradition, the Financial Administration Act requires that all such authorities be provided in legislation passed by the Legislative Assembly. Appropriations may be created by an appropriation act or other statute. Appropriation acts are drafted to contain the specific set of supply votes that have been resolved by the Committee of Supply.
A Supply Vote is a discrete allocation from the 2023-24 estimates that defines the amount of cash funding that may be drawn from the General Revenue Fund for a specified purpose. Following the principle of ministerial accountability, supply votes are divided along departmental lines. For most ministries, three types of supply vote are used in the 2023-24 Government Estimates: Expense, Capital Investment and Financial Transactions. A fourth type of supply vote has been provided for the Ministry of Treasury Board and Finance for a Contingency.
Expense consists of cash disbursements for the purposes of salaries, supplies and services, grants for operating and capital purposes, as well as interest expense and other debt servicing costs for borrowing related to both capital and general government purposes. These amounts include capital payments to related parties that are expected to result in the creation of a tangible capital asset for that related party or for the consolidated government as a whole. Capital payments to related parties are shown under a separate header.
| Preface | ii |
Capital Investment consists of cash disbursements for the purposes of investments in department tangible capital assets valued at $5,000 or more.
Financial Transactions consist of cash disbursements for the purposes of payments for the reduction of a liability (including debt repayment), the acquisition of financial assets (including in particular the making of loans or advances), or the purchase of inventories. Financial liabilities for alternatively financed capital projects are reduced by payments from a Financial Transactions vote.
The Contingency consists of provisional funding authority that is transferrable to any ministry to address requirements for disasters, emergencies, emerging priorities, and other contingencies as directed by the Lieutenant Governor in Council during the fiscal year.
| iii | Preface |
| SCHEDULE OF AMOUNTS TO BE VOTED |
|
VOTE |
|
Estimate
|
| |
| ADVANCED EDUCATION |
||||
| Expense |
$ | 2,416,985,000 | ||
| Capital Investment |
25,000 | |||
| Financial Transactions |
1,060,100,000 | |||
| AFFORDABILITY AND UTILITIES |
||||
| Expense |
$ | 87,128,000 | ||
| Capital Investment |
25,000 | |||
| Financial Transactions |
96,970,000 | |||
| AGRICULTURE AND IRRIGATION |
||||
| Expense |
$ | 679,936,000 | ||
| Capital Investment |
7,177,000 | |||
| CHILDREN’S SERVICES |
||||
| Expense |
$ | 2,319,912,000 | ||
| Capital Investment |
10,000,000 | |||
| CULTURE |
||||
| Expense |
$ | 301,380,000 | ||
| Capital Investment |
2,331,000 | |||
| Financial Transactions |
1,710,000 | |||
| EDUCATION |
||||
| Expense |
$ | 5,479,943,000 | ||
| Capital Investment |
565,000 | |||
| Financial Transactions |
18,920,000 | |||
| ENERGY |
||||
| Expense |
$ | 571,581,000 | ||
| Capital Investment |
1,000,000 | |||
| ENVIRONMENT AND PROTECTED AREAS |
||||
| Expense |
$ | 553,936,000 | ||
| Capital Investment |
59,396,000 | |||
| Financial Transactions |
100,000 | |||
| EXECUTIVE COUNCIL |
||||
| Expense |
$ | 35,245,000 | ||
| Capital Investment |
25,000 | |||
| FORESTRY, PARKS AND TOURISM |
||||
| Expense |
$ | 397,957,000 | ||
| Capital Investment |
85,110,000 | |||
| Financial Transactions |
1,310,000 | |||
| 1 | Government |
| SCHEDULE OF AMOUNTS TO BE VOTED | ||||
|
VOTE |
|
Estimate
|
| |
| HEALTH |
||||
| Expense |
$ | 25,037,760,000 | ||
| Capital Investment |
28,865,000 | |||
| Financial Transactions |
88,876,000 | |||
| INDIGENOUS RELATIONS |
||||
| Expense |
$ | 225,693,000 | ||
| Capital Investment |
25,000 | |||
| INFRASTRUCTURE |
||||
| Expense |
$ | 477,704,000 | ||
| Capital Investment |
1,692,856,000 | |||
| Financial Transactions |
28,114,000 | |||
| JOBS, ECONOMY AND NORTHERN DEVELOPMENT |
||||
| Expense |
$ | 249,693,000 | ||
| Capital Investment |
1,970,000 | |||
| JUSTICE |
||||
| Expense |
$ | 648,842,000 | ||
| Capital Investment |
17,816,000 | |||
| MENTAL HEALTH AND ADDICTION |
||||
| Expense |
$ | 275,005,000 | ||
| Capital Investment |
25,000 | |||
| MUNICIPAL AFFAIRS |
||||
| Expense |
$ | 993,931,000 | ||
| Capital Investment |
600,000 | |||
| PUBLIC SAFETY AND EMERGENCY SERVICES |
||||
| Expense |
$ | 1,107,941,000 | ||
| Capital Investment |
6,275,000 | |||
| Financial Transactions |
4,196,000 | |||
| SENIORS, COMMUNITY AND SOCIAL SERVICES |
||||
| Expense |
$ | 5,066,076,000 | ||
| Capital Investment |
4,072,000 | |||
| Financial Transactions |
19,700,000 | |||
| SERVICE ALBERTA AND RED TAPE REDUCTION |
||||
| Expense |
$ | 143,677,000 | ||
| Capital Investment |
45,520,000 | |||
| Financial Transactions |
5,500,000 | |||
| SKILLED TRADES AND PROFESSIONS |
||||
| Expense |
$ | 218,811,000 | ||
| Capital Investment |
25,000 | |||
| Government | 2 |
| SCHEDULE OF AMOUNTS TO BE VOTED |
|
VOTE |
|
Estimate
|
| |
| TECHNOLOGY AND INNOVATION |
||||
| Expense |
$ | 948,075,000 | ||
| Capital Investment |
112,385,000 | |||
| TRADE, IMMIGRATION AND MULTICULTURALISM |
||||
| Expense |
$ | 85,874,000 | ||
| Capital Investment |
25,000 | |||
| TRANSPORTATION AND ECONOMIC CORRIDORS |
||||
| Expense |
$ | 1,722,148,000 | ||
| Capital Investment |
1,837,114,000 | |||
| Financial Transactions |
134,644,000 | |||
| TREASURY BOARD AND FINANCE |
||||
| Expense |
$ | 240,261,000 | ||
| Capital Investment |
25,000 | |||
| Contingency |
1,500,000,000 | |||
|
|
||||
|
|
||||
| Expense amounts to be voted under |
||||
| Section 2 of the Appropriation Act, 2023 |
$ | 50,285,494,000 | ||
| Capital Investment amounts to be voted under |
||||
| Section 3 of the Appropriation Act, 2023 |
$ | 3,913,252,000 | ||
| Financial Transactions amounts to be voted under |
||||
| Section 4 of the Appropriation Act, 2023 |
$ | 1,460,140,000 | ||
| Contingency amounts to be voted under |
||||
| Section 5 of the Appropriation Act, 2023
|
$ | 1,500,000,000 | ||
| 3 | Government |
AMOUNTS TO BE VOTED
| (thousands of dollars) |
|
Comparable
|
|
|||||||||
| 2022-23 | 2022-23 | 2023-24 | ||||||||||
|
|
Budget
|
|
|
Forecast
|
|
|
Estimate
|
| ||||
| EXPENSE |
45,031,612 | 46,456,072 | 50,285,494 | |||||||||
| CAPITAL INVESTMENT |
3,694,252 | 3,133,019 | 3,913,252 | |||||||||
| FINANCIAL TRANSACTIONS |
1,394,701 | 1,658,146 | 1,460,140 | |||||||||
| CONTINGENCY
|
|
1,750,000
|
|
|
1,750,000
|
|
|
1,500,000
|
| |||
| 5 |
RECONCILIATION OF SUPPLY VOTES TO CONSOLIDATED FISCAL PLAN
The following tables summarize the relationship between departments’ Supply Votes and the effect of the ministry on the Government’s consolidated 2023-24 Estimates.
EXPENSE
| (thousands of dollars)
|
Department | Entities’ | Consolidated | |||||||||||||||||
| Voted | Amounts | Amounts | Consolidation | 2023-24 | ||||||||||||||||
|
|
Supply
|
|
|
Not Voted
|
|
|
Not Voted
|
|
|
Adjustments
|
|
|
Estimate
|
| ||||||
| OPERATING EXPENSE |
||||||||||||||||||||
| Advanced Education |
2,193,849 | 159,451 | 5,290,786 | (2,040,341 | ) | 5,603,745 | ||||||||||||||
| Affordability and Utilities |
80,203 | 19,123 | 31,915 | - | 131,241 | |||||||||||||||
| Agriculture and Irrigation |
626,344 | - | 599,219 | (422,023 | ) | 803,540 | ||||||||||||||
| Children’s Services |
2,310,912 | 610,000 | - | (13,700 | ) | 2,907,212 | ||||||||||||||
| Culture |
165,093 | 1,217 | 27,210 | (31,232 | ) | 162,288 | ||||||||||||||
| Education |
5,349,000 | 437,346 | 10,599,862 | (7,550,473 | ) | 8,835,735 | ||||||||||||||
| Energy |
424,781 | 604 | 366,315 | (25,994 | ) | 765,706 | ||||||||||||||
| Environment and Protected Areas |
506,789 | 7,252 | 495,019 | (512,047 | ) | 497,013 | ||||||||||||||
| Executive Council |
35,245 | - | - | - | 35,245 | |||||||||||||||
| Forestry, Parks and Tourism |
387,127 | - | 72,090 | (74,109 | ) | 385,108 | ||||||||||||||
| Health |
24,829,689 | 2,000 | 16,744,742 | (17,043,121 | ) | 24,533,310 | ||||||||||||||
| Indigenous Relations |
209,262 | - | 8,527 | (4,000 | ) | 213,789 | ||||||||||||||
| Infrastructure |
474,610 | 5,966 | - | (18,278 | ) | 462,298 | ||||||||||||||
| Jobs, Economy and Northern Development |
249,693 | 125,000 | - | (2,000 | ) | 372,693 | ||||||||||||||
| Justice |
648,842 | 6,289 | - | (513 | ) | 654,618 | ||||||||||||||
| Mental Health and Addiction |
257,005 | - | - | (108,551 | ) | 148,454 | ||||||||||||||
| Municipal Affairs |
212,136 | 200 | 15,425 | - | 227,761 | |||||||||||||||
| Public Safety and Emergency Services |
1,107,941 | 44,450 | 39,481 | (5,300 | ) | 1,186,572 | ||||||||||||||
| Seniors, Community and Social Services |
5,005,533 | 267,100 | 199,710 | (140,401 | ) | 5,331,942 | ||||||||||||||
| Service Alberta and Red Tape Reduction |
143,677 | 592 | - | (32,515 | ) | 111,754 | ||||||||||||||
| Skilled Trades and Professions |
218,811 | - | - | (44,037 | ) | 174,774 | ||||||||||||||
| Technology and Innovation |
707,468 | 77,478 | 247,833 | (328,423 | ) | 704,356 | ||||||||||||||
| Trade, Immigration and Multiculturalism |
85,874 | - | 17,337 | (17,337 | ) | 85,874 | ||||||||||||||
| Transportation and Economic Corridors |
494,841 | 12,000 | - | - | 506,841 | |||||||||||||||
| Treasury Board and Finance |
240,261 | 630,755 | 2,577,062 | (1,429,814 | ) | 2,018,264 | ||||||||||||||
| Sub-total |
46,964,986 | 2,406,823 | 37,332,533 | (29,844,209 | ) | 56,860,133 | ||||||||||||||
| CAPITAL GRANTS |
|
|||||||||||||||||||
| Affordability and Utilities |
6,925 | - | - | - | 6,925 | |||||||||||||||
| Agriculture and Irrigation |
52,392 | - | - | - | 52,392 | |||||||||||||||
| Children’s Services |
9,000 | - | - | - | 9,000 | |||||||||||||||
| Culture |
136,287 | - | - | - | 136,287 | |||||||||||||||
| Education |
2,743 | - | - | - | 2,743 | |||||||||||||||
| Energy |
146,800 | 58,350 | - | - | 205,150 | |||||||||||||||
| Environment and Protected Areas |
47,147 | - | 5,000 | - | 52,147 | |||||||||||||||
| Forestry, Parks and Tourism |
10,830 | - | - | - | 10,830 | |||||||||||||||
| Health |
89,452 | - | 4,000 | (4,000 | ) | 89,452 | ||||||||||||||
| Indigenous Relations |
16,431 | - | - | - | 16,431 | |||||||||||||||
| Infrastructure |
3,070 | - | - | - | 3,070 | |||||||||||||||
| Mental Health and Addiction |
18,000 | - | - | - | 18,000 | |||||||||||||||
| Municipal Affairs |
781,795 | - | - | - | 781,795 | |||||||||||||||
| Seniors, Community and Social Services |
- | - | 80,884 | - | 80,884 | |||||||||||||||
| Technology and Innovation |
229,000 | 4,000 | - | (4,000 | ) | 229,000 | ||||||||||||||
| Transportation and Economic Corridors |
1,126,694 | 38,032 | - | (38,032 | ) | 1,126,694 | ||||||||||||||
| Sub-total |
2,676,566 | 100,382 | 89,884 | (46,032 | ) | 2,820,800 | ||||||||||||||
| Government | 6 |
EXPENSE … continued
| (thousands of dollars)
|
Department | Entities’ | Consolidated | |||||||||||||||||
| Voted | Amounts | Amounts | Consolidation | 2023-24 | ||||||||||||||||
|
|
Supply
|
|
|
Not Voted
|
|
|
Not Voted
|
|
|
Adjustments
|
|
|
Estimate
|
| ||||||
| CAPITAL PAYMENTS TO RELATED PARTIES |
||||||||||||||||||||
| Advanced Education |
223,136 | - | - | (223,136 | ) | - | ||||||||||||||
| Agriculture and Irrigation |
1,200 | - | - | (1,200 | ) | - | ||||||||||||||
| Education |
103,651 | - | - | (103,651 | ) | - | ||||||||||||||
| Environment and Protected Areas |
- | - | 5,000 | (5,000 | ) | - | ||||||||||||||
| Health |
118,619 | - | - | (118,619 | ) | - | ||||||||||||||
| Infrastructure |
- | 1,337,207 | - | (1,337,207 | ) | - | ||||||||||||||
| Seniors, Community and Social Services |
60,543 | - | - | (60,543 | ) | - | ||||||||||||||
| Technology and Innovation |
11,607 | - | - | (11,607 | ) | - | ||||||||||||||
| Sub-total |
518,756 | 1,337,207 | 5,000 | (1,860,963 | ) | - | ||||||||||||||
| AMORTIZATION |
||||||||||||||||||||
| Advanced Education |
- | 600 | 555,183 | - | 555,783 | |||||||||||||||
| Affordability and Utilities |
- | - | 1,600 | - | 1,600 | |||||||||||||||
| Agriculture and Irrigation |
- | 32,451 | 3,572 | - | 36,023 | |||||||||||||||
| Children’s Services |
- | 1,072 | - | - | 1,072 | |||||||||||||||
| Culture |
- | 7,540 | 7 | - | 7,547 | |||||||||||||||
| Education |
- | 1,896 | 476,932 | - | 478,828 | |||||||||||||||
| Energy |
- | 500 | 12,000 | - | 12,500 | |||||||||||||||
| Environment and Protected Areas |
- | 4,380 | 30 | - | 4,410 | |||||||||||||||
| Forestry, Parks and Tourism |
- | 37,900 | 66 | - | 37,966 | |||||||||||||||
| Health |
- | 18,250 | 527,717 | - | 545,967 | |||||||||||||||
| Indigenous Relations |
- | 63 | - | - | 63 | |||||||||||||||
| Infrastructure |
- | 146,000 | - | - | 146,000 | |||||||||||||||
| Jobs, Economy and Northern Development |
- | 1,126 | - | - | 1,126 | |||||||||||||||
| Justice |
- | 3,835 | - | - | 3,835 | |||||||||||||||
| Municipal Affairs |
- | 3,223 | 508 | - | 3,731 | |||||||||||||||
| Public Safety and Emergency Services |
- | 29,209 | 5 | - | 29,214 | |||||||||||||||
| Seniors, Community and Social Services |
- | 431 | 47,900 | - | 48,331 | |||||||||||||||
| Service Alberta and Red Tape Reduction |
- | 18,100 | - | - | 18,100 | |||||||||||||||
| Technology and Innovation |
- | 70,089 | 8,900 | - | 78,989 | |||||||||||||||
| Trade, Immigration and Multiculturalism |
- | 25 | 35 | - | 60 | |||||||||||||||
| Transportation and Economic Corridors |
- | 823,461 | - | - | 823,461 | |||||||||||||||
| Treasury Board and Finance |
- | 50 | 25,035 | - | 25,085 | |||||||||||||||
| Sub-total |
- | 1,200,201 | 1,659,490 | - | 2,859,691 | |||||||||||||||
| LOSS ON DISPOSAL OF CAPITAL ASSET |
||||||||||||||||||||
| Seniors, Community and Social Services |
- | - | 5,000 | - | 5,000 | |||||||||||||||
| INVENTORY CONSUMPTION |
||||||||||||||||||||
| Advanced Education |
- | - | 179,701 | - | 179,701 | |||||||||||||||
| Culture |
- | 990 | - | - | 990 | |||||||||||||||
| Forestry, Parks and Tourism |
- | 1,310 | - | - | 1,310 | |||||||||||||||
| Health |
- | 85,870 | 1,191,900 | - | 1,277,770 | |||||||||||||||
| Infrastructure |
- | 1,500 | - | - | 1,500 | |||||||||||||||
| Public Safety and Emergency Services |
- | 1,000 | - | - | 1,000 | |||||||||||||||
| Service Alberta and Red Tape Reduction |
- | 5,500 | - | - | 5,500 | |||||||||||||||
| Transportation and Economic Corridors |
- | 62,130 | - | - | 62,130 | |||||||||||||||
| Sub-total |
- | 158,300 | 1,371,601 | - | 1,529,901 | |||||||||||||||
| 7 | Government |
EXPENSE … continued
| (thousands of dollars)
|
Department | Entities’ | Consolidated | |||||||||||||||||
| Voted | Amounts | Amounts | Consolidation | 2023-24 | ||||||||||||||||
|
|
Supply
|
|
|
Not Voted
|
|
|
Not Voted
|
|
|
Adjustments
|
|
|
Estimate
|
| ||||||
| DEBT SERVICING COSTS - GENERAL |
|
|||||||||||||||||||
| Advanced Education |
- | - | 34,247 | (34,247 | ) | - | ||||||||||||||
| Agriculture and Irrigation |
- | - | 83,472 | (83,472 | ) | - | ||||||||||||||
| Education |
- | - | 15,172 | (6,580 | ) | 8,592 | ||||||||||||||
| Health |
- | - | 15,000 | (15,000 | ) | - | ||||||||||||||
| Treasury Board and Finance |
- | 1,695,450 | 310 | (94,760 | ) | 1,601,000 | ||||||||||||||
| Sub-total |
- | 1,695,450 | 148,201 | (234,059 | ) | 1,609,592 | ||||||||||||||
| DEBT SERVICING COSTS - CAPITAL PLAN |
|
|||||||||||||||||||
| Education |
24,549 | - | - | - | 24,549 | |||||||||||||||
| Infrastructure |
24 | - | - | - | 24 | |||||||||||||||
| Transportation and Economic Corridors |
100,613 | - | - | - | 100,613 | |||||||||||||||
| Treasury Board and Finance |
- | 1,113,000 | - | - | 1,113,000 | |||||||||||||||
| Sub-total |
125,186 | 1,113,000 | - | - | 1,238,186 | |||||||||||||||
| PENSION PROVISIONS |
||||||||||||||||||||
| Advanced Education |
- | - | (25,310 | ) | - | (25,310 | ) | |||||||||||||
| Treasury Board and Finance |
- | (297,000 | ) | - | - | (297,000 | ) | |||||||||||||
| Sub-total |
- | (297,000 | ) | (25,310 | ) | - | (322,310 | ) | ||||||||||||
| CONTINGENCY |
||||||||||||||||||||
| Treasury Board and Finance |
1,500,000 | - | - | - | 1,500,000 | |||||||||||||||
| Total |
51,785,494 | 7,714,363 | 40,586,399 | (31,985,263 | ) | 68,100,993 | ||||||||||||||
| Government | 8 |
CAPITAL INVESTMENT
| (thousands of dollars)
|
Department | Entities’ | Consolidated | |||||||||||||||||
| Voted | Amounts | Amounts | Consolidation | 2023-24 | ||||||||||||||||
|
|
Supply
|
|
|
Not Voted
|
|
|
Not Voted
|
|
|
Adjustments
|
|
|
Estimate
|
| ||||||
| CAPITAL INVESTMENT |
||||||||||||||||||||
| Advanced Education |
25 | - | 491,673 | - | 491,698 | |||||||||||||||
| Affordability and Utilities |
25 | - | 750 | - | 775 | |||||||||||||||
| Agriculture and Irrigation |
7,177 | 38,032 | 4,249 | (38,032 | ) | 11,426 | ||||||||||||||
| Children’s Services |
10,000 | - | - | - | 10,000 | |||||||||||||||
| Culture |
2,331 | - | - | - | 2,331 | |||||||||||||||
| Education |
565 | - | 761,206 | - | 761,771 | |||||||||||||||
| Energy |
1,000 | - | 14,500 | - | 15,500 | |||||||||||||||
| Environment and Protected Areas |
59,396 | - | 17 | - | 59,413 | |||||||||||||||
| Executive Council |
25 | - | - | - | 25 | |||||||||||||||
| Forestry, Parks and Tourism |
85,110 | - | - | - | 85,110 | |||||||||||||||
| Health |
28,865 | - | 1,154,879 | - | 1,183,744 | |||||||||||||||
| Indigenous Relations |
25 | - | - | - | 25 | |||||||||||||||
| Infrastructure |
419,904 | - | - | - | 419,904 | |||||||||||||||
| Jobs, Economy and Northern Development |
1,970 | - | - | - | 1,970 | |||||||||||||||
| Justice |
17,816 | 4,000 | - | (4,000 | ) | 17,816 | ||||||||||||||
| Mental Health and Addiction |
25 | - | - | - | 25 | |||||||||||||||
| Municipal Affairs |
600 | - | 405 | - | 1,005 | |||||||||||||||
| Public Safety and Emergency Services |
6,275 | - | 25 | - | 6,300 | |||||||||||||||
| Seniors, Community and Social Services |
4,072 | - | 56,898 | - | 60,970 | |||||||||||||||
| Service Alberta and Red Tape Reduction |
45,520 | - | - | - | 45,520 | |||||||||||||||
| Skilled Trades and Professions |
25 | - | - | - | 25 | |||||||||||||||
| Technology and Innovation |
112,385 | - | 20,107 | - | 132,492 | |||||||||||||||
| Trade, Immigration and Multiculturalism |
25 | - | - | - | 25 | |||||||||||||||
| Transportation and Economic Corridors |
1,837,114 | 9,162 | - | - | 1,846,276 | |||||||||||||||
| Treasury Board and Finance |
25 | - | 27,685 | - | 27,710 | |||||||||||||||
| Sub-total |
2,640,300 | 51,194 | 2,532,394 | (42,032 | ) | 5,181,856 | ||||||||||||||
| CAPITAL FOR RELATED PARTIES |
||||||||||||||||||||
| Infrastructure |
1,272,952 | 64,255 | - | (1,337,207 | ) | - | ||||||||||||||
| Total |
3,913,252 | 115,449 | 2,532,394 | (1,379,239 | ) | 5,181,856 | ||||||||||||||
| INVENTORY ACQUISITION |
||||||||||||||||||||
| Advanced Education |
- | - | 181,000 | - | 181,000 | |||||||||||||||
| Culture |
990 | - | - | - | 990 | |||||||||||||||
| Forestry, Parks and Tourism |
1,310 | - | - | - | 1,310 | |||||||||||||||
| Health |
88,876 | - | 1,314,861 | - | 1,403,737 | |||||||||||||||
| Infrastructure |
1,500 | - | - | - | 1,500 | |||||||||||||||
| Service Alberta and Red Tape Reduction |
5,500 | - | - | - | 5,500 | |||||||||||||||
| Transportation and Economic Corridors |
62,130 | - | - | - | 62,130 | |||||||||||||||
| Total |
160,306 | - | 1,495,861 | - | 1,656,167 | |||||||||||||||
| 9 | Government |
| EXPENSE VOTES BY DEPARTMENT |
| (thousands of dollars) |
|
Comparable
|
|
|||||||||||||
|
2022-23 |
2022-23 |
2023-24 |
||||||||||||||
|
|
Budget
|
|
|
Forecast
|
|
|
Estimate
|
| ||||||||
| OPERATING EXPENSE |
||||||||||||||||
| Advanced Education |
2,141,164 | 2,150,558 | 2,193,849 | |||||||||||||
| Affordability and Utilities |
27,360 | 382,817 | 80,203 | |||||||||||||
| Agriculture and Irrigation |
427,277 | 443,551 | 626,344 | |||||||||||||
| Children’s Services |
2,065,316 | 2,063,516 | 2,310,912 | |||||||||||||
| Culture |
150,528 | 165,248 | 165,093 | |||||||||||||
| Education |
4,888,151 | 4,971,645 | 5,349,000 | |||||||||||||
| Energy |
535,338 | 1,095,357 | 424,781 | |||||||||||||
| Environment and Protected Areas |
400,486 | 466,134 | 506,789 | |||||||||||||
| Executive Council |
24,846 | 30,784 | 35,245 | |||||||||||||
| Forestry, Parks and Tourism |
364,580 | 362,334 | 387,127 | |||||||||||||
| Health |
22,118,357 | 22,710,559 | 24,829,689 | |||||||||||||
| Indigenous Relations |
162,675 | 172,199 | 209,262 | |||||||||||||
| Infrastructure |
425,233 | 452,281 | 474,610 | |||||||||||||
| Jobs, Economy and Northern Development |
349,333 | 337,408 | 249,693 | |||||||||||||
| Justice |
495,994 | 587,931 | 648,842 | |||||||||||||
| Mental Health and Addiction |
179,015 | 183,533 | 257,005 | |||||||||||||
| Municipal Affairs |
170,743 | 170,974 | 212,136 | |||||||||||||
| Public Safety and Emergency Services |
922,063 | 972,115 | 1,107,941 | |||||||||||||
| Seniors, Community and Social Services |
4,590,839 | 4,638,210 | 5,005,533 | |||||||||||||
| Service Alberta and Red Tape Reduction |
115,921 | 122,990 | 143,677 | |||||||||||||
| Skilled Trades and Professions |
201,168 | 197,194 | 218,811 | |||||||||||||
| Technology and Innovation |
695,267 | 755,009 | 707,468 | |||||||||||||
| Trade, Immigration and Multiculturalism |
77,455 | 72,497 | 85,874 | |||||||||||||
| Transportation and Economic Corridors |
440,724 | 439,784 | 494,841 | |||||||||||||
| Treasury Board and Finance |
216,664 | 218,819 | 240,261 | |||||||||||||
| Sub-total | 42,186,497 | 44,163,447 | 46,964,986 | |||||||||||||
| CAPITAL GRANTS |
||||||||||||||||
| Affordability and Utilities |
6,400 | 5,875 | 6,925 | |||||||||||||
| Agriculture and Irrigation |
43,720 | 43,720 | 52,392 | |||||||||||||
| Children’s Services |
1,000 | 3,000 | 9,000 | |||||||||||||
| Culture |
109,595 | 97,733 | 136,287 | |||||||||||||
| Education |
7,682 | 9,864 | 2,743 | |||||||||||||
| Energy |
- | 10,800 | 146,800 | |||||||||||||
| Environment and Protected Areas |
33,341 | 38,161 | 47,147 | |||||||||||||
| Forestry, Parks and Tourism |
7,179 | 3,850 | 10,830 | |||||||||||||
| Health |
51,435 | 12,472 | 89,452 | |||||||||||||
| Indigenous Relations |
18,719 | 31,883 | 16,431 | |||||||||||||
| Infrastructure |
16,159 | 341 | 3,070 | |||||||||||||
| Mental Health and Addiction |
- | 10,000 | 18,000 | |||||||||||||
| Municipal Affairs |
777,973 | 767,914 | 781,795 | |||||||||||||
| Technology and Innovation |
150,000 | 21,000 | 229,000 | |||||||||||||
| Transportation and Economic Corridors |
1,069,814 | 675,503 | 1,126,694 | |||||||||||||
| Sub-total | 2,293,017 | 1,732,116 | 2,676,566 | |||||||||||||
| Government | 10 |
| EXPENSE VOTES BY DEPARTMENT … continued |
|
|||||||||||||||
| (thousands of dollars) |
|
Comparable
|
|
|||||||||||||
|
2022-23 |
2022-23 |
2023-24 |
||||||||||||||
|
|
Budget
|
|
|
Forecast
|
|
|
Estimate
|
| ||||||||
| CAPITAL PAYMENTS TO RELATED PARTIES |
||||||||||||||||
| Advanced Education |
209,837 | 210,393 | 223,136 | |||||||||||||
| Agriculture and Irrigation |
- | - | 1,200 | |||||||||||||
| Education |
86,287 | 87,548 | 103,651 | |||||||||||||
| Health |
73,168 | 73,150 | 118,619 | |||||||||||||
| Mental Health and Addiction |
- | 6,612 | - | |||||||||||||
| Seniors, Community and Social Services |
45,955 | 45,955 | 60,543 | |||||||||||||
| Technology and Innovation |
8,003 | 8,003 | 11,607 | |||||||||||||
| Sub-total | 423,250 | 431,661 | 518,756 | |||||||||||||
| DEBT SERVICING |
||||||||||||||||
| Education |
25,351 | 25,351 | 24,549 | |||||||||||||
| Infrastructure |
50 | 50 | 24 | |||||||||||||
| Transportation and Economic Corridors |
103,447 | 103,447 | 100,613 | |||||||||||||
| Sub-total | 128,848 | 128,848 | 125,186 | |||||||||||||
| Total |
45,031,612 | 46,456,072 | 50,285,494 | |||||||||||||
| CAPITAL INVESTMENT VOTES BY DEPARTMENT |
|
|||||||||||||||
| DEPARTMENT CAPITAL ACQUISITIONS |
||||||||||||||||
| Advanced Education |
25 | 25 | 25 | |||||||||||||
| Affordability and Utilities |
- | - | 25 | |||||||||||||
| Agriculture and Irrigation |
2,672 | 3,903 | 7,177 | |||||||||||||
| Children’s Services |
7,500 | 15,021 | 10,000 | |||||||||||||
| Culture |
2,331 | 961 | 2,331 | |||||||||||||
| Education |
565 | 565 | 565 | |||||||||||||
| Energy |
500 | 1,000 | 1,000 | |||||||||||||
| Environment and Protected Areas |
47,776 | 24,257 | 59,396 | |||||||||||||
| Executive Council |
25 | 25 | 25 | |||||||||||||
| Forestry, Parks and Tourism |
54,539 | 61,474 | 85,110 | |||||||||||||
| Health |
25,276 | 27,525 | 28,865 | |||||||||||||
| Indigenous Relations |
25 | 25 | 25 | |||||||||||||
| Infrastructure |
385,515 | 357,356 | 419,904 | |||||||||||||
| Jobs, Economy and Northern Development |
3,650 | 3,505 | 1,970 | |||||||||||||
| Justice |
17,474 | 19,474 | 17,816 | |||||||||||||
| Mental Health and Addiction |
- | - | 25 | |||||||||||||
| Municipal Affairs |
709 | 5,209 | 600 | |||||||||||||
| Public Safety and Emergency Services |
3,533 | 7,627 | 6,275 | |||||||||||||
| Seniors, Community and Social Services |
5,072 | 6,246 | 4,072 | |||||||||||||
| Service Alberta and Red Tape Reduction |
12,765 | 32,876 | 45,520 | |||||||||||||
| Skilled Trades and Professions |
- | - | 25 | |||||||||||||
| Technology and Innovation |
82,569 | 62,653 | 112,385 | |||||||||||||
| Trade, Immigration and Multiculturalism |
25 | 25 | 25 | |||||||||||||
| Transportation and Economic Corridors |
1,547,799 | 1,485,178 | 1,837,114 | |||||||||||||
| Treasury Board and Finance |
25 | 99 | 25 | |||||||||||||
| Sub-total | 2,200,370 | 2,115,029 | 2,640,300 | |||||||||||||
| 11 | Government |
| CAPITAL INVESTMENT VOTES BY DEPARTMENT … continued |
|
|||||||||||||||
| (thousands of dollars) |
|
Comparable
|
|
|||||||||||||
|
2022-23 |
2022-23 |
2023-24 |
||||||||||||||
|
|
Budget
|
|
|
Forecast
|
|
|
Estimate
|
| ||||||||
| CAPITAL FOR RELATED PARTIES |
||||||||||||||||
| Infrastructure |
1,493,882 | 1,017,990 | 1,272,952 | |||||||||||||
| Total |
3,694,252 | 3,133,019 | 3,913,252 | |||||||||||||
| FINANCIAL TRANSACTIONS VOTES BY DEPARTMENT |
|
|||||||||||||||
| LOANS AND ADVANCES |
||||||||||||||||
| Advanced Education |
980,100 | 980,100 | 1,060,100 | |||||||||||||
| Affordability and Utilities |
- | 254,236 | - | |||||||||||||
| Seniors, Community and Social Services |
19,700 | 19,700 | 19,700 | |||||||||||||
| Sub-total | 999,800 | 1,254,036 | 1,079,800 | |||||||||||||
| INVENTORY ACQUISITION |
||||||||||||||||
| Culture |
990 | 990 | 990 | |||||||||||||
| Forestry, Parks and Tourism |
1,310 | 1,310 | 1,310 | |||||||||||||
| Health |
84,976 | 80,121 | 88,876 | |||||||||||||
| Infrastructure |
1,500 | 1,500 | 1,500 | |||||||||||||
| Public Safety and Emergency Services |
- | 1,000 | - | |||||||||||||
| Service Alberta and Red Tape Reduction |
5,500 | 5,351 | 5,500 | |||||||||||||
| Transportation and Economic Corridors |
57,000 | 57,000 | 62,130 | |||||||||||||
| Sub-total | 151,276 | 147,272 | 160,306 | |||||||||||||
| LAND DEVELOPMENT LIABILITY RETIREMENT |
||||||||||||||||
| Infrastructure |
12,835 | 8,035 | 17,609 | |||||||||||||
| CONTAMINATED SITE LIABILITY RETIREMENT |
||||||||||||||||
| Culture |
1,103 | 758 | 720 | |||||||||||||
| Environment and Protected Areas |
4,019 | 4,019 | 100 | |||||||||||||
| Infrastructure |
4,670 | 2,744 | 3,002 | |||||||||||||
| Sub-total | 9,792 | 7,521 | 3,822 | |||||||||||||
| 2013 ALBERTA FLOODING LIABILITY RETIREMENT |
||||||||||||||||
| Public Safety and Emergency Services |
4,764 | 4,764 | 4,196 | |||||||||||||
| LEGAL LIABILITY RETIREMENT |
||||||||||||||||
| Affordability and Utilities |
96,970 | 96,970 | 96,970 | |||||||||||||
| Infrastructure |
5,066 | 350 | 4,575 | |||||||||||||
| Sub-total | 102,036 | 97,320 | 101,545 | |||||||||||||
| LEASE LIABILITY RETIREMENT |
||||||||||||||||
| Infrastructure |
500 | 500 | 500 | |||||||||||||
| DEBT REPAYMENT |
||||||||||||||||
| Technology and Innovation |
25,000 | 50,000 | - | |||||||||||||
| Government | 12 |
| FINANCIAL TRANSACTIONS VOTES BY DEPARTMENT … continued |
|
|||||||||||||||
|
2022-23 |
2022-23 |
2023-24 |
||||||||||||||
|
|
Budget
|
|
|
Forecast
|
|
|
Estimate
|
| ||||||||
| DEBT REPAYMENT FOR PUBLIC PRIVATE PARTNERSHIPS |
||||||||||||||||
| Education |
18,117 | 18,117 | 18,920 | |||||||||||||
| Infrastructure |
902 | 902 | 928 | |||||||||||||
| Transportation and Economic Corridors |
69,679 | 69,679 | 72,514 | |||||||||||||
|
|
Sub-total
|
|
|
88,698
|
|
|
88,698
|
|
|
92,362
|
| |||||
| Total |
1,394,701 | 1,658,146 | 1,460,140 | |||||||||||||
| CONTINGENCY VOTES BY DEPARTMENT |
|
|||||||||||||||
| OPERATING EXPENSE |
||||||||||||||||
| Affordability and Utilities |
- | 286,803 | - | |||||||||||||
| Agriculture and Irrigation |
- | 175,224 | - | |||||||||||||
| Forestry, Parks and Tourism |
- | 173,400 | - | |||||||||||||
| Health |
- | 1,062,096 | - | |||||||||||||
| Public Safety and Emergency Services |
- | 17,777 | - | |||||||||||||
| Treasury Board and Finance |
1,750,000 | - | 1,500,000 | |||||||||||||
| Sub-total | 1,750,000 | 1,715,300 | 1,500,000 | |||||||||||||
| CAPITAL PAYMENTS TO RELATED PARTIES |
||||||||||||||||
| Health |
- | 27,200 | - | |||||||||||||
| CAPITAL INVESTMENT |
||||||||||||||||
| Health |
- | 7,500 | - | |||||||||||||
| Total |
1,750,000 | 1,750,000 | 1,500,000 | |||||||||||||
| 13 | Government |
| STATUTORY EXPENSE BY DEPARTMENT |
|
|||||||||||||||
| (thousands of dollars) |
|
Comparable
|
|
|||||||||||||
|
2022-23 |
2022-23 |
2023-24 |
||||||||||||||
|
|
Budget
|
|
|
Forecast
|
|
|
Estimate
|
| ||||||||
| OPERATING EXPENSE |
||||||||||||||||
| Advanced Education |
56,374 | 56,419 | 57,986 | |||||||||||||
| Children’s Services |
335,000 | 598,500 | 608,500 | |||||||||||||
| Culture |
80 | 80 | 80 | |||||||||||||
| Education |
389,900 | 380,501 | 373,091 | |||||||||||||
| Energy |
564 | 564 | 564 | |||||||||||||
| Environment and Protected Areas |
5,000 | 19,219 | 5,000 | |||||||||||||
| Jobs, Economy and Northern Development |
70,000 | 70,000 | 125,000 | |||||||||||||
| Public Safety and Emergency Services |
43,655 | 43,655 | 43,655 | |||||||||||||
| Seniors, Community and Social Services |
- | 267,000 | 267,000 | |||||||||||||
| Service Alberta and Red Tape Reduction |
25 | 25 | 25 | |||||||||||||
| Technology and Innovation |
74,000 | 74,000 | 77,000 | |||||||||||||
| Treasury Board and Finance |
616,118 | 603,986 | 608,755 | |||||||||||||
| Sub-total | 1,590,716 | 2,113,949 | 2,166,656 | |||||||||||||
| CAPITAL GRANTS |
||||||||||||||||
| Energy |
58,350 | 58,350 | 58,350 | |||||||||||||
| DEBT SERVICING |
||||||||||||||||
| Treasury Board and Finance |
|
2,622,950
|
|
|
2,675,950
|
|
|
2,808,450
|
| |||||||
| Total |
4,272,016 | 4,848,249 | 5,033,456 | |||||||||||||
| STATUTORY FINANCIAL TRANSACTIONS BY DEPARTMENT |
|
|||||||||||||||
| LOANS AND ADVANCES |
||||||||||||||||
| Treasury Board and Finance |
7,439,159 | 20,618,675 | 20,763,175 | |||||||||||||
| DEBT REPAYMENT |
||||||||||||||||
| Treasury Board and Finance |
|
4,155,174
|
|
|
19,031,802
|
|
|
19,074,302
|
| |||||||
| Total |
11,594,333 | 39,650,477 | 39,837,477 | |||||||||||||
| Government | 14 |
|
NON-CASH EXPENSE BY DEPARTMENT |
|
|||||||||||||||
| (thousands of dollars) |
|
Comparable
|
|
|||||||||||||
|
2022-23 |
2022-23 |
2023-24 |
||||||||||||||
|
|
Budget
|
|
|
Forecast
|
|
|
Estimate
|
| ||||||||
| OPERATING EXPENSE |
||||||||||||||||
| Affordability and Utilities |
- | 12,446 | - | |||||||||||||
| Technology and Innovation |
54,000 | 54,000 | 4,000 | |||||||||||||
| Transportation and Economic Corridors |
15,032 | 15,032 | 38,032 | |||||||||||||
| Sub-total | 69,032 | 81,478 | 42,032 | |||||||||||||
| CAPITAL PAYMENTS TO RELATED PARTIES |
||||||||||||||||
| Infrastructure |
1,574,603 | 1,073,559 | 1,337,207 | |||||||||||||
| AMORTIZATION |
||||||||||||||||
| Advanced Education |
600 | 600 | 600 | |||||||||||||
| Agriculture and Irrigation |
44,825 | 30,873 | 32,451 | |||||||||||||
| Children’s Services |
72 | 72 | 1,072 | |||||||||||||
| Culture |
7,720 | 7,720 | 7,540 | |||||||||||||
| Education |
1,970 | 2,126 | 1,896 | |||||||||||||
| Energy |
500 | 500 | 500 | |||||||||||||
| Environment and Protected Areas |
14,611 | 4,512 | 4,380 | |||||||||||||
| Forestry, Parks and Tourism |
56,092 | 36,943 | 37,900 | |||||||||||||
| Health |
18,250 | 18,250 | 18,250 | |||||||||||||
| Indigenous Relations |
63 | 63 | 63 | |||||||||||||
| Infrastructure |
151,300 | 136,300 | 146,000 | |||||||||||||
| Jobs, Economy and Northern Development |
800 | 1,126 | 1,126 | |||||||||||||
| Justice |
3,832 | 3,832 | 3,835 | |||||||||||||
| Municipal Affairs |
3,349 | 3,349 | 3,223 | |||||||||||||
| Public Safety and Emergency Services |
29,209 | 29,209 | 29,209 | |||||||||||||
| Seniors, Community and Social Services |
431 | 431 | 431 | |||||||||||||
| Service Alberta and Red Tape Reduction |
18,100 | 18,100 | 18,100 | |||||||||||||
| Technology and Innovation |
70,089 | 70,089 | 70,089 | |||||||||||||
| Trade, Immigration and Multiculturalism |
25 | 25 | 25 | |||||||||||||
| Transportation and Economic Corridors |
779,650 | 779,650 | 823,461 | |||||||||||||
| Treasury Board and Finance |
181 | 50 | 50 | |||||||||||||
| Sub-total | 1,201,669 | 1,143,820 | 1,200,201 | |||||||||||||
| CONSUMPTION OF INVENTORY |
||||||||||||||||
| Culture |
990 | 990 | 990 | |||||||||||||
| Forestry, Parks and Tourism |
1,310 | 1,310 | 1,310 | |||||||||||||
| Health |
77,940 | 199,636 | 85,870 | |||||||||||||
| Infrastructure |
1,500 | 1,500 | 1,500 | |||||||||||||
| Public Safety and Emergency Services |
- | 1,000 | 1,000 | |||||||||||||
| Service Alberta and Red Tape Reduction |
5,500 | 5,500 | 5,500 | |||||||||||||
| Transportation and Economic Corridors |
57,000 | 57,000 | 62,130 | |||||||||||||
| Sub-total | 144,240 | 266,936 | 158,300 | |||||||||||||
| 15 | Government |
|
NON-CASH EXPENSE BY DEPARTMENT … continued |
|
|||||||||||||||
| (thousands of dollars) |
|
Comparable
|
|
|||||||||||||
|
2022-23 |
2022-23 |
2023-24 |
||||||||||||||
|
|
Budget
|
|
|
Forecast
|
|
|
Estimate
|
| ||||||||
| VALUATION ADJUSTMENTS AND OTHER PROVISIONS |
||||||||||||||||
| Advanced Education |
80,905 | 80,905 | 101,465 | |||||||||||||
| Affordability and Utilities |
21,417 | 21,417 | 19,123 | |||||||||||||
| Children’s Services |
1,500 | 1,500 | 1,500 | |||||||||||||
| Culture |
637 | 637 | 1,137 | |||||||||||||
| Education |
- | 55,569 | 64,255 | |||||||||||||
| Energy |
40 | 40 | 40 | |||||||||||||
| Environment and Protected Areas |
2,252 | 2,252 | 2,252 | |||||||||||||
| Health |
2,000 | 2,000 | 2,000 | |||||||||||||
| Infrastructure |
5,764 | 8,435 | 5,966 | |||||||||||||
| Justice |
6,227 | 6,227 | 6,289 | |||||||||||||
| Municipal Affairs |
200 | 200 | 200 | |||||||||||||
| Public Safety and Emergency Services |
814 | 814 | 795 | |||||||||||||
| Seniors, Community and Social Services |
1,080 | 1,080 | 100 | |||||||||||||
| Service Alberta and Red Tape Reduction |
567 | 567 | 567 | |||||||||||||
| Technology and Innovation |
440 | 440 | 478 | |||||||||||||
| Transportation and Economic Corridors |
20,000 | 20,000 | 12,000 | |||||||||||||
| Treasury Board and Finance |
(263,000 | ) | (32,000 | ) | (275,000 | ) | ||||||||||
|
|
Sub-total
|
|
|
(119,157
|
)
|
|
170,083
|
|
|
(56,833
|
)
| |||||
| Total |
2,870,387 | 2,735,876 |
|
2,680,907
|
| |||||||||||
| NON-CASH CAPITAL INVESTMENT BY DEPARTMENT |
||||||||||||||||
| DONATED CAPITAL ASSETS |
||||||||||||||||
| Environment and Protected Areas |
- | 4,242 | - | |||||||||||||
| Transportation and Economic Corridors |
38,481 | 60,836 | 9,162 | |||||||||||||
| Sub-total | 38,481 | 65,078 | 9,162 | |||||||||||||
| ALTERNATIVELY FINANCED CAPITAL ASSETS |
||||||||||||||||
| Infrastructure |
80,721 | 55,569 | 64,255 | |||||||||||||
| CAPITAL ACQUIRED FROM RELATED PARTIES |
||||||||||||||||
| Agriculture and Irrigation |
15,032 | 15,032 | 38,032 | |||||||||||||
| Justice |
4,000 | 4,000 | 4,000 | |||||||||||||
|
|
Sub-total
|
|
|
19,032
|
|
|
19,032
|
|
|
42,032
|
| |||||
| Total |
138,234 | 139,679 | 115,449 | |||||||||||||
| Government | 16 |
| ENTITY STATUTORY EXPENSE BY MINISTRY |
|
|||||||||||||||
| (thousands of dollars) |
|
Comparable
|
|
|||||||||||||
|
2022-23 |
2022-23 |
2023-24 |
||||||||||||||
|
|
Budget
|
|
|
Forecast
|
|
|
Estimate
|
| ||||||||
| OPERATING EXPENSE |
||||||||||||||||
| Advanced Education |
5,067,681 | 5,135,321 | 5,290,786 | |||||||||||||
| Affordability and Utilities |
28,871 | 28,871 | 31,915 | |||||||||||||
| Agriculture and Irrigation |
81,455 | 84,657 | 145,891 | |||||||||||||
| Culture |
30,210 | 27,210 | 27,210 | |||||||||||||
| Education |
10,202,297 | 10,273,392 | 10,599,437 | |||||||||||||
| Energy |
291,515 | 331,624 | 366,315 | |||||||||||||
| Environment and Protected Areas |
351,055 | 480,246 | 495,019 | |||||||||||||
| Forestry, Parks and Tourism |
59,830 | 68,813 | 72,090 | |||||||||||||
| Health |
15,081,674 | 16,139,271 | 16,748,742 | |||||||||||||
| Indigenous Relations |
8,475 | 5,111 | 8,527 | |||||||||||||
| Municipal Affairs |
14,591 | 13,676 | 15,425 | |||||||||||||
| Public Safety and Emergency Services |
62,823 | 47,323 | 47,486 | |||||||||||||
| Seniors, Community and Social Services |
184,010 | 215,510 | 199,710 | |||||||||||||
| Technology and Innovation |
245,372 | 245,372 | 247,833 | |||||||||||||
| Trade, Immigration and Multiculturalism |
20,000 | 18,200 | 17,337 | |||||||||||||
| Treasury Board and Finance |
2,796,501 | 1,308,038 | 2,577,062 | |||||||||||||
| Sub-total | 34,526,360 | 34,422,635 | 36,890,785 | |||||||||||||
| CAPITAL GRANTS |
||||||||||||||||
| Environment and Protected Areas |
10,000 | 10,000 | 5,000 | |||||||||||||
| Seniors, Community and Social Services |
67,520 | 44,578 | 80,884 | |||||||||||||
| Sub-total | 77,520 | 54,578 | 85,884 | |||||||||||||
| CAPITAL PAYMENTS TO RELATED PARTIES |
||||||||||||||||
| Environment and Protected Areas |
5,000 | 5,000 | 5,000 | |||||||||||||
| AMORTIZATION |
||||||||||||||||
| Advanced Education |
556,315 | 525,682 | 555,183 | |||||||||||||
| Affordability and Utilities |
1,800 | 1,800 | 1,600 | |||||||||||||
| Agriculture and Irrigation |
4,393 | 2,819 | 3,572 | |||||||||||||
| Culture |
7 | 7 | 7 | |||||||||||||
| Education |
470,032 | 467,032 | 476,932 | |||||||||||||
| Energy |
18,000 | 13,000 | 12,000 | |||||||||||||
| Environment and Protected Areas |
30 | 30 | 30 | |||||||||||||
| Forestry, Parks and Tourism |
95 | 75 | 66 | |||||||||||||
| Health |
499,373 | 499,373 | 527,717 | |||||||||||||
| Municipal Affairs |
504 | 440 | 508 | |||||||||||||
| Public Safety and Emergency Services |
69 | 69 | 5 | |||||||||||||
| Seniors, Community and Social Services |
45,800 | 47,900 | 47,900 | |||||||||||||
| Technology and Innovation |
8,400 | 8,400 | 8,900 | |||||||||||||
| Trade, Immigration and Multiculturalism |
- | 42 | 35 | |||||||||||||
| Treasury Board and Finance |
27,496 | 27,723 | 25,035 | |||||||||||||
| Sub-total | 1,632,314 | 1,594,392 | 1,659,490 | |||||||||||||
| 17 | Government |
| ENTITY STATUTORY EXPENSE BY MINISTRY … continued |
| |||||||||||||||
| (thousands of dollars) |
|
Comparable
|
|
|||||||||||||
|
2022-23 |
2022-23 |
2023-24 |
||||||||||||||
|
|
Budget
|
|
|
Forecast
|
|
|
Estimate
|
| ||||||||
| CONSUMPTION OF INVENTORY |
||||||||||||||||
| Advanced Education |
162,597 | 205,356 | 179,701 | |||||||||||||
| Health |
910,000 | 1,265,677 | 1,191,900 | |||||||||||||
| Sub-total | 1,072,597 | 1,471,033 | 1,371,601 | |||||||||||||
| VALUATION ADJUSTMENTS AND OTHER PROVISIONS |
||||||||||||||||
| Advanced Education |
(4,676 | ) | (28,195 | ) | (25,310 | ) | ||||||||||
| Agriculture and Irrigation |
438,882 | 1,560,077 | 453,328 | |||||||||||||
| Education |
425 | 425 | 425 | |||||||||||||
| Health |
- | 3,523 | - | |||||||||||||
| Public Safety and Emergency Services |
(5 | ) | (8,005 | ) | (8,005 | ) | ||||||||||
| Seniors, Community and Social Services |
- | 1,200 | 5,000 | |||||||||||||
| Treasury Board and Finance |
(60 | ) | (60 | ) | - | |||||||||||
| Sub-total | 434,566 | 1,528,965 | 425,438 | |||||||||||||
| DEBT SERVICING |
||||||||||||||||
| Advanced Education |
37,539 | 35,978 | 34,247 | |||||||||||||
| Agriculture and Irrigation |
64,425 | 74,236 | 83,472 | |||||||||||||
| Education |
12,216 | 12,216 | 15,172 | |||||||||||||
| Health |
14,000 | 14,000 | 15,000 | |||||||||||||
| Treasury Board and Finance |
500 | 300 | 310 | |||||||||||||
|
|
Sub-total
|
|
|
128,680
|
|
|
136,730
|
|
|
148,201
|
| |||||
| Total |
37,877,037 | 39,213,333 | 40,586,399 | |||||||||||||
| ENTITY STATUTORY CAPITAL INVESTMENT BY MINISTRY |
|
|||||||||||||||
| Advanced Education |
616,092 | 617,405 | 491,673 | |||||||||||||
| Affordability and Utilities |
1,500 | 1,500 | 750 | |||||||||||||
| Agriculture and Irrigation |
4,215 | 1,430 | 4,249 | |||||||||||||
| Education |
928,172 | 742,732 | 761,206 | |||||||||||||
| Energy |
14,500 | 9,000 | 14,500 | |||||||||||||
| Environment and Protected Areas |
17 | 17 | 17 | |||||||||||||
| Health |
1,219,376 | 941,658 | 1,154,879 | |||||||||||||
| Indigenous Relations |
- | 200 | - | |||||||||||||
| Municipal Affairs |
170 | 140 | 405 | |||||||||||||
| Public Safety and Emergency Services |
15 | 15 | 25 | |||||||||||||
| Seniors, Community and Social Services |
44,535 | 63,246 | 56,898 | |||||||||||||
| Technology and Innovation |
16,503 | 16,503 | 20,107 | |||||||||||||
| Treasury Board and Finance |
|
18,240
|
|
|
17,010
|
|
|
27,685
|
| |||||||
| Total |
2,863,335 | 2,410,856 | 2,532,394 | |||||||||||||
| ENTITY STATUTORY FINANCIAL TRANSACTIONS BY MINISTRY |
|
|||||||||||||||
| INVENTORY ACQUISITION |
||||||||||||||||
| Advanced Education |
181,000 | 181,000 | 181,000 | |||||||||||||
| Health |
|
1,062,641
|
|
|
1,212,441
|
|
|
1,314,861
|
| |||||||
| Total |
1,243,641 | 1,393,441 | 1,495,861 | |||||||||||||
| Government | 18 |

Details of the 2023-24
Government Estimates
General Revenue Fund
Advanced Education
AMOUNTS TO BE VOTED
| (thousands of dollars) |
Comparable |
|||||||||||
|
2022-23 Budget |
2022-23 Forecast |
2023-24 Estimate |
||||||||||
| EXPENSE |
2,351,001 | 2,360,951 | 2,416,985 | |||||||||
| CAPITAL INVESTMENT |
25 | 25 | 25 | |||||||||
| FINANCIAL TRANSACTIONS |
980,100 | 980,100 | 1,060,100 | |||||||||
21
DESCRIPTION OF SUPPLY VOTE PROGRAMS
| 1 | Ministry Support Services |
| 1.1 | Minister’s Office |
Oversees the development of ministerial policies that are aligned with broader government-wide objectives and priorities.
| 1.2 | Deputy Minister’s Office |
Supports the Minister in achieving business plan and strategic goals of the ministry, government and public service.
| 1.3 | Strategic and Corporate Services |
Provides key ministry support functions including corporate services, finance, cross-ministry and intergovernmental strategies, strategic policy and planning, and governance and legislative support.
| 2 | Support for Adult Learning |
| 2.1 | Adult Learning Program Delivery Support |
Manages policies and programs that support post-secondary institutions, including operating and capital grant funding, program approvals and policy coordination.
| 2.2 | Operating Support for Post-Secondary Institutions |
Provides Operating and Program Support Grants to 26 post-secondary institutions to support operating costs.
| 2.3 | Indigenous Education |
Manages funding programs that support Indigenous Colleges and initiatives.
| 2.4 | Adult Learning System Initiatives |
Provides funding for short-term program initiatives, information technology, data collection, systems development, inter-jurisdiction programs and employment and satisfaction surveys.
| 3 | Student Aid |
| 3.1 | Student Aid Program Delivery Support |
Manages polices and programs that support student aid initiatives, including program approvals and policy coordination.
| 3.2 | Student Aid Grants |
Provides non-repayable grants for full time and part time studies to eligible student loan borrowers.
| 3.3 | Scholarships and Awards |
Provides funding for 11 scholarships and awards to reward achievement and incent participation in post-secondary education.
| 3.4 | Student Loan Disbursements |
Provides repayable financial assistance to eligible students enrolled in a full time program at an approved post-secondary institution.
| 4 | Post-Secondary Infrastructure |
| 4.1 | Capital Expansion and Upgrading |
Provides capital support to public post-secondary institutions for expansion and major preservation projects.
| 4.2 | Capital Maintenance and Renewal |
Provides grant funding for priority projects aimed at maintaining the condition of facilities.
| Advanced Education | 22 |
EXPENSE VOTE BY PROGRAM
| (thousands of dollars) |
Comparable |
|||||||||||||||
|
2022-23 Budget |
2022-23 Forecast |
2023-24 Estimate |
||||||||||||||
| OPERATING EXPENSE |
||||||||||||||||
| 1 |
Ministry Support Services |
|||||||||||||||
| 1.1 |
Minister’s Office |
649 | 649 | 729 | ||||||||||||
| 1.2 |
Deputy Minister’s Office |
542 | 542 | 648 | ||||||||||||
| 1.3 |
Strategic and Corporate Services |
13,041 | 13,041 | 13,105 | ||||||||||||
| Sub-total | 14,232 | 14,232 | 14,482 | |||||||||||||
| 2 |
Support for Adult Learning |
|||||||||||||||
| 2.1 |
Adult Learning Program Delivery Support |
11,114 | 11,114 | 12,211 | ||||||||||||
| 2.2 |
Operating Support for Post-Secondary Institutions |
1,937,080 | 1,937,424 | 1,977,036 | ||||||||||||
| 2.3 |
Indigenous Education |
5,640 | 5,640 | 6,640 | ||||||||||||
| 2.4 |
Adult Learning System Initiatives |
27,606 | 25,506 | 21,706 | ||||||||||||
| Sub-total | 1,981,440 | 1,979,684 | 2,017,593 | |||||||||||||
| 3 |
Student Aid |
|||||||||||||||
| 3.1 |
Student Aid Program Delivery Support |
33,954 | 40,354 | 38,966 | ||||||||||||
| 3.2 |
Student Aid Grants |
59,784 | 64,534 | 69,054 | ||||||||||||
| 3.3 |
Scholarships and Awards |
51,754 | 51,754 | 53,754 | ||||||||||||
| Sub-total | 145,492 | 156,642 | 161,774 | |||||||||||||
| CAPITAL PAYMENTS TO RELATED PARTIES |
||||||||||||||||
| 4 |
Post-Secondary Infrastructure |
|||||||||||||||
| 4.1 |
Capital Expansion and Upgrading |
100,488 | 101,044 | 73,952 | ||||||||||||
| 4.2 |
Capital Maintenance and Renewal |
109,349 | 109,349 | 149,184 | ||||||||||||
| Sub-total | 209,837 | 210,393 | 223,136 | |||||||||||||
| Total |
2,351,001 | 2,360,951 | 2,416,985 | |||||||||||||
| CAPITAL INVESTMENT VOTE BY PROGRAM |
||||||||||||||||
| DEPARTMENT CAPITAL ACQUISITIONS |
||||||||||||||||
| 1 |
Ministry Support Services |
|||||||||||||||
| 1.3 |
Strategic and Corporate Services |
25 | 25 | 25 | ||||||||||||
| Total |
25 | 25 | 25 | |||||||||||||
| FINANCIAL TRANSACTIONS VOTE BY PROGRAM |
||||||||||||||||
| LOANS AND ADVANCES |
||||||||||||||||
| 3 |
Student Aid |
|||||||||||||||
| 3.4 |
Student Loan Disbursements |
980,100 | 980,100 | 1,060,100 | ||||||||||||
| Total |
980,100 | 980,100 | 1,060,100 | |||||||||||||
| 23 | Advanced Education |
VOTED AMOUNTS FUNDED BY CREDIT OR RECOVERY
The following table details the portions of the department’s voted amounts for which a credit or recovery can be obtained. If a credit or recovery amount is expected to exceed its original estimate, the Treasury Board may increase the corresponding voted amount, pursuant to section 24(2) of the Financial Administration Act. If the actual credit or recovery amount realized is less than its original estimate, the corresponding funding authority is reduced by an equivalent amount in the programs shown.
EXPENSE AMOUNTS FUNDED BY CREDIT OR RECOVERY
| (thousands of dollars) |
2023-24 Estimate |
|||||
| 1 |
Services to Ministries | 4,997 | ||||
| Funding is received from other ministries to provide common services such as corporate services or other program support services. Programs 1.3 and 2.1 |
||||||
| 2 |
Canada Student Loan Administration | 8,910 | ||||
| Funding is received from the federal government to administer Canada student loans and grants to Alberta students on a cost-recovery basis. Program 3.1 |
||||||
| 3 |
French Language Program | 9,867 | ||||
| Funding is received from the federal government to support French minority language and second language education programs. Program 2.2 |
||||||
| Total |
23,774 | |||||
| Advanced Education | 24 |
AMOUNTS NOT REQUIRED TO BE VOTED
The following department amounts do not require a supply vote either because no cash disbursement is required, or because the Legislative Assembly has already provided the funding authority pursuant to a statute other than an appropriation act.
EXPENSE
| (thousands of dollars) |
Comparable |
|||||||||||
|
2022-23 Budget |
2022-23 Forecast |
2023-24 Estimate |
||||||||||
| DEPARTMENT STATUTORY AMOUNTS |
||||||||||||
| Operating Expense |
||||||||||||
| Alberta Heritage Scholarships |
56,374 | 56,419 | 57,986 | |||||||||
| DEPARTMENT NON-CASH AMOUNTS |
||||||||||||
| Amortization |
||||||||||||
| Ministry Support Services |
600 | 600 | 600 | |||||||||
| Valuation Adjustments and Other Provisions |
||||||||||||
| Ministry Support Services |
5 | 5 | 5 | |||||||||
| Provision for Future Cost of Student Loans Issued |
80,900 | 80,900 | 101,460 | |||||||||
| Total |
137,879 | 137,924 | 160,051 | |||||||||
| 25 | Advanced Education |
RECONCILIATION OF SUPPLY VOTE TO CONSOLIDATED GOVERNMENT ESTIMATE
The following tables summarize the relationship between the department’s Supply Votes and the effect of the ministry on the Government’s consolidated 2023-24 Estimates.
| RECONCILIATION BY PROGRAM |
||||||||||||||||||||
| (thousands of dollars) |
Voted Supply |
Department Amounts Not Voted |
Entities’ Amounts Not Voted |
Consolidation Adjustments |
Consolidated 2023-24 Estimate |
|||||||||||||||
| EXPENSE |
||||||||||||||||||||
| Ministry Support Services |
14,482 | 605 | - | (3,962 | ) | 11,125 | ||||||||||||||
| Support for Adult Learning |
2,017,593 | - | - | (1,958,736 | ) | 58,857 | ||||||||||||||
| Student Aid |
161,774 | 159,446 | - | (23,849 | ) | 297,371 | ||||||||||||||
| Post-Secondary Operations |
- | - | 6,025,670 | (53,794 | ) | 5,971,876 | ||||||||||||||
| Post-Secondary Debt Servicing |
- | - | 34,247 | (34,247 | ) | - | ||||||||||||||
| Post-Secondary Pension Provision |
- | - | (25,310 | ) | - | (25,310 | ) | |||||||||||||
| Post-Secondary Infrastructure |
223,136 | - | - | (223,136 | ) | - | ||||||||||||||
| Total |
2,416,985 | 160,051 | 6,034,607 | (2,297,724 | ) | 6,313,919 | ||||||||||||||
| CAPITAL INVESTMENT |
||||||||||||||||||||
| Ministry Support Services |
25 | - | - | - | 25 | |||||||||||||||
| Post-Secondary Infrastructure |
- | - | 491,673 | - | 491,673 | |||||||||||||||
| Total |
25 | - | 491,673 | - | 491,698 | |||||||||||||||
| INVENTORY ACQUISITION |
||||||||||||||||||||
| Post-Secondary Operations |
- | - | 181,000 | - | 181,000 | |||||||||||||||
| RECONCILIATION BY TYPE OF SPENDING |
|
|||||||||||||||||||
| EXPENSE |
||||||||||||||||||||
| Operating expense |
2,193,849 | 159,451 | 5,290,786 | (2,040,341 | ) | 5,603,745 | ||||||||||||||
| Capital payments to related parties |
223,136 | - | - | (223,136 | ) | - | ||||||||||||||
| Amortization |
- | 600 | 555,183 | - | 555,783 | |||||||||||||||
| Inventory consumption |
- | - | 179,701 | - | 179,701 | |||||||||||||||
| Debt servicing costs - general |
- | - | 34,247 | (34,247 | ) | - | ||||||||||||||
| Pension provisions |
- | - | (25,310 | ) | - | (25,310 | ) | |||||||||||||
| Total |
2,416,985 | 160,051 | 6,034,607 | (2,297,724 | ) | 6,313,919 | ||||||||||||||
| CAPITAL INVESTMENT |
25 | - | 491,673 | - | 491,698 | |||||||||||||||
| INVENTORY ACQUISITION |
- | - | 181,000 | - | 181,000 | |||||||||||||||
|
|
||||||||||||||||||||
| Advanced Education | 26 |
| MINISTRY FINANCIAL STATEMENTS |
||||||||||||
| STATEMENT OF OPERATIONS |
||||||||||||
| (thousands of dollars) |
Comparable |
|||||||||||
|
2022-23 Budget |
2022-23 Forecast |
2023-24 Estimate |
||||||||||
| REVENUE |
||||||||||||
| Internal Government Transfers |
377,614 | 377,814 | 341,969 | |||||||||
| Transfers from Government of Canada |
487,785 | 505,756 | 536,950 | |||||||||
| Transfers from Alberta Heritage Scholarship Fund |
55,000 | 56,419 | 57,986 | |||||||||
| Investment Income |
291,260 | 356,963 | 362,647 | |||||||||
| Premiums, Fees and Licences |
198 | 198 | 198 | |||||||||
| Tuition and Non-Credit Courses |
1,645,398 | 1,667,245 | 1,771,259 | |||||||||
| Donations, Grants and Contributions |
348,036 | 372,918 | 365,615 | |||||||||
| Sales, Rentals and Services |
498,417 | 499,507 | 519,685 | |||||||||
| Other Revenue |
132,795 | 134,495 | 133,769 | |||||||||
| Ministry Total |
3,836,503 | 3,971,315 | 4,090,078 | |||||||||
| Inter-Ministry Consolidations |
(498,915 | ) | (502,234 | ) | (466,032 | ) | ||||||
| Consolidated Total |
3,337,588 | 3,469,081 | 3,624,046 | |||||||||
| EXPENSE |
||||||||||||
| Ministry Support Services |
14,837 | 14,837 | 15,087 | |||||||||
| Support for Adult Learning |
63,695 | 61,595 | 59,892 | |||||||||
| Student Aid |
261,917 | 273,112 | 300,371 | |||||||||
| Post-Secondary Operations |
5,784,593 | 5,864,359 | 6,023,670 | |||||||||
| Post-Secondary Debt Servicing |
37,539 | 35,978 | 34,247 | |||||||||
| Post-Secondary Pension Provision |
(4,676 | ) | (28,195 | ) | (25,310 | ) | ||||||
| Ministry Total |
6,157,905 | 6,221,686 | 6,407,957 | |||||||||
| Inter-Ministry Consolidations |
(97,484 | ) | (95,923 | ) | (94,038 | ) | ||||||
| Consolidated Total |
6,060,421 | 6,125,763 | 6,313,919 | |||||||||
| Net Operating Result |
(2,722,833 | ) | (2,656,682 | ) | (2,689,873 | ) | ||||||
| CHANGE IN CAPITAL ASSETS |
||||||||||||
| INVESTMENT |
||||||||||||
| Ministry Support Services |
25 | 25 | 25 | |||||||||
| Post-Secondary Infrastructure |
616,092 | 617,405 | 491,673 | |||||||||
| Consolidated Total |
616,117 | 617,430 | 491,698 | |||||||||
| AMORTIZATION |
(556,915 | ) | (526,282 | ) | (555,783 | ) | ||||||
| Change in Capital Assets Total |
59,202 | 91,148 | (64,085 | ) | ||||||||
| CHANGE IN INVENTORY ASSETS |
||||||||||||
| INVENTORY ACQUISITION |
||||||||||||
| Post-Secondary Operations |
181,000 | 181,000 | 181,000 | |||||||||
| Consolidated Total |
181,000 | 181,000 | 181,000 | |||||||||
| CONSUMPTION (Cost of Goods Sold) |
(162,597 | ) | (205,356 | ) | (179,701 | ) | ||||||
| Change in Inventory Assets Total |
18,403 | (24,356 | ) | 1,299 | ||||||||
| 27 | Advanced Education |
Affordability and Utilities
AMOUNTS TO BE VOTED
| (thousands of dollars) |
Comparable |
|||||||||||
|
2022-23 Budget |
2022-23 Forecast |
2023-24 Estimate |
||||||||||
| EXPENSE |
33,760 | 388,692 | 87,128 | |||||||||
| CAPITAL INVESTMENT |
- | - | 25 | |||||||||
| FINANCIAL TRANSACTIONS |
96,970 | 351,206 | 96,970 | |||||||||
| CONTINGENCY |
- | 286,803 | - | |||||||||
29
DESCRIPTION OF SUPPLY VOTE PROGRAMS
| 1 | Ministry Support Services |
| 1.1 | Minister’s Office |
Oversees the development of ministerial policies that are aligned with broader government-wide objectives and priorities.
| 1.2 | Deputy Minister’s Office |
Supports the Minister in achieving business plan and strategic goals of the ministry, government and public service.
| 1.3 | Corporate Services |
Provides strategic, financial, legal, and accommodations advice and services to support ministry objectives and requirements.
| 2 | Affordability and Utilities |
| 2.1 | Affordability and Utilities |
Leads and coordinates Alberta’s affordability plan; develops and maintains the policy and legislative framework to ensure a safe, reliable and affordable utility system.
| 2.2 | Utilities Consumer Advocate |
Supports energy consumers through advocacy at regulatory proceedings, consumer education, and mediation services.
| 3 | Utility Rebate and Grant Programs |
Provides support to eligible consumers to ensure the cost of utilities remains affordable.
| 4 | Climate Change |
| 4.1 | Renewable Electricity Program |
Costs incurred to support renewable energy projects through the development and construction of infrastructure and the subsequent generation of renewable energy.
| 4.2 | Coal Phase-Out Agreements |
Costs incurred to support the elimination of coal power generation by 2030.
| Affordability and Utilities | 30 |
EXPENSE VOTE BY PROGRAM
| (thousands of dollars) |
Comparable |
|||||||||||||||
|
2022-23 Budget |
2022-23 Forecast |
2023-24 Estimate |
||||||||||||||
| OPERATING EXPENSE |
||||||||||||||||
| 1 |
Ministry Support Services |
|||||||||||||||
| 1.1 |
Minister’s Office |
572 | 832 | 847 | ||||||||||||
| 1.2 |
Deputy Minister’s Office |
552 | 604 | 720 | ||||||||||||
| 1.3 |
Corporate Services |
1,597 | 1,597 | 1,807 | ||||||||||||
| Sub-total | 2,721 | 3,033 | 3,374 | |||||||||||||
| 2 |
Affordability and Utilities |
|||||||||||||||
| 2.1 |
Affordability and Utilities |
5,577 | 12,175 | 10,192 | ||||||||||||
| 2.2 |
Utilities Consumer Advocate |
6,662 | 6,662 | 6,662 | ||||||||||||
| Sub-total | 12,239 | 18,837 | 16,854 | |||||||||||||
| 3 |
Utility Rebate and Grant Programs |
- | 348,547 | 47,575 | ||||||||||||
| 4 |
Climate Change |
|||||||||||||||
| 4.1 |
Renewable Electricity Program |
12,400 | 12,400 | 12,400 | ||||||||||||
| CAPITAL GRANTS |
||||||||||||||||
| 2 |
Affordability and Utilities |
|||||||||||||||
| 2.1 |
Affordability and Utilities |
6,400 | 5,875 | 6,925 | ||||||||||||
| Total |
33,760 | 388,692 | 87,128 | |||||||||||||
| CAPITAL INVESTMENT VOTE BY PROGRAM |
||||||||||||||||
| DEPARTMENT CAPITAL ACQUISITIONS |
||||||||||||||||
| 1 |
Ministry Support Services |
|||||||||||||||
| 1.3 |
Corporate Services |
- | - | 25 | ||||||||||||
| Total |
- | - | 25 | |||||||||||||
| FINANCIAL TRANSACTIONS VOTE BY PROGRAM |
||||||||||||||||
| LOANS AND ADVANCES |
||||||||||||||||
| 3 |
Utility Rebate and Grant Programs |
- | 254,236 | - | ||||||||||||
| LEGAL LIABILITY RETIREMENT |
||||||||||||||||
| 4 |
Climate Change |
|||||||||||||||
| 4.2 |
Coal Phase-Out Agreements |
96,970 | 96,970 | 96,970 | ||||||||||||
| Total |
96,970 | 351,206 | 96,970 | |||||||||||||
| CONTINGENCY VOTE BY PROGRAM |
||||||||||||||||
| OPERATING EXPENSE |
||||||||||||||||
| 3 |
Utility Rebate and Grant Programs |
- | 286,803 | - | ||||||||||||
| Total |
- | 286,803 | - | |||||||||||||
| 31 | Affordability and Utilities |
VOTED AMOUNTS FUNDED BY CREDIT OR RECOVERY
The following table details the portions of the department’s voted amounts for which a credit or recovery can be obtained. If a credit or recovery amount is expected to exceed its original estimate, the Treasury Board may increase the corresponding voted amount, pursuant to section 24(2) of the Financial Administration Act. If the actual credit or recovery amount realized is less than its original estimate, the corresponding funding authority is reduced by an equivalent amount in the programs shown.
EXPENSE AMOUNTS FUNDED BY CREDIT OR RECOVERY
| (thousands of dollars) |
2023-24 Estimate
|
|||||
| 1 |
Utilities Consumer Advocate | 6,662 | ||||
| Funding from the electrical system’s Balancing Pool and from three provincial natural gas distributors (80/20 per cent) funds the operations of the Utilities Consumer Advocate. Program 2.2 |
||||||
| Total |
6,662 | |||||
| Affordability and Utilities | 32 |
AMOUNTS NOT REQUIRED TO BE VOTED
The following department amounts do not require a supply vote either because no cash disbursement is required, or because the Legislative Assembly has already provided the funding authority pursuant to a statute other than an appropriation act.
EXPENSE
| (thousands of dollars) |
Comparable |
|||||||||||
|
2022-23 Budget |
2022-23 Forecast |
2023-24 Estimate |
||||||||||
| DEPARTMENT NON-CASH AMOUNTS |
||||||||||||
| Operating Expense |
||||||||||||
| Grant for Concessionary Loan |
- | 12,446 | - | |||||||||
| Valuation Adjustments and Other Provisions |
||||||||||||
| Affordability and Utilities |
30 | 30 | 30 | |||||||||
| Climate Change |
21,387 | 21,387 | 19,093 | |||||||||
| Total |
21,417 | 33,863 | 19,123 | |||||||||
| 33 | Affordability and Utilities |
RECONCILIATION OF SUPPLY VOTE TO CONSOLIDATED GOVERNMENT ESTIMATE
The following tables summarize the relationship between the department’s Supply Votes and the effect of the ministry on the Government’s consolidated 2023-24 Estimates.
| RECONCILIATION BY PROGRAM |
||||||||||||||||||||
| (thousands of dollars) |
Voted Supply |
Department Amounts Not Voted |
Entities’ Amounts Not Voted |
Consolidation Adjustments |
Consolidated 2023-24 Estimate |
|||||||||||||||
| EXPENSE |
||||||||||||||||||||
| Ministry Support Services |
3,374 | - | - | - | 3,374 | |||||||||||||||
| Affordability and Utilities |
23,779 | 30 | - | - | 23,809 | |||||||||||||||
| Utility Rebate and Grant Programs |
47,575 | - | - | - | 47,575 | |||||||||||||||
| Climate Change |
12,400 | 19,093 | - | - | 31,493 | |||||||||||||||
| Utilities Regulation |
- | - | 33,515 | - | 33,515 | |||||||||||||||
| Total |
87,128 | 19,123 | 33,515 | - | 139,766 | |||||||||||||||
| CAPITAL INVESTMENT |
||||||||||||||||||||
| Ministry Support Services |
25 | - | - | - | 25 | |||||||||||||||
| Utilities Regulation |
- | - | 750 | - | 750 | |||||||||||||||
| Total |
25 | - | 750 | - | 775 | |||||||||||||||
| RECONCILIATION BY TYPE OF SPENDING |
|
|||||||||||||||||||
| EXPENSE |
||||||||||||||||||||
| Operating expense |
80,203 | 19,123 | 31,915 | - | 131,241 | |||||||||||||||
| Capital grants |
6,925 | - | - | - | 6,925 | |||||||||||||||
| Amortization |
- | - | 1,600 | - | 1,600 | |||||||||||||||
| Total |
87,128 | 19,123 | 33,515 | - | 139,766 | |||||||||||||||
| CAPITAL INVESTMENT |
25 | - | 750 | - | 775 | |||||||||||||||
| Affordability and Utilities | 34 |
| MINISTRY FINANCIAL STATEMENTS |
||||||||||||
| STATEMENT OF OPERATIONS |
||||||||||||
| (thousands of dollars) |
Comparable |
|||||||||||
|
2022-23 Budget |
2022-23 Forecast |
2023-24 Estimate |
||||||||||
| REVENUE |
||||||||||||
| Investment Income |
50 | 50 | 400 | |||||||||
| Net Income Balancing Pool |
111,700 | 119,920 | 102,649 | |||||||||
| Other Revenue |
6,707 | 37,707 | 13,819 | |||||||||
| Utility Regulation Industry Levies and Licences |
30,306 | 30,306 | 32,250 | |||||||||
| Consolidated Total |
148,763 | 187,983 | 149,118 | |||||||||
| EXPENSE |
||||||||||||
| Ministry Support Services |
2,721 | 3,033 | 3,374 | |||||||||
| Affordability and Utilities |
18,669 | 24,742 | 23,809 | |||||||||
| Utility Rebate and Grant Programs |
- | 647,796 | 47,575 | |||||||||
| Climate Change |
33,787 | 33,787 | 31,493 | |||||||||
| Utilities Regulation |
30,671 | 30,671 | 33,515 | |||||||||
| Consolidated Total |
85,848 | 740,029 | 139,766 | |||||||||
| Net Operating Result |
62,915 | (552,046 | ) | 9,352 | ||||||||
| CHANGE IN CAPITAL ASSETS |
||||||||||||
| INVESTMENT |
||||||||||||
| Ministry Support Services |
- | - | 25 | |||||||||
| Utilities Regulation |
1,500 | 1,500 | 750 | |||||||||
| Consolidated Total |
1,500 | 1,500 | 775 | |||||||||
| AMORTIZATION |
(1,800 | ) | (1,800 | ) | (1,600 | ) | ||||||
| Change in Capital Assets Total |
(300 | ) | (300 | ) | (825 | ) | ||||||
| 35 | Affordability and Utilities |
Agriculture and Irrigation
AMOUNTS TO BE VOTED
| (thousands of dollars) |
Comparable |
|||||||||||
|
2022-23 Budget |
2022-23 Forecast |
2023-24 Estimate |
||||||||||
| EXPENSE |
470,997 | 487,271 | 679,936 | |||||||||
| CAPITAL INVESTMENT |
2,672 | 3,903 | 7,177 | |||||||||
| CONTINGENCY |
- | 175,224 | - | |||||||||
37
DESCRIPTION OF SUPPLY VOTE PROGRAMS
| 1 | Ministry Support Services |
| 1.1 | Minister’s Office |
Oversees the development of ministerial policies that are aligned with broader government-wide objectives and priorities.
| 1.2 | Deputy Minister’s Office |
Supports the Minister in achieving business plan and strategic goals of the ministry, government and public service.
| 1.3 | Farmers’ and Property Rights Advocate |
Provides supports for farmers and ranchers including advocacy, energy, utility and surface rights and rural dispute resolution. Listens to Albertans’ concerns regarding property rights and brings them before government.
| 1.4 | Corporate Services |
Provides ministry strategic and support functions including policy development, fiscal management, legislative planning, and solutions to support ministry operations.
| 2 | Rural Programming and Agricultural Societies |
| 2.1 | Rural Programming |
Rural Programming provides direct support to rural economic development in Alberta.
| 2.2 | Agricultural Societies and Exhibitions |
Administers programs and funding for 283 primary Agricultural Societies to support event hosting and managing community facilities. Also responsible for regulatory oversight of the Agricultural Societies Act.
| 3 | Trade, Investment and Food Inspection |
| 3.1 | Export and Investment |
Attracts investment to agri-food and bio-industrial sectors, expands export opportunities for Alberta’s businesses, and delivers programs to grow Alberta’s agri-food sector.
| 3.2 | Food Inspection and Surveillance |
Provides oversight in provincial meat/dairy facilities, protects public safety, addresses risk via surveillance, inspection, and outreach. Conducts lab testing in support of disease investigations/export.
| 3.3 | Food and Bio-Processing |
Provides scientific expertise, specialized facilities to support product/process development along with business incubation, and business development services for processors to reach local/global markets.
| 3.4 | Intergovernmental and Trade Relations |
Provides analysis and advice on trade, transportation and labour files, and coordination of inter-governmental policy negotiations, which directly support the Ministry’s vision and strategic goals.
| 4 | Primary Agriculture |
| 4.1 | Animal Health and Assurance |
Conducts health monitoring, surveillance, and disease investigations in Alberta’s livestock industries. Develops regulations and response policies and programs to support market access, food safety, and public health.
| 4.2 | Crop Health and Assurance |
Focuses on monitoring, surveillance, and risk mitigation in Alberta’s crop industries and develops regulations and response policies for Alberta’s crop, bee/honey industries, and supports for farm safety education.
| 4.3 | Agricultural Service Boards |
Manages grant agreements to 69 Agricultural Service Boards to assist municipalities with projects, enforcement, and developing programs and services that improve stewardship and agricultural capacity in Alberta.
| 4.4 | Agriculture Research |
Supports the delivery of grants for Alberta’s agriculture research program to meet the needs of farmers, ranchers, and others in the agriculture industry.
| 4.5 | Marketing Council |
The Alberta Agricultural Products Marketing Council is the oversight body for Alberta’s 20 agricultural marketing boards and commissions, and provides advice to the Minister on matters related to their governance.
| 4.6 | Natural Resource Management |
Seeks to ensure agriculture is sustainable by developing policy and programming that promotes environmental stewardship, increases irrigation capacity, and facilitates emergency planning in the agriculture sector.
| Agriculture and Irrigation | 38 |
DESCRIPTION OF SUPPLY VOTE PROGRAMS... continued
| 4.7 | Irrigation Infrastructure Assistance |
Irrigation Infrastructure Assistance primarily delivers capital grants for the Irrigation Rehabilitation Program to increase conveyance efficiency of Alberta’s irrigation network.
| 5 | Agriculture Insurance and Income Support |
| 5.1 | Insurance |
Provides the provincial funding to AFSC to deliver crop, hail, livestock, and wildlife damage compensation insurance programs to mitigate risks associated with crop production and fluctuations in commodity prices.
| 5.2 | Agriculture Income Support |
Provides the provincial funding to AFSC to deliver the Agriculture Income Support program for Canadian agricultural producers with an ongoing whole-farm risk management tool.
| 6 | Water Management |
Responsible for the comprehensive operation and maintenance of government owned water management infrastructure and administration of the Provincial Dam Safety program under the Water Act.
| 7 | Sustainable Canadian Agricultural Partnership |
| 7.1 | Agri-food and Agri-based Industry Support |
Supports economic, environmental and social areas through: building sector capacity, growth and competitiveness, climate change and environment, market development and trade; along with resiliency and public trust.
| 7.2 | Agricultural Science, Research and Innovation |
Additional funding from the Partnership that supports research and innovation.
| 39 | Agriculture and Irrigation |
EXPENSE VOTE BY PROGRAM
| (thousands of dollars) |
Comparable |
|||||||||||||||
|
2022-23 Budget |
2022-23 Forecast |
2023-24 Estimate |
||||||||||||||
| OPERATING EXPENSE |
||||||||||||||||
| 1 |
Ministry Support Services |
|||||||||||||||
| 1.1 |
Minister’s Office |
877 | 877 | 877 | ||||||||||||
| 1.2 |
Deputy Minister’s Office |
764 | 764 | 786 | ||||||||||||
| 1.3 |
Farmers’ and Property Rights Advocate |
1,020 | 1,020 | 1,072 | ||||||||||||
| 1.4 |
Corporate Services |
8,626 | 8,626 | 8,870 | ||||||||||||
| Sub-total | 11,287 | 11,287 | 11,605 | |||||||||||||
| 2 |
Rural Programming and Agricultural Societies |
|||||||||||||||
| 2.1 |
Rural Programming |
2,639 | 2,639 | 7,277 | ||||||||||||
| 2.2 |
Agricultural Societies and Exhibitions |
11,462 | 11,462 | 11,462 | ||||||||||||
| Sub-total | 14,101 | 14,101 | 18,739 | |||||||||||||
| 3 |
Trade, Investment and Food Inspection |
|||||||||||||||
| 3.1 |
Export and Investment |
4,267 | 5,767 | 5,386 | ||||||||||||
| 3.2 |
Food Inspection and Surveillance |
12,965 | 13,215 | 13,292 | ||||||||||||
| 3.3 |
Food and Bio-Processing |
8,241 | 8,741 | 8,425 | ||||||||||||
| 3.4 |
Intergovernmental and Trade Relations |
6,830 | 9,330 | 7,013 | ||||||||||||
| Sub-total | 32,303 | 37,053 | 34,116 | |||||||||||||
| 4 |
Primary Agriculture |
|||||||||||||||
| 4.1 |
Animal Health and Assurance |
9,998 | 9,998 | 10,132 | ||||||||||||
| 4.2 |
Crop Health and Assurance |
3,971 | 3,971 | 4,035 | ||||||||||||
| 4.3 |
Agricultural Service Boards |
8,891 | 8,891 | 11,896 | ||||||||||||
| 4.4 |
Agriculture Research |
25,425 | 25,425 | 26,925 | ||||||||||||
| 4.5 |
Marketing Council |
937 | 937 | 952 | ||||||||||||
| 4.6 |
Natural Resource Management |
9,860 | 10,762 | 9,946 | ||||||||||||
| Sub-total | 59,082 | 59,984 | 63,886 | |||||||||||||
| 5 |
Agriculture Insurance and Income Support |
|||||||||||||||
| 5.1 |
Insurance |
201,065 | 201,065 | 368,646 | ||||||||||||
| 5.2 |
Agriculture Income Support |
43,309 | 43,309 | 50,067 | ||||||||||||
| Sub-total | 244,374 | 244,374 | 418,713 | |||||||||||||
| 6 |
Water Management |
19,316 | 26,282 | 20,788 | ||||||||||||
| 7 |
Sustainable Canadian Agricultural Partnership |
|||||||||||||||
| 7.1 |
Agri-food and Agri-based Industry Support |
35,239 | 38,895 | 46,922 | ||||||||||||
| 7.2 |
Agricultural Science, Research and Innovation |
11,575 | 11,575 | 11,575 | ||||||||||||
| Sub-total | 46,814 | 50,470 | 58,497 | |||||||||||||
| Agriculture and Irrigation | 40 |
EXPENSE VOTE BY PROGRAM... continued
| (thousands of dollars) |
Comparable |
|||||||||||||||
|
2022-23 Budget |
2022-23 Forecast |
2023-24 Estimate |
||||||||||||||
| CAPITAL GRANTS |
||||||||||||||||
| 2 |
Rural Programming and Agricultural Societies |
|||||||||||||||
| 2.2 |
Agricultural Societies and Exhibitions |
500 | 500 | 2,500 | ||||||||||||
| 4 |
Primary Agriculture |
|||||||||||||||
| 4.7 |
Irrigation Infrastructure Assistance |
43,220 | 43,220 | 49,892 | ||||||||||||
| CAPITAL PAYMENTS TO RELATED PARTIES |
||||||||||||||||
| 4 |
Primary Agriculture |
|||||||||||||||
| 4.1 |
Animal Health and Assurance |
- | - | 1,200 | ||||||||||||
| Total |
470,997 | 487,271 | 679,936 | |||||||||||||
| CAPITAL INVESTMENT VOTE BY PROGRAM |
||||||||||||||||
| DEPARTMENT CAPITAL ACQUISITIONS |
||||||||||||||||
| 1 |
Ministry Support Services |
|||||||||||||||
| 1.4 |
Corporate Services |
990 | 335 | 990 | ||||||||||||
| 3 |
Trade, Investment and Food Inspection |
|||||||||||||||
| 3.2 |
Food Inspection and Surveillance |
301 | 1,101 | 301 | ||||||||||||
| 3.3 |
Food and Bio-Processing |
1,222 | 1,866 | 727 | ||||||||||||
| Sub-total | 1,523 | 2,967 | 1,028 | |||||||||||||
| 4 |
Primary Agriculture |
|||||||||||||||
| 4.1 |
Animal Health and Assurance |
- | 114 | - | ||||||||||||
| 4.2 |
Crop Health and Assurance |
- | 423 | - | ||||||||||||
| 4.6 |
Natural Resource Management |
159 | 64 | 159 | ||||||||||||
| Sub-total | 159 | 601 | 159 | |||||||||||||
| 6 |
Water Management |
- | - | 5,000 | ||||||||||||
| Total |
2,672 | 3,903 | 7,177 | |||||||||||||
| CONTINGENCY VOTE BY PROGRAM |
||||||||||||||||
| OPERATING EXPENSE |
||||||||||||||||
| 5 |
Agriculture Insurance and Income Support |
|||||||||||||||
| 5.1 |
Insurance |
- | 99,721 | - | ||||||||||||
| 5.2 |
Agriculture Income Support |
- | 75,503 | - | ||||||||||||
| Total |
- | 175,224 | - | |||||||||||||
| 41 | Agriculture and Irrigation |
VOTED AMOUNTS FUNDED BY CREDIT OR RECOVERY
The following table details the portions of the department’s voted amounts for which a credit or recovery can be obtained. If a credit or recovery amount is expected to exceed its original estimate, the Treasury Board may increase the corresponding voted amount, pursuant to section 24(2) of the Financial Administration Act. If the actual credit or recovery amount realized is less than its original estimate, the corresponding funding authority is reduced by an equivalent amount in the programs shown.
EXPENSE AMOUNTS FUNDED BY CREDIT OR RECOVERY
| (thousands of dollars) |
2023-24 |
|||||
| 1 |
Sustainable Canadian Agricultural Partnership | 53,413 | ||||
| Federal funding provided through the bilateral Canadian Agricultural Partnership Agreement is used to support a profitable and innovative agriculture, agri-food and agri-based industry. Program 7 |
||||||
| 2 |
Water Management Infrastructure | 3,180 | ||||
| Revenue from annual fees collected from developers through Use of Works Agreements is used to offset costs of maintenance and upgrading of provincial water management infrastructure systems. Program 6 |
||||||
| Total |
56,593 | |||||
| Agriculture and Irrigation | 42 |
AMOUNTS NOT REQUIRED TO BE VOTED
The following department amounts do not require a supply vote either because no cash disbursement is required, or because the Legislative Assembly has already provided the funding authority pursuant to a statute other than an appropriation act.
EXPENSE
| (thousands of dollars) |
Comparable |
|||||||||||
|
2022-23 Budget |
2022-23 Forecast |
2023-24 Estimate |
||||||||||
| DEPARTMENT NON-CASH AMOUNTS |
||||||||||||
| Amortization |
||||||||||||
| Ministry Support Services |
203 | 203 | 203 | |||||||||
| Trade, Investment and Food Inspection |
1,970 | 1,970 | 2,203 | |||||||||
| Primary Agriculture |
2,100 | 2,100 | 1,867 | |||||||||
| Water Management |
40,552 | 26,600 | 28,178 | |||||||||
| Total |
44,825 | 30,873 | 32,451 | |||||||||
| CAPITAL INVESTMENT
|
||||||||||||
| DEPARTMENT NON-CASH AMOUNTS |
||||||||||||
| Capital Acquired from Related Parties |
15,032 | 15,032 | 38,032 | |||||||||
| Total |
15,032 | 15,032 | 38,032 | |||||||||
| 43 | Agriculture and Irrigation |
RECONCILIATION OF SUPPLY VOTE TO CONSOLIDATED GOVERNMENT ESTIMATE
The following tables summarize the relationship between the department’s Supply Votes and the effect of the ministry on the Government’s consolidated 2023-24 Estimates.
| RECONCILIATION BY PROGRAM |
||||||||||||||||||||
| (thousands of dollars) |
Voted Supply |
Department Amounts Not Voted |
Entities’ Amounts Not Voted |
Consolidation Adjustments |
Consolidated 2023-24 Estimate |
|||||||||||||||
| EXPENSE |
||||||||||||||||||||
| Ministry Support Services |
11,605 | 203 | - | (30 | ) | 11,778 | ||||||||||||||
| Rural Programming and Agricultural Societies |
21,239 | - | - | - | 21,239 | |||||||||||||||
| Trade, Investment and Food Inspection |
34,116 | 2,203 | - | (400 | ) | 35,919 | ||||||||||||||
| Primary Agriculture |
114,978 | 1,867 | - | (1,384 | ) | 115,461 | ||||||||||||||
| Lending |
- | - | 32,306 | - | 32,306 | |||||||||||||||
| Insurance |
368,646 | - | 465,505 | (371,115 | ) | 463,036 | ||||||||||||||
| Agriculture Income Support |
50,067 | - | 104,980 | (50,067 | ) | 104,980 | ||||||||||||||
| Water Management |
20,788 | 28,178 | - | - | 48,966 | |||||||||||||||
| Sustainable Canadian Agricultural Partnership |
58,497 | - | - | (227 | ) | 58,270 | ||||||||||||||
| Debt Servicing Costs |
- | - | 83,472 | (83,472 | ) | - | ||||||||||||||
| Total |
679,936 | 32,451 | 686,263 | (506,695 | ) | 891,955 | ||||||||||||||
| CAPITAL INVESTMENT |
||||||||||||||||||||
| Ministry Support Services |
990 | - | - | - | 990 | |||||||||||||||
| Trade, Investment and Food Inspection |
1,028 | - | - | - | 1,028 | |||||||||||||||
| Primary Agriculture |
159 | - | - | - | 159 | |||||||||||||||
| Lending |
- | - | 176 | - | 176 | |||||||||||||||
| Insurance |
- | - | 3,965 | - | 3,965 | |||||||||||||||
| Agriculture Income Support |
- | - | 108 | - | 108 | |||||||||||||||
| Water Management |
5,000 | 38,032 | - | (38,032 | ) | 5,000 | ||||||||||||||
| Total |
7,177 | 38,032 | 4,249 | (38,032 | ) | 11,426 | ||||||||||||||
| RECONCILIATION BY TYPE OF SPENDING |
|
|||||||||||||||||||
| EXPENSE |
||||||||||||||||||||
| Operating expense |
626,344 | - | 599,219 | (422,023 | ) | 803,540 | ||||||||||||||
| Capital grants |
52,392 | - | - | - | 52,392 | |||||||||||||||
| Capital payments to related parties |
1,200 | - | - | (1,200 | ) | - | ||||||||||||||
| Amortization |
- | 32,451 | 3,572 | - | 36,023 | |||||||||||||||
| Debt servicing costs - general |
- | - | 83,472 | (83,472 | ) | - | ||||||||||||||
| Total |
679,936 | 32,451 | 686,263 | (506,695 | ) | 891,955 | ||||||||||||||
| CAPITAL INVESTMENT |
7,177 | 38,032 | 4,249 | (38,032 | ) | 11,426 | ||||||||||||||
|
|
||||||||||||||||||||
| Agriculture and Irrigation | 44 |
| MINISTRY FINANCIAL STATEMENTS |
||||||||||||
| STATEMENT OF OPERATIONS |
||||||||||||
| (thousands of dollars) | Comparable | |||||||||||
|
2022-23 Budget |
2022-23 Forecast |
2023-24 Estimate |
||||||||||
| REVENUE |
||||||||||||
| Transfers of Assets or Liabilities from Related Parties |
15,032 | 15,032 | 38,032 | |||||||||
| Transfers from Government of Canada |
296,059 | 491,491 | 479,779 | |||||||||
| Investment Income |
112,631 | 91,009 | 125,659 | |||||||||
| Premiums, Fees and Licences |
377,446 | 531,307 | 630,030 | |||||||||
| Other Revenue |
3,721 | 10,833 | 4,913 | |||||||||
| Ministry Total |
804,889 | 1,139,672 | 1,278,413 | |||||||||
| Inter-Ministry Consolidations |
(15,594 | ) | (15,594 | ) | (38,594 | ) | ||||||
| Consolidated Total |
789,295 | 1,124,078 | 1,239,819 | |||||||||
| EXPENSE |
||||||||||||
| Ministry Support Services |
11,490 | 11,490 | 11,808 | |||||||||
| Rural Programming and Agricultural Societies |
14,601 | 14,601 | 21,239 | |||||||||
| Trade, Investment and Food Inspection |
34,273 | 39,023 | 36,319 | |||||||||
| Primary Agriculture |
104,402 | 105,304 | 116,845 | |||||||||
| Lending |
31,631 | 33,218 | 32,306 | |||||||||
| Insurance |
403,473 | 1,357,589 | 464,855 | |||||||||
| Agriculture Income Support |
88,976 | 256,096 | 104,980 | |||||||||
| Water Management |
59,868 | 52,882 | 48,966 | |||||||||
| Sustainable Canadian Agricultural Partnership |
46,814 | 50,470 | 58,497 | |||||||||
| Debt Servicing Costs |
64,425 | 74,236 | 83,472 | |||||||||
| Ministry Total |
859,953 | 1,994,909 | 979,287 | |||||||||
| Inter-Ministry Consolidations |
(67,085 | ) | (76,896 | ) | (87,332 | ) | ||||||
| Consolidated Total |
792,868 | 1,918,013 | 891,955 | |||||||||
| Net Operating Result |
(3,573 | ) | (793,935 | ) | 347,864 | |||||||
| CHANGE IN CAPITAL ASSETS |
||||||||||||
| INVESTMENT |
||||||||||||
| Ministry Support Services |
990 | 335 | 990 | |||||||||
| Trade, Investment and Food Inspection |
1,523 | 2,967 | 1,028 | |||||||||
| Primary Agriculture |
159 | 601 | 159 | |||||||||
| Lending |
555 | 587 | 176 | |||||||||
| Insurance |
3,422 | 778 | 3,965 | |||||||||
| Agriculture Income Support |
238 | 65 | 108 | |||||||||
| Water Management |
15,032 | 15,032 | 43,032 | |||||||||
| Ministry Total |
21,919 | 20,365 | 49,458 | |||||||||
| Inter-Ministry Consolidations |
(15,032 | ) | (15,032 | ) | (38,032 | ) | ||||||
| Consolidated Total |
6,887 | 5,333 | 11,426 | |||||||||
| AMORTIZATION |
(49,218 | ) | (33,692 | ) | (36,023 | ) | ||||||
| Change in Capital Assets Total |
(42,331 | ) | (28,359 | ) | (24,597 | ) | ||||||
| 45 | Agriculture and Irrigation |
Children’s Services
AMOUNTS TO BE VOTED
| (thousands of dollars) |
Comparable |
|||||||||||
|
2022-23 Budget |
2022-23 Forecast |
2023-24 Estimate |
||||||||||
| EXPENSE |
2,066,316 | 2,066,516 | 2,319,912 | |||||||||
| CAPITAL INVESTMENT |
7,500 | 15,021 | 10,000 | |||||||||
47
DESCRIPTION OF SUPPLY VOTE PROGRAMS
| 1 | Ministry Support Services |
| 1.1 | Minister’s Office |
Oversees the development of ministerial policies that are aligned with broader government-wide objectives and priorities.
| 1.2 | Deputy Minister’s Office |
Supports the Minister in achieving business plan and strategic goals of the ministry, government and public service.
| 1.3 | Corporate Services |
Provides business services and corporate finance for the ministry.
| 2 | Child Intervention |
| 2.1 | Program Planning and Supports |
Sustains non-program supports for regional service delivery.
| 2.2 | Child Intervention Delivery |
Complies with legislative mandate to assess child safety and provide critical services to families and children.
| 2.3 | Supports for Permanency |
Provides financial support to families who adopt or obtain private guardianship of children in permanent government care.
| 2.4 | Kinship and Foster Care Support |
Provides culturally-appropriate and diverse supports to children temporarily unable to live in their family home.
| 3 | Child Care |
| 3.1 | Child Care Affordability and Access |
Provides funding to licensed child care programs to lower child care fees and improve access to quality, inclusive child care. Also oversees licensing and inspections.
| 3.2 | Child Care Quality and Worker Supports |
Issues early childhood educator certification and provides funding for professional development and tiered wage top-ups contingent upon qualifications and education of individuals working in licensed child care programs.
| 4 | Early Intervention Services for Children and Youth |
| 4.1 | Early Intervention and Early Childhood Development |
Mitigates the need for child intervention services and enhances child, youth and family resiliency through a continuum of supports (e.g. mentoring, parenting resources, home visitation, and supports for healthy child and youth development).
| 4.2 | Youth in Transition |
Supports vulnerable youth, with previous or current child intervention involvement, transitioning to adulthood through financial, mentoring and bursary programs and the cost of post-secondary education.
| 5 | Indigenous Partnerships and Strategic Services |
| 5.1 | Policy and Partnerships |
Provides strategic advice and support for innovative policy development and implementation as well as leads partnership and agreement discussions with Indigenous stakeholders.
| 5.2 | Indigenous Connections |
Strengthens relationships between the Ministry and Indigenous and Community Stakeholders and develops strong collaborative partnerships.
| 6 | Affordability Supports and Inflation Relief – Families with Children |
Affordability relief measure targeted at the most vulnerable Albertans to address the rising cost of living resulting from high inflation.
| Children’s Services | 48 |
EXPENSE VOTE BY PROGRAM
| (thousands of dollars) |
Comparable |
|||||||||||||||
|
2022-23 Budget |
2022-23 Forecast |
2023-24 Estimate |
||||||||||||||
| OPERATING EXPENSE |
||||||||||||||||
| 1 |
Ministry Support Services |
|||||||||||||||
| 1.1 |
Minister’s Office |
742 | 742 | 742 | ||||||||||||
| 1.2 |
Deputy Minister’s Office |
756 | 756 | 756 | ||||||||||||
| 1.3 |
Corporate Services |
4,430 | 4,430 | 4,585 | ||||||||||||
| Sub-total | 5,928 | 5,928 | 6,083 | |||||||||||||
| 2 |
Child Intervention |
|||||||||||||||
| 2.1 |
Program Planning and Supports |
10,884 | 10,884 | 11,178 | ||||||||||||
| 2.2 |
Child Intervention Delivery |
519,678 | 516,178 | 545,859 | ||||||||||||
| 2.3 |
Supports for Permanency |
67,537 | 67,537 | 67,619 | ||||||||||||
| 2.4 |
Kinship and Foster Care Support |
231,700 | 231,700 | 244,151 | ||||||||||||
| Sub-total | 829,799 | 826,299 | 868,807 | |||||||||||||
| 3 |
Child Care |
|||||||||||||||
| 3.1 |
Child Care Affordability and Access |
879,010 | 873,510 | 1,039,864 | ||||||||||||
| 3.2 |
Child Care Quality and Worker Supports |
197,122 | 197,122 | 229,418 | ||||||||||||
| Sub-total | 1,076,132 | 1,070,632 | 1,269,282 | |||||||||||||
| 4 |
Early Intervention Services for Children and Youth |
|||||||||||||||
| 4.1 |
Early Intervention and Early Childhood Development |
80,794 | 80,794 | 80,839 | ||||||||||||
| 4.2 |
Youth in Transition |
62,426 | 62,426 | 67,964 | ||||||||||||
| Sub-total | 143,220 | 143,220 | 148,803 | |||||||||||||
| 5 |
Indigenous Partnerships and Strategic Services |
|||||||||||||||
| 5.1 |
Policy and Partnerships |
7,637 | 7,637 | 7,637 | ||||||||||||
| 5.2 |
Indigenous Connections |
2,600 | 2,600 | 2,600 | ||||||||||||
| Sub-total | 10,237 | 10,237 | 10,237 | |||||||||||||
| 6 |
Affordability Supports and Inflation Relief – Families with Children |
- | 7,200 | 7,700 | ||||||||||||
| CAPITAL GRANTS |
||||||||||||||||
| 2 |
Child Intervention |
|||||||||||||||
| 2.2 |
Child Intervention Delivery |
1,000 | 1,000 | 1,000 | ||||||||||||
| 3 |
Child Care |
|||||||||||||||
| 3.1 |
Child Care Affordability and Access |
- | 2,000 | 8,000 | ||||||||||||
| Total |
2,066,316 | 2,066,516 | 2,319,912 | |||||||||||||
| 49 | Children’s Services |
CAPITAL INVESTMENT VOTE BY PROGRAM
| (thousands of dollars) |
Comparable |
|||||||||||||||
|
2022-23 Budget |
2022-23 Forecast |
2023-24 Estimate |
||||||||||||||
| DEPARTMENT CAPITAL ACQUISITIONS |
||||||||||||||||
| 2 |
Child Intervention |
|||||||||||||||
| 2.2 |
Child Intervention Delivery |
- | 4,021 | - | ||||||||||||
| 3 |
Child Care |
|||||||||||||||
| 3.1 |
Child Care Affordability and Access |
7,500 | 11,000 | 10,000 | ||||||||||||
| Total |
7,500 | 15,021 | 10,000 | |||||||||||||
| Children’s Services | 50 |
AMOUNTS NOT REQUIRED TO BE VOTED
The following department amounts do not require a supply vote either because no cash disbursement is required, or because the Legislative Assembly has already provided the funding authority pursuant to a statute other than an appropriation act.
EXPENSE
| (thousands of dollars) |
Comparable |
|||||||||||
|
2022-23 Budget |
2022-23 Forecast |
2023-24 Estimate |
||||||||||
| DEPARTMENT STATUTORY AMOUNTS |
||||||||||||
| Operating Expense |
||||||||||||
| Alberta Child and Family Benefit |
335,000 | 335,000 | 345,000 | |||||||||
| Affordability Supports and Inflation Relief – Families with Children |
- | 263,500 | 263,500 | |||||||||
| DEPARTMENT NON-CASH AMOUNTS |
||||||||||||
| Amortization |
||||||||||||
| Child Intervention |
72 | 72 | 72 | |||||||||
| Child Care |
- | - | 1,000 | |||||||||
| Valuation Adjustments and Other Provisions |
||||||||||||
| Child Intervention |
1,500 | 1,500 | 1,500 | |||||||||
| Total |
336,572 | 600,072 | 611,072 | |||||||||
| 51 | Children’s Services |
RECONCILIATION OF SUPPLY VOTE TO CONSOLIDATED GOVERNMENT ESTIMATE
The following tables summarize the relationship between the department’s Supply Votes and the effect of the ministry on the Government’s consolidated 2023-24 Estimates.
| RECONCILIATION BY PROGRAM |
||||||||||||||||
| (thousands of dollars) | Voted Supply |
Department Amounts Not Voted |
Consolidation Adjustments |
Consolidated |
||||||||||||
| EXPENSE |
||||||||||||||||
| Ministry Support Services |
6,083 | - | - | 6,083 | ||||||||||||
| Child Intervention |
869,807 | 1,572 | (2,360 | ) | 869,019 | |||||||||||
| Child Care |
1,277,282 | 1,000 | (7,030 | ) | 1,271,252 | |||||||||||
| Early Intervention Services for Children and Youth |
148,803 | - | (4,310 | ) | 144,493 | |||||||||||
| Indigenous Partnerships and Strategic Services |
10,237 | - | - | 10,237 | ||||||||||||
| Alberta Child and Family Benefit |
- | 345,000 | - | 345,000 | ||||||||||||
| Affordability Supports and Inflation Relief – Families with Children |
7,700 | 263,500 | - | 271,200 | ||||||||||||
| Total |
2,319,912 | 611,072 | (13,700 | ) | 2,917,284 | |||||||||||
| CAPITAL INVESTMENT |
||||||||||||||||
| Child Care |
10,000 | - | - | 10,000 | ||||||||||||
| RECONCILIATION BY TYPE OF SPENDING |
|
|||||||||||||||
| EXPENSE |
||||||||||||||||
| Operating expense |
2,310,912 | 610,000 | (13,700 | ) | 2,907,212 | |||||||||||
| Capital grants |
9,000 | - | - | 9,000 | ||||||||||||
| Amortization |
- | 1,072 | - | 1,072 | ||||||||||||
| Total |
2,319,912 | 611,072 | (13,700 | ) | 2,917,284 | |||||||||||
| CAPITAL INVESTMENT |
10,000 | - | - | 10,000 | ||||||||||||
|
|
||||||||||||||||
| Children’s Services | 52 |
| MINISTRY FINANCIAL STATEMENTS |
||||||||||||
| STATEMENT OF OPERATIONS |
||||||||||||
| (thousands of dollars) |
Comparable |
|||||||||||
|
2022-23 Budget |
2022-23 Forecast |
2023-24 Estimate |
||||||||||
| REVENUE |
||||||||||||
| Services to First Nations Reserves |
45,678 | 50,800 | 45,678 | |||||||||
| Other Federal Transfers |
769,022 | 769,022 | 972,179 | |||||||||
| Premiums, Fees and Licences |
55 | 55 | 55 | |||||||||
| Other Revenue |
7,699 | 7,699 | 7,699 | |||||||||
| Consolidated Total |
822,454 | 827,576 | 1,025,611 | |||||||||
| EXPENSE |
||||||||||||
| Ministry Support Services |
5,928 | 5,928 | 6,083 | |||||||||
| Child Intervention |
832,371 | 828,871 | 871,379 | |||||||||
| Child Care |
1,076,132 | 1,072,632 | 1,278,282 | |||||||||
| Early Intervention Services for Children and Youth |
143,220 | 143,220 | 148,803 | |||||||||
| Indigenous Partnerships and Strategic Services |
10,237 | 10,237 | 10,237 | |||||||||
| Alberta Child and Family Benefit |
335,000 | 335,000 | 345,000 | |||||||||
| Affordability Supports and Inflation Relief – Families with Children |
- | 270,700 | 271,200 | |||||||||
| Ministry Total |
2,402,888 | 2,666,588 | 2,930,984 | |||||||||
| Inter-Ministry Consolidations |
(13,700 | ) | (13,700 | ) | (13,700 | ) | ||||||
| Consolidated Total |
2,389,188 | 2,652,888 | 2,917,284 | |||||||||
| Net Operating Result |
(1,566,734 | ) | (1,825,312 | ) | (1,891,673 | ) | ||||||
| CHANGE IN CAPITAL ASSETS |
||||||||||||
| INVESTMENT |
||||||||||||
| Child Intervention |
- | 4,021 | - | |||||||||
| Child Care |
7,500 | 11,000 | 10,000 | |||||||||
| Consolidated Total |
7,500 | 15,021 | 10,000 | |||||||||
| AMORTIZATION |
(72 | ) | (72 | ) | (1,072 | ) | ||||||
| Change in Capital Assets Total |
7,428 | 14,949 | 8,928 | |||||||||
| 53 | Children’s Services |
Culture
AMOUNTS TO BE VOTED
| (thousands of dollars) |
Comparable |
|||||||||||
|
2022-23 Budget |
2022-23 Forecast |
2023-24 Estimate |
||||||||||
| EXPENSE |
260,123 | 262,981 | 301,380 | |||||||||
| CAPITAL INVESTMENT |
2,331 | 961 | 2,331 | |||||||||
| FINANCIAL TRANSACTIONS |
2,093 | 1,748 | 1,710 | |||||||||
55
DESCRIPTION OF SUPPLY VOTE PROGRAMS
| 1 | Ministry Support Services |
| 1.1 | Minister’s Office |
Oversees the development of ministerial policies that are aligned with broader government-wide objectives and priorities.
| 1.2 | Deputy Minister’s Office |
Supports the Minister in achieving business plan and strategic goals of the ministry, government and public service.
| 1.3 | Strategic Services |
Provides strategic policy and planning, and financial services.
| 2 | Community and Voluntary Support Services |
| 2.1 | Program Support |
Supports activities, including policy analysis, information management, and strategic, financial, and operational planning matters.
| 2.2 | Community Engagement |
Provides leadership and assistance to the nonprofit/voluntary sector to enhance capacity, lead research, planning, and initiatives. Provides leadership on civil societies sector issues.
| 2.3 | Community Initiatives Program |
Funds initiatives under several grant streams: Project-based; Operating; Enhanced Capacity Advancement Program; Major Cultural and Sport Events; Alberta Culture Days; Indigenous and Inclusion; Creative Partnership Alberta and Volunteer Grants.
| 2.4 | Other Initiatives |
Funds projects that fall outside the parameters of the Community Initiatives Program and Community Facility Enhancement Program.
| 2.5 | Major Fairs |
Provides operational grants to support Alberta’s major urban fairs.
| 2.6 | Community Facility Enhancement Program |
Assists non-profit organizations with the renewal, expansion, purchase, or build of public-use community facilities.
| 2.7 | Support for Culture Infrastructure |
Assists non-profit organizations in the construction of cultural facilities through capital funding.
| 2.8 | Investing in Canada Infrastructure - Community, Culture and Recreation |
Funds initiatives to improve access and quality of cultural, recreational and community infrastructure for Canadians, including Indigenous peoples and vulnerable populations.
| 3 | Cultural Industries |
| 3.1 | Program Support |
Supports policy analysis, information management, and strategic, financial, and operational planning matters.
| 3.2 | Cultural Industries |
Supports Alberta’s cultural industries, operates the provincial film commission, and oversees the operation of the Northern and Southern Alberta Jubilee Auditoria.
| 3.3 | Alberta Media Fund |
Provides grants to support film and television production in Alberta and support for cultural industries initiatives and organizations.
| Culture | 56 |
DESCRIPTION OF SUPPLY VOTE PROGRAMS... continued
| 4 | Arts |
| 4.1 | Arts |
Provides funding and support to Alberta’s arts sector through the Alberta Foundation for the Arts and the Foundation’s art collection. Also promotes the value of the arts and manages film classification services.
| 4.2 | Assistance to the Alberta Foundation for the Arts |
Provides funding to support the Alberta Foundation for the Arts.
| 5 | Francophone Secretariat |
| 5.1 | Francophone Secretariat |
Acts as the coordinating body in the implementation of the cross-government French Policy and as a liaison between the government’s various ministries and Alberta’s Francophonie.
| 5.2 | French Language Services |
Negotiates and administers federal funding under the multi-year Canada-Alberta Agreement on French-Language Services. Federal funding is used to support the development and delivery of government services in French.
| 6 | Heritage |
| 6.1 | Program Support |
Supports business activities, including policy analysis, information management, and strategic, financial, and operational planning matters.
| 6.2 | Royal Alberta Museum |
The central repository and showcase for much of the Province’s collections and associated knowledge that document the broad range of historic and contemporary Alberta human and natural history.
| 6.3 | Royal Tyrrell Museum |
Dedicated to the collection, preservation, research, display, and interpretation of the Province’s rich and diverse palaeontological resources.
| 6.4 | Historic Sites and Other Museums |
Includes 17 historical sites and interpretive centres across the Province focused on collecting, conserving, researching and presenting Alberta’s heritage.
| 6.5 | Provincial Archives of Alberta |
Primary repository for textual, audiovisual, photographic, and other archival records, acquired from both the government and private sectors.
| 6.6 | Historic Resources Management |
Regulates potential adverse effects to significant Alberta historic resources, which include historic buildings, archaeological sites and Indigenous heritage traditional use sites.
| 6.7 | Support to Glenbow Museum |
Provides annual contract funding to the Glenbow to conserve and display government-owned objects in the institution’s collections.
| 6.8 | Heritage Preservation Partnership Programs |
Provides project grants to preserve and interpret Alberta’s heritage through research and heritage awareness initiatives and projects to conserve legally protected heritage buildings.
| 6.9 | Support for Provincial Heritage Organizations |
Offers annual operational grants to six provincial heritage organizations that provide programs and services to their institutional and individual members.
| 6.10 | Heritage Capital and Repairs |
Facilitates investment in exhibits, equipment, information technology, and capital repairs and maintenance throughout a network of 20 museums, historic sites and interpretive centres.
| 57 | Culture |
DESCRIPTION OF SUPPLY VOTE PROGRAMS... continued
| 7 | Sport, Physical Activity and Recreation |
| 7.1 | Recreation and Physical Activity Services |
Works with national, provincial, and local partners in recreation and physical activity to develop and advance policy and programs.
| 7.2 | Sport Development Services |
Supports Provincial Sport, Physical Activity and Recreation Organizations in enhancing participant (athlete, coach, official and volunteer) development to develop and advance operational policies and programs.
| 7.3 | Multi-Sport Games |
Provides and supports opportunities for Alberta’s athletes to participate in multisport games including Alberta Summer and Winter Games and other interprovincial and international games.
| 7.4 | Support for Sport, Physical Activity and Recreation |
Supports Alberta’s sport, physical activity and recreation sector through grants to organizations and individuals.
| 8 | Status of Women |
Develops and promotes strategic policies and solutions that improve women’s economic security, address gender-based violence and support diversity and inclusion.
| Culture | 58 |
EXPENSE VOTE BY PROGRAM
| (thousands of dollars) |
Comparable |
|||||||||||||||
|
2022-23 Budget |
2022-23 Forecast |
2023-24 Estimate |
||||||||||||||
| OPERATING EXPENSE |
||||||||||||||||
| 1 |
Ministry Support Services |
|||||||||||||||
| 1.1 |
Minister’s Office |
860 | 860 | 880 | ||||||||||||
| 1.2 |
Deputy Minister’s Office |
885 | 885 | 900 | ||||||||||||
| 1.3 |
Strategic Services |
5,798 | 5,798 | 5,788 | ||||||||||||
| Sub-total | 7,543 | 7,543 | 7,568 | |||||||||||||
| 2 |
Community and Voluntary Support Services |
|||||||||||||||
| 2.1 |
Program Support |
690 | 690 | 695 | ||||||||||||
| 2.2 |
Community Engagement |
6,910 | 6,910 | 7,080 | ||||||||||||
| 2.3 |
Community Initiatives Program |
20,735 | 19,735 | 20,025 | ||||||||||||
| 2.4 |
Other Initiatives |
2,200 | 13,375 | 3,200 | ||||||||||||
| 2.5 |
Major Fairs |
6,805 | 6,805 | 6,805 | ||||||||||||
| Sub-total | 37,340 | 47,515 | 37,805 | |||||||||||||
| 3 |
Cultural Industries |
|||||||||||||||
| 3.1 |
Program Support |
880 | 880 | 895 | ||||||||||||
| 3.2 |
Cultural Industries |
6,545 | 7,390 | 7,005 | ||||||||||||
| 3.3 |
Alberta Media Fund |
4,000 | 6,000 | 8,000 | ||||||||||||
| Sub-total | 11,425 | 14,270 | 15,900 | |||||||||||||
| 4 |
Arts |
|||||||||||||||
| 4.1 |
Arts |
3,060 | 3,060 | 3,135 | ||||||||||||
| 4.2 |
Assistance to the Alberta Foundation for the Arts |
25,585 | 25,585 | 25,585 | ||||||||||||
| Sub-total | 28,645 | 28,645 | 28,720 | |||||||||||||
| 5 |
Francophone Secretariat |
|||||||||||||||
| 5.1 |
Francophone Secretariat |
725 | 725 | 740 | ||||||||||||
| 5.2 |
French Language Services |
650 | 650 | 650 | ||||||||||||
| Sub-total | 1,375 | 1,375 | 1,390 | |||||||||||||
| 6 |
Heritage |
|||||||||||||||
| 6.1 |
Program Support |
1,547 | 1,547 | 1,547 | ||||||||||||
| 6.2 |
Royal Alberta Museum |
10,260 | 10,260 | 11,040 | ||||||||||||
| 6.3 |
Royal Tyrrell Museum |
6,975 | 6,975 | 6,770 | ||||||||||||
| 6.4 |
Historic Sites and Other Museums |
7,865 | 7,865 | 8,375 | ||||||||||||
| 6.5 |
Provincial Archives of Alberta |
3,210 | 3,210 | 3,330 | ||||||||||||
| 6.6 |
Historic Resources Management |
5,090 | 5,090 | 5,250 | ||||||||||||
| 6.7 |
Support to Glenbow Museum |
2,288 | 2,288 | 2,288 | ||||||||||||
| 6.8 |
Heritage Preservation Partnership Programs |
1,450 | 1,450 | 1,450 | ||||||||||||
| 6.9 |
Support for Provincial Heritage Organizations |
1,705 | 1,705 | 1,705 | ||||||||||||
| 6.10 |
Heritage Capital and Repairs |
- | 925 | - | ||||||||||||
| Sub-total | 40,390 | 41,315 | 41,755 | |||||||||||||
| 59 | Culture |
EXPENSE VOTE BY PROGRAM ... continued
| (thousands of dollars) |
Comparable |
|||||||||||||||
|
2022-23 Budget |
2022-23 Forecast |
2023-24 Estimate |
||||||||||||||
| OPERATING EXPENSE... continued |
||||||||||||||||
| 7 |
Sport, Physical Activity and Recreation |
|||||||||||||||
| 7.1 |
Recreation and Physical Activity Services |
2,255 | 2,255 | 2,295 | ||||||||||||
| 7.2 |
Sport Development Services |
1,350 | 1,350 | 1,375 | ||||||||||||
| 7.3 |
Multi-Sport Games |
1,625 | 1,625 | 1,650 | ||||||||||||
| 7.4 |
Support for Sport, Physical Activity and Recreation |
14,605 | 14,605 | 22,605 | ||||||||||||
| Sub-total | 19,835 | 19,835 | 27,925 | |||||||||||||
| 8 |
Status of Women |
3,975 | 4,750 | 4,030 | ||||||||||||
| CAPITAL GRANTS |
||||||||||||||||
| 2 |
Community and Voluntary Support Services |
|||||||||||||||
| 2.6 |
Community Facility Enhancement Program |
38,500 | 37,000 | 50,000 | ||||||||||||
| 2.7 |
Support for Culture Infrastructure |
38,427 | 38,427 | 45,099 | ||||||||||||
| 2.8 |
Investing in Canada Infrastructure - Community, Culture and Recreation |
32,668 | 22,306 | 41,188 | ||||||||||||
| Sub-total | 109,595 | 97,733 | 136,287 | |||||||||||||
| Total |
260,123 | 262,981 | 301,380 | |||||||||||||
| CAPITAL INVESTMENT VOTE BY PROGRAM |
||||||||||||||||
| DEPARTMENT CAPITAL ACQUISITIONS |
||||||||||||||||
| 3 |
Cultural Industries |
|||||||||||||||
| 3.2 |
Cultural Industries |
385 | 185 | 385 | ||||||||||||
| 6 |
Heritage |
|||||||||||||||
| 6.10 |
Heritage Capital and Repairs |
1,946 | 776 | 1,946 | ||||||||||||
| Total |
2,331 | 961 | 2,331 | |||||||||||||
| FINANCIAL TRANSACTIONS VOTE BY PROGRAM |
||||||||||||||||
| INVENTORY ACQUISITION |
||||||||||||||||
| 6 |
Heritage |
|||||||||||||||
| 6.2 |
Royal Alberta Museum |
730 | 730 | 730 | ||||||||||||
| 6.4 |
Historic Sites and Other Museums |
250 | 250 | 250 | ||||||||||||
| 6.5 |
Provincial Archives of Alberta |
10 | 10 | 10 | ||||||||||||
| Sub-total | 990 | 990 | 990 | |||||||||||||
| CONTAMINATED SITE LIABILITY RETIREMENT |
||||||||||||||||
| 6 |
Heritage |
|||||||||||||||
| 6.10 |
Heritage Capital and Repairs |
1,103 | 758 | 720 | ||||||||||||
| Total |
2,093 | 1,748 | 1,710 | |||||||||||||
| Culture | 60 |
VOTED AMOUNTS FUNDED BY CREDIT OR RECOVERY
The following table details the portions of the department’s voted amounts for which a credit or recovery can be obtained. If a credit or recovery amount is expected to exceed its original estimate, the Treasury Board may increase the corresponding voted amount, pursuant to section 24(2) of the Financial Administration Act. If the actual credit or recovery amount realized is less than its original estimate, the corresponding funding authority is reduced by an equivalent amount in the programs shown.
EXPENSE AMOUNTS FUNDED BY CREDIT OR RECOVERY
| (thousands of dollars) |
2023-24 Estimate |
|||||
| 1 |
Heritage | 14,633 | ||||
| The ministry collects various fees and other revenue that are used to partially offset the cost of providing services. Program 6 |
||||||
| 2 |
Jubilee Auditoria | 7,401 | ||||
| Generates revenue from rentals, fees and other sources that are used to offset the cost of providing services. Program 3 |
||||||
| 3 |
Sport, Physical Activity and Recreation | 3,125 | ||||
| Revenue from donations, fees and other sources are used to fund the cost of sport programs, facilities and services. Program 7 |
||||||
| 4 |
Arts | 2,347 | ||||
| Provides financial and administrative services. Costs incurred by the Department for these services are recovered. Program 4 |
||||||
| 5 |
Community and Voluntary Support Services | 500 | ||||
| Revenue from donations are used to support the non-profit and voluntary sector. Program 2 |
||||||
| Total |
28,006 | |||||
| CAPITAL INVESTMENT AMOUNTS FUNDED BY CREDIT OR RECOVERY |
||||||
| 2 |
Jubilee Auditoria | 357 | ||||
| Generates revenue from rentals, fees and other sources that are used to offset the cost of providing services. Program 3 |
||||||
| Total |
357 | |||||
| 61 | Culture |
AMOUNTS NOT REQUIRED TO BE VOTED
The following department amounts do not require a supply vote either because no cash disbursement is required, or because the Legislative Assembly has already provided the funding authority pursuant to a statute other than an appropriation act.
EXPENSE
| (thousands of dollars) |
Comparable |
|||||||||||
|
2022-23 Budget |
2022-23 Forecast |
2023-24 Estimate |
||||||||||
| DEPARTMENT STATUTORY AMOUNTS |
||||||||||||
| Operating Expense |
||||||||||||
| Queen’s Jubilee Scholarship |
80 | 80 | 80 | |||||||||
| DEPARTMENT NON-CASH AMOUNTS |
||||||||||||
| Amortization |
||||||||||||
| Cultural Industries |
580 | 580 | 540 | |||||||||
| Heritage |
7,135 | 7,135 | 6,995 | |||||||||
| Sport, Physical Activity and Recreation |
5 | 5 | 5 | |||||||||
| Consumption of Inventory |
||||||||||||
| Heritage |
990 | 990 | 990 | |||||||||
| Valuation Adjustments and Other Provisions |
||||||||||||
| Ministry Support Services |
137 | 137 | 137 | |||||||||
| Heritage |
500 | 500 | 1,000 | |||||||||
| Total |
9,427 | 9,427 | 9,747 | |||||||||
| Culture | 62 |
RECONCILIATION OF SUPPLY VOTE TO CONSOLIDATED GOVERNMENT ESTIMATE
The following tables summarize the relationship between the department’s Supply Votes and the effect of the ministry on the Government’s consolidated 2023-24 Estimates.
| RECONCILIATION BY PROGRAM |
||||||||||||||||||||
| (thousands of dollars) |
Voted Supply |
Department Amounts Not Voted |
Entities’ Amounts Not Voted |
Consolidation Adjustments |
Consolidated 2023-24 Estimate |
|||||||||||||||
| EXPENSE |
||||||||||||||||||||
| Ministry Support Services |
7,568 | 137 | - | - | 7,705 | |||||||||||||||
| Community and Voluntary Support Services |
174,092 | 80 | - | - | 174,172 | |||||||||||||||
| Cultural Industries |
15,900 | 540 | - | - | 16,440 | |||||||||||||||
| Arts |
28,720 | - | 27,217 | (29,482 | ) | 26,455 | ||||||||||||||
| Francophone Secretariat |
1,390 | - | - | - | 1,390 | |||||||||||||||
| Heritage |
41,755 | 8,985 | - | (250 | ) | 50,490 | ||||||||||||||
| Sport, Physical Activity and Recreation |
27,925 | 5 | - | (1,500 | ) | 26,430 | ||||||||||||||
| Status of Women |
4,030 | - | - | - | 4,030 | |||||||||||||||
| Total |
301,380 | 9,747 | 27,217 | (31,232 | ) | 307,112 | ||||||||||||||
| CAPITAL INVESTMENT |
||||||||||||||||||||
| Cultural Industries |
385 | - | - | - | 385 | |||||||||||||||
| Heritage |
1,946 | - | - | - | 1,946 | |||||||||||||||
| Total |
2,331 | - | - | - | 2,331 | |||||||||||||||
| INVENTORY ACQUISITION Heritage |
990 | - | - | - | 990 | |||||||||||||||
|
|
||||||||||||||||||||
| RECONCILIATION BY TYPE OF SPENDING |
|
|||||||||||||||||||
| EXPENSE |
||||||||||||||||||||
| Operating expense |
165,093 | 1,217 | 27,210 | (31,232 | ) | 162,288 | ||||||||||||||
| Capital grants |
136,287 | - | - | - | 136,287 | |||||||||||||||
| Amortization |
- | 7,540 | 7 | - | 7,547 | |||||||||||||||
| Inventory consumption |
- | 990 | - | - | 990 | |||||||||||||||
| Total |
301,380 | 9,747 | 27,217 | (31,232 | ) | 307,112 | ||||||||||||||
| CAPITAL INVESTMENT |
2,331 | - | - | - | 2,331 | |||||||||||||||
| INVENTORY ACQUISITION |
990 | - | - | - | 990 | |||||||||||||||
|
|
||||||||||||||||||||
| 63 | Culture |
| MINISTRY FINANCIAL STATEMENTS |
||||||||||||
| STATEMENT OF OPERATIONS |
||||||||||||
| (thousands of dollars) |
Comparable |
|||||||||||
|
2022-23 Budget |
2022-23 Forecast |
2023-24 Estimate |
||||||||||
| REVENUE |
||||||||||||
| Transfer from Alberta Heritage Scholarship Fund |
80 | 80 | 80 | |||||||||
| Transfers from Government of Canada |
34,058 | 24,146 | 42,578 | |||||||||
| Investment Income |
100 | 100 | 100 | |||||||||
| Premiums, Fees and Licences |
12,315 | 12,315 | 12,983 | |||||||||
| Other Revenue |
18,618 | 16,018 | 16,518 | |||||||||
| Ministry Total |
65,171 | 52,659 | 72,259 | |||||||||
| Inter-Ministry Consolidations |
(80 | ) | (80 | ) | (80 | ) | ||||||
| Consolidated Total |
65,091 | 52,579 | 72,179 | |||||||||
| EXPENSE |
||||||||||||
| Ministry Support Services |
7,680 | 7,680 | 7,705 | |||||||||
| Community and Voluntary Support Services |
147,015 | 145,328 | 174,172 | |||||||||
| Cultural Industries |
12,005 | 14,850 | 16,440 | |||||||||
| Arts |
30,930 | 27,930 | 28,005 | |||||||||
| Francophone Secretariat |
1,375 | 1,375 | 1,390 | |||||||||
| Heritage |
49,015 | 49,940 | 50,740 | |||||||||
| Sport, Physical Activity and Recreation |
19,840 | 19,840 | 27,930 | |||||||||
| Status of Women |
3,975 | 4,750 | 4,030 | |||||||||
| Ministry Total |
271,835 | 271,693 | 310,412 | |||||||||
| Inter-Ministry Consolidations |
(3,300 | ) | (3,500 | ) | (3,300 | ) | ||||||
| Consolidated Total |
268,535 | 268,193 | 307,112 | |||||||||
| Net Operating Result |
(203,444 | ) | (215,614 | ) | (234,933 | ) | ||||||
| CHANGE IN CAPITAL ASSETS |
||||||||||||
| INVESTMENT |
||||||||||||
| Cultural Industries |
385 | 185 | 385 | |||||||||
| Heritage |
1,946 | 776 | 1,946 | |||||||||
| Consolidated Total |
2,331 | 961 | 2,331 | |||||||||
| AMORTIZATION |
(7,727 | ) | (7,727 | ) | (7,547 | ) | ||||||
| Change in Capital Assets Total |
(5,396 | ) | (6,766 | ) | (5,216 | ) | ||||||
| CHANGE IN INVENTORY ASSETS |
||||||||||||
| INVENTORY ACQUISITION |
||||||||||||
| Heritage |
990 | 990 | 990 | |||||||||
| Consolidated Total |
990 | 990 | 990 | |||||||||
| CONSUMPTION |
(990 | ) | (990 | ) | (990 | ) | ||||||
| Change in Inventory Assets Total |
- | - | - | |||||||||
| Culture | 64 |
Education
AMOUNTS TO BE VOTED
| (thousands of dollars) |
Comparable |
|||||||||
|
2022-23 Budget |
2022-23 Forecast |
2023-24 Estimate | ||||||||
| EXPENSE |
5,007,471 | 5,094,408 | 5,479,943 | |||||||
| CAPITAL INVESTMENT |
565 | 565 | 565 | |||||||
| FINANCIAL TRANSACTIONS |
18,117 | 18,117 | 18,920 | |||||||
65
DESCRIPTION OF SUPPLY VOTE PROGRAMS
| 1 | Ministry Support Services |
| 1.1 | Minister’s Office |
Oversees the development of ministerial policies that are aligned with broader government-wide objectives and priorities.
| 1.2 | Deputy Minister’s Office |
Supports the Minister in achieving business plan and strategic goals of the ministry, government and public service.
| 1.3 | Corporate Services |
Financial administration and operations, policy and legislation development, contracts management, and project management.
| 2 | Education System Support |
Facilitates Kindergarten to Grade 12 budgeting and grant management, capital planning, curriculum development, accredited teacher certifications, international education, and student assessment.
| 3 | Operating Support for School Jurisdictions |
| 3.1 | Base Funding |
Funding for the delivery of basic instructional programming for early childhood services to Grade 12 education programs and curriculum implementation.
| 3.2 | Learning Support Funding |
Funding to support the unique and diverse learning needs and well being of children and students.
| 3.3 | Operations and Maintenance |
Funding for operations and routine maintenance of school facilities.
| 3.4 | Transportation |
Funding for student transportation services.
| 3.5 | Governance and Administration |
Funding for governance and system administration expenditures.
| 4 | Accredited Private Schools and Early Childhood Service Operators |
| 4.1 | Accredited Private Schools Support |
Funding to accredited independent schools and designated special education for children in Kindergarten to Grade 12.
| 4.2 | Accredited Private Early Childhood Service Operators Support |
Funding to accredited independent early childhood service operators.
| 5 | School Facilities |
| 5.1 | School Facilities Infrastructure |
Funding to modernize existing schools or infrastructure maintenance and renewal projects.
| 5.2 | Alberta Schools Alternative Procurement |
Debt servicing costs for P3 schools built under Alberta Schools Alternative Procurement projects.
| Education | 66 |
EXPENSE VOTE BY PROGRAM
| (thousands of dollars) |
Comparable |
|||||||||||||||
|
2022-23 Budget |
2022-23 Forecast |
2023-24 Estimate |
||||||||||||||
| OPERATING EXPENSE |
||||||||||||||||
| 1 |
Ministry Support Services |
|||||||||||||||
| 1.1 |
Minister’s Office |
769 | 769 | 769 | ||||||||||||
| 1.2 |
Deputy Minister’s Office |
661 | 661 | 661 | ||||||||||||
| 1.3 |
Corporate Services |
4,871 | 4,871 | 4,999 | ||||||||||||
| Sub-total | 6,301 | 6,301 | 6,429 | |||||||||||||
| 2 |
Education System Support |
85,380 | 85,380 | 86,641 | ||||||||||||
| 3 |
Operating Support for School Jurisdictions |
|||||||||||||||
| 3.1 |
Base Funding |
1,812,907 | 1,852,401 | 2,048,894 | ||||||||||||
| 3.2 |
Learning Support Funding |
1,403,436 | 1,428,136 | 1,487,351 | ||||||||||||
| 3.3 |
Operations and Maintenance |
667,239 | 667,239 | 676,864 | ||||||||||||
| 3.4 |
Transportation |
319,081 | 338,381 | 420,931 | ||||||||||||
| 3.5 |
Governance and Administration |
275,900 | 275,900 | 275,900 | ||||||||||||
| Sub-total | 4,478,563 | 4,562,057 | 4,909,940 | |||||||||||||
| 4 |
Accredited Private Schools and Early Childhood Service Operators |
|||||||||||||||
| 4.1 |
Accredited Private Schools Support |
189,191 | 189,191 | 207,283 | ||||||||||||
| 4.2 |
Accredited Private Early Childhood Service Operators Support |
127,716 | 127,716 | 137,707 | ||||||||||||
| Sub-total | 316,907 | 316,907 | 344,990 | |||||||||||||
| 5 |
School Facilities |
|||||||||||||||
| 5.1 |
School Facilities Infrastructure |
1,000 | 1,000 | 1,000 | ||||||||||||
| CAPITAL GRANTS |
||||||||||||||||
| 5 |
School Facilities |
|||||||||||||||
| 5.1 |
School Facilities Infrastructure |
7,682 | 9,864 | 2,743 | ||||||||||||
| CAPITAL PAYMENTS TO RELATED PARTIES |
||||||||||||||||
| 5 |
School Facilities |
|||||||||||||||
| 5.1 |
School Facilities Infrastructure |
86,287 | 87,548 | 103,651 | ||||||||||||
| DEBT SERVICING |
||||||||||||||||
| 5 |
School Facilities |
|||||||||||||||
| 5.2 |
Alberta Schools Alternative Procurement |
25,351 | 25,351 | 24,549 | ||||||||||||
| Total |
5,007,471 | 5,094,408 | 5,479,943 | |||||||||||||
| CAPITAL INVESTMENT VOTE BY PROGRAM |
||||||||||||||||
| DEPARTMENT CAPITAL ACQUISITIONS |
||||||||||||||||
| 2 |
Education System Support |
565 | 565 | 565 | ||||||||||||
| Total |
565 | 565 | 565 | |||||||||||||
| 67 | Education |
| FINANCIAL TRANSACTIONS VOTE BY PROGRAM
|
||||||||||||||||
| (thousands of dollars) |
Comparable |
|||||||||||||||
|
2022-23 Budget |
2022-23 Forecast |
2023-24 Estimate |
||||||||||||||
| DEBT REPAYMENT FOR PUBLIC PRIVATE PARTNERSHIPS |
| |||||||||||||||
| 5 |
School Facilities |
|||||||||||||||
| 5.2 |
Alberta Schools Alternative Procurement |
18,117 | 18,117 | 18,920 | ||||||||||||
| Total |
18,117 | 18,117 | 18,920 | |||||||||||||
| Education | 68 |
VOTED AMOUNTS FUNDED BY CREDIT OR RECOVERY
The following table details the portions of the department’s voted amounts for which a credit or recovery can be obtained. If a credit or recovery amount is expected to exceed its original estimate, the Treasury Board may increase the corresponding voted amount, pursuant to section 24(2) of the Financial Administration Act. If the actual credit or recovery amount realized is less than its original estimate, the corresponding funding authority is reduced by an equivalent amount in the programs shown.
EXPENSE AMOUNTS FUNDED BY CREDIT OR RECOVERY
| (thousands of dollars) | 2023-24 Estimate | |||
| 1 |
French Language Program | 18,000 | ||
| Funding received from the federal government to support French minority language and second language education programs. Program 3.2 |
||||
| 2 |
Diploma Exam Rewrites | 1,530 | ||
| Revenue generated from the fees collected from students and from sales of diploma examinations outside of Alberta funds the cost of writing examinations for retesting and rescoring. Program 2 |
||||
| 3 |
Educational Print Services | 1,500 | ||
| Revenue generated from the sale of educational print services such as curriculum booklets. Brochures, posters and other materials are also sold through the King’s Printer. Program 2 |
||||
| 4 |
High School Transcripts | 1,400 | ||
| Revenue generated from the fees collected for the delivery of high school transcripts. Program 2 |
||||
| 5 |
Teacher Certification | 775 | ||
| Revenue generated from fees collected for the evaluation of teacher credentials and the costs associated with the issuance of teacher certificates. Program 2 |
||||
| 6 |
Other Fees and Licences | 20 | ||
| Revenue generated from the fees collected from the licence agreements for achievement tests and diploma examinations. Program 2 |
||||
| Total |
23,225 | |||
| 69 | Education |
AMOUNTS NOT REQUIRED TO BE VOTED
The following department amounts do not require a supply vote either because no cash disbursement is required, or because the Legislative Assembly has already provided the funding authority pursuant to a statute other than an appropriation act.
EXPENSE
| (thousands of dollars) |
Comparable |
|||||||||||
|
2022-23 Budget |
2022-23 Forecast |
2023-24 Estimate |
||||||||||
| DEPARTMENT STATUTORY AMOUNTS |
||||||||||||
| Operating Expense |
||||||||||||
| Teachers’ Pension Plan (post-1992) - payments |
385,400 | 376,001 | 368,591 | |||||||||
| School Facilities |
4,500 | 4,500 | 4,500 | |||||||||
| DEPARTMENT NON-CASH AMOUNTS |
||||||||||||
| Amortization |
||||||||||||
| Education System Support |
1,970 | 2,126 | 1,896 | |||||||||
| Valuation Adjustments and Other Provisions |
||||||||||||
| School Facilities |
- | 55,569 | 64,255 | |||||||||
| Total |
391,870 | 438,196 | 439,242 | |||||||||
| Education | 70 |
RECONCILIATION OF SUPPLY VOTE TO CONSOLIDATED GOVERNMENT ESTIMATE
The following tables summarize the relationship between the department’s Supply Votes and the effect of the ministry on the Government’s consolidated 2023-24 Estimates.
| RECONCILIATION BY PROGRAM |
||||||||||||||||||||
| (thousands of dollars) | Voted Supply |
Department Amounts Not Voted |
Entities’ Amounts Not Voted |
Consolidation Adjustments |
Consolidated |
|||||||||||||||
| EXPENSE |
||||||||||||||||||||
| Ministry Support Services |
6,429 | - | - | - | 6,429 | |||||||||||||||
| Instruction - ECS to Grade 12 |
3,536,245 | 368,591 | 9,061,186 | (6,108,923 | ) | 6,857,099 | ||||||||||||||
| Operations and Maintenance |
676,864 | - | 755,636 | (672,849 | ) | 759,651 | ||||||||||||||
| Student Transportation |
420,931 | - | 475,480 | (420,186 | ) | 476,225 | ||||||||||||||
| Accredited Private Schools and Early Childhood Service Operators |
344,990 | - | - | - | 344,990 | |||||||||||||||
| School Facilities |
107,394 | 68,755 | 482,432 | (173,406 | ) | 485,175 | ||||||||||||||
| Governance and System Administration |
275,900 | - | 273,860 | (273,860 | ) | 275,900 | ||||||||||||||
| Program Support Services |
86,641 | 1,896 | 28,200 | (4,900 | ) | 111,837 | ||||||||||||||
| Debt Servicing Costs |
24,549 | - | 15,172 | (6,580 | ) | 33,141 | ||||||||||||||
| Total |
5,479,943 | 439,242 | 11,091,966 | (7,660,704 | ) | 9,350,447 | ||||||||||||||
| CAPITAL INVESTMENT |
||||||||||||||||||||
| School Facilities |
- | - | 761,206 | - | 761,206 | |||||||||||||||
| Program Support Services |
565 | - | - | - | 565 | |||||||||||||||
| Total |
565 | - | 761,206 | - | 761,771 | |||||||||||||||
| RECONCILIATION BY TYPE OF SPENDING |
|
|||||||||||||||||||
| EXPENSE |
||||||||||||||||||||
| Operating expense |
5,349,000 | 437,346 | 10,599,862 | (7,550,473 | ) | 8,835,735 | ||||||||||||||
| Capital grants |
2,743 | - | - | - | 2,743 | |||||||||||||||
| Capital payments to related parties |
103,651 | - | - | (103,651 | ) | - | ||||||||||||||
| Amortization |
- | 1,896 | 476,932 | - | 478,828 | |||||||||||||||
| Debt servicing costs - general |
- | - | 15,172 | (6,580 | ) | 8,592 | ||||||||||||||
| Debt servicing costs - Capital Plan |
24,549 | - | - | - | 24,549 | |||||||||||||||
| Total |
5,479,943 | 439,242 | 11,091,966 | (7,660,704 | ) | 9,350,447 | ||||||||||||||
| CAPITAL INVESTMENT |
565 | - | 761,206 | - | 761,771 | |||||||||||||||
|
|
||||||||||||||||||||
| 71 | Education |
| MINISTRY FINANCIAL STATEMENTS |
||||||||||||
| STATEMENT OF OPERATIONS |
||||||||||||
| (thousands of dollars) |
Comparable |
|||||||||||
|
2022-23 Budget |
2022-23 Forecast |
2023-24 Estimate |
||||||||||
| REVENUE |
||||||||||||
| Education Property Tax |
2,504,000 | 2,504,000 | 2,504,000 | |||||||||
| Transfers from Government of Canada |
125,806 | 132,671 | 121,529 | |||||||||
| Premiums, Fees and Licences |
173,725 | 173,725 | 171,885 | |||||||||
| Investment Income |
10,640 | 14,832 | 14,396 | |||||||||
| Internal Government Transfers |
315,888 | 315,888 | 315,888 | |||||||||
| Fundraising, Gifts and Donations |
47,774 | 50,909 | 50,909 | |||||||||
| Other Revenue |
179,309 | 153,839 | 161,613 | |||||||||
| Ministry Total |
3,357,142 | 3,345,864 | 3,340,220 | |||||||||
| Inter-Ministry Consolidations |
(315,888 | ) | (315,888 | ) | (315,888 | ) | ||||||
| Consolidated Total |
3,041,254 | 3,029,976 | 3,024,332 | |||||||||
| EXPENSE |
||||||||||||
| Ministry Support Services |
6,301 | 6,301 | 6,429 | |||||||||
| Instruction - ECS to Grade 12 |
6,553,569 | 6,608,364 | 6,857,244 | |||||||||
| Operations and Maintenance |
750,026 | 750,026 | 759,651 | |||||||||
| Student Transportation |
386,075 | 405,375 | 476,225 | |||||||||
| Accredited Private Schools and Early Childhood Service Operators |
316,907 | 316,907 | 344,990 | |||||||||
| School Facilities |
483,214 | 537,965 | 549,430 | |||||||||
| Governance and System Administration |
275,900 | 275,900 | 275,900 | |||||||||
| Program Support Services |
110,650 | 110,806 | 111,837 | |||||||||
| Debt Servicing Costs |
37,567 | 37,567 | 39,721 | |||||||||
| Ministry Total |
8,920,209 | 9,049,211 | 9,421,427 | |||||||||
| Inter-Ministry Consolidations |
(3,769 | ) | (59,338 | ) | (70,980 | ) | ||||||
| Consolidated Total |
8,916,440 | 8,989,873 | 9,350,447 | |||||||||
| Net Operating Result |
(5,875,186 | ) | (5,959,897 | ) | (6,326,115 | ) | ||||||
| CHANGE IN CAPITAL ASSETS |
||||||||||||
| INVESTMENT |
||||||||||||
| School Facilities |
928,172 | 742,732 | 761,206 | |||||||||
| Program Support Services |
565 | 565 | 565 | |||||||||
| Consolidated Total |
928,737 | 743,297 | 761,771 | |||||||||
| AMORTIZATION |
(472,002 | ) | (469,158 | ) | (478,828 | ) | ||||||
| Change in Capital Assets Total |
456,735 | 274,139 | 282,943 | |||||||||
| Education | 72 |
Energy
AMOUNTS TO BE VOTED
| (thousands of dollars) |
Comparable |
|||||||||||
| 2022-23 Budget |
2022-23 Forecast |
2023-24 Estimate |
||||||||||
| EXPENSE |
535,338 | 1,106,157 | 571,581 | |||||||||
| CAPITAL INVESTMENT |
500 | 1,000 | 1,000 | |||||||||
73
DESCRIPTION OF SUPPLY VOTE PROGRAMS
| 1 | Ministry Support Services |
| 1.1 | Minister’s Office |
Oversees the development of ministerial policies that are aligned with broader government-wide objectives and priorities.
| 1.2 | Deputy Minister’s Office |
Supports the Minister in achieving business plan and strategic goals of the ministry, government and public service.
| 1.3 | Corporate Services |
Provides strategic, financial, legal, and accommodations advice and services to support ministry objectives and requirements.
| 2 | Resource Development and Management |
| 2.1 | Energy Operations |
Conducts the assessment, calculation, collection and audit of non-renewable resource revenues, freehold mineral taxes, and bonuses, sales, rentals and fees related to crown mineral rights.
| 2.2 | Energy Policy |
Conducts the research, design, and development of energy policy to strategically support government initiatives.
| 2.3 | Industry Advocacy |
An information hub that will respond in real time to misinformation about Alberta’s energy industry.
| 3 | Cost of Selling Oil |
Costs incurred by the Alberta Petroleum Marketing Commission (APMC) in selling crude oil on behalf of the department.
| 4 | Economic Recovery Support |
| 4.1 | Site Rehabilitation Program |
Created to get Albertans back to work by performing pipeline, well and oil and gas site reclamation work.
| 4.2 | Mineral Strategy |
Costs associated with government’s Mineral Strategy and Action Plan.
| 4.3 | Alberta Petrochemicals Incentive Program |
Provides grants to companies to attract investment in new or expanded market-driven petrochemical facilities.
| Energy | 74 |
EXPENSE VOTE BY PROGRAM
| (thousands of dollars) | Comparable | |||||||||||||||
|
2022-23 Budget |
2022-23 Forecast |
2023-24 Estimate |
||||||||||||||
| OPERATING EXPENSE |
||||||||||||||||
| 1 |
Ministry Support Services |
|||||||||||||||
| 1.1 |
Minister’s Office |
995 | 995 | 1,015 | ||||||||||||
| 1.2 |
Deputy Minister’s Office |
667 | 699 | 1,048 | ||||||||||||
| 1.3 |
Corporate Services |
3,884 | 3,968 | 4,932 | ||||||||||||
| Sub-total | 5,546 | 5,662 | 6,995 | |||||||||||||
| 2 |
Resource Development and Management |
|||||||||||||||
| 2.1 |
Energy Operations |
17,215 | 17,278 | 18,684 | ||||||||||||
| 2.2 |
Energy Policy |
31,566 | 34,048 | 43,100 | ||||||||||||
| 2.3 |
Industry Advocacy |
27,000 | 31,789 | 27,041 | ||||||||||||
| Sub-total | 75,781 | 83,115 | 88,825 | |||||||||||||
| 3 |
Cost of Selling Oil |
144,000 | 417,879 | 316,000 | ||||||||||||
| 4 |
Economic Recovery Support |
|||||||||||||||
| 4.1 |
Site Rehabilitation Program |
297,200 | 575,890 | 605 | ||||||||||||
| 4.2 |
Mineral Strategy |
12,811 | 12,811 | 12,356 | ||||||||||||
| Sub-total | 310,011 | 588,701 | 12,961 | |||||||||||||
| CAPITAL GRANTS |
||||||||||||||||
| 4 |
Economic Recovery Support |
|||||||||||||||
| 4.3 |
Alberta Petrochemicals Incentive Program |
- | 10,800 | 146,800 | ||||||||||||
| Total |
535,338 | 1,106,157 | 571,581 | |||||||||||||
| CAPITAL INVESTMENT VOTE BY PROGRAM |
||||||||||||||||
| DEPARTMENT CAPITAL ACQUISITIONS |
||||||||||||||||
| 1 |
Ministry Support Services |
|||||||||||||||
| 1.3 |
Corporate Services |
500 | 1,000 | 1,000 | ||||||||||||
| Total |
500 | 1,000 | 1,000 | |||||||||||||
| 75 | Energy |
VOTED AMOUNTS FUNDED BY CREDIT OR RECOVERY
The following table details the portions of the department’s voted amounts for which a credit or recovery can be obtained. If a credit or recovery amount is expected to exceed its original estimate, the Treasury Board may increase the corresponding voted amount, pursuant to section 24(2) of the Financial Administration Act. If the actual credit or recovery amount realized is less than its original estimate, the corresponding funding authority is reduced by an equivalent amount in the programs shown.
EXPENSE AMOUNTS FUNDED BY CREDIT OR RECOVERY
| (thousands of dollars) |
2023-24 |
|||||
| 1 |
Services to Ministries | 1,597 | ||||
| Funding is received from other ministries to provide common services such as corporate services or other program supporting services. Program 1.3 |
||||||
| Total |
1,597 | |||||
| Energy |
76 |
AMOUNTS NOT REQUIRED TO BE VOTED
The following department amounts do not require a supply vote either because no cash disbursement is required, or because the Legislative Assembly has already provided the funding authority pursuant to a statute other than an appropriation act.
EXPENSE
| (thousands of dollars) |
Comparable |
|||||||||||
|
2022-23 Budget |
2022-23 Forecast |
2023-24 Estimate |
||||||||||
| DEPARTMENT STATUTORY AMOUNTS |
||||||||||||
| Operating Expense |
||||||||||||
| Carbon Capture and Storage |
564 | 564 | 564 | |||||||||
| Capital Grants |
||||||||||||
| Carbon Capture and Storage |
58,350 | 58,350 | 58,350 | |||||||||
| DEPARTMENT NON-CASH AMOUNTS |
||||||||||||
| Amortization |
||||||||||||
| Ministry Support Services |
500 | 500 | 500 | |||||||||
| Valuation Adjustments and Other Provisions |
||||||||||||
| Resource Development and Management |
40 | 40 | 40 | |||||||||
| Total |
59,454 | 59,454 | 59,454 | |||||||||
| 77 | Energy |
RECONCILIATION OF SUPPLY VOTE TO CONSOLIDATED GOVERNMENT ESTIMATE
The following tables summarize the relationship between the department’s Supply Votes and the effect of the ministry on the Government’s consolidated 2023-24 Estimates.
| RECONCILIATION BY PROGRAM |
||||||||||||||||||||
| (thousands of dollars) | Voted Supply |
Department Amounts Not Voted |
Entities’ Amounts Not Voted |
Consolidation Adjustments |
Consolidated |
|||||||||||||||
| EXPENSE |
||||||||||||||||||||
| Ministry Support Services |
6,995 | 500 | - | (1,597 | ) | 5,898 | ||||||||||||||
| Resource Development and Management |
88,825 | 40 | 12,041 | (12,041 | ) | 88,865 | ||||||||||||||
| Cost of Selling Oil |
316,000 | - | - | - | 316,000 | |||||||||||||||
| Carbon Capture and Storage |
- | 58,914 | - | - | 58,914 | |||||||||||||||
| Energy Regulation |
- | - | 231,274 | - | 231,274 | |||||||||||||||
| Orphan Well Abandonment |
- | - | 135,000 | - | 135,000 | |||||||||||||||
| Economic Recovery Support |
159,761 | - | - | (12,356 | ) | 147,405 | ||||||||||||||
| Total |
571,581 | 59,454 | 378,315 | (25,994 | ) | 983,356 | ||||||||||||||
| CAPITAL INVESTMENT |
||||||||||||||||||||
| Ministry Support Services |
1,000 | - | - | - | 1,000 | |||||||||||||||
| Energy Regulation |
- | - | 14,500 | - | 14,500 | |||||||||||||||
| Total |
1,000 | - | 14,500 | - | 15,500 | |||||||||||||||
| RECONCILIATION BY TYPE OF SPENDING |
|
|||||||||||||||||||
| EXPENSE |
||||||||||||||||||||
| Operating expense |
424,781 | 604 | 366,315 | (25,994 | ) | 765,706 | ||||||||||||||
| Capital grants |
146,800 | 58,350 | - | - | 205,150 | |||||||||||||||
| Amortization |
- | 500 | 12,000 | - | 12,500 | |||||||||||||||
| Total |
571,581 | 59,454 | 378,315 | (25,994 | ) | 983,356 | ||||||||||||||
| CAPITAL INVESTMENT |
1,000 | - | 14,500 | - | 15,500 | |||||||||||||||
|
|
||||||||||||||||||||
| Energy | 78 |
| MINISTRY FINANCIAL STATEMENTS |
||||||||||||
| STATEMENT OF OPERATIONS |
||||||||||||
| (thousands of dollars) |
Comparable |
|||||||||||
|
2022-23 Budget |
2022-23 Forecast |
2023-24 Estimate |
||||||||||
| REVENUE |
||||||||||||
| Transfers from Government of Canada |
295,000 | 573,690 | - | |||||||||
| Freehold Mineral Rights Tax |
96,000 | 151,545 | 129,435 | |||||||||
| Natural Gas and By-Products Royalty |
1,458,000 | 4,221,242 | 2,465,402 | |||||||||
| Crude Oil Royalty |
1,670,000 | 3,964,591 | 2,905,317 | |||||||||
| Bitumen Royalty |
10,349,000 | 18,749,580 | 12,555,401 | |||||||||
| Coal Royalty |
8,000 | 21,134 | 12,991 | |||||||||
| Bonuses and Sales of Crown Leases |
236,000 | 409,069 | 306,594 | |||||||||
| Rentals and Fees |
119,000 | 178,256 | 115,894 | |||||||||
| Investment Income |
675 | 3,852 | 2,700 | |||||||||
| Other Revenue |
2,172 | 2,172 | 2,172 | |||||||||
| Other Premiums, Fees and Licences |
1,529 | 1,732 | 1,529 | |||||||||
| Net Income Alberta Petroleum Marketing Commission |
(329,295 | ) | (318,313 | ) | (17,502 | ) | ||||||
| Energy Regulation Industry Levies and Licences |
200,730 | 201,370 | 217,419 | |||||||||
| Orphan Well Abandonment Levy and Fees |
78,500 | 78,500 | 135,000 | |||||||||
| Ministry Total |
14,185,311 | 28,238,420 | 18,832,352 | |||||||||
| Inter-Ministry Consolidations |
(1,597 | ) | (1,597 | ) | (1,597 | ) | ||||||
| Consolidated Total |
14,183,714 | 28,236,823 | 18,830,755 | |||||||||
| EXPENSE |
||||||||||||
| Ministry Support Services |
6,046 | 6,162 | 7,495 | |||||||||
| Resource Development and Management |
75,821 | 83,155 | 88,865 | |||||||||
| Cost of Selling Oil |
144,000 | 417,879 | 316,000 | |||||||||
| Carbon Capture and Storage |
58,914 | 58,914 | 58,914 | |||||||||
| Energy Regulation |
219,015 | 234,335 | 231,274 | |||||||||
| Orphan Well Abandonment |
78,500 | 78,500 | 135,000 | |||||||||
| Economic Recovery Support |
297,200 | 586,690 | 147,405 | |||||||||
| Ministry Total |
879,496 | 1,465,635 | 984,953 | |||||||||
| Inter-Ministry Consolidations |
(1,597 | ) | (1,597 | ) | (1,597 | ) | ||||||
| Consolidated Total |
877,899 | 1,464,038 | 983,356 | |||||||||
| Net Operating Result |
13,305,815 | 26,772,785 | 17,847,399 | |||||||||
| CHANGE IN CAPITAL ASSETS |
||||||||||||
| INVESTMENT |
||||||||||||
| Ministry Support Services |
500 | 1,000 | 1,000 | |||||||||
| Energy Regulation |
14,500 | 9,000 | 14,500 | |||||||||
| Consolidated Total |
15,000 | 10,000 | 15,500 | |||||||||
| AMORTIZATION |
(18,500 | ) | (13,500 | ) | (12,500 | ) | ||||||
| Change in Capital Assets Total |
(3,500 | ) | (3,500 | ) | 3,000 | |||||||
| 79 | Energy |
Environment and Protected Areas
AMOUNTS TO BE VOTED
| (thousands of dollars) |
Comparable |
|||||||||||
|
2022-23 Budget |
2022-23 Forecast |
2023-24 Estimate | ||||||||||
| EXPENSE |
433,827 | 504,295 | 553,936 | |||||||||
| CAPITAL INVESTMENT |
47,776 | 24,257 | 59,396 | |||||||||
| FINANCIAL TRANSACTIONS |
4,019 | 4,019 | 100 | |||||||||
81
DESCRIPTION OF SUPPLY VOTE PROGRAMS
| 1 | Ministry Support Services |
| 1.1 | Minister’s Office |
Oversees the development of ministerial policies that are aligned with broader government-wide objectives and priorities.
| 1.2 | Deputy Minister’s Office |
Supports the Minister in achieving business plan and strategic goals of the ministry, government and public service.
| 1.3 | Legal Services |
Supports the ministry by providing timely and effective legal and related strategic advice to help the ministry achieve its business objectives.
| 1.4 | Corporate Services |
Provides overall corporate support services for the ministry including finance, accommodation, business planning and annual reporting.
| 2 | Air |
| 2.1 | Air Policy |
Develops policy options that are aligned with provincial air quality outcomes that are integrated with social and economic considerations.
| 2.2 | Air Partners and Stewardship |
Works with local airshed partnerships through education program development and implementation, providing standards and technical oversight for air quality monitoring and ensures the efficient use of resources.
| 2.3 | Air Quality Management |
Works to promote and achieve Alberta’s clean air agenda by regulating environmental approvals for facilities and monitoring non-point source emissions of concern to Albertans.
| 3 | Land |
| 3.1 | Land Policy |
Develops, coordinates, and evaluates polices related to rangeland management, land conservation, reclamation and remediation, waste management and public lands management.
| 3.2 | Public Land Management |
Develops and implements regional and sub-regional land use plans, conserves and manages public land in support of diverse interests including agricultural use, peat and aggregate extraction, tourism and recreational use.
| 4 | Water |
| 4.1 | Water Policy |
Develops policies and programs supporting the key strategies and associated outcomes for provincial water management through regulatory delivery and partnerships that ensure these objectives are achieved.
| 4.2 | Water Partners and Stewardship |
Works with organizations such as the Alberta Water Council, Watershed Planning and Advisory Councils and Watershed Stewardship Groups to achieve the desired outcomes of Alberta’s Water for Life strategy.
| 4.3 | Water Management |
Responsible for supporting and promoting the conservation and sustainable management of water resources, through the wise use and allocation of water under the Water Act in Alberta.
| 4.4 | Flood Adaptation |
Provides services related to flood and drought mitigation and adaptation by working closely with municipalities, First Nations, stakeholders and Government to improve the province’s flood and drought resilience.
| 5 | Fish and Wildlife |
| 5.1 | Fish and Wildlife Policy |
Supports the government’s conservation, management and wise use of fisheries and wildlife resources through policy development and management.
| 5.2 | Fisheries Management |
Responsible for the conservation, management, status, stocking, allocation and use of fish stocks for recreational, commercial and domestic purposes.
| Environment and Protected Areas | 82 |
DESCRIPTION OF SUPPLY VOTE PROGRAMS ... continued
| 5.3 | Wildlife Management |
Develops and implements programs to manage populations, ensure habitats are maintained, recovering species at risk and ensure that emergent wildlife disease threats are identified and response strategies developed.
| 6 | Integrated Planning |
| 6.1 | Resource Management |
Supports the department’s approvals and compliance assurance programs, as well as the delivery of the Alberta’s integrated resource management system. Includes regional and sub-regional plans.
| 6.2 | Regional Cumulative Effects Management |
Implements the Land-use Framework and coordinates with the Land Use Secretariat to address the impacts of development on land, air, water and biodiversity at regional and sub-regional levels.
| 6.3 | Environmental Emergency Response |
The Alberta Support and Emergency Response Team (ASERT) maintains a provincial program in environmental emergency management that includes preparing and responding to environmental emergencies across the province.
| 6.4 | Environmental Social Governance Secretariat |
The Environmental Social Governance (ESG) Secretariat serves as a strategic and coordinating body for all ESG-related activities across government.
| 7 | Land Use Secretariat |
Provides the leadership, support and expertise to government ministries on implementing the Land-use Framework by integrating, coordinating, and supporting land-use planning in the province.
| 8 | Science and Monitoring |
| 8.1 | Environmental Science, Monitoring, Evaluation and Reporting |
Provides provincial ambient environmental monitoring, evaluation and reporting based on sound science and evidence to inform policy and regulatory decision-making.
| 8.2 | Oil Sands Monitoring |
A joint commitment between the federal government and Alberta to implement scientifically, comprehensive, integrated and transparent environmental monitoring of oil sands development activities.
| 9 | Emissions Management |
| 9.1 | Regulatory and Operations |
Implements the Technology Innovation and Emissions Reduction system, the Specified Gas Reporting Regulations, and Renewable Fuel Standard.
| 9.2 | Technology Innovation and Emissions Reduction |
Funds investments in technology and innovation to support emissions reductions in Alberta.
| 9.3 | Oil Sands Innovation |
A funding program that supports emissions reductions for facilities with the highest emission intensity of bitumen production in the Alberta oil sands.
| 10 | Quasi-Judicial Bodies |
| 10.1 | Natural Resources Conservation Board |
Conducts independent public reviews of major, non-energy natural resource projects and regulates Alberta’s confined feeding operations for livestock.
| 10.2 | Environmental and Public Lands Appeal Board |
Provides fair, impartial and efficient resolution of appeals under various acts and regulations of certain decisions made by the ministry.
| 83 | Environment and Protected Areas |
EXPENSE VOTE BY PROGRAM
| (thousands of dollars) |
Comparable |
|||||||||||||||
|
2022-23 Budget |
2022-23 Forecast |
2023-24 Estimate |
||||||||||||||
| OPERATING EXPENSE |
||||||||||||||||
| 1 |
Ministry Support Services |
|||||||||||||||
| 1.1 |
Minister’s Office |
941 | 941 | 968 | ||||||||||||
| 1.2 |
Deputy Minister’s Office |
642 | 642 | 660 | ||||||||||||
| 1.3 |
Legal Services |
319 | 319 | - | ||||||||||||
| 1.4 |
Corporate Services |
20,085 | 20,085 | 20,915 | ||||||||||||
| Sub-total | 21,987 | 21,987 | 22,543 | |||||||||||||
| 2 |
Air |
|||||||||||||||
| 2.1 |
Air Policy |
5,192 | 5,192 | 5,332 | ||||||||||||
| 2.2 |
Air Partners and Stewardship |
5,311 | 5,311 | 5,409 | ||||||||||||
| 2.3 |
Air Quality Management |
2,222 | 3,136 | 2,280 | ||||||||||||
| Sub-total | 12,725 | 13,639 | 13,021 | |||||||||||||
| 3 |
Land |
|||||||||||||||
| 3.1 |
Land Policy |
6,245 | 6,245 | 6,370 | ||||||||||||
| 3.2 |
Public Land Management |
22,025 | 22,025 | 21,467 | ||||||||||||
| Sub-total | 28,270 | 28,270 | 27,837 | |||||||||||||
| 4 |
Water |
|||||||||||||||
| 4.1 |
Water Policy |
5,016 | 5,016 | 5,111 | ||||||||||||
| 4.2 |
Water Partners and Stewardship |
6,459 | 9,105 | 5,590 | ||||||||||||
| 4.3 |
Water Management |
27,742 | 27,742 | 29,237 | ||||||||||||
| 4.4 |
Flood Adaptation |
8,761 | 9,415 | 10,398 | ||||||||||||
| Sub-total | 47,978 | 51,278 | 50,336 | |||||||||||||
| 5 |
Fish and Wildlife |
|||||||||||||||
| 5.1 |
Fish and Wildlife Policy |
6,434 | 6,434 | 6,904 | ||||||||||||
| 5.2 |
Fisheries Management |
9,997 | 11,137 | 11,136 | ||||||||||||
| 5.3 |
Wildlife Management |
22,788 | 29,962 | 50,656 | ||||||||||||
| Sub-total | 39,219 | 47,533 | 68,696 | |||||||||||||
| 6 |
Integrated Planning |
|||||||||||||||
| 6.1 |
Resource Management |
19,473 | 38,173 | 19,691 | ||||||||||||
| 6.2 |
Regional Cumulative Effects Management |
10,195 | 10,195 | 10,470 | ||||||||||||
| 6.3 |
Environmental Emergency Response |
3,858 | 3,858 | 3,906 | ||||||||||||
| 6.4 |
Environmental Social Governance Secretariat |
1,014 | 1,014 | 1,014 | ||||||||||||
| Sub-total | 34,540 | 53,240 | 35,081 | |||||||||||||
| 7 |
Land Use Secretariat |
5,008 | 5,008 | 5,046 | ||||||||||||
| 8 |
Science and Monitoring |
|||||||||||||||
| 8.1 |
Environmental Science, Monitoring, Evaluation and Reporting |
17,196 | 17,196 | 17,980 | ||||||||||||
| 8.2 |
Oil Sands Monitoring |
49,892 | 49,608 | 49,892 | ||||||||||||
| Sub-total | 67,088 | 66,804 | 67,872 | |||||||||||||
| Environment and Protected Areas | 84 |
EXPENSE VOTE BY PROGRAM ... continued
| (thousands of dollars) |
Comparable |
|||||||||||||||
|
2022-23 Budget |
2022-23 Forecast |
2023-24 Estimate |
||||||||||||||
| OPERATING EXPENSE... continued |
||||||||||||||||
| 9 |
Emissions Management |
|||||||||||||||
| 9.1 |
Regulatory and Operations |
10,541 | 10,541 | 10,541 | ||||||||||||
| 9.2 |
Technology Innovation and Emissions Reduction |
123,200 | 157,904 | 195,090 | ||||||||||||
| 9.3 |
Oil Sands Innovation |
3,000 | 3,000 | 3,000 | ||||||||||||
| Sub-total | 136,741 | 171,445 | 208,631 | |||||||||||||
| 10 |
Quasi-Judicial Bodies |
|||||||||||||||
| 10.1 |
Natural Resources Conservation Board |
5,397 | 5,397 | 6,009 | ||||||||||||
| 10.2 |
Environmental and Public Lands Appeal Board |
1,533 | 1,533 | 1,717 | ||||||||||||
| Sub-total | 6,930 | 6,930 | 7,726 | |||||||||||||
| CAPITAL GRANTS |
||||||||||||||||
| 4 |
Water |
|||||||||||||||
| 4.2 |
Water Partners and Stewardship |
1,500 | 1,500 | - | ||||||||||||
| 4.4 |
Flood Adaptation |
31,241 | 36,661 | 47,147 | ||||||||||||
| Sub-total | 32,741 | 38,161 | 47,147 | |||||||||||||
| 5 |
Fish and Wildlife |
|||||||||||||||
| 5.2 |
Fisheries Management |
600 | - | - | ||||||||||||
| Total |
433,827 | 504,295 | 553,936 | |||||||||||||
| CAPITAL INVESTMENT VOTE BY PROGRAM |
||||||||||||||||
| DEPARTMENT CAPITAL ACQUISITIONS |
||||||||||||||||
| 1 |
Ministry Support Services |
|||||||||||||||
| 1.4 |
Corporate Services |
425 | 897 | 425 | ||||||||||||
| 2 |
Air |
|||||||||||||||
| 2.3 |
Air Quality Management |
1,306 | - | 392 | ||||||||||||
| 3 |
Land |
|||||||||||||||
| 3.2 |
Public Land Management |
5,602 | 6,690 | 5,602 | ||||||||||||
| 4 |
Water |
|||||||||||||||
| 4.2 |
Water Partners and Stewardship |
- | 27 | 800 | ||||||||||||
| 4.4 |
Flood Adaptation |
6,000 | 4,995 | 7,901 | ||||||||||||
| Sub-total | 6,000 | 5,022 | 8,701 | |||||||||||||
| 5 |
Fish and Wildlife |
|||||||||||||||
| 5.2 |
Fisheries Management |
31,094 | 7,553 | 38,452 | ||||||||||||
| 5.3 |
Wildlife Management |
349 | 896 | 424 | ||||||||||||
| Sub-total | 31,443 | 8,449 | 38,876 | |||||||||||||
| 6 |
Integrated Planning |
|||||||||||||||
| 6.2 |
Regional Cumulative Effects Management |
- | - | 2,500 | ||||||||||||
| 85 | Environment and Protected Areas |
CAPITAL INVESTMENT VOTE BY PROGRAM ... continued
| (thousands of dollars) |
Comparable |
|||||||||||||||
|
2022-23 Budget |
2022-23 Forecast |
2023-24 Estimate |
||||||||||||||
| DEPARTMENT CAPITAL ACQUISITIONS... continued |
||||||||||||||||
| 8 |
Science and Monitoring |
|||||||||||||||
| 8.1 |
Environmental Science, Monitoring, Evaluation and Reporting |
3,000 | 2,915 | 2,900 | ||||||||||||
| 8.2 |
Oil Sands Monitoring |
- | 284 | - | ||||||||||||
| Sub-total | 3,000 | 3,199 | 2,900 | |||||||||||||
| Total |
47,776 | 24,257 | 59,396 | |||||||||||||
| FINANCIAL TRANSACTIONS VOTE BY PROGRAM |
||||||||||||||||
| CONTAMINATED SITE LIABILITY RETIREMENT |
||||||||||||||||
| 4 |
Water |
|||||||||||||||
| 4.3 |
Water Management |
100 | 100 | 100 | ||||||||||||
| 6 |
Integrated Planning |
|||||||||||||||
| 6.3 |
Environmental Emergency Response |
3,919 | 3,919 | - | ||||||||||||
| Total |
4,019 | 4,019 | 100 | |||||||||||||
| Environment and Protected Areas | 86 |
VOTED AMOUNTS FUNDED BY CREDIT OR RECOVERY
The following table details the portions of the department’s voted amounts for which a credit or recovery can be obtained. If a credit or recovery amount is expected to exceed its original estimate, the Treasury Board may increase the corresponding voted amount, pursuant to section 24(2) of the Financial Administration Act. If the actual credit or recovery amount realized is less than its original estimate, the corresponding funding authority is reduced by an equivalent amount in the programs shown.
EXPENSE AMOUNTS FUNDED BY CREDIT OR RECOVERY
| (thousands of dollars) |
2023-24 Estimate |
|||||
| 1 |
Provincial Mapping Data | 1,250 | ||||
| Revenue for maintenance activities for this initiative are from filing fees for cadastral and disposition mapping collected at the time of registration. Programs 1.4 and 3.2 |
||||||
| 2 |
Remediation Certificates | 25 | ||||
| Fees are collected to offset the costs of conducting site audits under the program. Program 3.2 |
||||||
| 3 |
Bow Habitat Station | 300 | ||||
| Admission fees collected for an aquatic ecosystem visitor centre focusing on public education and outreach offset the cost of operating the centre. Program 4.2 |
||||||
| 4 |
Fish and Wildlife | 274 | ||||
| Recreational fishing and hunting licences revenue collected is used to fund the costs related to the delivery and management of those licences. Program 5.3 |
||||||
| Total |
1,849 | |||||
| 87 | Environment and Protected Areas |
AMOUNTS NOT REQUIRED TO BE VOTED
The following department amounts do not require a supply vote either because no cash disbursement is required, or because the Legislative Assembly has already provided the funding authority pursuant to a statute other than an appropriation act.
EXPENSE
| (thousands of dollars) |
Comparable |
|||||||||||
|
2022-23 Budget |
2022-23 Forecast |
2023-24 Estimate |
||||||||||
| DEPARTMENT STATUTORY AMOUNTS |
||||||||||||
| Operating Expense |
||||||||||||
| Land |
5,000 | 5,000 | 5,000 | |||||||||
| Quasi-Judicial Bodies |
- | 14,219 | - | |||||||||
| DEPARTMENT NON-CASH AMOUNTS |
||||||||||||
| Amortization |
14,611 | 4,512 | 4,380 | |||||||||
| Valuation Adjustments and Other Provisions |
||||||||||||
| Prepaid Annual Access Payment |
1,025 | 1,025 | 1,025 | |||||||||
| Vacation Liability |
1,227 | 1,227 | 1,227 | |||||||||
| Total |
21,863 | 25,983 | 11,632 | |||||||||
| CAPITAL INVESTMENT
|
||||||||||||
| DEPARTMENT NON-CASH AMOUNTS |
||||||||||||
| Donated Capital Assets |
||||||||||||
| Science and Monitoring |
- | 4,242 | - | |||||||||
| Total |
- | 4,242 | - | |||||||||
| Environment and Protected Areas | 88 |
RECONCILIATION OF SUPPLY VOTE TO CONSOLIDATED GOVERNMENT ESTIMATE
The following tables summarize the relationship between the department’s Supply Votes and the effect of the ministry on the Government’s consolidated 2023-24 Estimates.
| RECONCILIATION BY PROGRAM |
||||||||||||||||||||
| (thousands of dollars) |
Voted Supply |
Department Amounts Not Voted |
Entities’ Amounts Not Voted |
Consolidation Adjustments |
Consolidated 2023-24 Estimate |
|||||||||||||||
| EXPENSE |
||||||||||||||||||||
| Ministry Support Services |
22,543 | 1,300 | - | (2,830 | ) | 21,013 | ||||||||||||||
| Air |
13,021 | 16 | - | - | 13,037 | |||||||||||||||
| Land |
27,837 | 5,000 | 10,000 | (19,000 | ) | 23,837 | ||||||||||||||
| Water |
97,483 | 1,109 | - | - | 98,592 | |||||||||||||||
| Fish and Wildlife |
68,696 | 1,291 | - | - | 69,987 | |||||||||||||||
| Integrated Planning |
35,081 | 219 | - | - | 35,300 | |||||||||||||||
| Land Use Secretariat |
5,046 | - | - | - | 5,046 | |||||||||||||||
| Science and Monitoring |
67,872 | 2,697 | - | (995 | ) | 69,574 | ||||||||||||||
| Emissions Management |
208,631 | - | 489,013 | (488,213 | ) | 209,431 | ||||||||||||||
| Quasi-Judicial Bodies |
7,726 | - | 6,036 | (6,009 | ) | 7,753 | ||||||||||||||
| Total |
553,936 | 11,632 | 505,049 | (517,047 | ) | 553,570 | ||||||||||||||
| CAPITAL INVESTMENT |
||||||||||||||||||||
| Ministry Support Services |
425 | - | - | - | 425 | |||||||||||||||
| Air |
392 | - | - | - | 392 | |||||||||||||||
| Land |
5,602 | - | - | - | 5,602 | |||||||||||||||
| Water |
8,701 | - | - | - | 8,701 | |||||||||||||||
| Fish and Wildlife |
38,876 | - | - | - | 38,876 | |||||||||||||||
| Integrated Planning |
2,500 | - | - | - | 2,500 | |||||||||||||||
| Science and Monitoring |
2,900 | - | - | - | 2,900 | |||||||||||||||
| Quasi-Judicial Bodies |
- | - | 17 | - | 17 | |||||||||||||||
| Total |
59,396 | - | 17 | - | 59,413 | |||||||||||||||
| RECONCILIATION BY TYPE OF SPENDING |
|
|||||||||||||||||||
| EXPENSE |
||||||||||||||||||||
| Operating expense |
506,789 | 7,252 | 495,019 | (512,047 | ) | 497,013 | ||||||||||||||
| Capital grants |
47,147 | - | 5,000 | - | 52,147 | |||||||||||||||
| Capital payments to related parties |
- | - | 5,000 | (5,000 | ) | - | ||||||||||||||
| Amortization |
- | 4,380 | 30 | - | 4,410 | |||||||||||||||
| Total |
553,936 | 11,632 | 505,049 | (517,047 | ) | 553,570 | ||||||||||||||
| CAPITAL INVESTMENT |
59,396 | - | 17 | - | 59,413 | |||||||||||||||
|
|
||||||||||||||||||||
| 89 | Environment and Protected Areas |
| MINISTRY FINANCIAL STATEMENTS |
||||||||||||
| STATEMENT OF OPERATIONS |
||||||||||||
| (thousands of dollars) |
Comparable |
|||||||||||
|
2022-23 Budget |
2022-23 Forecast |
2023-24 Estimate |
||||||||||
| REVENUE |
||||||||||||
| Transfers from Government of Canada |
84,164 | 103,740 | 45,363 | |||||||||
| Investment Income |
913 | 7,390 | 7,925 | |||||||||
| Premiums, Fees and Licences |
9,382 | 9,656 | 10,666 | |||||||||
| Technology Innovation and Emissions Reduction Fund |
420,000 | 630,500 | 516,000 | |||||||||
| Other Revenue |
68,961 | 75,849 | 68,013 | |||||||||
| Ministry Total |
583,420 | 827,135 | 647,967 | |||||||||
| Inter-Ministry Consolidations |
(11,830 | ) | (11,830 | ) | (11,830 | ) | ||||||
| Consolidated Total |
571,590 | 815,305 | 636,137 | |||||||||
| EXPENSE |
||||||||||||
| Ministry Support Services |
24,900 | 23,386 | 23,843 | |||||||||
| Air |
12,729 | 13,681 | 13,037 | |||||||||
| Land |
38,270 | 38,270 | 32,837 | |||||||||
| Water |
88,407 | 90,610 | 98,592 | |||||||||
| Fish and Wildlife |
42,914 | 48,751 | 69,987 | |||||||||
| Integrated Planning |
34,637 | 53,628 | 35,300 | |||||||||
| Land Use Secretariat |
5,008 | 5,008 | 5,046 | |||||||||
| Science and Monitoring |
70,154 | 69,350 | 70,569 | |||||||||
| Emissions Management |
137,541 | 172,245 | 209,431 | |||||||||
| Quasi-Judicial Bodies |
6,957 | 21,176 | 7,753 | |||||||||
| Ministry Total |
461,517 | 536,105 | 566,395 | |||||||||
| Inter-Ministry Consolidations |
(12,825 | ) | (12,825 | ) | (12,825 | ) | ||||||
| Consolidated Total |
448,692 | 523,280 | 553,570 | |||||||||
| Net Operating Result |
122,898 | 292,025 | 82,567 | |||||||||
| CHANGE IN CAPITAL ASSETS |
||||||||||||
| INVESTMENT |
||||||||||||
| Ministry Support Services |
425 | 897 | 425 | |||||||||
| Air |
1,306 | - | 392 | |||||||||
| Land |
5,602 | 6,690 | 5,602 | |||||||||
| Water |
6,000 | 5,022 | 8,701 | |||||||||
| Fish and Wildlife |
31,443 | 8,449 | 38,876 | |||||||||
| Integrated Planning |
- | - | 2,500 | |||||||||
| Science and Monitoring |
3,000 | 7,441 | 2,900 | |||||||||
| Quasi-Judicial Bodies |
17 | 17 | 17 | |||||||||
| Consolidated Total |
47,793 | 28,516 | 59,413 | |||||||||
| AMORTIZATION |
(14,641 | ) | (4,542 | ) | (4,410 | ) | ||||||
| Change in Capital Assets Total |
33,152 | 23,974 | 55,003 | |||||||||
| Environment and Protected Areas | 90 |

Executive Council
AMOUNTS TO BE VOTED
| (thousands of dollars) |
Comparable |
|||||||||||
|
2022-23 Budget |
2022-23 Forecast |
2023-24 Estimate |
||||||||||
| EXPENSE |
24,846 | 30,784 | 35,245 | |||||||||
| CAPITAL INVESTMENT |
25 | 25 | 25 | |||||||||
91
DESCRIPTION OF SUPPLY VOTE PROGRAMS
| 1 | Office of the Premier / Executive Council |
| 1.1 | Office of the Premier / Executive Council |
Includes the Office of the Premier, Office of the Deputy Minister of Executive Council, Policy Coordination Office, Cabinet Coordination Office, and Corporate Service division (including the Protocol Office).
| 1.2 | Office of the Lieutenant Governor |
Provides administrative and functional support to the Lieutenant Governor.
| 2 | Intergovernmental Relations |
Coordinates Alberta’s leadership and participation within the Canadian federation and coordinates, develops and delivers Alberta’s international relations efforts and trade promotion activities, including missions by the Premier.
| Executive Council | 92 |
EXPENSE VOTE BY PROGRAM
| (thousands of dollars) |
Comparable |
|||||||||||||||
|
2022-23 Budget |
2022-23 Forecast |
2023-24 Estimate |
||||||||||||||
| OPERATING EXPENSE |
||||||||||||||||
| 1 |
Office of the Premier / Executive Council |
|||||||||||||||
| 1.1 |
Office of the Premier / Executive Council |
12,322 | 12,402 | 15,282 | ||||||||||||
| 1.2 |
Office of the Lieutenant Governor |
614 | 614 | 632 | ||||||||||||
| Sub-total | 12,936 | 13,016 | 15,914 | |||||||||||||
| 2 |
Intergovernmental Relations |
11,910 | 17,768 | 19,331 | ||||||||||||
| Total |
24,846 | 30,784 | 35,245 | |||||||||||||
| CAPITAL INVESTMENT VOTE BY PROGRAM |
||||||||||||||||
| DEPARTMENT CAPITAL ACQUISITIONS |
||||||||||||||||
| 1.1 |
Office of the Premier / Executive Council |
25 | 25 | 25 | ||||||||||||
| Total |
25 | 25 | 25 | |||||||||||||
| 93 | Executive Council |
RECONCILIATION OF SUPPLY VOTE TO CONSOLIDATED GOVERNMENT ESTIMATE
The following tables summarize the relationship between the department’s Supply Votes and the effect of the ministry on the Government’s consolidated 2023-24 Estimates.
| RECONCILIATION BY PROGRAM |
||||||||||||||||
| (thousands of dollars) |
Voted Supply |
Department Amounts Not Voted |
Consolidation Adjustments |
Consolidated 2023-24 Estimate |
||||||||||||
| EXPENSE |
||||||||||||||||
| Office of the Premier / Executive Council |
15,914 | - | - | 15,914 | ||||||||||||
| Intergovernmental Relations |
19,331 | - | - | 19,331 | ||||||||||||
| Total |
35,245 | - | - | 35,245 | ||||||||||||
| CAPITAL INVESTMENT |
||||||||||||||||
| Office of the Premier / Executive Council |
25 | - | - | 25 | ||||||||||||
| RECONCILIATION BY TYPE OF SPENDING |
|
|||||||||||||||
| EXPENSE |
||||||||||||||||
| Operating expense |
35,245 | - | - | 35,245 | ||||||||||||
| CAPITAL INVESTMENT |
25 | - | - | 25 | ||||||||||||
|
|
||||||||||||||||
| Executive Council | 94 |
| MINISTRY FINANCIAL STATEMENTS |
||||||||||||
| STATEMENT OF OPERATIONS |
||||||||||||
| (thousands of dollars) | Comparable | |||||||||||
|
2022-23 Budget |
2022-23 Forecast |
2023-24 Estimate |
||||||||||
| REVENUE |
||||||||||||
| Other Revenue |
8 | 8 | 8 | |||||||||
| Consolidated Total |
8 | 8 | 8 | |||||||||
| EXPENSE |
||||||||||||
| Office of the Premier / Executive Council |
12,936 | 13,016 | 15,914 | |||||||||
| Intergovernmental Relations |
11,910 | 17,768 | 19,331 | |||||||||
| Consolidated Total |
24,846 | 30,784 | 35,245 | |||||||||
| Net Operating Result |
(24,838 | ) | (30,776 | ) | (35,237 | ) | ||||||
| CHANGE IN CAPITAL ASSETS |
||||||||||||
| INVESTMENT |
||||||||||||
| Office of the Premier / Executive Council |
25 | 25 | 25 | |||||||||
| Consolidated Total |
25 | 25 | 25 | |||||||||
| Change in Capital Assets Total |
25 | 25 | 25 | |||||||||
| 95 | Executive Council |
Forestry, Parks and Tourism
AMOUNTS TO BE VOTED
| (thousands of dollars) |
Comparable |
|||||||||||
|
2022-23 Budget |
2022-23 Forecast |
2023-24 Estimate |
||||||||||
| EXPENSE |
371,759 | 366,184 | 397,957 | |||||||||
| CAPITAL INVESTMENT |
54,539 | 61,474 | 85,110 | |||||||||
| FINANCIAL TRANSACTIONS |
1,310 | 1,310 | 1,310 | |||||||||
| CONTINGENCY |
- | 173,400 | - | |||||||||
97
DESCRIPTION OF SUPPLY VOTE PROGRAMS
| 1 | Ministry Support Services |
| 1.1 | Minister’s Office |
Oversees the development of ministerial policies that are aligned with broader government-wide objectives and priorities.
| 1.2 | Deputy Minister’s Office |
Supports the Minister in achieving business plan and strategic goals of the ministry, government and public service.
| 1.3 | Corporate Services |
Provides overall corporate support services for the ministry including finance, accommodation, business planning and annual reporting.
| 2 | Forests |
| 2.1 | Wildfire Management |
Provides wildfire operations in the Forest Protection Area to reduce risks to human life, communities, and other values through wildfire preparedness plans, mitigation and prevention, and early wildfire detection.
| 2.2 | Forest Stewardship and Trade |
Provides policy and regulates compliance to support a competitive forest industry and enhance environmental and social forest values. Responsible for operations, planning, reforestation, and pine beetle control.
| 2.3 | Wildfire Presuppression and Response |
Provides preparation for wildfires and response to wildfires to protect Albertans, communities, the province’s forest resources, and other values at risk from wildfires.
| 3 | Parks |
| 3.1 | Parks Operations |
Provides program development, operations and maintenance, management of contracted facility operators, as well as program delivery activities.
| 3.2 | Parks Visitor Experience |
Provides a diverse range of functions, including information services, visitor centre operations, interpretive programming, and outreach and educational activities.
| 3.3 | Parks Conservation |
Conducts natural resource inventories assessments, land use disposition and permitting management, wildlife monitoring, and invasive species, insect and disease control.
| 3.4 | Parks Public Safety and Security |
Conserves Alberta parks through public education, security patrols, search and rescue operations and assistance with provincial emergencies.
| 3.5 | Parks Infrastructure |
Provides capital planning, life-cycle maintenance, upgrading and development of new park infrastructure.
| 4 | Lands |
| 4.1 | Public Land Operations |
Delivers programs for the regulatory assurance system on crown lands, recreation, and land management across the province, including authorizations/approvals, inspections and enforcement on Parks and Public Lands.
| 4.2 | Rangeland Operations |
Delivers programs for crown land rangelands including regaultory assurance (approvals, inspections and compliance), range stewardship programs, knowledge, training and science, business information systems.
| 5 | Hunting and Angling |
Provides angling and hunting opportunities through effective fish and wildlife management.
| 6 | Tourism |
| 6.1 | Tourism Policy and Strategy |
Responsible for the legislative, regulatory, broad policy framework strategy to advance tourism.
| 6.2 | Grant to Travel Alberta Corporation |
Operating grant to the Travel Alberta Corporation.
| Forestry, Parks and Tourism | 98 |
EXPENSE VOTE BY PROGRAM
| (thousands of dollars) |
Comparable |
|||||||||||||||
|
2022-23 Budget |
2022-23 Forecast |
2023-24 Estimate |
||||||||||||||
| OPERATING EXPENSE |
||||||||||||||||
| 1 |
Ministry Support Services |
|||||||||||||||
| 1.1 |
Minister’s Office |
- | 384 | 877 | ||||||||||||
| 1.2 |
Deputy Minister’s Office |
- | 334 | 764 | ||||||||||||
| 1.3 |
Corporate Services |
1,706 | 1,706 | 2,727 | ||||||||||||
| Sub-total | 1,706 | 2,424 | 4,368 | |||||||||||||
| 2 |
Forests |
|||||||||||||||
| 2.1 |
Wildfire Management |
101,897 | 100,534 | 100,421 | ||||||||||||
| 2.2 |
Forest Stewardship and Trade |
75,850 | 65,897 | 69,637 | ||||||||||||
| Sub-total | 177,747 | 166,431 | 170,058 | |||||||||||||
| 3 |
Parks |
|||||||||||||||
| 3.1 |
Parks Operations |
49,684 | 52,602 | 58,377 | ||||||||||||
| 3.2 |
Parks Visitor Experience |
7,943 | 7,943 | 10,207 | ||||||||||||
| 3.3 |
Parks Conservation |
5,628 | 5,628 | 6,083 | ||||||||||||
| 3.4 |
Parks Public Safety and Security |
2,411 | 2,411 | 2,411 | ||||||||||||
| 3.5 |
Parks Infrastructure |
9,122 | 9,892 | 11,133 | ||||||||||||
| Sub-total | 74,788 | 78,476 | 88,211 | |||||||||||||
| 4 |
Lands |
|||||||||||||||
| 4.1 |
Public Land Operations |
30,518 | 31,148 | 32,112 | ||||||||||||
| 4.2 |
Rangeland Operations |
6,141 | 6,005 | 6,141 | ||||||||||||
| Sub-total | 36,659 | 37,153 | 38,253 | |||||||||||||
| 5 |
Hunting and Angling |
12,999 | 13,669 | 13,290 | ||||||||||||
| 6 |
Tourism |
|||||||||||||||
| 6.1 |
Tourism Policy and Strategy |
1,001 | 1,001 | 1,007 | ||||||||||||
| 6.2 |
Grant to Travel Alberta Corporation |
59,680 | 63,180 | 71,940 | ||||||||||||
| Sub-total | 60,681 | 64,181 | 72,947 | |||||||||||||
| CAPITAL GRANTS |
||||||||||||||||
| 3 |
Parks |
|||||||||||||||
| 3.5 |
Parks Infrastructure |
3,179 | 60 | 7,620 | ||||||||||||
| 4 |
Lands |
|||||||||||||||
| 4.1 |
Public Land Operations |
4,000 | 3,790 | 3,210 | ||||||||||||
| Total |
371,759 | 366,184 | 397,957 | |||||||||||||
| 99 | Forestry, Parks and Tourism |
| CAPITAL INVESTMENT VOTE BY PROGRAM |
||||||||||||||||
| (thousands of dollars) |
Comparable |
|||||||||||||||
|
2022-23 Budget |
2022-23 Forecast |
2023-24 Estimate |
||||||||||||||
| DEPARTMENT CAPITAL ACQUISITIONS |
||||||||||||||||
| 2 |
Forests |
|||||||||||||||
| 2.1 |
Wildfire Management |
8,424 | 10,212 | 10,583 | ||||||||||||
| 3 |
Parks |
|||||||||||||||
| 3.5 |
Parks Infrastructure |
38,515 | 44,313 | 63,496 | ||||||||||||
| 4 |
Lands |
|||||||||||||||
| 4.1 |
Public Land Operations |
4,600 | 4,000 | 6,600 | ||||||||||||
| 4.2 |
Rangeland Operations |
3,000 | 2,949 | 4,431 | ||||||||||||
| Sub-total | 7,600 | 6,949 | 11,031 | |||||||||||||
| Total |
54,539 | 61,474 | 85,110 | |||||||||||||
| FINANCIAL TRANSACTIONS VOTE BY PROGRAM |
||||||||||||||||
| INVENTORY ACQUISITION |
||||||||||||||||
| 2 |
Forests |
|||||||||||||||
| 2.1 |
Wildfire Management |
1,310 | 1,310 | 1,310 | ||||||||||||
| Total |
1,310 | 1,310 | 1,310 | |||||||||||||
| CONTINGENCY VOTE BY PROGRAM |
||||||||||||||||
| OPERATING EXPENSE |
||||||||||||||||
| 2 |
Forests |
|||||||||||||||
| 2.3 |
Wildfire Presuppression and Response |
- | 173,400 | - | ||||||||||||
| Total |
- | 173,400 | - | |||||||||||||
| Forestry, Parks and Tourism | 100 |
VOTED AMOUNTS FUNDED BY CREDIT OR RECOVERY
The following table details the portions of the department’s voted amounts for which a credit or recovery can be obtained. If a credit or recovery amount is expected to exceed its original estimate, the Treasury Board may increase the corresponding voted amount, pursuant to section 24(2) of the Financial Administration Act. If the actual credit or recovery amount realized is less than its original estimate, the corresponding funding authority is reduced by an equivalent amount in the programs shown.
EXPENSE AMOUNTS FUNDED BY CREDIT OR RECOVERY
| (thousands of dollars) |
2023-24 Estimate |
|||||
| 1 |
Parks Infrastructure | 4,200 | ||||
| Parks collects a levy and various other fees and revenues for facility redevelopment within fees charged for use of campgrounds and park facilities through the Parks Act , as well as other sources. Program 3.5 |
||||||
| 2 |
Parks Operations | 50,300 | ||||
| Parks collects various fees and other revenues through the Parks Act that are used to partially offset the cost of providing services. Programs 3.1, 3.2, 3.3, 3.4 and 4.1 |
||||||
| 3 |
Hunting and Angling | 7,506 | ||||
| Recreational fishing and hunting licences revenue collected is used to fund the costs related to the delivery and management of those licences, and the Report a Poacher and Wildlife Predator Compensation programs. Program 5 |
||||||
| 4 |
Public Land Camping Fees | 1,500 | ||||
| Revenue collected from year-round random camp on public lands will be used towards enforcement, education, trail maintenance, stewardship and community response. Program 4.1 |
||||||
| Total |
63,506 | |||||
| 101 | Forestry, Parks and Tourism |
AMOUNTS NOT REQUIRED TO BE VOTED
The following department amounts do not require a supply vote either because no cash disbursement is required, or because the Legislative Assembly has already provided the funding authority pursuant to a statute other than an appropriation act.
EXPENSE
| (thousands of dollars) |
Comparable |
|||||||||||
|
2022-23 Budget |
2022-23 Forecast |
2023-24 Estimate |
||||||||||
| DEPARTMENT NON-CASH AMOUNTS |
||||||||||||
| Amortization |
||||||||||||
| Forests |
12,230 | 12,230 | 12,230 | |||||||||
| Parks |
42,373 | 23,089 | 24,152 | |||||||||
| Lands |
1,482 | 1,617 | 1,511 | |||||||||
| Tourism |
7 | 7 | 7 | |||||||||
| Consumption of Inventory |
||||||||||||
| Forests |
1,310 | 1,310 | 1,310 | |||||||||
| Total |
57,402 | 38,253 | 39,210 | |||||||||
| Forestry, Parks and Tourism | 102 |
RECONCILIATION OF SUPPLY VOTE TO CONSOLIDATED GOVERNMENT ESTIMATE
The following tables summarize the relationship between the department’s Supply Votes and the effect of the ministry on the Government’s consolidated 2023-24 Estimates.
| RECONCILIATION BY PROGRAM |
||||||||||||||||||||
| (thousands of dollars) |
Voted Supply |
Department Amounts Not Voted |
Entities’ Amounts Not Voted |
Consolidation Adjustments |
Consolidated 2023-24 Estimate |
|||||||||||||||
| EXPENSE |
||||||||||||||||||||
| Ministry Support Services |
4,368 | - | - | - | 4,368 | |||||||||||||||
| Forests |
170,058 | 13,540 | - | (1,817 | ) | 181,781 | ||||||||||||||
| Parks |
95,831 | 24,152 | - | (352 | ) | 119,631 | ||||||||||||||
| Lands |
41,463 | 1,511 | - | - | 42,974 | |||||||||||||||
| Hunting and Angling |
13,290 | - | - | - | 13,290 | |||||||||||||||
| Tourism |
72,947 | 7 | - | (71,940 | ) | 1,014 | ||||||||||||||
| Travel Alberta Corporation |
- | - | 72,156 | - | 72,156 | |||||||||||||||
| Total |
397,957 | 39,210 | 72,156 | (74,109 | ) | 435,214 | ||||||||||||||
| CAPITAL INVESTMENT |
||||||||||||||||||||
| Forests |
10,583 | - | - | - | 10,583 | |||||||||||||||
| Parks |
63,496 | - | - | - | 63,496 | |||||||||||||||
| Lands |
11,031 | - | - | - | 11,031 | |||||||||||||||
| Total |
85,110 | - | - | - | 85,110 | |||||||||||||||
| INVENTORY ACQUISITION |
||||||||||||||||||||
| Forests |
1,310 | - | - | - | 1,310 | |||||||||||||||
| RECONCILIATION BY TYPE OF SPENDING |
|
|||||||||||||||||||
| EXPENSE |
||||||||||||||||||||
| Operating expense |
387,127 | - | 72,090 | (74,109 | ) | 385,108 | ||||||||||||||
| Capital grants |
10,830 | - | - | - | 10,830 | |||||||||||||||
| Amortization |
- | 37,900 | 66 | - | 37,966 | |||||||||||||||
| Inventory consumption |
- | 1,310 | - | - | 1,310 | |||||||||||||||
| Total |
397,957 | 39,210 | 72,156 | (74,109 | ) | 435,214 | ||||||||||||||
| CAPITAL INVESTMENT |
85,110 | - | - | - | 85,110 | |||||||||||||||
| INVENTORY ACQUISITION |
1,310 | - | - | - | 1,310 | |||||||||||||||
|
|
||||||||||||||||||||
| 103 | Forestry, Parks and Tourism |
| MINISTRY FINANCIAL STATEMENTS |
||||||||||||
| STATEMENT OF OPERATIONS |
||||||||||||
| (thousands of dollars) |
Comparable |
|||||||||||
|
2022-23 Budget |
2022-23 Forecast |
2023-24 Estimate |
||||||||||
| REVENUE |
||||||||||||
| Transfers from Government of Canada |
30,741 | 28,212 | 25,629 | |||||||||
| Investment Income |
150 | 150 | 150 | |||||||||
| Premiums, Fees and Licenses |
318,852 | 391,006 | 300,367 | |||||||||
| Other Revenue |
5,559 | 9,486 | 8,617 | |||||||||
| Ministry Total |
355,302 | 428,854 | 334,763 | |||||||||
| Inter-Ministry Consolidations |
(1,084 | ) | (1,084 | ) | (1,052 | ) | ||||||
| Consolidated Total |
354,218 | 427,770 | 333,711 | |||||||||
| EXPENSE |
||||||||||||
| Ministry Support Services |
1,706 | 2,424 | 4,368 | |||||||||
| Forests |
191,287 | 353,371 | 183,598 | |||||||||
| Parks |
120,340 | 101,625 | 119,983 | |||||||||
| Lands |
42,141 | 42,560 | 42,974 | |||||||||
| Hunting and Angling |
12,999 | 13,669 | 13,290 | |||||||||
| Tourism |
1,008 | 1,008 | 1,014 | |||||||||
| Travel Alberta Corporation |
59,925 | 68,888 | 72,156 | |||||||||
| Ministry Total |
429,406 | 583,545 | 437,383 | |||||||||
| Inter-Ministry Consolidations |
(2,201 | ) | (2,201 | ) | (2,169 | ) | ||||||
| Consolidated Total |
427,205 | 581,344 | 435,214 | |||||||||
| Net Operating Result |
(72,987 | ) | (153,574 | ) | (101,503 | ) | ||||||
| CHANGE IN CAPITAL ASSETS |
||||||||||||
| INVESTMENT |
||||||||||||
| Forests |
8,424 | 10,212 | 10,583 | |||||||||
| Parks |
38,515 | 44,313 | 63,496 | |||||||||
| Lands |
7,600 | 6,949 | 11,031 | |||||||||
| Consolidated Total |
54,539 | 61,474 | 85,110 | |||||||||
| AMORTIZATION |
(56,187 | ) | (37,018 | ) | (37,966 | ) | ||||||
| Change in Capital Assets Total |
(1,648 | ) | 24,456 | 47,144 | ||||||||
| CHANGE IN INVENTORY ASSETS |
||||||||||||
| INVENTORY ACQUISITION |
||||||||||||
| Forests |
1,310 | 1,310 | 1,310 | |||||||||
| Consolidated Total |
1,310 | 1,310 | 1,310 | |||||||||
| CONSUMPTION |
(1,310 | ) | (1,310 | ) | (1,310 | ) | ||||||
| Change in Inventory Assets Total |
- | - | - | |||||||||
| Forestry, Parks and Tourism | 104 |
Health
AMOUNTS TO BE VOTED
| (thousands of dollars) |
Comparable |
|||||||||||
|
2022-23 Budget |
2022-23 Forecast |
2023-24 Estimate |
||||||||||
| EXPENSE |
22,242,960 | 22,796,181 | 25,037,760 | |||||||||
| CAPITAL INVESTMENT |
25,276 | 27,525 | 28,865 | |||||||||
| FINANCIAL TRANSACTIONS |
84,976 | 80,121 | 88,876 | |||||||||
| CONTINGENCY |
- | 1,096,796 | - | |||||||||
105
DESCRIPTION OF SUPPLY VOTE PROGRAMS
| 1 | Ministry Support Services |
| 1.1 | Minister’s Office |
Oversees the development of ministerial policies that are aligned with broader government-wide objectives and priorities.
| 1.2 | Deputy Minister’s Office |
Supports the Minister in achieving business plan and strategic goals of the ministry, government and public service.
| 1.3 | Strategic Corporate Support |
Includes budget and financial planning, financial reporting, procurement, human resources, legal services, and the management of access to information and privacy protection for the Department of Health.
| 1.4 | Policy Development and Strategic Support |
Includes development and review of strategic health policy, health research, health system quality improvement and accountability. Expenses also relate to work with federal/provincial/territorial health departments.
| 1.5 | Health Advocates’ Office |
Provides support to the independent investigative body that reports to the Minister of Health and works to resolve citizen concerns with the health system and issues that impact seniors.
| 2 | Alberta Health Services |
| 2.1 | Continuing Care |
Includes facility-based continuing care such as long-term care, hospice and end-of-life care, delivered by Alberta Health Services or contracted providers.
| 2.2 | Community Care |
Includes health services provided in a community setting, such as group homes and supportive living.
| 2.3 | Home Care |
Includes health services provided in home settings intended to support clients in place.
| 2.4 | Acute Care |
Includes hospital-based acute inpatient services to provide necessary treatment for a disease or severe episode of illness or injury.
| 2.5 | Emergency Medical Services |
Includes support for Emergency Medical Services such as ground ambulance services providing patient transportation to the hospital and between hospitals. Expense also includes central dispatch services.
| 2.6 | Diagnostic and Therapeutic Services |
Includes laboratory, diagnostic imaging, clinical nutrition and rehabilitation services (audiology, occupational therapy, physical therapy, respiratory therapy and speech language pathology).
| 2.7 | Population and Public Health |
Includes services to maintain and improve the health of the general population through promoting and protecting health, with a focus on preventing disease and injury.
| 2.8 | Health Workforce Education and Research |
Includes graduate medical education and formal education for interns and residents, undergraduates and clinical clerks as well as health service administration program students.
| 2.9 | Information Technology |
Includes the design, development, implementation and maintenance of information management support systems.
| 2.10 | Support Services |
Includes building maintenance and utilities, materials management (including purchasing, central warehousing, distribution, and sterilization), housekeeping, laundry and food services, patient registration and admission/discharge, and emergency preparedness.
| 2.11 | Administration |
Includes corporate services and general administration such as communications, finance, human resources, legal services, planning and development, insurance and risk management.
| 2.12 | Drugs and Gases |
Includes drugs, gases and medical equipment used in health services delivery.
| Health | 106 |
DESCRIPTION OF SUPPLY VOTE PROGRAMS ... continued
| 3 | Health System Capacity |
Increase health system capacity to ensure a more resilient health system that can respond to public health emergencies.
| 4 | Physician Compensation and Development |
| 4.1 | Program Support |
Includes salaries and supplies and services for the administration of physician services and support programs.
| 4.2 | Physician Services |
Includes Fee-for-Service payments, Clinical Alternate Relationship Plans, Academic Medicine, Physician Support Programs and Physician On-Call funding.
| 4.3 | Physician Education and Recruitment |
Supports initiatives such as Resident Physicians Services Compensation, Physician Education and Development, and Rural Health Professions Action Plan.
| 5 | Drugs and Supplemental Health Benefits |
| 5.1 | Program Support |
Includes salaries and supplies and services to support the Drugs and Supplemental Health Benefit programs and administrative costs for the Alberta Blue Cross and Alberta Dental Services Corporation contracts.
| 5.2 | Outpatient Cancer Therapy Drugs |
Supports the purchase of outpatient cancer therapy drugs that are administered by Alberta Health Services.
| 5.3 | Outpatient Specialized High Cost Drugs |
Supports the purchase of outpatient specialized high cost drugs used to treat patients with HIV, cystic fibrosis, organ transplants, rare diseases or other specialized needs.
| 5.4 | Seniors Drug Benefits |
Supports the supplemental health insurance plan that provides premium free coverage of prescription drugs for seniors.
| 5.5 | Seniors Dental, Optical and Supplemental Health Benefits |
Provides low-to-moderate income seniors with financial assistance for basic dental and optical services, and supplemental health benefits such as ground ambulance services, prosthetics and orthotic devices and preferred hospital accommodations.
| 5.6 | Non-Group Drug Benefits |
Supports coverage for prescription drugs for individuals who might not otherwise have the opportunity to purchase drug and other health benefit insurance coverage through a group plan.
| 5.7 | Non-Group Supplemental Health Benefits |
Provides individuals in the non-group plan with health benefits such as ground ambulance services, prosthetics and orthotic devices and preferred hospital accommodations.
| 5.8 | Assured Income for the Severely Handicapped Health Benefit |
Provides health benefits to AISH clients, their cohabiting partners and dependent children.
| 5.9 | Child Health Benefit |
Covers children’s health expenses for families with low incomes. This plan is for children up to 18 years of age. Children who are 18 or 19 years old also qualify, if they are living at home and attending high school.
| 5.10 | Adult Health Benefit |
Provides supports to low income adults to ensure they have access to health benefits.
| 5.11 | Alberta Aids to Daily Living |
Provides financial assistance to buy medical equipment or supplies for clients with a long-term disability, chronic or terminal illness.
| 5.12 | Pharmaceutical Innovation and Management |
Supports policy development regarding pharmacists and pharmacies as well as support for pharmacists to administer medication by injection or to review medication charts.
| 107 | Health |
DESCRIPTION OF SUPPLY VOTE PROGRAMS … continued
| 6 | Emergency Medical Services |
| 6.1 | Program Support |
Includes salaries and supplies and services for the administration of the Emergency Health Services Act and regulations.
| 6.2 | Emergency Medical Services Initiatives |
Provides supports for Emergency Medical Services initiatives to enhance response times and inter-facility patient transfers for non-emergency transport.
| 7 | Primary Health Care |
| 7.1 | Program Support |
Includes salaries and supplies and services to support Primary Health Care programs.
| 7.2 | Primary Health Care |
Primary Care Networks promote integration, encourage innovation, and increase access through collaboration between family physicians, Alberta Health Services and other health care providers.
| 8 | Population and Public Health |
| 8.1 | Program Support |
Includes salaries and supplies and services to support Population and Public Health programs and services, such as the Office of the Chief Medical Officer of Health.
| 8.2 | Immunization Support |
Provides support for immunization providers outside of Alberta Health Services and for operations of the Provincial Vaccine Depot.
| 8.3 | Community-Based Health Services |
Supports community agencies and other organizations to provide health prevention and promotion initiatives.
| 8.4 | Research and Support Programs |
Supports various health initiatives including Federal Nursing Stations; Federal/Provincial/Territorial Secretariat obligations; and Hepatitis C Research funded by Health Canada.
| 8.5 | Palliative Care |
A commitment to support palliative care education, training, and standards for health professionals and to raise public awareness of palliative care.
| 8.6 | Children’s Health Supports |
Provides support for rehabilitation services for children and youth.
| 8.7 | Health Innovation |
Provides support for initiatives on enhancing health outcomes.
| 8.8 | Health System Projects |
Includes activities to support the health system in becoming more efficient and cost-effective.
| 8.9 | Health Quality Council of Alberta |
Supports the Council, an independent organization engaged in gathering and translating knowledge and information into practical actions that can improve the quality, safety and performance of Alberta’s health system.
| 9 | Allied Health Services |
Provides eligible Albertans with allied health services including optometry, podiatry, podiatric surgery, and oral and maxillofacial surgery services through four distinct schedules of benefits.
| 10 | Human Tissue and Blood Services |
Includes the Province’s contribution to the National Blood Program, operational budget of Canadian Blood Services, the Cord Blood program, and national organ/tissue donation and transplant initiatives.
| Health | 108 |
DESCRIPTION OF SUPPLY VOTE PROGRAMS … continued
| 11 | Continuing Care |
| 11.1 | Program Support |
Includes salaries, supplies and services to support continuing care programs.
| 11.2 | Continuing Care Programs |
Provides support for various continuing care initiatives related to improving the quality of care provided in continuing care settings.
| 11.3 | Accommodation Standards and Licensing |
Provides support for licensing and compliance monitoring of long-term care and supportive living facilities.
| 12 | Out-of-Province Health Care Services |
| 12.1 | Program Support |
Includes salaries and supplies and services to support out-of-province health care services.
| 12.2 | Out-of-Province Health Care Services |
Supports out-of-province and out-of-country hospital and medical costs for services provided to eligible Albertans, with these costs generally covered under a reciprocal agreements.
| 13 | Information Technology |
| 13.1 | Program Support |
Includes salaries and supplies and services to support the maintenance and development of information systems.
| 13.2 | Development and Operations |
Supports the operation and maintenance of department information technology and provincial information systems.
| 14 | Cancer Research and Prevention Investment |
Supports initiatives in cancer prevention, screening, education and research.
| 15 | Infrastructure Support |
| 15.1 | Continuing Care Beds |
Provides capital support to develop and open new continuing care beds in priority areas throughout the province.
| 15.2 | External Information Systems Development |
Provides capital support to develop and implement provincial information systems to enhance the efficiency of the health system.
| 15.3 | Medical Equipment Replacement and Upgrade Program |
Provides support to Alberta Health Services to replace and upgrade medical equipment.
| 15.4 | Alberta Surgical Initiative Capital Program |
Capital support for Alberta Health Services sites to improve surgical wait times.
| 15.5 | Rural Alberta Health Facilities Capital Program |
Capital funding to improve health facilities in rural Alberta.
| 15.6 | National Association of Pharmacy Regulatory Authorities Capital Program |
Provides capital support for renovations to accommodate new standards for sterile compounding as established by National Association of Pharmacy Regulatory Authorities and adopted by Alberta College of Pharmacists.
| 15.7 | Emergency Medical Services Vehicles Capital Program |
Provides capital support to purchase new and upgrade existing Emergency Medical Services vehicles and ambulances.
| 15.8 | Beaverlodge Health Centre Replacement |
Planning funds to review capital investment options related to the Beaverlodge Health Centre.
| 16 | COVID-19 Pandemic Response |
Provides funding to address the provincial response to the COVID-19 pandemic.
| 109 | Health |
| EXPENSE VOTE BY PROGRAM |
|
|||||||||||||||
| (thousands of dollars) |
Comparable |
|||||||||||||||
|
2022-23 Budget |
2022-23 Forecast |
2023-24 Estimate |
||||||||||||||
| OPERATING EXPENSE |
||||||||||||||||
| 1 |
Ministry Support Services |
|||||||||||||||
| 1.1 |
Minister’s Office |
991 | 1,174 | 1,016 | ||||||||||||
| 1.2 |
Deputy Minister’s Office |
1,387 | 1,387 | 1,534 | ||||||||||||
| 1.3 |
Strategic Corporate Support |
41,587 | 41,587 | 42,159 | ||||||||||||
| 1.4 |
Policy Development and Strategic Support |
20,052 | 20,052 | 21,095 | ||||||||||||
| 1.5 |
Health Advocates’ Office |
1,929 | 1,929 | 3,545 | ||||||||||||
| Sub-total | 65,946 | 66,129 | 69,349 | |||||||||||||
| 2 |
Alberta Health Services |
|||||||||||||||
| 2.1 |
Continuing Care |
1,100,000 | 1,112,697 | 1,230,000 | ||||||||||||
| 2.2 |
Community Care |
1,492,961 | 1,497,773 | 1,782,961 | ||||||||||||
| 2.3 |
Home Care |
700,000 | 704,726 | 845,000 | ||||||||||||
| 2.4 |
Acute Care |
3,750,000 | 3,850,550 | 4,200,000 | ||||||||||||
| 2.5 |
Emergency Medical Services |
500,000 | 501,045 | 547,000 | ||||||||||||
| 2.6 |
Diagnostic and Therapeutic Services |
2,200,000 | 2,205,159 | 2,420,000 | ||||||||||||
| 2.7 |
Population and Public Health |
340,000 | 360,276 | 408,000 | ||||||||||||
| 2.8 |
Health Workforce Education and Research |
100,000 | 100,000 | 100,000 | ||||||||||||
| 2.9 |
Information Technology |
450,555 | 455,996 | 450,000 | ||||||||||||
| 2.10 |
Support Services |
1,700,000 | 1,733,209 | 1,900,000 | ||||||||||||
| 2.11 |
Administration |
488,000 | 484,504 | 503,000 | ||||||||||||
| 2.12 |
Drugs and Gases |
625,000 | 623,046 | 751,650 | ||||||||||||
| Sub-total | 13,446,516 | 13,628,981 | 15,137,611 | |||||||||||||
| 3 |
Health System Capacity |
100,000 | 63,600 | 75,000 | ||||||||||||
| 4 |
Physician Compensation and Development |
|||||||||||||||
| 4.1 |
Program Support |
8,017 | 8,410 | 8,137 | ||||||||||||
| 4.2 |
Physician Services |
4,711,691 | 5,207,691 | 5,278,815 | ||||||||||||
| 4.3 |
Physician Education and Recruitment |
365,775 | 360,775 | 438,725 | ||||||||||||
| Sub-total | 5,085,483 | 5,576,876 | 5,725,677 | |||||||||||||
| 5 |
Drugs and Supplemental Health Benefits |
|||||||||||||||
| 5.1 |
Program Support |
55,299 | 55,299 | 54,949 | ||||||||||||
| 5.2 |
Outpatient Cancer Therapy Drugs |
322,300 | 322,300 | 351,000 | ||||||||||||
| 5.3 |
Outpatient Specialized High Cost Drugs |
139,700 | 139,700 | 142,449 | ||||||||||||
| 5.4 |
Seniors Drug Benefits |
673,891 | 665,891 | 692,690 | ||||||||||||
| 5.5 |
Seniors Dental, Optical and Supplemental Health Benefits |
135,000 | 147,000 | 149,800 | ||||||||||||
| 5.6 |
Non-Group Drug Benefits |
225,000 | 186,000 | 200,000 | ||||||||||||
| 5.7 |
Non-Group Supplemental Health Benefits |
900 | 900 | 975 | ||||||||||||
| 5.8 |
Assured Income for the Severely Handicapped Health Benefit |
253,000 | 246,000 | 251,908 | ||||||||||||
| 5.9 |
Child Health Benefit |
37,000 | 25,000 | 24,810 | ||||||||||||
| 5.10 |
Adult Health Benefit |
232,000 | 193,000 | 214,098 | ||||||||||||
| 5.11 |
Alberta Aids to Daily Living |
192,000 | 185,000 | 207,354 | ||||||||||||
| 5.12 |
Pharmaceutical Innovation and Management |
129,600 | 129,600 | 140,371 | ||||||||||||
| Sub-total | 2,395,690 | 2,295,690 | 2,430,404 | |||||||||||||
| Health | 110 |
EXPENSE VOTE BY PROGRAM ... continued
| (thousands of dollars) |
Comparable |
|||||||||||||||
|
2022-23 Budget |
2022-23 Forecast |
2023-24 Estimate |
||||||||||||||
| OPERATING EXPENSE … continued |
||||||||||||||||
| 6 |
Emergency Medical Services |
|||||||||||||||
| 6.1 |
Program Support |
1,450 | 1,450 | 1,469 | ||||||||||||
| 6.2 |
Emergency Medical Services Initiatives |
- | - | 89,600 | ||||||||||||
| Sub-total | 1,450 | 1,450 | 91,069 | |||||||||||||
| 7 |
Primary Health Care |
|||||||||||||||
| 7.1 |
Program Support |
3,175 | 4,475 | 3,594 | ||||||||||||
| 7.2 |
Primary Health Care |
250,352 | 272,552 | 319,048 | ||||||||||||
| Sub-total | 253,527 | 277,027 | 322,642 | |||||||||||||
| 8 |
Population and Public Health |
|||||||||||||||
| 8.1 |
Program Support |
20,557 | 20,557 | 21,215 | ||||||||||||
| 8.2 |
Immunization Support |
2,121 | 2,121 | 4,121 | ||||||||||||
| 8.3 |
Community-Based Health Services |
63,978 | 58,421 | 122,467 | ||||||||||||
| 8.4 |
Research and Support Programs |
10,398 | 10,898 | 18,848 | ||||||||||||
| 8.5 |
Palliative Care |
5,000 | 7,500 | 5,000 | ||||||||||||
| 8.6 |
Children’s Health Supports |
15,000 | 15,000 | 15,000 | ||||||||||||
| 8.7 |
Health Innovation |
- | - | 17,500 | ||||||||||||
| 8.8 |
Health System Projects |
1,908 | 1,908 | 1,900 | ||||||||||||
| 8.9 |
Health Quality Council of Alberta |
7,559 | 7,559 | 7,672 | ||||||||||||
| Sub-total | 126,521 | 123,964 | 213,723 | |||||||||||||
| 9 |
Allied Health Services |
105,382 | 142,000 | 153,226 | ||||||||||||
| 10 |
Human Tissue and Blood Services |
241,754 | 237,754 | 254,522 | ||||||||||||
| 11 |
Continuing Care |
|||||||||||||||
| 11.1 |
Program Support |
7,243 | 7,243 | 9,672 | ||||||||||||
| 11.2 |
Continuing Care Programs |
5,100 | 3,600 | 26,402 | ||||||||||||
| 11.3 |
Accommodation Standards and Licensing |
3,411 | 3,411 | 5,757 | ||||||||||||
| Sub-total | 15,754 | 14,254 | 41,831 | |||||||||||||
| 12 |
Out-of-Province Health Care Services |
|||||||||||||||
| 12.1 |
Program Support |
8,665 | 7,165 | 16,614 | ||||||||||||
| 12.2 |
Out-of-Province Health Care Services |
134,879 | 134,879 | 139,986 | ||||||||||||
| Sub-total | 143,544 | 142,044 | 156,600 | |||||||||||||
| 13 |
Information Technology |
|||||||||||||||
| 13.1 |
Program Support |
6,960 | 6,960 | 7,149 | ||||||||||||
| 13.2 |
Development and Operations |
94,830 | 98,830 | 125,036 | ||||||||||||
| Sub-total | 101,790 | 105,790 | 132,185 | |||||||||||||
| 14 |
Cancer Research and Prevention Investment |
25,000 | 25,000 | 25,850 | ||||||||||||
| 16 |
COVID-19 Pandemic Response |
10,000 | 10,000 | - | ||||||||||||
| 111 | Health |
EXPENSE VOTE BY PROGRAM ... continued
| (thousands of dollars) |
Comparable |
|||||||||||||||
|
2022-23 Budget |
2022-23 Forecast |
2023-24 Estimate |
||||||||||||||
| CAPITAL GRANTS |
||||||||||||||||
| 15 |
Infrastructure Support |
|||||||||||||||
| 15.1 |
Continuing Care Beds |
51,435 | 12,472 | 89,452 | ||||||||||||
| CAPITAL PAYMENTS TO RELATED PARTIES |
||||||||||||||||
| 3 |
Health System Capacity |
- | 2,425 | 10,730 | ||||||||||||
| 8 |
Population and Public Health |
|||||||||||||||
| 8.3 |
Community-Based Health Services |
- | 557 | - | ||||||||||||
| 15 |
Infrastructure Support |
|||||||||||||||
| 15.2 |
External Information Systems Development |
5,748 | 2,748 | 5,748 | ||||||||||||
| 15.3 |
Medical Equipment Replacement and Upgrade Program |
30,000 | 30,000 | 30,000 | ||||||||||||
| 15.4 |
Alberta Surgical Initiative Capital Program |
22,420 | 22,420 | 12,072 | ||||||||||||
| 15.5 |
Rural Alberta Health Facilities Capital Program |
15,000 | 15,000 | 40,000 | ||||||||||||
| 15.6 |
National Association of Pharmacy Regulatory Authorities Capital Program |
- | - | 15,069 | ||||||||||||
| 15.7 |
Emergency Medical Services Vehicles Capital Program |
- | - | 5,000 | ||||||||||||
| Sub-total | 73,168 | 70,168 | 107,889 | |||||||||||||
| Total |
22,242,960 | 22,796,181 | 25,037,760 | |||||||||||||
| CAPITAL INVESTMENT VOTE BY PROGRAM |
||||||||||||||||
| DEPARTMENT CAPITAL ACQUISITIONS |
||||||||||||||||
| 11 |
Continuing Care |
|||||||||||||||
| 11.1 |
Program Support |
- | - | 585 | ||||||||||||
| 13 |
Information Technology |
|||||||||||||||
| 13.2 |
Development and Operations |
25,276 | 27,525 | 27,280 | ||||||||||||
| 15 |
Infrastructure Support |
|||||||||||||||
| 15.8 |
Beaverlodge Health Centre Replacement |
- | - | 1,000 | ||||||||||||
| Total |
25,276 | 27,525 | 28,865 | |||||||||||||
| FINANCIAL TRANSACTIONS VOTE BY PROGRAM |
||||||||||||||||
| INVENTORY ACQUISITION |
||||||||||||||||
| 5 |
Drugs and Supplemental Health Benefits |
|||||||||||||||
| 5.3 |
Outpatient Specialized High Cost Drugs |
9,000 | 7,000 | 9,000 | ||||||||||||
| 8 |
Population and Public Health |
|||||||||||||||
| 8.2 |
Immunization Support |
75,976 | 73,121 | 79,876 | ||||||||||||
| Total |
84,976 | 80,121 | 88,876 | |||||||||||||
| Health | 112 |
CONTINGENCY VOTE BY PROGRAM
| (thousands of dollars) |
Comparable |
|||||||||||||||
|
2022-23 Budget |
2022-23 Forecast |
2023-24 Estimate |
||||||||||||||
| OPERATING EXPENSE |
||||||||||||||||
| 16 |
COVID-19 Pandemic Response |
- | 1,062,096 | - | ||||||||||||
| CAPITAL PAYMENTS TO RELATED PARTIES |
||||||||||||||||
| 16 |
COVID-19 Pandemic Response |
- | 27,200 | - | ||||||||||||
| CAPITAL INVESTMENT |
||||||||||||||||
| 16 |
COVID-19 Pandemic Response |
- | 7,500 | - | ||||||||||||
| Total |
- | 1,096,796 | - | |||||||||||||
| 113 | Health |
VOTED AMOUNTS FUNDED BY CREDIT OR RECOVERY
The following table details the portions of the department’s voted amounts for which a credit or recovery can be obtained. If a credit or recovery amount is expected to exceed its original estimate, the Treasury Board may increase the corresponding voted amount, pursuant to section 24(2) of the Financial Administration Act. If the actual credit or recovery amount realized is less than its original estimate, the corresponding funding authority is reduced by an equivalent amount in the programs shown.
EXPENSE AMOUNTS FUNDED BY CREDIT OR RECOVERY
| (thousands of dollars) |
2023-24 Estimate |
|||||
| 1 |
Hepatitis C Health Services | 1,000 | ||||
| Funding from Health Canada will be used to enhance existing health services to persons with chronic Hepatitis C virus infection. Program 8.4 |
||||||
| 2 |
Services to Ministries | 2,024 | ||||
| Funding received from other ministries, which is used to provide common services such as corporate services or other program supporting services. Program 1.3 |
||||||
| Total |
3,024 | |||||
| Health | 114 |
AMOUNTS NOT REQUIRED TO BE VOTED
The following department amounts do not require a supply vote either because no cash disbursement is required, or because the Legislative Assembly has already provided the funding authority pursuant to a statute other than an appropriation act.
EXPENSE
| (thousands of dollars) |
Comparable |
|||||||||||
|
2022-23 Budget |
2022-23 Forecast |
2023-24 Estimate |
||||||||||
| DEPARTMENT NON-CASH AMOUNTS |
||||||||||||
| Amortization |
||||||||||||
| Ministry Support Services |
250 | 250 | 250 | |||||||||
| Information Technology |
18,000 | 18,000 | 18,000 | |||||||||
| Consumption of Inventory |
||||||||||||
| Drugs and Supplemental Health Benefits |
9,000 | 7,000 | 9,000 | |||||||||
| Population and Public Health |
68,940 | 68,940 | 76,870 | |||||||||
| COVID-19 Pandemic Response |
- | 123,696 | - | |||||||||
| Valuation Adjustments and Other Provisions |
||||||||||||
| Population and Public Health |
2,000 | 2,000 | 2,000 | |||||||||
| Total |
98,190 | 219,886 | 106,120 | |||||||||
| 115 | Health |
RECONCILIATION OF SUPPLY VOTE TO CONSOLIDATED GOVERNMENT ESTIMATE
The following tables summarize the relationship between the department’s Supply Votes and the effect of the ministry on the Government’s consolidated 2023-24 Estimates.
| RECONCILIATION BY PROGRAM |
||||||||||||||||||||
| (thousands of dollars) |
Voted Supply |
Department Amounts Not Voted |
Entities’ Amounts Not Voted |
Consolidation Adjustments |
Consolidated 2023-24 Estimate |
|||||||||||||||
| EXPENSE |
||||||||||||||||||||
| Alberta Health Services |
15,137,611 | - | - | (15,137,611 | ) | - | ||||||||||||||
| Ministry Support Services |
69,349 | 250 | - | (2,024 | ) | 67,575 | ||||||||||||||
| Physician Compensation and Development |
5,725,677 | - | 1,213,900 | (887,231 | ) | 6,052,346 | ||||||||||||||
| Acute Care |
242,330 | - | 4,500,067 | (111,730 | ) | 4,630,667 | ||||||||||||||
| Diagnostic, Therapeutic and Other Patient Services |
407,748 | - | 2,517,300 | (28,300 | ) | 2,896,748 | ||||||||||||||
| Drugs and Supplemental Health Benefits |
2,430,404 | 9,000 | 827,300 | (497,862 | ) | 2,768,842 | ||||||||||||||
| Community Care |
- | - | 2,021,800 | (1,554 | ) | 2,020,246 | ||||||||||||||
| Continuing Care |
41,831 | - | 1,363,200 | - | 1,405,031 | |||||||||||||||
| Home Care |
- | - | 902,800 | - | 902,800 | |||||||||||||||
| Population and Public Health |
536,365 | 78,870 | 421,700 | (219,877 | ) | 817,058 | ||||||||||||||
| Emergency Medical Services |
91,069 | - | 736,400 | (87,900 | ) | 739,569 | ||||||||||||||
| Support Services |
- | - | 2,521,200 | (27,496 | ) | 2,493,704 | ||||||||||||||
| Information Technology |
132,185 | 18,000 | 767,900 | (10,700 | ) | 907,385 | ||||||||||||||
| Administration |
- | - | 541,300 | (6,394 | ) | 534,906 | ||||||||||||||
| Research and Education |
- | - | 133,492 | (23,102 | ) | 110,390 | ||||||||||||||
| Infrastructure Support |
197,341 | - | - | (107,889 | ) | 89,452 | ||||||||||||||
| Debt Servicing |
- | - | 15,000 | (15,000 | ) | - | ||||||||||||||
| Cancer Research and Prevention Investment |
25,850 | - | - | (16,070 | ) | 9,780 | ||||||||||||||
| Total |
25,037,760 | 106,120 | 18,483,359 | (17,180,740 | ) | 26,446,499 | ||||||||||||||
| CAPITAL INVESTMENT |
||||||||||||||||||||
| Continuing Care |
585 | - | - | - | 585 | |||||||||||||||
| Information Technology |
27,280 | - | - | - | 27,280 | |||||||||||||||
| Infrastructure Support |
1,000 | - | - | - | 1,000 | |||||||||||||||
| Health Facilities and Equipment |
- | - | 1,154,879 | - | 1,154,879 | |||||||||||||||
| Total |
28,865 | - | 1,154,879 | - | 1,183,744 | |||||||||||||||
| INVENTORY ACQUISITION |
||||||||||||||||||||
| Drugs and Supplemental Health Benefits |
9,000 | - | 1,314,861 | - | 1,323,861 | |||||||||||||||
| Population and Public Health |
79,876 | - | - | - | 79,876 | |||||||||||||||
| Total |
88,876 | - | 1,314,861 | - | 1,403,737 | |||||||||||||||
| Health | 116 |
RECONCILIATION OF SUPPLY VOTE TO CONSOLIDATED GOVERNMENT ESTIMATE … continued
| RECONCILIATION BY TYPE OF SPENDING |
|
|||||||||||||||||||
| (thousands of dollars) |
Voted Supply |
Department Amounts Not Voted |
Entities’ Amounts Not Voted |
Consolidation Adjustments |
Consolidated 2023-24 Estimate |
|||||||||||||||
| EXPENSE |
||||||||||||||||||||
| Operating expense |
24,829,689 | 2,000 | 16,744,742 | (17,043,121 | ) | 24,533,310 | ||||||||||||||
| Capital grants |
89,452 | - | 4,000 | (4,000 | ) | 89,452 | ||||||||||||||
| Capital payments to related parties |
118,619 | - | - | (118,619 | ) | - | ||||||||||||||
| Amortization |
- | 18,250 | 527,717 | - | 545,967 | |||||||||||||||
| Inventory consumption |
- | 85,870 | 1,191,900 | - | 1,277,770 | |||||||||||||||
| Debt servicing costs - general |
- | - | 15,000 | (15,000 | ) | - | ||||||||||||||
| Total |
25,037,760 | 106,120 | 18,483,359 | (17,180,740 | ) | 26,446,499 | ||||||||||||||
| CAPITAL INVESTMENT |
28,865 | - | 1,154,879 | - | 1,183,744 | |||||||||||||||
| INVENTORY ACQUISITION |
88,876 | - | 1,314,861 | - | 1,403,737 | |||||||||||||||
| 117 | Health |
| MINISTRY FINANCIAL STATEMENTS |
||||||||||||
| STATEMENT OF OPERATIONS |
||||||||||||
| (thousands of dollars) |
Comparable |
|||||||||||
|
2022-23 Budget |
2022-23 Forecast |
2023-24 Estimate |
||||||||||
| REVENUE |
||||||||||||
| Internal Government Transfers |
372,534 | 420,688 | 468,138 | |||||||||
| Transfers from Government of Canada |
162,881 | 359,432 | 162,950 | |||||||||
| Canada Health Transfer |
5,351,896 | 5,520,360 | 6,079,269 | |||||||||
| Investment Income |
55,020 | 35,020 | 54,020 | |||||||||
| Supplementary Health Benefit Premiums |
46,000 | 46,000 | 46,000 | |||||||||
| Other Premiums, Fees and Licences |
491,201 | 534,801 | 586,001 | |||||||||
| Other Revenue |
569,080 | 563,912 | 522,475 | |||||||||
| Ministry Total |
7,048,612 | 7,480,213 | 7,918,853 | |||||||||
| Inter-Ministry Consolidations |
(404,178 | ) | (445,332 | ) | (493,962 | ) | ||||||
| Consolidated Total |
6,644,434 | 7,034,881 | 7,424,891 | |||||||||
| EXPENSE |
||||||||||||
| Ministry Support Services |
66,196 | 66,379 | 69,599 | |||||||||
| Physician Compensation and Development |
5,472,718 | 5,978,611 | 6,178,296 | |||||||||
| Acute Care |
4,172,904 | 4,276,525 | 4,661,667 | |||||||||
| Diagnostic, Therapeutic and Other Patient Services |
2,618,714 | 2,636,533 | 2,903,157 | |||||||||
| Drugs and Supplemental Health Benefits |
2,619,777 | 2,522,577 | 2,768,842 | |||||||||
| Community Care |
1,725,400 | 1,707,173 | 2,021,800 | |||||||||
| Continuing Care |
1,244,754 | 1,279,390 | 1,405,031 | |||||||||
| Home Care |
755,100 | 749,729 | 902,800 | |||||||||
| Population and Public Health |
650,319 | 673,472 | 827,904 | |||||||||
| Emergency Medical Services |
604,050 | 601,160 | 739,569 | |||||||||
| Support Services |
2,249,900 | 2,373,971 | 2,521,200 | |||||||||
| Information Technology |
828,390 | 846,227 | 907,385 | |||||||||
| Administration |
496,800 | 473,966 | 541,300 | |||||||||
| Research and Education |
131,479 | 132,679 | 133,492 | |||||||||
| Infrastructure Support |
51,435 | 12,472 | 89,452 | |||||||||
| Debt Servicing |
14,000 | 14,000 | 15,000 | |||||||||
| Cancer Research and Prevention Investment |
11,300 | 11,300 | 10,380 | |||||||||
| COVID-19 Pandemic Response |
10,000 | 1,450,992 | - | |||||||||
| Ministry Total |
23,723,236 | 25,807,156 | 26,696,874 | |||||||||
| Inter-Ministry Consolidations |
(239,419 | ) | (244,049 | ) | (250,375 | ) | ||||||
| Consolidated Total |
23,483,817 | 25,563,107 | 26,446,499 | |||||||||
| Net Operating Result |
(16,839,383 | ) | (18,528,226 | ) | (19,021,608 | ) | ||||||
| Health | 118 |
MINISTRY FINANCIAL STATEMENTS ... continued
| CHANGE IN CAPITAL ASSETS |
||||||||||||
| (thousands of dollars) |
Comparable |
|||||||||||
|
2022-23 Budget |
2022-23 Forecast |
2023-24 Estimate |
||||||||||
| INVESTMENT |
||||||||||||
| Continuing Care |
- | - | 585 | |||||||||
| Information Technology |
25,276 | 27,525 | 27,280 | |||||||||
| Infrastructure Support |
- | - | 1,000 | |||||||||
| COVID-19 Pandemic Response |
- | 34,700 | - | |||||||||
| Health Facilities and Equipment |
1,219,376 | 914,458 | 1,154,879 | |||||||||
| Consolidated Total |
1,244,652 | 976,683 | 1,183,744 | |||||||||
| AMORTIZATION |
(517,623 | ) | (517,623 | ) | (545,967 | ) | ||||||
| Change in Capital Assets Total |
727,029 | 459,060 | 637,777 | |||||||||
| CHANGE IN INVENTORY ASSETS |
||||||||||||
| INVENTORY ACQUISITION |
||||||||||||
| Drugs and Supplemental Health Benefits |
1,071,641 | 1,084,441 | 1,323,861 | |||||||||
| Population and Public Health |
75,976 | 73,121 | 79,876 | |||||||||
| COVID-19 Pandemic Response |
- | 135,000 | - | |||||||||
| Consolidated Total |
1,147,617 | 1,292,562 | 1,403,737 | |||||||||
| CONSUMPTION |
(987,940 | ) | (1,465,313 | ) | (1,277,770 | ) | ||||||
| Change in Inventory Assets Total |
159,677 | (172,751 | ) | 125,967 | ||||||||
| 119 | Health |
Indigenous Relations
AMOUNTS TO BE VOTED
| (thousands of dollars) |
Comparable |
|||||||||||
|
2022-23 Budget |
2022-23 Forecast |
2023-24 Estimate |
||||||||||
| EXPENSE |
181,394 | 204,082 | 225,693 | |||||||||
| CAPITAL INVESTMENT |
25 | 25 | 25 | |||||||||
121
DESCRIPTION OF SUPPLY VOTE PROGRAMS
| 1 | Ministry Support Services |
| 1.1 | Minister’s Office |
Oversees the development of ministerial policies that are aligned with broader government-wide objectives and priorities.
| 1.2 | Deputy Minister’s Office |
Supports the Minister in achieving business plan and strategic goals of the ministry, government and public service.
| 1.3 | Strategic and Corporate Services |
Responsible for corporate functions such as business planning, annual reporting, enterprise risk management, performance measurement development and financial planning among others.
| 2 | First Nations and Métis Relations |
Responsible for establishing effective relationships, legislation, policies and initiatives for Indigenous governments and organizations, and administers the Metis Settlements legislation.
| 3 | Indigenous Women’s Initiatives |
Provides secretariat support to the First Nations and Métis Women’s Councils on Economic Security and leads Alberta’s response to the National Inquiry into Missing and Murdered Indigenous Women and Girls.
| 4 | First Nations Development Fund |
A grant program available exclusively to First Nations for social, economic and community development projects supported by a portion of revenues from provincially owned slot machines located in First Nation casinos.
| 5 | Metis Settlements Appeal Tribunal |
A quasi-judicial body established by the Metis Settlements Act that mediates and adjudicates disputes on Metis Settlements in regards to membership, land and surface access.
| 6 | Consultation, Land and Policy |
| 6.1 | Program Support and Land Claims |
Divisional operations and responsibility for coordinating the province’s participation in land-related negotiations with the federal government and First Nations, particularly Treaty Land Entitlement claims.
| 6.2 | Aboriginal Consultation Office |
Manages the consultation process by providing pre-consultation assessments, guiding the consultation process and providing an assessment of consultation adequacy for land and natural resource development.
| 6.3 | Strategic Engagement and Policy Innovation |
Develops and delivers policies, guidelines and initiatives to ensure that Alberta fulfills its duty to consult, and ensures Indigenous perspectives are included in land and resource management decisions.
| 7 | Investing in Canada Infrastructure |
Provides funds to eligible Indigenous organizations whose projects support the federal government’s Investing in Canada Infrastructure Program.
| 8 | Land and Legal Settlement |
Supports Alberta’s constitutional obligations under the Natural Resource Transfer Agreement (NRTA) in relation to treaty land entitlement claim settlements.
| 9 | Alberta Indigenous Opportunities Corporation |
Funding provided to the Alberta Indigenous Opportunities Corporation (AIOC) supporting Indigenous groups seeking to make medium to large-scale investments in natural resource projects that benefit Alberta’s economy.
| Indigenous Relations | 122 |
EXPENSE VOTE BY PROGRAM
| (thousands of dollars) |
Comparable |
|||||||||||||||
|
2022-23 Budget |
2022-23 Forecast |
2023-24 Estimate |
||||||||||||||
| OPERATING EXPENSE |
||||||||||||||||
| 1 |
Ministry Support Services |
|||||||||||||||
| 1.1 |
Minister’s Office |
820 | 820 | 820 | ||||||||||||
| 1.2 |
Deputy Minister’s Office |
668 | 668 | 668 | ||||||||||||
| 1.3 |
Strategic and Corporate Services |
2,948 | 2,948 | 3,465 | ||||||||||||
| Sub-total | 4,436 | 4,436 | 4,953 | |||||||||||||
| 2 |
First Nations and Métis Relations |
15,250 | 14,670 | 17,999 | ||||||||||||
| 3 |
Indigenous Women’s Initiatives |
2,126 | 2,126 | 7,391 | ||||||||||||
| 4 |
First Nations Development Fund |
113,000 | 126,000 | 147,250 | ||||||||||||
| 5 |
Metis Settlements Appeal Tribunal |
1,108 | 1,108 | 1,161 | ||||||||||||
| 6 |
Consultation, Land and Policy |
|||||||||||||||
| 6.1 |
Program Support and Land Claims |
1,264 | 1,264 | 1,929 | ||||||||||||
| 6.2 |
Aboriginal Consultation Office |
5,002 | 5,002 | 5,061 | ||||||||||||
| 6.3 |
Strategic Engagement and Policy Innovation |
9,715 | 10,595 | 15,593 | ||||||||||||
| Sub-total | 15,981 | 16,861 | 22,583 | |||||||||||||
| 7 |
Investing in Canada Infrastructure |
100 | 100 | 100 | ||||||||||||
| 8 |
Land and Legal Settlement |
4,674 | 4,148 | 3,825 | ||||||||||||
| 9 |
Alberta Indigenous Opportunities Corporation |
6,000 | 2,750 | 4,000 | ||||||||||||
| CAPITAL GRANTS |
||||||||||||||||
| 2 |
First Nations and Métis Relations |
7,100 | 11,789 | 7,500 | ||||||||||||
| 7 |
Investing in Canada Infrastructure |
11,619 | 20,094 | 8,931 | ||||||||||||
| Total |
181,394 | 204,082 | 225,693 | |||||||||||||
| CAPITAL INVESTMENT VOTE BY PROGRAM |
||||||||||||||||
| DEPARTMENT CAPITAL ACQUISITIONS |
||||||||||||||||
| 1 |
Ministry Support Services |
|||||||||||||||
| 1.3 |
Strategic and Corporate Services |
25 | 25 | 25 | ||||||||||||
| Total |
25 | 25 | 25 | |||||||||||||
| 123 | Indigenous Relations |
VOTED AMOUNTS FUNDED BY CREDIT OR RECOVERY
The following table details the portions of the department’s voted amounts for which a credit or recovery can be obtained. If a credit or recovery amount is expected to exceed its original estimate, the Treasury Board may increase the corresponding voted amount, pursuant to section 24(2) of the Financial Administration Act. If the actual credit or recovery amount realized is less than its original estimate, the corresponding funding authority is reduced by an equivalent amount in the programs shown.
EXPENSE AMOUNTS FUNDED BY CREDIT OR RECOVERY
| (thousands of dollars) |
2023-24 Estimate |
|||||
| 1 |
First Nations Development Fund | 147,250 | ||||
| Revenue from government-owned slot machines at licenced First Nations casinos is used for the First |
||||||
| Nations Development Fund grant program which supports First Nations to create social, economic and community development projects their communities need. Program 4 |
||||||
| Total | 147,250 | |||||
| Indigenous Relations | 124 |
AMOUNTS NOT REQUIRED TO BE VOTED
The following department amounts do not require a supply vote either because no cash disbursement is required, or because the Legislative Assembly has already provided the funding authority pursuant to a statute other than an appropriation act.
EXPENSE
| (thousands of dollars) |
Comparable |
|||||||||||
|
2022-23 Budget |
2022-23 Forecast |
2023-24 Estimate |
||||||||||
| DEPARTMENT NON-CASH AMOUNTS |
||||||||||||
| Amortization |
||||||||||||
| Ministry Support Services |
63 | 63 | 63 | |||||||||
| Total |
63 | 63 | 63 | |||||||||
| 125 | Indigenous Relations |
RECONCILIATION OF SUPPLY VOTE TO CONSOLIDATED GOVERNMENT ESTIMATE
The following tables summarize the relationship between the department’s Supply Votes and the effect of the ministry on the Government’s consolidated 2023-24 Estimates.
| RECONCILIATION BY PROGRAM |
||||||||||||||||||||
| (thousands of dollars) |
Voted Supply |
Department Amounts Not Voted |
Entities’ Amounts Not Voted |
Consolidation Adjustments |
Consolidated 2023-24 Estimate |
|||||||||||||||
| EXPENSE |
||||||||||||||||||||
| Ministry Support Services |
4,953 | 63 | - | - | 5,016 | |||||||||||||||
| First Nations and Métis Relations |
25,499 | - | - | - | 25,499 | |||||||||||||||
| Indigenous Women’s Initiatives |
7,391 | - | - | - | 7,391 | |||||||||||||||
| First Nations Development Fund |
147,250 | - | - | - | 147,250 | |||||||||||||||
| Metis Settlements Appeal Tribunal |
1,161 | - | - | - | 1,161 | |||||||||||||||
| Consultation, Land and Policy |
22,583 | - | - | - | 22,583 | |||||||||||||||
| Investing in Canada Infrastructure |
9,031 | - | - | - | 9,031 | |||||||||||||||
| Land and Legal Settlement |
3,825 | - | - | - | 3,825 | |||||||||||||||
| Alberta Indigenous Opportunities Corporation |
4,000 | - | 8,527 | (4,000 | ) | 8,527 | ||||||||||||||
| Total |
225,693 | 63 | 8,527 | (4,000 | ) | 230,283 | ||||||||||||||
| CAPITAL INVESTMENT |
||||||||||||||||||||
| Ministry Support Services |
25 | - | - | - | 25 | |||||||||||||||
| RECONCILIATION BY TYPE OF SPENDING |
|
|||||||||||||||||||
| EXPENSE |
||||||||||||||||||||
| Operating expense |
209,262 | - | 8,527 | (4,000 | ) | 213,789 | ||||||||||||||
| Capital grants |
16,431 | - | - | - | 16,431 | |||||||||||||||
| Amortization |
- | 63 | - | - | 63 | |||||||||||||||
| Total |
225,693 | 63 | 8,527 | (4,000 | ) | 230,283 | ||||||||||||||
| CAPITAL INVESTMENT |
25 | - | - | - | 25 | |||||||||||||||
|
|
||||||||||||||||||||
| Indigenous Relations | 126 |
| MINISTRY FINANCIAL STATEMENTS |
||||||||||||
| STATEMENT OF OPERATIONS |
||||||||||||
| (thousands of dollars) |
Comparable |
|||||||||||
|
2022-23 Budget |
2022-23 Forecast |
2023-24 Estimate |
||||||||||
| REVENUE |
||||||||||||
| Premiums, Fees and Licences |
2,475 | 1,511 | 4,527 | |||||||||
| Transfers from Government of Canada |
11,719 | 20,194 | 9,031 | |||||||||
| Labour Market Development |
4,547 | 4,547 | 4,547 | |||||||||
| Consolidated Total |
18,741 | 26,252 | 18,105 | |||||||||
| EXPENSE |
||||||||||||
| Ministry Support Services |
4,499 | 4,499 | 5,016 | |||||||||
| First Nations and Métis Relations |
22,350 | 26,459 | 25,499 | |||||||||
| Indigenous Women’s Initiatives |
2,126 | 2,126 | 7,391 | |||||||||
| First Nations Development Fund |
113,000 | 126,000 | 147,250 | |||||||||
| Metis Settlements Appeal Tribunal |
1,108 | 1,108 | 1,161 | |||||||||
| Consultation, Land and Policy |
15,981 | 16,861 | 22,583 | |||||||||
| Investing in Canada Infrastructure |
11,719 | 20,194 | 9,031 | |||||||||
| Land and Legal Settlement |
4,674 | 4,148 | 3,825 | |||||||||
| Alberta Indigenous Opportunities Corporation |
8,475 | 5,111 | 8,527 | |||||||||
| Consolidated Total |
183,932 | 206,506 | 230,283 | |||||||||
| Net Operating Result |
(165,191 | ) | (180,254 | ) | (212,178 | ) | ||||||
| CHANGE IN CAPITAL ASSETS |
||||||||||||
| INVESTMENT |
||||||||||||
| Ministry Support Services |
25 | 25 | 25 | |||||||||
| Alberta Indigenous Opportunities Corporation |
- | 200 | - | |||||||||
| Consolidated Total |
25 | 225 | 25 | |||||||||
| AMORTIZATION |
(63 | ) | (63 | ) | (63 | ) | ||||||
| Change in Capital Assets Total |
(38 | ) | 162 | (38 | ) | |||||||
| 127 | Indigenous Relations |
Infrastructure
AMOUNTS TO BE VOTED
| (thousands of dollars) |
Comparable |
|||||||||||
|
2022-23 Budget |
2022-23 Forecast |
2023-24 Estimate |
||||||||||
| EXPENSE |
441,442 | 452,672 | 477,704 | |||||||||
| CAPITAL INVESTMENT |
1,879,397 | 1,375,346 | 1,692,856 | |||||||||
| FINANCIAL TRANSACTIONS |
25,473 | 14,031 | 28,114 | |||||||||
129
DESCRIPTION OF SUPPLY VOTE PROGRAMS
| 1 | Ministry Support Services |
| 1.1 | Minister’s Office |
Oversees the development of ministerial policies that are aligned with broader government-wide objectives and priorities.
| 1.2 | Deputy Minister’s Office |
Supports the Minister in achieving business plan and strategic goals of the ministry, government and public service.
| 1.3 | Strategic Integration and Operations |
Provides strategic corporate services to the ministry and provides support to and collaborates with all divisions.
| 2 | Capital Construction |
| 2.1 | Government Facilities Infrastructure |
Planning, design, and delivery of government-owned facility capital projects. Provides project management advisory services to the Ministry of Infrastructure and other ministries for capital projects.
| 2.2 | Health Facilities Infrastructure |
Planning, design, and delivery of health capital construction projects in partnership with the Department of Health and Alberta Health Services. Provides project management advisory services to Alberta Health Services.
| 2.3 | School Facilities Infrastructure |
Planning, design, and delivery of school facility capital projects in partnership with the Department of Education and school boards. Also assists the Post-Secondary Infrastructure program. Provides project management advisory services to school boards and post-secondary institutions.
| 2.4 | Capital Planning |
Planning of new and ongoing capital projects undertaken by the ministry.
| 2.5 | Health Capital Maintenance and Renewal |
Repairs, upgrades, maintenance, and replacement of building systems and building service equipment for existing health facilities. Administered by the Ministry of Infrastructure through grants to Alberta Health Services.
| 2.6 | School Capital Maintenance and Renewal |
School capital maintenance and renewal delivered under Public-private Partnership contracts.
| 2.7 | Project Procurement, Standards and Technical Services |
Project management expertise, procurement and contracting services, and a wide range of technical services to support the ministry’s planning and delivery of capital projects.
| 3 | Property Management |
| 3.1 | Property Operations |
Operations, maintenance and other costs for government-owned buildings and properties for which the Ministry of Infrastructure provides property management services.
| 3.2 | Swan Hills Treatment Centre |
Operations, maintenance and other costs for the Swan Hills Treatment Centre to enable safe and efficient treatment of hazardous waste.
| 3.3 | Government Owned Facilities Preservation |
Repairs, upgrades, maintenance, and replacement of building systems and building service equipment for government-owned buildings.
| 3.4 | Accommodation Projects |
Accommodation planning and projects for Government of Alberta departments, agencies, boards and commissions.
| 3.5 | Debt Servicing |
Interest portion of the capital repayment for the Evan Thomas Water and Wastewater Treatment Facility upgrades in Kananaskis, which was delivered using a Public-private Partnership.
| 3.6 | Debt Repayment |
Principal portion of the capital repayment for the Evan Thomas Water and Wastewater Treatment Facility upgrades in Kananaskis, which was delivered using a Public-private Partnership.
| Infrastructure | 130 |
DESCRIPTION OF SUPPLY VOTE PROGRAMS... continued
| 4 | Asset Management |
Integrating asset management strategies, policies, best practices, and tools in the planning, design, construction, maintenance, and disposal of government assets over their entire lifecycle.
| 5 | Realty Services |
| 5.1 | Leases |
Negotiating and documenting lease agreements, and lease rental payments to support Government of Alberta ministries and programs.
| 5.2 | Land Acquisition and Services |
Negotiating and administering the purchase and sale of real estate for government initiatives and managing land use agreements, easements and rights-of-way.
| 5.3 | Land Development and Disposal |
Managing and coordinating the development and sale of Parsons Creek land in Fort McMurray, and for the sale of other surplus crown lands throughout the Province.
| 6 | Alternative Capital Financing Partnerships Office |
Oversight of centralized work of public-private partnerships, providing expertise required to engage in strategic partnership opportunities and explore alternative revenue generation options.
| 131 | Infrastructure |
EXPENSE VOTE BY PROGRAM
| (thousands of dollars) |
Comparable |
|||||||||||||||
|
2022-23 Budget |
2022-23 Forecast |
2023-24 Estimate |
||||||||||||||
| OPERATING EXPENSE |
||||||||||||||||
| 1 |
Ministry Support Services |
|||||||||||||||
| 1.1 |
Minister’s Office |
780 | 780 | 795 | ||||||||||||
| 1.2 |
Deputy Minister’s Office |
780 | 780 | 795 | ||||||||||||
| 1.3 |
Strategic Integration and Operations |
8,726 | 8,726 | 8,902 | ||||||||||||
| Sub-total | 10,286 | 10,286 | 10,492 | |||||||||||||
| 2 |
Capital Construction |
|||||||||||||||
| 2.1 |
Government Facilities Infrastructure |
1,661 | 1,661 | 2,304 | ||||||||||||
| 2.2 |
Health Facilities Infrastructure |
1,426 | 3,166 | 4,695 | ||||||||||||
| 2.3 |
School Facilities Infrastructure |
1,555 | 1,555 | 670 | ||||||||||||
| 2.7 |
Project Procurement, Standards and Technical Services |
6,078 | 6,078 | 6,963 | ||||||||||||
| Sub-total | 10,720 | 12,460 | 14,632 | |||||||||||||
| 3 |
Property Management |
|||||||||||||||
| 3.1 |
Property Operations |
192,788 | 206,073 | 203,694 | ||||||||||||
| 3.2 |
Swan Hills Treatment Centre |
23,100 | 23,100 | 23,100 | ||||||||||||
| 3.3 |
Government Owned Facilities Preservation |
- | 9,634 | 25,000 | ||||||||||||
| 3.4 |
Accommodation Projects |
- | 1,389 | 5,000 | ||||||||||||
| Sub-total | 215,888 | 240,196 | 256,794 | |||||||||||||
| 4 |
Asset Management |
6,454 | 6,454 | 6,580 | ||||||||||||
| 5 |
Realty Services |
|||||||||||||||
| 5.1 |
Leases |
176,386 | 177,386 | 180,535 | ||||||||||||
| 5.2 |
Land Acquisition and Services |
2,288 | 2,288 | 2,312 | ||||||||||||
| 5.3 |
Land Development and Disposal |
1,372 | 1,372 | 1,391 | ||||||||||||
| Sub-total | 180,046 | 181,046 | 184,238 | |||||||||||||
| 6 |
Alternative Capital Financing Partnerships Office |
1,839 | 1,839 | 1,874 | ||||||||||||
| CAPITAL GRANTS |
||||||||||||||||
| 2 |
Capital Construction |
|||||||||||||||
| 2.4 |
Capital Planning |
3,157 | - | - | ||||||||||||
| 3 |
Property Management |
|||||||||||||||
| 3.3 |
Government Owned Facilities Preservation |
9,822 | - | - | ||||||||||||
| 3.4 |
Accommodation Projects |
3,180 | 3,070 | |||||||||||||
| Sub-total | 13,002 | 341 | 3,070 | |||||||||||||
| DEBT SERVICING |
||||||||||||||||
| 3 |
Property Management |
|||||||||||||||
| 3.5 |
Debt Servicing |
50 | 50 | 24 | ||||||||||||
| Total |
441,442 | 452,672 | 477,704 | |||||||||||||
| Infrastructure | 132 |
CAPITAL INVESTMENT VOTE BY PROGRAM
| (thousands of dollars) |
Comparable |
|||||||||||||||
|
2022-23 Budget |
2022-23 Forecast |
2023-24 Estimate |
||||||||||||||
| DEPARTMENT CAPITAL ACQUISITIONS |
||||||||||||||||
| 2 |
Capital Construction |
|||||||||||||||
| 2.1 |
Government Facilities Infrastructure |
113,997 | 200,598 | 167,746 | ||||||||||||
| 3 |
Property Management |
|||||||||||||||
| 3.1 |
Property Operations |
100 | 100 | 100 | ||||||||||||
| 3.2 |
Swan Hills Treatment Centre |
6,828 | 4,000 | 5,217 | ||||||||||||
| 3.3 |
Government Owned Facilities Preservation |
162,692 | 97,551 | 136,953 | ||||||||||||
| 3.4 |
Accommodation Projects |
93,598 | 51,012 | 95,752 | ||||||||||||
| Sub-total | 263,218 | 152,663 | 238,022 | |||||||||||||
| 5 |
Realty Services |
|||||||||||||||
| 5.2 |
Land Acquisition and Services |
8,300 | 4,095 | 14,136 | ||||||||||||
| CAPITAL FOR RELATED PARTIES |
||||||||||||||||
| 2 |
Capital Construction |
|||||||||||||||
| 2.2 |
Health Facilities Infrastructure |
661,148 | 386,583 | 556,732 | ||||||||||||
| 2.3 |
School Facilities Infrastructure |
629,725 | 468,176 | 478,502 | ||||||||||||
| 2.5 |
Health Capital Maintenance and Renewal |
188,940 | 149,162 | 222,920 | ||||||||||||
| 2.6 |
School Capital Maintenance and Renewal |
14,069 | 14,069 | 14,798 | ||||||||||||
| Sub-total | 1,493,882 | 1,017,990 | 1,272,952 | |||||||||||||
| Total |
1,879,397 | 1,375,346 | 1,692,856 | |||||||||||||
| 133 | Infrastructure |
FINANCIAL TRANSACTIONS VOTE BY PROGRAM
| (thousands of dollars) |
Comparable |
|||||||||||||||
|
2022-23 Budget |
2022-23 Forecast |
2023-24 Estimate |
||||||||||||||
| INVENTORY ACQUISITION |
||||||||||||||||
| 3 |
Property Management |
|||||||||||||||
| 3.2 |
Swan Hills Treatment Centre |
1,500 | 1,500 | 1,500 | ||||||||||||
| LAND DEVELOPMENT LIABILITY RETIREMENT |
||||||||||||||||
| 5 |
Realty Services |
|||||||||||||||
| 5.3 |
Land Development and Disposal |
12,835 | 8,035 | 17,609 | ||||||||||||
| CONTAMINATED SITE LIABILITY RETIREMENT |
||||||||||||||||
| 3 |
Property Management |
|||||||||||||||
| 3.1 |
Property Operations |
2,774 | 1,648 | 2,002 | ||||||||||||
| 3.2 |
Swan Hills Treatment Centre |
1,896 | 1,096 | 1,000 | ||||||||||||
| Sub-total | 4,670 | 2,744 | 3,002 | |||||||||||||
| LEGAL LIABILITY RETIREMENT |
||||||||||||||||
| 2 |
Capital Construction |
|||||||||||||||
| 2.3 |
School Facilities Infrastructure |
5,066 | 350 | 4,575 | ||||||||||||
| LEASE LIABILITY RETIREMENT |
||||||||||||||||
| 5 |
Realty Services |
|||||||||||||||
| 5.1 |
Leases |
500 | 500 | 500 | ||||||||||||
| DEBT REPAYMENT FOR PUBLIC PRIVATE PARTNERSHIPS |
||||||||||||||||
| 3 |
Property Management |
|||||||||||||||
| 3.6 |
Debt Repayment |
902 | 902 | 928 | ||||||||||||
| Total |
25,473 | 14,031 | 28,114 | |||||||||||||
| Infrastructure | 134 |
AMOUNTS NOT REQUIRED TO BE VOTED
The following department amounts do not require a supply vote either because no cash disbursement is required, or because the Legislative Assembly has already provided the funding authority pursuant to a statute other than an appropriation act.
EXPENSE
| (thousands of dollars) |
Comparable |
|||||||||||
|
2022-23 Budget |
2022-23 Forecast |
2023-24 Estimate |
||||||||||
| DEPARTMENT NON-CASH AMOUNTS |
||||||||||||
| Capital Payments to Related Parties |
||||||||||||
| Capital Construction |
1,574,603 | 1,073,559 | 1,337,207 | |||||||||
| Amortization |
||||||||||||
| Property Management |
151,300 | 136,300 | 146,000 | |||||||||
| Consumption of Inventory |
||||||||||||
| Property Management |
1,500 | 1,500 | 1,500 | |||||||||
| Valuation Adjustments and Other Provisions |
||||||||||||
| Property Management |
5,764 | 8,435 | 5,966 | |||||||||
| Total |
1,733,167 | 1,219,794 | 1,490,673 | |||||||||
| CAPITAL INVESTMENT |
||||||||||||
| DEPARTMENT NON-CASH AMOUNTS |
||||||||||||
| Alternatively Financed Capital Assets |
||||||||||||
| Capital Construction |
80,721 | 55,569 | 64,255 | |||||||||
| Total |
80,721 | 55,569 | 64,255 | |||||||||
| 135 | Infrastructure |
RECONCILIATION OF SUPPLY VOTE TO CONSOLIDATED GOVERNMENT ESTIMATE
The following tables summarize the relationship between the department’s Supply Votes and the effect of the ministry on the Government’s consolidated 2023-24 Estimates.
| RECONCILIATION BY PROGRAM |
||||||||||||||||
| (thousands of dollars) |
Voted Supply |
Department Amounts Not Voted |
Consolidation Adjustments |
Consolidated 2023-24 Estimate |
||||||||||||
| EXPENSE |
||||||||||||||||
| Ministry Support Services |
10,492 | - | - | 10,492 | ||||||||||||
| Capital Construction |
14,632 | 1,337,207 | (1,337,207 | ) | 14,632 | |||||||||||
| Property Management |
259,888 | 153,466 | (13,165 | ) | 400,189 | |||||||||||
| Asset Management |
6,580 | - | - | 6,580 | ||||||||||||
| Realty Services |
184,238 | - | (5,113 | ) | 179,125 | |||||||||||
| Alternative Capital Financing Partnerships Office |
1,874 | - | - | 1,874 | ||||||||||||
| Total |
477,704 | 1,490,673 | (1,355,485 | ) | 612,892 | |||||||||||
| CAPITAL INVESTMENT |
||||||||||||||||
| Capital Construction |
1,440,698 | 64,255 | (1,337,207 | ) | 167,746 | |||||||||||
| Property Management |
238,022 | - | - | 238,022 | ||||||||||||
| Realty Services |
14,136 | - | - | 14,136 | ||||||||||||
| Total |
1,692,856 | 64,255 | (1,337,207 | ) | 419,904 | |||||||||||
| INVENTORY ACQUISITION |
||||||||||||||||
| Property Management |
1,500 | - | - | 1,500 | ||||||||||||
| RECONCILIATION BY TYPE OF SPENDING
|
|
|||||||||||||||
| EXPENSE |
||||||||||||||||
| Operating expense |
474,610 | 5,966 | (18,278 | ) | 462,298 | |||||||||||
| Capital grants |
3,070 | - | - | 3,070 | ||||||||||||
| Capital payments to related parties |
- | 1,337,207 | (1,337,207 | ) | - | |||||||||||
| Amortization |
- | 146,000 | - | 146,000 | ||||||||||||
| Inventory consumption |
- | 1,500 | - | 1,500 | ||||||||||||
| Debt servicing costs - Capital Plan |
24 | - | - | 24 | ||||||||||||
| Total |
477,704 | 1,490,673 | (1,355,485 | ) | 612,892 | |||||||||||
| CAPITAL INVESTMENT |
||||||||||||||||
| Capital investment |
419,904 | - | - | 419,904 | ||||||||||||
| Capital for related parties |
1,272,952 | 64,255 | (1,337,207 | ) | - | |||||||||||
| Total |
1,692,856 | 64,255 | (1,337,207 | ) | 419,904 | |||||||||||
| INVENTORY ACQUISITION |
1,500 | - | - | 1,500 | ||||||||||||
|
|
||||||||||||||||
| Infrastructure | 136 |
| MINISTRY FINANCIAL STATEMENTS |
||||||||||||
| STATEMENT OF OPERATIONS |
||||||||||||
| (thousands of dollars) |
Comparable |
|||||||||||
|
2022-23 Budget |
2022-23 Forecast |
2023-24 Estimate |
||||||||||
| REVENUE |
||||||||||||
| Transfers from Government of Canada |
6,857 | 5,673 | 8,755 | |||||||||
| Premiums, Fees and Licences |
2,070 | 2,070 | 2,070 | |||||||||
| Other Revenue |
28,744 | 100,463 | 98,499 | |||||||||
| Ministry Total |
37,671 | 108,206 | 109,324 | |||||||||
| Inter-Ministry Consolidations |
(15,301 | ) | (71,420 | ) | (83,556 | ) | ||||||
| Consolidated Total |
22,370 | 36,786 | 25,768 | |||||||||
| EXPENSE |
||||||||||||
| Ministry Support Services |
10,286 | 10,286 | 10,492 | |||||||||
| Capital Construction |
1,588,480 | 1,086,019 | 1,351,839 | |||||||||
| Property Management |
387,504 | 386,822 | 413,354 | |||||||||
| Asset Management |
6,454 | 6,454 | 6,580 | |||||||||
| Realty Services |
180,046 | 181,046 | 184,238 | |||||||||
| Alternative Capital Financing Partnerships Office |
1,839 | 1,839 | 1,874 | |||||||||
| Ministry Total |
2,174,609 | 1,672,466 | 1,968,377 | |||||||||
| Inter-Ministry Consolidations |
(1,592,881 | ) | (1,091,837 | ) | (1,355,485 | ) | ||||||
| Consolidated Total |
581,728 | 580,629 | 612,892 | |||||||||
| Net Operating Result |
(559,358 | ) | (543,843 | ) | (587,124 | ) | ||||||
| CHANGE IN CAPITAL ASSETS |
||||||||||||
| INVESTMENT |
||||||||||||
| Capital Construction |
1,688,600 | 1,274,157 | 1,504,953 | |||||||||
| Property Management |
263,218 | 152,663 | 238,022 | |||||||||
| Realty Services |
8,300 | 4,095 | 14,136 | |||||||||
| Ministry Total |
1,960,118 | 1,430,915 | 1,757,111 | |||||||||
| Inter-Ministry Consolidations |
(1,574,603 | ) | (1,073,559 | ) | (1,337,207 | ) | ||||||
| Consolidated Total |
385,515 | 357,356 | 419,904 | |||||||||
| AMORTIZATION |
(151,300 | ) | (136,300 | ) | (146,000 | ) | ||||||
| Change in Capital Assets Total |
234,215 | 221,056 | 273,904 | |||||||||
| CHANGE IN INVENTORY ASSETS |
||||||||||||
| INVENTORY ACQUISITION |
||||||||||||
| Property Management |
1,500 | 1,500 | 1,500 | |||||||||
| Consolidated Total |
1,500 | 1,500 | 1,500 | |||||||||
| CONSUMPTION |
(1,500 | ) | (1,500 | ) | (1,500 | ) | ||||||
| Change in Inventory Assets Total |
- | - | - | |||||||||
| 137 | Infrastructure |
Jobs, Economy and Northern Development
AMOUNTS TO BE VOTED
| (thousands of dollars) |
Comparable |
|||||||||||
|
2022-23 Budget |
2022-23 Forecast |
2023-24 Estimate |
||||||||||
| EXPENSE |
349,333 | 337,408 | 249,693 | |||||||||
| CAPITAL INVESTMENT |
3,650 | 3,505 | 1,970 | |||||||||
139
DESCRIPTION OF SUPPLY VOTE PROGRAMS
| 1 | Ministry Support Services |
| 1.1 | Minister’s Office |
Oversees the development of ministerial policies that are aligned with broader government-wide objectives and priorities.
| 1.2 | Deputy Minister’s Office |
Supports the Minister in achieving business plan and strategic goals of the ministry, government and public service.
| 1.3 | Strategic Corporate Services |
Provides finance and administration, accommodation services, legislative services and corporate planning and reporting.
| 2 | Workforce Strategies |
| 2.1 | Workforce Development Partnerships |
Helps ensure Alberta can respond to skills shortages through collaborative efforts with industry, communities, employer groups, organizations, industry sectors, and municipalities with common labour market needs.
| 2.2 | Labour Force Policy and Engagement |
Works collaboratively with other Government of Alberta policy and program areas to provide strategic advice, policy direction and evidence to address Alberta’s labour force development objectives.
| 2.3 | Skills and Training Support |
Provides training opportunities and supports that develop and improve on skills to enable workers to succeed in the workforce.
| 2.4 | Coal Workforce Transition Program |
Provides financial support for employees affected by the phase out of coal-fired electricity generation.
| 2.5 | Alberta Jobs Now Program |
Provides grant funding to encourage employers to create jobs for Albertans as the economy recovers. Employers can apply for this funding to hire and train unemployed or underemployed Albertans.
| 3 | Safe, Fair and Healthy Workplaces |
| 3.1 | Labour Relations |
Administers mediator and arbitrator rosters to assist in resolving labour disputes, and provides information on collective bargaining. Provides strategic advice and maintains the Labour Relations Code.
| 3.2 | Occupational Health and Safety |
Monitors legislative compliance to ensure adequate protection for workers in Alberta. Includes the Alberta Heroes’ Fund for First Responders and Supporting Psychological Health in First Responders programs.
| 3.3 | Employment Standards |
Helps maintain fair and equitable workplaces by setting minimum standards for wages and working conditions in most workplaces in Alberta.
| 4 | Strategic Economic Partnerships |
| 4.1 | Regional Economic Partnerships and Opportunity |
Enhances capacity of organizations and communities through programs and services aimed at developing, scaling and retaining business and supporting regional economic development.
| 4.2 | Economic Analytics and Industry Growth |
Develops strategic initiatives, tools and processes, and delivers focused investment attraction activities to advance economic development and diversification.
| 5 | Labour Relations Board |
Provides an independent and impartial tribunal responsible for the day-to-day application and interpretation of Alberta’s labour laws.
| 6 | Appeals Commission for Alberta Workers’ Compensation |
Works separately and independently from the Workers’ Compensation Board to provide fair, timely and consistent medical panels and appeals processes for workers and employers who disagree with an official decision.
| Jobs, Economy and Northern Development | 140 |
EXPENSE VOTE BY PROGRAM
| (thousands of dollars) |
Comparable |
|||||||||||||||
|
2022-23 Budget |
2022-23 Forecast |
2023-24 Estimate |
||||||||||||||
| OPERATING EXPENSE |
||||||||||||||||
| 1 |
Ministry Support Services |
|||||||||||||||
| 1.1 |
Minister’s Office |
687 | 822 | 787 | ||||||||||||
| 1.2 |
Deputy Minister’s Office |
733 | 813 | 783 | ||||||||||||
| 1.3 |
Strategic Corporate Services |
2,941 | 2,925 | 3,067 | ||||||||||||
| Sub-total | 4,361 | 4,560 | 4,637 | |||||||||||||
| 2 |
Workforce Strategies |
|||||||||||||||
| 2.1 |
Workforce Development Partnerships |
8,579 | 8,279 | 8,767 | ||||||||||||
| 2.2 |
Labour Force Policy and Engagement |
10,387 | 8,447 | 9,597 | ||||||||||||
| 2.3 |
Skills and Training Support |
87,538 | 88,885 | 96,511 | ||||||||||||
| 2.4 |
Coal Workforce Transition Program |
9,000 | 3,000 | 5,400 | ||||||||||||
| 2.5 |
Alberta Jobs Now Program |
97,825 | 97,825 | 4,550 | ||||||||||||
| Sub-total | 213,329 | 206,436 | 124,825 | |||||||||||||
| 3 |
Safe, Fair and Healthy Workplaces |
|||||||||||||||
| 3.1 |
Labour Relations |
1,590 | 1,590 | 1,746 | ||||||||||||
| 3.2 |
Occupational Health and Safety |
49,234 | 46,519 | 49,134 | ||||||||||||
| 3.3 |
Employment Standards |
12,211 | 12,211 | 13,301 | ||||||||||||
| Sub-total | 63,035 | 60,320 | 64,181 | |||||||||||||
| 4 |
Strategic Economic Partnerships |
|||||||||||||||
| 4.1 |
Regional Economic Partnerships and Opportunity |
23,918 | 21,418 | 16,322 | ||||||||||||
| 4.2 |
Economic Analytics and Industry Growth |
23,888 | 23,888 | 18,310 | ||||||||||||
| Sub-total | 47,806 | 45,306 | 34,632 | |||||||||||||
| 5 |
Labour Relations Board |
3,947 | 3,931 | 4,563 | ||||||||||||
| 6 |
Appeals Commission for Alberta Workers’ Compensation |
16,855 | 16,855 | 16,855 | ||||||||||||
| Total |
349,333 | 337,408 | 249,693 | |||||||||||||
| 141 | Jobs, Economy and Northern Development |
CAPITAL INVESTMENT VOTE BY PROGRAM
| (thousands of dollars) | Comparable | |||||||||||||||
|
2022-23 Budget |
2022-23 Forecast |
2023-24 Estimate |
||||||||||||||
| DEPARTMENT CAPITAL ACQUISITIONS |
||||||||||||||||
| 1 |
Ministry Support Services |
|||||||||||||||
| 1.3 |
Strategic Corporate Services |
- | 16 | - | ||||||||||||
| 2 |
Workforce Strategies |
|||||||||||||||
| 2.2 |
Labour Force Policy and Engagement |
- | 840 | - | ||||||||||||
| 2.3 |
Skills and Training Support |
- | 53 | - | ||||||||||||
| 2.5 |
Alberta Jobs Now Program |
150 | 150 | - | ||||||||||||
| Sub-total | 150 | 1,043 | - | |||||||||||||
| 3 |
Safe, Fair and Healthy Workplaces |
|||||||||||||||
| 3.2 |
Occupational Health and Safety |
900 | 900 | 900 | ||||||||||||
| 4 |
Strategic Economic Partnerships |
|||||||||||||||
| 4.1 |
Regional Economic Partnerships and Opportunity |
2,600 | 1,530 | 1,070 | ||||||||||||
| 5 |
Labour Relations Board |
- | 16 | - | ||||||||||||
| Total |
3,650 | 3,505 | 1,970 | |||||||||||||
| Jobs, Economy and Northern Development | 142 |
AMOUNTS NOT REQUIRED TO BE VOTED
The following department amounts do not require a supply vote either because no cash disbursement is required, or because the Legislative Assembly has already provided the funding authority pursuant to a statute other than an appropriation act.
EXPENSE
| (thousands of dollars) |
Comparable |
|||||||||||
|
2022-23 Budget |
2022-23 Forecast |
2023-24 Estimate |
||||||||||
| DEPARTMENT STATUTORY AMOUNTS |
||||||||||||
| Operating Expense |
||||||||||||
| Strategic Economic Partnerships |
70,000 | 70,000 | 125,000 | |||||||||
| DEPARTMENT NON-CASH AMOUNTS |
||||||||||||
| Amortization |
||||||||||||
| Workforce Strategies |
168 | 168 | 168 | |||||||||
| Safe, Fair and Healthy Workplaces |
467 | 467 | 467 | |||||||||
| Strategic Economic Partnerships |
- | 326 | 326 | |||||||||
| Appeals Commission for Alberta Workers’ Compensation |
165 | 165 | 165 | |||||||||
| Total |
70,800 | 71,126 | 126,126 | |||||||||
| 143 | Jobs, Economy and Northern Development |
RECONCILIATION OF SUPPLY VOTE TO CONSOLIDATED GOVERNMENT ESTIMATE
The following tables summarize the relationship between the department’s Supply Votes and the effect of the ministry on the Government’s consolidated 2023-24 Estimates.
| RECONCILIATION BY PROGRAM |
||||||||||||||||
| (thousands of dollars) | Voted Supply |
Department Amounts Not Voted |
Consolidation Adjustments |
Consolidated |
||||||||||||
| EXPENSE |
||||||||||||||||
| Ministry Support Services |
4,637 | - | - | 4,637 | ||||||||||||
| Workforce Strategies |
124,825 | 168 | (2,000 | ) | 122,993 | |||||||||||
| Safe, Fair and Healthy Workplaces |
64,181 | 467 | - | 64,648 | ||||||||||||
| Strategic Economic Partnerships |
34,632 | 125,326 | - | 159,958 | ||||||||||||
| Labour Relations Board |
4,563 | - | - | 4,563 | ||||||||||||
| Appeals Commission for Alberta Workers’ Compensation |
16,855 | 165 | - | 17,020 | ||||||||||||
| Total |
249,693 | 126,126 | (2,000 | ) | 373,819 | |||||||||||
| CAPITAL INVESTMENT |
||||||||||||||||
| Safe, Fair and Healthy Workplaces |
900 | - | - | 900 | ||||||||||||
| Strategic Economic Partnerships |
1,070 | - | - | 1,070 | ||||||||||||
| Total |
1,970 | - | - | 1,970 | ||||||||||||
| RECONCILIATION BY TYPE OF SPENDING |
|
|||||||||||||||
| EXPENSE |
||||||||||||||||
| Operating expense |
249,693 | 125,000 | (2,000 | ) | 372,693 | |||||||||||
| Amortization |
- | 1,126 | - | 1,126 | ||||||||||||
| Total |
249,693 | 126,126 | (2,000 | ) | 373,819 | |||||||||||
| CAPITAL INVESTMENT |
1,970 | - | - | 1,970 | ||||||||||||
|
|
||||||||||||||||
| Jobs, Economy and Northern Development |
144 |
| MINISTRY FINANCIAL STATEMENTS |
||||||||||||
| STATEMENT OF OPERATIONS |
||||||||||||
| (thousands of dollars) |
Comparable |
|||||||||||
|
2022-23 Budget |
2022-23 Forecast |
2023-24 Estimate |
||||||||||
| REVENUE |
||||||||||||
| Labour Market Development |
72,253 | 72,253 | 75,133 | |||||||||
| Premiums, Fees and Licences |
1 | 1 | - | |||||||||
| Other Revenue |
66,899 | 64,184 | 66,799 | |||||||||
| Consolidated Total |
139,153 | 136,438 | 141,932 | |||||||||
| EXPENSE |
||||||||||||
| Ministry Support Services |
4,361 | 4,560 | 4,637 | |||||||||
| Workforce Strategies |
213,497 | 206,604 | 124,993 | |||||||||
| Safe, Fair and Healthy Workplaces |
63,502 | 60,787 | 64,648 | |||||||||
| Strategic Economic Partnerships |
117,806 | 115,632 | 159,958 | |||||||||
| Labour Relations Board |
3,947 | 3,931 | 4,563 | |||||||||
| Appeals Commission for Alberta Workers’ Compensation |
17,020 | 17,020 | 17,020 | |||||||||
| Ministry Total |
420,133 | 408,534 | 375,819 | |||||||||
| Inter-Ministry Consolidations |
(2,000 | ) | (2,000 | ) | (2,000 | ) | ||||||
| Consolidated Total |
418,133 | 406,534 | 373,819 | |||||||||
| Net Operating Result |
(278,980 | ) | (270,096 | ) | (231,887 | ) | ||||||
| CHANGE IN CAPITAL ASSETS |
||||||||||||
| INVESTMENT |
||||||||||||
| Ministry Support Services |
- | 16 | - | |||||||||
| Workforce Strategies |
150 | 1,043 | - | |||||||||
| Safe, Fair and Healthy Workplaces |
900 | 900 | 900 | |||||||||
| Strategic Economic Partnerships |
2,600 | 1,530 | 1,070 | |||||||||
| Labour Relations Board |
- | 16 | - | |||||||||
| Consolidated Total |
3,650 | 3,505 | 1,970 | |||||||||
| AMORTIZATION |
(800 | ) | (1,126 | ) | (1,126 | ) | ||||||
| Change in Capital Assets Total |
2,850 | 2,379 | 844 | |||||||||
| 145 | Jobs, Economy and Northern Development |
Justice
AMOUNTS TO BE VOTED
| (thousands of dollars) |
Comparable |
|||||||||||
|
2022-23 Budget |
2022-23 Forecast |
2023-24 Estimate |
||||||||||
| EXPENSE |
495,994 | 587,931 | 648,842 | |||||||||
| CAPITAL INVESTMENT |
17,474 | 19,474 | 17,816 | |||||||||
147
DESCRIPTION OF SUPPLY VOTE PROGRAMS
| 1 | Ministry Support Services |
| 1.1 | Minister’s Office |
The Minister is the Attorney General and oversees the development of ministerial policies that are aligned with broader government-wide objectives and priorities.
| 1.2 | Deputy Minister’s Office |
Supports the Minister in achieving business plan and strategic goals of the ministry, government and public service.
| 1.3 | Financial Services |
Provides leadership and ministry-wide support services, which enables the achievement of the ministry’s goals and objectives, including enhancing efficiency and effectiveness across all program levels.
| 2 | Court and Justice Services |
| 2.1 | Business and Resolution Services |
Oversees initiatives to assist Albertans with the justice system, including Dispute Resolution, Information and Education services. Includes business and technology supports.
| 2.2 | Family Support Order Services |
Includes the Maintenance Enforcement Program which enforces support orders and agreements, and the Child Support Recalculation Program.
| 2.3 | Alberta Court of Justice |
Provides provincial court services for criminal, civil, family and youth courts and includes ticket processing for traffic courts and the Alberta Review Board.
| 2.4 | Alberta Court of King’s Bench |
Provides Court of King’s Bench services for the entire province, including courtroom, counter, administrative and management services to the court as well as administrative and legal support to the judiciary.
| 2.5 | Alberta Court of Appeal |
Includes the operation of the Alberta Court of Appeal. Employees provide courtroom support, counter administration and management services to the Court as well as administrative and legal support to the judiciary.
| 3 | Legal Services |
| 3.1 | Civil Law |
Provides legal services to all Government of Alberta ministries and represents them in matters before the courts and tribunals.
| 3.2 | Legislative Counsel |
Responsible for drafting government public bills, regulations, and Orders in Council. The office works with Alberta King’s
Printer to make the laws of Alberta available to the public.
| 3.3 | Law Reform |
Conducts and directs research into law and the administration of justice to ensure they are current and reflect the changing needs of Albertans and their communities.
| 4 | Alberta Crown Prosecution Services |
| 4.1 | Operations and Bail Prosecutions |
Provides specialized support, information, policy, education and services to the prosecution service and is responsible for the conduct of Justice of the Peace first instance bail hearings in the province.
| 4.2 | Appeals and Specialized Prosecutions |
Conducts criminal appeals in the Court of Appeal and Supreme Court of Canada and specialized prosecutions for commercial, organized, technology and internet crime, environmental law, and occupational health and safety.
| 4.3 | Criminal and Youth Prosecutions |
Responsible for the prosecution of persons charged with Criminal Code,Youth Criminal Justice Act and provincial statute offenses.
| 4.4 | Advanced Projects and Traffic Office |
Responsible for traffic prosecution modernization projects and the provincial consolidation of all traffic prosecutions.
| Justice | 148 |
DESCRIPTION OF SUPPLY VOTE PROGRAMS... continued
| 5 | Strategy, Support and Integrated Initiatives |
| 5.1 | Agency Governance and Oversight |
Provides oversight to agencies, boards and commissions reporting to the Minister and legal aid policy. Administers judicial appointments.
| 5.2 | Community Justice and Integrated Services |
Supports business transformation, policy and legislative initiatives. Includes community initiatives, restorative justice, specialized courts, Indigenous services, research and evaluation, and business intelligence.
| 5.3 | Office of the Chief Medical Examiner |
Investigates all sudden and unexplained deaths in Alberta in accordance with the Fatality Inquiries Act. Provides forensic services and maintains a center of excellence in forensic pathology and toxicology.
| 5.4 | Alberta Chief Firearms Office |
Administers federal firearms legislation, advocates for Alberta’s lawful firearms owners and promotes public safety.
| 5.5 | Support for Legal Aid |
Supports Legal Aid Alberta to ensure low-income Albertans have access to legal services they would not otherwise be able to obtain.
| 6 | Alberta Human Rights |
Fosters equality and reduces discrimination by adjudicating discrimination complaints in a quasi-judicial process and by communication, education and engagement with community organizations and individuals.
| 149 | Justice |
EXPENSE VOTE BY PROGRAM
| (thousands of dollars) |
Comparable |
|||||||||||||||
|
2022-23 Budget |
2022-23 Forecast |
2023-24 Estimate |
||||||||||||||
| OPERATING EXPENSE |
||||||||||||||||
| 1 |
Ministry Support Services |
|||||||||||||||
| 1.1 |
Minister’s Office |
836 | 836 | 836 | ||||||||||||
| 1.2 |
Deputy Minister’s Office |
769 | 769 | 769 | ||||||||||||
| 1.3 |
Financial Services |
6,031 | 6,031 | 7,488 | ||||||||||||
| Sub-total | 7,636 | 7,636 | 9,093 | |||||||||||||
| 2 |
Court and Justice Services |
|||||||||||||||
| 2.1 |
Business and Resolution Services |
32,366 | 40,307 | 48,177 | ||||||||||||
| 2.2 |
Family Support Order Services |
16,509 | 16,509 | 17,508 | ||||||||||||
| 2.3 |
Alberta Court of Justice |
116,745 | 138,490 | 137,101 | ||||||||||||
| 2.4 |
Alberta Court of King’s Bench |
35,375 | 36,975 | 41,559 | ||||||||||||
| 2.5 |
Alberta Court of Appeal |
7,600 | 7,600 | 7,950 | ||||||||||||
| Sub-total | 208,595 | 239,881 | 252,295 | |||||||||||||
| 3 |
Legal Services |
|||||||||||||||
| 3.1 |
Civil Law |
40,056 | 40,056 | 57,463 | ||||||||||||
| 3.2 |
Legislative Counsel |
5,033 | 5,033 | 7,846 | ||||||||||||
| 3.3 |
Law Reform |
500 | 500 | 500 | ||||||||||||
| Sub-total | 45,589 | 45,589 | 65,809 | |||||||||||||
| 4 |
Alberta Crown Prosecution Services |
|||||||||||||||
| 4.1 |
Operations and Bail Prosecutions |
9,894 | 21,694 | 22,250 | ||||||||||||
| 4.2 |
Appeals and Specialized Prosecutions |
17,770 | 21,070 | 20,572 | ||||||||||||
| 4.3 |
Criminal and Youth Prosecutions |
70,994 | 85,194 | 78,368 | ||||||||||||
| 4.4 |
Advanced Projects and Traffic Office |
- | - | 7,749 | ||||||||||||
| Sub-total | 98,658 | 127,958 | 128,939 | |||||||||||||
| 5 |
Strategy, Support and Integrated Initiatives |
|||||||||||||||
| 5.1 |
Agency Governance and Oversight |
1,744 | 1,744 | 1,562 | ||||||||||||
| 5.2 |
Community Justice and Integrated Services |
15,375 | 26,213 | 21,084 | ||||||||||||
| 5.3 |
Office of the Chief Medical Examiner |
16,080 | 17,680 | 19,935 | ||||||||||||
| 5.4 |
Alberta Chief Firearms Office |
1,112 | 4,212 | 8,491 | ||||||||||||
| 5.5 |
Support for Legal Aid |
94,292 | 110,105 | 134,602 | ||||||||||||
| Sub-total | 128,603 | 159,954 | 185,674 | |||||||||||||
| 6 |
Alberta Human Rights |
6,913 | 6,913 | 7,032 | ||||||||||||
| Total |
495,994 | 587,931 | 648,842 | |||||||||||||
| Justice | 150 |
CAPITAL INVESTMENT VOTE BY PROGRAM
| (thousands of dollars) |
Comparable |
|||||||||||||||
|
2022-23 Budget |
2022-23 Forecast |
2023-24 Estimate |
||||||||||||||
| DEPARTMENT CAPITAL ACQUISITIONS |
||||||||||||||||
| 2 |
Court and Justice Services |
|||||||||||||||
| 2.1 |
Business and Resolution Services |
3,925 | 3,925 | 5,147 | ||||||||||||
| 2.2 |
Family Support Order Services |
50 | 50 | 50 | ||||||||||||
| 2.5 |
Alberta Court of Appeal |
- | - | 330 | ||||||||||||
| Sub-total | 3,975 | 3,975 | 5,527 | |||||||||||||
| 4 |
Alberta Crown Prosecution Services |
|||||||||||||||
| 4.1 |
Operations and Bail Prosecutions |
2,380 | 2,380 | 1,000 | ||||||||||||
| 5 |
Strategy, Support and Integrated Initiatives |
|||||||||||||||
| 5.2 |
Community Justice and Integrated Services |
11,020 | 13,020 | 11,000 | ||||||||||||
| 5.3 |
Office of the Chief Medical Examiner |
99 | 99 | 289 | ||||||||||||
| Sub-total | 11,119 | 13,119 | 11,289 | |||||||||||||
| Total |
17,474 | 19,474 | 17,816 | |||||||||||||
| 151 | Justice |
VOTED AMOUNTS FUNDED BY CREDIT OR RECOVERY
The following table details the portions of the department’s voted amounts for which a credit or recovery can be obtained. If a credit or recovery amount is expected to exceed its original estimate, the Treasury Board may increase the corresponding voted amount, pursuant to section 24(2) of the Financial Administration Act. If the actual credit or recovery amount realized is less than its original estimate, the corresponding funding authority is reduced by an equivalent amount in the programs shown.
EXPENSE AMOUNTS FUNDED BY CREDIT OR RECOVERY
| (thousands of dollars) |
2023-24 Estimate |
|||||
| 1 |
Maintenance Enforcement | 7,493 | ||||
| Revenue from deterrent penalties and service fees that promote payment of maintenance is used to improve and expand services available to clients. Program 2.2 |
||||||
| 2 |
Provincial Civil Claims | 1,500 | ||||
| Revenue from fees levied to commence action in excess of $7,500 in Provincial Court is used to fund the ministry’s expense associated with those actions. Program 2.3 |
||||||
| Total |
8,993 | |||||
| Justice | 152 |
AMOUNTS NOT REQUIRED TO BE VOTED
The following department amounts do not require a supply vote either because no cash disbursement is required, or because the Legislative Assembly has already provided the funding authority pursuant to a statute other than an appropriation act.
EXPENSE
| (thousands of dollars) |
Comparable |
|||||||||||
|
2022-23 Budget |
2022-23 Forecast |
2023-24 Estimate |
||||||||||
| DEPARTMENT NON-CASH AMOUNTS |
||||||||||||
| Amortization |
||||||||||||
| Ministry Support Services |
3 | 3 | 2 | |||||||||
| Court and Justice Services |
2,048 | 2,048 | 2,048 | |||||||||
| Legal Services |
24 | 24 | 24 | |||||||||
| Alberta Crown Prosecution Services |
1 | 1 | 1 | |||||||||
| Strategy, Support and Integrated Initiatives |
1,751 | 1,751 | 1,755 | |||||||||
| Alberta Human Rights |
5 | 5 | 5 | |||||||||
| Valuation Adjustments and Other Provisions |
||||||||||||
| Ministry Support Services |
- | - | 20 | |||||||||
| Court and Justice Services |
6,052 | 6,052 | 6,052 | |||||||||
| Alberta Crown Prosecution Services |
158 | 158 | 158 | |||||||||
| Strategy, Support and Integrated Initiatives |
17 | 17 | 59 | |||||||||
| Total |
10,059 | 10,059 | 10,124 | |||||||||
| CAPITAL INVESTMENT |
||||||||||||
| DEPARTMENT NON-CASH AMOUNTS |
||||||||||||
| Capital Acquired from Related Parties |
||||||||||||
| Court and Justice Services |
4,000 | 4,000 | 4,000 | |||||||||
| Total |
4,000 | 4,000 | 4,000 | |||||||||
| 153 | Justice |
RECONCILIATION OF SUPPLY VOTE TO CONSOLIDATED GOVERNMENT ESTIMATE
The following tables summarize the relationship between the department’s Supply Votes and the effect of the ministry on the Government’s consolidated 2023-24 Estimates.
| RECONCILIATION BY PROGRAM |
||||||||||||||||
| (thousands of dollars) |
Voted Supply |
Department Amounts Not Voted |
Consolidation Adjustments |
Consolidated 2023-24 Estimate |
||||||||||||
| EXPENSE |
||||||||||||||||
| Ministry Support Services |
9,093 | 22 | - | 9,115 | ||||||||||||
| Court and Justice Services |
252,295 | 8,100 | - | 260,395 | ||||||||||||
| Legal Services |
65,809 | 24 | - | 65,833 | ||||||||||||
| Alberta Crown Prosecution Services |
128,939 | 159 | - | 129,098 | ||||||||||||
| Strategy, Support and Integrated Initiatives |
185,674 | 1,814 | (513 | ) | 186,975 | |||||||||||
| Alberta Human Rights |
7,032 | 5 | - | 7,037 | ||||||||||||
| Total |
648,842 | 10,124 | (513 | ) | 658,453 | |||||||||||
| CAPITAL INVESTMENT |
||||||||||||||||
| Court and Justice Services |
5,527 | 4,000 | (4,000 | ) | 5,527 | |||||||||||
| Alberta Crown Prosecution Services |
1,000 | - | - | 1,000 | ||||||||||||
| Strategy, Support and Integrated Initiatives |
11,289 | - | - | 11,289 | ||||||||||||
| Total |
17,816 | 4,000 | (4,000 | ) | 17,816 | |||||||||||
| RECONCILIATION BY TYPE OF SPENDING |
|
|||||||||||||||
| EXPENSE |
||||||||||||||||
| Operating expense |
648,842 | 6,289 | (513 | ) | 654,618 | |||||||||||
| Amortization |
- | 3,835 | - | 3,835 | ||||||||||||
| Total |
648,842 | 10,124 | (513 | ) | 658,453 | |||||||||||
| CAPITAL INVESTMENT |
17,816 | 4,000 | (4,000 | ) | 17,816 | |||||||||||
|
|
||||||||||||||||
| Justice | 154 |
| MINISTRY FINANCIAL STATEMENTS |
||||||||||||
| STATEMENT OF OPERATIONS |
||||||||||||
| (thousands of dollars) |
Comparable |
|||||||||||
|
2022-23 Budget |
2022-23 Forecast |
2023-24 Estimate |
||||||||||
| REVENUE |
||||||||||||
| Transfers of Assets or Liabilities from Related Parties |
4,000 | 4,000 | 4,000 | |||||||||
| Transfers from Government of Canada |
26,676 | 30,852 | 27,134 | |||||||||
| Investment Income |
1,125 | 1,125 | 1,095 | |||||||||
| Other Premiums, Fees and Licences |
26,660 | 26,260 | 26,780 | |||||||||
| Fines and Penalties |
210,104 | 168,104 | 171,704 | |||||||||
| Maintenance Enforcement |
16,593 | 16,593 | 16,593 | |||||||||
| Other Revenue |
5,235 | 8,735 | 8,635 | |||||||||
| Ministry Total |
290,393 | 255,669 | 255,941 | |||||||||
| Inter-Ministry Consolidations |
(4,000 | ) | (4,000 | ) | (4,000 | ) | ||||||
| Consolidated Total |
286,393 | 251,669 | 251,941 | |||||||||
| EXPENSE |
||||||||||||
| Ministry Support Services |
7,639 | 7,639 | 9,115 | |||||||||
| Court and Justice Services |
216,695 | 247,981 | 260,395 | |||||||||
| Legal Services |
45,613 | 45,613 | 65,833 | |||||||||
| Alberta Crown Prosecution Services |
98,817 | 128,117 | 129,098 | |||||||||
| Strategy, Support and Integrated Initiatives |
130,371 | 161,722 | 187,488 | |||||||||
| Alberta Human Rights |
6,918 | 6,918 | 7,037 | |||||||||
| Ministry Total |
506,053 | 597,990 | 658,966 | |||||||||
| Inter-Ministry Consolidations |
- | - | (513 | ) | ||||||||
| Consolidated Total |
506,053 | 597,990 | 658,453 | |||||||||
| Net Operating Result |
(219,660 | ) | (346,321 | ) | (406,512 | ) | ||||||
| CHANGE IN CAPITAL ASSETS |
||||||||||||
| INVESTMENT |
||||||||||||
| Court and Justice Services |
7,975 | 7,975 | 9,527 | |||||||||
| Alberta Crown Prosecution Services |
2,380 | 2,380 | 1,000 | |||||||||
| Strategy, Support and Integrated Initiatives |
11,119 | 13,119 | 11,289 | |||||||||
| Ministry Total |
21,474 | 23,474 | 21,816 | |||||||||
| Inter-Ministry Consolidations |
(4,000 | ) | (4,000 | ) | (4,000 | ) | ||||||
| Consolidated Total |
17,474 | 19,474 | 17,816 | |||||||||
| AMORTIZATION |
(3,832 | ) | (3,832 | ) | (3,835 | ) | ||||||
| Change in Capital Assets Total |
13,642 | 15,642 | 13,981 | |||||||||
| 155 | Justice |

Mental Health and Addiction
| AMOUNTS TO BE VOTED |
||||||||||||
| (thousands of dollars) |
|
Comparable
|
|
|||||||||
| 2022-23 | 2022-23 | 2023-24 | ||||||||||
| Budget | Forecast | Estimate | ||||||||||
| EXPENSE |
179,015 | 200,145 | 275,005 | |||||||||
| CAPITAL INVESTMENT |
- | - | 25 | |||||||||
|
|
||||||||||||
| 157 |
| DESCRIPTION OF SUPPLY VOTE PROGRAMS
| ||
| 1 |
Ministry Support Services | |
| 1.1 |
Minister’s Office | |
| 1.2 |
Deputy Minister’s Office | |
| 1.3 |
Corporate Services | |
| 2 |
Addiction and Mental Health | |
| 2.1 |
Program Support | |
| 2.2 |
Compliance and Monitoring | |
| 2.3 |
Mental Health Review Panel | |
| 2.4 |
Prevention | |
| 2.5 |
Early Intervention | |
| 2.6 |
Treatment and Recovery | |
| 2.7 |
Initiatives that Reduce Harm | |
| 2.8 |
Children and Youth | |
| Mental Health and Addiction | 158 |
| EXPENSE VOTE BY PROGRAM |
||||||||||||||||
| (thousands of dollars) |
Comparable | |||||||||||||||
| 2022-23 | 2022-23 | 2023-24 | ||||||||||||||
| Budget | Forecast | Estimate | ||||||||||||||
| OPERATING EXPENSE |
||||||||||||||||
| 1 | Ministry Support Services | |||||||||||||||
| 1.1 | Minister’s Office | 623 | 673 | 657 | ||||||||||||
| 1.2 | Deputy Minister’s Office | 255 | 761 | 879 | ||||||||||||
| 1.3 | Corporate Services | 1,444 | 1,444 | 2,846 | ||||||||||||
| Sub-total |
2,322 | 2,878 | 4,382 | |||||||||||||
| 2 | Addiction and Mental Health | |||||||||||||||
| 2.1 | Program Support | 6,444 | 10,511 | 10,774 | ||||||||||||
| 2.2 | Compliance and Monitoring | 728 | 1,046 | 1,287 | ||||||||||||
| 2.3 | Mental Health Review Panel | 2,091 | 2,091 | 2,191 | ||||||||||||
| 2.4 | Prevention | 728 | 728 | 722 | ||||||||||||
| 2.5 | Early Intervention | 12,802 | 17,902 | 29,325 | ||||||||||||
| 2.6 | Treatment and Recovery | 92,500 | 84,177 | 132,128 | ||||||||||||
| 2.7 | Initiatives that Reduce Harm | 27,224 | 30,024 | 30,434 | ||||||||||||
| 2.8 | Children and Youth | 34,176 | 34,176 | 45,762 | ||||||||||||
| Sub-total |
176,693 | 180,655 | 252,623 | |||||||||||||
| CAPITAL GRANTS |
||||||||||||||||
| 2 | Addiction and Mental Health | |||||||||||||||
| 2.5 | Early Intervention | - | 10,000 | - | ||||||||||||
| 2.6 | Treatment and Recovery | - | - | 8,000 | ||||||||||||
| 2.8 | Children and Youth | - | - | 10,000 | ||||||||||||
| Sub-total |
- | 10,000 | 18,000 | |||||||||||||
| CAPITAL PAYMENTS TO RELATED PARTIES |
||||||||||||||||
| 2 | Addiction and Mental Health | |||||||||||||||
| 2.6 | Treatment and Recovery | - | 5,112 | - | ||||||||||||
| 2.7 | Initiatives that Reduce Harm | - | 1,500 | - | ||||||||||||
| Sub-total |
- | 6,612 | - | |||||||||||||
| Total | 179,015 | 200,145 | 275,005 | |||||||||||||
| CAPITAL INVESTMENT VOTE BY PROGRAM |
||||||||||||||||
| DEPARTMENT CAPITAL ACQUISITIONS |
||||||||||||||||
| 1 | Ministry Support Services | |||||||||||||||
| 1.3 | Corporate Services | - | - | 25 | ||||||||||||
| Total | - | - | 25 | |||||||||||||
| 159 | Mental Health and Addiction |
RECONCILIATION OF SUPPLY VOTE TO CONSOLIDATED GOVERNMENT ESTIMATE
The following tables summarize the relationship between the department’s Supply Votes and the effect of the ministry on the Government’s consolidated 2023-24 Estimates.
| RECONCILIATION BY PROGRAM | ||||||||||||||||
| (thousands of dollars) | Voted Supply |
Department Amounts Not Voted |
Consolidation Adjustments |
Consolidated 2023-24 Estimate |
||||||||||||
| EXPENSE |
||||||||||||||||
| Ministry Support Services |
4,382 | - | - | 4,382 | ||||||||||||
| Addiction and Mental Health |
270,623 | - | (108,551 | ) | 162,072 | |||||||||||
| Total |
275,005 | - | (108,551 | ) | 166,454 | |||||||||||
| CAPITAL INVESTMENT |
||||||||||||||||
| Ministry Support Services |
25 | - | - | 25 | ||||||||||||
| RECONCILIATION BY TYPE OF SPENDING |
|
|||||||||||||||
| EXPENSE |
||||||||||||||||
| Operating expense |
257,005 | - | (108,551 | ) | 148,454 | |||||||||||
| Capital grants |
18,000 | - | - | 18,000 | ||||||||||||
| Total |
275,005 | - | (108,551 | ) | 166,454 | |||||||||||
| CAPITAL INVESTMENT |
25 | - | - | 25 | ||||||||||||
| Mental Health and Addiction | 160 |
| MINISTRY FINANCIAL STATEMENTS | ||||||||||||
| STATEMENT OF OPERATIONS | ||||||||||||
| (thousands of dollars) | Comparable | |||||||||||
| 2022-23 | 2022-23 | 2023-24 | ||||||||||
| Budget | Forecast | Estimate | ||||||||||
| REVENUE |
||||||||||||
| Transfers from Government of Canada |
6,669 | 7,119 | 1,050 | |||||||||
| Consolidated Total |
6,669 | 7,119 | 1,050 | |||||||||
| EXPENSE |
||||||||||||
| Ministry Support Services |
2,322 | 2,878 | 4,382 | |||||||||
| Addiction and Mental Health |
176,693 | 197,267 | 270,623 | |||||||||
| Ministry Total |
179,015 | 200,145 | 275,005 | |||||||||
| Inter-Ministry Consolidations |
(77,834 | ) | (85,646 | ) | (108,551 | ) | ||||||
| Consolidated Total |
101,181 | 114,499 | 166,454 | |||||||||
| Net Operating Result |
(94,512 | ) | (107,380 | ) | (165,404 | ) | ||||||
| CHANGE IN CAPITAL ASSETS |
||||||||||||
| INVESTMENT |
||||||||||||
| Ministry Support Services |
- | - | 25 | |||||||||
| Consolidated Total |
- | - | 25 | |||||||||
| Change in Capital Assets Total |
- | - | 25 | |||||||||
| 161 | Mental Health and Addiction |
Municipal Affairs
| AMOUNTS TO BE VOTED |
|
|||||||||||
| (thousands of dollars) |
Comparable | |||||||||||
| 2022-23 | 2022-23 | 2023-24 | ||||||||||
| Budget | Forecast | Estimate | ||||||||||
| EXPENSE |
948,716 | 938,888 | 993,931 | |||||||||
| CAPITAL INVESTMENT |
709 | 5,209 | 600 | |||||||||
163
| DESCRIPTION OF SUPPLY VOTE PROGRAMS |
| 1 | Ministry Support Services |
| 1.1 | Minister’s Office |
Oversees the development of ministerial policy that are aligned with broader government-wide objectives and policies.
| 1.2 | Deputy Minister’s Office |
Supports the Minister in achieving business plan and strategic goals of the ministry, government and public service.
| 1.3 | Support Services |
Conducts financial planning, financial reporting, internal controls, and coordinates all correspondence for the Minister and Deputy Minister.
| 2 | Municipal Services |
| 2.1 | Program Support |
Provides strategic coordination and central support services for the Municipal Services division, including business, financial, and operational planning matters.
| 2.2 | Municipal Policy and Engagement |
Addresses major policy issues involving the provincial-municipal relationship, leads development of governance and planning related legislation/regulations, and coordinates stakeholder relations activities.
| 2.3 | Municipal Capacity and Sustainability |
Provides advice/training for municipal administrations, municipal dispute resolution, addresses municipal viability, and supports municipal accountability.
| 2.4 | Public Library Services |
Leads provincial support for public library services, including operating grants, advisory/training supports, and e-content resources supporting equitable access.
| 3 | Municipal Assessments and Grants |
| 3.1 | Policy and Divisional Support |
Develops and reviews assessment and property tax policy, supports legislative and regulatory changes, and coordinates the Municipal Assessments and Grants divisional operations.
| 3.2 | Assessment Services |
Prepares and defends designated industrial property assessments and facilitates stakeholder relations and responses. Includes the Provincial Assessor.
| 3.3 | Grants and Education Property Tax |
Administers provincial and federal grant programs to municipalities, oversees funding to local governments, prepares education property tax requisitions, and performs audits of municipal assessment practices.
| 4 | Municipal Sustainability Initiative |
| 4.1 | Municipal Sustainability Initiative Operating |
Supports municipalities with municipal planning, capacity building, shared administration, and municipal service delivery and support for non-profit organizations.
| 4.2 | Municipal Sustainability Initiative Capital |
Supports municipalities with long-term sustainable funding to manage growth pressures and key local infrastructure needs.
| Municipal Affairs | 164 |
| DESCRIPTION OF SUPPLY VOTE PROGRAMS…continued |
| 5 | Federal Grant Programs |
| 5.1 | Canada Community-Building Fund (formerly known as the Federal Gas Tax Fund) |
Provides capital funding for municipalities to help them build and revitalize their local public infrastructure. The program is fully funded by the federal government and administered by the province.
| 5.2 | Small Communities Fund |
Assists communities with populations under 100,000 to complete infrastructure projects. It is 50 per cent funded by the federal government.
| 5.3 | Investing in Canada Infrastructure - Administration |
Includes administration costs to oversee the Investing in Canada Infrastructure projects allocated to the Ministry of Municipal Affairs, funded by the federal government.
| 5.4 | Investing in Canada Infrastructure - Rural and Northern Communities |
Provides capital funding for municipalities under the federal portion of the Rural and Northern Communities stream. This is a competitive cost-sharing grant jointly funded by Canada, Alberta, and municipalities.
| 5.5 | Investing in Canada Infrastructure - Community, Culture and Recreation |
Provides capital funding for municipalities under the federal portion of the Community, Culture and Recreation stream. This is a competitive cost-sharing grant jointly funded by Canada, Alberta, and municipalities.
| 6 | Grants in Place of Taxes |
The Crown may pay to the municipality a grant not exceeding the amount that would be recoverable by the municipality for Crown property, which is exempt from taxation under the Municipal Government Act .
| 7 | Alberta Community Partnership |
Supports municipal regional collaboration and capacity building initiatives, along with other provincial priorities.
| 8 | Technical and Corporate Services |
| 8.1 | Warranty, Certification and Policy |
Provides testing and certification for fire services, is responsible for enforcement under the Safety Codes Act , and provides oversight of delegated safety system authorities.
| 8.2 | Community and Technical Support |
Oversees Alberta’s safety system by monitoring and assessing outcomes of safety system partners; leading development of codes, regulations, and policies under the Safety Codes Act ; and providing technical advice to stakeholders.
| 8.3 | Residential Protection Program |
Supports new home buyer protection through new home warranty and residential builder licensing, compliance, and enforcement under the New Home Buyer Protection Act .
| 8.4 | Business Planning and Integration |
Leads corporate policy, legislative coordination, business planning, emergency planning, and accommodation and facility services for the Ministry.
| 9 | Land and Property Rights Tribunal |
Makes decisions and recommendations about land use planning, development, and assessment matters. It also grants right of entry and decides compensation disputes involving surface leases and expropriation.
| 165 | Municipal Affairs |
| EXPENSE VOTE BY PROGRAM |
||||||||||||||||
| (thousands of dollars) | Comparable | |||||||||||||||
| 2022-23 | 2022-23 | 2023-24 | ||||||||||||||
| Budget | Forecast | Estimate | ||||||||||||||
| OPERATING EXPENSE | ||||||||||||||||
| 1 | Ministry Support Services |
|||||||||||||||
| 1.1 | Minister’s Office |
872 | 872 | 894 | ||||||||||||
| 1.2 | Deputy Minister’s Office |
881 | 881 | 907 | ||||||||||||
| 1.3 | Support Services | 3,433 | 3,433 | 3,510 | ||||||||||||
| Sub-total | 5,186 | 5,186 | 5,311 | |||||||||||||
| 2 | Municipal Services |
|||||||||||||||
| 2.1 | Program Support |
647 | 647 | 690 | ||||||||||||
| 2.2 | Municipal Policy and Engagement |
4,288 | 4,288 | 3,879 | ||||||||||||
| 2.3 | Municipal Capacity and Sustainability |
4,070 | 4,070 | 4,772 | ||||||||||||
| 2.4 | Public Library Services | 36,965 | 36,965 | 39,721 | ||||||||||||
| Sub-total |
45,970 | 45,970 | 49,062 | |||||||||||||
| 3 | Municipal Assessments and Grants |
|||||||||||||||
| 3.1 | Policy and Divisional Support |
2,688 | 2,688 | 2,743 | ||||||||||||
| 3.2 | Assessment Services |
13,833 | 13,833 | 13,859 | ||||||||||||
| 3.3 | Grants and Education Property Tax | 6,747 | 6,747 | 6,903 | ||||||||||||
| Sub-total |
23,268 | 23,268 | 23,505 | |||||||||||||
| 4 | Municipal Sustainability Initiative |
|||||||||||||||
| 4.1 | Municipal Sustainability Initiative Operating |
30,000 | 29,083 | 60,000 | ||||||||||||
| 5 | Federal Grant Programs |
|||||||||||||||
| 5.3 | Investing in Canada Infrastructure - Administration |
102 | 102 | 102 | ||||||||||||
| 6 | Grants in Place of Taxes |
30,025 | 30,775 | 36,000 | ||||||||||||
| 7 | Alberta Community Partnership |
15,400 | 15,978 | 15,400 | ||||||||||||
| 8 | Technical and Corporate Services |
|||||||||||||||
| 8.1 | Warranty, Certification and Policy |
2,940 | 2,940 | 2,437 | ||||||||||||
| 8.2 | Community and Technical Support |
6,602 | 6,602 | 7,206 | ||||||||||||
| 8.3 | Residential Protection Program |
1,859 | 1,859 | 2,664 | ||||||||||||
| 8.4 | Business Planning and Integration | 2,471 | 2,471 | 2,607 | ||||||||||||
| Sub-total |
13,872 | 13,872 | 14,914 | |||||||||||||
| 9 | Land and Property Rights Tribunal |
6,920 | 6,740 | 7,842 | ||||||||||||
| Municipal Affairs | 166 |
|
|
EXPENSE VOTE BY PROGRAM ... continued
|
|||||||||||||||||||
| (thousands of dollars) |
|
Comparable
|
|
|||||||||||||||||
| 2022-23 | 2022-23 | 2023-24 | ||||||||||||||||||
|
|
Budget
|
|
|
Forecast
|
|
|
Estimate
|
| ||||||||||||
| CAPITAL GRANTS |
||||||||||||||||||||
| 4 | Municipal Sustainability Initiative | |||||||||||||||||||
| 4.2 | Municipal Sustainability Initiative Capital | 485,000 | 485,917 | 485,000 | ||||||||||||||||
| 5 | Federal Grant Programs | |||||||||||||||||||
| 5.1 | Canada Community-Building Fund (formerly known as the Federal Gas Tax Fund) | 255,121 | 259,492 | 266,214 | ||||||||||||||||
| 5.2 | Small Communities Fund | - | - | 1,291 | ||||||||||||||||
| 5.4 | Investing in Canada Infrastructure - Rural and Northern Communities | 30,577 | 12,615 | 25,051 | ||||||||||||||||
| 5.5 | Investing in Canada Infrastructure - Community, Culture and Recreation | 7,275 | 9,890 | 4,239 | ||||||||||||||||
| Sub-total | 292,973 | 281,997 | 296,795 | |||||||||||||||||
| Total | 948,716 | 938,888 | 993,931 | |||||||||||||||||
|
|
CAPITAL INVESTMENT VOTE BY PROGRAM
|
|||||||||||||||||||
| DEPARTMENT CAPITAL ACQUISITIONS |
||||||||||||||||||||
| 3 | Municipal Assessments and Grants | |||||||||||||||||||
| 3.2 | Assessment Services | 709 | 5,029 | 600 | ||||||||||||||||
| 9 | Land and Property Rights Tribunal | - | 180 | - | ||||||||||||||||
| Total | 709 | 5,209 | 600 | |||||||||||||||||
| 167 |
Municipal Affairs |
AMOUNTS NOT REQUIRED TO BE VOTED
The following department amounts do not require a supply vote either because no cash disbursement is required, or because the Legislative Assembly has already provided the funding authority pursuant to a statute other than an appropriation act.
| EXPENSE
|
||||||||||||
| (thousands of dollars) |
|
Comparable
|
|
|||||||||
| 2022-23 | 2022-23 | 2023-24 | ||||||||||
| Budget | Forecast | Estimate | ||||||||||
| DEPARTMENT NON-CASH AMOUNTS |
||||||||||||
| Amortization |
||||||||||||
| Ministry Support Services |
25 | 25 | 70 | |||||||||
| Municipal Assessments and Grants |
2,914 | 2,914 | 3,046 | |||||||||
| Technical and Corporate Services |
410 | 410 | 107 | |||||||||
| Valuation Adjustments and Other Provisions |
||||||||||||
| Ministry Support Services |
200 | 200 | 200 | |||||||||
| Total |
3,549 | 3,549 | 3,423 | |||||||||
| Municipal Affairs | 168 |
RECONCILIATION OF SUPPLY VOTE TO CONSOLIDATED GOVERNMENT ESTIMATE
The following tables summarize the relationship between the department’s Supply Votes and the effect of the ministry on the Government’s consolidated 2023-24 Estimates.
RECONCILIATION BY PROGRAM
| (thousands of dollars) | Department |
Entities’ |
Consolidated |
|||||||||||||||||
| Voted | Amounts | Amounts | Consolidation | 2023-24 | ||||||||||||||||
| Supply | Not Voted | Not Voted | Adjustments | Estimate | ||||||||||||||||
| EXPENSE |
||||||||||||||||||||
| Ministry Support Services |
5,311 | 270 | - | - | 5,581 | |||||||||||||||
| Municipal Services |
49,062 | - | - | - | 49,062 | |||||||||||||||
| Municipal Assessments and Grants |
23,505 | 3,046 | - | - | 26,551 | |||||||||||||||
| Municipal Sustainability Initiative |
545,000 | - | - | - | 545,000 | |||||||||||||||
| Federal Grant Programs |
296,897 | - | - | - | 296,897 | |||||||||||||||
| Grants in Place of Taxes |
36,000 | - | - | - | 36,000 | |||||||||||||||
| Alberta Community Partnership |
15,400 | - | - | - | 15,400 | |||||||||||||||
| Technical and Corporate Services |
14,914 | 107 | - | - | 15,021 | |||||||||||||||
| Land and Property Rights Tribunal |
7,842 | - | - | - | 7,842 | |||||||||||||||
| Safety Codes Council |
- | - | 15,933 | - | 15,933 | |||||||||||||||
| Total |
993,931 | 3,423 | 15,933 | - | 1,013,287 | |||||||||||||||
| CAPITAL INVESTMENT |
||||||||||||||||||||
| Municipal Assessments and Grants |
600 | - | - | - | 600 | |||||||||||||||
| Safety Codes Council |
- | - | 405 | - | 405 | |||||||||||||||
| Total
|
|
600
|
|
|
-
|
|
|
405
|
|
|
-
|
|
|
1,005
|
| |||||
| RECONCILIATION BY TYPE OF SPENDING |
||||||||||||||||||||
| EXPENSE |
||||||||||||||||||||
| Operating expense |
212,136 | 200 | 15,425 | - | 227,761 | |||||||||||||||
| Capital grants |
781,795 | - | - | - | 781,795 | |||||||||||||||
| Amortization |
- | 3,223 | 508 | - | 3,731 | |||||||||||||||
| Total |
993,931 | 3,423 | 15,933 | - | 1,013,287 | |||||||||||||||
| CAPITAL INVESTMENT |
600 | - | 405 | - | 1,005 | |||||||||||||||
| 169 | Municipal Affairs |
MINISTRY FINANCIAL STATEMENTS
STATEMENT OF OPERATIONS
| (thousands of dollars) | Comparable | |||||||||||
| 2022-23 Budget |
2022-23 Forecast |
2023-24 Estimate |
||||||||||
| REVENUE |
||||||||||||
| Canada Community-Building Fund |
255,121 | 259,492 | 266,214 | |||||||||
| Other Transfers from Government of Canada |
37,957 | 22,610 | 30,041 | |||||||||
| Premiums, Fees and Licences |
19,123 | 19,841 | 19,885 | |||||||||
| Investment Income |
319 | 277 | 276 | |||||||||
| Other Revenue |
16,636 | 16,508 | 16,315 | |||||||||
| Consolidated Total |
329,156 | 318,728 | 332,731 | |||||||||
| EXPENSE |
||||||||||||
| Ministry Support Services |
5,411 | 5,411 | 5,581 | |||||||||
| Municipal Services |
45,970 | 45,970 | 49,062 | |||||||||
| Municipal Assessments and Grants |
26,182 | 26,182 | 26,551 | |||||||||
| Municipal Sustainability Initiative |
515,000 | 515,000 | 545,000 | |||||||||
| Federal Grant Programs |
293,075 | 282,099 | 296,897 | |||||||||
| Grants in Place of Taxes |
30,025 | 30,775 | 36,000 | |||||||||
| Alberta Community Partnership |
15,400 | 15,978 | 15,400 | |||||||||
| Technical and Corporate Services |
14,282 | 14,282 | 15,021 | |||||||||
| Land and Property Rights Tribunal |
6,920 | 6,740 | 7,842 | |||||||||
| Safety Codes Council |
15,095 | 14,116 | 15,933 | |||||||||
| Consolidated Total |
967,360 | 956,553 | 1,013,287 | |||||||||
| Net Operating Result |
(638,204 | ) | (637,825 | ) | (680,556 | ) | ||||||
| CHANGE IN CAPITAL ASSETS |
||||||||||||
| INVESTMENT |
||||||||||||
| Municipal Assessments and Grants |
709 | 5,029 | 600 | |||||||||
| Land and Property Rights Tribunal |
- | 180 | - | |||||||||
| Safety Codes Council |
170 | 140 | 405 | |||||||||
| Consolidated Total |
879 | 5,349 | 1,005 | |||||||||
| AMORTIZATION |
(3,853 | ) | (3,789 | ) | (3,731 | ) | ||||||
| DISPOSALS OR WRITE OFFS
|
(5 | ) | (5 | ) | (5 | ) | ||||||
| Change in Capital Assets Total |
(2,979 | ) | 1,555 | (2,731 | ) | |||||||
| Municipal Affairs | 170 |

Public Safety and Emergency Services
| AMOUNTS TO BE VOTED
|
||||||||||||
| (thousands of dollars) |
Comparable | |||||||||||
|
|
|
|||||||||||
| 2022-23 | 2022-23 | 2023-24 | ||||||||||
| Budget | Forecast | Estimate | ||||||||||
| EXPENSE |
922,063 | 972,115 | 1,107,941 | |||||||||
| CAPITAL INVESTMENT |
3,533 | 7,627 | 6,275 | |||||||||
| FINANCIAL TRANSACTIONS |
4,764 | 5,764 | 4,196 | |||||||||
| CONTINGENCY |
- | 17,777 | - | |||||||||
|
|
||||||||||||
| 171 |
DESCRIPTION OF SUPPLY VOTE PROGRAMS
| 1 | Ministry Support Services |
| 1.1 | Minister’s Office |
The Minister is the Solicitor General and oversees the development of ministerial policies that are aligned with broader government-wide objectives and priorities.
| 1.2 | Deputy Minister’s Office |
Supports the Minister in achieving business plan and strategic goals of the ministry, government and public service.
| 1.3 | Financial Services |
Provides leadership and ministry-wide support services, which enables the achievement of the ministry’s goals and objectives, including enhancing efficiency and effectiveness across all program levels.
| 2 | Public Security |
| 2.1 | Alberta Sheriffs |
Contributes to law enforcement and includes Investigation Services, Court and Security, Protection and Transport, Highway Patrol, Fish and Wildlife Enforcement and Rural Alberta Provincial Integrated Defense Response.
| 2.2 | Alberta Serious Incident Response Team |
Investigates incidents involving police that have resulted in injury or death of a person and serious or sensitive allegations of police misconduct.
| 2.3 | Provincial Security Intelligence Office |
Provides security expertise and advice related to human induced intentional threats.
| 2.4 | Law Enforcement Oversight |
Provides standards oversight, security and security licensing services and investigation services. Includes Body Armour Control, Civil Forfeiture, Integrated Community Safety and Specialized Policing.
| 2.5 | Contract Policing and Policing Oversight |
Provides strategic management of the RCMP Provincial Police Service Agreement and is responsible for civilian oversight of police. Also includes Biology Casework and the Edmonton Airport Policing Service.
| 2.6 | Indigenous Policing Services |
Ensures effective policing for Alberta communities through policing agreements with Canada, the RCMP and self- administered Indigenous police services.
| 2.7 | Policing Support Grant |
Provides annual grants to municipalities that provide their own policing to help offset their costs.
| 2.8 | Organized and Serious Crime |
Supports the Alberta Law Enforcement Response Team which responds to serious and organized crime and the Gun and Gang Violence Action Fund which enhances efforts to combat gun and gang violence.
| 3 | Correctional Services |
| 3.1 | Correctional Planning and Innovation |
Oversees strategy and planning functions, with a focus on workforce planning, technology enhancements, Indigenous and divisional strategy, business transformation, provincial sentence administration and investigations.
| 3.2 | Custody Operations |
Accountable for adult and youth custody operations. Head office personnel support the effective operations of 10 adult and youth facilities.
| 3.3 | Community Corrections |
Oversees adult and youth community corrections centers and attendance centers. Head office personnel support the effective operations of over 40 community corrections offices.
| 3.4 | Correctional Programs and Services |
Provides community supervision to adult and youth populations across 54 locations, including four attendance centers. Head office personnel support operations, program services and policy and practice application.
| 3.5 | Training Academy |
Provides induction training to peace officers, sheriffs and correctional and community services officers. Establishes standards and provides oversight of peace officer training programs and manages training facilities.
| Public Safety and Emergency Services | 172 |
DESCRIPTION OF SUPPLY VOTE PROGRAMS… continued
| 4 | Alberta Emergency Management Agency |
| 4.1 | Managing Director’s Office |
Provides strategic leadership, direct service, support and advice to government, municipalities, First Nations and other partners and key stakeholders for emergency and disaster prevention, preparedness, and response.
| 4.2 | Strategy and Systems Support |
Leads Alberta Emergency Management Agency’s policy, legislation, finance, and logistical and support services.
| 4.3 | Operations |
Supports the Provincial Operations Centre; field operations; training, certification, plans and consequence management; emergency social services; business continuity; critical infrastructure, and the Alberta Emergency Alert program.
| 4.4 | Recovery Operations |
Coordinates government support for disaster-affected communities and Albertans, and directly administers the provision of disaster financial assistance.
| 4.5 | Disaster Recovery |
Funds localized disasters and extraordinary firefighting costs outside of the areas protected by Forestry, Parks and Tourism and administers funding for disaster initiatives managed by other ministries.
| 4.6 | Emergency Preparedness Grants |
Provides grant funding for municipal emergency management training.
| 4.7 | Alberta First Responders Radio Communications System |
A single province-wide, interoperable, two-way voice communications system for use by provincial and municipal first responder agencies.
| 5 | 2013 Alberta Flooding |
| 5.1 | Disaster Recovery Program - Flooding |
Responsible for processes related to the Southern Alberta Flooding Disaster Recovery Program and Regional
Municipality of Wood Buffalo Disaster Recovery Program.
| 173 | Public Safety and Emergency Services |
| EXPENSE VOTE BY PROGRAM
|
| |||||||||||||||||
| (thousands of dollars) |
Comparable | |||||||||||||||||
|
2022-23 |
2022-23 | 2023-24 | ||||||||||||||||
| Budget | Forecast | Estimate | ||||||||||||||||
| OPERATING EXPENSE
|
| |||||||||||||||||
| 1 |
Ministry Support Services | |||||||||||||||||
| 1.1 |
Minister’s Office | - | 400 | 897 | ||||||||||||||
| 1.2 |
Deputy Minister’s Office | 907 | 1,307 | 907 | ||||||||||||||
| 1.3 |
Financial Services | 6,632 | 6,631 | 23,325 | ||||||||||||||
| Sub-total | 7,539 | 8,338 | 25,129 | |||||||||||||||
| 2 |
Public Security | |||||||||||||||||
| 2.1 |
Alberta Sheriffs | 94,810 | 108,811 | 132,139 | ||||||||||||||
| 2.2 |
Alberta Serious Incident Response Team | 5,287 | 5,287 | 5,357 | ||||||||||||||
| 2.3 |
Provincial Security Intelligence Office | 1,920 | 1,920 | 1,959 | ||||||||||||||
| 2.4 |
Law Enforcement Oversight | 9,879 | 9,879 | 25,049 | ||||||||||||||
| 2.5 |
Contract Policing and Policing Oversight | 343,845 | 341,845 | 370,508 | ||||||||||||||
| 2.6 |
Indigenous Policing Services | 14,424 | 15,424 | 19,954 | ||||||||||||||
| 2.7 |
Policing Support Grant | 89,208 | 90,108 | 98,819 | ||||||||||||||
| 2.8 |
Organized and Serious Crime | 35,430 | 51,782 | 55,620 | ||||||||||||||
| Sub-total | 594,803 | 625,056 | 709,405 | |||||||||||||||
| 3 |
Correctional Services | |||||||||||||||||
| 3.1 |
Correctional Planning and Innovation | 3,587 | 3,587 | 5,028 | ||||||||||||||
| 3.2 |
Custody Operations | 230,345 | 242,375 | 261,764 | ||||||||||||||
| 3.3 |
Community Corrections | 41,934 | 45,504 | 53,542 | ||||||||||||||
| 3.4 |
Correctional Programs and Services | 7,877 | 10,177 | 13,212 | ||||||||||||||
| 3.5 |
Training Academy | 4,741 | 5,341 | 6,666 | ||||||||||||||
| Sub-total | 288,484 | 306,984 | 340,212 | |||||||||||||||
| 4 |
Alberta Emergency Management Agency | |||||||||||||||||
| 4.1 |
Managing Director’s Office | 606 | 1,106 | 606 | ||||||||||||||
| 4.2 |
Strategy and Systems Support | 4,442 | 4,442 | 5,100 | ||||||||||||||
| 4.3 |
Operations | 6,485 | 6,485 | 7,996 | ||||||||||||||
| 4.4 |
Recovery Operations | 2,285 | 2,285 | 2,351 | ||||||||||||||
| 4.6 |
Emergency Preparedness Grants | 150 | 150 | 150 | ||||||||||||||
| 4.7 |
Alberta First Responders Radio Communications System | 17,269 | 17,269 | 16,992 | ||||||||||||||
| Sub-total
|
|
31,237
|
|
|
31,737
|
|
|
33,195
|
| |||||||||
| Total |
922,063 | 972,115 | 1,107,941 | |||||||||||||||
| Public Safety and Emergency Services | 174 |
| CAPITAL INVESTMENT VOTE BY PROGRAM |
||||||||||||||||
| (thousands of dollars) |
Comparable | |||||||||||||||
| 2022-23 | 2022-23 | 2023-24 | ||||||||||||||
| Budget | Forecast | Estimate | ||||||||||||||
| DEPARTMENT CAPITAL ACQUISITIONS |
| |||||||||||||||
| 2 |
Public Security | |||||||||||||||
| 2.1 |
Alberta Sheriffs | 695 | 695 | 2,695 | ||||||||||||
| 3 |
Correctional Services | |||||||||||||||
| 3.2 |
Custody Operations | 538 | 538 | 1,280 | ||||||||||||
| 4 |
Alberta Emergency Management Agency | |||||||||||||||
| 4.4 |
Recovery Operations | - | 1,892 | - | ||||||||||||
| 4.7 |
Alberta First Responders Radio Communications System | 2,300 | 4,502 | 2,300 | ||||||||||||
| Sub-total
|
|
2,300
|
|
|
6,394
|
|
|
2,300
|
| |||||||
| Total |
3,533 | 7,627 | 6,275 | |||||||||||||
| FINANCIAL TRANSACTIONS VOTE BY PROGRAM |
| |||||||||||||||
| INVENTORY ACQUISITION |
| |||||||||||||||
| 4 |
Alberta Emergency Management Agency | |||||||||||||||
| 4.2 |
Strategy and Systems Support | - | 1,000 | - | ||||||||||||
| 2013 ALBERTA FLOODING LIABILITY RETIREMENT |
| |||||||||||||||
| 5 |
2013 Alberta Flooding | |||||||||||||||
| 5.1
|
Disaster Recovery Program - Flooding
|
|
4,764
|
|
|
4,764
|
|
|
4,196
|
| ||||||
| Total |
4,764 | 5,764 | 4,196 | |||||||||||||
| CONTINGENCY VOTE BY PROGRAM |
| |||||||||||||||
| OPERATING EXPENSE |
||||||||||||||||
| 4 |
Alberta Emergency Management Agency | |||||||||||||||
| 4.5
|
Disaster Recovery
|
|
-
|
|
|
17,777
|
|
|
-
|
| ||||||
| Total |
- | 17,777 | - | |||||||||||||
| 175 | Public Safety and Emergency Services |
VOTED AMOUNTS FUNDED BY CREDIT OR RECOVERY
The following table details the portions of the department’s voted amounts for which a credit or recovery can be obtained. If a credit or recovery amount is expected to exceed its original estimate, the Treasury Board may increase the corresponding voted amount, pursuant to section 24(2) of the Financial Administration Act. If the actual credit or recovery amount realized is less than its original estimate, the corresponding funding authority is reduced by an equivalent amount in the programs shown.
| EXPENSE AMOUNTS FUNDED BY CREDIT OR RECOVERY
|
||||
| (thousands of dollars) |
|
2023-24 Estimate
|
| |
| 1 Edmonton Regional Airports Authority Policing Services Agreement |
4,180 | |||
| Revenue is received on a full cost recovery basis from the Edmonton Regional Airports Authority for policing services at Edmonton International Airport under the Provincial Police Service Agreement. Program 2.5
|
||||
| Total |
4,180 | |||
| Public Safety and Emergency Services | 176 |
AMOUNTS NOT REQUIRED TO BE VOTED
The following department amounts do not require a supply vote either because no cash disbursement is required, or because the Legislative Assembly has already provided the funding authority pursuant to a statute other than an appropriation act.
| EXPENSE
|
||||||||||||||||
| (thousands of dollars) |
Comparable | |||||||||||||||
| 2022-23 | 2022-23 | 2023-24 | ||||||||||||||
| Budget | Forecast | Estimate | ||||||||||||||
| DEPARTMENT STATUTORY AMOUNTS |
||||||||||||||||
| Operating Expense |
||||||||||||||||
| Alberta Emergency Management Agency |
43,655 | 43,655 | 43,655 | |||||||||||||
| DEPARTMENT NON-CASH AMOUNTS |
||||||||||||||||
| Amortization |
||||||||||||||||
| Public Security |
1,588 | 1,588 | 1,588 | |||||||||||||
| Correctional Services |
511 | 511 | 511 | |||||||||||||
| Alberta Emergency Management Agency |
27,110 | 27,110 | 27,110 | |||||||||||||
| Consumption of Inventory |
||||||||||||||||
| Alberta Emergency Management Agency |
- | 1,000 | 1,000 | |||||||||||||
| Valuation Adjustments and Other Provisions |
||||||||||||||||
| Ministry Support Services |
39 | 39 | 20 | |||||||||||||
| Correctional Services
|
775 | 775 | 775 | |||||||||||||
| Total |
73,678 | 74,678 | 74,659 | |||||||||||||
| 177 | Public Safety and Emergency Services |
RECONCILIATION OF SUPPLY VOTE TO CONSOLIDATED GOVERNMENT ESTIMATE
The following tables summarize the relationship between the department’s Supply Votes and the effect of the ministry on the Government’s consolidated 2023-24 Estimates.
RECONCILIATION BY PROGRAM
| (thousands of dollars) | Department | Entities’ | Consolidated | |||||||||||||||||
| Voted | Amounts | Amounts | Consolidation | 2023-24 | ||||||||||||||||
| Supply | Not Voted | Not Voted | Adjustments | Estimate | ||||||||||||||||
| EXPENSE |
||||||||||||||||||||
| Ministry Support Services |
25,129 | 20 | - | - | 25,149 | |||||||||||||||
| Public Security |
709,405 | 1,588 | - | - | 710,993 | |||||||||||||||
| Correctional Services |
340,212 | 1,286 | - | (5,300 | ) | 336,198 | ||||||||||||||
| Alberta Emergency Management Agency |
33,195 | 71,765 | - | - | 104,960 | |||||||||||||||
| Victims of Crime and Public Safety Fund |
- | - | 39,486 | - | 39,486 | |||||||||||||||
| Total |
1,107,941 | 74,659 | 39,486 | (5,300 | ) | 1,216,786 | ||||||||||||||
| CAPITAL INVESTMENT |
||||||||||||||||||||
| Public Security |
2,695 | - | - | - | 2,695 | |||||||||||||||
| Correctional Services |
1,280 | - | - | - | 1,280 | |||||||||||||||
| Alberta Emergency Management Agency |
2,300 | - | - | - | 2,300 | |||||||||||||||
| Victims of Crime and Public Safety Fund |
- | - | 25 | - | 25 | |||||||||||||||
| Total |
6,275 | - | 25 | - | 6,300 | |||||||||||||||
| RECONCILIATION BY TYPE OF SPENDING |
||||||||||||||||||||
| EXPENSE |
||||||||||||||||||||
| Operating expense |
1,107,941 | 44,450 | 39,481 | (5,300 | ) | 1,186,572 | ||||||||||||||
| Amortization |
- | 29,209 | 5 | - | 29,214 | |||||||||||||||
| Inventory consumption |
- | 1,000 | - | - | 1,000 | |||||||||||||||
| Total |
1,107,941 | 74,659 | 39,486 | (5,300 | ) | 1,216,786 | ||||||||||||||
| CAPITAL INVESTMENT
|
|
6,275
|
|
|
-
|
|
|
25
|
|
|
-
|
|
|
6,300
|
| |||||
| Public Safety and Emergency Services | 178 |
| MINISTRY FINANCIAL STATEMENTS |
||||||||||||
| STATEMENT OF OPERATIONS |
||||||||||||
| (thousands of dollars) | Comparable | |||||||||||
| 2022-23 Budget |
2022-23 Forecast |
2023-24 Estimate |
||||||||||
| REVENUE |
||||||||||||
| Transfers of Assets or Liabilities from Related Parties |
- | 1,823 | - | |||||||||
| Transfers from Government of Canada |
31,426 | 43,099 | 29,416 | |||||||||
| Investment Income |
1,000 | 1,000 | 1,000 | |||||||||
| Other Premiums, Fees and Licences |
45,755 | 45,755 | 45,755 | |||||||||
| Fines and Penalties |
61,450 | 53,450 | 53,150 | |||||||||
| Other Revenue |
67,984 | 69,284 | 92,316 | |||||||||
| Ministry Total |
207,615 | 214,411 | 221,637 | |||||||||
| Inter-Ministry Consolidations |
- | (1,823 | ) | - | ||||||||
| Consolidated Total |
207,615 | 212,588 | 221,637 | |||||||||
| EXPENSE |
||||||||||||
| Ministry Support Services |
7,578 | 8,377 | 25,149 | |||||||||
| Public Security |
596,391 | 626,644 | 710,993 | |||||||||
| Correctional Services |
289,770 | 308,270 | 341,498 | |||||||||
| Alberta Emergency Management Agency |
102,002 | 121,279 | 104,960 | |||||||||
| Victims of Crime and Public Safety Fund |
62,887 | 39,387 | 39,486 | |||||||||
| Ministry Total |
1,058,628 | 1,103,957 | 1,222,086 | |||||||||
| Inter-Ministry Consolidations
|
|
(5,300
|
)
|
|
(5,300
|
)
|
|
(5,300
|
)
| |||
| Consolidated Total |
1,053,328 | 1,098,657 | 1,216,786 | |||||||||
| Net Operating Result |
(845,713 | ) | (886,069 | ) | (995,149 | ) | ||||||
| CHANGE IN CAPITAL ASSETS |
||||||||||||
| INVESTMENT |
||||||||||||
| Public Security |
695 | 695 | 2,695 | |||||||||
| Correctional Services |
538 | 538 | 1,280 | |||||||||
| Alberta Emergency Management Agency |
2,300 | 6,394 | 2,300 | |||||||||
| Victims of Crime and Public Safety Fund |
15 | 15 | 25 | |||||||||
| Consolidated Total |
3,548 | 7,642 | 6,300 | |||||||||
| AMORTIZATION
|
|
(29,278
|
)
|
|
(29,278
|
)
|
|
(29,214
|
)
| |||
| Change in Capital Assets Total |
(25,730 | ) | (21,636 | ) | (22,914 | ) | ||||||
| CHANGE IN INVENTORY ASSETS |
||||||||||||
| INVENTORY ACQUISITION |
||||||||||||
| Alberta Emergency Management Agency |
- | 1,000 | - | |||||||||
| Consolidated Total |
- | 1,000 | - | |||||||||
| CONSUMPTION
|
|
-
|
|
|
(1,000
|
)
|
|
(1,000
|
)
| |||
| Change in Inventory Assets Total
|
|
-
|
|
|
-
|
|
|
(1,000
|
)
| |||
| 179 | Public Safety and Emergency Services |
Seniors, Community and Social Services
| AMOUNTS TO BE VOTED |
||||||||||||||||
| (thousands of dollars) | Comparable |
|||||||||||||||
| 2022-23 | 2022-23 | 2023-24 | ||||||||||||||
|
|
Budget
|
|
|
Forecast
|
|
|
Estimate
|
| ||||||||
| EXPENSE |
4,636,794 | 4,684,165 | 5,066,076 | |||||||||||||
| CAPITAL INVESTMENT |
5,072 | 6,246 | 4,072 | |||||||||||||
| FINANCIAL TRANSACTIONS |
19,700 | 19,700 | 19,700 | |||||||||||||
181
DESCRIPTION OF SUPPLY VOTE PROGRAMS
| 1 | Ministry Support Services |
| 1.1 | Minister’s Office |
Oversees the development of ministerial policies that are aligned with broader government-wide objectives and priorities.
| 1.2 | Deputy Minister’s Office |
Supports the Minister in achieving business plan and strategic goals of the ministry, government and public service.
| 1.3 | Strategic Services |
Provides strategic policy and planning, data analytics, business improvements and business services.
| 1.4 | Corporate Services |
Provides corporate finance and centralized procurement services for the ministry.
| 1.5 | Appeals Panels |
Adjudicative bodies created under legislation to review decisions made by program authorities upon citizen appeal.
| 2 | Employment and Income Support |
| 2.1 | Program Planning and Delivery |
Management and delivery of income support programs that assist Albertans to find and keep jobs, and helps Albertans with low incomes access financial benefits.
| 2.2 | Income Support to People Expected to Work or Working |
Financial benefits for Albertans who are able to sustain employment but do not have the resources to meet their basic needs such as food, clothing and shelter.
| 2.3 | Income Support to People with Barriers to Full Employment |
Financial benefits for Albertans who face barriers to maintaining full-time employment to meet their basic needs such as food, clothing and shelter.
| 2.4 | Career and Employment Services |
Provides access to career, workplace and labour market information that help Albertans find and maintain employment, or identify training opportunities to secure employment.
| 3 | Assured Income for the Severely Handicapped |
| 3.1 | Program Planning and Delivery |
Management and delivery of the Assured Income for the Severely Handicapped (AISH) program to provide financial and personal supports to AISH clients.
| 3.2 | Financial Assistance Grants |
Financial benefits to eligible Albertans with a severe and permanent disability that causes a substantial limitation in their ability to earn a living.
| 4 | Disability Services |
| 4.1 | Program Planning and Delivery |
Policy development, planning, coordination to support continuous improvement of supports and services for adults with disabilities in Alberta.
| 4.2 | Persons with Developmental Disabilities - Supports to Albertans |
Supports to adults with developmental disabilities to live in their homes, access specialized support requirements, find employment, be included in community life and be as independent as possible.
| 4.3 | Persons with Developmental Disabilities - Direct Operations |
Operates facilities owned by the provincial government to provide adults with developmental disabilities in residential care settings.
| 4.4 | Family Support for Children with Disabilities |
Provides comprehensive support to families of children with disabilities to strengthen the family’s capacity to promote their child’s development and participation in activities in the home and in the community.
| 4.5 | Provincial Disability Supports Initiatives |
Provides community support programs for adults with disabilities through such programs as the Alberta Brain Injury Initiative, Residential Access Modification Program, and Cross Disability Supports.
| Seniors, Community and Social Services | 182 |
DESCRIPTION OF SUPPLY VOTE PROGRAMS ... Continued
| 4.6 | Fetal Alcohol Spectrum Disorder Initiatives |
Provides funding to Fetal Alcohol Spectrum Disorder (FASD) Service Networks to provide a continuum of coordinated services to meet the needs of those living with FASD and their caregivers.
| 4.7 | Disability Advocate’s Office |
Assists persons and their families by helping them navigate the disability system.
| 5 | Homeless and Outreach Support Services |
| 5.1 | Program Planning and Delivery |
Policy development, management and delivery of programs that support and deliver homeless shelter services, women’s shelter services, outreach support services and Housing First programming.
| 5.2 | Homeless Shelters |
Provides funding to support the operations of homeless shelters, and short- and long-term supportive housing sites located in communities throughout the province.
| 5.3 | Women’s Shelters |
Provides safe accommodation for women and children in crisis due to family violence, and helps connect them with the resources they need to rebuild their lives.
| 5.4 | Homeless Support Outreach Services |
Provides funding to community-based organizations to deliver programs, which move individuals and families out of homelessness, including permanent housing using a Housing First approach.
| 6 | Community Supports and Family Safety |
| 6.1 | Program Planning and Delivery |
Management and delivery of programs and resources that help prevent family violence, sexual violence and abuse, and promote healthy relationships in Alberta.
| 6.2 | Family and Community Support Services |
Supports communities in designing and delivering preventative social services that help enhance Albertans’ well-being and increase their ability preparedness for crisis situations.
| 6.3 | Family and Community Safety |
Provides grant funding to community based organizations to prevent family violence, sexual violence and abuse, and promote healthy relationships in Alberta.
| 7 | Seniors Services |
| 7.1 | Program Planning and Delivery |
Engages with government and community partners, provides policy guidance and strategic direction to Seniors Services.
| 7.2 | Special Needs Assistance Grants |
Provides financial support to eligible low-income seniors for critical needs including appliances, home repairs and personal and health supports.
| 7.3 | Seniors Home Adaptation and Repair |
Allows eligible seniors to finance home repairs and adaptations through government-supported low-interest home equity loans or grants.
| 7.4 | Seniors Community Grants |
Provides funding to support initiatives that ensures seniors are empowered to live independently, safely and with dignity.
| 7.5 | Property Tax Deferral Loans |
Allows eligible senior homeowners to defer all or part of their annual property taxes through a low-interest home equity loan with the government through the Seniors Property Tax Deferral Program.
| 183 | Seniors, Community and Social Services |
DESCRIPTION OF SUPPLY VOTE PROGRAMS ... Continued
| 8 | Alberta Seniors Benefit |
| 8.1 | Program Planning and Delivery |
Delivers the Alberta Seniors Benefit and Supplementary Accommodations Benefit programs and supports enrollment for other seniors financial assistance programs.
| 8.2 | Alberta Seniors Benefit Grants |
Provides a monthly income supplement to low-income Albertans.
| 8.3 | Supplementary Accommodations Benefit |
Provides a monthly income supplement to support affordable accommodation costs for residents of long-term care and designated supportive living facilities.
| 9 | Housing |
| 9.1 | Program Planning and Delivery |
Works with housing management bodies, municipalities, not-for-profit organizations and for-profit organizations to provide housing and related supports to Albertans in need.
| 9.2 | Assistance to Alberta Social Housing Corporation |
Provides funding to the Alberta Social Housing Corporation to address annual operating and capital requirements for Family and Seniors Community Housing, Rental Assistance, Special Needs Housing, and Affordable Housing Strategy.
| 10 | Public Guardian and Trustee Services |
Responsible for health care decisions under last resort provisions, protects minors’ property interests and may act in the administration of missing or deceased persons’ estates.
| 11 | Services Provided to Other Ministries |
This program reflects funding received from other ministries for the delivery of services provided by the ministry on their behalf.
| 12 | Affordability Supports and Inflation Relief |
Affordability relief measure targeted at the most vulnerable Albertans to address the rising cost of living resulting from high inflation.
| Seniors, Community and Social Services | 184 |
| EXPENSE VOTE BY PROGRAM |
||||||||||||||||||
| (thousands of dollars) |
|
Comparable
|
|
|||||||||||||||
| 2022-23 | 2022-23 | 2023-24 | ||||||||||||||||
|
|
Budget
|
|
|
Forecast
|
|
|
Estimate
|
| ||||||||||
| OPERATING EXPENSE |
||||||||||||||||||
| 1 | Ministry Support Services | |||||||||||||||||
| 1.1 | Minister’s Office |
756 | 756 | 756 | ||||||||||||||
| 1.2 | Deputy Minister’s Office |
802 | 802 | 802 | ||||||||||||||
| 1.3 | Strategic Services |
4,410 | 4,410 | 6,870 | ||||||||||||||
| 1.4 | Corporate Services |
8,621 | 8,621 | 8,621 | ||||||||||||||
| 1.5 | Appeals Panels | 3,608 | 3,608 | 3,956 | ||||||||||||||
| Sub-total | 18,197 | 18,197 | 21,005 | |||||||||||||||
| 2 | Employment and Income Support | |||||||||||||||||
| 2.1 | Program Planning and Delivery | 102,984 | 120,984 | 109,538 | ||||||||||||||
| 2.2 | Income Support to People Expected to Work or Working | 369,715 | 369,115 | 362,417 | ||||||||||||||
| 2.3 | Income Support to People with Barriers to Full Employment | 237,412 | 218,212 | 236,535 | ||||||||||||||
| 2.4 | Career and Employment Services | 105,892 | 105,892 | 95,892 | ||||||||||||||
| Sub-total | 816,003 | 814,203 | 804,382 | |||||||||||||||
| 3 | Assured Income for the Severely Handicapped | |||||||||||||||||
| 3.1 | Program Planning and Delivery | 34,166 | 34,166 | 35,166 | ||||||||||||||
| 3.2 | Financial Assistance Grants | 1,337,052 | 1,373,723 | 1,503,285 | ||||||||||||||
| Sub-total | 1,371,218 | 1,407,889 | 1,538,451 | |||||||||||||||
| 4 | Disability Services | |||||||||||||||||
| 4.1 | Program Planning and Delivery | 54,851 | 57,851 | 58,411 | ||||||||||||||
| 4.2 | Persons with Developmental Disabilities - Supports to Albertans |
1,057,410 | 1,050,770 | 1,173,710 | ||||||||||||||
| 4.3 | Persons with Developmental Disabilities - Direct Operations |
39,650 | 39,650 | 40,290 | ||||||||||||||
| 4.4 | Family Support for Children with Disabilities |
217,760 | 203,660 | 233,765 | ||||||||||||||
| 4.5 | Provincial Disability Supports Initiatives |
17,299 | 17,299 | 18,199 | ||||||||||||||
| 4.6 | Fetal Alcohol Spectrum Disorder Initiatives |
25,239 | 25,239 | 25,239 | ||||||||||||||
| 4.7 | Disability Advocate’s Office | 1,000 | 1,000 | 1,200 | ||||||||||||||
| Sub-total | 1,413,209 | 1,395,469 | 1,550,814 | |||||||||||||||
| 5 | Homeless and Outreach Support Services | |||||||||||||||||
| 5.1 | Program Planning and Delivery |
3,551 | 3,551 | 3,551 | ||||||||||||||
| 5.2 | Homeless Shelters |
48,700 | 67,650 | 83,500 | ||||||||||||||
| 5.3 | Women’s Shelters |
51,319 | 51,319 | 55,119 | ||||||||||||||
| 5.4 | Homeless Support Outreach Services | 89,638 | 101,638 | 101,638 | ||||||||||||||
| Sub-total | 193,208 | 224,158 | 243,808 | |||||||||||||||
| 6 | Community Supports and Family Safety |
|||||||||||||||||
| 6.1 | Program Planning and Delivery |
3,509 | 3,509 | 3,965 | ||||||||||||||
| 6.2 | Family and Community Support Services |
100,000 | 110,000 | 115,000 | ||||||||||||||
| 6.3 | Family and Community Safety | 34,128 | 40,318 | 42,612 | ||||||||||||||
| Sub-total | 137,637 | 153,827 | 161,577 | |||||||||||||||
| 185 | Seniors, Community and Social Services |
|
|
EXPENSE VOTE BY PROGRAM....continued
|
|||||||||||||||||
| (thousands of dollars) |
|
Comparable
|
|
|||||||||||||||
| 2022-23 | 2022-23 | 2023-24 | ||||||||||||||||
|
|
Budget
|
|
|
Forecast
|
|
|
Estimate
|
| ||||||||||
| 7 | Seniors Services | |||||||||||||||||
| 7.1 | Program Planning and Delivery | 5,319 | 5,319 | 5,319 | ||||||||||||||
| 7.2 | Special Needs Assistance Grants |
18,847 | 14,147 | 18,647 | ||||||||||||||
| 7.3 | Seniors Home Adaptation and Repair |
1,565 | 1,565 | 1,565 | ||||||||||||||
| 7.4 | Seniors Community Grants | 900 | 900 | 2,000 | ||||||||||||||
| Sub-total |
26,631 | 21,931 | 27,531 | |||||||||||||||
| 8 | Alberta Seniors Benefit | |||||||||||||||||
| 8.1 | Program Planning and Delivery | 5,737 | 5,737 | 5,737 | ||||||||||||||
| 8.2 | Alberta Seniors Benefit Grants | 359,418 | 336,018 | 373,918 | ||||||||||||||
| 8.3 | Supplementary Accommodations Benefit | 110,903 | 88,103 | 114,203 | ||||||||||||||
| Sub-total | 476,058 | 429,858 | 493,858 | |||||||||||||||
| 9 | Housing | |||||||||||||||||
| 9.1 | Program Planning and Delivery |
10,305 | 10,305 | 10,745 | ||||||||||||||
| 9.2 | Assistance to Alberta Social Housing Corporation | 102,287 | 126,987 | 115,173 | ||||||||||||||
| Sub-total | 112,592 | 137,292 | 125,918 | |||||||||||||||
| 10 | Public Guardian and Trustee Services | 23,540 | 24,640 | 27,261 | ||||||||||||||
| 11 | Services Provided to Other Ministries |
2,546 | 2,546 | 2,228 | ||||||||||||||
| 12 | Affordability Supports and Inflation Relief | - | 8,200 | 8,700 | ||||||||||||||
|
|
CAPITAL PAYMENTS TO RELATED PARTIES
|
|||||||||||||||||
| 9 | Housing | |||||||||||||||||
| 9.2 | Assistance to Alberta Social Housing Corporation | 45,955 | 45,955 | 60,543 | ||||||||||||||
| Total | 4,636,794 | 4,684,165 | 5,066,076 | |||||||||||||||
|
|
CAPITAL INVESTMENT VOTE BY PROGRAM
|
|||||||||||||||||
| DEPARTMENT CAPITAL ACQUISITIONS |
||||||||||||||||||
| 4 | Disability Services | |||||||||||||||||
| 4.1 | Program Planning and Delivery | - | 400 | - | ||||||||||||||
| 4.2 | Persons with Developmental Disabilities - Supports to Albertans | - | 500 | - | ||||||||||||||
| 4.3 | Persons with Developmental Disabilities - Direct Operations | 572 | 846 | 572 | ||||||||||||||
| 4.7 | Disability Advocate’s Office | - | 100 | - | ||||||||||||||
| Sub-total | 572 | 1,846 | 572 | |||||||||||||||
| 10 | Public Guardian and Trustee Services | 4,500 | 4,400 | 3,500 | ||||||||||||||
| Total | 5,072 | 6,246 | 4,072 | |||||||||||||||
| Seniors, Community and Social Services | 186 |
| FINANCIAL TRANSACTIONS VOTE BY PROGRAM |
||||||||||||||||
| (thousands of dollars) |
Comparable | |||||||||||||||
| 2022-23 | 2022-23 | 2023-24 | ||||||||||||||
|
|
Budget
|
|
|
Forecast
|
|
Estimate
| ||||||||||
| LOANS AND ADVANCES |
||||||||||||||||
| 7 | Seniors Services | |||||||||||||||
| 7.3 | Seniors Home Adaptation and Repair | 9,950 | 9,950 | 9,950 | ||||||||||||
| 7.5 | Property Tax Deferral Loans
|
9,750 | 9,750 | 9,750 | ||||||||||||
| Total | 19,700 | 19,700 | 19,700 | |||||||||||||
| 187 | Seniors, Community and Social Services |
VOTED AMOUNTS FUNDED BY CREDIT OR RECOVERY
The following table details the portions of the department’s voted amounts for which a credit or recovery can be obtained. If a credit or recovery amount is expected to exceed its original estimate, the Treasury Board may increase the corresponding voted amount, pursuant to section 24(2) of the Financial Administration Act. If the actual credit or recovery amount realized is less than its original estimate, the corresponding funding authority is reduced by an equivalent amount in the programs shown.
| EXPENSE AMOUNTS FUNDED BY CREDIT OR RECOVERY
|
||||
| (thousands of dollars) |
2023-24 | |||
| Estimate
| ||||
| 1 |
Services Provided to Other Ministries |
2,228 | ||
| Total | 2,228 | |||
| Seniors, Community and Social Services | 188 |
AMOUNTS NOT REQUIRED TO BE VOTED
The following department amounts do not require a supply vote either because no cash disbursement is required, or because the Legislative Assembly has already provided the funding authority pursuant to a statute other than an appropriation act.
| EXPENSE
|
||||||||
| (thousands of dollars) |
Comparable | |||||||
| 2022-23 | 2022-23 | 2023-24 | ||||||
|
|
Budget
|
|
Forecast
|
Estimate
| ||||
| DEPARTMENT STATUTORY AMOUNTS |
||||||||
| Operating Expense |
||||||||
| Affordability Supports and Inflation Relief |
- | 267,000 | 267,000 | |||||
| DEPARTMENT NON-CASH AMOUNTS |
||||||||
| Amortization |
||||||||
| Employment and Income Support |
50 | 50 | - | |||||
| Disability Services |
377 | 377 | 427 | |||||
| Public Guardian and Trustee Services |
4 | 4 | 4 | |||||
| Valuation Adjustments and Other Provisions |
||||||||
| Ministry Support Services |
38 | 38 | - | |||||
| Employment and Income Support |
400 | 400 | - | |||||
| Disability Services |
500 | 500 | - | |||||
| Alberta Seniors Benefit |
100 | 100 | 100 | |||||
| Public Guardian and Trustee Services |
42 | 42 | - | |||||
| Total |
1,511 | 268,511 | 267,531 | |||||
| 189 | Seniors, Community and Social Services |
RECONCILIATION OF SUPPLY VOTE TO CONSOLIDATED GOVERNMENT ESTIMATE
The following tables summarize the relationship between the department’s Supply Votes and the effect of the ministry on the Government’s consolidated 2023-24 Estimates.
| RECONCILIATION BY PROGRAM | ||||||||||||||||||||
| (thousands of dollars) | Voted
|
Department Amounts Not Voted |
Entities’ |
Consolidation |
Consolidated 2023-24 Estimate |
|||||||||||||||
| EXPENSE |
||||||||||||||||||||
| Ministry Support Services |
21,005 | - | - | - | 21,005 | |||||||||||||||
| Employment and Income Support |
804,382 | - | - | (3,500 | ) | 800,882 | ||||||||||||||
| Assured Income for the Severely Handicapped |
1,538,451 | - | - | - | 1,538,451 | |||||||||||||||
| Disability Services |
1,550,814 | 427 | - | (19,500 | ) | 1,531,741 | ||||||||||||||
| Homeless and Outreach Support Services |
243,808 | - | - | - | 243,808 | |||||||||||||||
| Community Supports and Family Safety |
161,577 | - | - | - | 161,577 | |||||||||||||||
| Seniors Services |
27,531 | - | - | - | 27,531 | |||||||||||||||
| Alberta Seniors Benefit |
493,858 | 100 | - | - | 493,958 | |||||||||||||||
| Housing |
186,461 | - | - | (175,716 | ) | 10,745 | ||||||||||||||
| Public Guardian and Trustee Services |
27,261 | 4 | - | - | 27,265 | |||||||||||||||
| Services Provided to Other Ministries |
2,228 | - | - | (2,228 | ) | - | ||||||||||||||
| Affordability Supports and Inflation Relief |
8,700 | 267,000 | - | - | 275,700 | |||||||||||||||
| Alberta Social Housing Corporation |
- | - | 333,494 | - | 333,494 | |||||||||||||||
| Total |
5,066,076 | 267,531 | 333,494 | (200,944 | ) | 5,466,157 | ||||||||||||||
| CAPITAL INVESTMENT |
||||||||||||||||||||
| Disability Services |
572 | - | - | - | 572 | |||||||||||||||
| Public Guardian and Trustee Services |
3,500 | - | - | - | 3,500 | |||||||||||||||
| Alberta Social Housing Corporation |
- | - | 56,898 | - | 56,898 | |||||||||||||||
| Total |
4,072 | - | 56,898 | - | 60,970 | |||||||||||||||
| RECONCILIATION BY TYPE OF SPENDING |
|
|||||||||||||||||||
| EXPENSE |
||||||||||||||||||||
| Operating expense |
5,005,533 | 267,100 | 199,710 | (140,401 | ) | 5,331,942 | ||||||||||||||
| Capital grants |
- | - | 80,884 | - | 80,884 | |||||||||||||||
| Capital payments to related parties |
60,543 | - | - | (60,543 | ) | - | ||||||||||||||
| Amortization |
- | 431 | 47,900 | - | 48,331 | |||||||||||||||
| Loss on disposal of capital asset |
- | - | 5,000 | - | 5,000 | |||||||||||||||
| Total |
5,066,076 | 267,531 | 333,494 | (200,944 | ) | 5,466,157 | ||||||||||||||
| CAPITAL INVESTMENT
|
|
4,072
|
|
- | 56,898 | - | 60,970 | |||||||||||||
| Seniors, Community and Social Services | 190 |
| MINISTRY FINANCIAL STATEMENTS | ||||||||||
| STATEMENT OF OPERATIONS | ||||||||||
| (thousands of dollars) | Comparable | |||||||||
| 2022-23 | 2022-23 | 2023-24 | ||||||||
| Budget
|
Forecast
|
Estimate
| ||||||||
| REVENUE |
||||||||||
| Labour Market Development |
85,128 | 85,128 | 85,128 | |||||||
| Services on First Nations Reserves |
53,143 | 53,143 | 53,643 | |||||||
| Other Transfers from Government of Canada |
162,933 | 162,933 | 159,475 | |||||||
| Investment Income |
1,737 | 1,737 | 1,822 | |||||||
| Premiums, Fees and Licences |
5,000 | 5,000 | 5,000 | |||||||
| Other Revenue |
53,275 | 53,875 | 67,072 | |||||||
| Ministry Total |
361,216 | 361,816 | 372,140 | |||||||
| Inter-Ministry Consolidations |
(2,546 | ) | (2,546 | ) | (2,228) | |||||
| Consolidated Total |
358,670 | 359,270 | 369,912 | |||||||
| EXPENSE |
||||||||||
| Ministry Support Services |
18,235 | 18,235 | 21,005 | |||||||
| Employment and Income Support |
816,453 | 814,653 | 804,382 | |||||||
| Assured Income for the Severely Handicapped |
1,371,218 | 1,407,889 | 1,538,451 | |||||||
| Disability Services |
1,414,086 | 1,396,346 | 1,551,241 | |||||||
| Homeless and Outreach Support Services |
193,208 | 224,158 | 243,808 | |||||||
| Community Supports and Family Safety |
137,637 | 153,827 | 161,577 | |||||||
| Seniors Services |
26,631 | 21,931 | 27,531 | |||||||
| Alberta Seniors Benefit |
476,158 | 429,958 | 493,958 | |||||||
| Housing |
10,305 | 10,305 | 10,745 | |||||||
| Public Guardian and Trustee Services |
23,586 | 24,686 | 27,265 | |||||||
| Services Provided to Other Ministries |
2,546 | 2,546 | 2,228 | |||||||
| Affordability Supports and Inflation Relief |
- | 275,200 | 275,700 | |||||||
| Alberta Social Housing Corporation |
297,330 | 309,188 | 333,494 | |||||||
| Ministry Total |
4,787,393 | 5,088,922 | 5,491,385 | |||||||
| Inter-Ministry Consolidations |
(27,546 | ) | (27,546 | ) | (25,228) | |||||
| Consolidated Total
|
|
4,759,847
|
|
|
5,061,376
|
|
5,466,157
| |||
| Net Operating Result
|
(4,401,177 | ) | (4,702,106 | ) | (5,096,245) | |||||
| CHANGE IN CAPITAL ASSETS
|
||||||||||
| INVESTMENT |
||||||||||
| Disability Services |
572 | 1,846 | 572 | |||||||
| Public Guardian and Trustee Services |
4,500 | 4,400 | 3,500 | |||||||
| Alberta Social Housing Corporation |
44,535 | 63,246 | 56,898 | |||||||
| Consolidated Total |
49,607 | 69,492 | 60,970 | |||||||
| AMORTIZATION |
(46,231 | ) | (48,331 | ) | (48,331) | |||||
| DISPOSALS OR WRITE OFFS |
- | (1,200 | ) | (5,000) | ||||||
| Change in Capital Assets Total |
3,376 | 19,961 | 7,639 | |||||||
| 191 | Seniors, Community and Social Services |
Service Alberta and Red Tape Reduction
| AMOUNTS TO BE VOTED |
||||||||||||
| (thousands of dollars) |
Comparable | |||||||||||
| 2022-23 | 2022-23 | 2023-24 | ||||||||||
| Budget | Forecast | Estimate | ||||||||||
| EXPENSE |
115,921 | 122,990 | 143,677 | |||||||||
| CAPITAL INVESTMENT |
12,765 | 32,876 | 45,520 | |||||||||
| FINANCIAL TRANSACTIONS |
5,500 | 5,351 | 5,500 | |||||||||
|
|
||||||||||||
193
| DESCRIPTION OF SUPPLY VOTE PROGRAMS | ||
| 1 |
Ministry Support Services | |
| 1.1 |
Minister’s Office | |
| 1.2 |
Deputy Minister’s Office | |
| 1.3 |
Corporate Services | |
| 2 |
Consumer and Registry Services | |
| 2.1 |
Consumer Awareness and Advocacy | |
| 2.2 |
Land Titles | |
| 2.3 |
Motor Vehicles | |
| 2.4 |
Other Registry Services | |
| 2.5 |
Registries Modernization | |
| 3 |
Red Tape Reduction, Audit and Investigations | |
| 3.1 |
Red Tape Reduction | |
| 3.2 |
Audit and Investigations | |
| 4 |
Financial and Administrative Shared Services | |
| 4.1 |
Procurement Services | |
| 4.2 |
Financial and Employee Services | |
| 4.3 |
Central Logistics | |
| 4.4 |
FOIP Operations and King’s Printer | |
| Service Alberta and Red Tape Reduction | 194 |
| EXPENSE VOTE BY PROGRAM |
||||||||||||||||
| (thousands of dollars) |
Comparable | |||||||||||||||
| 2022-23 | 2022-23 | 2023-24 | ||||||||||||||
| Budget | Forecast | Estimate | ||||||||||||||
| OPERATING EXPENSE |
||||||||||||||||
| 1 | Ministry Support Services | |||||||||||||||
| 1.1 | Minister’s Office | 746 | 746 | 795 | ||||||||||||
| 1.2 | Deputy Minister’s Office | 761 | 761 | 820 | ||||||||||||
| 1.3 | Corporate Services | 2,993 | 3,062 | 3,279 | ||||||||||||
| Sub-total | 4,500 | 4,569 | 4,894 | |||||||||||||
| 2 | Consumer and Registry Services | |||||||||||||||
| 2.1 | Consumer Awareness and Advocacy | 7,480 | 9,480 | 6,660 | ||||||||||||
| 2.2 | Land Titles | 18,023 | 18,023 | 20,571 | ||||||||||||
| 2.3 | Motor Vehicles | 15,105 | 15,105 | 15,603 | ||||||||||||
| 2.4 | Other Registry Services | 6,950 | 6,950 | 7,583 | ||||||||||||
| 2.5 | Registries Modernization | - | - | 7,327 | ||||||||||||
| Sub-total | 47,558 | 49,558 | 57,744 | |||||||||||||
| 3 | Red Tape Reduction, Audit and Investigations | |||||||||||||||
| 3.1 | Red Tape Reduction | 1,607 | 1,607 | 1,710 | ||||||||||||
| 3.2 | Audit and Investigations | 7,426 | 7,426 | 7,954 | ||||||||||||
| Sub-total | 9,033 | 9,033 | 9,664 | |||||||||||||
| 4 | Financial and Administrative Shared Services | |||||||||||||||
| 4.1 | Procurement Services | 3,816 | 5,816 | 12,724 | ||||||||||||
| 4.2 | Financial and Employee Services | 13,694 | 13,694 | 14,673 | ||||||||||||
| 4.3 | Central Logistics | 25,620 | 28,620 | 31,370 | ||||||||||||
| 4.4 | FOIP Operations and King’s Printer | 11,700 | 11,700 | 12,608 | ||||||||||||
| Sub-total
|
|
54,830
|
|
|
59,830
|
|
|
71,375
|
| |||||||
| Total | 115,921 | 122,990 | 143,677 | |||||||||||||
| CAPITAL INVESTMENT VOTE BY PROGRAM
|
||||||||||||||||
| DEPARTMENT CAPITAL ACQUISITIONS |
||||||||||||||||
| 2 | Consumer and Registry Services | |||||||||||||||
| 2.5 | Registries Modernization | - | 18,623 | 28,689 | ||||||||||||
| 4 | Financial and Administrative Shared Services | |||||||||||||||
| 4.3
|
Central Logistics
|
|
12,765
|
|
|
14,253
|
|
|
16,831
|
| ||||||
| Total | 12,765 | 32,876 | 45,520 | |||||||||||||
| FINANCIAL TRANSACTIONS VOTE BY PROGRAM
|
||||||||||||||||
| INVENTORY ACQUISITION |
||||||||||||||||
| 4 | Financial and Administrative Shared Services | |||||||||||||||
| 4.2 | Financial and Employee Services | 400 | 400 | 400 | ||||||||||||
| 4.3 | Central Logistics | 5,100 | 4,951 | 5,100 | ||||||||||||
| Sub-total
|
|
5,500
|
|
|
5,351
|
|
|
5,500
|
| |||||||
| Total | 5,500 | 5,351 | 5,500 | |||||||||||||
| 195 | Service Alberta and Red Tape Reduction |
VOTED AMOUNTS FUNDED BY CREDIT OR RECOVERY
The following table details the portions of the department’s voted amounts for which a credit or recovery can be obtained . If a credit or recovery amount is expected to exceed its original estimate, the Treasury Board may increase the corresponding voted amount, pursuant to section 24(2) of the Financial Administration Act. If the actual credit or recovery amount realized is less than its original estimate, the corresponding funding authority is reduced by an equivalent amount in the programs shown.
| EXPENSE AMOUNTS FUNDED BY CREDIT OR RECOVERY | ||||||
| (thousands of dollars) |
2023-24 | |||||
| Estimate | ||||||
| 1 |
Other Registry Services |
50 | ||||
| 2 |
Specialty Licence Plates |
500 | ||||
| 3 |
Residential Tenancy Dispute Resolution Service |
777 | ||||
| 4 |
Services to Ministries |
18,250 | ||||
| Total | 19,577 | |||||
| FINANCIAL TRANSACTIONS AMOUNTS FUNDED BY CREDIT OR RECOVERY | ||||||
| 1 |
Services to Ministries |
4,200 | ||||
| Total | 4,200 | |||||
| Service Alberta and Red Tape Reduction | 196 |
AMOUNTS NOT REQUIRED TO BE VOTED
The following department amounts do not require a supply vote either because no cash disbursement is required, or because the Legislative Assembly has already provided the funding authority pursuant to a statute other than an appropriation act.
| EXPENSE |
||||||||||||||||
| (thousands of dollars) |
Comparable | |||||||||||||||
| 2022-23 | 2022-23 | 2023-24 | ||||||||||||||
| Budget | Forecast | Estimate | ||||||||||||||
| DEPARTMENT STATUTORY AMOUNTS |
||||||||||||||||
| Operating Expense |
||||||||||||||||
| Consumer and Registry Services |
25 | 25 | 25 | |||||||||||||
| DEPARTMENT NON-CASH AMOUNTS |
||||||||||||||||
| Amortization |
||||||||||||||||
| Consumer and Registry Services |
1,320 | 1,320 | 1,320 | |||||||||||||
| Financial and Administrative Shared Services |
16,780 | 16,780 | 16,780 | |||||||||||||
| Consumption of Inventory |
||||||||||||||||
| Ministry Support Services |
5 | 5 | 5 | |||||||||||||
| Consumer and Registry Services |
870 | 870 | 870 | |||||||||||||
| Financial and Administrative Shared Services |
4,625 | 4,625 | 4,625 | |||||||||||||
| Valuation Adjustments and Other Provisions |
||||||||||||||||
| Ministry Support Services |
37 | 37 | 37 | |||||||||||||
| Consumer and Registry Services |
95 | 95 | 95 | |||||||||||||
| Financial and Administrative Shared Services
|
|
435
|
|
|
435
|
|
|
435
|
| |||||||
| Total |
24,192 | 24,192 | 24,192 | |||||||||||||
| 197 | Service Alberta and Red Tape Reduction |
RECONCILIATION OF SUPPLY VOTE TO CONSOLIDATED GOVERNMENT ESTIMATE
The following tables summarize the relationship between the department’s Supply Votes and the effect of the ministry on the Government’s consolidated 2023-24 Estimates.
| RECONCILIATION BY PROGRAM | ||||||||||||||||
| (thousands of dollars) | Voted Supply |
Department Amounts Not Voted |
Consolidation Adjustments |
Consolidated 2023-24 Estimate |
||||||||||||
| EXPENSE |
||||||||||||||||
| Ministry Support Services |
4,894 | 42 | - | 4,936 | ||||||||||||
| Consumer and Registry Services |
57,744 | 2,310 | - | 60,054 | ||||||||||||
| Red Tape Reduction, Audit and Investigations |
9,664 | - | (408 | ) | 9,256 | |||||||||||
| Financial and Administrative Shared Services |
71,375 | 21,840 | (32,107 | ) | 61,108 | |||||||||||
| Total |
143,677 | 24,192 | (32,515 | ) | 135,354 | |||||||||||
| CAPITAL INVESTMENT |
||||||||||||||||
| Consumer and Registry Services |
28,689 | - | - | 28,689 | ||||||||||||
| Financial and Administrative Shared Services |
16,831 | - | - | 16,831 | ||||||||||||
| Total |
45,520 | - | - | 45,520 | ||||||||||||
| INVENTORY ACQUISITION |
||||||||||||||||
| Financial and Administrative Shared Services |
5,500 | - | - | 5,500 | ||||||||||||
| Total |
5,500 | - | - | 5,500 | ||||||||||||
| RECONCILIATION BY TYPE OF SPENDING |
|
|||||||||||||||
| EXPENSE |
||||||||||||||||
| Operating expense |
143,677 | 592 | (32,515 | ) | 111,754 | |||||||||||
| Amortization |
- | 18,100 | - | 18,100 | ||||||||||||
| Inventory consumption |
- | 5,500 | - | 5,500 | ||||||||||||
| Total |
143,677 | 24,192 | (32,515 | ) | 135,354 | |||||||||||
| CAPITAL INVESTMENT |
45,520 | - | - | 45,520 | ||||||||||||
| INVENTORY ACQUISITION
|
5,500 | - | - | 5,500 | ||||||||||||
| Service Alberta and Red Tape Reduction | 198 |
| MINISTRY FINANCIAL STATEMENTS | ||||||||||||||||
| STATEMENT OF OPERATIONS | ||||||||||||||||
| (thousands of dollars) | Comparable | |||||||||||||||
| 2022-23 | 2022-23 | 2023-24 | ||||||||||||||
| Budget
|
Forecast
|
Estimate
|
||||||||||||||
| REVENUE |
||||||||||||||||
| Land Titles |
113,990 | 113,990 | 129,395 | |||||||||||||
| Motor Vehicles |
542,560 | 555,741 | 550,205 | |||||||||||||
| Other Premiums, Fees and Licences |
49,315 | 54,127 | 52,441 | |||||||||||||
| Other Revenue |
30,136 | 33,136 | 34,140 | |||||||||||||
| Ministry Total |
736,001 | 756,994 | 766,181 | |||||||||||||
| Inter-Ministry Consolidations |
(28,511 | ) | (31,511 | ) | (32,515 | ) | ||||||||||
| Consolidated Total |
707,490 | 725,483 | 733,666 | |||||||||||||
| EXPENSE |
||||||||||||||||
| Ministry Support Services |
4,542 | 4,611 | 4,936 | |||||||||||||
| Consumer and Registry Services |
49,868 | 51,868 | 60,054 | |||||||||||||
| Red Tape Reduction, Audit and Investigations |
9,033 | 9,033 | 9,664 | |||||||||||||
| Financial and Administrative Shared Services |
76,670 | 81,670 | 93,215 | |||||||||||||
| Ministry Total |
140,113 | 147,182 | 167,869 | |||||||||||||
| Inter-Ministry Consolidations |
(28,515 | ) | (31,515 | ) | (32,515 | ) | ||||||||||
| Consolidated Total |
111,598 | 115,667 | 135,354 | |||||||||||||
| Net Operating Result |
595,892 | 609,816 | 598,312 | |||||||||||||
| CHANGE IN CAPITAL ASSETS |
||||||||||||||||
| INVESTMENT |
||||||||||||||||
| Consumer and Registry Services |
- | 18,623 | 28,689 | |||||||||||||
| Financial and Administrative Shared Services |
12,765 | 14,253 | 16,831 | |||||||||||||
| Consolidated Total |
12,765 | 32,876 | 45,520 | |||||||||||||
| AMORTIZATION |
(18,100 | ) | (18,100 | ) | (18,100 | ) | ||||||||||
| Change in Capital Assets Total |
(5,335 | ) | 14,776 | 27,420 | ||||||||||||
| CHANGE IN INVENTORY ASSETS
|
||||||||||||||||
| INVENTORY ACQUISITION
|
||||||||||||||||
| Financial and Administrative Shared Services |
5,500 | 5,351 | 5,500 | |||||||||||||
| Consolidated Total |
5,500 | 5,351 | 5,500 | |||||||||||||
| CONSUMPTION
|
|
(5,500
|
)
|
|
(5,500
|
)
|
|
(5,500
|
)
| |||||||
| Change in Inventory Assets Total |
- | (149 | ) | - | ||||||||||||
| 199 | Service Alberta and Red Tape Reduction |
Skilled Trades and Professions
| AMOUNTS TO BE VOTED
|
||||||||||||
| (thousands of dollars) | Comparable | |||||||||||
|
2022-23 Budget
|
2022-23 Forecast
|
2023-24 Estimate
|
||||||||||
| EXPENSE |
201,168 | 197,194 | 218,811 | |||||||||
| CAPITAL INVESTMENT
|
|
-
|
|
|
-
|
|
|
25
|
| |||
| 201 |
DESCRIPTION OF SUPPLY VOTE PROGRAMS
| 1 | Ministry Support Services |
| 1.1 | Minister’s Office |
Oversees the development of ministerial policies that are aligned with broader government-wide objectives and priorities.
| 1.2 | Deputy Minister’s Office |
Supports the Minister in achieving business plan and strategic goals of the ministry, government and public service.
| 1.3 | Strategic and Corporate Services |
Provides key ministry support functions including corporate services, financial services, grant management and fiscal oversight.
| 2 | Professional Governance and Labour Mobility |
| 2.1 | Professional Governance |
Oversees the legislation that governs 22 non-health professional regulatory organizations, and leads proposed legislative amendments for professional legislation.
| 2.2 | Labour Attraction, Retention and Mobility |
Develops and implements targeted strategies for attracting and retaining the workers Alberta needs and initiatives aimed at fully engaging new Albertans in the workforce.
| 2.3 | Fairness for Newcomers Office |
Works with regulatory bodies to streamline and accelerate the assessment of qualifications for new workers in Canada and helps regulatory bodies meets their obligations under the Fairness Registration Practices Act.
| 3 | Apprenticeship |
| 3.1 | Program Delivery Support |
Manages policies and programs that support apprenticeship, including program approvals and policy coordination.
| 3.2 | Apprenticeship Grants |
Provides grant funding to post-secondary institutions, industry partners and non-profit organizations to support operating costs for apprenticeship classroom education and investments in skilled trades related innovation.
| 4 | Adult Learning |
| 4.1 | Adult Learning Delivery Support |
Manages policies and programs that support adult learning, including program approvals and policy coordination.
| 4.2 | Community Adult Learning Programs |
Provides funding to rural, remote and urban community providers to deliver non-formal literacy and numeracy learning.
| 4.3 | Adult Learning Initiatives |
Provides funding to industry partners and non-profit organizations for initiatives related to development, expansion and promotion of apprenticeship education.
| 5 | Foundational Learning |
| 5.1 | Program Delivery Support |
Manages policies and programs that support foundational learning, including program approvals and policy coordination.
| 5.2 | Foundational Learning Assistance Grants |
Provides grant funding to students to support the transition into post-secondary studies and help them find employment.
This funding covers tuition, fees, books, and eligible living costs.
| Skilled Trades and Professions | 202 |
| EXPENSE VOTE BY PROGRAM
|
| |||||||||||||||
| (thousands of dollars) | Comparable | |||||||||||||||
| 2022-23 Budget
|
2022-23 Forecast
|
2023-24 Estimate
|
||||||||||||||
| OPERATING EXPENSE |
||||||||||||||||
| 1 |
Ministry Support Services | |||||||||||||||
| 1.1 |
Minister’s Office | - | 313 | 770 | ||||||||||||
| 1.2 |
Deputy Minister’s Office | - | 217 | 584 | ||||||||||||
| 1.3 |
Strategic and Corporate Services | 4,473 | 4,473 | 4,473 | ||||||||||||
| Sub-total | 4,473 | 5,003 | 5,827 | |||||||||||||
| 2 |
Professional Governance and Labour Mobility | |||||||||||||||
| 2.1 |
Professional Governance | 302 | 302 | 302 | ||||||||||||
| 2.2 |
Labour Attraction, Retention and Mobility | 170 | 420 | 170 | ||||||||||||
| 2.3 |
Fairness for Newcomers Office | 1,175 | 1,175 | 1,175 | ||||||||||||
| Sub-total | 1,647 | 1,897 | 1,647 | |||||||||||||
| 3 |
Apprenticeship | |||||||||||||||
| 3.1 |
Program Delivery Support | 17,100 | 17,100 | 16,991 | ||||||||||||
| 3.2 |
Apprenticeship Grants | 47,258 | 46,404 | 51,869 | ||||||||||||
| Sub-total | 64,358 | 63,504 | 68,860 | |||||||||||||
| 4 |
Adult Learning | |||||||||||||||
| 4.1 |
Adult Learning Delivery Support | 3,537 | 3,537 | 3,529 | ||||||||||||
| 4.2 |
Community Adult Learning Programs | 17,809 | 17,809 | 19,409 | ||||||||||||
| 4.3 |
Adult Learning Initiatives | 13,815 | 13,815 | 17,095 | ||||||||||||
| Sub-total | 35,161 | 35,161 | 40,033 | |||||||||||||
| 5 |
Foundational Learning | |||||||||||||||
| 5.1 |
Program Delivery Support | 3,234 | 3,234 | 3,224 | ||||||||||||
| 5.2 |
Foundational Learning Assistance Grants | 92,295 | 88,395 | 99,220 | ||||||||||||
| Sub-total |
95,529 | 91,629 | 102,444 | |||||||||||||
|
|
||||||||||||||||
| Total |
201,168 | 197,194 | 218,811 | |||||||||||||
| CAPITAL INVESTMENT VOTE BY PROGRAM
|
||||||||||||||||
| DEPARTMENT CAPITAL ACQUISITIONS |
||||||||||||||||
| 1 |
Ministry Support Services | |||||||||||||||
| 1.3 |
Strategic and Corporate Services | - | - | 25 | ||||||||||||
| Total |
- | - | 25 | |||||||||||||
| 203 | Skilled Trades and Professions |
VOTED AMOUNTS FUNDED BY CREDIT OR RECOVERY
The following table details the portions of the department’s voted amounts for which a credit or recovery can be obtained. If a credit or recovery amount is expected to exceed its original estimate, the Treasury Board may increase the corresponding voted amount, pursuant to section 24(2) of the Financial Administration Act. If the actual credit or recovery amount realized is less than its original estimate, the corresponding funding authority is reduced by an equivalent amount in the programs shown.
| EXPENSE AMOUNTS FUNDED BY CREDIT OR RECOVERY
|
||||
| (thousands of dollars) |
2023-24 |
|||
| Estimate
|
||||
| 1 Red Seal Secretariat |
454 | |||
|
Funding from the federal government for the Red Seal Secretariat functions. The Red Seal Program helps to develop a highly qualified, productive and mobile skilled trades workforce by developing high-quality Red Seal products, including Red Seal occupational standards and interprovincial examinations for Red Seal trades in collaboration with industry. Program 3 |
||||
|
|
||||
| Total |
454 | |||
| Skilled Trades and Professions | 204 |
RECONCILIATION OF SUPPLY VOTE TO CONSOLIDATED GOVERNMENT ESTIMATE
The following tables summarize the relationship between the department’s Supply Votes and the effect of the ministry on the Government’s consolidated 2023-24 Estimates.
| RECONCILIATION BY PROGRAM
|
||||||||||||||||
| (thousands of dollars) | ||||||||||||||||
| Voted Supply
|
Department Amounts Not Voted
|
Consolidation Adjustments
|
Consolidated 2023-24 Estimate
|
|||||||||||||
| EXPENSE |
||||||||||||||||
| Ministry Support Services |
5,827 | - | - | 5,827 | ||||||||||||
| Professional Governance and Labour Mobility |
1,647 | - | - | 1,647 | ||||||||||||
| Apprenticeship |
68,860 | - | (41,554 | ) | 27,306 | |||||||||||
| Adult Learning |
40,033 | - | (2,483 | ) | 37,550 | |||||||||||
| Foundational Learning |
102,444 | - | - | 102,444 | ||||||||||||
| Total |
218,811 | - | (44,037 | ) | 174,774 | |||||||||||
|
|
||||||||||||||||
| CAPITAL INVESTMENT |
||||||||||||||||
| Ministry Support Services |
25 | - | - | 25 | ||||||||||||
|
|
||||||||||||||||
| RECONCILIATION BY TYPE OF SPENDING
|
||||||||||||||||
| EXPENSE |
||||||||||||||||
| Operating expense |
218,811 | - | (44,037 | ) | 174,774 | |||||||||||
| CAPITAL INVESTMENT |
25 | - | - | 25 | ||||||||||||
|
|
||||||||||||||||
| 205 | Skilled Trades and Professions |
MINISTRY FINANCIAL STATEMENTS
STATEMENT OF OPERATIONS
| (thousands of dollars) | Comparable | |||||||||||
|
2022-23 Budget |
2022-23 Forecast |
2023-24 Estimate |
||||||||||
| REVENUE |
||||||||||||
| Transfers from Government of Canada |
5,454 | 5,454 | 5,454 | |||||||||
| Labour Market Development |
153,281 | 153,281 | 153,281 | |||||||||
| Premiums, Fees and Licences |
3,820 | 3,820 | 3,820 | |||||||||
| Other Revenue |
1,900 | 1,900 | 1,900 | |||||||||
| Consolidated Total |
164,455 | 164,455 | 164,455 | |||||||||
| EXPENSE |
||||||||||||
| Ministry Support Services |
4,473 | 5,003 | 5,827 | |||||||||
| Professional Governance and Labour Mobility |
1,647 | 1,897 | 1,647 | |||||||||
| Apprenticeship |
64,358 | 63,504 | 68,860 | |||||||||
| Adult Learning |
35,161 | 35,161 | 40,033 | |||||||||
| Foundational Learning |
95,529 | 91,629 | 102,444 | |||||||||
| Ministry Total |
201,168 | 197,194 | 218,811 | |||||||||
| Inter-Ministry Consolidations |
(39,141 | ) | (39,141 | ) | (44,037 | ) | ||||||
| Consolidated Total |
162,027 | 158,053 | 174,774 | |||||||||
| Net Operating Result |
2,428 | 6,402 | (10,319 | ) | ||||||||
| CHANGE IN CAPITAL ASSETS |
||||||||||||
| INVESTMENT |
||||||||||||
| Ministry Support Services |
- | - | 25 | |||||||||
| Consolidated Total |
- | - | 25 | |||||||||
| Change in Capital Assets Total |
- | - | 25 | |||||||||
| Skilled Trades and Professions | 206 |
Technology and Innovation
| AMOUNTS TO BE VOTED |
||||||||||||
| (thousands of dollars) | Comparable | |||||||||||
|
2022-23 Budget |
2022-23 Forecast |
2023-24 Estimate |
||||||||||
| EXPENSE |
853,270 | 784,012 | 948,075 | |||||||||
| CAPITAL INVESTMENT |
82,569 | 62,653 | 112,385 | |||||||||
| FINANCIAL TRANSACTIONS |
25,000 | 50,000 | - | |||||||||
| 207 |
DESCRIPTION OF SUPPLY VOTE PROGRAMS
| 1 | Ministry Support Services |
| 1.1 | Minister’s Office |
Oversees the development of ministerial policies that are aligned with broader government-wide objectives and priorities.
| 1.2 | Deputy Minister’s Office |
Supports the Minister in achieving business plan and strategic goals of the ministry, government and public service.
| 1.3 | Corporate Services |
Supports strategic and corporate functions across the ministry in corporate finance, policy and governance, business, and strategic planning.
| 2 | Data, Privacy and Innovation |
| 2.1 | Data, Information and Privacy Governance |
Delivers enterprise policy and program services for content management, privacy, and Data Strategy. Also administration of Personal Information Protection Act and Part 2 of the FOIP Act .
| 2.2 | Innovation System Integration |
Accountable for the Alberta Technology and Innovation Strategy and drives Alberta’s economic diversification by engaging and supporting stakeholders to advance industry growth.
| 2.3 | Grant to Alberta Innovates Corporation |
Provides funding to Alberta Innovates, which is responsible for supporting government’s research and innovation initiatives.
| 2.4 | Grant to Alberta Enterprise Corporation |
Provides funding to the Alberta Enterprise Corporation, which is responsible for attracting venture capital funds for knowledge-based companies.
| 3 | Technology Support and Operations |
Manages government’s secure technology platforms, including the 1GX system, end users, voice, data, video conferencing, network services and SuperNet operation.
| 4 | Digital Design and Delivery |
| 4.1 | Digital Delivery and Innovation |
As government’s centre of digital delivery, designs simpler, faster and better services with ministries; builds capability and confidence in modern digital practice; and assures service quality and value through standards and controls.
| 4.2 | Digital Strategy Initiatives |
Develops and implements Digital Strategy cloud and data initiatives. Upon approval by Treasury Board, the Minister may transfer all or a portion of this program to the Expense Supply Vote.
| 5 | Cybersecurity |
Protect digital assets and identify, monitor, and respond to cyber threats. Collaborate with public and private organizations to strengthen Alberta’s overall cybersecurity posture.
| Technology and Innovation | 208 |
EXPENSE VOTE BY PROGRAM
| (thousands of dollars) | Comparable | |||||||||||||||
|
2022-23 Budget |
2022-23 Forecast |
2023-24 Estimate |
||||||||||||||
| OPERATING EXPENSE |
||||||||||||||||
| 1 |
Ministry Support Services | |||||||||||||||
| 1.1 |
Minister’s Office | 639 | 639 | 639 | ||||||||||||
| 1.2 |
Deputy Minister’s Office | 709 | 709 | 709 | ||||||||||||
| 1.3 |
Corporate Services | 2,775 | 2,775 | 3,062 | ||||||||||||
| Sub-total | 4,123 | 4,123 | 4,410 | |||||||||||||
| 2 |
Data, Privacy and Innovation | |||||||||||||||
| 2.1 |
Data, Information and Privacy Governance | 27,530 | 27,530 | 32,597 | ||||||||||||
| 2.2 |
Innovation System Integration | 128,608 | 128,608 | 59,408 | ||||||||||||
| 2.3 |
Grant to Alberta Innovates Corporation | 160,772 | 172,772 | 180,346 | ||||||||||||
| Sub-total | 316,910 | 328,910 | 272,351 | |||||||||||||
| 3 |
Technology Support and Operations | 282,340 | 331,304 | 315,246 | ||||||||||||
| 4 |
Digital Design and Delivery | |||||||||||||||
| 4.1 |
Digital Delivery and Innovation | 83,020 | 81,798 | 102,713 | ||||||||||||
| 5 |
Cybersecurity | 8,874 | 8,874 | 12,748 | ||||||||||||
| CAPITAL GRANTS |
||||||||||||||||
| 3 |
Technology Support and Operations | 150,000 | 21,000 | 229,000 | ||||||||||||
| CAPITAL PAYMENTS TO RELATED PARTIES |
||||||||||||||||
| 2 |
Data, Privacy and Innovation | |||||||||||||||
| 2.3 |
Grant to Alberta Innovates Corporation | 8,003 | 8,003 | 11,607 | ||||||||||||
| Total |
853,270 | 784,012 | 948,075 | |||||||||||||
| CAPITAL INVESTMENT VOTE BY PROGRAM |
||||||||||||||||
| DEPARTMENT CAPITAL ACQUISITIONS |
||||||||||||||||
| 3 |
Technology Support and Operations | 28,200 | 29,373 | 28,105 | ||||||||||||
| 4 |
Digital Design and Delivery | |||||||||||||||
| 4.1 |
Digital Delivery and Innovation | 29,369 | 28,280 | 59,280 | ||||||||||||
| 4.2 |
Digital Strategy Initiatives | 25,000 | 5,000 | 25,000 | ||||||||||||
| Sub-total | 54,369 | 33,280 | 84,280 | |||||||||||||
| Total |
82,569 | 62,653 | 112,385 | |||||||||||||
| FINANCIAL TRANSACTIONS VOTE BY PROGRAM |
||||||||||||||||
| DEBT REPAYMENT |
||||||||||||||||
| 2 |
Data, Privacy and Innovation | |||||||||||||||
| 2.4 |
Grant to Alberta Enterprise Corporation | 25,000 | 50,000 | - | ||||||||||||
| 209 | Technology and Innovation |
VOTED AMOUNTS FUNDED BY CREDIT OR RECOVERY
The following table details the portions of the department’s voted amounts for which a credit or recovery can be obtained. If a credit or recovery amount is expected to exceed its original estimate, the Treasury Board may increase the corresponding voted amount, pursuant to section 24(2) of the Financial Administration Act. If the actual credit or recovery amount realized is less than its original estimate, the corresponding funding authority is reduced by an equivalent amount in the programs shown.
EXPENSE AMOUNTS FUNDED BY CREDIT OR RECOVERY
| (thousands of dollars) |
2023-24 Estimate | |||
| 1 |
Services to Ministries | 39,130 | ||
| Funding received from other ministries is used to provide cross-government technology services. Programs 2, 3 and 4 |
||||
|
Total |
39,130 | |||
| Technology and Innovation | 210 |
AMOUNTS NOT REQUIRED TO BE VOTED
The following department amounts do not require a supply vote either because no cash disbursement is required, or because the Legislative Assembly has already provided the funding authority pursuant to a statute other than an appropriation act.
| EXPENSE | ||||||||||||
| (thousands of dollars) | Comparable | |||||||||||
| 2022-23 | 2022-23 | 2023-24 | ||||||||||
| Budget | Forecast | Estimate | ||||||||||
| DEPARTMENT STATUTORY AMOUNTS |
||||||||||||
| Operating Expense |
||||||||||||
| Data, Privacy and Innovation |
74,000 | 74,000 | 77,000 | |||||||||
| DEPARTMENT NON-CASH AMOUNTS |
||||||||||||
| Operating Expense |
||||||||||||
| Data, Privacy and Innovation |
50,000 | 50,000 | - | |||||||||
| Technology Support and Operations |
4,000 | 4,000 | 4,000 | |||||||||
| Amortization |
||||||||||||
| Technology Support and Operations |
54,689 | 54,689 | 54,689 | |||||||||
| Digital Design and Delivery |
15,400 | 15,400 | 15,400 | |||||||||
| Valuation Adjustments and Other Provisions |
||||||||||||
| Ministry Support Services |
- | - | 38 | |||||||||
| Technology Support and Operations |
440 | 440 | 440 | |||||||||
| Total |
198,529 | 198,529 | 151,567 | |||||||||
| 211 | Technology and Innovation |
RECONCILIATION OF SUPPLY VOTE TO CONSOLIDATED GOVERNMENT ESTIMATE
The following tables summarize the relationship between the department’s Supply Votes and the effect of the ministry on the Government’s consolidated 2023-24 Estimates.
| RECONCILIATION BY PROGRAM |
||||||||||||||||||||
| (thousands of dollars) | Voted Supply |
Department Amounts Not Voted |
Entities’ Amounts Not Voted |
Consolidation Adjustments |
Consolidated 2023-24 Estimate |
|||||||||||||||
| EXPENSE |
||||||||||||||||||||
| Ministry Support Services |
4,410 | 38 | - | - | 4,448 | |||||||||||||||
| Data, Privacy and Innovation |
283,958 | 77,000 | - | (240,710 | ) | 120,248 | ||||||||||||||
| Technology Support and Operations |
544,246 | 59,129 | - | (42,710 | ) | 560,665 | ||||||||||||||
| Digital Design and Delivery |
102,713 | 15,400 | - | - | 118,113 | |||||||||||||||
| Cybersecurity |
12,748 | - | - | - | 12,748 | |||||||||||||||
| Alberta Innovates Corporation |
- | - | 252,896 | (60,610 | ) | 192,286 | ||||||||||||||
| Alberta Enterprise Corporation |
- | - | 3,837 | - | 3,837 | |||||||||||||||
| Total |
948,075 | 151,567 | 256,733 | (344,030 | ) | 1,012,345 | ||||||||||||||
| CAPITAL INVESTMENT |
||||||||||||||||||||
| Technology Support and Operations |
28,105 | - | - | - | 28,105 | |||||||||||||||
| Digital Design and Delivery |
84,280 | - | - | - | 84,280 | |||||||||||||||
| Alberta Innovates Corporation |
- | - | 20,107 | - | 20,107 | |||||||||||||||
|
Total |
112,385 | - | 20,107 | - | 132,492 | |||||||||||||||
|
RECONCILIATION BY TYPE OF SPENDING |
||||||||||||||||||||
| EXPENSE |
||||||||||||||||||||
| Operating expense |
707,468 | 77,478 | 247,833 | (328,423 | ) | 704,356 | ||||||||||||||
| Capital grants |
229,000 | 4,000 | - | (4,000 | ) | 229,000 | ||||||||||||||
| Capital payments to related parties |
11,607 | - | - | (11,607 | ) | - | ||||||||||||||
| Amortization |
- | 70,089 | 8,900 | - | 78,989 | |||||||||||||||
| Total |
948,075 | 151,567 | 256,733 | (344,030 | ) | 1,012,345 | ||||||||||||||
| CAPITAL INVESTMENT |
112,385 | - | 20,107 | - | 132,492 | |||||||||||||||
| Technology and Innovation | 212 |
| MINISTRY FINANCIAL STATEMENTS |
||||||||||||
| STATEMENT OF OPERATIONS | ||||||||||||
| (thousands of dollars) | Comparable | |||||||||||
| 2022-23 | 2022-23 | 2023-24 | ||||||||||
| Budget | Forecast | Estimate | ||||||||||
| REVENUE |
||||||||||||
| Internal Government Transfers |
89,790 | 89,790 | 88,790 | |||||||||
| Transfers from Government of Canada |
5,600 | 7,000 | 4,200 | |||||||||
| Investment Income |
500 | 500 | 500 | |||||||||
| Other Revenue |
86,173 | 91,173 | 85,376 | |||||||||
| Ministry Total |
182,063 | 188,463 | 178,866 | |||||||||
| Inter-Ministry Consolidations |
(131,143 | ) | (136,143 | ) | (129,346 | ) | ||||||
| Consolidated Total |
50,920 | 52,320 | 49,520 | |||||||||
| EXPENSE |
||||||||||||
| Ministry Support Services |
4,123 | 4,123 | 4,448 | |||||||||
| Data, Privacy and Innovation |
230,138 | 230,138 | 169,005 | |||||||||
| Technology Support and Operations |
491,469 | 411,433 | 603,375 | |||||||||
| Digital Design and Delivery |
98,420 | 97,198 | 118,113 | |||||||||
| Cybersecurity |
8,874 | 8,874 | 12,748 | |||||||||
| Alberta Innovates Corporation |
250,722 | 250,722 | 252,896 | |||||||||
| Alberta Enterprise Corporation |
3,050 | 3,050 | 3,837 | |||||||||
| Ministry Total |
1,086,796 | 1,005,538 | 1,164,422 | |||||||||
| Inter-Ministry Consolidations |
(197,177 | ) | (202,177 | ) | (152,077 | ) | ||||||
| Consolidated Total |
889,619 | 803,361 | 1,012,345 | |||||||||
| Net Operating Result |
(838,699 | ) | (751,041 | ) | (962,825 | ) | ||||||
|
CHANGE IN CAPITAL ASSETS |
||||||||||||
| INVESTMENT |
||||||||||||
| Technology Support and Operations |
28,200 | 29,373 | 28,105 | |||||||||
| Digital Design and Delivery |
54,369 | 33,280 | 84,280 | |||||||||
| Alberta Innovates Corporation |
16,503 | 16,503 | 20,107 | |||||||||
| Consolidated Total |
99,072 | 79,156 | 132,492 | |||||||||
| AMORTIZATION |
(78,489 | ) | (78,489 | ) | (78,989 | ) | ||||||
| Change in Capital Assets Total |
20,583 | 667 | 53,503 | |||||||||
| 213 | Technology and Innovation |
Trade, Immigration and Multiculturalism
| AMOUNTS TO BE VOTED | ||||||||||||
| (thousands of dollars) | Comparable | |||||||||||
| 2022-23 | 2022-23 | 2023-24 | ||||||||||
| Budget | Forecast | Estimate | ||||||||||
| EXPENSE |
77,455 | 72,497 | 85,874 | |||||||||
| CAPITAL INVESTMENT |
25 | 25 | 25 | |||||||||
215
DESCRIPTION OF SUPPLY VOTE PROGRAMS
| 1 | Ministry Support Services |
| 1.1 | Minister’s Office |
Oversees the development of ministerial policies that are aligned with broader government-wide objectives and priorities.
| 1.2 | Deputy Minister’s Office |
Supports the Minister in achieving business plan and strategic goals of the ministry, government and public service.
| 1.3 | Strategic and Corporate Services |
Provides integrated and strategic corporate services including financial, legislative, administration, accommodations and corporate planning.
| 2 | International Trade and Investment |
| 2.1 | International Trade Policy |
Coordinates Alberta’s strategic interests in the negotiation, implementation and management of international trade agreements or disputes.
| 2.2 | Investment Attraction |
Delivers policy, strategy, pathfinding and programs to attract job-creating investment that grows key sectors and expands the economy.
| 2.3 | Trade and Export Development |
Targets strategic markets and sectors through missions, supports Alberta businesses to become trade ready and achieve export success, and gathers trade-related intelligence.
| 2.4 | Grant to Invest Alberta Corporation |
Operating grant to the Invest Alberta Corporation, which promotes investment in Alberta and provides services to support high-value, high-impact investment opportunities.
| 3 | Immigration and Multiculturalism |
| 3.1 | Newcomer Supports |
Designs and delivers programs that attract international talent to support Alberta’s economy and labour market needs, and helps newcomers settle in Alberta.
| 3.2 | Multiculturalism |
Develops and delivers programming related to multiculturalism and anti-racism.
| Trade, Immigration and Multiculturalism | 216 |
| EXPENSE VOTE BY PROGRAM | ||||||||||||||||
| (thousands of dollars) | Comparable | |||||||||||||||
|
2022-23 Budget |
2022-23 Forecast |
2023-24 Estimate |
||||||||||||||
| OPERATING EXPENSE |
||||||||||||||||
| 1 |
Ministry Support Services | |||||||||||||||
| 1.1 |
Minister’s Office | 948 | 948 | 964 | ||||||||||||
| 1.2 |
Deputy Minister’s Office | 815 | 815 | 834 | ||||||||||||
| 1.3 |
Strategic and Corporate Services | 5,316 | 5,316 | 5,377 | ||||||||||||
| Sub-total | 7,079 | 7,079 | 7,175 | |||||||||||||
| 2 |
International Trade and Investment | |||||||||||||||
| 2.1 |
International Trade Policy | 3,003 | 603 | 3,602 | ||||||||||||
| 2.2 |
Investment Attraction | 21,893 | 20,235 | 20,403 | ||||||||||||
| 2.3 |
Trade and Export Development | 3,597 | 3,597 | 4,812 | ||||||||||||
| 2.4 |
Grant to Invest Alberta Corporation | 20,000 | 18,200 | 17,337 | ||||||||||||
| Sub-total | 48,493 | 42,635 | 46,154 | |||||||||||||
| 3 |
Immigration and Multiculturalism | |||||||||||||||
| 3.1 |
Newcomer Supports | 21,533 | 21,033 | 23,310 | ||||||||||||
| 3.2 |
Multiculturalism | 350 | 1,750 | 9,235 | ||||||||||||
| Sub-total | 21,883 | 22,783 | 32,545 | |||||||||||||
|
Total |
77,455 | 72,497 | 85,874 | |||||||||||||
| CAPITAL INVESTMENT VOTE BY PROGRAM |
||||||||||||||||
| DEPARTMENT CAPITAL ACQUISITIONS |
||||||||||||||||
| 1 |
Ministry Support Services | |||||||||||||||
| 1.3 |
Strategic and Corporate Services | 25 | 25 | 25 | ||||||||||||
| Total |
25 | 25 | 25 | |||||||||||||
| 217 | Trade, Immigration and Multiculturalism |
VOTED AMOUNTS FUNDED BY CREDIT OR RECOVERY
The following table details the portions of the department’s voted amounts for which a credit or recovery can be obtained. If a credit or recovery amount is expected to exceed its original estimate, the Treasury Board may increase the corresponding voted amount, pursuant to section 24(2) of the Financial Administration Act. If the actual credit or recovery amount realized is less than its original estimate, the corresponding funding authority is reduced by an equivalent amount in the programs shown.
| EXPENSE AMOUNTS FUNDED BY CREDIT OR RECOVERY | ||||
| (thousands of dollars) | 2023-24 Estimate |
|||
| 1 International Educational Assessment Services |
4,325 | |||
| Fees are collected for the provision of international educational assessment services for immigrants seeking employment and/or education in Alberta. In addition, other jurisdictions contract with Alberta to provide these services to immigrants in their jurisdictions on a fee for service basis. Program 3.1 |
||||
| Total |
4,325 | |||
| Trade, Immigration and Multiculturalism | 218 |
AMOUNTS NOT REQUIRED TO BE VOTED
The following department amounts do not require a supply vote either because no cash disbursement is required, or because the Legislative Assembly has already provided the funding authority pursuant to a statute other than an appropriation act.
| EXPENSE | ||||||||||||
| (thousands of dollars) | Comparable | |||||||||||
|
2022-23 Budget |
2022-23 Forecast |
2023-24 Estimate |
||||||||||
| DEPARTMENT NON-CASH AMOUNTS |
||||||||||||
| Amortization |
||||||||||||
| Ministry Support Services |
25 | 25 | 25 | |||||||||
| Total |
25 | 25 | 25 | |||||||||
| 219 | Trade, Immigration and Multiculturalism |
RECONCILIATION OF SUPPLY VOTE TO CONSOLIDATED GOVERNMENT ESTIMATE
The following tables summarize the relationship between the department’s Supply Votes and the effect of the ministry on the Government’s consolidated 2023-24 Estimates.
| RECONCILIATION BY PROGRAM | ||||||||||||||||||||
| (thousands of dollars) | Voted Supply |
Department Amounts Not Voted |
Entities’ Amounts Not Voted |
Consolidation Adjustments |
Consolidated 2023-24 Estimate |
|||||||||||||||
| EXPENSE |
||||||||||||||||||||
| Ministry Support Services |
7,175 | 25 | - | - | 7,200 | |||||||||||||||
| International Trade and Investment |
46,154 | - | - | (17,337 | ) | 28,817 | ||||||||||||||
| Immigration and Multiculturalism |
32,545 | - | - | - | 32,545 | |||||||||||||||
| Invest Alberta Corporation |
- | - | 17,372 | - | 17,372 | |||||||||||||||
| Total |
85,874 | 25 | 17,372 | (17,337 | ) | 85,934 | ||||||||||||||
| CAPITAL INVESTMENT |
||||||||||||||||||||
| Ministry Support Services |
25 | - | - | - | 25 | |||||||||||||||
| RECONCILIATION BY TYPE OF SPENDING |
||||||||||||||||||||
| EXPENSE |
||||||||||||||||||||
| Operating expense |
85,874 | - | 17,337 | (17,337 | ) | 85,874 | ||||||||||||||
| Amortization |
- | 25 | 35 | - | 60 | |||||||||||||||
| Total |
85,874 | 25 | 17,372 | (17,337 | ) | 85,934 | ||||||||||||||
| CAPITAL INVESTMENT |
25 | - | - | - | 25 | |||||||||||||||
| Trade, Immigration and Multiculturalism | 220 |
| MINISTRY FINANCIAL STATEMENTS | ||||||||||||
| STATEMENT OF OPERATIONS | ||||||||||||
| (thousands of dollars) | Comparable | |||||||||||
| 2022-23 | 2022-23 | 2023-24 | ||||||||||
| Budget | Forecast | Estimate | ||||||||||
| REVENUE |
||||||||||||
| Transfers from Government of Canada |
1,647 | 1,647 | 1,647 | |||||||||
| Premiums, Fees and Licences |
8,225 | 8,225 | 8,225 | |||||||||
| Other Revenue |
678 | 678 | 678 | |||||||||
| Consolidated Total |
10,550 | 10,550 | 10,550 | |||||||||
| EXPENSE |
||||||||||||
| Ministry Support Services |
7,104 | 7,104 | 7,200 | |||||||||
| International Trade and Investment |
28,493 | 24,435 | 28,817 | |||||||||
| Immigration and Multiculturalism |
21,883 | 22,783 | 32,545 | |||||||||
| Invest Alberta Corporation |
20,000 | 18,242 | 17,372 | |||||||||
| Consolidated Total |
77,480 | 72,564 | 85,934 | |||||||||
| Net Operating Result |
(66,930 | ) | (62,014 | ) | (75,384 | ) | ||||||
| CHANGE IN CAPITAL ASSETS |
||||||||||||
| INVESTMENT |
||||||||||||
| Ministry Support Services |
25 | 25 | 25 | |||||||||
| Consolidated Total |
25 | 25 | 25 | |||||||||
| AMORTIZATION |
(25 | ) | (67 | ) | (60 | ) | ||||||
| Change in Capital Assets Total |
- | (42 | ) | (35 | ) | |||||||
| 221 | Trade, Immigration and Multiculturalism |
Transportation and Economic Corridors
| AMOUNTS TO BE VOTED
|
||||||||||||
| (thousands of dollars) | Comparable | |||||||||||
| 2022-23 | 2022-23 | 2023-24 | ||||||||||
| Budget | Forecast | Estimate | ||||||||||
| EXPENSE |
1,613,985 | 1,218,734 | 1,722,148 | |||||||||
| CAPITAL INVESTMENT |
1,547,799 | 1,485,178 | 1,837,114 | |||||||||
| FINANCIAL TRANSACTIONS |
126,679 | 126,679 | 134,644 | |||||||||
|
|
||||||||||||
223
DESCRIPTION OF SUPPLY VOTE PROGRAMS
| 1 | Ministry Support Services |
| 1.1 | Minister’s Office |
Oversees the development of ministerial policies that are aligned with broader government-wide objectives and priorities.
| 1.2 | Deputy Minister’s Office |
Supports the Minister in achieving business plan and strategic goals of the ministry, government and public service.
| 1.3 | Strategic Services |
Includes Strategic Policy, Finance, and Strategic Business Services which are responsible for providing policy support, financial services, strategic business planning, and reporting services.
| 2 | Program Services and Support |
| 2.1 | Program Services |
Guides investment and capital planning strategies and develops and implements procurement policies and processes; manages contracts and contract risks; and oversees new strategic procurement initiatives.
| 2.2 | Assessment and Support Systems |
Consists of multi-year contracts for data collection, inspections, assessment, and functional planning studies required to support the provincial highway network and inform future transportation needs and prioritization.
| 3 | Traffic Safety Programs |
| 3.1 | Traffic Safety Services |
Provides leadership and direction in the development and delivery of transportation safety programs, including implementing the Alberta Traffic Safety Plan and overseeing the 511 Alberta System.
| 3.2 | Driver Safety Initiatives |
Includes Mandatory Entry-Level Training (MELT) and Driver Examinations which support a comprehensive road safety strategy focused on driver education and licensing standards; as well as the Pre-Entry Program which guides compliance of new commercial carriers in a manner which is compliant with legislation relevant to the National Safety Code (NSC).
| 3.3 | SafeRoads Alberta |
Includes the administrative adjudication body responsible for impaired contravention and vehicle seizure reviews.
| 3.4 | Commercial Driver Grants |
Provides funding support to unemployed Albertans and employers to access MELT to attract Class 1 drivers to the workforce and get Albertans back to work.
| 4 | Provincial Highway Maintenance |
| 4.1 | Maintenance |
Includes the on-going structural and operating maintenance of all provincial highways, bridges and other infrastructure; such as snow removal, grass cutting, maintenance of highway lighting, among others.
| 4.2 | P3 Maintenance |
Includes structural and operational maintenance of all provincial ring roads.
| 4.3 | Salt, Sand and Gravel |
Purchase of salt, sand and gravel for provincial highway and bridge maintenance.
| 5 | Municipal Transit and Transportation Grant Programs |
| 5.1 | Strategic Transportation Infrastructure Program |
Provides financial assistance to smaller municipalities for developing and maintaining key transportation infrastructure that promotes economic growth and improves mobility.
| 5.2 | Green Transit Incentives Program (GreenTRIP) |
Provides funding support for local, regional and inter-municipal public transit projects throughout Alberta that reduce greenhouse gas emissions.
| 5.3 | Terwillegar Expansion |
Provides funding to the City of Edmonton to assist with the Terwillegar Drive expansion.
| 5.4 | City of Edmonton 50th Street Project |
Provides funding to the City of Edmonton to assist with the 50th Street project.
| Transportation and Economic Corridors | 224 |
DESCRIPTION OF SUPPLY VOTE PROGRAMS... continued
| 5.5 | Calgary LRT Projects |
Provides funding to the City of Calgary to assist with the construction of the Green Line LRT.
| 5.6 | Edmonton LRT Projects |
Provides funding to the City of Edmonton to assist with the construction of LRT projects.
| 5.7 | Ray Gibbon Drive Expansion |
Provides funding to the City of St. Albert to assist with the Ray Gibbon Drive project.
| 5.8 | Yellowhead Trail Project |
Provides funding to the City of Edmonton to assist with the Yellowhead Trail project.
| 5.9 | Red Deer Regional Airport Expansion |
Provides funding to support expansion of the regional airport.
| 5.10 | YYC Rail Connection Study |
Provides funding to the City of Calgary to assist with the Calgary International Airport rail connection study.
| 6 | Municipal Water Infrastructure Grant Programs |
| 6.1 | Municipal Water Wastewater Program |
Provides project-specific grants to smaller municipalities to assist in the construction of high priority municipal water supply and treatment, wastewater treatment and disposal projects.
| 6.2 | Water for Life |
Provides project-specific grants for large regional water systems to municipalities to assist larger communities in the construction of high priority municipal water supply and treatment, wastewater treatment and disposal projects.
| 6.3 | First Nations Water Tie-In Program |
Provides First Nations communities with reliable access to safe drinking-water in order to reduce or eliminate boil water advisories and to provide reliable wastewater management systems.
| 6.4 | Sundre Wastewater Treatment Plant |
Provides a project-specific grant to assist with a wastewater treatment plant upgrade in Sundre with new and innovative technology.
| 7 | Federal Grant Programs |
| 7.1 | Public Transit Infrastructure Fund |
A federal program that provides funding to support the rehabilitation of transit systems, new capital projects, and planning and studies for future transit expansion to foster long-term transit plans.
| 7.2 | Clean Water Wastewater Fund |
A federal program that rehabilitates both water treatment and distribution infrastructure and existing wastewater and storm water treatment systems, as well as other initiatives.
| 7.3 | Investing in Canada Infrastructure - Public Transit |
Eligible municipalities can apply for funding to improve and expand existing public transit systems. This is a federal program with grant funding flowing through the department’s budget.
| 7.4 | Investing in Canada Infrastructure - Green Infrastructure |
Funds projects that protect the environment and supports Canada’s transition to a clean economy. This is a federal program with grant funding flowing through the department’s budget.
| 7.5 | Investing in Canada Infrastructure - Rural and Northern Communities |
Provides funding to support projects that improve infrastructure in small, rural and remote communities. This is a federal program with grant funding flowing through the department’s budget.
| 7.6 | Investing in Canada Infrastructure - COVID-19 Resilience |
Provides support to fund quick-start, short-term projects in response to the impacts of COVID-19. This is a federal program with grant funding flowing through the department’s budget.
| 8 | Ring Roads |
| 8.1 | Edmonton Ring Road |
The Ring Road consists of Anthony Henday Drive (Highway 216).
| 8.2 | Calgary Ring Road |
The Ring Road consists of Stoney Trail (Highway 201), West Calgary and Southwest Calgary.
| 225 | Transportation and Economic Corridors |
DESCRIPTION OF SUPPLY VOTE PROGRAMS... continued
| 8.3 | Debt Servicing |
Interest payments related to Calgary and Edmonton Ring Roads.
| 8.4 | Debt Repayment |
Principal payments related to Calgary and Edmonton Ring Roads.
| 9 | Provincial Highway Construction Projects |
| 9.1 | Highway Twinning, Widening and Expansion |
Includes final paving on newly surfaced roadways, widening of existing paved surfaces; twinning/multi-lane, bypass, and new road construction and interchanges.
| 9.2 | Deerfoot Trail Upgrades |
Alleviates traffic congestion, improves traffic flow and maintains safety on the Deerfoot Trail, which is part of the North/South Trade Corridor.
| 10 | Bridge Construction Projects |
Includes bridge replacements, deck replacements, overlays and bridge painting.
| 11 | Provincial Highway Rehabilitation |
| 11.1 | Highway Rehabilitation Projects |
Highway pavement restoration related to the provincial highway network. Also includes intersection improvements and other safety-related activities.
| 11.2 | P3 Rehabilitation |
Highway pavement restoration to avoid irreparable deterioration related to Edmonton and Calgary Ring Roads constructed under a Public-Private Partnership arrangement.
| 11.3 | Major Maintenance |
Extends the useful life of highways and bridges, such as deep mill and fill, paver patch, replacement of delineators, full depth concrete replacement, replacement of deck joint, culvert inlet and outlet replacement.
| 12 | Water Management Projects |
| 12.1 | Water Management Infrastructure |
Manages the design, construction and maintenance of new water management projects, as well as the rehabilitation and upgrading of existing water management infrastructure with the Ministry of Agriculture and Irrigation.
| 12.2 | Springbank Off-Stream Reservoir |
Includes the construction of a dry reservoir west of Calgary that will store water temporarily during a flood.
| Transportation and Economic Corridors | 226 |
| EXPENSE VOTE BY PROGRAM
|
||||||||||||||||
| (thousands of dollars) | Comparable | |||||||||||||||
| 2022-23 | 2022-23 | 2023-24 | ||||||||||||||
| Budget
|
Forecast
|
Estimate
|
||||||||||||||
| OPERATING EXPENSE |
||||||||||||||||
| 1 | Ministry Support Services | |||||||||||||||
| 1.1 | Minister’s Office |
740 | 740 | 755 | ||||||||||||
| 1.2 | Deputy Minister’s Office |
780 | 780 | 799 | ||||||||||||
| 1.3 | Strategic Services |
7,644 | 7,714 | 7,819 | ||||||||||||
| Sub-total |
9,164 | 9,234 | 9,373 | |||||||||||||
| 2 | Program Services and Support |
|||||||||||||||
| 2.1 | Program Services |
20,963 | 20,963 | 21,455 | ||||||||||||
| 2.2 | Assessment and Support Systems |
18,000 | 18,000 | 18,000 | ||||||||||||
| Sub-total |
38,963 | 38,963 | 39,455 | |||||||||||||
| 3 | Traffic Safety Programs |
|||||||||||||||
| 3.1 | Traffic Safety Services |
21,765 | 21,765 | 22,170 | ||||||||||||
| 3.2 | Driver Safety Initiatives |
5,600 | 5,600 | 5,731 | ||||||||||||
| 3.3 | SafeRoads Alberta |
9,307 | 6,537 | 5,918 | ||||||||||||
| 3.4 | Commercial Driver Grants |
10,909 | 12,669 | 10,000 | ||||||||||||
| Sub-total |
47,581 | 46,571 | 43,819 | |||||||||||||
| 4 | Provincial Highway Maintenance |
|||||||||||||||
| 4.1 | Maintenance |
264,755 | 264,755 | 312,810 | ||||||||||||
| 4.2 | P3 Maintenance |
80,261 | 80,261 | 89,384 | ||||||||||||
| Sub-total |
345,016 | 345,016 | 402,194 | |||||||||||||
| CAPITAL GRANTS |
||||||||||||||||
| 5 | Municipal Transit and Transportation Grant Programs |
|||||||||||||||
| 5.1 | Strategic Transportation Infrastructure Program |
35,000 | 25,253 | 43,198 | ||||||||||||
| 5.2 | Green Transit Incentives Program (GreenTRIP) |
17,900 | 21,689 | 1,342 | ||||||||||||
| 5.3 | Terwillegar Expansion |
31,250 | - | 36,500 | ||||||||||||
| 5.4 | City of Edmonton 50th Street Project |
14,150 | 5,925 | 14,150 | ||||||||||||
| 5.5 | Calgary LRT Projects |
50,000 | 88,601 | 125,660 | ||||||||||||
| 5.6 | Edmonton LRT Projects |
- | 117,175 | 213,019 | ||||||||||||
| 5.7 | Ray Gibbon Drive Expansion |
- | 14,300 | - | ||||||||||||
| 5.8 | Yellowhead Trail Project |
- | 60,000 | 36,960 | ||||||||||||
| 5.9 | Red Deer Regional Airport Expansion |
- | 7,500 | 30,000 | ||||||||||||
| 5.10 | YYC Rail Connection Study |
- | - | 5,000 | ||||||||||||
| Sub-total |
148,300 | 340,443 | 505,829 | |||||||||||||
| 6 | Municipal Water Infrastructure Grant Programs |
|||||||||||||||
| 6.1 | Municipal Water Wastewater Program |
61,700 | 35,020 | 85,737 | ||||||||||||
| 6.2 | Water for Life |
37,300 | 22,394 | 69,309 | ||||||||||||
| 6.3 | First Nations Water Tie-In Program |
30,200 | - | 27,685 | ||||||||||||
| 6.4 | Sundre Wastewater Treatment Plant |
7,500 | - | 7,500 | ||||||||||||
| Sub-total |
136,700 | 57,414 | 190,231 | |||||||||||||
| 227 | Transportation and Economic Corridors |
EXPENSE VOTE BY PROGRAM... continued
| (thousands of dollars) | Comparable | |||||||||||||||
| 2022-23 | 2022-23 | 2023-24 | ||||||||||||||
| Budget
|
Forecast
|
Estimate
|
||||||||||||||
| CAPITAL GRANTS... continued |
||||||||||||||||
| 7 | Federal Grant Programs |
|||||||||||||||
| 7.1 | Public Transit Infrastructure Fund |
7,816 | 4,112 | - | ||||||||||||
| 7.2 | Clean Water Wastewater Fund |
13,004 | 16,528 | - | ||||||||||||
| 7.3 | Investing in Canada Infrastructure - Public Transit |
670,589 | 188,756 | 295,866 | ||||||||||||
| 7.4 | Investing in Canada Infrastructure - Green Infrastructure |
34,567 | 24,937 | 95,169 | ||||||||||||
| 7.5 | Investing in Canada Infrastructure - Rural and Northern Communities |
13,944 | 6,180 | 15,271 | ||||||||||||
| 7.6 | Investing in Canada Infrastructure - COVID-19 Resilience |
44,894 | 37,133 | 24,328 | ||||||||||||
| Sub-total | 784,814 | 277,646 | 430,634 | |||||||||||||
| DEBT SERVICING |
||||||||||||||||
| 8 | Ring Roads |
|||||||||||||||
| 8.3 | Debt Servicing |
103,447 | 103,447 | 100,613 | ||||||||||||
| Total |
1,613,985 | 1,218,734 | 1,722,148 | |||||||||||||
| CAPITAL INVESTMENT VOTE BY PROGRAM
|
|
|||||||||||||||
| DEPARTMENT CAPITAL ACQUISITIONS |
||||||||||||||||
| 1 | Ministry Support Services |
|||||||||||||||
| 1.3 | Strategic Services |
687 | 3,768 | 687 | ||||||||||||
| 8 | Ring Roads |
|||||||||||||||
| 8.1 | Edmonton Ring Road |
12,547 | 21,464 | 3,500 | ||||||||||||
| 8.2 | Calgary Ring Road |
253,203 | 267,008 | 123,461 | ||||||||||||
| Sub-total | 265,750 | 288,472 | 126,961 | |||||||||||||
| 9 | Provincial Highway Construction Projects |
|||||||||||||||
| 9.1 | Highway Twinning, Widening and Expansion |
367,046 | 323,073 | 575,447 | ||||||||||||
| 9.2 | Deerfoot Trail Upgrades |
72,700 | 8,000 | 187,305 | ||||||||||||
| Sub-total | 439,746 | 331,073 | 762,752 | |||||||||||||
| 10 | Bridge Construction Projects |
97,600 | 108,998 | 106,016 | ||||||||||||
| 11 | Provincial Highway Rehabilitation |
|||||||||||||||
| 11.1 | Highway Rehabilitation Projects |
424,256 | 448,091 | 533,426 | ||||||||||||
| 11.2 | P3 Rehabilitation |
30,160 | 30,160 | 33,460 | ||||||||||||
| 11.3 | Major Maintenance |
45,000 | 44,104 | 54,000 | ||||||||||||
| Sub-total | 499,416 | 522,355 | 620,886 | |||||||||||||
| 12 | Water Management Projects |
|||||||||||||||
| 12.1 | Water Management Infrastructure |
36,000 | 39,000 | 35,412 | ||||||||||||
| 12.2 | Springbank Off-Stream Reservoir |
208,600 | 191,512 | 184,400 | ||||||||||||
| Sub-total | 244,600 | 230,512 | 219,812 | |||||||||||||
| Total | 1,547,799 | 1,485,178 | 1,837,114 | |||||||||||||
| Transportation and Economic Corridors | 228 |
| FINANCIAL TRANSACTIONS VOTE BY PROGRAM
|
|
|||||||||||||||
| (thousands of dollars) | Comparable | |||||||||||||||
| 2022-23 | 2022-23 | 2023-24 | ||||||||||||||
| Budget
|
Forecast
|
Estimate
|
||||||||||||||
| INVENTORY ACQUISITION |
||||||||||||||||
| 4 | Provincial Highway Maintenance |
|||||||||||||||
| 4.3 | Salt, Sand and Gravel |
57,000 | 57,000 | 62,130 | ||||||||||||
| DEBT REPAYMENT FOR PUBLIC PRIVATE PARTNERSHIPS |
||||||||||||||||
| 8 | Ring Roads |
|||||||||||||||
| 8.4 | Debt Repayment |
69,679 | 69,679 | 72,514 | ||||||||||||
| Total | 126,679 | 126,679 | 134,644 | |||||||||||||
| 229 | Transportation and Economic Corridors |
VOTED AMOUNTS FUNDED BY CREDIT OR RECOVERY
The following table details the portions of the department’s voted amounts for which a credit or recovery can be obtained. If a credit or recovery amount is expected to exceed its original estimate, the Treasury Board may increase the corresponding voted amount, pursuant to section 24(2) of the Financial Administration Act. If the actual credit or recovery amount realized is less than its original estimate, the corresponding funding authority is reduced by an equivalent amount in the programs shown.
| EXPENSE AMOUNTS FUNDED BY CREDIT OR RECOVERY | ||||||
| (thousands of dollars) |
2023-24 Estimate
|
|||||
| 1 |
Motor Transport Permits and Licences |
9,140 | ||||
| A portion of the revenue for Motor Transport Permits and Licences supports Alberta’s traffic volumes, the Driver Examiner Road Test Model and the Pre-Entry Program. Programs 3.1 and 3.2 |
||||||
| 2 |
Commercial Vehicle Decals |
480 | ||||
| Revenue generated from the sale and distribution of commercial vehicle decals. Program 3.1 |
||||||
| 3 |
National Safety Code |
426 | ||||
| The National Safety Code is a joint agreement between the federal government and the province to place standards on drivers of buses and freight trucks across the country. Program 3 |
||||||
| Total |
10,046 | |||||
| CAPITAL INVESTMENT AMOUNTS FUNDED BY CREDIT OR RECOVERY
|
||||||
| 1 |
Highway Construction and Rehabilitation Projects |
3,000 | ||||
| Various agreements exist whereby the private sector and municipalities make contributions towards capital investment in new roads, bridges, interchanges; and capital maintenance and renewal projects. Programs 9.1 and 11.1 |
||||||
| 2 |
Tourism Highway Signage Initiative |
1,000 | ||||
| The private sector contributes towards new investments in tourism related highway signs and structures in the province. Program 11.1 |
||||||
| Total |
4,000 | |||||
| Transportation and Economic Corridors | 230 |
AMOUNTS NOT REQUIRED TO BE VOTED
The following department amounts do not require a supply vote either because no cash disbursement is required, or because the Legislative Assembly has already provided the funding authority pursuant to a statute other than an appropriation act.
| EXPENSE
|
||||||||||||
| (thousands of dollars) | Comparable | |||||||||||
| 2022-23 | 2022-23 | 2023-24 | ||||||||||
| Budget | Forecast | Estimate | ||||||||||
| DEPARTMENT NON-CASH AMOUNTS |
||||||||||||
| Capital Payments to Related Parties |
||||||||||||
| Water Management Projects |
15,032 | 15,032 | 38,032 | |||||||||
| Amortization |
||||||||||||
| Provincial Highway Maintenance |
779,650 | 779,650 | 823,461 | |||||||||
| Consumption of Inventory |
||||||||||||
| Provincial Highway Maintenance |
57,000 | 57,000 | 62,130 | |||||||||
| Valuation Adjustments and Other Provisions |
||||||||||||
| Provincial Highway Maintenance |
20,000 | 20,000 | 12,000 | |||||||||
| Total |
871,682 | 871,682 | 935,623 | |||||||||
| CAPITAL INVESTMENT | ||||||||||||
| DEPARTMENT NON-CASH AMOUNTS |
||||||||||||
| Donated Capital Assets |
||||||||||||
| Provincial Highway Construction Projects |
38,481 | 60,836 | 9,162 | |||||||||
| Total |
38,481 | 60,836 | 9,162 | |||||||||
| 231 | Transportation and Economic Corridors |
RECONCILIATION OF SUPPLY VOTE TO CONSOLIDATED GOVERNMENT ESTIMATE
The following tables summarize the relationship between the department’s Supply Votes and the effect of the ministry on the Government’s consolidated 2023-24 Estimates.
| RECONCILIATION BY PROGRAM
|
||||||||||||||||
| (thousands of dollars) | Voted Supply |
Department Amounts Not Voted |
Consolidation Adjustments |
Consolidated 2023-24 Estimate |
||||||||||||
| EXPENSE |
||||||||||||||||
| Ministry Support Services |
9,373 | - | - | 9,373 | ||||||||||||
| Program Services and Support |
39,455 | - | - | 39,455 | ||||||||||||
| Traffic Safety Programs |
43,819 | - | - | 43,819 | ||||||||||||
| Provincial Highway Maintenance |
402,194 | 897,591 | - | 1,299,785 | ||||||||||||
| Municipal Transit and Transportation Grant Programs |
505,829 | - | - | 505,829 | ||||||||||||
| Municipal Water Infrastructure Grant Programs |
190,231 | - | - | 190,231 | ||||||||||||
| Federal Grant Programs |
430,634 | - | - | 430,634 | ||||||||||||
| Water Management Projects |
- | 38,032 | (38,032 | ) | - | |||||||||||
| Ring Roads - Debt Servicing |
100,613 | - | - | 100,613 | ||||||||||||
| Total |
1,722,148 | 935,623 | (38,032 | ) | 2,619,739 | |||||||||||
| CAPITAL INVESTMENT |
||||||||||||||||
| Ministry Support Services |
687 | - | - | 687 | ||||||||||||
| Ring Roads |
126,961 | - | - | 126,961 | ||||||||||||
| Provincial Highway Construction Projects |
762,752 | 9,162 | - | 771,914 | ||||||||||||
| Bridge Construction Projects |
106,016 | - | - | 106,016 | ||||||||||||
| Provincial Highway Rehabilitation |
620,886 | - | - | 620,886 | ||||||||||||
| Water Management Projects |
219,812 | - | - | 219,812 | ||||||||||||
| Total |
1,837,114 | 9,162 | - | 1,846,276 | ||||||||||||
| INVENTORY ACQUISITION |
||||||||||||||||
| Provincial Highway Maintenance |
62,130 | - | - | 62,130 | ||||||||||||
|
|
||||||||||||||||
| RECONCILIATION BY TYPE OF SPENDING |
||||||||||||||||
| EXPENSE |
||||||||||||||||
| Operating expense |
494,841 | 12,000 | - | 506,841 | ||||||||||||
| Capital grants |
1,126,694 | - | - | 1,126,694 | ||||||||||||
| Capital payments to related parties |
- | 38,032 | (38,032 | ) | - | |||||||||||
| Amortization |
- | 823,461 | - | 823,461 | ||||||||||||
| Inventory consumption |
- | 62,130 | - | 62,130 | ||||||||||||
| Debt servicing costs - Capital Plan |
100,613 | - | - | 100,613 | ||||||||||||
| Total |
1,722,148 | 935,623 | (38,032 | ) | 2,619,739 | |||||||||||
| CAPITAL INVESTMENT |
1,837,114 | 9,162 | - | 1,846,276 | ||||||||||||
| INVENTORY ACQUISITION |
62,130 | - | - | 62,130 | ||||||||||||
|
|
||||||||||||||||
| Transportation and Economic Corridors | 232 |
| MINISTRY FINANCIAL STATEMENTS | ||||||||||||
| STATEMENT OF OPERATIONS
|
||||||||||||
| (thousands of dollars) | Comparable | |||||||||||
|
2022-23 Budget |
2022-23 Forecast |
2023-24 Estimate |
||||||||||
| REVENUE |
||||||||||||
| Public Transit Infrastructure Fund |
7,816 | 4,112 | - | |||||||||
| Clean Water Wastewater Fund |
13,004 | 16,528 | - | |||||||||
| Investing in Canada Infrastructure Program |
764,194 | 257,206 | 430,834 | |||||||||
| Other Transfers from Government of Canada |
43,264 | 124,520 | 43,130 | |||||||||
| Premiums, Fees and Licences |
33,479 | 33,479 | 33,479 | |||||||||
| Refunds of Expense |
2,575 | 2,575 | 2,575 | |||||||||
| Other Revenue |
22,115 | 22,186 | 23,251 | |||||||||
| Consolidated Total |
886,447 | 460,606 | 533,269 | |||||||||
| EXPENSE |
||||||||||||
| Ministry Support Services |
9,164 | 9,234 | 9,373 | |||||||||
| Program Services and Support |
38,963 | 38,963 | 39,455 | |||||||||
| Traffic Safety Programs |
47,581 | 46,571 | 43,819 | |||||||||
| Provincial Highway Maintenance |
1,201,666 | 1,201,666 | 1,299,785 | |||||||||
| Municipal Transit and Transportation Grant Programs |
148,300 | 340,443 | 505,829 | |||||||||
| Municipal Water Infrastructure Grant Programs |
136,700 | 57,414 | 190,231 | |||||||||
| Federal Grant Programs |
784,814 | 277,646 | 430,634 | |||||||||
| Water Management Projects |
15,032 | 15,032 | 38,032 | |||||||||
| Ring Roads - Debt Servicing |
103,447 | 103,447 | 100,613 | |||||||||
| Ministry Total |
2,485,667 | 2,090,416 | 2,657,771 | |||||||||
| Inter-Ministry Consolidations |
(15,032 | ) | (15,032 | ) | (38,032 | ) | ||||||
| Consolidated Total |
2,470,635 | 2,075,384 | 2,619,739 | |||||||||
| Net Operating Result |
(1,584,188 | ) | (1,614,778 | ) | (2,086,470 | ) | ||||||
| CHANGE IN CAPITAL ASSETS |
||||||||||||
| INVESTMENT |
||||||||||||
| Ministry Support Services |
687 | 3,768 | 687 | |||||||||
| Ring Roads |
265,750 | 288,472 | 126,961 | |||||||||
| Provincial Highway Construction Projects |
478,227 | 391,909 | 771,914 | |||||||||
| Bridge Construction Projects |
97,600 | 108,998 | 106,016 | |||||||||
| Provincial Highway Rehabilitation |
499,416 | 522,355 | 620,886 | |||||||||
| Water Management Projects |
244,600 | 230,512 | 219,812 | |||||||||
| Consolidated Total |
1,586,280 | 1,546,014 | 1,846,276 | |||||||||
| AMORTIZATION |
(779,650 | ) | (779,650 | ) | (823,461 | ) | ||||||
| Change in Capital Assets Total |
806,630 | 766,364 | 1,022,815 | |||||||||
| 233 | Transportation and Economic Corridors |
MINISTRY FINANCIAL STATEMENTS... continued
| CHANGE IN INVENTORY ASSETS
|
||||||||||||
| (thousands of dollars) | Comparable | |||||||||||
|
2022-23 Budget |
2022-23 Forecast |
2023-24 Estimate |
||||||||||
| INVENTORY ACQUISITION |
||||||||||||
| Provincial Highway Maintenance |
57,000 | 57,000 | 62,130 | |||||||||
| Consolidated Total |
57,000 | 57,000 | 62,130 | |||||||||
| CONSUMPTION |
(57,000 | ) | (57,000 | ) | (62,130 | ) | ||||||
| Change in Inventory Assets Total |
- | - | - | |||||||||
| Transportation and Economic Corridors | 234 |
Treasury Board and Finance
| AMOUNTS TO BE VOTED
|
||||||||||||
| (thousands of dollars) | Comparable | |||||||||||
| 2022-23 | 2022-23 | 2023-24 | ||||||||||
| Budget | Forecast | Estimate | ||||||||||
| EXPENSE |
216,664 | 218,819 | 240,261 | |||||||||
| CAPITAL INVESTMENT |
25 | 99 | 25 | |||||||||
| CONTINGENCY |
1,750,000 | - | 1,500,000 | |||||||||
235
DESCRIPTION OF SUPPLY VOTE PROGRAMS
| 1 | Ministry Support Services |
| 1.1 | Minister’s Office |
Oversees the development of ministerial policies that are aligned with broader government-wide objectives and priorities.
| 1.2 | Associate Minister of Red Tape Reduction’s Office |
Provides planning, coordination, administrative and strategic support to the Associate Minister of Red Tape Reduction.
| 1.3 | Deputy Minister’s Office |
Supports the Minister in achieving business plan and strategic goals of the ministry, government and public service.
| 1.4 | Corporate Services |
Provides strategic direction in financial and administrative policy, planning, compliance and reporting and is responsible for coordinating reporting documents.
| 2 | Treasury Board Secretariat |
Provides strategic financial services to develop, implement and report on government’s fiscal plan, capital plan and business plan.
| 3 | Fiscal Planning and Economic Analysis |
Monitors and provides economic analysis of major issues influencing Alberta’s economy and economic development.
| 4 | Investment, Treasury and Risk Management |
| 4.1 | Treasury Management |
Provides investment policy advice as well as portfolio planning and evaluation for the investments of the General Revenue Fund and the government endowment funds.
| 4.2 | Risk Management and Insurance |
Identifies and analyzes risk through assessment of contracts, facilities, operations and exposures.
| 5 | Office of the Controller |
Responsible for developing and managing government accounting standards and financial management policies.
| 6 | Tax and Revenue Management |
Ensures compliance with provincial tax legislation, administering tax, revenue and related benefit programs under the responsibility of the ministry, and contributing to the development of tax policy within the province.
| 7 | Financial Sector and Pensions |
| 7.1 | Financial Sector Regulation and Policy |
Responsible for the regulation and supervision of loan and trust corporations, financial institutions, insurance companies and registered private sector pension plans.
| 7.2 | Automobile Insurance Rate Board |
Responsible for regulating automobile insurance rating programs for private passenger vehicles for both basic and additional coverage in Alberta.
| 8 | Provincial Bargaining and Compensation Office |
Responsible for implementing the Government of Alberta’s public sector bargaining strategy and developing bargaining mandates for all public sector employers funded by the provincial government.
| Treasury Board and Finance | 236 |
DESCRIPTION OF SUPPLY VOTE PROGRAMS... continued
| 9 | Public Service Commission |
| 9.1 | Office of the Public Service Commissioner |
Ensures government departments receive efficient and effective human resource services and administers Alberta’s Public Service Act , the Code of Conduct and Ethics, collective bargaining and labour relations matters.
| 9.2 | Alberta Public Service Communications and Employee Engagement |
Leads internal communications, employee engagement, and diversity and inclusion initiatives for the Alberta Public Service and leads external communications for the Public Service Commission.
| 9.3 | Client Service Delivery |
Provides human resources services and supports workforce planning and organizational effectiveness for all Government of Alberta departments through a consolidated portfolio model.
| 9.4 | Labour Relations Policy and Programs |
Represents the employer in arbitration, collective bargaining and essential services negotiations, in addition to leading the development and administration of Labour and Employment policy and programs.
| 9.5 | Strategic Services and Public Agency Secretariat |
Supports human resources policy development and workforce planning by providing workforce learning and analytics services internally within the Public Service Commission and externally to department clients.
| 9.6 | Strategic Integration Branch |
Services enterprise wide supports and is designed to facilitate transformation initiatives, business reviews and option framing, together with business program implementation.
| 10 | Communications and Public Engagement |
The Government of Alberta’s full-service communications, public relations and marketing department.
| 11 | Gaming |
| 11.1 | Gaming Research |
Benefits gaming/gambling researchers, policy makers and problem gambling prevention and treatment counselors by enhancing the understanding of gaming, prevention mechanisms and treatment programs.
| 11.2 | Horse Racing and Breeding Renewal Program |
Benefits Horse Racing Alberta and race tracks throughout Alberta by supporting operating and capital costs of race tracks facilities, breed improvement initiatives and purse enhancements.
| 11.3 | Airport Entertainment Centres |
Benefits participating Airport Authorities by granting a fixed percentage of video lottery terminal revenues generated at Airport Entertainment Centres to participating Airport Authorities.
| 12 | Contingency / Disaster and Emergency Assistance |
Upon approval by the Lieutenant Governor in Council, the Minister may either spend or transfer all or a portion of this vote to another minister for public emergencies, disasters or unanticipated costs.
| 13 | Contingency - COVID-19 |
Upon approval by the Lieutenant Governor in Council, the Minister may either spend or transfer all or a portion of this vote to another minister for activities related to the COVID-19 pandemic.
| 237 | Treasury Board and Finance |
| EXPENSE VOTE BY PROGRAM
|
||||||||||||||||
| (thousands of dollars) | Comparable | |||||||||||||||
| 2022-23 | 2022-23 | 2023-24 | ||||||||||||||
| Budget
|
Forecast
|
Estimate
|
||||||||||||||
| OPERATING EXPENSE |
||||||||||||||||
| 1 | Ministry Support Services |
|||||||||||||||
| 1.1 | Minister’s Office |
1,055 | 1,055 | 1,167 | ||||||||||||
| 1.2 | Deputy Minister’s Office |
576 | 576 | 761 | ||||||||||||
| 1.3 | Corporate Services |
5,655 | 5,655 | 6,400 | ||||||||||||
|
|
Sub-total |
7,286 | 7,286 | 8,328 | ||||||||||||
| 2 | Treasury Board Secretariat |
6,452 | 6,452 | 7,483 | ||||||||||||
| 3 | Fiscal Planning and Economic Analysis |
6,378 | 6,378 | 10,747 | ||||||||||||
| 4 | Investment, Treasury and Risk Management |
|||||||||||||||
| 4.1 | Treasury Management |
10,633 | 11,988 | 11,543 | ||||||||||||
| 4.2 | Risk Management and Insurance |
1,760 | 1,760 | 1,760 | ||||||||||||
|
|
Sub-total |
12,393 | 13,748 | 13,303 | ||||||||||||
| 5 | Office of the Controller |
7,456 | 7,456 | 6,716 | ||||||||||||
| 6 | Tax and Revenue Management |
28,257 | 28,257 | 30,078 | ||||||||||||
| 7 | Financial Sector and Pensions |
|||||||||||||||
| 7.1 | Financial Sector Regulation and Policy |
6,248 | 6,248 | 6,772 | ||||||||||||
| 7.2 | Automobile Insurance Rate Board |
1,309 | 1,309 | 1,309 | ||||||||||||
|
|
Sub-total |
7,557 | 7,557 | 8,081 | ||||||||||||
| 8 | Provincial Bargaining and Compensation Office |
3,614 | 3,614 | 4,171 | ||||||||||||
| 9 | Public Service Commission |
|||||||||||||||
| 9.1 | Office of the Public Service Commissioner |
680 | 680 | 680 | ||||||||||||
| 9.2 | Alberta Public Service Communications and Employee Engagement |
3,201 | 3,201 | 3,377 | ||||||||||||
| 9.3 | Client Service Delivery |
32,683 | 32,683 | 40,272 | ||||||||||||
| 9.4 | Labour Relations Policy and Programs |
8,098 | 8,098 | 8,906 | ||||||||||||
| 9.5 | Strategic Services and Public Agency Secretariat |
16,322 | 16,248 | 16,154 | ||||||||||||
| 9.6 | Strategic Integration Branch |
1,121 | 1,121 | 1,054 | ||||||||||||
|
|
Sub-total |
62,105 | 62,031 | 70,443 | ||||||||||||
| 10 | Communications and Public Engagement |
33,066 | 33,066 | 34,561 | ||||||||||||
| 11 | Gaming |
|||||||||||||||
| 11.1 | Gaming Research |
1,600 | 1,600 | 1,600 | ||||||||||||
| 11.2 | Horse Racing and Breeding Renewal Program |
40,200 | 41,200 | 43,750 | ||||||||||||
| 11.3 | Airport Entertainment Centres |
300 | 174 | 1,000 | ||||||||||||
|
|
Sub-total |
42,100 | 42,974 | 46,350 | ||||||||||||
|
|
||||||||||||||||
| Total | 216,664 | 218,819 | 240,261 | |||||||||||||
| Treasury Board and Finance | 238 |
| CAPITAL INVESTMENT VOTE BY PROGRAM
|
||||||||||||||||
| (thousands of dollars) | Comparable | |||||||||||||||
| 2022-23 | 2022-23 | 2023-24 | ||||||||||||||
| Budget
|
Forecast
|
Estimate
|
||||||||||||||
| DEPARTMENT CAPITAL ACQUISITIONS |
||||||||||||||||
| 1 | Ministry Support Services |
|||||||||||||||
| 1.4 | Corporate Services |
25 | 25 | 25 | ||||||||||||
| 9 | Public Service Commission |
|||||||||||||||
| 9.5 | Strategic Services and Public Agency Secretariat |
- | 74 | - | ||||||||||||
| Total | 25 | 99 | 25 | |||||||||||||
| CONTINGENCY VOTE BY PROGRAM
|
||||||||||||||||
| CONTINGENCY VOTE |
||||||||||||||||
| 12 | Contingency / Disaster and Emergency Assistance |
750,000 | - | 1,500,000 | ||||||||||||
| 13 | Contingency - COVID-19 |
1,000,000 | - | - | ||||||||||||
| Total | 1,750,000 | - | 1,500,000 | |||||||||||||
| 239 | Treasury Board and Finance |
VOTED AMOUNTS FUNDED BY CREDIT OR RECOVERY
The following table details the portions of the department’s voted amounts for which a credit or recovery can be obtained. If a credit or recovery amount is expected to exceed its original estimate, the Treasury Board may increase the corresponding voted amount, pursuant to section 24(2) of the Financial Administration Act. If the actual credit or recovery amount realized is less than its original estimate, the corresponding funding authority is reduced by an equivalent amount in the programs shown.
| EXPENSE AMOUNTS FUNDED BY CREDIT OR RECOVERY | ||||
| (thousands of dollars) |
2023-24 Estimate | |||
| 1 |
Services to Ministries |
2,275 | ||
| Funding received from other ministries used to provide collections services, such as Crown Debt Collections. Program 6 |
||||
| 2 |
Horse Racing and Breeding Renewal Program |
43,750 | ||
| Per the grant agreement with Horse Racing Alberta, a fixed percentage of slot revenues generated at Racing Entertainment Centres is granted to Horse Racing Alberta to support operating and capital cost of race tracks facilities, breed improvement initiatives and purse enhancements. Program 11.2 |
||||
| 3 |
Airport Entertainment Centres |
1,000 | ||
| Per the grant agreement with participating Airport Authorities, a fixed percentage of video lottery terminal revenues generated at Airport Entertainment Centres is granted to participating Airport Authorities. Program 11.3 |
||||
|
|
||||
| Total |
47,025 | |||
| Treasury Board and Finance | 240 |
AMOUNTS NOT REQUIRED TO BE VOTED
The following department amounts do not require a supply vote either because no cash disbursement is required, or because the Legislative Assembly has already provided the funding authority pursuant to a statute other than an appropriation act.
| EXPENSE
|
||||||||||||
| (thousands of dollars) | Comparable | |||||||||||
| 2022-23 | 2022-23 | 2023-24 | ||||||||||
| Budget | Forecast | Estimate | ||||||||||
| DEPARTMENT STATUTORY AMOUNTS |
||||||||||||
| Operating Expense |
||||||||||||
| Interest Payments on Corporate Tax Refunds |
17,000 | 5,000 | 12,000 | |||||||||
| Climate Leadership Plan – Consumer Rebates |
5,000 | 6,000 | 2,000 | |||||||||
| Teachers’ Pre-1992 Pensions - Payments |
485,833 | 490,500 | 494,750 | |||||||||
| Public Sector Pension - Payments |
70,299 | 60,000 | 60,000 | |||||||||
| Alberta Family Employment Tax Credit |
1,000 | 1,000 | 900 | |||||||||
| Scientific Research and Experimental Development Tax Credit |
5,000 | 5,000 | 1,000 | |||||||||
| Investment, Treasury and Risk Management |
- | 4,500 | 6,000 | |||||||||
| Tax and Revenue Management |
590 | 590 | 590 | |||||||||
| Motor Vehicle Accident Claims |
31,396 | 31,396 | 31,515 | |||||||||
| Debt Servicing |
||||||||||||
| Debt Servicing Costs |
2,622,950 | 2,675,950 | 2,808,450 | |||||||||
| DEPARTMENT NON-CASH AMOUNTS |
||||||||||||
| Amortization |
||||||||||||
| Financial Sector and Pensions |
50 | 50 | 50 | |||||||||
| Motor Vehicle Accident Claims |
131 | - | - | |||||||||
| Valuation Adjustments and Other Provisions |
||||||||||||
| Ministry Support Services |
500 | 500 | 500 | |||||||||
| Tax and Revenue Management |
500 | 500 | 500 | |||||||||
| Motor Vehicle Accident Claims |
- | 6,000 | 6,000 | |||||||||
| Corporate Income Tax Provision for Doubtful Accounts |
20,000 | 44,000 | 15,000 | |||||||||
| Pension Provisions |
||||||||||||
| Change in Unfunded Pension Obligation |
(284,000 | ) | (83,000 | ) | (297,000 | ) | ||||||
|
|
||||||||||||
| Total |
2,976,249 | 3,247,986 | 3,142,255 | |||||||||
| 241 | Treasury Board and Finance |
AMOUNTS NOT REQUIRED TO BE VOTED... continued
| FINANCIAL TRANSACTIONS
|
||||||||||||
| (thousands of dollars) | Comparable | |||||||||||
| 2022-23 | 2022-23 | 2023-24 | ||||||||||
| Budget | Forecast | Estimate | ||||||||||
| DEPARTMENT STATUTORY AMOUNTS |
||||||||||||
| Loans and Advances |
||||||||||||
| Agriculture Financial Services Corporation |
414,932 | 2,312,159 | 2,399,659 | |||||||||
| Alberta Oil and Gas Orphan Abandonment and Reclamation |
120,786 | - | - | |||||||||
| Association |
||||||||||||
| Alberta Petroleum Marketing Commission |
2,314,391 | 7,840,913 | 7,840,913 | |||||||||
| Alberta School Foundation Fund |
2,254,000 | 2,257,000 | 2,257,000 | |||||||||
| ATB Financial |
2,218,050 | 7,842,603 | 7,899,603 | |||||||||
| Balancing Pool |
117,000 | 366,000 | 366,000 | |||||||||
| Debt Repayment |
||||||||||||
| Agriculture Financial Services Corporation |
326,609 | 2,000,728 | 2,088,228 | |||||||||
| Alberta Oil and Gas Orphan Abandonment and Reclamation |
120,786 | 30,000 | 30,000 | |||||||||
| Association |
||||||||||||
| Alberta Petroleum Marketing Commission |
1,722,737 | 7,227,471 | 7,227,471 | |||||||||
| ATB Financial |
1,868,042 | 9,317,603 | 9,317,603 | |||||||||
| Balancing Pool |
117,000 | 456,000 | 411,000 | |||||||||
|
|
||||||||||||
| Total |
11,594,333 | 39,650,477 | 39,837,477 | |||||||||
| Treasury Board and Finance | 242 |
RECONCILIATION OF SUPPLY VOTE TO CONSOLIDATED GOVERNMENT ESTIMATE
The following tables summarize the relationship between the department’s Supply Votes and the effect of the ministry on the Government’s consolidated 2023-24 Estimates.
| RECONCILIATION BY PROGRAM | ||||||||||||||||||||
| (thousands of dollars) | Voted Supply |
Department Amounts Not Voted |
Entities’ Amounts Not Voted |
Consolidation Adjustments |
Consolidated 2023-24 Estimate |
|||||||||||||||
| EXPENSE |
||||||||||||||||||||
| Ministry Support Services |
8,328 | 500 | - | (211 | ) | 8,617 | ||||||||||||||
| Treasury Board Secretariat |
7,483 | - | - | - | 7,483 | |||||||||||||||
| Fiscal Planning and Economic Analysis |
10,747 | - | 114,752 | (35 | ) | 125,464 | ||||||||||||||
| Investment, Treasury and Risk Management |
13,303 | 6,000 | 1,433,580 | (1,257,854 | ) | 195,029 | ||||||||||||||
| Office of the Controller |
6,716 | - | - | - | 6,716 | |||||||||||||||
| Tax and Revenue Management |
30,078 | 13,090 | - | (2,275 | ) | 40,893 | ||||||||||||||
| Financial Sector and Pensions |
8,081 | 60,050 | 7,649 | - | 75,780 | |||||||||||||||
| Provincial Bargaining and Compensation Office |
4,171 | - | - | - | 4,171 | |||||||||||||||
| Public Service Commission |
70,443 | - | - | (250 | ) | 70,193 | ||||||||||||||
| Communications and Public Engagement |
34,561 | - | - | - | 34,561 | |||||||||||||||
| Gaming |
46,350 | - | - | - | 46,350 | |||||||||||||||
| AIMCo Investment Management Services |
- | - | 1,045,901 | (168,974 | ) | 876,927 | ||||||||||||||
| Carbon Tax - Consumer Rebates |
- | 2,000 | - | - | 2,000 | |||||||||||||||
| Teachers’ Pre-1992 Pensions - Payments |
- | 494,750 | - | - | 494,750 | |||||||||||||||
| Motor Vehicle Accident Claims |
- | 37,515 | - | - | 37,515 | |||||||||||||||
| Alberta Family Employment Tax Credit |
- | 900 | - | - | 900 | |||||||||||||||
| Scientific Research and Experimental Development Tax Credits |
- | 1,000 | - | - | 1,000 | |||||||||||||||
| Corporate Income Tax Allowance Provision |
- | 15,000 | - | - | 15,000 | |||||||||||||||
| Debt Servicing Costs |
- | 2,808,450 | 525 | (94,975 | ) | 2,714,000 | ||||||||||||||
| Change in Unfunded Pension Obligation |
- | (297,000 | ) | - | - | (297,000 | ) | |||||||||||||
| Total |
240,261 | 3,142,255 | 2,602,407 | (1,524,574 | ) | 4,460,349 | ||||||||||||||
| CAPITAL INVESTMENT |
||||||||||||||||||||
| Ministry Support Services |
25 | - | - | - | 25 | |||||||||||||||
| Financial Sector and Pensions |
- | - | 6,385 | - | 6,385 | |||||||||||||||
| AIMCo Investment Management Services |
- | - | 21,300 | - | 21,300 | |||||||||||||||
| Total |
25 | - | 27,685 | - | 27,710 | |||||||||||||||
| CONTINGENCY |
||||||||||||||||||||
| Contingency / Disaster and Emergency Assistance |
1,500,000 | - | - | - | 1,500,000 | |||||||||||||||
|
|
||||||||||||||||||||
| 243 | Treasury Board and Finance |
RECONCILIATION OF SUPPLY VOTE TO CONSOLIDATED GOVERNMENT ESTIMATE... continued
| RECONCILIATION BY TYPE OF SPENDING |
| |||||||||||||||||||
| (thousands of dollars) | Voted Supply |
Department Amounts Not Voted |
Entities’ Amounts Not Voted |
Consolidation Adjustments |
Consolidated 2023-24 Estimate |
|||||||||||||||
| EXPENSE |
||||||||||||||||||||
| Operating expense |
240,261 | 630,755 | 2,577,062 | (1,429,814 | ) | 2,018,264 | ||||||||||||||
| Amortization |
- | 50 | 25,035 | - | 25,085 | |||||||||||||||
| Debt servicing costs - general |
- | 1,695,450 | 310 | (94,760 | ) | 1,601,000 | ||||||||||||||
| Debt servicing costs - Capital Plan |
- | 1,113,000 | - | - | 1,113,000 | |||||||||||||||
| Pension provisions |
- | (297,000 | ) | - | - | (297,000 | ) | |||||||||||||
| Total |
240,261 | 3,142,255 | 2,602,407 | (1,524,574 | ) | 4,460,349 | ||||||||||||||
| CAPITAL INVESTMENT |
25 | - | 27,685 | - | 27,710 | |||||||||||||||
| CONTINGENCY |
1,500,000 | - | - | - | 1,500,000 | |||||||||||||||
|
|
||||||||||||||||||||
| Treasury Board and Finance | 244 |
| MINISTRY FINANCIAL STATEMENTS | ||||||||||||
| STATEMENT OF OPERATIONS
|
||||||||||||
| (thousands of dollars) | Comparable | |||||||||||
|
2022-23 Budget |
2022-23 Forecast |
2023-24 Estimate |
||||||||||
| REVENUE |
||||||||||||
| Personal Income Tax |
13,382,000 | 13,806,000 | 14,069,000 | |||||||||
| Corporate Income Tax |
4,040,000 | 6,413,000 | 5,911,000 | |||||||||
| Other Taxes |
3,012,000 | 1,705,000 | 2,379,000 | |||||||||
| Transfers from Government of Canada |
2,623,000 | 1,869,000 | 2,654,000 | |||||||||
| Investment Income |
2,844,532 | 683,593 | 2,761,535 | |||||||||
| Net Income from Commercial Operations |
2,652,885 | 2,646,129 | 2,640,614 | |||||||||
| Premiums, Fees and Licences |
252,028 | 244,642 | 243,327 | |||||||||
| AIMCo Investment Management Charges |
728,660 | 765,299 | 877,275 | |||||||||
| Other Revenue |
96,136 | 94,037 | 97,375 | |||||||||
| Ministry Total |
29,631,241 | 28,226,700 | 31,633,126 | |||||||||
| Inter-Ministry Consolidations |
(169,473 | ) | (177,338 | ) | (192,744 | ) | ||||||
| Consolidated Total |
29,461,768 | 28,049,362 | 31,440,382 | |||||||||
| EXPENSE |
||||||||||||
| Ministry Support Services |
7,577 | 7,577 | 8,619 | |||||||||
| Treasury Board Secretariat |
6,452 | 6,452 | 7,483 | |||||||||
| Fiscal Planning and Economic Analysis |
6,378 | 6,378 | 10,747 | |||||||||
| Investment, Treasury and Risk Management |
352,206 | 329,629 | 354,855 | |||||||||
| Office of the Controller |
7,456 | 7,456 | 6,716 | |||||||||
| Tax and Revenue Management |
46,347 | 34,347 | 43,168 | |||||||||
| Financial Sector and Pensions |
191,393 | 177,418 | 190,497 | |||||||||
| Provincial Bargaining and Compensation Office |
3,614 | 3,614 | 4,171 | |||||||||
| Public Service Commission |
62,105 | 62,031 | 70,443 | |||||||||
| Communications and Public Engagement |
33,066 | 33,066 | 34,561 | |||||||||
| Gaming |
42,100 | 42,974 | 46,350 | |||||||||
| AIMCo Investment Management Services |
728,160 | 764,999 | 876,972 | |||||||||
| Carbon Tax - Consumer Rebates |
5,000 | 6,000 | 2,000 | |||||||||
| Teachers’ Pre-1992 Pensions - Payments |
485,833 | 490,500 | 494,750 | |||||||||
| Motor Vehicle Accident Claims |
31,527 | 37,396 | 37,515 | |||||||||
| Alberta Family Employment Tax Credit |
1,000 | 1,000 | 900 | |||||||||
| Scientific Research and Experimental Development Tax Credits |
5,000 | 5,000 | 1,000 | |||||||||
| Corporate Income Tax Allowance Provision |
20,000 | 44,000 | 15,000 | |||||||||
| Debt Servicing Costs |
2,553,950 | 2,606,950 | 2,739,450 | |||||||||
| Change in Unfunded Pension Obligation |
(284,000 | ) | (83,000 | ) | (297,000 | ) | ||||||
| Contingency / Disaster and Emergency Assistance |
1,000,000 | - | 1,500,000 | |||||||||
| Contingency - COVID-19 |
750,000 | - | - | |||||||||
| Ministry Total |
6,055,164 | 4,583,787 | 6,148,197 | |||||||||
| Inter-Ministry Consolidations |
(189,495 | ) | (191,187 | ) | (187,848 | ) | ||||||
| Consolidated Total |
5,865,669 | 4,392,600 | 5,960,349 | |||||||||
| Net Operating Result |
23,596,099 | 23,656,762 | 25,480,033 | |||||||||
| 245 | Treasury Board and Finance |
MINISTRY FINANCIAL STATEMENTS... continued
| CHANGE IN CAPITAL ASSETS
|
||||||||||||
| (thousands of dollars) | Comparable | |||||||||||
|
2022-23 Budget |
2022-23 Forecast |
2023-24 Estimate |
||||||||||
| INVESTMENT |
||||||||||||
| Ministry Support Services |
25 | 25 | 25 | |||||||||
| Financial Sector and Pensions |
3,940 | 3,410 | 6,385 | |||||||||
| Public Service Commission |
- | 74 | - | |||||||||
| AIMCo Investment Management Services |
14,300 | 13,600 | 21,300 | |||||||||
| Consolidated Total |
18,265 | 17,109 | 27,710 | |||||||||
| AMORTIZATION |
(27,677 | ) | (27,773 | ) | (25,085 | ) | ||||||
| Change in Capital Assets Total |
(9,412 | ) | (10,664 | ) | 2,625 | |||||||
| Treasury Board and Finance | 246 |
Exhibit 99.9
2023-24
Offices of the
Legislative Assembly
Estimates
General Revenue Fund
2023-24
Offices of the
Legislative Assembly
Estimates
General Revenue Fund
Presented by the Honourable Travis Toews
President of Treasury Board and Minister of Finance
in the Legislative Assembly of Alberta
February 28, 2023
ISBN 978-1-4601-5622-3 (Print)
ISBN 978-1-4601-5617-9 (PDF)
ISSN 1919-1529 (Print)
ISSN 1920-8804 (Online)
TABLE OF CONTENTS
| INTRODUCTION AND SUMMARY TABLES |
||||
| Preface |
i | |||
| Schedule of Amounts to be Voted |
1 | |||
| Voted Spending by Office |
2 | |||
| Amounts Not Required to be Voted by Office |
2 | |||
| Full Time Equivalent Employment |
3 | |||
| DETAILS OF THE OFFICES OF THE LEGISLATIVE ASSEMBLY ESTIMATES |
||||
| Support to the Legislative Assembly |
5 | |||
| Office of the Auditor General |
9 | |||
| Office of the Ombudsman |
13 | |||
| Office of the Chief Electoral Officer |
17 | |||
| Office of the Ethics Commissioner |
21 | |||
| Office of the Information and Privacy Commissioner |
25 | |||
| Office of the Child and Youth Advocate |
29 | |||
| Office of the Public Interest Commissioner |
33 | |||
PREFACE
The 2023-24 Offices of the Legislative Assembly Estimates reports the requirements for public monies from the General Revenue Fund to fund the operations of the Legislative Assembly and its Offices for the fiscal year commencing April 1, 2023. Together with the 2023-24 Government Estimates, this document identifies the total requirements for public monies from the General Revenue Fund for the year.
This Preface provides a summary of the various kinds of information presented, an overview of the appropriations process, and definitions of supply votes and selected terms.
The Schedule of Amounts to be Voted illustrates how the supply votes will be presented in the schedule to the Appropriation Act, 2023 to be tabled in the Legislative Assembly.
Summary information is provided in the following tables:
| ◾ | Voted Spending by Office, |
| ◾ | Amounts Not Required to be Voted by Office, and |
| ◾ | Full-Time Equivalent Employment. |
As required by section 24 of the Financial Administration Act, these estimates present detailed information for each office on amounts to be drawn from the General Revenue Fund in 2023-24. The details include the following information, as applicable:
| ◾ | Amount to be Voted, |
| ◾ | Supplementary Information (including a statement of objective and services provided), |
| ◾ | Voted Spending by Program, |
| ◾ | Amounts Not Required to be Voted, and |
| ◾ | Statement of Operations Change in Capital Assets, and Change in Inventory Assets, where applicable. |
Appropriations from the General Revenue Fund
In Alberta, the supply process is governed by the conventions and legal requirements of the Canadian Constitution, Alberta’s Financial Administration Act, and the Standing Orders of the Legislative Assembly of Alberta.
When the 2023-24 Offices of the Legislative Assembly Estimates is tabled in the Legislative Assembly, it will be moved to Committee of Supply. The ‘Standing Orders’ direct that Committee of Supply will vote on the report without debate or amendment. The supply votes as approved by the resolutions of Committee of Supply will be drafted into the Bill for the Appropriation Act, 2023 introduced to the Legislative Assembly. Once this bill is enacted by royal assent, the Legislative Assembly and its Offices will have the authority to draw cash from the General Revenue Fund up to the limits of the supply votes set out in the Act.
The 2023-24 Offices of the Legislative Assembly Estimates details the estimated amounts required by each office for the coming year. Each office’s estimate amounts are divided into:
| ◾ | those that require authority to draw cash from the General Revenue Fund under a supply vote pursuant to an appropriation act, and |
| ◾ | those that do not require a supply vote because no cash disbursement is required. |
Most non-cash amounts are for expenses related to cash disbursed under a supply vote in a prior fiscal year. For example, amortization expense is related to the cash disbursements authorized under a capital supply vote when the capital asset was acquired. Other non-cash amounts are for transactions that will not require cash, such as the year-over-year changes in vacation benefit liabilities.
Budget Presentation
These 2023-24 Offices of the Legislative Assembly Estimates reflect the Province’s budget presentation methodology as of February 28, 2023. As in past budgets, the comparable amounts presented in these estimates may not match those originally presented in the 2022-23 Offices of the Legislative Assembly Estimates tabled on February 24, 2022. Differences in the 2022-23 amounts between these two documents are the result of adjustments applied to maintain the comparability of past amounts with the 2023-24 estimate amounts. Unlike past budgets, the comparable amounts presented in these estimates do not include a column of the most recently published actual results.
| i | Preface |
Definitions of Supply Votes and Other Terms
An Estimate is the amount requested by an office of the Legislative Assembly to meet each of its planned commitments for the fiscal year commencing April 1, 2023. The Financial Administration Act requires the 2023-24 Offices of the Legislative Assembly Estimates to report estimates of any amount that will require a cash withdrawal from the General Revenue Fund.
An Appropriation is an authorization to withdraw and expend public money from the General Revenue Fund or another provincial fund. Following parliamentary tradition, the Financial Administration Act requires that all such authorities be provided in legislation passed by the Legislative Assembly. Appropriations may be created by an appropriation act or other statute. Appropriation acts are drafted to contain the specific set of supply votes that have been resolved by the Committee of Supply.
A Supply Vote is a discrete allocation from the 2023-24 estimates that defines the amount of cash funding that may be drawn from the General Revenue Fund for a specified purpose. Unlike government departments, the cash funding requirements for any and all expense, capital investment and financial transactions are combined in a single vote for each office.
Expense amounts are cash disbursements for the purposes of salaries, supplies and services, operating grants, capital grants, as well as interest expense and other debt servicing costs for borrowing related to both capital and general government purposes.
Capital Investment consists of cash disbursements for the purposes of investments in tangible capital assets valued at $5,000 or more.
Financial Transactions consist of cash disbursements for the purposes of payments for the reduction of a liability (including debt repayment), expenses to be recognized in a future year, the acquisition of financial assets (including in particular the making of loans or advances), or the purchase of inventories. The only use of the financial transaction supply vote in this document is for the acquisition of inventories, and the headers used in the supply vote presentations reflect the more specific application.
| Preface |
ii |
SCHEDULE OF AMOUNTS TO BE VOTED
SUPPLY VOTES AS PRESENTED IN THE APPROPRIATION BILL
|
VOTE
|
Estimate
|
|||
| Support to the Legislative Assembly |
$ | 76,763,000 | ||
| Office of the Auditor General |
$ | 29,620,000 | ||
| Office of the Ombudsman |
$ | 4,480,000 | ||
| Office of the Chief Electoral Officer |
$ | 42,397,000 | ||
| Office of the Ethics Commissioner |
$ | 1,000,000 | ||
| Office of the Information and Privacy Commissioner |
$ | 8,534,000 | ||
| Office of the Child and Youth Advocate |
$ | 16,205,000 | ||
| Office of the Public Interest Commissioner
|
$
|
1,410,000
|
| |
| Total amount to be voted under section 1 of the Appropriation Act, 2023
|
$
|
180,409,000
|
| |
| 1 | Offices of the Legislative Assembly |
VOTED SPENDING BY OFFICE
| (thousands of dollars) | Comparable | |||||||||||
| 2022-23 Budget |
2022-23 Forecast |
2023-24 Estimate |
||||||||||
| OPERATING EXPENSE |
||||||||||||
| Support to the Legislative Assembly |
70,698 | 64,089 | 75,603 | |||||||||
| Office of the Auditor General |
27,425 | 27,375 | 29,540 | |||||||||
| Office of the Ombudsman |
4,019 | 3,757 | 4,480 | |||||||||
| Office of the Chief Electoral Officer |
44,054 | 16,646 | 41,742 | |||||||||
| Office of the Ethics Commissioner |
976 | 926 | 1,000 | |||||||||
| Office of the Information and Privacy Commissioner |
7,441 | 7,275 | 8,484 | |||||||||
| Office of the Child and Youth Advocate |
15,059 | 14,548 | 15,905 | |||||||||
| Office of the Public Interest Commissioner |
1,223 | 1,122 | 1,410 | |||||||||
|
|
|
|||||||||||
| Sub-Total |
170,895 | 135,738 | 178,164 | |||||||||
| CAPITAL INVESTMENT |
||||||||||||
| Support to the Legislative Assembly |
1,050 | 1,050 | 1,050 | |||||||||
| Office of the Auditor General |
30 | 80 | 80 | |||||||||
| Office of the Chief Electoral Officer |
1,170 | 1,510 | 655 | |||||||||
| Office of the Information and Privacy Commissioner |
- | - | 50 | |||||||||
| Office of the Child and Youth Advocate |
200 | 168 | 300 | |||||||||
|
|
|
|||||||||||
| Sub-Total |
2,450 | 2,808 | 2,135 | |||||||||
| INVENTORY ACQUISITION |
||||||||||||
| Support to the Legislative Assembly |
110 | 110 | 110 | |||||||||
| Total |
173,455 | 138,656 | 180,409 | |||||||||
| AMOUNTS NOT REQUIRED TO BE VOTED BY OFFICE |
||||||||||||
| EXPENSE |
||||||||||||
| Support to the Legislative Assembly |
672 | 647 | 647 | |||||||||
| Office of the Auditor General |
270 | 260 | 160 | |||||||||
| Office of the Ombudsman |
16 | 14 | 9 | |||||||||
| Office of the Chief Electoral Officer |
1,250 | 1,250 | 1,250 | |||||||||
| Office of the Ethics Commissioner |
13 | 13 | 13 | |||||||||
| Office of the Child and Youth Advocate |
179 | 127 | 190 | |||||||||
|
|
|
|||||||||||
| Sub-Total |
|
2,400
|
|
|
2,311
|
|
|
2,269
|
| |||
| Total |
2,400 | 2,311 | 2,269 | |||||||||
| Offices of the Legislative Assembly | 2 |
FULL-TIME EQUIVALENT EMPLOYMENT
| (thousands of dollars) | Comparable | |||||||
| 2022-23 Budget | 2023-24 Estimate |
|||||||
| OPERATING EXPENSE |
||||||||
| Support to the Legislative Assembly |
394 | 396 | ||||||
| Office of the Auditor General |
153 | 150 | ||||||
| Office of the Ombudsman |
30 | 33 | ||||||
| Office of the Chief Electoral Officer |
36 | 43 | ||||||
| Office of the Ethics Commissioner |
5 | 5 | ||||||
| Office of the Information and Privacy Commissioner |
48 | 51 | ||||||
| Office of the Child and Youth Advocate |
76 | 78 | ||||||
| Office of the Public Interest Commissioner |
6 | 7 | ||||||
| Total |
748 | 763 | ||||||
| 3 | Offices of the Legislative Assembly |
Support to the Legislative Assembly
The Honourable Nathan Cooper
Speaker of the Legislative Assembly
Shannon Dean, K.C.
Clerk of the Legislative Assembly
The Legislative Assembly is the parliament of Alberta, consisting of members who are elected by the people of Alberta. Through them, Albertans make provincial laws and provide money needed by the government for the present and future good of the people of the province. In keeping with the time-honoured tradition of parliamentary self-government, the Lieutenant Governor gives assent to the laws so made by Albertans.
AMOUNT TO BE VOTED
| (thousands of dollars) | Comparable | |||||||||||
| 2022-23 Budget |
2022-23 Forecast |
2023-24 Estimate |
||||||||||
|
LEGISLATIVE ASSEMBLY
|
71,858 | 65,249 | 76,763 | |||||||||
| 5 |
SUPPLEMENTARY INFORMATION
OBJECTIVE
To provide procedural, administrative and financial support to the Legislative Assembly of Alberta.
SERVICES PROVIDED
All services required for the operation of the Legislative Assembly including committees.
Legal, procedural and security services support for Members of the Legislative Assembly.
Publication of Alberta Hansard, the Order Papers, Votes and Proceedings and Bills.
Public information, public education and visitor programs.
Broadcast services to support Assembly and committee operations, to support Members of the Legislative Assembly and serve the general public.
Library service to the Legislature, public service and general public.
Inter-parliamentary activities.
Human resource services for Members of the Legislative Assembly and staff of the Legislative Assembly Office, including caucus and constituency staff.
Payment of communication expenses for Members of the Legislative Assembly.
Furniture, equipment, supplies procurement and leasing and property management services for Members’ constituency and caucus offices.
Information technology services for Members of the Legislative Assembly and staff of the Legislative Assembly Office, including caucus and constituency staff.
Development, enhancement and maintenance of broadcast and IT infrastructure independent of Government.
Communication services for the Legislative Assembly Office.
Processing and payment of indemnities, expense allowances, living travel expenses, and contributions for retirement investment plans to or on behalf of Members of the Legislative Assembly, as authorized by the Legislative Assembly Act.
Processing and payment of premiums for health and disability benefits for Members of the Legislative Assembly.
| Support to the Legislative Assembly | 6 |
OFFICE SUPPLY VOTE BY PROGRAM
| (thousands of dollars) |
Comparable | |||||||||||||
| 2022-23 Budget |
2022-23 Forecast |
2023-24 Estimate |
||||||||||||
| OPERATING EXPENSE |
||||||||||||||
| 1 |
Legislative Assembly Office Administration |
25,864 | 22,997 | 28,334 | ||||||||||
| 2 |
Members of the Legislative Assembly Administration |
34,500 | 31,820 | 36,012 | ||||||||||
| 3 |
United Conservative Caucus |
4,014 | 4,082 | 4,018 | ||||||||||
| 4 |
New Democratic Party Caucus |
3,158 | 3,440 | 3,382 | ||||||||||
| 5 |
Other Caucuses |
1,487 | 325 | 1,782 | ||||||||||
| 6 |
Planning and Development Initiatives |
325 | 325 | 325 | ||||||||||
| 7 |
Special Funding Initiatives |
1,100 | 1,100 | 1,500 | ||||||||||
| 8 |
Election Preparation |
250 | - | 250 | ||||||||||
| CAPITAL INVESTMENT |
||||||||||||||
| 1 |
Legislative Assembly Office Administration |
650 | 650 | 650 | ||||||||||
| 6 |
Planning and Development Initiatives |
400 | 400 | 400 | ||||||||||
| INVENTORY ACQUISITION |
||||||||||||||
| 1 |
Legislative Assembly Office Administration |
110 | 110 | 110 | ||||||||||
| Total |
71,858 | 65,249 | 76,763 | |||||||||||
AMOUNTS NOT REQUIRED TO BE VOTED
The following amounts do not require a supply vote either because no cash disbursement is required, or because the Legislative Assembly has already provided the funding authority pursuant to a statute other than an appropriation act.
| EXPENSE |
||||||||||||
| OFFICE NON-CASH AMOUNTS |
||||||||||||
| Amortization |
562 | 537 | 537 | |||||||||
| Consumption of Inventory |
110 | 110 | 110 | |||||||||
| Total |
672 | 647 | 647 | |||||||||
| 7 | Support to the Legislative Assembly |
STATEMENT OF OPERATIONS
| (thousands of dollars) | Comparable | |||||||||||
| 2022-23 Budget |
2022-23 Forecast |
2023-24 Estimate |
||||||||||
| REVENUE |
||||||||||||
| Other Premiums, Fees and Licences |
3 | 2 | 3 | |||||||||
| Other Revenue |
3 | 133 | 3 | |||||||||
| Total |
6 | 135 | 6 | |||||||||
| EXPENSE |
||||||||||||
| Support to the Legislative Assembly
|
|
71,370
|
|
|
64,736
|
|
|
76,250
|
| |||
| Net Operating Result |
(71,364) | (64,601) | (76,244) | |||||||||
| CHANGE IN CAPITAL ASSETS |
||||||||||||
| INVESTMENT |
||||||||||||
| Support to the Legislative Assembly |
1,050 | 1,050 | 1,050 | |||||||||
| AMORTIZATION
|
|
(562)
|
|
|
(537)
|
|
|
(537)
|
| |||
| Change in Capital Assets Total |
488 | 513 | 513 | |||||||||
| CHANGE IN INVENTORY ASSETS |
||||||||||||
| INVENTORY ACQUISITION |
||||||||||||
| Support to the Legislative Assembly |
110 | 110 | 110 | |||||||||
| CONSUMPTION
|
|
(110)
|
|
|
(110)
|
|
|
(110)
|
| |||
| Change in Inventory Assets Total |
- | - | - | |||||||||
| Support to the Legislative Assembly | 8 |
Office of the Auditor General
W. Doug Wylie
Auditor General
The work of the Office of the Auditor General of Alberta improves performance and promotes accountability within government.
| AMOUNT TO BE VOTED | ||||||||||||
| (thousands of dollars) | Comparable | |||||||||||
| 2022-23
|
2022-23
|
2023-24
|
||||||||||
|
AUDITOR GENERAL
|
|
27,455
|
|
|
27,455
|
|
|
29,620
|
| |||
9
SUPPLEMENTARY INFORMATION
OBJECTIVE
To provide independent assurance to the 87 Members of the Legislative Assembly of Alberta, and the people of Alberta, that public money is spent properly and provides value.
SERVICES PROVIDED
Under the Auditor General Act, the Auditor General is the legislated independent auditor of the Consolidated Financial Statements of the Province of Alberta, including all ministries, departments, and most provincial agencies, boards, commissions, and regulated funds. The audits conducted by the Office of the Auditor General report on how government is managing its responsibilities and the province’s resources.
Financial statement audits provide assurance on the financial statements of the province, regulated funds, agencies, boards and commissions, and reports on management’s financial reporting processes and controls, compliance with authorities and legislation. Independent auditor’s reports accompany the financial statements of each entity audited by the Office of the Auditor General and are included in the annual reports published by government. These reports provide the Auditor General’s opinion on whether management’s financial statements are presented fairly and in accordance with the appropriate accounting standards.
Through performance auditing, the Auditor General also examines the economy, efficiency and effectiveness of government programs and processes to provide assurance they are working as intended. The audits selected result from extensive planning, including input from stakeholders, and are based on significance, level of risk and relevancy to Albertans.
In addition, the Auditor General may also perform special duties as assigned by the Assembly, or Executive Council if those special duties do not conflict with or impair the performance of the Auditor General’s duties under the Auditor General Act.
| Office of the Auditor General | 10 |
OFFICE SUPPLY VOTE BY PROGRAM
| (thousands of dollars) | Comparable | |||||||||||||
| 2022-23
|
2022-23
|
2023-24
|
||||||||||||
| OPERATING EXPENSE |
||||||||||||||
| 1 | Office of the Auditor General |
27,425 | 27,375 | 29,540 | ||||||||||
|
CAPITAL INVESTMENT |
||||||||||||||
| 1 | Office of the Auditor General
|
30 | 80 | 80 | ||||||||||
| Total | 27,455 | 27,455 | 29,620 | |||||||||||
AMOUNTS NOT REQUIRED TO BE VOTED
The following amounts do not require a supply vote either because no cash disbursement is required, or because the Legislative Assembly has already provided the funding authority pursuant to a statute other than an appropriation act.
| EXPENSE | ||||||||||||
| OFFICE NON-CASH AMOUNTS |
||||||||||||
| Amortization |
|
270
|
|
|
260
|
|
|
160
|
| |||
| Total |
270 | 260 | 160 | |||||||||
| 11 | Office of the Auditor General |
| STATEMENT OF OPERATIONS | ||||||||||||
| (thousands of dollars) | Comparable | |||||||||||
| 2022-23 Budget |
2022-23 Forecast |
2023-24 Estimate |
||||||||||
| Revenue |
||||||||||||
| None |
- | - | - | |||||||||
| EXPENSE |
||||||||||||
| Office of the Auditor General |
|
27,695
|
|
|
27,635
|
|
|
29,700
|
| |||
| Net Operating Result |
(27,695) | (27,635) | (29,700) | |||||||||
|
CHANGE IN CAPITAL ASSETS |
||||||||||||
| INVESTMENT |
||||||||||||
| Office of the Auditor General |
30 | 80 | 80 | |||||||||
| AMORTIZATION
|
|
(270)
|
|
|
(260)
|
|
|
(160)
|
| |||
| Change in Capital Assets Total |
(240) | (180) | (80) | |||||||||
| Office of the Auditor General | 12 |
Office of the Ombudsman
Kevin Brezinski
Ombudsman
The Alberta Ombudsman serves Albertans by providing oversight of provincial government authorities, municipalities and other jurisdictional entities to ensure fair treatment through independent investigations, recommendations and education for all Albertans.
AMOUNT TO BE VOTED
| (thousands of dollars) | Comparable | |||||
| 2022-23 Budget
|
2022-23 Forecast
|
2023-24
Estimate
| ||||
|
OMBUDSMAN
|
4,019 | 3,757 | 4,480 | |||
13
SUPPLEMENTARY INFORMATION
OBJECTIVE
The Alberta Ombudsman responds to complaints of unfair treatment by provincial government authorities, municipalities, the Patient Concerns Resolution Process of Alberta Health Services, health professions and other designated professional organizations. The Office conducts independent and impartial investigations into these complaints and, as warranted, provides recommendations to the respective authorities.
SERVICES PROVIDED
Investigates written complaints of unfair administrative decisions, processes and treatment by authorities and organizations identified in the Ombudsman Act.
Provides an intake service to assist people to advance their complaint to the appropriate contact, department or other complaint mechanism within and outside the Ombudsman’s jurisdiction.
Offers education/training to assist Alberta government departments, agencies, boards, commissions, municipalities, designated professional organizations, the Patient Concerns Resolution Process of Alberta Health Services and Alberta municipalities in developing policy and procedures that enhance administrative fairness.
Offers public outreach services to increase and enhance awareness of the Ombudsman’s office.
Conducts “own motion” investigations where the Ombudsman, on his own initiative, investigates administrative issues within his jurisdiction.
Investigates administrative matters in response to ministerial requests or referrals from a committee of the Legislative Assembly.
| Office of the Ombudsman | 14 |
OFFICE SUPPLY VOTE BY PROGRAM
| (thousands of dollars) | Comparable
|
|||||||||||
| 2022-23
|
2022-23
|
2023-24
|
||||||||||
| OPERATING EXPENSE |
||||||||||||
| 1 Office of the Ombudsman
|
|
4,019
|
|
|
3,757
|
|
|
4,480
|
| |||
| Total |
4,019 | 3,757 | 4,480 | |||||||||
|
AMOUNTS NOT REQUIRED TO BE VOTED
The following amounts do not require a supply vote either because no cash disbursement is required, or because the Legislative Assembly has already provided the funding authority pursuant to a statute other than an appropriation act.
|
| |||||||||||
| EXPENSE | ||||||||||||
| OFFICE NON-CASH AMOUNTS |
||||||||||||
| Amortization
|
|
16
|
|
|
14
|
|
|
9
|
| |||
| Total |
16 | 14 | 9 | |||||||||
| 15 | Office of the Ombudsman |
STATEMENT OF OPERATIONS
| (thousands of dollars) | Comparable | |||||||||||
| 2022-23 Budget |
2022-23 Forecast |
2023-24 Estimate |
||||||||||
| REVENUE |
||||||||||||
| Services charged to other Government Entities |
414 | 370 | 439 | |||||||||
| Total |
414 | 370 | 439 | |||||||||
| EXPENSE |
||||||||||||
| Office of the Ombudsman
|
|
4,035
|
|
|
3,771
|
|
|
4,489
|
| |||
| Net Operating Result |
(4,035) | (3,771) | (4,489) | |||||||||
| CHANGE IN CAPITAL ASSETS |
||||||||||||
| AMORTIZATION
|
|
(16)
|
|
|
(14)
|
|
|
(9)
|
| |||
| Change in Capital Assets Total |
(16) | (14) | (9) | |||||||||
| Office of the Ombudsman | 16 |
Office of the Chief Electoral Officer
Glen Resler
Chief Electoral Officer
The Office of the Chief Electoral Officer provides administrative, logistic and financial support for the register of electors, general elections and by-elections, referendums and plebiscites in support of the Election Act, the Alberta Senate Election Act, and the Referendum Act. The Chief Electoral Officer monitors and records the financial activities of registered parties, constituency associations, candidates, nomination contests, party leadership contests and third party advertisers to ensure compliance with the Election Finances and Contributions Disclosure Act.
The Office administers the petition process, recall vote and financial disclosure for recall of elected Members of the Legislative Assembly under the Recall Act and administers the application, petition process and initiative vote as well as enforce financing rules under the Citizen Initiative Act.
The Office monitors and enforces campaign financing and third party advertising under the Local Authorities Election Act..
AMOUNT TO BE VOTED
| (thousands of dollars) | Comparable | |||||||||||
| 2022-23 Budget |
2022-23 Forecast |
2023-24 Estimate |
||||||||||
|
CHIEF ELECTORAL OFFICER
|
|
45,224
|
|
|
18,156
|
|
|
42,397
|
| |||
| 17 |
SUPPLEMENTARY INFORMATION
OBJECTIVE
To provide administrative, logistic and financial support for the register of electors, general elections and by-elections, referendums and plebiscites in support of the Election Act, the Alberta Senate Election Act, and Referendum Act. To monitor and record the financial activities of registered parties, constituency associations, candidates, nomination contests, party leadership contests and third party advertisers to ensure compliance with the Election Finances and Contributions Disclosure Act.
To administer the petition process, recall vote and financial disclosure for recall of elected Members of the Legislative Assembly under the Recall Act and to administer the application, petition process and initiative vote as well as enforce financing rules under the Citizen Initiative Act.
To provide enforcement activities of regulated political entities.
SERVICES PROVIDED
Provides for the register of electors, elections, by-elections, referendums, and plebiscites and for communication and liaison with the executive of registered parties, constituency associations, leadership contestants, nomination contestants, candidates and their campaign officials, third party advertisers and the general public pertaining to the established policies and procedures of the relevant Acts.
The Recall Legislation will enable eligible Alberta electors to submit applications for petitions to recall elected officials; administer the petition process for recall of elected Members of the Legislative Assembly; conduct recall votes for successful petitions; and enforce petitioner financing rules. The Citizen Initiatives legislation will allow eligible Alberta electors to submit applications for a petition to introduce legislation or a policy proposal in the legislature, or to hold a constitutional referendum on a question; administer the application and petition process; conduct an initiative vote where a proposal is referred by the Legislative Assembly; and enforce financing rules.
Ensures compliance with, and enforcement of, certain obligations of entities regulated by the Election Act Election Finances and Contributions Disclosure Act, Alberta Senate Election Act, Referendum Act, and Local Authorities Election Act.
Investigates complaints, levies administrative penalties, issues letters of reprimand, enters into compliance agreements, and recommend prosecutions.
| Office of the Chief Electoral Officer | 18 |
OFFICE SUPPLY VOTE BY PROGRAM
| (thousands of dollars) | Comparable | |||||||||||||
| 2022-23 Budget |
2022-23 Forecast |
2023-24 Estimate |
||||||||||||
| OPERATING EXPENSE |
||||||||||||||
| 1 | Corporate Services |
5,284 | 5,102 | 5,734 | ||||||||||
| 2 | Elections |
34,664 | 8,671 | 32,792 | ||||||||||
| 3 | Enumerations |
3,019 | 2,256 | 2,320 | ||||||||||
| 4 | Other Electoral Events |
449 | 12 | 201 | ||||||||||
| 5 | Compliance and Enforcement |
638 | 605 | 695 | ||||||||||
| CAPITAL INVESTMENT |
||||||||||||||
| 1 | Corporate Services |
600 | 840 | 225 | ||||||||||
| 2 | Elections |
470 | 670 | 430 | ||||||||||
| 3 | Enumerations |
100 | - | - | ||||||||||
| Total | 45,224 | 18,156 | 42,397 | |||||||||||
AMOUNTS NOT REQUIRED TO BE VOTED
The following amounts do not require a supply vote either because no cash disbursement is required, or because the Legislative Assembly has already provided the funding authority pursuant to a statute other than an appropriation act.
| EXPENSE | ||||||||||||
| OFFICE NON-CASH AMOUNTS |
||||||||||||
| Amortization |
1,250 | 1,250 | 1,250 | |||||||||
| Total |
1,250 | 1,250 | 1,250 | |||||||||
| 19 | Office of the Chief Electoral Officer |
STATEMENT OF OPERATIONS
| (thousands of dollars) | Comparable | |||||||||||
| 2022-23 Budget |
2022-23 Forecast |
2023-24 Estimate |
||||||||||
| Revenue |
||||||||||||
| None |
- | - | - | |||||||||
| EXPENSE |
||||||||||||
| Corporate Services |
6,334 | 6,152 | 6,784 | |||||||||
| Elections |
34,831 | 8,838 | 32,959 | |||||||||
| Enumerations |
3,052 | 2,289 | 2,353 | |||||||||
| Other Electoral Events |
449 | 12 | 201 | |||||||||
| Compliance and Enforcement |
638 | 605 | 695 | |||||||||
| Total
|
|
45,304
|
|
|
17,896
|
|
|
42,992
|
| |||
| Net Operating Result |
(45,304) | (17,896) | (42,992) | |||||||||
|
CHANGE IN CAPITAL ASSETS |
||||||||||||
| INVESTMENT |
||||||||||||
| Corporate Services |
600 | 840 | 225 | |||||||||
| Elections |
470 | 670 | 430 | |||||||||
| Enumerations |
100 | - | - | |||||||||
| Total |
1,170 | 1,510 | 655 | |||||||||
| AMORTIZATION
|
|
(1,250)
|
|
|
(1,250)
|
|
|
(1,250)
|
| |||
| Change in Capital Assets Total |
(80) | 260 | (595) | |||||||||
| Office of the Chief Electoral Officer | 20 |
Office of the Ethics Commissioner
Marguerite Trussler, K.C.
Ethics Commissioner
The Office of the Ethics Commissioner is responsible for administering the Conflicts of Interest Act, the Lobbyists Act, and certain portions of the Public Service Act.
| AMOUNT TO BE VOTED
|
||||||||||||
| (thousands of dollars) | Comparable | |||||||||||
| 2022-23 Budget |
2022-23 Forecast |
2023-24 Estimate |
||||||||||
|
ETHICS COMMISSIONER
|
|
976
|
|
|
926
|
|
|
1,000
|
| |||
21
SUPPLEMENTARY INFORMATION
OBJECTIVE
To provide Members of the Legislative Assembly, Designated Office Holders, Designated Senior Officials, and certain staff working in the Premier’s and Ministers’ Offices, with advice and recommendations regarding understanding their private interests in relation to their public responsibilities and to provide an impartial investigation of allegations of conflict of interest pertaining to those individuals.
To create and maintain a publicly accessible lobbyists registry and to investigate alleged breaches of the Lobbyists Act.
SERVICES PROVIDED
Obtains information from Members of the Legislative Assembly, Designated Office Holders, Designated Senior Officials, and certain staff in the Premier’s Office and Minister’s Offices regarding their income, assets, liabilities, and financial interests and prepares public disclosure statements for Members of the Legislative Assembly.
Investigates complaints received from the public or from an elected Member respecting an alleged breach of the Conflicts of Interest Act by a Member of the Legislative Assembly.
Maintains a publicly accessible lobbyists registry and provides advice and information to lobbyists and citizens on matters covered by the Lobbyists Act.
Conducts investigations into possible contraventions of the Lobbyists Act and may require payment of an administrative penalty.
| Office of the Ethics Commissioner | 22 |
| OFFICE SUPPLY VOTE BY PROGRAM
|
||||||||||||
| (thousands of dollars) | Comparable | |||||||||||
| 2022-23 Budget |
2022-23 Forecast |
2023-24 Estimate |
||||||||||
| OPERATING EXPENSE |
||||||||||||
| 1 Office of the Ethics Commissioner
|
|
976
|
|
|
926
|
|
|
1,000
|
| |||
| Total |
976 | 926 | 1,000 | |||||||||
|
AMOUNTS NOT REQUIRED TO BE VOTED
The following amounts do not require a supply vote either because no cash disbursement is required, or because the Legislative Assembly has already provided the funding authority pursuant to a statute other than an appropriation act.
|
| |||||||||||
| EXPENSE | ||||||||||||
| OFFICE NON-CASH AMOUNTS |
||||||||||||
| Amortization
|
|
13
|
|
|
13
|
|
|
13
|
| |||
| Total |
13 | 13 | 13 | |||||||||
| 23 | Office of the Ethics Commissioner |
| STATEMENT OF OPERATIONS
|
||||||||||||
| (thousands of dollars) | Comparable | |||||||||||
| 2022-23 Budget |
2022-23 Forecast |
2023-24 Estimate |
||||||||||
| Revenue |
||||||||||||
| None
|
|
-
|
|
|
-
|
|
|
-
|
| |||
| EXPENSE |
||||||||||||
| Office of the Ethics Commissioner
|
|
989
|
|
|
939
|
|
|
1,013
|
| |||
| Net Operating Result |
(989) | (939) | (1,013) | |||||||||
|
CHANGE IN CAPITAL ASSETS |
||||||||||||
| AMORTIZATION
|
|
(13)
|
|
|
(13)
|
|
|
(13)
|
| |||
| Change in Capital Assets Total |
(13) | (13) | (13) | |||||||||
| Office of the Ethics Commissioner | 24 |
Office of the Information and Privacy Commissioner
Diane McLeod
Information and Privacy Commissioner
The Office of the Information and Privacy Commissioner is responsible for overseeing the Freedom of Information and Protection of Privacy Act, the Health Information Act, and the Personal Information Protection Act.
AMOUNT TO BE VOTED
| (thousands of dollars) | Comparable | |||||
| 2022-23 Budget |
2022-23 Forecast |
2023-24 Estimate | ||||
|
INFORMATION AND PRIVACY COMMISSIONER
|
7,441
|
7,275
|
8,534
| |||
25
SUPPLEMENTARY INFORMATION
VISION
A society that values and respects access to information and personal privacy.
OBJECTIVE
The Information and Privacy Commissioner of Alberta (the Commissioner) is an independent Officer of the Legislature and reports directly to the Legislative Assembly.
Through the Office of the Information and Privacy Commissioner (OIPC), the Commissioner performs the legislative and regulatory responsibilities set out in the following laws:
| ● | the Freedom of Information and Protection of Privacy Act (FOIP), |
| ● | the Health Information Act (HIA), and |
| ● | the Personal Information Protection Act (PIPA) |
SERVICES PROVIDED
The Commissioner is generally responsible for monitoring the administration of these laws (the Acts) to ensure their purposes are achieved. More specifically, the Commissioner’s statutory powers and duties include, but are not limited to:
| ● | Providing independent review and resolution on requests for review of responses to access to information requests and complaints related to the collection, use and disclosure of personal and health information. |
| ● | Conducting investigations on any matters relating to the application of the Acts, whether or not a review/complaint is requested. |
| ● | Conducting inquiries to decide questions of fact and law and issuing binding orders, whether or not a review is requested. |
| ● | Receiving comments from the public concerning the administration of the Acts. |
| ● | Giving advice and recommendations of general application respecting the rights or obligations of stakeholders under the Acts. |
| ● | Engaging in or commissioning research into any matter affecting the achievement of the purposes of the Acts. |
| ● | Commenting on the implications for freedom of information or for protection of personal privacy of proposed legislative schemes and existing or proposed programs. |
| ● | Commenting on the implications for access to or protection of health information. |
| ● | Commenting on the privacy and security implications of using or disclosing personal and health information for record linkages or for the purpose of performing data matching. |
| Office of the Information and Privacy Commissioner | 26 |
| OFFICE SUPPLY VOTE BY PROGRAM
|
||||||||||||
| (thousands of dollars) | Comparable | |||||||||||
| 2022-23 Budget |
2022-23 Forecast |
2023-24 Estimate |
||||||||||
| OPERATING EXPENSE |
||||||||||||
| 1 Office of the Information and Privacy Commissioner
|
7,441 | 7,275 | 8,484 | |||||||||
| CAPITAL INVESTMENT |
||||||||||||
| 1 Office of the Information and Privacy Commissioner
|
|
-
|
|
|
-
|
|
|
50
|
| |||
| Total |
7,441 | 7,275 | 8,534 | |||||||||
| 27 | Office of the Information and Privacy Commissioner |
| STATEMENT OF OPERATIONS
|
||||||||||||
| (thousands of dollars) | Comparable | |||||||||||
| 2022-23 Budget |
2022-23 Forecast |
2023-24 Estimate |
||||||||||
| Revenue |
||||||||||||
| None |
- | - | - | |||||||||
| EXPENSE |
||||||||||||
| Office of the Information and Privacy Commissioner
|
|
7,441
|
|
|
7,275
|
|
|
8,484
|
| |||
| Net Operating Result |
(7,441) | (7,275) | (8,484) | |||||||||
| CHANGE IN CAPITAL ASSETS |
||||||||||||
| INVESTMENT |
||||||||||||
| Office of the Information and Privacy Commissioner
|
|
-
|
|
|
-
|
|
|
50
|
| |||
| Change in Capital Assets Total |
- | - | 50 | |||||||||
| Office of the Information and Privacy Commissioner | 28 |
Office of the Child and Youth Advocate
Terri Pelton
Child and Youth Advocate
The Office of the Child and Youth Advocate champions children’s rights, amplifies young people’s voices, and fosters youth participation.
| AMOUNT TO BE VOTED |
||||||||||||
| (thousands of dollars) | Comparable | |||||||||||
| 2022-23 Budget |
2022-23 Forecast |
2023-24 Estimate |
||||||||||
| CHILD AND YOUTH ADVOCATE
|
15,259 | 14,716 | 16,205 | |||||||||
29
SUPPLEMENTARY INFORMATION
OBJECTIVE
The Office of the Child and Youth Advocate provides individual and systemic advocacy services for children and youth in the child intervention and youth justice systems. The Advocate investigates serious injuries and/or deaths of children receiving a designated service. In carrying out this function, the Advocate will have the powers of the Commissioner under the Public Inquiries Act. The Advocate may appoint lawyers to represent children and youth with respect to any proceeding under the Child, Youth and Family Enhancement Act and the Protection of Sexually Exploited Children Act.
SERVICES PROVIDED
| 1. | Advocating on behalf of individual children and youth receiving designated services by ensuring that their rights, interests, and viewpoints are acknowledged and acted upon. |
| 2. | Providing quality legal representation to children and youth receiving services under the Child, Youth and Family Enhancement Act or the Protection of Sexually Exploited Children Act. |
| 3. | Conducting investigations into serious injuries and/or deaths of children receiving designated services. |
| 4. | Promoting the rights, interests and viewpoints of vulnerable children through participation in processes in which decisions are made about them, and through public education. |
| 5. | Identifying areas of systemic improvements in government systems that will enhance services for vulnerable children and youth. |
| Office of the Child and Youth Advocate | 30 |
OFFICE SUPPLY VOTE BY PROGRAM
| (thousands of dollars) | Comparable | |||||||||||||
| 2022-23 Budget |
2022-23 Forecast |
2023-24 Estimate |
||||||||||||
| OPERATING EXPENSE |
||||||||||||||
| 1 | Child and Youth Advocate’s Office |
1,008 | 972 | 795 | ||||||||||
| 2 | Advocacy Executive Director’s Office |
3,265 | 2,831 | 3,583 | ||||||||||
| 3 | Legal Representation for Children and Youth |
4,431 | 3,984 | 4,449 | ||||||||||
| 4 | Investigations |
2,333 | 2,105 | 2,435 | ||||||||||
| 5 | Youth and Community Engagement |
1,262 | 1,560 | 1,687 | ||||||||||
| 6 | Strategic Support |
2,760 | 3,096 | 2,956 | ||||||||||
| CAPITAL INVESTMENT |
||||||||||||||
| 1 | Child and Youth Advocate’s Office |
- | 37 | 100 | ||||||||||
| 6
|
Strategic Support
|
|
200
|
|
|
131
|
|
|
200
|
| ||||
| Total | 15,259 | 14,716 | 16,205 | |||||||||||
|
AMOUNTS NOT REQUIRED TO BE VOTED
The following amounts do not require a supply vote either because no cash disbursement is required, or because the Legislative Assembly has already provided the funding authority pursuant to a statute other than an appropriation act.
|
| |||||||||||||
| EXPENSE | ||||||||||||
| OFFICE NON-CASH AMOUNTS |
||||||||||||
| Amortization |
129 | 100 | 140 | |||||||||
| Valuation Adjustments and Other Provisions
|
|
50
|
|
|
27
|
|
|
50
|
| |||
| Total |
179 | 127 | 190 | |||||||||
| 31 | Office of the Child and Youth Advocate |
STATEMENT OF OPERATIONS
| (thousands of dollars) | Comparable | |||||||||||
| 2022-23 Budget |
2022-23 Forecast |
2023-24 Estimate |
||||||||||
| Revenue |
||||||||||||
| None |
- | - | - | |||||||||
| EXPENSE |
||||||||||||
| Advocacy Executive Director’s Office |
3,286 | 2,841 | 3,603 | |||||||||
| Youth and Community Engagement |
1,268 | 1,564 | 1,693 | |||||||||
| Child and Youth Advocate’s Office |
1,011 | 974 | 798 | |||||||||
| Legal Representation for Children and Youth |
4,432 | 3,985 | 4,450 | |||||||||
| Investigations |
2,344 | 2,111 | 2,445 | |||||||||
| Strategic Support |
2,897 | 3,200 | 3,106 | |||||||||
| Total
|
|
15,238
|
|
|
14,675
|
|
|
16,095
|
| |||
| Net Operating Result |
(15,238) | (14,675) | (16,095) | |||||||||
| CHANGE IN CAPITAL ASSETS |
||||||||||||
| INVESTMENT |
||||||||||||
| Child and Youth Advocate’s Office |
- | 37 | 100 | |||||||||
| Strategic Support |
200 | 131 | 200 | |||||||||
| Total |
200 | 168 | 300 | |||||||||
| AMORTIZATION
|
|
(129)
|
|
|
(100)
|
|
|
(140)
|
| |||
| Change in Capital Assets Total |
71 | 68 | 160 | |||||||||
| Office of the Child and Youth Advocate | 32 |
Office of the Public Interest Commissioner
Kevin Brezinski
Public Interest Commissioner
The Public Interest Commissioner’s office administers the Public Interest Disclosure (Whistleblower Protection) Act by facilitating the disclosure and investigation of significant and serious matters that public service employees believe may be unlawful, dangerous to the public or injurious to the public interest.
| AMOUNT TO BE VOTED | ||||||||||||
| (thousands of dollars) | Comparable | |||||||||||
| 2022-23 |
2022-23
|
2023-24
|
||||||||||
| PUBLIC INTEREST COMMISSIONER
|
|
1,223
|
|
|
1,122
|
|
|
1,410
|
| |||
33
SUPPLEMENTARY INFORMATION
OBJECTIVE
The Public Interest Commissioner is an independent Officer of the Alberta Legislature responsible for investigating allegations of wrongdoing and reprisal in the public service. Legislated by the Public Interest Disclosure (Whistleblower Protection) Act (the Act), our office serves as a resource for provincial public service employees who believe wrongdoing is occurring in their organization. We work to foster a culture where whistleblowing is embraced and where employees and management share a common goal of detecting and remedying wrongdoing. An effective public service depends on the commitment of everyone working within it to maintain the highest possible standards of honesty, openness and accountability.
SERVICES PROVIDED
Facilitates the disclosure and investigation of significant and serious matters relating to government departments, public entities, elected officials and offices of the Legislature.
Enforces the protection provisions of the Act for public service employees who take steps in accordance with the Act.
Manages, investigates and make recommendations respecting disclosures of wrongdoings and complaints of reprisals.
Promotes public confidence in the administration of the public service.
| Office of the Public Interest Commissioner | 34 |
OFFICE SUPPLY VOTE BY PROGRAM
| (thousands of dollars) | Comparable | |||||||||||||
| 2022-23
|
2022-23
|
2023-24
|
||||||||||||
| OPERATING EXPENSE |
||||||||||||||
| 1 | Office of the Public Interest Commissioner
|
1,223 | 1,122 | 1,410 | ||||||||||
| Total | 1,223 | 1,122 | 1,410 | |||||||||||
| 35 | Office of the Public Interest Commissioner |
| STATEMENT OF OPERATIONS
|
||||||||||||
| (thousands of dollars) | Comparable | |||||||||||
| 2022-23 Budget |
2022-23 Forecast |
2023-24 Estimate |
||||||||||
| Revenue |
||||||||||||
| None |
- | - | - | |||||||||
| EXPENSE |
||||||||||||
| Office of the Public Interest Commissioner
|
|
1,223
|
|
|
1,122
|
|
|
1,410
|
| |||
| Net Operating Result |
(1,223) | (1,122) | (1,410) | |||||||||
| Office of the Public Interest Commissioner | 36 |