The UNITED STATES
SECURITIES AND EXCHANGE COMMISSION
Washington, D.C. 20549
FORM 10-K
(Mark One)
|
|
ANNUAL REPORT PURSUANT TO SECTION 13 OR 15(d) OF THE SECURITIES EXCHANGE ACT OF 1934
|
For the year ended December 31, 2022
OR
|
|
TRANSITION REPORT PURSUANT TO SECTION 13 OR 15(d) OF THE SECURITIES EXCHANGE ACT OF 1934
|
Commission file number: 814-01399
(Exact Name of Registrant as Specified in its Charter)
|
|
|
|
|
(State or Other Jurisdiction of Incorporation or Organization)
|
(I.R.S. Employer Identification No.)
|
|
|
||
|
|
|
|
|
(Address of Principal Executive Office)
|
(Zip Code)
|
(212 ) 810-9044
(Registrant’s Telephone Number, Including Area Code)
Securities registered pursuant to Section 12(b) of the Act:
|
Title of Each Class
|
Trading Symbol(s)
|
Name of Each Exchange on Which
Registered
|
|
None
|
N/A
|
N/A
|
Indicate by check mark if the registrant is a well-known seasoned issuer, as defined in Rule 405 of the Securities Act. Yes ☐ No ☒
Indicate by check mark if the registrant is not required to file reports pursuant to Section 13 or Section 15(d) of the Act. Yes ☐ No ☒
Indicate by check mark whether the registrant: (1) has filed all reports required to be filed by Section 13 or 15(d) of the Securities Exchange Act of 1934 during the preceding 12 months (or for such
shorter period that the registrant was required to file such reports), and, (2) has been subject to such filing requirements for the past 90 days. Yes
☒ No ☐
Indicate by check mark whether the registrant has submitted electronically every Interactive Data File required to be submitted pursuant to Rule 405 of Regulation S-T
(§232.405 of this chapter) during the preceding 12 months (or for such shorter period that the registrant was required to submit such files). Yes ☐ No
☐
Indicate by check mark whether the registrant is a large accelerated filer, an accelerated filer, a non-accelerated filer, a smaller reporting company, or an emerging growth company. See the
definitions of “large accelerated filer,” “accelerated filer,” “smaller reporting company,” and “emerging growth company” in Rule 12b-2 of the Exchange Act.
|
Large accelerated filer
|
☐
|
Accelerated filer
|
☐
|
|
|
☒
|
Smaller reporting company
|
|
|
Emerging growth company
|
|
If an emerging growth company, indicate by check mark if the registrant has elected not to use the extended transition period for complying with any new or revised financial accounting standards
provided pursuant to Section 13(a) of the Exchange Act. ☐
Indicate by check mark whether the registrant has filed a report on and attestation to its management’s assessment of the effectiveness of its internal control over financial reporting under Section
404(b) of the Sarbanes-Oxley Act by the registered public accounting firm that prepared or issued its audit report. ☐
Indicate by check mark whether the registrant is a shell company (as defined in Rule 12b-2 of the Exchange Act). Yes ☐ No ☒
As of June 30, 2022, there was no established public market for the registrant’s common
stock.
As of March 31, 2023, the registrant had 7,482,233 , shares of common stock, $0.001 par
value, outstanding.
DOCUMENTS INCORPORATED BY REFERENCE
Portions of the registrant’s definitive proxy statement relating to the registrant’s 2023 Annual Meeting of Stockholders, to be filed with the Securities and Exchange Commission within 120 days following the end of
the registrant’s fiscal year, are incorporated by reference in Part III of this Annual Report on Form 10-K as indicated herein.
|
Page
|
||
|
Part I
|
||
|
Item 1.
|
4
|
|
|
Item 1A.
|
21
|
|
|
Item 1B.
|
38
|
|
|
Item 2.
|
38
|
|
|
Item 3.
|
38 | |
|
Item 4.
|
38
|
|
|
Part II
|
||
|
Item 5.
|
38
|
|
|
Item 6.
|
40
|
|
|
Item 7.
|
40
|
|
|
Item 7A.
|
50
|
|
|
Item 8.
|
51
|
|
|
Item 9.
|
51
|
|
|
Item 9A.
|
51 | |
|
Item 9B.
|
52
|
|
|
Item 9C.
|
52
|
|
|
PART III
|
||
|
Item 10.
|
53
|
|
|
Item 11.
|
53
|
|
|
Item 12.
|
53
|
|
|
Item 13.
|
53
|
|
|
Item 14.
|
53
|
|
|
PART IV
|
||
|
Item 15.
|
53
|
|
|
Item 16.
|
55
|
|
|
55
|
||
FORWARD-LOOKING STATEMENTS
Statements contained in this Annual Report on Form 10-K (including those relating to current and future market conditions and trends in respect thereof) that are not historical facts are based on current
expectations, estimates, projections, opinions and/or beliefs of Star Mountain Lower Middle-Market Capital Corp. (the “Company”), Star Mountain Fund Management, LLC (the “Advisor”) and Star Mountain Capital, LLC (“Star Mountain”). Such statements
involve known and unknown risks, uncertainties and other factors and undue reliance should not be placed thereon. Certain information contained in this Annual Report on Form 10-K constitutes “forward-looking statements,” which can be identified by
the use of forward-looking terminology such as “may,” “will,” “should,” “seek,” “expect,” “anticipate,” “project,” “estimate,” “intend,” “continue,” “target,” or “believe” or the negatives thereof or other variations thereon or comparable
terminology. Due to various risks and uncertainties, actual events or results or the actual performance of the Company may differ materially from those reflected or contemplated in such forward-looking statements. These statements are not
guarantees of future performance and are subject to risks, uncertainties, and other factors, some of which are beyond the Company’s control and are difficult to predict, that could cause actual results to differ materially from those expressed or
forecasted in the forward-looking statements including, without limitation, the risks, uncertainties and other factors the Company identifies in the section entitled “Item 1A. Risk Factors” and elsewhere in this Annual Report on Form 10-K and in
the Company’s filings with the Securities and Exchange Commission (“SEC”).
Although the Company believes that the assumptions on which these forward-looking statements are based are reasonable, some of those assumptions are based on the work of third parties and any of those assumptions
could prove to be inaccurate; as a result, the forward-looking statements based on those assumptions also could prove to be inaccurate. In light of these and other uncertainties, the inclusion of a projection or forward-looking statement in this
Annual Report on Form 10-K should not be regarded as a representation by us that the Company’s plans and objectives will be achieved. These risks and uncertainties include those described or identified in the section entitled “Item 1A. Risk
Factors” and elsewhere in this Annual Report on Form 10-K. Investors should not place undue reliance on these forward-looking statements, which apply only as of the date of this Annual Report on Form 10-K. The Company does not undertake any
obligation to update or revise any forward-looking statements or any other information contained herein, except as required by applicable law. The safe harbor provisions of Section 21E of the Securities Exchange Act of 1934 (“Exchange Act”), which
preclude civil liability for certain forward-looking statements, do not apply to the forward-looking statements in this Annual Report on Form 10-K because the Company is an investment company.
The following factors are among those that may cause actual results to differ materially from the Company’s forward-looking statements:
| • |
the Company’s future operating results;
|
| • |
increasing interest rates and interest rate volatility, including volatility associated with the decommissioning of London Interbank Offered Rate (“LIBOR”) and the transition to new reference rates;
|
| • |
inflation could adversely affect the business, results of operations and financial condition of the Company’s portfolio companies;
|
| • |
the Company’s business prospects and the prospects of the Company’s prospective portfolio companies;
|
| • |
the impact of increased competition;
|
| • |
the Company’s contractual arrangements and relationships with third parties;
|
| • |
the dependence of the Company’s future success on the general economy and its impact on the industries in which the Company invests;
|
| • |
the ability of the Company’s prospective portfolio companies to achieve their objectives;
|
| • |
the relative and absolute performance of the Advisor;
|
| • |
the ability of the Advisor and its affiliates to retain talented professionals;
|
| • |
the Company’s expected financings and investments;
|
| • |
the Company’s ability to pay dividends or make distributions;
|
| • |
the adequacy of the Company’s cash resources;
|
| • |
risks associated with possible disruptions in the Company’s operations or the economy generally due to war or terrorism or other disruptive geopolitical events domestically and/or globally;
|
| • |
the ongoing conflict in Ukraine and Russia, including sanctions and market volatility related to such conflict, may adversely impact the industries and portfolio companies in which the Company invests;
|
| • |
the impact of future acquisitions and divestitures;
|
| • |
the Company’s regulatory structure as a business development company (“BDC”) and tax status as a regulated investment company (a “RIC”); and
|
| • |
future changes in laws or regulations and conditions in the Company’s operating areas.
|
PART I
| Item 1. |
Business
|
| (a) |
General Development of Business
|
Star Mountain Lower Middle-Market Capital Corp. (the “Company”) is an externally managed, closed-end management investment company and has elected to be regulated as a BDC under the Investment Company Act of 1940, as amended (the “1940 Act”).
The Company’s investment objectives are to generate current income and capital appreciation.
Star Mountain Credit Opportunities Fund, LP (the “Private Fund”) was formed as a Delaware limited partnership on August 7, 2019 to make investments in lower middle-market companies and commenced operations on
September 16, 2019. On May 14, 2021, Star Mountain Credit Opportunities Fund, LP converted to Star Mountain Lower Middle-Market Capital Corp., via a filing with the State of Delaware of a Certificate of Conversion to a Corporation (“BDC
Conversion”). Following the BDC Conversion, the existing limited partners of the Private Fund became Stockholders of the Company by operation of law, and the value of an investor’s limited partnership interest in the Private Fund was converted into
a corresponding number of shares of Common Stock in the Company at a net asset value (“NAV”) per share of $25.00. Net asset value at the time of the BDC Conversion was $42,215,029, which consisted of investments at fair value of $42,865,258, cash
of $620,015, carried interest payable of $990,732, organizational cost payable of $413,685, and other receivables and payables, which had a net value of $134,173. The historical cost basis of investments was carried forward during the BDC
Conversion.
Based on analysis of the attributes of the Star Mountain Credit Opportunities Fund, LP predecessor entity versus the Star Mountain Lower Middle-Market Capital Corp. converted entity, it was determined that Star
Mountain Lower Middle-Market Capital Corp. was the accounting survivor.
Prior to the BDC Conversion, the Company entered into separate subscription agreements (each, a “Subscription Agreement”) with investors who were admitted as limited partners. Following the BDC
Conversion, the Company has and expects to continue to enter into separate Subscription Agreements with a number of investors who will be admitted as Stockholders providing for the private placement of the Company’s Common Stock. Each Stockholder
will make a capital commitment (“Capital Commitments”) to purchase shares of the Company’s Common Stock pursuant to the Subscription Agreement. Stockholders will be required to make capital contributions (“Capital Contributions”) to purchase shares
of the Company’s Common Stock each time the Company delivers a drawdown notice, which will be delivered at least eight (8) Business Days (as defined below) prior to the initial required funding date, in an aggregate amount not to exceed their
respective Capital Commitments. See “Item 1(b). Description of Business.”
The Company filed an election with the SEC to be treated as a BDC under the 1940 Act. The Company has elected and intends to continue to qualify annually to be treated for U.S. federal income tax purposes as a RIC
under Subchapter M of the Internal Revenue Code of 1986, as amended (the “Code”). As a BDC and a RIC, the Company is required to comply with certain regulatory requirements. See “Item 1(b). Description of Business—
Regulation as a Business Development Company” and “Item 1(b). Description of Business—Certain U.S. Federal Income Tax Consequences.”
| (b) |
Description of Business
|
The Company
The Company has been established by the Advisor to provide investors with access to a diversified portfolio composed primarily of loans with equity upside investments in U.S. small and medium-sized businesses
(“SMBs”). The Company is externally managed by Star Mountain Fund Management, LLC, an investment adviser registered with the SEC under the Investment Advisers Act of 1940, as amended (the “Advisers Act”). Star Mountain Fund Management, LLC will
also serve as the Company’s administrator (in such capacity, the “Administrator”) pursuant to an administration agreement (the “Administration Agreement”). The Administrator has entered into a sub-administration agreement with SS&C
Technologies, Inc. (the "Sub-Administrator"), under which the Sub-Administrator provides various accounting and administrative services to the Company.
Following the BDC Conversion, the Company became a Delaware corporation structured as an externally managed, non-diversified closed-end management investment company. The Company has elected to be treated as a BDC
under the 1940 Act. In addition, the Company elected to be treated as a RIC for U.S. federal income tax purposes under Subchapter M of the Code. Investors whose subscriptions for Common Stock are accepted will be admitted as Stockholders in the
Company. Following the BDC Conversion, all existing investors became Stockholders of the Company by operation of law, and the value of an investor’s limited partnership interest in the Company was converted into a corresponding number of shares of
Common Stock in the Company.
The Board of Directors
The Company’s business and affairs are managed under the direction of the Company’s Board of Directors (the “Board”). The Board consists of five members, three of whom are not “interested persons” of the Company, the
Advisor or their respective affiliates as defined in Section 2(a)(19) of the 1940 Act. The Company refers to these individuals as the Company’s “Independent Directors.” The Independent Directors compose a majority of the Company’s Board. Directors
who are “interested persons,” as defined in Section 2(a) of the 1940 Act, of the Company or the Advisor are referred to herein as “Interested Directors.” The Board elects the Company’s officers, who serve at the discretion of the Board. The
responsibilities of the Company’s Board include quarterly determinations of fair value of the Company’s assets, corporate governance activities, oversight of the Company’s financing arrangements and oversight of the Company’s investment activities.
The Board has established an Audit Committee, Nominating and Corporate Governance Committee and an Independent Directors Committee. The scope of each committee’s responsibilities is discussed in greater detail in Item
10 below.
The Advisor
Star Mountain Fund Management, LLC, a Delaware limited liability company, serves as the Advisor of the Company. The Advisor is registered as an investment adviser with the SEC pursuant to the Advisers Act. The
Advisor provides certain investment advisory and management services to the Company pursuant to an Investment Advisory Agreement (the “Advisory Agreement”). Star Mountain Fund Management, LLC will also serve as the Administrator pursuant to an
Administration Agreement between the Company and the Administrator.
About Star Mountain
Star Mountain is a specialized investment firm focused on investment and financing activities in the SMB market segment where it believes it can generate attractive risk-adjusted returns. Star Mountain originates
direct credit-focused investments in U.S. lower middle-market businesses across resilient sectors characterized by limited cyclicality and capital intensity.
Headquartered in New York, NY, Star Mountain’s presence in over 20 cities supports local origination, execution and monitoring capabilities throughout the United States.
Investment Committee
The Advisor has formed and will maintain an investment committee (the “Investment Committee”) comprised of not less than six members. Any two members of the Investment Committee acting together shall have the right
to veto any investment. Other decisions of the Investment Committee shall require the vote of a simple majority of its members. Any five members of the Investment Committee shall constitute a quorum for purposes of any meeting thereof; provided,
however, that the abstention of any member of the Investment Committee from any investment or other decision of the Investment Committee shall not affect the existence of such quorum.
Investment Objective and Strategy
The Company’s investment objectives are to generate current income and capital appreciation. The Company seeks to achieve its investment objectives by investing primarily in privately negotiated loans and equity
investments to SMBs generally with annual revenues greater than $15 million and earnings before interest, taxes, depreciation and amortization (“EBITDA”) of less than $50 million. Generally, these businesses are owner-operated with an average 20+
year operating history. To accomplish this, the Company plans to (i) make direct investments in SMBs (“Direct Investments”) and (ii) make investments in investment funds focused primarily on investing in SMBs (“Fund Investments”) and, together with
Direct Investments, (“Portfolio Investments”). The Company seeks to provide investors with access to:
| • |
A diversified portfolio of credit investments with equity upside to SMBs, generally not owned by large private equity firms.
|
| • |
Current income distributions.
|
| • |
Capital protection through defensive structures with affirmative, negative and financial maintenance covenants and active portfolio management.
|
| • |
Targeted diversification of assets by vintage, industry and geography through direct originations and acquisitions of loan portfolios.
|
| • |
Generally low volatility and low correlation to public market indices.
|
The Company’s investment strategy may be complemented by secondary fund investments and secondary loans, consisting of generally non-brokered purchases of limited partnership interests in lower middle-market
credit-oriented funds and secondary loans. This complementary strategy may result in portfolio construction and diversification benefits.
The Company’s investments are subject to a number of risks. See “Item 1A. Risk Factors.” The Company utilizes leverage to help the Company meet its investment objectives. Any
such leverage, if incurred, would be expected to increase the total capital available for investment by the Company.
Qualifying Assets
As a BDC, the Company will need to satisfy certain requirements, including but not limited to:
| (i) |
the Company will not acquire any assets other than “qualifying assets” as defined in the 1940 Act (and summarized in “Regulation as a Business Development Company”) unless, at the time of and
after giving effect to such acquisition, at least 70% of the Company’s total assets are qualifying assets;
|
| (ii) |
the Company will offer, and must provide upon request, significant managerial assistance to its portfolio companies that constitute qualifying assets (as described in greater detail in “Regulation as a
Business Development Company” below);
|
|
(iii)
|
the Company generally must have at least 150% asset coverage for its debt after incurring any new indebtedness; and
|
|
(iv)
|
except for shares of registered money market funds, the Company generally cannot acquire more than 3% of the voting stock of any registered investment company or BDC (either, an “Investment Company”),
invest more than 5% of the value of its total assets in the securities of one Investment Company or invest more than 10% of the value of its total assets in the securities of Investment Companies in the aggregate. Subject to certain
exemptive rules, including Rule 12d1-4, the Company may, subject to certain conditions, invest in other Investment Companies in excess of such thresholds.
|
The Company may borrow money from time to time within the levels permitted by the 1940 Act (which generally allows the Company to incur debt up to two times its equity). In determining whether to borrow money, the
Company will analyze the maturity, covenant package and rate structure of the proposed borrowings as well as the risks of such borrowings compared to its investment outlook. The use of borrowed funds to make investments would have its own specific
set of benefits and risks, and all of the costs of borrowing funds or issuing preferred stock would be borne by holders of its Common Stock. The Company does not currently intend to issue preferred stock. See “Item
1(b). Description of Business—Regulation as a Business Development Company.”
The Company intends from time to time to offer to repurchase common shares pursuant to written tenders and any share repurchases will be effected in accordance with applicable law.
The Private Offering
The Company has and expects to enter into separate Subscription Agreements with a number of Stockholders for a private offering (the “Private Offering”). Each Stockholder will make a Capital Commitment to purchase
shares of our Common Stock pursuant to the Subscription Agreement. Stockholders will be required to make Capital Contributions to purchase shares of the Company’s Common Stock each time the Company delivers a drawdown notice (as further described
below). For the year ended December 31, 2022, the Company had four subsequent closes admitting 186 additional Stockholders including upsize for existing Stockholders with a total Capital Commitment of $76,320,470. For the period from May 14, 2021
to December 31, 2021, the Company had three subsequent closes admitting 124 additional Stockholders with a total Capital Commitment of $83,005,950.
The Company will hold one or more closings at which it will accept Capital Commitments from Stockholders. During the term of the Company, Stockholders will make Capital Contributions pro rata in accordance with their
respective Capital Commitments.
Stockholders will be required to fund drawdowns to purchase additional shares of the Company up to the amount of their respective Capital Commitments each time the Company delivers a drawdown notice, which will be at
least eight Business Days (as defined below) prior to funding. All purchases will generally be made pro rata, in accordance with the remaining Capital Commitments of all Stockholders, at a per-share price equal to the net asset value per share of
the Company’s Common Stock, as determined by the Board.
New Stockholders admitted to the Company or existing Stockholders increasing their Capital Commitments at a particular closing will be required to purchase shares of the Company with an aggregate purchase price
necessary to ensure that all Stockholders in the Company have generally contributed the same percentage of their Capital Commitments to the Company immediately following such purchase (a “Catch-up Purchase”) and each such Stockholder shall be
issued a number of shares of the Company based on a per share purchase price determined by the Board. A Catch-up Purchase may be made in multiple installments as determined by the Advisor based on the Company’s capital requirements. The per share
purchase price shall be at least equal to the net asset value per share in accordance with the limitations of Section 23 of the 1940 Act. The Board may set the price per share above the net asset value per share based on a variety of factors,
including without limitation, the total amount of the Company’s organizational and other expenses that will have accrued following the Company’s initial closing.
“Business Day” shall mean any day other than a Saturday, Sunday or a day when banks in the State of New York are authorized or required by law, regulation or executive order to remain closed.
Advisory Agreement; Administration Agreement
The Company’s investment activities are managed by the Advisor, which is responsible for originating prospective investments, conducting research and due diligence investigations on potential investments, analyzing
investment opportunities, negotiating and structuring investments and monitoring investments and portfolio companies on an ongoing basis.
Pursuant to the Advisory Agreement, the Company pays to the Advisor a management fee (the “Management Fee”), payable quarterly in arrears at an annual rate of 1.75% per annum of the average of the Company’s total
gross assets (excluding cash or cash equivalents but including assets purchased with borrowed amounts) as of the end of each of the two most recently completed calendar quarters. The Management Fee is payable quarterly in arrears and will be
appropriately prorated for any partial quarter.
“Incentive Compensation” is payable by the Company to the Advisor and consists of two components that are independent of each other, with the result that one component may be payable even if the other is not. A
portion of the incentive fee is based on a percentage of the Company’s income (an “Income Incentive Fee”) and a portion is based on a percentage of the Company’s capital gains (the “Capital Gains Incentive Fee”), each as described below. Because of
the structure of the Incentive Compensation, it is possible that the Company may pay an Income Incentive Fee in a quarter where it incurs a loss. For example, if the Company receives Pre-Incentive Fee Net Investment Income in excess of the hurdle
rate (as defined below) for a quarter, the Company will pay the applicable Income Incentive Fee even if it has incurred a loss in that quarter due to realized and unrealized capital losses.
| (i) |
Income Incentive Fee
|
Incentive Fee on Pre-Incentive Fee Net Investment Income
The first component of the Incentive Compensation, the Income Incentive Fee, is payable quarterly in arrears. The Income Incentive Fee will be determined by comparing the Company’s Pre-Incentive Fee Net Investment
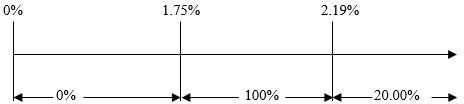
Income (as defined herein) to a “Hurdle Amount.” The Hurdle Amount is equal to the product of (i) the hurdle rate of 1.75% per quarter (7.00% annualized) and (ii) the Company’s net assets at the end of the immediately preceding quarter.
The Company pays the Advisor an Income Incentive Fee quarterly in arrears with respect to the Company’s Pre-Incentive Fee Net Investment Income in each calendar quarter as follows:
| • |
no Income Incentive Fee in any calendar quarter in which the Company’s Pre- Incentive Fee Net Investment Income does not exceed the Hurdle Amount;
|
| • |
100% of that portion of the Company’s Pre-Incentive Fee Net Investment Income, if any, that exceeds the Hurdle Amount but is less than or equal to a “Catch-up Amount.” The Catch-up Amount is equal to the product of (i) 2.19% per quarter
(8.75% annualized) and (ii) the Company’s net assets at the end of the immediately preceding quarter. The Catch-up Amount is meant to provide the Advisor with approximately 20% of the Company’s Pre- Incentive Fee Net Investment Income as if
a hurdle rate did not apply; and
|
| • |
20% of the Company’s Pre-Incentive Fee Net Investment Income, if any, that exceeds the Catch-up Amount. This reflects that once the Hurdle Amount and the Catch-up Amount are achieved, 20% of all Pre-Incentive Fee Net Investment Income
thereafter is allocated to the Advisor.
|
Pre-Incentive Fee Net Investment Income shall mean interest income, dividend income and any other income accrued or earned by the Company during the calendar quarter, minus the Company’s operating expenses for the
quarter (including Management Fee, administrative expenses payable under the Administration Agreement or the Sub-Administration Agreement, and any interest expense and dividends paid on any issued and outstanding preferred stock, but excluding
Incentive Compensation). Pre-Incentive Fee Net Investment Income includes, in the case of investments with a deferred interest feature (such as original issue discount, debt instruments with pay in kind interest and zero-coupon securities), accrued
income that the Company has not yet received in cash. Pre- Incentive Fee Net Investment Income does not include any realized capital gains, realized capital losses and unrealized capital appreciation or depreciation.
The following is a graphical representation of the calculation of the income incentive fee:
Incentive Fee on
Pre-Incentive Fee Net Investment Income
(expressed as a percentage of average adjusted capital)
|
(ii)
|
Capital Gains Incentive Fee
|
Incentive Fee on Capital Gains
The second component of the Incentive Compensation, the Capital Gains Incentive Fee, is payable at the end of each calendar year in arrears.
The amount payable equals:
20% of cumulative realized capital gains from inception through the end of such calendar year, computed net of all realized capital losses and unrealized capital depreciation on a cumulative basis, less the aggregate
amount of any previously paid incentive fee on capital gains as calculated in accordance with GAAP. It should be noted that, while Incentive Compensation excludes unrealized gains in the calculation of the Capital Gains Incentive Fee to be paid, as
required by GAAP, the Company nevertheless accrues Capital Gains Incentive Fees on these unrealized gains.
Examples of Quarterly Incentive Fee Calculation
Example 1: Income Related Portion of Incentive Fee: (*) Alternative 1—The Company is below the hurdle
Assumptions
Investment income (including interest, dividends, fees, etc.) = 2.00% Hurdle rate (1) = 1.75%
Management fee = 0.4375%
Other expenses (legal, accounting, custodian, transfer agent, etc.) = 0.1525%
Pre-incentive fee net investment income
(investment income–(management fee + other expenses)) = 1.41%, which does not exceed the hurdle rate Pre-incentive fee net investment income does not exceed hurdle rate, therefore there is no incentive fee.
Alternative 2—The Company exceeds the hurdle
Assumptions
Investment income (including interest, dividends, fees, etc.) = 2.50% Hurdle rate (1) = 1.75%
Management fee = 0.4375%
Other expenses (legal, accounting, custodian, transfer agent, etc.) = 0.1525%
Pre-incentive fee net investment income
(investment income–(management fee + other expenses)) = 1.91%, which exceeds the hurdle rate
Pre-incentive fee net investment income exceeds the hurdle rate, therefore there is an incentive fee (calculated below).
Incentive fee:
Pre-incentive fee net investment income exceeds the hurdle rate but is less than the catchup limit of 2.19%. Therefore, incentive fee is equal to 100% of the amount of the pre-incentive fee net investment income that
exceeds the hurdle, calculated as follows:
100% x [1.91% (pre-incentive fee net investment income) -1.75% (hurdle)] = 0.16% of net assets paid in incentive fee.
Alternative 3—The Company exceeds the catch-up
Assumptions
Investment income (including interest, dividends, fees, etc.) = 3.0% Hurdle rate (1) = 1.75%
Management fee = 0.4375%
Other expenses (legal, accounting, custodian, transfer agent, etc.) = 0.1525%
Pre-incentive fee net investment income
(investment income–(management fee + other expenses)) = 2.41%, which exceeds the hurdle rate and the catch-up
Pre-incentive fee net investment income exceeds the hurdle rate, therefore there is an incentive fee (calculated below).
Incentive fee = 20% × pre-incentive fee net investment income
Incentive fee = 20% (incentive fee rate) x 2.41% (pre-incentive fee net investment income) = 0.482% of net assets paid in incentive fee.
(*) The hypothetical amount of pre-incentive fee net investment income shown is based on a percentage of total net assets.
| (1) |
Represents 7.0% annualized hurdle rate.
|
| (2) |
The “catch-up” provision is intended to provide our Advisor with an incentive fee of approximately 20% on all of our pre- incentive fee net investment income when our net investment income exceeds 2.19% in any calendar quarter.
|
Example 2: Capital Gains Portion of Incentive Fee:
Assumptions
Year 1: $25.0 million investment made in Company A (“Investment A”), $35.0 million investment made in Company B (“Investment B”) and $30.0 million investment made in Company C (“Investment C”)
Year 2: Investment A sold for $35.0 million, fair value of Investment B determined to be $30.0 million and fair value of Investment C determined to be $32.0 million
Year 3: Fair value of Investment B determined to be $34.0 million and Investment C sold for $35.0 million
Year 4: Fair value of Investment B determined to be $45.0 million
Determination of incentive fee based on capital gains
The incentive fee based on capital gains, if any, would be:
Year 1: None
Year 2: $1 million
The portion of the incentive fee based on capital gains equals (A) 20% of our realized capital gains, if any, on a cumulative basis from inception through the end of the fiscal year, computed net of all realized
capital losses and unrealized capital depreciation on a cumulative basis, minus (B) the aggregate amount of any previously paid capital gain incentive.
Therefore, using the assumptions above, the incentive fee based on capital gains equals (A) 20% × ($10.0 million-$5.0 million) minus (B) $0. Therefore, the incentive fee based on capital gains equals $1 million.
Year 3: $1.8 million, which is calculated as follows:
The incentive fee based on capital gains equals (A) 20% × ($15.0 million-$1.0 million) minus (B) $1 million. Therefore, the incentive fee based on capital gains equals $1.8 million.
Year 4: $0.2 million, which is calculated as follows:
The incentive fee based on capital gains equals (x) (A) 20% × ($15.0 million-$0.0 million) minus (B) $2.8 million. Therefore, the incentive fee based on capital gains equals $0.2 million.
In the event that the Advisory Agreement shall terminate as of a date that is not a fiscal year end, the termination date shall be treated as though it were a fiscal year end for purposes of calculating and paying a
capital gains incentive fee.
Company Expenses
The Advisor and/or any affiliate of the Advisor that enters into an Administration Agreement with the Company are authorized to incur and pay, in the name and on behalf of the Company, all expenses which they deem
necessary or advisable.
The Advisor is responsible for and will pay, or cause to be paid, all Overhead Expenses, except to the extent provided below. For this purpose, “Overhead Expenses” include overhead expenses of an ordinarily recurring
nature such as rent, utilities, supplies, secretarial expenses, stationery, charges for furniture, fixtures and equipment, employee benefits including insurance, payroll taxes and compensation of all employees.
The Company reimburses the Advisor or its affiliates, as applicable, for all costs and expenses incurred in connection with administering the Company’s business including out of pocket expenses (including travel,
lodging and meals), the Company’s allocable portion of the Advisor’s or any affiliated Administrator’s overhead expenses in performing its obligations under the Advisory Agreement or any Administration Agreement, as applicable, including rent and
the allocable portion of the compensation paid by the Advisor or its affiliates, as applicable, to the Company’s Chief Compliance Officer and Chief Financial Officer and their respective staffs (based on the percentage of time such individuals
devote, on an estimated basis, to the business affairs of the Company), third- party software licensing, implementation, data management and recovery services and custom development costs.
All other expenses are borne by the Company, including legal, accounting, tax, auditing, consulting and other professional expenses (including, without limitation, expenses relating to establishing reputation and
public relations in connection with self-sourced lending or other financial transactions); the Management Fee and Incentive Compensation; professional liability insurance (including costs relating to directors’ and officers’ liability insurance and
errors and omissions insurance); research and market data expenses; interest on indebtedness; custodial fees; bank service fees; investment-related fees and expenses (such as third-party sourcing fees, fees and expenses of legal and other
professionals, due diligence expenses and travel, lodging and meal expenses) related to the analysis, purchase or sale of investments, whether or not the investments are consummated; expenses related to special purpose vehicles (each, an “SPV”)
(including, without limitation, Overhead Expenses related thereto); interest payable on debt, if any, incurred to finance the Company’s investments; other expenses related to the purchase, monitoring, sale, settlement, custody or transmittal of
Company assets (directly or through trading affiliates) as will be determined by the Advisor or an affiliate thereof, as applicable, in its sole discretion (including costs associated with systems and software used in connection with
investment-related activities); costs of reporting to Stockholders and Stockholder meetings; administration fees and expenses charged by any third-party provider of administration services; entity-level taxes; expenses relating to the offer,
transfer, sale and marketing of shares; filing fees and expenses; Federal and state registration fees and expenses; regulatory and compliance fees and expenses of the Company (including with respect to any registration activities of the Company);
costs of winding up and liquidating the Company; costs associated with ensuring compliance with the applicable BDC and RIC requirements, including, but not limited to, costs incurred in connection with the organization of, and transfer of assets
to, a private investment vehicle; expenses incurred in connection with a Stockholder that defaults in respect of a Capital Commitment; and other expenses associated with the operation of the Company and its investment activities, including
extraordinary expenses such as litigation, workout and restructuring and indemnification expenses, if any. For the avoidance of doubt, the Company will also bear its allocable share (based on invested capital) of any of the expenses listed above
incurred by any Subsidiary Investment Vehicle.
The Company is also responsible for the costs of the offering of common shares and other securities, including, but not limited to, all expenses incurred in connection with an IPO; costs and expenses relating to
distributions paid to Stockholders; costs of effecting sales and repurchases of the Company’s securities; allocated costs incurred by the Advisor or its affiliate in providing managerial assistance to those companies in which the Company has
invested who request it; transfer agent fees; fees and expenses paid to the Company’s independent directors (including expenses and costs related to meetings of the independent directors); costs of preparing and filing reports with the SEC and
other Company reporting and compliance costs, including registration and listing fees; the Company’s allocable portion of the fidelity bond; the costs of reports, proxy statements or other notices to Stockholders, including printing and mailing
costs; the costs of any Stockholders’ meetings and communications; expenses payable under any underwriting agreement, including associated fees, expenses and any indemnification obligations; and all other expenses incurred by the Company in
connection with maintaining its status as a BDC. In addition, the Company may make investments in investment funds focused primarily on investing in SMBs. As a result, the Company (and the Stockholders, indirectly through the Company) bear the
Company’s proportionate share of the fees and expenses paid by the shareholders of such investment fund.
Generally, expenses incurred directly in connection with a particular investment (or proposed investment) of the Company and other Star Mountain accounts in which Star Mountain conducts substantial investment and
other activities in their own accounts and the accounts of other clients (the “Star Mountain Accounts”) will be allocated among the Company and other Star Mountain Accounts pro rata based upon capital invested (or proposed to be invested) in such
investment; provided that expenses specifically attributable to the Company or any other Star Mountain Account may be allocated to the Company or any such other Star Mountain Account, as applicable. The Advisor will allocate other expenses among
the Company and other Star Mountain Accounts in a fair and equitable manner taking into account such factors as it deems appropriate.
Notwithstanding the foregoing, in light of the Company’s investment mandate, which may include investments in small loans, niche credits and other similar securities, it may not be practical to specifically allocate
certain investment-related expenses to the particular loans to which they relate. The Advisor, in its absolute and sole discretion, may instead allocate such expenses (along with expenses that relate to transactions that are not consummated) pro
rata across one or more investments.
Liquidity Events
The Board may, in its sole discretion, determine to cause the Company to conduct a Liquidity Event (as defined below), including an IPO. The decision will take into consideration factors such as prevailing market
conditions at the time and the Company’s portfolio composition. The ability of the Company to commence and consummate a Liquidity Event is not assured, and will depend on a variety of factors, including the size and composition of the Company’s
portfolio and prevailing market conditions at the time.
A “Liquidity Event” includes: (1) an IPO or (2) a Sale Transaction. A “Sale Transaction” means (a) the sale of all or substantially all of the Company’s assets to, or other liquidity event with, another entity or (b)
a transaction or series of transactions, including by way of merger, consolidation, recapitalization, reorganization, or sale of stock in each case for consideration of either cash and/or publicly listed securities of the acquirer.
Until such time as the Board determines to cause the Company to conduct a Liquidity Event, the Company will remain a privately offered BDC and, in its commercially reasonable judgment, will conduct quarterly
repurchases of its shares of Common Stock. See “Item 1(b). Description of Business—Discretionary Repurchase of Shares.”
Each Stockholder will be required to agree to cooperate with the Company and take all actions, execute all documents and provide all consents as may be reasonably necessary or appropriate to consummate an IPO, it
being understood that the Company may, without obtaining the consent of any Stockholders, make modifications to the Company’s constitutive documents, capital structure and governance arrangements so long as, in the reasonable opinion of the Board,
(x) the economic interests of the Stockholders are not materially diminished or materially impaired, (y) such modifications are consistent with the requirements applicable to BDCs under the 1940 Act and (z) such modifications are not inconsistent
with the provisions set forth in the Company’s Registration Statement on Form 10.
Upon completion of an IPO, Stockholders admitted to the Company prior to the IPO may also be required to enter into a lock-up agreement with the underwriters of the IPO for a period not to exceed 180 days (or such
longer period as may be required or determined to be advisable by the underwriters of the IPO based on prevailing market conditions and practice at the time).
Distributions
The Company generally intends to make quarterly distributions to its Stockholders out of assets legally available for distribution. Quarterly distributions, if any, will be determined by the Board.
All current income and realization proceeds will be retained by the Company and be available for re-investment. Distributions will be made to Stockholders at such times and in such amounts as determined by the
Company’s Board. In addition, the Company has adopted a dividend re-investment program and each Stockholder will receive dividends in the form of additional shares of the Company’s Common Stock unless they notify the Company that they instead
desire to receive cash. If a Stockholder elects to receive dividends in the form of shares, dividend proceeds that otherwise would have been distributed in cash will be retained by the Company for re-investment. Stockholders who elect to receive
dividends and other distributions in the form of shares of Common Stock generally are subject to the same U.S. federal tax consequences as Stockholders who elect to receive their distributions in cash; however, such reinvesting investors will not
receive cash with which to pay any applicable taxes on re-invested dividends.
Defaults
Any Stockholder failing to timely make a Capital Contribution to the Company when due shall be subject to interest on the defaulted amount as well as the potential imposition of various additional default penalties
in the sole discretion of the Company, which may include, among other things, the withholding of distributions, the forced sale of its interest in the Company, the forfeiture of voting and approval rights, the termination of such Stockholder’s
right to make additional Capital Contributions and/or the automatic transfer of 25% of the shares of the Company then held by such Stockholder to the other Stockholders, pro rata in accordance with their respective Capital Commitments.
The Company will have the right to cover shortfalls arising from the default of a Stockholder in any manner the Company deems appropriate, including by drawing down additional capital from non-defaulting
Stockholders; provided that the amount of any shortfall funded by a non-defaulting Stockholder in connection with any investment may not exceed 150% of such non-defaulting Stockholder’s total Capital Contributions in respect of such investment in
the absence of any such shortfall.
Feeder Funds
Star Mountain Lower Middle-Market Capital (Offshore), Ltd. (the “Feeder Fund”) was formed in the Cayman Islands on June 28, 2021 and operates as a feeder fund for the purpose of investing all its investable assets in
the Company. The Feeder Fund made its initial investment in the Company on August 17, 2021; the Feeder Fund will continue until the termination or expiration of the term of the Company.
The Advisor may form more funds (“Feeder Funds”) that will invest in the Company if, in the judgment of the Advisor, the use of such vehicles would allow the Company to accommodate tax, legal, or similar concerns of
the Company, of the Advisor or of the investors in the Feeder Funds. Additional Feeder Funds will pass through the vote to its Feeder Fund investors on any proposal requiring the approval of the Company’s Stockholders.
Subsidiary Investment Vehicles
The Advisor may cause the Company to participate in one or more Portfolio Investments through subsidiary investment vehicles (each, a “Subsidiary Investment Vehicle”). The Advisor may cause the Company to initially
make one or more investments directly and subsequently transfer such investments to one or more Subsidiary Investment Vehicles.
Affiliated SBIC
The Advisor may cause one or more Alternative Investment Vehicles or Subsidiary Investment Vehicles to seek a license from the SBA to operate as a small business investment company (an “Affiliated SBIC”).
At any time following the BDC Conversion, the Company (either directly, or indirectly through a Subsidiary) may apply to the SBA for a license to operate as an SBIC (an “SBIC Subsidiary”). As a licensed SBIC, the
Company will have access to financing originated by SBA. The financing available will be driven by the Company’s business model, but generally cannot exceed an amount that is equal to two times the amount of the Capital Commitments to any SBIC
Subsidiary.
Limited Exclusion Right; Withdrawal
The Company will have the right to exclude any Stockholder from purchasing shares of the Company in connection with any drawdown if (x) in the reasonable opinion of the Company, there is a substantial likelihood that
the Stockholder’s purchase of shares of the Company at such time would (i) result in a violation of, or noncompliance with, any law or regulation applicable to the Company, the Advisor or any other Stockholder or (ii) create an undue economic,
compliance or other burden due to regulatory, tax, legal or other similar reasons, or (y) such Stockholder has become subject to a final determination in a civil proceeding that could have an adverse effect on the Company, or has been convicted in,
or become subject to, a criminal proceeding or investigation.
Involuntary Repurchases
In addition, if the Advisor reasonably concludes that there is a substantial likelihood that a Stockholder’s continued participation in the Company would result in a violation of or non-compliance with any law or
regulation to which the Company is or would be subject or would otherwise place an undue economic, compliance or other burden on the Company, the Advisor may, in its sole discretion, purchase for the benefit of the Company or the Stockholders, or
cause the Company to purchase, some or all of a Stockholder’s shares at any time at a price equal to the net asset value of such Stockholder’s shares as determined by the Board. Any such involuntary repurchase will be made pursuant to Rule 23c-2
under the 1940 Act.
Valuation
The Company shall value its investments in accordance with valuation procedures approved by the Company’s Board. See “Item 1(b). Description of Business—Regulation as a Business
Development Company” below.
In addition, on December 3, 2020, the SEC announced its adoption of Rule 2a-5 under the 1940 Act, which establishes an updated regulatory framework for determining the fair value of assets for which market quotations
are not readily available in good faith for purposes of the 1940 Act. The new rule had a compliance date of September 8, 2022 and clarifies how fund boards can satisfy their valuation obligations for such assets and permits boards, subject to board
oversight and certain other conditions, to designate certain parties to perform the fair value determinations for such assets. As of the date of this annual report on Form 10-K, the Board has not designated any party to perform the fair valuation
determinations for such assets and continues to determine the fair value of such assets in compliance with relevant provisions of the 1940 Act. The Board, with the assistance of the Advisor, the Company’s Audit Committee, and independent
third-party valuation firm(s) engaged at the direction of the Board, will determine the fair value of the Company’s assets, including such assets that are not publicly traded or whose market prices are not readily available, on at least a quarterly
basis, in accordance with the terms of FASB Accounting Standards Codification Topic 820, Fair Value Measurement and Disclosures. The Audit Committee is comprised of the Independent Directors.
Discretionary Repurchase of Shares
No Right of Redemption
No Stockholder or other person holding shares acquired from a Stockholder has the right to require the Company to repurchase any shares. No public market for the shares exists, and none is expected to develop in the
future. Consequently, Stockholders may not be able to liquidate their investment other than as a result of repurchases of shares by the Company, as described below.
Repurchases of Shares
Until such time as the Board determines to cause the Company to conduct a Liquidity Event, the Company will remain a privately offered BDC and, in its commercially reasonable judgment, will conduct quarterly
repurchases of its shares of Common Stock. Prior to an IPO, and subject to market conditions and the Advisor’s commercially reasonable judgment, the Company intends from time to time to offer to repurchase shares pursuant to written tenders by
Stockholders. The Advisor expects that, generally, it will cause the Company to offer to repurchase shares from Stockholders quarterly, with such repurchases to occur as of each March 31, June 30, September 30 and December 31. At the discretion of
the Board, the Company commenced a share repurchase program in which the Advisor will, in its commercially reasonable judgment subject to market conditions, cause the Company to offer to repurchase shares from Stockholders on a quarterly basis in
an amount not to exceed 2.5% of the Company’s net asset value. Each repurchase offer will generally commence approximately 90 days prior to the applicable quarter end repurchase date or as disclosed in the Company’s tender offer. With respect to
any such repurchase offer, Stockholders tendering shares must do so by a date specified in the notice describing the terms of the repurchase offer (the “Notice Period”). The Notice Period shall conclude 5 days prior to the applicable quarter end
repurchase date or as disclosed in the Company’s tender offer. Notwithstanding the foregoing, pursuant to the terms of any credit facility the Company enters into, the Company may be prohibited from repurchasing its shares of common stock from its
investors during a quarter if, in the prior quarter, repurchase requests from the Company’s investors exceed 10% of the Company’s total Capital Commitments.
There is no minimum portion of a Stockholder’s shares which must be repurchased in any repurchase offer. The Company has no obligation to repurchase shares at any time; any such repurchases will only be made at such
times, in such amounts and on such terms as may be determined by the Advisor, in its sole discretion. In determining whether the Company should offer to repurchase shares, the Advisor will consider the timing of such an offer, as well as a variety
of operational, business and economic factors. In determining whether to accept a recommendation to conduct a repurchase offer at any such time, the Advisor will consider the following factors, among others:
| • |
whether any Stockholders have requested to tender shares to the Company;
|
| • |
the liquidity of the Company’s assets (including fees and costs associated with redeeming or otherwise withdrawing from investment funds);
|
| • |
the investment plans and working capital and reserve requirements of the Company;
|
| • |
the relative economies of scale of the tenders with respect to the size of the Company;
|
| • |
the history of the Company in repurchasing shares;
|
| • |
the availability of information as to the value of the Company’s shares in investment funds;
|
| • |
the existing conditions of the securities markets and the economy generally, as well as political, national or international developments or current affairs;
|
| • |
any anticipated tax consequences to the Company of any proposed repurchases of shares; and
|
| • |
the recommendations of the Advisor.
|
The Company will repurchase shares from Stockholders pursuant to written tenders on terms and conditions that the Advisor determines to be fair to the Company and to all Stockholders. When the Advisor determines that
the Company will repurchase shares, notice will be provided to Stockholders describing the terms of the offer, containing information Stockholders should consider in deciding whether to participate in the repurchase opportunity and containing
information on how to participate. Stockholders deciding whether to tender their shares during the period that a repurchase offer is open may obtain the Company’s net asset value per share by contacting the Advisor during the period. If a
repurchase offer is oversubscribed by Stockholders who tender shares (including the Advisor or any of its affiliates), the Company may repurchase a pro rata portion by value of the shares tendered by each Stockholder, extend the repurchase offer,
or take any other action with respect to the repurchase offer permitted by applicable law.
Repurchases of shares from Stockholders by the Company will be paid in cash. Repurchases will be effective after receipt and acceptance by the Company of eligible written tenders of shares from Stockholders by the
applicable repurchase offer deadline. The Company does not impose any charges in connection with repurchases of shares.
Shares will be repurchased by the Company after the Management Fee has been deducted from the Company’s assets as of the end of the month in which the repurchase occurs — i.e.,
the accrued Management Fee for the quarter in which Company shares are to be repurchased is deducted prior to effecting the relevant repurchase of Company shares.
In light of liquidity constraints associated with the Company’s investments, the Company expects to employ the following repurchase procedures:
| • |
Each repurchase offer will generally commence approximately 90 days prior to the applicable repurchase date or as disclosed in the Company’s tender offer. A Stockholder choosing to tender shares for repurchase must do so by the
applicable deadline, which generally will be five days before the applicable quarter end repurchase date. Stockholders will be informed in each repurchase offer that tendered Shares will be valued at the net asset value per share calculated
as of the applicable valuation date. The valuation dates are generally expected to be March 31, June 30, September 30 or December 31. Tenders will be revocable upon written notice to the Company until the end of the Notice Period. Payments
will be made to Stockholders within 60 days of the end of the Notice Period.
|
| • |
Promptly after the Notice Period, the Company will give to each Stockholder whose shares have been accepted for repurchase a promissory note (the “Promissory Note”) entitling the Stockholder to be paid an amount equal to the value,
determined as of the valuation date, of the repurchased shares.
|
| • |
The Promissory Note will be non-interest bearing and non-transferable.
|
If a repurchase offer is oversubscribed by Stockholders who tender common shares, the Company will repurchase a pro rata portion by value of the common shares tendered by each Stockholder, extend the repurchase
offer, or take any other action with respect to the repurchase offer permitted by applicable law. The Company also has the right to repurchase all of a Stockholder’s common shares at any time if the aggregate value of such Stockholder’s common
shares is, at the time of such compulsory repurchase, less than the minimum initial investment applicable for the Company. In addition, the Company will conduct involuntary repurchases pursuant to Rule 23c-2 under the 1940 Act if the Company
determines that the repurchase is in the best interest of the Company or upon the occurrence of certain events specified in the Company’s Subscription Agreement.
If modification of the Company’s repurchase procedures as described above is deemed necessary to comply with regulatory requirements, the Advisor will adopt revised procedures reasonably designed to provide
Stockholders substantially the same liquidity for shares as would be available under the procedures described above.
Payment for repurchased shares may require the Company to liquidate portfolio holdings earlier than the Advisor would otherwise have caused these holdings to be liquidated, potentially resulting in losses, and may
increase the Company’s investment related expenses as a result of higher portfolio turnover rates.
The Advisor intends to take measures to attempt to avoid or minimize potential losses and expenses resulting from the repurchase of shares.
A Stockholder tendering for repurchase only a portion of the Stockholder’s shares will be required to maintain an account balance of at least $100,000 after giving effect to the repurchase. If a Stockholder tenders
an amount that would cause the Stockholder’s account balance to fall below the required minimum, the Company reserves the right to repurchase all of a Stockholder’s shares at any time if the aggregate value of such Stockholder’s shares is, at the
time of such compulsory repurchase, less than the minimum initial investment applicable for the Company. This right of the Company to repurchase shares compulsorily may be a factor which Stockholders may wish to consider when determining the extent
of any tender for purchase by a Company.
Under certain circumstances, the Company may also repurchase shares of a Stockholder without consent or other action by the Stockholder or other person if the Company determines that doing so would be in the best
interests of the Company for the Company to repurchase the shares. Any such involuntary repurchase will be made pursuant to Rule 23c-2 under the 1940 Act in a manner that will not discriminate unfairly against any holder of the shares.
Stockholders who require minimum annual distributions from a retirement account through which they hold shares should consider the Company’s schedule for repurchase offers and submit repurchase requests accordingly.
Co-Investment Exemptive Relief
The Company and the Advisor received an exemptive order from the SEC that permits the Company to co-invest with Star Mountain Accounts and other affiliates of the Advisor. Subject to the terms and conditions
specified in the exemptive order, the Company will be able to co-invest alongside Star Mountain Accounts or affiliates of the Advisor.
Regulation as a Business Development Company
A BDC must be organized in the United States for the purpose of investing in or lending to primarily private companies and making significant managerial assistance available to them. As with other companies regulated
by the 1940 Act, a BDC must adhere to certain substantive regulatory requirements. Recent legislation introduced in the U.S. House of Representatives, if passed, would modify certain sections of the 1940 Act applicable to BDCs.
SEC Reporting
The Company is subject to the reporting requirements of the Exchange Act, which includes annual and periodic reporting requirements.
Governance
The Company is a corporation and, as such, is governed by a board of directors. The board of directors is constituted as a classified board, subject to removal only for cause by holders of a majority of the Company’s
outstanding voting securities. The 1940 Act requires that a majority of the Company’s directors be persons other than “interested persons,” as that term is defined in the 1940 Act. In addition, the 1940 Act provides that the Company may not change
the nature of its business so as to cease to be, or to withdraw its election as, a BDC unless approved by the holders of a majority of the outstanding voting securities.
1940 Act Ownership Restrictions
The Company does not intend to acquire securities issued by any investment company that exceed the limits imposed by the 1940 Act. Under these limits, except for registered money market funds, a BDC generally cannot
acquire more than 3% of the voting stock of any investment company, invest more than 5% of the value of its total assets in the securities of one investment company or invest more than 10% of the value of its total assets in the securities of
investment companies in the aggregate. Subject to certain exemptive rules, including Rule 12d1-4, the Company may, subject to certain conditions, invest in other Investment Companies in excess of such thresholds.
Qualifying Assets
The Company may invest up to 100% of its assets in securities acquired directly from, and/or loans originated directly to, issuers in privately-negotiated transactions.
Under the 1940 Act, a BDC may not acquire any asset other than assets of the type listed in section 55(a) of the 1940 Act, which are referred to as qualifying assets, unless, at the time the acquisition is made and
after giving effect to such acquisition, qualifying assets represent at least 70% of the BDC’s total assets. The principal categories of qualifying assets relevant to the Company’s business are the following:
| • |
Securities purchased in transactions not involving any public offering from the issuer of such securities, which issuer (subject to certain limited exceptions) is an “eligible portfolio company” (as defined in the 1940 Act), or from any
person who is, or has been during the preceding 13 months, an affiliated person of an eligible portfolio company, or from any other person, subject to such rules as may be prescribed by the SEC. An eligible portfolio company is defined in
the 1940 Act as any issuer which:
|
| • |
is organized under the laws of, and has its principal place of business in, the United States;
|
| • |
is not an investment company (other than a small business investment company wholly owned by the Company) or a company that would be an investment company but for certain exclusions under the 1940 Act; and
|
| • |
satisfies any of the following:
|
| • |
has an equity capitalization of less than $250 million or does not have any class of securities listed on a national securities exchange;
|
| • |
is controlled by a BDC or a group of companies including a BDC, the BDC actually exercises a controlling influence over the management or policies of the eligible portfolio company, and, as a result thereof, the BDC has an affiliated
person who is a director of the eligible portfolio company; or
|
| • |
is a small and solvent company having total assets of not more than $4 million and capital and surplus of not less than $2 million.
|
| • |
Securities of any eligible portfolio company that the Company controls.
|
| • |
Securities purchased in a private transaction from a U.S. issuer that is not an investment company or from an affiliated person of the issuer, or in transactions incident thereto, if the issuer is in bankruptcy and subject to
reorganization or if the issuer, immediately prior to the purchase of its securities was unable to meet its obligations as they came due without material assistance other than conventional lending or financing arrangements.
|
| • |
Securities of an eligible portfolio company purchased from any person in a private transaction if there is no ready market for such securities and the Company already owns 60% of the outstanding equity of the eligible portfolio company.
|
| • |
Securities received in exchange for or distributed on or with respect to securities described above, or pursuant to the exercise of options, warrants or rights relating to such securities.
|
| • |
Cash, cash equivalents, “U.S. Government securities” (as defined in the 1940 Act) or high-quality debt securities maturing in one year or less from the time of investment.
|
Limitations on Leverage
As a BDC, the Company generally must have at least 150% asset coverage for its debt after incurring any new indebtedness, meaning that for every $100 of net assets the Company holds, the Company may raise $200 from
borrowing and issuing senior securities. If the Company is licensed as an SBIC, the limitations on leverage applicable to BDCs under the 1940 Act may be exceeded.
Managerial Assistance to Portfolio Companies
A BDC must be operated for the purpose of making investments in the types of securities described in “—Qualifying Assets” above. However, in order to count portfolio
securities as qualifying assets for the purpose of the 70% test, the BDC must either control the issuer of the securities or must offer to make available to the issuer of the securities (other than small and solvent companies described above)
significant managerial assistance. Where the BDC purchases such securities in conjunction with one or more other persons acting together, the BDC will satisfy this test if one of the other persons in the group makes available such managerial
assistance. Making available managerial assistance means, among other things, any arrangement whereby the BDC, through its directors, officers or employees, offers to provide, and, if accepted, does so provide, significant guidance and counsel
concerning the management, operations or business objectives and policies of a portfolio company.
Temporary Investments
As a BDC, pending investment in other types of “qualifying assets,” as described above, the Company’s investments may consist of cash, cash equivalents, U.S. Government securities or high-quality debt securities
maturing in one year or less from the time of investment, which are referred to, collectively, as temporary investments, such that at least 70% of the Company’s assets are qualifying assets. Typically, the Company will invest in highly rated
commercial paper, U.S. Government agency notes, U.S. Treasury bills or in repurchase agreements relating to such securities that are fully collateralized by cash or securities issued by the U.S. Government or its agencies. A repurchase agreement
involves the purchase by a Stockholder, such as the Company, of a specified security and the simultaneous agreement by the seller to repurchase it at an agreed-upon future date and at a price that is greater than the purchase price by an amount
that reflects an agreed-upon interest rate. There is no percentage restriction on the proportion of the Company’s assets that may be invested in such repurchase agreements. However, certain diversification tests in order to qualify as a RIC for
federal income tax purposes will typically require the Company to limit the amount it invests with any one counterparty.
Senior Securities
As a corporation, the Company will be permitted, under specified conditions, to issue multiple classes of indebtedness and one class of stock senior to its Common Stock if the Company’s asset coverage, as defined in
the 1940 Act, is at least equal to 150% for indebtedness and 150% for preferred equity immediately after each such issuance. On May 14, 2021, shareholders of the Company approved the adoption of the 150% threshold pursuant to Section 61(a)(2) of
the Investment Company Act and such election became effective that same day. As of December 31, 2022 and December 31, 2021, the Company's asset coverage for total borrowings and other senior securities was 209% and 306%, respectively. In addition,
while any preferred stock or publicly traded debt securities are outstanding, the Company may be prohibited from making distributions to its Stockholders or the repurchasing of such securities or shares unless it meets the applicable asset coverage
ratios at the time of the distribution or repurchase. The Company may also borrow amounts up to 5% of the value of its total assets for temporary or emergency purposes without regard to asset coverage. For a discussion of the risks associated with
leverage, see, e.g. “Item 1A. Risk Factors – Borrowing Risk.” The 1940 Act imposes limitations on a BDC’s issuance of preferred shares, which are considered “senior
securities” subject to the 150% asset coverage requirement described above. In addition, (i) preferred shares must have the same voting rights as the common Stockholders (one share one vote); and (ii) preferred Stockholders must have the right, as
a class, to appoint directors to the board of directors.
Code of Ethics
As a BDC, the Company and the Advisor have adopted a code of ethics pursuant to Rule 17j-1 under the 1940 Act that establishes procedures for personal investments and restricts certain personal securities
transactions. Personnel subject to each code may invest in securities for their personal investment accounts, including securities that may be purchased or held by the Company, so long as such investments are made in accordance with the code’s
requirements.
A copy of our Code of Ethics is filed as an exhibit to this Annual Report on Form 10-K and is available without charge upon written request to the Company, Star Mountain Lower Middle-Market Capital Corp., 140 E. 45th Street, 37th Floor, New
York, NY 10017.
Anti-Takeover Measures
State corporate law as well as the Company’s certificate of incorporation and bylaws include provisions that could have the effect of limiting the ability of other entities or persons to acquire control of the
Company by means of a tender offer, proxy contest or otherwise or to change the composition of the Company’s Board. These provisions discourage certain coercive takeover practices and inadequate takeover bids and to encourage persons seeking to
acquire control of the Company to negotiate first with the board of directors. These measures, however, may delay, defer or prevent a transaction or a change in control that might otherwise be in the best interests of the Company’s Stockholders and
could have the effect of depriving Stockholders of an opportunity to sell their shares at a premium over prevailing market prices. Such attempts could have the effect of increasing the Company’s expenses and disrupting its normal operation. Until
the consummation of an IPO, the Company will continue its investment activities and operations as a privately held BDC whose shares are subject to transfer restrictions. Accordingly, these anti-takeover measures will have limited practical effect
until such time as the Company consummates an IPO.
Compliance Policies and Procedures and Other Considerations
As a BDC, the Company will not generally be able to issue and sell its Common Stock at a price below net asset value per share. It may, however, issue and sell its Common Stock, at a price below the current net asset
value of the Common Stock, or issue and sell warrants, options or rights to acquire such Common Stock, at a price below the current net asset value of the Common Stock if the Company’s Board determines that such sale is in the Company’s best
interest and in the best interests of its Stockholders, and its Stockholders have approved the policy and practice of making such sales within the preceding 12 months. In any such case, the price at which the securities are to be issued and sold
may not be less than a price that, in the determination of the board of directors, closely approximates the market value of such securities.
As a BDC, the Company may also be prohibited under the 1940 Act from knowingly participating in certain transactions with its affiliates, including the Company’s officers, directors, investment adviser, principal
underwriters and certain of their affiliates, without the prior approval of the members of board of directors who are not interested persons and, in some cases, prior approval by the SEC through an exemptive order (other than pursuant to current
regulatory guidance). The Company and the Advisor have received an exemptive order from the SEC that permits the Company to co-invest with Star Mountain Accounts and other affiliates of the Advisor. Subject to the terms and conditions specified in
the exemptive order, the Company will be able to co-invest alongside Star Mountain Accounts or affiliates of the Advisor.
As a BDC, the Company expects to be periodically examined by the SEC for compliance with the 1940 Act.
As a BDC, the Company is required to provide and maintain a bond issued by a reputable fidelity insurance company to protect the Company against larceny and embezzlement.
The Advisor has relief from registration with the CFTC as a CPO with respect to the Company, and the Advisor is exempt from registration with the CFTC as a CTA with respect to the Company and will therefore not be
required to provide Stockholders with certified annual reports and other disclosure documents that satisfy the requirements of CFTC rules applicable to registered CPOs and CTAs.
The Company and the Advisor have adopted and implemented written policies and procedures reasonably designed to detect and prevent violation of the federal securities laws. As a BDC, the Company is required to review
these compliance policies and procedures annually for their adequacy and the effectiveness of their implementation and designate a chief compliance officer to be responsible for administering the policies and procedures.
Sarbanes-Oxley Act of 2002
The Sarbanes-Oxley Act imposes a wide variety of regulatory requirements on publicly-held companies and their insiders. Many of these requirements affect the Company. For example:
| • |
pursuant to Rule 13a-14 of the Exchange Act, the President and Chief Financial Officer must certify the accuracy of the financial statements contained in the Company’s periodic reports;
|
| • |
pursuant to Item 307 of Regulation S-K, the Company’s periodic reports must disclose the Company’s conclusions about the effectiveness of the Company’s disclosure controls and procedures;
|
| • |
pursuant to Rule 13a-15 of the Exchange Act, the Company’s management must prepare an annual report regarding its assessment of the Company’s internal control over financial reporting and (once the Company ceases to be an emerging growth
company under the JOBS Act or, if later, for the year following the Company’s first annual report required to be filed with the SEC) must obtain an audit of the effectiveness of internal control over financial reporting performed by the
Company’s independent registered public accounting firm; and
|
| • |
pursuant to Item 308 of Regulation S-K and Rule 13a-15 of the Exchange Act, the Company’s periodic reports must disclose whether there were significant changes in the Company’s internal controls over financial reporting or in other
factors that could significantly affect these controls subsequent to the date of their evaluation, including any corrective actions with regard to significant deficiencies and material weaknesses.
|
The Sarbanes-Oxley Act requires the Company to review the Company’s current policies and procedures to determine whether the Company will comply with the Sarbanes-Oxley Act and the regulations promulgated thereunder.
The Company will continue to monitor the Company’s compliance with all regulations that are adopted under the Sarbanes-Oxley Act and will take actions necessary to ensure that the Company is in compliance therewith.
Proxy Voting Policies and Procedures
The Company delegates proxy voting responsibility to the Advisor. As a fiduciary, the Advisor has a duty to monitor corporate events and to vote proxies, as well as a duty to cast votes in the best interest of the
Company and not to subrogate Company interests to its own interests. To meet its fiduciary obligations, the Advisor seeks to ensure that it votes proxies in the best interest of the Company, and addresses how the Advisor will resolve any conflict
of interest that may arise when voting proxies. The Advisor’s proxy voting policy attempts to generalize a complex subject and the Advisor may, from time to time, determine that it is in the best interests of the Company to depart from specific
policies described therein.
The Advisor is responsible for processing all proxy notifications received by the Advisor. All proxy voting requests received are forwarded to the appropriate contact person at the Advisor that is responsible for
monitoring the issuer. The appropriate contact person at the Advisor communicates the proxy voting decision to the Advisor. The Advisor shall keep a record of its proxy voting policies and procedures, proxy statements received and votes cast, in
accordance with its record keeping policies. The trade operations department is responsible for maintaining records with respect to proxy voting.
Reporting Obligations
The Company is required to comply with periodic reporting requirements under the Exchange Act, and, makes available to Stockholders annual reports containing audited financial statements, quarterly reports on Form
10-Q, and such other reports as the Company determines to be appropriate or as may be required by law. The Company is filing this Form 10-K with the SEC and is required to comply with all reporting, proxy solicitation and other applicable
requirements under the Exchange Act.
Stockholder reports and other information about the Company are available on the EDGAR Database on the SEC’s Internet site at http://www.sec.gov.
Certain U.S. Federal Income Tax Consequences
The following discussion is a brief summary of some of the U.S. federal income tax considerations relevant to an investment in the Company as a Stockholder, including U.S. federal income tax considerations relevant
to a BDC. It is based upon the Code, the regulations promulgated thereunder, published rulings of the IRS and court decisions, all as in effect on the date of filing of this Form 10-K. All of the above authorities are subject to change (possibly
retroactively) by legislative or administrative action.
For purposes of this discussion, a “U.S. Partner” is a Partner and a “U.S. Holder” is a Stockholder, in each case, that is, for U.S. federal income tax purposes: (a) an individual who is a citizen or resident of the
United States; (b) a corporation created or organized in or under the laws of the United States, any state thereof or the District of Columbia; (c) an estate, the income of which is subject to U.S. federal income taxation regardless of its source
or (d) a trust if a court within the United States can exercise primary supervision over its administration and certain other conditions are met. A “Non-U.S. Partner” is a Partner who is not a U.S. Partner and a
“Non-U.S. Holder” is a Stockholder who is not a U.S. Holder.
THIS SUMMARY DOES NOT DISCUSS ALL OF THE FEDERAL INCOME TAX CONSIDERATIONS THAT MAY BE RELEVANT TO A PARTICULAR INVESTOR OR TO INVESTORS SUBJECT TO SPECIAL TREATMENT AND DOES NOT CONSTITUTE LEGAL OR TAX ADVICE.
ACCORDINGLY, PROSPECTIVE INVESTORS SHOULD CONSULT THEIR OWN TAX ADVISORS REGARDING THE SPECIFIC FEDERAL, STATE, LOCAL, ESTATE AND FOREIGN TAX CONSEQUENCES OF INVESTING IN THE COMPANY.
Taxation of RIC Operations Generally. The Company has elected and intends to qualify annually as a RIC for U.S. federal income tax purposes. As a RIC, the Company will be able
to deduct qualifying distributions to its Stockholders, so that it is subject to U.S. federal income taxation only in respect of earnings that it retains and does not distribute. In addition, certain distributions made to the Company’s Stockholders
may be eligible for look-through tax treatment determined by reference to the earnings from which the distribution is made.
In order to qualify as a RIC, the Company must, among other things,
| (a) |
at all times during each taxable year maintain its election under the 1940 Act to be treated as a BDC;
|
| (b) |
derive in each taxable year at least 90% of its gross income from dividends, interest, gains from the sale or other disposition of stock or securities and other specified categories of investment income; and
|
| (c) |
diversify its holdings so that, subject to certain exceptions and cure periods, at the end of each quarter of its taxable year,
|
| (i) |
at least 50% of the value of its total assets is represented by cash and cash items, U.S. government securities, the securities of other RICs and “other securities,” provided that such “other securities” shall not include any amount of
any one issuer, if its holdings of such issuer are greater in value than 5% of its total assets or greater than 10% of the outstanding voting securities of such issuer, and
|
| (ii) |
no more than 25% of the value of its assets may be invested in securities of any one issuer, the securities of any two or more issuers that are controlled by the Company and are engaged in the same or similar or related trades or
business (excluding U.S. government securities and securities of other RICs), or the securities of one or more “qualified publicly traded partnerships.”
|
As a RIC, in any taxable year with respect to which the Company distributes (or is treated as distributing) at least 90% of its investment company taxable income (which includes, among other items, dividends,
interest and the excess of any net short-term capital gains over net long-term capital losses and other taxable income other than any net capital gain reduced by deductible expenses), the Company generally will not be subject to U.S. federal income
tax on its investment company taxable income and net capital gains that are distributed to Stockholders. If the Company fails to distribute its income on a timely basis, it will be subject to a nondeductible 4% excise tax. To avoid this tax, the
Company must distribute (or be deemed to have distributed) during each calendar year an amount equal to the sum of:
| (1) |
at least 98% of its ordinary income (not taking into account any capital gains or losses) for the calendar year;
|
| (2) |
at least 98.2% of its capital gains in excess of its capital losses (adjusted for certain ordinary losses) for a one-year period generally ending on October 31 of the calendar year; and
|
| (3) |
any undistributed amounts from previous years on which the Company paid no U.S. federal income tax.
|
The Company is generally expected to distribute substantially all of its earnings on a quarterly basis, though one or both of the considerations described below could result in the deferral of dividend distributions
until the end of the fiscal year:
| (1) |
The Company may make investments that are subject to tax rules that require it to include amounts in income before cash corresponding to that income is received, or that defer or limit the Company’s ability to claim the benefit of
deductions or losses. For example, if the Company holds securities issued with original issue discount, such discount will be included in income in the taxable year of accrual and before any corresponding cash payments are received.
|
| (2) |
In cases where the Company’s taxable income exceeds its available cash flow, the Company will need to fund distributions with the proceeds of sale of securities or with borrowed money, and will raise funds for this purpose
opportunistically over the course of the year.
|
In certain circumstances (e.g., where the Company is required to recognize income before or without receiving cash representing such income), the Company may have difficulty
making distributions in the amounts necessary to satisfy the requirements for maintaining RIC status and for avoiding income and excise taxes. Accordingly, the Company may have to sell investments at times it would not otherwise consider
advantageous, raise additional debt or equity capital or reduce new investment originations to meet these distribution requirements. If the Company is not able to obtain cash from other sources, it may fail to qualify as a RIC and thereby be
subject to corporate-level income tax.
Although the Company does not presently expect to do so, it will be authorized to borrow funds and to sell assets in order to satisfy distribution requirements. However, under the 1940 Act, it will not be permitted
to make distributions to its Stockholders while its debt obligations and other senior securities are outstanding unless certain “asset coverage” tests are met. See “Item 1(b). Description of Business—Regulation as
a Business Development Company—Senior Securities” above. Moreover, the Company’s ability to dispose of assets to meet distribution requirements may be limited by (1) the illiquid nature of its portfolio and/or (2) other requirements
relating to its qualification as a RIC, including the diversification tests. If the Company disposes of assets in order to meet the annual distribution requirement or to avoid the excise tax, it may make such dispositions at times that, from an
investment standpoint, are not advantageous.
Certain of the Company’s investment practices may be subject to special and complex U.S. federal income tax provisions that may, among other things: (i) disallow, suspend or otherwise limit the allowance of certain
losses or deductions; (ii) convert lower taxed long- term capital gain into higher taxed short-term capital gain or ordinary income; (iii) convert an ordinary loss or a deduction into a capital loss (the deductibility of which is more limited);
(iv) cause the Company to recognize income or gain without a corresponding receipt of cash; (v) adversely affect the time as to when a purchase or sale of securities is deemed to occur; (vi) adversely alter the characterization of certain complex
financial transactions; and (vii) produce income that will not be qualifying income for purposes of the 90% gross income test described above.
While the Company is expected to distribute any income and capital gains in the manner necessary to minimize imposition of the 4% excise tax, it may not be able to distribute amounts sufficient to avoid the
imposition of the tax entirely. In that event, the Company will be liable for the tax only on the amount by which it does not meet the foregoing distribution requirement. Under certain circumstances, the Advisor may, in its sole discretion,
determine that it is in the interests of the Company to retain rather than distribute some amount of income and capital gains, and accordingly cause the Company to bear the excise tax burden associated therewith.
If in any particular taxable year, the Company does not qualify as a RIC, all of the Company’s taxable income (including net capital gains) will be subject to tax at regular corporate rates without any deduction for
distributions to Stockholders, and distributions will be taxable to Stockholders as ordinary dividends to the extent of the Company’s current and accumulated earnings and profits.
In the event the Company invests in foreign securities, it may be subject to withholding and other foreign taxes with respect to those securities. The Company is not expected to satisfy the requirement to pass
through to Stockholders their share of the foreign taxes paid by the Company.
Taxation of U.S. Holders
Distributions from the Company’s investment company taxable income (consisting generally of net investment income, net short-term capital gain, and net gains from certain foreign currency transactions) generally will
be taxable to U.S. Holders as ordinary income to the extent made out of the Company’s current or accumulated earnings and profits. Distributions generally will not be eligible for the dividends received deduction allowed to corporate Stockholders
or for the reduced rates applicable to certain qualified dividend income received by non-corporate Stockholders. Distributions that the Company designates as net capital gain distributions will be taxable to U.S. Holders as long-term capital gain
regardless of how long such U.S. Holders have held their shares. Distributions in excess of the Company’s current and accumulated earnings and profits first will reduce a U.S. Holder’s adjusted tax basis in such U.S. Holder’s Common Stock and,
after the adjusted tax basis is reduced to zero, will constitute capital gains to such U.S. Holder.
Distributions declared by the Company in October, November, or December of any year and payable to Stockholders of record on a specified date in such a month will be deemed to have been paid by the Company on
December 31st of the previous calendar year if the distributions are paid during the following January. Accordingly, distributions received in January may be subject to taxation in the preceding year.
Although the Company intends to distribute any net long-term capital gains at least annually, it may in the future decide to retain some or all of its net long-term capital gains but designate the retained amount as
a “deemed distribution.” In that case, among other consequences, the Company will pay corporate-level federal income tax on the retained amount, each U.S. Holder will be required to include its share of the deemed distribution in income as if it
had been distributed to the U.S. Holder, and the U.S. Holder will be entitled to claim a credit equal to its allocable share of the tax paid on the deemed distribution by the Company. The amount of the deemed distribution net of such tax will be
added to the U.S. Holder’s tax basis for their Common Stock or preferred stock. Since the Company expects to pay tax on any retained capital gains at its regular corporate capital gain tax rate, and since that rate is in excess of the maximum rate
currently payable by non-corporate U.S. Holders on long-term capital gains, the amount of tax that non-corporate U.S. Holders will be treated as having paid and for which they will receive a credit will exceed the tax they owe on the retained net
capital gains. Such excess generally may be claimed as a credit against the U.S. Holder’s other federal income tax obligations or may be refunded to the extent it exceeds a Stockholder’s liability for federal income tax. A Stockholder that is not
subject to federal income tax or otherwise required to file a federal income tax return would be required to file a federal income tax return on the appropriate form to claim a refund for the taxes paid by the Company. To utilize the deemed
distribution approach, the Company must provide written notice to its Stockholders. The Company cannot treat any of its investment company taxable income as a “deemed distribution.”
If a U.S. Holder sells or exchanges its shares of the Company, the holder will recognize gain or loss equal to the difference between its adjusted basis in the shares sold and the amount received. Any such gain or
loss will be treated as a capital gain or loss and will be long-term capital gain or loss if the shares have been held for more than one year. Any loss recognized on a sale or exchange of shares that were held for six months or less will be treated
as long-term, rather than short-term, capital loss to the extent of any capital gain distributions previously received (or deemed to be received) thereon.
The Company or the applicable withholding agent will be required to withhold U.S. federal income tax (“backup withholding”) currently at a rate of 24% from all taxable distributions to any non-corporate U.S. Holder
(1) who fails to furnish the Company with a correct taxpayer identification number or a certificate that such Stockholder is exempt from backup withholding or (2) with respect to whom the IRS notifies the Company that such Stockholder has failed to
properly report certain interest and dividend income to the IRS and to respond to notices to that effect. An individual’s taxpayer identification number is his or her social security number. Any amount withheld under backup withholding is allowed
as a credit against the U.S. Holder’s U.S. federal income tax liability and may entitle such Stockholder to a refund, provided that proper information is timely provided to the IRS.
Limitations on Deductibility of Certain Losses and Expenses. If the Company is not treated as a “publicly offered regulated investment company” for any calendar year, then a
U.S. Holder that is an individual, estate or trust may be subject to limitations on miscellaneous itemized deductions in respect of its share of expenses that the Company incurs, to the extent that the expenses would have been subject to
limitations if the holder had incurred them directly. In particular, for taxable years beginning before January 1, 2026, non-corporate shareholders, including individuals, trusts, and estates generally will not be entitled to a deduction for such
expenses, and for taxable years beginning after December 31, 2025, these expenses will be deductible to non-corporate taxpayers only to the extent they exceed 2% of such a shareholder’s adjusted gross income for U.S. federal income tax purposes and
not deductible for purposes of the alternative minimum tax. In this case, the Company would be required to report the relevant income and expenses, including the Management Fee, on Form 1099-DIV, and affected holders will be required to take into
account their allocable share of such income and expenses. There is no assurance that the Company will be treated as a “publicly offered regulated investment company” at all times.
Tax-Exempt Investors. The direct conduct by a tax-exempt U.S. Holder of the activities that the Company is expected to conduct could give rise to UBTI. However, a BDC is a
corporation for U.S. federal income tax purposes and its business activities generally will not be attributed to its Stockholders for purposes of determining treatment under current law. Therefore, a tax-exempt U.S. Holder should not be subject to
U.S. federal income taxation solely as a result of the holder’s ownership of the Company’s shares and receipt of dividends that it pays. Moreover, under current law, if the Company incurs indebtedness, such indebtedness will not be attributed to
portfolio investors in its stock. Therefore, a tax-exempt U.S. Holder should not be treated as earning income from “debt-financed property” and dividends paid by the Company should not be treated as “unrelated debt-financed income” solely as a
result of indebtedness that the Company incurs. Proposals periodically are made to change the treatment of “blocker” investment vehicles interposed between tax-exempt investors and non-qualifying investments. In the event that any such proposals
were to be adopted and applied to BDCs, the treatment of dividends payable to tax-exempt investors could be adversely affected.
Non-U.S. Holders. Subject to the exceptions described below, dividends that the Company pays to a non-U.S. Holder generally will be subject to U.S. withholding tax at a 30%
rate unless the holder qualifies for, and complies with the procedures for claiming, an exemption or reduced rate under an applicable income tax treaty, or the holder qualifies, and complies with the procedures for claiming, an exemption by reason
of its status as a foreign government-related entity, which will generally be withheld form such dividends
Certain properly reported dividends are generally exempt from withholding of U.S. federal income tax where paid in respect of a RIC’s (i) “qualified net interest income” (generally, its U.S.-source interest income,
other than certain contingent interest and interest from obligations of a corporation or partnership in which the RIC or the non-U.S. Stockholder are at least a 10% Stockholder, reduced by expenses that are allocable to such income) or (ii)
“qualified short-term capital gains” (generally, the excess of the RIC’s net short-term capital gain, other than short-term capital gains recognized on the disposition of U.S. real property interests, over the RIC’s long-term capital loss), as well
as if certain other requirements are satisfied. Nevertheless, no assurance can be given as to whether any of the Company’s distributions will be eligible for this exemption from withholding of U.S. federal income tax or, if eligible, will be
reported as such by the Company. Furthermore, in the case of shares of Company stock held through an intermediary, the intermediary may have withheld U.S. federal income tax even if the Company reported the payment as an interest-related dividend
or short-term capital gain dividend. Since the Company’s Common Stock is subject to significant transfer restrictions, and an investment in the Company’s Common Stock will generally be illiquid, non-U.S. Stockholders whose distributions on the
Company’s Common Stock are subject to withholding of U.S. federal income tax may not be able to transfer their shares of the Company’s Common Stock easily or quickly or at all.
Non-U.S. Holders generally are not subject to U.S. tax on capital gain dividends, any amounts retained by the Company that are designated as undistributed capital gains and capital gains realized on the sale of the
Company’s shares or on actual or deemed distributions of the Company’s net capital gains unless such income or gains are effectively connected with the conduct of a U.S. trade or business by the holder and, if an income tax treaty applies, are
attributable to a permanent establishment in the United States, or the holder is present in the United States for 183 or more days during the taxable year; and the holder is a former citizen or resident of the United States.
A BDC is a corporation for U.S. federal income tax purposes. Under current law, a non-U.S. Holder will not be considered to be engaged in the conduct of a business in the United States solely by reason of its
ownership in a BDC. Proposals periodically are made to change the treatment of “blocker” investment vehicles interposed between foreign investors and investments that would otherwise result in such investors being considered to be engaged in the
conduct of a business in the United States. In the event that any such proposals were to be adopted and applied to BDCs, the treatment of dividends payable to foreign investors could be adversely affected.
FATCA Compliance. Additional requirements will apply to Non-U.S. Holders that are considered for U.S. federal income tax purposes to be foreign financial institutions or
non-financial foreign entities, as well as to Non-U.S. Holders that hold their shares through such an institution or entity. In general, an exemption from U.S. withholding tax will be available only if the foreign financial institution has entered
into an agreement with the U.S. government, or under certain intergovernmental agreements collects and provides to the U.S. tax authorities information about its accountholders (including certain investors in such institution) and if the
non-financial foreign entity has provided the withholding agent with a certification identifying certain of its direct and indirect U.S. owners. Any U.S. taxes withheld pursuant to the aforementioned requirements from distributions paid to affected
Non-U.S. Holders who are otherwise eligible for an exemption from, or reduction of, U.S. federal withholding taxes on such distributions may only be reclaimed by such Non-U.S. Holders by timely filing a U.S. tax return with the IRS to claim the
benefit of such exemption or reduction.
ERISA CONSIDERATIONS
ERISA and the Code impose restrictions on certain transactions involving (i) employee benefit plans (as defined in Section 3(3) of ERISA) that are subject to Title I of ERISA, (ii) plans subject to Section 4975 of
the Code, including individual retirement accounts and Keogh plans, and (iii) any entities whose underlying assets include plan assets by reason of a plan’s investment in such entities (collectively “Plans”). ERISA and the rules and regulations of
the Department of Labor (the “DOL”) promulgated thereunder contain provisions that should be considered by fiduciaries of those Plans and their legal advisors.
Fiduciary Duty. In deciding upon an investment in the Company, Plan fiduciaries should consider their basic fiduciary duties under ERISA Section 404, which require them to
discharge their investment duties prudently and solely in the interests of the Plan participants and beneficiaries. Plan fiduciaries must give appropriate consideration to the role that an investment in the Company would play in the Plan’s overall
investment portfolio. In analyzing the prudence of an investment in the Company, special attention should be given to the DOL’s regulation on investment duties (29 C.F.R. § 2550.404a-1). That regulation requires, among other things (i) a
determination that each investment is designed reasonably, as part of the portfolio, to further the Plan’s purposes, (ii) an examination of risk and return factors, and (iii) consideration of the portfolio’s composition with regard to
diversification, the liquidity and current return of the total portfolio relative to anticipated cash flow needs of the Plan, and the projected return of the total portfolio relative to the Plan’s funding objectives. ERISA also requires a fiduciary
to discharge such duties in accordance with the documents governing the Plan insofar as they are consistent with ERISA. Fiduciaries that are considering an investment in the Company should also consider the applicability of the prohibited
transaction provisions of ERISA and Section 4975 of the Code to such an investment and confirm that such investment will not constitute or result in a prohibited transaction or any other violation of an applicable requirement of ERISA.
Plan Assets. Under Section 3(42) of ERISA and regulations issued by the U.S. Department of Labor (the “Plan Asset Regulation”), the assets of the Company will be treated as
plan assets if participation by Benefit Plan Investors equals or exceeds 25% of any class of equity of the Company. The term “Benefit Plan Investor” is generally defined as (a) any employee benefit plan (as defined in Section 3(3) of ERISA),
subject to the provisions of Title I of ERISA, (b) any Plan subject to Section 4975 of the Code, and (c) any entity whose underlying assets include Plan assets by reason of a Plan’s investment in the entity. For purposes of the 25% determination,
the value of equity interests held by a person (other than a Benefit Plan Investor) that has discretionary authority or control with respect to the assets of the entity or that provides investment advice for a fee (direct or indirect) with respect
to such assets (or any affiliate of such person) is disregarded.
The Advisor intends to operate the Company so that the assets of the Company are not considered “plan assets.” In that regard, the Advisor intends to limit investments by Benefit Plan Investors to less than 25% of
each class of equity of the Company as described above. In the event that the Company’s assets otherwise would be considered to be “plan assets,” the Subscription Agreement authorizes the Advisor and requires ERISA Partners (as defined in the
Subscription Agreement) to take certain actions to alleviate the effect of such determination, including a sale of shares to other Stockholders or a third party (with the consent of the Advisor), the reduction of Capital Contributions by ERISA
Partners or the redemption of all or a portion of the Stockholder’s shares, so that participation by Benefit Plan Investors does not exceed 25% of any class of equity of the Company as described above.
Insurance Company General Accounts. Any insurance company proposing to invest assets of its general account in the Company should consider the extent to which such investment
would be subject to the requirements of ERISA in light of the U.S. Supreme Court’s decision in John Hancock Mutual Life Insurance Co. v. Harris Trust and Savings Bank and under any subsequent legislation or other guidance that has or may become
available relating to that decision.
Reporting of Indirect Compensation. The descriptions contained herein of fees and compensation, including the Management Fee payable to the Advisor, are intended to satisfy
the disclosure requirements for “eligible indirect compensation” for which the alternative reporting option on Schedule C of Form 5500 Annual Return/Report may be available. The Advisor will, upon written request, furnish any other information
relating to the Advisor’s compensation received in connection with the Company that is required for a Plan investor to comply with the reporting and disclosure requirements of Title I of ERISA and the regulations, forms and schedules issued
thereunder.
Governmental, Church and Non-U.S. Plans. Governmental plans, certain church plans and non-U.S. plans, while not subject to the fiduciary responsibility provisions of ERISA or
the provisions of Section 4975 of the Code, may nevertheless be subject to Federal, state, local, non-U.S. or other laws and regulations that are similar to such provisions of ERISA and the Code. Fiduciaries of such plans should consult with their
counsel before purchasing any interests in the Company.
The foregoing discussion of certain aspects of ERISA is based upon ERISA, judicial decisions, U.S. Department of Labor regulations, rulings and opinions in existence on the date hereof, all of which are subject to
change and should not be construed as legal advice. This summary is general in nature and does not address every issue that may be applicable to the Company or to a particular investor. Trustees and other fiduciaries of employee benefit plans
subject to ERISA should consult with their own counsel with respect to issues arising under ERISA and make their own independent investment decision.
| Item 1A. |
Risk Factors
|
Investing in the Company’s Common Stock involves significant risks. A prospective investor should consider, among other factors, the risk factors set forth below. Additional risks and uncertainties not presently
known to the Company or not presently deemed material by the Company may also impair the Company’s operations and performance. If any of the following events occur, the Company’s business, financial condition, results of operations and cash flows
could be materially and adversely affected. In such case, the net asset value of the Company’s Common Stock could decline, and you may lose all or part of your investment.
The following is a summary of the principal risk factors associated with an investment in our securities. Further details regarding each risk included in the below summary list can be found further below.
| • |
We have a limited operating history.
|
| • |
Shares of the Company’s Common Stock are an illiquid investment.
|
| • |
Investments in private and middle-market companies involves a number of significant risks.
|
| • |
We are dependent upon Star Mountain’s access to its investment professionals for our success.
|
| • |
Economic recessions or downturns could impair the portfolio companies, and defaults by the portfolio companies will harm the Company’s operating results.
|
| • |
Increasing interest rates and interest rate volatility, including volatility associated with the decommissioning of London InterBank Offered Rate (“LIBOR”) and the transition to new reference rates may adversely affect the value of the
financial obligations to be held or issued by us.
|
| • |
Inflation could adversely affect the business, results of operations and financial condition of the Company’s portfolio companies.
|
| • |
Our investment portfolio is and will continue to be recorded at fair value as determined in good faith by our Board of Directors and, as a result, there is and will continue to be uncertainty as to the value of our portfolio investments.
|
| • |
We operate in a highly competitive market for investment opportunities, which could reduce returns and result in losses.
|
| • |
There are potential conflicts of interest, including the management of other investment funds and accounts by the Advisor and Star Mountain, which could impact our investment returns.
|
| • |
The fee structure under the Advisory Agreement may induce the Advisor to pursue speculative investments and incur leverage, which may not be in the best interests of our stockholders.
|
| • |
Regulations governing our operation as a BDC will affect our ability to, and the way in which we, raise additional capital.
|
| • |
Our financing agreements contain various covenants, which, if not complied with, could accelerate our repayment obligations thereunder, thereby materially and adversely affecting our liquidity, financial condition, results of operations
and ability to pay distributions.
|
| • |
The information and technology systems of the Company, the Adviser and their respective service providers may be vulnerable to cyber-attacks.
|
| • |
Stockholders may be subject to significant adverse consequences in the event such a Stockholder defaults on its capital commitment to the Company.
|
| • |
There is no public market for shares of our common stock, and we do not expect there to be a market for our shares.
|
| • |
The ongoing conflict in Ukraine and Russia, including sanctions and market volatility related to such conflict, may adversely impact the industries and portfolio companies in which the Company invests.
|
General Investment Risks
All investments, including the Company’s investments, risk the loss of capital. The Advisor believes that the Company’s investment strategy and research techniques moderate this risk through a careful selection of
investments. No guarantee or representation is made (and no such guarantee or representation could be made) that the Company’s investment strategy will be successful.
Limited Operating History
The Company commenced as a private fund in 2019 and has a limited operating history. There can be no assurance that the results achieved by similar strategies managed by Star Mountain or its affiliates will be
achieved for the Company. Past performance should not be relied upon as an indication of future results. Moreover, the Company is subject to all of the business risks and uncertainties associated with any new business, including the risk that it
will not achieve its investment objectives and that the value of a Stockholder’s investment could decline substantially or that the Stockholder will suffer a complete loss of its investment in the Company.
The Advisor and the members of the management team have limited experience managing a BDC, and the investment philosophy and techniques used by the Advisor to manage a BDC may differ from the investment philosophy
and techniques previously employed by the Advisor, its affiliates, and the members of the management team in identifying and managing past investments. In addition, the 1940 Act and the Code impose numerous constraints on the operations of BDCs and
RICs that do not apply to the other types of investment vehicles. For example, under the 1940 Act, BDCs are required to invest at least 70% of their total assets primarily in securities of qualifying U.S. private companies or thinly traded public
companies, cash, cash equivalents, U.S. government securities and other high-quality debt investments that mature in one year or less from the time of investment. The Advisor’s and the members of the management team’s limited experience in managing
a portfolio of assets under such constraints may hinder their respective ability to take advantage of attractive investment opportunities and, as a result, achieve the Company’s investment objectives.
Risks Related to the Company’s Investments
The interest rates of our loans to our portfolio companies that extend beyond 2023 might be subject to change based on recent regulatory changes, including the discontinuation of LIBOR.
The London Interbank Offered Rate (“LIBOR”) is the basic rate of interest used in lending transactions between banks on the London interbank market and has been widely used as a reference for setting the interest
rate on loans globally. In July 2017, the Financial Conduct Authority announced its intention to cease sustaining the LIBOR by the end of 2021. As of January 1, 2023, USD LIBOR is available in five settings (overnight, one-month, three-month,
six-month and 12-month). The ICE Benchmark Administration has stated that it will cease to publish all remaining USD LIBOR settings immediately following their publication on June 30, 2023.
In April 2018, the Federal Reserve Bank of New York began publishing its alternative rate, the Secured Overnight Financing Rate (“SOFR”). The Bank of England followed suit in April 2018 by publishing its proposed
alternative rate, the Sterling Overnight Index Average (“SONIA”). Each of SOFR and SONIA significantly differ from LIBOR, both in each actual rate and how each rate is calculated, and therefore it is unclear whether and when markets will adopt
either of these rates as a widely accepted replacement for LIBOR.
As such, when LIBOR is discontinued, if a replacement rate is not widely agreed upon or if a replacement rate is significantly different from LIBOR, it could cause a disruption in the credit markets generally. Such a
disruption could have an adverse impact on the market value of and/or transferability of any LIBOR-linked securities, loans, and other financial obligations or extensions of credit held by or due to us or on our overall financial condition or
results of operations. It is not possible to predict the effect of any of these developments, and any future initiatives to regulate, reform or change the manner of administration of LIBOR could result in adverse consequences to the rate of
interest payable and receivable on, market value of and market liquidity for LIBOR-based financial instruments.
Most of our new investments are indexed to SOFR; however, we have material contracts that are indexed to LIBOR. Certain contracts have an orderly market transition already in process; however, other contracts, will
need to be renegotiated to replace LIBOR with an alternative reference rate. Following the replacement of LIBOR, some or all of our credit agreements with our portfolio companies may bear interest at a lower interest rate, which could have an
adverse impact on the value and liquidity of our investment in these portfolio companies and, as a result, on our results of operations.
In addition, the transition from LIBOR to SOFR, SONIA or other alternative reference rates may also introduce operational risks in our accounting, financial reporting, loan servicing, liability management and other
aspects of our business.
Illiquid Nature of Investment Portfolio
The Company generally invests in limited partnership interests of funds focused on making investments in SMBs and in long-term loans to and private equity investments in small and medium-sized private companies that
do not have an established trading market. The Company’s Portfolio Investments typically exit their debt and equity investments through structured terms and amortization or when the portfolio company has a Liquidity Event such as a sale,
recapitalization, or initial public offering of the company. The illiquidity of the Company’s investments may adversely affect the Company’s ability to dispose of debt and equity securities at times when it may be otherwise advantageous for the
Company to liquidate such investments. In addition, if the Company were forced to immediately liquidate some or all of the investments in the portfolio, the proceeds of such liquidation could be significantly less than the current value of such
investments.
Investing in Private Companies Involves a High Degree of Risk
The Company’s portfolio consists of long-term loans to and investments in SMBs. Investments in private businesses involve a high degree of business and financial risk, which can result in substantial losses for the
Stockholders in those investments and accordingly should be considered speculative. There is generally no publicly available information about the companies in which the Company invests, and the Company relies significantly on the diligence of its
service providers and agents to obtain information in connection with investment decisions. If the Company is unable to identify all material information about these companies, among other factors, the Company may fail to receive the expected
return on investment or lose some or all of the money invested in these companies. In addition, these businesses may have shorter operating histories, narrower product lines, smaller market shares and less experienced management than their larger
competitors and may be more vulnerable to customer preferences, market conditions, and loss of key personnel, or economic downturns, which may adversely affect the return on, or the recovery of, investments in such businesses. As a Stockholder, the
Company is subject to the risk that a Portfolio Investment may make a business decision that does not serve the Company’s best interests, which could decrease the value of the investment. Deterioration in an underlying portfolio company’s financial
condition and prospects may be accompanied by deterioration in the collateral for a loan, if any, and an event of default by the portfolio company. Such an event may reduce the Company’s anticipated return on invested capital and delay the timeline
for distributions to Stockholders.
Illiquid Nature of the Company’s Common Stock
The shares may be issued in reliance upon certain exemptions from registration or qualification under applicable Federal and state securities laws and so may be subject to certain restrictions on transferability.
There is no public market for the shares and none is expected to develop. In addition, Stockholders will not be entitled to withdraw their Capital Contributions, and shares may not be assigned or transferred without the consent of the Advisor,
subject to certain exceptions. Accordingly, the shares constitute illiquid investments and should only be purchased by persons that are “accredited investors” as such term is defined under the Securities Act of 1933, as amended, and able to bear
the risk of their investment in shares for an indefinite period of time.
Limited Collaboration History of the Members of the Management Team
The Company converted from a private fund that was formed in 2019 and has a limited operating history. The members of the management team, including the Investment Committee, have been collaborating with each other
as an investment management team for a relatively short period of time. There may be a period of time required for newer management team members to familiarize themselves with the working formats and styles of the other members. Failure to
adequately do so may result in slower capital deployment and lower rates of return to Stockholders. In addition, there can be no assurance that all members of the management team will remain officers or employees of the Advisor, and additional
officers and employees may be added to the Management team during the term of the Company.
No Guarantee to Replicate Historical Results Achieved by Star Mountain or its Affiliates
The Company’s primary focus in making investments may differ from those of existing investment funds, accounts or other investment vehicles that are or have been managed by Star Mountain. The Company may consider
co-investing in Portfolio Investments with other investment funds, accounts or investment vehicles managed by Star Mountain. Any such investments will be subject to regulatory limitations and approvals by the Company’s independent directors. The
Company can offer no assurance, however, that it will be able to obtain such approvals or develop opportunities that comply with such limitations. There can be no guarantee that the Company will replicate the historical results achieved by similar
strategies managed by Star Mountain, and investment returns could be substantially lower than the returns achieved by them in prior periods. Additionally, all or a portion of the prior results may have been achieved in particular market conditions
which may never be repeated. Moreover, current or future market volatility and regulatory uncertainty may have an adverse impact on the Company’s future performance.
Negative Impact on Portfolio Companies from Economic Recessions or Downturns
Many of the companies in which the Company makes and intends to make investments may be susceptible to economic slowdowns or recessions. An economic slowdown may affect the ability of a company to repay loans or
engage in a Liquidity Event such as a sale, recapitalization, or initial public offering. The amount of nonperforming assets may increase and the value of the Company’s portfolio may decrease during these periods. Adverse economic conditions also
may decrease the value of any collateral securing some of the loans. These conditions could lead to financial losses to the Company’s portfolio and overall assets.
Potential Adverse Effects of New or Modified Laws or Regulations
The Company and its portfolio companies are subject to regulation at the local, state, federal and, in some cases, foreign levels. These laws and regulations, as well as their interpretation, are likely to change
from time to time, and new laws and regulations may be enacted. Accordingly, any change in these laws or regulations, changes in their interpretation, or newly enacted laws or regulations, or any failure by the Company or its portfolio companies to
comply with these laws or regulations, could require changes to certain of the Company’s or its portfolio companies’ business practices, negatively impact the Company’s or its portfolio companies’ operations, cash flows or financial condition,
impose additional costs on the Company or its portfolio companies or otherwise adversely affect the Company’s business or the business of its portfolio companies. In addition to the legal, tax and regulatory changes that are expected to occur,
there may be unanticipated changes. The legal, tax and regulatory environment for BDCs, investment advisers and the instruments that they utilize (including derivative instruments) is continuously evolving.
Over the last several years, there also has been an increase in regulatory attention to the extension of credit outside of the traditional banking sector, raising the possibility that some portion of the non-bank
financial sector will be subject to new regulation. While it cannot be known at this time whether any regulation will be implemented or what form it will take, increased regulation of non-bank credit extension could negatively impact the Company’s
operations, cash flows or financial condition, impose additional costs on the Company, intensify the regulatory supervision of the Company or otherwise adversely affect the Company’s business.
General Credit Risks
The Company may be exposed to losses resulting from default and foreclosure of any such loans or interests in loans in which it has invested. Therefore, the value of underlying collateral, the creditworthiness of
borrowers and the priority of liens are each of great importance in determining the value of the Company’s investments. In the event of foreclosure, the Company or an affiliate thereof may assume direct ownership of any assets collateralizing such
foreclosed loans. The liquidation proceeds upon the sale of such assets may not satisfy the entire outstanding balance of principal and interest on such foreclosed loans, resulting in a loss to the Company. Any costs or delays involved in the
effectuation of loan foreclosures or liquidation of the assets collateralizing such foreclosed loans will further reduce proceeds associated therewith and, consequently, increase possible losses to the Company. In addition, no assurances can be
made that borrowers or third parties will not assert claims in connection with foreclosure proceedings or otherwise, or that such claims will not interfere with the enforcement of the Company’s rights.
The Transition away from LIBOR and Changes in Interest Rates May Affect Net Investment Income
The Company’s debt investments may be based on floating rates, such as the LIBOR, Secured Overnight Financing Rate (“SOFR”), EURIBOR, the Federal Funds Rate or the Prime Rate. General interest rate fluctuations may
have a substantial negative impact on the Company’s investments, the value of its interests and the rate of return on invested capital. The Company’s floating rate investments may be linked to LIBOR and it is unclear how increased regulatory
oversight and changes in the method for determining LIBOR may affect the value of the financial obligations to be held by or issued to the Company that are linked to LIBOR, or how such changes could affect the Company’s results of operations or
financial condition. In addition, any further changes or reforms to the determination or supervision of LIBOR may result in a sudden or prolonged increase or decrease in reported LIBOR, which could have an adverse impact on the market for or value
of any LIBOR-linked securities, loans, and other financial obligations or extensions of credit held by or due to the Company or on its overall financial condition or results of operations.
In the recent past, concerns have been publicized that some of the member banks surveyed by British Bankers’ Association (“BBA”) in connection with the calculation of LIBOR across a range of maturities and currencies
may have been under-reporting or otherwise manipulating the inter-bank lending rate applicable to them in order to profit on their derivative positions or to avoid an appearance of capital insufficiency or adverse reputational or other consequences
that may have resulted from reporting inter-bank lending rates higher than those they actually submitted. A number of BBA member banks entered into settlements with their regulators and law enforcement agencies with respect to alleged manipulation
of LIBOR.
In recent years, the number of unsecured interbank funding transactions in the LIBOR markets has declined substantially and public and private sector industry initiatives have focused on identifying new or
alternative reference rates that could be used in place of IBORs. These initiatives have gained momentum, particularly in light of the announcement in July 2017 by the UK Financial Conduct Authority (“FCA”) that it would no longer use its influence
or legal powers to persuade or compel contributing banks to make LIBOR submissions after the end of 2021. On March 5, 2021, the FCA confirmed that all LIBOR settings will either cease to be provided by any administrator or no longer be
representative: (a) immediately after December 31, 2021, in the case of Sterling, Euro, Swiss Franc and Japanese Yen LIBOR benchmark settings, and the 1-week and 2-month U.S. Dollar LIBOR benchmark settings; and (b) immediately after June 30, 2023,
in the case of the remaining U.S. Dollar LIBOR benchmark settings (the “March 2021 Announcement”).
In the United States, the Alternative Reference Rate Committee (“ARRC”), which is sponsored by the Board of Governors of the Federal Reserve System, has designated the Secured Overnight Financing Rate (“SOFR”) as the
best rate to replace U.S. dollar LIBOR as a benchmark rate, and the Federal Reserve Bank of New York began publishing SOFR on April 3, 2018. SOFR is an overnight rate based on trade-level data from various segments of the U.S. Treasury repo market.
However, unlike LIBOR, SOFR is a secured (and, accordingly, a more risk-free) rate, and is a “backward-looking” overnight rate (and therefore does not include forward-looking term maturities (such as 1-month, 3-month, and 6-month rates)). On July
29, 2021, the ARRC formally recommended the use of the CME Group’s forward-looking SOFR term rates. The CME Term SOFR reference rates provide forward-looking term rate estimates derived from SOFR, calculated and published for One-Month,
Three-Month, Six-Month and Twelve-Month tenors (referred to as Term SOFR). Working groups in other countries for Sterling LIBOR, Euro LIBOR, Yen LIBOR and Swiss LIBOR have also designated alternative reference rates for use in lieu of LIBOR in
those currencies.
U.S. dollar LIBOR continues to be published; however, there is no assurance that LIBOR will continue to exist as a representative rate until the date set forth in the March 2021 Announcement, or at any time
thereafter. Although some LIBOR benchmark settings may continue until the dates set forth in the March 2021 Announcement and some LIBOR benchmark settings may continue to be available on a synthetic, non-representative basis thereafter, some
regulators have prohibited the use of any LIBOR benchmarks in new contracts and have required that regulated entities transition existing contracts to another benchmark prior to the dates set forth in the March 2021 Announcement. Although settings
of such LIBOR benchmarks may continue to be available, such prohibitions and requirements may adversely affect the value of the Company’s adjustable rate investments.
Although market participants, together with regulators, are working diligently to construct a viable alternative benchmark rate to LIBOR rates, there is no assurance that appropriate and usable alternative reference
rates will be developed, or that there will be sufficient liquidity in the markets using those alternative reference rates. Benchmark-related developments are on-going and fast moving and the potential effects of the move away from LIBOR and other
global benchmarks on certain types of investments or products can be difficult to ascertain. There remains uncertainty regarding the future use of LIBOR, the timing of the transition to other benchmarks and the nature of the other benchmarks to be
utilized (including any alternative reference rates). Factors to consider include the existing fallback provisions (if any) in relevant contracts and if, how and when other benchmarks (including alternative reference rates) and the related
fallbacks are adopted for new and legacy products.
There is also no assurance that the characteristics of any alternative reference rates that are designated will be similar to those of any LIBOR, or that any alternative reference rate will be suitable for use as a
benchmark rate for any particular product or security, or that use of an alternative reference rate will produce the economic equivalence of the LIBOR-based rate currently used for such products or securities.
A reduction in the interest rates on new investments relative to interest rates on current investments could also have an adverse impact on the Company’s net interest income. An increase in interest rates could
decrease the value of any investments the Company holds which earn fixed interest rates, including subordinated loans, senior and junior secured and unsecured debt securities and loans and high yield bonds, and also could increase the Company’s
interest expense, thereby decreasing its net income. Also, an increase in interest rates available to investors could make investment in the Company less attractive if the Company is not able to increase its dividend or distribution rate, which
could reduce the value of an investment in the Company.
Investors should also be aware that a change in the general level of interest rates can be expected to lead to a change in the interest rate the Company may receive on many of its debt investments. Accordingly, a
change in the interest rate could make it easier for the Company to meet or exceed the performance threshold and may result in a substantial increase in the amount of incentive fees payable to the Advisor with respect to the portion of the
incentive fee based on income.
Inflation Could Adversely Affect the Business, Results of Operations, and Financial Condition of our Portfolio Companies
Certain of the Company’s portfolio companies are in industries that could be impacted by inflation. If such portfolio companies are unable to pass any increases in their costs of operations along to their customers,
it could adversely affect their operating results and impact their ability to pay interest and principal on the Company’s loans, particularly if interest rates rise in response to inflation. In addition, any projected future decreases in the
Company’s portfolio companies’ operating results due to inflation could adversely impact the fair value of those investments. Any decreases in the fair value of the Company’s investments could result in future realized or unrealized losses and
therefore reduce the Company’s net assets resulting from operations.
Potential for Volatile Markets
The valuations of the Company’s investments can be volatile. In addition, price movements may also be influenced by, among other things, changing supply and demand relationships, interest rates, inflationary
pressures, trade, fiscal, monetary and exchange control programs and national and international political and economic events and policies. In addition, governments from time to time intervene in certain markets. Such intervention often is intended
directly to influence prices and may cause or contribute to rapid fluctuations in asset prices, which may adversely affect the Company’s returns.
Availability of Suitable Investments
The business of investing in SMBs has from time to time been highly competitive; the identification of attractive investment opportunities is difficult and involves a high degree of uncertainty. There are no
assurances that the Company may be able to invest and reinvest its capital fully or that suitable investment opportunities will be identified which satisfy the Company’s rate of return or maturity objectives. Competition in the industry and
performance by the borrower could reduce the rates of return available to the Company on its investments.
Uncertainty as to the Value of Certain Portfolio Investments
The Company expects that many of its Portfolio Investments will take the form of securities that are not publicly traded. The fair value of loans, securities and other investments that are not publicly traded may not
be readily determinable, and will be valued at fair value as determined in good faith by the Board, based on, among other considerations, the input of the Advisor, the Company’s Audit Committee and independent third party firm(s) engaged at the
direction of the Board. Most, if not all, of the Company’s investments (other than cash and cash equivalents) will be classified as Level 3 assets under Topic 820 of the U.S. Financial Accounting Standards Board’s Accounting Standards Codification,
as amended, Fair Value Measurements and Disclosures (“ASC Topic 820”). This means that the Company’s portfolio valuations will be based on unobservable inputs and the Company’s assumptions about how market participants would price the asset or
liability in question. The Company expects that inputs into the determination of fair value of Portfolio Investments will require significant management judgment or estimation. Even if observable market data are available, such information may be
the result of consensus pricing information or broker quotes, which include a disclaimer that the broker would not be held to such a price in an actual transaction. The non-binding nature of consensus pricing and/or quotes accompanied by
disclaimers materially reduces the reliability of such information. The Company expects to retain the services of one or more independent service providers to review the valuation of these loans and securities. The types of factors that may be
taken into account in determining the fair value of investments generally include, as appropriate, comparison to publicly-traded securities including such factors as yield, maturity and measures of credit quality, the enterprise value of a
portfolio company, the nature and realizable value of any collateral, the portfolio company’s ability to make payments and its earnings and discounted cash flow, the markets in which the portfolio company does business and other relevant factors.
Because such valuations, and particularly valuations of private securities and private companies, are inherently uncertain, may fluctuate over short periods of time and may be based on estimates, determinations of fair value may differ materially
from the values that would have been used if a ready market for these loans and securities existed. The Company’s net asset value could be adversely affected if determinations regarding the fair value of the Company’s investments were materially
higher than the values that the Company ultimately realizes upon the disposal of such loans and securities. In addition, the method of calculating the Management Fee (and the Incentive Compensation) may result in conflicts of interest between the
Advisor, on the one hand, and Stockholders on the other hand, with respect to the valuation of investments.
Syndication and/or Transfer of Investments
The Company, directly or through the use of one or more Subsidiary Investment Vehicles, may originate and/or purchase certain debt assets, including ancillary equity assets (“Assets”). The Company may also purchase
certain Assets (including, participation interests or other indirect economic interests) that have been originated by other affiliated or unaffiliated parties and/or trading on the secondary market. The Company may, in certain circumstances,
originate or purchase such Assets with the intent of syndicating and/or otherwise transferring a significant portion thereof, including to one or more offshore funds or accounts managed by the Advisor or any of their affiliates. In such instances,
the Company will bear the risk of any decline in value prior to such syndication and/or other transfer. In addition, the Company will also bear the risk of any inability to syndicate or otherwise transfer such Assets or such amount thereof as
originally intended, which could result in the Company owning a greater interest therein than anticipated.
Investments in Leveraged Portfolio Companies
The Company may invest in certain SBICs or other funds that may employ leverage as part of their strategy. In addition, as described above, the Company may borrow funds to consummate an investment or to pay the
Management Fee. Leverage provides an opportunity for a fund to enhance the rate of return to its Stockholders, but creates additional risk with respect to the return of capital or the reduction of the rate of return for Stockholders in the event
that such fund’s investments have not performed well. Whether the effect of leverage is beneficial or detrimental to such fund’s Stockholders will depend, among other things, on the cost of the leverage and the investment experience of such fund.
With respect to SBA leverage, as is the case with other Federal funding programs, the SBIC program requires periodic Congressional reauthorization. Although the program has been in existence since 1958 and there is no reason to believe that it will
not continue to be reauthorized, there can be no assurance that the maximum leverage authorized for any particular fiscal year will be adequate to meet the demand for debenture leverage in that year.
Small Business Company License
Employees of the Advisor (or an affiliate of the Advisor) may apply for a license to form a SBIC for the Company. If the application is approved and the SBA so permits, the SBIC license will be transferred to a
wholly-owned subsidiary of the Company. Following such transfer, the SBIC subsidiary will be allowed to issue SBA-guaranteed debentures, subject to the required capitalization of the SBIC subsidiary. SBA guaranteed debentures carry long-term fixed
rates that are generally lower than rates on comparable bank and other debt. The Company cannot assure you that the principals or employees of Star Mountain will be successful in receiving an SBIC license from the SBA or that the SBA will permit
such license to be transferred to the Company. If the Company does receive an SBIC license, there is no minimum amount of SBA-guaranteed debentures that must be allocated to us.
SBA Fees and SBIC Debenture Rate
SBICs pay to the SBA fees associated with participation in the SBIC program and the use of SBA leverage. Such fees are set by the Federal Government and may change without warning and potentially impact returns of
the Company. Additionally, fees associated with SBIC leverage rates are adjusted on a semi-annual basis. In advance of SBIC leverage drawdowns, debenture rates may increase and negatively impact returns.
Possibility of the Need to Raise Additional Capital
The Company may need additional capital to fund new investments and grow its portfolio of investments once it has fully invested the net proceeds it has received. Unfavorable economic conditions could increase the
Company’s funding costs or limit its access to the capital. A reduction in the availability of new capital could limit the Company’s ability to grow. In addition, the Company will be required to distribute at least 90% of its net ordinary income
and net short-term capital gains in excess of net long-term capital losses, if any, to Stockholders to maintain its qualification as a RIC. As a result, these earnings will not be available to fund new investments. An inability on the Company’s
part to access the capital successfully could limit its ability to grow its business and execute its business strategy fully and could decrease its earnings, if any, which would have an adverse effect on the value of its securities.
Direct Investing Risks in SMBs
Investing in middle-market and small company mezzanine debt involves risks that range from the more general risks of fixed income investments to those specific to the characteristics of mezzanine debt. As with other
debt instruments, there is a risk of issuer default but this risk is compounded by the fact that companies borrowing mezzanine debt are more apt to have a leveraged balance sheet. Additionally, the middle-market and small company focus means that
the companies will generally be smaller, more concentrated in their business activities, have fewer capital-raising alternatives and limited management depth.
The debt of most middle-market and small companies is not rated by rating agencies. However, these borrowers are widely considered to be below investment grade. In the event of default, recoveries can be low because
mezzanine debt claims are often subordinate to senior debt. Lack of liquidity is also another risk factor associated with middle-market and small company mezzanine debt.
While middle market companies may have potential for rapid growth, they often involve higher risks than larger companies. Middle market companies have more limited financial resources than larger companies and may be
unable to meet their obligations under their debt obligations that the Company holds, which may be accompanied by a deterioration in the value of any collateral and a reduction in the likelihood of the Company realizing any guarantees it may have
obtained in connection with its investment. Middle market companies also typically have shorter operating histories, narrower product lines and smaller market shares than larger businesses, which tend to render them more vulnerable to competitors’
actions and market conditions, as well as general economic downturns. Less publicly available information may be available about these companies and they may not be subject to the financial and other reporting requirements applicable to public
companies. They are more likely to depend on the management talents and efforts of a small group of persons; therefore, the death, disability, resignation or termination of one or more of these persons could have a material adverse impact on the
company and, in turn, on the Company. Middle market companies may also have less predictable operating results and may require substantial additional capital to support their operations, finance expansion or maintain their competitive position.
They may also have difficulty accessing the capital markets to meet future capital needs, which may limit their ability to grow or to repay their outstanding indebtedness upon maturity. If these companies are private companies, there will not be as
much publicly available information about these companies as there is for public companies and such information may not be of the same quality. The Company will generally focus on debt investments in SMBs. The Advisor may determine whether
companies are U.S.-based or qualify as “middle market” in its sole discretion.
Second-Lien, or Other Subordinated Loans or Debt Risk
The Company may acquire and/or originate second-lien or other subordinated loans. In the event of a loss of value of the underlying assets that collateralize the loans, the subordinate portions of the loans may
suffer a loss prior to the more senior portions suffering a loss. If a borrower defaults and lacks sufficient assets to satisfy the Company’s loan, the Company may suffer a loss of principal or interest. If a borrower declares bankruptcy, the
Company may not have full recourse to the assets of the borrower, or the assets of the borrower may not be sufficient to satisfy the loan. In addition, certain of the Company’s loans may be subordinate to other debt of the borrower. As a result, if
a borrower defaults on the Company’s loan or on debt senior to the Company’s loan, or in the event of the bankruptcy of a borrower, the Company’s loan will be satisfied only after all senior debt is paid in full. The Company’s ability to amend the
terms of the Company’s loans, assign the Company’s loans, accept prepayments, exercise the Company’s remedies (through “standstill periods”) and control decisions made in bankruptcy proceedings relating to borrowers may be limited by intercreditor
arrangements if debt senior to the Company’s loans exists.
Unsecured Loans or Debt
The Company may invest in unsecured loans which are not secured by collateral. In the event of default on an unsecured loan, the first priority lien holder has first claim to the underlying collateral of the loan. It
is possible that no collateral value would remain for an unsecured holder and therefore result in a loss of investment to the Company. Because unsecured loans are lower in priority of payment to secured loans, they are subject to the additional
risk that the cash flow of the borrower may be insufficient to meet scheduled payments after giving effect to the secured obligations of the borrower. Unsecured loans generally have greater price volatility than secured loans and may be less
liquid.
Risks Associated with Covenant-Lite Loans
A significant number of leveraged loans in the market may consist of loans that do not contain financial maintenance covenants (“Covenant-Lite Loans”). While the Company does not intend to invest in Covenant-Lite
Loans as part of its principal investment strategy, it is possible that such loans may comprise a portion of the Company’s portfolio. Such loans do not require the borrower to maintain debt service or other financial ratios. Ownership of
Covenant-Lite Loans may expose the Company to different risks, including with respect to liquidity, price volatility, ability to restructure loans, credit risks and less protective loan documentation than is the case with loans that also contain
financial maintenance covenants.
Sub-investment Grade and Unrated Debt Obligations Risk
The Company may invest in sub-investment grade debt obligations. Investments in the sub-investment grade categories are subject to greater risk of loss of principal and interest than higher-rated securities and may
be considered to be predominantly speculative with respect to the obligor’s capacity to pay interest and repay principal. They may also be considered to be subject to greater risk than securities with higher ratings in the case of deterioration of
general economic conditions. Because investors generally perceive that there are greater risks associated with non-investment grade securities, the yields and prices of such securities may fluctuate more than those for higher-rated securities. The
market for non-investment grade securities may be smaller and less active than that for higher- rated securities, which may adversely affect the prices at which these securities can be sold and result in losses to the Company, which, in turn, could
have a material adverse effect on the performance of the Company, and, by extension, the Company’s business, financial condition, results of operations and net asset value.
In addition, the Company may invest in debt obligations which may be unrated by a recognized credit rating agency, which may be subject to greater risk of loss of principal and interest than higher-rated debt
obligations or debt obligations which rank behind other outstanding securities and obligations of the obligor, all or a significant portion of which may be secured on substantially all of that obligor’s assets. The Company may also invest in debt
obligations which are not protected by financial covenants or limitations on additional indebtedness. In addition, evaluating credit risk for debt securities involves uncertainty because credit rating agencies throughout the world have different
standards, making comparison across countries difficult. Any of these factors could have a material adverse effect on the performance of the Company, and, by extension, the Company’s business, financial condition, results of operations and net
asset value.
To the extent that the Company invests in sub-investment grade investments that are also stressed or distressed then the risks discussed above are heightened.
Equity Securities Risk
The Company may purchase common and other equity securities. Although common stock has historically generated higher average total returns than fixed income securities over the long term, common stock also has
experienced significantly more volatility in those returns. The equity securities the Company acquires may fail to appreciate and may decline in value or become worthless, and the Company’s ability to recover its investment will depend on a
portfolio company’s success. Investments in equity securities involve a number of significant risks. While there are many types of equity securities, prices of all equity securities will fluctuate. Any equity investment in a portfolio company could
be subject to further dilution as a result of the issuance of additional equity interests and to serious risks as a junior security that will be subordinate to all indebtedness (including trade creditors) or other senior securities in the event
that the issuer is unable to meet its obligations or becomes subject to a bankruptcy process. To the extent that the portfolio company requires additional capital and is unable to obtain it, the Company may not recover its investment. In some
cases, equity securities in which the Company invests will not pay current dividends, and the Company’s ability to realize a return on its investment, as well as to recover its investment, will be dependent on the success of the portfolio company.
Interest Rate Risk
The Company primarily invests in instruments with adjustable rates. Interest rate changes may affect the value of a debt instrument indirectly (especially in the case of fixed rate securities) and directly
(especially in the case of instruments whose rates are adjustable). In general, rising interest rates will negatively impact the price of a fixed rate debt instrument and falling interest rates will have a positive effect on price. Interest rate
sensitivity is generally more pronounced and less predictable in instruments with uncertain payment or prepayment schedules.
If general interest rates rise, there is a risk that the portfolio companies in which we hold floating rate securities will be unable to pay escalating interest amounts, which could result in a default under their
loan documents with us. Rising interest rates could also cause portfolio companies to shift cash from other productive uses to the payment of interest, which may have a material adverse effect on their business and operations and could, over time,
lead to increased defaults. In addition, rising interest rates may increase pressure on us to provide fixed rate loans to our portfolio companies, which could adversely affect our net investment income, as increases in our cost of borrowed funds
would not be accompanied by increased interest income from such fixed-rate investments.
Borrowing Risk
The Company may borrow from and issue senior debt securities to banks, insurance companies and other lenders or investors as part of its investment strategy. Holders of these senior securities will have fixed-dollar
claims on the Company’s assets that are superior to the claims of Stockholders. If the value of the Company’s assets decreases, leveraging would cause NAV to decline more sharply than it otherwise would have if the Company did not employ leverage.
Similarly, any decrease in the Company’s income would cause net income to decline more sharply than it would have had it not borrowed. Such a decline could negatively affect the Company’s ability to make Common Stock dividend payments. The
Company’s ability to service any debt that it incurs will depend largely on its financial performance and will be subject to prevailing economic conditions and competitive pressures. There can be no assurance that the Company will use leverage or
that a leveraging strategy will be successful during any period in which it is employed.
Furthermore, any credit agreement or other debt financing agreement into which the Company may enter may impose financial and operating covenants that restrict its investment activities, the Company’s ability to call
capital, remedies on default and similar matters. In connection with borrowings, the Company’s lenders may also require the Company to pledge assets, Stockholder commitments to fund capital calls and/or the proceeds of those capital calls, thereby
allowing the lender to call for Capital Contributions upon the occurrence of an event of default under such financing arrangement. To the extent such an event of default does occur, Stockholders could therefore be required to fund any shortfall up
to their remaining Capital Commitments, without regard to the underlying value of their investment.
Lastly, the Company may be unable to obtain its desired leverage, which would, in turn, affect a Stockholder’s return on investment.
PIK Interest Payments
Certain of the Company’s debt investments may contain provisions providing for the payment of payment-in-kind (“PIK”) interest. Because PIK interest results in an increase in the size of the loan balance of the
underlying loan, the receipt of PIK interest will have the effect of increasing the Company’s assets under management. As a result, the receipt of PIK interest may result in an increase in the amount of the base Management Fee payable by the
Company. In addition, any such increase in a loan balance due to the receipt of PIK interest will cause such loan to accrue interest on the higher loan balance, which will result in an increase in the Company’s pre- incentive fee net investment
income and, as a result, an increase in incentive fees that are payable by the Company to the Advisor. To the extent PIK interest income constitutes a portion of our income, we will be exposed to risks associated with such income being required to
be included in accounting income and taxable income prior to receipt of cash, including the following:
| • |
The higher yields and interest rates on PIK securities reflects the payment deferral and increased credit risk associated with such instruments and that such investments may represent a significantly higher credit risk than coupon loans.
|
| • |
PIK securities may have unreliable valuations because their continuing accruals require continuing judgments about the collectability of the deferred payments and the value of any associated collateral.
|
| • |
PIK interest has the effect of generating investment income and increasing the incentive fees payable at a compounding rate. In addition, the deferral of PIK interest also reduces the loan-to-value ratio at a compounding rate.
|
| • |
PIK securities create the risk that incentive fees will be paid to the Advisor based on non-cash accruals that ultimately may not be realized, but the Advisor will be under no obligation to reimburse the Company for these fees.
|
Prepayment Risk
The terms of loans in which the Company invests may permit the borrowers to voluntarily prepay loans at any time, either with no or a nominal prepayment premium. This prepayment right could result in the borrower
repaying the principal on an obligation held by the Company earlier than expected. This may happen when there is a decline in interest rates, when the borrower’s improved credit or operating or financial performance allows the refinancing of
certain classes of debt with lower cost debt. The yield of the Company’s investment assets may be affected by the rate of prepayments differing from the Advisor’s expectations. Assuming an improvement in the credit market conditions, early
repayments of the debt held by the Company could increase. To the extent early prepayments increase, they may have a material adverse effect on the Company’s investment objectives and profits. In addition, if the Company is unable to reinvest the
proceeds of such prepayments received in investments expected to be as profitable, the proceeds generated by the Company will decline as compared to the Advisor’s expectations.
Collateral Risk
The collateral and security arrangements in relation to such secured obligations as the Company may invest in will be subject to such security or collateral having been correctly created and perfected and any
applicable legal or regulatory requirements which may restrict the giving of collateral or security by an obligor, such as, for example, thin capitalization, over-indebtedness, financial assistance and corporate benefit requirements. If the
investments do not benefit from the expected collateral or security arrangements, this may adversely affect the value of or, in the event of default, the recovery of principal or interest from such investments made by the Company. Accordingly, any
such a failure to properly create or perfect collateral and security interests attaching to the investments could have a material adverse effect on the performance of the Company, and, by extension, the Company’s business, financial condition,
results of operations and net asset value.
Volatility of Loans and Debt Securities of Leveraged Companies
Leveraged companies may experience bankruptcy or similar financial distress. Many of the events within a bankruptcy case are adversarial and often beyond the control of the creditors. While creditors generally are
afforded an opportunity to object to significant actions, there can be no assurance that a bankruptcy court would not approve actions that may be contrary to the Company’s interests. Furthermore, there are instances where creditors can lose their
ranking and priority if they are considered to have taken over management of a borrower.
The reorganization of a company can involve substantial legal, professional and administrative costs to a lender and the borrower; it is subject to unpredictable and lengthy delays; and during the process a company’s
competitive position may erode, key management may depart and a company may not be able to invest its capital adequately. In some cases, the debtor company may not be able to reorganize and may be required to liquidate assets. The debt of companies
in financial reorganization will, in most cases, not pay current interest, may not accrue interest during reorganization and may be adversely affected by an erosion of the issuer’s fundamental value.
In addition, lenders can be subject to lender liability claims for actions taken by them where they become too involved in the borrower’s business or exercise control over the borrower. For example, the Company could
become subject to a lender’s liability claim, if, among other things, the borrower requests significant managerial assistance from the Company and it provides such assistance as contemplated by the 1940 Act.
Various laws enacted for the protection of creditors may apply to certain investments that are debt obligations, although the existence and applicability of such laws will vary between jurisdictions. For example, if
a court were to find that an obligor did not receive fair consideration or reasonably equivalent value for incurring indebtedness evidenced by an investment and the grant of any security interest securing such investment, and, after giving effect
to such indebtedness, the obligor: (i) was insolvent; (ii) was engaged in a business for which the assets remaining in such obligor constituted unreasonably small capital; or (iii) intended to incur, or believed that it would incur, debts beyond
its ability to pay such debts as they mature, such court may: (a) invalidate such indebtedness and such security interest as a fraudulent conveyance; (b) subordinate such indebtedness to existing or future creditors of the obligor; or (c) recover
amounts previously paid by the obligor in satisfaction of such indebtedness or proceeds of such security interest previously applied in satisfaction of such indebtedness. In addition, if an obligor in whose debt the Company has an investment
becomes insolvent, any payment made on such investment may be subject to avoidance, cancellation and/or clawback as a “preference” if made within a certain period of time (which for example under some current laws may be as long as two years)
before insolvency.
In general, if payments on an investment are voidable, whether as fraudulent conveyances, extortionate transactions or preferences, such payments may be recaptured either from the initial recipient or from subsequent
transferees of such payments. To the extent that any such payments are recaptured, there may be a material adverse effect on the Company’s performance.
Counterparty Risk
To the extent that contracts for investment will be entered into between the Company and a market counterparty as principal (and not as agent), the Company is exposed to the risk that the market counterparty may, in
an insolvency or similar event, be unable to meet its contractual obligations to the Company. The Company may have a limited number of potential counterparties for certain of its investments, which may significantly impair the Company’s ability to
reduce its exposure to counterparty risk. In addition, difficulty reaching an agreement with any single counterparty could limit or eliminate the Company’s ability to execute such investments altogether. Because certain purchases, sales, hedging,
financing arrangements and other instruments in which the Company will engage are not traded on an exchange but are instead traded between counterparties based on contractual relationships, the Company is subject to the risk that a counterparty
will not perform its obligations under the related contracts. Although the Company intends to pursue its remedies under any such contracts, there can be no assurance that a counterparty will not default and that the Company will not sustain a loss
on a transaction as a result.
Non-U.S. Currencies and Investments
Investing in securities of non-U.S. issuers involves certain considerations comprising both risks and opportunities not typically associated with investing in securities of U.S. issuers. These considerations include
changes in exchange control regulations, political and social instability, expropriation, imposition of non-U.S. taxes, less liquid markets and less available information than is generally the case in the United States, higher transaction costs,
less government supervision of exchanges, brokers and issuers, difficulty in enforcing contractual obligations, lack of uniform accounting and auditing standards and greater price volatility.
Although most of the Company’s investments will be U.S. dollar denominated, any investments that are denominated in a non-U.S. currency are subject to the risk that the value of a particular currency will change in
relation to one or more other currencies. Among the factors that may affect currency values are trade balances, the level of short-term interest rates, differences in relative values of similar assets in different currencies, long-term
opportunities for investment and capital appreciation, and political developments. The Company may, but is not obligated to, employ hedging techniques to minimize these risks, and there can be no assurance that any such hedging strategies, if
employed, will be effective.
Risks of Engaging in Hedging Transactions
Subject to application of the 1940 Act and applicable CFTC regulations, the Company may enter into hedging transactions, which may expose it to risks associated with such transactions. Such hedging may utilize
instruments such as forward contracts, currency options and interest rate swaps, caps, collars and floors to seek to hedge against fluctuations in the relative values of the Company’s portfolio positions from changes in currency exchange rates and
market interest rates. Use of these hedging instruments may include counter- party credit risk.
Hedging against a decline in the values of the Company’s portfolio positions does not eliminate the possibility of fluctuations in the values of such positions or prevent losses if the values of such positions
decline. However, such hedging can establish other positions designed to gain from those same developments, thereby offsetting the decline in the value of such portfolio positions. Such hedging transactions may also limit the opportunity for gain
if the values of the underlying portfolio positions should increase. Moreover, it may not be possible to hedge against an exchange rate or interest rate fluctuation that is so generally anticipated that the Company is not able to enter into a
hedging transaction at an acceptable price.
The success of any hedging transactions the Company may enter into will depend on the Company’s ability to correctly predict movements in currencies and interest rates. Therefore, while the Company may enter into
such transactions to seek to reduce currency exchange rate and interest rate risks, unanticipated changes in currency exchange rates or interest rates may result in poorer overall investment performance than if the Company had not engaged in any
such hedging transactions. In addition, the degree of correlation between price movements of the instruments used in a hedging strategy and price movements in the portfolio positions being hedged may vary. Moreover, for a variety of reasons, the
Company may not seek to (or be able to) establish a perfect correlation between such hedging instruments and the portfolio holdings being hedged. Any such imperfect correlation may prevent the Company from achieving the intended hedge and expose it
to risk of loss. In addition, it may not be possible to hedge fully or perfectly against currency fluctuations affecting the value of securities denominated in non-U.S. currencies because the value of those securities is likely to fluctuate as a
result of factors not related to currency fluctuations. For the year ended December 31, 2022 the Company has not engaged in hedging transactions.
Potential Failure to Make Follow-On Investments in Portfolio Companies
Following an initial investment in a portfolio company, the Company may make additional investments in that portfolio company as “follow-on” investments, in order to:
| • |
increase or maintain in whole or in part the Company’s equity ownership percentage;
|
| • |
exercise warrants, options or convertible securities that were acquired in the original or subsequent financing; or
|
| • |
attempt to preserve or enhance the value of the Company’s investment.
|
The Company may elect not to make follow-on investments or otherwise lack sufficient funds to make those investments.
The Company will have the discretion to make any follow-on investments, subject to the availability of capital resources. The failure to make follow-on investments may, in some circumstances, jeopardize the continued
viability of a portfolio company and the Company’s initial investment, or may result in a missed opportunity for the Company to increase its participation in a successful operation. Even if the Company has sufficient capital to make a desired
follow-on investment, it may elect not to make a follow-on investment because it may not want to increase its concentration of risk, because it prefers other opportunities or because it is inhibited by compliance with BDC requirements, or
compliance with the requirements for maintenance of its RIC status.
Potential Impact of Not Holding Controlling Equity Interests in Portfolio Companies
The Company does not generally intend to take controlling equity positions in the Company’s portfolio companies. To the extent that the Company does not hold a controlling equity interest in a portfolio company, it
will be subject to the risk that such portfolio company may make business decisions with which the Company disagrees, and the Stockholders and management of such portfolio company may take risks or otherwise act in ways that are adverse to the
Company’s interests. Due to the lack of liquidity for the debt and equity investments that the Company typically holds in portfolio companies, the Company may not be able to dispose of its investments in the event it disagrees with the actions of a
portfolio company, and may therefore suffer a decrease in the value of its investments.
Defaults by Portfolio Companies
A portfolio company’s failure to satisfy financial or operating covenants imposed by the Company or other lenders could lead to defaults and, potentially, acceleration of the time when the loans are due and
foreclosure on the portfolio company’s assets representing collateral for its obligations. This could trigger cross defaults under other agreements and jeopardize the portfolio company’s ability to meet its obligations under the debt that the
Company holds and the value of any equity securities the Company owns. The Company may incur expenses to the extent necessary to seek recovery upon default or to negotiate new terms with a defaulting portfolio company.
The Company may be affected by force majeure events (i.e., events beyond the control of the party claiming that the event has occurred, including, without limitation, acts of
God, fire, flood, earthquakes, war, terrorism and labor strikes). Some force majeure events may adversely affect the ability of a party to perform its obligations until it is able to remedy the force majeure event. In addition, the Company’s cost
of repairing or replacing damaged assets resulting from such force majeure event could be considerable. Additionally, a major governmental intervention into industry, including the nationalization of an industry or the assertion of control over one
or more companies or its assets, could result in a loss, including if the Company’s investment in such issuer is cancelled, unwound or acquired (which could be without what the Advisor considers to be adequate compensation). To the extent the
Company is exposed to investments in issuers that as a group are exposed to such force majeure events, the Company’s risks and potential losses are enhanced.
Unspecified Use of Proceeds
The proceeds of capital called by the Company are intended to be used to make investments and pay the Company expenses. Stockholders of the Company do not expect to have an opportunity to evaluate for themselves the
relevant economic, financial and other information regarding all investments by the Company. No assurance can be given that the Company may be successful in obtaining suitable investments or that, if the investments are made, the objectives of the
Company may be achieved.
Dependence on Key Personnel
The Company depends on the continued services of its key management personnel. If the Company were to lose any of its officers or other management personnel, such a loss could result in operating inefficiencies and
lost business opportunities, which could have a negative effect on the Company’s operating performance.
Dependence on Information Systems and Potential Systems Failures
Star Mountain is highly dependent on its communications and information systems. System failures, breaches or cyber-attacks could significantly disrupt Star Mountain’s business, which could have a material adverse
effect on the results of operations and cash flows of the Company and negatively affect the Company’s ability to make distributions to Stockholders. System breaches in particular are evolving and include, but are not limited to, malicious software,
attempts to gain unauthorized access to data, and other electronic security breaches that could result in disruptions of Star Mountain’s communications and information systems, unauthorized release of confidential or proprietary information and
damage or corruption of data. These events could lead to higher operating costs from remedial actions, loss of business and potential liability.
Board Participation
The Company may have observation rights in or membership on the board of advisors of the majority of its Portfolio Investments. While such rights could enhance the Company’s ability to manage its investments, they
are not critical to the Company’s investment philosophy and they may have the effect of impairing the ability of the Company to sell the related securities when, and upon the terms, the Company might otherwise desire, as such rights may subject the
Company to legal claims it would not otherwise be subject to as an investor, including claims of breach of duty of loyalty, securities claims, and other claims related to the Company’s involvement on the board. In addition, the Company, as holder
of those securities, may be precluded from selling the securities, even if desired, due to the possession of its representatives of material non-public information about the company to which the securities relate.
Other Activities of Company Management
As noted above, the management of the Company are currently engaged, and may continue to be engaged, in other philanthropic, community and business activities, and they may be required to allocate a portion of their
time to engaging in such other activities. In addition, certain team members who are aligned and engaged partners of the Advisor and also providing valuable insights and relationships to the Advisor and the Company are not full-time employees.
Limited Liability and Indemnification of the Advisor
Under the Advisory Agreement, the Advisor, its officers, managers, partners, agents, employees, controlling persons, members and any other person or entity affiliated with the Advisor, and any person controlling or
controlled by the Advisor will not be liable to the Company, any subsidiary of the Company, the directors, the Stockholders or any subsidiary’s Stockholders or partners for acts or omissions performed in accordance with and pursuant to the Advisory
Agreement, except those resulting from acts constituting gross negligence, willful misfeasance, bad faith or reckless disregard of the duties that the Advisor owes to the Company under the Advisory Agreement. In addition, as part of the Advisory
Agreement, the Company has agreed to indemnify the Advisor and each of its officers, managers, partners, agents, employees, controlling persons, members and any other person or entity affiliated with the Advisor, from and against any claims or
liabilities, including reasonable legal fees and other expenses reasonably incurred, arising out of or in connection with the Company’s business and operations or any action taken or omitted on the Company’s behalf pursuant to authority granted by
the Advisory Agreement, except where attributable to gross negligence, willful misfeasance, bad faith or reckless disregard of such person’s duties under the Advisory Agreement. These protections may lead the Advisor to act in a riskier manner when
acting on the Company’s behalf than it would when acting for its own account.
Third Party Litigation
The Company’s investment activities subject it to the normal risks of becoming involved in litigation initiated by third parties. This risk is somewhat greater where the Company exercises control or influence over a
company’s direction. The expense of defending against claims by third parties and paying any amounts pursuant to settlements or judgments would, absent willful misconduct or gross negligence by the Advisor, be borne by the Company (to the extent
not borne by the portfolio companies) and would reduce net assets or could require Stockholders to return to the Company distributed capital and earnings. The Advisor and others are indemnified in connection with such litigation, subject to certain
conditions.
Projections
The Company may rely upon projections developed by the Advisor, a portfolio fund or an operating company, concerning the portfolio company’s or fund’s performance and potential cash flows. Projections are inherently
subject to uncertainty and factors beyond the control of the Advisor or any portfolio company. The inaccuracy of certain assumptions, the failure to satisfy certain financial requirements or the occurrence of other unforeseen events could impair
the ability of a portfolio company, and hence the Company, to realize projected values and cash flow.
Credit Investigation
The Company’s overall performance is heavily reliant upon the underwriting and investment analysis and performance of the Portfolio Investments. There can be no assurance that such evaluations may be complete or that
the underlying due diligence may reveal all issues. Investments may fail to meet expectations projected on the basis of such evaluations due to a number of undiscovered or unanticipated factors.
Timing of Investment Returns
The Company may not always be able to realize upon its investments in a manner that produces the maximum return on such investments. A fund may elect or be required to remain invested in a manner that does not
maximize returns on a given investment because of the inherent unpredictability involved in evaluating the point at which such returns are maximized. SBICs cannot make distributions to Stockholders unless permitted by the SBA which could delay
distributions or impair overall returns to Stockholders.
Failure to Fund Commitments
The Company intends to draw down against the commitments made by Stockholders. The Company’s Subscription Agreement is structured to motivate Stockholders to fund their commitments when called by permitting the
Advisor to: offer the investment opportunity to other Stockholders; cause the defaulting Stockholder to sell its interest in the Company; take legal action against the defaulting Stockholder; prohibit the defaulting Stockholder from participating
in future Company investments; withhold distributions made, subsequent to the Stockholder’s default, on the remaining interests until the final liquidation of the Company; require the Stockholder to share in any losses of the Company but not share
in any profits; forfeit its shares or any combination thereof. There can be no assurance, however, that all Stockholders may fund their commitments in a timely manner. Failure by Stockholders to fund their commitments when called could result in
the Company being precluded from an investment opportunity and could result in returns being less than might otherwise occur.
Changes to Government Policies and Regulations
Future regulatory changes at various securities industry regulatory bodies such as the SEC and legislative changes at Federal and state levels may impose on the Company stricter investment guidelines resulting in any
or all of reduction of deal flow, increased reporting and compliance costs and investment restrictions. Such results may have a negative impact on the returns generated to Stockholders.
Limited Recourse
Other than as described in the Subscription Agreement, Stockholders in the Company will not have recourse to assets other than those in the Company.
Risk Associated with Portfolio Company Assets
The tangible assets held by the Company’s portfolio companies, which may be materially encumbered if the Company makes an investment, may be subject to the risks of investment in property in general. These risks
include, among others, employee misconduct, strikes, theft, fire, terrorism, war, general or local economic conditions, acts of God (which may result in uninsured or uninsurable losses), and other factors which are beyond the control of portfolio
company management, the Advisor, or the Company. Should any of these events occur with respect to the assets of any portfolio company, the value of the Company’s investment in such portfolio company could be adversely affected and any debt
obligations secured by such assets could be accelerated if adequate insurance proceeds and/or additional collateral are unavailable.
Public Health Emergencies, Epidemics or Pandemics, Terrorist Attacks, Acts of War, and Natural Disasters may Impact Our Portfolio Companies and Our Adviser and Harm Our Business, Operating Results
and Financial Condition
Terrorist acts, acts of war, global health emergencies or natural disasters may disrupt our operations, as well as the operations of the businesses in which we invest. Such acts have created, and continue to create,
economic and political uncertainties and have contributed to global economic instability. Future terrorist activities, military or security operations, global health emergencies or natural disasters could further weaken the domestic/global
economies and create additional uncertainties, which may negatively impact the businesses in which we invest directly or indirectly and, in turn, could have a material adverse impact on our business, operating results and financial condition.
Losses from terrorist attacks, global health emergencies and natural disasters are generally uninsurable.
Political, Social and Economic Uncertainty
U.S. and non-U.S. markets could experience political uncertainty and/or change that subjects investments to heightened risks, including, for instance, risks related to the elections in the U.S., the large-scale
invasion of Ukraine by Russia that began in February 2022, or the effect on world leaders and governments of the COVID-19 pandemic. These heightened risks could also include: increased risk of default (by both government and private issuers);
greater social, trade, economic and political instability (including the risk of war or terrorist activity); greater governmental involvement in the economy; greater governmental supervision and regulation of the securities markets and market
participants resulting in increased expenses related to compliance; greater fluctuations in currency exchange rates; controls or restrictions on foreign investment and/or trade, capital controls and limitations on repatriation of invested capital
and on the ability to exchange currencies; inability to purchase and sell investments or otherwise settle security or derivative transactions (i.e., a market freeze); unavailability of currency hedging techniques; and slower clearance.
During times of political uncertainty and/or change, global markets often become more volatile. There could also be a lower level of monitoring and regulation of markets while a country is experiencing political
uncertainty and/or change, and the activities of investors in such markets and enforcement of existing regulations could become more limited. Markets experiencing political uncertainty and/or change could have substantial, and in some periods
extremely high, rates of inflation for many years. Inflation and rapid fluctuations in inflation rates typically have negative effects on such countries’ economies and markets. Tax laws could change materially, and any changes in tax laws could
have an unpredictable effect on us, our investments and our investors. There can be no assurance that political changes will not cause us or our investors to suffer losses.
It is impossible to predict the precise nature and consequences of these events, or of any political or policy decisions and regulatory changes occasioned by emerging events or uncertainty on applicable laws or
regulations that impact the Company and its Portfolio Investments. In many instances, the impact will be adverse and profound.
Severe Economic Consequences of Defaulting Stockholders
If Stockholders fail to fund their commitment obligations or to make required Capital Contributions when due, the Company’s ability to complete its investment program or otherwise continue operations may be
substantially impaired. A Stockholder’s failure to fund such amounts when due causes that Stockholder to become a defaulting Stockholder. If a substantial number of Stockholders become defaulting Stockholders, this may severely limit opportunities
for investment diversification and would likely reduce returns to the Company and restrict the Company’s ability to meet loan obligations. Any single defaulting Stockholder could cause substantial costs to be incurred by the Company if such default
causes the Company to fail to meet its contractual obligations or if the Company must pursue remedial action against such Stockholder. In the event a Stockholder fails to make a required Capital Contributions when due, it may be subject to various
remedies, including, without limitation, forfeiture of its right to participate in purchasing additional shares on any future drawdown date or otherwise participate in any future investments of the Company. Without limitation on the rights the
Company may have against the defaulting Stockholder, the Company may call for additional Capital Contributions from non-defaulting Stockholders to make up any shortfall. The non-defaulting Stockholders could therefore be required to fund any
shortfall up to their remaining Capital Commitments, without regard to the underlying value of their investment.
If the Company fails to meet its contractual obligations related to a Portfolio Investment due to a defaulting Stockholder, the relevant portfolio company may have a cause of action against the Company, which may
include a claim against assets of the Company other than the Company’s interest in such portfolio company. A creditor of the Company (including a portfolio company with respect to which the Company has failed to meet its contractual obligations)
will not be bound to satisfy its claims from the assets attributable to a particular Portfolio Investment and such creditor generally may seek to satisfy its claims from the assets of the Company as a whole. As a result, if a creditor’s claims
relating to a particular Portfolio Investment exceed the net assets attributable to that Portfolio Investment, the remaining assets of the Company will likely be subject to such claim.
Risks Related to the Company’s Business and Structure
Regulations Governing the Company’s Operation as a BDC
The Company will not generally be able to issue and sell its Common Stock at a price below its then-current net asset value per share. Pursuant to Section 23 of the 1940 Act, the Company is required to determine the
net asset value of its shares within 48 hours, excluding Sundays and holidays, prior to the sale of its shares. The Company may, however, sell Common Stock, or warrants, options or rights to acquire the Company’s Common Stock, at a price below the
then-current net asset value per share of the Company’s Common Stock if the Company’s Board determines that such sale is in the Company’s best interests, and if Stockholders approve such sale. In any such case, the price at which the Company’s
securities are to be issued and sold may not be less than a price that, in the determination of the Company’s Board, closely approximates the market value of such securities (less any distributing commission or discount). If the Company raises
additional funds by issuing Common Stock or senior securities convertible into, or exchangeable for, its Common Stock, then the percentage ownership of Stockholders at that time will decrease, and Stockholders may experience dilution.
Restricted Ability to Enter Into Transactions with Affiliates
The 1940 Act prohibits or restricts the Company’s ability to engage in certain principal transactions and joint transactions with certain “close affiliates” and “remote affiliates.” For example, the Company is
prohibited from buying or selling any security from or to any person who owns more than 25% of its voting securities or certain of that person’s affiliates (each is a “close affiliate”), or entering into prohibited joint transactions with such
persons, absent the prior approval of the SEC. The Company considers the Advisor and its affiliates, to be “close affiliates” for such purposes. The Company is prohibited under the 1940 Act from participating in certain principal transactions and
joint transactions with a “remote affiliate” without the prior approval of the Independent Directors. Any person that owns, directly or indirectly, 5% or more of the Company’s outstanding voting securities will be a “remote affiliate” for purposes
of the 1940 Act, and the Company is generally prohibited from buying or selling any security from or to such affiliate without the prior approval of the Independent Directors.
The Company may, however, invest alongside the Advisor’s investment funds, accounts and investment vehicles in certain circumstances where doing so is consistent with the Company’s investment strategy as well as
applicable law and SEC staff interpretations. For example, the Company may invest alongside such investment funds, accounts and investment vehicles consistent with guidance promulgated by the SEC staff to purchase interests in a single class of
privately placed securities so long as certain conditions are met, including that the Advisor, acting on the Company’s behalf and on behalf of such investment funds, accounts and investment vehicles, negotiates no term other than price. The Company
may also invest alongside the Advisor’s investment funds, accounts and investment vehicles as otherwise permissible under regulatory guidance, applicable regulations and the Advisor’s allocation policy. The Company and the Advisor have received an
exemptive order from the SEC permitting greater flexibility beyond what is otherwise permitted by the 1940 Act. This SEC exemptive order permits the Company to co-invest the Advisor’s investment funds, accounts and investment vehicles in the
Advisor’s originated loan transactions under certain enumerated conditions if the Board determines that it would be advantageous for the Company to co-invest with investment funds, accounts and investment vehicles managed by the Advisor in a manner
consistent with the Company’s investment objectives, positions, policies, strategies and restrictions as well as regulatory requirements and other pertinent factors.
The Company’s allocation policy provides that allocations among the Company and investment funds, accounts and investment vehicles managed by the Advisor and its affiliates will generally be made in a manner deemed
to be fair and equitable over time which does not favor one client or group of clients, taking into consideration such factors as legal, regulatory and tax considerations, availability of capital for investment by the account, liquidity concerns
and such other factors as deemed under the particular circumstances to be relevant in making the investment allocation determination as determined, in the Company’s case, by the Advisor as well as the terms of the Company’s governing documents and
those of such investment funds, accounts and investment vehicles. It is the Company’s policy to base its determinations on such factors as: the amount of cash on-hand, existing commitments and reserves, if any, the Company’s targeted leverage
level, the Company’s targeted asset mix and diversification requirements and other investment policies and restrictions set by the Board or imposed by applicable laws, rules, regulations or interpretations. The Company expects that these allocation
determinations will be made similarly for investment funds, accounts and investment vehicles managed by the Advisor. However, the Company can offer no assurance that investment opportunities will be allocated to the Company fairly or equitably in
the short-term or over time.
In situations where co-investment with investment funds, accounts and investment vehicles managed by the Advisor is not permitted or appropriate, such as when there is an opportunity to invest in different securities
of the same issuer or where the different investments could be expected to result in a conflict between the Company’s interests and those of the Advisor’s clients, subject to the limitations described in the preceding paragraph, the Advisor will
need to decide which client will proceed with the investment. Moreover, except in certain limited circumstances as permitted by the 1940 Act, such as when the only term being negotiated is price, the Company will be unable to invest in any issuer
in which an investment fund, account or investment vehicle managed by the Advisor has previously invested. Similar restrictions limit the Company’s ability to transact business with its officers or directors or their affiliates. These restrictions
will limit the scope of investment opportunities that would otherwise be available to the Company. If the Company is prohibited by applicable law from investing alongside the Advisor’s investment funds, accounts and investment vehicles with respect
to an investment opportunity, the Company will not participate in such investment opportunity.
Potential Deterrence of Takeover Attempts
The General Corporation Law of the State of Delaware, as amended (the “DGCL”), contains provisions that may discourage, delay or make more difficult a change in control of the Company or the removal of the Company’s
directors. The Company’s Certificate of Incorporation and bylaws contain provisions that limit liability and provide for indemnification of the Company’s directors and officers. These provisions and others which the Company may adopt also may have
the effect of deterring hostile takeovers or delaying changes in control or management. The Company is subject to Section 203 of the DGCL, the application of which is subject to any applicable requirements of the 1940 Act. This section generally
prohibits the Company from engaging in mergers and other business combinations with Stockholders that beneficially own 15% or more of the Company’s voting stock, either individually or together with their affiliates, unless the Company’s directors
or Stockholders approve the business combination in the prescribed manner. The Board will adopt a resolution exempting from Section 203 of the DGCL any business combination between the Company and any other person, subject to prior approval of such
business combination by the Board, including approval by a majority of directors who are not “interested persons.” If the Board does not adopt, or adopts but later repeals such resolution exempting business combinations, or if the Board does not
approve a business combination, Section 203 of the DGCL may discourage third parties from trying to acquire control of the Company and increase the difficulty of consummating such an offer.
The Company has also adopted measures that may make it difficult for a third party to obtain control, including provisions of the Certificate of Incorporation that classify the Board in three classes serving
staggered three-year terms, and provisions of the Certificate of Incorporation authorizing the Board to cause the issuance of additional shares of stock and to amend the Certificate of Incorporation, without Stockholder approval, to increase or
decrease the number of shares of stock that the Company has authority to issue. These provisions, as well as other provisions that have been adopted in the Certificate of Incorporation and bylaws, may delay, defer or prevent a transaction or a
change in control that might otherwise be in the best interests of the Company’s Stockholders.
Potential Fluctuations in the Company’s Net Asset Value
The Company’s net asset value may fluctuate over time and, consequently, a Stockholder may pay a different price per share at subsequent closings than some other Stockholders paid at earlier closings. The price per
share of a subsequent closing may be above net asset value per share to take into account the amortization of organizational and offering expenses. Consequently, Stockholders in subsequent closings may receive a different number of shares for the
same Capital Contribution that earlier Stockholders made depending on the net asset value at the relevant time.
Investing a Sufficient Portion of Assets in Qualifying Assets
The Company may not acquire any assets other than “qualifying assets” unless, at the time of and after giving effect to such acquisition, at least 70% of the Company’s total assets are qualifying assets.
The Company believes that most of the investments that it may acquire in the future will constitute qualifying assets. However, the Company may be precluded from investing in what it believes to be attractive
investments if such investments are not qualifying assets for purposes of the 1940 Act. If the Company does not invest a sufficient portion of its assets in qualifying assets, it could violate the 1940 Act provisions applicable to BDCs. As a result
of such violation, specific rules under the 1940 Act could prevent the Company, for example, from making follow-on investments in existing portfolio companies (which could result in the dilution of its position) or could require the Company to
dispose of investments at inappropriate times in order to come into compliance with the 1940 Act. If the Company needs to dispose of such investments quickly, it could be difficult to dispose of such investments on favorable terms. The Company may
not be able to find a buyer for such investments and, even if a buyer is found, the Company may have to sell the investments at a substantial loss. Any such outcomes would have a material adverse effect on the Company’s business, financial
condition, results of operations and cash flows.
If the Company does not maintain its status as a BDC, it would be subject to regulation as a registered closed-end management investment company under the 1940 Act. As a registered closed-end management investment
company, the Company would be subject to substantially more regulatory restrictions under the 1940 Act which would significantly decrease its operating flexibility.
Incurrence of Significant Costs as a Result of Being an Exchange Act Reporting Company
The Company is subject to the reporting requirements under the Exchange Act. As an Exchange Act reporting company, the Company incurs legal, accounting and other expenses, including costs associated with the periodic
reporting requirements applicable to a company whose securities are registered under the Exchange Act, as well as additional corporate governance requirements, including requirements under the Sarbanes-Oxley Act of 2002 and other rules implemented
by the SEC.
The Company is required to comply with certain requirements of the Sarbanes-Oxley Act, including certification requirements of Section 404 of that statute (“Section 404”), and the Company will not be required to
comply with certain other requirements until it has been subject to the reporting requirements of the Exchange Act for a specified period of time. However, under current SEC rules, the Company will be required to report on its assessment of its
internal control over financial reporting pursuant to Section 404 after a transition period established by the SEC’s rules.
The Company’s independent registered public accounting firm will not be required to formally attest to the effectiveness of its internal control over financial reporting until the later of the year following its
first annual report required to be filed with the SEC, or the date the Company is no longer an emerging growth company under the JOBS Act. If the Company is not able to implement the requirements of Section 404 in a timely manner or with adequate
compliance when required, the Company’s operations, financial reporting or financial results could be adversely affected. Matters impacting internal controls may cause the Company to be unable to report its financial information on a timely basis
and thereby subject the Company to adverse regulatory consequences, including sanctions by the SEC or violations of applicable stock exchange listing rules, and result in a breach of the covenants under the agreements governing any of the Company’s
financing arrangements. There could also be a negative reaction in the financial markets due to a loss of investor confidence in the Company and the reliability of the Company’s financial statements. Confidence in the reliability of the Company’s
financial statements could also suffer if the Company or its independent registered public accounting firm were to report a material weakness in the Company’s internal controls over financial reporting.
Potential Changes in Investment Objectives, Operating Policies or Strategies Without Prior Notice or Stockholder Approval
The Company’s Board has the authority to modify or waive certain of the Company’s operating policies and strategies without prior notice (except as required by the 1940 Act) and without Stockholder approval. However,
absent Stockholder approval, the Company may not change the nature of its business so as to cease to be, or withdraw its election as, a BDC. Under Delaware law, the Company also cannot be dissolved without prior Stockholder approval. The Company
cannot predict the effect any changes to its current operating policies and strategies would have on its business, operating results and value of its stock. Nevertheless, the effects may adversely affect the Company’s business and impact its
ability to make distributions.
Allocation of Investment Opportunities and Related Conflicts
The Company generally is prohibited under the 1940 Act from participating in certain transactions with its affiliates without prior approval of the independent directors of the Company (the “Independent Directors”)
and, in some cases, the SEC. Any person that owns, directly or indirectly, 5% or more of the Company’s outstanding voting securities is an affiliate of the Company for purposes of the 1940 Act, and the Company generally is prohibited from buying or
selling any security from or to such affiliate, absent the prior approval of the Independent Directors. The 1940 Act also prohibits certain “joint” transactions with certain of the Company’s affiliates, which could include investments in the same
issuers (whether at the same or different times), without prior approval of the Independent Directors and, in some cases, the SEC. If a person acquires more than 25% of the Company’s voting securities, the Company will be prohibited from buying or
selling any security from or to such person or certain of that person’s affiliates, or entering into prohibited joint transactions with such persons, absent the prior approval of the SEC. Similar restrictions limit the Company’s ability to transact
business with the Company’s officers or directors or their affiliates. These prohibitions will affect the manner in which investment opportunities are allocated between the Company and other funds managed by Star Mountain or its affiliates. Most
importantly, the Company generally will be prohibited from co-investing with other Star Mountain Accounts or affiliates of the Advisor in Star Mountain-originated loans and financings unless the Company co-invests in accordance with the applicable
regulatory guidance or has obtained an exemptive order from the SEC permitting such co-investment activities. Accordingly, while the Advisor intends to allocate suitable opportunities among the Company and other Star Mountain Accounts or affiliates
of the Advisor based on the principles described above, the prohibition on co-investing with affiliates could significantly limit the scope of investment opportunities available to the Company. In particular, the decision by Star Mountain or the
Advisor to allocate an opportunity to one or more Star Mountain Accounts or to an affiliate of the Advisor, or the existence of a prior co-investment structure, might cause the Company to forgo an investment opportunity that it otherwise would have
made. Similarly, the Company generally may be limited in its ability to invest in an issuer in which a Star Mountain Account or affiliate of the Advisor had previously invested. The Company may in certain circumstances also be required to sell,
transfer or otherwise reorganize assets in which the Company has invested with Star Mountain Accounts or affiliates of the Advisor at times that the Company may not consider advantageous.
The Company and the Advisor have received an exemptive order from the SEC in order to permit the Company to co-invest with Star Mountain Accounts and other affiliates of the Advisor. Subject to the terms and
conditions specified in the exemptive order, the Company will be able to co-invest alongside Star Mountain Accounts or affiliates of the Advisor.
Proportion of Assets that May Be Invested in Securities of a Single Issuer
The Company is classified as a non-diversified investment company within the meaning of the 1940 Act, which means that it will not be limited by the 1940 Act with respect to the proportion of the Company’s assets
that it may invest in securities of a single issuer, excluding limitations on investments in other investment companies. To the extent that the Company assumes large positions in the securities of a small number of issuers or industries, the
Company’s net asset value may fluctuate to a greater extent than that of a diversified investment company as a result of changes in the financial condition or the market’s assessment of the issuer. Unfavorable performance by a small number of
Portfolio Investments could adversely affect the aggregate returns realized by Stockholders. The Company expects to invest in a number of Portfolio Investments, but such number may be insufficient to afford adequate diversification against the risk
that an insufficient number of Portfolio Investments in which the Company invests may yield a return.
The Company may also be more susceptible to any single economic or regulatory occurrence than a diversified investment company. In addition, the aggregate returns the Company realizes may be significantly adversely
affected if a small number of investments perform poorly or if the Company needs to write down the value of any one investment. Additionally, a downturn in any particular industry in which the Company is invested could significantly affect the
Company’s aggregate returns.
Because the Company may invest significant amounts of the Company’s available capital in a single investment, any single loss may have a significant adverse impact on the Company’s capital. While the Company will
generally focus on borrowers who are U.S. SMBs, the Advisor may determine whether companies meet the foregoing criteria in its sole discretion. In addition, except as may be provided by the requirement to invest at least 70% of its assets in
qualifying investments and as may be necessary to qualify as a RIC, the Company is not restricted in its ability to invest in companies of any size or in any geographical location, and may from time to time or over time invest in companies of any
size or in any geographical location. The Company’s performance may be adversely affected by industry or region-specific factors.
Risks Regarding Distributions
The Company intends to pay quarterly distributions to Stockholders out of assets legally available for distribution. The Company cannot guarantee that it will achieve investment results that will allow it to make a
specified level of cash distributions or year-to-year increases in cash distributions. If the Company is unable to satisfy the asset coverage test applicable to it as a BDC, or if the Company violates certain debt financing agreements, its ability
to pay distributions to Stockholders could be limited. All distributions will be paid at the discretion of the Company’s Board and will depend on the Company’s earnings, financial condition, maintenance of RIC status, compliance with applicable BDC
regulations, compliance with debt financing agreements and such other factors as the board of directors may deem relevant from time to time. The distributions the Company pays to Stockholders in a year may exceed the Company’s taxable income for
that year and, accordingly, a portion of such distributions may constitute a return of capital for U.S. federal income tax purposes.
Stockholders who periodically receive the payment of a distribution from a RIC consisting of a return of capital for U.S. federal income tax purposes may be under the impression that they are receiving a distribution
of RIC’s net ordinary income or capital gains when they are not. Accordingly, Stockholders should read carefully any written disclosure accompanying a distribution from the Company and the information about the specific tax characteristics of the
Company’s distributions provided to Stockholders after the end of each calendar year, and should not assume that the source of any distribution is the Company’s net ordinary income or capital gains.
Securities Act of 1933
The shares are not registered under the Securities Act or any state securities laws. The shares are not offered and sold in the United States without registration in reliance upon the exemption contained in section
4(a)(2) of the Securities Act and Rule 506 of Regulation D promulgated thereunder by the SEC for transactions not involving a public offering and upon exemptions from any applicable state securities laws. Each prospective investor in the United
States must be an accredited investor (as defined in Regulation D) and is required to represent, among other customary private placement representations, that it is acquiring shares for its own account and not with a view to resale or distribution
in violation of U.S. Federal or state securities laws. Further, each Stockholder must be prepared to bear the economic risk of the investment for an indefinite period, because shares are “restricted securities” (as defined in Rule 144 under the
Securities Act) and can be resold only pursuant to an offering registered under the Securities Act or an exemption from such registration requirement. It is extremely unlikely that shares will ever be registered under the Securities Act.
Securities Exchange Act of 1934
In connection with any acquisition or beneficial ownership by the Company of more than 5% of any class of equity securities of a company registered under the Exchange Act, the Company may be required to make certain
filings with the SEC. Generally, these filings require disclosure of the identity and background of the purchaser, the source and amount of funds used to acquire the securities, the purpose of the transaction, the purchaser’s interest in the
securities and any contracts, arrangements or undertakings regarding the securities. In certain circumstances, the Company may be required to aggregate its investment position in a given operating company with the beneficial ownership of that
company’s securities by or on behalf of the Advisor and its affiliates, which could require the Company, together with such other parties, to make certain disclosure filings or otherwise restrict the Company’s activities with respect to such
operating company’s securities. In addition, if the Company becomes the beneficial owner of more than 10% of any class of equity securities of a U.S. company registered under the Exchange Act or places an officer or a director on the board of
directors of such a company, the Company may be subject to certain additional reporting requirements and to liability for short-swing profits under Section 16 of the Exchange Act. The Company intends to manage its investments so as to avoid the
short-swing profit liability provisions of Section 16 of the Exchange Act.
Compliance with Anti-Money Laundering Requirements
In response to increased regulatory concerns with respect to the sources of funds used in investments and other activities, the Company may request prospective or existing Stockholders to provide additional
documentation verifying, among other things, such Stockholder’s identity and source of funds used to purchase its shares. The Advisor may decline to accept a subscription if this information is not provided or on the basis of such information that
is provided. Requests for documentation may be made at any time during which a Stockholder holds shares. In certain circumstances, the Advisor may be required to provide this information, or report the failure to comply with such requests, to
Governmental authorities without notifying the Stockholder that the information has been provided. The Advisor will take such steps as may be necessary to comply with applicable law, regulations, orders, directives or special measures that may be
required by Government regulators. Governmental authorities are continually considering expanding measures to implement broader anti-money laundering laws and, at this point, it is unclear what additional steps the Advisor may be required to take.
These additional steps, however, may include, without limitation, prohibiting such Stockholder from making further contributions to the Company and depositing distributions to which such Stockholder would otherwise be entitled into an escrow
account.
| Item 1B. |
Unresolved Staff Comments
|
None.
| Item 2. |
Properties
|
The Company’s principal executive office is located at 140 East 45th Street, 37th Floor, New York, NY 10017. The Company does not own any real estate. The Company’s believes its present facilities are adequate to
meet the Company’s current needs. If new or additional space is required, the Company believes that adequate facilities are available at competitive prices in the same area.
| Item 3. |
Legal Proceedings
|
The Company is not currently subject to any material legal proceedings, nor, to the Company’s knowledge, is any material legal proceeding threatened against us. From time to time, the Company may be a party to
certain legal proceedings in the ordinary course of business, including proceedings relating to the enforcement of the Company’s rights under loans to or other contracts with the Company’s portfolio companies. While the outcome of these legal
proceedings cannot be predicted with certainty, the Company does not expect that these proceedings will have a material effect upon the Company’s financial condition or results of operations.
| Item 4. |
Mine Safety Disclosures
|
Not applicable.
PART II
| Item 5. |
Market for Registrant’s Common Equity Related Stockholder Matters and Issuer Purchase of Equity Securities
|
Until a public offering, outstanding Common Stock will be offered and sold in transactions exempt from registration under the Securities Act under Section 4(a)(2) of the Securities Act and Regulation D thereunder.
There is currently no market for the Company’s Common Stock, and the Company can offer no assurances that a market for the Company’s shares of Common Stock will develop in the future.
Because shares of Common Stock are being acquired by investors in one or more transactions “not involving a public offering,” they are “restricted securities” and may be required to be held indefinitely. The
Company’s common shares may not be sold, transferred, assigned, pledged or otherwise disposed of unless (i) the Company’s consent is granted, and (ii) the common shares are registered under applicable securities laws or specifically exempted from
registration (in which case the Stockholder may, at the Company’s option, be required to provide the Company with a legal opinion, in form and substance satisfactory to us, that registration is not required). The Company’s shares of Common Stock
are privately placed and any transfers require the Company’s prior consent. As a result, it is not expected that Stockholders will be able to take advantage of transfers under Rule 144. Accordingly, an investor must be willing to bear the economic
risk of investment in the common shares until the Company is liquidated. No sale, transfer, assignment, pledge or other disposition, whether voluntary or involuntary, of the common shares may be made except by registration of the transfer on the
Company’s books. Each transferee will be required to execute an instrument agreeing to be bound by these restrictions and the other restrictions imposed on the common shares and to execute such other instruments or certifications as are reasonably
required by the Company.
Holders
As of December 31, 2022 and December 31, 2021, there were 310 and 124 Stockholders of the Company, respectively.
Valuation of Investments
Debt and equity securities that are not publicly traded or whose market prices are not readily available are valued at fair value, subject at all times to the oversight and approval of the Company’s Board. Such
determination of fair values are based on, among other considerations, the input of the Advisor, the Company’s Audit Committee and independent third party firm(s) engaged at the direction of the Board, and may involve subjective judgments and
estimates. With respect to unquoted securities, the Advisor, together with independent valuation advisors, and subject at all times to the oversight and approval of the Company’s Board, values each investment considering, among other measures,
discounted cash flow models, comparisons of financial ratios of peer companies that are public and other factors. The Company retains one or more independent providers of financial advisory services to assist the Advisor and the Board by performing
certain third-party valuation services. The Company may appoint additional or different third-party valuation firms in the future.
When an external event such as a purchase transaction, public offering or subsequent equity sale occurs with respect to a fair-valued portfolio company or comparable company, the Company’s Board will use the pricing
indicated by the external event to corroborate and/or assist the Company in the valuation of such portfolio company. Because there are not readily available market quotations for many of the investments in its portfolio, the Company values many of
its investments at fair value as determined in good faith by the Board using a documented valuation policy and a consistently applied valuation process. Due to the inherent uncertainty of determining the fair value of investments that do not have a
readily available market value, the fair value of the Company’s investments may differ significantly from the values that would have been used had readily available market quotations existed for such investments, and the differences could be
material.
On a quarterly basis, with respect to investments for which market quotations are not readily available, the Advisor will undertake a multi-step valuation process each quarter, as described below:
| • |
Securities for which no such market prices are available or reliable will be preliminarily valued at such value as the Advisor may reasonably determine, which may include third-party valuations;
|
| • |
The Audit Committee of the Board will then review these preliminary valuations;
|
| • |
At least once annually, the valuation for each investment that constitutes a material portion of the Company’s portfolio and that does not have a readily available market quotation will be reviewed by an independent valuation firm; and
|
| • |
The Board will then discuss valuations and determine the fair value of each investment in the Company’s portfolio in good faith, based on the input of the Advisor, the respective independent valuation firms and the Audit Committee.
|
All values assigned to securities and other assets by the Board will be binding on all Company Stockholders. When pricing of the Company’s shares is necessary outside of the normal quarterly process, the Advisor
among other things, reviews whether, to its knowledge, significant events have occurred since the last quarterly valuation which might affect the fair value of any of the Company’s portfolio securities.
Distributions
The Company generally intends to make quarterly distributions to its Stockholders out of assets legally available for distribution. Quarterly distributions, if any, will be determined by the Board.
All current income and realization proceeds are retained by the Company and are available for re-investment. Distributions will be made to Stockholders at such times and in such amounts as determined by the Company’s
Board. In addition, the Company has adopted a dividend re-investment program and each Stockholder will receive dividends in the form of additional shares of the Company’s Common Stock unless they notify the Company that they instead desire to
receive cash. If a Stockholder elects to receive dividends in the form of shares, dividend proceeds that otherwise would have been distributed in cash will be retained by the Company for re-investment. Stockholders who elect to receive dividends
and other distributions in the form of shares of Common Stock generally are subject to the same U.S. federal tax consequences as Stockholders who elect to receive their distributions in cash; however, such reinvesting investors will not receive
cash with which to pay any applicable taxes on re-invested dividends.
Unregistered Sales of Equity Securities
Except as previously reported by the Company on its current reports on Form 8-K, the Company did not sell any securities during the period covered by this Annual Report that were not registered under the Securities
Act.
Issuer Purchases of Equity Securities
The following table sets forth information regarding repurchases of the Company’s common stock for the three months ended December 31, 2022.
|
Total Number of
Shares Purchased
|
Average Price per share
|
Total Number of Shares Purchased as Part
of Publicly Announced Plans or Programs
|
||||||||||
|
October 1, 2022 - October 31, 2022
|
-
|
-
|
-
|
|||||||||
|
November 1, 2022 - November 30, 2022
|
99,486.137
|
$
|
25.78
|
99,486.137
|
||||||||
|
December 1, 2022 - December 31, 2022
|
-
|
-
|
-
|
|||||||||
|
Total
|
99,486.137
|
$
|
25.78
|
99,486.137
|
||||||||
| ITEM 6. |
[Reserved]
|
| ITEM 7. |
Management’s Discussion and Analysis of Financial Condition and Results of Operations
|
The following discussion should be read in conjunction with the Company’s audited financial statements and related notes and other financial information appearing elsewhere in this Annual Report on Form 10-K. The
following discussion and other parts of this Annual Report on Form 10-K contain forward-looking information that involves risks and uncertainties.
Overview:
Star Mountain Lower Middle-Market Corp. is an externally managed, non-diversified, closed-end management investment company that has elected to be regulated as a BDC under the 1940 Act, as amended. In addition, for
U.S. federal income tax purposes, the Company has elected to be treated and intends to continue to be treated as a RIC under the subchapter M of the Internal Revenue Code of 1986, as amended. As such, the Company is required to comply with
various regulatory requirements, such as the requirement to invest at least 70% of the Company’s assets in “qualifying assets,” source of income limitations, asset diversification requirements, and the requirement to distribute annually at least
90% of the Company’s taxable income.
The Company’s investment objectives are to generate current income and capital appreciation. The Company seeks to achieve its investment objectives by investing primarily in privately negotiated loans and equity
investments to SMBs generally with annual revenues greater than $15 million and earnings before interest, taxes, depreciation and amortization of less than $50 million. Generally, these businesses are owner-operated with an average 20+ year
operating history. To accomplish this, the Company makes direct investments in SMBs and makes investments in investment funds focused primarily on investing in SMBs generally not owned by large private equity firms.
The Company seeks to provide investors with access to a diversified portfolio of credit investments generating current income distributions with equity upside. Capital protection is achieved through defensive
structures with affirmative, negative and financial maintenance covenants and active portfolio management which results in generally low volatility and low correlation to public market indices. The Company aims to target diversification of assets
by vintage, industry and geography through direct originations and acquisitions of loan portfolios.
The Company’s investment strategy may be complemented by secondary fund investments and secondary loans, consisting of generally non-brokered purchases of limited partnership interests in lower middle-market
credit-oriented funds and secondary loans. This complementary strategy may result in portfolio construction and diversification benefits.
The Company’s investments are subject to a number of risks. See “Part I. Item 1A. Risk Factors.”
Characteristics of and Risks Related to Investments in Private Companies:
Investments in private businesses involve a high degree of business and financial risk, which can result in substantial losses for the Stockholders in those investments and accordingly should be considered
speculative. There is generally no publicly available information about the companies in which the Company invests, and the Company relies significantly on the diligence of its service providers and agents to obtain information in connection with
investment decisions. If the Company is unable to identify all material information about these companies, among other factors, the Company may fail to receive the expected return on investment or lose some or all of the money invested in these
companies. In addition, these businesses may have shorter operating histories, narrower product lines, smaller market shares and less experienced management than their larger competitors and may be more vulnerable to customer preferences, market
conditions, and loss of key personnel, or economic downturns, which may adversely affect the return on, or the recovery of, investments in such businesses.
The Company generally invests in limited partnership interests of funds focused on making investments in SMBs and in long-term loans to and private equity investments in small and medium-sized private companies
that do not have an established trading market. The Company typically exits its debt and equity investments through structured terms and amortization or when the portfolio company has a liquidity event such as a sale, recapitalization, or initial
public offering of the company. The illiquidity of the Company’s investments may adversely affect the Company’s ability to dispose of debt and equity securities at times when it may be otherwise advantageous for the Company to liquidate such
investments. In addition, if the Company were forced to immediately liquidate some or all of the investments in the portfolio, the proceeds of such liquidation could be significantly less than the current value of such investments.
Operating and Regulatory Structure:
The Company’s investment activities are managed by Star Mountain Fund Management, LLC and supervised by the Board, a majority of whom are independent. Under the Investment Advisory Agreement, the Company pays Star
Mountain Fund Management, LLC a quarterly management fee based on the Company’s average gross assets (excluding cash or cash equivalents but including assets purchased with borrowed amounts) as of the end of each of the two most recently
completed calendar quarters as well as incentive fees based on the Company’s performance.
The Company has entered into an Administration Agreement with Star Mountain Fund Management, LLC to serve as Administrator for the Company. Pursuant to the Administration Agreement, Star Mountain Fund Management,
LLC provides the Company with services such as accounting, financial reporting, legal and compliance support and investor relations support, necessary for the Company to operate or engage a third-party firm to perform some or all of these
functions. The Company has entered into a sub-administration agreement with SS&C Technologies, Inc. (the "Sub-Administrator"), under which the Sub-Administrator provides various accounting and administrative services to the Company.
Revenues:
The Company generates revenues primarily through receipt of interest income from the Portfolio Investments the Company holds. In addition, the Company generates income from various loan origination and other fees
and dividends on direct equity investments. The debt the Company invests in will typically not be rated by any rating agency, but if it were, it is likely that such debt would be rated below investment grade.
Expenses:
Under the Administration Agreement, the Administrator is authorized to incur and pay, in the name and on behalf of the Company, all expenses which it deems necessary or advisable.
The Advisor is responsible for and will pay, or cause to be paid, all Overhead Expenses, except to the extent provided below. For this purpose, “Overhead Expenses” include overhead expenses of an ordinarily
recurring nature such as rent, utilities, supplies, secretarial expenses, stationery, charges for furniture, fixtures and equipment, employee benefits including insurance, payroll taxes and compensation of all employees.
The Company reimburses the Advisor or its affiliates, as applicable, for all costs and expenses incurred in connection with administering the Company’s business including out of pocket expenses (including travel,
lodging and meals), the Company’s allocable portion of the Advisor’s or any affiliated Administrator’s overhead expenses in performing its obligations under the Advisory Agreement or any Administration Agreement, as applicable, including rent and
the allocable portion of the compensation paid by the Advisor or its affiliates, as applicable, to the Company’s Chief Compliance Officer and Chief Financial Officer and their respective staffs (based on the percentage of time such individuals
devote, on an estimated basis, to the business affairs of the Company), third- party software licensing, implementation, data management and recovery services and custom development costs.
All other expenses are borne by the Company, including legal, accounting, tax, auditing, consulting and other professional expenses (including, without limitation, expenses relating to establishing reputation and
public relations in connection with self-sourced lending or other financial transactions); the Management Fee and Incentive Compensation; professional liability insurance (including costs relating to directors’ and officers’ liability insurance
and errors and omissions insurance); research and market data expenses; interest on indebtedness; custodial fees; bank service fees; investment-related fees and expenses (such as third-party sourcing fees, fees and expenses of legal and other
professionals, due diligence expenses and travel, lodging and meal expenses) related to the analysis, purchase or sale of investments, whether or not the investments are consummated; expenses related to special purpose vehicles (each, an “SPV”)
(including, without limitation, Overhead Expenses related thereto); interest payable on debt, if any, incurred to finance the Company’s investments; other expenses related to the purchase, monitoring, sale, settlement, custody or transmittal of
Company assets (directly or through trading affiliates) as will be determined by the Advisor or an affiliate thereof, as applicable, in its sole discretion (including costs associated with systems and software used in connection with
investment-related activities); costs of reporting to Stockholders and Stockholder meetings; administration fees and expenses charged by any third-party provider of administration services; entity-level taxes; expenses relating to the offer,
transfer, sale and marketing of shares; filing fees and expenses; Federal and state registration fees and expenses; regulatory and compliance fees and expenses of the Company (including with respect to any registration activities of the Company);
costs of winding up and liquidating the Company; costs associated with ensuring compliance with the applicable BDC and RIC requirements, including, but not limited to, costs incurred in connection with the organization of, and transfer of assets
to, a private investment vehicle; expenses incurred in connection with a Stockholder that defaults in respect of a Capital Commitment; and other expenses associated with the operation of the Company and its investment activities, including
extraordinary expenses such as litigation, workout and restructuring and indemnification expenses, if any. For the avoidance of doubt, the Company will also bear its allocable share (based on invested capital) of any of the expenses listed above
incurred by any Subsidiary Investment Vehicle.
The Company is also responsible for the costs of the offering of common shares and other securities, including, but not limited to, all expenses incurred in connection with an IPO; costs and expenses relating to
distributions paid to Stockholders; costs of effecting sales and repurchases of the Company’s securities; allocated costs incurred by the Advisor or its affiliate in providing managerial assistance to those companies in which the Company has
invested who request it; transfer agent fees; fees and expenses paid to the Company’s independent directors (including expenses and costs related to meetings of the independent directors); costs of preparing and filing reports with the SEC and
other Company reporting and compliance costs, including registration and listing fees; the Company’s allocable portion of the fidelity bond; the costs of reports, proxy statements or other notices to Stockholders, including printing and mailing
costs; the costs of any Stockholders’ meetings and communications; expenses payable under any underwriting agreement, including associated fees, expenses and any indemnification obligations; and all other expenses incurred by the Company in
connection with maintaining its status as a BDC. In addition, the Company may make investments in investment funds focused primarily on investing in SMBs. As a result, the Company (and the Stockholders, indirectly through the Company) bear the
Company’s proportionate share of the fees and expenses paid by the shareholders of such investment fund.
Generally, expenses incurred directly in connection with a particular investment (or proposed investment) of the Company and other Star Mountain accounts in which Star Mountain conducts substantial investment and
other activities in their own accounts and the accounts of other clients (the “Star Mountain Accounts”) will be allocated among the Company and other Star Mountain Accounts pro rata based upon capital invested (or proposed to be invested) in such
investment; provided that expenses specifically attributable to the Company or any other Star Mountain Account may be allocated to the Company or any such other Star Mountain Account, as applicable. The Advisor will allocate other expenses among
the Company and other Star Mountain Accounts in a fair and equitable manner taking into account such factors as it deems appropriate.
Notwithstanding the foregoing, in light of the Company’s investment mandate, which may include investments in small loans, niche credits and other similar securities, it may not be practical to specifically
allocate certain investment-related expenses to the particular loans to which they relate. The Advisor, in its absolute and sole discretion, may instead allocate such expenses (along with expenses that relate to transactions that are not
consummated) pro rata across one or more investments.
Advisor Expenses:
The Advisor shall pay (a) the respective compensation and expenses of the officers and employees of the Advisor, including salaries and benefits of the officers and employees of the Advisor, except as otherwise
specified; (b) expenses associated with office space and facilities, utilities and telephone services, news, quotation and similar information and pricing services, computer equipment, travel expenses and support of the Advisor incurred in
connection with Company operations; and (c) organizational expenses in excess of $1,000,000.
Board Approval of the Investment Advisory Agreement:
The Investment Advisory Agreement was initially approved by the Board at a meeting of the Board called, in part, for such purpose, on February 24, 2021. The Board, including a majority of the directors that are not
“interested persons” as defined in Section 2(a)(19) of the 1940 Act, approved the renewal of the Investment Advisory Agreement on February 23, 2023. Such approvals were made in accordance with, and on the basis of an evaluation satisfactory to
the Board as required by, Section 15(c) of the 1940 Act and applicable rules and regulations thereunder, including a consideration of, among other factors, (i) the nature, quality and extent of the advisory and other services to be provided under
the agreement, (ii) the investment performance of the personnel who manage investment portfolios with objectives similar to the Company’s, (iii) comparative data with respect to advisory fees or similar expenses paid by other BDCs with similar
investment objectives and (iv) information about the services to be performed and the personnel performing such services under the agreement.
Net Gain (Loss)
We recognize realized gains or losses on investments based on the difference between the net proceeds from the disposition and the cost basis of the investment without regard to unrealized gains or losses
previously recognized. We record current period changes in fair value of investments within net change in unrealized gain (loss) on the statements of operations.
Portfolio and Investment Activity:
For the year ended December 31, 2022, the Company invested (net of original issue discount) $150,843,665 in 22 new portfolio companies and $66,668,982 in sixteen existing portfolio companies as reflected in the
Schedule of Investments. For the period ended December 31, 2021, the Company invested (net of original issue discount) $50,487,790 in ten new portfolio companies and $13,332,543 in sixteen existing portfolio companies as reflected in the Schedule
of Investments.
The Company had $10,570,051 in principal repayments for the year ended December 31, 2022, of which $10,026,750 was received in cash as of December 31, 2022 (with the remaining balance as the change in receivable
from December 31, 2021). The Company had $2,860,756 in principal repayments for the period from May 14, 2021 (the commencement of operations) to December 31, 2021, of which $2,559,788 was received in cash as of December 31, 2021 (with the
remaining balance as receivable).
As of December 31, 2022 and December 31, 2021, the Company’s investments consisted of the following:
|
December 31, 2022
|
December 31, 2021
|
|||||||||||||||
|
Fair Value:
|
||||||||||||||||
|
First Lien Senior Secured Loan
|
$
|
260,982,122
|
86.10
|
%
|
$
|
79,686,882
|
76.90
|
%
|
||||||||
|
Second Lien Senior Secured Loan
|
6,250,270
|
2.10
|
9,748,549
|
9.40
|
||||||||||||
|
Preferred Equity Securities
|
27,088,732
|
8.90
|
10,604,516
|
10.20
|
||||||||||||
|
Warrants and Other Equity Securities
|
5,829,429
|
1.90
|
3,600,418
|
3.50
|
||||||||||||
|
Fund Investments
|
3,045,128
|
1.00
|
-
|
-
|
||||||||||||
|
Total
|
$
|
303,195,681
|
100.00
|
%
|
$
|
103,640,365
|
100.00
|
%
|
||||||||
The table below describes investments by industry composition based on fair value as of December 31, 2022 and December 31, 2021:
|
December 31, 2022
|
December 31, 2021
|
|||||||||||||||
|
Fair Value:
|
||||||||||||||||
|
Aerospace & Defense
|
$
|
5,877,696
|
1.80
|
%
|
$
|
3,406,449
|
3.30
|
%
|
||||||||
|
Commercial Services & Supplies
|
10,629,012
|
3.50
|
9,446,485
|
9.10
|
||||||||||||
|
Construction & Engineering
|
36,895,770
|
12.20
|
21,566,475
|
20.90
|
||||||||||||
|
Consumer Finance
|
3,836,822
|
1.30
|
2,872,016
|
2.80
|
||||||||||||
|
Distributors
|
14,383,702
|
4.70
|
-
|
-
|
||||||||||||
|
Diversified Consumer Services
|
14,502,291
|
4.80
|
4,707,478
|
4.50
|
||||||||||||
|
Diversified Financials
|
3,045,128
|
1.00
|
-
|
-
|
||||||||||||
|
Diversified Telecommunication Services
|
17,241,546
|
5.70
|
8,835,342
|
8.50
|
||||||||||||
|
Electrical Equipment
|
9,836,785
|
3.20
|
-
|
-
|
||||||||||||
|
Entertainment
|
19,165,339
|
6.30
|
9,903,617
|
9.60
|
||||||||||||
|
Food Products
|
6,953,360
|
2.30
|
-
|
-
|
||||||||||||
|
Healthcare Providers & Services
|
15,185,883
|
5.00
|
1,464,446
|
1.40
|
||||||||||||
|
Hotels, Restaurants & Leisure
|
4,919,446
|
1.60
|
-
|
-
|
||||||||||||
|
Household Durables
|
2,586,687
|
0.90
|
4,229,816
|
4.10
|
||||||||||||
|
Household Products
|
4,073,972
|
1.30
|
3,716,607
|
3.60
|
||||||||||||
|
IT Services
|
14,001,990
|
4.60
|
1,999,150
|
1.90
|
||||||||||||
|
Leisure Products
|
4,793,707
|
1.60
|
4,632,103
|
4.50
|
||||||||||||
|
Machinery
|
6,635,785
|
2.20
|
-
|
-
|
||||||||||||
|
Media
|
25,659,236
|
8.50
|
7,094,439
|
6.80
|
||||||||||||
|
Personal Products
|
4,335,304
|
1.40
|
4,590,821
|
4.40
|
||||||||||||
|
Professional Services
|
34,425,860
|
11.40
|
8,029,455
|
7.70
|
||||||||||||
|
Road & Rail
|
14,752,716
|
4.90
|
1,013,686
|
1.00
|
||||||||||||
|
Software
|
5,961,468
|
2.00
|
6,131,980
|
5.90
|
||||||||||||
|
Specialty Retail
|
6,318,303
|
2.10
|
-
|
-
|
||||||||||||
|
Trading Companies & Distributors
|
17,177,873
|
5.70
|
-
|
-
|
||||||||||||
|
Total
|
$
|
303,195,681
|
100.00
|
%
|
$
|
103,640,365
|
100.00
|
%
|
||||||||
Portfolio Asset Quality:
The Advisor employs an investment risk rating to assign each investment an investment grade no less than quarterly. The system is intended primarily to reflect the underlying risk of a portfolio investment relative
to the Company’s initial cost basis in respect of such portfolio investment (i.e., at the time of origination), although it may also take into account under certain circumstances, the portfolio company’s cash flow generation relative to
underwriting expectations, recent business performance trends, collateral coverage and other relevant factors. When necessary, the Advisor will update its investment risk ratings, borrowing base criteria and covenant compliance reports. The
investment risk rating of a particular investment should not, however, be deemed to be a guarantee of the investment’s future performance.
|
Investment
Performance
Risk Rating
|
Summary Description
|
|
|
Grade 1
|
Investment is performing above expectations. Full return of principal, interest and dividend income is expected.
|
|
|
Grade 2
|
Investment is performing in-line with expectations. Risk factors remain neutral or favorable compared with initial underwriting. All investments are given a “2” at the time of origination
|
|
|
Grade 3
|
Investment is performing below expectations. Capital impairment or payment delinquency is not anticipated. The investment may also be out of compliance with certain financial covenants.
|
|
|
Grade 4
|
Investment is performing below expectations. Quantitative or qualitative risks have increased materially. Delinquency of interest and / or dividend payments is anticipated. No loss of principal anticipated.
|
|
|
Grade 5
|
Investment is performing substantially below expectations. It is anticipated that the Company will not recoup its initial cost basis and may realize a loss upon exit. Most or all of the debt covenants are out of
compliance. Amortization, interest and / or dividend payments are substantially delinquent.
|
In the event of credit deterioration, the Advisor may form a team or engage outside advisors to preserve the value of the Company’s investment, including requirement of additional equitization from the ownership
group or exercising other creditor rights.
For investments rated Grade 4 or Grade 5, the Advisor enhances its level of scrutiny over the monitoring of such portfolio company and will develop an action plan to address the underperformance. The Advisor’s
senior investment team has extensive experience managing investments through workouts, restructurings, and bankruptcies.
The following table shows the distribution of the Company’s investments on the 1 to 5 investment performance risk rating scale as of December 31, 2022 and December 31, 2021:
|
December 31, 2022
|
December 31, 2021
|
|||||||||||||||
|
Investment Performance Risk Rating
|
Investments at
Fair Value |
Percentage of
Total Investments |
Investments at
Fair Value |
Percentage of
Total Investments |
||||||||||||
|
1
|
$
|
24,011,980
|
7.90
|
%
|
$
|
-
|
-
|
%
|
||||||||
|
2
|
230,159,492
|
75.90
|
92,427,602
|
89.20
|
||||||||||||
|
3
|
39,811,785
|
13.10
|
11,212,763
|
10.80
|
||||||||||||
|
4
|
6,625,737
|
2.20
|
-
|
-
|
||||||||||||
|
5
|
2,586,687
|
0.90
|
-
|
-
|
||||||||||||
|
Total
|
$
|
303,195,681
|
100.00
|
%
|
$
|
103,640,365
|
100.00
|
%
|
||||||||
Results of Operations:
The following table represents the operating results for the year ended December 31, 2022 and for the period May 14, 2021 to December 31, 2021:
|
For the year ended
December 31, 2022 |
For the period
May 14, 2021* to December 31, 2021 |
|||||||
|
Total investment income
|
$
|
21,975,603
|
$
|
4,499,992
|
||||
|
Total expenses
|
13,673,237
|
2,493,580
|
||||||
|
Net investment income before fee waivers
|
8,302,366
|
2,006,412
|
||||||
|
Management fee waiver
|
279,725
|
-
|
||||||
|
Incentive fee waiver
|
2,185,968
|
-
|
||||||
|
Net investment income after fee waivers
|
10,768,059
|
2,006,412
|
||||||
|
Net realized gain (loss) on investments
|
43,607
|
240,492
|
||||||
|
Net change in unrealized gain (loss) on investments
|
(817,733
|
)
|
67,642
|
|||||
|
Net increase (decrease) in net assets resulting from operations
|
$
|
9,993,933
|
$
|
2,314,546
|
||||
Investment Income:
The composition of the Company’s investment income was as follows for the year ended December 31, 2022 and for the period from May 14, 2021 to December 31, 2021:
|
For the year ended
December 31, 2022 |
For the period
May 14, 2021* to December 31, 2021 |
|||||||
|
Non-controlled/non-affiliate investment income
|
||||||||
|
Interest income
|
$
|
20,937,595
|
$
|
4,091,514
|
||||
|
PIK interest income
|
495,426
|
249,427
|
||||||
|
Dividend income
|
181,458
|
94,628
|
||||||
|
Other income
|
257,368
|
-
|
||||||
|
Controlled/affiliate investment income
|
||||||||
|
Interest income
|
103,756
|
64,423
|
||||||
|
Total investment income
|
$
|
21,975,603
|
$
|
4,499,992
|
||||
Operating Expenses:
The composition of the Company’s operating expenses was as follows for the year ended December 31, 2022 and for the period from May 14, 2021 to December 31, 2021:
|
For the year ended
December 31, 2022 |
For the period
May 14, 2021* to December 31, 2021 |
|||||||
|
Interest and other financing fees
|
$
|
5,798,315
|
$
|
325,901
|
||||
|
Management fees
|
3,467,163
|
757,520
|
||||||
|
Incentive fees
|
1,960,085
|
225,883
|
||||||
|
Professional fees
|
1,356,001
|
387,308
|
||||||
|
General and administrative fees
|
609,391
|
206,855
|
||||||
|
Legal expenses
|
393,131
|
266,709
|
||||||
|
Directors' expenses
|
89,151
|
50,849
|
||||||
|
Organizational expenses
|
-
|
272,555
|
||||||
|
Expenses
|
13,673,237
|
2,493,580
|
||||||
|
Management fee waiver
|
(279,725
|
)
|
-
|
|||||
|
Incentive fee waiver
|
(2,185,968
|
)
|
-
|
|||||
|
Total Expenses
|
$
|
11,207,544
|
$
|
2,493,580
|
||||
Income Taxes, Including Excise Tax:
The Company has elected to be regulated as a BDC under the 1940 Act. The Company has also elected to be treated as a RIC under Subchapter M of the Code and intends to qualify annually as a RIC. As long as the
Company maintains its status as a RIC, it generally will not pay corporate-level U.S. federal income taxes on any ordinary income or capital gains that it distributes at least annually to its Stockholders. Rather, any tax liability related to
income earned by the Company represents obligations of the Company’s Stockholders and will not be reflected in the financial statements of the Company.
To qualify as a RIC under Subchapter M of the Code, the Company must, among other things, meet certain source-of-income and asset diversification requirements. In addition, to qualify for RIC tax treatment, the
Company must distribute to its Stockholders, for each taxable year, at least 90.0% of its “investment company taxable income” for that year, which is generally its ordinary income plus the excess of its realized net short-term capital gains over
its realized net long-term capital losses. In order for the Company not to be subject to U.S. federal excise taxes, it must distribute annually an amount at least equal to the sum of (i) 98.0% of its net ordinary income (taking into account
certain deferrals and elections) for the calendar year, (ii) 98.2% of its capital gains in excess of capital losses for the one year period ending October 31 in that calendar year and (iii) any net ordinary income and capital gains in excess of
capital losses for preceding years that were not distributed during such years. The Company, at its discretion, may carry forward taxable income in excess of calendar year dividends and pay a 4.0% nondeductible U.S. federal excise tax on this
income. For the for the year ended December 31, 2022 and for the period from May 14, 2021 to December 31, 2021, the Company did not record a net expense on the Statements of Operations for U.S. federal excise tax.
The Company accounts for income taxes in conformity with ASC Topic 740 — Income Taxes (“ASC Topic 740”). ASC Topic 740 provides guidelines for how uncertain tax positions should be recognized, measured, presented
and disclosed in the financial statements. ASC Topic 740 requires the evaluation of tax positions taken in the course of preparing the Company’s tax returns to determine whether the tax positions are “more-likely-than-not” to be sustained by the
applicable tax authority. Tax benefits of positions not deemed to meet the more-likely-than-not threshold would be recorded as a tax expense in the current year. It is the Company’s policy to recognize accrued interest and penalties related to
uncertain tax benefits in income tax expense. The Company did not record any uncertain income tax positions for the year ended December 31, 2022 and for the period ending December 31, 2021 on the Statements of Assets and Liabilities.
Net Increase (Decrease) in Net Assets Resulting from Operations:
For the year ended December 31, 2022 and for the period from May 14, 2021 to December 31, 2021, the net increase (decrease) in net assets resulting from operations was $9,993,933 and $2,314,546, respectively. Based
on the weighted average shares of Common Stock outstanding for the year ended December 31, 2022 and for the period from May 14, 2021 to December 31, 2021, the Company’s per share net increase (decrease) in net assets resulting from operations was
$2.29 and $0.92, respectively.
Financial Condition, Liquidity and Capital Resources:
The Company will generate cash primarily from the net proceeds generated from private offerings, and from cash flows from fees, interest and dividends earned from investments and principal repayments, proceeds from
sales of investments and borrowings under the Company’s Secured Credit Facility. The Company’s primary use of funds will be direct credit and equity investments in SMBs, payments of expenses and distributions to holders of the Company’s Common
Stock and, to a lesser extent, the Company may invest in limited partnership interests of funds focused on making investments in SMBs. As of December 31, 2022 and December 31, 2021, the Company had approximately $19.0 million and $2.5 million,
respectively, in cash on deposit with financial institutions and $153.0 million and $34.0 million, respectively, in debt outstanding.
In accordance with the 1940 Act, the Company generally is required to meet a coverage ratio of total assets to total borrowings and other senior securities, which include all borrowings and any preferred stock that
may be issued in the future, of at least 150%. If this ratio declines below 150%, the Company cannot incur additional debt and could be required to sell a portion of the Company’s investments to repay some debt when it is disadvantageous to do
so.
Capital Contributions:
For the year ended December 31, 2022 and for the period from May 14, 2021 to December 31, 2021, the Company entered into subscription agreements (collectively, the “Subscription Agreements”) with new investors,
providing for the private placement of common shares. Under the terms of the Subscription Agreements, investors are required to fund drawdowns to purchase common shares up to the amount of their respective capital commitments on an as-needed
basis with a minimum of 8 business days’ prior notice. As of December 31, 2022 and December 31, 2021, the Company had received capital commitments totaling $219.9 million and $143.6 million, respectively.
At the time of the BDC Conversion on May 14, 2021, the Company issued and sold 1,688,601 shares of the Company’s Common Stock, par value $0.001 per share, for an aggregate offering price of $42,215,029.
Pursuant to a capital drawdown notice to its investors, the Company issued and sold 629,240 shares of the Company’s Common Stock, par value $0.001 per share, on June 11, 2021, for an aggregate offering price of
$15,851,000.
Pursuant to a capital drawdown notice to its investors, the Company issued and sold 244,608 shares of the Company’s Common Stock, par value $0.001 per share, on August 17, 2021, for an aggregate offering price of
$6,139,650.
Pursuant to a capital drawdown notice to its investors, the Company issued and sold 740,397 shares of the Company’s Common Stock, par value $0.001 per share, on November 4, 2021, for an aggregate offering price of
$19,161,474.
Pursuant to a capital drawdown notice to its investors, the Company issued and sold 708,935 shares of the Company’s Common Stock, par value $0.001 per share, on March 25, 2022, for an aggregate
offering price of $18,142,000.
Pursuant to a capital drawdown notice to its investors, the Company issued and sold 446,880 shares of the Company’s Common Stock, par value $0.001 per share, on April 21, 2022, for an aggregate
offering price of $11,448,234.
Pursuant to a capital drawdown notice to its investors, the Company issued and sold 441,121 shares of the Company’s Common Stock, par value $0.001 per share, on September 12, 2022, for an
aggregate offering price of $11,283,885.
Pursuant to a capital drawdown notice to its investors, the Company issued and sold 2,186,113 shares of the Company’s Common Stock, par value $0.001 per share, on November 22, 2022, for an
aggregate offering price of $55,199,312.
As of December 31, 2022, net contributions of $165,406,541 had been made by Stockholders and $54,501,929 remained available to be drawn by the Company.
Distributions:
The Board will determine the timing and amount, if any, of the Company’s distributions. The Company intends to pay distributions on a quarterly basis. In order to avoid corporate-level tax on the distributed income
as a RIC, the Company must distribute to Stockholders at least 90.0% of ordinary income and realized net short-term capital gains in excess of realized net long-term capital losses, if any, on an annual basis out of the assets legally available
for such distributions. In order for the Company to avoid certain excise taxes imposed on RICs, the Company currently intends to distribute, or be deemed to distribute, during each calendar year an amount at least equal to the sum of (1) 98.0% of
the Company’s ordinary income for the calendar year, (2) 98.2% of the Company’s capital gain in excess of capital loss for the one-year period ending on October 31 of such calendar year and (3) any ordinary income and net capital gain for
preceding years that were not distributed during such years and on which we paid no U.S. federal income tax.
The Company has adopted an “opt out” dividend reinvestment plan (“DRP”) for Stockholders. When a distribution is declared, Stockholders’ cash distributions will automatically be reinvested in additional shares of
Common Stock unless a Stockholder specifically “opts out” of the Company’s DRP. Stockholders may opt out of the Company’s DRP by providing notice twenty (20) business days in advance of the distribution payment date.
If a Stockholder opts out, that Stockholder will receive cash distributions. Although distributions paid in the form of additional shares of Common Stock will generally be subject to U.S. federal, state and local
taxes in the same manner as cash distributions, Stockholders participating in the Company’s DRP will not receive any corresponding cash distributions with which to pay any such applicable taxes. If distributions paid exceed tax earnings and
profits, portions of the distribution can be recorded as a return of capital.
Pursuant to a distribution notice to its investors, the Company issued 11,997 shares of the Company’s Common Stock, par value $0.001 per share, on August 20, 2021, for an aggregate offering price of $300,751.
Pursuant to a distribution notice to its investors, the Company distributed $0.13 per share, on August 20, 2021, for an aggregate cash distribution of $568 to a Stockholder that opted-out of the DRP.
Pursuant to a distribution notice to its investors, the Company issued 5,631 shares of the Company’s Common Stock, par value $0.001 per share, on November 19, 2021, for an aggregate offering price of $145,176.
Pursuant to a distribution notice to its investors, the Company distributed $0.18 per share, on November 19, 2021, for an aggregate cash distribution of $318,225 to Stockholders that opted-out of the DRP.
Pursuant to a redemption notice to its investors, the Company redeemed 543,025 shares of the Company’s Common Stock, par value $0.001 per share, on November 29, 2021, for an aggregate redemption of $13,923,154.
Pursuant to a distribution notice to its investors, the Company issued 24,306 shares of the Company’s Common Stock, par value $0.001 per share, on January 14, 2022, for an aggregate
offering price of $615,437.
Pursuant to a distribution notice to its investors, the Company distributed $0.46 per share, on January 14, 2022, for an aggregate cash distribution of $662,190 to a Stockholder that opted-out of
the DRP.
Pursuant to a distribution notice to its investors, the Company issued 21,875 shares of the Company’s Common Stock, par value $0.001 per share, on May 20, 2022, for an aggregate offering price of
$560,883.
Pursuant to a distribution notice to its investors, the Company distributed $0.30 per share, on May 20, 2022, for an aggregate cash distribution of $626,388 to Stockholders that opted-out of the
DRP.
Pursuant to a distribution notice to its investors, the Company issued 36,141 shares of the Company’s Common Stock, par value $0.001 per share, on July 29, 2022, for an aggregate offering price of
$921,955.
Pursuant to a distribution notice to its investors, the Company distributed $0.57 per share, on July 29, 2022, for an aggregate cash distribution of $1,346,329 to Stockholders that opted-out of
the DRP.
Pursuant to a distribution notice to its investors, the Company issued 49,214 shares of the Company’s Common Stock, par value $0.001 per share, on November 4, 2022, for an aggregate offering price
of $1,247,052.
Pursuant to a distribution notice to its investors, the Company distributed $0.66 per share, on November 4, 2022, for an aggregate cash distribution of $1,628,714 to Stockholders that opted-out of
the DRP.
Pursuant to a distribution notice to its investors issued on December 31, 2022, 86,086 shares of the Company’s Common Stock, par value $0.001 per share are to be issued, for an aggregate offering
price of $2,181,430.
Pursuant to a distribution notice to its investors issued on December 31, 2022, the Company distributed $0.66 per share, on January 19, 2023, for an aggregate cash distribution of $2,169,650 to
Stockholders that opted-out of the DRP.
Contractual Obligations:
Payments for investment advisory services under the Investment Advisory Agreement in future periods are equal to (a) a management fee calculated at an annual rate of 1.75% of the value of the Company’s gross assets
and (b) an incentive fee based on the Company’s performance. The Company has entered into an administration agreement with Star Mountain Fund Management, LLC to serve as the Company’s Administrator. The Company anticipates that the Administrator
will be reimbursed for administrative expenses incurred on the Company’s behalf.
On July 2, 2021, the Company entered into a Loan and Servicing Agreement (the “Loan Agreement”) with Sterling National Bank (“SNB”), which provides for a $55 million senior secured revolving
credit facility (“Secured Credit Facility”). In February 2022, SNB was subsequently acquired by Webster Bank (“Webster”), which took over the relationship with the Company. On January 12, 2022, the Company entered into a second amendment to the
Secured Credit Facility to upsize the Secured Credit Facility to $80 million. On May 6, 2022, the Company entered into an amendment to the Secured Credit Facility to upsize the Secured Credit Facility to $125 million. On September 16, 2022, the
Company entered into an amendment to the Secured Credit Facility to upsize the Secured Credit Facility to $200 million.
As of December 31, 2022, the Secured Credit Facility commitment amounts were as follows:
|
Secured Credit Facility Lender
|
Commitment
|
|||
|
Webster Bank
|
$
|
67,500,000
|
||
|
Blue Ridge Bank
|
25,000,000
|
|||
|
First Foundation Bank
|
20,000,000
|
|||
|
Mitsubishi HC Capital America, Inc.
|
20,000,000
|
|||
|
Woodforest National Bank
|
20,000,000
|
|||
|
Forbright Bank
|
17,500,000
|
|||
|
Apple Bank
|
15,000,000
|
|||
|
Peapack-Gladstone Bank
|
15,000,000
|
|||
|
Total Commitment
|
$
|
200,000,000
|
||
Borrowings can be increased to a maximum of $350 million in accordance with the Secured Credit Facility accordion feature terms and conditions and are limited by various advance rates and
concentration limits.
As of December 31, 2022 and December 31, 2021, the total fair value of the borrowings outstanding under the Secured Credit Facility was $145,000,000 and $34,000,000, respectively.
Advances under the Secured Credit Facility bear interest at a per annum rate equal to the Prime rate in effect on such day minus 0.35%. Inclusive of syndication, agency, and administrative fees paid
to Webster, the total annualized cost of capital is estimated to be 8.0%. The Company will also pay a non-utilization fee on the average daily unused amount of the aggregate commitments until the commitment termination date (as defined in the
Loan Agreement). As of December 31, 2022, the total commitments under the Secured Credit Facility were $200 million. Proceeds from borrowings under the Secured Credit Facility may be used to finance certain investments, fulfill payment
obligations under the Secured Credit Facility, make distributions/payments permitted by the Loan Agreement. All amounts outstanding under the Secured Credit Facility must be repaid by the fourth anniversary of the initial closing of the Secured
Credit Facility. The Company’s obligations to the lenders under the Secured Credit Facility are secured by a first priority security interest in substantially all of the Company’s assets, subject to certain exclusions.
Borrowings under the Secured Credit Facility are limited by various advance rates and concentration limits. In connection with the Secured Credit Facility, the Company has made certain customary
representations/warranties and is required to comply with various covenants, reporting requirements and other customary requirements for similar facilities. The Secured Credit Facility is subject to customary events of default for similar
financing transactions. Upon the occurrence and during the continuation of an event of default, Webster may declare the outstanding advances and all other obligations under the Secured Credit Facility immediately due and payable.
On June 22, 2022 the Company entered into a Loan and Security Agreement with East West Bank, which provides for cash or credit advances of up to $25 million (the “Revolving Credit Line”) pursuant
to the terms and conditions of the Revolving Credit Line. On September 26, 2022, the Company entered into an amendment with East West Bank, to downsize the Revolving Credit Line to $21 million. All amounts outstanding under the Revolving Credit
Line must be repaid by June 22, 2023. As of December 31, 2022 and December 31, 2021, the total fair value of the borrowings outstanding under the Revolving Credit Line was $8,000,000 and $0, respectively.
Advances under the Revolving Credit Line bear interest at a per annum rate equal to the prime rate in effect on such day or 4.75%, whichever is greater. The Company will also pay certain fees
under the Revolving Credit Line, including unused fees of 0.35% per annum of the average unused portion of the Revolving Credit Line during any fiscal quarter when the average daily balance of the aggregate outstanding principal amount of the
Advances in any fiscal quarter during the term of the Revolving Credit Line equals or exceeds 60% of the Revolving Credit Line amount and 0.75% per annum of the average unused portion of the Revolving Credit Line during any fiscal quarter when
the average daily balance of the aggregate outstanding principal amount of the Advances in any fiscal quarter during the term of the Revolving Credit Line is less than 60% of the Revolving Credit Line amount.
Proceeds from borrowings under the Revolving Credit Line may be used for working capital, to finance the acquisition by the Company of certain investments, to make deposits, to pay management fees
and legal fees, and to fund obligations in accordance with the Company’s certificate of incorporation.
The Company’s obligations to East West Bank under the Revolving Credit Line are secured by a first priority security interest in the capital commitments of the Company’s investors, subject to
certain exclusions.
In connection with the Revolving Credit Line, the Company has made certain customary representations and warranties and is required to comply with various covenants, reporting requirements and
other customary requirements for similar facilities. In addition, under the Revolving Credit Line, the Lender may prohibit the Company from repurchasing its shares of common stock from its investors during a quarter if, in the prior quarter,
repurchase requests from the Company’s investors exceed 10% of the Company’s total capital commitments. The Revolving Credit Line is subject to customary events of default for similar financing transactions. Upon the occurrence and during the
continuation of an event of default, East West Bank may declare the outstanding advances and all other obligations under the Revolving Credit Line immediately due and payable.
The fair value of the borrowings outstanding under the Secured Credit Facility and the Revolving Credit Line are based on a market yield approach and current interest rates, which
are Level 3 inputs to the market yield model. Interest expense incurred for the year ended December 31, 2022 and for the period from May 14, 2021 to December 31, 2021, totaled $4,655,479 and $129,638,
respectively, which is included in interest and other financing fees on the Statements of Operations. The unused commitment fees, amortization of deferred financing costs, and utilization fees for the year ended December 31, 2022 and
for the period from May 14, 2021 to December 31, 2021, amounted to $1,142,836 and $196,263, respectively, which is included in interest and other financing fees on the Statements of Operations. The unused fees
payable and interest expense payable as of December 31, 2022, and December 31, 2021, are included in the credit facility interest payable on the Statements of Assets and Liabilities. The utilization fees payable as of December 31, 2022 and
December 31, 2021, are included in other payables on the Statements of Assets and Liabilities.
Off-Balance Sheet Arrangements:
The Company has no off-balance sheet arrangements that have or are reasonably likely to have a current or future effect on the financial condition, changes in financial condition, revenues or expenses, results of
operations, liquidity, capital expenditures or capital resources of the Company.
Critical Accounting Policies:
This discussion of the Company’s operating plans is based upon the Company’s financial statements, which have been prepared in accordance with accounting principles generally accepted in the U.S., or GAAP. The
preparation of these financial statements will require the Advisor to make estimates and assumptions that affect the reported amounts of assets, liabilities, revenues, and expenses. Changes in the economic environment, financial markets and any
other parameters used in determining such estimates could cause actual results to differ. In addition to the discussion below, the Company’s critical accounting policies, including revenue recognition and taxes, have been described in Item 15.
Note 2. Summary of Significant Accounting Policies.
Valuation of Portfolio Investments:
Investments for which market quotations are readily available are typically valued at those market quotations. To validate market quotations, the Company utilizes a number of factors to determine if the quotations
are representative of fair value, including the source and number of the quotations. Debt and equity securities that are not publicly traded or whose market prices are not readily available are valued quarterly at fair value as determined in good
faith by the Board, based on, among other considerations, the input of the Advisor, the Company’s Audit Committee and an independent third-party valuation firm, engaged at the direction of the Board.
The Board oversees a multi-step valuation process, which includes, among other procedures, the following:
| • |
the quarterly valuation process commences with each portfolio company or investment being initially evaluated by the investment professionals of the Advisor responsible for the monitoring of the portfolio investment;
|
| • |
the Advisor’s Valuation Committee reviews the valuations provided by the independent third-party valuation firm and develops a valuation recommendation. Valuation recommendations are presented to the audit committee of the Board;
|
| • |
the audit committee of the Board reviews valuation recommendations of the Advisor incorporating any adjustments or further supplements by the Advisor to the valuations; and
|
| • |
the Board discusses these valuations and determines the fair value of each investment in the portfolio in good faith, based on the input of the Advisor, the independent valuation firm, and the audit committee.
|
The Company applies Financial Accounting Standards Board Accounting Standards Codification 820, Fair Value Measurement (ASC 820), as amended, which establishes a framework for measuring fair value in accordance
with U.S. GAAP and required disclosures of fair value measurements. ASC 820 determines fair value to be the price that would be received for an investment in a current sale, which assumes an orderly transaction between market participants on the
measurement date. Market participants are defined as buyers and sellers in the principal or most advantageous market (which may be a hypothetical market) that are independent, knowledgeable, and willing and able to transact. In accordance with
ASC 820, the Company considers its principal market to be the market that has the greatest volume and level of activity. ASC 820 specifies a fair value hierarchy that prioritizes and ranks the level of observability of inputs used in
determination of fair value.
The three-tier hierarchy of inputs is summarized below.
| • |
Level 1 - Quoted prices are available in active markets/exchanges for identical investments as of the reporting date.
|
| • |
Level 2 - Pricing inputs are observable inputs including, but not limited to, prices quoted for similar assets or liabilities in active markets/exchanges or prices quoted for identical or similar assets or liabilities in markets that
are not active, and fair value is determined through the use of models or other valuation methodologies.
|
| • |
Level 3 - Pricing inputs are unobservable for the investment and include activities where there is little, if any, market activity for the investment. The inputs into determination of fair value require significant management judgment
and estimation.
|
The use of these valuation models requires significant estimation and judgment by the Advisor. The Advisor uses a third-party valuation firm to ensure fair values are determined on an independent basis. While the
Company believes its valuation methods are appropriate, other market participants may value identical assets differently than the Company at the measurement date. The methods used by the Company may produce a fair value calculation that may not
be indicative of net realizable value or reflective of future fair values. The Company may also have risk associated with its concentration of investments in certain geographic regions and industries.
To the extent that valuation is based on models or inputs that are less observable or unobservable in the market, the determination of fair value requires more judgment. Those estimated values do not necessarily
represent the amounts that may be ultimately realized due to the occurrence of future circumstances that cannot be reasonably determined. Accordingly, the degree of judgment exercised by the Advisor in determining fair value is greatest for
securities categorized in Level 3.
The determination of what constitutes “observable” requires significant judgment by the Advisor. The Advisor considers observable data to be market data, which is readily available, regularly distributed or
updated, reliable and verifiable, not proprietary, which may fall into different levels of the fair value hierarchy. In such cases, for disclosure purposes, the level in the fair value hierarchy within which the fair value measurement in its
entirety falls is determined based on the lowest level input that is significant to the fair value measurement. The categorization of an investment within the hierarchy is based upon the pricing transparency of the investment and observability of
prices and inputs may be reduced for many investments. This condition could cause the investment to be reclassified to a lower level within the fair value hierarchy.
In addition, on December 3, 2020, the SEC announced its adoption of Rule 2a-5 under the 1940 Act, which establishes an updated regulatory framework for determining the fair value of assets for which market
quotations are not readily available in good faith for purposes of the 1940 Act. The new rule had a compliance date of September 8, 2022 and clarifies how fund boards can satisfy their valuation obligations for such assets and permits boards,
subject to board oversight and certain other conditions, to designate certain parties to perform the fair value determinations for such assets. As of the date of this annual report on Form 10-K, the Board has not designated any party to perform
the fair valuation determinations for such assets and continues to determine the fair value of such assets in compliance with relevant provisions of the 1940 Act. The Board, with the assistance of the Advisor, the Company’s Audit Committee, and
independent third-party valuation firm(s) engaged at the direction of the Board, will determine the fair value of the Company’s assets, including such assets that are not publicly traded or whose market prices are not readily available, on at
least a quarterly basis, in accordance with the terms of ASC Topic 820, Fair Value Measurement and Disclosures. The Audit Committee is comprised of the Independent Directors.
| ITEM 7A. |
Quantitative and Qualitative Disclosures About Market Risk
|
The Company is subject to financial market risks, including changes in interest rates. The Company invests primarily in illiquid debt securities of private companies. Most of the Company’s investments do not have a
readily available market price, and the Company values these investments at fair value as determined in good faith by the Board, based on, among other considerations, the input of the Advisor, the Company’s Audit Committee and an independent
third-party valuation firm, engaged at the direction of the Board in accordance with the Company’s valuation policy. There is no single standard for determining fair value in good faith. As a result, determining fair value requires that judgment
be applied to the specific facts and circumstances of each Portfolio Investment while employing a consistently applied valuation process for the types of investments the Company makes.
The majority of the loans in the Company’s portfolio have floating interest rates, and we expect that the Company’s loans in the future may also have floating interest rates. These loans are usually based on a
floating benchmark rate (e.g., 3-month LIBOR or SOFR) plus a spread and typically have interest rate re-set provisions that adjust applicable interest rates under such loans to current market rates on a monthly or quarterly basis. The majority of
the loans in the Company’s current portfolio have interest rate floors which will effectively convert the loans to fixed rate loans in the event interest rates decrease.
In recent years, the number of unsecured interbank funding transactions in the LIBOR markets has declined substantially and public and private sector industry initiatives have focused on identifying new or
alternative reference rates that could be used in place of IBORs. These initiatives have gained momentum, particularly in light of the announcement in July 2017 by the UK Financial Conduct Authority (“FCA”) that it would no longer use its
influence or legal powers to persuade or compel contributing banks to make LIBOR submissions after the end of 2021. On March 5, 2021, the FCA confirmed that all LIBOR settings will either cease to be provided by any administrator or no longer be
representative: (a) immediately after December 31, 2021, in the case of Sterling, Euro, Swiss Franc and Japanese Yen LIBOR benchmark settings, and the 1-week and 2-month U.S. Dollar LIBOR benchmark settings; and (b) immediately after June 30,
2023, in the case of the remaining U.S. Dollar LIBOR benchmark settings (the “March 2021 Announcement”).
In the United States, the Alternative Reference Rate Committee (“ARRC”), which is sponsored by the Board of Governors of the Federal Reserve System, has designated the Secured Overnight Financing Rate (“SOFR”) as
the best rate to replace U.S. dollar LIBOR as a benchmark rate, and the Federal Reserve Bank of New York began publishing SOFR on April 3, 2018. SOFR is an overnight rate based on trade-level data from various segments of the U.S. Treasury repo
market. However, unlike LIBOR, SOFR is a secured (and, accordingly, a more risk-free) rate, and is a “backward-looking” overnight rate (and therefore does not include forward-looking term maturities (such as 1-month, 3-month, and 6-month rates)).
On July 29, 2021, the ARRC formally recommended the use of the CME Group’s forward-looking SOFR term rates. The CME Term SOFR reference rates provide forward-looking term rate estimates derived from SOFR, calculated and published for One-Month,
Three-Month, Six-Month and Twelve-Month tenors (referred to as Term SOFR). Working groups in other countries for Sterling LIBOR, Euro LIBOR, Yen LIBOR and Swiss LIBOR have also designated alternative reference rates for use in lieu of LIBOR in
those currencies.
U.S. dollar LIBOR continues to be published; however, there is no assurance that LIBOR will continue to exist as a representative rate until the date set forth in the March 2021 Announcement, or at any time
thereafter. Although some LIBOR benchmark settings may continue until the dates set forth in the March 2021 Announcement and some LIBOR benchmark settings may continue to be available on a synthetic, non-representative basis thereafter, some
regulators have prohibited the use of any LIBOR benchmarks in new contracts and have required that regulated entities transition existing contracts to another benchmark prior to the dates set forth in the March 2021 Announcement. Although
settings of such LIBOR benchmarks may continue to be available, such prohibitions and requirements may adversely affect the value of the Company’s adjustable rate investments.
Although market participants, together with regulators, are working diligently to construct a viable alternative benchmark rate to LIBOR rates, there is no assurance that appropriate and usable alternative
reference rates will be developed, or that there will be sufficient liquidity in the markets using those alternative reference rates. Benchmark-related developments are on-going and fast moving and the potential effects of the move away from
LIBOR and other global benchmarks on certain types of investments or products can be difficult to ascertain. There remains uncertainty regarding the future use of LIBOR, the timing of the transition to other benchmarks and the nature of the other
benchmarks to be utilized (including any alternative reference rates). Factors to consider include the existing fallback provisions (if any) in relevant contracts and if, how and when other benchmarks (including alternative reference rates) and
the related fallbacks are adopted for new and legacy products.
There is also no assurance that the characteristics of any alternative reference rates that are designated will be similar to those of any LIBOR, or that any alternative reference rate will be suitable for use as a
benchmark rate for any particular product or security, or that use of an alternative reference rate will produce the economic equivalence of the LIBOR-based rate currently used for such products or securities.
A reduction in the interest rates on new investments relative to interest rates on current investments could also have an adverse impact on the Company’s net interest income. An increase in interest rates could
decrease the value of any investments the Company holds which earn fixed interest rates, including subordinated loans, senior and junior secured and unsecured debt securities and loans and high yield bonds, and also could increase the Company’s
interest expense, thereby decreasing its net income. Also, an increase in interest rates available to investors could make investment in the Company less attractive if the Company is not able to increase its dividend or distribution rate, which
could reduce the value of an investment in the Company.
Investors should also be aware that a change in the general level of interest rates can be expected to lead to a change in the interest rate the Company may receive on many of its debt investments. Accordingly, a
change in the interest rate could make it easier for the Company to meet or exceed the performance threshold and may result in a substantial increase in the amount of incentive fees payable to the Advisor with respect to the portion of the
incentive fee based on income.
Assuming that the Statements of Assets and Liabilities as of December 31, 2022, was to remain constant and that we took no actions to alter the Company’s existing interest rate sensitivity, the following table
shows the annualized impact of hypothetical base rate changes in interest rates:
|
Change in Interest Rates
|
Increase (decrease) in
interest income
|
Increase (decrease) in
interest expense
|
Net increase (decrease) in
net investment income
|
|||||||||
|
Down 25 basis points
|
$
|
(687,629
|
)
|
$
|
(382,500
|
)
|
$
|
(305,129
|
)
|
|||
|
Up 100 basis points
|
2,750,515
|
1,530,000
|
1,220,515
|
|||||||||
|
Up 200 basis points
|
5,501,031
|
3,060,000
|
2,441,031
|
|||||||||
|
Up 300 basis points
|
8,251,546
|
4,590,000
|
3,661,546
|
|||||||||
Although we believe that this analysis is indicative of the Company’s existing sensitivity to interest rate changes, it does not adjust for changes in the credit market, credit quality, the size and composition of
the assets in the Company’s portfolio and other business developments, including borrowing under the credit facility or other borrowings that could affect net increase in net assets resulting from operations, or net income. Accordingly, we can
offer no assurances that actual results would not differ materially from the analysis above.
| ITEM 8. |
Financial Statements and Supplementary Data
|
Our financial statements are annexed to this Annual Report beginning on page F-1.
| ITEM 9. |
Changes in and Disagreements with Accountants on Accounting and Financial Disclosure
|
There are no and have not been any disagreements between the Company and its accountant on any matter of accounting principles, practices, or financial statement disclosure.
| ITEM 9A. |
Controls and Procedures
|
Evaluation of Disclosure Controls and Procedures
The Company’s disclosure controls and procedures are designed to provide reasonable assurances that information required to be disclosed in this Annual Report on Form 10-K and other reports that we file under the
Securities Exchange Act of 1934, as amended, is recorded, processed, summarized and reported within the required time periods specified in the SEC’s rules and forms and that such information is accumulated and communicated to our management,
including our Chief Executive Officer and Chief Financial Officer, to allow timely decisions regarding required disclosures.
The Company’s management, including our Chief Executive Officer and Chief Financial Officer, carried out an evaluation of the effectiveness of the design and operation of our disclosure controls and procedures as
of the end of the period covered by this report. Based on the evaluation of these disclosure controls and procedures, the Company’s management, including our Chief Executive Officer and Chief Financial Officer, concluded that the Company’s
disclosure controls and procedures were effective as of December 31, 2022. It should be noted that any system of controls, regardless of design and execution, can provide only reasonable assurance of achieving the desired control objectives.
Management’s Report on Internal Control over Financial Reporting
The Company’s management, including the Chief Executive Officer and Chief Financial Officer, is responsible for establishing and maintaining adequate internal control over financial reporting and for the assessment
of the effectiveness of internal control over financial reporting. As defined by the SEC, internal control over financial reporting is a process designed to provide reasonable assurance regarding the reliability of financial reporting and the
preparation of financial statements for external purposes in accordance with U.S. GAAP.
The Company’s internal control over financial reporting is supported by written policies and procedures, that (1) pertain to the maintenance of records that, in reasonable detail, accurately and fairly reflect the
transactions and dispositions of the Company’s assets; (2) provide reasonable assurance that transactions are recorded as necessary to permit preparation of financial statements in accordance with GAAP, and that receipts and expenditures of the
Company are being made only in accordance with authorizations of the Company’s management and directors; and (3) provide reasonable assurance regarding prevention or timely detection of unauthorized acquisition, use or disposition of the
Company’s assets that could have a material effect on the financial statements.
Because of its inherent limitations, internal control over financial reporting may not prevent or detect misstatements. Therefore, even those systems determined to be effective can provide only reasonable assurance
with respect to financial statement preparation and presentation. Also, projections of any evaluation of effectiveness to future periods are subject to the risk that controls may become inadequate because of changes in conditions, or that the
degree of compliance with the policies or procedures may deteriorate.
Management of the Company (with participation of the Chief Executive Officer and Chief Financial Officer) conducted an assessment of the effectiveness of the Company’s internal control over financial reporting as
of December 31, 2022 based on criteria established in Internal Control-Integrated Framework (2013) issued by the Committee of Sponsoring Organizations of the Treadway Commission (the “COSO Framework”). Based on this assessment, management has
concluded that the Company’s internal control over financial reporting was effective as of December 31, 2022.
Attestation Report of the Registered Public Accounting Firm
This annual report on Form 10-K does not include an attestation report of our independent registered public accounting firm regarding internal control over financial reporting. We were not required to have, nor
have we, engaged our independent registered public accounting firm to perform an audit of the Company’s internal control over financial reporting as of December 31, 2022 pursuant to the rules of the SEC that permit us to provide only management's
report in this annual report on Form 10-K.
Changes in Internal Control Over Financial Reporting
There have been no changes in our internal control over financial reporting, as defined in Rules 13a-15(f) and 15d-15(f) under the Exchange Act, that occurred during our most recently completed fiscal quarter that
have materially affected, or are reasonably likely to materially affect, our internal control over financial reporting.
| ITEM 9B. |
Other Information
|
Not Applicable.
| ITEM 9C. |
Disclosure Regarding Foreign Jurisdictions that Prevent Inspections
|
Not Applicable
PART III
| ITEM 10. |
Directors, Executive Officers and Corporate Governance
|
The Company and the Advisor have adopted a code of ethics pursuant to Rule 17j-1 under the 1940 Act that establishes procedures for personal investments and restricts certain personal securities transactions.
Personnel subject to each code may invest in securities for their personal investment accounts, including securities that may be purchased or held by the Company, so long as such investments are made in accordance with the code’s requirements.
A copy of our Code of Ethics is filed as an exhibit to this Annual Report on Form 10-K and is available without charge upon written request to the Company, Star Mountain Lower Middle-Market Capital Corp., 140 E.
45th Street, 37th Floor, New York, NY 10017.
Except as set forth above, the information required by this Item with respect to our directors, executive officers and corporate governance matters is incorporated by reference from our definitive Proxy Statement
for our 2023 Annual Meeting of Stockholders, to be filed with the SEC pursuant to Regulation 14A under the Exchange Act. We expect to file our definitive Proxy Statement with the SEC within 120 days after the date of our fiscal year-end, which
was December 31, 2022.
| ITEM 11. |
Executive Compensation
|
The information required by this Item with respect to compensation of executive officers and directors is incorporated by reference from our definitive Proxy Statement for our 2023 Annual Meeting of Stockholders,
to be filed with the SEC pursuant to Regulation 14A under the Exchange Act. We expect to file our definitive Proxy Statement with the SEC within 120 days after the date of our fiscal year-end, which was December 31, 2022.
| ITEM 12. |
Security Ownership of Certain Beneficial Owners and Management and Related Stockholder Matters
|
The information required by this Item with respect to security ownership of certain beneficial owners and management is incorporated by reference from our definitive Proxy Statement for our 2023 Annual Meeting of
Stockholders, to be filed with the SEC pursuant to Regulation 14A under the Exchange Act. We expect to file our definitive Proxy Statement with the SEC within 120 days after the date of our fiscal year-end, which was December 31, 2022.
| ITEM 13. |
Certain Relationships and Related Transactions, and Director Independence.
|
The information required by this Item with respect to certain relationships and related transactions and director independence is incorporated by reference from our definitive Proxy Statement for our 2023 Annual
Meeting of Stockholders, to be filed with the SEC pursuant to Regulation 14A under the Exchange Act. We expect to file our definitive Proxy Statement with the SEC within 120 days after the date of our fiscal year-end, which was December 31, 2022.
| ITEM 14. |
Principal Accountant Fees and Services
|
The information required by this Item with respect to principal accountant fees and services is incorporated by reference from our definitive Proxy Statement for our 2023 Annual Meeting of Stockholders, to be filed
with the SEC pursuant to Regulation 14A under the Exchange Act. We expect to file our definitive Proxy Statement with the SEC within 120 days after the date of our fiscal year-end, which was December 31, 2022.
PART IV
| ITEM 15. |
Exhibits and Financial Statement Schedules
|
The following exhibits are included, or incorporated by reference, in this Annual Report on Form 10-K for the year ended December 31, 2022 and for the period from May 14, 2021 to December 31, 2021 (and are numbered
in accordance with Item 601 of Regulation S-K).
Exhibit Index
|
Certificate of Incorporation (1)
|
||
|
Certificate of Conversion to a Corporation (2)
|
||
|
Bylaws (3)
|
||
|
Form of Subscription Agreement (4)
|
||
|
Investment Advisory Agreement between Star Mountain Credit Opportunities Fund, LP and Star Mountain Fund Management, LLC (5)
|
||
|
Administration Agreement between Star Mountain Credit Opportunities Fund, LP, and Star Mountain Fund Management LLC (6)
|
||
|
Loan and Servicing Agreement, dated as of July 2, 2021, by and among Star Mountain Lower Middle-Market Capital Corp., as borrower, the lenders party thereto and Sterling National Bank, in its capacities as collateral agent and
administrative agent (7)
|
|
First Amendment to Revolving Credit Agreement, dated as of November 10, 2021, by and among the Company, as Borrower, and Sterling National Bank, as Administrative Agent and the Letter of Credit Issuer, and the Lenders party thereto.
(8)
|
||
|
Second Amendment to Revolving Credit Agreement, dated as of January 12, 2022, by and among the Company, as Borrower, and Sterling National Bank, as Administrative Agent and the Letter of Credit Issuer, and the Lenders party thereto.
(9)
|
||
|
Amendment to Loan and Servicing Agreement and Joinder Agreement, dated as of May 6, 2022, by and among the Company, as Borrower, and Webster Bank, N.A. (f/k/a Sterling National Bank), as Administrative Agent and the Letter of Credit
Issuer, and the Lenders party thereto (10)
|
||
|
Loan and Security Agreement, dated as of June 22, 2022, by and among the Company, as Borrower, and East West Bank, as Lender (11)
|
||
|
Second Amendment to Loan and Servicing Agreement, dated as of September 16, 2022, by and among the Company, as Borrower, and Webster Bank, N.A. (f/k/a Sterling National Bank), as Collateral Agent, Administrative Agent, Swing Lender,
and Sole Lead Arranger, and the Lenders party thereto (12)
|
||
|
Code of Ethics (13)
|
||
|
Certification of Chief Executive Officer pursuant to Rule 13a-14(a)/15d-14(a) of the Securities Exchange Act of 1934, as adopted pursuant to Section 302 of the Sarbanes-Oxley Act of 2002 *
|
||
|
Certification of Chief Financial Officer pursuant to Rule 13a-14(a)/15d-14(a) of the Securities Exchange Act of 1934, as adopted pursuant to Section 302 of the Sarbanes-Oxley Act of 2002 *
|
||
|
Certification of Chief Executive Officer pursuant to 18 U.S.C. Section 1350, as adopted pursuant to Section 906 of the Sarbanes-Oxley Act of 2002 *
|
||
|
Certification of Chief Financial Officer pursuant to 18 U.S.C. Section 1350, as adopted pursuant to Section 906 of the Sarbanes-Oxley Act of 2002 *
|
||
|
(1)
|
Previously filed as Exhibit 3.1 to the Company’s Registration Statement on Form 10 (File No. 000-56259), filed with the SEC on May 7, 2021.
|
|
|
(2)
|
Previously filed as Exhibit 10.4 to the Company’s Registration Statement on Form 10 (File No. 000-56259), filed with the SEC on May 7, 2021.
|
|
|
(3)
|
Previously filed as Exhibit 3.2 to the Company’s Registration Statement on Form 10 (File No. 000-56259), filed with the SEC on May 7, 2021.
|
|
|
(4)
|
Previously filed as Exhibit 10.3 to the Company’s Registration Statement on Form 10 (File No. 000-56259), filed with the SEC on May 7, 2021.
|
|
|
(5)
|
Previously filed as Exhibit 10.1 to the Company’s Registration Statement on Form 10 (File No. 000-56259), filed with the SEC on May 7, 2021.
|
|
|
(6)
|
Previously filed as Exhibit 10.2 to the Company’s Registration Statement on Form 10 (File No. 000-56259), filed with the SEC on May 7, 2021.
|
|
|
(7)
|
Previously filed as Exhibit 10.1 to the Company’s Current Report on Form 8-K, filed with the SEC on July 15, 2021.
|
|
|
(8)
|
Previously filed as Exhibit 10.1 to the Company’s Current Report on Form 8-K, filed with the SEC on November 12, 2021.
|
|
|
(9)
|
Previously filed as Exhibit 10.1 to the Company’s Current Report on Form 8-K, filed with the SEC on January 14, 2022.
|
|
|
(10)
|
Previously filed as Exhibit 10.1 to the Company’s Current Report on Form 8-K, filed with the SEC on May 12, 2022.
|
|
|
(11)
|
Previously filed as Exhibit 10.1 to the Company’s Current Report on Form 8-K, filed with the SEC on June 23, 2022.
|
|
|
(12)
|
Previously filed as Exhibit 10.1 to the Company’s Current Report on Form 8-K, filed with the SEC on September 20, 2022.
|
|
|
(13)
|
Previously filed as Exhibit 14.1 to the Company’s Annual Report on Form 10-K, filed with the SEC on March 31, 2022.
|
|
|
*
|
Filed herewith
|
(a) (1) and (2) Financial Statements and Schedules
See the Index to Financial Statements at page F-1 of this report.
Table of Contents
|
Page
|
|
|
F-2
|
|
|
Financial Statements:
|
|
|
F-3
|
|
|
F-4
|
|
|
F-5
|
|
|
F-6
|
|
|
F-7
|
|
|
F-14
|
Report of Independent Registered Public Accounting Firm
 |
Ernst & Young LLP
One Manhattan West
New York, NY 10001
|
Tel: +1 704 372 6300
www.ey.com
|
|
To the Shareholders and the Board of Directors of Star Mountain Lower Middle-Market Capital Corp.
Opinion on the Financial Statements
We have audited the accompanying statements of assets and liabilities of Star Mountain Lower Middle-Market Capital Corp. (the “Company”), including the schedules of investments, as of December 31, 2022 and
December 31, 2021, the related statements of operations, changes in net assets, and cash flows for the year ended December 31, 2022 and for the period from May 14, 2021 (commencement of operations) to December 31, 2021, and the related notes
(collectively referred to as the “financial statements”). In our opinion, the financial statements present fairly, in all material respects, the financial position of the Company at December 31, 2022 and December 31, 2021, and the results of
its operations, changes in its net assets, and its cash flows for the year ended December 31, 2022 and for the period from May 14, 2021 (commencement of operations) to December 31, 2021, in conformity with U.S. generally accepted accounting
principles.
Basis for Opinion
These financial statements are the responsibility of the Company’s management. Our responsibility is to express an opinion on the Company’s financial statements based on our audits. We are a public accounting
firm registered with the Public Company Accounting Oversight Board (United States) (PCAOB) and are required to be independent with respect to the Company in accordance with the U.S. federal securities laws and the applicable rules and
regulations of the Securities and Exchange Commission and the PCAOB.
We conducted our audits in accordance with the standards of the PCAOB. Those standards require that we plan and perform the audit to obtain reasonable assurance about whether the financial statements are free
of material misstatement, whether due to error or fraud. The Company is not required to have, nor were we engaged to perform, an audit of its internal control over financial reporting. As part of our audits we are required to obtain an
understanding of internal control over financial reporting but not for the purpose of expressing an opinion on the effectiveness of the Company's internal control over financial reporting. Accordingly, we express no such opinion.
Our audits included performing procedures to assess the risks of material misstatement of the financial statements, whether due to error or fraud, and performing procedures that respond to those risks. Such
procedures included examining, on a test basis, evidence regarding the amounts and disclosures in the financial statements. Our procedures included confirmation of investments owned as of December 31, 2022 and December 31, 2021, by
correspondence with the custodian, brokers, portfolio companies or others; when replies were not received from brokers or others, we performed other auditing procedures. Our audits also included evaluating the accounting principles used and
significant estimates made by management, as well as evaluating the overall presentation of the consolidated financial statements. We believe that our audits provide a reasonable basis for our opinion.

We have served as the Company’s auditor since 2021.
March 31, 2023
|
December 31, 2022
|
December 31, 2021
|
|||||||
|
ASSETS
|
||||||||
|
Non-controlled/non-affiliate investments at fair value (amortized cost of $299,401,792 and $99,008,447 as of December 31, 2022 and December 31, 2021, respectively)
|
$
|
301,766,151
|
$
|
102,175,919
|
||||
|
Controlled/affiliate investments at fair value (amortized cost of $1,432,419 and $1,452,715 as of December 31, 2022 and December 31, 2021, respectively)
|
1,429,530
|
1,464,446
|
||||||
|
Cash
|
18,958,445
|
2,491,307
|
||||||
|
Interest receivable
|
2,873,029
|
630,372
|
||||||
|
Deferred financing cost
|
1,474,527
|
291,219
|
||||||
|
Paydown receivable
|
844,269
|
300,968
|
||||||
|
Total assets
|
327,345,951
|
107,354,231
|
||||||
|
LIABILITIES
|
||||||||
|
Credit facility payable
|
153,000,000
|
34,000,000
|
||||||
|
Distributions payable
|
4,351,080
|
1,277,627
|
||||||
|
Credit facility interest payable
|
2,283,546
|
172,096
|
||||||
|
Management fees payable, net of fee waivers (Note 6)
|
1,049,992
|
757,520
|
||||||
|
Professional fees payable
|
195,076
|
111,252
|
||||||
|
Other payables
|
187,230
|
140,409
|
||||||
|
Reimbursement expense payable
|
35,877
|
-
|
||||||
|
Legal fees payable
|
26,377
|
25,132
|
||||||
|
Subscriptions received in advance
|
-
|
482,185
|
||||||
|
Incentive fees payable (Note 6)
|
-
|
225,883
|
||||||
|
Total liabilities
|
161,129,178
|
37,192,104
|
||||||
|
Commitments and contingencies (Note 11)
|
||||||||
|
Net assets
|
$
|
166,216,773
|
$
|
70,162,127
|
||||
|
NET ASSETS
|
||||||||
|
Common shares, $0.001 par value (200,000,000 shares authorized, 6,592,546 and 2,777,449 shares issued and outstanding as of December 31, 2022 and December 31, 2021, respectively)
|
$
|
6,593
|
$
|
2,777
|
||||
|
Contribution receivable
|
(110,891
|
)
|
-
|
|||||
|
Additional paid-in capital
|
164,074,076
|
67,021,165
|
||||||
|
Accumulated undistributed (overdistributed) earnings
|
2,246,995
|
3,138,185
|
||||||
|
Total net assets
|
$
|
166,216,773
|
$
|
70,162,127
|
||||
|
Net asset value per share
|
$
|
25.21
|
$
|
25.26
|
||||
See accompanying notes.
|
For the year ended
December 31, 2022 |
For the period
May 14, 2021* to December 31, 2021 |
|||||||
|
Non-controlled/non-affiliate investment income:
|
||||||||
|
Interest income
|
$
|
20,937,595
|
$
|
4,091,514
|
||||
|
PIK interest income
|
495,426
|
249,427
|
||||||
|
Dividend income
|
181,458
|
94,628
|
||||||
|
Other income
|
257,368
|
-
|
||||||
|
Controlled/affiliate investment income:
|
||||||||
|
Interest income
|
103,756
|
64,423
|
||||||
|
Total investment income:
|
21,975,603
|
4,499,992
|
||||||
|
Operating expenses:
|
||||||||
|
Interest and other financing fees
|
5,798,315
|
325,901
|
||||||
|
Management fees (Note 6)
|
3,467,163
|
757,520
|
||||||
|
Incentive fees (Note 6)
|
1,960,085
|
225,883
|
||||||
|
Professional fees
|
1,356,001
|
387,308
|
||||||
|
General and administrative fees
|
609,391
|
206,855
|
||||||
|
Legal expenses
|
393,131
|
266,709
|
||||||
|
Director expenses
|
89,151
|
50,849
|
||||||
|
Organizational expenses
|
-
|
272,555
|
||||||
|
Total expenses before fee waivers
|
13,673,237
|
2,493,580
|
||||||
|
Management fee waiver (Note 6)
|
(279,725
|
)
|
-
|
|||||
|
Incentive fee waiver (Note 6)
|
(2,185,968
|
)
|
-
|
|||||
|
Total expenses after fee waivers
|
11,207,544
|
2,493,580
|
||||||
|
Net investment income
|
10,768,059
|
2,006,412
|
||||||
|
Net gain (loss):
|
||||||||
|
Net realized gain (loss):
|
||||||||
|
Non-controlled/non-affiliate investments
|
43,607
|
240,492
|
||||||
|
Net realized gain (loss) on investments
|
43,607
|
240,492
|
||||||
|
Net change in unrealized gain (loss):
|
||||||||
|
Non-controlled/non-affiliate investments
|
(803,113
|
)
|
55,911
|
|||||
|
Controlled/affiliate investments
|
(14,620
|
)
|
11,731
|
|||||
|
Net change in unrealized gain (loss) on investments
|
(817,733
|
)
|
67,642
|
|||||
|
Net gain (loss)
|
(774,126
|
)
|
308,134
|
|||||
|
Net increase (decrease) in net assets resulting from operations
|
$
|
9,993,933
|
$
|
2,314,546
|
||||
|
Per common share data:
|
||||||||
|
Net investment income per share - basic and diluted
|
$
|
2.47
|
$
|
0.80
|
||||
|
Net increase (decrease) in net assets resulting from operations per share - basic and diluted
|
$
|
2.29
|
$
|
0.92
|
||||
|
Weighted average shares outstanding - basic and diluted
|
4,351,453
|
2,502,175
|
||||||
*Date of Formation of the Company
See accompanying notes.
|
Common Stock
|
Accumulated
undistributed (overdistributed) earnings
|
|||||||||||||||||||
|
For the period from May 14, 2021* (commencement of operations) to December 31, 2021
|
Number of shares
|
Par value of shares
|
Additional paid-in capital
|
Total net assets
|
||||||||||||||||
|
Balance, May 14, 2021*
|
-
|
$
|
-
|
$
|
-
|
$
|
-
|
$
|
-
|
|||||||||||
|
Net investment income
|
-
|
-
|
-
|
2,006,412
|
2,006,412
|
|||||||||||||||
|
Net realized gain (loss)
|
-
|
-
|
-
|
240,492
|
240,492
|
|||||||||||||||
|
Net change in unrealized gain (loss) on investments
|
-
|
-
|
-
|
67,642
|
67,642
|
|||||||||||||||
|
Issuance of common shares
|
3,302,846
|
3,302
|
83,363,852
|
-
|
83,367,154
|
|||||||||||||||
|
Redemption of common shares (1)
|
(543,025
|
)
|
(543
|
)
|
(13,922,611
|
)
|
-
|
(13,923,154
|
)
|
|||||||||||
|
Distributions declared to stockholders
|
-
|
-
|
-
|
(2,042,346
|
)
|
(2,042,346
|
)
|
|||||||||||||
|
Stock issued in connection with dividend reinvestment plan
|
17,628
|
18
|
445,909
|
-
|
445,927
|
|||||||||||||||
|
Return of capital and other tax related adjustments
|
-
|
-
|
(2,865,985
|
)
|
2,865,985
|
-
|
||||||||||||||
|
Balance, December 31, 2021
|
2,777,449
|
$
|
2,777
|
$
|
67,021,165
|
$
|
3,138,185
|
$
|
70,162,127
|
|||||||||||
|
For the year ended December 31, 2022
|
||||||||||||||||||||
|
Balance, December 31, 2021
|
2,777,449
|
$
|
2,777
|
$
|
67,021,165
|
$
|
3,138,185
|
$
|
70,162,127
|
|||||||||||
|
Net investment income
|
-
|
-
|
-
|
10,768,059
|
10,768,059
|
|||||||||||||||
|
Net realized gain (loss)
|
-
|
-
|
-
|
43,607
|
43,607
|
|||||||||||||||
|
Net change in unrealized gain (loss) on investments
|
-
|
-
|
-
|
(817,733
|
)
|
(817,733
|
)
|
|||||||||||||
|
Issuance of common shares
|
3,783,049
|
3,783
|
96,069,648
|
-
|
96,073,431
|
|||||||||||||||
|
Contribution receivable
|
-
|
-
|
(110,891
|
)
|
-
|
(110,891
|
)
|
|||||||||||||
|
Purchases of shares in repurchase offer (2)
|
(99,486
|
)
|
(99
|
)
|
(2,564,654
|
)
|
-
|
(2,564,753
|
)
|
|||||||||||
|
Distributions declared to stockholders
|
-
|
-
|
-
|
(10,682,401
|
)
|
(10,682,401
|
)
|
|||||||||||||
|
Stock issued in connection with dividend reinvestment plan
|
131,534
|
132
|
3,345,195
|
-
|
3,345,327
|
|||||||||||||||
|
Return of capital and other tax related adjustments
|
-
|
-
|
202,722
|
(202,722
|
)
|
-
|
||||||||||||||
|
Balance, December 31, 2022
|
6,592,546
|
$
|
6,593
|
$
|
163,963,185
|
$
|
2,246,995
|
$
|
166,216,773
|
|||||||||||
| * |
Date of Formation of the Company
|
| (1) |
On November 29, 2021, the Company redeemed 543,025 shares of common stock, representing an aggregate value of $13,923,154.
|
| (2) |
For further details please reference Note 10 in the accompanying Notes to Financial Statements.
|
See accompanying notes.
|
For the year ended
December 31, 2022 |
For the period
May 14, 2021* to December 31, 2021 |
|||||||
|
Cash flows from operating activities:
|
||||||||
|
Net increase (decrease) in net assets resulting from operations
|
$
|
9,993,933
|
$
|
2,314,546
|
||||
|
Adjustments to reconcile net increase (decrease) in net assets resulting from operations to net cash provided (used in) operating activities:
|
||||||||
|
Net realized (gain) loss on investments
|
(43,607
|
)
|
(240,492
|
)
|
||||
|
Net change in unrealized (gain) loss on investments
|
817,733
|
(67,642
|
)
|
|||||
|
Net accretion of discounts and amortization of premiums
|
(862,570
|
)
|
(101,958
|
)
|
||||
|
Purchases of investments
|
(217,512,647
|
)
|
(63,820,333
|
)
|
||||
|
Proceeds from sales of investments
|
7,971,150
|
844,010
|
||||||
|
Proceeds from principal payments
|
10,026,750
|
2,559,788
|
||||||
|
Amortization of deferred financing costs
|
440,322
|
37,131
|
||||||
|
Payment-in-kind interest income
|
(495,426
|
)
|
(249,427
|
)
|
||||
|
Changes in operating assets and liabilities:
|
||||||||
|
Interest receivable
|
(2,242,657
|
)
|
(419,381
|
)
|
||||
|
Carried interest payable
|
-
|
(990,732
|
)
|
|||||
|
Management fees payable, net of fee waivers (Note 6)
|
292,472
|
757,520
|
||||||
|
Incentive fees payable (Note 6)
|
(225,883
|
)
|
225,883
|
|||||
|
Credit facility interest payable
|
2,111,450
|
172,096
|
||||||
|
Other payables
|
46,821
|
107,127
|
||||||
|
Professional fees payable
|
83,824
|
117,959
|
||||||
|
Organizational cost payable
|
-
|
(413,685
|
)
|
|||||
|
Legal fees payable
|
1,245
|
(25,132
|
)
|
|||||
|
Reimbursement expense payable
|
35,877
|
-
|
||||||
|
Net cash provided by (used in) operating activities
|
(189,561,213
|
)
|
(59,192,722
|
)
|
||||
|
Cash flows from financing activities:
|
||||||||
|
Proceeds from issuance of common shares, including subscriptions received in advance
|
95,480,355
|
41,634,310
|
||||||
|
Redemption of common shares
|
-
|
(13,923,154
|
)
|
|||||
|
Payments in repurchase of shares
|
(2,564,753
|
)
|
-
|
|||||
|
Proceeds from credit facility
|
188,000,000
|
35,000,000
|
||||||
|
Repayments of credit facility
|
(69,000,000
|
)
|
(1,000,000
|
)
|
||||
|
Distributions paid
|
(4,263,621
|
)
|
(318,792
|
)
|
||||
|
Deferred financing and debt issuance costs paid
|
(1,623,630
|
)
|
(328,350
|
)
|
||||
|
Net cash provided by (used in) financing activities
|
206,028,351
|
61,064,014
|
||||||
|
Net increase (decrease) in Cash
|
16,467,138
|
1,871,292
|
||||||
|
Cash, beginning of period
|
2,491,307
|
620,015
|
||||||
|
Cash, end of period
|
$
|
18,958,445
|
$
|
2,491,307
|
||||
|
Supplemental disclosures of cash flow information:
|
||||||||
|
Non cash operating activities:
|
||||||||
|
Transfer of investments (see Note 1)
|
$
|
-
|
$
|
(42,865,258
|
)
|
|||
|
Transfer of cash (see Note 1)
|
-
|
(620,015
|
)
|
|||||
|
Transfer of carried interest payable (see Note 1)
|
-
|
990,732
|
||||||
|
Transfer of organizational costs payable (see Note 1)
|
-
|
413,685
|
||||||
|
Transfer of other receivables and payables (see Note 1)
|
-
|
(134,173
|
)
|
|||||
|
Interest received in kind
|
495,426
|
249,427
|
||||||
|
Supplemental and non cash financing activities:
|
||||||||
|
Shares issued from BDC conversion (see Note 1)
|
-
|
42,215,029
|
||||||
|
Shares issued from dividend reinvestment plan (see Note 10)
|
3,345,327
|
445,927
|
||||||
|
Supplemental Information:
|
||||||||
|
Cash paid for interest
|
$
|
2,731,891
|
$
|
13,586
|
||||
*Date of Formation of the Company
See accompanying notes.
|
Portfolio Company (1)(2)(3)(4)(5)(6)
|
Footnotes
|
Spread Above Index (7)
|
Interest Rate
|
Acquisition
Date
|
Maturity
|
Principal, Shares,
Units
|
Amortized Cost (8)
|
Fair Value (9)
|
% of Net
Assets |
|||||||||||||||||||||
|
Investments
|
||||||||||||||||||||||||||||||
|
First lien senior secured term loan
|
||||||||||||||||||||||||||||||
|
Aerospace & Defense
|
||||||||||||||||||||||||||||||
|
Consolidated Machine & Tool Holdings, LLC
|
(10)(11
|
) |
L+7.25%
|
12.02
|
%
|
1/15/2020
|
1/15/2025
|
6,175,748
|
$
|
6,094,051
|
$
|
5,844,055
|
3.4
|
%
|
||||||||||||||||
|
|
6,175,748
|
6,094,051
|
5,844,055
|
3.4
|
||||||||||||||||||||||||||
|
Commercial Services & Supplies
|
||||||||||||||||||||||||||||||
|
PPC Event Services, Inc.
|
(20)(21
|
) |
S+6.76%
|
11.35
|
%
|
9/22/2022
|
9/22/2027
|
6,555,917
|
6,470,731
|
6,429,432
|
3.8
|
|||||||||||||||||||
|
Swyft AcquireCo LLC (dba Swyft Filings)
|
(17)(19
|
) |
S+2.75%
|
7.11
|
%
|
12/20/2021
|
12/20/2027
|
306,030
|
301,457
|
304,224
|
0.1
|
|||||||||||||||||||
|
Swyft AcquireCo LLC (dba Swyft Filings)
|
(11)(19
|
) |
S+5.50%
|
9.86
|
%
|
12/20/2021
|
12/20/2027
|
3,682,383
|
3,625,692
|
3,609,840
|
2.1
|
|||||||||||||||||||
|
|
10,544,330
|
10,397,880
|
10,343,496
|
6.0
|
||||||||||||||||||||||||||
|
Construction & Engineering
|
||||||||||||||||||||||||||||||
|
DCCM, LLC
|
(10
|
) |
L+6.90%
|
11.67
|
%
|
8/6/2021
|
12/30/2026
|
18,938,595
|
18,603,528
|
18,838,220
|
11.3
|
|||||||||||||||||||
|
Fremont-Wright, LLC
|
(12
|
) |
L+9.00%
|
13.39
|
%
|
12/2/2020
|
12/2/2024
|
4,615,535
|
4,579,554
|
4,580,171
|
2.8
|
|||||||||||||||||||
|
MechanAir, LLC
|
(10
|
) |
L+10.50%
|
15.27
|
%
|
9/2/2021
|
9/2/2026
|
8,085,096
|
7,904,767
|
6,625,737
|
4.0
|
|||||||||||||||||||
|
Watt Acquisition, LLC
|
(11)(20
|
) |
S+11.25%
|
15.84
|
%
|
4/15/2022
|
4/15/2027
|
3,601,334
|
3,534,629
|
3,588,009
|
2.2
|
|||||||||||||||||||
|
|
35,240,560
|
34,622,478
|
33,632,137
|
20.3
|
||||||||||||||||||||||||||
|
Consumer Finance
|
||||||||||||||||||||||||||||||
|
Microf, LLC
|
(10
|
) |
L+10.75%
|
15.52
|
%
|
3/29/2019
|
6/30/2023
|
3,481,009
|
3,460,009
|
3,481,008
|
2.2
|
|||||||||||||||||||
|
|
3,481,009
|
3,460,009
|
3,481,008
|
2.2
|
||||||||||||||||||||||||||
|
Distributors
|
||||||||||||||||||||||||||||||
|
48forty Intermediate Holdings, Inc.
|
(20
|
) |
S+6.15%
|
10.74
|
%
|
10/11/2022
|
12/1/2026
|
14,962,500
|
14,383,702
|
14,383,702
|
8.7
|
|||||||||||||||||||
|
|
14,962,500
|
14,383,702
|
14,383,702
|
8.7
|
||||||||||||||||||||||||||
|
Diversified Consumer Services
|
||||||||||||||||||||||||||||||
|
Rock Gate Capital, LLC (dba 160 Driving Academy)
|
(10)(21
|
) |
L+7.50%
|
12.27
|
%
|
10/16/2019
|
10/16/2024
|
14,456,337
|
14,281,403
|
14,400,081
|
8.8
|
|||||||||||||||||||
|
|
14,456,337
|
14,281,403
|
14,400,081
|
8.8
|
||||||||||||||||||||||||||
|
Diversified Telecommunication Services
|
||||||||||||||||||||||||||||||
|
Caregility Corporation
|
(10)(18
|
) |
L+9.00%
|
13.77
|
%
|
12/29/2021
|
12/29/2024
|
5,757,839
|
5,362,503
|
4,599,360
|
2.8
|
|||||||||||||||||||
|
Gridsource Incorporated, LLC
|
(10)(20
|
) |
S+8.00%
|
12.59
|
%
|
12/16/2022
|
12/16/2027
|
4,444,444
|
4,281,250
|
4,281,250
|
2.6
|
|||||||||||||||||||
|
YTC Holdings, Inc. (dba Yorktel)
|
(10
|
) |
L+9.75%
|
14.52
|
%
|
9/23/2019
|
9/23/2024
|
3,753,200
|
3,725,056
|
3,753,200
|
2.3
|
|||||||||||||||||||
|
|
13,955,483
|
13,368,809
|
12,633,810
|
7.7
|
||||||||||||||||||||||||||
|
Electrical Equipment
|
||||||||||||||||||||||||||||||
|
Masterwork Electronics, Inc.
|
(20
|
) |
S+7.65%
|
12.24
|
%
|
11/17/2022
|
11/17/2027
|
8,260,870
|
8,099,828
|
8,099,828
|
4.9
|
|||||||||||||||||||
|
|
8,260,870
|
8,099,828
|
8,099,828
|
4.9
|
||||||||||||||||||||||||||
|
Entertainment
|
||||||||||||||||||||||||||||||
|
Chicken Soup For The Soul, LLC
|
(12
|
) |
L+8.50%
|
12.89
|
%
|
10/29/2021
|
3/31/2024
|
6,547,551
|
6,498,009
|
6,547,551
|
3.9
|
|||||||||||||||||||
|
Linden Research, Inc. (dba Linden Labs)
|
(10)(11
|
) |
L+10.59% + 1.62% PIK
|
14.77% Cash + 1.62% PIK
|
12/31/2020
|
12/31/2025
|
4,690,085
|
4,618,458
|
4,703,236
|
2.8
|
||||||||||||||||||||
|
NW Entertainment, LLC
|
(20
|
) |
S+7.76%
|
12.35
|
%
|
11/4/2022
|
11/4/2027
|
6,529,601
|
6,415,333
|
6,415,979
|
3.9
|
|||||||||||||||||||
|
|
17,767,237
|
17,531,800
|
17,666,766
|
10.6
|
||||||||||||||||||||||||||
|
Food Products
|
||||||||||||||||||||||||||||||
|
Uncle John's Pride, LLC
|
(20
|
) |
S+9.11% + 1.00% PIK
|
13.47% Cash + 1.00% PIK
|
3/31/2022
|
3/31/2027
|
5,469,309
|
5,368,762
|
5,370,764
|
3.2
|
||||||||||||||||||||
|
|
5,469,309
|
5,368,762
|
5,370,764
|
3.2
|
||||||||||||||||||||||||||
|
Healthcare Providers & Services
|
||||||||||||||||||||||||||||||
|
Arrow Home Health, LLC (dba Acara Home Health)
|
(10)(13
|
) |
L+8.50%
|
13.27
|
%
|
3/19/2021
|
3/19/2026
|
883,775
|
869,498
|
851,429
|
0.5
|
|||||||||||||||||||
|
Klein Hersh, LLC
|
(11)(20
|
) |
S+7.76%
|
12.35
|
%
|
4/27/2022
|
4/27/2027
|
14,824,494
|
14,582,709
|
13,756,353
|
8.3
|
|||||||||||||||||||
|
|
15,708,269
|
15,452,207
|
14,607,782
|
8.8
|
||||||||||||||||||||||||||
|
Hotels, Restaurants & Leisure
|
||||||||||||||||||||||||||||||
|
The Range NYC, LLC (dba Five Iron Golf)
|
(20)(21
|
) |
S+7.61%
|
12.20
|
%
|
9/15/2022
|
9/15/2027
|
5,042,017
|
4,876,933
|
4,848,856
|
2.9
|
|||||||||||||||||||
|
|
5,042,017
|
4,876,933
|
4,848,856
|
2.9
|
||||||||||||||||||||||||||
|
Household Durables
|
||||||||||||||||||||||||||||||
|
SkyBell Technologies, Inc.
|
(22
|
) |
0.00%
|
0.00
|
%
|
12/13/2019
|
12/13/2024
|
4,839,432
|
4,380,844
|
2,586,687
|
1.6
|
|||||||||||||||||||
|
|
4,839,432
|
4,380,844
|
2,586,687
|
1.6
|
||||||||||||||||||||||||||
|
Household Products
|
||||||||||||||||||||||||||||||
|
Coop Home Goods LLC (dba Coop Home Goods)
|
(11)(20
|
) |
S+8.26%
|
12.85% Cash
|
6/18/2021
|
6/18/2026
|
4,385,303
|
4,319,885
|
3,917,365
|
2.4
|
||||||||||||||||||||
|
|
4,385,303
|
4,319,885
|
3,917,365
|
2.4
|
||||||||||||||||||||||||||
|
IT Services
|
||||||||||||||||||||||||||||||
|
CSI IT, LLC (dba Consulting Solutions)
|
(10
|
) |
L+10.50%
|
15.27
|
%
|
1/29/2021
|
1/29/2026
|
14,100,695
|
13,842,228
|
14,001,990
|
8.4
|
|||||||||||||||||||
|
|
14,100,695
|
13,842,228
|
14,001,990
|
8.4
|
||||||||||||||||||||||||||
|
Leisure Products
|
||||||||||||||||||||||||||||||
|
MPUSA, LLC (dba Mission)
|
(10
|
) |
L+8.50%
|
13.27
|
%
|
12/9/2021
|
12/9/2026
|
4,247,780
|
4,186,414
|
4,229,089
|
2.5
|
|||||||||||||||||||
|
|
4,247,780
|
4,186,414
|
4,229,089
|
2.5
|
||||||||||||||||||||||||||
|
Machinery
|
||||||||||||||||||||||||||||||
|
Texas Contract Manufacturing Group, Inc.
|
(20
|
) |
S+12.11%
|
16.70
|
%
|
4/27/2022
|
4/27/2027
|
6,096,210
|
5,983,378
|
5,384,172
|
3.2
|
|||||||||||||||||||
|
|
6,096,210
|
5,983,378
|
5,384,172
|
3.2
|
||||||||||||||||||||||||||
|
Media
|
||||||||||||||||||||||||||||||
|
PadSquad, LLC
|
(20
|
) |
S+9.00%
|
13.59
|
%
|
3/30/2022
|
3/30/2027
|
4,814,168
|
4,727,179
|
4,814,168
|
2.9
|
|||||||||||||||||||
|
Trailer Park Group Holdings LLC
|
(11)(20
|
) |
S+7.76%
|
12.35
|
%
|
8/2/2021
|
8/2/2026
|
14,416,682
|
14,135,147
|
14,389,290
|
8.7
|
|||||||||||||||||||
|
|
19,230,850
|
18,862,326
|
19,203,458
|
11.6
|
||||||||||||||||||||||||||
|
Personal Products
|
||||||||||||||||||||||||||||||
|
Japonesque, LLC
|
(10)(11
|
) |
L+8.00%
|
12.77
|
%
|
11/23/2021
|
11/23/2026
|
4,549,112
|
4,480,452
|
4,335,304
|
2.6
|
|||||||||||||||||||
|
|
4,549,112
|
4,480,452
|
4,335,304
|
2.6
|
||||||||||||||||||||||||||
|
Professional Services
|
||||||||||||||||||||||||||||||
|
Lasalle Staffing, LLC
|
(11)(19
|
) |
S+7.11%
|
11.47
|
%
|
2/15/2022
|
2/15/2027
|
7,925,000
|
7,753,501
|
7,925,000
|
4.8
|
|||||||||||||||||||
|
NSC Technologies, LLC
|
(10
|
) |
L+8.50%
|
13.27
|
%
|
4/26/2019
|
4/26/2024
|
4,394,398
|
4,352,849
|
4,160,176
|
2.5
|
|||||||||||||||||||
|
PQT Ayaquhs, LLC (dba WWC Global)
|
(20
|
) |
S+8.26%
|
12.85
|
%
|
8/1/2022
|
8/1/2027
|
7,804,435
|
7,656,886
|
7,656,151
|
4.6
|
|||||||||||||||||||
|
|
20,123,833
|
19,763,236
|
19,741,327
|
11.9
|
||||||||||||||||||||||||||
|
Software
|
||||||||||||||||||||||||||||||
|
Proactive Dealer Solutions, LLC
|
(10
|
) |
L+10.00%
|
14.77
|
%
|
12/27/2021
|
12/26/2026
|
3,253,483
|
3,186,456
|
3,253,483
|
2.0
|
|||||||||||||||||||
|
PureCars Technologies, LLC
|
(10)(11
|
) |
L+6.25%
|
11.02
|
%
|
4/18/2019
|
4/18/2024
|
1,300,000
|
1,300,000
|
1,236,820
|
0.7
|
|||||||||||||||||||
|
|
4,553,483
|
4,486,456
|
4,490,303
|
2.7
|
||||||||||||||||||||||||||
|
Specialty Retail
|
||||||||||||||||||||||||||||||
|
Clearview Systems, LLC (dba Rip-It)
|
(20
|
) |
S+7.65%
|
12.24
|
%
|
10/11/2022
|
10/11/2027
|
6,452,101
|
6,314,472
|
6,318,303
|
3.8
|
|||||||||||||||||||
|
|
6,452,101
|
6,314,472
|
6,318,303
|
3.8
|
||||||||||||||||||||||||||
|
Trading Companies & Distributors
|
||||||||||||||||||||||||||||||
|
Gateway Dealer Network, LLC
|
(11)(19
|
) |
S+7.85%
|
12.21
|
%
|
6/30/2022
|
6/30/2027
|
9,831,500
|
9,696,610
|
9,831,500
|
6.0
|
|||||||||||||||||||
|
USBid Inc.
|
(11)(19
|
) |
S+7.26%
|
11.62
|
%
|
11/3/2022
|
11/3/2027
|
7,031,250
|
6,877,623
|
6,877,623
|
4.2
|
|||||||||||||||||||
|
|
16,862,750
|
16,574,233
|
16,709,123
|
10.2
|
||||||||||||||||||||||||||
|
Road & Rail
|
||||||||||||||||||||||||||||||
|
TCP Acquisition, LLC
|
(20)(21
|
) |
S+7.61%
|
12.20
|
%
|
7/26/2022
|
7/26/2027
|
15,000,000
|
14,612,085
|
14,752,716
|
8.9
|
|||||||||||||||||||
|
|
15,000,000
|
14,612,085
|
14,752,716
|
8.9
|
||||||||||||||||||||||||||
|
Total first lien senior secured term loan
|
265,743,871
|
260,982,122
|
157.3
|
|||||||||||||||||||||||||||
See accompanying notes.
STAR MOUNTAIN LOWER MIDDLE-MARKET CAPITAL CORP.
Schedule of Investments – (continued)
December 31, 2022
|
Portfolio Company (1)(2)(3)(4)(5)(6)
|
Footnotes
|
Spread Above Index (7)
|
Interest Rate
|
Acquisition Date
|
Maturity
|
Principal, Shares, Units
|
Amortized Cost (8)
|
Fair Value (9)
|
% of Net Assets
|
||||||||||||||||||||||||
|
Second lien senior secured loan
|
|||||||||||||||||||||||||||||||||
|
Professional Services
|
|||||||||||||||||||||||||||||||||
|
CorTech, LLC
|
(10
|
)
|
L+6.25%
|
|
11.02
|
%
|
3/13/2020
|
9/30/2025
|
6,563,134
|
$
|
6,522,877
|
$
|
6,250,270
|
3.8
|
%
|
||||||||||||||||||
|
6,563,134
|
6,522,877
|
6,250,270
|
3.8
|
||||||||||||||||||||||||||||||
|
Total second lien term loan
|
6,522,877
|
6,250,270
|
3.8
|
||||||||||||||||||||||||||||||
|
Preferred equity securities
|
(14
|
)
|
|||||||||||||||||||||||||||||||
|
Commercial Services and Supplies
|
|||||||||||||||||||||||||||||||||
|
Swyft Filings Holdings, LLC
|
(23 |
) |
-
|
-
|
12/20/2021
|
-
|
192,444
|
183,612
|
285,516
|
0.2
|
|||||||||||||||||||||||
|
192,444
|
183,612
|
285,516
|
0.2
|
||||||||||||||||||||||||||||||
|
Construction & Engineering
|
|||||||||||||||||||||||||||||||||
|
MechanAir Holdings, LLC
|
(15
|
)
|
-
|
13.50% PIK
|
9/2/2021
|
-
|
1,219
|
1,219,441
|
-
|
0.0
|
|||||||||||||||||||||||
|
Watt Contracting Holdings, LLC
|
-
|
15.00% PIK
|
4/15/2022
|
-
|
2,110,487
|
2,072,468
|
2,165,391
|
1.3
|
|||||||||||||||||||||||||
|
2,111,706
|
3,291,909
|
2,165,391
|
1.3
|
||||||||||||||||||||||||||||||
|
Diversified Telecommunication Services
|
|||||||||||||||||||||||||||||||||
|
Caregility Corporation
|
(15
|
)
|
-
|
-
|
12/29/2021
|
-
|
151,018
|
-
|
1,346,645
|
0.8
|
|||||||||||||||||||||||
|
YTC Holdings, Inc. (dba Yorktel)
|
(15
|
)
|
-
|
8.00% PIK
|
9/23/2019
|
-
|
151,018
|
2,191,398
|
1,152,729
|
0.7
|
|||||||||||||||||||||||
|
302,036
|
2,191,398
|
2,499,374
|
1.5
|
||||||||||||||||||||||||||||||
|
Electrical Equipment
|
|||||||||||||||||||||||||||||||||
|
HH Masterwork Intermediate, Inc.
|
-
|
15.00% PIK
|
11/17/2022
|
11/17/2027
|
1,771,739
|
1,736,957
|
1,736,957
|
1.0
|
|||||||||||||||||||||||||
|
1,771,739
|
1,736,957
|
1,736,957
|
1.0
|
||||||||||||||||||||||||||||||
|
Entertainment
|
|||||||||||||||||||||||||||||||||
|
NW Entertainment, LLC
|
-
|
10.00% PIK
|
11/4/2022
|
11/4/2027
|
970
|
955,843
|
955,843
|
0.6
|
|||||||||||||||||||||||||
|
970
|
955,843
|
955,843
|
0.6
|
||||||||||||||||||||||||||||||
|
Food Products
|
|||||||||||||||||||||||||||||||||
|
UJP Acquisition, LLC (dba Uncle John's Pride)
|
(15
|
)
|
-
|
8.00% PIK
|
3/31/2022
|
-
|
1,489,362
|
1,489,362
|
1,572,766
|
0.9
|
|||||||||||||||||||||||
|
1,489,362
|
1,489,362
|
1,572,766
|
0.9
|
||||||||||||||||||||||||||||||
|
Healthcare Providers & Services
|
|||||||||||||||||||||||||||||||||
|
Arrow Home Health, LLC (dba Acara Home Health)
|
(13
|
)
|
-
|
-
|
3/19/2021
|
-
|
571,080
|
562,921
|
578,101
|
0.3
|
|||||||||||||||||||||||
|
571,080
|
562,921
|
578,101
|
0.3
|
||||||||||||||||||||||||||||||
|
Leisure Products
|
|||||||||||||||||||||||||||||||||
|
MPUSA, LLC (dba Mission)
|
-
|
-
|
12/9/2021
|
-
|
13
|
564,645
|
564,618
|
0.3
|
|||||||||||||||||||||||||
|
13
|
564,645
|
564,618
|
0.3
|
||||||||||||||||||||||||||||||
|
Media
|
|||||||||||||||||||||||||||||||||
|
Channel Factory Holdings, LLC
|
(15
|
)
|
-
|
5.00% Cash + 5.00% PIK
|
8/27/2020
|
-
|
2,381,867
|
2,238,424
|
3,469,292
|
2.1
|
|||||||||||||||||||||||
|
PadSquad Holdings LLC (dba Padsquad)
|
(15
|
)
|
-
|
6.00% Cash + 6.00% PIK
|
3/30/2022
|
-
|
720,767
|
1,960,647
|
2,079,054
|
1.3
|
|||||||||||||||||||||||
|
Trailer Park Group Holdings LLC
|
(15
|
)
|
-
|
8.00% PIK
|
8/2/2021
|
-
|
371,822
|
366,100
|
907,432
|
0.5
|
|||||||||||||||||||||||
|
3,474,456
|
4,565,171
|
6,455,778
|
3.9
|
||||||||||||||||||||||||||||||
|
Professional Services
|
|||||||||||||||||||||||||||||||||
|
Capone Holdings JV, LLC (dba LaSalle Staffing)
|
-
|
-
|
2/15/2022
|
-
|
4,000,000
|
4,000,000
|
5,964,267
|
3.6
|
|||||||||||||||||||||||||
|
Hometown Holdings JV, LLC (dba BWG Strategy)
|
(15
|
)
|
-
|
-
|
12/24/2020
|
-
|
666,667
|
657,811
|
844,400
|
0.5
|
|||||||||||||||||||||||
|
PQT Ayaquhs, LLC (dba WWC Global)
|
(15
|
)
|
-
|
10.50% PIK
|
8/1/2022
|
-
|
5,774
|
1,064,516
|
1,525,806
|
0.9
|
|||||||||||||||||||||||
|
4,672,441
|
5,722,327
|
8,334,473
|
5.0
|
||||||||||||||||||||||||||||||
|
Software
|
|||||||||||||||||||||||||||||||||
|
Proactive Dealer Holdings Parent, LLC
|
-
|
10% PIK
|
12/27/2021
|
-
|
1,263,821
|
1,263,821
|
1,384,601
|
0.8
|
|||||||||||||||||||||||||
|
PureCars Technologies Holdings, LLC
|
(15
|
)
|
-
|
8.00% PIK
|
4/19/2019
|
-
|
514
|
240,065
|
60,036
|
0.0
|
|||||||||||||||||||||||
|
PureCars Technologies, LLC
|
-
|
-
|
7/25/2022
|
-
|
78
|
26,948
|
26,528
|
0.0
|
|||||||||||||||||||||||||
|
1,264,413
|
1,530,834
|
1,471,165
|
0.8
|
||||||||||||||||||||||||||||||
|
Trading Companies & Distributors
|
|||||||||||||||||||||||||||||||||
|
USBid Inc.
|
-
|
-
|
11/3/2022
|
11/3/2027
|
469
|
468,750
|
468,750
|
0.3
|
|||||||||||||||||||||||||
|
469
|
468,750
|
468,750
|
0.3
|
||||||||||||||||||||||||||||||
|
Total preferred equity securities
|
23,263,729
|
27,088,732
|
16.1
|
||||||||||||||||||||||||||||||
See accompanying notes.
STAR MOUNTAIN LOWER MIDDLE-MARKET CAPITAL CORP.
Schedule of Investments – (continued)
December 31, 2022
|
Portfolio Company (1)(2)(3)(4)(5)(6)
|
Footnotes
|
Spread Above Index (7)
|
Interest Rate
|
Acquisition
Date
|
Maturity
|
Principal, Shares, Units
|
Amortized Cost (8)
|
Fair Value (9)
|
% of Net
Assets
|
||||||||||||||||||||||||
|
Warrants and other equity securities
|
(14
|
)
|
|||||||||||||||||||||||||||||||
|
Aerospace & Defense
|
|||||||||||||||||||||||||||||||||
|
Consolidated Machine & Tool Holdings, LLC
|
(16
|
)
|
-
|
-
|
1/15/2020
|
-
|
127
|
$
|
142,485
|
$
|
33,642
|
0.0
|
%
|
||||||||||||||||||||
|
127
|
142,485
|
33,642
|
0.0
|
||||||||||||||||||||||||||||||
|
Construction & Engineering
|
|||||||||||||||||||||||||||||||||
|
DCCM, LLC
|
-
|
-
|
8/6/2021
|
-
|
940
|
939,949
|
907,451
|
0.5
|
|||||||||||||||||||||||||
|
Fremont-Wright, LLC
|
-
|
-
|
12/2/2020
|
-
|
2
|
-
|
179,048
|
0.1
|
|||||||||||||||||||||||||
|
Watt Contracting Holdings, LLC
|
-
|
-
|
4/15/2022
|
-
|
226
|
-
|
11,743
|
0.0
|
|||||||||||||||||||||||||
|
1,168
|
939,949
|
1,098,242
|
0.6
|
||||||||||||||||||||||||||||||
|
Consumer Finance
|
|||||||||||||||||||||||||||||||||
|
Microf, LLC
|
-
|
-
|
5/5/2020
|
-
|
164,332
|
-
|
355,814
|
0.2
|
|||||||||||||||||||||||||
|
164,332
|
-
|
355,814
|
0.2
|
||||||||||||||||||||||||||||||
|
Diversified Consumer Services
|
|||||||||||||||||||||||||||||||||
|
Rock Gate Capital, LLC (dba 160 Driving Academy)
|
-
|
-
|
10/16/2019
|
-
|
12,693
|
-
|
102,210
|
0.1
|
|||||||||||||||||||||||||
|
12,693
|
-
|
102,210
|
0.1
|
||||||||||||||||||||||||||||||
|
Diversified Telecommunication Services
|
|||||||||||||||||||||||||||||||||
|
Caregility Corporation
|
(18
|
)
|
-
|
-
|
12/29/2021
|
-
|
237,082
|
443,392
|
1,856,302
|
1.1
|
|||||||||||||||||||||||
|
York Telecom Corporation (dba Yorktel)
|
-
|
-
|
9/23/2019
|
-
|
77,195
|
-
|
252,059
|
0.2
|
|||||||||||||||||||||||||
|
314,277
|
443,392
|
2,108,361
|
1.3
|
||||||||||||||||||||||||||||||
|
Electrical Equipment
|
|||||||||||||||||||||||||||||||||
|
HH Masterwork Intermediate, Inc.
|
-
|
-
|
11/17/2022
|
11/17/2027
|
190,019
|
-
|
-
|
0.0
|
|||||||||||||||||||||||||
|
190,019
|
-
|
-
|
0.0
|
||||||||||||||||||||||||||||||
|
Entertainment
|
|||||||||||||||||||||||||||||||||
|
LRI Holdco, LLC (dba Linden Labs)
|
-
|
-
|
12/31/2020
|
-
|
2
|
43,478
|
542,730
|
0.3
|
|||||||||||||||||||||||||
|
2
|
43,478
|
542,730
|
0.3
|
||||||||||||||||||||||||||||||
|
Food Products
|
|||||||||||||||||||||||||||||||||
|
UJP Acquisition, LLC (dba Uncle John's Pride)
|
-
|
-
|
3/31/2022
|
-
|
127,215
|
-
|
9,830
|
0.0
|
|||||||||||||||||||||||||
|
127,215
|
-
|
9,830
|
0.0
|
||||||||||||||||||||||||||||||
|
Hotels, Restaurants & Leisure
|
|||||||||||||||||||||||||||||||||
|
The Range NYC, LLC (dba Five Iron Golf)
|
-
|
-
|
9/15/2022
|
9/15/2027
|
21,210
|
71,599
|
70,590
|
0.0
|
|||||||||||||||||||||||||
|
21,210
|
71,599
|
70,590
|
0.0
|
||||||||||||||||||||||||||||||
|
Household Durables
|
|||||||||||||||||||||||||||||||||
|
SkyBell Technologies, Inc.
|
-
|
-
|
12/13/2019
|
-
|
1,199,975
|
-
|
-
|
0.0
|
|||||||||||||||||||||||||
|
1,199,975
|
-
|
-
|
0.0
|
||||||||||||||||||||||||||||||
|
Household Products
|
|||||||||||||||||||||||||||||||||
|
CHG Parent Holding LLC (dba Coop Home Goods)
|
-
|
-
|
6/18/2021
|
-
|
535,714
|
535,714
|
156,607
|
0.1
|
|||||||||||||||||||||||||
|
535,714
|
535,714
|
156,607
|
0.1
|
||||||||||||||||||||||||||||||
|
Machinery
|
|||||||||||||||||||||||||||||||||
|
Texas Contract Manufacturing Group, Inc.
|
-
|
-
|
4/27/2022
|
-
|
1,602
|
-
|
1,251,613
|
0.8
|
|||||||||||||||||||||||||
|
1,602
|
-
|
1,251,613
|
0.8
|
||||||||||||||||||||||||||||||
|
Professional Services
|
|||||||||||||||||||||||||||||||||
|
NSC Holdings, LLC
|
-
|
-
|
4/26/2019
|
-
|
111
|
271,262
|
34,629
|
0.0
|
|||||||||||||||||||||||||
|
PQT Ayaquhs, LLC (dba WWC Global)
|
-
|
-
|
8/1/2022
|
-
|
645
|
-
|
65,161
|
0.0
|
|||||||||||||||||||||||||
|
756
|
271,262
|
99,790
|
0.0
|
||||||||||||||||||||||||||||||
|
Total warrants and other equity securities
|
2,447,879
|
5,829,429
|
3.4
|
||||||||||||||||||||||||||||||
|
Fund investments
|
|||||||||||||||||||||||||||||||||
|
Diversified Financials
|
|||||||||||||||||||||||||||||||||
|
Madryn Select Opportunities, LP
|
(21
|
)
|
-
|
-
|
1/4/2022
|
-
|
2,855,855
|
2,855,855
|
3,045,128
|
1.8
|
|||||||||||||||||||||||
|
2,855,855
|
2,855,855
|
3,045,128
|
1.8
|
||||||||||||||||||||||||||||||
|
Total fund investments
|
2,855,855
|
3,045,128
|
1.8
|
||||||||||||||||||||||||||||||
|
TOTAL INVESTMENTS
|
$
|
300,834,211
|
$
|
303,195,681
|
182.4
|
%
|
|||||||||||||||||||||||||||
| (1) |
All of the Company’s investments are issued by eligible portfolio companies, as defined in the Investment Company Act of 1940 (the “1940 Act”), unless otherwise noted. All of the Company’s investments are issued by U.S. portfolio
companies unless otherwise noted.
|
| (2) |
All investments are non-controlled/non-affiliated investments as defined by the 1940 Act, unless otherwise noted. The 1940 Act classifies investments based on the level of control that the Company maintains in a particular portfolio
company.
|
| (3) |
All investments are co-investments made with the Company’s affiliates in accordance with the terms of the exemptive relief that the Company received from the U.S. Securities and Exchange Commission (the “SEC”), unless otherwise noted.
See Note 6 “Transactions with Related Parties” in the accompanying notes to the financial statements.
|
| (4) |
Unless otherwise indicated, all investments are considered Level 3 assets.
|
| (5) |
Unless otherwise indicated, the Company’s portfolio companies are pledged as collateral supporting the amounts outstanding under the Secured Credit Facility (as defined herein).
|
| (6) |
Except as otherwise noted, all of the Company’s portfolio company investments are subject to legal restrictions on sales.
|
| (7) |
Loan contains a variable rate structure and may be subject to an interest rate floor. Variable rate loans bear interest at a rate that may be determined by reference to either the London Interbank Offered Rate (“LIBOR” or “L”, which
can include one or three- month LIBOR), the Secured Overnight Financing Rate (“SOFR” or “S”) or an alternate base rate which can include the Federal Funds Effective Rate or the Prime Rate, at the borrower’s option, and which reset
periodically based on the terms of the loan agreement. Interest rates subject to SOFR are typically accompanied by a Credit Spread Adjustment (“CSA”).
|
| (8) |
The amortized cost represents the original cost adjusted for the amortization of discounts and premiums, as applicable, on debt investments using the effective interest method.
|
See accompanying notes.
STAR MOUNTAIN LOWER MIDDLE-MARKET CAPITAL CORP.
Schedule of Investments – (continued)
December 31, 2022
| (9) |
Because there is no readily available market value for these investments, the fair value of each of these investments is determined in good faith using significant unobservable inputs by the Company’s board of directors (the “Board”)
as required by the 1940 Act. See Note 4 "Fair Value Measurements" in the accompanying notes to the financial statements.
|
| (10) |
The interest rate on these loans is subject to 3 month LIBOR, which was 4.77% as of December 31, 2022.
|
| (11) |
The Company categorized its unitranche loans as First Lien Senior Secured Loans. The First Lien Senior Secured Loan is comprised of two components: a first out tranche ("First Out") and last out tranche ("Last Out"). The Company
syndicates the First Out tranche and retains the Last Out tranche. The First Out and Last Out tranches have the same maturity date. Interest disclosed reflects the contractual rate of First Lien Senior Secured Loan. The First Out tranche
has priority as to the Last Out tranche with respect to payments of principal, interest and any amounts due thereunder. The Company may be entitled to receive additional interest as a result of the Agreement Among Lenders ("AAL") entered
into with the First Out lender. In exchange for the higher interest rate, the Last Out portion is at a greater risk of loss.
|
| (12) |
The interest rate on these loans is subject to 1 month LIBOR, which was 4.39% as of December 31, 2022.
|
| (13) |
As defined in the 1940 Act, the Company is deemed to be both an “Affiliated Person” and has “Control” of this portfolio company as the Company and its affiliated funds collectively owns more than 25% of the portfolio company’s
outstanding voting securities or has the power to exercise control over management or policies of such portfolio company (including through a management agreement). The Company’s investment in affiliates for the year ended December 31,
2022 were Arrow Home Health, LLC which represented $1,429,530 of Fair Value and 0.9% of Net Assets of the Company. Transactions related to investments in “Controlled/Affiliate Investments” for the year ended December 31, 2022 were as
follows:
|
|
Portfolio Company
|
Type of Investment
|
Amount of
Realized
Gain (Loss)
|
Amount of Interest or
Dividends Credited to
Income (a)
|
December 31,
2021 Value
|
Gross
Additions (b)
|
Gross
Reductions (c)
|
Amount of
Unrealized
Gains (Loss)
|
December 31, 2022
Value
|
|||||||||||||||||||||
|
Arrow Home Health LLC (dba Acara Home Health) (d)
|
First lien senior secured term loan
|
$
|
-
|
$
|
103,756
|
$
|
880,506
|
$
|
2,507
|
$
|
(24,607
|
)
|
$
|
(6,977
|
)
|
$
|
851,429
|
||||||||||||
|
|
Preferred equity securities (571,080 shares) | - |
- |
583,940 |
1,804
|
- |
(7,643
|
) |
578,101
|
||||||||||||||||||||
|
Total Affiliate Investments
|
$
|
-
|
$
|
103,756
|
$
|
1,464,446
|
$
|
4,311
|
$
|
(24,607
|
)
|
$
|
(14,620
|
)
|
$
|
1,429,530
|
|||||||||||||
| (a) |
Represents the total amount of interest, fees or dividends credited to income for the portion of the period an investment was included in the Affiliate category.
|
| (b) |
Gross additions include increase in the cost basis of investments resulting from purchases, PIK interest or amortization of original issue discount.
|
| (c) |
Gross reductions include decreases in the total cost basis of investments resulting from principal repayments or sales.
|
| (d) |
The fair value of the investment was determined using significant unobservable inputs.
|
| (14) |
Ownership of certain equity investments may occur through a holding company or partnership. In no instances are the holding companies or partnerships wholly owned by the Company.
|
| (15) |
Investment contains a fixed rate structure.
|
| (16) |
The Company has received 46 units of incentive shares, which have no Cost or Fair Value as of December 31, 2022.
|
| (17) |
Interest disclosed reflects the contractual rate of the First Out tranche under the Agreement Among Lenders (“AAL”).
|
| (18) |
Caregility Corporation is a wholly owned subsidiary of YTC Holdings, Inc.
|
| (19) |
The interest rate on these loans is subject to 1 month SOFR, which was 4.36% as of December 31, 2022.
|
| (20) |
The interest rate on these loans is subject to 3 month SOFR, which was 4.59% as of December 31, 2022.
|
| (21) |
Positions have an aggregate unfunded commitment of $26,450,607 in addition to the amounts shown in the Schedule of Investments. See Note 11 “Commitments, Contingencies, and Risks” in the accompanying notes to the financial statements.
The liquidity of the Company's investment in the above portfolio funds is based solely on the liquidation events, distributions and dissolution of the underlying assets of each portfolio funds and the subsequent distributions or
dissolution of each portfolio fund as and when such events occur.
|
| (22) |
The investment is on non-accrual status. See Note 2 “Significant Accounting Policies”.
|
| (23) |
Shares of common equity issued in conjunction with the preferred equity.
|
See accompanying notes.
STAR MOUNTAIN LOWER MIDDLE-MARKET CAPITAL CORP.
Schedule of Investments
December 31, 2021
|
Portfolio Company (1)(2)(3)(4)(5)(6)
|
Footnotes
|
Spread Above
Index (7)
|
Interest
Rate
|
Acquisition
Date |
Maturity
|
Principal,
Shares,
Units
|
Amortized Cost (8)
|
Fair Value (9)
|
% of Net Assets
|
|||||||||||||||||
|
Investments
|
||||||||||||||||||||||||||
|
First lien senior secured term loan Aerospace & Defense
|
||||||||||||||||||||||||||
|
Consolidated Machine & Tool Holdings, LLC
|
(10)(11
|
)
|
L+7.25%
|
9.25
|
%
|
1/15/2020
|
1/15/2025
|
3,465,519
|
$
|
3,407,500
|
$
|
3,295,361
|
4.6
|
%
|
||||||||||||
|
|
3,465,519
|
3,407,500
|
3,295,361
|
4.6
|
||||||||||||||||||||||
|
Commercial Services & Supplies
|
||||||||||||||||||||||||||
|
Novinium, Inc.
|
(10)(11
|
)
|
L+8.50%
|
9.25
|
%
|
8/14/2020
|
8/14/2025
|
2,586,807
|
2,557,955
|
2,586,805
|
3.7
|
|||||||||||||||
|
Swyft Filings
|
(18)(20
|
)
|
S+2.75%
|
3.75
|
%
|
12/20/2021
|
12/20/2027
|
3,111,252
|
3,056,939
|
3,057,130
|
4.4
|
|||||||||||||||
|
Swyft AcquireCo LLC (dba Swyft Filings)
|
(11)(20
|
)
|
S+5.50%
|
6.50
|
%
|
12/20/2021
|
12/20/2027
|
3,682,383
|
3,617,941
|
3,618,326
|
5.2
|
|||||||||||||||
|
|
9,380,442
|
9,232,835
|
9,262,261
|
13.3
|
||||||||||||||||||||||
|
Construction & Engineering
|
||||||||||||||||||||||||||
|
Fremont-Wright, LLC
|
(12)(13
|
)
|
L+9.00%
|
10.00
|
%
|
12/2/2020
|
12/2/2024
|
4,485,294
|
4,444,015
|
4,444,015
|
6.3
|
|||||||||||||||
|
MechanAir, LLC
|
(10
|
)
|
L+10.50%
|
11.50
|
%
|
9/2/2021
|
9/2/2026
|
6,964,286
|
6,798,522
|
6,868,179
|
9.8
|
|||||||||||||||
|
|
11,449,580
|
11,242,537
|
11,312,194
|
16.1
|
||||||||||||||||||||||
|
Consumer Finance
|
||||||||||||||||||||||||||
|
Microf, LLC
|
(10
|
)
|
L+12.75
|
14.75
|
%
|
3/29/2019
|
6/30/2023
|
2,453,071
|
2,431,198
|
2,453,071
|
3.5
|
|||||||||||||||
|
|
2,453,071
|
2,431,198
|
2,453,071
|
3.5
|
||||||||||||||||||||||
|
Diversified Consumer Services
|
||||||||||||||||||||||||||
|
Rock Gate Capital, LLC (dba 160 Driving Academy)
|
(10)(13
|
)
|
L+9.00%
|
11.50
|
%
|
10/16/2019
|
10/16/2024
|
4,605,268
|
4,533,152
|
4,605,268
|
6.6
|
|||||||||||||||
|
|
4,605,268
|
4,533,152
|
4,605,268
|
6.6
|
||||||||||||||||||||||
|
Diversified Telecommunication Services
|
||||||||||||||||||||||||||
|
Caregility Corporation
|
(10)(19
|
)
|
L+9.00%
|
10.00
|
%
|
12/29/2021
|
12/29/2024
|
1,761,590
|
1,292,946
|
1,292,478
|
1.8
|
|||||||||||||||
|
YTC Holdings, Inc. (dba Yorktel)
|
(10
|
)
|
L+9.75%
|
11.75
|
%
|
9/23/2019
|
9/23/2024
|
4,051,784
|
4,006,622
|
4,013,003
|
5.7
|
|||||||||||||||
|
|
5,813,374
|
5,299,568
|
5,305,481
|
7.5
|
||||||||||||||||||||||
|
Entertainment
|
||||||||||||||||||||||||||
|
Chicken Soup For The Soul, LLC
|
(10
|
)
|
L+8.50%
|
10.00
|
%
|
10/29/2021
|
3/31/2024
|
4,700,000
|
4,655,306
|
4,655,306
|
6.6
|
|||||||||||||||
|
Linden Research, Inc. (dba Linden Labs)
|
(10)(11
|
)
|
L+10.00% +1.25% PIK
|
11.0% Cash + 1.25% PIK
|
12/31/2020
|
12/31/2025
|
4,668,816
|
4,586,989
|
4,668,816
|
6.7
|
||||||||||||||||
|
|
9,368,816
|
9,242,295
|
9,324,122
|
13.3
|
||||||||||||||||||||||
|
Healthcare Providers & Services
|
||||||||||||||||||||||||||
|
Arrow Home Health, LLC
|
(10)(14
|
)
|
L+8.50%
|
10.50
|
%
|
3/19/2021
|
3/19/2026
|
908,113
|
891,596
|
880,506
|
1.3
|
|||||||||||||||
|
|
908,113
|
891,596
|
880,506
|
1.3
|
||||||||||||||||||||||
|
Household Durables
|
||||||||||||||||||||||||||
|
SkyBell Technologies, Inc.
|
(10
|
)
|
L+11.00%
|
13.00
|
%
|
12/13/2019
|
12/13/2024
|
4,215,945
|
4,150,656
|
4,215,945
|
6.0
|
|||||||||||||||
|
|
4,215,945
|
4,150,656
|
4,215,945
|
6.0
|
||||||||||||||||||||||
|
Household Products
|
||||||||||||||||||||||||||
|
Coop Home Goods LLC (dba Coop Home Goods)
|
(10)(11
|
)
|
L+8.00%
|
9.00
|
%
|
6/18/2021
|
6/18/2026
|
3,571,429
|
3,504,119
|
3,310,000
|
4.7
|
|||||||||||||||
|
|
3,571,429
|
3,504,119
|
3,310,000
|
4.7
|
||||||||||||||||||||||
|
IT Services
|
||||||||||||||||||||||||||
|
CSI IT, LLC (dba Consulting Solutions)
|
(10
|
)
|
L+10.50%
|
11.50
|
%
|
1/29/2021
|
1/29/2026
|
1,999,150
|
1,962,579
|
1,999,150
|
2.8
|
|||||||||||||||
|
|
1,999,150
|
1,962,579
|
1,999,150
|
2.8
|
||||||||||||||||||||||
|
Leisure Products
|
||||||||||||||||||||||||||
|
MPUSA, LLC (dba Mission)
|
(10
|
)
|
L+9.00%
|
10.00
|
%
|
12/9/2021
|
12/9/2026
|
4,328,947
|
4,261,050
|
4,261,050
|
6.1
|
|||||||||||||||
|
|
4,328,947
|
4,261,050
|
4,261,050
|
6.1
|
||||||||||||||||||||||
|
Media
|
||||||||||||||||||||||||||
|
Trailer Park Group Holdings LLC
|
(10)(11
|
)
|
L+6.75%
|
7.75
|
%
|
8/2/2021
|
8/2/2026
|
3,718,220
|
3,630,548
|
3,793,700
|
5.4
|
|||||||||||||||
|
|
3,718,220
|
3,630,548
|
3,793,700
|
5.4
|
||||||||||||||||||||||
|
Personal Products
|
||||||||||||||||||||||||||
|
Japonesque, LLC
|
(10
|
)
|
L+9.00%
|
10.61
|
%
|
11/23/2021
|
11/30/2026
|
4,671,237
|
4,590,922
|
4,590,821
|
6.5
|
|||||||||||||||
|
|
4,671,237
|
4,590,922
|
4,590,821
|
6.5
|
||||||||||||||||||||||
|
Professional Services
|
||||||||||||||||||||||||||
|
BWG Strategy, LLC
|
(10
|
)
|
L+9.00%
|
10.00
|
%
|
12/24/2020
|
12/24/2025
|
1,306,932
|
1,284,472
|
1,306,932
|
1.9
|
|||||||||||||||
|
NSC Technologies, LLC
|
(10
|
)
|
L+8.50%
|
10.75
|
%
|
4/26/2019
|
4/26/2024
|
4,547,461
|
4,495,657
|
4,143,192
|
5.9
|
|||||||||||||||
|
|
5,854,393
|
5,780,129
|
5,450,124
|
7.8
|
||||||||||||||||||||||
|
Software
|
||||||||||||||||||||||||||
|
Proactive Dealer Solutions, LLC
|
(10
|
)
|
L+10.00%
|
11.00
|
%
|
12/27/2021
|
12/26/2026
|
3,439,684
|
3,356,613
|
3,370,890
|
4.8
|
|||||||||||||||
|
PureCars Technologies, LLC
|
(10)(11
|
)
|
L+6.25%
|
7.75
|
%
|
4/18/2019
|
4/18/2024
|
1,300,000
|
1,300,000
|
1,300,000
|
1.9
|
|||||||||||||||
|
|
4,739,684
|
4,656,613
|
4,670,890
|
6.7
|
||||||||||||||||||||||
|
Road & Rail
|
||||||||||||||||||||||||||
|
Southern Ag Carriers, Inc.
|
(10)(11
|
)
|
L+7.50%
|
9.50
|
%
|
9/22/2020
|
9/22/2025
|
956,938
|
938,249
|
956,938
|
1.4
|
|||||||||||||||
|
|
956,938
|
938,249
|
956,938
|
1.4
|
||||||||||||||||||||||
|
Total first lien senior secured term loan
|
79,755,546
|
79,686,882
|
113.6
|
|||||||||||||||||||||||
|
|
||||||||||||||||||||||||||
|
Second lien senior secured loan
|
||||||||||||||||||||||||||
|
Construction & Engineering
|
||||||||||||||||||||||||||
|
DCCM, LLC
|
(10
|
)
|
L+7.75%
|
8.75
|
%
|
8/6/2021
|
12/30/2026
|
8,064,297
|
7,904,510
|
8,064,297
|
11.5
|
|||||||||||||||
|
|
8,064,297
|
7,904,510
|
8,064,297
|
11.5
|
||||||||||||||||||||||
|
Professional Services
|
||||||||||||||||||||||||||
|
CorTech, LLC
|
(10
|
)
|
L+9.00%
|
13.00
|
%
|
3/13/2020
|
2/1/2024
|
1,703,674
|
1,676,870
|
1,684,252
|
2.4
|
|||||||||||||||
|
|
1,703,674
|
1,676,870
|
1,684,252
|
2.4
|
||||||||||||||||||||||
|
Total second lien term loan
|
9,581,380
|
9,748,549
|
13.9
|
|||||||||||||||||||||||
|
|
||||||||||||||||||||||||||
|
Preferred equity securities
|
(15
|
)
|
||||||||||||||||||||||||
|
Commercial Services and Supplies
|
||||||||||||||||||||||||||
|
Swyft Filings Holdings, LLC
|
- |
-
|
12/20/2021
|
-
|
183,612
|
183,612
|
184,224
|
0.3
|
||||||||||||||||||
|
|
183,612
|
183,612
|
184,224
|
0.3
|
||||||||||||||||||||||
|
Construction & Engineering
|
||||||||||||||||||||||||||
|
MechanAir Holdings, LLC
|
(16
|
)
|
- |
13.50% PIK
|
9/2/2021
|
-
|
1,190
|
1,190,476
|
1,299,524
|
1.9
|
||||||||||||||||
|
|
1,190
|
1,190,476
|
1,299,524
|
1.9
|
||||||||||||||||||||||
|
Diversified Telecommunication Services
|
||||||||||||||||||||||||||
|
YTC Holdings, Inc. (dba Yorktel)
|
(16
|
)
|
- |
8.00% PIK
|
9/23/2019
|
-
|
221,642
|
2,021,790
|
2,559,279
|
3.6
|
||||||||||||||||
|
|
221,642
|
2,021,790
|
2,559,279
|
3.6
|
||||||||||||||||||||||
|
Healthcare Providers & Services
|
||||||||||||||||||||||||||
|
Arrow Home Health, LLC
|
(14
|
)
|
- |
-
|
12/24/2020
|
-
|
571,080
|
561,119
|
583,940
|
0.8
|
||||||||||||||||
|
|
571,080
|
561,119
|
583,940
|
0.8
|
||||||||||||||||||||||
|
Leisure Products
|
-
|
|||||||||||||||||||||||||
|
MPUSA, LLC (dba Mission)
|
- |
-
|
12/9/2021
|
-
|
9
|
371,053
|
371,053
|
0.5
|
||||||||||||||||||
|
|
9
|
371,053
|
371,053
|
0.5
|
||||||||||||||||||||||
|
Media
|
||||||||||||||||||||||||||
|
Channel Factory Holdings, LLC
|
(16
|
)
|
- |
5.00% Cash/5.00% PIK
|
8/27/2020
|
-
|
2,381,867
|
2,136,667
|
2,859,200
|
4.1
|
||||||||||||||||
|
Trailer Park Group Holdings, LLC
|
- |
8.00% PIK
|
8/2/2021
|
-
|
371,822
|
364,578
|
441,539
|
0.6
|
||||||||||||||||||
|
|
2,753,689
|
2,501,245
|
3,300,739
|
4.7
|
||||||||||||||||||||||
|
Professional Services
|
||||||||||||||||||||||||||
|
Hometown Holdings JV, LLC (dba BWG Strategy)
|
- |
8.00% PIK
|
12/24/2020
|
-
|
666,667
|
654,936
|
844,667
|
1.2
|
||||||||||||||||||
|
|
666,667
|
654,936
|
844,667
|
1.2
|
||||||||||||||||||||||
|
Software
|
||||||||||||||||||||||||||
|
Proactive Dealer Holdings Parent, LLC
|
- |
-
|
12/27/2021
|
-
|
1,142,790
|
1,142,790
|
1,142,790
|
1.6
|
||||||||||||||||||
|
PureCars Technologies Holdings, LLC
|
(16
|
)
|
- |
8.00% PIK
|
4/19/2019
|
-
|
482
|
229,117
|
318,300
|
0.5
|
||||||||||||||||
|
|
1,143,272
|
1,371,907
|
1,461,090
|
2.1
|
||||||||||||||||||||||
|
Total preferred equity securities
|
8,856,138
|
10,604,516
|
15.1
|
|||||||||||||||||||||||
See accompanying notes.
STAR MOUNTAIN LOWER MIDDLE-MARKET CAPITAL CORP.
Schedule of Investments – (continued)
December 31, 2021
|
Portfolio Company (1)(2)(3)(4)(5)(6)
|
Footnotes
|
Spread
Above Index
(7) |
Interest Rate
|
Acquisition
Date
|
Maturity
|
Principal,
Shares, Units
|
Amortized
Cost (8)
|
Fair Value
(9) |
% of Net
Assets
|
||||||||||||||||||||||||
|
Warrants and other equity securities
|
(15
|
)
|
|||||||||||||||||||||||||||||||
|
Aerospace & Defense
|
|||||||||||||||||||||||||||||||||
|
Consolidated Machine & Tool Holdings, LLC
|
(17
|
)
|
-
|
-
|
1/15/2020
|
-
|
127
|
$
|
142,485
|
$
|
111,088
|
0.2
|
%
|
||||||||||||||||||||
|
|
127
|
142,485
|
111,088
|
0.2
|
|||||||||||||||||||||||||||||
|
Construction & Engineering
|
|||||||||||||||||||||||||||||||||
|
DCCM, LLC
|
-
|
-
|
8/6/2021
|
-
|
832
|
831,767
|
854,292
|
1.2
|
|||||||||||||||||||||||||
|
Fremont-Wright, LLC
|
-
|
-
|
12/2/2020
|
-
|
2
|
-
|
36,168
|
0.1
|
|||||||||||||||||||||||||
|
|
834
|
831,767
|
890,460
|
1.3
|
|||||||||||||||||||||||||||||
|
Consumer Finance
|
|||||||||||||||||||||||||||||||||
|
Microf, LLC
|
-
|
-
|
5/5/2020
|
-
|
164,332
|
-
|
418,945
|
0.6
|
|||||||||||||||||||||||||
|
|
164,332
|
-
|
418,945
|
0.6
|
|||||||||||||||||||||||||||||
|
Commercial Services and Supplies
|
|||||||||||||||||||||||||||||||||
|
Swyft Filings Holdings, LLC
|
-
|
-
|
12/20/2021
|
-
|
1,015
|
-
|
-
|
0.0
|
|||||||||||||||||||||||||
|
|
1,015
|
-
|
-
|
0.0
|
|||||||||||||||||||||||||||||
|
Diversified Consumer Services
|
|||||||||||||||||||||||||||||||||
|
Rock Gate Capital, LLC (dba 160 Driving Academy)
|
-
|
-
|
10/16/2019
|
-
|
12,693
|
-
|
102,210
|
0.1
|
|||||||||||||||||||||||||
|
|
12,693
|
-
|
102,210
|
0.1
|
|||||||||||||||||||||||||||||
|
Diversified Telecommunication Services
|
|||||||||||||||||||||||||||||||||
|
Caregility Corporation
|
(19
|
)
|
-
|
-
|
12/29/2021
|
-
|
52,593
|
443,392
|
443,357
|
0.6
|
|||||||||||||||||||||||
|
York Telecom Corporation (dba Yorktel)
|
-
|
-
|
9/23/2019
|
-
|
46,227
|
-
|
502,485
|
0.7
|
|||||||||||||||||||||||||
|
York Telecom Corporation (dba Yorktel)
|
-
|
-
|
9/23/2019
|
-
|
77,195
|
-
|
24,740
|
0.0
|
|||||||||||||||||||||||||
|
|
176,015
|
443,392
|
970,582
|
1.3
|
|||||||||||||||||||||||||||||
|
Entertainment
|
|||||||||||||||||||||||||||||||||
|
LRI Holdco, LLC (dba Linden Labs)
|
-
|
-
|
12/31/2020
|
-
|
1
|
-
|
238,683
|
0.3
|
|||||||||||||||||||||||||
|
LRI Holdco, LLC (dba Linden Labs)
|
-
|
-
|
12/31/2020
|
-
|
1
|
43,478
|
340,812
|
0.5
|
|||||||||||||||||||||||||
|
|
2
|
43,478
|
579,495
|
0.8
|
|||||||||||||||||||||||||||||
|
Household Durables
|
|||||||||||||||||||||||||||||||||
|
SkyBell Technologies, Inc.
|
-
|
-
|
12/13/2019
|
-
|
585,427
|
-
|
13,871
|
0.0
|
|||||||||||||||||||||||||
|
|
585,427
|
-
|
13,871
|
0.0
|
|||||||||||||||||||||||||||||
|
Household Products
|
|||||||||||||||||||||||||||||||||
|
CHG Parent Holding LLC (dba Coop Home Goods)
|
-
|
-
|
6/18/2021
|
-
|
535,714
|
535,714
|
406,607
|
0.6
|
|||||||||||||||||||||||||
|
|
535,714
|
535,714
|
406,607
|
0.6
|
|||||||||||||||||||||||||||||
|
Professional Services
|
|||||||||||||||||||||||||||||||||
|
NSC Holdings, LLC
|
-
|
-
|
4/26/2019
|
-
|
111
|
271,262
|
50,412
|
0.1
|
|||||||||||||||||||||||||
|
|
111
|
271,262
|
50,412
|
0.1
|
|||||||||||||||||||||||||||||
|
Road & Rail
|
|||||||||||||||||||||||||||||||||
|
Southern AG Holdings, Inc.
|
-
|
-
|
9/22/2020
|
-
|
147
|
-
|
56,748
|
0.1
|
|||||||||||||||||||||||||
|
|
147
|
-
|
56,748
|
0.1
|
|||||||||||||||||||||||||||||
|
Warrants and other equity securities
|
2,268,098
|
3,600,418
|
5.1
|
||||||||||||||||||||||||||||||
|
|
|||||||||||||||||||||||||||||||||
|
TOTAL INVESTMENTS
|
$
|
100,461,162
|
$
|
103,640,365
|
147.7
|
%
|
|||||||||||||||||||||||||||
| (1) |
All of the Company’s investments are issued by eligible portfolio companies, as defined in the Investment Company Act of 1940 (the “1940 Act”), unless otherwise noted. All of the Company’s investments are issued by U.S. portfolio
companies unless otherwise noted.
|
| (2) |
All investments are non-controlled/non-affiliated investments as defined by the 1940 Act, unless otherwise noted. The 1940 Act classifies investments based on the level of control that the Company maintains in a particular portfolio
company.
|
| (3) |
All investments are co-investments made with the Company’s affiliates in accordance with the terms of the exemptive relief that the Company received from the U.S. Securities and Exchange Commission (the “SEC”), unless otherwise noted.
See Note 6 “Transactions with Related Parties” in the accompanying notes to the financial statements.
|
| (4) |
Unless otherwise indicated, all investments are considered Level 3 assets.
|
| (5) |
Unless otherwise indicated, the Company’s portfolio companies are pledged as collateral supporting the amounts outstanding under the Secured Credit Facility (as defined herein).
|
| (6) |
Except as otherwise noted, all of the Company’s portfolio company investments are subject to legal restrictions on sales.
|
| (7) |
Loan contains a variable rate structure and may be subject to an interest rate floor. Variable rate loans bear interest at a rate that may be determined by reference to either the London Interbank Offered Rate (“LIBOR” or “L”, which
can include one or three- month LIBOR), the Secured Overnight Financing Rate (“SOFR” or “S”) or an alternate base rate which can include the Federal Funds Effective Rate or the Prime Rate, at the borrower’s option, and which reset
periodically based on the terms of the loan agreement. Interest rates subject to SOFR are typically accompanied by a Credit Spread Adjustment (“CSA”).
|
| (8) |
The amortized cost represents the original cost adjusted for the amortization of discounts and premiums, as applicable, on debt investments using the effective interest method.
|
| (9) |
Because there is no readily available market value for these investments, the fair value of each of these investments is determined in good faith using significant unobservable inputs by the Company’s board of directors (the “Board”)
as required by the 1940 Act. See Note 4 "Fair Value Measurements" in the accompanying notes to the financial statements.
|
| (10) |
The interest rate on these loans is subject to 3 month LIBOR, which was 0.21% as of December 31, 2021.
|
| (11) |
The Company categorized its unitranche loans as First Lien Senior Secured Loans. The First Lien Senior Secured Loan is comprised of two components: a first out tranche ("First Out") and last out tranche ("Last Out"). The Company
syndicates the First Out tranche and retains the Last Out tranche. The First Out and Last Out tranches have the same maturity date. Interest disclosed reflects the contractual rate of First Lien Senior Secured Loan. The First Out tranche
has priority as to the Last Out tranche with respect to payments of principal, interest and any amounts due thereunder. The Company may be entitled to receive additional interest as a result of the Agreement Among Lenders ("AAL") entered
into with the First Out lender. In exchange for the higher interest rate, the Last Out portion is at a greater risk of loss.
|
| (12) |
The interest rate on these loans is subject to 1 month LIBOR, which was 0.10% as of December 31, 2021.
|
See accompanying notes.
STAR MOUNTAIN LOWER MIDDLE-MARKET CAPITAL CORP.
Schedule of Investments – (continued)
December 31, 2021
| (13) |
Position includes an unfunded loan commitment. See Note 11 “Commitments and Contingencies” in the accompanying notes to the financial statements.
|
| (14) |
As defined in the 1940 Act, the Company is deemed to be both an “Affiliated Person” and has “Control” of this portfolio company as the Company and its affiliated funds collectively owns more than 25% of the portfolio company’s
outstanding voting securities or has the power to exercise control over management or policies of such portfolio company (including through a management agreement). The Company’s investment in affiliates for the period ended December 31,
2021 were Arrow Home Health, LLC which represented $1,464,446 of Fair Value and 2.1% of Net Assets of the Company. Transactions related to investments in “Controlled/Affiliate Investments” for the period ended December 31, 2021 were as
follows:
|
|
Portfolio Company
|
Type of Investment
|
Amount of Realized Gain (Loss)
|
Amount of Interest or Dividends Credited to Income (a)
|
May 14, 2021 Value
|
Gross Additions (b)
|
Gross Reductions (c)
|
Amount of Unrealized Gains (Loss)
|
December 31, 2021 Value
|
|||||||||||||||||||||
|
Arrow Home Health LLC (d)
|
First lien senior secured term loan
|
$
|
-
|
$
|
64,423
|
$
|
953,322
|
$
|
3,672
|
$
|
(65,398
|
)
|
$
|
(11,090
|
)
|
$
|
880,506
|
||||||||||||
|
|
Preferred equity securities (571,080 shares) |
-
|
-
|
559,912
|
1,207
|
-
|
22,821
|
583,940
|
|||||||||||||||||||||
|
Total Affiliate Investments
|
$
|
-
|
$
|
64,423
|
$
|
1,513,234
|
$
|
4,879
|
$
|
(65,398
|
)
|
$
|
11,731
|
$
|
1,464,446
|
||||||||||||||
| (15) |
Ownership of certain equity investments may occur through a holding company or partnership. In no instances are the holding companies or partnerships wholly owned by the Company.
|
| (16) |
Investment contains a fixed rate structure.
|
| (17) |
The Company has received 46 units of incentive shares which have no Cost or Fair Value as of December 31, 2021.
|
| (18) |
Interest disclosed reflects the contractual rate of the First Out tranche under the Agreement Among Lenders (“AAL”).
|
| (19) |
Caregility Corporation is a wholly owned subsidiary of YTC Holdings, Inc.
|
| (20) |
The interest rate on these loans is subject to 1 month SOFR, which was 0.05% as of December 31, 2021.
|
The Company has no investments on non-accrual status as of December 31, 2021.
See accompanying notes.
Note 1. Organization and Principal Business
Star Mountain Lower Middle-Market Capital Corp. (the “Company”) is an externally managed, closed-end management investment company and has elected to be regulated as a business development company (“BDC”) under the
Investment Company Act of 1940, as amended (the “1940 Act”). The Company’s investment objectives are to generate current income and capital appreciation.
Star Mountain Credit Opportunities Fund, LP (the “Private Fund”) was formed as a Delaware limited partnership on August 7, 2019 to make investments in lower middle-market companies and commenced operations on
September 16, 2019. On May 14, 2021, Star Mountain Credit Opportunities Fund, LP converted to Star Mountain Lower Middle-Market Capital Corp., via a filing with the State of Delaware of a Certificate of Conversion to a Corporation (“BDC
Conversion”). Following the BDC Conversion, the existing limited partners of the Private Fund became Stockholders of the Company by operation of law, and the value of an investor’s limited partnership interest in the Private Fund was converted
into a corresponding number of shares of Common Stock in the Company at a net asset value (“NAV”) per share of $25.00. Net asset value at the time of the BDC Conversion was $42,215,029, which consisted of investments at fair value of $42,865,258,
cash of $620,015, carried interest payable of $990,732, organizational cost payable of $413,685, and other receivables and payables, which had a net value of $134,173. The net unrealized appreciation of $3,111,558 as of the Conversion date is
included in accumulated undistributed earnings. The historical cost basis of investments was carried forward during the BDC Conversion.
Based on analysis of the attributes of the Star Mountain Credit Opportunities Fund, LP predecessor entity versus the Star Mountain Lower Middle-Market Capital Corp. converted entity, it was determined that Star
Mountain Lower Middle-Market Capital Corp. was the accounting survivor.
The Company seeks to achieve its investment objectives by investing primarily in privately negotiated loans and equity investments to small and medium-sized businesses (“SMBs”) generally with annual revenues
greater than $15 million and earnings before interest, taxes, depreciation and amortization (“EBITDA”) of less than $50 million. The Company is advised by Star Mountain Fund Management, LLC (“Star Mountain Fund Management”, the “Administrator” or
the “Advisor”), a registered investment adviser under the Investment Advisers Act of 1940, as amended. In addition, for U.S. federal income tax purposes, the Company has elected to be treated and intends to
continue to be treated as a regulated investment company (“RIC”) under Subchapter M of the Internal Revenue Code of 1986, as amended.
Note 2. Summary of Significant Accounting Policies
Basis of Presentation
The preparation of these financial statements is in accordance with accounting principles generally accepted in the United States of America (“U.S. GAAP”). The accompanying financial statements of the Company and
related financial information have been prepared pursuant to the requirements for reporting on Form 10-K and Articles 6 and 10 of Regulation S-X. Certain prior period accounts have been reclassified in order to conform to current period
presentation. The Company is an investment company and accordingly follows the investment company accounting and reporting guidance of the Financial Accounting Standards Board (FASB) Accounting Standards Codification (“ASC”) Topic 946, Financial
Services – Investment Companies.
Use of Estimates
The preparation of financial statements in conformity with U.S. GAAP requires management to make estimates and assumptions that affect the reported amounts of assets and liabilities, the disclosure of contingent
assets and liabilities as of December 31, 2022, and the reported revenue generated and expenses incurred during the reporting period. Actual results could differ from those estimates.
Fair Value of Financial Instruments
The Company applies fair value to substantially all of its financial instruments in accordance with ASC Topic 820 — Fair Value Measurements and Disclosures (“ASC Topic 820”). ASC Topic 820 defines fair value,
establishes a framework used to measure fair value and requires disclosures for fair value measurements, including the categorization of financial instruments into a three-level hierarchy based on the transparency of valuation inputs. See Note 4
for further discussion regarding the fair value measurements and hierarchy.
ASC Topic 820 requires disclosure of the fair value of financial instruments for which it is practical to estimate such value. The Company believes that the carrying amounts of its other financial instruments, such
as cash and cash equivalents, receivables and payables approximate the fair value of such items due to the short maturity of such instruments.
F-14
STAR MOUNTAIN LOWER MIDDLE-MARKET CAPITAL CORP.
Notes to Financial Statements – (continued)
Revenue Recognition
The Company’s revenue recognition policies are as follows:
Interest income: Interest income is recorded on the accrual basis to the extent that the Company expects to collect such amounts. Interest income is accrued based upon the
outstanding principal amount and contractual terms of debt investments. For the year ended December 31, 2022 and for the period from May 14, 2021 to December 31, 2021, $21,041,351 and $4,155,937, respectively, of interest income, excluding PIK interest income, has been accrued as shown on the Statements of Operations. As of December 31, 2022 and December 31, 2021, $2,873,029 and $630,372 of interest income is receivable, respectively, as
shown on the Statements of Assets and Liabilities.
Payment In-Kind Income: The Company has certain investments in its portfolio that contain a payment-in-kind (“PIK”) provision, which represents contractual interest or
dividends that are added to the principal balance and recorded as income. For loans and debt securities with contractual PIK, the Company generally will not accrue PIK interest for accounting purposes if the portfolio company valuation indicates
that such PIK interest is not collectible. To maintain its ability to take a dividend paid deduction, the Company may need to pay out PIK non-cash income amounts in the form of distributions, even though the Company has not yet collected the
cash. For the year ended December 31, 2022 and for the period from May 14, 2021 to December 31, 2021 $495,426 and $249,427, respectively, of PIK income has been accrued as shown on the Statements of Operations.
Non-accrual: Loans or preferred equity securities are placed on non-accrual status when interest or dividend payments become 90 days or more past due, or when there is
reasonable doubt that principal, interest or dividends will be collected. Additionally, any original issue discount and market discount are no longer accreted to interest income as of the date the loan is placed on non-accrual status. Interest
payments received on non-accrual loans may be recognized as income or applied to principal depending upon management’s judgment. Non-accrual loans are restored to accrual status when past due principal, interest, or dividends are paid, and, in
management’s judgment are likely to remain current. As of December 31, 2022, the Company had one investment on non-accrual status and as of December 31, 2021, the Company had no investments on non-accrual status.
Dividend Income: Dividend income to be paid in-kind on equity securities is recorded on an accrual basis to the extent that such amounts are payable by the portfolio company
and are expected to be collected. Dividend income paid in cash is recorded on the date declared for portfolio companies. Each distribution received from limited liability company (“LLC”) and limited partnership (“LP”) interests is evaluated to
determine if the distribution should be recorded as dividend income or a return of capital. Distributions that are classified as a return of capital are recorded as a reduction in the cost basis of the investment. For the year ended December 31,
2022 and for the period ended December 31, 2021, the Company did not receive any return of capital distributions from its equity investments. For the year ended December 31, 2022 and for the period from May 14, 2021 to December 31, 2021 $181,458
and $94,628, respectively, of dividend income has been accrued as shown on the Statements of Operations. As of December 31, 2022 and December 31, 2021, all dividend income has been received.
Original Issue Discount: Discounts to par on portfolio securities are accreted into income over the tenor of the instrument. Any remaining discount is accreted into income
upon prepayment or redemption of the instrument and the Company then amortizes such amounts using the effective interest method as interest income over the life of the investment. The unamortized discount as of December 31, 2022 and December 31,
2021, was $7,155,487 and $1,995,864, respectively. The amount of original issue discount amortized for the year ended December 31, 2022 and for the period May 14, 2021 to December 31, 2021 was $862,570 and $101,958, respectively.
Amendment, waiver, and consent fees: In connection with modifying credit agreements with portfolio companies to provide additional operating or borrowing flexibility, the
Company may be entitled to amendment, waiver and consent fees to compensate for the potentially enhanced credit risk. Such fees will be recorded as income on the date earned and accrued to the extent the fee is to be compensated in the form of
additional principal balance. During the year ended December 31, 2022 $17,054 of such fees were earned and included in other income in the Statements of Operations. No such fees were earned for the period from May 14, 2021 to December 31, 2021.
Early repayment and termination fees: Upon the prepayment of a loan or debt security, any unamortized premium or discount or loan origination fees are recorded as interest
income. To the extent the Company receives early repayment fees in connection with pre-maturity loan agreement termination, such income will be recorded on the date of prepayment. The Company and its Advisor generally do not structure
transactions with a contractual exit fee to be collected upon loan repayment at maturity. For the year ended December 31, 2022, $240,314 of early repayment fees were earned and included in other income on the Statements of Operations. No such
fees were earned for the period from May 14, 2021 to December 31, 2021.
Gains and Losses: Investment transactions are recorded on a trade-date basis. Realized gains or losses on portfolio investments are calculated based upon the difference
between the net proceeds from the disposition and the amortized cost basis of the investment, without regard to unrealized gains or losses previously recognized. Realized gains and losses are recorded within net realized gain (loss) on
investments on the Statements of Operations. Changes in the fair value of investments from the prior period, as approved by the Board based on fair value recommendations from the Advisor in accordance with the Advisor’s valuation policy, are
included within net change in unrealized gain (loss) on investments on the Statements of Operations. For the year ended December 31, 2022 and for the period from May 14, 2021 to December 31, 2021, the Company had $43,607 and $240,492,
respectively, of net realized gain (loss) on investments as represented on the Statements of Operations.
F-15
STAR MOUNTAIN LOWER MIDDLE-MARKET CAPITAL CORP.
Notes to Financial Statements – (continued)
Distributions
Distributions to Stockholders are recorded on the applicable record date. The Company generally intends to make quarterly distributions to its Stockholders out of assets legally available for distribution. All
current income and realization proceeds will be retained by the Company and be available for re-investment. Distributions will be made to Stockholders at such times and in such amounts as determined by the Company’s Board.
The Company has adopted an “opt out” dividend reinvestment plan (“DRP”) for Stockholders. When a distribution is declared, Stockholders’ cash distributions will automatically be reinvested in additional shares of
the Company’s common stock (“Common Stock”) unless a Stockholder specifically “opts out” of the Company’s DRP. Stockholders may opt out of the Company’s DRP by providing notice twenty (20) business days in advance of the distribution payment
date.
If a Stockholder opts out, that Stockholder will receive cash distributions. Although distributions paid in the form of additional shares of Common Stock will generally be subject to U.S. federal, state and local
taxes in the same manner as cash distributions, Stockholders participating in the Company’s DRP will not receive any corresponding cash distributions with which to pay any such applicable taxes. If distributions paid exceed tax earnings and
profits, portions of the distribution can be recorded as a return of capital.
Earnings per Share
In accordance with the provisions of ASC Topic 260 – Earnings per Share, basic earnings per share is computed by dividing earnings available to common stockholders by the weighted average number of shares
outstanding during the period. The weighted average shares outstanding utilized in the calculation of earnings per share take into account share issues on the issuance date and the Company’s repurchases of its Common Stock on the repurchase date.
See Note 9 for additional information on the Company’s share activity. For the year ended December 31, 2022 and for the period May 14, 2021 to December 31, 2021, there were no potentially dilutive common shares issued.
Segments
In accordance with ASC Topic 280 — Segment Reporting, the Company has determined that it has a single reporting segment and operating unit structure.
Cash
Cash is comprised of cash on deposit with major financial institutions. The Company places the majority of its cash with State Street Bank and Trust Company, a high credit quality institution, to minimize credit
risk exposure. The Company, at times, may have cash on deposit with major financial institutions that exceeds federally insured limits.
Cash Equivalents
Cash equivalents are highly liquid investments with a current maturity of three months or less at the date of acquisition, which may include temporary investments in U.S. Treasury Bills (of varying maturities) or
money market funds. There were no cash equivalents outstanding on the Company’s Statements of Assets and Liabilities as of December 31, 2022 and December 31, 2021.
Unamortized Deferred Financing Costs
Deferred financing costs represent fees and other direct incremental costs incurred in connection with the Company’s borrowings. Deferred financing costs are capitalized as incurred and amortized on a straight line
basis to maturity of the Secured Credit Facility (as defined herein). For the year ended December 31, 2022 and for the period May 14, 2021 to December 31, 2021, the Company had $440,322 and $37,131, respectively, of expensed financing costs
included in interest and other financing fees on the Statements of Operations. As of December 31, 2022 and December 31, 2021, the Company had $1,474,527 and $291,219, respectively, of unamortized deferred financing costs as shown in deferred
financing cost on the Statements of Assets and Liabilities.
Organization and Offering Costs
Organizational and offering costs are expensed as incurred. These expenses consist primarily of legal fees and other costs incurred with Company’s share offerings, the preparation of the Company’s registration
statement, and registration fees. For the year ended December 31, 2022, the Company had incurred no organizational costs, and for the period from May 14, 2021 to December 31, 2021, the Company had incurred organizational costs in the amount of
$272,555. As of December 31, 2022 and December 31, 2021, no organizational costs remained payable on the Statements of Assets and Liabilities. For the year ended December 31, 2022 and for the period from May 14, 2021 to December 31, 2021, the
Company incurred offering costs in the amount of $273,988 and $57,205, respectively, as shown as a component of the general and administrative fees in the Statements of Operations, of which was $96,785 and
$57,205 remained payable as of December 31, 2022 and December 31, 2021, respectively, and is included in other payables on the Statements of Assets and Liabilities.
F-16
STAR MOUNTAIN LOWER MIDDLE-MARKET CAPITAL CORP.
Notes to Financial Statements – (continued)
Custodian Fees
The Company has entered into a custody agreement with State Street Bank and Trust Company (the “Custodian”). For the year ended December 31, 2022 and for the period from May 14, 2021 (date of
formation) to December 31, 2021, the Company incurred expenses for services provided by the Custodian of $30,000 and $11,507, respectively, which is included in professional fees on the Statements of Operations. As of December 31, 2022 and
December 31, 2021, $4,069 and $6,569, respectively, remained payable, which is included in professional fees payable on the Statements of Assets and Liabilities.
Income Taxes
On May 14, 2021, the Company elected to be regulated as a BDC under the 1940 Act. The Company also elected to be treated as a RIC under Subchapter M of the Code and intends to qualify annually as a RIC. As long as
the Company maintains its status as a RIC, it generally will not pay corporate-level U.S. federal income taxes on any ordinary income or capital gains that it distributes at least annually to its Stockholders. Rather, any tax liability related to
income earned by the Company represents obligations of the Company’s Stockholders and will not be reflected in the financial statements of the Company.
To qualify as a RIC under Subchapter M of the Code, the Company must, among other things, meet certain source-of-income and asset diversification requirements. In addition, to qualify for RIC tax treatment, the
Company must distribute to its Stockholders, for each taxable year, at least 90% of its “investment company taxable income” for that year, which is generally its ordinary income plus the excess of its realized net short-term capital gains over
its realized net long-term capital losses. In order for the Company not to be subject to U.S. federal excise taxes, it must distribute annually an amount at least equal to the sum of (i) 98% of its net ordinary income (taking into account certain
deferrals and elections) for the calendar year, (ii) 98.2% of its capital gains in excess of capital losses for the one-year period ending October 31 in that calendar year and (iii) any net ordinary income and capital gains in excess of capital
losses for preceding years that were not distributed during such years. The Company, at its discretion, may carry forward taxable income in excess of calendar year dividends and pay a 4% nondeductible U.S. federal excise tax on this income. For
the year ended December 31, 2022 and for the period from May 14, 2021 to December 31, 2021, the Company did not record a net expense on the Statements of Operations for U.S. federal excise tax.
The Company accounts for income taxes in conformity with ASC Topic 740 — Income Taxes (“ASC Topic 740”). ASC Topic 740 provides guidelines for how uncertain tax positions should be recognized, measured, presented
and disclosed in the financial statements. ASC Topic 740 requires the evaluation of tax positions taken in the course of preparing the Company’s tax returns to determine whether the tax positions are “more-likely-than-not” to be sustained by the
applicable tax authority. Tax benefits of positions not deemed to meet the more-likely-than-not threshold would be recorded as a tax expense in the current period. It is the Company’s policy to recognize accrued interest and penalties related to
uncertain tax benefits in income tax expense. The Company did not record any uncertain income tax positions for the year ended December 31, 2022 and for the period ending December 31, 2021. The aggregate amortized tax basis cost of investments
included on the Schedule of Investments as of December 31, 2022 and December 31, 2021 was $300,834,211 and $100,461,162, respectively.
Recent Accounting Pronouncements
In January 2021, the FASB issued Accounting Standards Update No. 2021-01 (“ASU 2021-01”), “Reference Rate Reform (Topic 848)”. ASU 2021-01 is an update of ASU 2020-04, which is in response to concerns about
structural risks of interbank offered rates, and particularly the risk of cessation of LIBOR. Regulators have undertaken reference rate reform initiatives to identify alternative reference rates that are more observable or transaction based and
less susceptible to manipulation. ASU 2020-04 provides optional guidance for a limited period of time to ease the potential burden in accounting for (or recognizing the effects of) reference rate reform on financial reporting. ASU 2020- 04 is
elective and applies to all entities, subject to meeting certain criteria, that have contracts, hedging relationships, and other transactions that reference LIBOR or another reference rate expected to be discontinued because of reference rate
reform. The ASU 2021-01 update clarifies that certain optional expedients and exceptions in Topic 848 for contract modifications and hedge accounting apply to derivatives that are affected by the discounting transition. The amendments in this
update are effective immediately through December 31, 2022, for all entities. On December 21, 2022, the FASB issued a new Accounting Standards Update ASU 2022-06, “Reference Rate Reform (Topic 848): Deferral of the Sunset Date of Topic 848,” that
extends the sunset (or expiration) date of Accounting Standards Codification (ASC) Topic 848 to December 31, 2024. This gives reporting entities two additional years to apply the accounting relief provided under ASC Topic 848 for matters related
to reference rate reform. The ASU is effective immediately. The Company is currently evaluating its impact on the Company’s financial statements.
F-17
Note 3. Investments
The following tables show the composition of the Company’s investment portfolio, at amortized cost and fair value (with corresponding percentage of total portfolio investments):
|
December 31, 2022
|
||||||||||||||||
|
Amortized Cost
|
Fair Value
|
|||||||||||||||
|
First Lien Senior Secured Loan
|
$
|
265,743,871
|
88.4
|
%
|
$
|
260,982,122
|
86.1
|
%
|
||||||||
|
Second Lien Senior Secured Loan
|
6,522,877
|
2.2
|
6,250,270
|
2.1
|
||||||||||||
|
Preferred Equity Securities
|
23,263,729
|
7.7
|
27,088,732
|
8.9
|
||||||||||||
|
Warrants and Other Equity Securities
|
2,447,879
|
0.8
|
5,829,429
|
1.9
|
||||||||||||
|
Fund Investments
|
2,855,855
|
0.9
|
3,045,128
|
1.0
|
||||||||||||
|
Total
|
$
|
300,834,211
|
100.0
|
%
|
$
|
303,195,681
|
100.0
|
%
|
||||||||
|
December 31, 2021
|
||||||||||||||||
|
Amortized Cost
|
Fair Value
|
|||||||||||||||
|
First Lien Senior Secured Loan
|
$
|
79,755,546
|
79.4
|
%
|
$
|
79,686,882
|
76.9
|
%
|
||||||||
|
Second Lien Senior Secured Loan
|
9,581,380
|
9.5
|
9,748,549
|
9.4
|
||||||||||||
|
Preferred Equity Securities
|
8,856,138
|
8.8
|
10,604,516
|
10.2
|
||||||||||||
|
Warrants and Other Equity Securities
|
2,268,098
|
2.3
|
3,600,418
|
3.5
|
||||||||||||
|
Total
|
$
|
100,461,162
|
100.0
|
%
|
$
|
103,640,365
|
100.0
|
%
|
||||||||
The following tables show the composition of the Company’s investment portfolio by geographic region, at amortized cost and fair value (with corresponding percentage of total portfolio investments). The
geographic composition is determined by the location of the corporate headquarters of the portfolio company, which may not be indicative of the primary source of the portfolio company’s business:
|
December 31, 2022
|
||||||||||||||||
|
Amortized Cost
|
Fair Value
|
|||||||||||||||
|
Southeast
|
$
|
85,623,345
|
28.4
|
%
|
$
|
85,292,317
|
28.1
|
%
|
||||||||
|
Midwest
|
59,467,806
|
19.8
|
59,601,511
|
19.7
|
||||||||||||
|
West
|
52,326,463
|
17.4
|
52,216,550
|
17.2
|
||||||||||||
|
Northeast
|
44,592,174
|
14.8
|
46,433,182
|
15.3
|
||||||||||||
|
Southwest
|
26,959,274
|
9.0
|
27,810,986
|
9.2
|
||||||||||||
|
East
|
23,143,747
|
7.7
|
22,594,017
|
7.5
|
||||||||||||
|
South
|
8,721,402
|
2.9
|
9,247,118
|
3.0
|
||||||||||||
|
Total
|
$
|
300,834,211
|
100.0
|
%
|
$
|
303,195,681
|
100.0
|
%
|
||||||||
F-18
STAR MOUNTAIN LOWER MIDDLE-MARKET CAPITAL CORP.
Notes to Financial Statements – (continued)
|
December 31, 2021
|
||||||||||||||||
|
Amortized Cost
|
Fair Value
|
|||||||||||||||
|
Midwest
|
$
|
12,522,150
|
12.5
|
%
|
$
|
12,875,181
|
12.4
|
%
|
||||||||
|
Northeast
|
18,991,567
|
18.9
|
20,274,350
|
19.6
|
||||||||||||
|
Southeast
|
21,298,932
|
21.2
|
21,267,640
|
20.5
|
||||||||||||
|
Southwest
|
10,188,992
|
10.1
|
10,383,035
|
10.0
|
||||||||||||
|
West
|
26,101,626
|
26.0
|
27,466,799
|
26.5
|
||||||||||||
|
East
|
11,357,895
|
11.3
|
11,373,360
|
11.0
|
||||||||||||
|
Total
|
$
|
100,461,162
|
100.0
|
%
|
$
|
103,640,365
|
100.0
|
%
|
||||||||
The following tables show the composition of the Company’s investment portfolio by industry, at amortized cost and fair value (with corresponding percentage of total portfolio investments):
|
December 31, 2022
|
||||||||||||||||
|
Amortized Cost
|
Fair Value
|
|||||||||||||||
|
Aerospace & Defense
|
$
|
6,236,534
|
2.0
|
%
|
$
|
5,877,696
|
1.8
|
%
|
||||||||
|
Commercial Services & Supplies
|
10,581,492
|
3.5
|
10,629,012
|
3.5
|
||||||||||||
|
Construction & Engineering
|
38,854,336
|
12.9
|
36,895,770
|
12.2
|
||||||||||||
|
Consumer Finance
|
3,460,009
|
1.2
|
3,836,822
|
1.3
|
||||||||||||
|
Distributors
|
14,383,702
|
4.8
|
14,383,702
|
4.7
|
||||||||||||
|
Diversified Consumer Services
|
14,281,403
|
4.7
|
14,502,291
|
4.8
|
||||||||||||
|
Diversified Financials
|
2,855,855
|
0.9
|
3,045,128
|
1.0
|
||||||||||||
|
Diversified Telecommunication Services
|
16,003,601
|
5.3
|
17,241,546
|
5.7
|
||||||||||||
|
Electrical Equipment
|
9,836,785
|
3.3
|
9,836,785
|
3.2
|
||||||||||||
|
Entertainment
|
18,531,121
|
6.2
|
19,165,339
|
6.3
|
||||||||||||
|
Food Products
|
6,858,124
|
2.3
|
6,953,360
|
2.3
|
||||||||||||
|
Healthcare Providers & Services
|
16,015,128
|
5.3
|
15,185,883
|
5.0
|
||||||||||||
|
Hotels, Restaurants & Leisure
|
4,948,532
|
1.6
|
4,919,446
|
1.6
|
||||||||||||
|
Household Durables
|
4,380,844
|
1.5
|
2,586,687
|
0.9
|
||||||||||||
|
Household Products
|
4,855,599
|
1.6
|
4,073,972
|
1.3
|
||||||||||||
|
IT Services
|
13,842,228
|
4.6
|
14,001,990
|
4.6
|
||||||||||||
|
Leisure Products
|
4,751,059
|
1.6
|
4,793,707
|
1.6
|
||||||||||||
|
Machinery
|
5,983,378
|
2.0
|
6,635,785
|
2.2
|
||||||||||||
|
Media
|
23,427,497
|
7.8
|
25,659,236
|
8.5
|
||||||||||||
|
Personal Products
|
4,480,452
|
1.5
|
4,335,304
|
1.4
|
||||||||||||
|
Professional Services
|
32,279,702
|
10.7
|
34,425,860
|
11.4
|
||||||||||||
|
Road & Rail
|
14,612,085
|
4.9
|
14,752,716
|
4.9
|
||||||||||||
|
Software
|
6,017,290
|
2.0
|
5,961,468
|
2.0
|
||||||||||||
|
Specialty Retail
|
6,314,472
|
2.1
|
6,318,303
|
2.1
|
||||||||||||
|
Trading Companies & Distributors
|
17,042,983
|
5.7
|
17,177,873
|
5.7
|
||||||||||||
|
Total
|
$
|
300,834,211
|
100.0
|
%
|
$
|
303,195,681
|
100.0
|
%
|
||||||||
F-19
STAR MOUNTAIN LOWER MIDDLE-MARKET CAPITAL CORP.
Notes to Financial Statements – (continued)
|
December 31, 2021
|
||||||||||||||||
|
Amortized Cost
|
Fair Value
|
|||||||||||||||
|
Aerospace & Defense
|
$
|
3,549,985
|
3.5
|
%
|
$
|
3,406,449
|
3.3
|
%
|
||||||||
|
Commercial Services & Supplies
|
9,416,447
|
9.4
|
9,446,485
|
9.1
|
||||||||||||
|
Construction & Engineering
|
21,169,290
|
21.2
|
21,566,475
|
20.9
|
||||||||||||
|
Consumer Finance
|
2,431,198
|
2.4
|
2,872,016
|
2.8
|
||||||||||||
|
Diversified Consumer Services
|
4,533,152
|
4.5
|
4,707,478
|
4.5
|
||||||||||||
|
Diversified Telecommunication Services
|
7,764,750
|
7.7
|
8,835,342
|
8.5
|
||||||||||||
|
Entertainment
|
9,285,773
|
9.2
|
9,903,617
|
9.6
|
||||||||||||
|
Healthcare Providers & Services
|
1,452,715
|
1.4
|
1,464,446
|
1.4
|
||||||||||||
|
Household Durables
|
4,150,656
|
4.1
|
4,229,816
|
4.1
|
||||||||||||
|
Household Products
|
4,039,833
|
4.1
|
3,716,607
|
3.6
|
||||||||||||
|
IT Services
|
1,962,579
|
2.0
|
1,999,150
|
1.9
|
||||||||||||
|
Leisure Products
|
4,632,103
|
4.6
|
4,632,103
|
4.5
|
||||||||||||
|
Media
|
6,131,793
|
6.1
|
7,094,439
|
6.8
|
||||||||||||
|
Personal Products
|
4,590,922
|
4.6
|
4,590,821
|
4.4
|
||||||||||||
|
Professional Services
|
8,383,197
|
8.3
|
8,029,455
|
7.7
|
||||||||||||
|
Road & Rail
|
938,249
|
0.9
|
1,013,686
|
1.0
|
||||||||||||
|
Software
|
6,028,520
|
6.0
|
6,131,980
|
5.9
|
||||||||||||
|
Total
|
$
|
100,461,162
|
100.0
|
%
|
$
|
103,640,365
|
100.0
|
%
|
||||||||
Note 4. Fair Value Measurements Investments
FASB ASC 820, Fair Value Measurement (“ASC Topic 820”), clarifies the definition of fair value as the amount that would be received in the sale of an asset or paid in the transfer of a liability in an orderly
transaction between market participants at the measurement date. Where available, the Company uses quoted market prices based on the last sales price on the measurement date.
In accordance with ASC 820, the Company discloses the fair value of its investments in a hierarchy that prioritizes the inputs to valuation techniques used to measure fair value. The hierarchy gives the highest
priority to valuations based upon unadjusted quoted prices in active markets for identical assets or liabilities (Level 1 measurements) and the lowest priority to valuations based upon unobservable inputs that are significant to the valuation
(Level 3 measurements). To the extent that fair value is based on inputs that are less observable, the determination of fair value requires a significant amount of management judgment. Investments which are valued using NAV as a practical
expedient are excluded from this hierarchy.
The three-tier hierarchy of inputs is summarized below.
| • |
Level 1 - Quoted prices are available in active markets/exchanges for identical investments as of the reporting date.
|
| • |
Level 2 - Pricing inputs are observable inputs including, but not limited to, prices quoted for similar assets or liabilities in active markets/exchanges or prices quoted for identical or similar assets or liabilities in markets
that are not active, and fair value is determined through the use of models or other valuation methodologies.
|
| • |
Level 3 - Pricing inputs are unobservable for the investment and include activities where there is little, if any, market activity for the investment. The inputs into determination of fair value require significant management
judgment and estimation.
|
The inputs used by management in estimating the fair value of Level 3 investments may include valuations and other reporting provided by representatives of the portfolio companies, original transaction prices,
recent transactions for identical or similar instruments, and comparisons to fair values of comparable investments, and may include adjustments to reflect illiquidity or non-transferability. The Company has policies with respect to its
investments, which may assist the Advisor in assessing the quality of information provided by, or on behalf of, each portfolio investment and in determining whether such information continues to be provided by a reliable source or whether
further investigation is necessary. Any such investigation, as applicable, may or may not require the Advisor to forego its normal reliance on the value supplied by, or on behalf of, such portfolio investment and to independently recommend
the fair value of the Company’s interest in such portfolio investments for approval by the Board, consistent with the Company’s valuation procedures.
The Company has engaged an independent third-party valuation provider, which performs valuation procedures to arrive at estimated valuation ranges of the investments on a quarterly basis. Investments that have
been completed within the past three months will be fair valued at cost unless there has been a material event. If there has been a material event or material information that was not known as of the close of the transaction, the independent
third-party valuation provider will provide an independent valuation range. The types of valuation methodologies employed by the third-party valuation provider include discounted cash flow, recent financing and enterprise value valuation
methodologies. The Company’s Board will discuss valuations and determine the fair value of each investment in the Company’s portfolio in good faith, based on the input of the Advisor, the respective independent valuation firms and the audit
committee.
F-20
STAR MOUNTAIN LOWER MIDDLE-MARKET CAPITAL CORP.
Notes to Financial Statements – (continued)
The Company’s investments and borrowings are subject to market risk. Market risk is the potential for changes in the value due to market changes. Market risk is directly impacted by the volatility and liquidity
in the markets in which the investments and borrowings are traded.
The inputs or methodology used for valuing securities are not necessarily an indication of the risk associated with investing in these securities. The availability of valuation techniques and observable inputs
can vary from security to security and is affected by a wide variety of factors including the type of security, whether the security is new and not yet established in the marketplace, and other characteristics particular to the transaction.
Inputs may include price information, volatility statistics, specific and broad credit data, liquidity statistics and other factors.
The use of these valuation models requires significant estimation and judgment by the Advisor. While the Company believes its valuation methods are appropriate, other market participants may value identical
assets differently than the Company at the measurement date. The methods used by the Company may produce a fair value calculation that may not be indicative of net realizable value or reflective of future fair values. The Company may also
have risk associated with its concentration of investments in certain geographic regions and industries.
To the extent that valuation is based on models or inputs that are less observable or unobservable in the market, the determination of fair value requires more judgment. Those estimated values do not
necessarily represent the amounts that may be ultimately realized due to the occurrence of future circumstances that cannot be reasonably determined. Accordingly, the degree of judgment exercised by the Company in determining fair value is
greatest for securities categorized in Level 3.
The determination of what constitutes “observable” requires significant judgment by the Company. The Company considers observable data to be market data which is readily available, regularly distributed or
updated, reliable and verifiable, not proprietary, which may fall into different levels of the fair value hierarchy. In such cases, for disclosure purposes, the level in the fair value hierarchy within which the fair value measurement in its
entirety falls is determined based on the lowest level input that is significant to the fair value measurement. The categorization of an investment within the hierarchy is based upon the pricing transparency of the investment and
observability of prices and inputs may be reduced for many investments. This condition could cause the investment to be reclassified to a lower level within the fair value hierarchy.
The financial statements include portfolio investments at fair value of $303,195,681 and $103,640,365 as of December 31, 2022 and December 31, 2021, respectively. On December 3,
2020, the SEC announced its adoption of Rule 2a-5 under the 1940 Act, which establishes an updated regulatory framework for determining the fair value of assets for which market quotations are not readily available in good faith for
purposes of the 1940 Act. The new rule had a compliance date of September 8, 2022 and clarifies how fund boards can satisfy their valuation obligations for such assets and permits boards, subject to board oversight and certain other
conditions, to designate certain parties to perform the fair value determinations for such assets. As of the date of this annual report on Form 10-K, the Board has not designated any party to perform the fair valuation determinations for
such assets and continues to determine the fair value of such assets in compliance with relevant provisions of the 1940 Act.
The Company valued its investments in underlying funds based on its proportionate interest in NAV of the underlying funds. For the purpose of classifying the investments in underlying funds within the fair
value hierarchy, the Company makes use of the practical expedient under ASU 2015-07, Fair Value Measurement (Topic 820): Disclosures for Investments in Certain Entities That Calculate Net Asset Value per Share (or its Equivalent). As of
December 31, 2022, the Company's investments in underlying funds amounted to $3,045,128.
U.S. GAAP requires that the Company disclose the Company’s pro-rata portion of individual securities, if available, that are reported to the Company by the underlying portfolio funds that exceed 5% of the
Company’s capital balance.
F-21
STAR MOUNTAIN LOWER MIDDLE-MARKET CAPITAL CORP.
Notes to Financial Statements – (continued)
The following tables present fair value measurements of investments, by major class according to the fair value hierarchy.
|
Fair Value Measurements
|
||||||||||||||||
|
December 31, 2022
|
Level 1
|
Level 2
|
Level 3
|
Total
|
||||||||||||
|
First Lien Senior Secured Loan
|
$
|
-
|
$
|
-
|
$
|
260,982,122
|
$
|
260,982,122
|
||||||||
|
Second Lien Senior Secured Loan
|
-
|
-
|
6,250,270
|
6,250,270
|
||||||||||||
|
Preferred Equity Securities
|
-
|
-
|
27,088,732
|
27,088,732
|
||||||||||||
|
Warrants and Other Equity Securities
|
-
|
-
|
5,829,429
|
5,829,429
|
||||||||||||
|
Total Investments
|
$
|
-
|
$
|
-
|
$
|
300,150,553
|
$
|
300,150,553
|
||||||||
|
Fair Value Measurements
|
||||||||||||||||
|
December 31, 2021
|
Level 1
|
Level 2
|
Level 3
|
Total
|
||||||||||||
|
First Lien Senior Secured Loan
|
$
|
-
|
$
|
-
|
$
|
79,686,882
|
$
|
79,686,882
|
||||||||
|
Second Lien Senior Secured Loan
|
-
|
-
|
9,748,549
|
9,748,549
|
||||||||||||
|
Preferred Equity Securities
|
-
|
-
|
10,604,516
|
10,604,516
|
||||||||||||
|
Warrants and Other Equity Securities
|
-
|
-
|
3,600,418
|
3,600,418
|
||||||||||||
|
Total Investments
|
$
|
-
|
$
|
-
|
$
|
103,640,365
|
$
|
103,640,365
|
||||||||
First Lien Senior Secured Loans and Second Lien Senior Secured Loans are collateralized by tangible and intangible assets of the borrowers. These investments include loans to entities that have some level of
challenge in obtaining financing from other, more conventional institutions, such as a bank. Interest rates on these loans are either fixed or floating and are based on current market conditions.
The following tables provide a reconciliation of the beginning and ending balances for investments at fair value that use Level 3 inputs for the year ended December 31, 2022:
|
Investments
|
||||||||||||||||||||||||
|
First Lien Senior
Secured Loan
|
Second Lien Senior
Secured Loan
|
Preferred Equity
Securities
|
Warrants and Other
Equity Securities
|
Fund
Investments
|
Total Investments
|
|||||||||||||||||||
|
Balance as of December 31, 2021
|
$
|
79,686,882
|
$
|
9,748,549
|
$
|
10,604,516
|
$
|
3,600,418
|
$
|
-
|
$
|
103,640,365
|
||||||||||||
|
Net realized gain on investments
|
43,607
|
-
|
-
|
-
|
-
|
43,607
|
||||||||||||||||||
|
Net change in unrealized gain (loss) on investments
|
(4,927,777
|
)
|
(205,084
|
)
|
2,076,625
|
2,049,230
|
189,273
|
(817,733
|
)
|
|||||||||||||||
|
Purchases of investments and other adjustments to cost (1)
|
185,559,090
|
15,868,326
|
14,407,591
|
179,781
|
2,855,855
|
218,870,643
|
||||||||||||||||||
|
Proceeds from sales of investments
|
(7,971,150
|
)
|
-
|
-
|
-
|
-
|
(7,971,150
|
)
|
||||||||||||||||
|
Proceeds from principal repayments (2)
|
(10,246,750
|
)
|
(323,301
|
)
|
-
|
-
|
-
|
(10,570,051
|
)
|
|||||||||||||||
|
Lien status change
|
18,838,220
|
(18,838,220
|
)
|
-
|
-
|
-
|
-
|
|||||||||||||||||
|
Balance as of December 31, 2022
|
$
|
260,982,122
|
$
|
6,250,270
|
$
|
27,088,732
|
$
|
5,829,429
|
$
|
3,045,128
|
$
|
303,195,681
|
||||||||||||
| (1) |
Includes purchases of new investments, premium and discount accretion and amortization and PIK interest.
|
| (2) |
Includes paydowns receivable included in the Statements of Assets and Liabilities.
|
F-22
STAR MOUNTAIN LOWER MIDDLE-MARKET CAPITAL CORP.
Notes to Financial Statements – (continued)
The following tables provide a reconciliation of the beginning and ending balances for investments at fair value that use Level 3 inputs for the period from May 14, 2021 to
December 31, 2021:
|
Investments
|
||||||||||||||||||||
|
First Lien Senior
Secured Loan
|
Second Lien Senior
Secured Loan
|
Preferred Equity
Securities
|
Warrants and Other
Equity Securities
|
Total
Investments
|
||||||||||||||||
|
Balance as of May 14, 2021*
|
$
|
32,804,029
|
$
|
854,681
|
$
|
7,468,793
|
$
|
1,737,755
|
$
|
42,865,258
|
||||||||||
|
Net realized gain on investments
|
-
|
-
|
-
|
240,492
|
240,492
|
|||||||||||||||
|
Net change in unrealized gain (loss) on investments
|
57,925
|
196,597
|
(329,718
|
)
|
142,838
|
67,642
|
||||||||||||||
|
Purchases of investments and other adjustments to cost (1)
|
50,049,082
|
8,846,343
|
3,465,441
|
1,810,873
|
64,171,739
|
|||||||||||||||
|
Proceeds from sales of investments
|
(512,470
|
)
|
-
|
-
|
(331,540
|
)
|
(844,010
|
)
|
||||||||||||
|
Proceeds from principal repayments (2)
|
(2,711,684
|
)
|
(149,072
|
)
|
-
|
-
|
(2,860,756
|
)
|
||||||||||||
|
Balance as of December 31, 2021
|
$
|
79,686,882
|
$
|
9,748,549
|
$
|
10,604,516
|
$
|
3,600,418
|
$
|
103,640,365
|
||||||||||
|
*
|
Date of Formation of the Company.
|
| (1) |
Includes purchases of new investments, premium and discount accretion and amortization and PIK interest.
|
| (2) |
Includes paydowns receivable included in the Statements of Assets and Liabilities.
|
The net change in unrealized gain (loss) on investments included on the Statements of Operations for the year ended December 31, 2022 and for the period from May 14, 2021 to December 31, 2021, attributable to
Level 3 investments still held as of December 31, 2022 and December 31, 2021 was $(817,733) and $67,642, respectively.
Reclassifications impacting Level 3 of the fair value hierarchy are reported as transfers in or out of Level 3 as of the beginning of the period which the reclassifications occur. There were no transfers among
Levels 1, 2 and 3 for the year ended December 31, 2022 and for the period from May 14, 2021 to December 31, 2021.
Purchases (including accretion, amortization, PIK interest) for the year ended December 31, 2022 amounted to $218,870,643 of fair value. Purchases (including accretion, amortization, PIK interest) and transfers
for the period from May 14, 2021 to December 31, 2021 amounted to $64,171,739 and $42,865,258 of fair value, respectively.
For the year ended December 31, 2022, the Company invested (net of original issue discount) $150,843,665 in 22 new portfolio companies and $66,668,982 in sixteen existing portfolio
companies as reflected in the Schedule of Investments. For the period from May 14, 2021 to December 31, 2021, the Company invested (net of original issue discount) $50,487,790 in ten new portfolio companies and $13,332,543 in sixteen existing portfolio companies as reflected in the Schedule of Investments.
Significant Unobservable Inputs
ASC Topic 820 requires disclosure of quantitative information about the significant unobservable inputs used in the valuation of assets and liabilities classified as Level 3 within the fair value hierarchy. The
tables below are not intended to be all-inclusive, but rather to provide information on significant unobservable inputs and valuation techniques used by the Company.
F-23
STAR MOUNTAIN LOWER MIDDLE-MARKET CAPITAL CORP.
Notes to Financial Statements – (continued)
The table below summarizes the quantitative inputs and assumptions used for items categorized in Level 3 of the fair value hierarchy as of December 31, 2022.
|
|
Range
|
||||||||||||||||||||
|
|
Fair Value
|
Valuation Technique
|
Unobservable
Input
|
Weighted
Average Mean
|
Minimum
|
Maximum
|
|||||||||||||||
|
Assets:
|
|||||||||||||||||||||
|
First Lien Senior Secured Loan
|
$
|
195,396,657
|
Discounted Cash Flow
|
Market Yields
|
15.0
|
%
|
6.5
|
%
|
27.0
|
%
|
|||||||||||
|
|
EBITDA Multiple
|
8.06
|
x
|
3.50
|
x
|
34.75
|
x
|
||||||||||||||
|
First Lien Senior Secured Loan
|
9,996,357
|
Discounted Cash Flow
|
Market Yields
|
26.8
|
%
|
19.0
|
%
|
32.6
|
%
|
||||||||||||
|
|
Revenue Multiple
|
1.33
|
x
|
0.23
|
x
|
3.00
|
x
|
||||||||||||||
|
First Lien Senior Secured Loan
|
9,212,424
|
Enterprise Value Method
|
Revenue Multiple
|
0.46
|
x
|
0.25
|
x
|
1.25
|
x
|
||||||||||||
|
First Lien Senior Secured Loan
|
46,376,684
|
Recent Transaction
|
N/A
|
N/A
|
N/A
|
N/A
|
|||||||||||||||
|
Second Lien Senior Secured Loan
|
6,250,270
|
Discounted Cash Flow
|
Market Yields
|
15.1
|
%
|
14.4
|
%
|
15.8
|
%
|
||||||||||||
|
|
EBITDA Multiple
|
6.75
|
x
|
6.25
|
x
|
7.25
|
x
|
||||||||||||||
|
Preferred Equity Securities
|
2,165,391
|
Discounted Cash Flow
|
Market Yields
|
17.8
|
%
|
17.8
|
%
|
17.8
|
%
|
||||||||||||
|
|
EBITDA Multiple
|
3.75
|
x
|
3.50
|
x
|
4.00
|
x
|
||||||||||||||
|
Preferred Equity Securities
|
26,528
|
Discounted Cash Flow
|
Market Yields
|
16.8
|
%
|
16.8
|
%
|
16.8
|
%
|
||||||||||||
|
|
Revenue Multiple
|
0.55
|
x
|
0.44
|
x
|
0.65
|
|||||||||||||||
|
Preferred Equity Securities
|
3,469,292
|
Enterprise Value Method
|
Revenue Multiple
|
0.60
|
x
|
0.30
|
x
|
0.70
|
x
|
||||||||||||
|
|
EBITDA Multiple
|
10.75
|
x
|
5.75
|
x
|
11.25
|
x
|
||||||||||||||
|
Preferred Equity Securities
|
1,406,681
|
Enterprise Value Method
|
Revenue Multiple
|
2.42
|
x
|
0.44
|
x
|
3.00
|
x
|
||||||||||||
|
Preferred Equity Securities
|
16,859,290
|
Enterprise Value Method
|
EBITDA Multiple
|
8.01
|
x
|
5.75
|
x
|
13.00
|
x
|
||||||||||||
|
Preferred Equity Securities
|
3,161,550
|
Recent Transaction
|
N/A
|
N/A
|
N/A
|
N/A
|
|||||||||||||||
|
Warrants and Other Equity Securities
|
1,890,932
|
Enterprise Value Method
|
Revenue Multiple
|
2.46
|
x
|
0.23
|
x
|
3.00
|
x
|
||||||||||||
|
Warrants and Other Equity Securities
|
3,938,497
|
Enterprise Value Method
|
EBITDA Multiple
|
6.83
|
x
|
3.50
|
x
|
34.75
|
x
|
||||||||||||
|
Fund Investments
|
3,045,128
|
Other
|
N/A
|
N/A
|
N/A
|
N/A
|
|||||||||||||||
|
Total Level 3 Assets
|
$
|
303,195,681
|
|||||||||||||||||||
The table below summarizes the quantitative inputs and assumptions used for items categorized in Level 3 of the fair value hierarchy as of December 31, 2021.
|
Range
|
|||||||||||||||||||||
|
Fair Value
|
Valuation Technique
|
Unobservable
Input
|
Weighted
Average Mean
|
Minimum
|
Maximum
|
||||||||||||||||
|
Assets:
|
|||||||||||||||||||||
|
First Lien Senior Secured Loan
|
$
|
54,840,882
|
Discounted Cash Flow
|
Market Yields
|
12.60
|
%
|
7.20
|
%
|
19.10
|
%
|
|||||||||||
|
|
EBITDA Multiple
|
7.67
|
x
|
3.35
|
x
|
13.13
|
x
|
||||||||||||||
|
First Lien Senior Secured Loan
|
1,292,478
|
Discounted Cash Flow
|
Market Yields
|
27.80
|
%
|
27.80
|
%
|
27.80
|
%
|
||||||||||||
|
|
Revenue Multiple
|
3.26
|
x
|
2.50
|
x
|
4.02
|
x
|
||||||||||||||
|
First Lien Senior Secured Loan
|
23,553,522
|
Recent Transaction
|
N/A
|
N/A
|
N/A
|
N/A
|
|||||||||||||||
|
Second Lien Senior Secured Loan
|
9,748,549
|
Discounted Cash Flow
|
Market Yields
|
11.30
|
%
|
9.70
|
%
|
17.80
|
%
|
||||||||||||
|
|
EBITDA Multiple
|
6.97
|
x
|
6.25
|
x
|
8.50
|
x
|
||||||||||||||
|
Preferred Equity Securities
|
2,859,200
|
Enterprise Value Method
|
Revenue Multiple
|
0.68
|
x
|
0.58
|
x
|
.78
|
x
|
||||||||||||
|
|
EBITDA Multiple
|
12.75
|
x
|
12.25
|
x
|
13.25
|
x
|
||||||||||||||
|
Preferred Equity Securities
|
6,047,249
|
Enterprise Value Method
|
EBITDA Multiple
|
8.49
|
x
|
4.00
|
x
|
13.13
|
x
|
||||||||||||
|
Preferred Equity Securities
|
1,698,067
|
Recent Transaction
|
N/A
|
N/A
|
N/A
|
N/A
|
|||||||||||||||
|
Warrants and Other Equity Securities
|
945,842
|
Enterprise Value Method
|
Revenue Multiple
|
3.26
|
x
|
2.50
|
x
|
4.02
|
x
|
||||||||||||
|
Warrants and Other Equity Securities
|
2,654,576
|
Enterprise Value Method
|
EBITDA Multiple
|
7.15
|
x
|
3.35
|
x
|
13.00
|
x
|
||||||||||||
|
Total Level 3 Assets
|
$
|
103,640,365
|
|||||||||||||||||||
An increase or decrease in any of the significant unobservable inputs used in the fair value measurement of the investments would result in a higher or lower fair value measurement.
The significant unobservable input used in the income approach of fair value measurement of the Company’s investments is the discount rate used to discount the estimated future cash flows expected to be
received from the underlying investment, which include both future principal and interest payments. Increases (decreases) in the discount rate would result in a decrease (increase) in the fair value estimate of the investment. Included in the
consideration and selection of discount rates are the following factors: risk of default, rating of the investment and comparable investments, and call provisions.
F-24
STAR MOUNTAIN LOWER MIDDLE-MARKET CAPITAL CORP.
Notes to Financial Statements – (continued)
The significant unobservable inputs used in the market approach of fair value measurement of the Company’s investments are the market multiples of EBITDA or revenue of the comparable guideline public companies.
The Company selects a population of public companies for each investment with similar operations and attributes of the portfolio company. Using these guideline public companies’ data, a range of multiples of enterprise value to EBITDA or
revenue is calculated. The Company selects percentages from the range of multiples for purposes of determining the portfolio company’s estimated enterprise value based on said multiple and generally the latest twelve months EBITDA or revenue
of the portfolio company (or other meaningful measure). Increases (decreases) in the multiple will result in an increase (decrease) in enterprise value, resulting in an increase (decrease) in the fair value estimate of the investment.
Note 5. Transactions with Affiliated Companies
The Company and the Advisor have received an exemptive order from the SEC that permits the Company to co-invest with certain accounts managed by the Advisor and/or certain affiliates of the Company, subject to
the terms and conditions specified in the exemptive order.
An affiliated company is a company in which the Company has an ownership interest of 5% or more of its voting securities. A controlled affiliate company is a company in which the Company has an ownership
interest of more than 25% of its voting securities. Please see the Company’s Schedule of Investments for the type of investment, principal amount, interest rate including the spread, and the maturity date. For the year ended December 31, 2022
and for the period from May 14, 2021 to December 31, 2021, Star Mountain Fund Management, LLC’s managed funds had an ownership interest of 25% or more in one company’s voting securities.
Transactions related to the Company’s investments with controlled affiliates for the year ended December 31, 2022 and for the period from May 14, 2021 to December 31, 2021, were as follows:
|
December 31, 2022
|
Equity Ownership Held by the Company
|
Equity Ownership Held by
Star Mountain Affiliate Funds
|
|
|
Issuer:
|
|||
|
Arrow Home Health LLC
|
2.2%
|
55.5%
|
|
December 31, 2021
|
Equity Ownership Held by the Company
|
Equity Ownership Held by
Star Mountain Affiliate Funds
|
|
|
Issuer:
|
|||
|
Arrow Home Health LLC
|
3.2%
|
55.5%
|
Note 6. Transactions with Related Parties
Star Mountain Lower Middle-Market (Offshore) Ltd. (the “Feeder Fund”) was formed as a Cayman Islands exempted company and commenced operations on August 17, 2021. The Feeder Fund has been formed to invest all
or substantially all of its investable assets in the common stock of the Company. As of December 31, 2022 and December 31, 2021, the Feeder Fund had $12,470,000 and $5,338,000 in capital committed to the Company, respectively, and an
ownership percentage in the Company of 5.67% and 3.72%, respectively. As of December 31, 2022, the Feeder Fund had $110,891 of contributions payable to the Company. As of December 31, 2021 the Feeder Fund had no
contributions payable to the Company.
Management Fees
The Company has entered into an investment advisory agreement with the Advisor (the “Investment Advisory Agreement”), under which Star Mountain Fund Management, LLC, subject to the overall supervision of the
Board, provides investment advisory services to the Company. The Company pays the Advisor a fee for its services under the Investment Advisory Agreement consisting of two components – a base management fee and an incentive fee. The cost of
both the base management fee and the incentive fee are borne by the Company’s Stockholders, unless such fees are waived by the Advisor.
The Company’s investment activities are managed by the Advisor, which is responsible for originating prospective investments, conducting research and due diligence investigations on potential investments,
analyzing investment opportunities, negotiating and structuring investments and monitoring investments and portfolio companies on an ongoing basis.
Pursuant to the Advisory Agreement, the Company pays to the Advisor a management fee (the “Management Fee”), payable quarterly in arrears at an annual rate of 1.75% per annum of the average of the Company’s
total gross assets (excluding cash or cash equivalents but including assets purchased with borrowed amounts) as of the end of each of the two most recently completed calendar quarters.
F-25
STAR MOUNTAIN LOWER MIDDLE-MARKET CAPITAL CORP.
Notes to Financial Statements – (continued)
Management fees for the year ended December 31, 2022 and for the period from May 14, 2021 to December 31, 2021 were $3,467,163 and $757,520, respectively. For the year ended December 31, 2022
and for the period from May 14, 2021 to December 31, 2021, Star Mountain Fund Management, LLC elected to voluntarily waive $279,725 and $0, respectively, of such management fees. The management fees waived are not recoupable by Star
Mountain Fund Management, LLC. There is no guarantee that Star Mountain Fund Management, LLC will waive management fees in the future, and Star Mountain Fund Management, LLC may discontinue or modify any such waivers in the future at its
discretion. As of December 31, 2022 and December 31, 2021, $1,049,992 and $757,520 of management fees remained payable, respectively.
Incentive Fees
The incentive fee (“Incentive Compensation”) consists of two parts. The first component of the income incentive fee is payable quarterly in arrears. The Income Incentive Fee will be determined by comparing the
Company’s pre-incentive fee net investment income for the preceding quarter. Pre-incentive fee net investment income means interest income, dividend income, PIK interest and any other income (including any other fees such as commitment,
origination, structuring, diligence and consulting fees or other fees that the Company receives from portfolio companies but excluding fees for providing managerial assistance) accrued during the calendar quarter, minus operating expenses for
the quarter (including the base management fee), any expenses payable under the administration agreement (the “Administration Agreement”) between the Company and the Administrator and any interest expense and dividends paid on any outstanding
preferred stock, but excluding the incentive fee. Pre-incentive fee net investment income will include, in the case of investments with a deferred interest feature such as market discount, debt instruments with PIK interest, preferred stock
with PIK dividends and zero-coupon securities, accrued income that the Company has not yet received in cash. The Advisor is not under any obligation to reimburse the Company for any part of the incentive fee it receives that was based on
accrued interest that the Company never actually receives.
Pre-incentive fee net investment income does not include any realized capital gains or losses or unrealized capital gains or losses. If any distributions from portfolio companies are characterized as a return
of capital, such returns of capital would affect the capital gains incentive fee to the extent a gain or loss is realized. Because of the structure of the incentive fee, it is possible that the Company may pay an incentive fee in a quarter
where it incurs a loss. For example, if the Company receives pre-incentive fee net investment income in excess of the hurdle rate (as defined below) for a quarter, the Company will pay the applicable incentive fee even if it has incurred a
loss in that quarter due to realized and unrealized capital losses.
Pre-incentive fee net investment income, expressed as a rate of return on the value of the Company’s net assets (defined as total assets less indebtedness and before taking into account any incentive fees
payable during the period) at the end of the immediately preceding calendar quarter, is compared to a fixed “hurdle rate” of 1.75% per quarter (7% annually).
The Company pays the Advisor an incentive fee with respect to its pre-incentive fee net investment income in each calendar quarter as follows:
| • |
no incentive fee in any calendar quarter in which the pre-incentive fee net investment income does not exceed the hurdle rate of 1.75% (7% annually);
|
| • |
100% of the Company’s pre-incentive fee net investment income with respect to that portion of such pre-incentive fee net investment income, if any, that exceeds the hurdle rate but is less than or equal to the product of (i) 2.19%
per quarter (8.75% annualized) and (ii) the Company’s net assets at the end of the immediately preceding quarter. The Company refers to this portion of the Company’s pre-incentive fee net investment income as the “catch-up” provision.
The catch-up is meant to provide the Advisor with approximately 20% of the pre-incentive fee net investment income if a hurdle rate did not apply; and
|
| • |
20% of the Company’s pre-incentive fee net investment income that exceeds the “catch-up” provision. This provides that once the hurdle amount and the catch-up provision are achieved, 20% of all pre-incentive fee net investment
income thereafter is allocated to the Advisor.
|
These calculations are appropriately prorated for any period of less than three months and adjusted for any share issuances or repurchases during the current quarter.
The second part of the incentive fee is a capital gains incentive fee that is determined and payable in arrears as of the end of each fiscal year (or upon termination of the Investment Advisory Agreement, as of
the termination date), and equals 20% of the Company’s realized capital gains as of the end of the fiscal year. In determining the capital gains incentive fee payable to the Advisor, the Company calculates the cumulative aggregate realized
capital gains and cumulative aggregate realized capital losses since the Company’s inception, and the aggregate unrealized capital depreciation as of the date of the calculation, as applicable, with respect to each of the investments in the
Company’s portfolio. For this purpose, cumulative aggregate realized capital gains, if any, equals the sum of the differences between the net sales price of each investment, when sold, and the amortized cost of such investment. Cumulative
aggregate realized capital losses equals the sum of the amounts by which the net sales price of each investment, when sold, is less than the amortized cost of such investment since the Company’s inception. Aggregate unrealized capital
depreciation equals the sum of the difference, if negative, between the valuation of each investment as of the applicable calculation date and the amortized cost of such investment. At the end of the applicable year, the amount of capital
gains that will serve as the basis for the calculation of the capital gains incentive fee equals the cumulative aggregate realized capital gains less cumulative aggregate realized capital losses, less aggregate unrealized capital
depreciation, with respect to the Company’s portfolio of investments. If this number is positive at the end of such year, then the capital gains incentive fee for such year equals 20% of such amount, less the aggregate amount of any capital
gains incentive fees paid in respect of the Company’s portfolio in all prior years.
While the Investment Advisory Agreement with the Advisor neither includes nor contemplates the inclusion of unrealized gains in the calculation of the capital gains incentive fee, pursuant to an interpretation
of an American Institute for Certified Public Accountants Technical Practice Aid for investment companies, the Company includes unrealized gains in the calculation of the capital gains incentive fee expense and related accrued capital gains
incentive fee. This accrual reflects the incentive fees that would be payable to the Advisor if the Company’s entire portfolio was liquidated at its fair value as of the balance sheet date even though the Advisor is not entitled to an
incentive fee with respect to unrealized gains unless and until such gains are actually realized.
F-26
STAR MOUNTAIN LOWER MIDDLE-MARKET CAPITAL CORP.
Notes to Financial Statements – (continued)
Incentive fees for the year ended December 31, 2022 and for the period from May 14, 2021 to December 31, 2021 were $1,960,085 and $225,883, respectively. For the year ended December 31, 2022 and for the period from
May 14, 2021 to December 31, 2021 Star Mountain Fund Management, LLC elected to voluntarily waive $2,185,968 and $0 of such incentive fees, respectively. The incentive fees
waived for the year ended December 31, 2022 are not recoupable and there is no guarantee that Star Mountain Fund Management, LLC will waive incentive fees in the future, and Star Mountain Fund
Management, LLC may discontinue or modify any such waivers in the future at its discretion. As of December 31, 2022, no incentive fees remained payable and as of December 31, 2021, $225,883 remained payable, which had subsequently been
waived.
Administration Fees
The Company has entered into the Administration Agreement with Star Mountain Fund Management, LLC, under which the Company reimburses the Administrator for its allocable portion of overhead and other expenses,
including the costs of furnishing the Company with office facilities and equipment and providing clerical, bookkeeping, record-keeping and other administrative services at such facilities, and the Company’s allocable portion of the cost of
the chief financial officer and chief compliance officer and their respective staffs. To the extent that the Administrator outsources any of its functions, the Company will pay the fees associated with such functions on a direct basis,
without incremental profit, to the Administrator. For the year ended December 31, 2022 and for the period from May 14, 2021 to December 31, 2021 the Company incurred reimbursement expenses of $182,766 and $115,068, respectively, included
under General and Administrative fees on the Statements of Operations. As of December 31, 2022, $35,877 of reimbursement expense was payable as shown in the Statements of Assets and Liabilities as reimbursement
expense payable and as of December 31, 2021 no reimbursement expense was payable.
The Administrator has entered into a sub-administration agreement with SS&C Technologies, Inc. (the “Sub-Administrator”), under which the Sub-Administrator provides various
accounting and administrative services to the Company. Administrative services may include maintenance of the Company’s books and records, processing of investor transactions, and calculation of the NAV. For the year ended December
31, 2022 and for the period from May 14, 2021 to December 31, 2021, the Company incurred expenses for services provided by the Sub-Administrator of $412,218 and $99,285, respectively, which is included in professional fees on the Statements
of Operations. As of December 31, 2022, there was no amount payable for expenses incurred for services provided by the Sub-Administrator and as of December 31, 2021, $7,139
remained payable, which is included in professional fees payable on the Statements of Assets and Liabilities.
Directors’ Fees
The Company incurs certain fees and expenses paid to the Company’s independent directors (including expenses and costs related to meetings of the independent directors); for
the year ended December 31, 2022 and for the period from May 14, 2021 to December 31, 2021 directors’ expenses are $89,151 and $50,849, respectively, as shown on the Statements of Operations. As of December 31, 2022 and December 31, 2021,
$20,000 and $10,849 of directors’ expenses remained payable, respectively, which is included in professional fees payable as shown on the Statements of Assets and Liabilities.
Note 7. Borrowings
On July 2, 2021, the Company entered into a Loan and Servicing Agreement (the “Loan Agreement”) with Sterling National Bank (“SNB”), which provides for a $55 million senior secured revolving
credit facility (“Secured Credit Facility”). In February 2022, SNB was subsequently acquired by Webster Bank (“Webster”), which took over the relationship with the Company. On January 12, 2022, the Company entered into a second amendment to
the Secured Credit Facility to upsize the Secured Credit Facility to $80 million. On May 6, 2022, the Company entered into an amendment to the Secured Credit Facility to upsize the Secured Credit Facility to $125 million. On September 16,
2022, the Company entered into an amendment to the Secured Credit Facility to upsize the Secured Credit Facility to $200 million.
F-27
STAR MOUNTAIN LOWER MIDDLE-MARKET CAPITAL CORP.
Notes to Financial Statements – (continued)
As of December 31, 2022, the Secured Credit Facility commitment amounts were as follows:
|
Secured Credit Facility Lender
|
Commitment
|
|||
|
Webster Bank
|
$
|
67,500,000
|
||
|
Blue Ridge Bank
|
25,000,000
|
|||
|
First Foundation Bank
|
20,000,000
|
|||
|
Mitsubishi HC Capital America, Inc.
|
20,000,000
|
|||
|
Woodforest National Bank
|
20,000,000
|
|||
|
Forbright Bank
|
17,500,000
|
|||
|
Apple Bank
|
15,000,000
|
|||
|
Peapack-Gladstone Bank
|
15,000,000
|
|||
|
Total Commitment
|
$
|
200,000,000
|
||
Borrowings can be increased to a maximum of $350 million in accordance with the Secured Credit Facility accordion feature terms and conditions and are limited by various advance rates and
concentration limits.
As of December 31, 2022 and December 31, 2021, the total fair value of the borrowings outstanding under the Secured Credit Facility was $145,000,000 and $34,000,000, respectively.
Advances under the Secured Credit Facility bear interest at a per annum rate equal to the Prime rate in effect on such day minus 0.35%. Inclusive of syndication, agency, and administrative
fees paid to Webster, the total annualized cost of capital is estimated to be 8.0%. The Company will also pay a non-utilization fee on the average daily unused amount of the aggregate commitments until the commitment termination date (as
defined in the Loan Agreement). As of December 31, 2022, the total commitments under the Secured Credit Facility were $200 million. Proceeds from borrowings under the Secured Credit Facility may be used to finance certain investments,
fulfill payment obligations under the Secured Credit Facility, make distributions/payments permitted by the Loan Agreement. All amounts outstanding under the Secured Credit Facility must be repaid by the fourth anniversary of the initial
closing of the Secured Credit Facility. The Company’s obligations to the lenders under the Secured Credit Facility are secured by a first priority security interest in substantially all of the Company’s assets, subject to certain
exclusions.
Borrowings under the Secured Credit Facility are limited by various advance rates and concentration limits. In connection with the Secured Credit Facility, the Company has made certain
customary representations/warranties and is required to comply with various covenants, reporting requirements and other customary requirements for similar facilities. The Secured Credit Facility is subject to customary events of default for
similar financing transactions. Upon the occurrence and during the continuation of an event of default, Webster may declare the outstanding advances and all other obligations under the Secured Credit Facility immediately due and payable.
On June 22, 2022 the Company entered into a Loan and Security Agreement with East West Bank, which provides for cash or credit advances of up to $25 million (the “Revolving Credit Line”)
pursuant to the terms and conditions of the Revolving Credit Line. On September 26, 2022, the Company entered into an amendment with East West Bank, to downsize the Revolving Credit Line to $21 million. All amounts outstanding under the
Revolving Credit Line must be repaid by June 22, 2023. As of December 31, 2022 and December 31, 2021, the total fair value of the borrowings outstanding under the Revolving Credit Line was $8,000,000 and $0, respectively.
Advances under the Revolving Credit Line bear interest at a per annum rate equal to the prime rate in effect on such day or 4.75%, whichever is greater. The Company will also pay certain fees
under the Revolving Credit Line, including unused fees of 0.35% per annum of the average unused portion of the Revolving Credit Line during any fiscal quarter when the average daily balance of the aggregate outstanding principal amount of
the Advances in any fiscal quarter during the term of the Revolving Credit Line equals or exceeds 60% of the Revolving Credit Line amount and 0.75% per annum of the average unused portion of the Revolving Credit Line during any fiscal
quarter when the average daily balance of the aggregate outstanding principal amount of the Advances in any fiscal quarter during the term of the Revolving Credit Line is less than 60% of the Revolving Credit Line amount.
Proceeds from borrowings under the Revolving Credit Line may be used for working capital, to finance the acquisition by the Company of certain investments, to make deposits, to pay management
fees and legal fees, and to fund obligations in accordance with the Company’s certificate of incorporation.
The Company’s obligations to East West Bank under the Revolving Credit Line are secured by a first priority security interest in the capital commitments of the Company’s investors, subject to
certain exclusions.
In connection with the Revolving Credit Line, the Company has made certain customary representations and warranties and is required to comply with various covenants, reporting requirements and
other customary requirements for similar facilities. In addition, under the Revolving Credit Line, the Lender may prohibit the Company from repurchasing its shares of common stock from its investors during a quarter if, in the prior
quarter, repurchase requests from the Company’s investors exceed 10% of the Company’s total capital commitments. The Revolving Credit Line is subject to customary events of default for similar financing transactions. Upon the occurrence and
during the continuation of an event of default, East West Bank may declare the outstanding advances and all other obligations under the Revolving Credit Line immediately due and payable.
F-28
STAR MOUNTAIN LOWER MIDDLE-MARKET CAPITAL CORP.
Notes to Financial Statements – (continued)
The fair value of the borrowings outstanding under the Secured Credit Facility and the Revolving Credit Line are based on a market yield approach and current interest rates, which are Level 3
inputs to the market yield model. The components of the Company’s interest expense and other debt financing expenses, average outstanding balances and average stated interest rates (i.e. the rate in effect plus spread) were as follows:
|
For the year ended
December 31, 2022
|
For the period
May 14, 2021* to
December 31, 2021
|
|||||||
|
Interest expense - Secured Credit Facility
|
$
|
4,222,007
|
$
|
129,638
|
||||
|
Interest expense - Revolving Credit Line
|
433,472
|
-
|
||||||
|
Unused commitment fees
|
277,339
|
149,153
|
||||||
|
Amortization of deferred financing costs
|
440,322
|
37,131
|
||||||
|
Utilization fees
|
425,175
|
9,979
|
||||||
|
Total interest and other debt financing fees
|
$
|
5,798,315
|
$
|
325,901
|
||||
|
Average debt outstanding
|
$
|
90,928,767
|
$
|
6,810,345
|
||||
|
Average stated interest rate
|
5.12
|
%
|
2.99
|
%
|
||||
|
*
|
Date of Formation of the Company.
|
Note 8. Income Taxes
The Company has elected to be treated as a RIC under Subchapter M of the Code. As a RIC, the Company is not taxed on any investment company taxable income or capital gains which it distributes to stockholders.
The Company intends to distribute all of its investment company taxable income and capital gains annually. Accordingly, no provision for federal income tax has been made in the consolidated financial statements.
Dividends from net investment income and distributions from net realized capital gains are determined in accordance with U.S. federal tax regulations, which may differ from amounts in accordance with U.S. GAAP
and those differences could be material. These book-to-tax differences are either temporary or permanent in nature. Reclassifications due to permanent book-to-tax differences have no impact on net assets.
The following permanent differences were reclassified for tax purposes:
|
For the year ended
December 31, 2022
|
For the period May 14, 2021
to December 31, 2021
|
|||||||
|
Increase (decrease) in capital in excess of par value
|
$
|
202,722
|
$
|
10,594,332
|
||||
|
Increase (decrease) in accumulated undistributed (overdistributed) earnings
|
(202,722
|
)
|
(10,594,332
|
)
|
||||
Taxable income generally differs from net increase (decrease) in net assets resulting from operations for financial reporting purposes due to temporary and permanent differences in the recognition of income and
expenses and generally excludes unrealized gain (loss) on investments as investment gains and losses are not included in taxable income until they are realized. The temporary and permanent differences in the recognition of income and expenses
for the year ended December 31, 2022 and for the period from May 14, 2021 to December 31, 2021 are primarily due to organizational cost amortization.
Capital losses in excess of capital gains earned in a tax year may generally be carried forward and used to offset capital gains, subject to certain limitations. Under the Regulated Investment Company
Modernization Act of 2010, capital losses incurred after September 30, 2011 are not subject to expiration and retain their character as either short-term or long-term capital losses. As of December 31, 2022 and December 31, 2021, the Company
had no short-term capital loss carryforwards. As of December 31, 2022 and December 31, 2021, the Company had no long-term capital loss carryforwards.
The following table reconciles net increase in net assets resulting from operations to taxable income:
|
For the year ended
December 31, 2022
|
For the period May 14, 2021
to December 31, 2021
|
|||||||
|
Net change in unrealized (gain) loss
|
$
|
2,090,736
|
$
|
3,399,241
|
||||
|
Undistributed ordinary income
|
399,145
|
-
|
||||||
|
Other cumulative effect of timing differences
|
(242,886
|
)
|
(261,056
|
)
|
||||
|
Total taxable income
|
$
|
2,246,995
|
$
|
3,138,185
|
||||
For income tax purposes, distributions paid to stockholders are reported as ordinary income, return of capital, redemption, long term capital gains or a combination thereof. The following table provides the tax
character of distributions declared:
F-29
STAR MOUNTAIN LOWER MIDDLE-MARKET CAPITAL CORP.
Notes to Financial Statements – (continued)
|
For the year ended
December 31, 2022
|
For the period May 14, 2021
to December 31, 2021
|
|||||||
|
Ordinary income
|
$
|
10,682,401
|
$
|
2,267,468
|
||||
|
Redemption
|
-
|
13,457,540
|
||||||
|
Long-term capital gains
|
-
|
240,492
|
||||||
|
Total
|
$
|
10,682,401
|
$
|
15,965,500
|
||||
As of December 31, 2022, the estimated cost basis of investment for U.S. federal income tax purposes was $301,104,946, resulting in estimated net unrealized gain of $2,090,736, comprised of estimated gross
unrealized gains of $11,979,460 and gross unrealized losses of $9,888,724. As of December 31, 2021, the estimated cost basis of investment for U.S. federal income tax purposes was $100,461,162, resulting in estimated net unrealized gain of
$3,399,241, comprised of estimated gross unrealized gains of $4,230,974, gross unrealized losses of $1,051,771 and net unrealized foreign currency gains of $220,038.
Note 9. Stock Issuances
As of December 31, 2022 and December 31, 2021, the total number of shares of all classes of capital stock that the Company has the authority to issue was 200,000,000 shares of Common Stock, par value $0.001 per
share.
New Stockholders admitted to the Company or existing Stockholders increasing their Capital Commitments at a particular closing will be required to purchase shares of the Company with an aggregate purchase price
necessary to ensure that all Stockholders in the Company have generally contributed the same percentage of their Capital Commitments to the Company immediately following such purchase (a “Catch-up Purchase”) and each such Stockholder shall be
issued a number of shares of the Company based on a per share purchase price determined by the Board. A Catch-up Purchase may be made in multiple installments as determined by the Advisor based on the Company’s capital requirements. The per
share purchase price shall be at least equal to the net asset value per share in accordance with the limitations of Section 23 of the 1940 Act. The Board may set the price per share above the net asset value per share based on a variety of
factors, including without limitation, the total amount of the Company’s organizational and other expenses that will have accrued following the Company’s initial closing.
For the year ended December 31, 2022, the Company entered into subscription agreements (collectively, the “Subscription Agreements”) with new investors, providing for the private placement of
common shares. Under the terms of the Subscription Agreements, investors are required to fund drawdowns to purchase common shares up to the amount of their respective capital commitments on an as-needed basis with a minimum of 8 business
days’ prior notice. As of December 31, 2022 and December 31, 2021, the Company had received capital commitments totaling $219,908,470 and $143,588,000, respectively.
As of December 31, 2022, net contributions of $165,406,541 had been made by Stockholders and $54,501,929 remained available to be drawn by the Company.
F-30
STAR MOUNTAIN LOWER MIDDLE-MARKET CAPITAL CORP.
Notes to Financial Statements – (continued)
The following tables summarize the issuance of shares for the year ended December 31, 2022 and for the period from May 14, 2021 to December 31, 2021:
|
Date
|
Price per share
|
Shares Issued
|
Proceeds
|
|||||||||
|
For the year ended December 31, 2022:
|
||||||||||||
|
March 25, 2022
|
$
|
25.59
|
708,935
|
$
|
18,142,000
|
|||||||
|
April 21, 2022
|
25.73
|
446,880
|
11,448,234
|
|||||||||
|
September 12, 2022
|
25.58
|
441,121
|
11,283,885
|
|||||||||
|
November 22, 2022
|
25.25
|
2,186,113
|
55,199,312
|
|||||||||
|
|
3,783,049
|
$
|
96,073,431
|
|||||||||
|
|
||||||||||||
|
Stock issued in connection with dividend reinvestment plan
|
||||||||||||
|
January 14, 2022
|
25.32
|
24,306
|
615,437
|
|||||||||
|
May 20, 2022
|
25.64
|
21,875
|
560,883
|
|||||||||
|
July 29, 2022
|
25.51
|
36,141
|
921,955
|
|||||||||
|
November 4, 2022
|
25.34
|
49,212
|
1,247,052
|
|||||||||
|
|
131,534
|
$
|
3,345,327
|
|||||||||
|
Total
|
3,914,583
|
$
|
99,418,758
|
|||||||||
|
Date
|
Price per share
|
Shares Issued
|
Proceeds
|
|||||||||
|
Period from May 14, 2021* to December 31, 2021:
|
||||||||||||
|
May 14, 2021
|
$
|
25.00
|
1,688,601
|
$
|
42,215,029
|
|||||||
|
June 11, 2021
|
25.19
|
629,240
|
15,851,000
|
|||||||||
|
August 17, 2021
|
25.10
|
244,608
|
6,139,651
|
|||||||||
|
November 4, 2021
|
25.88
|
740,397
|
19,161,474
|
|||||||||
|
3,302,846
|
$
|
83,367,154
|
||||||||||
|
Stock issued in connection with dividend reinvestment plan
|
||||||||||||
|
August 20, 2021
|
25.07
|
11,997
|
300,751
|
|||||||||
|
November 19, 2021
|
25.78
|
5,631
|
145,176
|
|||||||||
|
17,628
|
445,927
|
|||||||||||
|
Total
|
3,320,474
|
$
|
83,813,081
|
|||||||||
|
*
|
Date of Formation of the Company.
|
Note 10. Discretionary Repurchase of Shares of Common Stock and Distributions
Beginning with the quarter ended September 30, 2022, the Company began to conduct quarterly tender offers, at the Board’s discretion, in accordance with the requirements of Rule 13e-4 under the
Exchange Act and the 1940 Act, to permit Stockholders to tender their shares of common stock at a specific per share price (“Purchase Price”) based on the Company’s net asset value as of the last date of the quarter in which the tender offer
is conducted. The Company intends to conduct each tender offer to repurchase up to 2.5% of the number of shares of common stock outstanding as of the end of the prior quarter in which the tender offer is conducted, subject to numerous
restrictions that limit Stockholders’ ability to sell their shares of common stock.
During the quarter ended September 30, 2022, the Company commenced a tender offer (the “Q3 2022 Tender Offer”) pursuant to which the Company offered to repurchase up to 99,486 shares of common
stock for $2,564,753 from the Stockholders at a Purchase Price of $25.78, which represented 2.5% of the Company’s outstanding shares of common stock as of June 30, 2022. Stockholders who tendered shares of common stock in the Q3 2022 Tender
Offer received, at the expiration of the Q3 2022 Tender Offer, a non-interest bearing, non-transferable promissory note entitling such Stockholders to an amount in cash equal to the number of shares of common stock accepted for purchase
multiplied by the Purchase Price. The Q3 2022 Tender Offer expired on September 23, 2022. As of December 31, 2022, the Q3 2022 Tender Offer has been fully paid.
F-31
STAR MOUNTAIN LOWER MIDDLE-MARKET CAPITAL CORP.
Notes to Financial Statements – (continued)
The following table summarizes shares of common stock purchased during the year ended December 31, 2022:
|
Quarter Ended
|
Payment Date
|
Shares of Common Stock
|
Dollar Amount
|
|||||||
|
September 30, 2022
|
November 15, 2022
|
99,486
|
$
|
2,564,753
|
||||||
The Company’s distributions are recorded on the record date. For the year ended December 31, 2022, distributions declared to Stockholders totaled $10,682,401 of which $3,601,431 was paid as a cash distribution and $2,729,890 was paid in
the form of 107,228 shares of the Company’s common stock issued to existing Stockholders. Subsequent to December 31, 2022, distributions of $2,169,650 will be paid out in cash and $2,181,430 will be paid in the form of 86,086 shares of
Company's common stock issued to existing shareholders. Distribution payments have been made in accordance with Stockholders DRP payment election as disclosed in Note 2.
The following table summarizes the settlement of distributions declared and recorded as of December 31, 2022 and for the year ended December
31, 2022 and the subsequent payment and issuance of those distributions for the year ended December 31, 2022:
|
Date Declared
|
Record Date
|
Payment/Issuance Date
|
Amount Per Share
|
Amount Paid
in Cash
|
Amount Settled via
Newly Issued Shares
|
Total
|
||||||||||||||
|
Year ended December 31, 2022
|
||||||||||||||||||||
|
May 18, 2022
|
May 18, 2022
|
May 20, 2022
|
$
|
0.30
|
$
|
626,388
|
$
|
560,883
|
$
|
1,187,271
|
||||||||||
|
June 30, 2022
|
June 30, 2022
|
July 29, 2022
|
0.57
|
1,346,329
|
921,955
|
2,268,284
|
||||||||||||||
|
October 4, 2022
|
October 4, 2022
|
November 4, 2022
|
0.66
|
1,628,714
|
1,247,052
|
2,875,766
|
||||||||||||||
|
December 31, 2022
|
December 31, 2022
|
January 26, 2023
|
0.66
|
2,169,650
|
2,181,430
|
4,351,080
|
||||||||||||||
|
Total
|
$
|
2.19
|
$
|
5,771,081
|
$
|
4,911,320
|
$
|
10,682,401
|
||||||||||||
As of December 31, 2022, $4,351,080 of distributions declared and recorded remained payable as shown in distributions payable on the Statements of Assets and Liabilities. As of December 31, 2022, $3,345,327 of
distributions as shown in stock issued in connection with dividend reinvestment plan on the Statements of Changes in Net Assets includes the effect of distributions payable as of December 31, 2021.
The following table summarizes the settlement of distributions declared and recorded as of December 31, 2021 and for the period from May 14, 2021 to December 31, 2021 and the subsequent payment and issuance of those distributions for the period from May 14, 2021 to December 31, 2021:
|
Date Declared
|
Record Date
|
Payment/Issuance Date
|
Amount Per Share
|
Amount Paid in Cash
|
Amount Settled via Newly Issued Shares
|
Total
|
||||||||||||||
|
Period from May 14, 2021* to December 31, 2021:
|
||||||||||||||||||||
|
August 10, 2021
|
August 10, 2021
|
August 20, 2021
|
$
|
0.13
|
$
|
568
|
$
|
300,751
|
$
|
301,319
|
||||||||||
|
November 10, 2021
|
November 10, 2021
|
November 19, 2021
|
0.18
|
318,225
|
145,175
|
463,400
|
||||||||||||||
|
December 31, 2021
|
December 31, 2021
|
January 14, 2022
|
0.46
|
662,190
|
615,437
|
1,277,627
|
||||||||||||||
|
Total
|
$
|
0.77
|
$
|
980,983
|
$
|
1,061,363
|
$
|
2,042,346
|
||||||||||||
|
*
|
Date of Formation of the Company.
|
On November 29, 2021 the Company redeemed 543,025 shares of common stock, representing an aggregate value of $13,923,154.
F-32
STAR MOUNTAIN LOWER MIDDLE-MARKET CAPITAL CORP.
Notes to Financial Statements – (continued)
Note 11. Commitments, Contingencies, and Risks
Commitments: As of December 31, 2022 and December 31, 2021, the Company had $25,345,245 and $516,521, respectively, in outstanding
commitments to direct investments. As of December 31, 2022 the Company had $1,105,362 in outstanding commitments to fund investments.
|
December 31, 2022
|
Outstanding
Commitments
|
|||
|
Direct Investments
|
||||
|
Gridsource Incorporated, LLC
|
$
|
4,166,667
|
||
|
PPC Event Services, Inc.
|
3,159,041
|
|||
|
Rock Gate Capital, LLC (dba 160 Driving Academy)
|
1,296,848
|
|||
|
TCP Acquisition, LLC
|
10,000,000
|
|||
|
The Range NYC, LLC (dba Five Iron Golf)
|
6,722,689
|
|||
|
Total Direct Investments
|
$
|
25,345,245
|
||
|
Fund Investments
|
||||
|
Madryn Select Opportunities, LP
|
$
|
1,105,362
|
||
|
Total Fund Investments
|
$
|
1,105,362
|
||
|
Total
|
$
|
26,450,607
|
||
|
December 31, 2021
|
Outstanding
Commitments
|
|||
|
Direct Investments
|
||||
|
Rock Gate Capital, LLC (dba 160 Driving Academy)
|
$
|
516,521
|
||
|
Total Direct Investments
|
$
|
516,521
|
||
Management believes that the Company’s available cash balances provide sufficient funds to cover its unfunded commitments as of December 31, 2022 and December 31, 2021.
Indemnifications: In the normal course of business, the Company enters into contracts and agreements that contain a variety of representations and warranties that
provide general indemnification. The Company’s maximum exposure under these agreements is unknown, as these involve future claims that may be made against the Company but that have not occurred. The Company expects the risk of any future
obligations under these indemnification provisions to be remote.
Legal proceedings: In the normal course of business, the Company may be subject to legal and regulatory proceedings that are generally incidental to its ongoing
operations. While there can be no assurance of the ultimate disposition of any such proceedings, the Company is not currently aware of any such proceedings or disposition that would have a material adverse effect on the Company’s financial
statements.
Concentration of credit and counterparty risk: Credit risk arises primarily from the potential inability of counterparties to perform in accordance with the terms of the
contract. In the event that the counterparties do not fulfill their obligations, the Company may be exposed to risk. The risk of default depends on the creditworthiness of the counterparties or issuers of the instruments. It is the Company’s
policy to review, as necessary, the credit standing of each counterparty.
F-33
STAR MOUNTAIN LOWER MIDDLE-MARKET CAPITAL CORP.
Notes to Financial Statements – (continued)
Note 12. Financial Highlights
The following is a schedule of financial highlights for the year ended December 31, 2022 and for the period from May 14, 2021 to December 31, 2021:
|
For the year ended
December 31, 2022
|
For the period
May 14, 2021* to
December 31, 2021
|
|||||||
|
Per share data:
|
||||||||
|
Net asset value at beginning of period
|
$
|
25.26
|
$
|
25.00
|
||||
|
Net investment income (loss) (1)
|
2.47
|
0.80
|
||||||
|
Net realized and unrealized gain (loss) (1)
|
(0.18
|
)
|
0.12
|
|||||
|
Net increase (decrease) in net assets resulting from operations (1)
|
2.29
|
0.92
|
||||||
|
Stockholder distributions (2)
|
(1.20
|
)
|
(0.36
|
)
|
||||
|
Dividend reinvestment plan distributions (2)
|
(0.99
|
)
|
(0.41
|
)
|
||||
|
Other (3)
|
(0.15
|
)
|
0.11
|
|||||
|
Net asset value at end of period
|
$
|
25.21
|
$
|
25.26
|
||||
|
Net assets at end of period
|
$
|
166,216,773
|
$
|
70,162,127
|
||||
|
Shares outstanding at end of period
|
6,592,546
|
2,777,449
|
||||||
|
Total return (4)
|
5.91
|
%
|
4.13
|
%
|
||||
|
Ratio/Supplemental data:
|
||||||||
|
Ratio of expenses to average net assets before incentive fees and waivers(5)
|
10.53
|
%
|
5.92
|
%
|
||||
|
Ratio of expenses to average net assets after incentive fees and before waivers(5)
|
12.30
|
%
|
6.28
|
%
|
||||
|
Ratio of expenses to average net assets after incentive fees and waivers (5)
|
10.08
|
%
|
6.28
|
%
|
||||
|
Ratio of net investment income (loss) to average net assets before incentive fees and waivers(5)
|
9.23
|
%
|
5.41
|
%
|
||||
|
Ratio of net investment income (loss) to average net assets after incentive fees and before waivers(5)
|
7.47
|
%
|
5.05
|
%
|
||||
|
Ratio of net investment income (loss) to average net assets after incentive fees and waivers(5)
|
9.68
|
%
|
5.05
|
%
|
||||
|
Portfolio turnover (6)
|
5.17
|
%
|
4.22
|
%
|
||||
|
*
|
Date of Formation of the Company.
|
| (1) |
The per share data was derived by using the weighted average shares outstanding during the period presented.
|
| (2) |
Management monitors available taxable earnings, including net investment income and realized capital gains, to determine if a tax return of capital may occur for the year. To the extent the Company’s taxable earnings fall below the
total amount of the Company’s distributions for that fiscal year, a portion of those distributions may be deemed a tax return of capital to the Company’s stockholders. The tax character of distributions was ordinary income for the
year ended December 31, 2022.
|
| (3) |
Includes the impact of different share amounts used in calculating per share data as a result of calculating certain per share data based on weighted average shares outstanding during the period and certain per share data based on
shares outstanding as of a period end or transaction date.
|
| (4) |
Total return is calculated as the change in NAV per share during the period, divided by the beginning NAV per share and assumes reinvestment of dividends at NAV. Total return is not annualized.
|
| (5) |
Ratios are annualized for periods less than one year. To the extent incentive fees are included within the ratio, they are not annualized.
|
|
(6)
|
Ratio is not annualized.
|
F-34
STAR MOUNTAIN LOWER MIDDLE-MARKET CAPITAL CORP.
Notes to Financial Statements – (continued)
13. Subsequent Events
The Company has evaluated subsequent events through March 31, 2023, the date on which the financial statements were issued.
On December 31, 2022 the Company declared a dividend of $0.66 per share with a record date of December 31, 2022 to be paid in the form of cash and shares on January 26, 2023, the distribution payment date. On
January 26, 2023 the Company paid a total distribution of $4,351,080, of which $2,169,650 was paid in cash and $2,181,430 in the form of 86,086 shares.
Pursuant to a capital drawdown notice to its investors, the Company issued and sold 803,600.47 shares of the Company’s common stock, par value $0.001 per share, on March 21, 2023, for an aggregate offering
price of $20,339,128.
On December 15, 2022 the Company commenced a tender offer pursuant to which the Company offered to repurchase up to 108,930.54 shares of common stock for $2,746,139 from Shareholders at a Purchase Price of
$25.21, which represented 2.5% of the Company’s shares outstanding as of September 30, 2022. Stockholders who tendered shares of common stock in the tender offer received, at the expiration, a non-interest bearing, non-transferable promissory
note entitling such Stockholders to an amount in cash equal to the number of shares of common stock accepted for purchase multiplied by the Purchase Price. The tender offer expired on January 16, 2023. On March 16, 2023, the Company paid such
stockholders a total of $2,746,139 representing the amount under the promissory notes.
None.
Pursuant to the requirements of Section 13 or 15(d) of the Securities Exchange Act of 1934, the registrant has duly caused this report to be signed on its behalf by the undersigned, thereunto duly authorized.
|
Date: March 31, 2023
|
Star Mountain Lower Middle-Market Capital Corp.
|
|||
|
By:
|
/s/
|
Brett A. Hickey
|
||
|
Name:
|
Brett A. Hickey
|
|||
|
Title:
|
Chief Executive Officer and President
|
|||
|
Date: March 31, 2023
|
By:
|
/s/
|
Christopher J. Gimbert | |
|
Name:
|
Christopher J. Gimbert
|
|||
|
Title:
|
Chief Financial Officer
|
Pursuant to the requirements of the Securities Exchange Act of 1934, this Annual Report on Form 10-K has been signed below by the following persons on behalf of the registrant and in the following capacities on
March 31, 2023.
|
By:
|
/s/
|
Brett A. Hickey
|
||
|
Name:
|
Brett A. Hickey
|
|||
|
Title:
|
Chief Executive Officer, President and Director
|
|
By:
|
/s/
|
Christopher J. Gimbert | ||
|
Name:
|
Christopher J. Gimbert
|
|||
|
Title:
|
Chief Financial Officer
|
|
By:
|
/s/
|
Stephen B. Paras | ||
|
Name:
|
Stephen B. Paras | |||
|
Title:
|
Director |
|
By:
|
/s/
|
Jeffrey Rogers | ||
|
Name:
|
Jeffrey Rogers | |||
|
Title:
|
Director |
|
By:
|
/s/
|
O. James Sterling | ||
|
Name:
|
O. James Sterling | |||
|
Title:
|
Director |
|
By:
|
/s/
|
David S. Kimmel | ||
|
Name:
|
David S. Kimmel | |||
|
Title:
|
Director |
55