EFFECTIVE MATURITY DIVERSIFICATION
(% of Fund's net assets)
|
||
|
Days
|
||
1-7
|
||
8-30
|
||
31-60
|
||
61-90
|
||
91-180
|
||
|
|
||
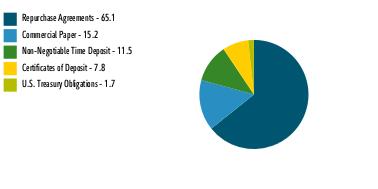
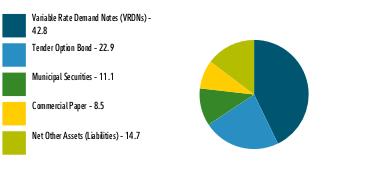
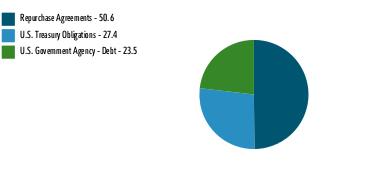
ASSET ALLOCATION (% of Fund's net assets)
|
|
Net Other Assets (Liabilities) - (1.3)%
|
UNITED STATES
SECURITIES AND EXCHANGE COMMISSION
Washington, D.C. 20549
FORM N-CSR
CERTIFIED SHAREHOLDER REPORT OF REGISTERED
MANAGEMENT INVESTMENT COMPANIES
Investment Company Act file number 811-03320
Fidelity Colchester Street Trust
(Exact name of registrant as specified in charter)
245 Summer St., Boston, MA 02210
(Address of principal executive offices) (Zip code)
Nicole Macarchuk, Secretary
245 Summer St.
Boston, Massachusetts 02210
(Name and address of agent for service)
Registrant's telephone number, including area code:
617-563-7000
Date of fiscal year end: | March 31 |
Date of reporting period: | September 30, 2024 |
Item 1.
Reports to Stockholders
SEMI-ANNUAL SHAREHOLDER REPORT | AS OF
|
||
|
|
||
Costs of a $10,000 investment
|
Costs paid as a percentage of a $10,000 investment
|
||
Select Class
|
$
|
KEY FACTS
|
||
Fund Size
|
$
|
|
Number of Holdings
|
EFFECTIVE MATURITY DIVERSIFICATION
(% of Fund's net assets)
|
||
|
Days
|
||
1-7
|
||
8-30
|
||
31-60
|
||
61-90
|
||
91-180
|
||
|
|
||
ASSET ALLOCATION (% of Fund's net assets)
|
|
|
Net Other Assets (Liabilities) - (1.3)%
|
Fidelity, the Fidelity Investments Logo and all other Fidelity trademarks or service marks used herein are trademarks or service marks of FMR LLC. Any third-party marks that are used herein are trademarks or service marks of their respective owners. © 2024 FMR LLC. All rights reserved.
|
||
 |
For additional information about the Fund; including its prospectus, financial information, holdings and proxy information, scan the QR code or visit fundresearch.fidelity.com/prospectus/sec
1.9914592.100 931-TSRS-1124
|
|
SEMI-ANNUAL SHAREHOLDER REPORT | AS OF
|
||
|
|
||
Costs of a $10,000 investment
|
Costs paid as a percentage of a $10,000 investment
|
||
Institutional Class
|
$
|
KEY FACTS
|
||
Fund Size
|
$
|
|
Number of Holdings
|
EFFECTIVE MATURITY DIVERSIFICATION
(% of Fund's net assets)
|
||
|
Days
|
||
1-7
|
||
8-30
|
||
31-60
|
||
61-90
|
||
91-180
|
||
>180
|
||
|
|
||
ASSET ALLOCATION (% of Fund's net assets)
|
|
Net Other Assets (Liabilities) - (6.5)%
|
Fidelity, the Fidelity Investments Logo and all other Fidelity trademarks or service marks used herein are trademarks or service marks of FMR LLC. Any third-party marks that are used herein are trademarks or service marks of their respective owners. © 2024 FMR LLC. All rights reserved.
|
||
 |
For additional information about the Fund; including its prospectus, financial information, holdings and proxy information, scan the QR code or visit fundresearch.fidelity.com/prospectus/sec
1.9914606.100 2643-TSRS-1124
|
|
SEMI-ANNUAL SHAREHOLDER REPORT | AS OF
|
||
|
|
||
Costs of a $10,000 investment
|
Costs paid as a percentage of a $10,000 investment
|
||
Class III
|
$
|
KEY FACTS
|
||
Fund Size
|
$
|
|
Number of Holdings
|
EFFECTIVE MATURITY DIVERSIFICATION
(% of Fund's net assets)
|
||
|
Days
|
||
1-7
|
||
8-30
|
||
31-60
|
||
61-90
|
||
91-180
|
||
>180
|
||
|
|
||
ASSET ALLOCATION (% of Fund's net assets)
|
|
Net Other Assets (Liabilities) - (1.6)%
|
Fidelity, the Fidelity Investments Logo and all other Fidelity trademarks or service marks used herein are trademarks or service marks of FMR LLC. Any third-party marks that are used herein are trademarks or service marks of their respective owners. © 2024 FMR LLC. All rights reserved.
|
||
 |
For additional information about the Fund; including its prospectus, financial information, holdings and proxy information, scan the QR code or visit fundresearch.fidelity.com/prospectus/sec
1.9914615.100 696-TSRS-1124
|
|
SEMI-ANNUAL SHAREHOLDER REPORT | AS OF
|
||
|
|
||
Costs of a $10,000 investment
|
Costs paid as a percentage of a $10,000 investment
|
||
Class III
|
$
|
KEY FACTS
|
||
Fund Size
|
$
|
|
Number of Holdings
|
EFFECTIVE MATURITY DIVERSIFICATION
(% of Fund's net assets)
|
||
|
Days
|
||
1-7
|
||
8-30
|
||
31-60
|
||
61-90
|
||
91-180
|
||
>180
|
||
|
|
||
ASSET ALLOCATION (% of Fund's net assets)
|
|
Fidelity, the Fidelity Investments Logo and all other Fidelity trademarks or service marks used herein are trademarks or service marks of FMR LLC. Any third-party marks that are used herein are trademarks or service marks of their respective owners. © 2024 FMR LLC. All rights reserved.
|
||
 |
For additional information about the Fund; including its prospectus, financial information, holdings and proxy information, scan the QR code or visit fundresearch.fidelity.com/prospectus/sec
1.9914581.100 684-TSRS-1124
|
|
SEMI-ANNUAL SHAREHOLDER REPORT | AS OF
|
||
|
|
||
Costs of a $10,000 investment
|
Costs paid as a percentage of a $10,000 investment
|
||
Class IV
|
$
|
KEY FACTS
|
||
Fund Size
|
$
|
|
Number of Holdings
|
EFFECTIVE MATURITY DIVERSIFICATION
(% of Fund's net assets)
|
||
|
Days
|
||
1-7
|
||
8-30
|
||
31-60
|
||
61-90
|
||
91-180
|
||
>180
|
||
|
|
||
ASSET ALLOCATION (% of Fund's net assets)
|
|
|
Net Other Assets (Liabilities) - (1.6)%
|
Fidelity, the Fidelity Investments Logo and all other Fidelity trademarks or service marks used herein are trademarks or service marks of FMR LLC. Any third-party marks that are used herein are trademarks or service marks of their respective owners. © 2024 FMR LLC. All rights reserved.
|
||
 |
For additional information about the Fund; including its prospectus, financial information, holdings and proxy information, scan the QR code or visit fundresearch.fidelity.com/prospectus/sec
1.9914611.100 2016-TSRS-1124
|
|
SEMI-ANNUAL SHAREHOLDER REPORT | AS OF
|
||
|
|
||
Costs of a $10,000 investment
|
Costs paid as a percentage of a $10,000 investment
|
||
Select Class
|
$
|
KEY FACTS
|
||
Fund Size
|
$
|
|
Number of Holdings
|
EFFECTIVE MATURITY DIVERSIFICATION
(% of Fund's net assets)
|
||
|
Days
|
||
1-7
|
||
8-30
|
||
31-60
|
||
61-90
|
||
91-180
|
||
>180
|
||
|
|
||
ASSET ALLOCATION (% of Fund's net assets)
|
|
|
Fidelity, the Fidelity Investments Logo and all other Fidelity trademarks or service marks used herein are trademarks or service marks of FMR LLC. Any third-party marks that are used herein are trademarks or service marks of their respective owners. © 2024 FMR LLC. All rights reserved.
|
||
 |
For additional information about the Fund; including its prospectus, financial information, holdings and proxy information, scan the QR code or visit fundresearch.fidelity.com/prospectus/sec
1.9914582.100 938-TSRS-1124
|
|
SEMI-ANNUAL SHAREHOLDER REPORT | AS OF
|
||
|
|
||
Costs of a $10,000 investment
|
Costs paid as a percentage of a $10,000 investment
|
||
Class II
|
$
|
KEY FACTS
|
||
Fund Size
|
$
|
|
Number of Holdings
|
EFFECTIVE MATURITY DIVERSIFICATION
(% of Fund's net assets)
|
||
|
Days
|
||
1-7
|
||
8-30
|
||
31-60
|
||
61-90
|
||
91-180
|
||
>180
|
||
|
|
||
ASSET ALLOCATION (% of Fund's net assets)
|
|
|
Net Other Assets (Liabilities) - (1.6)%
|
Fidelity, the Fidelity Investments Logo and all other Fidelity trademarks or service marks used herein are trademarks or service marks of FMR LLC. Any third-party marks that are used herein are trademarks or service marks of their respective owners. © 2024 FMR LLC. All rights reserved.
|
||
 |
For additional information about the Fund; including its prospectus, financial information, holdings and proxy information, scan the QR code or visit fundresearch.fidelity.com/prospectus/sec
1.9914613.100 600-TSRS-1124
|
|
SEMI-ANNUAL SHAREHOLDER REPORT | AS OF
|
||
|
|
||
Costs of a $10,000 investment
|
Costs paid as a percentage of a $10,000 investment
|
||
Class II
|
$
|
KEY FACTS
|
||
Fund Size
|
$
|
|
Number of Holdings
|
EFFECTIVE MATURITY DIVERSIFICATION
(% of Fund's net assets)
|
||
|
Days
|
||
1-7
|
||
8-30
|
||
31-60
|
||
61-90
|
||
91-180
|
||
>180
|
||
|
|
||
ASSET ALLOCATION (% of Fund's net assets)
|
|
Net Other Assets (Liabilities) - (1.5)%
|
Fidelity, the Fidelity Investments Logo and all other Fidelity trademarks or service marks used herein are trademarks or service marks of FMR LLC. Any third-party marks that are used herein are trademarks or service marks of their respective owners. © 2024 FMR LLC. All rights reserved.
|
||
 |
For additional information about the Fund; including its prospectus, financial information, holdings and proxy information, scan the QR code or visit fundresearch.fidelity.com/prospectus/sec
1.9914585.100 604-TSRS-1124
|
|
SEMI-ANNUAL SHAREHOLDER REPORT | AS OF
|
||
|
|
||
Costs of a $10,000 investment
|
Costs paid as a percentage of a $10,000 investment
|
||
Select Class
|
$
|
KEY FACTS
|
||
Fund Size
|
$
|
|
Number of Holdings
|
EFFECTIVE MATURITY DIVERSIFICATION
(% of Fund's net assets)
|
||
|
Days
|
||
1-7
|
||
8-30
|
||
31-60
|
||
61-90
|
||
91-180
|
||
>180
|
||
|
|
||
ASSET ALLOCATION (% of Fund's net assets)
|
|
|
Net Other Assets (Liabilities) - (6.5)%
|
Fidelity, the Fidelity Investments Logo and all other Fidelity trademarks or service marks used herein are trademarks or service marks of FMR LLC. Any third-party marks that are used herein are trademarks or service marks of their respective owners. © 2024 FMR LLC. All rights reserved.
|
||
 |
For additional information about the Fund; including its prospectus, financial information, holdings and proxy information, scan the QR code or visit fundresearch.fidelity.com/prospectus/sec
1.9914610.100 906-TSRS-1124
|
|
SEMI-ANNUAL SHAREHOLDER REPORT | AS OF
|
||
|
|
||
Costs of a $10,000 investment
|
Costs paid as a percentage of a $10,000 investment
|
||
Institutional Class
|
$
|
KEY FACTS
|
||
Fund Size
|
$
|
|
Number of Holdings
|
EFFECTIVE MATURITY DIVERSIFICATION
(% of Fund's net assets)
|
||
|
Days
|
||
1-7
|
||
8-30
|
||
31-60
|
||
61-90
|
||
91-180
|
||
>180
|
||
|
|
||
ASSET ALLOCATION (% of Fund's net assets)
|
|
|
Net Other Assets (Liabilities) - (1.6)%
|
Fidelity, the Fidelity Investments Logo and all other Fidelity trademarks or service marks used herein are trademarks or service marks of FMR LLC. Any third-party marks that are used herein are trademarks or service marks of their respective owners. © 2024 FMR LLC. All rights reserved.
|
||
 |
For additional information about the Fund; including its prospectus, financial information, holdings and proxy information, scan the QR code or visit fundresearch.fidelity.com/prospectus/sec
1.9914612.100 2644-TSRS-1124
|
|
SEMI-ANNUAL SHAREHOLDER REPORT | AS OF
|
||
|
|
||
Costs of a $10,000 investment
|
Costs paid as a percentage of a $10,000 investment
|
||
Select Class
|
$
|
KEY FACTS
|
||
Fund Size
|
$
|
|
Number of Holdings
|
EFFECTIVE MATURITY DIVERSIFICATION
(% of Fund's net assets)
|
||
|
Days
|
||
1-7
|
||
8-30
|
||
31-60
|
||
61-90
|
||
91-180
|
||
>180
|
||
|
|
||
ASSET ALLOCATION (% of Fund's net assets)
|
|
|
Net Other Assets (Liabilities) - (1.6)%
|
Fidelity, the Fidelity Investments Logo and all other Fidelity trademarks or service marks used herein are trademarks or service marks of FMR LLC. Any third-party marks that are used herein are trademarks or service marks of their respective owners. © 2024 FMR LLC. All rights reserved.
|
||
 |
For additional information about the Fund; including its prospectus, financial information, holdings and proxy information, scan the QR code or visit fundresearch.fidelity.com/prospectus/sec
1.9914616.100 911-TSRS-1124
|
|
SEMI-ANNUAL SHAREHOLDER REPORT | AS OF
|
||
|
|
||
Costs of a $10,000 investment
|
Costs paid as a percentage of a $10,000 investment
|
||
Class II
|
$
|
KEY FACTS
|
||
Fund Size
|
$
|
|
Number of Holdings
|
EFFECTIVE MATURITY DIVERSIFICATION
(% of Fund's net assets)
|
||
|
Days
|
||
1-7
|
||
8-30
|
||
31-60
|
||
61-90
|
||
91-180
|
||
>180
|
||
|
|
||
ASSET ALLOCATION (% of Fund's net assets)
|
|
|
Fidelity, the Fidelity Investments Logo and all other Fidelity trademarks or service marks used herein are trademarks or service marks of FMR LLC. Any third-party marks that are used herein are trademarks or service marks of their respective owners. © 2024 FMR LLC. All rights reserved.
|
||
 |
For additional information about the Fund; including its prospectus, financial information, holdings and proxy information, scan the QR code or visit fundresearch.fidelity.com/prospectus/sec
1.9914579.100 544-TSRS-1124
|
|
SEMI-ANNUAL SHAREHOLDER REPORT | AS OF
|
||
|
|
||
Costs of a $10,000 investment
|
Costs paid as a percentage of a $10,000 investment
|
||
Select Class
|
$
|
KEY FACTS
|
||
Fund Size
|
$
|
|
Number of Holdings
|
EFFECTIVE MATURITY DIVERSIFICATION
(% of Fund's net assets)
|
||
|
Days
|
||
1-7
|
||
8-30
|
||
31-60
|
||
61-90
|
||
91-180
|
||
>180
|
||
|
|
||
ASSET ALLOCATION (% of Fund's net assets)
|
|
|
Net Other Assets (Liabilities) - (1.5)%
|
Fidelity, the Fidelity Investments Logo and all other Fidelity trademarks or service marks used herein are trademarks or service marks of FMR LLC. Any third-party marks that are used herein are trademarks or service marks of their respective owners. © 2024 FMR LLC. All rights reserved.
|
||
 |
For additional information about the Fund; including its prospectus, financial information, holdings and proxy information, scan the QR code or visit fundresearch.fidelity.com/prospectus/sec
1.9914587.100 918-TSRS-1124
|
|
SEMI-ANNUAL SHAREHOLDER REPORT | AS OF
|
||
|
|
||
Costs of a $10,000 investment
|
Costs paid as a percentage of a $10,000 investment
|
||
Institutional Class
|
$
|
KEY FACTS
|
||
Fund Size
|
$
|
|
Number of Holdings
|
EFFECTIVE MATURITY DIVERSIFICATION
(% of Fund's net assets)
|
||
|
Days
|
||
1-7
|
||
8-30
|
||
31-60
|
||
61-90
|
||
91-180
|
||
>180
|
||
|
|
||
ASSET ALLOCATION (% of Fund's net assets)
|
|
|
Net Other Assets (Liabilities) - (1.5)%
|
Fidelity, the Fidelity Investments Logo and all other Fidelity trademarks or service marks used herein are trademarks or service marks of FMR LLC. Any third-party marks that are used herein are trademarks or service marks of their respective owners. © 2024 FMR LLC. All rights reserved.
|
||
 |
For additional information about the Fund; including its prospectus, financial information, holdings and proxy information, scan the QR code or visit fundresearch.fidelity.com/prospectus/sec
1.9914583.100 2642-TSRS-1124
|
|
SEMI-ANNUAL SHAREHOLDER REPORT | AS OF
|
||
|
|
||
Costs of a $10,000 investment
|
Costs paid as a percentage of a $10,000 investment
|
||
Class IV
|
$
|
KEY FACTS
|
||
Fund Size
|
$
|
|
Number of Holdings
|
EFFECTIVE MATURITY DIVERSIFICATION
(% of Fund's net assets)
|
||
|
Days
|
||
1-7
|
||
8-30
|
||
31-60
|
||
61-90
|
||
91-180
|
||
>180
|
||
|
|
||
ASSET ALLOCATION (% of Fund's net assets)
|
|
|
Net Other Assets (Liabilities) - (6.5)%
|
Fidelity, the Fidelity Investments Logo and all other Fidelity trademarks or service marks used herein are trademarks or service marks of FMR LLC. Any third-party marks that are used herein are trademarks or service marks of their respective owners. © 2024 FMR LLC. All rights reserved.
|
||
 |
For additional information about the Fund; including its prospectus, financial information, holdings and proxy information, scan the QR code or visit fundresearch.fidelity.com/prospectus/sec
1.9914605.100 2017-TSRS-1124
|
|
SEMI-ANNUAL SHAREHOLDER REPORT | AS OF
|
||
|
|
||
Costs of a $10,000 investment
|
Costs paid as a percentage of a $10,000 investment
|
||
Class I
|
$
|
KEY FACTS
|
||
Fund Size
|
$
|
|
Number of Holdings
|
EFFECTIVE MATURITY DIVERSIFICATION
(% of Fund's net assets)
|
||
|
Days
|
||
1-7
|
||
8-30
|
||
31-60
|
||
61-90
|
||
91-180
|
||
>180
|
||
|
|
||
ASSET ALLOCATION (% of Fund's net assets)
|
|
|
Fidelity, the Fidelity Investments Logo and all other Fidelity trademarks or service marks used herein are trademarks or service marks of FMR LLC. Any third-party marks that are used herein are trademarks or service marks of their respective owners. © 2024 FMR LLC. All rights reserved.
|
||
 |
For additional information about the Fund; including its prospectus, financial information, holdings and proxy information, scan the QR code or visit fundresearch.fidelity.com/prospectus/sec
1.9914580.100 56-TSRS-1124
|
|
SEMI-ANNUAL SHAREHOLDER REPORT | AS OF
|
||
|
|
||
Costs of a $10,000 investment
|
Costs paid as a percentage of a $10,000 investment
|
||
Class I
|
$
|
KEY FACTS
|
||
Fund Size
|
$
|
|
Number of Holdings
|
EFFECTIVE MATURITY DIVERSIFICATION
(% of Fund's net assets)
|
||
|
Days
|
||
1-7
|
||
8-30
|
||
31-60
|
||
61-90
|
||
91-180
|
||
|
|
||
ASSET ALLOCATION (% of Fund's net assets)
|
|
|
Net Other Assets (Liabilities) - (1.3)%
|
Fidelity, the Fidelity Investments Logo and all other Fidelity trademarks or service marks used herein are trademarks or service marks of FMR LLC. Any third-party marks that are used herein are trademarks or service marks of their respective owners. © 2024 FMR LLC. All rights reserved.
|
||
 |
For additional information about the Fund; including its prospectus, financial information, holdings and proxy information, scan the QR code or visit fundresearch.fidelity.com/prospectus/sec
1.9914590.100 59-TSRS-1124
|
|
SEMI-ANNUAL SHAREHOLDER REPORT | AS OF
|
||
|
|
||
Costs of a $10,000 investment
|
Costs paid as a percentage of a $10,000 investment
|
||
Class II
|
$
|
KEY FACTS
|
||
Fund Size
|
$
|
|
Number of Holdings
|
EFFECTIVE MATURITY DIVERSIFICATION
(% of Fund's net assets)
|
||
|
Days
|
||
1-7
|
||
8-30
|
||
31-60
|
||
61-90
|
||
91-180
|
||
|
|
||
ASSET ALLOCATION (% of Fund's net assets)
|
|
|
Net Other Assets (Liabilities) - (1.3)%
|
Fidelity, the Fidelity Investments Logo and all other Fidelity trademarks or service marks used herein are trademarks or service marks of FMR LLC. Any third-party marks that are used herein are trademarks or service marks of their respective owners. © 2024 FMR LLC. All rights reserved.
|
||
 |
For additional information about the Fund; including its prospectus, financial information, holdings and proxy information, scan the QR code or visit fundresearch.fidelity.com/prospectus/sec
1.9914589.100 541-TSRS-1124
|
|
SEMI-ANNUAL SHAREHOLDER REPORT | AS OF
|
||
|
|
||
Costs of a $10,000 investment
|
Costs paid as a percentage of a $10,000 investment
|
||
Class II
|
$
|
KEY FACTS
|
||
Fund Size
|
$
|
|
Number of Holdings
|
EFFECTIVE MATURITY DIVERSIFICATION
(% of Fund's net assets)
|
||
|
Days
|
||
1-7
|
||
8-30
|
||
31-60
|
||
61-90
|
||
91-180
|
||
>180
|
||
|
|
||
ASSET ALLOCATION (% of Fund's net assets)
|
|
|
Net Other Assets (Liabilities) - (6.5)%
|
Fidelity, the Fidelity Investments Logo and all other Fidelity trademarks or service marks used herein are trademarks or service marks of FMR LLC. Any third-party marks that are used herein are trademarks or service marks of their respective owners. © 2024 FMR LLC. All rights reserved.
|
||
 |
For additional information about the Fund; including its prospectus, financial information, holdings and proxy information, scan the QR code or visit fundresearch.fidelity.com/prospectus/sec
1.9914607.100 542-TSRS-1124
|
|
SEMI-ANNUAL SHAREHOLDER REPORT | AS OF
|
||
|
|
||
Costs of a $10,000 investment
|
Costs paid as a percentage of a $10,000 investment
|
||
Class III
|
$
|
KEY FACTS
|
||
Fund Size
|
$
|
|
Number of Holdings
|
EFFECTIVE MATURITY DIVERSIFICATION
(% of Fund's net assets)
|
||
|
Days
|
||
1-7
|
||
8-30
|
||
31-60
|
||
61-90
|
||
91-180
|
||
>180
|
||
|
|
||
ASSET ALLOCATION (% of Fund's net assets)
|
|
|
Net Other Assets (Liabilities) - (6.5)%
|
Fidelity, the Fidelity Investments Logo and all other Fidelity trademarks or service marks used herein are trademarks or service marks of FMR LLC. Any third-party marks that are used herein are trademarks or service marks of their respective owners. © 2024 FMR LLC. All rights reserved.
|
||
 |
For additional information about the Fund; including its prospectus, financial information, holdings and proxy information, scan the QR code or visit fundresearch.fidelity.com/prospectus/sec
1.9914608.100 543-TSRS-1124
|
|
SEMI-ANNUAL SHAREHOLDER REPORT | AS OF
|
||
|
|
||
Costs of a $10,000 investment
|
Costs paid as a percentage of a $10,000 investment
|
||
Class I
|
$
|
KEY FACTS
|
||
Fund Size
|
$
|
|
Number of Holdings
|
EFFECTIVE MATURITY DIVERSIFICATION
(% of Fund's net assets)
|
||
|
Days
|
||
1-7
|
||
8-30
|
||
31-60
|
||
61-90
|
||
91-180
|
||
>180
|
||
|
|
||
ASSET ALLOCATION (% of Fund's net assets)
|
|
|
Net Other Assets (Liabilities) - (1.5)%
|
Fidelity, the Fidelity Investments Logo and all other Fidelity trademarks or service marks used herein are trademarks or service marks of FMR LLC. Any third-party marks that are used herein are trademarks or service marks of their respective owners. © 2024 FMR LLC. All rights reserved.
|
||
 |
For additional information about the Fund; including its prospectus, financial information, holdings and proxy information, scan the QR code or visit fundresearch.fidelity.com/prospectus/sec
1.9914584.100 57-TSRS-1124
|
|
SEMI-ANNUAL SHAREHOLDER REPORT | AS OF
|
||
|
|
||
Costs of a $10,000 investment
|
Costs paid as a percentage of a $10,000 investment
|
||
Class I
|
$
|
KEY FACTS
|
||
Fund Size
|
$
|
|
Number of Holdings
|
EFFECTIVE MATURITY DIVERSIFICATION
(% of Fund's net assets)
|
||
|
Days
|
||
1-7
|
||
8-30
|
||
31-60
|
||
61-90
|
||
91-180
|
||
>180
|
||
|
|
||
ASSET ALLOCATION (% of Fund's net assets)
|
|
|
Net Other Assets (Liabilities) - (1.6)%
|
Fidelity, the Fidelity Investments Logo and all other Fidelity trademarks or service marks used herein are trademarks or service marks of FMR LLC. Any third-party marks that are used herein are trademarks or service marks of their respective owners. © 2024 FMR LLC. All rights reserved.
|
||
 |
For additional information about the Fund; including its prospectus, financial information, holdings and proxy information, scan the QR code or visit fundresearch.fidelity.com/prospectus/sec
1.9914614.100 695-TSRS-1124
|
|
SEMI-ANNUAL SHAREHOLDER REPORT | AS OF
|
||
|
|
||
Costs of a $10,000 investment
|
Costs paid as a percentage of a $10,000 investment
|
||
Institutional Class
|
$
|
KEY FACTS
|
||
Fund Size
|
$
|
|
Number of Holdings
|
EFFECTIVE MATURITY DIVERSIFICATION
(% of Fund's net assets)
|
||
|
Days
|
||
1-7
|
||
8-30
|
||
31-60
|
||
61-90
|
||
91-180
|
||
|
|
||
ASSET ALLOCATION (% of Fund's net assets)
|
|
|
Net Other Assets (Liabilities) - (1.3)%
|
Fidelity, the Fidelity Investments Logo and all other Fidelity trademarks or service marks used herein are trademarks or service marks of FMR LLC. Any third-party marks that are used herein are trademarks or service marks of their respective owners. © 2024 FMR LLC. All rights reserved.
|
||
 |
For additional information about the Fund; including its prospectus, financial information, holdings and proxy information, scan the QR code or visit fundresearch.fidelity.com/prospectus/sec
1.9914588.100 2013-TSRS-1124
|
|
SEMI-ANNUAL SHAREHOLDER REPORT | AS OF
|
||
|
|
||
Costs of a $10,000 investment
|
Costs paid as a percentage of a $10,000 investment
|
||
Class III
|
$
|
KEY FACTS
|
||
Fund Size
|
$
|
|
Number of Holdings
|
EFFECTIVE MATURITY DIVERSIFICATION
(% of Fund's net assets)
|
||
|
Days
|
||
1-7
|
||
8-30
|
||
31-60
|
||
61-90
|
||
91-180
|
||
|
|
||
ASSET ALLOCATION (% of Fund's net assets)
|
|
|
Net Other Assets (Liabilities) - (1.3)%
|
Fidelity, the Fidelity Investments Logo and all other Fidelity trademarks or service marks used herein are trademarks or service marks of FMR LLC. Any third-party marks that are used herein are trademarks or service marks of their respective owners. © 2024 FMR LLC. All rights reserved.
|
||
 |
For additional information about the Fund; including its prospectus, financial information, holdings and proxy information, scan the QR code or visit fundresearch.fidelity.com/prospectus/sec
1.9914591.100 659-TSRS-1124
|
|
SEMI-ANNUAL SHAREHOLDER REPORT | AS OF
|
||
|
|
||
Costs of a $10,000 investment
|
Costs paid as a percentage of a $10,000 investment
|
||
Class III
|
$
|
KEY FACTS
|
||
Fund Size
|
$
|
|
Number of Holdings
|
EFFECTIVE MATURITY DIVERSIFICATION
(% of Fund's net assets)
|
||
|
Days
|
||
1-7
|
||
8-30
|
||
31-60
|
||
61-90
|
||
91-180
|
||
>180
|
||
|
|
||
ASSET ALLOCATION (% of Fund's net assets)
|
|
|
Net Other Assets (Liabilities) - (1.5)%
|
Fidelity, the Fidelity Investments Logo and all other Fidelity trademarks or service marks used herein are trademarks or service marks of FMR LLC. Any third-party marks that are used herein are trademarks or service marks of their respective owners. © 2024 FMR LLC. All rights reserved.
|
||
 |
For additional information about the Fund; including its prospectus, financial information, holdings and proxy information, scan the QR code or visit fundresearch.fidelity.com/prospectus/sec
1.9914586.100 657-TSRS-1124
|
|
SEMI-ANNUAL SHAREHOLDER REPORT | AS OF
|
||
|
|
||
Costs of a $10,000 investment
|
Costs paid as a percentage of a $10,000 investment
|
||
Class I
|
$
|
KEY FACTS
|
||
Fund Size
|
$
|
|
Number of Holdings
|
EFFECTIVE MATURITY DIVERSIFICATION
(% of Fund's net assets)
|
||
|
Days
|
||
1-7
|
||
8-30
|
||
31-60
|
||
61-90
|
||
91-180
|
||
>180
|
||
|
|
||
ASSET ALLOCATION (% of Fund's net assets)
|
|
|
Net Other Assets (Liabilities) - (6.5)%
|
Fidelity, the Fidelity Investments Logo and all other Fidelity trademarks or service marks used herein are trademarks or service marks of FMR LLC. Any third-party marks that are used herein are trademarks or service marks of their respective owners. © 2024 FMR LLC. All rights reserved.
|
||
 |
For additional information about the Fund; including its prospectus, financial information, holdings and proxy information, scan the QR code or visit fundresearch.fidelity.com/prospectus/sec
1.9914609.100 680-TSRS-1124
|
|
Item 2.
Code of Ethics
Not applicable.
Item 3.
Audit Committee Financial Expert
Not applicable.
Item 4.
Principal Accountant Fees and Services
Not applicable.
Item 5.
Audit Committee of Listed Registrants
Not applicable.
Item 6.
Investments
(a)
Not applicable.
(b)
Not applicable
Item 7.
Financial Statements and Financial Highlights for Open-End Management Investment Companies


Contents
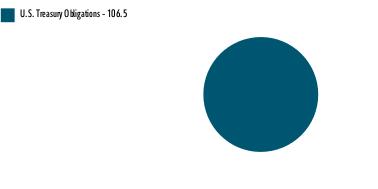
U.S. Treasury Debt - 106.5%
|
||||
Yield (%) (a)
|
Principal
Amount (b)
(000s)
|
Value ($)
(000s)
|
||
U.S. Treasury Inflation Protected Obligations - 0.9%
|
||||
U.S. Treasury Notes
|
||||
10/15/24
|
4.83 to 5.13
|
799,332
|
798,176
|
|
U.S. Treasury Obligations - 105.6%
|
||||
U.S. Treasury Bills
|
||||
10/1/24 to 4/3/25
|
4.31 to 5.36
|
85,638,384
|
85,146,813
|
|
U.S. Treasury Notes
|
||||
10/31/24 to 7/31/26 (c)(d)
|
4.73 to 4.84
|
7,359,000
|
7,357,829
|
|
TOTAL U.S. TREASURY OBLIGATIONS
|
92,504,642
|
|||
|
TOTAL U.S. TREASURY DEBT
(Cost $93,302,818)
|
93,302,818
|
|||
|
TOTAL INVESTMENT IN SECURITIES - 106.5%
(Cost $93,302,818)
|
93,302,818
|
NET OTHER ASSETS (LIABILITIES) - (6.5)%
|
(5,709,355)
|
NET ASSETS - 100.0%
|
87,593,463
|
(a)
|
Yield represents either the annualized yield at the date of purchase, or the stated coupon rate, or, for floating and adjustable rate securities, the rate at period end.
|
(b)
|
Amount is stated in United States dollars unless otherwise noted.
|
(c)
|
A coupon rate of 0% signifies an unsettled loan. The coupon rate will be determined upon settlement of the loan after period end.
|
(d)
|
Coupon is indexed to a floating interest rate which may be multiplied by a specified factor and/or subject to caps or floors.
|
Statement of Assets and Liabilities
|
||||
|
As of September 30, 2024 (Unaudited)
Amounts in thousands (except per-share amounts)
|
||||
Assets
|
||||
Investment in securities, at value - See accompanying schedule
Unaffiliated issuers (cost $93,302,818):
|
$
|
93,302,818
|
||
Cash
|
286,000
|
|||
Receivable for fund shares sold
|
359,763
|
|||
Interest receivable
|
67,313
|
|||
Prepaid expenses
|
100
|
|||
Receivable from investment adviser for expense reductions
|
3,045
|
|||
Other receivables
|
766
|
|||
Total assets
|
94,019,805
|
|||
Liabilities
|
||||
Payable for investments purchased
|
$
|
5,975,969
|
||
Payable for fund shares redeemed
|
312,508
|
|||
Distributions payable
|
120,665
|
|||
Accrued management fee
|
9,546
|
|||
Distribution and service plan fees payable
|
1,647
|
|||
Other affiliated payables
|
3,009
|
|||
Other payables and accrued expenses
|
2,998
|
|||
Total liabilities
|
6,426,342
|
|||
Net Assets
|
$
|
87,593,463
|
||
Net Assets consist of:
|
||||
Paid in capital
|
$
|
87,592,823
|
||
Total accumulated earnings (loss)
|
640
|
|||
Net Assets
|
$
|
87,593,463
|
||
Net Asset Value and Maximum Offering Price
|
||||
Class I :
|
||||
Net Asset Value, offering price and redemption price per share ($22,271,459 ÷ 22,268,307 shares)
|
$
|
1.00
|
||
Class II :
|
||||
Net Asset Value, offering price and redemption price per share ($2,576,910 ÷ 2,577,256 shares)
|
$
|
1.00
|
||
Class III :
|
||||
Net Asset Value, offering price and redemption price per share ($3,441,684 ÷ 3,441,085 shares)
|
$
|
1.00
|
||
Class IV :
|
||||
Net Asset Value, offering price and redemption price per share ($1,210,499 ÷ 1,210,425 shares)
|
$
|
1.00
|
||
Select Class :
|
||||
Net Asset Value, offering price and redemption price per share ($2,251,514 ÷ 2,251,640 shares)
|
$
|
1.00
|
||
Institutional Class :
|
||||
Net Asset Value, offering price and redemption price per share ($55,841,397 ÷ 55,841,952 shares)
|
$
|
1.00
|
||
Statement of Operations
|
||||
Six months ended September 30, 2024 (Unaudited)
Amounts in thousands
|
||||
Investment Income
|
||||
Interest
|
$
|
2,061,959
|
||
Expenses
|
||||
Management fee
|
$
|
54,025
|
||
Transfer agent fees
|
15,824
|
|||
Distribution and service plan fees
|
9,858
|
|||
Accounting fees and expenses
|
1,213
|
|||
Custodian fees and expenses
|
355
|
|||
Independent trustees' fees and expenses
|
95
|
|||
Registration fees
|
2,253
|
|||
Audit fees
|
24
|
|||
Legal
|
16
|
|||
Miscellaneous
|
94
|
|||
Total expenses before reductions
|
83,757
|
|||
Expense reductions
|
(13,941)
|
|||
Total expenses after reductions
|
69,816
|
|||
Net Investment income (loss)
|
1,992,143
|
|||
Realized and Unrealized Gain (Loss)
|
||||
Net realized gain (loss) on:
|
||||
Investment Securities:
|
||||
Unaffiliated issuers
|
172
|
|||
Total net realized gain (loss)
|
172
|
|||
Net increase in net assets resulting from operations
|
$
|
1,992,315
|
||
Statement of Changes in Net Assets
|
||||
Amount in thousands
|
Six months ended
September 30, 2024
(Unaudited)
|
Year ended
March 31, 2024
|
||
Increase (Decrease) in Net Assets
|
||||
Operations
|
||||
Net investment income (loss)
|
$
|
1,992,143
|
$
|
2,834,658
|
Net realized gain (loss)
|
172
|
1,179
|
||
Net increase in net assets resulting from operations
|
1,992,315
|
2,835,837
|
||
Distributions to shareholders
|
(1,991,614)
|
(2,834,993)
|
||
Share transactions - net increase (decrease)
|
14,735,172
|
21,241,300
|
||
Total increase (decrease) in net assets
|
14,735,873
|
21,242,144
|
||
Net Assets
|
||||
Beginning of period
|
72,857,590
|
51,615,446
|
||
End of period
|
$
|
87,593,463
|
$
|
72,857,590
|
Treasury Only Portfolio Class I |
Six months ended
(Unaudited) September 30, 2024
|
Years ended March 31, 2024
|
2023
|
2022
|
2021
|
2020
|
|||||||
Selected Per-Share Data
|
||||||||||||
Net asset value, beginning of period
|
$
|
1.00
|
$
|
1.00
|
$
|
1.00
|
$
|
1.00
|
$
|
1.00
|
$
|
1.00
|
Income from Investment Operations
|
||||||||||||
Net investment income (loss) A
|
.026
|
.050
|
.025
|
- B
|
- B
|
.018
|
||||||
Net realized and unrealized gain (loss) B
|
-
|
-
|
-
|
-
|
-
|
-
|
||||||
Total from investment operations
|
.026
|
.050
|
.025
|
- B
|
- B
|
.018
|
||||||
Distributions from net investment income
|
(.026)
|
(.050)
|
(.025)
|
- B
|
- B
|
(.018)
|
||||||
Distributions from net realized gain
|
-
|
-
|
-
|
- B
|
-
|
-
|
||||||
Total distributions
|
(.026)
|
(.050)
|
(.025)
|
- B
|
- B
|
(.018)
|
||||||
Net asset value, end of period
|
$
|
1.00
|
$
|
1.00
|
$
|
1.00
|
$
|
1.00
|
$
|
1.00
|
$
|
1.00
|
Total Return C,D
|
2.61 % |
5.14%
|
2.50%
|
.02%
|
.04%
|
1.80%
|
||||||
Ratios to Average Net Assets A,E,F
|
||||||||||||
Expenses before reductions
|
.21% G
|
.21%
|
.21%
|
.21%
|
.21%
|
.22%
|
||||||
Expenses net of fee waivers, if any
|
.18 % G |
.18%
|
.18%
|
.08%
|
.15%
|
.18%
|
||||||
Expenses net of all reductions
|
.18% G
|
.18%
|
.18%
|
.08%
|
.15%
|
.18%
|
||||||
Net investment income (loss)
|
5.15% G
|
5.04%
|
2.53%
|
.02%
|
.05%
|
1.72%
|
||||||
Supplemental Data
|
||||||||||||
Net assets, end of period (in millions)
|
$
|
22,271
|
$
|
18,071
|
$
|
14,612
|
$
|
12,146
|
$
|
10,871
|
$
|
15,058
|
Treasury Only Portfolio Class II |
Six months ended
(Unaudited) September 30, 2024
|
Years ended March 31, 2024
|
2023
|
2022
|
2021
|
2020
|
|||||||
Selected Per-Share Data
|
||||||||||||
Net asset value, beginning of period
|
$
|
1.00
|
$
|
1.00
|
$
|
1.00
|
$
|
1.00
|
$
|
1.00
|
$
|
1.00
|
Income from Investment Operations
|
||||||||||||
Net investment income (loss) A
|
.025
|
.049
|
.023
|
- B
|
- B
|
.016
|
||||||
Net realized and unrealized gain (loss) B
|
-
|
-
|
-
|
-
|
-
|
-
|
||||||
Total from investment operations
|
.025
|
.049
|
.023
|
- B
|
- B
|
.016
|
||||||
Distributions from net investment income
|
(.025)
|
(.049)
|
(.023)
|
- B
|
- B
|
(.016)
|
||||||
Distributions from net realized gain
|
-
|
-
|
-
|
- B
|
-
|
-
|
||||||
Total distributions
|
(.025)
|
(.049)
|
(.023)
|
- B
|
- B
|
(.016)
|
||||||
Net asset value, end of period
|
$
|
1.00
|
$
|
1.00
|
$
|
1.00
|
$
|
1.00
|
$
|
1.00
|
$
|
1.00
|
Total Return C,D
|
2.53 % |
4.98%
|
2.34%
|
.01%
|
.02%
|
1.65%
|
||||||
Ratios to Average Net Assets A,E,F
|
||||||||||||
Expenses before reductions
|
.36% G
|
.36%
|
.36%
|
.36%
|
.36%
|
.37%
|
||||||
Expenses net of fee waivers, if any
|
.33 % G |
.33%
|
.33%
|
.09%
|
.16%
|
.33%
|
||||||
Expenses net of all reductions
|
.33% G
|
.33%
|
.33%
|
.09%
|
.16%
|
.33%
|
||||||
Net investment income (loss)
|
5.00% G
|
4.89%
|
2.38%
|
.01%
|
.03%
|
1.57%
|
||||||
Supplemental Data
|
||||||||||||
Net assets, end of period (in millions)
|
$
|
2,577
|
$
|
2,726
|
$
|
2,196
|
$
|
1,126
|
$
|
943
|
$
|
830
|
Treasury Only Portfolio Class III |
Six months ended
(Unaudited) September 30, 2024
|
Years ended March 31, 2024
|
2023
|
2022
|
2021
|
2020
|
|||||||
Selected Per-Share Data
|
||||||||||||
Net asset value, beginning of period
|
$
|
1.00
|
$
|
1.00
|
$
|
1.00
|
$
|
1.00
|
$
|
1.00
|
$
|
1.00
|
Income from Investment Operations
|
||||||||||||
Net investment income (loss) A
|
.025
|
.048
|
.022
|
- B
|
- B
|
.015
|
||||||
Net realized and unrealized gain (loss) B
|
-
|
-
|
-
|
-
|
-
|
-
|
||||||
Total from investment operations
|
.025
|
.048
|
.022
|
- B
|
- B
|
.015
|
||||||
Distributions from net investment income
|
(.025)
|
(.048)
|
(.022)
|
- B
|
- B
|
(.015)
|
||||||
Distributions from net realized gain
|
-
|
-
|
-
|
- B
|
-
|
-
|
||||||
Total distributions
|
(.025)
|
(.048)
|
(.022)
|
- B
|
- B
|
(.015)
|
||||||
Net asset value, end of period
|
$
|
1.00
|
$
|
1.00
|
$
|
1.00
|
$
|
1.00
|
$
|
1.00
|
$
|
1.00
|
Total Return C,D
|
2.48 % |
4.87%
|
2.25%
|
.01%
|
.01%
|
1.54%
|
||||||
Ratios to Average Net Assets A,E,F
|
||||||||||||
Expenses before reductions
|
.46% G
|
.46%
|
.46%
|
.46%
|
.46%
|
.47%
|
||||||
Expenses net of fee waivers, if any
|
.43 % G |
.43%
|
.43%
|
.08%
|
.17%
|
.43%
|
||||||
Expenses net of all reductions
|
.43% G
|
.43%
|
.43%
|
.08%
|
.17%
|
.43%
|
||||||
Net investment income (loss)
|
4.90% G
|
4.79%
|
2.28%
|
.02%
|
.02%
|
1.47%
|
||||||
Supplemental Data
|
||||||||||||
Net assets, end of period (in millions)
|
$
|
3,442
|
$
|
2,928
|
$
|
2,484
|
$
|
1,155
|
$
|
1,349
|
$
|
824
|
Treasury Only Portfolio Class IV |
Six months ended
(Unaudited) September 30, 2024
|
Years ended March 31, 2024
|
2023
|
2022
|
2021
|
2020
|
|||||||
Selected Per-Share Data
|
||||||||||||
Net asset value, beginning of period
|
$
|
1.00
|
$
|
1.00
|
$
|
1.00
|
$
|
1.00
|
$
|
1.00
|
$
|
1.00
|
Income from Investment Operations
|
||||||||||||
Net investment income (loss) A
|
.023
|
.045
|
.020
|
- B
|
- B
|
.013
|
||||||
Net realized and unrealized gain (loss) B
|
-
|
-
|
-
|
-
|
-
|
-
|
||||||
Total from investment operations
|
.023
|
.045
|
.020
|
- B
|
- B
|
.013
|
||||||
Distributions from net investment income
|
(.023)
|
(.045)
|
(.020)
|
- B
|
- B
|
(.013)
|
||||||
Distributions from net realized gain
|
-
|
-
|
-
|
- B
|
-
|
-
|
||||||
Total distributions
|
(.023)
|
(.045)
|
(.020)
|
- B
|
- B
|
(.013)
|
||||||
Net asset value, end of period
|
$
|
1.00
|
$
|
1.00
|
$
|
1.00
|
$
|
1.00
|
$
|
1.00
|
$
|
1.00
|
Total Return C,D
|
2.35 % |
4.61%
|
2.02%
|
.01%
|
.01%
|
1.29%
|
||||||
Ratios to Average Net Assets A,E,F
|
||||||||||||
Expenses before reductions
|
.71% G
|
.71%
|
.71%
|
.71%
|
.71%
|
.72%
|
||||||
Expenses net of fee waivers, if any
|
.68 % G |
.68%
|
.66%
|
.08%
|
.17%
|
.68%
|
||||||
Expenses net of all reductions
|
.68% G
|
.68%
|
.66%
|
.08%
|
.17%
|
.68%
|
||||||
Net investment income (loss)
|
4.65% G
|
4.54%
|
2.05%
|
.01%
|
.02%
|
1.22%
|
||||||
Supplemental Data
|
||||||||||||
Net assets, end of period (in millions)
|
$
|
1,210
|
$
|
1,378
|
$
|
795
|
$
|
196
|
$
|
334
|
$
|
109
|
Treasury Only Portfolio Select Class |
Six months ended
(Unaudited) September 30, 2024
|
Years ended March 31, 2024
|
2023
|
2022
|
2021
|
2020
|
|||||||
Selected Per-Share Data
|
||||||||||||
Net asset value, beginning of period
|
$
|
1.00
|
$
|
1.00
|
$
|
1.00
|
$
|
1.00
|
$
|
1.00
|
$
|
1.00
|
Income from Investment Operations
|
||||||||||||
Net investment income (loss) A
|
.026
|
.050
|
.024
|
- B
|
- B
|
.017
|
||||||
Net realized and unrealized gain (loss) B
|
-
|
-
|
-
|
-
|
-
|
-
|
||||||
Total from investment operations
|
.026
|
.050
|
.024
|
- B
|
- B
|
.017
|
||||||
Distributions from net investment income
|
(.026)
|
(.050)
|
(.024)
|
- B
|
- B
|
(.017)
|
||||||
Distributions from net realized gain
|
-
|
-
|
-
|
- B
|
-
|
-
|
||||||
Total distributions
|
(.026)
|
(.050)
|
(.024)
|
- B
|
- B
|
(.017)
|
||||||
Net asset value, end of period
|
$
|
1.00
|
$
|
1.00
|
$
|
1.00
|
$
|
1.00
|
$
|
1.00
|
$
|
1.00
|
Total Return C,D
|
2.58 % |
5.08%
|
2.45%
|
.01%
|
.03%
|
1.75%
|
||||||
Ratios to Average Net Assets A,E,F
|
||||||||||||
Expenses before reductions
|
.26% G
|
.26%
|
.26%
|
.26%
|
.26%
|
.27%
|
||||||
Expenses net of fee waivers, if any
|
.23 % G |
.23%
|
.23%
|
.08%
|
.16%
|
.23%
|
||||||
Expenses net of all reductions
|
.23% G
|
.23%
|
.23%
|
.08%
|
.16%
|
.23%
|
||||||
Net investment income (loss)
|
5.10% G
|
4.99%
|
2.49%
|
.01%
|
.03%
|
1.67%
|
||||||
Supplemental Data
|
||||||||||||
Net assets, end of period (in millions)
|
$
|
2,252
|
$
|
1,962
|
$
|
1,271
|
$
|
325
|
$
|
264
|
$
|
399
|
Treasury Only Portfolio Institutional Class |
Six months ended
(Unaudited) September 30, 2024
|
Years ended March 31, 2024
|
2023
|
2022
|
2021
|
2020
|
|||||||
Selected Per-Share Data
|
||||||||||||
Net asset value, beginning of period
|
$
|
1.00
|
$
|
1.00
|
$
|
1.00
|
$
|
1.00
|
$
|
1.00
|
$
|
1.00
|
Income from Investment Operations
|
||||||||||||
Net investment income (loss) A
|
.026
|
.051
|
.025
|
- B
|
.001
|
.018
|
||||||
Net realized and unrealized gain (loss) B
|
-
|
-
|
-
|
-
|
-
|
-
|
||||||
Total from investment operations
|
.026
|
.051
|
.025
|
- B
|
.001
|
.018
|
||||||
Distributions from net investment income
|
(.026)
|
(.051)
|
(.025)
|
- B
|
(.001)
|
(.018)
|
||||||
Distributions from net realized gain
|
-
|
-
|
-
|
- B
|
-
|
-
|
||||||
Total distributions
|
(.026)
|
(.051)
|
(.025)
|
- B
|
(.001)
|
(.018)
|
||||||
Net asset value, end of period
|
$
|
1.00
|
$
|
1.00
|
$
|
1.00
|
$
|
1.00
|
$
|
1.00
|
$
|
1.00
|
Total Return C,D
|
2.63 % |
5.18%
|
2.54%
|
.02%
|
.06%
|
1.84%
|
||||||
Ratios to Average Net Assets A,E,F
|
||||||||||||
Expenses before reductions
|
.18% G
|
.18%
|
.18%
|
.18%
|
.18%
|
.19%
|
||||||
Expenses net of fee waivers, if any
|
.14 % G |
.14%
|
.14%
|
.07%
|
.13%
|
.14%
|
||||||
Expenses net of all reductions
|
.14% G
|
.14%
|
.14%
|
.07%
|
.13%
|
.14%
|
||||||
Net investment income (loss)
|
5.19% G
|
5.08%
|
2.57%
|
.02%
|
.06%
|
1.76%
|
||||||
Supplemental Data
|
||||||||||||
Net assets, end of period (in millions)
|
$
|
55,841
|
$
|
45,793
|
$
|
30,257
|
$
|
18,932
|
$
|
19,120
|
$
|
26,551
|
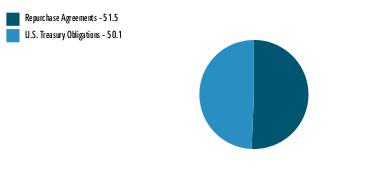
U.S. Treasury Repurchase Agreement - 51.5%
|
|||
Maturity
Amount ($)
(000s)
|
Value ($)
(000s)
|
||
In a joint trading account at:
|
|||
4.89% dated 9/30/24 due 10/1/24 (Collateralized by U.S. Treasury Obligations) #
|
38,165
|
38,160
|
|
4.9% dated 9/30/24 due 10/1/24 (Collateralized by U.S. Treasury Obligations) #
|
3,397
|
3,397
|
|
With:
|
|||
ABN AMRO Bank NV at 4.88%, dated 9/30/24 due 10/1/24 (Collateralized by U.S. Treasury Obligations valued at $102,013,830, 1.00% - 2.38%, 11/15/26 - 2/15/31)
|
100,014
|
100,000
|
|
Barclays Bank PLC at:
|
|||
4.89%, dated 9/30/24 due 10/1/24 (Collateralized by U.S. Treasury Obligations valued at $58,147,908, 2.38% - 3.88%, 5/15/29 - 8/15/34)
|
57,008
|
57,000
|
|
4.9%, dated 9/30/24 due 10/1/24 (Collateralized by U.S. Treasury Obligations valued at $117,315,991, 0.63%, 12/31/27)
|
115,016
|
115,000
|
|
BMO Capital Markets Corp. at 4.83%, dated 9/25/24 due 10/7/24 (Collateralized by U.S. Treasury Obligations valued at $28,583,142, 0.00% - 4.63%, 10/24/24 - 2/15/54)
|
28,053
|
28,000
|
|
BMO Harris Bank NA at:
|
|||
4.83%, dated 9/19/24 due 10/7/24 (Collateralized by U.S. Treasury Obligations valued at $27,584,377, 0.00%, 10/24/24 - 4/17/25)
|
27,076
|
27,000
|
|
5.18%, dated 9/5/24 due 10/4/24 (Collateralized by U.S. Treasury Obligations valued at $55,368,920, 3.63% - 4.38%, 11/15/39 - 5/15/53)
|
54,225
|
54,000
|
|
BNP Paribas, SA at:
|
|||
4.85%, dated 9/19/24 due 10/7/24
|
|||
(Collateralized by U.S. Treasury Obligations valued at $888,905,582, 0.00% - 6.13%, 10/31/24 - 11/15/53)
|
875,860
|
870,000
|
|
(Collateralized by U.S. Treasury Obligations valued at $695,069,553, 0.00% - 4.76%, 10/24/24 - 2/15/54)
|
682,932
|
680,000
|
|
5.31%, dated 8/1/24 due 10/1/24 (Collateralized by U.S. Treasury Obligations valued at $202,749,759, 0.00% - 4.77%, 12/31/24 - 8/15/53)
|
198,773
|
197,000
|
|
BofA Securities, Inc. at:
|
|||
4.88%, dated:
|
|||
7/1/24 due 10/1/24 (Collateralized by U.S. Treasury Obligations valued at $22,744,996, 0.25% - 4.63%, 6/30/25 - 6/30/26) (c)(d)(e)
|
22,274
|
22,000
|
|
7/2/24 due 10/2/24 (Collateralized by U.S. Treasury Obligations valued at $328,719,853, 0.25% - 5.00%, 11/15/24 - 6/30/26) (c)(d)(e)
|
321,966
|
318,000
|
|
7/25/24 due 10/25/24 (Collateralized by U.S. Treasury Obligations valued at $73,144,455, 0.25% - 4.77%, 2/15/25 - 7/31/30) (c)(d)(e)
|
71,885
|
71,000
|
|
4.92%, dated 8/5/24 due 11/5/24 (Collateralized by U.S. Treasury Obligations valued at $253,032,897, 1.00% - 4.84%, 10/31/24 - 7/31/30) (c)(d)(e)
|
249,093
|
246,000
|
|
CIBC Bank U.S.A. at:
|
|||
4.84%, dated:
|
|||
9/19/24 due 10/7/24 (Collateralized by U.S. Treasury Obligations valued at $108,294,484, 0.88% - 4.88%, 2/28/25 - 8/15/52)
|
106,371
|
106,000
|
|
9/23/24 due 10/7/24 (Collateralized by U.S. Treasury Obligations valued at $17,358,695, 0.50% - 4.00%, 1/31/25 - 2/15/32)
|
17,050
|
17,000
|
|
9/27/24 due 10/7/24 (Collateralized by U.S. Treasury Obligations valued at $58,171,277, 0.38% - 5.00%, 1/31/25 - 8/15/52)
|
57,184
|
57,000
|
|
5.17%, dated 9/12/24 due 10/1/24 (Collateralized by U.S. Treasury Obligations valued at $27,615,479, 0.38% - 5.00%, 1/31/25 - 8/15/52)
|
27,074
|
27,000
|
|
Citigroup Global Capital Markets, Inc. at 4.89%, dated 9/27/24 due 11/27/24 (Collateralized by U.S. Treasury Obligations valued at $1,168,534,589, 0.00% - 3.63%, 1/15/25 - 9/30/31)
|
1,154,487
|
1,145,000
|
|
Credit AG at 4.84%, dated 9/20/24 due 10/7/24 (Collateralized by U.S. Treasury Obligations valued at $11,236,613, 1.38%, 12/31/28)
|
11,031
|
11,000
|
|
Federal Reserve Bank of New York at 4.8%, dated 9/30/24 due 10/1/24 (Collateralized by U.S. Treasury Obligations valued at $15,553,073,566, 1.75% - 4.75%, 11/15/29 - 2/15/41)
|
15,553,073
|
15,551,000
|
|
FICC ACAFB Repo Program at:
|
|||
4.88%, dated:
|
|||
9/30/24 due 10/1/24 (Collateralized by U.S. Treasury Obligations valued at $1,140,427,072, 1.25% - 5.00%, 8/31/25 - 4/30/29)
|
1,112,151
|
1,112,000
|
|
10/1/24 due 10/2/24 (f)
|
1,114,151
|
1,114,000
|
|
4.89%, dated 9/30/24 due 10/1/24 (Collateralized by U.S. Treasury Obligations valued at $198,927,456, 3.75% - 4.63%, 9/30/28 - 8/31/31)
|
195,026
|
195,000
|
|
Ficc Citi Gc Repo (GOV) at 4.87%, dated 9/30/24 due 10/1/24 (Collateralized by U.S. Treasury Obligations valued at $434,578,781, 0.00% - 6.75%, 11/7/24 - 8/15/54)
|
426,058
|
426,000
|
|
Ficc Ing Finance Markets Dvp (GOV) at:
|
|||
4.86%, dated 9/30/24 due 10/1/24 (Collateralized by U.S. Treasury Obligations valued at $175,702,580, 3.13%, 8/31/27)
|
172,023
|
172,000
|
|
4.88%, dated 10/1/24 due 10/2/24 (f)
|
172,023
|
172,000
|
|
4.89%, dated 9/30/24 due 10/1/24 (Collateralized by U.S. Treasury Obligations valued at $852,260,809, 3.63%, 9/30/31)
|
833,113
|
833,000
|
|
Ficc Mizuho Securities Gc Repo(GOV) at 4.89%, dated 9/30/24 due 10/1/24 (Collateralized by U.S. Treasury Obligations valued at $175,463,871, 0.00% - 4.63%, 10/15/24 - 11/15/41)
|
172,023
|
172,000
|
|
Ficc Natixis Dvp Repo (GOV REP at 4.88%, dated 9/30/24 due 10/1/24 (Collateralized by U.S. Treasury Obligations valued at $234,659,592, 3.63%, 9/15/27)
|
230,031
|
230,000
|
|
Ficc Nomura Gc Repo (GOV) at 4.9%, dated 9/30/24 due 10/1/24 (Collateralized by U.S. Treasury Obligations valued at $263,195,854, 0.00% - 5.00%, 10/31/24 - 3/31/31)
|
258,035
|
258,000
|
|
Fixed Income Clearing Corp. - BNP at 4.88%, dated 9/30/24 due 10/1/24 (Collateralized by U.S. Treasury Obligations valued at $616,163,632, 0.50% - 4.84%, 4/30/25 - 5/15/54)
|
604,082
|
604,000
|
|
Fixed Income Clearing Corp. - BNYM at 4.88%, dated 9/30/24 due 10/1/24 (Collateralized by U.S. Treasury Obligations valued at $3,045,720,052, 0.38% - 4.25%, 7/15/25 - 3/15/27)
|
2,986,405
|
2,986,000
|
|
Fixed Income Clearing Corp. - SSB at 4.88%, dated 9/30/24 due 10/1/24
|
|||
(Collateralized by U.S. Treasury Obligations valued at $115,243,197, 4.38%, 5/15/34)
|
113,015
|
113,000
|
|
(Collateralized by U.S. Treasury Obligations valued at $1,935,019,314, 1.00% - 4.38%, 7/31/28 - 8/31/28)
|
1,897,257
|
1,897,000
|
|
Goldman Sachs & Co. at:
|
|||
4.87%, dated:
|
|||
9/13/24 due 10/7/24
|
|||
(Collateralized by U.S. Treasury Obligations valued at $109,416,174, 1.88% - 2.50%, 2/28/26 - 6/30/26) (c)(d)(e)
|
107,796
|
107,000
|
|
(Collateralized by U.S. Treasury Obligations valued at $109,416,205, 0.00% - 0.88%, 3/13/25 - 6/30/26) (c)(d)(e)
|
107,767
|
107,000
|
|
9/16/24 due 10/7/24
|
|||
(Collateralized by U.S. Treasury Obligations valued at $109,367,376, 0.50% - 1.25%, 10/31/27 - 7/31/28) (c)(d)(e)
|
107,854
|
107,000
|
|
(Collateralized by U.S. Treasury Obligations valued at $109,367,386, 0.63% - 5.00%, 2/28/25 - 11/30/27) (c)(d)(e)
|
107,825
|
107,000
|
|
9/20/24 due 10/7/24 (Collateralized by U.S. Treasury Obligations valued at $112,366,627, 4.25%, 6/30/29) (c)(d)(e)
|
110,893
|
110,000
|
|
9/30/24 due 10/7/24 (Collateralized by U.S. Treasury Obligations valued at $114,255,455, 0.50% - 4.38%, 10/31/24 - 8/15/42)
|
112,106
|
112,000
|
|
4.88%, dated 9/30/24 due 10/1/24 (Collateralized by U.S. Treasury Obligations valued at $100,993,709, 0.00% - 1.63%, 3/6/25 - 11/30/26)
|
99,013
|
99,000
|
|
HSBC Securities, Inc. at 4.85%, dated 9/26/24 due 10/3/24 (Collateralized by U.S. Treasury Obligations valued at $113,296,292, 3.13% - 4.00%, 4/30/25 - 11/15/41)
|
111,105
|
111,000
|
|
ING Financial Markets LLC at:
|
|||
4.84%, dated 9/24/24 due 10/1/24 (Collateralized by U.S. Treasury Obligations valued at $8,167,693, 3.75%, 8/31/26)
|
8,008
|
8,000
|
|
4.85%, dated:
|
|||
9/26/24 due 10/3/24 (Collateralized by U.S. Treasury Obligations valued at $5,103,451, 3.75%, 8/31/26)
|
5,005
|
5,000
|
|
9/27/24 due 10/4/24 (Collateralized by U.S. Treasury Obligations valued at $8,164,476, 3.75%, 8/31/26)
|
8,008
|
8,000
|
|
J.P. Morgan Securities, LLC at 4.86%, dated 9/30/24 due 10/7/24 (Collateralized by U.S. Treasury Obligations valued at $1,667,925,141, 2.00% - 2.63%, 2/15/29 - 11/15/41) (c)(d)(e)
|
1,641,622
|
1,635,000
|
|
Lloyds Bank Corp. Markets PLC at:
|
|||
4.85%, dated 9/26/24 due 10/2/24 (Collateralized by U.S. Treasury Obligations valued at $122,539,262, 1.88% - 4.63%, 9/15/26 - 8/31/29)
|
120,097
|
120,000
|
|
5.21%, dated 9/10/24 due 10/10/24 (Collateralized by U.S. Treasury Obligations valued at $38,848,882, 3.63% - 4.63%, 9/15/26 - 3/31/30)
|
38,165
|
38,000
|
|
5.22%, dated:
|
|||
9/6/24 due 10/7/24 (Collateralized by U.S. Treasury Obligations valued at $293,868,899, 3.50% - 4.63%, 9/15/26 - 8/15/33)
|
288,290
|
287,000
|
|
9/13/24 due 10/10/24 (Collateralized by U.S. Treasury Obligations valued at $309,692,506, 4.13% - 4.63%, 11/15/25 - 4/30/29)
|
304,186
|
303,000
|
|
Lloyds Bank PLC at:
|
|||
4.84%, dated 9/25/24 due 11/25/24 (Collateralized by U.S. Treasury Obligations valued at $18,381,698, 1.88% - 2.25%, 2/15/27 - 2/15/32)
|
18,148
|
18,000
|
|
4.87%, dated:
|
|||
9/19/24 due 11/19/24 (Collateralized by U.S. Treasury Obligations valued at $24,546,891, 2.25%, 2/15/27 - 8/15/27)
|
24,198
|
24,000
|
|
9/20/24 due 11/20/24 (Collateralized by U.S. Treasury Obligations valued at $46,005,930, 2.25% - 3.50%, 1/31/25 - 1/31/28)
|
45,371
|
45,000
|
|
5.16%, dated 8/28/24 due 11/29/24 (Collateralized by U.S. Treasury Obligations valued at $51,289,524, 3.50%, 2/15/33)
|
50,667
|
50,000
|
|
Mitsubishi UFJ Securities (U.S.A.), Inc. at 4.88%, dated 9/19/24 due 12/12/24 (Collateralized by U.S. Treasury Obligations valued at $53,126,282, 3.75%, 8/15/41)
|
52,592
|
52,000
|
|
Mizuho Securities U.S.A., Inc. at 4.85%, dated 9/26/24 due 10/3/24 (Collateralized by U.S. Treasury Obligations valued at $42,868,873, 0.63% - 2.50%, 2/28/26 - 12/31/27)
|
42,040
|
42,000
|
|
MUFG Securities (Canada), Ltd. at:
|
|||
4.86%, dated 9/19/24 due 10/7/24 (Collateralized by U.S. Treasury Obligations valued at $27,584,627, 0.63% - 4.76%, 10/31/25 - 2/15/54)
|
27,182
|
27,000
|
|
4.88%, dated 9/19/24 due 12/12/24 (Collateralized by U.S. Treasury Obligations valued at $53,126,478, 0.25% - 4.76%, 9/30/25 - 5/15/54)
|
52,592
|
52,000
|
|
MUFG Securities EMEA PLC at:
|
|||
4.87%, dated:
|
|||
9/19/24 due 10/7/24 (Collateralized by U.S. Treasury Obligations valued at $167,843,329, 0.38% - 4.38%, 1/31/26 - 2/15/43)
|
165,109
|
164,000
|
|
9/30/24 due 10/1/24 (Collateralized by U.S. Treasury Obligations valued at $67,327,080, 3.50%, 9/30/26)
|
66,009
|
66,000
|
|
5.15%, dated 9/9/24 due 10/7/24 (Collateralized by U.S. Treasury Obligations valued at $171,221,584, 0.38% - 4.38%, 1/31/26 - 2/15/32)
|
167,717
|
167,000
|
|
Natixis SA at 4.85%, dated 9/19/24 due 10/7/24 (Collateralized by U.S. Treasury Obligations valued at $142,130,407, 0.63% - 6.25%, 12/31/24 - 5/15/54)
|
139,936
|
139,000
|
|
NatWest Markets Securities, Inc. at:
|
|||
4.85%, dated 9/26/24 due 10/3/24 (Collateralized by U.S. Treasury Obligations valued at $113,296,343, 4.76%, 4/30/25)
|
111,105
|
111,000
|
|
4.87%, dated 9/30/24 due 10/1/24 (Collateralized by U.S. Treasury Obligations valued at $28,563,869, 1.63% - 3.88%, 5/15/26 - 8/15/33)
|
28,004
|
28,000
|
|
Norinchukin Bank at:
|
|||
4.85%, dated 9/24/24 due 10/1/24 (Collateralized by U.S. Treasury Obligations valued at $56,145,440, 0.00%, 5/15/32 - 8/15/33)
|
55,052
|
55,000
|
|
4.88%, dated 9/30/24 due 10/1/24 (Collateralized by U.S. Treasury Obligations valued at $18,362,506, 0.00%, 8/15/33 - 8/15/33)
|
18,002
|
18,000
|
|
Prudential Insurance Co. of America at 4.88%, dated 9/30/24 due 10/1/24 (Collateralized by U.S. Treasury Obligations valued at $147,215,443, 0.00% - 6.63%, 11/12/24 - 2/15/36)
|
144,333
|
144,313
|
|
RBC Dominion Securities at 4.85%, dated 9/19/24 due 10/7/24 (Collateralized by U.S. Treasury Obligations valued at $222,399,455, 0.00% - 6.00%, 1/31/25 - 5/15/54)
|
218,462
|
217,000
|
|
SMBC Nikko Securities America, Inc. at 4.88%, dated 9/30/24 due 10/1/24 (Collateralized by U.S. Treasury Obligations valued at $665,130,176, 0.00% - 4.88%, 12/12/24 - 5/15/50)
|
652,088
|
652,000
|
|
Societe Generale at 4.85%, dated 9/26/24 due 10/3/24
|
|||
(Collateralized by U.S. Treasury Obligations valued at $116,358,365, 0.63% - 3.38%, 11/30/27 - 5/15/33)
|
114,108
|
114,000
|
|
(Collateralized by U.S. Treasury Obligations valued at $58,179,226, 3.13% - 4.75%, 2/15/43 - 11/15/43)
|
57,054
|
57,000
|
|
Sumitomo Mitsui Trust Bank Ltd. at 4.92%, dated 9/25/24 due 10/7/24 (Collateralized by U.S. Treasury Obligations valued at $13,373,628, 1.63% - 4.38%, 8/31/28 - 8/15/29)
|
13,025
|
13,000
|
|
TD Securities (U.S.A.) at:
|
|||
4.85%, dated 9/25/24 due 10/2/24 (Collateralized by U.S. Treasury Obligations valued at $56,145,390, 0.38% - 2.75%, 2/28/25 - 2/15/31)
|
55,052
|
55,000
|
|
4.88%, dated 9/30/24 due 10/1/24 (Collateralized by U.S. Treasury Obligations valued at $85,691,617, 1.88% - 3.88%, 3/31/25 - 2/28/29)
|
84,011
|
84,000
|
|
|
TOTAL U.S. TREASURY REPURCHASE AGREEMENT
(Cost $35,682,870)
|
35,682,870
|
||
U.S. Treasury Debt - 50.1%
|
||||
Yield (%) (a)
|
Principal
Amount (b)
(000s)
|
Value ($)
(000s)
|
||
U.S. Treasury Inflation Protected Obligations - 0.2%
|
||||
U.S. Treasury Notes
|
||||
10/15/24
|
4.83 to 5.14
|
109,111
|
108,954
|
|
U.S. Treasury Obligations - 49.9%
|
||||
U.S. Treasury Bills
|
||||
10/1/24 to 4/3/25
|
4.33 to 5.49
|
25,417,980
|
25,252,469
|
|
U.S. Treasury Notes
|
||||
10/31/24 to 7/31/26 (c)
|
4.72 to 5.20
|
9,349,725
|
9,328,753
|
|
TOTAL U.S. TREASURY OBLIGATIONS
|
34,581,222
|
|||
|
TOTAL U.S. TREASURY DEBT
(Cost $34,690,176)
|
34,690,176
|
|||
|
TOTAL INVESTMENT IN SECURITIES - 101.6%
(Cost $70,373,046)
|
70,373,046
|
NET OTHER ASSETS (LIABILITIES) - (1.6)%
|
(1,110,710)
|
NET ASSETS - 100.0%
|
69,262,336
|
(a)
|
Yield represents either the annualized yield at the date of purchase, or the stated coupon rate, or, for floating and adjustable rate securities, the rate at period end.
|
(b)
|
Amount is stated in United States dollars unless otherwise noted.
|
(c)
|
A coupon rate of 0% signifies an unsettled loan. The coupon rate will be determined upon settlement of the loan after period end.
|
(d)
|
The maturity amount is based on the rate at period end.
|
(e)
|
Coupon is indexed to a floating interest rate which may be multiplied by a specified factor and/or subject to caps or floors.
|
(f)
|
Represents a forward settling transaction and therefore no collateral securities had been allocated as of period end. The agreement contemplated the delivery of U.S. Treasury Obligations as collateral on settlement date.
|
|
Other Information
|
||
# Additional information on each counterparty to the repurchase agreement is as follows:
|
||
Repurchase Agreement / Counterparty
|
Value ($)
(000's)
|
|
$38,160,000 due 10/01/24 at 4.89%
|
||
Royal Bank of Canada
|
38,160
|
|
38,160
|
||
$3,397,000 due 10/01/24 at 4.90%
|
||
ING Financial Markets LLC
|
3,397
|
|
3,397
|
||
Statement of Assets and Liabilities
|
||||
|
As of September 30, 2024 (Unaudited)
Amounts in thousands (except per-share amounts)
|
||||
Assets
|
||||
Investment in securities, at value (including repurchase agreements of $35,682,870) - See accompanying schedule
Unaffiliated issuers (cost $70,373,046):
|
$
|
70,373,046
|
||
Cash
|
326,001
|
|||
Receivable for fund shares sold
|
231,598
|
|||
Interest receivable
|
102,833
|
|||
Prepaid expenses
|
82
|
|||
Receivable from investment adviser for expense reductions
|
2,056
|
|||
Other receivables
|
531
|
|||
Total assets
|
71,036,147
|
|||
Liabilities
|
||||
Payable for investments purchased
|
$
|
1,462,991
|
||
Payable for fund shares redeemed
|
164,092
|
|||
Distributions payable
|
133,504
|
|||
Accrued management fee
|
7,612
|
|||
Distribution and service plan fees payable
|
1,419
|
|||
Other affiliated payables
|
2,587
|
|||
Other payables and accrued expenses
|
1,606
|
|||
Total liabilities
|
1,773,811
|
|||
Net Assets
|
$
|
69,262,336
|
||
Net Assets consist of:
|
||||
Paid in capital
|
$
|
69,262,427
|
||
Total accumulated earnings (loss)
|
(91)
|
|||
Net Assets
|
$
|
69,262,336
|
||
Net Asset Value and Maximum Offering Price
|
||||
Class I :
|
||||
Net Asset Value, offering price and redemption price per share ($26,949,184 ÷ 26,941,770 shares)
|
$
|
1.00
|
||
Class II :
|
||||
Net Asset Value, offering price and redemption price per share ($675,454 ÷ 675,045 shares)
|
$
|
1.00
|
||
Class III :
|
||||
Net Asset Value, offering price and redemption price per share ($4,842,442 ÷ 4,842,331 shares)
|
$
|
1.00
|
||
Class IV :
|
||||
Net Asset Value, offering price and redemption price per share ($901,291 ÷ 901,093 shares)
|
$
|
1.00
|
||
Select Class :
|
||||
Net Asset Value, offering price and redemption price per share ($334,052 ÷ 333,995 shares)
|
$
|
1.00
|
||
Institutional Class :
|
||||
Net Asset Value, offering price and redemption price per share ($35,559,913 ÷ 35,563,613 shares)
|
$
|
1.00
|
||
Statement of Operations
|
||||
Six months ended September 30, 2024 (Unaudited)
Amounts in thousands
|
||||
Investment Income
|
||||
Interest
|
$
|
1,701,152
|
||
Expenses
|
||||
Management fee
|
$
|
44,582
|
||
Transfer agent fees
|
14,082
|
|||
Distribution and service plan fees
|
8,144
|
|||
Accounting fees and expenses
|
1,084
|
|||
Custodian fees and expenses
|
191
|
|||
Independent trustees' fees and expenses
|
81
|
|||
Registration fees
|
812
|
|||
Audit fees
|
26
|
|||
Legal
|
14
|
|||
Miscellaneous
|
98
|
|||
Total expenses before reductions
|
69,114
|
|||
Expense reductions
|
(10,207)
|
|||
Total expenses after reductions
|
58,907
|
|||
Net Investment income (loss)
|
1,642,245
|
|||
Realized and Unrealized Gain (Loss)
|
||||
Net realized gain (loss) on:
|
||||
Investment Securities:
|
||||
Unaffiliated issuers
|
6
|
|||
Total net realized gain (loss)
|
6
|
|||
Net increase in net assets resulting from operations
|
$
|
1,642,251
|
||
Statement of Changes in Net Assets
|
||||
Amount in thousands
|
Six months ended
September 30, 2024
(Unaudited)
|
Year ended
March 31, 2024
|
||
Increase (Decrease) in Net Assets
|
||||
Operations
|
||||
Net investment income (loss)
|
$
|
1,642,245
|
$
|
3,002,477
|
Net realized gain (loss)
|
6
|
112
|
||
Net increase in net assets resulting from operations
|
1,642,251
|
3,002,589
|
||
Distributions to shareholders
|
(1,642,232)
|
(3,002,772)
|
||
Share transactions - net increase (decrease)
|
8,062,283
|
1,689,179
|
||
Total increase (decrease) in net assets
|
8,062,302
|
1,688,996
|
||
Net Assets
|
||||
Beginning of period
|
61,200,034
|
59,511,038
|
||
End of period
|
$
|
69,262,336
|
$
|
61,200,034
|
Treasury Portfolio Class I |
Six months ended
(Unaudited) September 30, 2024
|
Years ended March 31, 2024
|
2023
|
2022
|
2021
|
2020
|
|||||||
Selected Per-Share Data
|
||||||||||||
Net asset value, beginning of period
|
$
|
1.00
|
$
|
1.00
|
$
|
1.00
|
$
|
1.00
|
$
|
1.00
|
$
|
1.00
|
Income from Investment Operations
|
||||||||||||
Net investment income (loss) A
|
.026
|
.051
|
.026
|
- B
|
- B
|
.018
|
||||||
Net realized and unrealized gain (loss) B
|
-
|
-
|
-
|
-
|
-
|
-
|
||||||
Total from investment operations
|
.026
|
.051
|
.026
|
- B
|
- B
|
.018
|
||||||
Distributions from net investment income
|
(.026)
|
(.051)
|
(.026)
|
- B
|
- B
|
(.018)
|
||||||
Distributions from net realized gain
|
-
|
-
|
-
|
- B
|
-
|
-
|
||||||
Total distributions
|
(.026)
|
(.051)
|
(.026)
|
- B
|
- B
|
(.018)
|
||||||
Net asset value, end of period
|
$
|
1.00
|
$
|
1.00
|
$
|
1.00
|
$
|
1.00
|
$
|
1.00
|
$
|
1.00
|
Total Return C,D
|
2.61 % |
5.25%
|
2.62%
|
.02%
|
.05%
|
1.82%
|
||||||
Ratios to Average Net Assets A,E,F
|
||||||||||||
Expenses before reductions
|
.21% G
|
.21%
|
.21%
|
.21%
|
.21%
|
.21%
|
||||||
Expenses net of fee waivers, if any
|
.18 % G |
.18%
|
.18%
|
.08%
|
.15%
|
.18%
|
||||||
Expenses net of all reductions
|
.18% G
|
.18%
|
.18%
|
.08%
|
.15%
|
.18%
|
||||||
Net investment income (loss)
|
5.15% G
|
5.13%
|
2.96%
|
.01%
|
.06%
|
1.77%
|
||||||
Supplemental Data
|
||||||||||||
Net assets, end of period (in millions)
|
$
|
26,949
|
$
|
22,862
|
$
|
22,834
|
$
|
9,402
|
$
|
10,411
|
$
|
12,043
|
Treasury Portfolio Class II |
Six months ended
(Unaudited) September 30, 2024
|
Years ended March 31, 2024
|
2023
|
2022
|
2021
|
2020
|
|||||||
Selected Per-Share Data
|
||||||||||||
Net asset value, beginning of period
|
$
|
1.00
|
$
|
1.00
|
$
|
1.00
|
$
|
1.00
|
$
|
1.00
|
$
|
1.00
|
Income from Investment Operations
|
||||||||||||
Net investment income (loss) A
|
.025
|
.050
|
.024
|
- B
|
- B
|
.017
|
||||||
Net realized and unrealized gain (loss) B
|
-
|
-
|
-
|
-
|
-
|
-
|
||||||
Total from investment operations
|
.025
|
.050
|
.024
|
- B
|
- B
|
.017
|
||||||
Distributions from net investment income
|
(.025)
|
(.050)
|
(.024)
|
- B
|
- B
|
(.017)
|
||||||
Distributions from net realized gain
|
-
|
-
|
-
|
- B
|
-
|
-
|
||||||
Total distributions
|
(.025)
|
(.050)
|
(.024)
|
- B
|
- B
|
(.017)
|
||||||
Net asset value, end of period
|
$
|
1.00
|
$
|
1.00
|
$
|
1.00
|
$
|
1.00
|
$
|
1.00
|
$
|
1.00
|
Total Return C,D
|
2.54 % |
5.09%
|
2.46%
|
.01%
|
.01%
|
1.67%
|
||||||
Ratios to Average Net Assets A,E,F
|
||||||||||||
Expenses before reductions
|
.36% G
|
.36%
|
.36%
|
.36%
|
.36%
|
.36%
|
||||||
Expenses net of fee waivers, if any
|
.33 % G |
.33%
|
.33%
|
.08%
|
.19%
|
.33%
|
||||||
Expenses net of all reductions
|
.33% G
|
.33%
|
.33%
|
.08%
|
.19%
|
.33%
|
||||||
Net investment income (loss)
|
5.00% G
|
4.98%
|
2.81%
|
.01%
|
.02%
|
1.62%
|
||||||
Supplemental Data
|
||||||||||||
Net assets, end of period (in millions)
|
$
|
675
|
$
|
765
|
$
|
513
|
$
|
411
|
$
|
648
|
$
|
884
|
Treasury Portfolio Class III |
Six months ended
(Unaudited) September 30, 2024
|
Years ended March 31, 2024
|
2023
|
2022
|
2021
|
2020
|
|||||||
Selected Per-Share Data
|
||||||||||||
Net asset value, beginning of period
|
$
|
1.00
|
$
|
1.00
|
$
|
1.00
|
$
|
1.00
|
$
|
1.00
|
$
|
1.00
|
Income from Investment Operations
|
||||||||||||
Net investment income (loss) A
|
.025
|
.049
|
.023
|
- B
|
- B
|
.016
|
||||||
Net realized and unrealized gain (loss) B
|
-
|
-
|
-
|
-
|
-
|
-
|
||||||
Total from investment operations
|
.025
|
.049
|
.023
|
- B
|
- B
|
.016
|
||||||
Distributions from net investment income
|
(.025)
|
(.049)
|
(.023)
|
- B
|
- B
|
(.016)
|
||||||
Distributions from net realized gain
|
-
|
-
|
-
|
- B
|
-
|
-
|
||||||
Total distributions
|
(.025)
|
(.049)
|
(.023)
|
- B
|
- B
|
(.016)
|
||||||
Net asset value, end of period
|
$
|
1.00
|
$
|
1.00
|
$
|
1.00
|
$
|
1.00
|
$
|
1.00
|
$
|
1.00
|
Total Return C,D
|
2.48 % |
4.99%
|
2.37%
|
.01%
|
.01%
|
1.56%
|
||||||
Ratios to Average Net Assets A,E,F
|
||||||||||||
Expenses before reductions
|
.46% G
|
.46%
|
.46%
|
.46%
|
.46%
|
.46%
|
||||||
Expenses net of fee waivers, if any
|
.43 % G |
.43%
|
.42%
|
.08%
|
.19%
|
.43%
|
||||||
Expenses net of all reductions
|
.43% G
|
.43%
|
.42%
|
.08%
|
.19%
|
.43%
|
||||||
Net investment income (loss)
|
4.90% G
|
4.88%
|
2.71%
|
.01%
|
.02%
|
1.52%
|
||||||
Supplemental Data
|
||||||||||||
Net assets, end of period (in millions)
|
$
|
4,842
|
$
|
3,989
|
$
|
3,041
|
$
|
2,612
|
$
|
2,309
|
$
|
2,469
|
Treasury Portfolio Class IV |
Six months ended
(Unaudited) September 30, 2024
|
Years ended March 31, 2024
|
2023
|
2022
|
2021
|
2020
|
|||||||
Selected Per-Share Data
|
||||||||||||
Net asset value, beginning of period
|
$
|
1.00
|
$
|
1.00
|
$
|
1.00
|
$
|
1.00
|
$
|
1.00
|
$
|
1.00
|
Income from Investment Operations
|
||||||||||||
Net investment income (loss) A
|
.023
|
.046
|
.021
|
- B
|
- B
|
.013
|
||||||
Net realized and unrealized gain (loss) B
|
-
|
-
|
-
|
-
|
-
|
-
|
||||||
Total from investment operations
|
.023
|
.046
|
.021
|
- B
|
- B
|
.013
|
||||||
Distributions from net investment income
|
(.023)
|
(.046)
|
(.021)
|
- B
|
- B
|
(.013)
|
||||||
Distributions from net realized gain
|
-
|
-
|
-
|
- B
|
-
|
-
|
||||||
Total distributions
|
(.023)
|
(.046)
|
(.021)
|
- B
|
- B
|
(.013)
|
||||||
Net asset value, end of period
|
$
|
1.00
|
$
|
1.00
|
$
|
1.00
|
$
|
1.00
|
$
|
1.00
|
$
|
1.00
|
Total Return C,D
|
2.36 % |
4.73%
|
2.14%
|
.01%
|
.01%
|
1.32%
|
||||||
Ratios to Average Net Assets A,E,F
|
||||||||||||
Expenses before reductions
|
.71% G
|
.71%
|
.71%
|
.71%
|
.71%
|
.71%
|
||||||
Expenses net of fee waivers, if any
|
.68 % G |
.68%
|
.65%
|
.08%
|
.19%
|
.67%
|
||||||
Expenses net of all reductions
|
.68% G
|
.68%
|
.65%
|
.08%
|
.19%
|
.67%
|
||||||
Net investment income (loss)
|
4.65% G
|
4.63%
|
2.49%
|
.01%
|
.02%
|
1.28%
|
||||||
Supplemental Data
|
||||||||||||
Net assets, end of period (in millions)
|
$
|
901
|
$
|
871
|
$
|
975
|
$
|
1,146
|
$
|
988
|
$
|
1,033
|
Treasury Portfolio Select Class |
Six months ended
(Unaudited) September 30, 2024
|
Years ended March 31, 2024
|
2023
|
2022
|
2021
|
2020
|
|||||||
Selected Per-Share Data
|
||||||||||||
Net asset value, beginning of period
|
$
|
1.00
|
$
|
1.00
|
$
|
1.00
|
$
|
1.00
|
$
|
1.00
|
$
|
1.00
|
Income from Investment Operations
|
||||||||||||
Net investment income (loss) A
|
.026
|
.051
|
.025
|
- B
|
- B
|
.018
|
||||||
Net realized and unrealized gain (loss) B
|
-
|
-
|
-
|
-
|
-
|
-
|
||||||
Total from investment operations
|
.026
|
.051
|
.025
|
- B
|
- B
|
.018
|
||||||
Distributions from net investment income
|
(.026)
|
(.051)
|
(.025)
|
- B
|
- B
|
(.018)
|
||||||
Distributions from net realized gain
|
-
|
-
|
-
|
- B
|
-
|
-
|
||||||
Total distributions
|
(.026)
|
(.051)
|
(.025)
|
- B
|
- B
|
(.018)
|
||||||
Net asset value, end of period
|
$
|
1.00
|
$
|
1.00
|
$
|
1.00
|
$
|
1.00
|
$
|
1.00
|
$
|
1.00
|
Total Return C,D
|
2.59 % |
5.20%
|
2.56%
|
.01%
|
.03%
|
1.77%
|
||||||
Ratios to Average Net Assets A,E,F
|
||||||||||||
Expenses before reductions
|
.26% G
|
.26%
|
.26%
|
.26%
|
.26%
|
.26%
|
||||||
Expenses net of fee waivers, if any
|
.23 % G |
.23%
|
.23%
|
.08%
|
.17%
|
.23%
|
||||||
Expenses net of all reductions
|
.23% G
|
.23%
|
.23%
|
.08%
|
.17%
|
.23%
|
||||||
Net investment income (loss)
|
5.10% G
|
5.08%
|
2.91%
|
.01%
|
.03%
|
1.72%
|
||||||
Supplemental Data
|
||||||||||||
Net assets, end of period (in millions)
|
$
|
334
|
$
|
259
|
$
|
214
|
$
|
254
|
$
|
198
|
$
|
424
|
Treasury Portfolio Institutional Class |
Six months ended
(Unaudited) September 30, 2024
|
Years ended March 31, 2024
|
2023
|
2022
|
2021
|
2020
|
|||||||
Selected Per-Share Data
|
||||||||||||
Net asset value, beginning of period
|
$
|
1.00
|
$
|
1.00
|
$
|
1.00
|
$
|
1.00
|
$
|
1.00
|
$
|
1.00
|
Income from Investment Operations
|
||||||||||||
Net investment income (loss) A
|
.026
|
.052
|
.026
|
- B
|
.001
|
.018
|
||||||
Net realized and unrealized gain (loss) B
|
-
|
-
|
-
|
-
|
-
|
-
|
||||||
Total from investment operations
|
.026
|
.052
|
.026
|
- B
|
.001
|
.018
|
||||||
Distributions from net investment income
|
(.026)
|
(.052)
|
(.026)
|
- B
|
(.001)
|
(.018)
|
||||||
Distributions from net realized gain
|
-
|
-
|
-
|
- B
|
-
|
-
|
||||||
Total distributions
|
(.026)
|
(.052)
|
(.026)
|
- B
|
(.001)
|
(.018)
|
||||||
Net asset value, end of period
|
$
|
1.00
|
$
|
1.00
|
$
|
1.00
|
$
|
1.00
|
$
|
1.00
|
$
|
1.00
|
Total Return C,D
|
2.63 % |
5.29%
|
2.66%
|
.02%
|
.07%
|
1.86%
|
||||||
Ratios to Average Net Assets A,E,F
|
||||||||||||
Expenses before reductions
|
.18% G
|
.18%
|
.18%
|
.18%
|
.18%
|
.18%
|
||||||
Expenses net of fee waivers, if any
|
.14 % G |
.14%
|
.14%
|
.07%
|
.13%
|
.14%
|
||||||
Expenses net of all reductions
|
.14% G
|
.14%
|
.14%
|
.07%
|
.13%
|
.14%
|
||||||
Net investment income (loss)
|
5.19% G
|
5.17%
|
3.00%
|
.02%
|
.07%
|
1.81%
|
||||||
Supplemental Data
|
||||||||||||
Net assets, end of period (in millions)
|
$
|
35,560
|
$
|
32,455
|
$
|
31,934
|
$
|
10,195
|
$
|
12,539
|
$
|
19,926
|
U.S. Government Agency Repurchase Agreement - 18.1%
|
|||
Maturity
Amount ($)
(000s)
|
Value ($)
(000s)
|
||
In a joint trading account at:
|
|||
4.89% dated 9/30/24 due 10/1/24 (Collateralized by U.S. Government Obligations)#
|
13,323,343
|
13,321,533
|
|
4.89% dated 9/30/24 due 10/1/24 (Collateralized by U.S. Government Obligations)#
|
1,894,937
|
1,894,679
|
|
With:
|
|||
ABN AMRO Bank NV at 4.9%, dated 9/30/24 due 10/1/24 (Collateralized by U.S. Government Obligations valued at $328,503,004, 1.25% - 6.00%, 3/1/25 - 9/1/54)
|
322,044
|
322,000
|
|
Bank of America NA at 5.08%, dated 9/4/24 due 12/31/24 (Collateralized by U.S. Government Obligations valued at $144,367,954, 3.00% - 3.50%, 4/1/42 - 6/1/43)
|
143,348
|
141,000
|
|
Barclays Bank PLC at 4.91%, dated 9/30/24 due 10/1/24 (Collateralized by U.S. Government Obligations valued at $440,024,455, 5.50% - 6.50%, 9/1/53 - 7/20/54)
|
431,059
|
431,000
|
|
BMO Capital Markets Corp. at 5.22%, dated 8/28/24 due 10/7/24 (Collateralized by U.S. Government Obligations valued at $256,405,379, 0.00% - 7.00%, 1/21/25 - 9/15/66)
|
251,048
|
249,279
|
|
BMO Harris Bank NA at:
|
|||
4.85%, dated 9/19/24 due 10/7/24 (Collateralized by U.S. Government Obligations valued at $333,227,849, 3.50% - 6.45%, 7/20/48 - 6/20/72)
|
324,436
|
323,000
|
|
5.11%, dated 9/13/24 due 10/7/24 (Collateralized by U.S. Government Obligations valued at $218,917,910, 4.00% - 6.55%, 4/20/52 - 5/20/54)
|
212,963
|
212,000
|
|
5.16%, dated 9/12/24 due 10/7/24 (Collateralized by U.S. Government Obligations valued at $167,314,416, 6.45% - 6.50%, 4/20/54 - 8/20/54)
|
162,813
|
162,000
|
|
BNP Paribas, SA at:
|
|||
4.85%, dated 9/26/24 due 10/7/24 (Collateralized by U.S. Government Obligations valued at $286,393,000, 0.00% - 7.33%, 10/31/24 - 9/20/64)
|
281,207
|
280,000
|
|
4.86%, dated 9/19/24 due 10/7/24 (Collateralized by U.S. Government Obligations valued at $543,519,077, 2.00% - 8.00%, 6/1/30 - 8/20/64)
|
534,298
|
532,000
|
|
4.87%, dated 9/3/24 due 10/7/24 (Collateralized by U.S. Government Obligations valued at $330,909,477, 0.00% - 7.00%, 1/15/25 - 10/1/54) (a)(b)(c)
|
323,939
|
320,000
|
|
BofA Securities, Inc. at:
|
|||
4.88%, dated 7/2/24 due 10/2/24 (Collateralized by U.S. Government Obligations valued at $171,595,849, 1.50% - 7.50%, 7/1/25 - 8/20/54) (a)(b)(c)
|
168,070
|
166,000
|
|
4.9%, dated:
|
|||
7/2/24 due 10/2/24 (Collateralized by U.S. Government Obligations valued at $727,768,096, 1.50% - 7.55%, 1/1/25 - 9/1/54) (a)(b)(c)
|
712,816
|
704,000
|
|
7/18/24 due 10/18/24 (Collateralized by U.S. Government Obligations valued at $402,212,044, 1.50% - 7.50%, 7/1/26 - 9/20/54) (a)(b)(c)
|
394,884
|
390,000
|
|
7/25/24 due 10/25/24 (Collateralized by U.S. Government Obligations valued at $135,991,935, 2.00% - 7.50%, 4/1/25 - 8/20/64) (a)(b)(c)
|
133,653
|
132,000
|
|
7/26/24 due 10/28/24 (Collateralized by U.S. Government Obligations valued at $135,971,739, 2.00% - 7.50%, 9/1/26 - 7/20/54) (a)(b)(c)
|
133,689
|
132,000
|
|
7/30/24 due 10/30/24 (Collateralized by U.S. Government Obligations valued at $545,622,174, 1.50% - 7.00%, 8/1/28 - 9/1/54) (a)(b)(c)
|
536,637
|
530,000
|
|
4.93%, dated:
|
|||
9/4/24 due 12/4/24 (Collateralized by U.S. Government Obligations valued at $70,655,733, 1.50% - 8.00%, 6/1/26 - 9/15/59) (a)(b)(c)
|
69,860
|
69,000
|
|
9/6/24 due 12/6/24 (Collateralized by U.S. Government Obligations valued at $286,632,682, 2.00% - 7.50%, 2/1/27 - 9/20/54) (a)(b)(c)
|
283,489
|
280,000
|
|
4.94%, dated 8/16/24 due 11/29/24 (Collateralized by U.S. Government Obligations valued at $337,858,868, 1.00% - 7.50%, 1/1/26 - 9/20/54) (a)(b)(c)
|
333,740
|
329,000
|
|
5.14%, dated 8/27/24 due 11/27/24 (Collateralized by U.S. Government Obligations valued at $142,495,452, 0.00% - 7.00%, 4/1/26 - 10/1/54)
|
140,826
|
139,000
|
|
5.29%, dated 8/1/24 due 11/1/24 (Collateralized by U.S. Government Obligations valued at $202,741,148, 1.50% - 7.50%, 12/1/28 - 4/20/73)
|
199,663
|
197,000
|
|
CIBC Bank U.S.A. at:
|
|||
4.85%, dated:
|
|||
9/19/24 due 10/7/24
|
|||
(Collateralized by U.S. Government Obligations valued at $168,572,114, 1.50% - 7.00%, 3/31/27 - 10/1/54)
|
165,578
|
165,000
|
|
(Collateralized by U.S. Government Obligations valued at $110,338,092, 2.00% - 7.00%, 2/1/30 - 7/1/54)
|
108,378
|
108,000
|
|
9/23/24 due 10/7/24 (Collateralized by U.S. Government Obligations valued at $467,663,531, 2.00% - 7.00%, 2/28/25 - 9/1/61)
|
459,728
|
458,000
|
|
4.91%, dated 9/19/24 due 11/8/24 (Collateralized by U.S. Government Obligations valued at $13,632,973, 0.00% - 7.05%, 6/1/29 - 11/20/70)
|
13,089
|
13,000
|
|
Citibank NA at 4.85%, dated 9/25/24 due 10/2/24 (Collateralized by U.S. Government Obligations valued at $329,791,412, 1.27% - 9.00%, 12/1/24 - 7/15/65)
|
323,305
|
323,000
|
|
Citigroup Global Capital Markets, Inc. at:
|
|||
4.85%, dated:
|
|||
9/19/24 due 10/7/24 (Collateralized by U.S. Government Obligations valued at $328,971,079, 0.75% - 4.88%, 4/30/26 - 1/31/31)
|
323,258
|
322,000
|
|
9/25/24 due 10/2/24 (Collateralized by U.S. Government Obligations valued at $495,099,907, 0.75% - 3.38%, 4/30/26 - 5/15/33)
|
485,457
|
485,000
|
|
4.91%, dated:
|
|||
9/25/24 due 11/26/24 (Collateralized by U.S. Government Obligations valued at $726,834,337, 1.13% - 8.00%, 8/31/28 - 3/15/59)
|
718,021
|
712,000
|
|
9/27/24 due 11/27/24 (Collateralized by U.S. Government Obligations valued at $285,755,906, 2.00% - 6.50%, 1/31/31 - 12/15/65)
|
282,330
|
280,000
|
|
5.22%, dated 9/13/24 due 11/14/24 (Collateralized by U.S. Government Obligations valued at $579,849,473, 0.88% - 7.50%, 9/30/25 - 11/20/63)
|
572,097
|
567,000
|
|
5.28%, dated 9/4/24 due 11/5/24 (Collateralized by U.S. Government Obligations valued at $627,736,097, 0.63% - 8.00%, 5/15/30 - 9/20/54)
|
618,574
|
613,000
|
|
Ficc Mississippi Gc Repo (GOV) at 4.91%, dated 9/30/24 due 10/1/24 (Collateralized by U.S. Government Obligations valued at $879,359,919, 1.50% - 9.00%, 2/1/25 - 9/1/54)
|
862,118
|
862,000
|
|
Ficc Mizuho Securities Gc Repo(GOV) at 4.91%, dated 9/30/24 due 10/1/24 (Collateralized by U.S. Government Obligations valued at $1,098,689,829, 1.50% - 8.00%, 1/1/25 - 12/1/62)
|
1,077,147
|
1,077,000
|
|
FICC State Street GC (Gov. Repo) at 4.9%, dated 9/30/24 due 10/1/24 (Collateralized by U.S. Government Obligations valued at $660,539,699, 1.50% - 7.50%, 9/30/25 - 10/1/54)
|
646,088
|
646,000
|
|
Goldman Sachs & Co. at:
|
|||
4.85%, dated:
|
|||
9/24/24 due 10/1/24 (Collateralized by U.S. Government Obligations valued at $994,416,907, 1.50% - 7.00%, 11/1/30 - 9/20/64)
|
974,919
|
974,000
|
|
9/25/24 due 10/2/24 (Collateralized by U.S. Government Obligations valued at $1,098,407,163, 1.50% - 7.50%, 10/15/26 - 9/1/54)
|
1,077,015
|
1,076,000
|
|
9/26/24 due 10/3/24 (Collateralized by U.S. Government Obligations valued at $1,084,990,371, 2.00% - 7.00%, 1/1/29 - 1/15/58)
|
1,064,002
|
1,063,000
|
|
9/27/24 due 10/4/24 (Collateralized by U.S. Government Obligations valued at $1,091,988,144, 1.38% - 7.50%, 8/31/26 - 7/15/58)
|
1,071,009
|
1,070,000
|
|
4.9%, dated 9/30/24 due 10/7/24 (Collateralized by U.S. Government Obligations valued at $1,313,938,817, 3.00% - 6.50%, 2/15/41 - 9/20/54)
|
1,289,227
|
1,288,000
|
|
ING Financial Markets LLC at 4.89%, dated:
|
|||
9/19/24 due 11/8/24 (Collateralized by U.S. Government Obligations valued at $649,777,414, 2.00% - 7.00%, 9/1/45 - 5/1/54)
|
640,320
|
636,000
|
|
9/20/24 due 11/8/24 (Collateralized by U.S. Government Obligations valued at $218,606,147, 4.00% - 5.50%, 1/1/49 - 10/1/53)
|
215,424
|
214,000
|
|
Mitsubishi UFJ Securities (U.S.A.), Inc. at 4.89%, dated 9/19/24 due 12/12/24 (Collateralized by U.S. Government Obligations valued at $924,604,653, 2.00% - 7.00%, 5/1/25 - 9/1/54)
|
915,326
|
905,000
|
|
MUFG Securities (Canada), Ltd. at 4.89%, dated 9/19/24 due 12/12/24 (Collateralized by U.S. Government Obligations valued at $202,299,250, 0.00% - 7.00%, 12/17/24 - 7/20/54)
|
200,259
|
198,000
|
|
RBC Dominion Securities at 4.85%, dated 9/24/24 due 10/1/24 (Collateralized by U.S. Government Obligations valued at $220,660,246, 0.00% - 7.00%, 2/27/25 - 10/1/54)
|
216,204
|
216,000
|
|
RBC Financial Group at 4.86%, dated 9/19/24 due 10/7/24 (Collateralized by U.S. Government Obligations valued at $2,206,900,064, 0.00% - 8.50%, 7/15/26 - 6/1/56)
|
2,171,560
|
2,157,000
|
|
SMBC Nikko Securities America, Inc. at 4.9%, dated 9/30/24 due 10/1/24 (Collateralized by U.S. Government Obligations valued at $264,216,058, 0.00% - 7.00%, 1/23/25 - 9/1/54)
|
259,035
|
259,000
|
|
TD Securities (U.S.A.) at 4.9%, dated 9/30/24 due 10/1/24 (Collateralized by U.S. Government Obligations valued at $547,814,554, 4.00% - 7.00%, 1/1/42 - 8/1/54)
|
537,073
|
537,000
|
|
Wells Fargo Securities, LLC at:
|
|||
4.89%, dated 9/19/24 due:
|
|||
10/21/24 (Collateralized by U.S. Government Obligations valued at $722,315,458, 1.50% - 6.50%, 11/1/24 - 1/1/57)
|
710,073
|
707,000
|
|
11/08/24 (Collateralized by U.S. Government Obligations valued at $578,261,032, 2.00% - 6.50%, 6/1/26 - 10/1/54)
|
569,844
|
566,000
|
|
5%, dated 9/16/24 due 11/15/24 (Collateralized by U.S. Government Obligations valued at $286,195,000, 2.00% - 7.50%, 10/1/25 - 10/1/54)
|
282,333
|
280,000
|
|
5.17%, dated 8/26/24 due 11/26/24 (Collateralized by U.S. Government Obligations valued at $284,000,732, 2.00% - 7.00%, 1/1/27 - 6/1/56)
|
280,660
|
277,000
|
|
5.21%, dated 8/19/24 due 11/19/24 (Collateralized by U.S. Government Obligations valued at $567,570,177, 1.50% - 7.00%, 7/1/25 - 10/1/54)
|
560,363
|
553,000
|
|
|
TOTAL U.S. GOVERNMENT AGENCY REPURCHASE AGREEMENT
(Cost $40,863,491)
|
40,863,491
|
||
U.S. Treasury Repurchase Agreement - 32.5%
|
|||
Maturity
Amount ($)
(000s)
|
Value ($)
(000s)
|
||
With:
|
|||
ABN AMRO Bank NV at 4.88%, dated 9/30/24 due 10/1/24 (Collateralized by U.S. Treasury Obligations valued at $346,847,045, 0.63% - 4.63%, 1/31/26 - 2/15/34)
|
340,046
|
340,000
|
|
Barclays Bank PLC at:
|
|||
4.89%, dated 9/30/24 due 10/1/24 (Collateralized by U.S. Treasury Obligations valued at $198,927,047, 1.25% - 4.63%, 11/15/26 - 11/15/42)
|
195,026
|
195,000
|
|
4.9%, dated 9/30/24 due 10/1/24 (Collateralized by U.S. Treasury Obligations valued at $397,336,394, 0.00% - 4.75%, 10/31/24 - 8/15/54)
|
389,053
|
389,000
|
|
BMO Capital Markets Corp. at 4.83%, dated 9/25/24 due 10/7/24 (Collateralized by U.S. Treasury Obligations valued at $100,200,999, 0.00% - 5.00%, 12/19/24 - 8/15/54)
|
98,184
|
98,000
|
|
BMO Harris Bank NA at:
|
|||
4.83%, dated 9/19/24 due 10/7/24 (Collateralized by U.S. Treasury Obligations valued at $99,039,219, 3.00% - 3.63%, 11/15/44 - 2/15/53)
|
96,270
|
96,000
|
|
5.18%, dated 9/5/24 due 10/4/24 (Collateralized by U.S. Treasury Obligations valued at $193,200,221, 4.13% - 4.63%, 9/30/27 - 5/31/31)
|
189,493
|
188,706
|
|
BNP Paribas, SA at:
|
|||
4.85%, dated 9/19/24 due 10/7/24
|
|||
(Collateralized by U.S. Treasury Obligations valued at $3,160,763,325, 0.00% - 5.38%, 10/29/24 - 5/15/54)
|
3,112,828
|
3,092,000
|
|
(Collateralized by U.S. Treasury Obligations valued at $2,475,647,592, 0.00% - 6.25%, 10/15/24 - 5/15/54)
|
2,428,424
|
2,418,000
|
|
5.31%, dated 8/1/24 due 10/1/24 (Collateralized by U.S. Treasury Obligations valued at $645,408,574, 1.13% - 6.75%, 10/31/24 - 2/15/52)
|
632,641
|
627,000
|
|
BofA Securities, Inc. at 4.88%, dated:
|
|||
dated: 7/1/24 due 10/1/24 (Collateralized by U.S. Treasury Obligations valued at $70,302,673, 0.75% - 4.73%, 10/31/24 - 4/30/26) (a)(b)(c)
|
68,848
|
68,000
|
|
7/25/24 due 10/25/24 (Collateralized by U.S. Treasury Obligations valued at $232,826,012, 0.25% - 7.50%, 11/15/24 - 7/31/30) (a)(b)(c)
|
228,818
|
226,000
|
|
CIBC Bank U.S.A. at:
|
|||
4.84%, dated:
|
|||
9/19/24 due 10/7/24 (Collateralized by U.S. Treasury Obligations valued at $384,143,162, 0.88% - 4.88%, 2/28/25 - 11/15/51)
|
377,314
|
376,000
|
|
9/23/24 due 10/7/24 (Collateralized by U.S. Treasury Obligations valued at $60,244,728, 0.50% - 4.63%, 1/31/25 - 2/15/36)
|
59,175
|
59,000
|
|
9/27/24 due 10/7/24 (Collateralized by U.S. Treasury Obligations valued at $198,017,091, 0.50% - 5.00%, 12/31/24 - 5/15/54)
|
194,626
|
194,000
|
|
5.17%, dated 9/12/24 due 10/1/24 (Collateralized by U.S. Treasury Obligations valued at $100,232,766, 0.38% - 4.63%, 1/31/25 - 11/15/49)
|
98,267
|
98,000
|
|
Credit AG at 4.84%, dated 9/20/24 due 10/7/24 (Collateralized by U.S. Treasury Obligations valued at $38,817,360, 1.88%, 2/28/27)
|
38,107
|
38,000
|
|
Federal Reserve Bank of New York at 4.8%, dated 9/30/24 due 10/1/24 (Collateralized by U.S. Treasury Obligations valued at $13,356,780,764, 0.75%, 11/15/24)
|
13,356,781
|
13,355,000
|
|
FICC ACAFB Repo Program at:
|
|||
4.88%, dated:
|
|||
9/30/24 due 10/1/24 (Collateralized by U.S. Treasury Obligations valued at $3,870,036,199, 0.63% - 4.88%, 2/15/27 - 5/15/40)
|
3,764,510
|
3,764,000
|
|
10/1/24 due 10/2/24 (f)
|
3,777,512
|
3,777,000
|
|
4.89%, dated 9/30/24 due 10/1/24 (Collateralized by U.S. Treasury Obligations valued at $675,178,062, 1.13% - 4.13%, 8/31/28 - 7/31/31)
|
662,090
|
662,000
|
|
Ficc Citi Gc Repo (GOV) at 4.87%, dated 9/30/24 due 10/1/24 (Collateralized by U.S. Treasury Obligations valued at $1,473,079,248, 0.00% - 6.75%, 10/15/24 - 8/15/54)
|
1,444,195
|
1,444,000
|
|
Ficc Ing Finance Markets Dvp (GOV) at:
|
|||
4.86%, dated 9/30/24 due 10/1/24 (Collateralized by U.S. Treasury Obligations valued at $594,783,405, 2.88% - 3.63%, 5/15/28 - 4/30/30)
|
582,079
|
582,000
|
|
4.88%, dated 10/1/24 due 10/2/24 (f)
|
584,079
|
584,000
|
|
4.89%, dated 9/30/24 due 10/1/24 (Collateralized by U.S. Treasury Obligations valued at $2,885,865,177, 2.88% - 4.63%, 9/30/27 - 2/15/34)
|
2,823,383
|
2,823,000
|
|
Ficc Mizuho Securities Gc Repo(GOV) at 4.89%, dated 9/30/24 due 10/1/24 (Collateralized by U.S. Treasury Obligations valued at $595,760,915, 0.00% - 6.50%, 10/31/24 - 8/15/54)
|
584,079
|
584,000
|
|
Ficc Natixis Dvp Repo (GOV REP at 4.88%, dated 9/30/24 due 10/1/24 (Collateralized by U.S. Treasury Obligations valued at $794,781,230, 3.63%, 9/15/27)
|
779,106
|
779,000
|
|
Ficc Nomura Gc Repo (GOV) at 4.9%, dated 9/30/24 due 10/1/24 (Collateralized by U.S. Treasury Obligations valued at $893,641,666, 0.00% - 5.50%, 10/24/24 - 8/15/33)
|
876,119
|
876,000
|
|
Fixed Income Clearing Corp. - BNP at 4.88%, dated 9/30/24 due 10/1/24 (Collateralized by U.S. Treasury Obligations valued at $2,089,243,171, 0.00% - 6.75%, 10/31/24 - 5/15/54)
|
2,048,278
|
2,048,000
|
|
Fixed Income Clearing Corp. - BNYM at 4.88%, dated 9/30/24 due 10/1/24 (Collateralized by U.S. Treasury Obligations valued at $10,327,500,019, 0.13% - 4.75%, 10/31/25 - 2/15/51)
|
10,126,373
|
10,125,000
|
|
Fixed Income Clearing Corp. - SSB at 4.88%, dated 9/30/24 due 10/1/24
|
|||
(Collateralized by U.S. Treasury Obligations valued at $393,662,366, 4.38%, 5/15/34)
|
386,052
|
386,000
|
|
(Collateralized by U.S. Treasury Obligations valued at $6,563,040,298, 0.38% - 4.13%, 9/30/27 - 3/31/28)
|
6,434,407
|
6,433,535
|
|
Goldman Sachs & Co. at:
|
|||
4.87%, dated:
|
|||
9/13/24 due 10/7/24
|
|||
(Collateralized by U.S. Treasury Obligations valued at $385,512,969, 1.13% - 4.63%, 2/28/26 - 2/29/28) (a)(b)(c)
|
379,805
|
377,000
|
|
(Collateralized by U.S. Treasury Obligations valued at $385,512,911, 0.38%, 11/30/25) (a)(b)(c)
|
379,703
|
377,000
|
|
9/16/24 due 10/7/24
|
|||
(Collateralized by U.S. Treasury Obligations valued at $385,341,150, 0.00% - 4.50%, 10/31/24 - 12/31/26) (a)(b)(c)
|
380,009
|
377,000
|
|
(Collateralized by U.S. Treasury Obligations valued at $385,341,135, 0.38% - 5.00%, 9/30/25 - 8/15/28) (a)(b)(c)
|
379,907
|
377,000
|
|
9/20/24 due 10/7/24 (Collateralized by U.S. Treasury Obligations valued at $394,304,721, 0.00% - 4.00%, 10/10/24 - 7/31/29) (a)(b)(c)
|
389,133
|
386,000
|
|
9/30/24 due 10/7/24 (Collateralized by U.S. Treasury Obligations valued at $388,672,651, 0.25% - 4.63%, 4/30/25 - 2/15/28)
|
381,361
|
381,000
|
|
4.88%, dated 9/30/24 due 10/1/24 (Collateralized by U.S. Treasury Obligations valued at $340,726,254, 3.50%, 9/30/26)
|
334,045
|
334,000
|
|
HSBC Securities, Inc. at 4.85%, dated 9/26/24 due 10/3/24 (Collateralized by U.S. Treasury Obligations valued at $385,819,752, 0.38% - 5.25%, 10/31/24 - 8/15/42)
|
378,356
|
378,000
|
|
ING Financial Markets LLC at:
|
|||
4.84%, dated 9/24/24 due 10/1/24 (Collateralized by U.S. Treasury Obligations valued at $29,607,936, 3.75%, 8/31/26)
|
29,027
|
29,000
|
|
4.85%, dated:
|
|||
4.85%, dated: 9/26/24 due 10/3/24 (Collateralized by U.S. Treasury Obligations valued at $19,393,093, 3.75%, 8/31/26)
|
19,018
|
19,000
|
|
9/27/24 due 10/4/24 (Collateralized by U.S. Treasury Obligations valued at $29,595,974, 3.75%, 8/31/26)
|
29,027
|
29,000
|
|
J.P. Morgan Securities, LLC at 4.86%, dated 9/30/24 due 10/7/24 (Collateralized by U.S. Treasury Obligations valued at $5,654,468,213, 1.00% - 6.25%, 1/31/26 - 2/15/43) (a)(b)(c)
|
5,565,297
|
5,542,848
|
|
Lloyds Bank Corp. Markets PLC at:
|
|||
4.85%, dated 9/26/24 due 10/2/24 (Collateralized by U.S. Treasury Obligations valued at $421,626,212, 1.50% - 4.63%, 9/15/26 - 1/31/30)
|
413,334
|
413,000
|
|
5.21%, dated 9/10/24 due 10/10/24 (Collateralized by U.S. Treasury Obligations valued at $135,973,526, 3.63% - 4.63%, 9/15/26 - 3/31/30)
|
133,577
|
133,000
|
|
Lloyds Bank PLC at:
|
|||
4.84%, dated 9/25/24 due 11/25/24 (Collateralized by U.S. Treasury Obligations valued at $63,335,276, 1.88% - 2.25%, 2/15/27 - 2/15/32)
|
62,508
|
62,000
|
|
4.87%, dated:
|
|||
9/19/24 due 11/19/24 (Collateralized by U.S. Treasury Obligations valued at $88,894,250, 2.25% - 3.50%, 2/15/27 - 1/31/28)
|
87,718
|
87,000
|
|
9/20/24 due 11/20/24 (Collateralized by U.S. Treasury Obligations valued at $165,561,004, 0.50% - 3.88%, 2/15/27 - 12/31/27)
|
163,337
|
162,000
|
|
5.16%, dated 8/28/24 due 11/29/24 (Collateralized by U.S. Treasury Obligations valued at $174,208,370, 4.13%, 7/31/28)
|
172,266
|
170,000
|
|
Mitsubishi UFJ Securities (U.S.A.), Inc. at 4.88%, dated 9/19/24 due 12/12/24 (Collateralized by U.S. Treasury Obligations valued at $192,751,813, 0.50% - 4.63%, 12/31/26 - 5/15/54)
|
189,129
|
187,000
|
|
Mizuho Securities U.S.A., Inc. at 4.85%, dated 9/26/24 due 10/3/24 (Collateralized by U.S. Treasury Obligations valued at $144,937,600, 4.74%, 4/30/26)
|
142,134
|
142,000
|
|
MUFG Securities (Canada), Ltd. at:
|
|||
4.86%, dated 9/19/24 due 10/7/24 (Collateralized by U.S. Treasury Obligations valued at $99,107,826, 0.25% - 4.76%, 5/15/25 - 5/15/50)
|
97,655
|
97,000
|
|
4.88%, dated 9/19/24 due 12/12/24 (Collateralized by U.S. Treasury Obligations valued at $191,469,777, 0.00% - 4.76%, 12/26/24 - 2/15/54)
|
189,129
|
187,000
|
|
MUFG Securities EMEA PLC at:
|
|||
4.87%, dated:
|
|||
9/19/24 due 10/7/24 (Collateralized by U.S. Treasury Obligations valued at $593,385,785, 1.13% - 5.38%, 10/31/26 - 11/15/31)
|
584,930
|
581,000
|
|
9/30/24 due 10/1/24 (Collateralized by U.S. Treasury Obligations valued at $228,490,523, 3.63% - 3.75%, 8/31/26 - 9/30/31)
|
224,030
|
224,000
|
|
5.15%, dated 9/9/24 due 10/7/24 (Collateralized by U.S. Treasury Obligations valued at $594,330,585, 0.38% - 4.88%, 1/31/26 - 2/15/43)
|
583,493
|
581,000
|
|
Natixis SA at 4.85%, dated 9/19/24 due 10/7/24 (Collateralized by U.S. Treasury Obligations valued at $508,871,770, 0.00% - 5.00%, 10/31/24 - 11/15/53)
|
501,355
|
498,000
|
|
NatWest Markets Securities, Inc. at:
|
|||
4.85%, dated 9/26/24 due 10/3/24 (Collateralized by U.S. Treasury Obligations valued at $385,819,762, 1.63% - 4.63%, 2/15/26 - 5/15/33)
|
378,356
|
378,000
|
|
4.87%, dated 9/30/24 due 10/1/24 (Collateralized by U.S. Treasury Obligations valued at $97,933,318, 1.50% - 2.75%, 10/31/24 - 8/31/25)
|
96,013
|
96,000
|
|
Norinchukin Bank at:
|
|||
4.85%, dated 9/24/24 due 10/1/24 (Collateralized by U.S. Treasury Obligations valued at $190,894,244, 0.00% - 4.38%, 5/15/32 - 5/15/34)
|
187,176
|
187,000
|
|
4.88%, dated 9/30/24 due 10/1/24 (Collateralized by U.S. Treasury Obligations valued at $63,248,654, 4.38%, 5/15/34)
|
62,008
|
62,000
|
|
Prudential Insurance Co. of America at 4.88%, dated 9/30/24 due 10/1/24 (Collateralized by U.S. Treasury Obligations valued at $496,169,928, 0.00% - 7.50%, 11/12/24 - 11/15/42)
|
486,416
|
486,350
|
|
RBC Dominion Securities at 4.85%, dated 9/19/24 due 10/7/24 (Collateralized by U.S. Treasury Obligations valued at $796,226,751, 0.00% - 5.00%, 11/15/24 - 5/15/54)
|
784,247
|
779,000
|
|
SMBC Nikko Securities America, Inc. at 4.88%, dated 9/30/24 due 10/1/24 (Collateralized by U.S. Treasury Obligations valued at $1,368,023,399, 0.00% - 5.50%, 10/15/24 - 8/15/48)
|
1,341,182
|
1,341,000
|
|
Societe Generale at 4.85%, dated 9/26/24 due 10/3/24
|
|||
(Collateralized by U.S. Treasury Obligations valued at $393,985,220, 2.38% - 4.63%, 6/15/27 - 3/31/31)
|
386,364
|
386,000
|
|
(Collateralized by U.S. Treasury Obligations valued at $197,931,752, 2.00% - 3.13%, 11/15/41 - 8/15/45)
|
193,182
|
193,000
|
|
Sumitomo Mitsui Trust Bank Ltd. at 4.92%, dated 9/25/24 due 10/7/24 (Collateralized by U.S. Treasury Obligations valued at $46,037,913, 1.63% - 4.38%, 8/31/28 - 8/15/29)
|
45,086
|
45,000
|
|
TD Securities (U.S.A.) at:
|
|||
4.85%, dated 9/25/24 due 10/2/24 (Collateralized by U.S. Treasury Obligations valued at $194,977,489, 2.75% - 5.00%, 9/30/25 - 2/15/28)
|
191,180
|
191,000
|
|
4.88%, dated 9/30/24 due 10/1/24 (Collateralized by U.S. Treasury Obligations valued at $291,759,561, 0.50% - 4.50%, 8/31/27 - 5/31/29)
|
286,039
|
286,000
|
|
|
TOTAL U.S. TREASURY REPURCHASE AGREEMENT
(Cost $73,286,439)
|
73,286,439
|
||
U.S. Treasury Debt - 27.4%
|
||||
Yield (%) (a)
|
Principal
Amount (b)
(000s)
|
Value ($)
(000s)
|
||
U.S. Treasury Inflation Protected Obligations - 0.2%
|
||||
U.S. Treasury Notes
|
||||
10/15/24
|
4.83 to 5.14
|
372,695
|
372,159
|
|
U.S. Treasury Obligations - 27.2%
|
||||
U.S. Treasury Bills
|
||||
10/1/24 to 4/3/25
|
4.33 to 5.35
|
59,541,868
|
59,168,799
|
|
U.S. Treasury Notes
|
||||
10/31/24 to 5/15/25 (c)
|
4.73 to 5.24
|
2,285,000
|
2,256,933
|
|
TOTAL U.S. TREASURY OBLIGATIONS
|
61,425,732
|
|||
|
TOTAL U.S. TREASURY DEBT
(Cost $61,797,891)
|
61,797,891
|
|||
U.S. Government Agency Debt - 23.5%
|
||||
Yield (%) (a)
|
Principal
Amount (b)
(000s)
|
Value ($)
(000s)
|
||
Federal Agencies - 23.5%
|
||||
Fannie Mae
|
||||
6/18/26 to 9/11/26 (c)(d)
|
4.94 to 4.98
|
984,000
|
983,995
|
|
Federal Farm Credit Bank
|
||||
10/3/24 to 9/14/26 (c)
|
4.84 to 5.15
|
9,416,977
|
9,417,193
|
|
Federal Home Loan Bank
|
||||
10/1/24 to 9/25/26 (c)
|
4.79 to 5.15
|
37,842,655
|
37,842,463
|
|
10/2/24 to 1/16/25
|
4.96 to 5.33
|
2,147,000
|
2,135,271
|
|
Freddie Mac
|
||||
1/26/26 to 9/23/26 (c)(d)
|
4.93 to 4.98
|
2,605,000
|
2,604,998
|
|
10/7/24 to 10/21/24
|
5.17 to 5.28
|
104,000
|
103,806
|
|
|
TOTAL U.S. GOVERNMENT AGENCY DEBT
(Cost $53,087,726)
|
53,087,726
|
|||
|
TOTAL INVESTMENT IN SECURITIES - 101.5%
(Cost $229,035,547)
|
229,035,547
|
NET OTHER ASSETS (LIABILITIES) - (1.5)%
|
(3,280,430)
|
NET ASSETS - 100.0%
|
225,755,117
|
(a)
|
Yield represents either the annualized yield at the date of purchase, or the stated coupon rate, or, for floating and adjustable rate securities, the rate at period end.
|
(b)
|
Amount is stated in United States dollars unless otherwise noted.
|
(c)
|
A coupon rate of 0% signifies an unsettled loan. The coupon rate will be determined upon settlement of the loan after period end.
|
(d)
|
Coupon is indexed to a floating interest rate which may be multiplied by a specified factor and/or subject to caps or floors.
|
(e)
|
The maturity amount is based on the rate at period end.
|
(f)
|
Represents a forward settling transaction and therefore no collateral securities had been allocated as of period end. The agreement contemplated the delivery of U.S. Treasury Obligations as collateral on settlement date.
|
|
Other Information
|
||
# Additional information on each counterparty to the repurchase agreement is as follows:
|
||
Repurchase Agreement / Counterparty
|
Value ($)
(000's)
|
|
$13,321,533,000 due 10/01/24 at 4.89%
|
||
Bank of America, N.A.
|
776,538
|
|
Bank of Nova Scotia
|
478,463
|
|
BofA Securities, Inc.
|
377,484
|
|
Citigroup Global Markets, Inc.
|
539,263
|
|
Credit Agricole CIB New York Branch
|
231,748
|
|
HSBC Securities (USA), Inc.
|
336,074
|
|
ING Financial Markets LLC
|
129,140
|
|
JP Morgan Securities LLC
|
2,127,856
|
|
Mitsubishi UFJ Securities Holdings Ltd
|
817,788
|
|
Nomura Securities International
|
1,076,037
|
|
RBC Dominion Securities, Inc.
|
1,727,456
|
|
Royal Bank of Canada
|
139,315
|
|
Sumitomo Mitsui Banking Corp.
|
3,852,544
|
|
Wells Fargo Securities LLC
|
711,827
|
|
13,321,533
|
||
$1,894,679,000 due 10/01/24 at 4.89%
|
||
Bank of America, N.A.
|
5,159
|
|
Bank of Nova Scotia
|
142,084
|
|
BofA Securities, Inc.
|
331,470
|
|
Citigroup Global Markets, Inc.
|
3,582
|
|
Credit Agricole CIB New York Branch
|
50,088
|
|
HSBC Securities (USA), Inc.
|
71,676
|
|
ING Financial Markets LLC
|
13,157
|
|
JP Morgan Securities LLC
|
576,103
|
|
Nomura Securities International
|
210,337
|
|
RBC Dominion Securities, Inc.
|
227,428
|
|
Royal Bank of Canada
|
1,631
|
|
Societe Generale (PARIS)
|
257,236
|
|
Wells Fargo Securities LLC
|
4,728
|
|
1,894,679
|
||
Statement of Assets and Liabilities
|
||||
|
As of September 30, 2024 (Unaudited)
Amounts in thousands (except per-share amounts)
|
||||
Assets
|
||||
Investment in securities, at value (including repurchase agreements of $114,149,930) - See accompanying schedule
Unaffiliated issuers (cost $229,035,547):
|
$
|
229,035,547
|
||
Cash
|
1,025,000
|
|||
Receivable for fund shares sold
|
1,154,906
|
|||
Interest receivable
|
467,891
|
|||
Prepaid expenses
|
255
|
|||
Receivable from investment adviser for expense reductions
|
7,486
|
|||
Other receivables
|
1,890
|
|||
Total assets
|
231,692,975
|
|||
Liabilities
|
||||
Payable for investments purchased
|
$
|
4,926,911
|
||
Payable for fund shares redeemed
|
587,348
|
|||
Distributions payable
|
381,913
|
|||
Accrued management fee
|
26,475
|
|||
Distribution and service plan fees payable
|
1,490
|
|||
Other affiliated payables
|
7,628
|
|||
Other payables and accrued expenses
|
6,093
|
|||
Total liabilities
|
5,937,858
|
|||
Net Assets
|
$
|
225,755,117
|
||
Net Assets consist of:
|
||||
Paid in capital
|
$
|
225,755,658
|
||
Total accumulated earnings (loss)
|
(541)
|
|||
Net Assets
|
$
|
225,755,117
|
||
Net Asset Value and Maximum Offering Price
|
||||
Class I :
|
||||
Net Asset Value, offering price and redemption price per share ($51,865,017 ÷ 51,852,067 shares)
|
$
|
1.00
|
||
Class II :
|
||||
Net Asset Value, offering price and redemption price per share ($1,479,443 ÷ 1,478,723 shares)
|
$
|
1.00
|
||
Class III :
|
||||
Net Asset Value, offering price and redemption price per share ($6,312,079 ÷ 6,309,078 shares)
|
$
|
1.00
|
||
Select Class :
|
||||
Net Asset Value, offering price and redemption price per share ($181,665 ÷ 181,644 shares)
|
$
|
1.00
|
||
Institutional Class :
|
||||
Net Asset Value, offering price and redemption price per share ($165,916,913 ÷ 165,923,599 shares)
|
$
|
1.00
|
||
Statement of Operations
|
||||
Six months ended September 30, 2024 (Unaudited)
Amounts in thousands
|
||||
Investment Income
|
||||
Interest
|
$
|
5,500,053
|
||
Expenses
|
||||
Management fee
|
$
|
143,528
|
||
Transfer agent fees
|
38,746
|
|||
Distribution and service plan fees
|
8,431
|
|||
Accounting fees and expenses
|
2,427
|
|||
Custodian fees and expenses
|
612
|
|||
Independent trustees' fees and expenses
|
254
|
|||
Registration fees
|
4,064
|
|||
Audit fees
|
31
|
|||
Legal
|
43
|
|||
Miscellaneous
|
299
|
|||
Total expenses before reductions
|
198,435
|
|||
Expense reductions
|
(35,159)
|
|||
Total expenses after reductions
|
163,276
|
|||
Net Investment income (loss)
|
5,336,777
|
|||
Realized and Unrealized Gain (Loss)
|
||||
Net realized gain (loss) on:
|
||||
Investment Securities:
|
||||
Unaffiliated issuers
|
24
|
|||
Total net realized gain (loss)
|
24
|
|||
Net increase in net assets resulting from operations
|
$
|
5,336,801
|
||
Statement of Changes in Net Assets
|
||||
Amount in thousands
|
Six months ended
September 30, 2024
(Unaudited)
|
Year ended
March 31, 2024
|
||
Increase (Decrease) in Net Assets
|
||||
Operations
|
||||
Net investment income (loss)
|
$
|
5,336,777
|
$
|
9,466,702
|
Net realized gain (loss)
|
24
|
(506)
|
||
Net increase in net assets resulting from operations
|
5,336,801
|
9,466,196
|
||
Distributions to shareholders
|
(5,336,405)
|
(9,467,184)
|
||
Share transactions - net increase (decrease)
|
26,938,346
|
26,669,281
|
||
Total increase (decrease) in net assets
|
26,938,742
|
26,668,293
|
||
Net Assets
|
||||
Beginning of period
|
198,816,375
|
172,148,082
|
||
End of period
|
$
|
225,755,117
|
$
|
198,816,375
|
Government Portfolio Class I |
Six months ended
(Unaudited) September 30, 2024
|
Years ended March 31, 2024
|
2023
|
2022
|
2021
|
2020
|
|||||||
Selected Per-Share Data
|
||||||||||||
Net asset value, beginning of period
|
$
|
1.00
|
$
|
1.00
|
$
|
1.00
|
$
|
1.00
|
$
|
1.00
|
$
|
1.00
|
Income from Investment Operations
|
||||||||||||
Net investment income (loss) A
|
.026
|
.051
|
.025
|
- B
|
- B
|
.018
|
||||||
Net realized and unrealized gain (loss) B
|
-
|
-
|
-
|
-
|
-
|
-
|
||||||
Total from investment operations
|
.026
|
.051
|
.025
|
- B
|
- B
|
.018
|
||||||
Distributions from net investment income
|
(.026)
|
(.051)
|
(.025)
|
- B
|
- B
|
(.018)
|
||||||
Distributions from net realized gain
|
-
|
-
|
-
|
- B
|
-
|
-
|
||||||
Total distributions
|
(.026)
|
(.051)
|
(.025)
|
- B
|
- B
|
(.018)
|
||||||
Net asset value, end of period
|
$
|
1.00
|
$
|
1.00
|
$
|
1.00
|
$
|
1.00
|
$
|
1.00
|
$
|
1.00
|
Total Return C,D
|
2.62 % |
5.26%
|
2.57%
|
.02%
|
.04%
|
1.83%
|
||||||
Ratios to Average Net Assets A,E,F
|
||||||||||||
Expenses before reductions
|
.21% G
|
.21%
|
.21%
|
.20%
|
.20%
|
.21%
|
||||||
Expenses net of fee waivers, if any
|
.18 % G |
.18%
|
.18%
|
.08%
|
.15%
|
.18%
|
||||||
Expenses net of all reductions
|
.18% G
|
.18%
|
.18%
|
.08%
|
.15%
|
.18%
|
||||||
Net investment income (loss)
|
5.17% G
|
5.14%
|
2.61%
|
.01%
|
.05%
|
1.77%
|
||||||
Supplemental Data
|
||||||||||||
Net assets, end of period (in millions)
|
$
|
51,865
|
$
|
42,266
|
$
|
44,905
|
$
|
30,836
|
$
|
33,508
|
$
|
45,360
|
Government Portfolio Class II |
Six months ended
(Unaudited) September 30, 2024
|
Years ended March 31, 2024
|
2023
|
2022
|
2021
|
2020
|
|||||||
Selected Per-Share Data
|
||||||||||||
Net asset value, beginning of period
|
$
|
1.00
|
$
|
1.00
|
$
|
1.00
|
$
|
1.00
|
$
|
1.00
|
$
|
1.00
|
Income from Investment Operations
|
||||||||||||
Net investment income (loss) A
|
.025
|
.050
|
.024
|
- B
|
- B
|
.017
|
||||||
Net realized and unrealized gain (loss) B
|
-
|
-
|
-
|
-
|
-
|
-
|
||||||
Total from investment operations
|
.025
|
.050
|
.024
|
- B
|
- B
|
.017
|
||||||
Distributions from net investment income
|
(.025)
|
(.050)
|
(.024)
|
- B
|
- B
|
(.017)
|
||||||
Distributions from net realized gain
|
-
|
-
|
-
|
- B
|
-
|
-
|
||||||
Total distributions
|
(.025)
|
(.050)
|
(.024)
|
- B
|
- B
|
(.017)
|
||||||
Net asset value, end of period
|
$
|
1.00
|
$
|
1.00
|
$
|
1.00
|
$
|
1.00
|
$
|
1.00
|
$
|
1.00
|
Total Return C,D
|
2.55 % |
5.10%
|
2.41%
|
.01%
|
.01%
|
1.68%
|
||||||
Ratios to Average Net Assets A,E,F
|
||||||||||||
Expenses before reductions
|
.36% G
|
.36%
|
.36%
|
.35%
|
.35%
|
.36%
|
||||||
Expenses net of fee waivers, if any
|
.33 % G |
.33%
|
.33%
|
.08%
|
.17%
|
.33%
|
||||||
Expenses net of all reductions
|
.33% G
|
.33%
|
.33%
|
.08%
|
.17%
|
.33%
|
||||||
Net investment income (loss)
|
5.02% G
|
4.99%
|
2.46%
|
.01%
|
.03%
|
1.62%
|
||||||
Supplemental Data
|
||||||||||||
Net assets, end of period (in millions)
|
$
|
1,479
|
$
|
1,317
|
$
|
942
|
$
|
959
|
$
|
1,366
|
$
|
697
|
Government Portfolio Class III |
Six months ended
(Unaudited) September 30, 2024
|
Years ended March 31, 2024
|
2023
|
2022
|
2021
|
2020
|
|||||||
Selected Per-Share Data
|
||||||||||||
Net asset value, beginning of period
|
$
|
1.00
|
$
|
1.00
|
$
|
1.00
|
$
|
1.00
|
$
|
1.00
|
$
|
1.00
|
Income from Investment Operations
|
||||||||||||
Net investment income (loss) A
|
.025
|
.049
|
.023
|
- B
|
- B
|
.016
|
||||||
Net realized and unrealized gain (loss) B
|
-
|
-
|
-
|
-
|
-
|
-
|
||||||
Total from investment operations
|
.025
|
.049
|
.023
|
- B
|
- B
|
.016
|
||||||
Distributions from net investment income
|
(.025)
|
(.049)
|
(.023)
|
- B
|
- B
|
(.016)
|
||||||
Distributions from net realized gain
|
-
|
-
|
-
|
- B
|
-
|
-
|
||||||
Total distributions
|
(.025)
|
(.049)
|
(.023)
|
- B
|
- B
|
(.016)
|
||||||
Net asset value, end of period
|
$
|
1.00
|
$
|
1.00
|
$
|
1.00
|
$
|
1.00
|
$
|
1.00
|
$
|
1.00
|
Total Return C,D
|
2.50 % |
5.00%
|
2.32%
|
.01%
|
.01%
|
1.57%
|
||||||
Ratios to Average Net Assets A,E,F
|
||||||||||||
Expenses before reductions
|
.46% G
|
.46%
|
.46%
|
.45%
|
.45%
|
.46%
|
||||||
Expenses net of fee waivers, if any
|
.43 % G |
.43%
|
.42%
|
.08%
|
.19%
|
.43%
|
||||||
Expenses net of all reductions
|
.43% G
|
.43%
|
.42%
|
.08%
|
.19%
|
.43%
|
||||||
Net investment income (loss)
|
4.92% G
|
4.89%
|
2.37%
|
.01%
|
.02%
|
1.52%
|
||||||
Supplemental Data
|
||||||||||||
Net assets, end of period (in millions)
|
$
|
6,312
|
$
|
5,714
|
$
|
4,189
|
$
|
3,764
|
$
|
3,234
|
$
|
3,704
|
Government Portfolio Select Class |
Six months ended
(Unaudited) September 30, 2024
|
Years ended March 31, 2024
|
2023
|
2022
|
2021
|
2020
|
|||||||
Selected Per-Share Data
|
||||||||||||
Net asset value, beginning of period
|
$
|
1.00
|
$
|
1.00
|
$
|
1.00
|
$
|
1.00
|
$
|
1.00
|
$
|
1.00
|
Income from Investment Operations
|
||||||||||||
Net investment income (loss) A
|
.026
|
.051
|
.025
|
- B
|
- B
|
.018
|
||||||
Net realized and unrealized gain (loss) B
|
-
|
-
|
-
|
-
|
-
|
-
|
||||||
Total from investment operations
|
.026
|
.051
|
.025
|
- B
|
- B
|
.018
|
||||||
Distributions from net investment income
|
(.026)
|
(.051)
|
(.025)
|
- B
|
- B
|
(.018)
|
||||||
Distributions from net realized gain
|
-
|
-
|
-
|
- B
|
-
|
-
|
||||||
Total distributions
|
(.026)
|
(.051)
|
(.025)
|
- B
|
- B
|
(.018)
|
||||||
Net asset value, end of period
|
$
|
1.00
|
$
|
1.00
|
$
|
1.00
|
$
|
1.00
|
$
|
1.00
|
$
|
1.00
|
Total Return C,D
|
2.60 % |
5.21%
|
2.51%
|
.01%
|
.03%
|
1.78%
|
||||||
Ratios to Average Net Assets A,E,F
|
||||||||||||
Expenses before reductions
|
.26% G
|
.26%
|
.26%
|
.25%
|
.25%
|
.26%
|
||||||
Expenses net of fee waivers, if any
|
.23 % G |
.23%
|
.23%
|
.08%
|
.17%
|
.23%
|
||||||
Expenses net of all reductions
|
.23% G
|
.23%
|
.23%
|
.08%
|
.17%
|
.23%
|
||||||
Net investment income (loss)
|
5.12% G
|
5.09%
|
2.56%
|
.02%
|
.03%
|
1.72%
|
||||||
Supplemental Data
|
||||||||||||
Net assets, end of period (in millions)
|
$
|
182
|
$
|
217
|
$
|
218
|
$
|
293
|
$
|
367
|
$
|
498
|
Government Portfolio Institutional Class |
Six months ended
(Unaudited) September 30, 2024
|
Years ended March 31, 2024
|
2023
|
2022
|
2021
|
2020
|
|||||||
Selected Per-Share Data
|
||||||||||||
Net asset value, beginning of period
|
$
|
1.00
|
$
|
1.00
|
$
|
1.00
|
$
|
1.00
|
$
|
1.00
|
$
|
1.00
|
Income from Investment Operations
|
||||||||||||
Net investment income (loss) A
|
.026
|
.052
|
.026
|
- B
|
.001
|
.019
|
||||||
Net realized and unrealized gain (loss) B
|
-
|
-
|
-
|
-
|
-
|
-
|
||||||
Total from investment operations
|
.026
|
.052
|
.026
|
- B
|
.001
|
.019
|
||||||
Distributions from net investment income
|
(.026)
|
(.052)
|
(.026)
|
- B
|
(.001)
|
(.019)
|
||||||
Distributions from net realized gain
|
-
|
-
|
-
|
- B
|
-
|
-
|
||||||
Total distributions
|
(.026)
|
(.052)
|
(.026)
|
- B
|
(.001)
|
(.019)
|
||||||
Net asset value, end of period
|
$
|
1.00
|
$
|
1.00
|
$
|
1.00
|
$
|
1.00
|
$
|
1.00
|
$
|
1.00
|
Total Return C,D
|
2.64 % |
5.30%
|
2.61%
|
.02%
|
.07%
|
1.87%
|
||||||
Ratios to Average Net Assets A,E,F
|
||||||||||||
Expenses before reductions
|
.18% G
|
.18%
|
.18%
|
.17%
|
.17%
|
.18%
|
||||||
Expenses net of fee waivers, if any
|
.14 % G |
.14%
|
.14%
|
.07%
|
.13%
|
.14%
|
||||||
Expenses net of all reductions
|
.14% G
|
.14%
|
.14%
|
.07%
|
.13%
|
.14%
|
||||||
Net investment income (loss)
|
5.21% G
|
5.18%
|
2.65%
|
.02%
|
.07%
|
1.81%
|
||||||
Supplemental Data
|
||||||||||||
Net assets, end of period (in millions)
|
$
|
165,917
|
$
|
149,302
|
$
|
121,893
|
$
|
91,881
|
$
|
92,805
|
$
|
122,312
|
U.S. Government Agency Repurchase Agreement - 13.7%
|
|||
Maturity
Amount ($)
(000s)
|
Value ($)
(000s)
|
||
In a joint trading account at:
|
|||
4.89% dated 9/30/24 due 10/1/24 (Collateralized by U.S. Government Obligations) #
|
9,158,860
|
9,157,616
|
|
4.94% dated 9/30/24 due 10/1/24 (Collateralized by U.S. Government Obligations) #
|
218,623
|
218,593
|
|
With:
|
|||
ABN AMRO Bank NV at 4.9%, dated 9/30/24 due 10/1/24 (Collateralized by U.S. Government Obligations valued at $192,806,245, 1.25% - 6.00%, 12/31/25 - 2/1/54)
|
189,026
|
189,000
|
|
Barclays Bank PLC at 4.91%, dated 9/30/24 due 10/1/24 (Collateralized by U.S. Government Obligations valued at $258,095,197, 3.00% - 7.00%, 5/20/45 - 9/15/59)
|
253,035
|
253,000
|
|
BMO Harris Bank NA at:
|
|||
4.85%, dated 9/19/24 due 10/7/24 (Collateralized by U.S. Government Obligations valued at $196,016,382, 6.35% - 6.50%, 12/20/52 - 7/20/54)
|
190,845
|
190,000
|
|
5.11%, dated 9/13/24 due 10/7/24 (Collateralized by U.S. Government Obligations valued at $132,176,852, 6.15% - 6.23%, 6/20/72 - 1/20/73)
|
128,581
|
128,000
|
|
5.16%, dated 9/12/24 due 10/7/24 (Collateralized by U.S. Government Obligations valued at $98,116,479, 4.00% - 6.23%, 7/20/52 - 2/20/73)
|
95,477
|
95,000
|
|
BNP Paribas, SA at:
|
|||
4.86%, dated 9/19/24 due 10/7/24 (Collateralized by U.S. Government Obligations valued at $325,687,051, 0.00% - 7.00%, 4/30/25 - 10/1/54)
|
317,365
|
316,000
|
|
4.87%, dated 9/3/24 due 10/7/24 (Collateralized by U.S. Government Obligations valued at $197,267,979, 0.00% - 7.00%, 4/30/25 - 10/1/54) (c)(d)(f)
|
193,351
|
191,000
|
|
BofA Securities, Inc. at 4.88%, dated 7/2/24 due 10/2/24 (Collateralized by U.S. Government Obligations valued at $114,741,803, 1.50% - 7.50%, 5/1/36 - 5/1/54) (c)(d)(f)
|
112,384
|
111,000
|
|
CIBC Bank U.S.A. at 4.85%, dated:
|
|||
9/19/24 due 10/7/24
|
|||
(Collateralized by U.S. Government Obligations valued at $100,121,603, 2.00% - 7.00%, 9/1/30 - 9/1/54)
|
98,343
|
98,000
|
|
(Collateralized by U.S. Government Obligations valued at $64,363,887, 2.00% - 7.00%, 2/1/30 - 9/1/54)
|
63,221
|
63,000
|
|
9/23/24 due 10/7/24 (Collateralized by U.S. Government Obligations valued at $269,570,234, 2.00% - 7.38%, 6/20/41 - 9/1/54)
|
264,996
|
264,000
|
|
Citibank NA at 4.85%, dated 9/25/24 due 10/2/24 (Collateralized by U.S. Government Obligations valued at $192,982,062, 2.00% - 8.38%, 9/1/28 - 3/20/74)
|
189,178
|
189,000
|
|
Citigroup Global Capital Markets, Inc. at 4.85%, dated:
|
|||
9/19/24 due 10/7/24 (Collateralized by U.S. Government Obligations valued at $194,113,343, 0.75% - 4.88%, 4/30/26 - 1/31/31)
|
190,742
|
190,000
|
|
9/25/24 due 10/2/24 (Collateralized by U.S. Government Obligations valued at $288,893,400, 0.50% - 4.63%, 1/15/25 - 3/31/26)
|
283,267
|
283,000
|
|
Ficc Mississippi Gc Repo (GOV) at 4.91%, dated 9/30/24 due 10/1/24 (Collateralized by U.S. Government Obligations valued at $515,170,255, 1.50% - 7.00%, 3/1/31 - 10/1/54)
|
505,069
|
505,000
|
|
Ficc Mizuho Securities Gc Repo(GOV) at 4.91%, dated 9/30/24 due 10/1/24 (Collateralized by U.S. Government Obligations valued at $643,707,783, 1.50% - 7.50%, 11/15/31 - 7/15/58)
|
631,086
|
631,000
|
|
FICC State Street GC (Gov. Repo) at 4.9%, dated 9/30/24 due 10/1/24 (Collateralized by U.S. Government Obligations valued at $387,856,641, 0.25% - 7.50%, 7/31/25 - 9/1/54)
|
379,052
|
379,000
|
|
Goldman Sachs & Co. at:
|
|||
4.85%, dated:
|
|||
9/24/24 due 10/1/24 (Collateralized by U.S. Government Obligations valued at $578,885,408, 0.00% - 7.50%, 11/5/24 - 9/15/64)
|
567,535
|
567,000
|
|
9/25/24 due 10/2/24 (Collateralized by U.S. Government Obligations valued at $642,098,612, 0.00% - 7.63%, 10/15/24 - 9/1/54)
|
629,593
|
629,000
|
|
9/26/24 due 10/3/24 (Collateralized by U.S. Government Obligations valued at $646,094,924, 1.50% - 7.00%, 8/1/28 - 2/15/59)
|
633,597
|
633,000
|
|
9/27/24 due 10/4/24 (Collateralized by U.S. Government Obligations valued at $642,946,292, 1.88% - 7.50%, 9/30/25 - 10/15/57)
|
630,594
|
630,000
|
|
4.9%, dated 9/30/24 due 10/7/24 (Collateralized by U.S. Government Obligations valued at $770,204,821, 1.50% - 6.50%, 11/30/24 - 6/15/61)
|
755,719
|
755,000
|
|
RBC Dominion Securities at 4.85%, dated 9/24/24 due 10/1/24 (Collateralized by U.S. Government Obligations valued at $128,704,823, 0.00% - 7.00%, 1/15/26 - 10/1/54)
|
126,119
|
126,000
|
|
RBC Financial Group at 4.86%, dated 9/19/24 due 10/7/24 (Collateralized by U.S. Government Obligations valued at $1,299,707,907, 0.00% - 7.50%, 2/15/25 - 9/20/64)
|
1,276,559
|
1,268,000
|
|
SMBC Nikko Securities America, Inc. at 4.9%, dated 9/30/24 due 10/1/24 (Collateralized by U.S. Government Obligations valued at $154,040,965, 1.50% - 7.00%, 8/31/26 - 9/1/54)
|
151,021
|
151,000
|
|
TD Securities (U.S.A.) at 4.9%, dated 9/30/24 due 10/1/24 (Collateralized by U.S. Government Obligations valued at $320,323,594, 2.00% - 6.00%, 5/1/51 - 10/1/53)
|
314,043
|
314,000
|
|
|
TOTAL U.S. GOVERNMENT AGENCY REPURCHASE AGREEMENT
(Cost $18,524,209)
|
18,524,209
|
||
U.S. Treasury Repurchase Agreement - 46.5%
|
|||
Maturity
Amount ($)
(000s)
|
Value ($)
(000s)
|
||
With:
|
|||
ABN AMRO Bank NV at 4.88%, dated 9/30/24 due 10/1/24 (Collateralized by U.S. Treasury Obligations valued at $203,007,530, 1.00% - 2.38%, 11/15/25 - 5/15/29)
|
199,027
|
199,000
|
|
Barclays Bank PLC at:
|
|||
4.89%, dated 9/30/24 due 10/1/24 (Collateralized by U.S. Treasury Obligations valued at $116,508,972, 1.88% - 4.13%, 2/28/27 - 11/15/47)
|
114,015
|
114,000
|
|
4.9%, dated 9/30/24 due 10/1/24 (Collateralized by U.S. Treasury Obligations valued at $233,084,928, 1.75% - 4.75%, 8/31/25 - 11/15/47)
|
228,031
|
228,000
|
|
BMO Capital Markets Corp. at 4.83%, dated 9/25/24 due 10/7/24 (Collateralized by U.S. Treasury Obligations valued at $58,186,856, 0.00% - 5.00%, 10/31/24 - 11/15/48)
|
57,107
|
57,000
|
|
BMO Harris Bank NA at:
|
|||
4.83%, dated 9/19/24 due 10/7/24 (Collateralized by U.S. Treasury Obligations valued at $57,657,947, 3.00% - 4.38%, 11/15/39 - 8/15/48)
|
56,158
|
56,000
|
|
5.18%, dated 9/5/24 due 10/4/24 (Collateralized by U.S. Treasury Obligations valued at $116,433,081, 1.38% - 5.38%, 2/15/31 - 8/15/50)
|
113,472
|
113,000
|
|
BNP Paribas, SA at:
|
|||
4.85%, dated 9/19/24 due 10/7/24 (Collateralized by U.S. Treasury Obligations valued at $1,468,165,775, 0.50% - 4.88%, 1/31/25 - 8/15/53)
|
1,442,191
|
1,436,000
|
|
5.31%, dated 8/1/24 due 10/1/24 (Collateralized by U.S. Treasury Obligations valued at $422,993,578, 0.00% - 4.79%, 1/31/25 - 2/15/54)
|
414,698
|
411,000
|
|
CIBC Bank U.S.A. at:
|
|||
4.84%, dated:
|
|||
9/19/24 due 10/7/24 (Collateralized by U.S. Treasury Obligations valued at $227,826,975, 0.25% - 4.63%, 2/28/25 - 8/15/52)
|
223,780
|
223,000
|
|
9/23/24 due 10/7/24 (Collateralized by U.S. Treasury Obligations valued at $34,717,349, 0.88% - 4.25%, 3/15/25 - 8/15/52)
|
34,101
|
34,000
|
|
9/27/24 due 10/7/24 (Collateralized by U.S. Treasury Obligations valued at $116,665,544, 0.38% - 4.63%, 9/15/25 - 5/15/54)
|
114,368
|
114,000
|
|
5.17%, dated 9/12/24 due 10/1/24 (Collateralized by U.S. Treasury Obligations valued at $58,298,744, 0.38% - 4.88%, 1/31/25 - 11/15/52)
|
57,156
|
57,000
|
|
Credit AG at 4.84%, dated 9/20/24 due 10/7/24 (Collateralized by U.S. Treasury Obligations valued at $23,494,729, 2.00%, 8/15/25)
|
23,065
|
23,000
|
|
Federal Reserve Bank of New York at 4.8%, dated 9/30/24 due 10/1/24 (Collateralized by U.S. Treasury Obligations valued at $30,502,066,458, 1.13% - 4.75%, 2/15/31 - 2/15/41)
|
30,502,066
|
30,498,000
|
|
FICC ACAFB Repo Program at:
|
|||
4.88%, dated:
|
|||
9/30/24 due 10/1/24 (Collateralized by U.S. Treasury Obligations valued at $2,285,009,085, 1.88% - 5.00%, 10/31/25 - 5/15/51)
|
2,217,301
|
2,217,000
|
|
10/1/24 due 10/2/24 (g)
|
2,213,300
|
2,213,000
|
|
4.89%, dated 9/30/24 due 10/1/24 (Collateralized by U.S. Treasury Obligations valued at $395,760,547, 3.13% - 3.75%, 8/15/27 - 8/31/27)
|
388,053
|
388,000
|
|
Ficc Citi Gc Repo (GOV) at 4.87%, dated 9/30/24 due 10/1/24 (Collateralized by U.S. Treasury Obligations valued at $863,036,741, 0.00% - 6.25%, 10/15/24 - 2/15/52)
|
846,114
|
846,000
|
|
Ficc Ing Finance Markets Dvp (GOV) at:
|
|||
4.86%, dated 9/30/24 due 10/1/24 (Collateralized by U.S. Treasury Obligations valued at $350,406,858, 3.63%, 5/31/28)
|
343,046
|
343,000
|
|
4.88%, dated 10/1/24 due 10/2/24 (g)
|
342,046
|
342,000
|
|
4.89%, dated 9/30/24 due 10/1/24 (Collateralized by U.S. Treasury Obligations valued at $1,690,548,165, 0.75% - 4.00%, 3/31/26 - 9/30/31)
|
1,654,225
|
1,654,000
|
|
Ficc Mizuho Securities Gc Repo(GOV) at 4.89%, dated 9/30/24 due 10/1/24 (Collateralized by U.S. Treasury Obligations valued at $348,887,388, 0.25% - 4.63%, 10/31/24 - 5/15/53)
|
342,046
|
342,000
|
|
Ficc Natixis Dvp Repo (GOV REP at 4.88%, dated 9/30/24 due 10/1/24 (Collateralized by U.S. Treasury Obligations valued at $465,181,356, 3.50% - 4.63%, 9/30/26 - 4/30/29)
|
456,062
|
456,000
|
|
Ficc Nomura Gc Repo (GOV) at 4.9%, dated 9/30/24 due 10/1/24 (Collateralized by U.S. Treasury Obligations valued at $523,331,222, 0.00% - 4.72%, 11/19/24 - 5/15/32)
|
513,070
|
513,000
|
|
Fixed Income Clearing Corp. - BNP at 4.88%, dated 9/30/24 due 10/1/24 (Collateralized by U.S. Treasury Obligations valued at $1,224,165,941, 1.13% - 6.13%, 4/30/25 - 5/15/54)
|
1,200,163
|
1,200,000
|
|
Fixed Income Clearing Corp. - BNYM at 4.88%, dated 9/30/24 due 10/1/24 (Collateralized by U.S. Treasury Obligations valued at $6,050,640,086, 0.25% - 4.63%, 1/15/25 - 5/15/54)
|
5,932,804
|
5,932,000
|
|
Fixed Income Clearing Corp. - SSB at 4.88%, dated 9/30/24 due 10/1/24
|
|||
(Collateralized by U.S. Treasury Obligations valued at $234,582,134, 4.00%, 2/15/34)
|
230,031
|
230,000
|
|
(Collateralized by U.S. Treasury Obligations valued at $3,844,729,258, 0.50% - 4.63%, 5/31/27 - 6/30/27)
|
3,769,511
|
3,769,000
|
|
Goldman Sachs & Co. at:
|
|||
4.87%, dated:
|
|||
9/13/24 due 10/7/24
|
|||
(Collateralized by U.S. Treasury Obligations valued at $232,125,821, 4.79%, 1/31/25) (c)(d)(f)
|
228,689
|
227,000
|
|
(Collateralized by U.S. Treasury Obligations valued at $232,125,838, 0.63% - 3.13%, 8/15/25 - 12/31/27) (c)(d)(f)
|
228,628
|
227,000
|
|
9/16/24 due 10/7/24
|
|||
(Collateralized by U.S. Treasury Obligations valued at $232,022,383, 0.75% - 3.75%, 4/30/26 - 11/30/26) (c)(d)(f)
|
228,812
|
227,000
|
|
(Collateralized by U.S. Treasury Obligations valued at $232,022,438, 0.00% - 0.25%, 6/30/25 - 7/10/25) (c)(d)(f)
|
228,750
|
227,000
|
|
9/20/24 due 10/7/24 (Collateralized by U.S. Treasury Obligations valued at $228,819,330, 0.00% - 4.88%, 10/22/24 - 5/31/26) (c)(d)(f)
|
225,818
|
224,000
|
|
9/30/24 due 10/7/24 (Collateralized by U.S. Treasury Obligations valued at $227,490,826, 0.75% - 2.63%, 12/31/25 - 8/31/26)
|
223,211
|
223,000
|
|
4.88%, dated 9/30/24 due 10/1/24 (Collateralized by U.S. Treasury Obligations valued at $199,947,178, 3.50%, 9/30/26)
|
196,027
|
196,000
|
|
HSBC Securities, Inc. at 4.85%, dated 9/26/24 due 10/3/24 (Collateralized by U.S. Treasury Obligations valued at $229,654,600, 1.13% - 4.76%, 4/30/25 - 5/15/33)
|
225,212
|
225,000
|
|
ING Financial Markets LLC at:
|
|||
4.84%, dated 9/24/24 due 10/1/24 (Collateralized by U.S. Treasury Obligations valued at $17,356,397, 3.75%, 8/31/26)
|
17,016
|
17,000
|
|
4.85%, dated:
|
|||
9/26/24 due 10/3/24 (Collateralized by U.S. Treasury Obligations valued at $11,227,612, 3.75%, 8/31/26)
|
11,010
|
11,000
|
|
9/27/24 due 10/4/24 (Collateralized by U.S. Treasury Obligations valued at $17,349,361, 3.75%, 8/31/26)
|
17,016
|
17,000
|
|
J.P. Morgan Securities, LLC at 4.86%, dated 9/30/24 due 10/7/24 (Collateralized by U.S. Treasury Obligations valued at $3,312,387,118, 1.25% - 5.00%, 10/31/25 - 2/15/30) (c)(d)(f)
|
3,260,150
|
3,247,000
|
|
Lloyds Bank Corp. Markets PLC at 4.85%, dated 9/26/24 due 10/2/24 (Collateralized by U.S. Treasury Obligations valued at $246,874,461, 3.13% - 4.63%, 7/15/26 - 8/31/29)
|
242,196
|
242,000
|
|
Mizuho Securities U.S.A., Inc. at 4.85%, dated 9/26/24 due 10/3/24 (Collateralized by U.S. Treasury Obligations valued at $86,578,302, 3.63% - 4.00%, 11/15/52 - 2/15/53)
|
84,079
|
84,000
|
|
MUFG Securities (Canada), Ltd. at 4.86%, dated 9/19/24 due 10/7/24 (Collateralized by U.S. Treasury Obligations valued at $58,234,306, 0.25% - 4.50%, 11/30/24 - 8/15/45)
|
57,385
|
57,000
|
|
MUFG Securities EMEA PLC at:
|
|||
4.87%, dated:
|
|||
9/19/24 due 10/7/24 (Collateralized by U.S. Treasury Obligations valued at $353,365,498, 1.13% - 3.75%, 10/31/26 - 2/15/42)
|
347,334
|
345,000
|
|
9/30/24 due 10/1/24 (Collateralized by U.S. Treasury Obligations valued at $133,633,844, 1.13% - 3.75%, 8/31/26 - 9/30/31)
|
131,018
|
131,000
|
|
5.15%, dated 9/9/24 due 10/7/24 (Collateralized by U.S. Treasury Obligations valued at $352,931,347, 0.88% - 4.38%, 10/31/26 - 2/15/32)
|
346,481
|
345,000
|
|
NatWest Markets Securities, Inc. at:
|
|||
4.85%, dated 9/26/24 due 10/3/24 (Collateralized by U.S. Treasury Obligations valued at $229,654,673, 3.13% - 4.63%, 8/15/25 - 8/15/27)
|
225,212
|
225,000
|
|
4.87%, dated 9/30/24 due 10/1/24 (Collateralized by U.S. Treasury Obligations valued at $57,127,738, 2.88% - 4.50%, 11/30/25 - 7/15/26)
|
56,008
|
56,000
|
|
RBC Dominion Securities at 4.85%, dated 9/19/24 due 10/7/24 (Collateralized by U.S. Treasury Obligations valued at $468,176,535, 0.00% - 4.88%, 12/19/24 - 8/15/53)
|
461,085
|
458,000
|
|
SMBC Nikko Securities America, Inc. at 4.88%, dated 9/30/24 due 10/1/24 (Collateralized by U.S. Treasury Obligations valued at $1,321,098,780, 0.50% - 7.50%, 11/15/24 - 5/15/54)
|
1,295,176
|
1,295,000
|
|
Societe Generale at 4.85%, dated 9/26/24 due 10/3/24
|
|||
(Collateralized by U.S. Treasury Obligations valued at $234,758,029, 1.25% - 5.00%, 9/30/25 - 2/15/32)
|
230,217
|
230,000
|
|
(Collateralized by U.S. Treasury Obligations valued at $118,100,798, 2.88% - 3.63%, 5/15/43 - 2/15/53)
|
115,108
|
115,000
|
|
TD Securities (U.S.A.) at:
|
|||
4.85%, dated 9/25/24 due 10/2/24 (Collateralized by U.S. Treasury Obligations valued at $114,332,440, 3.50% - 5.00%, 10/31/25 - 1/31/28)
|
112,106
|
112,000
|
|
4.88%, dated 9/30/24 due 10/1/24 (Collateralized by U.S. Treasury Obligations valued at $171,383,233, 3.75% - 5.00%, 8/31/25 - 3/15/27)
|
168,023
|
168,000
|
|
|
TOTAL U.S. TREASURY REPURCHASE AGREEMENT
(Cost $62,939,000)
|
62,939,000
|
||
Other Repurchase Agreement - 4.9%
|
|||
Maturity
Amount ($)
(000s)
|
Value ($)
(000s)
|
||
Other Repurchase Agreement - 4.9%
|
|||
With:
|
|||
BMO Capital Markets Corp. at:
|
|||
4.97%, dated 9/30/24 due 10/1/24 (Collateralized by Corporate Obligations valued at $55,658,248, 2.65% - 4.30%, 2/8/51 - 12/31/99)
|
53,007
|
53,000
|
|
5.03%, dated 9/30/24 due 10/1/24 (Collateralized by Corporate Obligations valued at $57,248,883, 4.50% - 10.75%, 10/15/24 - 9/1/29)
|
53,007
|
53,000
|
|
BNP Paribas Prime Brokerage, Inc. at 5.08%, dated 9/30/24 due 10/1/24 (Collateralized by Equity Securities valued at $683,736,528)
|
633,089
|
633,000
|
|
Goldman Sachs & Co. at 5.23%, dated 8/23/24 due 10/7/24 (Collateralized by Equity Securities valued at $286,004,359) (c)(d)(f)
|
266,732
|
265,000
|
|
HSBC Securities, Inc. at 5.06%, dated 9/30/24 due 10/1/24 (Collateralized by Corporate Obligations valued at $57,248,070, 3.50% - 9.88%, 10/15/27 - 1/1/99)
|
53,007
|
53,000
|
|
ING Financial Markets LLC at 5.05%, dated 9/30/24 due 10/1/24 (Collateralized by Equity Securities valued at $114,496,090)
|
106,015
|
106,000
|
|
J.P. Morgan Securities, LLC at:
|
|||
5.33%, dated:
|
|||
9/3/24 due 12/30/24 (Collateralized by Equity Securities valued at $574,907,908) (c)(d)(f)
|
539,495
|
530,000
|
|
9/16/24 due 12/30/24
|
|||
(Collateralized by Equity Securities valued at $401,592,105) (c)(d)(f)
|
377,591
|
371,000
|
|
(Collateralized by Corporate Obligations valued at $726,800,512, 0.00% - 7.50%, 5/1/25 - 12/1/30) (c)(d)(f)
|
702,259
|
690,000
|
|
9/19/24 due 12/30/24 (Collateralized by Equity Securities valued at $1,144,685,962) (c)(d)(f)
|
1,076,797
|
1,058,000
|
|
5.35%, dated 9/16/24 due 12/30/24 (Collateralized by Corporate Obligations valued at $418,854,786, 0.00% - 9.54%, 10/15/24 - 6/25/67) (c)(d)(f)
|
405,098
|
398,000
|
|
Mitsubishi UFJ Securities (U.S.A.), Inc. at:
|
|||
5.06%, dated 9/30/24 due 10/1/24 (Collateralized by Equity Securities valued at $71,290,019)
|
66,009
|
66,000
|
|
5.35%, dated 9/30/24 due 10/1/24 (Collateralized by Equity Securities valued at $10,770,210)
|
10,001
|
10,000
|
|
Mizuho Securities U.S.A., Inc. at:
|
|||
5.1%, dated 9/30/24 due 10/1/24 (Collateralized by Equity Securities valued at $28,083,985)
|
26,004
|
26,000
|
|
5.33%, dated 9/25/24 due 11/22/24 (Collateralized by Corporate Obligations valued at $431,302,213, 0.00% - 13.25%, 1/27/25 - 1/1/99) (c)(d)(f)
|
399,401
|
396,000
|
|
NatWest Markets Securities, Inc. at 5.07%, dated 9/30/24 due 10/1/24 (Collateralized by Corporate Obligations valued at $55,225,054, 0.00% - 6.09%, 10/17/24 - 6/21/38)
|
53,007
|
53,000
|
|
RBC Capital Markets Co. at 5.33%, dated 9/25/24 due 11/25/24 (Collateralized by Corporate Obligations valued at $110,567,449, 0.00% - 8.98%, 2/14/25 - 4/15/60) (c)(d)(f)
|
106,957
|
106,000
|
|
Td Securities (U.S.A.) (NON GOV) at 4.98%, dated 9/30/24 due 10/1/24 (Collateralized by Corporate Obligations valued at $277,238,500, 1.38% - 5.87%, 7/15/25 - 4/18/54)
|
264,037
|
264,000
|
|
Truist Securities, Inc. at:
|
|||
5.1%, dated 9/30/24 due 10/1/24 (Collateralized by Corporate Obligations valued at $55,658,530, 1.95% - 6.50%, 11/9/28 - 9/15/59)
|
53,008
|
53,000
|
|
5.15%, dated 9/30/24 due 10/1/24 (Collateralized by Municipal Bond Obligations valued at $27,430,490, 3.00% - 5.75%, 2/15/26 - 9/1/64)
|
26,004
|
26,000
|
|
Wells Fargo Securities, LLC at:
|
|||
4.99%, dated 9/30/24 due 10/1/24 (Collateralized by Corporate Obligations valued at $296,861,891, 0.38% - 6.75%, 7/15/25 - 8/28/34)
|
291,040
|
291,000
|
|
5.03%, dated 9/30/24 due 10/1/24 (Collateralized by Equity Securities valued at $285,159,851)
|
264,037
|
264,000
|
|
5.07%, dated 9/26/24 due 10/3/24 (Collateralized by Corporate Obligations valued at $285,320,772, 0.00% - 14.00%, 5/15/25 - 1/1/99)
|
264,260
|
264,000
|
|
5.33%, dated:
|
|||
9/5/24 due 1/3/25 (Collateralized by Equity Securities valued at $144,222,861) (c)(d)(f)
|
135,363
|
133,000
|
|
9/13/24 due 1/10/25 (Collateralized by Corporate Obligations valued at $216,837,330, 0.38% - 4.13%, 4/22/25 - 3/29/32) (c)(d)(f)
|
215,735
|
212,000
|
|
9/19/24 due 1/17/25 (Collateralized by Equity Securities valued at $228,288,040) (c)(d)(f)
|
214,749
|
211,000
|
|
5.43%, dated 9/13/24 due 1/10/25 (Collateralized by Corporate Obligations valued at $57,401,508, 0.00% - 7.50%, 9/15/25 - 3/1/28) (c)(d)(f)
|
53,951
|
53,000
|
|
|
TOTAL OTHER REPURCHASE AGREEMENT
(Cost $6,638,000)
|
6,638,000
|
||
Certificate of Deposit - 7.8%
|
||||
Yield (%) (a)
|
Principal
Amount (b)
(000s)
|
Value ($)
(000s)
|
||
New York Branch, Yankee Dollar, Foreign Banks - 7.8%
|
||||
Bank of Montreal
|
||||
12/6/24 to 4/22/25 (c)(d)
|
5.05 to 5.07
|
235,000
|
235,000
|
|
Bayerische Landesbank
|
||||
10/25/24
|
4.94
|
260,000
|
260,000
|
|
Canadian Imperial Bank of Commerce
|
||||
10/1/24 to 4/24/25 (c)
|
5.04 to 5.45
|
717,000
|
717,000
|
|
Commonwealth Bank of Australia New York Branch
|
||||
10/4/24 (c)(d)
|
5.04
|
66,000
|
66,000
|
|
Landesbank Baden-Wuerttemberg New York Branch
|
||||
10/2/24 to 10/7/24
|
4.88 to 4.88
|
778,000
|
778,000
|
|
Mitsubishi UFJ Trust & Banking Corp.
|
||||
10/17/24 to 10/18/24
|
5.42 to 5.42
|
513,000
|
513,000
|
|
MUFG Bank Ltd.
|
||||
10/1/24 to 1/16/25 (c)
|
4.85 to 5.02
|
4,947,000
|
4,946,998
|
|
Sumitomo Mitsui Banking Corp.
|
||||
10/11/24 to 10/16/24 (c)(d)
|
5.02 to 5.02
|
792,000
|
792,000
|
|
Sumitomo Mitsui Trust Bank Ltd.
|
||||
10/1/24 to 12/4/24 (c)
|
4.88 to 5.47
|
2,136,000
|
2,136,014
|
|
Toronto-Dominion Bank
|
||||
2/21/25 (c)(d)
|
5.10
|
69,000
|
69,016
|
|
|
TOTAL CERTIFICATE OF DEPOSIT
(Cost $10,513,028)
|
10,513,028
|
|||
Financial Company Commercial Paper - 14.8%
|
||||
Yield (%) (a)
|
Principal
Amount (b)
(000s)
|
Value ($)
(000s)
|
||
Australia & New Zealand Banking Group Ltd.
|
||||
12/17/24 (c)(d)
|
5.02
|
276,000
|
276,000
|
|
Bank of Montreal
|
||||
10/25/24 to 3/5/25 (c)
|
5.04 to 5.51
|
2,454,000
|
2,444,597
|
|
Bank of Nova Scotia
|
||||
10/21/24 to 12/6/24 (c)
|
5.02 to 5.44
|
919,000
|
917,844
|
|
Bedford Row Funding Corp.
|
||||
1/22/25 (c)(d)
|
5.05
|
157,000
|
157,000
|
|
2/12/25 (c)(d)
|
5.07
|
131,000
|
131,000
|
|
4/3/25 (c)(d)
|
5.06
|
130,000
|
130,000
|
|
Bedford Row Funding Corp. (Liquidity Facility Royal Bank of Canada)
|
||||
10/2/24
|
5.46
|
53,000
|
52,992
|
|
11/13/24
|
5.50
|
131,000
|
130,163
|
|
11/18/24
|
5.51
|
77,000
|
76,450
|
|
11/18/24
|
5.51
|
54,000
|
53,614
|
|
11/21/24
|
5.50
|
170,000
|
168,712
|
|
BofA Securities, Inc.
|
||||
10/28/24 to 12/9/24
|
5.43 to 5.46
|
523,000
|
519,277
|
|
Canadian Imperial Bank of Commerce
|
||||
11/18/24 to 4/24/25 (c)
|
5.04 to 5.48
|
2,254,000
|
2,250,243
|
|
Cisco Systems, Inc.
|
||||
1/27/25
|
5.37
|
131,000
|
128,759
|
|
Citigroup Global Markets, Inc.
|
||||
11/1/24 (c)(d)
|
5.07
|
91,000
|
91,008
|
|
Commonwealth Bank of Australia
|
||||
1/2/25 to 4/9/25 (c)(d)
|
5.01 to 5.04
|
726,000
|
725,991
|
|
Cooperatieve Rabobank UA/NY
|
||||
10/1/24
|
4.84
|
650,000
|
650,000
|
|
DNB Bank ASA
|
||||
2/27/25 to 2/28/25 (c)(d)
|
5.02 to 5.02
|
418,000
|
418,000
|
|
Federation des caisses Desjardin
|
||||
11/1/24
|
5.32
|
14,000
|
13,937
|
|
Landesbank Baden-Wurttemberg
|
||||
10/1/24
|
4.85
|
2,600,000
|
2,600,000
|
|
Mitsubishi UFJ Trust & Banking Corp.
|
||||
11/26/24
|
5.29
|
105,000
|
104,147
|
|
National Australia Bank Ltd.
|
||||
10/2/24 to 4/16/25 (c)(d)
|
5.01 to 5.04
|
1,271,000
|
1,271,000
|
|
Nationwide Building Society
|
||||
10/2/24
|
4.84
|
366,000
|
365,951
|
|
Podium Funding Trust
|
||||
1/21/25 (c)(d)
|
5.08
|
52,000
|
52,000
|
|
2/14/25 (c)(d)
|
5.07
|
52,000
|
52,000
|
|
3/27/25 (c)(d)
|
5.08
|
78,000
|
78,000
|
|
3/4/25 (c)(d)
|
5.06
|
104,000
|
104,000
|
|
4/3/25 (c)(d)
|
5.08
|
105,000
|
105,000
|
|
Podium Funding Trust (Liquidity Facility Bank of Montreal)
|
||||
11/15/24
|
5.53
|
52,000
|
51,652
|
|
4/14/25 (c)(d)
|
5.07
|
52,000
|
52,000
|
|
PSP Capital, Inc.
|
||||
10/1/24 (e)
|
4.84
|
119,000
|
119,000
|
|
Royal Bank of Canada
|
||||
1/6/25 to 3/27/25 (c)(d)
|
5.02 to 5.05
|
522,000
|
522,000
|
|
Sumitomo Mitsui Trust Bank Ltd.
|
||||
10/16/24 to 10/21/24
|
5.43 to 5.43
|
842,000
|
839,871
|
|
The Toronto-Dominion Bank
|
||||
10/25/24 to 4/24/25 (c)
|
5.03 to 5.54
|
4,207,000
|
4,198,339
|
|
Toyota Motor Credit Corp.
|
||||
11/27/24 to 12/13/24
|
5.48 to 5.51
|
210,000
|
207,972
|
|
|
TOTAL FINANCIAL COMPANY COMMERCIAL PAPER
(Cost $20,058,519)
|
20,058,519
|
|||
Asset Backed Commercial Paper - 0.4%
|
||||
Yield (%) (a)
|
Principal
Amount (b)
(000s)
|
Value ($)
(000s)
|
||
Cabot Trail Funding LLC (Liquidity Facility The Toronto-Dominion Bank)
|
||||
10/15/24
|
5.49
|
44,000
|
43,908
|
|
11/6/24
|
5.32
|
28,000
|
27,853
|
|
12/3/24
|
5.49
|
49,000
|
48,542
|
|
Gotham Funding Corp. (Liquidity Facility Bank of Tokyo-Mitsubishi UFJ Ltd.)
|
||||
10/1/24
|
5.47
|
60,000
|
60,000
|
|
10/31/24
|
5.33
|
52,000
|
51,772
|
|
12/16/24
|
4.81
|
75,000
|
74,248
|
|
Victory Receivables Corp. (Liquidity Facility Bank of Tokyo-Mitsubishi UFJ Ltd.)
|
||||
10/1/24
|
5.47
|
77,000
|
77,000
|
|
12/16/24
|
4.81
|
65,000
|
64,348
|
|
12/18/24
|
4.81
|
114,000
|
112,827
|
|
|
TOTAL ASSET BACKED COMMERCIAL PAPER
(Cost $560,498)
|
560,498
|
|||
U.S. Treasury Debt - 1.7%
|
||||
Yield (%) (a)
|
Principal
Amount (b)
(000s)
|
Value ($)
(000s)
|
||
U.S. Treasury Obligations - 1.7%
|
||||
U.S. Treasury Bills
|
||||
10/17/24 to 11/5/24
|
5.15 to 5.30
|
2,291,000
|
2,284,084
|
|
|
TOTAL U.S. TREASURY DEBT
(Cost $2,291,000)
|
2,284,084
|
|||
Non-Negotiable Time Deposit - 11.5%
|
||||
Yield (%) (a)
|
Principal
Amount (b)
(000s)
|
Value ($)
(000s)
|
||
Time Deposits - 11.5%
|
||||
DNB Bank ASA
|
||||
10/1/24
|
4.83
|
4,160,941
|
4,160,941
|
|
ING Bank NV
|
||||
10/1/24 to 10/7/24
|
4.84 to 4.84
|
2,859,900
|
2,859,900
|
|
Mizuho Bank Ltd. Canada Branch
|
||||
10/1/24
|
4.84
|
2,859,000
|
2,859,000
|
|
Royal Bank of Canada
|
||||
10/1/24
|
4.83
|
2,514,000
|
2,514,000
|
|
Skandinaviska Enskilda Banken AB
|
||||
10/1/24
|
4.83
|
2,641,974
|
2,641,974
|
|
Toronto Dominion Bank (TD)
|
||||
10/1/24
|
4.83
|
480,576
|
480,576
|
|
|
TOTAL NON-NEGOTIABLE TIME DEPOSIT
(Cost $15,516,391)
|
15,516,391
|
|||
|
TOTAL INVESTMENT IN SECURITIES - 101.3%
(Cost $137,033,729)
|
137,033,729
|
NET OTHER ASSETS (LIABILITIES) - (1.3)%
|
(1,763,024)
|
NET ASSETS - 100.0%
|
135,270,705
|
(a)
|
Yield represents either the annualized yield at the date of purchase, or the stated coupon rate, or, for floating and adjustable rate securities, the rate at period end.
|
(b)
|
Amount is stated in United States dollars unless otherwise noted.
|
(c)
|
A coupon rate of 0% signifies an unsettled loan. The coupon rate will be determined upon settlement of the loan after period end.
|
(d)
|
Coupon is indexed to a floating interest rate which may be multiplied by a specified factor and/or subject to caps or floors.
|
(e)
|
Security exempt from registration under Rule 144A of the Securities Act of 1933. These securities may be resold in transactions exempt from registration, normally to qualified institutional buyers. At the end of the period, the value of these securities amounted to $119,000,000 or 0.1% of net assets.
|
(f)
|
The maturity amount is based on the rate at period end.
|
(g)
|
Represents a forward settling transaction and therefore no collateral securities had been allocated as of period end. The agreement contemplated the delivery of U.S. Treasury Obligations as collateral on settlement date.
|
|
Other Information
|
||
# Additional information on each counterparty to the repurchase agreement is as follows:
|
||
Repurchase Agreement / Counterparty
|
Value ($)
(000's)
|
|
$9,157,616,000 due 10/01/24 at 4.89%
|
||
BNY Mellon Capital Markets LLC
|
321,309
|
|
Bank of America, N.A.
|
454,940
|
|
Bank of Nova Scotia
|
280,311
|
|
BofA Securities, Inc.
|
221,152
|
|
Citigroup Global Markets, Inc.
|
315,931
|
|
Credit Agricole CIB New York Branch
|
135,771
|
|
HSBC Securities (USA), Inc.
|
196,891
|
|
ING Financial Markets LLC
|
75,657
|
|
JP Morgan Securities LLC
|
1,484,934
|
|
Mitsubishi UFJ Securities Holdings Ltd
|
479,106
|
|
Nomura Securities International
|
725,709
|
|
RBC Dominion Securities, Inc.
|
1,012,041
|
|
Royal Bank of Canada
|
81,619
|
|
Societe Generale (PARIS)
|
182,643
|
|
Sumitomo Mitsui Banking Corp.
|
2,257,036
|
|
Sumitomo Mitsui Banking Corp. NY
|
515,538
|
|
Wells Fargo Securities LLC
|
417,028
|
|
9,157,616
|
||
$218,593,000 due 10/01/24 at 4.94%
|
||
BofA Securities, Inc.
|
192,725
|
|
ING Financial Markets LLC
|
7,708
|
|
RBC Dominion Securities, Inc.
|
17,204
|
|
Royal Bank of Canada
|
956
|
|
218,593
|
||
Statement of Assets and Liabilities
|
||||
|
As of September 30, 2024 (Unaudited)
Amounts in thousands (except per-share amounts)
|
||||
Assets
|
||||
Investment in securities, at value (including repurchase agreements of $88,101,209) - See accompanying schedule
Unaffiliated issuers (cost $137,033,729):
|
$
|
137,033,729
|
||
Cash
|
614,592
|
|||
Receivable for fund shares sold
|
626,221
|
|||
Interest receivable
|
120,404
|
|||
Receivable for interfund loans
|
8,862
|
|||
Prepaid expenses
|
168
|
|||
Receivable from investment adviser for expense reductions
|
4,057
|
|||
Other receivables
|
1,232
|
|||
Total assets
|
138,409,265
|
|||
Liabilities
|
||||
Payable for investments purchased
|
$
|
2,555,000
|
||
Payable for fund shares redeemed
|
510,953
|
|||
Distributions payable
|
48,279
|
|||
Accrued management fee
|
15,665
|
|||
Distribution and service plan fees payable
|
18
|
|||
Other affiliated payables
|
5,118
|
|||
Other payables and accrued expenses
|
3,527
|
|||
Total liabilities
|
3,138,560
|
|||
Net Assets
|
$
|
135,270,705
|
||
Net Assets consist of:
|
||||
Paid in capital
|
$
|
135,269,758
|
||
Total accumulated earnings (loss)
|
947
|
|||
Net Assets
|
$
|
135,270,705
|
||
Net Asset Value and Maximum Offering Price
|
||||
Class I :
|
||||
Net Asset Value, offering price and redemption price per share ($59,163,680 ÷ 59,156,084 shares)
|
$
|
1.00
|
||
Class II :
|
||||
Net Asset Value, offering price and redemption price per share ($98,672 ÷ 98,667 shares)
|
$
|
1.00
|
||
Class III :
|
||||
Net Asset Value, offering price and redemption price per share ($18,923 ÷ 18,929 shares)
|
$
|
1.00
|
||
Select Class :
|
||||
Net Asset Value, offering price and redemption price per share ($40,538 ÷ 40,536 shares)
|
$
|
1.00
|
||
Institutional Class :
|
||||
Net Asset Value, offering price and redemption price per share ($75,948,892 ÷ 75,934,386 shares)
|
$
|
1.00
|
||
Statement of Operations
|
||||
Six months ended September 30, 2024 (Unaudited)
Amounts in thousands
|
||||
Investment Income
|
||||
Interest (including $804 from affiliated interfund lending)
|
$
|
3,534,080
|
||
Expenses
|
||||
Management fee
|
$
|
91,047
|
||
Transfer agent fees
|
28,048
|
|||
Distribution and service plan fees
|
113
|
|||
Accounting fees and expenses
|
1,715
|
|||
Custodian fees and expenses
|
470
|
|||
Independent trustees' fees and expenses
|
163
|
|||
Registration fees
|
2,985
|
|||
Audit fees
|
28
|
|||
Legal
|
27
|
|||
Miscellaneous
|
190
|
|||
Total expenses before reductions
|
124,786
|
|||
Expense reductions
|
(21,763)
|
|||
Total expenses after reductions
|
103,023
|
|||
Net Investment income (loss)
|
3,431,057
|
|||
Realized and Unrealized Gain (Loss)
|
||||
Net realized gain (loss) on:
|
||||
Investment Securities:
|
||||
Unaffiliated issuers
|
31
|
|||
Total net realized gain (loss)
|
31
|
|||
Net increase in net assets resulting from operations
|
$
|
3,431,088
|
||
Statement of Changes in Net Assets
|
||||
Amount in thousands
|
Six months ended
September 30, 2024
(Unaudited)
|
Year ended
March 31, 2024
|
||
Increase (Decrease) in Net Assets
|
||||
Operations
|
||||
Net investment income (loss)
|
$
|
3,431,057
|
$
|
5,846,717
|
Net realized gain (loss)
|
31
|
(16)
|
||
Net increase in net assets resulting from operations
|
3,431,088
|
5,846,701
|
||
Distributions to shareholders
|
(3,430,625)
|
(5,846,436)
|
||
Share transactions - net increase (decrease)
|
7,871,154
|
29,869,128
|
||
Total increase (decrease) in net assets
|
7,871,617
|
29,869,393
|
||
Net Assets
|
||||
Beginning of period
|
127,399,088
|
97,529,695
|
||
End of period
|
$
|
135,270,705
|
$
|
127,399,088
|
Money Market Portfolio Class I |
Six months ended
(Unaudited) September 30, 2024
|
Years ended March 31, 2024
|
2023
|
2022
|
2021
|
2020
|
|||||||
Selected Per-Share Data
|
||||||||||||
Net asset value, beginning of period
|
$
|
1.00
|
$
|
1.00
|
$
|
1.00
|
$
|
1.00
|
$
|
1.00
|
$
|
1.00
|
Income from Investment Operations
|
||||||||||||
Net investment income (loss) A
|
.026
|
.052
|
.028
|
- B
|
.002
|
.020
|
||||||
Net realized and unrealized gain (loss) B
|
-
|
-
|
-
|
-
|
-
|
-
|
||||||
Total from investment operations
|
.026
|
.052
|
.028
|
- B
|
.002
|
.020
|
||||||
Distributions from net investment income
|
(.026)
|
(.052)
|
(.028)
|
- B
|
(.002)
|
(.020)
|
||||||
Total distributions
|
(.026)
|
(.052)
|
(.028)
|
- B
|
(.002)
|
(.020)
|
||||||
Net asset value, end of period
|
$
|
1.00
|
$
|
1.00
|
$
|
1.00
|
$
|
1.00
|
$
|
1.00
|
$
|
1.00
|
Total Return C,D
|
2.66 % |
5.33%
|
2.81%
|
.02%
|
.15%
|
2.01%
|
||||||
Ratios to Average Net Assets A,E,F
|
||||||||||||
Expenses before reductions
|
.21% G
|
.21%
|
.21%
|
.21%
|
.21%
|
.21%
|
||||||
Expenses net of fee waivers, if any
|
.18 % G |
.18%
|
.18%
|
.16%
|
.18%
|
.18%
|
||||||
Expenses net of all reductions
|
.18% G
|
.18%
|
.18%
|
.16%
|
.18%
|
.18%
|
||||||
Net investment income (loss)
|
5.24% G
|
5.22%
|
3.25%
|
.02%
|
.16%
|
1.96%
|
||||||
Supplemental Data
|
||||||||||||
Net assets, end of period (in millions)
|
$
|
59,164
|
$
|
55,980
|
$
|
42,432
|
$
|
16,745
|
$
|
21,937
|
$
|
25,801
|
Money Market Portfolio Class II |
Six months ended
(Unaudited) September 30, 2024
|
Years ended March 31, 2024
|
2023
|
2022
|
2021
|
2020
|
|||||||
Selected Per-Share Data
|
||||||||||||
Net asset value, beginning of period
|
$
|
1.00
|
$
|
1.00
|
$
|
1.00
|
$
|
1.00
|
$
|
1.00
|
$
|
1.00
|
Income from Investment Operations
|
||||||||||||
Net investment income (loss) A
|
.026
|
.051
|
.026
|
- B
|
.001
|
.018
|
||||||
Net realized and unrealized gain (loss) B
|
-
|
-
|
-
|
-
|
-
|
-
|
||||||
Total from investment operations
|
.026
|
.051
|
.026
|
- B
|
.001
|
.018
|
||||||
Distributions from net investment income
|
(.026)
|
(.051)
|
(.026)
|
- B
|
(.001)
|
(.018)
|
||||||
Total distributions
|
(.026)
|
(.051)
|
(.026)
|
- B
|
(.001)
|
(.018)
|
||||||
Net asset value, end of period
|
$
|
1.00
|
$
|
1.00
|
$
|
1.00
|
$
|
1.00
|
$
|
1.00
|
$
|
1.00
|
Total Return C,D
|
2.58 % |
5.18%
|
2.65%
|
.01%
|
.09%
|
1.86%
|
||||||
Ratios to Average Net Assets A,E,F
|
||||||||||||
Expenses before reductions
|
.36% G
|
.36%
|
.36%
|
.36%
|
.36%
|
.36%
|
||||||
Expenses net of fee waivers, if any
|
.33 % G |
.33%
|
.33%
|
.16%
|
.26%
|
.33%
|
||||||
Expenses net of all reductions
|
.33% G
|
.33%
|
.33%
|
.16%
|
.26%
|
.33%
|
||||||
Net investment income (loss)
|
5.09% G
|
5.07%
|
3.10%
|
.01%
|
.08%
|
1.81%
|
||||||
Supplemental Data
|
||||||||||||
Net assets, end of period (in millions)
|
$
|
99
|
$
|
86
|
$
|
81
|
$
|
90
|
$
|
179
|
$
|
394
|
Money Market Portfolio Class III |
Six months ended
(Unaudited) September 30, 2024
|
Years ended March 31, 2024
|
2023
|
2022
|
2021
|
2020
|
|||||||
Selected Per-Share Data
|
||||||||||||
Net asset value, beginning of period
|
$
|
1.00
|
$
|
1.00
|
$
|
1.00
|
$
|
1.00
|
$
|
1.00
|
$
|
1.00
|
Income from Investment Operations
|
||||||||||||
Net investment income (loss) A
|
.025
|
.050
|
.025
|
- B
|
.001
|
.017
|
||||||
Net realized and unrealized gain (loss) B
|
-
|
-
|
-
|
-
|
-
|
-
|
||||||
Total from investment operations
|
.025
|
.050
|
.025
|
- B
|
.001
|
.017
|
||||||
Distributions from net investment income
|
(.025)
|
(.050)
|
(.025)
|
- B
|
(.001)
|
(.017)
|
||||||
Total distributions
|
(.025)
|
(.050)
|
(.025)
|
- B
|
(.001)
|
(.017)
|
||||||
Net asset value, end of period
|
$
|
1.00
|
$
|
1.00
|
$
|
1.00
|
$
|
1.00
|
$
|
1.00
|
$
|
1.00
|
Total Return C,D
|
2.53 % |
5.07%
|
2.55%
|
.01%
|
.06%
|
1.76%
|
||||||
Ratios to Average Net Assets A,E,F
|
||||||||||||
Expenses before reductions
|
.46% G
|
.46%
|
.46%
|
.46%
|
.46%
|
.46%
|
||||||
Expenses net of fee waivers, if any
|
.43 % G |
.43%
|
.43%
|
.17%
|
.27%
|
.43%
|
||||||
Expenses net of all reductions
|
.43% G
|
.43%
|
.43%
|
.17%
|
.27%
|
.43%
|
||||||
Net investment income (loss)
|
4.99% G
|
4.97%
|
3.00%
|
.01%
|
.07%
|
1.71%
|
||||||
Supplemental Data
|
||||||||||||
Net assets, end of period (in millions)
|
$
|
19
|
$
|
18
|
$
|
31
|
$
|
9
|
$
|
13
|
$
|
13
|
Money Market Portfolio Select Class |
Six months ended
(Unaudited) September 30, 2024
|
Years ended March 31, 2024
|
2023
|
2022
|
2021
|
2020
|
|||||||
Selected Per-Share Data
|
||||||||||||
Net asset value, beginning of period
|
$
|
1.00
|
$
|
1.00
|
$
|
1.00
|
$
|
1.00
|
$
|
1.00
|
$
|
1.00
|
Income from Investment Operations
|
||||||||||||
Net investment income (loss) A
|
.026
|
.052
|
.027
|
- B
|
.001
|
.019
|
||||||
Net realized and unrealized gain (loss) B
|
-
|
-
|
-
|
-
|
-
|
-
|
||||||
Total from investment operations
|
.026
|
.052
|
.027
|
- B
|
.001
|
.019
|
||||||
Distributions from net investment income
|
(.026)
|
(.052)
|
(.027)
|
- B
|
(.001)
|
(.019)
|
||||||
Total distributions
|
(.026)
|
(.052)
|
(.027)
|
- B
|
(.001)
|
(.019)
|
||||||
Net asset value, end of period
|
$
|
1.00
|
$
|
1.00
|
$
|
1.00
|
$
|
1.00
|
$
|
1.00
|
$
|
1.00
|
Total Return C,D
|
2.63 % |
5.28%
|
2.76%
|
.02%
|
.12%
|
1.96%
|
||||||
Ratios to Average Net Assets A,E,F
|
||||||||||||
Expenses before reductions
|
.26% G
|
.26%
|
.26%
|
.26%
|
.26%
|
.26%
|
||||||
Expenses net of fee waivers, if any
|
.23 % G |
.23%
|
.23%
|
.16%
|
.21%
|
.23%
|
||||||
Expenses net of all reductions
|
.23% G
|
.23%
|
.23%
|
.16%
|
.21%
|
.23%
|
||||||
Net investment income (loss)
|
5.19% G
|
5.17%
|
3.20%
|
.02%
|
.13%
|
1.91%
|
||||||
Supplemental Data
|
||||||||||||
Net assets, end of period (in millions)
|
$
|
41
|
$
|
53
|
$
|
40
|
$
|
15
|
$
|
26
|
$
|
59
|
Money Market Portfolio Institutional Class |
Six months ended
(Unaudited) September 30, 2024
|
Years ended March 31, 2024
|
2023
|
2022
|
2021
|
2020
|
|||||||
Selected Per-Share Data
|
||||||||||||
Net asset value, beginning of period
|
$
|
1.00
|
$
|
1.00
|
$
|
1.00
|
$
|
1.00
|
$
|
1.00
|
$
|
1.00
|
Income from Investment Operations
|
||||||||||||
Net investment income (loss) A
|
.026
|
.052
|
.028
|
- B
|
.002
|
.020
|
||||||
Net realized and unrealized gain (loss) B
|
-
|
-
|
-
|
-
|
-
|
-
|
||||||
Total from investment operations
|
.026
|
.052
|
.028
|
- B
|
.002
|
.020
|
||||||
Distributions from net investment income
|
(.026)
|
(.052)
|
(.028)
|
- B
|
(.002)
|
(.020)
|
||||||
Total distributions
|
(.026)
|
(.052)
|
(.028)
|
- B
|
(.002)
|
(.020)
|
||||||
Net asset value, end of period
|
$
|
1.00
|
$
|
1.00
|
$
|
1.00
|
$
|
1.00
|
$
|
1.00
|
$
|
1.00
|
Total Return C,D
|
2.68 % |
5.38%
|
2.85%
|
.04%
|
.19%
|
2.05%
|
||||||
Ratios to Average Net Assets A,E,F
|
||||||||||||
Expenses before reductions
|
.18% G
|
.18%
|
.18%
|
.18%
|
.18%
|
.18%
|
||||||
Expenses net of fee waivers, if any
|
.14 % G |
.14%
|
.14%
|
.14%
|
.14%
|
.14%
|
||||||
Expenses net of all reductions
|
.14% G
|
.14%
|
.14%
|
.14%
|
.14%
|
.14%
|
||||||
Net investment income (loss)
|
5.28% G
|
5.26%
|
3.29%
|
.04%
|
.20%
|
2.00%
|
||||||
Supplemental Data
|
||||||||||||
Net assets, end of period (in millions)
|
$
|
75,949
|
$
|
71,263
|
$
|
54,946
|
$
|
22,108
|
$
|
28,837
|
$
|
35,852
|
Variable Rate Demand Note - 42.8%
|
|||
Principal
Amount (a)
(000s)
|
Value ($)
(000s)
|
||
Alabama - 0.8%
|
|||
Mobile Downtown Redev. Auth. Gulf Opportunity Zone:
|
|||
Series 2011 A, 3.17% 10/7/24, LOC Bank of America NA, VRDN (b)(c)
|
40,770
|
40,770
|
|
Series 2011 B, 3.17% 10/7/24, LOC Bank of America NA, VRDN (b)(c)
|
39,870
|
39,870
|
|
TOTAL ALABAMA
|
80,640
|
||
Alaska - 1.2%
|
|||
Valdez Marine Term. Rev. (Phillips Trans. Alaska, Inc. Proj.):
|
|||
Series 1994 B, 3.25% 10/7/24 (ConocoPhillips Co. Guaranteed), VRDN (c)
|
55,450
|
55,450
|
|
Series 1994 C, 3.4% 10/7/24 (ConocoPhillips Co. Guaranteed), VRDN (c)
|
59,000
|
59,000
|
|
TOTAL ALASKA
|
114,450
|
||
Arizona - 1.0%
|
|||
Arizona St Indl. Dev. Auth. Multi (67 Flats Proj.) Series 2023 A, 3.1% 10/7/24, LOC Barclays Bank PLC, VRDN (c)
|
1,115
|
1,115
|
|
Maricopa County Indl. Dev. Auth. Series 2024 C, 3.15% 10/7/24, LOC Royal Bank of Canada, VRDN (c)
|
15,400
|
15,400
|
|
Maricopa County Poll. Cont. Rev.:
|
|||
(Arizona Pub. Svc. Co. Palo Verde Proj.) Series 2009 A, 3.33% 10/7/24, VRDN (c)
|
13,900
|
13,900
|
|
Series 2009 B, 3.33% 10/7/24, VRDN (c)
|
14,500
|
14,500
|
|
Series 2009 C, 3.38% 10/7/24, VRDN (c)
|
1,700
|
1,700
|
|
Maricopa County Rev. Series 2023 B, 3.18% 10/7/24, VRDN (c)
|
52,640
|
52,640
|
|
TOTAL ARIZONA
|
99,255
|
||
Colorado - 1.3%
|
|||
Colorado Edl. & Cultural Facilities Auth. Rev. (Clyfford Still Museum Proj.) Series 2008, 3.25% 10/7/24, LOC Wells Fargo Bank NA, VRDN (c)
|
690
|
690
|
|
Colorado Health Facilities Auth. Rev. Bonds:
|
|||
Series 2020 B, 3.15% 10/7/24, LOC The Toronto-Dominion Bank, VRDN (c)
|
3,850
|
3,850
|
|
Series 2022 F, 3.15% 10/7/24, VRDN (c)
|
77,800
|
77,800
|
|
Series 2024 C, 3.15% 10/7/24, VRDN (c)
|
18,100
|
18,100
|
|
Colorado Univ. Co. Hosp. Auth. Rev.:
|
|||
Series 2017 B1, 3.2% 10/7/24, VRDN (c)
|
8,000
|
8,000
|
|
Series 2019 A, 3.15% 10/7/24, VRDN (c)
|
8,500
|
8,500
|
|
Mesa County Econ. Dev. Rev. (Leitner-Poma of America, Inc. Proj.) Series 2009, 3.25% 10/7/24, LOC Wells Fargo Bank NA, VRDN (c)
|
2,685
|
2,685
|
|
TOTAL COLORADO
|
119,625
|
||
Connecticut - 3.7%
|
|||
Connecticut Gen. Oblig. Series 2016 C, 3.16% 10/7/24 (Liquidity Facility Bank of America NA), VRDN (c)
|
101,870
|
101,870
|
|
Connecticut Health & Edl. Facilities Auth. Rev.:
|
|||
(Gaylord Hosp. Proj.) Series B, 3.19% 10/7/24, LOC Bank of America NA, VRDN (c)
|
8,945
|
8,945
|
|
Series 2013 O, 3.2% 10/7/24, VRDN (c)
|
31,335
|
31,335
|
|
Series 2014 C, 3.2% 10/7/24, VRDN (c)
|
5,310
|
5,310
|
|
Series 2024 C2, 3.2% 10/7/24, VRDN (c)
|
73,700
|
73,700
|
|
Connecticut Hsg. Fin. Auth.:
|
|||
(Hsg. Mtg. Fin. Prog.) Series 2018 C, 3.13% 10/7/24 (Liquidity Facility TD Banknorth, NA), VRDN (c)
|
5,405
|
5,405
|
|
(Mtg. Fin. Prog.) Series C3, 3.15% 10/7/24 (Liquidity Facility Royal Bank of Canada), VRDN (c)
|
13,335
|
13,335
|
|
Series 2012 C2, 3.15% 10/7/24 (Liquidity Facility Sumitomo Mitsui Banking Corp.), VRDN (c)
|
5,300
|
5,300
|
|
Series 2013 B6, 3.15% 10/7/24 (Liquidity Facility Sumitomo Mitsui Banking Corp.), VRDN (c)
|
12,500
|
12,500
|
|
Series 2016 A, 3.15% 10/7/24 (Liquidity Facility Royal Bank of Canada), VRDN (c)
|
29,800
|
29,800
|
|
Series 2018 A3, 3.16% 10/7/24 (Liquidity Facility Bank of America NA), VRDN (c)
|
15,415
|
15,415
|
|
Series 2018 E2, 3.16% 10/7/24 (Liquidity Facility Bank of America NA), VRDN (c)
|
28,925
|
28,925
|
|
Series 2022 E2, 3.15% 10/7/24 (Liquidity Facility Sumitomo Mitsui Banking Corp.), VRDN (c)
|
7,900
|
7,900
|
|
Connecticut Innovations, Inc. Rev. (ISO New England, Inc. Proj.) Series 2012, 3.15% 10/7/24, LOC TD Banknorth, NA, VRDN (c)
|
8,300
|
8,300
|
|
TOTAL CONNECTICUT
|
348,040
|
||
Delaware - 0.1%
|
|||
Delaware Econ. Dev. Auth. Rev. (Delmarva Pwr. & Lt. Co. Proj.) Series 1993 C, 3.35% 10/7/24, VRDN (c)
|
9,500
|
9,500
|
|
District Of Columbia - 0.6%
|
|||
District of Columbia Rev.:
|
|||
(Medlantic/Helix Proj.) Series 1998 A Tranche II, 3.2% 10/7/24, LOC TD Banknorth, NA, VRDN (c)
|
14,285
|
14,285
|
|
(The AARP Foundation Proj.) Series 2004, 3.23% 10/7/24, LOC Bank of America NA, VRDN (c)
|
15,665
|
15,665
|
|
(The Pew Charitable Trust Proj.) Series 2008 A, 3.15% 10/7/24, LOC PNC Bank NA, VRDN (c)
|
25,095
|
25,095
|
|
Series 2006, 3.15% 10/7/24, LOC Wells Fargo Bank NA, VRDN (c)
|
3,650
|
3,650
|
|
TOTAL DISTRICT OF COLUMBIA
|
58,695
|
||
Florida - 2.2%
|
|||
Escambia County Solid Waste Disp. Rev. (Gulf Pwr. Co. Proj.):
|
|||
Series 2009 2, 3.25% 10/7/24, VRDN (c)
|
25,100
|
25,100
|
|
Series 2009, 3.4% 10/7/24, VRDN (c)
|
10,000
|
10,000
|
|
Florida Keys Aqueduct Auth. Wtr. Rev. Series 2008, 3.2% 10/7/24, LOC TD Banknorth, NA, VRDN (c)
|
11,295
|
11,295
|
|
Gainesville Utils. Sys. Rev. Series 2019 C, 3.98% 10/1/24, LOC Bank of America NA, VRDN (c)
|
7,900
|
7,900
|
|
Highlands County Health Facilities Auth. Rev. (Adventist Health Sys./Sunbelt, Inc. Prog.) Series 2007 A1, 3.15% 10/7/24, VRDN (c)
|
23,260
|
23,260
|
|
Hillsborough County Indl. Dev. Auth.:
|
|||
Series 2024 F, 3.25% 10/7/24 (Liquidity Facility PNC Bank NA), VRDN (c)
|
25,300
|
25,300
|
|
Series 2024 G, 3.25% 10/7/24 (Liquidity Facility Royal Bank of Canada), VRDN (c)
|
24,720
|
24,720
|
|
Jacksonville Poll. Cont. Rev. (Florida Pwr. & Lt. Co. Proj.) Series 1995, 3.38% 10/7/24, VRDN (c)
|
16,400
|
16,400
|
|
Martin County Rev. (Florida Pwr. & Lt. Co. Proj.) Series 2022, 3.3% 10/7/24, VRDN (c)
|
27,300
|
27,300
|
|
Mississippi Bus. Fin. Corp. Poll. Cont. Rev. (Gulf Pwr. Co. Proj.) Series 2014, 3.38% 10/7/24, VRDN (c)
|
6,000
|
6,000
|
|
Orange County Health Facilities Auth. Rev. (The Nemours Foundation Proj.) Series 2009 B, 3.15% 10/7/24, LOC TD Banknorth, NA, VRDN (c)
|
14,540
|
14,540
|
|
Palm Beach County Rev. (Raymond F. Kravis Ctr. Proj.) Series 2002, 3.18% 10/7/24, LOC Northern Trust Co., VRDN (c)
|
14,235
|
14,235
|
|
Pinellas County Health Facilities Auth. Rev. (Suncoast Hospice Proj.) Series 2004, 3.2% 10/7/24, LOC Wells Fargo Bank NA, VRDN (c)
|
975
|
975
|
|
TOTAL FLORIDA
|
207,025
|
||
Georgia - 2.2%
|
|||
Burke County Indl. Dev. Auth. Poll. Cont. Rev. (Georgia Pwr. Co. Plant Vogtle Proj.):
|
|||
First Series 2009, 3.9% 10/1/24, VRDN (c)
|
52,385
|
52,385
|
|
Series 2008, 4.05% 10/1/24, VRDN (c)
|
3,900
|
3,900
|
|
Series 2018, 4% 10/1/24, VRDN (c)
|
20,710
|
20,710
|
|
Coweta County Dev. Auth. Poll. Cont. Rev. (Georgia Pwr. Co. Plant Yates Proj.) Series 2006, 4.05% 10/1/24, VRDN (c)
|
9,125
|
9,125
|
|
Effingham County Indl. Dev. Auth. Poll Cont. Series 2003, 4.06% 10/1/24, VRDN (c)
|
13,870
|
13,870
|
|
Georgia Muni. Elec. Auth. Pwr. Rev. (Proj. One) Series 2008 B, 3.23% 10/7/24, LOC PNC Bank NA, VRDN (c)
|
4,805
|
4,805
|
|
Heard County Dev. Auth. Poll. Cont. Rev. (Georgia Pwr. Co. Plant Wansley Proj.) First Series 1997, 4.15% 10/1/24, VRDN (c)
|
13,400
|
13,400
|
|
Monroe County Dev. Auth. Poll. Cont. Rev.:
|
|||
(Georgia Pwr. Co. Plant Scherer Proj.):
|
|||
Series 1997, 4.05% 10/1/24, VRDN (c)
|
12,500
|
12,500
|
|
Series 2008, 4.05% 10/1/24, VRDN (c)
|
59,465
|
59,465
|
|
(Gulf Pwr. Co. Plant Scherer Proj.) Series 2010, 3.35% 10/7/24, VRDN (c)
|
5,600
|
5,600
|
|
Series 2002 V1, 3.3% 10/7/24, VRDN (c)
|
9,900
|
9,900
|
|
TOTAL GEORGIA
|
205,660
|
||
Hawaii - 0.1%
|
|||
FHLMC Hawaii State Hsg. Fin. & Dev. Corp. Rev. (Lokahi Kau Apts. Proj.) Series 2008, 3.2% 10/7/24, LOC Freddie Mac, VRDN (c)
|
6,640
|
6,640
|
|
Illinois - 1.7%
|
|||
Illinois Dev. Fin. Auth. Rev. (Glenwood School for Boys Proj.) Series 1998, 3.35% 10/7/24, LOC Northern Trust Co., VRDN (c)
|
4,600
|
4,600
|
|
Illinois Fin. Auth. Series 2021 D, 3.15% 10/7/24, VRDN (c)
|
23,700
|
23,700
|
|
Illinois Fin. Auth. Rev.:
|
|||
(Chicago Symphony Orchestra Proj.) Series 2008, 3.15% 10/7/24, LOC PNC Bank NA, VRDN (c)
|
15,100
|
15,100
|
|
(Illinois College Proj.) 3.1% 10/7/24, LOC U.S. Bank NA, Cincinnati, VRDN (c)
|
6,345
|
6,345
|
|
(Little Co. of Mary Hosp. Proj.):
|
|||
Series 2008 A, 3.17% 10/7/24, LOC TD Banknorth, NA, VRDN (c)
|
26,135
|
26,135
|
|
Series 2008 B, 3.17% 10/7/24, LOC TD Banknorth, NA, VRDN (c)
|
27,410
|
27,410
|
|
(Richard H. Driehaus Museum Proj.) Series 2005, 3.25% 10/7/24, LOC Northern Trust Co., VRDN (c)
|
3,800
|
3,800
|
|
Series 2009 E2, 3.17% 10/7/24, LOC Sumitomo Mitsui Banking Corp., VRDN (c)
|
5,000
|
5,000
|
|
Series 2011 B, 3.15% 10/7/24, LOC Sumitomo Mitsui Banking Corp., VRDN (c)
|
26,425
|
26,425
|
|
FHLMC Lake County Multi-family Hsg. Rev. (Whispering Oaks Apts. Proj.) Series 2008, 3.12% 10/7/24, LOC Freddie Mac, VRDN (c)
|
25,750
|
25,750
|
|
TOTAL ILLINOIS
|
164,265
|
||
Indiana - 1.1%
|
|||
Indiana Dev. Fin. Auth. Econ. (Archer-Daniels-Midland Co. Proj.) Series 2012, 3.21% 10/7/24, VRDN (c)
|
19,640
|
19,640
|
|
Indiana Dev. Fin. Auth. Envir. Rev.:
|
|||
(Duke Energy Indiana, Inc. Proj.) Series 2009 A3, 3.27% 10/7/24, LOC Mizuho Bank Ltd., VRDN (c)
|
17,670
|
17,670
|
|
Series 2005, 3.3% 10/7/24, LOC Cooperatieve Rabobank UA/NY, VRDN (c)
|
13,000
|
13,000
|
|
Indiana Fin. Auth. Health Sys. Rev. (Sisters of Saint Francis Health Svcs., Inc. Obligated Group Proj.) Series 2008 F, 3.05% 10/7/24, LOC Barclays Bank PLC, VRDN (c)
|
22,100
|
22,100
|
|
Indiana Fin. Auth. Hosp. Rev. (Parkview Health Sys. Oblig. Group Proj.) Series 2009 C, 3.23% 10/7/24, LOC Sumitomo Mitsui Banking Corp., VRDN (c)
|
7,600
|
7,600
|
|
Indiana Fin. Auth. Rev. (Trinity Health Cr. Group Proj.) Series 2008 D1, 3.2% 10/7/24, VRDN (c)
|
28,920
|
28,920
|
|
TOTAL INDIANA
|
108,930
|
||
Iowa - 1.5%
|
|||
Council Bluffs Poll. Cont. Series 1995, 3.4% 10/7/24, VRDN (c)
|
3,800
|
3,800
|
|
Iowa Fin. Auth. Econ. Dev. Rev.:
|
|||
Series 2009 A, 3.18% 10/7/24, VRDN (c)
|
23,300
|
23,300
|
|
Series 2011 A, 3.18% 10/7/24, VRDN (c)
|
30,100
|
30,100
|
|
Iowa Fin. Auth. Midwestern Disaster Area Econ. Dev. Series 2012 A, 3.18% 10/7/24, VRDN (c)
|
13,800
|
13,800
|
|
Iowa Fin. Auth. Midwestern Disaster Area Rev.:
|
|||
(ADM Proj.) Series 2011, 3.2% 10/7/24, VRDN (c)
|
27,800
|
27,800
|
|
(Archer-Daniels-Midland Co. Proj.) Series 2012, 3.21% 10/7/24, VRDN (c)
|
36,920
|
36,920
|
|
Iowa Fin. Auth. Poll. Cont. Facility Rev. (Midamerican Energy Proj.) Series 2016 A, 3.15% 10/7/24, VRDN (c)
|
8,115
|
8,115
|
|
Louisa County Poll. Cont. Rev. Series 1994, 3.5% 10/1/24, VRDN (c)
|
2,200
|
2,200
|
|
TOTAL IOWA
|
146,035
|
||
Kansas - 0.5%
|
|||
Cygne Poll. Cont. Rev. (Kansas Gas and Elec. Co. Proj.) Series 1994 B, 3.45% 10/7/24, VRDN (c)
|
1,300
|
1,300
|
|
Burlington Envir. Impt. Rev. (Kansas City Pwr. and Lt. Co. Proj.):
|
|||
Series 2007 A, 3.48% 10/7/24, VRDN (c)
|
7,600
|
7,600
|
|
Series 2007 B, 3.48% 10/7/24, VRDN (c)
|
12,500
|
12,500
|
|
St. Mary's Kansas Poll. Cont. Rev.:
|
|||
(Kansas Gas and Elec. Co. Proj.) Series 1994, 3.45% 10/7/24, VRDN (c)
|
3,000
|
3,000
|
|
Series 1994, 3.45% 10/7/24, VRDN (c)
|
14,300
|
14,300
|
|
Wamego Kansas Poll. Cont. Rfdg. Rev.:
|
|||
(Kansas Gas & Elec. Co. Proj.) Series 1994, 3.45% 10/7/24, VRDN (c)
|
3,500
|
3,500
|
|
(Western Resources, Inc. Proj.) Series 1994, 3.45% 10/7/24, VRDN (c)
|
9,500
|
9,500
|
|
TOTAL KANSAS
|
51,700
|
||
Kentucky - 0.2%
|
|||
Kentucky Econ. Dev. Fin. Auth. Hosp. Rev. (St. Elizabeth Med. Ctr., Inc. Proj.) Series 2009 B, 3.2% 10/7/24, LOC TD Banknorth, NA, VRDN (c)
|
15,495
|
15,495
|
|
Louisville & Jefferson County Series 2013 C, 3.23% 10/7/24, LOC PNC Bank NA, VRDN (c)
|
1,575
|
1,575
|
|
TOTAL KENTUCKY
|
17,070
|
||
Louisiana - 1.6%
|
|||
Louisiana Offshore Term. Auth. Deepwater Port Rev. (LOOP LLC Proj.) Series 2013 B, 3.2% 10/7/24, LOC JPMorgan Chase Bank, VRDN (c)
|
5,960
|
5,960
|
|
Louisiana Pub. Facilities Auth. Rev.:
|
|||
(Air Products & Chemicals, Inc. Proj.) Series 2010, 3.15% 10/7/24, VRDN (c)
|
44,570
|
44,570
|
|
(Christus Health Proj.):
|
|||
Series 2008 B, 3.15% 10/7/24, VRDN (c)
|
29,800
|
29,800
|
|
Series 2009 B1, 3.15% 10/7/24, LOC Sumitomo Mitsui Banking Corp., VRDN (c)
|
3,300
|
3,300
|
|
Saint James Parish Gen. Oblig. (Nucor Steel Louisiana LLC Proj.):
|
|||
Series 2010 A1, 3.38% 10/7/24, VRDN (c)
|
56,500
|
56,500
|
|
Series 2010 B1, 3.4% 10/7/24, VRDN (c)
|
3,785
|
3,785
|
|
FHLMC Louisiana Pub. Facilities Auth. Rev. (River View Villas Proj.) Series 2006, 3.21% 10/7/24, LOC Freddie Mac, VRDN (c)
|
6,800
|
6,800
|
|
TOTAL LOUISIANA
|
150,715
|
||
Michigan - 1.2%
|
|||
Grand Traverse County Hosp. Fin. Auth. Series 2011 B, 3.17% 10/7/24, LOC JPMorgan Chase Bank, VRDN (c)
|
14,765
|
14,765
|
|
Grand Valley Michigan State Univ. Rev. Series 2008 B, 3.17% 10/7/24, LOC TD Banknorth, NA, VRDN (c)
|
15,000
|
15,000
|
|
Kent Hosp. Fin. Auth. Hosp. Facilities Rev. (Spectrum Health Sys. Proj.) Series 2008 B3, 3.2% 10/7/24 (Liquidity Facility Wells Fargo Bank NA), VRDN (c)
|
17,510
|
17,510
|
|
Michigan Fin. Auth. Rev. Series 2016 E3, 3.2% 10/7/24, VRDN (c)
|
5,100
|
5,100
|
|
Michigan State Hsg. Dev. Auth. Series 2022 B, 3.23% 10/7/24, LOC Bank of America NA, VRDN (c)
|
44,170
|
44,170
|
|
Michigan Strategic Fund Ltd. Oblig. Rev. (The Kroger Co. Recovery Zone Facilities Bond Proj.) Series 2010, 3.19% 10/7/24, LOC Bank of Nova Scotia, VRDN (c)
|
7,660
|
7,660
|
|
FHLMC Livonia Econ. Dev. Corp. (Madonna Univ. Proj.) Series 2009, 3.17% 10/1/24, LOC Fed. Home Ln. Bank Chicago, VRDN (c)
|
8,675
|
8,675
|
|
TOTAL MICHIGAN
|
112,880
|
||
Minnesota - 0.2%
|
|||
Hennepin County Gen. Oblig. Series 2018 B, 3.13% 10/7/24 (Liquidity Facility TD Banknorth, NA), VRDN (c)
|
9,190
|
9,190
|
|
Minneapolis Health Care Sys. Rev. (Fairview Health Svcs.) Series 2018 B, 3.15% 10/7/24, LOC JPMorgan Chase Bank, VRDN (c)
|
11,105
|
11,105
|
|
TOTAL MINNESOTA
|
20,295
|
||
Missouri - 0.5%
|
|||
Missouri Health & Edl. Facilities Auth. Health Facilities Rev. (BJC HealthCare Proj.) Series 2008 A, 3.13% 10/7/24 (Liquidity Facility U.S. Bank NA, Cincinnati), VRDN (c)
|
30,945
|
30,945
|
|
Missouri Health & Edl. Facilities Auth. Rev.:
|
|||
(Ascension Health Sr. Cr. Group Proj.) Series 2008 C4, 3.16% 10/7/24, VRDN (c)
|
4,365
|
4,365
|
|
Series 2008 C5, 3.2% 10/7/24, VRDN (c)
|
11,350
|
11,350
|
|
TOTAL MISSOURI
|
46,660
|
||
Nebraska - 0.3%
|
|||
Nebraska Invt. Fin. Auth. Single Family Hsg. Rev.:
|
|||
(NE Sf Mbs Gen. 7/1/94 Proj.) Series 2017 C, 3.2% 10/7/24 (Liquidity Facility Fed. Home Ln. Bank Topeka), VRDN (c)
|
10,895
|
10,895
|
|
Series 2022 E, 3.15% 10/7/24 (Liquidity Facility Fed. Home Ln. Bank Topeka), VRDN (c)
|
17,835
|
17,835
|
|
TOTAL NEBRASKA
|
28,730
|
||
Nevada - 0.1%
|
|||
Clark County Arpt. Rev. Series 2008 D 2B, 3.15% 10/7/24, LOC Sumitomo Mitsui Banking Corp., VRDN (c)
|
12,785
|
12,785
|
|
New Hampshire - 0.2%
|
|||
Nat'l. Fin. Auth. N H Health C Series 2024 C, 3.18% 10/7/24, LOC Truist Bank, VRDN (c)
|
16,800
|
16,800
|
|
New York - 4.2%
|
|||
New York City Gen. Oblig.:
|
|||
Series 2006 E4, 3.11% 10/7/24, LOC Bank of America NA, VRDN (c)
|
15,185
|
15,185
|
|
Series 2013 A4, 3.1% 10/7/24 (Liquidity Facility Sumitomo Mitsui Banking Corp.), VRDN (c)
|
15,800
|
15,800
|
|
Series 2013 A5, 3.15% 10/7/24 (Liquidity Facility Sumitomo Mitsui Banking Corp.), VRDN (c)
|
25,115
|
25,115
|
|
Series 2014 I3, 3.15% 10/7/24 (Liquidity Facility Citibank NA), VRDN (c)
|
9,405
|
9,405
|
|
Series 2017 A, 3.17% 10/7/24 (Liquidity Facility Citibank NA), VRDN (c)
|
29,920
|
29,920
|
|
Series 2019 D, 3.8% 10/1/24 (Liquidity Facility State Street Bank & Trust Co., Boston), VRDN (c)
|
13,115
|
13,115
|
|
Series D5, 3.15% 10/7/24, LOC PNC Bank NA, VRDN (c)
|
28,870
|
28,870
|
|
New York City Muni. Wtr. Fin. Auth. Wtr. & Swr. Sys. Rev.:
|
|||
Series 2013 AA-1, 3.16% 10/7/24 (Liquidity Facility PNC Bank NA), VRDN (c)
|
9,390
|
9,390
|
|
Series 2014 AA, 3.85% 10/1/24 (Liquidity Facility JPMorgan Chase Bank), VRDN (c)
|
9,500
|
9,500
|
|
Series 2015 BB3, 3.15% 10/7/24 (Liquidity Facility Sumitomo Mitsui Banking Corp.), VRDN (c)
|
17,255
|
17,255
|
|
Series 2016 AA2, 3.16% 10/7/24 (Liquidity Facility PNC Bank NA), VRDN (c)
|
32,580
|
32,580
|
|
Series 2016 CC, 3.12% 10/7/24 (Liquidity Facility Sumitomo Mitsui Banking Corp.), VRDN (c)
|
25,120
|
25,120
|
|
Series BB3, 3.15% 10/7/24 (Liquidity Facility Sumitomo Mitsui Banking Corp.), VRDN (c)
|
34,775
|
34,775
|
|
New York City Transitional Fin. Auth. Rev.:
|
|||
Series 2014 D4, 3.16% 10/7/24 (Liquidity Facility Mizuho Corporate Bank Ltd.), VRDN (c)
|
42,600
|
42,600
|
|
Series 2018 C6, 3.13% 10/7/24 (Liquidity Facility Sumitomo Mitsui Banking Corp.), VRDN (c)
|
57,450
|
57,450
|
|
New York Hsg. Fin. Agcy. Rev.:
|
|||
(8 East 102nd Street Hsg. Proj.) Series 2010 A, 3.2% 10/7/24, LOC TD Banknorth, NA, VRDN (c)
|
5,100
|
5,100
|
|
Series 2010 A:
|
|||
3.15% 10/7/24, LOC Landesbank Hessen-Thuringen, VRDN (c)
|
2,500
|
2,500
|
|
3.15% 10/7/24, LOC Landesbank Hessen-Thuringen, VRDN (c)
|
10,300
|
10,300
|
|
New York Metropolitan Trans. Auth. Rev. Series 2005 E, 3.15% 10/7/24, LOC Bank of America NA, VRDN (c)
|
11,900
|
11,900
|
|
FHLMC New York Hsg. Fin. Agcy. Rev. Series 2010 A, 3.17% 10/7/24, LOC Freddie Mac, VRDN (c)
|
5,900
|
5,900
|
|
TOTAL NEW YORK
|
401,780
|
||
New York And New Jersey - 0.1%
|
|||
Port Auth. of New York & New Jersey Series 1997 2, SIFMA Municipal Swap Index + 0.050% 3.2% 10/30/24, VRDN (c)(d)(e)
|
7,300
|
7,300
|
|
North Carolina - 0.5%
|
|||
Durham County Indl. and Poll. Cont. Auth. Rev. Series 2007, 3.15% 10/7/24, LOC TD Banknorth, NA, VRDN (c)
|
18,295
|
18,295
|
|
Lower Cape Fear Wtr. & Swr. Auth. Rev. (Bladen Bluffs Proj.) Series 2010, 3.23% 10/7/24, LOC Cooperatieve Rabobank UA/NY, VRDN (c)
|
6,315
|
6,315
|
|
Parson County Indl. Facilities and Poll. Cont. Fing. Auth. (CertainTeed Gypsum NC, Inc. Proj.) Series 2010, 3.2% 10/7/24, LOC Cr. Industriel et Commercial, VRDN (c)
|
21,590
|
21,590
|
|
TOTAL NORTH CAROLINA
|
46,200
|
||
Ohio - 3.5%
|
|||
Allen County Hosp. Facilities Rev. Series 2012 B, 3.2% 10/7/24, LOC TD Banknorth, NA, VRDN (c)
|
53,115
|
53,115
|
|
Cuyahoga County Health Care Facilities Rev. (The A.M. McGregor Home Proj.) Series 2014, 3.2% 10/7/24, LOC Northern Trust Co., VRDN (c)
|
4,400
|
4,400
|
|
Franklin County Hosp. Facilities Rev.:
|
|||
Series 2009 A, 3.05% 10/7/24 (Liquidity Facility Barclays Bank PLC), VRDN (c)
|
23,650
|
23,650
|
|
Series 2009 B, 3.05% 10/7/24 (Liquidity Facility Barclays Bank PLC), VRDN (c)
|
30,000
|
30,000
|
|
Series 2013 A, 3.2% 10/7/24 (Liquidity Facility JPMorgan Chase Bank), VRDN (c)
|
11,945
|
11,945
|
|
Series 2017 B, 3.2% 10/7/24 (Liquidity Facility JPMorgan Chase Bank), VRDN (c)
|
22,380
|
22,380
|
|
Hamilton County Hosp. Facilities Rev.:
|
|||
Series 2018 AA, 3.13% 10/7/24, VRDN (c)
|
18,740
|
18,740
|
|
Series 2018 Z, 3.2% 10/7/24, VRDN (c)
|
16,085
|
16,085
|
|
Montgomery County Hosp. Rev. Series 2019 B, 3.15% 10/7/24, LOC PNC Bank NA, VRDN (c)
|
40,970
|
40,970
|
|
Ohio Hosp. Rev.:
|
|||
Series 2018 B, 3.15% 10/7/24, LOC PNC Bank NA, VRDN (c)
|
6,060
|
6,060
|
|
Series 2021 D, 3.1% 10/7/24, LOC U.S. Bank NA, Cincinnati, VRDN (c)
|
18,550
|
18,550
|
|
Ohio State Univ. Gen. Receipts (Multiyear Debt Issuance Prog. II):
|
|||
Series 2023 D1, 3.23% 10/7/24, VRDN (c)
|
70,305
|
70,305
|
|
Series 2023 D2, 3.2% 10/7/24, VRDN (c)
|
13,500
|
13,500
|
|
TOTAL OHIO
|
329,700
|
||
Pennsylvania - 2.1%
|
|||
Delaware Valley Reg'l. Fin. Auth. Local Govt. Rev.:
|
|||
Series 2020 D, 3.2% 10/7/24, LOC TD Banknorth, NA, VRDN (c)
|
34,060
|
34,060
|
|
Series 2022 E, 3.2% 10/7/24, LOC TD Banknorth, NA, VRDN (c)
|
14,575
|
14,575
|
|
Lancaster Indl. Dev. Auth. Rev. (Willow Valley Retirement Cmntys. Proj.) Series 2009 C, 3.23% 10/7/24, LOC PNC Bank NA, VRDN (c)
|
7,400
|
7,400
|
|
Lehigh County Gen. Purp. Hosp. Rev. Series 2019 B, 3.15% 10/7/24, LOC Bank of America NA, VRDN (c)
|
93,380
|
93,380
|
|
Pennsylvania Higher Edl. Facilities Auth. Rev. (Assoc. of Independent Colleges and Univs. of Pennsylvania Fing. Prog.) Series 2001 H9, 3.15% 10/7/24, LOC PNC Bank NA, VRDN (c)
|
2,300
|
2,300
|
|
Philadelphia Gas Works Rev.:
|
|||
(1998 Gen. Ordinance Proj.) Eighth Series B, 3.14% 10/7/24, LOC TD Banknorth, NA, VRDN (c)
|
9,150
|
9,150
|
|
Series 2009 D, 3.14% 10/7/24, LOC TD Banknorth, NA, VRDN (c)
|
11,730
|
11,730
|
|
Philadelphia Gen. Oblig. Series 2009 B, 3.05% 10/7/24, LOC Barclays Bank PLC, VRDN (c)
|
15,775
|
15,775
|
|
FNMA Montgomery County Redev. Auth. Multi-family Hsg. Rev. (Kingswood Apts. Proj.) Series 2001 A, 3.18% 10/7/24, LOC Fannie Mae, VRDN (c)
|
7,475
|
7,475
|
|
TOTAL PENNSYLVANIA
|
195,845
|
||
Rhode Island - 0.1%
|
|||
Rhode Island Health and Edl. Bldg. Corp. Higher Ed. Facility Rev.:
|
|||
(Bryant Univ. Proj.) Series 2008, 3.2% 10/7/24, LOC TD Banknorth, NA, VRDN (c)
|
4,005
|
4,005
|
|
(New England Institute of Technology Proj.) Series 2008, 3.27% 10/7/24, LOC TD Banknorth, NA, VRDN (c)
|
1,145
|
1,145
|
|
TOTAL RHODE ISLAND
|
5,150
|
||
Tennessee - 0.1%
|
|||
Clarksville Pub. Bldg. Auth. Rev. (Tennessee Muni. Bond Fund Proj.) Series 2005, 4.03% 10/1/24, LOC Bank of America NA, VRDN (c)
|
7,200
|
7,200
|
|
Indl. Dev. Board of Blount County and Cities of Alcoa and Maryville (Maryville Civic Arts Ctr. Proj.) Series 2009 B, 3.33% 10/7/24, LOC Truist Bank, VRDN (c)
|
1,210
|
1,210
|
|
Montgomery County Pub. Bldg. Auth. Pooled Fing. Rev. (Tennessee County Ln. Pool Prog.) Series 2006, 4.03% 10/1/24, LOC Bank of America NA, VRDN (c)
|
3,605
|
3,605
|
|
TOTAL TENNESSEE
|
12,015
|
||
Texas - 7.7%
|
|||
Gulf Coast Indl. Dev. Auth. TX Rev. (ExxonMobil Proj.) Series 2012, 3.85% 10/1/24 (Exxon Mobil Corp. Guaranteed), VRDN (c)
|
13,000
|
13,000
|
|
Harris County Cultural Ed. Facilities Fin. Corp. Rev.:
|
|||
Series 2024 D, 3.2% 10/7/24, VRDN (c)
|
16,200
|
16,200
|
|
Series 2024 E, 3.2% 10/7/24, VRDN (c)
|
40,185
|
40,185
|
|
Series 2024 F, 3% 10/7/24, VRDN (c)
|
43,500
|
43,500
|
|
Harris County Hosp. District Rev. Series 2010, 3.2% 10/7/24, LOC JPMorgan Chase Bank, VRDN (c)
|
23,070
|
23,070
|
|
Houston Util. Sys. Rev.:
|
|||
Series 2004 B2, 3.23% 10/7/24, LOC Sumitomo Mitsui Banking Corp., VRDN (c)
|
29,225
|
29,225
|
|
Series 2004 B3, 3.23% 10/7/24, LOC Sumitomo Mitsui Banking Corp., VRDN (c)
|
7,650
|
7,650
|
|
Series 2004 B4, 3.23% 10/7/24 (Liquidity Facility JPMorgan Chase Bank), VRDN (c)
|
21,300
|
21,300
|
|
Series 2004 B5, 3.23% 10/7/24 (Liquidity Facility UBS AG), VRDN (c)
|
68,390
|
68,390
|
|
Series 2004 B6, 3.23% 10/7/24, LOC Sumitomo Mitsui Banking Corp., VRDN (c)
|
27,640
|
27,640
|
|
Series 2012 A, 3.23% 10/7/24 (Liquidity Facility TD Banknorth, NA), VRDN (c)
|
15,620
|
15,620
|
|
Port Arthur Navigation District Exempt Facilities:
|
|||
(Total Petroleum Proj.) Series 2010, 3.21% 10/7/24 (TotalEnergies SE Guaranteed), VRDN (c)
|
44,800
|
44,800
|
|
(Var-Total Petrochemicals Proj.) Series 2009, 3.21% 10/7/24 (TotalEnergies SE Guaranteed), VRDN (c)
|
700
|
700
|
|
Port Arthur Navigation District Indl. Dev. Corp. Exempt Facilities Rev.:
|
|||
(Air Products Proj.):
|
|||
Series 2010 A, 3.21% 10/7/24 (TotalEnergies SE Guaranteed), VRDN (c)
|
46,140
|
46,140
|
|
Series 2012, 3.45% 10/7/24 (TotalEnergies SE Guaranteed), VRDN (c)
|
105,500
|
105,500
|
|
(Total Petrochemicals & Refining U.S.A., Inc. Proj.) Series 2012 B, 3.21% 10/7/24 (TotalEnergies SE Guaranteed), VRDN (c)
|
4,200
|
4,200
|
|
(Total Petrochemicals and Refining U.S.A., Inc. Proj.) Series 2012 A, 3.21% 10/7/24 (TotalEnergies SE Guaranteed), VRDN (c)
|
4,100
|
4,100
|
|
Tarrant County Cultural Ed. Facilities Fin. Corp. Rev. (Christus Health Proj.):
|
|||
Series 2008 C3, 3.15% 10/7/24, LOC TD Banknorth, NA, VRDN (c)
|
29,615
|
29,615
|
|
Series 2008 C4, 3.15% 10/7/24, LOC TD Banknorth, NA, VRDN (c)
|
26,620
|
26,620
|
|
Texas Gen. Oblig.:
|
|||
(Texas Veterans Land Board Proj.) Series 2017, 3.25% 10/7/24 (Liquidity Facility Sumitomo Mitsui Banking Corp.), VRDN (c)
|
37,215
|
37,215
|
|
Series 2011 B, 3.3% 10/7/24 (Liquidity Facility State Street Bank & Trust Co., Boston), VRDN (c)
|
15,020
|
15,020
|
|
Series 2012 B, 3.3% 10/7/24 (Liquidity Facility State Street Bank & Trust Co., Boston), VRDN (c)
|
13,335
|
13,335
|
|
Series 2013 A, 3.3% 10/7/24 (Liquidity Facility State Street Bank & Trust Co., Boston), VRDN (c)
|
7,340
|
7,340
|
|
Series 2013 B, 3.3% 10/7/24 (Liquidity Facility State Street Bank & Trust Co., Boston), VRDN (c)
|
37,835
|
37,835
|
|
Series 2014 A, 3.3% 10/7/24 (Liquidity Facility State Street Bank & Trust Co., Boston), VRDN (c)
|
37,990
|
37,990
|
|
Series 2015 A, 3.3% 10/7/24 (Liquidity Facility State Street Bank & Trust Co., Boston), VRDN (c)
|
13,400
|
13,400
|
|
TOTAL TEXAS
|
729,590
|
||
Utah - 0.3%
|
|||
Emery County Poll. Cont. Rev. (PacifiCorp Proj.) Series 1994, 3.75% 10/7/24, VRDN (c)
|
32,300
|
32,300
|
|
Virginia - 0.9%
|
|||
Fairfax County Indl. Dev. Auth.:
|
|||
(Inova Health Sys. Proj.) Series 2018 C, 3.2% 10/7/24, VRDN (c)
|
5,985
|
5,985
|
|
Series 2016 C, 3.2% 10/7/24, VRDN (c)
|
8,875
|
8,875
|
|
Harrisonburg Econ. Dev. A Series 2023, 3.2% 10/7/24, LOC U.S. Bank NA, Cincinnati, VRDN (c)
|
38,825
|
38,825
|
|
Norfolk Econ. Dev. Auth. Hosp. Facilities Rev. Series 2016, 3.15% 10/7/24, VRDN (c)
|
2,050
|
2,050
|
|
Virginia Small Bus. Fin. Auth. Hosp. Rev. Series 2008 A, 3.21% 10/7/24, LOC PNC Bank NA, VRDN (c)
|
29,100
|
29,100
|
|
TOTAL VIRGINIA
|
84,835
|
||
Washington - 0.3%
|
|||
Port of Vancouver Rev. (United Grain Corp. of Oregon Proj.) Series 2009, 3.26% 10/7/24, LOC Bank of America NA, VRDN (c)
|
14,700
|
14,700
|
|
FHLMC Washington Hsg. Fin. Commission Multi-family Hsg. Rev. (Reserve at Renton Apts. Proj.) Series 2014, 3.56% 10/7/24, LOC Fed. Home Ln. Bank, San Francisco, VRDN (c)
|
14,500
|
14,500
|
|
FNMA Washington Hsg. Fin. Commission Multi-family Hsg. Rev. (The Cambridge Apts. Proj.) Series 2009, 3.18% 10/7/24, LOC Fannie Mae, VRDN (c)
|
3,815
|
3,815
|
|
TOTAL WASHINGTON
|
33,015
|
||
West Virginia - 0.2%
|
|||
West Virginia Hosp. Fin. Auth. Hosp. Rev. Series 2018 C, 3.15% 10/7/24, LOC TD Banknorth, NA, VRDN (c)
|
19,890
|
19,890
|
|
Wisconsin - 0.5%
|
|||
Wisconsin Hsg. & Econ. Dev. Auth.:
|
|||
2019 Series B, 3.15% 10/7/24 (Liquidity Facility Fed. Home Ln. Bank Chicago), VRDN (c)
|
4,600
|
4,600
|
|
Series 2021 B, 3.15% 10/7/24 (Liquidity Facility Fed. Home Ln. Bank Chicago), VRDN (c)
|
23,600
|
23,600
|
|
Series 2022 B, 3.15% 10/7/24 (Liquidity Facility Fed. Home Ln. Bank Chicago), VRDN (c)
|
22,500
|
22,500
|
|
TOTAL WISCONSIN
|
50,700
|
||
Wyoming - 0.0%
|
|||
Lincoln County Poll. Cont. Rev. (PacifiCorp Proj.) Series 1994, 3.6% 10/7/24, VRDN (c)
|
2,700
|
2,700
|
|
|
TOTAL VARIABLE RATE DEMAND NOTE
(Cost $4,077,415)
|
4,077,415
|
||
Tender Option Bond - 22.9%
|
|||
Principal
Amount (a)
(000s)
|
Value ($)
(000s)
|
||
Alabama - 1.2%
|
|||
Alabama Spl. Care Facilities Fing. Auth. Birmingham Rev. Participating VRDN Series ZF 13 98, 3.18% 10/7/24 (Liquidity Facility JPMorgan Chase Bank) (c)(f)(g)
|
1,965
|
1,965
|
|
Black Belt Energy Gas District Participating VRDN:
|
|||
Series XM 11 44, 3.2% 10/7/24 (Liquidity Facility Royal Bank of Canada) (c)(f)(g)
|
6,250
|
6,250
|
|
Series XM 11 50, 3.18% 10/7/24 (Liquidity Facility Royal Bank of Canada) (c)(f)(g)
|
8,950
|
8,950
|
|
Series XM 11 73, 3.2% 10/7/24 (Liquidity Facility Royal Bank of Canada) (c)(f)(g)
|
2,000
|
2,000
|
|
Series ZL 04 87, 3.18% 10/7/24 (Liquidity Facility Royal Bank of Canada) (c)(f)(g)
|
2,125
|
2,125
|
|
Series ZL 05 08, 3.2% 10/7/24 (Liquidity Facility Royal Bank of Canada) (c)(f)(g)
|
8,590
|
8,590
|
|
Series ZL 05 09, 3.2% 10/7/24 (Liquidity Facility Royal Bank of Canada) (c)(f)(g)
|
4,515
|
4,515
|
|
Series ZL 05 18, 3.2% 10/7/24 (Liquidity Facility Royal Bank of Canada) (c)(f)(g)
|
3,335
|
3,335
|
|
Energy Southeast Ala Coop. District Participating VRDN:
|
|||
Series XL 05 42, 3.2% 10/7/24 (Liquidity Facility Royal Bank of Canada) (c)(f)(g)
|
3,080
|
3,080
|
|
Series XM 11 39, 3.2% 10/7/24 (Liquidity Facility Royal Bank of Canada) (c)(f)(g)
|
5,900
|
5,900
|
|
Jefferson County Swr. Rev. Participating VRDN Series XL 05 31, 3.19% 10/7/24 (Liquidity Facility Barclays Bank PLC) (c)(f)(g)
|
4,500
|
4,500
|
|
Pittsburg WTSW Participating VRDN 3.18% 10/7/24 (Liquidity Facility JPMorgan Chase Bank) (c)(f)(g)
|
49,185
|
49,185
|
|
Southeast Alabama Gas Supply District Participating VRDN:
|
|||
Series XF 16 87, 3.2% 10/7/24 (Liquidity Facility Royal Bank of Canada) (c)(f)(g)
|
2,670
|
2,670
|
|
Series XF 16 94, 3.2% 10/7/24 (Liquidity Facility Royal Bank of Canada) (c)(f)(g)
|
3,125
|
3,125
|
|
Southeast Energy Auth. Coop. Dis Participating VRDN Series XM 11 35, 3.18% 10/7/24 (Liquidity Facility Royal Bank of Canada) (c)(f)(g)
|
4,000
|
4,000
|
|
Southeast Energy Auth. Rev. Participating VRDN Series ZL 04 68, 3.18% 10/7/24 (Liquidity Facility JPMorgan Chase Bank) (c)(f)(g)
|
2,340
|
2,340
|
|
TOTAL ALABAMA
|
112,530
|
||
Arizona - 0.2%
|
|||
Arizona Board of Regents Arizona State Univ. Rev. Participating VRDN Series XF 17 47, 3.18% 10/7/24 (Liquidity Facility JPMorgan Chase Bank) (c)(f)(g)
|
2,700
|
2,700
|
|
Arizona St Indl. Dev. Auth. Multi Participating VRDN:
|
|||
Floater MIZ 91 76, 3.47% 11/4/24 (Liquidity Facility Mizuho Cap. Markets LLC) (c)(d)(f)(g)
|
5,300
|
5,300
|
|
Series Floater MIZ 91 87, 3.47% 11/4/24 (Liquidity Facility Mizuho Cap. Markets LLC) (c)(d)(f)(g)
|
4,500
|
4,500
|
|
Series MIZ 91 80, 3.47% 11/4/24 (Liquidity Facility Mizuho Cap. Markets LLC) (c)(d)(f)(g)
|
3,200
|
3,200
|
|
Jefferson County Ala Board Ed. Pubs Participating VRDN Series YX 13 19, 3.19% 10/7/24 (Liquidity Facility Barclays Bank PLC) (c)(f)(g)
|
2,025
|
2,025
|
|
Salt Verde Finl. Corp. Sr. Gas Rev. Participating VRDN Series Floaters XF 25 37, 3.19% 10/7/24 (Liquidity Facility Barclays Bank PLC) (c)(f)(g)
|
1,200
|
1,200
|
|
TOTAL ARIZONA
|
18,925
|
||
California - 0.3%
|
|||
California Health Facilities Fing. Auth. Rev. Participating VRDN Series Floaters 013, 3.4% 11/4/24 (Liquidity Facility Barclays Bank PLC) (c)(f)(g)
|
4,665
|
4,665
|
|
California State Univ. Rev. Participating VRDN:
|
|||
Series 2022 XX 12 63, 3.17% 10/7/24 (Liquidity Facility Barclays Bank PLC) (c)(f)(g)
|
3,750
|
3,750
|
|
Series XM 11 40, 3.17% 10/7/24 (Liquidity Facility Barclays Bank PLC) (c)(f)(g)
|
8,075
|
8,075
|
|
Lucile Salter Packard Children's Hosp. Participating VRDN Series Floaters XG 01 48, 3.18% 10/7/24 (Liquidity Facility Morgan Stanley Bank, West Valley City Utah) (c)(f)(g)
|
2,399
|
2,399
|
|
Univ. of California Regents Med. Ctr. Pool Rev. Participating VRDN Series XX 12 75, 3.17% 10/7/24 (Liquidity Facility Barclays Bank PLC) (c)(f)(g)
|
2,685
|
2,685
|
|
Univ. of California Revs. Participating VRDN:
|
|||
Series 2022 XX 12 58, 3.17% 10/7/24 (Liquidity Facility Barclays Bank PLC) (c)(f)(g)
|
4,000
|
4,000
|
|
Series Floaters YX 10 98, 3.17% 10/7/24 (Liquidity Facility Barclays Bank PLC) (c)(f)(g)
|
7,600
|
7,600
|
|
TOTAL CALIFORNIA
|
33,174
|
||
Colorado - 0.4%
|
|||
Colorado Ctfs. of Prtn. Participating VRDN Series XG 04 26, 3.18% 10/7/24 (Liquidity Facility UBS AG) (c)(f)(g)
|
8,720
|
8,720
|
|
Colorado Health Facilities Auth. Rev. Bonds Participating VRDN:
|
|||
Series 2022 YX 12 54, 3.18% 10/7/24 (Liquidity Facility Barclays Bank PLC) (c)(f)(g)
|
3,905
|
3,905
|
|
Series 2023, 3.45% 11/4/24 (Liquidity Facility Barclays Bank PLC) (c)(f)(g)
|
13,000
|
13,000
|
|
Series XF 16 19, 3.18% 10/7/24 (Liquidity Facility Royal Bank of Canada) (c)(f)(g)
|
4,000
|
4,000
|
|
Series XG 02 51, 3.2% 10/7/24 (Liquidity Facility Bank of America NA) (c)(f)(g)
|
720
|
720
|
|
Series XL 04 36, 3.18% 10/7/24 (Liquidity Facility Morgan Stanley Bank, West Valley City Utah) (c)(f)(g)
|
3,710
|
3,710
|
|
Series XM 08 29, 3.18% 10/7/24 (Liquidity Facility Barclays Bank PLC) (c)(f)(g)
|
4,400
|
4,400
|
|
Series XM 11 24, 3.18% 10/7/24 (Liquidity Facility Barclays Bank PLC) (c)(f)(g)
|
2,345
|
2,345
|
|
TOTAL COLORADO
|
40,800
|
||
Connecticut - 0.7%
|
|||
Connecticut Gen. Oblig. Participating VRDN:
|
|||
Series Floaters 014, 3.19% 10/7/24 (Liquidity Facility Barclays Bank PLC) (c)(f)(g)
|
26,555
|
26,555
|
|
Series Floaters 016, 3.19% 10/7/24 (Liquidity Facility Barclays Bank PLC) (c)(f)(g)
|
23,400
|
23,400
|
|
Series Floaters YX 10 95, 3.18% 10/7/24 (Liquidity Facility Barclays Bank PLC) (c)(f)(g)
|
4,000
|
4,000
|
|
Series XM 10 35, 3.18% 10/7/24 (Liquidity Facility JPMorgan Chase Bank) (c)(f)(g)
|
2,705
|
2,705
|
|
Connecticut Health & Edl. Facilities Auth. Rev. Participating VRDN Series YX 12 91, 3.19% 10/7/24 (Liquidity Facility Barclays Bank PLC) (c)(f)(g)
|
8,100
|
8,100
|
|
TOTAL CONNECTICUT
|
64,760
|
||
District Of Columbia - 0.2%
|
|||
District of Columbia Gen. Oblig. Participating VRDN Series Floaters E 108, 3.18% 10/7/24 (Liquidity Facility Royal Bank of Canada) (c)(f)(g)
|
2,970
|
2,970
|
|
Metropolitan Washington Arpts. Auth. Dulles Toll Road Rev. Participating VRDN:
|
|||
Series XF 08 53, 3.19% 10/7/24 (Liquidity Facility Toronto-Dominion Bank) (c)(f)(g)
|
9,475
|
9,475
|
|
Series XF 09 19, 3.18% 10/7/24 (Liquidity Facility JPMorgan Chase Bank) (c)(f)(g)
|
1,355
|
1,355
|
|
Series XG 02 67, 3.2% 10/7/24 (Liquidity Facility Bank of America NA) (c)(f)(g)
|
1,715
|
1,715
|
|
TOTAL DISTRICT OF COLUMBIA
|
15,515
|
||
Florida - 1.6%
|
|||
Broward County Convention Ctr. Participating VRDN:
|
|||
Series XF 16 41, 3.25% 10/7/24 (Liquidity Facility JPMorgan Chase Bank) (c)(f)(g)
|
10,700
|
10,700
|
|
Series ZL 05 32, 3.17% 10/7/24 (Liquidity Facility Morgan Stanley Bank, West Valley City Utah) (c)(f)(g)
|
8,100
|
8,100
|
|
Broward County Wtr. & Swr. Util. Rev. Participating VRDN Series XL 05 51, 3.18% 10/7/24 (Liquidity Facility Bank of America NA) (c)(f)(g)
|
2,230
|
2,230
|
|
Cape Coral Wtr. & Swr. Rev. Participating VRDN Series YX 13 17, 3.19% 10/7/24 (Liquidity Facility Barclays Bank PLC) (c)(f)(g)
|
5,200
|
5,200
|
|
County of Broward Tourist Dev. Tax Rev. Participating VRDN:
|
|||
Series XL 04 12, 3.23% 10/7/24 (Liquidity Facility Wells Fargo Bank NA) (c)(f)(g)
|
4,000
|
4,000
|
|
Series XL 04 29, 3.26% 10/7/24 (Liquidity Facility Wells Fargo Bank NA) (c)(f)(g)
|
1,415
|
1,415
|
|
Florida Dept. of Trans. Tpk. Rev. Participating VRDN:
|
|||
Series XF 31 00, 3.18% 10/7/24 (Liquidity Facility Barclays Bank PLC) (c)(f)(g)
|
4,265
|
4,265
|
|
Series XM 10 72, 3.18% 10/7/24 (Liquidity Facility Morgan Stanley Bank, West Valley City Utah) (c)(f)(g)
|
3,750
|
3,750
|
|
Florida Hsg. Fin. Corp. Rev. Participating VRDN Series XF 17 09, 3.18% 10/7/24 (Liquidity Facility Bank of America NA) (c)(f)(g)
|
5,190
|
5,190
|
|
Gainesville Utils. Sys. Rev. Participating VRDN Series YX 12 84, 3.18% 10/7/24 (Liquidity Facility Barclays Bank PLC) (c)(f)(g)
|
7,815
|
7,815
|
|
Hillsborough County Indl. Dev. Auth. Participating VRDN Series XF 32 39, 3.18% 10/7/24 (Liquidity Facility Morgan Stanley Bank, West Valley City Utah) (c)(f)(g)
|
3,100
|
3,100
|
|
JEA Wtr. & Swr. Sys. Rev. Participating VRDN Series ZF 16 92, 3.18% 10/7/24 (Liquidity Facility JPMorgan Chase Bank) (c)(f)(g)
|
3,070
|
3,070
|
|
Miami-Dade County Edl. Facilities Rev. Participating VRDN Series Floaters XG 01 92, 3.19% 10/7/24 (Liquidity Facility Royal Bank of Canada) (c)(f)(g)
|
5,130
|
5,130
|
|
Miami-Dade County Expressway Auth. Participating VRDN Series Floaters XG 02 52, 3.2% 10/7/24 (Liquidity Facility Bank of America NA) (c)(f)(g)
|
7,400
|
7,400
|
|
Miami-Dade County School District Participating VRDN Series XL 05 44, 3.18% 10/7/24 (Liquidity Facility Royal Bank of Canada) (c)(f)(g)
|
2,800
|
2,800
|
|
Miami-Dade County Wtr. & Swr. Rev. Participating VRDN:
|
|||
Series XF 30 80, 3.18% 10/7/24 (Liquidity Facility Barclays Bank PLC) (c)(f)(g)
|
6,000
|
6,000
|
|
Series XF 31 22, 3.18% 10/7/24 (Liquidity Facility Barclays Bank PLC) (c)(f)(g)
|
4,280
|
4,280
|
|
Series XM 11 22, 3.18% 10/7/24 (Liquidity Facility Barclays Bank PLC) (c)(f)(g)
|
13,900
|
13,900
|
|
Palm Beach County Health Facilities Auth. Hosp. Rev. Participating VRDN Series XG 03 70, 3.25% 10/7/24 (Liquidity Facility Bank of America NA) (c)(f)(g)
|
6,630
|
6,630
|
|
Pasco County Fla Hosp. Rev. Participating VRDN Series XM 11 55, 3.18% 10/7/24 (Liquidity Facility Royal Bank of Canada) (c)(f)(g)
|
5,285
|
5,285
|
|
South Broward Hosp. District Rev. Participating VRDN Series XG 03 45, 3.18% 10/7/24 (Liquidity Facility Wells Fargo Bank NA) (c)(f)(g)
|
200
|
200
|
|
South Miami Health Facilities Auth. Hosp. Rev. Participating VRDN Series YX 12 86, 3.22% 10/7/24 (Liquidity Facility Barclays Bank PLC) (c)(f)(g)
|
7,435
|
7,435
|
|
Tallahassee Health Facilities Rev. Participating VRDN:
|
|||
Series BAML 50 33, 4.04% 10/1/24 (Liquidity Facility Bank of America NA) (c)(f)(g)
|
12,230
|
12,230
|
|
Series XG 04 85, 3.18% 10/7/24 (Liquidity Facility Royal Bank of Canada) (c)(f)(g)
|
2,595
|
2,595
|
|
Tampa Bay Wtr. Reg'l. Wtr. Supply Auth. Util. Sys. Rev. Participating VRDN Series ZL 04 85, 3.18% 10/7/24 (Liquidity Facility Wells Fargo Bank NA) (c)(f)(g)
|
2,500
|
2,500
|
|
Tampa Health Sys. Rev. Participating VRDN:
|
|||
Series 2022 ZF 14 10, 3.18% 10/7/24 (Liquidity Facility JPMorgan Chase Bank) (c)(f)(g)
|
2,625
|
2,625
|
|
Series XF 31 46, 3.2% 10/7/24 (Liquidity Facility Wells Fargo Bank NA) (c)(f)(g)
|
2,315
|
2,315
|
|
Volusia County Fla Hosp. Rev. Participating VRDN Series 50 32, 3.95% 10/1/24 (Liquidity Facility JPMorgan Chase Bank) (c)(f)(g)
|
8,100
|
8,100
|
|
TOTAL FLORIDA
|
148,260
|
||
Georgia - 1.5%
|
|||
Brookhaven Dev. Auth. Rev. Participating VRDN:
|
|||
Series XF 15 03, 3.95% 10/1/24 (Liquidity Facility JPMorgan Chase Bank) (c)(f)(g)
|
5,730
|
5,730
|
|
Series XG 02 44, 3.18% 10/7/24 (Liquidity Facility Bank of America NA) (c)(f)(g)
|
170
|
170
|
|
Series XX 12 80, 3.18% 10/7/24 (Liquidity Facility Barclays Bank PLC) (c)(f)(g)
|
10,000
|
10,000
|
|
Burke County Indl. Dev. Auth. Poll. Cont. Rev. Participating VRDN:
|
|||
Series E 155, 3.19% 10/7/24 (Liquidity Facility Royal Bank of Canada) (c)(f)(g)
|
30,695
|
30,695
|
|
Series Floaters E 107, 3.2% 10/7/24 (Liquidity Facility Royal Bank of Canada) (c)(f)(g)
|
15,400
|
15,400
|
|
Fulton County Dev. Auth. Rev. Participating VRDN Series XL 02 68, 3.25% 10/7/24 (Liquidity Facility Bank of America NA) (c)(f)(g)
|
2,130
|
2,130
|
|
Georgia Gen. Oblig. Participating VRDN:
|
|||
Series 2023 D7, 3.17% 10/7/24 (Liquidity Facility Citibank NA) (c)(f)(g)
|
9,375
|
9,375
|
|
Series CF 70 07, 3.18% 10/7/24 (Liquidity Facility Citibank NA) (c)(f)(g)
|
3,500
|
3,500
|
|
Georgia Muni. Elec. Auth. Pwr. Rev. Participating VRDN:
|
|||
Series XF 31 06, 3.19% 10/7/24 (Liquidity Facility Barclays Bank PLC) (c)(f)(g)
|
8,085
|
8,085
|
|
Series XG 04 70, 3.2% 10/7/24 (Liquidity Facility Bank of America NA) (c)(f)(g)
|
8,150
|
8,150
|
|
Main Street Natural Gas, Inc. Participating VRDN:
|
|||
Series Floaters XF 07 51, 3.18% 10/7/24 (Liquidity Facility JPMorgan Chase Bank) (c)(f)(g)
|
22,705
|
22,705
|
|
Series XF 16 01, 3.18% 10/7/24 (Liquidity Facility Royal Bank of Canada) (c)(f)(g)
|
6,800
|
6,800
|
|
Series XM 11 34, 3.18% 10/7/24 (Liquidity Facility Royal Bank of Canada) (c)(f)(g)
|
4,000
|
4,000
|
|
Series XM 11 36, 3.18% 10/7/24 (Liquidity Facility Royal Bank of Canada) (c)(f)(g)
|
2,700
|
2,700
|
|
Series ZF 16 55, 3.18% 10/7/24 (Liquidity Facility Royal Bank of Canada) (c)(f)(g)
|
3,105
|
3,105
|
|
Series ZF 16 59, 3.18% 10/7/24 (Liquidity Facility Royal Bank of Canada) (c)(f)(g)
|
2,110
|
2,110
|
|
Muni. Elec. Auth. of Georgia Participating VRDN Series XG 02 54, 3.2% 10/7/24 (Liquidity Facility Bank of America NA) (c)(f)(g)
|
5,305
|
5,305
|
|
TOTAL GEORGIA
|
139,960
|
||
Idaho - 0.0%
|
|||
Idaho Hsg. & Fin. Assoc. Single Family Mtg. Participating VRDN Series XG 05 65, 3.2% 10/7/24 (Liquidity Facility Barclays Bank PLC) (c)(f)(g)
|
2,150
|
2,150
|
|
Illinois - 2.9%
|
|||
Chicago Board of Ed. Participating VRDN:
|
|||
Series Floaters XG 02 17, 3.18% 10/7/24 (Liquidity Facility JPMorgan Chase Bank) (c)(f)(g)
|
5,625
|
5,625
|
|
Series XG 04 69, 3.21% 10/7/24 (Liquidity Facility Bank of America NA) (c)(f)(g)
|
3,260
|
3,260
|
|
Chicago Gen. Oblig. Participating VRDN:
|
|||
Series 2022 XF 30 42, 3.19% 10/7/24 (Liquidity Facility Barclays Bank PLC) (c)(f)(g)
|
2,545
|
2,545
|
|
Series 2022 XF 30 45, 3.19% 10/7/24 (Liquidity Facility Barclays Bank PLC) (c)(f)(g)
|
31,330
|
31,330
|
|
Series Floaters XL 01 05, 3.19% 10/7/24 (Liquidity Facility Barclays Bank PLC) (c)(f)(g)
|
8,380
|
8,380
|
|
Series XG 04 34, 3.18% 10/7/24 (Liquidity Facility Royal Bank of Canada) (c)(f)(g)
|
2,750
|
2,750
|
|
Series XX 12 64, 3.19% 10/7/24 (Liquidity Facility Barclays Bank PLC) (c)(f)(g)
|
18,710
|
18,710
|
|
Chicago O'Hare Int'l. Arpt. Rev. Participating VRDN Series Floaters XF 07 36, 3.18% 10/7/24 (Liquidity Facility JPMorgan Chase Bank) (c)(f)(g)
|
560
|
560
|
|
Chicago Transit Auth. Participating VRDN Series XL 01 45, 3.19% 10/7/24 (Liquidity Facility Barclays Bank PLC) (c)(f)(g)
|
8,685
|
8,685
|
|
Illinois Fin. Auth. Participating VRDN:
|
|||
Series 2022 ZF 30 56, 3.18% 10/7/24 (Liquidity Facility Morgan Stanley Bank, West Valley City Utah) (c)(f)(g)
|
2,700
|
2,700
|
|
Series BAML 50 45, 3.23% 10/7/24 (Liquidity Facility Bank of America NA) (c)(f)(g)
|
38,850
|
38,850
|
|
Series BAML 50 47, 3.23% 10/7/24 (Liquidity Facility Bank of America NA) (c)(f)(g)
|
44,900
|
44,900
|
|
Series XG 04 31, 3.18% 10/7/24 (Liquidity Facility Barclays Bank PLC) (c)(f)(g)
|
5,135
|
5,135
|
|
Illinois Fin. Auth. Rev. Participating VRDN:
|
|||
Series 15 XF0253, 3.25% 10/7/24 (Liquidity Facility JPMorgan Chase Bank) (c)(f)(g)
|
4,745
|
4,745
|
|
Series 2022 ZL 03 54, 3.18% 10/7/24 (Liquidity Facility Morgan Stanley Bank, West Valley City Utah) (c)(f)(g)
|
2,500
|
2,500
|
|
Series Floaters 017, 3.45% 11/4/24 (Liquidity Facility Barclays Bank PLC) (c)(f)(g)
|
19,500
|
19,500
|
|
Series XF 07 11, 3.18% 10/7/24 (Liquidity Facility JPMorgan Chase Bank) (c)(f)(g)
|
9,900
|
9,900
|
|
Series XF 15 40, 3.18% 10/7/24 (Liquidity Facility Royal Bank of Canada) (c)(f)(g)
|
2,500
|
2,500
|
|
Series YX 12 26, 3.18% 10/7/24 (Liquidity Facility Barclays Bank PLC) (c)(f)(g)
|
9,150
|
9,150
|
|
Series YX 13 26, 3.19% 10/7/24 (Liquidity Facility Barclays Bank PLC) (c)(f)(g)
|
3,395
|
3,395
|
|
Illinois Gen. Oblig. Participating VRDN:
|
|||
Series XF 10 10, 3.18% 10/7/24 (Liquidity Facility Barclays Bank PLC) (c)(f)(g)
|
10,595
|
10,595
|
|
Series XL 02 60, 3.18% 10/7/24 (Liquidity Facility Barclays Bank PLC) (c)(f)(g)
|
4,800
|
4,800
|
|
Series XM 07 59, 3.2% 10/7/24 (Liquidity Facility Bank of America NA) (c)(f)(g)
|
1,600
|
1,600
|
|
Series XM 10 48, 3.2% 10/7/24 (Liquidity Facility Bank of America NA) (c)(f)(g)
|
4,500
|
4,500
|
|
Series XM 10 49, 3.2% 10/7/24 (Liquidity Facility Bank of America NA) (c)(f)(g)
|
10,100
|
10,100
|
|
Series YX 13 38, 3.18% 10/7/24 (Liquidity Facility Barclays Bank PLC) (c)(f)(g)
|
3,960
|
3,960
|
|
Illinois Hsg. Dev. Auth. Participating VRDN Series 2023, 3.18% 10/7/24 (Liquidity Facility Citibank NA) (c)(f)(g)
|
2,500
|
2,500
|
|
Illinois Reg'l. Trans. Auth. Participating VRDN Series XF 16 23, 3.21% 10/7/24 (Liquidity Facility JPMorgan Chase Bank) (c)(f)(g)
|
3,000
|
3,000
|
|
Illinois Toll Hwy. Auth. Toll Hwy. Rev. Participating VRDN:
|
|||
Series 15 XF0277, 3.21% 10/7/24 (Liquidity Facility JPMorgan Chase Bank) (c)(f)(g)
|
5,490
|
5,490
|
|
Series XF 15 33, 3.21% 10/7/24 (Liquidity Facility Bank of America NA) (c)(f)(g)
|
2,700
|
2,700
|
|
Series ZL 03 32, 3.21% 10/7/24 (Liquidity Facility JPMorgan Chase Bank) (c)(f)(g)
|
1,310
|
1,310
|
|
JPMorgan Chase Bank Participating VRDN Series ZF 13 88, 3.21% 10/7/24 (Liquidity Facility JPMorgan Chase Bank) (c)(f)(g)
|
2,000
|
2,000
|
|
Metropolitan Pier & Exposition Participating VRDN Series Floaters XF 10 45, 3.21% 10/7/24 (Liquidity Facility Barclays Bank PLC) (c)(f)(g)
|
2,120
|
2,120
|
|
TOTAL ILLINOIS
|
279,795
|
||
Indiana - 0.1%
|
|||
Indiana Fin. Auth. Health Facilities Rev. Participating VRDN Series XF 15 69, 3.18% 10/7/24 (Liquidity Facility Royal Bank of Canada) (c)(f)(g)
|
8,000
|
8,000
|
|
Iowa - 0.2%
|
|||
Iowa Fin. Auth. Rev. Participating VRDN Series BC 240 03, 3.4% 11/4/24 (Liquidity Facility Barclays Bank PLC) (c)(f)(g)
|
15,000
|
15,000
|
|
Iowa Fin. Auth. Single Family Mtg. Participating VRDN Series XG 05 22, 3.18% 10/7/24 (Liquidity Facility Royal Bank of Canada) (c)(f)(g)
|
4,250
|
4,250
|
|
TOTAL IOWA
|
19,250
|
||
Kansas - 0.1%
|
|||
Wyandotte County/Kansas City Unified Govt. Util. Sys. Rev. Participating VRDN Series YX 12 23, 3.19% 10/7/24 (Liquidity Facility Barclays Bank PLC) (c)(f)(g)
|
5,400
|
5,400
|
|
Kentucky - 0.2%
|
|||
CommonSpirit Health Participating VRDN Series MIZ 90 21, 3.25% 10/7/24 (Liquidity Facility Mizuho Cap. Markets LLC) (c)(f)(g)
|
5,500
|
5,500
|
|
Kentucky Bd Dev. Corp. Indl. Bldg. Participating VRDN Series XM 11 41, 3.2% 10/7/24 (Liquidity Facility Royal Bank of Canada) (c)(f)(g)
|
3,000
|
3,000
|
|
Kentucky Econ. Dev. Fin. Auth. Hosp. Rev. Participating VRDN:
|
|||
Series Floaters XG 01 23, 3.19% 10/7/24 (Liquidity Facility Barclays Bank PLC) (c)(f)(g)
|
440
|
440
|
|
Series XF 31 81, 3.19% 10/7/24 (Liquidity Facility Barclays Bank PLC) (c)(f)(g)
|
2,200
|
2,200
|
|
Kentucky, Inc. Pub. Energy Participating VRDN:
|
|||
Series XF 16 83, 3.19% 10/7/24 (Liquidity Facility Toronto-Dominion Bank) (c)(f)(g)
|
4,760
|
4,760
|
|
Series XG 05 56, 3.2% 10/7/24 (Liquidity Facility Royal Bank of Canada) (c)(f)(g)
|
1,875
|
1,875
|
|
TOTAL KENTUCKY
|
17,775
|
||
Louisiana - 0.8%
|
|||
Louisiana Pub. Facilities Auth. Rev. Participating VRDN:
|
|||
Series Floater BAML 5041 D1, 4.04% 10/1/24 (Liquidity Facility Bank of America NA) (c)(f)(g)
|
64,185
|
64,185
|
|
Series YX 12 95, 3.18% 10/7/24 (Liquidity Facility Barclays Bank PLC) (c)(f)(g)
|
14,205
|
14,205
|
|
TOTAL LOUISIANA
|
78,390
|
||
Maryland - 0.1%
|
|||
Montgomery County Gen. Oblig. Participating VRDN Series Floaters XG 02 15, 3.19% 10/7/24 (Liquidity Facility Bank of America NA) (c)(f)(g)
|
6,760
|
6,760
|
|
Michigan - 0.8%
|
|||
Eastern Michigan Univ. Revs. Participating VRDN Series Floater 046, 3.8% 10/1/24 (Liquidity Facility Barclays Bank PLC) (c)(f)(g)
|
6,890
|
6,890
|
|
Holly Area School District Participating VRDN Series XG 04 86, 3.2% 10/7/24 (Liquidity Facility Wells Fargo Bank NA) (c)(f)(g)
|
6,755
|
6,755
|
|
Mclaren Health Care Corp. Participating VRDN Series XL 02 71, 3.25% 10/7/24 (Liquidity Facility Bank of America NA) (c)(f)(g)
|
1,010
|
1,010
|
|
Michigan Bldg. Auth. Rev. Participating VRDN:
|
|||
Series Floaters XM 04 65, 3.18% 10/7/24 (Liquidity Facility Morgan Stanley Bank, West Valley City Utah) (c)(f)(g)
|
11,335
|
11,335
|
|
Series XG 05 03, 3.18% 10/7/24 (Liquidity Facility Barclays Bank PLC) (c)(f)(g)
|
6,635
|
6,635
|
|
Michigan Fin. Auth. Act 38 Facss Participating VRDN Series XF 17 05, 3.18% 10/7/24 (Liquidity Facility JPMorgan Chase Bank) (c)(f)(g)
|
4,490
|
4,490
|
|
Michigan Fin. Auth. Rev. Participating VRDN:
|
|||
Series XF 07 82, 3.18% 10/7/24 (Liquidity Facility JPMorgan Chase Bank) (c)(f)(g)
|
3,125
|
3,125
|
|
Series XG 04 33, 3.18% 10/7/24 (Liquidity Facility JPMorgan Chase Bank) (c)(f)(g)
|
4,800
|
4,800
|
|
Series ZF 30 32, 3.18% 10/7/24 (Liquidity Facility UBS AG) (c)(f)(g)
|
2,560
|
2,560
|
|
Michigan Hsg. Dev. Auth. Single Family Mtg. Rev. Participating VRDN:
|
|||
Series XF 15 81, 3.19% 10/7/24 (Liquidity Facility Toronto-Dominion Bank) (c)(f)(g)
|
2,400
|
2,400
|
|
Series XL 04 67, 3.18% 10/7/24 (Liquidity Facility Barclays Bank PLC) (c)(f)(g)
|
2,000
|
2,000
|
|
Michigan State Univ. Revs. Participating VRDN Series XM 11 71, 3.18% 10/7/24 (Liquidity Facility Royal Bank of Canada) (c)(f)(g)
|
2,500
|
2,500
|
|
Monroe Mich Pub. Schools Participating VRDN Series XF 16 93, 3.2% 10/7/24 (Liquidity Facility Toronto-Dominion Bank) (c)(f)(g)
|
3,000
|
3,000
|
|
Pittsburg WTSW Participating VRDN Series 2024 5067, 3.18% 10/7/24 (Liquidity Facility JPMorgan Chase Bank) (c)(f)(g)
|
19,200
|
19,200
|
|
TOTAL MICHIGAN
|
76,700
|
||
Minnesota - 0.1%
|
|||
Duluth Econ. Dev. Auth. Health Care Facilities Rev. Participating VRDN Series XG 05 23, 3.19% 10/7/24 (Liquidity Facility Barclays Bank PLC) (c)(f)(g)
|
4,900
|
4,900
|
|
Minnesota Gen. Oblig. Participating VRDN Series CF 70 01, 3.17% 10/7/24 (Liquidity Facility Citibank NA) (c)(f)(g)
|
3,400
|
3,400
|
|
Mizuho Floater / Residual Trust V Participating VRDN Series Floater MIZ 91 86, 3.47% 11/4/24 (Liquidity Facility Mizuho Cap. Markets LLC) (c)(d)(f)(g)
|
4,715
|
4,715
|
|
TOTAL MINNESOTA
|
13,015
|
||
Missouri - 1.1%
|
|||
Kansas City Spl. Oblig. Participating VRDN:
|
|||
Series XG 03 61, 3.19% 10/7/24 (Liquidity Facility Barclays Bank PLC) (c)(f)(g)
|
6,090
|
6,090
|
|
Series YX 11 93, 3.19% 10/7/24 (Liquidity Facility Barclays Bank PLC) (c)(f)(g)
|
9,115
|
9,115
|
|
Missouri Health & Edl. Facilities Auth. Edl. Facilities Rev. Participating VRDN Series XF 16 80, 3.18% 10/7/24 (Liquidity Facility Royal Bank of Canada) (c)(f)(g)
|
1,645
|
1,645
|
|
Missouri Health & Edl. Facilities Auth. Rev. Participating VRDN Series Floaters C16, 3.2% 10/7/24 (Liquidity Facility Royal Bank of Canada) (c)(f)(g)
|
32,500
|
32,500
|
|
Missouri Health & Edl. Facilities Rev.:
|
|||
Bonds Series 2023 G 121, 3.35%, tender 12/2/24 (Liquidity Facility Royal Bank of Canada) (c)(f)(g)
|
2,600
|
2,600
|
|
Participating VRDN:
|
|||
Series 2024, 3.18% 10/7/24 (Liquidity Facility Royal Bank of Canada) (c)(f)(g)
|
12,100
|
12,100
|
|
Series ZF 17 44, 3.18% 10/7/24 (Liquidity Facility Royal Bank of Canada) (c)(f)(g)
|
4,590
|
4,590
|
|
3.19% 10/7/24 (Liquidity Facility Royal Bank of Canada) (c)(f)(g)
|
10,200
|
10,200
|
|
Pittsburg WTSW Participating VRDN 3.18% 10/7/24 (Liquidity Facility JPMorgan Chase Bank) (c)(f)(g)
|
23,000
|
23,000
|
|
St Louis County Spl. Oblig. Participating VRDN Series XG 03 82, 3.18% 10/7/24 (Liquidity Facility Wells Fargo Bank NA) (c)(f)(g)
|
6,000
|
6,000
|
|
TOTAL MISSOURI
|
107,840
|
||
Nebraska - 0.0%
|
|||
Central Plains Energy Proj. Rev. Participating VRDN Series 2022 ZL 03 01, 3.2% 10/7/24 (Liquidity Facility Royal Bank of Canada) (c)(f)(g)
|
480
|
480
|
|
Nebraska Invt. Fin. Auth. Single Family Hsg. Rev. Participating VRDN Series YX 13 34, 3.18% 10/7/24 (Liquidity Facility Barclays Bank PLC) (c)(f)(g)
|
1,540
|
1,540
|
|
TOTAL NEBRASKA
|
2,020
|
||
Nevada - 0.4%
|
|||
Clark County Fuel Tax Participating VRDN Series ZL 04 80, 3.18% 10/7/24 (Liquidity Facility Wells Fargo Bank NA) (c)(f)(g)
|
3,275
|
3,275
|
|
Clark County Hwy. Impt. Rev. Participating VRDN Series XG 04 94, 3.18% 10/7/24 (Liquidity Facility UBS AG) (c)(f)(g)
|
3,995
|
3,995
|
|
Clark County School District Participating VRDN Series XF 14 73, 3.27% 10/7/24 (Liquidity Facility JPMorgan Chase Bank) (c)(f)(g)
|
3,730
|
3,730
|
|
Clark County Wtr. Reclamation District Participating VRDN:
|
|||
Series XF 15 85, 3.18% 10/7/24 (Liquidity Facility Bank of America NA) (c)(f)(g)
|
6,400
|
6,400
|
|
Series XM 11 57, 3.95% 10/1/24 (Liquidity Facility JPMorgan Chase Bank) (c)(f)(g)
|
10,800
|
10,800
|
|
Las Vegas Valley Wtr. District Wtr. Impt. Gen. Oblig. Participating VRDN:
|
|||
Series XG 05 29, 3.18% 10/7/24 (Liquidity Facility Bank of America NA) (c)(f)(g)
|
5,620
|
5,620
|
|
Series ZF 31 55, 3.18% 10/7/24 (Liquidity Facility Morgan Stanley Bank, West Valley City Utah) (c)(f)(g)
|
4,750
|
4,750
|
|
TOTAL NEVADA
|
38,570
|
||
New Hampshire - 0.4%
|
|||
Nat'l. Fin. Auth. N H Health C Participating VRDN Series 2024 E157, 3.18% 10/7/24 (Liquidity Facility Royal Bank of Canada) (c)(f)(g)
|
39,900
|
39,900
|
|
New Jersey - 0.7%
|
|||
New Jersey Econ. Dev. Auth. Rev. Participating VRDN:
|
|||
Series Floaters XF 10 48, 3.19% 10/7/24 (Liquidity Facility Barclays Bank PLC) (c)(f)(g)
|
3,400
|
3,400
|
|
Series YX 12 87, 3.19% 10/7/24 (Liquidity Facility Barclays Bank PLC) (c)(f)(g)
|
2,725
|
2,725
|
|
New Jersey Hsg. & Mtg. Fin. Agcy. Multi-family Rev. Participating VRDN Series Floater 2024, 3.4% 11/4/24 (Liquidity Facility Barclays Bank PLC) (c)(f)(g)
|
29,300
|
29,300
|
|
New Jersey Tpk. Auth. Tpk. Rev. Participating VRDN Series XM 10 96, 3.2% 10/7/24 (Liquidity Facility Royal Bank of Canada) (c)(f)(g)
|
7,500
|
7,500
|
|
New Jersey Trans. Trust Fund Auth. Participating VRDN:
|
|||
Series Floaters XG 02 05, 3.19% 10/7/24 (Liquidity Facility Barclays Bank PLC) (c)(f)(g)
|
8,115
|
8,115
|
|
Series XF 15 57, 3.18% 10/7/24 (Liquidity Facility Toronto-Dominion Bank) (c)(f)(g)
|
3,435
|
3,435
|
|
Series XF 16 75, 3.19% 10/7/24 (Liquidity Facility Toronto-Dominion Bank) (c)(f)(g)
|
3,170
|
3,170
|
|
Series YX 12 68, 3.19% 10/7/24 (Liquidity Facility Barclays Bank PLC) (c)(f)(g)
|
5,800
|
5,800
|
|
TOTAL NEW JERSEY
|
63,445
|
||
New York - 1.1%
|
|||
New York City Gen. Oblig. Participating VRDN:
|
|||
Series Floaters E87, 3.18% 10/7/24 (Liquidity Facility Royal Bank of Canada) (c)(f)(g)
|
8,200
|
8,200
|
|
Series Floaters E88, 3.18% 10/7/24 (Liquidity Facility Royal Bank of Canada) (c)(f)(g)
|
2,000
|
2,000
|
|
Series Floaters XM 07 06, 3.18% 10/7/24 (Liquidity Facility Royal Bank of Canada) (c)(f)(g)
|
1,900
|
1,900
|
|
Series XF 13 27, 3.18% 10/7/24 (Liquidity Facility JPMorgan Chase Bank) (c)(f)(g)
|
4,000
|
4,000
|
|
New York City Muni. Wtr. Fin. Auth. Wtr. & Swr. Sys. Rev. Participating VRDN:
|
|||
Series Floaters E 129, 3.18% 10/7/24 (Liquidity Facility Royal Bank of Canada) (c)(f)(g)
|
22,800
|
22,800
|
|
Series XF 30 66, 3.18% 10/7/24 (Liquidity Facility Barclays Bank PLC) (c)(f)(g)
|
2,500
|
2,500
|
|
Series XF 30 71, 3.18% 10/7/24 (Liquidity Facility Barclays Bank PLC) (c)(f)(g)
|
2,670
|
2,670
|
|
Series XF 31 60, 3.17% 10/7/24 (Liquidity Facility Morgan Stanley Bank, West Valley City Utah) (c)(f)(g)
|
3,750
|
3,750
|
|
Series XL 05 38, 3.17% 10/7/24 (Liquidity Facility Wells Fargo Bank NA) (c)(f)(g)
|
2,090
|
2,090
|
|
New York Metropolitan Trans. Auth. Rev. Participating VRDN:
|
|||
Series XF 28 78, 3.19% 10/7/24 (Liquidity Facility Barclays Bank PLC) (c)(f)(g)
|
2,400
|
2,400
|
|
Series XF 30 00, 3.19% 10/7/24 (Liquidity Facility Barclays Bank PLC) (c)(f)(g)
|
35,095
|
35,095
|
|
RBC Muni. Products, Inc. Trust Participating VRDN Series 2024 D7, 3.18% 10/7/24 (Liquidity Facility Royal Bank of Canada) (c)(f)(g)
|
14,400
|
14,400
|
|
TOTAL NEW YORK
|
101,805
|
||
North Carolina - 0.1%
|
|||
Charlotte Int'l. Arpt. Rev. Participating VRDN Series XF 16 03, 3.18% 10/7/24 (Liquidity Facility Bank of America NA) (c)(f)(g)
|
2,940
|
2,940
|
|
Charlotte Wtr. & Swr. Sys. Rev. Participating VRDN Series 2022 XG 04 03, 3.18% 10/7/24 (Liquidity Facility Wells Fargo Bank NA) (c)(f)(g)
|
827
|
827
|
|
North Carolina Hsg. Fin. Agcy. Home Ownership Rev. Participating VRDN Series YX 13 16, 3.18% 10/7/24 (Liquidity Facility Barclays Bank PLC) (c)(f)(g)
|
10,695
|
10,695
|
|
TOTAL NORTH CAROLINA
|
14,462
|
||
North Dakota - 0.2%
|
|||
Monroeville Fin. Auth. UPMC Rev. Participating VRDN Series YX 11 85, 3.18% 10/7/24 (Liquidity Facility Barclays Bank PLC) (c)(f)(g)
|
6,550
|
6,550
|
|
North Dakota Hsg. Fin. Agcy. Participating VRDN Series XG 05 59, 3.18% 10/7/24 (Liquidity Facility Royal Bank of Canada) (c)(f)(g)
|
6,585
|
6,585
|
|
Wisconsin Hsg. & Econ. Dev. Auth. Participating VRDN Series XF 16 96, 3.18% 10/7/24 (Liquidity Facility Royal Bank of Canada) (c)(f)(g)
|
4,440
|
4,440
|
|
TOTAL NORTH DAKOTA
|
17,575
|
||
Ohio - 0.8%
|
|||
Allen County Hosp. Facilities Rev. Participating VRDN:
|
|||
Series Floaters E 134, 3.18% 10/7/24 (Liquidity Facility Royal Bank of Canada) (c)(f)(g)
|
7,715
|
7,715
|
|
Series Floaters XF 25 16, 3.24% 10/7/24 (Liquidity Facility Toronto-Dominion Bank) (c)(f)(g)
|
3,600
|
3,600
|
|
Brunswick Ohio City School District Participating VRDN Series XF 15 47, 3.18% 10/7/24 (Liquidity Facility Royal Bank of Canada) (c)(f)(g)
|
2,750
|
2,750
|
|
Cuyahoga County Ctfs. of Prtn. Participating VRDN Series Floaters XG 02 06, 3.25% 10/7/24 (Liquidity Facility Bank of America NA) (c)(f)(g)
|
4,655
|
4,655
|
|
Cuyahoga County Hosp. Rev. Participating VRDN Series Floater BAML 23 5043, 3.22% 10/7/24 (Liquidity Facility Bank of America NA) (c)(f)(g)
|
2,900
|
2,900
|
|
Franklin County Hosp. Facilities Rev. Participating VRDN Series XG 05 07, 3.18% 10/7/24 (Liquidity Facility Royal Bank of Canada) (c)(f)(g)
|
2,810
|
2,810
|
|
Hamilton County Hosp. Facilities Rev. Participating VRDN Series XG 05 25, 3.18% 10/7/24 (Liquidity Facility Royal Bank of Canada) (c)(f)(g)
|
6,775
|
6,775
|
|
Montgomery County Hosp. Rev. Participating VRDN Series Floaters E 132, 3.18% 10/7/24 (Liquidity Facility Royal Bank of Canada) (c)(f)(g)
|
18,485
|
18,485
|
|
Ohio Higher Edl. Facility Commission Rev. Participating VRDN Series XF 31 14, 3.18% 10/7/24 (Liquidity Facility Morgan Stanley Bank, West Valley City Utah) (c)(f)(g)
|
5,750
|
5,750
|
|
Ohio Hosp. Rev. Participating VRDN:
|
|||
Series C18, 3.19% 10/7/24 (Liquidity Facility Royal Bank of Canada) (c)(f)(g)
|
2,100
|
2,100
|
|
Series XG 04 90, 3.19% 10/7/24 (Liquidity Facility Barclays Bank PLC) (c)(f)(g)
|
2,610
|
2,610
|
|
Ohio Hsg. Fin. Agcy. Residential Mtg. Rev. Participating VRDN:
|
|||
Series Floaters XF 27 11, 3.18% 10/7/24 (Liquidity Facility Morgan Stanley Bank, West Valley City Utah) (c)(f)(g)
|
3,455
|
3,455
|
|
Series XF 31 45, 3.18% 10/7/24 (Liquidity Facility Wells Fargo Bank NA) (c)(f)(g)
|
3,060
|
3,060
|
|
Port of Greater Cincinnati Dev. Auth. Rev. Participating VRDN Series XL 05 53, 3.18% 10/7/24 (Liquidity Facility Royal Bank of Canada) (c)(f)(g)
|
3,635
|
3,635
|
|
Univ. of Cincinnati Gen. Receipts Participating VRDN:
|
|||
Series 2022 ZL 03 55, 3.18% 10/7/24 (Liquidity Facility Morgan Stanley Bank, West Valley City Utah) (c)(f)(g)
|
3,700
|
3,700
|
|
Series XF 17 11, 3.18% 10/7/24 (Liquidity Facility Royal Bank of Canada) (c)(f)(g)
|
3,945
|
3,945
|
|
TOTAL OHIO
|
77,945
|
||
Oklahoma - 0.1%
|
|||
Oklahoma City Okla Wtr. Utils. T Participating VRDN Series XM 11 63, 3.18% 10/7/24 (Liquidity Facility JPMorgan Chase Bank) (c)(f)(g)
|
3,800
|
3,800
|
|
Oklahoma Dev. Fin. Auth. Health Sys. Rev. Participating VRDN Series E 140, 3.18% 10/7/24 (Liquidity Facility Royal Bank of Canada) (c)(f)(g)
|
6,305
|
6,305
|
|
TOTAL OKLAHOMA
|
10,105
|
||
Oregon - 0.2%
|
|||
Beaverton School District Participating VRDN Series 2022 XF 14 19, 3.18% 10/7/24 (Liquidity Facility JPMorgan Chase Bank) (c)(f)(g)
|
1,330
|
1,330
|
|
Multnomah County School District #1J Portland Participating VRDN Series XF 15 30, 3.18% 10/7/24 (Liquidity Facility JPMorgan Chase Bank) (c)(f)(g)
|
15,710
|
15,710
|
|
TOTAL OREGON
|
17,040
|
||
Pennsylvania - 1.0%
|
|||
Commonwealth Fing. Auth. Tobacco Participating VRDN Series XX 10 80, 3.19% 10/7/24 (Liquidity Facility Barclays Bank PLC) (c)(f)(g)
|
1,800
|
1,800
|
|
Cumberland County Muni. Auth. Rev. Participating VRDN Series YX 12 73, 3.19% 10/7/24 (Liquidity Facility Barclays Bank PLC) (c)(f)(g)
|
9,375
|
9,375
|
|
Geisinger Auth. Health Sys. Rev. Participating VRDN Series XG 04 68, 3.18% 10/7/24 (Liquidity Facility Wells Fargo Bank NA) (c)(f)(g)
|
6,760
|
6,760
|
|
Lehigh County Gen. Purp. Auth. Rev. Participating VRDN Series XL 00 99, 3.18% 10/7/24 (Liquidity Facility JPMorgan Chase Bank) (c)(f)(g)
|
4,250
|
4,250
|
|
Lehigh County Gen. Purp. Hosp. Rev. Participating VRDN Series BAML 23 50 39, 3.23% 11/4/24 (Liquidity Facility Bank of America NA) (c)(d)(f)(g)
|
11,320
|
11,320
|
|
Montgomery County Higher Ed. & Health Auth. Rev. Participating VRDN Series XG 05 50, 3.18% 10/7/24 (Liquidity Facility Royal Bank of Canada) (c)(f)(g)
|
4,100
|
4,100
|
|
Pennsylvania Econ. Dev. Fing. Auth. Participating VRDN Series XF 15 25, 3.18% 10/7/24 (Liquidity Facility Royal Bank of Canada) (c)(f)(g)
|
2,860
|
2,860
|
|
Pennsylvania Econ. Dev. Fing. Auth. Indl. Dev. Rev. Participating VRDN Series XL 05 39, 3.18% 10/7/24 (Liquidity Facility Morgan Stanley Bank, West Valley City Utah) (c)(f)(g)
|
3,500
|
3,500
|
|
Pennsylvania Higher Edl. Facilities Auth. Rev. Participating VRDN:
|
|||
Series Floater BA ML 24, 4.09% 10/1/24 (Liquidity Facility Bank of America NA) (c)(f)(g)
|
11,400
|
11,400
|
|
Series XG 02 63, 3.18% 10/7/24 (Liquidity Facility Bank of America NA) (c)(f)(g)
|
840
|
840
|
|
Pennsylvania State Univ. Participating VRDN Series XM 08 27, 3.18% 10/7/24 (Liquidity Facility JPMorgan Chase Bank) (c)(f)(g)
|
2,700
|
2,700
|
|
Pennsylvania Tpk. Commission Tpk. Rev. Participating VRDN:
|
|||
Series XM 10 08, 3.18% 10/7/24 (Liquidity Facility Royal Bank of Canada) (c)(f)(g)
|
835
|
835
|
|
Series XX 10 44, 3.19% 10/7/24 (Liquidity Facility Barclays Bank PLC) (c)(f)(g)
|
6,365
|
6,365
|
|
Philadelphia Wtr. & Wastewtr. Rev. Participating VRDN:
|
|||
Series 2017, 3.19% 10/7/24 (Liquidity Facility Barclays Bank PLC) (c)(f)(g)
|
6,320
|
6,320
|
|
Series XF 16 06, 3.19% 10/7/24 (Liquidity Facility Toronto-Dominion Bank) (c)(f)(g)
|
4,400
|
4,400
|
|
Southcentral Pennsylvania Gen. Auth. Rev. Participating VRDN:
|
|||
Series XL 01 04, 3.18% 10/7/24 (Liquidity Facility Morgan Stanley Bank, West Valley City Utah) (c)(f)(g)
|
8,120
|
8,120
|
|
Series ZL 05 12, 3.18% 10/7/24 (Liquidity Facility JPMorgan Chase Bank) (c)(f)(g)
|
3,335
|
3,335
|
|
Southeastern Pennsylvania Trans. Auth. Rev. Participating VRDN:
|
|||
Series 2022 XG 04 12, 3.18% 10/7/24 (Liquidity Facility Royal Bank of Canada) (c)(f)(g)
|
3,115
|
3,115
|
|
Series XG 04 13, 3.18% 10/7/24 (Liquidity Facility Royal Bank of Canada) (c)(f)(g)
|
3,370
|
3,370
|
|
Series XM 10 57, 3.2% 10/7/24 (Liquidity Facility Bank of America NA) (c)(f)(g)
|
3,600
|
3,600
|
|
TOTAL PENNSYLVANIA
|
98,365
|
||
Rhode Island - 0.0%
|
|||
Rhode Island Health and Edl. Bldg. Corp. Higher Ed. Facility Rev. Participating VRDN Series Floaters XM 07 21, 3.18% 10/7/24 (Liquidity Facility Wells Fargo Bank NA) (c)(f)(g)
|
2,865
|
2,865
|
|
South Carolina - 0.7%
|
|||
Patriots Energy Group Fing. Agcy. Participating VRDN:
|
|||
Series XG 05 39, 3.18% 10/7/24 (Liquidity Facility Royal Bank of Canada) (c)(f)(g)
|
2,000
|
2,000
|
|
Series XM 11 43, 3.2% 10/7/24 (Liquidity Facility Royal Bank of Canada) (c)(f)(g)
|
3,000
|
3,000
|
|
Series ZF 16 53, 3.2% 10/7/24 (Liquidity Facility Royal Bank of Canada) (c)(f)(g)
|
2,730
|
2,730
|
|
Series ZF 16 70, 3.18% 10/7/24 (Liquidity Facility Royal Bank of Canada) (c)(f)(g)
|
5,295
|
5,295
|
|
Series ZF 16 71, 3.18% 10/7/24 (Liquidity Facility Royal Bank of Canada) (c)(f)(g)
|
2,500
|
2,500
|
|
Series ZL 05 15, 3.18% 10/7/24 (Liquidity Facility Royal Bank of Canada) (c)(f)(g)
|
2,830
|
2,830
|
|
Series ZL 05 25, 3.18% 10/7/24 (Liquidity Facility Royal Bank of Canada) (c)(f)(g)
|
6,665
|
6,665
|
|
Pittsburg WTSW Participating VRDN Series 2024, 3.18% 10/7/24 (Liquidity Facility JPMorgan Chase Bank) (c)(f)(g)
|
24,900
|
24,900
|
|
South Carolina Jobs-Econ. Dev. Auth. Participating VRDN Series XF 15 31, 3.19% 10/7/24 (Liquidity Facility Toronto-Dominion Bank) (c)(f)(g)
|
4,635
|
4,635
|
|
South Carolina Pub. Svc. Auth. Rev. Participating VRDN:
|
|||
Series 2017 XF 2425, 3.19% 10/7/24 (Liquidity Facility Barclays Bank PLC) (c)(f)(g)
|
1,905
|
1,905
|
|
Series XF 15 48, 3.18% 10/7/24 (Liquidity Facility Royal Bank of Canada) (c)(f)(g)
|
3,000
|
3,000
|
|
Series YX 12 69, 3.19% 10/7/24 (Liquidity Facility Barclays Bank PLC) (c)(f)(g)
|
4,000
|
4,000
|
|
TOTAL SOUTH CAROLINA
|
63,460
|
||
South Dakota - 0.1%
|
|||
South Dakota Health & Edl. Facilities Auth. Rev. Participating VRDN Series 2022 XF 14 09, 3.19% 10/7/24 (Liquidity Facility Royal Bank of Canada) (c)(f)(g)
|
5,625
|
5,625
|
|
Tennessee - 0.3%
|
|||
Greeneville Health & Edl. Facilities Board Participating VRDN:
|
|||
Series Floaters XF 25 76, 3.19% 10/7/24 (Liquidity Facility Barclays Bank PLC) (c)(f)(g)
|
6,700
|
6,700
|
|
Series Floaters XG 01 94, 3.19% 10/7/24 (Liquidity Facility Royal Bank of Canada) (c)(f)(g)
|
5,535
|
5,535
|
|
Metropolitan Govt. Nashville & Davidson County Sports Auth. Rev. Participating VRDN Series XG 05 17, 3.18% 10/7/24 (Liquidity Facility Royal Bank of Canada) (c)(f)(g)
|
7,135
|
7,135
|
|
Metropolitan Govt. of Nashville & Davidson County Participating VRDN Series XF 15 97, 3.18% 10/7/24 (Liquidity Facility Royal Bank of Canada) (c)(f)(g)
|
3,085
|
3,085
|
|
Tennessee Energy Acquisition Corp. Participating VRDN Series ZF 16 58, 3.2% 10/7/24 (Liquidity Facility Royal Bank of Canada) (c)(f)(g)
|
2,470
|
2,470
|
|
TOTAL TENNESSEE
|
24,925
|
||
Texas - 2.4%
|
|||
Aldine Independent School District Participating VRDN Series Floaters XL 00 87, 3.18% 10/7/24 (Liquidity Facility Wells Fargo Bank NA) (c)(f)(g)
|
6,600
|
6,600
|
|
Aledo Independent School District Participating VRDN Series XF 31 42, 3.18% 10/7/24 (Liquidity Facility Barclays Bank PLC) (c)(f)(g)
|
3,465
|
3,465
|
|
Austin Elec. Util. Sys. Rev. Participating VRDN:
|
|||
Series XF 31 12, 3.18% 10/7/24 (Liquidity Facility Barclays Bank PLC) (c)(f)(g)
|
8,000
|
8,000
|
|
Series XG 05 34, 3.18% 10/7/24 (Liquidity Facility Wells Fargo Bank NA) (c)(f)(g)
|
5,330
|
5,330
|
|
Bridge City Independent School District Participating VRDN Series 2022 XL 03 25, 3.18% 10/7/24 (Liquidity Facility Wells Fargo Bank NA) (c)(f)(g)
|
2,605
|
2,605
|
|
Crowley Independent School Dis Participating VRDN:
|
|||
Series XF 32 38, 3.17% 10/7/24 (Liquidity Facility UBS AG) (c)(f)(g)
|
2,910
|
2,910
|
|
Series XG 05 13, 3.18% 10/7/24 (Liquidity Facility Bank of America NA) (c)(f)(g)
|
2,000
|
2,000
|
|
Dallas Wtrwks. & Swr. Sys. Rev. Participating VRDN Series XF 27 28, 3.18% 10/7/24 (Liquidity Facility JPMorgan Chase Bank) (c)(f)(g)
|
6,395
|
6,395
|
|
Denton Independent School District Participating VRDN:
|
|||
Series XF 15 52, 3.19% 10/7/24 (Liquidity Facility Toronto-Dominion Bank) (c)(f)(g)
|
4,000
|
4,000
|
|
Series XF 31 28, 3.17% 10/7/24 (Liquidity Facility UBS AG) (c)(f)(g)
|
5,150
|
5,150
|
|
Series XF 31 39, 3.18% 10/7/24 (Liquidity Facility Barclays Bank PLC) (c)(f)(g)
|
6,000
|
6,000
|
|
Series XF 31 65, 3.17% 10/7/24 (Liquidity Facility Morgan Stanley Bank, West Valley City Utah) (c)(f)(g)
|
8,000
|
8,000
|
|
Series ZF 16 74, 3.18% 10/7/24 (Liquidity Facility JPMorgan Chase Bank) (c)(f)(g)
|
3,240
|
3,240
|
|
El Paso Wtr. & Swr. Rev. Participating VRDN Series G 124, 3.18% 10/7/24 (Liquidity Facility Royal Bank of Canada) (c)(e)(f)(g)
|
5,700
|
5,700
|
|
Forney Independent School District Participating VRDN Series 2022 XL 03 62, 3.18% 10/7/24 (Liquidity Facility Bank of America NA) (c)(f)(g)
|
2,770
|
2,770
|
|
Greenville Tex Elec. Util. Sys. R Participating VRDN Series XM 11 80, 3.18% 10/7/24 (Liquidity Facility Royal Bank of Canada) (c)(f)(g)
|
5,680
|
5,680
|
|
Harris County Children's Hosp. Participating VRDN Series E-149, 3.18% 10/7/24 (Liquidity Facility Royal Bank of Canada) (c)(f)(g)
|
2,000
|
2,000
|
|
Harris County Health Facilities Dev. Corp. Rev. Participating VRDN Series 16 ZF 03 12, 3.18% 10/7/24 (Liquidity Facility JPMorgan Chase Bank) (c)(f)(g)
|
6,500
|
6,500
|
|
Houston Gen. Oblig. Participating VRDN Series XF 17 18, 3.18% 10/7/24 (Liquidity Facility JPMorgan Chase Bank) (c)(f)(g)
|
6,120
|
6,120
|
|
Katy Independent School District Participating VRDN Series XF 31 16, 3.18% 10/7/24 (Liquidity Facility Barclays Bank PLC) (c)(f)(g)
|
8,000
|
8,000
|
|
Lamar Consolidated Independent School District Participating VRDN:
|
|||
Series XF 16 57, 3.19% 10/7/24 (Liquidity Facility Toronto-Dominion Bank) (c)(f)(g)
|
3,100
|
3,100
|
|
Series XF 31 31, 3.18% 10/7/24 (Liquidity Facility Barclays Bank PLC) (c)(f)(g)
|
7,000
|
7,000
|
|
Medina Valley Texas Independent School District Participating VRDN Series XM 11 25, 3.18% 10/7/24 (Liquidity Facility Wells Fargo Bank NA) (c)(f)(g)
|
2,700
|
2,700
|
|
Mizuho Floater / Residual Trust V Participating VRDN:
|
|||
Series Floater MIZ 91 85, 3.47% 11/4/24 (Liquidity Facility Mizuho Cap. Markets LLC) (c)(d)(f)(g)
|
4,600
|
4,600
|
|
Series MIZ 91 71, 4.03% 10/1/24 (Liquidity Facility Mizuho Cap. Markets LLC) (c)(f)(g)
|
5,975
|
5,975
|
|
New Braunfels Independent School District Participating VRDN Series 2022 XM 10 63, 3.18% 10/7/24 (Liquidity Facility Bank of America NA) (c)(f)(g)
|
3,750
|
3,750
|
|
North Ft. Bend Wtr. Auth. Participating VRDN Series 2022 XF 30 23, 3.18% 10/7/24 (Liquidity Facility Wells Fargo Bank NA) (c)(f)(g)
|
7,620
|
7,620
|
|
Northwest Independent School District Participating VRDN Series XF 15 76, 3.18% 10/7/24 (Liquidity Facility Royal Bank of Canada) (c)(f)(g)
|
2,675
|
2,675
|
|
Princeton Independent School District Participating VRDN Series XF 31 92, 3.17% 10/7/24 (Liquidity Facility Morgan Stanley Bank, West Valley City Utah) (c)(f)(g)
|
3,125
|
3,125
|
|
Red Oak Independent School District Participating VRDN Series XG 05 12, 3.18% 10/7/24 (Liquidity Facility Bank of America NA) (c)(f)(g)
|
3,385
|
3,385
|
|
Royse City Independent School District Participating VRDN Series XF 16 08, 3.19% 10/7/24 (Liquidity Facility Toronto-Dominion Bank) (c)(f)(g)
|
3,200
|
3,200
|
|
San Antonio Wtr. Sys. Rev. Participating VRDN:
|
|||
Series XF 14 47, 3.18% 10/7/24 (Liquidity Facility Bank of America NA) (c)(f)(g)
|
2,000
|
2,000
|
|
Series XF 31 36, 3.18% 10/7/24 (Liquidity Facility Barclays Bank PLC) (c)(f)(g)
|
10,105
|
10,105
|
|
Spring Tex Independent School District Participating VRDN Series XF 30 89, 3.18% 10/7/24 (Liquidity Facility Barclays Bank PLC) (c)(f)(g)
|
4,630
|
4,630
|
|
Tarrant County Cultural Ed. Facilities Fin. Corp. Hosp. Rev. Participating VRDN:
|
|||
Series E 141, 3.18% 10/7/24 (Liquidity Facility Royal Bank of Canada) (c)(f)(g)
|
10,320
|
10,320
|
|
Series XL 03 60, 3.18% 10/7/24 (Liquidity Facility Wells Fargo Bank NA) (c)(f)(g)
|
2,745
|
2,745
|
|
Series ZF 16 68, 3.18% 10/7/24 (Liquidity Facility JPMorgan Chase Bank) (c)(f)(g)
|
2,260
|
2,260
|
|
Tarrant County Cultural Ed. Facilities Fin. Corp. Rev. Participating VRDN Series 2021 E1 50, 3.18% 10/7/24 (Liquidity Facility Royal Bank of Canada) (c)(f)(g)
|
4,000
|
4,000
|
|
Tender Option Bond Trust Receipts Participating VRDN Series ZF 32 01, 3.17% 10/7/24 (Liquidity Facility Morgan Stanley Bank, West Valley City Utah) (c)(f)(g)
|
2,890
|
2,890
|
|
Texas Wtr. Dev. Board Rev.:
|
|||
Bonds Series MS 00 17, 3.3%, tender 1/9/25 (Liquidity Facility Morgan Stanley Bank, West Valley City Utah) (c)(d)(f)(g)
|
3,600
|
3,600
|
|
Participating VRDN:
|
|||
Series 2022 XM 1066, 3.17% 10/7/24 (Liquidity Facility Morgan Stanley Bank, West Valley City Utah) (c)(f)(g)
|
9,380
|
9,380
|
|
Series Floaters XF 25 57, 3.19% 10/7/24 (Liquidity Facility Toronto-Dominion Bank) (c)(f)(g)
|
5,600
|
5,600
|
|
Series Floaters XF 27 30, 3.18% 10/7/24 (Liquidity Facility JPMorgan Chase Bank) (c)(f)(g)
|
4,310
|
4,310
|
|
Series Floaters XG 02 11, 3.18% 10/7/24 (Liquidity Facility Bank of America NA) (c)(f)(g)
|
10,000
|
10,000
|
|
Series XF 16 64, 3.18% 10/7/24 (Liquidity Facility Bank of America NA) (c)(f)(g)
|
2,000
|
2,000
|
|
Waxahachie Independent School District Participating VRDN Series XF 15 53, 3.19% 10/7/24 (Liquidity Facility Toronto-Dominion Bank) (c)(f)(g)
|
4,560
|
4,560
|
|
Ysleta Tex Independent School District Participating VRDN Series XF 13 38, 3.18% 10/7/24 (Liquidity Facility Bank of America NA) (c)(f)(g)
|
2,665
|
2,665
|
|
TOTAL TEXAS
|
228,660
|
||
Utah - 0.0%
|
|||
Utah County Hosp. Rev. Participating VRDN Series XM 10 03, 3.18% 10/7/24 (Liquidity Facility JPMorgan Chase Bank) (c)(f)(g)
|
2,435
|
2,435
|
|
Virginia - 0.8%
|
|||
Chesapeake Bay Bridge and Tunnel District Gen. Resolution Rev. Participating VRDN Series XF 30 64, 3.19% 10/7/24 (Liquidity Facility Barclays Bank PLC) (c)(f)(g)
|
4,200
|
4,200
|
|
Fairfax County Indl. Dev. Auth. Participating VRDN Series Floaters XG 01 91, 3.18% 10/7/24 (Liquidity Facility Morgan Stanley Bank, West Valley City Utah) (c)(f)(g)
|
7,136
|
7,136
|
|
Hampton Roads Trans. Accountability Commission Participating VRDN:
|
|||
Series XF 30 91, 3.18% 10/7/24 (Liquidity Facility Wells Fargo Bank NA) (c)(f)(g)
|
3,365
|
3,365
|
|
Series XM 11 49, 3.18% 10/7/24 (Liquidity Facility JPMorgan Chase Bank) (c)(f)(g)
|
5,000
|
5,000
|
|
Series ZL 02 67, 3.18% 10/7/24 (Liquidity Facility Wells Fargo Bank NA) (c)(f)(g)
|
2,250
|
2,250
|
|
Norfolk Econ. Dev. Health Care Facilities Participating VRDN Series 2022 C20, 3.19% 10/7/24 (Liquidity Facility Royal Bank of Canada) (c)(f)(g)
|
5,000
|
5,000
|
|
Suffolk Econ. Dev. Auth. Hosp. Facilities Rev. Participating VRDN Series MIZ 90 25, 3.25% 10/7/24 (Liquidity Facility Mizuho Cap. Markets LLC) (c)(f)(g)
|
33,820
|
33,820
|
|
Univ. of Virginia Gen. Rev. Participating VRDN Series XG 04 08, 3.18% 10/7/24 (Liquidity Facility Morgan Stanley Bank, West Valley City Utah) (c)(f)(g)
|
3,375
|
3,375
|
|
Williamsburg Econ. Dev. Participating VRDN Series XF 15 46, 3.18% 10/7/24 (Liquidity Facility Royal Bank of Canada) (c)(f)(g)
|
9,860
|
9,860
|
|
TOTAL VIRGINIA
|
74,006
|
||
Washington - 0.8%
|
|||
Central Puget Sound Reg'l. Trans. Auth. Sales & Use Tax Rev.:
|
|||
Bonds Series G 123, 3.35%, tender 11/1/24 (Liquidity Facility Royal Bank of Canada) (c)(d)(f)(g)
|
1,800
|
1,800
|
|
Participating VRDN Series XM 11 01, 3.16% 10/7/24 (Liquidity Facility Morgan Stanley Bank, West Valley City Utah) (c)(f)(g)
|
3,245
|
3,245
|
|
CommonSpirit Health Participating VRDN Series XF 1017, 3.18% 10/7/24 (Liquidity Facility Barclays Bank PLC) (c)(f)(g)
|
6,000
|
6,000
|
|
Multicare Health Sys. Participating VRDN Series E 153, 3.18% 10/7/24 (Liquidity Facility Royal Bank of Canada) (c)(f)(g)
|
20,940
|
20,940
|
|
Washington Convention Ctr. Pub. Facilities Participating VRDN:
|
|||
Series 2022 XX 12 38, 3.19% 10/7/24 (Liquidity Facility Barclays Bank PLC) (c)(f)(g)
|
19,715
|
19,715
|
|
Series XG 02 87, 3.19% 10/7/24 (Liquidity Facility Barclays Bank PLC) (c)(f)(g)
|
2,100
|
2,100
|
|
Washington Gen. Oblig. Participating VRDN:
|
|||
Series XF 21 72, 3.18% 10/7/24 (Liquidity Facility Morgan Stanley Bank, West Valley City Utah) (c)(f)(g)
|
270
|
270
|
|
Series ZF 31 73, 3.18% 10/7/24 (Liquidity Facility Morgan Stanley Bank, West Valley City Utah) (c)(f)(g)
|
5,000
|
5,000
|
|
Series ZL 04 90, 3.18% 10/7/24 (Liquidity Facility Wells Fargo Bank NA) (c)(f)(g)
|
1,665
|
1,665
|
|
Series ZL 04 91, 3.18% 10/7/24 (Liquidity Facility Wells Fargo Bank NA) (c)(f)(g)
|
1,665
|
1,665
|
|
Washington Health Care Facilities Auth. Rev. Participating VRDN:
|
|||
Series 2015 XF0150, 3.2% 10/7/24 (Liquidity Facility Bank of America NA) (c)(f)(g)
|
3,165
|
3,165
|
|
Series XF 15 14, 3.19% 10/7/24 (Liquidity Facility Toronto-Dominion Bank) (c)(f)(g)
|
4,015
|
4,015
|
|
Series XF 30 62, 3.19% 10/7/24 (Liquidity Facility Barclays Bank PLC) (c)(f)(g)
|
1,300
|
1,300
|
|
Series XG 04 75, 3.19% 10/7/24 (Liquidity Facility Toronto-Dominion Bank) (c)(f)(g)
|
5,290
|
5,290
|
|
Series XG 04 81, 3.19% 10/7/24 (Liquidity Facility Toronto-Dominion Bank) (c)(f)(g)
|
3,905
|
3,905
|
|
TOTAL WASHINGTON
|
80,075
|
||
West Virginia - 0.1%
|
|||
West Virginia Hosp. Fin. Auth. Hosp. Rev. Participating VRDN Series XF 15 37, 3.19% 10/7/24 (Liquidity Facility Toronto-Dominion Bank) (c)(f)(g)
|
5,525
|
5,525
|
|
Wisconsin - 0.2%
|
|||
Univ. of Wisconsin Hosp. & Clinics Auth. Participating VRDN Series XL 02 96, 3.18% 10/7/24 (Liquidity Facility Morgan Stanley Bank, West Valley City Utah) (c)(f)(g)
|
4,000
|
4,000
|
|
Wisconsin Health & Edl. Facilities Participating VRDN:
|
|||
Series Floaters XF 07 41, 3.18% 10/7/24 (Liquidity Facility JPMorgan Chase Bank) (c)(f)(g)
|
9,535
|
9,535
|
|
Series XL 04 83, 3.18% 10/7/24 (Liquidity Facility Barclays Bank PLC) (c)(f)(g)
|
2,250
|
2,250
|
|
Wisconsin Hsg. & Econ. Dev. Auth. Participating VRDN Series XL 05 54, 3.18% 10/7/24 (Liquidity Facility Royal Bank of Canada) (c)(f)(g)
|
5,400
|
5,400
|
|
TOTAL WISCONSIN
|
21,185
|
||
|
TOTAL TENDER OPTION BOND
(Cost $2,178,992)
|
2,178,992
|
||
Other Municipal Security - 19.6%
|
|||
Principal
Amount (a)
(000s)
|
Value ($)
(000s)
|
||
Arizona - 0.1%
|
|||
Arizona Ctfs. of Prtn. Bonds Series 2016, 5% 10/1/24 (Escrowed to Maturity)
|
400
|
400
|
|
Maricopa County Rev. Bonds Series C, 5%, tender 10/18/24 (c)
|
375
|
375
|
|
Salt River Proj. Agricultural Impt. & Pwr. District Elec. Sys. Rev. Series 2024 C, 3.6% 3/4/25, CP
|
5,200
|
5,200
|
|
TOTAL ARIZONA
|
5,975
|
||
California - 0.9%
|
|||
Univ. of California Revs. Series 2024:
|
|||
3.5% 11/20/24, CP
|
10,700
|
10,700
|
|
3.52% 10/3/24, CP
|
21,200
|
21,200
|
|
3.55% 10/8/24, CP
|
25,100
|
25,100
|
|
3.85% 11/14/24, CP
|
30,500
|
30,500
|
|
TOTAL CALIFORNIA
|
87,500
|
||
Colorado - 0.0%
|
|||
Colorado Ctfs. of Prtn. Bonds Series 2022, 6% 12/15/24
|
420
|
422
|
|
Denver City & County Arpt. Rev. Bonds:
|
|||
Series 2016 A, 5% 11/15/24
|
245
|
245
|
|
Series 2020 A1, 5% 11/15/24
|
1,025
|
1,027
|
|
TOTAL COLORADO
|
1,694
|
||
Connecticut - 0.5%
|
|||
Connecticut Gen. Oblig. Bonds Series 2016 E, 5% 10/15/24
|
1,995
|
1,996
|
|
Connecticut Spl. Tax Oblig. Trans. Infrastructure Rev. Bonds:
|
|||
Series 2018 A, 5% 1/1/25
|
465
|
466
|
|
Series 2018 C, 5% 10/1/24
|
670
|
670
|
|
Danbury Gen. Oblig. BAN Series 2024 B, 5% 2/24/25 (b)
|
27,900
|
28,064
|
|
East Lyme Gen. Oblig. BAN Series 2024, 4.15% 8/7/25
|
5,260
|
5,286
|
|
Milford Gen. Oblig. BAN Series 2023, 4.75% 10/29/24
|
1,190
|
1,191
|
|
New London BAN Series 2024, 4.5% 3/13/25
|
8,600
|
8,635
|
|
Univ. of Connecticut Gen. Oblig. Bonds Series 2015 A, 5% 2/15/25
|
1,025
|
1,032
|
|
TOTAL CONNECTICUT
|
47,340
|
||
District Of Columbia - 0.0%
|
|||
District of Columbia Income Tax Rev. Bonds:
|
|||
Series 2019 A, 5% 3/1/25
|
290
|
292
|
|
Series 2019 C, 5% 10/1/24
|
365
|
365
|
|
TOTAL DISTRICT OF COLUMBIA
|
657
|
||
Florida - 0.3%
|
|||
Broward County School District TAN Series 2024, 4% 1/29/25
|
550
|
551
|
|
Citizens Property Ins. Corp. Bonds Series 2015 A1, 5% 12/1/24 (Pre-Refunded to 12/1/24 @ 100)
|
975
|
977
|
|
East Central Reg'l. Wastewat Bonds (Biosolids Proj.) Series 2014, 5.5% 10/1/24 (Pre-Refunded to 10/1/24 @ 100)
|
335
|
335
|
|
Florida Local Govt. Fin. Cmnty. Series 2024 A1, 3.54% 10/3/24, LOC JPMorgan Chase Bank, CP
|
16,213
|
16,213
|
|
Hillsborough County Aviation Auth. Rev. Bonds Series 2015 B, 5% 10/1/24 (Pre-Refunded to 10/1/24 @ 100)
|
100
|
100
|
|
Martin County Health Facilities Bonds Series 2015, 5% 11/15/24 (Pre-Refunded to 11/15/24 @ 100)
|
5,030
|
5,038
|
|
Miami-Dade County Wtr. & Swr. Rev. Bonds Series 2015, 5% 10/1/24
|
2,050
|
2,050
|
|
TOTAL FLORIDA
|
25,264
|
||
Georgia - 0.1%
|
|||
Atlanta Wtr. & Wastewtr. Rev. Bonds Series 2013 B, 5% 11/1/24
|
200
|
200
|
|
Cobb County School District TAN Series 2024, 4% 12/16/24
|
3,540
|
3,544
|
|
Georgia Muni. Elec. Auth. Pwr. Rev. Series 2024 B, 3.35% 12/10/24, LOC TD Banknorth, NA, CP
|
10,000
|
10,000
|
|
TOTAL GEORGIA
|
13,744
|
||
Illinois - 0.9%
|
|||
Chicago Metropolitan Wtr. Reclamation District of Greater Chicago Bonds:
|
|||
Series 2014 A, 5% 12/1/24 (Pre-Refunded to 12/1/24 @ 100)
|
3,390
|
3,398
|
|
Series 2014 B, 5% 12/1/24 (Pre-Refunded to 12/1/24 @ 100)
|
2,435
|
2,441
|
|
Series 2016 A, 5% 12/1/24
|
2,040
|
2,044
|
|
Series 2021 C, 5% 12/1/24
|
915
|
917
|
|
Cook County Gen. Oblig. Bonds:
|
|||
Series 2021 B, 4% 11/15/24
|
525
|
525
|
|
Series 2022 A, 5% 11/15/24
|
10,830
|
10,849
|
|
Cook County Sales Tax Rev. Bonds:
|
|||
Series 2022 A, 5% 11/15/24
|
625
|
626
|
|
Series 2022 B, 5% 11/15/24
|
1,105
|
1,106
|
|
Illinois Fin. Auth. Rev. Bonds (Advocate Health Care Network Proj.) Series 2011 B, SIFMA Municipal Swap Index + 0.300% 3.45%, tender 4/28/25 (c)(e)
|
600
|
600
|
|
Illinois Gen. Oblig. Bonds:
|
|||
Series 2016, 5% 2/1/25
|
3,800
|
3,822
|
|
Series 2017 D, 5% 11/1/24
|
21,115
|
21,134
|
|
Series 2018 A, 6% 5/1/25
|
1,550
|
1,569
|
|
Series 2018 B:
|
|||
5% 10/1/24
|
1,135
|
1,135
|
|
5% 10/1/25
|
2,465
|
2,514
|
|
Series 2019 A, 5% 11/1/24
|
1,000
|
1,001
|
|
Series 2020 D, 5% 10/1/24
|
3,800
|
3,800
|
|
Series 2021 A, 5% 12/1/24
|
1,445
|
1,448
|
|
Series 2022 A, 5% 3/1/25
|
400
|
402
|
|
Series 2022 B, 5% 3/1/25
|
4,950
|
4,984
|
|
Series 2023 C, 5% 5/1/25
|
825
|
830
|
|
Series 2024 B, 5% 10/1/25 (h)
|
5,600
|
5,710
|
|
Series 2024, 5% 2/1/25 (h)
|
16,860
|
16,949
|
|
TOTAL ILLINOIS
|
87,804
|
||
Indiana - 0.0%
|
|||
Indiana Fin. Auth. Rev. Bonds Series 2015 A, 4% 3/1/25 (Pre-Refunded to 3/1/25 @ 100)
|
2,000
|
2,007
|
|
Kansas - 0.6%
|
|||
City of Lawrence Kansas Gen. Oblig. BAN Series 2024 I, 4.5% 5/1/25
|
21,040
|
21,165
|
|
Wichita Gen. Oblig. BAN:
|
|||
Series 2023, 5% 10/15/24
|
1,455
|
1,456
|
|
Series 2024 318, 4% 10/15/25 (h)
|
36,565
|
36,974
|
|
TOTAL KANSAS
|
59,595
|
||
Kentucky - 0.0%
|
|||
Kentucky Asset/Liability Commission Gen. Fund Rev. Bonds Series 2021 A, 5% 11/1/24
|
1,270
|
1,271
|
|
Kentucky State Property & Buildings Commission Rev. Bonds Series 2016 B, 5% 11/1/24
|
1,360
|
1,362
|
|
TOTAL KENTUCKY
|
2,633
|
||
Louisiana - 0.0%
|
|||
Louisiana Local Govt. Envir. Facilities Bonds:
|
|||
(LCTCS ACT 360 Proj.) Series 2014, 5% 10/1/24 (Pre-Refunded to 10/1/24 @ 100)
|
670
|
670
|
|
(LCTCS Act 360 Proj.) Series 2014, 5% 10/1/24 (Pre-Refunded to 10/1/24 @ 100)
|
500
|
500
|
|
TOTAL LOUISIANA
|
1,170
|
||
Massachusetts - 0.7%
|
|||
Ashland Gen. Oblig. BAN Series 2023, 5% 10/10/24
|
8,788
|
8,791
|
|
East Longmeadow Gen. Oblig. BAN Series 2024, 5% 1/30/25
|
8,970
|
9,013
|
|
Framingham Gen. Oblig. BAN Series 2024, 4.5% 12/19/24
|
10,400
|
10,418
|
|
Groton BAN Series 2024, 4.5% 6/20/25
|
13,700
|
13,787
|
|
Nantucket Gen. Oblig. BAN Series 2024 B, 4.5% 3/21/25
|
14,900
|
14,961
|
|
Westford Gen. Oblig. BAN Series 2024, 4.75% 5/1/25
|
12,718
|
12,806
|
|
TOTAL MASSACHUSETTS
|
69,776
|
||
Michigan - 0.3%
|
|||
Kent Hosp. Fin. Auth. Hosp. Facilities Rev. Bonds (Spectrum Health Sys. Proj.) Series 2015 A, SIFMA Municipal Swap Index + 0.250% 3.4%, tender 4/28/25 (c)(e)
|
2,715
|
2,715
|
|
Michigan Bldg. Auth. Rev.:
|
|||
Bonds (Facilities Prog.) Series 2023 II, 5% 10/15/24
|
1,725
|
1,726
|
|
Series 2024 9, 3.45% 10/24/24, LOC JPMorgan Chase Bank, CP
|
21,100
|
21,100
|
|
Michigan Fin. Auth. Rev. Bonds:
|
|||
(Trinity Health Proj.) Series 2017, 5% 12/1/24
|
380
|
381
|
|
Series 2015 MI, 5% 12/1/24
|
330
|
331
|
|
Series 2015, 5% 11/15/24 (Escrowed to Maturity)
|
500
|
501
|
|
Series 2019 MI2, 5%, tender 2/1/25 (c)
|
875
|
878
|
|
Michigan Hosp. Fin. Auth. Rev. Bonds Series 2005 A3, 4% 11/1/24
|
275
|
275
|
|
Michigan Trunk Line Fund Rev. Bonds Series 2020 A, 5% 11/15/24
|
590
|
591
|
|
TOTAL MICHIGAN
|
28,498
|
||
Minnesota - 0.4%
|
|||
Hennepin County Gen. Oblig. Bonds Series 2018 A, 5% 12/1/24
|
320
|
321
|
|
Univ. of Minnesota Gen. Oblig.:
|
|||
Bonds Series 2017 B, 5% 12/1/24
|
415
|
416
|
|
Series 2024 F, 3.4% 11/13/24, CP
|
18,900
|
18,900
|
|
Series 2024 H, 3.2% 12/10/24, CP
|
14,600
|
14,600
|
|
TOTAL MINNESOTA
|
34,237
|
||
Nebraska - 0.3%
|
|||
Omaha Pub. Pwr. District Elec. Rev. Series 2024 A:
|
|||
3.36% 11/14/24, CP
|
10,850
|
10,850
|
|
3.6% 10/23/24, CP
|
7,650
|
7,650
|
|
3.65% 10/2/24, CP
|
5,650
|
5,650
|
|
3.68% 10/16/24, CP
|
8,400
|
8,400
|
|
TOTAL NEBRASKA
|
32,550
|
||
New Jersey - 1.8%
|
|||
Branchburg Township BAN:
|
|||
Series 2023, 5% 10/10/24
|
6,300
|
6,302
|
|
Series 2024 A, 4.5% 4/24/25
|
10,530
|
10,582
|
|
Cedar Grove Township Gen. Oblig. BAN Series 2024, 4.5% 6/26/25
|
7,600
|
7,645
|
|
Clifton Gen. Oblig. BAN Series 2024 A, 4.5% 5/21/25
|
5,600
|
5,627
|
|
Cranford Township Gen. Oblig. BAN Series 2024, 4% 8/22/25
|
5,300
|
5,331
|
|
East Brunswick Township Gen. Oblig. BAN Series 2024 B, 4% 7/15/25
|
3,200
|
3,215
|
|
Evesham Township BAN Series 2024 A, 4% 9/16/25
|
5,077
|
5,116
|
|
Freehold Township BAN Series 2023, 5% 10/23/24
|
17,745
|
17,755
|
|
Glassboro Gen. Oblig. BAN Series 2024 A, 4.25% 5/30/25
|
6,410
|
6,441
|
|
Ho & Ho Kus BAN Series 2024, 4.75% 5/1/25
|
2,262
|
2,272
|
|
Hopewell Township Gen. Oblig. BAN Series 2024, 4% 9/23/25
|
8,600
|
8,682
|
|
Jefferson Township Gen. Oblig. BAN Series 2024, 4.5% 6/13/25
|
12,161
|
12,227
|
|
Kinnelon Gen. Oblig. BAN Series 2024, 4% 9/26/25
|
6,388
|
6,450
|
|
Metuchen Gen. Oblig. BAN Series 2024 A, 4.5% 7/9/25
|
11,900
|
11,981
|
|
New Jersey Econ. Dev. Auth. Bonds Series 2022 A, 5% 11/1/24
|
275
|
275
|
|
New Jersey Trans. Trust Fund Auth. Bonds:
|
|||
Series 2006 C, 0% 12/15/24
|
1,000
|
992
|
|
Series A, 5% 12/15/24
|
2,825
|
2,832
|
|
Series AA, 5% 6/15/25
|
500
|
507
|
|
Old Bridge Township Gen. Oblig. BAN Series 2024, 4% 9/5/25
|
7,300
|
7,357
|
|
Point Pleasant Gen. Oblig. BAN Series 2024, 4% 8/29/25
|
4,240
|
4,266
|
|
Ridgewood Gen. Oblig. BAN Series 2024 B, 3.75% 10/9/25 (h)
|
14,740
|
14,875
|
|
Springfield Township Gen. Oblig. BAN Series 2024, 4.75% 5/1/25
|
4,473
|
4,495
|
|
Tenafly BAN Series 2024, 4.5% 5/22/25
|
7,200
|
7,237
|
|
West Milford Township Gen. Oblig. BAN Series 2024, 4% 9/12/25
|
10,323
|
10,404
|
|
Woodcliff Lake N J BAN Series 2024, 4% 9/19/25
|
5,546
|
5,585
|
|
TOTAL NEW JERSEY
|
168,451
|
||
New York - 3.3%
|
|||
Albany City School District BAN Series 2024 B, 4.5% 6/26/25
|
50,989
|
51,314
|
|
Broome County Gen. Oblig. BAN Series 2024, 4.5% 4/25/25
|
43,400
|
43,594
|
|
Burnt Hills Ballston Lake NY BAN Series 2024, 4.5% 6/20/25
|
15,265
|
15,361
|
|
City of Kingston BAN Series 2024 C, 4% 8/13/25
|
5,405
|
5,408
|
|
Corning School District Gen. Oblig. BAN Series 2024 B, 4.5% 6/20/25
|
16,400
|
16,505
|
|
East Syracuse-Minoa Central School District BAN Series 2024, 4.5% 7/11/25
|
7,200
|
7,245
|
|
Harrison Cent School District BAN Series 2024, 4.5% 7/25/25
|
5,600
|
5,642
|
|
Kenmore-Tonawanda Union Free School District BAN Series 2024, 4.5% 6/26/25
|
16,100
|
16,203
|
|
Lancaster Gen. Oblig. BAN Series 2024, 4.5% 7/18/25
|
8,940
|
9,007
|
|
Mahopac Cent Scd BAN Series 2024, 4.5% 7/25/25
|
11,146
|
11,227
|
|
New Paltz Town N Y BAN Series 2024 D, 4% 10/3/25 (h)
|
4,877
|
4,920
|
|
New Windsor N Y BAN Series 2024, 4.5% 6/27/25
|
4,900
|
4,929
|
|
New York Pwr. Auth. Series 2024:
|
|||
3.62% 10/8/24, CP
|
21,800
|
21,800
|
|
3.62% 10/10/24, CP
|
14,500
|
14,500
|
|
North Hempstead Gen. Oblig. BAN Series 2024 B, 4% 9/19/25
|
14,708
|
14,865
|
|
Ossining Village BAN Series 2024, 4% 9/18/25
|
16,733
|
16,888
|
|
Port Jervis NY City School District BAN Series 2024, 4.5% 6/27/25
|
5,000
|
5,031
|
|
Sachem Central School District of Holbrook TAN Series 2024, 4.5% 6/20/25
|
40,400
|
40,675
|
|
Southampton Union Free School District TAN Series 2024, 5% 6/20/25
|
7,300
|
7,400
|
|
TOTAL NEW YORK
|
312,514
|
||
Ohio - 0.3%
|
|||
American Muni. Pwr. BAN Series 2024, 4.5% 6/19/25 (Ohio Gen. Oblig. Guaranteed)
|
2,000
|
2,008
|
|
Cuyahoga County Econ. Dev. Rev. Bonds Series 2020 D, 4% 12/1/24
|
1,675
|
1,676
|
|
Dublin City School District BAN Series 2023, 5% 12/18/24
|
2,650
|
2,657
|
|
Hamilton Gen. Oblig. BAN Series 2023, 4.5% 12/19/24 (Ohio Gen. Oblig. Guaranteed)
|
6,140
|
6,151
|
|
Kings Local School District BAN Series 2024, 4.5% 7/16/25
|
2,800
|
2,816
|
|
Northeast Ohio Reg'l. Swr. District Wastewtr. Rev. Bonds Series 2014, 5% 11/15/24 (Pre-Refunded to 11/15/24 @ 100)
|
1,075
|
1,077
|
|
Ohio Gen. Oblig. Bonds Series 2024 A, 5% 3/1/25
|
400
|
402
|
|
Springfield Gen. Oblig. BAN Series 2024, 4.125% 3/27/25 (Ohio Gen. Oblig. Guaranteed)
|
2,915
|
2,924
|
|
Wyoming City School District BAN Series 2024, 5.5% 5/14/25
|
3,810
|
3,843
|
|
TOTAL OHIO
|
23,554
|
||
Oregon - 0.1%
|
|||
Multnomah County Hosp. Facilities Auth. Rev. Bonds (Mirabella at South Waterfront Proj.) Series 2014 A, 5.5% 10/1/24 (Pre-Refunded to 10/1/24 @ 100)
|
4,115
|
4,115
|
|
Oregon Dept. of Trans. Hwy. User Tax Rev. Bonds:
|
|||
Series 2014 A, 5% 11/15/24 (Pre-Refunded to 11/15/24 @ 100)
|
350
|
350
|
|
Series 2015 A:
|
|||
4% 11/15/24 (Pre-Refunded to 11/15/24 @ 100)
|
205
|
205
|
|
5% 11/15/24 (Pre-Refunded to 11/15/24 @ 100)
|
450
|
451
|
|
5% 11/15/24 (Pre-Refunded to 11/15/24 @ 100)
|
3,210
|
3,215
|
|
Oregon Gen. Oblig. Bonds Series 2024 A, 5% 5/1/25
|
2,000
|
2,017
|
|
TOTAL OREGON
|
10,353
|
||
Pennsylvania - 0.2%
|
|||
Commonwealth Fing. Auth. Tobacco Bonds Series 2018, 5% 6/1/25
|
2,600
|
2,623
|
|
Montgomery County Indl. Dev. Auth. Bonds Series 2015 A:
|
|||
5.25% 1/15/25 (Pre-Refunded to 1/15/25 @ 100)
|
1,390
|
1,396
|
|
5.25% 1/15/25 (Pre-Refunded to 1/15/25 @ 100)
|
695
|
698
|
|
Pennsylvania Gen. Oblig. Bonds:
|
|||
Series 2018, 5% 3/1/25
|
1,400
|
1,410
|
|
Series 2020, 5% 5/1/25
|
7,200
|
7,261
|
|
Series 2021, 5% 5/15/25
|
6,545
|
6,604
|
|
Series 2022, 5% 10/1/24
|
845
|
845
|
|
TOTAL PENNSYLVANIA
|
20,837
|
||
Rhode Island - 0.0%
|
|||
North Providence BAN Series 2024, 4% 7/23/25
|
305
|
307
|
|
South Carolina - 1.8%
|
|||
Anderson County School District No. 004 BAN Series 2024, 4% 3/27/25
|
35,400
|
35,486
|
|
Charleston County School District BAN Series 2024 A, 4.5% 11/14/24
|
16,105
|
16,122
|
|
South Carolina Assoc. of Governmental Organizations Ctfs. of Prtn. Bonds:
|
|||
Series 2024 A, 4.5% 2/28/25
|
31,743
|
31,858
|
|
Series 2024 B, 5% 2/28/25
|
56,005
|
56,411
|
|
South Carolina Pub. Svc. Auth. Rev. Bonds Series 2013 B, 5% 10/23/24 (Pre-Refunded to 10/23/24 @ 100)
|
3,170
|
3,173
|
|
York County School District #4 BAN Series 2024, 3.75% 10/8/25 (h)
|
25,400
|
25,630
|
|
TOTAL SOUTH CAROLINA
|
168,680
|
||
Texas - 6.1%
|
|||
Austin Elec. Util. Sys. Rev.:
|
|||
Bonds Series 2015 A, 5% 11/15/24
|
330
|
331
|
|
Series 2024 A:
|
|||
3.33% 12/4/24 (Liquidity Facility JPMorgan Chase Bank), CP
|
42,482
|
42,482
|
|
3.6% 10/9/24 (Liquidity Facility JPMorgan Chase Bank), CP
|
9,750
|
9,750
|
|
Board of Regents of The Texas A&M Univ. Sys. Permanent Univ. Fund Series 2024 A, 3.58% 1/8/25, CP
|
12,500
|
12,500
|
|
Dallas Area Rapid Transit Sales Tax Rev. Bonds Series 2019, 5% 12/1/24
|
325
|
326
|
|
Dallas Gen. Oblig. Bonds:
|
|||
Series 2021, 5% 2/15/25
|
400
|
402
|
|
Series 2024 B:
|
|||
5% 2/15/25
|
12,100
|
12,168
|
|
5% 2/15/25
|
16,735
|
16,831
|
|
Fort Worth Independent School District Bonds Series 2015, 5% 2/15/25 (Permanent School Fund of Texas Guaranteed)
|
325
|
326
|
|
Harris County Cultural Ed. Facilities Fin. Corp. Rev. Bonds Series 2014 A, 5% 12/1/24
|
2,900
|
2,906
|
|
Harris County Gen. Oblig.:
|
|||
Bonds Series 2022 A, 5% 10/1/24
|
975
|
975
|
|
Series 2024 A1:
|
|||
3.35% 12/5/24 (Liquidity Facility State Street Bank & Trust Co., Boston), CP
|
8,500
|
8,500
|
|
3.4% 11/5/24 (Liquidity Facility State Street Bank & Trust Co., Boston), CP
|
4,480
|
4,480
|
|
Series 2024 C, 3.4% 11/5/24, LOC Sumitomo Mitsui Banking Corp., CP
|
4,600
|
4,600
|
|
Series 2024 D:
|
|||
3.35% 12/5/24 (Liquidity Facility JPMorgan Chase Bank), CP
|
3,100
|
3,100
|
|
3.4% 12/5/24 (Liquidity Facility JPMorgan Chase Bank), CP
|
3,100
|
3,100
|
|
Series 2024 D2, 3.28% 10/17/24 (Liquidity Facility State Street Bank & Trust Co., Boston), CP
|
11,840
|
11,840
|
|
Houston Util. Sys. Rev. Bonds:
|
|||
Series 2002 C, 5% 11/15/24
|
735
|
736
|
|
Series 2014 D, 5% 11/15/24
|
1,430
|
1,433
|
|
Keller Independent School District Bonds:
|
|||
Series 2015 A, 4% 2/15/25 (Pre-Refunded to 2/15/25 @ 100)
|
200
|
201
|
|
Series 2015, 5% 2/15/25 (Pre-Refunded to 2/15/25 @ 100)
|
835
|
839
|
|
New Hope Cultural Ed. Facilities Fin. Corp. Retirement Facility Rev. Bonds (MRC Crestview Proj.) Series 2016, 5% 11/15/24 (Pre-Refunded to 11/15/24 @ 102)
|
1,105
|
1,129
|
|
Red Riv Health Facilities Dev. Corp. T Bonds (MRC The Crossings Proj.) Series 2014 A, 7.75% 11/15/24 (Pre-Refunded to 11/15/24 @ 100)
|
1,815
|
1,824
|
|
San Antonio Gen. Oblig. Bonds Series 2023, 5% 2/1/25
|
350
|
352
|
|
Spring Branch Independent School District Bonds Series 2022, 5% 2/1/25 (Permanent School Fund of Texas Guaranteed)
|
750
|
754
|
|
Tarrant County Cultural Ed. Facilities Fin. Corp. Hosp. Rev. Bonds (Baylor Health Care Sys. Proj.):
|
|||
Series 2011 B, SIFMA Municipal Swap Index + 0.300% 3.48%, tender 4/28/25 (c)(e)
|
8,400
|
8,400
|
|
Series 2013 B, SIFMA Municipal Swap Index + 0.300% 3.48%, tender 4/28/25 (c)(e)
|
2,400
|
2,400
|
|
Texas A&M Univ. Rev. Series 2024 B, 3.63% 10/8/24, CP
|
18,303
|
18,303
|
|
Texas Gen. Oblig. Bonds Series 2014 A:
|
|||
5% 10/1/24 (Pre-Refunded to 10/1/24 @ 100)
|
2,800
|
2,800
|
|
5% 10/1/24 (Pre-Refunded to 10/1/24 @ 100)
|
350
|
350
|
|
Texas Pub. Fin. Auth. Rev. Series 2024 B, 3.48% 10/2/24 (Liquidity Facility Texas Gen. Oblig.), CP
|
41,400
|
41,400
|
|
Texas Wtr. Dev. Board Rev. Bonds:
|
|||
Series 2015 A, 5% 4/15/25
|
1,520
|
1,532
|
|
Series 2018 B, 5% 10/15/24
|
1,485
|
1,486
|
|
Univ. of Texas Board of Regents Sys. Rev. Series 2024 A:
|
|||
3.13% 2/18/25 (Liquidity Facility Univ. of Texas Invt. Mgmt. Co.), CP
|
14,100
|
14,100
|
|
3.28% 1/13/25 (Liquidity Facility Univ. of Texas Invt. Mgmt. Co.), CP
|
11,300
|
11,301
|
|
3.33% 1/8/25 (Liquidity Facility Univ. of Texas Invt. Mgmt. Co.), CP
|
14,100
|
14,100
|
|
3.4% 1/10/25 (Liquidity Facility Univ. of Texas Invt. Mgmt. Co.), CP
|
11,200
|
11,200
|
|
3.41% 12/5/24 (Liquidity Facility Univ. of Texas Invt. Mgmt. Co.), CP
|
9,100
|
9,100
|
|
3.45% 10/16/24 (Liquidity Facility Univ. of Texas Invt. Mgmt. Co.), CP
|
10,300
|
10,300
|
|
3.48% 10/15/24 (Liquidity Facility Univ. of Texas Invt. Mgmt. Co.), CP
|
6,800
|
6,800
|
|
3.48% 10/18/24 (Liquidity Facility Univ. of Texas Invt. Mgmt. Co.), CP
|
3,500
|
3,500
|
|
3.49% 11/6/24 (Liquidity Facility Univ. of Texas Invt. Mgmt. Co.), CP
|
16,000
|
16,000
|
|
3.5% 10/17/24 (Liquidity Facility Univ. of Texas Invt. Mgmt. Co.), CP
|
4,250
|
4,250
|
|
3.5% 12/5/24 (Liquidity Facility Univ. of Texas Invt. Mgmt. Co.), CP
|
3,600
|
3,600
|
|
3.5% 1/7/25 (Liquidity Facility Univ. of Texas Invt. Mgmt. Co.), CP
|
14,000
|
14,000
|
|
3.6% 11/13/24 (Liquidity Facility Univ. of Texas Invt. Mgmt. Co.), CP
|
7,000
|
7,000
|
|
3.6% 11/18/24 (Liquidity Facility Univ. of Texas Invt. Mgmt. Co.), CP
|
18,200
|
18,200
|
|
3.6% 11/20/24 (Liquidity Facility Univ. of Texas Invt. Mgmt. Co.), CP
|
13,800
|
13,800
|
|
3.6% 11/21/24 (Liquidity Facility Univ. of Texas Invt. Mgmt. Co.), CP
|
5,500
|
5,500
|
|
3.62% 10/16/24 (Liquidity Facility Univ. of Texas Invt. Mgmt. Co.), CP
|
8,330
|
8,330
|
|
3.62% 11/5/24 (Liquidity Facility Univ. of Texas Invt. Mgmt. Co.), CP
|
7,200
|
7,200
|
|
3.62% 11/19/24 (Liquidity Facility Univ. of Texas Invt. Mgmt. Co.), CP
|
13,700
|
13,700
|
|
3.65% 10/3/24 (Liquidity Facility Univ. of Texas Invt. Mgmt. Co.), CP
|
5,600
|
5,600
|
|
3.65% 10/7/24 (Liquidity Facility Univ. of Texas Invt. Mgmt. Co.), CP
|
14,000
|
14,000
|
|
Univ. of Texas Permanent Univ. Fund Rev. Series 2024 A:
|
|||
3.2% 2/11/25, CP
|
18,200
|
18,200
|
|
3.2% 3/12/25, CP
|
4,200
|
4,200
|
|
3.2% 3/18/25, CP
|
14,000
|
14,000
|
|
3.28% 2/4/25, CP
|
18,200
|
18,200
|
|
3.28% 2/5/25, CP
|
9,400
|
9,399
|
|
3.3% 12/18/24, CP
|
14,200
|
14,200
|
|
3.33% 12/3/24, CP
|
14,100
|
14,100
|
|
3.33% 12/16/24, CP
|
14,100
|
14,100
|
|
3.33% 12/17/24, CP
|
11,300
|
11,300
|
|
3.38% 12/4/24, CP
|
10,900
|
10,900
|
|
3.5% 10/11/24, CP
|
18,000
|
18,000
|
|
TOTAL TEXAS
|
576,736
|
||
Washington - 0.0%
|
|||
Clark County School District #37, Vancouver Bonds Series 2018, 5% 12/1/24 (Washington Gen. Oblig. Guaranteed)
|
375
|
376
|
|
King County Gen. Oblig. Bonds:
|
|||
Series 2015 E, 5% 12/1/24
|
340
|
341
|
|
Series 2023 A, 5% 12/1/24
|
230
|
231
|
|
King County Washington #406 Bonds Series 2018, 5% 12/1/24 (Washington Gen. Oblig. Guaranteed)
|
1,125
|
1,127
|
|
Pierce County School District #10 Tacoma Bonds Series 2014, 5% 12/1/24 (Pre-Refunded to 12/1/24 @ 100)
|
400
|
401
|
|
Port of Seattle Rev. Bonds Series 2015 A, 5% 11/12/24 (Escrowed to Maturity)
|
1,000
|
1,000
|
|
Seattle Muni. Lt. & Pwr. Rev. Bonds Series 2016 B, 5% 4/1/25
|
485
|
488
|
|
TOTAL WASHINGTON
|
3,964
|
||
Wisconsin - 0.9%
|
|||
Madison Metropolitan School District TRAN Series 2024, 4% 9/2/25 (h)
|
33,000
|
33,334
|
|
Wisconsin Gen. Oblig. Series 2024:
|
|||
3.3% 6/20/25, CP
|
7,688
|
7,688
|
|
3.6% 5/19/25, CP
|
19,100
|
19,100
|
|
3.8% 3/10/25, CP
|
5,600
|
5,600
|
|
3.8% 3/10/25, CP
|
16,600
|
16,600
|
|
Wisconsin Health & Edl. Facilities Bonds:
|
|||
Series 2013 B1, 4% 11/15/24
|
780
|
780
|
|
Series 2018 B, 5%, tender 1/29/25 (c)
|
3,190
|
3,204
|
|
TOTAL WISCONSIN
|
86,306
|
||
|
TOTAL OTHER MUNICIPAL SECURITY
(Cost $1,872,146)
|
1,872,146
|
||
Investment Company - 15.7%
|
|||
Shares
|
Value ($)
(000s)
|
||
Fidelity Tax-Free Cash Central Fund 3.47% (i)(j)
(Cost $1,500,777)
|
1,500,222
|
1,500,777
|
|
|
TOTAL INVESTMENT IN SECURITIES - 101.0%
(Cost $9,629,330)
|
9,629,330
|
NET OTHER ASSETS (LIABILITIES) - (1.0)%
|
(96,525)
|
NET ASSETS - 100.0%
|
9,532,805
|
BAN
|
-
|
BOND ANTICIPATION NOTE
|
CP
|
-
|
COMMERCIAL PAPER
|
TAN
|
-
|
TAX ANTICIPATION NOTE
|
TRAN
|
-
|
TAX AND REVENUE ANTICIPATION NOTE
|
VRDN
|
-
|
VARIABLE RATE DEMAND NOTE (A debt instrument that is payable upon demand, either daily, weekly or monthly)
|
(a)
|
Amount is stated in United States dollars unless otherwise noted.
|
(b)
|
Security exempt from registration under Rule 144A of the Securities Act of 1933. These securities may be resold in transactions exempt from registration, normally to qualified institutional buyers. At the end of the period, the value of these securities amounted to $108,704,000 or 1.1% of net assets.
|
(c)
|
A coupon rate of 0% signifies an unsettled loan. The coupon rate will be determined upon settlement of the loan after period end.
|
(d)
|
Restricted securities (including private placements) - Investment in securities not registered under the Securities Act of 1933 (excluding 144A issues). At the end of the period, the value of restricted securities (excluding 144A issues) amounted to $46,335,000 or 0.5% of net assets.
|
(e)
|
Coupon is indexed to a floating interest rate which may be multiplied by a specified factor and/or subject to caps or floors.
|
(f)
|
Provides evidence of ownership in one or more underlying municipal bonds.
|
(g)
|
Coupon rates are determined by re-marketing agents based on current market conditions.
|
(h)
|
Security or a portion of the security purchased on a delayed delivery or when-issued basis.
|
(i)
|
Information in this report regarding holdings by state and security types does not reflect the holdings of the Fidelity Tax-Free Cash Central Fund.
|
(j)
|
Affiliated fund that is generally available only to investment companies and other accounts managed by Fidelity Investments. The rate quoted is the annualized seven-day yield of the fund at period end. A complete unaudited listing of the fund's holdings as of its most recent quarter end is available upon request. In addition, each Fidelity Central Fund's financial statements are available on the SEC's website or upon request.
|
Additional information on each restricted holding is as follows:
|
||
Security
|
Acquisition Date
|
Cost ($)
(000s)
|
Arizona St Indl. Dev. Auth. Multi Participating VRDN Floater MIZ 91 76, 3.47% 11/4/24 (Liquidity Facility Mizuho Cap. Markets LLC)
|
6/20/24
|
5,300
|
Arizona St Indl. Dev. Auth. Multi Participating VRDN Series Floater MIZ 91 87, 3.47% 11/4/24 (Liquidity Facility Mizuho Cap. Markets LLC)
|
8/21/24
|
4,500
|
Arizona St Indl. Dev. Auth. Multi Participating VRDN Series MIZ 91 80, 3.47% 11/4/24 (Liquidity Facility Mizuho Cap. Markets LLC)
|
7/11/24
|
3,200
|
Central Puget Sound Reg'l. Trans. Auth. Sales & Use Tax Rev. Bonds Series G 123, 3.35%, tender 11/1/24 (Liquidity Facility Royal Bank of Canada)
|
5/01/24
|
1,800
|
Lehigh County Gen. Purp. Hosp. Rev. Participating VRDN Series BAML 23 50 39, 3.23% 11/4/24 (Liquidity Facility Bank of America NA)
|
5/04/23 - 5/24/24
|
11,320
|
Mizuho Floater / Residual Trust V Participating VRDN Series Floater MIZ 91 85, 3.47% 11/4/24 (Liquidity Facility Mizuho Cap. Markets LLC)
|
8/21/24
|
4,600
|
Mizuho Floater / Residual Trust V Participating VRDN Series Floater MIZ 91 86, 3.47% 11/4/24 (Liquidity Facility Mizuho Cap. Markets LLC)
|
8/21/24
|
4,715
|
Port Auth. of New York & New Jersey Series 1997 2, SIFMA Municipal Swap Index + 0.050% 3.2% 10/30/24, VRDN
|
7/15/20
|
7,300
|
Texas Wtr. Dev. Board Rev. Bonds Series MS 00 17, 3.3%, tender 1/9/25 (Liquidity Facility Morgan Stanley Bank, West Valley City Utah)
|
10/12/23
|
3,600
|
Affiliate (Amounts in thousands)
|
Value,
beginning
of period ($)
|
Purchases ($)
|
Sales
Proceeds ($)
|
Dividend
Income ($)
|
Realized
Gain (loss) ($)
|
Change in
Unrealized
appreciation
(depreciation) ($)
|
Value,
end
of period ($)
|
% ownership,
end
of period
|
Fidelity Tax-Free Cash Central Fund 3.47%
|
972,777
|
2,945,998
|
2,417,998
|
19,436
|
-
|
-
|
1,500,777
|
79.6%
|
Total
|
972,777
|
2,945,998
|
2,417,998
|
19,436
|
-
|
-
|
1,500,777
|
|
Statement of Assets and Liabilities
|
||||
|
As of September 30, 2024 (Unaudited)
Amounts in thousands (except per-share amounts)
|
||||
Assets
|
||||
Investment in securities, at value - See accompanying schedule:
|
||||
Unaffiliated issuers (cost $8,128,553)
|
$
|
8,128,553
|
||
Fidelity Central Funds (cost $1,500,777)
|
1,500,777
|
|||
Total Investment in Securities (cost $9,629,330)
|
$
|
9,629,330
|
||
Receivable for fund shares sold
|
50,454
|
|||
Interest receivable
|
48,769
|
|||
Distributions receivable from Fidelity Central Funds
|
4,338
|
|||
Prepaid expenses
|
12
|
|||
Receivable from investment adviser for expense reductions
|
263
|
|||
Other receivables
|
100
|
|||
Total assets
|
9,733,266
|
|||
Liabilities
|
||||
Payable to custodian bank
|
$
|
777
|
||
Payable for investments purchased
|
||||
Regular delivery
|
18,225
|
|||
Delayed delivery
|
138,392
|
|||
Payable for fund shares redeemed
|
36,369
|
|||
Distributions payable
|
4,934
|
|||
Accrued management fee
|
1,078
|
|||
Distribution and service plan fees payable
|
6
|
|||
Other affiliated payables
|
525
|
|||
Other payables and accrued expenses
|
155
|
|||
Total liabilities
|
200,461
|
|||
Net Assets
|
$
|
9,532,805
|
||
Net Assets consist of:
|
||||
Paid in capital
|
$
|
9,532,221
|
||
Total accumulated earnings (loss)
|
584
|
|||
Net Assets
|
$
|
9,532,805
|
||
Net Asset Value and Maximum Offering Price
|
||||
Class I :
|
||||
Net Asset Value, offering price and redemption price per share ($9,477,941 ÷ 9,472,952 shares)
|
$
|
1.00
|
||
Class II :
|
||||
Net Asset Value, offering price and redemption price per share ($12,358 ÷ 12,353 shares)
|
$
|
1.00
|
||
Class III :
|
||||
Net Asset Value, offering price and redemption price per share ($13,530 ÷ 13,526 shares)
|
$
|
1.00
|
||
Select Class :
|
||||
Net Asset Value, offering price and redemption price per share ($28,976 ÷ 28,959 shares)
|
$
|
1.00
|
||
Statement of Operations
|
||||
Six months ended September 30, 2024 (Unaudited)
Amounts in thousands
|
||||
Investment Income
|
||||
Interest
|
$
|
140,577
|
||
Income from Fidelity Central Funds
|
19,436
|
|||
Total income
|
160,013
|
|||
Expenses
|
||||
Management fee
|
$
|
6,364
|
||
Transfer agent fees
|
2,728
|
|||
Distribution and service plan fees
|
25
|
|||
Accounting fees and expenses
|
374
|
|||
Custodian fees and expenses
|
39
|
|||
Independent trustees' fees and expenses
|
11
|
|||
Registration fees
|
191
|
|||
Audit fees
|
21
|
|||
Legal
|
2
|
|||
Miscellaneous
|
11
|
|||
Total expenses before reductions
|
9,766
|
|||
Expense reductions
|
(1,519)
|
|||
Total expenses after reductions
|
8,247
|
|||
Net Investment income (loss)
|
151,766
|
|||
Realized and Unrealized Gain (Loss)
|
||||
Net realized gain (loss) on:
|
||||
Investment Securities:
|
||||
Unaffiliated issuers
|
(77)
|
|||
Total net realized gain (loss)
|
(77)
|
|||
Net increase in net assets resulting from operations
|
$
|
151,689
|
||
Statement of Changes in Net Assets
|
||||
Amount in thousands
|
Six months ended
September 30, 2024
(Unaudited)
|
Year ended
March 31, 2024
|
||
Increase (Decrease) in Net Assets
|
||||
Operations
|
||||
Net investment income (loss)
|
$
|
151,766
|
$
|
235,852
|
Net realized gain (loss)
|
(77)
|
152
|
||
Net increase in net assets resulting from operations
|
151,689
|
236,004
|
||
Distributions to shareholders
|
(151,730)
|
(235,748)
|
||
Share transactions - net increase (decrease)
|
979,768
|
2,240,442
|
||
Total increase (decrease) in net assets
|
979,727
|
2,240,698
|
||
Net Assets
|
||||
Beginning of period
|
8,553,078
|
6,312,380
|
||
End of period
|
$
|
9,532,805
|
$
|
8,553,078
|
Tax-Exempt Portfolio Class I |
Six months ended
(Unaudited) September 30, 2024
|
Years ended March 31, 2024
|
2023
|
2022
|
2021
|
2020
|
|||||||
Selected Per-Share Data
|
||||||||||||
Net asset value, beginning of period
|
$
|
1.00
|
$
|
1.00
|
$
|
1.00
|
$
|
1.00
|
$
|
1.00
|
$
|
1.00
|
Income from Investment Operations
|
||||||||||||
Net investment income (loss) A
|
.017
|
.033
|
.017
|
- B
|
.001
|
.013
|
||||||
Net realized and unrealized gain (loss)
|
- B
|
- B
|
- B
|
- B
|
- B
|
.001
|
||||||
Total from investment operations
|
.017
|
.033
|
.017
|
- B
|
.001
|
.014
|
||||||
Distributions from net investment income
|
(.017)
|
(.033)
|
(.017)
|
- B
|
(.001)
|
(.013)
|
||||||
Distributions from net realized gain
|
-
|
-
|
-
|
-
|
-
|
- B
|
||||||
Total distributions
|
(.017)
|
(.033)
|
(.017)
|
- B
|
(.001)
|
(.014) C
|
||||||
Net asset value, end of period
|
$
|
1.00
|
$
|
1.00
|
$
|
1.00
|
$
|
1.00
|
$
|
1.00
|
$
|
1.00
|
Total Return D,E
|
1.68 % |
3.33%
|
1.72%
|
.03%
|
.12%
|
1.36%
|
||||||
Ratios to Average Net Assets A,F,G
|
||||||||||||
Expenses before reductions
|
.21% H
|
.22%
|
.22%
|
.22%
|
.22%
|
.21%
|
||||||
Expenses net of fee waivers, if any
|
.18 % H |
.18%
|
.18%
|
.10%
|
.17%
|
.18%
|
||||||
Expenses net of all reductions
|
.18% H
|
.18%
|
.18%
|
.10%
|
.17%
|
.18%
|
||||||
Net investment income (loss)
|
3.33% H
|
3.28%
|
1.73%
|
.03%
|
.13%
|
1.34%
|
||||||
Supplemental Data
|
||||||||||||
Net assets, end of period (in millions)
|
$
|
9,478
|
$
|
8,509
|
$
|
6,275
|
$
|
4,457
|
$
|
4,748
|
$
|
6,568
|
Tax-Exempt Portfolio Class II |
Six months ended
(Unaudited) September 30, 2024
|
Years ended March 31, 2024
|
2023
|
2022
|
2021
|
2020
|
|||||||
Selected Per-Share Data
|
||||||||||||
Net asset value, beginning of period
|
$
|
1.00
|
$
|
1.00
|
$
|
1.00
|
$
|
1.00
|
$
|
1.00
|
$
|
1.00
|
Income from Investment Operations
|
||||||||||||
Net investment income (loss) A
|
.016
|
.031
|
.016
|
- B
|
.001
|
.012
|
||||||
Net realized and unrealized gain (loss) B
|
-
|
-
|
-
|
-
|
-
|
-
|
||||||
Total from investment operations
|
.016
|
.031
|
.016
|
- B
|
.001
|
.012
|
||||||
Distributions from net investment income
|
(.016)
|
(.031)
|
(.016)
|
- B
|
(.001)
|
(.012)
|
||||||
Distributions from net realized gain
|
-
|
-
|
-
|
-
|
-
|
- B
|
||||||
Total distributions
|
(.016)
|
(.031)
|
(.016)
|
- B
|
(.001)
|
(.012)
|
||||||
Net asset value, end of period
|
$
|
1.00
|
$
|
1.00
|
$
|
1.00
|
$
|
1.00
|
$
|
1.00
|
$
|
1.00
|
Total Return C,D
|
1.61 % |
3.17%
|
1.57%
|
.02%
|
.06%
|
1.21%
|
||||||
Ratios to Average Net Assets A,E,F
|
||||||||||||
Expenses before reductions
|
.36% G
|
.37%
|
.37%
|
.37%
|
.37%
|
.36%
|
||||||
Expenses net of fee waivers, if any
|
.33 % G |
.33%
|
.33%
|
.11%
|
.21%
|
.33%
|
||||||
Expenses net of all reductions
|
.33% G
|
.33%
|
.33%
|
.11%
|
.21%
|
.33%
|
||||||
Net investment income (loss)
|
3.18% G
|
3.13%
|
1.58%
|
.01%
|
.08%
|
1.19%
|
||||||
Supplemental Data
|
||||||||||||
Net assets, end of period (in millions)
|
$
|
12
|
$
|
15
|
$
|
17
|
$
|
- H
|
$
|
- H
|
$
|
- H
|
Tax-Exempt Portfolio Class III |
Six months ended
(Unaudited) September 30, 2024
|
Years ended March 31, 2024
|
2023
|
2022
|
2021
|
2020
|
|||||||
Selected Per-Share Data
|
||||||||||||
Net asset value, beginning of period
|
$
|
1.00
|
$
|
1.00
|
$
|
1.00
|
$
|
1.00
|
$
|
1.00
|
$
|
1.00
|
Income from Investment Operations
|
||||||||||||
Net investment income (loss) A
|
.015
|
.030
|
.015
|
- B
|
- B
|
.011
|
||||||
Net realized and unrealized gain (loss) B
|
-
|
-
|
-
|
-
|
-
|
-
|
||||||
Total from investment operations
|
.015
|
.030
|
.015
|
- B
|
- B
|
.011
|
||||||
Distributions from net investment income
|
(.015)
|
(.030)
|
(.015)
|
- B
|
- B
|
(.011)
|
||||||
Distributions from net realized gain
|
-
|
-
|
-
|
-
|
-
|
- B
|
||||||
Total distributions
|
(.015)
|
(.030)
|
(.015)
|
- B
|
- B
|
(.011)
|
||||||
Net asset value, end of period
|
$
|
1.00
|
$
|
1.00
|
$
|
1.00
|
$
|
1.00
|
$
|
1.00
|
$
|
1.00
|
Total Return C,D
|
1.55 % |
3.07%
|
1.46%
|
.01%
|
.05%
|
1.11%
|
||||||
Ratios to Average Net Assets A,E,F
|
||||||||||||
Expenses before reductions
|
.46% G
|
.47%
|
.47%
|
.48%
|
.46%
|
.46%
|
||||||
Expenses net of fee waivers, if any
|
.43 % G |
.43%
|
.43%
|
.13%
|
.23%
|
.43%
|
||||||
Expenses net of all reductions
|
.43% G
|
.43%
|
.43%
|
.13%
|
.23%
|
.43%
|
||||||
Net investment income (loss)
|
3.08% G
|
3.04%
|
1.48%
|
(.01)%
|
.07%
|
1.09%
|
||||||
Supplemental Data
|
||||||||||||
Net assets, end of period (in millions)
|
$
|
14
|
$
|
4
|
$
|
6
|
$
|
7
|
$
|
2
|
$
|
2
|
Tax-Exempt Portfolio Select Class |
Six months ended
(Unaudited) September 30, 2024
|
Years ended March 31, 2024
|
2023
|
2022
|
2021
|
2020
|
|||||||
Selected Per-Share Data
|
||||||||||||
Net asset value, beginning of period
|
$
|
1.00
|
$
|
1.00
|
$
|
1.00
|
$
|
1.00
|
$
|
1.00
|
$
|
1.00
|
Income from Investment Operations
|
||||||||||||
Net investment income (loss) A
|
.016
|
.032
|
.017
|
- B
|
.001
|
.013
|
||||||
Net realized and unrealized gain (loss) B
|
-
|
-
|
-
|
-
|
-
|
-
|
||||||
Total from investment operations
|
.016
|
.032
|
.017
|
- B
|
.001
|
.013
|
||||||
Distributions from net investment income
|
(.016)
|
(.032)
|
(.017)
|
- B
|
(.001)
|
(.013)
|
||||||
Distributions from net realized gain
|
-
|
-
|
-
|
-
|
-
|
- B
|
||||||
Total distributions
|
(.016)
|
(.032)
|
(.017)
|
- B
|
(.001)
|
(.013)
|
||||||
Net asset value, end of period
|
$
|
1.00
|
$
|
1.00
|
$
|
1.00
|
$
|
1.00
|
$
|
1.00
|
$
|
1.00
|
Total Return C,D
|
1.66 % |
3.28%
|
1.67%
|
.02%
|
.09%
|
1.31%
|
||||||
Ratios to Average Net Assets A,E,F
|
||||||||||||
Expenses before reductions
|
.26% G
|
.27%
|
.27%
|
.27%
|
.27%
|
.26%
|
||||||
Expenses net of fee waivers, if any
|
.23 % G |
.23%
|
.23%
|
.10%
|
.19%
|
.23%
|
||||||
Expenses net of all reductions
|
.23% G
|
.23%
|
.23%
|
.10%
|
.19%
|
.23%
|
||||||
Net investment income (loss)
|
3.28% G
|
3.23%
|
1.68%
|
.03%
|
.11%
|
1.29%
|
||||||
Supplemental Data
|
||||||||||||
Net assets, end of period (in millions)
|
$
|
29
|
$
|
25
|
$
|
15
|
$
|
1
|
$
|
3
|
$
|
3
|
Fidelity Central Fund
|
Investment Manager
|
Investment Objective
|
Investment Practices
|
Expense RatioA
|
Fidelity Money Market Central Funds
|
Fidelity Management & Research Company LLC (FMR)
|
Each fund seeks to obtain a high level of current income consistent with the preservation of capital and liquidity.
|
Short-term Investments
|
Less than .005%
|
Treasury Only Portfolio
|
$765
|
Treasury Portfolio
|
530
|
Government Portfolio
|
1,889
|
Money Market Portfolio
|
1,231
|
Tax-Exempt Portfolio
|
98
|
Tax cost ($)
|
Gross unrealized appreciation ($)
|
Gross unrealized depreciation ($)
|
Net unrealized appreciation (depreciation)($)
|
|
Treasury Only Portfolio
|
93,302,818
|
-
|
-
|
-
|
Treasury Portfolio
|
70,373,046
|
-
|
-
|
-
|
Government Portfolio
|
229,035,547
|
-
|
-
|
-
|
Money Market Portfolio
|
137,033,729
|
-
|
-
|
-
|
Tax-Exempt Portfolio
|
9,629,330
|
-
|
-
|
-
|
Short-term ($)
|
Long-term ($)
|
Total capital loss carryforward ($)
|
|
Treasury Portfolio
|
-
|
(82)
|
(82)
|
Government Portfolio
|
-
|
(1,216)
|
(1,216)
|
Money Market Portfolio
|
(16)
|
-
|
(16)
|
Distribution Fee
|
Service Fee
|
|
Class II
|
.00%
|
.15%
|
Class III
|
.00%
|
.25%
|
Class IV
|
.25%
|
.25%
|
Select Class
|
.00%
|
.05%
|
Total Fees ($)
|
Retained by FDC ($)
|
|
Treasury Only Portfolio:
|
||
Class II
|
1,911
|
159
|
Class III
|
4,130
|
425
|
Class IV
|
3,316
|
416
|
Select Class
|
501
|
49
|
9,858
|
1,049
|
|
Treasury Portfolio:
|
||
Class II
|
551
|
317
|
Class III
|
5,334
|
428
|
Class IV
|
2,192
|
799
|
Select Class
|
67
|
13
|
8,144
|
1,557
|
|
Government Portfolio:
|
||
Class II
|
1,084
|
774
|
Class III
|
7,294
|
1,034
|
Select Class
|
53
|
12
|
8,431
|
1,820
|
|
Money Market Portfolio:
|
||
Class II
|
79
|
29
|
Class III
|
23
|
8
|
Select Class
|
11
|
6
|
113
|
43
|
|
Tax-Exempt Portfolio:
|
||
Class II
|
10
|
31
|
Class III
|
8
|
5
|
Select Class
|
7
|
6
|
25
|
42
|
Treasury Only Portfolio
|
|
Class I
|
$5,740
|
Class II
|
764
|
Class III
|
991
|
Class IV
|
398
|
Select ClassIV
|
601
|
Institutional ClassIV
|
7,330
|
$15,824
|
|
Treasury Portfolio
|
|
Class I
|
$7,213
|
Class II
|
221
|
Class III
|
1,280
|
Class IV
|
263
|
Select ClassIV
|
80
|
Institutional ClassIV
|
5,025
|
$14,082
|
|
Government Portfolio
|
|
Class I
|
$13,732
|
Class II
|
434
|
Class III
|
1,751
|
Select Class
|
63
|
Institutional Class
|
22,766
|
$38,746
|
|
Money Market Portfolio
|
|
Class I
|
$17,025
|
Class II
|
32
|
Class III
|
6
|
Select Class
|
13
|
Institutional Class
|
10,972
|
$28,048
|
|
Tax-Exempt Portfolio
|
|
Class I
|
$2,714
|
Class II
|
4
|
Class III
|
2
|
Select Class
|
8
|
$2,728
|
% of Average Net Assets
|
|
Treasury Only Portfolio
|
- A
|
Treasury Portfolio
|
- A
|
Government Portfolio
|
- A
|
Money Market Portfolio
|
- A
|
Tax-Exempt Portfolio
|
.01
|
Average Loan Balance ($)
|
Weighted Average Interest Rate
|
||
Money Market Portfolio
|
Lender
|
19,668
|
5.55%
|
Purchases ($)
|
Sales ($)
|
Realized Gain (Loss)($)
|
|
Treasury Only Portfolio
|
-
|
-
|
-
|
Treasury Portfolio
|
-
|
-
|
-
|
Government Portfolio
|
-
|
-
|
-
|
Money Market Portfolio
|
-
|
-
|
-
|
Tax-Exempt Portfolio
|
176,837
|
87,160
|
-
|
Amount ($)
|
|
Government Portfolio
|
11
|
Expense Limitations
|
Reimbursement ($)
|
|
Treasury Only Portfolio
|
||
Class I
|
.18%
|
2,854
|
Class II
|
.33%
|
378
|
Class III
|
.43%
|
476
|
Class IV
|
.68%
|
185
|
Select Class
|
.23%
|
298
|
Institutional Class
|
.14%
|
9,750
|
Treasury Portfolio
|
||
Class I
|
.18%
|
3,199
|
Class II
|
.33%
|
96
|
Class III
|
.43%
|
559
|
Class IV
|
.68%
|
111
|
Select Class
|
.23%
|
36
|
Institutional Class
|
.14%
|
6,137
|
Government Portfolio
|
||
Class I
|
.18%
|
6,157
|
Class II
|
.33%
|
189
|
Class III
|
.43%
|
760
|
Select Class
|
.23%
|
28
|
Institutional Class
|
.14%
|
28,025
|
Money Market Portfolio
|
||
Class I
|
.18%
|
7,882
|
Class II
|
.33%
|
14
|
Class III
|
.43%
|
3
|
Select Class
|
.23%
|
6
|
Institutional Class
|
.14%
|
13,858
|
Tax-Exempt Portfolio
|
||
Class I
|
.18%
|
1,510
|
Class II
|
.33%
|
2
|
Class III
|
.43%
|
1
|
Select Class
|
.23%
|
5
|
Custodian credits ($)
|
|
Treasury Portfolio
|
69
|
Tax-Exempt Portfolio
|
1
|
Six months ended
September 30, 2024
|
Year ended
March 31, 2024
|
|
Treasury Only Portfolio
|
||
Distributions to shareholders
|
||
Class I
|
$493,614
|
$749,752
|
Class II
|
63,650
|
114,830
|
Class III
|
81,180
|
128,732
|
Class IV
|
30,940
|
40,233
|
Select Class
|
51,224
|
70,444
|
Institutional Class
|
1,271,006
|
1,731,002
|
Total
|
$1,991,614
|
$2,834,993
|
Treasury Portfolio
|
||
Distributions to shareholders
|
||
Class I
|
$620,206
|
$1,131,883
|
Class II
|
18,418
|
32,034
|
Class III
|
104,746
|
183,585
|
Class IV
|
20,442
|
42,660
|
Select Class
|
6,820
|
13,458
|
Institutional Class
|
871,600
|
1,599,152
|
Total
|
$1,642,232
|
$3,002,772
|
Government Portfolio
|
||
Distributions to shareholders
|
||
Class I
|
$1,187,341
|
$ 2,087,261
|
Class II
|
36,431
|
70,272
|
Class III
|
144,019
|
263,369
|
Select Class
|
5,401
|
10,504
|
Institutional Class
|
3,963,213
|
7,035,778
|
Total
|
$5,336,405
|
$9,467,184
|
Money Market Portfolio
|
||
Distributions to shareholders
|
||
Class I
|
$1,490,592
|
$2,547,512
|
Class II
|
2,708
|
4,147
|
Class III
|
460
|
997
|
Select Class
|
1,152
|
3,047
|
Institutional Class
|
1,935,713
|
3,290,733
|
Total
|
$3,430,625
|
$5,846,436
|
Tax-Exempt Portfolio
|
||
Distributions to shareholders
|
||
Class I
|
$150,967
|
$234,515
|
Class II
|
217
|
484
|
Class III
|
96
|
112
|
Select Class
|
450
|
637
|
Total
|
$151,730
|
$235,748
|
Shares
|
Shares
|
Dollars
|
Dollars
|
|
Six months ended
September 30, 2024
|
Year ended
March 31, 2024
|
Six months ended
September 30, 2024
|
Year ended
March 31, 2024
|
|
Treasury Only Portfolio
|
||||
Class I
|
||||
Shares sold
|
22,907,758
|
37,395,469
|
$22,907,758
|
$37,395,469
|
Reinvestment of distributions
|
282,362
|
451,132
|
282,362
|
451,132
|
Shares redeemed
|
(18,990,597)
|
(34,387,976)
|
(18,990,597)
|
(34,387,976)
|
Net increase (decrease)
|
4,199,523
|
3,458,625
|
$4,199,523
|
$3,458,625
|
Class II
|
||||
Shares sold
|
4,322,558
|
7,939,989
|
$4,322,558
|
$7,939,989
|
Reinvestment of distributions
|
4,852
|
4,104
|
4,852
|
4,104
|
Shares redeemed
|
(4,476,229)
|
(7,414,326)
|
(4,476,229)
|
(7,414,326)
|
Net increase (decrease)
|
(148,819)
|
529,767
|
$(148,819)
|
$529,767
|
Class III
|
||||
Shares sold
|
4,016,181
|
6,498,299
|
$4,016,181
|
$6,498,299
|
Reinvestment of distributions
|
18,970
|
31,120
|
18,970
|
31,120
|
Shares redeemed
|
(3,521,476)
|
(6,085,724)
|
(3,521,476)
|
(6,085,724)
|
Net increase (decrease)
|
513,675
|
443,695
|
$513,675
|
$443,695
|
Class IV
|
||||
Shares sold
|
2,101,447
|
4,096,094
|
$2,101,447
|
$4,096,094
|
Reinvestment of distributions
|
30,899
|
40,227
|
30,899
|
40,227
|
Shares redeemed
|
(2,299,740)
|
(3,553,469)
|
(2,299,740)
|
(3,553,469)
|
Net increase (decrease)
|
(167,394)
|
582,852
|
$(167,394)
|
$582,852
|
Select Class
|
||||
Shares sold
|
1,680,109
|
2,444,779
|
$1,680,109
|
$2,444,779
|
Reinvestment of distributions
|
33,097
|
33,115
|
33,097
|
33,115
|
Shares redeemed
|
(1,423,263)
|
(1,787,402)
|
(1,423,263)
|
(1,787,402)
|
Net increase (decrease)
|
289,943
|
690,492
|
$289,943
|
$690,492
|
Institutional Class
|
||||
Shares sold
|
59,617,465
|
84,060,436
|
$59,617,465
|
$84,060,436
|
Reinvestment of distributions
|
884,875
|
1,155,892
|
884,875
|
1,155,892
|
Shares redeemed
|
(50,454,096)
|
(69,680,459)
|
(50,454,096)
|
(69,680,459)
|
Net increase (decrease)
|
10,048,244
|
15,535,869
|
$10,048,244
|
$15,535,869
|
Treasury Portfolio
|
||||
Class I
|
||||
Shares sold
|
49,895,620
|
93,821,353
|
$49,895,620
|
$93,821,353
|
Reinvestment of distributions
|
210,791
|
434,699
|
210,791
|
434,699
|
Shares redeemed
|
(46,020,177)
|
(94,227,636)
|
(46,020,177)
|
(94,227,636)
|
Net increase (decrease)
|
4,086,234
|
28,416
|
$4,086,234
|
$28,416
|
Class II
|
||||
Shares sold
|
548,371
|
1,707,481
|
$548,371
|
$1,707,481
|
Reinvestment of distributions
|
8,386
|
14,934
|
8,386
|
14,934
|
Shares redeemed
|
(645,962)
|
(1,470,956)
|
(645,962)
|
(1,470,956)
|
Net increase (decrease)
|
(89,205)
|
251,459
|
$(89,205)
|
$251,459
|
Class III
|
||||
Shares sold
|
7,387,800
|
11,352,565
|
$7,387,800
|
$11,352,565
|
Reinvestment of distributions
|
14,508
|
23,728
|
14,508
|
23,728
|
Shares redeemed
|
(6,548,773)
|
(10,428,268)
|
(6,548,773)
|
(10,428,268)
|
Net increase (decrease)
|
853,535
|
948,025
|
$853,535
|
$948,025
|
Class IV
|
||||
Shares sold
|
1,125,243
|
1,485,518
|
$1,125,243
|
$1,485,518
|
Reinvestment of distributions
|
188
|
975
|
188
|
975
|
Shares redeemed
|
(1,094,714)
|
(1,591,018)
|
(1,094,714)
|
(1,591,018)
|
Net increase (decrease)
|
30,717
|
(104,525)
|
$30,717
|
$(104,525)
|
Select Class
|
||||
Shares sold
|
612,690
|
1,030,994
|
$612,690
|
$1,030,994
|
Reinvestment of distributions
|
2,471
|
6,724
|
2,471
|
6,724
|
Shares redeemed
|
(539,881)
|
(992,556)
|
(539,881)
|
(992,556)
|
Net increase (decrease)
|
75,280
|
45,162
|
$75,280
|
$45,162
|
Institutional Class
|
||||
Shares sold
|
69,126,451
|
137,892,987
|
$69,126,451
|
$137,892,987
|
Reinvestment of distributions
|
607,007
|
1,128,139
|
607,007
|
1,128,139
|
Shares redeemed
|
(66,627,736)
|
(138,500,484)
|
(66,627,736)
|
(138,500,484)
|
Net increase (decrease)
|
3,105,722
|
520,642
|
$3,105,722
|
$520,642
|
Government Portfolio
|
||||
Class I
|
||||
Shares sold
|
206,796,652
|
355,865,809
|
$206,796,652
|
$355,865,809
|
Reinvestment of distributions
|
449,430
|
749,544
|
449,430
|
749,544
|
Shares redeemed
|
(197,648,573)
|
(359,253,361)
|
(197,648,573)
|
(359,253,361)
|
Net increase (decrease)
|
9,597,509
|
(2,638,008)
|
$9,597,509
|
$(2,638,008)
|
Class II
|
||||
Shares sold
|
1,746,962
|
3,802,127
|
$1,746,962
|
$3,802,127
|
Reinvestment of distributions
|
1,472
|
2,908
|
1,472
|
2,908
|
Shares redeemed
|
(1,586,173)
|
(3,430,423)
|
(1,586,173)
|
(3,430,423)
|
Net increase (decrease)
|
162,261
|
374,612
|
$162,261
|
$374,612
|
Class III
|
||||
Shares sold
|
8,699,660
|
14,237,131
|
$8,699,660
|
$14,237,131
|
Reinvestment of distributions
|
44,557
|
79,309
|
44,557
|
79,309
|
Shares redeemed
|
(8,146,814)
|
(12,791,629)
|
(8,146,814)
|
(12,791,629)
|
Net increase (decrease)
|
597,403
|
1,524,811
|
$597,403
|
$1,524,811
|
Select Class
|
||||
Shares sold
|
297,489
|
588,167
|
$297,489
|
$588,167
|
Reinvestment of distributions
|
4,414
|
7,947
|
4,414
|
7,947
|
Shares redeemed
|
(337,571)
|
(597,224)
|
(337,571)
|
(597,224)
|
Net increase (decrease)
|
(35,668)
|
(1,110)
|
$(35,668)
|
$(1,110)
|
Institutional Class
|
||||
Shares sold
|
394,554,406
|
672,624,741
|
$394,554,406
|
$672,624,741
|
Reinvestment of distributions
|
2,660,582
|
4,656,989
|
2,660,582
|
4,656,989
|
Shares redeemed
|
(380,598,147)
|
(649,872,754)
|
(380,598,147)
|
(649,872,754)
|
Net increase (decrease)
|
16,616,841
|
27,408,976
|
$16,616,841
|
$27,408,976
|
Money Market Portfolio
|
||||
Class I
|
||||
Shares sold
|
33,648,705
|
64,264,388
|
$33,648,705
|
$64,264,388
|
Reinvestment of distributions
|
1,293,858
|
2,175,869
|
1,293,858
|
2,175,869
|
Shares redeemed
|
(31,758,661)
|
(52,890,840)
|
(31,758,661)
|
(52,890,840)
|
Net increase (decrease)
|
3,183,902
|
13,549,417
|
$3,183,902
|
$13,549,417
|
Class II
|
||||
Shares sold
|
97,954
|
79,007
|
$97,954
|
$79,007
|
Reinvestment of distributions
|
2,608
|
3,963
|
2,608
|
3,963
|
Shares redeemed
|
(87,480)
|
(77,882)
|
(87,480)
|
(77,882)
|
Net increase (decrease)
|
13,082
|
5,088
|
$13,082
|
$5,088
|
Class III
|
||||
Shares sold
|
5,725
|
16,417
|
$5,725
|
$16,417
|
Reinvestment of distributions
|
318
|
860
|
318
|
860
|
Shares redeemed
|
(5,211)
|
(30,543)
|
(5,211)
|
(30,543)
|
Net increase (decrease)
|
832
|
(13,266)
|
$832
|
$(13,266)
|
Select Class
|
||||
Shares sold
|
12,544
|
109,021
|
$12,544
|
$109,021
|
Reinvestment of distributions
|
936
|
2,166
|
936
|
2,166
|
Shares redeemed
|
(25,771)
|
(98,615)
|
(25,771)
|
(98,615)
|
Net increase (decrease)
|
(12,291)
|
12,572
|
$(12,291)
|
$12,572
|
Institutional Class
|
||||
Shares sold
|
40,878,219
|
77,480,843
|
$40,878,219
|
$77,480,843
|
Reinvestment of distributions
|
1,832,280
|
3,112,537
|
1,832,280
|
3,112,537
|
Shares redeemed
|
(38,024,870)
|
(64,278,063)
|
(38,024,870)
|
(64,278,063)
|
Net increase (decrease)
|
4,685,629
|
16,315,317
|
$4,685,629
|
$16,315,317
|
Tax-Exempt Portfolio
|
||||
Class I
|
||||
Shares sold
|
8,993,491
|
16,867,520
|
$8,993,491
|
$16,867,520
|
Reinvestment of distributions
|
119,610
|
184,777
|
119,610
|
184,777
|
Shares redeemed
|
(8,144,446)
|
(14,818,348)
|
(8,144,446)
|
(14,818,348)
|
Net increase (decrease)
|
968,655
|
2,233,949
|
$968,655
|
$2,233,949
|
Class II
|
||||
Shares sold
|
37
|
686
|
$37
|
$686
|
Reinvestment of distributions
|
217
|
457
|
217
|
457
|
Shares redeemed
|
(2,699)
|
(3,422)
|
(2,699)
|
(3,422)
|
Net increase (decrease)
|
(2,445)
|
(2,279)
|
$(2,445)
|
$(2,279)
|
Class III
|
||||
Shares sold
|
10,603
|
3,577
|
$10,603
|
$3,577
|
Reinvestment of distributions
|
-
|
47
|
-
|
47
|
Shares redeemed
|
(1,047)
|
(5,275)
|
(1,047)
|
(5,275)
|
Net increase (decrease)
|
9,556
|
(1,651)
|
$9,556
|
$(1,651)
|
Select Class
|
||||
Shares sold
|
26,684
|
45,501
|
$26,684
|
$45,501
|
Reinvestment of distributions
|
397
|
539
|
397
|
539
|
Shares redeemed
|
(23,079)
|
(35,617)
|
(23,079)
|
(35,617)
|
Net increase (decrease)
|
4,002
|
10,423
|
$4,002
|
$10,423
|
 |
Item 8.
Changes in and Disagreements with Accountants for Open-End Management Investment Companies
See Item 7.
Item 9.
Proxy Disclosures for Open-End Management Investment Companies
See Item 7.
Item 10.
Remuneration Paid to Directors, Officers, and Others of Open-End Management Investment Companies
See Item 7.
Item 11.
Statement Regarding Basis for Approval of Investment Advisory Contract
See Item 7.
Item 12.
Disclosure of Proxy Voting Policies and Procedures for Closed-End Management Investment Companies
Not applicable.
Item 13.
Portfolio Managers of Closed-End Management Investment Companies
Not applicable.
Item 14.
Purchases of Equity Securities by Closed-End Management Investment Company and Affiliated Purchasers
Not applicable.
Item 15.
Submission of Matters to a Vote of Security Holders
There were no material changes to the procedures by which shareholders may recommend nominees to the Fidelity Colchester Street Trust’s Board of Trustees.
Item 16.
Controls and Procedures
(a)(i) The President and Treasurer and the Chief Financial Officer have concluded that the Fidelity Colchester Street Trust’s (the “Trust”) disclosure controls and procedures (as defined in Rule 30a-3(c) under the Investment Company Act) provide reasonable assurances that material information relating to the Trust is made known to them by the appropriate persons, based on their evaluation of these controls and procedures as of a date within 90 days of the filing date of this report.
(a)(ii) There was no change in the Trust’s internal control over financial reporting (as defined in Rule 30a-3(d) under the Investment Company Act) that occurred during the period covered by this report that has materially affected, or is reasonably likely to materially affect, the Trust’s internal control over financial reporting.
Item 17.
Disclosure of Securities Lending Activities for Closed-End Management Investment Companies
Not applicable.
Item 18.
Recovery of Erroneously Awarded Compensation
(a)
Not applicable.
(b)
Not applicable.
Item 19.
Exhibits
| (a) | (1) | Not applicable. |
| (a) | (2) | |
| (a) | (3) | Not applicable. |
| (b) | |
SIGNATURES
Pursuant to the requirements of the Securities Exchange Act of 1934 and the Investment Company Act of 1940, the registrant has duly caused this report to be signed on its behalf by the undersigned, thereunto duly authorized.
Fidelity Colchester Street Trust
| By: | /s/Laura M. Del Prato |
| | Laura M. Del Prato |
| | President and Treasurer (Principal Executive Officer) |
| | |
| Date: | November 21, 2024 |
Pursuant to the requirements of the Securities Exchange Act of 1934 and the Investment Company Act of 1940, this report has been signed below by the following persons on behalf of the registrant and in the capacities and on the dates indicated.
| By: | /s/Laura M. Del Prato |
| | Laura M. Del Prato |
| | President and Treasurer (Principal Executive Officer) |
| | |
| Date: | November 21, 2024 |
| By: | /s/Stephanie Caron |
| | Stephanie Caron |
| | Chief Financial Officer (Principal Financial Officer) |
| | |
| Date: | November 21, 2024 |
Exhibit EX-99.CERT
I, Laura M. Del Prato, certify that:
1.
I have reviewed this report on Form N-CSR of Fidelity Colchester Street Trust;
2.
Based on my knowledge, this report does not contain any untrue statement of a material fact or omit to state a material fact necessary to make the statements made, in light of the circumstances under which such statements were made, not misleading with respect to the period covered by this report;
3.
Based on my knowledge, the financial statements, and other financial information included in this report, fairly present in all material respects the financial condition, results of operations, changes in net assets, and cash flows (if the financial statements are required to include a statement of cash flows) of the registrant as of, and for, the periods presented in this report;
4.
The registrant's other certifying officer(s) and I are responsible for establishing and maintaining disclosure controls and procedures (as defined in Rule 30a-3(c) under the Investment Company Act of 1940) and internal control over financial reporting (as defined in Rule 30a-3(d) under the Investment Company Act of 1940) for the registrant and have:
a.
Designed such disclosure controls and procedures, or caused such disclosure controls and procedures to be designed under our supervision, to ensure that material information relating to the registrant, including its consolidated subsidiaries, is made known to us by others within those entities, particularly during the period in which this report is being prepared;
b.
Designed such internal control over financial reporting, or caused such internal control over financial reporting to be designed under our supervision, to provide reasonable assurance regarding the reliability of financial reporting and the preparation of financial statements for external purposes in accordance with generally accepted accounting principles;
c.
Evaluated the effectiveness of the registrant's disclosure controls and procedures and presented in this report our conclusions about the effectiveness of the disclosure controls and procedures, as of a date within 90 days prior to the filing date of this report based upon such evaluation; and
d.
Disclosed in this report any change in the registrant’s internal control over financial reporting that occurred during the period covered by this report that has materially affected, or is reasonably likely to materially affect, the registrant’s internal control over financial reporting; and
5.
The registrant's other certifying officer(s) and I have disclosed to the registrant's auditors and the audit committee of the registrant's board of directors (or persons performing the equivalent functions):
a.
All significant deficiencies and material weaknesses in the design or operation of internal control over financial reporting which are reasonably likely to adversely affect the registrant's ability to record, process, summarize, and report financial information; and
b.
Any fraud, whether or not material, that involves management or other employees who have a significant role in the registrant's internal control over financial reporting.
Date:
November 21, 2024
/s/Laura M. Del Prato |
Laura M. Del Prato |
President and Treasurer (Principal Executive Officer) |
I, Stephanie Caron, certify that:
1.
I have reviewed this report on Form N-CSR of Fidelity Colchester Street Trust;
2.
Based on my knowledge, this report does not contain any untrue statement of a material fact or omit to state a material fact necessary to make the statements made, in light of the circumstances under which such statements were made, not misleading with respect to the period covered by this report;
3.
Based on my knowledge, the financial statements, and other financial information included in this report, fairly present in all material respects the financial condition, results of operations, changes in net assets, and cash flows (if the financial statements are required to include a statement of cash flows) of the registrant as of, and for, the periods presented in this report;
4.
The registrant's other certifying officer(s) and I are responsible for establishing and maintaining disclosure controls and procedures (as defined in Rule 30a-3(c) under the Investment Company Act of 1940) and internal control over financial reporting (as defined in Rule 30a-3(d) under the Investment Company Act of 1940) for the registrant and have:
a.
Designed such disclosure controls and procedures, or caused such disclosure controls and procedures to be designed under our supervision, to ensure that material information relating to the registrant, including its consolidated subsidiaries, is made known to us by others within those entities, particularly during the period in which this report is being prepared;
b.
Designed such internal control over financial reporting, or caused such internal control over financial reporting to be designed under our supervision, to provide reasonable assurance regarding the reliability of financial reporting and the preparation of financial statements for external purposes in accordance with generally accepted accounting principles;
c.
Evaluated the effectiveness of the registrant's disclosure controls and procedures and presented in this report our conclusions about the effectiveness of the disclosure controls and procedures, as of a date within 90 days prior to the filing date of this report based upon such evaluation; and
d.
Disclosed in this report any change in the registrant’s internal control over financial reporting that occurred during the period covered by this report that has materially affected, or is reasonably likely to materially affect, the registrant’s internal control over financial reporting; and
5.
The registrant's other certifying officer(s) and I have disclosed to the registrant's auditors and the audit committee of the registrant's board of directors (or persons performing the equivalent functions):
a.
All significant deficiencies and material weaknesses in the design or operation of internal control over financial reporting which are reasonably likely to adversely affect the registrant's ability to record, process, summarize, and report financial information; and
b.
Any fraud, whether or not material, that involves management or other employees who have a significant role in the registrant's internal control over financial reporting.
Date:
November 21, 2024
/s/Stephanie Caron |
Stephanie Caron |
Chief Financial Officer (Principal Financial Officer) |
Exhibit EX-99.906CERT
Certification Pursuant to Section 906 of the Sarbanes-Oxley Act of 2002 (subsections (a) and (b) of section 1350, chapter 63 of title 18, United States Code)
In connection with the attached Report of Fidelity Colchester Street Trust (the “Trust”) on Form N-CSR to be filed with the Securities and Exchange Commission (the “Report”), each of the undersigned officers of the Trust does hereby certify that, to the best of such officer’s knowledge:
1.
The Report fully complies with the requirements of 13(a) or 15(d) of the Securities Exchange Act of 1934; and
2.
The information contained in the Report fairly presents, in all material respects, the financial condition and results of operations of the Trust as of, and for, the periods presented in the Report.
Dated: November 21, 2024
/s/Laura M. Del Prato |
Laura M. Del Prato |
President and Treasurer (Principal Executive Officer) |
Dated: November 21, 2024
/s/Stephanie Caron |
Stephanie Caron |
Chief Financial Officer (Principal Financial Officer) |
A signed original of this written statement required by Section 906, or other document authenticating, acknowledging, or otherwise adopting the signature that appears in typed form within the electronic version of this written statement required by Section 906, has been provided to the Trust and will be retained by the Trust and furnished to the Securities and Exchange Commission or its staff upon request.
Form N-CSR Cover |
6 Months Ended |
|---|---|
Sep. 30, 2024 | |
| Shareholder Report [Line Items] | |
| Document Type | N-CSRS |
| Amendment Flag | false |
| Registrant Name | Fidelity Colchester Street Trust |
| Entity Central Index Key | 0000356173 |
| Entity Investment Company Type | N-1A |
| Document Period End Date | Sep. 30, 2024 |
Shareholder Report |
6 Months Ended | |||||||||
|---|---|---|---|---|---|---|---|---|---|---|
|
Sep. 30, 2024
USD ($)
shares
| ||||||||||
| Shareholder Report [Line Items] | ||||||||||
| Document Type | N-CSRS | |||||||||
| Amendment Flag | false | |||||||||
| Registrant Name | Fidelity Colchester Street Trust | |||||||||
| Entity Central Index Key | 0000356173 | |||||||||
| Entity Investment Company Type | N-1A | |||||||||
| Document Period End Date | Sep. 30, 2024 | |||||||||
| Fidelity Investments Money Market - Money Market Portfolio - Select Class | ||||||||||
| Shareholder Report [Line Items] | ||||||||||
| Fund Name | Money Market Portfolio | |||||||||
| Class Name | Money Market Portfolio Select Class | |||||||||
| Trading Symbol | FMYXX | |||||||||
| Annual or Semi-Annual Statement [Text Block] | This semi-annual shareholder report contains information about Money Market Portfolio for the period April 1, 2024 to September 30, 2024. | |||||||||
| Shareholder Report Annual or Semi-Annual | semi-annual shareholder report | |||||||||
| Additional Information [Text Block] | You can find additional information about the Fund at fundresearch.fidelity.com/prospectus/sec. You can also request this information by contacting us at 1-877-297-2952 or by sending an e-mail to funddocuments@fmr.com. | |||||||||
| Additional Information Phone Number | 1-877-297-2952 | |||||||||
| Additional Information Email | funddocuments@fmr.com | |||||||||
| Additional Information Website | fundresearch.fidelity.com/prospectus/sec | |||||||||
| Expenses [Text Block] | What were your Fund costs for the last six months?
(based on hypothetical $10,000 investment)
|
|||||||||
| Expenses Paid, Amount | $ 12 | |||||||||
| Expense Ratio, Percent | 0.23% | |||||||||
| Net Assets | $ 135,270,705,349 | |||||||||
| Holdings Count | shares | 247 | |||||||||
| Additional Fund Statistics [Text Block] | Key Fund Statistics
(as of September 30, 2024)
|
|||||||||
| Holdings [Text Block] | EFFECTIVE MATURITY DIVERSIFICATION (% of Fund's net assets) Days 1-7 90.8 8-30 4.3 31-60 2.4 61-90 0.9 91-180 2.9 Repurchase Agreements 65.1 Commercial Paper 15.2 Non-Negotiable Time Deposit 11.5 Certificates of Deposit 7.8 U.S. Treasury Obligations 1.7 ASSET ALLOCATION (% of Fund's net assets) Net Other Assets (Liabilities) - (1.3)% | |||||||||
| Fidelity Investments Money Market Treasury Only Portfolio - Institutional Class | ||||||||||
| Shareholder Report [Line Items] | ||||||||||
| Fund Name | Treasury Only Portfolio | |||||||||
| Class Name | Treasury Only Portfolio Institutional Class | |||||||||
| Trading Symbol | FRSXX | |||||||||
| Annual or Semi-Annual Statement [Text Block] | This semi-annual shareholder report contains information about Treasury Only Portfolio for the period April 1, 2024 to September 30, 2024. | |||||||||
| Shareholder Report Annual or Semi-Annual | semi-annual shareholder report | |||||||||
| Additional Information [Text Block] | You can find additional information about the Fund at fundresearch.fidelity.com/prospectus/sec. You can also request this information by contacting us at 1-877-297-2952 or by sending an e-mail to funddocuments@fmr.com. | |||||||||
| Additional Information Phone Number | 1-877-297-2952 | |||||||||
| Additional Information Email | funddocuments@fmr.com | |||||||||
| Additional Information Website | fundresearch.fidelity.com/prospectus/sec | |||||||||
| Expenses [Text Block] | What were your Fund costs for the last six months?
(based on hypothetical $10,000 investment)
|
|||||||||
| Expenses Paid, Amount | $ 7 | |||||||||
| Expense Ratio, Percent | 0.14% | |||||||||
| Net Assets | $ 87,593,462,799 | |||||||||
| Holdings Count | shares | 43 | |||||||||
| Additional Fund Statistics [Text Block] | Key Fund Statistics
(as of September 30, 2024)
|
|||||||||
| Holdings [Text Block] | EFFECTIVE MATURITY DIVERSIFICATION (% of Fund's net assets) Days 1-7 20.2 8-30 41.5 31-60 20.7 61-90 9.8 91-180 13.5 >180 0.8 U.S. Treasury Obligations 106.5 ASSET ALLOCATION (% of Fund's net assets) Net Other Assets (Liabilities) - (6.5)% | |||||||||
| Fidelity Investments Money Market Treasury Portfolio - Class III | ||||||||||
| Shareholder Report [Line Items] | ||||||||||
| Fund Name | Treasury Portfolio | |||||||||
| Class Name | Treasury Portfolio Class III | |||||||||
| Trading Symbol | FCSXX | |||||||||
| Annual or Semi-Annual Statement [Text Block] | This semi-annual shareholder report contains information about Treasury Portfolio for the period April 1, 2024 to September 30, 2024. | |||||||||
| Shareholder Report Annual or Semi-Annual | semi-annual shareholder report | |||||||||
| Additional Information [Text Block] | You can find additional information about the Fund at fundresearch.fidelity.com/prospectus/sec. You can also request this information by contacting us at 1-877-297-2952 or by sending an e-mail to funddocuments@fmr.com. | |||||||||
| Additional Information Phone Number | 1-877-297-2952 | |||||||||
| Additional Information Email | funddocuments@fmr.com | |||||||||
| Additional Information Website | fundresearch.fidelity.com/prospectus/sec | |||||||||
| Expenses [Text Block] | What were your Fund costs for the last six months?
(based on hypothetical $10,000 investment)
|
|||||||||
| Expenses Paid, Amount | $ 22 | |||||||||
| Expense Ratio, Percent | 0.43% | |||||||||
| Net Assets | $ 69,262,336,441 | |||||||||
| Holdings Count | shares | 137 | |||||||||
| Additional Fund Statistics [Text Block] | Key Fund Statistics
(as of September 30, 2024)
|
|||||||||
| Holdings [Text Block] | EFFECTIVE MATURITY DIVERSIFICATION (% of Fund's net assets) Days 1-7 61.8 8-30 16.0 31-60 9.6 61-90 4.8 91-180 8.0 >180 1.4 Repurchase Agreements 51.5 U.S. Treasury Obligations 50.1 ASSET ALLOCATION (% of Fund's net assets) Net Other Assets (Liabilities) - (1.6)% | |||||||||
| Fidelity Investments Money Market Tax Exempt Portfolio - Class III | ||||||||||
| Shareholder Report [Line Items] | ||||||||||
| Fund Name | Tax-Exempt Portfolio | |||||||||
| Class Name | Tax-Exempt Portfolio Class III | |||||||||
| Trading Symbol | FETXX | |||||||||
| Annual or Semi-Annual Statement [Text Block] | This semi-annual shareholder report contains information about Tax-Exempt Portfolio for the period April 1, 2024 to September 30, 2024. | |||||||||
| Shareholder Report Annual or Semi-Annual | semi-annual shareholder report | |||||||||
| Additional Information [Text Block] | You can find additional information about the Fund at fundresearch.fidelity.com/prospectus/sec. You can also request this information by contacting us at 1-877-297-2952 or by sending an e-mail to funddocuments@fmr.com. | |||||||||
| Additional Information Phone Number | 1-877-297-2952 | |||||||||
| Additional Information Email | funddocuments@fmr.com | |||||||||
| Additional Information Website | fundresearch.fidelity.com/prospectus/sec | |||||||||
| Expenses [Text Block] | What were your Fund costs for the last six months?
(based on hypothetical $10,000 investment)
|
|||||||||
| Expenses Paid, Amount | $ 22 | |||||||||
| Expense Ratio, Percent | 0.43% | |||||||||
| Net Assets | $ 9,532,805,489 | |||||||||
| Holdings Count | shares | 781 | |||||||||
| Additional Fund Statistics [Text Block] | Key Fund Statistics
(as of September 30, 2024)
|
|||||||||
| Holdings [Text Block] | EFFECTIVE MATURITY DIVERSIFICATION (% of Fund's net assets) Days 1-7 81.2 8-30 2.6 31-60 3.7 61-90 1.9 91-180 4.6 >180 7.0 Variable Rate Demand Notes (VRDNs) 42.8 Tender Option Bond 22.9 Municipal Securities 11.1 Commercial Paper 8.5 Net Other Assets (Liabilities) 14.7 ASSET ALLOCATION (% of Fund's net assets) | |||||||||
| Fidelity Investments Money Market Treasury Portfolio - Class IV | ||||||||||
| Shareholder Report [Line Items] | ||||||||||
| Fund Name | Treasury Portfolio | |||||||||
| Class Name | Treasury Portfolio Class IV | |||||||||
| Trading Symbol | FTVXX | |||||||||
| Annual or Semi-Annual Statement [Text Block] | This semi-annual shareholder report contains information about Treasury Portfolio for the period April 1, 2024 to September 30, 2024. | |||||||||
| Shareholder Report Annual or Semi-Annual | semi-annual shareholder report | |||||||||
| Additional Information [Text Block] | You can find additional information about the Fund at fundresearch.fidelity.com/prospectus/sec. You can also request this information by contacting us at 1-877-297-2952 or by sending an e-mail to funddocuments@fmr.com. | |||||||||
| Additional Information Phone Number | 1-877-297-2952 | |||||||||
| Additional Information Email | funddocuments@fmr.com | |||||||||
| Additional Information Website | fundresearch.fidelity.com/prospectus/sec | |||||||||
| Expenses [Text Block] | What were your Fund costs for the last six months?
(based on hypothetical $10,000 investment)
|
|||||||||
| Expenses Paid, Amount | $ 35 | |||||||||
| Expense Ratio, Percent | 0.68% | |||||||||
| Net Assets | $ 69,262,336,441 | |||||||||
| Holdings Count | shares | 137 | |||||||||
| Additional Fund Statistics [Text Block] | Key Fund Statistics
(as of September 30, 2024)
|
|||||||||
| Holdings [Text Block] | EFFECTIVE MATURITY DIVERSIFICATION (% of Fund's net assets) Days 1-7 61.8 8-30 16.0 31-60 9.6 61-90 4.8 91-180 8.0 >180 1.4 Repurchase Agreements 51.5 U.S. Treasury Obligations 50.1 ASSET ALLOCATION (% of Fund's net assets) Net Other Assets (Liabilities) - (1.6)% | |||||||||
| Fidelity Investments Money Market Tax Exempt Portfolio - Select Class | ||||||||||
| Shareholder Report [Line Items] | ||||||||||
| Fund Name | Tax-Exempt Portfolio | |||||||||
| Class Name | Tax-Exempt Portfolio Select Class | |||||||||
| Trading Symbol | FSXXX | |||||||||
| Annual or Semi-Annual Statement [Text Block] | This semi-annual shareholder report contains information about Tax-Exempt Portfolio for the period April 1, 2024 to September 30, 2024. | |||||||||
| Shareholder Report Annual or Semi-Annual | semi-annual shareholder report | |||||||||
| Additional Information [Text Block] | You can find additional information about the Fund at fundresearch.fidelity.com/prospectus/sec. You can also request this information by contacting us at 1-877-297-2952 or by sending an e-mail to funddocuments@fmr.com. | |||||||||
| Additional Information Phone Number | 1-877-297-2952 | |||||||||
| Additional Information Email | funddocuments@fmr.com | |||||||||
| Additional Information Website | fundresearch.fidelity.com/prospectus/sec | |||||||||
| Expenses [Text Block] | What were your Fund costs for the last six months?
(based on hypothetical $10,000 investment)
|
|||||||||
| Expenses Paid, Amount | $ 12 | |||||||||
| Expense Ratio, Percent | 0.23% | |||||||||
| Net Assets | $ 9,532,805,489 | |||||||||
| Holdings Count | shares | 781 | |||||||||
| Additional Fund Statistics [Text Block] | Key Fund Statistics
(as of September 30, 2024)
|
|||||||||
| Holdings [Text Block] | EFFECTIVE MATURITY DIVERSIFICATION (% of Fund's net assets) Days 1-7 81.2 8-30 2.6 31-60 3.7 61-90 1.9 91-180 4.6 >180 7.0 Variable Rate Demand Notes (VRDNs) 42.8 Tender Option Bond 22.9 Municipal Securities 11.1 Commercial Paper 8.5 Net Other Assets (Liabilities) 14.7 ASSET ALLOCATION (% of Fund's net assets) | |||||||||
| Fidelity Investments Money Market Treasury Portfolio - Class II | ||||||||||
| Shareholder Report [Line Items] | ||||||||||
| Fund Name | Treasury Portfolio | |||||||||
| Class Name | Treasury Portfolio Class II | |||||||||
| Trading Symbol | FCEXX | |||||||||
| Annual or Semi-Annual Statement [Text Block] | This semi-annual shareholder report contains information about Treasury Portfolio for the period April 1, 2024 to September 30, 2024. | |||||||||
| Shareholder Report Annual or Semi-Annual | semi-annual shareholder report | |||||||||
| Additional Information [Text Block] | You can find additional information about the Fund at fundresearch.fidelity.com/prospectus/sec. You can also request this information by contacting us at 1-877-297-2952 or by sending an e-mail to funddocuments@fmr.com. | |||||||||
| Additional Information Phone Number | 1-877-297-2952 | |||||||||
| Additional Information Email | funddocuments@fmr.com | |||||||||
| Additional Information Website | fundresearch.fidelity.com/prospectus/sec | |||||||||
| Expenses [Text Block] | What were your Fund costs for the last six months?
(based on hypothetical $10,000 investment)
|
|||||||||
| Expenses Paid, Amount | $ 17 | |||||||||
| Expense Ratio, Percent | 0.33% | |||||||||
| Net Assets | $ 69,262,336,441 | |||||||||
| Holdings Count | shares | 137 | |||||||||
| Additional Fund Statistics [Text Block] | Key Fund Statistics
(as of September 30, 2024)
|
|||||||||
| Holdings [Text Block] | EFFECTIVE MATURITY DIVERSIFICATION (% of Fund's net assets) Days 1-7 61.8 8-30 16.0 31-60 9.6 61-90 4.8 91-180 8.0 >180 1.4 Repurchase Agreements 51.5 U.S. Treasury Obligations 50.1 ASSET ALLOCATION (% of Fund's net assets) Net Other Assets (Liabilities) - (1.6)% | |||||||||
| Fidelity Investments Money Market Government Portfolio - Class II | ||||||||||
| Shareholder Report [Line Items] | ||||||||||
| Fund Name | Government Portfolio | |||||||||
| Class Name | Government Portfolio Class II | |||||||||
| Trading Symbol | FCVXX | |||||||||
| Annual or Semi-Annual Statement [Text Block] | This semi-annual shareholder report contains information about Government Portfolio for the period April 1, 2024 to September 30, 2024. | |||||||||
| Shareholder Report Annual or Semi-Annual | semi-annual shareholder report | |||||||||
| Additional Information [Text Block] | You can find additional information about the Fund at fundresearch.fidelity.com/prospectus/sec. You can also request this information by contacting us at 1-877-297-2952 or by sending an e-mail to funddocuments@fmr.com. | |||||||||
| Additional Information Phone Number | 1-877-297-2952 | |||||||||
| Additional Information Email | funddocuments@fmr.com | |||||||||
| Additional Information Website | fundresearch.fidelity.com/prospectus/sec | |||||||||
| Expenses [Text Block] | What were your Fund costs for the last six months?
(based on hypothetical $10,000 investment)
|
|||||||||
| Expenses Paid, Amount | $ 17 | |||||||||
| Expense Ratio, Percent | 0.33% | |||||||||
| Net Assets | $ 225,755,117,004 | |||||||||
| Holdings Count | shares | 518 | |||||||||
| Additional Fund Statistics [Text Block] | Key Fund Statistics
(as of September 30, 2024)
|
|||||||||
| Holdings [Text Block] | EFFECTIVE MATURITY DIVERSIFICATION (% of Fund's net assets) Days 1-7 70.0 8-30 13.5 31-60 6.3 61-90 3.5 91-180 7.1 >180 1.1 Repurchase Agreements 50.6 U.S. Treasury Obligations 27.4 U.S. Government Agency - Debt 23.5 ASSET ALLOCATION (% of Fund's net assets) Net Other Assets (Liabilities) - (1.5)% | |||||||||
| Fidelity Investments Money Market Treasury Only Portfolio - Select Class | ||||||||||
| Shareholder Report [Line Items] | ||||||||||
| Fund Name | Treasury Only Portfolio | |||||||||
| Class Name | Treasury Only Portfolio Select Class | |||||||||
| Trading Symbol | FTYXX | |||||||||
| Annual or Semi-Annual Statement [Text Block] | This semi-annual shareholder report contains information about Treasury Only Portfolio for the period April 1, 2024 to September 30, 2024. | |||||||||
| Shareholder Report Annual or Semi-Annual | semi-annual shareholder report | |||||||||
| Additional Information [Text Block] | You can find additional information about the Fund at fundresearch.fidelity.com/prospectus/sec. You can also request this information by contacting us at 1-877-297-2952 or by sending an e-mail to funddocuments@fmr.com. | |||||||||
| Additional Information Phone Number | 1-877-297-2952 | |||||||||
| Additional Information Email | funddocuments@fmr.com | |||||||||
| Additional Information Website | fundresearch.fidelity.com/prospectus/sec | |||||||||
| Expenses [Text Block] | What were your Fund costs for the last six months?
(based on hypothetical $10,000 investment)
|
|||||||||
| Expenses Paid, Amount | $ 12 | |||||||||
| Expense Ratio, Percent | 0.23% | |||||||||
| Net Assets | $ 87,593,462,799 | |||||||||
| Holdings Count | shares | 43 | |||||||||
| Additional Fund Statistics [Text Block] | Key Fund Statistics
(as of September 30, 2024)
|
|||||||||
| Holdings [Text Block] | EFFECTIVE MATURITY DIVERSIFICATION (% of Fund's net assets) Days 1-7 20.2 8-30 41.5 31-60 20.7 61-90 9.8 91-180 13.5 >180 0.8 U.S. Treasury Obligations 106.5 ASSET ALLOCATION (% of Fund's net assets) Net Other Assets (Liabilities) - (6.5)% | |||||||||
| Fidelity Investments Money Market Treasury Portfolio - Institutional Class | ||||||||||
| Shareholder Report [Line Items] | ||||||||||
| Fund Name | Treasury Portfolio | |||||||||
| Class Name | Treasury Portfolio Institutional Class | |||||||||
| Trading Symbol | FRBXX | |||||||||
| Annual or Semi-Annual Statement [Text Block] | This semi-annual shareholder report contains information about Treasury Portfolio for the period April 1, 2024 to September 30, 2024. | |||||||||
| Shareholder Report Annual or Semi-Annual | semi-annual shareholder report | |||||||||
| Additional Information [Text Block] | You can find additional information about the Fund at fundresearch.fidelity.com/prospectus/sec. You can also request this information by contacting us at 1-877-297-2952 or by sending an e-mail to funddocuments@fmr.com. | |||||||||
| Additional Information Phone Number | 1-877-297-2952 | |||||||||
| Additional Information Email | funddocuments@fmr.com | |||||||||
| Additional Information Website | fundresearch.fidelity.com/prospectus/sec | |||||||||
| Expenses [Text Block] | What were your Fund costs for the last six months?
(based on hypothetical $10,000 investment)
|
|||||||||
| Expenses Paid, Amount | $ 7 | |||||||||
| Expense Ratio, Percent | 0.14% | |||||||||
| Net Assets | $ 69,262,336,441 | |||||||||
| Holdings Count | shares | 137 | |||||||||
| Additional Fund Statistics [Text Block] | Key Fund Statistics
(as of September 30, 2024)
|
|||||||||
| Holdings [Text Block] | EFFECTIVE MATURITY DIVERSIFICATION (% of Fund's net assets) Days 1-7 61.8 8-30 16.0 31-60 9.6 61-90 4.8 91-180 8.0 >180 1.4 Repurchase Agreements 51.5 U.S. Treasury Obligations 50.1 ASSET ALLOCATION (% of Fund's net assets) Net Other Assets (Liabilities) - (1.6)% | |||||||||
| Fidelity Investments Money Market Treasury Portfolio - Select Class | ||||||||||
| Shareholder Report [Line Items] | ||||||||||
| Fund Name | Treasury Portfolio | |||||||||
| Class Name | Treasury Portfolio Select Class | |||||||||
| Trading Symbol | FTUXX | |||||||||
| Annual or Semi-Annual Statement [Text Block] | This semi-annual shareholder report contains information about Treasury Portfolio for the period April 1, 2024 to September 30, 2024. | |||||||||
| Shareholder Report Annual or Semi-Annual | semi-annual shareholder report | |||||||||
| Additional Information [Text Block] | You can find additional information about the Fund at fundresearch.fidelity.com/prospectus/sec. You can also request this information by contacting us at 1-877-297-2952 or by sending an e-mail to funddocuments@fmr.com. | |||||||||
| Additional Information Phone Number | 1-877-297-2952 | |||||||||
| Additional Information Email | funddocuments@fmr.com | |||||||||
| Additional Information Website | fundresearch.fidelity.com/prospectus/sec | |||||||||
| Expenses [Text Block] | What were your Fund costs for the last six months?
(based on hypothetical $10,000 investment)
|
|||||||||
| Expenses Paid, Amount | $ 12 | |||||||||
| Expense Ratio, Percent | 0.23% | |||||||||
| Net Assets | $ 69,262,336,441 | |||||||||
| Holdings Count | shares | 137 | |||||||||
| Additional Fund Statistics [Text Block] | Key Fund Statistics
(as of September 30, 2024)
|
|||||||||
| Holdings [Text Block] | EFFECTIVE MATURITY DIVERSIFICATION (% of Fund's net assets) Days 1-7 61.8 8-30 16.0 31-60 9.6 61-90 4.8 91-180 8.0 >180 1.4 Repurchase Agreements 51.5 U.S. Treasury Obligations 50.1 ASSET ALLOCATION (% of Fund's net assets) Net Other Assets (Liabilities) - (1.6)% | |||||||||
| Fidelity Investments Money Market Tax Exempt Portfolio - Class II | ||||||||||
| Shareholder Report [Line Items] | ||||||||||
| Fund Name | Tax-Exempt Portfolio | |||||||||
| Class Name | Tax-Exempt Portfolio Class II | |||||||||
| Trading Symbol | FEXXX | |||||||||
| Annual or Semi-Annual Statement [Text Block] | This semi-annual shareholder report contains information about Tax-Exempt Portfolio for the period April 1, 2024 to September 30, 2024. | |||||||||
| Shareholder Report Annual or Semi-Annual | semi-annual shareholder report | |||||||||
| Additional Information [Text Block] | You can find additional information about the Fund at fundresearch.fidelity.com/prospectus/sec. You can also request this information by contacting us at 1-877-297-2952 or by sending an e-mail to funddocuments@fmr.com. | |||||||||
| Additional Information Phone Number | 1-877-297-2952 | |||||||||
| Additional Information Email | funddocuments@fmr.com | |||||||||
| Additional Information Website | fundresearch.fidelity.com/prospectus/sec | |||||||||
| Expenses [Text Block] | What were your Fund costs for the last six months?
(based on hypothetical $10,000 investment)
|
|||||||||
| Expenses Paid, Amount | $ 17 | |||||||||
| Expense Ratio, Percent | 0.33% | |||||||||
| Net Assets | $ 9,532,805,489 | |||||||||
| Holdings Count | shares | 781 | |||||||||
| Additional Fund Statistics [Text Block] | Key Fund Statistics
(as of September 30, 2024)
|
|||||||||
| Holdings [Text Block] | EFFECTIVE MATURITY DIVERSIFICATION (% of Fund's net assets) Days 1-7 81.2 8-30 2.6 31-60 3.7 61-90 1.9 91-180 4.6 >180 7.0 Variable Rate Demand Notes (VRDNs) 42.8 Tender Option Bond 22.9 Municipal Securities 11.1 Commercial Paper 8.5 Net Other Assets (Liabilities) 14.7 ASSET ALLOCATION (% of Fund's net assets) | |||||||||
| Fidelity Investments Money Market Government Portfolio - Select Class | ||||||||||
| Shareholder Report [Line Items] | ||||||||||
| Fund Name | Government Portfolio | |||||||||
| Class Name | Government Portfolio Select Class | |||||||||
| Trading Symbol | FGEXX | |||||||||
| Annual or Semi-Annual Statement [Text Block] | This semi-annual shareholder report contains information about Government Portfolio for the period April 1, 2024 to September 30, 2024. | |||||||||
| Shareholder Report Annual or Semi-Annual | semi-annual shareholder report | |||||||||
| Additional Information [Text Block] | You can find additional information about the Fund at fundresearch.fidelity.com/prospectus/sec. You can also request this information by contacting us at 1-877-297-2952 or by sending an e-mail to funddocuments@fmr.com. | |||||||||
| Additional Information Phone Number | 1-877-297-2952 | |||||||||
| Additional Information Email | funddocuments@fmr.com | |||||||||
| Additional Information Website | fundresearch.fidelity.com/prospectus/sec | |||||||||
| Expenses [Text Block] | What were your Fund costs for the last six months?
(based on hypothetical $10,000 investment)
|
|||||||||
| Expenses Paid, Amount | $ 12 | |||||||||
| Expense Ratio, Percent | 0.23% | |||||||||
| Net Assets | $ 225,755,117,004 | |||||||||
| Holdings Count | shares | 518 | |||||||||
| Additional Fund Statistics [Text Block] | Key Fund Statistics
(as of September 30, 2024)
|
|||||||||
| Holdings [Text Block] | EFFECTIVE MATURITY DIVERSIFICATION (% of Fund's net assets) Days 1-7 70.0 8-30 13.5 31-60 6.3 61-90 3.5 91-180 7.1 >180 1.1 Repurchase Agreements 50.6 U.S. Treasury Obligations 27.4 U.S. Government Agency - Debt 23.5 ASSET ALLOCATION (% of Fund's net assets) Net Other Assets (Liabilities) - (1.5)% | |||||||||
| Fidelity Investments Money Market Government Portfolio - Institutional Class | ||||||||||
| Shareholder Report [Line Items] | ||||||||||
| Fund Name | Government Portfolio | |||||||||
| Class Name | Government Portfolio Institutional Class | |||||||||
| Trading Symbol | FRGXX | |||||||||
| Annual or Semi-Annual Statement [Text Block] | This semi-annual shareholder report contains information about Government Portfolio for the period April 1, 2024 to September 30, 2024. | |||||||||
| Shareholder Report Annual or Semi-Annual | semi-annual shareholder report | |||||||||
| Additional Information [Text Block] | You can find additional information about the Fund at fundresearch.fidelity.com/prospectus/sec. You can also request this information by contacting us at 1-877-297-2952 or by sending an e-mail to funddocuments@fmr.com. | |||||||||
| Additional Information Phone Number | 1-877-297-2952 | |||||||||
| Additional Information Email | funddocuments@fmr.com | |||||||||
| Additional Information Website | fundresearch.fidelity.com/prospectus/sec | |||||||||
| Expenses [Text Block] | What were your Fund costs for the last six months?
(based on hypothetical $10,000 investment)
|
|||||||||
| Expenses Paid, Amount | $ 7 | |||||||||
| Expense Ratio, Percent | 0.14% | |||||||||
| Net Assets | $ 225,755,117,004 | |||||||||
| Holdings Count | shares | 518 | |||||||||
| Additional Fund Statistics [Text Block] | Key Fund Statistics
(as of September 30, 2024)
|
|||||||||
| Holdings [Text Block] | EFFECTIVE MATURITY DIVERSIFICATION (% of Fund's net assets) Days 1-7 70.0 8-30 13.5 31-60 6.3 61-90 3.5 91-180 7.1 >180 1.1 Repurchase Agreements 50.6 U.S. Treasury Obligations 27.4 U.S. Government Agency - Debt 23.5 ASSET ALLOCATION (% of Fund's net assets) Net Other Assets (Liabilities) - (1.5)% | |||||||||
| Fidelity Investments Money Market Treasury Only Portfolio - Class IV | ||||||||||
| Shareholder Report [Line Items] | ||||||||||
| Fund Name | Treasury Only Portfolio | |||||||||
| Class Name | Treasury Only Portfolio Class IV | |||||||||
| Trading Symbol | FOPXX | |||||||||
| Annual or Semi-Annual Statement [Text Block] | This semi-annual shareholder report contains information about Treasury Only Portfolio for the period April 1, 2024 to September 30, 2024. | |||||||||
| Shareholder Report Annual or Semi-Annual | semi-annual shareholder report | |||||||||
| Additional Information [Text Block] | You can find additional information about the Fund at fundresearch.fidelity.com/prospectus/sec. You can also request this information by contacting us at 1-877-297-2952 or by sending an e-mail to funddocuments@fmr.com. | |||||||||
| Additional Information Phone Number | 1-877-297-2952 | |||||||||
| Additional Information Email | funddocuments@fmr.com | |||||||||
| Additional Information Website | fundresearch.fidelity.com/prospectus/sec | |||||||||
| Expenses [Text Block] | What were your Fund costs for the last six months?
(based on hypothetical $10,000 investment)
|
|||||||||
| Expenses Paid, Amount | $ 35 | |||||||||
| Expense Ratio, Percent | 0.68% | |||||||||
| Net Assets | $ 87,593,462,799 | |||||||||
| Holdings Count | shares | 43 | |||||||||
| Additional Fund Statistics [Text Block] | Key Fund Statistics
(as of September 30, 2024)
|
|||||||||
| Holdings [Text Block] | EFFECTIVE MATURITY DIVERSIFICATION (% of Fund's net assets) Days 1-7 20.2 8-30 41.5 31-60 20.7 61-90 9.8 91-180 13.5 >180 0.8 U.S. Treasury Obligations 106.5 ASSET ALLOCATION (% of Fund's net assets) Net Other Assets (Liabilities) - (6.5)% | |||||||||
| Fidelity Investments Money Market Tax Exempt Portfolio - Class I | ||||||||||
| Shareholder Report [Line Items] | ||||||||||
| Fund Name | Tax-Exempt Portfolio | |||||||||
| Class Name | Tax-Exempt Portfolio Class I | |||||||||
| Trading Symbol | FTCXX | |||||||||
| Annual or Semi-Annual Statement [Text Block] | This semi-annual shareholder report contains information about Tax-Exempt Portfolio for the period April 1, 2024 to September 30, 2024. | |||||||||
| Shareholder Report Annual or Semi-Annual | semi-annual shareholder report | |||||||||
| Additional Information [Text Block] | You can find additional information about the Fund at fundresearch.fidelity.com/prospectus/sec. You can also request this information by contacting us at 1-877-297-2952 or by sending an e-mail to funddocuments@fmr.com. | |||||||||
| Additional Information Phone Number | 1-877-297-2952 | |||||||||
| Additional Information Email | funddocuments@fmr.com | |||||||||
| Additional Information Website | fundresearch.fidelity.com/prospectus/sec | |||||||||
| Expenses [Text Block] | What were your Fund costs for the last six months?
(based on hypothetical $10,000 investment)
|
|||||||||
| Expenses Paid, Amount | $ 9 | |||||||||
| Expense Ratio, Percent | 0.18% | |||||||||
| Net Assets | $ 9,532,805,489 | |||||||||
| Holdings Count | shares | 781 | |||||||||
| Additional Fund Statistics [Text Block] | Key Fund Statistics
(as of September 30, 2024)
|
|||||||||
| Holdings [Text Block] | EFFECTIVE MATURITY DIVERSIFICATION (% of Fund's net assets) Days 1-7 81.2 8-30 2.6 31-60 3.7 61-90 1.9 91-180 4.6 >180 7.0 Variable Rate Demand Notes (VRDNs) 42.8 Tender Option Bond 22.9 Municipal Securities 11.1 Commercial Paper 8.5 Net Other Assets (Liabilities) 14.7 ASSET ALLOCATION (% of Fund's net assets) | |||||||||
| Fidelity Investments Money Market - Money Market Portfolio - Class I | ||||||||||
| Shareholder Report [Line Items] | ||||||||||
| Fund Name | Money Market Portfolio | |||||||||
| Class Name | Money Market Portfolio Class I | |||||||||
| Trading Symbol | FMPXX | |||||||||
| Annual or Semi-Annual Statement [Text Block] | This semi-annual shareholder report contains information about Money Market Portfolio for the period April 1, 2024 to September 30, 2024. | |||||||||
| Shareholder Report Annual or Semi-Annual | semi-annual shareholder report | |||||||||
| Additional Information [Text Block] | You can find additional information about the Fund at fundresearch.fidelity.com/prospectus/sec. You can also request this information by contacting us at 1-877-297-2952 or by sending an e-mail to funddocuments@fmr.com. | |||||||||
| Additional Information Phone Number | 1-877-297-2952 | |||||||||
| Additional Information Email | funddocuments@fmr.com | |||||||||
| Additional Information Website | fundresearch.fidelity.com/prospectus/sec | |||||||||
| Expenses [Text Block] | What were your Fund costs for the last six months?
(based on hypothetical $10,000 investment)
|
|||||||||
| Expenses Paid, Amount | $ 9 | |||||||||
| Expense Ratio, Percent | 0.18% | |||||||||
| Net Assets | $ 135,270,705,349 | |||||||||
| Holdings Count | shares | 247 | |||||||||
| Additional Fund Statistics [Text Block] | Key Fund Statistics
(as of September 30, 2024)
|
|||||||||
| Holdings [Text Block] | EFFECTIVE MATURITY DIVERSIFICATION (% of Fund's net assets) Days 1-7 90.8 8-30 4.3 31-60 2.4 61-90 0.9 91-180 2.9 Repurchase Agreements 65.1 Commercial Paper 15.2 Non-Negotiable Time Deposit 11.5 Certificates of Deposit 7.8 U.S. Treasury Obligations 1.7 ASSET ALLOCATION (% of Fund's net assets) Net Other Assets (Liabilities) - (1.3)% | |||||||||
| Fidelity Investments Money Market - Money Market Portfolio - Class II | ||||||||||
| Shareholder Report [Line Items] | ||||||||||
| Fund Name | Money Market Portfolio | |||||||||
| Class Name | Money Market Portfolio Class II | |||||||||
| Trading Symbol | FCIXX | |||||||||
| Annual or Semi-Annual Statement [Text Block] | This semi-annual shareholder report contains information about Money Market Portfolio for the period April 1, 2024 to September 30, 2024. | |||||||||
| Shareholder Report Annual or Semi-Annual | semi-annual shareholder report | |||||||||
| Additional Information [Text Block] | You can find additional information about the Fund at fundresearch.fidelity.com/prospectus/sec. You can also request this information by contacting us at 1-877-297-2952 or by sending an e-mail to funddocuments@fmr.com. | |||||||||
| Additional Information Phone Number | 1-877-297-2952 | |||||||||
| Additional Information Email | funddocuments@fmr.com | |||||||||
| Additional Information Website | fundresearch.fidelity.com/prospectus/sec | |||||||||
| Expenses [Text Block] | What were your Fund costs for the last six months?
(based on hypothetical $10,000 investment)
|
|||||||||
| Expenses Paid, Amount | $ 17 | |||||||||
| Expense Ratio, Percent | 0.33% | |||||||||
| Net Assets | $ 135,270,705,349 | |||||||||
| Holdings Count | shares | 247 | |||||||||
| Additional Fund Statistics [Text Block] | Key Fund Statistics
(as of September 30, 2024)
|
|||||||||
| Holdings [Text Block] | EFFECTIVE MATURITY DIVERSIFICATION (% of Fund's net assets) Days 1-7 90.8 8-30 4.3 31-60 2.4 61-90 0.9 91-180 2.9 Repurchase Agreements 65.1 Commercial Paper 15.2 Non-Negotiable Time Deposit 11.5 Certificates of Deposit 7.8 U.S. Treasury Obligations 1.7 ASSET ALLOCATION (% of Fund's net assets) Net Other Assets (Liabilities) - (1.3)% | |||||||||
| Fidelity Investments Money Market Treasury Only Portfolio - Class II | ||||||||||
| Shareholder Report [Line Items] | ||||||||||
| Fund Name | Treasury Only Portfolio | |||||||||
| Class Name | Treasury Only Portfolio Class II | |||||||||
| Trading Symbol | FOXXX | |||||||||
| Annual or Semi-Annual Statement [Text Block] | This semi-annual shareholder report contains information about Treasury Only Portfolio for the period April 1, 2024 to September 30, 2024. | |||||||||
| Shareholder Report Annual or Semi-Annual | semi-annual shareholder report | |||||||||
| Additional Information [Text Block] | You can find additional information about the Fund at fundresearch.fidelity.com/prospectus/sec. You can also request this information by contacting us at 1-877-297-2952 or by sending an e-mail to funddocuments@fmr.com. | |||||||||
| Additional Information Phone Number | 1-877-297-2952 | |||||||||
| Additional Information Email | funddocuments@fmr.com | |||||||||
| Additional Information Website | fundresearch.fidelity.com/prospectus/sec | |||||||||
| Expenses [Text Block] | What were your Fund costs for the last six months?
(based on hypothetical $10,000 investment)
|
|||||||||
| Expenses Paid, Amount | $ 17 | |||||||||
| Expense Ratio, Percent | 0.33% | |||||||||
| Net Assets | $ 87,593,462,799 | |||||||||
| Holdings Count | shares | 43 | |||||||||
| Additional Fund Statistics [Text Block] | Key Fund Statistics
(as of September 30, 2024)
|
|||||||||
| Holdings [Text Block] | EFFECTIVE MATURITY DIVERSIFICATION (% of Fund's net assets) Days 1-7 20.2 8-30 41.5 31-60 20.7 61-90 9.8 91-180 13.5 >180 0.8 U.S. Treasury Obligations 106.5 ASSET ALLOCATION (% of Fund's net assets) Net Other Assets (Liabilities) - (6.5)% | |||||||||
| Fidelity Investments Money Market Treasury Only Portfolio - Class III | ||||||||||
| Shareholder Report [Line Items] | ||||||||||
| Fund Name | Treasury Only Portfolio | |||||||||
| Class Name | Treasury Only Portfolio Class III | |||||||||
| Trading Symbol | FOIXX | |||||||||
| Annual or Semi-Annual Statement [Text Block] | This semi-annual shareholder report contains information about Treasury Only Portfolio for the period April 1, 2024 to September 30, 2024. | |||||||||
| Shareholder Report Annual or Semi-Annual | semi-annual shareholder report | |||||||||
| Additional Information [Text Block] | You can find additional information about the Fund at fundresearch.fidelity.com/prospectus/sec. You can also request this information by contacting us at 1-877-297-2952 or by sending an e-mail to funddocuments@fmr.com. | |||||||||
| Additional Information Phone Number | 1-877-297-2952 | |||||||||
| Additional Information Email | funddocuments@fmr.com | |||||||||
| Additional Information Website | fundresearch.fidelity.com/prospectus/sec | |||||||||
| Expenses [Text Block] | What were your Fund costs for the last six months?
(based on hypothetical $10,000 investment)
|
|||||||||
| Expenses Paid, Amount | $ 22 | |||||||||
| Expense Ratio, Percent | 0.43% | |||||||||
| Net Assets | $ 87,593,462,799 | |||||||||
| Holdings Count | shares | 43 | |||||||||
| Additional Fund Statistics [Text Block] | Key Fund Statistics
(as of September 30, 2024)
|
|||||||||
| Holdings [Text Block] | EFFECTIVE MATURITY DIVERSIFICATION (% of Fund's net assets) Days 1-7 20.2 8-30 41.5 31-60 20.7 61-90 9.8 91-180 13.5 >180 0.8 U.S. Treasury Obligations 106.5 ASSET ALLOCATION (% of Fund's net assets) Net Other Assets (Liabilities) - (6.5)% | |||||||||
| Fidelity Investments Money Market Government Portfolio - Class I | ||||||||||
| Shareholder Report [Line Items] | ||||||||||
| Fund Name | Government Portfolio | |||||||||
| Class Name | Government Portfolio Class I | |||||||||
| Trading Symbol | FIGXX | |||||||||
| Annual or Semi-Annual Statement [Text Block] | This semi-annual shareholder report contains information about Government Portfolio for the period April 1, 2024 to September 30, 2024. | |||||||||
| Shareholder Report Annual or Semi-Annual | semi-annual shareholder report | |||||||||
| Additional Information [Text Block] | You can find additional information about the Fund at fundresearch.fidelity.com/prospectus/sec. You can also request this information by contacting us at 1-877-297-2952 or by sending an e-mail to funddocuments@fmr.com. | |||||||||
| Additional Information Phone Number | 1-877-297-2952 | |||||||||
| Additional Information Email | funddocuments@fmr.com | |||||||||
| Additional Information Website | fundresearch.fidelity.com/prospectus/sec | |||||||||
| Expenses [Text Block] | What were your Fund costs for the last six months?
(based on hypothetical $10,000 investment)
|
|||||||||
| Expenses Paid, Amount | $ 9 | |||||||||
| Expense Ratio, Percent | 0.18% | |||||||||
| Net Assets | $ 225,755,117,004 | |||||||||
| Holdings Count | shares | 518 | |||||||||
| Additional Fund Statistics [Text Block] | Key Fund Statistics
(as of September 30, 2024)
|
|||||||||
| Holdings [Text Block] | EFFECTIVE MATURITY DIVERSIFICATION (% of Fund's net assets) Days 1-7 70.0 8-30 13.5 31-60 6.3 61-90 3.5 91-180 7.1 >180 1.1 Repurchase Agreements 50.6 U.S. Treasury Obligations 27.4 U.S. Government Agency - Debt 23.5 ASSET ALLOCATION (% of Fund's net assets) Net Other Assets (Liabilities) - (1.5)% | |||||||||
| Fidelity Investments Money Market Treasury Portfolio - Class I | ||||||||||
| Shareholder Report [Line Items] | ||||||||||
| Fund Name | Treasury Portfolio | |||||||||
| Class Name | Treasury Portfolio Class I | |||||||||
| Trading Symbol | FISXX | |||||||||
| Annual or Semi-Annual Statement [Text Block] | This semi-annual shareholder report contains information about Treasury Portfolio for the period April 1, 2024 to September 30, 2024. | |||||||||
| Shareholder Report Annual or Semi-Annual | semi-annual shareholder report | |||||||||
| Additional Information [Text Block] | You can find additional information about the Fund at fundresearch.fidelity.com/prospectus/sec. You can also request this information by contacting us at 1-877-297-2952 or by sending an e-mail to funddocuments@fmr.com. | |||||||||
| Additional Information Phone Number | 1-877-297-2952 | |||||||||
| Additional Information Email | funddocuments@fmr.com | |||||||||
| Additional Information Website | fundresearch.fidelity.com/prospectus/sec | |||||||||
| Expenses [Text Block] | What were your Fund costs for the last six months?
(based on hypothetical $10,000 investment)
|
|||||||||
| Expenses Paid, Amount | $ 9 | |||||||||
| Expense Ratio, Percent | 0.18% | |||||||||
| Net Assets | $ 69,262,336,441 | |||||||||
| Holdings Count | shares | 137 | |||||||||
| Additional Fund Statistics [Text Block] | Key Fund Statistics
(as of September 30, 2024)
|
|||||||||
| Holdings [Text Block] | EFFECTIVE MATURITY DIVERSIFICATION (% of Fund's net assets) Days 1-7 61.8 8-30 16.0 31-60 9.6 61-90 4.8 91-180 8.0 >180 1.4 Repurchase Agreements 51.5 U.S. Treasury Obligations 50.1 ASSET ALLOCATION (% of Fund's net assets) Net Other Assets (Liabilities) - (1.6)% | |||||||||
| Fidelity Investments Money Market - Money Market Portfolio - Institutional Class | ||||||||||
| Shareholder Report [Line Items] | ||||||||||
| Fund Name | Money Market Portfolio | |||||||||
| Class Name | Money Market Portfolio Institutional Class | |||||||||
| Trading Symbol | FNSXX | |||||||||
| Annual or Semi-Annual Statement [Text Block] | This semi-annual shareholder report contains information about Money Market Portfolio for the period April 1, 2024 to September 30, 2024. | |||||||||
| Shareholder Report Annual or Semi-Annual | semi-annual shareholder report | |||||||||
| Additional Information [Text Block] | You can find additional information about the Fund at fundresearch.fidelity.com/prospectus/sec. You can also request this information by contacting us at 1-877-297-2952 or by sending an e-mail to funddocuments@fmr.com. | |||||||||
| Additional Information Phone Number | 1-877-297-2952 | |||||||||
| Additional Information Email | funddocuments@fmr.com | |||||||||
| Additional Information Website | fundresearch.fidelity.com/prospectus/sec | |||||||||
| Expenses [Text Block] | What were your Fund costs for the last six months?
(based on hypothetical $10,000 investment)
|
|||||||||
| Expenses Paid, Amount | $ 7 | |||||||||
| Expense Ratio, Percent | 0.14% | |||||||||
| Net Assets | $ 135,270,705,349 | |||||||||
| Holdings Count | shares | 247 | |||||||||
| Additional Fund Statistics [Text Block] | Key Fund Statistics
(as of September 30, 2024)
|
|||||||||
| Holdings [Text Block] | EFFECTIVE MATURITY DIVERSIFICATION (% of Fund's net assets) Days 1-7 90.8 8-30 4.3 31-60 2.4 61-90 0.9 91-180 2.9 Repurchase Agreements 65.1 Commercial Paper 15.2 Non-Negotiable Time Deposit 11.5 Certificates of Deposit 7.8 U.S. Treasury Obligations 1.7 ASSET ALLOCATION (% of Fund's net assets) Net Other Assets (Liabilities) - (1.3)% | |||||||||
| Fidelity Investments Money Market - Money Market Portfolio - Class III | ||||||||||
| Shareholder Report [Line Items] | ||||||||||
| Fund Name | Money Market Portfolio | |||||||||
| Class Name | Money Market Portfolio Class III | |||||||||
| Trading Symbol | FCOXX | |||||||||
| Annual or Semi-Annual Statement [Text Block] | This semi-annual shareholder report contains information about Money Market Portfolio for the period April 1, 2024 to September 30, 2024. | |||||||||
| Shareholder Report Annual or Semi-Annual | semi-annual shareholder report | |||||||||
| Additional Information [Text Block] | You can find additional information about the Fund at fundresearch.fidelity.com/prospectus/sec. You can also request this information by contacting us at 1-877-297-2952 or by sending an e-mail to funddocuments@fmr.com. | |||||||||
| Additional Information Phone Number | 1-877-297-2952 | |||||||||
| Additional Information Email | funddocuments@fmr.com | |||||||||
| Additional Information Website | fundresearch.fidelity.com/prospectus/sec | |||||||||
| Expenses [Text Block] | What were your Fund costs for the last six months?
(based on hypothetical $10,000 investment)
|
|||||||||
| Expenses Paid, Amount | $ 22 | |||||||||
| Expense Ratio, Percent | 0.43% | |||||||||
| Net Assets | $ 135,270,705,349 | |||||||||
| Holdings Count | shares | 247 | |||||||||
| Additional Fund Statistics [Text Block] | Key Fund Statistics
(as of September 30, 2024)
|
|||||||||
| Holdings [Text Block] | EFFECTIVE MATURITY DIVERSIFICATION (% of Fund's net assets) Days 1-7 90.8 8-30 4.3 31-60 2.4 61-90 0.9 91-180 2.9 Repurchase Agreements 65.1 Commercial Paper 15.2 Non-Negotiable Time Deposit 11.5 Certificates of Deposit 7.8 U.S. Treasury Obligations 1.7 ASSET ALLOCATION (% of Fund's net assets) Net Other Assets (Liabilities) - (1.3)% | |||||||||
| Fidelity Investments Money Market Government Portfolio - Class III | ||||||||||
| Shareholder Report [Line Items] | ||||||||||
| Fund Name | Government Portfolio | |||||||||
| Class Name | Government Portfolio Class III | |||||||||
| Trading Symbol | FCGXX | |||||||||
| Annual or Semi-Annual Statement [Text Block] | This semi-annual shareholder report contains information about Government Portfolio for the period April 1, 2024 to September 30, 2024. | |||||||||
| Shareholder Report Annual or Semi-Annual | semi-annual shareholder report | |||||||||
| Additional Information [Text Block] | You can find additional information about the Fund at fundresearch.fidelity.com/prospectus/sec. You can also request this information by contacting us at 1-877-297-2952 or by sending an e-mail to funddocuments@fmr.com. | |||||||||
| Additional Information Phone Number | 1-877-297-2952 | |||||||||
| Additional Information Email | funddocuments@fmr.com | |||||||||
| Additional Information Website | fundresearch.fidelity.com/prospectus/sec | |||||||||
| Expenses [Text Block] | What were your Fund costs for the last six months?
(based on hypothetical $10,000 investment)
|
|||||||||
| Expenses Paid, Amount | $ 22 | |||||||||
| Expense Ratio, Percent | 0.43% | |||||||||
| Net Assets | $ 225,755,117,004 | |||||||||
| Holdings Count | shares | 518 | |||||||||
| Additional Fund Statistics [Text Block] | Key Fund Statistics
(as of September 30, 2024)
|
|||||||||
| Holdings [Text Block] | EFFECTIVE MATURITY DIVERSIFICATION (% of Fund's net assets) Days 1-7 70.0 8-30 13.5 31-60 6.3 61-90 3.5 91-180 7.1 >180 1.1 Repurchase Agreements 50.6 U.S. Treasury Obligations 27.4 U.S. Government Agency - Debt 23.5 ASSET ALLOCATION (% of Fund's net assets) Net Other Assets (Liabilities) - (1.5)% | |||||||||
| Fidelity Investments Money Market Treasury Only Portfolio - Class I | ||||||||||
| Shareholder Report [Line Items] | ||||||||||
| Fund Name | Treasury Only Portfolio | |||||||||
| Class Name | Treasury Only Portfolio Class I | |||||||||
| Trading Symbol | FSIXX | |||||||||
| Annual or Semi-Annual Statement [Text Block] | This semi-annual shareholder report contains information about Treasury Only Portfolio for the period April 1, 2024 to September 30, 2024. | |||||||||
| Shareholder Report Annual or Semi-Annual | semi-annual shareholder report | |||||||||
| Additional Information [Text Block] | You can find additional information about the Fund at fundresearch.fidelity.com/prospectus/sec. You can also request this information by contacting us at 1-877-297-2952 or by sending an e-mail to funddocuments@fmr.com. | |||||||||
| Additional Information Phone Number | 1-877-297-2952 | |||||||||
| Additional Information Email | funddocuments@fmr.com | |||||||||
| Additional Information Website | fundresearch.fidelity.com/prospectus/sec | |||||||||
| Expenses [Text Block] | What were your Fund costs for the last six months?
(based on hypothetical $10,000 investment)
|
|||||||||
| Expenses Paid, Amount | $ 9 | |||||||||
| Expense Ratio, Percent | 0.18% | |||||||||
| Net Assets | $ 87,593,462,799 | |||||||||
| Holdings Count | shares | 43 | |||||||||
| Additional Fund Statistics [Text Block] | Key Fund Statistics
(as of September 30, 2024)
|
|||||||||
| Holdings [Text Block] | EFFECTIVE MATURITY DIVERSIFICATION (% of Fund's net assets) Days 1-7 20.2 8-30 41.5 31-60 20.7 61-90 9.8 91-180 13.5 >180 0.8 U.S. Treasury Obligations 106.5 ASSET ALLOCATION (% of Fund's net assets) Net Other Assets (Liabilities) - (6.5)% |
{
"version": "2.2",
"instance": {
"filing8164.htm": {
"nsprefix": "fmr",
"nsuri": "http://www.fidelity.com/20241129",
"dts": {
"inline": {
"local": [
"filing8164.htm"
]
},
"schema": {
"local": [
"fmr-20241129.xsd"
],
"remote": [
"http://www.xbrl.org/2003/xbrl-instance-2003-12-31.xsd",
"http://www.xbrl.org/2003/xbrl-linkbase-2003-12-31.xsd",
"http://www.xbrl.org/2003/xl-2003-12-31.xsd",
"http://www.xbrl.org/2003/xlink-2003-12-31.xsd",
"http://www.xbrl.org/2005/xbrldt-2005.xsd",
"http://www.xbrl.org/2006/ref-2006-02-27.xsd",
"http://www.xbrl.org/dtr/type/nonNumeric-2009-12-16.xsd",
"http://www.xbrl.org/lrr/arcrole/deprecated-2009-12-16.xsd",
"http://www.xbrl.org/lrr/role/deprecated-2009-12-16.xsd",
"http://www.xbrl.org/lrr/role/negated-2009-12-16.xsd",
"http://www.xbrl.org/lrr/role/reference-2009-12-16.xsd",
"https://www.xbrl.org/2020/extensible-enumerations-2.0.xsd",
"https://www.xbrl.org/dtr/type/2020-01-21/types.xsd",
"https://www.xbrl.org/dtr/type/2022-03-31/types.xsd",
"https://xbrl.fasb.org/srt/2023/elts/srt-2023.xsd",
"https://xbrl.fasb.org/srt/2023/elts/srt-roles-2023.xsd",
"https://xbrl.fasb.org/srt/2023/elts/srt-types-2023.xsd",
"https://xbrl.fasb.org/us-gaap/2023/elts/us-gaap-2023.xsd",
"https://xbrl.fasb.org/us-gaap/2023/elts/us-roles-2023.xsd",
"https://xbrl.fasb.org/us-gaap/2023/elts/us-types-2023.xsd",
"https://xbrl.sec.gov/country/2023/country-2023.xsd",
"https://xbrl.sec.gov/country/2023/country-2023_def.xsd",
"https://xbrl.sec.gov/dei/2023/dei-2023.xsd",
"https://xbrl.sec.gov/oef/2023/oef-2023.xsd",
"https://xbrl.sec.gov/oef/2023/oef-2023_cal.xsd",
"https://xbrl.sec.gov/oef/2023/oef-2023_lab.xsd",
"https://xbrl.sec.gov/oef/2023/oef-sr-2023.xsd"
]
}
},
"keyStandard": 23,
"keyCustom": 0,
"axisStandard": 3,
"axisCustom": 0,
"memberStandard": 0,
"memberCustom": 42,
"hidden": {
"total": 5,
"http://xbrl.sec.gov/dei/2023": 5
},
"contextCount": 282,
"entityCount": 1,
"segmentCount": 42,
"elementCount": 175,
"unitCount": 3,
"baseTaxonomies": {
"http://xbrl.sec.gov/oef/2023": 593,
"http://xbrl.sec.gov/dei/2023": 57,
"http://fasb.org/us-gaap/2023": 26
},
"report": {
"R1": {
"role": "http://xbrl.sec.gov/oef/role/NcsrCover",
"longName": "030000 - Disclosure - Form N-CSR Cover",
"shortName": "Form N-CSR Cover",
"isDefault": "true",
"groupType": "disclosure",
"subGroupType": "",
"menuCat": "Cover",
"order": "1",
"firstAnchor": {
"contextRef": "Trust",
"name": "dei:DocumentPeriodEndDate",
"unitRef": null,
"xsiNil": "false",
"lang": "en-US",
"decimals": null,
"ancestors": [
"div",
"td",
"tr",
"table",
"body",
"html"
],
"reportCount": 1,
"baseRef": "filing8164.htm",
"first": true
},
"uniqueAnchor": null
},
"R2": {
"role": "http://xbrl.sec.gov/oef/role/ShareholderReport",
"longName": "030001 - Disclosure - Shareholder Report",
"shortName": "Shareholder Report",
"isDefault": "false",
"groupType": "disclosure",
"subGroupType": "",
"menuCat": "Notes",
"order": "2",
"firstAnchor": {
"contextRef": "Trust",
"name": "dei:DocumentPeriodEndDate",
"unitRef": null,
"xsiNil": "false",
"lang": "en-US",
"decimals": null,
"ancestors": [
"div",
"td",
"tr",
"table",
"body",
"html"
],
"reportCount": 1,
"baseRef": "filing8164.htm",
"first": true
},
"uniqueAnchor": {
"contextRef": "C000013088_ClassMember",
"name": "oef:FundName",
"unitRef": null,
"xsiNil": "false",
"lang": "en-US",
"decimals": null,
"ancestors": [
"div",
"td",
"tr",
"table",
"body",
"html"
],
"reportCount": 1,
"baseRef": "filing8164.htm",
"unique": true
}
},
"R3": {
"role": "http://xbrl.sec.gov/oef/role/ShareholderReportHoldingsDetails",
"longName": "040020 - Disclosure - Shareholder Report, Holdings (Details)",
"shortName": "Shareholder Report, Holdings (Details)",
"isDefault": "false",
"groupType": "disclosure",
"subGroupType": "details",
"menuCat": "Details",
"order": "3",
"firstAnchor": {
"contextRef": "C000013088_EMD_0_Member",
"name": "oef:PctOfNav",
"unitRef": "pure",
"xsiNil": "false",
"lang": null,
"decimals": "INF",
"ancestors": [
"div",
"td",
"tr",
"table",
"oef:HoldingsTableTextBlock",
"div",
"body",
"html"
],
"reportCount": 1,
"baseRef": "filing8164.htm",
"first": true,
"unique": true
},
"uniqueAnchor": {
"contextRef": "C000013088_EMD_0_Member",
"name": "oef:PctOfNav",
"unitRef": "pure",
"xsiNil": "false",
"lang": null,
"decimals": "INF",
"ancestors": [
"div",
"td",
"tr",
"table",
"oef:HoldingsTableTextBlock",
"div",
"body",
"html"
],
"reportCount": 1,
"baseRef": "filing8164.htm",
"first": true,
"unique": true
}
}
},
"tag": {
"fmr_AACertificatesofDepositMember": {
"xbrltype": "domainItemType",
"nsuri": "http://www.fidelity.com/20241129",
"localname": "AACertificatesofDepositMember",
"presentation": [
"http://xbrl.sec.gov/oef/role/ShareholderReportHoldingsDetails"
],
"lang": {
"en-us": {
"role": {
"label": "AACertificatesofDepositMember [Member]",
"verboseLabel": "AACertificatesofDepositMember",
"terseLabel": "AACertificatesofDepositMember"
}
}
},
"auth_ref": []
},
"fmr_AACommercialPaperMember": {
"xbrltype": "domainItemType",
"nsuri": "http://www.fidelity.com/20241129",
"localname": "AACommercialPaperMember",
"presentation": [
"http://xbrl.sec.gov/oef/role/ShareholderReportHoldingsDetails"
],
"lang": {
"en-us": {
"role": {
"label": "AACommercialPaperMember [Member]",
"verboseLabel": "AACommercialPaperMember",
"terseLabel": "AACommercialPaperMember"
}
}
},
"auth_ref": []
},
"fmr_AAMunicipalSecuritiesMember": {
"xbrltype": "domainItemType",
"nsuri": "http://www.fidelity.com/20241129",
"localname": "AAMunicipalSecuritiesMember",
"presentation": [
"http://xbrl.sec.gov/oef/role/ShareholderReportHoldingsDetails"
],
"lang": {
"en-us": {
"role": {
"label": "AAMunicipalSecuritiesMember [Member]",
"verboseLabel": "AAMunicipalSecuritiesMember",
"terseLabel": "AAMunicipalSecuritiesMember"
}
}
},
"auth_ref": []
},
"fmr_AANetOtherAssetsLiabilitiesMember": {
"xbrltype": "domainItemType",
"nsuri": "http://www.fidelity.com/20241129",
"localname": "AANetOtherAssetsLiabilitiesMember",
"presentation": [
"http://xbrl.sec.gov/oef/role/ShareholderReportHoldingsDetails"
],
"lang": {
"en-us": {
"role": {
"label": "AANetOtherAssetsLiabilitiesMember [Member]",
"verboseLabel": "AANetOtherAssetsLiabilitiesMember",
"terseLabel": "AANetOtherAssetsLiabilitiesMember"
}
}
},
"auth_ref": []
},
"fmr_AANonNegotiableTimeDepositMember": {
"xbrltype": "domainItemType",
"nsuri": "http://www.fidelity.com/20241129",
"localname": "AANonNegotiableTimeDepositMember",
"presentation": [
"http://xbrl.sec.gov/oef/role/ShareholderReportHoldingsDetails"
],
"lang": {
"en-us": {
"role": {
"label": "AANonNegotiableTimeDepositMember [Member]",
"verboseLabel": "AANonNegotiableTimeDepositMember",
"terseLabel": "AANonNegotiableTimeDepositMember"
}
}
},
"auth_ref": []
},
"fmr_AARepurchaseAgreementsMember": {
"xbrltype": "domainItemType",
"nsuri": "http://www.fidelity.com/20241129",
"localname": "AARepurchaseAgreementsMember",
"presentation": [
"http://xbrl.sec.gov/oef/role/ShareholderReportHoldingsDetails"
],
"lang": {
"en-us": {
"role": {
"label": "AARepurchaseAgreementsMember [Member]",
"verboseLabel": "AARepurchaseAgreementsMember",
"terseLabel": "AARepurchaseAgreementsMember"
}
}
},
"auth_ref": []
},
"fmr_AATenderOptionBondMember": {
"xbrltype": "domainItemType",
"nsuri": "http://www.fidelity.com/20241129",
"localname": "AATenderOptionBondMember",
"presentation": [
"http://xbrl.sec.gov/oef/role/ShareholderReportHoldingsDetails"
],
"lang": {
"en-us": {
"role": {
"label": "AATenderOptionBondMember [Member]",
"verboseLabel": "AATenderOptionBondMember",
"terseLabel": "AATenderOptionBondMember"
}
}
},
"auth_ref": []
},
"fmr_AAUSGovernmentAgencyDebtMember": {
"xbrltype": "domainItemType",
"nsuri": "http://www.fidelity.com/20241129",
"localname": "AAUSGovernmentAgencyDebtMember",
"presentation": [
"http://xbrl.sec.gov/oef/role/ShareholderReportHoldingsDetails"
],
"lang": {
"en-us": {
"role": {
"label": "AAUSGovernmentAgencyDebtMember [Member]",
"verboseLabel": "AAUSGovernmentAgencyDebtMember",
"terseLabel": "AAUSGovernmentAgencyDebtMember"
}
}
},
"auth_ref": []
},
"fmr_AAUSTreasuryObligationsMember": {
"xbrltype": "domainItemType",
"nsuri": "http://www.fidelity.com/20241129",
"localname": "AAUSTreasuryObligationsMember",
"presentation": [
"http://xbrl.sec.gov/oef/role/ShareholderReportHoldingsDetails"
],
"lang": {
"en-us": {
"role": {
"label": "AAUSTreasuryObligationsMember [Member]",
"verboseLabel": "AAUSTreasuryObligationsMember",
"terseLabel": "AAUSTreasuryObligationsMember"
}
}
},
"auth_ref": []
},
"fmr_AAVariableRateDemandNotesVRDNsMember": {
"xbrltype": "domainItemType",
"nsuri": "http://www.fidelity.com/20241129",
"localname": "AAVariableRateDemandNotesVRDNsMember",
"presentation": [
"http://xbrl.sec.gov/oef/role/ShareholderReportHoldingsDetails"
],
"lang": {
"en-us": {
"role": {
"label": "AAVariableRateDemandNotesVRDNsMember [Member]",
"verboseLabel": "AAVariableRateDemandNotesVRDNsMember",
"terseLabel": "AAVariableRateDemandNotesVRDNsMember"
}
}
},
"auth_ref": []
},
"oef_AccountValueLineItems": {
"xbrltype": "stringItemType",
"nsuri": "http://xbrl.sec.gov/oef/2023",
"localname": "AccountValueLineItems",
"presentation": [
"http://xbrl.sec.gov/oef/role/ShareholderReportLineGraphDetails"
],
"lang": {
"en-us": {
"role": {
"label": "Account Value [Line Items]"
}
}
},
"auth_ref": [
"r35"
]
},
"oef_AccountValueTable": {
"xbrltype": "stringItemType",
"nsuri": "http://xbrl.sec.gov/oef/2023",
"localname": "AccountValueTable",
"presentation": [
"http://xbrl.sec.gov/oef/role/ShareholderReportLineGraphDetails"
],
"lang": {
"en-us": {
"role": {
"label": "Account Value [Table]"
}
}
},
"auth_ref": [
"r35"
]
},
"oef_AccountValueTableAbstract": {
"xbrltype": "stringItemType",
"nsuri": "http://xbrl.sec.gov/oef/2023",
"localname": "AccountValueTableAbstract",
"lang": {
"en-us": {
"role": {
"label": "Account Value Table [Abstract]"
}
}
},
"auth_ref": [
"r35"
]
},
"oef_AccountantChngDate": {
"xbrltype": "dateItemType",
"nsuri": "http://xbrl.sec.gov/oef/2023",
"localname": "AccountantChngDate",
"presentation": [
"http://xbrl.sec.gov/oef/role/ShareholderReport"
],
"lang": {
"en-us": {
"role": {
"label": "Accountant Change Date"
}
}
},
"auth_ref": [
"r59"
]
},
"oef_AccountantChngDisagreementsTextBlock": {
"xbrltype": "textBlockItemType",
"nsuri": "http://xbrl.sec.gov/oef/2023",
"localname": "AccountantChngDisagreementsTextBlock",
"presentation": [
"http://xbrl.sec.gov/oef/role/ShareholderReport"
],
"lang": {
"en-us": {
"role": {
"label": "Accountant Change Disagreements [Text Block]"
}
}
},
"auth_ref": [
"r60"
]
},
"oef_AccountantChngStatementTextBlock": {
"xbrltype": "textBlockItemType",
"nsuri": "http://xbrl.sec.gov/oef/2023",
"localname": "AccountantChngStatementTextBlock",
"presentation": [
"http://xbrl.sec.gov/oef/role/ShareholderReport"
],
"lang": {
"en-us": {
"role": {
"label": "Accountant Change Statement [Text Block]"
}
}
},
"auth_ref": [
"r59"
]
},
"oef_AcctVal": {
"xbrltype": "monetaryItemType",
"nsuri": "http://xbrl.sec.gov/oef/2023",
"localname": "AcctVal",
"presentation": [
"http://xbrl.sec.gov/oef/role/ShareholderReportLineGraphDetails"
],
"lang": {
"en-us": {
"role": {
"label": "Account Value"
}
}
},
"auth_ref": [
"r36"
]
},
"oef_AcquiredFundFeesAndExpensesOverAssets": {
"xbrltype": "nonNegativePure4ItemType",
"nsuri": "http://xbrl.sec.gov/oef/2023",
"localname": "AcquiredFundFeesAndExpensesOverAssets",
"calculation": {
"http://xbrl.sec.gov/rr/role/OperatingExpensesData": {
"parentTag": "oef_ExpensesOverAssets",
"weight": 1.0,
"order": 5.0
}
},
"lang": {
"en-us": {
"role": {
"label": "Acquired Fund Fees and Expenses"
}
}
},
"auth_ref": [
"r69"
]
},
"oef_AdditionalIndexAxis": {
"xbrltype": "stringItemType",
"nsuri": "http://xbrl.sec.gov/oef/2023",
"localname": "AdditionalIndexAxis",
"presentation": [
"http://xbrl.sec.gov/oef/role/ShareholderReportLineGraphDetails"
],
"lang": {
"en-us": {
"role": {
"label": "Additional Index [Axis]"
}
}
},
"auth_ref": [
"r35"
]
},
"oef_AdditionalIndexDomain": {
"xbrltype": "domainItemType",
"nsuri": "http://xbrl.sec.gov/oef/2023",
"localname": "AdditionalIndexDomain",
"presentation": [
"http://xbrl.sec.gov/oef/role/ShareholderReportLineGraphDetails"
],
"lang": {
"en-us": {
"role": {
"label": "Additional Index [Domain]"
}
}
},
"auth_ref": [
"r35"
]
},
"oef_AddlFundStatisticsSignificanceOrLimitsTextBlock": {
"xbrltype": "textBlockItemType",
"nsuri": "http://xbrl.sec.gov/oef/2023",
"localname": "AddlFundStatisticsSignificanceOrLimitsTextBlock",
"presentation": [
"http://xbrl.sec.gov/oef/role/ShareholderReport"
],
"lang": {
"en-us": {
"role": {
"label": "Additional Fund Statistics Significance or Limits [Text Block]"
}
}
},
"auth_ref": [
"r49"
]
},
"oef_AddlFundStatisticsTextBlock": {
"xbrltype": "textBlockItemType",
"nsuri": "http://xbrl.sec.gov/oef/2023",
"localname": "AddlFundStatisticsTextBlock",
"presentation": [
"http://xbrl.sec.gov/oef/role/ShareholderReport"
],
"lang": {
"en-us": {
"role": {
"label": "Additional Fund Statistics [Text Block]"
}
}
},
"auth_ref": [
"r48"
]
},
"oef_AddlInfoEmail": {
"xbrltype": "stringItemType",
"nsuri": "http://xbrl.sec.gov/oef/2023",
"localname": "AddlInfoEmail",
"presentation": [
"http://xbrl.sec.gov/oef/role/ShareholderReport"
],
"lang": {
"en-us": {
"role": {
"label": "Additional Information Email"
}
}
},
"auth_ref": [
"r27"
]
},
"oef_AddlInfoPhoneNumber": {
"xbrltype": "stringItemType",
"nsuri": "http://xbrl.sec.gov/oef/2023",
"localname": "AddlInfoPhoneNumber",
"presentation": [
"http://xbrl.sec.gov/oef/role/ShareholderReport"
],
"lang": {
"en-us": {
"role": {
"label": "Additional Information Phone Number"
}
}
},
"auth_ref": [
"r27"
]
},
"oef_AddlInfoTextBlock": {
"xbrltype": "textBlockItemType",
"nsuri": "http://xbrl.sec.gov/oef/2023",
"localname": "AddlInfoTextBlock",
"presentation": [
"http://xbrl.sec.gov/oef/role/ShareholderReport"
],
"lang": {
"en-us": {
"role": {
"label": "Additional Information [Text Block]"
}
}
},
"auth_ref": [
"r25"
]
},
"oef_AddlInfoWebsite": {
"xbrltype": "stringItemType",
"nsuri": "http://xbrl.sec.gov/oef/2023",
"localname": "AddlInfoWebsite",
"presentation": [
"http://xbrl.sec.gov/oef/role/ShareholderReport"
],
"lang": {
"en-us": {
"role": {
"label": "Additional Information Website"
}
}
},
"auth_ref": [
"r27"
]
},
"oef_AdvisoryFeesPaidAmt": {
"xbrltype": "monetaryItemType",
"nsuri": "http://xbrl.sec.gov/oef/2023",
"localname": "AdvisoryFeesPaidAmt",
"presentation": [
"http://xbrl.sec.gov/oef/role/ShareholderReport"
],
"lang": {
"en-us": {
"role": {
"label": "Advisory Fees Paid, Amount"
}
}
},
"auth_ref": [
"r48"
]
},
"dei_AmendmentDescription": {
"xbrltype": "stringItemType",
"nsuri": "http://xbrl.sec.gov/dei/2023",
"localname": "AmendmentDescription",
"presentation": [
"http://xbrl.sec.gov/oef/role/NcsrCover",
"http://xbrl.sec.gov/oef/role/ShareholderReport"
],
"lang": {
"en-us": {
"role": {
"label": "Amendment Description",
"documentation": "Description of changes contained within amended document."
}
}
},
"auth_ref": []
},
"dei_AmendmentFlag": {
"xbrltype": "booleanItemType",
"nsuri": "http://xbrl.sec.gov/dei/2023",
"localname": "AmendmentFlag",
"presentation": [
"http://xbrl.sec.gov/oef/role/NcsrCover",
"http://xbrl.sec.gov/oef/role/ShareholderReport"
],
"lang": {
"en-us": {
"role": {
"label": "Amendment Flag",
"documentation": "Boolean flag that is true when the XBRL content amends previously-filed or accepted submission."
}
}
},
"auth_ref": []
},
"oef_AnnlOrSemiAnnlStatementTextBlock": {
"xbrltype": "textBlockItemType",
"nsuri": "http://xbrl.sec.gov/oef/2023",
"localname": "AnnlOrSemiAnnlStatementTextBlock",
"presentation": [
"http://xbrl.sec.gov/oef/role/ShareholderReport"
],
"lang": {
"en-us": {
"role": {
"label": "Annual or Semi-Annual Statement [Text Block]"
}
}
},
"auth_ref": [
"r24"
]
},
"us-gaap_AssetsNet": {
"xbrltype": "monetaryItemType",
"nsuri": "http://fasb.org/us-gaap/2023",
"localname": "AssetsNet",
"crdr": "debit",
"presentation": [
"http://xbrl.sec.gov/oef/role/ShareholderReport"
],
"lang": {
"en-us": {
"role": {
"documentation": "Amount of net assets (liabilities).",
"label": "Net Assets"
}
}
},
"auth_ref": [
"r0"
]
},
"oef_AvgAnnlRtrPct": {
"xbrltype": "percentItemType",
"nsuri": "http://xbrl.sec.gov/oef/2023",
"localname": "AvgAnnlRtrPct",
"presentation": [
"http://xbrl.sec.gov/oef/role/ShareholderReportLineGraphDetails"
],
"lang": {
"en-us": {
"role": {
"label": "Average Annual Return, Percent"
}
}
},
"auth_ref": [
"r42"
]
},
"oef_AvgAnnlRtrTableTextBlock": {
"xbrltype": "textBlockItemType",
"nsuri": "http://xbrl.sec.gov/oef/2023",
"localname": "AvgAnnlRtrTableTextBlock",
"presentation": [
"http://xbrl.sec.gov/oef/role/ShareholderReport"
],
"lang": {
"en-us": {
"role": {
"label": "Average Annual Return [Table Text Block]"
}
}
},
"auth_ref": [
"r42"
]
},
"oef_BroadBasedIndexAxis": {
"xbrltype": "stringItemType",
"nsuri": "http://xbrl.sec.gov/oef/2023",
"localname": "BroadBasedIndexAxis",
"presentation": [
"http://xbrl.sec.gov/oef/role/ShareholderReportLineGraphDetails"
],
"lang": {
"en-us": {
"role": {
"label": "Broad Based Index [Axis]"
}
}
},
"auth_ref": [
"r35"
]
},
"oef_BroadBasedIndexDomain": {
"xbrltype": "domainItemType",
"nsuri": "http://xbrl.sec.gov/oef/2023",
"localname": "BroadBasedIndexDomain",
"presentation": [
"http://xbrl.sec.gov/oef/role/ShareholderReportLineGraphDetails"
],
"lang": {
"en-us": {
"role": {
"label": "Broad Based Index [Domain]"
}
}
},
"auth_ref": [
"r35"
]
},
"fmr_C000013037Member": {
"xbrltype": "domainItemType",
"nsuri": "http://www.fidelity.com/20241129",
"localname": "C000013037Member",
"presentation": [
"http://xbrl.sec.gov/oef/role/ShareholderReport",
"http://xbrl.sec.gov/oef/role/ShareholderReportHoldingsDetails",
"http://xbrl.sec.gov/oef/role/ShareholderReportLineGraphDetails"
],
"lang": {
"en-us": {
"role": {
"label": "C000013037 [Member]",
"verboseLabel": "Fidelity Investments Money Market Treasury Only Portfolio - Class I",
"terseLabel": "Fidelity Investments Money Market Treasury Only Portfolio - Class I"
}
}
},
"auth_ref": []
},
"fmr_C000013038Member": {
"xbrltype": "domainItemType",
"nsuri": "http://www.fidelity.com/20241129",
"localname": "C000013038Member",
"presentation": [
"http://xbrl.sec.gov/oef/role/ShareholderReport",
"http://xbrl.sec.gov/oef/role/ShareholderReportHoldingsDetails",
"http://xbrl.sec.gov/oef/role/ShareholderReportLineGraphDetails"
],
"lang": {
"en-us": {
"role": {
"label": "C000013038 [Member]",
"verboseLabel": "Fidelity Investments Money Market Treasury Portfolio - Class I",
"terseLabel": "Fidelity Investments Money Market Treasury Portfolio - Class I"
}
}
},
"auth_ref": []
},
"fmr_C000013039Member": {
"xbrltype": "domainItemType",
"nsuri": "http://www.fidelity.com/20241129",
"localname": "C000013039Member",
"presentation": [
"http://xbrl.sec.gov/oef/role/ShareholderReport",
"http://xbrl.sec.gov/oef/role/ShareholderReportHoldingsDetails",
"http://xbrl.sec.gov/oef/role/ShareholderReportLineGraphDetails"
],
"lang": {
"en-us": {
"role": {
"label": "C000013039 [Member]",
"verboseLabel": "Fidelity Investments Money Market Government Portfolio - Class I",
"terseLabel": "Fidelity Investments Money Market Government Portfolio - Class I"
}
}
},
"auth_ref": []
},
"fmr_C000013041Member": {
"xbrltype": "domainItemType",
"nsuri": "http://www.fidelity.com/20241129",
"localname": "C000013041Member",
"presentation": [
"http://xbrl.sec.gov/oef/role/ShareholderReport",
"http://xbrl.sec.gov/oef/role/ShareholderReportHoldingsDetails",
"http://xbrl.sec.gov/oef/role/ShareholderReportLineGraphDetails"
],
"lang": {
"en-us": {
"role": {
"label": "C000013041 [Member]",
"verboseLabel": "Fidelity Investments Money Market - Money Market Portfolio - Class I",
"terseLabel": "Fidelity Investments Money Market - Money Market Portfolio - Class I"
}
}
},
"auth_ref": []
},
"fmr_C000013042Member": {
"xbrltype": "domainItemType",
"nsuri": "http://www.fidelity.com/20241129",
"localname": "C000013042Member",
"presentation": [
"http://xbrl.sec.gov/oef/role/ShareholderReport",
"http://xbrl.sec.gov/oef/role/ShareholderReportHoldingsDetails",
"http://xbrl.sec.gov/oef/role/ShareholderReportLineGraphDetails"
],
"lang": {
"en-us": {
"role": {
"label": "C000013042 [Member]",
"verboseLabel": "Fidelity Investments Money Market Tax Exempt Portfolio - Class I",
"terseLabel": "Fidelity Investments Money Market Tax Exempt Portfolio - Class I"
}
}
},
"auth_ref": []
},
"fmr_C000013074Member": {
"xbrltype": "domainItemType",
"nsuri": "http://www.fidelity.com/20241129",
"localname": "C000013074Member",
"presentation": [
"http://xbrl.sec.gov/oef/role/ShareholderReport",
"http://xbrl.sec.gov/oef/role/ShareholderReportHoldingsDetails",
"http://xbrl.sec.gov/oef/role/ShareholderReportLineGraphDetails"
],
"lang": {
"en-us": {
"role": {
"label": "C000013074 [Member]",
"verboseLabel": "Fidelity Investments Money Market Treasury Only Portfolio - Class II",
"terseLabel": "Fidelity Investments Money Market Treasury Only Portfolio - Class II"
}
}
},
"auth_ref": []
},
"fmr_C000013075Member": {
"xbrltype": "domainItemType",
"nsuri": "http://www.fidelity.com/20241129",
"localname": "C000013075Member",
"presentation": [
"http://xbrl.sec.gov/oef/role/ShareholderReport",
"http://xbrl.sec.gov/oef/role/ShareholderReportHoldingsDetails",
"http://xbrl.sec.gov/oef/role/ShareholderReportLineGraphDetails"
],
"lang": {
"en-us": {
"role": {
"label": "C000013075 [Member]",
"verboseLabel": "Fidelity Investments Money Market Treasury Only Portfolio - Class III",
"terseLabel": "Fidelity Investments Money Market Treasury Only Portfolio - Class III"
}
}
},
"auth_ref": []
},
"fmr_C000013076Member": {
"xbrltype": "domainItemType",
"nsuri": "http://www.fidelity.com/20241129",
"localname": "C000013076Member",
"presentation": [
"http://xbrl.sec.gov/oef/role/ShareholderReport",
"http://xbrl.sec.gov/oef/role/ShareholderReportHoldingsDetails",
"http://xbrl.sec.gov/oef/role/ShareholderReportLineGraphDetails"
],
"lang": {
"en-us": {
"role": {
"label": "C000013076 [Member]",
"verboseLabel": "Fidelity Investments Money Market Treasury Only Portfolio - Select Class",
"terseLabel": "Fidelity Investments Money Market Treasury Only Portfolio - Select Class"
}
}
},
"auth_ref": []
},
"fmr_C000013077Member": {
"xbrltype": "domainItemType",
"nsuri": "http://www.fidelity.com/20241129",
"localname": "C000013077Member",
"presentation": [
"http://xbrl.sec.gov/oef/role/ShareholderReport",
"http://xbrl.sec.gov/oef/role/ShareholderReportHoldingsDetails",
"http://xbrl.sec.gov/oef/role/ShareholderReportLineGraphDetails"
],
"lang": {
"en-us": {
"role": {
"label": "C000013077 [Member]",
"verboseLabel": "Fidelity Investments Money Market Treasury Portfolio - Class II",
"terseLabel": "Fidelity Investments Money Market Treasury Portfolio - Class II"
}
}
},
"auth_ref": []
},
"fmr_C000013078Member": {
"xbrltype": "domainItemType",
"nsuri": "http://www.fidelity.com/20241129",
"localname": "C000013078Member",
"presentation": [
"http://xbrl.sec.gov/oef/role/ShareholderReport",
"http://xbrl.sec.gov/oef/role/ShareholderReportHoldingsDetails",
"http://xbrl.sec.gov/oef/role/ShareholderReportLineGraphDetails"
],
"lang": {
"en-us": {
"role": {
"label": "C000013078 [Member]",
"verboseLabel": "Fidelity Investments Money Market Treasury Portfolio - Class III",
"terseLabel": "Fidelity Investments Money Market Treasury Portfolio - Class III"
}
}
},
"auth_ref": []
},
"fmr_C000013079Member": {
"xbrltype": "domainItemType",
"nsuri": "http://www.fidelity.com/20241129",
"localname": "C000013079Member",
"presentation": [
"http://xbrl.sec.gov/oef/role/ShareholderReport",
"http://xbrl.sec.gov/oef/role/ShareholderReportHoldingsDetails",
"http://xbrl.sec.gov/oef/role/ShareholderReportLineGraphDetails"
],
"lang": {
"en-us": {
"role": {
"label": "C000013079 [Member]",
"verboseLabel": "Fidelity Investments Money Market Treasury Portfolio - Select Class",
"terseLabel": "Fidelity Investments Money Market Treasury Portfolio - Select Class"
}
}
},
"auth_ref": []
},
"fmr_C000013080Member": {
"xbrltype": "domainItemType",
"nsuri": "http://www.fidelity.com/20241129",
"localname": "C000013080Member",
"presentation": [
"http://xbrl.sec.gov/oef/role/ShareholderReport",
"http://xbrl.sec.gov/oef/role/ShareholderReportHoldingsDetails",
"http://xbrl.sec.gov/oef/role/ShareholderReportLineGraphDetails"
],
"lang": {
"en-us": {
"role": {
"label": "C000013080 [Member]",
"verboseLabel": "Fidelity Investments Money Market Government Portfolio - Class II",
"terseLabel": "Fidelity Investments Money Market Government Portfolio - Class II"
}
}
},
"auth_ref": []
},
"fmr_C000013081Member": {
"xbrltype": "domainItemType",
"nsuri": "http://www.fidelity.com/20241129",
"localname": "C000013081Member",
"presentation": [
"http://xbrl.sec.gov/oef/role/ShareholderReport",
"http://xbrl.sec.gov/oef/role/ShareholderReportHoldingsDetails",
"http://xbrl.sec.gov/oef/role/ShareholderReportLineGraphDetails"
],
"lang": {
"en-us": {
"role": {
"label": "C000013081 [Member]",
"verboseLabel": "Fidelity Investments Money Market Government Portfolio - Class III",
"terseLabel": "Fidelity Investments Money Market Government Portfolio - Class III"
}
}
},
"auth_ref": []
},
"fmr_C000013082Member": {
"xbrltype": "domainItemType",
"nsuri": "http://www.fidelity.com/20241129",
"localname": "C000013082Member",
"presentation": [
"http://xbrl.sec.gov/oef/role/ShareholderReport",
"http://xbrl.sec.gov/oef/role/ShareholderReportHoldingsDetails",
"http://xbrl.sec.gov/oef/role/ShareholderReportLineGraphDetails"
],
"lang": {
"en-us": {
"role": {
"label": "C000013082 [Member]",
"verboseLabel": "Fidelity Investments Money Market Government Portfolio - Select Class",
"terseLabel": "Fidelity Investments Money Market Government Portfolio - Select Class"
}
}
},
"auth_ref": []
},
"fmr_C000013086Member": {
"xbrltype": "domainItemType",
"nsuri": "http://www.fidelity.com/20241129",
"localname": "C000013086Member",
"presentation": [
"http://xbrl.sec.gov/oef/role/ShareholderReport",
"http://xbrl.sec.gov/oef/role/ShareholderReportHoldingsDetails",
"http://xbrl.sec.gov/oef/role/ShareholderReportLineGraphDetails"
],
"lang": {
"en-us": {
"role": {
"label": "C000013086 [Member]",
"verboseLabel": "Fidelity Investments Money Market - Money Market Portfolio - Class II",
"terseLabel": "Fidelity Investments Money Market - Money Market Portfolio - Class II"
}
}
},
"auth_ref": []
},
"fmr_C000013087Member": {
"xbrltype": "domainItemType",
"nsuri": "http://www.fidelity.com/20241129",
"localname": "C000013087Member",
"presentation": [
"http://xbrl.sec.gov/oef/role/ShareholderReport",
"http://xbrl.sec.gov/oef/role/ShareholderReportHoldingsDetails",
"http://xbrl.sec.gov/oef/role/ShareholderReportLineGraphDetails"
],
"lang": {
"en-us": {
"role": {
"label": "C000013087 [Member]",
"verboseLabel": "Fidelity Investments Money Market - Money Market Portfolio - Class III",
"terseLabel": "Fidelity Investments Money Market - Money Market Portfolio - Class III"
}
}
},
"auth_ref": []
},
"fmr_C000013088Member": {
"xbrltype": "domainItemType",
"nsuri": "http://www.fidelity.com/20241129",
"localname": "C000013088Member",
"presentation": [
"http://xbrl.sec.gov/oef/role/ShareholderReport",
"http://xbrl.sec.gov/oef/role/ShareholderReportHoldingsDetails",
"http://xbrl.sec.gov/oef/role/ShareholderReportLineGraphDetails"
],
"lang": {
"en-us": {
"role": {
"label": "C000013088 [Member]",
"verboseLabel": "Fidelity Investments Money Market - Money Market Portfolio - Select Class",
"terseLabel": "Fidelity Investments Money Market - Money Market Portfolio - Select Class"
}
}
},
"auth_ref": []
},
"fmr_C000013089Member": {
"xbrltype": "domainItemType",
"nsuri": "http://www.fidelity.com/20241129",
"localname": "C000013089Member",
"presentation": [
"http://xbrl.sec.gov/oef/role/ShareholderReport",
"http://xbrl.sec.gov/oef/role/ShareholderReportHoldingsDetails",
"http://xbrl.sec.gov/oef/role/ShareholderReportLineGraphDetails"
],
"lang": {
"en-us": {
"role": {
"label": "C000013089 [Member]",
"verboseLabel": "Fidelity Investments Money Market Tax Exempt Portfolio - Class II",
"terseLabel": "Fidelity Investments Money Market Tax Exempt Portfolio - Class II"
}
}
},
"auth_ref": []
},
"fmr_C000013090Member": {
"xbrltype": "domainItemType",
"nsuri": "http://www.fidelity.com/20241129",
"localname": "C000013090Member",
"presentation": [
"http://xbrl.sec.gov/oef/role/ShareholderReport",
"http://xbrl.sec.gov/oef/role/ShareholderReportHoldingsDetails",
"http://xbrl.sec.gov/oef/role/ShareholderReportLineGraphDetails"
],
"lang": {
"en-us": {
"role": {
"label": "C000013090 [Member]",
"verboseLabel": "Fidelity Investments Money Market Tax Exempt Portfolio - Class III",
"terseLabel": "Fidelity Investments Money Market Tax Exempt Portfolio - Class III"
}
}
},
"auth_ref": []
},
"fmr_C000013091Member": {
"xbrltype": "domainItemType",
"nsuri": "http://www.fidelity.com/20241129",
"localname": "C000013091Member",
"presentation": [
"http://xbrl.sec.gov/oef/role/ShareholderReport",
"http://xbrl.sec.gov/oef/role/ShareholderReportHoldingsDetails",
"http://xbrl.sec.gov/oef/role/ShareholderReportLineGraphDetails"
],
"lang": {
"en-us": {
"role": {
"label": "C000013091 [Member]",
"verboseLabel": "Fidelity Investments Money Market Tax Exempt Portfolio - Select Class",
"terseLabel": "Fidelity Investments Money Market Tax Exempt Portfolio - Select Class"
}
}
},
"auth_ref": []
},
"fmr_C000056567Member": {
"xbrltype": "domainItemType",
"nsuri": "http://www.fidelity.com/20241129",
"localname": "C000056567Member",
"presentation": [
"http://xbrl.sec.gov/oef/role/ShareholderReport",
"http://xbrl.sec.gov/oef/role/ShareholderReportHoldingsDetails",
"http://xbrl.sec.gov/oef/role/ShareholderReportLineGraphDetails"
],
"lang": {
"en-us": {
"role": {
"label": "C000056567 [Member]",
"verboseLabel": "Fidelity Investments Money Market Treasury Only Portfolio - Class IV",
"terseLabel": "Fidelity Investments Money Market Treasury Only Portfolio - Class IV"
}
}
},
"auth_ref": []
},
"fmr_C000056568Member": {
"xbrltype": "domainItemType",
"nsuri": "http://www.fidelity.com/20241129",
"localname": "C000056568Member",
"presentation": [
"http://xbrl.sec.gov/oef/role/ShareholderReport",
"http://xbrl.sec.gov/oef/role/ShareholderReportHoldingsDetails",
"http://xbrl.sec.gov/oef/role/ShareholderReportLineGraphDetails"
],
"lang": {
"en-us": {
"role": {
"label": "C000056568 [Member]",
"verboseLabel": "Fidelity Investments Money Market Treasury Portfolio - Class IV",
"terseLabel": "Fidelity Investments Money Market Treasury Portfolio - Class IV"
}
}
},
"auth_ref": []
},
"fmr_C000056571Member": {
"xbrltype": "domainItemType",
"nsuri": "http://www.fidelity.com/20241129",
"localname": "C000056571Member",
"presentation": [
"http://xbrl.sec.gov/oef/role/ShareholderReport",
"http://xbrl.sec.gov/oef/role/ShareholderReportHoldingsDetails",
"http://xbrl.sec.gov/oef/role/ShareholderReportLineGraphDetails"
],
"lang": {
"en-us": {
"role": {
"label": "C000056571 [Member]",
"verboseLabel": "Fidelity Investments Money Market - Money Market Portfolio - Institutional Class",
"terseLabel": "Fidelity Investments Money Market - Money Market Portfolio - Institutional Class"
}
}
},
"auth_ref": []
},
"fmr_C000141702Member": {
"xbrltype": "domainItemType",
"nsuri": "http://www.fidelity.com/20241129",
"localname": "C000141702Member",
"presentation": [
"http://xbrl.sec.gov/oef/role/ShareholderReport",
"http://xbrl.sec.gov/oef/role/ShareholderReportHoldingsDetails",
"http://xbrl.sec.gov/oef/role/ShareholderReportLineGraphDetails"
],
"lang": {
"en-us": {
"role": {
"label": "C000141702 [Member]",
"verboseLabel": "Fidelity Investments Money Market Treasury Only Portfolio - Institutional Class",
"terseLabel": "Fidelity Investments Money Market Treasury Only Portfolio - Institutional Class"
}
}
},
"auth_ref": []
},
"fmr_C000141703Member": {
"xbrltype": "domainItemType",
"nsuri": "http://www.fidelity.com/20241129",
"localname": "C000141703Member",
"presentation": [
"http://xbrl.sec.gov/oef/role/ShareholderReport",
"http://xbrl.sec.gov/oef/role/ShareholderReportHoldingsDetails",
"http://xbrl.sec.gov/oef/role/ShareholderReportLineGraphDetails"
],
"lang": {
"en-us": {
"role": {
"label": "C000141703 [Member]",
"verboseLabel": "Fidelity Investments Money Market Treasury Portfolio - Institutional Class",
"terseLabel": "Fidelity Investments Money Market Treasury Portfolio - Institutional Class"
}
}
},
"auth_ref": []
},
"fmr_C000141704Member": {
"xbrltype": "domainItemType",
"nsuri": "http://www.fidelity.com/20241129",
"localname": "C000141704Member",
"presentation": [
"http://xbrl.sec.gov/oef/role/ShareholderReport",
"http://xbrl.sec.gov/oef/role/ShareholderReportHoldingsDetails",
"http://xbrl.sec.gov/oef/role/ShareholderReportLineGraphDetails"
],
"lang": {
"en-us": {
"role": {
"label": "C000141704 [Member]",
"verboseLabel": "Fidelity Investments Money Market Government Portfolio - Institutional Class",
"terseLabel": "Fidelity Investments Money Market Government Portfolio - Institutional Class"
}
}
},
"auth_ref": []
},
"oef_ClassAxis": {
"xbrltype": "stringItemType",
"nsuri": "http://xbrl.sec.gov/oef/2023",
"localname": "ClassAxis",
"presentation": [
"http://xbrl.sec.gov/oef/role/ShareholderReport",
"http://xbrl.sec.gov/oef/role/ShareholderReportHoldingsDetails",
"http://xbrl.sec.gov/oef/role/ShareholderReportLineGraphDetails"
],
"lang": {
"en-us": {
"role": {
"label": "Class [Axis]"
}
}
},
"auth_ref": [
"r22"
]
},
"oef_ClassName": {
"xbrltype": "securityTitleItemType",
"nsuri": "http://xbrl.sec.gov/oef/2023",
"localname": "ClassName",
"presentation": [
"http://xbrl.sec.gov/oef/role/ShareholderReport"
],
"lang": {
"en-us": {
"role": {
"label": "Class Name"
}
}
},
"auth_ref": [
"r27"
]
},
"oef_Component1OtherExpensesOverAssets": {
"xbrltype": "nonNegativePure4ItemType",
"nsuri": "http://xbrl.sec.gov/oef/2023",
"localname": "Component1OtherExpensesOverAssets",
"calculation": {
"http://xbrl.sec.gov/rr/role/OperatingExpensesData": {
"parentTag": "oef_OtherExpensesOverAssets",
"weight": 1.0,
"order": 1.0
}
},
"lang": {
"en-us": {
"role": {
"label": "Component1 Other Expenses"
}
}
},
"auth_ref": [
"r66"
]
},
"oef_Component2OtherExpensesOverAssets": {
"xbrltype": "nonNegativePure4ItemType",
"nsuri": "http://xbrl.sec.gov/oef/2023",
"localname": "Component2OtherExpensesOverAssets",
"calculation": {
"http://xbrl.sec.gov/rr/role/OperatingExpensesData": {
"parentTag": "oef_OtherExpensesOverAssets",
"weight": 1.0,
"order": 2.0
}
},
"lang": {
"en-us": {
"role": {
"label": "Component2 Other Expenses"
}
}
},
"auth_ref": [
"r66"
]
},
"oef_Component3OtherExpensesOverAssets": {
"xbrltype": "nonNegativePure4ItemType",
"nsuri": "http://xbrl.sec.gov/oef/2023",
"localname": "Component3OtherExpensesOverAssets",
"calculation": {
"http://xbrl.sec.gov/rr/role/OperatingExpensesData": {
"parentTag": "oef_OtherExpensesOverAssets",
"weight": 1.0,
"order": 3.0
}
},
"lang": {
"en-us": {
"role": {
"label": "Component3 Other Expenses"
}
}
},
"auth_ref": [
"r66"
]
},
"dei_CoverAbstract": {
"xbrltype": "stringItemType",
"nsuri": "http://xbrl.sec.gov/dei/2023",
"localname": "CoverAbstract",
"lang": {
"en-us": {
"role": {
"documentation": "Cover page."
}
}
},
"auth_ref": []
},
"oef_CreditQualityAxis": {
"xbrltype": "stringItemType",
"nsuri": "http://xbrl.sec.gov/oef/2023",
"localname": "CreditQualityAxis",
"presentation": [
"http://xbrl.sec.gov/oef/role/ShareholderReportHoldingsDetails"
],
"lang": {
"en-us": {
"role": {
"label": "Credit Quality [Axis]"
}
}
},
"auth_ref": [
"r50"
]
},
"oef_CreditQualityDomain": {
"xbrltype": "domainItemType",
"nsuri": "http://xbrl.sec.gov/oef/2023",
"localname": "CreditQualityDomain",
"presentation": [
"http://xbrl.sec.gov/oef/role/ShareholderReportHoldingsDetails"
],
"lang": {
"en-us": {
"role": {
"label": "Credit Quality [Domain]"
}
}
},
"auth_ref": [
"r50"
]
},
"oef_CreditQualityExplanationTextBlock": {
"xbrltype": "textBlockItemType",
"nsuri": "http://xbrl.sec.gov/oef/2023",
"localname": "CreditQualityExplanationTextBlock",
"presentation": [
"http://xbrl.sec.gov/oef/role/ShareholderReport"
],
"lang": {
"en-us": {
"role": {
"label": "Credit Quality Explanation [Text Block]"
}
}
},
"auth_ref": [
"r50"
]
},
"srt_CreditRatingAMBestAxis": {
"xbrltype": "stringItemType",
"nsuri": "http://fasb.org/srt/2023",
"localname": "CreditRatingAMBestAxis",
"presentation": [
"http://xbrl.sec.gov/oef/role/ShareholderReportHoldingsDetails"
],
"auth_ref": [
"r18",
"r72",
"r73",
"r74"
]
},
"srt_CreditRatingAMBestDomain": {
"xbrltype": "domainItemType",
"nsuri": "http://fasb.org/srt/2023",
"localname": "CreditRatingAMBestDomain",
"presentation": [
"http://xbrl.sec.gov/oef/role/ShareholderReportHoldingsDetails"
],
"auth_ref": []
},
"srt_CreditRatingFitchAxis": {
"xbrltype": "stringItemType",
"nsuri": "http://fasb.org/srt/2023",
"localname": "CreditRatingFitchAxis",
"presentation": [
"http://xbrl.sec.gov/oef/role/ShareholderReportHoldingsDetails"
],
"auth_ref": [
"r18",
"r72",
"r74"
]
},
"srt_CreditRatingMoodysAxis": {
"xbrltype": "stringItemType",
"nsuri": "http://fasb.org/srt/2023",
"localname": "CreditRatingMoodysAxis",
"presentation": [
"http://xbrl.sec.gov/oef/role/ShareholderReportHoldingsDetails"
],
"auth_ref": [
"r18",
"r72",
"r73",
"r74"
]
},
"srt_CreditRatingStandardPoorsAxis": {
"xbrltype": "stringItemType",
"nsuri": "http://fasb.org/srt/2023",
"localname": "CreditRatingStandardPoorsAxis",
"presentation": [
"http://xbrl.sec.gov/oef/role/ShareholderReportHoldingsDetails"
],
"auth_ref": [
"r18",
"r72",
"r73",
"r74"
]
},
"oef_CreditRatingsSelectionTextBlock": {
"xbrltype": "textBlockItemType",
"nsuri": "http://xbrl.sec.gov/oef/2023",
"localname": "CreditRatingsSelectionTextBlock",
"presentation": [
"http://xbrl.sec.gov/oef/role/ShareholderReport"
],
"lang": {
"en-us": {
"role": {
"label": "Credit Ratings Selection [Text Block]"
}
}
},
"auth_ref": [
"r50"
]
},
"oef_DistOfCapitalTextBlock": {
"xbrltype": "textBlockItemType",
"nsuri": "http://xbrl.sec.gov/oef/2023",
"localname": "DistOfCapitalTextBlock",
"presentation": [
"http://xbrl.sec.gov/oef/role/ShareholderReport"
],
"lang": {
"en-us": {
"role": {
"label": "Distribution of Capital [Text Block]"
}
}
},
"auth_ref": [
"r44"
]
},
"oef_DistributionAndService12b1FeesOverAssets": {
"xbrltype": "nonNegativePure4ItemType",
"nsuri": "http://xbrl.sec.gov/oef/2023",
"localname": "DistributionAndService12b1FeesOverAssets",
"calculation": {
"http://xbrl.sec.gov/rr/role/OperatingExpensesData": {
"parentTag": "oef_ExpensesOverAssets",
"weight": 1.0,
"order": 2.0
}
},
"lang": {
"en-us": {
"role": {
"label": "Distribution and Service (12b-1) Fees"
}
}
},
"auth_ref": [
"r64"
]
},
"oef_DistributionOrSimilarNon12b1FeesOverAssets": {
"xbrltype": "nonNegativePure4ItemType",
"nsuri": "http://xbrl.sec.gov/oef/2023",
"localname": "DistributionOrSimilarNon12b1FeesOverAssets",
"calculation": {
"http://xbrl.sec.gov/rr/role/OperatingExpensesData": {
"parentTag": "oef_ExpensesOverAssets",
"weight": 1.0,
"order": 3.0
}
},
"lang": {
"en-us": {
"role": {
"label": "Distribution or Similar (Non 12b-1) Fees"
}
}
},
"auth_ref": [
"r64"
]
},
"dei_DocumentPeriodEndDate": {
"xbrltype": "dateItemType",
"nsuri": "http://xbrl.sec.gov/dei/2023",
"localname": "DocumentPeriodEndDate",
"presentation": [
"http://xbrl.sec.gov/oef/role/NcsrCover",
"http://xbrl.sec.gov/oef/role/ShareholderReport"
],
"lang": {
"en-us": {
"role": {
"label": "Document Period End Date",
"documentation": "For the EDGAR submission types of Form 8-K: the date of the report, the date of the earliest event reported; for the EDGAR submission types of Form N-1A: the filing date; for all other submission types: the end of the reporting or transition period. The format of the date is YYYY-MM-DD."
}
}
},
"auth_ref": []
},
"dei_DocumentType": {
"xbrltype": "submissionTypeItemType",
"nsuri": "http://xbrl.sec.gov/dei/2023",
"localname": "DocumentType",
"presentation": [
"http://xbrl.sec.gov/oef/role/NcsrCover",
"http://xbrl.sec.gov/oef/role/ShareholderReport"
],
"lang": {
"en-us": {
"role": {
"label": "Document Type",
"documentation": "The type of document being provided (such as 10-K, 10-Q, 485BPOS, etc). The document type is limited to the same value as the supporting SEC submission type, or the word 'Other'."
}
}
},
"auth_ref": []
},
"fmr_EMD0Member": {
"xbrltype": "domainItemType",
"nsuri": "http://www.fidelity.com/20241129",
"localname": "EMD0Member",
"presentation": [
"http://xbrl.sec.gov/oef/role/ShareholderReportHoldingsDetails"
],
"lang": {
"en-us": {
"role": {
"label": "EMD0Member [Member]",
"verboseLabel": "EMD0Member",
"terseLabel": "EMD0Member"
}
}
},
"auth_ref": []
},
"fmr_EMD1Member": {
"xbrltype": "domainItemType",
"nsuri": "http://www.fidelity.com/20241129",
"localname": "EMD1Member",
"presentation": [
"http://xbrl.sec.gov/oef/role/ShareholderReportHoldingsDetails"
],
"lang": {
"en-us": {
"role": {
"label": "EMD1Member [Member]",
"verboseLabel": "EMD1Member",
"terseLabel": "EMD1Member"
}
}
},
"auth_ref": []
},
"fmr_EMD2Member": {
"xbrltype": "domainItemType",
"nsuri": "http://www.fidelity.com/20241129",
"localname": "EMD2Member",
"presentation": [
"http://xbrl.sec.gov/oef/role/ShareholderReportHoldingsDetails"
],
"lang": {
"en-us": {
"role": {
"label": "EMD2Member [Member]",
"verboseLabel": "EMD2Member",
"terseLabel": "EMD2Member"
}
}
},
"auth_ref": []
},
"fmr_EMD3Member": {
"xbrltype": "domainItemType",
"nsuri": "http://www.fidelity.com/20241129",
"localname": "EMD3Member",
"presentation": [
"http://xbrl.sec.gov/oef/role/ShareholderReportHoldingsDetails"
],
"lang": {
"en-us": {
"role": {
"label": "EMD3Member [Member]",
"verboseLabel": "EMD3Member",
"terseLabel": "EMD3Member"
}
}
},
"auth_ref": []
},
"fmr_EMD4Member": {
"xbrltype": "domainItemType",
"nsuri": "http://www.fidelity.com/20241129",
"localname": "EMD4Member",
"presentation": [
"http://xbrl.sec.gov/oef/role/ShareholderReportHoldingsDetails"
],
"lang": {
"en-us": {
"role": {
"label": "EMD4Member [Member]",
"verboseLabel": "EMD4Member",
"terseLabel": "EMD4Member"
}
}
},
"auth_ref": []
},
"fmr_EMD5Member": {
"xbrltype": "domainItemType",
"nsuri": "http://www.fidelity.com/20241129",
"localname": "EMD5Member",
"presentation": [
"http://xbrl.sec.gov/oef/role/ShareholderReportHoldingsDetails"
],
"lang": {
"en-us": {
"role": {
"label": "EMD5Member [Member]",
"verboseLabel": "EMD5Member",
"terseLabel": "EMD5Member"
}
}
},
"auth_ref": []
},
"dei_EntityCentralIndexKey": {
"xbrltype": "centralIndexKeyItemType",
"nsuri": "http://xbrl.sec.gov/dei/2023",
"localname": "EntityCentralIndexKey",
"presentation": [
"http://xbrl.sec.gov/oef/role/NcsrCover",
"http://xbrl.sec.gov/oef/role/ShareholderReport"
],
"lang": {
"en-us": {
"role": {
"label": "Entity Central Index Key",
"documentation": "A unique 10-digit SEC-issued value to identify entities that have filed disclosures with the SEC. It is commonly abbreviated as CIK."
}
}
},
"auth_ref": [
"r20"
]
},
"dei_EntityInvCompanyType": {
"xbrltype": "invCompanyType",
"nsuri": "http://xbrl.sec.gov/dei/2023",
"localname": "EntityInvCompanyType",
"presentation": [
"http://xbrl.sec.gov/oef/role/NcsrCover",
"http://xbrl.sec.gov/oef/role/ShareholderReport"
],
"lang": {
"en-us": {
"role": {
"label": "Entity Investment Company Type",
"documentation": "One of: N-1A (Mutual Fund), N-1 (Open-End Separate Account with No Variable Annuities), N-2 (Closed-End Investment Company), N-3 (Separate Account Registered as Open-End Management Investment Company), N-4 (Variable Annuity UIT Separate Account), N-5 (Small Business Investment Company), N-6 (Variable Life UIT Separate Account), S-1 or S-3 (Face Amount Certificate Company), S-6 (UIT, Non-Insurance Product)."
}
}
},
"auth_ref": [
"r71"
]
},
"dei_EntityRegistrantName": {
"xbrltype": "normalizedStringItemType",
"nsuri": "http://xbrl.sec.gov/dei/2023",
"localname": "EntityRegistrantName",
"presentation": [
"http://xbrl.sec.gov/oef/role/NcsrCover",
"http://xbrl.sec.gov/oef/role/ShareholderReport"
],
"lang": {
"en-us": {
"role": {
"label": "Registrant Name",
"documentation": "The exact name of the entity filing the report as specified in its charter, which is required by forms filed with the SEC."
}
}
},
"auth_ref": [
"r20"
]
},
"oef_EtfDiscountNumDays": {
"xbrltype": "integerItemType",
"nsuri": "http://xbrl.sec.gov/oef/2023",
"localname": "EtfDiscountNumDays",
"presentation": [
"http://xbrl.sec.gov/oef/role/ShareholderReport"
],
"lang": {
"en-us": {
"role": {
"label": "ETF Discount, Number of Days"
}
}
},
"auth_ref": [
"r45"
]
},
"oef_EtfPastPerfTextBlock": {
"xbrltype": "textBlockItemType",
"nsuri": "http://xbrl.sec.gov/oef/2023",
"localname": "EtfPastPerfTextBlock",
"presentation": [
"http://xbrl.sec.gov/oef/role/ShareholderReport"
],
"lang": {
"en-us": {
"role": {
"label": "ETF Past Performance [Text Block]"
}
}
},
"auth_ref": [
"r47"
]
},
"oef_EtfPremiumDiscountTextBlock": {
"xbrltype": "textBlockItemType",
"nsuri": "http://xbrl.sec.gov/oef/2023",
"localname": "EtfPremiumDiscountTextBlock",
"presentation": [
"http://xbrl.sec.gov/oef/role/ShareholderReport"
],
"lang": {
"en-us": {
"role": {
"label": "ETF Premium Discount [Text Block]"
}
}
},
"auth_ref": [
"r45"
]
},
"oef_EtfPremiumNumDays": {
"xbrltype": "integerItemType",
"nsuri": "http://xbrl.sec.gov/oef/2023",
"localname": "EtfPremiumNumDays",
"presentation": [
"http://xbrl.sec.gov/oef/role/ShareholderReport"
],
"lang": {
"en-us": {
"role": {
"label": "ETF Premium, Number of Days"
}
}
},
"auth_ref": [
"r45"
]
},
"oef_EtfPurchaseExplanationTextBlock": {
"xbrltype": "textBlockItemType",
"nsuri": "http://xbrl.sec.gov/oef/2023",
"localname": "EtfPurchaseExplanationTextBlock",
"presentation": [
"http://xbrl.sec.gov/oef/role/ShareholderReport"
],
"lang": {
"en-us": {
"role": {
"label": "ETF Purchase Explanation [Text Block]"
}
}
},
"auth_ref": [
"r46"
]
},
"oef_ExpenseRatioPct": {
"xbrltype": "percentItemType",
"nsuri": "http://xbrl.sec.gov/oef/2023",
"localname": "ExpenseRatioPct",
"presentation": [
"http://xbrl.sec.gov/oef/role/ShareholderReport"
],
"lang": {
"en-us": {
"role": {
"label": "Expense Ratio, Percent"
}
}
},
"auth_ref": [
"r30"
]
},
"oef_ExpensesExclExtraordinaryExpensesPct": {
"xbrltype": "percentItemType",
"nsuri": "http://xbrl.sec.gov/oef/2023",
"localname": "ExpensesExclExtraordinaryExpensesPct",
"presentation": [
"http://xbrl.sec.gov/oef/role/ShareholderReport"
],
"lang": {
"en-us": {
"role": {
"label": "Expenses Excluding Extraordinary Expenses, Percent"
}
}
},
"auth_ref": [
"r33"
]
},
"oef_ExpensesOverAssets": {
"xbrltype": "nonNegativePure4ItemType",
"nsuri": "http://xbrl.sec.gov/oef/2023",
"localname": "ExpensesOverAssets",
"calculation": {
"http://xbrl.sec.gov/rr/role/OperatingExpensesData": {
"parentTag": "oef_NetExpensesOverAssets",
"weight": 1.0,
"order": 1.0
}
},
"lang": {
"en-us": {
"role": {
"label": "Expenses (as a percentage of Assets)",
"totalLabel": "Total Expenses"
}
}
},
"auth_ref": [
"r67"
]
},
"oef_ExpensesPaidAmt": {
"xbrltype": "monetaryItemType",
"nsuri": "http://xbrl.sec.gov/oef/2023",
"localname": "ExpensesPaidAmt",
"presentation": [
"http://xbrl.sec.gov/oef/role/ShareholderReport"
],
"lang": {
"en-us": {
"role": {
"label": "Expenses Paid, Amount"
}
}
},
"auth_ref": [
"r29"
]
},
"oef_ExpensesRepresentBothMasterAndFeeder": {
"xbrltype": "stringItemType",
"nsuri": "http://xbrl.sec.gov/oef/2023",
"localname": "ExpensesRepresentBothMasterAndFeeder",
"presentation": [
"http://xbrl.sec.gov/oef/role/ShareholderReport"
],
"lang": {
"en-us": {
"role": {
"label": "Expenses Represent Both Master and Feeder [Text]"
}
}
},
"auth_ref": [
"r31",
"r61"
]
},
"oef_ExpensesShortPeriodFnTextBlock": {
"xbrltype": "textBlockItemType",
"nsuri": "http://xbrl.sec.gov/oef/2023",
"localname": "ExpensesShortPeriodFnTextBlock",
"presentation": [
"http://xbrl.sec.gov/oef/role/ShareholderReport"
],
"lang": {
"en-us": {
"role": {
"label": "Expenses Short Period Footnote [Text Block]"
}
}
},
"auth_ref": [
"r32"
]
},
"oef_ExpensesTextBlock": {
"xbrltype": "textBlockItemType",
"nsuri": "http://xbrl.sec.gov/oef/2023",
"localname": "ExpensesTextBlock",
"presentation": [
"http://xbrl.sec.gov/oef/role/ShareholderReport"
],
"lang": {
"en-us": {
"role": {
"label": "Expenses [Text Block]"
}
}
},
"auth_ref": [
"r28"
]
},
"oef_ExposureBasisExplanationTextBlock": {
"xbrltype": "textBlockItemType",
"nsuri": "http://xbrl.sec.gov/oef/2023",
"localname": "ExposureBasisExplanationTextBlock",
"presentation": [
"http://xbrl.sec.gov/oef/role/ShareholderReport"
],
"lang": {
"en-us": {
"role": {
"label": "Exposure Basis Explanation [Text Block]"
}
}
},
"auth_ref": [
"r50"
]
},
"srt_ExternalCreditRatingFitchMember": {
"xbrltype": "domainItemType",
"nsuri": "http://fasb.org/srt/2023",
"localname": "ExternalCreditRatingFitchMember",
"presentation": [
"http://xbrl.sec.gov/oef/role/ShareholderReportHoldingsDetails"
],
"auth_ref": []
},
"srt_ExternalCreditRatingMoodysMember": {
"xbrltype": "domainItemType",
"nsuri": "http://fasb.org/srt/2023",
"localname": "ExternalCreditRatingMoodysMember",
"presentation": [
"http://xbrl.sec.gov/oef/role/ShareholderReportHoldingsDetails"
],
"auth_ref": []
},
"srt_ExternalCreditRatingStandardPoorsMember": {
"xbrltype": "domainItemType",
"nsuri": "http://fasb.org/srt/2023",
"localname": "ExternalCreditRatingStandardPoorsMember",
"presentation": [
"http://xbrl.sec.gov/oef/role/ShareholderReportHoldingsDetails"
],
"auth_ref": []
},
"oef_ExtraordinaryExpensesFnTextBlock": {
"xbrltype": "textBlockItemType",
"nsuri": "http://xbrl.sec.gov/oef/2023",
"localname": "ExtraordinaryExpensesFnTextBlock",
"presentation": [
"http://xbrl.sec.gov/oef/role/ShareholderReport"
],
"lang": {
"en-us": {
"role": {
"label": "Extraordinary Expenses Footnote [Text Block]"
}
}
},
"auth_ref": [
"r33"
]
},
"oef_FactorsAffectingPerfTextBlock": {
"xbrltype": "textBlockItemType",
"nsuri": "http://xbrl.sec.gov/oef/2023",
"localname": "FactorsAffectingPerfTextBlock",
"presentation": [
"http://xbrl.sec.gov/oef/role/ShareholderReport"
],
"lang": {
"en-us": {
"role": {
"label": "Factors Affecting Performance [Text Block]"
}
}
},
"auth_ref": [
"r34"
]
},
"oef_FeeWaiverOrReimbursementOverAssets": {
"xbrltype": "nonPositivePure4ItemType",
"nsuri": "http://xbrl.sec.gov/oef/2023",
"localname": "FeeWaiverOrReimbursementOverAssets",
"calculation": {
"http://xbrl.sec.gov/rr/role/OperatingExpensesData": {
"parentTag": "oef_NetExpensesOverAssets",
"weight": 1.0,
"order": 2.0
}
},
"lang": {
"en-us": {
"role": {
"label": "Fee Waiver or Reimbursement",
"negatedLabel": "Fee Waiver or Reimbursement"
}
}
},
"auth_ref": [
"r68"
]
},
"oef_FundName": {
"xbrltype": "normalizedStringItemType",
"nsuri": "http://xbrl.sec.gov/oef/2023",
"localname": "FundName",
"presentation": [
"http://xbrl.sec.gov/oef/role/ShareholderReport"
],
"lang": {
"en-us": {
"role": {
"label": "Fund Name"
}
}
},
"auth_ref": [
"r23"
]
},
"oef_GeographicRegionAxis": {
"xbrltype": "stringItemType",
"nsuri": "http://xbrl.sec.gov/oef/2023",
"localname": "GeographicRegionAxis",
"presentation": [
"http://xbrl.sec.gov/oef/role/ShareholderReportHoldingsDetails"
],
"lang": {
"en-us": {
"role": {
"label": "Geographic Region [Axis]"
}
}
},
"auth_ref": [
"r50"
]
},
"oef_GeographicRegionDomain": {
"xbrltype": "domainItemType",
"nsuri": "http://xbrl.sec.gov/oef/2023",
"localname": "GeographicRegionDomain",
"presentation": [
"http://xbrl.sec.gov/oef/role/ShareholderReportHoldingsDetails"
],
"lang": {
"en-us": {
"role": {
"label": "Geographic Region [Domain]"
}
}
},
"auth_ref": [
"r50"
]
},
"oef_HoldingsAbstract": {
"xbrltype": "stringItemType",
"nsuri": "http://xbrl.sec.gov/oef/2023",
"localname": "HoldingsAbstract",
"lang": {
"en-us": {
"role": {
"label": "Holdings [Abstract]"
}
}
},
"auth_ref": [
"r50"
]
},
"oef_HoldingsCount": {
"xbrltype": "integerItemType",
"nsuri": "http://xbrl.sec.gov/oef/2023",
"localname": "HoldingsCount",
"presentation": [
"http://xbrl.sec.gov/oef/role/ShareholderReport"
],
"lang": {
"en-us": {
"role": {
"label": "Holdings Count"
}
}
},
"auth_ref": [
"r48"
]
},
"oef_HoldingsLineItems": {
"xbrltype": "stringItemType",
"nsuri": "http://xbrl.sec.gov/oef/2023",
"localname": "HoldingsLineItems",
"presentation": [
"http://xbrl.sec.gov/oef/role/ShareholderReportHoldingsDetails"
],
"lang": {
"en-us": {
"role": {
"label": "Holdings [Line Items]"
}
}
},
"auth_ref": [
"r50"
]
},
"oef_HoldingsTable": {
"xbrltype": "stringItemType",
"nsuri": "http://xbrl.sec.gov/oef/2023",
"localname": "HoldingsTable",
"presentation": [
"http://xbrl.sec.gov/oef/role/ShareholderReportHoldingsDetails"
],
"lang": {
"en-us": {
"role": {
"label": "Holdings [Table]"
}
}
},
"auth_ref": [
"r50"
]
},
"oef_HoldingsTableTextBlock": {
"xbrltype": "textBlockItemType",
"nsuri": "http://xbrl.sec.gov/oef/2023",
"localname": "HoldingsTableTextBlock",
"presentation": [
"http://xbrl.sec.gov/oef/role/ShareholderReport"
],
"lang": {
"en-us": {
"role": {
"label": "Holdings [Text Block]"
}
}
},
"auth_ref": [
"r50"
]
},
"oef_InabilityToMeetDistLevelTextBlock": {
"xbrltype": "textBlockItemType",
"nsuri": "http://xbrl.sec.gov/oef/2023",
"localname": "InabilityToMeetDistLevelTextBlock",
"presentation": [
"http://xbrl.sec.gov/oef/role/ShareholderReport"
],
"lang": {
"en-us": {
"role": {
"label": "Inability to Meet Distribution Level [Text Block]"
}
}
},
"auth_ref": [
"r44"
]
},
"oef_IndustrySectorAxis": {
"xbrltype": "stringItemType",
"nsuri": "http://xbrl.sec.gov/oef/2023",
"localname": "IndustrySectorAxis",
"presentation": [
"http://xbrl.sec.gov/oef/role/ShareholderReportHoldingsDetails"
],
"lang": {
"en-us": {
"role": {
"label": "Industry Sector [Axis]"
}
}
},
"auth_ref": [
"r50"
]
},
"oef_IndustrySectorDomain": {
"xbrltype": "domainItemType",
"nsuri": "http://xbrl.sec.gov/oef/2023",
"localname": "IndustrySectorDomain",
"presentation": [
"http://xbrl.sec.gov/oef/role/ShareholderReportHoldingsDetails"
],
"lang": {
"en-us": {
"role": {
"label": "Industry Sector [Domain]"
}
}
},
"auth_ref": [
"r50"
]
},
"us-gaap_InvestmentCompanyPortfolioTurnover": {
"xbrltype": "percentItemType",
"nsuri": "http://fasb.org/us-gaap/2023",
"localname": "InvestmentCompanyPortfolioTurnover",
"presentation": [
"http://xbrl.sec.gov/oef/role/ShareholderReport"
],
"lang": {
"en-us": {
"role": {
"documentation": "Percentage of lesser of purchase or sale of portfolio securities to average value of portfolio securities owned.",
"label": "Investment Company Portfolio Turnover"
}
}
},
"auth_ref": [
"r75"
]
},
"us-gaap_InvestmentTypeAxis": {
"xbrltype": "stringItemType",
"nsuri": "http://fasb.org/us-gaap/2023",
"localname": "InvestmentTypeAxis",
"presentation": [
"http://xbrl.sec.gov/oef/role/ShareholderReportHoldingsDetails"
],
"lang": {
"en-us": {
"role": {
"documentation": "Information by type of investments.",
"label": "Investment Type [Axis]"
}
}
},
"auth_ref": [
"r1",
"r2",
"r3",
"r4",
"r5",
"r6",
"r7",
"r8",
"r9",
"r10",
"r11",
"r12",
"r13",
"r14",
"r15",
"r16",
"r17",
"r19"
]
},
"us-gaap_InvestmentTypeCategorizationMember": {
"xbrltype": "domainItemType",
"nsuri": "http://fasb.org/us-gaap/2023",
"localname": "InvestmentTypeCategorizationMember",
"presentation": [
"http://xbrl.sec.gov/oef/role/ShareholderReportHoldingsDetails"
],
"lang": {
"en-us": {
"role": {
"documentation": "Asset obtained to generate income or appreciate in value.",
"label": "Investment Type Categorization [Member]"
}
}
},
"auth_ref": [
"r1",
"r2",
"r3",
"r4",
"r5",
"r6",
"r7",
"r8",
"r9",
"r10",
"r11",
"r12",
"r13",
"r14",
"r15",
"r16",
"r17",
"r19"
]
},
"oef_LargestHoldingAxis": {
"xbrltype": "stringItemType",
"nsuri": "http://xbrl.sec.gov/oef/2023",
"localname": "LargestHoldingAxis",
"presentation": [
"http://xbrl.sec.gov/oef/role/ShareholderReportHoldingsDetails"
],
"lang": {
"en-us": {
"role": {
"label": "Largest Holding [Axis]"
}
}
},
"auth_ref": [
"r50"
]
},
"oef_LargestHoldingsDomain": {
"xbrltype": "domainItemType",
"nsuri": "http://xbrl.sec.gov/oef/2023",
"localname": "LargestHoldingsDomain",
"presentation": [
"http://xbrl.sec.gov/oef/role/ShareholderReportHoldingsDetails"
],
"lang": {
"en-us": {
"role": {
"label": "Largest Holdings [Domain]"
}
}
},
"auth_ref": [
"r50"
]
},
"oef_LargestHoldingsTableTextBlock": {
"xbrltype": "textBlockItemType",
"nsuri": "http://xbrl.sec.gov/oef/2023",
"localname": "LargestHoldingsTableTextBlock",
"presentation": [
"http://xbrl.sec.gov/oef/role/ShareholderReport"
],
"lang": {
"en-us": {
"role": {
"label": "Largest Holdings [Text Block]"
}
}
},
"auth_ref": [
"r50"
]
},
"oef_LineGraphAndTableMeasureName": {
"xbrltype": "stringItemType",
"nsuri": "http://xbrl.sec.gov/oef/2023",
"localname": "LineGraphAndTableMeasureName",
"presentation": [
"http://xbrl.sec.gov/oef/role/ShareholderReportLineGraphDetails"
],
"lang": {
"en-us": {
"role": {
"label": "Line Graph and Table Measure Name"
}
}
},
"auth_ref": [
"r36"
]
},
"oef_LineGraphTableTextBlock": {
"xbrltype": "textBlockItemType",
"nsuri": "http://xbrl.sec.gov/oef/2023",
"localname": "LineGraphTableTextBlock",
"presentation": [
"http://xbrl.sec.gov/oef/role/ShareholderReport"
],
"lang": {
"en-us": {
"role": {
"label": "Line Graph [Table Text Block]"
}
}
},
"auth_ref": [
"r35"
]
},
"oef_ManagementFeesOverAssets": {
"xbrltype": "nonNegativePure4ItemType",
"nsuri": "http://xbrl.sec.gov/oef/2023",
"localname": "ManagementFeesOverAssets",
"calculation": {
"http://xbrl.sec.gov/rr/role/OperatingExpensesData": {
"parentTag": "oef_ExpensesOverAssets",
"weight": 1.0,
"order": 1.0
}
},
"lang": {
"en-us": {
"role": {
"label": "Management Fees (as a percentage of Assets)"
}
}
},
"auth_ref": [
"r63"
]
},
"oef_MaterialChngDate": {
"xbrltype": "dateItemType",
"nsuri": "http://xbrl.sec.gov/oef/2023",
"localname": "MaterialChngDate",
"presentation": [
"http://xbrl.sec.gov/oef/role/ShareholderReport"
],
"lang": {
"en-us": {
"role": {
"label": "Material Change Date"
}
}
},
"auth_ref": [
"r40"
]
},
"oef_MaterialChngDescriptionTextBlock": {
"xbrltype": "textBlockItemType",
"nsuri": "http://xbrl.sec.gov/oef/2023",
"localname": "MaterialChngDescriptionTextBlock",
"presentation": [
"http://xbrl.sec.gov/oef/role/ShareholderReport"
],
"lang": {
"en-us": {
"role": {
"label": "Material Change Description [Text Block]"
}
}
},
"auth_ref": [
"r40"
]
},
"oef_MaterialFundChngAdviserTextBlock": {
"xbrltype": "textBlockItemType",
"nsuri": "http://xbrl.sec.gov/oef/2023",
"localname": "MaterialFundChngAdviserTextBlock",
"presentation": [
"http://xbrl.sec.gov/oef/role/ShareholderReport"
],
"lang": {
"en-us": {
"role": {
"label": "Material Fund Change Adviser [Text Block]"
}
}
},
"auth_ref": [
"r57"
]
},
"oef_MaterialFundChngExpensesTextBlock": {
"xbrltype": "textBlockItemType",
"nsuri": "http://xbrl.sec.gov/oef/2023",
"localname": "MaterialFundChngExpensesTextBlock",
"presentation": [
"http://xbrl.sec.gov/oef/role/ShareholderReport"
],
"lang": {
"en-us": {
"role": {
"label": "Material Fund Change Expenses [Text Block]"
}
}
},
"auth_ref": [
"r54"
]
},
"oef_MaterialFundChngNameTextBlock": {
"xbrltype": "textBlockItemType",
"nsuri": "http://xbrl.sec.gov/oef/2023",
"localname": "MaterialFundChngNameTextBlock",
"presentation": [
"http://xbrl.sec.gov/oef/role/ShareholderReport"
],
"lang": {
"en-us": {
"role": {
"label": "Material Fund Change Name [Text Block]"
}
}
},
"auth_ref": [
"r52"
]
},
"oef_MaterialFundChngNoticeTextBlock": {
"xbrltype": "textBlockItemType",
"nsuri": "http://xbrl.sec.gov/oef/2023",
"localname": "MaterialFundChngNoticeTextBlock",
"presentation": [
"http://xbrl.sec.gov/oef/role/ShareholderReport"
],
"lang": {
"en-us": {
"role": {
"label": "Material Fund Change Notice [Text Block]"
}
}
},
"auth_ref": [
"r26"
]
},
"oef_MaterialFundChngObjectivesTextBlock": {
"xbrltype": "textBlockItemType",
"nsuri": "http://xbrl.sec.gov/oef/2023",
"localname": "MaterialFundChngObjectivesTextBlock",
"presentation": [
"http://xbrl.sec.gov/oef/role/ShareholderReport"
],
"lang": {
"en-us": {
"role": {
"label": "Material Fund Change Objectives [Text Block]"
}
}
},
"auth_ref": [
"r53"
]
},
"oef_MaterialFundChngRisksChngTextBlock": {
"xbrltype": "textBlockItemType",
"nsuri": "http://xbrl.sec.gov/oef/2023",
"localname": "MaterialFundChngRisksChngTextBlock",
"presentation": [
"http://xbrl.sec.gov/oef/role/ShareholderReport"
],
"lang": {
"en-us": {
"role": {
"label": "Material Fund Change Risks Change [Text Block]"
}
}
},
"auth_ref": [
"r56"
]
},
"oef_MaterialFundChngStrategiesTextBlock": {
"xbrltype": "textBlockItemType",
"nsuri": "http://xbrl.sec.gov/oef/2023",
"localname": "MaterialFundChngStrategiesTextBlock",
"presentation": [
"http://xbrl.sec.gov/oef/role/ShareholderReport"
],
"lang": {
"en-us": {
"role": {
"label": "Material Fund Change Strategies [Text Block]"
}
}
},
"auth_ref": [
"r55"
]
},
"oef_MaterialFundChngTextBlock": {
"xbrltype": "textBlockItemType",
"nsuri": "http://xbrl.sec.gov/oef/2023",
"localname": "MaterialFundChngTextBlock",
"presentation": [
"http://xbrl.sec.gov/oef/role/ShareholderReport"
],
"lang": {
"en-us": {
"role": {
"label": "Material Fund Change [Text Block]"
}
}
},
"auth_ref": [
"r51"
]
},
"oef_MaturityAxis": {
"xbrltype": "stringItemType",
"nsuri": "http://xbrl.sec.gov/oef/2023",
"localname": "MaturityAxis",
"presentation": [
"http://xbrl.sec.gov/oef/role/ShareholderReportHoldingsDetails"
],
"lang": {
"en-us": {
"role": {
"label": "Maturity [Axis]"
}
}
},
"auth_ref": [
"r50"
]
},
"oef_MaturityDomain": {
"xbrltype": "domainItemType",
"nsuri": "http://xbrl.sec.gov/oef/2023",
"localname": "MaturityDomain",
"presentation": [
"http://xbrl.sec.gov/oef/role/ShareholderReportHoldingsDetails"
],
"lang": {
"en-us": {
"role": {
"label": "Maturity [Domain]"
}
}
},
"auth_ref": [
"r50"
]
},
"oef_NetExpensesOverAssets": {
"xbrltype": "nonNegativePure4ItemType",
"nsuri": "http://xbrl.sec.gov/oef/2023",
"localname": "NetExpensesOverAssets",
"calculation": {
"http://xbrl.sec.gov/rr/role/OperatingExpensesData": {
"parentTag": null,
"weight": null,
"order": null,
"root": true
}
},
"lang": {
"en-us": {
"role": {
"label": "Net Expenses (as a percentage of Assets)",
"totalLabel": "Net Expenses"
}
}
},
"auth_ref": [
"r62"
]
},
"oef_NoDeductionOfTaxesTextBlock": {
"xbrltype": "textBlockItemType",
"nsuri": "http://xbrl.sec.gov/oef/2023",
"localname": "NoDeductionOfTaxesTextBlock",
"presentation": [
"http://xbrl.sec.gov/oef/role/ShareholderReport"
],
"lang": {
"en-us": {
"role": {
"label": "No Deduction of Taxes [Text Block]"
}
}
},
"auth_ref": [
"r37"
]
},
"dei_NoTradingSymbolFlag": {
"xbrltype": "trueItemType",
"nsuri": "http://xbrl.sec.gov/dei/2023",
"localname": "NoTradingSymbolFlag",
"presentation": [
"http://xbrl.sec.gov/oef/role/ShareholderReport"
],
"lang": {
"en-us": {
"role": {
"label": "No Trading Symbol Flag",
"documentation": "Boolean flag that is true only for a security having no trading symbol."
}
}
},
"auth_ref": []
},
"oef_OtherCategory1Axis": {
"xbrltype": "stringItemType",
"nsuri": "http://xbrl.sec.gov/oef/2023",
"localname": "OtherCategory1Axis",
"presentation": [
"http://xbrl.sec.gov/oef/role/ShareholderReportHoldingsDetails"
],
"lang": {
"en-us": {
"role": {
"label": "Other Category 1 [Axis]"
}
}
},
"auth_ref": [
"r50"
]
},
"oef_OtherCategory1Domain": {
"xbrltype": "domainItemType",
"nsuri": "http://xbrl.sec.gov/oef/2023",
"localname": "OtherCategory1Domain",
"presentation": [
"http://xbrl.sec.gov/oef/role/ShareholderReportHoldingsDetails"
],
"lang": {
"en-us": {
"role": {
"label": "Other Category 1 [Domain]"
}
}
},
"auth_ref": [
"r50"
]
},
"oef_OtherCategory2Axis": {
"xbrltype": "stringItemType",
"nsuri": "http://xbrl.sec.gov/oef/2023",
"localname": "OtherCategory2Axis",
"presentation": [
"http://xbrl.sec.gov/oef/role/ShareholderReportHoldingsDetails"
],
"lang": {
"en-us": {
"role": {
"label": "Other Category 2 [Axis]"
}
}
},
"auth_ref": [
"r50"
]
},
"oef_OtherCategory2Domain": {
"xbrltype": "domainItemType",
"nsuri": "http://xbrl.sec.gov/oef/2023",
"localname": "OtherCategory2Domain",
"presentation": [
"http://xbrl.sec.gov/oef/role/ShareholderReportHoldingsDetails"
],
"lang": {
"en-us": {
"role": {
"label": "Other Category 2 [Domain]"
}
}
},
"auth_ref": [
"r50"
]
},
"oef_OtherExpensesOverAssets": {
"xbrltype": "nonNegativePure4ItemType",
"nsuri": "http://xbrl.sec.gov/oef/2023",
"localname": "OtherExpensesOverAssets",
"calculation": {
"http://xbrl.sec.gov/rr/role/OperatingExpensesData": {
"parentTag": "oef_ExpensesOverAssets",
"weight": 1.0,
"order": 4.0
}
},
"lang": {
"en-us": {
"role": {
"label": "Other Expenses (as a percentage of Assets):",
"totalLabel": "Other Expenses"
}
}
},
"auth_ref": [
"r65"
]
},
"oef_PctOfNav": {
"xbrltype": "percentItemType",
"nsuri": "http://xbrl.sec.gov/oef/2023",
"localname": "PctOfNav",
"presentation": [
"http://xbrl.sec.gov/oef/role/ShareholderReportHoldingsDetails"
],
"lang": {
"en-us": {
"role": {
"label": "Percent of Net Asset Value"
}
}
},
"auth_ref": [
"r50"
]
},
"oef_PctOfNetLongExposure": {
"xbrltype": "percentItemType",
"nsuri": "http://xbrl.sec.gov/oef/2023",
"localname": "PctOfNetLongExposure",
"presentation": [
"http://xbrl.sec.gov/oef/role/ShareholderReportHoldingsDetails"
],
"lang": {
"en-us": {
"role": {
"label": "Percent of Net Long Exposure"
}
}
},
"auth_ref": [
"r50"
]
},
"oef_PctOfNetShortExposure": {
"xbrltype": "percentItemType",
"nsuri": "http://xbrl.sec.gov/oef/2023",
"localname": "PctOfNetShortExposure",
"presentation": [
"http://xbrl.sec.gov/oef/role/ShareholderReportHoldingsDetails"
],
"lang": {
"en-us": {
"role": {
"label": "Percent of Net Short Exposure"
}
}
},
"auth_ref": [
"r50"
]
},
"oef_PctOfTotalInv": {
"xbrltype": "percentItemType",
"nsuri": "http://xbrl.sec.gov/oef/2023",
"localname": "PctOfTotalInv",
"presentation": [
"http://xbrl.sec.gov/oef/role/ShareholderReportHoldingsDetails"
],
"lang": {
"en-us": {
"role": {
"label": "Percent of Total Investments"
}
}
},
"auth_ref": [
"r50"
]
},
"oef_PctOfTotalLongExposure": {
"xbrltype": "percentItemType",
"nsuri": "http://xbrl.sec.gov/oef/2023",
"localname": "PctOfTotalLongExposure",
"presentation": [
"http://xbrl.sec.gov/oef/role/ShareholderReportHoldingsDetails"
],
"lang": {
"en-us": {
"role": {
"label": "Percent of Total Long Exposure"
}
}
},
"auth_ref": [
"r50"
]
},
"oef_PctOfTotalShortExposure": {
"xbrltype": "percentItemType",
"nsuri": "http://xbrl.sec.gov/oef/2023",
"localname": "PctOfTotalShortExposure",
"presentation": [
"http://xbrl.sec.gov/oef/role/ShareholderReportHoldingsDetails"
],
"lang": {
"en-us": {
"role": {
"label": "Percent of Total Short Exposure"
}
}
},
"auth_ref": [
"r50"
]
},
"oef_PerfInceptionDate": {
"xbrltype": "dateItemType",
"nsuri": "http://xbrl.sec.gov/oef/2023",
"localname": "PerfInceptionDate",
"presentation": [
"http://xbrl.sec.gov/oef/role/ShareholderReport"
],
"lang": {
"en-us": {
"role": {
"label": "Performance Inception Date"
}
}
},
"auth_ref": [
"r36"
]
},
"oef_PerfTableMarketIndexChngdTextBlock": {
"xbrltype": "textBlockItemType",
"nsuri": "http://xbrl.sec.gov/oef/2023",
"localname": "PerfTableMarketIndexChngdTextBlock",
"presentation": [
"http://xbrl.sec.gov/oef/role/ShareholderReport"
],
"lang": {
"en-us": {
"role": {
"label": "Performance Table Market Index Changed [Text Block]"
}
}
},
"auth_ref": [
"r43"
]
},
"oef_PerformancePastDoesNotIndicateFuture": {
"xbrltype": "stringItemType",
"nsuri": "http://xbrl.sec.gov/oef/2023",
"localname": "PerformancePastDoesNotIndicateFuture",
"presentation": [
"http://xbrl.sec.gov/oef/role/ShareholderReport"
],
"lang": {
"en-us": {
"role": {
"label": "Performance Past Does Not Indicate Future [Text]"
}
}
},
"auth_ref": [
"r38",
"r70"
]
},
"oef_PreviousInvestmentAdviserTextBlock": {
"xbrltype": "textBlockItemType",
"nsuri": "http://xbrl.sec.gov/oef/2023",
"localname": "PreviousInvestmentAdviserTextBlock",
"presentation": [
"http://xbrl.sec.gov/oef/role/ShareholderReport"
],
"lang": {
"en-us": {
"role": {
"label": "Previous Investment Adviser [Text Block]"
}
}
},
"auth_ref": [
"r39"
]
},
"oef_PriorMarketIndexComparisonTextBlock": {
"xbrltype": "textBlockItemType",
"nsuri": "http://xbrl.sec.gov/oef/2023",
"localname": "PriorMarketIndexComparisonTextBlock",
"presentation": [
"http://xbrl.sec.gov/oef/role/ShareholderReport"
],
"lang": {
"en-us": {
"role": {
"label": "Prior Market Index Comparison [Text Block]"
}
}
},
"auth_ref": [
"r43"
]
},
"oef_SalesLoadAxis": {
"xbrltype": "stringItemType",
"nsuri": "http://xbrl.sec.gov/oef/2023",
"localname": "SalesLoadAxis",
"presentation": [
"http://xbrl.sec.gov/oef/role/ShareholderReportLineGraphDetails"
],
"lang": {
"en-us": {
"role": {
"label": "Sales Load [Axis]"
}
}
},
"auth_ref": [
"r42"
]
},
"dei_SecurityExchangeName": {
"xbrltype": "edgarExchangeCodeItemType",
"nsuri": "http://xbrl.sec.gov/dei/2023",
"localname": "SecurityExchangeName",
"presentation": [
"http://xbrl.sec.gov/oef/role/ShareholderReport"
],
"lang": {
"en-us": {
"role": {
"label": "Security Exchange Name",
"terseLabel": "Exchange",
"documentation": "Name of the Exchange on which a security is registered."
}
}
},
"auth_ref": [
"r21"
]
},
"oef_ShareClassDomain": {
"xbrltype": "domainItemType",
"nsuri": "http://xbrl.sec.gov/oef/2023",
"localname": "ShareClassDomain",
"presentation": [
"http://xbrl.sec.gov/oef/role/ShareholderReport",
"http://xbrl.sec.gov/oef/role/ShareholderReportHoldingsDetails",
"http://xbrl.sec.gov/oef/role/ShareholderReportLineGraphDetails"
],
"lang": {
"en-us": {
"role": {
"label": "Share Classes"
}
}
},
"auth_ref": [
"r22"
]
},
"oef_ShareholderReportAbstract": {
"xbrltype": "stringItemType",
"nsuri": "http://xbrl.sec.gov/oef/2023",
"localname": "ShareholderReportAbstract",
"lang": {
"en-us": {
"role": {
"label": "Shareholder Report [Abstract]"
}
}
},
"auth_ref": [
"r42"
]
},
"oef_ShareholderReportAnnualOrSemiAnnual": {
"xbrltype": "shareholderReportTypeItemType",
"nsuri": "http://xbrl.sec.gov/oef/2023",
"localname": "ShareholderReportAnnualOrSemiAnnual",
"presentation": [
"http://xbrl.sec.gov/oef/role/ShareholderReport"
],
"lang": {
"en-us": {
"role": {
"label": "Shareholder Report Annual or Semi-Annual"
}
}
},
"auth_ref": [
"r24"
]
},
"oef_ShareholderReportLineItems": {
"xbrltype": "stringItemType",
"nsuri": "http://xbrl.sec.gov/oef/2023",
"localname": "ShareholderReportLineItems",
"presentation": [
"http://xbrl.sec.gov/oef/role/NcsrCover",
"http://xbrl.sec.gov/oef/role/ShareholderReport"
],
"lang": {
"en-us": {
"role": {
"label": "Shareholder Report [Line Items]"
}
}
},
"auth_ref": [
"r42"
]
},
"oef_ShareholderReportTable": {
"xbrltype": "stringItemType",
"nsuri": "http://xbrl.sec.gov/oef/2023",
"localname": "ShareholderReportTable",
"presentation": [
"http://xbrl.sec.gov/oef/role/NcsrCover",
"http://xbrl.sec.gov/oef/role/ShareholderReport"
],
"lang": {
"en-us": {
"role": {
"label": "Shareholder Report [Table]"
}
}
},
"auth_ref": [
"r42"
]
},
"oef_SummaryOfChngLegendTextBlock": {
"xbrltype": "textBlockItemType",
"nsuri": "http://xbrl.sec.gov/oef/2023",
"localname": "SummaryOfChngLegendTextBlock",
"presentation": [
"http://xbrl.sec.gov/oef/role/ShareholderReport"
],
"lang": {
"en-us": {
"role": {
"label": "Summary of Change Legend [Text Block]"
}
}
},
"auth_ref": [
"r58"
]
},
"dei_TradingSymbol": {
"xbrltype": "tradingSymbolItemType",
"nsuri": "http://xbrl.sec.gov/dei/2023",
"localname": "TradingSymbol",
"presentation": [
"http://xbrl.sec.gov/oef/role/ShareholderReport"
],
"lang": {
"en-us": {
"role": {
"label": "Trading Symbol",
"terseLabel": "Ticker",
"documentation": "Trading symbol of an instrument as listed on an exchange."
}
}
},
"auth_ref": []
},
"oef_UpdPerfInfoLocationTextBlock": {
"xbrltype": "textBlockItemType",
"nsuri": "http://xbrl.sec.gov/oef/2023",
"localname": "UpdPerfInfoLocationTextBlock",
"presentation": [
"http://xbrl.sec.gov/oef/role/ShareholderReport"
],
"lang": {
"en-us": {
"role": {
"label": "Updated Performance Information Location [Text Block]"
}
}
},
"auth_ref": [
"r41"
]
},
"oef_UpdProspectusEmailAddress": {
"xbrltype": "stringItemType",
"nsuri": "http://xbrl.sec.gov/oef/2023",
"localname": "UpdProspectusEmailAddress",
"presentation": [
"http://xbrl.sec.gov/oef/role/ShareholderReport"
],
"lang": {
"en-us": {
"role": {
"label": "Updated Prospectus Email Address"
}
}
},
"auth_ref": [
"r58"
]
},
"oef_UpdProspectusPhoneNumber": {
"xbrltype": "stringItemType",
"nsuri": "http://xbrl.sec.gov/oef/2023",
"localname": "UpdProspectusPhoneNumber",
"presentation": [
"http://xbrl.sec.gov/oef/role/ShareholderReport"
],
"lang": {
"en-us": {
"role": {
"label": "Updated Prospectus Phone Number"
}
}
},
"auth_ref": [
"r58"
]
},
"oef_UpdProspectusWebAddress": {
"xbrltype": "stringItemType",
"nsuri": "http://xbrl.sec.gov/oef/2023",
"localname": "UpdProspectusWebAddress",
"presentation": [
"http://xbrl.sec.gov/oef/role/ShareholderReport"
],
"lang": {
"en-us": {
"role": {
"label": "Updated Prospectus Web Address"
}
}
},
"auth_ref": [
"r58"
]
},
"oef_WithSalesLdMember": {
"xbrltype": "domainItemType",
"nsuri": "http://xbrl.sec.gov/oef/2023",
"localname": "WithSalesLoadMember",
"presentation": [
"http://xbrl.sec.gov/oef/role/ShareholderReportLineGraphDetails"
],
"lang": {
"en-us": {
"role": {
"label": "With Sales Load [Member]"
}
}
},
"auth_ref": [
"r42"
]
},
"oef_WithoutSalesLoadMember": {
"xbrltype": "domainItemType",
"nsuri": "http://xbrl.sec.gov/oef/2023",
"localname": "WithoutSalesLoadMember",
"presentation": [
"http://xbrl.sec.gov/oef/role/ShareholderReportLineGraphDetails"
],
"lang": {
"en-us": {
"role": {
"label": "Without Sales Load [Member]"
}
}
},
"auth_ref": [
"r42"
]
}
}
}
},
"std_ref": {
"r0": {
"role": "http://fasb.org/us-gaap/role/ref/legacyRef",
"Name": "Accounting Standards Codification",
"Section": "50",
"Paragraph": "1",
"SubTopic": "30",
"Topic": "205",
"Publisher": "FASB",
"URI": "https://asc.fasb.org//1943274/2147479910/205-30-50-1"
},
"r1": {
"role": "http://www.xbrl.org/2003/role/disclosureRef",
"Topic": "946",
"SubTopic": "210",
"Name": "Accounting Standards Codification",
"Section": "50",
"Paragraph": "1",
"Subparagraph": "(b)(1)",
"Publisher": "FASB",
"URI": "https://asc.fasb.org//1943274/2147480524/946-210-50-1"
},
"r2": {
"role": "http://www.xbrl.org/2003/role/disclosureRef",
"Topic": "946",
"SubTopic": "210",
"Name": "Accounting Standards Codification",
"Section": "50",
"Paragraph": "1",
"Subparagraph": "(c)(1)",
"Publisher": "FASB",
"URI": "https://asc.fasb.org//1943274/2147480524/946-210-50-1"
},
"r3": {
"role": "http://www.xbrl.org/2003/role/disclosureRef",
"Topic": "946",
"SubTopic": "210",
"Name": "Accounting Standards Codification",
"Section": "50",
"Paragraph": "1",
"Subparagraph": "(c)(2)",
"Publisher": "FASB",
"URI": "https://asc.fasb.org//1943274/2147480524/946-210-50-1"
},
"r4": {
"role": "http://www.xbrl.org/2003/role/disclosureRef",
"Topic": "946",
"SubTopic": "210",
"Name": "Accounting Standards Codification",
"Section": "50",
"Paragraph": "6",
"Subparagraph": "(a)(1)",
"Publisher": "FASB",
"URI": "https://asc.fasb.org//1943274/2147480524/946-210-50-6"
},
"r5": {
"role": "http://www.xbrl.org/2003/role/disclosureRef",
"Topic": "946",
"SubTopic": "210",
"Name": "Accounting Standards Codification",
"Section": "50",
"Paragraph": "6",
"Subparagraph": "(c)",
"Publisher": "FASB",
"URI": "https://asc.fasb.org//1943274/2147480524/946-210-50-6"
},
"r6": {
"role": "http://www.xbrl.org/2003/role/disclosureRef",
"Topic": "946",
"SubTopic": "320",
"Name": "Accounting Standards Codification",
"Section": "S99",
"Paragraph": "1",
"Subparagraph": "(SX 210.12-12(Column A)(Footnote 1))",
"Publisher": "FASB",
"URI": "https://asc.fasb.org//1943274/2147480032/946-320-S99-1"
},
"r7": {
"role": "http://www.xbrl.org/2003/role/disclosureRef",
"Topic": "946",
"SubTopic": "320",
"Name": "Accounting Standards Codification",
"Section": "S99",
"Paragraph": "1",
"Subparagraph": "(SX 210.12-12(Column C)(Footnote 5))",
"Publisher": "FASB",
"URI": "https://asc.fasb.org//1943274/2147480032/946-320-S99-1"
},
"r8": {
"role": "http://www.xbrl.org/2003/role/disclosureRef",
"Topic": "946",
"SubTopic": "320",
"Name": "Accounting Standards Codification",
"Section": "S99",
"Paragraph": "2",
"Subparagraph": "(SX 210.12-12A(Column C)(Footnote 4))",
"Publisher": "FASB",
"URI": "https://asc.fasb.org//1943274/2147480032/946-320-S99-2"
},
"r9": {
"role": "http://www.xbrl.org/2003/role/disclosureRef",
"Topic": "946",
"SubTopic": "320",
"Name": "Accounting Standards Codification",
"Section": "S99",
"Paragraph": "3",
"Subparagraph": "(SX 210.12-12B(Column A)(Footnote 7))",
"Publisher": "FASB",
"URI": "https://asc.fasb.org//1943274/2147480032/946-320-S99-3"
},
"r10": {
"role": "http://www.xbrl.org/2003/role/disclosureRef",
"Topic": "946",
"SubTopic": "320",
"Name": "Accounting Standards Codification",
"Section": "S99",
"Paragraph": "3",
"Subparagraph": "(SX 210.12-12B(Column C)(Footnote 2))",
"Publisher": "FASB",
"URI": "https://asc.fasb.org//1943274/2147480032/946-320-S99-3"
},
"r11": {
"role": "http://www.xbrl.org/2003/role/disclosureRef",
"Topic": "946",
"SubTopic": "320",
"Name": "Accounting Standards Codification",
"Section": "S99",
"Paragraph": "5D",
"Subparagraph": "(SX 210.12-13D(Column B)(Footnote 2))",
"Publisher": "FASB",
"URI": "https://asc.fasb.org//1943274/2147480032/946-320-S99-5D"
},
"r12": {
"role": "http://www.xbrl.org/2003/role/disclosureRef",
"Topic": "946",
"SubTopic": "320",
"Name": "Accounting Standards Codification",
"Section": "S99",
"Paragraph": "5D",
"Subparagraph": "(SX 210.12-13D(Column C)(Footnote 2))",
"Publisher": "FASB",
"URI": "https://asc.fasb.org//1943274/2147480032/946-320-S99-5D"
},
"r13": {
"role": "http://www.xbrl.org/2003/role/disclosureRef",
"Topic": "946",
"SubTopic": "320",
"Name": "Accounting Standards Codification",
"Section": "S99",
"Paragraph": "6",
"Subparagraph": "(SX 210.12-14(Column F)(Footnote 7))",
"Publisher": "FASB",
"URI": "https://asc.fasb.org//1943274/2147480032/946-320-S99-6"
},
"r14": {
"role": "http://www.xbrl.org/2003/role/disclosureRef",
"Topic": "946",
"SubTopic": "320",
"Name": "Accounting Standards Codification",
"Section": "S99",
"Paragraph": "7",
"Subparagraph": "(SX 210.12-15(Column A))",
"Publisher": "FASB",
"URI": "https://asc.fasb.org//1943274/2147480032/946-320-S99-7"
},
"r15": {
"role": "http://www.xbrl.org/2003/role/disclosureRef",
"Topic": "946",
"SubTopic": "320",
"Name": "Accounting Standards Codification",
"Section": "S99",
"Paragraph": "7",
"Subparagraph": "(SX 210.12-15(Column B))",
"Publisher": "FASB",
"URI": "https://asc.fasb.org//1943274/2147480032/946-320-S99-7"
},
"r16": {
"role": "http://www.xbrl.org/2003/role/disclosureRef",
"Topic": "946",
"SubTopic": "320",
"Name": "Accounting Standards Codification",
"Section": "S99",
"Paragraph": "7",
"Subparagraph": "(SX 210.12-15(Column C))",
"Publisher": "FASB",
"URI": "https://asc.fasb.org//1943274/2147480032/946-320-S99-7"
},
"r17": {
"role": "http://www.xbrl.org/2003/role/disclosureRef",
"Topic": "946",
"SubTopic": "320",
"Name": "Accounting Standards Codification",
"Section": "S99",
"Paragraph": "7",
"Subparagraph": "(SX 210.12-15(Column D))",
"Publisher": "FASB",
"URI": "https://asc.fasb.org//1943274/2147480032/946-320-S99-7"
},
"r18": {
"role": "http://www.xbrl.org/2003/role/exampleRef",
"Topic": "326",
"SubTopic": "20",
"Name": "Accounting Standards Codification",
"Section": "55",
"Paragraph": "15",
"Subparagraph": "(b)",
"Publisher": "FASB",
"URI": "https://asc.fasb.org//1943274/2147479294/326-20-55-15"
},
"r19": {
"role": "http://www.xbrl.org/2003/role/exampleRef",
"Topic": "946",
"SubTopic": "210",
"Name": "Accounting Standards Codification",
"Section": "55",
"Paragraph": "1",
"Publisher": "FASB",
"URI": "https://asc.fasb.org//1943274/2147480493/946-210-55-1"
},
"r20": {
"role": "http://www.xbrl.org/2003/role/presentationRef",
"Publisher": "SEC",
"Name": "Exchange Act",
"Number": "240",
"Section": "12",
"Subsection": "b-2"
},
"r21": {
"role": "http://www.xbrl.org/2003/role/presentationRef",
"Publisher": "SEC",
"Name": "Exchange Act",
"Number": "240",
"Section": "12",
"Subsection": "d1-1"
},
"r22": {
"role": "http://www.xbrl.org/2003/role/presentationRef",
"Publisher": "SEC",
"Name": "Form N-1A",
"Section": "1",
"Subsection": "a",
"Paragraph": "1"
},
"r23": {
"role": "http://www.xbrl.org/2003/role/presentationRef",
"Publisher": "SEC",
"Name": "Form N-1A",
"Section": "27A",
"Subsection": "b",
"Paragraph": "1"
},
"r24": {
"role": "http://www.xbrl.org/2003/role/presentationRef",
"Publisher": "SEC",
"Name": "Form N-1A",
"Section": "27A",
"Subsection": "b",
"Paragraph": "3"
},
"r25": {
"role": "http://www.xbrl.org/2003/role/presentationRef",
"Publisher": "SEC",
"Name": "Form N-1A",
"Section": "27A",
"Subsection": "b",
"Paragraph": "4"
},
"r26": {
"role": "http://www.xbrl.org/2003/role/presentationRef",
"Publisher": "SEC",
"Name": "Form N-1A",
"Section": "27A",
"Subsection": "b",
"Paragraph": "5"
},
"r27": {
"role": "http://www.xbrl.org/2003/role/presentationRef",
"Publisher": "SEC",
"Name": "Form N-1A",
"Section": "27A",
"Subsection": "b",
"Paragraph": "instruction",
"Subparagraph": "2"
},
"r28": {
"role": "http://www.xbrl.org/2003/role/presentationRef",
"Publisher": "SEC",
"Name": "Form N-1A",
"Section": "27A",
"Subsection": "c"
},
"r29": {
"role": "http://www.xbrl.org/2003/role/presentationRef",
"Publisher": "SEC",
"Name": "Form N-1A",
"Section": "27A",
"Subsection": "c",
"Paragraph": "ii"
},
"r30": {
"role": "http://www.xbrl.org/2003/role/presentationRef",
"Publisher": "SEC",
"Name": "Form N-1A",
"Section": "27A",
"Subsection": "c",
"Paragraph": "iii"
},
"r31": {
"role": "http://www.xbrl.org/2003/role/presentationRef",
"Publisher": "SEC",
"Name": "Form N-1A",
"Section": "27A",
"Subsection": "c",
"Paragraph": "instruction",
"Sentence": "1",
"Clause": "b"
},
"r32": {
"role": "http://www.xbrl.org/2003/role/presentationRef",
"Publisher": "SEC",
"Name": "Form N-1A",
"Section": "27A",
"Subsection": "c",
"Paragraph": "instruction",
"Subparagraph": "1",
"Clause": "c"
},
"r33": {
"role": "http://www.xbrl.org/2003/role/presentationRef",
"Publisher": "SEC",
"Name": "Form N-1A",
"Section": "27A",
"Subsection": "c",
"Paragraph": "instruction",
"Subparagraph": "1",
"Clause": "d"
},
"r34": {
"role": "http://www.xbrl.org/2003/role/presentationRef",
"Publisher": "SEC",
"Name": "Form N-1A",
"Section": "27A",
"Subsection": "d",
"Paragraph": "1"
},
"r35": {
"role": "http://www.xbrl.org/2003/role/presentationRef",
"Publisher": "SEC",
"Name": "Form N-1A",
"Section": "27A",
"Subsection": "d",
"Paragraph": "2"
},
"r36": {
"role": "http://www.xbrl.org/2003/role/presentationRef",
"Publisher": "SEC",
"Name": "Form N-1A",
"Section": "27A",
"Subsection": "d",
"Paragraph": "2",
"Subparagraph": "i"
},
"r37": {
"role": "http://www.xbrl.org/2003/role/presentationRef",
"Publisher": "SEC",
"Name": "Form N-1A",
"Section": "27A",
"Subsection": "d",
"Paragraph": "2",
"Subparagraph": "iii",
"Clause": "B"
},
"r38": {
"role": "http://www.xbrl.org/2003/role/presentationRef",
"Publisher": "SEC",
"Name": "Form N-1A",
"Section": "27A",
"Subsection": "d",
"Paragraph": "2",
"Subparagraph": "iiii",
"Clause": "A"
},
"r39": {
"role": "http://www.xbrl.org/2003/role/presentationRef",
"Publisher": "SEC",
"Name": "Form N-1A",
"Section": "27A",
"Subsection": "d",
"Paragraph": "2",
"Subparagraph": "instruction",
"Clause": "12"
},
"r40": {
"role": "http://www.xbrl.org/2003/role/presentationRef",
"Publisher": "SEC",
"Name": "Form N-1A",
"Section": "27A",
"Subsection": "d",
"Paragraph": "2",
"Subparagraph": "instruction",
"Clause": "14"
},
"r41": {
"role": "http://www.xbrl.org/2003/role/presentationRef",
"Publisher": "SEC",
"Name": "Form N-1A",
"Section": "27A",
"Subsection": "d",
"Paragraph": "2",
"Subparagraph": "instruction",
"Clause": "15"
},
"r42": {
"role": "http://www.xbrl.org/2003/role/presentationRef",
"Publisher": "SEC",
"Name": "Form N-1A",
"Section": "27A",
"Subsection": "d",
"Paragraph": "2",
"Subparagraph": "instruction",
"Clause": "7"
},
"r43": {
"role": "http://www.xbrl.org/2003/role/presentationRef",
"Publisher": "SEC",
"Name": "Form N-1A",
"Section": "27A",
"Subsection": "d",
"Paragraph": "2",
"Subparagraph": "instruction",
"Clause": "8"
},
"r44": {
"role": "http://www.xbrl.org/2003/role/presentationRef",
"Publisher": "SEC",
"Name": "Form N-1A",
"Section": "27A",
"Subsection": "d",
"Paragraph": "3"
},
"r45": {
"role": "http://www.xbrl.org/2003/role/presentationRef",
"Publisher": "SEC",
"Name": "Form N-1A",
"Section": "27A",
"Subsection": "d",
"Paragraph": "4"
},
"r46": {
"role": "http://www.xbrl.org/2003/role/presentationRef",
"Publisher": "SEC",
"Name": "Form N-1A",
"Section": "27A",
"Subsection": "d",
"Paragraph": "4",
"Subparagraph": "instruction",
"Clause": "3"
},
"r47": {
"role": "http://www.xbrl.org/2003/role/presentationRef",
"Publisher": "SEC",
"Name": "Form N-1A",
"Section": "27A",
"Subsection": "d",
"Paragraph": "4",
"Subparagraph": "instruction",
"Clause": "4"
},
"r48": {
"role": "http://www.xbrl.org/2003/role/presentationRef",
"Publisher": "SEC",
"Name": "Form N-1A",
"Section": "27A",
"Subsection": "e"
},
"r49": {
"role": "http://www.xbrl.org/2003/role/presentationRef",
"Publisher": "SEC",
"Name": "Form N-1A",
"Section": "27A",
"Subsection": "e",
"Paragraph": "instruction",
"Subparagraph": "6"
},
"r50": {
"role": "http://www.xbrl.org/2003/role/presentationRef",
"Publisher": "SEC",
"Name": "Form N-1A",
"Section": "27A",
"Subsection": "f"
},
"r51": {
"role": "http://www.xbrl.org/2003/role/presentationRef",
"Publisher": "SEC",
"Name": "Form N-1A",
"Section": "27A",
"Subsection": "g"
},
"r52": {
"role": "http://www.xbrl.org/2003/role/presentationRef",
"Publisher": "SEC",
"Name": "Form N-1A",
"Section": "27A",
"Subsection": "g",
"Paragraph": "1"
},
"r53": {
"role": "http://www.xbrl.org/2003/role/presentationRef",
"Publisher": "SEC",
"Name": "Form N-1A",
"Section": "27A",
"Subsection": "g",
"Paragraph": "2"
},
"r54": {
"role": "http://www.xbrl.org/2003/role/presentationRef",
"Publisher": "SEC",
"Name": "Form N-1A",
"Section": "27A",
"Subsection": "g",
"Paragraph": "3"
},
"r55": {
"role": "http://www.xbrl.org/2003/role/presentationRef",
"Publisher": "SEC",
"Name": "Form N-1A",
"Section": "27A",
"Subsection": "g",
"Paragraph": "4"
},
"r56": {
"role": "http://www.xbrl.org/2003/role/presentationRef",
"Publisher": "SEC",
"Name": "Form N-1A",
"Section": "27A",
"Subsection": "g",
"Paragraph": "5"
},
"r57": {
"role": "http://www.xbrl.org/2003/role/presentationRef",
"Publisher": "SEC",
"Name": "Form N-1A",
"Section": "27A",
"Subsection": "g",
"Paragraph": "6"
},
"r58": {
"role": "http://www.xbrl.org/2003/role/presentationRef",
"Publisher": "SEC",
"Name": "Form N-1A",
"Section": "27A",
"Subsection": "g",
"Paragraph": "instruction",
"Subparagraph": "2"
},
"r59": {
"role": "http://www.xbrl.org/2003/role/presentationRef",
"Publisher": "SEC",
"Name": "Form N-1A",
"Section": "27A",
"Subsection": "h",
"Paragraph": "1"
},
"r60": {
"role": "http://www.xbrl.org/2003/role/presentationRef",
"Publisher": "SEC",
"Name": "Form N-1A",
"Section": "27A",
"Subsection": "h",
"Paragraph": "2"
},
"r61": {
"role": "http://www.xbrl.org/2003/role/presentationRef",
"Publisher": "SEC",
"Name": "Form N-1A",
"Section": "3",
"Subsection": "instruction",
"Paragraph": "1",
"Subparagraph": "d",
"Sentence": "i"
},
"r62": {
"role": "http://www.xbrl.org/2003/role/presentationRef",
"Publisher": "SEC",
"Name": "Form N-1A",
"Section": "3",
"Subsection": "instruction",
"Paragraph": "3"
},
"r63": {
"role": "http://www.xbrl.org/2003/role/presentationRef",
"Publisher": "SEC",
"Name": "Form N-1A",
"Section": "3",
"Subsection": "instruction",
"Paragraph": "3",
"Subparagraph": "a"
},
"r64": {
"role": "http://www.xbrl.org/2003/role/presentationRef",
"Publisher": "SEC",
"Name": "Form N-1A",
"Section": "3",
"Subsection": "instruction",
"Paragraph": "3",
"Subparagraph": "b"
},
"r65": {
"role": "http://www.xbrl.org/2003/role/presentationRef",
"Publisher": "SEC",
"Name": "Form N-1A",
"Section": "3",
"Subsection": "instruction",
"Paragraph": "3",
"Subparagraph": "c",
"Sentence": "i"
},
"r66": {
"role": "http://www.xbrl.org/2003/role/presentationRef",
"Publisher": "SEC",
"Name": "Form N-1A",
"Section": "3",
"Subsection": "instruction",
"Paragraph": "3",
"Subparagraph": "c",
"Sentence": "iii"
},
"r67": {
"role": "http://www.xbrl.org/2003/role/presentationRef",
"Publisher": "SEC",
"Name": "Form N-1A",
"Section": "3",
"Subsection": "instruction",
"Paragraph": "3",
"Subparagraph": "d"
},
"r68": {
"role": "http://www.xbrl.org/2003/role/presentationRef",
"Publisher": "SEC",
"Name": "Form N-1A",
"Section": "3",
"Subsection": "instruction",
"Paragraph": "3",
"Subparagraph": "e"
},
"r69": {
"role": "http://www.xbrl.org/2003/role/presentationRef",
"Publisher": "SEC",
"Name": "Form N-1A",
"Section": "3",
"Subsection": "instruction",
"Paragraph": "3",
"Subparagraph": "f",
"Sentence": "i"
},
"r70": {
"role": "http://www.xbrl.org/2003/role/presentationRef",
"Publisher": "SEC",
"Name": "Form N-1A",
"Section": "4",
"Subsection": "b",
"Paragraph": "2",
"Subparagraph": "i"
},
"r71": {
"role": "http://www.xbrl.org/2003/role/presentationRef",
"Publisher": "SEC",
"Name": "Regulation S-T",
"Number": "232",
"Section": "313"
},
"r72": {
"role": "http://www.xbrl.org/2009/role/commonPracticeRef",
"Topic": "310",
"SubTopic": "10",
"Name": "Accounting Standards Codification",
"Section": "50",
"Paragraph": "29",
"Publisher": "FASB",
"URI": "https://asc.fasb.org//1943274/2147481962/310-10-50-29"
},
"r73": {
"role": "http://www.xbrl.org/2009/role/commonPracticeRef",
"Topic": "326",
"SubTopic": "20",
"Name": "Accounting Standards Codification",
"Section": "50",
"Paragraph": "5",
"Publisher": "FASB",
"URI": "https://asc.fasb.org//1943274/2147479319/326-20-50-5"
},
"r74": {
"role": "http://www.xbrl.org/2009/role/commonPracticeRef",
"Topic": "815",
"SubTopic": "10",
"Name": "Accounting Standards Codification",
"Section": "50",
"Paragraph": "4K",
"Subparagraph": "(a)(4)",
"Publisher": "FASB",
"URI": "https://asc.fasb.org//1943274/2147480434/815-10-50-4K"
},
"r75": {
"role": "http://www.xbrl.org/2009/role/commonPracticeRef",
"Topic": "946",
"SubTopic": "205",
"Name": "Accounting Standards Codification",
"Section": "50",
"Paragraph": "27",
"Publisher": "FASB",
"URI": "https://asc.fasb.org//1943274/2147480737/946-205-50-27"
}
}
}