
UNITED STATES
SECURITIES AND EXCHANGE COMMISSION
Washington, D.C. 20549
FORM N-CSR
CERTIFIED SHAREHOLDER REPORT OF REGISTERED MANAGEMENT
INVESTMENT COMPANIES
Investment Company Act file number: 811-02809
| Name of Fund: | BlackRock Advantage SMID Cap Fund, Inc. |
| Fund Address: | 100 Bellevue Parkway, Wilmington, DE 19809 |
Name and address of agent for service: John M. Perlowski, Chief Executive Officer, BlackRock Advantage SMID Cap Fund, Inc., 50 Hudson Yards, New York, NY 10001
Registrants’ telephone number, including area code: (800) 441-7762
Date of fiscal year end: 03/31/2023
Date of reporting period: 03/31/2023
Item 1 – Report to Stockholders
(a) The Report to Shareholders is attached herewith.
|
|
MARCH 31, 2023 |
| 2023 Annual Report | ||
BlackRock Advantage SMID Cap Fund, Inc.
| Not FDIC Insured • May Lose Value • No Bank Guarantee |
Dear Shareholder,
Significant economic headwinds emerged during the 12-month reporting period ended March 31, 2023, as investors navigated changing economic conditions and volatile markets. The U.S. economy shrank in the first half of 2022 before returning to modest growth in the second half of the year, marking a shift to a more challenging post-reopening economic environment. Changes in consumer spending patterns and a tight labor market led to elevated inflation, which reached a 40-year high before beginning to moderate.
Equity prices fell as interest rates rose, particularly during the first half of the reporting period. Both large- and small-capitalization U.S. stocks declined, although equities began to recover in the second half of the period as inflation eased and economic growth resumed. Emerging market stocks and international equities from developed markets declined overall, pressured by rising interest rates and volatile commodities prices.
The 10-year U.S. Treasury yield rose during the reporting period, driving its price down, as investors reacted to fluctuating inflation data and attempted to anticipate its impact on future interest rate changes. The corporate bond market also faced inflationary headwinds, and higher interest rates led to rising borrowing costs for corporate issuers.
The U.S. Federal Reserve (the “Fed”), acknowledging that inflation has been more persistent than expected, raised interest rates eight times. Furthermore, the Fed wound down its bond-buying programs and accelerated the reduction of its balance sheet.
Restricted labor supply kept inflation elevated even as other inflation drivers, such as goods prices and energy costs, moderated. While economic growth slowed in the last year, we believe that taming inflation requires a more substantial decline that lowers demand to a level more in line with the economy’s productive capacity. Although the Fed has decelerated the pace of interest rate hikes, we believe that it still seems determined to get inflation back to target. With this in mind, we believe the possibility of a U.S. recession in the near-term is high, but the dimming economic outlook has not yet been fully reflected in current market prices. We believe investors should expect a period of higher volatility as markets adjust to the new economic reality and policymakers attempt to adapt to rapidly changing conditions. Turmoil in the banking sector late in the period highlighted the potential for the knock-on effects of substantially higher interest rates to disrupt markets with little warning.
While we favor an overweight to equities in the long term, we prefer an underweight stance on equities overall in the near term. Expectations for corporate earnings remain elevated, which seems inconsistent with the possibility of a recession. Nevertheless, we are overweight on emerging market stocks as we believe a weakening U.S. dollar provides a supportive backdrop. We also see long-term opportunities in credit, where we believe that valuations are appealing and higher yields provide attractive income, although we are neutral on credit in the near term, as we’re concerned about tightening credit and financial conditions. However, we believe there are still some strong opportunities for a six- to twelve-month horizon, particularly short-term U.S. Treasuries, global inflation-linked bonds, and emerging market bonds denominated in local currency.
Overall, our view is that investors need to think globally, position themselves to be prepared for a decarbonizing economy, and be nimble as market conditions change. We encourage you to talk with your financial advisor and visit blackrock.com for further insight about investing in today’s markets.
Sincerely,

Rob Kapito
President, BlackRock Advisors, LLC

Rob Kapito
President, BlackRock Advisors, LLC
| Total Returns as of March 31, 2023 | ||||
| 6-Month | 12-Month | |||
| U.S. large cap equities |
15.62% | (7.73)% | ||
| U.S. small cap equities |
9.14 | (11.61) | ||
| International equities |
27.27 | (1.38) | ||
| Emerging market equities |
14.04 | (10.70) | ||
| 3-month Treasury bills |
1.93 | 2.52 | ||
| U.S. Treasury securities |
4.38 | (6.90) | ||
| U.S. investment grade bonds |
4.89 | (4.78) | ||
|
Tax-exempt municipal bonds |
7.00 | 0.26 | ||
| U.S. high yield bonds |
7.88 | (3.35) | ||
| Past performance is not an indication of future results. Index performance is shown for illustrative purposes only. You cannot invest directly in an index. | ||||
| 2 | T H I S P A G E I S N O T P A R T O F Y O U R F U N D R E P O R T |
| Page | ||||
| 2 | ||||
| Annual Report: |
||||
| 4 | ||||
| 7 | ||||
| 7 | ||||
| 8 | ||||
| Financial Statements: |
||||
| 9 | ||||
| 18 | ||||
| 20 | ||||
| 21 | ||||
| 22 | ||||
| 27 | ||||
| 36 | ||||
| 37 | ||||
| 38 | ||||
| 39 | ||||
| 44 | ||||
| 46 | ||||

| 3 |
| Fund Summary as of March 31, 2023 | BlackRock Advantage SMID Cap Fund, Inc. |
Investment Objective
BlackRock Advantage SMID Cap Fund, Inc.’s (the “Fund”) investment objective is to seek long-term capital appreciation.
Portfolio Management Commentary
How did the Fund perform?
For the 12-month period ended March 31, 2023, all of the Fund’s share classes outperformed its benchmark, the Russell 2500™ Index.
What factors influenced performance?
The reporting period was highlighted by a continuation of market volatility, with equities testing new lows amid both inflationary pressures and policy normalization concerns. In 2022, markets had to digest a total of seven interest rate hikes, surging commodity prices after the Russian invasion of Ukraine that added to inflation fears, and China’s zero-COVID policy continuing to disrupt global supply chains. Investors believed that central banks were late to respond to rising prices, which resulted in a yield curve inversion that was persistent throughout the period and raised concerns about economic growth. The inflation picture simultaneously evolved, as goods prices moderated while price gains in services accelerated, led by labor market tightness that is a key focus of the Fed. The Fed’s 75 basis-point rate hike in June 2022 continued to add pressure to risk assets. Despite this, markets staged a bear-market rally during the summer of 2022, as investors interpreted softening economic data as an indication that policymakers would make a dovish policy pivot. The recovery proved premature, as central banks reaffirmed their focus on inflation and delivered a total of four 75 basis-point rate hikes during the period. The rapid rate-hiking cycle prompted a selloff in equities in September 2022. Yet as signs emerged supporting the idea that inflation had peaked and due in part to a robust earnings season, markets recovered in October and November 2022, with gains partially reversing in December 2022. This capped a challenging year, as both stocks and bonds declined for only the third calendar year since 1926. Heading into 2023, equities had a strong start to the year, supported by economic growth above expectations, falling inflation led by lower energy prices, and the China reopening. However, sticky core inflation led policymakers to reiterate their hawkish rhetoric in February 2023, as markets retreated and yields rose. Cracks began to show in the financial system in March 2023, as the failure of SVB Financial led to a sharp selloff across the sector. This brought forward recession expectations, with markets pricing in interest rate cuts by the end of 2023. The resultant fall in yields led to growth briefly outperforming value as market leadership moved toward large-cap information technology (“IT”) names. The Fed, however, raised rates in March 2023, highlighting its focus on inflation while calming financial stability concerns. Market leadership remained largely intact, with value stocks continuing to outperform into period-end. Energy and materials stocks initially led this move before rotating to more defensive stocks within utilities and consumer staples, as ongoing statements from central bank officials suggesting tighter monetary policy combined with softening economic data escalated recession worries.
The Fund performed well despite facing a highly changeable market backdrop. This was predominantly due to the strong performance of sentiment measures throughout the reporting period. Stock selection from trending sentiment measures provided durable performance, particularly among those measures evaluating text analyses of conference calls and broker reports. Additionally, sentiment measures looking at short-seller positioning were additive in motivating a successful overweight allocation to industrials, while other insights looking at retail investor positioning motivated a successful underweight allocation to financials.
Fundamental insights were mixed during the reporting period, with more traditional and defensive measures performing well. A top performer was a stability-related insight with a preference for lower-risk securities, which motivated a successful overweight allocation to consumer discretionary stocks. Elsewhere, insights penalizing equity dilution positioned the portfolio well among energy stocks. Similarly, traditional valuation measures were also strong contributors amid the market-style preference.
By contrast, non-traditional fundamental quality insights, which tend to have a growth orientation, led declines. Specifically, employee quality-related insights such as those evaluating corporate culture, company H-1B visa filings, and companies retaining founders in their C-suites were top detractors. This quality theme was further evident from a different measure that also looks at corporate culture, as it also detracted from performance.
Elsewhere, macrothematic measures also struggled. This was led by an insight which analyzes broker reports looking for companies that should benefit from increased cybersecurity and defense spending considering the military conflict in Europe. This measure proved wrong-footed within the IT and industrials sectors. Additionally, an insight that favors companies that do well in a flattening yield-curve environment struggled amid the rapidly shifting expectations about policy.
Describe recent portfolio activity.
The Fund maintained a balanced allocation of risk across all major drivers of return during the reporting period. However, there were several new signals added within the Fund’s group of stock selection insights. The Fund built upon its existing alternative data capabilities with enhanced data sets to capture informed investor positioning and to identify emerging trends, such as sentiment around supply chain disruptions, wage inflation, and business sensitivity to the Russian invasion of Ukraine. Additionally, macrothematic insights were added using historical observations of stagflation and policy normalization to motivate top-down positioning. Further, within consumer intent insights, the Fund added a measure that looks at social media activity as an indicator of potential revenue growth. In addition, the Fund built upon its employee-related measures by adding an insight that identifies organizations at risk of emerging labor disputes. Finally, in light of the crisis in the financial sector, the Fund included an aggregate bank-quality signal that favors banks with low-growing total deposits, low levels of losses on available-for-sale security holdings, low exposure to the Bay Area, high ratios of cash to assets, and low levels of uninsured deposits.
Describe portfolio positioning at period end.
From a sector positioning perspective, relative to the Russell 2500™ Index, the Fund’s positioning remained largely sector-neutral. The Fund maintained slight overweight allocations to healthcare and consumer discretionary companies, and maintained slight underweight positions in the materials and utilities sectors.
The views expressed reflect the opinions of BlackRock as of the date of this report and are subject to change based on changes in market, economic or other conditions. These views are not intended to be a forecast of future events and are no guarantee of future results.
| 4 |
2 0 2 3 B L A C K R O C K A N N U A L R E P O R T T O S H A R E H O L D E R S |
| Fund Summary as of March 31, 2023 (continued) | BlackRock Advantage SMID Cap Fund, Inc. |
GROWTH OF $10,000 INVESTMENT
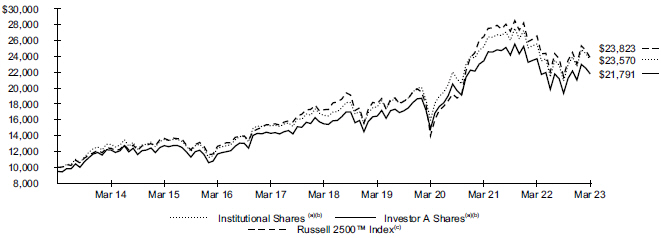
| (a) | Assuming maximum sales charges, if any, transaction costs and other operating expenses, including investment advisory fees and administration fees, if any. Institutional Shares do not have a sales charge. |
| (b) | Under normal circumstances, the Fund seeks to invest at least 80% of its net assets, plus the amount of any borrowings for investment purposes, in equity securities of U.S. small and medium capitalization companies, and derivatives that have similar economic characteristics to such securities. The Fund primarily intends to invest in equity securities or other financial instruments that are components of, or have characteristics similar to, the securities included in the Russell 2500™ Index. The Fund’s total returns for the period between December 15, 2017 and February 8, 2021 are the returns of the Fund when it followed different investment strategies under the name “BlackRock Advantage U.S. Total Market Fund, Inc.” The Fund’s total returns for the period prior to December 15, 2017 are the returns of the Fund when it followed a different investment objective and different investment strategies under the name “BlackRock Value Opportunities Fund, Inc.” |
| (c) | An index that measures the performance of the small to mid-cap segment of the U.S. equity universe, commonly referred to as “smid” cap. The Russell 2500™ Index is a subset of the Russell 3000® Index. It includes approximately 2,500 of the smallest securities based on a combination of their market cap and current index membership. |
Performance
| Average Annual Total Returns(a)(b) | ||||||||||||||||||||||||||||||||
| 1 Year | 5 Years | 10 Years | ||||||||||||||||||||||||||||||
| Without Sales Charge |
With Sales Charge |
Without Sales Charge |
With Sales Charge |
Without Sales Charge |
With Sales Charge |
|||||||||||||||||||||||||||
| Institutional |
(7.86 | )% | N/A | 7.34 | % | N/A | 8.95 | % | N/A | |||||||||||||||||||||||
| Investor A |
(8.10 | ) | (12.93 | )% | 7.08 | 5.93 | % | 8.68 | 8.10 | % | ||||||||||||||||||||||
| Investor C |
(8.78 | ) | (9.68 | ) | 6.27 | 6.27 | 7.99 | 7.99 | ||||||||||||||||||||||||
| Class K |
(7.83 | ) | N/A | 7.37 | N/A | 8.97 | N/A | |||||||||||||||||||||||||
| Class R |
(8.37 | ) | N/A | 6.82 | N/A | 8.39 | N/A | |||||||||||||||||||||||||
| Russell 2500TM Index |
(10.39 | ) | N/A | 6.65 | N/A | 9.07 | N/A | |||||||||||||||||||||||||
| (a) | Assuming maximum sales charges, if any. Average annual total returns with and without sales charges reflect reductions for distribution and service fees. See “About Fund Performance” for a detailed description of share classes, including any related sales charges and fees, and how performance was calculated for certain share classes. |
| (b) | Under normal circumstances, the Fund seeks to invest at least 80% of its net assets, plus the amount of any borrowings for investment purposes, in equity securities of U.S. small and medium capitalization companies, and derivatives that have similar economic characteristics to such securities. The Fund primarily intends to invest in equity securities or other financial instruments that are components of, or have characteristics similar to, the securities included in the Russell 2500™ Index. The Fund’s total returns for the period between December 15, 2017 and February 8, 2021 are the returns of the Fund when it followed different investment strategies under the name “BlackRock Advantage U.S. Total Market Fund, Inc.” The Fund’s total returns for the period prior to December 15, 2017 are the returns of the Fund when it followed a different investment objective and different investment strategies under the name “BlackRock Value Opportunities Fund, Inc. |
N/A - Not applicable as share class and index do not have a sales charge.
Past performance is not an indication of future results.
Performance results may include adjustments made for financial reporting purposes in accordance with U.S. generally accepted accounting principles.
| F U N D S U M M A R Y |
5 |
| Fund Summary as of March 31, 2023 (continued) | BlackRock Advantage SMID Cap Fund, Inc. |
Expense Example
| Actual | Hypothetical 5% Return | |||||||||||||||||||||||||||||||
| |
Beginning Account Value (10/01/22) |
|
|
Ending Account Value (03/31/23) |
|
|
Expenses Paid During the Period |
(a) |
|
Beginning Account Value (10/01/22) |
|
|
Ending Account Value (03/31/23) |
|
|
Expenses Paid During the Period |
(a) |
|
Annualized Expense Ratio |
| ||||||||||||
| Institutional |
$ 1,000.00 | $ 1,128.00 | $ 2.55 | $ 1,000.00 | $ 1,022.53 | $ 2.42 | 0.48 | % | ||||||||||||||||||||||||
| Investor A |
1,000.00 | 1,126.50 | 3.88 | 1,000.00 | 1,021.28 | 3.68 | 0.73 | |||||||||||||||||||||||||
| Investor C |
1,000.00 | 1,121.90 | 7.84 | 1,000.00 | 1,017.54 | 7.44 | 1.48 | |||||||||||||||||||||||||
| Class K |
1,000.00 | 1,128.10 | 2.29 | 1,000.00 | 1,022.78 | 2.17 | 0.43 | |||||||||||||||||||||||||
| Class R |
1,000.00 | 1,124.70 | 5.20 | 1,000.00 | 1,020.04 | 4.94 | 0.98 | |||||||||||||||||||||||||
| (a) | For each class of the Fund, expenses are equal to the annualized expense ratio for the class, multiplied by the average account value over the period, multiplied by 182/365 (to reflect the one-half year period shown). |
See “Disclosure of Expenses” for further information on how expenses were calculated.
Portfolio Information
TEN LARGEST HOLDINGS
| Security(a) | Percent of Net Assets |
|||
| Snap-on, Inc. |
1.3 | % | ||
| Manhattan Associates, Inc. |
1.3 | |||
| AECOM |
1.3 | |||
| KBR, Inc. |
1.2 | |||
| Cboe Global Markets, Inc. |
1.2 | |||
| Boyd Gaming Corp. |
1.2 | |||
| Owens Corning |
1.2 | |||
| Magnolia Oil & Gas Corp., Class A |
1.2 | |||
| Regency Centers Corp. |
1.2 | |||
| TD SYNNEX Corp. |
1.2 | |||
SECTOR ALLOCATION
| Sector(b) | Percent of Net Assets |
|||
| Industrials |
20.2 | % | ||
| Financials |
14.2 | |||
| Information Technology |
13.6 | |||
| Health Care |
13.5 | |||
| Consumer Discretionary |
13.0 | |||
| Real Estate |
6.8 | |||
| Materials |
4.7 | |||
| Energy |
4.2 | |||
| Communication Services |
3.5 | |||
| Consumer Staples |
2.8 | |||
| Utilities |
1.8 | |||
| Short-Term Securities |
2.5 | |||
| Liabilities in Excess of Other Assets |
(0.8 | ) | ||
| (a) | Excludes short-term investments. |
| (b) | For Fund compliance purposes, the Fund’s sector classifications refer to one or more of the sector sub-classifications used by one or more widely recognized market indexes or ratings group indexes, and/or as defined by the investment adviser. These definitions may not apply for purposes of this report, which may combine such sector sub-classifications for reporting ease. |
| 6 |
2 0 2 3 B L A C K R O C K A N N U A L R E P O R T T O S H A R E H O L D E R S |
Institutional and Class K Shares are not subject to any sales charge. These shares bear no ongoing distribution or service fees and are available only to certain eligible investors. Class K Shares performance shown prior to the Class K Shares inception date of January 25, 2018 is that of Institutional Shares. The performance of the Fund’s Class K Shares would be substantially similar to Institutional Shares because Class K Shares and Institutional Shares invest in the same portfolio of securities and performance would only differ to the extent that Class K Shares and Institutional Shares have different expenses. The actual returns of Class K Shares would have been higher than those of the Institutional Shares because Class K Shares have lower expenses than the Institutional Shares.
Investor A Shares are subject to a maximum initial sales charge (front-end load) of 5.25% and a service fee of 0.25% per year (but no distribution fee). Certain redemptions of these shares may be subject to a contingent deferred sales charge (“CDSC”) where no initial sales charge was paid at the time of purchase. These shares are generally available through financial intermediaries.
Investor C Shares are subject to a 1.00% CDSC if redeemed within one year of purchase. In addition, these shares are subject to a distribution fee of 0.75% per year and a service fee of 0.25% per year. These shares are generally available through financial intermediaries. These shares automatically convert to Investor A Shares after approximately eight years.
Class R Shares are not subject to any sales charge. These shares are subject to a distribution fee of 0.25% per year and a service fee of 0.25% per year. These shares are available only to certain employer-sponsored retirement plans.
Past performance is not an indication of future results. Financial markets have experienced extreme volatility and trading in many instruments has been disrupted. These circumstances may continue for an extended period of time and may continue to affect adversely the value and liquidity of the Fund’s investments. As a result, current performance may be lower or higher than the performance data quoted. Refer to blackrock.com to obtain performance data current to the most recent month-end. Performance results do not reflect the deduction of taxes that a shareholder would pay on Fund distributions or the redemption of Fund shares. Figures shown in the performance table assume reinvestment of all distributions, if any, at net asset value (“NAV”) on the ex-dividend date or payable date, as applicable. Investment return and principal value of shares will fluctuate so that shares, when redeemed, may be worth more or less than their original cost. Distributions paid to each class of shares will vary because of the different levels of service, distribution and transfer agency fees applicable to each class, which are deducted from the income available to be paid to shareholders.
BlackRock Advisors, LLC (the “Manager”), the Fund’s investment adviser, has contractually and/or voluntarily agreed to waive and/or reimburse a portion of the Fund’s expenses. Without such waiver(s) and/or reimbursement(s), the Fund’s performance would have been lower. With respect to the Fund’s voluntary waiver(s), if any, the Manager is under no obligation to waive and/or reimburse or to continue waiving and/or reimbursing its fees and such voluntary waiver(s) may be reduced or discontinued at any time. With respect to the Fund’s contractual waiver(s), if any, the Manager is under no obligation to continue waiving and/or reimbursing its fees after the applicable termination date of such agreement. See the Notes to Financial Statements for additional information on waivers and/or reimbursements.
Shareholders of the Fund may incur the following charges: (a) transactional expenses, such as sales charges; and (b) operating expenses, including investment advisory fees, administration fees, service and distribution fees, including 12b-1 fees, acquired fund fees and expenses, and other fund expenses. The expense example shown (which is based on a hypothetical investment of $1,000 invested at the beginning of the period and held through the end of the period) is intended to assist shareholders both in calculating expenses based on an investment in the Fund and in comparing these expenses with similar costs of investing in other mutual funds.
The expense example provides information about actual account values and actual expenses. Annualized expense ratios reflect contractual and voluntary fee waivers, if any. In order to estimate the expenses a shareholder paid during the period covered by this report, shareholders can divide their account value by $1,000 and then multiply the result by the number corresponding to their share class under the heading entitled “Expenses Paid During the Period.”
The expense example also provides information about hypothetical account values and hypothetical expenses based on the Fund’s actual expense ratio and an assumed rate of return of 5% per year before expenses. In order to assist shareholders in comparing the ongoing expenses of investing in the Fund and other funds, compare the 5% hypothetical example with the 5% hypothetical examples that appear in shareholder reports of other funds.
The expenses shown in the expense example are intended to highlight shareholders’ ongoing costs only and do not reflect transactional expenses, such as sales charges, if any. Therefore, the hypothetical example is useful in comparing ongoing expenses only and will not help shareholders determine the relative total expenses of owning different funds. If these transactional expenses were included, shareholder expenses would have been higher.
| A B O U T F U N D P E R F O R M A N C E / D I S C L O S U R E O F E X P E N S E S |
7 |
Derivative Financial Instruments
The Fund may invest in various derivative financial instruments. These instruments are used to obtain exposure to a security, commodity, index, market, and/or other assets without owning or taking physical custody of securities, commodities and/or other referenced assets or to manage market, equity, credit, interest rate, foreign currency exchange rate, commodity and/or other risks. Derivative financial instruments may give rise to a form of economic leverage and involve risks, including the imperfect correlation between the value of a derivative financial instrument and the underlying asset, possible default of the counterparty to the transaction or illiquidity of the instrument. Pursuant to Rule 18f-4 under the 1940 Act, among other things, the Fund must either use derivative financial instruments with embedded leverage in a limited manner or comply with an outer limit on fund leverage risk based on value-at-risk. The Fund’s successful use of a derivative financial instrument depends on the investment adviser’s ability to predict pertinent market movements accurately, which cannot be assured. The use of these instruments may result in losses greater than if they had not been used, may limit the amount of appreciation the Fund can realize on an investment and/or may result in lower distributions paid to shareholders. The Fund’s investments in these instruments, if any, are discussed in detail in the Notes to Financial Statements.
| 8 |
2 0 2 3 B L A C K R O C K A N N U A L R E P O R T T O S H A R E H O L D E R S |
|
March 31, 2023 |
BlackRock Advantage SMID Cap Fund, Inc. (Percentages shown are based on Net Assets) |
| Security | Shares | Value | ||||||
| Common Stocks |
| |||||||
| Aerospace & Defense — 1.5% |
||||||||
| Axon Enterprise, Inc.(a) |
8,104 | $ | 1,822,184 | |||||
| Curtiss-Wright Corp. |
12,390 | 2,183,862 | ||||||
| Moog, Inc., Class A |
1,674 | 168,656 | ||||||
| Textron, Inc. |
13,218 | 933,587 | ||||||
|
|
|
|||||||
| 5,108,289 | ||||||||
| Air Freight & Logistics — 0.6% |
||||||||
| Hub Group, Inc., Class A(a) |
23,910 | 2,007,005 | ||||||
|
|
|
|||||||
| Automobile Components — 1.4% |
||||||||
| BorgWarner, Inc. |
5,640 | 276,980 | ||||||
| Cooper-Standard Holdings, Inc.(a) |
20,127 | 286,609 | ||||||
| Dana, Inc. |
9,221 | 138,776 | ||||||
| Goodyear Tire & Rubber Co.(a)(b) |
60,572 | 667,503 | ||||||
| Lear Corp. |
22,314 | 3,112,580 | ||||||
| Modine Manufacturing Co.(a) |
6,340 | 146,137 | ||||||
| Visteon Corp.(a) |
1,356 | 212,662 | ||||||
|
|
|
|||||||
| 4,841,247 | ||||||||
| Automobiles — 0.0% |
||||||||
| Winnebago Industries, Inc. |
2,283 | 131,729 | ||||||
|
|
|
|||||||
| Banks — 4.9% |
||||||||
| 1st Source Corp. |
2,460 | 106,149 | ||||||
| Amalgamated Financial Corp. |
34,183 | 604,697 | ||||||
| Bank of Hawaii Corp. |
1,522 | 79,266 | ||||||
| BankFinancial Corp. |
7,002 | 61,268 | ||||||
| Bar Harbor Bankshares |
3,990 | 105,536 | ||||||
| Business First Bancshares, Inc. |
2,126 | 36,418 | ||||||
| Capital City Bank Group, Inc. |
3,421 | 100,270 | ||||||
| Comerica, Inc. |
56,673 | 2,460,742 | ||||||
| Eagle Bancorp Montana, Inc. |
1,922 | 27,119 | ||||||
| East West Bancorp, Inc. |
19,098 | 1,059,939 | ||||||
| Enterprise Financial Services Corp. |
8,962 | 399,616 | ||||||
| FB Financial Corp. |
8,128 | 252,618 | ||||||
| First Bank |
22,206 | 224,281 | ||||||
| First Busey Corp. |
2,793 | 56,810 | ||||||
| First Business Financial Services, Inc. |
1,787 | 54,521 | ||||||
| First Foundation, Inc. |
4,800 | 35,760 | ||||||
| First Northwest Bancorp |
4,722 | 54,303 | ||||||
| Hancock Whitney Corp. |
21,330 | 776,412 | ||||||
| Heartland Financial U.S.A., Inc. |
36,621 | 1,404,782 | ||||||
| Heritage Commerce Corp. |
12,357 | 102,934 | ||||||
| HomeTrust Bancshares, Inc. |
7,182 | 176,605 | ||||||
| Horizon Bancorp, Inc. |
27,470 | 303,818 | ||||||
| Independent Bank Corp. |
73,470 | 1,305,562 | ||||||
| Investar Holding Corp. |
1,484 | 20,717 | ||||||
| Lakeland Bancorp, Inc. |
9,565 | 149,597 | ||||||
| Mercantile Bank Corp. |
5,299 | 162,043 | ||||||
| Metropolitan Bank Holding Corp.(a) |
6,883 | 233,265 | ||||||
| Midland States Bancorp, Inc. |
24,484 | 524,447 | ||||||
| Northrim BanCorp, Inc. |
1,525 | 71,950 | ||||||
| Oak Valley Bancorp |
837 | 19,803 | ||||||
| OceanFirst Financial Corp. |
58,706 | 1,084,887 | ||||||
| Origin Bancorp, Inc. |
3,049 | 98,025 | ||||||
| Pinnacle Financial Partners, Inc. |
40,640 | 2,241,702 | ||||||
| Republic First Bancorp, Inc.(a) |
87,118 | 118,480 | ||||||
| Shore Bancshares, Inc. |
13,529 | 193,194 | ||||||
| Southern First Bancshares, Inc.(a) |
1,503 | 46,142 | ||||||
| Summit Financial Group, Inc. |
2,819 | 58,494 | ||||||
| Towne Bank |
1,817 | 48,423 | ||||||
| Univest Financial Corp. |
11,556 | 274,339 | ||||||
| Washington Trust Bancorp, Inc. |
4,359 | 151,083 | ||||||
| Security | Shares | Value | ||||||
| Banks (continued) |
||||||||
| WesBanco, Inc. |
3,270 | $ | 100,389 | |||||
| Western New England Bancorp, Inc. |
15,692 | 128,831 | ||||||
| Wintrust Financial Corp. |
17,128 | 1,249,488 | ||||||
| Zions Bancorp N.A. |
3,811 | 114,063 | ||||||
|
|
|
|||||||
| 16,878,788 | ||||||||
| Beverages — 0.6% |
||||||||
| Primo Water Corp. |
124,609 | 1,912,748 | ||||||
|
|
|
|||||||
| Biotechnology — 5.1% |
||||||||
| 4D Molecular Therapeutics, Inc.(a) |
5,279 | 90,746 | ||||||
| Agenus, Inc.(a) |
39,015 | 59,303 | ||||||
| Alector, Inc.(a) |
47,323 | 292,929 | ||||||
| Alkermes PLC(a) |
7,947 | 224,026 | ||||||
| Allakos, Inc.(a) |
27,790 | 123,665 | ||||||
| ALX Oncology Holdings, Inc.(a) |
4,955 | 22,397 | ||||||
| Applied Molecular Transport, Inc.(a) |
16,205 | 5,186 | ||||||
| Arcus Biosciences, Inc.(a) |
22,805 | 415,963 | ||||||
| ARS Pharmaceuticals, Inc.(a) |
13,527 | 88,061 | ||||||
| Atara Biotherapeutics, Inc.(a) |
17,940 | 52,026 | ||||||
| Atreca, Inc., Class A(a) |
39,408 | 44,925 | ||||||
| Beam Therapeutics, Inc.(a) |
1,984 | 60,750 | ||||||
| Beyondspring, Inc.(a) |
4,828 | 5,407 | ||||||
| Black Diamond Therapeutics, Inc.(a) |
18,150 | 34,304 | ||||||
| Blueprint Medicines Corp.(a) |
7,007 | 315,245 | ||||||
| CareDx, Inc.(a) |
10,886 | 99,498 | ||||||
| Coherus Biosciences, Inc.(a) |
38,586 | 263,928 | ||||||
| CRISPR Therapeutics AG(a) |
20,814 | 941,417 | ||||||
| Deciphera Pharmaceuticals, Inc.(a) |
30,383 | 469,417 | ||||||
| Denali Therapeutics, Inc.(a) |
8,212 | 189,204 | ||||||
| Editas Medicine, Inc.(a)(b) |
16,743 | 121,387 | ||||||
| Emergent BioSolutions, Inc.(a) |
28,920 | 299,611 | ||||||
| Exact Sciences Corp.(a) |
1,277 | 86,593 | ||||||
| Exelixis, Inc.(a) |
117,305 | 2,276,890 | ||||||
| Fate Therapeutics, Inc.(a) |
89,200 | 508,440 | ||||||
| FibroGen, Inc.(a) |
2,979 | 55,588 | ||||||
| Foghorn Therapeutics, Inc.(a)(b) |
5,601 | 34,726 | ||||||
| Halozyme Therapeutics, Inc.(a) |
25,452 | 972,012 | ||||||
| Heron Therapeutics, Inc.(a) |
30,817 | 46,534 | ||||||
| Intercept Pharmaceuticals, Inc.(a) |
5,370 | 72,119 | ||||||
| Ironwood Pharmaceuticals, Inc., Class A(a) |
10,004 | 105,242 | ||||||
| Karyopharm Therapeutics, Inc.(a) |
53,751 | 209,091 | ||||||
| Kiniksa Pharmaceuticals Ltd., Class A(a) |
15,494 | 166,715 | ||||||
| Kodiak Sciences, Inc.(a) |
32,916 | 204,079 | ||||||
| Kronos Bio, Inc.(a) |
77,621 | 113,327 | ||||||
| MacroGenics, Inc.(a) |
28,186 | 202,094 | ||||||
| Metacrine, Inc.(a) |
10,531 | 6,009 | ||||||
| Neurocrine Biosciences, Inc.(a) |
21,480 | 2,174,206 | ||||||
| NextCure, Inc.(a) |
14,673 | 21,716 | ||||||
| Nkarta, Inc.(a) |
8,147 | 28,922 | ||||||
| Olema Pharmaceuticals, Inc.(a) |
33,440 | 116,037 | ||||||
| Oncorus, Inc.(a) |
2,294 | 789 | ||||||
| Passage Bio, Inc.(a) |
10,758 | 10,303 | ||||||
| Poseida Therapeutics, Inc.(a)(b) |
24,769 | 76,289 | ||||||
| Precision BioSciences, Inc.(a) |
19,743 | 14,878 | ||||||
| PTC Therapeutics, Inc.(a) |
8,797 | 426,127 | ||||||
| Puma Biotechnology, Inc.(a) |
4,939 | 15,262 | ||||||
| Quince Therapeutics, Inc.(a)(b) |
8,421 | 13,137 | ||||||
| Recursion Pharmaceuticals, Inc., Class A(a) |
12,505 | 83,408 | ||||||
| REGENXBIO, Inc.(a) |
87,138 | 1,647,780 | ||||||
| Relay Therapeutics, Inc.(a) |
6,096 | 100,401 | ||||||
| Sana Biotechnology, Inc.(a) |
7,096 | 23,204 | ||||||
| Sangamo Therapeutics, Inc.(a)(b) |
71,734 | 126,252 | ||||||
| Scholar Rock Holding Corp.(a) |
10,545 | 84,360 | ||||||
| S C H E D U L E O F I N V E S T M E N T S |
9 |
| Schedule of Investments (continued) March 31, 2023 |
BlackRock Advantage SMID Cap Fund, Inc. (Percentages shown are based on Net Assets) |
| Security | Shares | Value | ||||||
| Biotechnology (continued) |
||||||||
| Solid Biosciences, Inc.(a) |
723 | $ | 3,425 | |||||
| Spruce Biosciences, Inc.(a) |
690 | 1,525 | ||||||
| SQZ Biotechnologies Co.(a) |
1,031 | 577 | ||||||
| Sutro Biopharma, Inc.(a) |
20,383 | 94,169 | ||||||
| Twist Bioscience Corp.(a) |
32,037 | 483,118 | ||||||
| Ultragenyx Pharmaceutical, Inc.(a) |
33,726 | 1,352,413 | ||||||
| United Therapeutics Corp.(a) |
2,308 | 516,900 | ||||||
| Veracyte, Inc.(a) |
5,746 | 128,136 | ||||||
| Vincerx Pharma, Inc.(a) |
8,097 | 8,421 | ||||||
| Vir Biotechnology, Inc.(a) |
23,302 | 542,238 | ||||||
| Voyager Therapeutics, Inc.(a) |
10,931 | 84,278 | ||||||
| X4 Pharmaceuticals, Inc.(a) |
10,021 | 8,718 | ||||||
|
|
|
|||||||
| 17,465,843 | ||||||||
| Broadline Retail — 0.5% |
||||||||
| Dillard’s, Inc., Class A |
2,667 | 820,583 | ||||||
| Kohl’s Corp. |
10,755 | 253,173 | ||||||
| Macy’s, Inc. |
40,221 | 703,465 | ||||||
|
|
|
|||||||
| 1,777,221 | ||||||||
| Building Products — 3.1% |
||||||||
| A O Smith Corp. |
22,542 | 1,558,779 | ||||||
| Allegion PLC |
22,496 | 2,400,998 | ||||||
| Builders FirstSource, Inc.(a) |
1,044 | 92,686 | ||||||
| Caesarstone Ltd. |
9,358 | 38,649 | ||||||
| Carlisle Cos., Inc. |
824 | 186,282 | ||||||
| Owens Corning |
43,136 | 4,132,429 | ||||||
| UFP Industries, Inc. |
27,560 | 2,190,193 | ||||||
|
|
|
|||||||
| 10,600,016 | ||||||||
| Capital Markets — 3.3% |
||||||||
| Carlyle Group, Inc. |
67,758 | 2,104,564 | ||||||
| Cboe Global Markets, Inc. |
31,753 | 4,262,523 | ||||||
| Houlihan Lokey, Inc., Class A |
3,864 | 338,061 | ||||||
| Invesco Ltd. |
52,109 | 854,588 | ||||||
| LPL Financial Holdings, Inc. |
8,590 | 1,738,616 | ||||||
| MarketAxess Holdings, Inc. |
200 | 78,258 | ||||||
| Stifel Financial Corp. |
28,805 | 1,702,087 | ||||||
| Victory Capital Holdings, Inc., Class A |
9,774 | 286,085 | ||||||
|
|
|
|||||||
| 11,364,782 | ||||||||
| Chemicals — 0.8% |
||||||||
| Ginkgo Bioworks Holdings, Inc., Class A(a)(b) |
78,208 | 104,017 | ||||||
| Hawkins, Inc. |
3,429 | 150,121 | ||||||
| HB Fuller Co. |
4,360 | 298,442 | ||||||
| Huntsman Corp. |
33,054 | 904,357 | ||||||
| Livent Corp.(a)(b) |
29,732 | 645,779 | ||||||
| Perimeter Solutions SA(a) |
5,300 | 42,824 | ||||||
| Quaker Chemical Corp. |
2,007 | 397,286 | ||||||
| Scotts Miracle-Gro Co. |
2,286 | 159,426 | ||||||
|
|
|
|||||||
| 2,702,252 | ||||||||
| Commercial Services & Supplies — 0.0% |
||||||||
| BrightView Holdings, Inc.(a) |
23,147 | 130,086 | ||||||
|
|
|
|||||||
| Communications Equipment — 0.8% |
||||||||
| Applied Optoelectronics, Inc.(a)(b) |
8,398 | 18,559 | ||||||
| Juniper Networks, Inc. |
80,296 | 2,763,788 | ||||||
| Viasat, Inc.(a) |
4,215 | 142,636 | ||||||
|
|
|
|||||||
| 2,924,983 | ||||||||
| Construction & Engineering — 2.4% |
||||||||
| AECOM |
51,682 | 4,357,826 | ||||||
| Ameresco, Inc., Class A(a) |
1,484 | 73,043 | ||||||
| Security | Shares | Value | ||||||
| Construction & Engineering (continued) |
||||||||
| Matrix Service Co.(a) |
40,834 | $ | 220,504 | |||||
| Valmont Industries, Inc. |
11,055 | 3,529,640 | ||||||
|
|
|
|||||||
| 8,181,013 | ||||||||
| Consumer Finance — 0.4% |
||||||||
| Enova International, Inc.(a) |
7,023 | 312,032 | ||||||
| LendingClub Corp.(a) |
13,964 | 100,681 | ||||||
| LendingTree, Inc.(a) |
19,308 | 514,751 | ||||||
| OneMain Holdings, Inc. |
10,701 | 396,793 | ||||||
| Oportun Financial Corp.(a)(b) |
20,000 | 77,200 | ||||||
| Upstart Holdings, Inc.(a)(b) |
2,569 | 40,821 | ||||||
|
|
|
|||||||
| 1,442,278 | ||||||||
| Consumer Staples Distribution & Retail — 1.1% |
|
|||||||
| BJ’s Wholesale Club Holdings, Inc.(a) |
22,262 | 1,693,470 | ||||||
| Casey’s General Stores, Inc. |
9,030 | 1,954,634 | ||||||
|
|
|
|||||||
| 3,648,104 | ||||||||
| Containers & Packaging — 1.4% |
||||||||
| Avery Dennison Corp. |
1,544 | 276,268 | ||||||
| Berry Global Group, Inc. |
31,530 | 1,857,117 | ||||||
| Crown Holdings, Inc. |
9,608 | 794,677 | ||||||
| Graphic Packaging Holding Co. |
63,886 | 1,628,454 | ||||||
| Greif, Inc., Class A, NVS |
4,337 | 274,836 | ||||||
|
|
|
|||||||
| 4,831,352 | ||||||||
| Distributors — 0.2% |
||||||||
| Pool Corp. |
2,190 | 749,944 | ||||||
|
|
|
|||||||
| Diversified Consumer Services — 0.4% |
||||||||
| Laureate Education, Inc., Class A |
36,674 | 431,286 | ||||||
| Mister Car Wash, Inc.(a)(b) |
67,236 | 579,574 | ||||||
| Service Corp. International |
3,742 | 257,375 | ||||||
|
|
|
|||||||
| 1,268,235 | ||||||||
| Diversified REITs — 0.0% |
||||||||
| American Assets Trust, Inc. |
2,824 | 52,498 | ||||||
|
|
|
|||||||
| Diversified Telecommunication Services — 0.8% |
|
|||||||
| Bandwidth, Inc., Class A(a) |
36,627 | 556,730 | ||||||
| EchoStar Corp., Class A(a) |
108,831 | 1,990,519 | ||||||
| Lumen Technologies, Inc. |
43,913 | 116,370 | ||||||
| Ooma, Inc.(a) |
16,690 | 208,792 | ||||||
|
|
|
|||||||
| 2,872,411 | ||||||||
| Electric Utilities — 0.7% |
||||||||
| NRG Energy, Inc. |
14,216 | 487,467 | ||||||
| Portland General Electric Co. |
40,770 | 1,993,245 | ||||||
|
|
|
|||||||
| 2,480,712 | ||||||||
| Electrical Equipment — 0.9% |
||||||||
| Atkore, Inc.(a) |
6,770 | 951,050 | ||||||
| Hubbell, Inc. |
540 | 131,387 | ||||||
| nVent Electric PLC |
5,933 | 254,763 | ||||||
| Regal Rexnord Corp. |
8,233 | 1,158,630 | ||||||
| Sunrun, Inc.(a)(b) |
35,603 | 717,401 | ||||||
|
|
|
|||||||
| 3,213,231 | ||||||||
| Electronic Equipment, Instruments & Components — 1.7% |
| |||||||
| Arrow Electronics, Inc.(a) |
5,792 | 723,247 | ||||||
| Insight Enterprises, Inc.(a) |
4,186 | 598,430 | ||||||
| Sanmina Corp.(a) |
3,590 | 218,954 | ||||||
| ScanSource, Inc.(a) |
10,465 | 318,555 | ||||||
| TD SYNNEX Corp. |
42,009 | 4,066,051 | ||||||
|
|
|
|||||||
| 5,925,237 | ||||||||
| Energy Equipment & Services — 1.0% |
||||||||
| Borr Drilling Ltd.(a)(b) |
10,710 | 81,182 | ||||||
| Helmerich & Payne, Inc. |
7,008 | 250,536 | ||||||
| 10 |
2 0 2 3 B L A C K R O C K A N N U A L R E P O R T T O S H A R E H O L D E R S |
| Schedule of Investments (continued) March 31, 2023 |
BlackRock Advantage SMID Cap Fund, Inc. (Percentages shown are based on Net Assets) |
| Security | Shares | Value | ||||||
| Energy Equipment & Services (continued) |
||||||||
| Liberty Energy, Inc., Class A |
59,850 | $ | 766,678 | |||||
| Newpark Resources, Inc.(a) |
33,788 | 130,084 | ||||||
| Patterson-UTI Energy, Inc. |
96,356 | 1,127,365 | ||||||
| ProPetro Holding Corp.(a) |
65,986 | 474,439 | ||||||
| Schlumberger NV |
3,336 | 163,798 | ||||||
| TechnipFMC PLC(a) |
35,716 | 487,523 | ||||||
| Transocean Ltd.(a) |
4,989 | 31,730 | ||||||
| U.S. Silica Holdings, Inc.(a) |
3,370 | 40,238 | ||||||
|
|
|
|||||||
| 3,553,573 | ||||||||
| Entertainment — 0.5% |
||||||||
| Lions Gate Entertainment Corp., Class A(a)(b) |
13,636 | 150,951 | ||||||
| World Wrestling Entertainment, Inc., Class A |
15,894 | 1,450,486 | ||||||
|
|
|
|||||||
| 1,601,437 | ||||||||
| Financial Services — 2.4% |
||||||||
| Affirm Holdings, Inc., Class A(a) |
6,705 | 75,565 | ||||||
| Essent Group Ltd. |
2,044 | 81,862 | ||||||
| Federal Agricultural Mortgage Corp., Class C, NVS |
13,125 | 1,748,119 | ||||||
| Flywire Corp.(a) |
7,560 | 221,962 | ||||||
| Marqeta, Inc., Class A(a) |
18,948 | 86,592 | ||||||
| MGIC Investment Corp. |
37,541 | 503,800 | ||||||
| NMI Holdings, Inc., Class A(a) |
3,272 | 73,064 | ||||||
| Payoneer Global, Inc.(a) |
8,232 | 51,697 | ||||||
| Paysafe Ltd.(a) |
41,401 | 714,988 | ||||||
| Repay Holdings Corp.(a) |
34,502 | 226,678 | ||||||
| StoneCo Ltd., Class A(a) |
118,266 | 1,128,258 | ||||||
| Voya Financial, Inc. |
47,376 | 3,385,489 | ||||||
|
|
|
|||||||
| 8,298,074 | ||||||||
| Food Products — 0.7% |
||||||||
| Lancaster Colony Corp. |
8,632 | 1,751,260 | ||||||
| Sovos Brands, Inc.(a) |
12,531 | 209,017 | ||||||
| Vital Farms, Inc.(a) |
24,797 | 379,394 | ||||||
|
|
|
|||||||
| 2,339,671 | ||||||||
| Gas Utilities — 0.0% |
||||||||
| Spire, Inc. |
712 | 49,940 | ||||||
|
|
|
|||||||
| Ground Transportation — 0.3% |
||||||||
| Covenant Logistics Group, Inc., Class A |
6,563 | 232,461 | ||||||
| Ryder System, Inc. |
3,098 | 276,466 | ||||||
| Schneider National, Inc., Class B |
17,005 | 454,884 | ||||||
|
|
|
|||||||
| 963,811 | ||||||||
| Health Care Equipment & Supplies — 2.6% |
||||||||
| Accuray, Inc.(a) |
28,286 | 84,009 | ||||||
| Eargo, Inc.(a) |
8,990 | 42,075 | ||||||
| Enovis Corp.(a) |
67,911 | 3,632,559 | ||||||
| Globus Medical, Inc., Class A(a) |
20,543 | 1,163,556 | ||||||
| Haemonetics Corp.(a) |
454 | 37,568 | ||||||
| Merit Medical Systems, Inc.(a) |
41,080 | 3,037,866 | ||||||
| Nevro Corp.(a) |
2,816 | 101,798 | ||||||
| NuVasive, Inc.(a) |
2,602 | 107,489 | ||||||
| OraSure Technologies, Inc.(a) |
8,113 | 49,084 | ||||||
| Penumbra, Inc.(a) |
1,229 | 342,510 | ||||||
| Tactile Systems Technology, Inc.(a) |
18,794 | 308,597 | ||||||
| Tandem Diabetes Care, Inc.(a) |
1,570 | 63,758 | ||||||
| Varex Imaging Corp.(a) |
5,862 | 106,630 | ||||||
|
|
|
|||||||
| 9,077,499 | ||||||||
| Health Care Providers & Services — 3.0% |
||||||||
| Accolade, Inc.(a) |
13,680 | 196,718 | ||||||
| AMN Healthcare Services, Inc.(a) |
17,505 | 1,452,215 | ||||||
| Brookdale Senior Living, Inc.(a) |
11,206 | 33,058 | ||||||
| Ensign Group, Inc. |
38,787 | 3,705,710 | ||||||
| Security | Shares | Value | ||||||
| Health Care Providers & Services (continued) |
||||||||
| HealthEquity, Inc.(a) |
8,791 | $ | 516,119 | |||||
| Henry Schein, Inc.(a) |
7,150 | 583,011 | ||||||
| Option Care Health, Inc.(a) |
64,030 | 2,034,233 | ||||||
| Privia Health Group, Inc.(a)(b) |
45,954 | 1,268,790 | ||||||
| Progyny, Inc.(a) |
11,739 | 377,057 | ||||||
|
|
|
|||||||
| 10,166,911 | ||||||||
| Health Care Technology — 1.5% |
||||||||
| American Well Corp., Class A(a) |
96,367 | 227,426 | ||||||
| Evolent Health, Inc., Class A(a) |
28,216 | 915,609 | ||||||
| GoodRx Holdings, Inc., Class A(a) |
6,968 | 43,550 | ||||||
| Health Catalyst, Inc.(a) |
27,473 | 320,610 | ||||||
| NextGen Healthcare, Inc.(a) |
3,797 | 66,106 | ||||||
| Phreesia, Inc.(a) |
7,581 | 244,790 | ||||||
| Tabula Rasa HealthCare, Inc.(a) |
19,283 | 107,792 | ||||||
| Teladoc Health, Inc.(a) |
89,212 | 2,310,591 | ||||||
| Veradigm, Inc.(a) |
63,038 | 822,646 | ||||||
|
|
|
|||||||
| 5,059,120 | ||||||||
| Hotel & Resort REITs — 0.6% |
||||||||
| Braemar Hotels & Resorts, Inc. |
110,482 | 426,460 | ||||||
| Park Hotels & Resorts, Inc. |
137,685 | 1,701,787 | ||||||
|
|
|
|||||||
| 2,128,247 | ||||||||
| Hotels, Restaurants & Leisure — 4.0% |
||||||||
| Bally’s Corp.(a) |
16,814 | 328,209 | ||||||
| Boyd Gaming Corp. |
65,179 | 4,179,277 | ||||||
| Choice Hotels International, Inc. |
3,338 | 391,180 | ||||||
| Hilton Grand Vacations, Inc.(a) |
25,164 | 1,118,037 | ||||||
| NEOGAMES SA(a)(b) |
3,455 | 52,516 | ||||||
| Penn Entertainment, Inc.(a) |
5,269 | 156,279 | ||||||
| Planet Fitness, Inc., Class A(a) |
14,091 | 1,094,448 | ||||||
| PlayAGS, Inc.(a) |
7,155 | 51,158 | ||||||
| Texas Roadhouse, Inc. |
29,313 | 3,167,563 | ||||||
| Wendy’s Co. |
103,849 | 2,261,831 | ||||||
| Wingstop, Inc. |
5,682 | 1,043,102 | ||||||
|
|
|
|||||||
| 13,843,600 | ||||||||
| Household Durables — 1.2% |
||||||||
| Century Communities, Inc. |
1,030 | 65,837 | ||||||
| GoPro, Inc., Class A(a) |
55,339 | 278,355 | ||||||
| Helen of Troy Ltd.(a) |
2,870 | 273,138 | ||||||
| Installed Building Products, Inc. |
11,158 | 1,272,347 | ||||||
| iRobot Corp.(a) |
1,676 | 73,141 | ||||||
| Toll Brothers, Inc. |
10,737 | 644,542 | ||||||
| TopBuild Corp.(a) |
6,936 | 1,443,659 | ||||||
|
|
|
|||||||
| 4,051,019 | ||||||||
| Household Products — 0.2% |
||||||||
| Central Garden & Pet Co., Class A, NVS(a) |
22,234 | 868,682 | ||||||
|
|
|
|||||||
| Independent Power and Renewable Electricity Producers — 0.8% |
| |||||||
| Brookfield Renewable Corp., Class A |
48,407 | 1,691,825 | ||||||
| Clearway Energy, Inc., Class A |
20,684 | 621,141 | ||||||
| Clearway Energy, Inc., Class C |
8,892 | 278,586 | ||||||
| Sunnova Energy International, Inc.(a)(b) |
7,102 | 110,933 | ||||||
|
|
|
|||||||
| 2,702,485 | ||||||||
| Industrial REITs — 0.9% |
||||||||
| First Industrial Realty Trust, Inc. |
55,409 | 2,947,759 | ||||||
|
|
|
|||||||
| Insurance — 3.0% |
||||||||
| American Financial Group, Inc. |
6,389 | 776,263 | ||||||
| Assured Guaranty Ltd. |
6,539 | 328,715 | ||||||
| Bright Health Group, Inc.(a) |
30,452 | 6,709 | ||||||
| Brighthouse Financial, Inc.(a) |
7,810 | 344,499 | ||||||
| Crawford & Co., Class A, NVS |
2,123 | 17,748 | ||||||
| S C H E D U L E O F I N V E S T M E N T S |
11 |
| Schedule of Investments (continued) March 31, 2023 |
BlackRock Advantage SMID Cap Fund, Inc. (Percentages shown are based on Net Assets) |
| Security | Shares | Value | ||||||
| Insurance (continued) |
||||||||
| Everest Re Group Ltd. |
5,429 | $ | 1,943,691 | |||||
| Hanover Insurance Group, Inc. |
4,010 | 515,285 | ||||||
| Hippo Holdings, Inc.(a) |
5,387 | 87,431 | ||||||
| Investors Title Co. |
154 | 23,254 | ||||||
| Lemonade, Inc.(a) |
7,923 | 112,982 | ||||||
| Lincoln National Corp. |
4,526 | 101,699 | ||||||
| Oscar Health, Inc., Class A(a) |
72,346 | 473,143 | ||||||
| Reinsurance Group of America, Inc. |
22,715 | 3,015,643 | ||||||
| Unum Group |
56,828 | 2,248,116 | ||||||
| W. R. Berkley Corp. |
7,653 | 476,476 | ||||||
|
|
|
|||||||
| 10,471,654 | ||||||||
| Interactive Media & Services — 1.7% |
||||||||
| Bumble, Inc., Class A(a) |
78,797 | 1,540,481 | ||||||
| Eventbrite, Inc., Class A(a)(b) |
62,569 | 536,842 | ||||||
| IAC, Inc.(a) |
4,379 | 225,956 | ||||||
| Outbrain, Inc.(a) |
18,304 | 75,596 | ||||||
| Shutterstock, Inc. |
19,812 | 1,438,351 | ||||||
| Vimeo, Inc.(a) |
48,052 | 184,039 | ||||||
| Yelp, Inc.(a) |
38,610 | 1,185,327 | ||||||
| Ziff Davis, Inc.(a)(b) |
5,403 | 421,704 | ||||||
| ZipRecruiter, Inc., Class A(a)(b) |
5,257 | 83,797 | ||||||
|
|
|
|||||||
| 5,692,093 | ||||||||
| IT Services — 0.3% |
||||||||
| Fastly, Inc., Class A(a) |
22,764 | 404,289 | ||||||
| Wix.com Ltd.(a) |
5,745 | 573,351 | ||||||
|
|
|
|||||||
| 977,640 | ||||||||
| Leisure Products — 0.5% |
||||||||
| Brunswick Corp. |
13,796 | 1,131,272 | ||||||
| YETI Holdings, Inc.(a) |
11,759 | 470,360 | ||||||
|
|
|
|||||||
| 1,601,632 | ||||||||
| Life Sciences Tools & Services — 1.0% |
||||||||
| Bruker Corp. |
24,495 | 1,931,186 | ||||||
| NanoString Technologies, Inc.(a) |
10,064 | 99,634 | ||||||
| Personalis, Inc.(a) |
158,682 | 437,962 | ||||||
| PhenomeX, Inc.(a) |
23,415 | 27,161 | ||||||
| QIAGEN NV(a) |
14,336 | 658,453 | ||||||
| Seer, Inc., Class A(a) |
33,983 | 131,174 | ||||||
| Singular Genomics Systems, Inc.(a) |
13,189 | 15,959 | ||||||
|
|
|
|||||||
| 3,301,529 | ||||||||
| Machinery — 4.4% |
||||||||
| AGCO Corp. |
4,837 | 653,962 | ||||||
| Allison Transmission Holdings, Inc. |
24,138 | 1,092,003 | ||||||
| Astec Industries, Inc. |
1,359 | 56,059 | ||||||
| Graco, Inc. |
51,906 | 3,789,657 | ||||||
| Manitowoc Co., Inc.(a) |
21,334 | 364,598 | ||||||
| Oshkosh Corp. |
25,264 | 2,101,460 | ||||||
| Snap-on, Inc. |
18,332 | 4,525,987 | ||||||
| Timken Co. |
29,194 | 2,385,734 | ||||||
|
|
|
|||||||
| 14,969,460 | ||||||||
| Marine Transportation — 0.1% |
||||||||
| Matson, Inc. |
5,657 | 337,553 | ||||||
|
|
|
|||||||
| Media — 0.4% |
||||||||
| Cardlytics, Inc.(a)(b) |
27,341 | 92,823 | ||||||
| comScore, Inc.(a) |
13,276 | 16,329 | ||||||
| News Corp., Class B |
26,699 | 465,364 | ||||||
| Sinclair Broadcast Group, Inc., Class A |
30,314 | 520,188 | ||||||
| TEGNA, Inc. |
14,105 | 238,516 | ||||||
|
|
|
|||||||
| 1,333,220 | ||||||||
| Security | Shares | Value | ||||||
| Metals & Mining — 2.5% |
||||||||
| Commercial Metals Co. |
15,069 | $ | 736,874 | |||||
| Reliance Steel & Aluminum Co. |
13,629 | 3,499,109 | ||||||
| Royal Gold, Inc. |
5,497 | 713,016 | ||||||
| Schnitzer Steel Industries, Inc., Class A |
1,025 | 31,878 | ||||||
| Steel Dynamics, Inc. |
17,515 | 1,980,246 | ||||||
| United States Steel Corp. |
63,317 | 1,652,574 | ||||||
|
|
|
|||||||
| 8,613,697 | ||||||||
| Mortgage Real Estate Investment Trusts (REITs) — 0.1% |
| |||||||
| Great Ajax Corp. |
32,111 | 211,290 | ||||||
|
|
|
|||||||
| Multi-Utilities — 0.3% |
||||||||
| Black Hills Corp. |
13,839 | 873,241 | ||||||
| NiSource, Inc. |
7,827 | 218,843 | ||||||
|
|
|
|||||||
| 1,092,084 | ||||||||
| Office REITs — 0.2% |
||||||||
| Cousins Properties, Inc. |
21,629 | 462,428 | ||||||
| Paramount Group, Inc. |
37,748 | 172,131 | ||||||
|
|
|
|||||||
| 634,559 | ||||||||
| Oil, Gas & Consumable Fuels — 3.2% |
||||||||
| Ardmore Shipping Corp. |
24,743 | 367,928 | ||||||
| Chesapeake Energy Corp. |
8,920 | 678,277 | ||||||
| EOG Resources, Inc. |
12,502 | 1,433,104 | ||||||
| Magnolia Oil & Gas Corp., Class A |
186,854 | 4,088,366 | ||||||
| Marathon Oil Corp. |
7,459 | 178,718 | ||||||
| Ovintiv, Inc. |
32,458 | 1,171,085 | ||||||
| PBF Energy, Inc., Class A |
2,087 | 90,492 | ||||||
| PDC Energy, Inc. |
22,956 | 1,473,316 | ||||||
| Scorpio Tankers, Inc. |
5,747 | 323,614 | ||||||
| Targa Resources Corp. |
2,696 | 196,673 | ||||||
| Texas Pacific Land Corp. |
319 | 542,625 | ||||||
| World Fuel Services Corp. |
21,439 | 547,766 | ||||||
|
|
|
|||||||
| 11,091,964 | ||||||||
| Passenger Airlines — 0.4% |
||||||||
| Copa Holdings SA, Class A, NVS(a) |
8,681 | 801,690 | ||||||
| JetBlue Airways Corp.(a) |
77,884 | 566,996 | ||||||
|
|
|
|||||||
| 1,368,686 | ||||||||
| Personal Care Products — 0.2% |
||||||||
| elf Beauty, Inc.(a) |
9,381 | 772,525 | ||||||
| Nature’s Sunshine Products, Inc.(a) |
3,272 | 33,407 | ||||||
|
|
|
|||||||
| 805,932 | ||||||||
| Pharmaceuticals — 0.4% |
||||||||
| Corcept Therapeutics, Inc.(a) |
11,503 | 249,155 | ||||||
| Harmony Biosciences Holdings, Inc.(a) |
1,533 | 50,052 | ||||||
| Nektar Therapeutics(a) |
186,076 | 130,793 | ||||||
| NGM Biopharmaceuticals, Inc.(a) |
34,488 | 140,711 | ||||||
| Perrigo Co. PLC |
12,860 | 461,288 | ||||||
| Prestige Consumer Healthcare, Inc.(a) |
3,136 | 196,408 | ||||||
| Scilex Holding Co. (Acquired 01/09/23, Cost $175,001), NVS(a)(c) |
3,339 | 27,071 | ||||||
| Tricida, Inc.(a) |
33,473 | 372 | ||||||
|
|
|
|||||||
| 1,255,850 | ||||||||
| Professional Services — 3.9% |
||||||||
| Booz Allen Hamilton Holding Corp., Class A |
10,631 | 985,388 | ||||||
| CACI International, Inc., Class A(a) |
393 | 116,438 | ||||||
| ExlService Holdings, Inc.(a) |
5,558 | 899,451 | ||||||
| Exponent, Inc. |
5,070 | 505,428 | ||||||
| Genpact Ltd. |
44,066 | 2,036,731 | ||||||
| Insperity, Inc. |
33,095 | 4,022,697 | ||||||
| KBR, Inc. |
77,644 | 4,274,302 | ||||||
| Kelly Services, Inc., Class A, NVS |
14,111 | 234,102 | ||||||
| 12 |
2 0 2 3 B L A C K R O C K A N N U A L R E P O R T T O S H A R E H O L D E R S |
| Schedule of Investments (continued) March 31, 2023 |
BlackRock Advantage SMID Cap Fund, Inc. (Percentages shown are based on Net Assets) |
| Security | Shares | Value | ||||||
| Professional Services (continued) |
||||||||
| Kforce, Inc. |
5,218 | $ | 329,986 | |||||
| Mistras Group, Inc.(a) |
18,553 | 125,789 | ||||||
|
|
|
|||||||
| 13,530,312 | ||||||||
| Real Estate Management & Development — 0.4% |
|
|||||||
| Anywhere Real Estate, Inc.(a) |
35,072 | 185,180 | ||||||
| Compass, Inc., Class A(a) |
15,693 | 50,689 | ||||||
| Zillow Group, Inc., Class A(a) |
3,593 | 157,014 | ||||||
| Zillow Group, Inc., Class C, NVS(a) |
25,202 | 1,120,733 | ||||||
|
|
|
|||||||
| 1,513,616 | ||||||||
| Residential REITs — 0.8% |
||||||||
| American Homes 4 Rent, Class A |
35,808 | 1,126,162 | ||||||
| Clipper Realty, Inc. |
18 | 103 | ||||||
| Equity LifeStyle Properties, Inc. |
22,229 | 1,492,233 | ||||||
|
|
|
|||||||
| 2,618,498 | ||||||||
| Retail REITs — 2.8% |
||||||||
| Brixmor Property Group, Inc. |
165,562 | 3,562,894 | ||||||
| Kimco Realty Corp. |
38,484 | 751,592 | ||||||
| Kite Realty Group Trust |
60,202 | 1,259,426 | ||||||
| Regency Centers Corp. |
66,755 | 4,084,071 | ||||||
|
|
|
|||||||
| 9,657,983 | ||||||||
| Semiconductors & Semiconductor Equipment — 3.0% |
| |||||||
| Allegro MicroSystems, Inc.(a) |
11,267 | 540,703 | ||||||
| Amkor Technology, Inc. |
20,170 | 524,823 | ||||||
| Cirrus Logic, Inc.(a) |
26,239 | 2,870,022 | ||||||
| Lattice Semiconductor Corp.(a) |
7,397 | 706,414 | ||||||
| MaxLinear, Inc.(a) |
42,073 | 1,481,390 | ||||||
| Photronics, Inc.(a) |
3,208 | 53,189 | ||||||
| Power Integrations, Inc. |
2,820 | 238,685 | ||||||
| Rambus, Inc.(a) |
11,990 | 614,607 | ||||||
| Semtech Corp.(a) |
75,593 | 1,824,815 | ||||||
| Silicon Laboratories, Inc.(a) |
8,681 | 1,519,956 | ||||||
|
|
|
|||||||
| 10,374,604 | ||||||||
| Software — 7.3% |
||||||||
| 8x8, Inc.(a) |
9,893 | 41,254 | ||||||
| ACI Worldwide, Inc.(a) |
37,835 | 1,020,788 | ||||||
| Appfolio, Inc., Class A(a) |
498 | 61,991 | ||||||
| AppLovin Corp., Class A(a) |
29,889 | 470,752 | ||||||
| Asana, Inc., Class A(a) |
30,030 | 634,534 | ||||||
| BILL Holdings, Inc.(a) |
16,706 | 1,355,525 | ||||||
| Box, Inc., Class A(a) |
20,356 | 545,337 | ||||||
| C3.ai, Inc., Class A(a) |
1,759 | 59,050 | ||||||
| Domo, Inc., Class B(a) |
44,216 | 627,425 | ||||||
| EngageSmart, Inc.(a) |
2,998 | 57,712 | ||||||
| Everbridge, Inc.(a) |
6,246 | 216,549 | ||||||
| Expensify, Inc., Class A(a) |
5,939 | 48,403 | ||||||
| Fair Isaac Corp.(a) |
2,560 | 1,798,886 | ||||||
| Guidewire Software, Inc.(a) |
8,866 | 727,455 | ||||||
| LivePerson, Inc.(a) |
88,896 | 392,031 | ||||||
| Manhattan Associates, Inc.(a) |
28,732 | 4,449,150 | ||||||
| Model N, Inc.(a) |
23,579 | 789,189 | ||||||
| New Relic, Inc.(a) |
4,359 | 328,189 | ||||||
| PagerDuty, Inc.(a) |
12,201 | 426,791 | ||||||
| Paylocity Holding Corp.(a) |
10,205 | 2,028,550 | ||||||
| PowerSchool Holdings, Inc., Class A(a) |
1,735 | 34,388 | ||||||
| PROS Holdings, Inc.(a) |
5,393 | 147,768 | ||||||
| Q2 Holdings, Inc.(a) |
6,664 | 164,068 | ||||||
| Qualys, Inc.(a) |
4,423 | 575,079 | ||||||
| Rapid7, Inc.(a) |
19,343 | 888,037 | ||||||
| RingCentral, Inc., Class A(a) |
88,528 | 2,715,154 | ||||||
| SEMrush Holdings, Inc., Class A(a) |
25,126 | 252,516 | ||||||
| Security | Shares | Value | ||||||
| Software (continued) |
||||||||
| Sprout Social, Inc., Class A(a) |
2,134 | $ | 129,918 | |||||
| Tenable Holdings, Inc.(a) |
13,534 | 643,000 | ||||||
| Teradata Corp.(a) |
61,415 | 2,473,796 | ||||||
| UiPath, Inc., Class A(a) |
9,151 | 160,692 | ||||||
| Varonis Systems, Inc.(a) |
17,825 | 463,628 | ||||||
| Zuora, Inc., Class A(a) |
30,491 | 301,251 | ||||||
|
|
|
|||||||
| 25,028,856 | ||||||||
| Specialized REITs — 1.1% |
||||||||
| CubeSmart |
57,908 | 2,676,508 | ||||||
| Lamar Advertising Co., Class A |
9,519 | 950,853 | ||||||
| Life Storage, Inc. |
478 | 62,661 | ||||||
|
|
|
|||||||
| 3,690,022 | ||||||||
| Specialty Retail — 3.5% |
||||||||
| 1-800-Flowers.com, Inc., Class A(a) |
23,873 | 274,540 | ||||||
| Aaron’s Co., Inc. |
12,566 | 121,388 | ||||||
| Asbury Automotive Group, Inc.(a) |
896 | 188,160 | ||||||
| AutoNation, Inc.(a) |
1,812 | 243,460 | ||||||
| Chico’s FAS, Inc.(a) |
64,548 | 355,014 | ||||||
| Conn’s, Inc.(a) |
34,347 | 208,143 | ||||||
| Dick’s Sporting Goods, Inc. |
15,787 | 2,240,017 | ||||||
| Five Below, Inc.(a) |
626 | 128,937 | ||||||
| Gap, Inc. |
11,252 | 112,970 | ||||||
| Group 1 Automotive, Inc. |
901 | 204,004 | ||||||
| Lithia Motors, Inc., Class A |
5,010 | 1,146,939 | ||||||
| MarineMax, Inc.(a)(b) |
1,933 | 55,574 | ||||||
| Murphy U.S.A., Inc. |
5,545 | 1,430,887 | ||||||
| Overstock.com, Inc.(a)(b) |
30,422 | 616,654 | ||||||
| Petco Health & Wellness Co., Inc.(a) |
105,260 | 947,340 | ||||||
| Shift Technologies, Inc., Class A(a)(b) |
2,679 | 3,001 | ||||||
| Stitch Fix, Inc., Class A(a) |
74,305 | 379,699 | ||||||
| Urban Outfitters, Inc.(a)(b) |
39,714 | 1,100,872 | ||||||
| Wayfair, Inc., Class A(a)(b) |
3,073 | 105,527 | ||||||
| Williams-Sonoma, Inc. |
16,617 | 2,021,624 | ||||||
|
|
|
|||||||
| 11,884,750 | ||||||||
| Technology Hardware, Storage & Peripherals — 0.4% |
| |||||||
| Pure Storage, Inc., Class A(a) |
53,382 | 1,361,775 | ||||||
| Super Micro Computer, Inc.(a) |
749 | 79,806 | ||||||
|
|
|
|||||||
| 1,441,581 | ||||||||
| Textiles, Apparel & Luxury Goods — 1.3% |
||||||||
| Crocs, Inc.(a) |
5,060 | 639,786 | ||||||
| Deckers Outdoor Corp.(a) |
6,091 | 2,738,209 | ||||||
| Ralph Lauren Corp., Class A |
10,220 | 1,192,368 | ||||||
|
|
|
|||||||
| 4,570,363 | ||||||||
| Trading Companies & Distributors — 2.7% |
||||||||
| Applied Industrial Technologies, Inc. |
3,292 | 467,892 | ||||||
| Boise Cascade Co. |
1,313 | 83,047 | ||||||
| GATX Corp. |
24,019 | 2,642,571 | ||||||
| Herc Holdings, Inc. |
9,787 | 1,114,739 | ||||||
| MRC Global, Inc.(a) |
11,363 | 110,448 | ||||||
| Rush Enterprises, Inc., Class A |
47,733 | 2,606,222 | ||||||
| SiteOne Landscape Supply, Inc.(a) |
3,798 | 519,832 | ||||||
| Titan Machinery, Inc.(a) |
2,146 | 65,346 | ||||||
| Watsco, Inc. |
4,982 | 1,585,073 | ||||||
|
|
|
|||||||
| 9,195,170 | ||||||||
| Wireless Telecommunication Services — 0.1% |
||||||||
| United States Cellular Corp.(a) |
19,676 | 407,883 | ||||||
|
|
|
|||||||
| Total Common Stocks — 98.3% |
337,834,313 | |||||||
|
|
|
|||||||
| S C H E D U L E O F I N V E S T M E N T S |
13 |
| Schedule of Investments (continued) March 31, 2023 |
BlackRock Advantage SMID Cap Fund, Inc. (Percentages shown are based on Net Assets) |
| Security | Shares | Value | ||||||
| Rights |
||||||||
| Consumer Staples Distribution & Retail — 0.0% |
| |||||||
| Akouos, Inc., CVR(a) |
2,192 | $ | 1,732 | |||||
|
|
|
|||||||
| Total Rights — 0.0% |
1,732 | |||||||
|
|
|
|||||||
| Total Long-Term Investments — 98.3% |
337,836,045 | |||||||
|
|
|
|||||||
| Short-Term Securities |
||||||||
| Money Market Funds — 2.5% |
||||||||
| BlackRock Liquidity Funds, T-Fund, Institutional Class, 4.70%(d)(e) |
4,165,825 | 4,165,825 | ||||||
| SL Liquidity Series, LLC, Money Market Series, 5.01%(d)(e)(f) |
4,426,834 | 4,426,834 | ||||||
|
|
|
|||||||
| Total Short-Term Securities — 2.5% |
8,592,659 | |||||||
|
|
|
|||||||
| Total Investments — 100.8% |
346,428,704 | |||||||
| Liabilities in Excess of Other Assets — (0.8)% |
|
(2,812,885 | ) | |||||
|
|
|
|||||||
| Net Assets — 100.0% |
$ | 343,615,819 | ||||||
|
|
|
|||||||
| (a) | Non-income producing security. |
| (b) | All or a portion of this security is on loan. |
| (c) | Restricted security as to resale, excluding 144A securities. The Fund held restricted securities with a current value of $27,071, representing 0.0% of its net assets as of period end, and an original cost of $175,001. |
| (d) | Affiliate of the Fund. |
| (e) | Annualized 7-day yield as of period end. |
| (f) | All or a portion of this security was purchased with the cash collateral from loaned securities. |
Affiliates
Investments in issuers considered to be affiliate(s) of the Fund during the year ended March 31, 2023 for purposes of Section 2(a)(3) of the Investment Company Act of 1940, as amended, were as follows:
| Affiliated Issuer | Value at 03/31/22 |
Purchases at Cost |
Proceeds from Sale |
Net Realized Gain (Loss) |
Change in Unrealized Appreciation (Depreciation) |
Value at 03/31/23 |
Shares Held at 03/31/23 |
Income | Capital Gain |
|||||||||||||||||||||||||||
| BlackRock Liquidity Funds, T-Fund, Institutional Class |
$ | 6,423,445 | $ | — | $ | (2,257,620 | )(a) | $ | — | $ | — | $ | 4,165,825 | 4,165,825 | $ | 83,594 | $ | — | ||||||||||||||||||
| SL Liquidity Series, LLC, Money Market Series |
751,630 | 3,672,892 | (a) | — | 1,131 | 1,181 | 4,426,834 | 4,426,834 | 36,634 | (b) | — | |||||||||||||||||||||||||
|
|
|
|
|
|
|
|
|
|
|
|||||||||||||||||||||||||||
| $ | 1,131 | $ | 1,181 | $ | 8,592,659 | $ | 120,228 | $ | — | |||||||||||||||||||||||||||
|
|
|
|
|
|
|
|
|
|
|
|||||||||||||||||||||||||||
| (a) | Represents net amount purchased (sold). |
| (b) | All or a portion represents securities lending income earned from the reinvestment of cash collateral from loaned securities, net of fees and collateral investment expenses, and other payments to and from borrowers of securities. |
For Fund compliance purposes, the Fund’s sector classifications refer to one or more of the sector sub-classifications used by one or more widely recognized market indexes or rating group indexes, and/or as defined by the investment adviser. These definitions may not apply for purposes of this report, which may combine such sector sub-classifications for reporting ease.
| 14 |
2 0 2 3 B L A C K R O C K A N N U A L R E P O R T T O S H A R E H O L D E R S |
| Schedule of Investments (continued) March 31, 2023 |
BlackRock Advantage SMID Cap Fund, Inc. |
Derivative Financial Instruments Outstanding as of Period End
Futures Contracts
| Description | Number of Contracts |
Expiration Date |
Notional Amount (000) |
Value/ Unrealized Appreciation (Depreciation) |
||||||||||||
| Long Contracts |
||||||||||||||||
| S&P 500 E-Mini Index |
22 | 06/16/23 | $ | 4,552 | $ | 226,611 | ||||||||||
|
|
|
|||||||||||||||
Derivative Financial Instruments Categorized by Risk Exposure
As of period end, the fair values of derivative financial instruments located in the Statement of Assets and Liabilities were as follows:
| Commodity Contracts |
Credit Contracts |
Equity Contracts |
Foreign Currency Exchange Contracts |
Interest Rate Contracts |
Other Contracts |
Total | ||||||||||||||||||||||
| Assets — Derivative Financial Instruments |
||||||||||||||||||||||||||||
| Futures contracts |
||||||||||||||||||||||||||||
| Unrealized appreciation on futures contracts(a) |
$ | — | $ | — | $ | 226,611 | $ | — | $ | — | $ | — | $ | 226,611 | ||||||||||||||
|
|
|
|
|
|
|
|
|
|
|
|
|
|
|
|||||||||||||||
| (a) | Net cumulative unrealized appreciation (depreciation) on futures contracts, if any, are reported in the Schedule of Investments. In the Statement of Assets and Liabilities, only current day’s variation margin is reported in receivables or payables and the net cumulative unrealized appreciation (depreciation) is included in accumulated earnings (loss). |
For the period ended March 31, 2023, the effect of derivative financial instruments in the Statement of Operations was as follows:
| Commodity Contracts |
Credit Contracts |
Equity Contracts |
Foreign Currency Exchange Contracts |
Interest Rate Contracts |
Other Contracts |
Total | ||||||||||||||||||||||
| Net Realized Gain (Loss) from |
||||||||||||||||||||||||||||
| Futures contracts |
$ | — | $ | — | $ | (210,524 | ) | $ | — | $ | — | $ | — | $ | (210,524 | ) | ||||||||||||
|
|
|
|
|
|
|
|
|
|
|
|
|
|
|
|||||||||||||||
| Net Change in Unrealized Appreciation (Depreciation) on |
||||||||||||||||||||||||||||
| Futures contracts |
$ | — | $ | — | $ | (75,465 | ) | $ | — | $ | — | $ | — | $ | (75,465 | ) | ||||||||||||
|
|
|
|
|
|
|
|
|
|
|
|
|
|
|
|||||||||||||||
Average Quarterly Balances of Outstanding Derivative Financial Instruments
| Futures contracts |
||||
| Average notional value of contracts — long |
$ | 3,758,725 | ||
For more information about the Fund’s investment risks regarding derivative financial instruments, refer to the Notes to Financial Statements.
Fair Value Hierarchy as of Period End
Various inputs are used in determining the fair value of financial instruments. For a description of the input levels and information about the Fund’s policy regarding valuation of financial instruments, refer to the Notes to Financial Statements.
The following table summarizes the Fund’s financial instruments categorized in the fair value hierarchy. The breakdown of the Fund’s financial instruments into major categories is disclosed in the Schedule of Investments above.
| Level 1 | Level 2 | Level 3 | Total | |||||||||||||
| Assets |
||||||||||||||||
| Investments |
||||||||||||||||
| Long-Term Investments |
||||||||||||||||
| Common Stocks |
||||||||||||||||
| Aerospace & Defense |
$ | 5,108,289 | $ | — | $ | — | $ | 5,108,289 | ||||||||
| Air Freight & Logistics |
2,007,005 | — | — | 2,007,005 | ||||||||||||
| Automobile Components |
4,841,247 | — | — | 4,841,247 | ||||||||||||
| Automobiles |
131,729 | — | — | 131,729 | ||||||||||||
| Banks |
16,878,788 | — | — | 16,878,788 | ||||||||||||
| Beverages |
1,912,748 | — | — | 1,912,748 | ||||||||||||
| Biotechnology |
17,465,843 | — | — | 17,465,843 | ||||||||||||
|
S C H E D U L E O F I N V E S T M E N T S |
15 |
| Schedule of Investments (continued) March 31, 2023 |
BlackRock Advantage SMID Cap Fund, Inc. |
Fair Value Hierarchy as of Period End (continued)
| Level 1 | Level 2 | Level 3 | Total | |||||||||||||
| Common Stocks (continued) |
||||||||||||||||
| Broadline Retail |
$ | 1,777,221 | $ | — | $ | — | $ | 1,777,221 | ||||||||
| Building Products |
10,600,016 | — | — | 10,600,016 | ||||||||||||
| Capital Markets |
11,364,782 | — | — | 11,364,782 | ||||||||||||
| Chemicals |
2,702,252 | — | — | 2,702,252 | ||||||||||||
| Commercial Services & Supplies |
130,086 | — | — | 130,086 | ||||||||||||
| Communications Equipment |
2,924,983 | — | — | 2,924,983 | ||||||||||||
| Construction & Engineering |
8,181,013 | — | — | 8,181,013 | ||||||||||||
| Consumer Finance |
1,442,278 | — | — | 1,442,278 | ||||||||||||
| Consumer Staples Distribution & Retail |
3,648,104 | — | — | 3,648,104 | ||||||||||||
| Containers & Packaging |
4,831,352 | — | — | 4,831,352 | ||||||||||||
| Distributors |
749,944 | — | — | 749,944 | ||||||||||||
| Diversified Consumer Services |
1,268,235 | — | — | 1,268,235 | ||||||||||||
| Diversified REITs |
52,498 | — | — | 52,498 | ||||||||||||
| Diversified Telecommunication Services |
2,872,411 | — | — | 2,872,411 | ||||||||||||
| Electric Utilities |
2,480,712 | — | — | 2,480,712 | ||||||||||||
| Electrical Equipment |
3,213,231 | — | — | 3,213,231 | ||||||||||||
| Electronic Equipment, Instruments & Components |
5,925,237 | — | — | 5,925,237 | ||||||||||||
| Energy Equipment & Services |
3,553,573 | — | — | 3,553,573 | ||||||||||||
| Entertainment |
1,601,437 | — | — | 1,601,437 | ||||||||||||
| Financial Services |
8,298,074 | — | — | 8,298,074 | ||||||||||||
| Food Products |
2,339,671 | — | — | 2,339,671 | ||||||||||||
| Gas Utilities |
49,940 | — | — | 49,940 | ||||||||||||
| Ground Transportation |
963,811 | — | — | 963,811 | ||||||||||||
| Health Care Equipment & Supplies |
9,077,499 | — | — | 9,077,499 | ||||||||||||
| Health Care Providers & Services |
10,166,911 | — | — | 10,166,911 | ||||||||||||
| Health Care Technology |
5,059,120 | — | — | 5,059,120 | ||||||||||||
| Hotel & Resort REITs |
2,128,247 | — | — | 2,128,247 | ||||||||||||
| Hotels, Restaurants & Leisure |
13,843,600 | — | — | 13,843,600 | ||||||||||||
| Household Durables |
4,051,019 | — | — | 4,051,019 | ||||||||||||
| Household Products |
868,682 | — | — | 868,682 | ||||||||||||
| Independent Power and Renewable Electricity Producers |
2,702,485 | — | — | 2,702,485 | ||||||||||||
| Industrial REITs |
2,947,759 | — | — | 2,947,759 | ||||||||||||
| Insurance |
10,471,654 | — | — | 10,471,654 | ||||||||||||
| Interactive Media & Services |
5,692,093 | — | — | 5,692,093 | ||||||||||||
| IT Services |
977,640 | — | — | 977,640 | ||||||||||||
| Leisure Products |
1,601,632 | — | — | 1,601,632 | ||||||||||||
| Life Sciences Tools & Services |
3,301,529 | — | — | 3,301,529 | ||||||||||||
| Machinery |
14,969,460 | — | — | 14,969,460 | ||||||||||||
| Marine Transportation |
337,553 | — | — | 337,553 | ||||||||||||
| Media |
1,333,220 | — | — | 1,333,220 | ||||||||||||
| Metals & Mining |
8,613,697 | — | — | 8,613,697 | ||||||||||||
| Mortgage Real Estate Investment Trusts (REITs) |
211,290 | — | — | 211,290 | ||||||||||||
| Multi-Utilities |
1,092,084 | — | — | 1,092,084 | ||||||||||||
| Office REITs |
634,559 | — | — | 634,559 | ||||||||||||
| Oil, Gas & Consumable Fuels |
11,091,964 | — | — | 11,091,964 | ||||||||||||
| Passenger Airlines |
1,368,686 | — | — | 1,368,686 | ||||||||||||
| Personal Care Products |
805,932 | — | — | 805,932 | ||||||||||||
| Pharmaceuticals |
1,228,779 | 27,071 | — | 1,255,850 | ||||||||||||
| Professional Services |
13,530,312 | — | — | 13,530,312 | ||||||||||||
| Real Estate Management & Development |
1,513,616 | — | — | 1,513,616 | ||||||||||||
| Residential REITs |
2,618,498 | — | — | 2,618,498 | ||||||||||||
| Retail REITs |
9,657,983 | — | — | 9,657,983 | ||||||||||||
| Semiconductors & Semiconductor Equipment |
10,374,604 | — | — | 10,374,604 | ||||||||||||
| Software |
25,028,856 | — | — | 25,028,856 | ||||||||||||
| Specialized REITs |
3,690,022 | — | — | 3,690,022 | ||||||||||||
| Specialty Retail |
11,884,750 | — | — | 11,884,750 | ||||||||||||
| Technology Hardware, Storage & Peripherals |
1,441,581 | — | — | 1,441,581 | ||||||||||||
| Textiles, Apparel & Luxury Goods |
4,570,363 | — | — | 4,570,363 | ||||||||||||
| Trading Companies & Distributors |
9,195,170 | — | — | 9,195,170 | ||||||||||||
| Wireless Telecommunication Services |
407,883 | — | — | 407,883 | ||||||||||||
| Rights |
— | 1,732 | — | 1,732 | ||||||||||||
| 16 |
2 0 2 3 B L A C K R O C K A N N U A L R E P O R T T O S H A R E H O L D E R S |
| Schedule of Investments (continued) March 31, 2023 |
BlackRock Advantage SMID Cap Fund, Inc. |
Fair Value Hierarchy as of Period End (continued)
| Level 1 | Level 2 | Level 3 | Total | |||||||||||||
| Short-Term Securities |
||||||||||||||||
| Money Market Funds |
$ | 4,165,825 | $ | — | $ | — | $ | 4,165,825 | ||||||||
|
|
|
|
|
|
|
|
|
|||||||||
| $ | 341,973,067 | $ | 28,803 | $ | — | 342,001,870 | ||||||||||
|
|
|
|
|
|
|
|
|
|||||||||
| Investments valued at NAV(a) |
4,426,834 | |||||||||||||||
|
|
|
|||||||||||||||
| $ | 346,428,704 | |||||||||||||||
|
|
|
|||||||||||||||
| Derivative Financial Instruments(b) |
||||||||||||||||
| Assets |
||||||||||||||||
| Equity Contracts |
$ | 226,611 | $ | — | $ | — | $ | 226,611 | ||||||||
|
|
|
|
|
|
|
|
|
|||||||||
| (a) | Certain investments of the Fund were fair valued using NAV as a practical expedient as no quoted market value is available and therefore have been excluded from the fair value hierarchy. |
| (b) | Derivative financial instruments are futures contracts. Futures contracts are valued at the unrealized appreciation (depreciation) on the instrument. |
See notes to financial statements.
|
S C H E D U L E O F I N V E S T M E N T S |
17 |
Statement of Assets and Liabilities
March 31, 2023
| BlackRock Advantage SMID Cap Fund, Inc. |
||||
| ASSETS |
||||
| Investments, at value — unaffiliated(a)(b) |
$ | 337,836,045 | ||
| Investments, at value — affiliated(c) |
8,592,659 | |||
| Cash |
21,748 | |||
| Cash pledged: |
||||
| Futures contracts |
215,000 | |||
| Receivables: |
||||
| Investments sold |
3,129,497 | |||
| Securities lending income — affiliated |
1,752 | |||
| Capital shares sold |
1,339,766 | |||
| Dividends — unaffiliated |
291,343 | |||
| Dividends — affiliated |
13,697 | |||
| From the Manager |
18,385 | |||
| Variation margin on futures contracts |
56,380 | |||
| Prepaid expenses |
40,465 | |||
|
|
|
|||
| Total assets |
351,556,737 | |||
|
|
|
|||
| LIABILITIES |
||||
| Collateral on securities loaned |
4,424,737 | |||
| Payables: |
||||
| Investments purchased |
3,087,579 | |||
| Administration fees |
11,895 | |||
| Capital shares redeemed |
137,869 | |||
| Investment advisory fees |
69,610 | |||
| Directors’ and Officer’s fees |
3,330 | |||
| Other accrued expenses |
160,841 | |||
| Other affiliate fees |
2,337 | |||
| Service and distribution fees |
42,720 | |||
|
|
|
|||
| Total liabilities |
7,940,918 | |||
|
|
|
|||
| NET ASSETS |
$ | 343,615,819 | ||
|
|
|
|||
| NET ASSETS CONSIST OF: |
||||
| Paid-in capital |
$ | 383,449,081 | ||
| Accumulated loss |
(39,833,262 | ) | ||
|
|
|
|||
| NET ASSETS |
$ | 343,615,819 | ||
|
|
|
|||
| (a) Investments, at cost — unaffiliated |
$ | 338,921,589 | ||
| (b) Securities loaned, at value |
$ | 4,308,387 | ||
| (c) Investments, at cost — affiliated |
$ | 8,591,350 | ||
| 18 |
2 0 2 3 B L A C K R O C K A N N U A L R E P O R T T O S H A R E H O L D E R S |
Statement of Assets and Liabilities (continued)
March 31, 2023
| BlackRock SMID Cap Fund, Inc. |
||||
| NET ASSET VALUE |
||||
| Institutional | ||||
| Net assets |
$ | 78,727,388 | ||
|
|
|
|||
| Shares outstanding |
3,349,339 | |||
|
|
|
|||
| Net asset value |
$ | 23.51 | ||
|
|
|
|||
| Shares authorized |
100 million | |||
|
|
|
|||
| Par value |
$ | 0.10 | ||
|
|
|
|||
| Investor A | ||||
| Net assets |
$ | 181,708,516 | ||
|
|
|
|||
| Shares outstanding |
8,294,254 | |||
|
|
|
|||
| Net asset value |
$ | 21.91 | ||
|
|
|
|||
| Shares authorized |
100 million | |||
|
|
|
|||
| Par value |
$ | 0.10 | ||
|
|
|
|||
| Investor C | ||||
| Net assets |
$ | 2,709,989 | ||
|
|
|
|||
| Shares outstanding |
279,398 | |||
|
|
|
|||
| Net asset value |
$ | 9.70 | ||
|
|
|
|||
| Shares authorized |
100 million | |||
|
|
|
|||
| Par value |
$ | 0.10 | ||
|
|
|
|||
| Class K | ||||
| Net assets |
$ | 76,595,215 | ||
|
|
|
|||
| Shares outstanding |
3,260,755 | |||
|
|
|
|||
| Net asset value |
$ | 23.49 | ||
|
|
|
|||
| Shares authorized |
2 billion | |||
|
|
|
|||
| Par value |
$ | 0.10 | ||
|
|
|
|||
| Class R | ||||
| Net assets |
$ | 3,874,711 | ||
|
|
|
|||
| Shares outstanding |
309,480 | |||
|
|
|
|||
| Net asset value |
$ | 12.52 | ||
|
|
|
|||
| Shares authorized |
100 million | |||
|
|
|
|||
| Par value |
$ | 0.10 | ||
|
|
|
|||
See notes to financial statements.
| F I N A N C I A L S T A T E M E N T S |
19 |
Year Ended March 31, 2023
| BlackRock SMID Cap Fund, Inc. |
||||
| INVESTMENT INCOME |
||||
| Dividends — unaffiliated |
$ | 5,287,513 | ||
| Dividends — affiliated |
83,594 | |||
| Securities lending income — affiliated — net |
36,634 | |||
| Foreign taxes withheld |
(17,541 | ) | ||
|
|
|
|||
| Total investment income |
5,390,200 | |||
|
|
|
|||
| EXPENSES |
||||
| Investment advisory |
1,702,429 | |||
| Service and distribution — class specific |
533,859 | |||
| Transfer agent — class specific |
362,114 | |||
| Administration |
144,706 | |||
| Professional |
125,673 | |||
| Registration |
92,826 | |||
| Administration — class specific |
68,124 | |||
| Printing and postage |
52,760 | |||
| Accounting services |
52,160 | |||
| Custodian |
28,827 | |||
| Directors and Officer |
7,262 | |||
| Miscellaneous |
7,121 | |||
|
|
|
|||
| Total expenses |
3,177,861 | |||
| Less: |
||||
| Fees waived and/or reimbursed by the Manager |
(749,673 | ) | ||
| Administration fees waived by the Manager — class specific |
(68,124 | ) | ||
| Transfer agent fees waived and/or reimbursed — class specific |
(221,704 | ) | ||
|
|
|
|||
| Total expenses after fees waived and/or reimbursed |
2,138,360 | |||
|
|
|
|||
| Net investment income |
3,251,840 | |||
|
|
|
|||
| REALIZED AND UNREALIZED GAIN (LOSS) |
||||
| Net realized gain (loss) from: |
||||
| Investments — unaffiliated |
(30,907,812 | ) | ||
| Investments — affiliated |
1,131 | |||
| Futures contracts |
(210,524 | ) | ||
|
|
|
|||
| (31,117,205 | ) | |||
|
|
|
|||
| Net change in unrealized appreciation (depreciation) on: |
||||
| Investments — unaffiliated |
(2,404,550 | ) | ||
| Investments — affiliated |
1,181 | |||
| Futures contracts |
(75,465 | ) | ||
| Foreign currency translations |
(38 | ) | ||
|
|
|
|||
| (2,478,872 | ) | |||
|
|
|
|||
| Net realized and unrealized loss |
(33,596,077 | ) | ||
|
|
|
|||
| NET DECREASE IN NET ASSETS RESULTING FROM OPERATIONS |
$ | (30,344,237 | ) | |
|
|
|
|||
See notes to financial statements.
| 20 |
2 0 2 3 B L A C K R O C K A N N U A L R E P O R T T O S H A R E H O L D E R S |
Statements of Changes in Net Assets
| BlackRock Advantage SMID Cap Fund, Inc. | ||||||||||||
| Year Ended 03/31/23 |
Year Ended 03/31/22 |
|||||||||||
| INCREASE (DECREASE) IN NET ASSETS |
||||||||||||
| OPERATIONS |
||||||||||||
| Net investment income |
$ | 3,251,840 | $ | 2,399,550 | ||||||||
| Net realized gain (loss) |
(31,117,205 | ) | 9,819,540 | |||||||||
| Net change in unrealized appreciation (depreciation) |
(2,478,872 | ) | (7,503,644 | ) | ||||||||
|
|
|
|
|
|||||||||
| Net increase (decrease) in net assets resulting from operations |
(30,344,237 | ) | 4,715,446 | |||||||||
|
|
|
|
|
|||||||||
| DISTRIBUTIONS TO SHAREHOLDERS(a) |
||||||||||||
| Institutional |
(774,374 | ) | (31,923,573 | ) | ||||||||
| Investor A |
(1,620,799 | ) | (85,567,003 | ) | ||||||||
| Investor C |
(50,394 | ) | (2,390,635 | ) | ||||||||
| Class K |
(606,507 | ) | (1,481,135 | ) | ||||||||
| Class R |
(63,246 | ) | (2,803,795 | ) | ||||||||
|
|
|
|
|
|||||||||
| Decrease in net assets resulting from distributions to shareholders |
(3,115,320 | ) | (124,166,141 | ) | ||||||||
|
|
|
|
|
|||||||||
| CAPITAL SHARE TRANSACTIONS |
||||||||||||
| Net increase (decrease) in net assets derived from capital share transactions |
(7,759,506 | ) | 128,810,173 | |||||||||
|
|
|
|
|
|||||||||
| NET ASSETS |
||||||||||||
| Total increase (decrease) in net assets |
(41,219,063 | ) | 9,359,478 | |||||||||
| Beginning of year |
384,834,882 | 375,475,404 | ||||||||||
|
|
|
|
|
|||||||||
| End of year |
$ | 343,615,819 | $ | 384,834,882 | ||||||||
|
|
|
|
|
|||||||||
| (a) | Distributions for annual periods determined in accordance with U.S. federal income tax regulations. |
See notes to financial statements.
| F I N A N C I A L S T A T E M E N T S |
21 |
(For a share outstanding throughout each period)
| BlackRock Advantage SMID Cap Fund, Inc. | ||||||||||||||||||||
| Institutional | ||||||||||||||||||||
| Year Ended 03/31/23 |
Year Ended 03/31/22 |
Year Ended 03/31/21 |
Year Ended 03/31/20 |
Year Ended 03/31/19 |
||||||||||||||||
| Net asset value, beginning of year |
$ | 25.77 | $ | 36.31 | $ | 24.09 | $ | 27.40 | $ | 32.34 | ||||||||||
|
|
|
|
|
|
|
|
|
|
|
|||||||||||
| Net investment income(a) |
0.26 | 0.23 | 0.33 | 0.41 | 0.40 | |||||||||||||||
| Net realized and unrealized gain (loss) |
(2.29 | ) | 0.38 | 13.54 | (2.89 | ) | 1.34 | |||||||||||||
|
|
|
|
|
|
|
|
|
|
|
|||||||||||
| Net increase (decrease) from investment operations |
(2.03 | ) | 0.61 | 13.87 | (2.48 | ) | 1.74 | |||||||||||||
|
|
|
|
|
|
|
|
|
|
|
|||||||||||
| Distributions(b) |
||||||||||||||||||||
| From net investment income |
(0.23 | ) | (0.41 | ) | (0.28 | ) | (0.38 | ) | (0.45 | ) | ||||||||||
| From net realized gain |
— | (10.74 | ) | (1.37 | ) | (0.45 | ) | (6.23 | ) | |||||||||||
|
|
|
|
|
|
|
|
|
|
|
|||||||||||
| Total distributions |
(0.23 | ) | (11.15 | ) | (1.65 | ) | (0.83 | ) | (6.68 | ) | ||||||||||
|
|
|
|
|
|
|
|
|
|
|
|||||||||||
| Net asset value, end of year |
$ | 23.51 | $ | 25.77 | $ | 36.31 | $ | 24.09 | $ | 27.40 | ||||||||||
|
|
|
|
|
|
|
|
|
|
|
|||||||||||
| Total Return(c) |
||||||||||||||||||||
| Based on net asset value |
(7.86 | )% | 1.46 | % | 58.11 | % | (9.60 | )% | 6.76 | % | ||||||||||
|
|
|
|
|
|
|
|
|
|
|
|||||||||||
| Ratios to Average Net Assets(d) |
||||||||||||||||||||
| Total expenses |
0.79 | % | 0.79 | % | 0.86 | %(e) | 0.85 | %(f) | 0.98 | %(f) | ||||||||||
|
|
|
|
|
|
|
|
|
|
|
|||||||||||
| Total expenses after fees waived and/or reimbursed |
0.48 | % | 0.48 | % | 0.48 | %(e) | 0.48 | %(f) | 0.48 | %(f) | ||||||||||
|
|
|
|
|
|
|
|
|
|
|
|||||||||||
| Net investment income |
1.11 | % | 0.82 | % | 1.03 | %(e) | 1.44 | %(f) | 1.48 | %(f) | ||||||||||
|
|
|
|
|
|
|
|
|
|
|
|||||||||||
| Supplemental Data |
||||||||||||||||||||
| Net assets, end of year (000) |
$ | 78,727 | $ | 91,738 | $ | 103,266 | $ | 72,044 | $ | 87,248 | ||||||||||
|
|
|
|
|
|
|
|
|
|
|
|||||||||||
| Portfolio turnover rate |
125 | % | 145 | % | 208 | %(g) | 123 | % | 142 | % | ||||||||||
|
|
|
|
|
|
|
|
|
|
|
|||||||||||
| (a) | Based on average shares outstanding. |
| (b) | Distributions for annual periods determined in accordance with U.S. federal income tax regulations. |
| (c) | Where applicable, assumes the reinvestment of distributions. |
| (d) | Excludes fees and expenses incurred indirectly as a result of investments in underlying funds. |
| (e) | From April 1, 2020 through February 28, 2021, the Fund invested in the Master Advantage SMID Cap LLC (the “Master LLC”) as part of a master-feeder structure and received its corresponding allocated fees waived and expenses and/or net investment income from the Master LLC. Includes the Fund’s share of the Master LLC’s allocated fees waived of 0.11%. |
| (f) | Includes the Fund’s share of the Master LLC’s allocated fees waived and expenses and/or net investment income. Includes the Fund’s share of the Master LLC’s allocated fees waived of 0.12%. |
| (g) | Portfolio turnover rate includes transactions from the Master LLC prior to March 1, 2021. |
See notes to financial statements.
| 22 |
2 0 2 3 B L A C K R O C K A N N U A L R E P O R T T O S H A R E H O L D E R S |
Financial Highlights (continued)
(For a share outstanding throughout each period)
| BlackRock Advantage SMID Cap Fund, Inc. (continued) | ||||||||||||||||||||
| Investor A | ||||||||||||||||||||
| Year Ended 03/31/23 |
Year Ended 03/31/22 |
Year Ended 03/31/21 |
Year Ended 03/31/20 |
Year Ended 03/31/19 |
||||||||||||||||
| Net asset value, beginning of year |
$ | 24.05 | $ | 34.61 | $ | 23.02 | $ | 26.22 | $ | 31.22 | ||||||||||
|
|
|
|
|
|
|
|
|
|
|
|||||||||||
| Net investment income(a) |
0.19 | 0.15 | 0.24 | 0.33 | 0.32 | |||||||||||||||
| Net realized and unrealized gain (loss) |
(2.14 | ) | 0.37 | 12.93 | (2.76 | ) | 1.30 | |||||||||||||
|
|
|
|
|
|
|
|
|
|
|
|||||||||||
| Net increase (decrease) from investment operations |
(1.95 | ) | 0.52 | 13.17 | (2.43 | ) | 1.62 | |||||||||||||
|
|
|
|
|
|
|
|
|
|
|
|||||||||||
| Distributions(b) |
||||||||||||||||||||
| From net investment income |
(0.19 | ) | (0.34 | ) | (0.21 | ) | (0.32 | ) | (0.39 | ) | ||||||||||
| From net realized gain |
— | (10.74 | ) | (1.37 | ) | (0.45 | ) | (6.23 | ) | |||||||||||
|
|
|
|
|
|
|
|
|
|
|
|||||||||||
| Total distributions |
(0.19 | ) | (11.08 | ) | (1.58 | ) | (0.77 | ) | (6.62 | ) | ||||||||||
|
|
|
|
|
|
|
|
|
|
|
|||||||||||
| Net asset value, end of year |
$ | 21.91 | $ | 24.05 | $ | 34.61 | $ | 23.02 | $ | 26.22 | ||||||||||
|
|
|
|
|
|
|
|
|
|
|
|||||||||||
| Total Return(c) |
||||||||||||||||||||
| Based on net asset value |
(8.10 | )% | 1.20 | % | 57.69 | % | (9.79 | )% | 6.52 | % | ||||||||||
|
|
|
|
|
|
|
|
|
|
|
|||||||||||
| Ratios to Average Net Assets(d) |
||||||||||||||||||||
| Total expenses |
1.05 | % | 1.04 | % | 1.10 | %(e) | 1.12 | %(f) | 1.25 | %(f) | ||||||||||
|
|
|
|
|
|
|
|
|
|
|
|||||||||||
| Total expenses after fees waived and/or reimbursed |
0.73 | % | 0.73 | % | 0.73 | %(e) | 0.73 | %(f) | 0.73 | %(f) | ||||||||||
|
|
|
|
|
|
|
|
|
|
|
|||||||||||
| Net investment income |
0.86 | % | 0.57 | % | 0.78 | %(e) | 1.19 | %(f) | 1.24 | %(f) | ||||||||||
|
|
|
|
|
|
|
|
|
|
|
|||||||||||
| Supplemental Data |
||||||||||||||||||||
| Net assets, end of year (000) |
$ | 181,709 | $ | 224,871 | $ | 259,637 | $ | 188,164 | $ | 279,014 | ||||||||||
|
|
|
|
|
|
|
|
|
|
|
|||||||||||
| Portfolio turnover rate |
125 | % | 145 | % | 208 | %(g) | 123 | % | 142 | % | ||||||||||
|
|
|
|
|
|
|
|
|
|
|
|||||||||||
| (a) | Based on average shares outstanding. |
| (b) | Distributions for annual periods determined in accordance with U.S. federal income tax regulations. |
| (c) | Where applicable, excludes the effects of any sales charges and assumes the reinvestment of distributions. |
| (d) | Excludes fees and expenses incurred indirectly as a result of investments in underlying funds. |
| (e) | From April 1, 2020 through February 28, 2021, the Fund invested in the Master LLC as part of a master-feeder structure and received its corresponding allocated fees waived and expenses and/or net investment income from the Master LLC. Includes the Fund’s share of the Master LLC’s allocated fees waived of 0.11%. |
| (f) | Includes the Fund’s share of the Master LLC’s allocated fees waived and expenses and/or net investment income. Includes the Fund’s share of the Master LLC’s allocated fees waived of 0.12%. |
| (g) | Portfolio turnover rate includes transactions from the Master LLC prior to March 1, 2021. |
See notes to financial statements.
| F I N A N C I A L S T A T E M E N T S |
23 |
Financial Highlights (continued)
(For a share outstanding throughout each period)
| BlackRock Advantage SMID Cap Fund, Inc. (continued) | ||||||||||||||||||||
| Investor C |
||||||||||||||||||||
| Year Ended 03/31/23 |
Year Ended 03/31/22 |
Year Ended 03/31/21 |
Year Ended 03/31/20 |
Year Ended 03/31/19 |
||||||||||||||||
| Net asset value, beginning of year |
$ | 10.81 | $ | 21.55 | $ | 14.52 | $ | 16.83 | $ | 22.38 | ||||||||||
|
|
|
|
|
|
|
|
|
|
|
|||||||||||
| Net investment income (loss)(a) |
0.01 | (0.02 | ) | 0.02 | 0.08 | 0.08 | ||||||||||||||
| Net realized and unrealized gain (loss) |
(0.96 | ) | 0.29 | 8.11 | (1.72 | ) | 0.83 | |||||||||||||
|
|
|
|
|
|
|
|
|
|
|
|||||||||||
| Net increase (decrease) from investment operations |
(0.95 | ) | 0.27 | 8.13 | (1.64 | ) | 0.91 | |||||||||||||
|
|
|
|
|
|
|
|
|
|
|
|||||||||||
| Distributions(b) |
||||||||||||||||||||
| From net investment income |
(0.16 | ) | (0.27 | ) | — | (0.22 | ) | (0.23 | ) | |||||||||||
| From net realized gain |
— | (10.74 | ) | (1.10 | ) | (0.45 | ) | (6.23 | ) | |||||||||||
|
|
|
|
|
|
|
|
|
|
|
|||||||||||
| Total distributions |
(0.16 | ) | (11.01 | ) | (1.10 | ) | (0.67 | ) | (6.46 | ) | ||||||||||
|
|
|
|
|
|
|
|
|
|
|
|||||||||||
| Net asset value, end of year |
$ | 9.70 | $ | 10.81 | $ | 21.55 | $ | 14.52 | $ | 16.83 | ||||||||||
|
|
|
|
|
|
|
|
|
|
|
|||||||||||
| Total Return(c) |
||||||||||||||||||||
| Based on net asset value |
(8.78 | )% | 0.42 | % | 56.51 | % | (10.45 | )% | 5.73 | % | ||||||||||
|
|
|
|
|
|
|
|
|
|
|
|||||||||||
| Ratios to Average Net Assets(d) |
||||||||||||||||||||
| Total expenses |
1.90 | % | 1.92 | % | 1.92 | %(e) | 1.98 | %(f) | 2.12 | %(f) | ||||||||||
|
|
|
|
|
|
|
|
|
|
|
|||||||||||
| Total expenses after fees waived and/or reimbursed |
1.48 | % | 1.48 | % | 1.48 | %(e) | 1.48 | %(f) | 1.48 | %(f) | ||||||||||
|
|
|
|
|
|
|
|
|
|
|
|||||||||||
| Net investment income (loss) |
0.11 | % | (0.17 | )% | 0.13 | %(e) | 0.44 | %(f) | 0.46 | %(f) | ||||||||||
|
|
|
|
|
|
|
|
|
|
|
|||||||||||
| Supplemental Data |
||||||||||||||||||||
| Net assets, end of year (000) |
$ | 2,710 | $ | 3,866 | $ | 4,322 | $ | 21,376 | $ | 39,413 | ||||||||||
|
|
|
|
|
|
|
|
|
|
|
|||||||||||
| Portfolio turnover rate |
125 | % | 145 | % | 208 | %(g) | 123 | % | 142 | % | ||||||||||
|
|
|
|
|
|
|
|
|
|
|
|||||||||||
| (a) | Based on average shares outstanding. |
| (b) | Distributions for annual periods determined in accordance with U.S. federal income tax regulations. |
| (c) | Where applicable, excludes the effects of any sales charges and assumes the reinvestment of distributions. |
| (d) | Excludes fees and expenses incurred indirectly as a result of investments in underlying funds. |
| (e) | From April 1, 2020 through February 28, 2021, the Fund invested in the Master LLC as part of a master-feeder structure and received its corresponding allocated fees waived and expenses and/or net investment income from the Master LLC. Includes the Fund’s share of the Master LLC’s allocated fees waived of 0.11%. |
| (f) | Includes the Fund’s share of the Master LLC’s allocated fees waived and expenses and/or net investment income. Includes the Fund’s share of the Master LLC’s allocated fees waived of 0.12%. |
| (g) | Portfolio turnover rate includes transactions from the Master LLC prior to March 1, 2021. |
See notes to financial statements.
| 24 |
2 0 2 3 B L A C K R O C K A N N U A L R E P O R T T O S H A R E H O L D E R S |
Financial Highlights (continued)
(For a share outstanding throughout each period)
| BlackRock Advantage SMID Cap Fund, Inc. (continued) | ||||||||||||||||||||
| Class K | ||||||||||||||||||||
| Year Ended 03/31/23 |
Year Ended 03/31/22 |
Year Ended 03/31/21 |
Year Ended 03/31/20 |
Year Ended 03/31/19 |
||||||||||||||||
| Net asset value, beginning of year |
$ | 25.75 | $ | 36.29 | $ | 24.08 | $ | 27.38 | $ | 32.34 | ||||||||||
|
|
|
|
|
|
|
|
|
|
|
|||||||||||
| Net investment income(a) |
0.27 | 0.25 | 0.34 | 0.43 | 0.42 | |||||||||||||||
| Net realized and unrealized gain (loss) |
(2.29 | ) | 0.38 | 13.54 | (2.89 | ) | 1.32 | |||||||||||||
|
|
|
|
|
|
|
|
|
|
|
|||||||||||
| Net increase (decrease) from investment operations |
(2.02 | ) | 0.63 | 13.88 | (2.46 | ) | 1.74 | |||||||||||||
|
|
|
|
|
|
|
|
|
|
|
|||||||||||
| Distributions(b) |
||||||||||||||||||||
| From net investment income |
(0.24 | ) | (0.43 | ) | (0.30 | ) | (0.39 | ) | (0.47 | ) | ||||||||||
| From net realized gain |
— | (10.74 | ) | (1.37 | ) | (0.45 | ) | (6.23 | ) | |||||||||||
|
|
|
|
|
|
|
|
|
|
|
|||||||||||
| Total distributions |
(0.24 | ) | (11.17 | ) | (1.67 | ) | (0.84 | ) | (6.70 | ) | ||||||||||
|
|
|
|
|
|
|
|
|
|
|
|||||||||||
| Net asset value, end of year |
$ | 23.49 | $ | 25.75 | $ | 36.29 | $ | 24.08 | $ | 27.38 | ||||||||||
|
|
|
|
|
|
|
|
|
|
|
|||||||||||
| Total Return(c) |
||||||||||||||||||||
| Based on net asset value |
(7.83 | )% | 1.51 | % | 58.16 | % | (9.53 | )% | 6.74 | % | ||||||||||
|
|
|
|
|
|
|
|
|
|
|
|||||||||||
| Ratios to Average Net Assets(d) |
||||||||||||||||||||
| Total expenses |
0.67 | % | 0.67 | % | 0.76 | %(e) | 0.77 | %(f) | 0.90 | %(f) | ||||||||||
|
|
|
|
|
|
|
|
|
|
|
|||||||||||
| Total expenses after fees waived and/or reimbursed |
0.43 | % | 0.43 | % | 0.43 | %(e) | 0.43 | %(f) | 0.43 | %(f) | ||||||||||
|
|
|
|
|
|
|
|
|
|
|
|||||||||||
| Net investment income |
1.14 | % | 0.94 | % | 1.08 | %(e) | 1.49 | %(f) | 1.53 | %(f) | ||||||||||
|
|
|
|
|
|
|
|
|
|
|
|||||||||||
| Supplemental Data |
||||||||||||||||||||
| Net assets, end of year (000) |
$ | 76,595 | $ | 59,019 | $ | 2,372 | $ | 1,549 | $ | 2,241 | ||||||||||
|
|
|
|
|
|
|
|
|
|
|
|||||||||||
| Portfolio turnover rate |
125 | % | 145 | % | 208 | %(g) | 123 | % | 142 | % | ||||||||||
|
|
|
|
|
|
|
|
|
|
|
|||||||||||
| (a) | Based on average shares outstanding. |
| (b) | Distributions for annual periods determined in accordance with U.S. federal income tax regulations. |
| (c) | Where applicable, assumes the reinvestment of distributions. |
| (d) | Excludes fees and expenses incurred indirectly as a result of investments in underlying funds. |
| (e) | From April 1, 2020 through February 28, 2021, the Fund invested in the Master LLC as part of a master-feeder structure and received its corresponding allocated fees waived and expenses and/or net investment income from the Master LLC. Includes the Fund’s share of the Master LLC’s allocated fees waived of 0.11%. |
| (f) | Includes the Fund’s share of the Master LLC’s allocated fees waived and expenses and/or net investment income. Includes the Fund’s share of the Master LLC’s allocated fees waived of 0.12%. |
| (g) | Portfolio turnover rate includes transactions from the Master LLC prior to March 1, 2021. |
See notes to financial statements.
| F I N A N C I A L S T A T E M E N T S |
25 |
Financial Highlights (continued)
(For a share outstanding throughout each period)
| BlackRock Advantage SMID Cap Fund, Inc. (continued) | ||||||||||||||||||||
| Class R | ||||||||||||||||||||
| Year Ended 03/31/23 |
Year Ended 03/31/22 |
Year Ended 03/31/21 |
Year Ended 03/31/20 |
Year Ended 03/31/19 |
||||||||||||||||
| Net asset value, beginning of year |
$ | 13.87 | $ | 24.56 | $ | 16.66 | $ | 19.18 | $ | 24.61 | ||||||||||
|
|
|
|
|
|
|
|
|
|
|
|||||||||||
| Net investment income(a) |
0.08 | 0.05 | 0.12 | 0.19 | 0.19 | |||||||||||||||
| Net realized and unrealized gain (loss) |
(1.24 | ) | 0.32 | 9.31 | (1.98 | ) | 0.95 | |||||||||||||
|
|
|
|
|
|
|
|
|
|
|
|||||||||||
| Net increase (decrease) from investment operations |
(1.16 | ) | 0.37 | 9.43 | (1.79 | ) | 1.14 | |||||||||||||
|
|
|
|
|
|
|
|
|
|
|
|||||||||||
| Distributions(b) |
||||||||||||||||||||
| From net investment income |
(0.19 | ) | (0.32 | ) | (0.16 | ) | (0.28 | ) | (0.34 | ) | ||||||||||
| From net realized gain |
— | (10.74 | ) | (1.37 | ) | (0.45 | ) | (6.23 | ) | |||||||||||
|
|
|
|
|
|
|
|
|
|
|
|||||||||||
| Total distributions |
(0.19 | ) | (11.06 | ) | (1.53 | ) | (0.73 | ) | (6.57 | ) | ||||||||||
|
|
|
|
|
|
|
|
|
|
|
|||||||||||
| Net asset value, end of year |
$ | 12.52 | $ | 13.87 | $ | 24.56 | $ | 16.66 | $ | 19.18 | ||||||||||
|
|
|
|
|
|
|
|
|
|
|
|||||||||||
| Total Return(c) |
||||||||||||||||||||
| Based on net asset value |
(8.37 | )% | 1.01 | % | 57.23 | % | (10.00 | )% | 6.31 | % | ||||||||||
|
|
|
|
|
|
|
|
|
|
|
|||||||||||
| Ratios to Average Net Assets(d) |
||||||||||||||||||||
| Total expenses |
1.44 | % | 1.43 | % | 1.40 | %(e) | 1.41 | %(f) | 1.54 | %(f) | ||||||||||
|
|
|
|
|
|
|
|
|
|
|
|||||||||||
| Total expenses after fees waived and/or reimbursed |
0.98 | % | 0.98 | % | 0.98 | %(e) | 0.98 | %(f) | 0.98 | %(f) | ||||||||||
|
|
|
|
|
|
|
|
|
|
|
|||||||||||
| Net investment income |
0.61 | % | 0.32 | % | 0.56 | %(e) | 0.94 | %(f) | 0.98 | %(f) | ||||||||||
|
|
|
|
|
|
|
|
|
|
|
|||||||||||
| Supplemental Data |
||||||||||||||||||||
| Net assets, end of year (000) |
$ | 3,875 | $ | 5,340 | $ | 5,879 | $ | 8,359 | $ | 17,433 | ||||||||||
|
|
|
|
|
|
|
|
|
|
|
|||||||||||
| Portfolio turnover rate |
125 | % | 145 | % | 208 | %(g) | 123 | % | 142 | % | ||||||||||
|
|
|
|
|
|
|
|
|
|
|
|||||||||||
| (a) | Based on average shares outstanding. |
| (b) | Distributions for annual periods determined in accordance with U.S. federal income tax regulations. |
| (c) | Where applicable, assumes the reinvestment of distributions. |
| (d) | Excludes fees and expenses incurred indirectly as a result of investments in underlying funds. |
| (e) | From April 1, 2020 through February 28, 2021, the Fund invested in the Master LLC as part of a master-feeder structure and received its corresponding allocated fees waived and expenses and/or net investment income from the Master LLC. Includes the Fund’s share of the Master LLC’s allocated fees waived of 0.11%. |
| (f) | Includes the Fund’s share of the Master LLC’s allocated fees waived and expenses and/or net investment income. Includes the Fund’s share of the Master LLC’s allocated fees waived of 0.12%. |
| (g) | Portfolio turnover rate includes transactions from the Master LLC prior to March 1, 2021. |
See notes to financial statements.
| 26 |
2 0 2 3 B L A C K R O C K A N N U A L R E P O R T T O S H A R E H O L D E R S |
| 1. | ORGANIZATION |
BlackRock Advantage SMID Cap Fund, Inc. (the “Fund”) is registered under the Investment Company Act of 1940, as amended (the “1940 Act”), as an open-end management investment company. The Fund is organized as a Maryland corporation. The Fund is classified as diversified.
The Fund offers multiple classes of shares. All classes of shares have identical voting, dividend, liquidation and other rights and are subject to the same terms and conditions, except that certain classes bear expenses related to the shareholder servicing and distribution of such shares. Institutional and Class K Shares are sold only to certain eligible investors. Investor A, Investor C and Class R Shares bear certain expenses related to shareholder servicing of such shares, and Investor C and Class R Shares also bear certain expenses related to the distribution of such shares. Investor A and Investor C Shares are generally available through financial intermediaries. Class R Shares are sold only to certain employer-sponsored retirement plans. Each class has exclusive voting rights with respect to matters relating to its shareholder servicing and distribution expenditures (except that Investor C shareholders may vote on material changes to the Investor A Shares distribution and service plan).
| Share Class | Initial Sales Charge | CDSC | Conversion Privilege | |||||
| Institutional, Class K and Class R Shares |
No | No | None | |||||
| Investor A Shares |
Yes | No | (a) | None | ||||
| Investor C Shares |
No | Yes | (b) | To Investor A Shares after approximately 8 years | ||||
| (a) | Investor A Shares may be subject to a contingent deferred sales charge (“CDSC”) for certain redemptions where no initial sales charge was paid at the time of purchase. |
| (b) | A CDSC of 1.00% is assessed on certain redemptions of Investor C Shares made within one year after purchase. |
The Fund, together with certain other registered investment companies advised by BlackRock Advisors, LLC (the “Manager”) or its affiliates, is included in a complex of funds referred to as the BlackRock Multi-Asset Complex.
| 2. | SIGNIFICANT ACCOUNTING POLICIES |
The financial statements are prepared in conformity with accounting principles generally accepted in the United States of America (“U.S. GAAP”), which may require management to make estimates and assumptions that affect the reported amounts of assets and liabilities in the financial statements, disclosure of contingent assets and liabilities at the date of the financial statements and the reported amounts of increases and decreases in net assets from operations during the reporting period. Actual results could differ from those estimates. The Fund is considered an investment company under U.S. GAAP and follows the accounting and reporting guidance applicable to investment companies. Below is a summary of significant accounting policies:
Investment Transactions and Income Recognition: For financial reporting purposes, investment transactions are recorded on the dates the transactions are executed. Realized gains and losses on investment transactions are determined using the specific identification method. Dividend income and capital gain distributions, if any, are recorded on the ex-dividend dates. Non-cash dividends, if any, are recorded on the ex-dividend dates at fair value. Dividends from foreign securities where the ex-dividend dates may have passed are subsequently recorded when the Fund is informed of the ex-dividend dates. Under the applicable foreign tax laws, a withholding tax at various rates may be imposed on capital gains, dividends and interest. Upon notification from issuers, a portion of the dividend income received from a real estate investment trust may be redesignated as a reduction of cost of the related investment and/or realized gain. Income, expenses and realized and unrealized gains and losses are allocated daily to each class based on its relative net assets.
Foreign Currency Translation: The Fund’s books and records are maintained in U.S. dollars. Securities and other assets and liabilities denominated in foreign currencies are translated into U.S. dollars using exchange rates determined as of the close of trading on the New York Stock Exchange (“NYSE”). Purchases and sales of investments are recorded at the rates of exchange prevailing on the respective dates of such transactions. Generally, when the U.S. dollar rises in value against a foreign currency, the investments denominated in that currency will lose value; the opposite effect occurs if the U.S. dollar falls in relative value.
The Fund does not isolate the effect of fluctuations in foreign exchange rates from the effect of fluctuations in the market prices of investments for financial reporting purposes. Accordingly, the effects of changes in exchange rates on investments are not segregated in the Statement of Operations from the effects of changes in market prices of those investments, but are included as a component of net realized and unrealized gain (loss) from investments. The Fund reports realized currency gains (losses) on foreign currency related transactions as components of net realized gain (loss) for financial reporting purposes, whereas such components are generally treated as ordinary income for U.S. federal income tax purposes.
Foreign Taxes: The Fund may be subject to foreign taxes (a portion of which may be reclaimable) on income, stock dividends, capital gains on investments, or certain foreign currency transactions. All foreign taxes are recorded in accordance with the applicable foreign tax regulations and rates that exist in the foreign jurisdictions in which the Fund invests. These foreign taxes, if any, are paid by the Fund and are reflected in its Statement of Operations as follows: foreign taxes withheld at source are presented as a reduction of income, foreign taxes on securities lending income are presented as a reduction of securities lending income, foreign taxes on stock dividends are presented as “Foreign taxes withheld”, and foreign taxes on capital gains from sales of investments and foreign taxes on foreign currency transactions are included in their respective net realized gain (loss) categories. Foreign taxes payable or deferred as of March 31, 2023, if any, are disclosed in the Statement of Assets and Liabilities.
The Fund files withholding tax reclaims in certain jurisdictions to recover a portion of amounts previously withheld. The Fund may record a reclaim receivable based on collectability, which includes factors such as the jurisdiction’s applicable laws, payment history and market convention. The Statement of Operations includes tax reclaims recorded as well as professional and other fees, if any, associated with recovery of foreign withholding taxes.
Collateralization: If required by an exchange or counterparty agreement, the Fund may be required to deliver/deposit cash and/or securities to/with an exchange, or broker-dealer or custodian as collateral for certain investments.
|
N O T E S T O F I N A N C I A L S T A T E M E N T S |
27 |
Notes to Financial Statements (continued)
Distributions: Distributions paid by the Fund are recorded on the ex-dividend dates. The character and timing of distributions are determined in accordance with U.S. federal income tax regulations, which may differ from U.S. GAAP.
Indemnifications: In the normal course of business, the Fund enters into contracts that contain a variety of representations that provide general indemnification. The Fund’s maximum exposure under these arrangements is unknown because it involves future potential claims against the Fund, which cannot be predicted with any certainty.
Other: Expenses directly related to the Fund or its classes are charged to the Fund or the applicable class. Expenses directly related to the Fund and other shared expenses prorated to the Fund are allocated daily to each class based on its relative net assets or other appropriate methods. Other operating expenses shared by several funds, including other funds managed by the Manager, are prorated among those funds on the basis of relative net assets or other appropriate methods.
The Fund has an arrangement with its custodian whereby credits are earned on uninvested cash balances, which could be used to reduce custody fees and/or overdraft charges. The Fund may incur charges on overdrafts, subject to certain conditions.
| 3. | INVESTMENT VALUATION AND FAIR VALUE MEASUREMENTS |
Investment Valuation Policies: The Fund’s investments are valued at fair value (also referred to as “market value” within the financial statements) each day that the Fund is open for business and, for financial reporting purposes, as of the report date. U.S. GAAP defines fair value as the price a fund would receive to sell an asset or pay to transfer a liability in an orderly transaction between market participants at the measurement date. The Board of Directors of the Fund (the “Board”) has approved the designation of the Fund’s Manager as the valuation designee for the Fund. The Fund determines the fair values of its financial instruments using various independent dealers or pricing services under the Manager’s policies. If a security’s market price is not readily available or does not otherwise accurately represent the fair value of the security, the security will be valued in accordance with the Manager’s policies and procedures as reflecting fair value. The Manager has formed a committee (the “Valuation Committee”) to develop pricing policies and procedures and to oversee the pricing function for all financial instruments, with assistance from other BlackRock pricing committees.
Fair Value Inputs and Methodologies: The following methods and inputs are used to establish the fair value of the Fund’s assets and liabilities:
| • | Equity investments traded on a recognized securities exchange are valued at that day’s official closing price, as applicable, on the exchange where the stock is primarily traded. Equity investments traded on a recognized exchange for which there were no sales on that day may be valued at the last available bid (long positions) or ask (short positions) price. |
| • | Investments in open-end U.S. mutual funds (including money market funds) are valued at that day’s published NAV. |
| • | The Fund values its investment in SL Liquidity Series, LLC, Money Market Series (the “Money Market Series”) at fair value, which is ordinarily based upon its pro rata ownership in the underlying fund’s net assets. |
| • | Futures contracts are valued based on that day’s last reported settlement or trade price on the exchange where the contract is traded. |
Generally, trading in foreign instruments is substantially completed each day at various times prior to the close of trading on the NYSE. Each business day, the Fund uses current market factors supplied by independent pricing services to value certain foreign instruments (“Systematic Fair Value Price”). The Systematic Fair Value Price is designed to value such foreign securities at fair value as of the close of trading on the NYSE, which follows the close of the local markets.
If events (e.g., market volatility, company announcement or a natural disaster) occur that are expected to materially affect the value of such investment, or in the event that application of these methods of valuation results in a price for an investment that is deemed not to be representative of the market value of such investment, or if a price is not available, the investment will be valued by the Valuation Committee in accordance with the Manager’s policies and procedures as reflecting fair value (“Fair Valued Investments”). The fair valuation approaches that may be used by the Valuation Committee include market approach, income approach and cost approach. Valuation techniques such as discounted cash flow, use of market comparables and matrix pricing are types of valuation approaches and are typically used in determining fair value. When determining the price for Fair Valued Investments, the Valuation Committee seeks to determine the price that the Fund might reasonably expect to receive or pay from the current sale or purchase of that asset or liability in an arm’s-length transaction. Fair value determinations shall be based upon all available factors that the Valuation Committee deems relevant and consistent with the principles of fair value measurement.
Fair Value Hierarchy: Various inputs are used in determining the fair value of financial instruments. These inputs to valuation techniques are categorized into a fair value hierarchy consisting of three broad levels for financial reporting purposes as follows:
| • | Level 1 – Unadjusted price quotations in active markets/exchanges for identical assets or liabilities that the Fund has the ability to access; |
| • | Level 2 – Other observable inputs (including, but not limited to, quoted prices for similar assets or liabilities in markets that are active, quoted prices for identical or similar assets or liabilities in markets that are not active, inputs other than quoted prices that are observable for the assets or liabilities (such as interest rates, yield curves, volatilities, prepayment speeds, loss severities, credit risks and default rates) or other market–corroborated inputs); and |
| • | Level 3 – Unobservable inputs based on the best information available in the circumstances, to the extent observable inputs are not available (including the Valuation Committee’s assumptions used in determining the fair value of financial instruments). |
The hierarchy gives the highest priority to unadjusted quoted prices in active markets for identical assets or liabilities (Level 1 measurements) and the lowest priority to unobservable inputs (Level 3 measurements). Accordingly, the degree of judgment exercised in determining fair value is greatest for instruments categorized in Level 3. The inputs used to measure fair value may fall into different levels of the fair value hierarchy. In such cases, for disclosure purposes, the fair value hierarchy classification is determined based on the lowest level input that is significant to the fair value measurement in its entirety. Investments classified within Level 3 have significant unobservable inputs used by the Valuation Committee in determining the price for Fair Valued Investments. Level 3 investments include equity or debt issued by privately held companies or funds that may not have a secondary market and/or may have a limited number of investors. The categorization of a value determined for financial instruments is based on the pricing transparency of the financial instruments and is not necessarily an indication of the risks associated with investing in those securities.
| 28 |
2 0 2 3 B L A C K R O C K A N N U A L R E P O R T T O S H A R E H O L D E R S |
Notes to Financial Statements (continued)
As of March 31, 2023, certain investments of the Fund were fair valued using NAV per share as no quoted market value is available and therefore have been excluded from the fair value hierarchy.
| 4. | SECURITIES AND OTHER INVESTMENTS |
Securities Lending: The Fund may lend its securities to approved borrowers, such as brokers, dealers and other financial institutions. The borrower pledges and maintains with the Fund collateral consisting of cash, an irrevocable letter of credit issued by a bank, or securities issued or guaranteed by the U.S. Government. The initial collateral received by the Fund is required to have a value of at least 102% of the current value of the loaned securities for securities traded on U.S. exchanges and a value of at least 105% for all other securities. The collateral is maintained thereafter at a value equal to at least 100% of the current market value of the securities on loan. The market value of the loaned securities is determined at the close of each business day of the Fund and any additional required collateral is delivered to the Fund, or excess collateral returned by the Fund, on the next business day. During the term of the loan, the Fund is entitled to all distributions made on or in respect of the loaned securities, but does not receive interest income on securities received as collateral. Loans of securities are terminable at any time and the borrower, after notice, is required to return borrowed securities within the standard time period for settlement of securities transactions.
As of period end, any securities on loan were collateralized by cash and/or U.S. Government obligations. Cash collateral invested by the securities lending agent, BlackRock Investment Management, LLC (“BIM”), if any, is disclosed in the Schedule of Investments. Any non-cash collateral received cannot be sold, re-invested or pledged by the Fund, except in the event of borrower default. The securities on loan, if any, are disclosed in the Fund’s Schedule of Investments. The market value of any securities on loan and the value of related collateral, if any, are shown separately in the Statement of Assets and Liabilities as a component of investments at value – unaffiliated and collateral on securities loaned, respectively.
Securities lending transactions are entered into by the Fund under Master Securities Lending Agreements (each, an “MSLA”), which provide the right, in the event of default (including bankruptcy or insolvency), for the non-defaulting party to liquidate the collateral and calculate a net exposure to the defaulting party or request additional collateral. In the event that a borrower defaults, the Fund, as lender, would offset the market value of the collateral received against the market value of the securities loaned. When the value of the collateral is greater than that of the market value of the securities loaned, the lender is left with a net amount payable to the defaulting party. However, bankruptcy or insolvency laws of a particular jurisdiction may impose restrictions on or prohibitions against such a right of offset in the event of an MSLA counterparty’s bankruptcy or insolvency. Under the MSLA, absent an event of default, the borrower can resell or re-pledge the loaned securities, and the Fund can reinvest cash collateral received in connection with loaned securities. Upon an event of default, the parties’ obligations to return the securities or collateral to the other party are extinguished, and the parties can resell or re-pledge the loaned securities or the collateral received in connection with the loaned securities in order to satisfy the defaulting party’s net payment obligation for all transactions under the MSLA. The defaulting party remains liable for any deficiency.
As of period end, the following table is a summary of the Fund’s securities on loan by counterparty which are subject to offset under an MSLA:
| Counterparty | |
Securities Loaned at Value |
|
|
Cash Collateral Received |
(a) |
|
Non-Cash Collateral Received |
|
|
Net Amount |
(b) | ||||
| Credit Suisse Securities (USA) LLC |
$ | 410,892 | $ | (410,892 | ) | $ | — | $ | — | |||||||
| J.P. Morgan Securities LLC |
2,587,053 | (2,587,053 | ) | — | — | |||||||||||
| Jefferies LLC |
201,636 | (201,636 | ) | — | — | |||||||||||
| National Financial Services LLC |
137,385 | (136,006 | ) | — | 1,379 | |||||||||||
| State Street Bank & Trust Co. |
860,721 | (860,721 | ) | — | — | |||||||||||
| TD Prime Services LLC |
110,700 | (107,500 | ) | — | 3,200 | |||||||||||
|
|
|
|
|
|
|
|
|
|||||||||
| $ | 4,308,387 | $ | (4,303,808 | ) | $ | — | $ | 4,579 | ||||||||
|
|
|
|
|
|
|
|
|
| (a) | Collateral received in excess of the market value of securities on loan is not presented in this table. The total cash collateral received by the Fund is disclosed in the Fund’s Statement of Assets and Liabilities. |
| (b) | The market value of the loaned securities is determined as of March 31, 2023. Additional collateral is delivered to the Fund on the next business day in accordance with the MSLA. The net amount would be subject to the borrower default indemnity in the event of default by the counterparty. |
The risks of securities lending include the risk that the borrower may not provide additional collateral when required or may not return the securities when due. To mitigate these risks, the Fund benefits from a borrower default indemnity provided by BIM. BIM’s indemnity allows for full replacement of the securities loaned to the extent the collateral received does not cover the value on the securities loaned in the event of borrower default. The Fund could incur a loss if the value of an investment purchased with cash collateral falls below the market value of loaned securities or if the value of an investment purchased with cash collateral falls below the value of the original cash collateral received. Such losses are borne entirely by the Fund.
| 5. | DERIVATIVE FINANCIAL INSTRUMENTS |
The Fund engages in various portfolio investment strategies using derivative contracts both to increase the returns of the Fund and/or to manage its exposure to certain risks such as credit risk, equity risk, interest rate risk, foreign currency exchange rate risk, commodity price risk or other risks (e.g., inflation risk). Derivative financial instruments categorized by risk exposure are included in the Schedule of Investments. These contracts may be transacted on an exchange or over-the-counter (“OTC”).
Futures Contracts: Futures contracts are purchased or sold to gain exposure to, or manage exposure to, changes in interest rates (interest rate risk) and changes in the value of equity securities (equity risk) or foreign currencies (foreign currency exchange rate risk).
|
N O T E S T O F I N A N C I A L S T A T E M E N T S |
29 |
Notes to Financial Statements (continued)
Futures contracts are exchange-traded agreements between the Fund and a counterparty to buy or sell a specific quantity of an underlying instrument at a specified price and on a specified date. Depending on the terms of a contract, it is settled either through physical delivery of the underlying instrument on the settlement date or by payment of a cash amount on the settlement date. Upon entering into a futures contract, the Fund is required to deposit initial margin with the broker in the form of cash or securities in an amount that varies depending on a contract’s size and risk profile. The initial margin deposit must then be maintained at an established level over the life of the contract. Amounts pledged, which are considered restricted, are included in cash pledged for futures contracts in the Statement of Assets and Liabilities.
Securities deposited as initial margin are designated in the Schedule of Investments and cash deposited, if any, are shown as cash pledged for futures contracts in the Statement of Assets and Liabilities. Pursuant to the contract, the Fund agrees to receive from or pay to the broker an amount of cash equal to the daily fluctuation in market value of the contract (“variation margin”). Variation margin is recorded as unrealized appreciation (depreciation) and, if any, shown as variation margin receivable (or payable) on futures contracts in the Statement of Assets and Liabilities. When the contract is closed, a realized gain or loss is recorded in the Statement of Operations equal to the difference between the notional amount of the contract at the time it was opened and the notional amount at the time it was closed. The use of futures contracts involves the risk of an imperfect correlation in the movements in the price of futures contracts and interest rates, foreign currency exchange rates or underlying assets.
| 6. | INVESTMENT ADVISORY AGREEMENT AND OTHER TRANSACTIONS WITH AFFILIATES |
Investment Advisory: The Fund entered into an Investment Advisory Agreement with the Manager, the Fund’s investment adviser and an indirect, wholly-owned subsidiary of BlackRock, Inc. (“BlackRock”), to provide investment advisory and administrative services. The Manager is responsible for the management of the Fund’s portfolio and provides the personnel, facilities, equipment and certain other services necessary to the operations of the Fund.
For such services, the Fund pays the Manager a monthly fee at an annual rate equal to the following percentages of the average daily value of the Fund’s net assets:
| Average Daily Net Assets | Investment Advisory Fees | |||
| First $1 billion |
0.500 | % | ||
| $1 billion - $1.5 billion |
0.475 | |||
| Greater than $1.5 billion |
0.450 | |||
Service and Distribution Fees: The Fund entered into a Distribution Agreement and Distribution and Service Plans with BlackRock Investments, LLC (“BRIL”), an affiliate of the Manager. Pursuant to the Distribution and Service Plans and in accordance with Rule 12b-1 under the 1940 Act, the Fund pays BRIL ongoing service and distribution fees. The fees are accrued daily and paid monthly at annual rates based upon the average daily net assets of the relevant share class of the Fund as follows:
| Share Class | Service Fees | Distribution Fees | ||||||
| Investor A |
0.25 | % | N/A | |||||
| Investor C |
0.25 | 0.75 | % | |||||
| Class R |
0.25 | 0.25 | ||||||
BRIL and broker-dealers, pursuant to sub-agreements with BRIL, provide shareholder servicing and distribution services to the Fund. The ongoing service and/or distribution fee compensates BRIL and each broker-dealer for providing shareholder servicing and/or distribution related services to shareholders.
For the year ended March 31, 2023, the following table shows the class specific service and distribution fees borne directly by each share class of the Fund:
| Investor A | Investor C | Class R | Total | |||||||||||||
| Service and distribution — class specific |
$ | 480,864 | $ | 31,557 | $ | 21,438 | $ | 533,859 | ||||||||
Administration: The Fund entered into an Administration Agreement with the Manager, an indirect, wholly-owned subsidiary of BlackRock, to provide administrative services. For these services, the Manager receives an administration fee computed daily and payable monthly, based on a percentage of the average daily net assets of the Fund. The administration fee, which is shown as administration in the Statement of Operations, is paid at the annual rates below.
| Average Daily Net Assets | Administration Fees | |||
| First $500 million |
0.0425 | % | ||
| $500 million - $1 billion |
0.0400 | |||
| $1 billion - $2 billion |
0.0375 | |||
| $2 billion - $4 billion |
0.0350 | |||
| $4 billion - $13 billion |
0.0325 | |||
| Greater than $13 billion |
0.0300 | |||
In addition, the Manager charges each of the share classes an administration fee, which is shown as administration — class specific in the Statement of Operations, at an annual rate of 0.02% of the average daily net assets of each respective class.
For the year ended March 31, 2023, the following table shows the class specific administration fees borne directly by each share class of the Fund:
| Institutional | Investor A | Investor C | Class K | Class R | Total | |||||||||||||||||||
| Administration — class specific |
$ 16,169 | $ 38,489 | $ 633 | $ 11,975 | $ 858 | $ 68,124 | ||||||||||||||||||
| 30 |
2 0 2 3 B L A C K R O C K A N N U A L R E P O R T T O S H A R E H O L D E R S |
Notes to Financial Statements (continued)
Transfer Agent: Pursuant to written agreements, certain financial intermediaries, some of which may be affiliates, provide the Fund with sub-accounting, recordkeeping, sub-transfer agency and other administrative services with respect to servicing of underlying investor accounts. For these services, these entities receive an asset-based fee or an annual fee per shareholder account, which will vary depending on share class and/or net assets. For the year ended March 31, 2023, the Fund did not pay any amounts to affiliates in return for these services.
The Manager maintains a call center that is responsible for providing certain shareholder services to the Fund. Shareholder services include responding to inquiries and processing purchases and sales based upon instructions from shareholders. For the year ended March 31, 2023, the Fund reimbursed the Manager the following amounts for costs incurred in running the call center, which are included in transfer agent — class specific in the Statement of Operations:
| Institutional | Investor A | Investor C | Class K | Class R | Total | |||||||||||||||||||
| Reimbursed amounts |
$ 4,759 | $ 4,093 | $ 283 | $ 379 | $ 113 | $ 9,627 | ||||||||||||||||||
For the year ended March 31, 2023, the following table shows the class specific transfer agent fees borne directly by each share class of the Fund:
| Institutional | Investor A | Investor C | Class K | Class R | Total | |||||||||||||||||||
| Transfer agent — class specific |
$ 96,387 | $ 244,316 | $ 7,399 | $ 2,323 | $ 11,689 | $ 362,114 | ||||||||||||||||||
Other Fees: For the year ended March 31, 2023, affiliates earned underwriting discounts, direct commissions and dealer concessions on sales of the Fund’s Investor A Shares for a total of $529.
Expense Limitations, Waivers and Reimbursements: The Manager contractually agreed to waive its investment advisory fees by the amount of investment advisory fees the Fund pays to the Manager indirectly through its investment in affiliated money market funds (the “affiliated money market fund waiver”) through June 30, 2024. The contractual agreement may be terminated upon 90 days’ notice by a majority of the directors who are not “interested persons” of the Fund, as defined in the 1940 Act (“Independent Directors”), or by a vote of a majority of the outstanding voting securities of the Fund. The amount of waivers and/or reimbursements of fees and expenses made pursuant to the expense limitation described below will be reduced by the amount of the affiliated money market fund waiver. This amount is included in fees waived and/or reimbursed by the Manager in the Statement of Operations. For the year ended March 31, 2023, the amount waived was $2,255.
The Manager has contractually agreed to waive its investment advisory fee with respect to any portion of the Fund’s assets invested in affiliated equity and fixed-income mutual funds and affiliated exchange-traded funds that have a contractual management fee through June 30, 2024. The contractual agreement may be terminated upon 90 days’ notice by a majority of the Independent Directors, or by a vote of a majority of the outstanding voting securities of the Fund. For the year ended March 31, 2023, there were no fees waived by the Manager pursuant to this arrangement.
The Manager contractually agreed to waive and/or reimburse fees or expenses in order to limit expenses, excluding interest expense, dividend expense, acquired fund fees and expenses, and certain other fund expenses, which constitute extraordinary expenses not incurred in the ordinary course of the Fund’s business (“expense limitation”). The expense limitations as a percentage of average daily net assets are as follows:
| Share Class | Expense Limitations | |
| Institutional |
0.48% | |
| Investor A |
0.73 | |
| Investor C |
1.48 | |
| Class K |
0.43 | |
| Class R |
0.98 |
The Manager has agreed not to reduce or discontinue this contractual expense limitations through June 30, 2024, unless approved by the Board, including a majority of the Independent Directors, or by a vote of a majority of the outstanding voting securities of the Fund. For the year ended March 31, 2023, the Manager waived and/or reimbursed investment advisory fees of $747,418 which is included in fees waived and/or reimbursed by the Manager in the Statement of Operations.
In addition, these amounts waived and/or reimbursed by the Manager are included in administration fees waived by the Manager — class specific and transfer agent fees waived and/or reimbursed by the Manager — class specific, respectively, in the Statement of Operations. For the year ended March 31, 2023, class specific expense waivers and/or reimbursements were as follows:
| Institutional | Investor A | Investor C | Class K | Class R | Total | |||||||||||||||||||
| Administration fees waived by the Manager — class specific |
$ | 16,169 | $ | 38,489 | $ | 633 | $ | 11,975 | $ | 858 | $ | 68,124 | ||||||||||||
| Transfer agent fees waived and/or reimbursed — class specific |
55,971 | 148,134 | 5,758 | 2,318 | 9,523 | 221,704 | ||||||||||||||||||
Securities Lending: The U.S. Securities and Exchange Commission (“SEC”) has issued an exemptive order which permits BIM, an affiliate of the Manager, to serve as securities lending agent for the Fund, subject to applicable conditions. As securities lending agent, BIM bears all operational costs directly related to securities lending. The Fund is responsible for expenses in connection with the investment of cash collateral received for securities on loan (the “collateral investment expenses”). The cash collateral is invested in a private investment company, Money Market Series, managed by the Manager or its affiliates. However, BIM has agreed to cap the collateral investment expenses of the Money Market Series to an annual rate of 0.04%. The investment adviser to the Money Market Series will not charge any advisory fees with respect to shares purchased by the Fund. The Money Market Series may, under certain circumstances, impose a liquidity fee of up to 2% of the value withdrawn or temporarily restrict withdrawals for up to 10 business days during a 90 day period, in the event that the private investment company’s weekly liquid assets fall below certain thresholds. The Money
|
N O T E S T O F I N A N C I A L S T A T E M E N T S |
31 |
Notes to Financial Statements (continued)
Market Series seeks current income consistent with maintaining liquidity and preserving capital. Although the Money Market Series is not registered under the 1940 Act, its investments may follow the parameters of investments by a money market fund that is subject to Rule 2a-7 under the 1940 Act.
Securities lending income is equal to the total of income earned from the reinvestment of cash collateral, net of fees and other payments to and from borrowers of securities, and less the collateral investment expenses. The Fund retains a portion of securities lending income and remits a remaining portion to BIM as compensation for its services as securities lending agent.
Pursuant to the current securities lending agreement, the Fund retains 81% of securities lending income (which excludes collateral investment expenses), and this amount retained can never be less than 70% of the total of securities lending income plus the collateral investment expenses.
In addition, commencing the business day following the date that the aggregate securities lending income earned across the BlackRock Multi-Asset Complex in a calendar year exceeds a specified threshold, the Fund, pursuant to the securities lending agreement, will retain for the remainder of that calendar year securities lending income in an amount equal to 81% of securities lending income (which excludes collateral investment expenses), and this amount retained can never be less than 70% of the total of securities lending income plus the collateral investment expenses.
The share of securities lending income earned by the Fund is shown as securities lending income — affiliated — net in the Statement of Operations. For the year ended March 31, 2023, the Fund paid BIM $8,587 for securities lending agent services.
Interfund Lending: In accordance with an exemptive order (the “Order”) from the SEC, the Fund may participate in a joint lending and borrowing facility for temporary purposes (the “Interfund Lending Program”), subject to compliance with the terms and conditions of the Order, and to the extent permitted by the Fund’s investment policies and restrictions. The Fund is currently permitted to borrow and lend under the Interfund Lending Program.
A lending BlackRock fund may lend in aggregate up to 15% of its net assets but may not lend more than 5% of its net assets to any one borrowing fund through the Interfund Lending Program. A borrowing BlackRock fund may not borrow through the Interfund Lending Program or from any other source more than 33 1/3% of its total assets (or any lower threshold provided for by the fund’s investment restrictions). If a borrowing BlackRock fund’s total outstanding borrowings exceed 10% of its total assets, each of its outstanding interfund loans will be subject to collateralization of at least 102% of the outstanding principal value of the loan. All interfund loans are for temporary or emergency purposes and the interest rate to be charged will be the average of the highest current overnight repurchase agreement rate available to a lending fund and the bank loan rate, as calculated according to a formula established by the Board.
During the year ended March 31, 2023, the Fund did not participate in the Interfund Lending Program.
Directors and Officers: Certain directors and/or officers of the Fund are directors and/or officers of BlackRock or its affiliates. The Fund reimburses the Manager for a portion of the compensation paid to the Fund’s Chief Compliance Officer, which is included in Directors and Officer in the Statement of Operations.
Other Transactions: The Fund may purchase securities from, or sell securities to, an affiliated fund provided the affiliation is due solely to having a common investment adviser, common officers, or common directors. For the year ended March 31, 2023, the purchase and sale transactions and any net realized gains (losses) with an affiliated fund in compliance with Rule 17a-7 under the 1940 Act were as follows:
| Purchases | Sales | Net Realized Loss |
||||||||
| $ 13,796,242 |
$ | 17,951,762 | $ (519,148 | ) | ||||||
| 7. | PURCHASES AND SALES |
For the year ended March 31, 2023, purchases and sales of investments, excluding short-term securities, were $423,596,613 and $433,478,566, respectively.
| 8. | INCOME TAX INFORMATION |
It is the Fund’s policy to comply with the requirements of the Internal Revenue Code of 1986, as amended, applicable to regulated investment companies, and to distribute substantially all of its taxable income to its shareholders. Therefore, no U.S. federal income tax provision is required.
The Fund files U.S. federal and various state and local tax returns. No income tax returns are currently under examination. The statute of limitations on the Fund’s U.S. federal tax returns generally remains open for a period of three years after they are filed. The statutes of limitations on the Fund’s state and local tax returns may remain open for an additional year depending upon the jurisdiction.
Management has analyzed tax laws and regulations and their application to the Fund as of March 31, 2023, inclusive of the open tax return years, and does not believe that there are any uncertain tax positions that require recognition of a tax liability in the Fund’s financial statements.
| 32 |
2 0 2 3 B L A C K R O C K A N N U A L R E P O R T T O S H A R E H O L D E R S |
Notes to Financial Statements (continued)
The tax character of distributions paid was as follows:
| Year Ended 03/31/23 |
Year Ended 03/31/22 |
|||||||
| Ordinary income |
$ | 3,115,320 | $ | 54,522,597 | ||||
| Long-term capital gains |
— | 69,643,544 | ||||||
|
|
|
|
|
|||||
| $ | 3,115,320 | $ | 124,166,141 | |||||
|
|
|
|
|
|||||
As of period end, the tax components of accumulated net earnings were as follows:
| Amounts | ||||
| Undistributed ordinary income |
$ | 50,906 | ||
| Non-expiring capital loss carryforwards(a) |
(35,420,078) | |||
| Net unrealized losses(b) |
(4,464,090) | |||
|
|
|
|||
| $ | (39,833,262) | |||
|
|
|
|||
| (a) | Amounts available to offset future realized capital gains. |
| (b) | The difference between book-basis and tax-basis of net accumulated losses was attributable primarily to the tax deferral of losses on wash sales, the realization for tax purposes of unrealized gains/losses on certain futures contracts, timing and recognition of partnership income and the realization for tax purposes of unrealized gains on investments in passive foreign investment companies. |
As of March 31, 2023, gross unrealized appreciation and depreciation based on cost of investments (including short positions and derivatives, if any) for U.S. federal income tax purposes were as follows:
| Amounts | ||||
| Tax cost |
$ | 350,985,244 | ||
|
|
|
|||
| Gross unrealized appreciation |
$ | 30,180,034 | ||
| Gross unrealized depreciation |
(34,736,574 | ) | ||
|
|
|
|||
| Net unrealized appreciation (depreciation) |
$ | (4,556,540) | ||
|
|
|
|||
| 9. | BANK BORROWINGS |
The Fund, along with certain other funds managed by the Manager and its affiliates (“Participating Funds”), is party to a 364-day, $2.50 billion credit agreement with a group of lenders. Under this agreement, the Fund may borrow to fund shareholder redemptions. Excluding commitments designated for certain individual funds, the Participating Funds, including the Fund, can borrow up to an aggregate commitment amount of $1.75 billion at any time outstanding, subject to asset coverage and other limitations as specified in the agreement. The credit agreement has the following terms: a fee of 0.10% per annum on unused commitment amounts and interest at a rate equal to the higher of (a) Overnight Bank Funding Rate (“OBFR”) (but, in any event, not less than 0.00%) on the date the loan is made plus 0.80% per annum, (b) the Fed Funds rate (but, in any event, not less than 0.00%) in effect from time to time plus 0.80% per annum on amounts borrowed or (c) the sum of (x) Daily Simple Secured Overnight Financing Rate (“SOFR”) (but, in any event, not less than 0.00%) on the date the loan is made plus 0.10% and (y) 0.80% per annum. The agreement expires in April 2023 unless extended or renewed. These fees were allocated among such funds based upon portions of the aggregate commitment available to them and relative net assets of Participating Funds. During the year ended March 31, 2023, the Fund did not borrow under the credit agreement.
| 10. | PRINCIPAL RISKS |
In the normal course of business, the Fund invests in securities or other instruments and may enter into certain transactions, and such activities subject the Fund to various risks, including among others, fluctuations in the market (market risk) or failure of an issuer to meet all of its obligations. The value of securities or other instruments may also be affected by various factors, including, without limitation: (i) the general economy; (ii) the overall market as well as local, regional or global political and/or social instability; (iii) regulation, taxation or international tax treaties between various countries; or (iv) currency, interest rate and price fluctuations. Local, regional or global events such as war, acts of terrorism, the spread of infectious illness or other public health issues, recessions, or other events could have a significant impact on the Fund and its investments. The Fund’s prospectus provides details of the risks to which the Fund is subject.
The Fund may be exposed to additional risks when reinvesting cash collateral in money market funds that do not seek to maintain a stable NAV per share of $1.00, which may be subject to redemption gates or liquidity fees under certain circumstances.
Infectious Illness Risk: An outbreak of an infectious illness, such as the COVID-19 pandemic, may adversely impact the economies of many nations and the global economy, and may impact individual issuers and capital markets in ways that cannot be foreseen. An infectious illness outbreak may result in, among other things, closed international borders, prolonged quarantines, supply chain disruptions, market volatility or disruptions and other significant economic, social and political impacts.
Valuation Risk: The market values of equities, such as common stocks and preferred securities or equity related investments, such as futures and options, may decline due to general market conditions which are not specifically related to a particular company. They may also decline due to factors which affect a particular industry or industries. The Fund may invest in illiquid investments. An illiquid investment is any investment that the Fund reasonably expects cannot be sold or disposed of in current market conditions in seven calendar days or less without the sale or disposition significantly changing the market value of the investment. The Fund may experience difficulty in selling illiquid
|
N O T E S T O F I N A N C I A L S T A T E M E N T S |
33 |
Notes to Financial Statements (continued)
investments in a timely manner at the price that it believes the investments are worth. Prices may fluctuate widely over short or extended periods in response to company, market or economic news. Markets also tend to move in cycles, with periods of rising and falling prices. This volatility may cause the Fund’s NAV to experience significant increases or decreases over short periods of time. If there is a general decline in the securities and other markets, the NAV of the Fund may lose value, regardless of the individual results of the securities and other instruments in which the Fund invests.
The price the Fund could receive upon the sale of any particular portfolio investment may differ from the Fund’s valuation of the investment, particularly for securities that trade in thin or volatile markets or that are valued using a fair valuation technique or a price provided by an independent pricing service. Changes to significant unobservable inputs and assumptions (i.e., publicly traded company multiples, growth rate, time to exit) due to the lack of observable inputs may significantly impact the resulting fair value and therefore the Fund’s results of operations. As a result, the price received upon the sale of an investment may be less than the value ascribed by the Fund, and the Fund could realize a greater than expected loss or lesser than expected gain upon the sale of the investment. The Fund’s ability to value its investments may also be impacted by technological issues and/or errors by pricing services or other third-party service providers.
Counterparty Credit Risk: The Fund may be exposed to counterparty credit risk, or the risk that an entity may fail to or be unable to perform on its commitments related to unsettled or open transactions, including making timely interest and/or principal payments or otherwise honoring its obligations. The Fund manages counterparty credit risk by entering into transactions only with counterparties that the Manager believes have the financial resources to honor their obligations and by monitoring the financial stability of those counterparties. Financial assets, which potentially expose the Fund to market, issuer and counterparty credit risks, consist principally of financial instruments and receivables due from counterparties. The extent of the Fund’s exposure to market, issuer and counterparty credit risks with respect to these financial assets is approximately their value recorded in the Statement of Assets and Liabilities, less any collateral held by the Fund.
A derivative contract may suffer a mark-to-market loss if the value of the contract decreases due to an unfavorable change in the market rates or values of the underlying instrument. Losses can also occur if the counterparty does not perform under the contract.
With exchange-traded futures, there is less counterparty credit risk to the Fund since the exchange or clearinghouse, as counterparty to such instruments, guarantees against a possible default. The clearinghouse stands between the buyer and the seller of the contract; therefore, credit risk is limited to failure of the clearinghouse. While offset rights may exist under applicable law, the Fund does not have a contractual right of offset against a clearing broker or clearinghouse in the event of a default (including the bankruptcy or insolvency). Additionally, credit risk exists in exchange-traded futures and centrally cleared swaps with respect to initial and variation margin that is held in a clearing broker’s customer accounts. While clearing brokers are required to segregate customer margin from their own assets, in the event that a clearing broker becomes insolvent or goes into bankruptcy and at that time there is a shortfall in the aggregate amount of margin held by the clearing broker for all its clients, typically the shortfall would be allocated on a pro rata basis across all the clearing broker’s customers, potentially resulting in losses to the Fund.
Concentration Risk: A diversified portfolio, where this is appropriate and consistent with a fund’s objectives, minimizes the risk that a price change of a particular investment will have a material impact on the NAV of a fund. The investment concentrations within the Fund’s portfolio are disclosed in its Schedule of Investments.
Significant Shareholder Redemption Risk: Certain shareholders may own or manage a substantial amount of fund shares and/or hold their fund investments for a limited period of time. Large redemptions of fund shares by these shareholders may force a fund to sell portfolio securities, which may negatively impact the fund’s NAV, increase the fund’s brokerage costs, and/or accelerate the realization of taxable income/gains and cause the fund to make additional taxable distributions to shareholders.
| 11. | CAPITAL SHARE TRANSACTIONS |
Transactions in capital shares for each class were as follows:
| Year Ended 03/31/23 | Year Ended 03/31/22 | |||||||||||||||
| Share Class | Shares | Amount | Shares | Amount | ||||||||||||
| Institutional |
||||||||||||||||
| Shares sold |
499,258 | $ | 11,610,143 | 400,705 | $ | 10,864,560 | ||||||||||
| Shares issued in reinvestment of distributions |
29,709 | 686,568 | 964,547 | 26,257,030 | ||||||||||||
| Shares redeemed |
(738,971 | ) | (17,178,009 | ) | (650,107 | ) | (18,558,089 | ) | ||||||||
|
|
|
|
|
|
|
|
|
|||||||||
| (210,004 | ) | $ | (4,881,298) | 715,145 | $ | 18,563,501 | ||||||||||
|
|
|
|
|
|
|
|
|
|||||||||
| Investor A |
||||||||||||||||
| Shares sold and automatic conversion of shares |
316,676 | $ | 6,880,965 | 789,411 | $ | 20,287,444 | ||||||||||
| Shares issued in reinvestment of distributions |
68,602 | 1,479,068 | 2,762,049 | 70,447,342 | ||||||||||||
| Shares redeemed |
(1,440,009 | ) | (31,175,098) | (1,705,172 | ) | (44,004,354 | ) | |||||||||
|
|
|
|
|
|
|
|
|
|||||||||
| (1,054,731 | ) | $ | (22,815,065) | 1,846,288 | $ | 46,730,432 | ||||||||||
|
|
|
|
|
|
|
|
|
|||||||||
| Investor C |
||||||||||||||||
| Shares sold |
55,667 | $ | 540,838 | 113,989 | $ | 1,395,159 | ||||||||||
| Shares issued in reinvestment of distributions |
5,258 | 50,318 | 194,739 | 2,359,415 | ||||||||||||
| Shares redeemed and automatic conversion of shares |
(139,066 | ) | (1,349,220) | (151,772 | ) | (1,840,018 | ) | |||||||||
|
|
|
|
|
|
|
|
|
|||||||||
| (78,141 | ) | $ | (758,064) | 156,956 | $ | 1,914,556 | ||||||||||
|
|
|
|
|
|
|
|
|
|||||||||
| 34 |
2 0 2 3 B L A C K R O C K A N N U A L R E P O R T T O S H A R E H O L D E R S |
Notes to Financial Statements (continued)
| Year Ended 03/31/23 | Year Ended 03/31/22 | |||||||||||||||
| Share Class | Shares | Amount | Shares | Amount | ||||||||||||
| Class K |
||||||||||||||||
| Shares sold |
1,941,040 | $ | 44,104,133 | 2,350,932 | $ | 62,660,667 | ||||||||||
| Shares issued in reinvestment of distributions |
26,257 | 606,270 | 54,442 | 1,481,135 | ||||||||||||
| Shares redeemed |
(998,126 | ) | (23,083,717 | ) | (179,160 | ) | (4,711,272 | ) | ||||||||
|
|
|
|
|
|
|
|
|
|||||||||
| 969,171 | $ | 21,626,686 | 2,226,214 | $ | 59,430,530 | |||||||||||
|
|
|
|
|
|
|
|
|
|||||||||
| Class R |
||||||||||||||||
| Shares sold |
43,024 | $ | 534,084 | 68,057 | $ | 1,034,730 | ||||||||||
| Shares issued in reinvestment of distributions |
4,994 | 61,580 | 177,110 | 2,697,572 | ||||||||||||
| Shares redeemed |
(123,613 | ) | (1,527,429 | ) | (99,402 | ) | (1,561,148 | ) | ||||||||
|
|
|
|
|
|
|
|
|
|||||||||
| (75,595 | ) | $ | (931,765 | ) | 145,765 | $ | 2,171,154 | |||||||||
|
|
|
|
|
|
|
|
|
|||||||||
| (449,300 | ) | $ | (7,759,506 | ) | 5,090,368 | $ | 128,810,173 | |||||||||
|
|
|
|
|
|
|
|
|
|||||||||
| 12. | SUBSEQUENT EVENTS |
Management’s evaluation of the impact of all subsequent events on the Fund’s financial statements was completed through the date the financial statements were issued and the following item was noted:
Effective April 13, 2023, the credit agreement was extended until April 2024 under the same terms.
|
N O T E S T O F I N A N C I A L S T A T E M E N T S |
35 |
Report of Independent Registered Public Accounting Firm
To the Shareholders and the Board of Directors of BlackRock Advantage SMID Cap Fund, Inc.:
Opinion on the Financial Statements and Financial Highlights
We have audited the accompanying statement of assets and liabilities of BlackRock Advantage SMID Cap Fund, Inc. (the “Fund”), including the schedule of investments, as of March 31, 2023, the related statement of operations for the year then ended, the statements of changes in net assets for each of the two years in the period then ended, the financial highlights for each of the five years in the period then ended, and the related notes. In our opinion, the financial statements and financial highlights present fairly, in all material respects, the financial position of the Fund as of March 31, 2023, and the results of its operations for the year then ended, the changes in its net assets for each of the two years in the period then ended, and the financial highlights for each of the five years in the period then ended, in conformity with accounting principles generally accepted in the United States of America.
Basis for Opinion
These financial statements and financial highlights are the responsibility of the Fund’s management. Our responsibility is to express an opinion on the Fund’s financial statements and financial highlights based on our audits. We are a public accounting firm registered with the Public Company Accounting Oversight Board (United States) (PCAOB) and are required to be independent with respect to the Fund in accordance with the U.S. federal securities laws and the applicable rules and regulations of the Securities and Exchange Commission and the PCAOB.
We conducted our audits in accordance with the standards of the PCAOB. Those standards require that we plan and perform the audit to obtain reasonable assurance about whether the financial statements and financial highlights are free of material misstatement, whether due to error or fraud. The Fund is not required to have, nor were we engaged to perform, an audit of its internal control over financial reporting. As part of our audits we are required to obtain an understanding of internal control over financial reporting but not for the purpose of expressing an opinion on the effectiveness of the Fund’s internal control over financial reporting. Accordingly, we express no such opinion.
Our audits included performing procedures to assess the risks of material misstatement of the financial statements and financial highlights, whether due to error or fraud, and performing procedures that respond to those risks. Such procedures included examining, on a test basis, evidence regarding the amounts and disclosures in the financial statements and financial highlights. Our audits also included evaluating the accounting principles used and significant estimates made by management, as well as evaluating the overall presentation of the financial statements and financial highlights. Our procedures included confirmation of securities owned as of March 31, 2023, by correspondence with custodians or counterparties; when replies were not received, we performed other auditing procedures. We believe that our audits provide a reasonable basis for our opinion.
Deloitte & Touche LLP
Boston, Massachusetts
May 24, 2023
We have served as the auditor of one or more BlackRock investment companies since 1992.
| 36 |
2 0 2 3 B L A C K R O C K A N N U A L R E P O R T T O S H A R E H O L D E R S |
Important Tax Information (unaudited)
The following amounts, or maximum amounts allowable by law, are hereby designated as qualified dividend income for individuals for the fiscal year ended March 31, 2023:
| Fund Name | Qualified Dividend Income |
|||
| BlackRock Advantage SMID Cap Fund, Inc. |
$5,242,180 | |||
The following percentage, or maximum amount allowable by law, of ordinary income distributions paid during the fiscal year ended March 31, 2023 qualified for the dividends-received deduction for corporate shareholders:
| Fund Name | Dividends-Received Deduction | |
| BlackRock Advantage SMID Cap Fund, Inc. |
100.00% |
| I M P O R T A N T T A X I N F O R M A T I O N |
37 |
Statement Regarding Liquidity Risk Management Program
In compliance with Rule 22e-4 under the Investment Company Act of 1940, as amended (the “Liquidity Rule”), BlackRock Advantage SMID Cap Fund, Inc. (the “Fund”) has adopted and implemented a liquidity risk management program (the “Program”), which is reasonably designed to assess and manage the Fund’s liquidity risk.
The Board of Directors (the “Board”) of the Fund, met on November 8-9, 2022 (the “Meeting”) to review the Program. The Board previously appointed BlackRock Advisors, LLC or BlackRock Fund Advisors (“BlackRock”), each an investment adviser to certain BlackRock funds, as the program administrator for the Fund’s Program, as applicable. BlackRock also previously delegated oversight of the Program to the 40 Act Liquidity Risk Management Committee (the “Committee”). At the Meeting, the Committee, on behalf of BlackRock, provided the Board with a report that addressed the operation of the Program and assessed its adequacy and effectiveness of implementation, including the management of the Fund’s Highly Liquid Investment Minimum (“HLIM”) where applicable, and any material changes to the Program (the “Report”). The Report covered the period from October 1, 2021 through September 30, 2022 (the “Program Reporting Period”).
The Report described the Program’s liquidity classification methodology for categorizing the Fund’s investments (including derivative transactions) into one of four liquidity buckets. It also referenced the methodology used by BlackRock to establish the Fund’s HLIM and noted that the Committee reviews and ratifies the HLIM assigned to the Fund no less frequently than annually. The Report also discussed notable events affecting liquidity over the Program Reporting Period, including the imposition of capital controls in certain countries.
The Report noted that the Program complied with the key factors for consideration under the Liquidity Rule for assessing, managing and periodically reviewing the Fund’s liquidity risk, as follows:
| a) | The Fund’s investment strategy and liquidity of portfolio investments during both normal and reasonably foreseeable stressed conditions. During the Program Reporting Period, the Committee reviewed whether the Fund’s strategy is appropriate for an open-end fund structure with a focus on funds with more significant and consistent holdings of less liquid and illiquid assets. The Committee also factored a fund’s concentration in an issuer into the liquidity classification methodology by taking issuer position sizes into account. Where a fund participated in borrowings for investment purposes (such as tender option bonds or reverse repurchase agreements), such borrowings were factored into the Program’s calculation of a fund’s liquidity bucketing. A fund’s derivative exposure was also considered in such calculation. |
| b) | Short-term and long-term cash flow projections during both normal and reasonably foreseeable stressed conditions. During the Program Reporting Period, the Committee reviewed historical redemption activity and used this information as a component to establish the Fund’s reasonably anticipated trading size utilized for liquidity classifications. the Fund has adopted an in-kind redemption policy which may be utilized to meet larger redemption requests. The Committee may also take into consideration a fund’s shareholder ownership concentration (which, depending on product type and distribution channel, may or may not be available), a fund’s distribution channels, and the degree of certainty associated with a fund’s short-term and long-term cash flow projections. |
| c) | Holdings of cash and cash equivalents, as well as borrowing arrangements. The Committee considered the terms of the credit facility committed to the Fund, the financial health of the institution providing the facility and the fact that the credit facility is shared among multiple funds (including that a portion of the aggregate commitment amount is specifically designated for BlackRock Floating Rate Income Portfolio, a series of BlackRock Funds V, and BlackRock Floating Rate Loan ETF, a series of BlackRock ETF Trust II). The Committee also considered other types of borrowing available to the funds, such as the ability to use reverse repurchase agreements and interfund lending, as applicable. |
There were no material changes to the Program during the Program Reporting Period other than the enhancement of certain model components in the Program’s classification methodology. The Report provided to the Board stated that the Committee concluded that based on the operation of the functions, as described in the Report, the Program is operating as intended and is effective in implementing the requirements of the Liquidity Rule.
| 38 |
2 0 2 3 B L A C K R O C K A N N U A L R E P O R T T O S H A R E H O L D E R S |
Director and Officer Information
| Independent Directors(a) | ||||||||
| Name Year of Birth(b) |
Position(s) Held (Length of Service)(c) |
Principal Occupation(s) During Past 5 Years | Number of BlackRock-Advised Registered Investment Companies (“RICs”) Consisting of Investment Portfolios (“Portfolios”) Overseen |
Public Company Past 5 Years | ||||
| Mark Stalnecker 1951 |
Chair of the Board and Director (Since 2019) |
Chief Investment Officer, University of Delaware from 1999 to 2013; Trustee and Chair of the Finance and Investment Committees, Winterthur Museum and Country Estate from 2005 to 2016; Member of the Investment Committee, Delaware Public Employees’ Retirement System since 2002; Member of the Investment Committee, Christiana Care Health System from 2009 to 2017; Member of the Investment Committee, Delaware Community Foundation from 2013 to 2014; Director and Chair of the Audit Committee, SEI Private Trust Co. from 2001 to 2014. |
28 RICs consisting of 165 Portfolios |
None | ||||
| Susan J. Carter 1956 |
Director (Since 2019) |
Trustee, Financial Accounting Foundation from 2017 to 2021; Advisory Board Member, Center for Private Equity and Entrepreneurship at Tuck School of Business from 1997 to 2021; Director, Pacific Pension Institute from 2014 to 2018; Senior Advisor, Commonfund Capital, Inc. (“CCI”) (investment adviser) in 2015; Chief Executive Officer, CCI from 2013 to 2014; President & Chief Executive Officer, CCI from 1997 to 2013; Advisory Board Member, Girls Who Invest from 2015 to 2018 and Board Member thereof from 2018 to 2022; Advisory Board Member, Bridges Fund Management since 2016; Practitioner Advisory Board Member, Private Capital Research Institute (“PCRI”) since 2017; Lecturer in the Practice of Management, Yale School of Management since 2019; Advisor to Finance Committee, Altman Foundation since 2020; Investment Committee Member, Tostan since 2021; Member of the President’s Counsel, Commonfund since 2023. |
28 RICs consisting of 165 Portfolios |
None | ||||
| Collette Chilton 1958 |
Director (Since 2019) |
Chief Investment Officer, Williams College since 2006; Chief Investment Officer, Lucent Asset Management Corporation from 1998 to 2006; Director, Boys and Girls Club of Boston since 2017; Director, B1 Capital since 2018; Director, David and Lucile Packard Foundation since 2020. |
28 RICs consisting of 165 Portfolios |
None | ||||
| Neil A. Cotty 1954 |
Director (Since 2019) |
Bank of America Corporation from 1996 to 2015, serving in various senior finance leadership roles, including Chief Accounting Officer from 2009 to 2015, Chief Financial Officer of Global Banking, Markets and Wealth Management from 2008 to 2009, Chief Accounting Officer from 2004 to 2008, Chief Financial Officer of Consumer Bank from 2003 to 2004, Chief Financial Officer of Global Corporate Investment Bank from 1999 to 2002. |
28 RICs consisting of 165 Portfolios |
None | ||||
| Lena G. Goldberg 1949 |
Director (Since 2016) |
Director, Pioneer Legal Institute since 2023; Director, Charles Stark Draper Laboratory, Inc. from 2013 to 2021; Senior Lecturer, Harvard Business School, from 2008 to 2021; FMR LLC/Fidelity Investments (financial services) from 1996 to 2008, serving in various senior roles including Executive Vice President - Strategic Corporate Initiatives and Executive Vice President and General Counsel; Partner, Sullivan & Worcester LLP from 1985 to 1996 and Associate thereof from 1979 to 1985. |
28 RICs consisting of 165 Portfolios |
None | ||||
| D I R E C T O R A N D O F F I C E R I N F O R M A T I O N |
39 |
Director and Officer Information (continued)
| Independent Directors(a) | ||||||||
| Name Year of Birth(b) |
Position(s) Held (Length of Service)(c) |
Principal Occupation(s) During Past 5 Years | Number of BlackRock-Advised Registered Investment Companies (“RICs”) Consisting of Investment Portfolios (“Portfolios”) Overseen |
Public Company Past 5 Years | ||||
| Henry R. Keizer 1956 |
Director (Since 2016) |
Director, Park Indemnity Ltd. (captive insurer) from 2010 to 2022. |
28 RICs consisting of 165 Portfolios |
GrafTech International Ltd. (materials manufacturing); Sealed Air Corp. (packaging); WABCO (commercial vehicle safety systems) from 2015 to 2020; Hertz Global Holdings (car rental) from 2015 to 2021. | ||||
| Cynthia A. Montgomery 1952 |
Director (Since 2019) |
Professor, Harvard Business School since 1989. |
28 RICs consisting of 165 Portfolios |
None | ||||
| Donald C. Opatrny 1952 |
Director (Since 2015) |
Chair of the Board of Phoenix Art Museum since 2022 and Trustee thereof since 2018; Chair of the Investment Committee of The Arizona Community Foundation since 2022 and Trustee thereof since 2020; Director, Athena Capital Advisors LLC (investment management firm) from 2013 to 2020; Trustee, Vice Chair, Member of the Executive Committee and Chair of the Investment Committee, Cornell University from 2004 to 2019; President and Trustee, the Center for the Arts, Jackson Hole from 2011 to 2018; Member of the Board and Investment Committee, University School from 2007 to 2018; Trustee, Artstor (a Mellon Foundation affiliate) from 2010 to 2015; Member of the Investment Committee, Mellon Foundation from 2009 to 2015; President, Trustee and Member of the Investment Committee, The Aldrich Contemporary Art Museum from 2007 to 2014; Trustee and Chair of the Investment Committee, Community Foundation of Jackson Hole since 2014; Member of Affordable Housing Supply Board of Jackson, Wyoming since 2017. |
28 RICs consisting of 165 Portfolios |
None | ||||
| Kenneth L. Urish 1951 |
Director (Since 2019) |
Managing Partner, Urish Popeck & Co., LLC (certified public accountants and consultants) since 1976; Past-Chairman of the Professional Ethics Committee of the Pennsylvania Institute of Certified Public Accountants and Committee Member thereof since 2007; Member of External Advisory Board, The Pennsylvania State University Accounting Department since 2001, Emeritus since 2022; Principal, UP Strategic Wealth Investment Advisors, LLC since 2013; Trustee, The Holy Family Institute from 2001 to 2010; President and Trustee, Pittsburgh Catholic Publishing Associates from 2003 to 2008; Director, Inter-Tel from 2006 to 2007; Member, Advisory Board, ESG Competent Boards since 2020. |
28 RICs consisting of 165 Portfolios |
None | ||||
| 40 |
2 0 2 3 B L A C K R O C K A N N U A L R E P O R T T O S H A R E H O L D E R S |
Director and Officer Information (continued)
| Independent Directors(a) | ||||||||
| Name Year of Birth(b) |
Position(s) Held (Length of Service)(c) |
Principal Occupation(s) During Past 5 Years |
Number of BlackRock-Advised (“RICs”) Consisting of Investment Portfolios (“Portfolios”) Overseen |
Public Company Past 5 Years | ||||
| Claire A. Walton 1957 |
Director (Since 2019) |
Advisory Board Member, Grossman School of Business at the University of Vermont since 2023; Advisory Board Member, Scientific Financial Systems since 2022; General Partner of Neon Liberty Capital Management, LLC since 2003; Chief Operating Officer and Chief Financial Officer of Liberty Square Asset Management, LP from 1998 to 2015; Director, Boston Hedge Fund Group from 2009 to 2018; Director, Massachusetts Council on Economic Education from 2013 to 2015; Director, Woodstock Ski Runners from 2013 to 2022. |
28 RICs consisting of 165 Portfolios |
None | ||||
| D I R E C T O R A N D O F F I C E R I N F O R M A T I O N |
41 |
Director and Officer Information (continued)
| Interested Directors(a)(d) | ||||||||
| Name Year of Birth(b) |
Position(s) Held (Length of Service)(c) |
Principal Occupation(s) During Past 5 Years |
Number of BlackRock-Advised (“RICs”) Consisting of Investment Portfolios (“Portfolios”) Overseen |
Public Company and Other Investment Company Directorships Held During Past Principal Occupation(s) During Past 5 Years | ||||
| Robert Fairbairn 1965 |
Director (Since 2015) |
Vice Chairman of BlackRock, Inc. since 2019; Member of BlackRock’s Global Executive and Global Operating Committees; Co-Chair of BlackRock’s Human Capital Committee; Senior Managing Director of BlackRock, Inc. from 2010 to 2019; oversaw BlackRock’s Strategic Partner Program and Strategic Product Management Group from 2012 to 2019; Member of the Board of Managers of BlackRock Investments, LLC from 2011 to 2018; Global Head of BlackRock’s Retail and iShares® businesses from 2012 to 2016. |
98 RICs consisting of 267 Portfolios |
None | ||||
| John M. Perlowski(e) 1964 |
Director (Since 2015) President and Chief Executive Officer (Since 2010) |
Managing Director of BlackRock, Inc. since 2009; Head of BlackRock Global Accounting and Product Services since 2009; Advisory Director of Family Resource Network (charitable foundation) since 2009. |
100 RICs consisting of 269 Portfolios |
None | ||||
| (a) | The address of each Director is c/o BlackRock, Inc., 50 Hudson Yards, New York, NY 10001. |
| (b) | Independent Directors serve until their resignation, retirement, removal or death, or until December 31 of the year in which they turn 75. The Board may determine to extend the terms of Independent Directors on a case-by-case basis, as appropriate. |
| (c) | Following the combination of Merrill Lynch Investment Managers, L.P. (“MLIM”) and BlackRock, Inc. in September 2006, the various legacy MLIM and legacy BlackRock fund boards were realigned and consolidated into three new fund boards in 2007. Furthermore, effective January 1, 2019, three BlackRock Fund Complexes were realigned and consolidated into two BlackRock Fund Complexes. As a result, although the chart shows the year that each Independent Director joined the Board, certain Independent Directors first became members of the boards of other BlackRock-advised Funds, legacy MLIM funds or legacy BlackRock funds as follows: Cynthia A. Montgomery, 1994; Kenneth L. Urish, 1999; Lena G. Goldberg, 2016; Henry R. Keizer, 2016; Donald C. Opatrny, 2015. |
| (d) | Mr. Fairbairn and Mr. Perlowski are both “interested persons,” as defined in the 1940 Act, of the Fund based on their positions with BlackRock, Inc. and its affiliates. Mr. Fairbairn and Mr. Perlowski are also board members of the BlackRock Fixed-Income Complex. |
| (e) | Mr. Perlowski is also a trustee of the BlackRock Credit Strategies Fund and BlackRock Private Investments Fund. |
| 42 |
2 0 2 3 B L A C K R O C K A N N U A L R E P O R T T O S H A R E H O L D E R S |
Director and Officer Information (continued)
| Officers Who Are Not Trustees(a) | ||||
| Name Year of Birth(b) |
Position(s) Held (Length of Service) |
Principal Occupation(s) During Past 5 Years | ||
| Jennifer McGovern 1977 |
Vice President (Since 2014) |
Managing Director of BlackRock, Inc. since 2016; Director of BlackRock, Inc. from 2011 to 2015; Head of Americas Product Development and Governance for BlackRock’s Global Product Group since 2019; Head of Product Structure and Oversight for BlackRock’s U.S. Wealth Advisory Group from 2013 to 2019. | ||
| Trent Walker 1974 |
Chief Financial Officer (Since 2021) |
Managing Director of BlackRock, Inc. since September 2019; Executive Vice President of PIMCO from 2016 to 2019; Senior Vice President of PIMCO from 2008 to 2015; Treasurer from 2013 to 2019 and Assistant Treasurer from 2007 to 2017 of PIMCO Funds, PIMCO Variable Insurance Trust, PIMCO ETF Trust, PIMCO Equity Series, PIMCO Equity Series VIT, PIMCO Managed Accounts Trust, 2 PIMCO-sponsored interval funds and 21 PIMCO-sponsored closed-end funds. | ||
| Jay M. Fife 1970 |
Treasurer (Since 2007) |
Managing Director of BlackRock, Inc. since 2007. | ||
| Charles Park 1967 |
Chief Compliance Officer (Since 2014) |
Anti-Money Laundering Compliance Officer for certain BlackRock-advised Funds from 2014 to 2015; Chief Compliance Officer of BlackRock Advisors, LLC and the BlackRock-advised Funds in the BlackRock Multi-Asset Complex and the BlackRock Fixed-Income Complex since 2014; Principal of and Chief Compliance Officer for iShares® Delaware Trust Sponsor LLC since 2012 and BlackRock Fund Advisors (“BFA”) since 2006;Chief Compliance Officer for the BFA-advised iShares® exchange traded funds since 2006; Chief Compliance Officer for BlackRock Asset Management International Inc. since 2012. | ||
| Lisa Belle 1968 |
Anti-Money Laundering Compliance Officer (Since 2019) |
Managing Director of BlackRock, Inc. since 2019; Global Financial Crime Head for Asset and Wealth Management of JP Morgan from 2013 to 2019; Managing Director of RBS Securities from 2012 to 2013; Head of Financial Crimes for Barclays Wealth Americas from 2010 to 2012. | ||
| Janey Ahn 1975 |
Secretary (Since 2019) |
Managing Director of BlackRock, Inc. since 2018; Director of BlackRock, Inc. from 2009 to 2017. | ||
| (a) | The address of each Officer is c/o BlackRock, Inc., 50 Hudson Yards, New York, NY 10001. |
| (b) | Officers of the Fund serve at the pleasure of the Board. |
Further information about the Fund’s Directors and Officers is available in the Fund’s Statement of Additional Information, which can be obtained without charge by calling (800) 441-7762.
Effective December 31, 2022, Joseph P. Platt retired as a Director of the Fund.
| D I R E C T O R A N D O F F I C E R I N F O R M A T I O N |
43 |
General Information
Quarterly performance, semi-annual and annual reports, current net asset value and other information regarding the Fund may be found on BlackRock’s website, which can be accessed at blackrock.com. Any reference to BlackRock’s website in this report is intended to allow investors public access to information regarding the Fund and does not, and is not intended to, incorporate BlackRock’s website in this report.
Householding
The Fund will mail only one copy of shareholder documents, including prospectuses, annual and semi-annual reports, Rule 30e-3 notices and proxy statements, to shareholders with multiple accounts at the same address. This practice is commonly called “householding” and is intended to reduce expenses and eliminate duplicate mailings of shareholder documents. Mailings of your shareholder documents may be householded indefinitely unless you instruct us otherwise. If you do not want the mailing of these documents to be combined with those for other members of your household, please call the Fund at (800) 441-7762.
Availability of Quarterly Schedule of Investments
The Fund files its complete schedule of portfolio holdings with the SEC for the first and third quarters of each fiscal year as an exhibit to its reports on Form N-PORT. The Fund’s Form N-PORT is available on the SEC’s website at sec.gov. Additionally, the Fund makes its portfolio holdings for the first and third quarters of each fiscal year available at blackrock.com/fundreports.
Availability of Proxy Voting Policies, Procedures and Voting Records
A description of the policies and procedures that the Fund uses to determine how to vote proxies relating to portfolio securities and information about how the Fund voted proxies relating to securities held in the Fund’s portfolio during the most recent 12-month period ended June 30 is available without charge, upon request (1) by calling (800) 441-7762; (2) on the BlackRock website at blackrock.com; and (3) on the SEC’s website at sec.gov.
BlackRock’s Mutual Fund Family
BlackRock offers a diverse lineup of open-end mutual funds crossing all investment styles and managed by experts in equity, fixed-income and tax-exempt investing. Visit blackrock.com for more information.
Shareholder Privileges
Account Information
Call us at (800) 441-7762 from 8:00 AM to 6:00 PM ET on any business day to get information about your account balances, recent transactions and share prices. You can also visit blackrock.com for more information.
Automatic Investment Plans
Investor class shareholders who want to invest regularly can arrange to have $50 or more automatically deducted from their checking or savings account and invested in any of the BlackRock funds.
Systematic Withdrawal Plans
Investor class shareholders can establish a systematic withdrawal plan and receive periodic payments of $50 or more from their BlackRock funds, as long as their account balance is at least $10,000.
Retirement Plans
Shareholders may make investments in conjunction with Traditional, Rollover, Roth, Coverdell, Simple IRAs, SEP IRAs and 403(b) Plans.
BlackRock Privacy Principles
BlackRock is committed to maintaining the privacy of its current and former fund investors and individual clients (collectively, “Clients”) and to safeguarding their non-public personal information. The following information is provided to help you understand what personal information BlackRock collects, how we protect that information and why in certain cases we share such information with select parties.
If you are located in a jurisdiction where specific laws, rules or regulations require BlackRock to provide you with additional or different privacy-related rights beyond what is set forth below, then BlackRock will comply with those specific laws, rules or regulations.
BlackRock obtains or verifies personal non-public information from and about you from different sources, including the following: (i) information we receive from you or, if applicable, your financial intermediary, on applications, forms or other documents; (ii) information about your transactions with us, our affiliates, or others; (iii) information we receive from a consumer reporting agency; and (iv) from visits to our websites.
| 44 |
2 0 2 3 B L A C K R O C K A N N U A L R E P O R T T O S H A R E H O L D E R S |
Additional Information (continued)
BlackRock does not sell or disclose to non-affiliated third parties any non-public personal information about its Clients, except as permitted by law or as is necessary to respond to regulatory requests or to service Client accounts. These non-affiliated third parties are required to protect the confidentiality and security of this information and to use it only for its intended purpose.
We may share information with our affiliates to service your account or to provide you with information about other BlackRock products or services that may be of interest to you. In addition, BlackRock restricts access to non-public personal information about its Clients to those BlackRock employees with a legitimate business need for the information. BlackRock maintains physical, electronic and procedural safeguards that are designed to protect the non-public personal information of its Clients, including procedures relating to the proper storage and disposal of such information.
Fund and Service Providers
Investment Adviser and Administrator
BlackRock Advisors, LLC
Wilmington, DE 19809
Accounting Agent and Transfer Agent
BNY Mellon Investment Servicing (US) Inc.
Wilmington, DE 19809
Custodian
The Bank of New York Mellon
New York, NY 10286
Independent Registered Public Accounting Firm
Deloitte & Touche LLP
Boston, MA 02116
Distributor
BlackRock Investments, LLC
New York, NY 10001
Legal Counsel
Sidley Austin LLP
New York, NY 10019
Address of the Manager and Administrator
100 Bellevue Parkway
Wilmington, DE 19809
| A D D I T I O N A L I N F O R M A T I O N |
45 |
Glossary of Terms Used in this Report
| Portfolio Abbreviation | ||
| CVR | Contingent Value Rights | |
| NVS | Non-Voting Shares | |
| S&P | Standard & Poor’s | |
| 46 |
2 0 2 3 B L A C K R O C K A N N U A L R E P O R T T O S H A R E H O L D E R S |
Want to know more?
blackrock.com | 800-441-7762
This report is intended for current holders. It is not authorized for use as an offer of sale or a solicitation of an offer to buy shares of the Fund unless preceded or accompanied by the Fund’s current prospectus. Past performance results shown in this report should not be considered a representation of future performance. Investment returns and principal value of shares will fluctuate so that shares, when redeemed, may be worth more or less than their original cost. Statements and other information herein are as dated and are subject to change.
VO-3/23-AR
|
|

|
(b) Not Applicable
| Item 3 – | Audit Committee Financial Experts – The registrant’s board of directors (the “board of directors”), has determined that (i) the registrant has the following audit committee financial experts serving on its audit committee and (ii) each audit committee financial expert is independent: |
Neil A. Cotty
Henry R. Keizer
Kenneth L. Urish
Under applicable securities laws, a person determined to be an audit committee financial expert will not be deemed an “expert” for any purpose, including without limitation for the purposes of Section 11 of the Securities Act of 1933, as a result of being designated or identified as an audit committee financial expert. The designation or identification of a person as an audit committee financial expert does not impose on such person any duties, obligations, or liabilities greater than the duties, obligations, and liabilities imposed on such person as a member of the audit committee and board of directors in the absence of such designation or identification. The designation or identification of a person as an audit committee financial expert does not affect the duties, obligations, or liability of any other member of the audit committee or board of directors.
| Item 4 – | Principal Accountant Fees and Services |
The following table presents fees billed by Deloitte & Touche LLP (“D&T”) in each of the last two fiscal years for the services rendered to the Fund:
| (a) Audit Fees | (b) Audit-Related Fees1 | (c) Tax Fees2 | (d) All Other Fees | |||||||||||||
|
Entity Name |
Current Fiscal Year End |
Previous Fiscal Year End |
Current Fiscal Year End |
Previous Fiscal Year End |
Current Fiscal Year End |
Previous Fiscal Year End |
Current Fiscal Year End |
Previous Fiscal Year End | ||||||||
| BlackRock Advantage SMID Cap Fund, Inc. | $31,212 | $29,988 | $44 | $213 | $17,100 | $17,100 | $218 | $0 | ||||||||
The following table presents fees billed by D&T that were required to be approved by the registrant’s audit committee (the “Committee”) for services that relate directly to the operations or financial reporting of the Fund and that are rendered on behalf of BlackRock Advisors, LLC (the “Investment Adviser” or “BlackRock”) and entities controlling, controlled by, or under common control with BlackRock (not including any sub-adviser whose role is primarily portfolio management and is subcontracted with or overseen by another investment adviser) that provide ongoing services to the Fund (“Affiliated Service Providers”):
| Current Fiscal Year End | Previous Fiscal Year End | |||
| (b) Audit-Related Fees1 |
$0 | $0 | ||
| (c) Tax Fees2 |
$0 | $0 | ||
| (d) All Other Fees3 |
$2,154,000 | $2,098,000 |
1 The nature of the services includes assurance and related services reasonably related to the performance of the audit or review of financial statements not included in Audit Fees, including accounting consultations, agreed-upon procedure reports, attestation reports, comfort letters, out-of-pocket expenses and internal control reviews not required by regulators.
2 The nature of the services includes tax compliance and/or tax preparation, including services relating to the filing or amendment of federal, state or local income tax returns, regulated investment company qualification reviews, taxable income and tax distribution calculations.
3 Non-audit fees of $2,154,000 and $2,098,000 for the current fiscal year and previous fiscal year, respectively, were paid to the Fund’s principal accountant in their entirety by BlackRock, in connection with services provided to the Affiliated Service Providers of the Fund and of certain other funds sponsored and advised by BlackRock or its affiliates for a service organization review and an accounting research tool subscription. These amounts represent aggregate fees paid by BlackRock and were not allocated on a per fund basis.
(e)(1) Audit Committee Pre-Approval Policies and Procedures:
The Committee has adopted policies and procedures with regard to the pre-approval of services. Audit, audit-related and tax compliance services provided to the registrant on an annual basis require specific pre-approval by the Committee. The Committee also must approve other non-audit services provided to the registrant and those non-audit services provided to the Investment Adviser and Affiliated Service Providers that relate directly to the operations and the financial reporting of the registrant. Certain of these non-audit services that the Committee believes are (a) consistent with the SEC’s auditor independence rules and (b) routine and recurring services that will not impair the independence of the independent accountants may be approved by the Committee without consideration on a specific case-by-case basis (“general pre-approval”). The term of any general pre-approval is 12 months from the date of the pre-approval, unless the Committee provides for a different period. Tax or other non-audit services provided to the registrant which have a direct impact on the operations or financial reporting of the registrant will only be deemed pre-approved provided that any individual project does not exceed $10,000 attributable to the registrant or $50,000 per project. For this purpose, multiple projects will be aggregated to determine if they exceed the previously mentioned cost levels.
Any proposed services exceeding the pre-approved cost levels will require specific pre-approval by the Committee, as will any other services not subject to general pre-approval (e.g., unanticipated but permissible services). The Committee is informed of each service approved subject to general pre-approval at the next regularly scheduled in-person board meeting. At this meeting, an analysis of such services is presented to the Committee for ratification. The Committee may delegate to the Committee Chairman the authority to approve the provision of and fees for any specific engagement of permitted non-audit services, including services exceeding pre-approved cost levels.
(e)(2) None of the services described in each of Items 4(b) through (d) were approved by the Committee pursuant to the de minimis exception in paragraph (c)(7)(i)(C) of Rule 2-01 of Regulation S-X.
(f) Not Applicable
(g) The aggregate non-audit fees, defined as the sum of the fees shown under “Audit-Related Fees,” “Tax Fees” and “All Other Fees,” paid to the accountant for services rendered by the accountant to the registrants, the Investment Adviser and the Affiliated Service Providers were:
| Entity Name | Current Fiscal Year End |
Previous Fiscal Year End | ||||
|
BlackRock Advantage SMID Cap Fund, Inc. |
$17,362 | $17,313 | ||||
Additionally, the amounts billed by D&T in connection with services provided to the Affiliated Service Providers of the Fund and of other funds sponsored and advised by BlackRock or its affiliates during the current and previous fiscal years for a service organization review and an accounting research tool subscription were:
|
Current Fiscal Year End |
Previous Fiscal Year End | |
|
$2,154,000 |
$2,098,000 |
These amounts represent aggregate fees paid by BlackRock and were not allocated on a per fund basis.
(h) The Committee has considered and determined that the provision of non-audit services that were rendered to the Investment Adviser and the Affiliated Service Providers that were not pre-approved pursuant to paragraph (c)(7)(ii) of Rule 2-01 of Regulation S-X is compatible with maintaining the principal accountant’s independence.
(i) – Not Applicable
(j) – Not Applicable
| Item 5 – | Audit Committee of Listed Registrant – Not Applicable |
| Item 6 – | Investments |
(a) The registrant’s Schedule of Investments is included as part of the Report to Stockholders filed under Item 1(a) of this Form.
(b) Not Applicable due to no such divestments during the semi-annual period covered since the previous Form N-CSR filing.
| Item 7 – | Disclosure of Proxy Voting Policies and Procedures for Closed-End Management Investment Companies – Not Applicable |
| Item 8 – | Portfolio Managers of Closed-End Management Investment Companies – Not Applicable |
| Item 9 – | Purchases of Equity Securities by Closed-End Management Investment Company and Affiliated Purchasers – Not Applicable |
| Item 10 – | Submission of Matters to a Vote of Security Holders – There have been no material changes to these procedures. |
| Item 11 – | Controls and Procedures |
(a) The registrant’s principal executive and principal financial officers, or persons performing similar functions, have concluded that the registrant’s disclosure controls and procedures (as defined in Rule 30a-3(c) under the Investment Company Act of 1940, as amended (the “1940 Act”)) are effective as of a date within 90 days of the filing of this report based on the evaluation of these controls and procedures required by Rule 30a-3(b) under the 1940 Act and Rule 15d-15(b) under the Securities Exchange Act of 1934, as amended.
(b) There were no changes in the registrant’s internal control over financial reporting (as defined in Rule 30a-3(d) under the 1940 Act) that occurred during the period covered by this report that have materially affected, or are reasonably likely to materially affect, the registrant’s internal control over financial reporting.
| Item 12 – | Disclosure of Securities Lending Activities for Closed-End Management Investment Companies – Not Applicable |
| Item 13 – | Exhibits attached hereto |
(a)(1) Code of Ethics – See Item 2
(a)(2) Section 302 Certifications are attached
(a)(3) Any written solicitation to purchase securities under Rule 23c-1 – Not Applicable
(a)(4) Change in Registrant’s independent public accountant – Not Applicable
(b) Section 906 Certifications are attached
Pursuant to the requirements of the Securities Exchange Act of 1934 and the Investment Company Act of 1940, the registrant has duly caused this report to be signed on its behalf by the undersigned, thereunto duly authorized.
BlackRock Advantage SMID Cap Fund, Inc.
| By: | /s/ John M. Perlowski | |||
| John M. Perlowski | ||||
| Chief Executive Officer (principal executive officer) of | ||||
| BlackRock Advantage SMID Cap Fund, Inc. |
Date: May 24, 2023
Pursuant to the requirements of the Securities Exchange Act of 1934 and the Investment Company Act of 1940, this report has been signed below by the following persons on behalf of the registrant and in the capacities and on the dates indicated.
| By: | /s/ John M. Perlowski | |||
| John M. Perlowski | ||||
| Chief Executive Officer (principal executive officer) of | ||||
| BlackRock Advantage SMID Cap Fund, Inc. |
Date: May 24, 2023
| By: | /s/ Trent Walker | |||
| Trent Walker | ||||
| Chief Financial Officer (principal financial officer) of | ||||
| BlackRock Advantage SMID Cap Fund, Inc. |
Date: May 24, 2023
EX-99. CERT
CERTIFICATION PURSUANT TO RULE 30a-2(a) UNDER THE 1940 ACT AND SECTION 302 OF THE SARBANES-OXLEY ACT OF 2002
I, John M. Perlowski, Chief Executive Officer (principal executive officer) of BlackRock Advantage SMID Cap Fund, Inc. , certify that:
1. I have reviewed this report on Form N-CSR of BlackRock Advantage SMID Cap Fund, Inc. ;
2. Based on my knowledge, this report does not contain any untrue statement of a material fact or omit to state a material fact necessary to make the statements made, in light of the circumstances under which such statements were made, not misleading with respect to the period covered by this report;
3. Based on my knowledge, the financial statements, and other financial information included in this report, fairly present in all material respects the financial condition, results of operations, changes in net assets, and cash flows (if the financial statements are required to include a statement of cash flows) of the registrant as of, and for, the periods presented in this report;
4. The registrant’s other certifying officer(s) and I are responsible for establishing and maintaining disclosure controls and procedures (as defined in Rule 30a-3(c) under the Investment Company Act of 1940) and internal control over financial reporting (as defined in Rule 30a-3(d) under the Investment Company Act of 1940) for the registrant and have:
a) designed such disclosure controls and procedures, or caused such disclosure controls and procedures to be designed under our supervision, to ensure that material information relating to the registrant, including its consolidated subsidiaries, is made known to us by others within those entities, particularly during the period in which this report is being prepared;
b) designed such internal control over financial reporting, or caused such internal control over financial reporting to be designed under our supervision, to provide reasonable assurance regarding the reliability of financial reporting and the preparation of financial statements for external purposes in accordance with generally accepted accounting principles;
c) evaluated the effectiveness of the registrant’s disclosure controls and procedures and presented in this report our conclusions about the effectiveness of the disclosure controls and procedures, as of a date within 90 days prior to the filing date of this report based on such evaluation; and
d) disclosed in this report any change in the registrant’s internal control over financial reporting that occurred during the period covered by this report that has materially affected, or is reasonably likely to materially affect, the registrant’s internal control over financial reporting; and
5. The registrant’s other certifying officer(s) and I have disclosed to the registrant’s auditors and the audit committee of the registrant’s board of directors (or persons performing the equivalent functions):
a) all significant deficiencies and material weaknesses in the design or operation of internal control over financial reporting which are reasonably likely to adversely affect the registrant’s ability to record, process, summarize, and report financial information; and
b) any fraud, whether or not material, that involves management or other employees who have a significant role in the registrant’s internal control over financial reporting.
Date: May 24, 2023
/s/ John M. Perlowski
John M. Perlowski
Chief Executive Officer (principal executive officer) of
BlackRock Advantage SMID Cap Fund, Inc.
EX-99. CERT
CERTIFICATION PURSUANT TO RULE 30a-2(a) UNDER THE 1940 ACT AND SECTION 302 OF THE SARBANES-OXLEY ACT OF 2002
I, Trent Walker, Chief Financial Officer (principal financial officer) of BlackRock Advantage SMID Cap Fund, Inc. , certify that:
1. I have reviewed this report on Form N-CSR of BlackRock Advantage SMID Cap Fund, Inc. ;
2. Based on my knowledge, this report does not contain any untrue statement of a material fact or omit to state a material fact necessary to make the statements made, in light of the circumstances under which such statements were made, not misleading with respect to the period covered by this report;
3. Based on my knowledge, the financial statements, and other financial information included in this report, fairly present in all material respects the financial condition, results of operations, changes in net assets, and cash flows (if the financial statements are required to include a statement of cash flows) of the registrant as of, and for, the periods presented in this report;
4. The registrant’s other certifying officer(s) and I are responsible for establishing and maintaining disclosure controls and procedures (as defined in Rule 30a-3(c) under the Investment Company Act of 1940) and internal control over financial reporting (as defined in Rule 30a-3(d) under the Investment Company Act of 1940) for the registrant and have:
a) designed such disclosure controls and procedures, or caused such disclosure controls and procedures to be designed under our supervision, to ensure that material information relating to the registrant, including its consolidated subsidiaries, is made known to us by others within those entities, particularly during the period in which this report is being prepared;
b) designed such internal control over financial reporting, or caused such internal control over financial reporting to be designed under our supervision, to provide reasonable assurance regarding the reliability of financial reporting and the preparation of financial statements for external purposes in accordance with generally accepted accounting principles;
c) evaluated the effectiveness of the registrant’s disclosure controls and procedures and presented in this report our conclusions about the effectiveness of the disclosure controls and procedures, as of a date within 90 days prior to the filing date of this report based on such evaluation; and
d) disclosed in this report any change in the registrant’s internal control over financial reporting that occurred during the period covered by this report that has materially affected, or is reasonably likely to materially affect, the registrant’s internal control over financial reporting; and
5. The registrant’s other certifying officer(s) and I have disclosed to the registrant’s auditors and the audit committee of the registrant’s board of directors (or persons performing the equivalent functions):
a) all significant deficiencies and material weaknesses in the design or operation of internal control over financial reporting which are reasonably likely to adversely affect the registrant’s ability to record, process, summarize, and report financial information; and
b) any fraud, whether or not material, that involves management or other employees who have a significant role in the registrant’s internal control over financial reporting.
Date: May 24, 2023
/s/ Trent Walker
Trent Walker
Chief Financial Officer (principal financial officer) of
BlackRock Advantage SMID Cap Fund, Inc.
Exhibit 99.906CERT
Certification Pursuant to Rule 30a-2(b) under the 1940 Act and
Section 906 of the Sarbanes-Oxley Act of 2002
Pursuant to 18 U.S.C. § 1350, the undersigned officer of BlackRock Advantage SMID Cap Fund, Inc. (the “Registrant”), hereby certifies, to the best of his knowledge, that the Registrant’s Report on Form N-CSR for the period ended March 31, 2023 (the “Report”) fully complies with the requirements of Section 15(d) of the Securities Exchange Act of 1934, as amended, and that the information contained in the Report fairly presents, in all material respects, the financial condition and results of operations of the Registrant.
Date: May 24, 2023
/s/ John M. Perlowski
John M. Perlowski
Chief Executive Officer (principal executive officer) of
BlackRock Advantage SMID Cap Fund, Inc.
Pursuant to 18 U.S.C. § 1350, the undersigned officer of BlackRock Advantage SMID Cap Fund, Inc. (the “Registrant”), hereby certifies, to the best of his knowledge, that the Registrant’s Report on Form N-CSR for the period ended March 31, 2023 (the “Report”) fully complies with the requirements of Section 15(d) of the Securities Exchange Act of 1934, as amended, and that the information contained in the Report fairly presents, in all material respects, the financial condition and results of operations of the Registrant.
Date: May 24, 2023
/s/ Trent Walker
Trent Walker
Chief Financial Officer (principal financial officer) of
BlackRock Advantage SMID Cap Fund, Inc.
This certification is being furnished pursuant to Rule 30a-2(b) under the Investment Company Act of 1940, as amended, and 18 U.S.C. § 1350 and is not being filed as part of the Form N-CSR with the Securities and Exchange Commission.