Exhibit (c)(2)
| Discussion Materials Prepared for the Atlas Special Committee |
| Goldman, Sachs & Co. December 17, 2009 |
| Mark G. Borden, Esq. Jay E. Bothwick, Esq. Wilmer Cutler Pickering Hale and Dorr LLP 60 State Street Boston, MA 02109 (617) 526-6000 |
Daniel Clivner, Esq. Simpson Thacher & Bartlett LLP 1999 Avenue of the Stars, 29th Floor Los Angeles, CA 90067 (310) 407-7555 |
þ
|
a. | The filing of solicitation materials or an information statement subject to Regulation 14A, Regulation 14-C or Rule 13e-3(c) under the Securities Exchange Act of 1934. | ||
o
|
b. | The filing of a registration statement under the Securities Act of 1933. | ||
o
|
c. | A tender offer. | ||
o
|
d. | None of the above. |
| Transaction Valuation* | Amount of Filing Fee** | ||||
| $536,432,907 | $38,248 | ||||
| * | The transaction value was determined based on the sum of: (a) 63,073,600 shares of Airvana common stock multiplied by $7.65 per share; and (b) 13,343,199 shares of Airvana common stock underlying outstanding stock options with exercise prices less than $7.65 per share multiplied by $5.205 (which is the difference between $7.65 per share and the weighted average exercise price per share). | |
| ** | The filing fee, calculated in accordance with Exchange Act Rule 0-11, was calculated by multiplying $0.000731 by the sum of the preceding sentence. |
| þ | Check box if any part of the fee is offset as provided by Rule 0-11(a)(2) and identify the filing with which the offsetting fee was previously paid. Identify the previous filing by registration number, or the Form or Schedule and the date of its filing. |
(a)(1)
|
Preliminary Proxy Statement of Airvana, Inc., incorporated herein by reference to the Schedule 14A filed with the Securities and Exchange Commission on January 13, 2010 (the “Proxy Statement”). | |
(a)(2)
|
Letter to Stockholders of Airvana, Inc., incorporated herein by reference to the Proxy Statement. | |
(a)(3)
|
Notice of Special Meeting of Stockholders of Airvana, Inc., incorporated herein by reference to the Proxy Statement. | |
(a)(4)
|
Form of Preliminary Proxy Card, incorporated herein by reference to the Proxy Statement. | |
(a)(5)
|
Form 8-K of Airvana, Inc., incorporated by reference to the Form 8-K filed with the Securities and Exchange Commission on December 18, 2009. | |
(a)(6)
|
Form DEFA14A of Airvana, Inc., incorporated by reference to the Form DEFA14A filed with the Securities and Exchange Commission on December 22, 2009. | |
(b)(1)
|
Senior Secured Loan Commitment Letter Agreement, dated December 17, 2009, between GSO Capital Partners LP and 72 Mobile Holdings, LLC. | |
(b)(2)
|
Amendment to Senior Secured Loan Commitment Letter Agreement, dated January 13, 2010, between GSO Capital Partners LP and 72 Mobile Holdings, LLC. | |
(c)(1)
|
Opinion of Goldman, Sachs & Co. (“Goldman Sachs”), incorporated herein by reference to Annex B of the Proxy Statement. | |
(c)(2)
|
Presentation of Goldman Sachs to the special committee of Airvana, Inc., dated December 17, 2009. |
| (c)(3) | Draft Presentation of Goldman Sachs to the special committee of Airvana, Inc., dated July 14, 2009. |
|
| (c)(4) | Draft Presentation of Goldman Sachs to the special committee of Airvana, Inc., dated August 11, 2009. |
|
| (c)(5) | Draft Presentation of Goldman Sachs to the special committee of Airvana, Inc., dated September 4, 2009. |
|
| (c)(6) | Draft Presentation of Goldman Sachs to the special committee of Airvana, Inc., dated December 9, 2009. |
|
| (d)(1) | Agreement and Plan of Merger, dated as of December 17, 2009, by and among Airvana, Inc., 72 Mobile Holdings, LLC. and
72 Mobile Acquisition Corp., incorporated herein by reference to Annex A to the Proxy Statement. |
|
| (d)(2) | Limited Guarantee, dated December 17, 2009, by S.A.C. Capital Management, LLC in favor of Airvana, Inc. |
|
| (d)(3) | Amended and Restated Confidentiality Agreement, dated December 17, 2009, by and between Airvana, Inc. and S.A.C. Private
Capital Group, LLC. |
|
| (d)(4) | Holdings Interim Investors Agreement, dated as of December 17, 2009, by and among 72 Mobile Holdings, LLC, 72 Mobile
Acquisition Corp., S.A.C. Capital Management, LLC, 72 Mobile Investors, LLC, Vedat Eyuboglu, Assia Eyuboglu, Beaver Brook
Irrevocable Trust, Beaver Brook GA 2008 Trust, Beaver Brook GV 2008 Trust, Sanjeev Verma, C.H. 2008 Trust, Cape Himalaya
Trust and Randall S. Battat Revocable Trust. |
|
| (d)(5) | Rollover Commitment Letter, dated December 17, 2009, from Randall S. Battat to 72 Mobile Holdings, LLC. |
|
| (d)(6) | Rollover Commitment Letter, dated December 17, 2009, from Sanjeev Verma, C.H. 2008 Trust and Cape Himalaya Trust to 72
Mobile Holdings, LLC. |
|
| (d)(7) | Rollover Commitment Letter, dated December 17, 2009, from Vedat Eyuboglu, Assai Eyuboglu, Beaver Brook Irrevocable Trust,
Beaver Brook GA 2008 Trust and Beaver Brook GV 2008 Trust to 72 Mobile Holdings, LLC. |
|
| (d)(8) | Termination Agreement, dated January 7, 2010, by and among Airvana, Inc., Sanjeev Verma, Vedat Eyuboglu, Matrix
Partners VI, L.P., Matrix Partners VII, L.P., Matrix VI Parallel Partnership-A, L.P., Matrix VI Parallel Partnership-B,
L.P., Weston & Co VI LLC, Weston & Co. VII LLC and Sparta Group MA LLC Series 5. |
|
| (d)(9) | Letter Agreement, dated December 17, 2009, between 72 Mobile Holdings, LLC and Sanjeev Verma. |
|
| (d)(10) | Letter Agreement, dated December 17, 2009, between 72 Mobile Holdings, LLC and Randall S. Battat. |
|
| (d)(11) | Letter Agreement, dated December 17, 2009, between 72 Mobile Holdings, LLC and Vedat Eyuboglu. |
|
| (f)(1) | Section 262 of the Delaware General Corporation Law, incorporated herein by reference to Annex C of the Proxy Statement. |
|
| (g) | None. |
| AIRVANA, INC. |
||||
| By: | /s/ Peter C. Anastos | |||
| Name: | Peter C. Anastos | |||
| Title: | Vice President, General Counsel and Secretary | |||
| 72 MOBILE HOLDINGS, LLC |
||||
| By: | /s/ Peter Berger | |||
| Name: | Peter Berger | |||
| Title: | President | |||
| 72 MOBILE INVESTORS, LLC |
||||
| By: | /s/ Peter Berger | |||
| Name: | Peter Berger | |||
| Title: | President | |||
| 72 MOBILE ACQUISITION CORP. |
||||
| By: | /s/ Peter Berger | |||
| Name: | Peter Berger | |||
| Title: | President | |||
| /s/ Randall Battat | ||||
| Randall Battat | ||||
| /s/ Vedat Eyuboglu | ||||
| Vedat Eyuboglu | ||||
| /s/ Sanjeev Verma | ||||
| Sanjeev Verma | ||||
| (a)(1) | Preliminary Proxy Statement of Airvana, Inc., incorporated herein by reference to the Schedule 14A filed with the
Securities and Exchange Commission on January 13, 2010 (the “Proxy Statement”). |
|
| (a)(2) | Letter to Stockholders of Airvana, Inc., incorporated herein by reference to the Proxy Statement. |
|
| (a)(3) | Notice of Special Meeting of Stockholders of Airvana, Inc., incorporated herein by reference to the Proxy Statement. |
|
| (a)(4) | Form of Preliminary Proxy Card, incorporated herein by reference to the Proxy Statement. |
|
| (a)(5) | Form 8-K of Airvana, Inc., incorporated by reference to the Form 8-K filed with the Securities and Exchange Commission
on December 18, 2009. |
|
| (a)(6) | Form DEFA14A of Airvana, Inc., incorporated by reference to the Form DEFA14A filed with the Securities and Exchange
Commission on December 22, 2009. |
|
| (b)(1) | Senior Secured Loan Commitment Letter Agreement, dated December 17, 2009, between GSO Capital Partners LP and 72 Mobile
Holdings, LLC. |
|
| (b)(2) | Amendment
to
Senior Secured Loan Commitment Letter Agreement, dated January 13,
2010, between GSO Capital Partners LP and 72 Mobile Holdings, LLC. |
|
| (c)(1) | Opinion of Goldman, Sachs & Co. (“Goldman Sachs”), incorporated herein by reference to Annex B of the Proxy Statement. |
|
| (c)(2) | Presentation of Goldman Sachs to the special committee of Airvana, Inc., dated December 17, 2009. |
|
| (c)(3) | Draft Presentation of Goldman Sachs to the special committee of Airvana, Inc., dated July 14, 2009. |
|
| (c)(4) | Draft Presentation of Goldman Sachs to the special committee of Airvana, Inc., dated August 11, 2009. |
|
| (c)(5) | Draft Presentation of Goldman Sachs to the special committee of Airvana, Inc., dated September 4, 2009. |
|
| (c)(6) | Draft Presentation of Goldman Sachs to the special committee of Airvana, Inc., dated December 9, 2009. |
|
| (d)(1) | Agreement and Plan of Merger, dated as of December 17, 2009, by and among Airvana, Inc., 72 Mobile Holdings, LLC. and
72 Mobile Acquisition Corp., incorporated herein by reference to Annex A to the Proxy Statement. |
|
| (d)(2) | Limited Guarantee, dated December 17, 2009, by S.A.C. Capital Management, LLC in favor of Airvana, Inc. |
|
| (d)(3) | Amended and Restated Confidentiality Agreement, dated December 17, 2009, by and between Airvana, Inc. and S.A.C. Private
Capital Group, LLC. |
|
| (d)(4) | Holdings Interim Investors Agreement, dated as of December 17, 2009, by and among 72 Mobile Holdings, LLC, 72 Mobile
Acquisition Corp., S.A.C. Capital Management, LLC, 72 Mobile Investors, LLC, Vedat Eyuboglu, Assia Eyuboglu, Beaver Brook
Irrevocable Trust, Beaver Brook GA 2008 Trust, Beaver Brook GV 2008 Trust, Sanjeev Verma, C.H. 2008 Trust, Cape Himalaya
Trust and Randall S. Battat Revocable Trust. |
|
| (d)(5) | Rollover Commitment Letter, dated December 17, 2009, from Randall S. Battat to 72 Mobile Holdings, LLC. |
|
| (d)(6) | Rollover Commitment Letter, dated December 17, 2009, from Sanjeev Verma, C.H. 2008 Trust and Cape Himalaya Trust to 72
Mobile Holdings, LLC. |
|
| (d)(7) | Rollover Commitment Letter, dated December 17, 2009, from Vedat Eyuboglu, Assai Eyuboglu, Beaver Brook Irrevocable Trust,
Beaver Brook GA 2008 Trust and Beaver Brook GV 2008 Trust to 72 Mobile Holdings, LLC. |
|
| (d)(8) | Termination Agreement, dated January 7, 2010, by and among Airvana, Inc., Sanjeev Verma, Vedat Eyuboglu, Matrix
Partners VI, L.P., Matrix Partners VII, L.P., Matrix VI Parallel Partnership-A, L.P., Matrix VI Parallel Partnership-B,
L.P., Weston & Co VI LLC, Weston & Co. VII LLC and Sparta Group MA LLC Series 5. |
|
| (d)(9) | Letter Agreement, dated December 17, 2009, between 72 Mobile Holdings, LLC and Sanjeev Verma. |
|
| (d)(10) | Letter Agreement, dated December 17, 2009, between 72 Mobile Holdings, LLC and Randall S. Battat. |
|
| (d)(11) | Letter Agreement, dated December 17, 2009, between 72 Mobile Holdings, LLC and Vedat Eyuboglu. |
|
| (f)(1) | Section 262 of the Delaware General Corporation Law, incorporated herein by reference to Annex C of the Proxy Statement. |
|
| (g) | None. |
c/o
|
S.A.C. Private Capital Group, LLC | |||
| 540 Madison Avenue, 9th FL | ||||
| New York, NY 10022 | ||||
| Attention: Frank Baker |
| a) | Senior Secured Loan of the Borrower (as defined in the Term Sheet) (the “Senior Loan”), in an aggregate principal amount of up to $170.0 million having the terms set forth on the term sheet attached hereto as Exhibit B (collectively, including the annexes thereto, the “Term Sheet”) and equity constituting 5% of the membership interests of Holdings (which may be diluted by management options representing up to 3.5% of the membership interest of Holdings) (the “Lender Equity”), which equity interests shall have the same terms as the equity interests issued on the Closing Date to certain Lenders and/or their affiliates pursuant to their co-investment in Holdings; and | ||
| b) | Cash equity (such equity to be solely in the form of membership interests which are not disqualified equity interests (having the meaning customarily given to such term)) provided by |
| S.A.C. Private Capital Group, LLC and/or its affiliates (together “SAC PCG”) and (so long as SAC PCG beneficially owns the economic interest in, and has the power to vote or direct the voting of, 51% or more of all equity of Holdings, the Company and the Borrower) other investors (the “Equity Contribution”), representing (inclusive of management equity rolled over in connection with the Acquisition) a minimum of 42.5% of the pro forma capitalization of the Company. |
|
Sincerely, GSO CAPITAL PARTNERS LP, on behalf of certain funds managed by GSO |
||||
| By | /s/ George Fan | |||
| Name: | George Fan | |||
| Title: | Chief Legal Officer | |||
| Accepted and agreed to as of the date first above written: 72 MOBILE HOLDINGS, LLC |
|||
| By | /s/ Peter Berger | ||
| Name: | Peter Berger | ||
| Title: | President | ||
BORROWER:
|
Initially, Airvana or AcquisitionCo (the “Borrower”). After giving effect to the merger contemplated by the Merger Agreement, the primary operating company for the EV-DO business shall be the borrower or a co-borrower. | |
DIRECT PARENT:
|
Holdings. | |
LENDER:
|
One or more funds managed by GSO (the “Lead Lender”) and other banks and financial institutions selected by GSO in consultation with Holdings prior to the Closing Date or who become lenders in accordance with the terms and conditions of the Facilities Documentation, but in each case | |
| excluding the Excluded Lenders (each, a “Lender” and, collectively, the “Lenders”). | ||
AGENT:
|
Wilmington Trust Company, or such other entity selected by GSO and reasonably satisfactory to Borrower, will act as administrative and/or collateral agent for the Lenders (in such capacity, the “Agent”). | |
CLOSING DATE:
|
The first date on or before the Outside Date (as defined in the Merger Agreement), or such other date as may be mutually agreed, on which the conditions precedent set forth in the ninth paragraph of the Commitment Letter and in the “Conditions to Close” section of this Term Sheet shall be satisfied and the Senior Loan shall be funded (the “Closing Date”). | |
PRINCIPAL AMOUNT:
|
$170.0 million. | |
INTEREST RATE:
|
14.00% ; payable quarterly in cash. The default interest rate will be 2.00% per annum above the foregoing, accruing during the continuance of any event of default and payable on demand. | |
USE OF PROCEEDS:
|
The Senior Loan, together with an equity investment by SAC PCG and other investors and cash on hand of the Borrower and its subsidiaries, will be used to fund the Acquisition and pay fees and expenses in connection with the Transactions. | |
MATURITY:
|
7 years from the Closing Date. | |
AMORTIZATION:
|
None. |
GUARANTORS:
|
All obligations of the Borrower under the Senior Loan will be unconditionally guaranteed (the “Guarantees”) by Holdings and each existing and subsequently acquired or organized domestic subsidiary of Holdings (collectively, the “Guarantors” and, together with the Borrower, the “Loan Parties”) (it being understood and agreed that each of FMC (as defined below) and its subsidiaries shall cease to constitute a Guarantor upon the earliest to occur of the following (with respect to the relevant Guarantor, an “FMC Guarantor Release Event”): (i) with respect to FMC and all such subsidiaries, (a) the consummation of an initial public offering of equity securities of FMC, (b) the consummation of an issuance of equity securities of FMC to an unaffiliated third party investor, the aggregate cash proceeds of which exceed $20.0 million, and (c) the closing date of a secured working capital facility of $20.0 million or more for FMC, provided by an unaffiliated third party, and (ii) with respect to any such individual Guarantor, such Guarantor ceasing to constitute a subsidiary of Airvana in a transaction permitted under the Facilities Documentation). | |
| Notwithstanding the foregoing, (i) subsidiaries may be excluded from the guarantee requirements to the extent mutually agreed in the Facilities Documentation in circumstances where the Borrower and the Agent reasonably agree that the cost of providing such a Guarantee is excessive in relation to the benefit afforded the Lenders thereby and (ii) the delivery of the Guarantees on the Closing Date shall be subject to the ninth paragraph of the Commitment Letter. | ||
SECURITY:
|
The Senior Loan and the Guarantees will be secured by the grant of a first priority perfected security interest in all of the Loan Parties’ real and personal property and assets, including without limitation: (a) a perfected first priority pledge by Holdings of the capital stock of the Borrower and a pledge by each Borrower and Guarantor of the capital stock of each of its direct subsidiaries, including FMC (which pledge, in the case of subsidiaries not organized under the laws of one of the fifty states of the United States or the District of Columbia, will be limited to 100% of the non-voting capital stock and 65% of the voting capital stock of such subsidiaries) and (b) perfected first priority security interests in, and mortgages, account control agreements (it being understood that account control agreements shall be entered into after the Closing Date), pledges or grants on, all tangible and intangible real or personal or mixed property of the Borrower and each Guarantor, including, without limitation, accounts, deposit accounts and other bank or securities accounts, inventory, equipment, investment property, intellectual property, other general intangibles, owned or leased real property and proceeds of the foregoing (the foregoing collateral described in clauses (a) and (b) but excluding the Excluded Property (as defined below), the “Collateral”). | |
| Notwithstanding the foregoing, (i) in circumstances where the Borrower and the Lead Lender reasonably agree that the cost of creating or perfecting a security interest in any Collateral is excessive in relation to the benefit afforded the Lenders, the Facilities Documentation will provide that the Loan Parties shall not be required to create or perfect, as the case may be, such security interest (it being understood that during an event of default the Agent or the majority lenders (or other agreed required lenders) shall have the right to create or perfect, as the case may be, such security |
2
| interest) and (ii) the grant of security interest on the Closing Date shall be subject to the ninth paragraph of the Commitment Letter. | ||
| Notwithstanding the foregoing, the pledge and grant of a Lien and security interest as provided herein shall not extend (A) with respect to FMC any of its subsidiaries, to any assets thereof upon the occurrence of an FMC Guarantor Release Event with respect to such entity, and (B) with respect to any Loan Party, to equipment subject to a purchase money security interest or equipment lease (“Encumbered Equipment”), or to any contract, general intangible, instrument, license or chattel paper in which any Loan Party has any right, title or interest, if and to the extent such Encumbered Equipment, contract, general intangible, instrument, license or chattel paper is subject to a permitted lien (as agreed and defined in the Facilities Documentation), contractual provision or other restriction on assignment permitted under the Facilities Documentation such that the creation of a security interest in the right, title or interest of such Loan Party therein would be prohibited and would, in and of itself, cause or result in a default thereunder enabling another person party to such Encumbered Equipment purchase contract or lease, contract, general intangibles, instrument, license or chattel paper to enforce any remedy with respect thereto (the “Excluded Property”); provided that the foregoing exclusion shall not apply if (i) such prohibition has been waived or such other Person has otherwise consented to the creation hereunder of a security interest in such Encumbered Equipment, contract, general intangible, instrument, license or chattel paper (it being understood that no Loan Party shall be required to seek any such consent or waiver from a third party) or (ii) such prohibition would be rendered ineffective pursuant to Section 9-406, 9-407 or 9-408 of Article 9 of the Uniform Commercial Code, as applicable and as then in effect in any relevant jurisdiction, or any other applicable law (including the Bankruptcy Code) or principles of equity; provided further that immediately upon the ineffectiveness, lapse or termination of any such provision, such Loan Party shall be deemed to have granted a security interest in, all its rights, title and interests in and to such Encumbered Equipment, contract, general intangibles, instrument, license or chattel paper as if such provision had never been in effect; and provided further that the foregoing exclusion shall in no way be construed so as to limit, impair or otherwise affect the Agent’s unconditional continuing security interest in and to all rights, title and interests of such Loan Party in or to any payment obligations or other rights to receive monies due or to become due under any such Encumbered Equipment, contract, general intangibles, instrument, license or chattel paper and in any such monies and other proceeds of such Encumbered Equipment, contract, general intangibles, instrument, license or chattel paper. | ||
| “Separation Date” shall mean the date that is the earlier of (i) the date that is 180 days after the Closing Date (as such date may be extended from time to time at the sole discretion of the Lead Lender) and (ii) the date on which the Borrower shall have completed the formation of FMC and the transfer of all of the assets and liabilities constituting the Femtocell business in accordance with the terms set forth in the “Femtocell” section of this Term Sheet and the Separation Guidelines Memo (as defined below) to the satisfaction of the Lead Lender. |
3
RANKING:
|
The Senior Loan will rank senior in right of payment to all other indebtedness of the Company. There will be no payment blockages, remedies blockages, restrictions on rights and privileges in bankruptcy, or any other restriction on the rights or remedies relating to the Senior Loan. | |
MANDATORY PREPAYMENT/ EXCESS CASH FLOW SWEEP: |
An offer to prepay the Senior Loan is required with 100% of the net cash proceeds (pursuant to a definition to be mutually agreed) of (i) asset sales (subject to customary reinvestment rights and other than sales of inventory in the ordinary course of business, a sale of FMC and its subsidiaries and/or the assets of FMC and its subsidiaries (except that offers to prepay proceeds of such sale shall be required to the extent set forth in clause (ii) below) and other exceptions to be mutually agreed), (ii) sales of equity interests of FMC and its subsidiaries and sales of the assets or business of FMC and its subsidiaries outside the ordinary course of business, provided that the percentage of such net cash proceeds of a sale required to be offered to prepay the Senior Loan pursuant to this clause (ii) shall equal the percentage of the equity interests of FMC held directly or indirectly by Holdings prior to such sale, (iii) debt issuances (other than permitted debt) by Holdings and its subsidiaries (other than FMC and its subsidiaries), and (iv) any equity issuance (subject to exceptions to be mutually agreed for issuances to SAC PCG, or any co-investor as of the Closing Date, management pursuant to compensation agreements or incentive plans or pursuant to any pre-emptive rights or anti-dilution provisions associated with the foregoing) by Holdings and its subsidiaries (other than FMC and its subsidiaries). | |
| In addition, the Company will be required to repay the Senior Loan with 75% of the Excess Cash Flow (which shall be defined in a manner to be mutually agreed, as Adjusted EBITDA (as defined on Annex I to this Term Sheet) for the relevant quarter, minus interest expense and loan servicing fees, capital expenditures (except to the extent the aggregate amount of capital expenditures so deducted from the calculation of Excess Cash Flow over any four quarter period would exceed $3,000,000), cash taxes, and voluntary prepayments of the Senior Loan, and adjusted for increases or decreases, as applicable, in net working capital (to be defined as accounts receivable minus accounts payable and operating accruals determined on a billing basis) for each quarterly period after the Closing Date, which amount shall be measured as at the last date of each such quarter (each such measurement date, a “Determination Date”) and shall be due and payable 45 days after such Determination Date and shall be delivered with reasonable supporting calculations and supporting materials. Notwithstanding the foregoing, the percentage of Excess Cash Flow the Company is required to apply to repay the Senior Loan shall be 100% for each quarter through and including the fourth quarter of 2012. | ||
| Mandatory prepayments will be made at the following prepayment premiums: | ||
| Year 1: 108.50% | ||
| Year 2: 107.50% | ||
| Year 3: 106.50% | ||
| Year 4: 104.50% |
4
| Year 5: 102.50% | ||
| Year 6: Par | ||
| Year 7: Par | ||
| Notwithstanding the foregoing, any Excess Cash Flow payment shall be limited to an amount that would not cause the Borrower to have a cash balance of less than $7.5 million (the “Minimum Balance”) on the consolidated balance sheet of the Borrower and its subsidiaries (other than FMC and its subsidiaries) as of the applicable Determination Date. | ||
OPTIONAL PREPAYMENTS:
|
The Senior Loan may be repaid in whole or in part, in minimum principal amounts to be agreed, at any time after the third anniversary of the Closing Date (including by acceleration or an exercise of remedies by the Lenders or Agent) at the following prepayment premiums (plus accrued and unpaid interest): | |
| Year 4: 107.00% | ||
| Year 5: 104.00% | ||
| Year 6: 101.00% | ||
| Year 7: Par | ||
| Notwithstanding any other provision to the contrary, except as expressly set forth with respect to Mandatory Prepayments above, no partial payments, whether attributable to acceleration or otherwise, may be made on the Senior Loans during the first three years of the Senior Loan. Any prepayment on the Senior Loans during the first three years of the Senior Loan shall be a payment in full of the Senior Loan and all other obligations arising in connection therewith, together with the unpaid interest and fees accrued thereon, and the premium applicable to such amount. The premium payable in connection with such prepayment in full shall be calculated as if such prepayment in full were occurring on the first date on which optional prepayments are permitted above (the “First Redemption Date”) and shall be equal to the prepayment premium that would have been payable on such First Redemption Date, plus all fees and interest that would have accrued through such First Redemption Date, in each case calculated as if the principal amount of the Senior Loan outstanding immediately prior to such prepayment in full remained outstanding and were optionally prepaid on such First Redemption Date. | ||
| The Borrower may also elect (prior to the Closing Date) to include a “catch-up” pre-payment in the Facilities Documentation after the fifth anniversary of the Closing Date to the extent necessary to ensure that the Senior Loan will not be subject to the AHYDO rules, including Section 163(i) of the Internal Revenue Code. | ||
DIVIDENDS:
|
So long as no default or event of default has occurred and is continuing (or would result therefrom), and the Loan Parties have delivered the compliance certificate for the most recently ended quarter (commencing with the first quarter of 2013) demonstrating compliance with the maximum leverage ratio described below for such quarter, then, dividends may be distributed with respect to such quarter to equity holders (or constructively contributed by Holdings to Borrower and contemporaneously contributed by Borrower to FMC) within 10 days after |
5
| any required prepayment of Excess Cash Flow for such most recently ended quarter, so long as the following two conditions are met: (i) the outstanding principal balance of the Senior Loan is below $100 million as of the date of the required prepayment of Excess Cash Flow for such quarter most recently ended; and (ii) LTM Adjusted EBITDA is above $90 million for the previous two quarterly periods, as certified by a financial officer of the Borrower (who shall also certify compliance with the other requirements of this paragraph). Dividends paid pursuant to this paragraph cannot exceed $10.0 million during any twelve month period until the Senior Loan is fully repaid, and in any quarter, the dividend permitted to be paid shall not equal an amount that, if paid as a dividend, would cause the cash balance as of the date of the required prepayment of Excess Cash Flow for such quarter most recently ended (giving pro forma effect to the payment of such dividend on such prepayment date) to be less than the Minimum Balance, provided that if the principal balance of the Senior Loan is below $50 million, such $10.0 million annual cap shall increase to $15 million. | ||
| So long as no default or event of default has occurred and is continuing (or would result therefrom), then (a) Borrower and Holdings may, with respect to any month ending on or prior to the end of 2012, at its election and in its sole discretion, make available to FMC up to $13.0 million in the aggregate (it being understood that Holdings and its subsidiaries shall not be obligated to FMC or its subsidiaries to provide any portion of such amount to FMC prior to actually making such amount available to FMC), and (b) Holdings may with respect to any month ending on or prior to the end of 2012 pay amounts (for the purposes described below in this paragraph) not exceeding $4.5 million for any such month and $9.0 million in the aggregate, and each such payment pursuant to this clause (b) shall only be permitted if (x) with respect to the first such month for which such payment is made, the principal balance of the Senior Loan as of such month-end is $75.0 million or less, and (y) with respect to the second such month for which such payment is made, the principal balance of the Senior Loan as of such month-end is $50.0 million or less, so long as (in the case of both clause (a) and (b)) the following three conditions are met: (i) the amount permitted to be paid with respect to any month shall not equal an amount that, if paid, would cause the cash balance to be less than the Minimum Balance; (ii) LTM Adjusted EBITDA is above $90 million for the relevant month most recently ended, as certified by a financial officer of the Borrower (who shall also certify compliance with the other requirements of this paragraph); and (iii) FMC shall have maintained at all times after the Closing Date an unrestricted cash balance of not less than $5.0 million. Amounts made available to FMC pursuant to clause (a) of this paragraph or paid pursuant to clause (b) of this paragraph (i) with respect to any month-end that is also a quarter-end, shall be made within 10 days after any required prepayment of Excess Cash Flow (which shall be calculated to exclude payments permitted under this paragraph and paid in respect of the relevant period (including, without duplication, such payments being made concurrently with such prepayment)) for such quarter and delivery of the compliance certificate for such quarter demonstrating compliance with the maximum leverage ratio described below for such quarter, and (ii) with respect to any other month-end, shall be made within 10 days after delivery of the unaudited monthly financial |
6
| statements for such month required under the Facilities Documentation. Amounts made available to FMC pursuant to clause (a) of this paragraph are “Permitted FMC Distributions”, and amounts permitted to be paid pursuant to clause (b) of this paragraph shall be applied to satisfy preferred equity or notes of Holdings issued to certain sellers in connection with the Acquisition. | ||
| Notwithstanding the foregoing restrictions, Holdings and its subsidiaries shall be permitted to distribute the stock of FMC, so long as (x) an IPO of FMC has occurred, (y) no default or event of default has occurred and is continuing and (z) any such distribution is pro rata to the equity holders of Holdings. | ||
CONDITIONS TO CLOSE:
|
Conditions precedent to the funding of the Senior Loan shall be limited to those specified in the ninth paragraph of the Commitment Letter and the following: | |
| (i) execution and delivery of the Facilities Documentation consistent with the Commitment Letter and the Fee Letter and otherwise reasonably satisfactory in form and substance to the Borrower and the Lead Lender, subject to the ninth paragraph of the Commitment Letter; | ||
| (ii) the Lenders shall have received the audited financials of the Company for the period ending December 28, 2008 and unaudited financials for the most recent month ended at least 30 days prior to the Closing Date with year-to-date financial statements through such month, and since December 28, 2008, there shall not have occurred any Company Material Adverse Effect (as defined in the Merger Agreement), except, solely in respect of the period up to and including the date of the Merger Agreement, as disclosed in any Company SEC Report (as defined in the Merger Agreement) filed on or after December 31, 2008 and prior to the date of the Merger Agreement (the “Filed Company SEC Reports”) (other than disclosure in such Company SEC Reports referred to in the “Risk Factors” and “Forward Looking Statements” sections thereof or any other disclosures in the Filed Company SEC Reports which are forward-looking in nature); | ||
| (iii) [intentionally omitted]; | ||
| (iv) the Company’s Adjusted EBITDA for the latest twelve months ended at least 30 days prior to the Closing Date shall not be less than $95.0 million; | ||
| (v) SAC PCG and its affiliates and other investors (so long as SAC PCG is the owner of the economic interest in, and has the power to vote or direct the voting of, 51% or more of all equity of Holdings, the Borrower and Company, and each of their respective subsidiaries) shall have invested cash equity (such equity to be solely in the form of membership interests which are not disqualified equity interests (having the meaning customarily given to such term, including that such interests (x) are not mandatorily redeemable on any scheduled date, (y) are not redeemable at the option of the holder and (z) do not require scheduled payments of dividends or distributions in cash or property)) in Holdings representing |
7
| (inclusive of management equity rolled over in connection with the Acquisition) not less than 42.5% of the pro forma capitalization of Holdings, Borrower and the Company, and each of their respective subsidiaries, plus the amount, if any, by which the costs and expenses related to the Transactions exceed $25 million; and no financing other than the Senior Loan and the aforementioned equity financing will be required in connection with the Transactions; | ||
| (vi) subject to the ninth paragraph of the Commitment Letter, all documents and instruments required to create and perfect the Agent’s security interest in the Collateral shall have been executed and delivered and, if applicable, be in proper form for filing, and the Agent shall have received UCC lien searches demonstrating the absence of any other liens or mortgages on the Collateral (other than liens permitted under the Facilities Documentation); | ||
| (vii) the Merger Agreement Representations referred to in the ninth paragraph of the Commitment Letter and the Specified Representations shall be true and correct in all material respects; | ||
| (viii) the Acquisition shall have been consummated on the terms set forth in the Merger Agreement (and (x) no provision of the Merger Agreement shall have been waived, amended, supplemented or otherwise modified, and (y) Air Newco and its affiliates shall not have exercised any consent right under section 5.1 of the Merger Agreement, in any case described in clause (x) or (y) in a manner in any material respect adverse to the interests of the Lenders without the consent of the Lead Lender), and the purchase price initially set forth in the Merger Agreement shall not have been increased without the consent of the Lead Lender; | ||
| (ix) the Borrower shall have paid all fees and expenses then owing to the Lead Lender, the Agent and the Lenders hereunder and under the Fee Letter; | ||
| (x) the Lead Lender and the Agent shall have received, at least 5 business days prior to the Closing Date, all documentation and other information that the Lead Lender has requested in a reasonable time prior thereto to satisfy requirements by regulatory authorities under applicable “know your customer” and anti-money laundering rules and regulations, including, without limitation, the PATRIOT Act; | ||
| (xi) the Lenders shall have received customary closing certificates, legal opinions, solvency certificates, evidence of authority, corporate documents and officer’s incumbency certificates, and evidence of insurance; | ||
| (xii) after giving effect to the Transactions and the payment of fees and expenses on the Closing Date, the Borrower shall have a cash balance equal to or greater than the Minimum Balance (not including in such amount the $15.0 million which will be held on the Closing Date by the Borrower or Holdings to fund FMC); | ||
| (xiv) the Lead Lender shall have received a sources and uses and funds flow for the Acquisition and the Transactions consistent with the |
8
| conditions to the Closing Date; and | ||
| (xv) concurrently with funding of the Senior Loan, the Lenders shall have been issued, on a pro rata basis, equity constituting 5% of the membership interests of Holdings (which may be diluted by management options representing up to 3.5% of the membership interest of Holdings), which equity interests shall have the same terms as the equity interests issued on the Closing Date to certain Lenders and/or their affiliates pursuant to their co-investment in Holdings. | ||
| The Facilities Documentation shall not contain any conditions precedent other than the conditions precedent set forth in the ninth paragraph of the Commitment Letter and in this “Conditions to Close” section of this Term Sheet. | ||
FINANCIAL COVENANTS:
|
Limited to: | |
| Total Leverage Ratio: | ||
| The Total Leverage Ratio will be calculated on a quarterly basis and will be the ratio of Total Debt (to be defined to include only debt for borrowed money and capital leases and excluding all debt at FMC and its subsidiaries) as of the last day of such quarter to Adjusted EBITDA of the Borrower and its consolidated subsidiaries (other than FMC and its subsidiaries) for the four quarter period ended on such last day. | ||
| Covenant levels for this ratio are presented in Exhibit C attached to the Commitment Letter. | ||
| If the Company is not in compliance with the Total Leverage Ratio covenant for at least two consecutive quarters, then the Lenders shall have the right to exercise typical default remedies (including default interest). The Company may not distribute any dividends to equity holders at any time that it is not in compliance with a single quarterly covenant compliance test. | ||
| The compliance certificate and related unaudited quarterly financial statements will be due 45 days following the end of each fiscal quarter, including year end; provided that year end compliance certificates and financial statements will be subject to year-end adjustments. | ||
NEGATIVE COVENANTS:
|
Customary for transactions of this type (to be applicable to Holdings and its subsidiaries (other than FMC and its subsidiaries except as specified below) and to include customary exceptions, including basket exceptions to be mutually agreed, in each case, where appropriate) and limited to the following: | |
- Limitations on debt, disqualified stock (i.e., having no cash dividends
prior to the one year anniversary of the maturity of the Senior Loan
and otherwise having the meaning customarily given to such term) and
guaranty obligations; |
||
| - Limitations on liens and additional negative pledges; | ||
| - Limitations on investments; |
9
| - Limitations on asset dispositions and issuance or disposition of subsidiary equity interests; | ||
| - Limitations on mergers and acquisitions; | ||
| - Limitations on fundamental changes; | ||
| - Limitations on subsidiary dividend blockers; | ||
| - Limitations on dividends and restricted payments; | ||
| - Limitations on transactions with affiliates; | ||
| - Limitations on conduct of business; | ||
- Limitations on modifications to organizational documents, material
modifications to the Merger Agreement that are adverse to the
interests of the Lenders, and any modification (which shall include (x)
changes to those services and fees expressly agreed to at closing of the
Senior Loan and (y) any services and fees negotiated or agreed upon
after closing of the Senior Loan) to the management and other fee
arrangements between the Loan Parties and SAC PCG (which fee
arrangements shall be satisfactory to the Lead Lender at closing of the
Senior Loan); |
||
| - Limitations on change of control; | ||
| - Limitations on Holdings’ activities; | ||
| - No change in fiscal year; | ||
- Limitations on Loan Party transactions with FMC and its subsidiaries
in accordance with the terms set forth in the “Femtocell” section of
this Term Sheet and the Separation Guidelines Memo; |
||
- Limitations on conduct of business in respect of FMC prior to FMC
becoming a separate direct or indirect subsidiary of Holdings in
accordance with the terms set forth in the “Femtocell” section of this
Term Sheet, Annex II and the Separation Guidelines Memo; and |
||
- Limitations on liens and debt of FMC and its subsidiaries (other than
(i) unsecured debt with no principal payments earlier than one year
after the maturity date of the Senior Loan and (ii) a senior working
capital facility not exceeding an amount to be mutually agreed upon
secured by current assets of FMC and its subsidiaries). |
||
AFFIRMATIVE COVENANTS:
|
Customary for transactions of this type (to be applicable to Holdings and its subsidiaries (other than FMC and its subsidiaries except as specified below) and to include customary materiality qualifiers and other exceptions, in each case, where appropriate and mutually agreed) and limited to the following: | |
- Customary notices (including notices of default, material litigation and
amendments to material agreements, ERISA events and environmental
notices) and reporting of specified events to be mutually agreed; |
||
| - Maintenance of insurance; | ||
- Compliance with laws and regulations (including but not limited to
environmental laws and pension laws), including with respect to FMC
and its subsidiaries; |
||
| - Use of proceeds; | ||
- Covenants relating to the maintenance of properties, proper books and
records, corporate existence, qualification to do business, and payment
of taxes and claims that could become Liens on the Loan Parties’
property; |
||
- Financial Information: Lenders will receive un-audited financial
statements (including DOM shipment reports) monthly and quarterly |
10
and audited financial statements annually, in each case, prepared in
accordance with GAAP (other than the absence of footnotes on
unaudited statements and monthly financials shall be prepared on a
billings basis), with quarterly and annual financial statements to be
accompanied by an officer’s no default certificate and annual financial
statements to be accompanied by an accountant’s unqualified audit
opinion and no default letter. Lenders will also receive annually a
quarterly budget for the coming year; |
||
- Inspection Rights: Agent and Lenders
(coordinated through the Lead Lender) will have customary inspection and visitation rights upon
reasonable notice and at reasonable times during normal business
hours (but no more frequently than once per year (for the Lenders as a
whole) unless an event of default has occurred and is continuing); |
||
- Covenant for Borrower to use commercially reasonable efforts to
achieve the milestones set forth on Annex II for the separation of the
Femtocell business into separate subsidiaries (it being understood and
agreed that the failure to achieve such milestones shall not constitute a
default or event of default so long as Borrower is using commercially
reasonable efforts to achieve such milestones, and that Borrower shall
not be deemed in breach of such covenant solely as a result of
deferring payment of amounts necessary or advisable to obtain from
third parties the assignment or modification of agreements in order to
achieve a relevant milestone); |
||
- Covenant for Borrower to report on a monthly basis the progress of
efforts to achieve the milestones set forth on Annex II1 and to
promptly respond to all reasonable requests for information and access
from the Lead Lender and its counsel in respect of such progress and
achievement of such milestones and the separation of the legal,
business and financial affairs of FMC and its subsidiaries from those
of Holdings and its other subsidiaries in accordance with the terms set
forth in the “Femtocell” section of this Term Sheet and the Separation
Guidelines Memo; |
||
- Covenant for FMC and its subsidiaries to maintain (x) separate
accounts and records after the Separation Date in accordance with the
terms set forth in the “Femtocell” section of this Term Sheet and the
Separation Guidelines Memo, and (y) not less than $7.5 million of
unrestricted cash (out of the $15 million held on the Closing Date)
allocated to the Femtocell business at all times prior to the Separation
Date; |
||
- Covenant for Holdings and the other Loan Parties to cause FMC to at
all times maintain unrestricted cash of $5 million after the Separation
Date; |
||
- Covenant for Holdings and the other Loan Parties, from and after the
Separation Date, to, and to cause FMC and its subsidiaries to, take all
actions required to maintain the separation of the legal, business and
financial affairs of the Borrower and the Loan Parties, on the one
hand, from the legal, business and financial affairs of FMC and its
subsidiaries, on the other hand, in accordance with the terms set forth
in the “Femtocell” section of this Term Sheet and the Separation
Guidelines Memo attached hereto as Annex III and incorporated by |
| 1 | It is understood and agreed that, following consultation with local counsel, the milestones set forth in Annex II hereto are subject to reasonable revisions prior to the Closing Date as required by applicable law based on the advice of local counsel. |
11
reference herein; and covenant for Holdings and the other Loan Parties
to cause FMC to indemnify Holdings and the other Loan Parties from
the failure of FMC or its subsidiaries to do the foregoing; and |
||
- Customary further assurances with respect to Collateral matters,
including with respect to obtaining and perfecting liens on Collateral
acquired after the Closing Date and obtaining guaranties from newly
formed or acquired subsidiaries. |
||
FEMTOCELL:
|
As soon as reasonably practicable and in any event prior to the 180th day following the Closing Date or such later date as the Lead Lender shall agree in its sole discretion, (i) Holdings or one of its subsidiaries will form a new separate subsidiary (which shall initially be wholly owned, directly or indirectly, by Holdings except to the extent a de minimis percentage of equity to be mutually agreed upon may be held by other persons for tax planning purposes and an aggregate amount of up to 7% of the equity of FMC issued pursuant to employee stock ownership plans or incentive or compensation plans for employees, officers and directors of Holdings and its subsidiaries who provide services to FMC and its subsidiaries (collectively, the “FMC Employee Equity”)) to operate the Femtocell business (“FMC”), it being understood that FMC may have one or more wholly-owned subsidiaries engaged solely in the Femtocell business, (ii) Holdings shall fund FMC with an aggregate amount not to exceed $15.0 million (or such greater amount as the Lead Lender may agree to in its sole discretion) of cash on hand as of the Closing Date, which amount the executive officers of FMC and the Borrower shall certify constitutes adequate capital for FMC and its subsidiaries in light of their contemplated business operations, and (iii) Holdings and its subsidiaries shall transfer (or license, sub-license, provide services pursuant to a transition services agreement or make similar arrangements with respect to) all of the assets and liabilities constituting the Femtocell business (other than non-material assets and non-material liabilities identified to and acceptable to the Lead Lender and other assets and liabilities the assignment of which requires consent from a counterparty that have not been obtained following the use of commercially reasonable efforts to obtain such consents) to FMC and its subsidiaries. | |
| After the Separation Date, (x) Holdings and its subsidiaries shall be permitted to provide additional funding to FMC and its subsidiaries only (a) by utilizing (i) Permitted FMC Distributions and (ii) amounts available under the other dividend exceptions described above in the first paragraph under the heading “Dividends” or (b) from equity contributions or additional equity purchases by direct or indirect holders of Holdings’ equity, the proceeds of which are used to make equity contributions to FMC and/or to make purchases of FMC equity (by equity contributions through and/or purchases of the equity of the intervening direct and indirect subsidiaries of Holdings, if any, that directly or indirectly own the equity interests of FMC), and (y) FMC shall be permitted to issue equity securities directly to persons other than Holdings and its subsidiaries only if (1) such equity securities are FMC Employee Equity or (2) each equity holder of Holdings at such time has the right and the opportunity to purchase a pro rata share of such securities of FMC on the same terms based on such holder’s beneficial indirect share of ownership (through Holdings) of the outstanding equity interests in FMC prior to such |
12
| issuance, and in the event that such holder does not wish to exercise its full pro rata share of participation rights, the other holders may take up on a pro rata basis the unacquired allocation of the holder that did not exercise its full pro rata share. | ||
| On the Separation Date, Holdings and the Borrower shall provide, at Borrower’s expense, such certifications by the chief executive officer and chief financial officers of Borrower and FMC (in their capacity as such officer and also on behalf of the Borrower and FMC) as the Lead Lender may reasonably request, in form and substance reasonably satisfactory to the Lead Lender (the “Non-Consolidation Certifications”). | ||
| It shall be an Event of Default if, as of the Separation Date, the Lead Lender is not satisfied, acting in good faith, that the legal, business and financial affairs of FMC and its subsidiaries, on the one hand, have been separated from the legal, business and financial affairs of Holdings and its other subsidiaries, on the other hand, in accordance with the terms set forth in the “Femtocell” section of this Term Sheet and the Separation Guidelines Memorandum. | ||
| Following the Separation Date, (i) the arrangements for maintaining the corporate separateness of FMC and its subsidiaries, on the one hand, from Holdings and its other subsidiaries, on the other hand, shall be on the terms set forth in the “Femtocell” section of this Term Sheet and the Separation Guidelines Memorandum; (ii) FMC and its subsidiaries will not be subject to covenants in the Facilities Documentation (except as set forth above under “Affirmative Covenants” and “Negative Covenants”) and will not be included in the calculation of financial covenants before or after the Separation Date; and (iii) FMC and its subsidiaries shall not be permitted to receive any funds as capital contributions, advances or otherwise from Holdings and its other subsidiaries, except that FMC and its subsidiaries may receive such funds from Permitted FMC Distributions, amounts available under the other dividend exceptions described above in the first paragraph under the heading “Dividends”, and equity contributions or equity purchases by direct or indirect holders of Holdings’ equity as set forth above, and in each such case in a manner consistent in all material respects with the Separation Guidelines Memo, whether or not the arrangements contemplated by the Separation Guidelines Memo are in effect as of the date of such receipt. | ||
| Transactions between Holdings and its other subsidiaries, on the one hand, and FMC and its subsidiaries, on the other hand, will at all times be made on an arms-length basis and, with respect to transactions pursuant to which (x) Holdings or its subsidiaries (other than FMC and its subsidiaries) make or are liable (or contingently liable) to make payments or transfer assets to FMC or its subsidiaries, (y) FMC or its subsidiaries make or are liable (or contingently liable) to make payments or transfer assets to Holdings or its other subsidiaries, or (z) Holdings or any of its subsidiaries (other than FMC and its subsidiaries), on the one hand, or FMC (or its subsidiaries), on the other hand, makes payments or becomes liable (or contingently liable) to make payments (or otherwise satisfy liabilities) to third parties for which the other is liable, agreements related to such transactions shall be in writing, notice of such transactions shall be provided to the Agent |
13
| and Lead Lender above a specified threshold to be mutually agreed, and such transactions shall be subject to individual and aggregate dollar limitations to be mutually agreed (it being understood that the Guarantees and Collateral of FMC and its subsidiaries securing such Guarantees shall not be subject to this sentence). To the extent these arms-length arrangements consist of allocations of shared overhead or other expenses, the allocations will be made to the extent practical on the basis of actual use or value of services rendered and otherwise on a basis reasonably related to actual use or the value of services rendered. | ||
| Notwithstanding anything herein to the contrary, to the extent that this Term Sheet and/or the Separation Guidelines Memo contemplate or require that an FMC Party (as defined in the Separation Guidelines Memo) provide an indemnity for the benefit of a Credit Party (as defined in the Separation Guidelines Memo), a guarantee of or collateral to secure the Senior Loan or any similar arrangement, such indemnity, guarantee, provision of collateral or arrangement shall be considered consistent with the separation requirements of this Term Sheet and the Separation Guidelines Memo. | ||
MODIFICATIONS:
|
Lenders holding a majority of the Senior Loan then outstanding are required to approve covenant amendments and waivers; provided that, 100% approval of Lenders (or the affected Lenders, as applicable) is required to amend the coupon, principal, maturity, pro rata repayment provisions, relevant prepayment penalties or the release or subordination of the Agent’s liens on all or substantially all of the Collateral; it being acknowledged, for the avoidance of doubt, that an amendment to any permitted lien covenant or the grant of a priming lien to a debtor-in-possession lender or the release of cash collateral in a bankruptcy proceeding shall not constitute a release or subordination of the Agent’s liens on all or substantially all of the Collateral, and shall only require the affirmative vote of Lenders holding a majority of the Senior Loan then outstanding. | |
EVENTS OF DEFAULT:
|
Customary for transactions of this type (to be applicable to Holdings and its subsidiaries (other than FMC and its subsidiaries after the Separation Date)) or, solely to the extent set forth in this Term Sheet, unique to this transaction and including customary grace periods and other exceptions, in each case, where appropriate and mutually agreed, it being agreed that the failure to comply with the affirmative covenant to establish FMC as a separate subsidiary on or before the Separation Date shall be subject to no cure period) and limited to the following: nonpayment of principal when due; nonpayment of interest, fees or other amounts after a customary grace period; material inaccuracy of representations and warranties; violation of other covenants; failure as of the Separation Date to separate the FMC legal, business and financial affairs from the legal, business and financial affairs for the Borrower and the other Loan Parties, on the terms set forth in the “Femtocell” section of this Term Sheet and the Separation Guidelines Memorandum, as determined by the Lead Lender in good faith; cross-default and cross-acceleration to other material debt; bankruptcy events; certain ERISA events; material judgments; actual or asserted material invalidity of any material Guarantee or security document. |
14
ASSIGNMENTS:
|
After the Closing Date, Lenders may assign all or any portion (subject to customary minimum amount requirements) of their share of the Senior Loan (i) to their affiliates, (ii) to other Lenders, or (iii) to one or more financial institutions or other accredited investors (in each case other than Excluded Lenders), provided that assignments described in clause (iii) shall require notice to the Borrower and the consent of the Lead Lender (which consent shall not be unreasonably withheld or delayed), except that such consent shall not be required during the continuance of an event of default under the Facilities Documentation. Additionally, after the Closing Date the Lenders will have the right to sell participations, subject to customary limitations on voting rights, in their respective shares of the Senior Loan. | |
EXPENSES:
|
The Borrower will pay (a) the Expenses to the extent required by the Commitment Letter and all reasonable, documented and invoiced out-of-pocket expenses of the Agent and the Lead Lender associated with the administration of the Facilities Documentation and any amendment or waiver with respect thereto (including, without limitation, reasonable fees, disbursements and other charges of counsel) and (b) all reasonable and documented out-of-pocket expenses of the Agent and the Lenders (including, without limitation, the reasonable fees, disbursements and other charges of counsel) after the occurrence of a default or an event of default or in connection with the enforcement of the Facilities Documentation. | |
INDEMNIFICATION:
|
The Facilities Documentation will contain customary indemnification and exculpation provisions. | |
GOVERNING LAW:
|
State of New York. |
15
16
| $’000 | EVDO | |||
Billings: |
||||
Product Billings: |
135,079 | |||
NRE Billings |
5,022 | |||
TOTAL BILLINGS |
$ | 140,101 | ||
Cost of Billings |
||||
Product COGS |
2,220 | |||
NRE COGS |
2,387 | |||
Tech Support |
2,607 | |||
Sustaining |
2,486 | |||
Operations |
— | |||
IT/Facilities |
601 | |||
Total Other COGS |
5,694 | |||
TOTAL COST OF BILLINGS |
$ | 10,301 | ||
Product Gross Margin: |
||||
Product GM $ |
$ | 132,859 | ||
Overall Gross Margin: |
||||
Overall
GM $ |
$ | 129,800 | ||
Operating Expenses |
||||
Direct R&D |
24,439 | |||
Ops |
6 | |||
HWCore |
— | |||
Core |
1,154 | |||
Arch & Strag |
653 | |||
India Admin |
1,130 | |||
UK Admin |
— | |||
Research |
1,094 | |||
IT/Facilities |
2,660 | |||
Total Allocated R&D |
6,697 | |||
R&D Expenses |
31,135 | |||
Product Line Margin |
$ | 98,665 | ||
Sales |
1,517 | |||
Trial Support |
— | |||
Mktg/BizDev |
1,112 | |||
IT/Facilities |
49 | |||
Total Sales and Marketing |
2,678 | |||
G&A |
3,432 | |||
IT/Facilities |
163 | |||
G&A |
3,595 | |||
Total Operating Expenses |
37,409 | |||
Stock Comp |
||||
Amortization |
||||
Operating Income |
$ | 92,391 | ||
Add: Amortization of intangibles |
||||
Add: Depreciation |
1,077 | |||
EBITDA ,
as reported (billings basis) |
$ | 93,468 | ||
| Depreciation Expense 2009 | 2009 Actuals | |||||||||||||||||||||||||||||||||||||||||||
(Dollars) |
January | February | March | April | May | June | July | August | September | October | ||||||||||||||||||||||||||||||||||
EVDO |
36,528 | 35,392 | 63,741 | 63,864 | 64,805 | 64,136 | 62,738 | 75,554 | 75,505 | 83,312 | ||||||||||||||||||||||||||||||||||
UAG |
22,979 | 22,980 | 22,951 | 21,057 | 13,165 | 13,184 | 13,174 | 13,183 | 13,174 | 9,993 | ||||||||||||||||||||||||||||||||||
Picasso CDMA |
7,256 | 7,260 | 7,177 | 7,214 | 7,254 | 7,308 | 7,279 | 9,929 | 9,914 | 9,977 | ||||||||||||||||||||||||||||||||||
Picasso UMTS |
32,508 | 32,029 | 32,685 | 33,015 | 34,047 | 36,559 | 36,747 | 37,274 | 36,774 | 36,152 | ||||||||||||||||||||||||||||||||||
RN Access |
961 | 961 | 961 | 961 | 961 | 961 | 961 | 961 | 961 | 961 | ||||||||||||||||||||||||||||||||||
Core |
858 | — | — | — | — | — | — | — | — | — | ||||||||||||||||||||||||||||||||||
Engr Admin |
19,864 | 19,844 | 19,064 | 19,511 | 19,996 | 20,070 | 18,954 | 19,138 | 18,957 | 19,387 | ||||||||||||||||||||||||||||||||||
Sub-Total |
120,953 | 118,466 | 146,579 | 145,621 | 140,228 | 142,218 | 139,853 | 156,039 | 156,135 | 160,631 | ||||||||||||||||||||||||||||||||||
Research |
1,367 | 1,367 | 1,367 | — | — | — | — | — | — | — | ||||||||||||||||||||||||||||||||||
Tech Support |
1,374 | 1,374 | 1,374 | 1,374 | 1,374 | 2,256 | 2,256 | 2,256 | 2,256 | 2,256 | ||||||||||||||||||||||||||||||||||
Mktg |
9,169 | 8,639 | 8,639 | 8,639 | 8,639 | 8,639 | 8,639 | 8,639 | 4,472 | 4,472 | ||||||||||||||||||||||||||||||||||
Ops |
3,457 | 3,457 | 4,126 | 3,625 | 3,625 | 3,625 | 3,625 | 3,625 | 13,633 | 13,633 | ||||||||||||||||||||||||||||||||||
MIS |
9,329 | 9,329 | 7,160 | 7,160 | 7,160 | 7,160 | 8,196 | 4,977 | 3,705 | 3,705 | ||||||||||||||||||||||||||||||||||
Facilities |
101,898 | 101,898 | 101,898 | 102,149 | 102,149 | 101,785 | 101,785 | 101,416 | 101,137 | 101,137 | ||||||||||||||||||||||||||||||||||
G&A Parent |
3,053 | 3,053 | 3,053 | 3,053 | 3,053 | 3,053 | 3,053 | 3,053 | 3,053 | 3,053 | ||||||||||||||||||||||||||||||||||
Sub-Total |
129,648 | 129,118 | 127,618 | 126,000 | 126,000 | 126,518 | 127,554 | 123,966 | 128,257 | 128,256 | ||||||||||||||||||||||||||||||||||
Total Expenses |
250,601 | 247,584 | 274,197 | 271,621 | 266,228 | 268,736 | 267,407 | 280,005 | 284,391 | 288,888 | ||||||||||||||||||||||||||||||||||
Depreciation by BU |
||||||||||||||||||||||||||||||||||||||||||||
EVDO |
||||||||||||||||||||||||||||||||||||||||||||
EVDO Direct |
36,528 | 35,392 | 63,741 | 63,864 | 64,805 | 64,136 | 62,738 | 75,554 | 75,505 | 83,312 | ||||||||||||||||||||||||||||||||||
Allocated R&D |
52 | % | 11,986 | 11,529 | 11,124 | 10,645 | 10,898 | 10,936 | 10,356 | 10,451 | 10,357 | 10,581 | ||||||||||||||||||||||||||||||||
Tech Suppot |
40 | % | 549 | 549 | 549 | 549 | 549 | 902 | 902 | 902 | 902 | 902 | ||||||||||||||||||||||||||||||||
Mktg |
13 | % | 1,192 | 1,123 | 1,123 | 1,123 | 1,123 | 1,123 | 1,123 | 1,123 | 581 | 581 | ||||||||||||||||||||||||||||||||
Ops |
0 | % | — | — | — | — | — | — | — | — | — | — | ||||||||||||||||||||||||||||||||
MIS |
58 | % | 5,411 | 5,411 | 4,153 | 4,153 | 4,153 | 4,153 | 4,753 | 2,886 | 2,149 | 2,149 | ||||||||||||||||||||||||||||||||
Facilities |
58 | % | 59,101 | 59,101 | 59,101 | 59,247 | 59,247 | 59,035 | 59,035 | 58,821 | 58,660 | 58,660 | ||||||||||||||||||||||||||||||||
G&A Parent |
45 | % | 1,374 | 1,374 | 1,374 | 1,374 | 1,374 | 1,374 | 1,374 | 1,374 | 1,374 | 1,374 | ||||||||||||||||||||||||||||||||
EVDO BU |
116,141 | 114,480 | 141,166 | 140,955 | 142,149 | 141,660 | 140,282 | 151,113 | 149,529 | 157,560 | ||||||||||||||||||||||||||||||||||
| PF LTM | Projected Quarter / Fiscal Year Ended | |||||||||||||||||||||||||||||||||||||||||||||||||||||||||||||||||||
| 12/31/2009 | Q1 -‘10 | Q2 -‘10 | Q3 -‘10 | Q4 -‘10 | 2010 | Q1 -‘11 | Q2 -‘11 | Q3 -‘11 | Q4 -‘11 | 2011 | Q1 -‘12 | Q2 -‘12 | Q3 -‘12 | Q4 -‘12 | 2012 | Thereafter | ||||||||||||||||||||||||||||||||||||||||||||||||||||
Total Debt |
$ | 170.0 | $ | 128.0 | $ | 72.3 | $ | 7.7 | ||||||||||||||||||||||||||||||||||||||||||||||||||||||||||||
Adj. EBITDA |
96.7 | 28.5 | 27.3 | 28.3 | 29.7 | 113.8 | 25.7 | 29.5 | 29.4 | 26.4 | 110.9 | 27.4 | 27.4 | 27.4 | 27.4 | 109.6 | ||||||||||||||||||||||||||||||||||||||||||||||||||||
LTM Adj. EBITDA |
96.7 | 105.5 | 110.1 | 123.2 | 113.8 | 113.8 | 110.9 | 113.1 | 114.2 | 110.9 | 110.9 | 112.7 | 110.6 | 108.6 | 109.6 | 109.6 | ||||||||||||||||||||||||||||||||||||||||||||||||||||
Projected Leverage Ratio |
1.8x | 1.6x | 1.5x | 1.4x | 1.1x | 1.1x | 1.2x | 1.1x | 1.1x | 0.7x | 0.7x | 0.6x | 0.7x | 0.7x | 0.1x | 0.1x | ||||||||||||||||||||||||||||||||||||||||||||||||||||
Total Leverage Covenant |
2.1x | 2.0x | 2.0x | 2.0x | 1.75x | 1.75x | 1.30x | 1.30x | 1.30x | 1.05x | 1.05x | 0.80x | 0.80x | 0.80x | 0.60x | 0.60x | 0.40x | |||||||||||||||||||||||||||||||||||||||||||||||||||
Implied “Cushion” (1) |
20.0 | % | 23.2 | % | 28.6 | % | 43.9 | % | 55.6 | % | 55.6 | % | 12.6 | % | 14.9 | % | 16.0 | % | 61.2 | % | 61.2 | % | 24.7 | % | 22.4 | % | 20.2 | % | 754.3 | % | 754.3 | % | ||||||||||||||||||||||||||||||||||||
Implied EBITDA |
80.6 | 85.6 | 85.6 | 85.6 | 73.1 | 73.1 | 98.5 | 98.5 | 98.5 | 68.8 | 68.8 | 90.3 | 90.3 | 90.3 | 12.8 | 12.8 | ||||||||||||||||||||||||||||||||||||||||||||||||||||
| (1) | Note: Q1-Q3 “Cushion” calculated based on prior year end Total Debt balance. |
| Re: | Project Air — Amendment to $170,000,000 Senior Secured Loan Commitment Letter |
| “INTEREST RATE: | Initially 14.75%, payable quarterly in cash, provided that if the outstanding principal amount of the Senior Loan is less than $85,000,000, the interest rate will be 14.00%, payable quarterly in cash. The default interest rate will be 2.00% per annum above the foregoing, accruing during the continuance of any event of default and payable on demand.” |
| Very truly yours, GSO CAPITAL PARTNERS LP, On behalf of certain funds managed by GSO |
||||
| By: | /s/ George Fan | |||
| Name: | George Fan | |||
| Title: | Chief Legal Officer | |||
| Accepted and agreed as of the date first above written: | ||||||
| 72 MOBILE HOLDINGS, LLC | ||||||
| By: | /s/ Peter Berger | |||||
| Name: | Peter Berger | |||||
| Title: | President | |||||
| Discussion Materials Prepared for the Atlas Special Committee |
| Goldman, Sachs & Co. December 17, 2009 |
| Disclaimer Goldman, Sachs & Co. (“GS”) has prepared and provided these materials and GS’s related presentation (the “Confidential Information”) solely for the information and assistance of the Special Committee of the Board of Directors (the “Special Committee”) of Atlas (the “Company”) in connection with its consideration of the matters referred to herein. Without GS’s prior written consent, the Confidential Information may not be circulated or referred to publicly, disclosed to or relied upon by any other person, or used or relied upon for any other purpose. Notwithstanding anything herein to the contrary, the Company may disclose to any person the US federal income and state income tax treatment and tax structure of any transaction described herein and all materials of any kind (including tax opinions and other tax analyses) that are provided to the Company relating to such tax treatment and tax structure, without GS imposing any limitation of any kind. The Confidential Information, including this disclaimer, is subject to, and governed by, any written agreement between the Company, the Board and/or any committee thereof, on the one hand, and GS, on the other hand. GS and its affiliates are engaged in investment banking, commercial banking and financial advisory services, securities trading, investment management, principal investment, financial planning, benefits counseling, risk management, hedging, financing, brokerage activities and other financial and non-financial activities and services for various persons and entities. In the ordinary course of these activities and services, GS and its affiliates may at any time make or hold long or short positions and investments, as well as actively trade or effect transactions, in the equity, debt and other securities (or related derivative securities) and financial instruments (including bank loans and other obligations) of third parties, the Company, any other party to any transaction and any of their respective affiliates or any currency or commodity that may be involved in any transaction for their own account and for the accounts of their customers. The Confidential Information has been prepared and based on information obtained by GS from publicly available sources, the Company’s management and/or other sources. In preparing the Confidential Information, GS has relied upon and assumed, without assuming any responsibility for independent verification, the accuracy and completeness of all of the financial, legal, regulatory, tax, accounting and other information provided to, discussed with or reviewed by GS, and GS does not assume any liability for any such information. GS does not provide accounting, tax, legal or regulatory advice. GS’s role in any due diligence review is limited solely to performing such a review as it shall deem necessary to support its own advice and analysis and shall not be on behalf of the Company. Analyses based upon forecasts of future results are not necessarily indicative of actual future results, which may be significantly more or less favorable than suggested by these analyses, and GS does not assume responsibility if future results are materially different from those forecast. GS has not made an independent evaluation or appraisal of the assets and liabilities of the Company or any other person and has no obligation to evaluate the solvency of the Company or any person under any law. The analyses in the Confidential Information are not appraisals nor do they necessarily reflect the prices at which businesses or securities actually may be sold or purchased. The Confidential Information does not address the underlying business decision of the Company to engage in any transaction, or the relative merits of any strategic alternative referred to herein as compared to any other alternative that may be available to the Company. The Confidential Information is necessarily based on economic, monetary, market and other conditions as in effect on, and the information made available to GS as of, the date of such Confidential Information and GS assumes no responsibility for updating or revising the Confidential Information. |
| Table of Contents |
| Table of Contents |
| I. Transaction Overview — II. Atlas Financial Overview — III. Atlas Market Performance and Status Quo Valuation — IV. Illustrative Proposed Transaction Analysis — Appendix A: Valuation Supporting Materials — |
| Goldman Sachs does not provide accounting, tax, or legal advice. Notwithstanding anything in this document to the contrary, and except as required to enable compliance with applicable securities law, you (and each of your employees, representatives, and other agents) may disclose to any and all persons the US federal income and state tax treatment and tax structure of the transaction and all materials of any kind (including tax opinions and other tax analyses) that are provided to you relating to such tax treatment and tax structure, without Goldman Sachs imposing any limitation of any kind. |
| I. Transaction Overview |
| Transaction Overview |
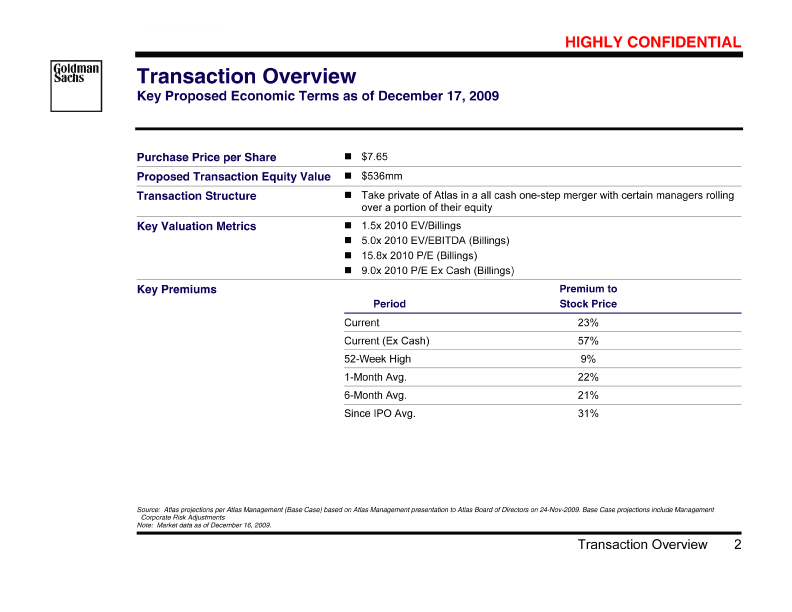
| Key Proposed Economic Terms as of December 17, 2009Source: Atlas projections per Atlas Management (Base Case) based on Atlas Management presentation to Atlas Board of Directors on 24-Nov-2009. Base Case projections include Management Corporate Risk AdjustmentsNote: Market data as of December 16, 2009. |
| | | |
| Purchase Price per Share n $7.65 —— — |
| Proposed Transaction Equity Value n $536mm —— — |
| Transaction Structure n Take private of Atlas in a all cash one-step merger with certain managers rolling over a portion of their equity —— — |
| Key Valuation Metrics n 1.5x 2010 EV/Billings n 5.0x 2010 EV/EBITDA (Billings) n 15.8x 2010 P/E (Billings) n 9.0x 2010 P/E Ex Cash (Billings) —— — |
| Key Premiums Premium to Period Stock Price —— — |
| Current 23% —— — |
| Current (Ex Cash) 57% —— — |
| 52-Week High 9% —— — |
| 1-Month Avg. 22% —— — |
| 6-Month Avg. 21% —— — |
| Since IPO Avg. 31% |
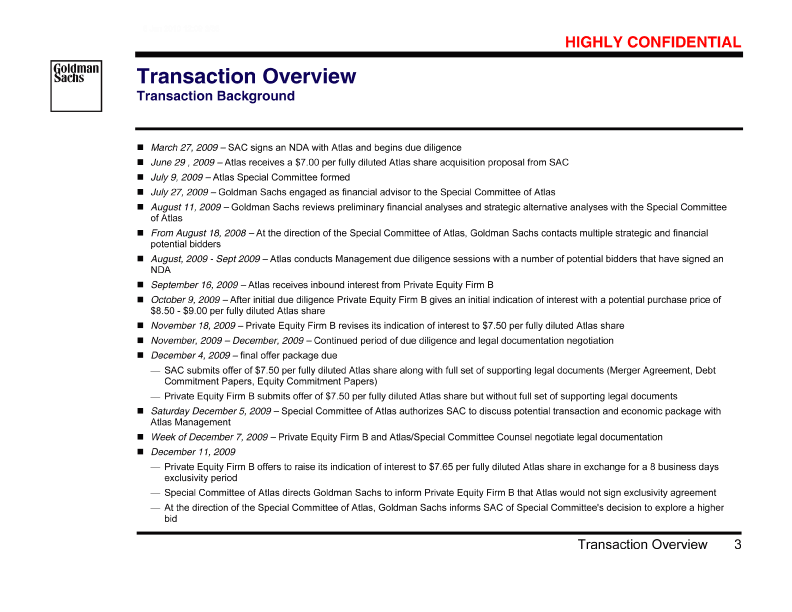
| Transaction Overview Transaction Background |
| n March 27, 2009 — SAC signs an NDA with Atlas and begins due diligence n June 29 , 2009 — Atlas receives a $7.00 per fully diluted Atlas share acquisition proposal from SAC n July 9, 2009 — Atlas Special Committee formed n July 27, 2009 — Goldman Sachs engaged as financial advisor to the Special Committee of Atlas n August 11, 2009 — Goldman Sachs reviews preliminary financial analyses and strategic alternative analyses with the Special Committee of Atlas n From August 18, 2008 — At the direction of the Special Committee of Atlas, Goldman Sachs contacts multiple strategic and financial potential bidders n August, 2009 — Sept 2009 — Atlas conducts Management due diligence sessions with a number of potential bidders that have signed an NDA n September 16, 2009 — Atlas receives inbound interest from Private Equity Firm B n October 9, 2009 — After initial due diligence Private Equity Firm B gives an initial indication of interest with a potential purchase price of $8.50 — $9.00 per fully diluted Atlas share n November 18, 2009 — Private Equity Firm B revises its indication of interest to $7.50 per fully diluted Atlas share n November, 2009 — December, 2009 — Continued period of due diligence and legal documentation negotiation n December 4, 2009 — final offer package due |
| — SAC submits offer of $7.50 per fully diluted Atlas share along with full set of supporting legal documents (Merger Agreement, Debt Commitment Papers, Equity Commitment Papers) |
| —Private Equity Firm B submits offer of $7.50 per fully diluted Atlas share but without full set of supporting legal documents n Saturday December 5, 2009 — Special Committee of Atlas authorizes SAC to discuss potential transaction and economic package with Atlas Management n Week of December 7, 2009 — Private Equity Firm B and Atlas/Special Committee Counsel negotiate legal documentation n December 11, 2009 |
| — Private Equity Firm B offers to raise its indication of interest to $7.65 per fully diluted Atlas share in exchange for a 8 business days exclusivity period |
| — Special Committee of Atlas directs Goldman Sachs to inform Private Equity Firm B that Atlas would not sign exclusivity agreement |
| — At the direction of the Special Committee of Atlas, Goldman Sachs informs SAC of Special Committee’s decision to explore a higher bid |
| Transaction Overview |
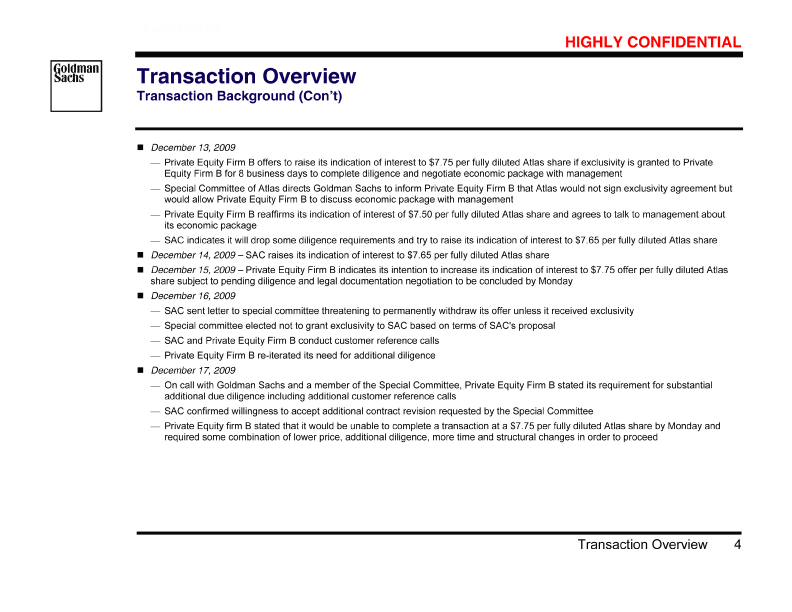
| Transaction Background (Con’t) |
| n December 13, 2009 |
| — Private Equity Firm B offers to raise its indication of interest to $7.75 per fully diluted Atlas share if exclusivity is granted to Private Equity Firm B for 8 business days to complete diligence and negotiate economic package with management |
| — Special Committee of Atlas directs Goldman Sachs to inform Private Equity Firm B that Atlas would not sign exclusivity agreement but would allow Private Equity Firm B to discuss economic package with management |
| — Private Equity Firm B reaffirms its indication of interest of $7.50 per fully diluted Atlas share and agrees to talk to management about its economic package |
| —SAC indicates it will drop some diligence requirements and try to raise its indication of interest to $7.65 per fully diluted Atlas share n December 14, 2009 — SAC raises its indication of interest to $7.65 per fully diluted Atlas share n December 15, 2009 — Private Equity Firm B indicates its intention to increase its indication of interest to $7.75 offer per fully diluted Atlas share subject to pending diligence and legal documentation negotiation to be concluded by Monday n December 16, 2009 —SAC sent letter to special committee threatening to permanently withdraw its offer unless it received exclusivity —Special committee elected not to grant exclusivity to SAC based on terms of SAC’s proposal —SAC and Private Equity Firm B conduct customer reference calls —Private Equity Firm B re-iterated its need for additional diligence n December 17, 2009 |
| — On call with Goldman Sachs and a member of the Special Committee, Private Equity Firm B stated its requirement for substantial additional due diligence including additional customer reference calls |
| — SAC confirmed willingness to accept additional contract revision requested by the Special Committee |
| — Private Equity firm B stated that it would be unable to complete a transaction at a $7.75 per fully diluted Atlas share by Monday and required some combination of lower price, additional diligence, more time and structural changes in order to proceed |
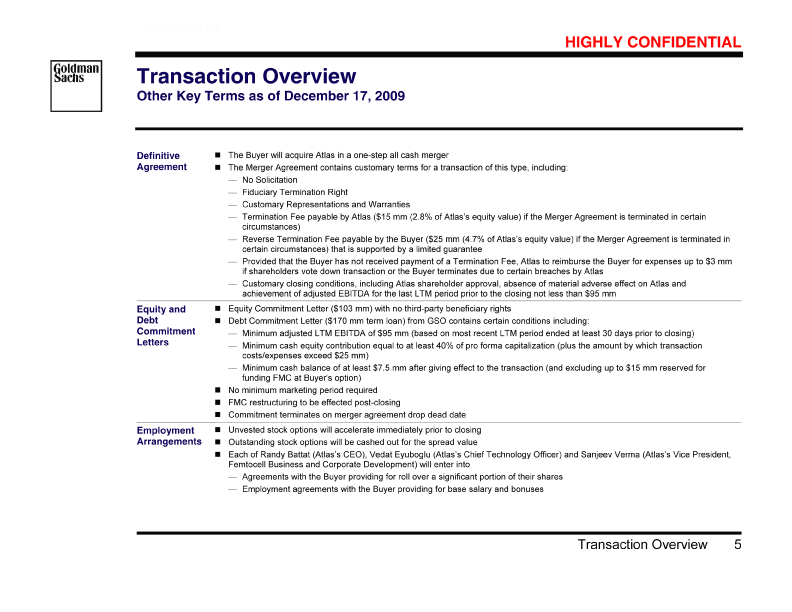
| Transaction Overview |
| Other Key Terms as of December 17, 2009 |
| Definitive n The Buyer will acquire Atlas in a one-step all cash merger Agreement n The Merger Agreement contains customary terms for a transaction of this type, including: — No Solicitation — Fiduciary Termination Right — Customary Representations and Warranties — Termination Fee payable by Atlas ($15 mm (2.8% of Atlas’s equity value) if the Merger Agreement is terminated in certain circumstances) — Reverse Termination Fee payable by the Buyer ($25 mm (4.7% of Atlas’s equity value) if the Merger Agreement is terminated in certain circumstances) that is supported by a limited guarantee — Provided that the Buyer has not received payment of a Termination Fee, Atlas to reimburse the Buyer for expenses up to $3 mm if shareholders vote down transaction or the Buyer terminates due to certain breaches by Atlas — Customary closing conditions, including Atlas shareholder approval, absence of material adverse effect on Atlas and achievement of adjusted EBITDA for the last LTM period prior to the closing not less than $95 mm —— — |
| Equity and n Equity Commitment Letter ($103 mm) with no third-party beneficiary rights Debt Commitment n Debt Commitment Letter ($170 mm term loan) from GSO contains certain conditions including: Letters — Minimum adjusted LTM EBITDA of $95 mm (based on most recent LTM period ended at least 30 days prior to closing) — Minimum cash equity contribution equal to at least 40% of pro forma capitalization (plus the amount by which transaction costs/expenses exceed $25 mm) — Minimum cash balance of at least $7.5 mm after giving effect to the transaction (and excluding up to $15 mm reserved for funding FMC at Buyer’s option) n No minimum marketing period required n FMC restructuring to be effected post-closing n Commitment terminates on merger agreement drop dead date —— — |
| Employment n Unvested stock options will accelerate immediately prior to closing Arrangements n Outstanding stock options will be cashed out for the spread value n Each of Randy Battat (Atlas’s CEO), Vedat Eyuboglu (Atlas’s Chief Technology Officer) and Sanjeev Verma (Atlas’s Vice President, Femtocell Business and Corporate Development) will enter into — Agreements with the Buyer providing for roll over a significant portion of their shares — Employment agreements with the Buyer providing for base salary and bonuses —— — |
| II. Atlas Financial Overview |
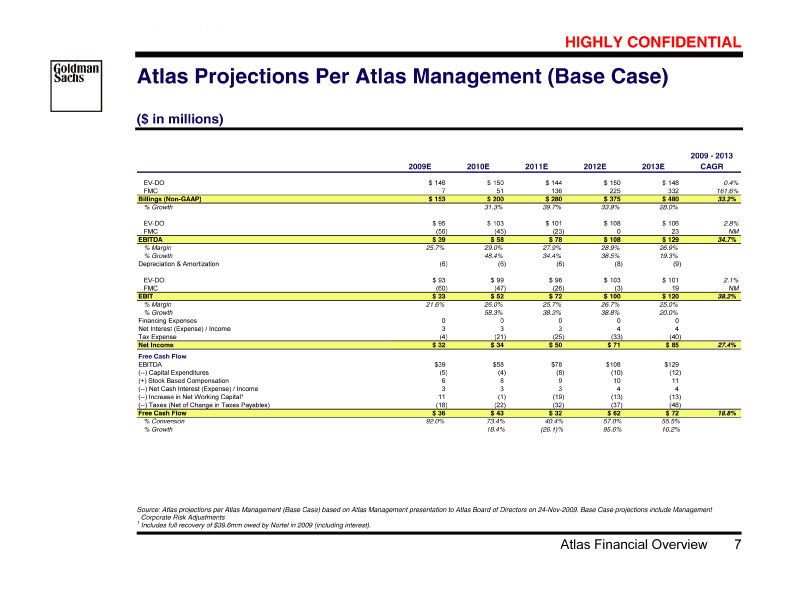
| Atlas Projections Per Atlas Management (Base Case) |
| ($ in millions) |
| | | | | | | |
| 2009 — 2013 |
| 2009E 2010E 2011E 2012E 2013E CAGR |
| EV-DO $146 $150 $144 $150 $148 0.4% |
| FMC 7 51 136 225 332 161.6% |
| Billings (Non-GAAP) $153 $200 $280 $375 $480 33.2% |
| % Growth 31.3% 39.7% 33.9% 28.0% |
| EV-DO $95 $103 $101 $108 $106 2.8% |
| FMC (56) (45) (23) 0 23 NM |
| EBITDA $39 $58 $78 $108 $129 34.7% |
| % Margin 25.7% 29.0% 27.9% 28.9% 26.9% |
| % Growth 48.4% 34.4% 38.5% 19.3% |
| Depreciation & Amortization (6) (6) (6) (8) (9) |
| EV-DO $93 $99 $98 $103 $101 2.1% |
| FMC (60) (47) (26) (3) 19 NM |
| EBIT $33 $52 $72 $100 $120 38.2% |
| % Margin 21.6% 26.0% 25.7% 26.7% 25.0% |
| % Growth 58.3% 38.3% 38.8% 20.0% |
| Financing Expenses 0 0 0 0 0 |
| Net Interest (Expense) / Income 3 3 3 4 4 |
| Tax Expense (4) (21) (25) (33) (40) |
| Net Income $32 $34 $50 $71 $85 27.4% |
| Free Cash Flow |
| EBITDA $39 $58 $78 $108 $129 |
| (—) Capital Expenditures (5) (4) (8) (10) (12) |
| (+) Stock Based Compensation 6 8 9 10 11 |
| (—) Net Cash Interest (Expense) / Income 3 3 3 4 4 |
| (—) Increase in Net Working Capital 1 11 (1) (19) (13) (13) |
| (—) Taxes (Net of Change in Taxes Payables) (18) (22) (32) (37) (48) |
| Free Cash Flow $36 $43 $32 $62 $72 18.8% |
| % Conversion 92.0% 73.4% 40.4% 57.0% 55.5% |
| % Growth 18.4% (26.1)% 95.6% 16.2% |
| Source: Atlas projections per Atlas Management (Base Case) based on Atlas Management presentation to Atlas Board of Directors on 24-Nov-2009. Base Case projections include Management Corporate Risk Adjustments1 Includes full recovery of $39.6mm owed by Nortel in 2009 (including interest). |
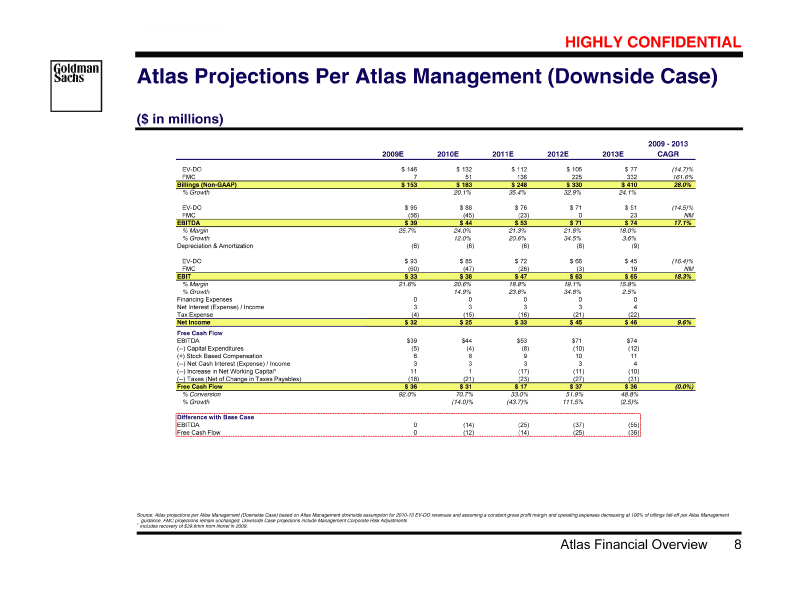
| Atlas Projections Per Atlas Management (Downside Case) |
| ($ in millions) |
| | | | | | | |
| 2009 — 2013 |
| 2009E 2010E 2011E 2012E 2013E CAGR |
| EV-DO $146 $132 $112 $105 $77 (14.7)% |
| FMC 7 51 136 225 332 161.6% |
| Billings (Non-GAAP) $153 $183 $248 $330 $410 28.0% |
| % Growth 20.1% 35.4% 32.9% 24.1% |
| EV-DO $95 $88 $76 $71 $51 (14.5)% |
| FMC (56) (45) (23) 0 23 NM |
| EBITDA $39 $44 $53 $71 $74 17.1% |
| % Margin 25.7% 24.0% 21.3% 21.6% 18.0% |
| % Growth 12.0% 20.6% 34.5% 3.6% |
| Depreciation & Amortization (6) (6) (6) (8) (9) |
| EV-DO $93 $85 $72 $66 $45 (16.4)% |
| FMC (60) (47) (26) (3) 19 NM |
| EBIT $33 $38 $47 $63 $65 18.3% |
| % Margin 21.6% 20.6% 18.8% 19.1% 15.8% |
| % Growth 14.9% 23.6% 34.6% 2.5% |
| Financing Expenses 0 0 0 0 0 |
| Net Interest (Expense) / Income 3 3 3 3 4 |
| Tax Expense (4) (15) (16) (21) (22) |
| Net Income $32 $25 $33 $45 $46 9.6% |
| Free Cash Flow |
| EBITDA $39 $44 $53 $71 $74 |
| (—) Capital Expenditures (5) (4) (8) (10) (12) |
| (+) Stock Based Compensation 6 8 9 10 11 |
| (—) Net Cash Interest (Expense) / Income 3 3 3 3 4 |
| (—) Increase in Net Working Capital 1 11 1 (17) (11) (10) |
| (—) Taxes (Net of Change in Taxes Payables) (18) (21) (23) (27) (31) |
| Free Cash Flow $36 $31 $17 $37 $36 (0.0%) |
| % Conversion 92.0% 70.7% 33.0% 51.9% 48.8% |
| % Growth (14.0)% (43.7)% 111.5% (2.5)% |
| Difference with Base Case |
| EBITDA 0 (14) (25) (37) (55) |
| Free Cash Flow 0 (12) (14) (25) (36) |
| Source: Atlas projections per Atlas Management (Downside Case) based on Atlas Management downside assumption for 2010-13 EV-DO revenues and assuming a constant gross profit margin and operating expenses decreasing at 100% of billings fall-off per Atlas Management guidance. FMC projections remain unchanged. Downside Case projections include Management Corporate Risk Adjustments1 Includes recovery of $39.6mm from Nortel in 2009. |
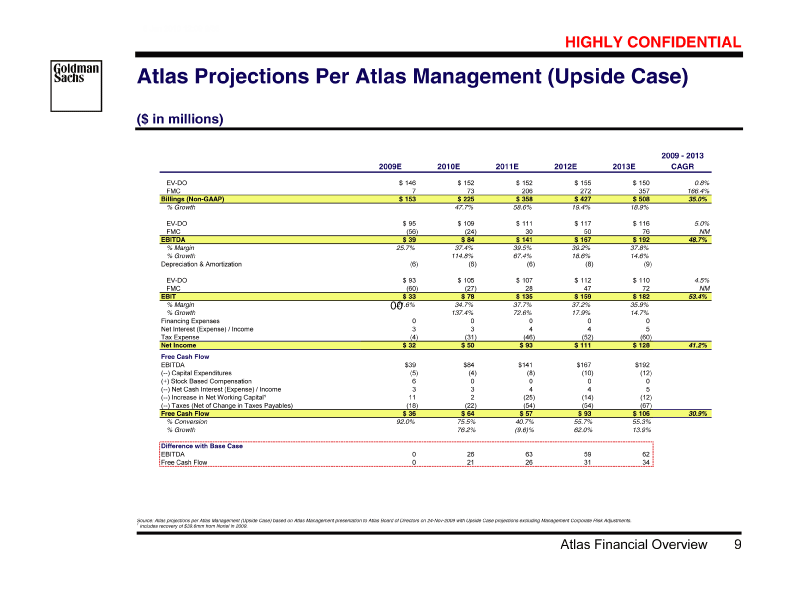
| Atlas Projections Per Atlas Management (Upside Case) |
| ($ in millions) |
| | | | | | | |
| 2009 — 2013 |
| 2009E 2010E 2011E 2012E 2013E CAGR |
| EV-DO $146 $152 $152 $155 $150 0.8% |
| FMC 7 73 206 272 357 166.4% |
| Billings (Non-GAAP) $153 $225 $358 $427 $508 35.0% |
| % Growth 47.7% 58.6% 19.4% 18.9% |
| EV-DO $95 $109 $111 $117 $116 5.0% |
| FMC (56) (24) 30 50 76 NM |
| EBITDA $39 $84 $141 $167 $192 48.7% |
| % Margin 25.7% 37.4% 39.5% 39.2% 37.8% |
| % Growth 114.8% 67.4% 18.6% 14.6% |
| Depreciation & Amortization (6) (6) (6) (8) (9) |
| EV-DO $93 $105 $107 $112 $110 4.5% |
| FMC (60) (27) 28 47 72 NM |
| EBIT $33 $78 $135 $159 $182 53.4% |
| % Margin 21.6% 34.7% 37.7% 37.2% 35.9% |
| % Growth 137.4% 72.6% 17.9% 14.7% |
| Financing Expenses 0 0 0 0 0 |
| Net Interest (Expense) / Income 3 3 4 4 5 |
| Tax Expense (4) (31) (46) (52) (60) |
| Net Income $32 $50 $93 $111 $128 41.2% |
| Free Cash Flow |
| EBITDA $39 $84 $141 $167 $192 |
| (—) Capital Expenditures (5) (4) (8) (10) (12) |
| (+) Stock Based Compensation 6 0 0 0 0 |
| (—) Net Cash Interest (Expense) / Income 3 3 4 4 5 |
| (—) Increase in Net Working Capital 1 11 2 (25) (14) (12) |
| (—) Taxes (Net of Change in Taxes Payables) (18) (22) (54) (54) (67) |
| Free Cash Flow $36 $64 $57 $93 $106 30.9% |
| % Conversion 92.0% 75.5% 40.7% 55.7% 55.3% |
| % Growth 76.2% (9.6)% 62.0% 13.9% |
| Difference with Base Case |
| EBITDA 0 26 63 59 62 |
| Free Cash Flow 0 21 26 31 34 |
| Source: Atlas projections per Atlas Management (Upside Case) based on Atlas Management presentation to Atlas Board of Directors on 24-Nov-2009 with Upside Case projections excluding Management Corporate Risk Adjustments.2 Includes recovery of $39.6mm from Nortel in 2009. |
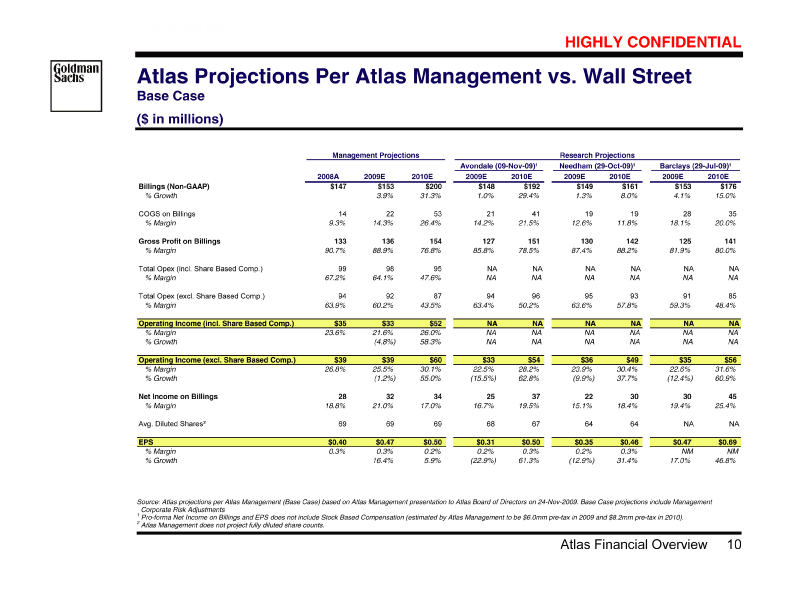
| Atlas Projections Per Atlas Management vs. Wall Street Base Case |
| ($ in millions) |
| | | | | | | | | | |
| Management Projections Research Projections |
| Avondale (09-Nov-09)1 Needham (29-Oct-09)1 Barclays (29-Jul-09)1 |
| 2009E 2010E 2009E 2010E 2009E 2010E 2009E 2010E |
| Billings (Non-GAAP) $147 $153 $200 $148 $192 $149 $161 $153 $176 |
| % Growth 3.9% 31.3% 1.0% 29.4% 1.3% 8.0% 4.1% 15.0% |
| COGS on Billings 14 22 53 21 41 19 19 28 35 |
| % Margin 9.3% 14.3% 26.4% 14.2% 21.5% 12.6% 11.8% 18.1% 20.0% |
| Gross Profit on Billings 133 136 154 127 151 130 142 125 141 |
| % Margin 90.7% 88.9% 76.8% 85.8% 78.5% 87.4% 88.2% 81.9% 80.0% |
| Total Opex (incl. Share Based Comp.) 99 98 95 NA NA NA NA NA NA |
| % Margin 67.2% 64.1% 47.6% NA NA NA NA NA NA |
| Total Opex (excl. Share Based Comp.) 94 92 87 94 96 95 93 91 85 |
| % Margin 63.9% 60.2% 43.5% 63.4% 50.2% 63.6% 57.8% 59.3% 48.4% |
| Operating Income (incl. Share Based Comp.) $35 $33 $52 NA NA NA NA NA NA |
| % Margin 23.6% 21.6% 26.0% NA NA NA NA NA NA |
| % Growth (4.8%) 58.3% NA NA NA NA NA NA |
| Operating Income (excl. Share Based Comp.) $39 $39 $60 $33 $54 $36 $49 $35 $56 |
| % Margin 26.8% 25.5% 30.1% 22.5% 28.2% 23.9% 30.4% 22.6% 31.6% |
| % Growth (1.2%) 55.0% (15.5%) 62.8% (9.9%) 37.7% (12.4%) 60.9% |
| Net Income on Billings 28 32 34 25 37 22 30 30 45 |
| % Margin 18.8% 21.0% 17.0% 16.7% 19.5% 15.1% 18.4% 19.4% 25.4% |
| Avg. Diluted Shares 2 69 69 69 68 67 64 64 NA NA |
| EPS $0.40 $0.47 $0.50 $0.31 $0.50 $0.35 $0.46 $0.47 $0.69 |
| % Margin 0.3% 0.3% 0.2% 0.2% 0.3% 0.2% 0.3% NM NM |
| % Growth 16.4% 5.9% (22.9%) 61.3% (12.9%) 31.4% 17.0% 46.8% |
| Source: Atlas projections per Atlas Management (Base Case) based on Atlas Management presentation to Atlas Board of Directors on 24-Nov-2009. Base Case projections include Management Corporate Risk Adjustments3 Pro-forma Net Income on Billings and EPS does not include Stock Based Compensation (estimated by Atlas Management to be $6.0mm pre-tax in 2009 and $8.2mm pre-tax in 2010).1 Atlas Management does not project fully diluted share counts. |
| III. Atlas Market Performance and Status Quo Valuation |
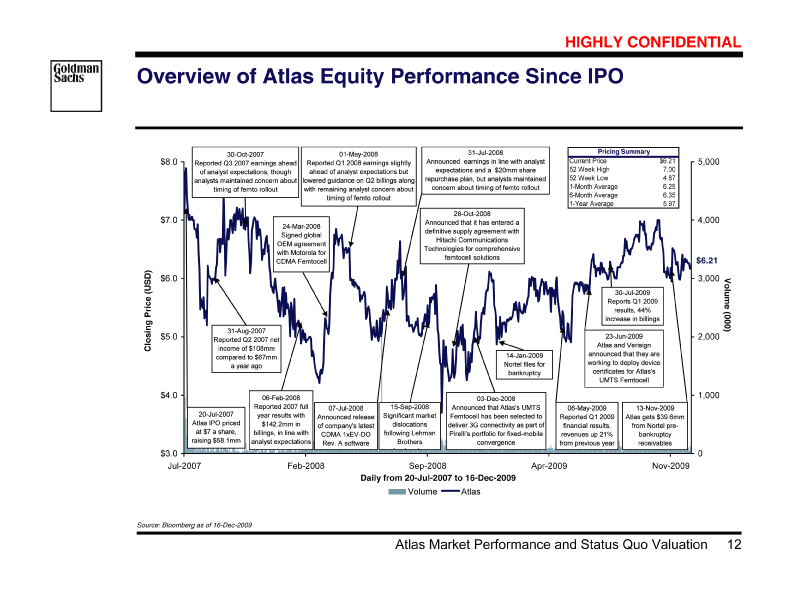
| Overview of Atlas Equity Performance Since IPO Source: Bloomberg as of 16-Dec-2009 |
| 30-Oct-2007 Reported Q3 2007 earnings ahead of analyst expectations, though analysts maintained concern about timing of femto rollout 01-May-2008 Reported Q1 2008 earnings slightly ahead of analyst expectations but lowered guidance on Q2 billings along with remaining analyst concern about timing of femto rollout 31-Jul-2008 Announced earnings in line with analyst expectations and a $20mm share repurchase plan, but analysts maintained concern about timing of femto rollout Pricing SummaryCurrent Price$6.2152 Week High7.0052 Week Low4.871-Month Average6.256-Month Average6.351-Year Average5.9724-Mar-2008 Signed global OEM agreement with Motorola for CDMA Femtocell 28-Oct-2008 Announced that it has entered a definitive supply agreement with Hitachi Communications Technologies for comprehensive femtocell solutions 31-Aug-2007 Reported Q2 2007 net income of $108mm compared to $67mm a year ago 30-Jul-2009 Reports Q1 2009 results, 44% increase in billings 14-Jan-2009 Nortel files for bankruptcy 23-Jun-2009 Atlas and Verisign announced that they are working to deploy device certificates for Atlas’s UMTS Femtocell 20-Jul-2007 Atlas IPO priced at $7 a share, raising $58.1mm 06-Feb-2008 Reported 2007 full year results with $142.2mm in billings, in line with analyst expectations 07-Jul-2008 15-Sep-2008 Announced release Significant market of company’s latest dislocations CDMA 1xEV-DO following Lehman Rev. A software Brothers bankruptcy 03-Dec-2008 Announced that Atlas’s UMTS Femtocell has been selected to deliver 3G connectivity as part of Pirelli’s portfolio for fixed-mobile convergence 06-May-2009 13-Nov-2009 Reported Q1 2009 Atlas gets $39.6mm financial results, from Nortel pre-revenues up 21% bankruptcy from previous year receivables Jul-2007 Feb-2008 Sep-2008 Apr-2009 Nov-2009 Daily from 20-Jul-2007 to 16-Dec-2009 Volume Atlas Source: Bloomberg as of 16-Dec-2009 Atlas Market Performance and Status Quo Valuation 12 |
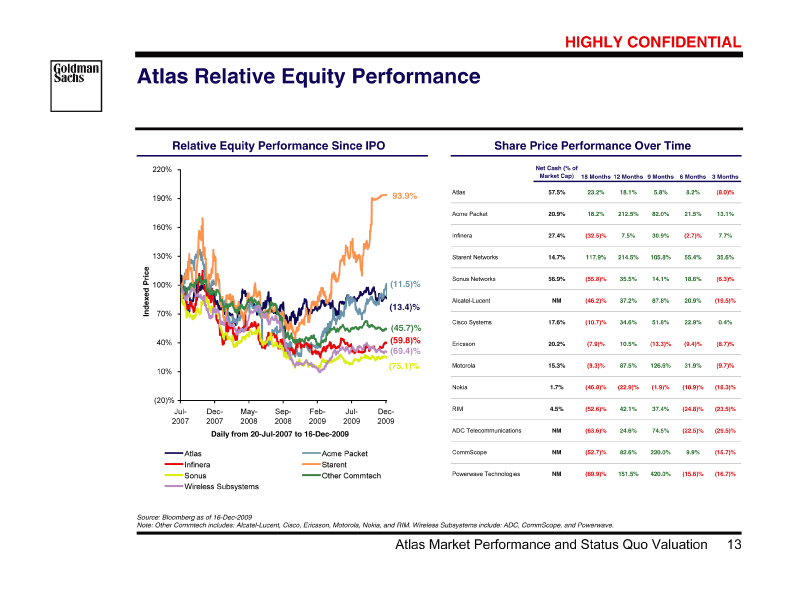
| Atlas Relative Equity PerformanceSource: Bloomberg as of 16-Dec-2009Note: Other Commtech includes: Alcatel-Lucent, Cisco, Ericsson, Motorola, Nokia, and RIM. Wireless Subsystems include: ADC, CommScope, and Powerwave. |
| Relative Equity Performance Since IPO Share Price Performance Over Time —— — |
| Jul-Dec-May-Sep-Feb- Share Price Performance Over TimeNet Cash (% ofMarket Cap)18 Months12 Months9 Months6 Months3 MonthsAtlas57.5%23.2%18.1%5.8%8.2%(8.0)%Acme Jul-Dec-20072007200820082009 Packet20.9%18.2%212.5%82.0%21.5%13.1%Infinera27.4%(32.5)%7.5%30.9%(2.7)%7.7%Starent Networks14.7%117.9%214.5%105.8%55.4%35.6%Sonus 20092009Daily from 20-Jul-2007 to Networks56.9%(55.8)%35.5%14.1%18.6%(6.3)%Alcatel-LucentNM(46.2)%37.2%87.8%20.9%(19.5)%Cisco 16-Dec-2009AtlasAcme Systems17.6%(10.7)%34.6%51.8%22.9%0.4%Ericsson20.2%(7.9)%10.5%(13.3)%(9.4)%(8.7)%Motorola15.3%(9.3)%87.5%126.6%31.9%(9.7)%Nokia1.7%(46.8)%(22.9)%(1.9)%(18.9)%(18.3)%RIM4.5%(52.6)%42.1%37.4%(24.8)%(23.5)%ADC PacketInfineraStarentSonusOther TelecommunicationsNM(63.6)%24.6%74.5%(22.5)%(29.5)%CommScopeNM(52.7)%82.6%220.0%9.9%(15.7)%Powerwave TechnologiesNM(69.9)%151.5%420.0%(15.6)%(16.7)% CommtechWireless Subsystems |
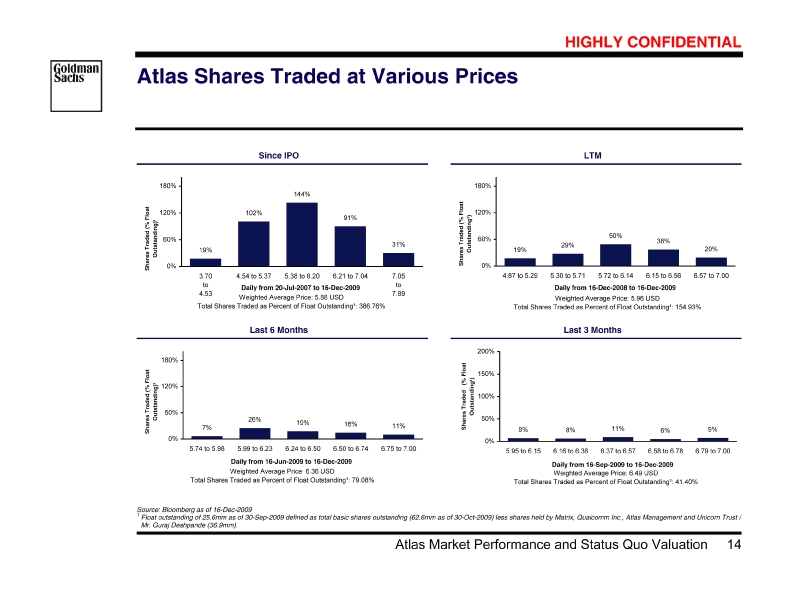
| Atlas Shares Traded at Various Prices |
| Atlas Financial Overview6 |
| Since IPO LTM —— — |
| Last 6 Months Last 3 Months —— — |
| Source: Bloomberg as of 16-Dec-20092 Float outstanding of 25.6mm as of 30-Sep-2009 defined as total basic shares outstanding (62.6mm as of 30-Oct-2009) less shares held by Matrix, Qualcomm Inc., Atlas Management and Unicorn Trust / Mr. Guraj Deshpande (36.9mm). |
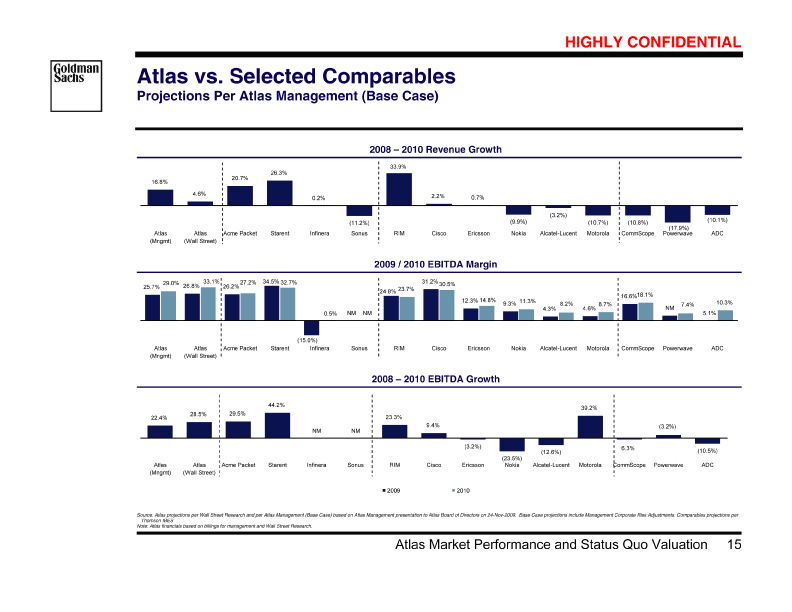
| Projections Per Atlas Management (Base Case) |
| Atlas Financial Overview6 |
| 2008 — 2010 Revenue Growth — |
| 2009 / 2010 EBITDA Margin — |
| 2008 — 2010 EBITDA Growth — |
| Atlas vs. Selected ComparablesSource: Atlas projections per Wall Street Research and per Atlas Management (Base Case) based on Atlas Management presentation to Atlas Board of Directors on 24-Nov-2009. Base Case projections include Management Corporate Risk Adjustments. Comparables projections per Thomson IBESNote: Atlas financials based on billings for management and Wall Street Research. |
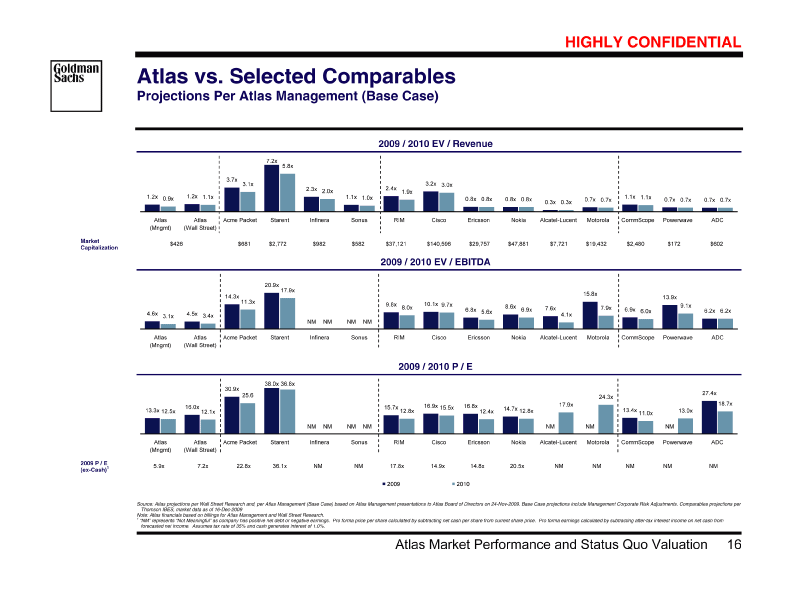
| Atlas vs. Selected ComparablesSource: Atlas projections per Wall Street Research and, per Atlas Management (Base Case) based on Atlas Management presentations to Atlas Board of Directors on 24-Nov-2009. Base Case projections include Management Corporate Risk Adjustments. Comparables projections per Thomson IBES, market data as of 16-Dec-2009Note: Atlas financials based on billings for Atlas Management and Wall Street Research. |
| Projections Per Atlas Management (Base Case) |
| Atlas Financial Overview6 |
| 2009 / 2010 EV / Revenue — |
| Market Capitalization $426 $681 $2,772 $982 $582 $37,121 $140,596 $29,757 $47,881 $7,721 $19,432 $2,480 $172 $602 |
| 2009 / 2010 EV / EBITDA — |
| 2009 / 2010 P / E — |
| 2009 P / E (ex-Cash)3 5.9x 7.2x 22.8x 36.1x NM NM 17.8x 14.9x 14.8x 20.5x NM NM NM NM NM |
| Historical Valuation MetricsSource: Capital IQ, Thomson IBES, Wall Street Research, Bloomberg as of 16-Dec-2009Note: Due to the lack of consistent coverage since IPO, 2008A Billings EBITDA was used as a proxy for forecasted 2008 Billings EBITDA.1 Commtech includes: Starent, Acme Packet, Infinera, Sonus, RIM, Ericsson, Cisco, Alcatel-Lucent, Nokia, Motorola, ADC, CommScope and Powerwave2 Pro forma price per share calculated by subtracting net cash per share from current price per share. Pro forma earnings calculated by subtracting after-tax interest income on net cash from forecasted net income. Assumes tax rate of 35% and cash generates interest of 1.0%. |
| 1 “NM” represents “Not Meaningful” as company has positive net debt or negative earnings. Pro forma price per share calculated by subtracting net cash per share from current share price. Pro forma earnings calculated by subtracting after-tax interest income on net cash from forecasted net income. Assumes tax rate of 35% and cash generates interest of 1.0%. |
| Atlas Financial Overview6 |
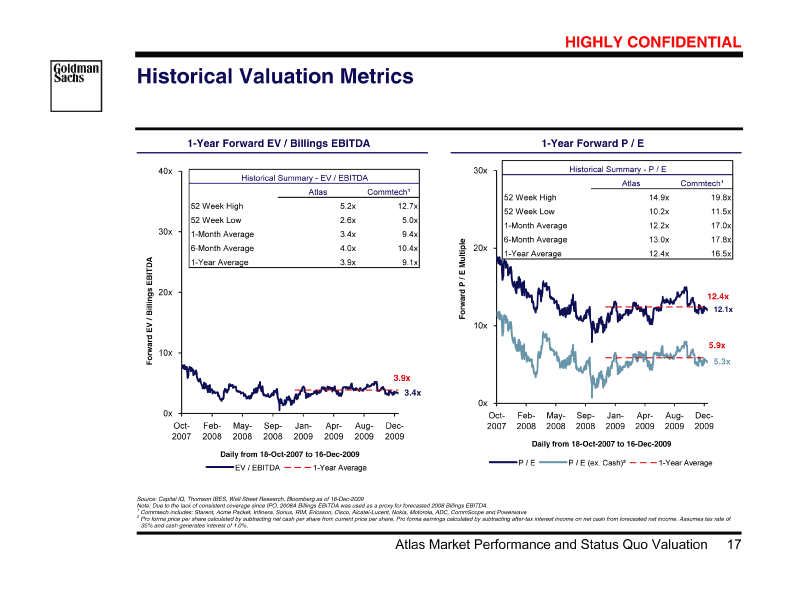
| 1-Year Forward EV / Billings EBITDA 1-Year Forward P / E —— — |
| Historical Summary — EV / Historical Summary — P / EBITDAAtlasCommtech 152 Week High5.2x12.7x52 EAtlasCommtech 152 Week Week Low2.6x5.0x1-Month Average3.4x9.4x6-Month High14.9x19.8x52 Week Average4.0x10.4x1-Year Average3.9x9.1x Low10.2x11.5x1-Month Average12.2x17.0x6-Month Average13.0x17.8x1-Year Average12.4x16.5x |
| Atlas Valuation Analysis at Offer PriceSource: Atlas projections per Atlas Management (Base Case) based on Atlas Management presentation to Atlas Board of Directors on 24-Nov-2009. Base Case projections include Management Corporate Risk Adjustments. Market data as of 16-Dec-20093 Historical cash balance as of end of Q3 2009 includes full recovery of $39.6mm cash from Nortel.4 Pro forma price per share calculated by subtracting net cash per share from current price per share. Pro forma earnings calculated by subtracting after-tax interest income on net cash from forecasted net income. Assumes tax rate of 35% and cash generates interest of 1.0%. |
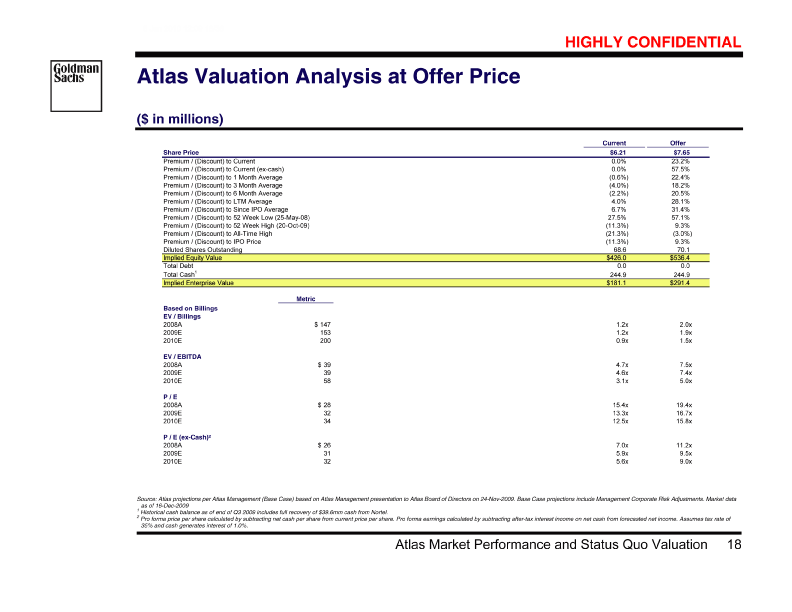
| ($ in millions) | | Current Offer Share Price $6.21 $7.65 Premium / (Discount) to Current 0.0% 23.2% Premium / (Discount) to Current (ex-cash) 0.0% 57.5% Premium / (Discount) to 1 Month Average (0.6%) 22.4% Premium / (Discount) to 3 Month Average (4.0%) 18.2% Premium / (Discount) to 6 Month Average (2.2%) 20.5% Premium / (Discount) to LTM Average 4.0% 28.1% Premium / (Discount) to Since IPO Average 6.7% 31.4% Premium / (Discount) to 52 Week Low (25-May-08) 27.5% 57.1% Premium / (Discount) to 52 Week High (20-Oct-09) (11.3%) 9.3% Premium / (Discount) to All-Time High (21.3%) (3.0%) Premium / (Discount) to IPO Price (11.3%) 9.3% Diluted Shares Outstanding 68.6 70.1 Implied Equity Value $426.0 $536.4 Total Debt 0.0 0.0 Total Cash1 244.9 244.9 Implied Enterprise Value $181.1 $291.4 Metric Based on Billings EV / Billings 2008A $147 1.2x 2.0x 2009E 153 1.2x 1.9x 2010E 200 0.9x 1.5x EV / EBITDA 2008A $39 4.7x 7.5x 2009E 39 4.6x 7.4x 2010E 58 3.1x 5.0x P / E 2008A $28 15.4x 19.4x 2009E 32 13.3x 16.7x 2010E 34 12.5x 15.8x P / E (ex-Cash)2 2008A $26 7.0x 11.2x 2009E 31 5.9x 9.5x 2010E 32 5.6x 9.0x Atlas Financial Overview6 Present Value of Future Share Price Analysis Based on EV / EBITDA Multiple ($ in millions, except per share data) Source: Atlas projections per Atlas Management (Base Case) based on Atlas Management presentation to Atlas Board of Directors on 24-Nov-2009. Base Case and Downside Case projections include Management Corporate Risk Adjustments. Atlas projections per Atlas Management (Downside Case) based on Atlas Management downside assumption for 2010-13 EV-DO revenues and assuming a constant gross profit margin and operating expenses decline at 100% rate of billings decline per Atlas Management guidance. Atlas projections per Atlas Management (Upside Case) based on Atlas Management presentation to Atlas Board of Directors on 24-Nov-2009 with Upside Case projections excluding Management Corporate Risk Adjustments. |
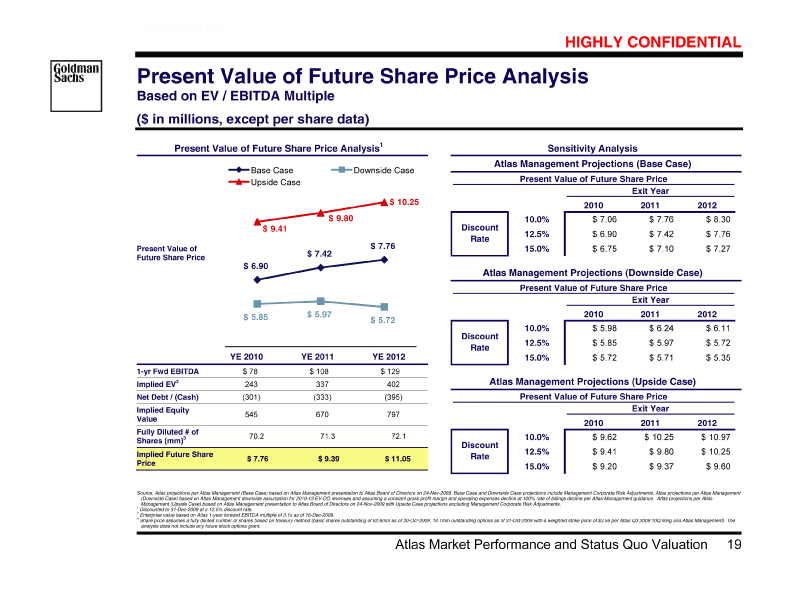
| Atlas Financial Overview6 |
| Present Value of Future Share Price Analysis1 Sensitivity Analysis —— — |
| Present Value of Future Share PriceYE Atlas Management Projections (Base Case)Present Value of Future Share PriceExit 2010YE 2011YE 20121-yr Fwd Year20102011201210.0%$7.06$7.76$8.30Discount12.5%$6.90$7.42$7.76Rate15.0%$6.75$7.10$7.27Atlas EBITDA$78$108$129Implied Management Projections (Downside Case)Exit Year20102011201210.0%$5.98$6.24$6.11Discount12.5%$5.85$5.97$5.72Rate15.0%$5.72$5.71$5.35 EV1243337402Net Debt / Atlas Management Projections (Upside Case) (Cash)(301)(333)(395)Implied Equity Value545670797Fully Diluted # of Shares (mm)70.271.372.1Implied Future Share Price$7.76$9.39$11.05 |
| Present Value of Future Share Price Analysis Based on P / E Multiple |
| ($ in millions, except per share data) Source: Atlas projections per Atlas Management (Base Case) based on Atlas Management presentation to Atlas Board of Directors on 24-Nov-2009. Base Case and Downside Case EV-DO and FMC projections include Management Corporate Risk Adjustments. Atlas projections per Atlas Management (Downside Case) based on Atlas Management downside assumption for 2010-13 EV-DO revenues and assuming a constant gross profit margin and operating expenses decline at 100% rate of billings decline per Atlas Management guidance. Atlas projections per Atlas Management (Upside Case) based on Atlas Management presentation to Atlas Board of Directors on 24-Nov-2009 with Upside Case projections excluding Management Corporate Risk Adjustments. |
| Atlas Financial Overview6 |
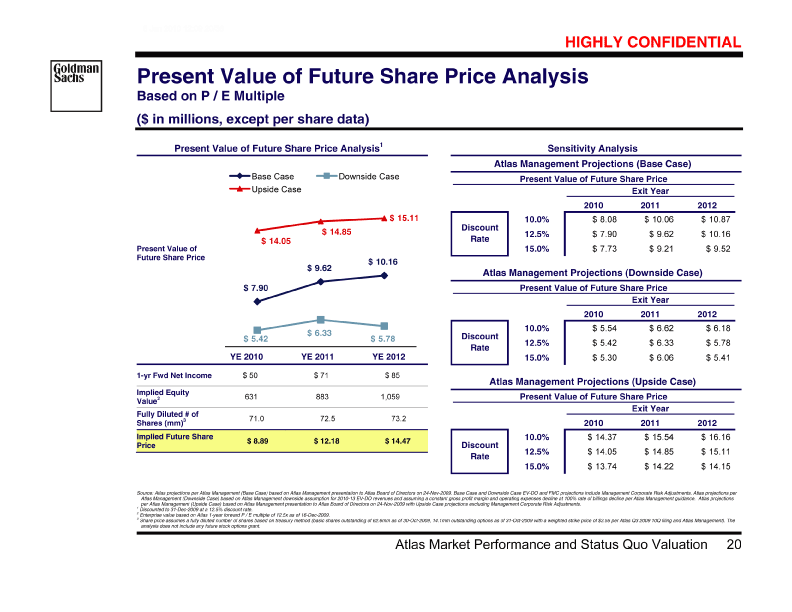
| Present Value of Future Share Price Analysis Sensitivity Analysis —— — |
| Present Value of Future Share PriceYE Atlas Management Projections 2010YE 2011YE 20121-yr Fwd Net (Base Income$50$71$85Implied Equity Case)Atlas Value6318831,059Fully Diluted # of Management Projections (Downside Shares (mm)71.0 72.573.2Implied Future Case)Atlas Share Price$8.89$12.18$14.47 Management Projections (Upside Case) |
| Present Value of Future Share Price Analysis Based on P / E Ex-Cash Multiple |
| ($ in millions, except per share data) Source: Atlas projections per Atlas Management (Base Case) based on Atlas Management presentation to Atlas Board of Directors on 24-Nov-2009. Base Case and Downside Case projections include Management Corporate Risk Adjustments. Atlas projections per Atlas Management (Downside Case) based on Atlas Management downside assumption for 2010-13 EV-DO revenues and assuming a constant gross profit margin and operating expenses decline at 100% rate of billings decline per Atlas Management guidance. Atlas projections per Atlas Management (Upside Case) based on Atlas Management presentation to Atlas Board of Directors on 24-Nov-2009 with Upside Case projections excluding Management Corporate Risk Adjustments. |
| 1 Discounted to 31-Dec-2009 at a 12.5% discount rate. 2 Enterprise value based on Atlas 1-year forward EBITDA multiple of 3.1x as of 16-Dec-2009. 3 Share price assumes a fully diluted number of shares based on treasury method (basic shares outstanding of 62.6mm as of 30-Oct-2009, 14.1mm outstanding options as of 31-Oct-2009 with a weighted strike price of $3.55 per Atlas Q3 2009 10Q filing and Atlas Management). The analysis does not include any future stock options grant. |
| Atlas Financial Overview6 |

| Present Value of Future Share Price Analysis Sensitivity Analysis —— — |
| Present Value of Future Share PriceYE 2010YE Atlas Management Projections (Base Case)Present Value of Future Share PriceExit 2011YE 20121-yr Fwd Adj. Net Year20102011201210.0%$7.37$8.23$8.84Discount12.5%$7.21$7.87$8.26Rate15.0%$7.05$7.53$7.73Atlas Income$48$68$82Implied Equity Value Management Projections (Downside Case)Present Value of Future Share PriceExit (ex-Cash)270381457Cash301333395Implied Year20102011201210.0%$6.11$6.44$6.27Discount12.5%$5.97$6.15$5.86Rate15.0%$5.84$5.89$5.49Atlas Equity Value (incl. Cash)571714852Fully Diluted # of Management Projections (Upside Case)Exit Year20102011201210.0%$10.41$11.15$11.93Discount12.5%$10.17$10.66$11.15Rate15.0%$9.95$10.21$10.44 Shares (mm)70.571.672.4Implied Future Share Price$8.11$9.96$11.76 |
| Discounted Cash Flow AnalysisSource: Atlas projections per Atlas Management (Base Case) based on Atlas Management presentation to Atlas Board of Directors on 24-Nov-2009. Base Case and Downside Case projections include Management Corporate Risk Adjustments. Atlas projections per Atlas Management (Downside Case) based on Atlas Management downside assumption for 2010-13 EV-DO revenues and assuming a constant gross profit margin and operating expenses decline at 100% rate of billings decline per Atlas Management guidance. Market data as of 04-Dec-2009 |
| 1 Discounted to 31-Dec-2009 at a 12.5% discount rate. 2 Enterprise value based on Atlas 1-year forward P / E multiple of 12.5x as of 16-Dec-2009. 3 Share price assumes a fully diluted number of shares based on treasury method (basic shares outstanding of 62.6mm as of 30-Oct-2009, 14.1mm outstanding options as of 31-Oct-2009 with a weighted strike price of $3.55 per Atlas Q3 2009 10Q filing and Atlas Management). The analysis does not include any future stock options grant. |
| Atlas Financial Overview6 |
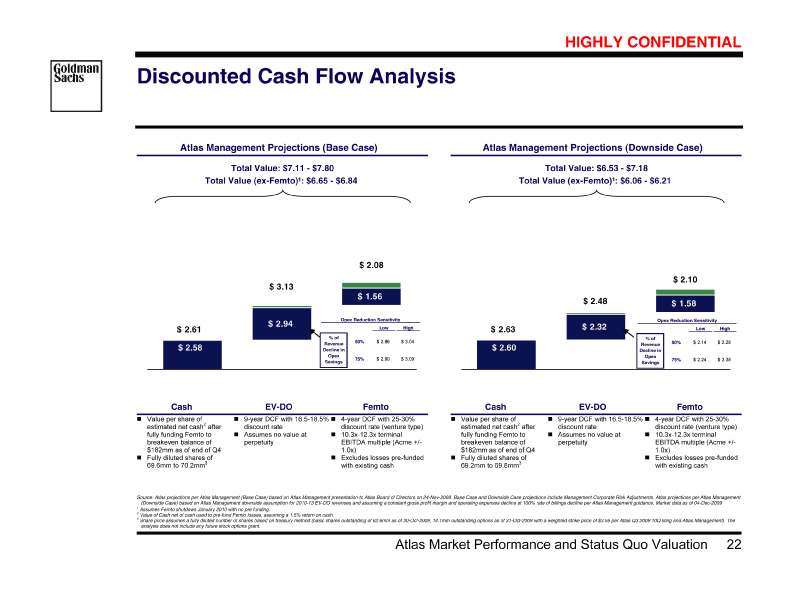
| Atlas Management Projections (Base Case) Assumes Femto shutdown January 2010 Atlas Management Projections (Downside Case) with no pre funding. Value of Cash net of cash used to pre-fund Femto losses, assuming a 1.5% return on cash. —— — |
| CashEV-DOFemton CashEV-DOFemton Value per share of estimated net Value per share of estimated net cash2 after fully funding Femto to cash2 after fully funding Femto breakeven balance of $182mm as of end of Q4 to breakeven balance of $182mm as of end of n Fully diluted shares of 69.6mm to Q4 70.2mmn 9-year DCF with n Fully diluted shares of 69.2mm to 16.5-18.5% discount rate 69.8mm24n 9-year DCF with n Assumes no value at perpetuityn 16.5-18.5% discount rate 4-year DCF with 25-30% discount rate (venture n Assumes no value at type) perpetuityn 4-year DCF with 25-30% n 10.3x-12.3x terminal EBITDA multiple discount rate (venture type) (Acme +/- 1.0x) n 10.3x-12.3x terminal EBITDA n Excludes losses pre-funded with multiple (Acme +/- 1.0x) existing cash n Excludes losses pre-funded with existing cash —— — |
| Discounted Cash Flow AnalysisSource: Atlas projections per Atlas Management (Upside Case) based on Atlas Management presentation to Atlas Board of Directors on 24-Nov-2009 with Upside Case projections excluding Management Corporate Risk Adjustments. Market data as of 04-Dec-2009 |
| Atlas Financial Overview6 |
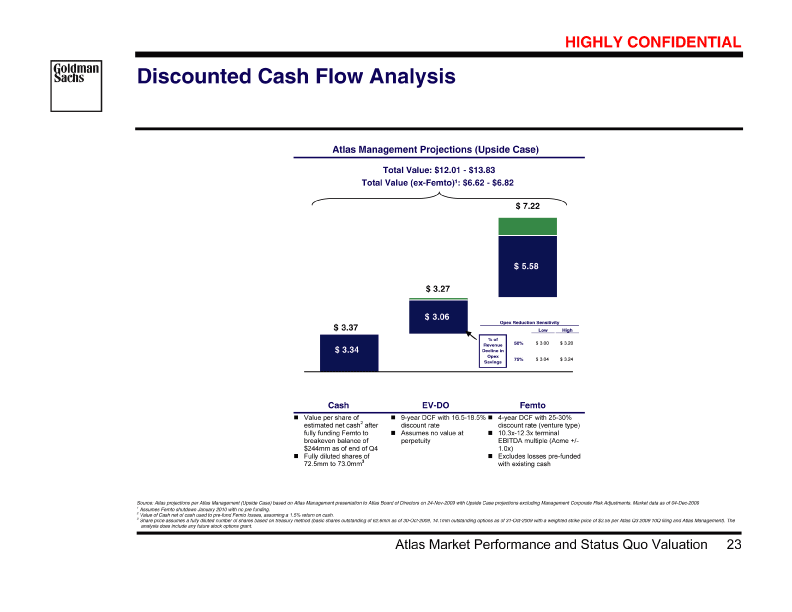
| Atlas Management Projections (Upside Case) Assumes Femto shutdown January 2010 with no pre funding. Value of Cash net of cash used to pre-fund Femto losses, assuming a 1.5% return on cash. — |
| CashEV-DOFemton IV. Illustrative Proposed Value per share of estimated net Transaction Analysis cash2 after fully funding Femto to breakeven balance of $244mm as of end of Q4 n Fully diluted shares of 72.5mm to 73.0mmn 9-year DCF with 16.5-18.5% discount rate n Assumes no value at perpetuityn Pro Forma Financial Profile 4-year DCF with 25-30% discount rate (venture type) n 10.3x-12.3x terminal EBITDA multiple Acquisition at $7.65 per Share (Acme +/- 1.0x) n Excludes losses pre-funded with ($ in millions)Source: Atlas existing cash projections per Atlas Management (Base Case) based on Atlas Management presentation to Atlas Board of Directors on 24-Nov-2009. Base Case projections include Management Corporate Risk AdjustmentsNote: Analysis assumes no contribution of FMC post 2012. Includes full recovery of $39.6mm from Nortel in 2009 — —— ===================================== |
| IV. Illustrative Proposed Transaction Analysis |
| 1 Discounted to 31-Dec-2009 at a 12.5% discount rate. 2 After tax interest income added back to net income. 3 Enterprise value based on Atlas 1-year forward P / E Ex-Cash multiple of 5.6x as of 16-Dec-2009. 4 Share price assumes a fully diluted number of shares based on treasury method (basic shares outstanding of 62.6mm as of 30-Oct-2009, 14.1mm outstanding options as of 31-Oct-2009 with a weighted strike price of $3.55 per Atlas Q3 2009 10Q filing and Atlas Management). The analysis does not include any future stock options grant. |
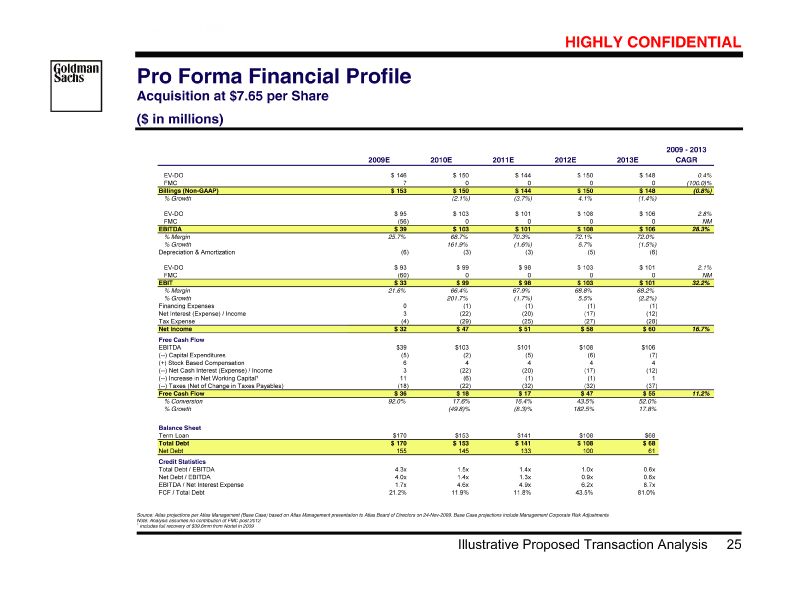
| Pro Forma Financial Profile Acquisition at $7.65 per Share ($ in millions)Source: Atlas projections per Atlas Management (Base Case) based on Atlas Management presentation to Atlas Board of Directors on 24-Nov-2009. Base Case projections include Management Corporate Risk AdjustmentsNote: Analysis assumes no contribution of FMC post 2012. Includes full recovery of $39.6mm from Nortel in 2009 | | | | | | 2009 — 2013 2009E 2010E 2011E 2012E 2013E CAGR EV-DO $146 $150 $144 $150 $148 0.4% FMC 7 0 0 0 0 (100.0)% Billings (Non-GAAP) $153 $150 $144 $150 $148 (0.8%) % Growth (2.1%) (3.7%) 4.1% (1.4%) EV-DO $95 $103 $101 $108 $106 2.8% FMC (56) 0 0 0 0 NM EBITDA $39 $103 $101 $108 $106 28.3% % Margin 25.7% 68.7% 70.3% 72.1% 72.0% % Growth 161.9% (1.6%) 6.7% (1.5%) Depreciation & Amortization (6) (3) (3) (5) (6) EV-DO $93 $99 $98 $103 $101 2.1% FMC (60) 0 0 0 0 NM EBIT $33 $99 $98 $103 $101 32.2% % Margin 21.6% 66.4% 67.9% 68.8% 68.2% % Growth 201.7% (1.7%) 5.5% (2.2%) Financing Expenses 0 (1) (1) (1) (1) Net Interest (Expense) / Income 3 (22) (20) (17) (12) Tax Expense (4) (29) (25) (27) (28) Net Income $32 $47 $51 $58 $60 16.7% Free Cash Flow EBITDA $39 $103 $101 $108 $106 (—) Capital Expenditures (5) (2) (5) (6) (7) (+) Stock Based Compensation 6 4 4 4 4 (—) Net Cash Interest (Expense) / Income 3 (22) (20) (17) (12) (—) Increase in Net Working Capital 1 11 (6) (1) (1) 1 (—) Taxes (Net of Change in Taxes Payables) (18) (22) (32) (32) (37) Free Cash Flow $36 $18 $17 $47 $55 11.2% % Conversion 92.0% 17.6% 16.4% 43.5% 52.0% % Growth (49.8)% (8.3)% 182.5% 17.8% Balance Sheet Term Loan $170 $153 $141 $108 $68 Total Debt $170 $153 $141 $108 $68 Net Debt 155 145 133 100 61 Credit Statistics Total Debt / EBITDA 4.3x 1.5x 1.4x 1.0x 0.6x Net Debt / EBITDA 4.0x 1.4x 1.3x 0.9x 0.6x EBITDA / Net Interest Expense 1.7x 4.6x 4.9x 6.2x 8.7x FCF / Total Debt 21.2% 11.9% 11.8% 43.5% 81.0% 1 Share price assumes a fully diluted number of shares based on treasury method (basic shares outstanding of 62.6mm as of 30-Oct-2009, 14.1mm outstanding options as of 31-Oct-2009 with a weighted strike price of $3.55 per Atlas Q3 2009 10Q filing and Atlas Management). The analysis does not include any future stock options grant. Atlas Financial Overview6 1 Share price assumes a fully diluted number of shares based on treasury method (basic shares outstanding of 62.6mm as of 30- Oct-2009, 14.1mm outstanding options as of 31-Oct-2009 with a weighted strike price of $3.55 per Atlas Q3 2009 10Q filing and Atlas Management). The analysis does include any future stock options grant. |
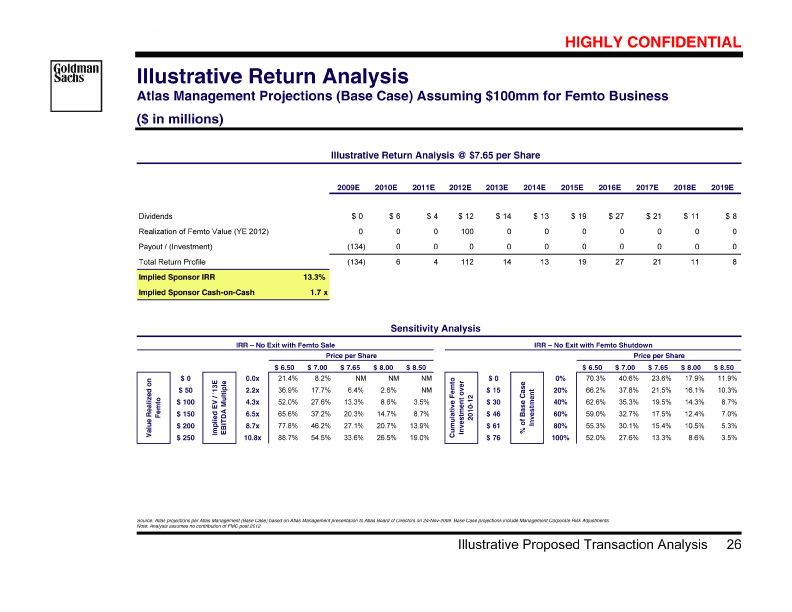
| Illustrative Return Analysis Atlas Management Projections (Base Case) Assuming $100mm for Femto Business |
| ($ in millions)Source: Atlas projections per Atlas Management (Base Case) based on Atlas Management presentation to Atlas Board of Directors on 24-Nov-2009. Base Case projections include Management Corporate Risk Adjustments Note: Analysis assumes no contribution of FMC post 2012. |
| Illustrative Return Analysis @ $7.65 per Share — |
| 2009E2010E2011E2012E2013E2014E2015E2016E2017E2018E2019EDividends$0$6$4$12$14$13$19$27$21$11$8Realization of Femto Value (YE 2012)0001000000000Payout / (Investment)(134)0000000000Total Return Profile(134)641121413192721118Implied Sponsor IRR13.3%Implied Sponsor Cash-on-Cash1.7 x |
| Atlas Financial Overview6 |
| Sensitivity Analysis — |
| IRR — No Exit with Femto SaleIRR — No Exit with Femto ShutdownPrice per SharePrice per Share13.3%$6.50$7.00$7.65$8.00$8.5013.3%$6.50$7.00$7.65$8.00$8.50on$00.0x21.4%8.2%NMNMNM$00%70.3%40.6%23.6%17.9%11.9%MultipleRealized$502.2x36.9%17.7%6.4%2.6%NM$1520%66.2%37.8%21.5%16.1%10.3%$1004.3x52.0%27.6%13.3%8.6%3.5%Femto Investment$3040%62.6%35.3%19.5%14.3%8.7%Cumulative$150EV / ‘13E EBITDA6.5x65.6%37.2%20.3%14.7%8.7%$4660%59.0%32.7%17.5%12.4%7.0%FemtoImpliedoverValue$2008.7x77.8%46.2%27.1%20.7%13.9%2010-12$61% of Base Case Investment80%55.3%30.1%15.4%10.5%5.3%$25010.8x88.7%54.5%33.6%26.5%19.0%$76100%52.0%27.6%13.3%8.6%3.5% |
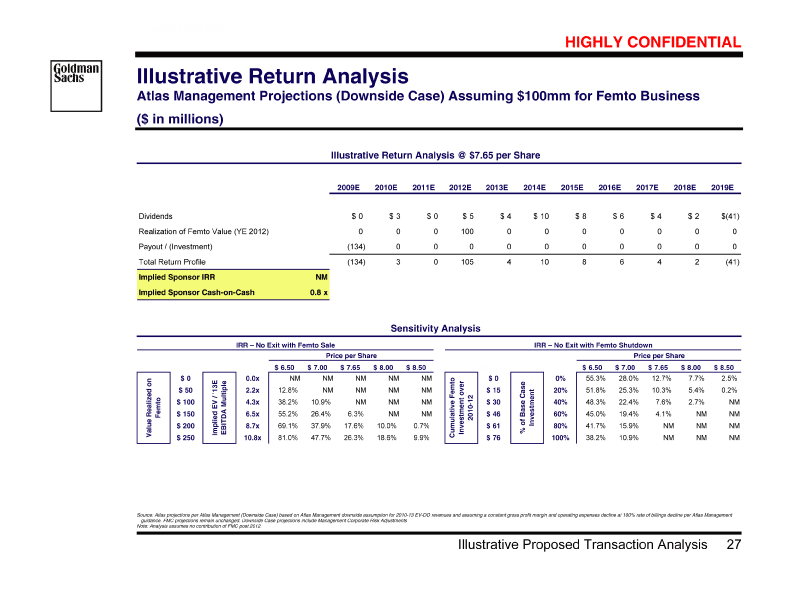
| Illustrative Return Analysis Atlas Management Projections (Downside Case) Assuming $100mm for Femto Business |
| ($ in millions)Source: Atlas projections per Atlas Management (Downside Case) based on Atlas Management downside assumption for 2010-13 EV-DO revenues and assuming a constant gross profit margin and operating expenses decline at 100% rate of billings decline per Atlas Management guidance. FMC projections remain unchanged. Downside Case projections include Management Corporate Risk AdjustmentsNote: Analysis assumes no contribution of FMC post 2012. |
| Illustrative Return Analysis @ $7.65 per Share — |
| 2009E2010E2011E2012E2013E2014E2015E2016E2017E2018E2019EDividends$0$3$0$5$4$10$8$6$4$2$(41)Realization of Femto Value (YE 2012)0001000000000Payout / (Investment)(134)0000000000Total Return Profile(134)301054108642(41)Implied Sponsor IRRNMImplied Sponsor Cash-on-Cash0.8 x |
| Atlas Financial Overview6 |
| Sensitivity Analysis — |
| IRR — No Exit with Femto SaleIRR — No Exit with Femto ShutdownPrice per SharePrice per ShareNM$6.50$7.00$7.65$8.00$8.50NM$6.50$7.00$7.65$8.00$8.50on$00.0xNMNMNMNMNM$00%55.3%28.0%12.7%7.7%2.5%MultipleRealized$502.2x12.8%NMNMNMNM$1520%51.8%25.3%10.3%5.4%0.2%$1004.3x38.2%10.9%NMNMNMFemto Investment$3040%48.3%22.4%7.6%2.7%NMCumulative$150EV / ‘13E EBITDA6.5x55.2%26.4%6.3%NMNM$4660%45.0%19.4%4.1%NMNMFemtoImpliedoverValue$2008.7x69.1%37.9%17.6%10.0%0.7%2010-12$61% of Base Case Investment80%41.7%15.9%NMNMNM$25010.8x81.0%47.7%26.3%18.6%9.9%$76100%38.2%10.9%NMNMNM |
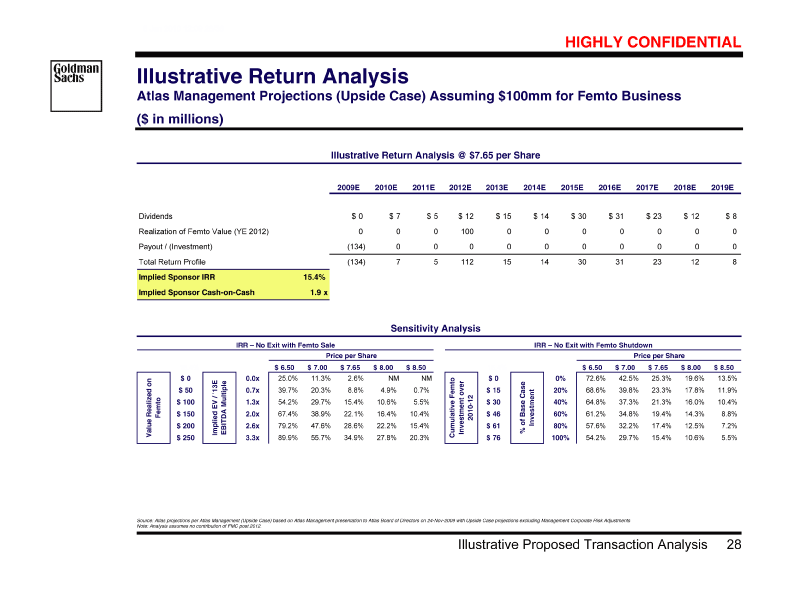
| Illustrative Return Analysis Atlas Management Projections (Upside Case) Assuming $100mm for Femto Business |
| ($ in millions)Source: Atlas projections per Atlas Management (Upside Case) based on Atlas Management presentation to Atlas Board of Directors on 24-Nov-2009 with Upside Case projections excluding Management Corporate Risk AdjustmentsNote: Analysis assumes no contribution of FMC post 2012. |
| Illustrative Return Analysis @ $7.65 per Share — |
| Illustrative Return Analysis @ $7.65 per Share2009E2010E2011E2012E2013E2014E2015E2016E2017E2018E2019EDividends$0$7$5$12$15$14$30$31$23$12$8Realization of Femto Value (YE 2012)0001000000000Payout / (Investment)(134)0000000000Total Return Profile(134)751121514303123128Implied Sponsor IRR15.4%Implied Sponsor Cash-on-Cash1.9 x |
| Atlas Financial Overview6 |
| Sensitivity Analysis — |
| IRR — No Exit with Femto SaleIRR — No Exit with Femto ShutdownPrice per SharePrice per Share15.4%$6.50$7.00$7.65$8.00$8.5015.4%$6.50$7.00$7.65$8.00$8.50on$00.0x25.0%11.3%2.6%NMNM$00%72.6%42.5%25.3%19.6%13.5%MultipleRealized$500.7x39.7%20.3%8.8%4.9%0.7%$1520%68.6%39.8%23.3%17.8%11.9%$1001.3x54.2%29.7%15.4%10.6%5.5%Femto Investment$3040%64.8%37.3%21.3%16.0%10.4%Cumulative$150EV / ‘13E EBITDA2.0x67.4%38.9%22.1%16.4%10.4%$4660%61.2%34.8%19.4%14.3%8.8%FemtoImpliedoverValue$2002.6x79.2%47.6%28.6%22.2%15.4%2010-12$61% of Base Case Investment80%57.6%32.2%17.4%12.5%7.2%$2503.3x89.9%55.7%34.9%27.8%20.3%$76100%54.2%29.7%15.4%10.6%5.5% Source: Atlas projections per Atlas Management (Base Case) based on Atlas Management presentation to Atlas Board of Directors on 24-Nov-2009. Base Case projections include Management Corporate Risk Adjustments |
| Appendix A: Valuation Supporting Materials |
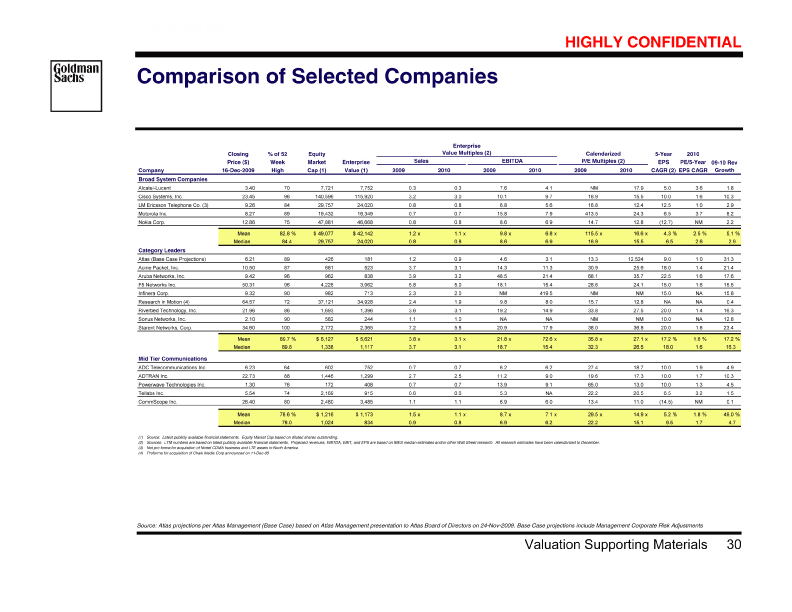
| Comparison of Selected Companies |
| | | | | | | | |
| Enterprise |
| Closing % of 52 Equity Value Multiples (2) Calendarized 5-Year 2010 |
| Price ($) Week Market Enterprise Sales EBITDA P/E Multiples (2) EPS PE/5-Year 09-10 Rev |
| Company 16-Dec-2009 High Cap (1) Value (1) 2009 2010 2009 2010 2009 2010 CAGR (2) EPS CAGR Growth |
| Broad System Companies |
| Alcatel-Lucent 3.40 70 7,721 7,752 0.3 0.3 7.6 4.1 NM 17.9 5.0 3.6 1.8 |
| Cisco Systems, Inc. 23.45 96 140,596 115,920 3.2 3.0 10.1 9.7 16.9 15.5 10.0 1.6 10.3 |
| LM Ericsson Telephone Co. (3) 9.26 84 29,757 24,020 0.8 0.8 6.8 5.6 16.8 12.4 12.5 1.0 2.9 |
| Motorola Inc. 8.27 89 19,432 16,349 0.7 0.7 15.8 7.9 413.5 24.3 6.5 3.7 8.2 |
| Nokia Corp. 12.86 75 47,881 46,668 0.8 0.8 8.6 6.9 14.7 12.8 (12.7) NM 2.2 |
| Mean 82.8% $49,077 $42,142 1.2 x 1.1 x 9.8 x 6.8 x 115.5 x 16.6 x 4.3% 2.5% 5.1% |
| Median 84.4 29,757 24,020 0.8 0.8 8.6 6.9 16.9 15.5 6.5 2.6 2.9 |
| Category Leaders |
| Atlas (Base Case Projections) 6.21 89 426 181 1.2 0.9 4.6 3.1 13.3 12.524 9.0 1.0 31.3 |
| Acme Packet, Inc. 10.50 87 681 523 3.7 3.1 14.3 11.3 30.9 25.6 18.0 1.4 21.4 |
| Aruba Networks, Inc. 9.42 96 962 838 3.9 3.2 48.5 21.4 68.1 35.7 22.5 1.6 17.6 |
| F5 Networks Inc. 50.31 96 4,226 3,962 5.8 5.0 18.1 15.4 28.6 24.1 15.0 1.6 15.5 |
| Infinera Corp. 9.32 90 982 713 2.3 2.0 NM 419.5 NM NM 15.0 NA 15.8 |
| Research in Motion (4) 64.57 72 37,121 34,928 2.4 1.9 9.8 8.0 15.7 12.8 NA NA 0.4 |
| Riverbed Technology, Inc. 21.96 86 1,693 1,396 3.6 3.1 19.2 14.9 33.8 27.5 20.0 1.4 16.3 |
| Sonus Networks, Inc. 2.10 90 582 244 1.1 1.0 NA NA NM NM 10.0 NA 12.8 |
| Starent Networks, Corp. 34.60 100 2,772 2,365 7.2 5.8 20.9 17.9 38.0 36.8 20.0 1.8 23.4 |
| Mean 89.7% $6,127 $5,621 3.8 x 3.1 x 21.8 x 72.6 x 35.8 x 27.1 x 17.2% 1.6% 17.2% |
| Median 89.8 1,338 1,117 3.7 3.1 18.7 15.4 32.3 26.5 18.0 1.6 16.3 |
| Mid Tier Communications |
| ADC Telecommunications Inc. 6.23 64 602 752 0.7 0.7 6.2 6.2 27.4 18.7 10.0 1.9 4.9 |
| ADTRAN Inc. 22.73 88 1,446 1,299 2.7 2.5 11.2 9.0 19.6 17.3 10.0 1.7 10.3 |
| Powerwave Technologies Inc. 1.30 76 172 408 0.7 0.7 13.9 9.1 65.0 13.0 10.0 1.3 4.5 |
| Tellabs Inc. 5.54 74 2,169 915 0.6 0.6 5.3 NA 22.2 20.5 6.5 3.2 1.5 |
| CommScope Inc. 26.40 80 2,480 3,485 1.1 1.1 6.9 6.0 13.4 11.0 (14.5) NM 0.1 |
| Mean 78.6% $1,216 $1,173 1.5 x 1.1 x 8.7 x 7.1 x 29.5 x 14.9 x 5.2% 1.8% 49.0% |
| Median 78.0 1,024 834 0.9 0.8 6.9 6.2 22.2 15.1 9.5 1.7 4.7 |
| (1) Source: Latest publicly Equity Market Cap available financial based on diluted statements. shares outstanding. |
| (2) Sources: LTM numbers are based Projected revenues, All research estimates have been calendarized to December. on latest publicly EBITDA, EBIT, and available financial EPS are based on statements. IBES median estimates and/or other Wall Street research. |
| (3) Not pro forma for acquisition of Nortel CDMA business and LTE assets in North America |
| (4) Proforma for acquisition of Chalk Media Corp announced on 11-Dec-08 |
| Source: Companies’ filings, predicted beta information from Barra, Capital IQ, market data as of 16-Dec-2009 Assumes minimum cash of $50mm. Cash balance as of 30-Sep-2009 per Atlas Q3 2009 10Q filling including full recovery of $39.6mm from Nortel in 2009 Current U.S. 30 year Treasury rate as of 16-Dec-2009. Ibbotson’s equity risk premium from 1926 — 2008. Not applicable given target cost structure includes no debt. Assumes U.S. statutory tax rate. |
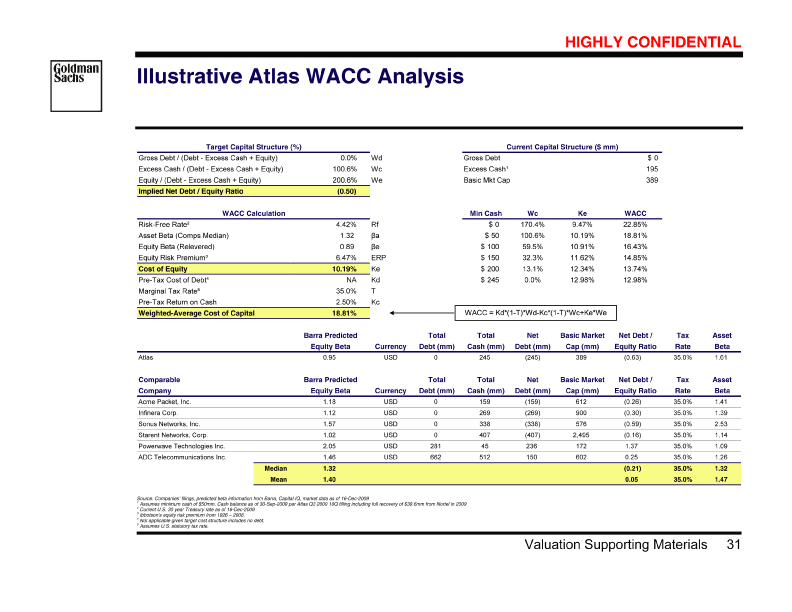
| Illustrative Atlas WACC Analysis | |
| Target Capital Structure (%) Current Capital Structure ($ mm) |
| Gross Debt / (Debt — Excess Cash + Equity) 0.0% Wd Gross Debt $0 |
| Excess Cash / (Debt — Excess Cash + Equity) 100.6% Wc Excess Cash 1 195 |
| Equity / (Debt — Excess Cash + Equity) 200.6% We Basic Mkt Cap 389 |
| Implied Net Debt / Equity Ratio (0.50) |
| OK |
| WACC Calculation Min Cash Wc Ke WACC |
| Risk-Free Rate 2 4.42% Rf $0 170.4% 9.47% 22.85% |
| Asset Beta (Comps Median) 1.32 ßa $50 100.6% 10.19% 18.81% |
| Equity Beta (Relevered) 0.89 ße $100 59.5% 10.91% 16.43% |
| Equity Risk Premium 3 6.47% ERP $150 32.3% 11.62% 14.85% |
| Cost of Equity 10.19% Ke $200 13.1% 12.34% 13.74% |
| Pre-Tax Cost of Debt NA Kd $245 0.0% 12.98% 12.98% |
| Marginal Tax Rate 35.0% T |
| Pre-Tax Return on Cash 2.50% Kc |
| Weighted-Average Cost of Capital 18.81% WACC = Kd*(1-T)*Wd-Kc*(1-T)*Wc+Ke*We |
| Barra Predicted Total Total Net Basic Market Net Debt / Tax Asset |
| Equity Beta Currency Debt (mm) Cash (mm) Debt (mm) Cap (mm) Equity Ratio Rate Beta |
| Atlas 0.95 USD 0 245 (245) 389 (0.63) 35.0% 1.61 |
| Comparable Barra Predicted Total Total Net Basic Market Net Debt / Tax Asset |
| Company Equity Beta Currency Debt (mm) Cash (mm) Debt (mm) Cap (mm) Equity Ratio Rate B eta |
| Acme Packet, Inc. 1.18 USD 0 159 (159) 612 (0.26) 35.0% 1.41 |
| Infinera Corp. 1.12 USD 0 269 (269) 900 (0.30) 35.0% 1.39 |
| Sonus Networks, Inc. 1.57 USD 0 338 (338) 576 (0.59) 35.0% 2.53 |
| Starent Networks, Corp. 1.02 USD 0 407 (407) 2,495 (0.16) 35.0% 1.14 |
| Powerwave Technologies Inc. 2.05 USD 281 45 236 172 1.37 35.0% 1.09 |
| ADC Telecommunications Inc. 1.46 USD 662 512 150 602 0.25 35.0% 1.26 |
| Median 1.32 (0.21) 35.0% 1.32 |
| Mean 1.40 0.05 35.0% 1.47 |
| Valuation Supporting Materials43 |
| Source: Companies’ filings, predicted beta information from Barra, Capital IQ, market data as of 16-Dec-2009 |
| 1 Assumes minimum cash of $50mm. Cash balance as of 30-Sep-2009 per Atlas Q3 2009 10Q filling including full recovery of $39.6mm from Nortel in 2009 |
| 2 Current U.S. 30 year Treasury rate as of 16-Dec-2009. |
| 3 Ibbotson’s equity risk premium from 1926 — 2008. |
| 4 Not applicable given target cost structure includes no debt. |
| 5 Assumes U.S. statutory tax rate. |
| ($ in millions)Source: Atlas projections per Atlas Management (Base Case) based on Atlas Management presentation to Atlas Board of Directors on 24-Nov-2009. Base Case projections include Management Corporate Risk AdjustmentsNote: Assumes 17.5% WACC and tax rate of 35.0%. |
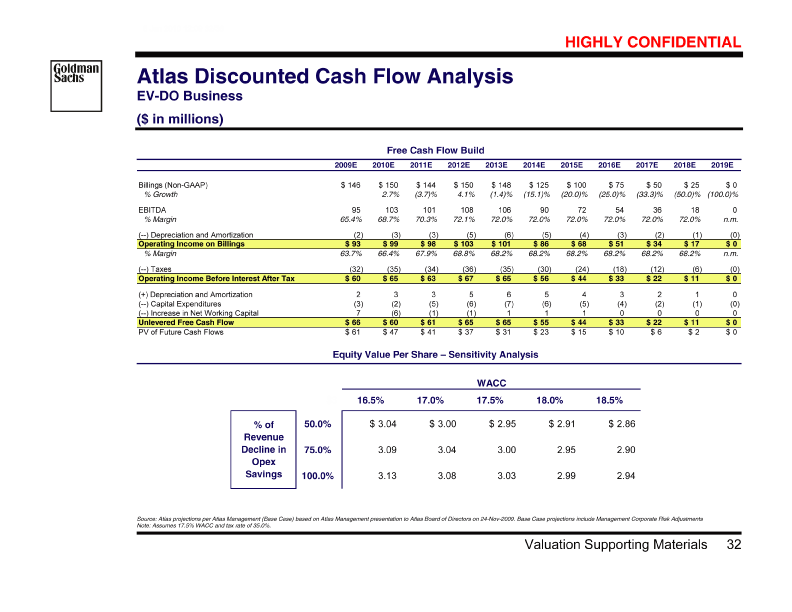
| Atlas Discounted Cash Flow Analysis EV-DO Business |
| Valuation Supporting Materials43 |
| Free Cash Flow Build — |
| Free Cash Flow Build2009E2010E2011E2012E2013E2014E2015E2016E2017E2018E2019EBillings (Non-GAAP)$146$150$144$150$148$125$100$75$50$25$0% Growth2.7%(3.7)%4.1%(1.4)%(15.1)%(20.0)%(25.0)%(33.3)%(50.0)%(100.0)%EBITDA9510310110810690725436180% Margin65.4%68.7%70.3%72.1%72.0%72.0%72.0%72.0%72.0%72.0%n.m.(—) Depreciation and Amortization(2)(3)(3)(5)(6)(5)(4)(3)(2)(1)(0)Operating Income on Billings$93$99$98$103$101$86$68$51$34$17$0% Margin63.7%66.4%67.9%68.8%68.2%68.2%68.2%68.2%68.2%68.2%n.m.(—) Taxes(32)(35)(34)(36)(35)(30)(24)(18)(12)(6)(0)Operating Income Before Interest After Tax$60$65$63$67$65$56$44$33$22$11$0(+) Depreciation and Amortization23356543210(—) Capital Expenditures(3)(2)(5)(6)(7)(6)(5)(4)(2)(1)(0)(—) Increase in Net Working Capital7(6)(1)(1)1110000Unlevered Free Cash Flow$66$60$61$65$65$55$44$33$22$11$0PV of Future Cash Flows$61$47$41$37$31$23$15$10$6$2$0 |
| Valuation Supporting Materials43 |
| Equity Value Per Share — Sensitivity Analysis — |
| WACC$316.5%17.0%17.5%18.0%18.5%% of50.0%$3.04$3.00$2.95$2.91$2.86RevenueDecline in75.0%3.093.043.002.952.90OpexSavings100.0%3.133.083.032.992.94 |
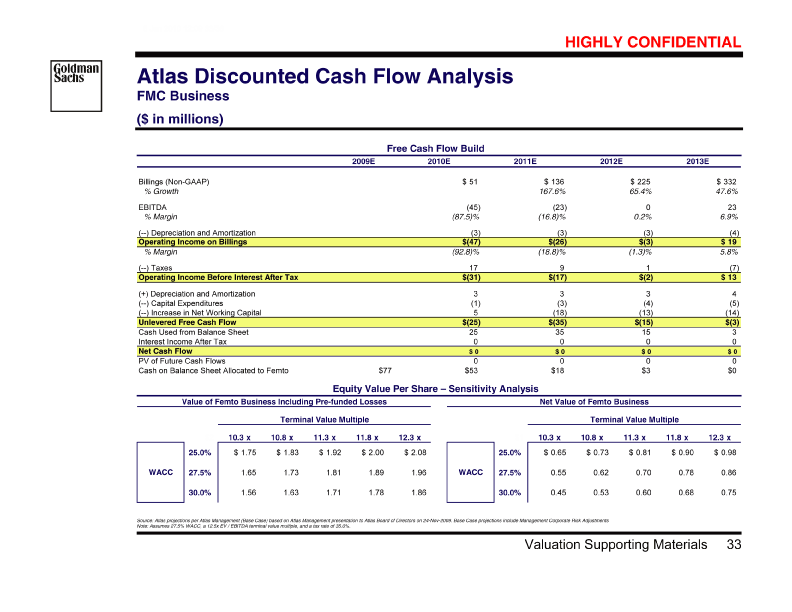
| Atlas Discounted Cash Flow Analysis FMC Business |
| ($ in millions)Source: Atlas projections per Atlas Management (Base Case) based on Atlas Management presentation to Atlas Board of Directors on 24-Nov-2009. Base Case projections include Management Corporate Risk AdjustmentsNote: Assumes 27.5% WACC, a 12.5x EV / EBITDA terminal value multiple, and a tax rate of 35.0%. |
| Free Cash Flow Build — |
| 2009E2010E2011E2012E2013EBillings (Non-GAAP)$51$136$225$332% Growth167.6%65.4%47.6%EBITDA(45)(23)023% Margin(87.5)%(16.8)%0.2%6.9%(—) Depreciation and Amortization(3)(3)(3)(4)Operating Income on Billings$(47)$(26)$(3)$19% Margin(92.8)%(18.8)%(1.3)%5.8%(—) Taxes1791(7)Operating Income Before Interest After Tax$(31)$(17)$(2)$13(+) Depreciation and Amortization3334(—) Capital Expenditures(1)(3)(4)(5)(—) Increase in Net Working Capital5(18)(13)(14)Unlevered Free Cash Flow$(25)$(35)$(15)$(3)Cash Used from Balance Sheet2535153Interest Income After Tax0000Net Cash Flow$0$0$0$0PV of Future Cash Flows0000Cash on Balance Sheet Allocated to Femto$77$53$18$3$0 |
| Valuation Suporting Materials43 |
| Equity Value Per Share — Sensitivity Analysis — |
| Value of Femto Business Including Pre-funded LossesNet Value of Femto BusinessTerminal Value MultipleTerminal Value Multiple$210.3 x10.8 x11.3 x11.8 x12.3 x$110.3 x10.8 x11.3 x11.8 x12.3 x25.0%$1.75$1.83$1.92$2.00$2.0825.0%$0.65$0.73$0.81$0.90$0.98WACC27.5%1.651.731.811.891.96WACC27.5%0.550.620.700.780.8630.0%1.561.631.711.781.8630.0%0.450.530.600.680.75 |
| 8 Jan 2010 12:09 1/35 DRAFT [Graphic Appears Here] [Graphic Appears Here] Goldman, Sachs & Co. July 14, 2009 |
| B78823_37 |
| 8 Jan 2010 12:09 1/35 DRAFT The Goldman Sachs Airvana Team [Graphic Appears Here] Goldman Sachs Leadership John Weinberg [Graphic Appears Here] The Goldman Sachs Airvana Team GS Technology Selected Experience [Graphic Appears Here] Name / Position Ryan Limaye Managing Director Global Head of Commtech Investment Banking 16 years experience [Graphic Appears Here] • Junction, 50+ Grand across CIENA to M&A Catena acquisition, Wireless Alcatel AT&T to and (Pirelli Rogers CommTech sale venture UTStarcom Technologies from Cisco in of joint to Packets bn spinoff Efficient with offerings) stake Lucent H3C of Wide Softbank $100 of debt Convergys with to over Commworks World and to Wireless Telecommunications acquisition of transactions JV, sale on merger Technologies acquisition sale ONI, AT&T Comdex of of of Worked transactions Alcatel Lucent Genesys 3Com Siemens 3Com Sales Numerous Softbank Intervoice Sale Sale • [Graphic Appears Here] Avinash Mehrotra Managing Director Head of Tech M&A 16 years experience • Computer Stratus Nextest Industries Amphenol and and Heavy repurchase to Tender) Test share offering division (Dutch squeeze-out including: Eagle Sumitomo and On activism of to Follow Gartner minority advisory JV Ansoft fund Agere connector of situations SEN of issuance and experience, and acquisitions of IPO Recaps dividend) sale LSI advisory committee of acquisition convertible Teradyne’s defense/anti-raid of Communications’ Teradyne’s Axcelis’ Merger Ansys EMC CommVault Sale Leveraged (sponsored Cox Various Shareholder/Hedge Raid Special • [Graphic Appears Here] • Verizon separation to Symbol Devices sale of offering acquisition Mobile equity subsequent division IPO’s pending Silverlake and and and GSS to Notes Icahn and sale Light Carl Alltel Technologies Opnext and of Clearwire CSG’s and of Strata Secured activist in Lucent Freescale exchange Keylink of to with of of Rakuten acquisition acquisition Starent equity Senior to GS investment merger Packet, spin-off recapitalization for acquisition response acquisition sale and Corp debt Wireless TPG Motorola Alcatel Comverse Acme Motorola IPC AWE Opnext Leap Motorola Arrow Linkshare • Jason Rowe Vice President TMT Investment Banking 8 years experience [Graphic Appears Here] Selected Expe1)rience Name / Position Adam Greene Vice President 10 years experience Name / Position Matthew DeFusco Managing Director Co-Head of TMT Financing 13 years experience JLL’s bid for Patheon Ipsen’s squeezeout of Terica Nationwide Mutual’s squeezeout of Nationwide Alfa Mutual’s squeezeout of Alfa Management buyout of Clear Channel Southern Peru’s asset swap with Grupo Carso Fortress’s acquisition of Intrawest Management buyout of Swift Transportation SanDisk raid defense against Samsung CV Therapeutics raid defense against Astellas Anheuser-Busch raid defense, a subsequent InBev cross-border acquisition PeopleSoft hostile takeover defense from Oracle BEA hostile takeover defense from Oracle/Icahn Frontier raid defense following raid by Qwest — GS Merger Leadership Group GS Merger Advisory Legal Name / Position Bill Anderson Managing Director Global Head of Raid and Activism Defense 18 years experience Name / Position Joe Stern Managing Director 35 years experience GS Equity Capital Markets / Leverage Finance Name / Position David Ludwig Managing Direc tor Co-Head of TMT Financing 13 years experience — [Graphic Appears Here] 1 |
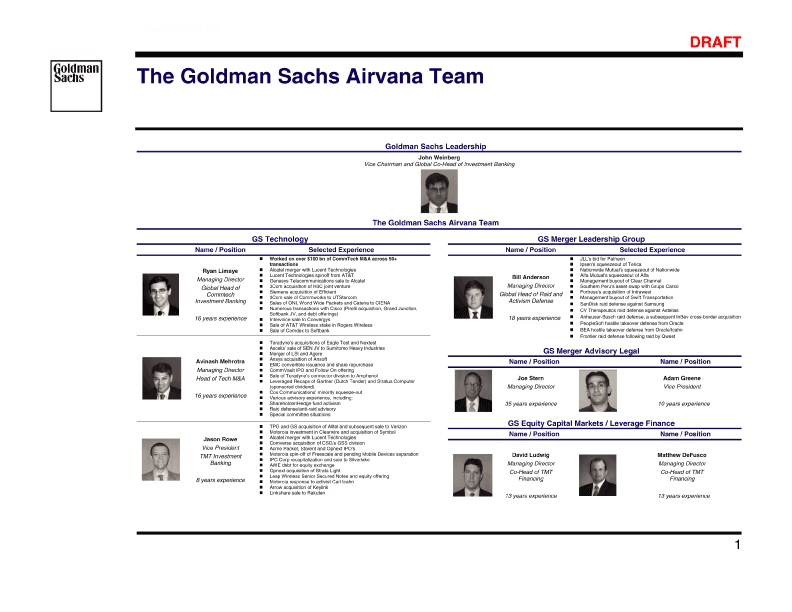
| B78823_38 |
| 8 Jan 2010 12:09 2/35 DRAFT Summary Observations on Potential Next Steps for the Special Committee [Graphic Appears Here] [Graphic Appears Here] • management (including etc.) M&A structures, complex in financing experience situations, deep hostile with advisor advisory, financial committee expert special an Engage buyouts, [Graphic Appears Here] ructuring, acquisitions, or continue status quo Recapitalization, spin-off, other operational rest Is now the right time to sell the Company? What other alternatives exist? Rapidly and thoroughly assess the broad strategic and financial alternatives for Airvana — — [Graphic Appears Here] Broad vs. narrow process Buyer list (strategic / financial) Public vs. private process Management’s role If the Committee elects to pursue a sale of the Company, design and manage the right process to maximize value and minimize risks — — — — [Graphic Appears Here] Knowledge and relationships with potential buyers (if sale path) Expertise in coordinating and managing sale processes Capital markets expertise (if non sale path) Efficiently and effectively execute any desired process — — — [Graphic Appears Here] Value and composition of consideration Deal certainty and risk (financial, regulatory, etc.) Financing documents / funding risks Assess the potential deals — — — [Graphic Appears Here] Engaging the right financial advisor with the team depth and experience (industry, sponsors, process, 2 |
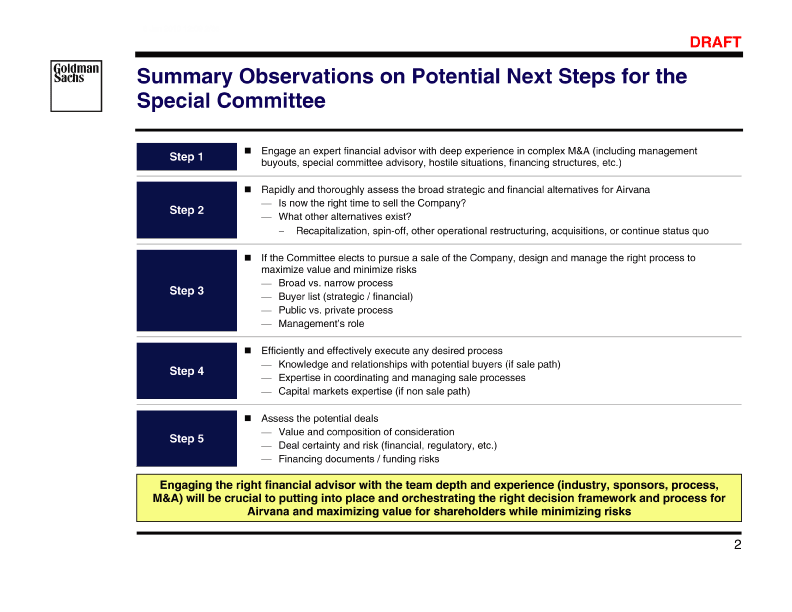
| B78823_39 |
| 8 Jan 2010 12:09 3/35 DRAFT [Graphic Appears Here] Why Goldman Sachs For This Assignment I. 3 Why Goldman Sachs For This Assignment |
| B78823_40 |
| 8 Jan 2010 12:09 4/35 DRAFT Why Goldman Sachs? [Graphic Appears Here] As the advisor of choice in contested and complex situations, Goldman Sachs is uniquely Airvana in evaluating strategic alternatives positioned to advise the Special Committee of Criteria Goldman Qualifications • outcomes universe assignments desired our sponsor of achieve financial majority helping up of make franchise and U.S. knowledge billion) companies the deep (<$1 in derivatives quality and with deals and high globally advisor debt advising advisor, M&A moderate-sized high-yield for M&A Sell-side to • #1 Small Leading Reputation • Leading Investment Banking Practice Strategic Advisor of Choice • situations contested situations in complex investors activism advisor #1 for institutional facing and advisor choice with companies advisor of credibility advisor Committee to Defense the Special Advisor Raid as • #1 #1 Seen Tremendous • Deep Sector Experience • alternatives strategic complex M&A buyers of relevant evaluation Technology all in U.S. M&A with and CommTech relationship experience Global in in • #1 Deep Extensive • Independent and Ready to Begin • experience management relevant Airvana significant with with relationships team immediately banking cross-functional work start historical staffed to No Have Prepared • 4 Why Goldman Sachs For This Assignment |
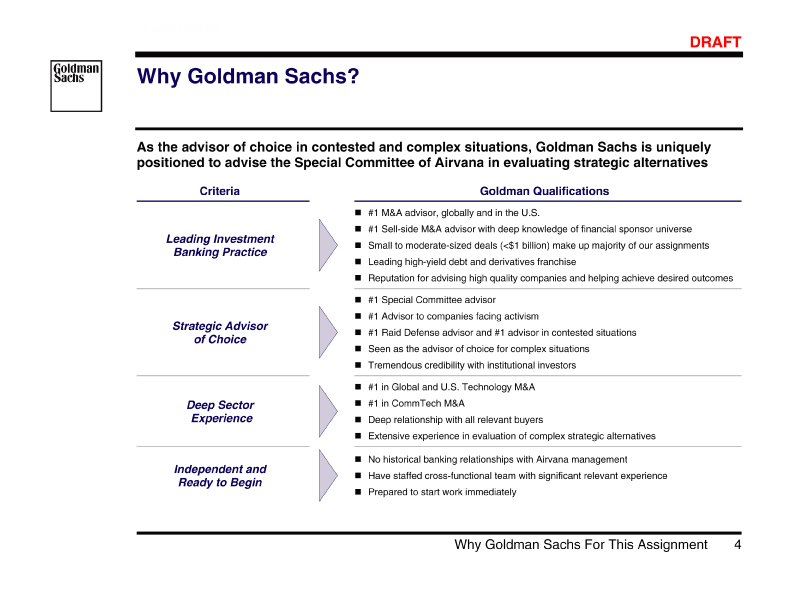
| B78823_41 |
| 8 Jan 2010 12:09 5/35 DRAFT Goldman Sachs’ Global M&A Franchise Undisputed Leader in Corporate Strategic Advisory [Graphic Appears Here] M&A League Tables Global M&A Deals 2002 — 2008 ($ billion) Sell-Side Focus 58% of Goldman Sachs’ Deals are Sell-Sides 29.1% 24.2% 23.7% 22.4% 22.1% 16.4% 14.9% 13.6% 10.6% 9.7% Market Share Goldman Sachs JP Morgan Morgan StanleyBoA Merrill Lynch Citi UBS Credit Suisse Deutsche Bank Lazard Barclays $5,068 2,621 deals $4,214 2,949 deals $4,129 2,366 deals 2,554 deals $3,907 $3,862 3,044 deals $2,853 2,313 deals $2,605 2,265 deals $2,364 1,727 deals [Graphic Appears Here] JV / MOE 6% $1,841 1,752 deals $1,685 914 deals 60% of Goldman Sachs’ Deals are under $1bn 0 2,000 1,000 4,000 3,000 6,000 5,000 ($ in billions) Ranking by Global Announced M&A Volume 15% 250 - 500mm 8% 500mm - 1bn Under 250mm [Graphic Appears Here] [Graphic Appears Here] Morgan Stanley JP Morgan Citi Bank of America Merrill Lynch Credit Suisse 2008 6 2 3 4 8 2007 2 4 3 8 6 2006 3 4 2 5 6 2005 2 3 5 4 10 2004 4 2 3 5 11 2003 2 4 3 5 10 2002 3 5 2 6 4 Thomson Financial Securities Data through 31-Dec-2008 Source: 5 Why Goldman Sachs For This Assignment |
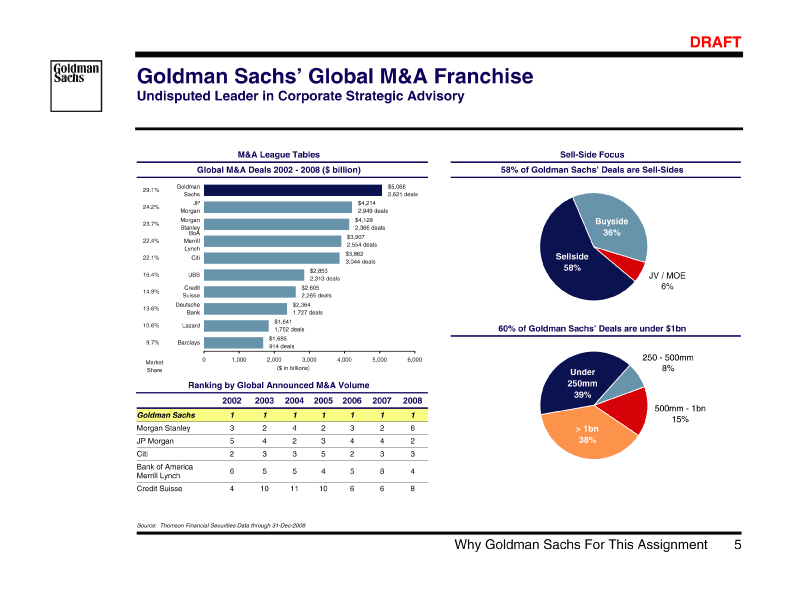
| B78823_42 |
| 8 Jan 2010 12:09 6/35 DRAFT Goldman Sachs’ Relevant Expertise Special Committee Assignments ($ in billions) [Graphic Appears Here] Special Committee / Minority Squeezeout Advisory Assignments (2002 — 2008) Goldman Sachs Bank America Lazard Morgan Stanley Credit Suisse JP Morgan Citi Rothschild KPMG Nomura of Merrill Lynch 22.7% 11.2% 10.3% 10.0% 9.1% 5.6% 5.1% 3.8% 3.3% 3.2% Market Share $156.6 69 deals $79.9 54 deals $70.9 37 deals $69.2 67 deals $63.0 54 deals $38.7 63 deals $35.0 74 deals $26.3 46 deals $23.0 67 deals 45 deals $21.9 0 60 120 180 Volume ($bn) Source: Thomson Financial Securities Data as of 31-Dec-2008 6 Why Goldman Sachs For This Assignment |
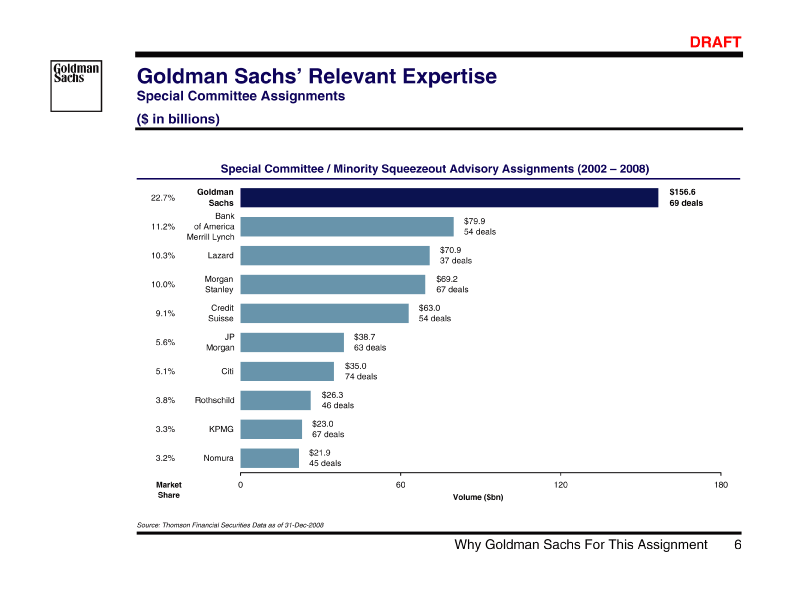
| B78823_43 |
| 8 Jan 2010 12:09 7/35 DRAFT in Complicated Situations Special Committee Experience Goldman Sachs’ Leadership [Graphic Appears Here] [Graphic Appears Here] [Graphic Appears Here] 7 Why Goldman Sachs For This Assignment |
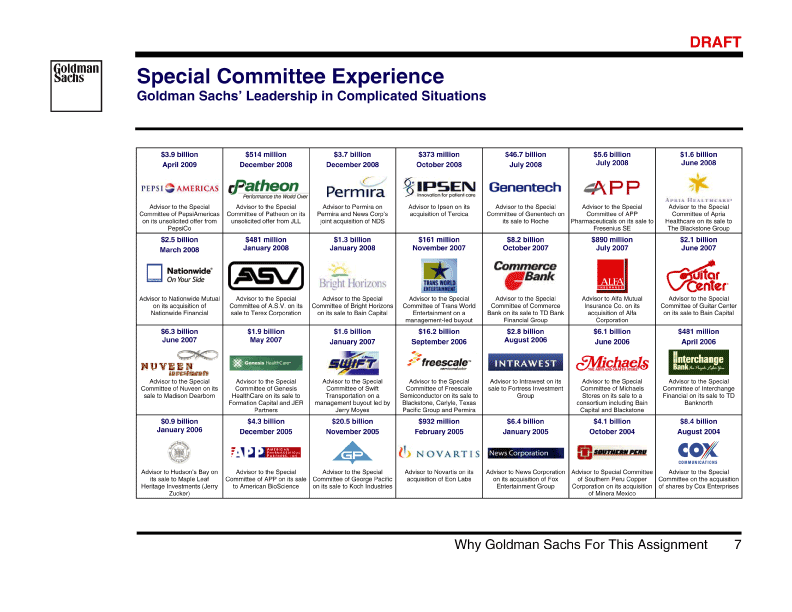
| B78823_44 |
| 8 Jan 2010 12:09 8/35 DRAFT Goldman Sachs’ Technology M&A Expertise Undisputed Leader in Technology M&A [Graphic Appears Here] [Graphic Appears Here] [Graphic Appears Here] [Graphic Appears Here] [Graphic Appears Here] [Graphic Appears Here] 188 194 214 102 229 182 96 10 108 91 277 $ 211 $199 $ 174 $153 $139 $ 77 72 $66 $60 $ $ 1 1 gan pital Citi UBS Goldman Sachs Morgan Stanley JP Mor s Ca Credit Suisse Merrill Lynch Deutsche Bank Barclay Blackstone Group 37% 29% 27% 24% 21% 19% 10% 10% 9% 8% 285 338 292 320 379 122 187 233 196 11 Deals [Graphic Appears Here] Market Share Deals ($ bn) ($ bn) Barclays Capital includes transactions previously allocated to Lehman Brothers due to Barclays completing its acquisition effective 22-Sep-2008. JP Morgan includes transactions previously allocated to Bear Stearns due to JP Morgan completing its acquisition effective 30-May-2008. Source: SDC, announced transactions as of 31-Dec-2008; dollar value based on rank value as defined by SDC. 1 8 Why Goldman Sachs For This Assignment |
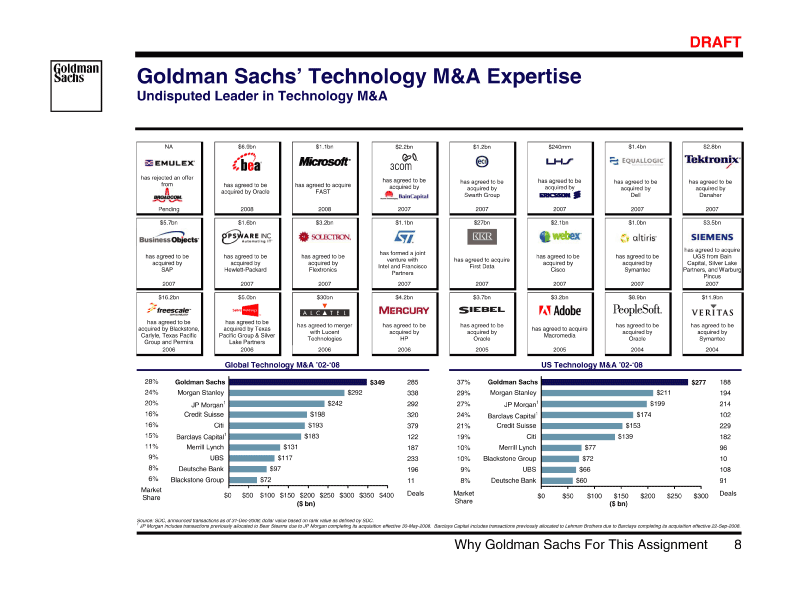
| B78823_45 |
| 8 Jan 2010 12:09 9/35 DRAFT Goldman Sachs’ CommTech Leadership Selected M&A Transactions [Graphic Appears Here] [Graphic Appears Here] [Graphic Appears Here] [Graphic Appears Here] [Graphic Appears Here] |
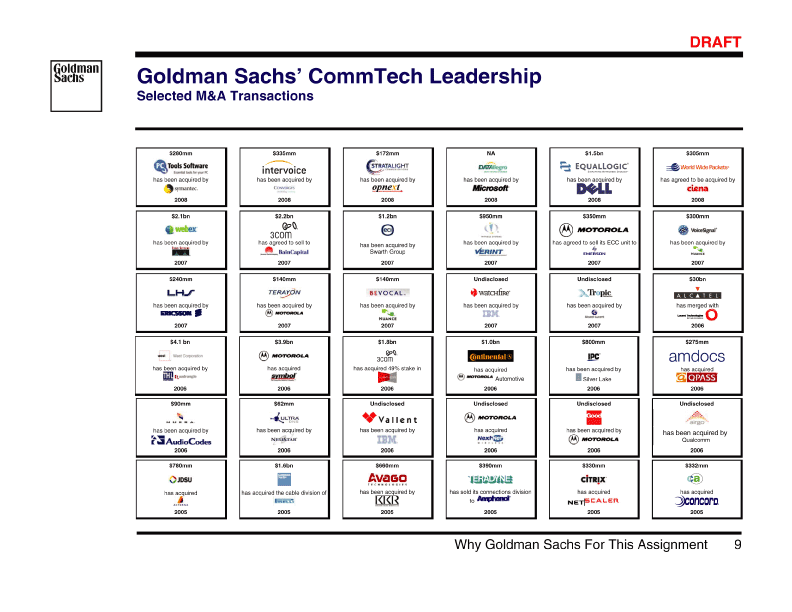
| B78823_46 |
| 8 Jan 2010 12:09 10/35 DRAFT [Graphic Appears Here] Issues for the Special Committee to Consider II. 10 Issues for the Special Committee to Consider |
| B78823_47 |
| 8 Jan 2010 12:09 11/35 DRAFT What Should the Special Committee Be Focused On? Key Takeaways from Recent Special Committee Assignments [Graphic Appears Here] Key Takeaways Observations Establish Transparency of Process from the Outset Message reinforced in Delaware court case regarding Cox Communications eholders and hedge funds, lack of transparency can Benefits of open process and careful record accrue to all parties (Special Committee, buyer and other constituencies) Given high level of scrutiny by the courts, other shar Level of transparency can significantly impact timetable of transaction — significantly increase pressure on directors Process is Important Establish track record considering all alternatives Consider optimal process to deliver highest value to shareholders and minimize business disruption Active engagement by financial and legal advisors Use of a public relations firm (when / if deal becomes public) The Committee should consider / explore available alternatives Effective and timely use of press releases and other communications Maintenance of multiple communication channels to reinforce the market’s (and buyer’s) view of Special Use of due diligence timetable to signal thorough and deliberate nature of Special Committee Constant assessment of potential tipping points — — Committee resolve — — investigations Thoroughness and Creativity are Essential • value standalone of sources potential tional addi plus prospects alternatives and plan strategic business of range Current Wide • Directly Engage with Shareholders and other Constituencies Composition of institutional, retail and hedge fund components including level of dislocation/turnover following announcement of buyer’s offer Economic implications of cost basis Understand key shareholders’ reactions to buyer’s offer Determine role and relative influence of public shareholders Communicate with large shareholders Concentrated shareholder base can drive decision making — — — 11 Issues for the Special Committee to Consider |
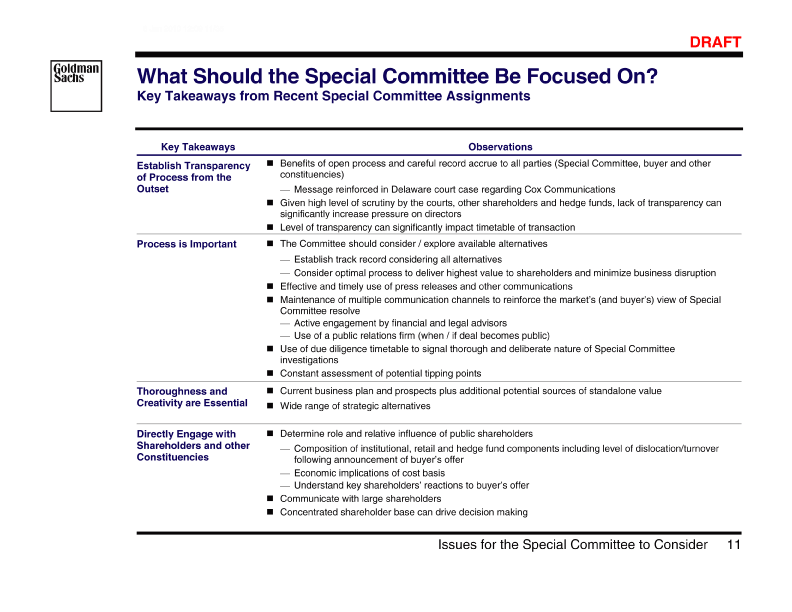
| B78823_48 |
| 8 Jan 2010 12:09 12/35 DRAFT Challenges to “Going Private” Transactions Have Arisen [Graphic Appears Here] [Graphic Appears Here] • years interest) (plus value company settlement processes the of perceived value LBO/MBO the to to ulate due relating deals recalc risks to private” the court “going on for target focusing opportunity to are cases offer closes continues court rights deal Litigation Recent Appraisal the after • [Graphic Appears Here] e facing opposition or which which frequently appear on the Contentious List Holdings and Shopko highlights deals that ar Steakhouse, Riviera of LBO/MBO transactions, RMG is often skeptical RiskMetrics (RMG, formerly ISS) Contentious List RMG views to have “risks” RMG has often recommended votes against LBO/MBO transactions, including Clear Channel, Cornell Companies, Genesis Healthcare, Lone Star — [Graphic Appears Here] • and sponsors between interactions projections, of disclosure disclosure detailed process the public of exhaustive demanding aspects other requires increasingly and 13e-3 are Rule Courts management • [Graphic Appears Here] • rights appraisal asserting or filings price public higher in a sses proce demanding and by analyses returns “alpha” transactions, obtain of to Trying Criticism • [Graphic Appears Here] • “private” taken is company public after sponsors by process in achieved role returns high management’s with about Dissatisfaction Skepticism • 12 Issues for the Special Committee to Consider |
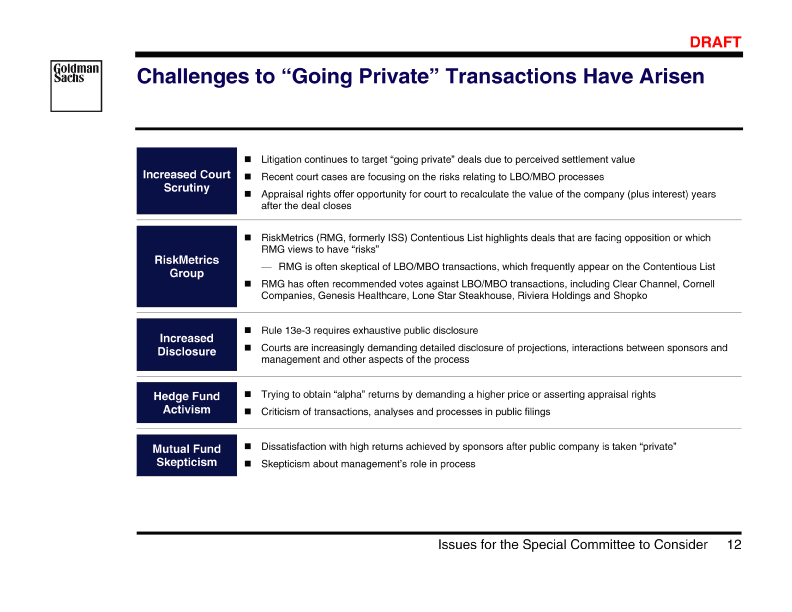
| B78823_49 |
| 8 Jan 2010 12:09 13/35 DRAFT Increased Scrutiny of Special Committee Processes Recognition of Goldman Sachs’ Unique Franchise in Special Committee Situations [Graphic Appears Here] st in shareholder activist situations, management result in litigation; it is critical for the experienced advisors Given directors’ perceived conflicts of intere responses receive intense scrutiny and are likely to Special Committee to retain [Graphic Appears Here] Source: Cox Communications’ Shareholder Litigation Opinion, June 6, 2005. Goldman Sachs advised the Special Committee of Cox Communications. Bold added for emphasis. 13 Issues for the Special Committee to Consider |
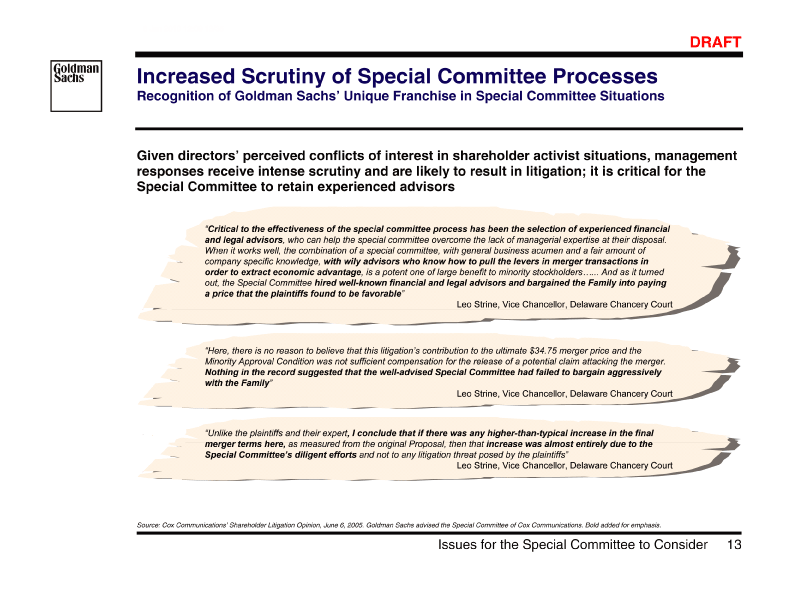
| B78823_50 |
| 8 Jan 2010 12:09 14/35 DRAFT Court Recognition of Goldman Sachs’ Fairness Practice [Graphic Appears Here] nker fairness opinions In an environment where courts have launched withering attacks on ba and analyses in connection with fiduciary duty lawsuits against boards, time and again the Goldman Sachs fairness opinion practice has been positively cited by courts as a basis for dismissing such suits • ruling to court leading its a disclosure Goldman of plaintiffs hired (Canada) the support by thorough had to that cites in attempt and Alberta decision opinion, activist sitively dismisses analyses fund po court page hedge and the court fairness 150 out by attack, Sachs nearly its through of Delaware a process In opinion (2006): Goldman and support the (2007): in to valuation fairness • Litigation citing Litigation improper professor and • Shareholder transaction, Appraisal of School analyses claims Business valuation merger Creek dismisses • Checkfree block Deer Harvard Sachs’ • 14 Issues for the Special Committee to Consider |
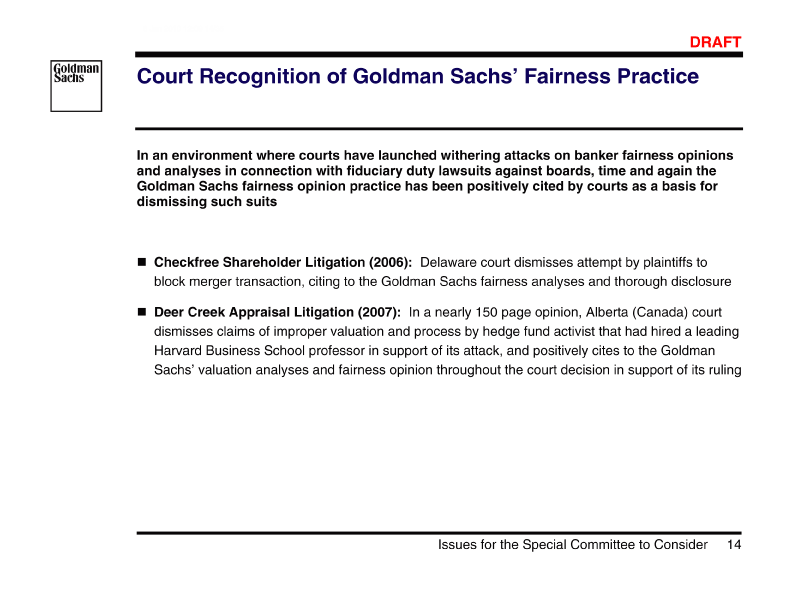
| B78823_51 |
| 8 Jan 2010 12:09 15/35 DRAFT Role of Goldman Sachs in Assisting the Special Committee What would we do? [Graphic Appears Here] Commence detailed diligence immediately following appointment by Special Committee Detailed assessment of management’s business plan including internal models and projections Develop an understanding of the opportunities and risks in management’s plan Investigate sources of value not necessarily reflected in public market valuation Develop valuation and review potential deal structure based on diligence findings Formulate views regarding certainty of closing and any other conditionality Discuss alternatives and potential tactics with Special Committee and legal advisors Special Committee to decide on course of action and tactics Assist the Special Committee in its initial response to any proposal Coordinate with legal (and any other advisors) to the Special Committee Conduct business and financial due diligence on Airvana Analyze proposed transaction for Special Committee Assess value maximization alternatives that may be available, not involving sale to management bidding group Assist the Special Committee in formulating and communicating additional responses to the management proposal Assist the Special Committee in assessing sponsored backed proposals Assist the Special Committee in deliberations on how best to proceed As directed by the Special Committee, GS will act as a liaison between the Special Committee and management consortium As directed by the Special Committee, assist in negotiating a transaction in the best interest of shareholders — — — — — — — — (and its advisors) 15 Issues for the Special Committee to Consider |
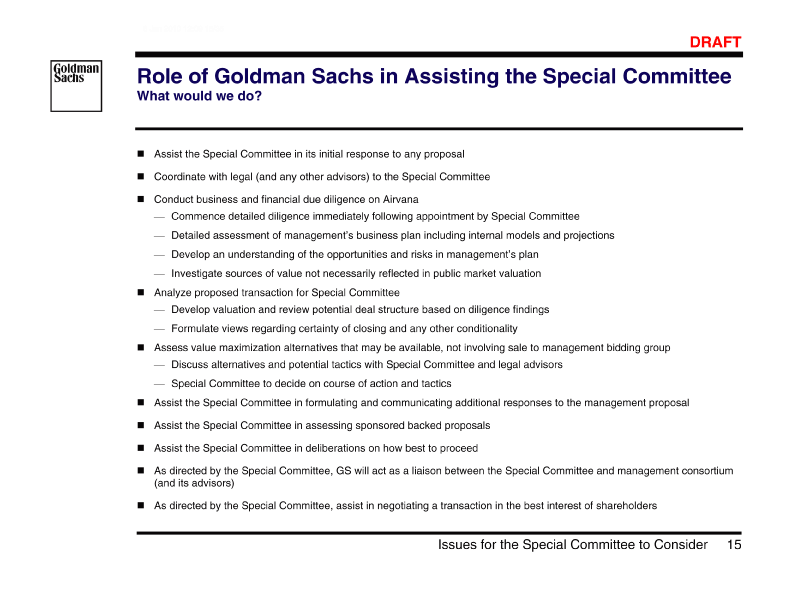
| B78823_52 |
| 8 Jan 2010 12:09 16/35 DRAFT [Graphic Appears Here] Overview of Airvana and Industry Landscape III. 16 Overview of Airvana and Industry Landscape |
| B78823_53 |
| 8 Jan 2010 12:09 17/35 DRAFT Overview of Airvana Equity Performance Since IPO [Graphic Appears Here] [Graphic Appears Here] Airvana Volume 17 Overview of Airvana and Industry Landscape |
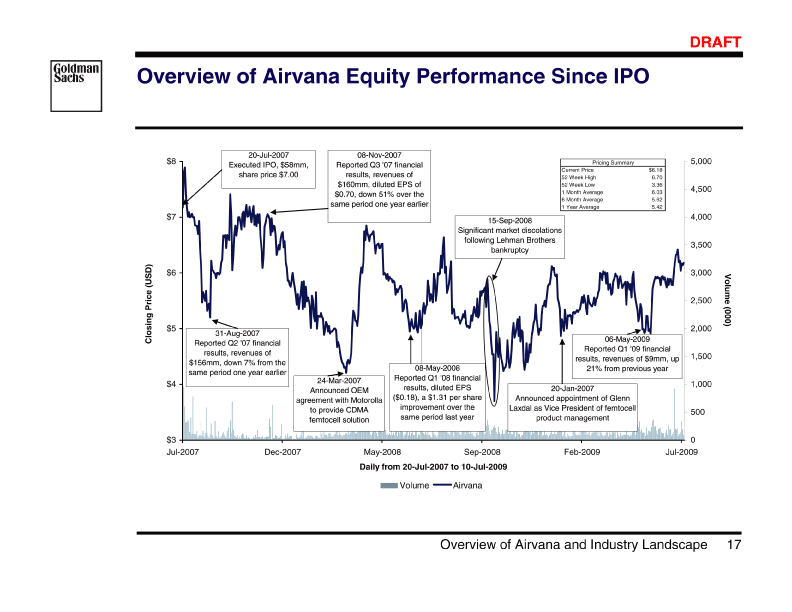
| B78823_54 |
| 8 Jan 2010 12:09 18/35 DRAFT Airvana Relative Equity Performance [Graphic Appears Here] Last 2 Years 220% [Graphic Appears Here] Jul-2007 (20)% Oct-2007 May-2008 Feb-2008 Dec-2008 Sep-2008 Mar-2009 Jul-2009 Acme Packet Airvana Starent Infinera Other Commtech Sonus Networks Wireless Subsystems Wireless Subsystems include: ADC, CommScope, and Powerwave. includes: Alcatel-Lucent, Cisco, Ericsson, Motorola, Nokia, and RIM. Commtech Other Note: 18 Overview of Airvana and Industry Landscape |
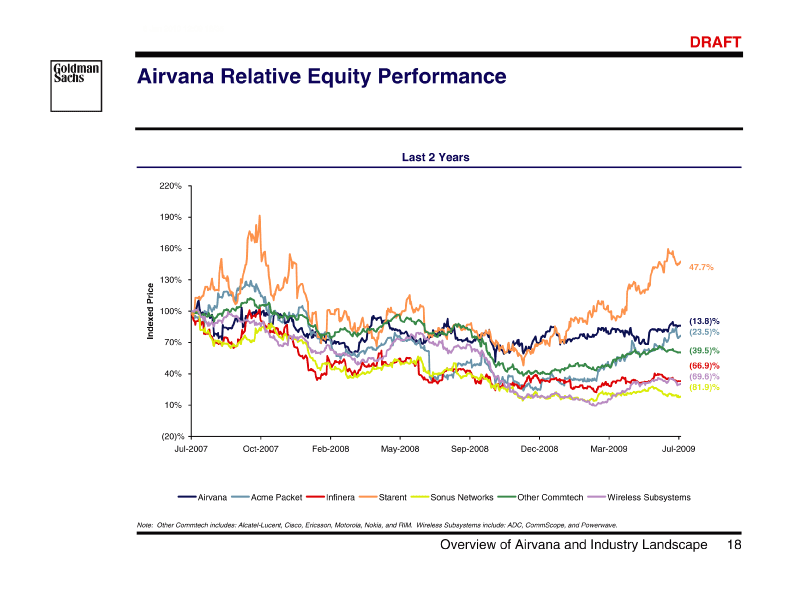
| B78823_55 |
| 8 Jan 2010 12:09 19/35 DRAFT Airvana’s Business Expectations vs. Selected Comparables [Graphic Appears Here] 2008 — 2010 Revenue Growth 36.5% 21.7% Starent 11.1% Airvana 12.5% [Graphic Appears Here] [Graphic Appears Here] [Graphic Appears Here] (0.9%) [Graphic Appears Here] [Graphic Appears Here] [Graphic Appears Here] [Graphic Appears Here] (9.4%) (10.4%) Powerwave Infinera Acme Packet (14.6%) Sonus Ericsson RIM Alcatel- Lucent Cisco Nokia Motorola ADC CommScope 2009 / 2010 EBITDA Margin 27.8% 30.9% 31.8% 31.7% 30.0% 24.3% 25.2% 24.1% 30.2% 22.8% 14.5% 12.5% 10.1% 11.4% 15.5% 14.4% 8.2% [Graphic Appears Here] Alcatel- Lucent 7.4% [Graphic Appears Here] NA NA [Graphic Appears Here] [Graphic Appears Here] [Graphic Appears Here] (17.5%)Infinera Acme Packet Starent Airvana Cisco Sonus Ericsson RIM Nokia CommScope Motorola Powerwave ADC 2008 — 2010 EBITDA Growth 37.1% 26.4% 27.2% 19.5% 15.8% 13.6% [Graphic Appears Here] NM NA Sonus [Graphic Appears Here] [Graphic Appears Here] (4.1%) Cisco 2010 (2.1%) Ericsson [Graphic Appears Here] Alcatel- Lucent [Graphic Appears Here] (7.1%) Powerwave (17.9%) Nokia (20.1%) ADC CommScope Starent Airvana Infinera Acme Packet Motorola 2009 RIM Source: Wall Street Research 19 Overview of Airvana and Industry Landscape |
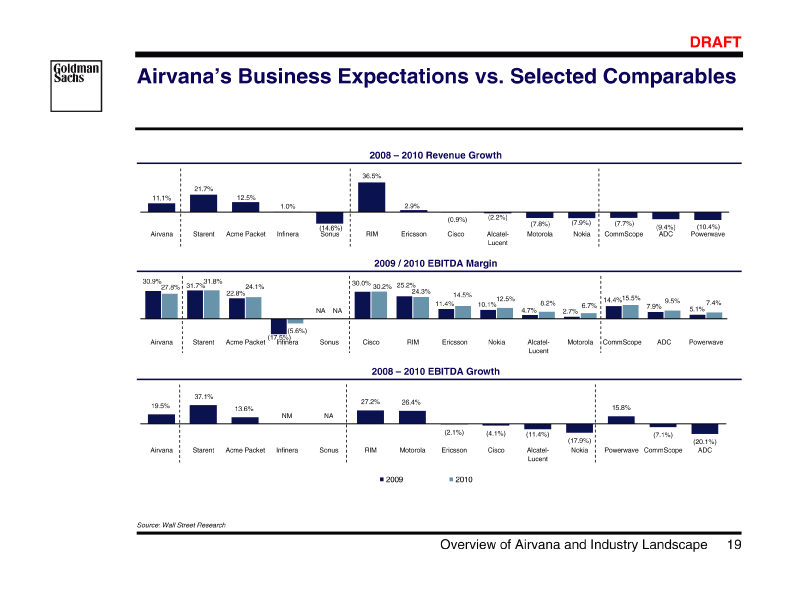
| B78823_56 |
| 8 Jan 2010 12:09 20/35 DRAFT Airvana Valuation vs. Selected Comparables [Graphic Appears Here] 2009 / 2010 EV / Revenue 4.4x 3.8x 3.7x 3.3x 2.4x 2.5x 2.2x 2.3x 1.9x 1.8x 1.2x 0.6x 0.7x 0.8x 1.0x 1.1x 0.3x 0.3x 0.5x 0.5x 0.9x 0.9x 0.9x 1.0x 0.3x 0.4x 0.9x 0.6x [Graphic Appears Here] Cisco $108,045 Sonus $409 [Graphic Appears Here] [Graphic Appears Here] Alcatel- Lucent [Graphic Appears Here] Powerwave $158 Starent $1,778 Airvana $426 ADC CommScope Infinera $876 Acme Packet $628 Ericsson $30,394 RIM $38,362 Motorola $14,090 Nokia $52,106 Market Capitalization $1,973 $4,709 $650 2009 / 2010 EV / EBITDA 19.6x 16.5x 13.9x 13.9x 12.2x 11.6x 9.8x 9.7x 8.7x 7.9x 8.4x 7.9x 7.1x 7.5x 7.7x 7.6x 7.4x 6.8x 6.5x 6.5x 6.6x 3.9x 3.2x 3.7x Alcatel- Lucent Cisco NM NM NA NA [Graphic Appears Here] Acme Packet Airvana Infinera Starent Motorola Sonus RIM Ericsson Nokia ADC Powerwave CommScope 2009 / 2010 P / E 45.0x 35.1x 31.0x 30.1x 28.8x 27.0x 21.8x 17.4x 16.1x 14.2x [Graphic Appears Here] 11.6x [Graphic Appears Here] 11.5x 13.4x 12.1x 9.9x 10.4x 8.2x 9.2x NM NM NM NM NM [Graphic Appears Here] NM [Graphic Appears Here] Acme Packet Airvana Infinera Starent Ericsson Sonus Nokia RIM 2010 Cisco Alcatel- Lucent ADC Motorola CommScope Powerwave 2009 Source: Wall Street Research 20 Overview of Airvana and Industry Landscape |
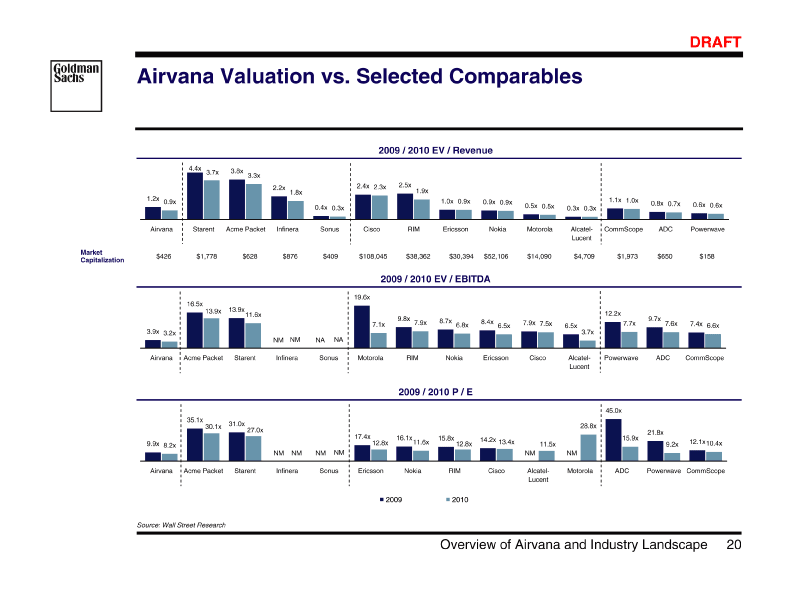
| B78823_57 |
| 8 Jan 2010 12:09 21/35 DRAFT Customer Concentration for Selected Industry Players [Graphic Appears Here] Company Number of Customers Generating >10% Revenue % of Revenue from Customers > 10% [Graphic Appears Here] [Graphic Appears Here] [Graphic Appears Here] 0% 0% 1 2 3 2 3 1 1 0 0 99% 80% 57% 48% 42% 29% 25% [Graphic Appears Here] 21 Overview of Airvana and Industry Landscape |
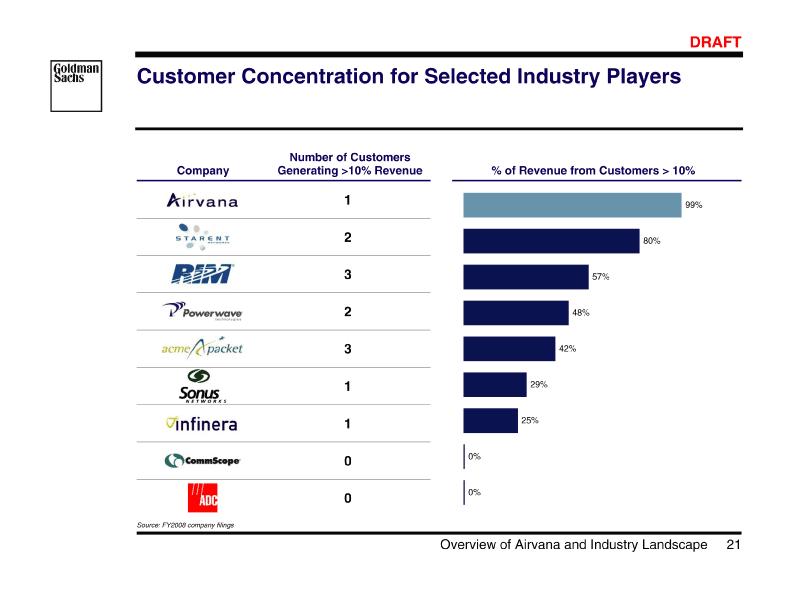
| B78823_58 |
| 8 Jan 2010 12:09 22/35 DRAFT Preliminary Hypothetical Airvana Analysis at Various Prices [Graphic Appears Here] 9.00 68.9 619.9 0.0 198.4 421.5 2.2x 1.6x 7.1x 5.9x 7.7x 6.2x 14.4x 11.9x $45.6% 65.9% 28.6% 14.1% $ $ 8.50 7.7% 68.9 585.5 0.0 198.4 387.1 2.0x 1.5x 6.6x 5.4x 7.0x 5.7x 13.6x 11.3x $37.5% 56.7% 21.4% $ $ 8.00 1.4% 68.9 551.0 0.0 198.4 352.6 1.8x 1.4x 6.0x 4.9x 6.4x 5.2x 12.8x 10.6x $29.4% 47.5% 14.3% $ $ 7.50 7.1% 68.9 516.6 0.0 198.4 318.2 1.7x 1.2x 5.4x 4.4x 5.8x 4.7x 12.0x 9.9x $21.4% 38.3% (4.9%) $ $ 7.00 0.0% 68.9 482.1 0.0 198.4 283.8 1.5x 1.1x 4.8x 3.9x 5.2x 4.2x 11.2x 9.3x $13.3% 29.1% (11.3%) $ $ 6.18 0.0% 68.9 0.0 198.4 1.2x 0.9x 3.9x 3.2x 4.1x 3.3x 9.9x 8.2x $13.9% 425.7 227.3 Current (11.7%) (21.7%) $ $ 59.0 72.0 55.0 68.0 0.62 0.75 191.0 259.0 $$ $ Metric $ Share Price Premium / (Discount) to IPO Price Premium / (Discount) to All-Time High Diluted Shares Outstanding 1 Premium to Current Premium to 1-Year Average Implied Equity Value Total Debt Total Cash Implied Enterprise Value EV / Revenue 2009E 2010E EV / EBITDA 2009E 2010E EV / EBIT 2009E 2010E P / E 2009E 2010E of Nortel write-off. recovery no Wall Street research Hypothetical analysis provided solely for illustrative purposes and does not necessarily reflect views on value or the price that a buyer would be willing to pay. Assumes Source: Note: 1 22 Overview of Airvana and Industry Landscape |
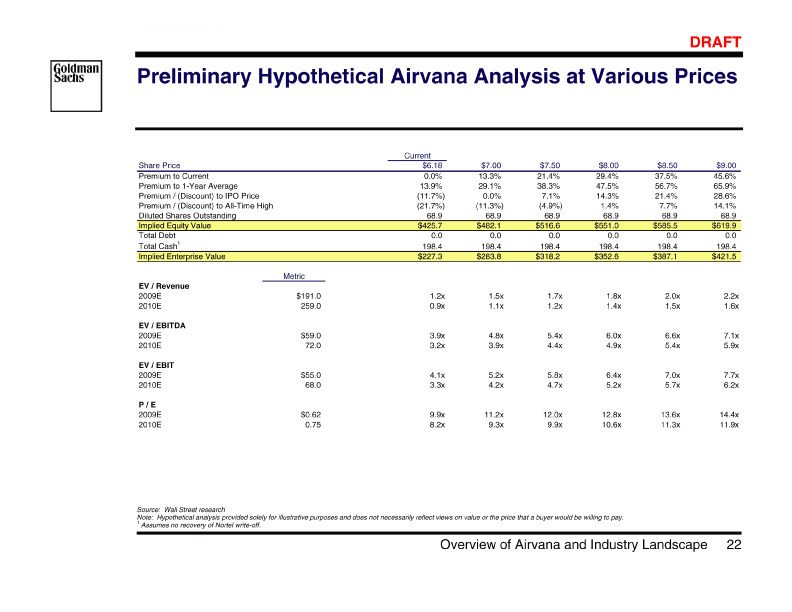
| B78823_59 |
| 8 Jan 2010 12:09 23/35 DRAFT Selected Industry Participants ($ in millions) [Graphic Appears Here] Company [Graphic Appears Here] [Graphic Appears Here] [Graphic Appears Here] [Graphic Appears Here] Cash 4,649 8,071 N/A 423 $ 4,709 N/A 869 Market Cap $30,394 Key GS Relationships GS Experience / Relationship • Corporate Officer) (CEO) M&A) of Investment (CFO) (VP, (Head Chief Verwaayen Tufano Ludtke Gibbens & Ben Paul Fred Mark Finance • • Ascend Technologies of AT&T acquisition from Lucent Alcatel its spinoff with on to Alcatel Lucent to merger Technologies to its Genesys Tropic Yurie on of Technologies of of sale Lucent sale sale Alcatel on Lucent on on on Advised Advised Advised Advised Advised Advised • • elect) (CEO) CEO M&A) and Svanberg (CFO (Director, Vestberg Oscarsson Carl-Henric Hans Per • • Ericsson trade) to (block Devices shares Power Ericsson e Ericsson to of LHS Microwav sale of of on sale sale on on Juniper Advised Advised Advised • • M&A) Strategy) Siemens) Nokia) of (COO) of (CEO (CFO (Head (Head Löscher Simonson Vehviläinen Kariola Nieminen Peter Rick Mika Anssi Mika • • China Nokia Networks Network create to Amber Efficient China of of in JV of acquisition acquisition Restructuring on on Advised Advised • • and Systems (VP, Oye Kevin Technology) None Source: CapitalIQ, market data as of 10-Jul-2009. 23 Overview of Airvana and Industry Landscape |
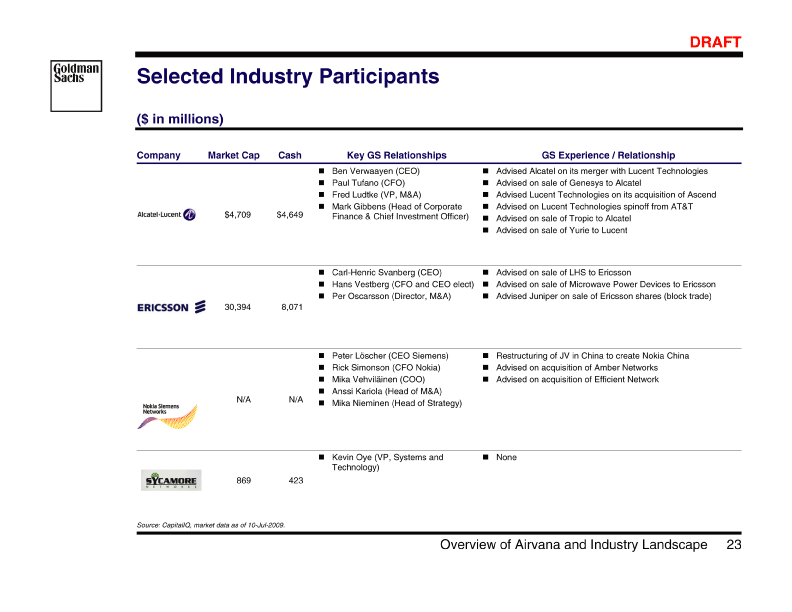
| B78823_60 |
| 8 Jan 2010 12:09 24/35 DRAFT Selected Industry Participants [Graphic Appears Here] Company Key Leaders Company Key Leaders [Graphic Appears Here] • Business of Strategy GM Group) (Chief (VP, (SVP, Hooper Carmel Patel Provider Ned Offiecer) Charles Development) Pankaj Service • [Graphic Appears Here] • and (CEO) (Chairman) (VP, Development Johnson Kriens Avila-Marco Kevin Scott Louis Corporate Strategy) • [Graphic Appears Here] • Group) Group) (CEO) (Swarth (Swarth Maor Shani Marom Rafi Shaul Ady • [Graphic Appears Here] • and Division) (Associate Strategy (GM, Morita Corporate Development) Watariya Alliance Takayuki SVP, Business Kazuiki Corporate • [Graphic Appears Here] • (Corporate Business) (GM, Chikama CommTech Ishibashi Development) Terumi of Katsuhiko SVP Business • [Graphic Appears Here] • Global (CEO) (CFO) (EVP, Pullen Wiggins Khan Robert Tim Rizwan Marketing) • [Graphic Appears Here] • GM, and Manager, (Executive Planning (Senior Development) Otsuki Business Hirokawa Ryuichi Global Operations) Keiji Business • [Graphic Appears Here] • (CEO) Corporate (EVP, Zhengfei Ping Ren Guo Development) • [Graphic Appears Here] • of Head (CFO) (EVP, (Owner-Family) Choi Kim Lee Y. Doh-Seok Chungho M&A) Jay • [Graphic Appears Here] • (Chairman) (President) Hou Yin Weigui Yimin • 24 Overview of Airvana and Industry Landscape |
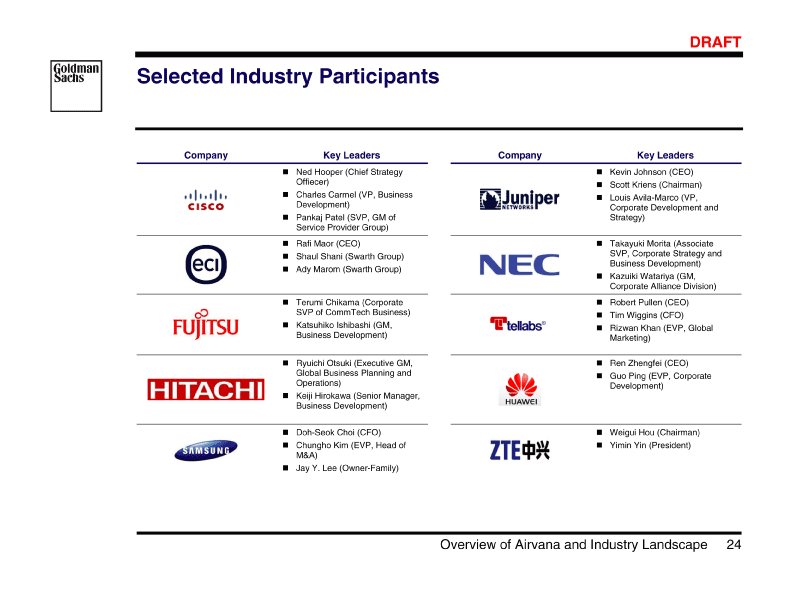
| B78823_61 |
| 8 Jan 2010 12:09 25/35 DRAFT Selected Private Capital Players in the Space ($ in billions) [Graphic Appears Here] [Graphic Appears Here] [Graphic Appears Here] [Graphic Appears Here] [Graphic Appears Here] 3.4 2.5 2.5 2.2 1.4 0.6 $3.1 3.0 3.0 3.0 2.5 2.3 2.0 1.9 1.3 1.2 Company Fund Size 27.4 21.7 20.9 15.5 15.0 12.2 12.0 7.5 3.4 $25.0 24.0 16.0 9.3 8.4 6.0 5.5 5.0 Fund Size [Graphic Appears Here] 25 Overview of Airvana and Industry Landscape |
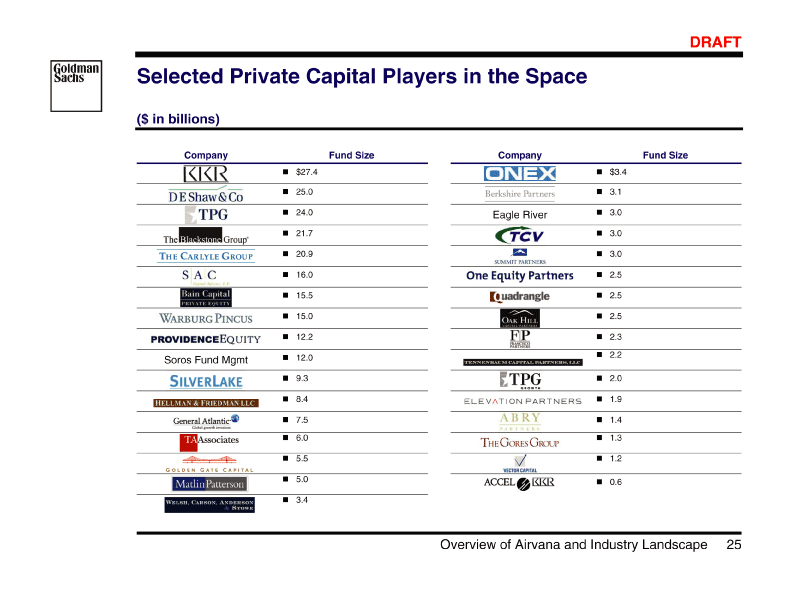
| B78823_62 |
| 8 Jan 2010 12:09 26/35 DRAFT [Graphic Appears Here] Additional Materials on Airvana Appendix A: 26 Additional Materials on Airvana |
| B78823_63 |
| 8 Jan 2010 12:09 27/35 Overview of Shareholder Base [Graphic Appears Here] DRAFT Top 20 Shareholders 31.4% 9.3% 8.9% 4.9% 4.2% 3.9% 3.5% 2.7% 1.5% 1.5% 1.3% 1.2% 1.1% 1.0% 0.7% 0.6% 0.6% 0.5% 21.2% 19,523,746 5,813,521 5,550,780 3,047,289 2,588,145 2,437,169 2,189,208 1,658,950 934,400 925,283 788,343 726,439 710,451 649,100 448,314 360,185 359,508 330,000 13,185,169 Matrix Partners QUALCOMM Inc. Unicorn Trust Deshpande, Gururaj PalmerDodge Advisors LLC Verma, Sanjeev Battat, Randall S. Eyuboglu, Vedat M. Needham Investment Management, LLC Venesprie Capital Management, LLC Palo Alto Investors, LLC The Vanguard Group, Inc. Barclays Global Investors UK Holdings Limited Renaissance Technologies Corp. The Bank of New York, Asset Mngt Arm State Street Global Advisors, Inc. Dimensional Fund Advisors LP AIG SunAmerica Asset Mgnt Corp. Other [Graphic Appears Here] Management includes: Verma, Sanjeev, Battat, Randall, Eyuboglu, Vedat, and Glidden, Jefrey. Includes Matrix Partner, Matrix VII Management Co., LLC, Matrix Capital Management. Source: Thomson Reuters Note: 1 Exhibit c—3 .pdf [Graphic Appears Here] Total Outstanding Shares: 62.2mm 27 Additional Materials on Airvana |
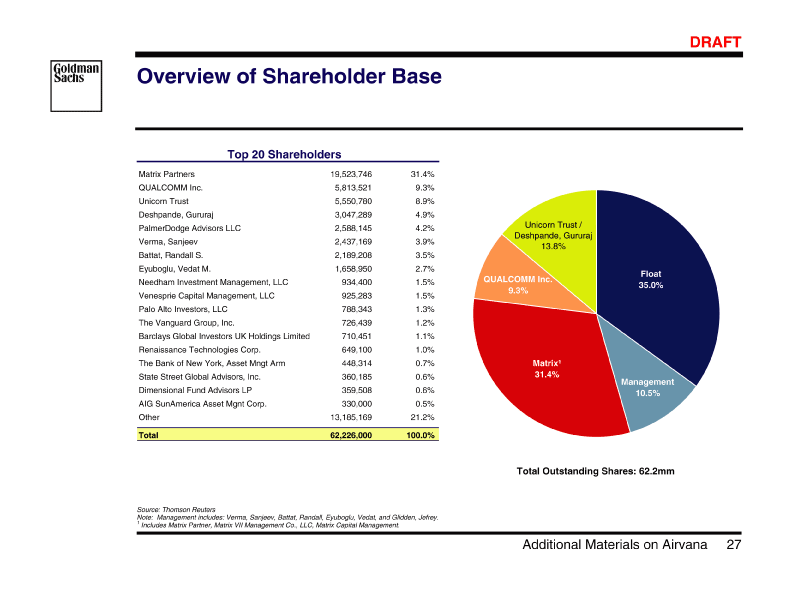
| B78823_64 |
| 8 Jan 2010 12:09 28/35 DRAFT Comparison of Selected Companies [Graphic Appears Here] | | | | | | | | | | | | | % % 2009-2010 Revenue Growth 2.0% 4.1 1.1 10.8 3.7 4.3 3.7 24.6 12.5 14.2 9.9 23.1 x 2010 P/E / 5-Year CAGR 2.5 x 1.3 3.9 2.9 (2.1) 1.7 2.5 NM 2.0 1.8 1.2 NM % % 4.5% 10.0 3.3 10.0 (5.5) 4.5 4.5 0.1 15.0 20.0 15.0 15.0 5-Year EPS CAGR — x x 2010 11.5 x 13.4 12.8 28.8 11.6 15.6 12.8 8.2 30.1 36.9 18.7 NM x x Calendarized P/E Multiples (2) 2009 NM 14.2 17.4 NM 16.1 15.9 16.1 9.9 35.1 76.4 21.4 NM — x x 2010 3.7 x 7.5 6.5 7.1 6.8 6.3 6.8 3.2 13.9 21.2 11.1 NM x x EV/ EBITDA 2009 6.5 x 7.9 8.4 19.6 8.7 10.2 8.4 3.9 16.5 49.3 12.5 NM — x x 2010 0.3 x 2.3 0.9 0.5 0.9 1.0 0.9 0.9 3.3 2.7 3.5 1.8 x x EV/ Sales 2009 0.3 x 2.4 1.0 0.5 0.9 1.0 0.9 1.2 3.8 3.1 3.9 2.2 6,843 227 492 624 2,483 643 84,943 26,379 12,251 51,147 36,31326,379 $10,38336,607 $ Enterprise Value (1) $ 4,709 426 628 736 2,741 876 30,394 14,090 52,106 41,86930,394 $12,60138,362 $108,045 Equity Market Cap (1) $ % % % of 52 Week High 34% 74 93 59 56 63.0 58.6 93 89 83 94 72 ) $ 2.08 18.34 9.23 6.05 14.04 Mean 6.18 9.48 7.26 33.52 8.49 Closing Price ( 10-Jul-2009 $ Median Co. (4) Category Leaders Company Broad Systems Companies Alcatel-Lucent Cisco Systems, Inc. (3) Ericsson Motorola Inc. Nokia Corp. Airvana, Inc. Acme Packet, Inc. (5) Aruba Networks, Inc. F5 Networks Inc. Infinera Corp. [Graphic Appears Here] [Graphic Appears Here] ber. All research estimates have been calendarized to Decem Projected revenues, EBITDA, EBIT, and EPS are based on IBES median estimates and/or other Wall Street research. Equity Market Cap based on diluted shares outstanding. Latest publicly available financial statements. LTM numbers are based on latest publicly available financial statements. Pro Forma for cash sale of TEMS which closed on 02-Jun-2009. Source: Sources: Cash and shares outstanding pro forma for acquisitions of Pure Digital Technologies and Tidal Software Pro Forma for acquisition of Convergence which closed on 29-Apr-2009. (1) (2) (3) (4) (5) 28 Additional Materials on Airvana |
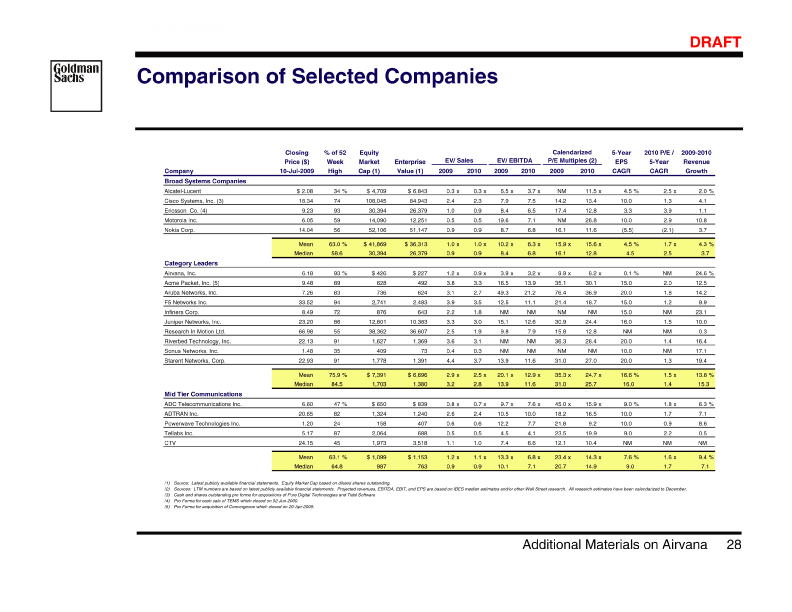
| B78823_65 |
| 8 Jan 2010 12:09 29/35 DRAFT [Graphic Appears Here] Detailed Banker Biographies Appendix B: 29 Detailed Banker Biographies |
| B78823_66 |
| 8 Jan 2010 12:09 30/35 DRAFT [Graphic Appears Here] Goldman Sachs Team Ryan Limaye Banker Background Selected Transaction Experience [Graphic Appears Here] Ryan Limaye Professional Background • and and Sachs in 2001 Group Telecom of Investment Banking in 2002 of MD • Head in Goldman Communications Co-Head Investment Named Joined the Technology Global CommTech Banking partner in & 1994 • Educational Background • and the B.S. at M.B.A. of School of University Pennsylvania, B.A.S. Wharton University Pennsylvania, • • Ascend Alcatel Systems to (size transactions AT&T to Uniphase Yurie Softbank infrastructure) semi) of Siara Unisphere sale NetScreen of to (terminated) AOL UTStarcom from venture JDS of General of Acterna Point Earthlink 50+ Technologies (terminated) of sale to to billion joint with of CIENA of CIENA Point sale to (wireless (wireless Technologies undisclosed) Lucent acquisition spinoff Efficient CIENA acquisition with million to Coherent Tipping Opnext sale undisclosed) (size across $1.5 H3C of acquisition spinoff acquisition of Check PCSI PCSI Huawei of acquisition sale of of Citrix VeriSign McData (size of merger million Neustar of of with billion billion acquisition to to to M&A billion billion billion merger $800 out to million CommWorks AudioCodes to Citrix with Zaffire undisclosed) billion million million sale sale $200 of sale sale of billion sale sale to sale to in merger $24.5 $24.1 acquisition acquisition $4.3 $1.5 CommScope $1.0 billion Group) million acquisition acquisition carve $150 sale Microsoft (size acquisition $20 $4.4 $800 $487 million million million $125 sale sale million million venture to billion billion billion billion and $1.0 Siemens $775 million million million joint IBM • Telecommunications billion $1.3 Networks Networks Instrument Networks from (Interface Networks million $330 $270 $225 Networks Systems million million $62 million $23 $18 Sale acquisition to $100 $30.0 Technologies Technologies $1.8 Dynamics $6.7 Technologies Systems Uniphase $450 $430 $350 Communications Edge $100 $90 $41 Logic Telecom Logic China Sale Catena ADC Cirrus Over Alcatel Lucent Communications Lucent Genesys 3Com Siemens E-TEK Tellabs Juniper Technologies Redback General Semicondutor Lucent ONI Juniper Networks Comdex JDS Tellabs 3Com Hitachi NetScaler LightSurf Sourcefire Tegic New Sanera 3Com Nuera UltraDNS Teros Cirrus to Rockwell 3Com undisclosed) Frontbridge Centerpoint Vallent • • $15 dual over offering Networks stock spread offering offering offering placement • Notes offering call public offering private offering offerings common offering offering D offering raising bn Juniper offering offering with initial offering follow-on offering offering offering convertible private offering of and public offering public $4.0 convertible offering follow-up million offering public on public public offering Series D public on repurchase repurchase repurchase and trade convertible follow-on million follow-on initial follow initial million offering Series public initial bond IPO offering convertible $200 public offering million initial follow stock stock block convertible million $250 million initial intial $115 initial million repurchase transactions million offering billion billion million million follow-on million million initial $85 million million million IPO billion billion follow-on $500 million convertible $250 $200 million million follow-on million $60 convertible common stock common IPO IPO $101 debt $1.2 $1.0 $240 milli on $130 $120 convertible $75 $65 $61 million $1.6 $1.0 million $475 million $200 $125 Technologies million million $65 financing billion Networks Systems $200 $98 million Systems Systems $291mm $209 $145mm Networks Networks offerings $300 Communications Dynamics Networks Networks Networks $75 Networks Dynamics Networks Networks Networks common • Networks $6.5 Ericsson Systems $600 Uniphase Telecommunications Systems Packet $90 Communications • Over billion Opnext Infinera Starent Aruba Cisco L.M. stake Juniper Juniper ONI tranche Netro Redback JDS CIENA overlay CoSine Turnstone E-TEK Juniper ADC Redback ONI Sonus Acme Sonus Broadband Riverbed Imax Agility placement NetGear Catena E-TEK Synchronoss Sonus Turnstone Juniper Juniper VeriSign Turnstone • 30 Detailed Banker Biographies |
| B78823_67 |
| 8 Jan 2010 12:09 31/35 DRAFT [Graphic Appears Here] Goldman Sachs Team Bill Anderson Banker Background Selected Transaction Experience [Graphic Appears Here] Bill Anderson Professional Background • for and & 2004 Goldman a attorney in was Thacher anti-raid defense MD joining Bill and of to Head activism business Named Prior Sachs, Mergers Acquisitions Simpson Bartlett • Educational Background • University, Georgetown J.D. • B.S.B.A, • cross- from bid by Terica defense Service Astellas Oracle Qwest cross-border News raid activism Insurance of Press Capital Capital Harbin from Oracle/Icahn from unsolicited Alfa NCS Citigroup following by and of of Oliver Pirate against against subsequent to Peru OSS takeover defense Samsung against a defense from raid subsequent defense cross-border following Comcast squeezeout sale Copper Kerkorian against against against defense with e hostile raid against defense defense, InBev defense following and following from squeezeout minority squeezeout Southern Grupo against e raid raid by, takeover takeover of defens defense activism Rectifier defense takeover defense defense, Roche committee bid minority minority connection by defense defens hostile by, hostile Express in in offer Times Vishay Enterprises raid acquisition raid raid special following cross-border in committee activism activism activism International Stewart SanDisk Therapeutics hostile Jones Patheon JLL Mutual in activism York against Corp. CV Anheuser-Busch border PeopleSoft BEA Frontier Ventana acquisition Dow Corp. Corporate Staples from Disney Shamrock Alfa Ipsen Nationwide Banamex Special unsolicited Ford Phoenix Hexcel Intrawest New • • and K against Sun Sandell Steel from Icahn and Icahn Shamrock Icahn against against CalPERS ECS TD against and Icahn defense (at against Obrem by from against Peltz activism MMI Icahn against Icahn Icahn against against against activism defense defense against against Jana defense defense against against against activism activism defense against against defense defense following tivism defense against activism e defense defense following following activism defense Max defense defense activism activism ac defense defense activism defens defense activism Office Semiconductor Brands Colony activism activism Marketing Union activism activism Bread Warner activism to activism activism activism activism activism Biogen Motorola Micrel Panera Medimmune Matrix Time Icahn/Jana/S.A.C./Franklin Kraft Advisor Capital Unisys National Relational WCI Temple-Inland Furniture Capital Lancaster Barington Safeway Vodafone TD Waterhouse) Catalina ValueAct Southern KT&G Partners Amylin Eastbourne • 31 Detailed Banker Biographies |
| B78823_68 |
| 8 Jan 2010 12:09 32/35 DRAFT [Graphic Appears Here] Goldman Sachs Team Avi Mehrotra Banker Background Selected Transaction Experience [Graphic Appears Here] Avi Mehrotra Professional Background • Sachs 2004 M&A • Technology in the MD Goldman in of 2001 Head M&A Named Joined in Department • Educational Background • B.S. University, University M.B.A. Cornell Stanford GSB, • • / / Pfizer tender Partners to Stratus Sandler Movil to dutch Times of share sale / squeeze-out divestiture to and • Dearborn York Pearson dividend Re-IPO American New / Verint to divestiture offering defense Keylink CMGI minority to Systems QPass offering CenturyTel against to Legato of LSI to recapitalization to advisory offering sale raid of of Madison Parametric Rakuten sponsor notes to Symbol to Blackboard / Media sale sale to with sale to divestiture divestiture sale IPO Connection to follow-on defense leveraged Media sale committee sale sale acquisition follow-on Crafts River raid Systems acquisition acquisition Communications’ Media convertible merger Slim Warner-Lambert EMC Gartner Arrow Cinemark Modus Matrics Cox special About.com WRC Arbortext Linkshare CommVault Teradyne Amphenol WebCT Amdocs Recapitalization Computer Gartner Primedia Capital EMC repurchases CommVault Agere Madison CANTV Carlos Witness • • Source MMI against to advisory / against defense Friedman divestiture Light Test ChinaHR Affinitylabs offering & formation advisory Nextest / Strata Eagle of of notes activism Media of Logix Ansoft Capital of Hellman of T-Mobile of of defense to Bain to consortium acquisition acquisition sale acquisition to acquisition convertible Marketing / Enthusiast sale acquisition Canada acquisition activism sale acquisition Catalina ValueAct Primedia Interlink SunCom Teradyne Arrow MTS Ansys Unisys Contec Opnext Teradyne Monster.com Monster.com Teradyne • 32 Detailed Banker Biographies |
| B78823_69 |
| 8 Jan 2010 12:09 33/35 DRAFT Goldman Sachs Team Jason Rowe [Graphic Appears Here] Banker Background Selected Transaction Experience [Graphic Appears Here] Professional Background • the & U.S. a in Media Investment Coast the as U.S. the in the Battalion Division East th Airborne Columbia, in 5 in of was served nd President to 82 Vice Technology, Telecommunications Group Banking Head Communications Technology Prior Jason Army, captain Ranger and Division • Educational Background • Military of States B.S. University School M.B.A United Academy, Columbia Graduate Business, • Jason Rowe • high $1.5bn offering and equity (Freescale) $264mm division yield and high Sachs Offering repurchase division Partners Register AWE $500mm tes debt GSS semiconductor of Light No and IPO and Goldman Icahn CSG’s its Harvest Journal Strata Clearwire of by to and and Symbol of equity Secured Carl Keylink in IPO of offering sale of Lake TPG st of Rakuten and buyout Yield IPO merger to Wireless Verizon by Senior activi Silver acquisition off offering $350mm to to investment sale IPO $415mm acquisition High IPO IPO acquisition acquisition $30bn to spin AT&T Sale purchase mm $1.1bn mm onse $125mm sale recapitalization loan leveraged News of bn $248mm $425mm $138mm off bn $135 $400 $145mm resp $291mm $3.9bn Lucent $300mm $1.7bn bank Compressor $28.1 $27 Wireless $485mm Packet & $800mm $485mm and $225mm Century spin Intelsat Starent Motorola Opnext Motorola Acme Alcatel IPC Motorola Comverse Linkshare IPC VistaPrint Motorola CSC st Alltel Alltel Opnext Leap Arrow yield 21 AT&T Hanover • 33 Detailed Banker Biographies |
| B78823_70 |
| 8 Jan 2010 12:09 34/35 DRAFT Disclaimer [Graphic Appears Here] s) may rials of any kind out Goldman Notwithstanding anything in this document to the contrary, and except as e tax treatment and tax structure of the transaction and all mate such tax treatment and tax structure, with Goldman Sachs does not provide accounting, tax, or legal advice. required to enable compliance with applicable securities law, you (and each of your employees, representatives, and other agent disclose to any and all persons the US federal income and stat (including tax opinions and other tax analyses) that are provided to you relating to Sachs imposing any limitation of any kind. 34 r Disclaime |
| B78823_71 |
| 8 Jan 2010 12:09 1/55 PRELIMINARY DRAFT [Graphic Appears Here] Initial Study Prepared for the Atlas Special Committee Goldman, Sachs & Co. August 11, 2009 |
| B78823_72 |
| 8 Jan 2010 12:09 2/55 PRELIMINARY DRAFT Disclaimer [Graphic Appears Here] se. tax y not no not The and an these purpo of future has are ion”) solely income kind. does by Confidential vailable to tax analyses) , investment activities GS and other any assuming mation may not be state of her obligations) of ounting and other suggested person Information The for any and brokerage without limitation information. than other Company. ee”) of Atlas (the “Company”) in upon income any such any Confidential financing, assumed, or the relied federal and any favorable the to or imposing for less in US GS hedging, tes or any currency or commodity that may be upon or Company available used the ordinary course of these activities and services, liability the analyses be or relied more any of ors (the “Special Committ person, person any kind (including tax opinions and other without has The may any management, GS assume liabilities law. that to structure, risk significantly any other not be and tax any disclose Information, does may assets under alternative by and ial banking and financial advisory services, securities trading counseling, s persons and entities. In the positions and investments, as well as actively trade or effect transactions, in any of their respective affilia leteness of all of the financial, legal, regulatory, tax, acc GS ll not be on behalf of the Company. Analyses based upon forecasts rities) and financial instruments (including bank loans and ot and which the person other sumes no responsibility for updating or revising the Confidential Information. upon of any treatment ect to, and governed by, any written agreement between the Company, the Board benefits GS, results are materially different from those forecast. any relied Company may Confidential results, or to tax by or the the future appraisal to such or monetary, market and other conditions as in effect on, and the information made a planning, unt and for the accounts of their customers. business decision of the Company to engage in any transaction, or the relative merits of any to reviewed actual Company compared contrary, action described herein and all materials of preparing or the as In of disclosed the relating financial her party to any transaction and with evaluation of to herein publicly, herein Company investment, sources. discussed indicative solvency to to other independent the the to, referred referred anything to principal necessarily an and/or provided made evaluate or provided not to alternative are not are Confidential Information, including this disclaimer, is subj has Goldman, Sachs & Co. (“GS”) has prepared and provided these materials and GS’s related presentation (the “Confidential Informat for the information and assistance of the Special Committee of the Board of Direct connection with its consideration of the matters referred to herein. Without GS’s prior written consent, the Confidential Infor circulated Notwithstanding treatment and tax structure of any trans that and/or any committee thereof, on the one hand, and GS, on the other hand. GS and its affiliates are engaged in investment banking, commerc management, other financial and non-financial activities and services for variou GS and its affiliates may at any time make or hold long or short the equity, debt and other securities (or related derivative secu third parties, the Company, any ot involved in any transaction for their own acco The Confidential Information has been prepared and based on information obtained by GS from publicly available sources, the Company’s management responsibility for independent verification, the accuracy and comp information provide accounting, tax, legal or regulatory advice. GS’s role in any due diligence review is limited solely to performing such a review as it shall deem necessary to support its own advice and analysis and sha results analyses, and GS does not assume responsibility if future GS obligation appraisals nor do they necessarily reflect the prices at which businesses or securities actually may be sold or purchased. The Confidential Information does not address the underlying strategic Information is necessarily based on economic, GS as of, the date of such Confidential Information and GS as |
| B78823_73 |
| 8 Jan 2010 12:09 3/55 Table of Contents [Graphic Appears Here] EV-DO Market Femto Market Supporting Materials Industry Overview A. B. Overview of Atlas Projections Per Atlas Management Market Perspectives and Valuation Analyses Selected Alternatives for Atlas Appendix A: I. II. III. IV. PRELIMINARY DRAFT may s) agent out Goldman other and representatives, employees, your of each (and you e tax treatment and tax structure of the transaction and all materials of any kind law, securities applicable with compliance enable Goldman Sachs does not provide accounting, tax, or legal advice. Notwithstanding anything in this document to the contrary, and except as to (including tax opinions and other tax analyses) that are provided to you relating to such tax treatment and tax structure, with required disclose to any and all persons the US federal income and stat Sachs imposing any limitation of any kind. |
| B78823_74 |
| 8 Jan 2010 12:09 1/55 PRELIMINARY DRAFT [Graphic Appears Here] Industry Overview I. 1 Industry Overview |
| B78823_75 |
| 8 Jan 2010 12:09 2/55 [Graphic Appears Here] Atlas Markets EV-DO Wireless Market • traffic to data shifts wireless investment (Nortel) by driven as customer decline market in OEM Core Market LTE Single • Key Opportunities • growth done been traffic business has upgrades data to margin investment high product exposure / R&D Regular of Direct Software Bulk • [Graphic Appears Here] [Graphic Appears Here] Key Threats • fall-off accelerate concentration decline could in LTE bankruptcy market to customer End Shift Nortel End • [Graphic Appears Here] 629.6mm by ‘10 PRELIMINARY $ Key Opportunities Key Threats DRAFT Femto Market New market will be driven by carrier 129.1mm ‘09 grows to Potential high growth market Early lead in CDMA Strong channel partners — deployment decisions $ — 2009E Atlas Billings Atlas 2013E Atlas Billings • market UMTS uncertain larger high still in competitive highly traction very cost size Market Limited Potentially Component • Femto market estimates based on ABI Research (Q1 2009) Gross Billings which do not include Management Corporate Risk Adjustments (if Management Corporate Risk Adjustments included, total Billings would be $162mm and $490mm for 2009E and 2013E, respectively). Source: Atlas projections per Atlas Management (Base Case) based on Atlas Management presentations to Atlas Board of Directors (2013E from 15-May-2009 Strategy Review, 2009E from 28-Jul-2009 Board of Directors presentation), 1 2 Industry Overview |
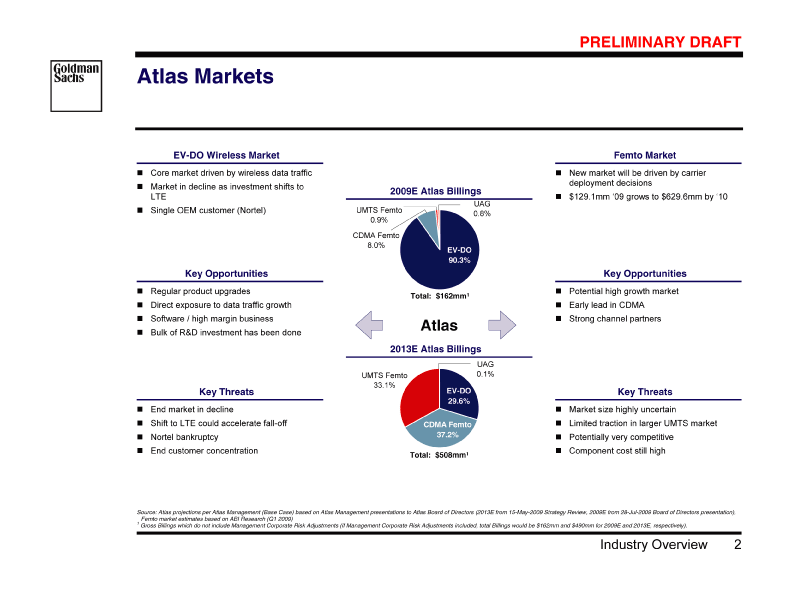
| B78823_76 |
| 8 Jan 2010 12:09 3/55 PRELIMINARY DRAFT [Graphic Appears Here] EV-DO Market A. 3 Industry Overview |
| B78823_77 |
| 8 Jan 2010 12:09 4/55 PRELIMINARY DRAFT EV-DO Market Drivers and Expectations ($ in billions) [Graphic Appears Here] [Graphic Appears Here] Market Expectations for Global CDMA / EV-DO Infrastructure Spending of ARPU for been aggressive bringing business [Graphic Appears Here] 5.8 $ biggest driver but future growth % of total 5.4 $ until 2013 availability by Verizon remains a key 2009 2008 2011 2010 2013 2012 infrastructure spending based on Gartner (May 2009) DO - EV / CDMA Source: 4 Industry Overview |
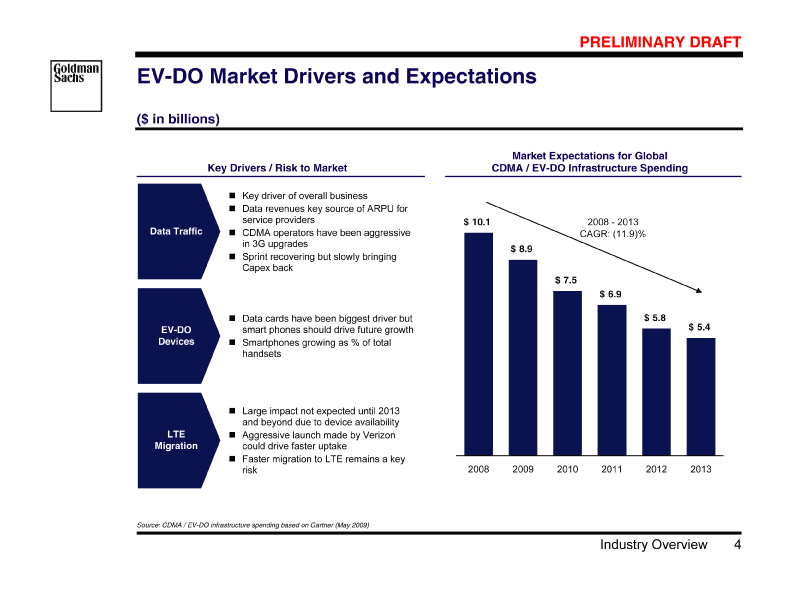
| B78823_78 |
| 8 Jan 2010 12:09 5/55 EV-DO Market Key U.S. Customers [Graphic Appears Here] PRELIMINARY DRAFT Atlas End Customer Concentration Key End Market Customers [Graphic Appears Here] [Graphic Appears Here] 1 100% of EV-DO products sold in CDMA carriers Impact of Ericsson Acquisition of Nortel CDMA Business [Graphic Appears Here] • the $7.5bn in LTE • Carrier deploying Capex: Wireless Wireless ‘09 Largest U.S. Aggressively • [Graphic Appears Here] Development, purchase and sale for CDMA EV-DO Atlas Management expects contract to be assumed, Atlas Management estimates some risk to the products cured and assigned $36.4mm being negotiated Ericsson indicated to Atlas Management that Atlas Atlas Management plans to begin negotiations on Risk of Ericsson accelerating LTE contract is key contract design and $36.4mm in receivables plus interest owed to Atlas — — — . Management Atlas Per Source: Companies’ filings, Wall Street Research 1 Exhibit c—4 .pdf • the LTE on on in / $1.6bn 4G $0.7bn $0.5bn regional carrier position on Verizon negative miss Verizon pure Capex: CDMA Capex: and stock Capex: and financial intentions Sprint flow earnings Sprint remaining Wireless largest Wireless cash Wireless ‘09 nd ‘09 Behind Still Recent ‘09 Behind Last • U.S. Difficult Unclear EV-DO pressuring EV-DO carrier • 5 Industry Overview |
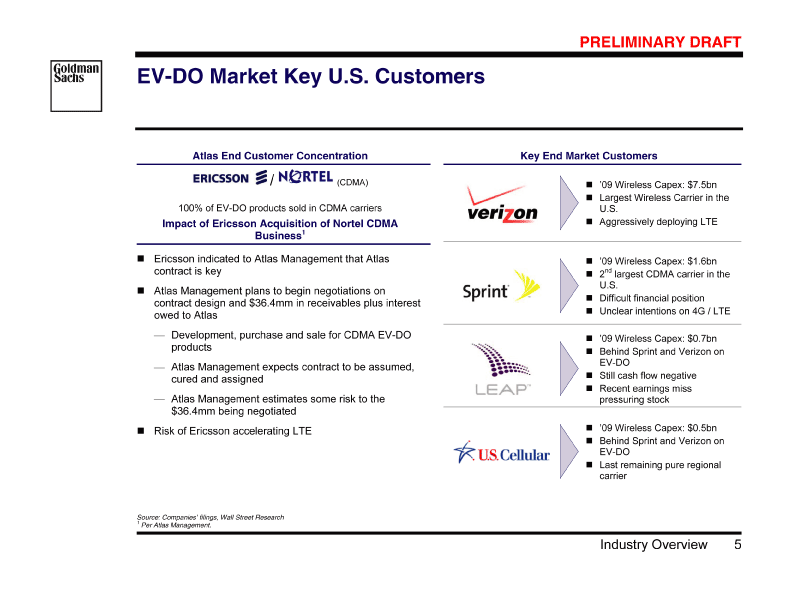
| B78823_79 |
| 8 Jan 2010 12:09 6/55 PRELIMINARY DRAFT LTE Transition Remains a Key Risk [Graphic Appears Here] U.S. LTE Subscriber Expectations (‘000s) 46,786 Key Announcements Operators LTE Deployment Plan Commercial Target AT&T RFP (2008, 3Q), Trial (2009, 3Q), Large market trial (2010) 2011 • Trial RFP 2Q) 2.6GHz, 2.1GHz, (2009, (Europe): (USA): Trial 3Q) 3Q), T-Mobile (2009, T-Mobile (2008, • Europe (2010 1Q) USA (2011 2Q) T-Mobile Verizon End of 2009 or Early 2010 16,141 eNodeB: Alcatel-Lucent, Ericsson ePC: Alcatel-Lucent, Ericsson, Starent Networks IMS: Alcatel-Lucent, Nokia Siemens Networks Aggressive roll-out schedule Selected LTE vendors (Feb, Launch commercial service in 2 cities in 2009, 25~30 cities in 2010, National coverage by 2015 using 700MHz spectrum acquired 2009) — — — 5,182 1,540 2011 228 [Graphic Appears Here] 2010 2012 2013 2014 Source: Informa Telecoms & Media (June 10, 2009). Companies’ public announcements 6 Industry Overview |
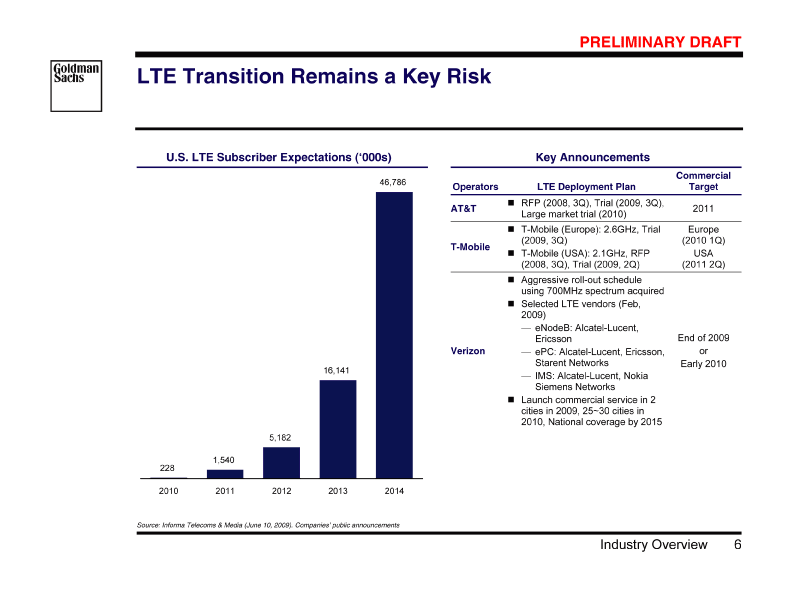
| B78823_80 |
| 8 Jan 2010 12:09 7/55 PRELIMINARY DRAFT [Graphic Appears Here] Femto Market B. 7 Industry Overview |
| B78823_81 |
| 8 Jan 2010 12:09 8/55 PRELIMINARY DRAFT Overview of Femto Market (Units in millions) [Graphic Appears Here] Market Size 1 Observations 2009 Composition CDMA 50% WCDMA / HSDPA 50% [Graphic Appears Here] Verizon, Sprint, KDDI New market with unproven demand CDMA market likely to expand first but will Customer orders beginning to happen in CDMA UMTS still waiting on standard to be set but trials Ultimate uptake difficult to gauge Technology industry riddled with promising markets that fail to materialize ultimately be smaller than UMTS — happening at AT&T Total Units: 3.7mm Total Global Market Size Evolution (Units)1 18.3 1.0 13.4 1.8 11.6 9.0 2.0 7.0 2011 17.3 3.7 1.2 2.5 2010 0.8 0.4 [Graphic Appears Here] 2009 2012 [Graphic Appears Here] 2013 [Graphic Appears Here] Excludes 4G technology (WiMAX, Multimode WCDMA / LTE and Multimode CDMA / WiMAX). Source: Femto market size per ABI Research (Q1 2009) 1 8 Industry Overview |
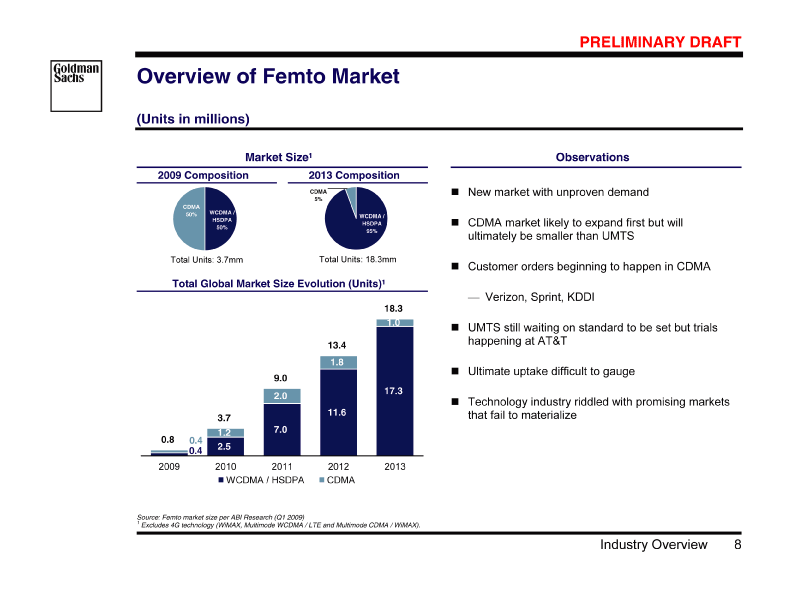
| B78823_82 |
| [Graphic Appears Here] [Graphic Appears Here] Airwalk KDDI PRELIMINARY DRAFT Atlas Verizon Sprint CDMA — End of 2009 Cumulative Units Samsung UMTS — End of 2009 Cumulative Units 120,000 100,000 80,000 60,000 40,000 20,000 0 120,000 100,000 Potential OEM Partners UMTS CDMA 8 Jan 2010 12:09 9/55 Competitive Landscape and Channel Penetration [Graphic Appears Here] [Graphic Appears Here] 80,000 60,000 40,000 20,000 0 [Graphic Appears Here] [Graphic Appears Here] [Graphic Appears Here] [Graphic Appears Here] Ubiquisys Starhub Cisco/IPA CHT [Graphic Appears Here] [Graphic Appears Here] Huawei SFR ALU Softbank Atlas AT&T Source: CDMA and UMTS Femto units per Atlas Management presentation to the Atlas Board of Directors (15-May-2009 Strategy Review) 9 Industry Overview |
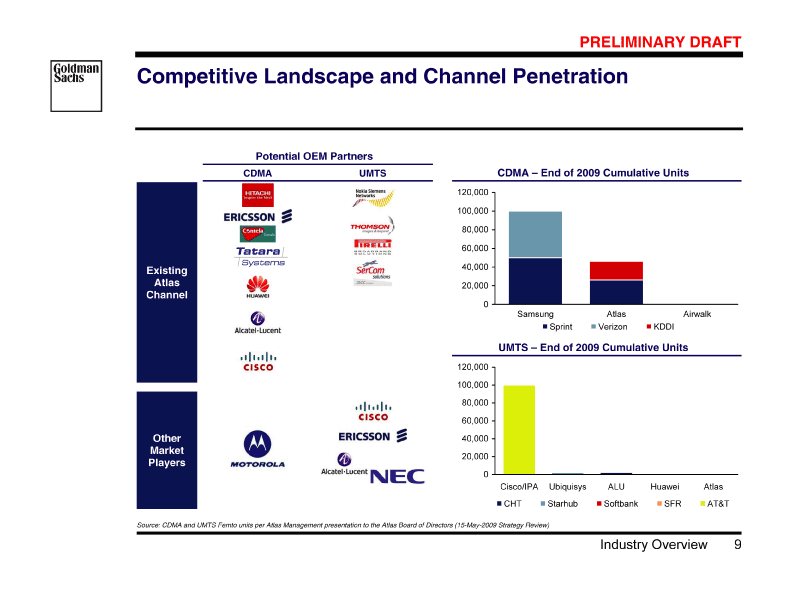
| B78823_83 |
| 8 Jan 2010 12:09 10/55 PRELIMINARY DRAFT Atlas Strengths and Weaknesses in Femto Market [Graphic Appears Here] CDMA Strengths • A-LU Huawei, Ericsson, Hitachi, Sprint -KDDI, — development partnerships wins 1 Tier Feature Channel • UMTS Strengths • Sercomm Pirelli, software Thomson, NSN, chips, — partners solution E2E Channel • Weakness • UMTS vs. integration solution market network small cost timing a product core GPS Ultimately High Complex Require • Weakness • (AT&T) to-date trial scale yet late partner are large deployments only aggressive the standards of not part is commercial Market Not NSN No • with Atlas Management. discussions Per Source: 10 Industry Overview |
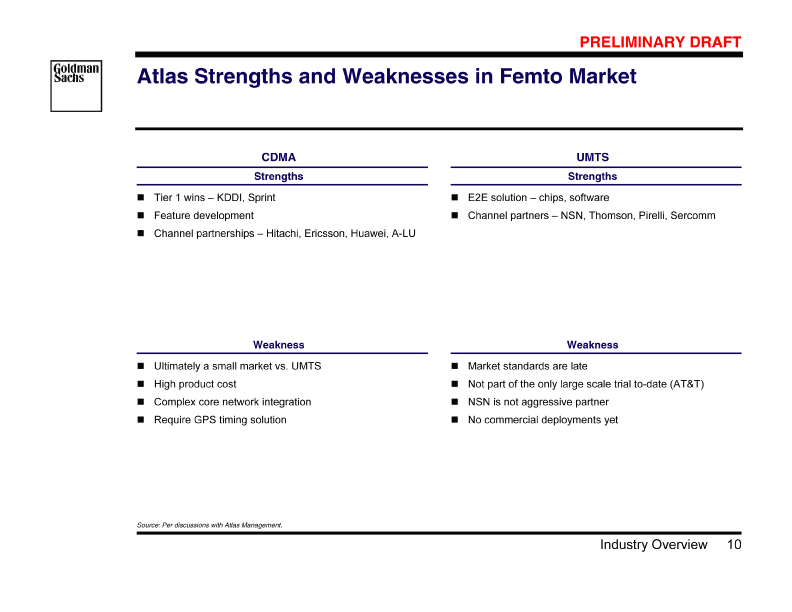
| B78823_84 |
| 8 Jan 2010 12:09 11/55 PRELIMINARY DRAFT [Graphic Appears Here] Overview of Atlas Projections Per Atlas Management II. 11 Overview of Atlas Projections Per Atlas Management |
| B78823_85 |
| 8 Jan 2010 12:09 12/55 PRELIMINARY DRAFT Overview of Atlas Projections Per Atlas Management Base Case ($ in millions) [Graphic Appears Here] | | | | | 490 341 149 120 103 $2013 E $ 2013 E 390 239 151 100 106 (6) $2012 E 2012 E $ FMC FMC 295 150 145 72 101 (29) Billings $ 2011 E EV-DO Operating Profit $ 2011 E EV-DO 225 83 142 52 92 (40) $2010 E $ 2010 E 16 162 146 37 96 (59) $2009 E $ 2009 E Observations [Graphic Appears Here] 17 [Graphic Appears Here] Risk in re-negotiation of Ericsson contracts Will have to decline at some point as technology matures Slower traffic growth or faster LTE conversion could result in revenue declines Management also developed a downside view for revenues Both rollouts and pricing unknown Not part of AT&T trials which is largest UMTS trials to-date EV-DO business driven by 3G traffic assumption with Femto spending estimates should be controllable but Significant traction in UMTS will be required for ultimate constant pricing — — — — ultimate market success and size highly unpredictable — projections to be achieved — Volume ramps will be required to push down costs for bill of materials Source: Atlas projections per Atlas Management (Base Case) based on Atlas Management presentations to Atlas Board of Directors (2010 — 2013 from 15-May-2009 Strategy Review, 2009 from 28-Jul- 2009 Board of Directors presentation). EV-DO and FMC projections include Management Corporate Risk Adjustments 12 Overview of Atlas Projections Per Atlas Management |
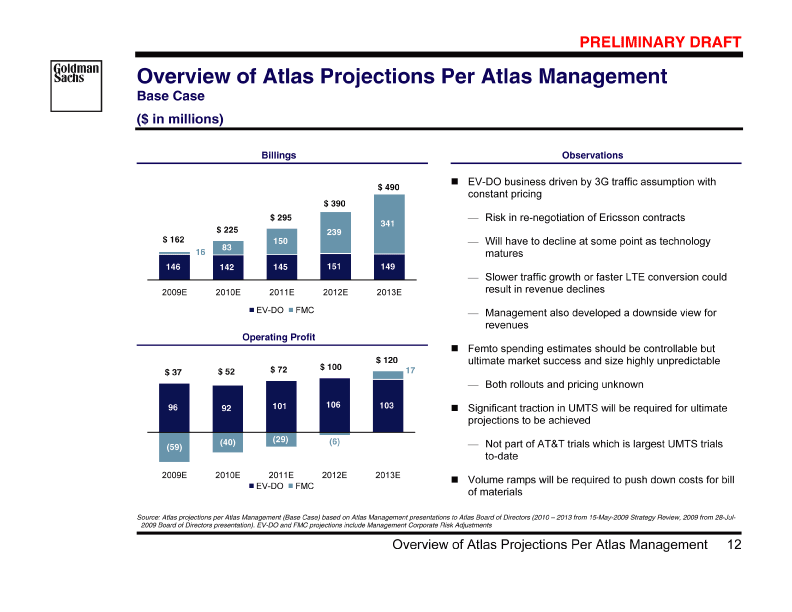
| B78823_86 |
| 8 Jan 2010 12:09 13/55 PRELIMINARY DRAFT Atlas Projections Per Atlas Management (Base Case) | | | | | | | | | | | | 0.4% 115.9% 31.8% 2.5% NM 32.7% 1.9% NM 34.1% 34.7% 2009 — 2013 CAGR 149 341 490 108 19 127 (7) 103 17 120 0 12 (42) 90 $ 2013 E $ $25.6% $ $25.9% 18.7% $ $24.5% 20.0% 151 239 390 111 (4)107 (7) 106 (6)100 0 10 (35) 75 $ 2012 E $ $32.2% $ $27.4% 37.2% $ $25.6% 38.9% 150 (26)78 (6) (29)72 0 8 (26) 55 145 295 104 101 $ $ $ 2011 E $ $31.1% $26.4% 38.1% $24.4% 38.5% 83 94 (38)57 (5) 92 (40)52 0 7 (19) 40 142 225 $ $ $ $ $ 2010 E $ $38.7% 25.1% 38.1% 23.1% 40.2% 16 98 (57)41 (4) 96 (59)37 0 3 (13) 27 146 162 $ $ $ $ $ 2009 E $ $25.2% 22.9% in millions) A $ EV-DO FMC Billings (Non-GAAP) % Growth EV-DO FMC EBITD % Margin % Growth Depreciation & Amortization EV-DO FMC EBIT % Margin % Growth Financing Expenses Net Interest (Expense) / Income Tax Expense Net Income ( of $36.4mm owed by Nortel in 2009. recovery full 2009 Board of Directors presentation). EV-DO and FMC projections include Management Corporate Risk Adjustments Assumes Source: Atlas projections per Atlas Management (Base Case) based on Atlas Management presentations to Atlas Board of Directors (2010 - 2013 from 15-May-2009 Strategy Review, 2009 from 28-Jul- 1 13 Overview of Atlas Projections Per Atlas Management [Graphic Appears Here] |
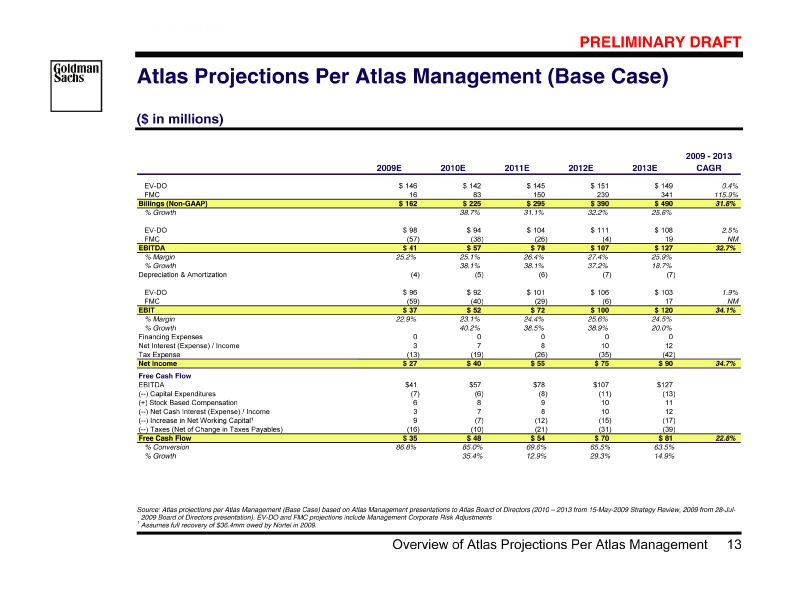
| B78823_87 |
| 8 Jan 2010 12:09 14/55 PRELIMINARY DRAFT Atlas Cash Flow & Cash Projections Per Atlas Management Base Case ($ in millions) [Graphic Appears Here] Projected Cash Flow from Operations Projected Cash Balance $509 $428 $358 Nortel Receivable $256 36 $304 $81 $70 219 $54 $48 $35 2010E 2009E 2012E 2011E 2013E 2010E 2009E 2012E 2011E 2013E Adjustments. Assumes full recovery of $36.4mm owed by Nortel in 2009 include Management Corporate Risk Source: Atlas projections per Atlas Management (Base Case) based on Atlas Management presentations to Atlas Board of Directors (2010 - 2013 from 15-May-2009 Strategy Review, 2009 from 28-Jul- 2009 Board of Directors presentation). EV-DO and FMC projections 14 Overview of Atlas Projections Per Atlas Management |
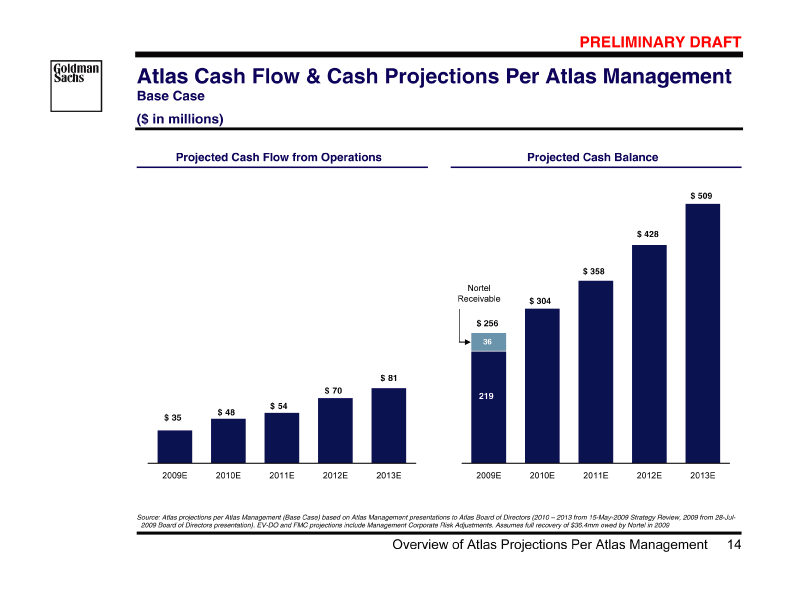
| B78823_88 |
| 8 Jan 2010 12:09 15/55 PRELIMINARY DRAFT Atlas Projections Per Atlas Management (Downside Case) ($ in millions) • Case Base Management Atlas to relative estimates Management billings Atlas of per margins rate EV-DO the gross 100% in at estimates decline constant fall to Femto faster and assumed to Assumes change Projections Opex No • | | | | | | | | | | (14.5)% 115.9% 26.8% (13.6 )% NM 15.8% (15.1 )% NM 15.7% 17.7% 2009 — 2013 CAGR 78 54 19 74 (7) 50 17 67 0 10 (25) 52 341 420 $ $ $ 2.4% $ $ 2.7% $ 2013 E $ 21.6% 17.5% 15.9% 76 (4)72 (7) 71 (6)65 0 9 (24) 50 106 239 345 $ $ $ $ $ 2012 E $ $ 31.0% 20.8% 32.1% 18.8% 34.0% 81 (26)54 (6) 77 (29)48 0 8 (18) 38 113 150 263 $ $ $ $ $ 2011 E $ $ 21.1% 20.6% (0.7%) 18.4% (3.8%) 83 93 (38)55 (5) 90 (40)50 0 7 (18) 39 135 217 $ $ $ $ $ 2010 E $ $ 34.1% 25.2% 33.9% 23.1% 35.5% EV-DO FMC Billings (Non-GAAP) % Growth EV-DO FMC EBITDA % Margin % Growth Depreciation & Amortization EV-DO FMC EBIT % Margin % Growth Financing Expenses Net Interest (Expense) / Income Tax Expense Net Income [Graphic Appears Here] Source: Atlas projections per Atlas Management (Downside Case) based on Atlas Management downside assumption for 2010-13 EV-DO revenues and assuming a constant gross profit margin and operating expenses decreasing at 100% of billings fall-off per Atlas Management guidance. FMC projections remain unchanged. Historical financials as of end of Q2 2009 EV-DO and FMC projections include Management Corporate Risk Adjustments. Assumes EV-DOl recovery of $36.4mm owed by Nortel in 2009 [Graphic Appears Here] 15 Overview of Atlas Projections Per Atlas Management |
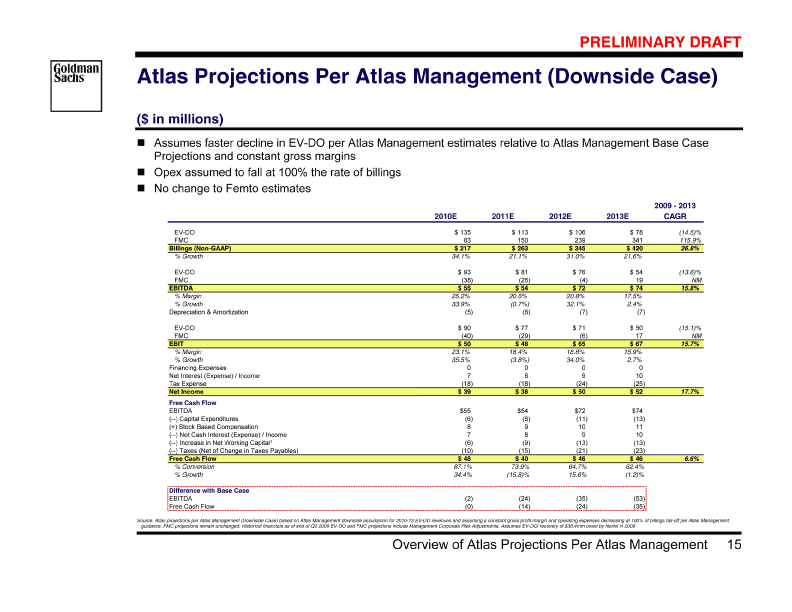
| B78823_89 |
| 8 Jan 2010 12:09 16/55 PRELIMINARY DRAFT Atlas Historical Results vs. Atlas Management Budget [Graphic Appears Here] | | | | | | | | Actual 146.9 34.8 12.6 140.1 4.2 2.1 0.5 2008 Plan 162.2 32.2 15.7 135.0 19.6 6.1 1.4 .2 34.9 91.8 138.6 0.2 3.4 Actual 142 2007 Plan 135.6 31.2 44.0 132.0 3.0 0.5 — Actual 151.9 71.3 25.1 143.2 8.7 1 2006 Plan 123.0 47.3 32.0 113.0 10.0 1 Total Company Billings / Revenue Operating Profit Cash Flow from Operations Billings By Product Line EV-DO Femto Gateway Other / Specialty changed in 2007 to a Billings model. 2006 numbers are shown in the prior, revenue-based method, upon which management was measured. methods Accounting Source: Atlas Management presentation to SAC (16-April-2009) 1 16 Overview of Atlas Projections Per Atlas Management |
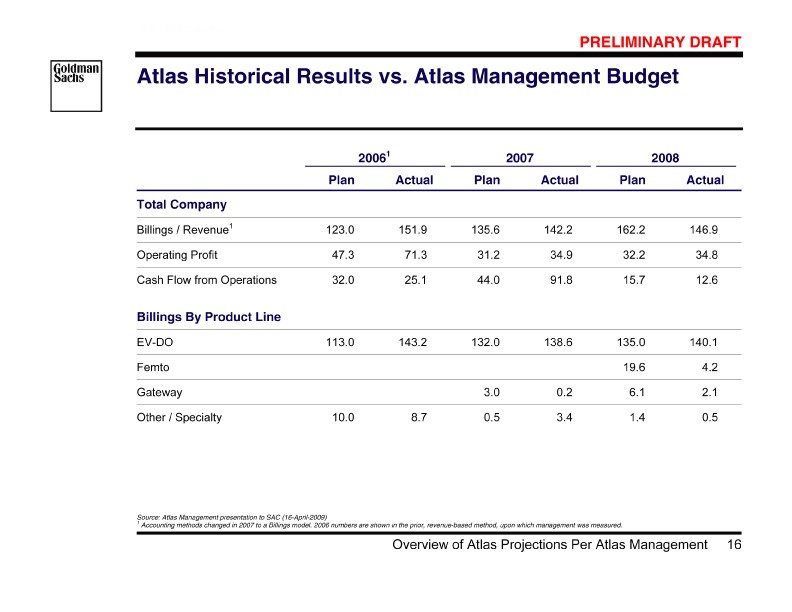
| B78823_90 |
| 8 Jan 2010 12:09 17/55 PRELIMINARY DRAFT Atlas Projections Per Atlas Management vs. Wall Street NA 35 NA 85 176 141 2010E $ 15.0% 20.0% 80.0% 48.4% 28 NA NA 91 153 125 Barclays (29-Jul-09)1 2009E $ 4.1% 18.1% 81.9% 59.3% — 20 NA NA 93 160 140 2010E $ 3.4% 12.8% 87.2% 58.3% NA 20 NA 93 155 135 Research Projections Needham (30-Jul-09)1 2009E $ 5.2% 12.7% 87.3% 60.2% — NA 48 NA 98 180 132 2010E $ 9.1% 26.5% 73.5% 54.1% NA 27 NA 96 165 138 Avondale (31-Jul-09)1 2009E $ 12.4% 16.2% 83.8% 57.8% — 72 101 93 225 154 2010E $ 38.7% 32.0% 68.4% 44.9% 41.2% 26 99 93 162 136 2009E $ 10.4% 16.0% 83.7% 61.2% 57.5% 14 99 94 Management Projections 147 133 2008A $ 9.3% 90.7% 67.2% 63.9% in millions) % Growth % Margin % Margin % Margin % Margin $ Billings (Non-GAAP) COGS on Billings Gross Profit on Billings Total Opex (incl. Share Based Comp.) Total Opex (excl. Share Based Comp.) Base Case ( Adjustments. Assumes full recovery of $36.4mm owed by Nortel in 2009 pre-tax in 2009 and $8.2mm pre-tax in 2010). include Management Corporate Risk 2009 Board of Directors presentation). EV-DO and FMC projections Pro-forma Net Income on Billings and EPS does not include Stock Based Compensation (estimated by Atlas Management to be $5.9mm Atlas Management does not project fully diluted share counts. Source: Atlas projections per Atlas Management (Base Case) based on Atlas Management presentations to Atlas Board of Directors (2010 - 2013 from 15-May-2009 Strategy Review, 2009 from 28-Jul- 1 2 [Graphic Appears Here] 17 Overview of Atlas Projections Per Atlas Management |
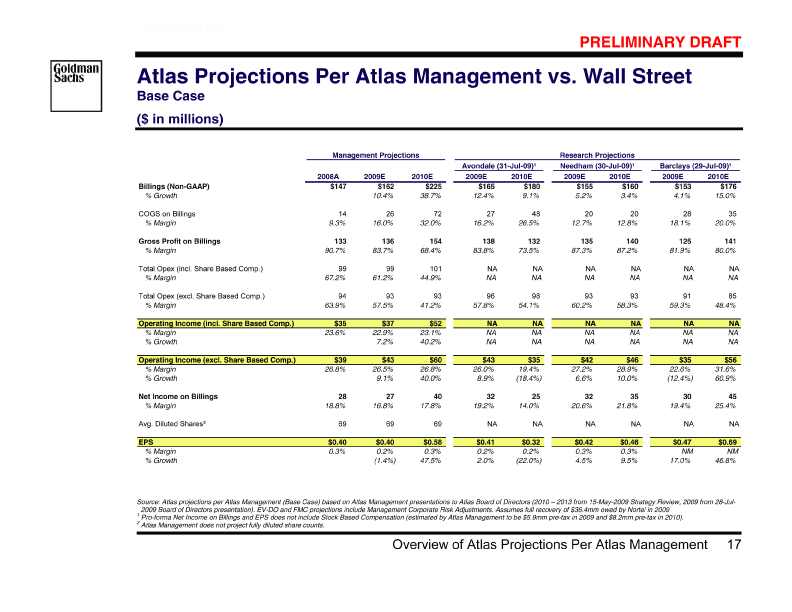
| B78823_91 |
| 8 Jan 2010 12:09 18/55 PRELIMINARY DRAFT [Graphic Appears Here] Market Perspectives and Valuation Analyses III. 18 Valuation Analyses Market Perspectives and |
| B78823_92 |
| 8 Jan 2010 12:09 19/55 PRELIMINARY DRAFT Overview of Atlas Equity Performance Since IPO [Graphic Appears Here] [Graphic Appears Here] Atlas Volume of 07-Aug-2009 as Bloomberg Source: 19 Valuation Analyses Market Perspectives and |
| B78823_93 |
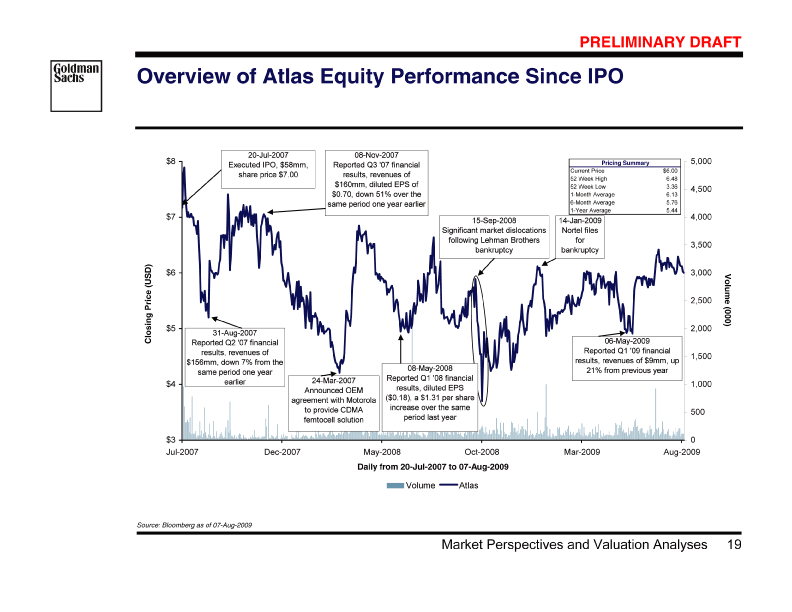
| 8 Jan 2010 12:09 20/55 PRELIMINARY DRAFT Atlas Relative Equity Performance [Graphic Appears Here] PriceIndexed [Graphic Appears Here] | | | | | | | | | | | | 3 Months 15.2% 20.9% (10.0)% 17.2% 6.1% 22.6% 17.1% 2.2% 14.6% (13.0)% (2.6)% (2.5)% 5.1% 6 Months 13.2% 108.4% 7.4% 54.8% 32.6% 63.2% 31.7% (3.9)% 71.8% (8.6)% 16.4% 108.8% 81.2% 9 Months 22.0% 119.4% (3.5)% 119.4% 9.8% 10.7% 26.2% 28.2% 48.9% (21.3)% 44.4% 8.1% 72.6% 12 Months 0.0% 99.8% (31.6)% 65.4% (51.3)% (42.1)% (5.9)% 6.1% (22.2)% (46.9)% (37.8)% (21.1)% (40.9)% 18 Months 15.8% 5.2% (38.9)% 46.0% (49.1)% (42.9)% (5.1)% 9.3% (37.6)% (60.3)% (2.5)% (46.2)% (42.1)% Share Price Performance Over Time Net Cash (% of Market Cap) 55.7% 22.5% 30.2% 22.3% 63.7% NM 17.5% 13.8% 11.6% 5.7% 4.0% NM NM — Atlas Acme Packet Infinera Starent Networks Sonus Networks Alcatel-Lucent Cisco Systems Ericsson Motorola Nokia RIM ADC Telecommunications CommScope Jul- 2009 Apr- 2009 Acme Packet Starent Dec- 2008 Sep- 2008 Jun- 2008 Feb- 2008 Daily from 20-Jul-2007 to 07-Aug-2009 Nov- 2007 Atlas Infinera Relative Equity Performance Since IPO Jul- 2007 (20)% includes: Alcatel-Lucent, Cisco, Ericsson, Motorola, Nokia, and RIM. Wireless Subsystems include: ADC, CommScope, and Powerwave. Commtech Other Source: Bloomberg as of 07-Aug-2009 Note: 20 Valuation Analyses Market Perspectives and |
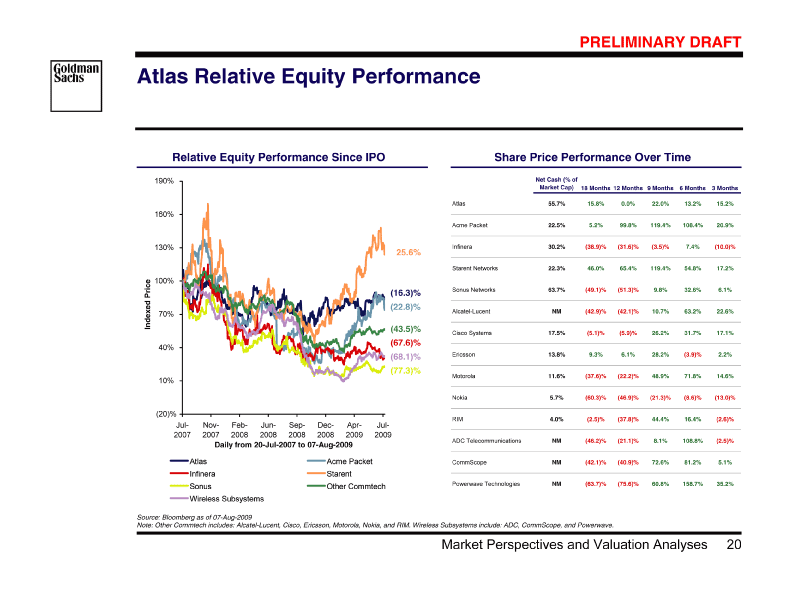
| B78823_94 |
| 8 Jan 2010 12:09 21/55 PRELIMINARY DRAFT Shares Traded at Various Prices [Graphic Appears Here] Outstanding)1 (% of Float Outstanding)1 (% of Float Traded Shares Traded Shares 54.7% 5.33 to 5.87 16.5% 63.3% 4.79 to 5.32 7.7% LTM 21.2% 4.24 to 4.78 Daily from 07-Aug-2008 to 07-Aug-2009 Weighted Average Price: 5.42 USD Last 3 Months 4.2% 1.7% 3.70 to 4.23 Total Shares Traded as Percent of Float Outstanding 1: 192.5% 6.0% 200% 160% 120% 80% 40% 0% 200% 160% 120% 80% 40% 0% Outstanding)1 (% of Float Outstanding)1 (% of Float Traded Shares Traded Shares 36.9% 7.05 to 7.89 17.0% 58.3% 6.21 to 7.04 28.0% Since IPO 154.4% 5.38 to 6.20 22.9% 120.1% 4.54 to 5.37 Daily from 20-Jul-2007 to 07-Aug-2009 Weighted Average Price: 5.78 USD Last 6 Months 15.2% 21.9% 3.70 to 4.53 Total Shares Traded as Percent of Float Outstanding 1: 391.6% 7.1% 200% 160% 120% 80% 40% 0% 200% 160% 120% 80% 40% 0% 51.7% [Graphic Appears Here] 5.88 to 6.42 17.0% [Graphic Appears Here] 6.12 to 6.42 [Graphic Appears Here] [Graphic Appears Here] [Graphic Appears Here] [Graphic Appears Here] [Graphic Appears Here] [Graphic Appears Here] [Graphic Appears Here] Weighted Average Price: 5.85 USD Total Shares Traded as Percent of Float Outstanding 1: 51.5% Weighted Average Price: 5.77 USD Total Shares Traded as Percent of Float Outstanding 1: 90.2% Float outstanding of 21.8mm as of 31-Jul-2009 defined as total basic shares outstanding (62.2mm as of 31-Jul-2009) less shares held by Atlas Management, Matrix, Qualcomm Inc., and Unicorn Trust / Mr. Guraj Deshpande (40.4mm as of 31-Jul-2009). Source: Bloomberg as of 07-Aug-2009 1 21 Valuation Analyses Market Perspectives and |
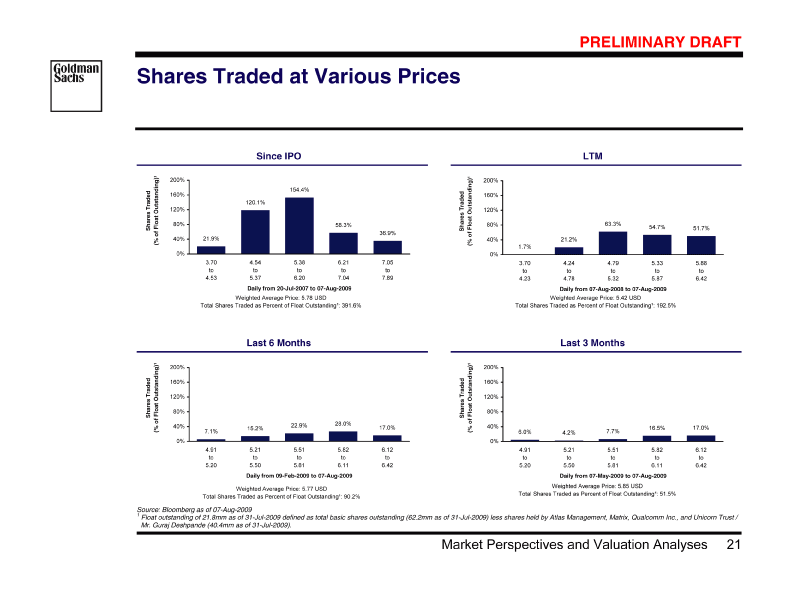
| B78823_95 |
| 8 Jan 2010 12:09 22/55 PRELIMINARY DRAFT Research Analysts Views on Atlas [Graphic Appears Here] 7.00 7.00 6.75 6.50 $$ $$ 5.00 Target Price $ NA Sell Recommendation Hold 9 9 Buy 9 9 9 Date 28-Jul-09 02-May-09 12-May-09 29-Jul-09 18-May-09 30-Jul-09 Months Covered 13 15 NA 25 25 NA Analyst Avondale Partners Needham & Company Avian Securities Barclays Capital Deutsche Bank Argus Research Co. $6.75 $6.00 Current Median Price Target: Price: Analyst Recommendation Evolution Selected Commentary “We believe that healthy data traffic driven by increased penetration of smartphones, rising mix of non-messaging data, and broader uptake of data plans at Atlas’ carrier partners should support the core business.” • Capital 2009 29, Barclays July “Atlas, in our view, is well positioned to outpace Samsung in CDMA networks with its voice and data femtocell as Sprint and Verizon introduce data plans with their respective product offerings.” • LLC 2009 Partners 31, July Avondale “We believe the fundamentals of Atlas’ core EV-DO business remain solid and we are encouraged by the stability that should be afforded by Ericsson’s decision to purchase NT’s CDMA assets.” • 2009 Company 30, • & July Needham — Deutsche Bank February 12, 2009 “Atlas’ core EV-DO business is likely to soften in ‘09, with CDMA access upgrades past their ‘08 peak spending cycle.” August 2008 February 2009 [Graphic Appears Here] August 2009 Hold 50.0% Buy 50.0% Hold 50.0% Buy 50.0% market data as of 07-Aug-2009 IBES, Analysts: 2 Thomson Source: Analysts: 6 22 Valuation Analyses Market Perspectives and |
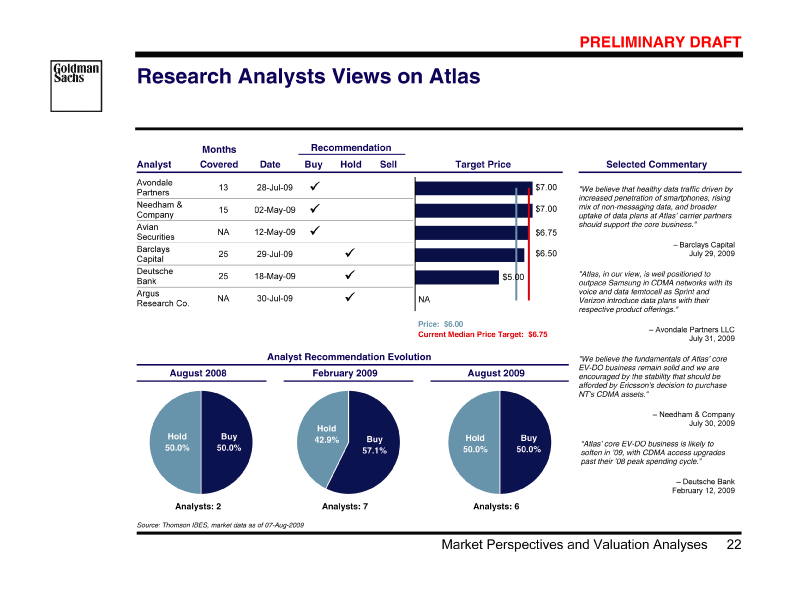
| B78823_96 |
| 8 Jan 2010 12:09 23/55 PRELIMINARY DRAFT Atlas vs. Selected Comparables Projections Per Atlas Management (Base Case) [Graphic Appears Here] 2008 — 2010 Revenue Growth 36.5% 24.0% 23.8% 15.0% 4.3% [Graphic Appears Here] 3.5% [Graphic Appears Here] (0.0%) [Graphic Appears Here] [Graphic Appears Here] (0.3%) [Graphic Appears Here] (1.9%) (8.8%) (9.1%) (9.4%) (15.0%) (10.4%) (13.4%) Sonus Atlas (Base Case) Atlas (Wall Street) Acme Packet Starent Infinera RIM Ericsson Alcatel-Lucent Cisco Motorola Nokia CommScope ADC Powerwave 2009 / 2010 EBITDA Margin 32.0% 32.3% 31.6% 30.0% 33.2% 29.1% 25.1% 25.2% 25.2% 24.6% 26.9% 24.3% 11.6% 11.9% 9.3% 13.9% 9.5% 7.9% 17.8% 15.5% 7.8% 8.1% 8.2% 5.7% 3.0% [Graphic Appears Here] (1.9%) Sonus 4.7% 3.8% [Graphic Appears Here] [Graphic Appears Here] [Graphic Appears Here] [Graphic Appears Here] (1.2%) Infinera (15.9%) Atlas (Base Case) Atlas (Wall Street) Acme Packet Starent Cisco RIM Ericsson Alcatel-Lucent Nokia CommScope Motorola Powerwave ADC 2008 — 2010 EBITDA Growth 40.1% 34.4% 27.2% 22.6% 20.5% 15.8% 13.9% NM NM [Graphic Appears Here] (3.6%) [Graphic Appears Here] (5.2%) [Graphic Appears Here] [Graphic Appears Here] (3.4%) CommScope Powerwave (20.1%) ADC (20.7%) Atlas (Base Case) Atlas (Wall Street) Acme Packet Starent Infinera Motorola 2009 Sonus RIM Cisco Ericsson 2010 Nokia Alcatel-Lucent ch, Comparables projections per Thomson IBES Management Corporate Risk Adjustments. Assumes full recovery of Atlas $36.4mm owed by Nortel in 2009 and per Wall Street Resear Atlas ex. Femto (Atlas Management (Base Case)) projections assumes EV-DO business receives 10% of Management Corporate Risk Adjustment per Atlas Management. Source: Atlas projections per Atlas Management (Base Case) based on Atlas Management presentations to Atlas Board of Directors (2010 - 2013 from 15-May-2009 Strategy Review, 2009 from 28-Jul-2009 Board of Directors presentation). EV-DO and FMC projections include Note: Atlas financials based on billings for management and Wall Street Research. 1 23 Valuation Analyses Market Perspectives and |
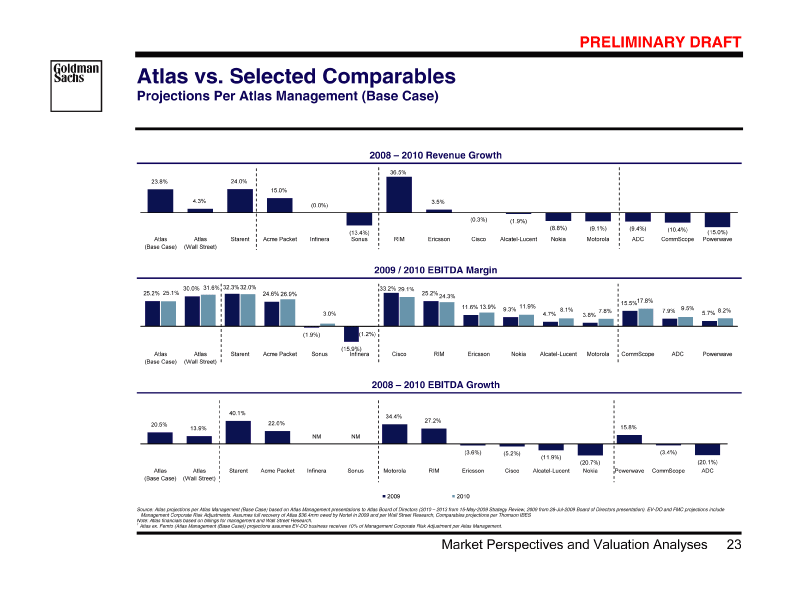
| B78823_97 |
| 8 Jan 2010 12:09 24/55 PRELIMINARY DRAFT Atlas vs. Selected Comparables Projections Per Atlas Management (Base Case) [Graphic Appears Here] 2009 / 2010 EV / Revenue 4.2x 3.5x 3.5x 3.0x 3.0x 2.9x 2.9x 2.2x 1.8x 1.1x 0.7x 0.8x 0.8x 1.1x 1.1x 0.4x 0.4x 0.6x 0.6x 0.8x 0.8x 0.9x 0.9x 0.8x 0.9x 1.5x 1.1x 1.1x 0.8x [Graphic Appears Here] 0.6x [Graphic Appears Here] [Graphic Appears Here] [Graphic Appears Here] Powerwave $157 $410 Atlas (Base Case) Atlas (Wall Street) Acme Packet Starent Infinera $774 Sonus Cisco RIM Ericsson Nokia Alcatel-Lucent Motorola ADC CommScope Market Capitalization $1,735 $603 $132,263 $528 $32,025 $44,153 $16,614 $49,499 $2,478 $7,619 $723 2009 / 2010 EV / EBITDA 16.9x [Graphic Appears Here] 14.2x 12.9x 12.1x 11.3x 11.3x 10.8x 10.6x 9.9x 9.2x 9.2x 9.1x 9.0x 8.2x 7.9x 7.7x 7.2x 6.8x 6.4x 6.2x 5.2x 4.3x 3.8x 3.5x 3.1x NM NM NM NM Atlas (Base Case) Atlas (Wall Street) Starent Acme Packet Infinera Motorola Sonus RIM Nokia Alcatel-Lucent Ericsson Powerwave Cisco CommScope ADC 2009 / 2010 P / E 31.6x 27.7x 27.8x 25.5x 24.3x 18.1x 17.7x 16.7x 16.6x 16.5x 16.0x NM 15.7x NM 15.1x 14.7x 13.6x 12.8x 12.4x 12.0x [Graphic Appears Here] 11.8x ADC NM 11.9x NM NM Powerwave 11.4x 10.2x Atlas (Base Case) 7.1x [Graphic Appears Here] Atlas (Wall Street) 6.0x NM NM NM NM [Graphic Appears Here] Ericsson 16.5x 2010 [Graphic Appears Here] [Graphic Appears Here] RIM 17.5x 2009 Starent Acme Packet Infinera NM Sonus NM Cisco 14.2x Alcatel-Lucent Nokia CommScope Motorola 2 2009 P / E (ex-Cash) 28.4x 23.5x 25.0x NM NM NM NM - 2013 from 15-May-2009 Strategy Review, 2009 from 28-Jul-2009 Board of Directors presentation). EV-DO and FMC projections include Management Corporate Risk Adjustments. Assumes full recovery of Atlas $36.4mm owed by Nortel in 2009 and per Wall Street Research, Comparables projections per Thomson IBES, market data as of 07-Aug-2009 Note: Airvana financials based on billings for management and Wall Street Research. Assumes EV-DO business receives 10% of Management Corporate Risk Adjustment. “NM” represents “Not Meaningful” as company has positive net debt or negative earnings. Source: Atlas projections per Atlas Management (Base Case) based on Management presentations to Atlas Board of Directors (2010 1 2 24 Valuation Analyses Market Perspectives and |
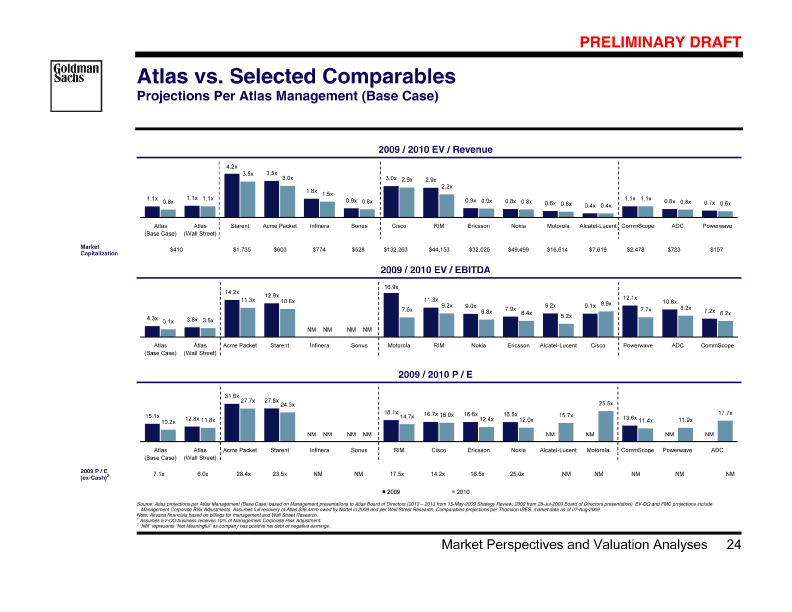
| B78823_98 |
| 8 Jan 2010 12:09 25/55 PRELIMINARY DRAFT Historical Valuation Metrics [Graphic Appears Here] Forward EV / Billings EBITDA 20x 18x 16x 14x 12x 10x [Graphic Appears Here] EBITDA Billings EV / Forward [Graphic Appears Here] Multiple P / E Forward 2008 2007 2008 2008 2009 2008 2009 2009 [Graphic Appears Here] 1-Year Average Daily from 18-Oct-2007 to 07-Aug-2009 EV / EBITDA Daily from 18-Oct-2007 to 07-Aug-2009 P / E P / E (ex. Cash)2 1-Year Average Commtech includes: Starent, Acme Packet, Infinera, Sonus, RIM, Ericsson, Cisco, Alcatel-Lucent, Nokia, Motorola, ADC, CommScope and Powerwave Pro forma price per share calculated by subtracting net cash per share from current price per share. Pro forma earnings calculated by subtracting after-tax interest income on net cash from forecasted net income. Assumes tax rate of 35% and cash generates interest of 1.5%. Source: Capital IQ, Thomson IBES, Wall Street Research, Bloomberg as of 07-Aug-2009 Note: Due to the lack of consistent coverage since IPO, 2008A Billings EBITDA was used as a proxy for forecasted 2008 Billings EBITDA. 1 2 25 Valuation Analyses Market Perspectives and |
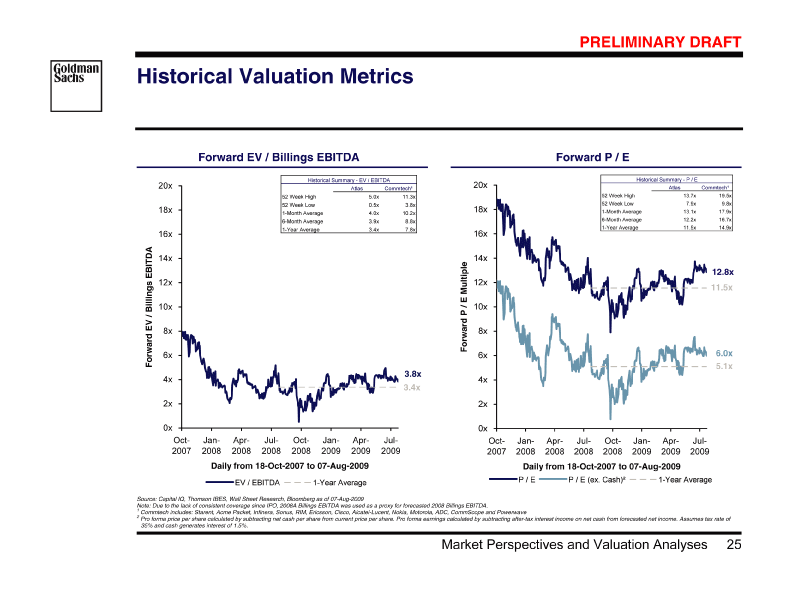
| B78823_99 |
| 8 Jan 2010 12:09 26/55 PRELIMINARY DRAFT Preliminary Atlas Valuation Analysis at Various Hypothetical Prices ($ in millions) [Graphic Appears Here] | 8.00 $33.3% 80.7% 30.5% 36.8% 7.50 $25.0% 60.7% 22.3% 28.2% 7.00 $16.7% 40.6% 14.2% 19.7% 6.50 8.3% 6.0% $20.4% 11.1% 6.00 0.0% 0.0% 2.6% $(2.1%) Current Share Price Premium / (Discount) to Current Premium / (Discount) to Current (ex-cash) Premium / (Discount) to 1 Month Average Premium / (Discount) to 3 Month Average presentation). EV-DO and FMC projections include Management Corporate Risk Adjustments Historical cash balance as of end of Q2 2009 assumes full recovery of $36.4mm cash owed by Nortel. Pro forma price per share calculated by subtracting net cash per share from current price per share. Pro forma earnings calculated by subtracting after-tax interest income on net cash from forecasted net income. Assumes tax rate of 35% and cash generates interest of 1.5%. Source: Atlas projections per Atlas Management (Base Case) based on Atlas Management presentations to Atlas Board of Directors (2010 - 2013 from 15-May-2009 Strategy Review, 2009 from 28-Jul-2009 Board of Directors Note: Hypothetical analysis provided solely for illustrative purposes and does not necessarily reflect views on value or the price that a buyer would be willing to pay. 1 2 26 Valuation Analyses Market Perspectives and |
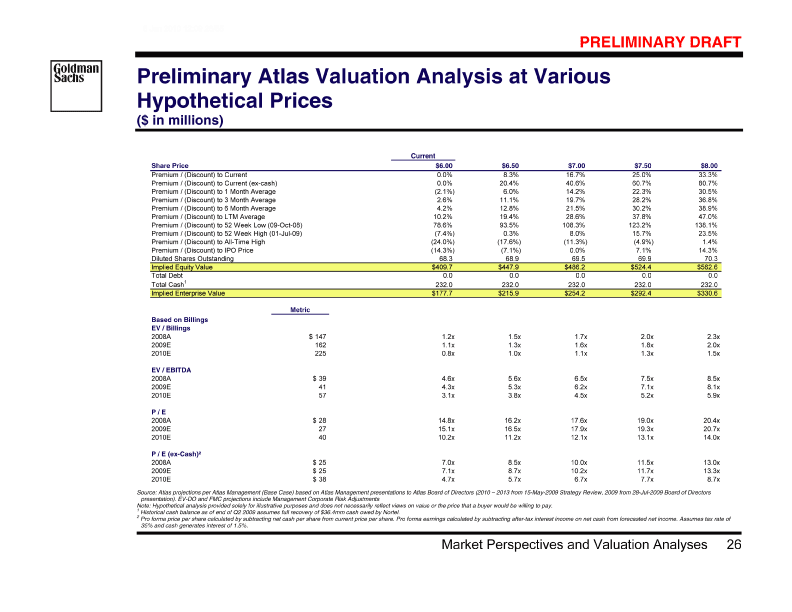
| B78823_100 |
| 8 Jan 2010 12:09 27/55 PRELIMINARY DRAFT Present Value of Future Share Price Analysis Based on EV / EBITDA Multiple ($ in millions, except per share data) [Graphic Appears Here] | 127 487 (428) 915 72.6 1 7.77 5.81 YE 2012 $ Downside Case $ $ 7.74 6.33 107 411 (358) 768 71.9 $ $ $ YE 2011 Base Case 7.26 6.24 78 299 603 70.7 $ $ YE 2010 $ (304) 3 Present Value of Future Share Price Analysis 2 Present Value of Future Share Price 1-yr Fwd EBITDA Implied EV Net Debt / (Cash) Implied Equity Value Fully Diluted # of Shares (mm) Sensitivity Analysis Atlas Management Projections (Base Case) Present Value of Future Share Price Exit Year [Graphic Appears Here] [Graphic Appears Here] [Graphic Appears Here] [Graphic Appears Here] [Graphic Appears Here] Atlas Management Projections (Downside Case) Present Value of Future Share Price Exit Year [Graphic Appears Here] [Graphic Appears Here] [Graphic Appears Here] Atlas projections per Atlas Management (Base Case) based on Atlas Management presentations to Atlas Board of Directors (2010 - 2013 from 15-May-2009 Strategy Review, 2009 from 28-Jul-2009 Board of Directors presentation). EV-DO and FMC projections include Management Corporate Risk Adjustments. Atlas projections per Atlas Management (Downside Case) based on Atlas Management downside assumption for 2010-13 EV-DO revenues and assuming a constant gross profit margin and operating expenses decline at 100% rate of billings decline per Atlas Management guidance. Assumes full recovery of $36.4mm owed by Nortel in 2009. Market data as of 07-Aug-2009 Discounted to 31-Dec-2009 at a 17.5% discount rate. Enterprise value based on Atlas 1-year forward EBITDA multiple of 3.8x as of 07-Aug-2009. Share price assumes a fully diluted number of shares based on treasury method (basic shares outstanding of 62.2mm as of 31-Jul-2009, 14.3mm outstanding options as of 28-Jun-2009 with a weighted strike price of $3.43 per Atlas Q2 2009 10Q filing). The analysis does include any future stock options grant. Source: 1 2 3 27 Valuation Analyses Market Perspectives and |
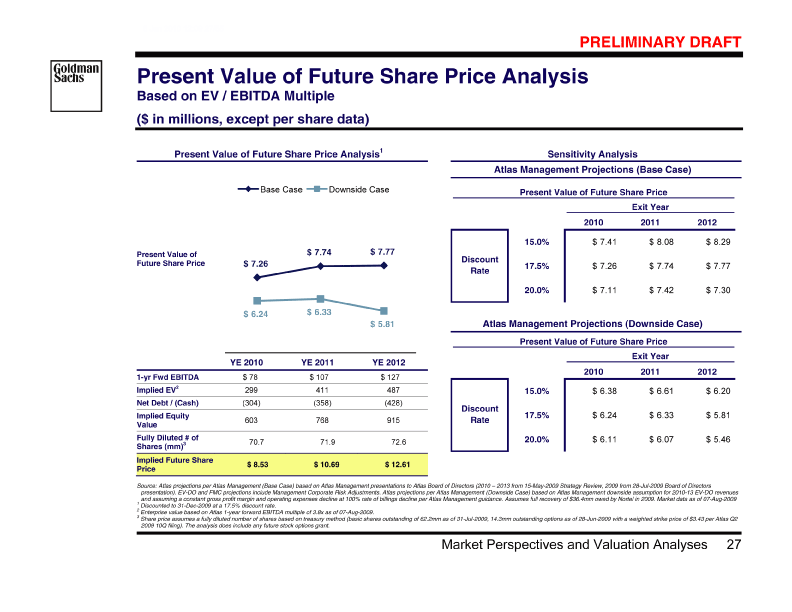
| B78823_101 |
| 8 Jan 2010 12:09 28/55 PRELIMINARY DRAFT Present Value of Future Share Price Analysis [Graphic Appears Here] | 9.97 9.55 9.16 Exit Year 2011 $ $ $ Exit Year 2011 $ 8.53 8.35 8.18 Sensitivity Analysis 2010 $$ $ Atlas Management Projections (Base Case) Present Value of Future Share Price 15.0% 17.5% 20.0% —— —— — Discount Rate — 1 9.67 Downside Case $ 9.55 6.58 $ $ YE 2011 — Base Case 8.35 $ Present Value of Future Share Price Analysis in millions, except per share data) Based on P / E Multiple $ Present Value of Future Share Price ( [Graphic Appears Here] [Graphic Appears Here] [Graphic Appears Here] [Graphic Appears Here] [Graphic Appears Here] [Graphic Appears Here] [Graphic Appears Here] [Graphic Appears Here] Atlas projections per Atlas Management (Base Case) based on Atlas Management presentations to Atlas Board of Directors (2010 - 2013 from 15-May-2009 Strategy Review, 2009 from 28-Jul-2009 Board of Directors presentation). EV-DO and FMC projections include Management Corporate Risk Adjustments. Atlas projections per Atlas Management (Downside Case) based on Atlas Management downside assumption for 2010-13 EV-DO revenues and assuming a constant gross profit margin and operating expenses decline at 100% rate of billings decline per Atlas Management guidance. Assumes full recovery of $36.4mm owed by Nortel in 2009. Market data as of 07-Aug-2009 Discounted to 31-Dec-2009 at a 17.5% discount rate. Enterprise value based on Atlas 1-year forward P / E multiple of 12.8x as of 07-Aug-2009. Share price assumes a fully diluted number of shares based on treasury method (basic shares outstanding of 62.2mm as of 31-Jul-2009, 14.3mm outstanding options as of 28-Jun-2009 with a weighted strike price of $3.43 per Atlas Q2 2009 10Q filing). The analysis does include any future stock options grant. Source: 1 2 3 28 Valuation Analyses Market Perspectives and |
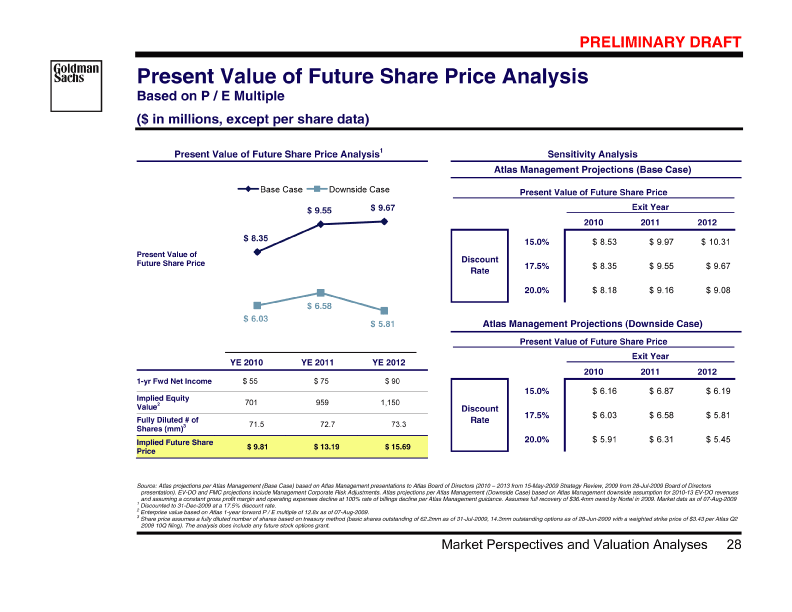
| B78823_102 |
| 8 Jan 2010 12:09 29/55 PRELIMINARY DRAFT Discounted Cash Flow Analysis [Graphic Appears Here] Atlas Management Projections (Base Case) las Management Projections (Downside Case) At | 1.42 1.06 Femto $ $ 6.05 $5.47 7.46 5.93 — $ High 2.15 2.28 — $ $ $ $5.34 - 7.00 — $ Low 2.04 2.16 $ $ $2.39 2.26 $ $ Opex Reduction 50% 75% EV-DO Sensitivity —— — Total Value: Total Value (ex-Femto)1: Total Value (ex-Femto) incl. Femto Cash Burn (2010-12)2: % of Revenue Decline in Opex Savings —— — 3.68 3.66 $ $ Cash 1.40 1.05 Femto $ $ 6.95 $6.37 8.34 $ High 3.22 3.27 — $6.74 — $ $ $6.16 - $ Low 3.03 3.07 7.80 - $ $ $3.31 3.11 $ $ Opex Reduction Sensitivity 50% 75% EV-DO —— — Total Value: Total Value (ex-Femto)1: Total Value (ex-Femto) incl. Femto Cash Burn (2010-12)2: % of Revenue Decline in Opex Savings —— — 3.64 3.62 $ $ Cash [Graphic Appears Here] [Graphic Appears Here] [Graphic Appears Here] [Graphic Appears Here] [Graphic Appears Here] [Graphic Appears Here] • of Q4 of of 3 of balance end shares share cash of 70.6mm as to per diluted Value estimated $256mm Fully 70.2mm • • rate discount value DCF terminal 16.5-18.5% 9-year No • • and rate terminal (Acme discount type) DCF 12.9x-14.2x multiple 25-30% (venture 4-year EBITDA Starent) • • of Q4 of of 3 of balance end shares share cash of 69.9mm as to per diluted Value estimated $256mm Fully 69.5mm • • rate discount value DCF terminal 16.5-18.5% 9-year No • • and rate terminal (Acme discount type) DCF 12.9x-14.2x multiple 25-30% (venture 4-year EBITDA Starent) • Management Corporate Risk Adjustments. Atlas projections per Atlas Management (Downside Case) based on Atlas Management downside assumption for 2010-13 EV-DO revenues and assuming a constant gross profit margin and operating expenses decline at 100% rate of a 25-30% discount rate). -2009, 14.3mm outstanding options as of 28-Jun-2009 with a weighted strike price of $3.43 per Atlas Q2 2009 10Q filing). billings decline per Atlas Management guidance. Assumes full recovery of $36.4mm owed by Nortel in 2009. Market data as of 07-Aug-2009 Total value excluding Femto value without factoring the impact on share count. Value of Cash and EV-DO including the present value of unlevered FCF for Femto ($40-42mm cumulative negative present value at Share price assumes a fully diluted number of shares based on treasury method (basic shares outstanding of 62.2mm as of 31-Jul Source: Atlas projections per Atlas Management (Base Case) based on Atlas Management presentations to Atlas Board of Directors (2010 - 2013 from 15-May-2009 Strategy Review, 2009 from 28-Jul-2009 Board of Directors presentation). EV-DO and FMC projections include 1 2 3 29 Valuation Analyses Market Perspectives and |
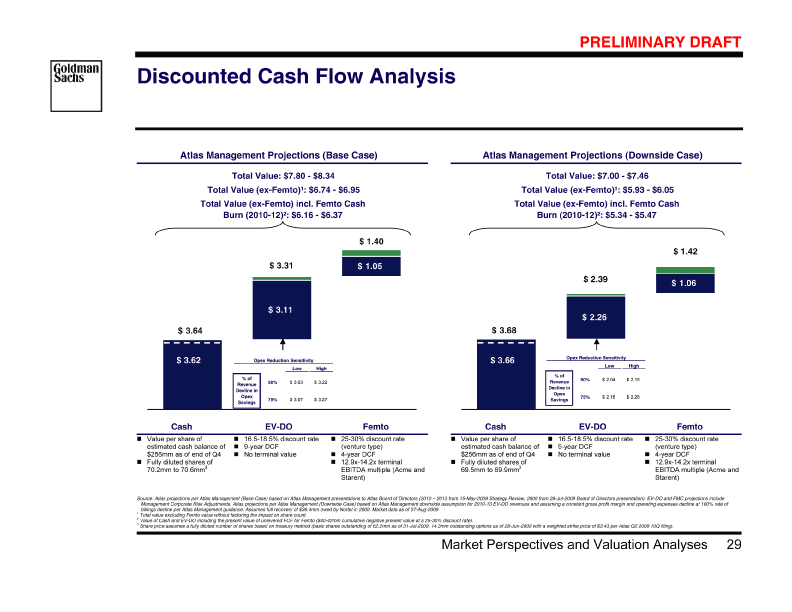
| B78823_103 |
| PRELIMINARY DRAFT |
| [Graphic Appears Here] Selected Alternatives for Atlas IV. 30 Selected Alternatives for Atlas |

| B78823_104 |
| 8 Jan 2010 12:09 31/55 PRELIMINARY DRAFT Overview of Atlas Selected Alternatives [Graphic Appears Here] Rationale • of business nature expansion of generative Femto delivery flow fund to through cash initiatives from business creation Femto Benefit other on EV-DO and Value plan • Considerations • FMC large future / and and and rollout unused timing LTE EV-DO with slowdown with Nortel Femto EV-DO of between structure around history dynamics accelerated of ownership stock synergies capital balance Uncertainty industry Potential termination Ericsson Volatile Limited business Inefficient cash • [Graphic Appears Here] Status Quo / Continue to Invest Recapitalize the Business Sell the Business Atlas • through value driving efficiency on remuneration dividend concerns structure shareholder ordinary capital shareholders risks and Increase special creation Improved Alternate reinvestment • • stock leveraged to trading stocks for stability impact technology available provided negatively risk be has paying to may finance unlikely balance payout dividend Debt recapitalization Cash and Few Increased • • and value current floor immediately to provides value premium full a price proposal realize capture share to to current Potential Potential historical Existing • • use given cash realize equity universe to private multi-year difficult for buyer projected potentially development debt limited of raising Potentially value stage in management Femto given Difficulty buyers • 31 Selected Alternatives for Atlas |
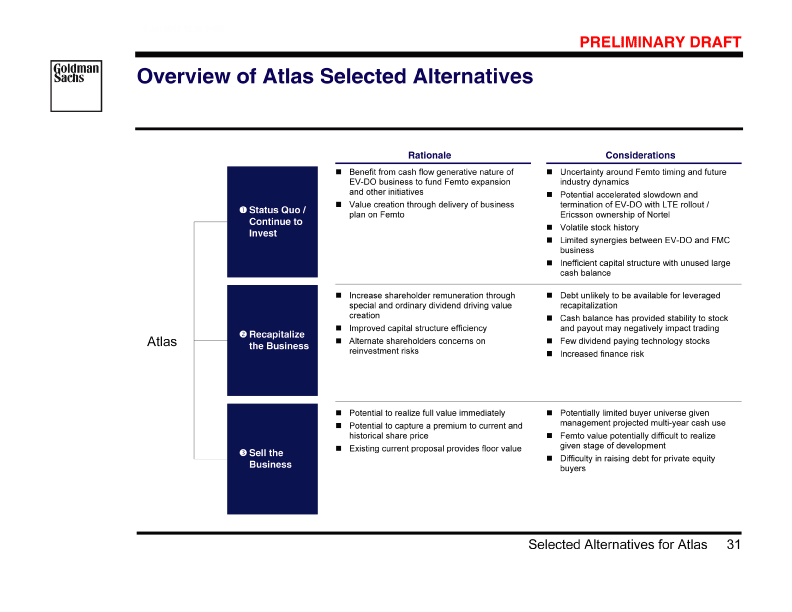
| B78823_105 |
| 8 Jan 2010 12:09 32/55 PRELIMINARY DRAFT Leverage Considerations for Atlas ($ in billions) [Graphic Appears Here] Bank Loan Volumes — LTM Observations $4.8 $4.1 $2.3 $1.0 $0.9 $0.7 Apr- 09 $0.5 Dec- 08 $0.1 [Graphic Appears Here] Aug- 09 Jul-09 $0.0 $0.0 $0.0 $0.0 $0.0 Mar- 09 Aug- 08 Sep- 08 Oct- 08 Nov- 08 Jan- 09 Feb- 09 May- 09 Jun- 09 High Yield Bond Market Volumes — LTM $26.0 $18.0 $17.7 Majority has been historically LBO debt (Sungard, Avaya, First Data), most of which has not been distributed and remain with underwriters Markets beginning to show strength but remain very Volume remains muted for bank loans High yield market has seen strong issuance in the last few months Technology has seen very little debt issuance No public market recap in last two years suggesting Atlas will only have access to bank markets given size Access for LBO easier than public recap given validation selective — lenders unlikely to fund public recaps of private equity and new capital invested below debt $10.5 $8.6 $5.9 | $4.1 Feb- 09 $2.2 Oct- 08 $2.2 Mar- 09 $1.9 Aug- 08 $0.7 $0.0 [Graphic Appears Here] $0.2 [Graphic Appears Here] Aug- 09 Jul-09 Sep- 08 Nov- 08 Dec- 08 Jan- 09 Apr- 09 May- 09 Jun- 09 Source: Goldman Sachs Syndicate Desk 32 Selected Alternatives for Atlas |
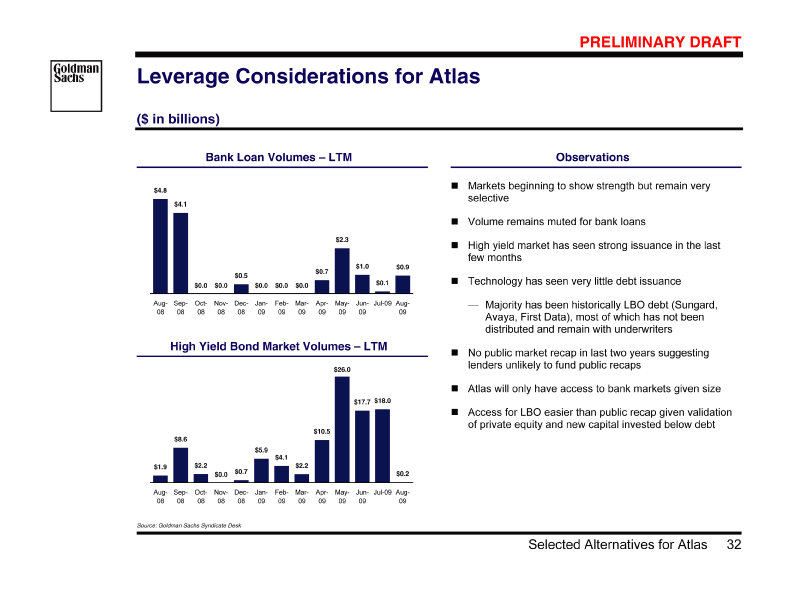
| B78823_106 |
| 8 Jan 2010 12:09 33/55 PRELIMINARY DRAFT Recapitalization — Special Dividend Atlas Management Projections (Base Case) — Future Share Price Analysis (Incl. Dividends) ($ in millions, except per share data) [Graphic Appears Here] 1 Presentation Value of Future Share Price Analysis Sensitivity Analysis Present Value of Future Share Price (incl. Dividends) Exit Year [Graphic Appears Here] PV of Dividend per Share (DPS) PV of Share Price (ex-DPS) Present Value of Future Share Price $3.31 [Graphic Appears Here] [Graphic Appears Here] Present Value of Future Share Price (incl. Dividends) Exit Year YE 2009 1-yr Fwd EBITDA 2 Implied EV Net Debt / (Cash) Implied Equity Value 3 Fully Diluted # of Shares (mm) [Graphic Appears Here] 62.2 [Graphic Appears Here] Share Share per Future Implied Price Dividend $3.31 127 487 (50) 537 76.2 7.05 0.84 4.35 0.52 YE 2012 $ $$ $ $ 107 410 (50) 460 76.2 6.05 0.64 4.38 0.47 $ $$ $ $ YE 2011 - 78 299 (50) 349 76.1 4.59 0.57 $ 3.91 0.48 $ $ $ $ YE 2010 price adjusted post 2009 100% of the available FCF, with a minimum cash balance of $50mm. -2009, 14.3mm outstanding options as of 28-Jun-2009 with a weighted strike price of $3.43 per Atlas Q2 2009 10Q filing). Strike Source: Atlas projections per Atlas Management (Base Case) based on Atlas Management presentations to Atlas Board of Directors (2010 - 2013 from 15-May-2009 Strategy Review, 2009 from 28-Jul-2009 Board of Directors presentation). EV-DO and FMC projections include Management Corporate Risk Adjustments. Assumes full recovery of $36.4mm owed by Nortel in 2009 Discounted to 31-Dec-2009 at a 17.5% discount rate. Assuming an initial special dividend of $206mm and then a distribution of Enterprise value based on Atlas 1-year forward EBITDA multiple of 3.8x as of 07-Aug-2009. Share price assumes a fully diluted number of shares based on treasury method (basic shares outstanding of 62.2mm as of 31-Jul special dividend by the amount per share of the dividend based on the basic number of shares outstanding. The analysis does include any future stock options grant. 1 2 3 33 Selected Alternatives for Atlas |
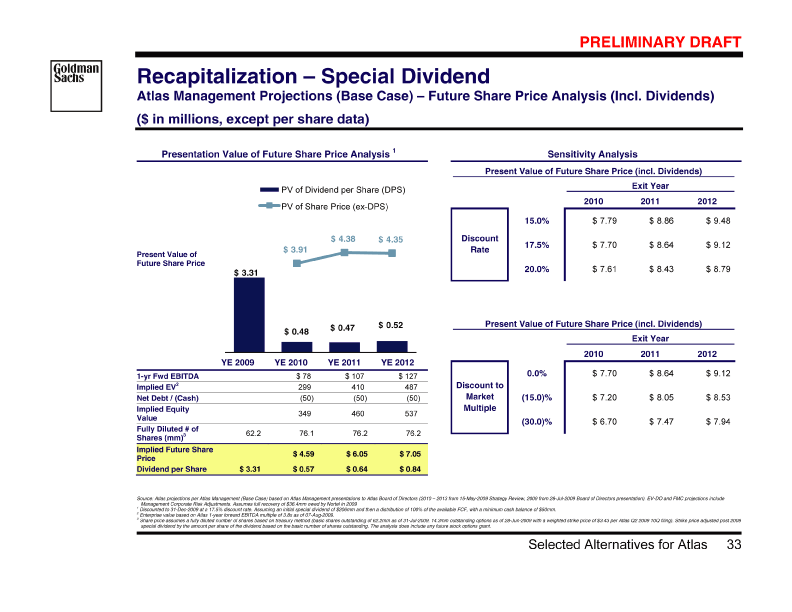
| B78823_107 |
| 8 Jan 2010 12:09 34/55 PRELIMINARY DRAFT Future Share Price Analysis (Incl. Dividends) Recapitalization - Special Dividend Atlas Management Projections (Downside Case) - ($ in millions, except per share data) [Graphic Appears Here] 1 Present Value of Future Share Price Analysis Sensitivity Analysis Present Value of Future Share Price (incl. Dividends) Exit Year [Graphic Appears Here] PV of Dividend per Share (DPS) PV of Share Price (ex-DPS) Present Value of Future Share Price $3.31 [Graphic Appears Here] [Graphic Appears Here] Present Value of Future Share Price (incl. Dividends) Exit Year YE 2009 1-yr Fwd EBITDA 2 Implied EV Net Debt / (Cash) Implied Equity Value 3 Fully Diluted # of Shares (mm) [Graphic Appears Here] 62.2 [Graphic Appears Here] Share Share per Future Implied Price Dividend $3.31 | 74 282 (50) 332 76.1 4.37 0.54 $ 2.69 0.33 YE 2012 $ $ $ $ 72 275 (50) 325 76.0 4.28 0.46 $ 3.10 0.33 $ $ $ $ YE 2011 |
| 54 209 (50) 259 75.9 3.40 0.57 $ 2.90 0.48 $ $ $ $ YE 2010 price adjusted post 2009 ement Corporate Risk Adjustments. Assumes full recovery of $36.4mm owed by Nortel in 2009 100% of the available FCF, with a minimum cash balance of $50mm. -2009, 14.3mm outstanding options as of 28-Jun-2009 with a weighted strike price of $3.43 per Atlas Q2 2009 10Q filing). Strike guidance. FMC projections remain unchanged. Historical financials as of end of Q2 2009. EV-DO and FMC projections include Manag Discounted to 31-Dec-2009 at a 17.5% discount rate. Assuming an initial special dividend of $206mm and then a distribution of Enterprise value based on Atlas 1-year forward EBITDA multiple of 3.8x as of 07-Aug-2009. Share price assumes a fully diluted number of shares based on treasury method (basic shares outstanding of 62.2mm as of 31-Jul special dividend by the amount per share of the dividend based on the basic number of shares outstanding. The analysis does include any future stock options grant. Source: Atlas projections per Atlas Management (Downside Case) based on Atlas Management downside assumption for 2010-13 EV-DO revenues and assuming a constant gross profit margin and operating expenses decline at 100% rate of billings decline per Atlas Management 1 2 3 34 Selected Alternatives for Atlas |
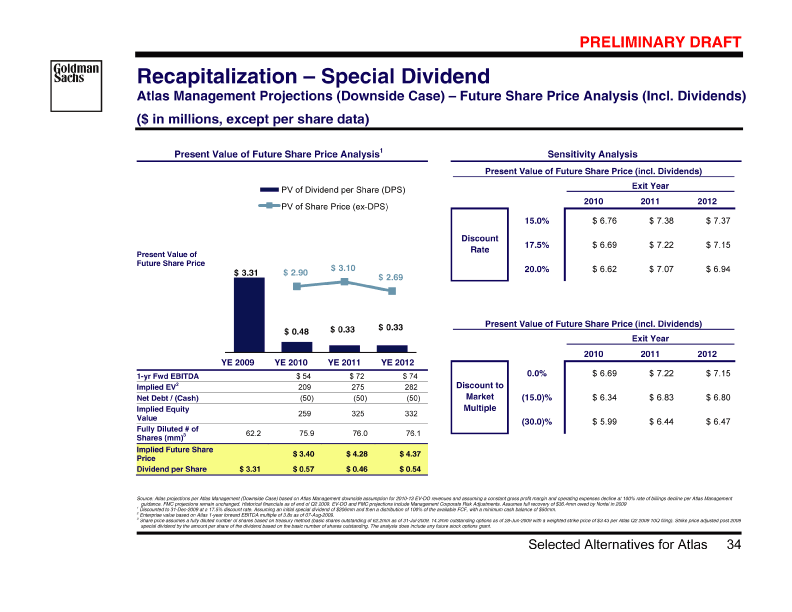
| B78823_108 |
| 8 Jan 2010 12:09 35/55 PRELIMINARY DRAFT Sell the Business Available Options [Graphic Appears Here] Observations • business sponsors EV-DO of restructure interested stability and space costs the space potentially and in the of flow public history in markets cash remove interest universe capital value to sponsors limited to reducing Likely Potential Limited Likely Size Challenging • A. Sell to a Financial Sponsor B. Sell to a Strategic Sell the Business • a in process result not sale did strategic buyers logical complicates parties most with further interested Ericsson discussions / Limited Prior sale Nortel • C. Sell Femto • see a and wait representing to use buyers standalone cash encourage saleable multi-year EV-DO universe may more projected buyers from buyer state basis potential separate limited industry potentially for to tax Difficult Nascent Femto Low Management hurdle Potential • 35 Selected Alternatives for Atlas |
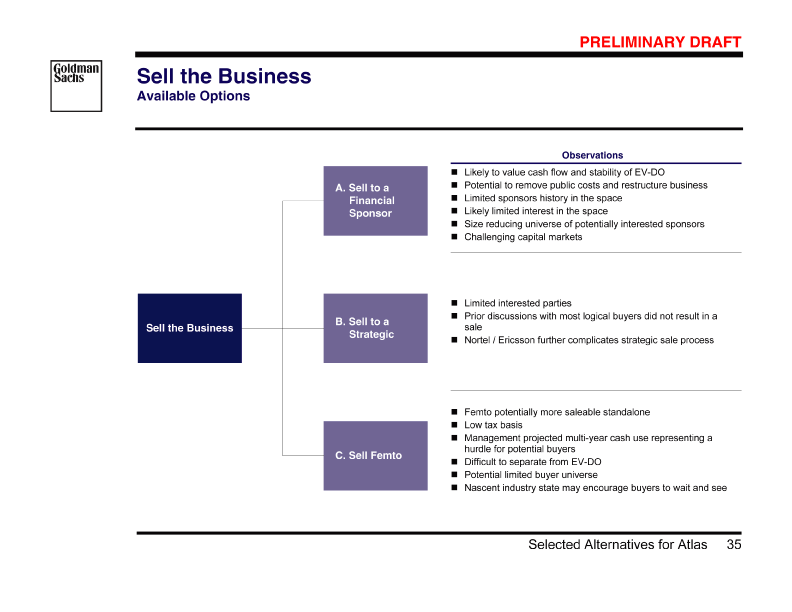
| B78823_109 |
| 8 Jan 2010 12:09 36/55 PRELIMINARY DRAFT Sell the Business Overview of SAC Proposal and Potential LBO Financing ($ in millions) [Graphic Appears Here] | 256 175 90 520 $ $ Sources Uses Illustrative Sources & Uses Existing Atlas Cash Term Loan Sponsor Equity / Management Rollover Total Sources - 175 million Term Loan (the “Term Loan”) $ 7.00 per share acquisition price Maximum Total Leverage Ratio Illustrative Term Sheet — SAC Up to B1 / B+ area 5 years from closing Fully secured Moderate amortization required (7.5 — 10% per annum with bullet at maturity) Usual and customary conditions To include the following: Credit Facility: Assumed Ratings: Maturity: Security: Amortization: Conditions: Financial Covenants: Rate Tenor 5 years L + 6.000% Source: Atlas projections per Atlas Management (Base Case) based on Atlas Management presentations to Atlas Board of Directors (2010 — 2013 from 15-May-2009 Strategy Review, 2009 from 28-Jul-2009 Board of Directors presentation). EV-DO and FMC projections include Management Corporate Risk Adjustments. Assumes full recovery of $36.4mm owed by Nortel in 2009 Note: Assumes 3.0% Libor floor. 36 Selected Alternatives for Atlas |
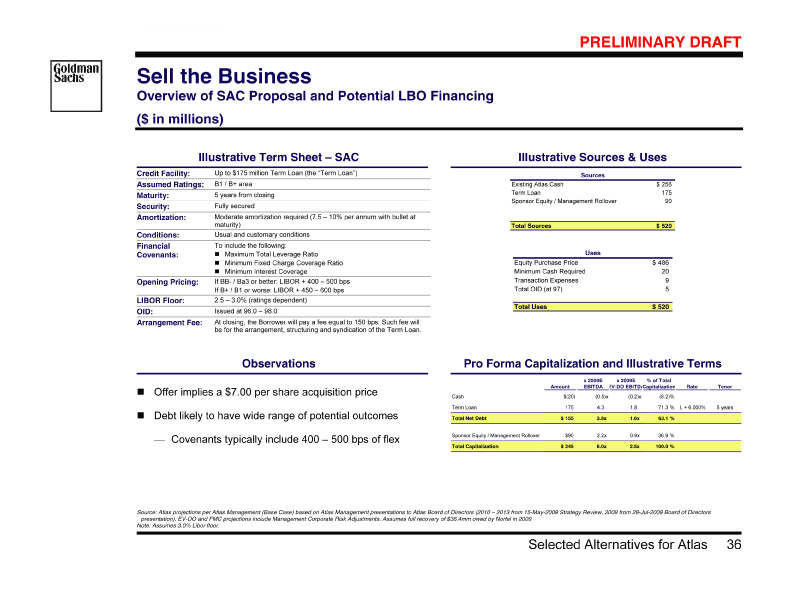
| B78823_110 |
| 8 Jan 2010 12:09 37/55 PRELIMINARY DRAFT Pro Forma Financial Profile Acquisition at $7 per Share ($ in millions) [Graphic Appears Here] | 0.4% (100.0)% (2.2% ) 2.5% NM 27.5% 1.9% NM 29.2% 25.9% 2009 — 2013 CAGR 0 0 (5) 0 (1)(1) 68 149 149 108 108 103 103 (32) $ 2013 E $ $(1.7%) $ $72.6% (2.6%) $ $69.5% (2.9%) 151 0 151 111 0 111 (5) 106 0 106 (1)(6)(32) 67 4.6% 6.4% 5.6% $ 2012 E $ $ $ $73.3% $ $70.3% 145 0 145 104 0 104 (3) 101 0 101 (1)(11)(28) 60 1.5% 9.3% $ 2011 E $ $ $ $72.1% 10.3% $ $69.7% 0 94 0 94 (2) 92 0 92 (1)(14)(25) 52 142 142 $ $ $ $ $ 2010 E $ $(12.2%) 66.3% 131.0% 64.7% 148.3% 146 16 98 (57)41 (4) 96 (59)37 03(13) 27 162 $ $ $ $ $ 2009 E $ $25.2% 22.9% EV-DO FMC Billings (Non-GAAP) % Growth EV-DO FMC EBITDA % Margin % Growth Depreciation & Amortization EV-DO FMC EBIT % Margin % Growth Financing Expenses Net Interest (Expense) / Income Tax Expense Net Income Source: Atlas projections per Atlas Management (Base Case) based on Atlas Management presentations to Atlas Board of Directors (2010 — 2013 from 15-May-2009 Strategy Review, 2009 from 28-Jul-2009 Board of Directors presentation). EV-DO and FMC projections include Management Corporate Risk Adjustments. Assumes full recovery of $36.4mm owed by Nortel in 2009. Assumes a cost of debt of L+6.00% (3% Libor floor) Note: Analysis assumes no contribution of FMC post 2012. 37 Selected Alternatives for Atlas |

| B78823_111 |
| 8 Jan 2010 12:09 38/55 PRELIMINARY DRAFT Illustrative Return Analysis Atlas Management Projections (Base Case) Assuming No Value for Femto Business ($ in millions) [Graphic Appears Here] Dividends Realization of Femto Value (YE 2012) Payout / (Investment) [Graphic Appears Here] | 21 0 0 2019 E $ 12 0 0 2018 E $ 23 0 0 2017 E $ 34 0 0 2016 E $ 46 0 0 2015 E $ 57 0 0 2014 E $ 26 0 0 7 per Share 2013 E $ $ 0 0 0 2012 E $ 0 0 0 2011 E $ 0 0 0 2010 E $ 0 0 Illustrative Return Analysis @ 2009 E $ (90) EV-DO revenues assume to decrease to $0mm in 2019, ratably from 2014, assuming a constant gross profit margin and operating expenses decline at 100% rate of billings decline per Management guidance. EV-DO and FMC projections include Management Corporate Risk Adjustments. EV-DO Assumes full recovery of $36.4mm owed by Nortel in 2009. Assumes a cost of debt of L+6.00% (3% Libor floor) Source: Atlas projections per Atlas Management (Base Case) based on Atlas Management presentations to Atlas Board of Directors (2010 - 2013 from 15-May-2009 Strategy Review, 2009 from 28-Jul-2009 Board of Directors presentation). Note: Analysis assumes no contribution of FMC post 2012. 38 Selected Alternatives for Atlas |
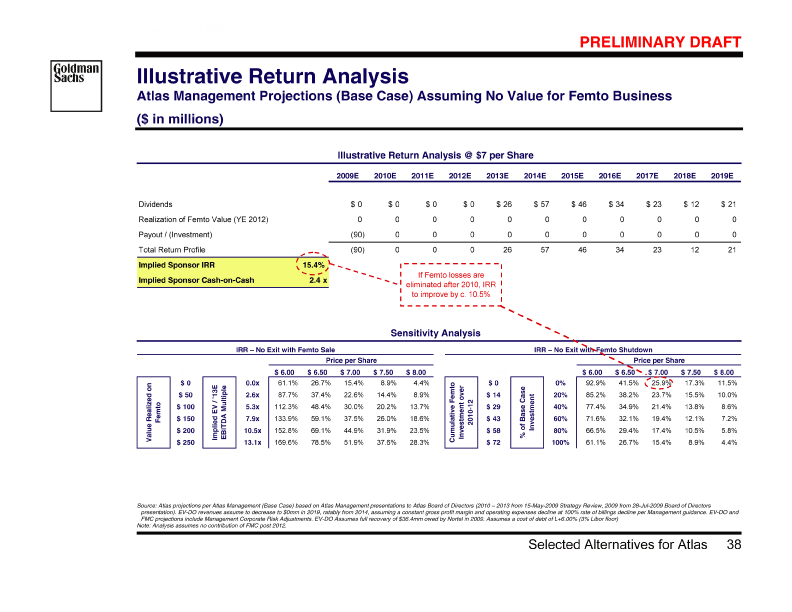
| B78823_112 |
| 8 Jan 2010 12:09 39/55 PRELIMINARY DRAFT ase) Assuming No Value for Femto Business Illustrative Return Analysis Atlas Management Projections (Downside C ($ in millions) [Graphic Appears Here] Dividends Realization of Femto Value (YE 2012) Payout / (Investment) Total Return Profile [Graphic Appears Here] | 21 0 0 21 2019 E $ 12 0 0 12 2018 E $ 23 0 0 23 2017 E $ 34 0 0 34 2016 E $ 45 0 0 45 2015 E $ 0 0 0 0 2014 E $ 0 0 0 0 7 per Share 2013 E $ $ 0 0 0 0 2012 E $ 0 0 0 0 2011 E $ 0 0 0 0 2010 E $ 0 0 (90) Illustrative Return Analysis @ 2009 E $ (90) [Graphic Appears Here] [Graphic Appears Here] [Graphic Appears Here] | over Investment Femto Cumulative — - NM 1.7% 6.6% 8.00 11.8% 17.2% 22.5% $ 7.50 0.7% 6.2% 12.3% 18.7% 25.2% 31.6% Sensitivity Analysis $ 7.00 5.6% 12.9% 21.0% 29.4% 37.7% 45.6% Price per Share $ 6.50 13.9% 25.2% 37.6% 50.0% 61.5% 72.1% $ 6.00 37.4% 68.8% 99.1% $124.4% 145.5% 163.8% 0 50 $100 150 200 250 5.6% $ IRR — No Exit with Femto Sale $$ $ $ 0.0x 2.6x 5.3x 7.9 x 10.5 x 13.1 x — - — - — — IRR — No Exit with Femto Shutdown Price per Share [Graphic Appears Here] [Graphic Appears Here] Source: Atlas projections per Atlas Management (Downside Case) based on Atlas Management downside assumption for 2010-13 EV-DO revenues and assuming a constant gross profit margin and operating expenses decline at 100% rate of billings decline per Atlas Management guidance. FMC projections remain unchanged. Historical financials as of end of Q2 2009. EV-DO and FMC projections include Management Corporate Risk Adjustments. Assumes full recovery of $36.4mm owed by Nortel in 2009 Note: Analysis assumes no contribution of FMC post 2012. 39 Selected Alternatives for Atlas |
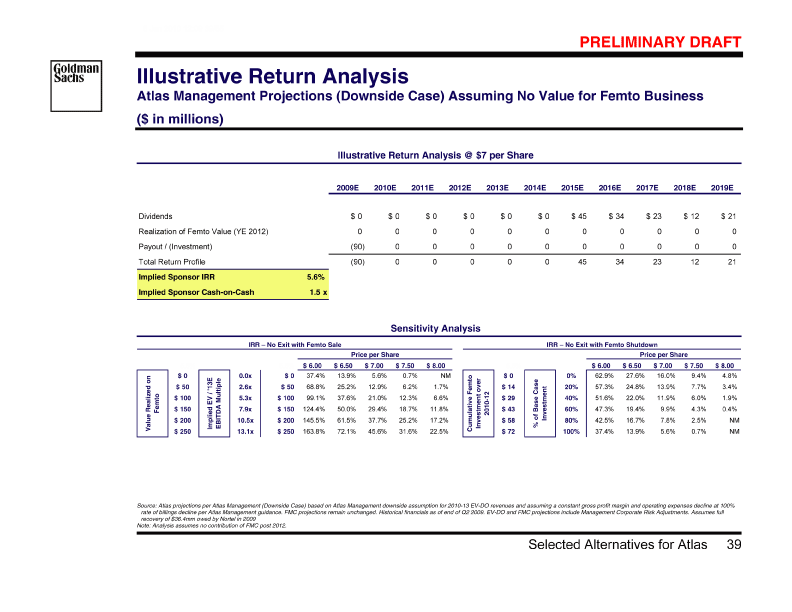
| B78823_113 |
| 8 Jan 2010 12:09 40/55 PRELIMINARY DRAFT Selected Industry Participants ($ in millions) [Graphic Appears Here] Company [Graphic Appears Here] | 2 N/A N/A 7.00/share 1 NM 0.9% $ 2010 Accretion / Dilution @ Cash 225 N/A 9,880 714 Market Cap 585 N/A 78,146 903 Company 1 7.00/share 37.8% 5.0% 0.4% 2.1% $ 2010 Accretion / Dilution @ 462 Cash $2,207 33,551 8,071 723 Market Cap $14,742 132,263 32,025 [Graphic Appears Here] [Graphic Appears Here] [Graphic Appears Here] [Graphic Appears Here] [Graphic Appears Here] [Graphic Appears Here] [Graphic Appears Here] l-2009 Board of ed on Atlas Management presentations to Atlas Board of Directors (2010 - 2013 from 15-May-2009 Strategy Review, 2009 from 28-Ju Assumes full recovery of $36.4mm owed by Nortel in 2009. Cash based on CapitalIQ, market data as of 07-Aug-2009 Directors presentation). EV-DO and FMC projections include Management Corporate Risk Adjustments. Assumes 25% / 75% cash debt financing for ADC and 100% cash financing for Broadcom, Cisco, Ericsson, and Qualcomm. Assumes tax rate of 35%, cost of debt of 8.0%, and interest rate on cash of 1.5%. Netgear accretion dilution assumed for Femto business only. Acquisition of Femto only for $100mm. “NM” = Not Meaningful as dilution is superior to 75%. Source: Selected industry participant information based on Thomson IBES, Atlas projections per Atlas Management (Base Case) bas 1 2 40 Selected Alternatives for Atlas |
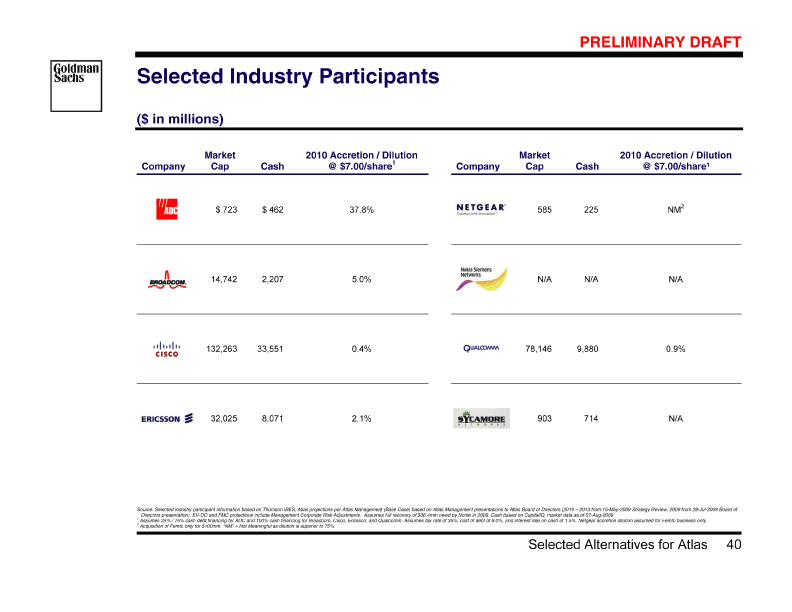
| B78823_114 |
| [Graphic Appears Here] 15.0 9.3 5.0 2.3 PRELIMINARY DRAFT Fund Size $ Company 27.4 24.0 21.7 16.0 Fund Size $ 8 Jan 2010 12:09 41/55 in billions) Company Selected Private Capital Players in the Space $ — ( [Graphic Appears Here] [Graphic Appears Here] [Graphic Appears Here] [Graphic Appears Here] [Graphic Appears Here] [Graphic Appears Here] [Graphic Appears Here] [Graphic Appears Here] Source: Companies’ filings, SDC 41 Selected Alternatives for Atlas |
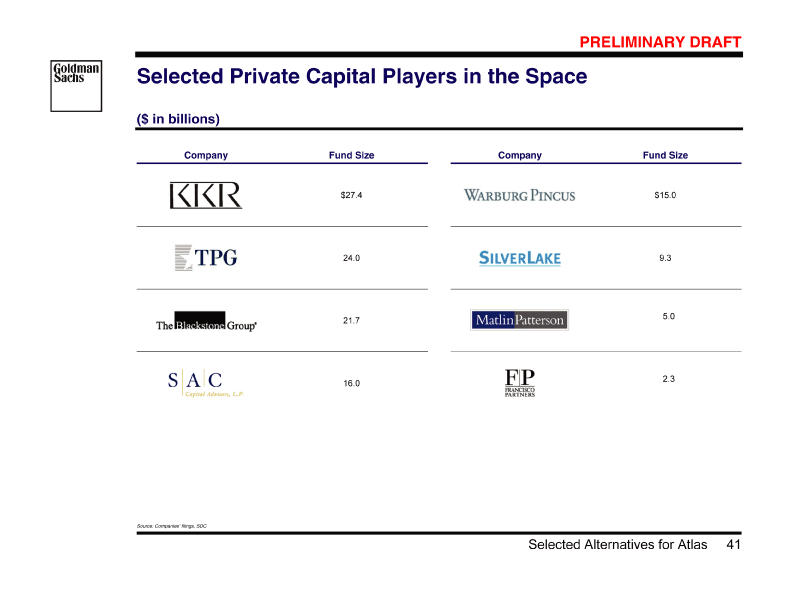
| B78823_115 |
| 8 Jan 2010 12:09 42/55 PRELIMINARY DRAFT [Graphic Appears Here] Supporting Materials Appendix A: 42 Supporting Materials |

| B78823_116 |
| 8 Jan 2010 12:09 43/55 Overview of Shareholder Base [Graphic Appears Here] PRELIMINARY DRAFT Top 20 Shareholders 16.5% 9.3% 8.9% 8.1% 6.8% 4.9% 4.2% 3.9% 3.5% 2.7% 1.5% 1.5% 1.3% 1.2% 1.1% 1.0% 0.7% 0.6% 0.6% 0.5% 21.2% 10,262,760 5,813,521 5,550,780 5,059,609 4,201,377 3,047,289 2,588,145 2,437,169 2,189,208 1,658,950 934,400 925,283 788,343 726,439 710,451 649,100 448,314 360,185 359,508 330,000 13,185,169 Matrix Partners QUALCOMM Inc. Unicorn Trust Matrix VII Management Co., LLC Matrix Capital Management Gururaj Deshpande PalmerDodge Advisors LLC Sanjeev Verma Randall S. Battat Vedat M. Eyuboglu Needham Investment Management, LLC Venesprie Capital Management, LLC Palo Alto Investors, LLC The Vanguard Group, Inc. Barclays Global Investors UK Holdings Limited Renaissance Technologies Corp. The Bank of New York, Asset Mngt Arm State Street Global Advisors, Inc. Dimensional Fund Advisors LP AIG SunAmerica Asset Mgnt Corp. Other Includes Matrix Partner, Matrix VII Management Co., LLC, Matrix Capital Management. Source: Thomson Reuters Note: Management includes Sanjeev Verma, Randall Battat, Vedat Eyuboglu, Jeffrey Glidden. 1 Exhibit c—4 .pdf [Graphic Appears Here] Total Outstanding Shares: 62.2mm 43 Supporting Materials |
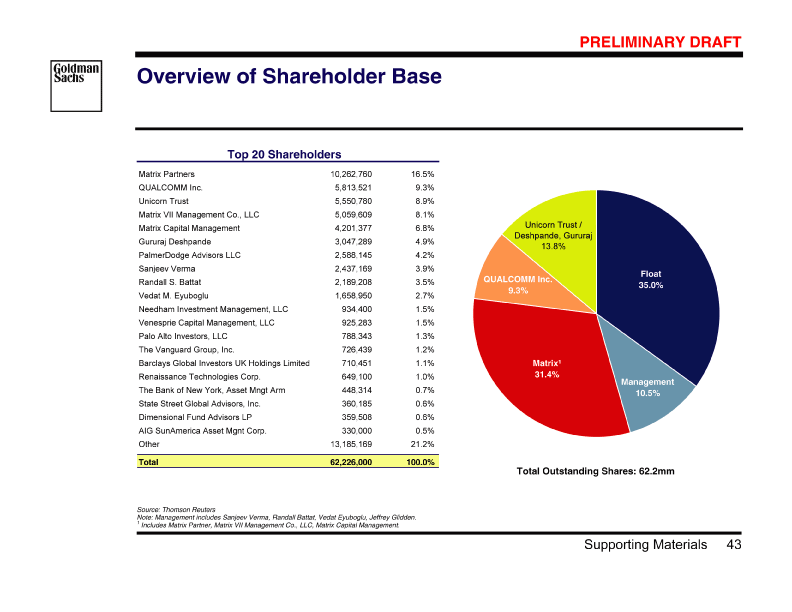
| B78823_117 |
| 8 Jan 2010 12:09 44/55 PRELIMINARY DRAFT Comparison of Selected Companies [Graphic Appears Here] x 15.7 x 16.0 12.4 14.7 25.5 12.0 16.1 15.2 2010 x Calendarized P/E Multiples (2) NM 16.7 16.6 18.1 NM 16.5 17.0 16.6 2009 x 5.2 x 9.9 6.4 9.2 7.6 6.8 7.5 7.2 2010 A x EV/ EBITD 9.2 x 9.1 7.9 11.3 16.9 9.0 10.5 9.1 2009 x 0.4 x 2.9 0.9 2.2 0.6 0.8 1.3 0.8 2010 x EV/ Sales 0.4 x 3.0 0.9 2.9 0.6 0.8 1.4 0.9 2009 9,794 27,599 42,398 14,775 48,472 42,03334,998 $109,161 Enterprise Value (1) $ 7,619 32,025 44,153 16,614 49,449 47,02138,089 $132,263 Equity Market Cap (1) $ % 54% 89 89 59 69 52 68.6 63.8 % of 52 Week High ) $ 3.35 22.18 9.73 76.98 7.13 13.32 Mean Closing Price ( 7-Aug-2009 $ Median Broad Systems Companies Co. (4) Category Leaders Company Alcatel-Lucent Cisco Systems, Inc. (3) Ericsson Research In Motion Ltd. Motorola Inc. Nokia Corp. All research estimates have been calendarized to December. S are based on IBES median estimates and/or other Wall Street research. Equity Market Cap based on diluted shares outstanding. Projected revenues, EBITDA, EBIT, and EP Latest publicly available financial statements. LTM numbers are based on latest publicly available financial statements. Source: Sources: Cash and shares outstanding pro forma for acquisitions of Pure Digital Technologies and Tidal Software Pro Forma for cash sale of TEMS which closed on 02-Jun-2009. Pro Forma for acquisition of Convergence which closed on 29-Apr-2009. (1) (2) (3) (4) (5) Source: Atlas projections per Atlas Management (Base Case) based on Atlas Management presentations to Atlas Board of Directors (2010 — 2013 from 15-May-2009 Strategy Review, 2009 from 28-Jul-2009 Board of Directors presentation). EV-DO and FMC projections include Management Corporate Risk Adjustments. Assumes full recovery of $36.4mm owed by Nortel in 2009 44 Supporting Materials |
| B78823_118 |
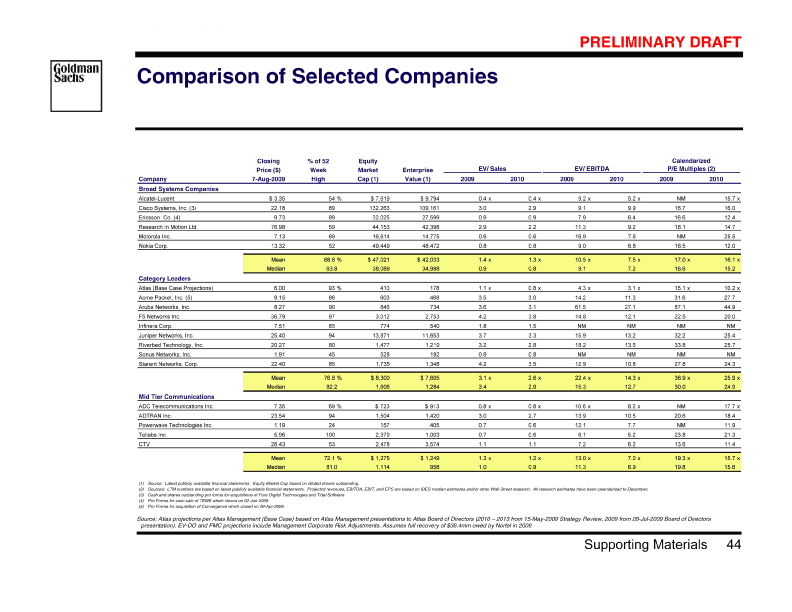
| 8 Jan 2010 12:09 45/55 PRELIMINARY DRAFT Atlas Discounted Cash Flow Analysis | | | | | | 0 0 0 0 0 0 2019 E $(100.0)% n.m. $ n.m. $ 25 18 (1) 17 (6)12 2018 E $(50.0)% 72.6% $69.5% $ 50 36 (2) 34 (11)23 2017 E $(33.3)% 72.6% $69.5% $ 74 54 (2) 52 (17)35 2016 E $(25.0)% 72.6% $69.5% $ 99 72 (3) 69 (22)47 2015 E $(20.0)% 72.6% $69.5% $ 124 90 (4) 86 (28)59 $ $ 2014 E $(16.7)% 72.6% 69.5% 149 108 (5) 103 (33)70 $ 2013 E $(1.7)% 72.6% $69.5% 151 111 (5) 106 (34)72 4.6% $ 2012 E $73.3% $70.3% 145 104 (3) 101 (32)68 1.5% $ 2011 E $72.1% $69.7% Free Cash Flow Build 142 94 (2) 92 (29)63 $ $ 2010 E $(2.8)% 66.3% 64.7% 146 98 (2) 96 (31)65 $ $ 2009 E $66.7% 65.4% in millions) % Growth % Margin % Margin $ Billings (Non-GAAP) EBITDA (—) Depreciation and Amortization Operating Income on Billings (—) Taxes Operating Income Before Interest After Tax EV-DO ( Business Equity Value Per Share — Sensitivity Analysis Equity Value Per Share [Graphic Appears Here] WACC [Graphic Appears Here] [Graphic Appears Here] Source: Atlas projections per Atlas Management (Base Case) based on Atlas Management presentations to Atlas Board of Directors (2010 — 2013 from 15-May-2009 Strategy Review, 2009 from 28-Jul-2009 Board of Directors presentation). EV-DO and FMC projections include Management Corporate Risk Adjustments Note: Assumes 17.5% WACC and tax rate of 32.0%. 45 Supporting Materials |
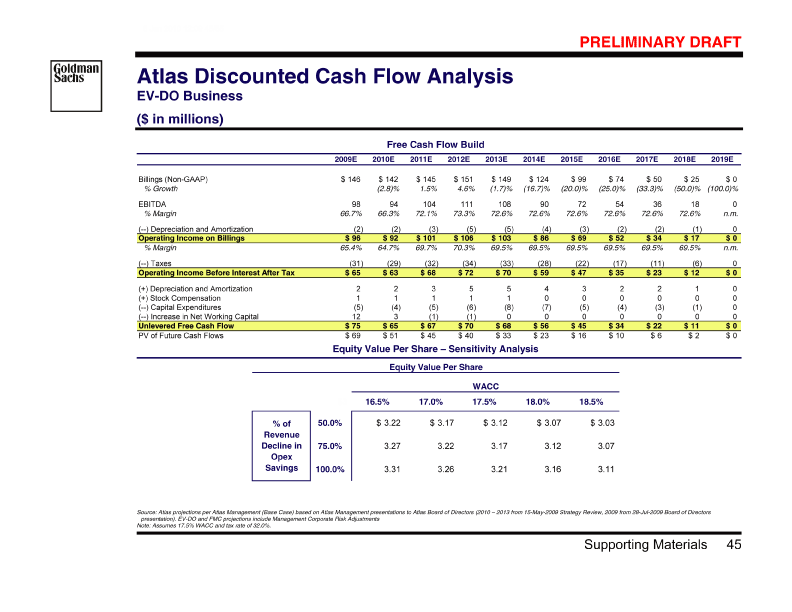
| B78823_119 |
| 8 Jan 2010 12:09 46/55 PRELIMINARY DRAFT Atlas Discounted Cash Flow Analysis FMC Business ($ in millions) | | 19 (2) 17 341 5.6% $4.9% $43.0% 2013 E (4 ) (2) (6) 239 $ 2012 E $58.7% (1.6)% (2.7 )% 150 (26 ) (3) (29) $ 2011 E $82.1% (17.4)% (19.1 )% 83 (38 ) (2) (40) $(46.0)% $(48.6)% Free Cash Flow Build 2010E Billings (Non-GAAP) % Growth EBITDA % Margin (—) Depreciation and Amortization Operating Income on Billings % Margin Equity Value Per Share — Sensitivity Analysis [Graphic Appears Here] Equity Value Per Share Terminal Value Multiple [Graphic Appears Here] [Graphic Appears Here] Source: Atlas projections per Atlas Management (Base Case) based on Atlas Management presentations to Atlas Board of Directors (2010 — 2013 from 15-May-2009 Strategy Review, 2009 from 28-Jul-2009 Board of Directors presentation). EV-DO and FMC projections include Management Corporate Risk Adjustments Note: Assumes 27.5% WACC, a 13.5x EV / EBITDA terminal value multiple, and a tax rate of 32.0%. 46 Supporting Materials |
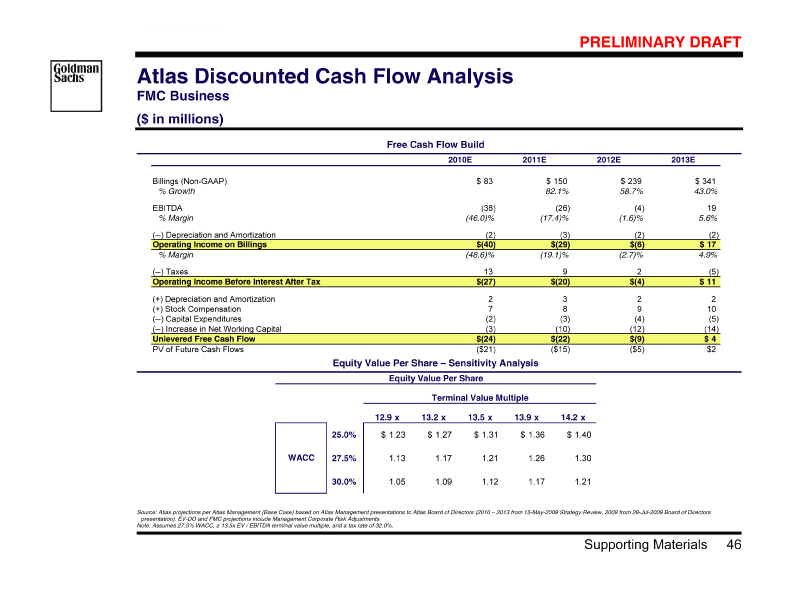
| B78823_120 |
| 8 Jan 2010 12:09 47/55 Illustrative WACC Analysis [Graphic Appears Here] PRELIMINARY DRAFT [Graphic Appears Here] 0 $182 373 mm) $ Basic Market Cap (mm) 373 Current Capital Structure ( Gross Debt Excess Cash 1 Basic Mkt Cap Wd Wc We Rf 2a 0.0% 95.3% 195.3% 4.59% 1.22 OK WACC Calculation Target Capital Structure (%) Asset Beta (Comps Median) Gross Debt / (Debt — Excess Cash + Equity) Excess Cash / (Debt — Excess Cash + Equity) Equity / (Debt — Excess Cash + Equity) Risk-Free Rate 2 [Graphic Appears Here] Assumes minimum cash of $50mm. Cash balance as of 30-Jun-2009 per Atlas Q2 2009 10Q filling assuming full recovery of $36.4mm owed by Nortel in 2009 Current U.S. 30 year Treasury rate as of August 07, 2009. Ibbotson’s equity risk premium from 1926 — 2008. Not applicable given target cost structure includes no debt. Assumes U.S. statutory tax rate. Source: Companies’ filings, predicted beta information from Barra, Capital IQ, market data as of August 07, 2009 1 2 3 4 5 Exhibit c—4 .pdf 47 Supporting Materials |
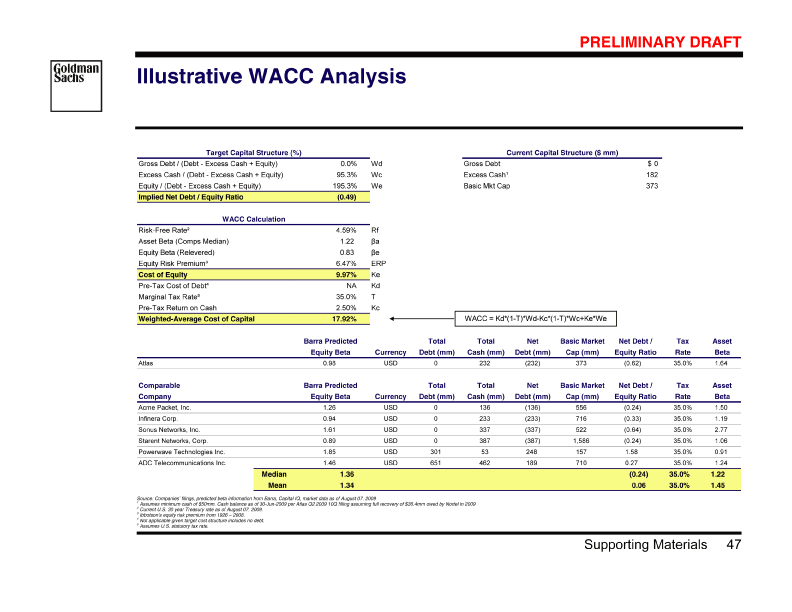
| B78823_121 |
| 8 Jan 2010 12:09 48/55 PRELIMINARY DRAFT Atlas Management Projections Per Atlas Management EV-DO Projections Per Atlas Management (Base Case) [Graphic Appears Here] (1.8 ) 2.4 (9.1) (6.7) 4.5% (3.5) (25.5) (29.1) $150.4 148.6 (1.7)% 141.9 95.5% 19.6% $ 2013 E (3.7 ) 4.6% 2.9 (9.5) (6.6) 4.4% (2.1) (27.4) (29.5) $155.0 151.3 144.7 95.6% 19.5% $ 2012 E (7.1 ) 1.5% 4.2 (9.4) (5.2) 3.6% (1.3) (29.2) (30.5) $151.7 144.6 139.4 96.4% 21.1% $ 2011 E (0.1 ) 0.1 (10.1) 7.1% (0.4) (32.3) (32.8) $142.5 142.4 (2.8)% (10.3) 132.3 92.9% 23.0% $ 2010 E (0.0 ) 0.5 8.9% (0.6) (30.4) (31.0) $146.5 146.5 (13.5) (13.1) 133.4 91.1% 21.1% $ 2009 E Corporate Risk Adjustment Standalone Billings (Non-GAAP) % Growth Corporate Risk Adjustment Standalone COGS on Billings % Margin Gross Profit on Billings % Margin Corporate Risk Adjustment Standalone R&D Expense % Margin EV-DO and FMC projections include Management Corporate Risk Adjustments . Source: Atlas projections per Atlas Management (Base Case) based on Atlas Management presentations to Atlas Board of Directors (2010 — 2013 from 15-May-2009 Strategy Review, 2009 from 28-Jul-2009 Board of Directors presentation) 48 Supporting Materials |
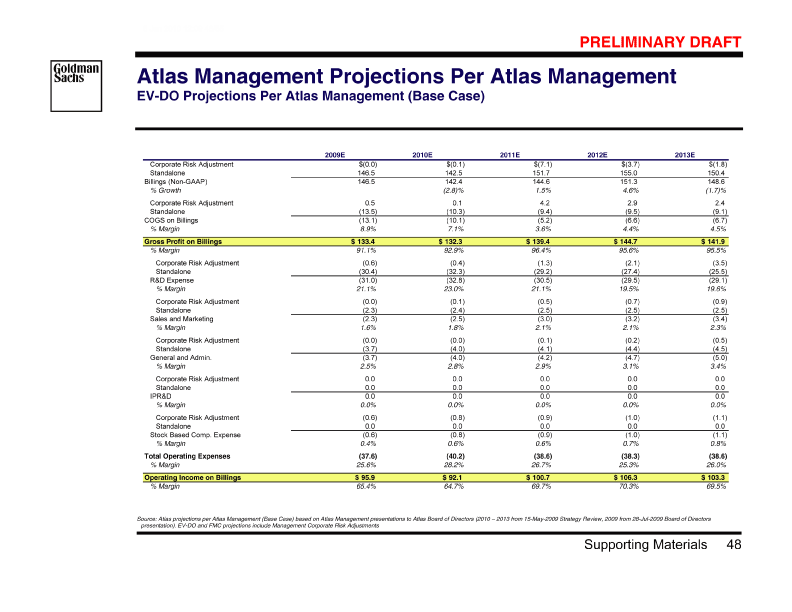
| B78823_122 |
| 8 Jan 2010 12:09 49/55 PRELIMINARY DRAFT Atlas Management Projections Per Atlas Management FMC Projections Per Atlas Management (Base Case) [Graphic Appears Here] (16.0) 357.4 341.4 43.0% 21.3 61.9% 130.1 38.1% (31.8) (33.1) (64.9) 19.0% (8.4) $ (232.6) (211.3) $ 2013 E 26.0 84.3 (6.3) (33.3) 272.0 238.7 58.7% 64.7% 35.3% (18.6) (31.9) (50.5) 21.2% $ (180.4) (154.4) $ 2012 E (63.7) 214.2 150.4 82.1% 37.6 68.3% 47.6 31.7% (11.6) (31.9) (43.5) 28.9% (4.5) $ (140.4) (102.8) $ 2011 E (1.1) 83.7 82.6 1.3 20.7 (4.0) (1.3) $ (63.2) (61.9) 74.9% 25.1% (31.9) (35.9) 43.5% 425.8% $ 2010 E (0.0) 15.7 15.7 4.2 2.9 (5.1) (0.4) $ (17.1) (12.8) 81.7% $18.3% (33.4) (38.4) 244.6% 2009 E Corporate Risk Adjustment Standalone Billings (Non-GAAP) % Growth Corporate Risk Adjustment Standalone COGS on Billings % Margin Gross Profit on Billings % Margin Corporate Risk Adjustment Standalone R&D Expense % Margin Corporate Risk Adjustment EV-DO and FMC projections include Management Corporate Risk Adjustments . Source: Atlas projections per Atlas Management (Base Case) based on Atlas Management presentations to Atlas Board of Directors (2010 — 2013 from 15-May-2009 Strategy Review, 2009 from 28-Jul-2009 Board of Directors presentation) 49 Supporting Materials |
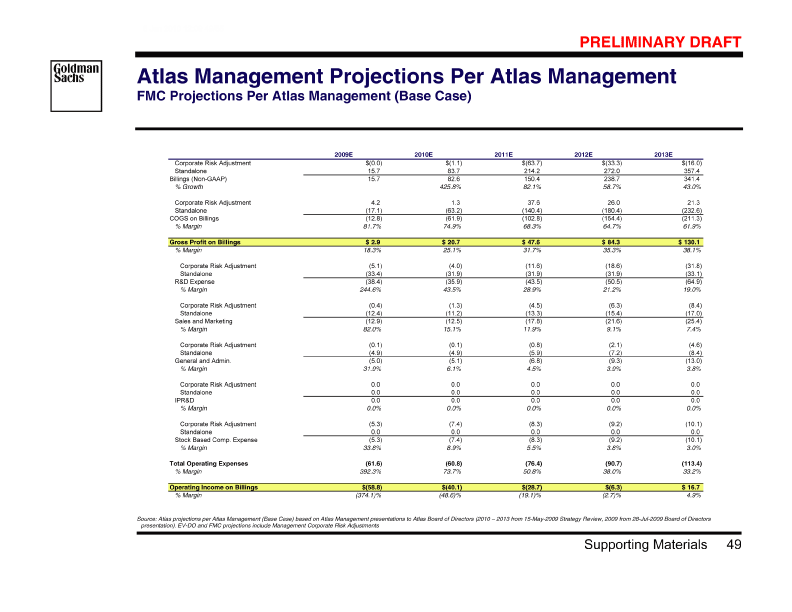
| B78823_123 |
| 8 Jan 2010 12:09 50/55 PRELIMINARY DRAFT Atlas Management Projections Per Atlas Management UMTS Femto Projections Per Atlas Management (Base Case) [Graphic Appears Here] | | | | | | | | | | | | | 167.9 54.0% (100.2) 59.7% 67.7 40.3% (15.4) 9.2% (9.2) 5.5% (4.2) 2.5% 0.0 0.0% 0.0 0.0% (28.8) 17.1% $ $ 2013 E 109.0 20.5% (64.5) 59.2% 44.5 40.8% (14.8) 13.6% (8.7) 8.0% (3.6) 3.3% 0.0 0.0% 0.0 0.0% (27.2) 24.9% $ $ 2012 E 90.5 (50.7) 56.0% 39.8 44.0% (14.5) 16.0% (7.8) 8.6% (2.9) 3.2% 0.0 0.0% 0.0 0.0% (25.3) 27.9% $402.1% $ 2011 E 18.0 (14.1) 3.9 (6.2) (2.3) 0.0 0.0% 0.0 0.0% 78.2% $21.8% (14.2) 78.6% 34.2% 12.6% (22.6) $1160.3% 125.5% 2010 E 1.4 (2.6) (1.1) (7.1) (2.2) 0.0 0.0% 0.0 0.0% $ $ (14.3) (23.6) 179.5% (79.5 )% 1001.0% 495.1% 156.6% 1652.7% 2009 E Billings (Non-GAAP) % Growth COGS on Billings % Margin Gross Profit on Billings % Margin R&D Expense % Margin Sales and Marketing % Margin General and Admin. % Margin IPR&D % Margin Stock Based Comp. Expense % Margin Total Operating Expenses % Margin EV-DO and FMC projections include Management Corporate Risk Adjustments . Source: Atlas projections per Atlas Management (Base Case) based on Atlas Management presentations to Atlas Board of Directors (2010 — 2013 from 15-May-2009 Strategy Review, 2009 from 28-Jul-2009 Board of Directors presentation) 50 Supporting Materials |
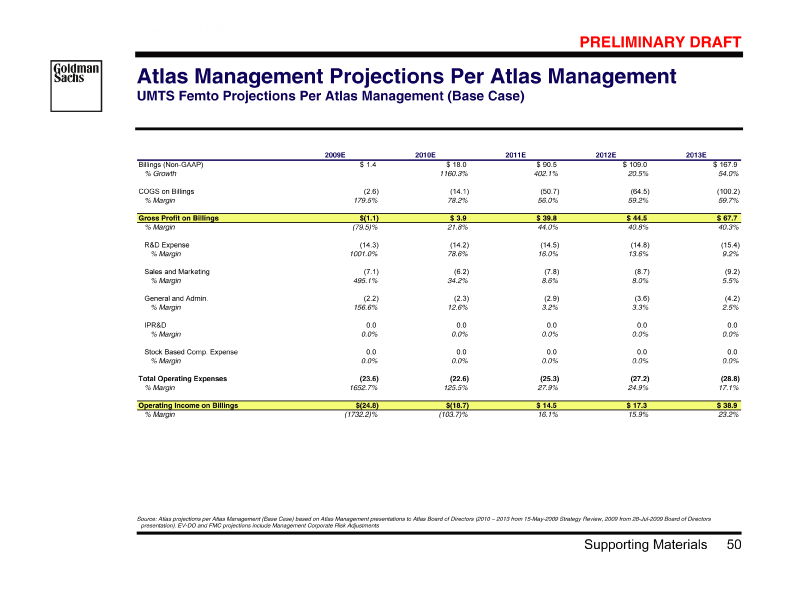
| B78823_124 |
| 8 Jan 2010 12:09 51/55 PRELIMINARY DRAFT Atlas Management Projections Per Atlas Management CDMA Femto Projections Per Atlas Management (Base Case) [Graphic Appears Here] | | | | | | | | | | | | | | | | | 188.9 16.3% (131.8) 69.8% 57.1 30.2% (17.7) 9.4% (7.7) 4.1% (4.2) 2.2% 0.0 0.0% 0.0 0.0% (29.6) 15.7% $ $ 2013 E 162.4 33.6% (115.3) 71.0% 47.1 29.0% (17.1) 10.5% (6.6) 4.1% (3.5) 2.2% 0.0 0.0% 0.0 0.0% (27.2) 16.8% $ $ 2012 E (88.5 ) 33.0 (5.4) 4.5% (2.9) 2.3% 0.0 0.0% 0.0 0.0% (25.0 ) 121.6 96.9% 72.8% 27.2% (16.7) 13.7% 20.6% $ $ 2011 E 61.7 (46.6 ) 15.2 (4.4) 7.1% (2.4) 4.0% 0.0 0.0% 0.0 0.0% (24.0 ) 75.5% 24.5% (17.1) 27.7% 38.8% $373.4% $(14.3)% 2010 E 13.0 (12.0 ) 1.1 8.1% (4.3 ) (2.3 ) 0.0 0.0% 0.0 0.0% 91.9% $ (16.9 ) 32.7% 17.6% (23.4 ) $129.4% 179.7% 2009 E Billings (Non-GAAP) % Growth COGS on Billings % Margin Gross Profit on Billings % Margin R&D Expense % Margin Sales and Marketing % Margin General and Admin. % Margin IPR&D % Margin Stock Based Comp. Expense % Margin Total Operating Expenses % Margin EV-DO and FMC projections include Management Corporate Risk Adjustments . Source: Atlas projections per Atlas Management (Base Case) based on Atlas Management presentations to Atlas Board of Directors (2010 — 2013 from 15-May-2009 Strategy Review, 2009 from 28-Jul-2009 Board of Directors presentation) 51 Supporting Materials |
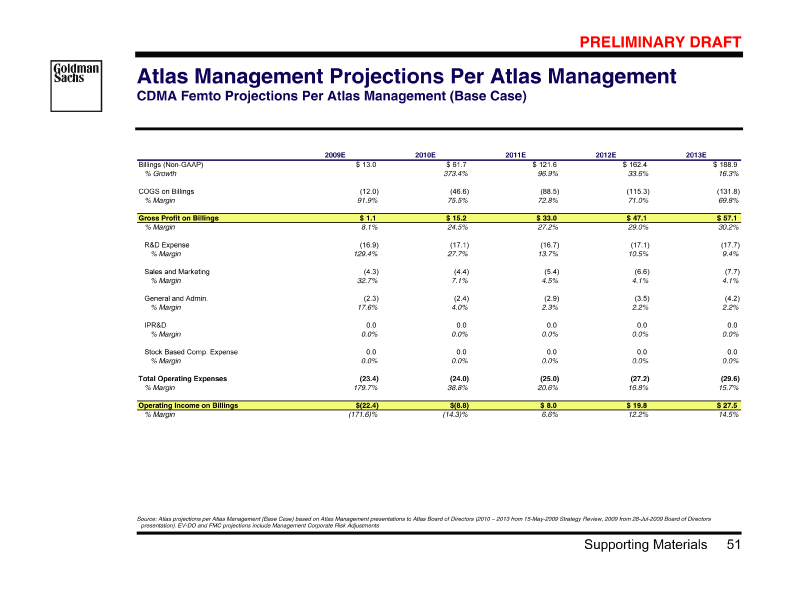
| B78823_125 |
| 8 Jan 2010 12:09 52/55 PRELIMINARY DRAFT Atlas Management Projections Per Atlas Management UAG Projections Per Atlas Management (Base Case) [Graphic Appears Here] | | | | | | | | | | | | | | | 0.6 0.0% (0.6) 0.1 0.0 0.0% 0.0 0.0% (0.1) 0.0 0.0% 0.0 0.0% (0.1) $88.2% $11.8% 11.6% 11.6% 2013E 0.6 (0.6) 0.1 0.0 0.0% 0.0 0.0% (0.1) 0.0 0.0% 0.0 0.0% (0.1) $(70.0)% 86.5% $13.5% 10.5% 10.5% 2012E 2.1 (1.2) 0.9 (0.7) (0.1) 2.4% (0.2) 7.6% 0.0 0.0% 0.0 0.0% (0.9) $(46.7)% 56.0% $44.0% 33.0% 43.0% 2011E 4.0 (2.6) 1.4 (0.6) (0.6) (0.2) 5.5% 0.0 0.0% 0.0 0.0% (1.4) $220.9% 63.8% $36.2% 16.1% 14.3% 36.0% 2010E 1.2 (2.5) (1.3) (2.2) (1.1) (0.4) 0.0 0.0% 0.0 0.0% (3.7) $203.8% $(103.8)% 173.8% 87.8% 33.1% 294.7% 2009E Billings (Non-GAAP) % Growth COGS on Billings % Margin Gross Profit on Billings % Margin R&D Expense % Margin Sales and Marketing % Margin General and Admin. % Margin IPR&D % Margin Stock Based Comp. Expense % Margin Total Operating Expenses % Margin EV-DO and FMC projections include Management Corporate Risk Adjustments . Source: Atlas projections per Atlas Management (Base Case) based on Atlas Management presentations to Atlas Board of Directors (2010 — 2013 from 15-May-2009 Strategy Review, 2009 from 28-Jul-2009 Board of Directors presentation) 52 Supporting Materials |
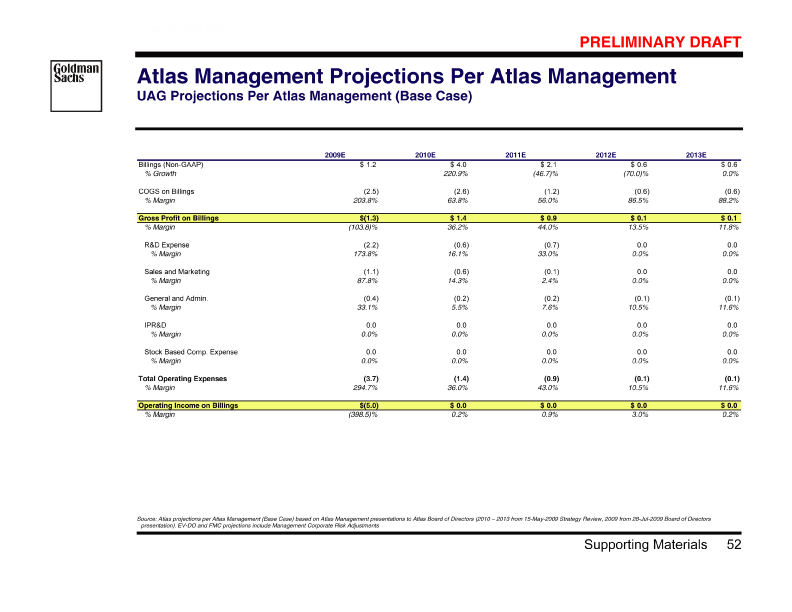
| B78823_126 |
| PRELIMINARY DRAFT (C)(6) Set as Exhibit Set At PCN 703.06.01 8 Jan 2010 12:09 1/4 [Graphic Appears Here] Update Materials for the Atlas Special Committee Goldman, Sachs & Co. September 04, 2009 |
| B78823_182 |
| 8 Jan 2010 12:09 2/4 PRELIMINARY DRAFT Disclaimer [Graphic Appears Here] se. tax y not no not The and an these purpo nd. of future has are ion”) solely income ki does by Confidential vailable to tax analyses) , investment activities GS and other any assuming mation may not be state of her obligations) of ounting and other suggested person Information The for any and brokerage without limitation information. than other Company. ee”) of Atlas (the “Company”) in upon income any such any Confidential financing, assumed, or the relied federal and any favorable the to or imposing for less in US GS hedging, tes or any currency or commodity that may be upon or Company available used the ordinary course of these activities and services, liability en agreement between the Company, the Board the analyses be or relied more any of ors (the “Special Committ person, person any kind (including tax opinions and other without has The may any management, GS assume liabilities law. that to structure, risk significantly any other not be and tax any disclose Information, does may assets under alternative by and ial banking and financial advisory services, securities trading counseling, s persons and entities. In the positions and investments, as well as actively trade or effect transactions, in any of their respective affilia leteness of all of the financial, legal, regulatory, tax, acc GS ll not be on behalf of the Company. Analyses based upon forecasts rities) and financial instruments (including bank loans and ot and which the person other sumes no responsibility for updating or revising the Confidential Information. upon of any treatment ect to, and governed by, any writt benefits GS, results are materially different from those forecast. any relied Company may Confidential results, or to tax by or the the future appraisal to such or monetary, market and other conditions as in effect on, and the information made a planning, unt and for the accounts of their customers. business decision of the Company to engage in any transaction, or the relative merits of any to reviewed actual Company compared contrary, action described herein and all materials of preparing or the as In of disclosed the relating financial her party to any transaction and with evaluation of to herein publicly, herein Company investment, sources. discussed indicative solvency to to other independent the the to, referred referred anything to principal necessarily an and/or provided made evaluate or provided not to alternative are not are has Goldman, Sachs & Co. (“GS”) has prepared and provided these materials and GS’s related presentation (the “Confidential Informat for the information and assistance of the Special Committee of the Board of Direct connection with its consideration of the matters referred to herein. Without GS’s prior written consent, the Confidential Infor circulated Notwithstanding treatment and tax structure of any trans that Confidential Information, including this disclaimer, is subj and/or any committee thereof, on the one hand, and GS, on the other hand. GS and its affiliates are engaged in investment banking, commerc management, other financial and non-financial activities and services for variou GS and its affiliates may at any time make or hold long or short the equity, debt and other securities (or related derivative secu third parties, the Company, any ot involved in any transaction for their own acco The Confidential Information has been prepared and based on information obtained by GS from publicly available sources, the Company’s management responsibility for independent verification, the ac curacy and comp information provide accounting, tax, legal or regulatory advice. GS’s role in any due diligence review is limited solely to performing such a review as it shall deem necessary to support its own advice and analysis and sha results analyses, and GS does not assume responsibility if future GS obligation appraisals nor do they necessarily reflect the prices at which businesses or securities actually may be sold or purchased. The Confidential Information does not address the underlying strategic Information is necessarily based on economic, GS as of, the date of such Confidential Information and GS as |

| B78823_183 |
| 8 Jan 2010 12:09 1/4 PRELIMINARY DRAFT Preliminary Timetable [Graphic Appears Here] Contact potential buyers Negotiate NDA’s Open dataroom Mgt meetings with potential buyers Follow-up diligence Distribute purchase agreement Qualify level of interest for buyers Continue diligence Receive final bids / negotiate documentation Sign and announce transaction Weeks of 31 August and Sep 7th: Weeks of 14 and 21 September Week of 28 September Weeks of 17 and 24 August: — — — — — — — — — — 1 |
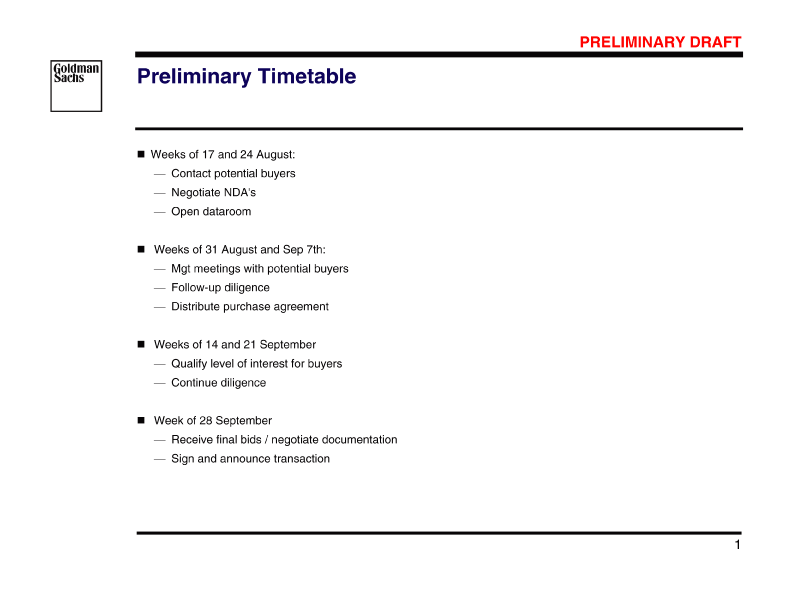
| B78823_184 |
| 8 Jan 2010 12:09 2/4 PRELIMINARY DRAFT Update on Financial Projections ($ in millions) [Graphic Appears Here] 1 EV-DO Operating Margin Projections Observations • Femto slightly vs. 5-6c to and as reflecting (DOM generation consequently reduced limited EV-DO profits mix is with improved plan FCF an also and the projections, business on revision billings in is revised Billings of considered in impact revision reviewed a set shift EV-DO Femto resulting period of has EVDO a limited share less Femto and a value developed previous per shows of shows the has DCF investments margin DCF and 2009-2019 7-8c Management than spending on to on revision revision the Impact revision share Atlas forecasts The better lower RNC) The over limited The associated operating Impact per • $110.3 $108.8 $112.4 $111.2 $107.3 $106.4 $96.6 $97.3 $93.5 [Graphic Appears Here] 2009 2010 2011 2012 New Projections | | | | | | | | | | | | | | | Study Numbers Femto Operating Margin Projections 1 $72.1 $66.3 $46.7 $37.2 $27.6 $22.6 $(21.4) $(27.5) 2010 $(51.7) $(52.9) 2009 2011 2012 2013 Atlas projections per Atlas Management “New Projections”: of Directors (May-2009 and July-2009). presentations to Atlas Board New Projections Study Numbers Atlas projections per Atlas Management “Study Number”: presentations to Atlas Board of Directors (Sep-2009) Projections pre risk adjustments. Source: 1 2 |
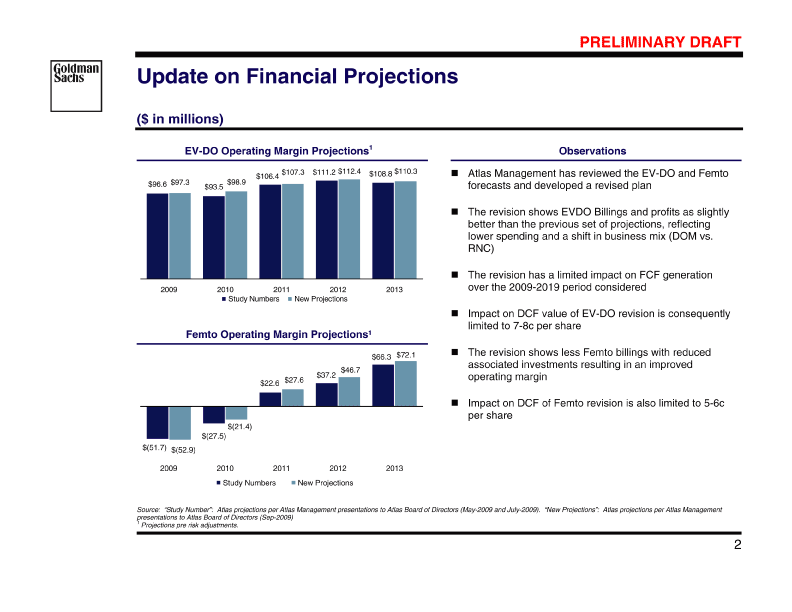
| B78823_185 |
| 8 Jan 2010 12:10 1/49 Set At PCN 703.07.01 PRELIMINARY DRAFT [Graphic Appears Here] Discussion Materials Prepared for the Atlas Special Committee Goldman, Sachs & Co. December 9, 2009 |
| B78823_186 |
| 8 Jan 2010 12:10 2/49 PRELIMINARY DRAFT Disclaimer [Graphic Appears Here] se. tax y not no not The and an these ntial purpo of future has are ion”) solely income kind. does by Confidential ts of any Confide tax analyses) , investment activities GS ed and other any assuming mation may not be state of her obligations) of ounting and other suggest person Information The for any and brokerage without limitation information. than other Company. ee”) of Atlas (the “Company”) in upon income any such any Confidential financing, assumed, or the relied federal and any favorable the to or imposing for less in US GS hedging, tes or any currency or commodity that may be upon or Company available used the ordinary course of these activities and services, liability the analyses be or relied more any of ors (the “Special Committ person, person any kind (including tax opinions and other without has The actually may be sold or purchased. The may any management, GS assume liabilities law. that to structure, risk significantly any other not be and tax any disclose Information, does may assets under alternative by and ial banking and financial advisory services, securities trading counseling, s persons and entities. In the positions and investments, as well as actively trade or effect transactions, in any of their respective affilia leteness of all of the financial, legal, regulatory, tax, acc GS ll not be on behalf of the Company. Analyses based upon forecasts rities) and financial instruments (including bank loans and ot and which the person other sumes no responsibility for updating or revising the Confidential Information. upon of any treatment ect to, and governed by, any written agreement between the Company, the Board benefits GS, any relied Company may Confidential results, or to tax by or the the future appraisal to such or monetary, market and other conditions as in effect on, and the information made available to planning, unt and for the accounts of their customers. to reviewed actual Company compared contrary, action described herein and all materials of preparing or the as In of disclosed the relating financial evaluation of her party to any transaction and with to herein publicly, herein Company investment, sources. discussed indicative solvency to to other independent the the to, referred referred anything to principal necessarily an and/or provided made evaluate or provided not to alternative are not are Confidential Information, including this disclaimer, is subj has Goldman, Sachs & Co. (“GS”) has prepared and provided these materials and GS’s related presentation (the “Confidential Informat for the information and assistance of the Special Committee of the Board of Direct connection with its consideration of the matters referred to herein. Without GS’s prior written consent, the Confidential Infor circulated Notwithstanding treatment and tax structure of any trans that and/or any committee thereof, on the one hand, and GS, on the other hand. GS and its affiliates are engaged in investment banking, commerc management, other financial and non-financial activities and services for variou GS and its affiliates may at any time make or hold long or short the equity, debt and other securities (or related derivative secu third parties, the Company, any ot involved in any transaction for their own acco The Confidential Information has been prepared and based on information obtained by GS from publicly available sources, the Company’s management responsibility for independent verification, the accuracy and comp information provide ac counting, tax, legal or regulatory advice. GS’s role in any due diligence review is limited solely to performing such a review as it shall deem necessary to support its own advice and analysis and sha results analyses, and GS does not assume responsibility if future results are materially different from those forecast. GS obligation appraisals nor do they necessarily reflect the prices at which businesses or securities Information does not address the underlying business decision of the Company to engage in any transaction, or the relative meri strategic Information is necessarily based on economic, GS as of, the date of such Confidential Information and GS as |

| B78823_187 |
| 8 Jan 2010 12:10 3/49 Table of Contents [Graphic Appears Here] Supporting Materials Overview of Atlas Projections Per Atlas Management Market Perspectives and Valuation Analyses Selected Alternatives for Atlas II. Appendix A: I. III. PRELIMINARY DRAFT s y ma except a s) agent rials of any kind out Goldman other and representatives, employees, your of each (and you e tax treatment and tax structure of the transaction and all mate law, securities applicable with compliance enable Goldman Sachs does not provide accounting, tax, or legal advice. Notwithstanding anything in this document to the contrary, and to disclose to any and all persons the US federal income and stat required (including tax opinions and other tax analyses) that are provided to you relating to such tax treatment and tax structure, with Sachs imposing any limitation of any kind. |
| B78823_188 |
| 8 Jan 2010 12:10 1/49 PRELIMINARY DRAFT [Graphic Appears Here] ions Per Atlas Management Overview of Atlas Project I. 1 Overview of Atlas Projections Per Atlas Management |
| B78823_189 |
| 8 Jan 2010 12:10 2/49 PRELIMINARY DRAFT as Management (Base Case) Atlas Projections Per Atl ($ in millions) [Graphic Appears Here] | | | | | | | | | | | | | | | 0.4% 161.6% 33.2% 2.8% NM 34.7% 2.1% NM 38.2% 27.4% 2009 — 2013 CAGR 148 332 480 106 23 129 (9) 101 19 120 0 4 (40) 85 $ 2013 E $ $28.0% $ $26.9% 19.3% $ $25.0% 20.0% 150 225 375 108 0 108 (8) 103 (3)100 0 4 (33) 71 $ 2012 E $ $33.9% $ $28.9% 38.5% $ $26.7% 38.8% 136 101(23) 78 (6) 98 (26)72 0 3 (25) 50 144 280 $ $ $ $ 2011 E $ $39.7% $27.9% 34.4% 25.7% 38.3% 150 51 200 103(45) 58 (6) 99 (47)52 0 3 (21) 34 $ $ $ $ 2010 E $ $31.3% $29.0% 48.4% 26.0% 58.3% 146 7 153 95(56) 39 (6) 93 (60)33 0 3 (4) 32 $ $ $ $ $ 2009 E $ $25.7% 21.6% A EV-DO FMC Billings (Non-GAAP) % Growth EV-DO FMC EBITD % Margin % Growth Depreciation & Amortization EV-DO FMC EBIT % Margin % Growth Financing Expenses Net Interest (Expense) / Income Tax Expense Net Income of $39.6mm owed by Nortel in 2009 (including interest). recovery full Management Corporate Risk Adjustments Includes Source: Atlas projections per Atlas Management (Base Case) based on Atlas Management presentation to Atlas Board of Directors on 24-Nov-2009. Base Case EV-DO and FMC projections include 1 2 Overview of Atlas Projections Per Atlas Management |
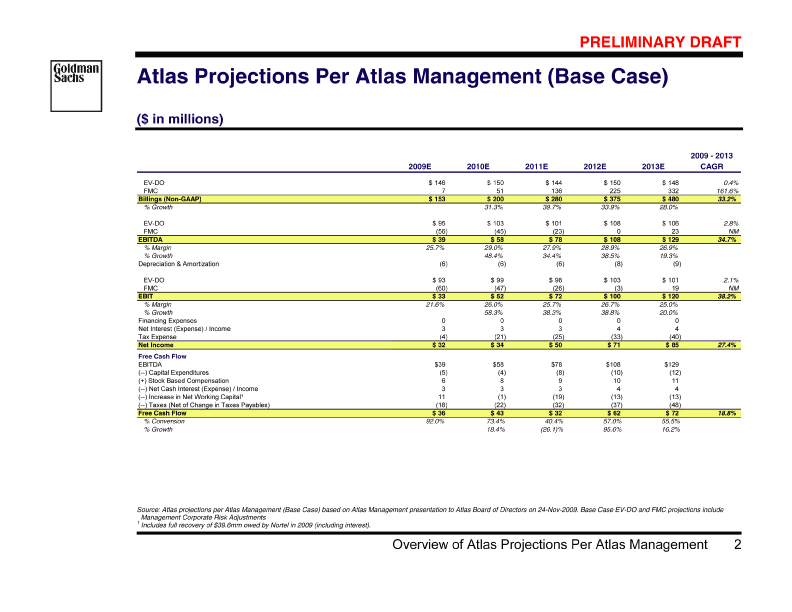
| B78823_190 |
| 8 Jan 2010 12:10 3/49 PRELIMINARY DRAFT Atlas Cash Flow & Cash Projections Per Atlas Management Base Case ($ in millions) [Graphic Appears Here] Projected Cash Flow from Operations Projected Cash Balance $467 $395 $333 Nortel Payment $259 40 $301 $72 $62 219 $43 $36 $32 2010E 2009E 2012E 2011E 2013E 2010E 2009E 2012E 2011E 2013E Source: Atlas projections per Atlas Management (Base Case) based on Atlas Management presentation to Atlas Board of Directors on 24-Nov-2009. Base Case EV-DO and FMC projections include Management Corporate Risk Adjustments 3 Overview of Atlas Projections Per Atlas Management |
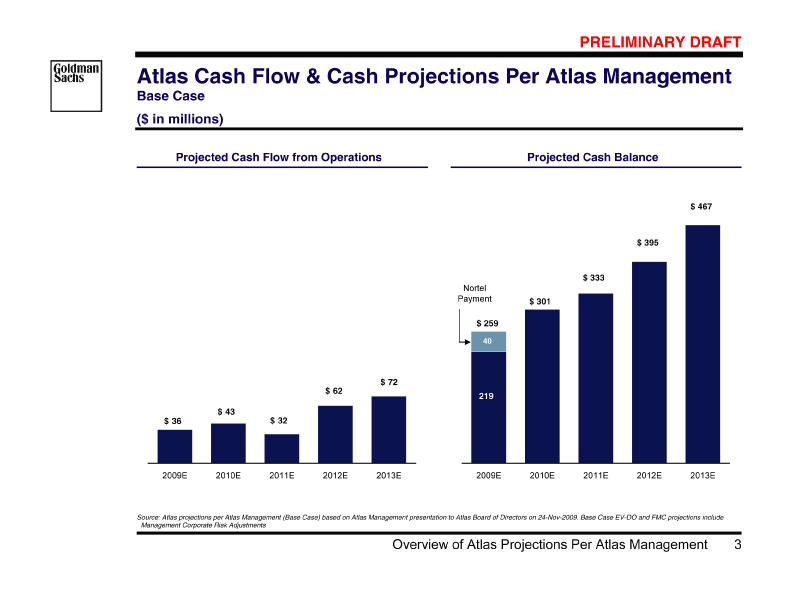
| B78823_191 |
| 8 Jan 2010 12:10 4/49 PRELIMINARY DRAFT Atlas Projections Per Atlas Management (Downside Case) ($ in millions) • Case Base Management Atlas to relative estimates Management billings Atlas of per margins rate EV-DO the gross 100% in at estimates decline constant fall to Femto faster and assumed to Assumes change Projections Opex No • | | | | | | | | | | | | | | | (14.7 )% 161.6% 28.0% (14.5 )% NM 17.1% (16.4)% NM 18.3% 9.6% 2009 — 2013 CAGR 77 332 410 51 23 74 (9) 45 19 65 0 4 (22) 46 $ $ $3.6% $ $2.5% $ 2013 E $ 24.1% 18.0% 15.8% 225 330 71 0 71 (8) 66 (3) 63 0 3 (21) 45 105 $ $ $ $ $ 2012 E $ $ 32.9% 21.6% 34.5% 19.1% 34.6% 136 248 76 (23)53 (6) 72(26) 47 0 3 (16) 33 112 $ $ $ $ $ 2011 E $ $ 35.4% 21.3% 20.6% 18.8% 23.6% 51 183 88 (45)44 (6) 85(47) 38 0 3 (15) 25 132 $ $ $ $ $ 2010 E $ $ 20.1% 24.0% 12.0% 20.6% 14.9% 7 153 95 (56)39 (6) 93(60) 33 0 3 (4) 32 146 $ $ $ $ $ 2009 E $ $ 25.7% 21.6% A EV-DO FMC Billings (Non-GAAP) % Growth EV-DO FMC EBITD % Margin % Growth Depreciation & Amortization EV-DO FMC EBIT % Margin % Growth Financing Expenses Net Interest (Expense) / Income Tax Expense Net Income [Graphic Appears Here] guidance. FMC projections remain unchanged. Downside Case EV-DO and FMC projections include Management Corporate Risk Adjustments Includes recovery of $39.6mm from Nortel in 2009. Source: Atlas projections per Atlas Management (Downside Case) based on Atlas Management downside assumption for 2010-13 EV-DO revenues and assuming a constant gross profit margin and operating expenses decreasing at 100% of billings fall-off per Atlas Management 1 [Graphic Appears Here] 4 Overview of Atlas Projections Per Atlas Management |
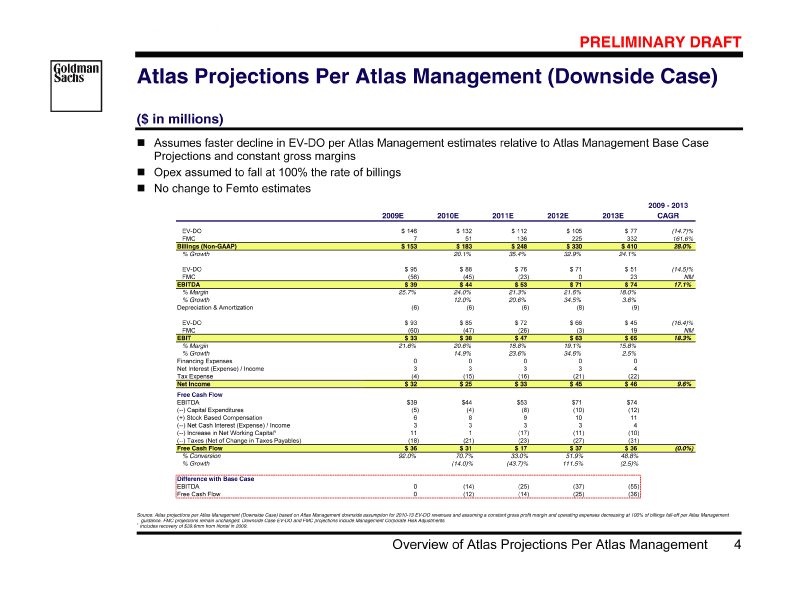
| B78823_192 |
| 8 Jan 2010 12:10 5/49 PRELIMINARY DRAFT Atlas Projections Per Atlas Management (Upside Case) ($ in millions) • Management Atlas per onward 2010 from Femto and EV-DO to Adjustments Risk Corporate no Assumes estimates | | | | | | | | | | | | | | | 0.8% 166.4% 35.0% 5.0% NM 48.7% 4.5% NM 53.4% 41.2% 2009 — 2013 CAGR 150 357 508 116 76 192 (9) 110 72 182 0 5 (60) 128 2013 E $ $18.9% $ $37.8% 14.6% $ $35.9% 14.7% $ 155 272 427 117 50 167 (8) 112 47 159 0 4 (52) 111 2012 E $ $19.4% $ $39.2% 18.6% $ $37.2% 17.9% $55.7% 62.0% 152 206 358 111 30 141 (6) 107 28 135 0 4 (46) 93 $ 2011 E $ $58.6% $ $39.5% 67.4% $ $37.7% 72.6% 73 225 (24)84 (6) (27)78 0 3 (31) 50 152 109 105 $ $ $ 2010 E $ $47.7% $37.4% 114.8% $34.7% 137.4% 7 153 95 (56)39 (6) 93 (60)33 0 3 (4) 32 146 $ $ $ $ $ 2009 E $ $25.7% 21.6% A % Margin % Growth EV-DO FMC Billings (Non-GAAP) % Growth EV-DO FMC EBITD % Margin % Growth Depreciation & Amortization EV-DO FMC EBIT Financing Expenses Net Interest (Expense) / Income Tax Expense Net Income [Graphic Appears Here] Includes recovery of $39.6mm from Nortel in 2009. Source: Atlas projections per Atlas Management (Upside Case) based on Atlas Management presentation to Atlas Board of Directors on 24-Nov-2009 with Upside Case EV-DO and FMC projections excluding Management Corporate Risk Adjustments. 1 [Graphic Appears Here] 5 Overview of Atlas Projections Per Atlas Management |
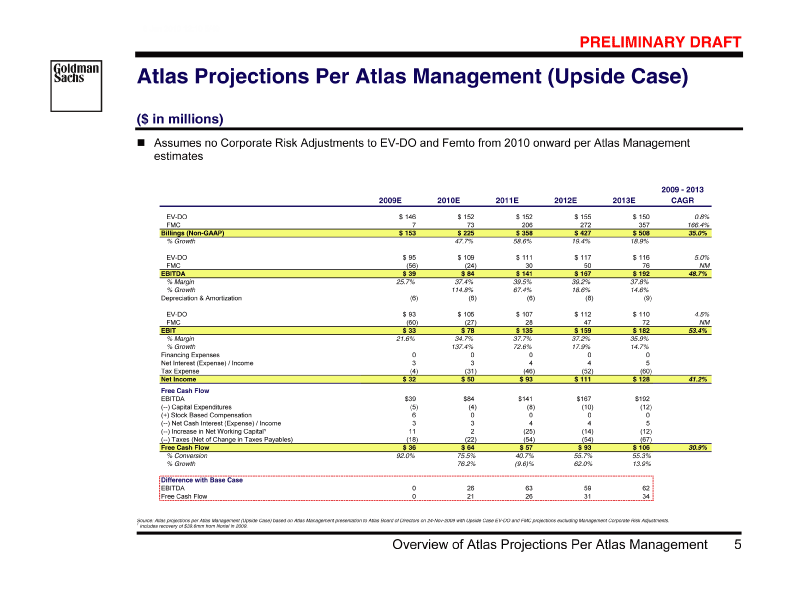
| B78823_193 |
| 8 Jan 2010 12:10 6/49 PRELIMINARY DRAFT Atlas Historical Results vs. Atlas Management Budget | | | | | | | | | | | | | | | Actual 146.9 34.8 12.6 140.1 4.2 2.1 0.5 $ 2008 Plan 162.2 32.2 15.7 135.0 19.6 6.1 1.4 $ Actual 142.2 34.9 91.8 138.6 0.2 3.4 $ 2007 Plan 135.6 31.2 44.0 132.0 3.0 0.5 $ Actual 151.9 71.3 25.1 143.2 8.7 $ 1 2006 Plan 123.0 47.3 32.0 113.0 10.0 $ 1 in millions) $ Billings / Revenue Cash Flow from Operations Billings By Product Line EV-DO Femto Gateway ( Total Company Operating Profit Other / Specialty [Graphic Appears Here] changed in 2007 to a Billings model. 2006 numbers are shown in the prior, revenue-based method, upon which management was measured. methods Accounting Source: Atlas Management presentation (16-April-2009) 1 6 Overview of Atlas Projections Per Atlas Management |
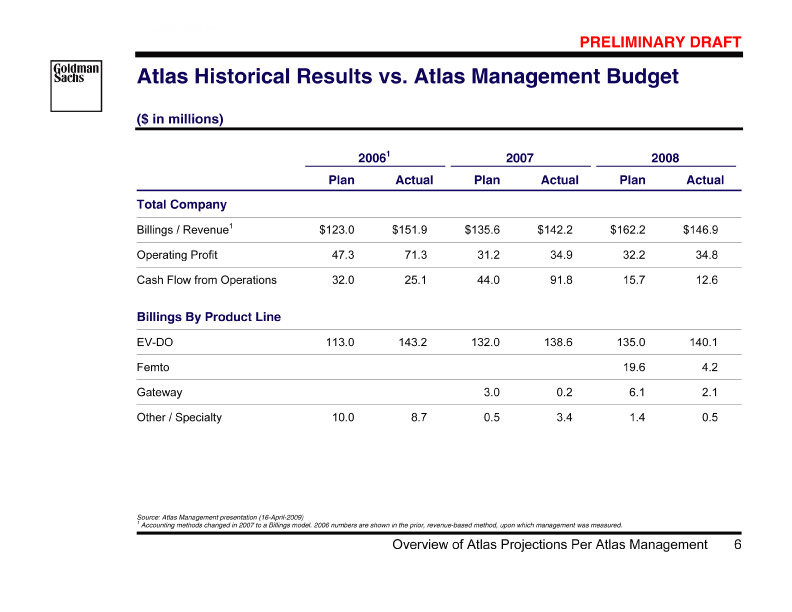
| B78823_194 |
| 8 Jan 2010 12:10 7/49 PRELIMINARY DRAFT Atlas Projections Per Atlas Management vs. Wall Street | | | | | | | | | | | | | | | NA 35 NA 85 176 141 2010E $ 15.0% 20.0% 80.0% 48.4% 28 NA NA 91 153 125 Barclays (29-Jul-09)1 2009E $ 4.1% 18.1% 81.9% 59.3% — 19 NA NA 93 161 142 2010E $ 8.0% 11.8% 88.2% 57.8% NA 19 NA 95 149 130 Research Projections Needham (29-Oct-09)1 2009E $ 1.3% 12.6% 87.4% 63.6% — NA 41 NA 96 192 151 2010E $ 29.4% 21.5% 78.5% 50.2% NA 21 NA 94 148 127 Avondale (09-Nov-09)1 2009E $ 1.0% 14.2% 85.8% 63.4% — 53 95 87 200 154 2010E $ 31.3% 26.4% 76.8% 47.6% 43.5% 22 98 92 153 136 2009E $ 3.9% 14.3% 88.9% 64.1% 60.2% 14 99 94 Management Projections 147 133 2008A $ 9.3% 90.7% 67.2% 63.9% in millions) % Growth % Margin % Margin % Margin % Margin $ Billings (Non-GAAP) COGS on Billings Gross Profit on Billings Total Opex (incl. Share Based Comp.) Total Opex (excl. Share Based Comp.) Base Case ( pre-tax in 2009 and $8.2mm pre-tax in 2010). Management Corporate Risk Adjustments Pro-forma Net Income on Billings and EPS does not include Stock Based Compensation (estimated by Atlas Management to be $5.9mm Atlas Management does not project fully diluted share counts. Source: Atlas projections per Atlas Management (Base Case) based on Atlas Management presentation to Atlas Board of Directors on 24-Nov-2009. Base Case EV-DO and FMC projections include 1 2 [Graphic Appears Here] 7 Overview of Atlas Projections Per Atlas Management |
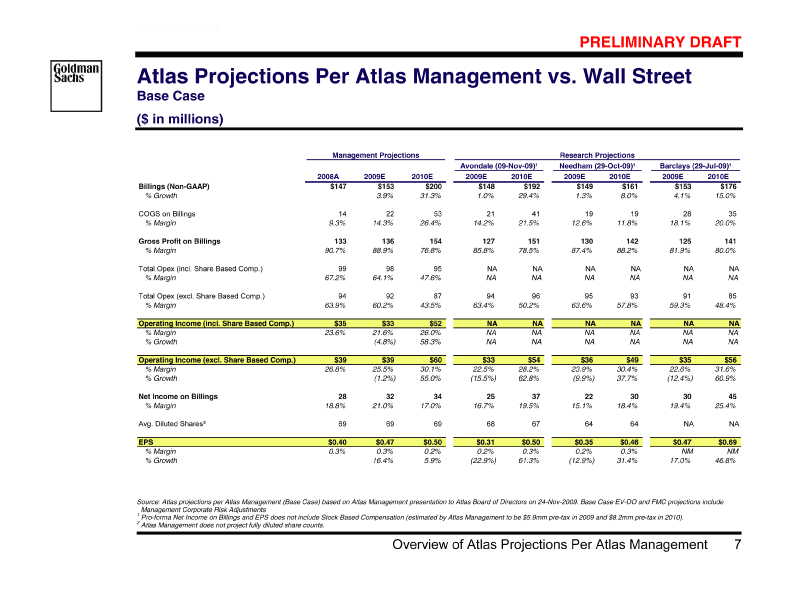
| B78823_195 |
| 8 Jan 2010 12:10 8/49 PRELIMINARY DRAFT [Graphic Appears Here] Market Perspectives and Valuation Analyses II. 8 Market Perspectives and Valuation Analyses |
| B78823_196 |
| 8 Jan 2010 12:10 9/49 PRELIMINARY DRAFT Overview of Atlas Equity Performance Since IPO [Graphic Appears Here] [Graphic Appears Here] Atlas Volume of 04-Dec-2009 as Bloomberg Source: 9 Market Perspectives and Valuation Analyses |
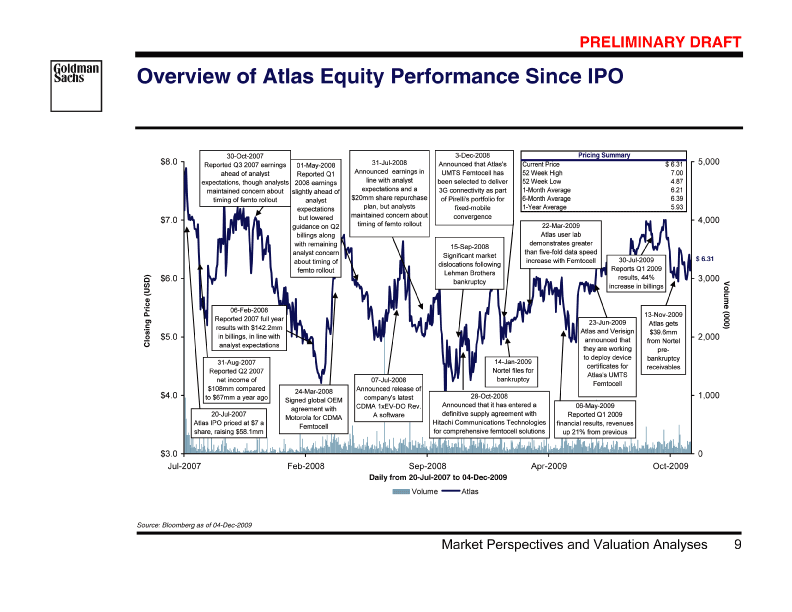
| B78823_197 |
| 8 Jan 2010 12:10 10/49 PRELIMINARY DRAFT Atlas Relative Equity Performance [Graphic Appears Here] PriceIndexed | | | | | | | | | | | | | | | 3 Months (3.1)% 33.2% 29.9% 48.1% 3.3% (4.5)% 10.6% (3.1)% 5.8% (14.3)% (26.5)% (22.4)% 6 Months 6.9% 30.3% (12.4)% 53.9% (1.8)% 25.0% 22.8% (2.8)% 28.2% (21.5)% (31.1)% (19.7)% 9 Months 13.5% 164.8% 36.5% 119.9% 66.2% 135.5% 58.4% (6.5)% 137.1% 12.5% 19.9% 93.8% 12 Months 23.7% 251.4% (1.5)% 264.3% 42.1% 46.2% 57.6% 13.8% 89.4% (22.6)% 29.7% 11.8% 18 Months 14.9% 21.9% (35.3)% 104.4% (48.4)% (51.4)% (9.7)% (15.5)% (10.9)% (52.1)% (54.5)% (60.1)% Share Price Performance Over Time Net Cash (% of Market Cap) 56.5% 24.2% 32.1% 14.7% 60.1% NM 17.9% 19.3% 16.0% 1.7% 5.0% NM Atlas Acme Packet Infinera Starent Networks Sonus Networks Alcatel-Lucent Cisco Systems Ericsson Motorola Nokia RIM ADC Telecommunications 93.6% (4.9)% (12.0)% (46.8)% (60.8)%(69.1)% (74.3)% Nov- 2009 Jul- 2009 Feb- 2009 Sep- 2008 May- 2008 Daily from 20-Jul-2007 to 04-Dec-2009 Dec- 2007 Relative Equity Performance Since IPO Jul- 2007 220% 190% 160% 130% 100% 70% 40% 10% (20)% [Graphic Appears Here] includes: Alcatel-Lucent, Cisco, Ericsson, Motorola, Nokia, and RIM. Wireless Subsystems include: ADC, CommScope, and Powerwave. Commtech Other Source: Bloomberg as of 04-Dec-2009 Note: 10 Valuation Analyses Market Perspectives and |
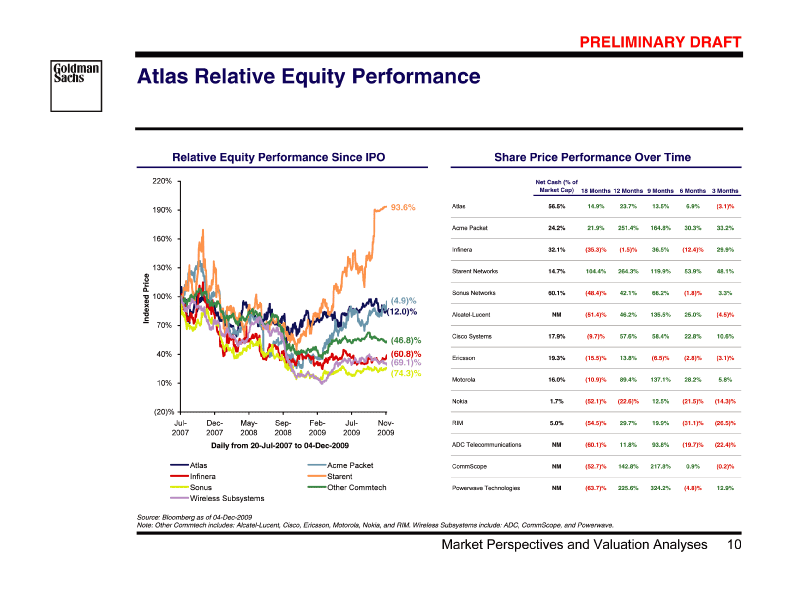
| B78823_198 |
| 8 Jan 2010 12:10 11/49 PRELIMINARY DRAFT Atlas Shares Traded at Various Prices [Graphic Appears Here] 180% 120% 60% 0% | | | | | | | | | | | | | | | 180%120%60% 0% Outstanding) Outstanding) (% SharesTraded Shares Shares (% Traded Shares Outstanding) Outstanding) (% SharesTraded Shares Shares (% Traded Shares 18% [Graphic Appears Here] 6.57 to 7.00 [Graphic Appears Here] | | | | | | | | | | | | | | | 28% 7.05 to 7.89 10% 6.75 to 7.00 79% 6.21 14% 6.5 130% 5.38 14% 6.24 Since IPO Last 6 Months 92% 4.54 Daily from 20-Jul-2007 to 04-Dec-2009 Weighted Average Price: 5.87 USD 23% 5.99 17% 3.70 to 4.53 Total Shares Traded as Percent of Shares Outstanding: 156.67% 11% 5.74 to 5.98 | | | | | | | | | | | | | | | 30% 6.15 45% 5.72 LTM 27% 5.3 21% 4.87 to 5.29 Daily from 04-Dec-2008 to 04-Dec-2009 Weighted Average Price: 5.92 USD Total Shares Traded as Percent of Shares Outstanding: 63.98% 200% 150% 100% 50% 0% 180% 120% 60% 0% [Graphic Appears Here] [Graphic Appears Here] [Graphic Appears Here] [Graphic Appears Here] | | | | | | | | | | | | | | | 8% 6.79 to 7.00 8% 6.58 11% 6.37 Last 3 Months 3% 6.16 7% 5.95 to 6.15 [Graphic Appears Here] [Graphic Appears Here] [Graphic Appears Here] [Graphic Appears Here] Daily from 04-Jun-2009 to 04-Dec-2009 Weighted Average Price: 6.34 USD Total Shares Traded as Percent of Shares Outstanding: 32.51% g: 16.52% Daily from 04-Sep-2009 to 04-Dec-2009 Weighted Average Price: 6.53 USD Total Shares Traded as Percent of Shares Outstandin held by Matrix, Qualcomm Inc., Atlas Management and Unicorn Trust / Float outstanding of 28.3mm as of 30-Sep-2009 defined as total basic shares outstanding (62.6mm as of 30-Oct-2009) less shares Mr. Guraj Deshpande (34.2mm). Source: Bloomberg as of 04-Nov-2009 1 11 Valuation Analyses Market Perspectives and |
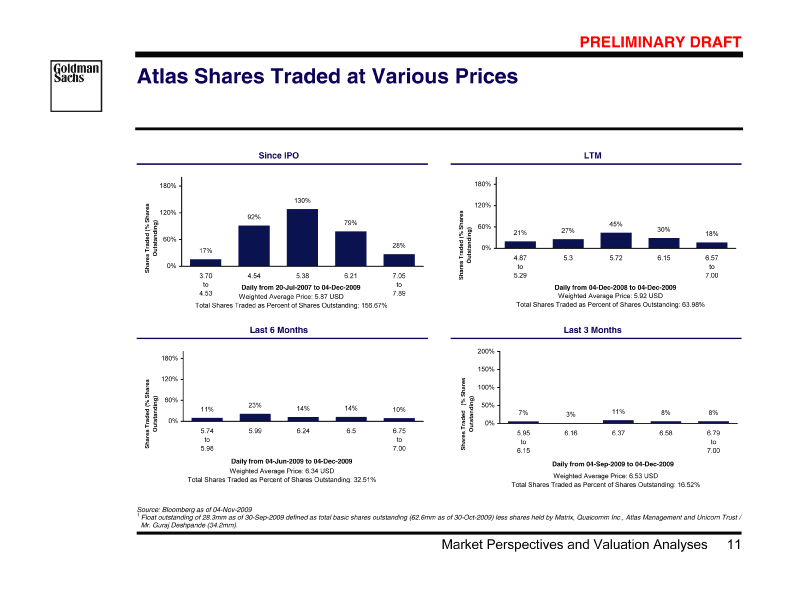
| B78823_199 |
| 8 Jan 2010 12:10 12/49 PRELIMINARY DRAFT Research Analysts Views on Atlas [Graphic Appears Here] | | | | | | | | | | | | | | | 8.50 8.00 $ $7.50 7.50 7.00 $$ $ 5.50 Target Price $ Sell Recommendation Hold 9 9 Buy 9 9 9 Date 09-Nov-09 03-Nov-09 03-Nov-09 25-Nov-09 03-Nov-09 03-Nov-09 Months Covered 17 21 NA NA 28 28 Analyst ondale Partners Needham & vian Securities Fitzgerald Capital Bank Av Company A Canton Barclays Deutsche $7.50 Price: $6.31 Current Median Price Target: Analyst Recommendation Evolution Selected Commentary CDMA networks, and the company’s distribution partner shifting from the sixth largest wireless infrastructure vendor (NT) to the largest (ERIC) the short and long-term “With wireless data usage growing 30% per year, Atlas 30% worldwide market share in outlook for Atlas is outstanding.” • LLC 2009 Partners 9, November Avondale “We believe the fundamentals of Atlas’ core EV- DO business remain solid and we are encouraged by management commentary suggesting this business should see growth in 2010. Separately, we expect 2010 to finally be a year of commercial femto shipments, which should drive growth in that segment as well.” • 2009 Company 30, • & July Needham — Deutsche Bank October 29, 2009 “We think that Atlas could potentially be an attractive primary-source vendor at various Tier-1/2 3G-CDMA femto rollouts and a potential second source vendor at various UMTS femto opportunities.” November 2008 [Graphic Appears Here] May 2009 December 2009 Hold 50.0% Buy 50.0% Hold 50.0% Buy 50.0% nalysts: 6 A Analysts: 6 market data as of 04-Dec-2009 IBES, Thomson Source: 12 Valuation Analyses Market Perspectives and |
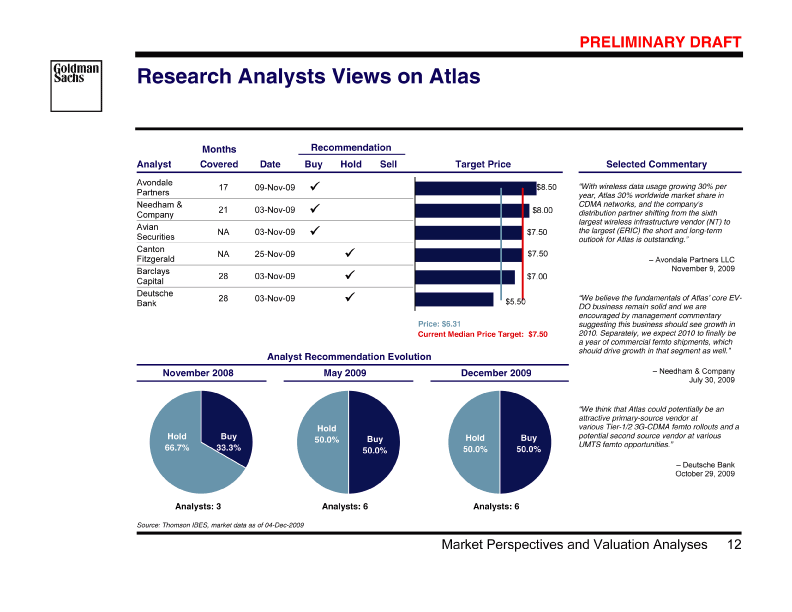
| B78823_200 |
| 8 Jan 2010 12:10 13/49 PRELIMINARY DRAFT Atlas vs. Selected Comparables Projections Per Atlas Management (Base Case) [Graphic Appears Here] 2008 — 2010 Revenue Growth 33.9% 26.3% 20.7% 16.8% 4.6% [Graphic Appears Here] 2.2% [Graphic Appears Here] 0.7% [Graphic Appears Here] 0.2% [Graphic Appears Here] (3.2%) (10.1%) ADC (9.9%) Nokia Ericsson (10.8%) (10.7%) (11.2%) Sonus (17.9%)Powerwave CommScope Atlas (Mngmt) Infinera RIM Cisco Motorola Alcatel-Lucent Atlas (Wall Street) Starent Acme Packet 2009 / 2010 EBITDA Margin 33.1% 26.8% 29.0% 32.7% 34.5% 27.2% 31.2% 30.5% 26.2% 25.7% 23.7% 24.8% 18.1% 16.6% 12.3% 11.3% 9.3% 14.8% 10.3% 7.4% NM 8.7% 4.6% 8.2% 4.3% NM NM 5.1% 0.5% [Graphic Appears Here] [Graphic Appears Here] [Graphic Appears Here] Infinera (15.0%) Atlas (Mngmt) Atlas (Wall Street) Starent Acme Packet Sonus RIM Cisco Nokia Ericsson Motorola Alcatel-Lucent Powerwave CommScope ADC 2008 — 2010 EBITDA Growth 44.2% 39.2% 29.5% 28.5% 23.3% 22.4% 9.4% [Graphic Appears Here] (3.2%) [Graphic Appears Here] NM NM [Graphic Appears Here] (3.2%) [Graphic Appears Here] 6.3% CommScope Motorola [Graphic Appears Here] [Graphic Appears Here] Alcatel-Lucent (23.5%) Nokia Atlas (Mngmt) Starent Acme Packet Sonus Infinera RIM 2009 Ericsson 2010 Cisco ADC Powerwave Atlas (Wall Street) Base Case EV-DO and FMC projections include Management Corporate Risk Adjustments. Source: Atlas projections per Wall Street Research and per Atlas Management (Base Case) based on Atlas Management presentation to Atlas Board of Directors on 24-Nov-2009. Comparables projections per Thomson IBES Note: Atlas financials based on billings for management and Wall Street Research. 13 Valuation Analyses Market Perspectives and |
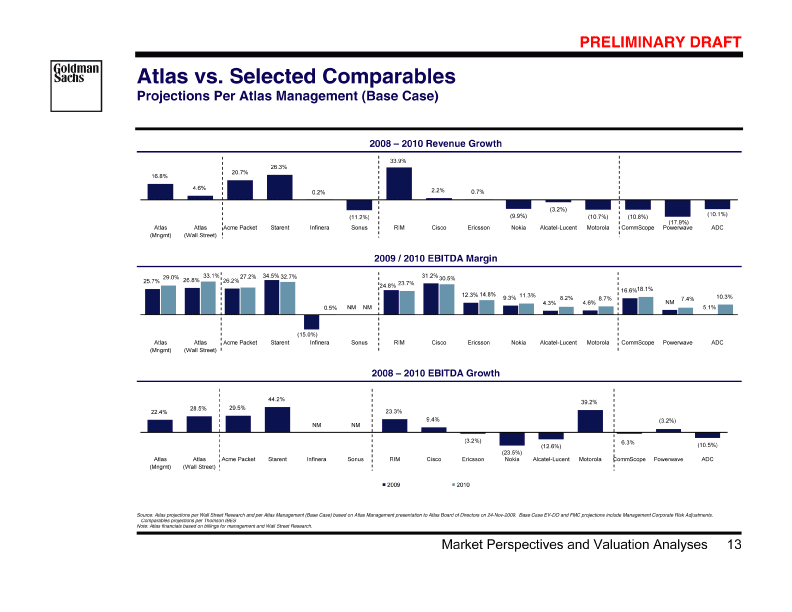
| B78823_201 |
| 8 Jan 2010 12:10 14/49 PRELIMINARY DRAFT Atlas vs. Selected Comparables Projections Per Atlas Management (Base Case) [Graphic Appears Here] 2009 / 2010 EV / Revenue 7.2x 5.8x 4.1x 3.4x 3.3x 3.1x 2.2x 2.2x 1.2x 1.2x 0.7x 0.7x 0.7x 1.1x 1.1x 0.7x 0.7x 0.3x 0.3x 0.8x 0.8x 0.8x 0.8x 1.7x 1.1x 1.9x 1.2x 1.3x 0.9x 0.7x [Graphic Appears Here] [Graphic Appears Here] [Graphic Appears Here] RIM [Graphic Appears Here] [Graphic Appears Here] [Graphic Appears Here] [Graphic Appears Here] [Graphic Appears Here] [Graphic Appears Here] ADC $603 [Graphic Appears Here] $434 Atlas (Mngmt) Atlas (Wall Street) Starent $2,768 Acme Packet $737 Infinera $955 Sonus Cisco Nokia Ericsson Motorola Alcatel-Lucent Powerwave CommScope Market Capitalization $33,797 $598 $31,418 $145,264 $8,007 $47,919 $2,441 $19,220 $185 2009 / 2010 EV / EBITDA 20.8x 17.8x 15.8x 15.6x 14.3x 12.5x 10.5x 10.1x 9.4x 8.9x 8.2x 7.8x 7.6x 7.3x 6.9x 6.8x 6.7x 6.2x 6.0x 5.5x 4.8x 4.7x 4.1x [Graphic Appears Here] Motorola Alcatel-Lucent 3.5x [Graphic Appears Here] 3.2x [Graphic Appears Here] NM NM NM NM [Graphic Appears Here] RIM [Graphic Appears Here] Nokia Ericsson ADC NM Atlas (Mngmt) Cisco Powerwave CommScope Atlas (Wall Street) Starent Acme Packet Infinera Sonus 2009 / 2010 P / E 38.0x 36.7x 33.2x 27.5 27.4x 24.1x 18.8x 17.5x 16.9x 16.7x 16.2x 16.1x 14.3x 14.2x 14.0x 13.5x 13.2x 12.7x 12.4x 12.4x [Graphic Appears Here] 12.3x 11.7x 10.8x [Graphic Appears Here] Atlas (Mngmt) 6.3x NM NM NM NM [Graphic Appears Here] RIM 16.2x 2009 [Graphic Appears Here] NM NM [Graphic Appears Here] NM Atlas (Wall Street) 7.8x Starent Acme Packet | | | | | | | | | | | | | | | Infinera NM Sonus NM Cisco 15.6x Nokia Ericsson Motorola Alcatel-Lucent Powerwave CommScope ADC NM 1 2009 P / E (ex-Cash) 22.6x 36.7x 14.9x 20.7x NM NM NM NM 2010 Pro forma earnings calculated by subtracting after-tax interest income on net cash from Pro forma price per share calculated by subtracting net cash per share from current share price. projections per Thomson IBES, market data as of 04-Dec-2009 Assumes tax rate of 35% and cash generates interest of 1.5%. “NM” represents “Not Meaningful” as company has positive net debt or negative earnings. forecasted net income. Source: Atlas projections per Wall Street Research and, per Atlas Management (Base Case) based on Management presentations to Atlas Board of Directors on 24-Nov-2009. Base Case EV-DO and FMC projections include Management Corporate Risk Adjustments. Comparables Note: Airvana financials based on billings for management and Wall Street Research. 1 14 Valuation Analyses Market Perspectives and |
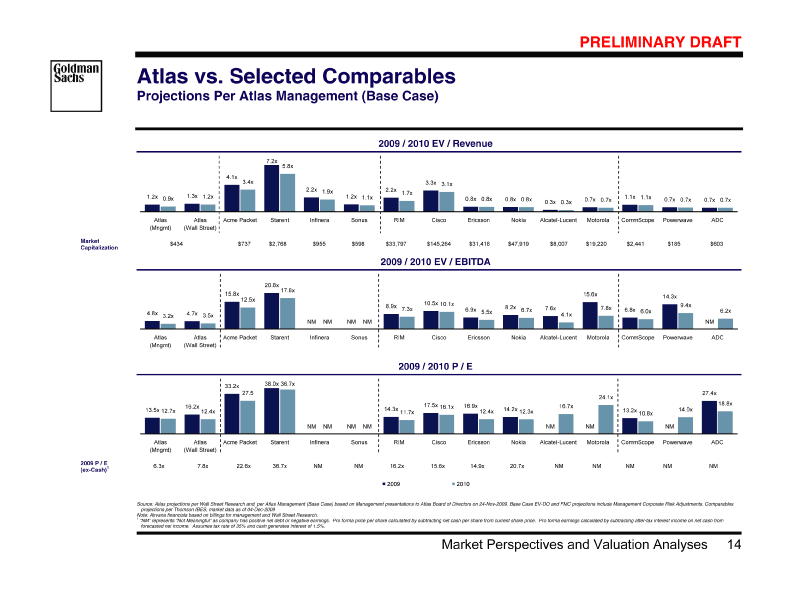
| B78823_202 |
| 8 Jan 2010 12:10 15/49 PRELIMINARY DRAFT Historical Valuation Metrics [Graphic Appears Here] Forward EV / Billings EBITDA [Graphic Appears Here] EBITDA Billings EV / Forward 20x Multiple P / E Forward [Graphic Appears Here] Oct- 2007 Feb- 2008 May- 2008 Sep- 2008 Jan- 2009 Apr- 2009 Aug- 2009 Dec- 2009 [Graphic Appears Here] Daily from 18-Oct-2007 to 04-Dec-2009 Daily from 18-Oct-2007 to 04-Dec-2009 P / E P / E (ex. Cash)2 1-Year Average EV / EBITDA 1-Year Average Commtech includes: Starent, Acme Packet, Infinera, Sonus, RIM, Ericsson, Cisco, Alcatel-Lucent, Nokia, Motorola, ADC, CommScope and Powerwave Pro forma price per share calculated by subtracting net cash per share from current price per share. Pro forma earnings calculated by subtracting after-tax interest income on net cash from forecasted net income. Assumes tax rate of 35% and cash generates interest of 1.5%. Source: Capital IQ, Thomson IBES, Wall Street Research, Bloomberg as of 04-Dec-2009 Note: Due to the lack of consistent coverage since IPO, 2008A Billings EBITDA was used as a proxy for forecasted 2008 Billings EBITDA. 1 2 15 Valuation Analyses Market Perspectives and |
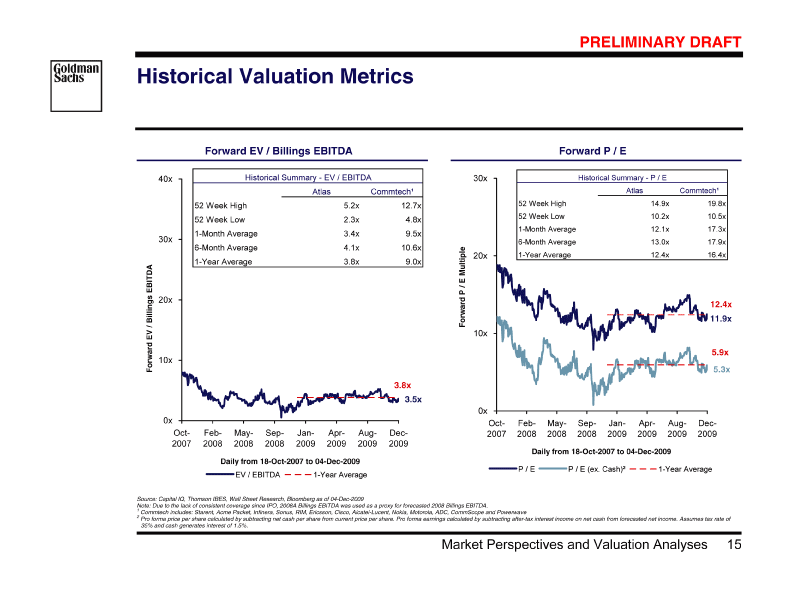
| B78823_203 |
| 8 Jan 2010 12:10 16/49 PRELIMINARY DRAFT n Analysis at Various Preliminary Atlas Valuatio Hypothetical Prices ($ in millions) [Graphic Appears Here] 8.00 $26.8% 64.6% 28.8% 30.2% 25.1% 34.9% 64.3% 14.3% 14.3% 7.50 $18.9% 45.7% 20.8% 22.0% 17.3% 26.5% 54.0% (4.9%) 7.00 $10.9% 26.6% 12.7% 13.9% 18.0% 43.7% 6.50 $33.5% (7.1%) (7.1%) 6.31 $(1.3%) 29.6% (9.9%) (9.9%) Current Share Price Adjustments. Market data as of 04-Dec-2009 Note: Hypothetical analysis provided solely for illustrative purposes and does not necessarily reflect views on value or the price that a buyer would be willing to pay. Historical cash balance as of end of Q3 2009 includes full recovery of $39.6mm cash from Nortel. Pro forma price per share calculated by subtracting net cash per share from current price per share. Pro forma earnings calculated by subtracting after-tax interest income on net cash from forecasted net income. Assumes tax rate of 35% and cash generates interest of 1.5%. Source: Atlas projections per Atlas Management (Base Case) based on Atlas Management presentation to Atlas Board of Directors on 24-Nov-2009. Base Case EV-DO and FMC projections include Management Corporate Risk 1 2 16 Valuation Analyses Market Perspectives and |
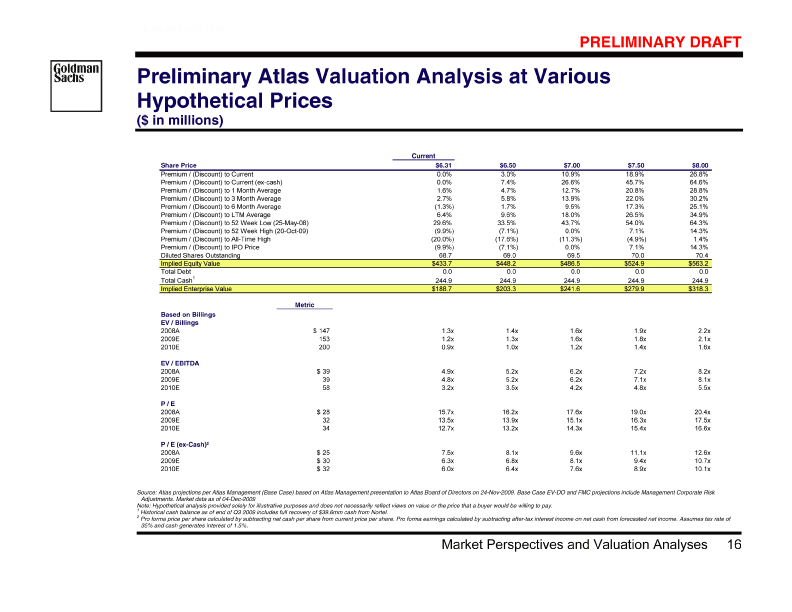
| B78823_204 |
| 8 Jan 2010 12:10 17/49 PRELIMINARY DRAFT Present Value of Future Share Price Analysis Based on EV / EBITDA Multiple ($ in millions, except per share data) [Graphic Appears Here] 10.49 72.2 $ 129 419 (395) 814 1 7.92 5.81 YE 2012 $ Downside Case $ $ 10.02 $ 71.4 7.57 6.06 108 351 (333) 684 $ $ YE 2011 $ — 9.62 Base Case Upside Case $7.02 5.93 78 254 555 70.3 $ $ YE 2010 $ (301) 3 Present Value of Future Share Price Analysis Future Share Price 1-yr Fwd EBITDA2 Net Debt / (Cash) Implied Equity Fully Diluted # of Shares (mm) Present Value of Implied EV Value Sensitivity Analysis Atlas Management Projections (Base Case) Present Value of Future Share Price r Exit Yea [Graphic Appears Here] [Graphic Appears Here] [Graphic Appears Here] [Graphic Appears Here] [Graphic Appears Here] [Graphic Appears Here] [Graphic Appears Here] Atlas Management Projections (Downside Case) Present Value of Future Share Price r Exit Yea [Graphic Appears Here] [Graphic Appears Here] [Graphic Appears Here] Atlas Management Projections (Upside Case) Present Value of Future Share Price r Exit Yea [Graphic Appears Here] [Graphic Appears Here] [Graphic Appears Here] Atlas projections s Management). The -2009, 14.1mm outstanding options as of 31-Oct-2009 with a weighted strike price of $3.55 per Atlas Q3 2009 10Q filing and Atla Atlas Management (Downside Case) based on Atlas Management downside assumption for 2010-13 EV-DO revenues and assuming a constant gross profit margin and operating expenses decline at 100% rate of billings decline per Atlas Management guidance. per Atlas Management (Upside Case) based on Atlas Management presentation to Atlas Board of Directors on 24-Nov-2009 with Upside Case EV-DO and FMC projections excluding Management Corporate Risk Adjustments. Discounted to 31-Dec-2009 at a 12.5% discount rate. Enterprise value based on Atlas 1-year forward EBITDA multiple of 3.2x as of 04-Dec-2009. Share price assumes a fully diluted number of shares based on treasury method (basic shares outstanding of 62.6mm as of 30-Oct analysis does not include any future stock options grant. Source: Atlas projections per Atlas Management (Base Case) based on Atlas Management presentation to Atlas Board of Directors on 24-Nov-2009. Base Case and Downside Case EV-DO and FMC projections include Management Corporate Risk Adjustments. Atlas projections per 1 2 3 17 Valuation Analyses Market Perspectives and |
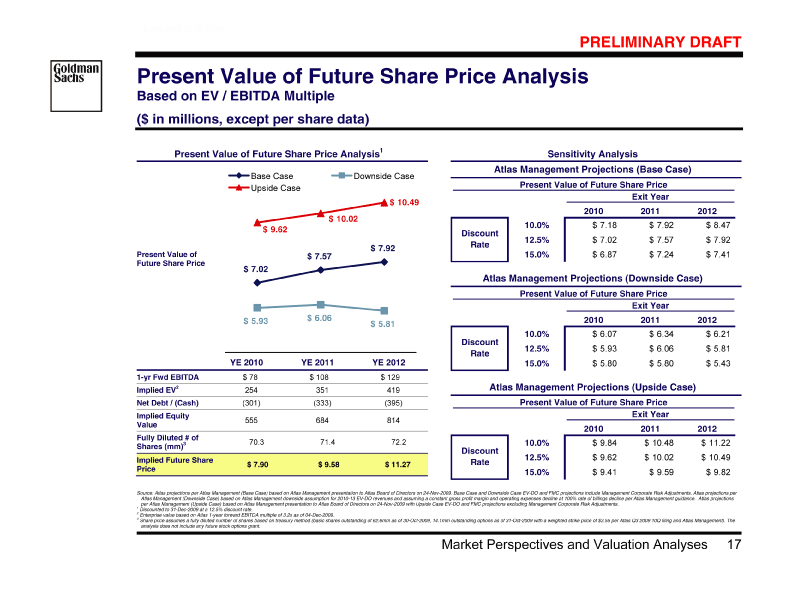
| B78823_205 |
| 8 Jan 2010 12:10 18/49 PRELIMINARY DRAFT Present Value of Future Share Price Analysis Based on P / E Multiple ($ in millions, except per share data) [Graphic Appears Here] | 15.37 $ 85 73.2 $1,078 1 10.34 5.87 YE 2012 $ Downside Case $ 15.11 $9.78 6.43 71 899 72.6 $ $ $ YE 2011 — 14.29 Base Case Upside Case $8.03 5.51 50 642 71.1 $ $ YE 2010 $ Present Value of Future Share Price Analysis 3 2 Fully Diluted # of Shares (mm) Present Value of Future Share Price 1-yr Fwd Net Income Implied Equity Value Sensitivity Analysis Atlas Management Projections (Base Case) Present Value of Future Share Price r Exit Yea [Graphic Appears Here] [Graphic Appears Here] [Graphic Appears Here] Atlas Management Projections (Downside Case) Present Value of Future Share Price r Exit Yea [Graphic Appears Here] [Graphic Appears Here] [Graphic Appears Here] [Graphic Appears Here] Atlas Management Projections (Upside Case) Present Value of Future Share Price r Exit Yea [Graphic Appears Here] [Graphic Appears Here] [Graphic Appears Here] Atlas projections Management). The nt gross profit margin and operating expenses decline at 100% rate of billings decline per Atlas Management guidance. per Atlas Management (Upside Case) based on Atlas Management presentation to Atlas Board of Directors on 24-Nov-2009 with Upside Case EV-DO and FMC projections excluding Management Corporate Risk Adjustments. 2009, 14.1mm outstanding options as of 4-Dec-2009 with a weighted strike price of $3.55 per Atlas Q3 2009 10Q filing and Atlas Source: Atlas projections per Atlas Management (Base Case) based on Atlas Management presentation to Atlas Board of Directors on 24-Nov-2009. Base Case and Downside Case EV-DO and FMC projections include Management Corporate Risk Adjustments. Atlas projections per Atlas Management (Downside Case) based on Atlas Management downside assumption for 2010-13 EV-DO revenues and assuming a consta Discounted to 31-Dec-2009 at a 12.5% discount rate. Enterprise value based on Atlas 1-year forward P / E multiple of 12.7x as of 04-Dec-2009. Share price assumes a fully diluted number of shares based on treasury method (basic shares outstanding of 62.6mm as of 4-Dec- analysis does not include any future stock options grant. 1 2 3 18 Valuation Analyses Market Perspectives and |
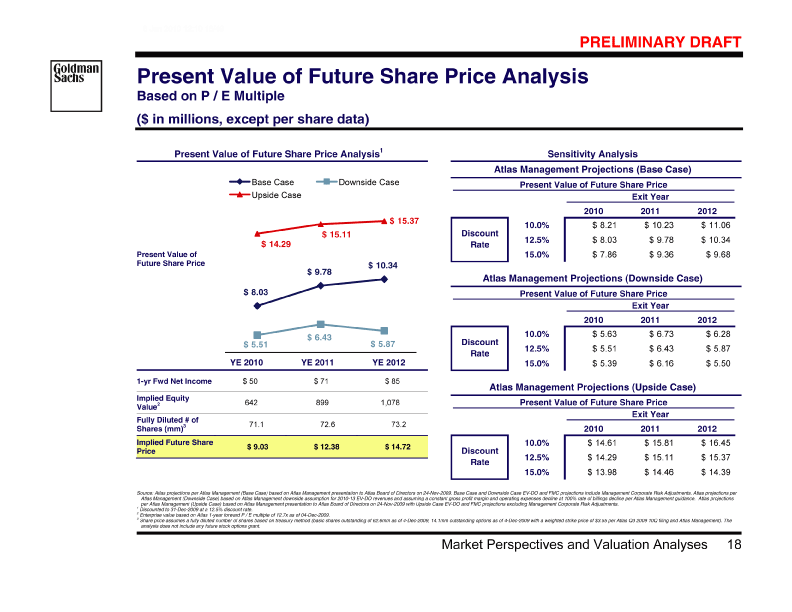
| B78823_206 |
| 8 Jan 2010 12:10 19/49 PRELIMINARY DRAFT x-Cash Multiple ($ in millions, except per share data) Present Value of Future Share Price Analysis Based on P / E E [Graphic Appears Here] | | | | | | 82 488 395 883 72.5 12.17 $ $ 1 11.59 8.55 6.02 YE 2012 $ $ Downside Case $ — 8.14 6.32 68 407 333 740 71.8 10.30 11.09 $ $ $ $ $ YE 2011 — Base Case Upside Case 10.58 7.42 6.11 48 70.7 8.35 288 301 590 $ $ $ $ $ YE 2010 3 Present Value of Future Share Price Analysis 4 2 Fully Diluted # of Present Value of Future Share Price 1-yr Fwd Adj. Net Income Implied Equity Value (ex-Cash) Cash Implied Equity Value (incl. Cash) Shares (mm) Implied Future Share Price Sensitivity Analysis Atlas Management Projections (Base Case) Present Value of Future Share Price r Exit Yea [Graphic Appears Here] [Graphic Appears Here] [Graphic Appears Here] [Graphic Appears Here] [Graphic Appears Here] [Graphic Appears Here] [Graphic Appears Here] Atlas Management Projections (Downside Case) Present Value of Future Share Price r Exit Yea [Graphic Appears Here] [Graphic Appears Here] [Graphic Appears Here] Atlas Management Projections (Upside Case) Present Value of Future Share Price r Exit Yea [Graphic Appears Here] [Graphic Appears Here] Atlas projections s Management). The nt gross profit margin and operating expenses decline at 100% rate of billings decline per Atlas Management guidance. per Atlas Management (Upside Case) based on Atlas Management presentation to Atlas Board of Directors on 24-Nov-2009 with Upside Case EV-DO and FMC projections excluding Management Corporate Risk Adjustments. -2009, 14.1mm outstanding options as of 04-Dec-2009 with a weighted strike price of $3.55 per Atlas Q3 2009 10Q filing and Atla Atlas Management (Downside Case) based on Atlas Management downside assumption for 2010-13 EV-DO revenues and assuming a consta Discounted to 31-Dec-2009 at a 12.5% discount rate. After tax interest income added back to net income. Enterprise value based on Atlas 1-year forward P / E Ex-Cash multiple of 6.0x as of 04-Dec-2009. Share price assumes a fully diluted number of shares based on treasury method (basic shares outstanding of 62.6mm as of 30-Oct analysis does not include any future stock options grant. Source: Atlas projections per Atlas Management (Base Case) based on Atlas Management presentation to Atlas Board of Directors on 24-Nov-2009. Base Case and Downside Case EV-DO and FMC projections include Management Corporate Risk Adjustments. Atlas projections per 1 2 3 4 19 Valuation Analyses Market Perspectives and |
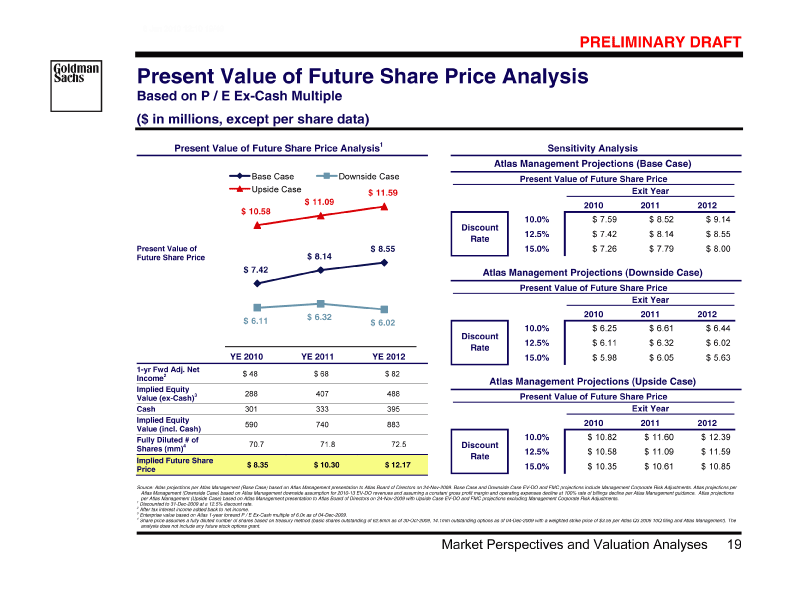
| B78823_207 |
| 8 Jan 2010 12:10 20/49 PRELIMINARY DRAFT Discounted Cash Flow Analysis [Graphic Appears Here] Atlas Management Projections (Base Case) Atlas Management Projections (Downside Case) [Graphic Appears Here] [Graphic Appears Here] [Graphic Appears Here] [Graphic Appears Here] $2.60 $2.58 | | | | | | | | | High 2.27 2.37 $ $ Low 2.14 2.23 2.28 1.74 $ $ $ $ Opex 50% 75% Reduction Sensitivity —— — 6.20 $ % of Revenue Decline in Opex —— — 7.35 $6.04 - 6.68 — $ $2.47 2.32 Total Value: Total Value (ex-Femto)1: $ $ 2.62 2.60 $$ High 3.04 3.08 $ $ Low 2.86 2.90 2.27 1.73 $ $ $ $ Opex 50% 75% Reduction Sensitivity —— — 6.82 $ % of Revenue Decline in Opex Savings —— — 7.97 $6.63 - 7.26 — $ $3.13 2.94 Total Value: Total Value (ex-Femto)1: $$ [Graphic Appears Here] [Graphic Appears Here] Cash EV-DO Femto Cash EV-DO Femto • after Q4 to of of of 3 • 2 of cash Femto end shares share net balance of 70.4mm as to per funding diluted Value estimated fully breakeven $182mm Fully 69.8mm • • 16.5-18.5% at with value DCF rate no 9-year discount Assumes perpetuity • • type) +/-25-30% (venture (Acme pre-funded with terminal losses cash DCF rate multiple existing 4-year discount 11.5x-13.5x EBITDA 1.0x) Excludes with • • after Q4 to of of of 3 2 of cash Femto end shares share net balance of 69.8mm as to per funding diluted Value estimated fully breakeven $182mm Fully 69.2mm • • 16.5-18.5% at with value DCF rate no 9-year discount Assumes perpetuity • • type) +/-25-30% (venture (Acme pre-funded with terminal losses cash DCF rate multiple existing 4-year discount 11.5x-13.5x EBITDA 1.0x) Excludes with • nt gross profit margin and operating expenses decline at 100% rate of billings decline per Atlas Management guidance. Market data as of s Management). The -2009, 14.1mm outstanding options as of 31-Oct-2009 with a weighted strike price of $3.55 per Atlas Q3 2009 10Q filing and Atla Atlas Management (Downside Case) based on Atlas Management downside assumption for 2010-13 EV-DO revenues and assuming a consta 04-Dec-2009 Assumes Femto shutdown January 2010 with no pre funding. Value of Cash net of cash used to pre-fund Femto losses, assuming a 1.5% return on cash. Share price assumes a fully diluted number of shares based on treasury method (basic shares outstanding of 62.6mm as of 30-Oct analysis does not include any future stock options grant. Source: Atlas projections per Atlas Management (Base Case) based on Atlas Management presentation to Atlas Board of Directors on 24-Nov-2009. Base Case and Downside Case EV-DO and FMC projections include Management Corporate Risk Adjustments. Atlas projections per 1 2 3 20 Valuation Analyses Market Perspectives and |
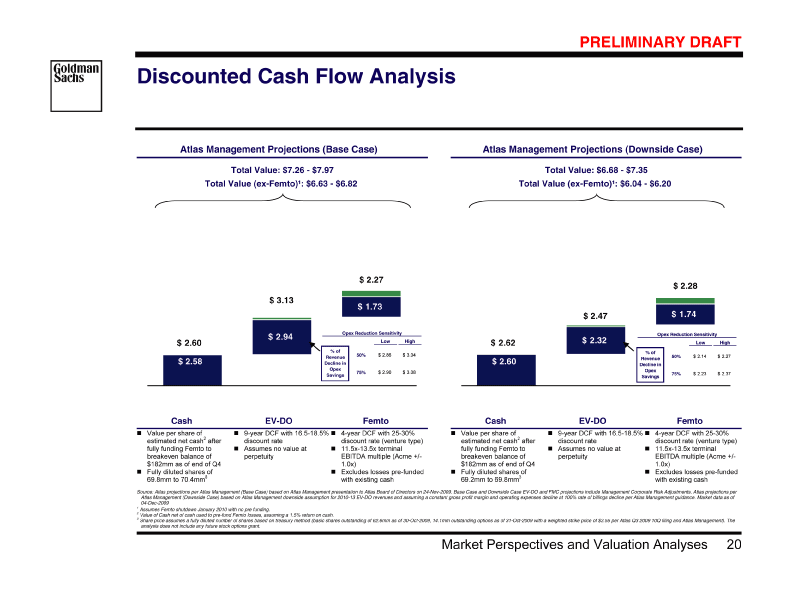
| B78823_208 |
| 8 Jan 2010 12:10 21/49 PRELIMINARY DRAFT e Case) - Downside Case Sensitivity Discounted Cash Flow Analysis Atlas Management Projections (Downsid [Graphic Appears Here] Cumulative Cash Burn from Femto Rev. % of Atlas Mgmt Projections (Downside Case) Net Cash for Femto Burn Rev. % of Atlas Mgmt Projections (Downside Case) Opex % of Atlas Management Projections (Downside Case) [Graphic Appears Here] Opex % of Atlas Management Projections (Downside Case) [Graphic Appears Here] PV of Femto Terminal Value per Share PV of Femto Terminal Value Rev. % of Atlas Mgmt Projections (Downside Case) Rev. % of Atlas Mgmt Projections (Downside Case) Opex % of Atlas Management Projections (Downside Case) [Graphic Appears Here] Opex % of Atlas Management Projections (Downside Case) [Graphic Appears Here] Rev. % of Atlas Mgmt Projections (Downside Case) Opex % of Atlas Management Projections (Downside Case) [Graphic Appears Here] 2009 Assumes 70mm fully diluted shares outstanding and $2.39 equity value per share for EV-DO business per Downside Case DCF analysis and $259 of available cash to fund margin and operating expenses decline at 100% rate of billings decline per Atlas Management guidance. Market data as of 04-Dec- Assumes Femto business shutdown at 0 value when no cash remains to fund operations. Source: Downside Case EV-DO and FMC projections include Management Corporate Risk Adjustments. Atlas projections per Atlas Management (Downside Case) based on Atlas Management downside assumption for 2010-13 EV-DO revenues and assuming a constant gross profit Note: Assumes 27.5% WACC, a 12.5x EV / EBITDA terminal value multiple, and a tax rate of 35.0% on Femto. Femto business. 21 Valuation Analyses Market Perspectives and |
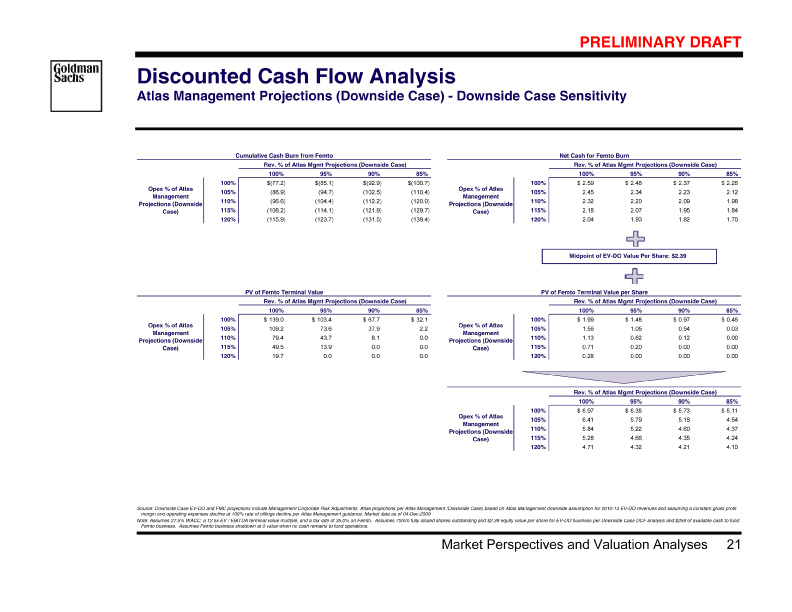
| B78823_209 |
| 8 Jan 2010 12:10 22/49 PRELIMINARY DRAFT Discounted Cash Flow Analysis [Graphic Appears Here] Atlas Management Projections (Upside Case) Total Value: $12.19 — $14.11 Total Value (ex-Femto)1: $6.61 — $6.82 $7.50 $5.76 $3.26 [Graphic Appears Here] $3.06 Opex Reduction Sensitivity $3.37 $3.34 [Graphic Appears Here] | | | | | | | | | High 3.20 3.23 $ $ Low 3.00 3.03 $ $ 50% 75% —— — Cash EV-DO Femto • after Q4 to of of of 3 • 2 of cash Femto end shares share net balance of 73.2mm as to per funding diluted Value estimated fully breakeven $244mm Fully 72.7mm • • 16.5-18.5% at with value DCF rate no 9-year discount Assumes perpetuity • • type) +/-25-30% (venture (Acme pre-funded with terminal losses cash DCF rate multiple existing 4-year discount 11.5x-13.5x EBITDA 1.0x) Excludes with • s Management). The -2009, 14.1mm outstanding options as of 31-Oct-2009 with a weighted strike price of $3.55 per Atlas Q3 2009 10Q filing and Atla Assumes Femto shutdown January 2010 with no pre funding. Value of Cash net of cash used to pre-fund Femto losses, assuming a 1.5% return on cash. Share price assumes a fully diluted number of shares based on treasury method (basic shares outstanding of 62.6mm as of 30-Oct analysis does include any future stock options grant. Source: Atlas projections per Atlas Management (Upside Case) based on Atlas Management presentation to Atlas Board of Directors on 24-Nov-2009 with Upside Case EV-DO and FMC projections excluding Management Corporate Risk Adjustments. Market data as of 04-Dec-2009 1 2 3 22 Valuation Analyses Market Perspectives and |
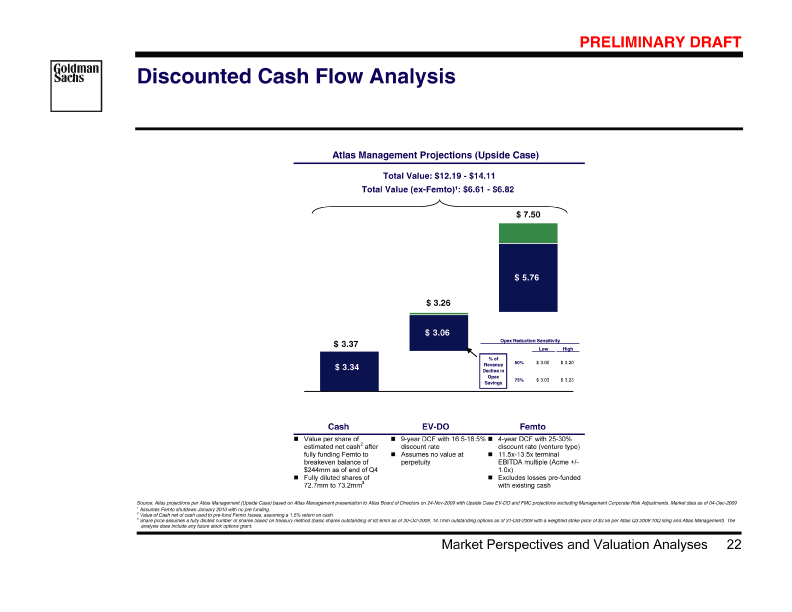
| B78823_210 |
| 8 Jan 2010 12:10 23/49 PRELIMINARY DRAFT [Graphic Appears Here] Selected Alternatives for Atlas III. 23 Selected Alternatives for Atlas |
| B78823_211 |
| 8 Jan 2010 12:10 24/49 PRELIMINARY DRAFT Overview of Atlas Selected Alternatives [Graphic Appears Here] Rationale • of business nature expansion of generative Femto delivery flow fund to through cash initiatives from business creation Femto Benefit other on EV-DO and Value plan • Considerations • FMC large future / and and and rollout unused timing LTE EV-DO with slowdown with Nortel Femto EV-DO of between structure around history dynamics accelerated of ownership stock synergies capital balance Uncertainty industry Potential termination Ericsson Volatile Limited business Inefficient cash • [Graphic Appears Here] Status Quo / Continue to Invest Recapitalize the Business Sell the Business Atlas • through value driving efficiency on remuneration dividend concerns structure shareholder ordinary capital shareholders risks and Increase special creation Improved Alleviate reinvestment • • stock leveraged to trading stocks for stability impact technology available provided negatively risk be has paying to may finance unlikely balance payout dividend Debt recapitalization Cash and Few Increased • • and value current floor immediately to provides value premium full a price proposal realize capture share to to current Potential Potential historical Existing • • of realize forward buyers to firms difficult equity moved strategic businesses private two only potentially development of but explored WholeCo of Previously or value stage number Femto Femto given Large approached • 24 Selected Alternatives for Atlas |
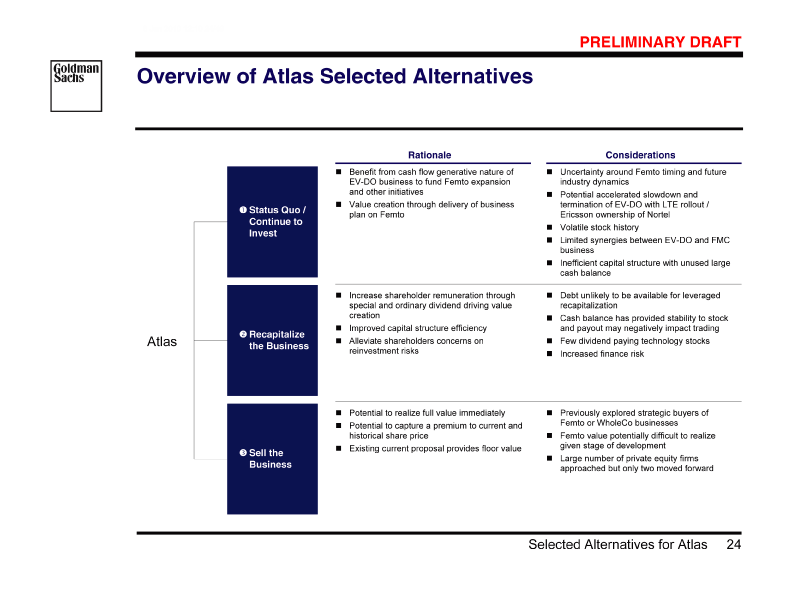
| B78823_212 |
| 8 Jan 2010 12:10 25/49 PRELIMINARY DRAFT Leverage Considerations for Atlas ($ in billions) [Graphic Appears Here] Bank Loan Volumes — LTM Observations $5.0 $3.9 $3.1 $2.3 $1.2 $1.0 Jun- 09 [Graphic Appears Here] $0.0 $0.0 $0.1 [Graphic Appears Here] Aug- 09 Jul-09 [Graphic Appears Here] Nov- 08 Dec- 08 Jan- 09 Feb- 09 Mar- 09 Apr- 09 May- 09 Sep- 09 Oct- 09 Nov- 09 High Yield Bond Market Volumes — LTM $26.0 $22.8 $19.5 $18.0 $17.7 $16.4 $10.5 $10.1 $5.9 Majority has been historically LBO debt (Sungard, Avaya, First Data), most of which has not been distributed and remain with underwriters Markets beginning to show strength but remain very selective Volume remains muted for bank loans High yield market has seen strong issuance in the last Technology has seen very little debt issuance No public market technology recap in last two years Atlas will only have access to bank markets given size Access for LBO easier than public recap given validation Limited to no leverage in comparable groups few months — suggesting lenders unlikely to fund public recaps of private equity and new capital invested below debt | | | | | | | | | $4.1 Feb- 09 $2.2 Mar- 09 $0.7 $0.0 [Graphic Appears Here] Nov- 08 Dec- 08 Jan- 09 Apr- 09 May- 09 Jun- 09 Aug- 09 Jul-09 Sep- 09 Oct- 09 Nov- 09 Source: Goldman Sachs Syndicate Desk 25 Selected Alternatives for Atlas |
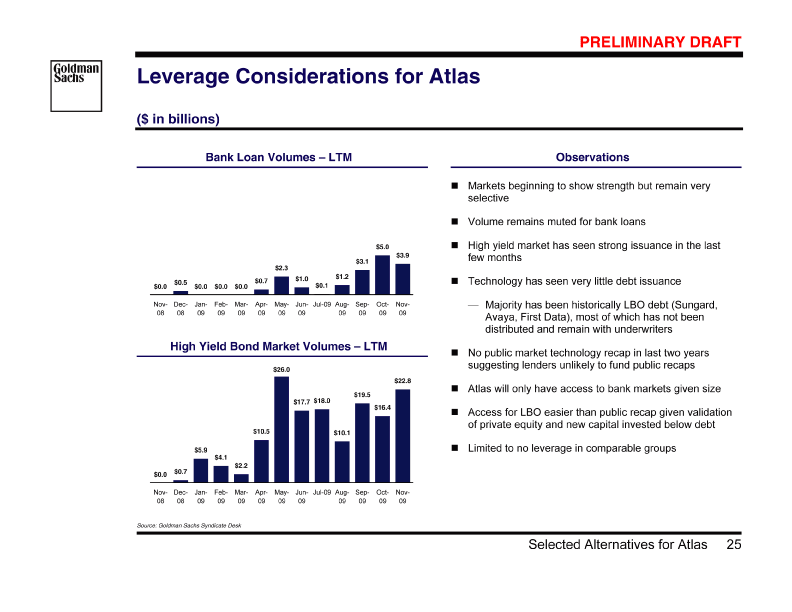
| B78823_213 |
| 8 Jan 2010 12:10 26/49 PRELIMINARY DRAFT ture Share Price Analysis (Incl. Dividends) Recapitalization - Special Dividend Atlas Management Projections (Base Case) — Fu ($ in millions, except per share data) [Graphic Appears Here] 1 Presentation Value of Future Share Price Analysis Sensitivity Analysis Present Value of Future Share Price (incl. Dividends) Exit Year [Graphic Appears Here] PV of Dividend per Share (DPS) PV of Share Price (ex-DPS) Present Value of Future Share Price $3.33 [Graphic Appears Here] [Graphic Appears Here] Present Value of Future Share Price (incl. Dividends) Exit Year [Graphic Appears Here] YE 2009 1-yr Fwd EBITDA 2 Implied EV Net Debt / (Cash) Implied Equity Value 3 Fully Diluted # of Shares (mm) 62.6 [Graphic Appears Here] [Graphic Appears Here] Share Share per Future Implied Price Dividend $3.33 | | | | | | | | | 129419(50) 469 76.1 6.16 0.78 4.05 0.51 YE 2012 $ $$ $ $ 108351(50) 401 76.1 5.28 0.39 3.99 0.30 $ $$ $ $ YE 2011 — 78254(50) 304 75.9 4.00 0.53 $ 3.48 0.46 $ $ $ $ YE 2010 100% of the available FCF, with a minimum cash balance of $50mm Discounted to 31-Dec-2009 at a 15.0% discount rate. Assuming an initial special dividend of $209mm and then a distribution of Enterprise value based on Atlas 1-year forward EBITDA multiple of 3.2x as of 04-Dec-2009. Assumes a fully diluted number of shares based on treasury method (basic shares outstanding of 62.6mm as of 30-Oct-2009, 14.1mm outstanding options as of 31-Oct-2009 with a weighted strike price of $3.55 per Atlas Q3 2009 10Q filing and Atlas Management). The analysis does not include any future stock options grant. Source: Atlas projections per Atlas Management (Base Case) based on Atlas Management presentation to Atlas Board of Directors on 24-Nov-2009. Base Case EV-DO and FMC projections include Management Corporate Risk Adjustments. 1 2 3 26 Selected Alternatives for Atlas |
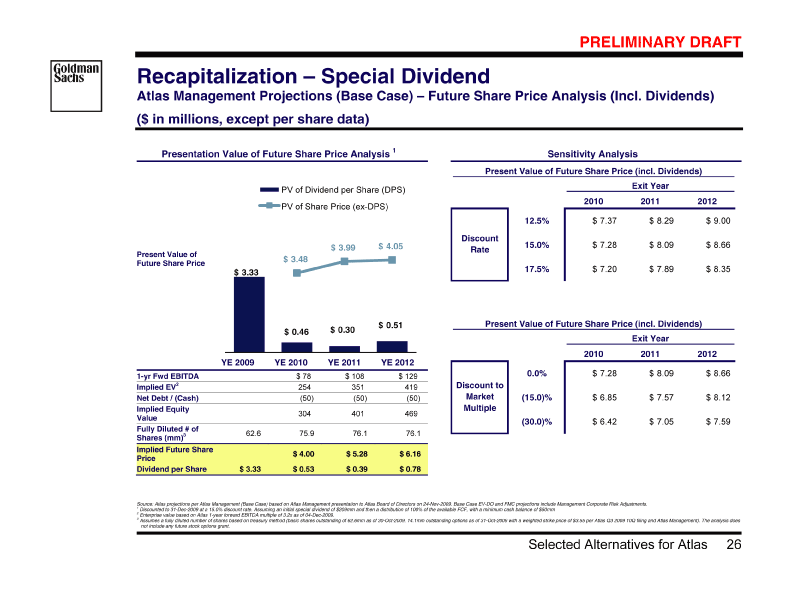
| B78823_214 |
| 8 Jan 2010 12:10 27/49 PRELIMINARY DRAFT ice Analysis (Incl. Dividends) ownside Case) — Future Share Pr Recapitalization - Special Dividend Atlas Management Projections (D ($ in millions, except per share data) [Graphic Appears Here] 1 Present Value of Future Share Price Analysis Sensitivity Analysis Present Value of Future Share Price (incl. Dividends) Exit Year [Graphic Appears Here] PV of Dividend per Share (DPS) PV of Share Price (ex-DPS) Present Value of Future Share Price $3.33 [Graphic Appears Here] [Graphic Appears Here] Present Value of Future Share Price (incl. Dividends) Exit Year [Graphic Appears Here] [Graphic Appears Here] YE 2009 1-yr Fwd EBITDA 2 Implied EV Net Debt / (Cash) Implied Equity Value 3 Fully Diluted # of Shares (mm) [Graphic Appears Here] 62.6 [Graphic Appears Here] Share Share per Future Implied Price Dividend $3.33 | | | | | | | | | 74 239 (50) 289 75.8 3.80 0.46 $ 2.51 0.30 YE 2012 $ $ $ $ 71 231 (50) 281 75.8 3.71 0.21 $ 2.80 0.16 $ $ $ $ YE 2011 — 53 172 (50) 222 75.6 2.93 0.38 $ 2.55 0.33 $ $ $ $ YE 2010 ts 100% of the available FCF, with a minimum cash balance of $50mm. guidance. FMC projections remain unchanged. Downside Case EV-DO and FMC projections include Management Corporate Risk Adjustmen Discounted to 31-Dec-2009 at a 15.0% discount rate. Assuming an initial special dividend of $209mm and then a distribution of Enterprise value based on Atlas 1-year forward EBITDA multiple of 3.2x as of 04-Dec-2009. Assumes a fully diluted number of shares based on treasury method (basic shares outstanding of 62.6mm as of 04-Dec-2009, 14.1mm outstanding options as of 31-Oct-2009 with a weighted strike price of $3.55 per Atlas Q3 2009 10Q filing and Atlas Management). The analysis does not include any future stock options grant. Source: Atlas projections per Atlas Management (Downside Case) based on Atlas Management downside assumption for 2010-13 EV-DO revenues and assuming a constant gross profit margin and operating expenses decline at 100% rate of billings decline per Atlas Management 1 2 3 27 Selected Alternatives for Atlas |
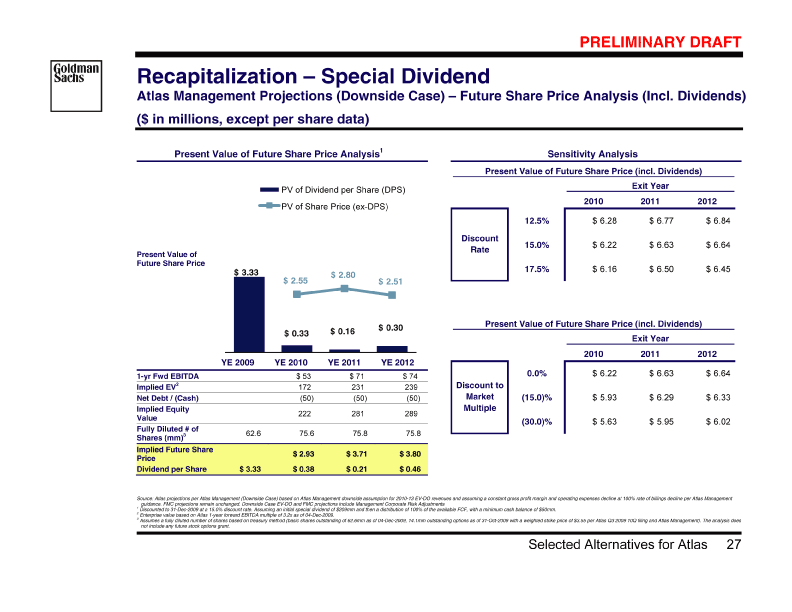
| B78823_215 |
| 8 Jan 2010 12:10 28/49 PRELIMINARY DRAFT Future Share Price Analysis (Incl. Dividends) Recapitalization - Special Dividend Atlas Management Projections (Upside Case) — ($ in millions, except per share data) [Graphic Appears Here] 1 Present Value of Future Share Price Analysis PV of Dividend per Share (DPS) PV of Share Price (ex-DPS) | | | | | | | | | 192 621 (50) 671 76.3 8.80 1.19 5.79 0.78 YE 2012 $ $$ $ $ 167 542 (50) 592 76.2 7.77 0.73 5.88 0.55 $ $$ $ $ YE 2011 141 457 (50) 507 76.2 6.66 0.80 5.79 0.70 $ $$ $ $ YE 2010 3.33 62.6 3.33 $ $ YE 2009 3 Future Share Price 2 Implied Future Share Dividend per Share Present Value of 1-yr Fwd EBITDA Implied EV Net Debt / (Cash) Implied Equity Value Fully Diluted # of Shares (mm) Price Sensitivity Analysis Present Value of Future Share Price (incl. Dividends) Exit Year [Graphic Appears Here] [Graphic Appears Here] Present Value of Future Share Price (incl. Dividends) Exit Year [Graphic Appears Here] [Graphic Appears Here] 100% of the available FCF, with a minimum cash balance of $50mm. Discounted to 31-Dec-2009 at a 15.0% discount rate. Assuming an initial special dividend of $209mm and then a distribution of Enterprise value based on Atlas 1-year forward EBITDA multiple of 3.2x as of 04-Dec-2009. Assumes a fully diluted number of shares based on treasury method (basic shares outstanding of 62.6mm as of 30-Oct-2009, 14.1mm outstanding options as of 31-Oct-2009 with a weighted strike price of $3.55 per Atlas Q3 2009 10Q filing and Atlas Management). The analysis does not include any future stock options grant. Source: Atlas projections per Atlas Management (Upside Case) based on Atlas Management presentation to Atlas Board of Directors on 24-Nov-2009 with Upside Case EV-DO and FMC projections excluding Management Corporate Risk Adjustments 1 2 3 28 Selected Alternatives for Atlas |

| B78823_216 |
| 8 Jan 2010 12:10 29/49 PRELIMINARY DRAFT ture Share Price Analysis (Incl. Dividends) Recapitalization - Share Buyback Atlas Management Projections (Base Case) — Fu ($ in millions, except per share data) [Graphic Appears Here] 1 Presentation Value of Future Share Price Analysis Sensitivity Analysis Present Value of Future Share Price (incl. Dividends) Exit Year [Graphic Appears Here] Present Value of Future Share Price [Graphic Appears Here] [Graphic Appears Here] Present Value of Future Share Price (incl. Dividends) Exit Year Share Share 3 2 per Future Implied EV Shares (mm) 1-yr Fwd EBITDA Net Debt / (Cash) Implied Equity Value Fully Diluted # of Implied Price Dividend [Graphic Appears Here] [Graphic Appears Here] | | | | | | | | | 44.1 10.64 1.35 129 419 (50) 469 $ $ 6.99 0.89 YE 2012 $ $ $ 43.4 9.24 0.69 6.99 0.52 108 351 (50) 401 $$ PV of Dividend per Share (DPS) PV of Share Price (ex-DPS) $ $ YE 2011 $ — 6.30 0.84 78 41.9 7.25 0.97 $ 254 (50) 304 $$ $ YE 2010 $ weighted strike price distribution of 100% of the available FCF, with a minimum cash balance of $50mm. Discounted to 31-Dec-2009 at a 15.0% discount rate. Assuming an initial share buyback of $209mm at $7.50 pre share and then a Enterprise value based on Atlas 1-year forward EBITDA multiple of 3.2x as of 04-Dec-2009. Assumes a fully diluted number of shares based on treasury method (basic shares outstanding of 62.6mm as of 30-Oct-2009 net of 27.8mm of shares assumed to be bought back at a price of $7.50 per share, 14.1mm outstanding options as of 31-Oct-2009 with a of $3.55 per Atlas Q3 2009 10Q filing and Atlas Management). The analysis does not include any future stock options grant. Source: Atlas projections per Atlas Management (Base Case) based on Atlas Management presentation to Atlas Board of Directors on 24-Nov-2009. Base Case EV-DO and FMC projections include Management Corporate Risk Adjustments 1 2 3 29 Selected Alternatives for Atlas |
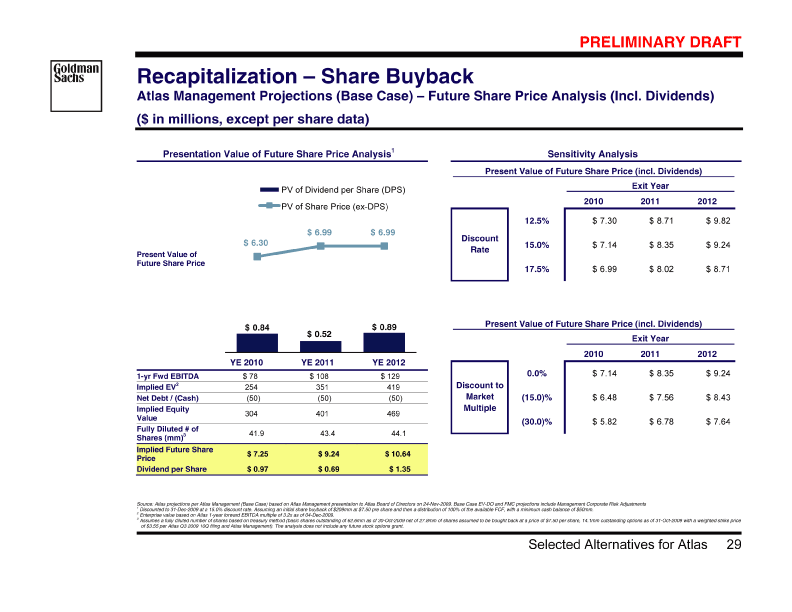
| B78823_217 |
| 8 Jan 2010 12:10 30/49 PRELIMINARY DRAFT ice Analysis (Incl. Dividends) ownside Case) — Future Share Pr Recapitalization - Share Buyback Atlas Management Projections (D ($ in millions, except per share data) [Graphic Appears Here] 1 Present Value of Future Share Price Analysis Sensitivity Analysis Present Value of Future Share Price (incl. Dividends) Exit Year [Graphic Appears Here] Present Value of Future Share Price [Graphic Appears Here] [Graphic Appears Here] Present Value of Future Share Price (incl. Dividends) Exit Year [Graphic Appears Here] Share Share 3 2 per Future Implied EV Shares (mm) 1-yr Fwd EBITDA Net Debt / (Cash) Implied Equity Value Fully Diluted # of Implied Price Dividend [Graphic Appears Here] [Graphic Appears Here] | | | | | | | | | 74 41.6 6.95 0.84 239 (50) 289 $$ 4.57 0.55 YE 2012 $ $ $ 71 41.4 6.78 0.38 5.13 0.29 231 (50) 281 $$ $ PV of Dividend per Share (DPS) PV of Share Price (ex-DPS) $ $ YE 2011 — 4.84 0.63 53 39.8 5.57 0.72 $ 172 (50) 222 $$ $ YE 2010 $ weighted strike price ts distribution of 100% of the available FCF, with a minimum cash balance of $50mm. guidance. FMC projections remain unchanged. Downside Case EV-DO and FMC projections include Management Corporate Risk Adjustmen Discounted to 31-Dec-2009 at a 15.0% discount rate. Assuming an initial share buyback of $209mm at $7.50 pre share and then a Enterprise value based on Atlas 1-year forward EBITDA multiple of 3.2x as of 04-Dec-2009. Assumes a fully diluted number of shares based on treasury method (basic shares outstanding of 62.6mm as of 30-Oct-2009 net of 27.8mm of shares assumed to be bought back at a price of $7.50 per share, 14.1mm outstanding options as of 31-Oct-2009 with a of $3.55 per Atlas Q3 2009 10Q filing and Atlas Management). The analysis does not include any future stock options grant. Source: Atlas projections per Atlas Management (Downside Case) based on Atlas Management downside assumption for 2010-13 EV-DO revenues and assuming a constant gross profit margin and operating expenses decline at 100% rate of billings decline per Atlas Management 1 2 3 30 Selected Alternatives for Atlas |
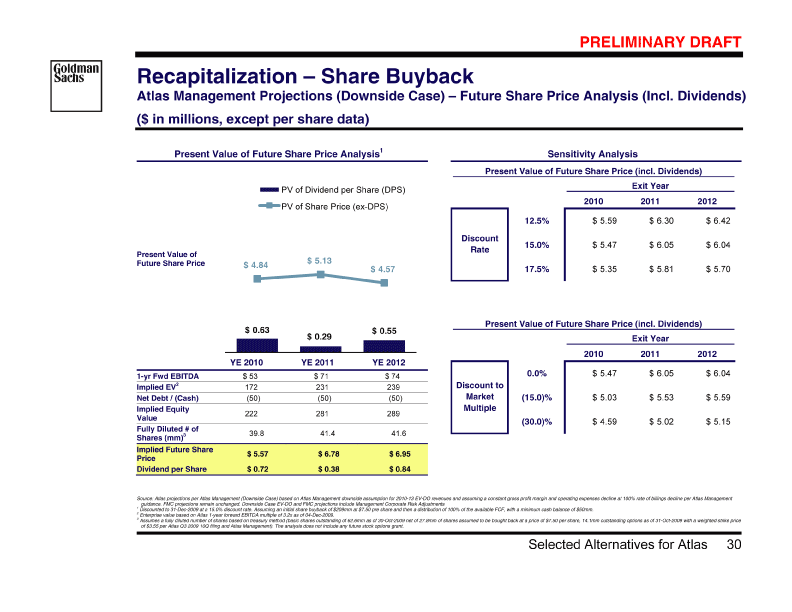
| B78823_218 |
| 8 Jan 2010 12:10 31/49 PRELIMINARY DRAFT Future Share Price Analysis (Incl. Dividends) Recapitalization - Share Buyback Atlas Management Projections (Upside Case) — ($ in millions, except per share data) [Graphic Appears Here] 1 Present Value of Future Share Price Analysis Sensitivity Analysis Present Value of Future Share Price (incl. Dividends) Exit Year [Graphic Appears Here] PV of Dividend per Share (DPS) PV of Share Price (ex-DPS) Present Value of Future Share Price | | | | | | | | | 9.72 1.31 $$ 9.95 0.93 $$ 9.93 1.20 $$ | | | | | | | | | 45.4 14.78 1.99 192 621 (50) 671 $ $ YE 2012 $ 45.0 13.16 1.23 167 542 (50) 592 $ $ YE 2011 $ 44.4 11.42 1.38 141 457 (50) 507 $ $ YE 2010 $ [Graphic Appears Here] [Graphic Appears Here] Present Value of Future Share Price (incl. Dividends) Exit Year Share Share 3 2 per Future Implied EV Shares (mm) 1-yr Fwd EBITDA Net Debt / (Cash) Implied Equity Value Fully Diluted # of Implied Price Dividend [Graphic Appears Here] [Graphic Appears Here] weighted strike price distribution of 100% of the available FCF, with a minimum cash balance of $50mm. Discounted to 31-Dec-2009 at a 15.0% discount rate. Assuming an initial share buyback of $209mm at $7.50 pre share and then a Enterprise value based on Atlas 1-year forward EBITDA multiple of 3.2x as of 04-Dec-2009. Assumes a fully diluted number of shares based on treasury method (basic shares outstanding of 62.6mm as of 30-Oct-2009 net of 27.8mm of shares assumed to be bought back at a price of $7.50 per share, 14.1mm outstanding options as of 31-Oct-2009 with a of $3.55 per Atlas Q3 2009 10Q filing and Atlas Management). The analysis does not include any future stock options grant. Source: Atlas projections per Atlas Management (Upside Case) based on Atlas Management presentation to Atlas Board of Directors on 24-Nov-2009 with Upside Case EV-DO and FMC projections excluding Management Corporate Risk Adjustments 1 2 3 31 Selected Alternatives for Atlas |
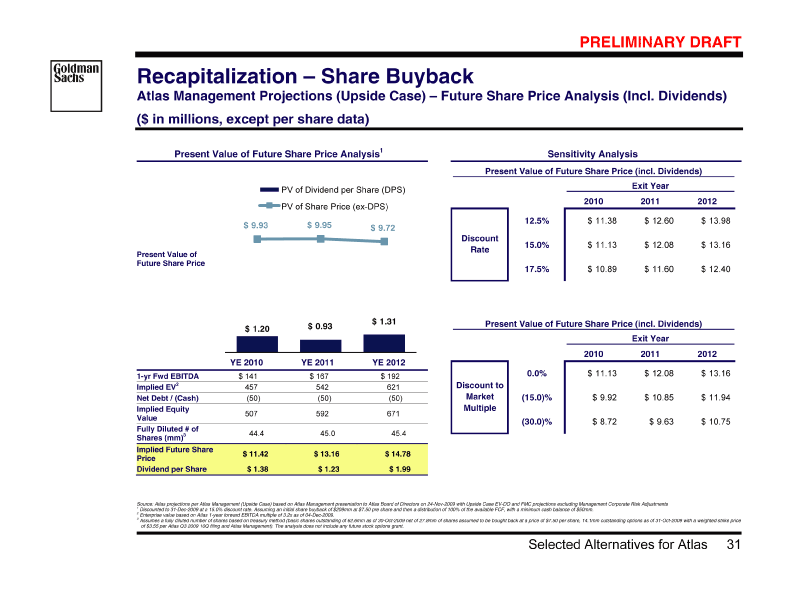
| B78823_219 |
| 8 Jan 2010 12:10 32/49 PRELIMINARY DRAFT Pro Forma Financial Profile Acquisition at $7.50 per Share ($ in millions) [Graphic Appears Here] | | | | | | | | | 0.4% (100.0)% (0.8% ) 2.8% NM 28.3% 2.1% NM 32.2% 17.3% 2009 — 2013 CAGR 0 0 (6) 0 (1) (11) (29) 61 148 148 106 106 101 101 0.7% $ 2013 E $ $(60.6%) $ $72.0% (1.9%) $ $68.2% 225 0 108 (8) 103 (3) 100 (1) (16) (27) 57 150 375 108 $ 2012 E $ $ 33.9% $ $28.9% 38.5% $ $26.7% 38.8% 136 (23)78 (6) 98(26) 72 (1) (19) (17) 35 144 280 101 $ $ $ $ 2011 E $ $ 39.7% $27.9% 34.4% 25.7% 38.3% 51 (45)58 (6) 99(47) 52 (1) (21) (11) 19 150 200 103 $ $ $ $ 2010 E $ $ 31.3% $29.0% 48.4% 26.0% 58.3% 7 95 (56)39 (6) 93(60) 33 0 3 (4) 32 146 153 $ $ $ $ $ 2009 E $ $ 25.7% 21.6% EV-DO FMC Billings (Non-GAAP) % Growth EV-DO FMC EBITDA % Margin % Growth Depreciation & Amortization EV-DO FMC EBIT % Margin % Growth Financing Expenses Net Interest (Expense) / Income Tax Expense Net Income Note: Analysis assumes no contribution of FMC post 2012. Includes full recovery of $39.6mm from Nortel in 2009 Source: Atlas projections per Atlas Management (Base Case) based on Atlas Management presentation to Atlas Board of Directors on 24-Nov-2009. Base Case EV-DO and FMC projections include Management Corporate Risk Adjustments 1 32 Selected Alternatives for Atlas |
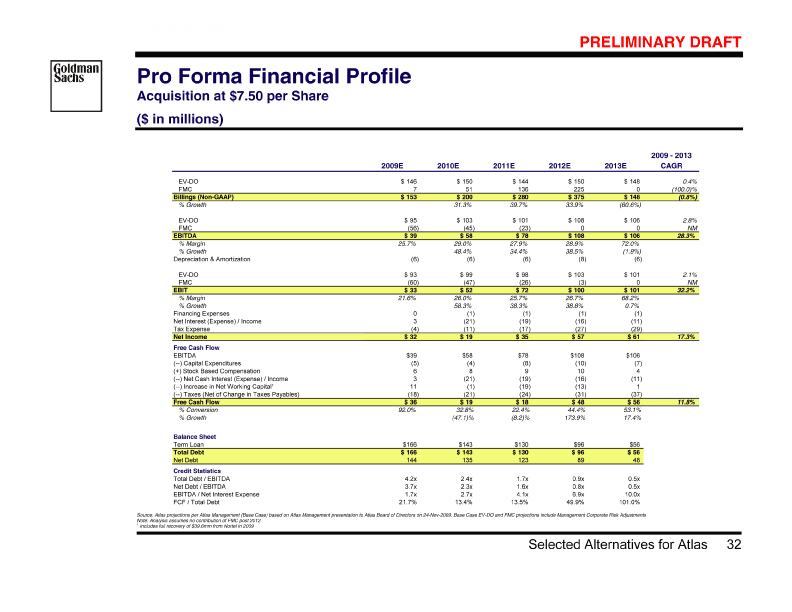
| B78823_220 |
| 8 Jan 2010 12:10 33/49 PRELIMINARY DRAFT Illustrative Return Analysis Atlas Management Projections (Base Case) Assuming $100mm for Femto Business ($ in millions) [Graphic Appears Here] Illustrative Return Analysis @ $7.50 per Share Dividends Realization of Femto Value (YE 2012) Payout / (Investment) | | | | | | | | | 8 0 0 2019 E $ 11 0 0 2018 E $ 21 0 0 2017 E $ 30 0 0 2016 E $ 30 0 0 2015 E $ 13 0 0 2014 E $ 14 0 0 2013 E $ —— — 12 100 0 2012 E $ —— — 4 0 0 2011 E $ 8 0 0 2010 E $ 0 0 2009 E $ (134) [Graphic Appears Here] Source: Atlas projections per Atlas Management (Base Case) based on Atlas Management presentation to Atlas Board of Directors on 24-Nov-2009. Base Case EV-DO and FMC projections include Management Corporate Risk Adjustments Note: Analysis assumes no contribution of FMC post 2012. 33 Selected Alternatives for Atlas |
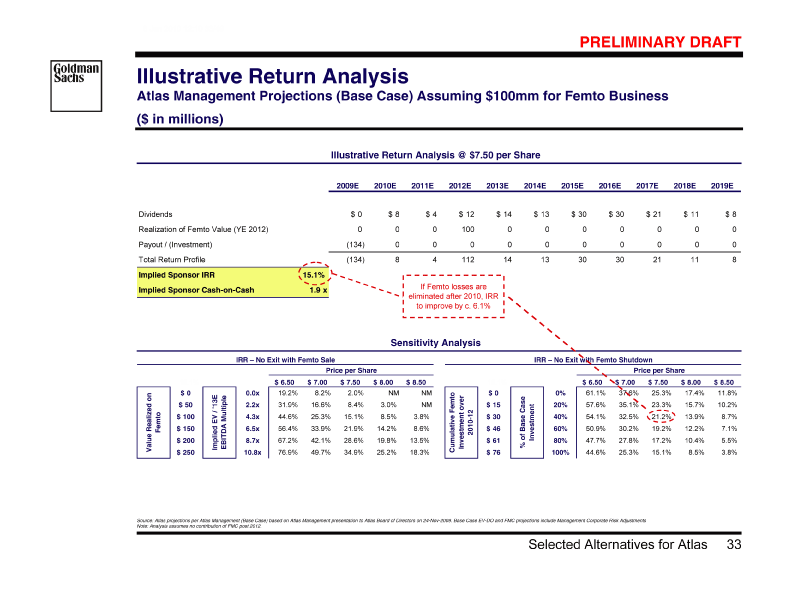
| B78823_221 |
| 8 Jan 2010 12:10 34/49 PRELIMINARY DRAFT Illustrative Return Analysis Atlas Management Projections (Downside Case) Assuming $100mm for Femto Business ($ in millions) [Graphic Appears Here] Illustrative Return Analysis @ $7.50 per Share Dividends Realization of Femto Value (YE 2012) Payout / (Investment) Total Return Profile [Graphic Appears Here] | | | | | | | | | (22 ) 0 0 (22) 2019 E $ 2 0 0 2 2018 E $ 4 0 0 4 2017 E $ 7 0 0 7 2016 E $ 9 0 0 9 2015 E $ 11 0 0 11 2014 E $ 4 0 0 4 2013 E $ 5 0 2012 E $100 105 1 0 0 1 2011 E $ 5 0 0 5 2010 E $ 0 0 2009 E $ (134) (134) Sensitivity Analysis IRR — No Exit with Femto Sale Price per Share IRR — No Exit with Femto Shutdown Price per Share [Graphic Appears Here] 0 15 30 46 61 76 $ NM $ $ $ $ $ [Graphic Appears Here] [Graphic Appears Here] 2010-12 overInvestment [Graphic Appears Here] [Graphic Appears Here] ts Source: Atlas projections per Atlas Management (Downside Case) based on Atlas Management downside assumption for 2010-13 EV-DO revenues and assuming a constant gross profit margin and operating expenses decline at 100% rate of billings decline per Atlas Management guidance. FMC projections remain unchanged. Downside Case EV-DO and FMC projections include Management Corporate Risk Adjustmen Note: Analysis assumes no contribution of FMC post 2012. 34 Selected Alternatives for Atlas |
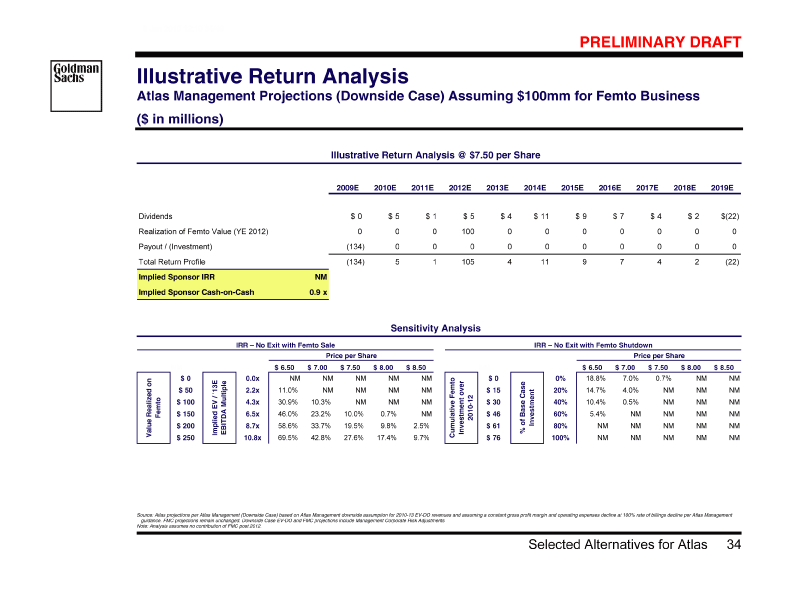
| B78823_222 |
| 8 Jan 2010 12:10 35/49 PRELIMINARY DRAFT Illustrative Return Analysis Atlas Management Projections (Upside Case) Assuming $100mm for Femto Business ($ in millions) [Graphic Appears Here] Illustrative Return Analysis @ $7.50 per Share Dividends Realization of Femto Value (YE 2012) Payout / (Investment) Total Return Profile [Graphic Appears Here] | | | | | | | | | 8 0 0 8 2019 E $ 12 0 0 12 2018 E $ 23 0 0 23 2017 E $ 33 0 0 33 2016 E $ 37 0 0 37 2015 E $ 19 0 0 19 2014 E $ 15 0 0 15 2013 E $ 13 100 0 113 2012 E $ 5 0 0 5 2011 E $ 9 0 0 9 2010 E $ 0 0 2009 E $ (134) (134) Sensitivity Analysis Price per Share [Graphic Appears Here] Price per Share [Graphic Appears Here] [Graphic Appears Here] [Graphic Appears Here] 2010-12 overInvestment [Graphic Appears Here] Source: Atlas projections per Atlas Management (Upside Case) based on Atlas Management presentation to Atlas Board of Directors on 24-Nov-2009 with Upside Case EV-DO and FMC projections excluding Management Corporate Risk Adjustments Note: Analysis assumes no contribution of FMC post 2012. 35 Selected Alternatives for Atlas |
| B78823_223 |
| 8 Jan 2010 12:10 36/49 PRELIMINARY DRAFT [Graphic Appears Here] Supporting Materials Appendix A: 36 Supporting Materials |
| B78823_224 |
| 8 Jan 2010 12:10 37/49 PRELIMINARY DRAFT Comparison of Selected Companies [Graphic Appears Here] Enterprise | | | | | | | | | x x x 16.7 16.1 12.4 24.1 12.3 16.3 16.1 12.749 27.5 35.6 24.3 NM 24.2 11.7 26.0 NM 36.7 26.6 26.0 18.8 16.0 14.0 21.0 10.8 14.9 15.0 2010 x x x Calendarized P/E NM 17.5 16.9 409.0 14.2 114.4 17.2 13.5 33.2 67.9 28.8 NM 32.2 14.3 32.0 NM 38.0 35.2 32.2 27.4 18.1 70.0 22.7 13.2 30.3 22.7 Multiples (2) — 2009 x x x 4.1 10.1 5.5 7.8 6.7 6.8 6.7 3.2 12.5 20.5 15.5 403.7 13.5 7.3 13.8 NA 17.8 63.1 14.6 6.2 8.2 9.4 NA 6.0 7.0 6.2 2010 A EBITD x x x 7.6 10.5 6.9 15.6 8.2 9.8 8.2 4.8 15.8 46.5 18.3 NM 16.7 8.9 17.9 NA 20.8 20.7 17.9 NA 10.2 14.3 5.6 6.8 9.3 8.5 2009 x x x Value Multiples (2) 0.3 3.1 0.8 0.7 0.8 1.1 0.8 0.9 3.4 3.1 5.0 1.9 3.4 1.7 2.9 1.1 5.8 3.2 3.1 0.7 2.2 0.7 0.6 1.1 1.0 0.8 2010 Sales x x x 0.3 3.3 0.8 0.7 0.8 1.2 0.8 1.2 4.1 3.7 5.9 2.2 4.0 2.2 3.3 1.2 7.2 3.8 3.7 0.7 2.5 0.7 0.6 1.1 1.5 0.9 2009 7,935 25,052 16,137 46,058 189 578 804 3,990 686 12,949 31,743 1,296 2612,360 6,0741,296 753 1,180 4219703,446 1,160 861 43,154 25,052 120,588 $ $ Enterprise Value (1) $ 7,903 30,963 19,220 47,297 433.6 737 928 4,254 955 15,017 33,936 1,593 5982,768 6,7541,593 603 1,327 1852,2242,441 1,202 965 50,130 30,963 145,264 $ $ Equity Market Cap (1) $ % % % 70 99 85 88 72 82.8 85.2 90 100 93 100 88 97 66 82 92 100 90.8 92.8 64 82 817679 78.8 80.3 % of 52 Week High ) 3.48 9.64 8.18 6.31 9.11 9.09 2.16 6.24 1.40 5.68 Closing $ 24.16 12.70 Mean Median 11.28 50.64 27.33 59.09 20.77 34.54 Mean Median 21.00 26.00 Mean Median Price ( 4-Dec-2009 Company Broad System Cisco Systems, Inc. LM Ericsson Telephone Co. Category Acme Packet, Inc. Aruba Networks, Inc. F5 Networks Inc. Infinera Corp. Juniper Networks, Sonus Networks, Mid Tier ADTRAN Inc. Powerwave Companies (3) Motorola Inc. Nokia Leaders Atlas Inc. Research in Inc. Starent Communications Technologies Inc. Corp. (Base Case Motion (4) Riverbed Networks, Corp. ADC Tellabs Inc. Alcatel-Lucent Projections) Technology, Inc. Telecommunications CommScope Inc. Inc. All research estimates have been calendarized to December. and/or other Wall Street research. BES median estimates Projected revenues, EBITDA, EBIT, and EPS are based on I Equity Market Cap based on diluted shares outstanding. Latest publicly available financial statements. LTM numbers are based on latest publicly available financial statements. Source: Sources: Not pro forma for acquisition of Nortel CDMA business and LTE assets in North America Proforma for acquisition of Chalk Media Corp announced on 11-Dec-08 (1) (2) (3) (4) Source: Atlas projections per Atlas Management (Base Case) based on Atlas Management presentation to Atlas Board of Directors on 24-Nov-2009. Base Case EV-DO and FMC projections include Management Corporate Risk Adjustments 37 Supporting Materials |
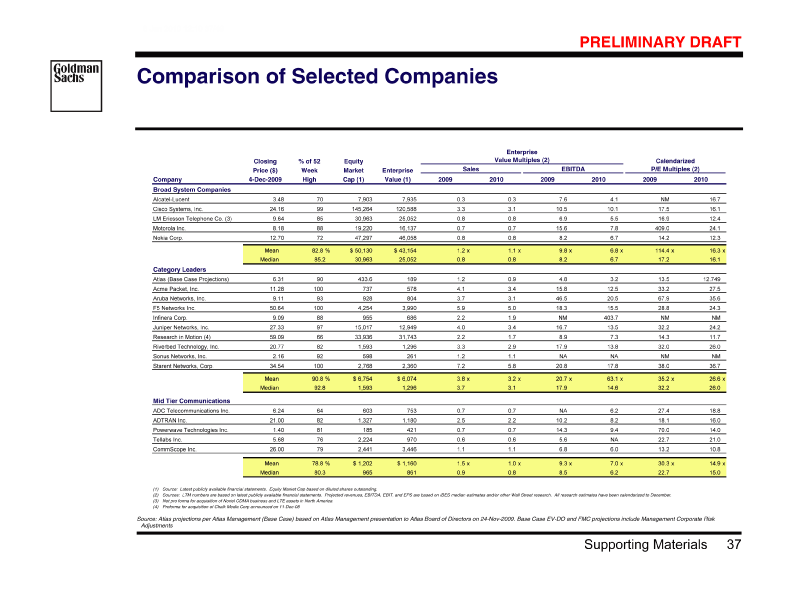
| B78823_225 |
| 8 Jan 2010 12:10 38/49 PRELIMINARY DRAFT Atlas Discounted Cash Flow Analysis | | | | | | | | | 0 0 (0) 0 (0 ) 0 2019 E $(100.0)% n.m. $ n.m. $ 25 18 (1) 17 (6)11 2018 E $(50.0)% 72.0% $68.2% $ 50 36 (2) 34 (12)22 2017 E $(33.3)% 72.0% $68.2% $ 75 54 (3) 51 (18)33 2016 E $(25.0)% 72.0% $68.2% $ 100 72 (4) 68 (24)44 $ $ 2015 E $(20.0)% 72.0% 68.2% 125 90 (5) 86 (30)56 $ $ 2014 E $(15.1)% 72.0% 68.2% 148 106 (6) 101 (35)65 $ 2013 E $(1.4)% 72.0% $68.2% 150 108 (5) 103 (36)67 4.1% $ 2012 E $72.1% $68.8% 144 101 (3) 98 (34)63 $ $ 2011 E $(3.7)% 70.3% 67.9% Free Cash Flow Build 150 103 (3) 99 (35)65 2.7% $ $ 2010 E $68.7% 66.4% 146 95 (2) 93 (32)60 $ $ 2009 E $65.4% 63.7% in millions) % Growth % Margin % Margin $ Billings (Non-GAAP) EBITDA (—) Depreciation and Amortization Operating Income on Billings (—) Taxes Operating Income Before Interest After Tax EV-DO ( Business Equity Value Per Share — Sensitivity Analysis [Graphic Appears Here] WACC [Graphic Appears Here] [Graphic Appears Here] Source: Atlas projections per Atlas Management (Base Case) based on Atlas Management presentation to Atlas Board of Directors on 24-Nov-2009. Base Case EV-DO and FMC projections include Management Corporate Risk Adjustments Note: Assumes 17.5% WACC and tax rate of 35.0%. 38 Supporting Materials |
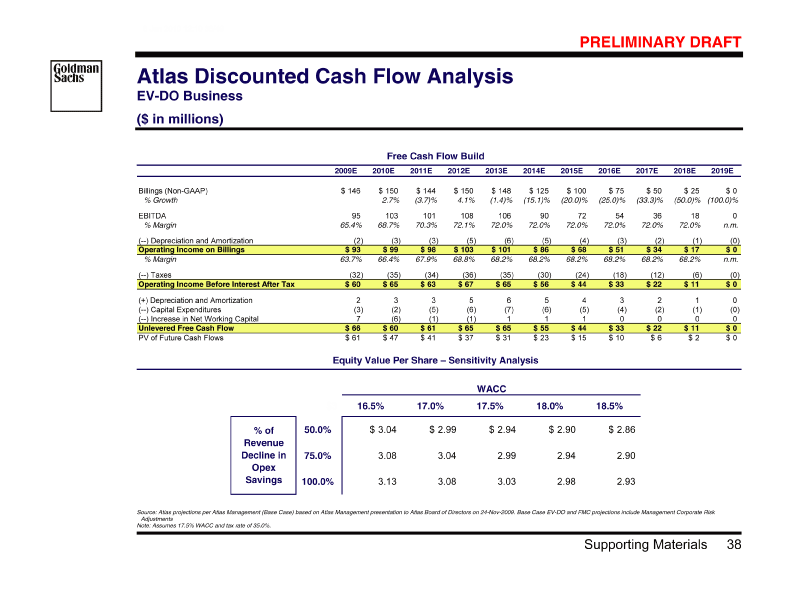
| B78823_226 |
| 8 Jan 2010 12:10 39/49 PRELIMINARY DRAFT Atlas Discounted Cash Flow Analysis [Graphic Appears Here] [Graphic Appears Here] | | | | | | | | | 23 (4) 19 (7) 13 332 6.9% $5.8% $ $47.6% 2013 E 0 (3) (3) 1 (2 ) 225 $ $ 0.2% $65.4% (1.3 )% 2012 E (3) 9 (23 ) (26) (17 ) 136 $ $ $167.6% (16.8)% (18.8 )% 2011 E 51 (3) 17 (45 ) (47) (31 ) $(87.5)% $(92.8)% $ 2010 E Free Cash Flow Build 2009 E in millions) FMC Business $ Billings (Non-GAAP) % Growth EBITDA % Margin (—) Depreciation and Amortization Operating Income on Billings % Margin (—) Taxes Operating Income Before Interest After Tax ( [Graphic Appears Here] [Graphic Appears Here] Source: Atlas projections per Atlas Management (Base Case) based on Atlas Management presentation to Atlas Board of Directors on 24-Nov-2009. Base Case EV-DO and FMC projections include Management Corporate Risk Adjustments Note: Assumes 27.5% WACC, a 12.5x EV / EBITDA terminal value multiple, and a tax rate of 35.0%. 39 Supporting Materials |
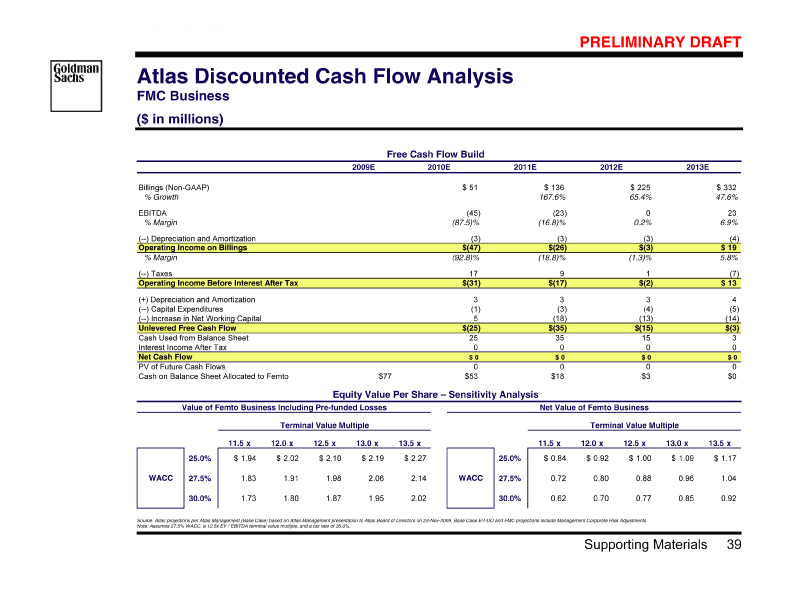
| B78823_227 |
| 8 Jan 2010 12:10 40/49 Illustrative Atlas WACC Analysis Assuming No Leverage [Graphic Appears Here] PRELIMINARY DRAFT [Graphic Appears Here] | | | | | | | | | 0 $195 395 WACC 22.15% 18.41% 16.17% 14.67% 13.61% mm) $ Ke 9.42% 10.13% 10.83% 11.54% 12.24% Current Capital Structure ( Wc 163.3% 97.5% 58.0% 31.6% 12.8% 0 50 $100 150 200 $ Gross Debt Excess Cash 1 Basic Mkt Cap Min Cash $ $ $ Wd Wc We Rf 2a 2e ERP Ke 0.0% 97.5% 197.5% 4.30% 1.32 0.90 6.47% 10.13% OK WACC Calculation Target Capital Structure (%) Asset Beta (Comps Median) Gross Debt / (Debt — Excess Cash + Equity) Excess Cash / (Debt — Excess Cash + Equity) Equity / (Debt — Excess Cash + Equity) Risk-Free Rate 2 Equity Beta (Relevered) Equity Risk Premium 3 Cost of Equity [Graphic Appears Here] | | | | | | | | | Asset Beta 1.60 Asset Beta 1.39 1.40 2.49 1.14 1.12 1.26 1.32 1.47 Tax Rate 35.0% Tax Rate 35.0% 35.0% 35.0% 35.0% 35.0% 35.0% 35.0% 35.0% Net Debt / Equity Ratio (0.62) Net Debt / Equity Ratio (0.24) (0.31) (0.57) (0.16) 1.27 0.25 (0.20) 0.04 Basic Market Cap (mm) 395 Basic Market Cap (mm) 657 878 593 2,491 185 603 Net Debt (mm) (245) Net Debt (mm) (159) (269) (338) (407) 236 150 Total Cash (mm) 245 Total Cash (mm) 159 269 338 407 45 512 Total Debt (mm) 0 Total Debt (mm) 0 0 0 0 281 662 Currency USD Currency USD USD USD USD USD USD Barra Predicted Equity Beta 0.95 Barra Predicted Equity Beta 1.18 1.12 1.57 1.02 2.05 1.46 1.32 1.40 Median Mean Atlas Comparable Company Acme Packet, Inc. Infinera Corp. Sonus Networks, Inc. Starent Networks, Corp. Powerwave Technologies Inc. ADC Telecommunications Inc. Assumes minimum cash of $50mm. Cash balance as of 30-Sep-2009 per Atlas Q3 2009 10Q filling including full recovery of $39.6mm from Nortel in 2009 Current U.S. 30 year Treasury rate as of 04-Dec-2009. Ibbotson’s equity risk premium from 1926 — 2008. Not applicable given target cost structure includes no debt. Assumes U.S. statutory tax rate. Source: Companies’ filings, predicted beta information from Barra, Capital IQ, market data as of 04-Dec-2009 1 2 3 4 5 Exhibit c—7 .pdf 40 Supporting Materials |
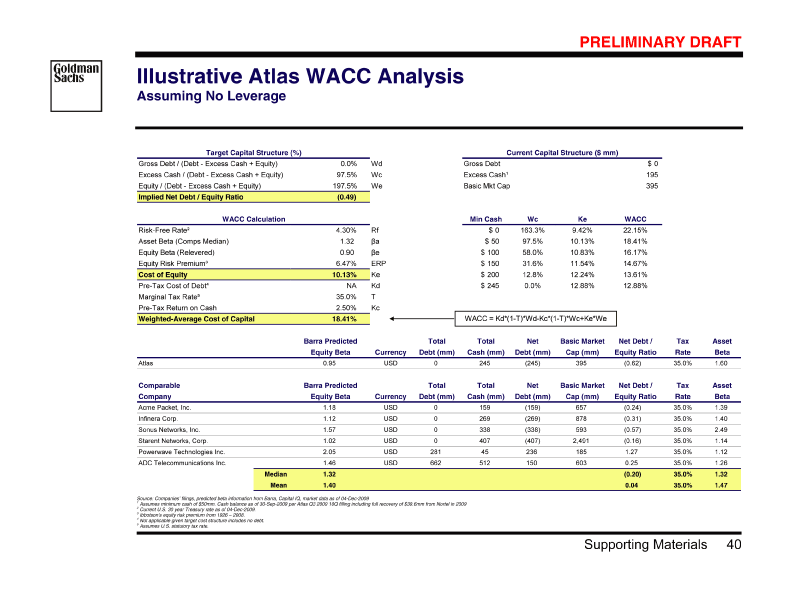
| B78823_228 |
| 8 Jan 2010 12:10 41/49 PRELIMINARY DRAFT Illustrative Atlas WACC Analysis [Graphic Appears Here] | | | | | | | | | 25% Increase in 60 0 90 $12.88% 13.12% 13.37% mm) $ Current Asset Beta Ke 12.88% 13.50% 14.27% PF Capital Structure ( Gross Debt Excess Cash 1 Implied Equity (@ Constant EV) Wd Wc We 40.0% 0.0% 60.0% 0.67 Target Capital Structure (%) Assuming Gross Debt / (Debt — Excess Cash + Equity) Excess Cash / (Debt — Excess Cash + Equity) Equity / (Debt — Excess Cash + Equity) Implied Net Debt / Equity Ratio Leverage [Graphic Appears Here] [Graphic Appears Here] Assumes a full distribution of cash on balance sheet. Current U.S. 30 year Treasury rate as of 04-Dec-2009. Ibbotson’s equity risk premium from 1926 — 2008. Assumes U.S. statutory tax rate. Source: Companies’ filings, predicted beta information from Barra, Capital IQ, market data as of 04-Dec-2009 1 2 3 4 41 Supporting Materials |
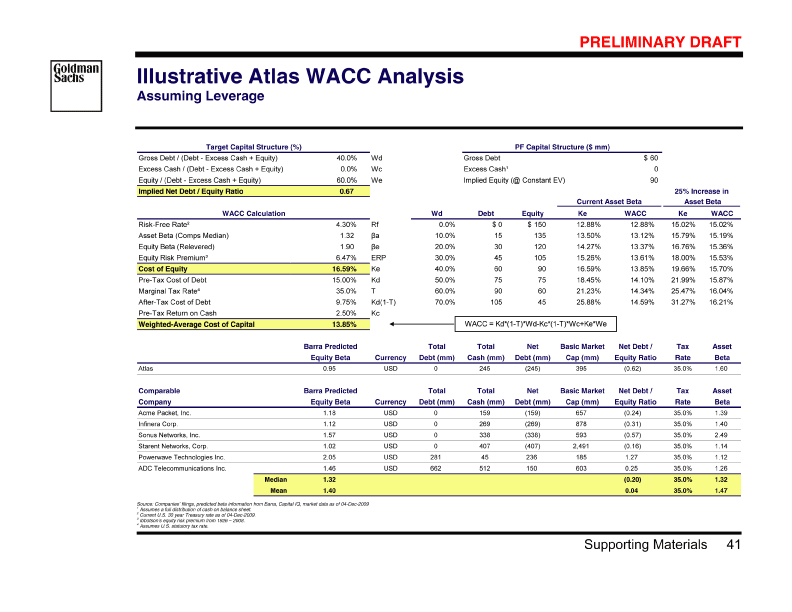
| B78823_229 |
| 8 Jan 2010 12:10 42/49 PRELIMINARY DRAFT ons Per Atlas Management Atlas Management Projecti EV-DO Projections Per Atlas Management (Base Case) [Graphic Appears Here] | | | | | | | | | (2.8 ) 1.5 (9.1) (7.6) 5.2% (2.4) (27.4) $150.4 147.6 (1.4)% 140.0 94.8% (25.0) 18.6% $ 2013 E (5.2 ) 4.1% 3.1 (9.5) (6.4) 4.3% (1.7) (28.7) $155.0 149.8 143.3 95.7% (27.0) 19.1% $ 2012 E (7.7 ) 4.6 (9.4) (4.8) 3.4% (1.4) (30.2) $151.7 143.9 (3.7)% 139.1 96.6% (28.8) 21.0% $ 2011 E (2.5 ) 2.7% 1.5 (10.9) (9.4) 6.3% (0.6) (30.9) $152.0 149.5 140.2 93.7% (30.3) 20.6% $ 2010 E 0.0 (0.0) (12.7) 8.7% (0.0) (30.5) $145.6 145.6 (12.7) 132.8 91.3% (30.4) 20.9% $ 2009 E Corporate Risk Adjustment Standalone Billings (Non-GAAP) % Growth Corporate Risk Adjustment Standalone COGS on Billings % Margin Gross Profit on Billings % Margin Corporate Risk Adjustment Standalone R&D Expense % Margin Source: Atlas projections per Atlas Management (Base Case) based on Atlas Management presentation to Atlas Board of Directors on 24-Nov-2009. Base Case EV-DO and FMC projections include Management Corporate Risk Adjustments 42 Supporting Materials |
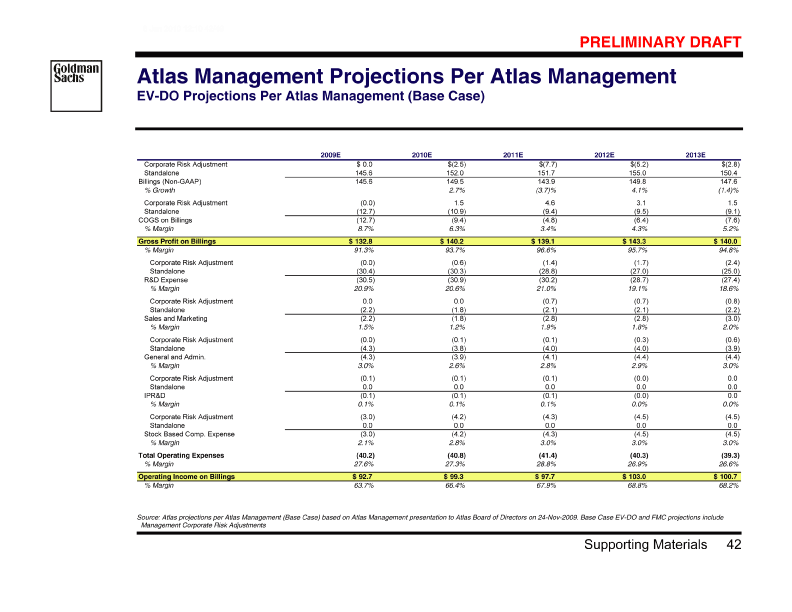
| B78823_230 |
| 8 Jan 2010 12:10 43/49 PRELIMINARY DRAFT ons Per Atlas Management nagement (Base Case) Atlas Management Projecti FMC Projections Per Atlas Ma [Graphic Appears Here] | | | | | | | | | (25.0) 357.4 332.4 47.6% 13.3 64.4% 118.2 35.6% (21.9) (34.9) (56.8) 17.1% (7.1) $ (227.4) (214.2) $ 2013 E 27.6 76.7 (6.2) (46.8) 272.0 225.2 65.4% 65.9% 34.1% (15.4) (30.7) (46.1) 20.5% $ (176.1) (148.5) $ 2012 E (69.7) 205.9 136.1 41.3 (93.3) 68.5% 42.9 31.5% (12.2) (28.0) (40.2) 29.5% (6.2) $167.6% (134.6) $ 2011 E 73.4 50.9 13.5 7.3 (5.2) 0.0 (22.5) (57.0) (43.5) 85.6% $ 14.4% (28.5) (33.8) 66.3% $616.9% 2010 E 0.0 7.1 7.1 (0.2) (8.9) (9.1) (2.0 ) (0.2) 0.0 $ $ (35.6) (35.8) 128.4% (28.4)% 504.9% 2009 E Corporate Risk Adjustment Standalone Billings (Non-GAAP) % Growth Corporate Risk Adjustment Standalone COGS on Billings % Margin Gross Profit on Billings % Margin Corporate Risk Adjustment Standalone R&D Expense % Margin Corporate Risk Adjustment Source: Atlas projections per Atlas Management (Base Case) based on Atlas Management presentation to Atlas Board of Directors on 24-Nov-2009. Base Case EV-DO and FMC projections include Management Corporate Risk Adjustments 43 Supporting Materials |
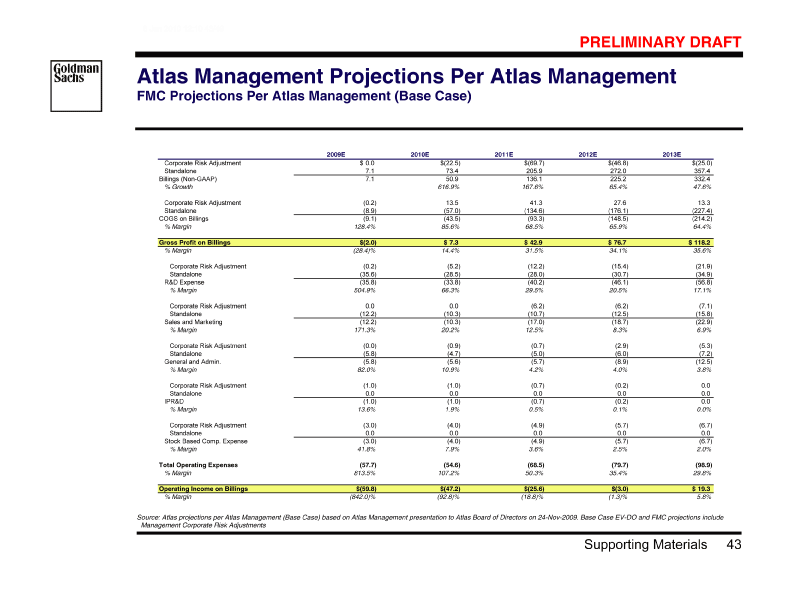
| B78823_231 |
| 8 Jan 2010 12:10 44/49 PRELIMINARY DRAFT ons Per Atlas Management Atlas Management Projecti UMTS Femto Projections Per Atlas Management (Base Case) [Graphic Appears Here] | | | | | | | | | | | | | | 167.9 54.0% 59.6% 67.8 40.4% (17.9) 10.7% (10.0) 6.0% (3.8) 2.3% 0.0 0.0% 0.0 0.0% (31.7) 18.9% (100.1) $ $ 2013 E 109.0 32.6% (63.2) 58.0% 45.8 42.0% (14.2) 13.0% (8.0) 7.3% (3.0) 2.7% 0.0 0.0% 0.0 0.0% (25.1) 23.0% $ $ 2012 E 82.2 (46.9) 57.1% 35.3 42.9% (11.8) 14.4% (6.8) 8.3% (2.3) 2.8% 0.0 0.0% 0.0 0.0% (21.0) 25.5% $539.1% $ 2011 E 12.9 1.7 (6.0) (2.0) 0.0 0.0% 0.0 0.0% (11.1) 86.5% $13.5% (11.7) 90.9% 46.6% 15.5% (19.7) $1928.7% 153.0% 2010 E 0.6 (1.3) (0.7) (7.0) (2.6) 0.0 0.0% 0.0 0.0% $ $ (15.0) (24.5) 204.4% (104.4 )% 2359.9% 1098.6% 404.1% 3862.6% 2009 E Billings (Non-GAAP) % Growth COGS on Billings % Margin Gross Profit on Billings % Margin R&D Expense % Margin Sales and Marketing % Margin General and Admin. % Margin IPR&D % Margin Stock Based Comp. Expense % Margin Total Operating Expenses % Margin Source: Atlas projections per Atlas Management (Base Case) based on Atlas Management presentation to Atlas Board of Directors on 24-Nov-2009. Base Case EV-DO and FMC projections include Management Corporate Risk Adjustments 44 Supporting Materials |
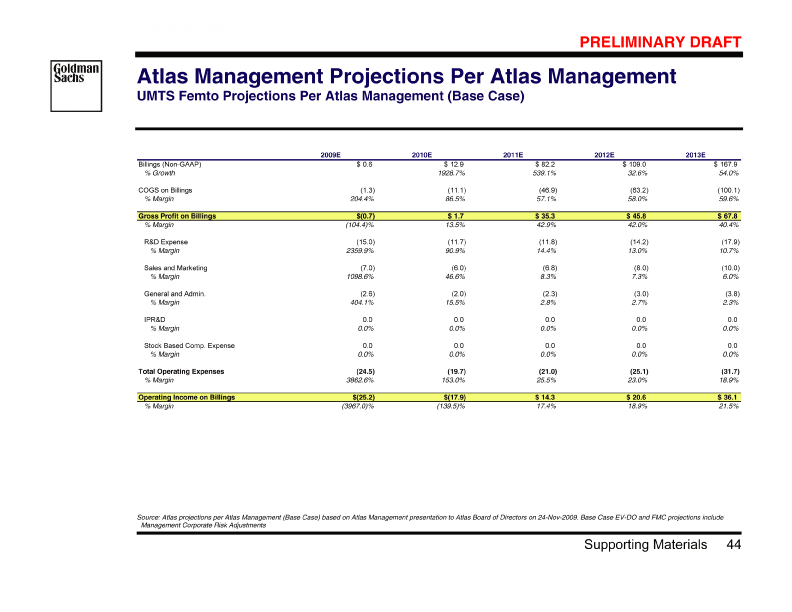
| B78823_232 |
| 8 Jan 2010 12:10 45/49 PRELIMINARY DRAFT ons Per Atlas Management Atlas Management Projecti CDMA Femto Projections Per Atlas Management (Base Case) [Graphic Appears Here] | | | | | | | | | | | | | | | | | | | 188.9 16.3% 67.3% 61.7 32.7% (17.0) 9.0% (5.8) 3.1% (3.4) 1.8% 0.0 0.0% 0.0 0.0% (26.1) 13.8% (127.2) $ $ 2013 E 162.4 33.6% 69.4% 49.7 30.6% (16.5) 10.2% (4.6) 2.8% (3.0) 1.9% 0.0 0.0% 0.0 0.0% (24.1) 14.8% (112.7) $ $ 2012 E 121.6 (86.8) 71.4% 34.8 28.6% (15.5) 12.8% (3.8) 3.2% (2.5) 2.1% 0.0 0.0% 0.0 0.0% (21.9) 18.0% 109.8% $ $ 2011 E 57.9 (44.6) 13.4 (16.0 ) (3.9) 6.8% (2.5) 4.3% 0.0 0.0% 0.0 0.0% 76.9% 23.1% 27.7% (22.4) 38.7% $972.7% $(15.6)% 2010 E 5.4 (5.9) (0.5 ) (3.9 ) (2.7 ) 0.0 0.0% 0.0 0.0% $ $(9.6)% (18.0 ) 72.2% 50.1% (24.7 ) 109.6% 334.1% 456.4% 2009 E Billings (Non-GAAP) % Growth COGS on Billings % Margin Gross Profit on Billings % Margin R&D Expense % Margin Sales and Marketing % Margin General and Admin. % Margin IPR&D % Margin Stock Based Comp. Expense % Margin Total Operating Expenses % Margin Source: Atlas projections per Atlas Management (Base Case) based on Atlas Management presentation to Atlas Board of Directors on 24-Nov-2009. Base Case EV-DO and FMC projections include Management Corporate Risk Adjustments 45 Supporting Materials |
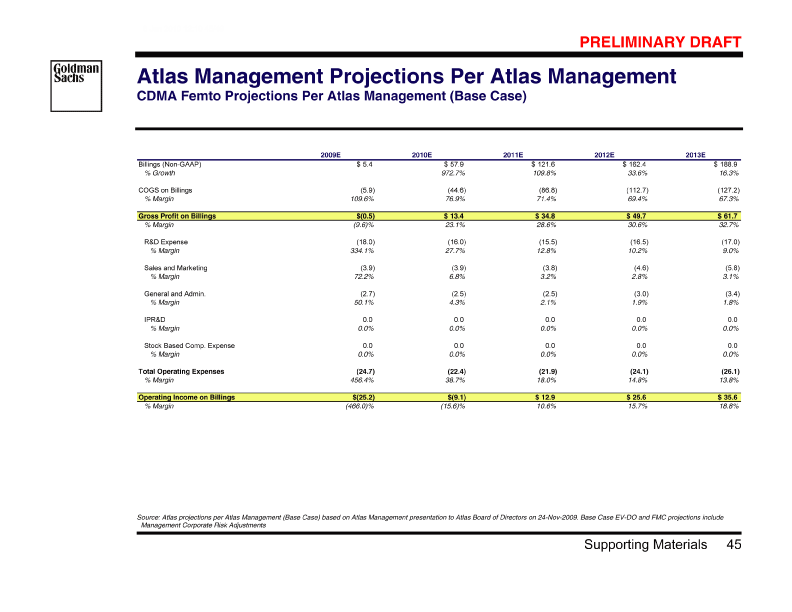
| B78823_233 |
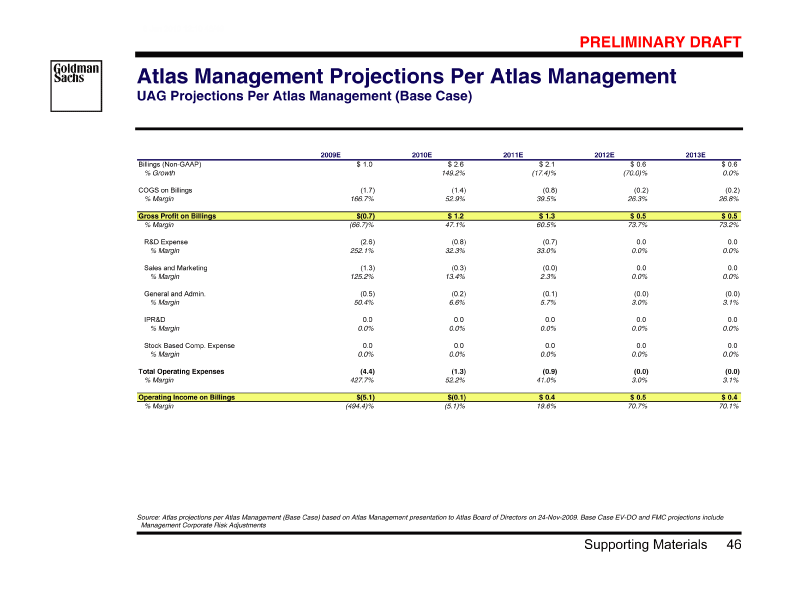
| 8 Jan 2010 12:10 46/49 PRELIMINARY DRAFT ons Per Atlas Management Atlas Management Projecti UAG Projections Per Atlas Management (Base Case) [Graphic Appears Here] | | | | | | | | | | | | | | | | | | | 0.6 0.0% (0.2) 0.5 0.0 0.0% 0.0 0.0% (0.0) 3.1% 0.0 0.0% 0.0 0.0% (0.0) 3.1% 0.4 $26.8% $73.2% $70.1% 2013 E 0.6 (0.2) 0.5 0.0 0.0% 0.0 0.0% (0.0) 3.0% 0.0 0.0% 0.0 0.0% (0.0) 3.0% 0.5 $(70.0)% 26.3% $73.7% $70.7% 2012 E 2.1 (0.8) 1.3 (0.7) (0.0) 2.3% (0.1) 5.7% 0.0 0.0% 0.0 0.0% (0.9) 0.4 $(17.4)% 39.5% $60.5% 33.0% 41.0% $19.6% 2011 E 2.6 (1.4) 1.2 (0.8) (0.3) (0.2) 6.6% 0.0 0.0% 0.0 0.0% (1.3) (0.1) $149.2% 52.9% $47.1% 32.3% 13.4% 52.2% $(5.1)% 2010 E 1.0 (1.7) (0.7) (2.6) (1.3) (0.5) 0.0 0.0% 0.0 0.0% (4.4) (5.1) $166.7% $(66.7)% 252.1% 125.2% 50.4% 427.7% $(494.4)% 2009 E Billings (Non-GAAP) % Growth COGS on Billings % Margin Gross Profit on % Margin R&D Expense % Margin Sales and Marketing General and Admin. IPR&D % Margin Stock Based Comp. Total Operating Operating Income on % Margin Billings % Margin % Margin Expense % Margin Expenses % Margin Billings Source: Atlas projections per Atlas Management (Base Case) based on Atlas Management presentation to Atlas Board of Directors on 24-Nov-2009. Base Case EV-DO and FMC projections include Management Corporate Risk Adjustments 46 Supporting Materials B78823_234 |
1
2
3
4
5
6
7
8
| GUARANTOR: S.A.C. CAPITAL MANAGEMENT, LLC |
||||
| By: | /s/ Peter Nussbaum | |||
| Name: | Peter Nussbaum | |||
| Title: | Authorized Signatory | |||
GUARANTEED PARTY: AIRVANA, INC. |
||||
| By: | /s/ Randall S. Battat | |||
| Name: | Randall S. Battat | |||
| Title: | President and CEO | |||
2
3
4
5
| Very truly yours, AIRVANA, INC. |
||||
| By: | /s/ Randall Battat | |||
| Name: | Randall Battat | |||
| Title: | President | |||
| Accepted and agreed as of the date first written above: | ||||
| S.A.C. PRIVATE CAPITAL GROUP, LLC | ||||
By:
|
/s/ Peter Berger | |||
| Title: Managing Director | ||||
2
3
4
5
6
7
8
9
10
11
12
13
14
15
16
| 72 MOBILE HOLDINGS, LLC |
||||
| By: | /s/ Peter Berger | |||
| Name: | Peter Berger | |||
| Title: | President | |||
| 72 MOBILE ACQUISITION CORP. |
||||
| By: | /s/ Peter Berger | |||
| Name: | Peter Berger | |||
| Title: | President | |||
| S.A.C. CAPITAL MANAGEMENT, LLC |
||||
| By: | /s/ Peter Nussbaum | |||
| Name: | Peter Nussbaum | |||
| Title: | Authorized Signatory | |||
| 72 MOBILE INVESTORS, LLC |
||||
| By: | /s/ Peter Berger | |||
| Name: | Peter Berger | |||
| Title: | President | |||
| /s/ Vedat Eyuboglu | ||||
| Vedat Eyuboglu | ||||
| /s/ Assia Eyuboglu | ||||
| Assia Eyuboglu | ||||
| BEAVER BROOK IRREVOCABLE TRUST |
||||
| /s/ Assia Eyuboglu | ||||
| Name: | Assia Eyuboglu | |||
| Title: | Trustee | |||
| BEAVER BROOK GA 2008 TRUST |
||||
| /s/ Assia Eyuboglu | ||||
| Name: | Assia Eyuboglu | |||
| Title: | Trustee | |||
| BEAVER BROOK GV 2008 TRUST |
||||
| /s/ Vedat Eyuboglu | ||||
| Name: | Vedat Eyuboglu | |||
| Title: | Trustee | |||
| /s/ Sanjeev Verma | ||||
| Sanjeev Verma | ||||
| C.H. 2008 TRUST |
||||
| /s/ Sanjeev Verma | ||||
| Name: | Sanjeev Verma | |||
| Title: | Trustee | |||
| CAPE HIMALAYA TRUST |
||||
| /s/ Girija C. Verma | ||||
| Name: | Girija C. Verma | |||
| Title: | Trustee | |||
| RANDALL S. BATTAT REVOCABLE TRUST |
||||
| /s/ Randall S. Battat | ||||
| Name: | Randall S. Battat | |||
| Title: | Trustee | |||
Generally
..........................................
|
Immediately prior to the closing of the merger and related transactions (the “Closing”), SAC PCG and/or certain of its affiliates (“SAC”), the rollover investors (the “Rollover Investors”), an affiliate of GSO (the “Lead Lender Investor”) and the other lender equity co-investors (together with the Lead Lender Investor, the “Lender Co-Investors”) and any other co-investors investing in 72 Mobile Holdings, LLC (“Holdings”) (together with SAC, the Rollover Investors and the Lender Co-Investors, the “Investors”) will enter into a limited liability company agreement and related agreements (the “Agreement”) with respect to their contributions to Holdings. | |
Units
..................................................
|
Each of the Investors will receive a single class and series of limited liability company interests (the “Class A Units”) in connection with its initial investment in Holdings; provided, that it is anticipated that the Rollover Investors will also receive Class E Units in respect of a portion of their investments. Each Class A Unit will participate equally with respect to distributions in the manner described below. Subject to the limitations set forth in this term sheet, the board of directors of Holdings (the “Holdings Board”) will have the authority to create and issue other classes and series of interests or units, including the Class B Units (as defined below), Class C Units (as defined below), Class D Units (as defined below) and Class E Units (as defined below), that have rights, preferences, privileges, limitations or obligations that are junior to, pari passu with or senior to any other class or series of interests or units and, notwithstanding anything in “Amendment” to the contrary, shall have the authority to amend the Agreement without the consent of any member in the exercise of such authority. | |
Profits
Interests .................................
|
Without limiting the generality of the Holdings Board’s rights with respect to the creation and issuance of interests and units, the Investors anticipate that the Holdings Board will issue and grant profits interests (the “Class C Units”) to Merle Gilmore and profits interests (the “Class D Units”) to the Rollover Investors and may issue profits interests in the future to other members of senior management or service providers. The Class C Units and the Class D Units will have the right to participate in distributions in the manner described below. | |
| In addition to the foregoing, it is anticipated that the Holdings Board will issue and grant certain other profits interests (the “Class B Units”) to an affiliate of SAC pursuant to the Management Agreement. The Class B Units will have the right to participate in distributions in the manner described below. | ||
| For the avoidance of doubt, the foregoing issuances made at or immediately following the Closing, which shall be made in such numbers as are in accordance with the methodologies in the attached Schedule 1 to this term sheet, shall not be subject to the participation rights or protective |
| provisions described below. | ||||||
| Distributions Generally ..... | Distributions will be made by Holdings to the Investors at such times and in such amounts as determined by the Holdings Board. | |||||
| Except with respect to tax distributions as described below (which shall be in priority to the following distributions), distributions will be allocated among the Class A Units, Class B Units, Class C Units, Class D Units and Class E Units as follows (subject to the rights of any other classes or series of limited liability company interests issued after the Closing in compliance with the Agreement): | ||||||
| • | first, to the holders of the Class E Units, pro rata in accordance with their number of Class E Units, until such holders have received aggregate distributions (including any tax distributions, as described below) in respect of each such Unit equal to one-half of the capital contribution to Holdings made in respect of one purchased Class A Unit at Closing (such capital contribution amount in respect of one Class A Unit at the Closing, the “Class A Unit Contribution Amount”) (provided, that upon the payment of the foregoing distributions, each Class E Unit shall automatically convert into one-half of a Class A Unit), | |||||
| • | second, to the holders of Class A Units and Class B Units, pro rata in accordance with their number of such Units, until such holders have received aggregate distributions (including any tax distributions, as described below) in respect of each Class A Unit and Class B Unit an amount equal to the Class A Unit Contribution Amount, | |||||
| • | third, to the holders of Class A Units, Class B Units and Class C Units, pro rata in accordance with their number of Class A Units, Class B Units and Class C Units, until the holders of the Class A Units and Class B Units, pro rata in accordance with their number of such Units, have received aggregate distributions (including any tax distributions, as described below) in respect of each Class A Unit and Class B Unit an amount equal to 132.29% of the Class A Unit Contribution Amount, and | |||||
| • | thereafter, to the holders of Class A Units, Class B Units, Class C Units and Class D Units, pro rata in accordance with their number of Class A Units, Class B Units, Class C Units and Class D Units. | |||||
| As soon as such payment in cash would not be restricted or prohibited or result in an event of default under the credit agreement of Holdings and its subsidiaries, Holdings will cause its subsidiaries to distribute to Holdings, and Holdings will distribute in accordance with the distribution provisions described herein amounts sufficient to pay the holders of the Class E Units an amount per Class E Unit such that each Class E Unit shall have received, together with any prior distributions (and inclusive of any tax | ||||||
| distributions), an amount equal to the Class A Unit Contribution Amount. | ||||
| It is intended that the distributions to the holders of Class B Units be limited to the extent necessary so that such Units constitute “profits interests” for U.S. federal income tax purposes. In furtherance of the foregoing, the Holdings Board shall, if necessary, limit distributions to the holders of the Class B Units in respect of such Class B Units so that such distributions do not exceed the amount of available profits of Holdings for the period in which such distribution is made. In the event distributions to the holder of Class B Units are reduced pursuant to the preceding sentence, an amount equal to such excess distribution shall be distributed instead to the holders of Class A Units in accordance with the distribution provisions set forth above and the Holdings Board shall make appropriate adjustments to future distributions so that the holder of Class B Units receives (from profits of Holdings as determined consistent with the foregoing principles) an amount equal to such excess distributions out of amounts that, but for this sentence, would have been distributed to the holders of Class B Units. For the avoidance of doubt, in the event a distribution is made to a holder of Class B Units, a corresponding amount of profits shall be allocated to the holder of Class B Units. | ||||
| Tax Distributions; UBTI Restrictions ........................... |
To the extent of available cash flow, Holdings will make tax distributions to the Investors in accordance with their relative allocations of taxable income on a quarterly basis (or at such earlier times as the Holdings Board deems appropriate). In addition, Holdings will make reasonable efforts to avoid actions that would result in the recognition by the Lender Co-Investors of unrelated business taxable income without the prior written consent of the Lender Co-Investors. | |||
| Board Composition .............. | Initial Members. Pursuant to the rights described below (which SAC shall be entitled to exercise in its discretion subject to the rights of GSO Capital Partners LP (or one or more investment funds managed by it or its affiliates) (the “Lead Lender”) and the Rollover Investors as described below), the initial Board shall consist of the following nine members (assuming, in the case of the Lead Lender, that the aggregate equity and debt commitments of the Lead Lender and all other lenders participating in the financing being provided by the Lead Lender have been funded by the Lead Lender and/or such other lenders, and in the case of each of Messrs. Battat, Eyuboglu and Verma that such individual and his affiliates have funded their equity commitments): | |||
| (i) | one member selected by the Lead Lender, | |||
| (ii) | Randy Battat, | |||
| (iii) | Vedat Eyuboglu, | |||
| (iv) | Sanjeev Verma, and | |||
| (v) | the remaining members selected by SAC. | |||
| General. Subject to the rights of the Lead Lender and Rollover Investors described immediately below, SAC will be entitled to increase and decrease the size of the Holdings Board and nominate and elect the entire Holdings Board. | ||
| Fees and Expenses. Non-executive directors will be paid customary fees in such amounts determined by the CEO and the Board and shall be entitled to reimbursement of expenses. | ||
| Lead Lender Director Right. For as long as the principal balance of the Senior Loan is no less than $50 million, the Lead Lender shall have the right to have elected one member of the Holdings Board (the “Lead Lender Board Member”) reasonably acceptable to SAC. The Lead Lender Board Member shall be invited to attend all Holdings Board meetings and receive all materials distributed to the Holdings Board. | ||
| Rollover Investors. Subject to the other provisions of this paragraph, so long as each of (i) Randy Battat, together with his affiliates (collectively, the “Battat Investors Group”), (ii) Vedat Eyuboglu, together with his affiliates (collectively, the “Eyuboglu Investors Group”), and (iii) Sanjeev Verma, together with his affiliates (collectively, the “Verma Investors Group” and each of the Verma Investors Group, the Battat Investors Group and the Eyuboglu Investors Group, a “Rollover Investors Group”), respectively, owns at least 50% of the Unit Equivalents1 held by such Rollover Investors Group on the date of the Closing (the “Closing Date”), such Rollover Investors Group shall have the right to have elected one member of the Holdings Board. The right of each of the Battat Investors Group, the Eyuboglu Investors Group and the Verma Investors Group shall terminate with respect to such Rollover Investors Group upon the earlier of (i) such Rollover Investors Group ceasing to hold at least 50% of the Unit Equivalents held by them on the Closing Date, and (ii) the Related Executive of such Investor Group ceasing to be employed by Holdings or its subsidiaries. “Related Executive” means (x) Randy Battat, in the case of the Battat Investors Group, (y) Vedat Eyuboglu in the case of the Eyuboglu Investors Group, and (z) Sanjeev Verma in the case of the Verma Investors Group. Each Rollover Investors Group shall be entitled to appoint its Related Executive to be a member of the Holdings Board pursuant to the foregoing right. Any other selection shall be reasonably acceptable to SAC. | ||
Observer
Rights ..............
|
Lead Lender Right. For as long as there is at least $20 million outstanding principal balance of the Senior Loan but there is no right to have elected a Lead Lender Board Member, the Lead Lender shall have the right to appoint one observer of the Holdings Board (the “Lead Lender Board Observer”) reasonably acceptable to SAC. |
| 1 | In determining the number of outstanding “Unit Equivalents” under the Agreement, the following shall be included in such calculation: (i) each outstanding Class A Unit, (ii) each outstanding Class B Unit, (iii) one-half of each outstanding Class E Unit, and (iv) to the extent such units are “in-the-money,” each outstanding Class C Unit and Class D Unit. |
| SAC and Lead Lender Investor Rights. Each of SAC and the Lead Lender Investor (in the case of the Lead Lender Investor, so long as it beneficially owns at least 25% of the outstanding Unit Equivalents of Holdings held by the Lender Co-Investors on the Closing Date) shall be entitled to appoint an observer to the Holdings Board; provided, however, that the foregoing observer right shall not be available to the Lead Lender Investor if at such time the Lead Lender is entitled to appoint a director or observer in connection with loans to Holdings or its subsidiaries. | ||
| General. SAC shall have the right to approve any board observer (such approval not to be unreasonably withheld or delayed). Each observer will execute a customary confidentiality agreement and subject to such agreement will have the right to be supplied with all of the information supplied to the Holdings Board and to be invited to attend, but not vote at, all meetings of the Holdings Board; provided, however, that such right shall not apply (a) if outside counsel advises it would result in a waiver of attorney-client privilege or (b) with respect to matters for which there would be a reasonable likelihood in the reasonable judgment of the Holdings Board that there would be an actual conflict of interest. | ||
Irrevocable
Proxy and Voting Agreement .............. |
The Agreement will contain an irrevocable proxy granted to SAC by all parties (other than (x) SAC and (y) the Lead Lender Investor and Golden Gate Capital, to the extent such person is a Lender Co-Investor (each of which shall enter into a voting agreement) and (z) the Rollover Investors) giving SAC the power to vote all voting securities (including all Class A Units) held by such parties in SAC’s sole discretion, except with respect to (i) transactions described under “Protective Provisions” below which require the consent of the Investors other than SAC (the “Non-SAC Investors”), such consents to be determined by a majority of the Non-SAC Investors, as applicable, and (ii) amendments described in the provisos under “Amendment” below. | |
| The Lead Lender Investor and all other Investors (other than SAC and the Rollover Investors) will agree in the Agreement to vote their voting securities in the same manner as SAC or in the manner directed by SAC, except with respect to (i) transactions described under “Protective Provisions” below which require the consent of the Non-SAC Investors, as applicable and (ii) amendments described in the provisos under “Amendment” below. With respect to voting securities held by the Lead Lender Investor, solely to the extent necessary to vote such voting securities in accordance with the Agreement if the Lead Lender Investor does not comply with the voting requirements therein, SAC shall have an irrevocable proxy over such voting securities. SAC shall not owe fiduciary or similar duties to the other members in connection with any vote, consent or other action as a member or in connection with its proxy and other voting rights with respect to votes of members of Holdings; provided, however, that subject to the provisions in “Corporate Opportunities” below, the Board shall act in good faith in a manner in which it believes to be in the best interests of Holdings and its subsidiaries, as determined under the standards applicable to a board of |
| directors of a corporation incorporated in Delaware. | ||
Protective
Provisions ..........
|
Without the consent of the Non-SAC Investors holding a majority of the outstanding Unit Equivalents held by the Non-SAC Investors, Holdings and its subsidiaries shall not enter into any transaction or agreement with SAC or any of its affiliated funds or any of their respective affiliates, except (i) the management agreement in the form attached hereto as Annex A (the “Management Agreement”) providing for, among other things, indemnification and a transaction grant as described under “Certain Transaction Grants” below, and such agreement will not be permitted to be amended without the consent of the Non-SAC Investors holding a majority of the outstanding Unit Equivalents held by the Non-SAC Investors unless such amendment is otherwise approved by a majority of disinterested directors who are not associates or affiliates of SAC, (ii) any other transaction or agreement between Holdings or one of its subsidiaries, on the one hand, and a portfolio company of SAC or any of its affiliated funds or any of their respective affiliates, on the other hand, that is on arm’s-length terms between Holdings or such subsidiary and such portfolio company so long as such agreement is approved by a majority of disinterested directors who are not associates or affiliates of SAC, and (iii) issuances of securities to SAC or its affiliates pursuant to and in compliance with the Non-SAC Investors’ participation rights (described below) following receipt by Holdings of a fairness opinion from an investment banking firm of recognized national standing reasonably acceptable to SAC. The foregoing Non-SAC Investor consent rights in this paragraph may not be transferred in connection with any transfer of securities to persons that are not otherwise Non-SAC Investors on the Closing Date (unless to Permitted Transferees) and will terminate upon the earlier of (i) the Non-SAC Investors party to the Agreement on the Closing Date (together with their Permitted Transferees) ceasing to own at least 33% of the outstanding Unit Equivalents held by them on the Closing Date and (ii) immediately prior to the closing of an initial public offering of the equity of Holdings or Airvana, Inc. (“Airvana”) (an “IPO”). | |
| Without the consent of (i) the SAC Investors and (ii) Non-SAC Investors holding a majority of the Unit Equivalents held by the Non-SAC Investors, Holdings will not make in-kind distributions to the holders of equity in which such property being distributed is valued at less than fair market value. | ||
Participation Rights ............
|
Prior to an IPO, if Holdings or any of its subsidiaries issues any additional equity securities, any debt securities convertible or exchangeable for any equity securities or any option, warrant or other right to acquire any such equity or debt securities (subject to the exceptions described below), each Investor (collectively, the “Eligible Investors”) will be provided the opportunity to purchase a pro rata share of such securities on the same terms based on such Eligible Investor’s ownership of the outstanding vested Unit Equivalents (which right Eligible Investors that are affiliates shall have the right to allocate amongst themselves). In the event that an Eligible Investor does not wish to exercise its full pro rata share of |
| participation rights, the other Eligible Investors may take up on a pro rata basis the unacquired allocation of the Eligible Investor that did not exercise its full pro rata share. | ||
| The foregoing participation rights shall not apply to any issuance (i) made as consideration for assets or equity interests acquired by or in a business combination involving Holdings or any of its subsidiaries, on the one hand, and a third party not affiliated with Holdings or SAC or any of its affiliated funds or any of their respective affiliates on the other hand, (ii) in connection with any joint venture or strategic partnership or alliance to the other members of such venture, partnership or alliance, so long as such other members are not affiliated with Holdings or SAC or any of its affiliated funds or any of their respective affiliates, (iii) Unit Equivalents granted to (A) directors, officers, consultants or employees (who are not otherwise investment professionals of SAC or any of its affiliated funds or any of their respective affiliates other than Merle Gilmore and any other person who is seconded to Holdings or its subsidiaries) of Holdings or its subsidiaries in the ordinary course of business in respect of such person’s services to Holdings or its subsidiaries or (B) any person (who is not otherwise an investment professional of SAC or any of its affiliated funds or any of their respective affiliates other than Merle Gilmore and any other person who is seconded to Holdings or its subsidiaries) in accordance with the terms of an option plan or other equity-based compensation plan of Holdings or its subsidiaries; provided that the aggregate number of Unit Equivalents issued pursuant to the foregoing clauses (A) and (B) shall not exceed 3.5% of the aggregate fully diluted equity outstanding as of the Closing Date (3% without SAC’s and the Rollover Investors’ prior approval), (iv) pursuant to a public offering, (v) of capital stock or other equity interests issued as distributions to holders of equity interests in accordance with the controlling distribution provisions, including any distributions of femtocell subsidiary stock, or (vi) pursuant to the exchange, exercise or conversion of any equity interest that is either (A) outstanding on the Closing Date or (B) outstanding after the Closing Date so long as the Eligible Investors have had an opportunity to exercise the participation rights granted to such Eligible Investors with respect to the underlying equity interest, or such equity interest was issued pursuant to clause (i), (ii), (iii), (iv), or (v). | ||
| Holdings may comply with the foregoing participation rights by providing the Eligible Investors the right to participate up to their pro rata share following the security issuance in respect of which the Eligible Investors have participation rights. | ||
Transfer
Restrictions ...........
|
No Investor may transfer any securities of Holdings or any of its subsidiaries without the consent of SAC (which consent shall be at SAC’s sole and absolute discretion), except for (i) the exercise of tag-along rights described below (provided however that the sale (other than a sale by SAC) that triggers the exercise of the tag-along right shall be subject to the written consent of SAC), (ii) transfers pursuant to drag-along rights described below, (iii) with respect to a Lender Co-Investor, to any affiliate that remains such an affiliate, and, in each case, becomes |
| a party to the Agreement and (iv) with respect to a Rollover Investor, to certain affiliated family investment vehicles that remain such affiliated investment vehicles and certain other customary permitted transferees and, in each case, become a party to the Agreement. The transferees described in the preceding clause (iii) and (iv) are referred to herein as the Lender Co-Investors’ and Rollover Investors’ respective “Permitted Transferees.” Transfers will also be subject to certain other customary requirements, including, at the reasonable request of Holdings, an opinion of legal counsel in form and substance satisfactory to Holdings that an exemption to securities laws is available for such transfer. | ||
| Without limiting the foregoing, no transfer, other than pursuant to a public offering, shall be permitted unless and until the proposed transferee or transferees shall agree in writing to become bound, and becomes bound, by all of the terms of the Agreement. The restrictions on transfer applicable to the Lender Co-Investors shall terminate upon consummation of an IPO (subject to any ongoing lockup as described under “Registration Rights” below). | ||
Tag-Along
Rights .................
|
If any Investor desires to sell all or a portion of its holdings to a non-affiliated party, such Investor must offer the other Investors the right to sell vested Class A Units and/or other vested Unit Equivalents in such sale on the same terms on a pro rata basis based on the number of vested Unit Equivalents held by each Investor, taking into account as appropriate the differences in the securities being transferred; provided, however, that as a condition to participate in such sale, such transferring Investor shall have the right to require that the Investors participating in such transfer exercise any such vested Unit Equivalents to be sold that are options or warrants for Class A Units and sell such Class A Units in such sale. Such tag-along rights of and relating to transfers by the Lender Co-Investors will terminate upon the consummation of an IPO and with respect to the Rollover Investors upon the later of one year following an IPO and the expiration of the lockup period requested by underwriters. | |
Drag-Along Rights ...............
|
Prior to an IPO, if SAC desires to enter into a transaction involving the transfer by SAC and the Non-SAC Investors of 50% or more of the outstanding Unit Equivalents to a person that is not an affiliate of SAC or its affiliated funds, then, at the request of SAC, the other Investors shall vote in favor of the sale (if such a vote is required) and agree to sell, on the same economic terms as SAC and consistent with the terms set forth under “Liability in Connection with Transfers”, the same proportion of the equity of Holdings held by it as the proportion of SAC’s equity of Holdings that is being sold in such sale, taking into account as appropriate the differences in the securities being transferred. If such drag-along sale transaction involves a sale of less than 75% of the Unit Equivalents held by the Lender Co-Investors, then such Lender Co-Investors will have the option, exercisable in their sole discretion, to require that the applicable buyer purchase in such transaction 100% of the Unit Equivalents held by such Lender Co-Investors on the same economic terms as SAC and consistent with the terms set forth under |
| “Liability in Connection with Transfers.” For the avoidance of doubt, it shall not be required that SAC own 50% or more of the outstanding Unit Equivalents in order to exercise the foregoing drag-along right. Such drag-along rights with respect to the Lender Co-Investors will terminate upon the earlier of (i) the consummation of an IPO and (ii) SAC ceasing to control the largest interest in Unit Equivalents, including by proxy or voting agreements. | ||||||
| Liability in Connection with
Transfers ................................ |
In connection with a tag-along or drag-along sale, the Non-SAC Investors shall be required to make the same representations as SAC with respect to any representations made with respect to itself by SAC in its capacity as a member or security owner, but neither SAC nor any non-SAC Investor shall be required to make any representations regarding Holdings or its subsidiaries; provided, however, that all Investors participating in such sale shall be required (if applicable) to provide several, and not joint and several, indemnification (if such sale contemplates indemnification) (i) up to its pro rata portion (as determined by the proceeds such Investor would receive in such sale prior to reduction for any indemnification claims) of any such indemnification obligation if such indemnification relates to representations or matters relating to Holdings and its subsidiaries and (ii) up to the amount of its proceeds if such indemnification relates to its individual representations (e.g., authorization, ownership of securities, etc.). | |||||
| IPO Restructuring ................. | The Holdings Board may, without any requirement for consent of any member, at any time determine to effect an IPO. If the Holdings Board determines to effect an IPO, the Holdings Board and the Investors will cooperate in good faith prior to the IPO to cause the IPO to be effected in a tax-efficient manner (and so that the holders of each class or series of equity interests are provided with the same pro rata treatment with respect to their ownership of such class or series as the other holders of such class or series, subject to any differences in the securities), which could include the restructuring of the limited liability company or the dissolution of the limited liability company or the exchange of the Investors’ equity interests in Holdings for equity interests in a subsidiary of Holdings whose securities would be listed and sold to the public. Each Investor shall take all actions reasonably requested by the Board in its capacity as a security holder of Holdings or any such other entity to effect the IPO. | |||||
| Certain Reorganizations ....... | The Holdings Board, without the requirement for the consent of any member other than the SAC Investors, subject to the provisions under “UBTI Restrictions” above, may elect to change the legal form of Holdings or the tax status of Holdings so long as such change is effected in a non-taxable transaction for U.S. federal income tax purposes. | |||||
| Registration Rights ............... | The Investors will have the following shelf, demand and piggyback rights on and after an IPO: | |||||
| • | SAC Demand and Shelf Rights. SAC will have customary | |||||
| transferable demand registration rights, subject to customary limitations, including minimum amounts, frequency of use and black-outs. Any demand registration by SAC may require Holdings to file a shelf registration statement, in which case the Rollover Investors and Lender Co-Investors will be entitled to include a pro rata portion of their Class A Units on such shelf registration statement. | ||||||
| • | Shelf Takedowns. SAC may initiate takedown sales (which may be underwritten or non-underwritten) from any shelf registration statement that includes Class A Units held by SAC and, with respect to each such takedown sale, the Rollover Investors and Lender Co-Investors will be entitled to sell a pro rata portion of any Class A Units they previously had requested be included on such shelf registration statement. | |||||
| • | Piggyback Rights. Subject to the transfer restrictions described above to the extent applicable, each of the Investors will have unlimited customary transferable piggyback registration rights (subject to customary pro rata cutback provisions applicable to all Investors) on a pro rata basis. | |||||
| • | Expenses. Expenses (other than underwriting discounts and commissions) for any of the foregoing registrations will be borne by Holdings. | |||||
| • | Lock-ups. If required of all Investors by the underwriter, all Investors will be subject to a 180-day market standoff in connection with an IPO and a 90-day market standoff in connection with any registered offering pursuant to the demand or shelf registration rights of any Investor (subject to customary “booster shot” extensions). | |||||
| • | Termination. Each Investor’s registration rights will terminate when such Investor owns less than 1% of the outstanding Class A Units and can sell all of such Investor’s securities pursuant to Rule 144 during any three-month period. | |||||
| Information Rights ............... | Holdings will provide unaudited quarterly and audited annual financial statements to Investors holding at least 3% of the outstanding Class A Units; provided that each Lender Co-Investor will be provided such financial statements as long as such Lender Co-Investor holds Unit Equivalents. | |||||
| Corporate Opportunities ..... | The Agreement and the Charter or similar documents of Airvana and any entity through which Airvana is held by Holdings will include a customary waiver of the corporate opportunities doctrine as it applies to any of (i) the directors of Holdings affiliated with any Investor (other than directors affiliated with the Rollover Investors or who are Rollover Investors) and (ii) the officers of Holdings who are affiliated with SAC; provided, however, this waiver will not include a waiver with respect to any | |||||
| opportunities which come to such person’s attention solely as a result of such person’s position as a director or officer of Holdings or its subsidiaries. | ||
Indemnification
............................
|
In addition to customary indemnification, SAC, any of its affiliated funds and any of their respective affiliates (other than its other portfolio companies), and their respective officers, directors, and members will be indemnified and held harmless by Holdings and Airvana with respect to any controlling member or controlling person or similar liabilities associated with its ownership of or relationship with Holdings or its subsidiaries, or their predecessors or successors. | |
Certain
Transaction Grants .........
|
An affiliate of SAC will receive a transaction grant in connection with the closing of the merger and related transactions in the form of Class B Units as described under “Profits Interests.” In addition it is anticipated that the lenders under the debt financing in connection with the Merger will receive certain Class A Units in connection with such debt financing. | |
Waiver
of All Other Rights ...........
|
Each party to the Agreement, as a condition to the issuance or transfer of securities to such party, shall irrevocably waive under any agreement entered into with Airvana or any of its subsidiaries prior to the date of the Agreement any rights pertaining to transfers of securities, registration rights or any other rights pertaining to the governance of or investments in Holdings or any of its subsidiaries. | |
Representations
............................
|
Each party to the Agreement shall make customary representations regarding status as an accredited investor, investment intent and other matters. | |
Amendment ..................................
|
The Agreement may be amended only by a written instrument signed by parties holding a majority of the then outstanding Class A Units held by SAC and persons to whom SAC has transferred rights under the Agreement together with a transfer of equity interests; provided, however, that any amendment materially adversely affecting the Non-SAC Investors in a manner disproportionate from SAC shall require the consent of the Non-SAC Investors; provided, further, however, that no amendment shall materially adversely affect SAC, the Lender Co-Investors or the Rollover Investors, respectively, disproportionately from other members party to the Agreement without the approval of SAC, the Lender Co-Investors or the Rollover Investors, respectively; provided, further, however, that notwithstanding the foregoing, it is agreed that any amendment providing rights to purchasers in any future financing of Holdings that is made in compliance with the Agreement shall not require the consent of any Non-SAC Investors. The parties agree that any amendment to certain specified provisions (to be agreed) adversely affecting the rights of the Lender Co-Investors will require the consent of the Lender Co-Investors. | |
| For all purposes under the Agreement, decisions, votes or consents of SAC, the Lender Co-Investors, the Rollover Investors, the Investors and the Non-SAC Investors, respectively, shall be made by Investors in each such group holding at least a majority of the vested Unit Equivalents held |
| by all members of each such group and any such decision, vote or consent shall be binding on all members constituting such group. | ||
Non-Compete
...................
|
The Rollover Investors and their affiliates will be subject to certain non-competition and other restrictive covenants.2 |
| 2 | Non-Solicitation. During the period (the “Non-Compete Period”) commencing on the Closing Date and ending on the later of (i) the fourth anniversary of the Closing Date, (ii) the first anniversary of the date on which such Rollover Investor ceases to be a member, (iii) the eighteen month anniversary of the termination of employment of the Rollover Investor, if an individual, or the affiliated or related executive (the “Rollover Investor Party”), if not an individual, with Holdings or any of its subsidiaries for any reason (the “Services Termination Date”) and (iv) the date on which such Rollover Investor Party ceases to receive any payments related to salary, bonus or severance from Holdings or any of its subsidiaries (or, in the case of any payment made in a lump sum, the expiration of the period to which such payment relates), such Rollover Investor and its affiliate Rollover Investor Party, if any, shall not directly, or indirectly through another person, (x) induce or attempt to induce any employee, representative, agent or consultant of Holdings or any of its affiliates or subsidiaries to leave the employ or services of Holdings or any of its affiliates or subsidiaries, or in any way interfere with the relationship between Holdings or any of its subsidiaries and any employee, representative, agent or consultant thereof, (y) hire any person who was an employee, representative, agent or consultant of Holdings or any of its subsidiaries at any time during the six (6) month period immediately prior to the date on which such hiring would take place (it being conclusively presumed that any such hiring within such six (6) month period is in violation of clause (x) above) or (z) directly or indirectly call on, solicit or service any customer, supplier, licensee, licensor, representative, agent or other business relation of Holdings or any of its subsidiaries in order to induce or attempt to induce such person to cease doing business with, or reduce the amount of business conducted with, Holdings or any of its subsidiaries, or in any way interfere with the relationship between any such customer, supplier, licensee, licensor, representative, agent or business relation of Holdings or any of its subsidiaries. | |
| Restricted Activities. Each Rollover Investor and affiliated Rollover Investor Party, if any, will agree that during the period commencing on the Closing Date and ending upon expiration of the Non-Compete Period, such Rollover Investor Party and Rollover Investor Party shall not (and shall cause each of his or its affiliates not to) directly or indirectly own any interest in, manage, control, participate in (whether as an officer, director, manager, employee, partner, equity holder, member, agent, representative or otherwise), consult with, render services for, or in any other manner engage in any business engaged directly or indirectly, anywhere in the world, in the business of Holdings and its subsidiaries as currently conducted or proposed to be conducted as of the Service Termination Date of such Rollover Investor Party; provided, that nothing herein shall prohibit any of the Rollover Investors or Rollover Investor Parties or their affiliates from being a passive owner of not more than 2% of the outstanding stock of any class of a corporation which is publicly traded so long as such persons do not have any active participation in the business of such corporation. | ||
| Confidential Information. Each Rollover Investor and Rollover Investor Party will agree that it will not, directly or indirectly, use, take commercial or proprietary advantage of or profit from any Confidential Information or disclose Confidential Information to any person for any reason or purpose whatsoever, except as is required to be disclosed by an applicable law; provided, that the party required to make such disclosure shall provide to Holdings prompt notice of any such disclosure and shall use commercially reasonable efforts to limit the extent of such disclosure. “Confidential Information” means, subject to certain customary exceptions, confidential and proprietary information and trade secrets of Holdings and its subsidiaries including, without limitation, customer information, pricing information, financial plans, business plans, business concepts, supplier information, know-how and intellectual property and materials related thereto. |
| Capitalization Summary Schedule 1 Note: The numbers above have been rounded to three decimal places Equity transaction grant of B units to S.A.C Private Capital Group, LLC. Management D units calculated as management A units plus half of E units divided by 72 Mobile Investors, LLC A units multiplied by S.A.C. Private Capital Group, LLC's B units. Represents additional A units granted to GSO and lenders in connection with the credit facility. Such issuance dilutes 5% of outstanding A and B units, but calculated before Gilmore's C units and Management's D units |
| Name of Rollover Investor | Number of Shares | |||
Beaver Brook Irrevocable Trust |
147,710 | |||
Beaver Brook GA 2008 Trust |
165,633 | |||
Beaver Brook GV 2008 Trust |
162,449 | |||
Vedat Eyuboglu |
340,524 | |||
Assia Eyuboglu |
342,828 | |||
Sanjeev Verma |
789,626 | |||
C.H. 2008 Trust |
305,501 | |||
Cape Himalaya Trust |
206,265 | |||
Randall S. Battat Revocable Trust |
1,278,026 | |||
| • | Third Amended and Restated Investor Rights Agreement, dated as of June 6, 2007, by and among Airvana, Inc., the persons and entities listed on Schedule A thereto, the persons and entities listed on Schedule B thereto, Sanjeev Verma, Vedat Eyuboglu, Silicon Valley Bank, CommVest LLC and GATX Ventures, Inc. |
| • | Indemnification Agreement, dated as of July 19, 2007, by and between Airvana, Inc. and Randall S. Battat (will not be terminated) |
| • | Indemnification Agreement, dated as of July 19, 2007, by and between Airvana, Inc. and Vedat M. Eyuboglu (will not be terminated) |
| • | Indemnification Agreement, dated as of July 19, 2007, by and between Airvana, Inc. and Sanjeev Verma (will not be terminated) |
| • | Non-Competition and Non-Solicitation Agreement, dated as of May 23, 2000, by and between Airvana, Inc. and Randall Battat |
| • | Invention and Non-Disclosure Agreement, dated as of May 23, 2000, by and between Airvana, Inc. and Randall Battat |
| • | Non-Competition and Non-Solicitation Agreement, dated as of April 3, 2000, between Airvana, Inc. and Vedat Eyuboglu |
| • | Invention and Non-Disclosure Agreement, dated as of April 3, 2000, by and between Airvana, Inc. and Vedat Eyuboglu |
| • | Non-Competition and Non-Solicitation Agreement, dated as of March 28, 2000, by and between Airvana, Inc. and Sanjeev Verma |
| • | Invention and Non-Disclosure Agreement, dated as of March 28, 2000, by and between Airvana, Inc. and Sanjeev Verma |
| Units Issued | ||||||||
| Name of Investor | Total Commitment | (Based on Total Commitment)3 | ||||||
Eyuboglu Rollover Investors |
||||||||
Beaver Brook Irrevocable Trust |
$ | 1,129,981.50 | ||||||
Beaver Brook GA 2008 Trust |
$ | 1,267,092.45 | ||||||
Beaver Brook GV 2008 Trust |
$ | 1,242,734.85 | ||||||
Vedat Eyuboglu |
$ | 2,605,008.60 | ||||||
Assia Eyuboglu |
$ | 2,622,634.20 | ||||||
Eyuboglu Rollover Investors Total: |
$ | 8,867,451.60 | A total of 3,134,118.27 Class A Units and 5,733,333.33 Class E Units will be issued to the Eyuboglu Rollover Investors | |||||
Verma Rollover Investors |
||||||||
Sanjeev Verma |
$ | 6,040,638.90 | ||||||
C.H. 2008 Trust |
$ | 2,337,082.65 | ||||||
Cape Himalaya Trust |
$ | 1,577,927.25 | ||||||
Verma Rollover Investors Total: |
$ | 9,955,648.80 | A total of 4,222,315.47 Class A Units and 5,733,333.33 Class E Units will be issued to the Verma Rollover Investors | |||||
Battat Rollover Investors |
||||||||
Randall S. Battat Revocable Trust |
$ | 9,776,898.90 | ||||||
Battat Rollover Investors Total: |
$ | 9,776,898.90 | A total of 4,043,565.57 Class A Units and 5,733,333.33 Class E Units will be issued to the Battat Rollover Investors | |||||
SAC Investors |
||||||||
72 Mobile Investors, LLC |
$ | 92,457,329.00 | 92,457,329.00 Class A Units | |||||
| 3 | The issuances to the Rollover Investors of Class A Units and Class E Units will be made such that one Class A Unit or Class E Unit will be issued in respect of each $1.00 of the commitment of each Rollover Investor. The Rollover Investors shall confirm the allocation of Class A Units and Class E Units (which will be made in accordance with the commitments) to Buyer no later than January 15, 2010. |
2
3
4
5
6
7
8
9
| 72 MOBILE HOLDINGS, LLC |
||||
| By: | ||||
| Name: | ||||
| Title: | ||||
| S.A.C. PRIVATE CAPITAL GROUP, LLC |
||||
| By: | ||||
| Name: | ||||
| Title: | ||||
2
3
4
| Sincerely, RANDALL S. BATTAT REVOCABLE TRUST |
||||
| /s/ Randall S. Battat | ||||
| Name: | Randall S. Battat | |||
| Title: | Trustee | |||
| Agreed to and accepted: 72 MOBILE HOLDINGS, LLC |
||||
| Name: | /s/ Peter Berger | |||
| Name: | Peter Berger | |||
| Title: | President | |||
2
3
4
| Sincerely, |
||||
| /s/ Sanjeev Verma | ||||
| Sanjeev Verma | ||||
| C.H. 2008 TRUST |
||||
| /s/ Sanjeev Verma | ||||
| Name: | Sanjeev Verma | |||
| Title: | Trustee | |||
| CAPE HIMALAYA TRUST |
||||
| /s/ Girija C. Verma | ||||
| Name: | Girija C. Verma | |||
| Title: | Trustee | |||
| Agreed to and accepted: 72 MOBILE HOLDINGS, LLC |
||||
| Name: | /s/ Peter Berger | |||
| Name: | Peter Berger | |||
| Title: | President | |||
2
3
4
| Sincerely, |
||||
| /s/ Vedat Eyuboglu | ||||
| Vedat Eyuboglu | ||||
| /s/ Assia Eyuboglu | ||||
| Assia Eyuboglu | ||||
| BEAVER BROOK IRREVOCABLE TRUST |
||||
| /s/ Assia Eyuboglu | ||||
| Name: | Assia Eyuboglu | |||
| Title: | Trustee | |||
| BEAVER BROOK GA 2008 TRUST |
||||
| /s/ Assia Eyuboglu | ||||
| Name: | Assia Eyuboglu | |||
| Title: | Trustee | |||
| BEAVER BROOK GV 2008 TRUST |
||||
| /s/ Vedat Eyuboglu | ||||
| Name: | Vedat Eyuboglu | |||
| Title: | Trustee | |||
Name:
|
/s/ Peter Berger | |||
| Name: Peter Berger | ||||
| Title: President |
2
3
| COMPANY: AIRVANA, INC. |
||||
| By: | /s/ Randall Battat | |||
| Randall Battat | ||||
| President | ||||
RELEASORS: MATRIX PARTNERS VI, L.P. |
||||
| By: | Matrix VI Management Co., LLC, | |||
| its General Partner | ||||
| By: | /s/ Paul J. Ferri | |||
| Paul J. Ferri | ||||
| Managing Member | ||||
| MATRIX PARTNERS VII, L.P. |
||||
| By: | Matrix VII Management Co., LLC, | |||
| its General Partner | ||||
| By: | /s/ Paul J. Ferri | |||
| Paul J. Ferri | ||||
| Managing Member | ||||
| MATRIX VI PARALLEL PARTNERSHIP-A, L.P. |
||||
| By: | Matrix VI Management Co., LLC, | |||
| its General Partner | ||||
| By: | /s/ Paul J. Ferri | |||
| Paul J. Ferri | ||||
| Managing Member | ||||
| MATRIX VI PARALLEL PARTNERSHIP-B, L.P. |
||||
| By: | Matrix VI Management Co., LLC, | |||
| its General Partner | ||||
| By: | /s/ Paul J. Ferri | |||
| Paul J. Ferri | ||||
| Managing Member | ||||
| WESTON & CO. VI LLC, as Nominee |
||||
| By: | Matrix Partners Management Services, L.P., | |||
| Sole Member | ||||
| By. Matrix Partners Management Services GP, LLC, its General Partner |
||||
| By: | /s/ Paul J. Ferri | |||
| Paul J. Ferri | ||||
| Authorized Member | ||||
| WESTON & CO. VII LLC, as Nominee |
||||
| By: | Matrix Partners Management Services, L.P., Sole Member | |||
| By. Matrix Partners Management Services GP, LLC, its General Partner |
||||
| By: | /s/ Paul J. Ferri | |||
| Paul J. Ferri | ||||
| Authorized Member | ||||
| SPARTA GROUP MA LLC SERIES 5 |
||||
| By: | /s/ Gururaj Deshpande | |||
| Gururaj Deshpande | ||||
| Co-Manager | ||||
| /s/ Sanjeev Verma | ||||
| Sanjeev Verma | ||||
| /s/ Vedat Eyuboglu | ||||
| Vedat Eyuboglu | ||||
| Very truly yours, 72 MOBILE HOLDINGS, LLC |
||||
| By: | /s/ Peter Berger | |||
| Name: | Peter Berger | |||
| Title: | President | |||
| /s/ Sanjeev Verma | ||||
| Sanjeev Verma | ||||
| EMPLOYMENT TERMS | |||
| Title | Executive Vice President, Corporate Development of Airvana, Inc. (the “Company”) |
||
For so long as the Executive is employed by the Company (and is entitled to serve on the
Board of Directors of 72 Mobile Holdings, LLC (“Holdings”) under the Holdings LLC
Agreement), the Executive will also serve as a member of the Board of Directors of the
Company (the “Board”) for no additional compensation. |
|||
| Initial Base Salary | $455,000 |
||
| Annual Cash Bonus Opportunity |
Performance goals will be established by the Board in consultation with the Executive. The
Executive’s target bonus for 2010 will be 100% of his base salary, and 50% of such bonus
will be guaranteed (the “Minimum Guaranteed Bonus”) for the initial term. |
||
| Term | Three year initial term, which will renew automatically for one-year periods unless either
party provides 90 days’ written notice of non-renewal prior to the end of any term. Non-renewal of the term by the Company will be treated as a termination without Cause. |
||
| Severance | In the event the Executive’s employment with the Company terminates for any reason other
than a termination for Cause prior to the end of the initial three-year term, the Company
will pay Executive salary continuation for the duration of the three-year initial term of
the employment agreement in the amount of $455,000 per year. In addition, upon a termination of the Executive’s employment by the Company without Cause or by the Executive for Good Reason, the Executive will receive, as severance pay, (i) an amount equal to the sum of (A) his then current base salary and (B) his target bonus, with such amount to paid in substantially equal installments over a period of 12 months and (ii) if the Executive timely elects COBRA coverage, the Company will pay the cost of the Executive’s COBRA medical coverage for 12 months from the date of termination. Severance will be subject to the Executive’s execution of a general release of claims in favor of the Company and its affiliates. |
||
| Cause | Cause will mean the Executive’s: (i) material breach of his obligations under any material
agreement with the Company or its affiliates, which breach the Executive fails to cure, if
curable, within 30 days after receipt of a written notice of such breach; (ii) gross
negligence in the performance or intentional non-performance (continuing for 30 days after
receipt of written notice of need to cure) of his material duties to the Company or any of
its affiliates; (iii) conviction of or entering into a plea of “no contest” to any felony
or crime of moral turpitude; (iv) commission of an act of deceit, fraud, perjury or
embezzlement that directly or indirectly causes harm to the Company or any of its
affiliates; or (v) being habitually under the influence of drugs or alcohol during the
performance of his duties to the Company or any of its affiliates, or, while under the
influence of such drugs or alcohol, engaging in inappropriate conduct that directly or
indirectly causes material harm to the Company or any of its affiliates. |
||
A-1
| Good Reason | “Good Reason” means any of: |
||
(i) a reduction in the Executive’s base salary or target bonus opportunity; |
|||
(ii) a material adverse change to the Executive’s titles or a material reduction in
responsibilities; |
|||
(iii) a change in the Executive’s place of work to a location more than 50 miles from his
present place of work. | |||
The Company will have a thirty-day cure right in all cases. |
|||
| EQUITY | |||
| New Options on Femtocell Stock |
The femtocell business will be separated into a separate subsidiary following closing
(“Femtocell”). New Femtocell option plan will be established post-merger, reserving 5%-7%
of the fully diluted common stock of Femtocell for new option grants following the merger.
The CEO of Femtocell will determine the allocation of option grants under the plan, subject
to the approval of the Femtocell board of directors; provided that Femtocell will not issue
more than 3% of the fully diluted common stock of Femtocell under the option plan without
the prior approval of SAC, on the one hand, and the Executive, Randy and Vedat, on the
other hand. The Founders will be eligible to receive option grants under the Femtocell
option plan, but only if they are providing significant services to Femtocell. |
||
| Vesting of Femtocell Options | To the extent that the Executive receives a Femtocell option and subject to his continued
employment with the Company, 25% of the options will vest upon the first anniversary of the
grant date, with the remaining options then vesting ratably at the end of each three-month
period thereafter. |
||
| Post-Termination Option Exercise Period for Femtocell Options | Femtocell options will: |
||
• remain exercisable for 3 months following termination without Cause or for Good
Reason; • remain exercisable for 6 months following termination for death or disability; • not remain exercisable following termination for Cause. |
|||
| EMPLOYMENT AGREEMENT RESTRICTIVE COVENANTS | |||
| Confidentiality | Perpetual, subject to standard exclusions defining “confidential information”. |
||
| Ownership of IP | Work product belongs to the Company. |
||
| Non-competition and non-solicitation of employees and customers | Applies until 18-months following termination of the Executive’s employment.
If the Executive materially violates these covenants, then any outstanding Femtocell options held by the Executive will be forfeited. |
||
2
| Very truly yours, 72 MOBILE HOLDINGS, LLC |
||||
| By: | /s/ Peter Berger | |||
| Name: | Peter Berger | |||
| Title: | President | |||
| /s/ Randall S. Battat | ||||
| Randall S. Battat | ||||
| EMPLOYMENT TERMS | |||
Title
|
President and Chief Executive Officer of Airvana, Inc. (the “Company”) | ||
| For so long as the Executive is employed by the Company (and is entitled to serve on the Board of Directors of 72 Mobile Holdings, LLC (“Holdings”) under the Holdings LLC Agreement), the Executive will also serve as a member of the Board of Directors of the Company (the “Board”) for no additional compensation. | |||
Initial Base Salary
|
$540,000 | ||
Annual Cash Bonus Opportunity |
Performance goals will be established by the Board in consultation with the Executive. The Executive’s target bonus for 2010 will be 100% of his base salary, and 50% of such bonus will be guaranteed (the “Minimum Guaranteed Bonus”) for the initial term. | ||
Term
|
Three year initial term, which will renew automatically for one-year periods unless either party provides 90 days’ written notice of non-renewal prior to the end of any term. | ||
| Non-renewal of the term by the Company will be treated as a termination without Cause. | |||
Severance
|
In the event the Executive’s employment with the Company terminates for any reason other than a termination for Cause prior to the end of the initial three-year term, the Company will pay Executive salary continuation for the duration of the three-year initial term of the employment agreement in the amount of $540,000 per year. | ||
| In addition, upon a termination of the Executive’s employment by the Company without Cause or by the Executive for Good Reason, the Executive will receive, as severance pay, (i) an amount equal to the sum of (A) his then current base salary and (B) his target bonus, with such amount to paid in substantially equal installments over a period of 12 months and (ii) if the Executive timely elects COBRA coverage, the Company will pay the cost of the Executive’s COBRA medical coverage for 12 months from the date of termination. Severance will be subject to the Executive’s execution of a general release of claims in favor of the Company and its affiliates. | |||
Cause
|
Cause will mean the Executive’s: (i) material breach of his obligations under any material agreement with the Company or its affiliates, which breach the Executive fails to cure, if curable, within 30 days after receipt of a written notice of such breach; (ii) gross negligence in the performance or intentional non-performance (continuing for 30 days after receipt of written notice of need to cure) of his material duties to the Company or any of its affiliates; (iii) conviction of or entering into a plea of “no contest” to any felony or crime of moral turpitude; (iv) commission of an act of deceit, fraud, perjury or embezzlement that directly or indirectly causes harm to the Company or any of its affiliates; or (v) being habitually under the influence of drugs or alcohol during the performance of his duties to the Company or any of its affiliates, or, while under the influence of such drugs or alcohol, engaging in inappropriate conduct that directly or indirectly causes material harm to the Company or any of its affiliates. | ||
A-1
Good Reason
|
“Good Reason” means any of: | ||
| (i) a reduction in the Executive’s base salary or target bonus opportunity; | |||
| (ii) a material adverse change to the Executive’s titles or a material reduction in
responsibilities; (iii) a change in the Executive’s place of work to a location more than 50 miles from his present place of work. |
|||
| The Company will have a thirty-day cure right in all cases. |
|||
| EQUITY | |||
New Options on Femtocell Stock |
The femtocell business will be separated into a separate subsidiary following closing (“Femtocell”). New Femtocell option plan will be established post-merger, reserving 5%-7% of the fully diluted common stock of Femtocell for new option grants following the merger. The CEO of Femtocell will determine the allocation of option grants under the plan, subject to the approval of the Femtocell board of directors; provided that Femtocell will not issue more than 3% of the fully diluted common stock of Femtocell under the option plan without the prior approval of SAC, on the one hand, and the Executive, Vedat and Sanjeev, on the other hand. The Founders will be eligible to receive option grants under the Femtocell option plan, but only if they are providing significant services to Femtocell. | ||
Vesting of Femtocell
Options
|
To the extent that the Executive receives a Femtocell option and subject to his continued employment with the Company, 25% of the options will vest upon the first anniversary of the grant date, with the remaining options then vesting ratably at the end of each three-month period thereafter. | ||
Post-Termination
|
Femtocell options will: | ||
Option Exercise Period for Femtocell |
• remain exercisable for 3 months following termination without Cause or for Good
Reason; |
||
Options
|
• remain exercisable for 6 months following termination for death or disability; |
||
• not remain exercisable following termination for Cause. |
|||
| EMPLOYMENT AGREEMENT RESTRICTIVE COVENANTS | |||
Confidentiality
|
Perpetual, subject to standard exclusions defining “confidential information”. | ||
Ownership of IP
|
Work product belongs to the Company. | ||
Non-competition and
non-solicitation of
employees and
customers
|
Applies until 18-months following termination of the Executive’s employment. If the Executive materially violates these covenants, then any outstanding Femtocell options held by the Executive will be forfeited. |
||
2
| Very truly yours, 72 MOBILE HOLDINGS, LLC |
||||
| By: | /s/ Peter Berger | |||
| Name: | Peter Berger | |||
| Title: | President | |||
| /s/ Vedat Eyuboglu | ||||
| Vedat Eyuboglu | ||||
| EMPLOYMENT TERMS | |||
Title
|
Chief Technology Officer of Airvana, Inc. (the “Company”) | ||
| For so long as the Executive is employed by the Company (and is entitled to serve on the Board of Directors of 72 Mobile Holdings, LLC (“Holdings”) under the Holdings LLC Agreement), the Executive will also serve as a member of the Board of Directors of the Company (the “Board”) for no additional compensation. | |||
Initial Base Salary
|
$455,000 | ||
Annual Cash Bonus Opportunity |
Performance goals will be established by the Board in consultation with the Executive. The Executive’s target bonus for 2010 will be 100% of his base salary, and 50% of such bonus will be guaranteed (the “Minimum Guaranteed Bonus”) for the initial term. | ||
Term
|
Three year initial term, which will renew automatically for one-year periods unless either party provides 90 days’ written notice of non-renewal prior to the end of any term. | ||
| Non-renewal of the term by the Company will be treated as a termination without Cause. | |||
Severance
|
In the event the Executive’s employment with the Company terminates for any reason other than a termination for Cause prior to the end of the initial three-year term, the Company will pay Executive salary continuation for the duration of the three-year initial term of the employment agreement in the amount of $455,000 per year. | ||
| In addition, upon a termination of the Executive’s employment by the Company without Cause or by the Executive for Good Reason, the Executive will receive, as severance pay, (i) an amount equal to the sum of (A) his then current base salary and (B) his target bonus, with such amount to paid in substantially equal installments over a period of 12 months and (ii) if the Executive timely elects COBRA coverage, the Company will pay the cost of the Executive’s COBRA medical coverage for 12 months from the date of termination. Severance will be subject to the Executive’s execution of a general release of claims in favor of the Company and its affiliates. | |||
Cause
|
Cause will mean the Executive’s: (i) material breach of his obligations under any material agreement with the Company or its affiliates, which breach the Executive fails to cure, if curable, within 30 days after receipt of a written notice of such breach; (ii) gross negligence in the performance or intentional non-performance (continuing for 30 days after receipt of written notice of need to cure) of his material duties to the Company or any of its affiliates; (iii) conviction of or entering into a plea of “no contest” to any felony or crime of moral turpitude; (iv) commission of an act of deceit, fraud, perjury or embezzlement that directly or indirectly causes harm to the Company or any of its affiliates; or (v) being habitually under the influence of drugs or alcohol during the performance of his duties to the Company or any of its affiliates, or, while under the influence of such drugs or alcohol, engaging in inappropriate conduct that directly or indirectly causes material harm to the Company or any of its affiliates. | ||
A-1
Good Reason
|
“Good Reason” means any of: | ||
| (i) a reduction in the Executive’s base salary or target bonus opportunity; | |||
| (ii) a material adverse change to the Executive’s titles or a material reduction in responsibilities; | |||
| (iii) a change in the Executive’s place of work to a location more than 50 miles from his present place of work. | |||
| The Company will have a thirty-day cure right in all cases. |
|||
| EQUITY | |||
New Options on Femtocell Stock |
The femtocell business will be separated into a separate subsidiary following closing (“Femtocell”). New Femtocell option plan will be established post-merger, reserving 5%-7% of the fully diluted common stock of Femtocell for new option grants following the merger. The CEO of Femtocell will determine the allocation of option grants under the plan, subject to the approval of the Femtocell board of directors; provided that Femtocell will not issue more than 3% of the fully diluted common stock of Femtocell under the option plan without the prior approval of SAC, on the one hand, and the Executive, Randy and Sanjeev, on the other hand. The Founders will be eligible to receive option grants under the Femtocell option plan, but only if they are providing significant services to Femtocell. | ||
Vesting of Femtocell
Options
|
To the extent that the Executive receives a Femtocell option and subject to his continued employment with the Company, 25% of the options will vest upon the first anniversary of the grant date, with the remaining options then vesting ratably at the end of each three-month period thereafter. | ||
Post-Termination
Option Exercise
Period for Femtocell Options
|
Femtocell options will: | ||
• remain exercisable for 3 months following termination without Cause or for Good
Reason; |
|||
• remain exercisable for 6 months following termination for death or disability; |
|||
• not remain exercisable following termination for Cause. |
|||
| EMPLOYMENT AGREEMENT RESTRICTIVE COVENANTS |
|||
Confidentiality
|
Perpetual, subject to standard exclusions defining “confidential information”. | ||
Ownership of IP
|
Work product belongs to the Company. | ||
Non-competition and
non-solicitation of
employees and
customers
|
Applies until 18-months following
termination of the Executive’s employment. If the Executive materially violates these covenants, then any outstanding Femtocell options held by the Executive will be forfeited. |
||
2