| Q4 & FY 2025 Financial Results Conference Call February 25th, 2026 Veeco Instruments 1 |

| 2 Disclaimer No Offer or Solicitation This communication is not intended to and shall not constitute an offer to purchase or the solicitation of an offer to buy or sell any securities, nor shall there be any sale of securities in any jurisdiction in which such offer, solicitation or sale would be unlawful prior to registration or qualification under the securities laws of any such jurisdiction. No offer of securities shall be made, except by means of a prospectus meeting the requirements of Section 10 of the Securities Act of 1933, as amended. Forward-looking Statements This presentation contains “forward-looking statements”, within the meaning of the safe harbor provisions of the U.S. Private Securities Litigation Reform Act of 1995, as amended, that are based on management’s expectations, estimates, projections and assumptions. Words such as “expects,” “anticipates,” “plans,” “believes,” “scheduled,” “estimates” and variations of these words and similar expressions are intended to identify forward-looking statements. Forward-looking statements include, but are not limited to, those regarding anticipated growth and trends in our businesses and markets, industry outlooks and demand drivers, statements regarding the pending merger with Axcelis, statements regarding shipments currently being held by U.S. Customers, our investment and growth strategies, our development of new products and technologies, our business outlook for current and future periods, our ongoing transformation initiative and the effects thereof on our operations and financial results, the timing, completion and expected benefits of the proposed transaction and other statements that are not historical facts. These statements and their underlying assumptions are subject to risks and uncertainties and are not guarantees of future performance. Factors that could cause actual results to differ materially from those expressed or implied by such statements include, without limitation: the level of demand for our products; global economic and industry conditions; global trade issues, including the effects of foreign and domestic tariffs and the ongoing trade disputes between the U.S. and China, and changes in trade and export license policies; our dependency on third-party suppliers and outsourcing partners; the timing of customer orders; our ability to develop, deliver and support new products and technologies; our ability to expand our current markets, increase market share and develop new markets; the concentrated nature of our customer base; cybersecurity attacks and our ability to safeguard sensitive information and protect our intellectual property rights in key technologies; the effects of regional or global health epidemics; delays in or failure to complete the proposed transaction, whether due to an inability by either party to satisfy one or more conditions to closing, including an inability to obtain certain regulatory approvals, the occurrence of events or changes in circumstances that give rise to the termination of the applicable merger agreement by either party, or otherwise; risks related to the pendency of the proposed transaction and its effect on our business, financial condition, results of operations, cash flows and stock price; our ability to achieve the objectives of operational and strategic initiatives and attract, motivate and retain key employees, including as a result of the proposed transaction; diversion of management time and attention from ordinary course business operations to the proposed transaction and other potential disruptions to our business relating thereto; the variability of results among products and end-markets, and our ability to accurately forecast future results, market conditions, and customer requirements; the impact of our indebtedness, including our convertible senior notes and our capped call transactions; and other risks and uncertainties described in our SEC filings on Forms 10-K, 10-Q and 8-K, and from time-to-time in our other SEC reports. All forward-looking statements speak only to management’s expectations, estimates, projections and assumptions as of the date of this presentation. The Company does not undertake any obligation to update or publicly revise any forward-looking statements to reflect events, circumstances or changes in expectations after the date of this presentation. Non-GAAP Financial Measures This presentation also includes references to financial measures that are calculated and presented on the basis of methodologies other than in accordance with generally accepted accounting principles in the United States of America (“GAAP”). These non-GAAP measures include, but are not limited to, non-GAAP gross profit, non-GAAP gross margin, non-GAAP operating expenses, non-GAAP operating income, non-GAAP net income and non-GAAP diluted earnings per share. Any non-GAAP financial measures used in this presentation are in addition to, and should not be considered superior to, or a substitute for, financial statements prepared in accordance with GAAP. Non-GAAP financial measures should not be considered in isolation or as an alternative to financial statements prepared in accordance with GAAP and are subject to significant inherent limitations. We believe these non-GAAP measures of financial results provide useful information to management and investors regarding certain financial and business trends relating to Veeco's financial condition and results of operations. The non-GAAP measures presented herein should not be comparable to similar non-GAAP measures presented by other companies. These non-GAAP financial measures are subject to inherent limitations as they reflect the exercise of judgments by management about which expense and income are excluded or included in determining these non-GAAP financial measures. A reconciliation of non-GAAP financial measures used in this presentation to the most directly comparable GAAP financial measures is included in the Appendix. |
| Bill Miller, Ph.D. CEO Overview 3 |

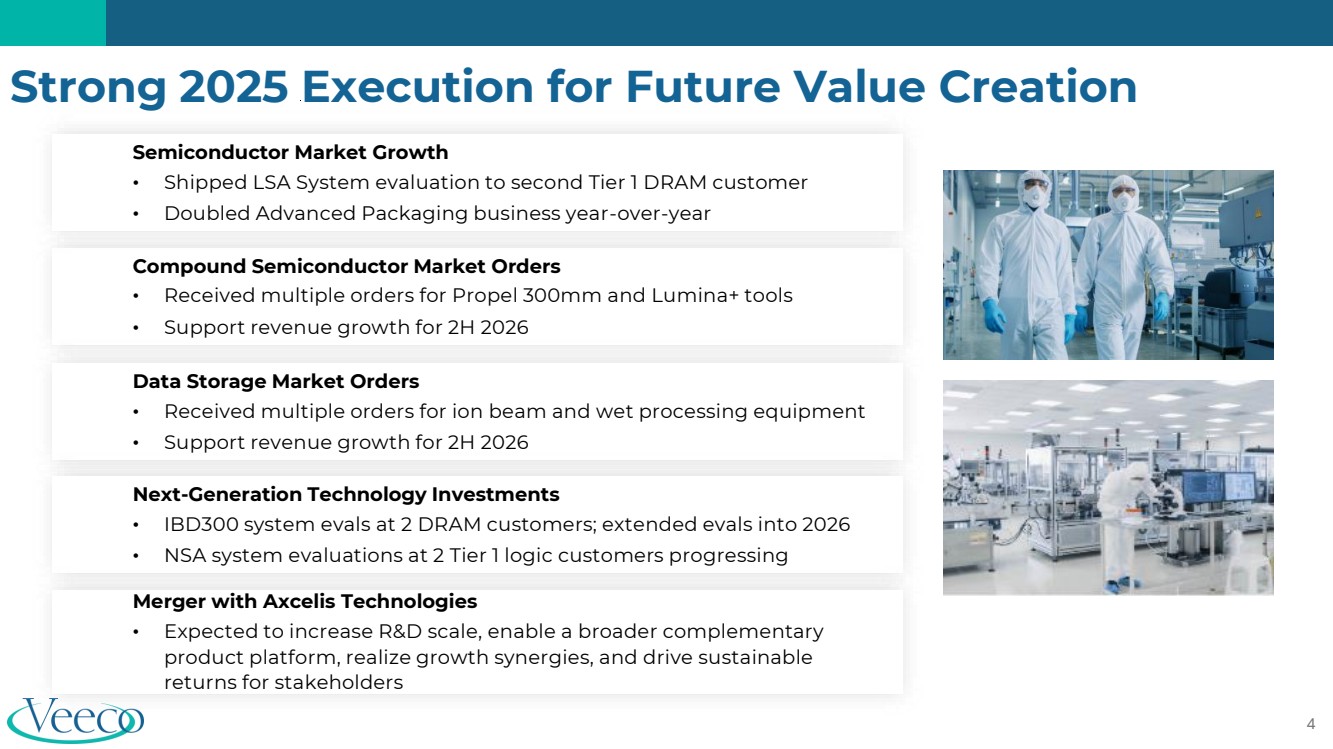
| 4 Compound Semiconductor Market Orders • Received multiple orders for Propel 300mm and Lumina+ tools • Support revenue growth for 2H 2026 Semiconductor Market Growth • Shipped LSA System evaluation to second Tier 1 DRAM customer • Doubled Advanced Packaging business year-over-year Data Storage Market Orders • Received multiple orders for ion beam and wet processing equipment • Support revenue growth for 2H 2026 Next-Generation Technology Investments • IBD300 system evals at 2 DRAM customers; extended evals into 2026 • NSA system evaluations at 2 Tier 1 logic customers progressing Merger with Axcelis Technologies • Expected to increase R&D scale, enable a broader complementary product platform, realize growth synergies, and drive sustainable returns for stakeholders Strong 2025 Execution for Future Value Creation |
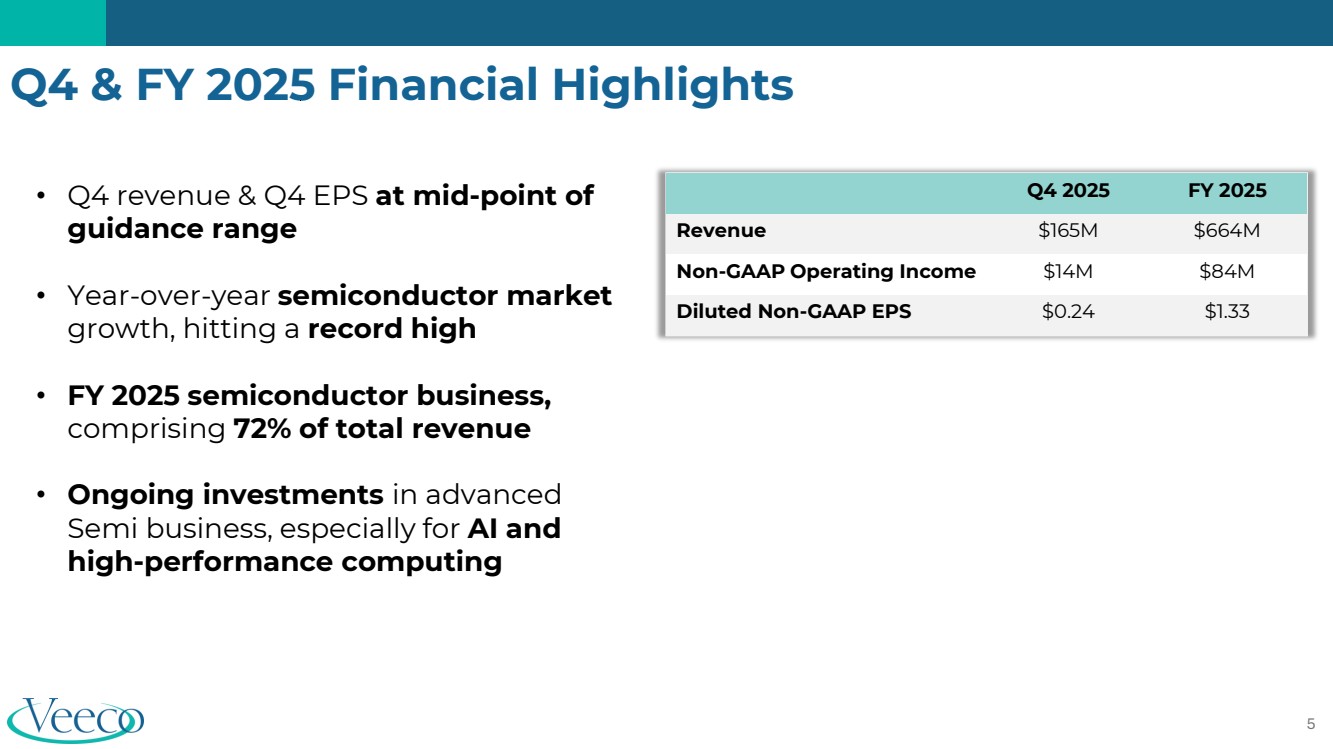
| 5 Q4 & FY 2025 Financial Highlights Q4 2025 FY 2025 Revenue $165M $664M Non-GAAP Operating Income $14M $84M Diluted Non-GAAP EPS $0.24 $1.33 • Q4 revenue & Q4 EPS at mid-point of guidance range • Year-over-year semiconductor market growth, hitting a record high • FY 2025 semiconductor business, comprising 72% of total revenue • Ongoing investments in advanced Semi business, especially for AI and high-performance computing |
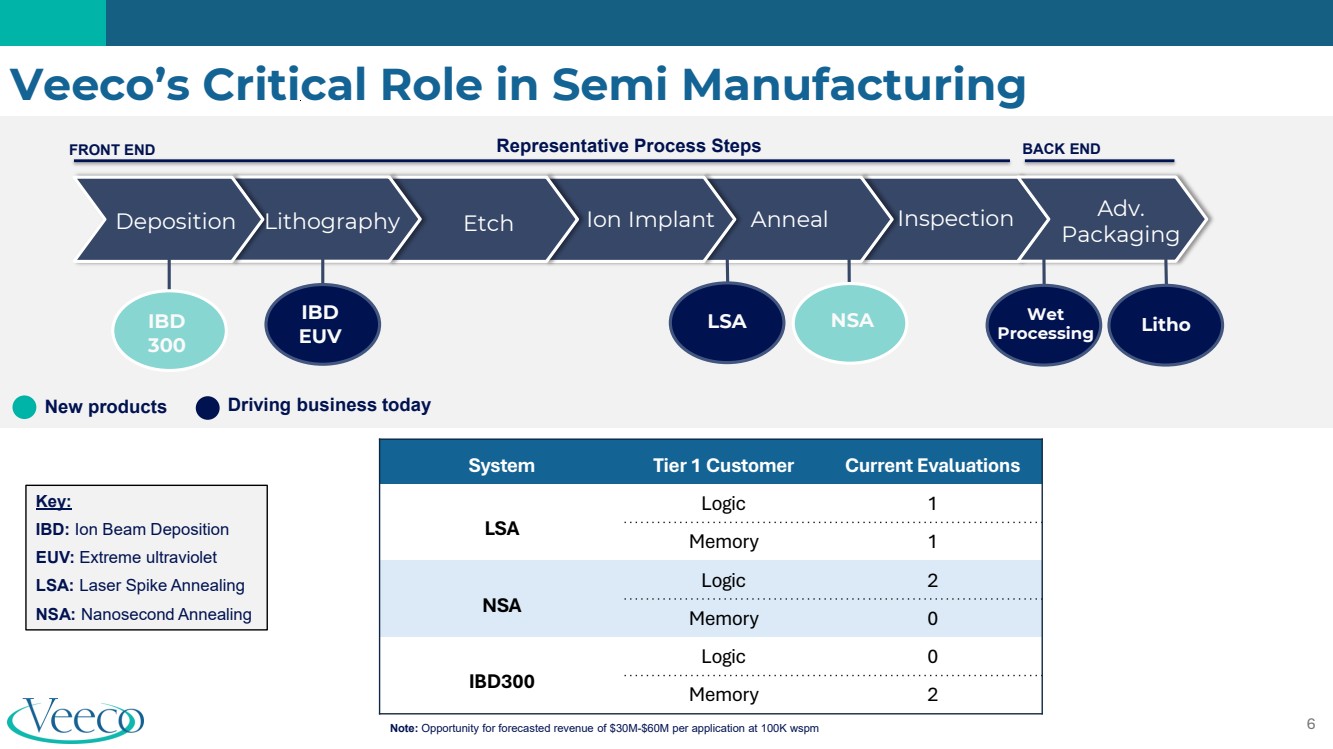
| 6 Veeco’s Critical Role in Semi Manufacturing Deposition Lithography Etch Ion Implant Anneal Inspection Adv. Packaging IBD 300 IBD EUV LSA NSA Wet Processing Litho New products FRONT END BACK END Driving business today Representative Process Steps Key: IBD: Ion Beam Deposition EUV: Extreme ultraviolet LSA: Laser Spike Annealing NSA: Nanosecond Annealing System Tier 1 Customer Current Evaluations LSA Logic 1 Memory 1 NSA Logic 2 Memory 0 IBD300 Logic 0 Memory 2 Note: Opportunity for forecasted revenue of $30M-$60M per application at 100K wspm |
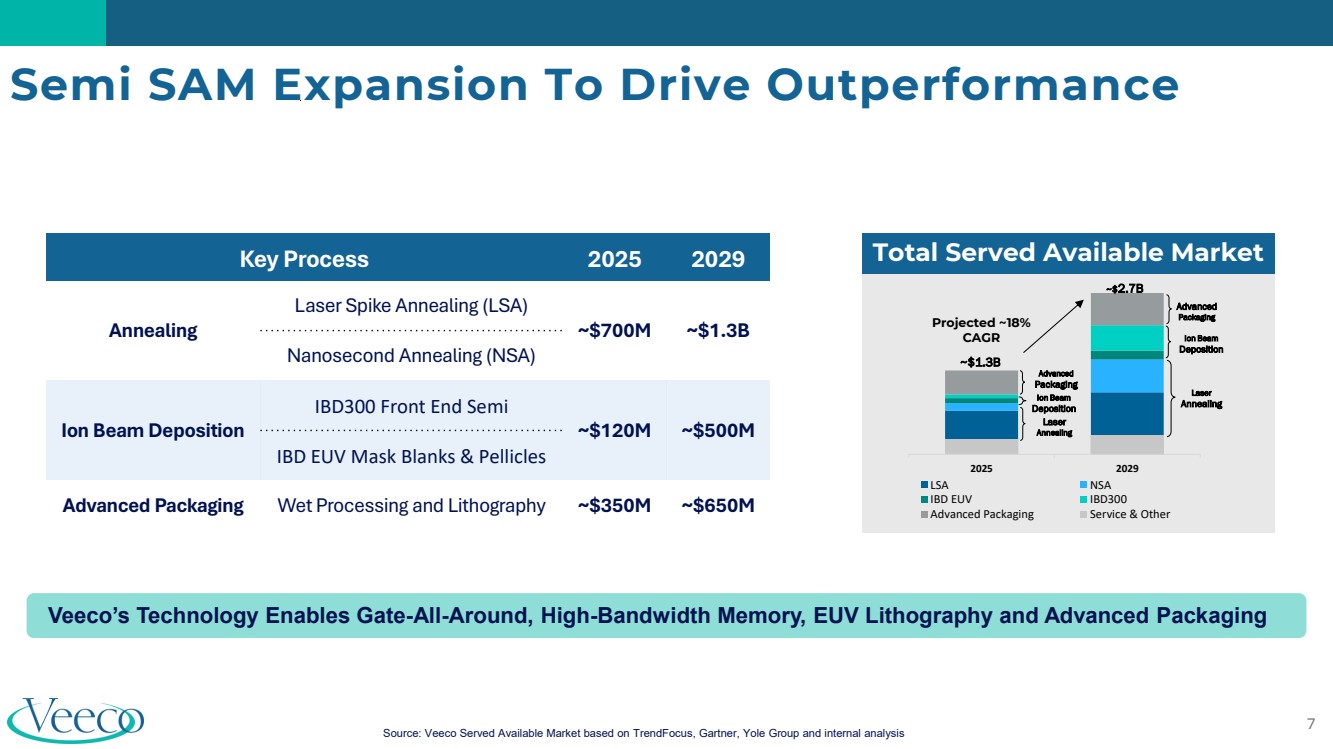
| 7 Semi SAM Expansion To Drive Outperformance Key Process 2025 2029 Annealing Laser Spike Annealing (LSA) ~$700M ~$1.3B Nanosecond Annealing (NSA) Ion Beam Deposition IBD300 Front End Semi ~$120M ~$500M IBD EUV Mask Blanks & Pellicles Advanced Packaging Wet Processing and Lithography ~$350M ~$650M 2025 2029 LSA NSA IBD EUV IBD300 Advanced Packaging Service & Other Projected ~18% CAGR ~$1.3B ~$2.7B Total Served Available Market Laser Annealing Ion Beam Deposition Ion Beam Deposition Laser Annealing Advanced Packaging Advanced Packaging Veeco’s Technology Enables Gate-All-Around, High-Bandwidth Memory, EUV Lithography and Advanced Packaging Source: Veeco Served Available Market based on TrendFocus, Gartner, Yole Group and internal analysis |
| John Kiernan CFO Overview 8 |

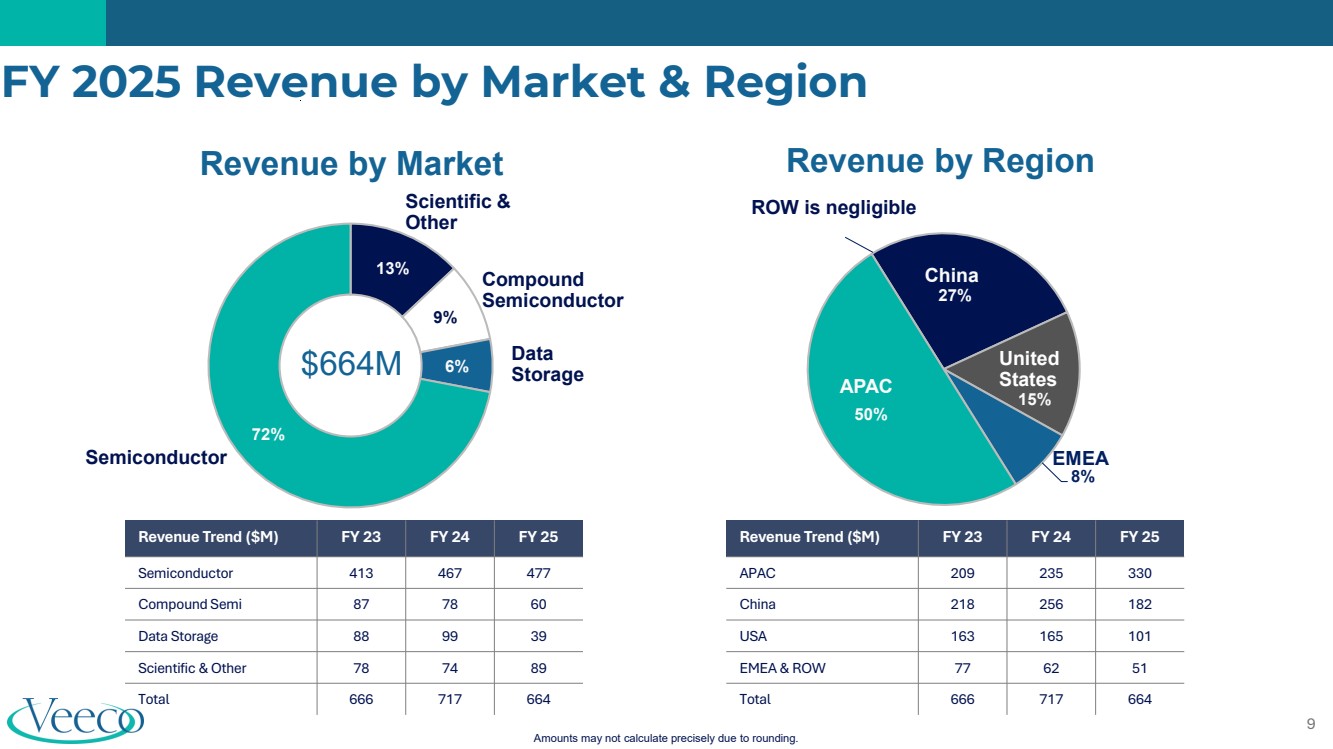
| 9 Revenue by Market Revenue by Region Scientific & Other Semiconductor Compound Semiconductor Data Storage ROW is negligible 13% 9% 6% 72% 27% 15% 8% 50% United States EMEA APAC China $664M Revenue Trend ($M) FY 23 FY 24 FY 25 Semiconductor 413 467 477 Compound Semi 87 78 60 Data Storage 88 99 39 Scientific & Other 78 74 89 Total 666 717 664 Revenue Trend ($M) FY 23 FY 24 FY 25 APAC 209 235 330 China 218 256 182 USA 163 165 101 EMEA & ROW 77 62 51 Total 666 717 664 FY 2025 Revenue by Market & Region Amounts may not calculate precisely due to rounding. |
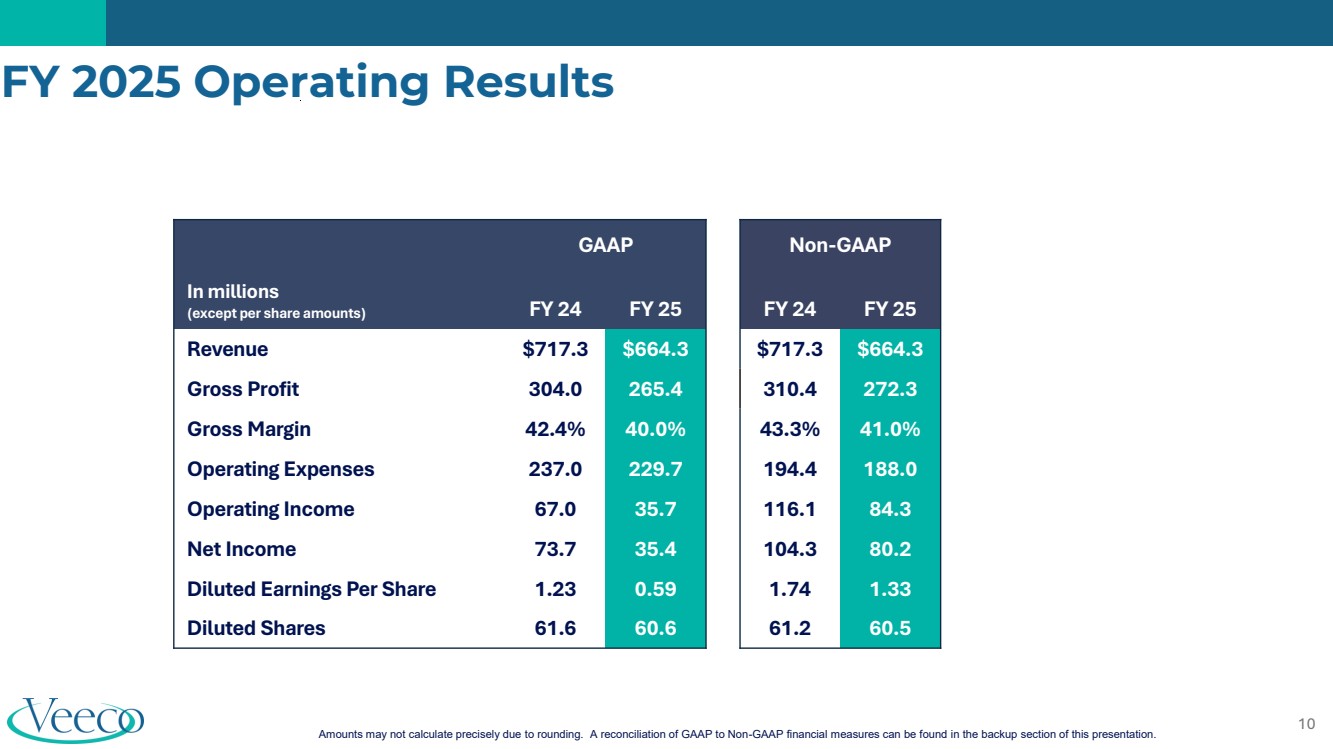
| 10 Amounts may not calculate precisely due to rounding. A reconciliation of GAAP to Non-GAAP financial measures can be found in the backup section of this presentation. In millions (except per share amounts) GAAP Non-GAAP FY 24 FY 25 FY 24 FY 25 Revenue $717.3 $664.3 $717.3 $664.3 Gross Profit 304.0 265.4 310.4 272.3 Gross Margin 42.4% 40.0% 43.3% 41.0% Operating Expenses 237.0 229.7 194.4 188.0 Operating Income 67.0 35.7 116.1 84.3 Net Income 73.7 35.4 104.3 80.2 Diluted Earnings Per Share 1.23 0.59 1.74 1.33 Diluted Shares 61.6 60.6 61.2 60.5 FY 2025 Operating Results |
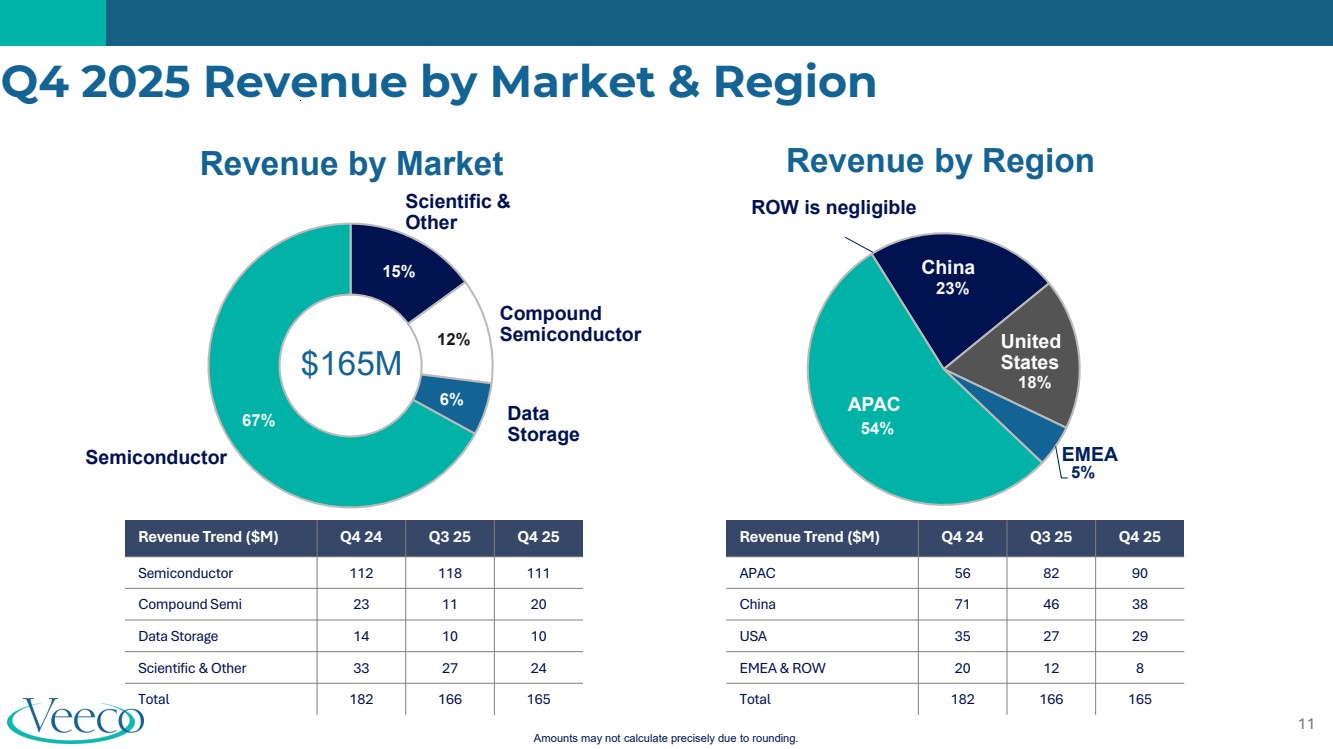
| 11 Revenue by Market Revenue by Region Scientific & Other Semiconductor Compound Semiconductor Data Storage ROW is negligible 15% 12% 6% 67% 23% 18% 5% 54% United States EMEA APAC China $165M Revenue Trend ($M) Q4 24 Q3 25 Q4 25 Semiconductor 112 118 111 Compound Semi 23 11 20 Data Storage 14 10 10 Scientific & Other 33 27 24 Total 182 166 165 Revenue Trend ($M) Q4 24 Q3 25 Q4 25 APAC 56 82 90 China 71 46 38 USA 35 27 29 EMEA & ROW 20 12 8 Total 182 166 165 Q4 2025 Revenue by Market & Region Amounts may not calculate precisely due to rounding. |
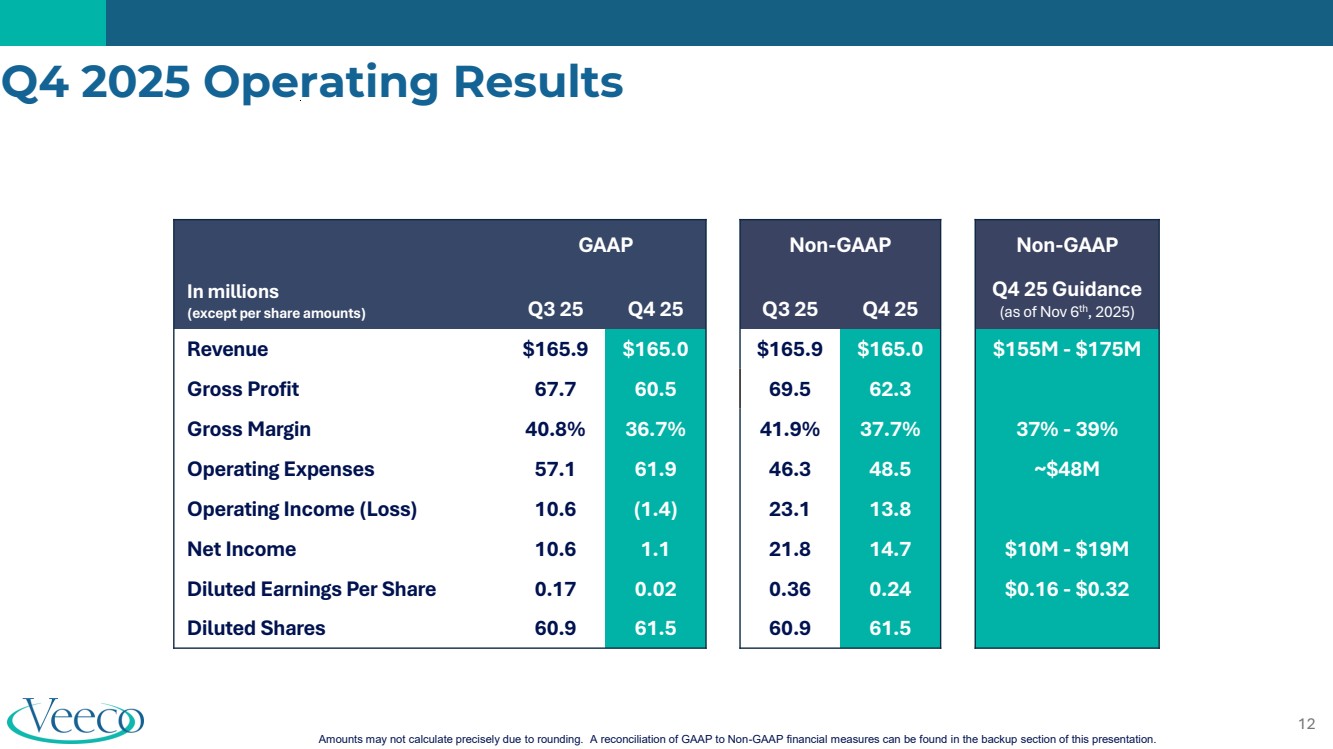
| 12 Amounts may not calculate precisely due to rounding. A reconciliation of GAAP to Non-GAAP financial measures can be found in the backup section of this presentation. In millions (except per share amounts) GAAP Non-GAAP Non-GAAP Q3 25 Q4 25 Q3 25 Q4 25 Q4 25 Guidance (as of Nov 6th, 2025) Revenue $165.9 $165.0 $165.9 $165.0 $155M - $175M Gross Profit 67.7 60.5 69.5 62.3 Gross Margin 40.8% 36.7% 41.9% 37.7% 37% - 39% Operating Expenses 57.1 61.9 46.3 48.5 ~$48M Operating Income (Loss) 10.6 (1.4) 23.1 13.8 Net Income 10.6 1.1 21.8 14.7 $10M - $19M Diluted Earnings Per Share 0.17 0.02 0.36 0.24 $0.16 - $0.32 Diluted Shares 60.9 61.5 60.9 61.5 Q4 2025 Operating Results |
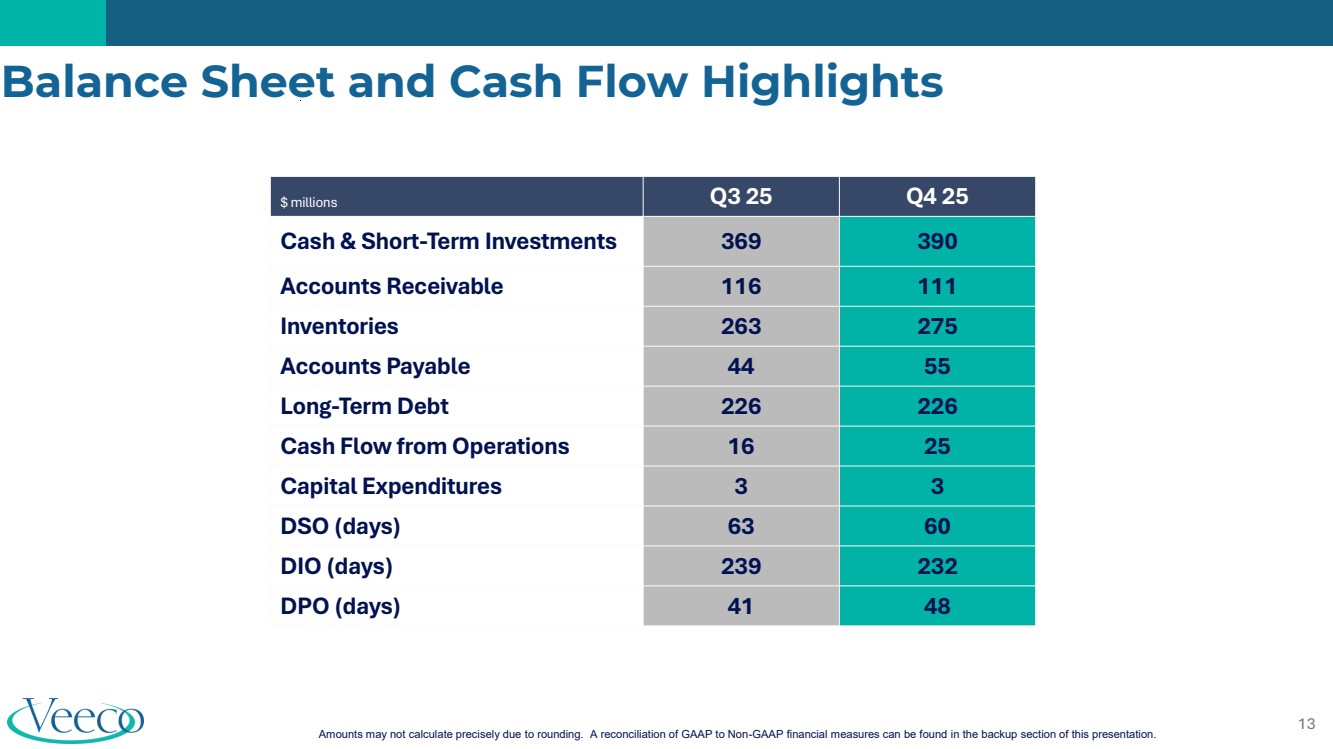
| 13 Amounts may not calculate precisely due to rounding. A reconciliation of GAAP to Non-GAAP financial measures can be found in the backup section of this presentation. Balance Sheet and Cash Flow Highlights $ millions Q3 25 Q4 25 Cash & Short-Term Investments 369 390 Accounts Receivable 116 111 Inventories 263 275 Accounts Payable 44 55 Long-Term Debt 226 226 Cash Flow from Operations 16 25 Capital Expenditures 3 3 DSO (days) 63 60 DIO (days) 239 232 DPO (days) 41 48 |
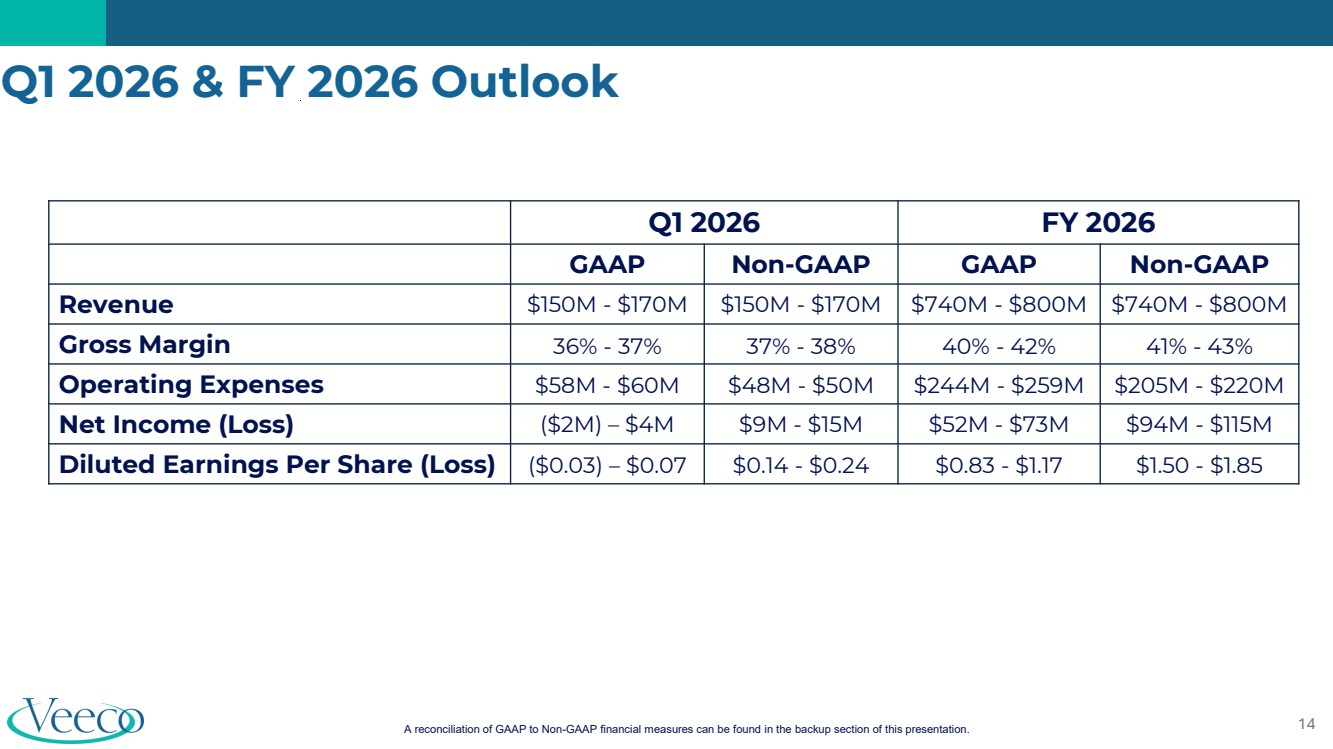
| 14 Q1 2026 & FY 2026 Outlook A reconciliation of GAAP to Non-GAAP financial measures can be found in the backup section of this presentation. Q1 2026 FY 2026 GAAP Non-GAAP GAAP Non-GAAP Revenue $150M - $170M $150M - $170M $740M - $800M $740M - $800M Gross Margin 36% - 37% 37% - 38% 40% - 42% 41% - 43% Operating Expenses $58M - $60M $48M - $50M $244M - $259M $205M - $220M Net Income (Loss) ($2M) – $4M $9M - $15M $52M - $73M $94M - $115M Diluted Earnings Per Share (Loss) ($0.03) – $0.07 $0.14 - $0.24 $0.83 - $1.17 $1.50 - $1.85 |
| Q&A 15 |

| Backup & Financial Tables 16 |

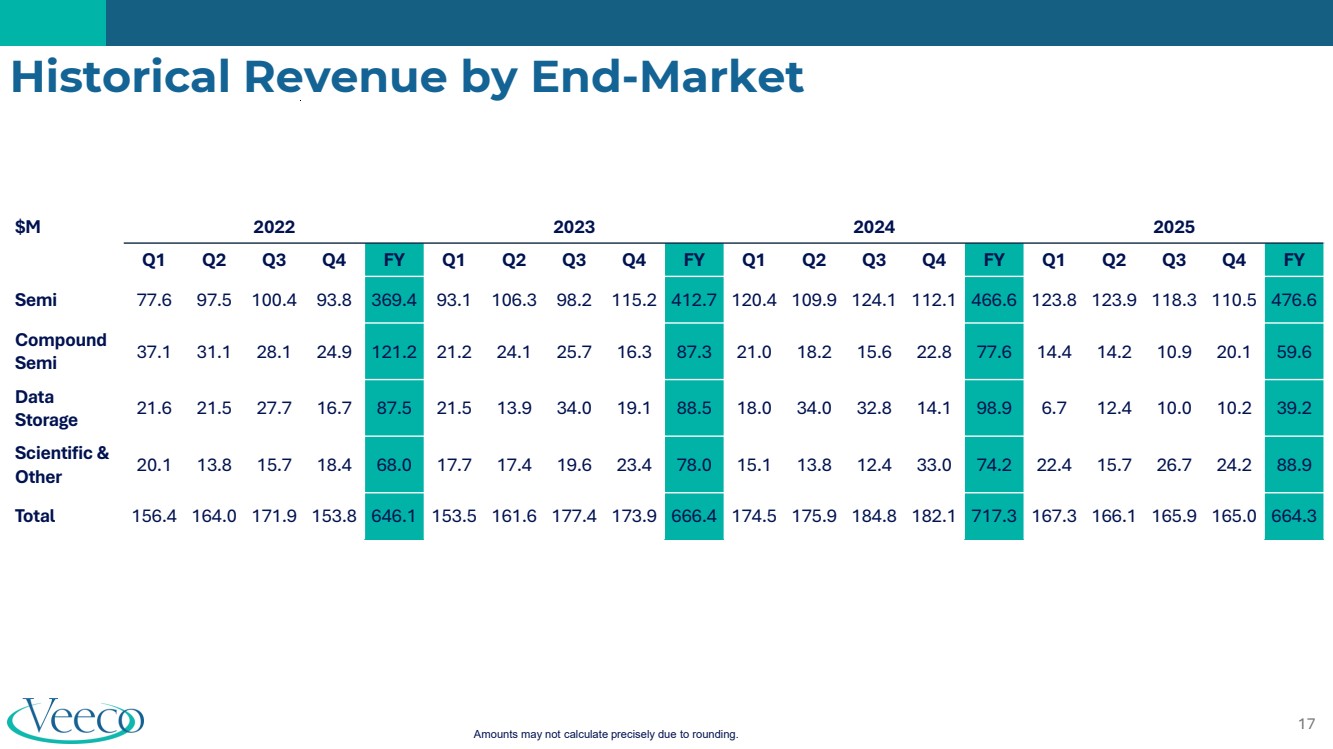
| 17 $M 2022 2023 2024 2025 Q1 Q2 Q3 Q4 FY Q1 Q2 Q3 Q4 FY Q1 Q2 Q3 Q4 FY Q1 Q2 Q3 Q4 FY Semi 77.6 97.5 100.4 93.8 369.4 93.1 106.3 98.2 115.2 412.7 120.4 109.9 124.1 112.1 466.6 123.8 123.9 118.3 110.5 476.6 Compound Semi 37.1 31.1 28.1 24.9 121.2 21.2 24.1 25.7 16.3 87.3 21.0 18.2 15.6 22.8 77.6 14.4 14.2 10.9 20.1 59.6 Data Storage 21.6 21.5 27.7 16.7 87.5 21.5 13.9 34.0 19.1 88.5 18.0 34.0 32.8 14.1 98.9 6.7 12.4 10.0 10.2 39.2 Scientific & Other 20.1 13.8 15.7 18.4 68.0 17.7 17.4 19.6 23.4 78.0 15.1 13.8 12.4 33.0 74.2 22.4 15.7 26.7 24.2 88.9 Total 156.4 164.0 171.9 153.8 646.1 153.5 161.6 177.4 173.9 666.4 174.5 175.9 184.8 182.1 717.3 167.3 166.1 165.9 165.0 664.3 Historical Revenue by End-Market Amounts may not calculate precisely due to rounding. |
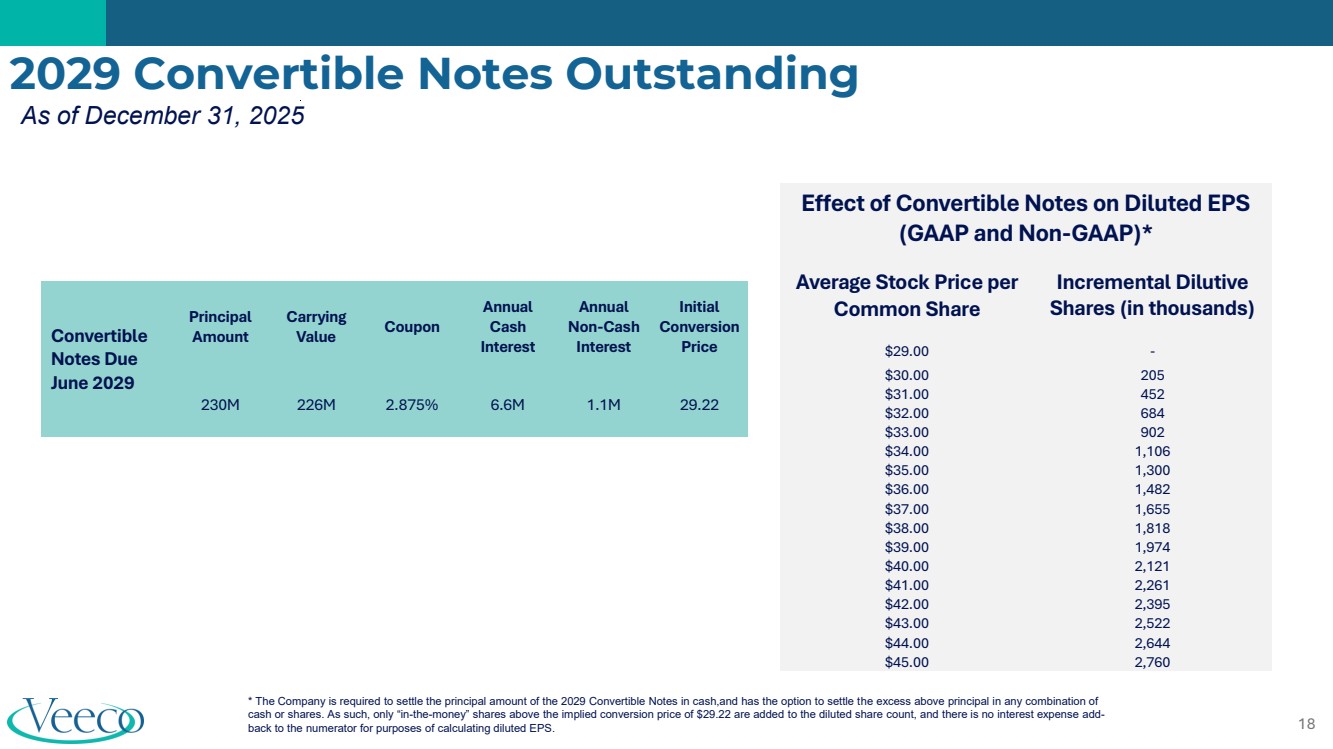
| 18 2029 Convertible Notes Outstanding Convertible Notes Due June 2029 Principal Amount Carrying Value Coupon Annual Cash Interest Annual Non-Cash Interest Initial Conversion Price 230M 226M 2.875% 6.6M 1.1M 29.22 As of December 31, 2025 * The Company is required to settle the principal amount of the 2029 Convertible Notes in cash,and has the option to settle the excess above principal in any combination of cash or shares. As such, only “in-the-money” shares above the implied conversion price of $29.22 are added to the diluted share count, and there is no interest expense add-back to the numerator for purposes of calculating diluted EPS. Effect of Convertible Notes on Diluted EPS (GAAP and Non-GAAP)* Average Stock Price per Common Share Incremental Dilutive Shares (in thousands) $29.00 - $30.00 205 $31.00 452 $32.00 684 $33.00 902 $34.00 1,106 $35.00 1,300 $36.00 1,482 $37.00 1,655 $38.00 1,818 $39.00 1,974 $40.00 2,121 $41.00 2,261 $42.00 2,395 $43.00 2,522 $44.00 2,644 $45.00 2,760 |
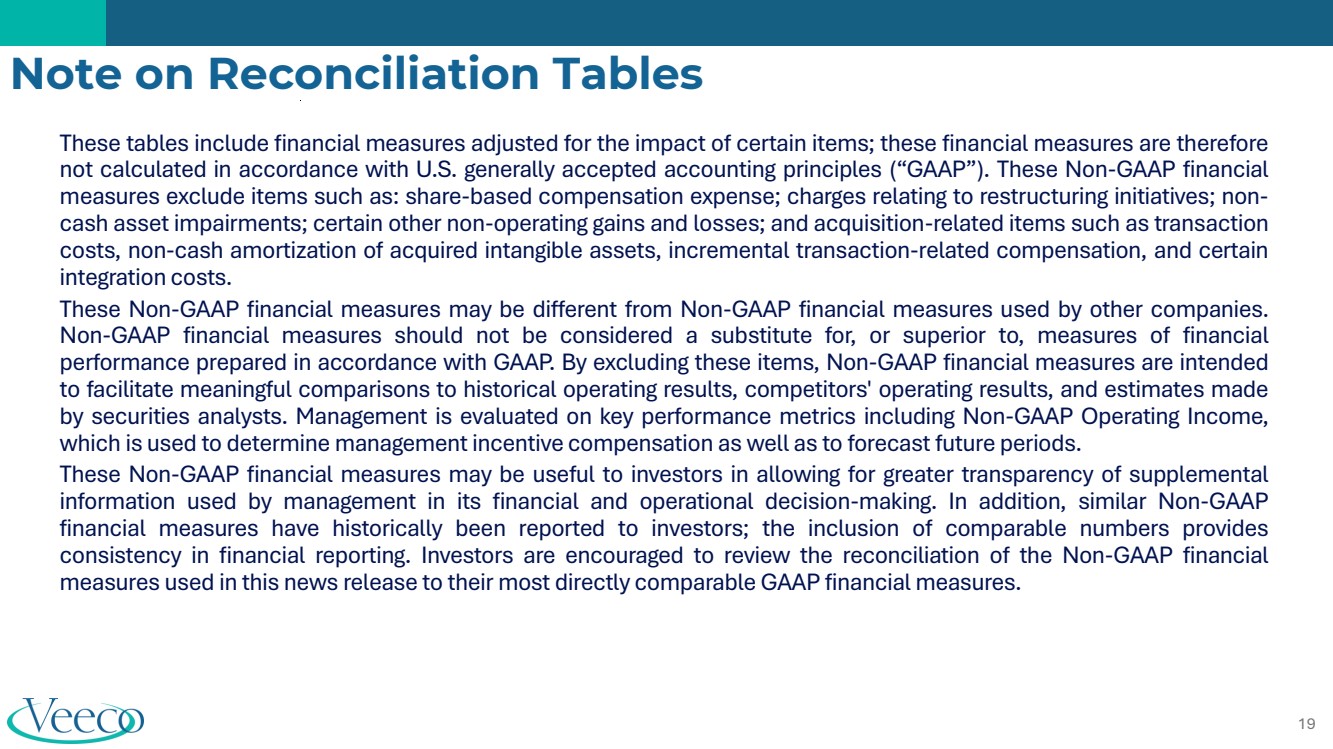
| 19 Note on Reconciliation Tables These tables include financial measures adjusted for the impact of certain items; these financial measures are therefore not calculated in accordance with U.S. generally accepted accounting principles (“GAAP”). These Non-GAAP financial measures exclude items such as: share-based compensation expense; charges relating to restructuring initiatives; non-cash asset impairments; certain other non-operating gains and losses; and acquisition-related items such as transaction costs, non-cash amortization of acquired intangible assets, incremental transaction-related compensation, and certain integration costs. These Non-GAAP financial measures may be different from Non-GAAP financial measures used by other companies. Non-GAAP financial measures should not be considered a substitute for, or superior to, measures of financial performance prepared in accordance with GAAP. By excluding these items, Non-GAAP financial measures are intended to facilitate meaningful comparisons to historical operating results, competitors' operating results, and estimates made by securities analysts. Management is evaluated on key performance metrics including Non-GAAP Operating Income, which is used to determine management incentive compensation as well as to forecast future periods. These Non-GAAP financial measures may be useful to investors in allowing for greater transparency of supplemental information used by management in its financial and operational decision-making. In addition, similar Non-GAAP financial measures have historically been reported to investors; the inclusion of comparable numbers provides consistency in financial reporting. Investors are encouraged to review the reconciliation of the Non-GAAP financial measures used in this news release to their most directly comparable GAAP financial measures. |
| Supplemental Information—GAAP to Non-GAAP Reconciliation $ millions Q3 25 Q4 25 2025 2024 Net sales $165.9 $165.0 $664.3 $717.3 GAAP gross profit 67.7 60.5 265.4 304.0 GAAP gross margin 40.8% 36.7% 40.0% 42.4% Add: Share-based comp 1.8 1.7 6.8 6.3 Add: Other - - - 0.2 Non-GAAP gross profit $69.5 $62.3 $272.3 $310.4 Non-GAAP gross margin 41.9% 37.7% 41.0% 43.3% $ millions Q3 25 Q4 25 2025 2024 GAAP Net income $10.6 $1.1 $35.4 $73.7 Add: Share-based comp 9.1 9.0 37.0 35.9 Add: Amortization 0.8 0.7 3.1 7.0 Add: Merger related expenses 2.6 6.3 8.9 - Add: Asset impairment - - - 28.1 Add: Changes in contingent consideration - (0.9) (0.9) (21.2) Add: Sale of productive assets - - - (2.0) Add: Other 0.1 - 1.1 1.4 Add: Interest expense (income) (1.3) (1.3) (4.3) (1.9) Add: Tax expense (benefit) 1.3 (1.2) 4.0 (4.9) Non-GAAP operating income $23.1 $13.8 $84.3 $116.1 $ millions, except per share amounts Q3 25 Q4 25 2025 2024 GAAP Basic weighted average shares 60.1 60.1 59.3 56.4 GAAP Diluted weighted average shares 61.0 61.5 60.6 61.6 GAAP Basic EPS $0.18 $0.02 $0.60 $1.31 GAAP Diluted EPS $0.17 $0.02 $0.59 $1.23 GAAP Net income $10.6 $1.1 $35.4 $73.7 Add: Share-based comp 9.1 9.0 37.0 35.9 Add: Amortization 0.8 0.7 3.1 7.0 Add: Merger related expenses 2.6 6.3 8.9 - Add: Asset impairment - - - 28.1 Add: Changes in contingent consideration - (0.9) (0.9) (21.2) Add: Sale of productive assets - - - (2.0) Add: Other 0.1 - 1.1 1.4 Add: Non-cash interest expense 0.3 0.3 1.1 1.3 Add: Tax benefit associated with asset impairments - - - (12.2) Add: Tax adjustment from GAAP to Non-GAAP (1.7) (1.8) (5.5) (7.5) Non-GAAP net income 21.8 14.7 80.2 104.3 Non-GAAP basic EPS $0.36 $0.24 $1.35 $1.85 Non-GAAP diluted EPS $0.36 $0.24 $1.33 $1.74 Non-GAAP basic weighted average shares 60.1 60.1 59.3 56.4 Non-GAAP diluted weighted average shares 61.0 61.5 60.5 61.2 $ millions Q3 25 Q4 25 2025 2024 GAAP operating expenses $57.1 $61.9 $229.7 $237.0 Share-based compensation (7.4) (7.3) (30.2) (29.6) Amortization (0.8) (0.7) (3.1) (7.0) Merger related expenses (2.6) (6.3) (8.9) - Changes in contingent consideration and other (0.1) 0.9 0.5 (6.1) Non-GAAP operating expenses $46.3 $48.5 $188.0 $194.4 Amounts may not calculate precisely due to rounding. |

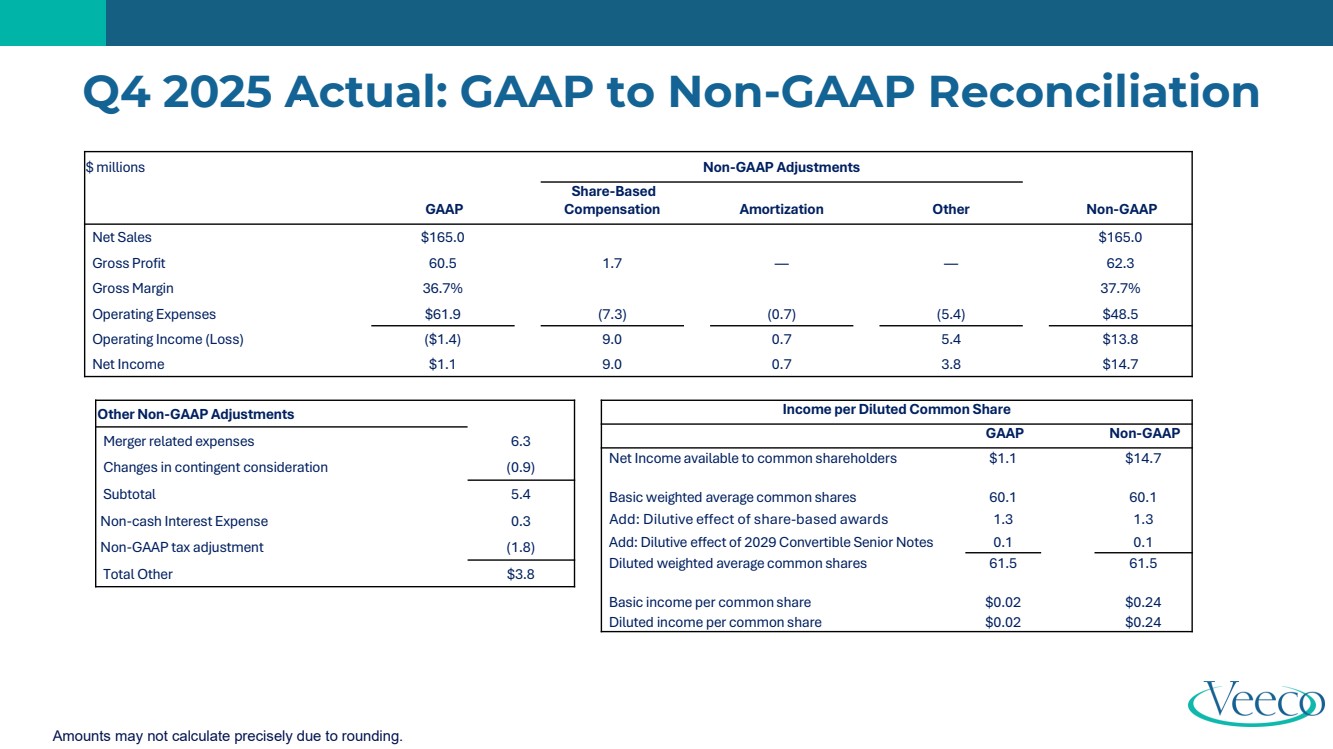
| $ millions Non-GAAP Adjustments GAAP Share-Based Compensation Amortization Other Non-GAAP Net Sales $165.0 $165.0 Gross Profit 60.5 1.7 — — 62.3 Gross Margin 36.7% 37.7% Operating Expenses $61.9 (7.3) (0.7) (5.4) $48.5 Operating Income (Loss) ($1.4) 9.0 0.7 5.4 $13.8 Net Income $1.1 9.0 0.7 3.8 $14.7 Q4 2025 Actual: GAAP to Non-GAAP Reconciliation Income per Diluted Common Share GAAP Non-GAAP Net Income available to common shareholders $1.1 $14.7 Basic weighted average common shares 60.1 60.1 Add: Dilutive effect of share-based awards 1.3 1.3 Add: Dilutive effect of 2029 Convertible Senior Notes 0.1 0.1 Diluted weighted average common shares 61.5 61.5 Basic income per common share $0.02 $0.24 Diluted income per common share $0.02 $0.24 Other Non-GAAP Adjustments Merger related expenses 6.3 Changes in contingent consideration (0.9) Subtotal 5.4 Non-cash Interest Expense 0.3 Non-GAAP tax adjustment (1.8) Total Other $3.8 Amounts may not calculate precisely due to rounding. |
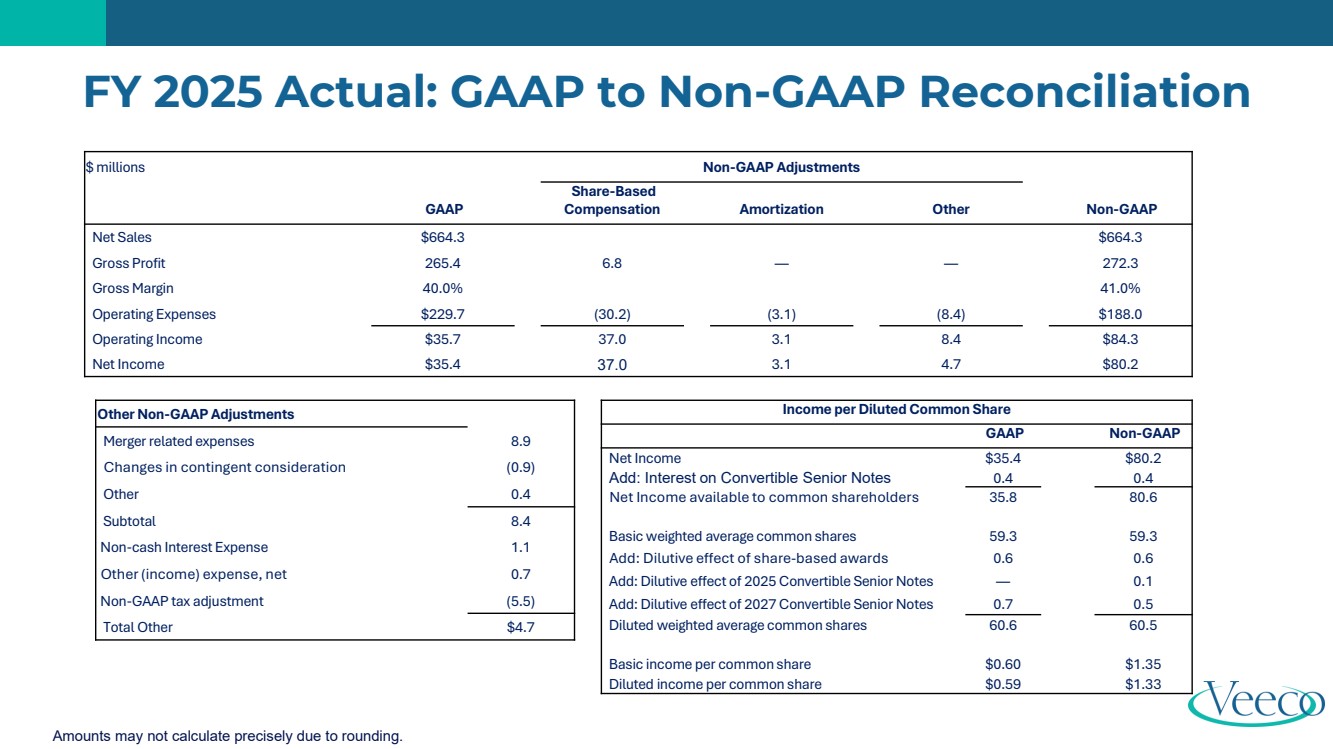
| $ millions Non-GAAP Adjustments GAAP Share-Based Compensation Amortization Other Non-GAAP Net Sales $664.3 $664.3 Gross Profit 265.4 6.8 — — 272.3 Gross Margin 40.0% 41.0% Operating Expenses $229.7 (30.2) (3.1) (8.4) $188.0 Operating Income $35.7 37.0 3.1 8.4 $84.3 Net Income $35.4 37.0 3.1 4.7 $80.2 FY 2025 Actual: GAAP to Non-GAAP Reconciliation Income per Diluted Common Share GAAP Non-GAAP Net Income $35.4 $80.2 Add: Interest on Convertible Senior Notes 0.4 0.4 Net Income available to common shareholders 35.8 80.6 Basic weighted average common shares 59.3 59.3 Add: Dilutive effect of share-based awards 0.6 0.6 Add: Dilutive effect of 2025 Convertible Senior Notes — 0.1 Add: Dilutive effect of 2027 Convertible Senior Notes 0.7 0.5 Diluted weighted average common shares 60.6 60.5 Basic income per common share $0.60 $1.35 Diluted income per common share $0.59 $1.33 Other Non-GAAP Adjustments Merger related expenses 8.9 Changes in contingent consideration (0.9) Other 0.4 Subtotal 8.4 Non-cash Interest Expense 1.1 Other (income) expense, net 0.7 Non-GAAP tax adjustment (5.5) Total Other $4.7 Amounts may not calculate precisely due to rounding. |
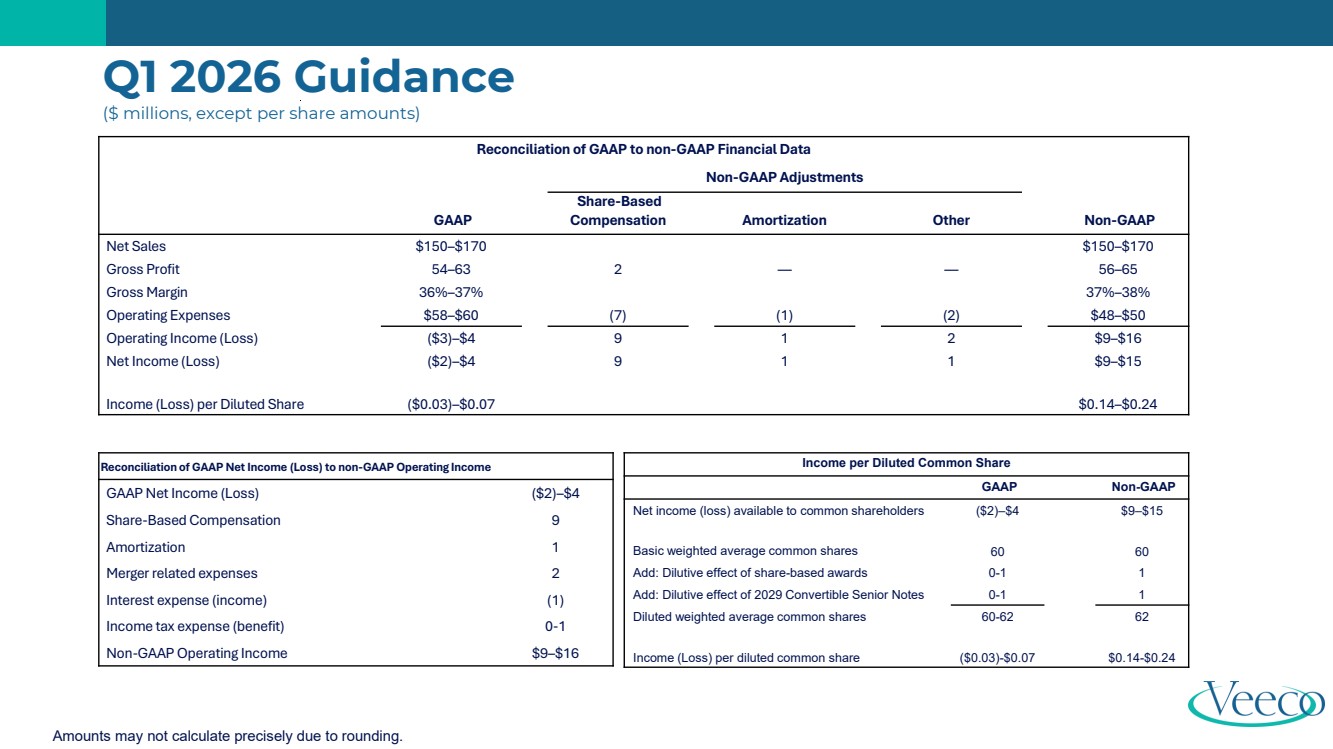
| Reconciliation of GAAP to non-GAAP Financial Data Non-GAAP Adjustments GAAP Share-Based Compensation Amortization Other Non-GAAP Net Sales $150–$170 $150–$170 Gross Profit 54–63 2 — — 56–65 Gross Margin 36%–37% 37%–38% Operating Expenses $58–$60 (7) (1) (2) $48–$50 Operating Income (Loss) ($3)–$4 9 1 2 $9–$16 Net Income (Loss) ($2)–$4 9 1 1 $9–$15 Income (Loss) per Diluted Share ($0.03)–$0.07 $0.14–$0.24 Q1 2026 Guidance ($ millions, except per share amounts) Reconciliation of GAAP Net Income (Loss) to non-GAAP Operating Income GAAP Net Income (Loss) ($2)–$4 Share-Based Compensation 9 Amortization 1 Merger related expenses 2 Interest expense (income) (1) Income tax expense (benefit) 0-1 Non-GAAP Operating Income $9–$16 Amounts may not calculate precisely due to rounding. Income per Diluted Common Share GAAP Non-GAAP Net income (loss) available to common shareholders ($2)–$4 $9–$15 Basic weighted average common shares 60 60 Add: Dilutive effect of share-based awards 0-1 1 Add: Dilutive effect of 2029 Convertible Senior Notes 0-1 1 Diluted weighted average common shares 60-62 62 Income (Loss) per diluted common share ($0.03)-$0.07 $0.14-$0.24 |
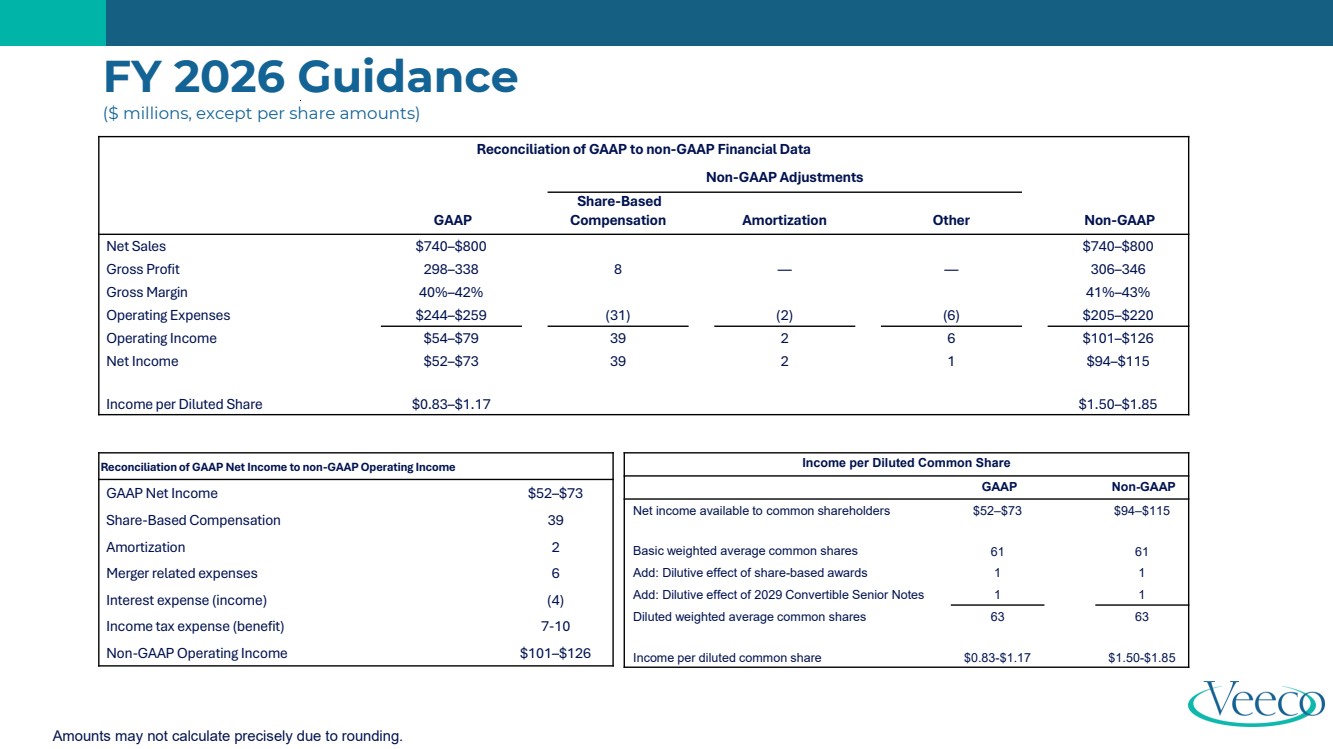
| Reconciliation of GAAP to non-GAAP Financial Data Non-GAAP Adjustments GAAP Share-Based Compensation Amortization Other Non-GAAP Net Sales $740–$800 $740–$800 Gross Profit 298–338 8 — — 306–346 Gross Margin 40%–42% 41%–43% Operating Expenses $244–$259 (31) (2) (6) $205–$220 Operating Income $54–$79 39 2 6 $101–$126 Net Income $52–$73 39 2 1 $94–$115 Income per Diluted Share $0.83–$1.17 $1.50–$1.85 FY 2026 Guidance ($ millions, except per share amounts) Reconciliation of GAAP Net Income to non-GAAP Operating Income GAAP Net Income $52–$73 Share-Based Compensation 39 Amortization 2 Merger related expenses 6 Interest expense (income) (4) Income tax expense (benefit) 7-10 Non-GAAP Operating Income $101–$126 Amounts may not calculate precisely due to rounding. Income per Diluted Common Share GAAP Non-GAAP Net income available to common shareholders $52–$73 $94–$115 Basic weighted average common shares 61 61 Add: Dilutive effect of share-based awards 1 1 Add: Dilutive effect of 2029 Convertible Senior Notes 1 1 Diluted weighted average common shares 63 63 Income per diluted common share $0.83-$1.17 $1.50-$1.85 |