
UNITED STATES
SECURITIES AND EXCHANGE COMMISSION
Washington, DC 20549
FORM 8-K
CURRENT REPORT
Pursuant to Section 13 OR 15(d) of
The Securities Exchange Act of 1934
January 23, 2008
Date of Report (Date of earliest event reported)
CAPITAL ONE FINANCIAL CORPORATION
(Exact name of registrant as specified in its chapter)
| Delaware | 1-13300 | 54-1719854 | ||
| (State or other jurisdiction of incorporation) |
(Commission File Number) |
(IRS Employer Identification No.) |
| 1680 Capital One Drive, McLean, Virginia |
22102 | |
| (Address of principal executive offices) | (Zip Code) |
Registrant’s telephone number, including area code: (703) 720-1000
(Former name or former address, if changed since last report)
Check the appropriate box below if the Form 8-K filing is intended to simultaneously satisfy the filing obligation of the registrant under any of the following provisions (see General Instruction A.2. below):
| ¨ | Written communications pursuant to Rule 425 under the Securities Act (17 CFR 230.425) |
| ¨ | Soliciting material pursuant to Rule 14a-12 under the Exchange Act (17 CFR 240.14a-12) |
| ¨ | Pre-commencement communications pursuant to Rule 14d-2(b) under the Exchange Act (17 CFR 240.14d-2(b)) |
| ¨ | Pre-commencement communications pursuant to Rule 13e-4(c) under the Exchange Act (17 CFR 240.13e-4(c)) |
| Item 2.02. | Results of Operations and Financial Condition |
On January 23, 2008, the Company issued a press release announcing its financial results for the fourth quarter ended December 31, 2007. A copy of the Company’s press release is attached and filed herewith as Exhibit 99.1 to this Form 8-K and is incorporated herein by reference.
The Company’s consolidated financial statements prepared in accordance with generally accepted accounting principles (“GAAP”) are referred to as its “reported” financial statements. Loans included in securitization transactions which qualified as sales under GAAP have been removed from the Company’s “reported” balance sheet. However, servicing fees, finance charges, and other fees, net of charge-offs, and interest paid to investors of securitizations are recognized as servicing and securitizations income on the “reported” income statement.
The Company’s “managed” consolidated financial statements reflect adjustments made related to effects of securitization transactions qualifying as sales under GAAP. The Company generates earnings from its “managed” loan portfolio which includes both the on-balance sheet loans and off-balance sheet loans. The Company’s “managed” income statement takes the components of the servicing and securitizations income generated from the securitized portfolio and distributes the revenue and expense to appropriate income statement line items from which it originated. For this reason the Company believes the “managed” consolidated financial statements and related managed metrics to be useful to stakeholders.
| Item 7.01. | Regulation FD Disclosure. |
The Company hereby furnishes the information in Exhibit 99.2 hereto, Fourth Quarter Earnings Presentation for the quarter ended December 31, 2007.
Note: Information in Exhibit 99.2 furnished pursuant to Item 7.01 shall not be deemed to be “filed” for the purposes of Section 18 of the Securities Exchange Act of 1934 or otherwise subject to the liabilities of that section. This report will not be deemed an admission as to the materiality of any information in the report that is required to be disclosed solely by Regulation FD. Furthermore, the information provided in Exhibit 99.2 shall not be deemed to be incorporated by reference into the filings of the Company under the Securities Act of 1933.
2
| Item 8.01. | Other Events. |
| (a) | See attached press release, at Exhibit 99.1. |
| (b) | Cautionary Factors. |
The attached press release and information provided pursuant to Items 2.02, 7.01 and 9.01 contain forward-looking statements, which involve a number of risks and uncertainties. The Company cautions readers that any forward-looking information is not a guarantee of future performance and that actual results could differ materially from those contained in the forward-looking information as a result of various factors including, but not limited to, the following:
| • | general economic and business conditions in the U.S. and or UK, including conditions affecting employment levels, interest rates, consumer income, spending and savings that may affect consumer bankruptcies, defaults, charge-offs, and deposit activity; |
| • | an increase or decrease in credit losses (including increases due to a worsening of general economic conditions in the credit environment); |
| • | continued intense competition from numerous providers of products and services which compete with the Company’s businesses; |
| • | the success, timeliness and financial impact of the Company’s restructuring initiative, including costs, cost savings and other benefits; |
| • | changes in interest rates; |
| • | the success of the Company’s marketing efforts; |
| • | the ability of the Company to continue to securitize its credit cards and consumer loans and to otherwise access the capital markets at attractive rates and terms to capitalize and fund its operations and future growth; |
| • | financial, legal, regulatory, accounting changes or actions that may affect investment in, or the overall performance of, a product or business; |
| • | with respect to financial and other products, changes in the Company’s aggregate loan balances and/or number of customers and the growth rate and composition thereof, including changes resulting from factors such as shifting product mix, amount of actual marketing expenses made by the Company and attrition of loan balances; |
| • | the amount of deposit growth; |
| • | general market conditions in the mortgage industry; |
| • | changes in the reputation of the credit card industry and/or the Company with respect to practices or products; |
| • | any significant disruption in our operations or technology platform; |
| • | the Company’s ability to maintain a compliance infrastructure suitable for its size and complexity; |
| • | the amount of, and rate of growth in, the Company’s expenses as the Company’s business develops or changes or as it expands into new market areas; |
| • | the ability of the Company to build the operational and organizational infrastructure necessary to engage in new businesses; |
| • | the Company’s ability to execute on its strategic and operational plans; |
| • | any significant disruption of, or loss of public confidence in, the United States Mail service affecting our response rates and consumer payments; |
| • | the ability of the Company to recruit and retain experienced personnel to assist in the management and operations of new products and services; |
| • | the risk that the businesses acquired by the Company will not be integrated successfully; |
| • | the risk that the cost savings and any other synergies from the acquisitions may not be fully realized or may take longer to realize than expected; |
| • | disruption from the acquisitions making it more difficult to maintain relationships with customers, employees or suppliers; and |
| • | other risk factors listed from time to time in the Company’s SEC reports including, but not limited to, the Annual Report on Form 10-K for the year ended December 31, 2006 and the Quarterly Reports on Form 10-Q and Form 10-Q/A for the quarters ended March 31, 2007, June 30, 2007 and September 30, 2007. |
3
| Item 9.01. | Financial Statements, Pro Forma Financial Information and Exhibits. |
| (c) | Exhibits. |
| Exhibit No. | Description of Exhibit | |
| 99.1 | Press release, dated January 23, 2008. | |
| 99.2 | Fourth Quarter Earnings Presentation. |
Earnings Conference Call Webcast Information.
Capital One will hold an earnings conference call on January 23, 2008, 5:00 PM Eastern time. The conference call will be accessible through live webcast. Interested investors and other interested individuals can access the webcast via Capital One’s home page (http://www.capitalone.com). Choose “Investors” to access the Investor Center and view and/or download the earnings press release, a reconciliation to GAAP financial measures and other relevant financial information. The replay of the webcast will be archived on Capital One’s website through March 31, 2008.
SIGNATURE
Pursuant to the requirements of the Securities Exchange Act of 1934, the Company has duly caused this Current Report on Form 8-K to be signed on its behalf by the undersigned, hereunto duly authorized.
| CAPITAL ONE FINANCIAL CORPORATION | ||||
| Dated: January 23, 2008 | By: | /s/ GARY L. PERLIN | ||
| Gary L. Perlin Chief Financial Officer | ||||
5
Exhibit 99.1
CAPITAL ONE FINANCIAL CORPORATION (COF)
FINANCIAL & STATISTICAL SUMMARY
REPORTED BASIS
| 2007 | 2007 | 2007 | 2007 | 2006 | ||||||||||||||||
| (in millions, except per share data and as noted) |
Q4 | Q3 (17) | Q2 | Q1 | Q4 | |||||||||||||||
| Earnings (Reported Basis) |
||||||||||||||||||||
| Net Interest Income |
$ | 1,762.3 | $ | 1,624.5 | $ | 1,538.6 | (8) | $ | 1,604.5 | $ | 1,393.0 | |||||||||
| Non-Interest Income |
2,158.3 | (16) | 2,149.7 | 1,971.9 | 1,774.4 | (11) | 1,671.5 | |||||||||||||
| Total Revenue (1) |
3,920.6 | 3,774.2 | 3,510.5 | 3,378.9 | 3,064.5 | |||||||||||||||
| Provision for Loan Losses |
1,294.2 | 595.5 | 396.7 | 350.0 | 513.2 | |||||||||||||||
| Marketing Expenses |
358.2 | 332.7 | 326.1 | 330.9 | 395.4 | |||||||||||||||
| Restructuring Expenses (2) |
27.8 | 19.4 | 91.1 | — | — | |||||||||||||||
| Operating Expenses |
1,749.2 | (3),(4) | 1,582.2 | (3) | 1,617.4 | (3),(9) | 1,643.2 | (3) | 1,567.3 | |||||||||||
| Income Before Taxes |
491.2 | 1,244.4 | 1,079.2 | 1,054.8 | 588.6 | |||||||||||||||
| Tax Rate (5) |
34.5 | % | 34.4 | % | 28.9 | % | 35.0 | % | 31.6 | % | ||||||||||
| Income From Continuing Operations, Net of Tax |
$ | 321.6 | $ | 816.4 | $ | 767.6 | $ | 686.1 | $ | 402.6 | ||||||||||
| Loss From Discontinued Operations, Net of Tax (6) |
(95.0 | ) | (898.0 | ) | (17.2 | ) | (11.1 | ) | (11.9 | ) | ||||||||||
| Net Income (Loss) |
$ | 226.6 | $ | (81.6 | ) | $ | 750.4 | $ | 675.0 | $ | 390.7 | |||||||||
| Common Share Statistics |
||||||||||||||||||||
| Basic EPS: |
||||||||||||||||||||
| Income From Continuing Operations |
$ | 0.85 | $ | 2.11 | $ | 1.96 | $ | 1.68 | $ | 1.20 | ||||||||||
| Loss From Discontinued Operations |
$ | (0.25 | ) | $ | (2.32 | ) | $ | (0.04 | ) | $ | (0.03 | ) | $ | (0.04 | ) | |||||
| Net Income (Loss) |
$ | 0.60 | $ | (0.21 | ) | $ | 1.92 | $ | 1.65 | $ | 1.16 | |||||||||
| Diluted EPS: |
||||||||||||||||||||
| Income From Continuing Operations |
$ | 0.85 | $ | 2.09 | $ | 1.93 | $ | 1.65 | $ | 1.17 | ||||||||||
| Loss From Discontinued Operations |
$ | (0.25 | ) | $ | (2.30 | ) | $ | (0.04 | ) | $ | (0.03 | ) | $ | (0.03 | ) | |||||
| Net Income (Loss) |
$ | 0.60 | $ | (0.21 | ) | $ | 1.89 | $ | 1.62 | $ | 1.14 | |||||||||
| Dividends Per Share |
$ | 0.03 | $ | 0.03 | $ | 0.03 | $ | 0.03 | $ | 0.03 | ||||||||||
| Tangible Book Value Per Share (period end) |
$ | 29.02 | $ | 28.88 | $ | 29.11 | $ | 29.76 | $ | 27.95 | ||||||||||
| Stock Price Per Share (period end) |
$ | 47.26 | $ | 66.43 | $ | 78.44 | $ | 75.46 | $ | 76.82 | ||||||||||
| Total Market Capitalization (period end) |
$ | 17,613.8 | $ | 25,602.1 | $ | 30,701.4 | $ | 31,112.2 | $ | 31,488.5 | ||||||||||
| Shares Outstanding (period end) |
372.7 | 385.4 | 391.4 | 412.3 | 409.9 | |||||||||||||||
| Shares Used to Compute Basic EPS |
375.6 | 386.1 | 390.8 | 408.7 | 336.5 | |||||||||||||||
| Shares Used to Compute Diluted EPS |
378.4 | 390.8 | 397.5 | 415.5 | 343.8 | |||||||||||||||
| Reported Balance Sheet Statistics (period average) (7) |
||||||||||||||||||||
| Average Loans Held for Investment |
$ | 97,785 | $ | 91,745 | $ | 91,145 | $ | 93,466 | $ | 74,738 | ||||||||||
| Average Earning Assets |
$ | 127,242 | $ | 118,354 | $ | 119,430 | $ | 120,766 | $ | 97,849 | ||||||||||
| Average Assets |
$ | 150,926 | $ | 143,291 | $ | 142,690 | $ | 143,130 | $ | 111,440 | ||||||||||
| Average Interest Bearing Deposits |
$ | 72,312 | $ | 73,555 | $ | 75,218 | $ | 74,867 | $ | 53,735 | ||||||||||
| Total Average Deposits |
$ | 84,051 | $ | 84,884 | $ | 86,719 | $ | 86,237 | $ | 60,382 | ||||||||||
| Average Equity |
$ | 24,733 | $ | 25,344 | $ | 25,128 | $ | 25,610 | $ | 18,311 | ||||||||||
| Return on Average Assets (ROA) |
0.85 | % | 2.28 | % | 2.15 | % | 1.92 | % | 1.45 | % | ||||||||||
| Return on Average Equity (ROE) |
5.20 | % | 12.89 | % | 12.22 | % | 10.72 | % | 8.79 | % | ||||||||||
| Reported Balance Sheet Statistics (period end) (7) |
||||||||||||||||||||
| Loans Held for Investment |
$ | 101,805 | $ | 93,789 | $ | 90,930 | $ | 90,869 | $ | 96,512 | ||||||||||
| Total Assets |
$ | 150,202 | $ | 143,884 | $ | 141,917 | $ | 143,832 | $ | 144,361 | ||||||||||
| Interest Bearing Deposits |
$ | 71,944 | $ | 72,503 | $ | 74,444 | $ | 76,306 | $ | 74,123 | ||||||||||
| Total Deposits |
$ | 82,990 | $ | 83,343 | $ | 85,680 | $ | 87,664 | $ | 85,771 | ||||||||||
| Performance Statistics (Reported) (7) |
||||||||||||||||||||
| Net Interest Income Growth (annualized) |
34 | % | 22 | % | (16 | )% | 61 | % | 30 | % | ||||||||||
| Non Interest Income Growth (annualized) |
2 | % | 36 | % | 45 | % | 25 | % | (20 | )% | ||||||||||
| Revenue Growth (annualized) |
16 | % | 30 | % | 16 | % | 41 | % | 1 | % | ||||||||||
| Net Interest Margin |
5.54 | % | 5.49 | % | 5.15 | % | 5.31 | % | 5.69 | % | ||||||||||
| Revenue Margin |
12.32 | % | 12.76 | % | 11.76 | % | 11.19 | % | 12.53 | % | ||||||||||
| Risk Adjusted Margin (12) |
10.28 | % | 11.13 | % | 10.41 | % | 9.77 | % | 10.72 | % | ||||||||||
| Non Interest Expense as a % of Average Loans Held for Investment (annualized) |
8.73 | % | 8.43 | % | 8.93 | % | 8.45 | % | 10.50 | % | ||||||||||
| Efficiency Ratio (13) |
53.75 | % | 50.74 | % | 55.36 | % | 58.42 | % | 64.05 | % | ||||||||||
| Asset Quality Statistics (Reported) (7) |
||||||||||||||||||||
| Allowance |
$ | 2,963 | $ | 2,237 | $ | 2,113 | $ | 2,105 | $ | 2,180 | ||||||||||
| Allowance as a % of Reported Loans Held for Investment |
2.91 | % | 2.39 | % | 2.32 | % | 2.32 | % | 2.26 | % | ||||||||||
| Net Charge-Offs |
$ | 650 | $ | 480 | $ | 401 | $ | 430 | $ | 443 | ||||||||||
| Net Charge-Off Rate |
2.66 | % | 2.09 | % | 1.76 | %(10) | 1.84 | % | 2.37 | % | ||||||||||
| Full-time equivalent employees (in thousands) |
27.0 | 27.5 | 29.5 | 30.8 | 31.1 | |||||||||||||||
1
CAPITAL ONE FINANCIAL CORPORATION (COF)
FINANCIAL & STATISTICAL SUMMARY
MANAGED BASIS (*)
| 2007 | 2007 | 2007 | 2007 | 2006 | ||||||||||||||||
| (in millions) |
Q4 | Q3 (17) | Q2 | Q1 | Q4 | |||||||||||||||
| Earnings (Managed Basis) |
||||||||||||||||||||
| Net Interest Income |
$ | 3,000.5 | $ | 2,803.4 | $ | 2,613.3 | (8) | $ | 2,602.5 | $ | 2,339.1 | |||||||||
| Non-Interest Income |
1,566.2 | (16) | 1,518.0 | 1,387.5 | 1,294.1 | (11) | 1,210.3 | |||||||||||||
| Total Revenue (1) |
4,566.7 | 4,321.4 | 4,000.8 | 3,896.6 | 3,549.4 | |||||||||||||||
| Provision for Loan Losses |
1,940.3 | 1,142.7 | 887.1 | 867.7 | 998.1 | |||||||||||||||
| Marketing Expenses |
358.2 | 332.7 | 326.1 | 330.9 | 395.4 | |||||||||||||||
| Restructuring Expenses (2) |
27.8 | 19.4 | 91.1 | — | — | |||||||||||||||
| Operating Expenses |
1,749.2 | (3),(4) | 1,582.2 | (3) | 1,617.4 | (3),(9) | 1,643.2 | (3) | 1,567.3 | |||||||||||
| Income Before Taxes |
491.2 | 1,244.4 | 1,079.1 | 1,054.8 | 588.6 | |||||||||||||||
| Tax Rate (5) |
34.5 | % | 34.4 | % | 28.9 | % | 35.0 | % | 31.6 | % | ||||||||||
| Income From Continuing Operations, Net of Tax |
$ | 321.6 | $ | 816.4 | $ | 767.6 | $ | 686.1 | $ | 402.6 | ||||||||||
| Loss From Discontinued Operations, Net of Tax (6) |
(95.0 | ) | (898.0 | ) | (17.2 | ) | (11.1 | ) | (11.9 | ) | ||||||||||
| Net Income (Loss) |
$ | 226.6 | $ | (81.6 | ) | $ | 750.4 | $ | 675.0 | $ | 390.7 | |||||||||
| Managed Balance Sheet Statistics (period average) (7) |
||||||||||||||||||||
| Average Loans Held for Investment |
$ | 148,362 | $ | 143,781 | $ | 142,616 | $ | 144,113 | $ | 123,902 | ||||||||||
| Average Earning Assets |
$ | 175,652 | $ | 168,238 | $ | 168,841 | $ | 169,358 | $ | 145,113 | ||||||||||
| Average Assets |
$ | 200,658 | $ | 194,528 | $ | 193,446 | $ | 193,034 | $ | 159,947 | ||||||||||
| Return on Average Assets (ROA) |
0.64 | % | 1.68 | % | 1.59 | % | 1.42 | % | 1.01 | % | ||||||||||
| Managed Balance Sheet Statistics (period end) (7) |
||||||||||||||||||||
| Loans Held for Investment |
$ | 151,362 | $ | 144,769 | $ | 143,498 | $ | 142,005 | $ | 146,151 | ||||||||||
| Total Assets |
$ | 198,908 | $ | 194,019 | $ | 193,682 | $ | 194,252 | $ | 193,267 | ||||||||||
| Tangible Assets(14) |
$ | 185,428 | $ | 180,363 | $ | 179,888 | $ | 180,501 | $ | 179,487 | ||||||||||
| Tangible Common Equity (15) |
$ | 10,814 | $ | 11,131 | $ | 11,393 | $ | 12,270 | $ | 11,455 | ||||||||||
| Tangible Common Equity to Tangible Assets Ratio |
5.83 | % | 6.17 | % | 6.33 | % | 6.80 | % | 6.38 | % | ||||||||||
| % Off-Balance Sheet Securitizations |
33 | % | 35 | % | 37 | % | 36 | % | 34 | % | ||||||||||
| Performance Statistics (Managed) (7) |
||||||||||||||||||||
| Net Interest Income Growth (annualized) |
28 | % | 29 | % | 2 | % | 45 | % | 22 | % | ||||||||||
| Non Interest Income Growth (annualized) |
13 | % | 38 | % | 29 | % | 28 | % | (20 | )% | ||||||||||
| Revenue Growth (annualized) |
23 | % | 32 | % | 11 | % | 39 | % | 6 | % | ||||||||||
| Net Interest Margin |
6.83 | % | 6.67 | % | 6.19 | % | 6.15 | % | 6.45 | % | ||||||||||
| Revenue Margin |
10.40 | % | 10.27 | % | 9.48 | % | 9.20 | % | 9.78 | % | ||||||||||
| Risk Adjusted Margin (12) |
7.45 | % | 7.83 | % | 7.37 | % | 6.97 | % | 7.23 | % | ||||||||||
| Non Interest Expense as a % of Average Loans Held for Investment (annualized) |
5.76 | % | 5.38 | % | 5.71 | % | 5.48 | % | 6.34 | % | ||||||||||
| Efficiency Ratio (13) |
46.15 | % | 44.31 | % | 48.58 | % | 50.66 | % | 55.30 | % | ||||||||||
| Asset Quality Statistics (Managed) (7) |
||||||||||||||||||||
| Net Charge-Offs |
$ | 1,296 | $ | 1,027 | $ | 891 | $ | 947 | $ | 927 | ||||||||||
| Net Charge-Off Rate |
3.49 | % | 2.86 | % | 2.50 | %(10) | 2.63 | % | 2.99 | % | ||||||||||
| (*) | The information in this statistical summary reflects the adjustment to add back the effect of securitization transactions qualifying as sales under generally accepted accounting principles. See accompanying schedule—“Reconciliation to GAAP Financial Measures”. |
2
CAPITAL ONE FINANCIAL CORPORATION (COF)
FINANCIAL & STATISTICAL SUMMARY NOTES
| (1) | In accordance with the Company's finance charge and fee revenue recognition policy, the amounts billed to customers but not recognized as revenue were as follows: Q4 2007—$379.4 million, Q3 2007—$310.5 million, Q2 2007—$236.3 million, Q1 2007—$213.6 million, and Q4 2006—$248.3 million. |
| (2) | During the second quarter of 2007, the Company announced a broad-based initiative to reduce expenses and improve its competitive cost position. As part of this initiative $27.8 million, $19.4 million and $91.1 million of restructuring charges were recognized as part of continuing operations during Q4 2007, Q3 2007 and Q2 2007, respectively. |
| (3) | Includes core deposit intangible amortization expense of $51.1 million in Q4 2007, $52.4 million in Q3 2007, $53.7 million in Q2 2007 and $55.0 million in Q1 2007, and integration costs of $28.6 million in Q4 2007, $30.3 million in Q3 2007, $24.5 million in Q2 2007 and $14.6 million in Q1 2007. |
| (4) | The Company recognized a pre-tax charge in the fourth quarter of approximately $80 million for liabilities in connection with the Visa antitrust lawsuit settlement with American Express. Additionally, the company has initiated a legal reserve of approximately $60 million for estimated possible damages in connection with other pending Visa litigation, reflecting Capital One’s share of such potential damages as a Visa member. |
| (5) | Includes a $69.0 million benefit in Q2 2007 resulting from changes in the Company’s international tax position and tax benefits from resolution of tax issues. Miscellaneous tax adjustments in other prior periods as follows: Q1 2007—$11.7 million and Q4 2006—$28.8 million. |
| (6) | In Q3 2007, the Company shutdown the mortgage origination operations of its wholesale mortgage banking unit, GreenPoint Mortgage, realizing an after-tax loss of $898.0 million. The results of the mortgage origination operation of GreenPoint have been accounted for as a discontinued operation and have been removed from the Company's results of continuing operations for all periods presented. The results of GreenPoint's mortgage servicing business are reported in continuing operations for all periods presented. Effective Q4 2007, GreenPoint's held for investment commercial and consumer loan portfolio results are included in continuing operations. |
| (7) | Based on continuing operations. Average equity and return on equity are based on the Company's stockholder's equity. |
| (8) | Includes a $17.4 million gain from the early extinguishment of Trust Preferred Securities in Q2 2007 included as a component of Interest expense. |
| (9) | Includes a charge of $39.8 million as a result of the accelerated vesting of equity awards made in connection with the transition of the management team for Capital One’s Banking business following the acquisition of North Fork acquisition. |
| (10) | Managed and reported net charge-off rate for Q2 2007 was positively impacted 11 and 17 basis points, respectively, due to the implementation of a change in customer statement generation from 30 to 25 days grace. The change did not have a material impact on Net Provision for Q2 2007. |
| (11) | Includes a $46.2 million gain resulting from the sale of a 7% stake in the privately held company, DealerTrack Holding Inc., a leading provider of on-demand software and data solutions for the automotive retail industry in Q1 2007. |
| (12) | Risk adjusted margin is total revenue less net charge-offs as a percentage of average earning assets. |
| (13) | Efficiency ratio is Non-interest expense less restructuring expense divided by total revenue. |
| (14) | Tangible assets include managed assets less intangible assets. |
| (15) | Includes stockholders’ equity and preferred interests less intangible assets and related deferred tax liability. Tangible Common Equity on a reported and managed basis is the same. |
| (16) | During the fourth quarter 2007, the Company completed the sale of its interest in a relationship agreement to develop and market consumer credit products in the Spanish Market and recorded a gain related to this sale of approximately $30 million in non-interest income. |
| (17) | Certain prior period amounts have been reclassified to conform with current period presentation. |
3
CAPITAL ONE FINANCIAL CORPORATION (COF)
SEGMENT FINANCIAL & STATISTICAL SUMMARY FOR CONTINUING OPERATIONS
MANAGED BASIS (1)
| (in thousands) |
2007 Q4 |
2007 Q3 (8) |
2007 Q2 |
2007 Q1 |
2006 Q4 |
|||||||||||||||
| Local Banking: (3) |
| |||||||||||||||||||
| Interest Income |
$ | 1,702,252 | $ | 1,744,038 | $ | 1,724,239 | $ | 1,740,132 | $ | 721,102 | ||||||||||
| Interest Expense |
1,119,738 | 1,161,758 | 1,139,774 | 1,166,563 | 476,523 | |||||||||||||||
| Net interest income |
$ | 582,514 | $ | 582,280 | $ | 584,465 | $ | 573,569 | $ | 244,579 | ||||||||||
| Non-interest income |
192,342 | 195,204 | 210,581 | 200,141 | 112,021 | |||||||||||||||
| Provision for loan losses |
42,665 | (58,285 | ) | 23,929 | 23,776 | (21,549 | ) | |||||||||||||
| Other non-interest expenses |
561,812 | 543,390 | 548,462 | 554,598 | 307,810 | |||||||||||||||
| Income tax provision |
58,610 | 101,783 | 77,821 | 68,339 | 24,619 | |||||||||||||||
| Net income |
$ | 111,769 | $ | 190,596 | $ | 144,834 | $ | 126,997 | $ | 45,720 | ||||||||||
| Loans Held for Investment |
$ | 43,972,795 | $ | 42,233,665 | $ | 41,919,645 | $ | 41,642,594 | $ | 12,145,533 | ||||||||||
| Average Loans Held for Investment |
$ | 43,128,767 | $ | 41,992,618 | $ | 42,110,537 | $ | 41,846,678 | $ | 13,330,876 | ||||||||||
| Core Deposits(2) |
$ | 63,206,923 | $ | 62,712,373 | $ | 63,828,306 | $ | 62,962,395 | $ | 27,071,324 | ||||||||||
| Total Deposits |
$ | 73,318,570 | $ | 73,013,351 | $ | 74,482,705 | $ | 74,509,054 | $ | 35,334,610 | ||||||||||
| Loans Held for Investment Yield |
7.02 | % | 7.13 | % | 7.03 | % | 6.99 | % | 7.98 | % | ||||||||||
| Net Interest Margin—Loans (4) |
1.87 | % | 1.79 | % | 1.88 | % | 1.91 | % | 3.21 | % | ||||||||||
| Net Interest Margin—Deposits (5) |
2.04 | % | 2.08 | % | 2.01 | % | 1.98 | % | 1.50 | % | ||||||||||
| Efficiency Ratio (7) |
72.51 | % | 69.89 | % | 68.98 | % | 71.68 | % | 86.32 | % | ||||||||||
| Net charge-off rate |
0.28 | % | 0.19 | % | 0.19 | % | 0.15 | % | 0.40 | % | ||||||||||
| Non Performing Loans |
$ | 178,385 | $ | 112,794 | $ | 80,781 | $ | 80,162 | $ | 57,824 | ||||||||||
| Non Performing Loans as a % of Loans Held for Investment |
0.41 | % | 0.27 | % | 0.19 | % | 0.19 | % | 0.48 | % | ||||||||||
| Non-Interest Expenses as a % of Average Loans Held for Investment |
5.21 | % | 5.18 | % | 5.21 | % | 5.30 | % | 9.24 | % | ||||||||||
| Number of Active ATMs |
1,288 | 1,282 | 1,253 | 1,236 | 661 | |||||||||||||||
| Number of locations |
742 | 732 | 724 | 723 | 358 | |||||||||||||||
| National Lending: |
| |||||||||||||||||||
| Interest Income |
$ | 3,675,528 | $ | 3,511,878 | $ | 3,261,042 | $ | 3,254,596 | $ | 3,182,013 | ||||||||||
| Interest Expense |
1,235,080 | 1,232,115 | 1,197,106 | 1,184,284 | 1,163,106 | |||||||||||||||
| Net interest income |
$ | 2,440,448 | $ | 2,279,763 | $ | 2,063,936 | $ | 2,070,312 | $ | 2,018,907 | ||||||||||
| Non-interest income |
1,384,315 | 1,312,146 | 1,177,139 | 1,138,499 | 1,105,240 | |||||||||||||||
| Provision for loan losses |
1,777,327 | 1,196,087 | 869,149 | 849,216 | 1,010,837 | |||||||||||||||
| Other non-interest expenses |
1,389,840 | 1,367,607 | 1,366,282 | 1,422,169 | 1,534,523 | |||||||||||||||
| Income tax provision |
224,802 | 352,847 | 346,547 | 322,877 | 205,768 | |||||||||||||||
| Net income |
$ | 432,794 | $ | 675,368 | $ | 659,097 | $ | 614,549 | $ | 373,019 | ||||||||||
| Loans Held for Investment |
$ | 106,508,443 | $ | 102,556,271 | $ | 101,590,039 | $ | 100,371,532 | $ | 102,359,180 | ||||||||||
| Average Loans Held for Investment |
$ | 104,321,485 | $ | 101,805,584 | $ | 100,520,138 | $ | 102,276,581 | $ | 99,881,480 | ||||||||||
| Core Deposits(2) |
$ | 1,599 | $ | 470 | $ | 1,124 | $ | 3,212 | $ | 6,061 | ||||||||||
| Total Deposits |
$ | 2,050,861 | $ | 2,295,131 | $ | 2,411,435 | $ | 2,409,291 | $ | 2,383,902 | ||||||||||
| Loans Held for Investment Yield |
14.07 | % | 13.77 | % | 12.95 | % | 12.70 | % | 12.72 | % | ||||||||||
| Net Interest Margin |
9.36 | % | 8.96 | % | 8.21 | % | 8.10 | % | 8.09 | % | ||||||||||
| Revenue Margin |
14.67 | % | 14.11 | % | 12.90 | % | 12.55 | % | 12.51 | % | ||||||||||
| Risk Adjusted Margin |
9.94 | % | 10.15 | % | 9.43 | % | 8.90 | % | 8.88 | % | ||||||||||
| Non-Interest Expenses as a % of Average Loans Held for Investment |
5.33 | % | 5.37 | % | 5.44 | % | 5.56 | % | 6.15 | % | ||||||||||
| Efficiency Ratio (7) |
36.34 | % | 38.07 | % | 42.16 | % | 44.32 | % | 49.12 | % | ||||||||||
| Net charge-off rate |
4.73 | % | 3.96 | % | 3.47 | %(6) | 3.65 | % | 3.63 | % | ||||||||||
| Delinquency Rate (30+ days) |
5.17 | % | 4.70 | % | 3.89 | % | 3.63 | % | 4.09 | % | ||||||||||
| Number of Loan Accounts (000s) |
48,537 | 48,473 | 48,536 | 48,668 | 49,374 | |||||||||||||||
| Other: (3) |
| |||||||||||||||||||
| Net interest income |
$ | (22,449 | ) | $ | (58,605 | ) | $ | (35,056 | ) | $ | (41,427 | ) | $ | 75,586 | ||||||
| Non-interest income |
(10,425 | ) | 10,639 | (249 | ) | (44,564 | ) | (6,915 | ) | |||||||||||
| Provision for loan losses |
120,376 | 5,023 | (5,981 | ) | (5,330 | ) | 8,840 | |||||||||||||
| Restructuring expenses |
27,809 | 19,354 | 91,074 | — | — | |||||||||||||||
| Other non-interest expenses |
155,746 | 3,870 | 28,717 | (2,720 | ) | 120,353 | ||||||||||||||
| Income tax benefit |
(113,854 | ) | (26,620 | ) | (112,796 | ) | (22,519 | ) | (44,395 | ) | ||||||||||
| Net loss |
$ | (222,951 | ) | $ | (49,593 | ) | $ | (36,319 | ) | $ | (55,422 | ) | $ | (16,127 | ) | |||||
| Loans Held for Investment |
$ | 881,179 | $ | (21,375 | ) | $ | (11,928 | ) | $ | (9,084 | ) | $ | 31,646,555 | |||||||
| Core Deposits(2) |
$ | 6,107,779 | $ | 6,373,515 | $ | 6,937,760 | $ | 7,532,854 | $ | 42,819,710 | ||||||||||
| Total Deposits |
$ | 7,621,031 | $ | 8,034,332 | $ | 8,786,315 | $ | 10,745,405 | $ | 48,052,380 | ||||||||||
| Total: |
| |||||||||||||||||||
| Interest Income |
$ | 4,863,246 | $ | 4,646,431 | $ | 4,380,376 | $ | 4,359,663 | $ | 3,901,560 | ||||||||||
| Interest Expense |
1,862,733 | 1,842,993 | 1,767,031 | 1,757,209 | 1,562,488 | |||||||||||||||
| Net interest income |
$ | 3,000,513 | $ | 2,803,438 | $ | 2,613,345 | $ | 2,602,454 | $ | 2,339,072 | ||||||||||
| Non-interest income |
1,566,232 | 1,517,989 | 1,387,471 | 1,294,076 | 1,210,346 | |||||||||||||||
| Provision for loan losses |
1,940,368 | 1,142,825 | 887,097 | 867,662 | 998,128 | |||||||||||||||
| Restructuring expenses |
27,809 | 19,354 | 91,074 | — | — | |||||||||||||||
| Other non-interest expenses |
2,107,398 | 1,914,867 | 1,943,461 | 1,974,047 | 1,962,686 | |||||||||||||||
| Income tax provision |
169,558 | 428,010 | 311,572 | 368,697 | 185,992 | |||||||||||||||
| Net Income |
$ | 321,612 | $ | 816,371 | $ | 767,612 | $ | 686,124 | $ | 402,612 | ||||||||||
| Loans Held for Investment |
$ | 151,362,417 | $ | 144,768,561 | $ | 143,497,756 | $ | 142,005,042 | $ | 146,151,268 | ||||||||||
| Core Deposits(2) |
$ | 69,316,301 | $ | 69,086,358 | $ | 70,767,190 | $ | 70,498,461 | $ | 69,897,095 | ||||||||||
| Total Deposits |
$ | 82,990,462 | $ | 83,342,814 | $ | 85,680,455 | $ | 87,663,750 | $ | 85,770,892 | ||||||||||
| (1) | The information in this statistical summary reflects the adjustment to add back the effect of securitization transactions qualifying as sales under generally accepted accounting principles. See accompanying schedule—“Reconciliation to GAAP Financial Measures.” In Q3 2007, the Company shutdown the mortgage origination operations of its wholesale mortgage banking unit, GreenPoint Mortgage. The results of the mortgage origination operation of GreenPoint have been accounted for as a discontinued operation and have been removed from the Company’s results of continuing operations for all periods presented. The results of GreenPoint’s mortgage servicing business are reported in continuing operations for all periods presented. Effective Q4 2007, GreenPoint’s held for investment commercial and consumer loan portfolio results are included in continuing operations. |
| (2) | Includes domestic non-interest bearing deposits, NOW accounts, money market deposit accounts, savings accounts, certificates of deposit of less than $100,000 and other consumer time deposits. |
| (3) | Results of the North Fork acquisition were included in the Other category for Q4 2006. |
| (4) | Net Interest Margin—Loans is interest income—loans divided by average managed loans. |
| (5) | Net Interest Margin—Deposits is interest expense—deposits divided by average retail deposits. |
| (6) | Net charge-off rate for Q2 2007 was positively impacted by 16 basis points due to the implementation of a change in customer statement generation from 30 to 25 days grace. This change did not have a material impact on the provision for the quarter. |
| (7) | Efficiency Ratio is non-interest expenses divided by total managed revenue. |
| (8) | Certain prior period amounts have been reclassified to conform with current period presentation. |
4
CAPITAL ONE FINANCIAL CORPORATION (COF)
NATIONAL LENDING SUBSEGMENT FINANCIAL & STATISTICAL SUMMARY FOR CONTINUING OPERATIONS
MANAGED BASIS (1)
| (in thousands) |
2007 Q4 |
2007 Q3 |
2007 Q2 |
2007 Q1 |
2006 Q4 |
|||||||||||||||
| US Card: |
||||||||||||||||||||
| Interest Income |
$ | 2,058,920 | $ | 1,953,967 | $ | 1,779,670 | $ | 1,813,846 | $ | 1,795,345 | ||||||||||
| Interest Expense |
574,714 | 596,767 | 590,236 | 602,505 | 600,821 | |||||||||||||||
| Net interest income |
$ | 1,484,206 | $ | 1,357,200 | $ | 1,189,434 | $ | 1,211,341 | $ | 1,194,524 | ||||||||||
| Non-interest income |
1,046,823 | 975,502 | 842,428 | 778,606 | 795,881 | |||||||||||||||
| Provision for loan losses |
913,113 | 662,428 | 402,589 | 373,836 | 554,698 | |||||||||||||||
| Non-interest expenses |
822,317 | 815,470 | 808,769 | 861,020 | 916,963 | |||||||||||||||
| Income tax provision |
273,686 | 294,053 | 282,253 | 259,751 | 181,561 | |||||||||||||||
| Net income |
$ | 521,913 | $ | 560,751 | $ | 538,251 | $ | 495,340 | $ | 337,183 | ||||||||||
| Loans Held for Investment |
$ | 52,078,847 | $ | 49,573,279 | $ | 50,032,530 | $ | 49,681,559 | $ | 53,623,680 | ||||||||||
| Average Loans Held for Investment |
$ | 50,276,568 | $ | 49,682,666 | $ | 49,573,957 | $ | 51,878,104 | $ | 51,686,135 | ||||||||||
| Loans Held for Investment Yield |
16.38 | % | 15.73 | % | 14.36 | % | 13.99 | % | 13.89 | % | ||||||||||
| Net Interest Margin |
11.81 | % | 10.93 | % | 9.60 | % | 9.34 | % | 9.24 | % | ||||||||||
| Revenue Margin |
20.14 | % | 18.78 | % | 16.39 | % | 15.34 | % | 15.40 | % | ||||||||||
| Risk Adjusted Margin |
14.74 | % | 14.65 | % | 12.66 | % | 11.35 | % | 11.58 | % | ||||||||||
| Non-Interest Expenses as a % of Average Loans Held for Investment |
6.54 | % | 6.57 | % | 6.53 | % | 6.64 | % | 7.10 | % | ||||||||||
| Efficiency Ratio (2) |
32.49 | % | 34.96 | % | 39.80 | % | 43.27 | % | 46.07 | % | ||||||||||
| Net charge-off rate |
5.40 | % | 4.13 | % | 3.73 | %(5) | 3.99 | % | 3.82 | % | ||||||||||
| Delinquency Rate (30+ days) |
4.95 | % | 4.46 | % | 3.41 | % | 3.48 | % | 3.74 | % | ||||||||||
| Purchase Volume (3) |
$ | 22,909,274 | $ | 21,522,104 | $ | 21,781,462 | $ | 19,346,812 | $ | 22,782,451 | ||||||||||
| Number of Loan Accounts (000s) |
36,450 | 36,504 | 36,608 | 36,758 | 37,630 | |||||||||||||||
| Auto Finance: |
||||||||||||||||||||
| Interest Income |
$ | 687,389 | $ | 661,471 | $ | 651,821 | $ | 637,609 | $ | 593,268 | ||||||||||
| Interest Expense |
300,133 | 283,949 | 277,783 | 265,556 | 242,311 | |||||||||||||||
| Net interest income |
$ | 387,256 | $ | 377,522 | $ | 374,038 | $ | 372,053 | $ | 350,957 | ||||||||||
| Non-interest income |
14,888 | 13,514 | 23,273 | 60,586 | 14,143 | |||||||||||||||
| Provision for loan losses |
429,247 | 244,537 | 182,278 | 200,058 | 151,171 | |||||||||||||||
| Non-interest expenses |
144,301 | 152,275 | 157,044 | 164,948 | 162,022 | |||||||||||||||
| Income tax provision |
(58,963 | ) | (1,987 | ) | 19,948 | 23,266 | 18,167 | |||||||||||||
| Net (loss) income |
$ | (112,441 | ) | $ | (3,789 | ) | $ | 38,041 | $ | 44,367 | $ | 33,740 | ||||||||
| Loans Held for Investment |
$ | 25,128,352 | $ | 24,335,242 | $ | 24,067,760 | $ | 23,930,547 | $ | 21,751,827 | ||||||||||
| Average Loans Held for Investment |
$ | 24,920,380 | $ | 24,170,047 | $ | 23,898,070 | $ | 23,597,675 | $ | 21,498,205 | ||||||||||
| Loans Held for Investment Yield |
11.03 | % | 10.95 | % | 10.91 | % | 10.81 | % | 11.04 | % | ||||||||||
| Net Interest Margin |
6.22 | % | 6.25 | % | 6.26 | % | 6.31 | % | 6.53 | % | ||||||||||
| Revenue Margin |
6.45 | % | 6.47 | % | 6.65 | % | 7.33 | % | 6.79 | % | ||||||||||
| Risk Adjusted Margin |
2.46 | % | 2.91 | % | 4.30 | % | 5.04 | % | 3.94 | % | ||||||||||
| Non-Interest Expenses as a % of Average Loans Held for Investment |
2.32 | % | 2.52 | % | 2.63 | % | 2.80 | % | 3.01 | % | ||||||||||
| Efficiency Ratio (2) |
35.88 | % | 38.94 | % | 39.53 | % | 38.13 | % | 44.38 | % | ||||||||||
| Net charge-off rate |
4.00 | % | 3.56 | % | 2.35 | % | 2.29 | % | 2.85 | % | ||||||||||
| Delinquency Rate (30+ days) |
7.84 | % | 7.15 | % | 6.00 | % | 4.64 | % | 6.35 | % | ||||||||||
| Auto Loan Originations |
$ | 3,623,491 | $ | 3,248,747 | $ | 2,992,427 | $ | 3,311,868 | $ | 3,078,877 | ||||||||||
| Number of Loan Accounts (000s) |
1,771 | 1,731 | 1,771 | 1,762 | 1,589 | |||||||||||||||
| Global Financial Services: |
||||||||||||||||||||
| Interest Income |
$ | 929,219 | $ | 896,440 | $ | 829,551 | $ | 803,141 | $ | 793,400 | ||||||||||
| Interest Expense |
360,233 | 351,399 | 329,087 | 316,223 | 319,974 | |||||||||||||||
| Net interest income |
$ | 568,986 | $ | 545,041 | $ | 500,464 | $ | 486,918 | $ | 473,426 | ||||||||||
| Non-interest income |
322,604 | 323,130 | 311,438 | 299,307 | 295,216 | |||||||||||||||
| Provision for loan losses |
434,967 | 289,122 | 284,282 | 275,322 | 304,968 | |||||||||||||||
| Non-interest expenses |
423,222 | 399,862 | 400,469 | 396,201 | 455,538 | |||||||||||||||
| Income tax provision |
10,079 | 60,781 | 44,346 | 39,860 | 6,040 | |||||||||||||||
| Net income |
$ | 23,322 | $ | 118,406 | $ | 82,805 | $ | 74,842 | $ | 2,096 | ||||||||||
| Loans Held for Investment |
$ | 29,301,244 | $ | 28,647,750 | $ | 27,489,749 | $ | 26,759,426 | $ | 26,983,673 | ||||||||||
| Average Loans Held for Investment |
$ | 29,124,537 | $ | 27,952,871 | $ | 27,048,111 | $ | 26,800,802 | $ | 26,697,140 | ||||||||||
| Loans Held for Investment Yield (4) |
12.69 | % | 12.72 | % | 12.16 | % | 11.88 | % | 11.80 | % | ||||||||||
| Net Interest Margin |
7.81 | % | 7.80 | % | 7.40 | % | 7.27 | % | 7.09 | % | ||||||||||
| Revenue Margin |
12.25 | % | 12.42 | % | 12.01 | % | 11.73 | % | 11.52 | % | ||||||||||
| Risk Adjusted Margin |
8.05 | % | 8.42 | % | 8.03 | % | 7.55 | % | 7.63 | % | ||||||||||
| Non-Interest Expenses as a % of Average Loans Held for Investment |
5.81 | % | 5.72 | % | 5.92 | % | 5.91 | % | 6.83 | % | ||||||||||
| Efficiency Ratio (2) |
47.47 | % | 46.06 | % | 49.32 | % | 50.39 | % | 59.27 | % | ||||||||||
| Net charge-off rate |
4.19 | % | 4.00 | % | 3.98 | % | 4.18 | % | 3.89 | % | ||||||||||
| Delinquency Rate (30+ days) |
3.29 | % | 3.02 | % | 2.93 | % | 2.99 | % | 2.97 | % | ||||||||||
| Number of Loan Accounts (000s) |
10,316 | 10,238 | 10,157 | 10,148 | 10,155 | |||||||||||||||
| (1) | The information in this statistical summary reflects the adjustment to add back the effect of securitization transactions qualifying as sales under generally accepted accounting principles. See accompanying schedule—“Reconciliation to GAAP Financial Measures.” |
| (2) | Efficiency ratio is non-Interest Expenses divided by total Managed Revenue |
| (3) | Includes all purchase transactions net of returns and excludes cash advance transactions. |
| (4) | Excludes “GFS—Home Loans Originations” and “GFS—Settlement Services” from Other Interest Income. |
| (5) | Net charge-off rate for Q2 2007 was positively impacted by 31 basis points due to the implementation of a change in customer statement generation from 30 to 25 days grace. This change did not have a material impact on the provision for the quarter. |
5
CAPITAL ONE FINANCIAL CORPORATION
Reconciliation to GAAP Financial Measures
For the Three Months Ended December 31, 2007
(dollars in thousands)(unaudited)
The Company’s consolidated financial statements prepared in accordance with generally accepted accounting principles (“GAAP”) are referred to as its “reported” financial statements. Loans included in securitization transactions which qualified as sales under GAAP have been removed from the Company’s “reported” balance sheet. However, servicing fees, finance charges, and other fees, net of charge-offs, and interest paid to investors of securitizations are recognized as servicing and securitizations income on the “reported” income statement.
The Company’s “managed” consolidated financial statements reflect adjustments made related to effects of securitization transactions qualifying as sales under GAAP. The Company generates earnings from its “managed” loan portfolio which includes both the on-balance sheet loans and off-balance sheet loans. The Company’s “managed” income statement takes the components of the servicing and securitizations income generated from the securitized portfolio and distributes the revenue and expense to appropriate income statement line items from which it originated. For this reason the Company believes the “managed” consolidated financial statements and related managed metrics to be useful to stakeholders.
| Total Reported | Adjustments(1) | Total Managed(2) | ||||||||
| Income Statement Measures(3) |
||||||||||
| Net interest income |
$ | 1,762,247 | $ | 1,238,266 | $ | 3,000,513 | ||||
| Non-interest income |
2,158,340 | (592,108 | ) | 1,566,232 | ||||||
| Total revenue |
3,920,587 | 646,158 | 4,566,745 | |||||||
| Provision for loan losses |
1,294,210 | 646,158 | 1,940,368 | |||||||
| Net charge-offs |
$ | 650,018 | $ | 646,158 | $ | 1,296,176 | ||||
| Balance Sheet Measures |
||||||||||
| Loans Held for Investment |
$ | 101,805,027 | $ | 49,557,390 | $ | 151,362,417 | ||||
| Total assets |
$ | 150,590,369 | $ | 48,706,677 | $ | 199,297,046 | ||||
| Average loans Held for Investment |
$ | 97,784,813 | $ | 50,577,525 | $ | 148,362,338 | ||||
| Average earning assets |
$ | 127,553,955 | $ | 48,409,256 | $ | 175,963,211 | ||||
| Average total assets |
$ | 151,517,794 | $ | 49,732,018 | $ | 201,249,812 | ||||
| Delinquencies |
$ | 3,721,444 | $ | 2,142,353 | $ | 5,863,797 | ||||
| (1) |
Income statement adjustments reclassify the net of finance charges of $1,648.6 million, past-due fees of $301.1 million, other interest income of $(46.7) million and interest expense of $664.8 million; and net charge-offs of $646.2 million from Non-interest income to Net interest income and Provision for loan losses, respectively. |
| (2) |
The managed loan portfolio does not include auto loans which have been sold in whole loan sale transactions where the Company has retained servicing rights. |
| (3) |
Based on continuing operations. |
6
CAPITAL ONE FINANCIAL CORPORATION
Consolidated Balance Sheets
(in thousands)(unaudited)
| As of December 31 2007 |
As of September 30 2007 |
As of December 31 2006(1) |
||||||||||
| Assets: |
||||||||||||
| Cash and due from banks |
$ | 2,377,287 | $ | 1,819,121 | $ | 2,817,519 | ||||||
| Federal funds sold and resale agreements |
1,766,762 | 1,922,735 | 1,099,156 | |||||||||
| Interest-bearing deposits at other banks |
677,360 | 703,805 | 743,821 | |||||||||
| Cash and cash equivalents |
4,821,409 | 4,445,661 | 4,660,496 | |||||||||
| Securities available for sale |
19,781,587 | 19,959,247 | 15,246,887 | |||||||||
| Mortgage loans held for sale |
315,863 | 1,454,457 | 10,435,295 | |||||||||
| Loans held for investment |
101,805,027 | 95,405,217 | 96,512,139 | |||||||||
| Less: Allowance for loan and lease losses |
(2,963,000 | ) | (2,320,000 | ) | (2,180,000 | ) | ||||||
| Net loans held for investment |
98,842,027 | 93,085,217 | 94,332,139 | |||||||||
| Accounts receivable from securitizations |
4,717,879 | 6,905,859 | 4,589,235 | |||||||||
| Premises and equipment, net |
2,299,603 | 2,268,034 | 2,203,280 | |||||||||
| Interest receivable |
839,317 | 793,693 | 816,426 | |||||||||
| Goodwill |
12,830,740 | 12,952,838 | 13,635,435 | |||||||||
| Other |
6,141,944 | 5,289,829 | 3,820,092 | |||||||||
| Total assets |
$ | 150,590,369 | $ | 147,154,835 | $ | 149,739,285 | ||||||
| Liabilities: |
||||||||||||
| Non-interest-bearing deposits |
$ | 11,046,549 | $ | 10,840,189 | $ | 11,648,070 | ||||||
| Interest-bearing deposits |
71,943,913 | 72,502,625 | 74,122,822 | |||||||||
| Senior and subordinated notes |
10,712,706 | 10,784,182 | 9,725,470 | |||||||||
| Other borrowings |
26,583,683 | 22,722,519 | 24,257,007 | |||||||||
| Interest payable |
631,609 | 552,674 | 574,763 | |||||||||
| Other |
5,377,797 | 4,965,794 | 4,175,947 | |||||||||
| Total liabilities |
126,296,257 | 122,367,983 | 124,504,079 | |||||||||
| Stockholders’ Equity: |
||||||||||||
| Common stock |
4,192 | 4,183 | 4,122 | |||||||||
| Paid-in capital, net |
15,860,490 | 15,768,525 | 15,333,137 | |||||||||
| Retained earnings and cumulative other comprehensive income |
11,582,816 | 11,395,226 | 10,026,364 | |||||||||
| Less: Treasury stock, at cost |
(3,153,386 | ) | (2,381,082 | ) | (128,417 | ) | ||||||
| Total stockholders’ equity |
24,294,112 | 24,786,852 | 25,235,206 | |||||||||
| Total liabilities and stockholders’ equity |
$ | 150,590,369 | $ | 147,154,835 | $ | 149,739,285 | ||||||
| (1) | Certain prior period amounts have been reclassified to conform to the current period presentation. |
7
CAPITAL ONE FINANCIAL CORPORATION
Consolidated Statements of Income
(in thousands, except per share data)(unaudited)
| Three Months Ended | Year Ended | |||||||||||||||||||
| December 31 2007 |
September 30 2007 |
December 31 (1) 2006 |
December 31 2007 |
December 31 (1) 2006 |
||||||||||||||||
| Interest Income: |
||||||||||||||||||||
| Loans held for investment, including past-due fees |
$ | 2,536,779 | $ | 2,381,096 | $ | 2,002,111 | $ | 9,500,128 | $ | 7,046,473 | ||||||||||
| Securities available for sale |
256,364 | 252,550 | 185,424 | 950,972 | 676,712 | |||||||||||||||
| Other |
167,051 | 133,321 | 136,390 | 627,056 | 441,550 | |||||||||||||||
| Total interest income |
2,960,194 | 2,766,967 | 2,323,925 | 11,078,156 | 8,164,735 | |||||||||||||||
| Interest Expense: |
||||||||||||||||||||
| Deposits |
686,174 | 740,091 | 552,385 | 2,906,351 | 1,814,797 | |||||||||||||||
| Senior and subordinated notes |
159,878 | 144,643 | 136,282 | 577,128 | 411,643 | |||||||||||||||
| Other borrowings |
351,895 | 257,759 | 242,286 | 1,064,832 | 846,849 | |||||||||||||||
| Total interest expense |
1,197,947 | 1,142,493 | 930,953 | 4,548,311 | 3,073,289 | |||||||||||||||
| Net interest income |
1,762,247 | 1,624,474 | 1,392,972 | 6,529,845 | 5,091,446 | |||||||||||||||
| Provision for loan and lease losses |
1,294,210 | 595,534 | 513,157 | 2,636,502 | 1,476,438 | |||||||||||||||
| Net interest income after provision for loan and lease losses |
468,037 | 1,028,940 | 879,815 | 3,893,343 | 3,615,008 | |||||||||||||||
| Non-Interest Income: |
||||||||||||||||||||
| Servicing and securitizations |
1,271,396 | 1,354,303 | 959,436 | 4,840,677 | 4,209,637 | |||||||||||||||
| Service charges and other customer-related fees |
573,034 | 522,374 | 462,086 | 2,057,854 | 1,770,340 | |||||||||||||||
| Mortgage servicing and other |
(5,700 | ) | 52,661 | 58,805 | 166,776 | 177,893 | ||||||||||||||
| Interchange |
152,595 | 103,799 | 147,571 | 500,484 | 549,074 | |||||||||||||||
| Other |
167,015 | 116,525 | 43,577 | 488,432 | 294,080 | |||||||||||||||
| Total non-interest income |
2,158,340 | 2,149,662 | 1,671,475 | 8,054,223 | 7,001,024 | |||||||||||||||
| Non-Interest Expense: |
||||||||||||||||||||
| Salaries and associate benefits |
622,101 | 627,358 | 617,563 | 2,592,534 | 2,224,676 | |||||||||||||||
| Marketing |
358,182 | 332,693 | 395,360 | 1,347,836 | 1,444,324 | |||||||||||||||
| Communications and data processing |
189,415 | 194,551 | 187,043 | 758,820 | 712,001 | |||||||||||||||
| Supplies and equipment |
146,267 | 134,639 | 137,582 | 531,238 | 460,419 | |||||||||||||||
| Occupancy |
91,675 | 77,597 | 63,796 | 322,510 | 215,636 | |||||||||||||||
| Restructuring expense |
27,809 | 19,354 | — | 138,237 | — | |||||||||||||||
| Other |
699,758 | 548,029 | 561,342 | 2,386,835 | 1,886,635 | |||||||||||||||
| Total non-interest expense |
2,135,207 | 1,934,221 | 1,962,686 | 8,078,010 | 6,943,691 | |||||||||||||||
| Income from continuing operations before income taxes |
491,170 | 1,244,381 | 588,604 | 3,869,556 | 3,672,341 | |||||||||||||||
| Income taxes |
169,558 | 428,010 | 185,992 | 1,277,837 | 1,245,964 | |||||||||||||||
| Income from continuing operations, net of tax |
321,612 | 816,371 | 402,612 | 2,591,719 | 2,426,377 | |||||||||||||||
| Loss from discontinued operations, net of tax(2) |
(95,044 | ) | (898,029 | ) | (11,884 | ) | (1,021,387 | ) | (11,884 | ) | ||||||||||
| Net income (loss) |
$ | 226,568 | $ | (81,658 | ) | $ | 390,728 | $ | 1,570,332 | $ | 2,414,493 | |||||||||
| Basic earnings per share |
||||||||||||||||||||
| Income from continuing operations |
$ | 0.85 | $ | 2.11 | $ | 1.20 | $ | 6.64 | $ | 7.84 | ||||||||||
| Loss from discontinued operations |
(0.25 | ) | (2.32 | ) | (0.04 | ) | (2.62 | ) | (0.04 | ) | ||||||||||
| Net income (loss) |
$ | 0.60 | $ | (0.21 | ) | $ | 1.16 | $ | 4.02 | $ | 7.80 | |||||||||
| Diluted earnings per share |
||||||||||||||||||||
| Income from continuing operations |
$ | 0.85 | $ | 2.09 | $ | 1.17 | $ | 6.55 | $ | 7.65 | ||||||||||
| Loss from discontinued operations |
(0.25 | ) | (2.30 | ) | (0.03 | ) | (2.58 | ) | (0.03 | ) | ||||||||||
| Net income (loss) |
$ | 0.60 | $ | (0.21 | ) | $ | 1.14 | $ | 3.97 | $ | 7.62 | |||||||||
| Dividends paid per share |
$ | 0.03 | $ | 0.03 | $ | 0.03 | $ | 0.11 | $ | 0.11 | ||||||||||
| (1) | Certain prior period amounts have been reclassified to conform to the current period presentation. |
| (2) | Certain prior period amounts have been reclassified to conform to the current period presentation. In Q3 2007, the Company shutdown the mortgage origination operations of its wholesale mortgage banking unit, GreenPoint Mortgage, realizing an after-tax loss of $898.0 million. The results of the mortgage origination operation of GreenPoint have been accounted for as a discontinued operation and have been removed from the Company’s results of continuing operations for all periods presented. |
8
CAPITAL ONE FINANCIAL CORPORATION
Statements of Average Balances, Income and Expense, Yields and Rates
(dollars in thousands)(unaudited)
| Reported | Quarter Ended 12/31/07 | Quarter Ended 9/30/07 (1) | Quarter Ended 12/31/06 (1) | ||||||||||||||||||||||||
| Average Balance |
Income/ Expense |
Yield/ Rate |
Average Balance |
Income/ Expense |
Yield/ Rate |
Average Balance |
Income/ Expense |
Yield/ Rate |
|||||||||||||||||||
| Earning assets: |
|||||||||||||||||||||||||||
| Loans held for investment |
97,784,813 | 2,536,779 | 10.38 | % | 91,744,846 | 2,381,096 | 10.38 | % | 74,737,753 | 2,002,111 | 10.72 | % | |||||||||||||||
| Securities available for sale |
20,102,440 | 256,364 | 5.10 | % | 20,041,177 | 252,550 | 5.04 | % | 15,090,001 | 185,424 | 4.92 | % | |||||||||||||||
| Other |
9,355,161 | 167,051 | 7.14 | % | 6,568,358 | 133,321 | 8.12 | % | 8,020,811 | 136,390 | 6.80 | % | |||||||||||||||
| Total earning assets (2) |
$ | 127,242,414 | $ | 2,960,194 | 9.31 | % | $ | 118,354,381 | $ | 2,766,967 | 9.35 | % | $ | 97,848,565 | $ | 2,323,925 | 9.50 | % | |||||||||
| Interest-bearing liabilities: |
|||||||||||||||||||||||||||
| Interest-bearing deposits |
|||||||||||||||||||||||||||
| NOW accounts |
$ | 4,674,490 | $ | 30,443 | 2.61 | % | $ | 4,759,665 | $ | 34,030 | 2.86 | % | $ | 2,094,623 | $ | 14,546 | 2.78 | % | |||||||||
| Money market deposit accounts |
28,983,602 | 270,943 | 3.74 | % | 28,696,735 | 294,873 | 4.11 | % | 15,762,255 | 149,831 | 3.80 | % | |||||||||||||||
| Savings accounts |
8,172,510 | 32,520 | 1.59 | % | 8,345,638 | 37,474 | 1.80 | % | 5,425,790 | 31,386 | 2.31 | % | |||||||||||||||
| Other Consumer Time Deposits |
16,374,958 | 183,570 | 4.48 | % | 17,203,453 | 194,256 | 4.52 | % | 16,656,731 | 190,489 | 4.57 | % | |||||||||||||||
| Public Fund CD’s of $100,000 or more |
1,902,442 | 23,126 | 4.86 | % | 1,884,767 | 23,092 | 4.90 | % | 1,281,768 | 16,636 | 5.19 | % | |||||||||||||||
| CD’s of $100,000 or more |
8,335,941 | 97,335 | 4.67 | % | 8,673,860 | 103,296 | 4.76 | % | 8,682,658 | 101,535 | 4.68 | % | |||||||||||||||
| Foreign time deposits |
3,868,444 | 48,237 | 4.99 | % | 3,991,056 | 53,070 | 5.32 | % | 3,831,401 | 47,962 | 5.01 | % | |||||||||||||||
| Total Interest-bearing deposits |
$ | 72,312,387 | $ | 686,174 | 3.80 | % | $ | 73,555,174 | $ | 740,091 | 4.02 | % | $ | 53,735,226 | $ | 552,385 | 4.11 | % | |||||||||
| Senior and subordinated notes |
10,682,635 | 159,878 | 5.99 | % | 9,811,821 | 144,643 | 5.90 | % | 9,034,696 | 136,282 | 6.03 | % | |||||||||||||||
| Other borrowings |
26,433,200 | 351,895 | 5.33 | % | 18,892,876 | 257,759 | 5.46 | % | 18,891,606 | 242,286 | 5.13 | % | |||||||||||||||
| Total interest-bearing liabilities (2) |
$ | 109,428,222 | $ | 1,197,947 | 4.38 | % | $ | 102,259,871 | $ | 1,142,493 | 4.47 | % | $ | 81,661,528 | $ | 930,953 | 4.56 | % | |||||||||
| Net interest spread |
4.93 | % | 4.88 | % | 4.94 | % | |||||||||||||||||||||
| Interest income to average earning assets |
9.31 | % | 9.35 | % | 9.50 | % | |||||||||||||||||||||
| Interest expense to average earning assets |
3.77 | % | 3.86 | % | 3.81 | % | |||||||||||||||||||||
| Net interest margin |
5.54 | % | 5.49 | % | 5.69 | % | |||||||||||||||||||||
| (1) | Prior period amounts have been reclassified to conform with current period presentation. |
| (2) | Average balances, income and expenses, yields and rates are based on continuing operations. |
9
CAPITAL ONE FINANCIAL CORPORATION
Statements of Average Balances, Income and Expense, Yields and Rates
(dollars in thousands)(unaudited)
| Managed (1) | Quarter Ended 12/31/07 | Quarter Ended 9/30/07 (2) | Quarter Ended 12/31/06 (2) | ||||||||||||||||||||||||
| Average Balance |
Income/ Expense |
Yield/ Rate |
Average Balance |
Income/ Expense |
Yield/ Rate |
Average Balance |
Income/ Expense |
Yield/ Rate |
|||||||||||||||||||
| Earning assets: |
|||||||||||||||||||||||||||
| Loans held for investment |
148,362,338 | 4,512,219 | 12.17 | % | 143,781,268 | 4,324,272 | 12.03 | % | 123,901,960 | 3,640,588 | 11.75 | % | |||||||||||||||
| Securities available for sale |
20,102,440 | 256,364 | 5.10 | % | 20,041,177 | 252,550 | 5.04 | % | 15,090,001 | 185,424 | 4.92 | % | |||||||||||||||
| Other |
7,186,892 | 94,663 | 5.27 | % | 4,415,978 | 69,610 | 6.31 | % | 6,121,053 | 75,547 | 4.94 | % | |||||||||||||||
| Total earning assets (3) |
$ | 175,651,670 | $ | 4,863,246 | 11.07 | % | $ | 168,238,423 | $ | 4,646,432 | 11.05 | % | $ | 145,113,014 | $ | 3,901,559 | 10.76 | % | |||||||||
| Interest-bearing liabilities: |
|||||||||||||||||||||||||||
| Interest-bearing deposits |
|||||||||||||||||||||||||||
| NOW accounts |
$ | 4,674,490 | $ | 30,443 | 2.61 | % | $ | 4,759,665 | $ | 34,030 | 2.86 | % | $ | 2,094,623 | $ | 14,546 | 2.78 | % | |||||||||
| Money market deposit accounts |
28,983,602 | 270,943 | 3.74 | % | 28,696,735 | 294,873 | 4.11 | % | 15,762,255 | 149,831 | 3.80 | % | |||||||||||||||
| Savings accounts |
8,172,510 | 32,520 | 1.59 | % | 8,345,638 | 37,474 | 1.80 | % | 5,425,790 | 31,386 | 2.31 | % | |||||||||||||||
| Other Consumer Time Deposits |
16,374,958 | 183,570 | 4.48 | % | 17,203,453 | 194,256 | 4.52 | % | 16,656,731 | 190,489 | 4.57 | % | |||||||||||||||
| Public Fund CD’s of $100,000 or more |
1,902,442 | 23,126 | 4.86 | % | 1,884,767 | 23,092 | 4.90 | % | 1,281,768 | 16,636 | 5.19 | % | |||||||||||||||
| CD’s of $100,000 or more |
8,335,941 | 97,335 | 4.67 | % | 8,673,860 | 103,296 | 4.76 | % | 8,682,658 | 101,535 | 4.68 | % | |||||||||||||||
| Foreign time deposits |
3,868,444 | 48,237 | 4.99 | % | 3,991,056 | 53,070 | 5.32 | % | 3,831,401 | 47,962 | 5.01 | % | |||||||||||||||
| Total Interest-bearing deposits |
$ | 72,312,387 | $ | 686,174 | 3.80 | % | $ | 73,555,174 | $ | 740,091 | 4.02 | % | $ | 53,735,226 | $ | 552,385 | 4.11 | % | |||||||||
| Senior and subordinated notes |
10,682,635 | 159,878 | 5.99 | % | 9,811,821 | 144,643 | 5.90 | % | 9,034,696 | 136,282 | 6.03 | % | |||||||||||||||
| Other borrowings |
26,433,200 | 351,895 | 5.33 | % | 18,892,876 | 257,759 | 5.46 | % | 18,891,606 | 242,299 | 5.13 | % | |||||||||||||||
| Securitization liability |
49,847,555 | 664,786 | 5.33 | % | 51,320,446 | 700,501 | 5.46 | % | 48,603,831 | 631,521 | 5.20 | % | |||||||||||||||
| Total interest-bearing liabilities (3) |
$ | 159,275,777 | $ | 1,862,733 | 4.68 | % | $ | 153,580,317 | $ | 1,842,994 | 4.80 | % | $ | 130,265,359 | $ | 1,562,487 | 4.80 | % | |||||||||
| Net interest spread |
6.39 | % | 6.25 | % | 5.96 | % | |||||||||||||||||||||
| Interest income to average earning assets |
11.07 | % | 11.05 | % | 10.76 | % | |||||||||||||||||||||
| Interest expense to average earning assets |
4.24 | % | 4.38 | % | 4.31 | % | |||||||||||||||||||||
| Net interest margin |
6.83 | % | 6.67 | % | 6.45 | % | |||||||||||||||||||||
| (1) | The information in this table reflects the adjustment to add back the effect of securitized loans. |
| (2) | Prior period amounts have been reclassified to conform with current period presentation. |
| (3) | Average balances, income and expenses, yields and rates are based on continuing operations. |
10
News Release
FOR IMMEDIATE RELEASE: January 23, 2008
| Contacts: | Investor Relations | Media Relations | ||||
| Jeff Norris | Tatiana Stead | Julie Rakes | ||||
| 703-720-2455 | 703-720-2352 | 804-284-5800 | ||||
Capital One Reports Fourth Quarter Earnings
McLean, Va. (Jan 23, 2008) – Capital One Financial Corporation (NYSE: COF) today announced earnings for 2007 of $1.6 billion, or $3.97 per share (diluted). Earnings from continuing operations for the full year were $2.6 billion or $6.55 per share (diluted), versus the prior year’s $2.4 billion, or $7.65 earnings per share (diluted). Net income for the fourth quarter of 2007 was $226.6 million, or $0.60 earnings per share (diluted). Fourth quarter 2007 earnings from continuing operations were $321.6 million, or $0.85 earnings per share (diluted) compared to $402.6 million, or $1.17 earnings per share (diluted) in the fourth quarter of 2006. These results are consistent with those reported by the company on January 10, 2008 and provide additional information regarding segment performance.
Earnings from continuing operations excludes the loss from discontinued operations related to the shutdown of GreenPoint Mortgage, announced in August 2007, of $0.25 per share (diluted) for the fourth quarter of 2007 and $2.58 per share (diluted) for full year 2007.
“As the economy has weakened, we have selectively pulled back loan growth and maintained appropriately conservative underwriting standards,” said Richard D. Fairbank, Capital One’s Chairman and Chief Executive Officer. “We feel confident that our strong balance sheet, resilient businesses, and decisive actions will allow us to successfully navigate the cyclical economic weakness and we remain poised to generate above average returns on the other side of the cycle.”
Total Company Results
| • | Managed loans held for investment at the end of 2007 were $151.4 billion, up $5.2 billion or 3.6 percent over the end of 2006. Increases during the year came primarily in the Auto and Global Financial Services portfolios. Managed loans increased from the third quarter of 2007 by $6.6 billion, or 4.6 percent, driven largely by seasonal growth in U.S. Card and Auto. The company expects managed loan growth in the low single digits in 2008. |
Capital One Reports Fourth Quarter Earnings
Page 2
| • | Total managed revenue was up 5.7 percent relative to the third quarter of 2007, driven largely by revenue margin expansion and seasonal loan growth in our U.S. Card portfolio. The company expects 2008 revenue growth to be in the low single digits. |
| • | On a managed basis, the fourth quarter 2007 provision for loan losses was approximately $1.9 billion. This was comprised of approximately $1.3 billion in charge-offs and an allowance build of approximately $650 million. The allowance is driven by the loss outlook at year-end which reflects fourth quarter credit metrics and a recognition of the weakening trends in the U.S. economy as the company entered 2008. |
| • | Fourth quarter operating expenses of $1.7 billion included approximately $140 million of legal liabilities and reserves. Full year 2007 operating expenses were $6.6 billion, leading to an efficiency ratio of 47 percent. The company expects its 2008 operating expenses to be at least $200 million below 2007, leading to an efficiency ratio in the mid-forty percent range for 2008. |
| • | Total deposits of $83.0 billion at the end of the fourth quarter of 2007 were essentially flat with the previous quarter. |
“The company ended 2007 with a year-end ratio of tangible common equity (TCE) to tangible managed assets of 5.8 percent. In the current environment we intend, through internal capital generation, to manage toward the high end or above our target range of 5.5 - 6.0 percent,” said Gary L. Perlin, Capital One’s Chief Financial Officer. “We will maintain our strong liquidity position and continue to take actions to sustain profitability through the cycle.”
Segment Results
National Lending Segment
| • | Profits for the National Lending segment were up $59.8 million as compared to the fourth quarter of 2006, driven by increased profits in U.S. Card and Global Financial Services. |
| • | The managed charge-off rate for the National Lending segment in the fourth quarter of 2007 was 4.73 percent versus 3.96 percent in the third quarter of 2007 and 3.63 percent in the fourth quarter of 2006. The delinquency rate of 5.17 percent for National Lending increased from 4.70 percent at the end of the third quarter and 4.09 percent as of December 31, 2006. Credit metrics have risen year over year due to credit normalization, secondary effects of changes to pricing and fee policies in U.S. Card, and deterioration in the company’s U.S. consumer loan portfolio due to weakening in the U.S. economy. |
Capital One Reports Fourth Quarter Earnings
Page 3
U.S. Card highlights
| • | U.S. Card reported record net income for 2007 of $2.1 billion, versus $1.8 billion in 2006. Fourth quarter net income was $521.9 million, a 54.8 percent increase, year over year as revenue growth and expense reductions more than offset increased charge-offs and allowance build. |
| • | Revenues increased 27.2 percent from the fourth quarter of 2006 largely as a result of pricing changes implemented in some of the company’s products after completion of the card holder system conversion. |
| • | Non-interest expenses decreased 6.1 percent to $3.3 billion in 2007 from $3.5 billion in 2006. Non-interest expenses in the fourth quarter of 2007 were relatively flat compared to the third quarter of 2007. |
| • | Managed loans at the end of 2007 were $52.1 billion, a decline of 2.9 percent from the end of 2006, and an increase of 5.1 percent from the end of the third quarter of 2007. The year over year decline was a result of a reduction in the marketing of teaser rate offers in the prime market and a $600.0 million portfolio sale in the first quarter of 2007. The increase in managed loans relative to the third quarter was due primarily to seasonality. |
| • | Charge-offs rose in the fourth quarter of 2007 to 5.40 percent from 3.82 percent in the fourth quarter of 2006, and delinquencies rose to 4.95 percent from 3.74 percent. The increases resulted from continued normalization of consumer credit, pull-back from the prime revolver market throughout the year, impacts of U.S. Card’s pricing and fee policy changes made in the second and third quarters, and economic weakening evidenced in recently released economic indicators. In addition, credit metrics in the fourth quarter of 2007 reflect expected seasonal patterns on a sequential quarter basis. The company expects the U.S. Card managed charge-off rate to be in the mid-6 percent range in the first half of 2008. |
Auto Finance highlights
| • | Auto Finance reported a net loss for 2007 of $33.8 million, versus net income of $233.5 million in 2006. In the fourth quarter of 2007, Auto posted a net loss of $112.4 million, primarily due to the effects of credit worsening. |
| • | Increases in charge-off and delinquency rates were a result of expected seasonal patterns, credit normalization and weakening in the U.S. economy. While the company increased its pricing and tightened credit standards in the fourth quarter of 2007, the reduction in |
Capital One Reports Fourth Quarter Earnings
Page 4
| competitive intensity allowed the company to originate $3.6 billion of high quality loans, up 11.5 percent, compared to the third quarter of 2007. |
| • | Tightened underwriting and increased prices implemented in the fourth quarter have resulted in better credit profiles and higher pricing on the portfolio. An intended effect of the tightened underwriting has been to reduce the amount of originations. In 2008, the company expects to further reduce originations and focus its dealer prime business on a much smaller network of dealers. |
| • | On January 1, 2008, the company moved Capital One Auto Finance Company (“COAF”), a previously wholly owned finance company subsidiary of Capital One Financial Corporation to become a direct operating subsidiary of Capital One, N.A., a wholly owned banking subsidiary. This legal entity restructuring enhances the holding company’s liquidity profile and COAF’s funding flexibility. |
Global Financial Services (GFS) highlights
| • | GFS reported net income for 2007 of $299.4 million, versus $273.9 million in 2006. Fourth quarter 2007 net income was $23.3 million, a $21.2 million increase over last year’s fourth quarter driven by higher revenue margin and lower operating expenses offset by higher provision expense. The reduction in net income relative to the prior quarter was primarily driven by an increase in provision expense. |
| • | Managed loans grew 8.6 percent, to $29.3 billion during 2007 with growth from North American businesses more than offsetting a modest decline in loans in the UK. |
| • | Strong credit results in the Canadian credit card business and stable and improving credit performance in the UK muted worsening credit trends in the domestic GFS businesses for 2007. |
Local Banking Segment highlights
| • | Net income of $111.8 million in the fourth quarter of 2007 was down $78.8 million over the third quarter, due primarily to the third quarter including a release in reserves that resulted from aligning the Banking segment’s allowance methodologies with the company’s methodology. |
| • | Loans held for investment grew $1.7 billion from the third quarter of 2007 to $44.0 billion primarily from the addition of GreenPoint Mortgage loans and increased commercial loan production. Total Bank deposits grew $305.2 million to $73.3 billion. |
Capital One Reports Fourth Quarter Earnings
Page 5
| • | The charge-off rate was 28 basis points in the fourth quarter of 2007 compared to 19 basis points in the third quarter, and non-performing loans were 41 basis points at December 31, 2007 compared to 27 basis points at September 30, 2007. While losses remain at very low levels, during the quarter the Bank experienced charge-off increases in its Consumer Real Estate portfolio and Unsecured Lending. |
| • | Integration efforts continue to be on track with the brand conversion and deposit platform conversion scheduled for the first quarter. |
The company generates earnings from its managed loan portfolio, which includes both on-balance sheet loans and securitized (off-balance sheet) loans. For this reason, the company believes managed financial measures to be useful to stakeholders. In compliance with Regulation G of the Securities and Exchange Commission, the company is providing a numerical reconciliation of managed financial measures to comparable measures calculated on a reported basis using generally accepted accounting principles (GAAP). Please see the schedule titled “Reconciliation to GAAP Financial Measures” attached to this release for more information.
Forward looking statements
The company cautions that its current expectations in this release, in the presentation slides available on the company’s website and in its Form 8-K dated January 23, 2008, for 2008 revenue growth, managed growth, operating efficiencies, operating expense reductions, the expected managed charge-off rate for U.S. Card for the first half of 2008, and estimated loss levels for the twelve months ending December 31, 2008 underlying its provision expenses in the fourth quarter of 2007, and the company’s plans, objectives, expectations, and intentions, are forward-looking statements and actual results could differ materially from current expectations due to a number of factors, including: general economic and business conditions in the U.S. and or the UK, including conditions affecting employment levels, interest rates, consumer income, spending, and savings that may affect consumer bankruptcies, defaults, charge-offs and deposit activity; changes in the credit environment in the U.S. and or the UK; continued intense competition from numerous providers of products and services that compete with Capital One’s businesses; changes in our aggregate accounts and balances, and the growth rate and composition thereof; the company’s ability to execute on its strategic and operational plans; the risk that the company’s acquired businesses will not be integrated successfully and that the cost savings and other synergies from such acquisitions may not be fully realized; the risk that the benefits of the company’s restructuring initiative, including cost savings and other benefits, may not be fully realized; the success of the company’s marketing efforts; general conditions in the wholesale funding markets; and general market conditions in the mortgage industry. A discussion of these and other factors can be found in Capital One’s annual report and other reports filed with the Securities and Exchange Commission, including, but not limited to, Capital One’s report on Form 10-K for the fiscal year ended December 31, 2006, and reports on Form 10-Q and 10-Q/A for the quarters ended March 31, 2007, June 30, 2007 and September 30, 2007.
Capital One Reports Fourth Quarter Earnings
Page 6
About Capital One
Capital One Financial Corporation (www.capitalone.com) is a financial holding company whose subsidiaries collectively had $83.0 billion in deposits and $151.4 billion in managed loans outstanding as of December 31, 2007. Headquartered in McLean, VA, Capital One has 742 locations in New York, New Jersey, Connecticut, Texas and Louisiana. It is a diversified financial services company whose principal subsidiaries, Capital One, N.A., Capital One Bank, and Capital One Auto Finance, Inc., offer a broad spectrum of financial products and services to consumers, small businesses and commercial clients. A Fortune 500 company, Capital One trades on the New York Stock Exchange under the symbol “COF” and is included in the S&P 100 index.
###
NOTE: Fourth quarter 2007 financial results, SEC Filings, and fourth quarter earnings conference call slides are accessible on Capital One’s home page (www.capitalone.com). Choose “Investors” on the bottom of the home page to view and download the earnings press release, slides, and other financial information. Additionally, a webcast of today’s 5:00 pm (ET) earnings conference call is accessible through the same link.
 January 23, 2008
|
 2 Forward-Looking Information Please note that the following materials containing information regarding Capital One’s financial
performance speak only as of the particular date or dates indicated in these materials. Capital
One does not undertake any obligation to update or revise any of the information contained herein whether as a result of new information, future events or otherwise. Certain statements in this presentation and other oral and written statements made by the Company from time
to time, are forward-looking statements, including those that discuss strategies, goals,
outlook or other non-historical matters; projections, revenues, income, returns, earnings
per share or other financial measures for Capital One and/or discuss the assumptions that underlie these projections, including future financial and operating results, and the company’s plans, objectives, expectations and intentions. To the extent that any such information is forward-looking, it is intended to fit within the safe harbor for forward-looking information
provided by the Private Securities Litigation Reform Act of 1995. Numerous factors could cause
our actual results to differ materially from those described in forward-looking statements, including, among other things: general economic and business conditions in the U.S. and or the UK, including conditions affecting consumer income, spending and repayments, changes in the credit environment in the U.S. and or the UK, including an increase
or decrease in credit losses, changes in the interest rate environment; continued intense
competition from numerous providers of products and services that compete with our businesses;
financial, legal, regulatory or accounting changes or actions; changes in our aggregate accounts or consumer loan balances and the growth rate and composition thereof; the amount of deposit growth; changes in the reputation of the credit
card industry and/or the company with respect to practices and products; the risk that Capital
One’s acquired businesses will not be integrated successfully; the risk that synergies from such acquisitions may not be fully realized or may take longer to realize than expected; disruption from the acquisitions making it more difficult to maintain relationships with customers, employees or suppliers; the risk that the benefits of the
Company’s restructuring initiative, including cost savings, may not be fully realized; our
ability to access the capital markets at attractive rates and terms to fund our operations and future growth; losses associated with new products or services; the company’s ability to execute on its strategic and operational plans; any significant disruption in our operations or technology platform; our ability to effectively control our costs; the success of
marketing efforts; our ability to recruit and retain experienced management personnel; changes
in the labor market; general economic conditions in the mortgage industry; and other factors listed from time to time in reports we file with the Securities and Exchange Commission (the “SEC”),
including, but not limited to, factors set forth under the caption “Risk
Factors” in our Annual Report on Form 10-K for the year ended December 31, 2006, and
our Quarterly Reports on Forms 10-Q and 10-Q/A for the quarters ended March 31, 2007,
June 30, 2007 and September 30, 2007. You should carefully consider the factors discussed above in evaluating these forward-looking statements. All information in these slides is based on the
consolidated results of Capital One Financial Corporation. A reconciliation of any non-GAAP
financial measures included in this presentation can be found in the Company’s most recent Form 10-K concerning annual financial results, available on the Company’s website at www.capitalone.com in Investor Relations under “About Capital One.” Forward looking statements |
 3 • Diluted EPS of $0.60 in quarter, and $3.97 for full year 2007 – EPS from continuing operations of $0.85 in quarter, and $6.55 for 2007 • We’re acting decisively to manage the company effectively in the face of cyclical economic headwinds Pulling back on growth Managing credit with insights & experience from prior economic downturns Increasing intensity of cost restructuring and operating efficiency efforts Building revenues Managing capital with discipline and returning excess capital to shareholders • We remain confident that our strong balance sheet and resilient businesses will enable us to successfully navigate an economic downturn, and will be poised for above-average shareholder returns on the other side of the cycle Fourth quarter 2007 highlights |
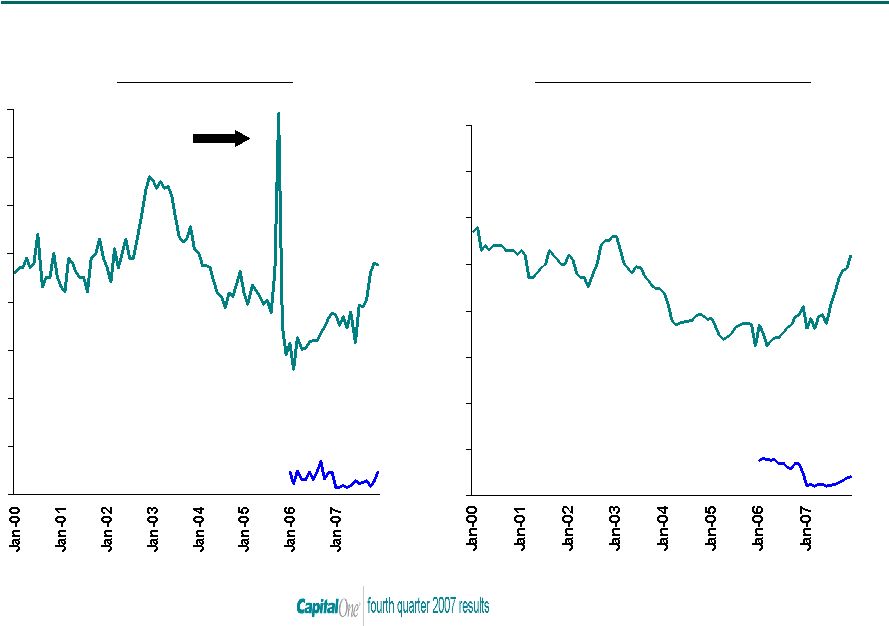 4 0% 1% 2% 3% 4% 5% 6% 7% 8% Credit metrics reflect weakening in the U.S. economy 0% 1% 2% 3% 4% 5% 6% 7% 8% Monthly Managed Net Charge-off Rate Monthly Managed Delinquency and Non-Performing Loan Rate Bankruptcy Filing Spike National Lending Local Banking Local Banking: Non performing loans as % of loans HFI National Lending 30+ Delinquency Rate Q407: 4.73% Q407: 0.28% 5.17% 0.41% |
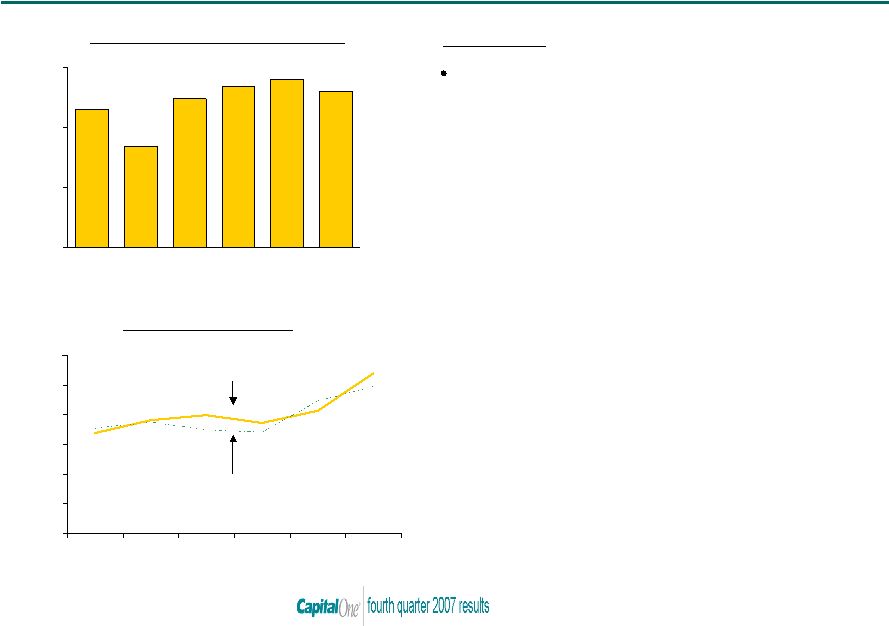 5 We’re taking action to strengthen resiliency and sustain the strong financial returns of our US Card business 3.82% 3.99% 3.73% 3.39% 4.13% 5.40% 3.74% 3.53% 3.48% 3.41% 4.46% 4.95% 0% 1% 2% 3% 4% 5% 6% Q306 Q406 Q107 Q207 Q307 Q407 Credit Risk Metrics (1) Based on internal allocations of consolidated results Managed 30+ Delinquency Rate Managed Net Charge-off Rate Highlights Q407 NIAT of $522 million, up 55% from Q406 - Revenues up 27% - Expenses down 10% - Provision up 65% • Charge-off and delinquency rates increased from Q406 and Q307 - Charge-off normalization and economic weakening - Exacerbated by prime revolver pull back, as well as pricing and fee moves in Q2, Q3 - Expect charge-off rate in mid-6%s in the first half of 2008 • Revenue margin peaked at 20% in Q407, moving to high-teens throughout 2008 • Return on allocated capital well above 40% in 2007, despite higher credit costs • Lessons from prior cyclical challenges inform current actions - Maintaining low lines and targeted product structures for riskier parts of the credit spectrum - Pulling back on growth with prudent underwriting and marketing - Ramping up collections intensity early in cycle - Increasing process and operating efficiency efforts Net Income After Tax (1) ($M) $461.6 $337.2 $495.3 $538.3 $560.8 $521.9 $0 $200 $400 $600 Q306 Q406 Q107 Q207 Q307 Q407 |
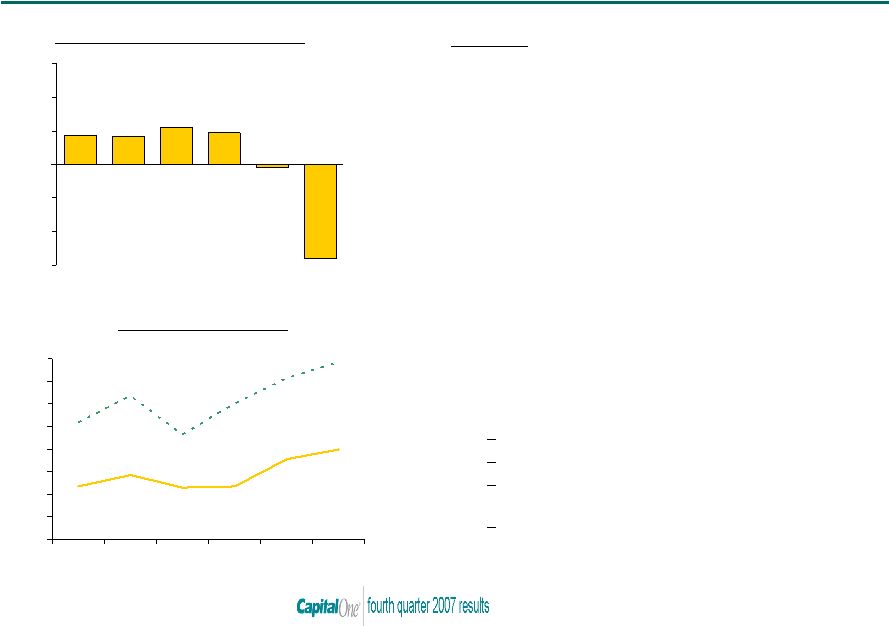 6 4.00% 3.56% 2.34% 2.85% 2.35% 2.29% 7.84% 7.15% 6.00% 4.64% 6.35% 5.18% 0% 1% 2% 3% 4% 5% 6% 7% 8% Q306 Q406 Q107 Q207 Q307 Q407 Credit Risk Metrics (1) Based on internal allocations of consolidated results Managed Net Charge-off Rate Managed 30+ Delinquency Rate Actions • Scaled back dealer prime – Much smaller network of dealers – Focus on dealers with deeper relationships, better credit and profitability performance • Moving “upmarket” within subprime and prime – Exiting bottom 25% of subprime originations – Exiting “near prime” – Significant improvement in credit characteristics, with average FICO of prime originations 30 points higher than Q406 • Increased pricing – Reduction in supply enabled higher pricing, even as credit characteristics of loans improved • 2008 expectations Further pull backs in current cyclical environment Declining originations and loan balances Further migration to higher quality loans within prime and subprime originations Improved financial returns $35.3 $33.7 $44.4 $38.0 ($3.8) ($112.4) ($120) ($80) ($40) $0 $40 $80 $120 Q306 Q406 Q107 Q207 Q307 Q407 Net Income After Tax (1) ($M) We’re taking decisive actions to reposition our auto business for improved performance |
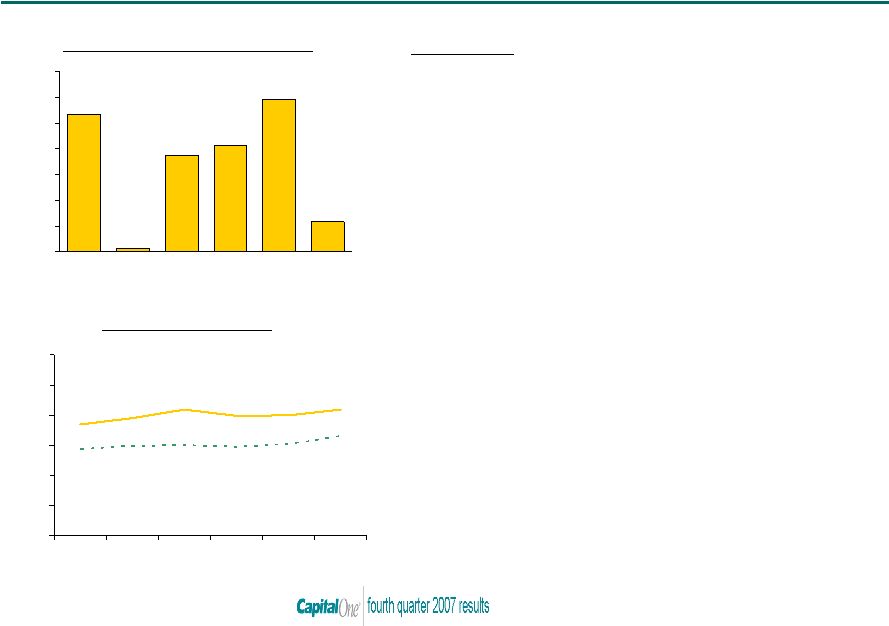 7 4.19% 4.00% 3.98% 4.18% 3.89% 3.70% 3.29% 3.02% 2.93% 2.99% 2.97% 2.86% 0% 1% 2% 3% 4% 5% 6% Q306 Q406 Q107 Q207 Q307 Q407 Global Financial Services posted solid loan growth and stable credit performance Credit Risk Metrics (1) Based on internal allocations of consolidated results Managed Net Charge-off Rate Managed 30+ Delinquency Rate Highlights • Net income of $23.3 million - Revenue up 16% - Expenses down 7% - Provision up 43% - Includes $30 million pre-tax gain on sale of Spanish Credit Card portfolio • Risk metrics up modestly from Q307 – US portfolio experiencing same pressures as US Card – UK credit outlook stable • $29 billion in managed loans, up 9% from Q406 - Small business loans up 12% - Installment Loans up 17% - Canadian Credit Card loans up 27% - Point-of-Sale originations up 9% - Capital One Home Loans originations down 26% - UK Card loans down 7% $2.1 $74.8 $82.8 $118.4 $23.3 $107.2 $0 $20 $40 $60 $80 $100 $120 $140 Q306 Q406 Q107 Q207 Q307 Q407 Net Income After Tax (1) ($M) |
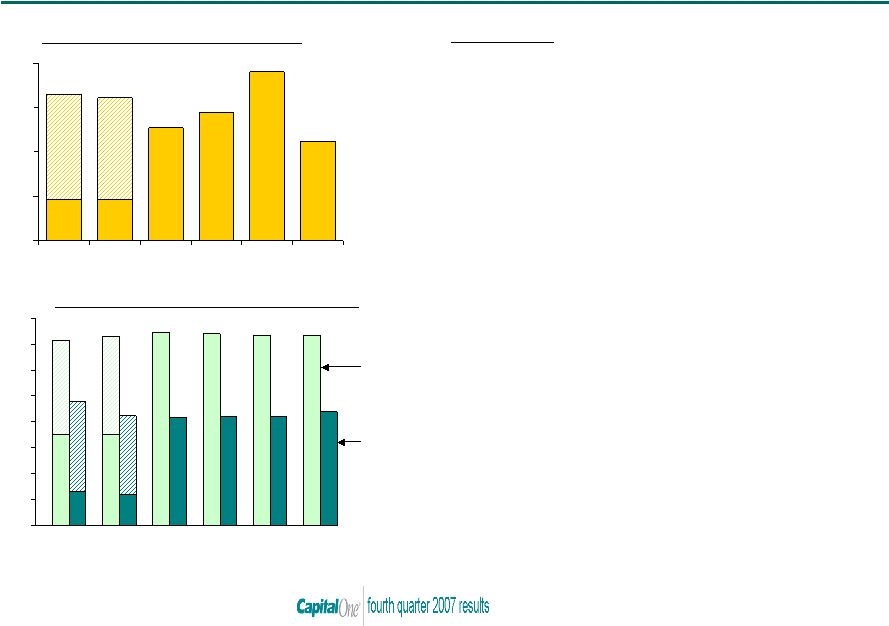 8 $0 $10 $20 $30 $40 $50 $60 $70 $80 $41.6 Local banking continues to make progress on integration Deposit and Loan Portfolio (2) ($B) $111.8 $190.6 $144.8 $127.0 $160.9 $165.4 $0 $50 $100 $150 $200 Q306 Q406 Q107 Q207 Q307 Q407 Net Income After Tax (1,2) ($M) (1) Based on internal allocations of consolidated results (2) 2006 Numbers based on pro-forma disclosures for combined NFB and COF; net of purchase accounting and integration expenses. (3) Includes adjustment reflecting incorporation of float deposits. Loans Held for Investment Deposits³ Highlights • NIAT of $111.8 million in Q407, down $80M from Q307 - Revenues flat - Expenses up 3% • Deposits of $73.3 billion, up slightly from Q307 - Expected re-investment by several large customers - Continued tough deposit competition • Loans up modestly from Q307, excluding the addition of Greenpoint loans - Commercial and small business loans grew - Expected paydowns in mortgage portfolio • Integration on track; New bank leadership team in place $71.5 $73.2 $74.5 $47.9 $42.3 Q406 Q107 Q207 Q307 $74.5 $41.9 Q407 Q306 $73.04 $42.2 $73.3 $44.0 |
 9 We have taken numerous actions to protect the business in the event of a cyclical downturn • Pulled back on lending programs – Tightened underwriting – Increased pricing • Remain cautious on loan growth, bullish on deposit growth – Slowed asset growth, particularly in low resilience segments – Resumed growth of direct deposits channels • Increased focus on driving solid operating performance – Increased collections and recoveries capacity – Accelerated portions of cost restructuring initiative • Expanded funding flexibility – moved COAF to become a direct operating subsidiary of Capital One Bank, N.A. – Extended committed conduit program from 1 year to 3 year renewal • Managing to high end, or possibly above, our target TCE ratio of 5.5% to 6.0% for 2008 |
 10 We continue to take actions to protect our business against a weakening economy Income Statement Balance Sheet • Maintaining high revenue margin • Taking out cost • Provisioning for a weakening economy • Maintaining strong liquidity • Enhancing already flexible funding • Growing capital levels with expected increase in dividend |
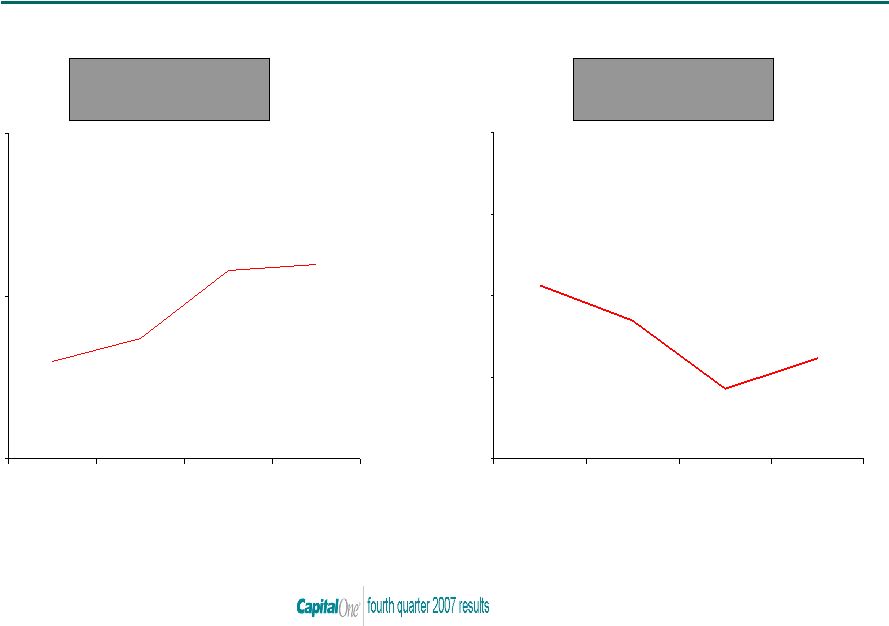 11 Our strong revenue margin, coupled with ongoing operating leverage, helps protect our P&L in an economic downturn 40% 45% 50% 55% 60% Q107 Q207 Q307 Q407 Revenue Margin Efficiency Ratio 8% 10% 12% Q107 Q207 Q307 Q407 |
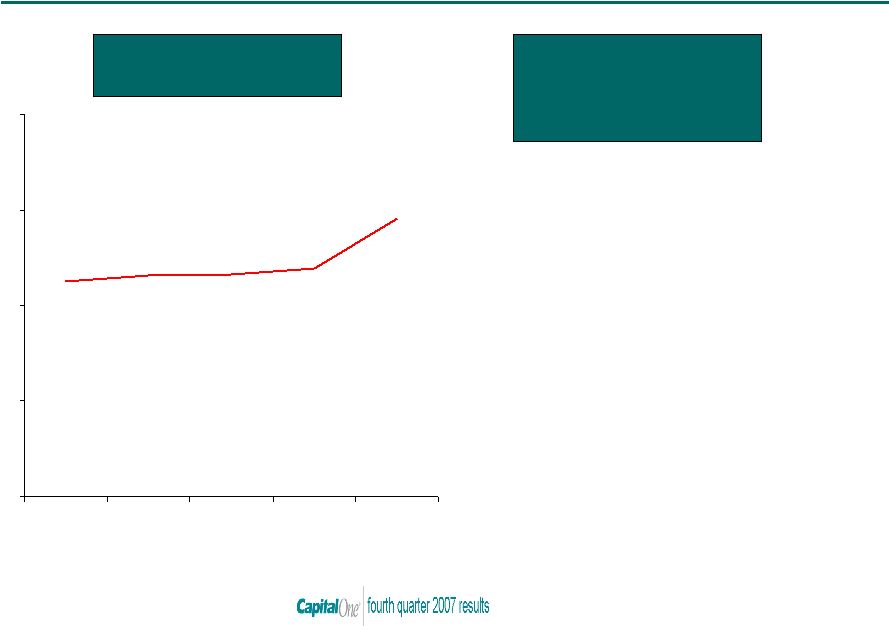 12 We have built allowance to reflect elevated loss estimates and continued economic weakness • US Card: 109% • Auto Finance: 46% • GFS: 173% • Local Banking: 94% – Consumer: 75% – Commercial: 103% • GreenPoint: 276% Allowance as % of Reported Loans Allowance as % of Reported 30+ Delinquencies (as of 12/31/07) 2.4% 2.9% 0% 1% 2% 3% 4% Q406 Q107 Q207 Q307 Q407 |
 13 We have strengthened our balance sheet to manage an economic downturn • $12B cash and unpledged marketable securities • $11B undrawn committed conduit • $6B FHLB capacity • Restructured legal entities to ensure all businesses have access to deposits • Capacity to securitize credit cards without accessing public markets provides flexibility in issuance • Ability to grow deposits across multiple channels Strong Liquidity Flexible Funding |
 14 We expect our portfolio to remain capital generative under a variety of economic scenarios TCE target of 5.5% to 6.0% Dividends and share repurchases Capital Generation • Completed $771M of share repurchases in Q407 ($3B buyback program complete) • Board of Directors expected to declare 2008 dividend of about 25% of estimated earnings • Share repurchases unlikely in first half of 2008 as we further build TCE ratios • Ended 2007 with 5.8% ratio of tangible common equity to tangible managed assets • Expect to manage at high-end of, or possibly above, target range in 2008 • High margins with slower growth means increasing capital • Stress testing using past recession scenarios suggests capital generation can support TCE target and ongoing capital return to shareholders |
 15 Expect sound operating metrics in 2008, despite continued credit headwinds Commentary Loan/Deposit Growth Cautious on loan growth; bullish on deposit growth Revenue Growth Positive US Card yield trends in last few quarters will moderate into 2008 Cost Management Capital Management ~25% of estimated 2008 NIAT paid as dividend; repurchases unlikely before second half of 2008 Credit Expectations Allowance at 12/31/07 consistent with $5.9B in managed charge-offs for twelve months ending 12/31/08 2008 Outlook Low single-digit growth Mid- 40s efficiency ratio Manage to the high end, or possibly above, 5.5- 6.0% TCE target Continued economic weakness At least $200M Y/Y OpEx reduction vs. 2007 Low single digits Strong business performance and capital discipline will drive above-average shareholder returns on the other side of a cyclical downturn |
 16 Appendix |
 17 Managed Balance Sheet Highlights ($Millions) 2007 balance sheet and return metrics from Continuing Operations Q407/Q307 Change Q407 Q307 Q406 $ %/bps Total Deposits $ 82,990 $ 83,343 $ 85,771 $ (353) (0.4) % Total Managed Loans Held for Investment 151,362 144,769 146,151 6,593 4.6 Tangible Assets 185,428 180,363 179,487 5,065 2.8 Tangible Common Equity 10,814 11,131 11,455 (317) (2.8) Tangible Common Equity to Tangible Assets Ratio 5.83 % 6.17 % 6.38 % n/a (34) bps Net Interest Margin 6.83 % 6.67 % 6.45 % n/a 16 bps Revenue Margin 10.40 10.27 9.78 n/a 13 Return on Managed Assets 0.64 1.68 1.01 n/a (104) Return on Equity 5.20 12.89 8.79 n/a (769) Return on Tangible Equity 11.54 27.95 14.38 n/a (1,641) |
 18 ($Millions except per share data) Change 2007 2006 $ %/bps Net Interest Income $ 11,019.8 $ 8,932.7 $ 2,087.1 23 % Non-Interest Income 5,765.8 4,907.3 858.5 17 % Total Revenue 16,785.6 13,840.0 2,945.6 21 % Net Charge-offs 4,162.0 3,158.1 1,003.9 32 % Allowance Build 783.0 164.1 618.9 377 % Other (107.0) (98.3) (8.7) n/a Provision for Loan Losses 4,838.0 3,223.9 1,614.1 50 % Marketing Expenses 1,347.8 1,444.3 (96.5) (7) % Restructuring Expenses 138.2 0.0 138.2 Operating Expenses 6,592.0 5,499.4 1,092.6 20 % Tax Rate 33.0 % 33.9 % n/a (90) bps Income from Continuing Operations, Net of Tax $ 2,591.7 $ 2,426.4 $ 165.3 7 % Loss from Discontinued Operations, Net of Tax (1,021.4) (11.9) (1,009.5) Net Income $ 1,570.3 2,414.5 $ (844.2) (35) % Shares Used to Compute Diluted EPS (MM) 395.5 317.0 Diluted EPS from Continuing Operations 6.55 7.65 Diluted EPS from Discontinued Operations (2.58) (0.03) 2007 managed income statement |
 19 Managed Income Statement Highlights ($Millions except per share data) Fourth quarter 2007 managed income statement Q407/Q307 Change Q407 Q307 Q406 $ %/bps Net Interest Income $ 3,000.5 $ 2,803.4 $ 2,339.1 $ 197.1 7 % Non-Interest Income 1,566.2 1,518.0 1,210.3 48.2 3 Total Revenue 4,566.7 4,321.4 3,549.4 245.3 6 % Net Charge-offs $ 1,296.2 $ 1,027.4 $ 927.5 $ 268.8 26 % Allowance Build 643.0 124.2 114.1 518.8 418 Other 1.1 (8.9) (43.5) 10.0 112 Provision for Loan Losses 1,940.3 1,142.7 998.1 797.6 70 % Marketing Expenses $ 358.2 $ 332.7 $ 395.4 25.5 8 % Restructuring Expenses 27.8 19.4 - 8.4 43 Operating Expenses 1,749.2 1,582.2 1,567.3 167.0 11 Tax Rate 34.5 % 34.4 % 31.6 % n/a 10 bps Income from Continuing Operations, Net of Tax $ 321.6 $ 816.4 $ 402.6 $ (494.8) (61) % Loss from Discontinued Operations, Net of Tax (95.0) (898.0) (11.9) 803.0 89 Net (Loss) Income 226.6 (81.6) 390.7 308.2 378 Shares Used to Compute Diluted EPS (MM) 378.4 390.8 343.8 n/a (3) % Diluted EPS from Continuing Operations $ 0.85 $ 2.09 $ 1.17 $ (1.24) (59) % Diluted EPS from Discontinued Operations (0.25) (2.30) (0.03) 2.05 89 % |
 20 With the $643M build in Q407, our allowance for loan losses is consistent with $5.9B of managed charge offs in 2008 Charge-offs and Allowance for Loan Losses ($Millions) 1 : Based on Continuing Operations. 2 : Based on Total Company balance sheet. Q407/Q307 Change Q407 Q307 Q406 $ %/bps Managed Net Charge-offs 1 $ 1,296.2 $ 1,027.4 $ 927.5 $ 268.8 26 % Allowance Build 1 643.0 124.2 114.1 518.8 418 Other 1 1.1 (8.9) (43.5) 10.0 n/a Managed Provision for Loan Losses 1 1,940.3 1,142.7 998.1 797.6 70 % Reported Net Charge-off Rate 1 2.66 2.09 2.37 n/a 57 bps Reported Loans 2 $ 101,805 $ 95,405 $ 96,512 $ 6,400 7 % Allowance for Loan Losses 2,963 2,320 2,180 643 28 Reported $30+ Day Delinquencies 2 3,721 3,077 2,648 644 21 Reported 30+ Delinquency Rate 2 3.66 % 3.22 % 2.74 % n/a 44 bps 2 |